solar irradiance, cosmic rays and cloudiness over daily timescales
TRANSCRIPT
Solar irradiance, cosmic rays and cloudiness over daily timescales
Benjamin A. Laken1,2 and Jasa Čalogović3
Received 23 September 2011; revised 15 November 2011; accepted 22 November 2011; published 29 December 2011.
[1] Although over centennial and greater timescales solarvariability may be one of the most influential climate forcingagents, the extent to which solar activity influences climateover shorter time periods is poorly understood. If a linkexists between solar activity and climate, it is likely via amechanism connected to one (or a combination) of the fol-lowing parameters: total solar irradiance (TSI), ultraviolet(UV) spectral irradiance, or the galactic cosmic ray (GCR)flux. We present an analysis based around a superposedepoch (composite) approach focusing on the largest TSIincreases and decreases (the latter occurring in both the pres-ence and absence of appreciable GCR reductions) over dailytimescales. Using these composites we test for the presenceof a robust link between solar activity and cloud cover overlarge areas of the globe using rigorous statistical techniques.We find no evidence that widespread variations in cloudcover at any tropospheric level are significantly associatedwith changes in the TSI, GCR or UV flux, and further con-clude that TSI or UV changes occurring during reductionsin the GCR flux are not masking a solar-cloud response.However, we note the detectability of any potential links isstrongly constrained by cloud variability. Citation: Laken,B. A., and J. Čalogović (2011), Solar irradiance, cosmic rays andcloudiness over daily timescales, Geophys. Res. Lett., 38,L24811, doi:10.1029/2011GL049764.
1. Introduction
[2] The Sun is one of the most important factors respon-sible for governing climate change over centennial andgreater timescales [e.g., Versteegh, 2005; Bard and Frank,2006; Beer et al., 2006], however the extent to which solaractivity may influence Earth’s climate over shorter timeperiods is still poorly understood. Several mechanisms havebeen proposed which may account for a solar-climate link,including: a connection between changes in total solar irra-diance (TSI) absorbed over cloud free regions of Earth’soceans, leading to modifications of synoptic circulationpatterns [Meehl et al., 2009]; a link between ultraviolet (UV)spectral irradiance changes and stratospheric temperaturesresulting from alterations to stratospheric ozone production[Austin et al., 2008], which may impact large scale tropo-spheric variability via dynamic stratosphere-tropospherecouplings [Haigh, 1996]; and, a link between the galactic
cosmic ray (GCR) flux and cloud properties, via either anion-mediated (clean-air) pathway, or a global electric circuit(GEC) related (near-cloud) pathway [Carslaw et al., 2002].The response times of these mechanisms ranges from min-utes (for mechanisms concerning the GEC) [Tinsley et al.,2001], to periods of around a week (for mechanismsconcerning the growth of cloud condensation nuclei ordynamic tropospheric links) [Arnold, 2007]. It should alsobe noted that irradiance-based mechanisms have been sug-gested which operate over long (annual-decadal) timescales(e.g. [White et al., 2003]), which are beyond the scope ofthis work.[3] These mechanisms all have the potential to amplify
relatively low energy changes in solar activity into climato-logically significant effects. Such an amplification is necessaryto account for the findings of palaeoclimatic reconstructionstudies which have demonstrated the existence of a pervasiveassociation between solar activity and numerous climatologi-cal parameters [e.g., Ram and Stolz, 1999; Bond et al., 2001;Mauas et al., 2011].[4] To investigate the possibility of daily timescale solar-
climate links a number of investigations have focused on theeffects of high amplitude short term reductions in the GCRflux (known as Forbush Decrease (FD) events) on cloudproperties. However, these studies have shown a range ofconflicting results. While some have demonstrated thepresence of significant positive correlations between cloudchanges and solar activity [Pudovkin and Veretenko, 1995;Todd and Kniveton, 2004; Harrison and Ambaum, 2010],others have shown significant negative correlations [Wanget al., 2006; Troshichev et al., 2008], or found no compel-ling evidence of significant correlations [Pallé and Butler,2001; Kristjánsson et al., 2008; Čalogović et al., 2010;Laken et al., 2009, 2011].[5] A number of possibilities may account for these
conflicting findings: 1) no relationship exists between solaractivity and climate; 2) a relationship exists, but it is con-strained by the atmospheric conditions at the time (i.e. not afirst order relationship) [Laken et al., 2010]; 3) even at dailytimescales studies have often failed to properly isolate theeffects of various solar parameters, consequently this mayhave interfered with their results [Laken et al., 2011]; 4) FDstudies deal with inherently small sample sizes, as thenumber of high magnitude solar events is low and conse-quently sample noise is high, limiting the detectability ofany solar-cloud signals. With regards to addressing thethird possibility, this work presents an analysis of thelargest daily timescale TSI variations using an epoch-superposition (composite) approach to test for the presenceof reliable daily-timescale link to satellite-detected cloudvariability. Samples have been carefully selected to iso-late a range of periods undergoing substantial changes in
1Instituto de Astrofísica de Canarias, Universidad de La Laguna,Tenerife, Spain.
2Department of Astrophysics, Faculty of Physics, Universidad de LaLaguna, Tenerife, Spain.
3Hvar Observatory, Faculty of Geodesy, University of Zagreb, Zagreb,Croatia.
Copyright 2011 by the American Geophysical Union.0094-8276/11/2011GL049764
GEOPHYSICAL RESEARCH LETTERS, VOL. 38, L24811, doi:10.1029/2011GL049764, 2011
L24811 1 of 6

solar activity of hypothesized significance to atmosphericvariability.
2. Datasets
[6] This investigation uses measurements of TSI emis-sions, cloud cover, the GCR flux, and the 10.7 cm solarradio flux (F10.7). TSI data are taken from the Active CavityRadiometer Irradiance Monitor (ACRIM) [Willson andMordvinov, 2003].[7] Variations in solar irradiance are caused by the pres-
ence of surface features such as sunspots and faculae, whichdiffer in brightness to the average surface intensity andcumulatively contribute to fluctuations in TSI. Variability atUV wavelengths is often connected with the presence ofplages: these are large bright complexes connected to mag-netically active regions in the chromosphere. The rotation offeatures such as plages and sunspots across the solar diskalters the amount of energy emitted towards the Earth (forfurther details see Lean and Woods [2010]). Changes in theGCR flux are linked to the solar wind and associated dis-turbances (such as coronal mass ejections CMEs). As thesolar wind travels at supersonic speeds, variations in theGCR flux resulting from solar disturbances can take up to2–4 days to occur [Brueckner et al., 1998], whereas irradi-ance associated changes are experienced on Earth almostinstantaneously following a solar event.[8] Cloud data are taken from the International Satellite
Cloud Climatology Project (ISCCP) D1 dataset infrared (IR)channels [Rossow and Schiffer, 1991]. ISCCP data are cre-ated from inter-calibrated radiance measurements recordedfrom polar orbiting and geostationary satellites. These dataare provided globally over on an equal-area grid of 280 �280 km2, at a 3-hour temporal resolution from 1983–2008.In this investigation daily average cloud data (retrieved at IRwavelengths) is used at 3 different altitude levels: for high(>6.5 km), middle (2–6.5 km) and low (0–3.2 km) clouds.At each of these altitude levels a further distinction is alsodrawn between high (>45°) and low (<45°) latitude regionsas well as over ocean and land regions. This area-averagingmethod was selected both in order to reduce noise associatedwith daily cloud variability and because the theoreticaleffects of solar irradiance and GCR flux on cloud cover mayvary across spatial domains.[9] GCR flux data are derived from the count rate recor-
ded by the Climax Colorado neutron monitor (39.37 N,�106.18 W, 3400 m, 2.99 GV). The F10.7 (2800 Mhz)radio flux is used as a proxy of extreme ultraviolet (EUV)solar activity [Rich et al., 2003]. All used data (except theF10.7) have been normalized to a static averaging periodfrom �20 to �10 days prior to the key composite date (i.e.all values displayed are an anomaly calculated against a10-day static averaging period).
3. Methods
[10] Three composite samples were constructed for thisanalysis. The first sample isolates dates of significantincreases in TSI occurring over a five day period where theincrease is half of the key date in magnitude and shallhereafter be referred to as IncTSI. The second sample iso-lates dates of significant decreases in TSI over a five day
period, and will be referred to as DecTSI-A. The third samplereferred to as DecTSI-B is identical to the DecTSI-A sample,however it is further restricted to events which show nosignificant GCR variations within �10 days of the keycomposite date.[11] The composited events were selected from a popula-
tion of the largest (95 percentile) daily timescale increases/decreases in TSI from 1978 to 2010. To calculate the chan-ges in the TSI record, a seven-day running mean was sub-tracted from a 31-day reference period, these originalpopulations were then reduced by excluding consecutivedates, leaving only the date of greatest TSI deviation.Finally, events were also removed from the populations ifsignificant TSI deviations (at least half of the key date inmagnitude) were observed to occur within a �10 day periodaround the key date. This treatment further reduced thesamples sizes to 19 events for the IncTSI sample, 48 eventsfor the DecTSI-A sample and 37 events for the DecTSI-Bsample presented in Table S1 in the auxiliary material.1
[12] The correlation coefficient (r) values were calculatedfor each three samples during an analysis period of�20 daysbetween the TSI, GCR and F10.7 fluxes and the corre-sponding cloud data. The analysis period of the cloud datawas extended by an additional 20 days allowing us to cal-culate the correlations with a lag of up to 20 days. MonteCarlo (MC) cased testing was employed to establish thethreshold significance values for every obtained correlation:random composite samples using the whole available clouddataset (ISCCP, 1983–2008) were constructed with samplesizes corresponding to the sample they were testing (e.g. n =19 random events for the IncTSI sample). These randomcomposites of cloud data were correlated with every inves-tigated parameter, and this process was repeated 100,000times. The resulting r values were found to be normallydistributed, according to the Shapiro-Wilk test of normalcy(W = 0.996, p = 4.8 � 10�10) [Shapiro and Wilk, 1965].Consequently, the statistical significance thresholds for thiswork are set by the two-tailed 95 percentile MC-generatedr values. This approach shows what a stochastic range ofcorrelations should be given random sampling. If the solarvariations of our samples were to affect cloud changes thenthe obtained correlations would be out of this stochasticrange and a significant correlation would be detected.[13] Consequently, this implies that for a solar-cloud
signal to be detected the efficiency of the mechanism mustbe high (where efficiency here refers to the ability of achange in a solar parameter to influence a change in cloud,e.g. if a 1% change in the GCR flux induced a 1% changein cloud cover the efficiency is 100%): for example, in thecase of low level clouds over ocean area regions we findthat for 100,000 randomly generated samples of 48 events,there is an average sample noise of 0.83(�0.15)% over a41-day period (Table 1). Thus, to detect a statisticallysignificant TSI-cloud correlation with this level of noiseunder the IncTSI sample (TSI increase of �0.08%), amechanism would have to have an efficiency greater than([0.83/0.08]*100=) 1,038%. Whereas, in the case of the
1Auxiliary materials are available in the HTML. doi:10.1029/2011GL049764.
LAKEN AND ČALOGOVIĆ: SOLAR IRRADIANCE, COSMIC RAYS AND CLOUD L24811L24811
2 of 6
DecTSI-A sample, with a GCR reduction of 2.8%, a GCRmechanism would have to have an efficiency greater than30% to produce a detectable signal.
4. Results and Discussion
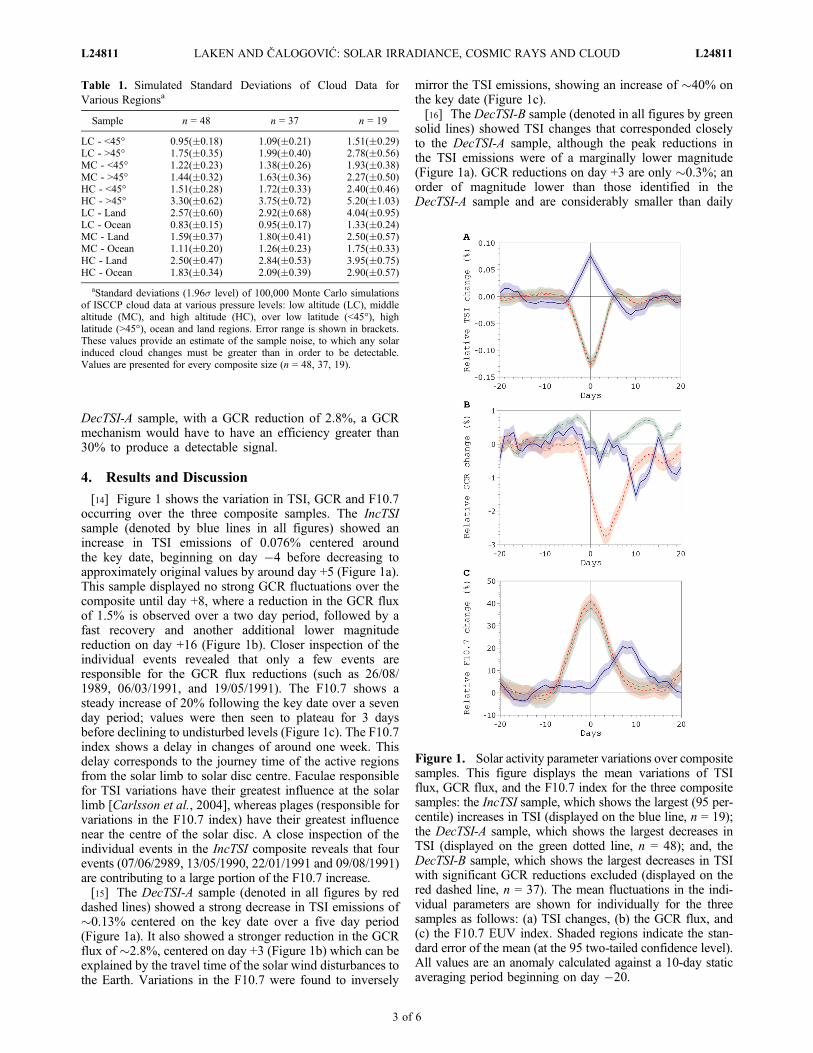
[14] Figure 1 shows the variation in TSI, GCR and F10.7occurring over the three composite samples. The IncTSIsample (denoted by blue lines in all figures) showed anincrease in TSI emissions of 0.076% centered aroundthe key date, beginning on day �4 before decreasing toapproximately original values by around day +5 (Figure 1a).This sample displayed no strong GCR fluctuations over thecomposite until day +8, where a reduction in the GCR fluxof 1.5% is observed over a two day period, followed by afast recovery and another additional lower magnitudereduction on day +16 (Figure 1b). Closer inspection of theindividual events revealed that only a few events areresponsible for the GCR flux reductions (such as 26/08/1989, 06/03/1991, and 19/05/1991). The F10.7 shows asteady increase of 20% following the key date over a sevenday period; values were then seen to plateau for 3 daysbefore declining to undisturbed levels (Figure 1c). The F10.7index shows a delay in changes of around one week. Thisdelay corresponds to the journey time of the active regionsfrom the solar limb to solar disc centre. Faculae responsiblefor TSI variations have their greatest influence at the solarlimb [Carlsson et al., 2004], whereas plages (responsible forvariations in the F10.7 index) have their greatest influencenear the centre of the solar disc. A close inspection of theindividual events in the IncTSI composite reveals that fourevents (07/06/2989, 13/05/1990, 22/01/1991 and 09/08/1991)are contributing to a large portion of the F10.7 increase.[15] The DecTSI-A sample (denoted in all figures by red
dashed lines) showed a strong decrease in TSI emissions of�0.13% centered on the key date over a five day period(Figure 1a). It also showed a stronger reduction in the GCRflux of �2.8%, centered on day +3 (Figure 1b) which can beexplained by the travel time of the solar wind disturbances tothe Earth. Variations in the F10.7 were found to inversely
mirror the TSI emissions, showing an increase of �40% onthe key date (Figure 1c).[16] The DecTSI-B sample (denoted in all figures by green
solid lines) showed TSI changes that corresponded closelyto the DecTSI-A sample, although the peak reductions inthe TSI emissions were of a marginally lower magnitude(Figure 1a). GCR reductions on day +3 are only �0.3%; anorder of magnitude lower than those identified in theDecTSI-A sample and are considerably smaller than daily
Figure 1. Solar activity parameter variations over compositesamples. This figure displays the mean variations of TSIflux, GCR flux, and the F10.7 index for the three compositesamples: the IncTSI sample, which shows the largest (95 per-centile) increases in TSI (displayed on the blue line, n = 19);the DecTSI-A sample, which shows the largest decreases inTSI (displayed on the green dotted line, n = 48); and, theDecTSI-B sample, which shows the largest decreases in TSIwith significant GCR reductions excluded (displayed on thered dashed line, n = 37). The mean fluctuations in the indi-vidual parameters are shown for individually for the threesamples as follows: (a) TSI changes, (b) the GCR flux, and(c) the F10.7 EUV index. Shaded regions indicate the stan-dard error of the mean (at the 95 two-tailed confidence level).All values are an anomaly calculated against a 10-day staticaveraging period beginning on day �20.
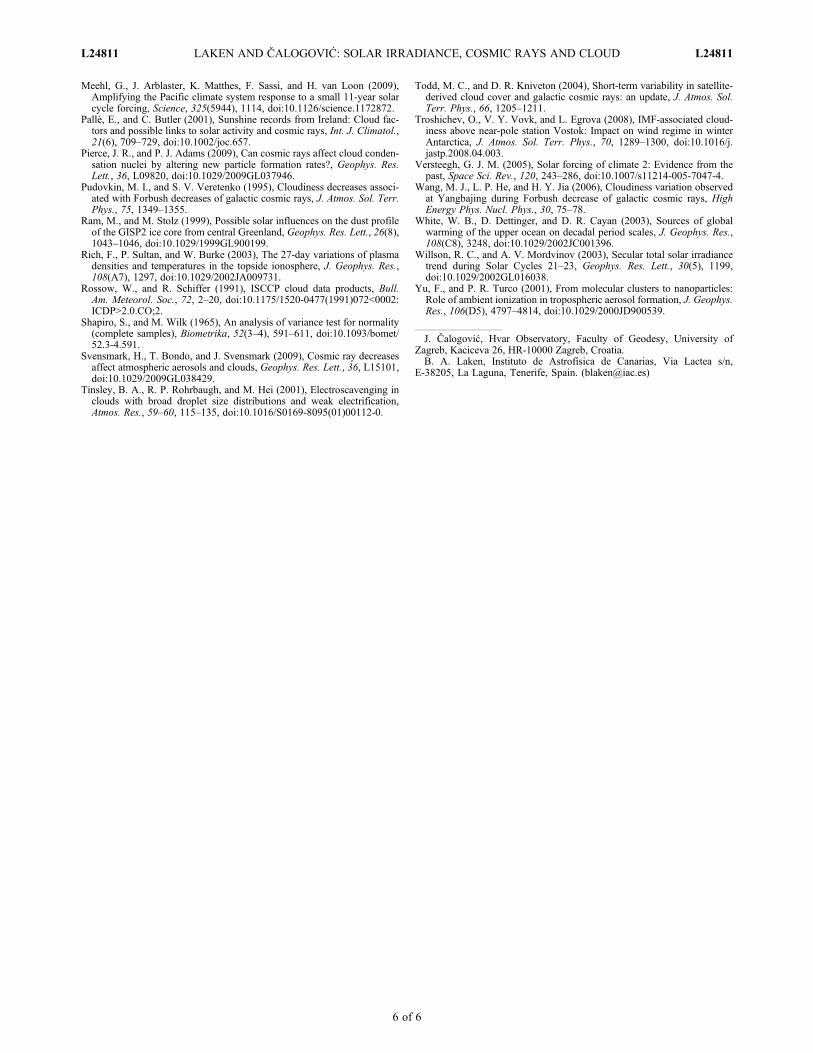
Table 1. Simulated Standard Deviations of Cloud Data forVarious Regionsa
Sample n = 48 n = 37 n = 19
LC - <45° 0.95(�0.18) 1.09(�0.21) 1.51(�0.29)LC - >45° 1.75(�0.35) 1.99(�0.40) 2.78(�0.56)MC - <45° 1.22(�0.23) 1.38(�0.26) 1.93(�0.38)MC - >45° 1.44(�0.32) 1.63(�0.36) 2.27(�0.50)HC - <45° 1.51(�0.28) 1.72(�0.33) 2.40(�0.46)HC - >45° 3.30(�0.62) 3.75(�0.72) 5.20(�1.03)LC - Land 2.57(�0.60) 2.92(�0.68) 4.04(�0.95)LC - Ocean 0.83(�0.15) 0.95(�0.17) 1.33(�0.24)MC - Land 1.59(�0.37) 1.80(�0.41) 2.50(�0.57)MC - Ocean 1.11(�0.20) 1.26(�0.23) 1.75(�0.33)HC - Land 2.50(�0.47) 2.84(�0.53) 3.95(�0.75)HC - Ocean 1.83(�0.34) 2.09(�0.39) 2.90(�0.57)
aStandard deviations (1.96s level) of 100,000 Monte Carlo simulationsof ISCCP cloud data at various pressure levels: low altitude (LC), middlealtitude (MC), and high altitude (HC), over low latitude (<45°), highlatitude (>45°), ocean and land regions. Error range is shown in brackets.These values provide an estimate of the sample noise, to which any solarinduced cloud changes must be greater than in order to be detectable.Values are presented for every composite size (n = 48, 37, 19).
LAKEN AND ČALOGOVIĆ: SOLAR IRRADIANCE, COSMIC RAYS AND CLOUD L24811L24811
3 of 6

GCR variations (Figure 1b). The F10.7 values were virtuallyidentical to the previously described DecTSI-A sample(Figure 1c).[17] None of the samples showed any significant correla-
tions between cloud anomalies and the TSI, GCR or F10.7flux for any of the investigated regions (high, low latitudesor ocean and land regions) at any altitude level (low, middleand high) within the 20-day lag period (Figure 2 andFigure S1). However, we note that TSI showed slightlyhigher correlation coefficients than in the case of the GCR ofF10.7 flux. Slightly higher, but non-significant correlationcoefficients were also noticed in the case of ocean regionsof the DecTSI-B sample compared to land regions, givingsome support for the mechanism suggested by Meehl et al.[2009]. Closer inspection of the spatial distributions ofcorrelation coefficients for TSI, GCR and F10.7 acrossthe globe (not shown) revealed inhomogeneous sporadiccorrelations, with no field significance.[18] Additionally, no significant correlations were identi-
fied between any dataset (TSI/GCR/F10.7) and globallyaveraged cloud cover, where the correlations were somewhatlower than those achieved by regional samples. This may beexplained by the observation of the existence of correlations/anti-correlations in the cloud data (particularly high cloudbetween low and high latitude regions), which (assuming thechanges represent absolute changes in cloud amount, as
opposed to shifts in cloud cover between the latitude divi-sions) may cancel out when considering a global area.[19] It is theoretically plausible that a correlation between
solar activity and cloud may exist over smaller regions thanthose considered in this work. However, reliably detectinglow amplitude signals with the data used in this study ishighly problematic. This is primarily due to the fact thatcloud datasets show a high degree of variability; the higherthe spatial resolution of the experiment, the greater this issuebecomes. This is demonstrated in Table 1, which displaysMC simulated 95% confidence level cloud variations at lowmiddle and high cloud levels for low and high latituderegions across the composite samples; in each instance thevariations are found to strongly increase with decreasingregion and sample size.[20] This important observation indicates that the detect-
ability of any potential signal over a given sample will bestrongly constrained by the size of the area, and the size ofthe sample, and may account for the wide-ranging andconflicting results obtained by workers dealing with suchstudies. We essentially have attempted to attain a balancebetween area-averaging (as a method of minimizing samplenoise), with selecting physically meaningful sample areaswith respect to theoretical solar-climate linkages. The aimwas to select our sample areas to reflect regions that mayallow us to both detect a solar signal and attribute it to a
Figure 2. Cloud variations at high and low latitudes. Normalized ISCCP cloud cover changes (%) at (a and b) low levels(0–3.2 km), (c and d) middle levels (3.2–6.5 km), and (e and f ) high levels (>6.5 km). Data are presented at low (<45°) andhigh (>45°) latitudes, over a�20 to +40 day period surrounding the key composite date. IncTSI sample denoted by blue line,DecTSI-A sample denoted by green dotted line, and DecTSI-B sample denoted by red dashed line. All values are an anomalycalculated against a 10-day static averaging period beginning on day �20.
LAKEN AND ČALOGOVIĆ: SOLAR IRRADIANCE, COSMIC RAYS AND CLOUD L24811L24811
4 of 6

mechanism, whilst minimizing potential noise-to-signal ratioissues.
5. No Evidence of a GCR-Based Solar-Cloud Link
[21] Comparing the cloud anomalies of the DecTSI-A andDecTSI-B samples (TSI reductions in the presence andabsence of significant GCR reductions) yields no apprecia-ble differences (Figure 1b). The same was observed in thecase of ocean and land regions (Figure S1), where due to thedifferent conditions low clouds cover ocean regions areclaimed to be more sensitive to GCR changes [Yu andTurco, 2001; Marsh and Svensmark, 2003]. From this weconclude that in the case of the selected events the variationsin the GCR flux do not significantly alter widespread cloudamount at any tropospheric level.[22] Large TSI reductions have been found to accompany
short term reductions in the GCR flux, and it has beensuggested that the co-variations in these parameters maycomplicate the unambiguous attribution of changes in atmo-spheric properties to a specific cause, or even interfere withthe detectability of potential signals [Laken et al., 2011],possibly influencing the results of studies [e.g., Pudovkin andVeretenko, 1995; Todd and Kniveton, 2004; Svensmark et al.,2009]. However, the analysis presented in this work showsthat following careful isolation of TSI and GCR variations,neither is found to be significantly associated with changes incloud cover.[23] Recent results from the Cosmic’s Leaving Outdoor
Droplets (CLOUD) experiment at CERN has shown evi-dence that the GCR flux may enhance the formation ofaerosols by ion-mediated nucleation [Kirkby et al., 2011].However, the enhancement is low, implying that for themajority of tropospheric conditions the enhanced nucleationrate is not large enough to ultimately affect cloud conden-sation nuclei (CCN) numbers significantly. Such conclu-sions have also been made independently based on climatemodel results [Pierce and Adams, 2009]. The results wepresent here are in agreement with these findings, as we findno significant change in cloud properties following signifi-cant GCR fluctuations. Furthermore, our selection of certainregions (e.g. low and high latitudes) and altitude levelssupport the findings of the CLOUD experiment, whichdemonstrates that temperature and altitude play a primaryrole in determining ion induced aerosol nucleation [Kirkbyet al., 2011].
6. Conclusions
[24] This work has attempted to test the notion of a linkbetween solar activity and cloud cover, using several highlyisolated composite samples. These samples reflected periodsof increasing and decreasing TSI, the latter being in thepresence/absence of significant reductions in the GCR flux.Although we successfully isolated periods of significantsolar activity changes, we found no widespread detectablechanges in cloud cover at any tropospheric level within a20 day period of the solar forcing clearly associated withsolar activity changes. Thus we can also conclude that TSIor UV changes occurring during reductions in the GCR fluxare not masking a solar-cloud response. It is still possiblethat any small amplitude or low efficiency solar-cloud sig-nals may be hidden by high meteorological variability of the
cloud data, although the sample selection and large areaaverages utilized provide some compensation for this effect.
[25] Acknowledgments. The authors thank Bojan Vršnak (HvarObservatory), Enric Pallé (Instituto de Astrofísica de Canarias) andDominic Kniveton (University of Sussex) for comments. ACRIM dataobtained from http://www.acrim.com/Data%20Products.htm. ISCCP dataare available from http://isccp.giss.nasa.gov, obtained from NASA LangleyResearch Centre Atmosphere Science Data Center. This research receivedfunding from the European 115 Commission’s Seventh Framework Pro-grams (FP7/2007-2013), grant 116, 218816. We also thank GeoffreyTyndall and two anonymous reviewers. The authors would like to acknowl-edge the support of the European COST Action ES1005.[26] The Editor thanks two anonymous reviewers for their assistance in
evaluating this paper.
ReferencesArnold, F. (2007), Atmospheric aerosol and cloud condensation nuclei
formation: A possible influence of cosmic rays, Space Sci. Rev., 125,169–186, doi:10.1007/s11214-006-9055-4.
Austin, J., et al. (2008), Coupled chemistry climate model simulations ofthe solar cycle in ozone and temperature, J. Geophys. Res., 113,D11306, doi:10.1029/2007JD009391.
Bard, E., and M. Frank (2006), Climate change and solar variability: What’snew under the Sun?, Earth Planet. Sci. Lett., 248, 1–14, doi:10.1016/j.epsl.2006.06.016.
Beer, J., M. Vonmoos, and R. Muscheler (2006), Solar variability over thepast several millennia, Space Sci. Rev., 125, 167–179, doi:10.1007/s11214-006-9047-4.
Bond, G., B. Kromer, J. Beer, R. Muscheler, M. N. Evans, W. Showers,S. Hoffmann, R. Lotti-Bond, I. Hajdas, and G. Bonani (2001), Persistentsolar influence on North Atlantic climate during the Holocene, Science,294, 2130–2136, doi:10.1126/science.1065680.
Brueckner, G. E., J.-P. Delaboudiniere, R. A. Howard, S. E. Paswaters,O. C. St. Cyr, R. Schwenn, P. Lamy, G. M. Simnett, B. Thompson,and D. Wang (1998), Geomagnetic storms caused by coronal mass ejec-tions (CMEs): March 1996 through June 1997, Geophys. Res. Lett., 25,3019–3022, doi:10.1029/98GL00704.
Čalogović, J., C. Albert, F. Arnold, J. Beer, L. Desorgher, and E. Flueckiger(2010), Sudden cosmic ray decreases: no change of global cloud cover,Geophys. Res. Lett., 37, L03802, doi:10.1029/2009GL041327.
Carlsson, M., F. R. Stein, A. Nordlund, and B. G. Scharmer (2004), Obser-vational Manifestations of solar magnetoconvection: Center-to-limb vari-ation, Astrophys. J., 610, L137–L140, doi:10.1086/423305.
Carslaw, K. S., R. G. Harrison, and J. Kirkby (2002), Cosmic rays, cloudsand climate, Science, 298(5599), 1732–1737, doi:10.1126/science.1076964.
Haigh, D. J. (1996), The impact of solar variability on climate, Science,272, 981–984, doi:10.1126/science.272.5264.981.
Harrison, R. G., and M. P. Ambaum (2010), Observing Forbush decreasesin cloud at Shetland, J. Atmos. Sol. Terr. Phys., 72, 1408–1414,doi:10.1016/j.jastp.2010.09.025.
Kirkby, J., et al. (2011), Role of sulphuric acid, ammonia and galactic cos-mic rays in atmospheric aerosol nucleation, Nature, 476, 429–433,doi:10.1038/nature10343.
Kristjánsson, J. E., C. W. Stjern, F. Stordal, A. M. Færaa, G. Myhre, andK. Jonasson (2008), Cosmic rays, cloud condensation nuclei andclouds—A reassessment using MODIS data, Atmos. Chem. Phys., 8,7373–7387, doi:10.5194/acp-8-7373-2008.
Laken, B., A. W. Wolfendale, and D. R. Kniveton (2009), Cosmic raydecreases and changes in the liquid water cloud fraction over the oceans,Geophys. Res. Lett., 36, L23803, doi:10.1029/2009GL040961.
Laken, B., D. Kniveton, and M. Frogley (2010), Cosmic rays linked to rapidmid-latitude cloud changes, Atmos. Chem. Phys., 10(22), 10,941–10,948,doi:10.5194/acp-10-10941-2010.
Laken, B., D. Kniveton, and A. Wolfendale (2011), Forbush decreases,solar irradiance variations and anomalous cloud changes, J. Geophys.Res., 116, D09201, doi:10.1029/2010JD014900.
Lean, J. L., and T. N. Woods (2010), Solar spectral irradiance: Measure-ments and models, in Heliophysics—Evolving Solar Activity and the Cli-mates of Space and Earth, pp. 269–298, Cambridge University Press,Cambridge, U. K.
Marsh, N. D., and H. Svensmark (2003), Galactic cosmic ray and El Niño–Southern Oscillation trends in International Satellite Cloud ClimatologyProject D2 low-cloud properties, J. Geophys. Res., 108(D6), 4195,doi:10.1029/2001JD001264.
Mauas, P., A. Buccino, and E. Flamenco (2011), Long-term solar activityinfluences on South American rivers, J. Atmos. Sol. Terr. Phys.,73(2–3), 377–382, doi:10.1016/j.jastp.2010.02.019.
LAKEN AND ČALOGOVIĆ: SOLAR IRRADIANCE, COSMIC RAYS AND CLOUD L24811L24811
5 of 6
Meehl, G., J. Arblaster, K. Matthes, F. Sassi, and H. van Loon (2009),Amplifying the Pacific climate system response to a small 11-year solarcycle forcing, Science, 325(5944), 1114, doi:10.1126/science.1172872.
Pallé, E., and C. Butler (2001), Sunshine records from Ireland: Cloud fac-tors and possible links to solar activity and cosmic rays, Int. J. Climatol.,21(6), 709–729, doi:10.1002/joc.657.
Pierce, J. R., and P. J. Adams (2009), Can cosmic rays affect cloud conden-sation nuclei by altering new particle formation rates?, Geophys. Res.Lett., 36, L09820, doi:10.1029/2009GL037946.
Pudovkin, M. I., and S. V. Veretenko (1995), Cloudiness decreases associ-ated with Forbush decreases of galactic cosmic rays, J. Atmos. Sol. Terr.Phys., 75, 1349–1355.
Ram, M., and M. Stolz (1999), Possible solar influences on the dust profileof the GISP2 ice core from central Greenland, Geophys. Res. Lett., 26(8),1043–1046, doi:10.1029/1999GL900199.
Rich, F., P. Sultan, and W. Burke (2003), The 27-day variations of plasmadensities and temperatures in the topside ionosphere, J. Geophys. Res.,108(A7), 1297, doi:10.1029/2002JA009731.
Rossow, W., and R. Schiffer (1991), ISCCP cloud data products, Bull.Am. Meteorol. Soc., 72, 2–20, doi:10.1175/1520-0477(1991)072<0002:ICDP>2.0.CO;2.
Shapiro, S., and M. Wilk (1965), An analysis of variance test for normality(complete samples), Biometrika, 52(3–4), 591–611, doi:10.1093/bomet/52.3-4.591.
Svensmark, H., T. Bondo, and J. Svensmark (2009), Cosmic ray decreasesaffect atmospheric aerosols and clouds, Geophys. Res. Lett., 36, L15101,doi:10.1029/2009GL038429.
Tinsley, B. A., R. P. Rohrbaugh, and M. Hei (2001), Electroscavenging inclouds with broad droplet size distributions and weak electrification,Atmos. Res., 59–60, 115–135, doi:10.1016/S0169-8095(01)00112-0.
Todd, M. C., and D. R. Kniveton (2004), Short-term variability in satellite-derived cloud cover and galactic cosmic rays: an update, J. Atmos. Sol.Terr. Phys., 66, 1205–1211.
Troshichev, O., V. Y. Vovk, and L. Egrova (2008), IMF-associated cloud-iness above near-pole station Vostok: Impact on wind regime in winterAntarctica, J. Atmos. Sol. Terr. Phys., 70, 1289–1300, doi:10.1016/j.jastp.2008.04.003.
Versteegh, G. J. M. (2005), Solar forcing of climate 2: Evidence from thepast, Space Sci. Rev., 120, 243–286, doi:10.1007/s11214-005-7047-4.
Wang, M. J., L. P. He, and H. Y. Jia (2006), Cloudiness variation observedat Yangbajing during Forbush decrease of galactic cosmic rays, HighEnergy Phys. Nucl. Phys., 30, 75–78.
White, W. B., D. Dettinger, and D. R. Cayan (2003), Sources of globalwarming of the upper ocean on decadal period scales, J. Geophys. Res.,108(C8), 3248, doi:10.1029/2002JC001396.
Willson, R. C., and A. V. Mordvinov (2003), Secular total solar irradiancetrend during Solar Cycles 21–23, Geophys. Res. Lett., 30(5), 1199,doi:10.1029/2002GL016038.
Yu, F., and P. R. Turco (2001), From molecular clusters to nanoparticles:Role of ambient ionization in tropospheric aerosol formation, J. Geophys.Res., 106(D5), 4797–4814, doi:10.1029/2000JD900539.
J. Čalogović, Hvar Observatory, Faculty of Geodesy, University ofZagreb, Kaciceva 26, HR-10000 Zagreb, Croatia.B. A. Laken, Instituto de Astrofísica de Canarias, Via Lactea s/n,
E-38205, La Laguna, Tenerife, Spain. ([email protected])
LAKEN AND ČALOGOVIĆ: SOLAR IRRADIANCE, COSMIC RAYS AND CLOUD L24811L24811
6 of 6