soil contamination in china: current priorities, defining
TRANSCRIPT
1
Soil contamination in China: current priorities, defining background levels and standards for
heavy metals
Yiming Sun (1), Hong Li (1), Guanlin Guo (2), Kirk T. Semple (1), Kevin C. Jones (1)
(1) Lancaster Environment Centre, Lancaster University, Lancaster, LA1 4YQ, UK
(2) State Key Laboratory of Environmental Criteria and Risk Assessment, Chinese Research
Academy of Environmental Sciences, Beijing 100012.P.R.China
Abstract
The Chinese Government is working to establish an effective framework in managing soil
contamination. Heavy metal contamination is key to the discussion about soil quality, health and
remediation in China. Soil heavy metal contamination in China is briefly reviewed and the concepts
of background values and standards discussed. The importance of contaminated land and its
management for China food security and urbanization are discussed. Priorities for China’s next steps
in developing an effective research and management regime are presented. We propose that critically
important to the science-based risk assessment of contaminants in soils is the incorporation of
speciation and bioavailability into the measurement and evaluation criteria. Consideration of soil
biology/ecological endpoints will be necessary to protect ecosystem health. National and regional/local
scenarios of land use type/usage will address residential/urban re-use of industrial land as well as
varying agricultural scenarios.
Keywords: Soil contamination, soil sampling, risk assessment, land use, China, United Kingdom
2
1. Introduction
Soil pollution refers to the occurrence of some substances in soil caused by human activities, which
can change soil quality and function, lead to soil degradation, damage basic soil structures and has the
potential to harm human and environmental health. Soil pollution has been identified as a key national
priority in China, with an increase of reports on agricultural land and human health affected by soil
pollution (Luo et al., 2015). With economic growth and industrial restructuring in China, soil pollution
from abandoned sites in urban areas has also drawn attention and concern regarding the safety of
human settlements and human health in industrial and brownfield sites (Cao and Guan, 2007; Luo et
al., 2015). According to the National Investigation Bulletin of Soil Pollution Status (NIBSPS) issued
by the Ministry of Environmental Protection of the People’s Republic of China (MEP-PRC),
investment in soil remediation will reach up to RMB 4,633,000 million (£526,000 million). This is a
huge financial commitment, so it is critical that sound science and knowledge are applied to the
decisions that determine how this money will be spent. There is still work to be done in China to
improve information to define soil background conditions and pollution status, the relevant science
and policies needed to set soil quality standards, the assessment system for site evaluation and soil
remediation strategies and technologies (State Council, 2016). The importance of soil pollution and
degradation in China has now been recognized at the highest level, with specific requirements included
in China 13th Five-Year National Development Plan and the Fifth Plenum of the 19th Central
Committee of the Communist Party of China (MEP-PRC, 2016).
This paper focusses on an assessment of some of the priorities relating to heavy metals in Chinese
soils. Soil heavy metal pollution has become a widespread and serious problem globally. Heavy metals
3
are present naturally in soils, but elevated levels may be derived from agricultural activities,
urbanization, industrialization and other human activities. To define and resolve pollution problems, it
is therefore necessary to be able to define what constitutes ‘clean’, ‘background’ and ‘contaminated’
and ‘polluted’ soils. Following surveys and analysis of heavy metals in soils, many countries such as
the United Kingdom, the United States and the Netherlands have developed such values. Depending
on the national environmental management and regulatory processes, different countries have different
approaches. Examples include the Soil Guideline Values (2009) in the UK, the US Soil Screening
Levels (2002), the Intervention Values (2009) in the Netherlands, and Environmental Quality
Standards (EQS) (1991 and 1994) in Japan.
China first developed its own Soil Environmental Quality Standards (SEQS) in 1995 (GB15618-1995)
(Xia, 1996). So far, there are 63 current standards related to soil environmental protection in China and
the number of standards released by the MEP-PRC has increased, especially in the last 5 years (Li et
al., 2016). Following China previous focus on air and water quality, the Government has now turned
a focus onto soils and groundwater, publishing a landmark ‘10-Measures for Soil Pollution Action Plan’
in 2016 (State Council, 2016). Its purpose is to manage, control and prevent soil pollution, to gradually
improve soil quality in China. The Plan’s first action recommends conducting surveys on soil pollution
to better define the status of China’s soil resources. GB15618-1995 first defined SEQS values for 8
heavy metals in China to apply to the whole country. Later, relevant soil quality standards in China
were developed by referring to GB15618-1995 as a basic standard (Li et al., 2016). For example, the
MEP-PRC issued a series of standards, such as ones for ‘Green food-technical conditions for
environmental areas’ (NY/T391-2000), but these are rarely applied in practice. In contrast, European
4
countries conduct soil pollution control mainly through a series of systematic assessment methods.
These are based on different land use type, soil specificity or local environmental factors for
understanding the risks either to the environment or human health. In China over the past 20 years, a
general soil standard value (GB15618-1995) was applied to the whole country, without considering
soil specificity and integrated environmental factors. During this period, in order to meet development
needs, some regional standards for soil risk assessment were also set; for example, Beijing issued
screening levels for soil environmental risk assessment of sites (DB11/T 811) in 2011.
A particular challenge for China is the country size and hence the range of soil types and conditions.
Heavy metal concentrations vary naturally in soils, as a function of the geology, climate, land use etc.
Hence, the Soil Environment Background Value (SEBV) will vary across the country. SEQS values
were originally set nationally, so now there is an important discussion about whether different SEQS
are needed regionally/locally. When managing contaminated sites, SEQS and SEBV will affect the
selection, formulation and cost of remediation strategies.
Internationally, different countries have prioritized soil pollution and management in different ways.
China has been eager to learn from this (Luo et al., 2015; Wang et al., 2005; Wen et al., 2010; Xia and
Luo, 2007) and – given the Government’s stated aim to manage its soil pollution problems effectively
- has the opportunity to put in place sound, strong policies and management structures. An interesting
comparison is with the UK, which has a long history and legacy of contaminated land problems and a
mature environmental regulatory system (Luo et al., 2009; Wu, 2007). The 10-Measures Soil Pollution
Action Plan strongly recommended that: surveys of the soil pollution situation be conducted;
regulations and laws of soil pollution prevention be amended; soil pollution control and remediation
5
be promoted; and a control system to prevent soil pollution be introduced (State Council, 2016).
Given the highly topical nature of soil contamination issues in China, in this paper we focus on the
following questions: 1. What is the situation of soil heavy metal contamination in China? 2. What
factors affect the background value of heavy metals in soils? 3. What are the background values of
selected heavy metals and how do they compare between China and the UK? 4. What can we learn
from the UK about soil survey methodologies and soil environmental standard assessment? 5. What
are future priorities and next steps for China in its management of soil pollution?
2. Heavy metal soil pollution in China
As in other countries, key sources of heavy metals to Chinese soils include: metal mining and smelting;
industrial activities, power generation; agricultural activities, including fertilizer and animal manure
amendments; waste disposal activities; urbanization, transportation. In some regions, high
contamination of the soil occurs around point sources, for example, mines and smelters – giving high
but generally localized problems. In other situations, for example, agricultural soils, contamination
may be lower, but important as a direct route of food contamination (Fu et al., 2016; Zhou et al., 2014;
Zhu et al., 2008). In some countries, inventories have been published which estimate the relative
importance of these different sources to the national soil resource. This approach would be very helpful
in China, because it provides a scientific basis to prioritize source reductions; we are not aware that
this exercise has been performed in China yet. The distinction between ‘high level hotspots’ of
contaminated land (e.g. brownfield sites; mines) and diffusive agricultural sources may also be
important in management. For example, should there be different standards for agricultural land? Can
6
brownfield sites be cleaned by simply excavating and removing dirty soils from important areas of re-
development? (Cao and Guan, 2007; Li et al., 2015; Wang et al., 2014; Wei and Yang, 2010).
Over the past decades, heavy metal contamination has increased worldwide, following large-scale
mining and industrial releases (Li et al., 2014). Ultimately much of the metal from such activities
reaches the soil, via wastes, disposal and atmospheric deposition. China has undergone huge and rapid
urbanization and industrial expansion over the past thirty years, which will have resulted in increased
release of heavy metals to the environment, and the burden of metals held in surface soils (Chen, 1991).
It has been estimated that nearly 20 million hectares of arable land has been polluted by heavy metals,
such as Cd, Pb, Cu, and Zn in China, accounting for approximately 20% of the total arable land area
(Lin, 2004; Zhao et al., 2007). Although information is not available on a site-specific basis, national
soil surveys conducted by the MEP-PRC and the Ministry of Land and Resources of the People’s
Republic of China (MLR-PRC) (2005 to 2013) concluded that 16.1% of national land (based on
sampling points, including arable land, some woodland, grassland, unused land, construction land) was
contaminated (i.e. exceeded background values), of which >80% were exceeded by inorganic
contaminants. Contamination may have been with heavy metals and other inorganic contaminants,
and/or with organic chemicals. Cd was responsible for most exceedances, accounting for 7% of
national land. It should be noted that there was a sampling bias, because soils were not sampled in
proportion to the national land coverage. Nonetheless, the Ministries concluded that “The overall
situation looked not optimistic, of which, the situation of arable land and industrial abandoned land
are the most severe”. In addition, in recent years, many reports in China have highlighted
contamination and poisoning of animal and human health through the food chain. Prominent cases
7
include Cd in rice, Pb and As poisoning incidents (Song et al., 2013). Hu et al. (2014) concluded that
Pb, Cr, As, Cd and Hg constituted the five most important heavy metal contaminants in Chinese soils.
3. Soil background values and factors that affect them
‘Soil environment background values’ (SEBV) are the concentration of elements or components in soil
with little influence from human activities (Connor and Shacklette, 1975; Wang and Yang, 1990). They
reflect the underlying geology and soil formation processes; hence they vary between locations and
are commonly expressed as a range of values for a particular country or region. The background value
could change over time, if environmental processes (including background human activities) affect the
burden in the soil. So, absolute uncontaminated or pristine soils may be difficult to identify, since
industrial activities have emitted heavy metals and other contaminants into the atmosphere. In general,
the SEBV is a relative concept (Xia and Luo, 2006). The geochemical background refers to the normal
abundance of an element in barren earth material or the normal range of an element in certain areas.
The concept of geochemical background aims to distinguish the normal and abnormal concentration
of elements. In the exploration geochemistry field, it may be an indicator of an ore occurrence, while
for environmental geochemistry, it may be an indicator of a contaminated or insufficient element
(Cheng et al., 2014; Hawkes and Webb, 1963). It is assumed that the range of SEBVs give ‘clean’ soils
where there are no adverse ‘pollution’ effects. Hence, contaminated soils are defined with levels of
heavy metals (and other constituents) above the SEBV (Xia and Luo, 2006). This is why it is so
important to conduct carefully designed surveys of contaminants in soils, because precise definition of
the SEBV will determine whether the soil is contaminated and to what degree.
8
As just noted, the SEBV is affected by various abiotic and biotic factors that change in space and time.
For example, parent materials, soil chemical properties, topographic factors, hydrological factors,
human activities, geological factors, weathering and leaching conditions of parent material driven by
climatic factors etc. (Chen and Wang, 1987; China National Environmental Monitoring Centre, 1990;
Fu and He, 1992, Liang and Zhang, 1988). Parent materials are a direct and main factor influencing
the SEBV in many studies (Chen and Wang, 1987; Nair and Cottenie, 1971; Oertel, 1961). Climatic
factors indirectly affect the SEBV by controlling weathering and leaching processes. Chen and Wang
(1987) found soil types and parent materials to be the main drivers that led to a decline from south to
north in Shanxi province and from southeast to northwest, based on a survey of distribution trends and
factors affecting the SEBV. Deng et al. (1986) showed that the main factors affecting background
values are different from region to region in Beijing; topographical characteristics are the main driver
in plain regions, while in mountain regions it is parent materials. Hydrological and topographical
factors directly influence soil formation factors, soil surface runoff, soil surface temperature, the degree
of surface erosion etc., and then influence soil parent materials and soil elemental composition. For
example, fine clays which are richer in heavy metals than sands and silts, will accumulate in
floodplains and result in higher concentrations than in hillslope soils. Thus, the determination of
SEBVs needs to be based on statistical analyses, with careful consideration given to sampling design
and soil sample collecting, statistical tests of sample frequency distribution, data distribution patterns
and eigenvalues, to show the range of background values with a given confidence interval (China
National Environmental Monitoring Centre, 1990). Further details on these issues are given later in
the paper.
9
Deriving soil background values in China and the UK
The UK has a widely varying geology for a comparatively small country, areas of heavy metal
mineralization, a long history of mining and industrial activity, a legacy of soil contamination, and a
lot of experience in the management and regulation of soil contamination. The development planning
process has been used to deal with contaminated sites since the creation of the current UK land use
planning system in 1947 (Luo et al., 2009). Soil remediation of contaminated sites has been carried
out since the 1960s, often with low cost and pragmatic solutions (Ferguson, 1999). In 1976, the Inter-
departmental Committee on the Redevelopment of Contaminated Land (ICRCL) was established as
the first central institutional mechanism to clearly address this issue. In the Environmental Protection
Act of 1990, the provision for registers of potentially contaminated sites was included. The current
system of regulation was created in the 1995 Environment Act. In 2005, the Contaminated Land
Exposure Assessment (CLEA) model was published with a series of soil guideline values and
toxicological reports on key soil contaminants. Hence, the UK has developed a relatively effective
management system from longstanding practice. China is experiencing a situation like the UK had
several decades ago, although on different scales. As noted earlier, mining and industrial activities have
become extensive in parts of China, whilst urban areas have expanded and re-developed on sites with
a legacy of contamination. In rural areas, there are several examples where agricultural land and
community areas have become contaminated too (Liu et al., 2013; Shi et al., 2008; Zhuang, 2015).
The UK approach to contaminated land management is underpinned by a series of comprehensive
surveys of soil contaminants, which allow a clear definition of the typical levels, ranges and
10
distributions of elements. It is therefore useful to compare the situation with China, which has
undertaken national surveys too and is planning further work of this kind.
4. Experience from surveying UK soils
In the UK, there have been different national soil surveys in past decades. In the late 1970s, soil
information in England and Wales was incomplete, knowledge of regional soil geochemistry was
limited, available soil maps only covered ~25% of the area, and the existing information was not based
on a representative and unbiased sampling strategy. Thus, between 1978 and 1983, the National Soil
Inventory (NSI) carried out a survey of soil background metal concentrations in England and Wales
(McGrath and Loveland, 1992).
In 1996, the Royal Commission on Environmental Pollution (RCEP) published the nineteenth report
on the Sustainable Use of Soil, which stressed the need for the assessment and monitoring of soil
quality, including certain chemical and physical attributes, and some biological parameters. A second
survey – the so-called Countryside Survey – therefore began in 1998. The purpose has been to assess
and monitor soil quality over time, by returning to the same locations over several years (Barr et al,
2003).
A third survey was conducted in 2011/12, to give guidance on normal levels of contaminants - to
support revision of the Part 2A Contaminated Land Statutory Guidance. This was conducted by the
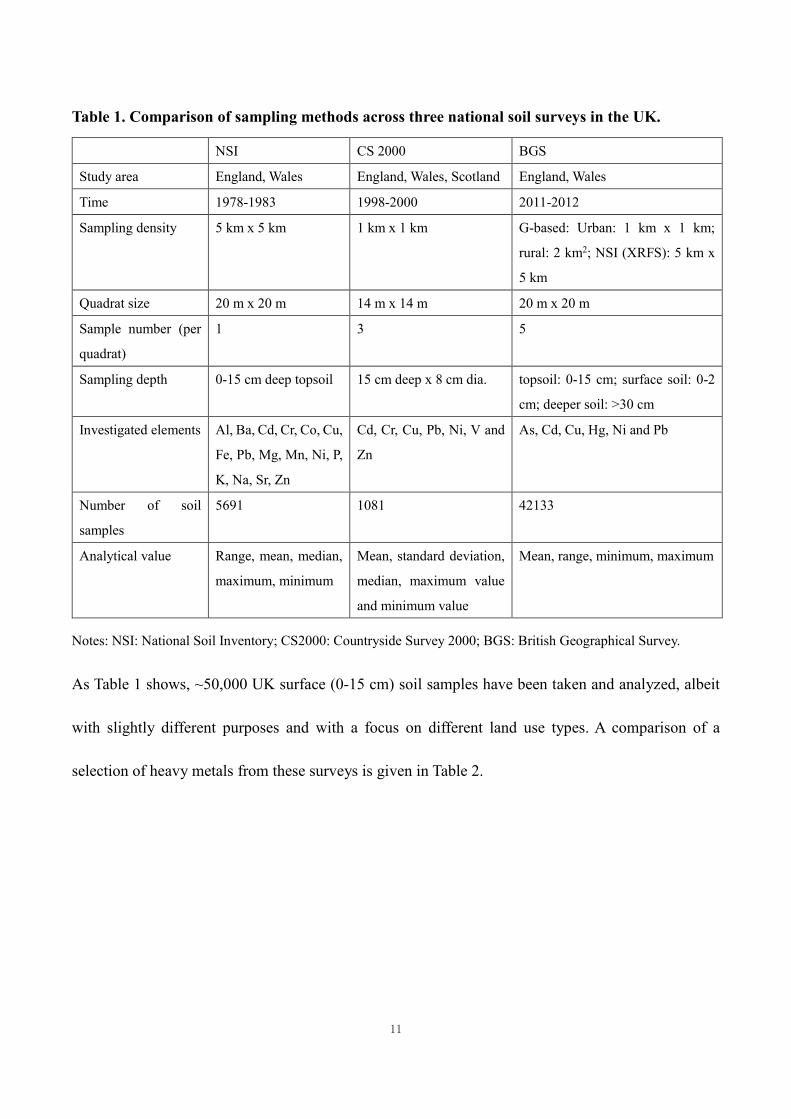
British Geological Survey (BGS) in England and Wales (Johnson et al., 2012). A summary comparison
of the survey designs and methodologies is presented in Table 1.
11
Table 1. Comparison of sampling methods across three national soil surveys in the UK.
NSI CS 2000 BGS
Study area England, Wales England, Wales, Scotland England, Wales
Time 1978-1983 1998-2000 2011-2012
Sampling density 5 km x 5 km 1 km x 1 km G-based: Urban: 1 km x 1 km;
rural: 2 km2; NSI (XRFS): 5 km x
5 km
Quadrat size 20 m x 20 m 14 m x 14 m 20 m x 20 m
Sample number (per
quadrat)
1 3 5
Sampling depth 0-15 cm deep topsoil 15 cm deep x 8 cm dia. topsoil: 0-15 cm; surface soil: 0-2
cm; deeper soil: >30 cm
Investigated elements Al, Ba, Cd, Cr, Co, Cu,
Fe, Pb, Mg, Mn, Ni, P,
K, Na, Sr, Zn
Cd, Cr, Cu, Pb, Ni, V and
Zn
As, Cd, Cu, Hg, Ni and Pb
Number of soil
samples
5691 1081 42133
Analytical value Range, mean, median,
maximum, minimum
Mean, standard deviation,
median, maximum value
and minimum value
Mean, range, minimum, maximum
Notes: NSI: National Soil Inventory; CS2000: Countryside Survey 2000; BGS: British Geographical Survey.
As Table 1 shows, ~50,000 UK surface (0-15 cm) soil samples have been taken and analyzed, albeit
with slightly different purposes and with a focus on different land use types. A comparison of a
selection of heavy metals from these surveys is given in Table 2.
12
Table 2. Comparison of range, mean and median of four comparative heavy metals (Cd, Cu, Ni, Pb) from the results of NSI, CS2000 and BGS surveys (all concentrations in mg/kg).
Cd Range Mean Median NSI <0.2-41 0.8 0.7 CS2000 0-11 0.49 0.3 BGS 0.3-20 0.5 0.3 Cu Range Mean Median NSI 1.2-1508 23 18 CS2000 0.3-448 18 14 BGS <1-5326 27 20 Ni Range Mean Median NSI 0.8-440 25 22.6 CS2000 0-1890 24 16.3 BGS 1-506 25 23 Pb Range Mean Median NSI 3-16338 74 40 CS2000 1.3-20600 88 37 BGS 3-10000 72 41 pH Range Mean Median NSI CS2000 3.4-8.71 5.72 5.58 BGS Soil organic matter
Range Mean Median
NSI CS2000 2-98.02 29.11 12.57 BGS
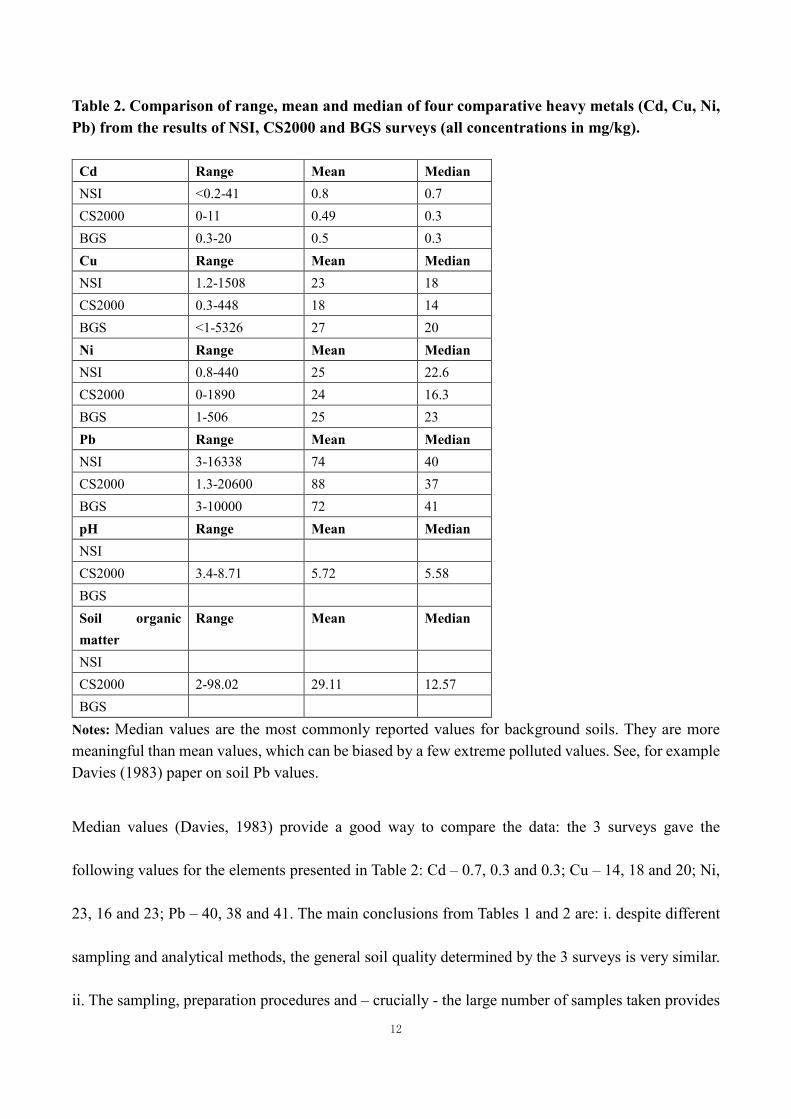
Notes: Median values are the most commonly reported values for background soils. They are more meaningful than mean values, which can be biased by a few extreme polluted values. See, for example Davies (1983) paper on soil Pb values.
Median values (Davies, 1983) provide a good way to compare the data: the 3 surveys gave the
following values for the elements presented in Table 2: Cd – 0.7, 0.3 and 0.3; Cu – 14, 18 and 20; Ni,
23, 16 and 23; Pb – 40, 38 and 41. The main conclusions from Tables 1 and 2 are: i. despite different
sampling and analytical methods, the general soil quality determined by the 3 surveys is very similar.
ii. The sampling, preparation procedures and – crucially - the large number of samples taken provides
13
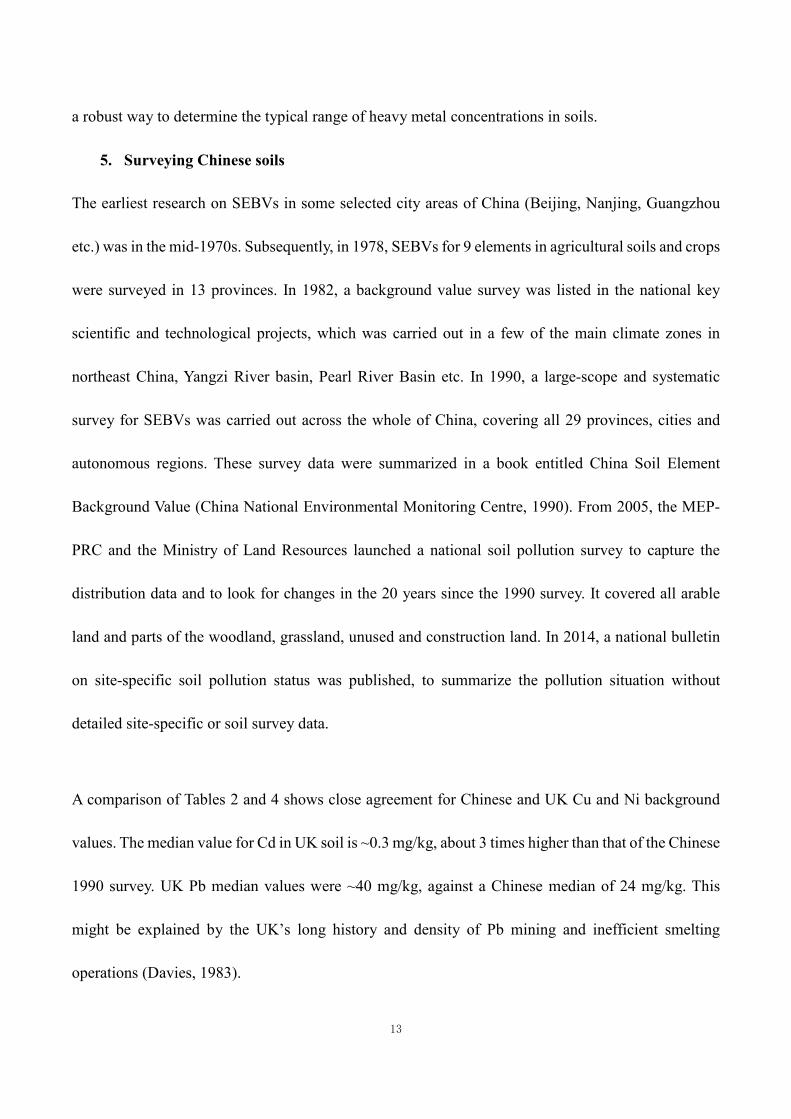
a robust way to determine the typical range of heavy metal concentrations in soils.
5. Surveying Chinese soils
The earliest research on SEBVs in some selected city areas of China (Beijing, Nanjing, Guangzhou
etc.) was in the mid-1970s. Subsequently, in 1978, SEBVs for 9 elements in agricultural soils and crops
were surveyed in 13 provinces. In 1982, a background value survey was listed in the national key
scientific and technological projects, which was carried out in a few of the main climate zones in
northeast China, Yangzi River basin, Pearl River Basin etc. In 1990, a large-scope and systematic
survey for SEBVs was carried out across the whole of China, covering all 29 provinces, cities and
autonomous regions. These survey data were summarized in a book entitled China Soil Element
Background Value (China National Environmental Monitoring Centre, 1990). From 2005, the MEP-
PRC and the Ministry of Land Resources launched a national soil pollution survey to capture the
distribution data and to look for changes in the 20 years since the 1990 survey. It covered all arable
land and parts of the woodland, grassland, unused and construction land. In 2014, a national bulletin
on site-specific soil pollution status was published, to summarize the pollution situation without
detailed site-specific or soil survey data.
A comparison of Tables 2 and 4 shows close agreement for Chinese and UK Cu and Ni background
values. The median value for Cd in UK soil is ~0.3 mg/kg, about 3 times higher than that of the Chinese
1990 survey. UK Pb median values were ~40 mg/kg, against a Chinese median of 24 mg/kg. This
might be explained by the UK’s long history and density of Pb mining and inefficient smelting
operations (Davies, 1983).
14
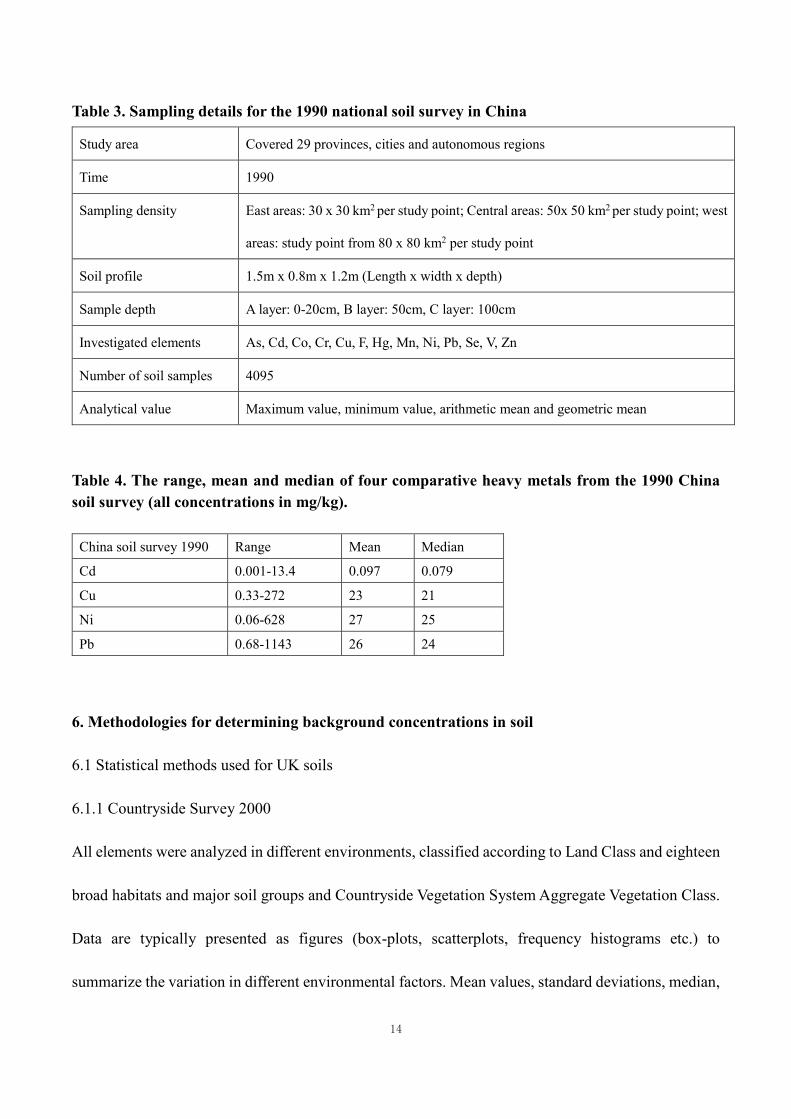
Table 3. Sampling details for the 1990 national soil survey in China
Study area Covered 29 provinces, cities and autonomous regions
Time 1990
Sampling density East areas: 30 x 30 km2 per study point; Central areas: 50x 50 km2 per study point; west
areas: study point from 80 x 80 km2 per study point
Soil profile 1.5m x 0.8m x 1.2m (Length x width x depth)
Sample depth A layer: 0-20cm, B layer: 50cm, C layer: 100cm
Investigated elements As, Cd, Co, Cr, Cu, F, Hg, Mn, Ni, Pb, Se, V, Zn
Number of soil samples 4095
Analytical value Maximum value, minimum value, arithmetic mean and geometric mean
Table 4. The range, mean and median of four comparative heavy metals from the 1990 China soil survey (all concentrations in mg/kg).
China soil survey 1990 Range Mean Median
Cd 0.001-13.4 0.097 0.079
Cu 0.33-272 23 21
Ni 0.06-628 27 25
Pb 0.68-1143 26 24
6. Methodologies for determining background concentrations in soil
6.1 Statistical methods used for UK soils
6.1.1 Countryside Survey 2000
All elements were analyzed in different environments, classified according to Land Class and eighteen
broad habitats and major soil groups and Countryside Vegetation System Aggregate Vegetation Class.
Data are typically presented as figures (box-plots, scatterplots, frequency histograms etc.) to
summarize the variation in different environmental factors. Mean values, standard deviations, median,
15
maximum value and minimum values are commonly calculated to represent the primary analysis
(Black et al., 2002).
6.1.2 National Soil Inventory
For all variables, the range, mean, median, maximum, minimum, skewness and kurtosis were
calculated for both transformed and log10-transformed data (except for pH). Box plot analysis was
performed for the data of Cd, Co, Cr, Cu, Ni, Pb and Zn. Correlation analysis was performed on soil
element concentrations (log10-tranformed data). Principal component analysis (PCA) was performed
on all datasets, including all elemental concentrations, organic carbon and pH to provide an overall
view of the relations among variables. Simple or multiple linear regression analysis was used to
exclude the outlier data (McGrath and Loveland 1992).
6.1.3 British Geological Survey
Values for contaminant domain normal background concentrations were calculated by a study of a
contaminant’s population distribution. Skewness coefficient and octile skew were used as statistical
measures. Percentiles for the domain data sets for each contaminant were generated along with
calculations of percentile confidence intervals. The upper limit for a normal background concentration
has been as the upper confidence limit of the 95th percentile (Johnson et al. 2012).
6.2 Statistical methods used in Chinese soils
Relevant information (soil types, parent materials, topography, latitude, longitude, vegetation, land use
types, administrative regions etc.) of 4,095 typical soil profiles, together with the chemical analytical
data were stored in a database of Chinese soil background values. In summary, soil types were divided
into 41 statistical units, parent materials were divided into 21 units, and administrative regions were
16
divided into 34 units, so in total, every element has 97 statistical units. Frequency distribution graphs
are available for different elements, with the maximum, minimum, arithmetic mean and geometric
mean values were presented. For elements with a log-normal distribution, the geometric mean (M) was
used to represent the data distribution, the geometric standard deviation (D) to represent the level of
dispersion, and M/D2-MD2 for the range of 95% confidence interval. For the elements with a normal
distribution, the arithmetic mean (x ) was used to represent the data distribution, the arithmetic
standard deviation (s) for the level of dispersion andx±2s for the range of 95% confidence interval
(China National Environmental Monitoring Centre, 1990).
6. Soil standards
Environmental Quality Standards (EQSs) for soils (GB15618-1995) in China were officially released
in 1995. They were derived based on several factors: data on the soil background in China; data from
soil ecological tests; data from geographically anomalous areas in China and information on soil
standards or guidelines from abroad (MEP-PRC, 1995; Wu and Zhou, 1991). These EQSs set the
maximum acceptable concentration of pollutants and relevant monitoring methods in the soil based on
different soil functions/uses, protection targets and soil properties.
Three types of standard were set: Type I is protective of soils in national nature reserves, centralized
drinking water resources, tea plantations, pasture and other protected areas, and the goal is to basically
maintain the natural background level. Type II is applicable to the soil in general farmland, land for
growing vegetables, tea plantations, orchards, pasture etc., where the goal is to not cause harm and
pollution to plants and the environment. Type III is applicable to woodland soil, and farmland soils
near to high background soils of more pollutant capacity and mineral fields, where the goal is basically
17
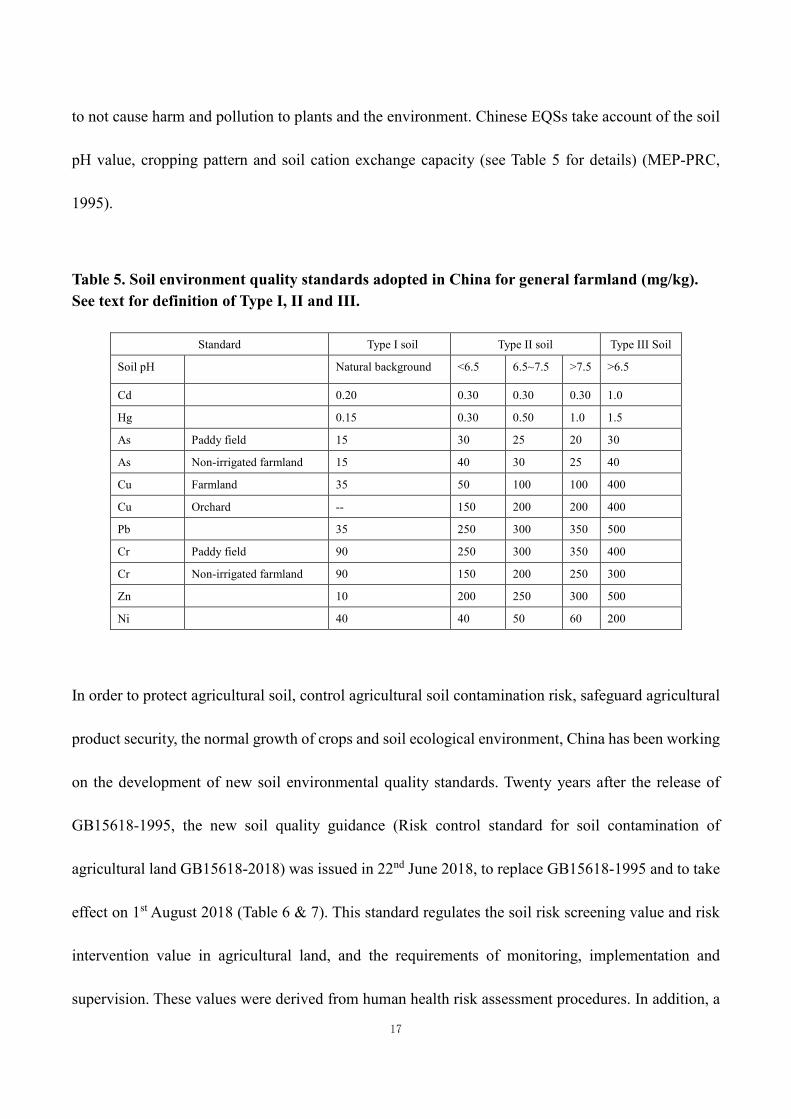
to not cause harm and pollution to plants and the environment. Chinese EQSs take account of the soil
pH value, cropping pattern and soil cation exchange capacity (see Table 5 for details) (MEP-PRC,
1995).
Table 5. Soil environment quality standards adopted in China for general farmland (mg/kg). See text for definition of Type I, II and III.
Standard Type I soil Type II soil Type III Soil
Soil pH Natural background <6.5 6.5~7.5 >7.5 >6.5
Cd 0.20 0.30 0.30 0.30 1.0
Hg 0.15 0.30 0.50 1.0 1.5
As Paddy field 15 30 25 20 30
As Non-irrigated farmland 15 40 30 25 40
Cu Farmland 35 50 100 100 400
Cu Orchard -- 150 200 200 400
Pb 35 250 300 350 500
Cr Paddy field 90 250 300 350 400
Cr Non-irrigated farmland 90 150 200 250 300
Zn 10 200 250 300 500
Ni 40 40 50 60 200
In order to protect agricultural soil, control agricultural soil contamination risk, safeguard agricultural
product security, the normal growth of crops and soil ecological environment, China has been working
on the development of new soil environmental quality standards. Twenty years after the release of
GB15618-1995, the new soil quality guidance (Risk control standard for soil contamination of
agricultural land GB15618-2018) was issued in 22nd June 2018, to replace GB15618-1995 and to take
effect on 1st August 2018 (Table 6 & 7). This standard regulates the soil risk screening value and risk
intervention value in agricultural land, and the requirements of monitoring, implementation and
supervision. These values were derived from human health risk assessment procedures. In addition, a
18
risk control standard for soil contamination of development land (GB36600-2018) was also issued, to
come into force at the same time to protect human health and living environmental security.
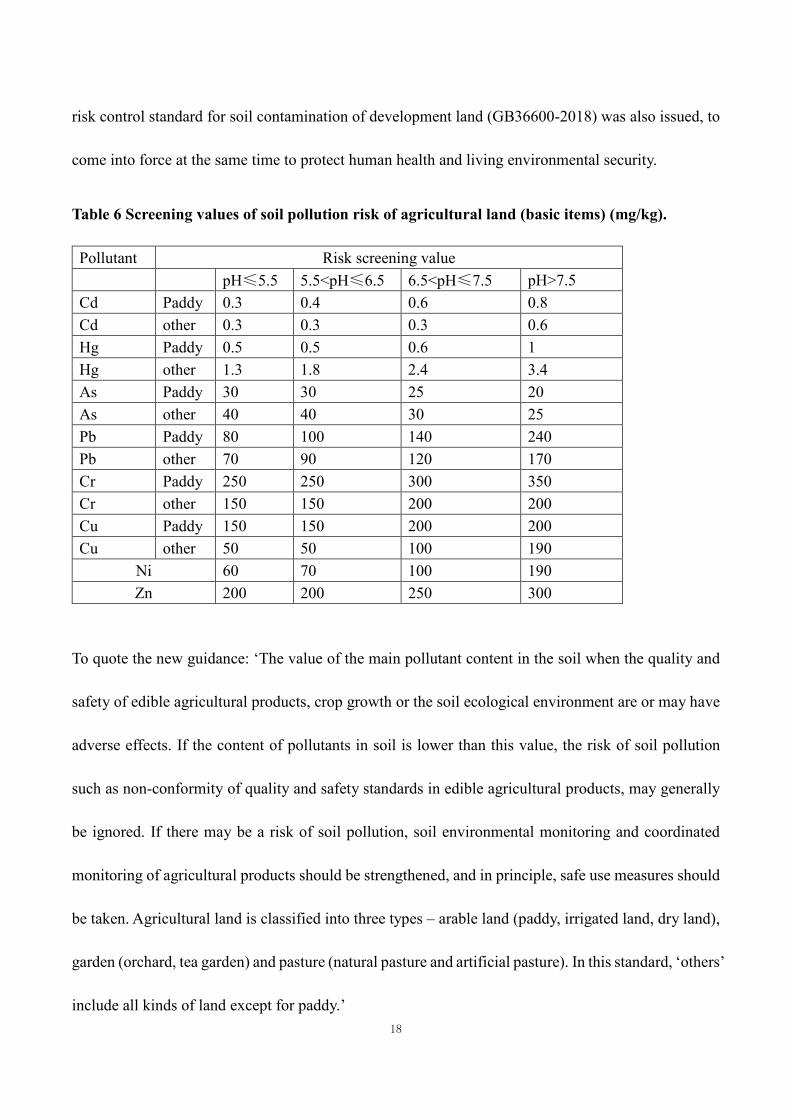
Table 6 Screening values of soil pollution risk of agricultural land (basic items) (mg/kg).
To quote the new guidance: ‘The value of the main pollutant content in the soil when the quality and
safety of edible agricultural products, crop growth or the soil ecological environment are or may have
adverse effects. If the content of pollutants in soil is lower than this value, the risk of soil pollution
such as non-conformity of quality and safety standards in edible agricultural products, may generally
be ignored. If there may be a risk of soil pollution, soil environmental monitoring and coordinated
monitoring of agricultural products should be strengthened, and in principle, safe use measures should
be taken. Agricultural land is classified into three types – arable land (paddy, irrigated land, dry land),
garden (orchard, tea garden) and pasture (natural pasture and artificial pasture). In this standard, ‘others’
include all kinds of land except for paddy.’
Pollutant Risk screening value pH≤5.5 5.5<pH≤6.5 6.5<pH≤7.5 pH>7.5 Cd Paddy 0.3 0.4 0.6 0.8 Cd other 0.3 0.3 0.3 0.6 Hg Paddy 0.5 0.5 0.6 1 Hg other 1.3 1.8 2.4 3.4 As Paddy 30 30 25 20 As other 40 40 30 25 Pb Paddy 80 100 140 240 Pb other 70 90 120 170 Cr Paddy 250 250 300 350 Cr other 150 150 200 200 Cu Paddy 150 150 200 200 Cu other 50 50 100 190
Ni 60 70 100 190 Zn 200 200 250 300
19
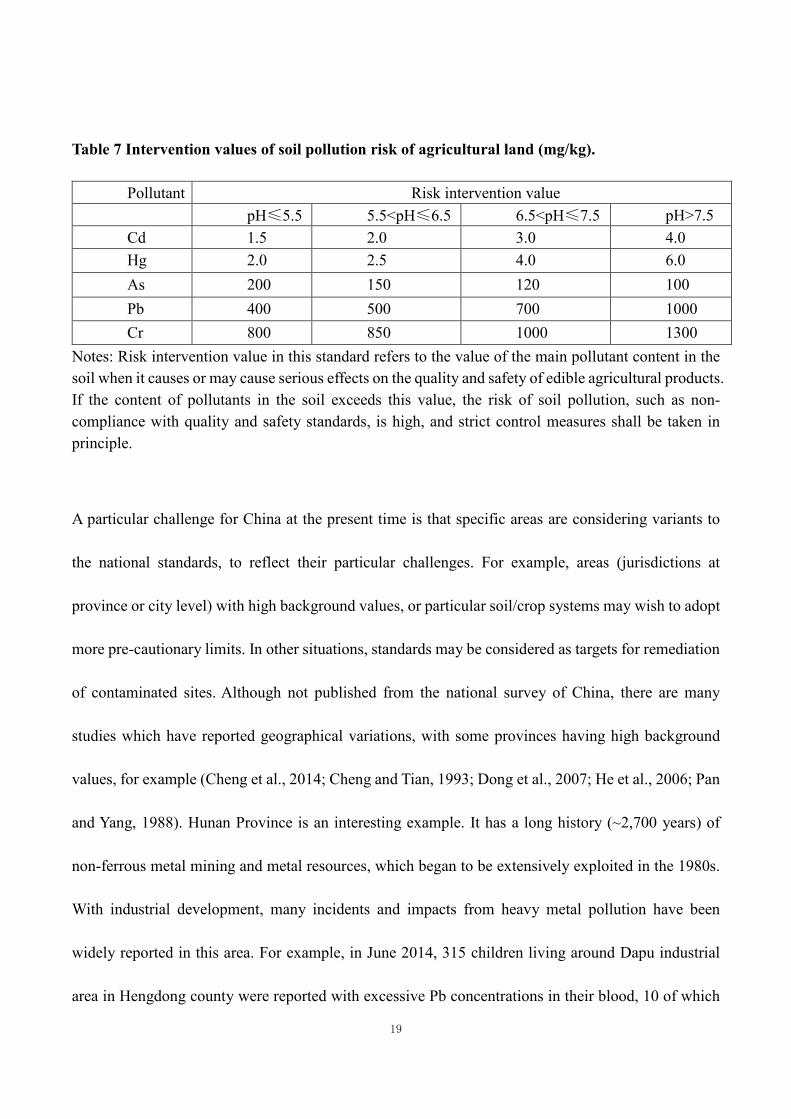
Table 7 Intervention values of soil pollution risk of agricultural land (mg/kg).
Notes: Risk intervention value in this standard refers to the value of the main pollutant content in the soil when it causes or may cause serious effects on the quality and safety of edible agricultural products. If the content of pollutants in the soil exceeds this value, the risk of soil pollution, such as non-compliance with quality and safety standards, is high, and strict control measures shall be taken in principle.
A particular challenge for China at the present time is that specific areas are considering variants to
the national standards, to reflect their particular challenges. For example, areas (jurisdictions at
province or city level) with high background values, or particular soil/crop systems may wish to adopt
more pre-cautionary limits. In other situations, standards may be considered as targets for remediation
of contaminated sites. Although not published from the national survey of China, there are many
studies which have reported geographical variations, with some provinces having high background
values, for example (Cheng et al., 2014; Cheng and Tian, 1993; Dong et al., 2007; He et al., 2006; Pan
and Yang, 1988). Hunan Province is an interesting example. It has a long history (~2,700 years) of
non-ferrous metal mining and metal resources, which began to be extensively exploited in the 1980s.
With industrial development, many incidents and impacts from heavy metal pollution have been
widely reported in this area. For example, in June 2014, 315 children living around Dapu industrial
area in Hengdong county were reported with excessive Pb concentrations in their blood, 10 of which
Pollutant Risk intervention value pH≤5.5 5.5<pH≤6.5 6.5<pH≤7.5 pH>7.5 Cd 1.5 2.0 3.0 4.0 Hg 2.0 2.5 4.0 6.0 As 200 150 120 100 Pb 400 500 700 1000 Cr 800 850 1000 1300
20
had been sub-chronically poisoned. Another heavy metal survey published in November 2014 from an
environmental protection organization showed that the As content of river sediments exceeded national
standards by 700 times and the Cd content in some paddy soils exceeded the standards by 200 times
in the Sanshiliuwan mining area from Chenzhou City (Cao and Li, 2014). Regulations have been issued
by the province – for example - an ‘Implementation Plan (2012-2015)’ of heavy metal pollution control
in the Xiangjiang river basin, which has been set to close illegal factories, control industrial pollution
sources and decrease heavy metal emissions and remediate the legacy contaminated sites. In 2016,
standards for soil remediation of heavy metal contaminated sites (DB43/T1165-2016) were issued by
the Environmental Protection Department of Hunan and Hunan Provincial Bureau of quality and
technical supervision. These provided the remediation standard for 11 heavy metals in residential land,
commercial land and industrial land (Table 8). These remediation targets are higher than the national
standard in GB15618-1995. For example, DB43/T1165-2016 values are: Cd-7, 20, 20 in residential
land, commercial land and industrial land, respectively; GB15618-1995 values are: Cd-0.3, 0.3, 0.6, 1
in Standard II pH <6.5, 6.5-7.5, >7.5, Standard III, respectively; GB15618-2018 screening values are:
Cd-0.3, 0.4, 0.6, 0.8 for paddy pH≤5.5, 5.5<pH≤6.5, 6.5<pH≤7.5, pH>7.5, respectively. Details of
how Hunan’s standards were derived are not clear, but they may be pragmatic and risk-based.
21
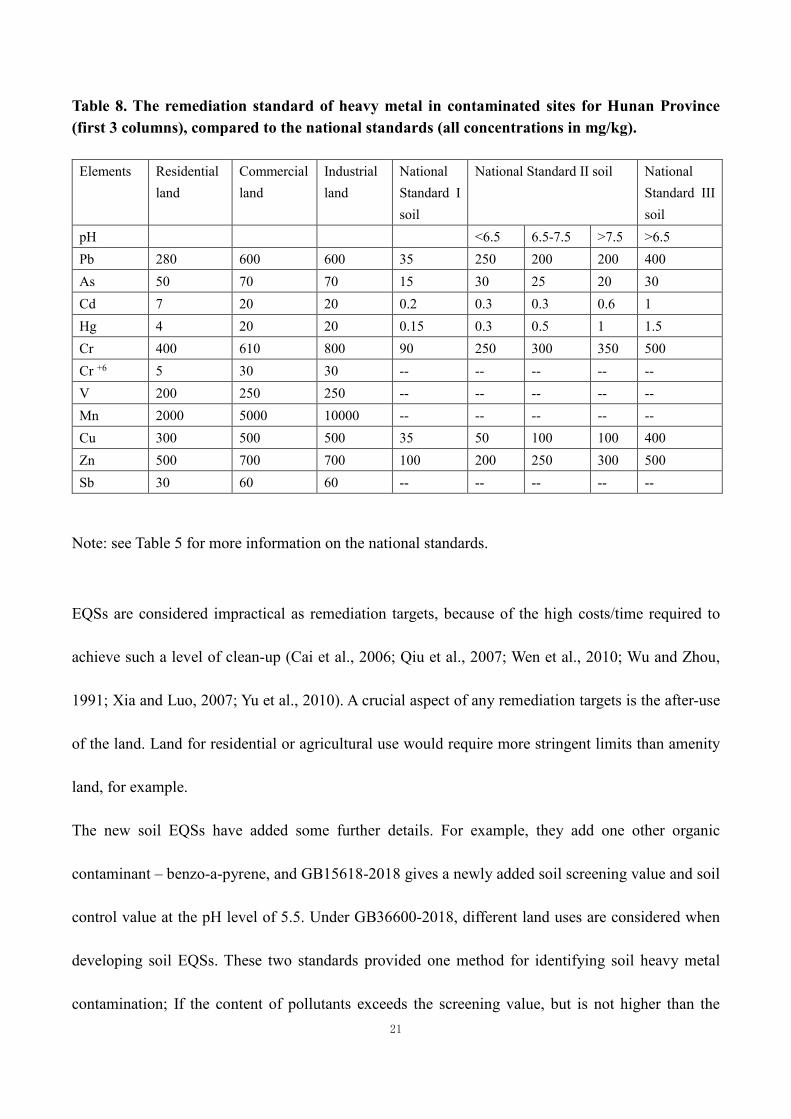
Table 8. The remediation standard of heavy metal in contaminated sites for Hunan Province (first 3 columns), compared to the national standards (all concentrations in mg/kg).
Elements Residential land
Commercial land
Industrial land
National Standard I soil
National Standard II soil National Standard III soil
pH <6.5 6.5-7.5 >7.5 >6.5 Pb 280 600 600 35 250 200 200 400 As 50 70 70 15 30 25 20 30 Cd 7 20 20 0.2 0.3 0.3 0.6 1 Hg 4 20 20 0.15 0.3 0.5 1 1.5 Cr 400 610 800 90 250 300 350 500 Cr +6 5 30 30 -- -- -- -- -- V 200 250 250 -- -- -- -- -- Mn 2000 5000 10000 -- -- -- -- -- Cu 300 500 500 35 50 100 100 400 Zn 500 700 700 100 200 250 300 500 Sb 30 60 60 -- -- -- -- --
Note: see Table 5 for more information on the national standards.
EQSs are considered impractical as remediation targets, because of the high costs/time required to
achieve such a level of clean-up (Cai et al., 2006; Qiu et al., 2007; Wen et al., 2010; Wu and Zhou,
1991; Xia and Luo, 2007; Yu et al., 2010). A crucial aspect of any remediation targets is the after-use
of the land. Land for residential or agricultural use would require more stringent limits than amenity
land, for example.
The new soil EQSs have added some further details. For example, they add one other organic
contaminant – benzo-a-pyrene, and GB15618-2018 gives a newly added soil screening value and soil
control value at the pH level of 5.5. Under GB36600-2018, different land uses are considered when
developing soil EQSs. These two standards provided one method for identifying soil heavy metal
contamination; If the content of pollutants exceeds the screening value, but is not higher than the
22
background value of the soil environment, it is not included in the management of contaminated land.
However, some considerations are still not resolved; for example, more contaminants still need to be
considered and soil ecological protection still needs to be addressed.
7. Current situation and future priorities
China is highly reliant on its ‘best quality’ soils for food security and agricultural production. It has
been estimated that 20% of China total arable land is contaminated (Lin, 2004; Zhao et al., 2007). This
may be different from the situation in most developed countries, where a higher proportion of
agricultural land is not contaminated. For example, a higher (~93%) proportion of European
agricultural land is considered safe for food production (Tóth et al., 2016). The reality is that China
will need to produce food for human consumption on soils which are already deemed ‘contaminated’.
Scientifically based risk assessments are necessary to inform practical decisions about the most
practical land use options. For example, important research is currently being conducted in China and
elsewhere to understand where and how ‘contaminated’ land can be used to support food production.
This requires knowledge of soil chemistry and soil-crop plant transfers of contaminants (Tangahu et
al., 2011; Xu et al., 2005). If China makes these changes/meets these priorities, it can be leading the
world in approaches to contaminated land management. It is in this context that China is committed to
conducting the most detailed and comprehensive soil survey to date. MEP-PRC carried out a nation
survey covered 6,300,000 km2 soil area from April 2005 to December 2013, and several geochemistry
surveys by MLR-PRC have been completed from 1999 to 2014, which covered 68% of total arable
land (MEP-PRC, 2016). There are several areas where revisions are being considered, to bring China
23
to a leading position internationally. It is hoped that the new regulatory approaches can be further
developed to:
1. Increase the range of analytes for which standards are set. Most focus so far has been on
inorganics, but there is a wide array of organic contaminants for which standards can be set.
2. Critically important to the science-based risk assessment of contaminants in soils is the
incorporation of speciation and bioavailability into the measurement and evaluation criteria.
On initial screening, soils and sites may be deemed ‘contaminated’, but after a second tier
analysis they may be shown to be suitable for crop production and use. Selection of appropriate
and validated measurement and evaluation tools is a priority. If this is done in a scientifically
transparent and defensible way, China will have a robust and internationally leading system for
soil management in place.
3. Derivation of standards has focused on human receptor endpoints. However, consideration of
soil biology/ecological endpoints will be necessary to protect ecosystem health.
4. National and regional/local scenarios of land use type/usage. This addresses residential/urban
re-use of industrial land, as well as varying agricultural scenarios, such as different agricultural
systems and cropping regimes.
Acknowledgements
We are grateful to Dr Lisa Norton and Dr Aidan Keith in Centre for Ecology & Hydrology-Lancaster for their
contribution to the knowledge of the Countryside Survey.
24
References
Barr, C., Bunce, R., Clarke, R., Firbank, L., Gillespie, M., Howard, D., Petit, S., Smart, S.M., Watkins, J., 2003. Methodology of Countryside Survey 2000 Module 1: Survey of Broad Habitats and Landscape Features: Final Report.
Black, H., Garnett, J., Ainsworth, G., Coward, P., Creamer, R., Ellwood, S., Horne, J., Hornung, M., Kennedy, V., Monson,
F., 2002. MASQ: Monitoring and Assessing Soil Quality in Great Britain. Survey Model 6: Soils and Pollution. Environment Agency, Rio House, Waterside Drive, Aztec West, Almondsbury, BRISTOL, BS32 4UD.
Cai, Y., Liu, F., Wang, Y., Shi, R., 2005. Discussion on soil environmental quality standard in China. Proceedings of the
first symposium on total agro-environmental science. 456-459. Cao, K., Guan, H., 2007. Brownfield redevelopment toward sustainable urban land use in China. Chin. Geogr. Sc. 17, 127-
134. Chen, H., 1991. Environment pedology. Advan. in Earth Sc. 6, 49-50. Chen, J., Wang, X., 1987. Factors affecting the background value of trace elements in soil. Envi. Monit. in Chin. 2, 41-45. Cheng, H., Li, k., Li, M., Yang, K., Liu, F., Cheng, X., 2014. Geochemical background and baseline value of chemical
elements in urban soil in China. Earth Sc. Front. 21, 265-306. Cheng, Y., Tian, J., 1993. Background value and distribution characteristics of soil elements in Tibet, Beijing: Science
Press. China National Environmental Monitoring Centre, 1990. China soil element background value. China Environmental
Science Press. Connor, J. J., Shacklette, H., 1975. Background geochemistry of some rocks, soils, plants, and vegetables in the
conterminous United States. United States Government Printing Office, Washington. Davies B. E., 1983. A graphical estimation of the normal lead content of some British soils. Geoderma, 29, 0-75. Deng, B., Qin, J., Li, T., 1986. Analysis of factors affecting soil background contents of metal background contents of metal
elements in Beijing area. Acta Sc. Cricum. 6, 446-454. Dong, Y., Zheng, W., Zhou, J., 2007. Soil geochemical background value in Zhejiang Province, Geological Publishing
House. Ferguson, C.C., 1999. Assessing risks from contaminated sites: policy and practice in 16 European countries. Land Cont.
and Recl. 7, 87-108.
25
Fu, Q., Zhang, Q., Liu, W., 2016. Pollution situation of soil and its countermeasures in China. Phosp. & Comp. Ferti. 31, 50-52.
Fu, S., He, Y., 1992. Effects of soil parents on soil background value. Env. Moni. in Chi. 8, 110-112. Hawkes, H., Webb, J., 1963. Geochemistry in Mineral Exploration. Soil Sci. 95, 283. He, J., Xu, G., Zhu, H., Peng, G., 2006. Research on soil background value in Jiangxi province, Beijing: China
Environmental Science Press. Hu, H., Jin, Q., Kavan, P., 2014. A study of heavy metal pollution in China: Current status, pollution-control policies and
countermeasures. Sustainability 6, 5820-5838. Johnson, C., Ander, E., Cave, M., Palumbo-Roe, B., 2012. Normal background concentrations (NBCs) of contaminants in
English soils: Final project report. British Geological Survey Commissioned Report, CR/12/035, 40pp. Li, M., Li, Q., Zhao, L., Wang, H., Cai, M., Zhu, J., Wang, H., 2016. Optimizing the soil environmental protection standard
system and suggestions. Research of Environmental Sciences, 29, pp. 1799-1810. Li, X., Jiao, W., Xiao, R., Chen, W., Chang, A., 2015. Soil pollution and site remediation policies in China: A review. Env.
Rev. 23, 263-274. Li, Z., Ma, Z., van der Kuijp, T. J., Yuan, Z., Huang, L., 2014. A review of soil heavy metal pollution from mines in China:
pollution and health risk assessment. Sci. Total Environ. 468, 843-853. Liang, W., Zhang, J., 1988. Analysis of influencing factors of soil element background value. Lin, Q., 2004. Current situation of soil pollution in China and its countermeasures. Fujian soil and water conserv. 16, 25-
28. Liu, L., Long, J., Wan, H., Li, J., 2013. Distribution characteristics and risk assessment of heavy metals in agricultural soils
in an abandoned antimony smelter in Guizhou Karst areas. Soils, 45. Luo, Q., Catney, P., Lerner, D., 2009. Risk-based management of contaminated land in the UK: Lessons for China? J.
Environ. Manage. 90, 1123-1134. Luo, Y., Zhang, H., Tu, C., Teng, Y., 2015. Soil environment and pollution remediation in China: current status and
prospectives research development. J. of the Chin. Ac.. of Sc. 30, 115-124. McGrath, S., Loveland, P., 1992. The soil geochemical atlas of England and Wales, Blackie Academic & Professional. MEP-PRC, 1995. Environmental quality standard for soils (GB15618-1995).
26
MEP-PRC, 2016. Ministry of Environmental Protection Detailed "soil ten": resolutely declared war on pollution: Ministry
of Environmental Protection of of the People’s Republic of China. Nair, K. P., Cottenie, A., 1971. Parent material-soil relationship in trace elements—a quantitative estimation. Geoderma, 5,
8193-8497. Oertel, A., 1961., Relation between trace‐element concentrations in soil and parent material. J. of Soil Sc. 12, 119-128. Pan, Y., Yang, G., 1988. Soil background value and research method in Hunan, Beijing: China Environmental Science
Press. Qiu, J., Zhang, S., Lin, Y., Jiang, X., 2007. Current situation and improvement of soil environmental standard system in
China. In Proceedings of the annual meeting of Chinese Environmental Science, 2007, 1384-1386. Shi, H., Song, W., Zhao, Z., 2008. The current condition and causes of agricultural soil pollution in China. Acta Agri.
Shanghai, 24, 122-126. Song, W., Chen, B., Liu, L., 2013. Soil heavy metal pollution of cultivated land in China. Res. of Soil and Water Conser.
20, 293-298. State Council, 2016. Action plan for soil pollution prevention and control. Tangahu, B. V., Sheikh Abdullah, S. R., Basri, H., Idris, M., Anuar, N., Mukhlisin, M., 2011. A review on heavy metals
(As, Pb, and Hg) uptake by plants through phytoremediation. Inter. J. of Chem. Eng. 2011, 1-31. The first release of heavey metal survey in Hunan Province. http://hn.people.com.cn/n/2014/1201/c356328-23073747.html
(Accessed 20th October 2017). Tóth, G., Hermann, T., Da Silva, M., Montanarella, L., 2016. Heavy metals in agricultural soils of the European Union
with implications for food safety. Environ. Int. 88, 299-309. Wang, G., Luo, Y., Song, J., Xia, J., 2005. Study on soil environmental quality guidelines and standards I. International
trend and suggestions for amendment in China. Tu Rang Xue Bao 42, 666-673. Wang, H., Yang, L., 1990. A perspective of the natural background research of the trace elements in China. Chi. Env. Sc.
10, 333-338. Wang, Y., Liu, C., Zhou, D., Chen, H., 2014. A critical view on the Status Quo of the farmland soil environmental quality
in China: discussion and suggestion of relevant issues on report on the national general survey of soil contamination. Nong Ye Huan Jing Ke Xue Xue Bao 33, 1465-1473.
27
Wei, B., Yang, L., 2010. A review of heavy metal contaminations in urban soils, urban road dusts and agricultural soils from China. Microchem. J., 94, 99-107.
Wen, X., Liang, C., Jiang, B., Du, L., Yu, X., 2010. Exisiting problems of soil environment quality standard in China and
revising suggestions on present standard. Guangdong Nong Ye Ke Xue 3, 89-94. Wu, Y., 2007. Definition and identification of contaminated land UK environmental law. In Environmental Rule of Law
and Building a Harmonious Society - Proceedings of the National Environmental Resources Law Conference. 893-895.
Wu, Y., Zhou, Q., 1991. An approach to the enactment of soil-environmental standards (Hg, Cd, Pb and As) in China. Ying
Yong Sheng Tai Xue Bao 2, 344-349. Xia, J., 1996. The explanation of soil environmental quality standard, Beijing: China environmental science press. Xia, J., Luo, Y., 2006. Definition and three evaluation guidelines of soil contamination. J. of Eco. and Rural Env. 22, 87-
90. Xia, J., Luo, Y., 2007. Several key issues in research of soil environmental quality in China. J. of Eco. and Rural Env. 23,
1-6. Xu, J., Yang, L., Wang, Y., Wang, Z., 2005. Advances in the study uptake and accumulation of heavy metal in rice (Oryza
sativa) and its mechanisms. Chi. Bul. of Bot. 22, 614-622. Yu, G., Zhang, Z., Ye, X., Yang, G., Zhang, Y., Zhao, S., 2010. Consideration on soil environmental standards in China. M.
Agri. Sc. and Tech. 9, 291-293. Zhao, M., Ta, L., Li, P., 2007. Research on heavy metal pollution to soil and countermeasures on prevention and restoration.
Env. Sc. and Manag. 32, 70-72. Zhou, X., Zheng, L., Hu, K., 2014. Sources and hazards of polluted soil. J. of Wuhan Inst. of Tech. 36, 12-19. Zhu, W., Cao, J., He, Y., 2008. The harm source prevention and cure on soil pollution. Agri. Tech. Servi. 25, 135-136. Zhuang, G., 2015. Current situation of National soil pollution and strategies on prevention and control. Bull. of the Chi.
Acad.of Sc. 30, 257-263.