socio-economic implications of gi registration for agricultural
TRANSCRIPT

Vol-1: Analysis of country-wide survey results of 75 products
An out put from project funded by United Nations Conference on
Trade and Development, New Delhi
Authors
S.K. Soam
&
R. Kalpana Sastry
National Academy of Agricultural Research Management, Rajendranagar, Hyderabad- 500 407
Socio-economic implications of GI registration for agricultural and non-
agricultural commodities/ products in India
Copyright© 2008 : National Academy of Agricultural Research Management,
Hyderabad and United Nations Conference on Trade and Development, New Delhi.
Authors : Dr S.K. Soam, Senior Scientist, NAARM and Dr R. Kalpana Sastry, Principal Scientist, NAARM.
Cover design : Shri P. Namdev, Technical Officer, NAARM.
Correspondence : National Academy of Agricultural Research Management (NAARM), Rajendranagar, Hyderabad- 500 407, India
Citation : S.K. Soam and R. Kalpana Sastry (2008). Socio-economic implications of GI registration for agricultural and non-agricultural commodities/ products in India: Volume-1: Analysis of country-wide survey results of 75 products. NAARM, Hyderabad.
First printed : 2008, 503 p+
Published by : Director National Academy of Agricultural Research Management (NAARM), Rajendranagar, Hyderabad- 500 407, India.
Printed at : NAARM, Hyderabad, India.

Acknowledgements
The development of this study owes much to the encouragement and support provided by the
education division of Indian Council of Agricultural Research (ICAR). We are indebted to Dr S. Prakash
Tiwari, DDG (Edn), ICAR for his approval, encouragement and wholehearted support to the project. We
express our grateful thanks to Dr S. M. Ilyas, Director, NAARM for his over all supervision and technical
guidance to the project. Dr Ilyas as an expert on technical and IPR matters provided his invaluable
guidance and unstinted support to this research study.
We express our profound thanks to Dr R.K. Samanta, formerly Acting Director, NAARM and
Joint Director (Trg), NAARM, who provided all kinds of technical guidance and administrative support.
The project team is also grateful to Dr N.H. Rao, Joint Director, NAARM and Dr T. Balaguru, HoD
(ARSMP) for their time-to-time interaction and overall supervision of the project progress. The special
thanks are due to Mr Suresh Kumar, CAO, NAARM, Mr V. S. Subramanian, FAO, NAARM, Mr Subodh
Kumar, Executive Counselor, APTDC, Hyderabad and Mr V.K. Unni, Associate Professor, NALSAR, who
in capacity of members of ‘Policy Backstopping Group’ contributed lot to the project.
Mr Abhijit Das, Senior Trade Officer, UNCTAD and Ms Rashmi Banga, consultant, UNCTAD
and Mr Sanjay Kumar, Formerly Director at Ministry of Commerce deserves special mention because of
their technical guidance through out the conceiving of project, data collection, analysis and interpretation.
We are also thankful to Mr Abhay Mishra, Managing Director, Fintec-Genesis, who as another partner of
the UNCTAD study project contributed at several milestone phases to the project.
The large data collection work may not have possible without active support of ‘Data Facilitators’
and ‘Data Enumerators’ affiliated to several Agricultural Universities, ICAR research institutes and other
organizations. The project team is highly thankful to them. Ms Delphine Marrie-VIVIEN, visiting
researcher at National Law School, Bangalore deserves special thanks for writing one of the chapters.
Thanks are due to facilitators of case studies namely Dr P. Nayak, of textile committee, Dr SS Chandel of
HP government, Mr Vijayan of KSIC, Mr Ramakrishna, SISI and Mr Muzaffar Kalle Bhai of Chanderi.
The Project Assistant, Ms H.B. Rashmi was the core of the project, the investigators do not have
words to thank her for her extraordinary contribution to the project. We acknowledge help from Dr
Jaganadham Challa, Principal Scientist, NAARM, who supported the project in most difficult times of data
analysis. The team is thankful to the analysis assistance provided by Ms Sneha and Ms Praveena. The
Administrative, Finance and Technical personals of the Academy contributed immensely for the success of
all small and big activities of the project. We thank Mr P.P. Brahmaji, AAO, Mr Y. Shanker Rao, AAO, Mr
C. Bagaiha, Ms Vijya Lakshmi, Mr P.G. Kohad, Mr M. Sridhar, Mrs Jhansi Laxmi, Mr P. Srinivas, Mr
Shekhar Reddy, Mr P. Namdev and other staff at the Academy.
NAARM, Hyderabad
April, 2008
S.K. Soam
R. Kalpana Sastry

Content
Chapter/ Annex no. Chapter/ Annex title Page no.
Volume-1
Executive Summary i-xii
Instructions for Readers xiii-xv Chapter-1 Introduction, Background and Scope of Work 01-07
Chapter-2 Listing, Ranking and Synopsis of GI Suitable Products 08-22
Chapter-3 Approach and Methodology 23-29
Chapter-4 Socio-economic Profile of Producers 30-47
Chapter-5 Analytical Profile of Agricultural Products and Producers: opinion survey of producers
48-80
Chapter-6 Analytical Profile of Non-Agricultural Products and Producers: opinion survey of producers
81-110
Chapter-7 Analytical Profile of Products Involving Indigenous Knowledge: opinion of stakeholders
111-142
Chapter-8 Analytical Profile of Registered GI Products: opinion of stakeholders
143-170
Chapter-9 Opinion, Knowledge, Role and Suggestions of Institutional Stakeholders about Agricultural and Non-Agricultural Products
171-204
Chapter-10 Opinion, Knowledge and Suggestions of Consumers about Agricultural and Non-Agricultural Products
205-213
Chapter-11 Opinion, Knowledge and Suggestions of Traders about Agricultural and Non-Agricultural Products
214-234
Chapter-12 Case Studies of Few Registered Products 235-278
Chapter-13 Geographical Indications in India: The legal framework, its implementation and Issues for the future
279-318
Chapter-14 Action Framework: Facts & Recommendations 319-337
Bibliography Annexure
Annexure-IV Socio-economic profile of producers 338-345
Annexure-V Analytical profile of agricultural products and producers 346-366
Annexure-VI Analytical profile of non-agricultural products and producers
367-393
Annexure-VII Analytical profile of products involving indigenous knowledge: opinion of stakeholders
394-404
Annexure-VIII Analytical profile of registered GI products: opinion of
stakeholders 405-416
Annexure-IX Opinion, knowledge, role and suggestions of institutional stakeholders about agric. and non-agricultural products
417-445
Annexure-X Opinion and knowledge of consumers about agricultural and non-agricultural products
446-454
Annexure-XI Opinion, knowledge and Suggestions of traders about agricultural and non-agricultural products
455-471
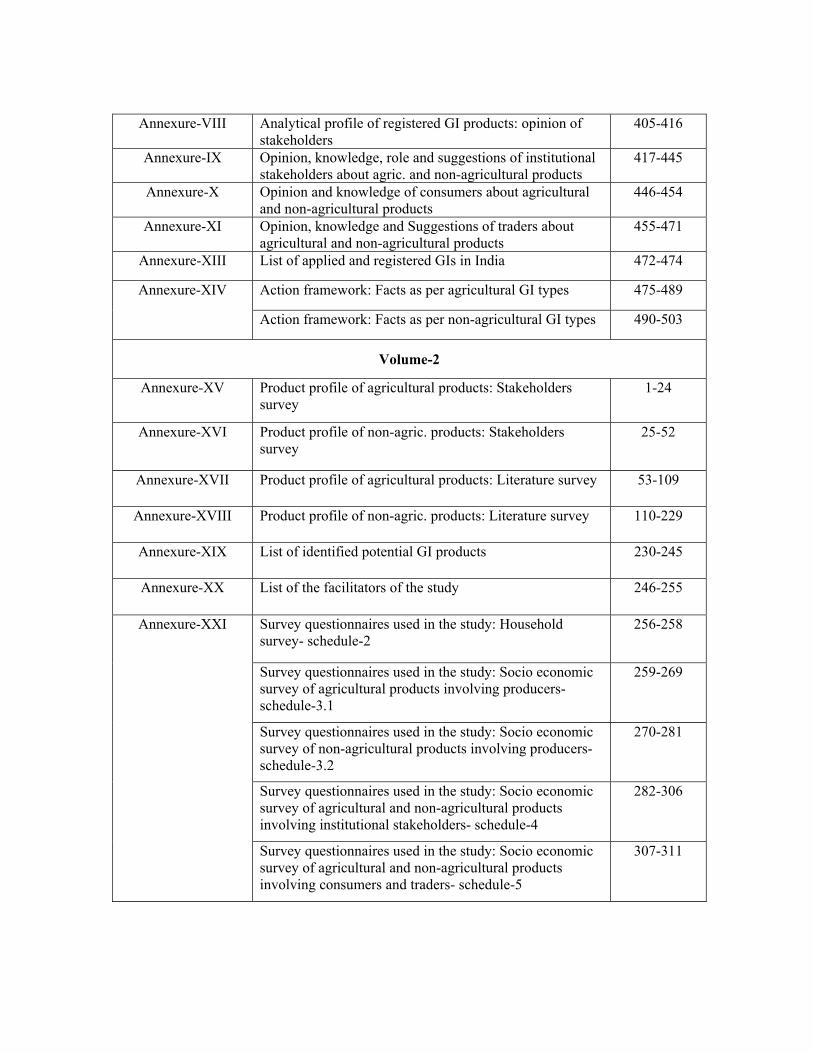
Annexure-XIII List of applied and registered GIs in India 472-474
Action framework: Facts as per agricultural GI types 475-489 Annexure-XIV
Action framework: Facts as per non-agricultural GI types 490-503
Volume-2
Annexure-XV Product profile of agricultural products: Stakeholders survey
1-24
Annexure-XVI Product profile of non-agric. products: Stakeholders survey
25-52
Annexure-XVII Product profile of agricultural products: Literature survey 53-109
Annexure-XVIII Product profile of non-agric. products: Literature survey 110-229
Annexure-XIX List of identified potential GI products 230-245
Annexure-XX List of the facilitators of the study 246-255
Survey questionnaires used in the study: Household survey- schedule-2
256-258
Survey questionnaires used in the study: Socio economic survey of agricultural products involving producers- schedule-3.1
259-269
Survey questionnaires used in the study: Socio economic survey of non-agricultural products involving producers- schedule-3.2
270-281
Survey questionnaires used in the study: Socio economic survey of agricultural and non-agricultural products involving institutional stakeholders- schedule-4
282-306
Annexure-XXI
Survey questionnaires used in the study: Socio economic survey of agricultural and non-agricultural products involving consumers and traders- schedule-5
307-311

Executive Summary
Objectives and scope of study
Following were the objectives of the study:
To explore, using specific examples, how geographical indications (GIs) as a
form of intellectual property impact the market opportunities
Analyze how the grant of GIs could impact the lives and livelihoods of those
producing (directly or indirectly) the products that have been/ could be protected
To understand whether geographical indications provides an extra competitive
advantage to people associated with the protected product under GI.
The terms of reference of the study included the identification of specific products in
different classes, both agricultural and non-agricultural, from three different regions, of
the country where GI protection play / can play a determining role in enhancing the value
of the product in the domestic/export market. Overall, at least 25 products must be
identified in each of the three regions, which may be suitable for GI registration. The
major items of observations in the study are:
1. Legal & policy structure of GI protection
2. Listing, classification, and ranking of GI products
3. Critical analysis of the producers
4. Critical analysis of marketing scenario and future strategies
a. Product profile
b. Production profile and strategies
c. Market profile and strategies
d. Pricing policies
e. Distribution networks
f. Livelihood systems of producers
ii
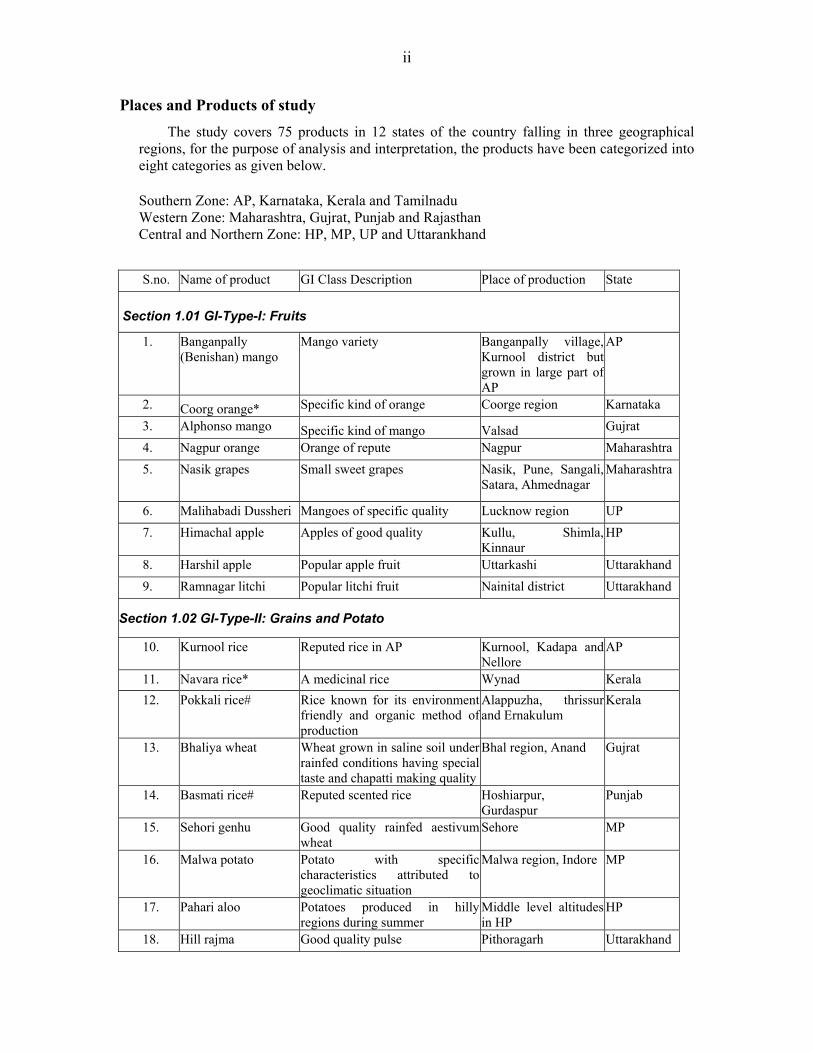
Places and Products of study
The study covers 75 products in 12 states of the country falling in three geographical regions, for the purpose of analysis and interpretation, the products have been categorized into eight categories as given below.
Southern Zone: AP, Karnataka, Kerala and Tamilnadu Western Zone: Maharashtra, Gujrat, Punjab and Rajasthan Central and Northern Zone: HP, MP, UP and Uttarankhand
S.no. Name of product GI Class Description Place of production State
Section 1.01 GI-Type-I: Fruits
1. Banganpally (Benishan) mango
Mango variety Banganpally village, Kurnool district but grown in large part of AP
AP
2. Coorg orange* Specific kind of orange Coorge region Karnataka 3. Alphonso mango Specific kind of mango Valsad Gujrat 4. Nagpur orange Orange of repute Nagpur Maharashtra 5. Nasik grapes Small sweet grapes Nasik, Pune, Sangali,
Satara, Ahmednagar Maharashtra
6. Malihabadi Dussheri Mangoes of specific quality Lucknow region UP 7. Himachal apple Apples of good quality Kullu, Shimla,
Kinnaur HP
8. Harshil apple Popular apple fruit Uttarkashi Uttarakhand 9. Ramnagar litchi Popular litchi fruit Nainital district Uttarakhand
Section 1.02 GI-Type-II: Grains and Potato
10. Kurnool rice Reputed rice in AP Kurnool, Kadapa and Nellore
AP
11. Navara rice* A medicinal rice Wynad Kerala 12. Pokkali rice# Rice known for its environment
friendly and organic method of production
Alappuzha, thrissur and Ernakulum
Kerala
13. Bhaliya wheat Wheat grown in saline soil under rainfed conditions having special taste and chapatti making quality
Bhal region, Anand Gujrat
14. Basmati rice# Reputed scented rice Hoshiarpur, Gurdaspur
Punjab
15. Sehori genhu Good quality rainfed aestivum wheat
Sehore MP
16. Malwa potato Potato with specific characteristics attributed to geoclimatic situation
Malwa region, Indore MP
17. Pahari aloo Potatoes produced in hilly regions during summer
Middle level altitudes in HP
HP
18. Hill rajma Good quality pulse Pithoragarh Uttarakhand

iii
Section 1.03 GI-Type-III: Plantation and spices
19. Guntur chilli (karam) Pungent and dark red colored chillies
Guntur AP
20. Coorg coffee Reputed coffee Coorge region Karnataka 21. Wayanadan tea Tea leaves Wayanad Kerala 22. Telichery black
pepper# Dried black pepper Telichery, Kannur
district Kerala
23. Alleppy cardamom# Good quality cardamom Alleppy Kerala 24. Nilgiri tea# Good quality tea Nilgiri ranges Tamilnadu 25. Dungarpur zinger Zinger of high quality Dungarpur Rajasthan 26. Amleta & Mahadev
garlic Good quality local garlic Mandsaur, Neemach MP
27. Kumbhraj dhania Coriander of good flavour and good oil content
Guna, Rajgarh, Neemach, Mandsaur
MP
28. Fenugreek (Methi) Good quality bold seeded fenugreek or methi
Jaora, Ratlam, Neemach
MP
29. Mahoba paan Betel leaf Mahoba UP 30. Kangra tea* Tea of repute Kangra district and
other areas of HP HP
GI-Type-IV: Unexploited indigenous products
31. Nannari sharbat A black color medicinal drink made from roots of a creeper wild plant known as 'sugandhapalu'.
Kadapa AP
32. Kokam fruit juice
Juice of Garcinia known to reduce weight
Western ghats Karnataka
33. Buraansh juice Juice made from red flowers of Buraansh tree (pink flower are known to be poisonous)
Hilly districts of Uttaranchal
Uttarakhand
GI-Type-V: Confectionery
34. Tirunelveli halwa A sweet food product Tirunelveli district Tamilnadu 35. Dodha A milk based sweet product
famous in Punjab and Haryana Muktsar, Ludhiana, Amritsar, Moga districts, originated from katkapura
Punjab
36. Bikaneri bhujia A salted snack material called 'namkeen'
Bikaner Rajasthan
37. Bikaneri rasgolla Sweet product Bikaner Rajasthan 38. Agra petha Sweet made of ash gourd Agra UP 39. Bal mithai Sweet chocolate blocks with
cover of post seeds Almora Uttarakhand
GI-Type-VI: Handicrafts
40. Kondapalli bommalu*
Wooden Toys Kondapalli, Krishna district
AP

iv
41. Chennapatana toys* Colored wooden toys Mandya, Bangalore rural
Karnataka
42. Thanjavur plate#
Painted plate used as souvinir Thanjavur Tamilnadu
43. Kolhapuri chappal Leather shoes and slippers Kolhapur Maharashtra 44. Warli paintings Traditional cloth painting by the
tribal people Thane Maharashtra
45. Panjabi jooti Special kind of footwear with embroidary on it for men and women, also known as khusa and kadi jooti
Patiala, Muktsar and other places
Punjab
GI-Type-VII: Manufactured products with organized trade
46. Hyderabad pearls Pearls of repute Hyderabad AP 47. Mysore sandal soap* Cosmatics Mysore Karnataka 48. Nilgiri oil Good quality non-edible oil Nilgiri ranges Tamilnadu 49. Sivakasi patakha Fire crackers Sivakasi,
Virudhunagar district Tamilnadu
50. Coimbatore wet grinder*
Machine used for making paste of cereal/pulses for prperation of south Indian dishes
Coimbatore Tamilnadu
51. Harambha thresher Wheat thresher Rampura phool district Bhatinda, Ludhiana, Faridkot and Moga
Punjab
52. Makrana marble Stone as building material Rajasthan Rajasthan 53. Jaipur blue pottery # Pottery and souvinirs made of
porcelain Jaipur Rajasthan
54. Ferozabad chundia and glassware
Specific design and process for making glass bangles (Chudia) and cut glass items
Ferozabad UP
55. Moradabad brass material
Utensils and decorative articles of brass
Moradabad UP
56. Saharanpur furniture Specific design of furniture made of 'Sisso'
Saharanpur UP
57. Khurja pottery China clay pottery Khurja, Bulandshahar district
UP
Section 1.04 GI-Type-VIII: Textiles
58. Gadwal saree Women wear in cotton, silk with pure silk border
Gadwal, Mahaboobnagar district
AP
59. Srikalahasti kalamkari*
Free hand printing on cloth with natural dyes
Chittoor AP
60. Mysore silk* Reputed silk clothing including Mysore Karnataka

v
saree 61. Kancheepuram silk*
Famous silk sarees Kancheepuram Tamilnadu
62. Bandhani saree
Sarees made from binding method and block printing with herbal dyes
Jamnagar, Ahemdabad
Gujrat
63. Patola saree
Double ikat known for design dyeing and weaving
Patan, Rajkot
Gujrat
64. Kutch embroidery# Specific embroidery with fabric designs and mirror on cloth, various decorative articles and on houses
Kutch Gujrat
65. Paithani saree Specific saree style prepared at Yewala
Paithan, Nasik district, Aurangabad
Maharashtra
66. Solapuri chadar* Bedsheets/ cover sheets Solapur Maharashtra 67. Phulkari# Specific Kind of embroidery on
women wear Patiala and adjacent areas
Punjab
68. Ludhiana hosiery
Cotton based undergarments and woolen material
Ludhiana
Punjab
69. Jaipuri rajai#
Light in weight quilt made of cotton
Jaipur Rajasthan
70. Sanganeri print A particular print for bedsheets Jaipur Rajasthan
71. Chanderi saree*
Half silk half cotton saree famous for brocade and muslin produced by twisting yarn and knitting or weaving
Chanderi, Guna (Ashoknagar)
MP
72. Banarasi saree# Specific design and process of saree
Varansi UP
73. Lucknavi chikan# Embroidery style for men and women wear
Lucknow UP
74. Bhadoi carpet High quality carpet Bhadoi town of district Mirzapur
UP
75. Kullu shawl* A woven woolen cloth with specific pattern
Kullu HP
*-Registered GI; #-Applied for registration as on 1 Jan 2008
Data collection and respondents for the survey
For the study, 1865 respondents were surveyed, therefore the interview schedules
so designed were administered to 28 persons for each product in the following fashion:
1. Ten producers on appropriate schedule. For agricultural product it is schedule 2
and schedule 3.1. For non-agricultural product it is schedule 2 and schedule 3.2.
2. Eight different institutional stakeholders on schedule 4
3. Five different consumers on schedule 5
4. Five different retailing traders on schedule 5

vi
The data collection process included arrangements of ‘Facilitators’ in various states
for each product for data collection administration and data is collected by the
‘Enumerators’. The data was collected from 45 villages and 60 district towns in 12 states.
Background of the producers
The producers of agricultural and non-agricultural products are mainly engaged in
their respective enterprise only, it is their main livelihood. About 7-8% respondents in
agricultural and non-agricultural products engaged in other subsidiary enterprise also.
The producers mainly belong to either other backward classes (OBCs) or communities
other than Scheduled Castes (SCs) or Scheduled Tribes (STs). The trend is almost same
for agricultural and non-agricultural enterprises.
Only 15.3% of total respondents provided any detail of their income, it has been
observed that respondents were not much willing to share information on income, asset
and expenditure etc., and this tendency was more prevalent in the non-agricultural
producers. About 62% of the total producers were below Rs. 50,000/- annual income,
10% between 50,000 to 100,000 and 28% beyond 100,000. The income-expenditure-asset
analysis was therefore, done for the following three groups.
• Category A: Respondents of annual income up to Rs 50,000/-
• Category B: Respondents of annual income > 50,000/- to 200,000/-
• Category C: respondents of annual income of >200,000/-
Highlight of opinion survey of agricultural producers
• Mostly the producers are engaged in production only. Some do the trading also
but providing training is mostly not in their agenda.
• In almost all cases, the head of family is also head of enterprise and in no case the
non-family members was principal operator.
• Skill acquisition through formal training is less than 3%.
• The number of engaged skilled women workers is almost double of the engaged
skilled men workers.
• The producers surveyed are mainly producers of product in question but they do
not allot the whole land for the product only. But producers of more than 50% of

vii
the product put their 60% or more land under the cultivation of product, therefore,
the product is main livelihood for them.
• About 53 percent of the producers have actually taken the loans, which is less
than Rs. 50,000, the loan is mostly taken for purchase of inputs.
• Only in 30 per cent respondents inform about pucca packing otherwise mostly it
is either no packing or raw packing.
• In 28 per cent cases no grading, in rest of the cases the grading is done but mostly
its is based on physical traits.
• In 14% cases only, it is either sale to government agency or cooperative society.
• The prices of product for sale are mostly decided either through individual
bargain or purchaser offer a price to which producers had to agree and there is no
other choice.
• The most important constraints in production are hindrances from
agronomic/natural factors, market insecurity leading to low profitability, labour
scarcity and low marketing infrastructure.
• In case of 75% of enterprises, the inspection and quality control is either by
producers themselves at production level on field and harvesting level or there is
no inspection and quality control.
• Technical standards are very weak, as observed from following responses from
the producers;
o Whether production is as per technical guidelines of government? About
74% respondents say ‘no’.
o Whether production is as per technical guidelines of any NGO? 92%
respondents say ‘no’
o Whether production is as per technical guidelines of producers
association? About 74% respondents say ‘no’.
• As post registration expectation, more than 70% wish higher unit price and
market expansion. About 42% producers expect 5-10% premium over prevailing
cost.
• About 58% producers feel that earning from enterprise is average.
viii
• On increasing the production, margin of profit and marketing needs, the producers
have given diverse views as per the GI type, but many of them are hopeful for
betterment, if timely availability of resources is assured to them.
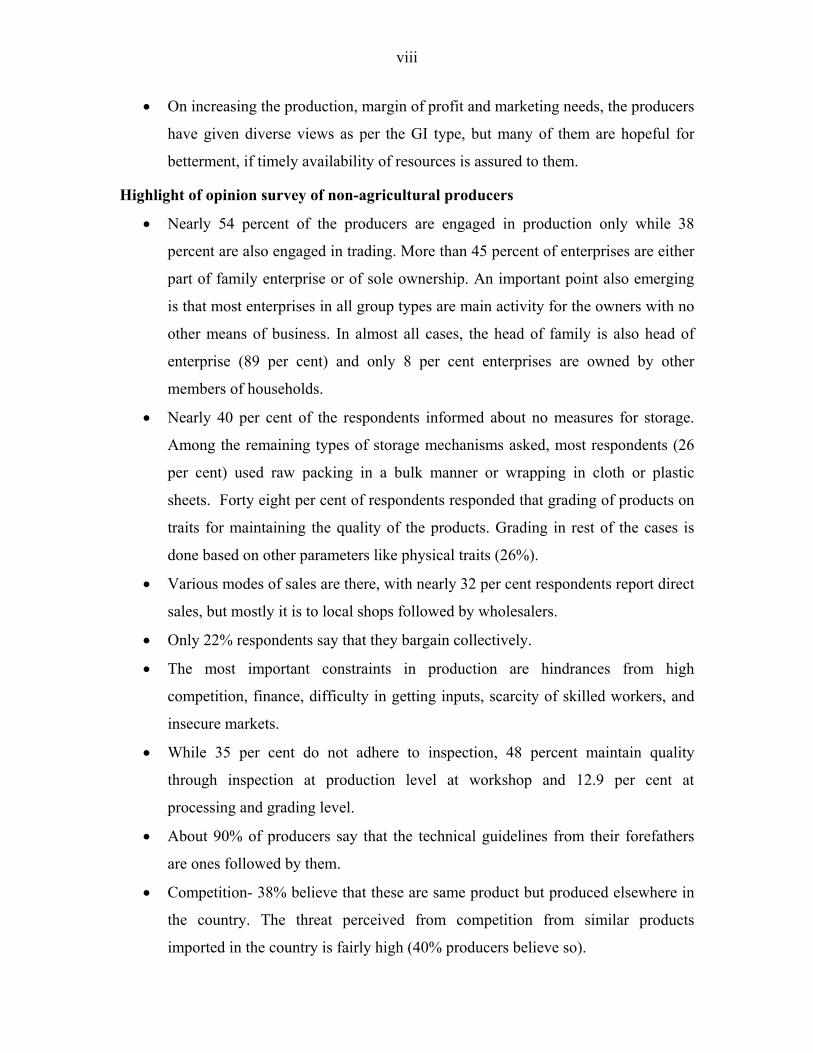
Highlight of opinion survey of non-agricultural producers
• Nearly 54 percent of the producers are engaged in production only while 38
percent are also engaged in trading. More than 45 percent of enterprises are either
part of family enterprise or of sole ownership. An important point also emerging
is that most enterprises in all group types are main activity for the owners with no
other means of business. In almost all cases, the head of family is also head of
enterprise (89 per cent) and only 8 per cent enterprises are owned by other
members of households.
• Nearly 40 per cent of the respondents informed about no measures for storage.
Among the remaining types of storage mechanisms asked, most respondents (26
per cent) used raw packing in a bulk manner or wrapping in cloth or plastic
sheets. Forty eight per cent of respondents responded that grading of products on
traits for maintaining the quality of the products. Grading in rest of the cases is
done based on other parameters like physical traits (26%).
• Various modes of sales are there, with nearly 32 per cent respondents report direct
sales, but mostly it is to local shops followed by wholesalers.
• Only 22% respondents say that they bargain collectively.
• The most important constraints in production are hindrances from high
competition, finance, difficulty in getting inputs, scarcity of skilled workers, and
insecure markets.
• While 35 per cent do not adhere to inspection, 48 percent maintain quality
through inspection at production level at workshop and 12.9 per cent at
processing and grading level.
• About 90% of producers say that the technical guidelines from their forefathers
are ones followed by them.
• Competition- 38% believe that these are same product but produced elsewhere in
the country. The threat perceived from competition from similar products
imported in the country is fairly high (40% producers believe so).
ix
• About 56% of producers are not members of any formal or informal group.
Highlights of opinion survey of institutional stakeholders
• In the opinion of institutional stakeholders, the agricultural products’ sale is
mostly confined to the region where their origin is claimed.
• Most respondents, 57% in agric and 62% in non-agric products believe that sale is
increasing.
• Stakeholders give their opinion about price increment in supply chain for
agricultural products and non-agricultural products. They feel that in the supply
chain, the intermediate stakeholders earn more than the producer.
• Inspection method: In agricultural products around 45% feel that on-site advice
and inspection is the most prevalent method of quality control. In case of non-
agricultural products 19% respondents clearly believe that there are no formal
methods.
• Quality assurance: The main form of government-defined method of quality
assurance in agriculture is regulating post harvest practices and production
practices along with input supply. In non-agricultural products, majority believes
that producers regulated raw material testing is the most prevailing method.
• Major source of competition is same product produced in other areas of country.
• Awareness of institutional stakeholders about community patent that is GI was
very low. In agriculture only 19% respondents knew it, while in non-agricultural
products 40% respondents knew it.
• The respondents have given various suggestions to improve the marketing of
products. The top three suggestions in agricultural products are – organized and
regulated market, government policy support and TQM, while the top three
suggestions in non-agricultural products are – publicity, government policy
support and TQM.
• The bankers also have suggested the areas of research. In agricultural products,
the top priority is TQM followed by futuristic development and enhancement of
productivity. While in non-agricultural products, the top area suggested is
x
enhancing productivity, followed by innovations and systems development with
equal emphasis.
• The major observations from institutional stakeholders analysis is;
- There is no specific department dealing with GI registration.
- There is no systematically arranged fixed responsibility along with target to
anyone.
- Mostly the GI registration have been done by the own knowledge gained by the
top brass/any dynamic individual of a department or subsidiary organizations
from training or elsewhere and out of their personal interest and involvement, the
registration could be done.
- In non-agricultural production, the responsibility has been taken by several
agencies of central or state government (e.g. textile committee, handicraft
development corporations, etc.). But this could not happen in case of agricultural
products except few products, where central government boards have taken
initiative.
- To avoid any future problems, it is strongly suggested that only government
supported departments and organizations should be allowed to retain the
ownership of a GI, and not any private organization because in very few cases
only a single organization represents the interest of larger group of society. The
small NGOs or any organization created by few persons does not necessarily
represent the interest of a larger group of society. Highlights of opinion survey of consumers
• Around 80% consumers in all GI types believe that product quality will become
standard and grading will improve after registration. While comparing agricultural
and non-agricultural product, it seems that impact would be more in case of
agricultural products.
• At the time of purchase a product, whether consumers are sure that product is
genuine? About 87% consumers in agricultural products and 96% in non-
agricultural products are sure about it. It means the confidence in agri-products is
little less. 51% consumers in agricultural product and 77% in non-agricultural
products make some efforts to ensure purchase of guanine products.
xi
• To ensure genuine product, the most reliable method for consumers is ‘going to
authorized/ reliable / reputed shop’ followed by looking for a label or trademark
in agricultural products and taking authentic receipt in case of no-agric. products.
• Depending on type of GI, 40-70% consumers favour registration. As post
registration effect, 85% consumers in agricultural products and 61% in non-
agricultural products are willing to pay higher. But how much premium over the
prevailing price? In agricultural products, most agree for 5 - 10%, in case of non-
agricultural products, most agree for 0 - 5.
• Most consumers consider that unique quality; reputation, traditionality and other
characteristics are attributed to geographical origin.
• Suggestions for increasing sale;
o In agricultural products- standardize the quality followed by easy assured
availability, more publicity and reasonable price and the last suggestion is
to make innovative changes keeping the traditional base.
o In non-agricultural products- standardization of quality, reasonable price
and innovative changes are most important.
• Consumers gave ranked suggestion for the future prospects of the product.
Products where future is either stationery or not bight are - Coorg orange, Pokkali
rice, Bhaliya wheat, Pahari aloo, Coorg coffee, Telicherry, Black pepper,
Mahoba pan, Punjabi jooti, Harambha thresher, Patola saree and Bhadoi carpe.
Highlights of opinion survey of traders
• The modes of purchase by the traders have direct impact on the price
decision-making system of the producers. In non-agricultural products, the
direct purchase is more prevalent than agricultural products.
• Depending upon type of GI, 20-30% traders feel that unique characteristics of
the product give better market value.
• In general about half of traders feel that sale is increasing significantly.
• In the price decision between trader and consumer bargaining is main process
to arrive on a win-win situation for both. In agricultural products, the main
bargaining is in GI type I, III and II in that order, in GI type IV no bargaining.

xii
In non-agricultural products, the main bargaining is in GI type VIII, followed
by VI, VII and V.
• In the products high quality production practices and also inputs is the major
concern.
• For non-agricultural products most traders’ view duplicates are available but
half of them believe that these are of inferior quality.
• About 67% percent traders feel that products are facing competition in their
items. Among these about 59 percent are for non-agricultural products
• Methods to face competition: In agricultural products, the most important
suggested method is introduction of quality control and inspection
mechanism. In non-agricultural products, the suggested methods are little
different than agricultural products. The most important method here is
improvement through design and development followed by equally important
‘improvement in marketing methods’ and ‘intensive publicity’.
• Traders gave their ranked opinion for trade suitability of the product.
• As post registration activity, the traders want increase over prevailing cost
price for agriculture 10% or less and for non-agric. products between 10-15%.
They wish to have enhanced premium over selling price, in case of both
agricultural and non-agricultural products, most traders expect enhancement
of 15% or below.
• Not many traders are satisfied with their earnings from sale of agricultural and
non-agric. GI product.
• Traders gave their opinion about future prospects of the product. For
improving the economic viability and future prospects of the product, the
traders have suggested various constructive measures. In case of agriculture,
the major suggestions are improvement at production level, quality
standardization, maintenance and assurance, good marketing practices and
publicity of the product. For non-agricultural products, the top priority is same
as in agricultural products i.e. production level improvements, it follows the
government support and then equally important quality management and good
marketing practices
xiii
Instructions for Readers Chapters and Annexes
The complete analysis and information has been presented in two volumes, the vol-2 does
not contain any chapter, and it contains seven annexure only, which is only
supportive/additional material for information. The volume-1 is the major analytical
component, which contains the major body text and associated annexure. In the vol-1,
there are 14 chapters and 10 annexure, chapters 4 to11 are the major analytical chapters.
The additional matter (mainly data tables) of a chapter are presented in the annexure;
therefore the number given to the annexure is same as the number given to a chapter, if
any chapter (e.g. chapters 1,2,3 &12) does not have any annexure, these numbers (in
roman) would be missing from the list of Annexure. All the data tables are in the
annexure and number of the table start with the number of the concerned chapter e.g.
tables in Annex-IV, which is for chapter-4 will start from table-4.1 and this annexure
contains 29 tables, therefore the last table is table-4.29, the same pattern is followed for
all other annexure. The figures (graphs), wherever available are included at the end of the
text of each chapter and figure no. in each chapter is the same as the table no. in the
respective annexure from where the material for figure (graph) has been taken e.g. Figure
no. 4.1 in chapter-4 has been taken from table 4.1 in Annexure-IV. If readers are
interested in more details they can refer the particular table.
Footnote Each chapter has its own footnotes with their numbers limited to that chapter only
Chapter content
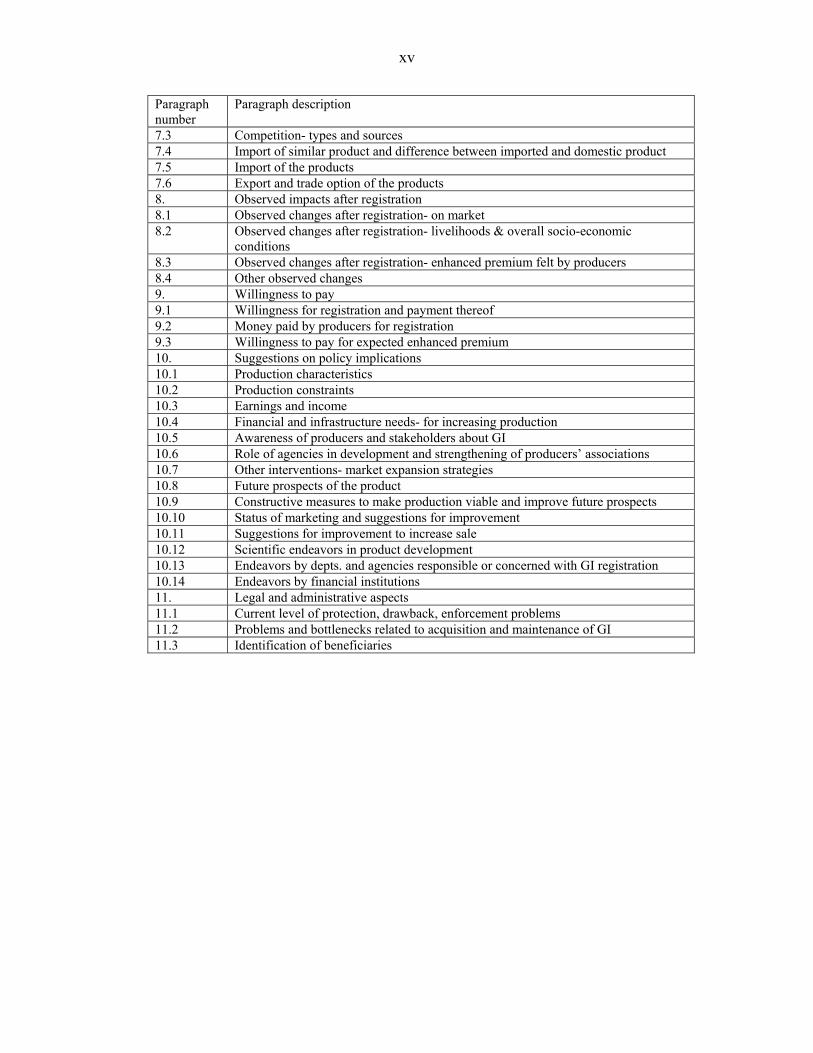
For the major analytical chapters i.e. chapter 4 to 11, a uniform pattern of paragraph has
been adopted. Each chapter has either all or selected few major heads/subheads of the
paragraph as given below in the table:

xiv
Paragraph number
Paragraph description
1. Socio-economic profile of producers 1.1 Livelihood and social groups 1.2 Household particulars 1.3 Housing particulars 1.4 Household income, expenditure and assets 1.5 Welfare indicators 2. Product description 2.1 Nature and geographical association 2.2 Unique characteristics 2.3 Specialty of production process 2.4 History of production- in region and by individual 3. Enterprise and operations 3.1 Ownership and activities 3.2 Activities-seasonality 3.3 Resources- persons engaged and equity issues 3.4 Resources- persons engaged in organizations 3.5 Resources skill & training 3.6 Resources- physical particulars of land (agric)/ inventory of fixed assets (non-agric) 3.7 Resources- loans 3.8 Resources- raw material 3.9 Quantity and value of production 4. Marketing operations 4.1 Storage methods and problems 4.2 Packing methods and problems 4.3 Grading methods 4.4 Mode of sale and satisfaction level 4.5 Mode of purchase by traders 4.6 Spectrum of region-wise sale of product 4.7 Contribution of uniqueness to sale 4.8 Trend of sale 4.9 Price decision and trend of unit price 4.10 Price increments in supply chain 4.11 Constraints in production and marketing 5. Inspection, quality control & quality assurance 5.1 Inspection, quality control at various stages of production 5.2 Govt defined quality assurance methods and advice given for quality improvement 5.3 Technical guidelines for production codes 5.4 Maintenance and monitoring of codes of production practices 5.5 Traders’ view to maintain product quality 6. Perceived changes after registration 6.1 Presumed results of non-registration 6.2 Expected changes after registration- on market 6.3 Expected changes after registration- enhanced premium as expected by producers
and traders 6.4 Expected changes after registration- livelihoods & overall socio-economic
conditions 6.5 Expected changes after registration- consumers’ expectations 6.6 Visualized benefits at time of GI registration Other changes 7. Perceived impact on market 7.1 Duplicates and similar products 7.2 Consumers’ efforts to purchase genuine product
xv
Paragraph number
Paragraph description
7.3 Competition- types and sources 7.4 Import of similar product and difference between imported and domestic product 7.5 Import of the products 7.6 Export and trade option of the products 8. Observed impacts after registration 8.1 Observed changes after registration- on market 8.2 Observed changes after registration- livelihoods & overall socio-economic
conditions 8.3 Observed changes after registration- enhanced premium felt by producers 8.4 Other observed changes 9. Willingness to pay 9.1 Willingness for registration and payment thereof 9.2 Money paid by producers for registration 9.3 Willingness to pay for expected enhanced premium 10. Suggestions on policy implications 10.1 Production characteristics 10.2 Production constraints 10.3 Earnings and income 10.4 Financial and infrastructure needs- for increasing production 10.5 Awareness of producers and stakeholders about GI 10.6 Role of agencies in development and strengthening of producers’ associations 10.7 Other interventions- market expansion strategies 10.8 Future prospects of the product 10.9 Constructive measures to make production viable and improve future prospects 10.10 Status of marketing and suggestions for improvement 10.11 Suggestions for improvement to increase sale 10.12 Scientific endeavors in product development 10.13 Endeavors by depts. and agencies responsible or concerned with GI registration 10.14 Endeavors by financial institutions 11. Legal and administrative aspects 11.1 Current level of protection, drawback, enforcement problems 11.2 Problems and bottlenecks related to acquisition and maintenance of GI 11.3 Identification of beneficiaries
Chapter 1
Introduction, Background and Scope of Work
Introduction
The geographical locations either due to geo-climatic features or due to specially
attained skills by the local people impart special characteristics and therefore reputation
to some agricultural (Fruits& vegetables, spices, cereals, and non-agricultural products
(such as sweets, textiles, handicraft & artifact, manufactured products & machines etc.),
which has reputation due to its belongingness to that particular place. In compliance with
Agreement on Trade Related Aspects of Intellectual Property Rights (TRIPS). The
intellectual worth of the geographical indications was established in India by The
Geographical Indications of Goods (Registration and Protection) Act 1999, which came
into force from 15th September 2003.
The definition of GI in GI Act is in accordance with Art 22.1 of TRIPS; in
addition the goods have been categorized into agricultural, natural, manufactures,
handicraft or industrial goods including foodstuff (Section 2.1.f), these goods as per
international classification are classified into 34 classes as given in the fourth schedule;
definition of producers is available in Section 2.1.k. TRIPS does not provide procedural
requirements for protection of GI, therefore GI Act has its own but TRIPS compliant
provisions for the application of registration for GI (Section 7.2) and authorized users
(Section 7.3). Application for registration of GI must fulfill certain requirements as given
in Section 11.2, the requirement of inspection body as asked in GI application form no.
GI-1 is not given under this section of GI Act but it is covered by Section 11.2.f, which
states ‘such other particulars as may be prescribed’’. The applicants have to provide
address of principal place of business in India, and address for service in India (Rule 16
& 17). In case, applicant does not have principal place of business, then address of
2
residence in India for Indian citizens (Rule 3.iii) and for foreign applicant from
convention countries, the address of residence must be given (Rule 15.3). With respect to
registration of GI and authorized user, the GI Act does not discriminate between Indian
citizens and foreigners, except few provisions such as 1. Pursuant to Art 24.9 of TRIPS,
Section 9.f of GI Act prohibits registration of those GI, which are not protected in their
country, 2. Under Rule 24.1 of GI Act, foreigners from convention countries have to
produce a certificate from registry or competent authority of GI office of that country.
Objectives of the study
Purpose of the study was to development of recommendation domain for the
effective and efficient geographical indications portfolios for sustainable rural livelihood
systems. Following were the objectives of the study:
To explore, using specific examples, how geographical indications (GIs) as a
form of intellectual property impact the market opportunities
Analyze how the grant of GIs could impact the lives and livelihoods of those
producing (directly or indirectly) the products that have been/ could be protected
To understand whether geographical indications provides an extra competitive
advantage to people associated with the protected product under GI.
The purpose, objectives and terms of reference given by the UNCTAD are
transformed into a mission statement of the proposed study as given hereunder,
“Comprehensive understanding of GIs with respect to their availability & suitability,
ranked priority, and existing and suggested scenario of associated stakeholders’ situation
such as- socio economic conditions, knowledge system and livelihood systems of
producers; marketing opportunities and competitive edge with regard to domestic and
foreign trade; and legal, administrative and policy framework of GI protection system in
India”

3
Scope of the study
The terms of reference of the study include the following:
i. To evaluate the legal and policy structure for the protection of GIs in India,
including the customary/common law protection, post GI Act protection and
enforcement problems.
ii. To identify specific products in different classes, both agricultural and non-
agricultural, from four different regions of the country where GI protection play /
can play a determining role in enhancing the value of the product in the
domestic/export market. Overall, at least 25 products must be identified in each of
the three regions, which may be suitable for GI registration.
iii. In respect of each of the product identified in a region, to highlight the product
profile, e.g. market, both domestic and export, value of the product, number of
people dependent on the product, nature of the product, special features of the
product etc. and how GI registration could have an impact on market
opportunities and enhance competitiveness of the product concerned.
iv. In respect of each of the product identified in a region, to highlight the socio-
economic condition of the community involved in the production and trade of the
product.
v. In respect of each of the product identified in a region, to analyze how the grant of
GIs could impact the lives and livelihoods of those producing (directly or
indirectly) the product.
vi. On the basis of objective criteria, to rank the products identified in a particular
region for their suitability for GI registration. Some of the objective criteria which
could be used for ranking include association of the product with geographical
name, restriction of production to specific geographical limits, distinct
characteristics of the product, contribution of natural factors like geo-climatic
factors to distinct product characteristics, contribution of local skills to distinct
product characteristics, potential for international trade.

4
vii. To assess the state of awareness about protecting GIs among producers and
suggest ways to enhance the awareness.
viii. To explore how GI protection can be exploited to protect traditional knowledge,
with reference to two or three products.
ix. To evaluate the quality control and inspection mechanisms existing in GI products
and suggest means for improving the same.
x. To identify the major bottlenecks in the acquisition and maintenance of a GI in
India.
xi. To explore the role(s) which state agencies/producer networks can play in the
acquisition and maintenance of a GI.
Items of observation
5. Legal & policy structure of GI protection
a. GI Enforcement procedures and bottlenecks in acquisition and
maintenance of GI
b. Critical study of registered GI
c. Identification of stakeholders for future GI portfolio development
6. Listing, classification, and ranking of GI products on the basis of following
criteria
a. Nature of product
b. Specific characteristics of the product
c. Specific characteristic as potential GI
d. Distribution of production area
e. Association of the product with geographical name
f. Restriction of production to specific geographical limits
g. Distinct characteristics of the product
h. Contribution of natural factors like geo-climatic factors to distinct product
characteristics
i. Contribution of local skills to distinct product characteristics

5
j. Potential for international trade
7. Critical analysis of the producers
a. Socio-economic conditions- Number of producers, do they belong to
certain community, do they have any association, district and
taluka/mandal/block of production, is it produced in another state, socio-
economic background of the producers
b. Knowledge system- Awareness level about GI, existing mechanism,
provisions for knowledge system development
c. Existing Livelihood systems, and likely to be changed after registered GI
d. Existing quality control and inspection mechanisms, provisions for its
development and strengthening
8. Critical analysis of marketing scenario and future strategies
a. Product profile
i. Product differentiation
ii. Uniqueness & Reputation
iii. Measures for building up collective reputation
iv. Protection against the dilution of an indication
b. Production profile and strategies
i. Quality control and inspection mechanisms (existing, proposed &
suggestion to improve)
ii. Codes of good production practices vis-à-vis technical regulations
and production standards
iii. Permissible changes
c. Market profile and strategies
i. Agencies/networks for acquisition and maintenance of GI
ii. Competitive edge as registered GI
iii. Marketing approaches- Advertising and publicity, Consumer
perceptions, Market spying to avoid free riding and loss to

6
reputation, lawful acquirement of GI, Packaging methods and
practices
iv. IP protection forms- Firm label, collective label, Certification
Trademark (CTM)
d. Pricing policies
i. Collective bargaining, individual firm bargaining, minimum agreed
price
e. Distribution networks
i. Wholesalers, retailers, exporters, direct selling, specialized outlets,
local markets, supermarkets
f. Livelihood systems of producers
i. Expected shift in present livelihood
ii. Expected growth in income generation of producer through
registered GI
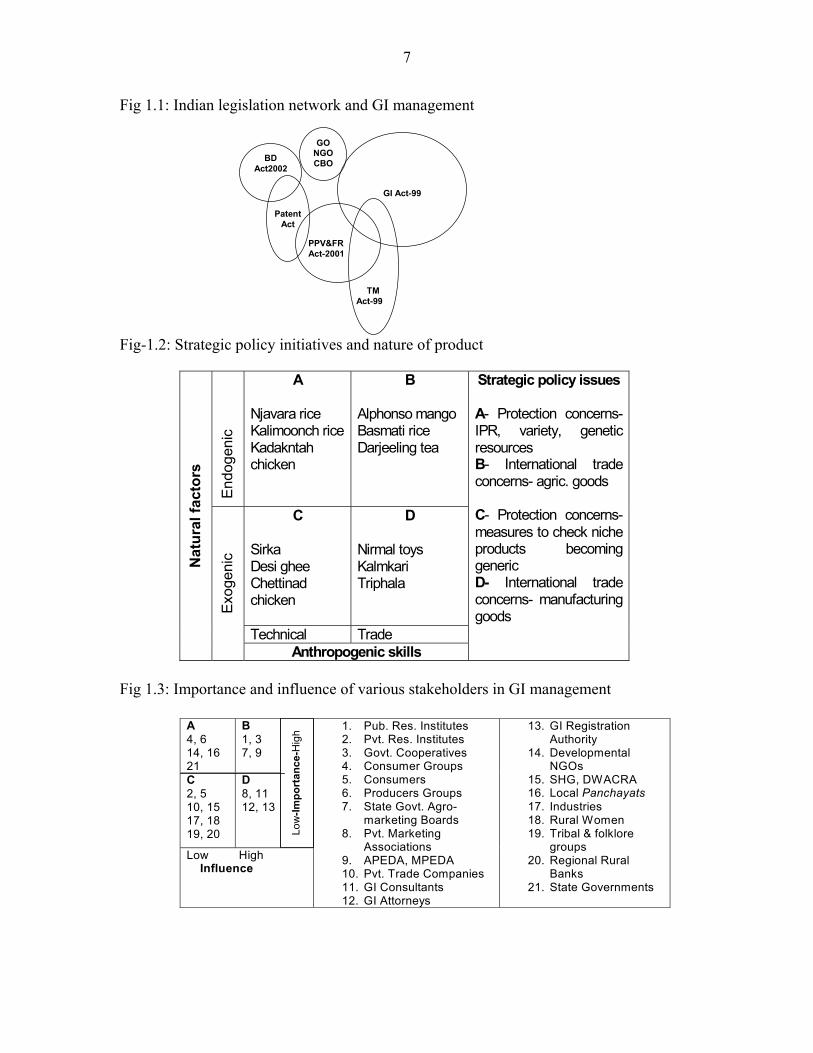
Strategic policy initiatives
The strategic policy initiatives to be identified in terms of action framework, on
the basis of mainly following sub-components1:
1. Interactions of various legal provisions (Biological diversity Act, patent Act,
Protection of Plant Variety and Farmers Rights Act, Trademark Act; and role
players such as government, non-government or community based organizations-
see fig 1.1
2. Contribution of natural factors/ anthropogenic factors in product development and
trade potential- see fig 1.2
3. Stakeholder management- see fig 1.3
1 For detailed analysis see Soam et al. (2007).
7
Fig 1.1: Indian legislation network and GI management
Fig-1.2: Strategic policy initiatives and nature of product
Fig 1.3: Importance and influence of various stakeholders in GI management
Endo
geni
c
A Njavara rice Kalimoonch rice Kadakntah chicken
B Alphonso mango Basmati rice Darjeeling tea
C Sirka Desi ghee Chettinad chicken
D Nirmal toys Kalmkari Triphala
Technical Trade
Nat
ural
fact
ors
Exog
enic
Anthropogenic skills
Strategic policy issues A- Protection concerns- IPR, variety, genetic resources B- International trade concerns- agric. goods C- Protection concerns- measures to check niche products becoming generic D- International trade concerns- manufacturing goods
GI Act-99
GONGOCBO
TM Act-99
PPV&FR Act-2001
BD Act2002
Patent Act
A 4, 6 14, 16 21
B 1, 3 7, 9
C 2, 5 10, 15 17, 18 19, 20
D 8, 11 12, 13
Low High Influence
1. Pub. Res. Institutes 2. Pvt. Res. Institutes 3. Govt. Cooperatives 4. Consumer Groups 5. Consumers 6. Producers Groups 7. State Govt. Agro-
marketing Boards 8. Pvt. Marketing
Associations 9. APEDA, MPEDA 10. Pvt. Trade Companies 11. GI Consultants 12. GI Attorneys
13. GI Registration Authority
14. Developmental NGOs
15. SHG, DWACRA 16. Local Panchayats 17. Industries 18. Rural Women 19. Tribal & folklore
groups 20. Regional Rural
Banks 21. State Governments
Low
-Impo
rtan
ce-H
igh
8
Chapter 2
Listing, Ranking and Synopsis of GI Suitable Products
For the selection of the product for the study, the following general process was
adopted
Identification of GI suitable agricultural and non-agricultural products in twelve
states of the country
Preliminary screening of the products for the preferential ranking
Preferential ranking for final selection of 75 products
The complete process in detail is described below:
1. Process of selection of the products
STEP-1
Identification of the products, about 629 products identified in 12 states (enclosed
as Annexure-XIX).
STEP-2
Screening of the products on the basis of secondary information available with
respect to their worthiness about eligibility as a GI and also feasible role in creating
socio-economic impact on the society. About 160 products short-listed for making final
selection, rest are rejected for consideration in the present study.

9
STEP-3
The products are selected finally on the basis of the preferential ranking method2.
About 150 persons participated in this exercise; the persons from the state ‘A’ gave rating
for the products from state ‘A’. Each participant was asked to rate the product on scale of
0-2 with respect each of the attribute from A to H. Later through computational analysis
as given in table-2.1, the weighted scores were assigned to each product. The score is
directly proportional to the desirability of the product for the study. Generally products
from top ranks have been selected with few exceptions as given in the justification for
selection of the products.
Table-2.1: A model of preferential ranking matrix used in selecting the products
Rating (ri) of attributes with respect to G.I.; no=0, medium = 1, high = 2 Attributes* and their weight# (in parenthesis- wi) Weighted
score
Product name
A (3)
B (1)
C (2)
D (4)
E (2)
F (3)
G (3)
H (4) ∑ riwi.
Rank
1 1 - - - - - - n n
* Attributes rated on the scale of 0-2 for each product A. Production restricted to geographical limits B. Unique product characteristics C. Product reputation D. Contribution of natural factors (geo-climatic) for specific
characteristics E. Contribution human (local skills) factors for specific
characteristics F. Domestic trade potential G. International trade potential H. As registered GI, the role in socio-economic upliftment of the
producers
# Weight of attributes (wi) 1- Reasonable importance 2- Moderate importance 3- High importance 4- Very high importance
2 Methodology suggested by Soam, 2005

10
2. Preferentially ranked GI suitable products- state-wise in various zones
Southern zone
Product
GI class code
GI class description Weighted Score
Ranking
Andhra Pradesh
Hyderabad pearls 14 Jewellery 39.75 1 Gadwal saree 24 Saree 38.75 2 Kalamkari art* 24,25 Textile products, clothing 37.50 3 Banganpally (Benishan) mango 31 Fruits / propagating material 35.50 4 Guntur chilli 31 Spices and condiments 33.75 5 Kondapalli Bommalu* 28 Toys 33.25 6 Nirmal paintings 16 Traditional painting 31.50 7 Hyderabad gun metal 6 Metal souvenirs 30.00 8 Tandur bluestone 19 Building material 28.75 9 Kurnool/Nellore /Molagolukulu rice
30 Rice Grains 25.50 10
Arku coffee 30 Coffee 24.00 11 Ponduru khadi3 24,25 Textile, Clothing 23.50 12 Kakinada kaja 30 Confectionary 22.25 13 Attrepuram tandra/Alamanda mango jelly/ pulp
29 Mango jelly 21.50 14
KP Onion 31 Vegetables 17.00 15 Nannari sharbat4 32 Fruit drink 14.00 16 Chitti mythylu 30 Rice grains 12.25 17 Pochampalli Ikat*5 Ranking was not done as its established GI, which is 1st product
registered GI product in the class of 24 and 25
3 It has unique process of khadi making, the cloths are of very high quality, usually worn by the wealthy people. Khadi Village Industry Commission (KVIC) is doing efforts for export of this product, while the weavers are poor. Complete information is available on various websites on net. 4 High amount of traditional knowledge is involved. The fruit drink is known to have several medicinal properties 5 Its first product registered as GI in the class of 24 and 25, trade value is established.

11
Tamilnadu
Kancheepuram silk* 24 Saree 38.86 1 Nilgiri tea 30 Tea 37.33 2 Nilgiri oil 3 Essential oil 36.38 3 Sivakasi patakha 13 Fireworks 34.86 4 Tirunelveli halwa 30 Confectionary 29.43 5 Thanjaur plate 16 Traditional souvenirs 29.33 6 Dindigul lock 6 Metal hardware 29.00 7 Virupakshi banana 31 Fruits 28.95 8 Thanjaur doll 28 Toys 28.14 9 Salem steel 14 Metal alloy 26.57 10 Oothukkuli butter 29 Milk &milk products 26.29 11 Chetinad Chicken 29 Meat recipe 19.14 12 Melur plough 7 Agricultural implement 17.38 13 Coimbatore Wet grinder*6 Ranking was not done as it is 1st product registered in class 7
Karnataka Mysore silk* 24 Textile goods 41.25 1 Chennapatana toys* 28 Toys 38.5 2 Mysore sandal soap* 3 Soap 37 3 Dharwar peda 29 Milk & milk products 36.5 4 Coorge coffee 30 Coffee/ propagating material 35.5 5 Mysore agarbatti* 3 Perfumery 35 6 Coorge orange* 31 Fruits 33 7 Mannakulnur saree 24 Saree 32.75 8 Coorge honey 30 Honey 32.5 9 Nanjanogod rasabale* 31 Fruits 32.25 10 Mysore mallige 31 Flowers/ 3 essential oil 31.5 11 Mysore rosewood* 20 Furniture 30 12 Ilkal sarees 24 Saree 28.75 13 Bidri craft* 6 Metal souvenirs 28.25 14 Mysore pak 30 Confectionary 26 15 Kokam fruit juice7 32 Fruit drink 23.25 16
Kerala
Njvara rice 30 Rice grain/31 seeds 34.8 1 Aranmula hand mirror*8 20 Mirror 34.6 2 6 First product registered in its class 7 High amount of traditional knowledge, the fruit drink is claimed to have lot of medicinal properties, the juice is famous through out the western coast. On internet lot of information is available about this fruit drink. The research paper published in current science about its antioxidant properties is also available. 8 Already registered product, made by very limited households, socio-economic impact on larger population is not very high
12
Wayanadan tea 30 Tea 32.2 3 Payyannur sacred ring9 14 Jewellery 31 4 Telichery black pepper 30 Spices and condiments 30.6 5 Alleppey cardamom 30 Spices and condiments 28.6 6 Pokkali rice 30 Rice grain/31 seeds 28.4 7
Jeerakshala / Gandhakshala rice 30 Rice grain/5- dietetic substances
27 8
Alleppy ginger 30 Spices and condiments 26 9 Alleppey turmeric 30 Spices and condiments 25.6 10 * Registered GI product at the time of preferential ranking done in March, 2007
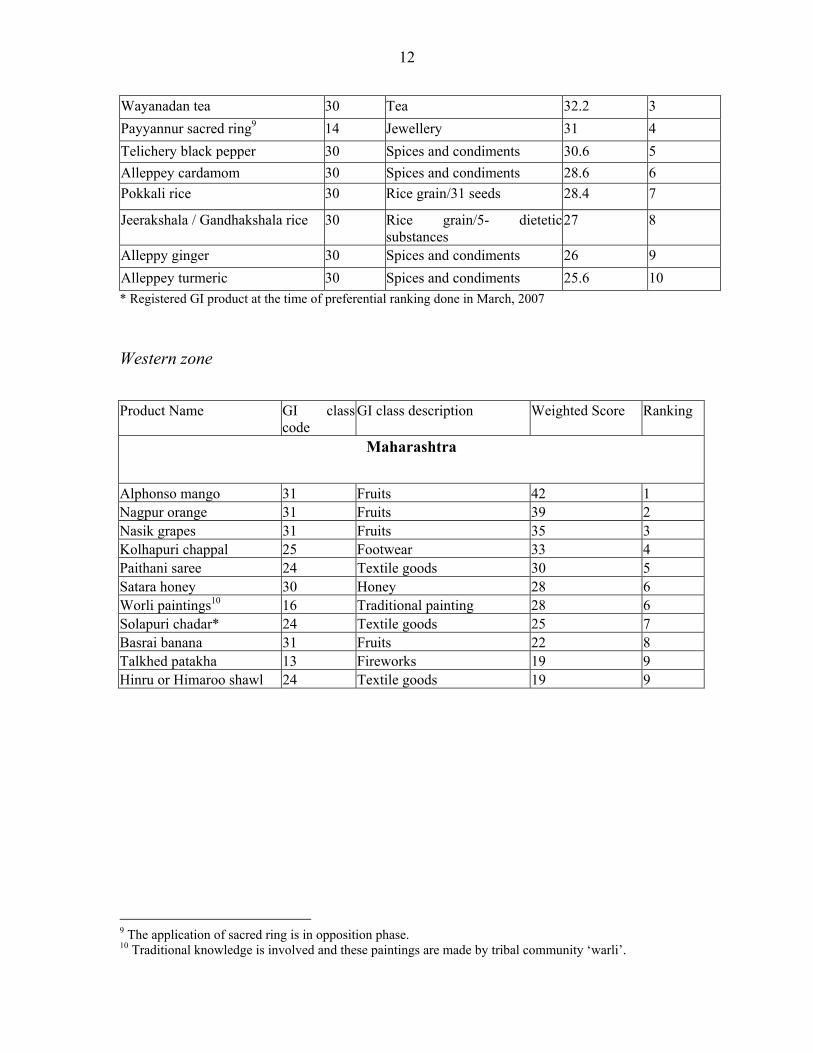
Western zone
Product Name
GI class code
GI class description
Weighted Score
Ranking
Maharashtra
Alphonso mango 31 Fruits 42 1 Nagpur orange 31 Fruits 39 2 Nasik grapes 31 Fruits 35 3 Kolhapuri chappal 25 Footwear 33 4 Paithani saree 24 Textile goods 30 5 Satara honey 30 Honey 28 6 Worli paintings10 16 Traditional painting 28 6 Solapuri chadar* 24 Textile goods 25 7 Basrai banana 31 Fruits 22 8 Talkhed patakha 13 Fireworks 19 9 Hinru or Himaroo shawl 24 Textile goods 19 9
9 The application of sacred ring is in opposition phase. 10 Traditional knowledge is involved and these paintings are made by tribal community ‘warli’.

13
Product Name
GI class code
GI class description
Weighted Score
Ranking
Punjab Punjabi jooti 25 Foot wear 36.00 1 Phulkari 26 Embroidery 36.00 1
Basmati rice 30 Rice grain 35.25 2 Dodha 29 Milk &milk products 35.00 3 Ruri marka11 33 Alcoholic beverages 34.00 4 Patiala shahi salwar 24 Textile goods 33.00 5 Pranda 25 Clothing 32.50 6 Laung 14 Jewellary 32.00 7 Harambha thresher12 7 Agricultural implement 31.50 8 Dhol 15 Musical instrument 31.00 9 Tumbi 15 Musical instrument 30.75 10 Wheat straw combine 7 Agricultural implement 29.00 11 Sandook 21 Household container of
wood 27.75 12
Ludhiana hosiery13 24,25 Clothing Rajasthan
Jaipuri rajai 24 Textile goods 28.33 1 Makrana marble 19 Building material 28.00 2
Sanganeri print 16 Print blocks/ 24 textile goods, 25 clothing 27.00 3
Bikaneri bhujia 30 Confectionary 26.00 4 Kota stone 19 Building material 24.00 5 Bikaneri rasgolla 29 Milk &milk products 22.67 6 Keshar kisturi/Jagmohan/ Mehansar special14 33 Alcoholic beverages 16.00 7 Dungarpur zinger
30
Spices and condiments/ 31 propagating material
14.00
8
Kota doria*15 24 Saree/ 25 clothings 12.67 9 Mavadi 33 Alcoholic beverage 11.00 10
11 Locally brewed liquor, high indigenous knowledge is involved, but it is brewed illegally, it would be difficult to collect data of illegal producers hence not considered for selection. 12 Punjab is famous for agricultural machinery, and it’s a fit product in its class 13 Geographical link to be established because it’s a large industry and large no. of persons depend on it 14 Locally brewed liquor since the time of raja maharajs, high indigenous knowledge is involved, but now these liquor are brewed by the state government factory ‘Ganganagar Suger Mills’. 15 This is the first product from Rajasthan, which has been registered.

14
Product Name
GI class code
GI class description
Weighted Score
Ranking
Ajrak printing 16 Printing block/ 24 textile goods, 25 clothing 7.67 11
Bandhani 24 Saree 6.00 12 Jaipur patang16 Kite Not ranked - Jaipur blue pottery17 Clay pottery Not ranked -
Gujrat18
Bhaliya wheat 31 Wheat grains Not ranked - Kesar mango 31 Fruit Not ranked - Bandhani saree 24 Textile product Not ranked - Patola saree 24 Textile product Not ranked - Kutch embroidery 26 Embroidery Not ranked - * Registered GI product at the time of preferential ranking done in March, 2007
Central and northern zone
Product Name
GI class code
GI class description
Weighted Score
Ranking
Himachal Pradesh
Himachal apple 31 Fruits 38.5 1 Kangra tea19* 30 Tea 31.5 2 Kullu shawl* 24 Textile goods 31 3 Pahari Aloo 31 Vegetables 28.5 4
Kangra painting 16 Traditional painting 24.5 5
Chamba juti 25 Footwear 24.5 5 Himachali honey 30 Honey 15 6
Himachali turmeric 30
Spices
15
6
Himachali zinger 30 Spices 13.5 7 Himachali topi 25 Head gear 12.5 8
16 It was not ranked, in Jaipur it is large industry involving hundreds of small households. The socio-economic impact would be tremendous as a GI. If geographical origin to be established 17 It was not ranked, in Jaipur it is large industry providing good employment 18 Formally preferential ranking has not been done for this state, the products are selected on the basis of feedback received from knowledgeable persons through email and personal telephonic conversations. 19 First agricultural product registered by the scientific institution

15
Product Name
GI class code
GI class description
Weighted Score
Ranking
Uttarakhand
Dehradooni Basmati 30 Rice grain 34.46 1 Ramnagar litchi 31 Fruits 32.50 2 Buraansh juice 32 Fruit drink 33.33 3 Rajma 31 Pulses 32.17 4 Bal Mithai 30 Confectionery 31.17 5 Ganga water/ natural mineral water20 32 Mineral water 31.17 5 Harshil apples 31 Fruits 28.00 6 Chakrata adrak 30 Spices 24.83 7 Beninag tea 30 Tea 23.50 8 Kalibhat- Kali Soybean 31 Pulse grain 21.67 9 Gahat (horse gram) 31 Pulse grain 17.67 10
Uttar Pradesh
Banarasi saree 24 Saree 36.91 1
Mahoba paan 31 Horticultural product 34.46 2
Ferozabad chundia and glassware 21 Glassware 34.43 3 Lucknavi chikan 26 Embroidery 34.17 4
Moradabad brass material
6
Metal souvinirs, mirror frames, picture frames/ 21 utensils, 28 toys, 34Ash trey
33.34
5
Agra petha 30 Confectionary 33.23 6 Kanpur leather21 18 Leather articles 31.97 7 Aligarh locks 6 Metal hardware 31.89 8 Mathura ka peda
29
Milk &milk products
31.29
9
Agra Shoes 25 Footwear 27.69 10 Bhadoi carpet22 27 Carpet 27.07 11
20 It may be good GI product only if significant number of producers of natural mineral water exist 21 It may be selected only after in-depth analysis for establishing uniqueness and geographical link 22 National Human Rights Commission made a special study during 2004 with respect to child labour involved in this industry and later took some corrective measures to address the problem
16
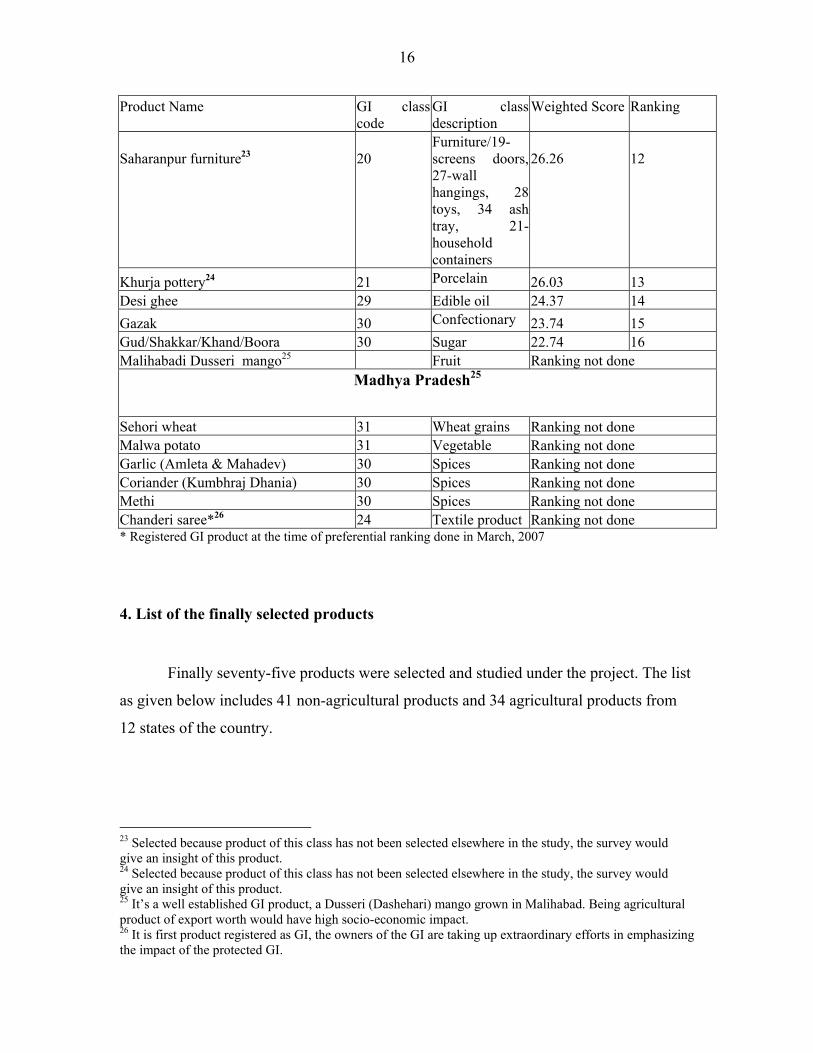
* Registered GI product at the time of preferential ranking done in March, 2007
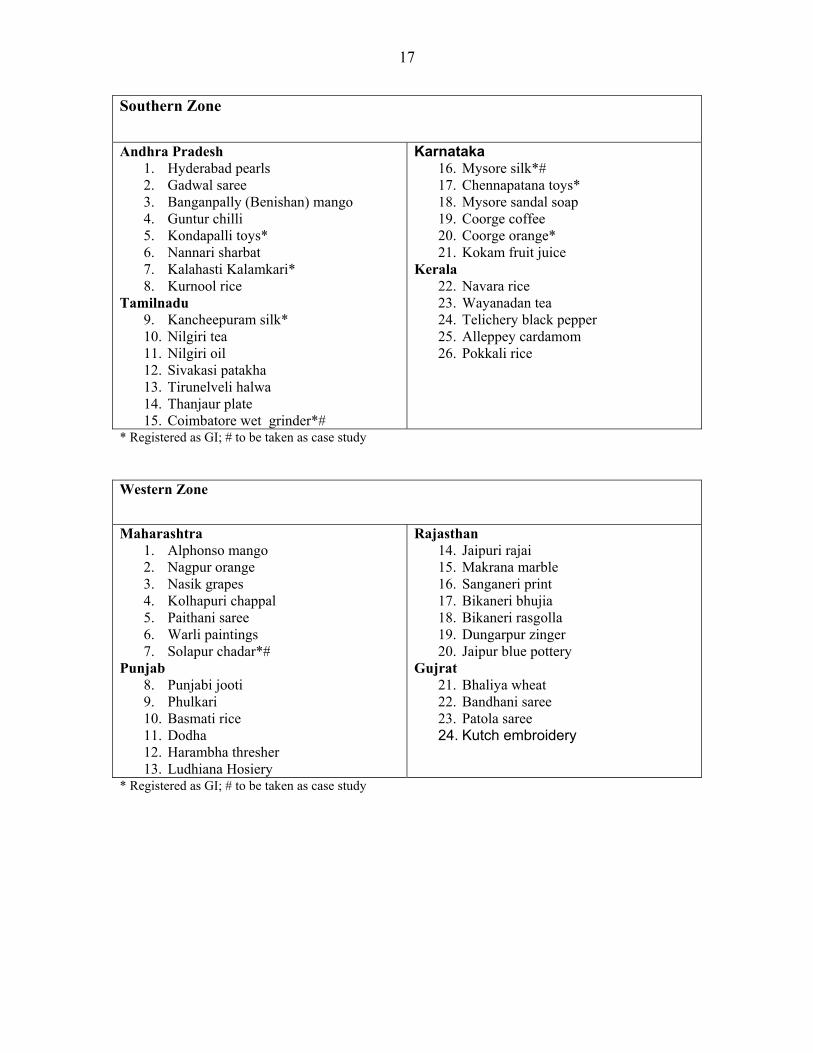
4. List of the finally selected products
Finally seventy-five products were selected and studied under the project. The list
as given below includes 41 non-agricultural products and 34 agricultural products from
12 states of the country.
23 Selected because product of this class has not been selected elsewhere in the study, the survey would give an insight of this product. 24 Selected because product of this class has not been selected elsewhere in the study, the survey would give an insight of this product. 25 It’s a well established GI product, a Dusseri (Dashehari) mango grown in Malihabad. Being agricultural product of export worth would have high socio-economic impact. 26 It is first product registered as GI, the owners of the GI are taking up extraordinary efforts in emphasizing the impact of the protected GI.
Product Name
GI class code
GI class description
Weighted Score
Ranking
Saharanpur furniture23
20
Furniture/19-screens doors, 27-wall hangings, 28 toys, 34 ash tray, 21-household containers
26.26
12
Khurja pottery24 21 Porcelain 26.03 13 Desi ghee 29 Edible oil 24.37 14 Gazak 30 Confectionary 23.74 15 Gud/Shakkar/Khand/Boora 30 Sugar 22.74 16 Malihabadi Dusseri mango25 Fruit Ranking not done
Madhya Pradesh25
Sehori wheat 31 Wheat grains Ranking not done Malwa potato 31 Vegetable Ranking not done Garlic (Amleta & Mahadev) 30 Spices Ranking not done Coriander (Kumbhraj Dhania) 30 Spices Ranking not done Methi 30 Spices Ranking not done Chanderi saree*26 24 Textile product Ranking not done
17
Southern Zone
Andhra Pradesh
1. Hyderabad pearls 2. Gadwal saree 3. Banganpally (Benishan) mango 4. Guntur chilli 5. Kondapalli toys* 6. Nannari sharbat 7. Kalahasti Kalamkari* 8. Kurnool rice
Tamilnadu 9. Kancheepuram silk* 10. Nilgiri tea 11. Nilgiri oil 12. Sivakasi patakha 13. Tirunelveli halwa 14. Thanjaur plate 15. Coimbatore wet grinder*#
Karnataka 16. Mysore silk*# 17. Chennapatana toys* 18. Mysore sandal soap 19. Coorge coffee 20. Coorge orange* 21. Kokam fruit juice
Kerala 22. Navara rice 23. Wayanadan tea 24. Telichery black pepper 25. Alleppey cardamom 26. Pokkali rice
* Registered as GI; # to be taken as case study
Western Zone
Maharashtra
1. Alphonso mango 2. Nagpur orange 3. Nasik grapes 4. Kolhapuri chappal 5. Paithani saree 6. Warli paintings 7. Solapur chadar*#
Punjab 8. Punjabi jooti 9. Phulkari 10. Basmati rice 11. Dodha 12. Harambha thresher 13. Ludhiana Hosiery
Rajasthan 14. Jaipuri rajai 15. Makrana marble 16. Sanganeri print 17. Bikaneri bhujia 18. Bikaneri rasgolla 19. Dungarpur zinger 20. Jaipur blue pottery
Gujrat 21. Bhaliya wheat 22. Bandhani saree 23. Patola saree 24. Kutch embroidery
* Registered as GI; # to be taken as case study

18
Central & Northern Zone
Himachal Pradesh
1. Himachal apple 2. Kangra tea*# 3. Kullu shawl* 4. Pahadi Aloo
Uttaranchal 5. Harshil Apple 6. Buraansh juice 7. Ramnagar litchi 8. Rajma 9. Bal Mithai
Madhya Pradesh 10. Sehori wheat 11. Malwa potato 12. Garlic (Amleta & Mahadev) 13. Coriander (Kumbhraj Dhania) 14. Methi 15. Chanderi saree*#
Uttar Pradesh 16. Banarasi saree 17. Mahoba paan 18. Ferozabad chundia and glassware 19. Lucknavi chikan 20. Moradabad brass material 21. Agra petha 22. Bhadoi carpet 23. Saharanpur furniture 24. Khurja pottery 25. Malihabadi dussehri mango
* Registered as GI; # to be taken as case study
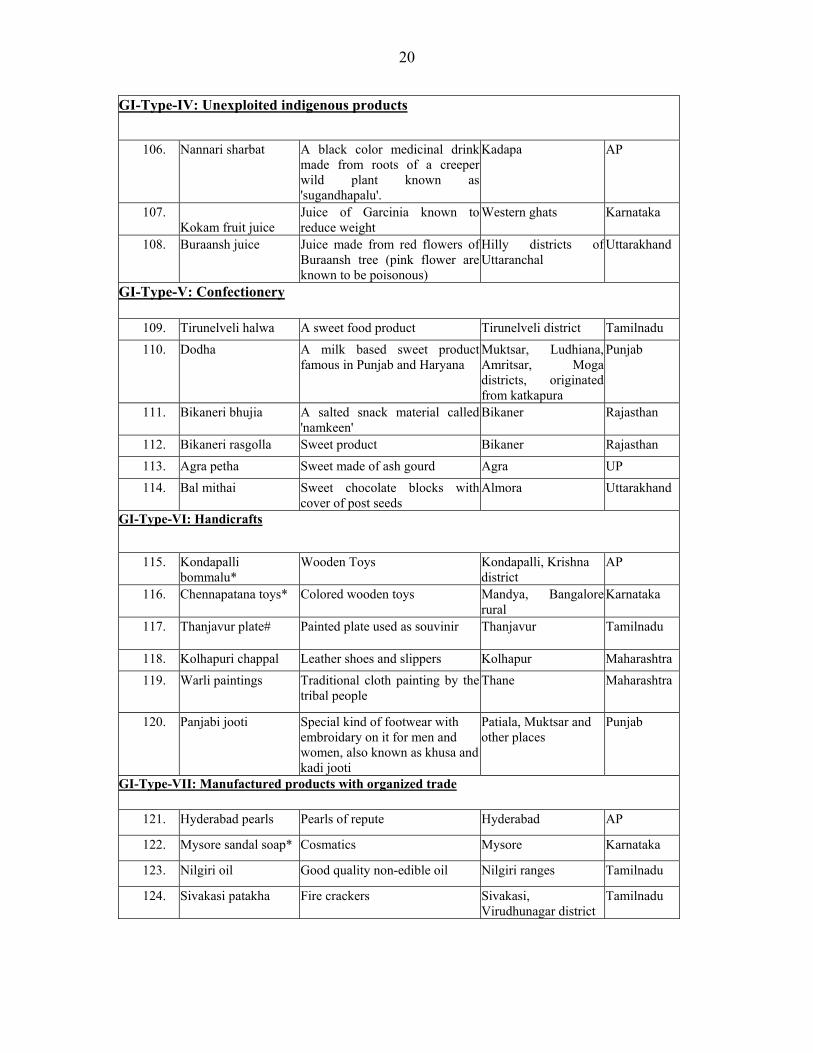
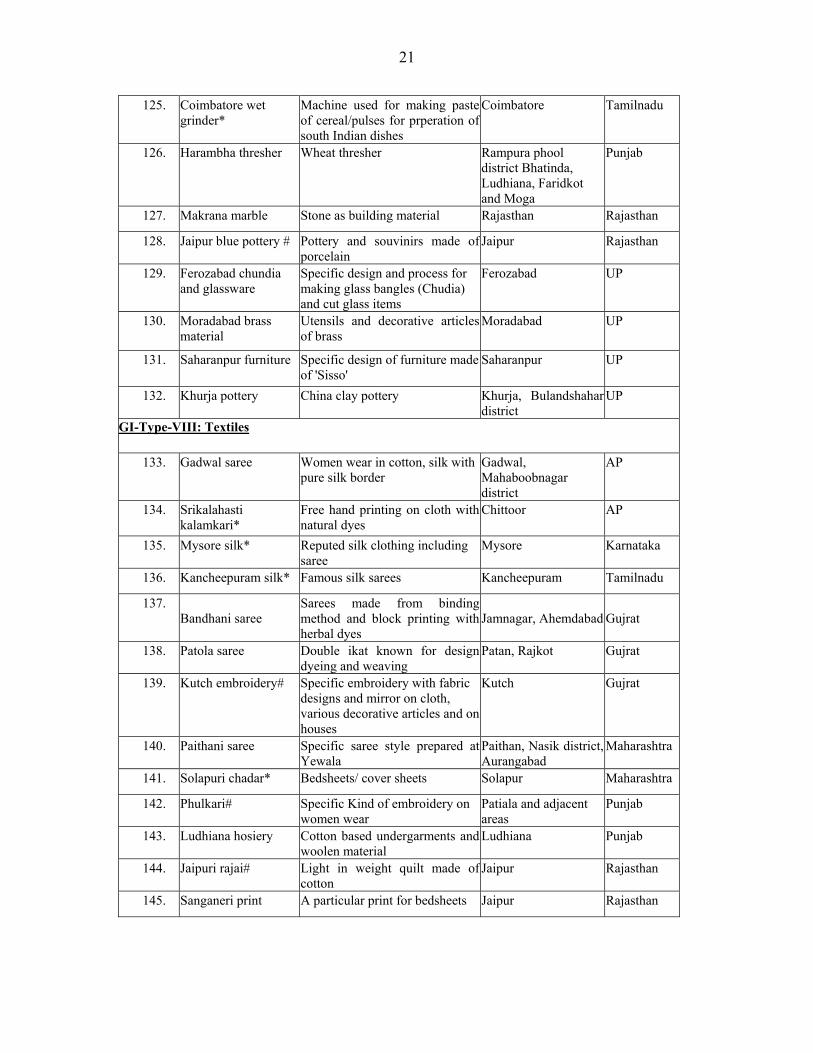
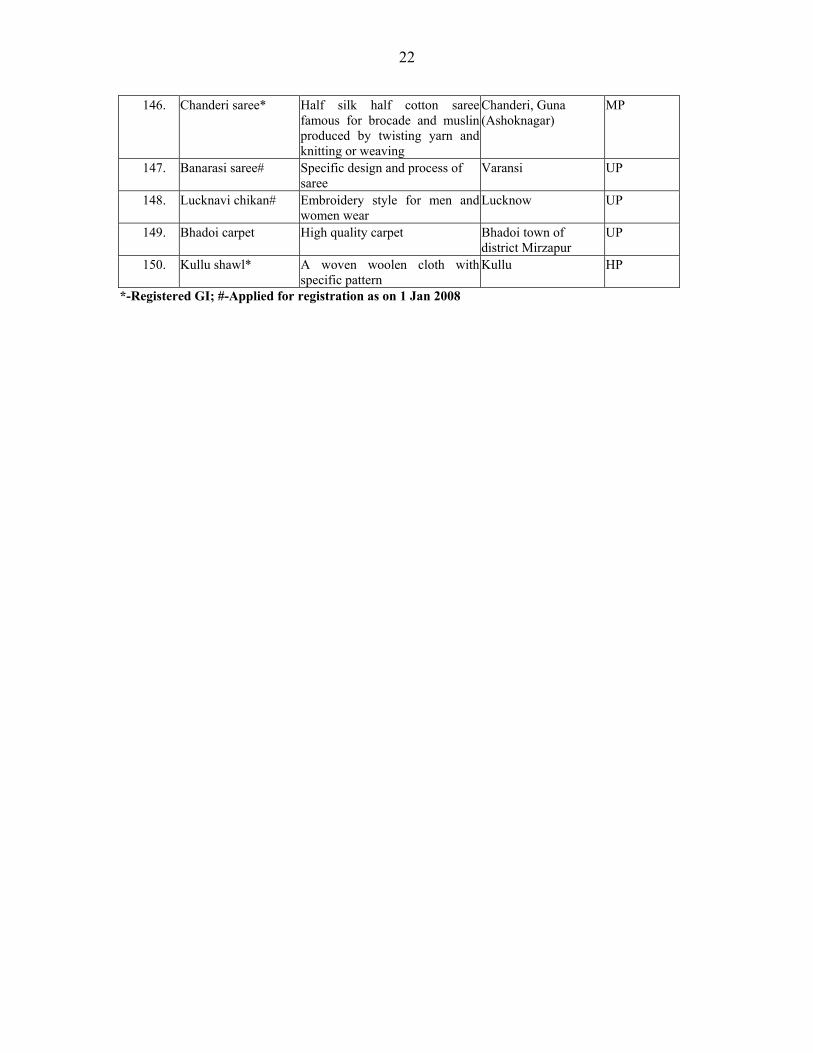
5. Synopsis of the products selected for study
Among the study of 75 products, 34 are agricultural products and 41 are non-
agricultural products. Out of the total 75 products, 13 products are registered (10 non-
agricultural and 03 are agricultural) and 12 products (07 non-agricultural and 05
agricultural) have been applied. The synopses of all the products under study have been
given below. These products have been classified into eight GI type groups.
S.no. Name of product GI Class Description Place of production State GI-Type-I: Fruits
76. Banganpally (Benishan) mango
Mango variety Banganpally village, Kurnool district but grown in large part of AP
AP
77. Coorg orange* Specific kind of orange Coorge region Karnataka 78. Alphonso mango Specific kind of mango Valsad Gujrat 79. Nagpur orange Orange of repute Nagpur Maharashtra 80. Nasik grapes Small sweet grapes Nasik, Pune, Sangali,
Satara, Ahmednagar Maharashtra

19
81. Malihabadi Dussheri Mangoes of specific quality Lucknow region UP 82. Himachal apple Apples of good quality Kullu, Shimla,
Kinnaur HP
83. Harshil apple Popular apple fruit Uttarkashi Uttarakhand 84. Ramnagar litchi Popular litchi fruit Nainital district Uttarakhand
GI-Type-II: Grains and Potato
85. Kurnool rice Reputed rice in AP Kurnool, Kadapa and Nellore
AP
86. Navara rice* A medicinal rice Wynad Kerala
87. Pokkali rice# Rice known for its environment friendly and organic method of production
Alappuzha, thrissur and Ernakulum
Kerala
88. Bhaliya wheat Wheat grown in saline soil under rainfed conditions having special taste and chapatti making quality
Bhal region, Anand Gujrat
89. Basmati rice# Reputed scented rice
Hoshiarpur, Gurdaspur
Punjab
90. Sehori genhu Good quality rainfed aestivum wheat
Sehore MP
91. Malwa potato Potato with specific characteristics attributed to geoclimatic situation
Malwa region, Indore MP
92. Pahari aloo Potatoes produced in hilly regions during summer
Middle level altitudes in HP
HP
93. Hill rajma Good quality pulse Pithoragarh Uttarakhand GI-Type-III: Plantation and spices
94. Guntur chilli (karam) Pungent and dark red colored chillies
Guntur AP
95. Coorg coffee Reputed coffee Coorge region Karnataka 96. Wayanadan tea Tea leaves Wayanad Kerala 97. Telichery black
pepper# Dried black pepper Telichery, Kannur
district Kerala
98. Alleppy cardamom# Good quality cardamom Alleppy Kerala
99. Nilgiri tea# Good quality tea Nilgiri ranges Tamilnadu 100. Dungarpur zinger Zinger of high quality Dungarpur Rajasthan 101. Amleta & Mahadev
garlic Good quality local garlic Mandsaur, Neemach MP
102. Kumbhraj dhania Coriander of good flavour and good oil content
Guna, Rajgarh, Neemach, Mandsaur
MP
103. Fenugreek (Methi) Good quality bold seeded fenugreek or methi
Jaora, Ratlam, Neemach
MP
104. Mahoba paan Betel leaf Mahoba UP 105. Kangra tea* Tea of repute Kangra district and
other areas of HP HP
20
GI-Type-IV: Unexploited indigenous products
106. Nannari sharbat A black color medicinal drink
made from roots of a creeper wild plant known as 'sugandhapalu'.
Kadapa AP
107. Kokam fruit juice
Juice of Garcinia known to reduce weight
Western ghats Karnataka
108. Buraansh juice Juice made from red flowers of Buraansh tree (pink flower are known to be poisonous)
Hilly districts of Uttaranchal
Uttarakhand
GI-Type-V: Confectionery
109. Tirunelveli halwa A sweet food product Tirunelveli district Tamilnadu 110. Dodha A milk based sweet product
famous in Punjab and Haryana Muktsar, Ludhiana, Amritsar, Moga districts, originated from katkapura
Punjab
111. Bikaneri bhujia A salted snack material called 'namkeen'
Bikaner Rajasthan
112. Bikaneri rasgolla Sweet product Bikaner Rajasthan 113. Agra petha Sweet made of ash gourd Agra UP 114. Bal mithai Sweet chocolate blocks with
cover of post seeds Almora Uttarakhand
GI-Type-VI: Handicrafts
115. Kondapalli
bommalu* Wooden Toys Kondapalli, Krishna
district AP
116. Chennapatana toys* Colored wooden toys Mandya, Bangalore rural
Karnataka
117. Thanjavur plate#
Painted plate used as souvinir Thanjavur Tamilnadu
118. Kolhapuri chappal Leather shoes and slippers Kolhapur Maharashtra 119. Warli paintings Traditional cloth painting by the
tribal people Thane Maharashtra
120. Panjabi jooti Special kind of footwear with embroidary on it for men and women, also known as khusa and kadi jooti
Patiala, Muktsar and other places
Punjab
GI-Type-VII: Manufactured products with organized trade
121. Hyderabad pearls Pearls of repute Hyderabad AP
122. Mysore sandal soap* Cosmatics Mysore Karnataka
123. Nilgiri oil Good quality non-edible oil Nilgiri ranges Tamilnadu
124. Sivakasi patakha Fire crackers Sivakasi, Virudhunagar district
Tamilnadu
21
125. Coimbatore wet grinder*
Machine used for making paste of cereal/pulses for prperation of south Indian dishes
Coimbatore Tamilnadu
126. Harambha thresher Wheat thresher Rampura phool district Bhatinda, Ludhiana, Faridkot and Moga
Punjab
127. Makrana marble Stone as building material Rajasthan Rajasthan
128. Jaipur blue pottery # Pottery and souvinirs made of porcelain
Jaipur Rajasthan
129. Ferozabad chundia and glassware
Specific design and process for making glass bangles (Chudia) and cut glass items
Ferozabad UP
130. Moradabad brass material
Utensils and decorative articles of brass
Moradabad UP
131. Saharanpur furniture Specific design of furniture made of 'Sisso'
Saharanpur UP
132. Khurja pottery China clay pottery Khurja, Bulandshahar district
UP
GI-Type-VIII: Textiles
133. Gadwal saree Women wear in cotton, silk with pure silk border
Gadwal, Mahaboobnagar district
AP
134. Srikalahasti kalamkari*
Free hand printing on cloth with natural dyes
Chittoor AP
135. Mysore silk* Reputed silk clothing including saree
Mysore Karnataka
136. Kancheepuram silk* Famous silk sarees Kancheepuram Tamilnadu
137. Bandhani saree
Sarees made from binding method and block printing with herbal dyes
Jamnagar, Ahemdabad
Gujrat
138. Patola saree
Double ikat known for design dyeing and weaving
Patan, Rajkot
Gujrat
139. Kutch embroidery# Specific embroidery with fabric designs and mirror on cloth, various decorative articles and on houses
Kutch Gujrat
140. Paithani saree Specific saree style prepared at Yewala
Paithan, Nasik district, Aurangabad
Maharashtra
141. Solapuri chadar* Bedsheets/ cover sheets Solapur Maharashtra
142. Phulkari# Specific Kind of embroidery on women wear
Patiala and adjacent areas
Punjab
143. Ludhiana hosiery
Cotton based undergarments and woolen material
Ludhiana
Punjab
144. Jaipuri rajai#
Light in weight quilt made of cotton
Jaipur Rajasthan
145. Sanganeri print A particular print for bedsheets Jaipur Rajasthan
22
146. Chanderi saree*
Half silk half cotton saree famous for brocade and muslin produced by twisting yarn and knitting or weaving
Chanderi, Guna (Ashoknagar)
MP
147. Banarasi saree# Specific design and process of saree
Varansi UP
148. Lucknavi chikan# Embroidery style for men and women wear
Lucknow UP
149. Bhadoi carpet High quality carpet Bhadoi town of district Mirzapur
UP
150. Kullu shawl* A woven woolen cloth with specific pattern
Kullu HP
*-Registered GI; #-Applied for registration as on 1 Jan 2008

23
Chapter 3 Approach and Methodology
The study of 75 products include 33 agricultural products and 42 non-agricultural
products. The detailed socio-economic survey was done for 70 products that include 32
agricultural and 38 non-agricultural products. Five products were studied through case
study method. Theses five products are- Coimbatore wet grinder, Mysore silk, Solapur
chaddar, Chanderi saree and Kangra tea.
1. Data collection methodology
Objectives and instruments of socio-economic survey
The objectives of the socio-economic survey were to collect information from
producers, institutional stakeholders, consumers and traders. Several data collection
instruments (interview schedules) were designed for the purpose; a brief description is
given below (schedules enclosed as Annex-XXI):
Schedule no. Purpose of schedule Schedule 1.1 Listing of Households Schedule 1.2 Listing of Non-household establishments and institutions Schedule 2 Household socio-economic survey and enterprise particulars Schedule 3.1 Household enterprise or non – household establishment survey on activities
relating to production of agricultural products under study Schedule 3.2 Household enterprise or Non-household establishment survey on activities
relating to production of Non-agricultural products under study Schedule 4 Survey on G.I. information/ activities related to products under study of: Govt.
Depts. / Agencies including G.I. specific offices; Apex Bodies/ Marketing Boards and similar institutions; NGOs/ SHGs/ Primary Cooperative Societies etc.; Producer’s Association; Scientific & Research Institutions, Knowledgeable Persons; and Banks and Financial Institutions
Schedule 5 Special survey of consumers, local shop-keepers in market complexes, stall holders in exhibition/fairs etc.

24
Respondents for the socio-economic survey
The interview schedules so designed were to be administered to 28 persons for
each product in the following fashion:
5. Ten producers on appropriate schedule. For agricultural product it is schedule 2
and schedule 3.1. For non-agricultural product it is schedule 2 and schedule 3.2.
6. Eight different institutional stakeholders on schedule 4
7. Five different consumers on schedule 5
8. Five different retailing traders on schedule 5
It can therefore be said that for 70 products, 1960 respondents were planned to be
interviewed in 12 states of the country. But finally 1865 were interviewed as given in the
table below:
Respondents Number Producers 691 Institutional stakeholders 429 Consumers 370 Traders 375 Total 1865
Case study of selected products
Five products are studied through case study method, the justification for case
study is also given. The salient features of the cases are also given.
S.No. Product-state Justification for study through case study method 1. Coimbatore wet grinder-
Tamilnadu It’s a first product as RGI in its class 7, the study will give directions for the future applicants in machines
2. Mysore silk- Karnataka This is the first product, which had opposition, the opposition was won and product was registered, it will give dimensions of establishment of uniqueness.
3. Kangra tea- HP This is the first product registered with initiatives of a scientific department, the study would throw the perspectives of involvement of scientific institutions
4. Chanderi saree- MP This is the only product till now registered. The owners have taken special initiatives such as hiring marketing spying agency for emphasizing the impact of their RGI. The study would therefore be highly useful to look into enforcement measures.
5. Solapur chadar- Maharashtra The trade value is quite high and lot of export takes place

25
Salient features of case study method
1. Identifying the expert, mostly those who have been involved in various phases of
GI registration, development and enforcement.
2. Requesting them to write a case about 10-15 pages case study report covering
various dimensions of RGI.
3. Dimensions of RGI would cover following
a. Owner of the RGI: Factors for initiatives, proprietors, authorized users,
whether anyone became authorized user after registration, if yes how the
proceedings held and role of proprietors
b. Product profile: Unique characteristics, amount of production, and area of
production
c. Inspection mechanisms: Formal inspection mechanism for RGI
d. Producers’ profile: Number of producers, general socio-economic
conditions, changes occurred and impact after registration
e. Market profile: Maintenance of quality and standards, grading, packaging,
marketing channels etc, changes occurred and impact after registration
f. Specialty feature of the RGI: it will vary product to product on the basis of
justification given above.
g. Future course of action: Market expansion plan, multiple protection plan,
enforcement of RGI plan etc.
2. Data collection places
The data for 70 products was collected from 45 villages and 60 district towns in
12 states representing four geographical regions.
Southern zone consisting of Andhra Pradesh, Karnataka, Kerala and Tamilnadu
Central & Northern zone consisting of Madhya Pradesh, Uttar Pradesh,
Uttarakhand and Himachal Pradesh;
Western zone consisting of Maharashtra, Gujrat, Rajasthan and Punjab.

26
Product-wise summary is given in table below:
Product Village District State
GI Type-I: Fruits Banganapalli Kurnool AP Banganpally mango
Yaganti Kurnool AP Coorg orange Coorg Karnataka
Ratnagiri MaharahstraAlphonso mango Sindhudurg Maharahstra
Marshi Amravati MaharahstraMaywadi Amravati MaharahstraNagpur orange
Pandhari Amravati MaharahstraNiphad Nasik MaharahstraNasik grapes
Dindori Nasik MaharahstraMalihabadi Dussheri Lucknow UP Himachal apple Naggar Kullu HP
Harshil Uttarkashi Uttaranchal Mukhaba Uttarkashi Uttaranchal Jaspur Uttarkashi Uttaranchal
Harshil apple Suravi Uttarkashi Uttaranchal
Ramnagar(Near police barrier)
Nainital Uttaranchal
Perumadara Nainital Uttaranchal Chorpani Nainital Uttaranchal
Ramnagar litchi Belapokhra Deharadun Uttaranchal GI Type-II: Grains & Potato Navara rice Pattambi Palakkad Kerala
Kadamakkudi Ernakulam Kerala Pokkali rice Pizhala Ernakulam Kerala Bhaliya wheat Bhal Panthak Anand Gujarat
Khokar Gurdaspur Punjab Lakhawal Gurdaspur Punjab Daburi Gurdaspur Punjab Lahri Gurdaspur Punjab
Basmati rice Bhotoyo Gurdaspur Punjab
Chaini Indore MP Sehori genhu - Sehore MP Kurnool rice Kurnool AP Malwa potato Kodaria Indore MP Pahari aloo Kullu HP Hill rajma Harshil, Mukhaba, Dharali Uttarkashi Uttaranchal GI Type-III: Plantation crops & spices Guntur chilli Pedhakurapadu Guntur AP Coorg coffee Coorg Karnataka Wayanadan tea Mananthavady Wayanad Kerala Telichery black pepper Edavaka Wayanad Kerala Alleppy cardamom Anakkara Idukki Kerala

27
Product Village District State Nilgiri tea Vantanmedu Niligiri Tamilnadu Dungarpur zinger Modar Dungarpur Rajasthan
Narayangarh Mandsaur MP Pipliya Mandsaur
Amleta & Mahadev garlic Vishhiya Mandsaur Kumbhraj dhania Kumbhraj Guna MP
Narayangarh Mandsaur MP Pipliya Mandsaur Methi (Fenugreek)
Vishhiya Mandsaur Mahoba paan Mahoba UP GI Type-IV: Unexploited indigenous products Nannari sharbat Kadapa AP Kokum fruit juice Dakshina
Karnataka Karnataka
Buraansh juice Pauri Uttaranchal GI Type-V: Confectionery Tirunelveli halwa Tirunelveli Tamilnadu Dodha Ludhiana Punjab Bikaneri bhujia Bikaner Rajasthan Bikaneri rasgolla Bikaner Rajasthan Agra petha Agra UP Bal mithai Almora Uttaranchal GI Type-VI: Handicrafts Kondapalli bommalu (toys) Kondapalli Krishna AP Chennapatana toys Chennapatna Mysore Karnataka Thanjaur art plate Thanjavur Tamilnadu Kolhapuri chappal Kolhapur MaharahstraWarli paintings Thane MaharahstraPunjabi jooti Patiala/
Chandigarh Punjab
Moradabad brass material Moradabad UP Saharanpur furniture Saharanpur UP GI Type-VII: Manufactured products with organized trade Hyderabad pearls Hyderabad AP Mysore sandal soap Mysore Karnataka Nilgiri oil Nilgiri Tamilnadu Sivakasi patakha Sivakasi Tamilnadu Harambha thresher Ludhiana Punjab Makrana marble Makrana Jaipur Rajasthan Jaipur blue pottery Jaipur Rajasthan Ferozabad chundia and glassware
Firozabad UP
Khurja pottery Khurja, Bulandsahar
UP
GI Type-VIII: Textiles Gadwal saree Gadwal Mahabubnagar AP Srikalahasti kalamkari Srikalahasti Chittoor AP

28
Product Village District State Kancheepuram silk Kanchipuram Tamilnadu Bandhani saree Jamnagar Gujarat Patola saree Rajkot Gujarat Kutch embroidery Dhaneti Kutch Gujarat Paithani saree Paithan Aurangabad MaharahstraPhulkari Patiala/
Chandigarh Punjab
Ludhiana hosiery Ludhiana Punjab Jaipuri rajai Jaipur Rajasthan Sanganeri print Jaipur Rajasthan Banarasi saree Banaras UP Lucknavi chikan Lucknow UP Bhadoi carpet Bhadoi (Mirzapur) UP Kullu shawl Kullu HP Total 45 villages 60 districts 12 states
3. Project administration
Institute level for project operation
The Principal Investigator and Co-PI share the plan, process and progress with the
‘Policy Backstopping Group’/ PBG of the project. The PBG constituted of following;
1. Director, NAARM
2. Joint Director, NAARM
3. Head, ARSMP Division, NAARM
4. Project Principal Investigator (PI)
5. Co-PI
6. Chief Administrative Officer, NAARM
7. Finance & Accounts Officer, NAARM
8. Outside experts from National Academy of Legal Studies and Research
(NALSAR), National Institute of Agricultural Extension Management
(MANAGE) and AP Technology Development & Promotion Corporation
(APTDC), Genesis Fintec, Kolkatta.
The PBG meetings were conducted at each milestone phase of the project.

29
Data collection process: instructions for data enumerators
1. Identify the persons to be interviewed and list their details on schedule 1.1 for agriculturalproducts, and on schedule 1.2 for non-agricultural products. Record other details also on these schedules.
2. Start interviewing producers as listed in schedule 1.1 or 1.2 using appropriate schedule andfill 10 schedules by interviewing 10 producers.
a. In the process of data collection from producers enquire about other stakeholders toidentify different key stakeholders for various blocks of schedule 4 (block 2 toblock 9). List the details of so identified stakeholders on schedule 1.3. Record otherdetails also on this schedule.
3. Interviewing key stakeholders as listed in schedule 1.3 and filling up details on schedule- 4. a. First four pages are about the details of the person to be interviewed. The actual
interview start from page-2 that is Block-2 to Block-9. Record the interview of the person in appropriate Block as given on top of each Block. Eight persons falling in Block-2 to Block-9 have to be interviewed
4. Interview of consumers and retailing traders would be recorded on schedule-5. For consumers the interview would be recorded in Block-2, interview 5 consumers. For traders interview would be recorded in Block-3, interview 5 traders. Use separate schedule-5. In total you have to submit 10 filled-in schedule-5 (5 for consumers and 5 for traders).
Important Notes:
1. For producers select only those respondents, who represent the actual producers group at large.
2. For key stakeholders try to interview the most appropriate person in the organization 3. Do not leave the questions empty, try to get the answer for each entry. 4. Wherever ‘Data enumerator’ has to record detailed explanation in his own writing. Try to
write in very short and neat and readable handwriting.
Filed level for data collection
For collection of data from various places in 12 states from four geographical
regions, ‘Facilitators’ were identified at several places, these facilitators are officials from
state government departments, public academic organizations or universities. These
facilitators identified ‘Data Enumerators’ for field level data collection, these data
enumerators are mostly PG students of academic organizations/universities (list enclosed
as Annexure-XX). The project consultants conducted personal meetings with ‘Facilitators
and Data Enumerators’ for the better understanding of GI and data collection process.
The instructions were provided to all the facilitators/ enumerators as given in box below.
30
Chapter 4 Socio-economic Profile of Producers
1.1: Livelihood and social groups
The producers of agricultural and non-agricultural products are mainly engaged in
their respective enterprise only, it is their main livelihood (Fig.4.1). About 7-8%
respondents in agricultural and non-agricultural products engaged in other subsidiary
enterprise also (Table-4.1). The producers mainly belong to either other backward classes
(OBCs) or communities other than Scheduled Castes (SCs) or Scheduled Tribes (STs).
The trend is almost same for agricultural and non-agricultural enterprises (Fig.4.2, for
more details see table-4.2).
1.2: Household particulars
For both agriculture and non-agriculture, male proportion is 57 - 58%, the average
age of the producers is between 31 - 33 yeas (Table-4.3). It is interesting to note that
large number of producers is in high productive group of 17 - 45 years. The less
productive group of more than 55 years is only 13% in agriculture and 9% in non-
agriculture. Among the less productive group 62% are male and 32% are female and
trend is same in both kinds of products (Fig.4.3 and table 4.3).
Education level of producers is fairly well because 57% of agriculture producers
and 62% of non-agricultural producers are at least secondary or beyond to graduate and
above level. In non-agriculture graduates and above are more than the agricultural
producers. In agriculture, illiterate person, though only 13% but higher than the non-
agriculture, where they are only 7% (Fig.4.5). The detailed break-up is presented in table
4.5.
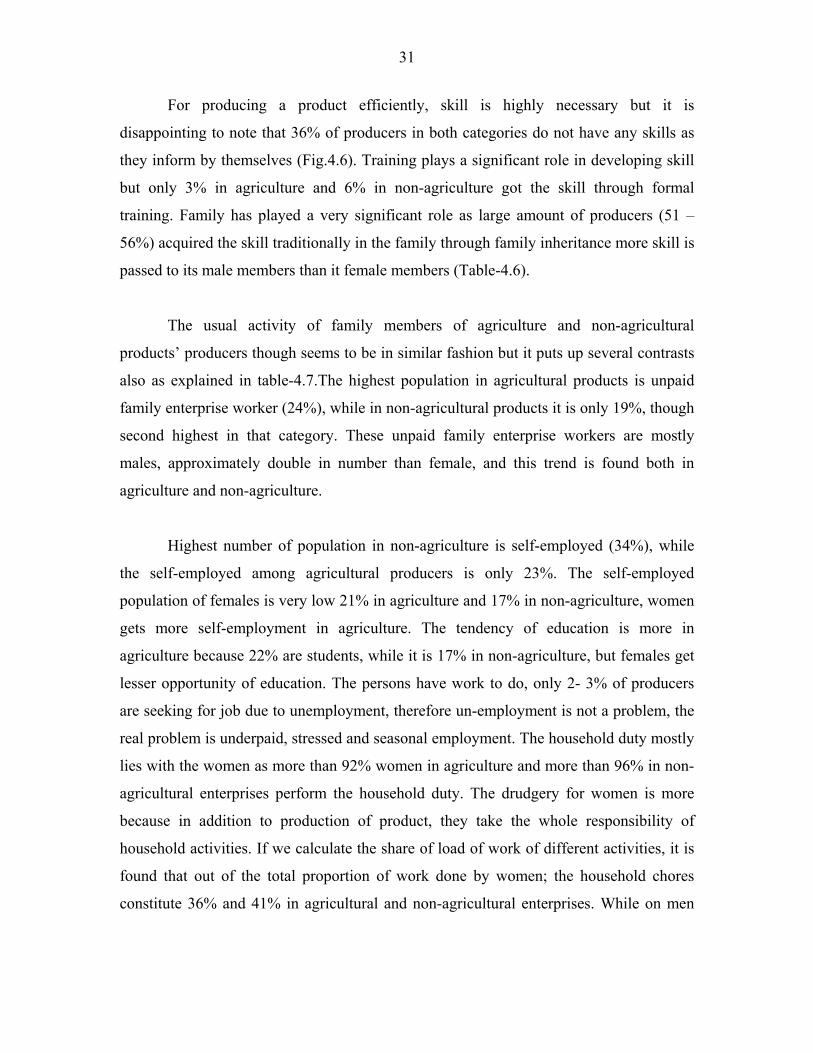
31
For producing a product efficiently, skill is highly necessary but it is
disappointing to note that 36% of producers in both categories do not have any skills as
they inform by themselves (Fig.4.6). Training plays a significant role in developing skill
but only 3% in agriculture and 6% in non-agriculture got the skill through formal
training. Family has played a very significant role as large amount of producers (51 –
56%) acquired the skill traditionally in the family through family inheritance more skill is
passed to its male members than it female members (Table-4.6).
The usual activity of family members of agriculture and non-agricultural
products’ producers though seems to be in similar fashion but it puts up several contrasts
also as explained in table-4.7.The highest population in agricultural products is unpaid
family enterprise worker (24%), while in non-agricultural products it is only 19%, though
second highest in that category. These unpaid family enterprise workers are mostly
males, approximately double in number than female, and this trend is found both in
agriculture and non-agriculture.
Highest number of population in non-agriculture is self-employed (34%), while
the self-employed among agricultural producers is only 23%. The self-employed
population of females is very low 21% in agriculture and 17% in non-agriculture, women
gets more self-employment in agriculture. The tendency of education is more in
agriculture because 22% are students, while it is 17% in non-agriculture, but females get
lesser opportunity of education. The persons have work to do, only 2- 3% of producers
are seeking for job due to unemployment, therefore un-employment is not a problem, the
real problem is underpaid, stressed and seasonal employment. The household duty mostly
lies with the women as more than 92% women in agriculture and more than 96% in non-
agricultural enterprises perform the household duty. The drudgery for women is more
because in addition to production of product, they take the whole responsibility of
household activities. If we calculate the share of load of work of different activities, it is
found that out of the total proportion of work done by women; the household chores
constitute 36% and 41% in agricultural and non-agricultural enterprises. While on men

32
this load is 1-2 percent only. About 5 – 6% of family members and not productive and
they are wholly dependent on the family.
1.3: Housing particulars
About 7% of producers do not have any dwelling and they are mostly agricultural
producers (69% of those do not have dwelling). About 6% of producers though do not
have own dwelling but they have hired; but they are also mostly non-agricultural
producers (93% of those hired). Approximately 85% of non-agriculture and 87% of
agriculture have their own dwelling unit, while others either hire it or do not have any
(Fig.4.8 and table-4.8).
Significant number (47%) of producers of non-agricultural enterprises lives in
houses of more than 150 m2 space, while the majority of producers of agricultural
enterprise (41%) live in houses of size of 100 – 150 m2 (Fig.4.9). Most of producers have
independent houses; the persons living in flat or chawl/bustee are very less but
comparatively higher in non-agricultural producers. The Katcha dwellings are very less
most of the houses are either pucca or semi-pucca, about 82% producers in non-
agriculture and 56% producers in agriculture have pucca houses (Fig.4.10 & 4.11).
Lighting facility, cooking fuel and sources of drinking water are other indicators
of development status of the producers. More than 94% producers use electricity, only 3
– 4% does not have any thing for lighting (Fig.4.12). Significant number of producers
(63% in agriculture and 78% in non-agriculture) uses LPG or piped gas as cooking fuel.
Next to electricity is the use of firewood but tendency of high use of firewood exist in
agricultural producers (26%) only 15% non-agriculture producers uses firewood
(Fig.4.13). For 81% of non-agriculture producers, tap is the source of drinking water;
while this facility is available to only 39% of agricultural producers. Next to tap, the
important source of water is the well for agricultural producers (31% use it) and the
tubewell for non-agriculture producers, where11% use it (Fig.4.14).

33
1.4: Household income, expenditure and assets
1.4.1: Income range
Only 15.3% of total respondents provided any detail of their income, it has been
observed that respondents were not much willing to share information on income, asset
and expenditure etc., and this tendency was more prevalent in the non-agricultural
producers. About 62% of the total producers were below Rs. 50,000/- annual income,
10% between 50,000 to 100,000 and 28% beyond 100,000 (Fig.4.15). The income-
expenditure-asset analysis was therefore, done for the following three groups.
− Category A: Respondents of annual income up to Rs 50,000/-
− Category B: Respondents of annual income > 50,000/- to 200,000/-
− Category C: respondents of annual income of >200,000/-
1.4.2: Contribution of different sources to annual income
Category A
The agricultural producers received 67% of their income from main enterprise,
while producers of non-agricultural products received 57% of their income from main
enterprise (Fig.4.16). These producers are holders of small enterprises therefore, adopted
the strategies of diversification as risk mitigation measure because the share from the
main enterprise is comparatively lesser than the share from the main enterprise received
by the producers of higher income bracket of category ‘B’ and ‘C’. Manufacturing and
agriculture are the second important source of earning for the producers of agriculture
and non-agricultural products respectively.
The income share from other enterprises is higher in case of agricultural producers than
producers of non-agricultural products. This trend has been observed in category ‘B’ also.
The non-agricultural producers earn more in component of wages/salary, it means
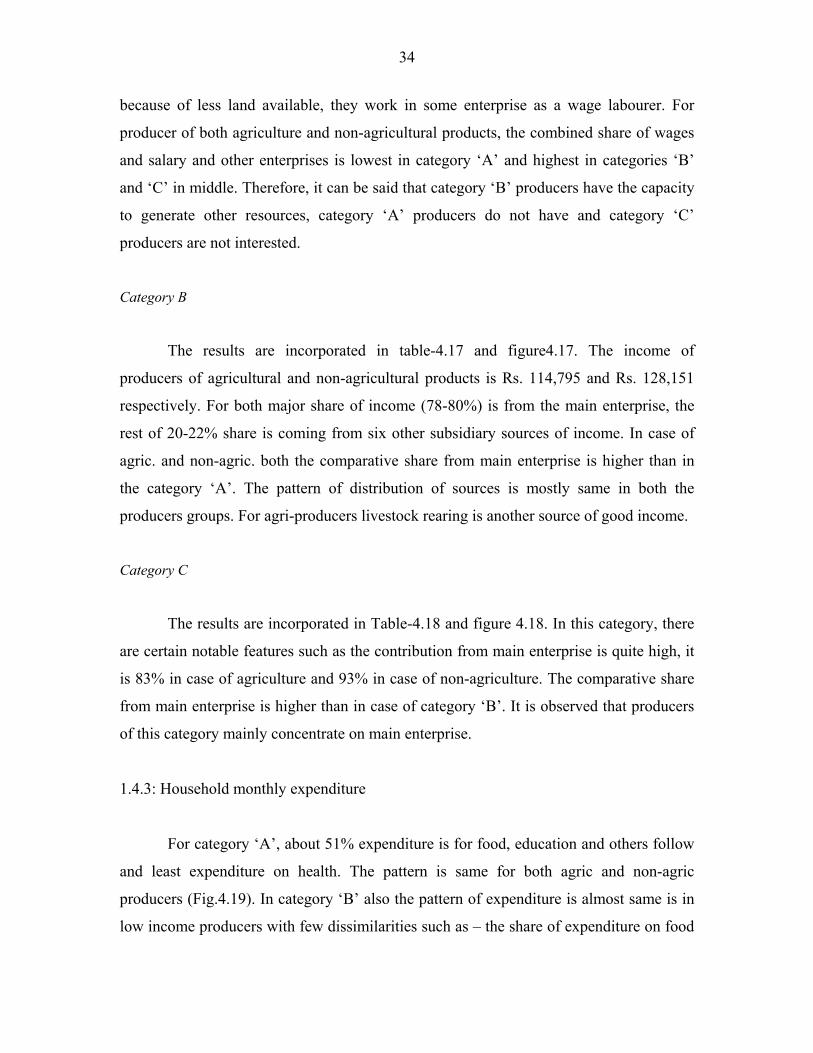
34
because of less land available, they work in some enterprise as a wage labourer. For
producer of both agriculture and non-agricultural products, the combined share of wages
and salary and other enterprises is lowest in category ‘A’ and highest in categories ‘B’
and ‘C’ in middle. Therefore, it can be said that category ‘B’ producers have the capacity
to generate other resources, category ‘A’ producers do not have and category ‘C’
producers are not interested.
Category B
The results are incorporated in table-4.17 and figure4.17. The income of
producers of agricultural and non-agricultural products is Rs. 114,795 and Rs. 128,151
respectively. For both major share of income (78-80%) is from the main enterprise, the
rest of 20-22% share is coming from six other subsidiary sources of income. In case of
agric. and non-agric. both the comparative share from main enterprise is higher than in
the category ‘A’. The pattern of distribution of sources is mostly same in both the
producers groups. For agri-producers livestock rearing is another source of good income.
Category C
The results are incorporated in Table-4.18 and figure 4.18. In this category, there
are certain notable features such as the contribution from main enterprise is quite high, it
is 83% in case of agriculture and 93% in case of non-agriculture. The comparative share
from main enterprise is higher than in case of category ‘B’. It is observed that producers
of this category mainly concentrate on main enterprise.
1.4.3: Household monthly expenditure
For category ‘A’, about 51% expenditure is for food, education and others follow
and least expenditure on health. The pattern is same for both agric and non-agric
producers (Fig.4.19). In category ‘B’ also the pattern of expenditure is almost same is in
low income producers with few dissimilarities such as – the share of expenditure on food
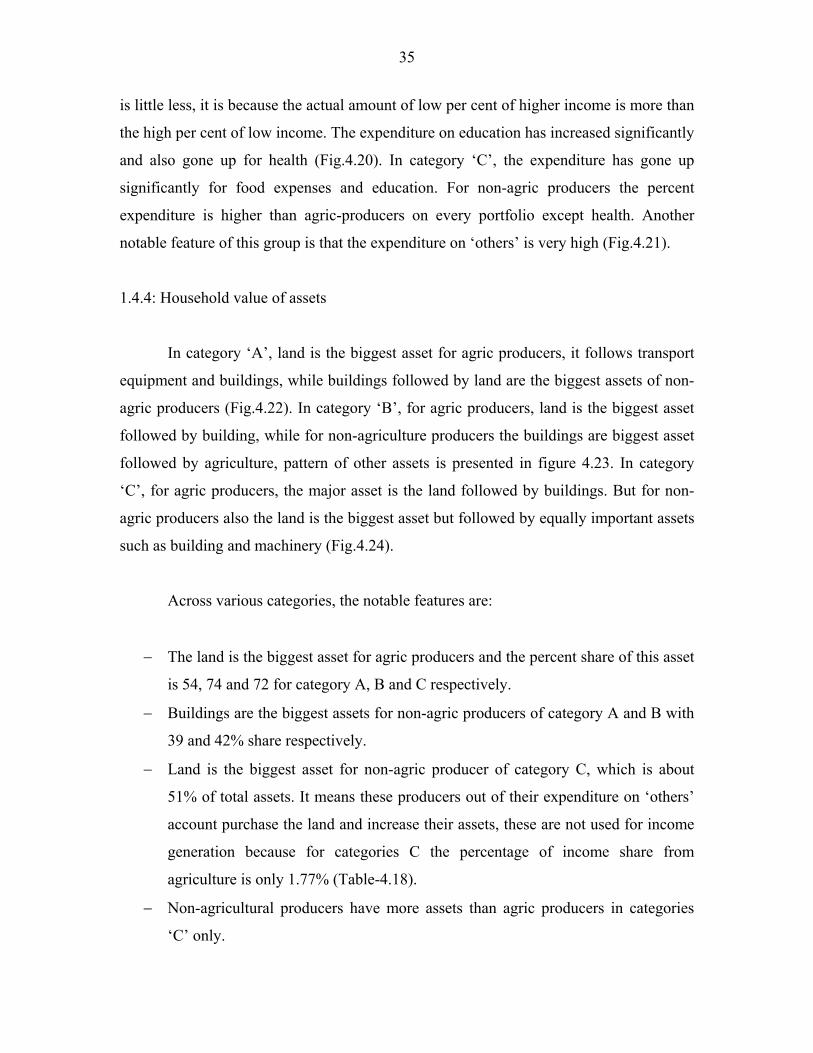
35
is little less, it is because the actual amount of low per cent of higher income is more than
the high per cent of low income. The expenditure on education has increased significantly
and also gone up for health (Fig.4.20). In category ‘C’, the expenditure has gone up
significantly for food expenses and education. For non-agric producers the percent
expenditure is higher than agric-producers on every portfolio except health. Another
notable feature of this group is that the expenditure on ‘others’ is very high (Fig.4.21).
1.4.4: Household value of assets
In category ‘A’, land is the biggest asset for agric producers, it follows transport
equipment and buildings, while buildings followed by land are the biggest assets of non-
agric producers (Fig.4.22). In category ‘B’, for agric producers, land is the biggest asset
followed by building, while for non-agriculture producers the buildings are biggest asset
followed by agriculture, pattern of other assets is presented in figure 4.23. In category
‘C’, for agric producers, the major asset is the land followed by buildings. But for non-
agric producers also the land is the biggest asset but followed by equally important assets
such as building and machinery (Fig.4.24).
Across various categories, the notable features are:
− The land is the biggest asset for agric producers and the percent share of this asset
is 54, 74 and 72 for category A, B and C respectively.
− Buildings are the biggest assets for non-agric producers of category A and B with
39 and 42% share respectively.
− Land is the biggest asset for non-agric producer of category C, which is about
51% of total assets. It means these producers out of their expenditure on ‘others’
account purchase the land and increase their assets, these are not used for income
generation because for categories C the percentage of income share from
agriculture is only 1.77% (Table-4.18).
− Non-agricultural producers have more assets than agric producers in categories
‘C’ only.

36
− Across the category, it is a general trend that in terms of percent value
contribution; non-agric producers have more assets than agric producers in case of
building, machinery durable goods and other assets.
− Agri producers of category ‘A’ only have more percent contribution to asset from
transport equipments. The reason for this is that purchase of transport equipments
such as tractor, trolley etc. which are used for hiring etc. also. In case of category
‘B’ and ‘C’, the transport equipment are more in case of non-agric producers and
their transport equipment mostly means two wheeler and four wheelers for
personal use or use for their own enterprise activities.
1.5: Welfare indicators
Food, cloth, healthcare and welfare schemes for poor were studied as important
welfare indicators of the producers. Some of the results can be stated in table-4.25.
− More than 96% of producers get enough food everyday.
− More than 96% of producers have at least a pair of footwear.
− More than 96% of producers have at least two sets of clothes.
− About 18% of producers fall sick injured within one month prior to survey. But
this is observed more in non-agricultural producers (< 22%) than the agriculture
producers (< 15%).
After falling sick or getting injured 31% of non-agricultural producers and 29% of
agricultural producers do not take any treatment. While 52% of agriculture producers and
42% of non-agriculture producers take treatment in hospital, clinic or dispensary.
Tendency of treatment by unqualified doctors is higher among agriculture producers,
while the tendency of home treatment is higher among non-agriculture producers (Table-
4.26).
Those, who take treatment mostly spent more than Rs. 1000 in the last one-month
of survey in case of non-agriculture producers (30%). But for most agriculture producers

37
the expenditure was between Rs. 200 and 500. Over all 70% of producers spent Rs. 1000
or less on medical treatment (Table-4.27). What are the reasons for not taking treatment?
Majority (66 – 77%) in agriculture and non-agriculture respectively) felt that it was minor
and medical treatment was not considered necessary. In 16% cases lack of medical
facility nearby led to ‘no treatment’, this is more prevalent in agriculture producers. In
12% cases, the producers were not able to afford the expenses on treatment, and this was
also prevalent more in case of agriculture producers (Table-4.28).
The benefits received from any welfare scheme are another indicator of social
welfare. The respondents are somewhat confused in giving the information related to last
one year because sometimes money received, sometimes, it is not received though
scheme is sanctioned, many times small schemes such as scholarship to children also
taken. The information provided for benefit received from welfare schemes does not
necessarily pertain to product under study only. About 89% respondents in non-
agricultural enterprises and 74% in agricultural neither said ‘no’ nor provide any
response, means either they have not received any benefit or they are not willing to share
the information. It can be said that 26% of agriculture producers and 11% of non-
agriculture producers surveyed have informed that they received any benefit from one or
another welfare schemes (Table-4.29).

38
Socio-economic Profile of Producers- Figures
Fig 4.1: Main livelihood of the surveyed producers
0
20
40
60
80
100
1 2 3 4
Livelihood sources
Perc
enta
ge
AgricultureProducersNon-AgricultureProducers
Livelihood sources: 1. Agri enterprise, 2. Non-agri enterprise, 3. Wage/salary income, 4. Others
Fig 4.2: Social groups of surveyed producers
0
20
40
60
SC ST OBC Others
Social groups
perc
enta
ge
AgricultureProducers Non-AgricultureProducers
Fig 4.4: Gender and age-wise group pattern of family members of surveyed producers
0
20
40
60
80
.1-16 17-45 46-55 >55
Age group(years)
Perc
enta
ge AgricultureProducersNon-agricultureProducers

39
Fig 4.5: Education level of family members of surveyed producers
0
10
20
30
1 2 3 4 5 6Education level
Perc
enta
ge AgricultureProducersNon-AgricultureProducers
Education level: 1- Not literate, 2- Literate but below primary, 3- Primary, 4- Secondary, 5- Higher Secondary, 6- Graduate & above
Fig 4.6:Skill level of family members of surveyed producers
0102030405060
1 2 3 4
Skill level
Perc
enta
ge
AgricultureProducers Non-AgricultureProducers
Skill level: 1.No Skill, 2. Traditionally acquired in the family, 3. Acquired through training, 4. Acquired traditionally and by training
Fig 4.8:Ownership details of the dwelling unit of surveyed producers
020406080
100
No dwelling Owned Hired
Ownership of dwelling units
Perc
enta
ge Agriculture Producers
Non-AgricultureProducers

40
Fig 4.9:Covered area particulars of dwelling units of surveyed producers
01020304050
<50 50-100 100-150 >150
Covered area (Sq. m.)
Perc
enta
ge AgricultureProducersNon-AgricultureProducers
Fig 4.10:Type of dwelling used for residing by surveyed producers
020406080
100
Independenthouse
Flat Chawl / bustee
Type of dwelling
Perc
enta
ge
AgricultureProducersNon-AgricultureProducers
Fig 4.11: Structure of respondent’s dwelling units surveyed
0
20
40
60
80
100
Pucca Semi-pucca Katcha
Type of structure
Perc
enta
ge
AgricultureProducersNon-AgricultureProducers

41
Fig 4.12: Lighting facilities availability to surveyed producers
0102030405060708090
100
None Electricity Kerosenelamp
Lighting
Perc
enta
ge
AgricultureProducersNon-AgricultureProducers
Fig 4.13:Cooking fuel utilization of surveyed producers
0
10
20
30
40
50
60
70
80
90
1 2 3 4 5 6
Cooking fuel
Perc
enta
ge AgricultureProducersNon-AgricultureProducers
Cooking fuel: 1. LPG/Piped gas, 2. Local/Gobar gas, 3. Electricity, 4. Kerosene, 5. Coal, 6. Firewood
Fig 4.14:Sources of drinking water availability to surveyed producers
0
10
20
30
40
50
60
70
80
90
1 2 3 4 5 6
Source of drinking water
Perc
enta
ge
Agriculture Producers
Non-AgricultureProducers
Source of drinking water: 1. Tap, 2. Tube-well, 3.Well, 4. Tank/pond, 5. River/canal/lake/spring, 6. Others

42
Fig 4.15:Spectrum of Income range of producers
0
20
40
60
80
UptoRs.10000/-
10000-50000
50000 – 1lakh
More than1 lakh
Income range (Rs)
Perc
enta
ge (%
)
Agriculture Producers
Non-AgricultureProducers
Fig 4.16:Contribution of different sources in net annual income of producers earning upto Rs.50,000 annually
01020304050607080
1 2 3 4 5 6 7
Sources of income
Perc
enta
ge (%
)
AgricultureProducers
Non-AgricultureProducers
1. Agriculture, horticulture, plantation, forestry, 2. Livestock, poultry, fishing, 3. Manufacturing, 4. Trading, 5. Other enterprises, 6. Wage/Salary income, 7. Other income (pensions, property, remittance received)
Fig 4.17:Contribution of different sources in net annual income of producers earning Rs. >50000/- to 2 lakhs annually
0
20
40
60
80
100
1 2 3 4 5 6 7
Sources of annual Income
Perc
enta
ge (%
)
AgricultureProducersNon-AgricultureProducers
1. Agriculture, horticulture, plantation, forestry, 2. Livestock, poultry, fishing, 3. Manufacturing, 4. Trading, 5. Other enterprises, 6. Wage/Salary income, 7. Other income(pensions, property, remittance received)
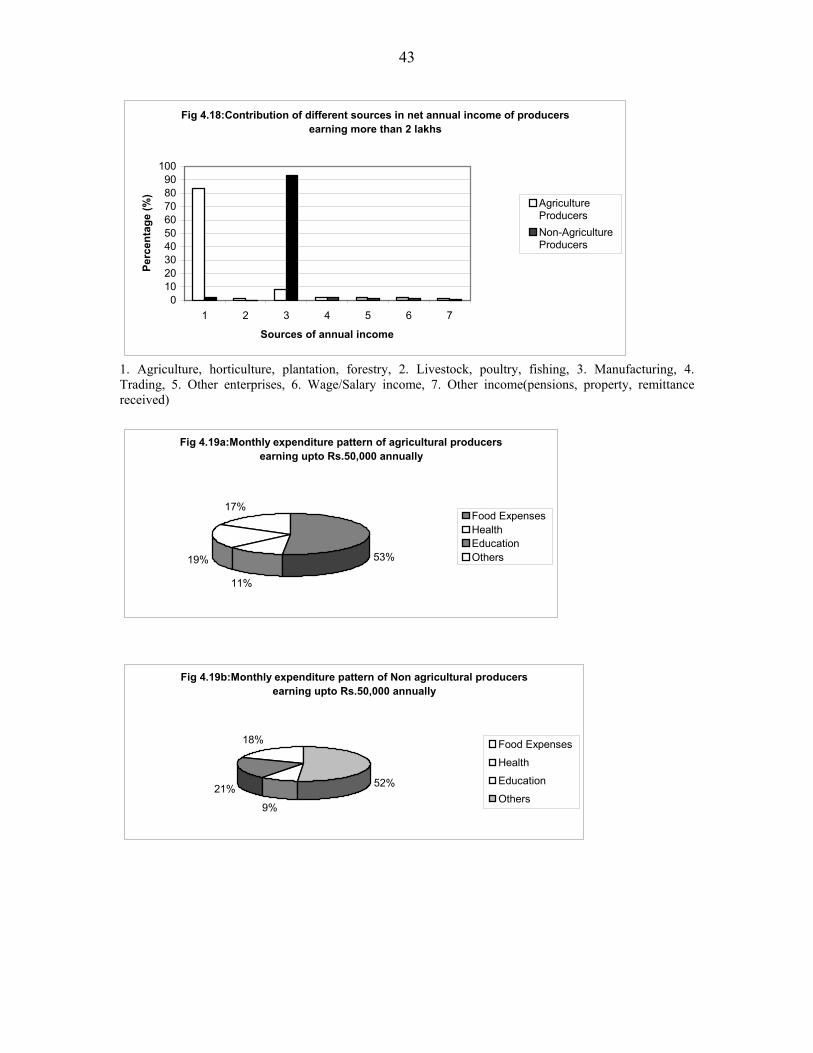
43
Fig 4.18:Contribution of different sources in net annual income of producers earning more than 2 lakhs
0102030405060708090
100
1 2 3 4 5 6 7
Sources of annual income
Perc
enta
ge (%
)
AgricultureProducersNon-AgricultureProducers
1. Agriculture, horticulture, plantation, forestry, 2. Livestock, poultry, fishing, 3. Manufacturing, 4. Trading, 5. Other enterprises, 6. Wage/Salary income, 7. Other income(pensions, property, remittance received)
Fig 4.19a:Monthly expenditure pattern of agricultural producers earning upto Rs.50,000 annually
53%
11%
19%
17%Food Expenses HealthEducationOthers
Fig 4.19b:Monthly expenditure pattern of Non agricultural producers earning upto Rs.50,000 annually
52%
9%
21%
18% Food Expenses
Health
Education
Others
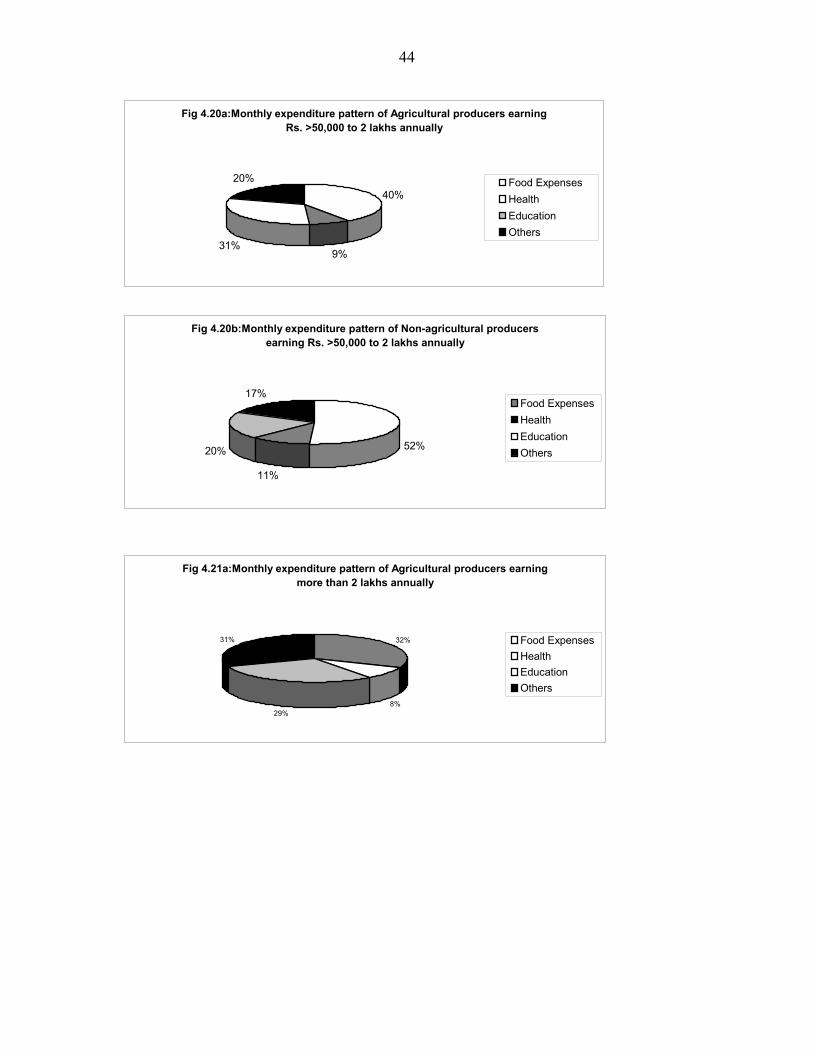
44
Fig 4.20a:Monthly expenditure pattern of Agricultural producers earning Rs. >50,000 to 2 lakhs annually
40%
9%31%
20% Food Expenses HealthEducationOthers
Fig 4.20b:Monthly expenditure pattern of Non-agricultural producers earning Rs. >50,000 to 2 lakhs annually
52%
11%
20%
17%Food Expenses HealthEducationOthers
Fig 4.21a:Monthly expenditure pattern of Agricultural producers earning more than 2 lakhs annually
32%
8%29%
31% Food Expenses HealthEducationOthers
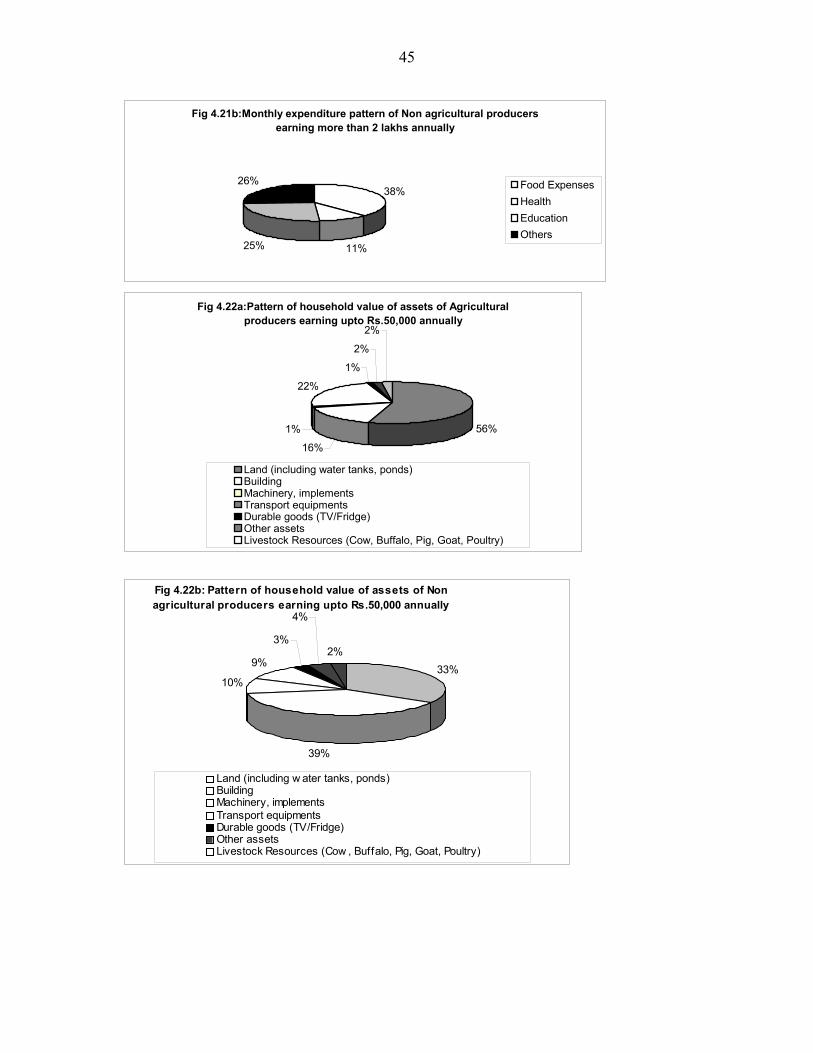
45
Fig 4.21b:Monthly expenditure pattern of Non agricultural producers earning more than 2 lakhs annually
38%
11%25%
26% Food Expenses HealthEducationOthers
Fig 4.22a:Pattern of household value of assets of Agricultural
producers earning upto Rs.50,000 annually
56%
16%
1%
22%
1%
2%
2%
Land (including water tanks, ponds)BuildingMachinery, implementsTransport equipmentsDurable goods (TV/Fridge)Other assetsLivestock Resources (Cow, Buffalo, Pig, Goat, Poultry)
Fig 4.22b: Pattern of household value of assets of Non agricultural producers earning upto Rs.50,000 annually
33%
39%
10%
9%
3%
4%
2%
Land (including w ater tanks, ponds)BuildingMachinery, implementsTransport equipmentsDurable goods (TV/Fridge)Other assetsLivestock Resources (Cow , Buffalo, Pig, Goat, Poultry)
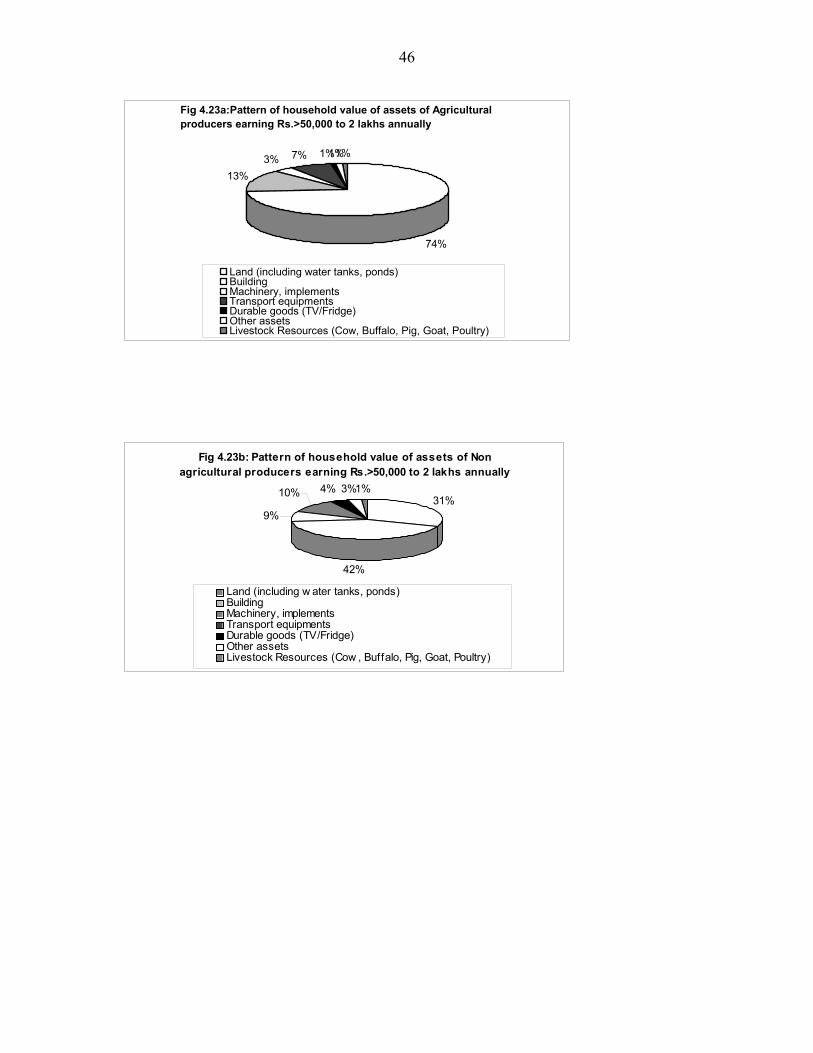
46
Fig 4.23a:Pattern of household value of assets of Agricultural producers earning Rs.>50,000 to 2 lakhs annually
74%
13%3% 7% 1%1%1%
Land (including water tanks, ponds)BuildingMachinery, implementsTransport equipmentsDurable goods (TV/Fridge)Other assetsLivestock Resources (Cow, Buffalo, Pig, Goat, Poultry)
Fig 4.23b: Pattern of household value of assets of Non agricultural producers earning Rs.>50,000 to 2 lakhs annually
31%
42%
9%
10% 4% 3%1%
Land (including w ater tanks, ponds)BuildingMachinery, implementsTransport equipmentsDurable goods (TV/Fridge)Other assetsLivestock Resources (Cow , Buffalo, Pig, Goat, Poultry)
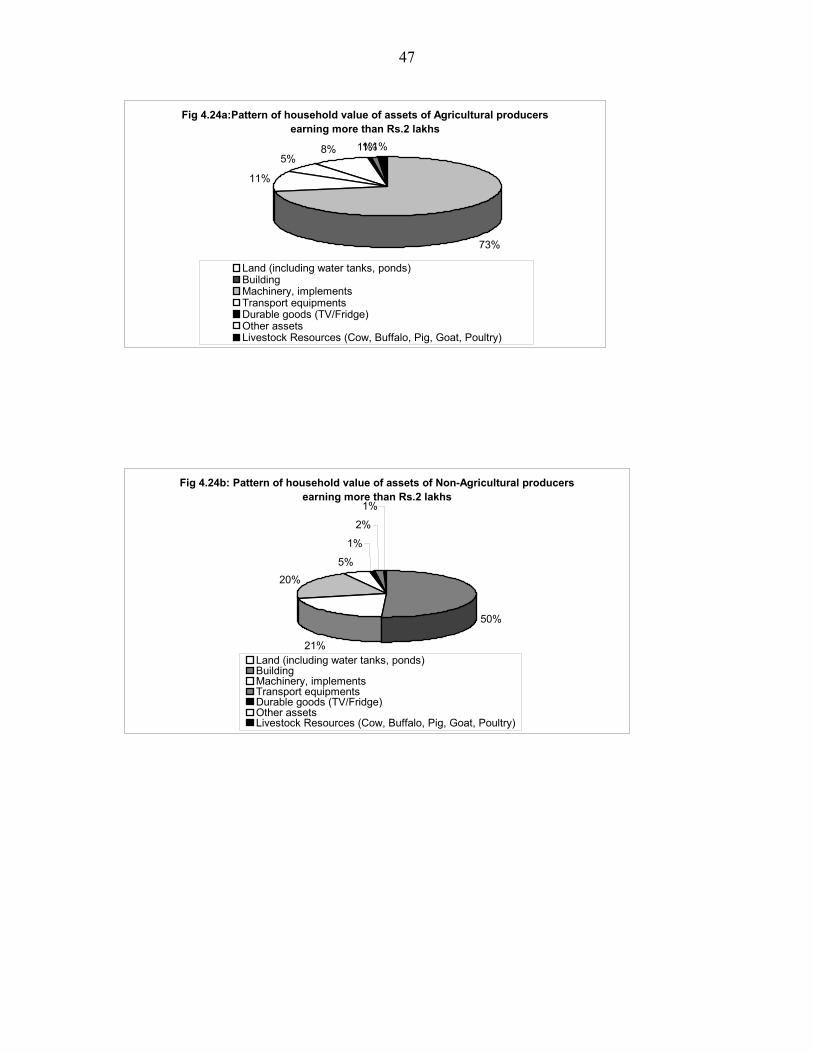
47
Fig 4.24a:Pattern of household value of assets of Agricultural producers earning more than Rs.2 lakhs
73%
11%
5%8% 1%1%1%
Land (including water tanks, ponds)BuildingMachinery, implementsTransport equipmentsDurable goods (TV/Fridge)Other assetsLivestock Resources (Cow, Buffalo, Pig, Goat, Poultry)
Fig 4.24b: Pattern of household value of assets of Non-Agricultural producers earning more than Rs.2 lakhs
50%
21%
20%5%
1%
2%
1%
Land (including water tanks, ponds)BuildingMachinery, implementsTransport equipmentsDurable goods (TV/Fridge)Other assetsLivestock Resources (Cow, Buffalo, Pig, Goat, Poultry)
48
Chapter 5 Analytical Profile of Agricultural Products and Producers: opinion survey of producers
1.1 to 1.5: Socio-economic conditions of producers in agriculture
Refer chapter 4
2.1: Nature and geographical association
The geographical association of the agricultural products is mainly due to geo
climatic factors, 83 per cent of producers believe so. Special raw material is another
important factor responsible for geographical association and this is especially true for
traditional juices. Fruits have historical association in some cases, where these have been
developed under patronizations of rules (Fig.5.1). Other product-wise remarks as opined
by the producers are enclosed in Annexure-XV (Table-15.1, Table-15.2)
2.2: Unique characteristics
Producers have described the unique characteristics of the products, listing of
characteristics that would be lost, if produced elsewhere out side the traditional
geographical area, and also the uniqueness of producing the product. The comprehensive
descriptive account of individual product about the unique characteristics as opined by
the producers and institutional stakeholders have been given along with the traditional
product profile (Annex-XV, Table-15.3, Table-15.25). The producers attributed to special
‘characteristics’ that would be lost if the products are produced elsewhere (Table-15.4)
because in their understanding the process of creating the product also has uniqueness
and specialty (Table-15.5).

49
2.3: Specialty of production process
Applicable to non-agricultural products
2.4: History of production- in region and by individual
A product-wise summary of history of production of the product in the producers’
region as known to them is given in table-5.6. For most products, it is believed that these
are grown since last 60 – 80 years. Kurnool rice is newer to as grown since last 18 years,
this rice is a variety BPT-5204 developed by Bapatala Agric. College, Andhra Pradesh
Agric. University in 1983 and became popular in the whole region. Some products are
grown since olden days, for example, pokkali rice since about 232 years.
The products are grown in the region since ages but the producers interviewed
expressed that they are growing the product, which ranges mostly between 25 – 40 years.
The average of all the interviewed producers is as high as 68 years for coorg orange, and
as low as 9.9 years for pahari aloo. The product-wise detail is available at (Table-5.34).
3.1: Ownership and activities
Mostly the producers are engaged in production only. Some do the trading also
but providing training is mostly not in their agenda. (Fig.5.2). About 80% of enterprise in
GI Type II, III and IV are sole proprietorship. (Fig.5.3). In GI Type I, about 50% are
family enterprises. Partnership with other households is almost negligible except about 5–
6% enterprises in IV and I. The ownership style would have certain implications with the
entrepreneurial decision-making. For enterprises of grains, plantation crops and
indigenous products or traditional drinks, the individual’s decision or decision of head of
enterprises will be important. But for enterprise of fruits, the collective decision will be
important. Therefore, important agribusiness decisions such as contract farming or
procurement of product for retail marketing will be influenced with the ownership style.

50
In almost all cases, the head of family is also head of enterprise and in no case the
non-family members was principal operator (Fig.5.4). The major issue of concern is that
70% of heads of enterprise acquire the skill traditionally only. Skill acquisition through
formal training is less than 3% (Fig.5.5). For the family members also, it has been
observed that about 37% of them do not have any skill and 56% acquired skill from the
family only (Table-4.6). The implication here is the head of the enterprise should be
trained formally, for boost in formal training of family members snowballing of
producer-to-producer training programme should be initiated. For this, the enterprises are
to be encouraged to impart training to a greater extent.
3.2: Activities-seasonality
On the basis of highest frequency of producers, the codes for ‘no activity’, lean
activity, normal activity and peak activity have assigned for various months and
presented for each product in table-5.7. The producers need to be provided employment
in the month of no activity and additional employment in the months of lean activity.
3.3: Resources- persons engaged and equity issues
Analysis of fig.5.8 and table-5.8 reveals the following factors covering labour
requirement and gender issues in agriculture.
− The workers requirement in enterprise is highest in G.I. type III followed by II
and I.
− In GI type I, II and III, the engagement of skilled workers are far more than non-
skilled workers.
− The number of engaged skilled women workers is almost double of the engaged
skilled men workers. In GI type I and II. In GI type III, the number of engaged
skilled women workers is triple of skilled men workers. It can, therefore, be said
that skilled women workers’ requirement is very high.
− In ‘others category’, the engagement of men workers is more than women
workers.
51
− In GI type III and I, the overall engagement is very less and the engagement of
skilled workers is more than the men workers.
− In GI type IV, the engagement of workers is very less and the engagement of
skilled men worker is more than the women workers. The requirement of less
number may be due to non-professional or less commercial approach in product
development.
− Engagement of paid workers is far more than the family workers.
3.4: Resources- persons engaged in organizations
Applicable to institutional stakeholders
3.5: Resources skill & training
Refer para 3.3
3.6: Resources- physical particulars of land
The producers on an average possess less than 10 hectares of land. Producers are,
therefore, middle level farmers. The per capital available land is highest for the producers
of GI type I (18 acres) followed by producers of GI type III (13.6 acres), II (11.5 acres)
and least with producers of GI type IV (8.9 acres). Out of the available land 83, 72, 58
and 42 per cent is irrigated in case of GI type III, II and I and IV respectively (Table-5.9).
The producers surveyed are mainly producers of product in question but they do
not allot the whole land for the product only. On the basis of their own decisions, a
particular amount of irrigated or un-irrigated level is put under production of the product
in question. Table-5.10 provides the product-wise information of the allotment of kind of
level to the product, a short summary is provided below.

52
Per cent of land put under cultivation of product
Product
0 - 30 Malwa potato, Dungarpur zinger, Amleta & Mahadev garlic, Fenugreek, Mahoba paan, Kokum fruit juice
30 – 60 Banganpally mango, Coorg orange, Malihabadi Dussheri, Navara rice, Bhaliya wheat, Basmati rice, Pahari aloo, Guntur chilli
60 – 90 Alphonso mango, Nasik grapes, Himachal apple, Harshil apple, Ramnagar litchi, Sehori genhu, Coorg coffee
> 90 Nagpur orange, Pokkali rice, Kurnool rice, Hill rajma, Wayanadan tea, Telichery black pepper, Alleppy cardamom, Nilgiri tea, Kumbhraj dhania
It can, therefore, said that producers of more than 50% of the product put their
60% or more land under the cultivation of product, therefore, the product is main
livelihood for them. Some products where land below 30% is kept under cultivation have
good market potential. Therefore, there is a need to increase the area of cultivation under
these products.
3.7: Resources- loans
Producers obtained loans from various sources but most (65%) producers took
from blanks, the distribution of sources is given in fig.5.12. Mostly the loan was taken for
purchase of inputs (62%) followed by purchase of other assets and machinery and
equipment (Fig.5.13). On an average, interest paid to the moneylenders is highest,
followed by traders and cooperative society. The cheapest interest rates were from bank
followed by government loans (Fig.5.14). The amount of outstanding loan is highest on
GI type I producers (Rs. 24186) followed by producers of GI type III and II. The owner
of GI type IV do not have any outstanding amount (Fig.5.15). About 53 percent of the
producers have actually taken the loans, which is less than Rs. 50,000 (Fig.5.16).
3.8: Resources- raw material
As presented in table 5.21, 82% of producers are satisfied with the supply of
inputs except in few cases such as malihabadi dusseri mango, himachal apple, nagpur
orange, wayanadan tea and tellichery black pepper etc. The producers’ opinion about
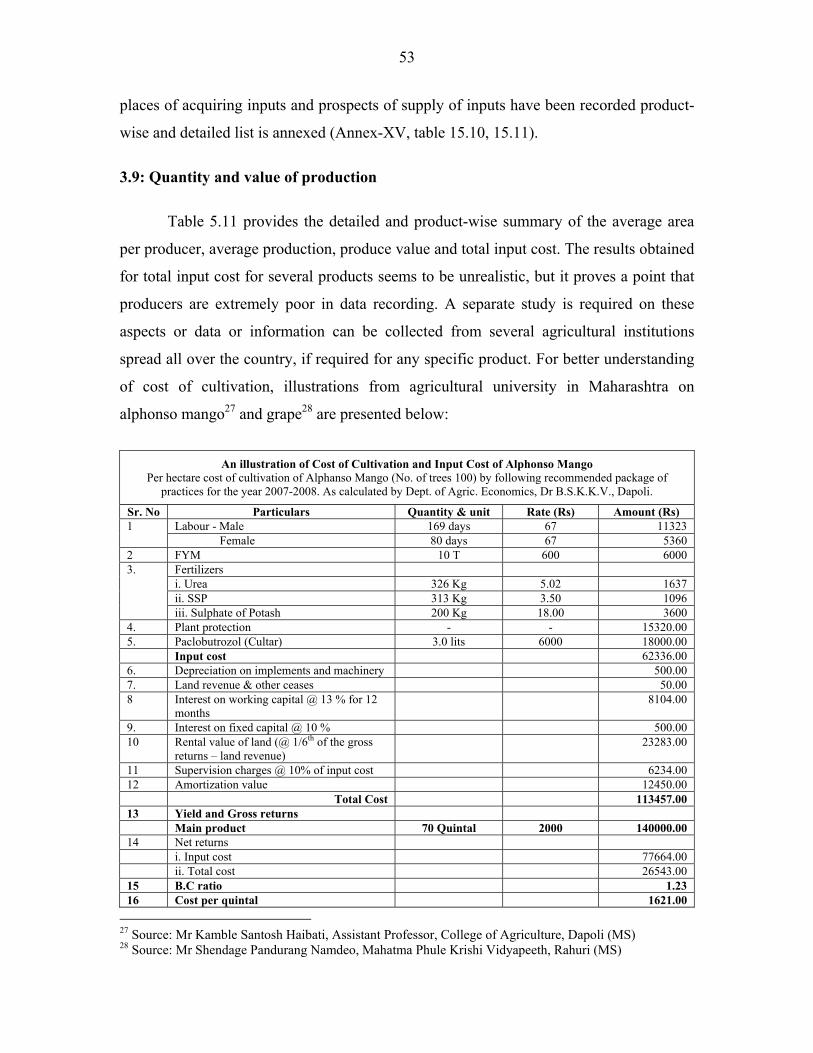
53
places of acquiring inputs and prospects of supply of inputs have been recorded product-
wise and detailed list is annexed (Annex-XV, table 15.10, 15.11).
3.9: Quantity and value of production
Table 5.11 provides the detailed and product-wise summary of the average area
per producer, average production, produce value and total input cost. The results obtained
for total input cost for several products seems to be unrealistic, but it proves a point that
producers are extremely poor in data recording. A separate study is required on these
aspects or data or information can be collected from several agricultural institutions
spread all over the country, if required for any specific product. For better understanding
of cost of cultivation, illustrations from agricultural university in Maharashtra on
alphonso mango27 and grape28 are presented below:
An illustration of Cost of Cultivation and Input Cost of Alphonso Mango
Per hectare cost of cultivation of Alphanso Mango (No. of trees 100) by following recommended package of practices for the year 2007-2008. As calculated by Dept. of Agric. Economics, Dr B.S.K.K.V., Dapoli.
Sr. No Particulars Quantity & unit Rate (Rs) Amount (Rs) Labour - Male 169 days 67 11323 1 Female 80 days 67 5360
2 FYM 10 T 600 6000 Fertilizers i. Urea 326 Kg 5.02 1637 ii. SSP 313 Kg 3.50 1096
3.
iii. Sulphate of Potash 200 Kg 18.00 3600 4. Plant protection - - 15320.00 5. Paclobutrozol (Cultar) 3.0 lits 6000 18000.00 Input cost 62336.00 6. Depreciation on implements and machinery 500.00 7. Land revenue & other ceases 50.00 8 Interest on working capital @ 13 % for 12
months 8104.00
9. Interest on fixed capital @ 10 % 500.00 10 Rental value of land (@ 1/6th of the gross
returns – land revenue) 23283.00
11 Supervision charges @ 10% of input cost 6234.00 12 Amortization value 12450.00 Total Cost 113457.00 13 Yield and Gross returns Main product 70 Quintal 2000 140000.00 14 Net returns i. Input cost 77664.00 ii. Total cost 26543.00 15 B.C ratio 1.23 16 Cost per quintal 1621.00
27 Source: Mr Kamble Santosh Haibati, Assistant Professor, College of Agriculture, Dapoli (MS) 28 Source: Mr Shendage Pandurang Namdeo, Mahatma Phule Krishi Vidyapeeth, Rahuri (MS)

54
SCHEME FOR COST OF CULTIVATION STUDIES.
(GOVT. OF MAHARASFITRA) Itemwise per hectare cost of cultivation
Crop : Grapes Practice : I Area (Ha.) 25.50 Year: 2003-04 No. of cultivators 30 Zone : All Village : All Taluka : All District :All ------------------------------------------------------------------------------------------------------------Sr. Cost items Quantity Rate (Rs.) Value (Rs.) ------------------------------------------------------------------------------------------------------------------------------------------------------------------------------------------------------------------------
1. Hired human labours (days) a. Male 270.35 67.48 18242.75 b. Female 898.75 40.47 36369.41 2. Bullock power (pair days) 7.16 273.94 1960.54 3. Machine power (I-Irs.) 187.18 21.74 4068.86 4. Seed (Kgs.) 0.00 0.00 0.00 5. Manures (Qtls.) 261.47 75.59 19765.22 6. Fertilizers (kgs.) Nitrogen(N) 315.35 15.01 4732.74 Phosphorous(P) 431.41 17.50 7547.68 Potash (K) 71.07 7.64 543.19 7. Irrigation Charges 16257.07 8. Bio-fertilizers/ Micronutrient 2566.82 9. Plant protection charges 34156.59 10. Incidental charges 833.08 11. Repairs on farm implements 571.43 12. Insurance Premium 0.00 13. Working Capital (1 to 12) 147615.37 14. Int. on working capital 20666.15 15. Depre. on farm implements 3,981.94 16. Land reve. & other taxes 405.31 17. Cost A (13+16) 172668.78 18. Rental value of Land 46058.14 19. Interest on fixed capital 6528.62 20. Amortization cost 12705.96 21. Cost B (17+18+19+20) 237961.51 22. Family labour (days) a. Male 254.62 69.60 17721.41 b. Female 14.60 39.01 569.69 23. Cost C (21+22) 256252.61 24. Output (Qtls.) a. Main Produce 190.71 1461.83 27878O.71 b. By Produce 0.00 0.00 0.00 25. Cost C Net By-Produce 256252.61 26. Per Quintal cost (25/24 a) 1343.70
4.1: Storage methods and problems
Applicable to non-agricultural products
4.2: Packing methods and problems
Only in 30 per cent respondents inform about pucca packing otherwise mostly it
is either no packing (6%) or raw packing, among raw packing the gunny or jute bag is
most popular (Fig.5.17). The problems faced by producers are explained in fig.5.18, most
of them do not have any problems, those who have mostly complained about
deterioration of packing material. Only few have perceived the limited knowledge, as a

55
problem. But the truth is that they have knowledge of the existing packing technology,
they do not know the newer technology that is why using the raw methods of packing.
Another most important thing is that new methods of sales would generate the new
requirement of packing technology and packing material. A product wise comprehensive
account of methods of packing (Table-15.6) and problems faced (Table-15.7) are
presented in Annex-XV.
4.3: Grading methods
In 28 per cent cases no grading, in rest of the cases the grading is done but mostly
its is based on physical traits, only 17% respondents reveal of grading on qualitative traits
(Fig.5.20). Therefore, challenge is to initiate some grading, wherever it is not there, and
convert physical traits based grading to qualitative traits based grading. A product wise
comprehensive account of methods of grading is presented in Annex-XV (Table-15.9).
4.4: Mode of sale and satisfaction level
Various modes of sales are there, 61 per cent respondents report direct sales, but
mostly it is so wholesalers or local shops, comparatively less to processing agency, and
very less to mahajans or experts (Fig.5.39). In 14% cases, it is either sale to government
agency or cooperative society, rest of the cases (29%) it is through middlemen.
The detailed study of table 5.39 about mode of sale reveals the following facts:
- 82% of sale to Mahajan is in GI type II
- Middlemen are most prevalent (44%) in GI type I and moderately in II and III.
- Government agency sale is most prevalent in GI type III (45%) and moderate in I
- Sale through cooperative society is most prevalent (37%) in GI type I and III.
- Sale to exporters is mostly (37%) in GI type I
- Sale to local shops or consumers is distributed across all GIs but most prevalent
(31%) and GI type II followed by moderate (27%) in I and III
56
- Sale to processing agency is also distributed across all GIs but most prevalent
(34%) in GI type II followed by moderate (27 – 28%) in I and III and least in IV.
On the basis of information available in Table-5.39, the following are the
implications with respect to each category of products:
GI Type I: Sale is mostly to middlemen or wholesalers, though 73% of total respondents
across GIs for sale to exporters belong to GI type I but fact is that within the category,
this number is very small (only 5%). In this category, there is a need encourage sale
through cooperative society for processing agency and export.
GI Type II: Mostly the sale is direct to wholesaler, middlemen, local market, and
mahajans. Mahajans have highest influence in this category. Sale through government
agency and cooperative is very low, which need to be increased mainly for processing
agency.
GI Type III: Sale through government agency and cooperative in this category is best
among all the GI types but the major mode of sale is still direct to wholesalers,
middlemen and local shops. There is a need to enhance share to exporters through
strengthening sale through cooperative society.
GI Type IV: Across the various categories of GIs, there is least involvement of
middlemen. Now the question is whether low involvement of middlemen without any
regulatory measures is an indicator of low commercial activity in the product? The sale is
mostly direct to local market followed by moderate sale to middle men and processing
agency and least sale is to wholesalers. In these products the supply chain is totally
disintegrated. The sale to government agencies and cooperative society is completely
missing. It is a serious concern. Therefore, there is a need do efforts for development of
supply chain on the basis of principles of common candidates.
57
About 50% of the producers in I, II, III GI types are satisfied with the mode of
sale, while it is amazing to see that in GI type IV about 82% of producers are satisfied
from mode of sale (Table-5.40). The high satisfaction levels of mode of sale along with
disintegrated supply chain is an indicator that commercialization has not taken place in
this category of products. The strongest reason for un-satisfaction over mode of sale is
‘low profit from venture’ followed by insufficient institutional support, involvement of
middlemen and high input cost etc. Over 10% of producers are not satisfied but not able
to assign any reason for that (Fig.5.41) and this type of respondents are highest in GI type
IV (46%), the details are available in table-5.41. For explanatory account of
dissatisfaction for individual products, refer table-15.21 in Annexure-XV.
4.5: Mode of purchase by traders
For view of traders refer Chapter 11 and table 11.30
4.6: Spectrum of region-wise sale of product
For view of institutional stakeholders refer Chapter 9, table 9.13
4.7: Contribution of uniqueness to sale
For view of institutional stakeholders refer Chapter 9 and table 9.60
4.8: Trend of sale
For view of institutional stakeholders refer chapter 9, table 9.15; for traders’ view,
also refer chapter 11, and table-11.4
4.9: Price decision and trend of unit price
The prices of product for sale are mostly decided either through individual
bargain or purchaser offer a price to which producers had to agree and there is no other

58
choice; 17% respondents say that they usually agree to a price offered by purchaser. The
collective bargaining and process of minimum agreed price between an association and
purchaser is extremely weak (Fig.5.43). While more than 30% of traders feel that
consumers always bargain (Table-11.8). The trend is almost same in all GI types except
few notable features. Such as in GI type II, the collective bargaining is almost nil, and in
GI type II and II significant number of producers do not have any other option than to
sale on a price offered by purchaser, details refer table-5.43. The trend of unit price is
almost of increasing side during 2004-06 except few products such as wayanadan tea,
telicherry blackpepper and malihabadi dussheri etc. (Table-5.42).
4.10: Price increments in supply chain
Refer chapter 9 and table 9.11
4.11: Constraints in production and marketing
In production and making of agricultural products on listed by producers, there
are 15 kinds of constraints. In order of their importance these have been listed in fig.5.44.
The most important constraints are hindrances from agronomic/natural factors, market
insecurity leading to low profitability, labour scarcity and low marketing infrastructure.
As detailed in table-5.44, the trend is almost same across all GI types with few notable
features such as:
- In GI type IV ‘difficulty in getting quality input’ is acute constraint.
- Improper marketing services is a severe constraint in GI type II and IV.
- Marketing insecurity leading to low profitability is a severe constraint in GI type
II, and III and IV and moderate constraint in I.
- Surprisingly ‘no organized producers association’ has not been perceived as a
constraint. This is probably due to unawareness of producers about fruits of
producers’ association in GI matters.

59
- Again surprisingly high competition has not been perceived as a constraint except
in case of GI type IV.
At individual level, the producers have also expressed other problems, which are
of individualistic nature; these are documented in Annex-XV (Table-15.18, Table-15.22).
5.1: Inspection, quality control at various stages of production
The situation of methods of inspection and quality control in agricultural products
is very pathetic. As described in fig.5.19, in case of 75% of enterprises, the inspection
and quality control is either by producers themselves at production level on field and
harvesting level or there is no inspection and quality control. Only in few cases it is done
at processing at grading level and in very few cases, there is a provision of inspection by
an authority. Even 15.1% of institutional stakeholders also agree that there is no formal
method of inspection and quality control, for more details please chapter 9 and table-9.2.
For each product the producers have given their opinion about method of inspection as
presented in table-15.8 of Annex-XV.
5.2: Govt. defined quality assurance methods and advice given for quality
improvement
For view of institutional stakeholders, refer chapter 9 and table 9.5 and 9.8
5.3: Technical guidelines for production codes
For a GI it is obvious to have certain specific methods and, therefore, code of
production to them. The queries to this effect were made from the producers, the results
(Table-5.36) are not only surprising but also have serious concerns as given below:
- Whether production is as per technical guidelines of government? About 74%
respondents say ‘no’.
- Whether production is as per technical guidelines of any NGO? 92% respondents
say ‘no’
60
- Whether production is as per technical guidelines of producers association? About
74% respondents say ‘no’.
Then, the questions arise, which technical guidelines they follow? And more than
92% say “production as per self guidelines learnt from forefathers”.
The respondents of traditional juices have also given other information regarding
technical guidelines (Annex-XV, table-15.19).
5.4: Maintenance and monitoring of codes of production practices
As find out, the producers certainly have their own codes to develop production
practices. But how these odes are maintained and monitored and what is the mechanism
available? The summary of results as described in table-5.36 is given below.
- About 57% of producers say that there are no technical guidelines from
government to follow.
- 85% say there is no quality control mechanism available.
- About 82% say there is no inspection by government, NGO or association.
- About 50% believe that production practices are maintained because purchaser
checks the quality.
- About 50% believe that they by themselves take care so that production practices
are maintained and monitored.
5.5: Traders’ view to maintain product quality
For traders’ view, refer chapter 11 and table-11.48
6.1: Presumed results of non-registration
During the interview, the producers are explained the benefits of registration of
product as GI. The producers, therefore, presumed certain disadvantages of not having
product registration (Table-5.45). These are:
61
- 69% producers believe non-registration leads to low volume of sale
- 46% producers believe non-registration leads to low wages to labour
- 82% producers believe that non-registration leads to low profit to producers
- 61% producers believe that non-registration leads to difficulty in getting loans
6.2: Expected changes after registration- on market
As post registration impact, the producers have several expectations related to
good market for products (Table-5.45). The salient features of these expectations are:
- 51% producers expect significant increase in sale and 39% expect marginal
increase in sale.
- 78% expect increase in unit price and 21% could say neither ‘yes’ nor ‘no’ and it
is only about 7%, who does not expect increase in unit price.62% expect less
market competition
- 74% expect market expansion
Institutional stakeholders also gave their opinion about it (chapter 9, table-9.39,
9.40)
6.3: Expected changes after registration- enhanced premium as expected by
producers and traders
Refer para 9.3
6.4: Expected changes after registration- livelihoods & overall socio-economic
conditions
As a post registration impact, change in livelihood pattern is expected and
improvement of socio-economic conditions is also expected. The producers’ opinion was
collected on these issues, the results are summarized below:
- 67% producers believe that registration would lead to over all improvement of
their socio-economic conditions, 26% are not sure but only 7% believe that it
would not (Table-5.45).

62
- As a result of GI registration, the producers leave their other livelihood activities
and shift to producing the GI product in question? Only 39% producers agree to
it, 26% do not agree and rest are not able to decide. As explained in table-5.49,
the trend is almost similar across all GI types.
- Mere registration of a product will not encourage producers to shift their
livelihood strategies. Along with registration, if other protection mechanisms are
also followed to ensure better incentives and more benefits. Under these
circumstances, 74% producers are willing to leave other livelihood activities and
shift to producing the product in question. About 26% still says ‘no’ to the
student (Table-5.47).
- Those who will not shift even after creating the situations of getting more benefit
ascertain several reasons to it. The most important is market risk integration (33%
respondents) followed by lack of awareness of GI system (23%), present option
more beneficial, production risk mitigation and risk avoidance arising due to
climatic vagaries (Table-5.48).
- Institutional stakeholders also gave their opinion about it (chapter 9, table-9.39,
9.40). The other changes as described by producers are presented in Annexure-
XV (Table-15.23).
6.5: Expected changes after registration- consumers’ expectations
Refer chapter 10, table 10.1
6.6: Visualized benefits at time of GI registration
Opinion of institutional stakeholders, refer chapter 9, table 9.51
7.1: Duplicates and similar products
An enquiry was made from producers about the existence of similar but not
genuine products that are so9ld in the market with the same name. The salient features of
results described in table-5.30 are given below and are also available in fig.5.30:
63
− The producers are almost equally divided among three categories i.e. who say
yes or no or can’t say
− 64% producers of GI type IV agree that no duplicates are available
− 41 – 42% producers of GI type II and I that duplicates are available
Other stakeholders’ opinion
Consumers
About 61% consumers believe that quality assurance led them to purchase
product, 33% purchased due to traditional character and only about 6% gave importance
to reasonable price (Table-10.3). It is very important to note that consumers are the
terminal point to the supply chain and are the most important stakeholders in supply
chain; they have given importance to quality assurance and traditional character.
Therefore, presence of duplicates is a matter of great concern.
− For view of institutional stakeholders, refer chapter 9, table-9.22 and 9.24.
− For view of traders, refer chapter 11, table-11.19 & 11.21
7.2: Consumers’ efforts to purchase genuine product
For view of consumers, refer chapter 10, table 10.13, 10.17, 10.19, 10.20
7.3: Competition- types and sources
About 53% producers (Table 5.36) feel that their products face competition. But
what are the sources of competition? The study analyzed in table-5.31 provides the
detained explanation, the main facts are given below:
- 42% believe that these are same product but produced elsewhere in the country
- 40% believe that there are different products but sold with the same name with the
deceptive similarity

64
- 12% believe about competition from similar products imported in the country
- Only 6% believe that competition is in export market from other countries
producing similar product.
Other stakeholders’ opinion:
Institutional stakeholders, refer chapter 9, table-9.16-9.18.
Traders, refer chapter 11, table-11.10, 11.11, 11.13
7.4: Import of similar product and difference between imported and domestic
product
The threat perceived from competition from similar products imported in the
country is very low (only 12% producers believe so). Most producers’ (59%) believe that
imported products are of inferior quality, the other reasons are of less significance and
presented in table-5.32.
Other stakeholders’ opinion
Institutional stakeholders, refer chapter 9, table-9.26
Traders, refer chapter 11, table-11.14
7.5: Import of the products
Opinion of institutional stakeholders, refer chapter 9, table-9.19
7.6: Export and trade option of the products
Opinion of traders, refer chapter 11, table-11.36-11.47
8.1: Observed changes after registration- on market
With the intention of measuring the observed changes in the registered product, a
question has been asked from the respondents. In fact at the time of survey only one

65
product i.e. coorg orange was a registered product. Therefore, the number of respondents
attempting this question are only 10 producers. Not much can be known on the basis of
small size of sample but it gives a trend, which cannot be generalized for other products.
The results are presented in table-5.51, the salient features are given below:
- Post registration change has been observed
- 78% of interviewed believe increase in production
- All interviewed believe increase in price and profit
- About 29% of interviewed believe that competition has been less and market has
expanded.
8.2: Observed changes after registration- livelihoods & overall socio-economic
conditions
About 67% of producers said that they have not shifted from other livelihood
activities and rests are not able to decide anything. But no one has shifted from other
livelihood to the production of RGI. Mostly they believe that registration had brought
improvement and or would bring change in socio-economic conditions of producers.
(Table-5.51).
8.3: Observed changes after registration- enhanced premium felt by producers
All of the respondents (09) feel that registration a product has provided enhanced
premium to the product. But how much? Mostly believe between 5 – 10% (Table-5.52).
8.4: Other observed changes
The other observed changes suggested in only coorg orange are ‘There should be
increase in production & marketing methods. Increase in Quality of fruit and proper
storage will increase unit price’.

66
9.1: Willingness for registration and payment thereof
About 84% producers intended for registration and 10% are not able to decade.
Only 6% are not willing for registration (Table-5.45). Are they willing to pay for
registration? About 73% are willing and 27% are not. If agreed to pay, then how much
can they pay? Across all the products 56% are ready to pay Rs. 500 and 24% are ready to
pay Rs. 1000. But those who are willing to provide more than Rs. 2000 are only 19% and
mostly in GI type III (Fig.5.46). The detailed information is given in table-5.46.
Other stakeholders’ opinion
Institutional stakeholders, refer chapter 9, table-9.47, 9.48, 9.70, 9.71
Consumers, refer chapter 10, table-10.1
9.2: Money paid by producers for registration
About 89% of producers informed that they have contributed money for GI
registration (Table-5.51) and it is between Rs. 250-500 per head (Table-5.53).
9.3: Willingness to pay for expected enhanced premium
About 72% of producers expect enhanced premium to producers, 23% are not
able to decide but rest do not expect any enhancement (Table-5.45). But how
enhancement much they expect?
Mostly (42%) they expect 5-10% premium over prevailing cost, only 22%
producers expect more than 15% and rest 21% expect between 10-15%, it can be said that
around 67% producers expect less than 10% premium (Table-5.50).
Other stakeholders’ opinion
Consumers, refer chapter 10, table 10.13, 10.15
Traders, refer chapter 11, table 11.8, 11.32, 11.34
67
10.1: Production characteristics
In the opinion of producers (Table-5.37) the trend of production in last three years
had been either stationery or increasing for most of products. In some products, the trend
has been either stationery or declining. These are:
- Coorg orange
- Basmati rice
- Kurnool rice
- Telicherry black pepper
- Dungarpur zinger
- Mahoba pan
Regarding the association of producers with the enterprise. The following
statement for agricultural products as approved by the producers can be given in order of
their importance.
- Largest section (30%) believe that ‘few more have started producing’ the product
- No one has discontinued the production of product – 26% producers believe it
- The situation is more or less same (no addition, no deletion) – 24% producers
believe it
- Few more have started producing – 11% producers believe it
- Many have discontinued producing the product – 8% producers believe.
The detailed analysis as per product wise is presented in table-5.38. The major
issues emerged from discussion are:
- Mostly status of number of producers is either same or increasing means there is
not much producers who have discontinued production. On the other hand it is
possible that area under production has been shrinked in some products because
the producers have reduced the area under cultivation but they have not left the
enterprise completely.
- Only a few producers believe that many have discontinued.

68
In few cases, the producers have given specific reason for increase in production
of the product (Table-15.20).
10.2: Production constraints
A list of production constraints in each product is enclosed (Annexure-XV, table
15.18, 15.22). Also refer para 4.11.
10.3: Earnings and income
Most producers (58%) feel that earning from enterprise is average (Fig.5.28). The
results are presented as per GI type in table-5.28. The salient points are:
- Those who feel good income, are mostly in GI type I. GI type II and III have
moderate number of such producers.
- In GI type III on one hand there are producers of good and average income but
highest number of producers with poor income are also from this GI type only. It
means in this GI type there is exist a very large variability between income
groups.
- GI type II and IV the producers are mostly of average earning only.
The producers’ opinion for individual product point of view please refer table-
15.15 for the reasons for average of poor income; table-15.16 for the types of assistance
required for increasing income; table-15.17 for the specific reasons of no scope to
increase income in some of products (Annex-XV).
Other stakeholders’ opinion
Opinion of traders, refer chapter 11, table-11.8

69
10.4: Financial and infrastructure needs- for increasing production
Whether the producers can increase production if national banks and other
financial institution provide adequate finance? About 80% producers say it can be
increased (Fig.5.22). But only 46% of producers have approached any financial agency,
the maximum of such persons are from GI type I (Fig.5.23). No one from GI type IV
approached any financial agency for financial help. Those who approached the financial
agency for help, 59% believe that response was not so good and there were many
formalities (Table-5.24).
Another dimension for increasing production is marketing infrastructure. Can the
production be increased, if better marketing infrastructure is available? 88% of
respondents say ‘yes’ (Table-5.25) and the maximum number of such respondents are in
each GI type III, I and II respectively.
Now the question arises, what kind of marketing facilities do they require? On top
is regulated market, minimum support price, on-line market information are the major
demands (Fig.5.26). If marketing is improved do they have the capacity to improve
production? 90% of respondents say ‘yes’ (Table-5.25). If the capacity to improve its
production is available, what kind of assistance do they require? Mostly they need
marketing assistance and financial assistance (Table-5.27).
The producers’ opinion for individual product point of view please refer table-
15.12 for the requirement of marketing facilities for improving production; tabl-15.13
for the types of assistance required for increasing production capacity; table-15.14 for the
specific reasons of no scope to increase production in some of products (Annex-XV).
10.5: Awareness of producers and stakeholders about GI
Several questions were asked from producers to measure the awareness and
system of interest about GI portfolio development. The results are presented in table-
5.36. The salient points are given below:
70
- Almost 100% producers know that uniqueness is due to geographical origin.
- About 69% do not know about effects of GI registration.
- There is a problem of attitude of producers, though more than 40% say that they
know about the effects of registration of product as GI but only 9% could know
the status of their product.
Other stakeholders’ opinion
Opinion of institutional stakeholders, refer chapter 9, table-9.35-9.40
Opinion of consumers, refer chapter 10, table-10.1
10.6: Role of agencies in development and strengthening of producers’ associations
The producers’ association is the key element in GI protection, development and
sustainable use of this IP. Only 40% of producers believe that some kind of
formal/informal group of producers, marketing, SHG or NGO is available to them. About
74% of producers are not members of any formal or informal group (Table 5.36).
10.7: Other interventions- market expansion strategies
Applicable to non-agricultural products
10.8: Future prospects of the product
Opinion of institutional stakeholders, refer chapter 9, table-9.34
Opinion of consumers, refer chapter 10, table-10.21
Opinion of traders, refer chapter 11, table-11.27
10.9: Constructive measures to make production viable and improve future
prospects
Opinion of institutional stakeholders, refer chapter 9, table-9.28
Opinion of traders, refer chapter 11, table 11.28

71
10.10: Status of marketing and suggestions for improvement
Opinion of institutional stakeholders, refer chapter 9, table-9.30, 9.32
Opinion of traders, refer chapter 11, table-11.23, 11.25
10.11: Suggestions for improvement to increase sale
Opinion of consumers, refer chapter 10, table-10.11
Opinion of traders, refer chapter 11, table-11.6
10.12: Scientific endeavors in product development
Opinion of institutional stakeholders, refer chapter 9, table-9.43-9.47
10.13: Endeavors by depts. and agencies responsible or concerned with GI
registration
Opinion of institutional stakeholders, refer chapter 9
10.14: Endeavors by financial institutions
Opinion of institutional stakeholders, refer chapter 9, table-9.65-9.71
11.1: Current level of protection, drawback, enforcement problems
Opinion of institutional stakeholders, refer chapter 9, table-9.48, 9.52, 9.63, 9.64
11.2: Problems and bottlenecks related to acquisition and maintenance of GI
Opinion of institutional stakeholders, refer chapter 9, table-9.53, 9.61, 9.62
11.3: Identification of beneficiaries
Opinion of institutional stakeholders, refer chapter 9, table-9.49, 9.50
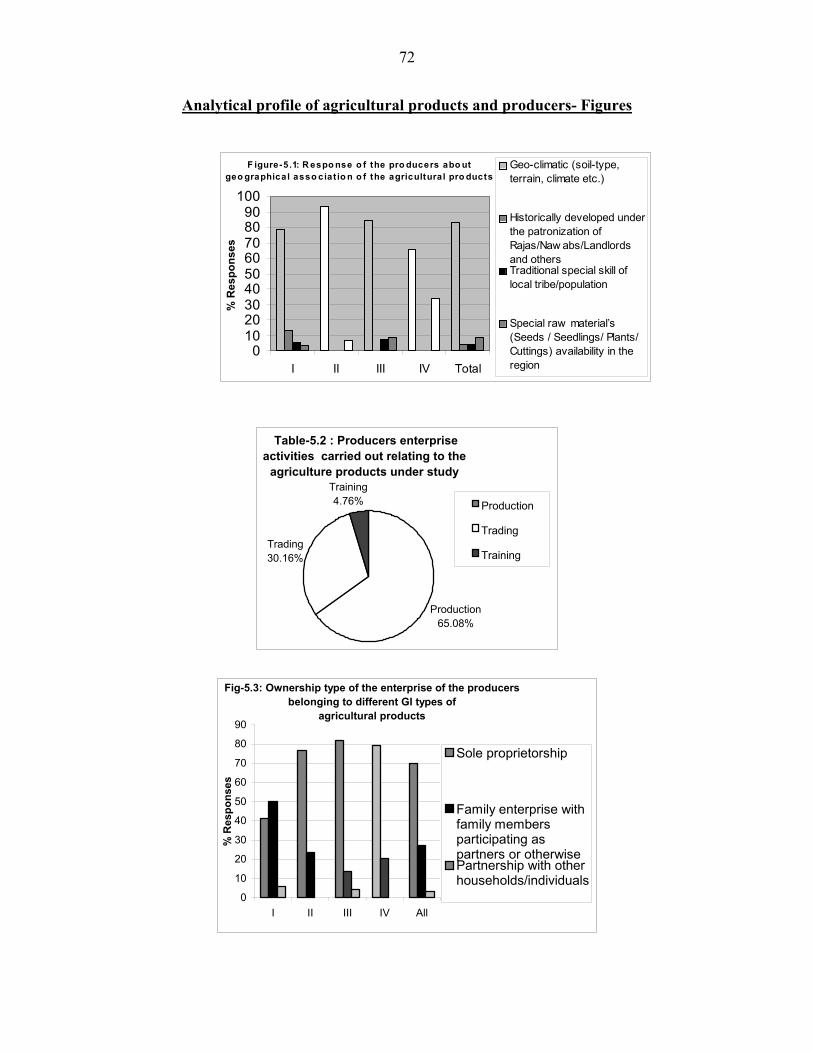
72
Analytical profile of agricultural products and producers- Figures
F igure-5.1: R espo nse o f the pro ducers abo ut geo graphical asso ciat io n o f the agricultural pro ducts
0102030405060708090
100
I II III IV Total
% R
espo
nses
Geo-climatic (soil-type,terrain, climate etc.)
Historically developed underthe patronization ofRajas/Naw abs/Landlordsand others Traditional special skill oflocal tribe/population
Special raw material’s(Seeds / Seedlings/ Plants/Cuttings) availability in theregion
Table-5.2 : Producers enterprise
activities carried out relating to the agriculture products under study
Production65.08%
Trading30.16%
Training4.76% Production
Trading
Training
Fig-5.3: Ownership type of the enterprise of the producers belonging to different GI types of
agricultural products
0
10
20
30
40
50
60
70
80
90
I II III IV All
% R
espo
nses
Sole proprietorship
Family enterprise withfamily membersparticipating aspartners or otherwisePartnership with otherhouseholds/individuals

73
Fig-5.4: Analysis of the head of the agricultural enterprise
0102030405060708090
100
I II III IV TotalGI Types & All
% R
espo
nses
Head of thehousehold
Other member ofthe household
Non-member of thehousehold but theprincipal operatorOthers
Fig-5.5: Acquisition of skill/ qualification by the head of
agriculture product’s enterprises
21.91%5.07%
2.53%
70.49%
Traditionally acquired skillas well as formaltraining/technicalqualificationTraditionally acquired skillonly
Formal training/technicalqualification but nottraditional skill
Informal learning only butno traditional skill or formaltraining
Fig-5.8: Monthly average number of persons engaged in the agricultural enterprise
0102030405060708090
I II III IV AllGI Types
% R
espo
nses
Skilled Others
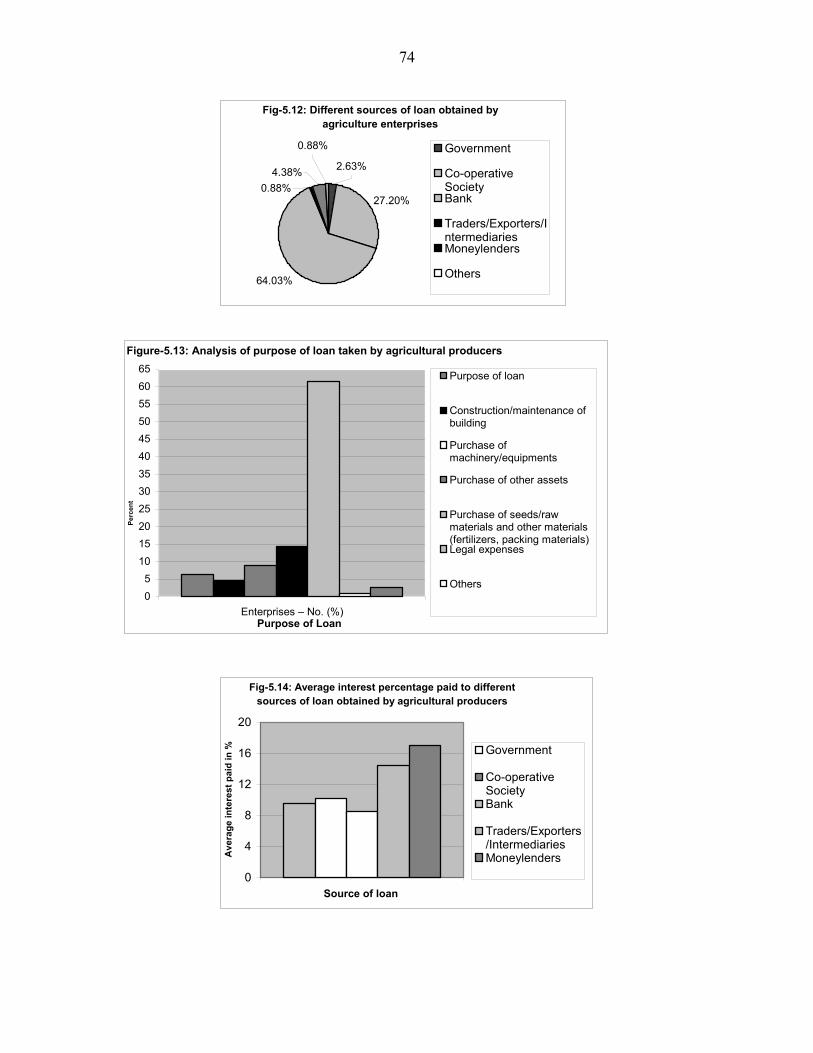
74
Fig-5.12: Different sources of loan obtained by agriculture enterprises
27.20%
64.03%
2.63%
0.88%4.38%
0.88% Government
Co-operativeSocietyBank
Traders/Exporters/IntermediariesMoneylenders
Others
Figure-5.13: Analysis of purpose of loan taken by agricultural producers
05
101520253035404550556065
Enterprises – No. (%)Purpose of Loan
Perc
ent
Purpose of loan
Construction/maintenance ofbuilding
Purchase ofmachinery/equipments
Purchase of other assets
Purchase of seeds/rawmaterials and other materials(fertilizers, packing materials)Legal expenses
Others
Fig-5.14: Average interest percentage paid to different sources of loan obtained by agricultural producers
0
4
8
12
16
20
Source of loan
Ave
rage
inte
rest
pai
d in
% Government
Co-operativeSocietyBank
Traders/Exporters/IntermediariesMoneylenders

75
Fig-5.16: Range of loan amount taken by agricultural enterprises
5.88%17.65%
23.53%52.94%
< 50,000
50000- 1lakh1-2 lakh
> 2 lakh
Fig-5.17: Types of packaging used by agricultural enterprises
05
1015202530354045
Nature of Packaging
Perc
ents
No packing
Basket/bamboo packing
Gunny /Jute bags
Glass bottles & containers
Plastic or polythene bags/plastic cansCorrugated card boardboxes/paper boxes/cartonsWooden boxes
Fig-5.18: Problems faced in packing by agricultural enterprises
05
10152025303540455055
Problems faced in packing
Perc
ent
No problems
Scarcity of skilledlabour
High cost of packingmaterial
Storage of packingmaterial
Deterioration ofpacking material
Limited knowledge ofpacking technology

76
Fig-5.19: Methods of inspection and quality control used at various stages
of production in agricultural enterprises
0
10
20
30
40
50
60
Inspection and quality control
Perc
ent
No inspection &quality control
Production level onfield
Harvesting level onfield
Processing &grading level
Inspection by anauthority
Fig-5.20:Type of grading of agricultural finished products
28.30%17.85%
53.85%
No grading
Grading on physicaltraits
Grading onqualitative traits
Fig-5.22: Whether production can be increased if nationalized banks and other institutions provide
adequate finance? Respondents opinion?
0
10
20
30
40
50
60
70
80
90
100
I II III IV AllGI Types
% R
espo
nses
Yes
No

77
Fig-5.23: Did agricultural producers approach to any financial agency for financial support to increase production?
0
10
20
30
40
50
60
70
80
90
100
110
I II III IV AllGI Types
% R
espo
nses
Yes
No
Fig-5.26: Type of marketing facilities required for increasing the agricultural production
048
12162024283236404448
Marketing facilities
% R
espo
nses
Regulated market
Facilitation from producer’sunion/ associationCold storage/warehouse
Online information of markettrendsMinimum support price
Transportation of produce
Export of produce
Processing units
Fig-5.28: Respondent’s opinion on the earning from the agricultural enterprise
010
2030
4050
6070
I II III IV AllGI Types
% R
espo
nses
GoodAveragePoor
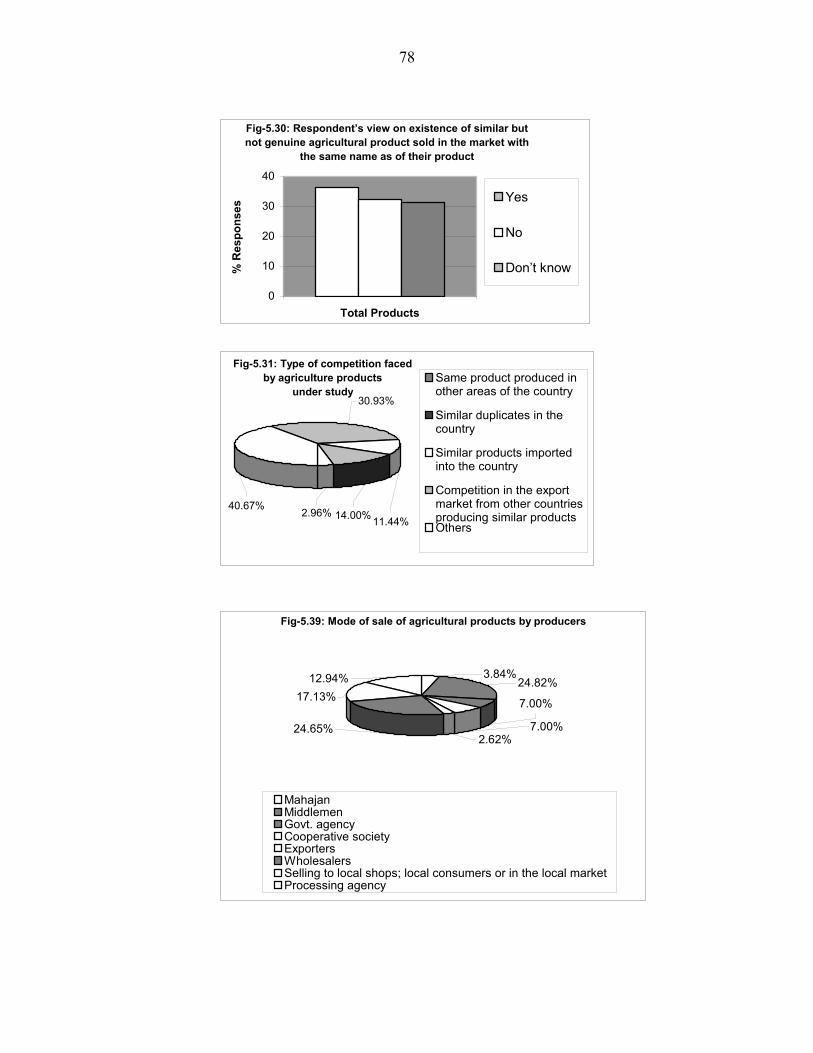
78
Fig-5.30: Respondent’s view on existence of similar but not genuine agricultural product sold in the market with
the same name as of their product
0
10
20
30
40
Total Products
% R
espo
nses
Yes
No
Don’t know
Fig-5.31: Type of competition faced by agriculture products
under study
11.44%14.00%
30.93%
40.67%2.96%
Same product produced inother areas of the country
Similar duplicates in thecountry
Similar products importedinto the country
Competition in the exportmarket from other countriesproducing similar products Others
Fig-5.39: Mode of sale of agricultural products by producers
17.13%12.94%
24.65%
3.84%24.82%
7.00%
7.00%2.62%
MahajanMiddlemen Govt. agencyCooperative societyExportersWholesalersSelling to local shops; local consumers or in the local marketProcessing agency
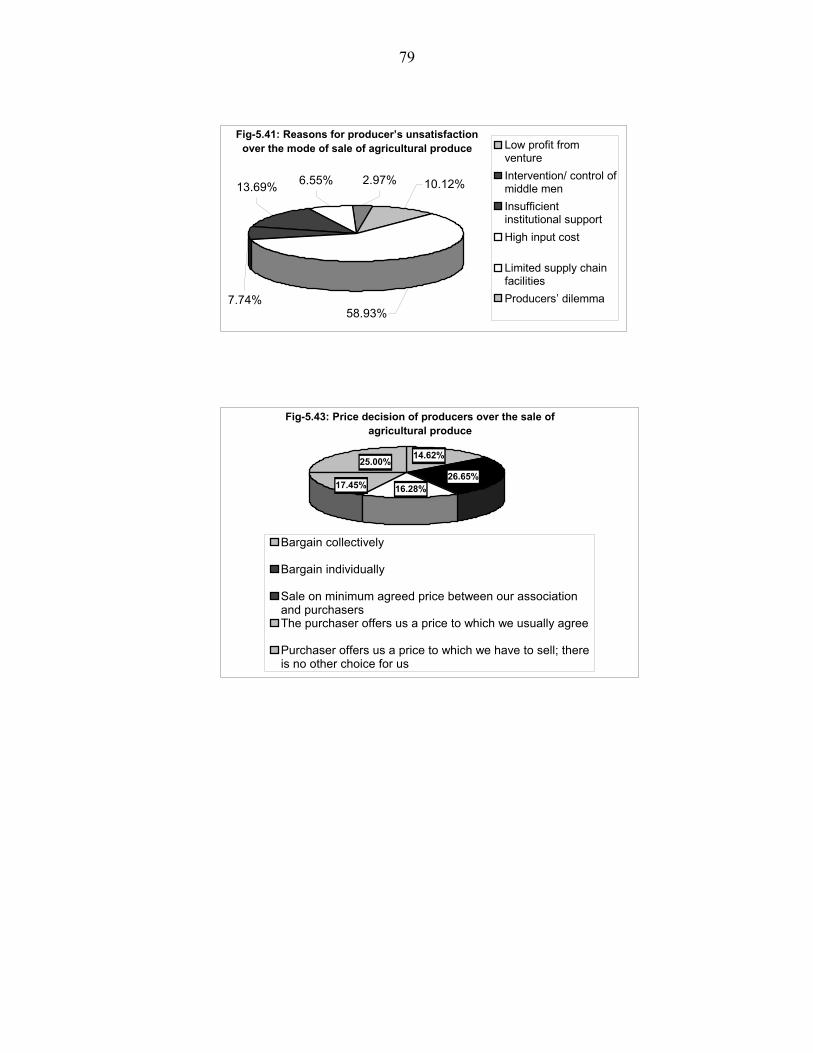
79
Fig-5.41: Reasons for producer’s unsatisfaction over the mode of sale of agricultural produce
7.74%
13.69% 6.55% 2.97% 10.12%
58.93%
Low profit fromventureIntervention/ control ofmiddle menInsufficientinstitutional supportHigh input cost
Limited supply chainfacilitiesProducers’ dilemma
Fig-5.43: Price decision of producers over the sale of agricultural produce
16.28%26.65%
14.62%25.00%
17.45%
Bargain collectively
Bargain individually
Sale on minimum agreed price between our associationand purchasersThe purchaser offers us a price to which we usually agree
Purchaser offers us a price to which we have to sell; thereis no other choice for us

80
Fig-5.44: Respondent’s constraints in production and marketing of
agricultural produce
0123456789
10111213141516171819202122
Constraints
% R
espo
nses
Financial difficulties
Limited availability of technical knowledge
No organized producers’ association
Hindrances from agronomic/ natural factors
Low marketing infrastructure
Lack of proper government policy & assistance
No constraints
Labour scarcity
High competition
Difficulty in getting quality inputs
Product specific concerns
Improper transportation arrangements
Market insecurity leading to low profitability
Improper marketing services
Electricity shortage
Fig-5.46: Willingness of respondents to pay for GI registration of agricultural produce
15.38%7.69%
30.77%
46.15%500100020003000

81
Chapter 6 Analytical Profile of Non-Agricultural Products and Producers: opinion survey of producers
1.1 to 1.5: Socio-economic conditions of producers
Refer chapter 4
2.1: Nature and geographical association
The geographical association of the non-agricultural products is mainly due to
strong patronage of development of the art by the royal houses in the local niches areas.
Nearly 76 percent respondents believe that such patronage of yesteryear rulers has helped
evolve the art into a trade, while 15 per cent attribute to geo climatic factors prevailing
there (Table 6.1). Special skills of the artisans rather than raw material are other
important factor responsible for geographical association and this is especially true for
products of GI –V and VII. (Fig.6.1). Other product-wise remarks as opined by the
producers are enclosed in Annexure-XVI (Table-16.1, Table-16.2)
2.2: Unique characteristics
Producers have described the unique characteristics of the products, listing of
characteristics that would be lost, if produced elsewhere out side the traditional
geographical area, and also the uniqueness of producing the product. The comprehensive
descriptive account of individual product about the unique characteristics as opined by
the producers and institutional stakeholders have been given along with the traditional
product profile (Table-16.3, Table-16.29). The producers attributed to special
‘characteristics’ that would be lost if the products are produced elsewhere (Table-16.4)
because in their understanding the process of creating the product also has uniqueness
and specialty (Table-16.5, Table-16.6).

82
Further most producers felt that quality of their products like taste, colour in GI
type -V products, durability, loss of creativity, GI type-VI; and increase in cost of
products in GI type -VII. In the case of GI type-VIII class, most producers opined quality
designs; fabric and product authenticity would suffer. Producers also pointed distinct
features like local resources like water, raw material like wood, and trained manpower as
additional features essential for each of their product specificity.
2.3: Specialty of production process
A tabulation of special requirements in the production process and suggestions for
improving as opined by the producers themselves is given in Annexure-XVI (Table-
16.7). For most products, the producers could clearly identify the special requirements in
the production process. Most of them were forthcoming in their needs to tune the
production process channels especially in terms of marketing especially for export,
financial assistance from reputed banking institutions, better living conditions for
families to attract younger generation to keep them in the same trade. The suggestions
from producers to improve the production process are given as product wise description
in Annexure-XVI (Table-16.8). The producers have listed several kinds of special skill
requirements (Table-16.9) in GI classes VI, VII and VIII emphasized on training
opportunities for craftsmen in methods in the art, use of technology and also in marketing
strategies.
2.4: History of production- in region and by individual
A product-wise summary of history of production of the product in the producers’
region as known to them is given in table 6.6. For most products, it is believed that the
production of these products has been since last century to as recent as last 10 years.
Products like kutch embroidery have been known to be produced since last 100 years
while producers of kullu shawls could identify themselves with its production during last
10 years. Most products, it was opined by the producers, were being produced between
20 to 50 years. The average of all the interviewed producers is as high as 99 years for
many products, and as low as 20 years for kolhapuri chappal. The product-wise detail is
available at (Table 6.6).
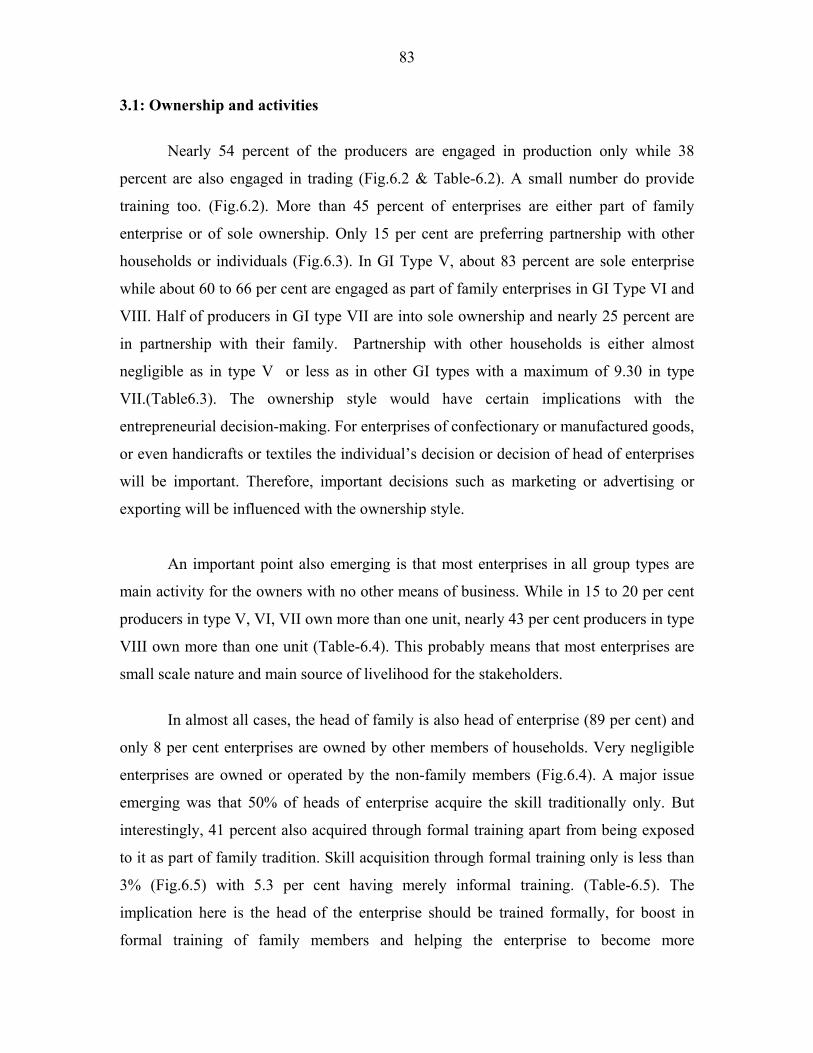
83
3.1: Ownership and activities
Nearly 54 percent of the producers are engaged in production only while 38
percent are also engaged in trading (Fig.6.2 & Table-6.2). A small number do provide
training too. (Fig.6.2). More than 45 percent of enterprises are either part of family
enterprise or of sole ownership. Only 15 per cent are preferring partnership with other
households or individuals (Fig.6.3). In GI Type V, about 83 percent are sole enterprise
while about 60 to 66 per cent are engaged as part of family enterprises in GI Type VI and
VIII. Half of producers in GI type VII are into sole ownership and nearly 25 percent are
in partnership with their family. Partnership with other households is either almost
negligible as in type V or less as in other GI types with a maximum of 9.30 in type
VII.(Table6.3). The ownership style would have certain implications with the
entrepreneurial decision-making. For enterprises of confectionary or manufactured goods,
or even handicrafts or textiles the individual’s decision or decision of head of enterprises
will be important. Therefore, important decisions such as marketing or advertising or
exporting will be influenced with the ownership style.
An important point also emerging is that most enterprises in all group types are
main activity for the owners with no other means of business. While in 15 to 20 per cent
producers in type V, VI, VII own more than one unit, nearly 43 per cent producers in type
VIII own more than one unit (Table-6.4). This probably means that most enterprises are
small scale nature and main source of livelihood for the stakeholders.
In almost all cases, the head of family is also head of enterprise (89 per cent) and
only 8 per cent enterprises are owned by other members of households. Very negligible
enterprises are owned or operated by the non-family members (Fig.6.4). A major issue
emerging was that 50% of heads of enterprise acquire the skill traditionally only. But
interestingly, 41 percent also acquired through formal training apart from being exposed
to it as part of family tradition. Skill acquisition through formal training only is less than
3% (Fig.6.5) with 5.3 per cent having merely informal training. (Table-6.5). The
implication here is the head of the enterprise should be trained formally, for boost in
formal training of family members and helping the enterprise to become more
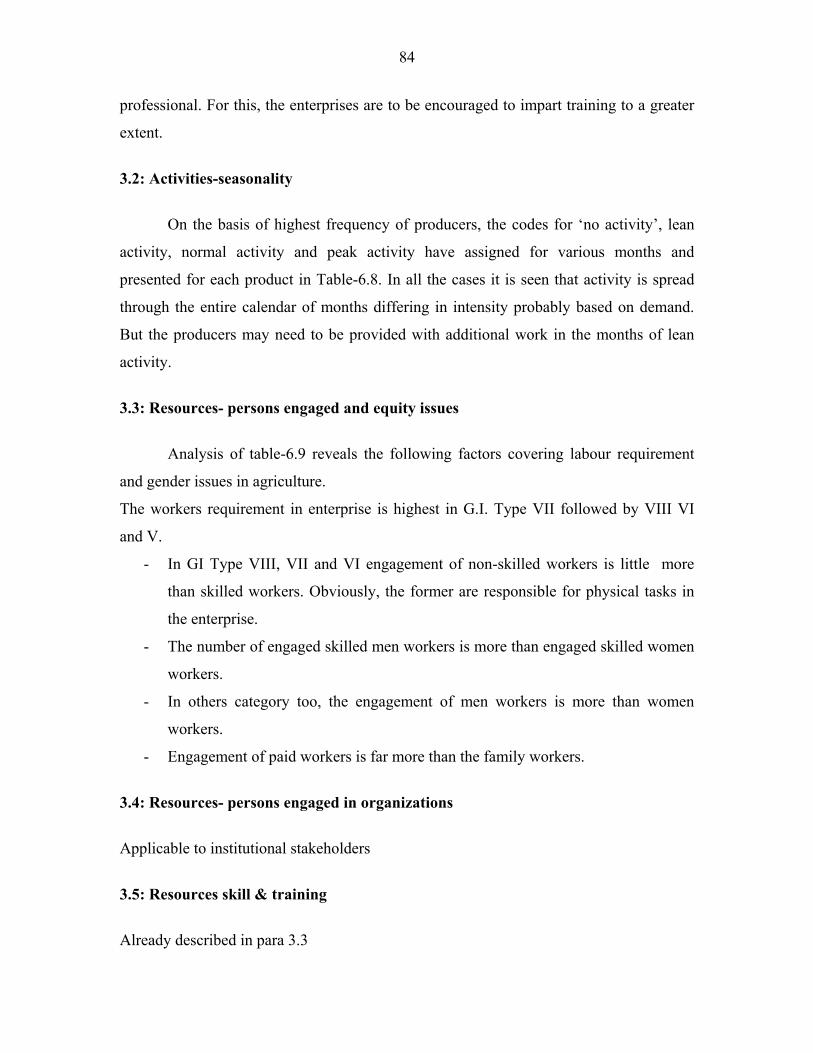
84
professional. For this, the enterprises are to be encouraged to impart training to a greater
extent.
3.2: Activities-seasonality
On the basis of highest frequency of producers, the codes for ‘no activity’, lean
activity, normal activity and peak activity have assigned for various months and
presented for each product in Table-6.8. In all the cases it is seen that activity is spread
through the entire calendar of months differing in intensity probably based on demand.
But the producers may need to be provided with additional work in the months of lean
activity.
3.3: Resources- persons engaged and equity issues
Analysis of table-6.9 reveals the following factors covering labour requirement
and gender issues in agriculture.
The workers requirement in enterprise is highest in G.I. Type VII followed by VIII VI
and V.
- In GI Type VIII, VII and VI engagement of non-skilled workers is little more
than skilled workers. Obviously, the former are responsible for physical tasks in
the enterprise.
- The number of engaged skilled men workers is more than engaged skilled women
workers.
- In others category too, the engagement of men workers is more than women
workers.
- Engagement of paid workers is far more than the family workers.
3.4: Resources- persons engaged in organizations
Applicable to institutional stakeholders
3.5: Resources skill & training
Already described in para 3.3

85
3.6: Resources- physical
A tabulation of inventory of assets owned or hired by the producers in various GI
types is placed at table-6.10. The tabulation is for individual products indicating unit,
building and other capital assets. In most cases, the enterprises were in the owners’ places
and not hire, except in case of few products hyderabad pearls, ludhiana hosiery, sivaksi
pataka, and harambha thresher. This indicates that most units of production are part of
family owned enterprises and are on a small scale .The producers surveyed are mainly
producers of product in question and often operate from their homes. Table-6.10 provides
the product-wise information of the allotment of kind of level to the product.
3.7: Resources- loans
Producers obtained loans from various sources but most (77%) producers took
from banks (Fig.6.12 & table-6.12). Mostly the loan was taken for purchase of inputs
(68%) followed by purchase of other assets and machinery and equipment (Fig.6.13 &
table-6.13). On an average, interest paid to moneylenders is highest followed by bank and
cooperative society. The lowest interest rates were from bank followed by government
loans (Fig.6.14 & table 6.14). The amount of outstanding loan is highest on GI Type VII
producers (Rs. 141588) followed by producers of GI Type VIII and VI. The respondents
of GI Type-V do not have any outstanding amount (Table-6.15). The producers actively
take loans (51%), which are less than 50,000 (Fig.6.16).
3.8: Resources- raw material
As tabulated in table-6.29, most of the of producers are satisfied with the supply
of inputs except in few cases such as kolhapuri chappals, and moradabad brass. The
producers’ opinions about places of acquiring inputs and prospects of supply of inputs
have been seconded product-wise and details are in Annexure-XVI (Table-16.15, Table-
16.16). Most producers opined optimistic view of their products in present and in future,
except kolhapuri chappals producers voiced uncertainty..

86
3.9: Quantity and value of production
Table 6.11 provides the detailed and product-wise summary of the average area
per producer, average production, produce value and total input cost. The results obtained
for total input cost for several products seems to be unrealistic, but it proves a point that
producers are extremely poor in data recording. A separate study is required on these
aspects or date can be collected from several agricultural institutions spread all over the
country.
4.1: Storage methods and problems
Nearly 40 per cent of the respondents informed about no measures for storage.
Among the remaining types of storage mechanisms asked, most respondents (26 per cent)
used raw packing in a bulk manner or wrapping in cloth or plastic sheets. A very low
percent producers (1 per cent) used glass containers.(Fig.6.23 & table 6.23.). The
problems faced by producers are explained in fig 6.24. Most of them do not have any
problems, those who have mostly complained about lack of accessible space or facilities
leading to deterioration of packing material. The producers have also described in detail
about the storage methods and also problems, which is available for each product in
Annexure-XVI (Table-16.13, Table-16.14).
4.2: Packing methods and problems
As presented in figure 6.25, the producers use many types of packing methods.
The limited knowledge, as a problem has been perceived by only few (Fig.6.26). But the
truth is that they have only knowledge of the existing practices for packing but are not
equipped with new developments in packaging technology.
4.3: Grading methods
Knowledge and awareness on importance of qualitative traits was high despite the
fact that most of products are traditional and of small-scale nature. 48 per cent of
respondents responded that grading of products on traits for maintaining the quality of the
87
products. Grading in rest of the cases is done based on other parameters like physical
traits (26%). The sector of 21 per cent who used no grading is of concern as much as the
low percent of which is based on market demand (Fig.6.28). Therefore, challenge is to
initiate some grading mode, which would help bring more professional level to the
products and also maintain the traditional attributes for which the products are closely
linked with by reputation or by consumers themselves.
4.4: Mode of sale and satisfaction level
Various modes of sales are there, with nearly 32 per cent respondents report direct
sales, but mostly it is to local shops followed by wholesalers. (Fig.6.44). About 13%
respondents responded that their sales are through cooperative society or middlemen,
while rest used govt. agencies (6%), cooperative societies (5%), processing agencies
(2.7%) or the local mahajan (2.5%). The detailed study of table 6.44 about mode of sale
reveals the following facts:
- 64% of sale to local market is in GI Type V, 34 % in GI Type VI
- In GI Type VII, wholesalers were more preferred as outlet for sale while
respondents in GI Type VII used local market and wholesalers equally.
- Exporters also formed a significant channel for selling for respondents in GI
Types VI, VII and VIII.
On the basis of information available in Table 6.44, the following are the
implications with respect to each category of products:
GI Type V: Sale is mostly to local markets or wholesalers with 12 percent also selling to
mahajan. The other avenues like exporters, govt., processing agencies are very negligible.
Encouraging sale through cooperative society or processing agency might help build
more market and induce strict quality parameters.
GI Type VI: Mostly the sale is direct to wholesalers, middlemen, local market, and
exporters in this category. Sale through government agency and cooperative is very low,
which needs attention considering the type of products like handicrafts in this group.

88
GI Type VII: Sale through local market, wholesalers, middlemen, and exporters is most
prevalent in this category. There is a need to enhance share to exporters through
strengthening sale through cooperative society.
GI Type VIII: The respondents in this type were the most aware of need of strategy for
sale. Across the various groups of agencies or people, respondents preferred wholesalers
(29%),, local markets( 28%), exporters (14%), middlemen (13%) . Low percent also used
cooperative societies (6.67%), and to lesser extent, govt. agencies (3.5%). Keeping the
high demand for textiles, the products in this type, its imperative to look at creating more
awareness on profitable routes of sale.
About 75 per cent producers were satisfied with modes of sale adopted by them.
The high satisfaction levels of mode of sale along with disintegrated supply chain is an
indicator that commercialization has not taken place in this category of products Between
the GI types, GI Type VIII producers (62%) were dissatisfied as compared to 19% in
Type VI; 15% in type V. Only 4% in Type VII were dissatisfied. The strongest reason for
low satisfaction or no satisfaction over mode of sale is ‘low profits’ followed by
insufficient institutional support (Fig.6.46). The involvement of middlemen and high
competition cost etc. this type of respondents are highest in GI Type VIII (52%), the
details are available in table-6.46. For explanatory account of dissatisfaction for
individual products, refer table-16.24 in Annexure-XVI.
4.5: Mode of purchase by traders
For view of traders refer Chapter 11 and table 11.31
4.6: Spectrum of region-wise sale of product
For view of institutional stakeholders refer Chapter 9, table 9.14
4.7: Contribution of uniqueness to sale
For view of institutional stakeholders refer Chapter 9 and table 9.60

89
4.8: Trend of sale
For view of institutional stakeholders refer chapter 9, table 9.15; for traders’ view, also
refer chapter 11, and table-11.5
4.9: Price decision and trend of unit price
The prices of product for sale are mostly decided either through individual
bargain or purchasers offer a price to which producers had to agree and there is no other
choice; 22% respondents say that they bargain collectively; 12% go through minimum
agreed price between association and purchasers, while 6.7% usually agree to a price
offered by purchaser. The collective bargaining and process of minimum agreed price
between an association and purchaser is there but needs more attention (Fig.6.48.). The
trend is almost same in all GI types except few notable features. Such as in GI Type V,
the collective bargaining is almost nil, and in GI type VI and VIII significant number of
producers bargain individually or do not have any other option than to sale on a price
offered by purchaser.(table 6.48). The trend of unit price is almost of increasing side
during 2004-06 except few products like paithani saree, kutch embroidery, srikalahasti
kalamkari, etc. (Table 6.47). For explanatory account of some of specific decision
elements for individual products, refer table-16.25 in Annexure-XVI.
4.10: Price increments in supply chain
Refer chapter 9 and table 9.12
4.11: Constraints in production and marketing
In production and making of agricultural products on listed by producers, there
are 11 kinds of constraints including no problems. These have been listed and analysed
for order of their importance (Fig.6.49). The most important constraints are hindrances
from high competition, finance, difficulty in getting inputs, scarcity of skilled workers,
insecure markets, lack of govt. policy, agronomic/natural factors, market insecurity
90
leading to low profitability, labour scarcity and low marketing infrastructure. As detailed
in table-6.49, the trend is almost same across all GI types with few notable features such
as:
- In GI type VIII ‘improper transportation’ is acute constraint.
- High competition is a constraint in types V, VII and VII while respondents from
VI aired difficulty in quality inputs
- Respondents in all types voiced scarcity of skilled workers , though less per cent
(14%) in type VI., indicating a need to develop training centers in all fields
through sound policy of government
- Marketing insecurity leading to low profitability is a constraint in GI type VII, V
and VII.
At individual level, the producers have also expressed other problems, which are
of individualistic nature; these are documented (Table-16.26).
5.1: Inspection, quality control at various stages of production
There are methods of inspection and quality control in non-agricultural products
but needs to be more professional to help better quality production. While 35 per cent do
not adhere to inspection, 48 percent maintain quality through inspection at production
level at workshop and 12.9 per cent at processing and grading level. Inspection by
qualified authorities is very meager (fig.6.27 & table-6.27) Even 15.1% of institutional
stakeholders also agree that there is no formal method of inspection and quality control,
for more details please chapter 9 and table-9.3.
5.2: Govt. defined quality assurance methods and advice given for quality
improvement
For view of institutional stakeholders, refer chapter 9 and table 9.6 and 9.9
5.3: Technical guidelines for production codes
The summary of results as described in Table 6.41is given below.
91
- About 90% of producers say that the technical guidelines from their forefathers
are ones followed by them.
- 21% agree that production is as per technical guidelines from Govt.
- About 9% agree that production is as per technical guidelines from NGO
- About 19% agree that production is as per technical guidelines from association
5.4: Maintenance and monitoring of codes of production practices
While it is acknowledged in any production system, the producers certainly have
their own codes to develop production practices; perhaps the challenge is to develop
maintenance and monitoring system. The summary of results as described in Table 6.41
is given below;
- Phulkari products have specific code developed by efforts of producers
themselves.
- Guidelines set by govt. dept is limited to only 21 percent of respondents who
follow
- 95 % maintain that monitoring of production is self driven and not through formal
systems
5.5: Traders’ view to maintain product quality
For traders’ view, refer chapter 11 and table-11.49.
6.1: Presumed results of non-registration
During the interview, the producers are explained the benefits of registration of
product as GI. The producers, therefore, presumed certain disadvantages of not having
product registration (Table-6.50):
- 48% producers believe non-registration leads to low volume of sale
- 46% producers believe non-registration leads to low wages to labour
- 58% producers believe that non-registration leads to low profit to producers

92
- 46% producers believe that non-registration leads to difficulty in getting loans
- 80% feel that non registration leads to sale of spurious products under same name
6.2: Expected changes after registration- on market
As post registration impact, the producers have several expectations related to
good market for products (Table-6.50. The salient features of these expectations are:
- 43% producers expect significant increase in sale
- 63% expect increase in unit price and 28.5% could say neither ‘yes’ nor ‘no’ and
it is only about 8%, who does not expect increase in unit price.
- 40% expect less market competition
- 57% expect market expansion
Institutional stakeholders also gave their opinion about it (chapter 9, table-9.41, 9.42)
6.3: Expected changes after registration- enhanced premium as expected by
producers and traders
Refer para 9.3
6.4: Expected changes after registration- livelihoods & overall socio-economic
conditions
As a post registration impact, change in livelihood pattern is expected and
improvement of socio-economic conditions is also expected. The producers’ opinion was
collected on these issues and the results are summarized below:
- 69% producers believe that registration would lead to changing to this from other
activities. (Table 6.52).
- Within each product type the response was varied with maximum in type VIII
(47%), followed by type VII (25%), type VI (15%) and type V (13%).
93
- The respondents who did not believe that GI registration would lead to shifting
from other means of work were asked to state the reasons. Out of 96 respondents,
78% cited ignorance of GI and implications as main reason.11 % believe present
option as safe and profitable while other reasons of risk and avoidance of risks
merited attention of very low per cent respondents.(Table 6.53).
- On post registration benefits, only 55 % per cent could give in affirmative (Table-
6.50).
- Institutional stakeholders also gave their opinion about it (chapter 9, table-9.41,
9.42). The other changes as described by producers are presented in Annexure
(12.6.9, PL).
The producers of few products have listed other expected changes (Table-16.27) also.
6.5: Expected changes after registration- consumers’ expectations
Refer chapter 10, table 10.1
6.6: Visualized benefits at time of GI registration
For opinion of institutional stakeholders about visualized benefits at time of GI
registration, refer chapter 9, table 9.51.
7.1: Duplicates and similar products
An enquiry was made from producers about the existence of similar but not
genuine products that are sold in the market with the same name. The salient features
of results described in Table 6.35 are given below:
- The producers are almost equally divided among three categories i.e. who say yes
or no or can’t say; 51 per cent agreed, 19% did not agree while remaining
undecided whether any other product similar to theirs was there.
- 68% producers of GI type V agree that no duplicates are available
94
- 63% producers of GI type VI and 48 per cent in type VIII agree that duplicates are
available
7.2: Consumers’ efforts to purchase genuine product
For view of consumers, refer chapter 10, table 10.14, 10.18, 10.19, 10.20
7.3: Competition- types and sources
About 32% producers (Table 6.36) feel that their products face competition. The
sources of competition are analyzed in Table-6.37 and presented in fig.6.37. Few
producers have listed specific reasons also for competition (Table-16.20). The main facts
are given below:
- 38% believe that these are same product but produced elsewhere in the country
- 35% believe that there are different products but sold with the same name with the
deceptive similarity
- 40% believe about competition from similar products imported in the country
- 22% believe that competition is in export market from other countries producing
similar product.
Other stakeholders’ opinion
Institutional stakeholders, refer chapter 9, table-9.16-9.18.
Traders, refer chapter 11, table-11.10, 11.12, 11.13
7.4: Import of similar product and difference between imported and domestic
product
The threat perceived from competition from similar products imported in the
country is fairly high (40% producers believe so). Most producers’ (33%) believe that
imported products are of inferior quality, the other reasons including less price of imports
or their quality are of less significance and presented in table- 6.38.

95
Other stakeholders’ opinion
Institutional stakeholders, refer chapter 9, table-9.27
Traders, refer chapter 11, table-11.15
7.5: Import of the products
Opinion of institutional stakeholders, refer chapter 9, table-9.19
7.6: Export and trade option of the products
Opinion of traders, refer chapter 11, table-11.36-11.47
8.1: Observed changes after registration- on market
With the intention of measuring the observed changes in the registered product, a
question has asked from the respondents. In fact at the time of survey some of the studied
products as chennapatnam toys and srikalahasti kalamkari were registered products
several products like kondapalli toys, kancheepuram saree and kullu shawl etc. got
registration during the project period. The results are presented in table-6.56; the salient
features are given below:
- Post registration change has been observed by 86%
- 76% of interviewed believe increase in production in post GI registration
- Most respondents that there will be increase in price and profit after GI
registration
- About 65% of interviewed believe that competition has been less and market has
expanded (100%).
8.2: Observed changes after registration- livelihoods & overall socio-economic
conditions
About 50% of producers said that they have shifted from other livelihood
activities to production of RGI. 91% believe that registration had brought important or
would ring change in socio-economic conditions of producers. (Table-6.56).
96
8.3: Observed changes after registration- enhanced premium felt by producers
There was a mixed reaction to enhanced premium to the product. While 50% felt
it enhanced, others felt it did not as of now. (Table-6.57).
8.4: Other observed changes
The other observed changes as observed by the producers is ‘organized into
groups, thrift habit increased, savings encouraged, self help groups getting loans’ as
reported in case of srikalahasti kalamkari.Table-16.28)
9.1: Willingness for registration and payment thereof
About 77% producers intended for registration and 15.6% were not able to decide.
About 7.8% were unwilling for registration (Table-6.50). An equal number also were
found willing to pay for registration while 23 % expressed their unwillingness to pay. In
terms of the amount to pay nearly 61 % opted to pat Rs 500with decreasing trend as
amount went up. Across each GI Type producers in Type VIII (37%) followed by those
in Type VI (29%) opted to pay Rs 500. But those who are willing to provide Rs 1000
were 38% in Type VII. (Fig.6.51). The detailed information is given in table-6.51.
Other stakeholders’ opinion
Institutional stakeholders, refer chapter 9, table-9.47, 9.48, 9.70, 9.71
Consumers, refer chapter 10, table-10.2
9.2: Money paid by producers for registration
All producers informed that they have contributed money for GI registration, which was
about Rs. 250 to 500 per head (Table-6.58).
97
9.3: Willingness to pay for expected enhanced premium
All producers expect an enhanced premium over prevailing costs after GI
registration. However the expected range differed in opinion of respondents in each GI
type. However, all favoured increase up to 15% only though differing in each type. 39%
expected increase in range of 5-10% and 30% favoured the other two ranges equally.
52% producers in GI-type VIII followed by 28% in GI-type VII and 26% in GI-type V
expected an increase in the range 10-15% (Table-6.55). Other stakeholders’ opinion Consumers, refer chapter 10, table 10.14, 10.16
Traders, refer chapter 11, table 11.9, 11.33, 11.35
10.1: Production characteristics
In the opinion of producers (Table-6.42) the trend of production in last three years
had been either increasing for most of products. Out of 38 products listed in four GI types
increasing trends are in all with three groups VI, VII and VIII all showing above 60%.
Only products in V showed about 50 % increase. Within each group few products
showed stationery trends, these are:
- Tirunelveli halwa
- Bal Mithai
- Thanjvur art plate
- Moradabad brass plate
- Makrana marble
- Kancheepuram silk
- Gadhwal
- Bhadoi carpet
Declining trends were expressed for some products. These include:
- Punjabi jooti
- Banarasi saree
- Bhadoi carpet
98
These trends should be viewed with concern and measures to offset these trends
be adopted. Regarding the association of producers with the enterprise. The following
statement for agricultural products as approved by the producers can be given in order of
their importance.
- Largest section (36%) believe that ‘few more have started producing’ the product
- No one has discontinued the production of product – 23% producers believe it
- The situation is more or less same (no addition, no deletion) – 8% producers
believe it
- Several more have started producing – 17% produce believe it
- Many have discontinued producing the product – 14% producers believe.
The detailed analysis as per product wise is presented in table-6.34, in few cases,
the producers have given specific reason for increase in production of the product (Table-
16.23).
10.2: Production constraints
A list of production constraints in each product is enclosed (Annexure-XVI, Table-
16.21). Also refer para 4.11.
10.3: Earnings and income
Nearly 50% of the producers feel that earning from enterprise is good. The results
are presented as per GI type in table-6.32. The salient points are:
- Those who feel good income are mostly in GI type V, GI type VI and VII. Only
30 % respondents of type VIII perceive that income is good and 61% felt that
there income is poor.
- In GI type VIII producers were more of average income.
The producers’ opinion for individual product point of view please refer table-
16.17 for the reasons for average of poor income; table-16.18 for the types of assistance

99
required for increasing income; table-16.19 for the specific reasons of no scope to
increase income in some of products (Annex-XVI).
Other stakeholders’ opinion
Opinion of traders, refer chapter 11, table-11.9
10.4: Financial and infrastructure needs- for increasing production
Adequate finance is important for enterprises to be successful. Respondents in all
types advocated (82%) felt that adequate finance from nationalized banks and other
institutions would increase production. But only 44% of producers have approached any
financial agency, the maximum persons are from GI type VIII. (Table.6.30). Only 13%
from GI type V approached any financial agency for financial help. However 64 %
respondents who approached financial agencies felt that the response was not too good
and had many formalities. Those who approached the financial agency for help, 59%
believe that response was not so good and there were many formalities (Table-6.31).
Another dimension for increasing production is marketing infrastructure. 74% of
respondents felt that the production could be increased, if better marketing infrastructure
is made available (Table-6.20). Maximum number of such respondents in all the GI types
V, VI, VII and VIII agreed that they could increase production of their products and also
they have the capacity to increase production if marketing outlets are improved. This they
felt would enhance their incomes too. The kind of marketing facilities required as voiced
by the respondents are listed in Table 8.12. Most respondents wanted better publicity and
regulated marketing. (Fig.6.12).
The producers’ opinion for individual product point of view please refer table-
16.10 for the requirement of marketing facilities for improving production; tabl-16.11 for
the types of assistance required for increasing production capacity; table-16.12 for the
specific reasons of no scope to increase production in some of products (Annex-XVI).

100
10.5: Awareness of roducers and stakeholders about GI
Several questions were asked from producers to measure the awareness and
system of interest about GI portfolio development. The results are presented in table-
6.40. Only 26 per cent of respondents were aware of fact that their product could be
protected as a GI. Among the various types, respondents in type-VI (45%) followed by
VIII (26%) were aware of such options. However, 82% were aware of uniqueness of their
product. (Table 6.41) and only 34 % knew that rafter GI registration only registered users
could use product name or produce in geographical area registered. Only 20 %
respondents knew even status of product as GI.
Other stakeholders’ opinion
Opinion of institutional stakeholders, refer chapter 9, table-9.35-9.38, 9.41, 9.42
Opinion of consumers, refer chapter 10, table-10.2
10.6: Role of agencies in development and strengthening of producers’ associations
The producers’ association is the key element in GI protection, development and
sustainable use of this IP. Only 54% of producers know that some kind of
formal/informal group of producers, marketing, SHG or NGO is available to them. About
56% of producers are not members of any formal or informal group (Table 6.41).
10.7: Other interventions- market expansion strategies
Regarding market expansion strategies, respondents were asked on their plans to
change technology to satisfy changing needs of consumers, awareness on market
potentiality and on product diversification to enlarge existing markets. In all types, larger
market potentiality and need to increase number of varieties of products were more
favoured by the respondents (Table-6.34). Producers in type V favoured less to change
technology as compared to those in VI, VII and VIII.

101
10.8: Future prospects of the product
Opinion of institutional stakeholders, refer chapter 9, table-9.34
Opinion of consumers, refer chapter 10, table-10.21
Opinion of traders, refer chapter 11, table-11.27
10.9: Constructive measures to make production viable and improve future
prospects
Opinion of institutional stakeholders, refer chapter 9, table-9.29
Opinion of traders, refer chapter 11, table 11.29
10.10: Status of marketing and suggestions for improvement
Opinion of institutional stakeholders, refer chapter 9, table-9.31, 9.33
Opinion of traders, refer chapter 11, table-11.24, 11.26
10.11: Suggestions for improvement to increase sale
Opinion of consumers, refer chapter 10, table-10.12
Opinion of traders, refer chapter 11, table-11.7
10.12: Scientific endeavors in product development
Opinion of institutional stakeholders, refer chapter 9, table-9.43-9.47
10.13: Endeavors by departments and agencies responsible or concerned with GI
registration
Opinion of institutional stakeholders, refer chapter 9
10.14: Endeavors by financial institutions
Opinion of institutional stakeholders, refer chapter 9, table-9.65-9.71
102
11.1: Current level of protection, drawback, enforcement problems
Opinion of institutional stakeholders, refer chapter 9, table-9.48, 9.52, 9.63, 9.64
11.2: Problems and bottlenecks related to acquisition and maintenance of GI
Opinion of institutional stakeholders, refer chapter 9, table-9.53, 9.61, 9.62
11.3: Identification of beneficiaries
Opinion of institutional stakeholders, refer chapter 9, table-9.49, 9.50
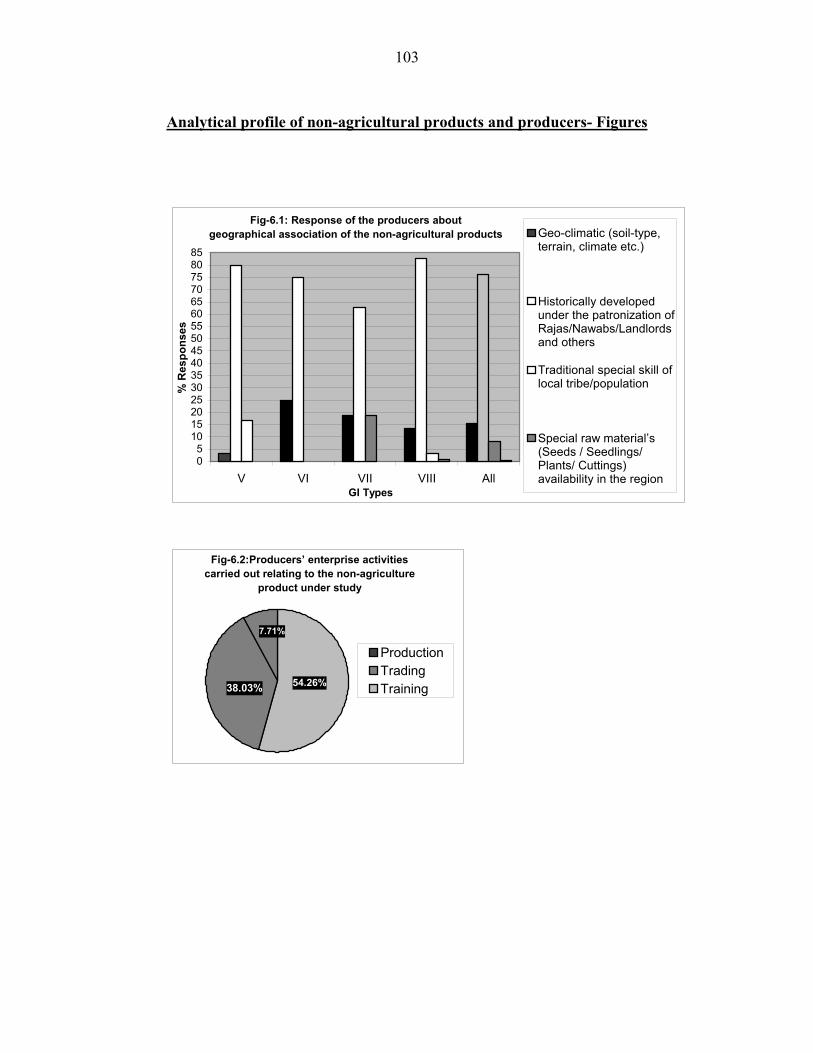
103
Analytical profile of non-agricultural products and producers- Figures
Fig-6.1: Response of the producers about geographical association of the non-agricultural products
05
10152025303540455055606570758085
V VI VII VIII AllGI Types
% R
espo
nses
Geo-climatic (soil-type,terrain, climate etc.)
Historically developedunder the patronization ofRajas/Nawabs/Landlordsand others
Traditional special skill oflocal tribe/population
Special raw material’s(Seeds / Seedlings/Plants/ Cuttings)availability in the region
Fig-6.2:Producers’ enterprise activities carried out relating to the non-agriculture
product under study
54.26%
7.71%
38.03%
ProductionTradingTraining
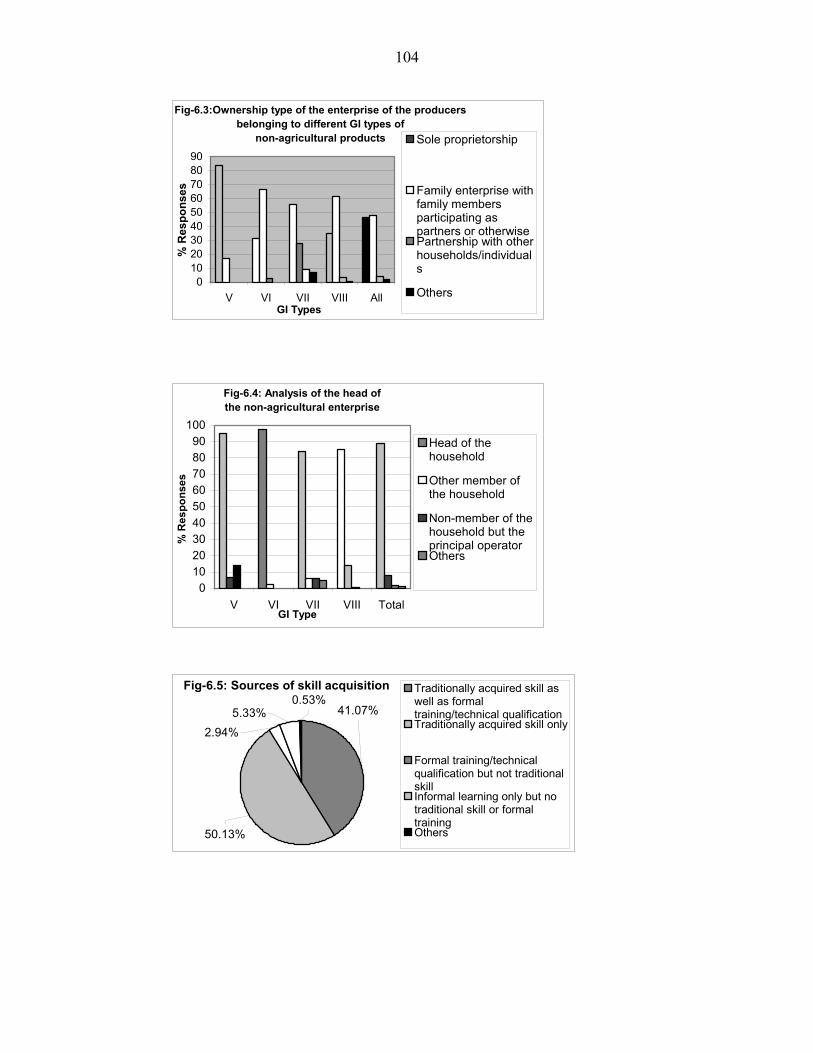
104
Fig-6.3:Ownership type of the enterprise of the producers belonging to different GI types of
non-agricultural products
0102030405060708090
V VI VII VIII AllGI Types
% R
espo
nses
Sole proprietorship
Family enterprise withfamily membersparticipating aspartners or otherwisePartnership with otherhouseholds/individuals
Others
Fig-6.4: Analysis of the head of the non-agricultural enterprise
0102030405060708090
100
V VI VII VIII TotalGI Type
% R
espo
nses
Head of thehousehold
Other member ofthe household
Non-member of thehousehold but theprincipal operatorOthers
Fig-6.5: Sources of skill acquisition
2.94%
50.13%
5.33%0.53%
41.07%
Traditionally acquired skill aswell as formaltraining/technical qualificationTraditionally acquired skill only
Formal training/technicalqualification but not traditionalskillInformal learning only but notraditional skill or formaltrainingOthers
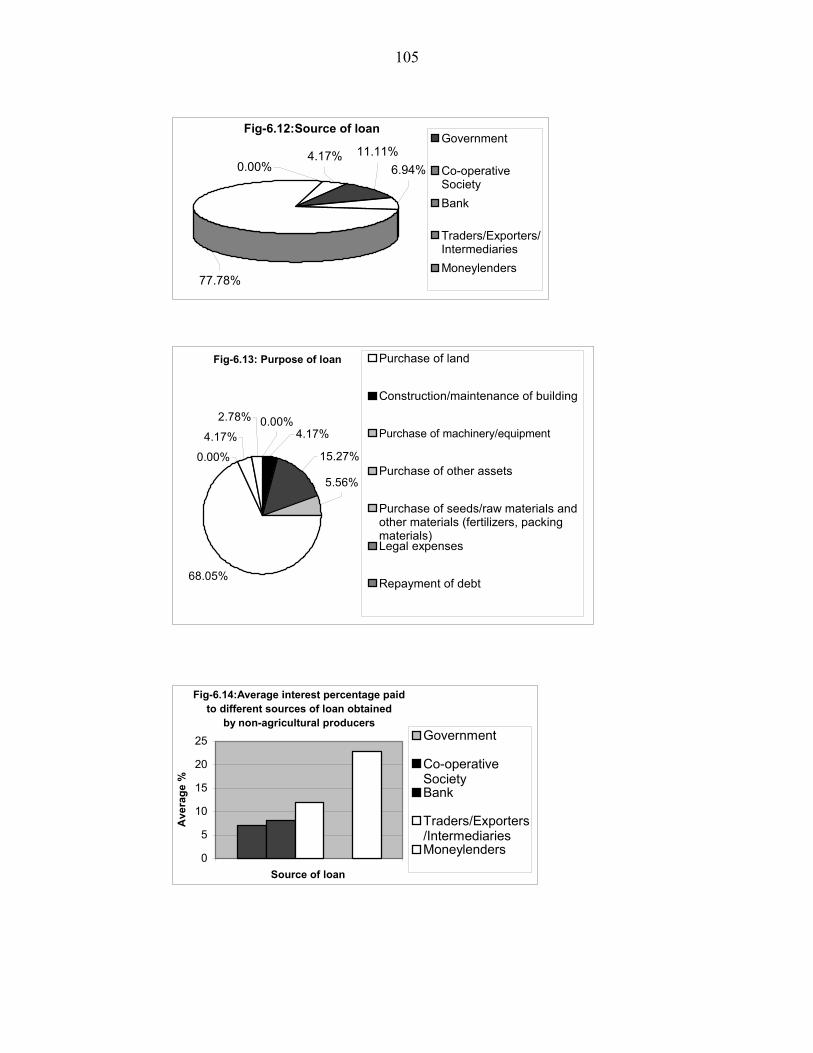
105
Fig-6.12:Source of loan
77.78%
0.00% 6.94%4.17% 11.11%
Government
Co-operativeSocietyBank
Traders/Exporters/IntermediariesMoneylenders
Fig-6.13: Purpose of loan
68.05%
0.00%
4.17%
2.78% 0.00%4.17%
15.27%
5.56%
Purchase of land
Construction/maintenance of building
Purchase of machinery/equipment
Purchase of other assets
Purchase of seeds/raw materials andother materials (fertilizers, packingmaterials)Legal expenses
Repayment of debt
O h
Fig-6.14:Average interest percentage paid to different sources of loan obtained
by non-agricultural producers
0
5
10
15
20
25
Source of loan
Ave
rage
%
Government
Co-operativeSocietyBank
Traders/Exporters/IntermediariesMoneylenders
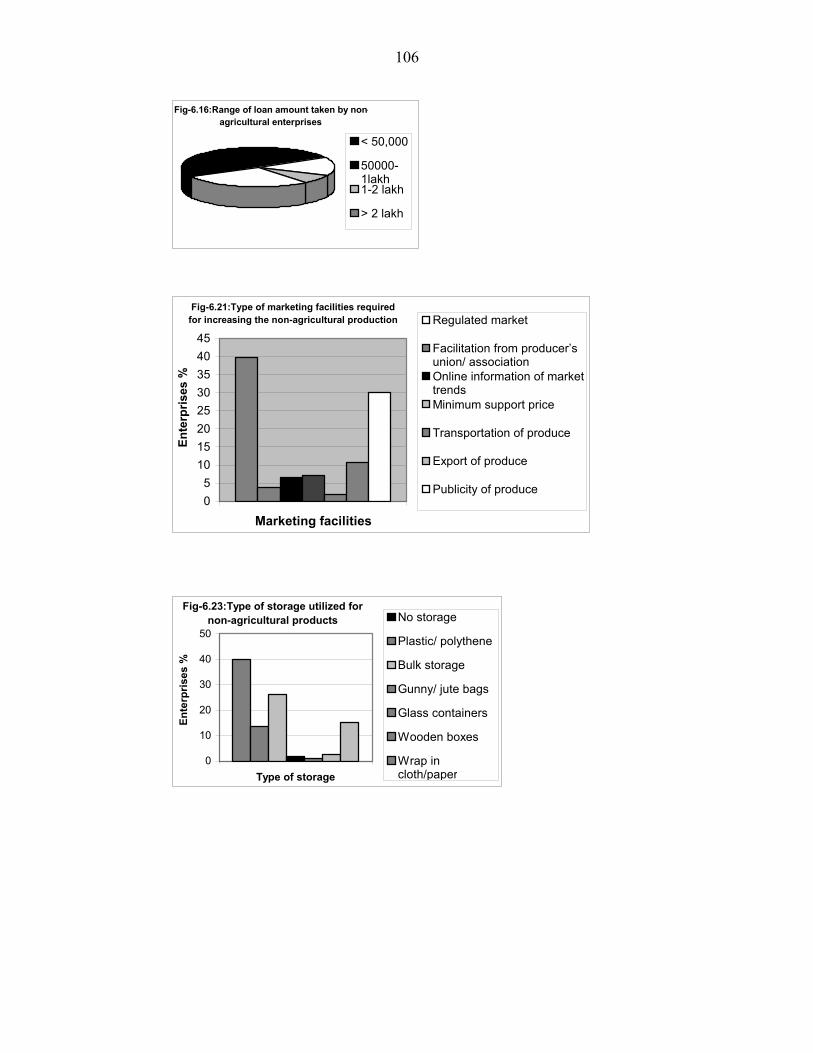
106
Fig-6.16:Range of loan amount taken by non-agricultural enterprises
< 50,000
50000-1lakh1-2 lakh
> 2 lakh
Fig-6.21:Type of marketing facilities required for increasing the non-agricultural production
05
1015202530354045
Marketing facilities
Ent
erpr
ises
%
Regulated market
Facilitation from producer’sunion/ associationOnline information of markettrendsMinimum support price
Transportation of produce
Export of produce
Publicity of produce
Fig-6.23:Type of storage utilized for non-agricultural products
0
10
20
30
40
50
Type of storage
Ente
rpris
es %
No storage
Plastic/ polythene
Bulk storage
Gunny/ jute bags
Glass containers
Wooden boxes
Wrap incloth/paper
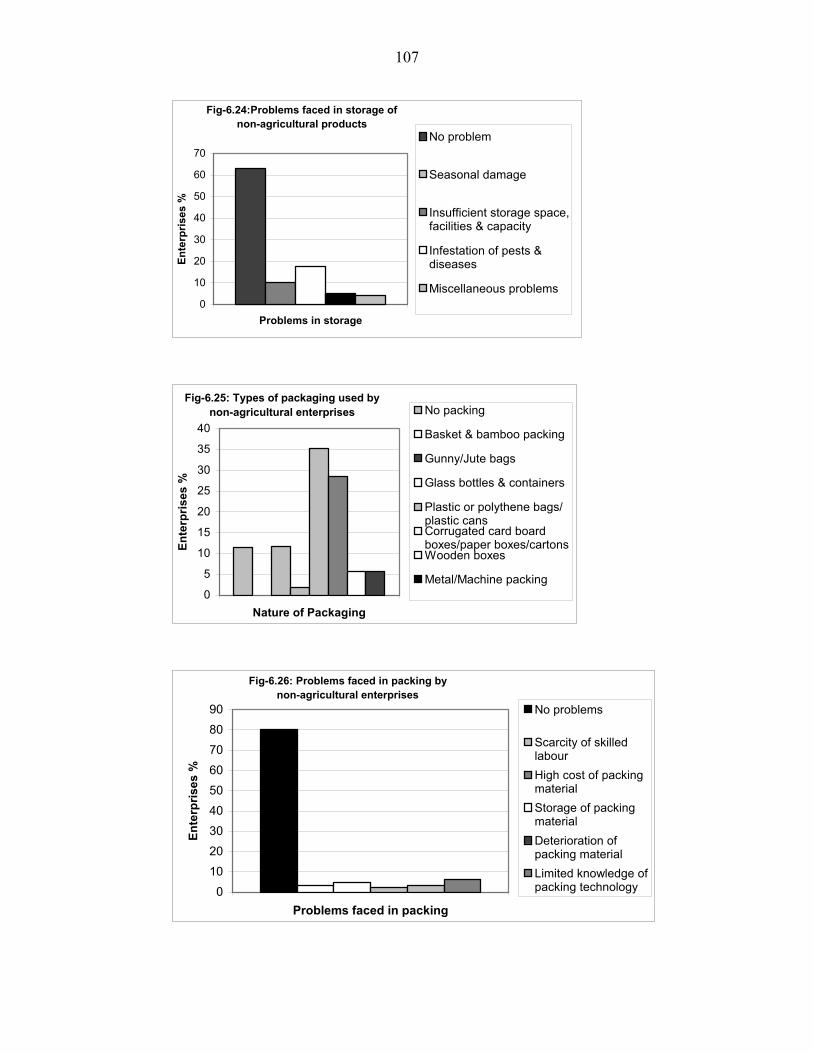
107
Fig-6.24:Problems faced in storage of non-agricultural products
0
10
20
30
40
50
60
70
Problems in storage
Ente
rpris
es %
No problem
Seasonal damage
Insufficient storage space,facilities & capacity
Infestation of pests &diseases
Miscellaneous problems
Fig-6.25: Types of packaging used by non-agricultural enterprises
0
5
10
15
20
25
30
35
40
Nature of Packaging
Ente
rpris
es %
No packing
Basket & bamboo packing
Gunny/Jute bags
Glass bottles & containers
Plastic or polythene bags/plastic cansCorrugated card boardboxes/paper boxes/cartonsWooden boxes
Metal/Machine packing
Fig-6.26: Problems faced in packing by non-agricultural enterprises
0102030405060708090
Problems faced in packing
Ente
rpris
es %
No problems
Scarcity of skilledlabourHigh cost of packingmaterialStorage of packingmaterialDeterioration ofpacking materialLimited knowledge ofpacking technology

108
Fig-6.27:Methods of inspection and quality controlused at various stages of production
35.99%47.56%
12.85%3.60%
No inspection & quality control
Production levelatestablishment/workshopProcessing &grading level
Fig-6.28:Type of grading of non-agricultural finished products
25.78%
5.01%
47.97%
21.24%
No grading
Grading on physicaltraits
Grading on qualitativetraits
Grading based onconsumer/ marketdemand
Fig-6.37:Type of competition faced by non-agriculture products under study
42.32%
6.38%11.59%
39.71%
Same product produced inother areas of the country
Similar duplicates in thecountry
Similar products importedinto the country
Competition in the exportmarket from other countriesproducing similar products

109
Fig-6.44:Mode of sale of non-agricultural products by producers
0.00% 2.57%2.72%
32.17%
25.38%12.68%
5.90%
5.74%
12.84%
Mahajan
Middlemen
Govt. agency
Cooperative society
Exporters
Wholesalers
Selling to local shops/localconsumers/local marketProcessing agency
Others
Fig-6.46:Reasons for producer’s unsatisfaction over the mode of sale of
non-agricultural produce
10.34%
0.00%
50.58%
28.74%
10.34%
Low profit fromventure
Intervention/control of middlemenInsufficientinstitutionalsupportHigh input cost
High competition
Fig-6.48: Price decision of producers
12.17% 33.62%
22.32%
0.00%6.67%
25.22%
Bargain collectively
Bargain individually
Sale on minimum agreed pricebetween our association andpurchasersThe purchaser offers us a priceto which we usually agree
Purchaser offers us a price towhich we have to sell; there is noother choice for usAny other
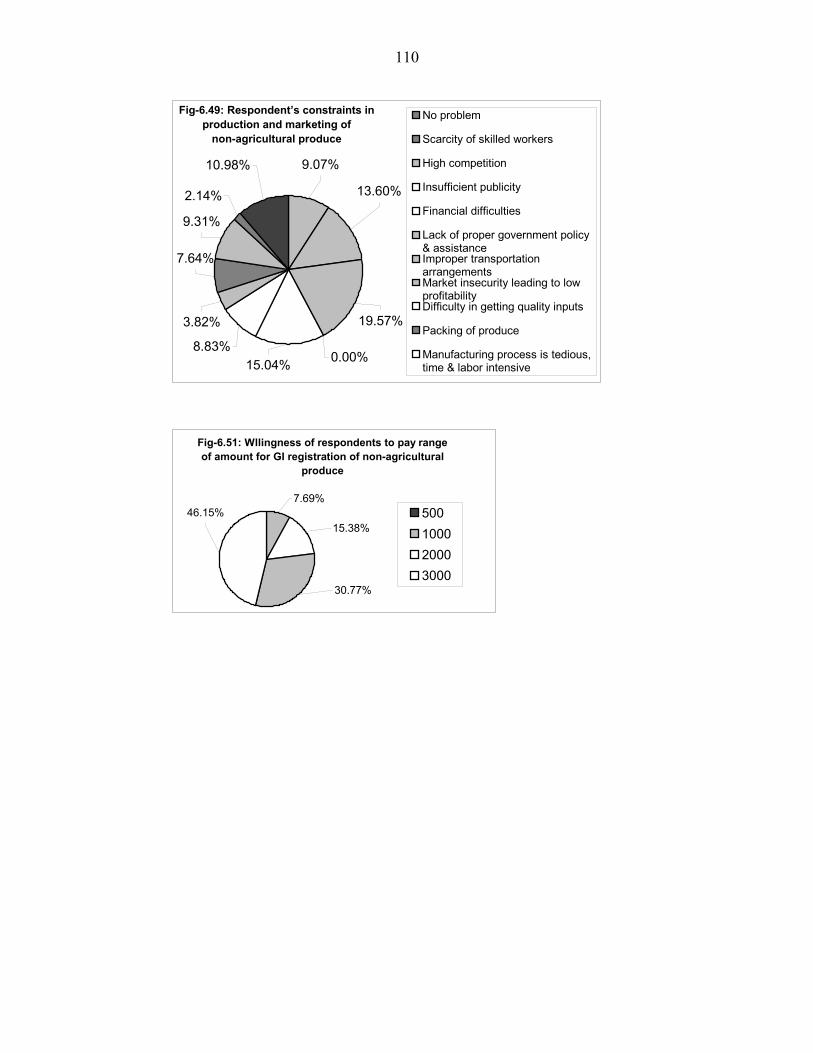
110
Fig-6.49: Respondent’s constraints in production and marketing of
non-agricultural produce
13.60%
15.04% 0.00%
19.57%
9.07%10.98%
2.14%
9.31%
7.64%
3.82%
8.83%
No problem
Scarcity of skilled workers
High competition
Insufficient publicity
Financial difficulties
Lack of proper government policy& assistanceImproper transportationarrangementsMarket insecurity leading to lowprofitabilityDifficulty in getting quality inputs
Packing of produce
Manufacturing process is tedious,time & labor intensive
Fig-6.51: Wllingness of respondents to pay range of amount for GI registration of non-agricultural
produce
7.69%
15.38%
30.77%
46.15% 500100020003000

111
Chapter 7
Indigenous Technical Knowledge: cases of unexploited products with high trade potential
Introduction
This chapter describes comparative account of ‘Nannari Sharbat’, ‘Kokum Juice’
and ‘Buraansh Juice’. Manufacturing, these products involve application of traditional
knowledge held by the community. The detailed account is available in the chapter on
product profile but a brief account of product is given below
Nannari also known as sugandhapalu in Telugu language and ‘Indian Sarsaparilla’
in English language. Botanically called Hemidesmus indicus R. Br. belongs to family
Asclepiadaceae and has several medicinal uses such as demulcent, diaphoretic, diuretic,
and also prescribed for rheumatism, urinary and skin diseases. `Nannari' is mostly found
in the foothills of Alagarmalai and Ezhumalai, but nowadays the producers procure it
from Coorg, Karnataka also. In AP ‘Nannari sharbat’ is traditionally produced since long
time, some producers sale under brand name also. Nannari is claimed to have several
properties and main uses include the flavouring of beverages, and homeopathic medicine.
Kokam or kukum, botanically known as Garcinia indica belongs to family
‘Clusiaceae’, it is a common tree found in tropical rain forests of Western Ghats from
Konkan to southwards in Mysore and Coorg in Karnataka and Wyanad in Kerala. Dried
rind of fruits is known as ‘Kokam’ is used in for making several vegetarian and non-
vegetarian ‘curry’ reparations, including the popular ‘solkadhi’. The fruits are steeped in
sugar syrup to make ‘amrutkokam’, a healthy soft drink ‘kokam sherbet’ to relieve
sunstroke, which is popular during summer. Kokam fruit is reported to have several
medicinal properties such as it is antihelmintic, cardiotonic, anti-obesity, anti-ulcer and
anti-cancer and so many more scientifically proved medicinal properties.
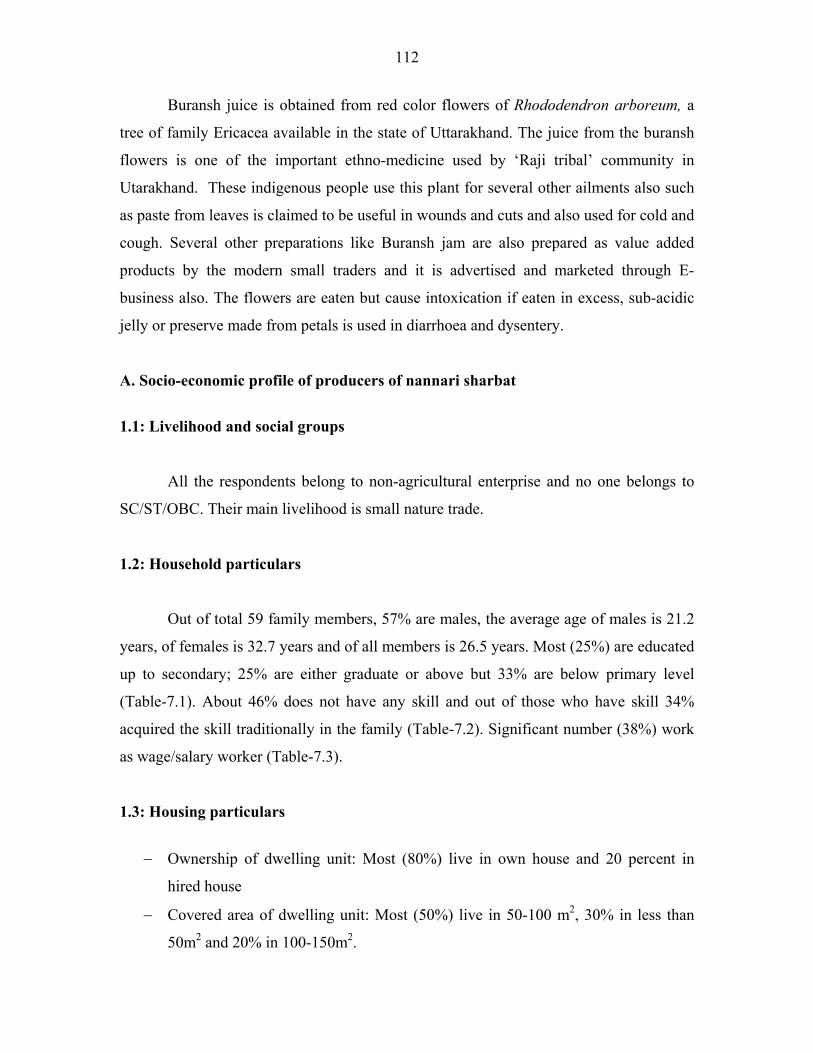
112
Buransh juice is obtained from red color flowers of Rhododendron arboreum, a
tree of family Ericacea available in the state of Uttarakhand. The juice from the buransh
flowers is one of the important ethno-medicine used by ‘Raji tribal’ community in
Utarakhand. These indigenous people use this plant for several other ailments also such
as paste from leaves is claimed to be useful in wounds and cuts and also used for cold and
cough. Several other preparations like Buransh jam are also prepared as value added
products by the modern small traders and it is advertised and marketed through E-
business also. The flowers are eaten but cause intoxication if eaten in excess, sub-acidic
jelly or preserve made from petals is used in diarrhoea and dysentery.
A. Socio-economic profile of producers of nannari sharbat
1.1: Livelihood and social groups
All the respondents belong to non-agricultural enterprise and no one belongs to
SC/ST/OBC. Their main livelihood is small nature trade.
1.2: Household particulars
Out of total 59 family members, 57% are males, the average age of males is 21.2
years, of females is 32.7 years and of all members is 26.5 years. Most (25%) are educated
up to secondary; 25% are either graduate or above but 33% are below primary level
(Table-7.1). About 46% does not have any skill and out of those who have skill 34%
acquired the skill traditionally in the family (Table-7.2). Significant number (38%) work
as wage/salary worker (Table-7.3).
1.3: Housing particulars
− Ownership of dwelling unit: Most (80%) live in own house and 20 percent in
hired house
− Covered area of dwelling unit: Most (50%) live in 50-100 m2, 30% in less than
50m2 and 20% in 100-150m2.

113
− Type of dwelling unit: Most (50%) live in independent house, 40 in chawl/bustee
and 10% in flat.
− Structure of dwelling unit: Most (60%) have pucca house, 40% semi-pucca.
− Source of lighting: Most (60%) use electricity others use nothing
− Source of cooking fuel: Most (70%) use LPG/ piped gas, 10% each use
electricity/kerosene/firewood as cooking fuel
− Source of drinking water: Most (60%) have tap and 40% have tube-well
1.4: Household income – expenditure
The annual average income is around Rs. 2 lakh (Table-7.5), which mostly come
from trading or other enterprises (Fig.7.5). The major expenditure (53%) is on food;
health expenses are least (Fig.7.4 & Table-7.4). The average value of household assets is
around Rs 8 lakhs, of which the maximum contribution (65%) is of buildings (Fig. 7.6 &
Table-7.6).
1.5: Welfare indicators
One month prior of survey, about 37% family members did not get food
everyday, did not have pair of footwear, did not have at least two set of clothes and 20%
of them often fall sick or injured (Table-7.7).
During last month of survey only 7 persons (58% of fall sick) reported to have
taken treatment by at hospial/clinic/dispensary, rest did not take any treatment (Table-
7.8). 28% of them spent more than Rs. 1000 and rest spent less than this (Table-7.9).
Another good welfare indicator is benefit received from any welfare scheme but 70 of
respondents inform that they did not receive any benefit.
B. Socio-economic profile of producers of kokum juice
1.1: Livelihood and social groups
All the ten producers belong to agriculture for their livelihood. 40% of them are
OBCs, others belong to other groups but no one belongs to SC or ST.

114
1.2: Household particulars
Out of total 65 family members, 57% are females, the average age of males is
28.3 years, of females is 24.3 years and of all members is 26.2 years. Most (27%) are
educated up to secondary; 25% are graduate or above but 44% are below primary level
(Table-7.1). About 42% does not have any skill and out of those who have skill 56%
acquired the skill traditionally in the family (Table-7.2). Significant number (28%) work
as wage/salary worker, 30 percent are unpaid family workers (Table-7.3).
1.3: Housing particulars
− Ownership of dwelling unit: All live in own house
− Covered area of dwelling unit: All live in more than150m2.
− Type of dwelling unit: Most (90%) live in independent house, and 10% in flat.
− Structure of dwelling unit: All have pucca house.
− Source of lighting: All use electricity
− Source of cooking fuel: Most (70%) use LPG/ piped gas, 10% use local/gobar gas
and 20% use firewood as cooking fuel
− Source of drinking water: Most (80%) have tube-well and 20% tap water
1.4: Household income – expenditure
The annual average income is around Rs. 3.4 lakh (Table-7.5), which mostly
come from agriculture (Fig.7.5). The major expenditure (53%) is education; health
expenses are least (Fig.7.4 & Table-7.4). The average value of household assets is around
Rs 26 lakhs, of which the maximum contribution (83%) is of land (Fig. 7.6 & Table-7.6).
1.5: Welfare indicators
One month prior of survey, about 13% family members did not get food
everyday, did not have pair of footwear, did not have at least two set of clothes and 15%
of them often fall sick or injured (Table-7.7).

115
During last month of survey only 4 persons (40% of fall sick) reported to have
taken treatment by at hospital/clinic/dispensary, rest did not take any treatment (Table-
7.8). 50% of them spent Rs 200-500 and other 50% spent Rs 500-1000 (Table-7.9).
Another good welfare indicator is benefit received from any welfare scheme but none of
respondents inform that they received any benefit.
C. Socio-economic profile of producers of buraansh Juice
1.1: Livelihood and social groups
The producers main livelihood is non-agricultural enterprise, they do neither full
time agriculture nor full time trade. They do partial trade and also have some land to do
agriculture on small piece of land, they are service based also either doing or on pension.
All the surveyed respondents belong to other social group.
1.2: Household particulars
Out of total 51 family members, 53% are females, the average age of males is
26.9 years, of females is 20.21 years and of all members is 23.6 years. Most (33%) are
educated up to secondary; 47% are graduate or above but 20% are below primary level
(Table-7.1). About 40% does not have any skill and out of those who have skill 59%
acquired the skill traditionally in the family (Table-7.2). Significant number (35%) are
students 30% work as wage/salary worker, 23 percent are busy in household duties
(Table-7.3).
1.3: Housing particulars
− Ownership of dwelling unit: 89% live in own house and 11% no house
− Covered area of dwelling unit: 67% 100 or above and 22% in 50-100 and 11%
less than 50m2.
− Type of dwelling unit: Most (90%) live in independent house, and 10% in flat.
− Structure of dwelling unit: 67%- pucca house, 33% semi-pucca.
− Source of lighting: 67% use electricity, 33% kerosene

116
− Source of cooking fuel: Most (56%) use LPG/ piped gas, 44 use firewood
− Source of drinking water: Most (67%) have tap, 33% river/canal/spring/lake
1.4: Household income – expenditure
The annual average income is around Rs. 1.4 lakh (Table-7.5), which mostly
come from wage/salary (Fig.7.5). The major expenditure (39%) is on food and education
each, health expenses are least (Fig.7.4 & Table-7.4). The average value of household
assets is around Rs 5 lakhs, of which the maximum contribution (85%) is of building and
land (Fig. 7.6 & Table-7.6).
1.5: Welfare indicators
One month prior of survey, about 17% family members did not get food
everyday, did not have pair of footwear, did not have at least two set of clothes and 5% of
them often fall sick or injured (Table-7.7).
During last month of survey only 2 persons (40% of fall sick) reported to have
taken treatment by at hospital/clinic/dispensary, rest did not take any treatment (Table-
7.8). All of them spent Rs 500-1000 (Table-7.9). Another good welfare indicator is
benefit received from any welfare scheme but none of respondents inform that they
received any benefit.
2.1: Nature and geographical association
Nannari sharbat: It is a beverage, natural roots extract brewed by heating in water along
with sugar-cool drink. Locally available & it is an effective cold drink in summer and
other seasons also. The plants available in palakondalu hillocks and the tribals get the
roots to sell in market- producers making it for almost by 150 Hakims. The nannari
sharbat is manufactured in old kadapa for so many long years. The grand parents started
production using roots, which was learnt from Hakims and kept in the families.
Kokam fruit Juice: It has good medicinal characteristics; juice is good for health & gives
good strength, less fat content, cooling effect on the body. Attractive red color, oval in

117
shape and semi hard look like tomato. Juice is also used in sambar preparation. It controls
vomiting also. Hot and humid climate with heavy rains, acid soil provide typical juice
quality and quantity. It is mostly available in forests of south kannada.
Buransh juice: It is a forestry product. Geo-climatic situation, special raw material
availability in the region traditionally special skill of local population are the factors of
geographical association.
2.2: Unique characteristics
Nannari sharbat: It is an original plant product, natural roots extract brewed by heating
in water along with sugar-cool drink. Locally available, good aroma, energetic and
control hunger, available in less price, control ulcers in stomach, blood cleansing, having
anti sunstroke. Earlier Hakim's used to prepare and administer to patients and
commercialized because of its medicinal Value. If produced elsewhere, the roots may
differ in quality, results in loss of aroma, taste and good keeping quality.
Views of institutional stakeholders about nannari: aroma, cooling effects, taste, the
quality of the roots, aroma is great in kadappa region so other state trades also buy roots;
roots are abundantly available in sesuachallam hills. The length of the root is most
important, mainly it cannot be cultivated elsewhere, if could be produced outside kadapa
but the aroma, taste and quality will differ a lot
Kokum juice: Juice, squash, powder & oil made from kokam seed used as ointment for
burns in addition to other medicinal uses. If produced elsewhere, only size & shape may
change & yield may decrease quantity and reddish color may not be obtained but
medicinal & chemical composition may remain same.
Views of institutional stakeholders about kokum: Sour sweet taste, good for health, good
medicinal value, it is also used as a vegetable, medicinal value of the fruits will decreases
as size changes.

118
Buransh juice: The product is unique in Uttarakhand state and flavor, cooling, medical
values are unique. If produced elsewhere, the flowers will loose all its characteristics,
therefore originality of the product.
2.3: Specialty of production process
Nannari sharbat: Specialty is extracting of nannari juice by boiling in water and sugar in
unique mixture for longer time-adding acid limejuice in typical ratio up to 1000kgs. The
roots are unique with its smell and sweetness; only available in and around palakondalu
range. Roots brewed with sugar in water for 7-8 hours traditionally as per their business
needs. Tribal and local people collect these. Process is difficult, raw material precious,
but economic. It’s keeping quality for 3 months.
Kokum juice: Very tall trees & harvesting is a problem, fruits has to be harvested at
correct stage of maturity. Good medicinal value. Extra care is not required, there is a
requirement of good varieties, no need of manure, fertilizers, irrigation by protection
from wild animals & birds should be provided.
Buransh juice: Uniqueness of the product is raw materials i.e. petals and traditional
Knowledge held by the community.
2.4: History of production- in region and by individual
The exploitation of history of production of these products in the region and also
by the respondents reveals that these products are being produced in the region since
quite long as given in the table ahead.
Long back (years) Average of all respondents
Product
Production in the region Production by respondents Nannari 113 23 Kokum 58 53 Buraansh 52 14
119
3.1: Ownership and activities
The enterprise are engaged in production only and mostly are sole proprietorship
(80%) with few as family enterprise where family members participate as partners (20%).
3.2: Activities-seasonality
For ‘Nannari’ producers and sellers March to May are the months of peak
activity; for ‘Kokum’ producers, it is March - April and sellers, it is April to July. For
‘Buraansh Juice’, the peak activity for producers is April to July. The months of August
to December are months of lean activity or no activity for producers and sellers of all the
three products. Therefore, in these months, some employment is to be provided. The
sellers of ‘Buraansh Juice’ have long period of ‘no activity’ i.e. from May to December
(Table-5.7, 9.54, 9.56).
3.3: Resources- persons engaged and equity issues
On average all the three enterprises enjoy about seven skilled and seven other
workers monthly. Men skilled workers are higher than female skilled workers. About half
of the workers are family workers and others are hired. More number of hired skilled men
workers are required to run the enterprise. For collective analysis of GI type IV, see
table-5.8.
3.6: Resources- physical
As presented in table-5.10, nannari producers on an average have 4.5 acres of land
with no land is under cultivation of product. Kokum producers have about 33 acres of
land but only 15% of their lands are put for cultivation of Kokum. About 85% of lands of
producers of nannari and kokum are un-irrigated.
3.7: Resources- loans
The producers of these products did not reveal any amount of loan outstanding on
them.

120
3.8: Resources- raw material
Seventy percent of nannari producers, about 78% of kokum producers and all
burransh producers are satisfied with adequacy and regularity of supply of raw material.
Nannari: raw material sources & prospectus of supply
Tribal from surrounding villages, local market in Dorumamilla and merchants
from Kadapa and Nadhirasool. Material may be available at increased cost, no problem in
supplies. Sometimes it may not be available because roots are being sold to Tamilnadu
and Kerala.
Kokum: raw material sources & prospectus of supply
From Horticulture & forest department, from Balthangadihalum and Dakshina
Kannada. In future peoples get good supply of seed from horticulture dept. requires fast
growing varieties. Good varieties with high yielding & fast growing characteristics and
less time for fruiting are needed.
Buransh: raw material sources & prospectus of supply
Present source is forests. It may increase if new plants are planted in the forest.
3.9: Quantity and value of production
As presented in table-5.11, the producers have not given much information. The
input cost as provided by them is given ahead. Product Input cost (Rs) /Q. in
2004 Input cost (Rs) /Q. in 2005
Input cost (Rs) /Q. in 2006
Nannari sharbat 2621 2892 3096 Kokum fruit juice 2283 2497 2462 Buraansh juice 1455 2242 2920 4.2: Packing methods and problems
All the Nannari producers pack their product in glass bottles and containers, while
about 64% of Kokum producers and 50% of Buraansh producers do so. About 36% of
Kokum producers and half of Buraansh producers use plastic or polythene bags or plastic

121
cans for packing (Table-7.10). Deterioration of packing material is biggest problem felt
by the producers (Nannari 70%; Kokum 42%; Buraansh 50%). There is no other felt
problem of packing (Table-7.11). The challenge is creating awareness about packaging,
provide access to modern packaging technology because the producers are using old
methods of packaging like glass bottles and plastic cans.
4.3: Grading methods
For Nannari, 11% of producers do not do any grading, 67% do grading on the
basis of physical traits and only 22% on the basis of qualitative traits. For Kokum 18% do
no grading, 73% on the basis of physical traits and only 9% on the basis of qualitative
traits. For Burransh also the pattern is almost same (Table-7.13). Therefore, challenge is
to expedite the grading on the basis of qualitative traits.
4.4: Mode of sale and satisfaction level
As given in figure 7.19, the producers mostly sell to local shop or local consumers
followed by middlemen and wholesalers (also see Table-7.19). The producers are
satisfied with the mode of sale except in case of Buraansh Juice, where all the
respondents are not satisfied (Table-7.20). It is important to note that mode of sale is
different in this product, where the sale is mostly direct local sale either to shop or
consumers; sale to middlemen or wholesalers is far less. The reason for un-satisfaction by
buransh producers is given in table-7.21.
4.5: Mode of purchase by traders
It is important to note that traders of these products purchase either directly
(33%), from local middlemen (27%) or any other sources (33%) such as individual,
tribal, farmers etc. The purchases from Mandi etc. are very low to the tune of 7% only
(Table-11.30).
122
4.6: Spectrum of region-wise sale of product
During various years from 2004 to 2006 it has been seen that 64 - 85% of sale is
within the region, where G.I is claimed. About 16–17% is in other parts of the country;
there is no export of these products (Refer table-9.13).
4.7: Contribution of uniqueness to sale
Key Stakeholders’ view
Only 60% of institutional stakeholders feel that unique characteristics of this
product give better sale value but 40% does not feel so. It is a serious concern specific to
this group of product (refer table-9.60). On the other hand, more than 90% traders believe
that due to unique characteristics, the sale of product is better than other product, and
almost all traders believe that unique characteristics provide better market value (Table-
11.8).
4.8: Trend of sale
About 71% institutional stakeholders believe that trend of volume and value of
marketing is increasing during last three years, others believe that it is stationery, while
no one said that it is declining (Table-9.15). About 80% of traders feel that sales is
increasing significantly, other believe that it is more or less stationery but no9ne believe
that sale is very little or declining (Table-11.4).
4.9: Price decision and trend of unit price
As presented in figure 7.22, producers feel that mostly it is individual bargain in
Nannari (100%) and Buraansh (91%). In Kokum collective bargain is practiced to some
extent (27%), individual bargain is very less (7%) but most prevalent is where purchaser
offers a price to which usually producers agree, it is felt by 60 percent of kokum
producers (Table-7.22). The comparative account is given below in table.

123
Price decision Nannari Kokum Buraansh
Collective bargain - + + - Individual bargain + + + + + + + + + + Minimum agreed price between association and purchaser - + + Purchaser offer a price and to which producer usually agree - + + + -
In the bargaining process between trader and consumer, almost all traders in
Nannari and Kokum believe that consumers do not bargain about the price (Table-17.35).
It seems that either it is almost fixed kinds of rate or distribution network between trader
and consumer is such that it does not offer any opportunity of bargaining process. As
presented in table 5.42, the unit price in last three years have been as given below:
Product Unit
Price (Rs) in 2004
Price (Rs) in 2005
Price (Rs) in 2006
Nannari sharbat Liters 44.0 51.3 55.8 Kokum fruit juice Liters 20.2 22.7 24.7 Buraansh juice Liters 31.8 45.9 46
4.10: Price increments in supply chain
As felt by institutional stakeholder, for these indigenous juices, the price
increment at producer level is lowest the maximum price increment is at the level of
middlemen or retailers (Table-9.11).
4.11: Constraints in production and marketing
The producers have expressed concerns to various constraints in production and
marketing (Fig.7.23 & table-7.23). The common concerns are related to various issues as
given in the matrix below:
Constraint Nannari Kokum Buraansh
Improper marketing service + + + + + - Lack of proper government policy and assistance + + - - Lack of marketing infrastructure - + + + + - High competition - + + + - Marketing insecurity leads to low profitability - + + - Labour scarcity - + - Difficult in getting quality input - - + + + +

124
In Nannari and Kokum, there are several product specific concerns raised by the
producers are given hereunder:
Nannari: Constraints in production and marketing
Prolonged time for preparation 7-8 hours and heat. Heavy weight of glass bottles
and plastic bottling spoils the product. Price difference of raw materials. Consumer base
is low and seasonal, though you can have it year around. Exposure to prolonged heat
spoils health of the producer.
Other bottled or tetra pack juices abundantly available in the market. Consumers
again looking for natural drinks and climate change. As other soft drinks not safe, sharbat
only remain healthy and effective during summer, now cola drinks are unpopular, every
body asking for nannari sharbat but constraints are in marketing and making them
available.
Kokum: Constraints in production and marketing
Kokum tree is very tall & harvesting is a problem as fruit may get damaged. The
tree starts giving fruit only after 5-6 years. Marketing problem & the pricing of the
product. Production is less, Problem of animals & birds. The price realized is less
compared to other products like areca nut & cashew nut. Fruit has to be collected from
forest, which is difficult. If grown in the fields, plants start giving fruit after 5-6 years,
which is not economical. There is a fear of damage from wild animals & birds.
There is no market outside the kokum growing areas. Production is restricted to only
Dakshina Kannada area & mostly used for home consumption. Hence, there is no
marketing. It is wild species grown mainly in forest areas, this fruit is usually not grown
commercially. Price is low & marketing is also not good.
In Buransh, less and no timely availability of raw material have been felt as a big
constraint in production.

125
5.1: Inspection, quality control at various stages of production
About 80% of Kokum producers and 22% of Nannari producers believe that there
is no inspection and quality control mechanism. If available, it is either on field
production level, harvesting level at field or processing or grading level. In Nannari, it is
mostly at processing or grading level followed by at harvesting level. In Kokum, it is
either at production or harvesting level at field. In Buraansh, it is mostly at production
level followed by at harvesting, processing and grading level (Fig.7.12 & Table-7.12).
The institutional stakeholders’ view in this regard is also disturbing. In case of
Nannari, Kokum, and Buraansh 25%, 33% and 50% of stakeholders believe that there is
no formal method of inspection and quality control (Fig.7.27). With regard to on site
advice and inspection 50% of stakeholders in Nannari and Buraansh and 33% in Kokum
believe that it is given and can be treated as method of inspection and control. The other
form of quality control and inspection is providing extension training and group
communication (Table-7.27).
5.2: Govt defined quality assurance methods and advice given for quality
improvement
As presented in figure 7.28 most of the institutional stakeholders believe that
there is no method of quality assurance as defined by the government. Mostly the
methods of quality assurance are adopted by the producers at the level of regulated raw
material testing and the core is approximately same all across the products (Table-7.28).
On the matters of advice, out of 18 institutional stakeholders, only 7 have
responded to the question (about 40%) and all of them agree that advice is given directly
on production aspects (Table-9.8)
5.3: Technical guidelines for production codes
Almost all of the producers of Nannari, Kokum and Buraansh agree to the
following statements.

126
- There are no technical guidelines of government / NGO / producers association,
which are to be followed for the production.
- The producers have their own guidelines, which they have learnt from their
forefathers (Table-7.18).
Respondents said NO- N (%) Observation
Nannari sharbat
Kokum Fruit Juice
Buraansh Juice
Production as per technical guidelines- of govt. dept 10 (100.00)
10 (100.00)
10 (100.00)
Production as per technical guidelines- of NGO 10 (100.00)
10 (100.00)
10 (100.00)
Production as per technical guidelines- producers association
10 (100.00)
10 (100.00)
10 (100.00)
5.4: Maintenance and monitoring of codes of production practices
For the quality control and quality assurance, it is necessary to monitor and
maintain the production codes. But the study reveals that almost all the producers agree
to the following (Table-7.18).
- There are no production codes, and technical guidelines from government thereof
to follow them.
- No quality control mechanism available that helps to follow production codes.
- No regular inspection by Government / NGO / producers association.
- Quality check by the purchaser is the only parameter that helps to follow
production codes.
- For maintenance and monitoring of production code, all producers of kokum and
buransh and 80% of nannari agree that they are not any technical guidelines of
government to follow. Therefore there is a producers self control without any
formal mechanism.
- For maintenance and monitoring of production code, all producers of nnnari,
kokum and buransh agree that there is no quality control mechanism available,
which allow them to maintain or monitor those codes.
127
5.5: Traders’ view to maintain product quality
The traders had a clear view that product quality can be maintained if practiced
certain good practices at production, processing and market yard. For comprehensive
description for GI type IV, refer chapter 11 and table 11.48.
6.1: Presumed results of non-registration
The producers are explained the benefit of registration after getting the information
about the benefits of G.I. registration. As presented in table 7.24, the majority producers
agree that non-registration leads to:
- Low volume of sale
- Low wages to labour
- Low profit to producers
- Difficulty in getting loans but majority (60%) of producers of Kokum do not feel
so.
- Nannari producers (66%) agree to the sale of fake products, 40% producers of
Kokum also agree to it. But this is not the case with Buraansh as only 12%
producers feel so.
6.2: Expected changes after registration- on market
With regard to expected changes in market the producers agree to that post
registration must lead to:
- Increase in sale
- Increase in net price
- Increase in net profit
- Expansion of market
- The producers of Kokum and Buraansh also feel that it would lead to less
competition also. In case of Nannari, only 30% producers believe so.

128
Large majority of the institutional stakeholders also agree to the changes expected by
the producers (Table-9.39) as given below: 1. About 90% or more stakeholders agree that
− Product Quality has standardized/will become standard,
− Product grading has improved /will improve,
− Traders are purchasing/will purchase from actual and authorized producers only,
− Income of producers has increased/will increase,
− Income of traders has increased/will increase,
− Number of producers has increased/will increase,
− Producers are producing/will produce more,
− Price of the product has increased/will increase
About 75% of institutional stakeholders agree on ‘Overall improvement in socio-
economic conditions of producers’. And about 44% of institutional stakeholders agree on
‘Producers have shifted/will shift from other livelihood activities’
6.3: Expected changes after registration- enhanced premium as expected by
producers and traders
Refer para 9.3
6.4: Expected changes after registration- livelihoods & overall socio-economic
conditions
About 80% of producers agree to shift from other livelihood activities, if their
products are registered and protection systems are followed to ensure more benefits.
(Table-7.24). The producers’ statements can be generated as given below:
- About 80% of Nannari and 20% of Kokum producers may shift from other
livelihood activities.
- About 80% of Buraansh, 40% of Kokum producers will not shift.

129
- About 40% of Kokum, 10% of Nannari and 20% of Buraansh producers are not in
a position to decide.
- Except Kokum, all producers feel that it will improve socio-economic conditions.
In case of Kokum only 50% producers believe so.
- About 44% of stakeholders believe that producers will shift from other livelihood
activities, and 33% say no to it. Further 75% of institutional stakeholders believe
that registration it will improve the socio-economic condition of production, and
to one said ‘no’, about 25% are indecisive (Table-9.39).
6.5: Expected changes after registration- consumers’ expectations
As presented in table-10.1 in chapter 10, the majority of consumers on post
registration changes agree that:
- Product quality will become standard
- Product grading will improve
- Consumer number will increase
6.6: Visualized benefits at time of GI registration
The study for agricultural products is available at the same para number at chapter
9 and table 9.51. Other expectations from producers are listed below:
Nannari: Recognition for producers. Improved family conditions of producers. Product
will be widely accepted as refreshment. Traders or sellers in other cities who take the
nannari from here will pay more & brand awareness will benefit producers.
Kokum: Kokum importance will be published & people will get good health drink. Price
of the kokum will increase. Market will be opened for kokum in areas where kokum can’t
be grown. There is a chance to create a market outside the state & in other countries.
Buransh: It will generate employment and increase living standards.

130
7.1: Duplicates and similar products
For Nannari, 60% producers feel that similar products are sold with same name,
while 40% could not say anything. For Kokum, all producers feel that there are no similar
products sold with same name, while 90% of Buraansh producers also feel so (Table-
7.18). The response is partly true because Nannari sharbat is produced and sold in
restaurants at Delhi also, but this is not the case yet with other products.
In GI type IV. About 40% institutional stakeholders believe that duplicates are
available, while same number believes that these are not available (Table-9.22). Theses
institutional stakeholders have also suggested ways and means to face presence of
duplicates and copy type in the market (Table-9.24).
About 31% of traders believe that duplicates are available, 31% believe that
inferior quality of duplicates are available and 31% said that there are no duplicates in the
market (Table-11.9).
When we study the attitude of consumers towards purchasing the product, it is found that
- Mostly traditional character led consumer to purchase, except Nannari, where
quality assurance also played significant role.
- Only 20% of consumers attracted due to reasonable price.
Consumers want traditional characters and quality assurance, therefore, duplicates
to be avoided. (Table-7.29).
7.2: Consumers’ efforts to purchase genuine product.
Refer chapter 10

131
7.3: Competition- types and sources
Nannari, Kokum and Buraansh, 60, 89 and 90% producers respectively feel that
there is no significant competition to the product (Table-7.18), while most (62%)
institutional stakeholders feel that competition is from similar products produced in other
areas of the country (Table-9.17); same is the view held by the traders as 66% of traders
feel so (Table-11.11).
7.4: Import of similar product and difference between imported and domestic
product
All the interviewed institutional stakeholders express that there is no import of
these products. (Table-9.26). Similarly traders are also not aware, only one respondent
answered the question saying no imports (Table-11.14).
7.5: Import of the products
No imports (Table-9.19)
7.6: Export and trade option of the products
For Nannari and Kokum producers feel that product is suitable for domestic
consumption in other states of the country and export must be last resort. (Table-11.45).
They further feel that strategy should be developed, which preferably boost the domestic
sale, strategies for export can be after this (Table-11.47).
9.1: Willingness for registration and payment thereof
Almost all the producers of these products are willing for registration of product
and willing to pay for its registration, except in case of Buraansh, where only 60% are
willing to pay for it (Table-7.24). Most producers of al these products are willing to pay

132
Rs. 500/- (Fig.7.25). Some kokum and buraansh producers are willing to pay Rs. 1000/-,
and for nannari some are willing to pay even more than Rs 1000/- (Table-7.25). About
72% consumers are also willing for registration, rest of them are not clear about it, but no
one said ‘no’ for registration. (Table-10.1).
9.3: Willingness to pay for expected enhanced premium
After registration, almost all the producers expect enhanced premiums to
producers, except in case of Buraansh, where 20% respondents are not able to say
anything about it. (Table-7.24). But how much enhanced premium they expect. Mostly
they expect some premium up to 5% fairly about 5 – 10%. The nannari producers expects
high premium (Table-7.26).
The enhanced premium will be borne by either consumers or traders. As a post
registration effect (Table-10.13), only 60% of consumers are wiling to pay more. But
how much more can they pay? Mostly they are willing to pay 5 – 10% more over the
prevailing price (Table-7.31).
Traders are the most important component of supply chain. All of Nannari traders
and 40% of Kokum traders feel that as a post registration effect, enhanced premium
should be available to producers and traders (Table-7.32). But, how much increase over
prevailing cost? Kokum traders feel up to 15% increase, while Nannari traders wish to
have little more i.e. 10 – 15% or even more. (Table-7.33). Once the enhanced premium is
agreed, the traders would be willing to increase the prices. But how much? Kokum
traders agree for increase between 5 to 10% but Nannari traders look for higher increase
i.e. 10 – 15% or beyond (Table-7.34).
10.1: Production characteristics
As felt by 80% of producers, the trend of production in last three years is
increasing for Nannari and Kokum. In case of Buraansh 90% producers feel that it is
stationery (Table-5.37). Majority of producers of Nannari and Kokum producers feel that
no one has discontinued the production. In case of Kokum majority of producers feel that

133
few more have also started the production of the product (Table-5.38). Other responses
from producers are reproduced below:
Nannari: Other bottled or tetra pack juices abundantly available in the market.
Consumers again looking for natural drinks and climate change. As other soft drinks not
safe, sharbat only remain healthy and effective during summer, now instead of cola
drinks people love to have nannari sharbat. Thus trend is increasing.
Buransh: Trend of marketing and the production in last 3 years is increasing. Kokum is
getting good publicity & peoples are becoming aware of kokum juice. Unless and until
good publicity is not given the demand for fruit will not increase. People are becoming
aware about the medicinal value of product and they are starting growing in the farms at
small scale.
10.2: Production constraints
Main constraints are different in all the three products as given in figure 7.23. For
details refer to table-7.23. The remarks of the producers are given on para 4.11 also.
10.3: Earnings and income
The earnings from the enterprise are average, except in case of Nannari, where
55% respondents feel that earnings are good (Table-7.16). The reasons of average income
are given below.
Nannari: Reasons for average or poor earning from enterprise
New generation goes for brand drinks; only old and known people prefer it. Less sales
coupled with competition from branded cool drinks. As it is seasonal for three months
only, enough income to be generated to take care of other nine months.
Kokum: Reasons for average or poor earning from enterprise
Market is there only in kokum growing areas, outside that areas market is not there. Only
Dakishna kannada people are using this product. This is not extended to other parts. The

134
season is only 3-4 months. It doesn't have good market value; yield also less because it is
not grown in large scale. Further it is not like other branded and commercial cool drinks,
therefore difficulty in increasing earning from this product.
In buransh juice, the unavailability of raw materials has been quoted as a reason
for average or poor income.
But 93% of producers feel that if better marketing infrastructure and improved
marketing outlets are available, there is a scope of increasing income (Table-7.14). The
requirements for increasing earning differ for all the three products (Table-7.17). Those,
who feel that it cannot increase the income despite providing it because these drinks are
not the commercial drinks as others available in the market. The traders in this category
of product are mostly satisfied with the current earning (Table-11.8).
10.4: Financial and infrastructure needs- for increasing production
Almost all the producers agree that adequate finance and better marketing can
lead to increased production; almost all the producers have capacity to improve the
production (Fig.7.14 & Table-7.14). The type of assistance required for enhancing the
production is different in all the three products (Table-7.15). A few, who could not
increase the production, cite the reason of lack of technology, which help in better and
faster production.
10.5: Awareness of producers and stakeholders about GI
All the producers are aware that uniqueness of the product is due to geographical
origin. In case of Nannari and Kokum 80% and 70% producers were aware of that
product can be protected as a G.I. but in case of Buraansh no producer was aware of that.
Interestingly in nannari only two producer (20%) and in kokum eight producer (80%)
admitted that they did not know the status of registration status of the product, in buransh
all said they can not say anything. The reason of more awareness in the producers of
Nannari and Kokum can be the G.I. registration activities for other products taken in A.P.
and Karnataka. But almost all the producers in case of Buraansh and Nannari were not

135
aware of status of their products (Table-7.18). But in Kokum, the knowledge is not
available. The knowledge about the other issues related to post registration effects was
good among Nannari and Kokum producers but almost nil in case of Buraansh producers
(Table-7.18).
Awareness among the institutional stakeholders was good, as almost all
respondents know about GI registration. (Table-9.35). Awareness among consumers
about uniqueness is very high, but about G.I. registration is very low. (Table-10.1).
10.6: Role of agencies in development and strengthening of producers’ associations
Almost all the producers made it a point that there is no producers’ association
and they are not the members of any such association also. This is a gray area in G.I.
protection, maintenance and use of GI. All the producers of nannari, kokum and buransh
agree there is no producers’ association or marketing group, and they are not member of
any such organization.
10.8: Future prospects of the product
All the institutional stakeholders of Nannari and Buraansh feel that the future of
product is bright and likely to improve in future. The institutional stakeholders of Kokum
are divided on the issue about 50% feel it will remain same and 50% feel it will improve
in future. (Table-9.34). The consumers see the future of those products as very bright or
bright with future improvement (Table-10.21). Significant number of traders (80 – 100%)
also see the future of these products as bright and which is likely to improve in future
(Table-11.27).
10.9: Constructive measures to make production viable and improve future
prospects
Refer chapter 9, and 11
136
10.10: Status of marketing and suggestions for improvement
Refer chapter 9, and 11
10.11: Suggestions for improvement to increase sale
The consumers have given various suggestions for improving sales. The most
important are more publicity to the product and making innovative changes keeping the
base of traditional structure (Fig.7.30). Also see table-7.30 for details.
10.12: Scientific endeavors in product development
Refer chapter 9
10.13: Endeavors by depts. and agencies responsible or concerned with GI
registration
Refer chapter 9
10.14: Endeavors by financial institutions
Refer chapter 9
11.1: Current level of protection, drawback, enforcement problems
Refer chapter 9
11.2: Problems and bottlenecks related to acquisition and maintenance of GI
Refer chapter 9
11.3: Identification of beneficiaries
Refer chapter 9
Indigenous Technical Knowledge: cases of unexploited products with high trade potential- Figures
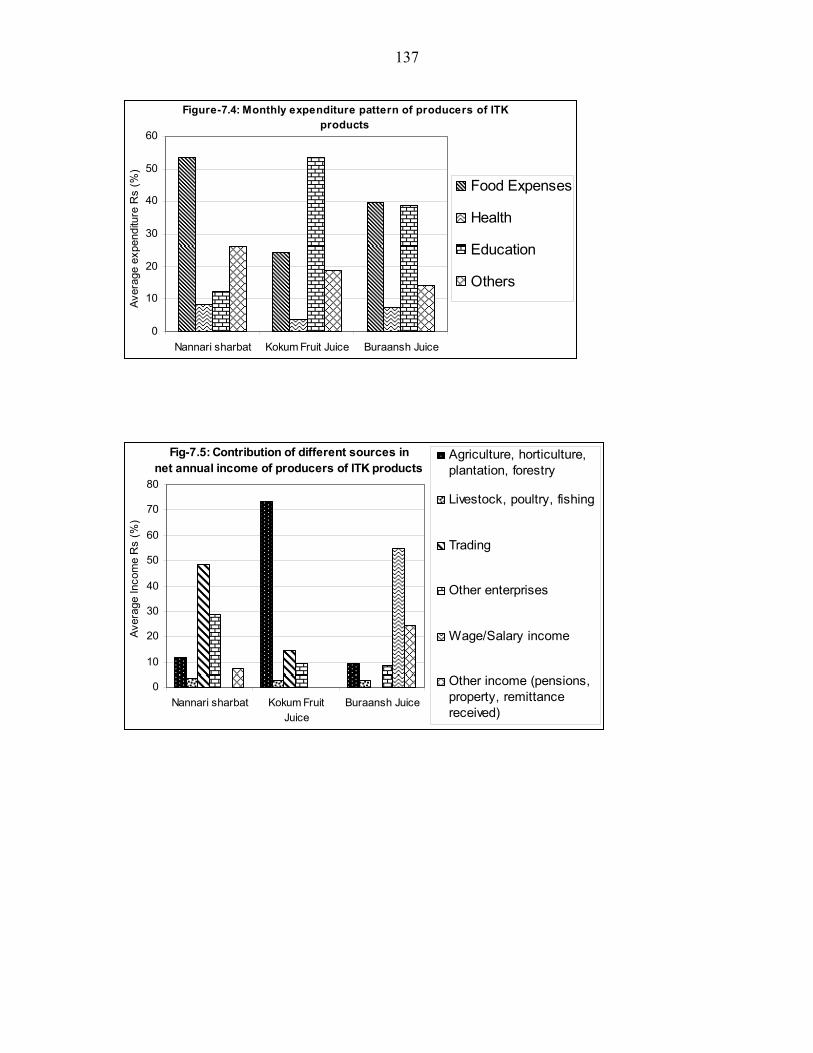
137
Figure-7.4: Monthly expenditure pattern of producers of ITK products
0
10
20
30
40
50
60
Nannari sharbat Kokum Fruit Juice Buraansh Juice
Aver
age
expe
nditu
re R
s (%
)
Food Expenses
Health
Education
Others
Fig-7.5: Contribution of different sources in net annual income of producers of ITK products
0
10
20
30
40
50
60
70
80
Nannari sharbat Kokum FruitJuice
Buraansh Juice
Aver
age
Inco
me
Rs
(%)
Agriculture, horticulture,plantation, forestry
Livestock, poultry, fishing
Trading
Other enterprises
Wage/Salary income
Other income (pensions,property, remittancereceived)

138
Fig-7.6: Pattern of household value of assets of producers of ITK products
0
10
20
30
40
50
60
70
80
90
Nannari sharbat Kokum FruitJuice
Buraansh Juice
Aver
age
Inco
me
Rs
(%)
Land (including watertanks, ponds)
Building
Machinery, implements
Transport equipments
Durable goods (TV/Fridge)
Other assets
Livestock Resources (Cow,Buffalo, Pig, Goat, Poultry)
Fig – 7.12: Methods of inspection and quality control used at various stages of production in ITK products enterprises
0
10
20
30
40
50
60
70
80
90
Nannari sharbat Kokum FruitJuice
Buraansh Juice
Res
pond
ent-
N (%
)
No inspection &quality control
Production levelon field
Harvesting level onfield
Processing &grading level
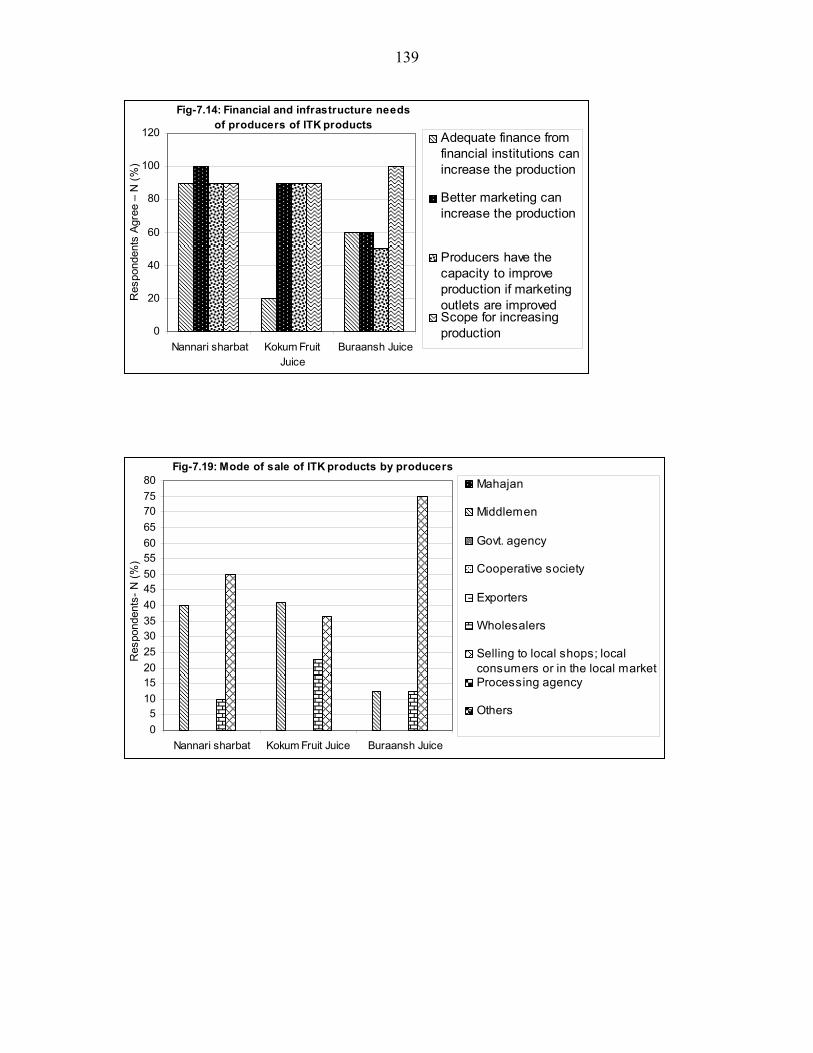
139
Fig-7.14: Financial and infrastructure needs of producers of ITK products
0
20
40
60
80
100
120
Nannari sharbat Kokum FruitJuice
Buraansh Juice
Res
pond
ents
Agr
ee –
N (%
)Adequate finance fromfinancial institutions canincrease the production
Better marketing canincrease the production
Producers have thecapacity to improveproduction if marketingoutlets are improvedScope for increasingproduction
Fig-7.19: Mode of sale of ITK products by producers
05
101520253035404550556065707580
Nannari sharbat Kokum Fruit Juice Buraansh Juice
Res
pond
ents
- N (%
)
Mahajan
Middlemen
Govt. agency
Cooperative society
Exporters
Wholesalers
Selling to local shops; localconsumers or in the local marketProcessing agency
Others

140
Fig-7.22: Price decision of producers over the sale of ITK products
0
10
2030
40
50
60
70
8090
100
110
Nannari sharbat Kokum FruitJuice
Buraansh Juice
Res
pond
ents
- N (%
)Bargain collectively
Bargain individually
Sale on minimumagreed price betweenour association andpurchasersThe purchaser offersus a price to which weusually agree
Fig-7.23: Producers’ constraints in production and marketing of ITK products
0
10
20
30
40
50
60
70
80
90
100
110
Nannari sharbat Kokum Fruit Juice Buraansh Juice
Res
pond
ents
- N (%
)
Hindrances fromagronomic/ natural factors Low marketinginfrastructure Lack of proper governmentpolicy & assistanceNo constraints
Labour scarcity
High competition
Difficulty in getting qualityinputsProduct specific concerns
Market insecurity leadingto low profitabilityImproper marketingservices

141
Fig-7.25: Willingness of producers to pay for GI registration of ITK products
0102030405060708090
100
Nannari sharbat Kokum Fruit Juice Buraansh Juice*
Res
pond
ents
N (%
)
500 1000 2000 3000
Fig-7.27: Method of inspection and quality control of ITK products as advised by institutional stakeholders
0
10
20
30
40
50
60
Nannari sharbat Kokum Fruit Juice Buraansh Juice
Res
pond
ents
N (%
)
No formal methodof inspection andquality controlExtension, trainingand groupcommunicationOn-site advice andinspection

142
Fig-7.28: Methods of government defined quality assurance in ITK products
0
10
20
30
40
50
60
70
80
90
Nannarisharbat
Kokum FruitJuice
BuraanshJuice
Res
pond
ents
N (%
) No qualityassurance
Producers’regulated rawmaterialtesting
Fig-7.30: Consumers’ suggestions for the areas of improvement in ITK products under study
0
10
20
30
40
50
60
Nannari sharbat Kokum FruitJuice
Buraansh Juice
Res
pond
ents
N (%
)
Quality to bestandardized
Innovative changes tobe made keepingtraditional basePrice to be controlledand kept withinreasonable limitsEasy availabilityassured
More publicityrequired
Others

143
Chapter 8 Analytical Profile of Products Involving Registered GI: opinion of stakeholders
This chapter provides the detailed study of three products that were registered at the time
of survey under the project. These products are:
1. Chennapatna toys- wooden colourful decorative toys made at Chennapatana
village near Mysore in Karnataka
2. Srikalahasti kalamkari- free hand painting on cotton clothing done at Srikalahasti
village near Tirupati in Andhra Pradesh
3. Coorg orange- a well known mandarin cultivated in Coorg region in Karnataka
A. Socio-economic profile
Producers of Chennapatna toys
1.1: Livelihood and social groups
All the ten producers belong to non-agricultural enterprise. From social grouping
point of view 10% belong to SC and 90% to OBC.
1.2: Household particulars
There are 49 family members in 10 households. Out of this 27 (55%) are male and
22 (45%) are female. The average age of males is 26.0 years and of female is 19.3 years.
While the average of both male and female is 22.6 years. As far as education level is
concerned, highest number (47%) are educated up to primary level; Higher secondary
(6.7%) and 10% are Graduate and above (Table-8.1). The literacy level is high among
144
males. Table-8.2 presents the skill level of the producers. Out of total 49 family members,
46 are reported to have some skill and all have acquired the skill traditionally in the
family. For the usual activity of family members, out of the 46 reported members, all are
self-employed (Table-8.3).
1.3: Housing particulars
- Out of 9 reported households, 44% have their own and 56% live in hired dwelling
units.
- Out of 10 reported households 90% live in dwelling units of >150m2 and 10% in
dwelling units of 100-150 m2.
- Out of 9 reported households, all have independent houses.
- Out of 10 reported households, 70% live in semi pucca, while 30% live in pucca
houses.
- Out of 10 reported households all have electricity for lighting.
- Out of 10 reported households, 80% use firewood, 10% kerosene and 10% LPG
as cooking fuel.
- Out of 10 reported households, all use tap as source of drinking water.
1.4: Household income-expenditure-asset analysis
As presented in table-8.5, the total annual income is Rs. 65000/- and most of this
comes from salary or wages (Fig.8.5). The details of expenditure of income are given in
fig.8.4, which clearly express that major expenditure is towards food (58%) followed by
education and least expenditure on health (Table-8.4). As presented in table-8.6, the
average value of assets of producers is Rs. 5.59 lakhs per producers but the major share
(98%) is of the buildings (Fig.8.6).
1.5: Welfare indicators
During last month of survey, all the family members got food everyday, all had at
least a pair of footwear and at least two sets of cloth. Ten family members i.e. about 20%
of total family members fallen sick during last moth of survey (Table-8.7). Out of those

145
who fell sick, 20% took no treatment, 40% treated by qualified medical doctor, 20%
treated by unqualified doctor or person and 20% took home treatment (Table-8.8). No
reason is given for not taking treatment. As presented in table-8.9, most of those who
took any treatment (40%) spent Rs. 200-500 or below for treatment.
Producers of Srikalahasti kalamkari
1.1: Livelihood and social groups
All the ten producers belong to non-agricultural enterprise. From social grouping
point of view 50% belong to OBC and rest with others.
1.2: Household particulars
There are 51 family members in 10 households. Out of this 22 (53%) are male and
29 (57%) are female. The average age of males is 29.2 years and of female is 33.8 years.
While the average of both male and female is 31.5 years. As far as education level is
concerned, highest number (38%) are educated up to secondary level; Higher secondary
(19%) and 4.7% are Graduate and above (Table-8.1). The literacy level is high among
males. Table-8.2 presents the skill level of the producers. Out of total 51 family members,
38 reported to have some skill and mostly acquired the skill traditionally in the family or
through formal/informal training. For the usual activity of family members, out of the 42
reported members 26% are self-employed and 29% are unpaid family enterprise workers
(Table-8.3).
1.3: Housing particulars
- Out of 10 reported households, 80% have their own and 20% live in hired
dwelling units.
- Out of 10 reported households 30 % live in less than 50 m2, 60% in 50-100 m2
and 10% in ore than 150 m2.
- Out of 10 reported households, 90% have independent houses and 10% in
chawl/bustee.

146
- Out of 10 reported households, 10% live in semi pucca, while 90% live in pucca
houses.
- Out of 10 reported households 90% have electricity for lighting.
- Out of 10 reported households, 90% use LPG as cooking fuel and 10% use
kerosene.
- Out of 10 reported households, all use tap as source of drinking water.
1.4: Household income-expenditure-asset analysis
As presented in table-8.5, the total annual income is Rs. 77800/- and most of this
comes from salary or wages (Fig.8.5). The details of expenditure of income are given in
fig.8.4, which clearly express that major expenditure is towards food (71%) followed by
education and least expenditure on health (Table-8.4). As presented in table-8.6, the
average value of assets of producers is Rs. 12.6 lakhs per producers but the major share
(94%) is of the land & buildings (Fig.8.6).
1.5: Welfare indicators
During last month of survey, 85% of the family members got food everyday, had
at least a pair of footwear and at least two sets of cloth. Twelve family members i.e. about
23% of total family members fallen sick during last month of survey (Table-8.7). Out of
those who fell sick, 17% took no treatment, 33% treated by qualified medical doctor,
17% treated by unqualified doctor or person and 33% took home treatment (Table-8.8).
No reason is given for not taking treatment. As presented in table-8.9, most of those who
took any treatment (55%) spent Rs. 500 or below for treatment.
Producers of Coorg orange
1.1: Livelihood and social groups
All the ten producers belong to agricultural enterprise. From social grouping point
of view 10% belong to ST and SC each and 80% to OBC.
147
1.2: Household particulars
There are 45 family members in 10 households. Out of this 22 (49%) are male and
23 (51%) are female. The average age of males is 19.8 years and of female is 25.5 years.
While the average of both male and female is 22.6 years. As far as education level is
concerned, highest number (53%) are educated up to primary level or below; Higher
secondary (11%) and 22% are Graduate and above (Table-8.1). The literacy level is high
among males. Table-8.2 presents the skill level of the producers. Out of total 44 reported
family members, 20 do not have any skill, and other 23 except one have acquired the skill
traditionally in the family. For the usual activity of family members, out of the 45
reported members, 40% are self-employed and 20% each are either students or
pensioners (Table-8.3).
1.3: Housing particulars
- Out of 10 reported households all live in own dwelling units.
- Out of 10 reported households 70 % live in more than 150 m2 and 30% live in
dwelling units of 100-150 m2.
- Out of 10 reported households 80% are independent houses and 20% flats.
- Out of 10 reported households, 80% live in pucca, while 20% live in semi-pucca
houses.
- Out of 10 reported households 90% have electricity for lighting 10% use
kerosene.
- Out of 10 reported households, 50% use LPG, 20% local gobar gas and 10 %
electricity as cooking fuel.
- Out of 10 reported households, all use tube-well or bore-well as source of
drinking water.
1.4: Household income-expenditure-asset analysis
As presented in table-8.5, the total annual income is Rs. 3.61 lakhs and most of
this comes from either agriculture or trading (Fig.8.5). The details of expenditure of
income are given in fig.8.4, which clearly express that major expenditure is towards food

148
(39%) followed by education and others; the least expenditure is on health (Table-8.4).
As presented in table-8.6, the average value of assets of producers is Rs. 10.0 lakhs per
producers but the major share (80%) is of land and buildings. Unlike other two products,
these have fairly good expenditure on machinery and transport vehicle also (Fig.8.6).
1.5: Welfare indicators
During last month of survey, all the family members got food everyday, all had at
least a pair of footwear and at least two sets of cloth. Nine family members i.e. about
20% of total family members fallen sick during last moth of survey (Table-8.7). Out of
those who fell sick, 22% took no treatment and 78% are treated by qualified medical
doctor (Table-8.8). As presented in table-8.9, most of those who took any treatment
(57%) spent Rs. 200-500, 29% spent Rs 500-1000 and rest 14 spent more than 1000/- for
treatment.
B. Opinion of producers and key stakeholders
2.1 Nature and geographical association
Chennapatana toys
These are variety of products horse, elephant, firki, egg, peacock, train, bus,
rabbit, bangles and necklace etc. The type of wood used for making the product is not
available elsewhere. This wood is specially suited for making the toys products and the
toys are made manually, therefore great role of skill of local persons.
Srikalahasti kalmakari
Artwork and traditional special skill of local population, geographical association
is partly due to use of locally available natural colors and due to specially acquired skills.

149
Coorg orange
Sweet mix sour taste of fruit makes it different in taste from other oranges. Juice
content is high, peel can be easily removed, used in production of squash, juice, biscuits,
chocolate & for cosmetics. Soil characteristic & fertilizer mgmt will influence the taste
(sweet-sour of juice) of the Fruit. Rain for long duration in a year, more humidity low
temp is responsible for more juice content.
2.2: Unique characteristics
Chennapatana toys
Method of product manufacture and type of raw material available locally only.
These are used for decorative purposes and display the traditional cultural identity. If
prepared elsewhere several unique qualities would be lost such as traditional identity.
Uniqueness of producing the product is raw material and manufacturing skill.
Srikalahasti kalmakari
Free hand artistic work on gada (cotton) cloth using natural dyes. The art work
depict mythological events of Hindu epics. The institutional stakeholders also opine the
similar kind of uniqueness e.g free hand style drawings using vegetables dyeing showing
mythological events, climate of Srikalahasthi suitable for many artists therefore they are
located here, drying in sand of Swarnamukhi River imparts color, Swarnamukhi water
gives good color also. If kalamkari prepared elsewhere several unique qualities would be
lost such as use of natural dyes, fine-ness of product and meaning of mythological
pictures etc. Uniqueness of producing the product is free hand drawing of God figures,
use of natural colours and other material such as buffalo milk to color cloth.
Coorg orange
Sweet mix sour, attractive and easily removable peel good keeping quality. If
produced elsewhere several unique qualities would be lost such as size and yield may
decrease, color, juice content, taste and chemical composition may change.

150
2.3: Specialty of production process
Chennapatana toys
Special requirements in the production process are- modern equipment, palm
leaves, sand paper, skilled labour and colorful materials. Producer’s feel to improve the
production process by- adoption of modern technology in the production process with use
of modern machines. The skill plays a greater role and to refine it the requirements are-
new machines operating skills, colours filling and final finishing of the product.
Srikalahasti kalmakari
Speciality of the production process are- Buffalo milk is used to soak cloth so as
to turn it into creamy colour, dried on river bed sand of srikalahasti swarnamukhi, use of
myrabolan seeds and flowers to fix colour on cloth. Special requirements in the
production process are- Myrabolan seeds and flowers for making and fixing, toddy pen or
kalam used for making art on cloth, alum gives red colour, myrabolan flowers yellow,
buffalo milk for derning gada cloth, rusted iron and toddy jaggery used to prepare colour
and toddy coal used to outline art, bamboo sticks used to point on cloth. Producer’s feel
to improve the production process by- diversification from traditional mythological
events to new themes based on nature, vegetation and lifestyle etc. The skill plays a
greater role and to refine it the requirements are- free hand artistic paintings on cloths
maintaining symmetry, knowledge of traditional and modern themes.
Coorg orange
Uniqueness of producing the product is standard agronomic practices, fertilizer
management during flowering time.
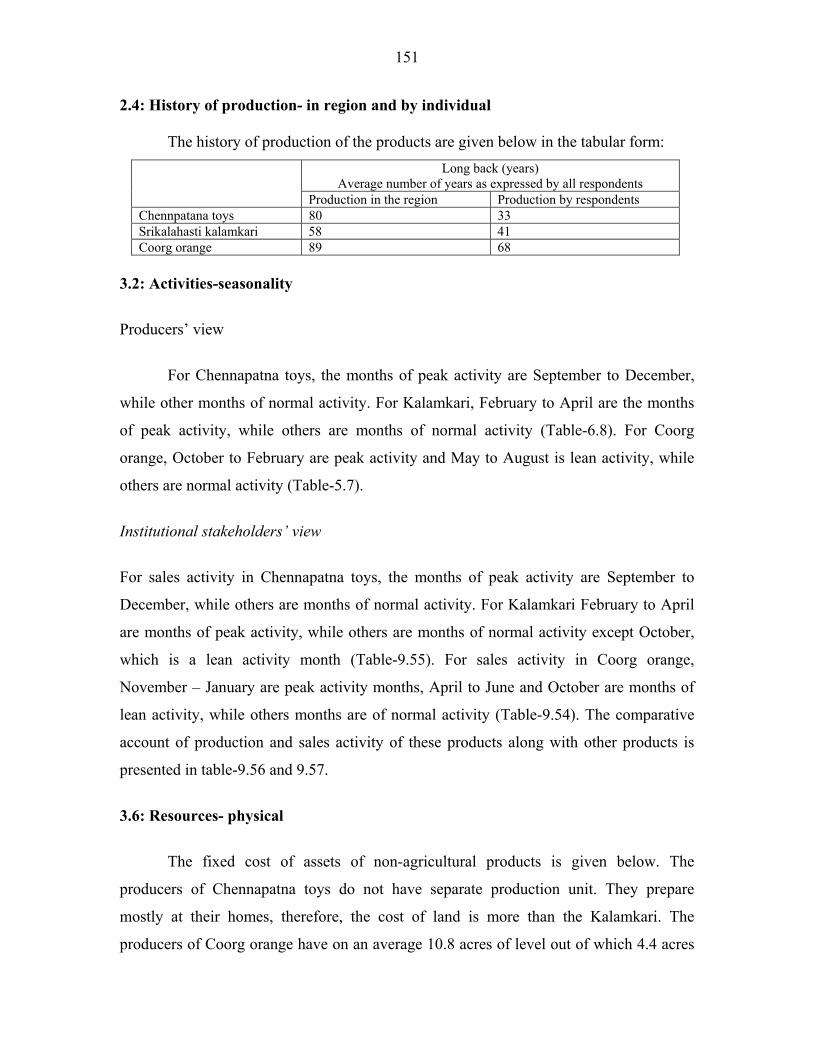
151
2.4: History of production- in region and by individual
The history of production of the products are given below in the tabular form: Long back (years)
Average number of years as expressed by all respondents
Production in the region Production by respondents Chennpatana toys 80 33 Srikalahasti kalamkari 58 41 Coorg orange 89 68
3.2: Activities-seasonality
Producers’ view
For Chennapatna toys, the months of peak activity are September to December,
while other months of normal activity. For Kalamkari, February to April are the months
of peak activity, while others are months of normal activity (Table-6.8). For Coorg
orange, October to February are peak activity and May to August is lean activity, while
others are normal activity (Table-5.7).
Institutional stakeholders’ view
For sales activity in Chennapatna toys, the months of peak activity are September to
December, while others are months of normal activity. For Kalamkari February to April
are months of peak activity, while others are months of normal activity except October,
which is a lean activity month (Table-9.55). For sales activity in Coorg orange,
November – January are peak activity months, April to June and October are months of
lean activity, while others months are of normal activity (Table-9.54). The comparative
account of production and sales activity of these products along with other products is
presented in table-9.56 and 9.57.
3.6: Resources- physical
The fixed cost of assets of non-agricultural products is given below. The
producers of Chennapatna toys do not have separate production unit. They prepare
mostly at their homes, therefore, the cost of land is more than the Kalamkari. The
producers of Coorg orange have on an average 10.8 acres of level out of which 4.4 acres

152
is un-irrigated. The Coorg average is produced in 41% of irrigated and 32% of un-
irrigated lands (Table-5.10).
Cost in Rupees Asset
Chennapatna toy Sri Kalahasti Kalamkari Land 84000 27500 Building 23500 23000 Machinery, equipments etc. 1250 4270 3.8: Resources- raw material
As presented in table-6.29, 70% of producers of Chennapatna toys and all
producers of Kalamkari admit that supply of raw material is adequate and regular. About
80% of Coorg orange producers also believe so (Table-5.21)
Chennapatana toys: Raw material mainly wood is purchased locally from timber
merchants based on the size, colour, & consumer demand. Prospects of supply are ok but
it will be good, if supplied through forest department. Product specific concerns are
presented below:
Srikalahasti kalmakari: Cloth is purchased from Chittor or Erode and colours from
Chennai. In local market, the material is definitely a shortage.
Coorg orange: producers collect seedling from Govt. agencies, KVK, co-operative
agencies and private nurseries. A high yielding disease résistance variety is required.
3.9: Quantity and value of production
The quantity, value of production and other parameters are given below in the matrix:
Product Observation 2004 2005 2006 Quantity produced (No. of pieces) 2070 2070 2700 Total input cost (Rs.) 91800 91800 91800 Per unit cost (Rs.) 44.35 44.35 34.00 Value (Rs.) 68000 68000 50000
Chennapatna toys
Per unit value 32.85 32.85 18.52 Quantity produced (No. of pieces) 170 257 370 Total input cost (Rs.) - - - Per unit cost (Rs.) - - - Value (Rs.) 50750 124800 215900
Srikalahasti kalamkari
Per unit value 298.5 485.6 583.5 Area/producer (acre) 2.70 2.70 2.70 Production value (Rs.)/Q 1956.2 1762.8 2102.9
Coorg orange
Input cost (Rs.) / Q 1022 1121 1163

153
It can be observed from above summary that producers of Chennapatna toys are in
pathetic condition. The cost of production is high, while the value of produce is low.
4.1: Storage methods and problems
In Chennapatna toys most storage is bulk storage and almost all the producers do
not have any storage problem. In case of Kalamkari, most storage source is plastic and
polythene and for 80% the seasonal damage is most important problem, while for 20%
insufficient storage facilities and capacity is a problem (Table-8.11 and 8.12).
How do they store, and what are specific problems? Product specific concerns are
presented below:
Chennapatana toys: In Normal rooms only, stored produces with the help of paperboards
& cart box etc., these are stored in normal conditions, so no problem of storage.
Srikalahasti kalmakari: In plastic covers, easy to store like other cloths. Dry storage away
from sunlight and moisture. If exposed to direct sun, colour will fade, therefore
requirement is to store in dry condition.
4.2: Packing methods and problems
The packaging types are different for the three products (Table-8.13). For
Chennapatna toys, it is metal/machine packing and plastic or polythene bags. For
Kalamkari, it is machine packing only. For Coorg orange, Traditionally fruits are packed
in cardboard, wooden boxes, paper bags, Gunny bags or Polyethylene bags. There are no
packing problem to producers for Chennapatna toys and Kalamkari but deterioration of
packing material is big problem in Coorg orange (Table-8.14). The problems of packing
in Coorg orange are- Packaging material may damage during transportation, exchange of
moisture with the surroundings. Cardboards won't provide sufficient protection. Disease
attack at the storage, rainfall & pest attack.
154
4.3: Grading methods
In case of Coorg orange, the grading is mostly on the basis of physical traits only.
While in Chennapatna toys and Kalamkari the equal weightage is given to physical and
qualitative traits (Table-8.16).
4.4: Mode of sale and satisfaction level
The mode of sale is through various means (Table-8.21), but middlemen either
directly as commission agent or as wholesaler or exporter are the mostly available means
of marketing. The direct middlemen and exporters are most active in Chennapatna toys,
while wholesaler in Kalamkari. For Coorg orange, the mode of sale is distributed to
various channels including processing agency, government agency or cooperative society
(Fig.8.21).
Except Chennapatna toys, where 70% producers are satisfied with the mode of
sale, other producers (70 – 75%) in other two products are not satisfied with the mode of
sale (Table-8.22). What are the reasons of un-satisfaction over the mode of sale. Various
reasons have been listed by the producers (Table-8.23) but the most important are:
- Intervention and control by middlemen in Chennapatna toys
- Insufficient institutional support in Coorg orange
- Low profit from venture in Kalamkari, it may be due to large scale presence of
wholesalers
In Chennapatana toys, the producers are satisfied with present mode of sale but in
other two products the producers are not satisfied because of several reasons, some of
specific reasons are recorded here:
Reasons of un-satisfaction in kalamkari: Workers getting low income where as
middlemen are getting high income. Srikalahasti is located in remote area hence less
direct sales. Government emporium and stalls like Lepakshi are not present in all towns.

155
Reasons of un-satisfaction in Coorg orange: Good market is not there for produce and
storage facilities are also not there. Export market should be improved.
4.9: Price decision and trend of unit price
Method and capacity of bargain is directly proportional to the profit from the venture.
About 40 – 50% producers of Kalamkari and Coorg orange admit of collective
bargaining, but only 25% of producers of Chennapatna toys do so. Other important
features as presented in table-8.24 are:
- Individual bargain is prominent in Chennapatna toys
- Sale to minimum agreed price between associates and purchase is found only in
Coorg orange
- Significant (50%) number of producers in Chennapatna toys and moderate (20 –
25%) number of producers of Kalamkari and Coorg orange believe that they
usually agree to a price offered by purchaser
Forced sale means ‘Purchaser offers a price to which producers are forced to sale
without any other choice’. And it is mostly (admitted by 20% producers) found in
Kalamkari only. But most consumers except in case of Coorg orange bargain for the price
(Table-8.41). As presented in Table-6.47 and 5.42, the unit price of the products are as
given below:
Average unit price (Rs.) Product 2004 2005 2006
Chennapatna toys 9.0 10.7 12.5 Sri Kalahasti Kalamkari saree
4150 4750 1840
Coorg orange (Per/kg) 24.6 29.2 33.8
It can be said the Coorg orange producers have been in very comfortable
situation. The rates in case of Chennapatna toys are increasing but they were quite low.
The prices of Sri Kalahasti Kalamkari were decreasing since last three years.

156
4.11: Constraints in production and marketing
There are several constraints in production and marketing of the products. As detailed
in table-8.25, the following issues are the major issues with respect to each product.
- High competition is most important hindrance in production and marketing
of Chennapatna toys
- Tedious, time consuming and labour intensive process in Kalamkari is the most
important hindrance, the other hindrances are high temperature and rainy season.
- In Coorg orange, agronomic limitations and low marketing infrastructure with
equal importance to each are the major constraints in production and marketing
The specific constraints as narrated by the producers are:
Chennapatana toys: Competition of the products from China, poor advertisement,
absence of improved online based marketing, power shortage for the production & less
availability of colour filling materials.
Srikalahasti kalamkari: Costly product therefore less number of purchasers it can be
purchased only by rich people, scarcity of artists, water scarcity in swarnamukhi river,
and pollution of sand bed.
Coorg orange: lack of marketing facilities, varieties are not resistant to diseases, citrus
greening decreases the yield of orange, lack of storage facility, lack of transportation
facility.
high rainfall during flowering & harvesting is a problem. In rainy season harvesting is a
problem. Lack of disease resistant variety and knowledge of fertilizer management and
other modern agronomic management practices.
5.1: Inspection, quality control at various stages of production
Producers’ view
157
All the producers of Chennapatna toys and Kalamkari and 80% producers of
Coorg orange believe that whatever methods of inspection and quality control, these are
at production level only. It means producers only have to take care of them with full
responsibility (Table-8.15).
Institutional stakeholders’ view
As presented in table-8.31, the institutional stakeholders also support, the view of
producers in following way:
- In Coorg orange formal methods and on-site inspection is available
- In Kalamkari, the quality management left to producers only
- In Chennapatna toys, few believe that training is imparted along with on-site
inspection
5.2: Govt defined quality assurance methods and advice given for quality
improvement
As presented in table-8.32, the institutional stakeholders believe that other than
Coorg orange, there is no method of quality assurance from government side. In Coorg
orange, the producers need to have certain mandatory and voluntary standards (Fig.8.32).
5.3: Technical guidelines for production codes
About 70 - 90% producers believe that they produce as per self-guidelines learnt from
forefathers. As detailed in table-8.20, the following statements can be generalized.
- 80% producers of Coorg orange and 20% of Chennapatna toys admit that
production is as per technical guidelines of government departments.
- 20% producers of Coorg orange and 30% of Chennapatna toys admit that
production is as per technical guidelines of an NGO.
- Almost all in all three products, the producers agree that production is as per
technical guidelines of producers association.
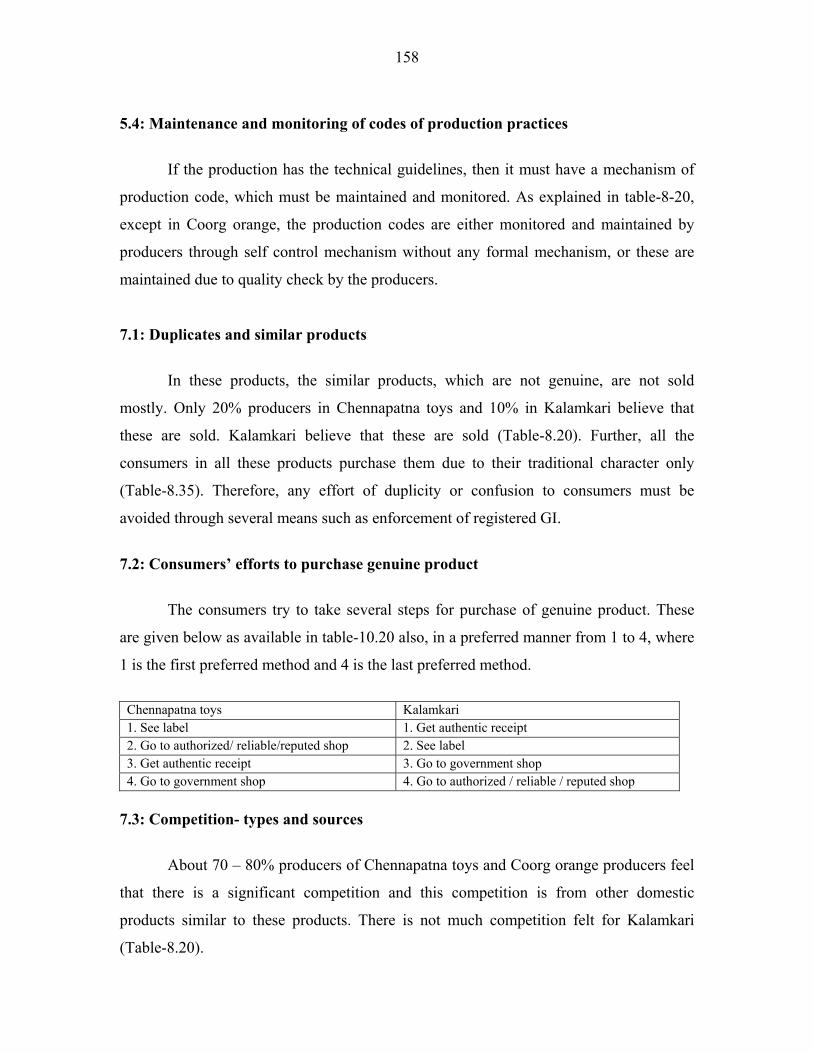
158
5.4: Maintenance and monitoring of codes of production practices
If the production has the technical guidelines, then it must have a mechanism of
production code, which must be maintained and monitored. As explained in table-8-20,
except in Coorg orange, the production codes are either monitored and maintained by
producers through self control mechanism without any formal mechanism, or these are
maintained due to quality check by the producers.
7.1: Duplicates and similar products
In these products, the similar products, which are not genuine, are not sold
mostly. Only 20% producers in Chennapatna toys and 10% in Kalamkari believe that
these are sold. Kalamkari believe that these are sold (Table-8.20). Further, all the
consumers in all these products purchase them due to their traditional character only
(Table-8.35). Therefore, any effort of duplicity or confusion to consumers must be
avoided through several means such as enforcement of registered GI.
7.2: Consumers’ efforts to purchase genuine product
The consumers try to take several steps for purchase of genuine product. These
are given below as available in table-10.20 also, in a preferred manner from 1 to 4, where
1 is the first preferred method and 4 is the last preferred method.
Chennapatna toys Kalamkari 1. See label 1. Get authentic receipt 2. Go to authorized/ reliable/reputed shop 2. See label 3. Get authentic receipt 3. Go to government shop 4. Go to government shop 4. Go to authorized / reliable / reputed shop
7.3: Competition- types and sources
About 70 – 80% producers of Chennapatna toys and Coorg orange producers feel
that there is a significant competition and this competition is from other domestic
products similar to these products. There is not much competition felt for Kalamkari
(Table-8.20).

159
7.6: Export and trade option of the products
The traders have given their opinion about trade suitability of the product. As
given in table-11.45, the following are prioritized suitability (1-top, 4-last) for each
product.
Trade option Chennapatna toys Kalamkari Coorg orange It is suited for the local consumption only 4 4 3 It is suited for the consumption in this state only 3 3 2 It is suited for the domestic consumption including other states also
1 1 1
It is suited for export to other countries 2 2 4
Here it is clear that for these products, the top-most trade suitability is domestic
consumption, therefore efforts to be done to enhance domestic sales. The traders have
also given their views about that what must be a preferred approach for trade of the
product. As tabulated in tabe-11.47, the topmost of four prioritized options are given
below:
Chennapatna toys: Equal preference to be given for both domestic and export
Kalamkari: Preference must be given for export than the domestic sales
Coorg orange: It is neither suited for export nor domestic sale. Therefore, it can be
sold in the state or neighbouring areas.
8.1: Observed changes after registration- on market
Several producers have observed post registration changes i.e. 70, 80 and 20% of
producers of Chennapatna toys, Kalamkari and Coorg orange respectively. But increase
in annual production is observed by 30% of Coorg orange producers and 20% of
Kalamkari producers (Table-8.27). The increase in net profit, less competition have been
observed by only about 10% producers in each product. The market expansion have been
observed by 70 – 80% producers (Table-8.27). But there is no evidentiary proof available
that it has occurred due to GI registration, in these products not any legal or infringement
action has been found, which could support the post registration changes. Of course the
registration has given more publicity to the product.

160
8.2: Observed changes after registration- livelihoods & overall socio-economic
conditions
There was no change observed on either shift from other livelihoods to RGI
product or any improvement in overall socio-economic conditions of producers (Table-
8.27).
8.3: Observed changes after registration- enhanced premium felt by producers
As presented in table-8.28, there was no change as far as enhanced premium to
the producers is concerned because 80 – 90% of the producers say ‘no’ to it (Fig.8.28).
Those meager number of producers (1 or 2) who said premium is enhanced, they also
admit that it was 0-5% only (Table-8.29).
9.1: Willingness for registration and payment thereof
The producers are willing to pay for registration of GI. It constitutes 80% of
Chennapatna toys producers, 90% of Coorg orange and 10% of Kalamkari producers
(Table-8.26). It is worth note these products are already registered but still the producers
need to be registered as authorized users and fees for that is also Rs. 500/-.
9.2: Money paid by producers for registration
No producer has paid money for registration (Table-8.27).
9.3: Willingness to pay for expected enhanced premium
What was the expectation of the producers as far as post-registration effect is
concerned? All Kalamkari producers had expectation of enhanced premium to them over
prevailing cost by 0 – 5%. About 70% of Chennapatna toys and 80% of Coorg orange
producers expected enhancement between 5 – 10%. No one except one Coorg orange
producer expected more than 10% (Fig.8.30). But would the consumer pay this expected
premium? As detailed in table-8.37, they are ready to pay it but mostly agree to 0 – 5%
premium over prevailing price and a few agree up to 5 – 10% also (Fig.8.37).
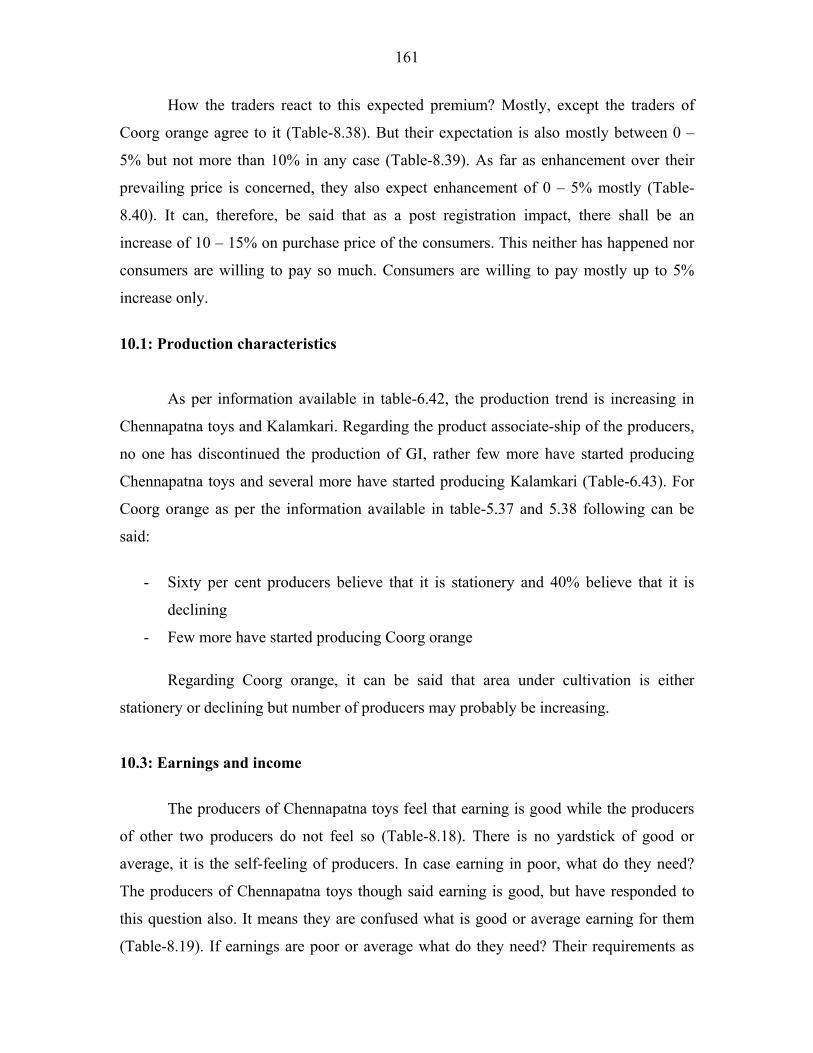
161
How the traders react to this expected premium? Mostly, except the traders of
Coorg orange agree to it (Table-8.38). But their expectation is also mostly between 0 –
5% but not more than 10% in any case (Table-8.39). As far as enhancement over their
prevailing price is concerned, they also expect enhancement of 0 – 5% mostly (Table-
8.40). It can, therefore, be said that as a post registration impact, there shall be an
increase of 10 – 15% on purchase price of the consumers. This neither has happened nor
consumers are willing to pay so much. Consumers are willing to pay mostly up to 5%
increase only.
10.1: Production characteristics
As per information available in table-6.42, the production trend is increasing in
Chennapatna toys and Kalamkari. Regarding the product associate-ship of the producers,
no one has discontinued the production of GI, rather few more have started producing
Chennapatna toys and several more have started producing Kalamkari (Table-6.43). For
Coorg orange as per the information available in table-5.37 and 5.38 following can be
said:
- Sixty per cent producers believe that it is stationery and 40% believe that it is
declining
- Few more have started producing Coorg orange
Regarding Coorg orange, it can be said that area under cultivation is either
stationery or declining but number of producers may probably be increasing.
10.3: Earnings and income
The producers of Chennapatna toys feel that earning is good while the producers
of other two producers do not feel so (Table-8.18). There is no yardstick of good or
average, it is the self-feeling of producers. In case earning in poor, what do they need?
The producers of Chennapatna toys though said earning is good, but have responded to
this question also. It means they are confused what is good or average earning for them
(Table-8.19). If earnings are poor or average what do they need? Their requirements as

162
explained by themselves in figure-8.19 are mostly related to financial and marketing
assistance.
10.4: Financial and infrastructure needs- for increasing production
The financial and infrastructure needs of the producers are given in table-8.17.
Almost all the producers need adequate marketing and better marketing (Fig.8.17). If
these are provided almost all the producers of Chennapatna toys and Sri Kalahasti
Kalamkari and 90% of Coorg orange producers have scope and capacity to improve the
production (Fig.8.17).
If, they have the capacity to improve the production, what they need then? As
presented in table-8.10, mostly the producers need financial and marketing assistance.
About 33% of Chennapatna producers and 19% of Coorg orange producers need supply
of machinery and equipments. While the Coorg orange producers (25%) also need
assistance in getting quality inputs also (Fig.8.10). Product specific concerns are
presented below:
Chennapatana toys: If marketing infrastructure is improved, sale of toys will increase and
there by increase the standard of living of the producers. Marketing can be done through
exhibitions, emporium, online based marketing etc.
Kalamkari: Organising more exhibitions, paying TA / DA to artists and marketing at
foreign fairs. More publicity through media, allotment of counters at temple towns viz.
Kanipakam, Tirumala, Tirupati and organising more exhibitions.
Coorg orange: High yielding and disease résistance variety should be developed and
supplied
10.5: Awareness of producers and stakeholders about GI
The knowledge level of producers of various products is presented in the matrix.
In addition to producers, what is the awareness level of institutional stakeholders about
the products, quality, reputation and other characteristics attributed to geographical

163
origin? And for this question no stakeholder said ‘no’ to it. It means all are aware about
the product (Table-9.35).
Percent respondents agree Parameters agreed by the producers Chennapatna toys
Srikalhasti kalamkari
Coorg orange
Uniqueness due to geographical origin 70.00 70.00 80.00 Knowledge that product can be protected as GI 60.00 10.00 (30.00 Knowledge of post registration effects- authority to use product name by registered producers
60.00 10.00 (90.00
Knowledge of post registration effects- restriction to produce within registered geographical area
40.00 10.00 100.00
Knowledge of post registration effects- restriction on trader to sell product produced by registered producers
0
10.00 20.00
Knowledge of post registration effects- traders can be sued in court of law
20.00 10.00 30.00
Knowledge of post registration effects- higher market value as a community monopoly
20.00 10.00 100.00
Status of registration of product as GI 80.00 0 70.00
10.6: Role of agencies in development and strengthening of producers’ associations
In all the three products, the producers’ association are available and 60%
producers in Chennapatna toys, 70% in Coorg orange and all in Kalamkari are the
members of such associations.
10.8: Future prospects of the product
Knowing about the future prospect of the product is very important. The key
stakeholders would be able to give some clue about it.
Opinion of most stakeholders Product
Institutional stakeholders (Table-9.34)
Consumers (Table-10.21)
Traders (Table-11.27)
Chennapatna toys
Bright and likely to improve Bright and likely to improve
Bright and likely to improve
Kalamkari Bright and likely to improve Very bright Bright and likely to improve
Coorg orange Bright and likely to improve Stationery Stationery
It can be said that all the stakeholders are in agreement except for Coorg orange, where
consumers and traders feel the situation would remain same.
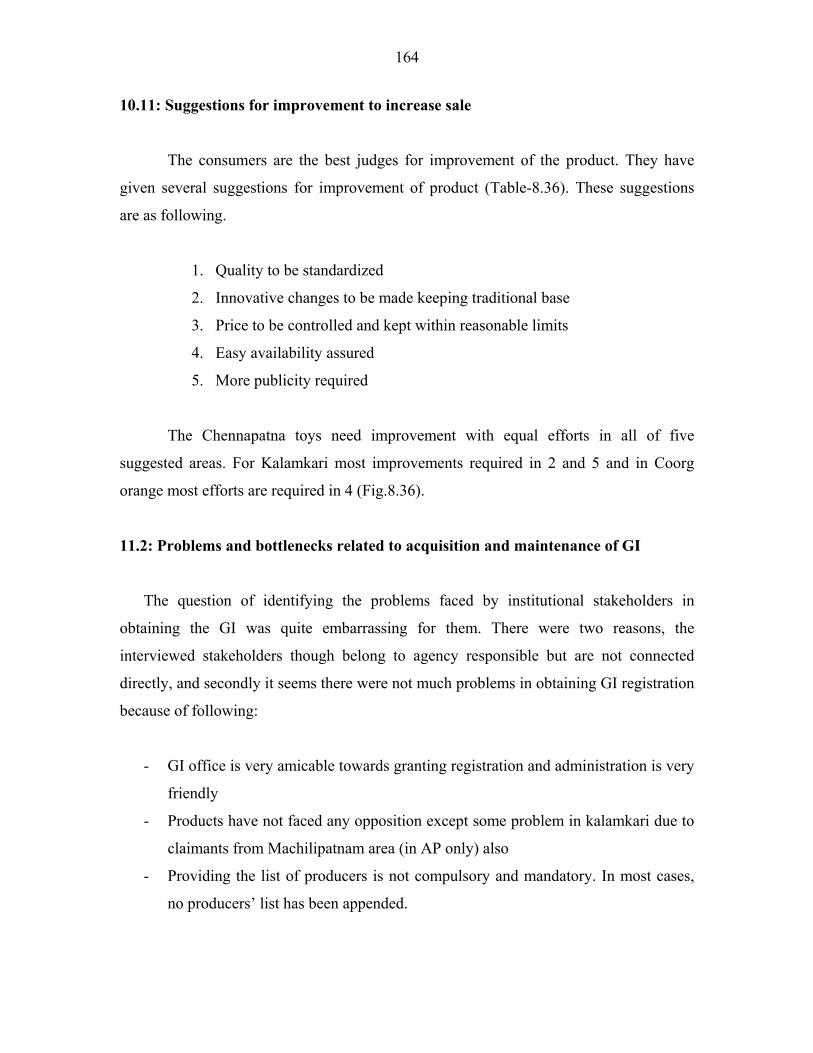
164
10.11: Suggestions for improvement to increase sale
The consumers are the best judges for improvement of the product. They have
given several suggestions for improvement of product (Table-8.36). These suggestions
are as following.
1. Quality to be standardized
2. Innovative changes to be made keeping traditional base
3. Price to be controlled and kept within reasonable limits
4. Easy availability assured
5. More publicity required
The Chennapatna toys need improvement with equal efforts in all of five
suggested areas. For Kalamkari most improvements required in 2 and 5 and in Coorg
orange most efforts are required in 4 (Fig.8.36).
11.2: Problems and bottlenecks related to acquisition and maintenance of GI
The question of identifying the problems faced by institutional stakeholders in
obtaining the GI was quite embarrassing for them. There were two reasons, the
interviewed stakeholders though belong to agency responsible but are not connected
directly, and secondly it seems there were not much problems in obtaining GI registration
because of following:
- GI office is very amicable towards granting registration and administration is very
friendly
- Products have not faced any opposition except some problem in kalamkari due to
claimants from Machilipatnam area (in AP only) also
- Providing the list of producers is not compulsory and mandatory. In most cases,
no producers’ list has been appended.

165
- Establishment of the claim of uniqueness has not been a difficult task at the level
of producers or those who claim a GI. There are several facts to support this
statement and one of them is that no rigorous scientific exercise and
experimentation have been done to establish the uniqueness of the products.
Therefore, as presented in table-8.33, in most cases, out of six interviewed
institutional stakeholders, many of them have expressed ‘can’t say’ or none’, only few
stakeholders said there is a dilemma at producers level because their ignorance about the
new law is a biggest hindrance in convincing them about the fruits of registered GI. In
some cases like Kalamkari, the technical and administrative needs of GI registration were
the main problems.
After registration, there is a question about constraints faced by institutional
stakeholders in maintenance of GI product. In this also, there is a great confusion about
the post registration role of institutional stakeholders. In most of the cases, they believe
that as soon as registration is done, their role is complete and target achieved. Therefore,
as presented in table-8.34 either they can’t say anything or they do not have any
constraint. All has said this. In Kalamkari all said maintenance of quality is the
constraints. But in maintenance and monitoring of GI, these are more than that. It can
therefore be said that institutional stakeholders are in mood to relieve them from the post
registration responsibilities. Also they need to be educated about their future role for
maintenance and monitoring of a GI, to which they are almost unaware.

166
Analytical Profile of Products Involving Registered GI: opinion of stakeholders- Figures
Fig-8.4: Monthly expenditure pattern of producers of RGI products
01020304050607080
ChennapatnaToys
Srikalahasthikalamkari
Coorg Orange
Ave
rage
exp
endi
ture
- Rs
(%)
Food Expenses
Health
Education
Others
Fig-8.5: Contribution of different sources in net annual income of producers of RGI products
0
1020
30
4050
60
7080
90
ChennapatnaToys
Srikalahasthikalamkari
Coorg Orange
Ave
rage
Inco
me-
Rs
(%)
Agriculture,horticulture,plantation, forestryLivestock, poultry,fishing
Trading
Other enterprises
Wage/Salary income
Other income
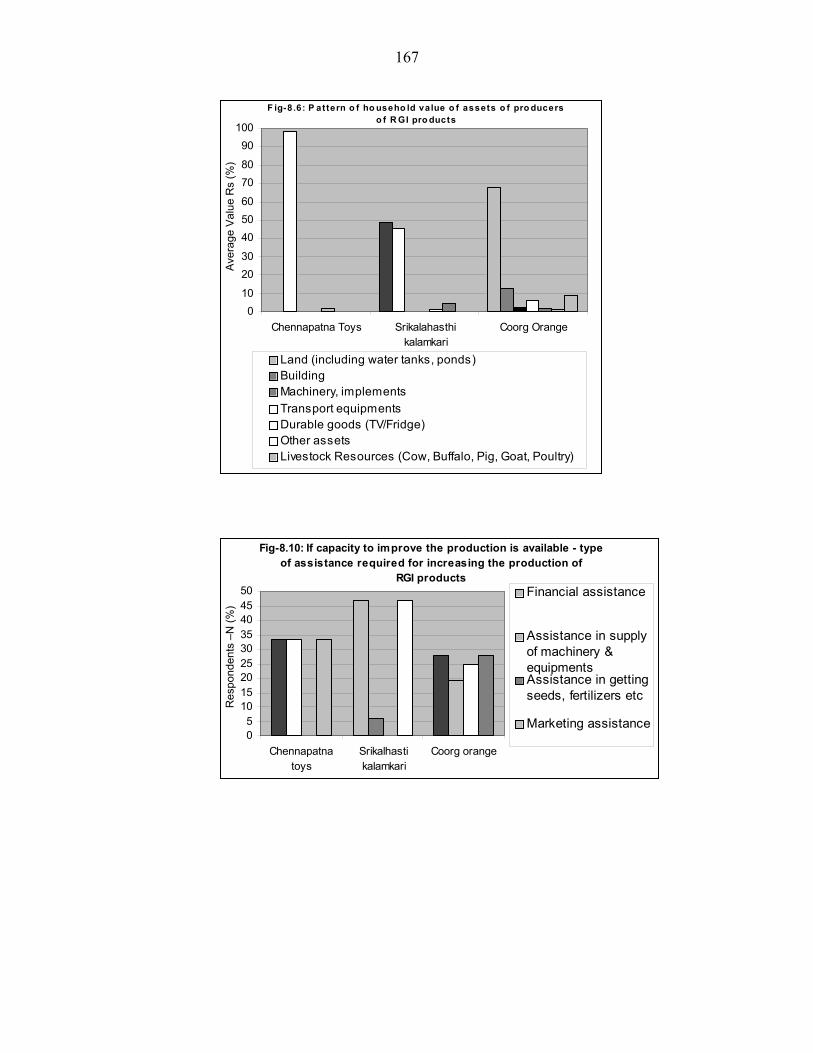
167
F ig-8.6: P attern o f ho useho ld value o f assets o f pro ducers o f R GI pro ducts
010
2030
405060
7080
90100
Chennapatna Toys Srikalahasthikalamkari
Coorg Orange
Ave
rage
Val
ue R
s (%
)
Land (including water tanks, ponds)Building Machinery, implements Transport equipmentsDurable goods (TV/Fridge)Other assetsLivestock Resources (Cow, Buffalo, Pig, Goat, Poultry)
Fig-8.10: If capacity to improve the production is available - type of assistance required for increasing the production of
RGI products
05
101520253035404550
Chennapatnatoys
Srikalhastikalamkari
Coorg orange
Res
pond
ents
–N
(%)
Financial assistance
Assistance in supplyof machinery &equipmentsAssistance in gettingseeds, fertilizers etc
Marketing assistance
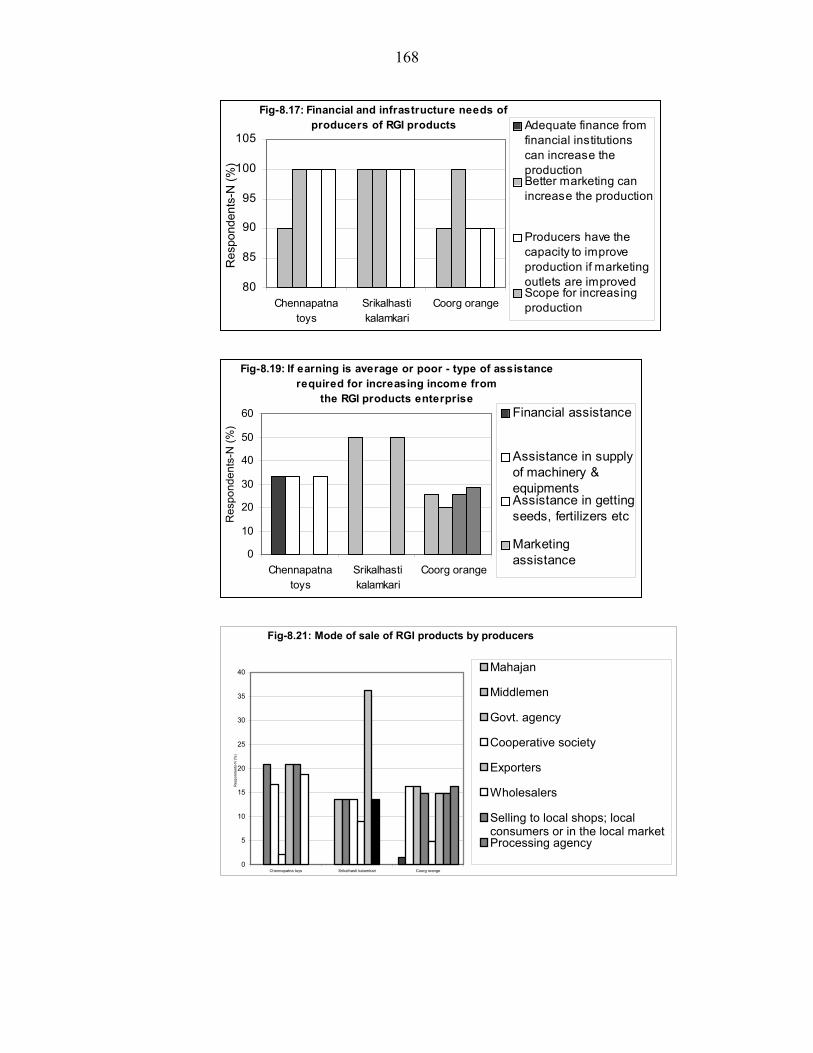
168
Fig-8.17: Financial and infrastructure needs of producers of RGI products
80
85
90
95
100
105
Chennapatnatoys
Srikalhastikalamkari
Coorg orange
Res
pond
ents
-N (%
)
Adequate finance fromfinancial institutionscan increase theproductionBetter marketing canincrease the production
Producers have thecapacity to improveproduction if marketingoutlets are improvedScope for increasingproduction
Fig-8.19: If earning is average or poor - type of assistance required for increasing income from
the RGI products enterprise
0
10
20
30
40
50
60
Chennapatnatoys
Srikalhastikalamkari
Coorg orange
Res
pond
ents
-N (%
)
Financial assistance
Assistance in supplyof machinery &equipmentsAssistance in gettingseeds, fertilizers etc
Marketingassistance
Fig-8.21: Mode of sale of RGI products by producers
0
5
10
15
20
25
30
35
40
Chennapatna toys Srikalhasti kalamkari Coorg orange
Res
pond
ents
-N (%
)
Mahajan
Middlemen
Govt. agency
Cooperative society
Exporters
Wholesalers
Selling to local shops; localconsumers or in the local marketProcessing agency

169
Fig-8.28: Producer’s response whether after registration of RGI products, the premium to the
producers has increased
0102030405060708090
100
Chennapatnatoys
Srikalhastikalamkari
Coorg orange
Res
pond
ents
-N (%
)
YesNo
Fig-8.30: Enhanced premium to the producers over the prevailing cost after GI registration of
the RGI products
0102030405060708090
100110
Chennapatnatoys
Srikalhastikalamkari
Coorgorange
Res
pond
ents
-N (%
)
0-55-1010-15
Fig-8.32: Methods of government defined quality assurance in RGI products
0
20
40
60
80
100
120
Chennapatnatoys
Srikalahastikalamkari
CoorgOrange
Res
pond
ents
-N (%
)
No formal qualityassurance
Producers’ regulatedraw material testing
Quality check forexports
Regulating compliancefor mandatory andvoluntary standards
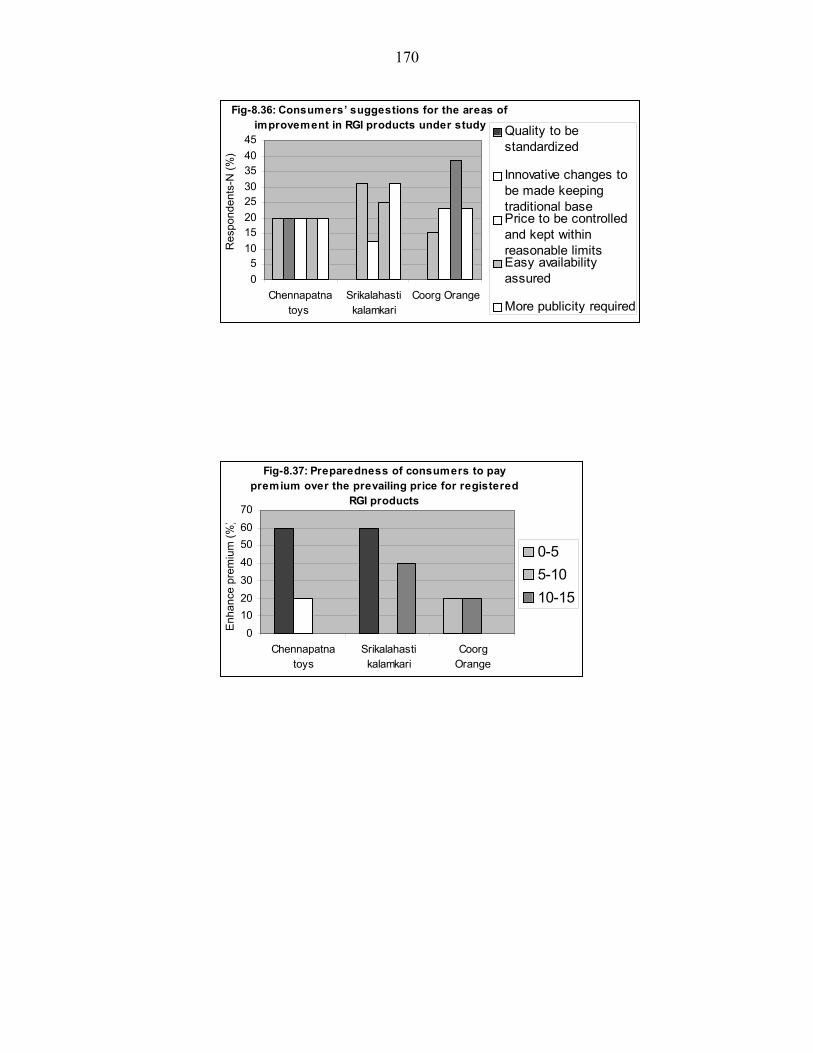
170
Fig-8.36: Consumers’ suggestions for the areas of improvement in RGI products under study
05
1015202530354045
Chennapatnatoys
Srikalahastikalamkari
Coorg Orange
Res
pond
ents
-N (%
)
Quality to bestandardized
Innovative changes tobe made keepingtraditional basePrice to be controlledand kept withinreasonable limitsEasy availabilityassured
More publicity required
Fig-8.37: Preparedness of consumers to pay premium over the prevailing price for registered
RGI products
010203040506070
Chennapatnatoys
Srikalahastikalamkari
CoorgOrange
Enh
ance
pre
miu
m (%
)
0-55-1010-15
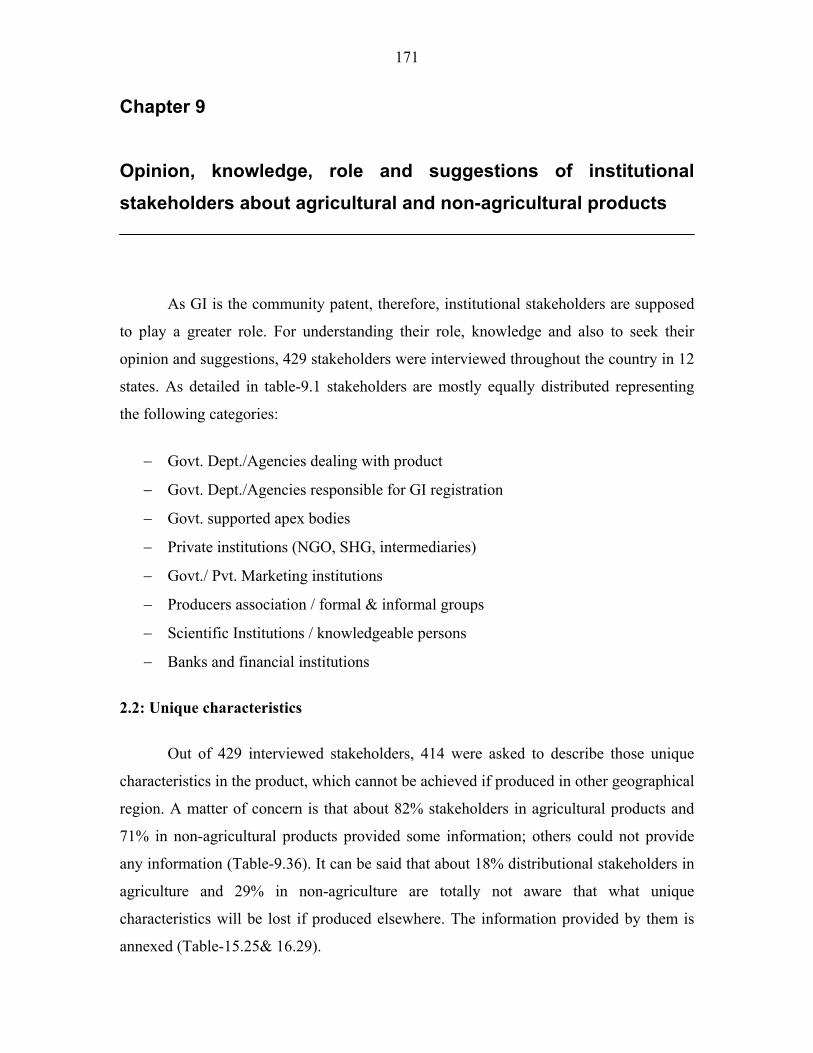
171
Chapter 9 Opinion, knowledge, role and suggestions of institutional stakeholders about agricultural and non-agricultural products
As GI is the community patent, therefore, institutional stakeholders are supposed
to play a greater role. For understanding their role, knowledge and also to seek their
opinion and suggestions, 429 stakeholders were interviewed throughout the country in 12
states. As detailed in table-9.1 stakeholders are mostly equally distributed representing
the following categories:
− Govt. Dept./Agencies dealing with product
− Govt. Dept./Agencies responsible for GI registration
− Govt. supported apex bodies
− Private institutions (NGO, SHG, intermediaries)
− Govt./ Pvt. Marketing institutions
− Producers association / formal & informal groups
− Scientific Institutions / knowledgeable persons
− Banks and financial institutions
2.2: Unique characteristics
Out of 429 interviewed stakeholders, 414 were asked to describe those unique
characteristics in the product, which cannot be achieved if produced in other geographical
region. A matter of concern is that about 82% stakeholders in agricultural products and
71% in non-agricultural products provided some information; others could not provide
any information (Table-9.36). It can be said that about 18% distributional stakeholders in
agriculture and 29% in non-agriculture are totally not aware that what unique
characteristics will be lost if produced elsewhere. The information provided by them is
annexed (Table-15.25& 16.29).

172
3.2: Activities-seasonality
A month-wise summary of activities of personnel related to sale of products is
given for each agricultural and non-agricultural product (Table-9.54 &9.55). A
comparative statement of activity chart of production and sale for each product is
provided on table-9.56 for agricultural products and on table-9.57 for non-agricultural
products.
3.4: Resources- persons engaged in organizations
All the institutional stakeholders do not belong to an organization that concern
with marketing / sale of product, but few are related to that kind of work. These were
interviewed, therefore, data reflected in table-9.58 and 9.59 does not belong to one shop
or establishment rather it belongs to organization such as government supported apex
body, marketing institution of government of private and producers associations. These
organizations may have several establishments in the state or country for marketing the
product.
The data presented in table-9.58 for agricultural products and in table-9.59 for non-
agricultural products reveals the following facts.
- Requirement of human resources is in increasing order from professionals,
technicians, other skilled persons and unskilled persons
- About 74% human resource for agricultural products and 70% for non-
agricultural product is skilled or unskilled labour.
- Requirement of agricultural organizations is more (216 per month) than the non-
agricultural organizations (153 per month).
- The payments are highest for professionals, which is Rs 1318 per month/person in
agricultural organizations and Rs. 3051 per moth/person in non-agricultural
organizations (Fig. 9.58, 9.59).
- Comparatively, skilled labour gets higher wages in non-agricultural products;
even this amount is more than the amount given to professionals in agricultural
products’ organizations.
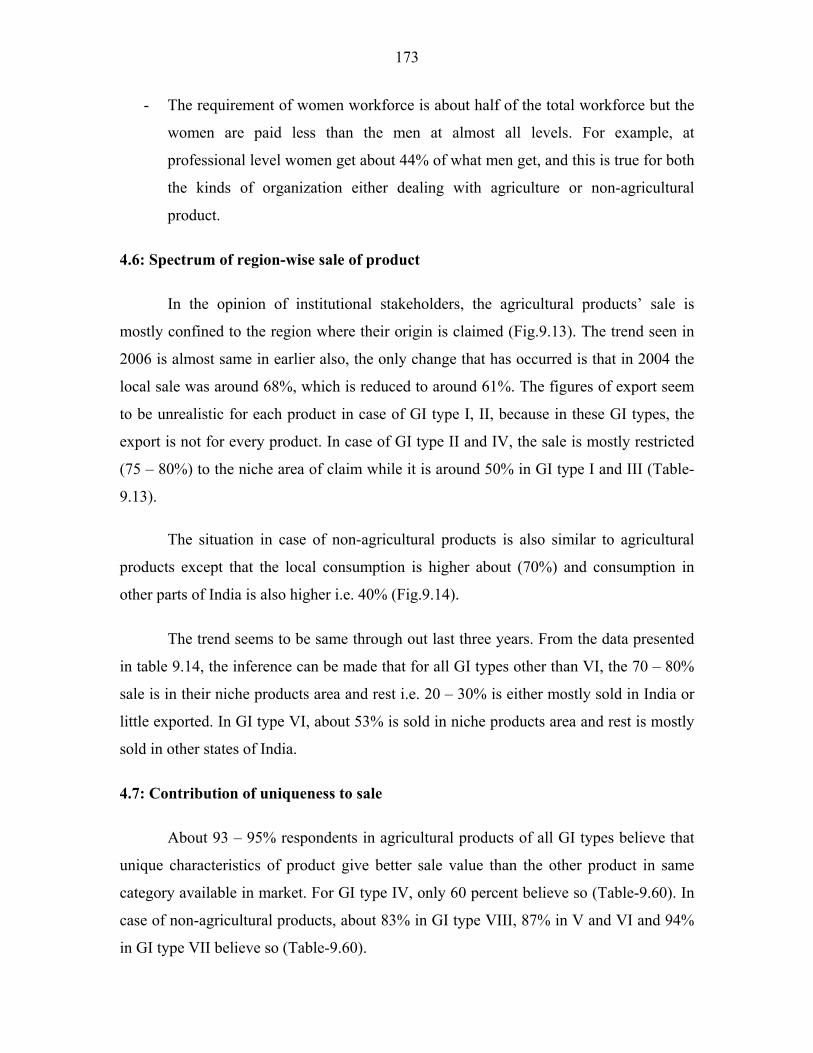
173
- The requirement of women workforce is about half of the total workforce but the
women are paid less than the men at almost all levels. For example, at
professional level women get about 44% of what men get, and this is true for both
the kinds of organization either dealing with agriculture or non-agricultural
product.
4.6: Spectrum of region-wise sale of product
In the opinion of institutional stakeholders, the agricultural products’ sale is
mostly confined to the region where their origin is claimed (Fig.9.13). The trend seen in
2006 is almost same in earlier also, the only change that has occurred is that in 2004 the
local sale was around 68%, which is reduced to around 61%. The figures of export seem
to be unrealistic for each product in case of GI type I, II, because in these GI types, the
export is not for every product. In case of GI type II and IV, the sale is mostly restricted
(75 – 80%) to the niche area of claim while it is around 50% in GI type I and III (Table-
9.13).
The situation in case of non-agricultural products is also similar to agricultural
products except that the local consumption is higher about (70%) and consumption in
other parts of India is also higher i.e. 40% (Fig.9.14).
The trend seems to be same through out last three years. From the data presented
in table 9.14, the inference can be made that for all GI types other than VI, the 70 – 80%
sale is in their niche products area and rest i.e. 20 – 30% is either mostly sold in India or
little exported. In GI type VI, about 53% is sold in niche products area and rest is mostly
sold in other states of India.
4.7: Contribution of uniqueness to sale
About 93 – 95% respondents in agricultural products of all GI types believe that
unique characteristics of product give better sale value than the other product in same
category available in market. For GI type IV, only 60 percent believe so (Table-9.60). In
case of non-agricultural products, about 83% in GI type VIII, 87% in V and VI and 94%
in GI type VII believe so (Table-9.60).
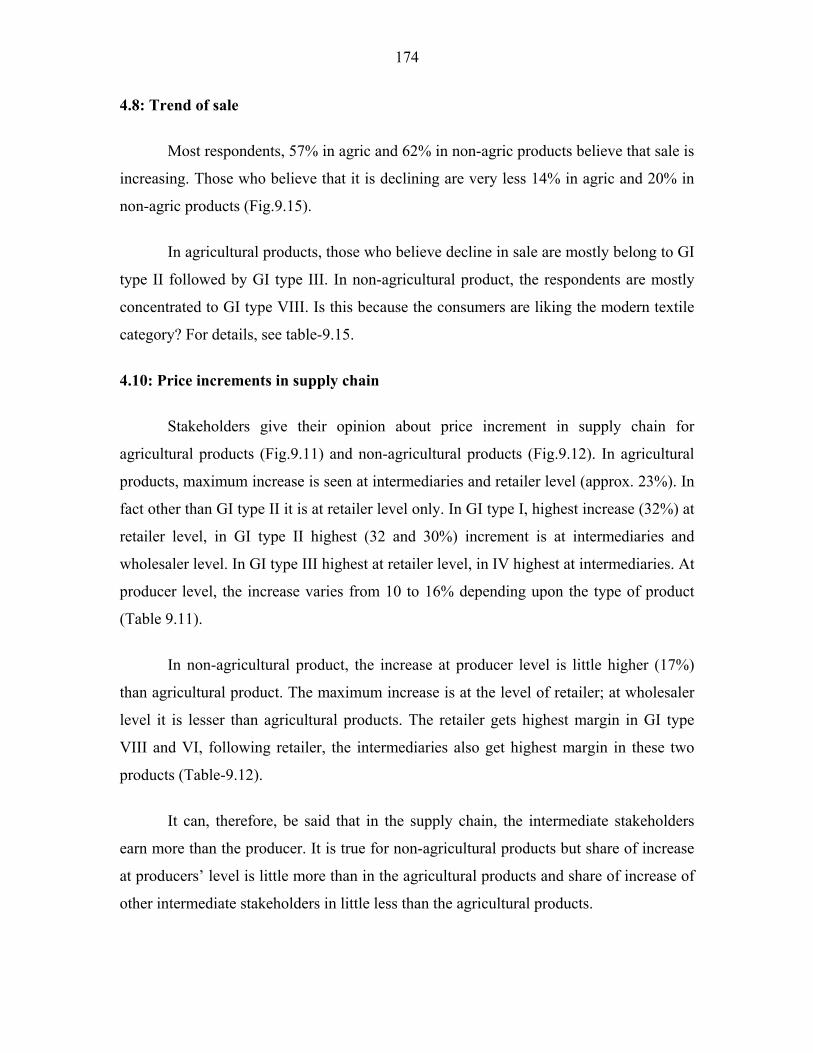
174
4.8: Trend of sale
Most respondents, 57% in agric and 62% in non-agric products believe that sale is
increasing. Those who believe that it is declining are very less 14% in agric and 20% in
non-agric products (Fig.9.15).
In agricultural products, those who believe decline in sale are mostly belong to GI
type II followed by GI type III. In non-agricultural product, the respondents are mostly
concentrated to GI type VIII. Is this because the consumers are liking the modern textile
category? For details, see table-9.15.
4.10: Price increments in supply chain
Stakeholders give their opinion about price increment in supply chain for
agricultural products (Fig.9.11) and non-agricultural products (Fig.9.12). In agricultural
products, maximum increase is seen at intermediaries and retailer level (approx. 23%). In
fact other than GI type II it is at retailer level only. In GI type I, highest increase (32%) at
retailer level, in GI type II highest (32 and 30%) increment is at intermediaries and
wholesaler level. In GI type III highest at retailer level, in IV highest at intermediaries. At
producer level, the increase varies from 10 to 16% depending upon the type of product
(Table 9.11).
In non-agricultural product, the increase at producer level is little higher (17%)
than agricultural product. The maximum increase is at the level of retailer; at wholesaler
level it is lesser than agricultural products. The retailer gets highest margin in GI type
VIII and VI, following retailer, the intermediaries also get highest margin in these two
products (Table-9.12).
It can, therefore, be said that in the supply chain, the intermediate stakeholders
earn more than the producer. It is true for non-agricultural products but share of increase
at producers’ level is little more than in the agricultural products and share of increase of
other intermediate stakeholders in little less than the agricultural products.
175
5.1: Inspection, quality control at various stages of production
In agricultural products around 45% feel that on-site advice and inspection is the
most prevalent method of quality control. In GI type III only scientific evidences are
method of quality control. Around 15% believe that there is not formal method of
inspection and quality control (In GI type II, III and IV). Significant proportion (21%)
believe that in-situ method by producers or extension, training and group communication
are other methods (Fig.9.2). The salient features from table-9.2 can be drawn as below:
- Scientific evidences in GI type III, and maintenance of voluntary and mandatory
standards in GI type I & III and in-situ methods by producers in GI type I are the
only available formal quality control method (expressed by 23% respondents).
- In GI type II and IV, extension, training and group communication, onsite advice
and inspection are the only methods of quality control. Can these be taken as
formal quality control methods? In these GI types there is no other method of
quality control available.
- Extension, training, group communication on site advice and inspection are the
major methods of quality control in all GI types in agriculture. But big question is
are these methods formal and regulatory for quality control or are these methods
just suggestions for helping producer with a view of enhancement of quality
production.
In case of non-agricultural products 19% respondents clearly believe that there are
no formal methods. About 46% believe the efforts done by producers at their own level
are the only quality control methods.
In strict sense, scientific evidences and maintenance of voluntary and mandatory
standards as believed by around 12% respondents are the only formal methods. From the
study of table-9.3, following inferences can be made.
- In-situ methods by producers are the strongest way of quality control applicable
across all GI types.
176
- Inspection by the producers at various levels such as raw material, manufacturing
and grading etc is available in GI type VIII only
- Extension and training communication prevalent in GI type VI and VII
- On Site advice and inspection is prevalent in GI type V, VI only
In GI type III & VII, the method of quality control is a formal and scientific,
which is not the case with other GI types. This kind of quality control is institutional
based. While for other GI types it is mostly self-controlled producers based.
The comparative account of methods of quality control in agricultural and non-
agriculture products are in given in table-9.4
5.2: Govt. defined quality assurance methods and advice given for quality
improvement
Methods of quality assurance
The main form of government-defined method of quality assurance in agriculture
is regulating post harvest practices and production practices along with input supply.
About 16% respondents believe that there is no formal quality assurance; it is mainly in
GI type II and IV (Fig.9.5). The other salient features as presented in table-9.5 are:
- In GI type I and III regulation of compliance for voluntary and mandatory
standard is available.
- In GI type IV, it is observed that no method of quality assurance is available;
producers’ regulated raw material testing is the only available method.
In non-agricultural products, majority believes that producers regulated raw
material testing is the most prevailing method except in GI type VII. About 19% believe
that there is no formal method (Fig.9.6). The other salient features as presented in table-
9.6 are:

177
- In GI type VII regulating production practices and input supply is main method,
followed by regulating compliance for mandatory and voluntary standards.
- In GI type VIII producers regulated raw material testing is the major method
followed by regulating compliance for certification standards (this method is
prevailing in GI type VIII only).
The comparative statement is given in table 9.7.
Technical advice for quality assurance
In agricultural products, advice or training is facilitated through public
organizations in all GI types except IV. The other major mode is advice or training
directly on production aspects, few respondents in GI type I, II and III believe that no
training is given (Fig.9.8, table 9.8).
In non-agricultural products also the pattern is same except that on top is the
advice/training directly followed by facilitation through the public organizations. Very
few (18%) but little higher than respondents in agriculture feel that no advice/training is
given. The comparative analysis of agricultural and non-agricultural products is presented
in table-9.10.
6.2: Expected changes after registration- on market
For agricultural products, a detailed analysis as per GI type is presented in table-
9.39. An overall analysis of all agricultural products as represented in fig.9.40 reveals
that more than 77% responses are in agreement about 5% are not in agreement and about
18% cannot say anything to the listed parameters. The major findings are:
More than 80% responses are in agreement that;
− Product Quality has standardized/will become standard
− Product grading has improved /will improve
− Income of producers has increased/will increase
− Income of traders has increased/will increase

178
− Price of the product has increased/will increase
− Overall improvement in socio-eco conditions of producers
70 – 80% responses are in agreement that
− Traders are purchasing/will purchase from actual and authorized producers
only
− Number of producers has increased/will increase
Only 60% responses are in favour that producers will produce more
Only 47% responses are in favour that producers will shift from other livelihood
activities.
For non-agricultural products, the detailed analysis as per GI type is presented in
Table 9.41. The overall analysis of all non-agricultural products (Fig.9.41) reveals that
76% responses are in agreement around 7% are in disagreement and around 17% are
indecisive to the listed parameters. The response is exactly similar to agricultural
products. The major highlights are:
More than 80% responses are in agreement that;
− Product Quality has standardized/will become standard
− Product grading has improved /will improve
− Traders are purchasing/will purchase from actual and authorized producers only
− Income of producers has increased/will increase
− Income of traders has increased/will increase
More than 75 – 80% responses are in agreement that;
− Number of producers has increased/will increase
− Producers are producing/will produce more
− Price of the product has increased/will increase
− Producers have shifted/will shift from other livelihood activities
− Overall improvement in socio-eco conditions of producers

179
Only 34% are in favour that producers will shift from other livelihood activities.
Results for agric and non-agric are same the institutional stakeholders do not have
enough confidence that producers will shift from other livelihoods.
6.4: Expected changes after registration- livelihoods & overall socio-economic
conditions
In agricultural products about 47% institutional stakeholders believe that
producers will shift from other livelihoods, around 27% are not able to decide anything
and rest have different opinions. The response is same across all the types, the response
for agreement is more in GI type II (50%), III (48%) and little less in GI type I (44%),
and IV (44%). Around 25% disagree; the disagreement is more in GI type I & IV. But as
far as impact is concerned about 80% believe that registration will bring overall
improvement in socio-economic conditions and rest 20% are indecisive, the response
among all categories is around 75% except in GI type I, where it is 95% (Table-9.40).
In non-agricultural products, the response is not much encouraging about shifting
of producers from other livelihood activities to production of GI, only 34% agree that
registration will bring change so that producers will shift from other livelihood activities
about 24% say no to it and 41% are indecisive. The response is poorest in GI type V,
where only 9% believe so but not 60% and rest are indecisive. For the change in overall
improvement in socio-economic conditions, the response is like agricultural products
only (78% agree, 3% disagree and 19% indecisive). The positive response was strongest
in GI type VI (97%) followed by VIII (81%) and moderate in the range of 63 – 65% in
GI type V and VII (Table-9.41).
6.6: Visualized benefits at time of GI registration
In the process of registration of product, several institutional stakeholders had
been involved in one-way or the other. What were their expectations at that time? The
response was poor as only 17 respondents in agriculture and 29 in non-agriculture could
180
provide input for this question, though number of respondents is low but some kind of
trend could be traced out of the responses. As presented in table-9.51, market
organization (24%) and enhancing regional, social and cultural benefits (24%) were the
most important expectations. Following this was the protection of production/sale rights
(13%) and next was the enhancing profit (11%). Interestingly 9% could not say anything.
Except that the enhanced production and productivity has been revealed by 11%
respondents in non-agricultural products the trend has been almost same in both the kinds
of products.
7.1: Duplicates and similar products
In agricultural products 46% believe that there are no duplicates and this belief is
most prevalent for GI type II (77% believe so, Fig.9.22). Moderate threat is available for
GI type I and III from other states. Though consumers prefer original only but this desire
is very strong for GI type I & III (Table-9.22).
In non-agricultural products also like agricultural products, 16% believe the
duplicates are present in market but unlike agricultural products 29% say no duplicates
available. The biggest problem in these products is that the duplicates from other areas
and states are threat (Table-9.23).
Institutional stakeholders have also suggested various ways and means to face
presence of duplicates and copy type in the market. In agricultural products and non-
agricultural products both, the top most method is administrative measures followed by
legal enforcement in agric products and IP protection in non-agric products. In
agriculture, next is branding and labeling, in non-agric, it is high quality standards but
both branding and high quality standards are two faces of same coin. Public awareness is
more important in agric products. For details, please see figures and tables 9.24 and 9.25.
The option of legal enforcement has come from those GI types where commercialization
is comparatively higher such as GI type I and VII. The dismal fact is that creating public
awareness has not been given much weightage across all the products.

181
7.3: Competition- types and sources
Duplicate may not be a problem but competition has been seen as a serious
matter; about 75% respondents believe that product faces competition. It seems
competition is more in non-agricultural products because 83% respondents feel so, while
in agriculture 65% believe that product faces competition (Fig.9.16). But competition
from where (See table-9.17)?
Source of competition for agricultural products
- Major source of competition is same product produced in other areas of country in
general for all GI types except in GI type IV.
- Second major sources in similar duplicates in the country and it is more severe in
GI type I and II and moderate in III.
- Competition in export market is severe in GI type III and moderate in I and low in
III.
- GI type IV does not have much competition
- Similar product imported in country is severe competition for GI type I and III
Source of competition for non-agricultural products
- Same products produced in other areas of the country combined with similar
duplicates are the biggest source of competition. It is severe in case of GI type
VIII and VII and moderate in GI type V and VI.
- Similar product imported in country and also export market competition have
been measured equally by the respondents and these are severe for GI type VI,
VII and VIII.
The respondents have also identified several other kinds of sources of competition
(Fig. 9.18). The most important is the competition from other products and also the
consumers’ preferences, especially in non-agricultural products, the preferences of
consumers are changing e.g. the modern artifacts are being preferred over traditional
handicrafts, souvenir made in Holland are preferred over khurja pottery and so on.

182
Another factor is less availability e.g. getting sehori wheat in Hyderabad or
kondapalli toys in Allahabad is a gigantic task. The last but not least is the competition
from producers group within, this is more prevalent in case of agricultural products e.g.
basmati farmers get around Rs 10 – 15/- a kilo, while the exporters groups or processing
units in Karnal get Rs. 30/- a kilo, the farmers are frustrated and feel better to grow a non-
basmati local non-descript variety such as ‘sharbati’, which gives value of Rs 8-9/- a
Kilo but production is more than double of basmati and input cost is also less.
7.4: Import of similar product and difference between imported and domestic
product
In agricultural products for GI type IV no import. In other GI types, 47%
respondents feel that imported product quality is inferior and in 25% cases respondents
are not aware of imported product. Some respondents in GI type I and III feel that
imported quality is better (Table-9.26). In case non-agric products most respondents feel
that imported quality is different (42%) and thus is applicable to each GI type except V.
In case of GI type V about 84% feels that there is no import and even if it is there product
quality may be inferior.
Like agriculture, 19% feel there is no import, 11% are not aware. About 22% feel
that imported quality is cheaper (Table-9.27).
7.5: Import of the products
The respondents are not much aware on this aspect and they do not have any
record to provide any information related to aspects like formal/informal channels of
import, volume, and entry point etc. Whatever little information available is presented in
table-19.19.
9.1: Willingness for registration and payment thereof
Average cost of registration is Rs 66,600. For agric products, little higher i.e. Rs.
83,200/-; while for non-agricultural products, little lower i.e. Rs. 50,000/-. For

183
agriculture, it may be higher because of collecting producers from far places and
conducting meetings etc. While for non-agriculture, people live in clusters and there are
associations also available. Average contribution per person was Rs. 378/- (Table-9.48).
Another significant feature about this question is that only 14 respondents each for
agriculture and non-agriculture products were available but 50% of them did not respond
to the question of cost of GI registration.
Several stakeholders have provided money for registration but government and
public institutions have been the major source (Table-9.47) followed by producers’
formal and informal associations. The contribution from individuals has been very less
and only a few cases are reported.
The producers especially small and marginal farmers or resource poor non-
agriculturists will not be able to afford any money for GI registration. In 12 cases out of
47 respondents told that financial assistance has been given by financial
institutions/banks for GI registration related activities (Table-9.69). But what is bankers’
views on future endeavours of GI registration. For providing financial support 75% of
bankers agreed, there were more agreement in agriculture (89%) than in non-agricultural
products (64%), the reason may be so many rural credit schemes are available for
agriculture so that disbursements can be adjusted against those approved credit schemes
(Table-9.70).
10.5: Awareness of producers and stakeholders about GI
In several products as presented in table-9.35 more than 90% and sometimes up to
95-96% respondents believe that uniqueness, quality and reputation of the product can be
attributed to geographical origin. In GI type VII and VIII, 66% and 72% respondents
believe so.
Awareness of institutional stakeholders about community patent that is GI was
very low. In agriculture only 19% respondents knew it, while in non-agricultural products
40% respondents knew it (Table-9.37). The reason is obvious because in non-agricultural
184
products, the activities related to GI registration or training have been more than in the
agric products.
Similarly, 11% respondents in agric and 26% in non-agricultural products know
that their product is registered under. About 25% stakeholders in agricultural products
and 6% in non-agricultural products did not know anything, rest said no to the question
asked from them (Table-9.38).
10.8: Future prospects of the product
The institutional stakeholders in extreme majority see the bright future of GI type
I (95%), III (92%), VIII (91%), VII (89%), V (87%), IV (85%) and VI (83%). But in case
of GI type II (Grains & potato etc) it is only 67% who believe bright future and likely to
improve, while 24% believe that it is likely to remain same. The salient features of data
presented in Table-9.34 can be summarized as given below:
Product type Likely to
worsen Remain same or likely to worsen
Remain same
Remain same but likely to be bright
Agricultural products Pokkali rice Pahari aloo Allepy cardamom
Kurnool rice Kokum fruit juice
Non-agricultural products
Punjabi jooti Saharanpur furniture Hyderabad pearls Kancheepuram silk Patola saree
The products studied and not listed in the above matrix has the bright future
prospects and that is likely to improve also.
10.9: Constructive measures to make production viable and improve future
prospects
In agriculture and non-agricultural products, the top suggestion to make
production viable and improve future prospects is improvements in production, followed
by government policy support and quality standardization maintenance and assurance
(Fig.9.28, 9.29). Good market practices are another area, which needs improvement.
Another observation is that GI registration has not been mentioned as areas of
improvement (only 25% in non-agriculture, 4.3% in agriculture mentioned it). It means
185
there is lack of complete understanding of GI portfolio at institutional stakeholders level
and it is a serious matter.
For agricultural products (Table-9.28), the highlights are:
- Post harvest level are also important and mostly in GI type III & I.
- Quality standardization is required in all but most concerned with GI type III and
least with IV.
- In GI type I good transport facilities are suggested
- Good marketing practices have been suggested is all except GI type IV.
- GI registration as a tool, has been thought of by few in GI type I & III.
- Publicity of product (8%) also needs improvement
For non-agricultural products (Table-9.29), the highlights are:
- Restriction on import has been sought by about 7% respondents and that too in GI
type VIII only.
- GI registration as a tool has been thought of by few in GI type V and VI.
- About 9% feel improvement through publicity as product.
10.10: Status of marketing and suggestions for improvement
In agricultural products, 46% respondents are satisfied with current status of
marketing. Surprisingly, the highest level of satisfaction is in GI type IV and lowest is in
GI type I (Fig.9.30). In non-agricultural products, about 69% respondents are satisfied, in
GI type V less number of respondents are satisfied. Surprisingly in GI type VI about 92%
respondents are satisfied (Fig.9.31).
The respondents have given various suggestions to improve the marketing of
products. There is difference in approach between agricultural products (Fig.9.32) and
non-agricultural products (Fig.9.33). The top three suggestions in agricultural products
are – organized and regulated market, government policy support and TQM, while the
top three suggestions in non-agricultural products are – publicity, government policy
186
support and TQM. Another big difference is that good marketing practices has been
viewed as serious suggestion in agricultural products but not in non-agric products. There
are certain specific issues in agricultural products (Table-9.32):
- Post harvest facility i.e. storage, transport and processing is a major issue in GI
type I & III.
- Though by few but suggestion has come for creating special marketing
- Organized and regulated market in GI type I & III.
Specific issues in non-agricultural products (Table-9.33):
- Good market practices have not been appreciated as a suggestion to improve
marketing.
- Organized and regulated market as suggestion in GI type VI and VIII.
- Though given by a few only, the wonderful idea has come i.e. use of ICTs in GI
type VI.
- Restricting import and duplicates is major issue concerning GI type VIII.
10.12: Scientific endeavors in product development
As described in fig.9.64 and table-9.64, the research institutions are in agreement
that they are conducting research studies to find out uniqueness (42%) and to establish
uniqueness (71%) but these institutions had very poor involvement for technical
interventions to stop infringement of GI and l facilitation of the GI registration process.
Though a fair number of respondents feel that they have been involved at one or another
step in facilitation of GI registration. The trend among agricultural and non-agricultural
product is same with few exception such as the initiative ness for GI registration very low
comparatively in non-agricultural products.
The bankers also have suggested the areas of research; the areas suggested for
agricultural and non-agricultural products are different (Fig.9.71 and 9.72). In agricultural
products, the top priority is TQM followed by futuristic development and enhancement of

187
productivity. While in non-agricultural products, the top area suggested is enhancing
productivity, followed by innovations and systems development with equal emphasis.
10.13: Endeavors by depts. and agencies responsible or concerned with GI
registration
Being a community property, the role of public institutions is expected to be the
strongest amongst other stakeholders. It is, therefore, decided to interview the
government department and agencies dealing with the product and also government
departments and agencies, which are supposed to be responsible for GI registration.
Therefore, 55 institutional stakeholders in agricultural products and 60 in non-agricultural
products were contacted to get information related to GI registration. In the state
governments, no specific responsibilities have been given to any government department
to facilitate the GI registration except in Himachal Pradesh, where State Council of
Science and Technology has been entrusted the specific responsibility of GI registration.
GI is a Common Property Resource (CPR) and as usually happens in CPRs, the
same occurs to GIs also ‘means’ ‘no man’s property’. The significant number of
‘supposed-to-be responsible’ refused to take any responsibility by simply saying, “it is
not our responsibility” go to that agency or this agency or top bosses of the department.
Out of the total contacted, at least half of them mean 32 in agricultural product and 29 in
non-agricultural products agreed to provide any information on this issue (Table-9.43)
and they also take the responsibility mostly indirectly (Fig.9.43). Out of those, who
responded 44% in agricultural products and 30% in non-agricultural products, agreed that
they have been trained in GI matters (Table-9.44). And in their opinion about, 45 – 47%
staff is trained (Table-9.45). But looking to very small number of respondents, this cannot
be generalized to other offices; the results are limited to their offices only. Out of those
who have taken the responsibility of GI registration about 50% have taken several
proactive steps as detailed in table-9.46.
The weaknesses have been only in following areas where only 30 – 36%
respondents say that they have taken some action. These weak areas are:
188
- Communication through radio / TV
- Not engaging NGOs / consultants to do the job
- Not taking any initiative to stop infringement of GI, mean they feel their
responsibility ends with registration
The major outcome of this portion of study is provided on following points:
- There is no specific department dealing with GI registration.
- Even in most concerned department e.g. Agricultural Department of M.P.
Government for sehori genhu does not have any instructions in this regard.
- There is no systematically arranged fixed responsibility along with target to
anyone.
- Mostly the GI registration have been done by the own knowledge gained by the
top brass/any dynamic individual of a department or subsidiary organizations
from training or elsewhere and out of their personal interest and involvement, the
registration could be done.
- In non-agricultural production, the responsibility has been taken by several
agencies of central or state government (e.g. textile committee, handicraft
development corporations, etc.) But this could not happen in case of agricultural
products except few products, where central government boards have taken
initiative.
- To avoid any future problems, it is strongly suggested that only government
supported departments and organizations should be allowed to retain the
ownership of a GI, and not any private organization because in very few cases
only a single organization represents the interest of larger group of society. The
small NGOs or any organization created by few persons does not necessarily
represent the interest of a larger group of society.
The problem of ownership will arise once the commercial part is strong. The
owner may refuse others to provide NOC for registration as authorized user. Are there
any guidelines for that? And ultimately it is a civil matter which may take years to
189
resolve in a civil court. Should then a genuine but unregistered producers wait for years?
An interest example can be quoted. An application for India’s most wanted product
“Basmati rice” has been put by a Karnal based organization called “Haryana Heritage
Trust”. Not a single farmer contacted in Punjab and even in Karnal itself knew about the
application and the applicant. Does this organization represent the interest of basmati rice
growers in Punjab and Haryana? The registration has not been issued to basmati rice but
reason is not that the organization does not represent the interest of producers.
More over for a common man it is impossible to find out the “actual physical
place of the applicant”, of India’s most wanted product i.e. “Basmati Rice”. It can well be
understood that what will be the case with other products of lesser commercial value.
Therefore, the responsibility of ownership of a GI cannot be left open to GI registry only,
state government must intervene in the matter above all it is the common property of the
residents of a state and not any private organization registered for the purpose. The
application system of a GI in India should not necessary be on the line of a patent i.e.
without any effective control and/or intervention of administration specially the state
governments.
10.14: Endeavors by financial institutions
There were only 28 respondents for this piece of information and at least half of
them agree that financial assistance is rendered for the producers (Table-9.65). The
average assistance is Rs. 1625 to 2089 per person for non-agric products but 1363 – 1568
for agric- products. The percent recovery is better by the producers of agricultural
products, the reason may be unlike agricultural loan, the gestation period of loans for
non-agricultural products may be higher (Table-9.66). The biggest reason for non-
financing is the non-availability of any specific scheme and secondly the producers did
not approach for assistance and third most important reason is that facilitation/
recommendation from government department is needed (Table-9.67). The bankers also
gave their views about GI and registration and majority believe that registration will
strengthen product as a organized sector of industrial good and will bring the

190
systematized welfare of producers (Fig.9.68). For financial assistance rendered (see para
9.1) and bankers’ views on R & D (see para 10.12).
11.1: Current level of protection, drawback, enforcement problems
Total infringement cases reported are 8 (2 in agricultural and 6 in non-agricultural
products, table-9.48 and table-9.63). The action to stop infringement cases has been
informed by 26 stakeholders (11 in agricultural and 15 in non-agricultural products). In
most cases (50%) it is the post infringement actions, but only 13 stakeholders say about
it. The rest are either pre-infringement legal enforcement actions (19%) or administrative
actions at producers/organizational level (11%). The details as presented in table 9.52
clearly reflect that not much action have been taken to stop infringement of the GIs.
11.2: Problems and bottlenecks related to acquisition and maintenance of GI
The institutional stakeholders are not much aware of the deficiencies or
difficulties found in getting the GI registration because only 27 respondents have
provided any response to it (Table-9.53). Probably not many stakeholders are directly
exposed to practical aspects of GI registration. But among those responded 48% believe
that there are deficiencies with respect to producers and collectivism (means lack of
formal/informal associations and groups). The second most (reported by 30%) important
deficiency lies with government departments in terms of initiatives on several fronts, and
22% report no deficiency.
Many responses are received for problems faced by institutional stakeholders in
obtaining GI registration but large section i.e. 27% of 176 responses is not in position to
say anything about it. The rest (24%) feel lack of responsiveness from government or
non-government organizations, 21% feel that producers are in dilemma (means who will
do? Is this beneficial, what is the process? Why should join? etc.). About 12% feel that
problem is getting for technical and administrative needs for registration. Only a handful
(about 8%) did not face any problem and another small section (7%) feel the lack of
responsive government policy in registration of products (Table-9.61).
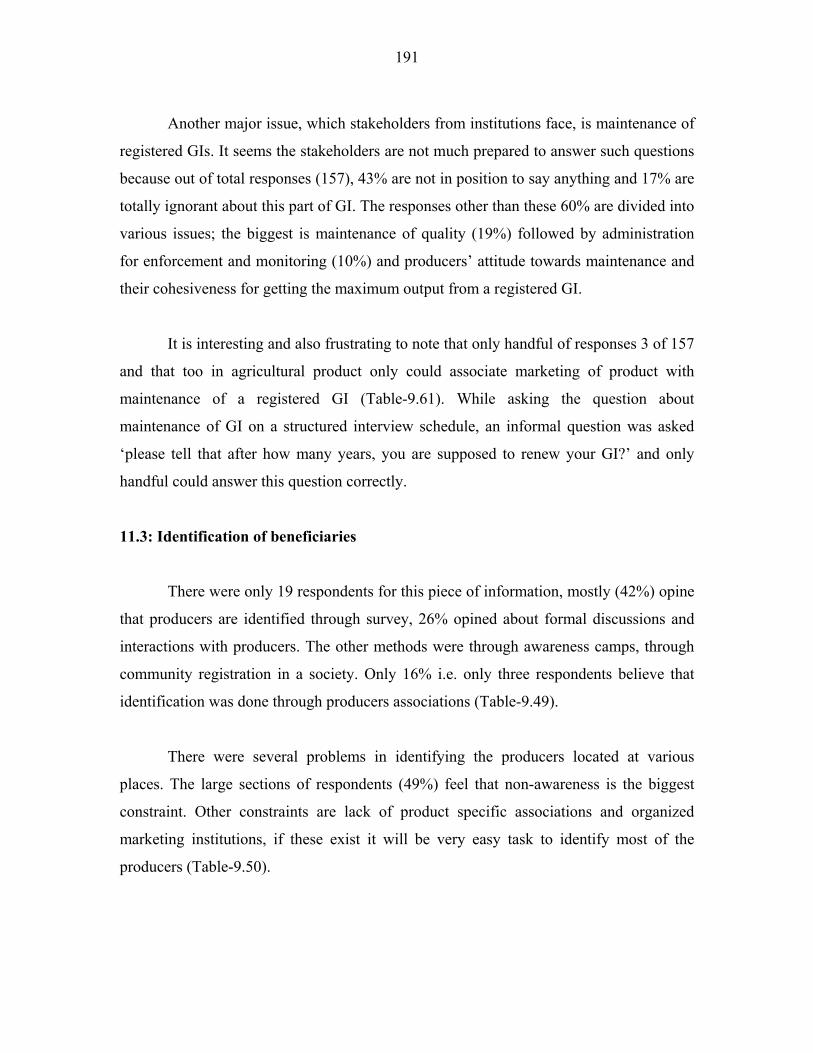
191
Another major issue, which stakeholders from institutions face, is maintenance of
registered GIs. It seems the stakeholders are not much prepared to answer such questions
because out of total responses (157), 43% are not in position to say anything and 17% are
totally ignorant about this part of GI. The responses other than these 60% are divided into
various issues; the biggest is maintenance of quality (19%) followed by administration
for enforcement and monitoring (10%) and producers’ attitude towards maintenance and
their cohesiveness for getting the maximum output from a registered GI.
It is interesting and also frustrating to note that only handful of responses 3 of 157
and that too in agricultural product only could associate marketing of product with
maintenance of a registered GI (Table-9.61). While asking the question about
maintenance of GI on a structured interview schedule, an informal question was asked
‘please tell that after how many years, you are supposed to renew your GI?’ and only
handful could answer this question correctly.
11.3: Identification of beneficiaries
There were only 19 respondents for this piece of information, mostly (42%) opine
that producers are identified through survey, 26% opined about formal discussions and
interactions with producers. The other methods were through awareness camps, through
community registration in a society. Only 16% i.e. only three respondents believe that
identification was done through producers associations (Table-9.49).
There were several problems in identifying the producers located at various
places. The large sections of respondents (49%) feel that non-awareness is the biggest
constraint. Other constraints are lack of product specific associations and organized
marketing institutions, if these exist it will be very easy task to identify most of the
producers (Table-9.50).

192
Opinion, knowledge, role and suggestions of institutional stakeholders about agricultural and non-agricultural products- Figures
Figure-9.1: Profile of institutional stakeholders
0369
121518
Gov
t.D
ept./
Age
ncie
sde
alin
g w
ithG
ovt.
Dep
t./A
genc
ies
resp
onsi
ble
for
Gov
t.su
ppor
ted
apex
bodi
esP
rivat
ein
stitu
tions
(NG
O, S
HG
,G
ovt./
Pvt
.M
arke
ting
inst
itutio
nsP
rodu
cers
asso
ciat
ion
/fo
rmal
&S
cien
tific
Inst
itutio
ns /
know
ledg
eabl
eB
anks
and
finan
cial
inst
itutio
ns
Perc
ent Agriculture
Products
NonAgricultureProducts
Figure-9.2: Method of inspection and quality control of agricultural products as advised by institutional stakeholders
05
101520253035404550
Methods of inspection
Res
pons
es %
No formal method of inspectionand quality controlIn-situ methods by producers
Maintenance of voluntary andmandatory standardsExtension, training and groupcommunicationOn-site advice and inspection
Scientific evidences
Figure-9.3: Method of inspection and quality control of non-agricultural products as advised by institutional stakeholders
02468
101214161820
Methods of inspection
Res
pons
es %
No formal method of inspection and qualitycontrolIn-situ methods by producers
Inspection by producer at level of purchaseof raw materialInspection by producer at level ofmanufacturing processInspection by producer at level of gradingand maintaining voluntary standardsMaintenance of voluntary and mandatorystandardsExtension, training and groupcommunicationOn-site advice and inspection
Scientific evidences
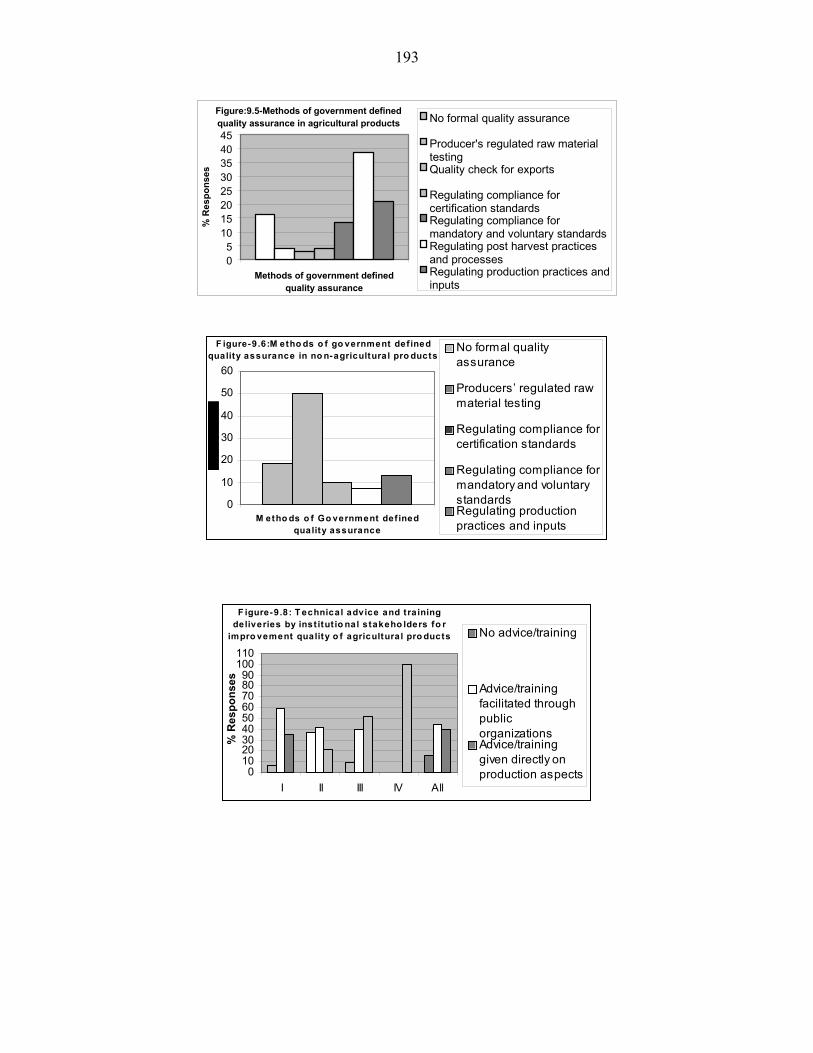
193
Figure:9.5-Methods of government defined quality assurance in agricultural products
05
1015202530354045
Methods of government definedquality assurance
% R
espo
nses
No formal quality assurance
Producer's regulated raw materialtestingQuality check for exports
Regulating compliance forcertification standardsRegulating compliance formandatory and voluntary standardsRegulating post harvest practicesand processesRegulating production practices andinputs
F igure-9.6:M etho ds o f go vernment def ined quality assurance in no n-agricultural pro ducts
0
10
20
30
40
50
60
M etho ds o f Go vernment def inedquality assurance
No formal qualityassurance
Producers’ regulated rawmaterial testing
Regulating compliance forcertification standards
Regulating compliance formandatory and voluntarystandardsRegulating productionpractices and inputs
F igure-9.8: T echnical advice and training deliveries by inst itut io nal stakeho lders fo r
impro vement quality o f agricultural pro ducts
0102030405060708090
100110
I II III IV All
% R
espo
nses
No advice/training
Advice/trainingfacilitated throughpublicorganizationsAdvice/traininggiven directly onproduction aspects
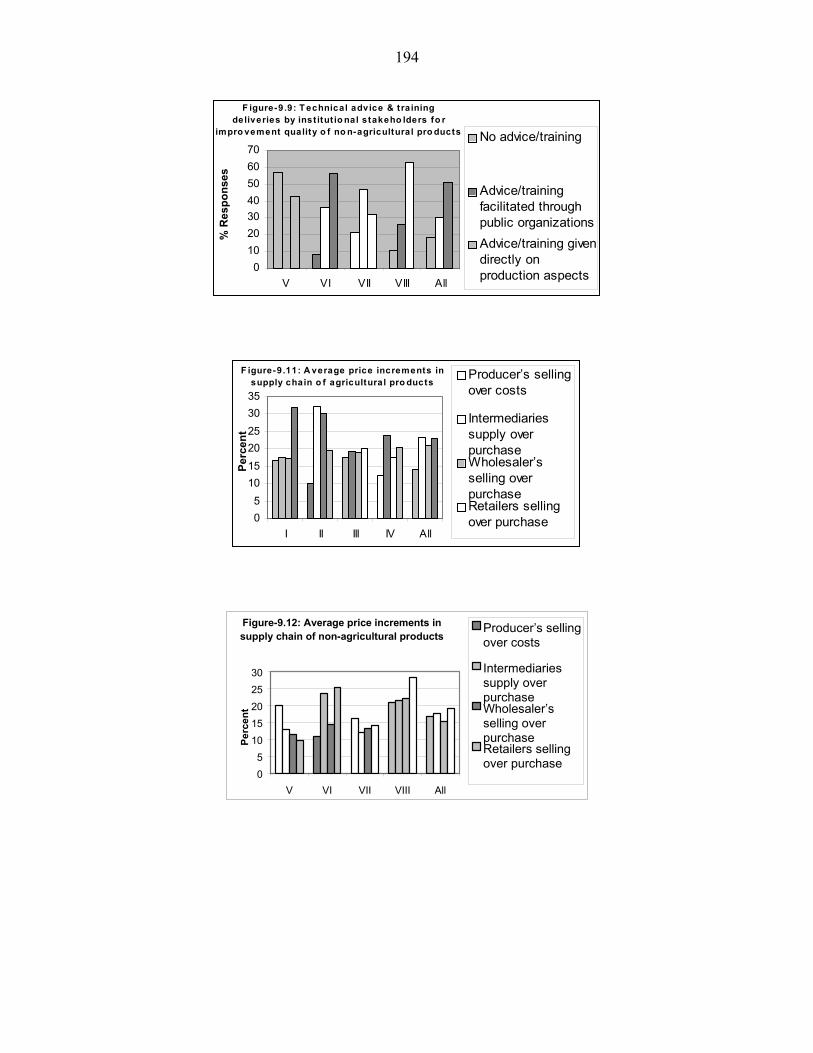
194
F igure-9.9: T echnical advice & training deliveries by inst itut io nal stakeho lders fo r
impro vement quality o f no n-agricultural pro ducts
010203040506070
V VI VII VIII All
% R
espo
nses
No advice/training
Advice/trainingfacilitated throughpublic organizationsAdvice/training givendirectly onproduction aspects
F igure-9.11: A verage price increments in supply chain o f agricultural pro ducts
05
101520253035
I II III IV All
Perc
ent
Producer’s sellingover costs
Intermediariessupply overpurchaseWholesaler’sselling overpurchaseRetailers sellingover purchase
Figure-9.12: Average price increments in supply chain of non-agricultural products
05
1015202530
V VI VII VIII All
Perc
ent
Producer’s sellingover costs
Intermediariessupply overpurchaseWholesaler’sselling overpurchaseRetailers sellingover purchase

195
F igure-9.13: A verage percent value o f spat ia l distribut io n o f sale o f agricultural pro ducts
fo r the year 2006
0102030405060708090
I II III IV All
Within theregion whereG.I. is claimedIn other partsof India
As exports
F igure-9.14: A verage percent value o f spat ia l distribut io n o f sale o f no n-agricultural pro ducts
fo r the year 2006
0102030405060708090
V VI VII VIII All
Perc
ent
Within theregion whereG.I. is claimedIn other partsof India
As exports
Figure-9.15: Trend of volume and value of marketing of products in last three years
010203040506070
Increasing-1
Stationary-2
Declining-3
% R
espo
nses All Agric.
products
All non-agricultureProducts
196
Figure-9.16: Institutional stakeholders’ views on significant competition to products
Facing (yes)
Not Facing(No)
Non Agriculture Products
Agriculture Products
Figure-9.17: Institutional stakeholders’ views about major type of competition faced by agricultural and non-agricultural products
0
10
2030
40
50
60
1 2 3 4
Res
pons
es %
All-agricultureproducts
All- nonAgricultureProducts
Figure-9.18: Institutional stakeholders’ views about supplementary types of competition faced by agricultural
and non-agricultural products
0
10
20
30
40
50
60
Agri.products
Non.AgriProducts
All products
Competition fromother products
Consumer’spreference
Less availability ofthe same produce
Competition fromProducers group

197
Figure-9.20: Institutional stakeholders’ views
about major methods to face competition
0
4
8
12
16
20
1 2 3 4 5 6 7 8
Res
pons
es %
Total-agricultureproductsTotal -nonAgricultureProducts
Note: Code [1.Production quality control and inspection quality assurance methods to be effectively introduced, 2.Through design and technological development, 3. Improvement of marketing methods, 4. Intensive publicity, 5. Export-oriented development, 6. Cutting down production and marketing costs, 7. Organizing exhibitions, expos, and market complexes etc., 8. Seeking GI Registration]
Figure-9.22: Institutional stakeholders’ views on presence of duplicate / copy type of the agricultural products in the market
01020304050607080
I II III IV All
No duplicates
Duplicates present in market
Inferior quality of duplicates
Duplicate from other area/ statesare threat
Consumers prefer original productsonly (for GI-8)/ Not muchcompetition from duplicates (for GI-I)
Figure-9.23: Institutional stakeholders’ views on presence of duplicate / copy type of the non-agricultural products in the market
0
10
20
30
40
50
60
70
V VI VII VIII All
No duplicates
Duplicates present in market
Inferior quality of duplicates
Duplicate from other area/ states arethreat
Consumers prefer original productsonly (for GI-VIII)/ Not muchcompetition from duplicates (for GI-I)

198
Fig- 9.24: Institutional stakeholders’ suggested ways & means to face presence of duplicates/
copy type agricultural products in market
05
1015202530354045
Ways and means
Perc
ent
Administrative measures
Branding and labeling
Consumers discourageduplicatesHigh quality standards
IP protection
Legal enforcement
Promoting originals
Public awareness
F igure-9.25: Inst itut io nal stakeho lders’ suggested ways & means to face presence o f duplicates/ co py
type no n-agricultural pro ducts in market
05
1015202530354045505560
Ways and means
Perc
ent
Administrative measures
Consumers prefer originalproducts onlyHigh quality standards
IP protection
Legal enforcement
Public awareness
T able-9.28 : Suggest io ns o f inst itut io nal stakeho lders abo ut measures to make pro duct io n eco no mic viable and impro ve
future pro spects o f agricultural pro ducts
05
1015202530354045
Suggestion
Perc
ent
Production level improvements
Post harvest level improvements
Quality standardization,maintenance and assuranceGovernment policy support
Good transport facilities
Good market practices
Publicity of the product
GI registration
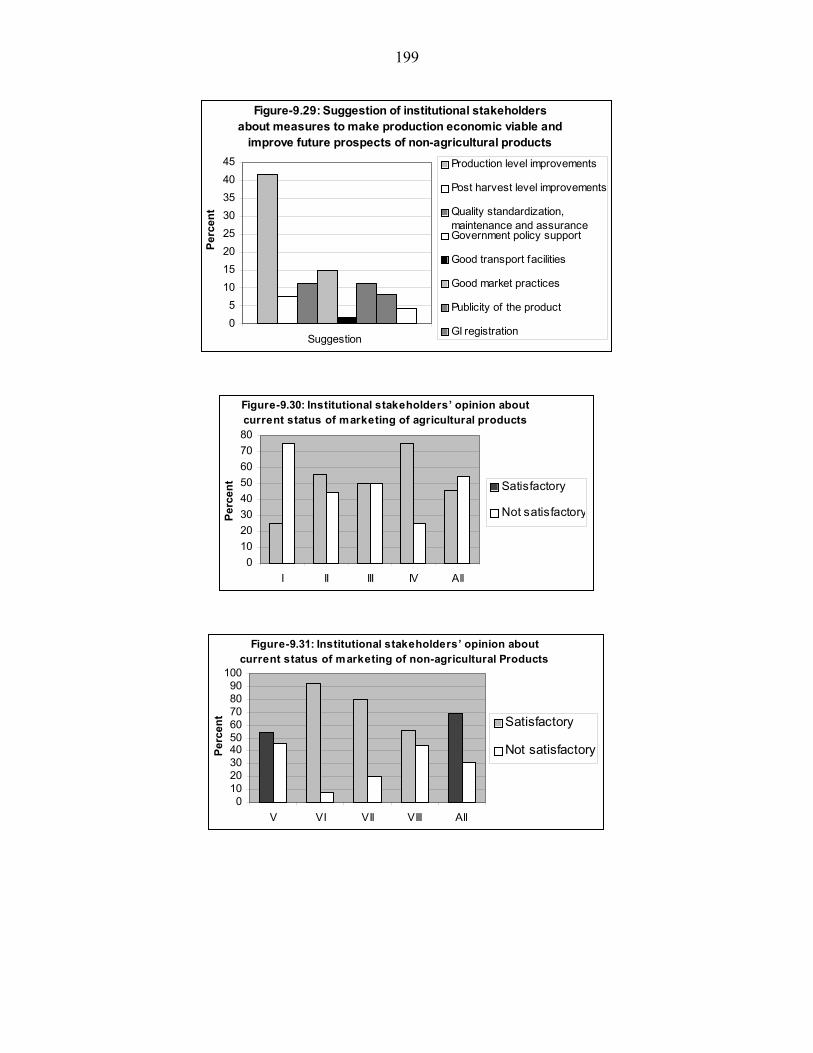
199
Figure-9.29: Suggestion of institutional stakeholders about measures to make production economic viable and
improve future prospects of non-agricultural products
05
1015202530354045
Suggestion
Perc
ent
Production level improvements
Post harvest level improvements
Quality standardization,maintenance and assuranceGovernment policy support
Good transport facilities
Good market practices
Publicity of the product
GI registration
Figure-9.30: Institutional stakeholders’ opinion about current status of marketing of agricultural products
01020304050607080
I II III IV All
Perc
ent Satisfactory
Not satisfactory
Figure-9.31: Institutional stakeholders’ opinion about current status of marketing of non-agricultural Products
0102030405060708090
100
V VI VII VIII All
Perc
ent Satisfactory
Not satisfactory
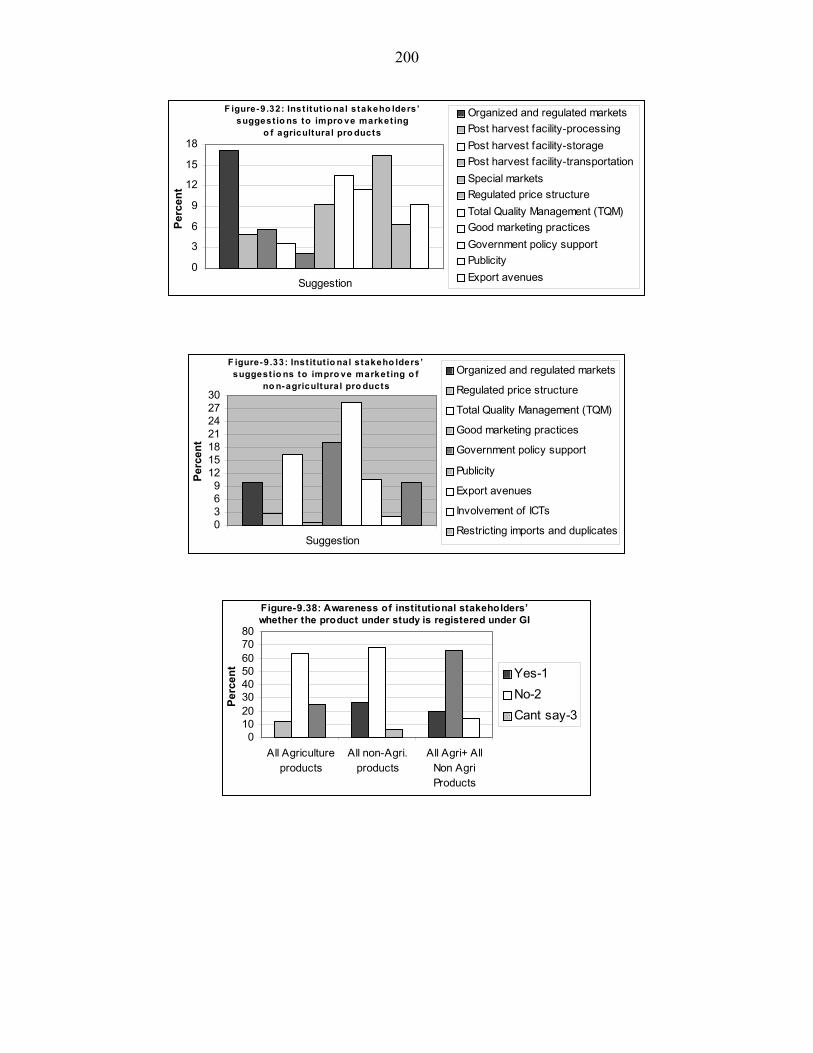
200
F igure-9.32: Inst itut io nal stakeho lders’ suggest io ns to impro ve market ing
o f agricultural pro ducts
0
3
6
9
12
15
18
Suggestion
Perc
ent
Organized and regulated marketsPost harvest facility-processingPost harvest facility-storagePost harvest facility-transportationSpecial marketsRegulated price structureTotal Quality Management (TQM)Good marketing practicesGovernment policy supportPublicityExport avenues
F igure-9.33: Inst itut io nal stakeho lders’ suggest io ns to impro ve market ing o f
no n-agricultural pro ducts
0369
12151821242730
Suggestion
Perc
ent
Organized and regulated markets
Regulated price structure
Total Quality Management (TQM)
Good marketing practices
Government policy support
Publicity
Export avenues
Involvement of ICTs
Restricting imports and duplicates
Figure-9.38: Awareness of institutional stakeholders’ whether the product under study is registered under GI
01020304050607080
All Agricultureproducts
All non-Agri.products
All Agri+ AllNon AgriProducts
Perc
ent Yes-1
No-2Cant say-3

201
F igure-9.40: Inst itut io nal stakeho lders’ v iew abo ut expected po st-registrat io n changes in pro duct io n and market ing o f vario us types o f
agricultural pro ducts in general
05
101520253035404550556065707580859095
1 2 3 4 5 6 7 8 9 10
Yes
No.
Can’t say
Note: Code [1. Product Quality has standardized/will become standard, 2. Product grading has improved /will improve, 3. Traders are purchasing/will purchase from actual and authorized producers only, 4. Income of producers has increased/will increase, 5. Income of traders has increased/will increase, 6. Number of producers has increased/will increase, 7. Producers are producing/will produce more, 8. Price of the product has increased/will increase, 9. Producers have shifted/will shift from other livelihood activities, 10. Overall improvement in socio-eco conditions of producers]
F igure-9.42: Inst itut io nal stakeho lders’ v iew abo ut expected po st-registrat io n changes in pro duct io n and market ing o f
vario us types o f no n-agricultural pro ducts in general
0102030405060708090
100
1 2 3 4 5 6 7 8 9 10
Perc
ent
YesNoCan’t say
Note: Code [1. Product Quality has standardized/will become standard, 2. Product grading has improved /will improve, 3. Traders are purchasing/will purchase from actual and authorized producers only, 4. Income of producers has increased/will increase, 5. Income of traders has increased/will increase, 6. Number of producers has increased/will increase, 7. Producers are producing/will produce more, 8. Price of the product has increased/will increase, 9. Producers have shifted/will shift from other livelihood activities, 10. Overall improvement in socio-eco conditions of producers]

202
Figure-9.43: Responsibility and functions of respondent’s office in relation to
G.I. registration in the State
0102030405060
AgricultureProducts
Non-AgricultureProducts
Perc
ent
No responsibilitytakenHiring IPRconsultantsCreatingawarenessConventionalactivities
Fig 9.58a: Average number of persons engaged in marketing of agricultural products under study
01020304050
Professional Technicians Other SkilledPersons
Unskilled Persons
Categories
Num
ber o
f wor
kers
MaleFemale
Fig 9.58b: Payments made to persons engaged in marketing of agricultural products during the last
operating month
0500
100015002000
Pro
fess
iona
l
Tech
nici
ans
Oth
erS
kille
dP
erso
ns
Uns
kille
dP
erso
ns
Categories
Paym
ent(R
s)/P
erso
n
MaleFemale

203
Fig 9.59a: Average number of persons engaged in marketing of non-agricultural products under study
0
10
20
30
40
50
Professional Technicians Other SkilledPersons
Unskilled Persons
Categories
Num
ber o
f wor
kers
Male
Female
Fig 9.59b: Payments made to persons engaged in marketing of non-agricultural products during the last operating month
010002000300040005000
Professional Technicians Other SkilledPersons
UnskilledPersons
Categories
Paym
ent p
er p
erso
n
Male Female
Figure-9.64: Scientific endeavors for GI registration
01020304050607080
Yes No
Perc
ent
Research Study forfinding out the uniquecharacteristics Scientificexperimentations toestablish uniquenessInitiative ness for GIregistration
Technical interventionto stop infringement ofthe GIFacilitation for G.I.Registration
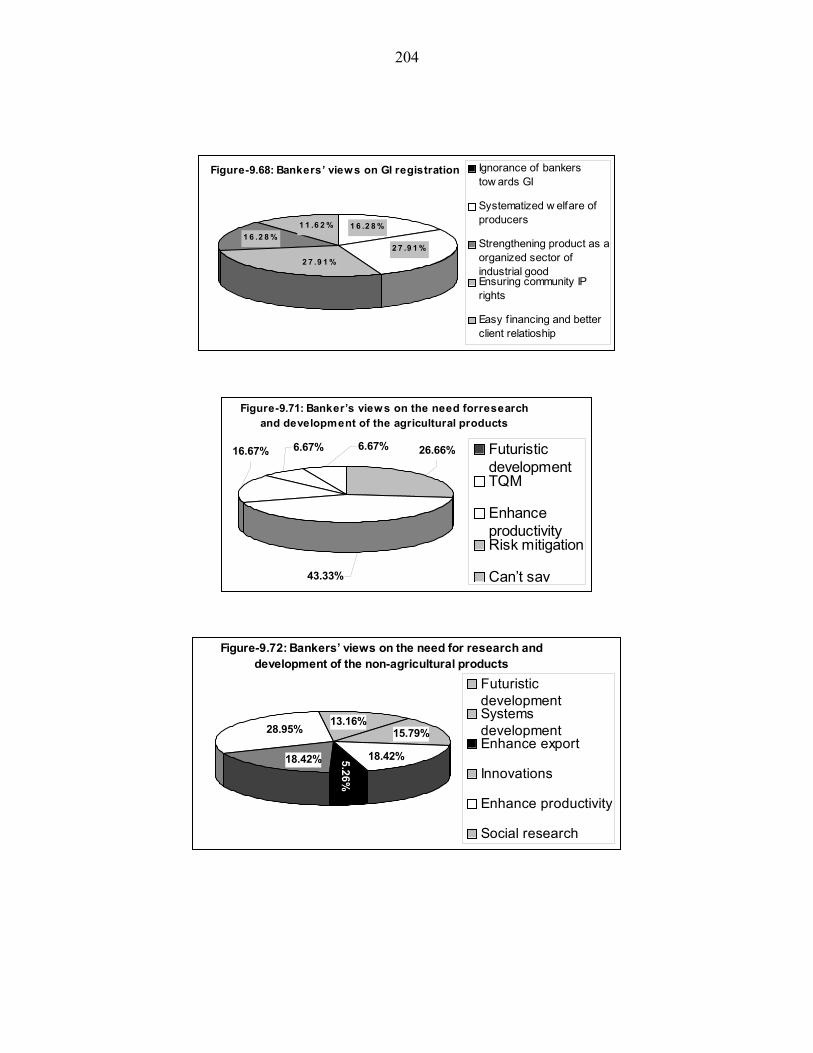
204
Figure-9.68: Bankers’ views on GI registration
2 7 .9 1 %
1 6 .2 8 %
2 7 .9 1 %
1 6 .2 8 %1 1 .6 2 %
Ignorance of bankerstow ards GI
Systematized w elfare ofproducers
Strengthening product as aorganized sector ofindustrial goodEnsuring community IPrights
Easy f inancing and betterclient relatioship
Figure-9.71: Banker’s views on the need forresearch and development of the agricultural products
16.67% 6.67% 6.67% 26.66%
43.33%
FuturisticdevelopmentTQM
EnhanceproductivityRisk mitigation
Can’t say
Figure-9.72: Bankers’ views on the need for research and development of the non-agricultural products
18.42%5.26%
18.42%
28.95% 15.79%13.16%
FuturisticdevelopmentSystemsdevelopmentEnhance export
Innovations
Enhance productivity
Social research

205
Chapter 10
Opinion, Knowledge and Suggestions of Consumers about Agricultural and Non-Agricultural Products
The consumers were asked limited and most pertinent questions only, and the data
of agricultural and non-agricultural have been interpreted together. Therefore, unlike
chapter 5 & 6, all the paragraph heads will not be available in this chapter. The chapter
will have only those paragraphs, which pertain to information collected from consumers,
but to keep the coherence with other chapters the paragraph bears the same number as in
other chapters.
For this survey, 370 consumers were interviewed. About 70% were male and 30%
were female. From living background point of view, 70% are from urban areas and 30%
from rural areas. The average age of the interviewed consumers was 39 years.
6.5: Expected changes after registration- consumers’ expectations
In agricultural products, bird's eye view of the expected changes is presented in
fig.10.1, the detail as per GI types are presented in tables-10.1 to 10.6. The salient
features of expected changes across all GI types are:
- More than 80% consumers in all GI types (75% in III) believe that product quality
will become standard.
- More than 80% consumers in all GI type (61% in III) believe that product grading
will improve.
- More than 73% consumers in al GI types (except 54% in III) believe that number
of consumers will increase.
206
In case of non-agricultural products, the bird's eye view is presented in fig.10.2
and details as per GI type are presented in tables-10.6 to 10.10. The salient features of
expected changes across all GI types are:
- More than 77% consumers (71% in VIII) believe that product quality will become
standard.
- About 60 and up to 83% consumers believe that product grading will improve.
- Generally 55 to 72% (49% in VIII) consumers believe that number of consumers
will increase.
While comparing agricultural and non-agricultural product, it seems that impact
would be more in case of agricultural products. For additional comments given by
consumers on ‘post registration expected changes’ refer Annexure-XV & XVI for
agricultural and non-agricultural products (Table-15.29 & 16.33).
7.1: Duplicates and similar products
Producers believe that duplicate and similar products are available in almost all
GI types. But whether quality assurance led the consumers to purchase a product?
- In agricultural products 54 and 60% consumers in GI type III & I believe so. But
for GI type II and IV, it is less number of consumers (Fig.10.1).
- In non-agricultural products 46% in GI type V and 86% in VII believe so. But for
GI type VI and VIII the number of consumers believing so is very less (Fig.10.2).
For additional comments given by consumers on ‘duplicates’ refer Annexure-XV
& XVI for agricultural and non-agricultural products (Table-15.26 & 16.30).
7.2: Consumers’ efforts to purchase genuine product
An attempt to analyze the efforts of consumes to ensure purchase of genuine
product was made. The salient features as presented in fig.10.13 and 10.14 as discussed
below:

207
- At the time of purchase a product, whether consumers are sure that product is
genuine? About 87% consumers in agricultural products and 96% in non-
agricultural products are sure about it. It means the confidence in agri-products is
little less (Table-10.13 & 10.14).
- It seems that surety about genuine product is because of several special efforts
made by consumers in purchasing the product. But do they really make any effort
of such kind? 51% consumers in agricultural product and 77% in non-agricultural
products make some efforts; the percent of consumers doing so is less in
agricultural products (Table-10.13 & 10.14).
Consumers make various kinds of attempts to make sure of purchase of a genuine
product. Table-10.17 and 10.18 for agricultural and non-agricultural products give
comprehensive understanding.
The most reliable method for consumers in agricultural products is ‘going to
authorized/ reliable / reputed shop’ followed by looking for a label or trademark. For
consumers of non-agricultural products most reliable important method is also ‘going to
authorized/reliable/reputed shop’ and getting authenticated receipt. The second most
important method of equal degree is ‘going to government shop ad looking for label or
trademark’. It is interesting to note that emotional relationship between seller and buyer is
very important. Therefore, it must put a pressure on trader to make sure in procuring a
genuine product to supply to consumers. The consumers' preferential priority strategy for
each GI type is given in table-10.19, and for each product-wise is given in table 10.20.
For additional comments given by consumers on ‘specific efforts’ refer Annexure-XV &
XVI for agricultural and non-agricultural products (Table-15.28 & 16.32).
9.1: Willingness for registration and payment thereof
In agricultural products, 61% consumers in GI type III and 71 - 75% in case of
other GI type are in favour of registration (Fig.10.1). In non-agricultural products 40%
and- 44% in GI type V & VII, and 61 and 67% in VIII and VI respectively are interested
for registration (Fig.10.2). Willingness for registration is higher in case of agricultural
products.
208
9.3: Willingness to pay for expected enhanced premium
When the consumers are willing for registration of product as GI, but if as a post-
registration effect the sale price is increased, are they willing to pay more? 85% in
agricultural products (Fig.10.13) and 61% in non-agricultural products are willing to pay
higher (Fig.10.14). But how much premium over the prevailing price? In agricultural
products, most agree for 5 - 10%, followed by 0 - 5% (Fig.10.15). For GI type summary
see table-10.15. In case of non-agricultural products, most agree for 0 - 5% followed by
few agreeing for 5 - 10% (Fig.10.16). For GI type summary seeTable-10.16.
10.5: Awareness of producers and stakeholders about GI
Most consumers consider that unique quality; reputation, traditionality and other
characteristics are attributed to geographical origin (Fig.10.1 and 10.2).
10.8: Future prospects of the product
The consumers have given their opinion about future prospects of the product.
The product-wise summary is presented in table-10.21. The salient features are given
below:
- Products where future is either stationery or not bight are - Coorg orange, Pokkali
rice, Bhaliya wheat, Pahari aloo, Coorg coffee, Telicherry, Black pepper,
Mahoba pan, Punjabi jooti, Harambha thresher, Patola saree and Bhadoi carpet.
In other products, most consumers feel that future is either very bright or bright.
- The products, where most consumes have given opinion about very bright future
are - Alphonso mango, Malihabadi dussheri, Himachal apple, Harshil apple,
Ramnagar litchi, Hill rajma, Allepy cardamom, Amleta and Mahadev garlic,
Fenugreek, Kumbhraj dhania, Nannari sharbat, Kokum fruit juice, Buraansh juice,
Dodha, Bikaneri bhujia, Agra petha, Bal mithai, Kolhapuri chappal, Saharanpur
furniture, Hyderabad pearl, Nilgiri oil, Sivakashi patakha, Makrana marble, Jaipur

209
blue pottery, Ferozbad chudia & glassware, Khurja pottery, Srikalahasti
kalamkari, Paithani saree, Jaipur razai, Sarganeri print, Lucknavi chikan and
Kullu shawl.
The futuristic matrix of products as expressed by the consumers is given below: Product type Likely to
worsen Remain same or likely to worsen
Remain same Remain same or likely to be bright
Agriculture Pokkali rice Bhaliya wheat
Pahari aloo Coorg orange Telicherry black pepper
Navara rice Coorg coffee Wayanadan tea Mahoba pan
Non-agriculture
-- -- -- Punjabi jooti Harambha thresher Bhadoi carpet Patola saree
10.11: Suggestions for improvement to increase sale
In agricultural products, the suggestions for improvement are presented in
fig.10.11. The most impartial suggestion is to standardize the quality followed by easy
assured availability, more publicity and reasonable price and the last suggestion is to
make innovative changes keeping the traditional base. The analysis of suggestions as per
GI type is presented in table-10.11. The major points in order of their importance are:
- In GI type I easy assured availability, reasonable price regulation and more
required publicity are most important
- In GI type II quality standardization, innovative changes and more publicity are
major suggestions.
- In GI type III quality standardization, reasonable price and innovative changes are
major suggestions.
- In GI type IV, more publicity, easy assured availability, and standardization of
quality which innovative changes are major suggestions.

210
In non-agricultural products, standardization of quality reasonable price and
innovative changes are most important for overall GIs (Fig.10.12). As per GI type
analysis, the major points in order of their importance are (Table-10.12):
- In GI type V more publicity, reasonable price and standardized quality with easy
assured availability are major suggestions.
- In GI type VI, innovative changes, reasonable price and standardized quality are
major suggestions.
- In GI type VII, standardized quality, reasonable price and innovative changes are
major suggestions
- In GI type VIII standardized quality, innovative changes and reasonable price are
major suggestions.
For additional comments given by consumers on ‘specific suggestions’ refer
Annexure-XV & XVI for agricultural and non-agricultural products (Table-15.27 &
16.31).

211
Opinion, Knowledge and Suggestions of Consumers about Agricultural and Non-Agricultural Products- Figures
Fig 10.1: Comparative statement of awareness of consumers about GI implications in agricultural products
0
20
40
60
80
100
120
1 2 3 4 5 6 7
Observations
Perc
ent
I
II
III
IV
Codes of Fig 10.1: 1. Quality, reputation & traditional characteristics attributable to geographical origin 2. Are consumers aware of GI Act? 3. If consumers are aware of GI Act, would they like to get product registered as GI 4.Quality assurance led consumers to purchase the product 5.Expected post registration changes: Product quality will become standard 6.Expected post registration changes: Product grading will improve 7.Expected post registration changes: Number of consumers will increase
Fig 10.2: Comparative statement of awareness of consumers about GI implications in non-agricultural products
0
20
40
60
80
100
120
1 2 3 4 5 6 7
Observations
Perc
enta
ge
V
VI
VII
VIII
Codes of Fig 10.2: 1. Quality, reputation & traditional characteristics attributable to geographical origin 2. Are consumers aware of GI Act? 3. If consumers are aware of GI Act, would they like to get product registered as GI 4.Quality assurance led consumers to purchase the product 5.Expected post registration changes: Product quality will become standard 6.Expected post registration changes: Product grading will improve 7.Expected post registration changes: Number of consumers will increase

212
Fig 10.11& 10.12: Consumers’ suggestions for the areas of improvement in agriculture & non agriculture products under study
05
1015202530
Agriculture Products Non-Agriculture Products
Suggestions for improvement
Perc
enta
ge
Quality to be standardizedInnovative changes to be made keeping traditional basePrice to be controlled and kept w ithin reasonable limits Easy availability assuredMore publicity requiredOthers
Fig 10.13: Consumers’ preferential purchase of genuine agricultural products and their willingness to pay extra for GI registered product
0102030405060708090
100
1 2 3
Observations
Perc
enta
ge IIIIIIIV
Codes of Fig 10.13: 1. At the time of purchase of products, whether consumers are sure that product is genuine 2. Whether consumers make any special effort to purchase genuine product 3. As a post registration effect, whether consumers are willing to pay more for the product

213
Fig 10.14:Consumers’ preferential purchase of genuine non-agricultural products and their w illingness to pay extra for GI
registered product
020
406080
100120
1 2 3
Observations
Perc
enta
ge
V
VI
VII
VIII
Codes of Fig 10.14: 1. At the time of purchase of products, whether consumers are sure that product is genuine 2. Whether consumers make any special effort to purchase genuine product 3. As a post registration effect, whether consumers are willing to pay more for the product
Fig 10.15 & 10.16: Preparedness of consumers to pay premium over the prevailing price for registered agricultural and non-agricultural products
0102030405060
0-5 5-10 10-15 >15
Percent premium
Perc
ent
AgricultureproductsNon-agricultureproducts

214
Chapter 11 Opinion, knowledge and suggestions of Traders about agricultural and non-agricultural products
Like consumers, the traders were also asked limited and most pertinent questions
only, and the data of agricultural and non-agricultural have been interpreted together.
Therefore, unlike chapter 5 & 6, all the paragraph heads will not be available in this
chapter. The chapter will have only those paragraphs, which pertain to information
collected from traders, but to keep the coherence with other chapters the paragraph bears
the same number as in other chapters.
For the opinion survey 375 traders were interviewed 70% of them were from
urban background (Table-11.1). About 45% are local shopkeepers (Table-11.2), some of
them are consumers also, mostly sale the products from home. About 93% are male and
average age of traders is 42 years (Table-11.3).
4.5: Mode of purchase by traders
The modes of purchase by the traders have direct impact on the price decision-
making system of the producers.
In agricultural products, the major purchase is direct followed by local middlemen
and mandi. Though the purchase from producer group is less but it is very strong in case
of GI type I and strong in GI type III, in these GI type, the presence of middlemen and
mandi is also good. In GI type IV, the purchasing is not organized and disturbing trend is
seen. Producers group are absent in GI type IV and quite weak in GI type II and III.
Direct purchase is most significant mode of purchase but it may not be good indicator for
the small producers (Fig.11.30). In some cases such as wayanadan tea, they purchase
from factory out let, packing group or whole sellers, and in others such as alleppy
cardamom from auctioneers (Table-15.30).
215
In non-agricultural products, the direct purchase is more prevalent than
agricultural products. The main source of purchase is direct, followed by producers
group, producers group are stronger in non-agricultural products than agricultural
products. The direct purchase and through producers group is very strong in GI type VIII
and VI. Local middlemen are most prevalent in GI type VIII and VII. For better
bargaining, a collective bargain process need to be initiated especially in GI type VI and
VIII. A mandi kind of arrangement is weak through all GI except GI type V, it need to be
strengthened. (Fig.11.31). Mandi is better in case of agricultural products. In many cases
traders are producers also (Bal mithai, thanjavur plate, haramba thresher, kullu shawl etc.
in some cases such as kancheepuram silk it is buy-back method of purchase. In some
cases such as phulkari, the purchase is direct from families producing in several villages.
In some cases traders purchase from importers such as Hyderabad pearls (Table-16.34).
4.7: Contribution of uniqueness to sale
In agricultural products, more than 32% traders in GI type I and III feel that
unique characteristics of the product give better market value. Also the sale of product is
better than the other products in the same category (The big question is around 60% do
not believe so?). In GI type II, the percent of such respondents is 25 – 28%, the situation
of GI type IV, the situation is worse because respondents below 7% only believe so
(Fig.11.8).
In non-agricultural products, the belief of traders that unique characteristics gives
better market value and because of the unique characteristics, the sale of product is better
than other products in the same category can be expressed in following way in decreasing
order of importance (Fig.11.9).
- In GI Type VIII , 37 – 38% believe so
- In GI Type VII , 24% believe so
- In GI Type VI , 21% believe so
- In GI type V, 16% believe so

216
4.8: Trend of sale
In agricultural products in general about half of traders feel that sale is increasing
significantly (Fig.11.4). The salient features from table-11.4 are as given below:
- Increase in sale is highest in GI type I, moderate in II and III but very low in IV.
- For those who believe sale is more or less stationery, about half belong to GI type
III and one fourth to GI type II.
- Only 15% traders across all GIs believe that sales are declining but 85% does not
believe so.
In non-agricultural products also, the trend is like agricultural products (Fig.11.5).
The salient factors from table-11.5 are as given below:
Across GI type, significant number of respondents GI type VIII (40%) and GI
type VI (25%) feel that sale is increasing significantly, but on negative side for example
75% respondents is GI type VI does not believe so.
- Those who said sale is more or less stationary most below to GI type VII (30%).
- Only 20% traders across all GIs believe that sale is either declining or very little
or no sale but 80% does not believe so.
4.9: Price decision and trend of unit price
In the price decision between trader and consumer bargaining is main process to
arrive on a win-win situation for both. In agricultural products, the main bargaining is in
GI type I, III and II in that order, in GI type IV no bargaining (Fig.11.8).
In non-agricultural products, the main bargaining is in GI type VIII, followed by
VI, VII and V (Fig.11.9). Gender issues are clearly reflected here e.g. in India for
purchase of textiles (GI type VIII) mostly women are involved, therefore, bargaining is
done it is felt by highest number of traders (42%). In case of handicraft also the
involvement of women is quite high. But where men are involved GI type V and GI type
VII the bargaining is least.

217
5.5: Traders’ view to maintain product quality
In agricultural products high quality production practices and also inputs is the major
concern; next to it is the good practices at market yard (Fig.11.48). These two have been
the major concerns through out all types of GIs but are of very high importance in case of
GI type III and II; good practices at market yard are of high importance in case of GI type
I and III (Table-11.48). The other salient features described in table-11.48 are:
- Good practices at processing unit and proper handling in supply chain are areas of
concern in GI type III and I.
- In GI type II removal of market malpractices and development and enforcement
of quality standards is area of concern.
- Purchasing through authorized dealers is area of concern in GI type III.
- Publicity, training and awareness creation is area of concern in GI type I and III.
In non-agricultural products also, the major concern is quality production practices
and inputs but next to it is involvement of technically efficient human resources.
Facilitation and enforcement of quality standards is another area of concern (Fig.11.49).
Other important features as detailed in table-11.49 can be summarized as given
below:
- Good practices at processing units is important in GI type VIII
- Publicity, training and awareness is important in GI type VIII and VI
- Inspection and monitoring are reflected in only GI type V, it’s a matter of further
study, whether inspection and monitoring is available in other kinds of GI types.
- Good practices at market yard are of high importance in GI type VI, VII and V.
- Some respondents in GI type V and VII feel that quality is already good.
218
7.1: Duplicates and similar products
In agricultural products regarding presence of duplicate or copy type, the views of
traders are conflicting. About 33% percent say no duplicates are available, while 27
percent says these are available. Another 27 percent says these are available but of
inferior quality (Fig.11.19). The detailed scrutiny of table-11.19 reveals the following
facts.
- Mostly no duplicates in GI type I and IV
- Duplicates are mostly available in GI type III and II
- If duplicates are available, these are of inferior quality mostly in GI type III.
- In GI type III, are mostly from other areas or states are threat
- In GI type III, mostly consumers prefer only, but this is not the case of mostly
with other GI types and not at all for GI type IV.
When duplicate or copy type products are available, then in traders’ view what are
means and ways to face the situation? In their view administrative measures are to be on
top, and other important measures are legal enforcement and public awareness
(Fig.11.21). The detailed picture is given in table-11.21, the salient features are:
- For GI type I public awareness must be the top priority
- For GI type II and III administrative must be the top priority
- Duplicates is not a problem in GI type IV
For non-agricultural products most traders’ view duplicates are available but half of
them believe that these are of inferior quality. The duplicates from other areas or states
are threat (Fig.11.20). The salient features from the data available in table-11.20 are:
- Duplicates from other areas and states is a threat in all GI types moreover these
duplicates are of inferior quality.
- The duplicates are available mostly in GI type VII and VIII and to little extent in
GI type VI also.
219
- In GI type VI and VIII mostly consumer prefer original products only.
The traders have also suggested the ways and means to face the duplicates or copy
type in non-agricultural products (Table-11.22). Like agricultural products, the most
important is administrative measures; and next to it is protection of product as IP
(Fig.11.21). The high quality standards along with IP protection are most suggested ways
and means for GI type VIII.
7.3: Competition- types and sources
About 67% percent traders feel that products are facing competition in their items.
Among these about 59 percent are for non-agricultural products (Fig.11.10).
In agriculture, the major competition is from same product produced in other
areas of the country followed by similar duplicates available in the country (Fig.11.11).
GI type III and I face highest competition (Table 11.11). Other important features are:
- Same product produced in other areas of country is extreme in GI type IV and III
and severe in II and I.
- Similar duplicates in the country is extreme in GI type I and II and severe in III.
- Similar product imparted in country put severe competition to GI type II and III
- Competition in export market is severe in GI type III and moderate in I.
Methods to face competition
The traders have also suggested several methods to face the competition arising in
agricultural and non-agricultural products.
In agricultural products, the most important suggested method is introduction of
quality control and inspection mechanism. The others are improvement in marketing
methods, intensive publicity and improved design and development (Fig.11.16). Table-
11.16 provides the detailed information with respect of each GI type and trend of
suggested methods is in the same pattern all through various GI types. A few traders have
also suggested supplementary methods also (Table-11.18).
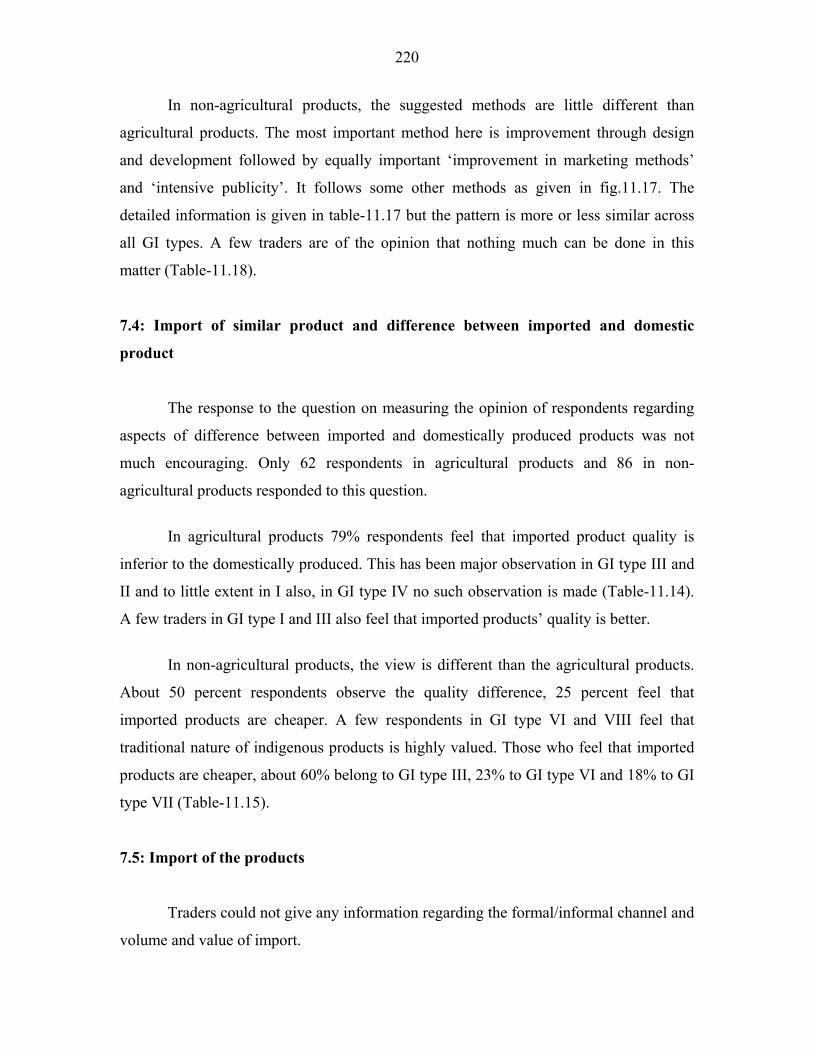
220
In non-agricultural products, the suggested methods are little different than
agricultural products. The most important method here is improvement through design
and development followed by equally important ‘improvement in marketing methods’
and ‘intensive publicity’. It follows some other methods as given in fig.11.17. The
detailed information is given in table-11.17 but the pattern is more or less similar across
all GI types. A few traders are of the opinion that nothing much can be done in this
matter (Table-11.18).
7.4: Import of similar product and difference between imported and domestic
product
The response to the question on measuring the opinion of respondents regarding
aspects of difference between imported and domestically produced products was not
much encouraging. Only 62 respondents in agricultural products and 86 in non-
agricultural products responded to this question.
In agricultural products 79% respondents feel that imported product quality is
inferior to the domestically produced. This has been major observation in GI type III and
II and to little extent in I also, in GI type IV no such observation is made (Table-11.14).
A few traders in GI type I and III also feel that imported products’ quality is better.
In non-agricultural products, the view is different than the agricultural products.
About 50 percent respondents observe the quality difference, 25 percent feel that
imported products are cheaper. A few respondents in GI type VI and VIII feel that
traditional nature of indigenous products is highly valued. Those who feel that imported
products are cheaper, about 60% belong to GI type III, 23% to GI type VI and 18% to GI
type VII (Table-11.15).
7.5: Import of the products
Traders could not give any information regarding the formal/informal channel and
volume and value of import.
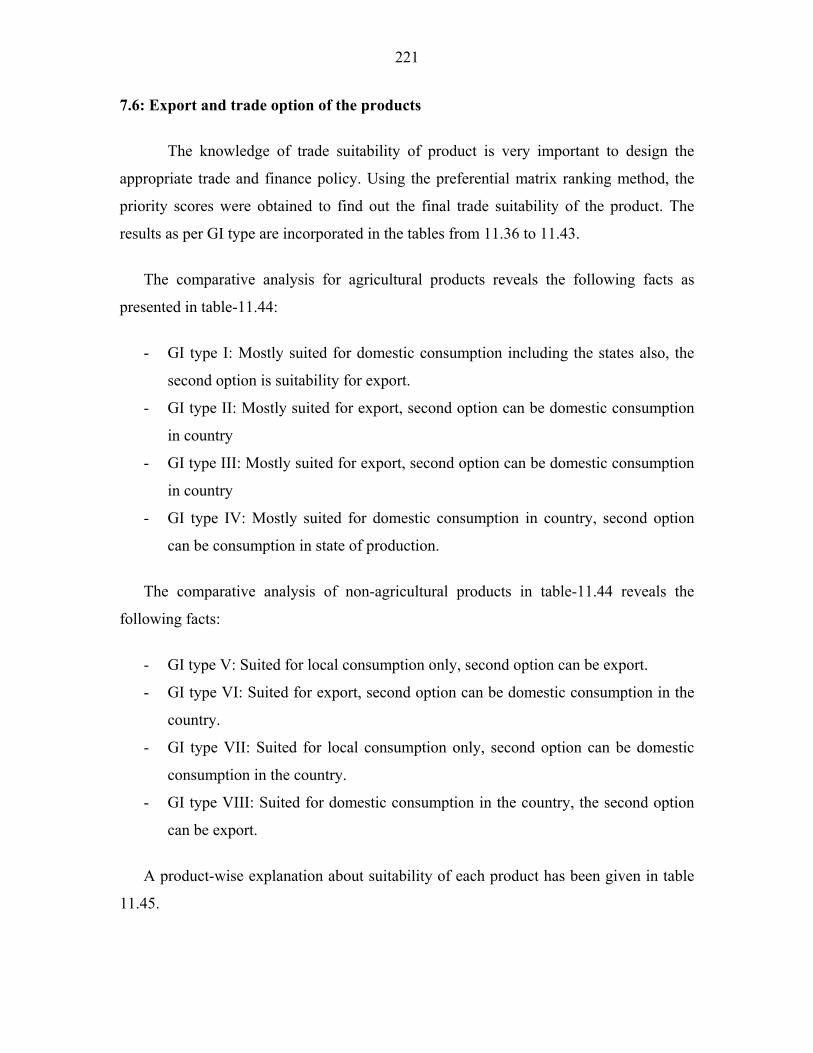
221
7.6: Export and trade option of the products
The knowledge of trade suitability of product is very important to design the
appropriate trade and finance policy. Using the preferential matrix ranking method, the
priority scores were obtained to find out the final trade suitability of the product. The
results as per GI type are incorporated in the tables from 11.36 to 11.43.
The comparative analysis for agricultural products reveals the following facts as
presented in table-11.44:
- GI type I: Mostly suited for domestic consumption including the states also, the
second option is suitability for export.
- GI type II: Mostly suited for export, second option can be domestic consumption
in country
- GI type III: Mostly suited for export, second option can be domestic consumption
in country
- GI type IV: Mostly suited for domestic consumption in country, second option
can be consumption in state of production.
The comparative analysis of non-agricultural products in table-11.44 reveals the
following facts:
- GI type V: Suited for local consumption only, second option can be export.
- GI type VI: Suited for export, second option can be domestic consumption in the
country.
- GI type VII: Suited for local consumption only, second option can be domestic
consumption in the country.
- GI type VIII: Suited for domestic consumption in the country, the second option
can be export.
A product-wise explanation about suitability of each product has been given in table
11.45.

222
The trade suitability will not always match with priority approach in trade. In the
understanding of traders, the preferential approach could be adopted as per the kind of the
product.
The results contained in table-11.46 reveal very high expectation from the
products. For almost all, they want to have the preferential approach, which must be
export oriented with equal weight to domestic sale. The second preferred approach differs
for different product types as given below:
- For GI type I, II, IV, V and VII: The approach can be more for the domestic sale.
- For GI type III, VI and VIII: The preference can be given for export than
domestic sale.
The product-wise details about the preferential approach are given in table-11.47.
9.3: Willingness to pay for expected enhanced premium
In agricultural products, 34, 31 and 28 percent traders respectively for GI type I,
II and III share the opinion that as a registered GI, the product should provide enhanced
premium to the producers an traders. For GI type IV, only 7 percent preferred this idea.
(Fig.11.8).
In case of non-agricultural products except GI type VIII, the traders favouring
enhanced premium are lesser than for agricultural products. In GI type VIII about 36%
percent believe so but in other GI types, it is between 19-22 percent (Fig.11.9).
Enhancement over prevailing cost price
Now the question arises how much increase over prevailing costly price is
expected? Most expect 10 percent increase or less in agriculture (Fig.11.32) and similar is
the situation for non-agricultural products (Fig.11.32). For agricultural products as
detailed in table-11.32 in GI type-I most traders see increase between 10-15%; in GI type
II between 5-10%; and in GI type III below 5% only.

223
For the non-agricultural products most traders in GI type V expect less than 5%;
in GI type VI between 5 - 10%; in GI type VII less than 10% and similarly in GI type
VIII also most see below 10%.
Enhancement over selling price
In case of both agricultural and non-agricultural products, most traders expect
enhancement of 15% or below (Fig.11.34, 11.35) while in case of prevailing cost price it
was mostly below 10% enhancement.
Expected increase in agricultural products in 15% or below for GI type I, 10% or
below in GI type II and III, in case of GI type IV, the traders are divided but most expect
the increase of 10% or more (Table-11.34). Similar was the trend observed for enhanced
premium over prevailing cost price in this GI type.
Expected increase in non-agricultural products in 10% or below for GI type V and
VI, 5 - 15% in GI type VII. In GI type VIII traders as fragmented, about half expect
increase of less the 5% and other half expect it more than 10% (Table-11.35).
In both agricultural and non-agricultural products, the traders expecting increase
of more than 15% are very few (26% in agri and 10% in non-agriculture).
10.3: Earnings and income
Not many traders are satisfied with their earnings from sale of agricultural
product. As detailed in table-11.8, 37% in GI type I, 35% in III, 15% in I and about 12%
in IV are satisfied. It means from 73 to 88 % in various GI types are not satisfied.
The situation in non-agricultural products is even worse, where only 12% in GI
type V, 18% in VI ad 28% in VII are satisfied. About 82-88% are not satisfied. For GI
type VIII a little relief is there because about 41% of traders are satisfied with their
earnings (Table-11.9).

224
10.8: Future prospects of the product
Traders have given their opinion about future prospects of the product. The salient
features of product-wise details are available in table-11.27. The summary is presented in
the matrix below:
Product type Likely to
worsen Remain same or likely to worsen
Remain same Remain same or likely to be bright
Agriculture Pokkali rice Bhaliya wheat Coorg orange Telicherry black pepper
Navra rice Coorg coffee Wayanadan tea
Non-agriculture Punjabi jooti Moradabad brass material Kancheepuram silk Ludhiana hosiery
Sanganeri print Worli painting Mysore sandal soap Nilgiri oil Maralubha thresher Jaipur blue pottery Patola saree Panthani saree Phulkari
All other studied products not listed in the matrix have bright future, which is
likely to be improved. For some products, no data is available; these are sehori genhu,
kurnool rice, malwa potato, kumbhraj dhanania and buraansh juice.
10.9: Constructive measures to make production viable and improve future
prospects
For improving the economic viability and future prospects of the product, the
traders have suggested various constructive measures. The detailed analysis is available
in table-11.28 and 11.29 for the agricultural and non-agricultural products.
In case of agriculture, the major suggestions are improvement at production level,
quality standardization, maintenance and assurance, good marketing practices and
publicity of the product (Fig.11.28). The trend is almost same except few deviations such
as:

225
- In GI type III much emphasis is given on quality management, good marketing
practices and post-harvest level improvements.
- Government policy support has been observed very important in case of GI type
II an IV.
- Publicity of product has been felt important in GI type I, III and IV.
- The unawareness of traders is reflected because in almost all cases, GI
registrations have not been understood as constructive measure for the purpose.
For non-agricultural products, the top priority is same as in agricultural products
i.e. production level improvements, it follows the government support and then equally
important quality management and good marketing practices (Fig.11.29). Other salient
features are:
- In the sector of textiles few have raised restriction on import as a measure
- GI registration has not been understood as an instrument of improvement except
in case of GI type V and VIII. But situation is better than agricultural products.
10.10: Status of marketing and suggestions for improvement
In agricultural products, 51% respondents are satisfied with the current status of
marketing. The satisfaction level in GI type I is low, in others it is five (Fig.11.23). In
non-agricultural products also the situation is similar to agricultural products. More than
50% of respondents are satisfied in each GI type, while for GI type III the satisfaction
level is up to 80% percent. (Fig.11.24).
10.11: Suggestions for improvement to increase sale
For agricultural products, the major suggestions are standardization of quality,
more publicity and reasonable price (Fig.11.6). As explained in table-11.6, the major
issues are:
- In GI type I, easy availability is also important
- In GI type II, innovative changes with keeping traditional base is also important
- More publicity is most important in case of GI type IV.

226
For agricultural products, the additional suggestions given by the traders for some
products are reproduced below:
Product Additional comments by traders
Banganpally mango Connecting yield with sale because when the yield is less marketing of the produce is also less, but when production is more, there is problem. Therefore early marketing is beneficial.
Alphonso mango People are ready to pay Rs.100/kg for apple. But attitude is such that they do not think beyond Rs.25/- for mango.
Pokkali rice Production should be increased. Bhaliya wheat Check adulteration and enhance production. Dungarpur zinger Mandi should be available in dungarpur district. Farmer’s training
also to make available. Nannari sharbat Government recognition and brand creation.
For non-agricultural product also, standardization of quality is most important. It
follows the innovative changes with keeping traditional base and more publicity
(Fig.11.7). As explained in table-11.7 the major issues are:
- Publicity is top most issue in GI type V and second top most in GI type VI and
VII
- Innovative changes keeping traditional base is most important in GI type III
followed by standardization of quality.
For non-agricultural products, the additional suggestions given by the traders for
some products are reproduced below:
Product Additional comments
Agra petha Need technical mechanism. Kondapalli bommalu Not recognized as the special artisans in the market. Thanjaur art plate Raw material cost should be controlled. Govt. should arrange for
export. Government should purchase as memento for government functions as before. Raw material cost should be controlled.
Kolhapuri chappal Duplicates avoided. Punjabi jooti Production in one area instead of spread here and there. Hyderabad pearls More number of shops and less customers. Not only sale but service
is also important. Govt. recognition to the labourers and traders’ involved in the business.
Patola saree New varieties as per demands and feedback from Consumer’s traders.
Phulkari Exhibitions for publicity.

227
Opinion, knowledge and suggestions of Traders about agricultural and non-agricultural products- Figures
Fig 11.4 & 11.5:Trend of sales of the products under study according to traders
010
2030
4050
60
Agriculture Products Non-agricultureProducts
Trend in Sale
Perc
enta
ge
Sales increasing signif icantlyMore or less stationarySales are decliningVery little or no sale at all
Fig 11.6 & 11.7:Traders’ suggestions to improve sales of agricultural and Non-agricultural products
0
5
10
15
20
25
30
35
Agriculture Products Non-agricultureproducts
Suggestions to improve sales
Perc
enta
ge
Quality to be standardized
Innovative changes to bemade keeping traditional basePrice to be controlled and keptw ithin reasonable limits Easy availability assured
More publicity required
Others
Fig 11.8: Traders’ views on agricultural products under study
05
10152025303540
1 2 3 4 5
Observations
Perc
enta
ge
IIIIIIIV
Codes in Fig 11.8 & 11.9: 1. Unique characteristics of this product give better market value than the other products in the same category available in the markets, 2. Due to unique characteristics, the sale of this product is better than the other products in the same category available in the markets, 3. Satisfaction with the current earnings from the product under study, 4. As a registered GI, it should provide enhanced premium to the producers and traders, 5. Do the customers bargain the prices of these products?

228
Fig 11.9:Traders’ views on non-agricultural products under study
05
1015202530354045
1 2 3 4 5
Observations
Perc
enta
ge VVIVIIVIII
Codes in Fig 11.8 & 11.9: 1. Unique characteristics of this product give better market value than the other products in the same category available in the markets, 2. Due to unique characteristics, the sale of this product is better than the other products in the same category available in the markets, 3. Satisfaction with the current earnings from the product under study, 4. As a registered GI, it should provide enhanced premium to the producers and traders, 5. Do the customers bargain the prices of these products? Fig 11.10: Traders’ view on products facing significant competition
Fig 11.11 & 11.12: Major types of competition faced by products under study as viewed by traders
01020304050
1 2 3 4Types of Competition
Perc
enta
ge
AgricultureproductsNon-agricultureproducts
Codes in Fig 11.11 &11.12: 1.Same product produced in other areas of the country, 2. Similar duplicates in the country, 3. Similar products imported into the country, 4. Competition in the export market from other countries producing similar products
Agriculture Products
58%
42%FacingCompetitionNot FacingCompetition
Non Agriculture Products
76%
24%FacingCompetitionNot FacingCompetition

229
Fig 11.16 & 11.17: Traders’ opinion about methods to face competition in agricultural & non-agricultural products
0
5
10
15
20
25
1 2 3 4 5 6 7 8
Responses for methods to face competition
Perc
enta
ge
AgricultureproductsNon- agricultureproducts
Codes for Fig 11.16 & 11.17: 1.Production quality control and inspection quality assurance methods to be effectively introduced, 2.Through design and technological development, 3. Improvement of marketing methods, 4. Intensive publicity, 5. Export-oriented development, 6. Cutting down production and marketing costs, 7. Organizing exhibitions, expos, and market complexes etc., 8. Seeking GI Registration
Fig 11.19: Traders’ views on presence of duplicate / copy type of the agricultural products under study in the market
01020304050607080
1 2 3 4 5
Views on duplicates
Perc
ent r
espo
nse
IIIIIIIV
Fig 11.20: Traders’ views on presence of duplicate / copy type of the non-agricultural products under study in the market
05
10152025303540
1 2 3 4 5
Views on duplicates
Perc
ent r
espo
nse
VVIVIIVIII
Codes for Fig 11.19 & 11.20: 1. No duplicates, 2. Duplicates present in market, 3. Inferior quality of duplicates, 4. Duplicate from other area/ states are threat, 5. Consumers prefer original products only (for GI-8)/ Not much competition from duplicates (for GI-I)
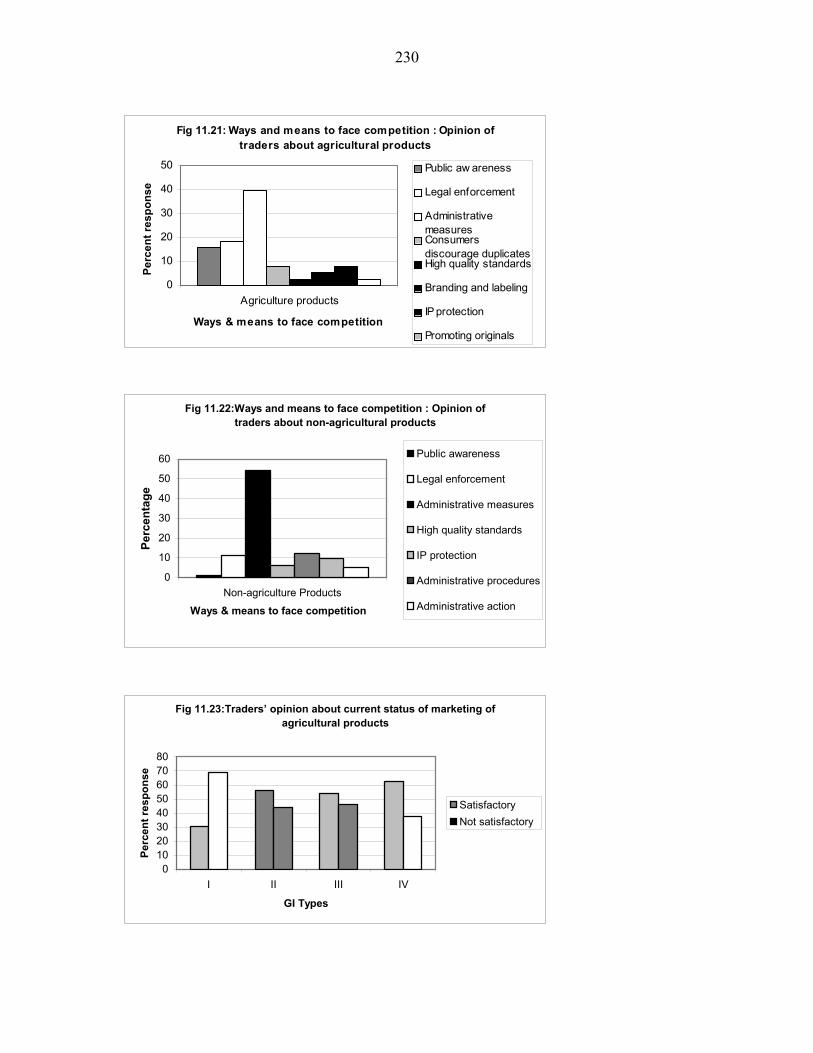
230
Fig 11.21: Ways and means to face competition : Opinion of traders about agricultural products
0
10
20
30
40
50
Agriculture products
Ways & means to face competition
Perc
ent r
espo
nse
Public aw areness
Legal enforcement
AdministrativemeasuresConsumersdiscourage duplicatesHigh quality standards
Branding and labeling
IP protection
Promoting originals
Fig 11.22:Ways and means to face competition : Opinion of traders about non-agricultural products
0
10
20
30
40
50
60
Non-agriculture Products
Ways & means to face competition
Perc
enta
ge
Public awareness
Legal enforcement
Administrative measures
High quality standards
IP protection
Administrative procedures
Administrative action
Fig 11.23:Traders’ opinion about current status of marketing of agricultural products
01020304050607080
I II III IV
GI Types
Perc
ent r
espo
nse
SatisfactoryNot satisfactory

231
Fig 11.24: Traders’ opinion about current status of marketing of non-agricultural products
0102030405060708090
V VI VII VIII
GI Type
Perc
ent r
espo
nse
Satisfactory
Notsatisfactory
Fig 11.25: Suggestions of traders to improve marketing of agricultural products
0
5
10
15
20
25
Suggestions to improve marketing
Perc
ent r
espo
nse
Organized and regulatedmarketsPost harvest facility-processing
Post harvest facility-storage
Post harvest facility-transportationExport avenues
Regulated price structure
Good marketing practices
Total Quality Management(TQM)Government policy support
Publicity
Special market
Fig 11.26: Suggestions of traders to improve marketing of non-agricultural products
0
5
10
15
20
25
30
35
Suggestions to improve marketing
Perc
ent r
espo
nse
Organized and regulatedmarketsGovernment policy support
Publicity
Good marketing practices
Export avenues
Total Quality Management(TQM)Regulated price structure
Involvement of ICTs
Restricting imports andduplicates

232
Fig 11.28: Traders’ suggestions for constructive measures to improve economic viability and future prospects of agricultural products
0
5
10
15
20
25
Constructive measures to improve economic viability and future prospects
Perc
ent r
espo
nse
Production levelimprovementsQuality standardization,maintenance and assurancePost harvest levelimprovementsGood transport facilities
Government policy support
Good market practices
Publicity of the product
GI registration
Fig 11.29: Traders’ suggestions for constructive measures to improve economic viability and future prospects of non-agricultural
products
05
10152025303540
Constructive measures to improve economic viability and future prospects
Perc
ent r
espo
nse
Can’t say
Production levelimprovementsQuality standardization,maintenance and assuranceGood marketing practices
Government policy support
Publicity of the product
GI registration
Restriction on import andduplicates
Fig 11.30: Sources of purchase of agricultural products by traders
05
1015202530354045
Direct Localmiddlemen
ProducersGroup
Mandi Local shop Any Other
Perc
ent r
espo
nse
I
II
III
IV

233
Fig 11.31: Sources of purchase of non-agricultural products by traders
0
10
20
30
40
50
60
Direct Localmiddlemen
ProducersGroup
Mandi Local shop Any Other
Perc
ent r
espo
nse
V
VI
VII
VIII
Fig 11.32 & 11.33: Traders’ expected percent increase over the prevailing cost price of agricultural products and non-agriculture products after GI
registration
0
10
20
30
40
50
0 – 5 5-10 10-15 >15
Percent increase over prevailing cost price
Perc
ent r
espo
nse Agriculture
ProductsNon-agricultureProducts
Fig 11.34 & 11.35: Traders’ expected percent increase over the prevailing selling price of GI registered agricultural and non-
agricultural products
05
10152025303540
0 – 5 5-10 10-15 >15
Percent increase over selling price
Perc
ent r
espo
nse
AgricultureproductsNon-agricultureproducts

234
Fig 11.48: Traders’ view about maintenance of quality of
agricultural products
0
5
10
15
20
25
30
35
Maintenance of Quality
Perc
ent r
espo
nse
High quality productionpractices and inputsGood practices at market yard
Good practices at processingunitsProper handling in supply chain
Publicity, training andawarenessPurchasing through authorizeddealersRemoving market malpractices
Developing quality standards
Facilitation and enforcement ofquality standards
Fig 11.49: Traders’ view about maintenance of quality of non-agricultural products
0
5
10
15
20
25
30
35
Maintenance of quality
Perc
ent r
espo
nse
High quality productionpractices and inputsGood practices at marketyardGood practices at processingunitsFacilitation and enforcementof quality standardsInspection and monitoring
Publicity, training andawarenessInvolvement of technicallyefficient human resourceMotivation through incentives
Quality already good

235
Chapter 12
Case Studies of Few Registered Products
In this chapter, the cases of ‘Coimbatore wet grinder’, ‘Mysore silk’, ‘Chanderi saree’,
‘Solapur chaddar’ and ‘Kangra tea’ have been discussed.
A. COIMBATORE WET GRINDER
Coimbatore Wet-grinder Manufacturers and Accessories Suppliers Association
(COWMA), Coimbatore has done the registration of ‘Coimbatore Wet Grinder’ (CWG)
as Geographical Indication (GI). Micro, Small and Medium Enterprise Development
Institute (MSMEDI), Coimbatore, which is an organ of Ministry of MSME, Govt. of
India has facilitated the process of GI registration. COWMA filed an application with GI
registry, Chennai on 14.03.2005 and granted registration on 30.01.2006 as GI no. 26 and
certificate no. 23.
1. What is CWG?
It is a grinder to make paste for idaly and dosa etc. it is mostly produced in
Coimabtore but also some producers available in Erode and Madurai in Tamilnadu.
2. How and to whom the idea of GI clicked?
It was clicked to MSMEDI, which obtained the first and foremost knowledge
about registration of industrial products as GI during a training program at Hyderabad
based institute. After that other stakeholders such as United Nations Industrial
Development Organization (UNIDO) consultants also informed about the GI possibility.

236
3. Why the idea of protecting product as GI?
The product is exclusive to Coimbatore, there were several un-answered questions
regarding need to protect this product as GI. There can be few strong reasons for getting
registration of GI for a product but these were not applicable for CWG as given below.
Will GI help in facing competition? Probably ‘no’ because this is an exclusive
product and local producers have competitive edge due to several reasons listed
elsewhere in this case. The main competition is among the producers at
Coimbatore itself, where GI is helpless.
Will GI help in getting a premium price? Probably ‘no’ because there is no similar
product is available in the market, it is ‘the only’ product and made in a restricted
area in Tamilnadu.
Will GI help in market expansion? Possibly ‘no’ or partly ‘yes’ because of
advertisement of the product during the process of registration, and also chances
are available to become proud owner of first manufactured product registered as
GI in India, it will lead to added value for advertisement.
Then, why the registration applied and done?
There were three basic questions for self-appraisal as given below along-with their
answers which support the idea of protecting the product as GI.
The producers association known, as COWMA consist of all the producers except
one manufacturer thus represents each and every producer at Coimbatore. It was
registered in 1995 with a purpose of functioning as a pressure group especially
with taxation departments but it was not active for other positive developments.
Now there was a question, whether existence of COWMA is a good opportunity
for GI registration and vice versa can GI make COWMA an effective pressure
group for socio-economic developments of producers? The answer to this
question was strong ‘yes’.

237
Does the product/producers need recognition as GI? Yes, because it is a special
product made by especially skilled people in a niche area using locally available
raw materials, therefore community intelligence must be recognized, respected
and honored, which can be done as GI only.
Can GI be used as a tool for standardization and quality management? The answer
was strong ‘yes’ because it was a long felt need to take actions for the
standardization and quality management. Other options like ISO certification etc
were available but GI had several added advantages over these certification
standards. In certification, it is given to producers individually, it need money
therefore small producers will be at loss. Further COWMA does not have any role
or control over standards and quality. While GI is almost free, applicable to all
and COWMA will have strong role not only developing protocols of standards but
also would have control over it. Moreover GI does not stop in having other
certifications; therefore option is always available for them who wish to have it.
4. Process of GI registration
There are several registration requirements as discussed below:
Step-1: Identifying producers and their association
The first question was, who will do it? There was no confusion as COWMA was
available and ready to take all responsibilities including financial implications. Then the
next question was to define the producers. Therefore in this case following are the
producers:
Producers Number at Coimbatore Medium Scale Unit (MSU) 01 Small Scale Industry (SSI)- composite 50 Small Scale Industry (SSI)- assemblers 150 Suppliers or sub-contractors (Manufacturers of drum, motor, stone, plastic injection moulders, and arm-set manufacturers and other component traders)
500
Total 701
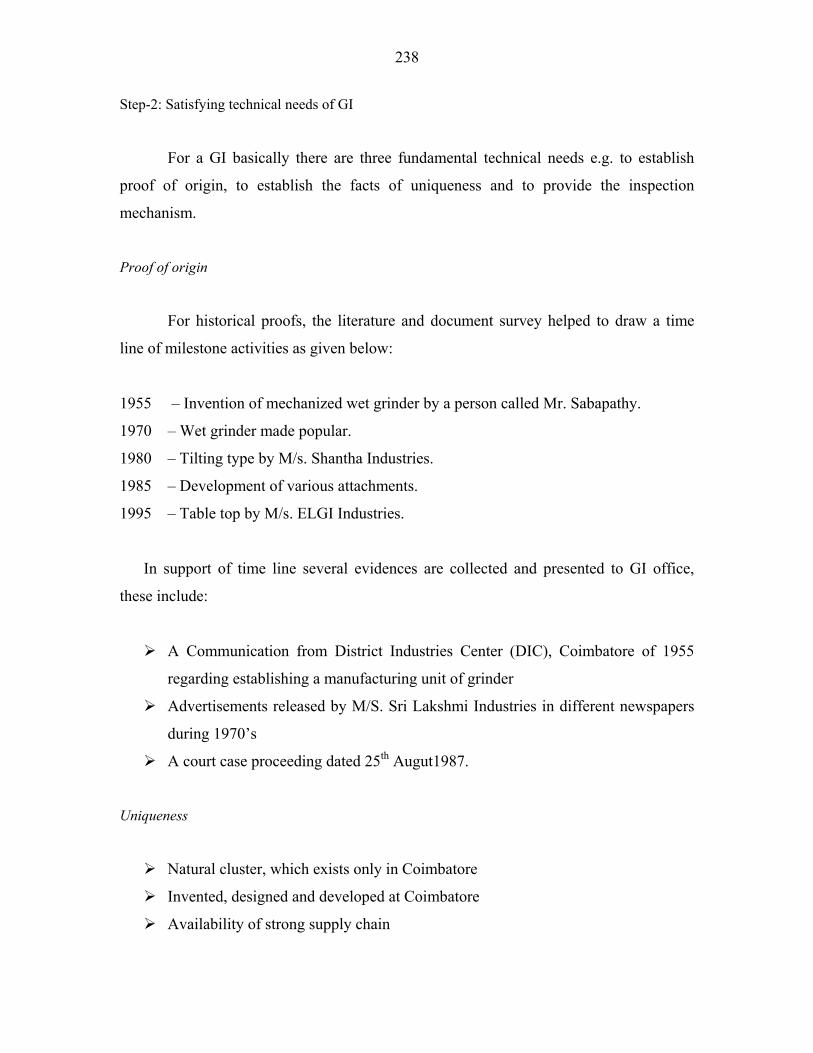
238
Step-2: Satisfying technical needs of GI
For a GI basically there are three fundamental technical needs e.g. to establish
proof of origin, to establish the facts of uniqueness and to provide the inspection
mechanism.
Proof of origin
For historical proofs, the literature and document survey helped to draw a time
line of milestone activities as given below:
1955 – Invention of mechanized wet grinder by a person called Mr. Sabapathy.
1970 – Wet grinder made popular.
1980 – Tilting type by M/s. Shantha Industries.
1985 – Development of various attachments.
1995 – Table top by M/s. ELGI Industries.
In support of time line several evidences are collected and presented to GI office,
these include:
A Communication from District Industries Center (DIC), Coimbatore of 1955
regarding establishing a manufacturing unit of grinder
Advertisements released by M/S. Sri Lakshmi Industries in different newspapers
during 1970’s
A court case proceeding dated 25th Augut1987.
Uniqueness
Natural cluster, which exists only in Coimbatore
Invented, designed and developed at Coimbatore
Availability of strong supply chain

239
Use of a particular stone from quarries available mostly at Coimbatore and 1-2%
at Erode. To establish the scientific facts, the physico-chemical analysis was done
by PSG College of Technology, Coimbatore.
Inspection mechanism
There is no IS specification for wet grinders.
These units are testing the motors as per the relevant IS standards.
The final product wet grinder is tested for its grinding performance, running
smoothness and safety.
The manufacturers have developed their own method of testing the product.
Some of the motor manufacturers have obtained ISI marking license. Because of
stringent procedures several of small producers are not interested in ISI
certification
COWMA and MSMEDI are doing all efforts to develop standards; till such
standards are developed the MSMEDI is doing the inspection. Once the standards
are finalized, the COWMA will take over this responsibility.
Step-3: Financial arrangements for GI registration
The fee of Rs 5000/- and the fee for legal consultants approximate Rs 15000/- was
paid by COWMA. The expenditure for conducting several meetings and training sessions
etc was done by MSMEDI and approximate expenditure on such activities was to the
tune of Rs 20000/-.
Step-4 collecting and establishing the product and production facts
Producers
There are middlemen exporters (05) with annual turn over of Rs 25 crore, but they
are not producer. And there are 201 manufactures (01 medium scale, 150 large

240
SSIs and 150 Medium SSIs) and 500 component suppliers (motors, drums,
castings, stones, arm sets etc). The SSI manufactures have annual turn over of Rs
200 crore and sub-contractors or accessories suppliers have Rs 150 crore annual
turn over.
About 10-15 manufactures have their own brand name and they have authorized
dealers and service centers at several places in the country. Most of the medium
SSI manufactures do not have any brand name and service delivery mechanism.
About 25% manufacturers are large type earning Rs 1- 5 lakh per month, about
75% are medium type earning Rs 10,000 to 100,000 per month. The accessories
suppliers earn Rs 10,000-20,000 per month.
Product
There are several kinds of grinders Product type Share in market (%) Product remark
Conventional 60 Take longer time about 45 minutes in grinding,
models ranges from 1 to 50 liter capacity Table top 20 Take less time about 15-20 minutes in grinding,
model ranges from half liter to two liters capacity Tilting 10 Hygenic as no hands are used, models ranges
from 1 to30 liter capacity Commercial 09 Mostly conventional or tilting types Special purpose 01 For restaurants or big catering units etc.

241
WET GRINDER PRODUCTION PROCESS – FLOW CHART
Stone Quarry
Finished stone
Stone dressing manually
Stainless steel sheet for basin
Stone machining
MS angles Stamping
Cutting
Rolling
Forming
Polishing
Welding
Assembling
Die-casting Winding
Machining
Fabrication
Varnishing
SS Sheet or plywood sheets
Stator Rotor
Assembling (Cast iron, MS body, Bearings, etc.)
Drum, Stone assembly
Packing
Testing
Final Assembly
Other bought out components such as belts, pulleys, plastic components etc.
Motor Cabinet
Production steps
The development of the product involves several steps as detailed in the flow diagram
below:

242
Market statistics
The annual turn over is approximate Rs 200 crore
The industry provides employment directly to 20000 persons and indirectly to
50000 persons.
About 80 percent of market is in four southern states and 20 percent market is in
other parts of the country or export.
The main marketing season is between two important festivals i.e. Deepawali to
Pongal
5. Post GI registration activities and impact
Development of a GI mark is in progress
COWMA does not force any standard, its purely a voluntary action at part of
producers
No infringement or GI protection administrative action has been taken because no
any such activity is reported and moreover the product is exclusive to the GI
claimed region.
The GI name ‘Coimbatore wet grinder’ is not in use even after one year of
registration. The COWMA has not permitted any one to use the GI name. The
name would be used after the standards are in place and regulated & enforced by
COWMA.
GI has been used as a tool for convincing government to reduce Value Added Tax
(VAT) from 12.5 to 4% in 2007-08 budget. It gave the big relief to the producers
Strengthening of COWMA has been the significant achievement of GI
registration.
Press coverage at several milestone activities, publicity and advertisement without
any cost.

243
6. Competition policy
There is no threat to the product from other similar product
The main competition is between local producers
Continuous innovations and R&D
Local producers have competitive edge over producers at other places such as
Delhi. The producers located at other places especially in Central and Northern
India can never compete with respect to quality and cost.
7. Price policy
The household grinders are sold at Rs 1750/- for conventional and table top and
for Rs 2250/- for tilting type. The price varies with the capacity and type of use
i.e. for household or commercial.
There has been an increase of 10% in the prices from last year but the rates of raw
material increasing. To keep the manufacturing cost less, the several tricks are
adopted- mass production, replace steel body to plastic body, reducing the
thickness of stone.
The producer earns 10-15% over manufacturing cost, the mediator earn 20-25%
over procurement cost, the efforts have been done to reduce middle-men and
ensure direct domestic sale or exports.
8. Marketing policy
All the manufacturers to have their own brands, they will use GI name and GI
mark.
All will follow the standards as agreed by COWMA, and also inspection
procedure as developed and adopted by COWMA.
The COWMA has a greater challenge of fixing the Maximum Retail Price (MRP).
Service support is provided to dealers through training their staff or sending the
service engineers in case of any special requirements. The manufacturers do not
have their own service centers like big companies.
244
Can the COWMA have a common brand and direct marketing through its own
outlets as done by KSIC? This model will not work because there are so many
producers, all would like to maintain their own identity and every producer would
like to sale their product on priority basis through these outlets. Further the
product nature is such that there cannot an exclusive showroom or outlet for this
product only; no trader would be interested in that. The traders would like to sale
this product along-with other consumer durables.
9. Gender issues
Women are engaged in various activities including men dominating activities
such as wielding and assembly etc.
Most of the medium units are located along-with the house or nearby area,
therefore 10-15% of such units are supervised by women
COWMA is organized body, the women members are there but they are not
officials of COWMA
10. GI vs brand name
All the manufactures of grinder are members of COWMA except one large
producer selling the product under brand name ‘ELGI’. The producer claims to be the
innovator and developer of the tabletop model, and further claims that others are copying
it. But still the producer has some own secret innovations in the product. The product is
popular in the market and brand name is an established name in the domestic and foreign
market. There is a conflict of GI and brand name, the producer is not willing to share the
secret innovation and bound the product as per standards of COWMA, the producer is
neither authorized nor willing to use GI name, the producer is confident that the brand
name does not require the support of GI name for selling their product either in India or
abroad.

245
11. Integrated efforts for product development
The erstwhile Small-scale Industry Service Institute (SISI) now known as
MSMEDI is taking care of this product in more organized way since 2004. The GI
registration was a small activity done under the organized efforts. As a component of
cluster development activity during 2004 to 2007, MSMEDI has spent around Rs 20-25
lakhs on various activities and about 100 lakhs on creation of Common Facility Center
(CFC). The major activities performed during the period of intervention are:
Strategic interventions
Strengthening the association
Technology up-gradation
Creating new markets
Taping export potential
Developing BDS to assist the cluster
Making the cluster an organized one
Problems identification at first phase
Main raw materials from outside cluster
Inadequate financial resources
No direct exports by manufacturers
Poor design and development
Non employment of BDS providers
Problems identification at second phase
Association office secretariat is weak
Absence of Technically qualified workers
No uniform standard for the product
Poor institutional linkages
Non employment of latest marketing techniques

246
On the basis of the problems identified the diagnostic actions were taken by MSMEDI,
which are presented below in the table.
Problem Initiative taken and outcome
Major raw materials from outside the cluster
Establishment of Common Facility Center (CFC). The CFC is in operation and Central and state government has given funds for this. The facility, in full operation will provide all kinds of raw material at one place, facility of quality testing of raw material and finished product, and also training for quality management.
Inadequate financial resources for Micro units of the cluster
Financing the units under Mutual Credit Guarantee Fund (MCGF) scheme, 30 units have been financed up to Rs one lakh.
No direct export by the manufacturers
Website launched with 50 member’s details , B2B meets organized at Kuala -Lumpur and Singapore with a 16 member delegation during Feb – 2007. Opportunity to establish direct contact for future business opportunities and also understand their product requirements.
Poor Design and Development of the product
Eight weeks technicians training programme organized by PSG college of Technology, Coimbatore with financial assistance of DST
Non employment of BDS providers BDS providers introduced in the areas of ISO 9001: 2000, Costing, Export promotion, Design, Marketing, etc. And the outcome is that 5 units are certified for ISO 9000, few more in progress; 5 units have started exporting directly and Other units are availing BDS services for various purposes
Association office secretariat is weak
Implementation of association strengthening activities such as opening a office, annual general body meeting, starting a news bulletin, weekly meetings and platform to discuss problems and also other activities as negotiations
No uniform standard for the product
Registration as GI to improve standardization. Formulation of IS for the product by BIS is under progress
Poor institutional linkages Linkages established with PSG Tech., GIR, NSIC, SIDBI, CGTSI, Banks, EEPC, MATRADE, KOTRA, IACC, TANSTIA – FNF, DIC, Other Industry associations, CII, ICC, Press media, etc.,
Non employment of latest marketing techniques
•Exclusive food melas, B2B meets organized at various places in North India resulting into orders of Rs 25 Lakhs and appointment of dealers. Same activity done for eastern India also •Common website launched •CD-ROM developed for marketing purpose
Un-organized functioning of cluster Lobbying at various quarters and submitting representations resulting into favourable business decisions such as reduction of VAT from 12.5% to 4% in 2007-08 financial budget. The units have started to function in an organized manner resulting into trebled turn over during first quarter of 2007-08. the sector was organized into various consortia as ‘Arm set consortium – each unit saving Rs. 6000 pm’, ‘ Accessories consortium – each unit save Rs. 10000 pm’, ‘III consortium – each unit save Rs. 10000 pm’ and ‘Motor consortium resulting into common purchase’. In total five consortia formed (3 for MCGF, 1 for export and 1 for RM ). Market for the product has been expanded into new areas. More mutual trust has been established among cluster actors due to formation of more no. of consortia and frequent meetings. Financing of CFC by Tamilnadu state government also
247
Financial strategy
A scheme known as Mutual Credit Guarantee Fund (MCGF) was launched by
MSMEDI involving producers and financial institutions. Under the scheme a consortium
of 10 producers collect 25 percent of desired loan amount, State Industrial Development
Bank of India (SIDBI) provide the matching grant without any interest. Now this amount
(50% of desired loan amount) put as Fixed Deposit (FD) with a commercial bank. The
consortium provides interest on the FD amount, and bank provides the desired loan
amount to the consortium on a subsidized interest rates. The benefit of this scheme is that
the consortium need to pay minimum interest rate, producers develop repaying capacity
and because of involvement of so many stakeholders, the commercial banks have the
confidence about repayments.
Marketing strategy
Promoting direct business contacts- producers official website: There is website
of COWMA ‘www.wetgrindercoimbatore.com’, in addition about five exporters
have their own exclusive websites.
Forward linkages- delegations to abroad: The expos are conducted at several
countries like Malaysia, Thailand and Singapore etc. Here the producers came
into direct contact of other effective bodies such as Kulalampur Little India
Merchant Association (KLCCI). The producers did get not only direct
orders/dealership but also important feedback such as expectations of importers,
desired modifications in the machine and food regulations of country such as
Singapore.
Forward linkages- delegations in the country: Several food melas in North and
Central India helped to boost the sales
Promotion of direct exports without involvement of any middlemen, in 2004 only
one establishment was doing direct export but now there are 10 units exporting
CWG worth Rs 25 crores directly.

248
Product publicity: Several means are adopted for publicity, the most innovative is
the development of a CD, the CD is distributed free and cost of developing a CD
was about Rs 25000/- that was borne by the COWMA.
Training strategy
Many of the producers and their workforce were not technically qualified,
therefore they were not very innovative. To think beyond present knowledge boundaries,
one need proper training. Several programs are organized with the funding support of
Department of Science and Technology (DST) and technical support of PSG College,
Coimbatore.
Service strategy
Hired consultants: The consultants are identified and provided to COWMA to support for
various services such as:
Certification- at least five units are certified for ISO
Marketing- at least ten units are exporting directly now
Institutional networking for backward and forward linkages
Costing method- this is an important area, where many of small and medium
producers are completely un-aware.
Networking and communication strategy
The organized and stronger COWMA now provide a platform for discussions and
formal and informal communications. Several problems are solved informally e.g. a
trader from Bangalore take the grinders from one producer and delay the payments for a
larger period, in the mean time he take the machine from other producers. Now the
producers’ came to know about his strategy so all decide not to supply him anything
without proper payment scheduling.

249
Creating common Facilities
A Common Facility Center (CFC) was created that would cater the needs of producers in
following way:
Opportunity of networking
Standardization and testing facilities
Training on innovative design etc.
Providing raw material under one roof
12. Growth of industry during integrated approach and exit
The impact of integrated approach has been discussed elsewhere in this case
study. The important growth parameters are presented in the table. The MSMEDI also
planned the exit from the scene now.
Parameter Before intervention- 2004 Post intervention-2007
Production (no.) 60,000 100,000 Direct employment (no.) 20,000 30,000 Business (Rs in crore) 225 400 Export (Rs in crore) 25 50 Direct exporting units 01 10 ISO 9001 certified units Nil 05 Exit strategy
Responsibility of organizing the activities shifted to the association.
Well established linkages developed with various agencies like State Govt.,
NSIC, SIDBI so that the activities can be continued in the future.
Association office has been strengthened with necessary infrastructure and
sources of information like magazines, internet, etc.
Linkages established with other associations for synergy.
Various BDS have been introduced in the cluster whose services can be availed in
future also.
COWMA cluster services registered under societies registration act will look after
the implementation of CFC

250
B. MYSORE SILK
1. Ownership of the ‘Mysore silk’ as GI
To the general public in India, ‘Mysore silk’ refers to the reputed fabric and
clothing such as ‘saree’ produced at Mysore. Karnataka Silk Industries Corporation
(KSIC), Bangalore, which is a state government enterprise, is the sole proprietor of the
‘Mysore silk’ as a GI, the registration has been done under various classes for yarn,
textile and clothing. The KSIC got registration of this GI in November 2005. The
dynamic Managing Director took steps for the registration of this product as GI but these
initiatives are the result of the awareness created by the Geographical Indication Registry
officers. The KSIC responded to the awareness with great zeal by initiating the
registration program immediately. The registered geographical area for this product is
Mysore city and nearby area only (not the complete Mysore district).
KSIC claims the sole ownership, there is no other producer of ‘Mysore Silk’.
Historical records put by KSIC trace the growth of this product since way back in 1912,
when ‘Maharaja of Mysore’ established a factory at Mysore primarily to meet the royal
needs of the silk fabric. In 1928, the cocoons grown at Mysore were taken to Europe for
reeling (yarn making) and crepe making through power looms. This experiment had sown
the seeds of crepe silk making in India as the suitable power looms were selected and
imported in India from Switzerland and other countries, hence the production of crepe
silk started in 1932. The factory at Mysore was later on handed over to Directorate of
Sericulture, Karnataka government, and finally to KSIC in 1980. KSIC is the only
organization in India, which is involved from yarn making to finally fabric and product
making such as ‘Sarees’ etc. The cocoon processing for yarn making is done at Narsapur
factory, while the processing of fabric is done at Mysore factory. The complete
production chain involves power-operated machines only. Because the KSIC is the sole
producer, therefore the complete expenditure on registration is born by KSIC, which was
around Rs 500,000/-.

251
At this moment, there is no authorized user other than the proprietor. The new
producers willing to become the authorized user shall take No Objection Certificate
(NOC) from KSIC, in such case, KSIC would give emphasis on:
Producer must be located in the registered geographical area i.e. Mysore city and
adjacent area of about 20 Kms.
Producer must follow quality and procedural standards of KSIC.
KSIC may ask for royalty also.
2. Uniqueness and geographical link
Following are major factors contributing for geographical link and uniqueness;
Product quality i.e. crepe silk, which does not shrink and uniform because it is
made using specific production method; it also has specific standards.
Use of the locally produced cocoons called ‘Mysore silk worm’, which produces
yellow yarn has certain specific features such as multi-voltaine.
Local climate influence mulberry production and finally rearing of local race
cocoons.
3. Method of production
Yarn preparation
There are two types of cocoons, one –Mysore local race, these are yellow in color
and multi-voltaine; other types are white/hybrid/import from china and Japan, these are
bi-voltaine. In Mysore silk, local silk worm cocoons are used for yarn making, each
cocoon approximately gives 2 dennier or about 600-800 meters of yarn, it means for
producing 26/28 dennier, about 13 cocoons are required. The worm inside the cocoon is
killed using impregnation in boiled water (the other methods of killing worm are hot air
treatment or storing for 6-8 months). The gum (sericin) loosen it for reeling. Semi-
252
automatic machines imported from Japan are used for reeling, these machines take care
whether to take 13, less or more number of cocoons to keep the standard of 26/28dennier.
The yarn is uniform. Yarn is manufactured in a factory situated at Narsapur, near Mysore.
Construction of fabric
It is unique, which is consist of WARP and WEFT of 26/28 dennier, it means, a
yarn of 9000 meters weighs 26 to 28 grams. WARP does not have any twist, but WEFT
has twist, where two yarns are twisted, one clockwise and another anti-clockwise (see
fig). The fabric so constructed known as ‘Crepe’; it is different than other product such as
‘Kancheepuram silk’ where neither WARP nor WEFT is twisted, while in ‘Georgette’
both are twisted, in ‘Chiffons’ both are highly twisted.
The border has interlacing of gold and silver, which constitute, 0.65% (1.52 gms)
of gold and 65% (15gms) of silver. First silver coating is done followed by coating of
gold using electrolysis method. Gold and silver as raw material is obtained from Surat in
Gujrat. The testing facility is available at a laboratory of defense situated at Chennai. The
fabric is manufactured in a factory at Mysore, weaving and processing is done in such a
way that uniformity is available throughout the fabric.
4. IP protection and enforcement
Prior to GI, the ‘Mysore silk’ was already protected as trademark, Soon after the
new legal Act came into existence, the product is registered as GI registration. In the
process of GI registration ‘Mysore silk’ faced opposition from a private establishment in
Bangalore called ‘Chamundi textiles’. The opposition was sorted out at the GI registry
office level by submitting a joint memorandum by both the parties that both GI ‘Mysore
silk’ and trademark ‘Chamundi silk’ would exist because both are different, and
‘Chamundi textiles’ withdrawn the opposition. Chamundi textile is situated in Bangalore,
they use imported cocoon and dinnier standard and type of twist is also different than the
‘Mysore silk’, therefore they will not use the name ‘Mysore silk’ and vice versa.

253
The legal registrations alone are not enough to protect any IP, therefore the other
measures were also adopted. One such measure was conducting a survey to know about
the use of name ‘Mysore silk’ by traders. A private company was hired for this survey at
Bangalore, Mysore and other parts of Karnataka, KSIC spent about Rs 50,000/- for this
purpose. Another post registration measure was to create awareness among traders and
consumers regarding GI and its scope, it was done through newspapers etc., the purpose
of these advertisements was to enhance the knowledge of stakholders about GI and
product both.
As a policy of IP enforcement as GI, the shop owners were informed about the
proprietorship of KSIC, complains were lodged with shop owners regarding not to use
the name ‘Mysore silk’. When it does not work, the legal notices were issued to these
shop ownership, since last two years about 20-25 such notices have been issued, mostly,
the shop owners are complying with such notices. In one case, in 2005, a First
Information Report (FIR) was registered against a shop owner ‘Karnataka International’
at Bangalore, who was using this name despite the legal notice. A police officer of the
rank of Assistant Commissioner of Police raided the shop and confiscated all the silk
sarees to which the name was used as ‘Mysore Silk Saree. The matter is under the
judicial process in a ‘Metropolitan Court’ at Bangalore.
Warp- no twisting
Weft- interlacing of two yarns fibers as twisted clockwise and anti-clockwise
Border of gold and silverof specific standard
Unique features of construction of fabric of Mysore Silk

254
The KSIC at this moment does not have any design patent, but there is a great
scope of protection of ‘Mysore silk’ in this form also. Further KSIC has also not
protected ‘Mysore silk’ as a trademark or certification mark of GI in any other country. If
KSIC protect these IP forms in other countries, it would certainly be linked with
enhanced manufacturing capacity to make out the rising demand from abroad.
5. Marketing networks
KSIC ensures quality product, and subsequently put lot of efforts for brand
development through various means such as ISO 9000 and ISO 14000 certification.
Advertisement in visual and print media is the major sales strategy; exhibitions and
institutional sales are other main sources for sales. Prior to 2003, the marketing was done
through dealership all over the country, KSIC had about 80 dealers, who sold the product
to customers. After 2003, the policy is changed to direct marketing, now KSIC has about
12 outlets of its own in various parts of country especially metro cities. For northern
India, there is a private wholesale distributor at Delhi. As a result of IP protection and
sales promotion measures, the annual sales increased from Rs 24 crore in 2005 to Rs 40
crore in 2007, the production of silk is around 35000 meter per month, previous to GI
registration, it was around 30000 meter per month. At present there is no export of
‘Mysore silk’ is done by KSIC.
6. Socio-economic upliftment of producers
As a producer of ‘Mysore silk’ KSIC is not directly involved in socio-economic
upliftment of producers because there is no other producer of ‘Mysore silk’ other than the
KSIC itself and it’s a public undertaking of Government of Karnataka. But KSIC does
support the cocoon producers in the local region.
The area near Bangalore and Mysore is famous for mulberry plantation and silk
worm rearing known as ‘Mysore silk worm’, these are yellow in color and reputed race
for good quality yarn. Unlike places like Dehradun, the mulberry plants are available
through out the year thus the production of cocoon.
255
In Ramnagram mandi itself the turnover through auction is around 25 tonnes
cocoons per day. KSIC purchases around 2 to 4% of it. Mostly the purchases are made by
the groups of reelers as collective bargaining, therefore silk worm producers remain at
loss. KSIC play a role in fixation of minimum price in the auction market. KSIC also
tried tie up with the producers but it does not work well because the constant supply of
cocoons is not assured, whenever these producers find better rate than the contract rate
with KSIC, they did not sell it to KSIC. From the point of socio-economic upliftment, the
protection of ‘Mysore silkworm race’ as a GI is another area, either cocoon or eggs can
be protected as GI. The efforts for its registration can be done by organization such
Central Silk Board of Govt. of India.

256
C. CHANDERI SAREE
1. About Chanderi
Chanderi is a small town inhabiting about 40,000 persons in District Ashoknagar
of Madhya Pradesh. The town is old and had been in history since 13th century AD.
Mostly (about 70%) population is engaged in textile manufacturing or business either
directly or indirectly because the land is not suited for agricultural purposes, therefore the
population adopted non-agricultural profession as a means of livelihood but it had been a
means of subsistence29 only. The rainfall is between 700-1100 mm and temperature
varies from 8-46 0C. The other means of livelihoods are cultivation of crops such as
wheat, maize, mustard, jowar, groundnut and soybean. Some families collect and sale
sand and gravel from the quarries.
2. History of chanderi fabric
The Chanderi was a place of textile production during the reign of Mugal
emperor, Aurangjeb, but the first descriptive account of chanderi fabric was given by Mr
I.C. Sterndale in 1857. He describes that the chanderi cloth was consumed through out
India in south and west parts also, the cost of fabric was quite high (Rs 800-1000/saree),
the value of the cloth was based on the softness and transparency of the cloth. The
industry has several ups and downs but the weavers population is increasing day by day.
In 1921, the 1811 persons were involved as weavers, one of the expert Mr A. H. Silver
supported the industry through providing several changes in designs etc.
3. Uniqueness
The chanderi saree has certain unique characteristics in the method of production
and also quality. Transparency is one specific characteristic. In earlier times there used to
be weavers, who use to make a pagari (head gear) of about 20 feet consisting of 100 29 Most weaver earn Rs sixty a day. About 2000 weavers’ families at the node of poverty, for details see- http://www.lred.info/locgov.pdf

257
grams only. Earlier the cloths were made from cotton, later shifted to cotton mixed with
silk and now it is mostly silk only, the uniqueness claimed is available in GI journal30.
4. Product characteristics
Following are the special characteristics produced at Chanderi
The main products i.e. Saree, salwar suite etc. is around 18 lakhs/annum. The
plane fabric is produced to the tune 09 lakhs meters/annum. The total production from the
industry in a year is about Rs 16.9 Crores with the profit of around Rs 3.62 crores every
year.
5. Producers’ characteristics
Type weavers by class
There are Master weavers and other weavers. Prsently more than 3600 families
are involved as given below31: Among the total weavers 56 percent are Muslims
(Ansaris) and rest are mostly Hindus (Kolis), some SCs are Muslims by religion.
Community No. of families Percent Muslims 2065 56.4 SC 1271 34.7 Others 310 8.5 STs 13 0.6 Total 3659 100 30 For details please refer ‘chanderi sarees’ application no. 7, GI Journal 02, September 2004. 31 See http://www.msmefoundation.org/pdf/chanderi.pdf.
Product Per cent production Special characteristics Saree 35 Transparent, length-5.5 m, width-46 inches Salvar/kameej 15 Semi-transparent, length-7.5 m, width-46 inches Duppatta 05 Transparent, length-2.5 m, width-36 inches Curtains 02 Transparent, length-2.5 m, width-46 inches Plain cloth 40 - Others 03 -

258
The share of wages out of the business is to the tune of Rs 5.9 crore annually but
most weavers earn Rs 55-65 per day and live at the subsistence level only mostly. The
recent reports claim that during 2004-2006, there had been an increase 10-15 per cent in
the wages32.
Type weavers by function
The weavers from Muslim and Hindu community are engaged in different
activities as described below in the table:
Percent weavers
Type of professional function Muslim weaver Hindu weaver Total
Master weavers provide raw material and design, the weavers work at their houses. They do job work only 25 15 40
Master weavers provide design only, the weavers arrange raw material, work at their houses. They provide ready material on agreed price
08 07 15
Master weavers provide design, raw material and loom. Weavers work at work place and take labour price 03 02 05
Independent weaving and sale 10 05 15 Weaving for the weavers cooperative societies and receive labour price 03 02 05
Working for Self Help Groups (SHGs) and Bunkar Vikas Sanstha. Receive raw material and design and also labour price for job work. In addition also get bonus every year
15 05 20
Total 64 36 100
6. Manufacturing units
There are about 39 registered Master weavers and 15 non- registered small scale
units, the total number looms are 2011 but only 1369 of them are working. The total
operating handlooms are 2756.
7. Producers association
The weavers’ cooperatives are quite strong at chanderi, there are around ten
weavers’ cooperatives functioning at Chanderi, the first cooperative known as ‘The
Bunkar Sahakari Sameti’ was registered in194633. Latest in this effort is ‘Bunkar Vikas
32 See http://www.unido.org/file-storage/download?file_id=81773. 33 Registration number 4468 dated 12.01.1946 has the membership of 557 weavers.

259
Sanstha’ registered in 200434 with membership of 119 persons. At present there are
around ten registered cooperatives in and around Chanderi. Besides there are 31 NGOs,
of which 25 are functioning. The GI ownership lies with ‘Chanderi Development
Foundation’ formed in 2004 with 11 representatives from weavers, traders and yarn
manufactures etc.
8. Stakeholders’ support
Chanderi silk industry has got support from various government and non-
governmental institutions. United Nations Industrial Development Organization
(UNIDO) helped in facilitation of GI registration. Hastshilpa and Hathkargha Vikas
Nigam (HHVN), an autonomous organization of Govt. of MP support various activities
in trade development including conduction of 118 exhibitions at various places in the
country during 2007.
Another important stakeholder is Self-Help Groups (SHGs). Presently about 60
SHGs are working at Chanderi, each consist of 10-12 weavers families. In 2002, UNIDO
collected most active SHGs and constituted an apex local organization called ‘Bunkar
Vikas Sanstha (BVS)’, which was registered in 2004. in the initial stage, only 7 SHGs
became its member by paying Rs 2000/- each. The BVS has played a vital role in not
only collecting orders from India and abroad but also keeping control over the quality.
The UNIDO and BVS explore the opportunities of market expansion, the training of
workers and also to improve their socio-economic conditions.
9. Marketing
The master weavers and other weavers sale their product at chanderi and also
send to other places. The market is mostly dominated by the traders or sahookars. The
raw material is now available at the chanderi only but the trade of raw material is
controlled by the middle-men, who sale at their own decided cost. Mostly the rates or
34 Registration number 8557 dated 25.02.2004

260
Market Channels of Chanderi Fabric
Yarn Supply
Banaras/Bangalore Coimbatore Surat
Silk Cotton Zari
Traders Master Weavers All Society &
Co.Operative Society
Weavers
Finished
Traders Master Weavers All Society &
Co.Operative Society
Sale throughout IndiaPrivate sale – 50%Exhibition Sale – 40%Govt. emporium – 10%
Source : India Entrepreneurship Development Institute, Ahmedabad office at Chanderi
prices of raw material and finished products are controlled and decided by the sahookars.
National Handloom
Development Corporation has
now interfered in the matter and
started supplying the raw
material to HHVN, which in
turn provide it to the needed.
But this supply is presently only
three per cent of demand.
HHVN has also initiated a
scheme called ‘Yarn bank’. If
we look to the style of domestic
sales, we observe the following:
Private sale channel- 50
%
Exhibition sale- 40%
Govt. supported
showrooms & emporiums-
10%
The complete flow of supply chain to marketing channel is given in the flow diagram
10. Use of GI as marketing tool
Though several plans like logo and market intelligence were there but the tool of
GI has never been used in practice
11. Reasons of poverty of weavers
Ineffective functioning of production units and other reasons lead to poverty of
weavers; some of the very important reasons are given below:

261
Managerial incapacity and less economic viability of weavers’ cooperatives
Improper and costly supply of raw material and tools
Master weavers are not fully trained in latest technologies
Well planned and institutional marketing channels are not available
Weavers takes loan and repaying capacity is less, therefore they are under debt,
they also fall prey to the bad habits such as drinking and gambling. They often
sale their houses to repay the loans and than work in the rented houses which is
not conducive for proper and effective work.
Due to less economic capabilities, the backward and forward marketing linkages
are very weak.
In case of no repayment of loans, the weavers shift to other means of livelihoods
such as vegetable vendors, fish vendors, bidee (locally made smoking material)
making and rural migratory vendors etc.
Predominance of traders and middle-men
Exploitation of some weavers by the master weavers and sahookars.
12. Suggestions to improve the socio-economic conditions of weavers
Reducing the cost of chanderi products to bring into reach of common man so that
there will be drastic improvement in domestic sales.
Chanderi products are made through handlooms only, the process is not only time
and labour consuming but also not competitive with other products, therefore
introduction of new techniques without power looms must be welcome.
It has been observed that the demand of traditional clothing and sarees from
chanderi have certainly reduced, therefore production should be on the basis of
market survey. In addition new verities of products should also be launched in the
market.
Proper availability of raw material at lowest prices in the local market of chanderi.
Advertising and publicity of traditional clothing from chanderi fabric.
Reducing the middle-men to the extent possible.
262
D. SOLAPUR CHADDAR AND TERRY TOWEL
1. History and Proof of origin
Corporate-Cooperative- Individual ownership
In the manufacturing of Solapur chaddar and terry towel several weaving
communities (60% from AP, 20% from Karnataka and 20% from Maharashtra) are
involved. The industry has long history of about 500 years, when the industry developed
at Medak in AP under the patron of Nizams. The Solapur spinning and weaving mills was
started by a corporate sector, and labour migrated from Medak to Solapur, slowly the
industry established. The main reason for the establishment was Jacquard design used by
the industry, which at that time was used in Manchester only and availability o cotton
from surrounding areas. Earlier it was the production of saree but later shifted to
production of chaddar. There was a beginning of deterioration of solapur mills from 1911
and following years due to plague epidemic, wars, labour and cotton shortage35.
After independence, the cooperative movement started, several mills started people
got employment. The corporate mill closed and several industries came up. The workers
became masters in several components of textile making e.g. yarn dying, weaving,
warping, stitching etc and a ‘Workmanship’ was developed and established with the use
of Jacquard design. During China war, there was a recession in the industry, cooperative
movement was failing, and another war with Pakistan. The cooperative mills started
closing down. The workers started their own small units, during 1970’s the production of
terry towel was also started. The erstwhile weavers became the owners of production
establishments. Why the industry established in the recent past, there are several reasons,
but being a decentralized sector, the major policy related reasons are:
No Value Added Tax (VAT)
No sales tax
35 For details refer Manjiri N. Kamat, 1998.
263
Subsidized electricity
Relaxation in labour laws
Relaxation in Employees Insurance Scheme laws
2. Present scenario of production units
Presently, there are about 750 weaving units with range of 8 to 24 power looms. In
total there are about 25,000 power looms. There were 24 spinning mills but four are
closed in the recent past, there were 03 composite units but two are closed in the recent
past, there were 06 sizing units but three are closed in recent past. About 300 units are
hand-processing units, out of the total 8 lakh population of Solapur, about 1 lakh are the
worker in the textile sector, and approximate 12% of them do the job work. The nature of
work distribution of different production units is given below:
1. Producing Terry towel only- 58%
2. Producing chaddar only- 31%
3. Producing chaddar and terry towel both- 8%
4. Others- 2%
The annual turn over of trade is to the tune of Rs 250 crore for chaddar in the
domestic market; for terry towel it is about Rs 500 crore in domestic market and about Rs
450 crore in the export market. Owing to decline of export during 2002 to 2004 Solapur
region lost the business to the tune of Rs 300- 350 crores36.
3. Producers’ Associations
The producers association in the sector are quite strong, at present there are 15
producers associations and one exporters association is available. The important ones are
given below: 36 Maharashtra losing out to Gujarat, an article by Renni Abraham in Mumbai, March 16, 2004 at rediff.com available at http://www.rediff.com/money/2004/mar/16maha.htm

264
Textile Development Foundation
Solapur M.I.D.C. Industries Association
Yantramag Sourakhan Samiti
Solapur Zilla Yantramag Dharak Sangh
The Textile Development Foundation (TDF), who is the proprietor of GI has its
own about 180 members and also about 500 members representing other production
units.
4. GI registration
How the idea of GI emerged?
The knowledge of about GI received in one of the training programs in 2003 at
Ahemdabad, the ideas was clicked to one individual and later it was facilitated for Textile
Development Foundation (TDF) to take the real shape. The total expenditure about Rs
50,000/- was born by the TDF.
Why the GI protection?
As far as name ‘solapur chaddar and terry towel’ is concerned there was no
competition, though competition is available within textile sector. For example chaddars
from panipat or other areas compete, the terry towel from companies like ‘Bombay
dyeing’ compete. But there were no reported cases, where the traders are selling, other
kind of textile material in the name of solapur chaddar or tery towel. Therefore the
reasons of GI registration are:
To protect the identity developed after so many years of learning
To protect the product from becoming generic

265
Which geographical area?
Very small geographical area i.e. industrial area of Maharashtra Industrial
Development Corporation (MIDC) has been registered. If the small registered area is not
sufficient in future, could the addition of new geographical area be done in future after
some time? Another question is what is the basis of marking the area? Is it the presence
of establishment of producers or exclusion of those geographical areas that do not
contribute to particular reputation? Therefore what is the principle of geographical
exclusion?
How uniqueness defined?
The uniqueness was defined on the basis of following three basis components
Jacquard design
Workmanship
Production under one roof
The complete process from raw material to final product at Solapur
Inspection mechanism
The standards are to be checked by TDF, testing facility on payment is provided
by textile committee also.
Was there any opposition?
Several companies put the opposition to the application of GI for solapur chaddar
and terry towel. But on the basis of proof of origin and uniqueness, the TDF won the
opposition, the final grant of GI certificate took about one year.

266
5. GI as a trade tool
Use and impact
Till now no administrative or infringement action has been taken
As such GI has not been used for any trade distinction etc
Indirectly it had been of some significance but it has not played major role37 such
as reduction in competition or enhancement of premium over product. Because
competition is within the local producers and also other domestic producers. The
prices are market controlled, these are not producers’ controlled.
Future planning
Development of inspection and monitoring system
Efforts for brand building in the form of GI mark
The trademark of each and every producer is not recommended because several of
producers are so small that they can not meet the market requirement. There are
several traders, who do not have any manufacturing unit but take material from
several manufacturers and sale under their trade name or with their own
trademark. But the traders can also be authorized user as per GI Act, this is a big
challenge for the producers’ organizations.
6. Integrated efforts for product development
Protection as GI was one of the integrated efforts, but the major effort has been
done through cluster development approach of the enterprise. The Government of India
has initiated cluster development program for Small and Medium Enterprises (SMEs),
which suffer from disadvantages of being in a relatively isolated environment. The
program involves technical assistance, subsidies for technology upgradation and
37 The initial studies of textile committee also reveals that solapur chaddar & Terry towel cluster has not received post registration benefits with respect to positive indicators in terms of productivity, disposable income and employment (Trade Globalisation & Textiles, Jan-June 2007, p 9, Textile committee, Mumbai)

267
marketing support. This program began in 2002 and would end in 2008, and has
strengthened the competitiveness of the SMEs, which has also consolidated their position
in the global value chain. A case in point is the initiative undertaken by the Textile
Committee under the Ministry of Textiles, which has undertaken a cluster-based
programme for capacity building in textile and clothing SMEs in across 20 clusters in the
country, the Solapur is one of them.
Some key objectives of a cluster based approach for developing SMEs are:
Networking among enterprises
Economies of scale
Improved bargaining power
Technology and skill up-gradation
Global visibility and being part of the value chain
Easier access to finance
Greater institutional support.
Some of the weaknesses in textile sector as identified by textile committee are:
Highly fragmented sector
High dependence on availability of basic raw material i.e. cotton
Low productivity
Declining mill segment
Technological obsolescence
Non-participants in trade agreements
7. Major efforts under cluster development program
Conducting benchmark surveys and diagnostic surveys time to time
Extensive training in various areas such as licensing, packaging, credit,
knowledge enrichment for technology Upgradation, inventory management, uses
of internet, marketing beyond boundaries etc
Improvement in water quality used for dyeing
268
Strengthening backward integration leading to discounted purchase, better price
negotiations and bulk purchases.
During 2004, formation of three consortium i.e. Robotox (for mini apparel park),
classic terry towel (for expos abroad) and Euro terry towel (for bulk purchase).
The conflicts in consortium has been a big challenge to manage.
8. Impact of integrated approach
Implementation of development programs on the basis of proper surveys
Extensive participation of producers in trainings in various one-day programs
Fourteen units have ISO certification
Expansion of market- earlier the middlemen at Mumbai used to procure the terry
towel @Rs110/kg and export it @Rs400/kg, but now producers either avoid them
or export directly.
Direct export- about 110 units export directly
Strengthening on-line information- about 65 units have their own websites
269
E. KANGRA TEA
1. Owner of Registered Geographical Indication
Himachal Pradesh Patent Information Centre, State Council for Science,
Technology & Environment, Govt. of H.P. is the proprietor at the behalf of growers and
producers of tea at Kangra, some parts of Chamba and Mandi Districts.
2. What is kangra tea?
Kangra Tea, grown in Kangra Valley & Jogindernagar area of Mandi District and
Bhatiyat Tehsil of Chamba District is mainly produced in the southern slopes of
Dhauladhar ranges of Western Himalayas at present with in the altitude range of 900m to
1400 m. The geographical map of present Kangra Tea growing areas and potential tea
growing areas comprising of Kangra, Chamba, Mandi, Kullu districts is enclosed. The
Kangra valley receives high amount of rainfall. Dharmshala town and its surrounding
areas are recorded to be second highest rain receiving areas after Mesynram in
Cherapunji district of Assam. The average rainfall at Dharmshala averages between 270-
350 cm per year. The Kangra tea can also be grown in potential areas at a later stage the
favourable conditions for tea cultivation prevail in the region.
3. Grades of Kangra Tea
Black tea grades
SFTGFOP: Super Fine Tippy Golden Flowery Orange Pekoe
FTFGOP: Fine Tippy Golden Flowerly Orange Pekoe
TGFOP: Tippy Golden Flowerly Orange Pekoe
GFOP: Golden Flowery Orange Pekoe
GOF: Golden Orange Fannings
FOF: Flowery Orange Fannings

270
Green tea grades
Whole leaf used- Y H F Y H: Young Hyson Fine Young Hyson
Broken leaves used- G P H F H: Gun Powder Hyson Fine Hyson
Fanning- SOUMEF
Dust
4. Biochemical characteristics
Kangra tea with perfect blend of liquor and flavour has bountiful of health
nourishing natural products. Kangra tea leaves have up to 13 % catechins that are saved
with high efficiency whole leaf - orthodox manufacture. These polyphenols are proven
antioxidant, hypolipidimic, hypotensive, anticarcinogenic, diuretic, antidentalcariatic and
antimicrobial. It also has 3 % caffeine and amino acids like theanine, glutamine, and
tryptophan - the important vitalizers. Kangra tea is derived from the leaves, buds and
tender stems of plants the botanical name of tea plants is Camellia sinensis or their
Sinensis grown in Kangra valley consisting of Kangra district and parts of Mandi, Chamba
districts of H.P. Kangra Tea is an agricultural plantation crop and the forest species of
economic importance as shade trees. Due to high intensive spreading nature this crop
provides the most suitable soil conservation measure particularly on hilly terrains under
high rainfall conditions. The woody after leaf fall and the lopping from trees can be
utilized as fuel wood by working labour/ supply to factories as energy source for
processing tea
5. Uniqueness
The colour and flavour of Kangra tea is unique and distinctive which can only be
called as Kangra tea flavour. In liquor characteristics Kangra teas have body, liquor, colour
and flavour which can only be called as Kangra flavour unlike Darjeeling teas which have
flavour but less of body liquor. The unique colour and flavour of Kangra tea is due to
unique climatic conditions prevailing in snow clad Dhauladhar ranges of Himalayas. The
grades of Kangra tea both black and green tea are given in Table 1. Kangra tea belongs to

271
species of tea Camellia sinensis, variety sinensis, having multi stemmed frame, narrow
leaves and planted from seed stock is raised here in Kangra valley. Both black and green
teas are manufactured as Kangra teas. The average age of the existing plantations is more
than 100 years, planted between 1850 to 1900 A.D. Since the plantation is raised from
seeds, the population is heterogeneous and is richest source of genetic variability and
existing gene pool in tea suitable for quality black orthodox tea and green tea. As compared
to other tea growing areas of India like Assam, Darjeeling, south India and Uttaranchal,
Kangra tea plantation is not much attacked by many pests. Kangra tea is attacked by Thrip,
mites, aphids, mealy bugs and other minor pests. Out of which if not checked only mealy
bugs are observed at an epidemic stage in past few years. The requirement of these
pesticides used to control these pests is very less as compared to other tea growing areas. If
the pesticides are used, it is only at the time of pest attack. In recent years, market survey of
Kangra tea reveals that the Kangra tea is free from the pesticide residues38.
6. Historical perspectives
Introduction of tea gardens
Tea industry of Himachal is about 150 yrs old. In 1849 Dr. Jameson, the
Superintendent of the Botanical Gardens, North-West Provinces, travelled through these
hills to identify the area to grow tea. He found the region suitable for growing tea later he
brought a number of tea plants from the nurseries at Almora and the Dehradun. These
were planted in three Government gardens, one at Kangra, at an elevation of 2500 feet,
another at Nagrota, in the valley at altitude of 2900 feet, and the third at Bhawarna, on the
higher plateau of Palam, 3200 feet above the sea. The plants were slightly damaged as
these were brought during the season of the hot winds from Almora to Kangra, and the
experiment was commenced under trying circumstances. At Kangra the plants did not
thrive, partly owing to the high temperature, aggravated by the vicinity of the town, and
38 Kolukkumalai tea in district Munnar, Tamilnadu ia also organic and processed in orthodox manner. The gardens started in 1935 spread over 500 acres utilize about 80 labours during normal activity and 350 labours during peak activity. The tea gardens on high mountains are used for tourist purposes also and generate additional income (Anita Satyajit, Windows & Aisles, Paramount airways, 2008, p 15).

272
partly on account of the scanty supply of irrigation. But in the other two gardens, the tea
flourished beyond even Dr. Jameson's anticipation. The subsequent history of the
introduction of tea up to 1872 is well given in a report furnished in that year by Major
Paske to Government. The formation of these nurseries were followed by the
establishment of a government plantation on a large scale, at Holta- a spot above six miles
far from the Bhawarna nursery, and an elevation of 4200 above the sea. The Holta
plantation was successful, under many unfavourable conditions by Mr. Rogers, who
remained incharge of it till government sold it in 1866 to Majot Strut, and in 1860 the
outturn of tea amounted to 29,312 lbs. In 1859 and 1860, the success of the government
plantation led to the introduction of private enterprise and capital. The lands which were
situated in different localities throughout the valley were all well suited for tea cultivation,
and have formed the nucleus of what have since become very valuable estate. Other land
was acquired by private purchase, and in 1867 there were 19 tea estates, the aggregate area
of which comprises 8708 acres, 2635 acres being actually under cultivation.
The gross aggregate produce for the season of 1868 was 241333 lbs. of tea. Major
Paske had attributed the tea plantations to show how far the Kangra valley possesses the
advantage of climate, soil and other conditions considered essential in the success of tea
cultivation. As regards climate, a hot, a damp climate, with a rainfall of not less than 100
inches per annum is shown to be required for teas, and this climate the Kangra valley
possesses for at least 7 months in the year, at elevation from 2500 feet to 4500 feet above
the sea. The lowest elevation at which an estate is situation is 2437 feet, and the highest
elevation of any estate is 5500 feet.
After observing preliminary success of tea plants at nursery stage, Dr Jameson
recommended the lower slopes of Dhauladhar ranging between 900m to 1400m above
mean sea level receiving an annual precipitation of 1500-2500 mm and soil below pH 6.0
as the most suitable areas for tea cultivation.
The first commercial tea plantation was established as “Hailey Nagar Tea Estate”
at Holta near Palampur in 1852 at an elevation of 1291 m above sea level. The production

273
from this plantation was sold at a very high premium in 1860. It encouraged many private
entrepreneurs and by the end of 1880, an area of about 4183 hectares was brought under
tea cultivation extending from Jogindernagar in Mandi district to Shahpur in Kangra
district. Tea industry in the region flourished well till 1905, when the great earthquake
ruined many establishments. The panic stricken Britishers sold their plantations to the
local buyers.
Historical testimony of quality tea
Kangra tea industry occupied prime position with respect to its quality from the
last quarter of nineteenth century to beginning of twentieth century. Tea made in Kangra
during this period was comparable with that of any part of India. The mention of quality of
Kangra tea in the Gazetteer of Kangra district (1882-83) is like this "The tea now made is
probably superior to that produced in any other part of India. The demand for it has been
steadily increasing and much is now bought up by natives for export via Peshawar to
Kabul and Central Asia". The gold and silver medals won by the Kangra tea in London
and Amsterdam markets in the late nineteenth century (1886 to 1895) bear testimony of its
quality at international level. The tea made in the hot weather used to be second to none
and was sold as well as any. Kangra tea as such has acquired substantial and international
reputation. The Kangra Tea has a vast market in London, and Europe and the Central Asia
and also exported to Europe, America and Australia. The Kangra valley during 1920's
produced nearly half the green tea manufactured in India, and it was exported to
Afghanistan and Iran.
7. Characteristics of Producers
A total no of 3679 tea growers representing an area under tea of 2312 hectare
spread over four tehsils of Palampur, Baijnath, Kangra, Dharmsala in the district of
Kangra and one each in Jogindernagar & Bhatiyat in the districts of Mandi and Chamba
respectively. Tehsil Palampur covers the maximum area of 1256 hect are followed by
Baijnath 564.4 hect, Dharmsala 231.7 hect, Jogindernagar 193.4 hect, Kangra 65.49 hect
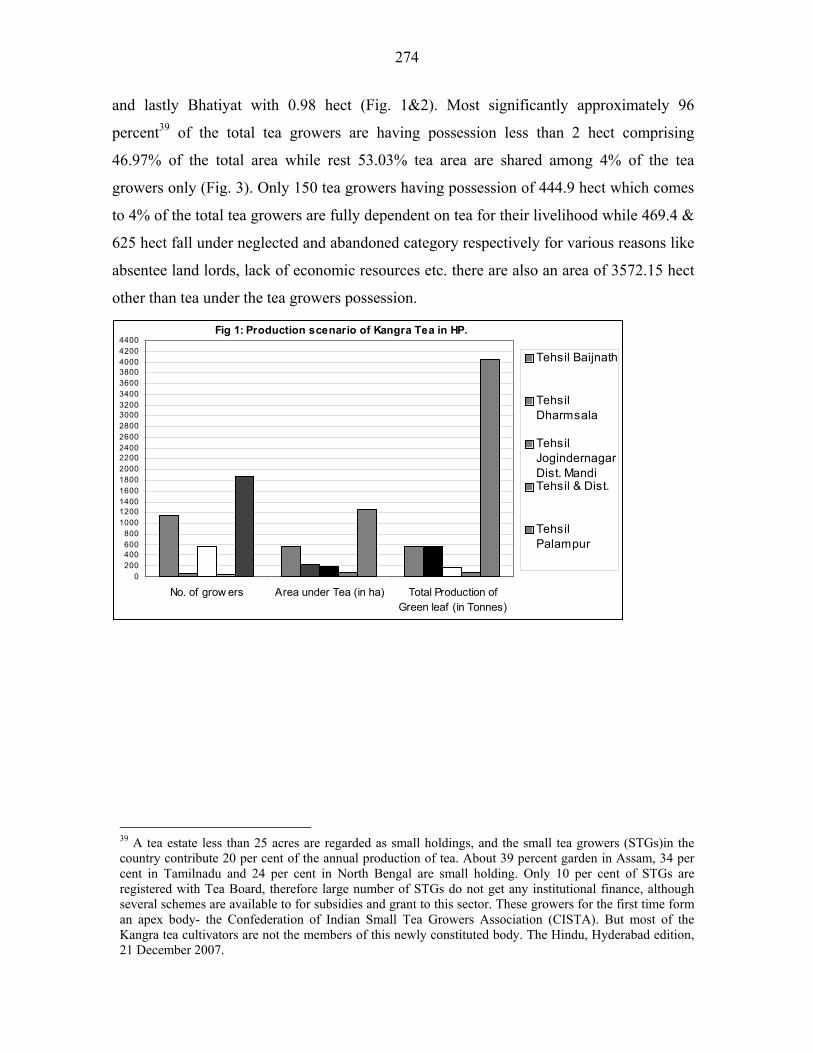
274
and lastly Bhatiyat with 0.98 hect (Fig. 1&2). Most significantly approximately 96
percent39 of the total tea growers are having possession less than 2 hect comprising
46.97% of the total area while rest 53.03% tea area are shared among 4% of the tea
growers only (Fig. 3). Only 150 tea growers having possession of 444.9 hect which comes
to 4% of the total tea growers are fully dependent on tea for their livelihood while 469.4 &
625 hect fall under neglected and abandoned category respectively for various reasons like
absentee land lords, lack of economic resources etc. there are also an area of 3572.15 hect
other than tea under the tea growers possession.
Fig 1: Production scenario of Kangra Tea in HP.
0200400600800
100012001400160018002000220024002600280030003200340036003800400042004400
No. of grow ers Area under Tea (in ha) Total Production ofGreen leaf (in Tonnes)
Tehsil Baijnath
TehsilDharmsala
TehsilJogindernagarDist. MandiTehsil & Dist.
TehsilPalampur
39 A tea estate less than 25 acres are regarded as small holdings, and the small tea growers (STGs)in the country contribute 20 per cent of the annual production of tea. About 39 percent garden in Assam, 34 per cent in Tamilnadu and 24 per cent in North Bengal are small holding. Only 10 per cent of STGs are registered with Tea Board, therefore large number of STGs do not get any institutional finance, although several schemes are available to for subsidies and grant to this sector. These growers for the first time form an apex body- the Confederation of Indian Small Tea Growers Association (CISTA). But most of the Kangra tea cultivators are not the members of this newly constituted body. The Hindu, Hyderabad edition, 21 December 2007.

275
Fig 2: Profile of small Producers of Kangra Tea in HP.
0100200300400500600700800900
1000110012001300140015001600170018001900
Tehsil Baijnath TehsilDharmsala
TehsilJogindernagar
Dist. M andi
Tehsil & Dist. TehsilPalampur
No. ofgrowers
AreaunderTea(in ha)
Fig 3: Kangra Tea holdings in Himachal Pradesh.
0200400600800
10001200140016001800200022002400260028003000320034003600
No. of Planters %age of total Planters Total Area of Holding(in ha)
Up to 2 Hect.
Above 2 Hect.
8. Characteristics of Production
Both black and green Kangra teas are manufactured in the Kangra valley. Earlier
only black tea was manufactured by the Europeans only, while green tea by the native
proprietors because the green tea manufacturing process required very less machinery and
also the market for green tea trade was available at Amritsar.
The process of black tea manufacture was not different in basic steps from today’s
manufacturing procedure – green leaves plucked by hands, brought to factories in baskets
276
and then spread out on round bamboo trays for “withering”. Next day, the withered leaves
are subjected to “rolling” in the rolling machines propelled by steam or water power for
about one hour. The capacity of each machine at one time was 100 to 200 lbs of withered
leaves. The rolled leaves then exposed for “fermentation” for about 4-6 hours. The
fermented leaves were “rerolled” for about half-an-hour, and then passed into drying
machine called ‘Siroccos’ for “drying” or “firing”. Alternatively, the drying was done over
the charcoal fires in grates, this completes the manufacturing process. The dried tea was
then subjected to “shifting” and “packing”.
For green tea manufacture, the leaves were “scorched” in heated pans and
“rolled” off at once by hand then “cooked” upon in the same pans. The leaves then
artificially “coloured” with soft stone. For this, the soft stone was powdered and sprinkled
into tea and both rubbed together in the pans.
Now days the modern industries are manufacturing the tea with new techniques.
Making of Black tea from fresh shoots involves several steps. During the first step the
shoots are spread in a leaf storage place (trough) and allowed to stand for 12-22 hours
under a floor of air (temperature below 35oC). This storage the nursery chemical changes
(chemical wither), which is essential for good tea. This storage step accounts for 50% of
parting square and also consumes mainly 20% of energy consumed in a factory. A new
technology, involving pre conditioning of fresh shoots, has been developed to enhance the
rate of withering. The technology depends upon inherent biochemical reactions to achieve
desired chemical changes as well as the ability to given physical wither needed for
processing of tea shoots. The main advantages are
The wither in time is reduced to 4-5 hours.
No loss in quality of made tea.
Reduction in power equipment,
Squaring of factory space for processing more leaf.

277
Predominating kinds of black teas were Pekoe, Pekoe Suchong. Coarse tea and
Fanings: while in green teas Hyson, Young hyson and Coarse grades were popular types.
The good quality teas were packed in lead and wooden cases while coarse grades in
coarse bags.
9. Marketing and profit
Apart from negligible private sale, most of the produce of Black & Green tea are sold at
Kolkata and Amritsar markets. Out of total produce of processed tea 55% & 45% are
manufactured in Co-operative and private tea factories respectively. There are several
constraints in marketing:
Producers are mostly small
Advertising not profitable
Only few producers have their own trademark
10. Future planning
The tea gardens can’t be used for cultivating any other crops, the profits are very low,
therefore several steps are in planned, these include:
Develop a common logo and advertise it as a brand
Sale of the common logo and use the generated money for the intensive advertising
of the product.
Use of tea gardens for other purposes such as eco-tourism
11. GI initiatives
The product was registered as a GI but the GI as a marketing tool has never been used. In
the process of registration approximately Rs 50,000 were spent on various accounts such as
awareness program and meetings etc. At the time of registration, no list of producers was
submitted, the efforts are in progress to prepare the complete list and submit it to the GI
office. There was no opposition for the product; the complete process of registration has been
done without involvement of any attorney. The scientific institutions were involved to
establish the uniqueness of the product.

278
Learning from the case studies
The various case studies display several management issues related to GI portfolio and
product development. The salient features are given below:
GI is not a primary marketing tool, it is an additional tool, which can be used at
appropriate time but it does not give additional value to the product.
The GI though registered but has mostly not been used in market expansion or
development.
An integrated approach of product development is the precursor of use of any GI.
GI initiatives have led to several non-monitory benefits such as cohesiveness
among producers.
The case studies have been developed in consultation with several key stakeholders
as given below:
Mysore silk Mr P. Vijayan, IAS Managing Director Karnataka Silk Industries Corporation (KSIC), Bangalore Other officials of KSIC
1. Mr T.S. Rajkumar, former General Manager 2. Mr C. Radhakrishnan, Finance Manager 3. Mr P.M. Chandrashekaraiah, Deputy Manager (Personnel
and Industrial Relation) Kangra tea Dr S.S. Chandel,
Principal Scientific Officer, HP Patent Information Center, Shimla, Himachal Pradesh
Coimbatore wet grinder
Mr N. Rama Krishnan, Assistant Director Small Scale Industries Service Institute (SISI), Coimbatore
Chanderi saree Mr Muzaffar Kalle Bhai Author of History of Chanderi (2005) Old Bus Stand, Chanderi- 473446, Madhya Pradesh
Solapur chaddar 1. Dr P. Nayak Director (Marketing) Textile Committee,Mumbai- 400 025 2. Mr S.A. Puranik, Quality Assurance Officer Textile committee, Solapur
Acknowledgments

279
Chapter 13
Geographical Indications in INDIA: The legal framework, its implementation and Issues for the future Introduction
The protection of Geographical Indications for Goods is an emerging topic in
India with up to now nearly 100 applications, out of which 40 registered geographical
indications. This demonstrates a wide implementation of the recent Geographical
Indications of Goods (Registration and Protection) Act, 1999, which entered into force in
September 2003. The Geographical Indications of Goods Act (GI Act) was passed to
comply with obligations from international agreement on intellectual property (TRIPS40,
1995, WTO). Before enactment of GI Act, geographical names were protected in India
under trademark law and passing off action, without granting specific protection to local
products part of the huge Heritage of India. However, the protection of Geographical
Indications was experimented in France since the beginning of the 20th Century, and then
homogenised at the European level in 1992, being an example of a legal system first
oriented to protect wines. The brief description of the French and European objectives of
the protection of Geographical Indications and the comparison with the objectives of
Indian GI Act will help to understand the different utilities of GIs. Clearly, the way the
Geographical Indication Act has been implemented and used by the interested party will
give some understandings on whether the GI Act reaches its objectives to protect
consumers from deception, add to the economic prosperity of the producer of such goods
and also to promote goods bearing Indian geographical indications in the export market.
The analysis will also help to determine what lessons could be learnt from these first
years of implementation in order to improve the efficiency of the protection of
Geographical Indications.
40 Trade related aspects of Intellectual Property

280
1. Ancient protection of GIs in France and in Europe French History
The protection of geographical indications started in Southern countries of Europe
like France, Italy and Spain at the beginning of the 20th century trough the protection of
appellation of origin and indication of sources and was harmonised at the European level
in 1992. The legal protection of Appellations of origin were motivated in France to
identify wines coming from a certain geographical area, following the important misuses
of names due to reconstructions of wine growing areas or “terroir”41, after the Phylloxéra
disease which destroyed most of French vineyard in the mid 1800’s. The first law in 1905
was on the repression of frauds, including repression of false indication of source and
origin, in the agro-food sector for public health reasons, following poisoning of
consumers by fake products. Thus protection was only of a geographical area, delimited
by administration, without mention of any method of production giving the quality. Later
the law of 1919 defines appellation of origin as a collective right which can never be
generic neither be registered as a trademark. Anybody could use the appellation he finds
himself legitimate to use and could file complaints in front of the courts on uses that were
considered prejudicial. But there were no description of the method of production of the
product, method which shall be “local, fair and constant”. Only courts would give such
description in case of conflict. Mainly appellations for wines were protected under such
law, and very little for other food products like cheese42. Only four appellations of origin
on handicraft products were protected by Courts according to the law of 191943. Indeed,
seeing the confusion of use of appellation of origin not predefined according to practices,
a new law in 1935 enacted the creation of a National Committee, which will become the
French National Institute for Appellation of Origin (INAO). INAO is responsible for the
grant of appellations of origin, according to both practices and geographical area, and
providing a controlling mechanism. INAO was first only for wines and spirit and then
enlarged to other agricultural products in 1990. 41 Unique combination of climate and soil composition. 42 Law of 1925 for the appellation of origin Roquefort, providing obligation of using sheep milk and processed only in Roquefort. 43 Dentelles du Puy, 19 february 1931, Court of the Puy; Mouchoirs et toiles de Cholet, 17th November 1936, Appeal Court of Angers; Poterie de Vallauris, 19th November 1930, Supreme Court; Emaux de Limoges, 14th November 1950, Supreme Court.

281
Later, in 1992, European Union, provided regulation for the protection of
appellations of origin and of geographical indications, for agro-food products. Thus, apart
from appellation of origin, a new concept of geographical indications was enacted in
French law. History explains the reason why GIs in Europe are only granted to
agricultural goods, whereas TRIPS Agreement opens it to all goods. But; trough the
internationalisation of GIs, the issue remains of the availability of GI protection for non
agro-food products from non European Countries.
Seen the history of building of GIs protection scheme, the literature usually
distinguishes four kinds of objectives pursued by geographical indications, which
appeared at different time of the construction of GI systems. First is the protection of
consumers against frauds, second is the protection of the producer who will control the
supply of the agricultural market, third is the territorial development, the local
development, the regional development and the rural development; and the last is the
conservation of the biological resources, biodiversity and cultural diversity
(SYLVANDER, ALLAIRE et al. 2006). Those objectives are added one to each other
and the new one do not replace the first one but on the contrary lead to different layers of
objectives, enriching the utility of GIs. The link between GIs and local biodiversity
appeared in the 1990’s, thanks to all the international debates around the Convention for
Biological Diversity forum.
GIs and European system
In Europe, GI are part of the common agricultural policy to enhance rural
development in a context of food production superior to demand and thus a shift from an
economy of quantity to an economy of quality. Therefore, preamble of Council
Regulation (EEC) No 2081/92 of 14 July 1992, confirmed by Council regulation (EEC)
No 516/2006 on the protection of geographical indications and designations of origin for
agricultural products reads: “as part of the adjustment of the common agricultural policy
the diversification of agricultural production should be encouraged so as to achieve a
better balance between supply and demand on the markets; whereas the promotion of
products having certain characteristics could be of considerable benefit to the rural

282
economy, in particular to less-favoured or remote areas, by improving the incomes of
farmers and by retaining the rural population in these areas”. In France, the protection of
GIs is mainly codified under the Rural Code and partly under the Consumer Code,
showing the importance of GI in the development of rural areas.
The cases law of the European Court of Justice were mainly on the justification of
the restriction of freedom of trade within the EU following the recognition of exclusive
rights on geographical names44. The restrictions were permitted because of the existence
of a link between the quality, characteristic of the product and the place of origin. Thus
depending on the importance of the link between the product and the place of origin, two
types of signs have been defined by the European Union in Regulation 2081/92:
designation of origin and geographical indication45. Designation of origin is considered in
France equal to appellation of origin while geographical indication was a new concept.
The designation of origin means the name of a region, a specific place or, in
exceptional cases, a country, used to describe an agricultural product or a foodstuff:
− Originating in that region, specific place or country,
− The quality or characteristics of which are essentially or exclusively due to a
particular geographical environment with its inherent natural and human factors, and
− The production, processing and preparation of which take place in the defined
geographical area; a specific place or, in exceptional cases, a country, used to
describe an agricultural product or a foodstuff:
− Originating in that region, specific place or country, and
− Which possesses a specific quality, reputation or other characteristics attributable
to that geographical origin, and
− The production and/or processing and/or preparation of which take place in the
defined geographical area.
44 See ECJ cases C 12/74, C 47/90, C 3/91, C 321/94, C 324/94 45 Article 2 of Regulation 2081/92 replaced by Regulation 516/96.

283
The very specific aspect of GIs is that it is a collective right for the producers of the
good. Thus EU regulation provides a definition of applicant: Only a group shall be
entitled to apply for registration. A ‘group’, means any association, irrespective of its
legal form or composition, of producers or processors working with the same agricultural
product or foodstuff. Other interested parties may participate in the group. A group may
lodge a registration application only for the agricultural products or foodstuffs, which it
produces or obtains46.
Concerning the scope of protection, it is very high as European regulation provides in
its article 13 that registered names shall be protected against:
(a) any direct or indirect commercial use of a registered name in respect of products not
covered by the registration in so far as those products are comparable to the products
registered under that name or in so far as using the name exploits the reputation of the
protected name;
(b) any misuse, imitation or evocation, even if the true origin of the product is indicated
or if the protected name is translated or accompanied by an expression such as ‘style’,
‘type’, ‘method’, ‘as produced in’, ‘imitation’ or similar;
(c) any other false or misleading indication as to the provenance, origin, nature or
essential qualities of the product, on the inner or outer packaging, advertising material or
documents relating to the product concerned, and the packing of the product in a
container liable to convey a false impression as to its origin;
(d) any other practice liable to mislead the consumer as to the true origin of the product.
Such level of protection has been agreed at the international level in the TRIPS
agreement (see §3 below), but, due to lack of consensus between the states, it is granted
only for the protection of GIs designating wines or spirits. Moreover, for example in
France, appellations of origin, one of the two signs protecting local product having a very
strong link with the place of origin are not only protected against any use infringing their
rights but the area itself is also protected, having specific statute for urbanisation. Here
again, the motivation for rural development was the main objective.
46 Article 5 of Regulation 2081/92 replaced by Regulation 516/96.

284
2. Situation before Indian GI Act: action in front of the Courts
Before the enactment of the GI Act, 1999 there was no specific statutory law
governing geographical indications of goods in the country. The protection of the
interests of producers of such goods was largely governed by the common law action of
passing off or unfair competition law, under the consumer protection law or by the law
dealing with certification trademarks.
Common Law Action of Passing off in India
Common law principles enables aggrieved person to file an action of ‘passing off’
for protection of his right. ‘Passing off’ is defined as an actionable wrong for the
defendant to represent, for trading purposes, that his goods are those or that his business
is that of the plaintiffs.
Scotch whisky cases in India
There have been several decisions by the various High Courts as well as the
Trademarks Office in India, refusing to register trademarks’ containing
geographical indications as well as trademarks suggestive of famous geographical
indications thereby upholding the rights in geographical indications. Interestingly,
most of these pertain to the protection of the geographical indication 'Scotch
whisky', introduced by the Scotch Whisky Association. The defendants were trading
whisky produced in India with label and devices suggesting Scottish origin and thus
damaging the reputation and goodwill of “Scotch Whisky” and its genuine distillers,
blenders.
The genesis of the first case in front of the Delhi High Court (AIR 1980 Delhi
125), was an application filed by Dyer Meakin Breweries, the defendant company,
to register the mark 'Highland Chief' in respect of a product described as 'malted
whisky', in 1964. The trademark also contained the device of the head and
shoulders of a Scottish gentleman wearing feather bonnet and plaid and a tartan
285
edging. Highland is the region in Scotland most famous for Scotch whisky.
The application was opposed by Scotch whisky Association which is a non-
trading body consisting of producers and sellers of Scotch whisky and established
with the principal aim to protect the interests of these producers and sellers in the
name Scotch whisky. The opposition was rejected on the grounds that there was no
evidence to indicate that the public in India associated the words 'Highland Chief' with
whisky produced in Scotland. Appeal was formed against this decision. However, the
Appellate Judge held that the use of Highland was a case of false trade description within
the meaning of Indian Trade and Merchandise Marks Act 1958. 'False trade description'
means, inter alia, a trade description which is untrue or misleading in a material respect
as regards the goods to which it is applied. Highlanders being Scottish soldiers arc well-
known in history and literature and the highlands are well-known ns the best region of
Scotland producing and thus the public is mislead when the whisky is sold under this
labelling but not made in Scotland. The High Court of Delhi confirmed the decision of
the Appeal, giving right to Scotch whisky Association.
The second case in front of the Bombay High Court (AIR 1992 Bombay 294),
was a passing off action initiated by the SW A along with a producer of Scotch whisky
against the use of the device of the Scottish Drummer wearing a kilt or the tartan band or
the word 'Scotch' coupled with the description 'Blended with Scotch' on whisky made in
India sold under the marks 'Drum Beater' and 'Gold Tycoon'. This use would amount to
passing off its whisky as Scotch whisky, thereby misleading other traders and customers
and damaging the reputation and goodwill of Scotch whisky. To prove their interest and
locus standi, the plaintiff annexed statements showing the exports of Scotch Whisky to
India for the years 1937 to 1986 and thus proved that scotch whisky was available in
India on a fairly large scale and is being consumed by various category of consumers.
The definition of Scotch whisky has been defined by British legislation as a whisky
which has been distilled and matured in Scotland. The definition of Blended Scotch
Whisky is taken from a booklet entitled published by the Scotch Whisky Association as a
blend of a number of distillates each of which separately is entitled to the description
Scotch Whisky. Accordingly, the said expression, when used in respect of whiskies

286
which are not Scotch, even if one of them is Scotch would be improper.
Scotch whisky Association succeeded in defending its geographical
indication because it could prove that the public was misled as the public was
aware of the origin being Scotland. This high burden of proof was only possible
because of long trade existing on this product and very high reputation. The
Common law principle of passing off would not be so efficient for GIs less famous
in India or recently introduced in the market, even if those GIs are very well known
in their country of origin. Even in India itself, some GIs might be well known at the
level of their place of origin and not in the entire country of India.
Unfair competition law in France: Darjeeling case in France
In European countries of civil law tradition, the action against misuses of
geographical indications is offered only to registered geographical indications according
to a statutory law on the protection of either protected denomination of origin or
protected geographical indications. This means that to be entitled to protection, GI have
to comply with the criteria required by the statutory law on GI to be registered. Such
application for registration is examined by a competent body, and goes trough an
opposition procedure to allow third parties to express their views. Once it is registered, it
will benefit of the protection attached to it, according to the level of protection in the
European Union, which is directly applicable in members’ states, together with the
national provisions which shall be consistent. Still, an action under unfair competition
law, which is quite similar to passing off action, can be lodged to defend geographical
indications which are not registered, according to article 10 bis of Paris Convention on
the Protection of Intellectual Property. But in that case, the burden of proof is very high
for the claimant who has to argue that the geographical indication is well known in the
country of the lawsuit.
One recent case law in France illustrates this uncertainty and the difficulty of the
burden of proof. This case involves the Tea Board of India and Jean-Luc Dusong who
had registered in France, in 2002, a trademark comprising the word Darjeeling and a
device of a teapot for artworks, engraving, books, journals, communication and
287
consultancy. The Tea Board has requested the cancellation of the trademark on the
allegation that the use would deceive customers into believing that these products and
services, though not related to tea, would somehow be associated with the superior
quality and reputation enjoyed by Darjeeling tea. The Tea Board had lost the first round
of its battle with the Court of the First Instance in Paris47 (akin to a trial court here), on
the ground that it has not been demonstrated that the consumer associates Darjeeling,
besides being a tea, to a precise geographical area and that there was no risk of confusion
with the trademark Darjeeling of JL Dusong as the goods covered by the trademark are
not similar and are not identified by their geographical origin. But India tasted success
when the Court of Appeals in Paris (which may be equivalent to a High Court) upheld
the Tea Board's claim that the use of the word Darjeeling with the teapot logo, and its
registration was a violation of the rights represented by the Tea Board in respect of
geographical indication Darjeeling for tea48.
The Court of Appeal reversed the Court of First Instance's ruling saying that on
the basis of various materials like French daily newspaper, scholarly works and
encyclopaedias in French placed before it by the Tea Board, it is evident that Darjeeling
is well known in France and thus qualified as a GI for a tea having unique attributes and
originating from Darjeeling in India. Thus Darjeeling could get the protection under
unfair competition law as provided by article 10bis of the Paris Convention on the
protection of Intellectual Property (1883) which calls for sanctions against acts which are
contrary to honest industrial and commercial uses and to which both India and France are
signatories.
Unfair competition law in France includes act that misleads the public as to the
true origin of the product but also act of exploiting the reputation of the geographical
indication, even for other goods, if the act is done as to benefit from the high reputation
of the GI. Then, although Mr. Dusong was using the mark on non-tea goods and
services, he was still riding on the superior reputation of Darjeeling Tea and benefiting
from the same. Indeed, Mr Dusong was using in its advertising the statement “La
47 Tribunal de Grande Instance de Paris, 3ème chambre, 1ère section, 6th July 2005 48 Cour d’Appel de Paris, 4ème chambre, sect.A, 22nd November 2006

288
communication, c’est notre tasse de thé” meaning “Communication is our cup of tea”,
typical expression meaning that Mr Dusong was very skilled in communication. Thus Mr
Dusong was using the reputation of high quality of tea of Darjeeling to give its products
high quality reputation.
An interesting comment is to look at what would have been the procedure and
decision if Darjeeling had been registered as either a protected denomination of origin
(PDO) or a protected geographical indication (PGI) in Europe and France. The main
difference is that the registration confers a proof of right that the denomination is a GI
and thus avoids the burden of proof of such reputation, which has to be proved in the
territory of the legal action, France, i.e. the exporting country. Whereas, to get the
registration of a denomination as a PDO or PGI, the reputation of the good in the place of
origin might be sufficient.
Trademark laws
Another solution to protect geographical indications before enactment of GI Act,
was to register them as collective trade mark or certification trade mark. Collective and
certification trade marks were first protected under the Indian Trade and Merchandise
Act 1958 which was replaced by Trade Mark Act, 1999.
A collective mark belongs to a group or association of persons and the use thereof
is reserved only for members of the group or association of persons and the use thereof is
reserved only for members of the group or association of persons. It intended merely to
distinguish the goods or services of such group for others. As an example, the trademark
TATA is reserved for use by only members of the TATA group of companies.
The purpose and function of a certification mark is to show that the goods on
which the mark is used have been certified by some competent person in respect of
certain characteristic of the goods such as origin, mode of manufacture, quality, etc. The
certification mark is not owned by an association or group of producers of persons but
owned by the certifying agency or authority, which does not itself trade in those goods.
One example is Silkmark.

289
As this was the only way to get protection trough intellectual property law,
certification trademark has been registered by Tea Board to protect the logo Darjeeling in
India filed on October 9th 1986 (trade mark n°532240). Later the word Darjeeling was
also registered as a certification trademark (n°831599) filed on 10 December 1998.
But getting a trademark for a geographical name is not always easy as the word
alone might be considered as descriptive and thus invalid for being a trademark. Indeed a
geographical indication as defined in GI Act is neither a collective mark nor a
certification mark and is in the nature of a public property as any producer producing the
good according to the specification shall be registered as authorised user of the
geographical indication. The conditions for registration of a GI are different from those
of a trade mark, as it only for particular goods originating in a certain country, region or
locality where a given quality, reputation or other characteristic of the goods are
essentially attributable to the geographical origin.
3. International Agreements
The bases for the enactment of the Indian GI Act are the provisions of the Trade-
Related Intellectual Property Right Agreement (TRIPS Agreement) of World Trade
Organisation which came into force on January 1, 1995. Its objective is to provide
minimum of protection of intellectual property in all WTO members in order to facilitate
their international protection. For countries like India without statutory protection of GIs
at the time of signature of TRIPS Agreement, TRIPS was not only useful in protecting
foreign GIs in India but first, it was useful to give the opportunity to protect Indian GIs in
the domestic market and eventually at the international level.
Articles 22 to 24 of Part II, Section III the TRIPS Agreement are concerned with
GIs. Article 22 defines GIs as “indications which identify a good as originating in the
territory of a Member, or a region or locality in that territory, where a given quality,
reputation or other characteristic of the good is essentially attributable to its geographical
origin”. TRIPS provides minimum standard of protection for all products and additional
protection for wines and spirits. Standard protection prevents uses of a GIs that misleads
the public as to the geographical origin of the goods or constitutes an act of unfair

290
competition. For the additional protection, uses of a geographical indication identifying
wines for wines not originating in the place indicated by the geographical indication in
question or identifying spirits for spirits not originating in the place indicated by the
geographical indication in question, even where the true origin of the goods is indicated
or the geographical indication is used in translation or accompanied by expressions such
as "kind", "type", "style", "imitation" or the like shall be prevented. Members’ states are
free to determine the legal means to achieve the objectives of TRIPS. Thus India, which
had the obligations to implement it before January 1st 2000, passed on December 30th
1999 a specific legal framework for the protection of GIs: the Geographical Indications
of Goods Act. The rules were enacted and entered into force on September 15th 2003.
The preamble to the GI Act refers to TRIPS Agreement as a basis and defines the
legislation as, “an Act to provide for the registration and the better protection of
Geographical Indications relating to Goods…in providing a statutory mechanism for the
registration of GIs for the first time in India, it was felt that the ‘exclusion of
unauthorized persons from misusing geographical indications would serve to protect
consumers from deception, add to the economic prosperity of the producer of such goods
and also to promote goods bearing Indian geographical indications in the export market.
Unless a geographical indication is protected in the country of its origin, there is no
obligation under the TRIPS Agreement for other countries to extend reciprocal
protection. India would, on the other hand, be required to extend protection to goods
imported from other countries which provide for such protection. Thus, in view of these
circumstances, it was felt that it was necessary and desirable that a comprehensive
legislation, for registration and for providing adequate protection for GIs, be enacted by
Parliament” 49.
4. Geographical Indications of Goods Act
Following the signature of TRIPS Agreement, India enacted GI Act in 1999. One
main difference and thus interest of GI compared to trademark is that the application for
GI protection shall be done by representative of the interest of the producers and that the
49 See Statement of Objects and Reasons, as appended to the Geographical Indications of Goods (Registration and Protection) Act, 1999.
291
good has to comply with the specification of the good of the GI application, which
guarantees the quality of the product and is an in depth description of the characteristics
of the product, its method of production, and the geographical area of production.
Geographical Indications of Goods Act is organised in 87 Sections. Sections 1-10
deal with definitions, settlement of registry and prohibition of certain geographical
indications. Sections 11-16 deal with the procedure for registration, sections 17 with the
registration of authorised user, section 18 and 19 with the duration and sections 20-26
deal with the effect of registration, i.e. with the rights conferred by registration of GIs.
The last sections deal with penalty, miscellaneous.
Definition of Geographical Indication50
The Act defines a GI as an indication which identifies such goods as agricultural
goods, natural goods or manufactured goods as originating, or manufactured in the
territory of a country, or a region or locality where a given quality, reputation or other
characteristic of such goods is essentially attributable to its geographical origin. For the
manufactured goods, one of the activities of either the production or of processing or
preparation of the goods concerned takes place in such territory, region or locality, as the
case may be.
Indication can be word, logo, geographical or not but which indicates the origin
of the good.
Goods51
The goods mean any agricultural, natural or manufactured goods or any goods of
handicraft or of industry and include food stuff. Thus, depending on the good, producer
shall mean any person who produces the goods, processes or packages such goods;
exploits the goods; makes or manufactures the goods.
The definition of Geographical Indication is exactly the one of TRIPS plus a more
precise but not exhaustive definition of goods: GI Act clearly embraces all goods and
50 Section 2 (e). 51 Section 2.1.f

292
opens the door to the protection of others than agricultural or agro food products as it is
the case in the European Union. The Act does not provide any protection for services, as
it was not included in TRIPS during its negotiation.
Registry52
The Act sets up a Registry of Geographical Indications, and also specifies that an
application must be filed at the said office of the Registrar. A GI register53 is created,
with part A for the registration of the geographical indication and part B for the
registration of authorised users.
Applicant54
The Indian system distinguishes between the applicant of the GI who will be the
registered proprietor and the authorised user being any person claiming to be the
producer of the goods in respect of which a geographical indication has been registered55.
Geographical Indication being in its concept a collective right, the applicant shall be any
association of persons or producers or any organization or authority established by or
under any law, representing the interest of the producers of the concerned goods.
Interestingly, the Act does not explicitly make clear what is an authority established by or
under law. Neither does it explain what it means to represent the interest the producers
and whether it shall be all the producers of the good concerned.
Authorised users56
It is only at the end of the Act that the provisions concerning the users are
coming. The producers have to register at the GI registry to get the exclusive right for
using the registered geographical indication. The authorised user has exclusive rights to
use the registered geographical indication in respect of goods to which it relates, subject
to any conditions and limitations to which the registration is subject. The Act also deals
with the rights of co-users and states that they have co-equal rights. 52 Section 5 and Section 6 53 Section 7 54 Section 11 55 Section 17 56 Section 21
293
Application57
To get registration of a GI, an application with technical details shall be filed at
the GI registry comprising:
(a) a statement as to how the geographical indication serves to designate the goods as
originating from the concerned territory of the country or region or locality in the
country, as the case may be, in respect of specific quality, reputation or other
characteristics of which are due exclusively or essentially to the geographical,
environment, with its inherent natural and human factors, and the production, processing
or preparation of which takes place in such territory, region or locality, as the case may
be;
(b) the class of goods to which the geographical indication shall apply;
(c) the geographical map of the territory of the country or region or locality in the country
in which the goods originate or are being manufactured;
(d) the particulars regarding the appearance of the geographical indication as to whether
it is comprised of the words or figurative elements or both;
(e) a statement containing such particulars of the producers of the concerned goods, if
any, proposed to be initially registered with the registration of the geographical indication
as may be prescribed; and
(f) such other particulars as may be prescribed.
Method of production58
The application shall contain the standard as regards the production, exploitation,
making or manufacture of the goods and the mechanism to ensure that such standards are
maintained by the producers. The statement shall also include the particulars of the
inspection structure.
Uniqueness59
The statement shall contain the particulars of special human skill involved or the
uniqueness of the geographical environment. 57 Section 2.2. 58 Rule 32 59 Rule 32
294
Producers60
The application shall comprise a statement containing such particulars of the
producers of the concerned goods proposed to be initially registered and any other
particulars including a collective reference to all the producers of the goods. As proof of
evidence of this collective aspect, the statement shall include an affidavit as to how the
applicant claim to represent the interest of the association of persons or producers or any
organisation or authority established by or under any law.
Examination procedure61
The application is first scrutinised by the GI registry and then by a Consultative
group of not more than seven persons from organisation well versed in that field.
Advertising62
After the acceptance by the registrar, advertisement of the application is made in
the GI Journal.
Opposition63
Any interested party can file an opposition within 3 months. This opposition is
then forwarded to the concerned applicant, who is required to reply within 2 months. In
the event the applicant replies, this shall then be forwarded to the person making the
opposition. Finally, the Registrar is required to make a decision as to whether the
opposition is to be accepted or rejected. If no opposition or if the opposition is rejected,
the GI is registered64.
It is interesting to consider the question as to who may oppose an application for
registration of a GI. The statute does not seem to lay down any restriction in this regard,
such as that the person must have a personal or commercial interest in the matter in order
to oppose. This sort of a procedure for opposition is more to protect the interest of the
public at large, than any particular individual. 60 Rule 32.1 61 Section 11 (5) 62 Section 13 63 Section 14 64 Section 16
295
Duration65
The protection of the GI is for 10 years. The registration of users is for 10 years.
Renewal is possible.
Right conferred66
As any intellectual property right, GI registration confers exclusive rights on the
use of the indication for the authorised user. The GI Act is silent about whether the
applicant is also an authorised user and therefore can use the geographical indication.
It gives both to the registered proprietor of the geographical indication and the
authorised user the right to obtain relief in respect of infringement. Infringement means
any uses of such GI that indicates or suggests that such goods originate in a geographical
area other than the true place of origin of such goods in a manner which misleads the
persons. It also prevents all the uses which constitute an act of unfair competition
including passing off.
But no more action for infringement is possible for geographical indications
which are not registered under the GI registry. Common law protection is still there for
passing off action. The main difference between infringement and passing off action is
the nature of evidence to be brought by the plaintiff and the scope of protection. GI
registration facilitates largely the action of the owner of the registered GI against misuse.
Central Government may, provide additional protection to certain goods
according to the possibility offered by TRIPS Agreement67. In that case, any uses of any
GI to goods not originating in the place indicated by such other GI is prohibited even if
there is the mention of the true origin of such goods (for example prohibition of Ceylon
65 Section 18 66 Section 20, 21, 22, 23 67 TRIPS agreement provides two level of protection : a standard level fo all products where the GI is protected against use that mislead the public and an additional level of protection for wine and spirits where the GI is protected per se, even without misleading of the public. India together with Europe and other developing countries is negotiating for the extension of the additional protection to all the products. See Addor, F. and A. Grazzioli (2002). Geographical Indications beyond wines and spirits, a roadmap for a better protection for Geographical Indications in WTO/TRIPS Agreement Journal of World Intellectual Property. vol 5.

296
tea from Malaysia even if it does not mislead the public) or accompanied by expression
such as “kind”, “style”, “imitation”, or the like expression. The effect of such additional
protection is to reduce the burden of proof upon the users of the GI. The registered
proprietor together with the registered authorised users of the GI may apply for additional
protection of the Act once it has been notified by government68. The special protection is
granted keeping in mind the reputation of the goods on a global scale
Law suits shall be filed in a court no lower than the district court69. In case of the
GI it could be for its infringement, relating to any right in it or for passing off. The courts
after hearing the case are allowed to pass only the following decrees, viz. injunction,
award damages or order an account of profits. The court may also order destruction of
such goods.
Relation with trademarks70
It is not possible to register a trademark if the trademark contains or consists of a
GI for same goods not originating from the place indicated by GI if such use misleads the
public as to the true origin of the good. When the GI is protected under the additional
protection scheme, it is not possible to register a trademark containing or consisting of
such GI without any further justification. Therefore there is a much better protection of
GI against registration of Trademark for goods benefiting of the additional protection
under section 22 (2).
In the case of prior trademark, if they were registered in good faith before the GI
was registered, or before the Act came into force, nothing contained in the GI Act shall
prejudice the registrability or the validity of the registration of such trade mark.
Assignment71
As GI is a right having some kind of “public” flavour, the rights can only rest in
the original application, as a GI shall not be the subject matter of assignment,
transmission, licensing, pledge, mortgage or any such other agreement. This is to secure 68 Section 22, rule 77 and 78 69 Section 66 and 67 70 Section 25 and 26 71 Section 24

297
the interest of the local producers, considering that the rights are linked to their territory
and accessible to all of them located in the area. This point is an important difference
with a trademark.
Foreign GIs72
For foreign GIs, countries members of the Paris Convention on the Protection of
Intellectual Property (1883) are eligible for application of protection of their GIs in front
of the GI registry following the same procedure as the domestic GIs.
5. Implementation of GI Act: who has applied for GI protection and for which
goods?
General figures
Table in Annexe-XIII gives all the data about the name of the geographical
indication, the applicant, the date of filing and the date of registration, when available. Up
to November 2007, there were 117 GI applications at the GI registry, out of which more
than 40 were registered. Until now, no application for GI was refused by the Registrar.
As the Act is very recent, no action for infringement in front of courts was noticed. But
13 oppositions to registration were noticed, most of which were rejected and little
concluded in amendment of the application. Still is it interesting to note that the number
of opposition is increasing, as people are more and more aware about GI.
Protection Conferred
Interestingly, no notification has been made by the government to provide
additional protection to certain goods according to section 22(2). Not for wines and spirit
as it is mandatory according to TRIPS Agreement or for Indian products like Darjeeling
Tea. However, India is very active at the negotiations on GI at WTO on the extension of
the standard protection to all products.
Kind of Goods
72 Section 84 and 85
298
GI Act defines none exhaustively four categories of goods: agricultural goods,
natural goods, manufactured goods, goods of handicraft, goods of industry, food stuff.
Looking at the list of GIs, it appears that there is 23 GIs for agricultural goods including
silk cocoon and horticulture. There are 20 applications in textiles, and 3 on embroidery.
The rest half is for handicrafts, whether in wood, metal, jewellery…Very little
applications for manufactured goods: one GI for soap and 5 GIs application still pending
for petrol and oil. Finally there has been one foreign application, for wine: Pisco from
Peru, in the process of opposition. It is interesting to note the diversity of product and the
important part of non agricultural products. Therefore the agricultural products and food
stuff represent less than a quarter of the GIs whereas in Europe, GIs are only granted for
agricultural products and food stuff. The issue is the link with the place of origin and the
maybe less important impact of the natural factors on the uniqueness of the product.
When the raw material is not from the area of origin, uniqueness of the handicraft is
mostly the result of human knowledge, which may more easily be delocalised.
Kind of applicants
Looking at the whole list of GI application, it appears that the applicant can be
divided in different categories. Most of the applicants request the help of an advocate for
the application.
Company
Some private companies have applied for GI as for example Reliance Industries
Limited, for the GI Jamnagar Petrol. On the other side, many state companies are there.
For example Karnataka silk industries corporation Ltd, a government of Karnataka
undertaking for Mysore Silk, Karnataka State Handicraft Development Corporation
limited, a government of Karnataka undertaking, for Channapatna toys, Mysore
rosewood inlay.
Society
Societies registered under society Act 1860, which already existed or created
especially for the protection of the GI are there as Payyanur pavithra ring Artisans &
Devp. Society for the GI Payyanur pavithra ring, Pochampally Handloom Weavers Co-op

299
Society Ltd for Pochampally Ikat…Association can be also qualified as societies, as there
are registered under same Society Act, 1860 are also applying for GIs as Alll India
Agarbathi Manufacturers Association (AIAMA) for the GI Mysore Agarbathi.
Foundation
Some foundation comprising stakeholders from all the interested party and
supported by government or other bodies have applied for a GI as one aspect of their
whole activity in managing the production and interest of the producers. Example is the
Chanderi Development Foundation.
Boards
Special authorities created by law or an Act to manage the production, marketing,
quality of a specific product are very active in filling GIs. For example Coir Board for
Allepey Coir, Tea board for Darjeeling Tea, Coffee board for Monsoon Coffee, Spices
board for Coorg green cardamom, Malabar pepper.
Each board is different, raising the following issues: What is the role of the board?
Does it have exclusivity of the marketing of the product? Is the registration of producers
of the good under board management mandatory?
Government
And finally, government itself has been the applicant for many products, as the
Director of horticulture, department of horticulture, Govt. of Karnataka for Coorg
Orange, Mysore Jasmin, or the Department of Handloom and textiles, govt of Tamil
Nadu for Kancheepuram Silk.
The government sometimes acts trough Counsel in Intellectual Property
established by the department of sciences and technology like Himachal Pradesh. Patent
Information Center, established by TIFAC (technology information, forecasting and
assessment council).
For applicant being Government and Board, the link between the applicant and
the place of production is not obvious. For example, National Institute of Fashion
300
Technology (NIFT), based in Delhi, has initiated nation-wide registration of crafts under
the Geographical Indication Act in collaboration with the Development Commissioner
(Handicrafts) to protect the traditional handicrafts in 20 States. The project entails in-
depth study of the “Handicrafts” in the respective States. Suitable crafts with GI potential
have been identified and GI applications for identified crafts are currently being drafted
to be filed73. It will be interesting to see who is the applicant of the GI: the government
or the artisan community?
The main issue is whether the applicant always qualifies to the definition of the
applicant according to the Geographical Indication Act, Section 11 in representing the
interest of the producers and whether it represents all the producers74. Depending on the
nature of the applicant, the answer might not be the same.
Users Concerning the authorised users, Part B of the register is empty, as no user has
applied for registration. The reason might be that it is a high burden for all producers as
they lack resources and awareness about it. Indeed the application for being authorised
user shall contain a statement of case of how the producer claims to produce the goods
covered by the Geographical Indication75 and such application will be scrutinize by the
Registrar in the same manner as the application for registering the GI in part A of the
register. The rules also provides for the authorisation of the registered proprietor to the
registration of the authorised user as the application for a producer to the Registrar as an
authorised user shall be made jointly by the registered proprietor and the proposed
authorised user (rule 56). Therefore the agreement of the registered proprietor is always
needed. The inexistence of authorised users raises the issue of who is eligible for using
the GI. According to the Act, only authorised users can use the GI, and not the applicant.
The reality is that the applicants are the one using the GI, as for a trademark.
73 Minister of the State in the Ministry of Textiles (SHRI E.V.K.S. ELANGOVAN), Lok Sabha unstarred question No 1946 to be answered on 13.03.2007. 74 Rule 32 (1) (5) provides that the application shall contain the particulars of the producers to be registered and may include a collective reference to all the producers. 75 Rule 56

301
Application
The application is organised trough the following items: name and address of the
applicant, list of association of persons/ producers/ organization/ authority, type of goods,
specification, name of the geographical indication, description of the goods, geographical
area of production and map, proof of origin (historical records), method of production,
uniqueness, inspection body, others. In the GI Journal, the item list of association of
persons/ producers/ organization/ authority is not published and shall be provided on
request. Historical records are usually very detailed as well as the method of production,
showing the interest of the applicant for the product. But it shall be paid attention to a too
narrow description of the method of production that could fix it without leaving space for
innovation. Indeed, the core of the method of production, which is responsible for
obtaining the quality of the product, should be mentioned. Indeed the conformity with
description is legally bending those willing to use the geographical indication.
Examination
Members of the Consultative group are generally tree persons from the
Intellectual Property Office and other experts from University or Research institutes,
nominated by the Registrar. An oral presentation of the case is made by applicant in front
of Consultative group which will the same day provide its report. In many cases, the short
report of the Consultative group is positive with little requirements. The main
requirement concerns the maps which are not properly provided. This shows that the
concept of an intellectual property right where the delimited geographical area
determines the scope of protection is not yet immediately understood by the applicant.
Moreover the geographical area is mostly the administrative area, not always
corresponding to the area of production of the goods. For the substantive analysis, is it
not sure whether the members of the consultative group, not having full understanding of
the whole background of the product may be able to make comments on the method of
production or the size of the geographical area claimed.
302
Enforcement of rights after registration
As the GI Act is very recent, there has been no action in front of the court up to
now. But some registered proprietor has used its rights to threaten unauthorised users of
the GI trough official letters and complaint at the police. For example the General
Director of Karnataka Silk Industries Corporation, registered proprietor of the GI Mysore
Silk sent a letter to the Assistant Commissioner of Police from Devaraja Division in
Mysore City to inform him about the registration of the GI Mysore Silk filed a filed a
plaint against owner of Mysore Silk Saree, St Philomena Church in Mysore. Another
action is the request of KSIC to seize the goods of Mysore Karnataka Silk International in
Bangalore.
Another example is the enforcement of GI « Pochampally Ikat » against the
misuse of the name by the trader « Hyco », settled in Mumbai and Hyderabad.
Following action in front of the court of Delhi High Court, an agreement has been signed
between the parties to stop the misuse of the name. The legal action was supported by the
government of India. Indeed, it is estimated that almost 60% of the market is with fake
products.
6. Examples of registration of GI: bottlenecks in the acquisition of rights
Darjeeling Tea
Darjeeling Tea was the first GI registered in India, both for the word Darjeeling
and the logo, to ascertain a strategy of protection of Darjeeling tea first organised trough
certification marks before GI Act was passed. Certification Trade Mark n°532240,
registered in India since 1986 for the logo consisting of the word DARJEELING and a
representation of an Indian woman holding tea leaves, all arranged in a roundel and has
been registered in many foreign countries76.
76 See http://www.teauction.com/industry/boards.asp
303
Applicant
The applicant is the Tea Board of India, created under the Tea Act, 1953. All teas
produced in the tea growing areas of India are administered by the Tea Board of India.
The Tea Board is not involved in the manufacture of any product and is run on a non-
profit basis. The functions of the Tea Board are, amongst other things, to regulate the
production and cultivation of Indian tea, to improve the quality of Indian tea and to
improve the marketing of Indian tea within India and abroad.
Product
Darjeeling tea is produced in the 87 gardens of Darjeeling district. It has the
distinctive and naturally occurring organoleptic characteristic of taste, aroma and mouth
feel which have won the patronage and recognition of discerning consumers all over the
world. Botanic name is “camellia sinensis”. It is a hardy, multi stemmed, slow growing
evergreen shrub which if allowed to can grow up to 2.5 meters in height. It takes 4 to 6
years to mature, is able to withstand severe winters, extended drought and the high
altitude of Darjeeling. Yield are much more lower than non Darjeeling Tea area. The
leaves are small, leathery, dark, glossy green in colour often covered with a downy
silvery pubescence. Processing is done in the area of production.
Plucking begins in March and closes by late November. A set of agricultural
practices has been developed to sustain growth of shoots, while maintaining bush heights
suitable for manual plucking. Darjeeling tea leaves are processed in the traditional
"Orthodox" way. Once the leaf reaches the factory, it is "withered". The object is to
evaporate moisture from the leaf. The leaf becomes limp so as to withstand twisting and
rolling under pressure without crumbling. The withered leaf is then removed from the
trough and loaded into rolling machines, which, by subjecting the withered leaf to a
rolling movement under pressure , twist the leaf, rupture the cells and release the natural
juices, promoting oxidation and accelerating the pigmentation. Next, the leaf is thinly
spread in a cool well ventilated room to slowly oxidize (ferment). This stage, in which
the flavanols combine with oxygen in the air develops the unique flavour of Darjeeling
Tea.

304
The distinctive, exclusive and rare character of Darjeeling tea is the result of
several factors. The tea gardens are situated at elevations from 610 to 2l34 meters on
steep slopes which provide ideal natural drainage for the generous rainfall the district
receives. Coupled with this, the intermittent cloud and sunshine combine to impart the
unique character of Darjeeling tea which has the distinctive and naturally occurring
organoleptic characteristics of taste, aroma and mouth feel which have won the patronage
and recognition of discerning consumers all over the world.
The population of the tea growing areas of the Darjeeling district is approximately
700,000 out of which 60 000 workers in the tea gardens.
Strategy
The objective of the Tea Board is to put in place a mechanism to ensure the
supply chain integrity for DARJEELING tea so that the tea leaving the shores of India
and claimed as 'DARJEELING' tea worldwide is truly a genuine Darjeeling tea. Indeed,
all the process is located in the area of production but the final packaging and thus the
risk of blending with other varieties is done in the exporting countries, with huge problem
of counterfeiting. Thus the word and logo Darjeeling is broadly protected in export
market countries, with a very offensive policy, trying to cancel all individuals trade
marks containing the name Darjeeling even if it is not for tea related products.
Tea board controls the quality by a strong traceability process monitored trough
declaration of production and granting of licences for the use of the Certificatin
Trademark ( CTM) Darjeeling word and the Darjeeling logo. Licenses are granted to
persons who wish to use the Certification Marks if it is satisfied that those persons will
only use the Marks in relation to tea conforming to appropriate standards and coming
from the Darjeeling area. The manner of use of the Certification Marks upon or in
relation to Darjeeling tea certified as such, would be determined by the Tea Board and be
subject to its approval before commercial use thereof. A license fee shall be paid. The
CTM is easy to handle for licensing system in India and in foreign countries. For GI,
there is no need of license as to be authorised user of the GI; registration at the GI
305
registry is needed. But there is no registered authorised user of the GI, not even the
licensees of the Certification trade mark.
Difference between GI and CTM is that the registration of users is made in front
of a government authority, according to GI Act provisions and with payment of a fixed
fee, equal for all producers and all GIs. There can be an opposition for registration of GI.
However, Tea Board is a kind of government agency, so it might be suggested that their
licensees shall automatically be authorised users according to GI Act. The problem will
be for other producers complying with the GI application but not licensee of the CTM:
they shall also be authorised user of the GI, but they can not use the logo and word
without a license. Thus this double protection represents for the producer a double
burden: registration at the GI registry and license with Tea Board.
Aranmula Metal Mirror
Aranmula Metal Mirror is a mirror giving an image similar to silicon synthetic
glass mirror image without any distortion produced in the small town of Aranmula in
Kerala, South India.
Aranmula Kannadi (Aranmula Metal Mirror) is a unique metal mirror of
reflecting a rich culture as well as mythological heritage in the history of Kannadi. This
wonderful creation of human skill is made of metal alloys. As traditional as the mirror
making technology is the artisans' belief that the metallurgical composition ofthe mirror
is divine and that some undisclosed metals alloyed with the copper and tin are responsible
for the distortion-free images. This highly brittle high-tin-bronze is also known as
Speculum Metal yields a highly polished surface and a clear reflection image and are
very popular for clarity. This Mirror also has got telescopic effect on its mage (i.e.)
distant objects can be seen near by.
Applicant
The applicant is the viswabrahmana aranmula kannadi nirman society, comprising
all the 28 producers. During the procedure the society became the applicant in place of

306
Parthasarathy Handicraft Center. Representative from Ministry of Commerce and
Industry and members from Gandhi University, Faculty of Chemistry (Kerala) came to
meet the artisans and took the initiative to register a GI. The registration fees have been
paid by the Indian government.
Method of Production
Preparation of moulding and casting are top secrets. First the alloy is prepared
consisting of 10 parts of copper to 5 ¼ parts of tin. Now two plates of extremely fine
Aranmula special clay are made in the shape of the mirror to be cast. One plate is placed
over the other with an oval ring of prepared wax between them along the edge. The
cavity is provided with an opening in the form of a jet. The mould is then strengthened by
adding several layers of clay. The mould is then heated and the wax inside is drained out
completely. The copper and tin are melted together in a separate crucible and then slowly
poured into a bamboo or wooden cylinder filled with rice bran. The hot liquid chars the
bran as it passes trough and solidifies into a rod. The impurities in the alloy disappear
during this carbonization process. The-purified alloy is then put into the crucible
attached to the mould, which is then sealed with clay and the mould is heated over a fire.
Then the mould is left undisturbed for 2-3 days to allow it to cool. It is then taken out and
the layers of burnt clay removed from the new metal mirror plate. The plate is then
polished. It is to be noted that the product is not completely described in the GI
application as the composition of the alloy is kept secret by the producers.
The legend of making the product has a strong religious meaning: 8 families of
expert in temple arts and craft had been brought by the local Royal Chief of Aranmula in
connection with certain works in the Parthasarathy Temple centuries ago. While working
with the bronze to make a crown for the Lord Parthasarathy, to their surprise the artisans
discovered the reflective property of one particular copper-tin alley. However they failed
to reproduce the compositions. The oral history continues to say that a divine interference
came from Parvathi Amma, a widow of community, through a dream. She received a
secret ratio of the alley.
The clay available in Aranmula Grama Panchayat area is peculiar and of better
quality than the clay available anywhere else, playing a key lead role in moulding and
307
casting. Thus the geographical area is the administrative boundaries of the town of
Aranmula. But as important, the features contributing to the uniqueness are the human
factors, beeing the very old and partly secret know how of the artisans.
Strategy
This case is very unique due the very little producers involved but for a very high
reputation product, very costly, and full of religious meaning. The composition of the
product is kept secret and even trough the GI registration is not disclosed, which raises
the issue of how can the GI be a collective right open to any producer complying with the
specification. It is more a collective right of a particular community, closed and limited as
only people inside the community can produce the mirror. However, thanks to the GI, the
traditional know how is protected. As the clay must come from the area of origin and
there is very important human know how, it is an interesting case of combination of
human and natural factors.
Coorg Orange
Coorg orange (Kodagina kittale) is an ecotype of mandarin. It is a small tree that
grows well in evergreen, subtropical, hilly tracts of 600-1200 meter elevation from sea
level. It requires annual rainfall of 80-200cm per annum and warm winter climate.
Applicant
The GI was filed by the Department of Horticulture, representing the
Government, which was thought be able to stand in for the orange producers, too few and
unorganized as per the Department perceptions to bear the costs of drafting the GI
application.
Product
Coorg Orange was first grown in India by British before 160 years.
Coorg orange is a variety of orange with thin, moose peel. It is an ecotype of
mandarins. It is medium sized, tight-skinned, yellow in colour, having dark orange pulp,
being tender, juicy with a rich flavour and excellent blend of acid and sugar with fairly

308
good keeping quality. Precise description of habit, root, stem, branching, leaf,
inflorescence, flower, fruit, seed. DNA finger print is under preparation by the applicant.
Coorg is a mountainous region and is famous for its orange. Soil should be loamy,
deep and well drained, slightly acidic. Climate should be sub-tropical summer but warm
winter. Propagation, planting is described. Oranges are grown in the coffee estate. The
high rainfall and duration of rainfall and hilly terrain with well drained soil gives the
specific taste, aroma and keeping quality to this particular cultivar. If grown in other
places, loses that specific aroma.
The map provided is not limited to Kodagu, as it includes also the districts of
Hassan and Chickmangalur.
Strategy
The two main objectives pursued by the Department of Horticulture were to
protect and revive a traditional crop variety and to provide high quality (disease free)
plant material, bringing economical development to the region. In response to the
conflicts over Basmati rice, the Government of India incited its administrations to
identify and protect the local varieties and products, in a push towards protection against
biopiracy.
Being a collective right, the strategy of the Department is to educate the farmers
about the GI and then try to gather them in a registered society to whom could be
transferred the ownership of the GI. The objective of such GI is the revival of a
traditional local variety and thus the protection of genetic resources diversity. Indeed, the
Coorg Orange is no more cultivated; following destruction of the plants by a disease a
decade ago. The Objective of Department of Horticulture is thus also to provide high
quality planting materials to farmers.
The main challenge faced now by the Department of Horticulture is successful
transfer to the producers and the revival.
309
Pochampally Ikat
Pochampally Ikat is a textile obtained trough a process involving tying and dyeing
the threads in a visualized design prior to the weaving of the fabric. The terme “Ikat"
stems from the Malay-Indonesian expression 'Mangikat' meaning to bind, knot or wind
around.
Applicant
The Applicant are Pochampally Tie & Dye Silk Sarees Manufacturing
Association and Pochampally Handloom weaver's cooperative society. The initiation of
the initiative of protection of the GI and the identification of the applicant has been
conducted by Andhra Pradesh Technology Development & Promotion Centre (An
autonomous society of CII, Government of AP & TIFAC under Dept. of Science &
Technology, Govt. of India) and Textile Committee, Govt. of India. Financial Resources
for filing of GIs & Prosecution was provided by NABARD - National Bank for
Agriculture & Rural Development.
Method of production
Pochampally Ikat is made of natural materials such as cotton or silk or a
combination of both, having designs that are evocative of the diffused diamond or
chowka design. Ikat or resist dyeing, involves the sequence of tying (or wrapping) and
dyeing sections of bundled yarn to a predetermined colour scheme (pattern) prior to
weaving. Thus the dye penetrates into the exposed sections, while the tied sections
remain undyed. The patterns formed by this process on the yarn are then woven into
fabric. There are more than 200 patterns. More precisely the process includes: 1.
Predying treatment of cotton yarn. 2. Mordanting treatment to facilitate the bonding of
dye. 3. Design is drawn out and broken into units. 4. Warp is spread out on a grid stips
and then tied. The area to remain not dyed are tightly wrapped separately to resist the dye
bath. 5. The warp is dyed by hand between the tightly boud resist area. 6. Unwrapping of
the yarn. 7. The loom is warped. 8. The weaving is done by shuttle by hand 9. either wrap
yarn or weft yarn or both (called double Ikat) are tyed and dyed.

310
The know-how located in that area is responsible for the uniqueness. Such method
of production started in late 19th century in Chirala near Chennaiwhich was the producer
place of cotton, a few hundred km from Pochampally. It was then later introduced in
Pochampally in the 60's by the All India Handicrafts Board assisted the weavers of
Pochampally to start weaving sarees. The Ikat technique is broadly spread in India and
Indonesia, the uniqueness being the specific patterns and motifs characterized by their
bold, geometrical motifs, in red, black and white, offset by wide single colored borders,
they were used in India by fisher folk and cowherds as loincloths, lungis or turbans. The
geographical area is Pochampally, districts of Nalgonda and parts of Warangal. There are
many duplicate: Fabric where the design is printed after weaving. No process of tye and
dye.
Strategy
To maintain the production in the area, Pochampally Ikat Foundation was then
created to develop the GI as a marketing tool. But ownership of the GI is not transferred
to the Foundation and rests in the hands of the association of producers and traders. Also
to help the revival of weaving, the Handloom Park is in progress, for training and
employing weavers in Pochampally, with important funding from the government.
Comments
In this case there is a strong public and private policy to protect the Pochampally
Ikat with ownership of the GI to associations of producers. The objective is to forbid
unauthorised uses and to use the GI as a marketing tool. But the product itself can be
easily reproduced elsewhere as the link with the place of origin is based exclusively on
human factors. Moreover, this knowledge was not traditionally located in Pochampally.
However, demand for Pochampally Ikat is increasing as their fabric is fashionable.
311
7. Example of a GI opposed
Mysore Silk
Mysore silk is defined in the GI application as 100% pure silk sarees in Crepe-de-
Chine or Georgette. The saree can be with or without Gold Lace in Borders, Body, Pallu
(Cross Border), with or without prints. Mysore silk also includes plain & printed dress
materials.
Applicant
The applicant is the Karnataka Silk Industries Corporation Limited, (A
Governement of Karnataka Enterprise), located in Bangalore. KSIC is managed by a
board of directors nominated by the government.
Products
Crepe-de-Chine is obtained using 26/28 Denier untwisted Raw Silk yam in warp,
26/28 Denier 2 ply twisted yarn in weft. Georgette is obtained using 26/28 Denier 2 ply
twisted yarn both in warp and weft.
Method of production:
Soaking: the outer sericin is made soft, thereby making the silk yam supple.
Softening (Supple) of the Raw Silk is necessary, so that the silk which is brittle to feel in
grey form withstands the further process like Winding, Doubling, Twisting etc.
Winding: the soaked hanks of silk are transferred on to the bobbins to facilitate further
processes like doubling etc.
Doubling: two or more number of silk threads are taken together and wound parallelly.
The number of threads so wound depends upon the finished weight of the fabric,
structure of the fabric etc. This is a preliminary process to twisting.
Twisting: the yam from doubling is twisted together to make the yam stronger and to
alter the structure of the fabric as per requirement. The twist per inch varies from 400
TPM to 3000 TPM, depending on the intended use of the yam. Twist is inserted in

312
different stages and directions of Sand Z.
Vacuum Heat Setting: the twist setting is done by keeping the twisted yam in a vacuum
chamber and then letting the steam for 15-45 minutes depending upon the twist inserted.
Rewinding: the twist set silk yam on the barrels are wound on to the bobbins at the
stage. After rewinding, the yam is sent for weaving.
Cone Winding: the yam from winding is taken and again rewound on to the cones, so as
to increase the length of the individual yam and also to remove weak points in the raw
silk, ifany.
Warping: a fabric consists of two sets of yam known as Warp which runs along the
length of the fabric.
Weaving: all done by machine. At weaving, both warp & weft interlacement takes place.
The yam from the warp is drawn through the healds and reeds in two sheets and between
the two sheets weft yam is introduced.
At the weaving stage, gold lace in border, body and at pallu is introduced depending upon
the pattern and the requirement of the designs.
Degumming: the sericin in the raw silk is removed and the fabric is made soft. This is
carried out in a stainless steel tub containing solution of chemicals like soap, hydros etc.
The degumming has to be made for the period varying from 4-6 hours at boiling
temperature.
Dyeing: colouring is introduced to the degummed fabrics. Normally, dyeing operation is
carried out on winches, where the fabrics in rope form is rotated in a solution of dye
stuff and other chemicals at high temperatures for about 1 Y2 to 2 hours.
Stentering: the dyed fabric is ironed out and t~e width of the fabric is set. Normally, the
width would be around 45" for the sarees. The dyed fabric is fed to the stentering
machine through clips and the fabric is finished on the Calendering Cylinders at the end
of the stentering machines.
313
Finishing: the stentered fabric is cut-out into saree lengths and are individually
inspected, labelled, folded and sent to the retail outlets.
Uniqueness
In the application, it is claimed that Mysore silk is unique due to the use of the
best quality yarn and the use of 65% Silver and 0.65% Gold Lace for the Zari. The
distinctive, exclusive characteristics of Mysore Silk Fabrics are the result of different
factors. Mysore Silk Fabrics are mainly grey woven and then piece dyed, with unique
twist patterns in the weft preparation resulting in grainy effect and drape. The Mysore
Silk Fabrics have a very high weight per linear metre of the finished fabrics. The designs
are mainly embossing type unlike flat type in many other silk fabrics. These fabrics are
washable any number of times due to the unique structure· and processes of these
fabrics. According to Mr Vijayan, General Director of KSIC, Mysore Silk is highly
reputated because the yarn used is coming from local cocoon and not from imported silk.
Further, the application stipulates that KSIC is the only company which
manufactures silk fabrics with different product range from cocoon to fabric.
According to KSIC, more than 65% of silk sold under name Mysore Silk is
duplicate (i.e. not coming from KSIC)
Procedure of examination
The Consultative group comprises: Registrar of GI, SN Maity; joint registrar of
Trade Mark, V. Ravi; Assistant registrar of GI, V. Natarajan; Dr T.N. Singh, IIT
Mumbai; Dr P.K. Bose, Professor, Mecahnical Engg Dept, Jadavpur University.
The Consultative group requested KSIC to provide the map of the geographical
are and the list of artisans and producers of Mysore Silk. KSIC provided the data on the
organisation of the company: president, director general, board of directors. Production
Units are managed by general directors. Thus the application was accepted and
advertised. The map of the city of Mysore were KSIC has its factory was produced.

314
Opposition77
A notice of opposition to application for registration of the GI Mysore Silk was
given by Chamundi Silks Textiles limited, Gandhinagar Bangalore78. The opposition is
based on the grounds that many producers are using the denomination Mysore Silk and
that such name can not be exclusively claimed by KSIC. The opponent further claims
that the method of production the silk described in the application is known by all the
producers and that the applicant can not claim any property on such production.
According to Chamundi (manager), the uniqueness of Mysore silk is the zari border on
the crepe, as the crepe itself is an usual product which started in France.
In response to the opposition, KSIC argues that it does not claim any property
right on Mysore silk but the registration the name according to section 11 of GI Act.
Concerning the uniqueness of the goods produced by the applicant, protection is
required against infringement of exclusive rights of the company to guarantee that the
public is not misled by unauthorised persons. Another argument is that KSIC is the only
company which produces 100% crepe the chine silk with zari comprising 65% of silver
and that the quality of the goods of KSIC depends upon the geographical area of
production, a specific link existing between the products and their geographic origin.
A hearing was organised and further postponed and eventually a memorandum of
understanding was signed between the applicant and the opponent: withdrawal of the
opposition by Chamundi if Chamundi can still use the name Chamundi Silk to sell its
products79.
According to a manager of Chamundi, Chamundi is doing the same as KSIC, and
the name Mysore is related to the previous name of the actual state of Karnataka and not
only to the actual Mysore district. KSIC has interpreted the name of Mysore in a very
narrow way because its factory is in Mysore City. But all the silk done in what was
before Mysore state is the same, using the cocoon of Mysore. During the opposition 77 All the information’s are from consultation of the file « Mysore Silk », available at the GI registry and open for public inspection according to GI Act, provision 78 78 Letter dated February 17th 2005. 79 Agreement dated 25th November 2005.² ²

315
procedure, Chamundi requested the extension of the geographical area to the whole state
of Karnataka but this proposal was not accepted80.
Another notice of opposition was given by Mysore Powerloom Silk
manufacturers’ cooperative society, Bangalore and Karnataka Weavers Federation,
Bangalore. The notice of opposition came too late at the GI registry81. One argument is
that the applicant, company owned by the government of Karnataka, has only one unit of
production. It is one producer or manufacturer but it does not represent the others silk
manufacturers in Mysore or in Karnataka. According to the opponents, the claim on the
yarn 26/28 deniers creates confusion: indeed, for georgette or crepe de chine, it can be
also produced with yarn 18/20, 20/22, 22/24 or 28/30. Small producers use denier 18/20.
Strategy
The uniqueness of the product comes from the whole supply chain: quality of the
cocoon and thus the yarn due to the geographical area, quality of the silk due to unique
process of weaving by adding the zari to the crepe. But this origin of the cocoon which is
the main reason for the quality was not claim in the GI application which only describes
the process of manufacturing of the silk fabric. Moreover the process is not handmade
but is with machines and quite recent.
But the main issue is about the registered proprietor. It is not sure whether KSIC
represent the interest of all the producers and the question remains of what is its
motivation to define the geographical area in such a narrow way. Indeed, the product as
defined in the application is the one produced by KSIC, with the yarn 26/28 deniers.
Others producers of Mysore silk were also using yarn deniers of 18/20, 20/22, 22/24 or
28/30. It is then doubtful that the GI Mysore Silk is a collective right as KSIC claims
many times to be the only producer of Mysore Silk. Its legal form as an enterprise of
government of Karnataka does not automatically make it representative of all the
producers. It seems, as claimed by the opponents that the GI was to increase the sale of
KSIC, single company. Indeed, according the director general of KSIC, there has been
80 Interview with Chamundi Textile, april 2007. 81 Notice of opposition dated February 23rd 2005.

316
more than 40% of increase of the sales following the registration of GI. This is due to a
very good marketing from KSIC on the GI and an active policy against competitors
saling duplicates at a very high level. Is it that this policy would have been less
successful if endorsed trough a collective action of all the producers? Would the
consumer be so easily helped in its choice for silk if Mysore Silk is produced and sold by
many producers? Is a GI meant for protecting public goods such as goods manufactured
by government companies? Or GI is before everything a collective right. Many defend
the concept that GI is for all the producers of a product having its uniqueness coming
from the place of origin, and is not a trademark to distinguish one company to another. It
shall rest in the hands of all the producers who are producing the product according to
core techniques. And Mysore silk seems to have a broader geographical area and a
broader definition in terms of yarn denier than the one of the GI application which only
refers to the manufacture of KSIC. Another aspect is that the quality of the silk is partly
due to the quality of the cocoon. Therefore, it might be relevant to include the producers
of cocoon and yarn in the GI process as the uniqueness of the product is also coming
from the origin of the yarn in the former Mysore state.
Conclusion
The dynamic of protection of GIs in India is very active, with more than 100
applications for GI registration in less than 4 years and a sharp increase. The nature of
the goods is quite broad, from handicraft to agriculture, from North India to South India.
One of the main issues behind the GI Act is who are the stakeholders concerned.
First it is to be noted that it is sometimes doubtful whether the applicant represents the
interest of the producers. Second there has been up to now no registration of authorised
users as part B of the register is still empty. Therefore the applicant is the one using the
GI whereas the GI Act provides that this right of use belongs to the user. No challenge of
GI Act in front of the Court has came yet but see the number of growing opposition and
the new awareness of the concept of geographical indications, this point might probably
come one day. Because the main difference between a trade mark and a geographical
indication is that the right belongs to all the producers of the geographical area, being a
collective right.
317
To be successful, a GI should rest in the hands of the producers, located in the
area. Therefore, a GI should be drafted by considering the knowledge of the producers on
the cultural practices which should be embedded in the specification. In fact, GI is
claimed to be also a way to preserve cultural biodiversity. Then, this diversity has to be
maintained in the area, by their possessors. The fact of delimiting a geographical area
was not obvious for the applicant and shall be looked at more carefully according to the
human factors and environmental factors and not according to the administrative rules to
strengthen the link between the product and the territory.
If comparing to EU regulation and its application in France, very promising
aspect of the Indian GI Act is the protection of any type of good and not only agricultural
or agro food products, which might help artisans to maintain their rich knowledge in
handicraft, whereas it has mainly disappeared from Europe. Seeing the TRIPS
Agreement covering all the goods, EU might have one day to think of opening GI
protection for others goods, if not for its products for products from third countries,
knocking at the door of EU for protection of their handicrafts.
Concerning the involvement of stakeholders and the right holders, it seems that
the EU system, build particularly on the French experience where the specification of the
good is draft by the producers themselves and not by an authority representing their
interest, has maybe helped in making the producers benefiting from the advantage of the
GI protection such as higher income. The distinction in Indian GI Act between applicant
and users, might create situations where producers are not the one behind the application
for registration of a GI and therefore not optimally included in the benefit sharing.
Finally, for the scope of protection, it will be interesting to see whether Indian
government will notify goods that shall benefit from the additional protection in order to
get better protection trough infringement action and opposition to trademarks. It will be
also interesting to see how the Courts will interpret GI Act. For example, Indian GI Act
provides protection of GI against trademark registration only for the same class of
products and for the standard protection, if it is of such nature as to confuse or misleads
the persons as to the true place of origin. Even for the additional protection, it protects
318
geographical indications against uses on the same class of goods. The similar conditions
apply for infringement which is only for uses of the GI on the same class of goods, with
or without misleading of the public whether it is standard or additional protection. Act
of unfair competition including passing off are also prohibited. But what about the
protection of GI against use on other products if it exploits the reputation of the GI as it
was decided in the Darjeeling case in France and as it is provided in EU regulation? In
that case, likelihood of confusion is not required. And French doctrine even considers
that appellation of origin, are per nature well-known, thus being protected for all goods
and not only same goods.
But at least, thanks to GI Act, the registration of GI such as Darjeeling is a bundle
of rights upon the registered proprietor and the registered users, helping to protect the use
of Darjeeling only for tea coming for Darjeeling produced according to the GI
specification, thus guarantying a high standard of quality as prescribed in the
specification. Indeed, the specification is the core of the GI system, and its success
depends on the choice made by the producers about the definition of such specification,
describing the product, its method of production and the geographical area, specification
draft according to the traditional know-how shared by the producers located in the
geographical area.
Note: This chapter has been contributed by Ms Delphine MARIE-VIVIEN, CIRAD, UMR
Innovation, Montpellier, France. Visiting Researcher, NLSIU, Bangalore, India.

319
Chapter 14
Action Framework: Facts and Recommendations
1. Socio-economic profile of producers
Facts
- Producers belong to several class categories, the highest are general category
followed by OBCs, SC and STs are less in number.
- More than 90% of producers have only single main livelihood
- Average age of producers is around 33 years and 53 – 60% producers are high
productive age i.e. between 17 to 45 years.
- Gender wise distribution of family members reveal that males are more than
the females in the producers’ families
- About half of the producers are educated up to primary level or below
- About 37% of family members do not possess any skill. The women are more
skilled than the men. But both men and women acquire these skills
traditionally in the family.
- Mostly producers are employed but the nature of employment i.e. seasonality,
earning and payments reveals the fact that there is lot of scope to improve the
employment conditions.
- The housing and living conditions of producers are average.
- The annual earning of most producers82 is low i.e. Rs 10000 - 50000. The
producers are, therefore, poor.
- Main livelihood is the major source of income. This trend is stronger in
agricultural products83.
82 As per Indian GI Act even the labour force is also covered under the definition of GI. Their situation is even worse. For example in Coorg coffee the labourers for plucking berries gets Rs 1.00- 1.25 per Kg and earn around Rs 100/day. December 11, 2007, page 13.

320
- The monthly expenditure on food is higher in case of poor producers and it is
reduced as they move next into the higher strata of the society
- Land and buildings constitute the major portion of the assets of producers.
The share of consumer durable is very less, the share of consumer durables go
down as producers move towards the strata of higher income.
- About 18% of producers have received any benefit from any of the welfare
schemes.
Recommendations
- Taking the younger age of producers, it is recommended to initiate mass level
training programmes on various dimensions of product
- The efforts are to be made to increase the share of income from other sources
also, which are regular. Therefore, income diversification.
- The expenditure on education, health and consumer durables need to be
enhanced through various support programmes.
2. Producers associations
Producers association is the key concept in GI protection system. The following
observations are made:
Facts
- Producers associations are the weakest link in the agricultural products, either
these are not existing or not properly organized for fruitful functioning.
- In the case of grains and indigenous products, there are no associations at all. In
case of fruits, plantation crops and spices, the producers associations are available
but these are not operating well; which is reflected from the fact that none of the
83 GI product based diversification to be initiated, it can be rural tourism. Felix Addor, Deputy Director General, Swiss Federal Institute of Intellectual Property, Bern, Switzerland shares several such example in different countries at ‘Symposium on Geographical Indications’, December 11, 2007 held at Chennai by GI Registry of India, Chennai
321
GI application in these products has come from such associations rather GI efforts
have been facilitated public organizations. In support of these facts, some best
examples are – Alphonso mango, Nagpur orange, Nasik grapes, Himachal apple
and Harshil apple. Despite being precious products there is no application since
four years of operation of GI registry.
- For GI facilitation, the role of public organizations such as central government
boards and state government departments is of very high importance. Because of
their interventions, the producers’ associations could become active in GI
registration, the best examples are – Coorg orange, Mysore mallige and Kangra
tea etc.
- The producers’ associations, who apply and get ownership, do they represent the
producers? Two examples can be seen critically i.e. basmati rice and navara rice.
For basmati rice, the most precious product of India, an unknown and untraceable
organization ‘Haryana Heritage’ at Karnal made the application. Does this organization
represent the producers’ interests? When we say producer we should not think of millers
and processing industry (though they are also producers as per Indian GI Act) rather we
should think of basmati farmers spread all over Haryana, Punjab, Western UP and
Uttarakhand. For a promising product like ‘navara rice’, in Kerala, the ownership has
been granted to a lesser known organization ‘Navara rice Farmers Society,
Karukamanikalam, Palakkad’. Does the organization was created for this specific
purpose? Does this organization represent the interests of navara producers in Kerala?
Differently named and specifically and recently created organization in Kerala
‘Palakkadan matta rice Farmers and Producers Company Limited, Karukamanikalam,
Palakkad’ probably constituted by the same patrons of navara rice farmers society made
the application for “Palakaddan matta” and got ownership for this rice also84. In Kerala,
there is a tradition of rice cultivators association known as “Padashekaram Committee’ at
every village panchayat, which are spread through out Kerala and these committees
could have been the true representative of interests of navara rice producers of concerned
districts in Kerala. 84 Application number 17 for navara rice and application number 36 for palakkaddan matta rice. GI Journal, 17, April 2007.
322
- Proprietorship of a community property to the organization not representing the
interest of each and every producer is a very serious matter. This problem may
become acute, once the intensive commercialization take place. Because as per GI
Act, any prospective ‘Authorized User’ applying to GI registry, need to
compulsorily take NOC from proprietor of GI.
- In case of non-agricultural products, the producers associations are mostly
available. These are strong in case of GI type VII and VIII but weak in GI type VI
i.e. handicraft, and informal in case of GI type I i.e. confectionary. Compare to
agricultural products, the associations have been more active in non-agricultural
products.
- The GI registration of non-agricultural products are far more in number than
agricultural products. The reason is not that non-agricultural products have more
trade than agricultural products. Rather most obvious reason is that public
organizations such as textile committee, patent facilitation centers, state
corporations as SISI, KSIC had been more active. In agricultural products, there
were a few active organizations such as tea board, spices board of central
government and horticultural department and biotechnology center of Karnataka
government. Therefore, due to active functioning of few
individuals/organizations, the products of less trade and virtually no serious
competition like ‘Mysore pan’ or ‘Mysore mallige’ were registered. While due to
lack of any initiation, the products of high importance like Banganpalli mango
and Alphonso mango, Nagpur orange, Sehori wheat etc were not even applied.
Recommendations
- Creation of commodity based associations in agricultural products and taking up
of advantage of formal groups such as Self Help Groups (SHGs), Water Users
Assocations (WUAs), Van Sarankshan Samitees (VSS), or Biodiversity
Management Committees (BMCs) constituted by state biodiversity boards.
- Strengthening of existing associations in non-agricultural products
- Institutionalization of process of GI application. For establishing right of
ownership, the approach has to be little different than patents. Therefore, state

323
intervention must always be there. Instead of leaving complete authority with GI
registry, the government(s) of concerned state(s) must be involved to a greater
extent.
- The associated bodies of state and central government must take part actively.
These organizations should have instruction to constitute, motivate and encourage
the truly representing associations/organizations for GI registration.
- A mechanism can be created for channeling the GI registration through a
designated department/organization of state government. The main purpose of this
arrangement should be to evaluate and ensure true representation of all the
producers
- GI registry should discourage application submitted without list of the producers.
The GI office should also ensure that all proper action and care has been taken in
identification and organization of producers. We must not forget that GI can be a
wonderful tool for creation and management of producers’ associations in the
country.
3. Uniqueness
Facts
Besides the geo-climatic features, the other factors to bring uniqueness are raw material
and production process. In non-agricultural products, the uniqueness is observed
morphologically85 and qualitatively but in agricultural products morphological traits are
also influenced by geographical origin86 but mostly it is qualitative trait87, which establish
85 For example in Kolhapuri chappal, 100% leather, decorative upper, charming contrast, intricate embroidery are main features, even shoes on the same pattern are also made at Kolhapur. In Panjabi jooti (also known as Rajasthani jooti in Rajasthan) all those features are available. But in later there is no distinction between left and right footwear, which is not the case with kolhapuri chappals. 86 Börner et al. (2005) finds associations between geographical origin and morphological characters such as glume, spike size etc in bread wheat. Can the same be done for several grains, vegetable and fruits in India also? 87 Thomas et al. (2006) found that Indian cardamom is superior to that from Srilanka and Guatemala. It is mostly based on biochemical parameters such as oil of Indian cardamom indicated high quantity of α-terpinyl acetate and 1,8-cineole, which imparts aroma and flavour to the cardamom, thus reinforcing the legendary belief of high intrinsic quality of the Indian cardamom.
324
the uniqueness from consumption point of view. Following are some important facts
regarding uniqueness:
- In most of non-agricultural products, it is easy to establish uniqueness because of
controlled raw material supply and physical features of the product. The
production process is also standardized but mostly not monitored/controlled by
any effective agency.
- In almost all agricultural products barring a few like Banganpalli mango,
Alphonso mango etc. it is a hard task to describe and confirm the uniqueness. For
example, in Himachal apple and Harshil apple neither the producer nor consumer
can easily differentiate between two at the time of purchase. Same is the case with
Bhaliya wheat, Sehori wheat and non-bhaliya and non-sehori wheat
- In agricultural products, the production process is not standardized and supply of
raw material such as seed and other vegetative propagation material of a GI
material is not regularized and controlled.
- The technical standards in agricultural products is the weakest area as the
producers follow their own technical standards and also monitor by themselves or
left open to the market to judge on the basis of final product available to them.
- In most of the applied GIs in agriculture, the uniqueness has been defined in a
vague manner without least scientific justification and evidences.
Recommendations
- Strengthen the production code in non-agricultural products and enforce them
through effective monitoring of technical standards. The producers associations in
consultation with government departments are capable to do it.
- Develop the production codes in agricultural products; define, document and list
proper technical standards. A mechanism need to be created for effective
implementation, monitoring and follow-up of these technical standards and
production codes. Except in few cases like Alphonso mango, Nasik grape,
Banganpalli mango, Basmatic rice, etc., the responsibility mainly lies on
government departments or other public organizations.

325
- The raw material used in producing agricultural products is purchased locally.
Most being a commodity of less commercial value, the effective and reliable seed
and propagating material system is not functioning. Therefore, big responsibility
lies with the research institutions to describe, evaluate, develop and provide
reliable raw material especially seed and propagating material.
- As uniqueness among most of agricultural products depends on qualitative traits,
it is recommended that scientific institutions must take steps to develop
qualitative trait protocols on the basis of modern technologies such as DNA
fingerprinting and PCR etc. These protocols should strengthen the case of not
only GI protection but also to bring confidence among the consumers.
- The ICAR, which is an agricultural research authority in the country, should
clearly list the varieties in each product, which constitute a particular GI.
4. Enterprise Operations
Facts
The functioning of agricultural and non-agricultural enterprises reflect little deviations
otherwise it is more or less same, the salient features are:
- The ownership of most enterprises is sole proprietorship and family enterprises
with family members. In agricultural enterprises, the sole proprietorship is very
high, while in non-agricultural enterprises; both role proprietorship and family are
almost equal with sole proprietorship having a little edge over later.
- In almost all cases in agriculture, the head of household is head of enterprises,
while in non-agricultural enterprises; other family members are also head of
enterprise.
- The skill of running an enterprise and producing the product in both cases have
been mostly acquired by traditionally from family. The formal and informal
training has played a little greater role in non-agricultural enterprises.
- The gender issues are very critical in both the enterprises. In agricultural
enterprises, the contribution of female workers is more than the men workers

326
because of more number of skilled workers are involved, of course the
involvement of non-skilled male are more than the non-skilled females. In non-
agricultural enterprises, though female workers contribute significantly but their
involvement is lesser than males. Unlike agriculture, in non-agricultural
enterprises, the involvement of skilled men worker is more than the skilled
women worker except in one case i.e. GI type VIII (textile). The payments to
women workers are far less than the male workers.
- The record keeping by the producers is unorganized in case of small producers of
non-agricultural products, and almost all sorts of producers in case of agricultural
products. Therefore, they are not able to provide the correct information about
input cost and also produce data of last two-three years.
Recommendations
- The sector of formal training is very poor in agricultural products. Formal training
programmes to be organized, the traditional training from families had been the
strength, therefore, trainers from these families to be involved in such formal
programs. Women workers in agriculture contribute significantly. Therefore,
women should not only be imparted training but also to be utilized as trainers.
- Women play significant role in non-agricultural enterprises and greater role in
agricultural enterprises but they are not represented in producers associations not
even in well established associations such as ‘Coimbatore Wet grinders and
Accessories Manufacturers Association’ i.e. COWMA, while several women are
running and supervising wet grinder enterprises at Coimbatore, because several of
enterprises are situated either as home unit or associated unit nearby to home.
- The agricultural producers and small sector non-agricultural producers, are
especially to be trained in record keeping. In these sectors, it will be a good idea
to develop and strengthen community registers. It will help in taking appropriate
business decisions and also function as important instrument in taking
administrative decisions under the Agreement on Anti-dumping.
- For better transparency, a mechanism to be developed for equal payments to
women for their work.
327
- Wholesale or retail marketing activities and business decisions are to be taken on
the basis of ownership style of a product enterprise.
5. Marketing operations Facts Packing, grading, price settlement and market access are the major issues of strategic
policy. These are given below:
- In non-agricultural products, only few producers store the products that too in a
kutcha style using polythene packs, jute bags, etc.
- The packing of products is a weak area in both agricultural and non-agricultural
products. Not much technological advancement has been done. The most
interesting finding is that producers are satisfied with the existing method of
packing, probably they have not understood the value of packing a product.
- Grading of a product is also a weak area. In agricultural products either grading is
not done, even if done it is mostly on the basis of physical traits. In non-
agricultural products, grading is little better and mostly it is done on the basis of
qualitative traits.
- Price decision is most important in market operation, the situation in agricultural
products is pity because mostly it is either individual bargain or purchaser offers a
price and producers are forced to sell without any other options left to them. The
situation in non-agricultural products is not much different except that collective
bargaining is little more improved and they usually agree to the price offered by
purchaser without forced sell. But still the price decision is of purchaser and not
of producer.
- The mode of sale is dominated by the middlemen. In few non-agricultural
products, the intervention of middlemen is less in the domestic market but high in
case of exports.
- Except few non-agricultural products, the consumption of the product is mostly
local. In some cases, it is only one or two districts or state. Few agricultural

328
products and little more non-agricultural products crosses the boundary of state
but exports are very little, only a few selected products are exported that too a
little extent. Uniqueness plays a significant role in sale of these products as
believed by around 90% of institutional stakeholders and traders. This holds true
for all products except GI type IV i.e. traditional health drinks.
Recommendations
- Bringing the attitudinal changes among producers regarding importance of
packing and grading.
- Introduction of product specific packing material
- Introduction of qualitative grading parameters and protocols, for agricultural
products, the agricultural institutions should take up this challenge.
- Development of mechanisms to enhance collective bargain and community
monopoly over price settlements and payment procedures. The financial
institutions need to play a greater role by providing credit facilities and also
strengthen the backward linkages for purchase of raw material on negotiated
prices and terms and conditions.
- Minimization of middlemen had always been a challenge in Indian economy88. In
case of few products, as Coimbatore wet grinder89 and Solapur chader and terry
towel, it has been done successfully. The similar approach is recommended for
other non-agricultural products and modified approach on similar pattern for
agricultural products.
- For many of the products, enough market is available in the country. Therefore,
popularizing them in domestic market should be taken at priority90. Few selected
products can be emphasized for export.
88 Can the farmers/producers through producers association become a share holders in large marketing companies? Or can they be partners in profit/loss sharing through investment in commodity exchanges? 89 Direct purchases can be done through official website of producers: www.wetgrindercoimbatore.com 90 For example indigenous fruit drinks such as –nannari sherbat, kokam juice and buransh juice have fairly good potential of commercialization in the domestic market but real challenge would lie in transferring the fair amount of revenue generation to them.

329
6. Inspection, quality control and quality assurance
Inspection and quality control at various stages of production is a major issue of inquiry.
What is the intervention mechanism of government for quality assurance and
improvement? Are there any technical guidelines for production codes and how the
production practices maintain those production codes? Quality is the whole crux of
product development. No consumer will buy any product merely on the basis of GI
registration, therefore, this sector of product development is not only important from
point of mandatory requirement of GI registration but also from point of view of market
satisfaction. The most important existing facts are narrated below:
Facts
- Most of the producers opine that either there is no inspection or quality control or
it is only at production level maintained by the producers during production
operations. Only a few admit that inspection by an authority is done.
- On inspection and quality control, the views of institutional stakeholders widely
differ from the producers. They opine that quality control is done through various
measures such as extension, training and group communication, and on-site
advice and inspection. But following facts are also observed:
15 –20% stakeholders opine that no formal method of inspection
and quality control available
About 45% stakeholders opine that in non-agricultural products,
the inspection and quality control is done by producers at various
stages of production and raw material purchase. While for
agricultural products, only 3% opine that it is done at producers
level.
The inspection on the basis of scientific evidences and voluntary
and mandatory standards exist only in GI type III and VII.
- Very less number of producers opine that they produce on the basis of
technical guidance received from government, NGO or producers association.

330
Excepting a few products, the producers of almost all products opine that they
produce as per self-guidelines as learnt from forefathers.
- What are government defined quality assurance methods? 16% institutional
stakeholders in agriculture and 19% in non-agricultural products opine that no
formal quality assurance is available. In agricultural products, regulated
production practices, input supply, post harvest practices and processes is
major strategy to ensure quality. In non-agricultural products, the intervention
at government level is less because 50% institutional stakeholders opine that
producers’ regulated raw material testing is the method of quality assurance.
Compliance to mandatory and voluntary standards and certification standards
has been of very low significance across most agricultural or non-agricultural
products.
- Advice and training plays an important role in quality enhancement. About
40% institutional stakeholders in agriculture and 50% in non-agricultural
products opine that advice and training is given directly to producers on
production aspects. While 30% in non-agriculture and 44% in agriculture
opine that advice and training is facilitated through public organizations.
Other institutional stakeholders in both agriculture and non-agriculture opine
that no advice and training is given.
- Production codes are self-learnt, self-guided and undocumented, then how are
these maintained and monitored. The quality check by purchaser is most
important method followed by technical guidelines from government
departments in agriculture, and inspection by government, NGO or
association in non-agriculture. Only 15% producers in agriculture and 33%
producers in non-agricultural products opine that quality control mechanism is
available which takes care of production codes.
Recommendations
- Evolving inspection and quality control mechanism in agricultural products
and strengthening existing mechanisms in non-agricultural products

331
- Encouraging and ensuring quality control on the basis of scientific evidences
and regulating standards
- Development of technical guidelines, production protocols and production
codes in several products. Refining and documenting the production codes,
wherever available. Scientific organizations must take special initiative in this
matter91.
- Encourage schemes and provide credit and facilitation for acquiring the
certification marks and standards such as ISO or India organic etc.
- Development and enforcement of mandatory standards in certain GIs
especially food items and selected agricultural products92. This cannot be done
without involvement of scientific institutions93.
- Facilitation of direct advice and training to the producers. To take the
advantage of rich knowledge of producers, some producer-to-producer
trainings can be organized.
- Production code enforcement and compliance mechanism should be
developed. The responsibility can be entrusted to concerned public
organization, NGO or producers associations as per nature and type of
product.
7. Perceived post-GI registration changes
The producers and other stakeholders expect several changes after registration of a
product as GI. The expectations can be met out or not or can take several years to receive
the perceived changes. But as a matter of fact, several GIs have been registered because
leaving apart the expected benefits, the first and foremost priority must be to register and
91 There is question of technical standards of other countries notified as per Technical Barriers to Trade (TBT) also. For example through a TBT notification (G/TBT/N/AUS/59, 10 December 2007) Australia has put extraneous residue limit (ERL) of 0.1 mg/kg for paradichlorobenzene (1,4- dichlorobenzene) in honey for five years. It means Coorg honey or Himachal honey producers must know it. 92 Indian food products are second highest import refusal in US because consignments appears to be out of compliance with country’s food regulations (doubtful quality, unsafe color, filthy and no English nutritional labels). Out of 94 consignments detained in November 2007, 70 items are processed and ready to eat items. Business Standard, Chennai, December 11, 2007 page 02. 93 Malte Hartmann (2006) has made the complete reference of the food products as GI, which can give several issues for quality development.

332
protect it. And this is the principle, which has been followed by stakeholders while
applying for registration of a product. Some of the facts of expectations are listed here:
Facts
- Producers opine that non-registration has certain disadvantages; the important
disadvantages are low volume of sale because of sale of fake products and
difficulty in getting loans etc.
- Producers and institutional stakeholders expect increase in sale and unit price,
enhanced premium to producers thus enhancing their profit, and reduction in
competition.
- Most producers feel that they will leave other livelihoods and shift to
production of registered GI product, if the protection systems are followed to
ensure more benefit. They will not shift their livelihood merely after
registration of a product as GI because they have their own production and
marketing risk mitigation strategies. But significant number of producers and
institutional stakeholders believe that GI registration will improve the overall
socio-economic conditions of producers.
Recommendations
- No producer or institutional stakeholder felt that non-registration may cause a
product ‘generic’; therefore, the registration process must continue without
bothering much about expected socio-economic changes. The registration
must be taken as a tool to protect the identity of product and producers,
strengthening of association among producers and to develop a comradeship
among producers. The registration should be used as a weapon, whenever it is
required to protect the interest of the producers. The weapons are not used in
day-today matters but these are procured and kept if any exigency or
emergency occurs.

333
- The producers have great expectations from the new regime of protection. But
these expectations cannot be fulfilled without an integrated94 and institutional
approach such as ‘cluster development program’ has been done for
coimbatore wet grinder or solapur chader and terry towel. The producers are
worried about production and marketing risk mitigation strategies. The
mechanism needs to be developed for enhancing the risk taking capacity of
the producers.
8. Perceived impact on market
Facts
The perceived impact on market can be brought out after careful diagnosis of the
marketing problem. Following are some facts of diagnostic survey:
- In most products the competition is either local producers or same product
produced in other areas of country or similar products as duplicates available
in the country. The import threat95. or competition in export market96 is a
form of competition only for few selected products The tough local
competition is faced by GI types VI and VIII, while almost all agricultural
products except GI type IV face such type of competition severely. 94 T.C. James, Ministry of Commerce, New Delhi shares the experiences of Phu Quoc, a fish sauce in Vietnam. About 90 enterprises produce 10 m. litres per annum but only 0.5 milliom reaches overseas. Arrangement with Uniliver company (a contract with consortium of 17 local producers), producers process it but company does works like marketing, distribution and label designing etc. Symposium on Geographical Indications, December 11, 2007 held at Chennai by GI Registry of India, Chennai. In India on similar approach a juice ‘Leh Berry’ from sea-buckthorn berries in Laddakh is developed by a private company in collaboration with DRDO laboratory. The rural livelihoods did not get anything out of this product development; rather they faced several other problems. Therefore any joint collaboration between a research institution and private company sans producers of any GI product is not recommended under any situation. 95 Cardamom: Import of 400 tonnes from Guatemala @ Rs 100/- ($2.50)/kg, even after 70% import duty, while domestic rates are Rs 550/- per kg. During August 2006 rate was Rs 325/- per kg. Cheap Cardamom is coming through informal channel from Nepal. India production 11,500 tonnes and domestic consumption is around 80%. Honduras, Tanzania and Srilanka are other producers producing 1000 tonnes, Guatamala produces 30,000 tonnes. Mint, Dec 11, 2007 page 17. 96 Pepper: Import of 3000 tonnes from Indonesia ($3300-3350/tonne) and 1000 tonnes from Brazil at $3000/tonne. Indian pepper remains at $3550-3600 /tonne. Brazilian pepper are bold and past experience that part of this is sold as ‘Wynadan pepper’. The pepper is being imported as value chain product for sterilization, grinding and further export. Business Line, December 11, 2007, page 15.
334
- At the time of purchase, about 87% consumers in agricultural product and
96% in non-agricultural products are sure that they are buying a genuine
product97. This is because about 54% consumer in agricultural product and
74% consumer in non-agricultural product make any special effort to purchase
a genuine product. But do the consumers prefer original products always?
Only 9- 10% traders believe so, here lies the competitiveness on product in
terms of quality and reasonable price. The consumers will not necessarily buy
the GI product only.
- In search of genuine product, the consumers apply several efforts, the topmost
approach followed for each type of product is given below:
For GI type I & VIII see label or trademark
For GI type II go to authorized/ reliable/ reputed shop
For GI type III get authentic receipt or go to
authorized/reliable/reputed shop
For GI type IV, V & VII go to authorized/reliable/reputed shop or
get authentic receipt or see label/trademark
For GI type VI get authentic receipt or see lable/trademark
Recommendations
- Focusing domestic market create a healthy competitive situation. Product
diversification can play a greater role e.g. in case of Pahari aloo, it can be a
Himachal vegetable potato or Himachal seed potato; in case of pokkali rice, it
can be naturally grown pokkali rice grains, pokkali paddy seeds, pokkali rice
bran natural oil etc.
- Understand the attitude of customers, initiate customer orientation programs
within competitiveness framework. For example, tell the customers about
identity of the product, the GIs are highly localized and customers out of their
97 In credence goods, the consumers may be interested in specific attributes such as production process, pay of the workers, gender or environmental rights or pesticide residues etc. (Rangnekar, 2004 as presented by Kasturi Das, 2007)

335
niche area do not know about the products. The methods and types of
orientation program shall differ as per type of consumer.
- Initiate forward and backward linkages and strengthen them. For example,
look for any possibility of sale of bhaliya wheat and bhaliya wheat flour
through retail supply chain mechanism of a reputed company.
- Ensure mechanism of supply of genuine product to the customers. The most
suitable mechanism can be developed as per GI type or nature of product. One
such mechanism can be traceability of the origin of the product98. Scientific
institutions needs to take greater responsibility to ensure traceability on the
basis of ICT applications.
- Government/ product associations should take up certain administrative
measures to face competition arising from duplicate or copy type products.
- Branding/labeling coupled with high quality standards and IP protection
would help to face competition.
9. Post registration impacts
Facts
- Most of the producers of registered products have not observed much changes
after registration of agricultural products because only nine respondents spoke
in favour of impact of registration.
- In non-agricultural products, the producers have felt impact of registration on
various socio-economic parameters.
- The impact observed in non-agricultural product is not due to GI registration
alone99. Rather it is the integrated approach which helped in positive effects.
For example, the efforts done by organizations like textile committee and 98 A Geographical Information System (GIS) based comprehensive traceability system for hot pepper is developed in Jamaica; it is used as a global trade tool to identify the originating farm of the product and also to track pests such as gall midge. CTA, issue no. 32, June 2006, for more details contact Dionne Clarke-Harris ([email protected]). 99 GI as a tool has played greater role in benefit accrual from Mysore silk. Because KSIC took several initiatives to exclude others from using the name. Therefore in 2006, there was a 5-10% increase in sale with turnover of Rs 45 crores. In 2007, KSIC expect turn over of Rs 50 crore with 5-7 crore of profit.

336
various organizations of central and state government has been done in a
mission mode manner, in which registration of GI is only one component. It
has been expressed by several stakeholders that observed changes are not the
effect of GI.
- The GI as a marketing tool has been used in a few products only, which is
reflected by the infringement cases or other administrative actions taken by
the proprietors of GIs.
- The GI registration has developed and strengthen the unity of producers, it has
opened the communication channel, changed the attitude of producers towards
community ownership and exclusion of others from taking advantage of their
property.
Recommendations
- Mission mode approach on the principle of cluster development problem to be
taken for the identified agricultural products.
- Even after registration of two to three years, the GI has not been used as a
marketing tool effectively. In case of few products only it has been used as an
effective tool.
- Approaching other nations for bilateral agreement to protect GIs mutually
without formal registration in other countries. Because for producers it
become highly difficult to protect product in each and every country and it is
highly money consuming activity also.
- Development of cross country producers networks
10. Willingness to pay
Facts
- Most producers are willing to pay Rs. 500/- towards GI registration.
- Most producers expect enhanced premium of 5 – 10% over the cost.
- About 35 – 40% of traders also feel that as registered GI should provide
premium of 5 - 10%.

337
- The enhanced premium to the consumers would, therefore be at least 10 –
15% over prevailing price.
- About 60% of consumers are ready to pay enhanced premium and mostly
below 10% over prevailing price100.
- Bankers are willing to pay for registration and also for the product
development activities.
Recommendations
- The government and association make sure that there should not be a price
rise of more than 10 per cent as willingness of consumers.
- The steps to be taken to build up the reputation, repayment capacity of the
producers so that bankers and financial institution have confidence about
effective recovery of loan and credit etc.
100 T.C. James, Ministry of Commerce, New Delhi informs ‘as per a survey conducted by EU in 1999, 43% people are willing to pay 10% premium’. Symposium on Geographical Indications, December 11, 2007 held at Chennai by GI Registry of India, Chennai. During the same symposium, Felix Addor, Deputy Director General, Swiss Federal Institute of Intellectual Property expressed his views that consumers in developed nations will be willing to pay higher with the intention of helping producers from developing nations. The only requirement would be availability of genuine products and not for example the Ceylon tea coming from Thailand.

338
Annexure-IV: Socio-economic profile of producers
Table-4.1: Main Livelihood of the surveyed producers Respondents – No. (%) Livelihood
Agriculture Products Non-Agriculture Products All Agriculture 289 (91.74) 18 (4.8) 309 (44.71) Non-agri enterprise 10 (3.17) 344 (91.5) 354 (51.23) Wage/salary income 6 (1.90) 13 (3.5) 19 (2.74) Others 10 (3.17) 1 (0.3) 11 (1.59) Total 315 (45.58) 376 (54.41) 691
Table-4.2: Social groups of surveyed producers Respondents – No. (%) Social group
Agriculture Products Non-Agriculture Products All SC 19 (6.0) 47 (12.47) 66 (9.56) ST 31 (9.8) 17 (4.46) 48 (6.95) OBC 114 (36.2) 146 (38.81) 260 (37.68) Others 151 (47.9) 166 (43.96) 317 (45.79) Total 315 (45.58) 376 (54.41) 691
Table-4.3: Gender-wise family members of surveyed producers Agriculture Products Non-Agri products All Family
members Average No. % Average
yrs Average No. % Average
yrs Average
No. % Average yrs
Male 3.13 57.01 32.62 2.48 58.71 33.12 2.78 58.07 32.86 Female 2.36 42.99 33.12 1.74 41.28 31.52 2.02 41.92 32.37
Table-4.4: Gender and age-wise group pattern of family members of surveyed producers Agriculture Products Non-Agriculture Products Age group Male Female Total Male Female Total
1-16 221 (60.38) (24.66)
145 (39.61) (19.43)
366 (22.28)
150 (53.9) (16.16)
128 (46.04) (19.51)
278 (17.55)
17-45 452 (51.83) (50.44)
420 (48.16) (56.30)
872 (53.10)
551 (58.0) (59.37)
399 (42.0) (60.82)
950 (59.97)
46-55 90 (47.61) (10.04)
99 (52.38) (13.27)
189 (11.51)
143 (64.70) (15.40)
78 (35.29) (11.89)
221 (13.95)
>55 133 (61.86) (14.84)
82 (38.13) (10.99)
215 (13.09)
84 (62.2) (9.05)
51 (37.7) (7.78)
135 (8.52)
Total 896 (54.56)
746 (45.46)
1642
928 (58.58)
656 (41.41)
1584
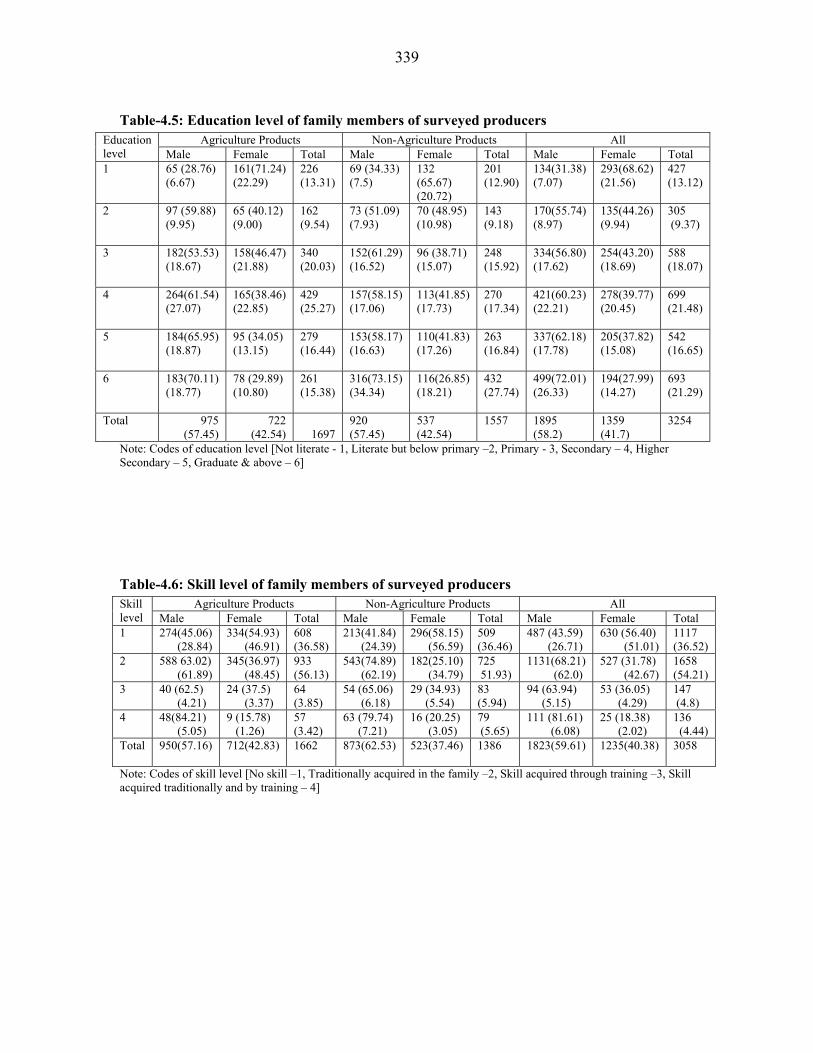
339
Table-4.5: Education level of family members of surveyed producers Agriculture Products Non-Agriculture Products All Education
level Male Female Total Male Female Total Male Female Total 1 65 (28.76)
(6.67)
161(71.24) (22.29)
226 (13.31)
69 (34.33) (7.5)
132 (65.67) (20.72)
201 (12.90)
134(31.38) (7.07)
293(68.62) (21.56)
427 (13.12)
2 97 (59.88) (9.95)
65 (40.12) (9.00)
162 (9.54)
73 (51.09) (7.93)
70 (48.95) (10.98)
143 (9.18)
170(55.74) (8.97)
135(44.26) (9.94)
305 (9.37)
3 182(53.53) (18.67)
158(46.47) (21.88)
340 (20.03)
152(61.29) (16.52)
96 (38.71) (15.07)
248 (15.92)
334(56.80) (17.62)
254(43.20) (18.69)
588 (18.07)
4 264(61.54) (27.07)
165(38.46) (22.85)
429 (25.27)
157(58.15) (17.06)
113(41.85) (17.73)
270 (17.34)
421(60.23) (22.21)
278(39.77) (20.45)
699 (21.48)
5 184(65.95) (18.87)
95 (34.05) (13.15)
279 (16.44)
153(58.17) (16.63)
110(41.83) (17.26)
263 (16.84)
337(62.18) (17.78)
205(37.82) (15.08)
542 (16.65)
6 183(70.11) (18.77)
78 (29.89) (10.80)
261 (15.38)
316(73.15) (34.34)
116(26.85) (18.21)
432 (27.74)
499(72.01) (26.33)
194(27.99) (14.27)
693 (21.29)
Total 975 (57.45)
722 (42.54) 1697
920 (57.45)
537 (42.54)
1557 1895 (58.2)
1359 (41.7)
3254
Note: Codes of education level [Not literate - 1, Literate but below primary –2, Primary - 3, Secondary – 4, Higher Secondary – 5, Graduate & above – 6]
Table-4.6: Skill level of family members of surveyed producers Agriculture Products Non-Agriculture Products All Skill
level Male Female Total Male Female Total Male Female Total 1 274(45.06)
(28.84) 334(54.93) (46.91)
608 (36.58)
213(41.84) (24.39)
296(58.15) (56.59)
509 (36.46)
487 (43.59) (26.71)
630 (56.40) (51.01)
1117 (36.52)
2 588 63.02) (61.89)
345(36.97) (48.45)
933 (56.13)
543(74.89) (62.19)
182(25.10) (34.79)
725 51.93)
1131(68.21) (62.0)
527 (31.78) (42.67)
1658 (54.21)
3 40 (62.5) (4.21)
24 (37.5) (3.37)
64 (3.85)
54 (65.06) (6.18)
29 (34.93) (5.54)
83 (5.94)
94 (63.94) (5.15)
53 (36.05) (4.29)
147 (4.8)
4 48(84.21) (5.05)
9 (15.78) (1.26)
57 (3.42)
63 (79.74) (7.21)
16 (20.25) (3.05)
79 (5.65)
111 (81.61) (6.08)
25 (18.38) (2.02)
136 (4.44)
Total 950(57.16)
712(42.83)
1662
873(62.53)
523(37.46)
1386
1823(59.61)
1235(40.38)
3058
Note: Codes of skill level [No skill –1, Traditionally acquired in the family –2, Skill acquired through training –3, Skill acquired traditionally and by training – 4]
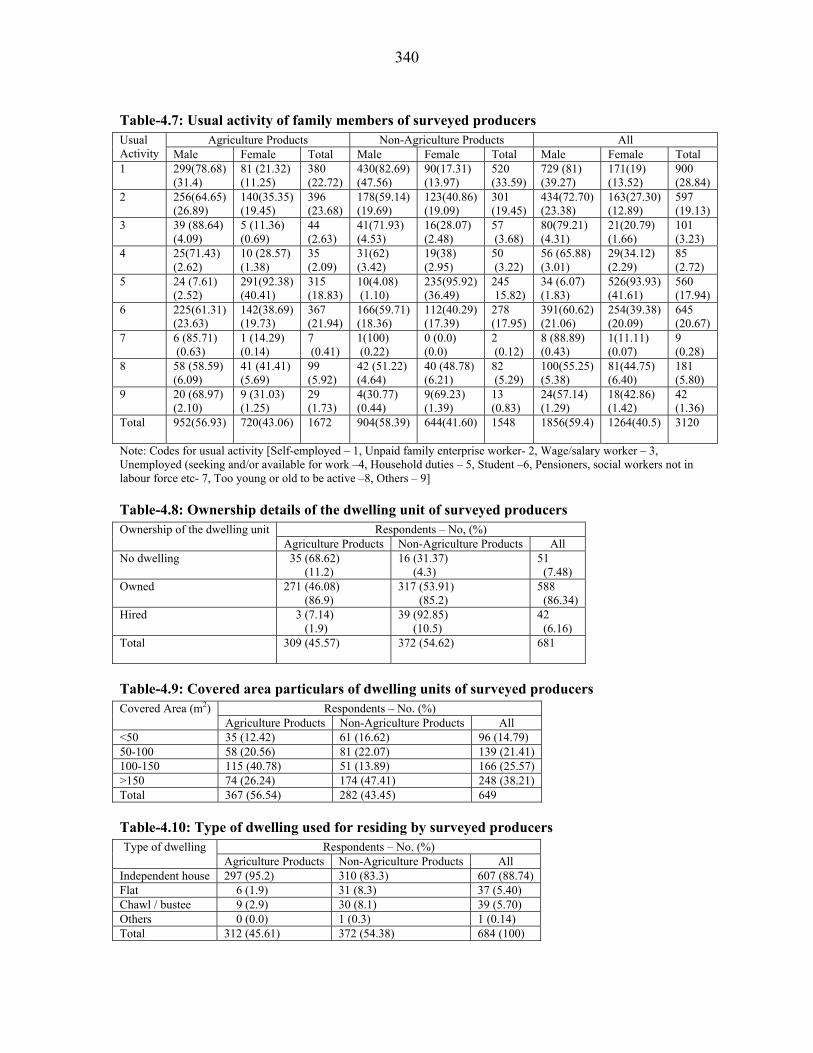
340
Table-4.7: Usual activity of family members of surveyed producers Agriculture Products Non-Agriculture Products All Usual
Activity Male Female Total Male Female Total Male Female Total 1 299(78.68)
(31.4) 81 (21.32) (11.25)
380 (22.72)
430(82.69) (47.56)
90(17.31) (13.97)
520 (33.59)
729 (81) (39.27)
171(19) (13.52)
900 (28.84)
2 256(64.65) (26.89)
140(35.35) (19.45)
396 (23.68)
178(59.14) (19.69)
123(40.86) (19.09)
301 (19.45)
434(72.70) (23.38)
163(27.30) (12.89)
597 (19.13)
3 39 (88.64) (4.09)
5 (11.36) (0.69)
44 (2.63)
41(71.93) (4.53)
16(28.07) (2.48)
57 (3.68)
80(79.21) (4.31)
21(20.79) (1.66)
101 (3.23)
4 25(71.43) (2.62)
10 (28.57) (1.38)
35 (2.09)
31(62) (3.42)
19(38) (2.95)
50 (3.22)
56 (65.88) (3.01)
29(34.12) (2.29)
85 (2.72)
5 24 (7.61) (2.52)
291(92.38) (40.41)
315 (18.83)
10(4.08) (1.10)
235(95.92) (36.49)
245 15.82)
34 (6.07) (1.83)
526(93.93) (41.61)
560 (17.94)
6 225(61.31) (23.63)
142(38.69) (19.73)
367 (21.94)
166(59.71) (18.36)
112(40.29) (17.39)
278 (17.95)
391(60.62) (21.06)
254(39.38) (20.09)
645 (20.67)
7 6 (85.71) (0.63)
1 (14.29) (0.14)
7 (0.41)
1(100) (0.22)
0 (0.0) (0.0)
2 (0.12)
8 (88.89) (0.43)
1(11.11) (0.07)
9 (0.28)
8 58 (58.59) (6.09)
41 (41.41) (5.69)
99 (5.92)
42 (51.22) (4.64)
40 (48.78) (6.21)
82 (5.29)
100(55.25) (5.38)
81(44.75) (6.40)
181 (5.80)
9 20 (68.97) (2.10)
9 (31.03) (1.25)
29 (1.73)
4(30.77) (0.44)
9(69.23) (1.39)
13 (0.83)
24(57.14) (1.29)
18(42.86) (1.42)
42 (1.36)
Total 952(56.93)
720(43.06) 1672 904(58.39) 644(41.60) 1548 1856(59.4) 1264(40.5) 3120
Note: Codes for usual activity [Self-employed – 1, Unpaid family enterprise worker- 2, Wage/salary worker – 3, Unemployed (seeking and/or available for work –4, Household duties – 5, Student –6, Pensioners, social workers not in labour force etc- 7, Too young or old to be active –8, Others – 9]
Table-4.8: Ownership details of the dwelling unit of surveyed producers Respondents – No, (%) Ownership of the dwelling unit
Agriculture Products Non-Agriculture Products All No dwelling 35 (68.62)
(11.2) 16 (31.37) (4.3)
51 (7.48)
Owned 271 (46.08) (86.9)
317 (53.91) (85.2)
588 (86.34)
Hired 3 (7.14) (1.9)
39 (92.85) (10.5)
42 (6.16)
Total 309 (45.57)
372 (54.62)
681
Table-4.9: Covered area particulars of dwelling units of surveyed producers Respondents – No. (%) Covered Area (m2)
Agriculture Products Non-Agriculture Products All <50 35 (12.42) 61 (16.62) 96 (14.79) 50-100 58 (20.56) 81 (22.07) 139 (21.41) 100-150 115 (40.78) 51 (13.89) 166 (25.57) >150 74 (26.24) 174 (47.41) 248 (38.21) Total 367 (56.54) 282 (43.45) 649
Table-4.10: Type of dwelling used for residing by surveyed producers Respondents – No. (%) Type of dwelling
Agriculture Products Non-Agriculture Products All Independent house 297 (95.2) 310 (83.3) 607 (88.74) Flat 6 (1.9) 31 (8.3) 37 (5.40) Chawl / bustee 9 (2.9) 30 (8.1) 39 (5.70) Others 0 (0.0) 1 (0.3) 1 (0.14) Total 312 (45.61) 372 (54.38) 684 (100)

341
Table-4.11: Structure of respondent’s dwelling units surveyed producers Respondents – No. (%) Type of structure
Agriculture Products Non-Agriculture Products All Pucca 175 (55.9) 307 (82.5) 482 (70.36) Semi-pucca 114 (36.4) 54 (14.5) 168 (24.52) Katcha 24 (7.7) 11 (3.0) 35 (5.10) Total 313 (45.69) 372 (54.62) 685
Table-4.12: Lighting facilities availability to surveyed producers Respondents – No. (%) Lighting
Agriculture Products Non-Agriculture Products All None 13 (4.2) 14 (3.8) 27 (3.95) Electricity 294 (94.5) 350 (94.3) 644 (94.42) Kerosene lamp 4 (1.3) 7 (1.9) 11 (1.61) Total 311 (45.60) 371 (54.39) 682
Table-4.13: Cooking fuel utilization of surveyed producers Respondents – No. (%) Cooking fuel
Agriculture Products Non-Agriculture Products All LPG/Piped gas 198 (63.3) 290 (78.0) 488 (71.24) Local/Gobar gas 28 (8.9) 11 (3.0) 39 (5.69) Electricity 4 (1.3) 1 (0.3) 5 (0.72) Kerosene 2 (0.6) 12 (3.2) 14 (2.04) Coal ------ 3 (0.8) 3 (0.43) Firewood 81 (25.9) 54 (14.5) 135 (19.70) Other --------- 1 (0.3) 1 (0.14) Total 313 (45.69) 372 (54.30) 685
Table-4.14: Sources of drinking water availability to surveyed producers Respondents – No. (%) Source of drinking water
Agriculture Products Non-Agriculture Products All Tap 121 (38.7) 301 (80.7) 422 (61.51) Tube-well 62 (19.8) 40 (10.7) 102 (14.86) Well 102 (32.6) 14 (3.8) 116 (16.90) Tank/pond 16 (5.1) 4 (1.1) 20 (2.91) River/canal/lake/spring 5 (1.6) 10 (2.7) 15 (2.18) Others 7 (2.2) 4 (1.1) 11 (1.60) Total 313 (45.62) 373 (54.73) 686
Table-4.15: Spectrum of Income range of producers Respondents – No. (%) Income range
Agriculture Products Non-Agriculture Products All Upto Rs.10000/- 1 (33.34)
(1.51) 2 (66.67) (5.0)
3 (2.83)
10000-50000 36 (58.06) (54.54)
26 (41.93) (65.0)
62 (58.49)
50000 – 1 lakh 7 (63.63) (10.60)
4 (36.36) (10.0)
11 (10.37)
More than 1 lakh 22 (73.33) (33.34)
8 (26.67) (20.0)
30 (28.30)
Total 66 (62.26)
40 (37.37)
106

342
Table-4.16: Contribution of different sources in net annual income of producers earning upto Rs.50,000 annually
Table-4.17: Contribution of different sources in net annual income of producers earning Rs. >50000/- to 2 lakhs annually
Average in Rs % Income of total Producers Annual income Agriculture Products
Non-Agriculture Products
All Agriculture Products
Non-Agriculture Products
All
Agriculture, horticulture, plantation, forestry
90118 6000 48059 78.50 4.68 39.56
Livestock, poultry, fishing
7896 1866 4881 6.88 1.46 4.02
Manufacturing 1200 102658 51929 1.05 80.11 42.75
Trading 3347 4364 3856 2.92 3.41 3.17
Other enterprises 3430 2400 2915 2.99 1.87 2.40
Wage/Salary income 6664 7030 6847 5.81 5.49 5.64
Other income (pensions, property, remittance received)
2140 3833 2987 1.86 2.99 2.46
Total 114795 128151 121473 100.00 100.00 100.00
Average in Rs % Income of total Producers Annual income Agriculture Products
Non-Agriculture Products
All Agriculture Products
Non-Agriculture Products
All
Agriculture, horticulture, plantation, forestry
23813 9681 16747 67.13 27.76 47.61
Livestock, poultry, fishing 1513 842 1178 4.27 2.41 3.35 Manufacturing 6500 19838 13169 18.32 56.89 37.44
Trading 1866 1175 1520 5.26 3.37 4.32
Other enterprises 277 329 303 0.78 0.94 0.86
Wage/Salary income 754 2393 1574 2.13 6.86 4.48
Other income (pensions, property, remittance received)
750 614 682 2.11 1.76 1.94
Total 35473 34872 35173 100.00 100.00 100.00
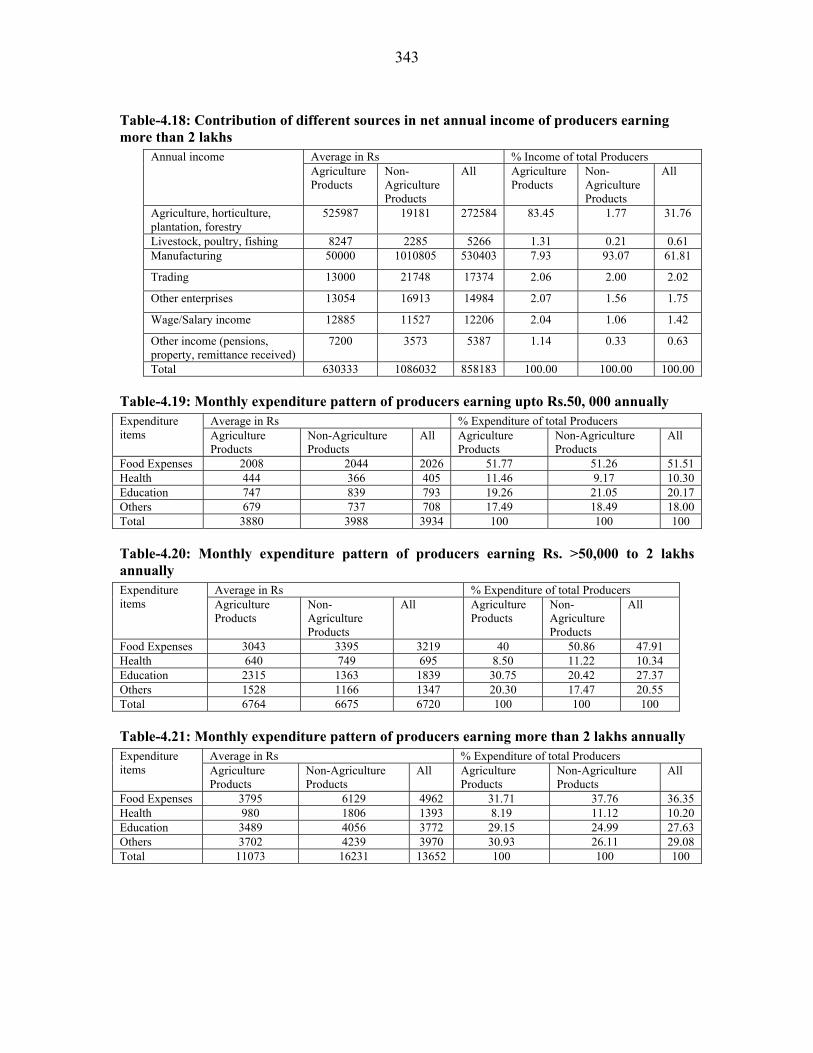
343
Table-4.18: Contribution of different sources in net annual income of producers earning more than 2 lakhs
Average in Rs % Income of total Producers Annual income Agriculture Products
Non-Agriculture Products
All Agriculture Products
Non-Agriculture Products
All
Agriculture, horticulture, plantation, forestry
525987 19181 272584 83.45 1.77 31.76
Livestock, poultry, fishing 8247 2285 5266 1.31 0.21 0.61 Manufacturing 50000 1010805 530403 7.93 93.07 61.81
Trading 13000 21748 17374 2.06 2.00 2.02
Other enterprises 13054 16913 14984 2.07 1.56 1.75
Wage/Salary income 12885 11527 12206 2.04 1.06 1.42
Other income (pensions, property, remittance received)
7200 3573 5387 1.14 0.33 0.63
Total 630333 1086032 858183 100.00 100.00 100.00
Table-4.19: Monthly expenditure pattern of producers earning upto Rs.50, 000 annually Average in Rs % Expenditure of total Producers Expenditure
items Agriculture Products
Non-Agriculture Products
All Agriculture Products
Non-Agriculture Products
All
Food Expenses 2008 2044 2026 51.77 51.26 51.51 Health 444 366 405 11.46 9.17 10.30 Education 747 839 793 19.26 21.05 20.17 Others 679 737 708 17.49 18.49 18.00 Total 3880 3988 3934 100 100 100
Table-4.20: Monthly expenditure pattern of producers earning Rs. >50,000 to 2 lakhs annually
Average in Rs % Expenditure of total Producers Expenditure items Agriculture
Products Non-Agriculture Products
All Agriculture Products
Non-Agriculture Products
All
Food Expenses 3043 3395 3219 40 50.86 47.91 Health 640 749 695 8.50 11.22 10.34 Education 2315 1363 1839 30.75 20.42 27.37 Others 1528 1166 1347 20.30 17.47 20.55 Total 6764 6675 6720 100 100 100
Table-4.21: Monthly expenditure pattern of producers earning more than 2 lakhs annually Average in Rs % Expenditure of total Producers Expenditure
items Agriculture Products
Non-Agriculture Products
All Agriculture Products
Non-Agriculture Products
All
Food Expenses 3795 6129 4962 31.71 37.76 36.35 Health 980 1806 1393 8.19 11.12 10.20 Education 3489 4056 3772 29.15 24.99 27.63 Others 3702 4239 3970 30.93 26.11 29.08 Total 11073 16231 13652 100 100 100

344
Table-4.22: Pattern of household value of assets of producers earning upto Rs.50, 000 annually
Average in Rs. % Value of assets of total Producers Value of Assets Agriculture
Products Non-
Agriculture Products
All Agriculture Products
Non-Agriculture
Products
All
Land (including water tanks, ponds)
426967 125125 276046 54.7 33.46 47.86
Building 126500 145914 136207 16.22 39.02 23.61 Machinery, implements 9490 35775 22632 1.21 9.56 3.92 Transport equipments 175000 33705 104352 22.45 9.01 18.09 Durable goods (TV/Fridge) 11234 10329 10782 1.44 2.76 1.86 Other assets 12857 13923.07 13390 1.64 3.72 2.32 Livestock Resources (Cow, Buffalo, Pig, Goat, Poultry)
17453 9114.28 13283 2.23 2.43 2.30
Total 779502 373888 576695 100 100 100
Table-4.23: Pattern of household value of assets of producers earning Rs.>50,000 to 2 lakhs annually
Average in Rs. % Value of assets of total Producers Value of Assets Agriculture
Products Non-
Agriculture Products
All Agriculture Products
Non-Agriculture
Products
All
Land (including water tanks, ponds)
1939389 323444 1131417 74.14 30.84 61.75
Building 348173 441304 394739 13.31 42.08 21.54 Machinery, implements 81540 90507 86023 3.11 8.63 4.69 Transport equipments 176390 108386 142388 6.74 10.33 7.77 Durable goods (TV/Fridge)
18095 41328 29711 0.69 3.94 1.62
Other assets 27638 31177 29408 1.05 2.97 1.60 Livestock Resources (Cow, Buffalo, Pig, Goat, Poultry)
24354 12571 18462 0.93 1.19 1.00
Total 2615582 1048719 1832151 100 100 100
Table-4.24: Pattern of household value of assets of producers’ earning more than Rs.2 lakhs Average in Rs. % Value of assets of total Producers Value of Assets
Agriculture Products
Non-Agriculture Products
All Agriculture Products
Non-Agriculture Products
All
Land (including water tanks, ponds)
3929025 3734216 3831621 72.56 50.74 59.99
Building 597025 1541828 1069427 11.02 20.95 16.74 Machinery, implements 286610 1483326 884968 5.29 20.15 13.85 Transport equipments 450194 370926 410560 8.31 5.04 6.42 Durable goods (TV/Fridge) 33597 69859 51728 0.62 0.94 0.80 Other assets 50250 115053 82651 0.92 1.56 1.29 Livestock Resources (Cow, Buffalo, Pig, Goat, Poultry)
67916 43800 55858 1.25 0.59 0.87
Total 541461 7359012 6386816 100 100 100

345
Table – 4.25: Welfare indicators of household members of surveyed producers Respondents – No. (%) Welfare indicators
Agriculture Products Non-Agriculture Products All Get enough food every day (during last 30 days) 1592 (96.95) 1510 (95.32) 3102 (96.15) Have at least a pair of footwear (during last 30 days) 1592 (96.95) 1510 (95.32) 3102 (96.15) Have at least two sets of clothes (during last 30 days) 1589 (96.77) 1511 (95.39) 3100 (96.09) Fell sick or get injured (during last 30 days) 238 (14.49) 339 (21.4) 577 (17.88) Total family members 1642 1584 3226
Table – 4.26: Mode of treatment obtained by household members of producers during their illness in last 30 days
Respondents – No. (%) Mode of treatment Agriculture Products Non-Agriculture Products All
No treatment 68 (28.57)
105 (30.97)
173 (29.98)
Treated at Hospital, Clinic or Dispensary 124 (52.10)
141 (41.59)
265 (45.92)
Treated by qualified medical doctor (Allopathy, Homeopathy, Ayurveda)
29 (12.18)
73 (21.53)
102 (17.67)
Treated by unqualified doctors/ persons 11 (4.62)
3 (0.88)
14 (2.42)
Home treatment 6 (2.52)
17 (5.01)
23 (3.98)
Total 238 (41.25) 339 (58.75) 577
Table – 4.27: Range of amount spent on medical treatment by producers in last 30 days Respondents – No. (%) Total amount spent on
treatment (Rs.) Agriculture Products Non-Agriculture Products All <50 3 (1.74) 0 (0.0) 3 (0.71) 50-100 10 (5.78) 5 (2.04) 15 (3.59) 100-200 36 (20.80) 35 (14.28) 71 (16.98) 200- 500 46 (26.59) 70 (28.57) 116 (27.75) 500- 1000 34 (19.65) 61 (24.89) 95 (22.72) >1000 44 (25.44) 74 (30.20) 118 (28.23) Total 173 (41.38) 245 (58.61) 418 Table – 4.28: Reasons for not taking treatment during illness by producers’ family
Respondents – No. (%) Reasons for not taking treatment Agriculture Products Non-Agriculture Products All
Minor, not considered necessary 45 (35.71) (66.17)
81 (64.28) (77.14)
126 (72.83)
Facility not available near by 13 (48.14) (19.12)
14 (51.85) (13.34)
27 (15.60)
Not able to afford financially 10 (50.0) (14.70)
10 (50.0) (9.52)
20 (11.56)
Total 68 (39.30) 105 (60.69) 173
Table – 4.29: Benefits received from any of the welfare schemes by the producers Observation Agriculture
Products Non-Agriculture Products
All
Total (no. & %) of respondents receiving benefits 81 (65.85) (25.71)
42 (41.19) (11.17)
123 (17.80)
Total (no & %) respondents with nil response 234 (34.14) (74.28)
334 (58.80) (88.82)
568 (82.19)
Total respondents interviewed 315 376 691 Total money received by the respondents (Rs) during last 12 months 7387844 2485350 9873194 Per respondent amount of assistance (Rs) available to respondents during last 12 months
91207 59175 80269
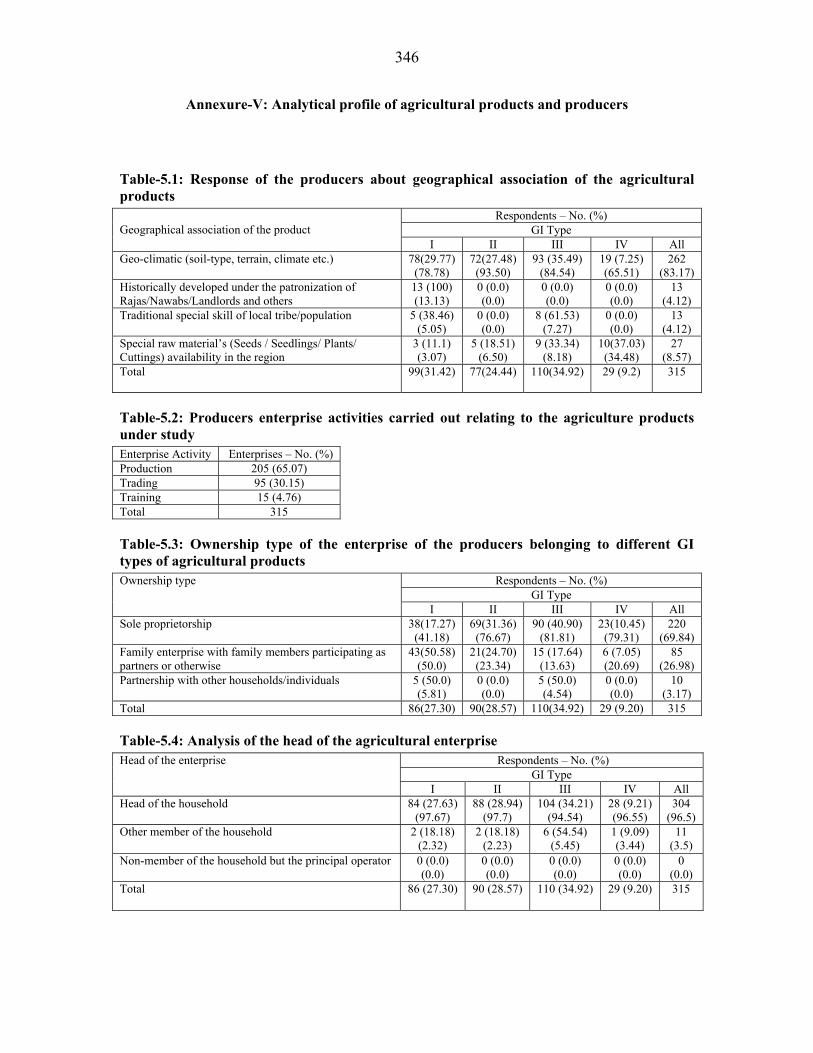
346
Annexure-V: Analytical profile of agricultural products and producers
Table-5.1: Response of the producers about geographical association of the agricultural products
Respondents – No. (%) GI Type Geographical association of the product
I II III IV All Geo-climatic (soil-type, terrain, climate etc.) 78(29.77)
(78.78) 72(27.48) (93.50)
93 (35.49) (84.54)
19 (7.25) (65.51)
262 (83.17)
Historically developed under the patronization of Rajas/Nawabs/Landlords and others
13 (100) (13.13)
0 (0.0) (0.0)
0 (0.0) (0.0)
0 (0.0) (0.0)
13 (4.12)
Traditional special skill of local tribe/population 5 (38.46) (5.05)
0 (0.0) (0.0)
8 (61.53) (7.27)
0 (0.0) (0.0)
13 (4.12)
Special raw material’s (Seeds / Seedlings/ Plants/ Cuttings) availability in the region
3 (11.1) (3.07)
5 (18.51) (6.50)
9 (33.34) (8.18)
10(37.03) (34.48)
27 (8.57)
Total 99(31.42)
77(24.44)
110(34.92)
29 (9.2)
315
Table-5.2: Producers enterprise activities carried out relating to the agriculture products under study Enterprise Activity Enterprises – No. (%) Production 205 (65.07) Trading 95 (30.15) Training 15 (4.76) Total 315
Table-5.3: Ownership type of the enterprise of the producers belonging to different GI types of agricultural products
Respondents – No. (%) GI Type
Ownership type
I II III IV All Sole proprietorship 38(17.27)
(41.18) 69(31.36) (76.67)
90 (40.90) (81.81)
23(10.45) (79.31)
220 (69.84)
Family enterprise with family members participating as partners or otherwise
43(50.58) (50.0)
21(24.70) (23.34)
15 (17.64) (13.63)
6 (7.05) (20.69)
85 (26.98)
Partnership with other households/individuals 5 (50.0) (5.81)
0 (0.0) (0.0)
5 (50.0) (4.54)
0 (0.0) (0.0)
10 (3.17)
Total 86(27.30) 90(28.57) 110(34.92) 29 (9.20) 315
Table-5.4: Analysis of the head of the agricultural enterprise Respondents – No. (%)
GI Type Head of the enterprise
I II III IV All Head of the household 84 (27.63)
(97.67) 88 (28.94)
(97.7) 104 (34.21)
(94.54) 28 (9.21) (96.55)
304 (96.5)
Other member of the household 2 (18.18) (2.32)
2 (18.18) (2.23)
6 (54.54) (5.45)
1 (9.09) (3.44)
11 (3.5)
Non-member of the household but the principal operator 0 (0.0) (0.0)
0 (0.0) (0.0)
0 (0.0) (0.0)
0 (0.0) (0.0)
0 (0.0)
Total 86 (27.30)
90 (28.57)
110 (34.92)
29 (9.20)
315
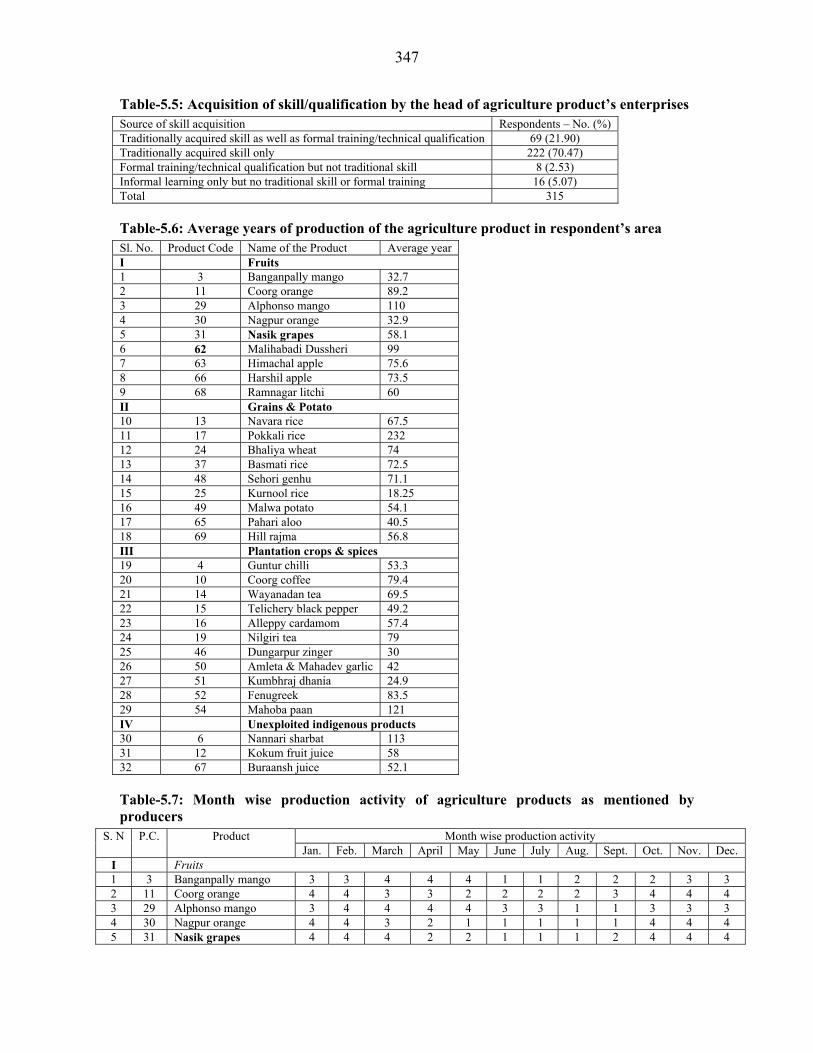
347
Table-5.5: Acquisition of skill/qualification by the head of agriculture product’s enterprises Source of skill acquisition Respondents – No. (%) Traditionally acquired skill as well as formal training/technical qualification 69 (21.90) Traditionally acquired skill only 222 (70.47) Formal training/technical qualification but not traditional skill 8 (2.53) Informal learning only but no traditional skill or formal training 16 (5.07) Total 315
Table-5.6: Average years of production of the agriculture product in respondent’s area Sl. No. Product Code Name of the Product Average year I Fruits 1 3 Banganpally mango 32.7 2 11 Coorg orange 89.2 3 29 Alphonso mango 110 4 30 Nagpur orange 32.9 5 31 Nasik grapes 58.1 6 62 Malihabadi Dussheri 99 7 63 Himachal apple 75.6 8 66 Harshil apple 73.5 9 68 Ramnagar litchi 60 II Grains & Potato 10 13 Navara rice 67.5 11 17 Pokkali rice 232 12 24 Bhaliya wheat 74 13 37 Basmati rice 72.5 14 48 Sehori genhu 71.1 15 25 Kurnool rice 18.25 16 49 Malwa potato 54.1 17 65 Pahari aloo 40.5 18 69 Hill rajma 56.8 III Plantation crops & spices 19 4 Guntur chilli 53.3 20 10 Coorg coffee 79.4 21 14 Wayanadan tea 69.5 22 15 Telichery black pepper 49.2 23 16 Alleppy cardamom 57.4 24 19 Nilgiri tea 79 25 46 Dungarpur zinger 30 26 50 Amleta & Mahadev garlic 42 27 51 Kumbhraj dhania 24.9 28 52 Fenugreek 83.5 29 54 Mahoba paan 121 IV Unexploited indigenous products 30 6 Nannari sharbat 113 31 12 Kokum fruit juice 58 32 67 Buraansh juice 52.1
Table-5.7: Month wise production activity of agriculture products as mentioned by producers
Month wise production activity S. N P.C. Product Jan. Feb. March April May June July Aug. Sept. Oct. Nov. Dec.
I Fruits 1 3 Banganpally mango 3 3 4 4 4 1 1 2 2 2 3 3 2 11 Coorg orange 4 4 3 3 2 2 2 2 3 4 4 4 3 29 Alphonso mango 3 4 4 4 4 3 3 1 1 3 3 3 4 30 Nagpur orange 4 4 3 2 1 1 1 1 1 4 4 4 5 31 Nasik grapes 4 4 4 2 2 1 1 1 2 4 4 4

348
Month wise production activity S. N P.C. Product Jan. Feb. March April May June July Aug. Sept. Oct. Nov. Dec.
6 62 Malihabadi Dussheri 2 2 4 4 4 4 4 3 2 2 1 1 7 63 Himachal apple 2 2 3 3 2 2 4 4 4 3 2 1 8 66 Harshil apple 2 2 3 3 4 4 4 4 3 3 2 2 9 68 Ramnagar litchi 2 3 3 4 3 1 1 1 1 1 2 2 II Grains & Potato 10 13 Navara rice 2 2 1 1 3 4 2 3 4 2 3 4 11 17 Pokkali rice 1 1 1 2 3 4 4 1 4 4 1 1 12 24 Bhaliya wheat 3 3 3 3 1 1 1 1 1 4 4 3 13 37 Basmati rice 2 2 2 4 3 4 4 3 2 4 4 2 14 48 Sehori genhu 0 0 0 0 0 0 0 0 0 0 0 0 15 25 Kurnool rice 4 2 2 4 1 2 4 4 3 2 2 4 16 49 Malwa potato 0 0 0 0 0 0 0 0 0 0 0 0 17 65 Pahari aloo 4 4 4 3 4 4 4 4 3 3 2 2 18 69 Hill rajma 1 2 3 4 4 4 4 3 2 1 2 2 III Plantation crops & spices 19 4 Guntur chilli 4 4 4 4 4 1 2 3 3 4 4 3 20 10 Coorg coffee 4 3 3 2 2 2 3 3 2 2 3 4 21 14 Wayanadan tea 3 3 2 2 4 4 3 3 3 3 3 3 22 15 Telichery black pepper 4 4 3 1 4 4 1 1 1 4 2 4 23 16 Alleppy cardamom 3 2 2 2 2 2 3 3 4 4 3 3 24 19 Nilgiri tea 3 2 2 2 1 4 4 3 3 4 4 3 25 46 Dungarpur zinger 3 2 3 3 4 4 2 3 2 3 4 4 26 50 Amleta & Mahadev
garlic 3 4 4 4 2 2 1 1 1 1 3 3
27 51 Kumbhraj dhania 3 3 4 4 4 3 2 2 1 1 1 3 28 52 Fenugreek 2 3 4 4 4 3 1 1 1 1 1 2 29 54 Mahoba paan 4 4 4 4 3 3 1 1 2 2 3 3 IV Unexploited indigenous products 30 6 Nannari sharbat 1 2 4 4 4 3 2 2 2 1 1 1 31 12 Kokum fruit juice 3 3 4 4 3 2 2 1 1 1 1 1 32 67 Buraansh juice 1 2 3 4 4 4 4 3 2 1 2 2
Note: [codes: no activity-1, lean activity-2, normal activity-3, peak activity-4] obtained on the basis of highest frequency of respondents
Table-5.8: Monthly average number of persons engaged in the agricultural enterprise Family Workers Paid workers Family + Paid workers
Male Female Total Male Female Total Male Female Total
GI Type
Skill
ed
Oth
ers
Skill
ed
Oth
ers
Skill
ed
Oth
ers
Skill
ed
Oth
ers
Skill
ed
Oth
ers
Skill
ed
Oth
ers
Skill
ed
Oth
ers
Skill
ed
Oth
ers
Skill
ed
Oth
ers
I 3.81 3.74 2.59 1.53 6.40 5.27 17 16.65 38.5 6.86 55.51 23.51 20.0 20.39 41.09 8.39 61.89 28.78
II 1.84 3.34 1.13 1.23 2.97 4.57 15 32.61 29.13 1.79 44.13 34.40 16.84 35.95 30.26 3.02 47.10 38.97
III 2.86 1.43 2.29 1.63 5.15 3.06 16.64 14.75 61.49 17.29 78.13 32.04 19.50 16.18 63.78 18.92 83.28 35.10
IV 1.62 1.33 1.32 2 2.95 2.65 2.4 2 1.44 1.25 3.84 3.25 4.04 3.33 2.78 3.25 6.82 6.58
Total
Products
2.53 2.46 1.83 1.59 4.36 3.88 12.76 16.50 32.64 6.75 45.4 23.30 15.09 18.96 34.47 7.58 49.77 27.35

349
Table-5.9: Percent of irrigated and unirrigated land possessed by producers belonging to different GI types of the agriculture products
Total and (%) land possessed (acres) GI Type Irrigated Un-irrigated Total Average Land possessed (acres)
I 927.51 (58.77) 650.5 (41.23) 1578.01 18.34
II 753.25 (72.17) 290.4 (27.82) 1043.65 11.58
III 1251.02 (83.28) 251.16 (16.71) 1502.18 13.65
IV 109.25 (42.01) 150.8 (57.98) 260.05 8.96
Total Products 3041.03 (69.36) 1342.86 (30.63) 4383.89 13.91
Table-5.10: Average cultivable land possessed and percent of land put under cultivation of the individual product under study
Average area in acres S.N. P.C. Product Land Characteristics Irrigated Unirrigated Total
I Fruits Total cultivable land possessed (Owned/Patta/Lease)
25.12 5.4 30.52 1 3 Banganpally mango
% Land put under cultivation of the product under study
47.25 0.0 38.89
Total cultivable land possessed (Owned/Patta/Lease)
6.4 4.4 10.8 2
11 Coorg orange
% Land put under cultivation of the product under study
40.63 31.81 37.03
Total cultivable land possessed (Owned/Patta/Lease)
20.85 5.6 26.45 3 29 Alphonso mango
% Land put under cultivation of the product under study
69.54 80.36 71.83
Total cultivable land possessed (Owned/Patta/Lease)
21.55 12.3 33.85 4 30 Nagpur orange
% Land put under cultivation of the product under study
92.57 88.62 91.14
Total cultivable land possessed (Owned/Patta/Lease)
10.32 3.5 13.82 5 31 Nasik grapes
% Land put under cultivation of the product under study
93.02 5.71 70.91
Total cultivable land possessed (Owned/Patta/Lease)
2.80 2.00 4.8 6 62 Malihabadi Dussheri
% Land put under cultivation of the product under study
63.57 0.0 37.08
Total cultivable land possessed (Owned/Patta/Lease)
6.0 5.0 11 7 63 Himachal apple
% Land put under cultivation of the product under study
56.67 100 76.36
Total cultivable land possessed (Owned/Patta/Lease)
4.03 2.86 6.89 8 66 Harshil apple
% Land put under cultivation of the product under study
66.99 91.96 77.36
Total cultivable land possessed (Owned/Patta/Lease)
3.67 0.0 3.67 9 68 Ramnagar litchi
% Land put under cultivation of the product under study
71.93 0.0 71.93
II Grains & Potato Total cultivable land possessed (Owned/Patta/Lease)
0.54 0.0 0.54 10 13 Navara rice
% Land put under cultivation of the product under study
42.59 0.0 42.59
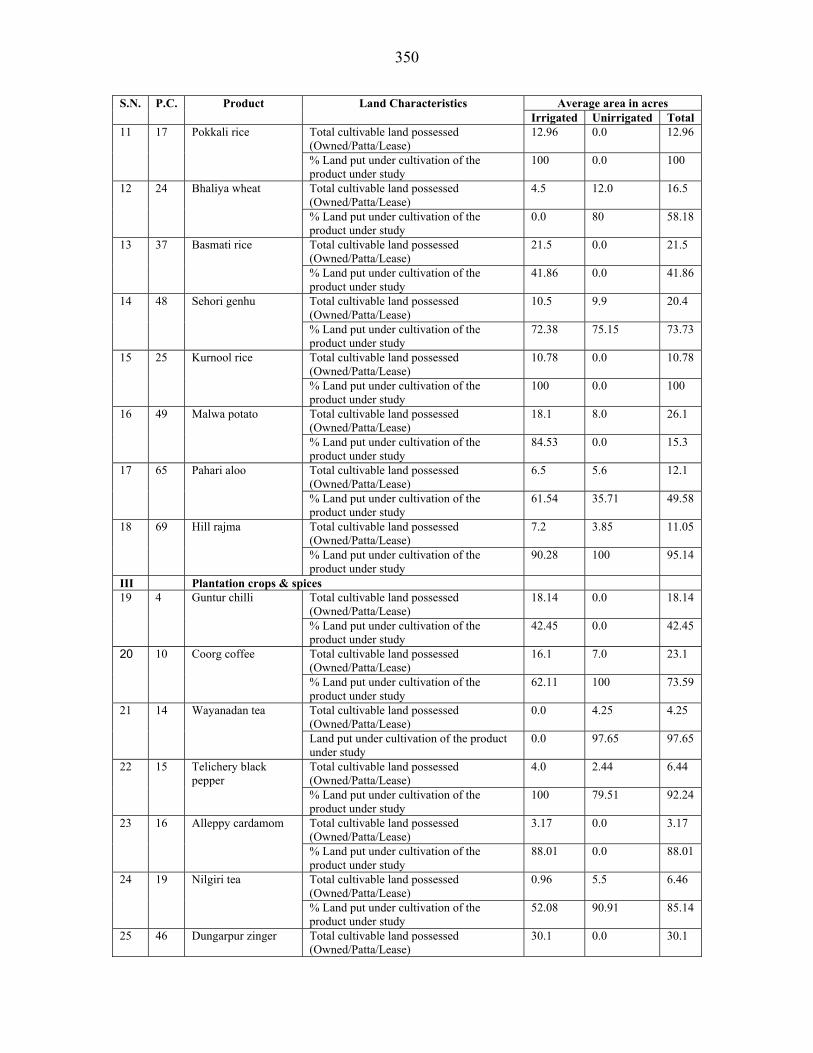
350
Average area in acres S.N. P.C. Product Land Characteristics Irrigated Unirrigated Total
Total cultivable land possessed (Owned/Patta/Lease)
12.96 0.0 12.96 11 17 Pokkali rice
% Land put under cultivation of the product under study
100 0.0 100
Total cultivable land possessed (Owned/Patta/Lease)
4.5 12.0 16.5 12 24 Bhaliya wheat
% Land put under cultivation of the product under study
0.0 80 58.18
Total cultivable land possessed (Owned/Patta/Lease)
21.5 0.0 21.5 13 37 Basmati rice
% Land put under cultivation of the product under study
41.86 0.0 41.86
Total cultivable land possessed (Owned/Patta/Lease)
10.5 9.9 20.4 14 48 Sehori genhu
% Land put under cultivation of the product under study
72.38 75.15 73.73
Total cultivable land possessed (Owned/Patta/Lease)
10.78 0.0 10.78 15 25 Kurnool rice
% Land put under cultivation of the product under study
100 0.0 100
Total cultivable land possessed (Owned/Patta/Lease)
18.1 8.0 26.1 16 49 Malwa potato
% Land put under cultivation of the product under study
84.53 0.0 15.3
Total cultivable land possessed (Owned/Patta/Lease)
6.5 5.6 12.1 17 65 Pahari aloo
% Land put under cultivation of the product under study
61.54 35.71 49.58
Total cultivable land possessed (Owned/Patta/Lease)
7.2 3.85 11.05 18 69 Hill rajma
% Land put under cultivation of the product under study
90.28 100 95.14
III Plantation crops & spices Total cultivable land possessed (Owned/Patta/Lease)
18.14 0.0 18.14 19 4 Guntur chilli
% Land put under cultivation of the product under study
42.45 0.0 42.45
Total cultivable land possessed (Owned/Patta/Lease)
16.1 7.0 23.1 20 10 Coorg coffee
% Land put under cultivation of the product under study
62.11 100 73.59
Total cultivable land possessed (Owned/Patta/Lease)
0.0 4.25 4.25 21 14 Wayanadan tea
Land put under cultivation of the product under study
0.0 97.65 97.65
Total cultivable land possessed (Owned/Patta/Lease)
4.0 2.44 6.44 22 15 Telichery black pepper % Land put under cultivation of the
product under study 100 79.51 92.24
Total cultivable land possessed (Owned/Patta/Lease)
3.17 0.0 3.17 23 16 Alleppy cardamom
% Land put under cultivation of the product under study
88.01 0.0 88.01
Total cultivable land possessed (Owned/Patta/Lease)
0.96 5.5 6.46 24 19 Nilgiri tea
% Land put under cultivation of the product under study
52.08 90.91 85.14
25 46 Dungarpur zinger Total cultivable land possessed (Owned/Patta/Lease)
30.1 0.0 30.1

351
Average area in acres S.N. P.C. Product Land Characteristics Irrigated Unirrigated Total
% Land put under cultivation of the product under study
28.90 0.0 28.90
Total cultivable land possessed (Owned/Patta/Lease)
12.57 10.8 23.37 26 50 Amleta & Mahadev garlic % Land put under cultivation of the
product under study 13.37 0.0 7.19
Total cultivable land possessed (Owned/Patta/Lease)
16.8 8.5 25.3 27 51 Kumbhraj dhania
% Land put under cultivation of the product under study
85.12 58.82 76.28
Total cultivable land possessed (Owned/Patta/Lease)
15.4 8.09 23.49 28 52 Fenugreek
% Land put under cultivation of the product under study
19.48 0.0 12.77
Total cultivable land possessed (Owned/Patta/Lease)
1.74 3.8 5.54 29 54 Mahoba paan
% Land put under cultivation of the product under study
93.68 0.0 29.42
IV Unexploited indigenous products Total cultivable land possessed (Owned/Patta/Lease)
1.62 2.9 4.52 30 6 Nannari sharbat
% Land put under cultivation of the product under study
0.0 0.0 0
Total cultivable land possessed (Owned/Patta/Lease)
17.5 16.1 33.6 31
12 Kokum fruit juice
% Land put under cultivation of the product under study
11.43 20.37 15.71
Total cultivable land possessed (Owned/Patta/Lease)
0.0 0.0 0 32 67 Buraansh juice
% Land put under cultivation of the product under study
0.0 0.0 0
Table-5.11: Analysis of average area per producer, production, produce value per acre and total input cost per quintal of agriculture products over past three years
Average 2004 2005 2006
S.N P.C. Product
Are
a/ P
rodu
cer
(Acr
es)
Prod
uctio
n (Q
/Acr
e)
Prod
uce
Val
ue/A
cre
Tota
l inp
ut
cost
/Qui
ntal
Are
a/ P
rodu
cer
(Acr
es)
Prod
uctio
n (Q
/Acr
e)
Prod
uce
Val
ue/A
cre
Tota
l inp
ut
cost
/Qui
ntal
Are
a/ P
rodu
cer
(Acr
es)
Prod
uctio
n (Q
/Acr
e)
Prod
uce
Val
ue/A
cre
Tota
l inp
ut
cost
/Qui
ntal
I Fruits
1 3 Banganapalli
Mango 8.67 18.19 9896 331 8.67 7.25 4510 614 8.87 19.05 10113 350
2 11 Coorg
Orange 2.70 8.52 16667 1022 2.70 8.53 15037 1121 2.70 9.07 19074 1163
3 29 Alphonso
Mango 19.30 28.81 58197 916 19.30 31.59 63612 827 19.30 33.82 73377 880
4 30 Nagpur
Orange 16.00 32.81 39131 517 15.80 24.46 45253 706 16.10 25.90 45373 598
5 31 Nasik
Grapes 14.93 50.70 82246 435 15.00 46.52 76913 591 14.56 50.12 85288 626
6
62 Malihabadi Dussaheri Mango 2.00 73.00 79175 1142 2.00 86.41 90325 1080 2.00 94.50 135525 1074

352
Average 2004 2005 2006
S.N P.C. Product
Are
a/ P
rodu
cer
(Acr
es)
Prod
uctio
n (Q
/Acr
e)
Prod
uce
Val
ue/A
cre
Tota
l inp
ut
cost
/Qui
ntal
Are
a/ P
rodu
cer
(Acr
es)
Prod
uctio
n (Q
/Acr
e)
Prod
uce
Val
ue/A
cre
Tota
l inp
ut
cost
/Qui
ntal
Are
a/ P
rodu
cer
(Acr
es)
Prod
uctio
n (Q
/Acr
e)
Prod
uce
Val
ue/A
cre
Tota
l inp
ut
cost
/Qui
ntal
7 63 Himachal
Apple 3.80 16.71 26447 1583 3.60 9.72 16111 1657 3.80 35.00 31711 906
8 66 Harshil
Apple 5.65 5.96 5080 2500 5.65 5.57 5080 3750 5.65 6.51 6619 4830
9 68 Ramnagar
Litchi 1.97 38.52 53892 5120 1.92 42.16 61393 5150 1.92 47.13 73718 5040 II Grains & Potato 10 13 Navara Rice 0.23 7.74 17961 667 0.23 8.60 21478 610 0.23 8.70 24497 608 11 17 Pokkali Rice 12.96 8.38 6008 489 12.96 8.46 6274 484 12.96 8.46 6155 484
12 24 Bhaliya
Wheat 8.85 6.04 8356 101 9.75 6.08 8969 132 10.60 6.00 10558 168
13 37 Kurnool
Rice 10.78 26.84 16937 354 10.78 26.43 19355 370 10.78 21.87 17467 454
14 48 Basmati
Rice 14.10 14.44 13519 1300 11.80 14.16 16088 1700 11.40 21.79 13614 1200
15 25 Sehori
Wheat 10.80 7.94 11204 252 10.70 7.63 11584 288 13.40 7.99 10381 301
16 49 Malwa
Potato 15.30 99.22 29883 3300 15.25 92.77 32857 3700 15.30 103.35 39526 3500 17 65 Pahari Aloo 2.55 19.73 9745 4940 2.50 18.20 9840 5410 2.85 20.88 12807 6130 18 69 Hill Rajma 5.79 2.23 3031 898 5.92 2.34 3518 940 6.12 2.60 4534 924 III Plantation crops & spices 19 4 Guntur chilli 7.70 25.68 34941 623 7.70 26.10 37417 766 7.70 25.37 35870 709 20 10 Coorg coffee 9.30 5.94 21511 978 9.30 5.62 22694 1066 9.30 6.09 23860 1098
21 14 Wayanadan
tea 4.05 12.78 4376 242 4.15 12.74 5804 237 4.15 30.04 24135 106
22 15 Telichery
black pepper 2.00 0.80 4742 2000 2.00 0.48 2877 3077 2.00 0.41 4433 6943
23 16 Alleppy
cardamom 3.19 1.6 3907 16990 2.62 2.39 74597 21797 2.80 3.28 98264 15755 24 19 Nilgiri tea 4.60 92.20 174348 7280 4.80 64.99 162521 1104 4.95 92.05 159556 8160
25
46 Dungarpur zinger 4.00 1.03 4063 3441 3.70 1.08 3730 3395 3.45 1.00 2877 2964
26
50 Amleta & Mahadev garlic 1.93 35.39 101684 847 1.68 34.52 129135 1117 1.88 33.99 129548 1274
27 51 Kumbhraj
dhania 13.30 5.09 7192 792 13.30 5.18 6208 794 13.80 2.71 11688 1728 28 52 Fenugreek 1.25 11.26 21867 385 1.58 7.11 14944 304 2.90 9.90 20772 474
29 54 Mahoba
paan 1.41 12.06 40355 1659 1.47 10.85 41769 2028 1.32 11.02 42462 2177 IV Unexploited indigenous products 30 6 Nannari
sharbat 0.00 - - 2621 0.00 - - 2892 0.00 - - 3096 31 12 Kokum fruit
juice - - - 2283 - - - 2497 - - - 2462 32 67 Buraansh
juice - - - 1455 - - - 2242 - - - 2920 Note: The information in table is purely collected by data enumerators from the producers. It need to be verified from experts of the subject and also to be analyzed further using scientific methodology as explained for grapes and Alphonso mango

353
Table-5.12: Different sources of loan obtained by agriculture enterprises Source of loan Enterprises – No. (%)
Government 3 (2.65) Co-operative Society 31 (27.4) Bank 73 (64.60) Traders/Exporters/Intermediaries 1 (0.88) Moneylenders 5 (4.42) Others 1 (0.88) Table-5.13: Analysis of purpose of loan taken by agricultural producers
Purpose of loan Enterprises – No. (%)
Purchase of land 7 (6.25) Construction/maintenance of building 5 (4.46) Purchase of machinery/equipments 11 (8.82) Purchase of other assets 16 (14.28) Purchase of seeds/raw materials and other materials (fertilizers, packing materials) 69 (61.6) Legal expenses 1 (0.98) Others 3 (2.67) Table-5.14: Average interest percentage paid to different sources of loan obtained by agricultural producers
Source of loan Average interest paid in %
Government 9.5 Co-operative Society 10.23 Bank 8.57 Traders/Exporters/Intermediaries 14.5 Moneylenders 17.0 Table-5.15: Average amount outstanding by different GI type of agricultural enterprises GI Type Total amount outstanding (Rs) Average amount outstanding
I 2080000 24,186
II 747000 8,300
III 1845000 16,772
IV Nil Nil
Table-5.16: Range of loan amount taken by agricultural enterprises Loan amount % of enterprises
< 50,000 18 (52.94) 50000- 1 lakh 8 (23.52)
1-2 lakh 2 (5.88) > 2 lakh 6 (17.64)
Table-5.17: Types of packaging used by agricultural enterprises Nature of Packaging Enterprises – No. (%)
No packing 25 (6.09) Basket/bamboo packing 22 (5.36) Gunny /Jute bags 166 (40.48) Glass bottles & containers 19 (4.63) Plastic or polythene bags/ plastic cans 60 (14.63) Corrugated card board boxes/paper boxes/cartons 45 (10.98) Wooden boxes 73 (17.80)

354
Table-5.18: Problems faced in packing by agricultural enterprises Problems faced in packing
Enterprises – No. (%)
No problems 134 (48.37) Scarcity of skilled labour 17 (6.14) High cost of packing material 10 (3.61) Storage of packing material 28 (10.11) Deterioration of packing material 86 (31.05) Limited knowledge of packing technology 2 (0.72)
Table – 5.19: Methods of inspection and quality control used at various stages of production in agricultural enterprises Inspection and quality control
Enterprises – No. (%)
No inspection & quality control 57 (18.15) Production level on field 150 (47.77) Harvesting level on field 30 (9.56) Processing & grading level 66 (21.01) Inspection by an authority 11 (3.50)
Table-5.20: Type of grading of agricultural finished products Type of grading Enterprises – No. (%)
No grading 92 (28.30) Grading on physical traits 175 (53.84) Grading on qualitative traits 58 (17.84)
Table- 5.21: Whether supply of seeds/raw materials during the last 12 months in agricultural products is adequate and regular: Opinion of producers?
Respondents – No. (%) S. N. P.C. Product
Yes - 1 No - 2 Can’t Say - 3
I Fruits 59 (72.8) 16 (19.75) 6 (7.40) 1 3 Banganpally mango 10 (100.0) 0 (0.0) 0 (0.0) 2 11 Coorg orange 8 (80.0) 0 (0.0) 2 (20.0) 3 29 Alphonso mango 10 (100.0) 0 (0.0) 0 (0.0) 4 30 Nagpur orange 5 (50.0) 5 (50.0) 0 (0.0) 5 31 Nasik grapes 3 (30.0) 0 (0.0) 3 (50.0) 6 62 Malihabadi Dussheri 3 (30.0) 7 (70.0) 0 (0.0) 7 63 Himachal apple 5 (50.0) 4 (40.0) 1 (10.0) 8 66 Harshil apple 10 (100.0) 0 (0.0) 0 (0.0) 9 68 Ramnagar litchi 5 (100) 0 (0.0) 0 (0.0) II Grains & Potato 78 (100) 0 (0.0) 0 (0.0) 10 13 Navara rice 4 (100) 0 (0.0) 0 (0.0) 11 17 Pokkali rice 10 (100.0) 0 (0.0) 0 (0.0) 12 24 Bhaliya wheat 4 (100.0) 0 (0.0) 0 (0.0) 13 37 Basmati rice 10 (100.0) 0 (0.0) 0 (0.0) 14 48 Sehori genhu 10 (100.0) 0 (0.0) 0 (0.0) 15 25 Kurnool rice 10 (100.0) 0 (0.0) 0 (0.0) 16 49 Malwa potato 10 (100.0) 0 (0.0) 0 (0.0) 17 65 Pahari aloo 10 (100.0) 0 (0.0) 0 (0.0) 18 69 Hill rajma 10 (100.0) 0 (0.0) 0 (0.0) III Plantation crops & spices 73 (76.04) 21(21.87) 2 (2.08) 19 4 Guntur chilli 9 (90.0) 1 (10.0) 0 (0.0) 20 10 Coorg coffee 5 (62.5) 3 (37.5) 0 (0.0) 21 14 Wayanadan tea 1 (50.0) 1 (50.0) 0 (0.0)

355
Respondents – No. (%) S. N. P.C. Product
Yes - 1 No - 2 Can’t Say - 3
22 15 Telichery black pepper 0 (0.0) 8 (88.9) 1 (11.1) 23 16 Alleppy cardamom 8 (88.9) 1 (11.1) 0 (0.0) 24 19 Nilgiri tea 7 (70.0) 3 (30.0) 0 (0.0) 25 46 Dungarpur zinger 9 (90.0) 0 (0.0) 1 (10.0) 26 50 Amleta & Mahadev garlic 9 (90.0) 1 (10.0) 0 (0.0) 27 51 Kumbhraj dhania 8 (80.0) 2 (20.0) 0 (0.0) 28 52 Fenugreek 9 (90.0) 1(10.0) 0 (0.0) 29 54 Mahoba paan 8 (100.0) 0 (0.0) 0 (0.0) IV Unexploited indigenous products 20 (80.0) 2 (8.0) 3 (12.0) 30 6 Nannari sharbat 7 (70.0) 2 (20.0) 1 (10.0) 31 12 Kokum fruit juice 7 (77.8) 0 (0.0) 2 (22.8) 32 67 Buraansh juice 6 (100.0) 0 (0.0) 0 (0.0) Total Agricultural Products 230 (82.1) 39 (13.9) 11 (3.9)
Table-5.22: Whether production can be increased if nationalized banks and other institutions provide adequate finance: Respondents’ opinion?
Respondents – No. (%) GI Type
Yes No Total
I 71 (83.5) (29.0)
14 (16.5) (23.3)
85 (27.9)
II 60 (71.4) (24.5)
24 (28.6) (40.0)
84 (27.5)
III 97 (88.2) (39.6)
13 (11.8) (21.7)
110 (36.1)
IV 17 (65.4) (6.9)
9 (34.6) (15.0)
26 (8.5)
Total Products 245 (80.3)
60 (19.7)
305
Table-5.23: Did agricultural producers approach to any financial agency for financial support to increase production?
Respondents – No. (%) GI Type
Yes No Total
I 44(62.0) (38.6)
27 (38.0) (20.6)
71 (29.0)
II 25 (41.7) (21.9)
35 (58.3) (26.7)
60 (24.5)
III 45 (46.4) (39.5)
52 (53.6) (39.7)
97 (39.6)
IV 0 (0.0) (0.0)
17 (100) (13.0)
17 (6.9)
Total Products 114 (46.5) 131 (53.5) 245
Table-5.24: Nature of response by financial agency to the agricultural producers’ approach for help
Respondents – No. (%)
Good Not so good and with many formalities No response
Agricultural Products
46 (40.35) 57 (50.00) 11 (9.65)
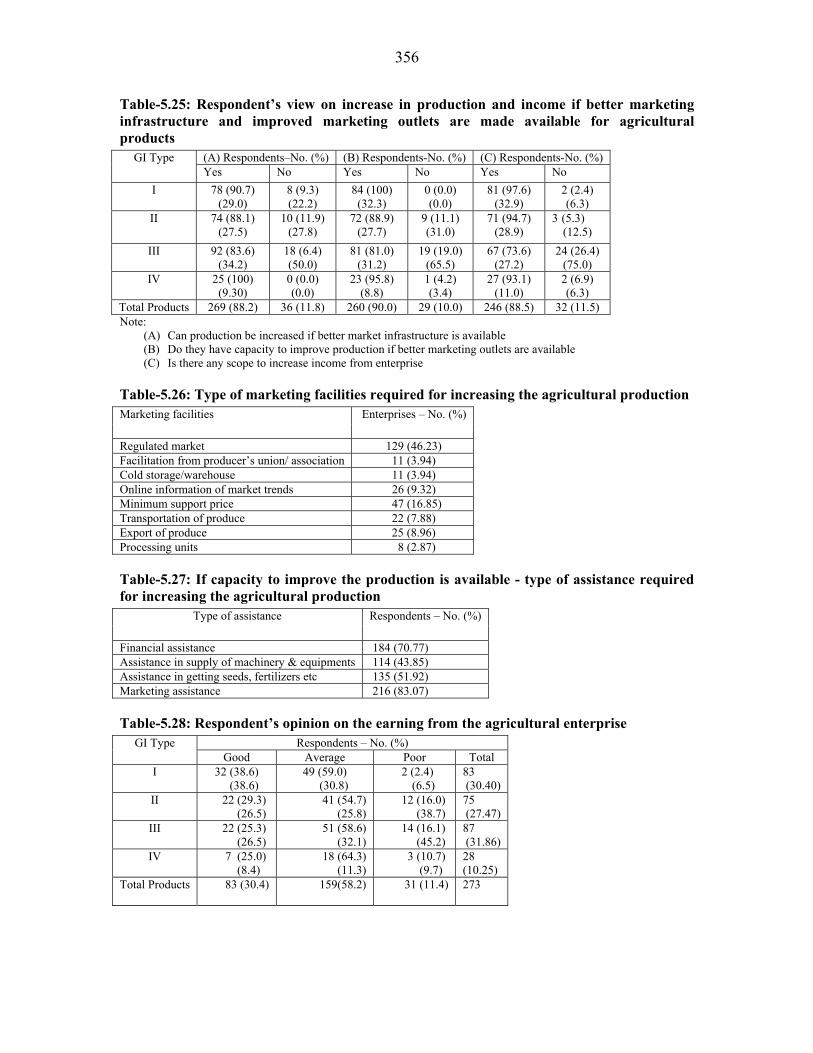
356
Table-5.25: Respondent’s view on increase in production and income if better marketing infrastructure and improved marketing outlets are made available for agricultural products
(A) Respondents–No. (%) (B) Respondents-No. (%) (C) Respondents-No. (%) GI Type Yes No Yes No Yes No
I 78 (90.7) (29.0)
8 (9.3) (22.2)
84 (100) (32.3)
0 (0.0) (0.0)
81 (97.6) (32.9)
2 (2.4) (6.3)
II 74 (88.1) (27.5)
10 (11.9) (27.8)
72 (88.9) (27.7)
9 (11.1) (31.0)
71 (94.7) (28.9)
3 (5.3) (12.5)
III 92 (83.6) (34.2)
18 (6.4) (50.0)
81 (81.0) (31.2)
19 (19.0) (65.5)
67 (73.6) (27.2)
24 (26.4) (75.0)
IV 25 (100) (9.30)
0 (0.0) (0.0)
23 (95.8) (8.8)
1 (4.2) (3.4)
27 (93.1) (11.0)
2 (6.9) (6.3)
Total Products 269 (88.2) 36 (11.8) 260 (90.0) 29 (10.0) 246 (88.5) 32 (11.5) Note:
(A) Can production be increased if better market infrastructure is available (B) Do they have capacity to improve production if better marketing outlets are available (C) Is there any scope to increase income from enterprise
Table-5.26: Type of marketing facilities required for increasing the agricultural production Marketing facilities
Enterprises – No. (%)
Regulated market 129 (46.23) Facilitation from producer’s union/ association 11 (3.94) Cold storage/warehouse 11 (3.94) Online information of market trends 26 (9.32) Minimum support price 47 (16.85) Transportation of produce 22 (7.88) Export of produce 25 (8.96) Processing units 8 (2.87)
Table-5.27: If capacity to improve the production is available - type of assistance required for increasing the agricultural production
Type of assistance Respondents – No. (%)
Financial assistance 184 (70.77) Assistance in supply of machinery & equipments 114 (43.85) Assistance in getting seeds, fertilizers etc 135 (51.92) Marketing assistance 216 (83.07)
Table-5.28: Respondent’s opinion on the earning from the agricultural enterprise Respondents – No. (%) GI Type
Good Average Poor Total I 32 (38.6)
(38.6) 49 (59.0) (30.8)
2 (2.4) (6.5)
83 (30.40)
II 22 (29.3) (26.5)
41 (54.7) (25.8)
12 (16.0) (38.7)
75 (27.47)
III 22 (25.3) (26.5)
51 (58.6) (32.1)
14 (16.1) (45.2)
87 (31.86)
IV 7 (25.0) (8.4)
18 (64.3) (11.3)
3 (10.7) (9.7)
28 (10.25)
Total Products 83 (30.4)
159(58.2)
31 (11.4)
273
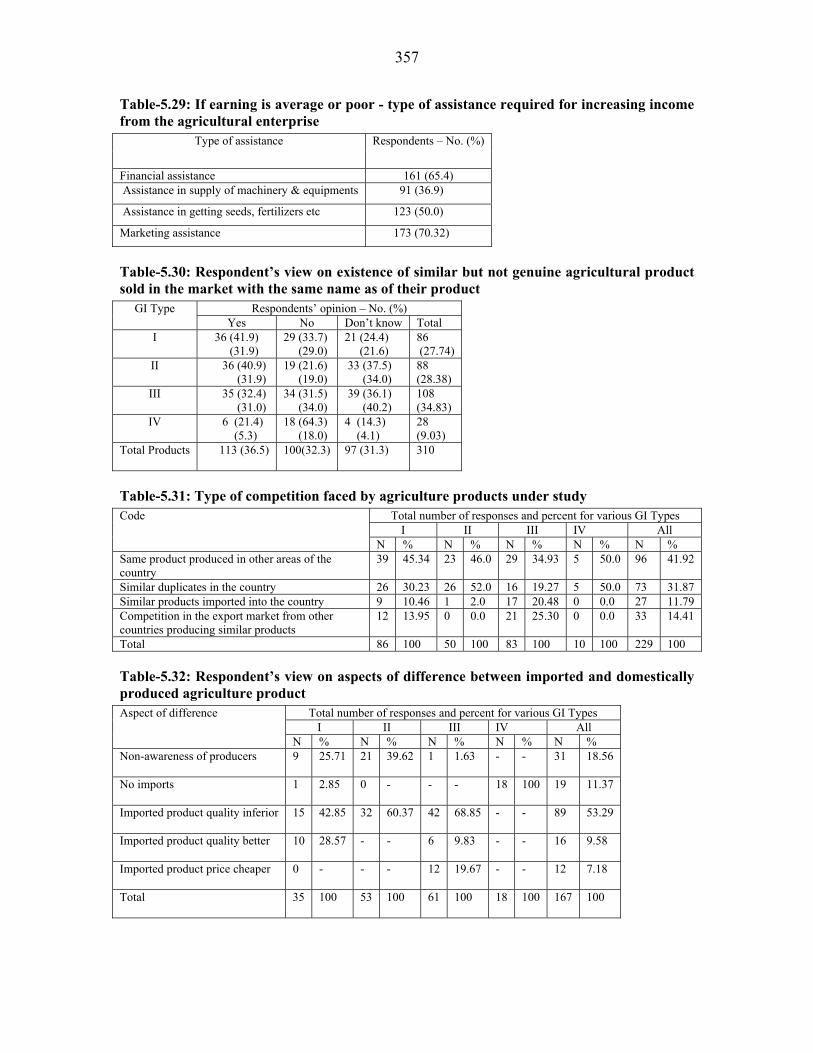
357
Table-5.29: If earning is average or poor - type of assistance required for increasing income from the agricultural enterprise
Type of assistance Respondents – No. (%)
Financial assistance 161 (65.4) Assistance in supply of machinery & equipments 91 (36.9)
Assistance in getting seeds, fertilizers etc 123 (50.0)
Marketing assistance 173 (70.32)
Table-5.30: Respondent’s view on existence of similar but not genuine agricultural product sold in the market with the same name as of their product
Respondents’ opinion – No. (%) GI Type Yes No Don’t know Total
I 36 (41.9) (31.9)
29 (33.7) (29.0)
21 (24.4) (21.6)
86 (27.74)
II 36 (40.9) (31.9)
19 (21.6) (19.0)
33 (37.5) (34.0)
88 (28.38)
III 35 (32.4) (31.0)
34 (31.5) (34.0)
39 (36.1) (40.2)
108 (34.83)
IV 6 (21.4) (5.3)
18 (64.3) (18.0)
4 (14.3) (4.1)
28 (9.03)
Total Products 113 (36.5)
100(32.3) 97 (31.3)
310
Table-5.31: Type of competition faced by agriculture products under study Total number of responses and percent for various GI Types
I II III IV All Code
N % N % N % N % N % Same product produced in other areas of the country
39 45.34 23 46.0 29 34.93 5 50.0 96 41.92
Similar duplicates in the country 26 30.23 26 52.0 16 19.27 5 50.0 73 31.87 Similar products imported into the country 9 10.46 1 2.0 17 20.48 0 0.0 27 11.79 Competition in the export market from other countries producing similar products
12 13.95 0 0.0 21 25.30 0 0.0 33 14.41
Total 86 100 50 100 83 100 10 100 229 100
Table-5.32: Respondent’s view on aspects of difference between imported and domestically produced agriculture product
Total number of responses and percent for various GI Types I II III IV All
Aspect of difference
N % N % N % N % N % Non-awareness of producers 9 25.71 21 39.62 1 1.63 - - 31 18.56
No imports 1 2.85 0 - - - 18 100 19 11.37
Imported product quality inferior 15 42.85 32 60.37 42 68.85 - - 89 53.29
Imported product quality better 10 28.57 - - 6 9.83 - - 16 9.58
Imported product price cheaper 0 - - - 12 19.67 - - 12 7.18
Total 35 100 53 100 61 100 18 100 167 100
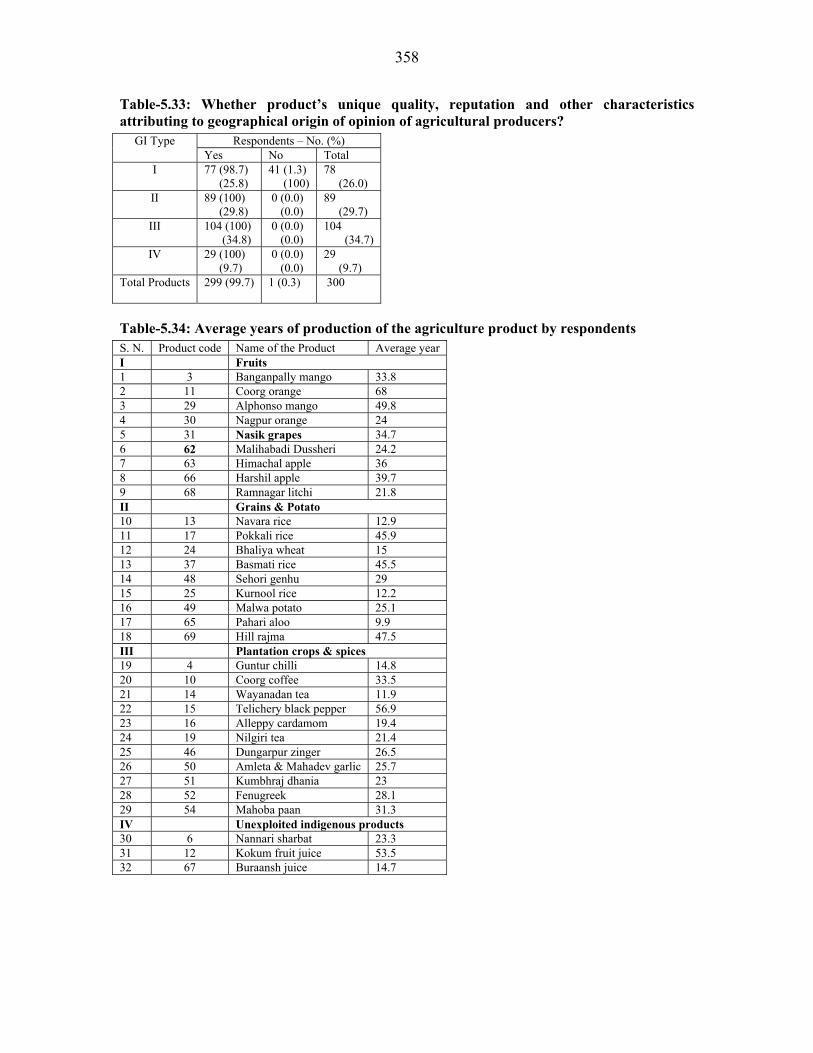
358
Table-5.33: Whether product’s unique quality, reputation and other characteristics attributing to geographical origin of opinion of agricultural producers?
Respondents – No. (%) GI Type Yes No Total
I 77 (98.7) (25.8)
41 (1.3) (100)
78 (26.0)
II 89 (100) (29.8)
0 (0.0) (0.0)
89 (29.7)
III 104 (100) (34.8)
0 (0.0) (0.0)
104 (34.7)
IV 29 (100) (9.7)
0 (0.0) (0.0)
29 (9.7)
Total Products 299 (99.7)
1 (0.3)
300
Table-5.34: Average years of production of the agriculture product by respondents S. N. Product code Name of the Product Average year I Fruits 1 3 Banganpally mango 33.8 2 11 Coorg orange 68 3 29 Alphonso mango 49.8 4 30 Nagpur orange 24 5 31 Nasik grapes 34.7 6 62 Malihabadi Dussheri 24.2 7 63 Himachal apple 36 8 66 Harshil apple 39.7 9 68 Ramnagar litchi 21.8 II Grains & Potato 10 13 Navara rice 12.9 11 17 Pokkali rice 45.9 12 24 Bhaliya wheat 15 13 37 Basmati rice 45.5 14 48 Sehori genhu 29 15 25 Kurnool rice 12.2 16 49 Malwa potato 25.1 17 65 Pahari aloo 9.9 18 69 Hill rajma 47.5 III Plantation crops & spices 19 4 Guntur chilli 14.8 20 10 Coorg coffee 33.5 21 14 Wayanadan tea 11.9 22 15 Telichery black pepper 56.9 23 16 Alleppy cardamom 19.4 24 19 Nilgiri tea 21.4 25 46 Dungarpur zinger 26.5 26 50 Amleta & Mahadev garlic 25.7 27 51 Kumbhraj dhania 23 28 52 Fenugreek 28.1 29 54 Mahoba paan 31.3 IV Unexploited indigenous products 30 6 Nannari sharbat 23.3 31 12 Kokum fruit juice 53.5 32 67 Buraansh juice 14.7

359
Table-5.35: Whether product can be protected as community patent known as Geographical Indication: awareness of agricultural producers?
Respondents – No. (%) GI Type Yes No Total
I 19 (23.8) (19.8)
61 (76.3) (28.8)
80 (26.0)
II 17 (19.1) (17.7)
72 (80.9) (34.0)
89 (28.9)
III 45 (40.9) (46.9)
65 (59.1) (30.7)
110 (35.7)
IV 15 (51.7) (15.6)
14 (48.3) (6.6)
29 (9.4)
Total products 96 (31.2)
212 (68.8)
308
Table-5.36: Need, protection and maintenance of product as GI: awareness, knowledge and system of interest of agricultural producers
Respondents Observation Yes-1
N Yes-1
% No-2
N No-2
%
Similar product sold with the same name* 113 36.5 100 32.3 Significant competition to product 162 53.1 143 46.9 Uniqueness due to geographical origin 299 99.7 1 0.3 Knowledge that product can be protected as GI 96 31.2 212 68.8 Knowledge of post registration effects- authority to use product name by registered producers
137 43.5 178 56.5
Knowledge of post registration effects- restriction to produce within registered geographical area
139 44.1 176 55.9
Knowledge of post registration effects- restriction on trader to sell product produced by registered producers
137 43.6 177 56.4
Knowledge of post registration effects- traders can be sued in court of law
148 47.3 165 52.7
Knowledge of post registration effects- higher market value as a community monopoly
169 54.3 142 45.7
Status of registration of product as GI# 30 9.5 113 35.9 Availability of producers association/ marketing group 124 39.5 190 60.5 Membership of producers association/ marketing group 84 26.8 299 73.2s Production as per technical guidelines- of govt. dept 82 26.1 232 73.9 Production as per technical guidelines- of NGO 25 7.9 390 92.1 Production as per technical guidelines- producers association
64 20.3 251 73.7
Production as per self guidelines learnt from forefathers 286 92.3 24 7.7 Maintenance & monitoring of production code- follow technical guidelines of govt
136 43.2 179 56.8
Maintenance & monitoring of production code- quality control mechanism available
46 14.6 268 85.4
Maintenance & monitoring of production code- inspection by govt., NGO, association
57 18.1 258 81.9
Maintenance & monitoring of production code- quality check by purchaser
156 49.5 159 50.5
Maintenance & monitoring of production code- self control without any formal mechanism
280 88.9 35 11.1
* can’t say N (97 ), % (31.3) # can’t say N (172), % (54.6)

360
Table-5.37: Opinion of producers about trend of the production of agricultural products in last three years
Respondents – No. (%) S. N. P.C. Product Increasing Stationary Declining
I Fruits 26 (30.58) 48 (56.47) 11 (12.94) 1 3 Banganpally mango 6 (60.0) 1 (10.0) 3 (30.0) 2 11 Coorg orange 0 (0.0) 6 (60.0) 4 (40.0) 3 29 Alphonso mango 4 (40.0) 5 (50.0) 1 (10.0) 4 30 Nagpur orange 4 (40.0) 5 (50.0) 1 (10.0) 5 31 Nasik grapes 0 (0.0) 8 (100.0) 0 (0.0) 6 62 Malihabadi Dussheri 4 (40.0) 4 (40.0) 2 (20.0) 7 63 Himachal apple 8 (80.0) 2 (20.0) 0 (0.0) 8 66 Harshil apple 0 (0.0) 10 (100.0) 0 (0.0) 9 68 Ramnagar litchi 0 (0.0) 7 (70.0) 0 (0.0) II Grains & Potato 33 (37.5) 31 (35.22) 24 (27.27) 10 13 Navara rice 0 (0.0) 10 (100.0) 0 (0.0) 11 17 Pokkali rice 1 (10.0) 1 (10.0) 8 (80.0) 12 24 Bhaliya wheat 4 (50.0) 4 (50.0) 0 (0.0) 13 37 Basmati rice 0 (0.0) 4 (40.0) 6 (60.0) 14 48 Sehori genhu 7 (70.0) 1 (10.0) 2 (20.0)) 15 25 Kurnool rice 0 (0.0) 5 (50.0)) 5 (50.0)) 16 49 Malwa potato 5 (50.0)) 2 (20.0)) 3 (30.0)) 17 65 Pahari aloo 10 (100.0) 0 (0.0) 0 (0.0) 18 69 Hill rajma 6 (60.0)) 4 (40.0) 0 (0.0) III Plantation crops & spices 55 (51.40) 26 (24.29) 26 (24.29) 19 4 Guntur chilli 7 (70.0) 0 (0.0) 0 (0.0) 20 10 Coorg coffee 3 (30.0) 7 (70.0) 0 (0.0) 21 14 Wayanadan tea 1 (10.0) 9 (90.0) 0 (0.0) 22 15 Telichery black pepper 0 (0.0) 1 (10.0) 9 (90.0) 23 16 Alleppy cardamom 7 (70.0) 3 (30.0) 0 (0.0) 24 19 Nilgiri tea 5 (50.0) 5 (50.0) 0 (0.0) 25 46 Dungarpur zinger 2 (20.0) 1 (10.0) 7 (70.0) 26 50 Amleta & Mahadev garlic 9 (90.0) 0 (0.0) 1 (10.0) 27 51 Kumbhraj dhania 10 (100.0) 0 (0.0) 0 (0.0) 28 52 Fenugreek 10 (100.0) 0 (0.0) 0 (0.0) 29 54 Mahoba paan 1 (10.0) 0 (0.0) 9 (90.0) IV Unexploited indigenous products 17 (56.67) 12 (40.0) 1 (3.34) 30 6 Nannari sharbat 8 (80.0) 1 (10.0) 1 (10.0) 31 12 Kokum fruit juice 8 (80.0) 2 (20.0) 0 (0.0) 32 67 Buraansh juice 1 (10.0) 9 (90.0) 0 (0.0) Total Agricultural Products 131 (42.3) 117 (37.7) 62 (20.0)
Table-5.38: Assessment of producers’ associate ship with the enterprise: opinion of agricultural producers
Respondents agree (marked correct) – No. (%) S. N.
P.C. Product No one has discontinued the production of GI
Many have discontinued the production of GI
Few more have started producing
Several more have started producing
The situation is same- no addition, no deletion
I Fruits 38 (22.48) 9 (4.73) 61 (36.09) 39 (23.07) 23 (13.60)
1 3 Banganpally
mango 6 (60.0) 0 (0.0) 8 (80.0) 3 (30.0) 0 (0.0)
2 11 Coorg orange 0 (0.0) 0 (0.0) 10 (100) 0 (0.0) 0 (0.0)
3 29 Alphonso
mango 8 (88.9) 0 (0.0) 1 (12.5) 8 (100) 0 (0.0)
4 30 Nagpur orange 3 (42.9) 0 (0.0) 6 (85.7) 4 (57.1) 6 (85.7) 5 31 Nasik grapes 8 (100) 0 (0.0) 8 (100) 2 (25.0) 3 (75.0) 6 62 Malihabadi 4 (44.4) 5 (55.6) 6 (66.7) 6 (66.7) 4 (44.4)
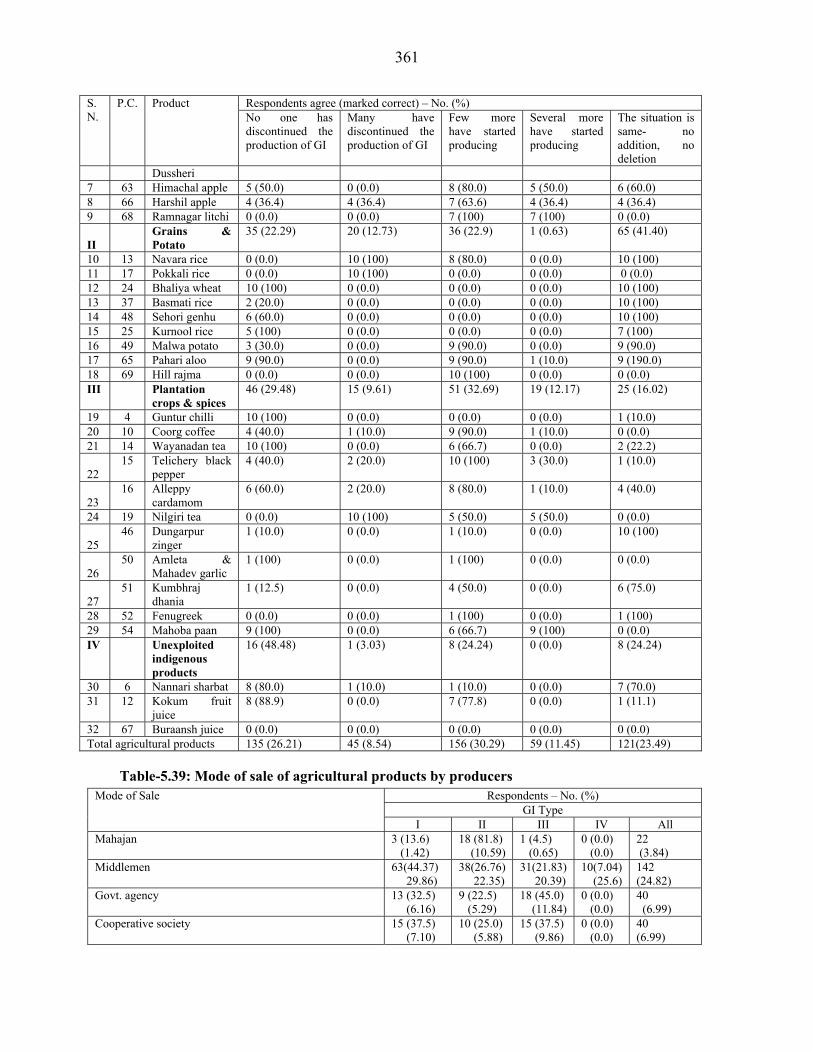
361
Respondents agree (marked correct) – No. (%) S. N.
P.C. Product No one has discontinued the production of GI
Many have discontinued the production of GI
Few more have started producing
Several more have started producing
The situation is same- no addition, no deletion
Dussheri 7 63 Himachal apple 5 (50.0) 0 (0.0) 8 (80.0) 5 (50.0) 6 (60.0) 8 66 Harshil apple 4 (36.4) 4 (36.4) 7 (63.6) 4 (36.4) 4 (36.4) 9 68 Ramnagar litchi 0 (0.0) 0 (0.0) 7 (100) 7 (100) 0 (0.0)
II Grains &
Potato 35 (22.29) 20 (12.73) 36 (22.9) 1 (0.63) 65 (41.40)
10 13 Navara rice 0 (0.0) 10 (100) 8 (80.0) 0 (0.0) 10 (100) 11 17 Pokkali rice 0 (0.0) 10 (100) 0 (0.0) 0 (0.0) 0 (0.0) 12 24 Bhaliya wheat 10 (100) 0 (0.0) 0 (0.0) 0 (0.0) 10 (100) 13 37 Basmati rice 2 (20.0) 0 (0.0) 0 (0.0) 0 (0.0) 10 (100) 14 48 Sehori genhu 6 (60.0) 0 (0.0) 0 (0.0) 0 (0.0) 10 (100) 15 25 Kurnool rice 5 (100) 0 (0.0) 0 (0.0) 0 (0.0) 7 (100) 16 49 Malwa potato 3 (30.0) 0 (0.0) 9 (90.0) 0 (0.0) 9 (90.0) 17 65 Pahari aloo 9 (90.0) 0 (0.0) 9 (90.0) 1 (10.0) 9 (190.0) 18 69 Hill rajma 0 (0.0) 0 (0.0) 10 (100) 0 (0.0) 0 (0.0) III Plantation
crops & spices 46 (29.48) 15 (9.61) 51 (32.69) 19 (12.17) 25 (16.02)
19 4 Guntur chilli 10 (100) 0 (0.0) 0 (0.0) 0 (0.0) 1 (10.0) 20 10 Coorg coffee 4 (40.0) 1 (10.0) 9 (90.0) 1 (10.0) 0 (0.0) 21 14 Wayanadan tea 10 (100) 0 (0.0) 6 (66.7) 0 (0.0) 2 (22.2)
22 15 Telichery black
pepper 4 (40.0) 2 (20.0) 10 (100) 3 (30.0) 1 (10.0)
23 16 Alleppy
cardamom 6 (60.0) 2 (20.0) 8 (80.0) 1 (10.0) 4 (40.0)
24 19 Nilgiri tea 0 (0.0) 10 (100) 5 (50.0) 5 (50.0) 0 (0.0)
25 46 Dungarpur
zinger 1 (10.0) 0 (0.0) 1 (10.0) 0 (0.0) 10 (100)
26 50 Amleta &
Mahadev garlic 1 (100) 0 (0.0) 1 (100) 0 (0.0) 0 (0.0)
27 51 Kumbhraj
dhania 1 (12.5) 0 (0.0) 4 (50.0) 0 (0.0) 6 (75.0)
28 52 Fenugreek 0 (0.0) 0 (0.0) 1 (100) 0 (0.0) 1 (100) 29 54 Mahoba paan 9 (100) 0 (0.0) 6 (66.7) 9 (100) 0 (0.0) IV Unexploited
indigenous products
16 (48.48) 1 (3.03) 8 (24.24) 0 (0.0) 8 (24.24)
30 6 Nannari sharbat 8 (80.0) 1 (10.0) 1 (10.0) 0 (0.0) 7 (70.0) 31 12 Kokum fruit
juice 8 (88.9) 0 (0.0) 7 (77.8) 0 (0.0) 1 (11.1)
32 67 Buraansh juice 0 (0.0) 0 (0.0) 0 (0.0) 0 (0.0) 0 (0.0) Total agricultural products 135 (26.21) 45 (8.54) 156 (30.29) 59 (11.45) 121(23.49)
Table-5.39: Mode of sale of agricultural products by producers Respondents – No. (%)
GI Type Mode of Sale
I II III IV All Mahajan 3 (13.6)
(1.42) 18 (81.8) (10.59)
1 (4.5) (0.65)
0 (0.0) (0.0)
22 (3.84)
Middlemen 63(44.37) 29.86)
38(26.76) 22.35)
31(21.83) 20.39)
10(7.04) (25.6)
142 (24.82)
Govt. agency 13 (32.5) (6.16)
9 (22.5) (5.29)
18 (45.0) (11.84)
0 (0.0) (0.0)
40 (6.99)
Cooperative society 15 (37.5) (7.10)
10 (25.0) (5.88)
15 (37.5) (9.86)
0 (0.0) (0.0)
40 (6.99)

362
Exporters 11 (73.3) (5.21)
1 (6.7) (0.58)
3 (20.0) (1.97)
0 (0.0) (0.0)
15 (2.62)
Wholesalers 60 (42.6) (28.44)
39 (27.7) (22.9)
37 (26.2) (24.34)
5 (3.5) 12.82)
141 (24.65)
Selling to local shops; local consumers or in the local market
26 (26.5) (12.32)
30 (30.6) (17.6)
26 (26.5) (17.1)
16(16.3) (41.03)
98 (17.13)
Processing agency 20 (27.0) (9.47)
25 (33.8) (14.7)
21 (28.4) (13.8)
8 (10.8) (20.51)
74 (12.93)
Total 211(36.89) 170(29.7) 152(26.5) 39(6.81) 572
Table-5.40: Whether producers’ are satisfied with mode of sale of product: opinion of agricultural producers
Respondents – No. (%) GI Type Yes No Total
I 40 (49.38) (27.21)
41 (50.61) (29.71)
81 (28.82)
II 41 (49.39) (27.89)
42 (50.60) (30.43)
83 (29.53)
III 48 (48.48) (32.65)
51 (51.51) (36.95)
99 (35.23)
IV 18 (81.81) (12.24)
3 (18.18) (2.89)
22 (7.82)
Total agricultural products 147 (51.57) 138 (48.42) 285
Table-5.41: Reasons for producer’s unsatisfaction over the mode of sale of agricultural produce
Respondents for each GI Type – No. (%) Reasons
I II III IV All Low profit from venture 19 (19.19)
(35.85) 39 (39.39) (79.59)
34 (34.34) (66.67)
7 (7.07) (46.6)
99 (58.9)
Intervention/ control of middle men 8 (61.53) (15.09)
0 (0.0) (0.0)
4 (30.76) (7.84)
1 (7.69) (6.67)
13 (7.73)
Insufficient institutional support 9 (39.13) (16.98)
5 (21.73) (10.2)
9 (39.13) (17.65)
0 (0.0) (0.0)
23 (13.69)
High input cost 5 (45.45) (9.43)
5 (45.45) (10.2)
1 (9.09) (1.96)
0 (0.0) (0.0)
11 (6.54)
Limited supply chain facilities 5 (1.00) (9.43)
0 (0.0) (0.0)
0 (0.0) (0.0)
0 (0.0) (0.0)
5 (2.97)
Producers’ dilemma 7 (41.17) (13.21)
0 (0.0) (0.0)
3 (17.64) (5.88)
7 (41.17) (46.6)
17 (10.11)
Total 53 (31.55) 49 (29.17) 51 (30.36) 15 (8.92) 168
Table-5.42: Opinion of producers about trend of the average unit price of agricultural produce in last three years
Average unit price (Rs) S. N. P.C. Product Unit 2004 2005 2006
I Fruits 1 3 Banganpally mango Kg 4.7 5.19 4.3 2 11 Coorg orange Kg 24.6 29.2 33.8 3 29 Alphonso mango Kg 28.7 33.0 27.3 4 30 Nagpur orange Kg 5.5 6.18 7.5 5 31 Nasik grapes Kg 12.3 13.5 14.5 6 62 Malihabadi Dussheri Kg 15.9 14.7 12.95 7 63 Himachal apple Kg 14.35 14.7 14.4 8 66 Harshil apple Kg 8.4 9.1 9.4

363
Average unit price (Rs) S. N. P.C. Product Unit 2004 2005 2006
9 68 Ramnagar litchi Kg 10.15 10.15 10.15 II Grains & Potato 10 13 Navara rice Kg 23.6 27.2 28.6 11 17 Pokkali rice Kg 6.92 6.97 7.3 12 24 Bhaliya wheat Kg 11.5 14.4 17.3 13 37 Basmati rice Kg 11.2 11.2 12.57 14 48 Sehori genhu Kg 16 17.2 15.5 15 25 Kurnool rice Kg 7.07 7.14 7.05 16 49 Malwa potato Kg 4.07 6.25 4.8 17 65 Pahari aloo Kg 6.6 6.2 6.35 18 69 Hill rajma Kg 17.6 19.1 21 III Plantation crops & spices 19 4 Guntur chilli Kg 34.2 58.3 48.5 20 10 Coorg coffee Kg 102 106.4 114 21 14 Wayanadan tea Kg 41.7 31.9 38.1 22 15 Telichery black pepper Kg 66 70.2 60.10 23 16 Alleppy cardamom Kg 193 236 299 24 19 Nilgiri tea Kg 7.97 7.82 7.99 25 46 Dungarpur zinger Kg 35.75 31 26.6 26 50 Amleta & Mahadev garlic Kg 26.0 34.3 42.7 27 51 Kumbhraj dhania Kg 31.2 29.5 36 28 52 Fenugreek Kg 18.55 21.55 23.2 29 54 Mahoba paan Kg 30.5 34.3 38.1 IV Unexploited indigenous products 30 6 Nannari sharbat Liters 44.0 51.3 55.8 31 12 Kokum fruit juice Liters 20.2 22.7 24.7 32 67 Buraansh juice Liters 31.8 45.9 46
Table-5.43: Price decision of producers over the sale of agricultural produce Respondents – No. (%)
GI Type Price Decision
I II III IV All Bargain collectively 31 (50.0)
(22.14) 1 (1.6) (1.01)
26 (41.9) (17.21)
4 (6.5) (11.76)
62 (14.62)
Bargain individually 38 (33.6) (27.14)
39 (34.5) (39.39)
16 (14.2) (10.59)
20(17.7) (58.8)
113 (26.65)
Sale on minimum agreed price between our association and purchasers
39 (56.5) (27.85)
9 (13.0) (9.09)
20 (29.0) (13.24)
1 (1.4) (2.94)
69 (16.27)
The purchaser offers us a price to which we usually agree
20 (27.0) (14.28)
21 (28.4) 21.21)
24 (32.4) 15.89)
9 (12.2) 26.47)
74 (17.45)
Purchaser offers us a price to which we have to sell; there is no other choice for us
12 (11.3) (8.57)
29 (27.4) (29.29)
65 (61.3) (43.04)
0 (0.0) (0.0)
106 (25.0)
Total 140(33.01)
99(23.34)
151(35.61)
34(8.01)
424
Table-5.44: Respondent’s constraints in production and marketing of agricultural produce Respondents for each GI Type – No. (%) Constraints
I II III IV All Financial difficulties 1 (4.34)
(1.22) 1 (4.34) (0.78)
15(65.21) (7.32)
6 (26.08) (13.64)
23 (5.01)
Limited availability of technical knowledge 4 (38.46) (6.09)
0 (0.0) (0.0)
8 (61.53) (3.90)
0 (0.0) (0.0)
13 (2.83)
No organized producers’ association 1 (33.34) (1.22)
0 (0.0) (0.0)
2 (66.67) (0.98)
0 (0.0) (0.0)
3 (0.65)

364
Respondents for each GI Type – No. (%) Constraints I II III IV All
Hindrances from agronomic/ natural factors 22 (23.91) (26.83)
26 (28.26) (20.31)
43 (46.73) (20.98)
1 (1.08) (2.27)
92 (20.04)
Low marketing infrastructure 17 (34.69) (20.73)
13 (26.53) (10.16)
14 (28.57) (6.83)
5 (10.20) (11.36)
49 (10.67)
Lack of proper government policy & assistance 1 (16.67) (1.22)
0 (0.0) (0.0)
4 (66.67) (1.95)
1 (16.67) (2.27)
6 (1.30)
No constraints 1 (7.69) (1.22)
8 (61.53) (6.25)
1 (7.69) (0.49)
3 (23.07) (6.81)
13 (2.83)
Labour scarcity 9 (17.30) (10.98)
9 (17.30) (7.03)
32 (61.53) (15.61)
2 (3.84) (4.55)
52 (11.32)
High competition 1 (25.0) (1.22)
0 (0.0) (0.0)
0 (0.0) (0.0)
3 (75.0) (6.81)
4 (0.87)
Difficulty in getting quality inputs 1 (4.76) (1.22)
7 (33.34) (5.47)
4 (19.04) (1.95)
9 (42.85) (20.45)
21 (4.57)
Product specific concerns 0 (0.0) (0.0)
10 (50.0) (7.81)
6 (30.0) (2.93)
4 (20.0) (9.09)
20 (4.35)
Improper transportation arrangements 5 (13.88) (7.32)
6 (16.67) (4.69)
25 (69.45) (12.20)
0 (0.0) (0.0)
36 (7.84)
Market insecurity leading to low profitability 8 (11.26) (9.76)
21 (29.57) (16.41)
37 (52.11) (18.05)
5 (7.04) (11.36)
71 (15.46)
Improper marketing services 8 (21.05) (9.76)
19 (50.0) (14.84)
6 (15.78) (2.93)
5 (13.15) (11.36)
38 (8.27)
Electricity shortage 2 (11.12) (2.44)
8 (44.45) (6.25)
8 (44.45) (3.90)
0 (0.0) (0.0)
18 (3.92)
Total 82 (17.86) 128 (27.88) 205 (44.67) 44 (9.58) 459
Table-5.45: Responses of agricultural producers about willingness and expectations from G.I. registration
Respondents Observation Yes- N
Yes- %
No- N
No- %
Can’t say- N
Can’t say- %
Willingness for registration of product 241 83.7 19 6.6 28 9.7 Willingness for payment for registration 200 72.7 75 27.3 -- -- Non-registration leads to- low volume of sale 192 68.6 88 31.4 -- -- Non-registration leads to- low wages to labour 129 46.1 151 53.9 -- -- Non-registration leads to- low profit to producers 229 81.8 51 18.2 -- -- Non-registration leads to- difficulty in getting loans 170 60.7 110 39.3 -- -- Non-registration leads to- sale of fake product with same name 194 69.3 86 30.7 -- -- Post registration expectations- increase in sale* 142 51.1 106 38.8 28 10.1 Post registration expectations- increase in unit price 224 77.5 4 1.4 61 21.1 Post registration expectations- increase in net profit 232 80.3 2 0.7 55 19.0 Post registration expectations- less competition 170 61.6 25 9.1 81 29.3 Post registration expectations- market expansion 210 73.9 5 1.8 69 24.3 Post registration expectations- enhanced premium to producers 207 72.4 9 3.1 70 24.5 Post registration expectations- Shift from other livelihoods to RGI 111 38.9 73 25.6 101 35.4 Post registration expectations- improvement in overall socio-economic conditions of producers
194 67.4 20 6.9 74 25.7
* Significant-1, Marginal-2, No increase-3
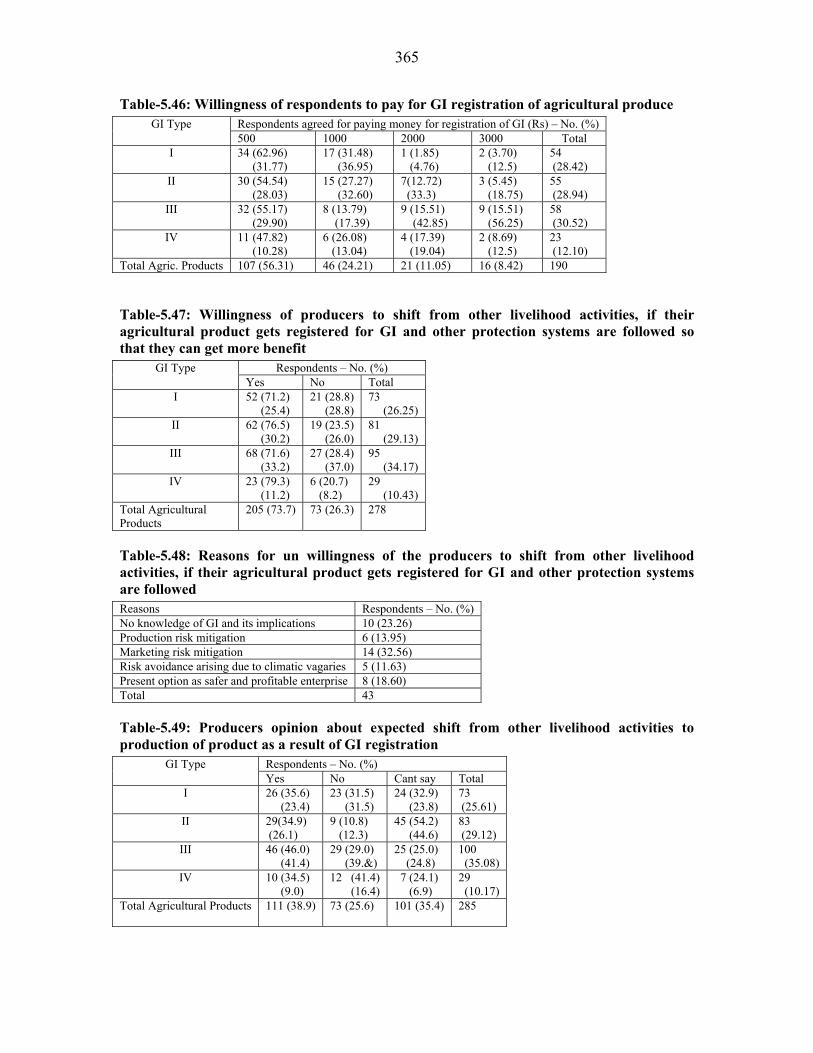
365
Table-5.46: Willingness of respondents to pay for GI registration of agricultural produce Respondents agreed for paying money for registration of GI (Rs) – No. (%) GI Type 500 1000 2000 3000 Total
I 34 (62.96) (31.77)
17 (31.48) (36.95)
1 (1.85) (4.76)
2 (3.70) (12.5)
54 (28.42)
II 30 (54.54) (28.03)
15 (27.27) (32.60)
7(12.72) (33.3)
3 (5.45) (18.75)
55 (28.94)
III 32 (55.17) (29.90)
8 (13.79) (17.39)
9 (15.51) (42.85)
9 (15.51) (56.25)
58 (30.52)
IV 11 (47.82) (10.28)
6 (26.08) (13.04)
4 (17.39) (19.04)
2 (8.69) (12.5)
23 (12.10)
Total Agric. Products 107 (56.31) 46 (24.21) 21 (11.05) 16 (8.42) 190
Table-5.47: Willingness of producers to shift from other livelihood activities, if their agricultural product gets registered for GI and other protection systems are followed so that they can get more benefit
Respondents – No. (%) GI Type Yes No Total
I 52 (71.2) (25.4)
21 (28.8) (28.8)
73 (26.25)
II 62 (76.5) (30.2)
19 (23.5) (26.0)
81 (29.13)
III 68 (71.6) (33.2)
27 (28.4) (37.0)
95 (34.17)
IV 23 (79.3) (11.2)
6 (20.7) (8.2)
29 (10.43)
Total Agricultural Products
205 (73.7)
73 (26.3)
278
Table-5.48: Reasons for un willingness of the producers to shift from other livelihood activities, if their agricultural product gets registered for GI and other protection systems are followed Reasons Respondents – No. (%) No knowledge of GI and its implications 10 (23.26) Production risk mitigation 6 (13.95) Marketing risk mitigation 14 (32.56) Risk avoidance arising due to climatic vagaries 5 (11.63) Present option as safer and profitable enterprise 8 (18.60) Total 43
Table-5.49: Producers opinion about expected shift from other livelihood activities to production of product as a result of GI registration
Respondents – No. (%) GI Type Yes No Cant say Total
I 26 (35.6) (23.4)
23 (31.5) (31.5)
24 (32.9) (23.8)
73 (25.61)
II 29(34.9) (26.1)
9 (10.8) (12.3)
45 (54.2) (44.6)
83 (29.12)
III 46 (46.0) (41.4)
29 (29.0) (39.&)
25 (25.0) (24.8)
100 (35.08)
IV 10 (34.5) (9.0)
12 (41.4) (16.4)
7 (24.1) (6.9)
29 (10.17)
Total Agricultural Products 111 (38.9)
73 (25.6)
101 (35.4)
285

366
Table-5.50: Producers opinion about expected enhanced premium to the producers over prevailing cost after GI registration of agricultural produce
Respondents – No. (%) in favor of % increase GI Type 0-5% 5-10% 10-15% >15% Total
I 9 (15.0) (32.14)
17 (28.34) (20.23)
18 (30.0) (41.86)
16 (26.67) (35.56)
60 (30.0)
II 6 (9.37) (21.42)
28 (43.75) (33.34)
16 (25.0) (31.20)
14 (21.87) (31.12)
64 (32.0)
III 10 (20.0) (35.71)
30 (60.0) (35.71)
2 (4.0) (4.65)
8 (16.0) (17.76)
50 (25.0)
IV 3 (11.53) (10.71)
9 (34.61) (10.71)
7 (26.92) (16.27)
7 (26.92) (15.56)
26 (13.0)
Total Agric. Products 28 (14.0)
84 (42.0)
43 (21.5)
45 (22.5)
200
Table-5.51: Responses of agricultural producers about post-registration observation regarding impact and changes recurred
Respondents Observation Yes- N
Yes- %
No- N
No- %
Can’t say-N
Can’t say-%
Post registration changes observed 2 100 0 0.0 0 0.0 Observed post registration changes- increase in annual production*
7 77.78 2 22.22 0 0.0
Observed post registration changes- increase in unit price 9 100 0 0.0 0 0.0 Observed post registration changes- increase in net profit 9 100 0 0.0 0 0.0 Observed post registration changes- less competition 8 88.89 0 0.0 1 11.11 Observed post registration changes- market expansion 8 88.89 0 0.0 1 11.11 Observed post registration changes- enhanced premium to producers
9 100 0 0.0 0 0.0
Observed post registration changes- Shift from other livelihoods to RGI
0 0.00 6 66.67 3 3.33
Observed post registration changes- improvement in overall socio-economic conditions of producers
8 88.89 0 0.0 1 11.1
Did they contribute money for registration 8 88.89 1 11.11 -- -- * Significant-1, Marginal-2, No increase-3
Table-5.52: Enhanced premium to the producers over the prevailing cost after GI registration of the agricultural produce Increase (%) Respondents – No. (%) 0 1 (11.11) 5-10 8 (88.89) 10-15 0 (0.0) >15 0 (0.0) Total 9
Table-5.53: Contribution of money for agricultural product GI registration by producers Rupees Respondents – No. (%) <250 0 (0.0) 250-500 7 (100.0) >500 0 (0.0) Total 7
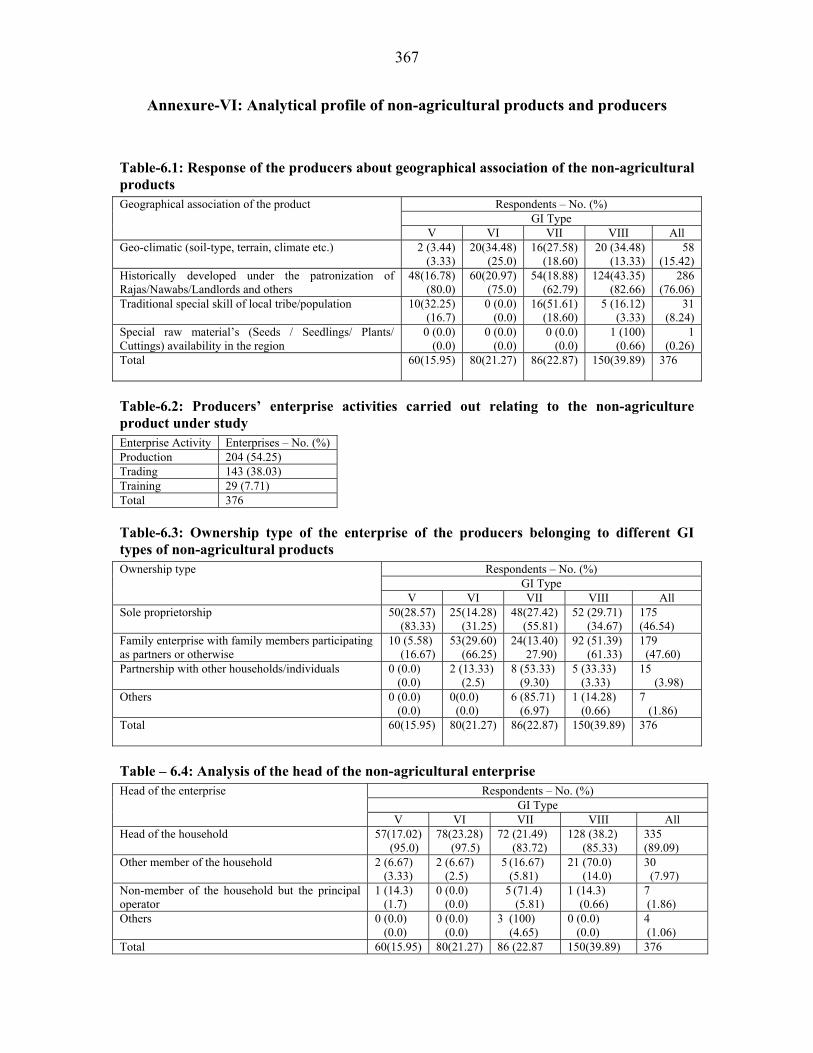
367
Annexure-VI: Analytical profile of non-agricultural products and producers
Table-6.1: Response of the producers about geographical association of the non-agricultural products
Respondents – No. (%) GI Type
Geographical association of the product
V VI VII VIII All Geo-climatic (soil-type, terrain, climate etc.) 2 (3.44)
(3.33) 20(34.48)
(25.0) 16(27.58)
(18.60) 20 (34.48)
(13.33) 58
(15.42) Historically developed under the patronization of Rajas/Nawabs/Landlords and others
48(16.78) (80.0)
60(20.97) (75.0)
54(18.88) (62.79)
124(43.35) (82.66)
286 (76.06)
Traditional special skill of local tribe/population 10(32.25) (16.7)
0 (0.0) (0.0)
16(51.61) (18.60)
5 (16.12) (3.33)
31 (8.24)
Special raw material’s (Seeds / Seedlings/ Plants/ Cuttings) availability in the region
0 (0.0) (0.0)
0 (0.0) (0.0)
0 (0.0) (0.0)
1 (100) (0.66)
1 (0.26)
Total 60(15.95)
80(21.27)
86(22.87)
150(39.89)
376
Table-6.2: Producers’ enterprise activities carried out relating to the non-agriculture product under study Enterprise Activity Enterprises – No. (%) Production 204 (54.25) Trading 143 (38.03) Training 29 (7.71) Total 376
Table-6.3: Ownership type of the enterprise of the producers belonging to different GI types of non-agricultural products
Respondents – No. (%) GI Type
Ownership type
V VI VII VIII All Sole proprietorship 50(28.57)
(83.33) 25(14.28) (31.25)
48(27.42) (55.81)
52 (29.71) (34.67)
175 (46.54)
Family enterprise with family members participating as partners or otherwise
10 (5.58) (16.67)
53(29.60) (66.25)
24(13.40) 27.90)
92 (51.39) (61.33)
179 (47.60)
Partnership with other households/individuals 0 (0.0) (0.0)
2 (13.33) (2.5)
8 (53.33) (9.30)
5 (33.33) (3.33)
15 (3.98)
Others 0 (0.0) (0.0)
0(0.0) (0.0)
6 (85.71) (6.97)
1 (14.28) (0.66)
7 (1.86)
Total 60(15.95)
80(21.27)
86(22.87)
150(39.89)
376
Table – 6.4: Analysis of the head of the non-agricultural enterprise Respondents – No. (%)
GI Type Head of the enterprise
V VI VII VIII All Head of the household 57(17.02)
(95.0) 78(23.28) (97.5)
72 (21.49) (83.72)
128 (38.2) (85.33)
335 (89.09)
Other member of the household 2 (6.67) (3.33)
2 (6.67) (2.5)
5 (16.67) (5.81)
21 (70.0) (14.0)
30 (7.97)
Non-member of the household but the principal operator
1 (14.3) (1.7)
0 (0.0) (0.0)
5 (71.4) (5.81)
1 (14.3) (0.66)
7 (1.86)
Others 0 (0.0) (0.0)
0 (0.0) (0.0)
3 (100) (4.65)
0 (0.0) (0.0)
4 (1.06)
Total 60(15.95) 80(21.27) 86 (22.87 150(39.89) 376

368
Table-6.5: Acquisition of skill/qualification by the head of non-agriculture product’s enterprises Sources of skill acquisition Respondents – No. (%) Traditionally acquired skill as well as formal training/technical qualification 154 (41.1) Traditionally acquired skill only 188 (50.1) Formal training/technical qualification but not traditional skill 11 (2.9) Informal learning only but no traditional skill or formal training 20 (5.3) Others 2 (0.5) Total 375
Table-6.6: Average years of production of the non-agriculture product in respondent’s area S. N. P. C. Name of the Product Average year V Confectionary
1 22 Tirunelveli halwa 37.3 2 38 Dodha 59.38 3 44 Bikaneri bhujia 30.8 4 45 Bikaneri rasgolla 33.5 5 58 Agra petha 99 6 70 Bal mithai 31
VI Handicrafts 7 5 Kondapalli bommalu (toys) 72.9 8 8 Chennapatana toys 80 9 23 Thanjaur art plate 86.5
10 32 Kolhapuri chappal 20.7 11 33 Warli paintings 94.1 12 35 Punjabi jooti 59.5 13 57 Moradabad brass material 40.71 14 60 Saharanpur furniture 99
VII Manufactured products with organized trade 15 1 Hyderabad pearls 74.5 16 9 Mysore sandal soap 81.6 17 20 Nilgiri oil 23.7 18 21 Sivakasi patakha 35 19 39 Harambha thresher 26.9 20 42 Makrana marble 81.1 21 47 Jaipur blue pottery 24.2 22 55 Ferozabad chundia and glassware 99 23 61 Khurja pottery 99
VIII Textiles 24 2 Gadwal saree 99 25 7 Srikalahasti kalamkari 58.2 26 18 Kancheepuram silk 99 27 26 Bandhani saree 70.1 28 27 Patola saree 30 29 28 Kutch embroidery 99 30 34 Paithani saree 27.4 31 36 Phulkari 29.3 32 40 Ludhiana hosiery 33.7 33 41 Jaipuri rajai 62.2 34 43 Sanganeri print 41.2 35 53 Banarasi saree 99 36 56 Lucknavi chikan 99 37 59 Bhadoi carpet 99 38 64 Kullu shawl 99
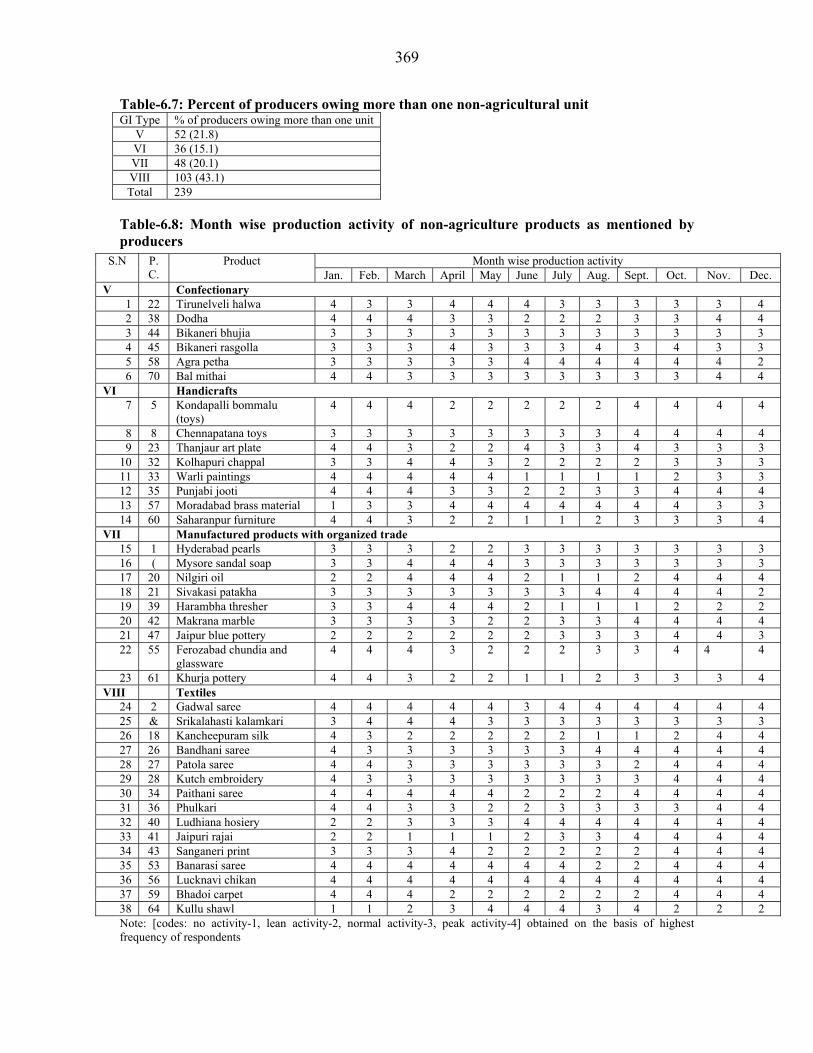
369
Table-6.7: Percent of producers owing more than one non-agricultural unit GI Type % of producers owing more than one unit
V 52 (21.8) VI 36 (15.1) VII 48 (20.1) VIII 103 (43.1) Total 239
Table-6.8: Month wise production activity of non-agriculture products as mentioned by producers
Month wise production activity S.N P.C.
Product Jan. Feb. March April May June July Aug. Sept. Oct. Nov. Dec.
V Confectionary 1 22 Tirunelveli halwa 4 3 3 4 4 4 3 3 3 3 3 4 2 38 Dodha 4 4 4 3 3 2 2 2 3 3 4 4 3 44 Bikaneri bhujia 3 3 3 3 3 3 3 3 3 3 3 3 4 45 Bikaneri rasgolla 3 3 3 4 3 3 3 4 3 4 3 3 5 58 Agra petha 3 3 3 3 3 4 4 4 4 4 4 2 6 70 Bal mithai 4 4 3 3 3 3 3 3 3 3 4 4
VI Handicrafts 7 5 Kondapalli bommalu
(toys) 4 4 4 2 2 2 2 2 4 4 4 4
8 8 Chennapatana toys 3 3 3 3 3 3 3 3 4 4 4 4 9 23 Thanjaur art plate 4 4 3 2 2 4 3 3 4 3 3 3
10 32 Kolhapuri chappal 3 3 4 4 3 2 2 2 2 3 3 3 11 33 Warli paintings 4 4 4 4 4 1 1 1 1 2 3 3 12 35 Punjabi jooti 4 4 4 3 3 2 2 3 3 4 4 4 13 57 Moradabad brass material 1 3 3 4 4 4 4 4 4 4 3 3 14 60 Saharanpur furniture 4 4 3 2 2 1 1 2 3 3 3 4
VII Manufactured products with organized trade 15 1 Hyderabad pearls 3 3 3 2 2 3 3 3 3 3 3 3 16 ( Mysore sandal soap 3 3 4 4 4 3 3 3 3 3 3 3 17 20 Nilgiri oil 2 2 4 4 4 2 1 1 2 4 4 4 18 21 Sivakasi patakha 3 3 3 3 3 3 3 4 4 4 4 2 19 39 Harambha thresher 3 3 4 4 4 2 1 1 1 2 2 2 20 42 Makrana marble 3 3 3 3 2 2 3 3 4 4 4 4 21 47 Jaipur blue pottery 2 2 2 2 2 2 3 3 3 4 4 3 22 55 Ferozabad chundia and
glassware 4 4 4 3 2 2 2 3 3 4 4 4
23 61 Khurja pottery 4 4 3 2 2 1 1 2 3 3 3 4 VIII Textiles
24 2 Gadwal saree 4 4 4 4 4 3 4 4 4 4 4 4 25 & Srikalahasti kalamkari 3 4 4 4 3 3 3 3 3 3 3 3 26 18 Kancheepuram silk 4 3 2 2 2 2 2 1 1 2 4 4 27 26 Bandhani saree 4 3 3 3 3 3 3 4 4 4 4 4 28 27 Patola saree 4 4 3 3 3 3 3 3 2 4 4 4 29 28 Kutch embroidery 4 3 3 3 3 3 3 3 3 4 4 4 30 34 Paithani saree 4 4 4 4 4 2 2 2 4 4 4 4 31 36 Phulkari 4 4 3 3 2 2 3 3 3 3 4 4 32 40 Ludhiana hosiery 2 2 3 3 3 4 4 4 4 4 4 4 33 41 Jaipuri rajai 2 2 1 1 1 2 3 3 4 4 4 4 34 43 Sanganeri print 3 3 3 4 2 2 2 2 2 4 4 4 35 53 Banarasi saree 4 4 4 4 4 4 4 2 2 4 4 4 36 56 Lucknavi chikan 4 4 4 4 4 4 4 4 4 4 4 4 37 59 Bhadoi carpet 4 4 4 2 2 2 2 2 2 4 4 4 38 64 Kullu shawl 1 1 2 3 4 4 4 3 4 2 2 2 Note: [codes: no activity-1, lean activity-2, normal activity-3, peak activity-4] obtained on the basis of highest frequency of respondents

370
Table-6.9: Monthly average number of persons engaged in the non-agricultural enterprise Family Workers Paid workers Family + Paid workers
Male Female Total Male Female Total Male Female Total GI Type
Skill
ed
Oth
ers
Skill
ed
Oth
ers
Skill
ed
Oth
ers
Skill
ed
Oth
ers
Skill
ed
Oth
ers
Skill
ed
Oth
ers
Skill
ed
Oth
ers
Skill
ed
Oth
ers
Skill
ed
Oth
ers
V 2.12 1.73 1.6 3.14 3.72 4.87 10.0 6.41 4 5 14.41 11.41 12.12 8.14 5.6 8.14 17.72 16.28
VI 2.20 2.14 1.64 2.0 3.84 4.14 6.72 10.89 3.67 5 10.39 15.89 8.92 13.03 5.3 7 14.22 20.03
VII 1.67 1.0 1.0 2.0 2.67 3.0 39.6 44.7 15.47 49.5 55.07 94.20 41.27 45.70 16.4 51.5 57.60 97.20
VIII 2.08 0.41 1.65 2.4 3.73 2.81 19.0 19.30 28.84 15.6 47.84 34.9 21.08 19.73 30.5 18 51.58 37.73
Total
Products
2.01 1.32 1.47 2.38 3.49 3.70 18.83 20.32 12.99 18.7 31.82 39.10 20.84 21.65 14.45 21.16 35.28 42.81
Table-6.10: Inventory of fixed assets owned and of those hired during the last 12 months with total rent paid during the period by non-agricultural enterprises
Product 1: Tirunelveli halwa Owned Hired Sl. Item Unit of quantity
Qty Value Qty Value Rent (Rs.)
1. Land 1 acre 0 200000 0 0 0
2. Building/structure No. 7 4250000 8 1687500 13950
3. Machinery, equipments etc. 2 16 155000 0 0 0
Product 2: Dodha Owned Hired Sl. Item Unit of quantity
Qty Value Qty Value Rent (Rs.)
1. Land 1 150000 0 0 0
2. Building/structure No. 6 111111.1 0 0 0
3. Machinery, equipments etc. No. 13 583888.8
Product 3: Bikaneri bhujia Owned Hired Sl. Item Unit of quantity
Qty Value Qty Value Rent (Rs.)
1. Land 0 0 0 0 0 0
2. Building/structure 0 0 0 0 0 0
3. Machinery, equipments etc. 0 0 0 0 0 0
Product 4: Bikaneri rasgolla Owned Hired Sl. Item Unit of quantity
Qty Value Qty Value Rent (Rs.)
1. Land 0 0 0 0 0 0
2. Building/structure No. 4 475000 3 350251.25 3000
3. Machinery, equipments etc. 0 0 0 0 0 0

371
Product 5: Agra petha Owned Hired Sl. Item Unit of quantity
Qty Value Qty Value Rent (Rs.)
1. Land 0 0 0 0 0 0
2. Building/structure 0 0 0 0 0 0
3. Machinery, equipments etc. 0 0 0 0 0 0
Product 6: Bal mithai Owned Hired Sl. Item Unit of quantity
Qty Value Qty Value Rent (Rs.)
1. Land 0 0 0 0 0 0
2. Building/structure 0 0 0 0 0 0
3. Machinery, equipments etc. 0 0 0 0 0 0
Product 7: Kondapalli bommalu (Toys) Owned Hired Sl. Item Unit of quantity
Qty Value Qty Value Rent (Rs.)
1. Land 0 0 300000 0 0 0
2. Building/structure No. 0 60000 0 0 0
3. Machinery, equipments etc. 0 0 0 0 0
Product 8: Chennapatatana toys Owned Hired Sl. Item Unit of quantity
Qty Value Qty Value Rent (Rs.)
1. Land 1 84000 0 0 0
2. Building/structure No. 1 23500 0 0 0
3. Machinery, equipments etc. No. 1 1250 0 0 0
Product 9: Thanjaur art plate Owned Hired Sl. Item Unit of quantity
Qty Value Qty Value Rent (Rs.)
1. Land acre 28 1265000 0 0 0
2. Building/structure No. 50 990000 0 0 0
3. Machinery, equipments etc. 0 0 0 0 0 0
Product 10: Kolhapuri chappal Owned Hired Sl. Item Unit of quantity
Qty Value Qty Value Rent (Rs.)
1. Land 0 0 0 0 0 0
2. Building/structure 0 0 0 0 0 0
3. Machinery, equipments etc. 0 0 0 0 0 0

372
Product 11: warli painting Owned Hired Sl. Item Unit of quantity
Qty Value Qty Value Rent (Rs.)
1. Land 0 0 0 0 0 0
2. Building/structure No. 6 10000000 0 0 0
3. Machinery, equipments etc. No. 5 138000 0 0 0
Product 12: Punjabi jooti Owned Hired Sl. Item Unit of quantity
Qty Value Qty Value Rent (Rs.)
1. Land 9 800000 1 3500 42000
2. Building/structure No. 10 866666.67 0 0 0
3. Machinery, equipments etc. 0 0 0 0 0
Product 13: Moradabad brass material Owned Hired Sl. Item Unit of quantity
Qty Value Qty Value Rent (Rs.)
1. Land 0 0 0 0 0 0
2. Building/structure 0 0 0 0 0 0
3. Machinery, equipments etc. 0 0 0 0 0 0
Product 14: Saharanpur furniture Owned Hired Sl. Item Unit of quantity
Qty Value Qty Value Rent (Rs.)
1. Land Acre 7 500000 0 0 0
2. Building/structure No. 10 88000 0 0 0
3. Machinery, equipments etc. 0 0 0 0 0
Product 15: Hyderabad pearls Owned Hired Sl. Item Unit of quantity
Qty Value Qty Value Rent (Rs.)
1. Land Acre 3 17000 0 0 0
2. Building/structure No. 298 41111.12 21 22862.85 4928.5
3. Machinery, equipments etc. No. 118 4125 0 0 0
Product 16: Mysore sandal soap Owned Hired Sl. Item Unit of quantity
Qty Value Qty Value Rent (Rs.)
1. Land Acre 13 48125 0 0 0
2. Building/structure No. 456 19444.45 0 0 0
3. Machinery, equipments etc. No. 1 45000 0 0 0

373
Product 17: Nilgiri oil Owned Hired Sl. Item Unit of quantity
Qty Value Qty Value Rent (Rs.)
1. Land Acre 4005 831250 0 0 0
2. Building/structure No. 10 525714.2 0 0 0
3. Machinery, equipments etc. No. 170 70000 1 3000 0
Product 18: Sivakasi patakha Owned Hired Sl. Item Unit of quantity
Qty Value Qty Value Rent (Rs.)
1. Land Sq.meters 0 340 100 1300000 200000
2. Building/structure No. 1300 595000 100 150000 1000
3. Machinery, equipments etc. No. 11 7200 0 0 0
Product 19: Harambha thresher Owned Hired Sl. Item Unit of quantity
Qty Value Qty Value Rent (Rs.)
1. Land Sq. mts 2860 12488888.9 0 0 0
2. Building/structure No. 2500 1611111.12 400 950000 15500
3. Machinery, equipments etc. No. 20 81250 0 0 0
Product 20: Makrana marble Owned Hired Sl. Item Unit of quantity
Qty Value Qty Value Rent (Rs.)
1. Land Sq.ft 850 2466666.67 0 0 0
2. Building/structure No. 4 2400000 0 0 0
3. Machinery, equipments etc. No. 21 433333.34 0 0 0
Product 21: Jaipur blue pottery Owned Hired Sl. Item Unit of quantity
Qty Value Qty Value Rent (Rs.)
1. Land Sq. ft 2 4500 0 0 0
2. Building/structure 0 0 0 0 0
3. Machinery, equipments etc. 0 0 0 0 0
Product 22: Ferozabad chundia & glassware Owned Hired Sl. Item Unit of quantity
Qty Value Qty Value Rent (Rs.)
1. Land Sq. yards 11027 0 0 0 0
2. Building/structure No. 2 0 0 0 0
3. Machinery, equipments etc. No. 600 14000000 0 0 0

374
Product 23: Khurja pottery Owned Hired Sl. Item Unit of quantity
Qty Value Qty Value Rent (Rs.)
1. Land Acre 10 470000 0 0 0
2. Building/structure No. 17 281000 4 33333.34 2500
3. Machinery, equipments etc. No. 60 20700 0 0 0
Product 24: Gadwal saree Owned Hired Sl. Item Unit of quantity
Qty Value Qty Value Rent (Rs.)
1. Land Acre 10 364000 0 0 0
2. Building/structure No. 13 336000 0 0 0
3. Machinery, equipments etc. No. 21 337000 0 0 0
Product 25: Srikalahasti kalamkari Owned Hired Sl. Item Unit of quantity
Qty Value Qty Value Rent (Rs.)
1. Land Acre 10 275000 0 0 0
2. Building/structure No. 51 230000 0 0 0
3. Machinery, equipments etc. No. 51 42700 0 0 0
Product 26: Kancheepuram silk Owned Hired Sl. Item Unit of quantity
Qty Value Qty Value Rent (Rs.)
1. Land ---- 0 0 0 0 0
2. Building/structure No. 11 740000 0 0 0
3. Machinery, equipments etc. No. 75 300000 0 0 0
Product 27: Bandhani saree Owned Hired Sl. Item Unit of quantity
Qty Value Qty Value Rent (Rs.)
1. Land ---- 0 0 0 0 0
2. Building/structure No. 10 760000 0 0 0
3. Machinery, equipments etc. No. 19 250000 0 0 0
Product 28: Patola saree Owned Hired Sl. Item Unit of quantity
Qty Value Qty Value Rent (Rs.)
1. Land Acre 9 400000 0 0 0
2. Building/structure No. 50 275000 0 0 0
3. Machinery, equipments etc. No. 49 41000 0 0 0
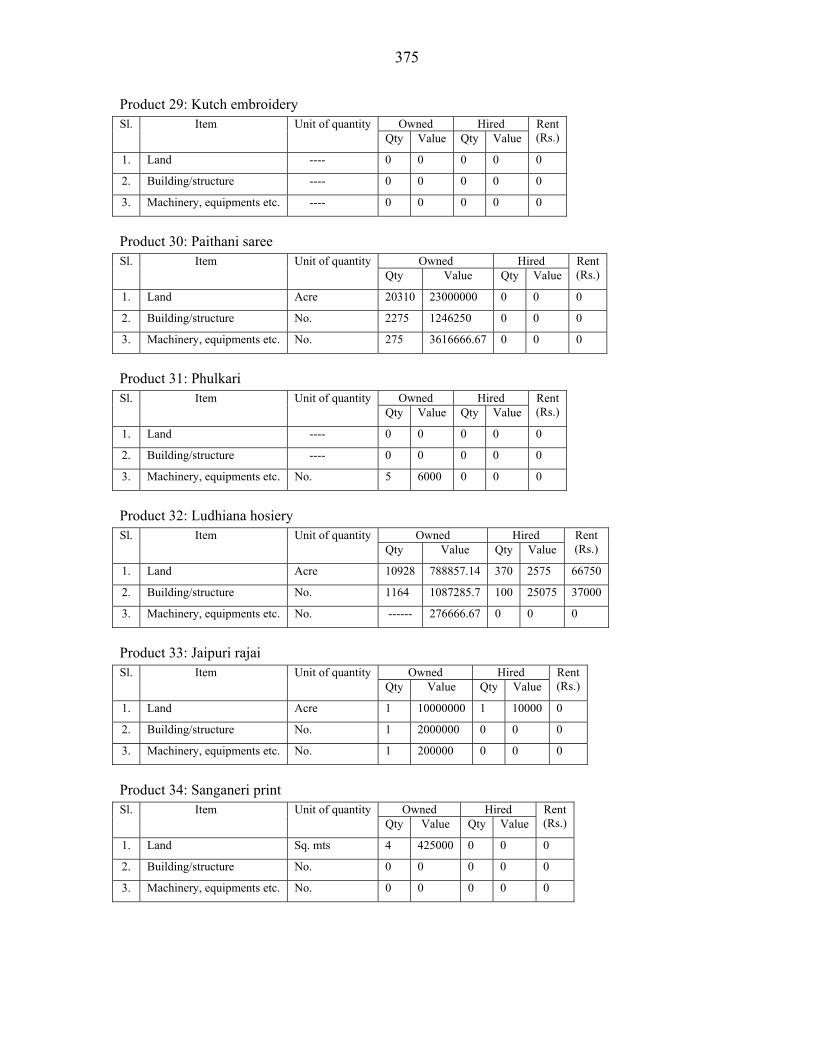
375
Product 29: Kutch embroidery Owned Hired Sl. Item Unit of quantity
Qty Value Qty Value Rent (Rs.)
1. Land ---- 0 0 0 0 0
2. Building/structure ---- 0 0 0 0 0
3. Machinery, equipments etc. ---- 0 0 0 0 0
Product 30: Paithani saree Owned Hired Sl. Item Unit of quantity
Qty Value Qty Value Rent (Rs.)
1. Land Acre 20310 23000000 0 0 0
2. Building/structure No. 2275 1246250 0 0 0
3. Machinery, equipments etc. No. 275 3616666.67 0 0 0
Product 31: Phulkari Owned Hired Sl. Item Unit of quantity
Qty Value Qty Value Rent (Rs.)
1. Land ---- 0 0 0 0 0
2. Building/structure ---- 0 0 0 0 0
3. Machinery, equipments etc. No. 5 6000 0 0 0
Product 32: Ludhiana hosiery Owned Hired Sl. Item Unit of quantity
Qty Value Qty Value Rent (Rs.)
1. Land Acre 10928 788857.14 370 2575 66750
2. Building/structure No. 1164 1087285.7 100 25075 37000
3. Machinery, equipments etc. No. ------ 276666.67 0 0 0
Product 33: Jaipuri rajai Owned Hired Sl. Item Unit of quantity
Qty Value Qty Value Rent (Rs.)
1. Land Acre 1 10000000 1 10000 0
2. Building/structure No. 1 2000000 0 0 0
3. Machinery, equipments etc. No. 1 200000 0 0 0
Product 34: Sanganeri print Owned Hired Sl. Item Unit of quantity
Qty Value Qty Value Rent (Rs.)
1. Land Sq. mts 4 425000 0 0 0
2. Building/structure No. 0 0 0 0 0
3. Machinery, equipments etc. No. 0 0 0 0 0

376
Product 35: Banarasi saree Owned Hired Sl. Item Unit of quantity
Qty Value Qty Value Rent (Rs.)
1. Land ---- 0 0 0 0 0
2. Building/structure ---- 0 0 0 0 0
3. Machinery, equipments etc. ---- 0 0 0 0 0
Product 36: Lucknavi chikan Owned Hired Sl. Item Unit of quantity
Qty Value Qty Value Rent (Rs.)
1. Land Acre 0 0 0 0 0
2. Building/structure No. 0 0 490 0 20000
3. Machinery, equipments etc. ---- 0 0 0 0 0
Product 37: Bhadoi carpet Owned Hired Sl. Item Unit of quantity
Qty Value Qty Value Rent (Rs.)
1. Land Acre 2 150000 0 0 0
2. Building/structure No. 0 338333.34 0 0 0
3. Machinery, equipments etc. No. 0 20000 0 0 0
Product 38: Kullu shawl Owned Hired Sl. Item Unit of quantity
Qty Value Qty Value Rent (Rs.)
1. Land ---- 0 0 0 0 0
2. Building/structure ---- 0 0 0 0 0
3. Machinery, equipments etc. ---- 0 0 0 0 0
Table-6.11: Average value of products, by-products manufactured (including products consumed at home) in a month and total input cost of non-agricultural products for the last 3 years
2004 2005 2006 SN Product
Unit of the Prod-uct
Qua
ntity
Val
ue (R
s)
Tota
l inp
ut
cost
Qua
ntity
Val
ue (R
s)
Tota
l inp
ut
cost
Qua
ntity
Val
ue (R
s)
Tota
l inp
ut
cost
V Confectionary
1 Tirunelveli halwa Kg 1235 73650 1270 76200 1482 93810
2 Dodha Kg 14140 1763600 17322.5 2295575 21470 3059100 3 Bikaneri bhujia Kg 18500 895000 19200 955000 20800 914000 4 Bikaneri
rasgolla Kg 34500 1350000 35200 1422000 38800 1046000
5 Agra petha Kg 6715 328985 342215 9917 398643 401138 10720 478270 481330 6 Bal mithai Kg 2088 126480 2290.2 159220 2487.3 174185
VI Handicrafts 7 Kondapalli
bommalu (toys) No. 51.5 4632.5 ----- 61 5945 75.8 7677.5 ----

377
2004 2005 2006 SN Product
Unit of the Prod-uct
Qua
ntity
Val
ue (R
s)
Tota
l inp
ut
cost
Qua
ntity
Val
ue (R
s)
Tota
l inp
ut
cost
Qua
ntity
Val
ue (R
s)
Tota
l inp
ut
cost
8 Chennapatana toys No. 2070 68000 91800 2070 68000 91800 2700 50000 91800
9 Thanjaur art plate No. 84.5 12400 102.5 15800 102 16950
10 Kolhapuri chappal No. 43.3 5225.2 5355 46.5 5870.5 6040.5 50.1 6555 6835
11 Warli paintings No. 141.5 28500 161.5 33200 180 38200 12 Punjabi jooti No. 36 54000 41.8 63760 66 105565 13 Moradabad
brass material No. 614.2 19085000 20735000 580.19 20380555.6 20380555.6
569.85 17730800 18455000
14 Saharanpur furniture Piece 21.5 71000 656200 19.2 65300 855100 22.8 76000 939200
VII Manufactured products with organized trade 15 Hyderabad
pearls 1 line 50991.5 118200 ---- 54630 125200 ---- 61453 116400 ----
16 Mysore sandal soap Ton 600 3950000 3500000 600 4000000 350000
0 600 4000000 3500000
17 Nilgiri oil Liter 38 6330 ---- 79.5 20030 ---- 138 69150 ----- 18 Sivakasi
patakha Case 34.5 70000 ---- 38 76000 40.5 81000
19 Harambha thresher No. 293 77720 347 78950 424 94300
20 Makrana marble Sq. ft 14300 2080000 15000 2380000 17100 2700000 21 Jaipur blue
pottery No. 11800 223300 217300 12351 282100 283500 13745 322700 329800
22 Ferozabad chundia and glassware
Bunch 2671.7 1990000 53112.4 2714.4 2130000 52842.6 2525.3 2100000 58689.8
23 Khurja pottery No. 3.91 130000 508000 4.70 144000 654200 4.75 159000 755000 VII
I Textiles
24 Gadwal saree Per Saree
44.5 50200 ---- 40.3 55900 ----- 47.2 69600 -----
25 Srikalahasti kalamkari No. 170.6 50750 --- 257.1 124800 ---- 369.8 215900 ----
26 Kancheepuram silk Mt. 25 14400 --- 25.8 15480 ---- 25.7 15180 ----
27 Bandhani saree Piece 3100 667750 3700 1106000 4160 1579950 28 Patola saree Piece 67 125150 79.2 159595 75.3 158585 29 Kutch
embroidery Piece 244.3 57830 249.3 74346 258.3 89005
30 Paithani saree No. 22 1091500 28.5 1402250 38.1 373800 31 Phulkari No. 1736 1121150 1118.& 365850 1144.5 482780 32 Ludhiana
hosiery Piece 179315 42122050 180350 40398000 187000 42971500
33 Jaipuri rajai Piece 3450 1280000 1920000 4220 1600000 2400000 5400 1920000 2780000 34 Sanganeri print No. 7410 715000 476650 13280 826500 571155 19040 970500 692155 35 Banarasi saree Piece 6.5 6700 46600 7.9 8200 66600 9.1 10000 89400 36 Lucknavi
chikan Piece 1735 325850 325850 1318.5 348262.5 348262.5 1395.5 375730 375730
37 Bhadoi carpet Sq. ft 182.5 1849000 1993000 194.5 1567500 2242500 210 2416500 2205000 38 Kullu shawl Piece 13.3 4166.67 12.8 4020 15.4 4900
*Note: The information in the table is purely collected by data enumerators from the producers. It need to be verified from experts of the subject and also to be analyzed further using scientific methodology

378
Table-6.12: Different sources of loan obtained by non-agriculture enterprises Source of loan Enterprises – No. (%)
Government 8 (11.12) Co-operative Society 5 (6.95) Bank 56 (77.78) Traders/Exporters/Intermediaries 0 (0.0) Moneylenders 3 (4.17) Total 72
Table-6.13: Analysis of purpose of loan taken by non-agricultural producers Purpose of loan Enterprises – No. (%)
Purchase of land No information Construction/maintenance of building 3 (4.17) Purchase of machinery/equipment 11 (15.28) Purchase of other assets 4 (5.56) Purchase of seeds/raw materials and other materials (fertilizers, packing materials) 49 (68.05) Legal expenses No information Repayment of debt 3 (4.17) Others 2 (2.78) Total 68
Table-6.14: Average interest percentage paid to different sources of loan obtained by non-agricultural producers
Source of loan Average interest paid in %
Government 7.0 Co-operative Society 8.06 Bank 12.05 Traders/Exporters/Intermediaries -- Moneylenders 22.83
Table-6.15: Average amount outstanding by a different GI type of non-agricultural enterprises GI Type Average Amount outstanding (Rs)
V ------ VI 28888 VII 141588 VIII 90588
Table-6.16: Range of loan amount taken by non-agricultural enterprises Loan amount Enterprises – No. (%)
< 50,000 35 (51.4) 50000- 1 lakh 1 (16.1)
1-2 lakh 5 (7.35) > 2 lakh 19 (27.94)
Total 68
Table-6.17: Skill acquired by non-agricultural producers to carry out production and related activities
Respondents – No. (%) Skill acquiring method V VI VII VIII
Knowledge gained traditionally 48 (69.5) 68 (67.32) 37 (43.02) 121 (69.14) Training 6 (8.69) 32 (31.68) 34 (39.53) 39 (22.28) Self interest and observations 15 (21.73) 1 (1.44) 15 (17.45) 15 (8.57) Total 69 101 86 175
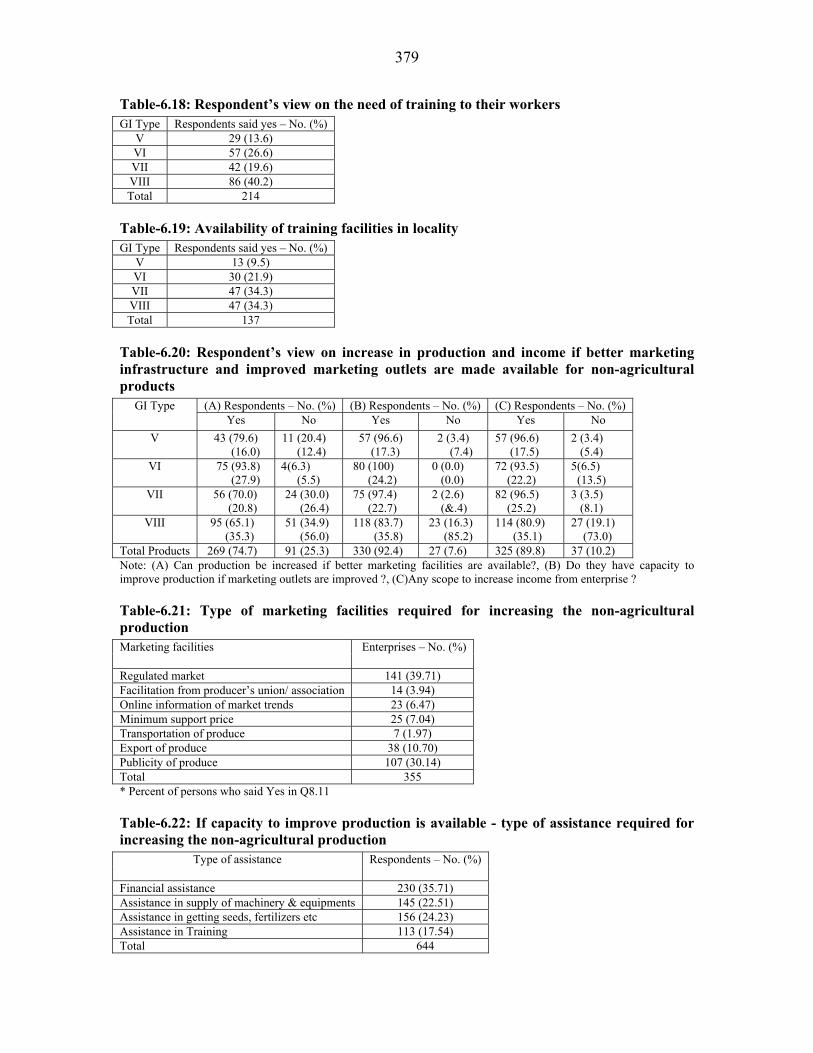
379
Table-6.18: Respondent’s view on the need of training to their workers GI Type Respondents said yes – No. (%)
V 29 (13.6) VI 57 (26.6) VII 42 (19.6) VIII 86 (40.2) Total 214
Table-6.19: Availability of training facilities in locality GI Type Respondents said yes – No. (%)
V 13 (9.5) VI 30 (21.9) VII 47 (34.3) VIII 47 (34.3) Total 137
Table-6.20: Respondent’s view on increase in production and income if better marketing infrastructure and improved marketing outlets are made available for non-agricultural products
(A) Respondents – No. (%) (B) Respondents – No. (%) (C) Respondents – No. (%) GI Type Yes No Yes No Yes No
V 43 (79.6) (16.0)
11 (20.4) (12.4)
57 (96.6) (17.3)
2 (3.4) (7.4)
57 (96.6) (17.5)
2 (3.4) (5.4)
VI 75 (93.8) (27.9)
4 (6.3) (5.5)
80 (100) (24.2)
0 (0.0) (0.0)
72 (93.5) (22.2)
5(6.5) (13.5)
VII 56 (70.0) (20.8)
24 (30.0) (26.4)
75 (97.4) (22.7)
2 (2.6) (&.4)
82 (96.5) (25.2)
3 (3.5) (8.1)
VIII 95 (65.1) (35.3)
51 (34.9) (56.0)
118 (83.7) (35.8)
23 (16.3) (85.2)
114 (80.9) (35.1)
27 (19.1) (73.0)
Total Products 269 (74.7) 91 (25.3) 330 (92.4) 27 (7.6) 325 (89.8) 37 (10.2) Note: (A) Can production be increased if better marketing facilities are available?, (B) Do they have capacity to improve production if marketing outlets are improved ?, (C)Any scope to increase income from enterprise ?
Table-6.21: Type of marketing facilities required for increasing the non-agricultural production Marketing facilities Enterprises – No. (%)
Regulated market 141 (39.71) Facilitation from producer’s union/ association 14 (3.94) Online information of market trends 23 (6.47) Minimum support price 25 (7.04) Transportation of produce 7 (1.97) Export of produce 38 (10.70) Publicity of produce 107 (30.14) Total 355 * Percent of persons who said Yes in Q8.11
Table-6.22: If capacity to improve production is available - type of assistance required for increasing the non-agricultural production
Type of assistance Respondents – No. (%)
Financial assistance 230 (35.71) Assistance in supply of machinery & equipments 145 (22.51) Assistance in getting seeds, fertilizers etc 156 (24.23) Assistance in Training 113 (17.54) Total 644
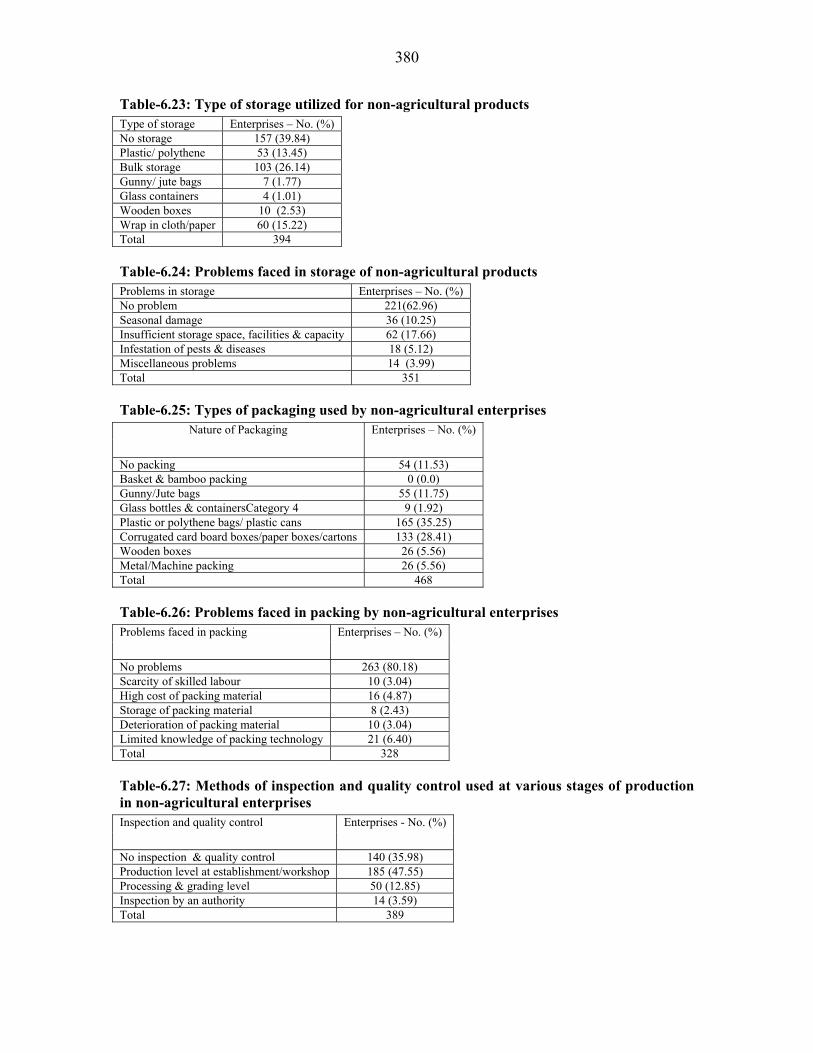
380
Table-6.23: Type of storage utilized for non-agricultural products Type of storage Enterprises – No. (%) No storage 157 (39.84) Plastic/ polythene 53 (13.45) Bulk storage 103 (26.14) Gunny/ jute bags 7 (1.77) Glass containers 4 (1.01) Wooden boxes 10 (2.53) Wrap in cloth/paper 60 (15.22) Total 394
Table-6.24: Problems faced in storage of non-agricultural products Problems in storage Enterprises – No. (%) No problem 221(62.96) Seasonal damage 36 (10.25) Insufficient storage space, facilities & capacity 62 (17.66) Infestation of pests & diseases 18 (5.12) Miscellaneous problems 14 (3.99) Total 351
Table-6.25: Types of packaging used by non-agricultural enterprises Nature of Packaging Enterprises – No. (%)
No packing 54 (11.53) Basket & bamboo packing 0 (0.0) Gunny/Jute bags 55 (11.75) Glass bottles & containersCategory 4 9 (1.92) Plastic or polythene bags/ plastic cans 165 (35.25) Corrugated card board boxes/paper boxes/cartons 133 (28.41) Wooden boxes 26 (5.56) Metal/Machine packing 26 (5.56) Total 468
Table-6.26: Problems faced in packing by non-agricultural enterprises Problems faced in packing
Enterprises – No. (%)
No problems 263 (80.18) Scarcity of skilled labour 10 (3.04) High cost of packing material 16 (4.87) Storage of packing material 8 (2.43) Deterioration of packing material 10 (3.04) Limited knowledge of packing technology 21 (6.40) Total 328
Table-6.27: Methods of inspection and quality control used at various stages of production in non-agricultural enterprises Inspection and quality control
Enterprises - No. (%)
No inspection & quality control 140 (35.98) Production level at establishment/workshop 185 (47.55) Processing & grading level 50 (12.85) Inspection by an authority 14 (3.59) Total 389
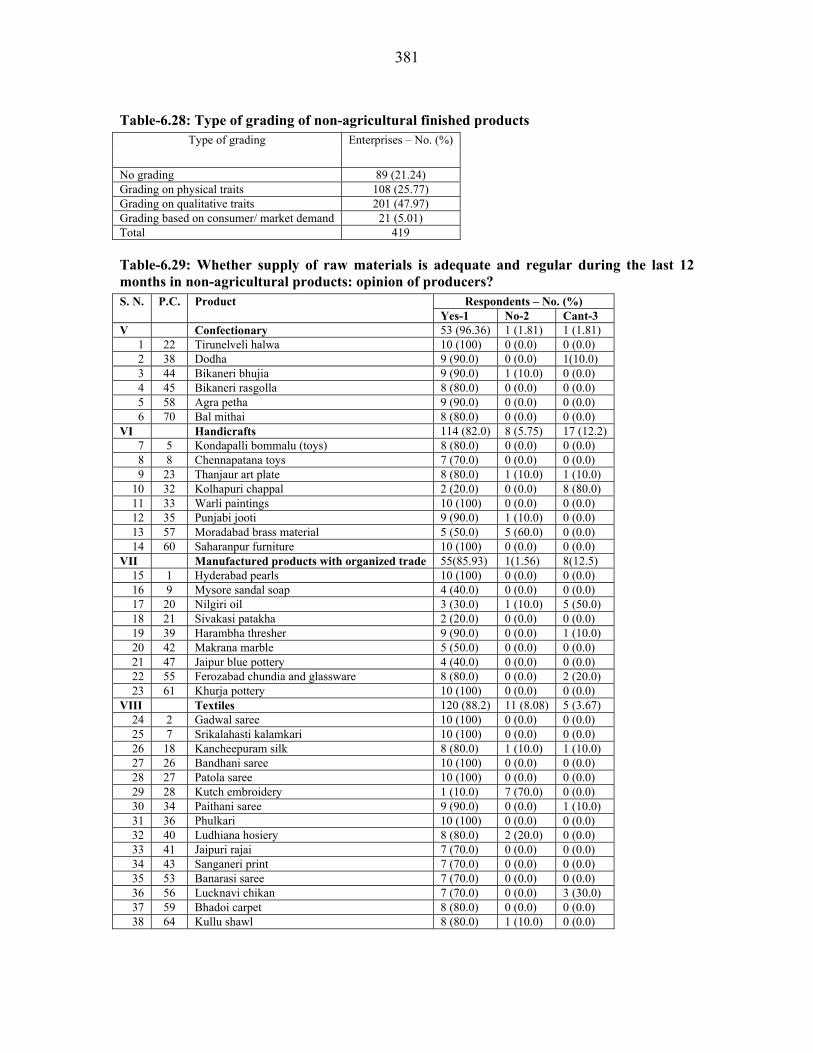
381
Table-6.28: Type of grading of non-agricultural finished products Type of grading Enterprises – No. (%)
No grading 89 (21.24) Grading on physical traits 108 (25.77) Grading on qualitative traits 201 (47.97) Grading based on consumer/ market demand 21 (5.01) Total 419
Table-6.29: Whether supply of raw materials is adequate and regular during the last 12 months in non-agricultural products: opinion of producers?
Respondents – No. (%) S. N. P.C. Product Yes-1 No-2 Cant-3
V Confectionary 53 (96.36) 1 (1.81) 1 (1.81) 1 22 Tirunelveli halwa 10 (100) 0 (0.0) 0 (0.0) 2 38 Dodha 9 (90.0) 0 (0.0) 1(10.0) 3 44 Bikaneri bhujia 9 (90.0) 1 (10.0) 0 (0.0) 4 45 Bikaneri rasgolla 8 (80.0) 0 (0.0) 0 (0.0) 5 58 Agra petha 9 (90.0) 0 (0.0) 0 (0.0) 6 70 Bal mithai 8 (80.0) 0 (0.0) 0 (0.0)
VI Handicrafts 114 (82.0) 8 (5.75) 17 (12.2) 7 5 Kondapalli bommalu (toys) 8 (80.0) 0 (0.0) 0 (0.0) 8 8 Chennapatana toys 7 (70.0) 0 (0.0) 0 (0.0) 9 23 Thanjaur art plate 8 (80.0) 1 (10.0) 1 (10.0)
10 32 Kolhapuri chappal 2 (20.0) 0 (0.0) 8 (80.0) 11 33 Warli paintings 10 (100) 0 (0.0) 0 (0.0) 12 35 Punjabi jooti 9 (90.0) 1 (10.0) 0 (0.0) 13 57 Moradabad brass material 5 (50.0) 5 (60.0) 0 (0.0) 14 60 Saharanpur furniture 10 (100) 0 (0.0) 0 (0.0)
VII Manufactured products with organized trade 55(85.93) 1(1.56) 8(12.5) 15 1 Hyderabad pearls 10 (100) 0 (0.0) 0 (0.0) 16 9 Mysore sandal soap 4 (40.0) 0 (0.0) 0 (0.0) 17 20 Nilgiri oil 3 (30.0) 1 (10.0) 5 (50.0) 18 21 Sivakasi patakha 2 (20.0) 0 (0.0) 0 (0.0) 19 39 Harambha thresher 9 (90.0) 0 (0.0) 1 (10.0) 20 42 Makrana marble 5 (50.0) 0 (0.0) 0 (0.0) 21 47 Jaipur blue pottery 4 (40.0) 0 (0.0) 0 (0.0) 22 55 Ferozabad chundia and glassware 8 (80.0) 0 (0.0) 2 (20.0) 23 61 Khurja pottery 10 (100) 0 (0.0) 0 (0.0)
VIII Textiles 120 (88.2) 11 (8.08) 5 (3.67) 24 2 Gadwal saree 10 (100) 0 (0.0) 0 (0.0) 25 7 Srikalahasti kalamkari 10 (100) 0 (0.0) 0 (0.0) 26 18 Kancheepuram silk 8 (80.0) 1 (10.0) 1 (10.0) 27 26 Bandhani saree 10 (100) 0 (0.0) 0 (0.0) 28 27 Patola saree 10 (100) 0 (0.0) 0 (0.0) 29 28 Kutch embroidery 1 (10.0) 7 (70.0) 0 (0.0) 30 34 Paithani saree 9 (90.0) 0 (0.0) 1 (10.0) 31 36 Phulkari 10 (100) 0 (0.0) 0 (0.0) 32 40 Ludhiana hosiery 8 (80.0) 2 (20.0) 0 (0.0) 33 41 Jaipuri rajai 7 (70.0) 0 (0.0) 0 (0.0) 34 43 Sanganeri print 7 (70.0) 0 (0.0) 0 (0.0) 35 53 Banarasi saree 7 (70.0) 0 (0.0) 0 (0.0) 36 56 Lucknavi chikan 7 (70.0) 0 (0.0) 3 (30.0) 37 59 Bhadoi carpet 8 (80.0) 0 (0.0) 0 (0.0) 38 64 Kullu shawl 8 (80.0) 1 (10.0) 0 (0.0)

382
Table-6.30: Respondent’s view of increase in production if nationalized banks and other institutions provide adequate finance and their approach
Adequate finance increases production, respondents – No. (%)
Did they approach any agency, respondents – No. (%)
GI Type
Yes No Yes No
V 42 (82.4) (13.9)
8 (17.6) (14.1)
17 (35.4) (13.4)
31 (64.6) (16.6)
VI 64 (80.0) (21.2)
16 (20.0) (25.0)
24 (34.8) (18.9)
45 (65.2) (24.1)
VII 74 (87.1) (24.5)
11 (12.9) (17.2)
31 (41.9) (24.4)
43 (58.1) (23.0)
VIII 122 (81.3) (40.4)
28 (18.7) (43.8)
55 (44.7) (43.3)
68 (55.3) (36.4)
Total Products 302 (82.5)
64 (17.5)
127 (40.4)
187 (59.6)
Note:
Table-6.31: Nature of response by financial agency to the non-agricultural producers’ approach for help
Respondents – No. (%) Good Not so good and with many formalities No response
Non – Agricultural Products
45 (29.8) 98 (64.9)
8 (5.3)
Table-6.32: Respondent’s opinion on the earning from the non-agricultural enterprise Respondents – No. (%) GI Type
Good Average Poor Total V 36 (60.0)
(19.1) 23 (38.3)
(15.8) 1 (1.7) (2.4)
60
VI 46 (57.5) (24.5)
28 (35.0) (19.2)
5 (7.5) (14.6)
80
VII 49 (57.6) (26.1)
27 (31.8) (18.5)
9 (10.6) (22.0)
85
VIII 57 (38.0) (30.3)
68 (45.3) (46.6)
25 (16.7) (61.0)
150
Total Products 188 (50.1)
146 (38.9)
41 (10.9)
375
Table-6.33: If earning is average or poor - type of assistance required for increasing income from the non-agricultural enterprise
Type of assistance Respondents – No. (%)
Financial assistance 216 (33.85)
Assistance in supply of machinery & equipments 152 (23.82)
Assistance in getting seeds, fertilizers etc 158 (24.76)
Assistance in Training 112 (17.55)
Others 638

383
Table-6.34 : Respondents views on enhancment of marketing potentiality of non-agricultural products
Respondents said yes – No. (%) Sl. No.
P. C.
Product Through changing technology (A)
larger market protentiality of product (B)
Increasing number of varieties of products (C)
V Confectionary 14 (10.68) 59 (45.03) 58 (44.27) 1 22 Tirunelveli halwa 7 (70.0) 10 (100) 10 (100) 2 38 Dodha 1 (10.0) 9 (90.0) 8 (80.0) 3 44 Bikaneri bhujia 2 (20.0) 10 (100) 10 (100) 4 45 Bikaneri rasgolla 0 (0.00 10 (100) 10 (100) 5 58 Agra petha 4 (40.0) 10 (100) 10 (100) 6 70 Bal mithai 0 (0.0) 10 (100) 10 (100)
VI Handicrafts 73 (32.45) 76 (33.78) 76 (33.78) 7 5 Kondapalli bommalu
(toys) 10 (100) 10 (100) 10 (100)
8 8 Chennapatana toys 10 (100) 10 (100) 10 (100) 9 23 Thanjaur art plate 10 (100) 10 (100) 10 (100) 10 32 Kolhapuri chappal 10 (100) 10 (100) 10 (100) 11 33 Warli paintings 10 (100) 10 (100) 10 (100) 12 35 Punjabi jooti 10 (100) 10 (100) 10 (100) 13 57 Moradabad brass
material 9 (100) 6 (66.7) 6 (60.0)
14 60 Saharanpur furniture 5 (50.0) 10 (100) 10 (100) VII Manufactured
products with organized trade
25 (16.12) 72 (46.45) 58 (37.41)
15 1 Hyderabad pearls 0 (0.0) 8 (100) 2 (20.0) 16 9 Mysore sandal soap 6 (75.0) 6 (60.0) 6 (60.0) 17 20 Nilgiri oil 1 (11.1) 10 (100) 10 (100) 18 21 Sivakasi patakha 10 (100) 10 (100) 9 (100) 19 39 Harambha thresher 4 (40.0) 8 (100) 10 (100) 20 42 Makrana marble 1 (10.0) 10 (100) 3 (30.0) 21 47 Jaipur blue pottery 0 (0.0) 10 (100) 10 (100) 22 55 Ferozabad chundia and
glassware 7 (70.0) 10 (100) 8 (100)
23 61 Khurja pottery 5 (50.0) 10 (100) 10 (100) VIII Textiles 73 (21.66) 131 (38.87) 133 (39.46)
24 2 Gadwal saree 0 (0.0) 9 (90.0) 6 (60.0) 25 7 Srikalahasti kalamkari 10 (100) 10 (100) 10 (100) 26 18 Kancheepuram silk 3 (30.0) 6 (60.0) 9 (100) 27 26 Bandhani saree 0 (0.0) 9 (100) 9 (100) 28 27 Patola saree 0 (0.0) 10 (100) 10 (100) 29 28 Kutch embroidery 10 (100) 0 (0.0) 10 (100) 30 34 Paithani saree 9 (100) 10 (100) 10 (100)
031 36 Phulkari 7 (100) 10 (100) 10 (100) 32 40 Ludhiana hosiery 7 (70.0) 7 (70.0) 8 (100) 33 41 Jaipuri rajai 0 (0.0) 10 (100) 10 (100) 34 43 Sanganeri print 0 (0.0) 10 (100) 10 (100) 35 53 Banarasi saree 8 (100) 10 (100) 9 (100) 36 56 Lucknavi chikan 10 (100) 10 (100) 9 (90.0) 37 59 Bhadoi carpet 3 (30.0) 10 (100) 4 (50.0) 38 64 Kullu shawl 6 (60.0) 10 (100) 9 (90.0)
Note : (A) Do you have any programme to change your technology of your products so as to satisfy the changing needs
of the consumers ? (B) Do you think that there is larger market protentialityof your product ? (C) Do you think that increasing number of varieties of your products would enlarge the existing market ?
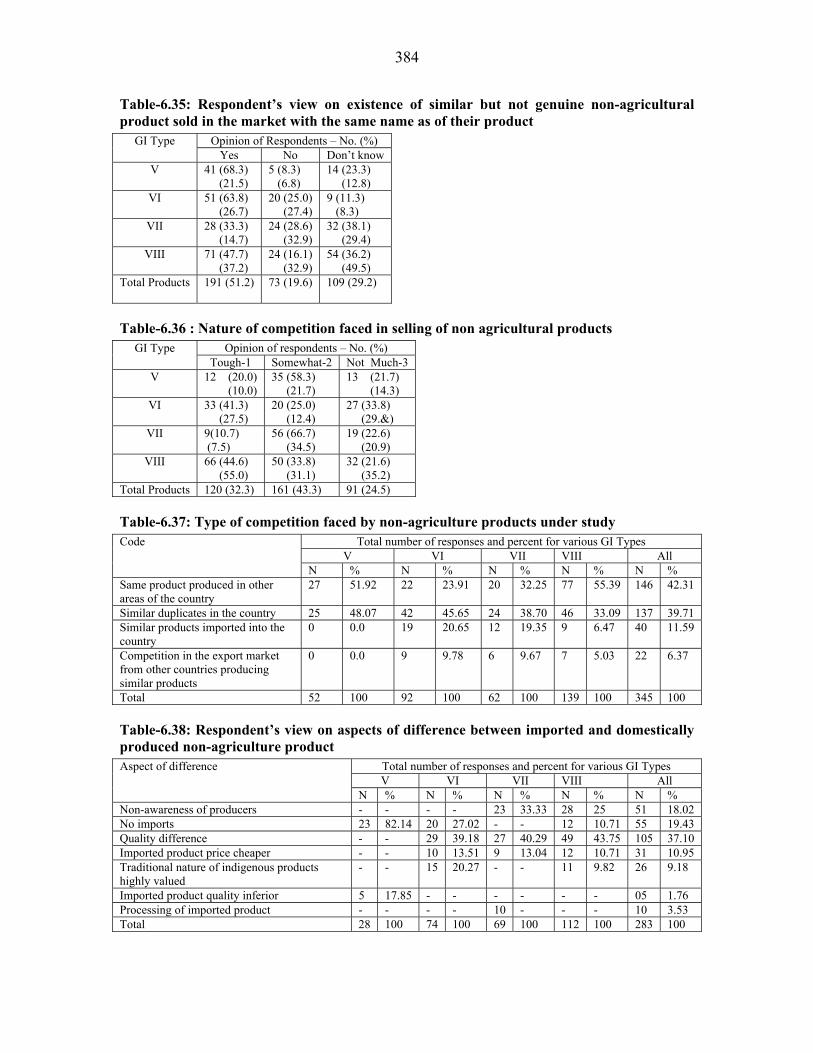
384
Table-6.35: Respondent’s view on existence of similar but not genuine non-agricultural product sold in the market with the same name as of their product
Opinion of Respondents – No. (%) GI Type Yes No Don’t know
V 41 (68.3) (21.5)
5 (8.3) (6.8)
14 (23.3) (12.8)
VI 51 (63.8) (26.7)
20 (25.0) (27.4)
9 (11.3) (8.3)
VII 28 (33.3) (14.7)
24 (28.6) (32.9)
32 (38.1) (29.4)
VIII 71 (47.7) (37.2)
24 (16.1) (32.9)
54 (36.2) (49.5)
Total Products 191 (51.2)
73 (19.6)
109 (29.2)
Table-6.36 : Nature of competition faced in selling of non agricultural products Opinion of respondents – No. (%) GI Type
Tough-1 Somewhat-2 Not Much-3 V 12 (20.0)
(10.0) 35 (58.3) (21.7)
13 (21.7) (14.3)
VI 33 (41.3) (27.5)
20 (25.0) (12.4)
27 (33.8) (29.&)
VII 9(10.7) (7.5)
56 (66.7) (34.5)
19 (22.6) (20.9)
VIII 66 (44.6) (55.0)
50 (33.8) (31.1)
32 (21.6) (35.2)
Total Products 120 (32.3) 161 (43.3) 91 (24.5)
Table-6.37: Type of competition faced by non-agriculture products under study Total number of responses and percent for various GI Types
V VI VII VIII All Code
N % N % N % N % N % Same product produced in other areas of the country
27 51.92 22 23.91 20 32.25 77 55.39 146 42.31
Similar duplicates in the country 25 48.07 42 45.65 24 38.70 46 33.09 137 39.71 Similar products imported into the country
0 0.0 19 20.65 12 19.35 9 6.47 40 11.59
Competition in the export market from other countries producing similar products
0 0.0 9 9.78 6 9.67 7 5.03 22 6.37
Total 52 100 92 100 62 100 139 100 345 100
Table-6.38: Respondent’s view on aspects of difference between imported and domestically produced non-agriculture product
Total number of responses and percent for various GI Types V VI VII VIII All
Aspect of difference
N % N % N % N % N % Non-awareness of producers - - - - 23 33.33 28 25 51 18.02 No imports 23 82.14 20 27.02 - - 12 10.71 55 19.43 Quality difference - - 29 39.18 27 40.29 49 43.75 105 37.10 Imported product price cheaper - - 10 13.51 9 13.04 12 10.71 31 10.95 Traditional nature of indigenous products highly valued
- - 15 20.27 - - 11 9.82 26 9.18
Imported product quality inferior 5 17.85 - - - - - - 05 1.76 Processing of imported product - - - - 10 - - - 10 3.53 Total 28 100 74 100 69 100 112 100 283 100

385
Table-6.39: Average years of production of the non-agriculture product by respondents Sl. No. P.C. Name of the Product Average year V Confectionary
1 22 Tirunelveli halwa 21.4 2 38 Dodha 40.3 3 44 Bikaneri bhujia 27.8 4 45 Bikaneri rasgolla 29.5 5 58 Agra petha 50.2 6 70 Bal mithai 32.5
VI Handicrafts 7 5 Kondapalli bommalu (toys) 83.3 8 8 Chennapatana toys 33 9 23 Thanjaur art plate 28.2
10 32 Kolhapuri chappal 20.7 11 33 Warli paintings 27.2 12 35 Punjabi jooti 57 13 57 Moradabad brass material 31 14 60 Saharanpur furniture 22.5
VII Manufactured products with organized trade 15 1 Hyderabad pearls 74.5 16 9 Mysore sandal soap 70.83 17 20 Nilgiri oil 23.6 18 21 Sivakasi patakha 35 19 39 Harambha thresher 27.6 20 42 Makrana marble 60.5 21 47 Jaipur blue pottery 21.6 22 55 Ferozabad chundia and glassware 23.4 23 61 Khurja pottery 20.2
VIII Textiles 24 2 Gadwal saree 25.2 25 7 Srikalahasti kalamkari 41.5 26 18 Kancheepuram silk 30.3 27 26 Bandhani saree 67.2 28 27 Patola saree 32 29 28 Kutch embroidery 99 30 34 Paithani saree 14.7 31 36 Phulkari 27.3 32 40 Ludhiana hosiery 30.4 33 41 Jaipuri rajai 73.5 34 43 Sanganeri print 51.8 35 53 Banarasi saree 57.6 36 56 Lucknavi chikan 44.4 37 59 Bhadoi carpet 51.5 38 64 Kullu shawl 10.6
Table-6.40: Whether product can be protected as community patent known as geographical indication: awareness of non-agricultural producers.
Opinion of respondents – No. (%) GI type Yes No Total
V 5 (8.3) (5.2)
55 (91.7) (20.0)
60 (16.2)
VI 43 (53.8) (44.8)
37 (46.3) (13.5)
80 (21.6)
VII 16 (19.5) (16.7)
66 (80.5) (24.0)
82 (22.1)
VIII 32 (21.5) (33.3)
117 (78.5) (42.5)
149 (40.2)
Total products 96 (25.9) 275 (74.1) 371
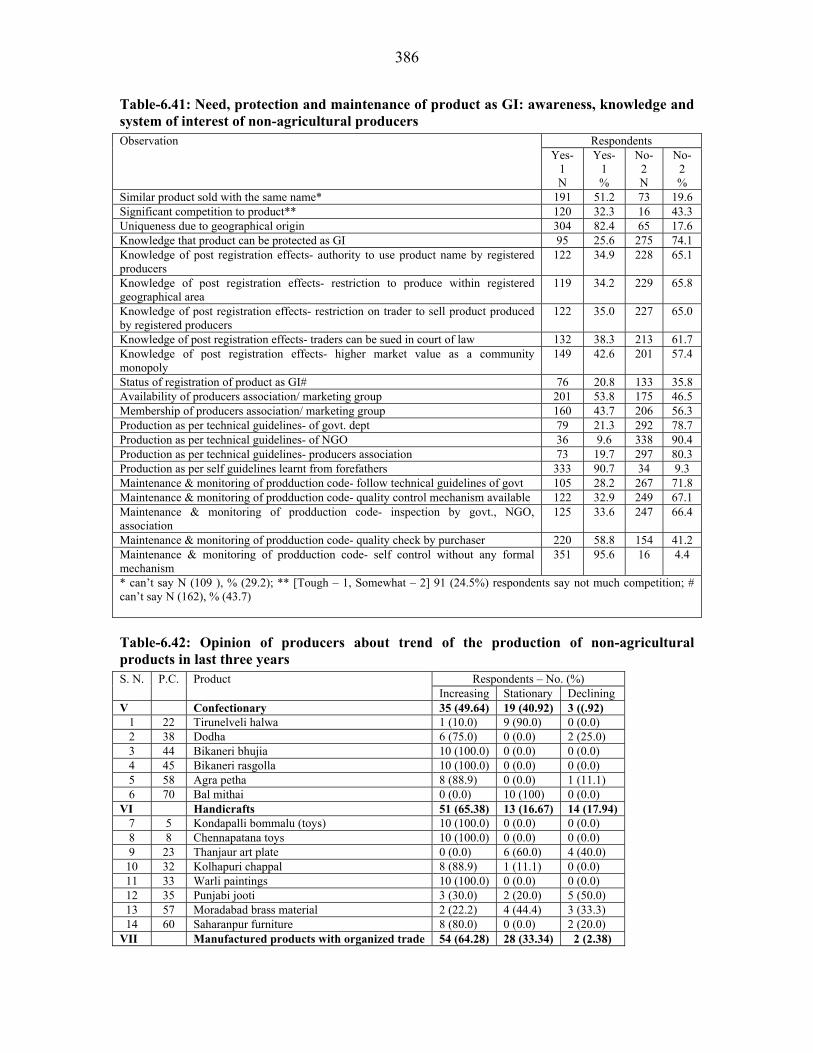
386
Table-6.41: Need, protection and maintenance of product as GI: awareness, knowledge and system of interest of non-agricultural producers
Respondents Observation Yes-
1 N
Yes-1 %
No-2 N
No-2 %
Similar product sold with the same name* 191 51.2 73 19.6 Significant competition to product** 120 32.3 16 43.3 Uniqueness due to geographical origin 304 82.4 65 17.6 Knowledge that product can be protected as GI 95 25.6 275 74.1 Knowledge of post registration effects- authority to use product name by registered producers
122 34.9 228 65.1
Knowledge of post registration effects- restriction to produce within registered geographical area
119 34.2 229 65.8
Knowledge of post registration effects- restriction on trader to sell product produced by registered producers
122 35.0 227 65.0
Knowledge of post registration effects- traders can be sued in court of law 132 38.3 213 61.7 Knowledge of post registration effects- higher market value as a community monopoly
149 42.6 201 57.4
Status of registration of product as GI# 76 20.8 133 35.8 Availability of producers association/ marketing group 201 53.8 175 46.5 Membership of producers association/ marketing group 160 43.7 206 56.3 Production as per technical guidelines- of govt. dept 79 21.3 292 78.7 Production as per technical guidelines- of NGO 36 9.6 338 90.4 Production as per technical guidelines- producers association 73 19.7 297 80.3 Production as per self guidelines learnt from forefathers 333 90.7 34 9.3 Maintenance & monitoring of prodduction code- follow technical guidelines of govt 105 28.2 267 71.8 Maintenance & monitoring of prodduction code- quality control mechanism available 122 32.9 249 67.1 Maintenance & monitoring of prodduction code- inspection by govt., NGO, association
125 33.6 247 66.4
Maintenance & monitoring of prodduction code- quality check by purchaser 220 58.8 154 41.2 Maintenance & monitoring of prodduction code- self control without any formal mechanism
351 95.6 16 4.4
* can’t say N (109 ), % (29.2); ** [Tough – 1, Somewhat – 2] 91 (24.5%) respondents say not much competition; # can’t say N (162), % (43.7)
Table-6.42: Opinion of producers about trend of the production of non-agricultural products in last three years
Respondents – No. (%) S. N. P.C. Product Increasing Stationary Declining
V Confectionary 35 (49.64) 19 (40.92) 3 ((.92) 1 22 Tirunelveli halwa 1 (10.0) 9 (90.0) 0 (0.0) 2 38 Dodha 6 (75.0) 0 (0.0) 2 (25.0) 3 44 Bikaneri bhujia 10 (100.0) 0 (0.0) 0 (0.0) 4 45 Bikaneri rasgolla 10 (100.0) 0 (0.0) 0 (0.0) 5 58 Agra petha 8 (88.9) 0 (0.0) 1 (11.1) 6 70 Bal mithai 0 (0.0) 10 (100) 0 (0.0)
VI Handicrafts 51 (65.38) 13 (16.67) 14 (17.94) 7 5 Kondapalli bommalu (toys) 10 (100.0) 0 (0.0) 0 (0.0) 8 8 Chennapatana toys 10 (100.0) 0 (0.0) 0 (0.0) 9 23 Thanjaur art plate 0 (0.0) 6 (60.0) 4 (40.0)
10 32 Kolhapuri chappal 8 (88.9) 1 (11.1) 0 (0.0) 11 33 Warli paintings 10 (100.0) 0 (0.0) 0 (0.0) 12 35 Punjabi jooti 3 (30.0) 2 (20.0) 5 (50.0) 13 57 Moradabad brass material 2 (22.2) 4 (44.4) 3 (33.3) 14 60 Saharanpur furniture 8 (80.0) 0 (0.0) 2 (20.0)
VII Manufactured products with organized trade 54 (64.28) 28 (33.34) 2 (2.38)

387
Respondents – No. (%) S. N. P.C. Product Increasing Stationary Declining
15 1 Hyderabad pearls 5 (50.0) 4 (40.0) 1 (10.0) 16 9 Mysore sandal soap 5 (100) 0 (0.0) 0 (0.0) 17 20 Nilgiri oil 4 (40.0) 5 (50.0) 1 (10.0) 18 21 Sivakasi patakha 10 (100.0) 0 (0.0) 0 (0.0) 19 39 Harambha thresher 9 (90.0) 1 (10.0) 0 (0.0) 20 42 Makrana marble 0 (0.0) 10 (100.0) 0 (0.0) 21 47 Jaipur blue pottery 4 (40.0) 6 (60.0) 0 (0.0) 22 55 Ferozabad chundia and glassware 7 (77.8) 2 (22.2) 0 (0.0) 23 61 Khurja pottery 10 (100.0) 0 (0.0) 0 (0.0)
VIII Textiles 70 (61.40) 57 (33.34) 14 (5.26) 24 2 Gadwal saree 1 (10.0) 9 (90.0) 0 (0.0) 25 7 Srikalahasti kalamkari 10 (100.0) 0 (0.0) 0 (0.0) 26 18 Kancheepuram silk 3 (30.0) 6 (60.0) 1 (10.0) 27 26 Bandhani saree 7 (70.0) 3 (30.0) 0 (0.0) 28 27 Patola saree 6 (60.0) 4 (40.0) 0 (0.0) 29 28 Kutch embroidery 0 (0.0) 10 (100) 0 (0.0) 30 34 Paithani saree 10 (100.0) 0 (0.0) 0 (0.0) 31 36 Phulkari 7 (70.0) 3 (30.00 0 (0.0) 32 40 Ludhiana hosiery 4 (50.0) 4 (50.0) 0 (0.0) 33 41 Jaipuri rajai 3 (30.0) 7 (70.0) 0 (0.0) 34 43 Sanganeri print 9 (90.0) 1 (10.0) 0 (0.0) 35 53 Banarasi saree 0 (0.0) 0 (0.0) 10 (100) 36 56 Lucknavi chikan 5 (55.6) 3 (33.3) 1 (11.1) 37 59 Bhadoi carpet 0 (0.0) 2 (50.0) 2 (50.0) 38 64 Kullu shawl 5 (50.0) 5 (50.0) 0 (0.0) Total non-agricultural products 210 (58.3) 117 (32.5) 33 (9.2)
Table-6.43: Assessment of producers’ associateship with the enterprise: opinion of non-agricultural producers
Agreement of respondents – No. (%) S. N P.C. Product No one has discontinued the production of GI
Many have discontinued the production of GI
Few more have started producing
Several more have started producing
The situation is same- no addition, no deletion
V Confectionary 32 (25.39) 5 (3.96) 48 (38.09) 32 (25.39) 9 (7.14) 1 22 Tirunelveli halwa 0 (0.0) 0 (0.0) 5 (50.0) 5 (50.0) 0 (0.0) 2 38 Dodha 4 (40.0) 3 (50.0) 3 (30.0) 6 (60.0) 3 (30.0) 3 44 Bikaneri bhujia 10 (100) 0 (0.0) 10 (100) 10 (100) 0 (0.0) 4 45 Bikaneri rasgolla 10 (100) 0 (0.0) 10 (100) 10 (100) 0 (0.0) 5 58 Agra petha 8 (80.0) 2 (50.0) 10 (100) 1 (11.1) 6 (60.0) 6 70 Bal mithai 0 (0.0) 0 (0.0) 10 (100) 0 (0.0) 0 (0.0)
VI Handicrafts 46 (28.04) 24 (14.63) 70 (42.68) 13 (7.92) 11 (6.70) 7 5 Kondapalli
bommalu (toys) 10 (100) 1 (10.0) 10 (100) 2 (50.0) 10 (100)
8 8 Chennapatana toys 10 (100) 0 (0.0) 10 (100) 0 (0.0) 0 (0.0) 9 23 Thanjaur art plate 1 (10.0) 10 (100) 7 (70.0) 0 (0.0) 0 (0.0)
10 32 Kolhapuri chappal 0 (0.0) 1 (10.0) 10 (100) 0 (0.0) 0 (0.0) 11 33 Warli paintings 10 (100) 1 (10.0) 10 (100) 0 (0.0) 0 (0.0) 12 35 Punjabi jooti & (70.0) 1 (11.1) 7 (77.8) 7 (70.0) 0 (0.0) 13 57 Moradabad brass
material 8 (80.0) 0 (0.0) 7 (77.8) 2 (22.2) 1 (11.1)
14 60 Saharanpur furniture
0 (0.0) 10 (100) 9 (90.0) 2 (20.0) 0 (0.0)
VII Manufactured products with organized trade
38 (21.34) 33 (18.53) 79 (44.38) 22 (12.35) 6 (3.37)
15 1 Hyderabad pearls 0 (0.0) 2 (50.0) 10 (100) 4 (100) 0 (0.0)

388
Agreement of respondents – No. (%) S. N P.C. Product No one has discontinued the production of GI
Many have discontinued the production of GI
Few more have started producing
Several more have started producing
The situation is same- no addition, no deletion
16 9 Mysore sandal soap 6 (66.8) 0 (0.0) 6 (60.0) 0 (0.0) 0 (0.0) 17 20 Nilgiri oil 8 (100) 0 (0.0) 9 (90.0) 1 (10.0) 1 (10.0) 18 21 Sivakasi patakha 0 (0.0) 10 (100) 10 (100) 0 (0.0) 0 (0.0) 19 39 Harambha thresher 10 (100) 0 (0.0) 10 (100) 6 (60.0) 1 (10.0) 20 42 Makrana marble & (77.8) 3 (30.0) 10 (100) 0 (0.0) 0 (0.0) 21 47 Jaipur blue pottery 4 (40.0) 6 (60.0) 7 (70.0) 4 (40.0) 0 (0.00 22 55 Ferozabad chundia
and glassware 3 (30.0) 2 (50.0) 7 (70.0) 7 (70.0) 4 (40.0)
23 61 Khurja pottery 0 (0.0) 10 (100) 10 (100) 0 (0.0) 0 (0.0) VIII Textiles 72 (21.11) 54 (15.83) 96 (28.15) 74 (21.70) 45 (13.19) 24 2 Gadwal saree 10 (100) 1 (10.0) 1 (10.0) 1 (10.0) 10 (100) 25 7 Srikalahasti
kalamkari 10 (100) 0 (0.0) 10 (100) 10 (100) 0 (0.0)
26 18 Kancheepuram silk 3 (30.0) 5 (50.0) 3 (30.0) 7 (70.0) 1 (11.1) 27 26 Bandhani saree 0 (0.0) 9 (90.0) 10 (100) 10 (100) 1 (10.0) 28 27 Patola saree 0 (0.0) 10 (100) 10 (100) 6 (60.0) 1 (10.0) 29 28 Kutch embroidery 10 (100) 0 (0.0) 9 (100) 0 (0.0) 6 (60.0) 30 34 Paithani saree 1 (10.0) 9 (90.0) 10 (100) 3 (30.0) 0 (0.0) 31 36 Phulkari ( (90.0) 0 (0.0) 4 (40.0) 4 (50.0) 3 (30.0) 32 40 Ludhiana hosiery 5 (50.0) 1 (10.0) 5 (50.0) 9 (90.0) 5 (50.0) 33 41 Jaipuri rajai 0 (0.0) 0 (0.0) 10 (100) 3 (30.0) 1 (10.0) 34 43 Sanganeri print ( (90.0) 0 (0.0) 1 (10.0) 9 (90.0) 0 (0.0) 35 53 Banarasi saree 1 (10.0) 10 (100) 1 (10.0) 1 (10.0) 1 (10.0) 36 56 Lucknavi chikan 2 (50.0) 6 (60.0) 6 (60.0) 4 (44.5) 6 (66.7) 37 59 Bhadoi carpet 4 (40.0) 3 (30.0) 5 (50.0) 6 (60.0) 0 (0.0) 38 64 Kullu shawl 8 (100) 0 (0.0) 10 (100) 1 (10.0) 10 (100) Total non-agricultural
products 188 (23.26) 116(14.35) 292 (36.13) 141 (17.45) 71 (8.78)
Table-6.44: Mode of sale of non-agricultural products by producers Respondents – No. (%)
GI Type Mode of Sale
V VI VII VIII All Mahajan 10 (58.8)
(12.34) 1 (5.8) (0.55)
3 (17.6) (1.71)
3 (17.6) (1.33)
17 (2.56)
Middlemen 2 (2.35) (2.46)
21 (24.70) (11.60)
32 (37.64) (18.28)
30 (35.29) (13.33)
85 (12.83)
Govt. agency 0 (0.0) (0.0)
22 (57.89) (12.15)
8 (21.05) (4.57)
8 (21.05) (3.56)
38 (5.74)
Cooperative society 0 (0.0) (0.0)
12 (30.76) (6.62)
12 (30.76) (6.85)
15 (38.46) (6.66)
39 (5.89)
Exporters 1 (1.19) (1.23)
27 (32.14) (14.91)
25 (29.76) (14.28)
31 (36.90) (13.77)
84 (12.68)
Wholesalers 15(8.92) (18.51)
37 (22.02) (20.44)
50 (29.76) (28.57)
66 (39.28) (29.33)
168 (25.37)
Selling to local shops; local consumers or in the local market
52 (24.4) (64.19)
60 (28.16) (33.14)
39 (18.30) (22.28)
62 (29.10) (27.5)
213 (32.17)
Processing agency 1 (5.56) (1.23)
1 (5.56) (0.55)
6 (33.3) (3.42)
10 (55.56) (4.45)
18 (2.71)
Total 81(12.23)
181(27.34)
175(26.43)
225(33.98)
662
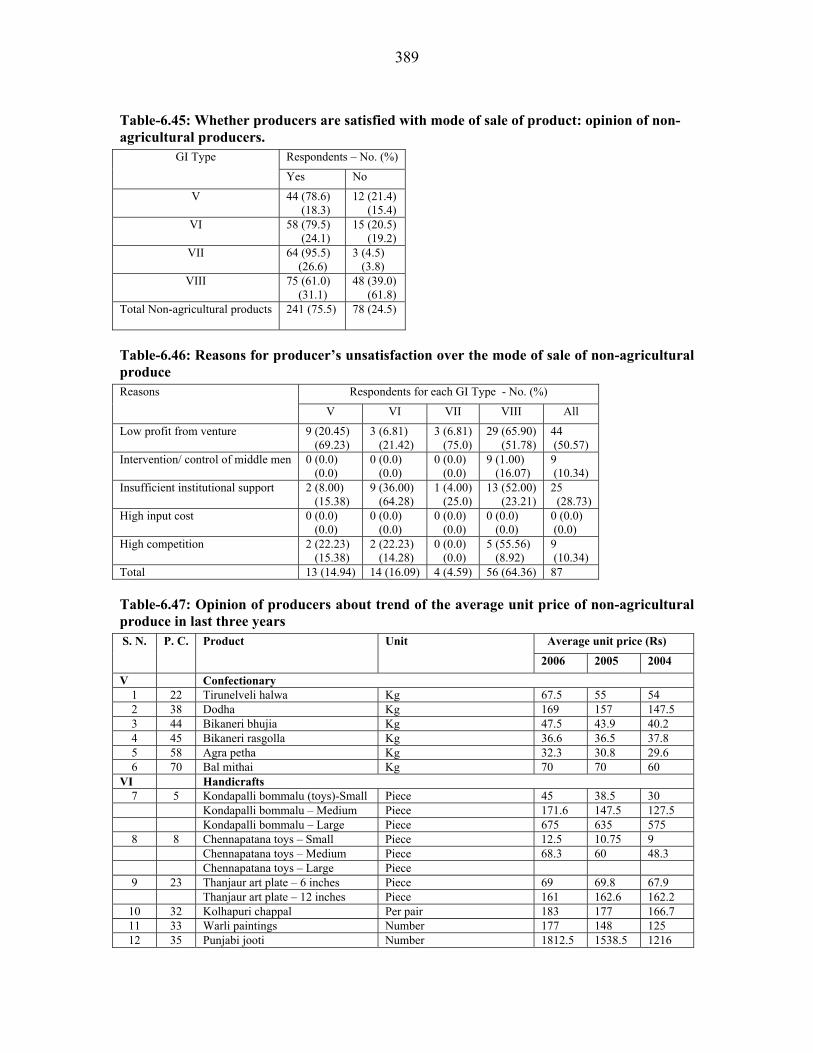
389
Table-6.45: Whether producers are satisfied with mode of sale of product: opinion of non-agricultural producers.
Respondents – No. (%) GI Type
Yes No
V 44 (78.6) (18.3)
12 (21.4) (15.4)
VI 58 (79.5) (24.1)
15 (20.5) (19.2)
VII 64 (95.5) (26.6)
3 (4.5) (3.8)
VIII 75 (61.0) (31.1)
48 (39.0) (61.8)
Total Non-agricultural products 241 (75.5)
78 (24.5)
Table-6.46: Reasons for producer’s unsatisfaction over the mode of sale of non-agricultural produce
Respondents for each GI Type - No. (%) Reasons
V VI VII VIII All
Low profit from venture 9 (20.45) (69.23)
3 (6.81) (21.42)
3 (6.81) (75.0)
29 (65.90) (51.78)
44 (50.57)
Intervention/ control of middle men 0 (0.0) (0.0)
0 (0.0) (0.0)
0 (0.0) (0.0)
9 (1.00) (16.07)
9 (10.34)
Insufficient institutional support 2 (8.00) (15.38)
9 (36.00) (64.28)
1 (4.00) (25.0)
13 (52.00) (23.21)
25 (28.73)
High input cost 0 (0.0) (0.0)
0 (0.0) (0.0)
0 (0.0) (0.0)
0 (0.0) (0.0)
0 (0.0) (0.0)
High competition 2 (22.23) (15.38)
2 (22.23) (14.28)
0 (0.0) (0.0)
5 (55.56) (8.92)
9 (10.34)
Total 13 (14.94) 14 (16.09) 4 (4.59) 56 (64.36) 87
Table-6.47: Opinion of producers about trend of the average unit price of non-agricultural produce in last three years
Average unit price (Rs) S. N. P. C. Product Unit
2006 2005 2004
V Confectionary 1 22 Tirunelveli halwa Kg 67.5 55 54 2 38 Dodha Kg 169 157 147.5 3 44 Bikaneri bhujia Kg 47.5 43.9 40.2 4 45 Bikaneri rasgolla Kg 36.6 36.5 37.8 5 58 Agra petha Kg 32.3 30.8 29.6 6 70 Bal mithai Kg 70 70 60
VI Handicrafts 7 5 Kondapalli bommalu (toys)-Small Piece 45 38.5 30 Kondapalli bommalu – Medium Piece 171.6 147.5 127.5 Kondapalli bommalu – Large Piece 675 635 575 8 8 Chennapatana toys – Small Piece 12.5 10.75 9 Chennapatana toys – Medium Piece 68.3 60 48.3 Chennapatana toys – Large Piece 9 23 Thanjaur art plate – 6 inches Piece 69 69.8 67.9 Thanjaur art plate – 12 inches Piece 161 162.6 162.2
10 32 Kolhapuri chappal Per pair 183 177 166.7 11 33 Warli paintings Number 177 148 125 12 35 Punjabi jooti Number 1812.5 1538.5 1216

390
Average unit price (Rs) S. N. P. C. Product Unit
2006 2005 2004
13 57 Moradabad brass material Kg 218.3 205 186.6 14 60 Saharanpur furniture Piece 22500 23500 28000
VII Manufactured products with organized trade 15 1 Hyderabad pearls-Processing -Kg Kg 129 126.75 124.5 Hyderabad pearls-String 1.04 1.05 1
16 9 Mysore sandal soap Piece 31.05 29.5 27.15 17 20 Nilgiri oil Liter 458 260 160 18 21 Sivakasi patakha-Flower pot Flower Pots/Box(10pieces) 37.3 21.7 32.9 Sivakasi patakha-Sparkler 12cm Sparklers/pack (10box) 23.3 22.3 20.4
19 39 Harambha thresher Number 145000 130800 118500 20 42 Makrana marble Sq ft 185.5 165.5 151 21 47 Jaipur blue pottery Number 95.5 80.3 60.4 22 55 Ferozabad chundia and glassware Bunch 23 20.9 17.9 23 61 Khurja pottery Number 81.5 71.3 59.7
VIII Textiles 24 2 Gadwal saree Piece 1330 1300 1110 25 7 Srikalahasti kalamkari Saree 1840 4750 4150 26 18 Kancheepuram silk-Saree Saree 16914.2 17285.7 19128.5 Kancheepuram silk-meter/weaving metre 108.6 108.3 106
27 26 Bandhani saree Saree 336.5 260.5 202.5 28 27 Patola saree Saree 2025 1910 1790 29 28 Kutch embroidery Piece 290 322 398 30 34 Paithani saree Saree 9375 7762.5 5875 31 36 Phulkari - Dupatta Piece 797 767 676 Phulkari – Cover sheet Piece 359 339 339
32 40 Ludhiana hosiery Piece 507.5 482.5 432 33 41 Jaipuri rajai Piece 332 360.5 342.5 34 43 Sanganeri print Number 169.5 158 131.5 35 53 Banarasi saree Saree 10000 8200 6700 36 56 Lucknavi chikan Piece 337 278 246.5 37 59 Bhadoi carpet -Small Piece 4866.6 4000 2216.6 Bhadoi carpet-Medium Piece 19000 16000 9375 Bhadoi carpet-Large Piece 48000 40166.6 26166.6
38 64 Kullu shawl Piece 37000 32000 32650
Table-6.48: Price decision of producers over the sale of non-agricultural produce Respondents – No. (%)
GI Type
Price Decision
V VI VII VIII All
Bargain collectively 0 (0.0) (0.0)
40 (51.94) (30.76)
13(16.88) (17.56)
24 (31.16) (23.07)
77 (22.31)
Bargain individually 23(19.82) (62.16)
24 (20.68) (18.46)
21(18.10) (28.57)
48 (41.37) (46.15)
116 (33.62)
Sale on minimum agreed price between our association and purchasers
8 (19.04) (21.62)
16 (38.09) (12.30)
9 (21.42) (12.16)
9 (21.42) (8.65)
42 (12.17)
The purchaser offers us a price to which we usually agree
6 (6.89) (16.21)
38 (43.67) (29.23)
28(32.18) (37.83)
15 (17.24) (14.42)
87 (25.21)
Purchaser offers us a price to which we have to sell; there is no other choice for us
0 (0.0) (0.0)
12 (52.17) (9.23)
3 (13.04) (4.05)
8 (34.78) (7.69)
23 (6.67)
Total 37(10.72) 130(37.68) 74(21.44) 104(30.14) 345

391
Table-6.49: Respondent’s constraints in production and marketing of non-agricultural produce
Respondents - No. (%) Constraints V VI VII VIII All
No problem 11(28.94) (19.64)
2 (5.26) (1.83)
12(31.57) (13.3)
13 (34.21) (7.92)
38 (9.06)
Scarcity of skilled workers 17(29.82) (30.35)
8 (14.03) (7.33)
16(28.07) (17.7)
16 (28.07) (9.75)
57 (13.60)
High competition 14(17.07) (25.0)
16 (19.51) (14.67)
22(26.82) (24.4)
30 (36.58) (18.29)
82 (19.57)
Insufficient publicity 0 (0.0) (0.0)
0 (0.0) (0.0)
0 (0.0) (0.0)
0 (0.0) (0.0)
0 (0.0)
Financial difficulties 2 (3.17) (3.57)
13 (20.63) (11.92)
15(23.80) (16.6)
33 (52.38) (20.12)
63 (15.03)
Lack of proper government policy & assistance 0 (0.0) (0.0)
12 (32.43) (11.0)
10(27.02) (11.11)
15 (40.54) (9.14)
37 (8.83)
Improper transportation arrangements 1 (6.25) (1.78)
4 (25.0) (3.66)
1 (6.25) (1.1)
10 (62.5) (6.09)
16 (3.81)
Market insecurity leading to low profitability 3 (9.37) (5.35)
10 (31.25) ((.17)
2 (6.25) (2.2)
17 (53.12) (10.36)
32 (7.63)
Difficulty in getting quality inputs 1 (2.56) (1.78)
27 (69.23) (24.77)
1 (2.56) (2.2)
10 (25.64) (6.09)
39 (9.30)
Packing of produce 0 (0.0) (0.0)
9 (100) (8.25)
0 (0.0) (0.0)
0 (0.0) (0.0)
9 (2.14)
Manufacturing process is tedious, time & labor intensive
7 (15.21) (12.5)
8 (17.39) (7.33)
11(23.91) (11.1)
20 (43.47) (12.19)
46 (10.97)
Total 56(13.36)
109(26.01)
90(21.47)
164(39.14)
419
Table-6.50: Responses of non-agricultural producers about willingness and expectations from GI registration
Respondents Observation Yes-
N Yes-
% No- N
No- %
Can’t say- N
Can’t say- %
Willingness for registration of product 266 76.7 27 7.8 54 15.6 Willingness for payment for registration 264 77.4 77 22.6 -- -- Non-registration leads to- low volume of sale 166 48.1 179 51.9 -- -- Non-registration leads to- low wages to labour 162 46.8 184 53.2 -- -- Non-registration leads to- low profit to producers 203 58.7 143 41.3 -- -- Non-registration leads to- difficulty in getting loans 159 46.0 187 54.0 -- -- Non-registration leads to- sale of fake product with same name 273 80.3 67 19.7 -- -- Post registration expectations- increase in sale* 145 43.2 160 47.6 31 9.2 Post registration expectations- increase in unit price 218 63.4 28 8.1 98 28.5 Post registration expectations- increase in net profit 252 73.3 10 2.9 82 23.8 Post registration expectations- less competition 136 39.5 57 16.6 151 43.9 Post registration expectations- market expansion 194 57.1 13 3.8 133 39.1 Post registration expectations- enhanced premium to producers 190 55.7 7 2.1 144 42.2 Post registration expectations- Shift from other livelihoods to RGI 126 37.4 84 24.9 127 37.7 Post registration expectations- improvement in overall socio-economic conditions of producers
195 60.6 15 4.7 112 34.8
* Significant-1, Marginal-2, No increase-3

392
Table-6.51: Willingness of respondents to pay range of amount for GI registration of non-agricultural produce
Respondents – No. (%) as per GI type Rupees V VI VII VIII All
500 37 (23.3) (69.8)
46 (28.9) (80.7)
18 (11.3) (34.6)
58 (36.5) (58.0)
159 (60.7)
1000 9 (15.0) (17.0)
7 (11.7) (12.3)
23 (38.3) (44.2)
21 (35.0) (21.0)
60 (22.9)
2000 4 (19.0) (7.5)
1 (4.8) (1.8)
4 (19.0) (7.7)
12 (57.1) (12.0)
21 (8.0)
3000 3 (13.6) (5.7)
3 (13.6) (5.3)
7 (31.8) (13.5)
9 (40.9) (9.0)
22 (8.4)
Total 53 (20.2)
57 (21.8)
52 (19.8)
100 (38.2)
262
Table-6.52: Willingness of producers to shift from other livelihood activities, if their non-agricultural product gets registered for GI and other protection systems are followed so that they can get more benefit
Respondents – No. (%) GI Type Yes No Total
V 30 (50.0) (12.8)
30 (50.0) (29.4)
60 (17.8)
VI 35 (53.8) (14.9)
30 (46.2) (29.4)
65 (19.3)
VII 59 (73.8) (25.1)
21 (26.3) (20.6)
80 (23.7)
VIII 111 (84.1) (47.2)
21 (15.9) (20.6)
132 (39.2)
Total Non-Agricultural Products 235 (69.7) 102 (30.3) 337
Table-6.53: Reasons for un willingness of the producers to shift from other livelihood activities, if their non-agricultural product gets registered for GI and other protection systems are followed Reasons % Respondents – No. (%) No knowledge of GI and its implications 75 (78.12) Production risk mitigation 4 (4.16) Marketing risk mitigation 5 (5.20) Risk avoidance arising due to climatic vagaries 2 (2.08) Present option as safer and profitable enterprise 10 (10.41) Total 96
Table-6.54: Producer’s opinion about expected shift from other livelihood activities to production of GI product as a result of GI registration
Respondents – No. (%) GI Type Yes No Can’t say Total
V 10 (16.9) (7.9)
37 (62.7) (44.0)
12 (20.3) (9.4)
59 (17.5)
VI 29 (43.9) (23.0)
30 (45.5) (35.7)
7 (10.6) (5.5)
66 (19.6)
VII 25 (32.5) (19.8)
5 (6.5) (6.0)
47 (45.2) (48.0)
135 (40.1)
VIII 62 (45.9) (49.2)
12 (8.9) (14.3)
61 (45.2) (48.0)
135 (40.1)
Total Non - Agricultural Products 126 (37.4) 84 (24.9) 127 (37.7) 337

393
Table-6.55: Producer’s opinion about expected enhanced premium to the producers over prevailing cost after GI registration of non-agricultural produce
Respondents – No. (%) in favor of % increase GI Type 0-5% 5-10% 10-15% >15% Total
V 13 (37.14) (20.96)
13 (37.14) (16.88)
9 (25.71) (14.51)
0 (0.0) (0.0)
35 (17.41)
VI 15 (35.71) (24.19)
27 (64.28) (35.06)
0 (0.0) (0.0)
0 (0.0) (0.0)
42 (20.89)
VII 13 (26.0) (20.96)
23 (46.0) (29.87)
14 (28.0) (22.58)
0 (0.0) (0.0)
50 (24.87)
VIII 21 (28.37) (33.87)
14 (18.91) (18.18)
39 (52.70) (62.90)
0 (0.0) (0.0)
74 (36.81)
Total Non-Agric. Products 62 (30.84)
77 (38.30)
62 (30.84)
0 (0.0)
201
Table-6.56: Responses of non-agricultural producers about post-registration observation regarding impact and change occurred
Respondents Observation Yes-1 N
Yes-1 %
No-2 N
No-2 %
Can’t say-3 N
Can’t say-3 %
Post registration changes observed 24 86.7 1 13.3 -- -- Observed post registration changes- increase in annual production*
35 76.1 10 21.7 1 2.2
Observed post registration changes- increase in unit price 44 95.7 1 2.2 1 2.2 Observed post registration changes- increase in net profit 39 84.8 6 13.0 1 2.2 Observed post registration changes- less competition 30 65.2 10 21.7 6 13.0 Observed post registration changes- market expansion 44 100 -- -- -- -- Observed post registration changes- enhanced premium to producers
37 82.2 8 17.8 -- --
Observed post registration changes- Shift from other livelihoods to RGI
23 50.0 23 50.0 -- --
Observed post registration changes- improvement in overall socio-economic conditions of producers
41 91.1 -- -- 4 8.9
Did they contribute money for registration 9 30.4 22 69.6 -- -- * Significant-1, Marginal-2, No increase-3
Table – 6.57: Enhanced premium to the producers over the prevailing cost after GI registration of the non-agricultural produce
Increase (%) Respondents – No. (%) 0 18 (51.42) 5-10 8 (22.85) 10-15 9 (25.71)
>15 0 (0.0) Total 35
Table-6.58: Contribution of money for agricultural product GI registration by producers Rupees Respondents – No. (%)
<250 0 (0.0) 250-500 5 (100)
>500 0 (0.0)
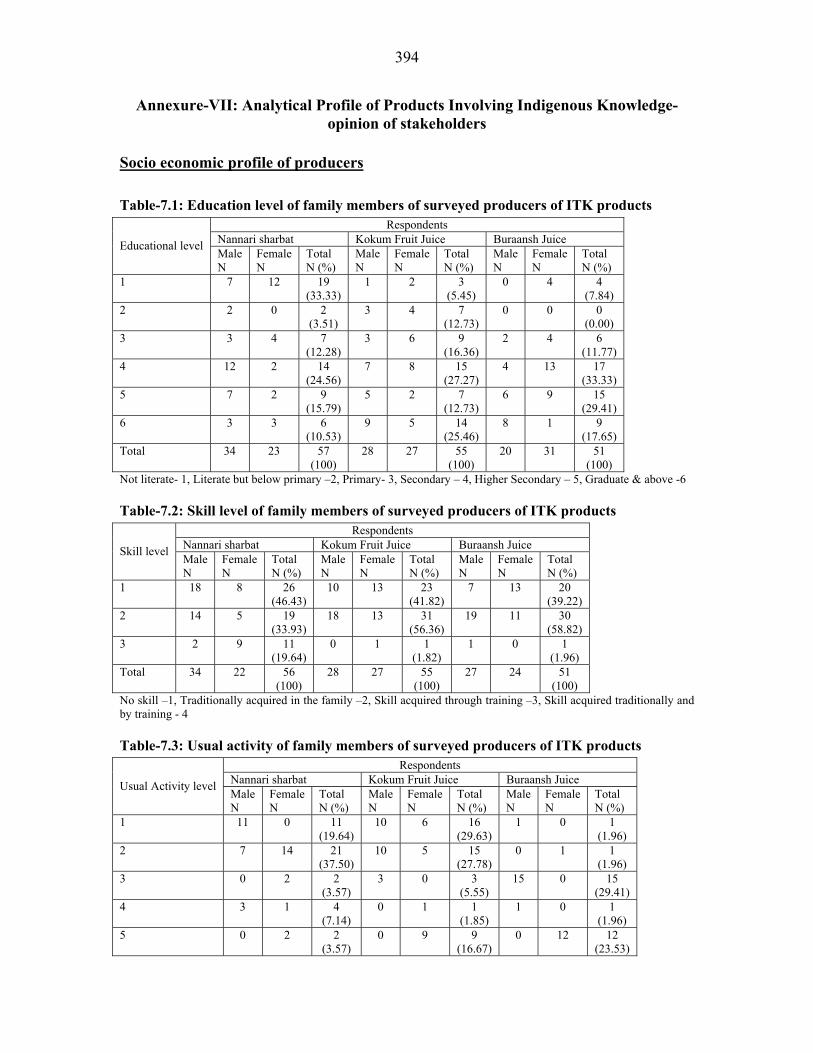
394
Annexure-VII: Analytical Profile of Products Involving Indigenous Knowledge- opinion of stakeholders
Socio economic profile of producers
Table-7.1: Education level of family members of surveyed producers of ITK products Respondents
Nannari sharbat Kokum Fruit Juice Buraansh Juice Educational level Male N
Female N
Total N (%)
Male N
Female N
Total N (%)
Male N
Female N
Total N (%)
1 7 12 19 (33.33)
1 2 3 (5.45)
0 4 4 (7.84)
2 2 0 2 (3.51)
3 4 7 (12.73)
0 0 0 (0.00)
3 3 4 7 (12.28)
3 6 9 (16.36)
2 4 6 (11.77)
4 12 2 14 (24.56)
7 8 15 (27.27)
4 13 17 (33.33)
5 7 2 9 (15.79)
5 2 7 (12.73)
6 9 15 (29.41)
6 3 3 6 (10.53)
9 5 14 (25.46)
8 1 9 (17.65)
Total 34 23 57 (100)
28 27 55 (100)
20 31 51 (100)
Not literate- 1, Literate but below primary –2, Primary- 3, Secondary – 4, Higher Secondary – 5, Graduate & above -6
Table-7.2: Skill level of family members of surveyed producers of ITK products Respondents
Nannari sharbat Kokum Fruit Juice Buraansh Juice Skill level Male N
Female N
Total N (%)
Male N
Female N
Total N (%)
Male N
Female N
Total N (%)
1 18 8 26 (46.43)
10 13 23 (41.82)
7 13 20 (39.22)
2 14 5 19 (33.93)
18 13 31 (56.36)
19 11 30 (58.82)
3 2 9 11 (19.64)
0 1 1 (1.82)
1 0 1 (1.96)
Total 34 22 56 (100)
28 27 55 (100)
27 24 51 (100)
No skill –1, Traditionally acquired in the family –2, Skill acquired through training –3, Skill acquired traditionally and by training - 4
Table-7.3: Usual activity of family members of surveyed producers of ITK products Respondents
Nannari sharbat Kokum Fruit Juice Buraansh Juice Usual Activity level Male N
Female N
Total N (%)
Male N
Female N
Total N (%)
Male N
Female N
Total N (%)
1 11 0 11 (19.64)
10 6 16 (29.63)
1 0 1 (1.96)
2 7 14 21 (37.50)
10 5 15 (27.78)
0 1 1 (1.96)
3 0 2 2 (3.57)
3 0 3 (5.55)
15 0 15 (29.41)
4 3 1 4 (7.14)
0 1 1 (1.85)
1 0 1 (1.96)
5 0 2 2 (3.57)
0 9 9 (16.67)
0 12 12 (23.53)

395
Respondents Nannari sharbat Kokum Fruit Juice Buraansh Juice Usual Activity level Male N
Female N
Total N (%)
Male N
Female N
Total N (%)
Male N
Female N
Total N (%)
6 10 1 11 (19.64)
5 4 9 (16.67)
8 10 18 (35.30)
7 0 0 0 (0.00)
0 0 0 (0.00)
1 0 1 (1.96)
8 2 2 4 (7.14)
0 1 1 (1.85)
1 1 2 (3.92)
9 0 1 1 (1.80)
0 0 0 (0.00)
0 0 0 (0.00)
Total 33 23 56 (100)
28 26 54 (100)
27 24 51 (100)
Self-employed – 1, Unpaid family enterprise worker- 2, Wage/salary worker – 3, Unemployed (seeking and/or available for work –4, Household duties – 5, Student –6, Pensioners, social workers not in labour force etc- 7, Too young or old to be active –8, Others - 9
Table-7.4: Monthly expenditure pattern of producers of ITK products Average expenditure Rs (%) Expenditure items Nannari sharbat Kokum Fruit Juice Buraansh Juice
Food Expenses 4300 (53.49)
2660 (24.04)
2333.33 (39.72)
Health 670 (8.34)
410 (3.71)
425 (7.23)
Education 978.5 (12.17)
5944.4 (53.72)
2283.33 (38.87)
Others 2090 (26.00)
2050 (18.53)
833.33 (14.18)
Total 8038.5 (100)
11064.4 (100)
5874.99 (100)
Table-7.5: Contribution of different sources in net annual income of producers of ITK products
Average Income Rs (%) Annual income Nannari sharbat Kokum Fruit Juice Buraansh Juice
Agriculture, horticulture, plantation, forestry 24000 (11.86)
255000 (73.38)
14000 (9.62)
Livestock, poultry, fishing 7000 (3.46)
10000 (2.88)
4000 (2.75)
Trading 98400 (48.61)
50000 (14.39)
0 (0.00)
Other enterprises 58000 (28.66)
32500 (9.35)
12500 (8.58)
Wage/Salary income 0 (0.00)
0 (0.00)
79750 (54.78)
Other income (pensions, property, remittance received) 15000 (7.41)
0 (0.00)
35333.33 (24.27)
Total 202400 (100)
347500 (100)
145583.33 (100)

396
Table-7.6: Pattern of household value of assets of producers of ITK products Average Income Rs (%) Value of Assets Nannari sharbat Kokum Fruit Juice Buraansh Juice
Land (including water tanks, ponds) 77000 (9.28)
2200000 (82.96)
87222.22 (17.21)
Building 542222.2 (65.36)
230000 (8.67)
352777.78 (69.59)
Machinery, implements 72800 (8.78)
50000 (1.89)
18000 (3.55)
Transport equipments 19666.6 (2.37)
97125 (3.66)
0 (0.00)
Durable goods (TV/Fridge) 11620 (1.40)
28000 (1.06)
14800 (2.92)
Other assets 96250 (11.60)
11666.67 (0.44)
28125 (5.55)
Livestock Resources (Cow, Buffalo, Pig, Goat, Poultry) 10000 (1.21)
35000 (1.32)
6000 (1.18)
Total 829558.8 (100)
2651791.67 (100)
506925 (100)
Table–7.7: Welfare indicators of household members of surveyed producers of ITK products
Respondents N (%) Welfare indicators Nannari sharbat Kokum Fruit Juice Buraansh Juice Get enough food every day (during last 30 days) 37
(62.71) 56
(86.15) 42
(82.35) Have at least a pair of footwear (during last 30 days) 37
(62.71) 56
(86.15) 42
(82.35) Have at least two sets of clothes (during last 30 days) 37
(62.71) 56
(86.15) 42
(82.35) Fell sick or get injured (during last 30 days) 12
(20.3) 10
(15.4) 05
(9.8) Total family members 59 65 51
Table – 7.8: Mode of treatment obtained by household members of producers of ITK products during their illness in last 30 days
Respondents- N (%) Mode of treatment Nannari sharbat Kokum Fruit Juice Buraansh Juice
No treatment 2 (16.7)
2 (20.0)
1 (20.0)
Treated at Hospital, Clinic or Dispensary 7 (58.3)
4 (40.0)
2 (40.0)
Home treatment 3 (25.0)
4 (40.0)
2 (40.0)
Total 12 (100)
10 (100)
05 (100)
Table – 7.9: Range of amount spent on medical treatment by producers in last 30 days
Respondents N (%) Total amount spent on treatment (Rs.) Nannari sharbat Kokum Fruit Juice Buraansh Juice
100-200 1 (14.28)
0 (0.00)
0 (0.00)
200- 500 2 (28.57)
2 (50.00)
0 (0.00)
500- 1000 2 (28.57)
2 (50.00)
2 (100.00)
>1000 2 (28.57)
0 (0.00)
0 (0.00)
Total 07 (100)
4 (100)
2 (100)

397
Opinion of producers regarding product scenario
Table-7.10: Types of packaging used by ITK products enterprises Respondents N (%) Nature of Packaging
Nannari sharbat Kokum Fruit Juice Buraansh Juice Glass bottles & containers 10
(100) 9
(64.29) 10
(50.00) Plastic or polythene bags/ plastic cans 0
(0.00) 5
(35.71) 10
(50.00) Total 10
(100.00) 14
(100.00) 20
(100.00)
Table-7.11: Problems faced in packing by ITK products enterprises Respondents N (%) Problems faced in packing
Nannari sharbat Kokum Fruit Juice Buraansh Juice No problems 3
(30.00) 7
(58.33) 7
(100.00) Deterioration of packing material 7
(70.00) 5
(41.67) 0
(0.00) Total 10
(100.00) 12
(100.00) 7
(100.00)
Table – 7.12: Methods of inspection and quality control used at various stages of production in ITK products enterprises
Respondent- N (%) Inspection and quality control Nannari sharbat Kokum Fruit Juice Buraansh Juice
No inspection & quality control 2 (22.22)
9 (81.82)
0 (0.00)
Production level on field 0 (0.00)
1 (9.09)
4 (66.66)
Harvesting level on field 2 (22.22)
1 (9.09)
1 (16.67)
Processing & grading level 5 (55.56)
0 (0.00)
1 (16.67)
Total 9 (100.00)
11 (100.00)
6 (100.00)
Table-7.13: Type of grading of finished ITK products Respondent- N (%) Type of grading
Nannari sharbat Kokum Fruit Juice Buraansh Juice
No grading 1 (11.11)
2 (18.18)
-
Grading on physical traits 6 (66.67)
8 (72.73)
-
Grading on qualitative traits 2 (22.22)
1 (9.09)
-
Total 9 (100.00)
11 (100.00)
-

398
Table-7.14: Financial and infrastructure needs of producers of ITK products Respondents Agree – N (%) Observation
Nannari sharbat
Kokum Fruit Juice
Buraansh Juice
Adequate finance from financial institutions can increase the production
9 (90.00)
2 (20.00)
6 (60.00)
Better marketing can increase the production 10 (100.00)
9 (90.00)
6 (60.00)
Producers have the capacity to improve production if marketing outlets are improved
9 (90.00)
9 (90.00)
5 (50.00)
Scope for increasing production 9 (90.00)
9 (90.00)
10 (100.00)
Table-7.15: If capacity to improve the production is available - type of assistance required for increasing the production of ITK products
Respondents- N (%) Type of assistance Nannari sharbat Kokum Fruit Juice Buraansh Juice
Financial assistance 9 (47.36)
1 (4.76)
2 (25.00)
Assistance in supply of machinery & equipments 5 (26.32)
1 (4.76)
3 (37.50)
Assistance in getting seeds, fertilizers etc 0 (0.00)
9 (42.86)
0 (0.00)
Marketing assistance 5 (26.32)
10 (47.62)
3 (37.50)
Total 19 (100)
21 (100)
8 (100)
Table 7.16: Producer’s opinion about earnings from ITK product’s enterprise Respondents N (%) Earning Nannari sharbat Kokum Fruit Juice Buraansh Juice
Good 5 (55.56)
2 (20.00)
0 (0.00)
Average 4 (44.44)
7 (70.00)
9 (90.00)
Poor 0 (0.00)
1 (10.00)
1 (10.00)
Total 9 (100)
10 (100)
10 (100)
Table-7.17: If earning is average or poor - type of assistance required for increasing income from the ITK products enterprise
Respondents – N (%) Type of assistance Nannari sharbat Kokum Fruit Juice Buraansh Juice
Financial assistance 10 (45.45)
2 (9.52)
3 (30.00)
Assistance in supply of machinery & equipments 5 (22.73)
1 (4.76)
3 (30.00)
Assistance in getting seeds, fertilizers etc 0 (0.00)
9 (42.86)
1 (10.00)
Marketing assistance 7 (31.82)
9 (42.86)
3 (30.00)
Total 22 (100)
21 (100)
10 (100)

399
Table-7.18: Need, protection and maintenance of product as GI: awareness, knowledge and system of interest of producers of ITK products
Respondents Agree- N (%) Observation Nannari sharbat
Kokum Fruit Juice
Buraansh Juice
Similar product sold with the same name* 6 (60.00)
0 (0.00)
1 (10.00)
Significant competition to product 4 (40.00)
1 (11.11)
1 (10.00)
Uniqueness due to geographical origin 10 (100.00)
9 (100.00)
10 (100.00)
Knowledge that product can be protected as GI# 8 (80.00)
7 (77.78)
0 (0.00)
Knowledge of post registration effects- authority to use product name by registered producers
8 (80.00)
8 (80.00)
0 (0.00)
Knowledge of post registration effects- restriction to produce within registered geographical area
5 (50.00)
9 (90.00)
0 (0.00)
Knowledge of post registration effects- restriction on trader to sell product produced by registered producers
9 (90.00)
7 (77.78)
0 (0.00)
Knowledge of post registration effects- traders can be sued in court of law
3 (30.00)
8 (100.00)
0 (0.00)
Knowledge of post registration effects- higher market value as a community monopoly
10 (100.00)
8 (100.00)
0 (0.00)
Production as per self guidelines learnt from forefathers 10 (100.00
9 (90.00)
10 (100.00)
Maintenance & monitoring of production code- follow technical guidelines of govt
2 20.00)
0 (0.00)
0 (0.00)
Maintenance & monitoring of production code- inspection by govt., NGO, association
2 20.00)
0 (0.00)
0 (0.00)
Maintenance & monitoring of production code- quality check by purchaser
8 80.00)
6 (60.00)
10 (100.00)
Maintenance & monitoring of production code- self control without any formal mechanism
10 100.00)
9 (90.00)
10 (100.00)
* can’t say- N (04 ), % (40) # can’t say- N (08 ), % (80)
Table-7.19: Mode of sale of ITK products by producers Respondents- N (%) Mode of sale
Nannari sharbat Kokum Fruit Juice Buraansh Juice Mahajan 0
(0.00) 0
(0.00) 0
(0.00) Middlemen 8
(40.00) 9
(40.91) 1
(12.50) Govt. agency 0
90.00) 0
(0.00) 0
(0.00) Cooperative society 0
(0.00) 0
(0.00) 0
(0.00) Exporters 0
(0.00) 0
(0.00) 0
(0.00) Wholesalers 2
(10.00) 5
(22.73) 1
(12.50) Selling to local shops; local consumers or in the local market 10
(50.00) 8
(36.36) 6
(75.00) Processing agency 0
(0.00) 0
(0.00) 0
(0.00) Others 0
(0.00) 0
(0.00) 0
(0.00) Total 20
(100) 22
(100.00) 8
(100.00)

400
Table-7.20: Whether producers’ are satisfied with mode of sale of ITK product: opinion of producers
Respondents- N (%) Satisfaction Nannari sharbat Kokum Fruit Juice Buraansh Juice
Yes 9 90.00)
9 (100.00)
0 (0.00)
No 1 10.00)
0 (0.00)
7 (100.00)
Total 10 100.00)
9 (100.00)
7 (100.00)
Table-7.21: Reasons for producer’s unsatisfaction over the mode of sale of ITK products Respondents- N (%) Reason
Nannari sharbat Kokum Fruit Juice Buraansh Juice Low profit from venture - - 7
(46.67) High input cost - - 1
(6.66) Producers’ dilemma - - 7
(46.67) Total - - 15
(100.00)
Table-7.22: Price decision of producers over the sale of ITK products Respondents- N (%) Method
Nannari sharbat Kokum Fruit Juice Buraansh Juice Bargain collectively 0
(0.00) 4
(26.66) 0
(0.00) Bargain individually 10
(100.00) 1
(6.67) 10
(90.91) Sale on minimum agreed price between our association and purchasers
0 (0.00)
1 (6.67)
1 (9.09)
The purchaser offers us a price to which we usually agree 0 (0.00)
9 (60.00)
0 (0.00)
Total 10 (100.00)
15 (100.00)
11 (100.00)
Table-7.23: Producers’ constraints in production and marketing of ITK products Respondents- N (%) Constraints
Nannari sharbat Kokum Fruit Juice Buraansh Juice Hindrances from agronomic/ natural factors 0
(0.00) 1
(6.67) 0
(0.00) Low marketing infrastructure 0
(0.00) 5
(33.33) 0
(0.00) Lack of proper government policy & assistance 1
(11.11) 0
(0.00) 0
(0.00) No constraints 3
(33.33) 0
(0.00) 0
(0.00) Labour scarcity 0
(0.00) 1
(6.67) 0
(0.00) High competition 0
(0.00) 3
(20.00) 0
(0.00) Difficulty in getting quality inputs 0
(0.00) 0
(0.00) 10
100.00 Product specific concerns 2
(22.23) 2
(13.33) 0
(0.00) Market insecurity leading to low profitability 0
(0.00) 2
(13.33) 0
(0.00)
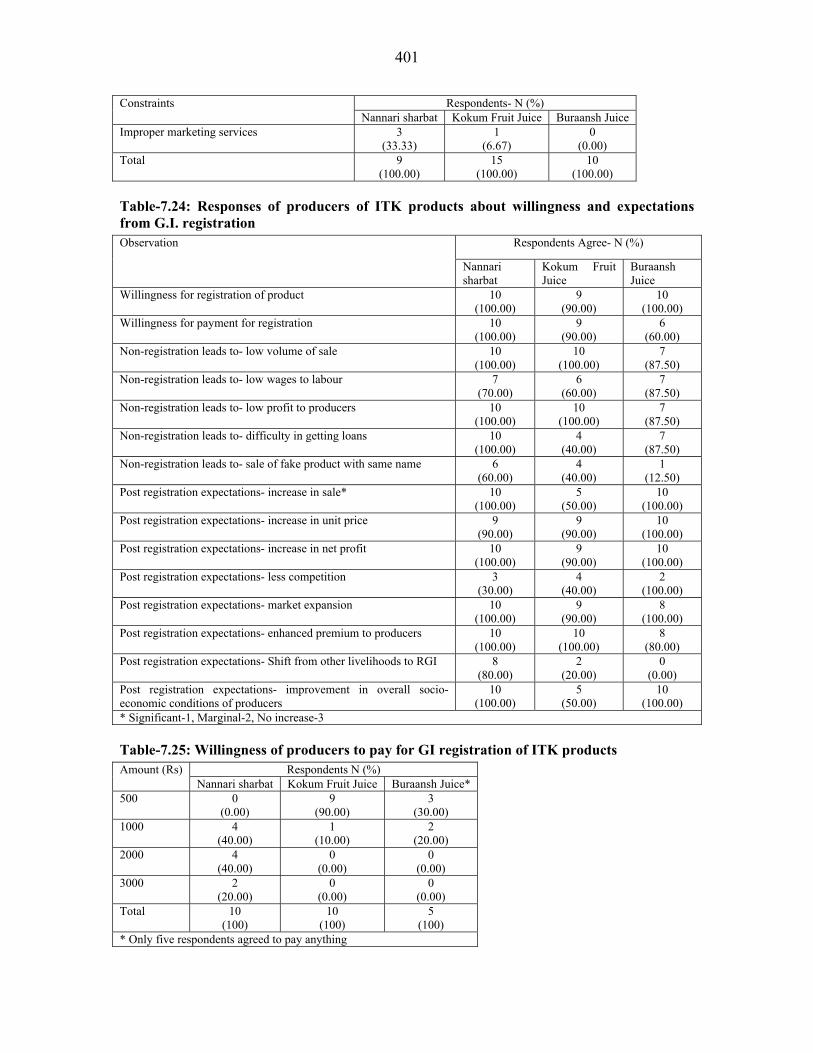
401
Respondents- N (%) Constraints Nannari sharbat Kokum Fruit Juice Buraansh Juice
Improper marketing services 3 (33.33)
1 (6.67)
0 (0.00)
Total 9 (100.00)
15 (100.00)
10 (100.00)
Table-7.24: Responses of producers of ITK products about willingness and expectations from G.I. registration
Respondents Agree- N (%) Observation
Nannari sharbat
Kokum Fruit Juice
Buraansh Juice
Willingness for registration of product 10 (100.00)
9 (90.00)
10 (100.00)
Willingness for payment for registration 10 (100.00)
9 (90.00)
6 (60.00)
Non-registration leads to- low volume of sale 10 (100.00)
10 (100.00)
7 (87.50)
Non-registration leads to- low wages to labour 7 (70.00)
6 (60.00)
7 (87.50)
Non-registration leads to- low profit to producers 10 (100.00)
10 (100.00)
7 (87.50)
Non-registration leads to- difficulty in getting loans 10 (100.00)
4 (40.00)
7 (87.50)
Non-registration leads to- sale of fake product with same name 6 (60.00)
4 (40.00)
1 (12.50)
Post registration expectations- increase in sale* 10 (100.00)
5 (50.00)
10 (100.00)
Post registration expectations- increase in unit price 9 (90.00)
9 (90.00)
10 (100.00)
Post registration expectations- increase in net profit 10 (100.00)
9 (90.00)
10 (100.00)
Post registration expectations- less competition 3 (30.00)
4 (40.00)
2 (100.00)
Post registration expectations- market expansion 10 (100.00)
9 (90.00)
8 (100.00)
Post registration expectations- enhanced premium to producers 10 (100.00)
10 (100.00)
8 (80.00)
Post registration expectations- Shift from other livelihoods to RGI 8 (80.00)
2 (20.00)
0 (0.00)
Post registration expectations- improvement in overall socio-economic conditions of producers
10 (100.00)
5 (50.00)
10 (100.00)
* Significant-1, Marginal-2, No increase-3
Table-7.25: Willingness of producers to pay for GI registration of ITK products Respondents N (%) Amount (Rs)
Nannari sharbat Kokum Fruit Juice Buraansh Juice* 500 0
(0.00) 9
(90.00) 3
(30.00) 1000 4
(40.00) 1
(10.00) 2
(20.00) 2000 4
(40.00) 0
(0.00) 0
(0.00) 3000 2
(20.00) 0
(0.00) 0
(0.00) Total 10
(100) 10
(100) 5
(100) * Only five respondents agreed to pay anything
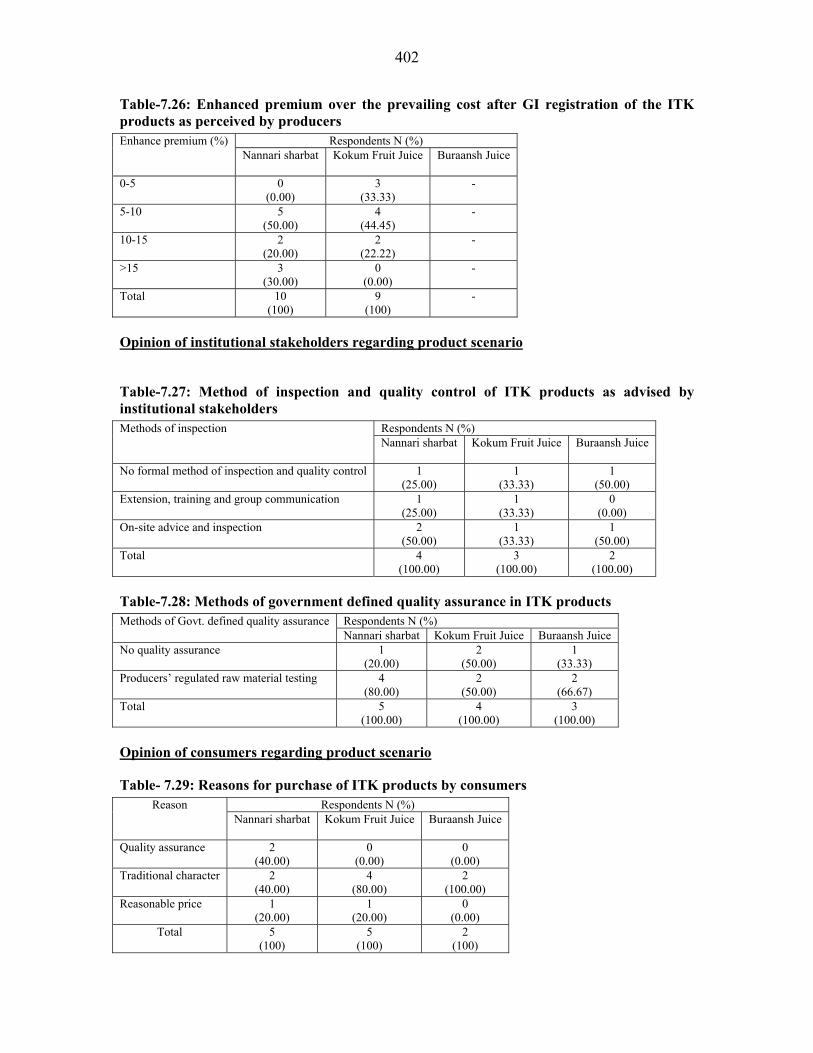
402
Table-7.26: Enhanced premium over the prevailing cost after GI registration of the ITK products as perceived by producers
Respondents N (%) Enhance premium (%) Nannari sharbat
Kokum Fruit Juice Buraansh Juice
0-5 0 (0.00)
3 (33.33)
-
5-10 5 (50.00)
4 (44.45)
-
10-15 2 (20.00)
2 (22.22)
-
>15 3 (30.00)
0 (0.00)
-
Total 10 (100)
9 (100)
-
Opinion of institutional stakeholders regarding product scenario
Table-7.27: Method of inspection and quality control of ITK products as advised by institutional stakeholders
Respondents N (%) Methods of inspection Nannari sharbat
Kokum Fruit Juice Buraansh Juice
No formal method of inspection and quality control 1 (25.00)
1 (33.33)
1 (50.00)
Extension, training and group communication 1 (25.00)
1 (33.33)
0 (0.00)
On-site advice and inspection 2 (50.00)
1 (33.33)
1 (50.00)
Total 4 (100.00)
3 (100.00)
2 (100.00)
Table-7.28: Methods of government defined quality assurance in ITK products Respondents N (%) Methods of Govt. defined quality assurance Nannari sharbat Kokum Fruit Juice Buraansh Juice
No quality assurance 1 (20.00)
2 (50.00)
1 (33.33)
Producers’ regulated raw material testing 4 (80.00)
2 (50.00)
2 (66.67)
Total 5 (100.00)
4 (100.00)
3 (100.00)
Opinion of consumers regarding product scenario
Table- 7.29: Reasons for purchase of ITK products by consumers Respondents N (%) Reason
Nannari sharbat
Kokum Fruit Juice Buraansh Juice
Quality assurance 2 (40.00)
0 (0.00)
0 (0.00)
Traditional character 2 (40.00)
4 (80.00)
2 (100.00)
Reasonable price 1 (20.00)
1 (20.00)
0 (0.00)
Total 5 (100)
5 (100)
2 (100)

403
Table-7.30: Consumers’ suggestions for the areas of improvement in ITK products under study
Respondents N (%) Suggestions Nannari sharbat Kokum Fruit Juice Buraansh Juice
Quality to be standardized 3 (18.75)
3 (21.43)
0 (0.00)
Innovative changes to be made keeping traditional base 3 (18.75)
3 (21.43)
0 (0.00)
Price to be controlled and kept within reasonable limits 1 (6.25)
0 (0.00)
0 (0.00)
Easy availability assured 3 (18.75)
3 (21.43)
4 (50.00)
More publicity required 5 (31.25)
5 (35.71)
4 (50.00)
Others 1 (6.25)
0 (0.00)
0 (0.00)
Total 16 (100)
14 (100)
8 (100)
Table-7.31: Preparedness of consumers to pay premium over the prevailing price for registered ITK products
Respondents N (%) Enhance premium (%) Nannari sharbat Kokum Fruit Juice Buraansh Juice
0-5 1 (20.00)
0 (0.00)
-
5-10 3 (60.00)
4 (100.00)
-
10-15 0 (0.00)
0 (0.00)
-
>15 1 (20.00)
0 (0.00)
-
Total 5 (100)
4 (100)
-
Opinion of traders regarding product scenario
Table 7.32: Traders’ view that as a post registration effect, ITK product should provide enhanced premium to the producers and traders
Respondents N (%) View Nannari sharbat Kokum Fruit Juice Buraansh Juice
Yes 5 (100.00)
2 (40.00)
-
No 0 (0.00)
3 (60.00)
-
Total 5 (100)
5 (100)
-

404
Table-7.33: Traders’ expected percent increase over the prevailing cost price of ITK products after GI registration
Respondents N (%) Expected increase (%) Nannari sharbat Kokum Fruit Juice Buraansh Juice
0-5 0 (0.00)
1 (50.00)
-
5-10 1 (20.00)
1 (50.00)
-
10-15 2 (40.00)
0 (0.00)
-
>15 2 (40.00)
0 (0.00)
-
Total 5 (100)
2 (100)
-
Table-7.34: Traders’ expected percent increase over the prevailing selling price of GI registered ITK products
Table- 7.35: Traders view about the customers bargain in the prices of ITK products Respondents N (%) Bargain
Nannari sharbat Kokum Fruit Juice Buraansh Juice Yes 0
(0.00) 0
(0.00) -
No 5 (100.00)
5 (100.00)
-
Total 5 (100)
5 (100)
-
Respondents N (%) Expected increase (%) Nannari sharbat Kokum Fruit Juice Buraansh Juice
0-5 0 (0.00)
1 (50.00)
-
5-10 1 (20.00)
1 (50.00)
-
10-15 2 (40.00)
0 (0.00)
-
>15 2 (40.00)
0 (0.00)
-
Total 5 (100)
2 (100)
-
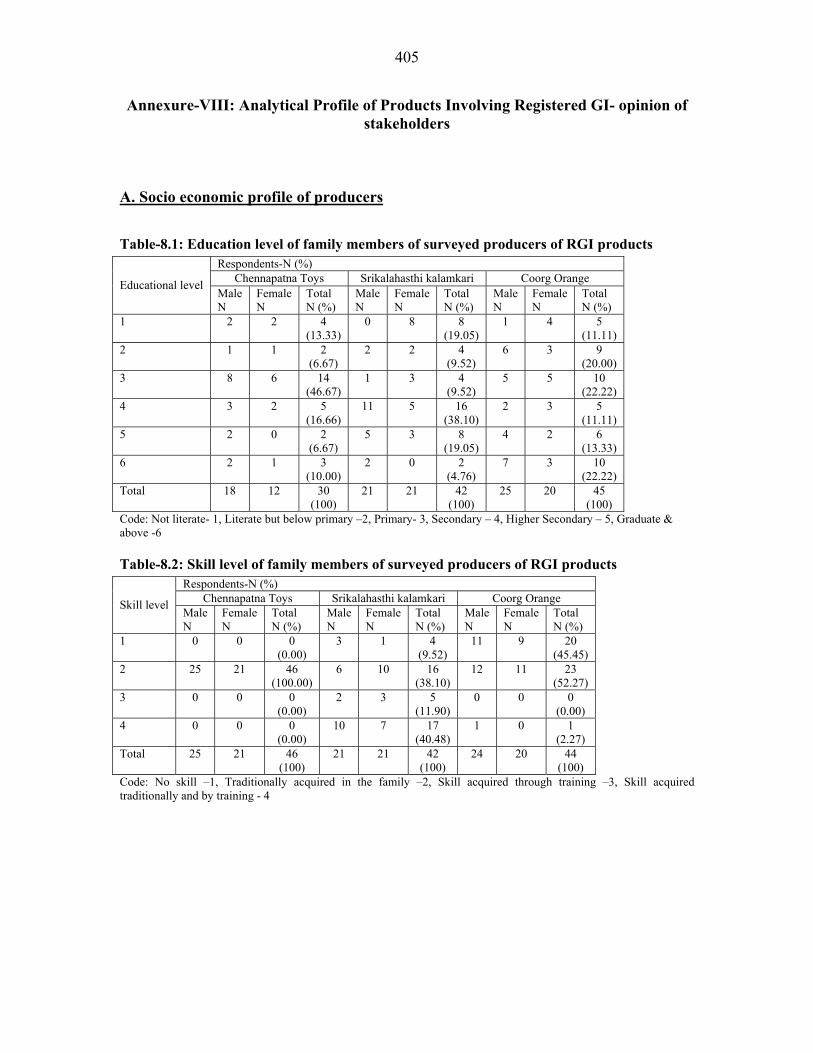
405
Annexure-VIII: Analytical Profile of Products Involving Registered GI- opinion of stakeholders
A. Socio economic profile of producers
Table-8.1: Education level of family members of surveyed producers of RGI products Respondents-N (%)
Chennapatna Toys Srikalahasthi kalamkari Coorg Orange Educational level Male N
Female N
Total N (%)
Male N
Female N
Total N (%)
Male N
Female N
Total N (%)
1 2 2 4 (13.33)
0 8 8 (19.05)
1 4 5 (11.11)
2 1 1 2 (6.67)
2 2 4 (9.52)
6 3 9 (20.00)
3 8 6 14 (46.67)
1 3 4 (9.52)
5 5 10 (22.22)
4 3 2 5 (16.66)
11 5 16 (38.10)
2 3 5 (11.11)
5 2 0 2 (6.67)
5 3 8 (19.05)
4 2 6 (13.33)
6 2 1 3 (10.00)
2 0 2 (4.76)
7 3 10 (22.22)
Total 18 12 30 (100)
21 21 42 (100)
25 20 45 (100)
Code: Not literate- 1, Literate but below primary –2, Primary- 3, Secondary – 4, Higher Secondary – 5, Graduate & above -6
Table-8.2: Skill level of family members of surveyed producers of RGI products Respondents-N (%)
Chennapatna Toys Srikalahasthi kalamkari Coorg Orange Skill level Male N
Female N
Total N (%)
Male N
Female N
Total N (%)
Male N
Female N
Total N (%)
1 0 0 0 (0.00)
3 1 4 (9.52)
11 9 20 (45.45)
2 25 21 46 (100.00)
6 10 16 (38.10)
12 11 23 (52.27)
3 0 0 0 (0.00)
2 3 5 (11.90)
0 0 0 (0.00)
4 0 0 0 (0.00)
10 7 17 (40.48)
1 0 1 (2.27)
Total 25 21 46 (100)
21 21 42 (100)
24 20 44 (100)
Code: No skill –1, Traditionally acquired in the family –2, Skill acquired through training –3, Skill acquired traditionally and by training - 4

406
Table-8.3: Usual activity of family members of surveyed producers of RGI products Respondents-N (%)
Chennapatna Toys Srikalahasthi kalamkari Coorg Orange Activity Male N
Female N
Total N (%)
Male N
Female N
Total N (%)
Male N
Female N
Total N (%)
1 27 21 46 (100.00)
10 1 11 (26.19)
14 4 18 (40.00)
2 0 0 0 (0.00)
5 7 12 (28.57)
0 0 0 (0.00)
5 0 0 0 (0.00)
0 9 9 (21.43)
0 12 12 (26.67)
6 0 0 0 (0.00)
6 1 7 (16.67)
9 3 12 (26.67)
8 0 0 0 (0.00)
0 3 3 (7.14)
0 1 1 (2.22)
9 0 0 0 (0.00)
0 0 0 (0.00)
2 0 2 (4.44)
Total 27 21 46 (100)
21 21 42 (100)
25 20 45 (100)
Code: Self-employed – 1, Unpaid family enterprise worker- 2, Wage/salary worker – 3, Unemployed (seeking and/or available for work –4, Household duties – 5, Student –6, Pensioners, social workers not in labour force etc- 7, Too young or old to be active –8, Others - 9
Table-8.4: Monthly expenditure pattern of producers of RGI products Average expenditure- Rs (%) Expenditure items Chennapatna Toys Srikalahasthi kalamkari Coorg Orange
Food Expenses 3150 (58.17)
3460 (70.83)
3922.22 (39.56)
Health 622.22 (11.49)
470 (9.62)
640 (3.67)
Education 1000 (18.47)
571.43 (11.70)
2850 (28.75)
Others 642.86 (11.87)
383.33 (7.85)
2500 (25.22)
Total 5415.08 (100)
4884.76 (100)
9912.22 (100)
Table-8.5: Contribution of different sources in net annual income of producers of RGI products
Average Income- Rs (%) Annual income Chennapatna
Toys Srikalahasthi
kalamkari Coorg Orange
Agriculture, horticulture, plantation, forestry 0 (0.00)
10000 (12.86)
112500 (31.1)
Livestock, poultry, fishing 0 (0.00)
0 (0.00)
16666.67 (4.60)
Trading 6500 (10.00)
0 (0.00)
120000 (33.17)
Other enterprises 8500 (13.07)
8000 (10.28)
32500 (8.98)
Wage/Salary income 50000 (76.92)
53800 (69.15)
80000 (22.12)
Other income (pensions, property, remittance received)
0 (0.00)
6000 (7.71)
0 (0.00)
Total 65000 (100)
77800 (100)
361666.67 (100)
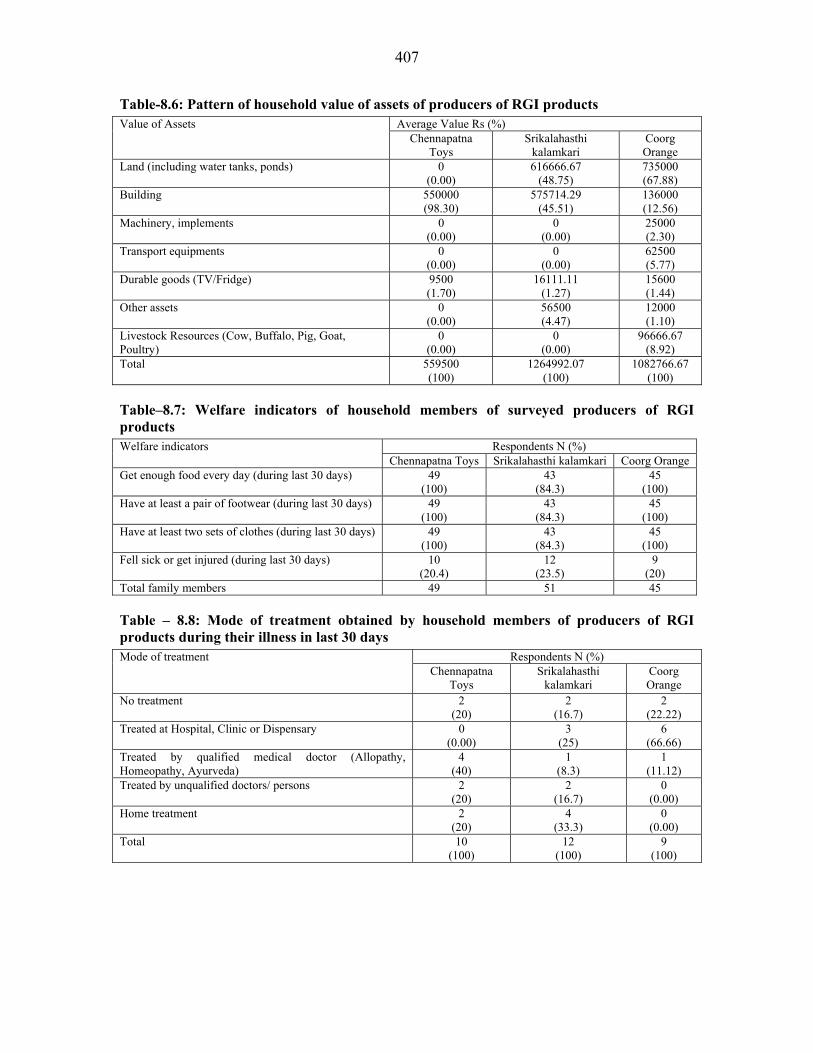
407
Table-8.6: Pattern of household value of assets of producers of RGI products Average Value Rs (%) Value of Assets
Chennapatna Toys
Srikalahasthi kalamkari
Coorg Orange
Land (including water tanks, ponds) 0 (0.00)
616666.67 (48.75)
735000 (67.88)
Building 550000 (98.30)
575714.29 (45.51)
136000 (12.56)
Machinery, implements 0 (0.00)
0 (0.00)
25000 (2.30)
Transport equipments 0 (0.00)
0 (0.00)
62500 (5.77)
Durable goods (TV/Fridge) 9500 (1.70)
16111.11 (1.27)
15600 (1.44)
Other assets 0 (0.00)
56500 (4.47)
12000 (1.10)
Livestock Resources (Cow, Buffalo, Pig, Goat, Poultry)
0 (0.00)
0 (0.00)
96666.67 (8.92)
Total 559500 (100)
1264992.07 (100)
1082766.67 (100)
Table–8.7: Welfare indicators of household members of surveyed producers of RGI products
Respondents N (%) Welfare indicators Chennapatna Toys Srikalahasthi kalamkari Coorg Orange Get enough food every day (during last 30 days) 49
(100) 43
(84.3) 45
(100) Have at least a pair of footwear (during last 30 days) 49
(100) 43
(84.3) 45
(100) Have at least two sets of clothes (during last 30 days) 49
(100) 43
(84.3) 45
(100) Fell sick or get injured (during last 30 days) 10
(20.4) 12
(23.5) 9
(20) Total family members 49 51 45
Table – 8.8: Mode of treatment obtained by household members of producers of RGI products during their illness in last 30 days
Respondents N (%) Mode of treatment Chennapatna
Toys Srikalahasthi
kalamkari Coorg Orange
No treatment 2 (20)
2 (16.7)
2 (22.22)
Treated at Hospital, Clinic or Dispensary 0 (0.00)
3 (25)
6 (66.66)
Treated by qualified medical doctor (Allopathy, Homeopathy, Ayurveda)
4 (40)
1 (8.3)
1 (11.12)
Treated by unqualified doctors/ persons 2 (20)
2 (16.7)
0 (0.00)
Home treatment 2 (20)
4 (33.3)
0 (0.00)
Total 10 (100)
12 (100)
9 (100)

408
Table – 8.9: Range of amount spent on medical treatment by RGI producers in last 30 days Respondents N (%) Total amount spent on treatment (Rs.) Chennapatna Toys Srikalahasthi kalamkari Coorg Orange
50-100 2 (20.00)
2 (22.2)
0 (0.00)
100-200 4 (40.00)
2 (22.2)
0 (0.00)
200- 500 4 (40.00)
1 (11.1)
4 (57.14)
500- 1000 0 (0.00)
0 (0.00)
2 (28.57)
>1000 0 (0.00)
4 (44.4)
1 (14.28)
Total 10 (100.00)
9 (100.00)
7 (100.00)
B. Opinion of producers
Table-8.10: If capacity to improve the production is available - type of assistance required for increasing the production of RGI products
Respondents –N (%) Type of assistance Chennapatna toys Srikalhasti kalamkari Coorg orange
Financial assistance 10 (33.3)
8 (47.06)
10 (27.78)
Assistance in supply of machinery & equipments 10 (33.3)
1 (5.88)
7 (19.44)
Assistance in getting seeds, fertilizers etc 0 (0.00)
0 (0.00)
9 (25.00)
Marketing assistance 10 (33.3)
8 (47.06)
10 (27.78)
Total 30 (100)
17 (100)
36 (100)
Table-8.11: Type of storage utilized for RGI products Respondents –N (%)
Type of storage Chennapatna toys Srikalhasti kalamkari Coorg orange Plastic/ polythene 0
(0.00) 8
(80.00) -
Bulk storage 9 (90.00)
1 (10.00)
-
Wrap in cloth/paper 1 (10.00)
1 (10.00)
-
Total 10 (100.00)
10 (100.00)
-
Table-8.12: Problems faced in storage of RGI products Respondents –N (%) Type of storage
Chennapatna toys Srikalhasti kalamkari Coorg orange
No problem 10 100.00
0 (0.00)
Seasonal damage 0 (0.00)
8 (80.00)
-
Insufficient storage space, facilities & capacity 0 (0.00)
2 (20.00)
-
Total 10 (100.00)
10 (100.00)
-

409
Table-8.13: Types of packaging used by RGI products enterprises Respondents –N (%) Nature of Packaging
Chennapatna toys Srikalhasti kalamkari Coorg orange
Gunny /Jute bags 0 (0.00)
0 (0.00)
3 (13.04)
Wooden boxes 0 (0.00)
0 (0.00)
8 (34.78)
Metal/Machine packing 10 (58.82)
10 (100.00)
0 (0.00)
Glass bottles & containers 0 (0.00)
0 (0.00)
0 (0.00)
Plastic or polythene bags/ plastic cans 7 (41.17)
0 (0.00)
2 (8.70)
Corrugated card board boxes/paper boxes/cartons 0 (0.00)
0 (0.00)
10 (43.48)
Total 17 (100.00)
10 (100.00)
23 (100.00)
Table-8.14: Problems faced in packing by RGI products enterprises Respondents –N (%) Problems faced in packing
Chennapatna toys Srikalhasti kalamkari Coorg orange No problems 10
(100.00) 10
(100.00) 0
(0.00) Deterioration of packing material 0
(0.00) 0
(0.00) 10
(100.00) Total 10
(100.00) 10
(100.00) 10
(100.00)
Table – 8.15: Methods of inspection and quality control used at various stages of production in RGI products enterprises
Respondents-N (%) Inspection and quality control Chennapatna toys Srikalhasti kalamkari Coorg orange
Production level on field - - 8 (80.0)
Harvesting level on field - - 2 (20.0)
Production level at establishment/workshop 10 (100.00)
10 (100.00)
-
Total 10 (100.00)
10 (100.00)
10 (100.00)
Table-8.16: Type of grading of finished RGI products Respondents-N (%) Type of grading
Chennapatna toys Srikalhasti kalamkari Coorg orange
Grading on physical traits 10 (50.00)
8 (44.44)
10 (83.33)
Grading on qualitative traits 10 (50.00)
10 (55.56)
2 (16.67)
Total 20 (100.00)
18 (100.00)
12 (100.00)
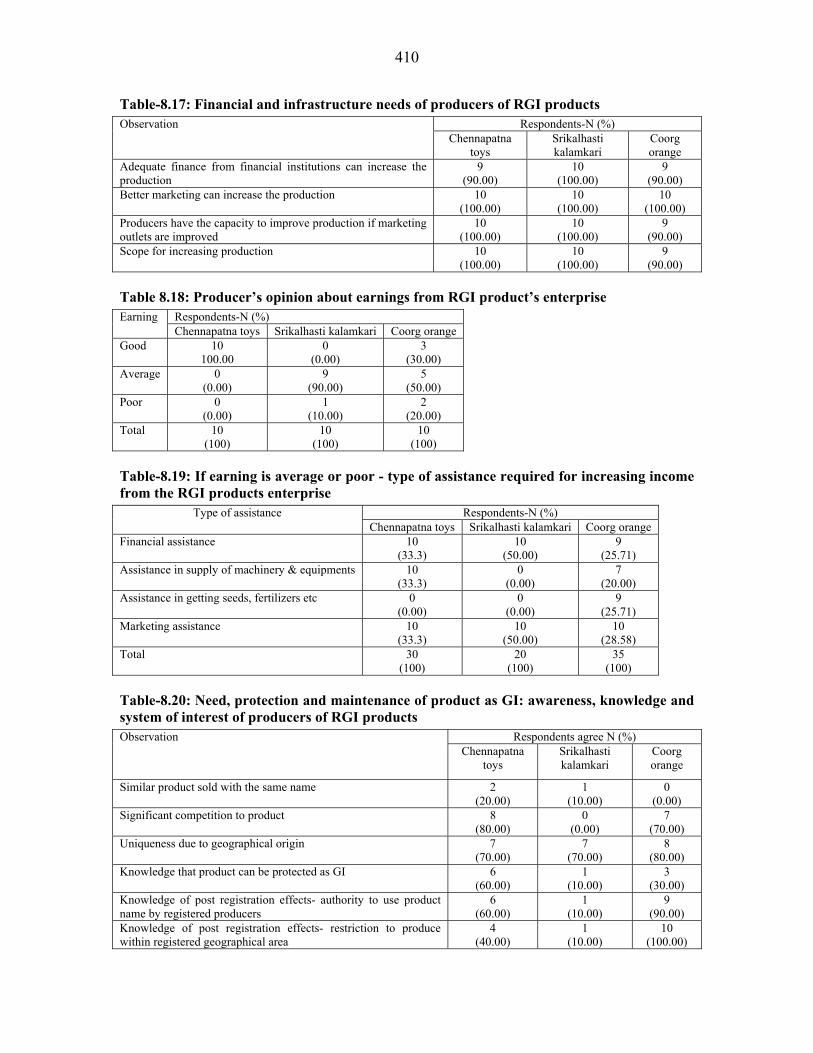
410
Table-8.17: Financial and infrastructure needs of producers of RGI products Respondents-N (%) Observation
Chennapatna toys
Srikalhasti kalamkari
Coorg orange
Adequate finance from financial institutions can increase the production
9 (90.00)
10 (100.00)
9 (90.00)
Better marketing can increase the production 10 (100.00)
10 (100.00)
10 (100.00)
Producers have the capacity to improve production if marketing outlets are improved
10 (100.00)
10 (100.00)
9 (90.00)
Scope for increasing production 10 (100.00)
10 (100.00)
9 (90.00)
Table 8.18: Producer’s opinion about earnings from RGI product’s enterprise Respondents-N (%) Earning Chennapatna toys Srikalhasti kalamkari Coorg orange
Good 10 100.00
0 (0.00)
3 (30.00)
Average 0 (0.00)
9 (90.00)
5 (50.00)
Poor 0 (0.00)
1 (10.00)
2 (20.00)
Total 10 (100)
10 (100)
10 (100)
Table-8.19: If earning is average or poor - type of assistance required for increasing income from the RGI products enterprise
Respondents-N (%) Type of assistance Chennapatna toys Srikalhasti kalamkari Coorg orange
Financial assistance 10 (33.3)
10 (50.00)
9 (25.71)
Assistance in supply of machinery & equipments 10 (33.3)
0 (0.00)
7 (20.00)
Assistance in getting seeds, fertilizers etc 0 (0.00)
0 (0.00)
9 (25.71)
Marketing assistance 10 (33.3)
10 (50.00)
10 (28.58)
Total 30 (100)
20 (100)
35 (100)
Table-8.20: Need, protection and maintenance of product as GI: awareness, knowledge and system of interest of producers of RGI products
Respondents agree N (%) Observation Chennapatna
toys Srikalhasti kalamkari
Coorg orange
Similar product sold with the same name 2 (20.00)
1 (10.00)
0 (0.00)
Significant competition to product 8 (80.00)
0 (0.00)
7 (70.00)
Uniqueness due to geographical origin 7 (70.00)
7 (70.00)
8 (80.00)
Knowledge that product can be protected as GI 6 (60.00)
1 (10.00)
3 (30.00)
Knowledge of post registration effects- authority to use product name by registered producers
6 (60.00)
1 (10.00)
9 (90.00)
Knowledge of post registration effects- restriction to produce within registered geographical area
4 (40.00)
1 (10.00)
10 (100.00)

411
Knowledge of post registration effects- restriction on trader to sell product produced by registered producers
0 (0.00)
1 (10.00)
2 (20.00)
Knowledge of post registration effects- traders can be sued in court of law
2 (20.00)
1 (10.00)
3 (30.00)
Knowledge of post registration effects- higher market value as a community monopoly
2 (20.00)
1 (10.00)
10 (100.00)
Status of registration of product as GI 8 (80.00)
0 (0.00)
7 (70.00)
Availability of producers association/ marketing group 10 (100.00)
10 (100.00)
10 (100.00)
Membership of producers association/ marketing group 6 (60.00)
10 (100.00)
7 (70.00)
Production as per technical guidelines- of govt. dept 2 (20.00)
0 (0.00)
8 (80.00)
Production as per technical guidelines- of NGO 3 (30.00)
0 (0.00)
2 (20.00)
Production as per technical guidelines- producers association 10 (100.00)
10 (100.00)
10 (100.00)
Production as per self guidelines learnt from forefathers 8 (80.00)
7 (70.00)
9 (90.00)
Maintenance & monitoring of production code- follow technical guidelines of govt
3 (30.00)
0 (0.00)
8 (80.00)
Maintenance & monitoring of production code- quality control mechanism available
1 (10.00)
0 (0.00)
1 (10.00)
Maintenance & monitoring of production code- inspection by govt., NGO, association
1 (10.00)
0 (0.00)
8 (80.00)
Maintenance & monitoring of production code- quality check by purchaser
6 (60.00)
7 (70.00)
10 (100.00)
Maintenance & monitoring of production code- self control without any formal mechanism
10 (100.00)
9 (90.00)
10 (100.00)
Table-8.21: Mode of sale of RGI products by producers Respondents-N (%) Mode of sale
Chennapatna toys
Srikalhasti kalamkari
Coorg orange
Mahajan 0 (0.00)
0 (0.00)
1 (1.64)
Middlemen 10 (20.83)
3 (13.64)
10 (16.39)
Govt. agency 8 (16.67)
3 (13.64)
10 (16.39)
Cooperative society 1 (2.09)
3 (13.64)
9 (14.76)
Exporters 10 (20.83)
2 (9.09)
3 (4.91)
Wholesalers 10 (20.83)
8 (36.36)
9 (14.76)
Selling to local shops; local consumers or in the local market
9 (18.75)
3 (13.64)
9 (14.76)
Processing agency 0 (0.00)
0 (0.00)
10 (16.39)
Total 48 (100.00)
22 (100.00)
61 (100.00)

412
Table-8.22: Whether producers’ are satisfied with mode of sale of RGI product: opinion of producers
Respondents-N (%) Satisfaction Chennapatna toys Srikalhasti kalamkari Coorg orange
Yes 7 (70.00)
2 (25.00)
3 (30.00)
No 3 (30.00)
6 (75.00)
7 (70.00)
Total 10 (100.00)
8 (100.00)
10 (100.00)
Table-8.23: Reasons for producer’s unsatisfaction over the mode of sale of RGI products Respondents-N (%) Reason
Chennapatna toys Srikalhasti kalamkari Coorg orange Low profit from venture 3
(37.5) 4
(57.14) 0
(0.00) Intervention/ control of middle men 5
(62.5) 1
(14.29) 2
(22.22) Insufficient institutional support 0
(0.00) 2
(28.57) 6
(66.67) High input cost 0
(0.00) 0
(0.00) 0
(0.00) Limited supply chain facilities - - 1
(11.11) Total 8
(100.00) 7
(100.00) 9
(100.00)
Table-8.24: Price decision of producers over the sale of RGI products Respondents-N (%) Method
Chennapatna toys
Srikalhasti kalamkari
Coorg orange
Bargain collectively 5 (25.00)
5 (50.00)
10 (40.00)
Bargain individually 5 (25.00)
1 (10.00)
1 (4.00)
Sale on minimum agreed price between our association and purchasers
0 (0.00)
0 (0.00)
8 (32.00)
The purchaser offers us a price to which we usually agree 10 (50.00)
2 (20.00)
6 (24.00)
Purchaser offers us a price to which we have to sell; there is no other choice for us
0 (0.00)
2 (20.00)
0 (0.00)
Total 20 (100.00)
10 (100.00)
25 (100.00)
Table-8.25: Respondent’s constraints in production and marketing of RGI products Respondents-N (%)s Constraints
Chennapatna toys Srikalhasti kalamkari Coorg orange Hindrances from agronomic/ natural factors - - 7
(38.89) Scarcity of skilled workers 2
(20.00) 2
(20.00) 0
(0.00) High competition 7
(70.00) 0
(0.00) 0
(0.00) Low marketing infrastructure - - 7
(38.89) Financial difficulties 1
(10.00) 0
(0.00) 0
(0.00)

413
Improper transportation arrangements 0 (0.00)
0 (0.00)
2 (11.11)
Difficulty in getting quality inputs 0 (0.00)
1 (10.00)
0 (0.00)
Improper marketing services - - 2 (11.11)
Manufacturing process is tedious, time & labor intensive 0 (0.00)
7 (70.00)
0 (0.00)
Total 10 (100.00)
10 (100.00)
18 (100.00)
Table-8.26: Willingness of respondents to pay for GI registration of RGI products Respondents-N (%) Amount (Rs)
Chennapatna toys Srikalhasti kalamkari Coorg orange 500 8
(80.00) 1
(10.00) 9
(90.00) 1000 0
(0.00) 0
(0.00) 1
(10.00)
Table-8.27: Responses of RGI producers about post-registration observation regarding impact and change occurred
Respondents agree Observation Chennapatna
toys Srikalhasti kalamkari Coorg orange
Post registration changes observed 7 (70.00)
8 (80.00)
2 (20.00)
Observed post registration changes- increase in annual production*
0 (0.00)
2 (20.00)
3 (30.00)
Observed post registration changes- increase in unit price 1 (10.00)
1 (10.00)
1 (10.00)
Observed post registration changes- increase in net profit 1 (10.00)
1 (10.00)
1 (10.00)
Observed post registration changes- less competition 0 (0.00)
2 (20.00)
1 (10.00)
Observed post registration changes- market expansion 9 (100.00)
7 (70.00)
8 (88.89)
Observed post registration changes- enhanced premium to producers
2 (20.00)
2 (20.00)
1 (10.00)
Observed post registration changes- Shift from other livelihoods to RGI
0 (0.00)
1 (10.00)
0 (0.00)
Observed post registration changes- improvement in overall socio-economic conditions of producers
1 (10.00)
0 (0.00)
0 (0.00)
Did they contribute money for registration 0 (0.00)
0 (0.00)
1 (10.00)
Table- 8.28: Producer’s response whether after registration of RGI products, the premium to the producers has increased
Respondents-N (%) Response Chennapatna toys Srikalhasti kalamkari Coorg orange
Yes 2 (20.00)
2 (20.00)
1 (10.00)
No 8 (80.00)
8 (80.00)
9 (90.00)
Total 10 (100.00)
10 (100.00)
10 (100.00)
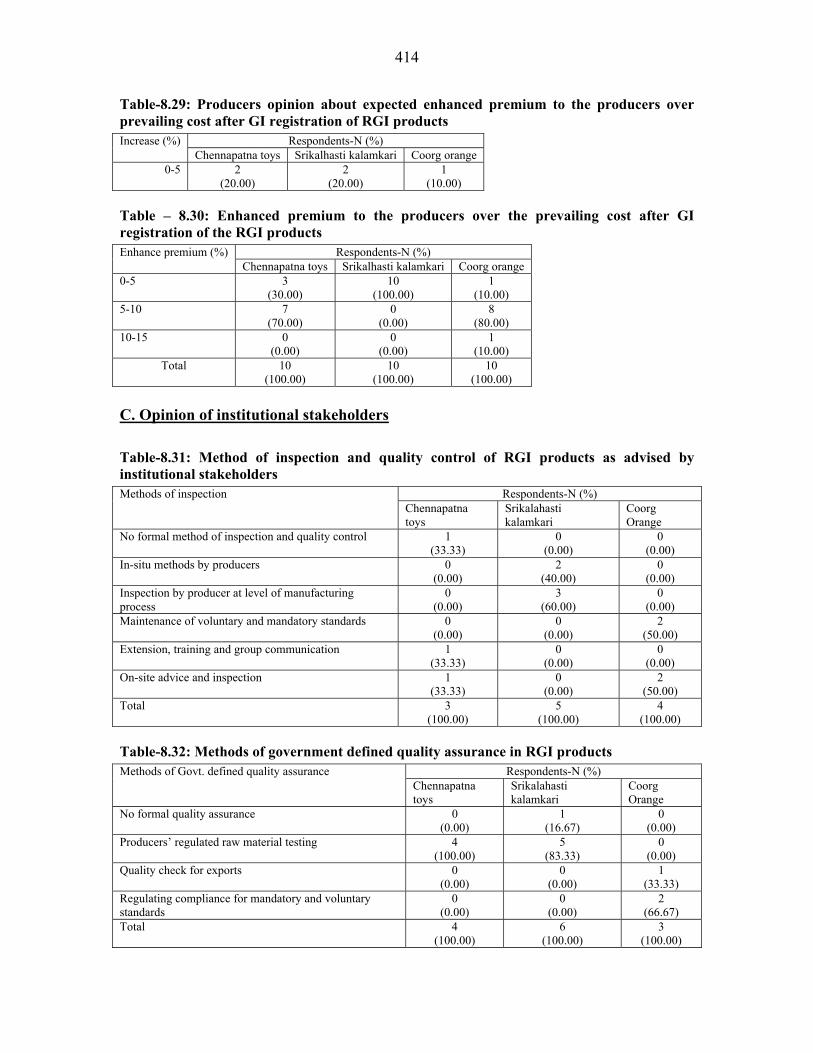
414
Table-8.29: Producers opinion about expected enhanced premium to the producers over prevailing cost after GI registration of RGI products
Respondents-N (%) Increase (%) Chennapatna toys Srikalhasti kalamkari Coorg orange
0-5 2 (20.00)
2 (20.00)
1 (10.00)
Table – 8.30: Enhanced premium to the producers over the prevailing cost after GI registration of the RGI products
Respondents-N (%) Enhance premium (%) Chennapatna toys Srikalhasti kalamkari Coorg orange
0-5 3 (30.00)
10 (100.00)
1 (10.00)
5-10 7 (70.00)
0 (0.00)
8 (80.00)
10-15 0 (0.00)
0 (0.00)
1 (10.00)
Total 10 (100.00)
10 (100.00)
10 (100.00)
C. Opinion of institutional stakeholders
Table-8.31: Method of inspection and quality control of RGI products as advised by institutional stakeholders
Respondents-N (%) Methods of inspection Chennapatna toys
Srikalahasti kalamkari
Coorg Orange
No formal method of inspection and quality control 1 (33.33)
0 (0.00)
0 (0.00)
In-situ methods by producers 0 (0.00)
2 (40.00)
0 (0.00)
Inspection by producer at level of manufacturing process
0 (0.00)
3 (60.00)
0 (0.00)
Maintenance of voluntary and mandatory standards 0 (0.00)
0 (0.00)
2 (50.00)
Extension, training and group communication 1 (33.33)
0 (0.00)
0 (0.00)
On-site advice and inspection 1 (33.33)
0 (0.00)
2 (50.00)
Total 3 (100.00)
5 (100.00)
4 (100.00)
Table-8.32: Methods of government defined quality assurance in RGI products Respondents-N (%) Methods of Govt. defined quality assurance
Chennapatna toys
Srikalahasti kalamkari
Coorg Orange
No formal quality assurance 0 (0.00)
1 (16.67)
0 (0.00)
Producers’ regulated raw material testing 4 (100.00)
5 (83.33)
0 (0.00)
Quality check for exports 0 (0.00)
0 (0.00)
1 (33.33)
Regulating compliance for mandatory and voluntary standards
0 (0.00)
0 (0.00)
2 (66.67)
Total 4 (100.00)
6 (100.00)
3 (100.00)

415
Table-8.33: Problems faced by institutional stakeholders to obtain GI registration of RGI products
Respondents-N (%) Problems faced in GI Registration Chennapatna toys Srikalahasti kalamkari Coorg Orange
Can’t say 2 (66.67)
0 (0.00)
0 (0.00)
Lack of responsiveness 0 (0.00)
1 (25.00)
0 (0.00)
None 1 (33.33)
0 (0.00)
3 (100.00)
Producers’ dilemma 0 (0.00)
2 (50.00)
0 (0.00)
Technical and administrative needs for GI registry 0 (0.00)
1 (25.00)
0 (0.00)
Total 3 (100.00)
4 (100.00)
3 (100.00)
Table-8.34: Constraints faced by institutional stakeholders in maintenance of registered GI products
Respondents-N (%) Problem Constraints faced in GI Registration Chennapatna toys Srikalahasti kalamkari Coorg Orange
Can’t say 2 (66.67)
0 (0.00)
0 (0.00)
None 1 (33.33)
0 (0.00)
3 (100.00)
Maintenance of quality 0 (0.00)
4 (100.00)
0 (0.00)
Total 3 (100.00)
4 (100.00)
3 (100.00)
D. Opinion of consumers
Table- 8.35: Reasons for purchase of RGI products by consumers Respondents-N (%) Reason
Chennapatna toys Srikalahasti kalamkari Coorg Orange Traditional character 5
(100) 5
(100) 5
(100) Total 5
(100) 5
(100) 5
(100)
Table-8.36: Consumers’ suggestions for the areas of improvement in RGI products under study
Respondents-N (%) Suggestions Chennapatna toys Srikalahasti kalamkari Coorg Orange
Quality to be standardized 5 (20.00)
0 (0.00)
0 (0.00)
Innovative changes to be made keeping traditional base 5 (20.00)
5 (31.25)
2 (15.38)
Price to be controlled and kept within reasonable limits 5 (20.00)
2 (12.50)
3 (23.08)
Easy availability assured 5 (20.00)
4 (25.00)
5 (38.46)
More publicity required 5 (20.00)
5 (31.25)
3 (23.08)
25 (100)
16 (100)
13 (100)
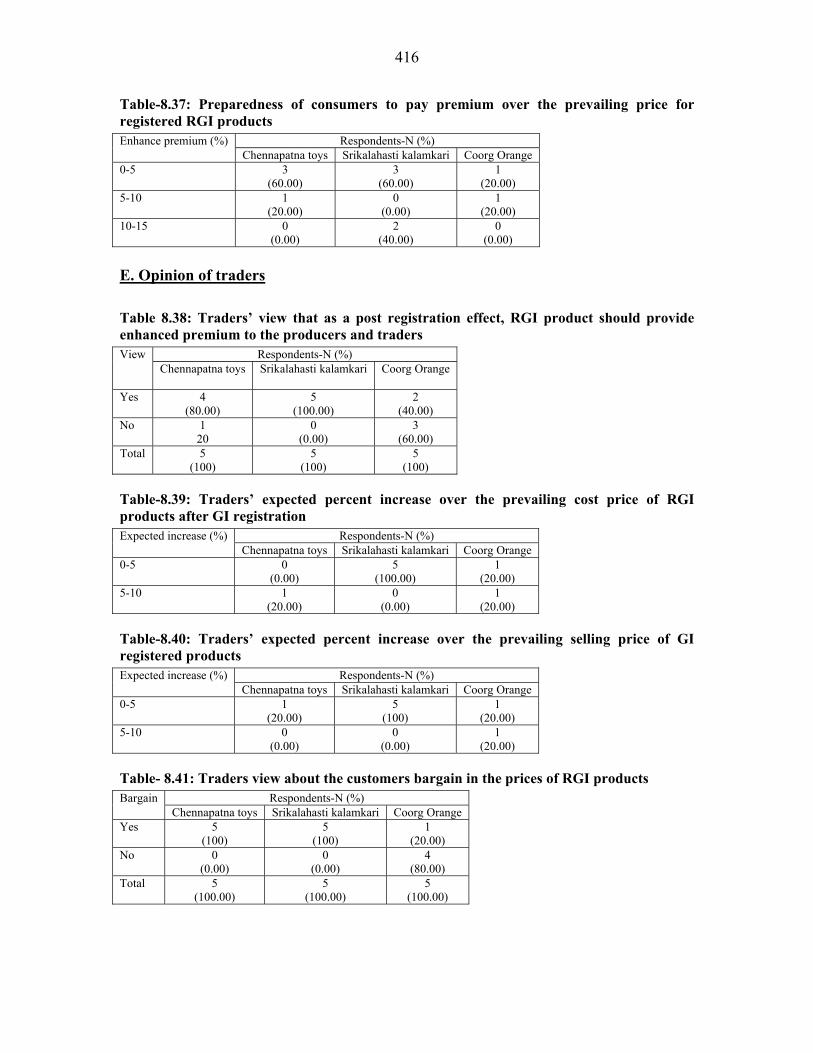
416
Table-8.37: Preparedness of consumers to pay premium over the prevailing price for registered RGI products
Respondents-N (%) Enhance premium (%) Chennapatna toys Srikalahasti kalamkari Coorg Orange
0-5 3 (60.00)
3 (60.00)
1 (20.00)
5-10 1 (20.00)
0 (0.00)
1 (20.00)
10-15 0 (0.00)
2 (40.00)
0 (0.00)
E. Opinion of traders
Table 8.38: Traders’ view that as a post registration effect, RGI product should provide enhanced premium to the producers and traders
Respondents-N (%) View Chennapatna toys Srikalahasti kalamkari
Coorg Orange
Yes 4 (80.00)
5 (100.00)
2 (40.00)
No 1 20
0 (0.00)
3 (60.00)
Total 5 (100)
5 (100)
5 (100)
Table-8.39: Traders’ expected percent increase over the prevailing cost price of RGI products after GI registration
Respondents-N (%) Expected increase (%) Chennapatna toys Srikalahasti kalamkari Coorg Orange
0-5 0 (0.00)
5 (100.00)
1 (20.00)
5-10 1 (20.00)
0 (0.00)
1 (20.00)
Table-8.40: Traders’ expected percent increase over the prevailing selling price of GI registered products
Respondents-N (%) Expected increase (%) Chennapatna toys Srikalahasti kalamkari Coorg Orange
0-5 1 (20.00)
5 (100)
1 (20.00)
5-10 0 (0.00)
0 (0.00)
1 (20.00)
Table- 8.41: Traders view about the customers bargain in the prices of RGI products Respondents-N (%) Bargain
Chennapatna toys Srikalahasti kalamkari Coorg Orange Yes 5
(100) 5
(100) 1
(20.00) No 0
(0.00) 0
(0.00) 4
(80.00) Total 5
(100.00) 5
(100.00) 5
(100.00)
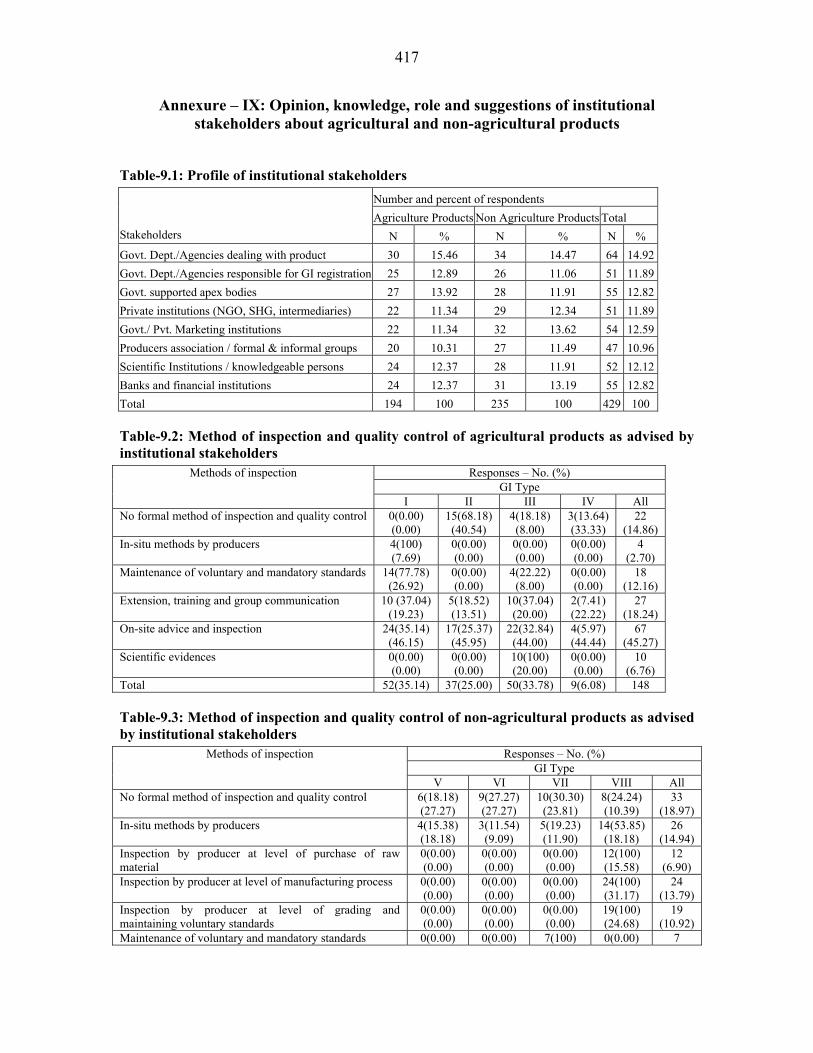
417
Annexure – IX: Opinion, knowledge, role and suggestions of institutional stakeholders about agricultural and non-agricultural products
Table-9.1: Profile of institutional stakeholders Number and percent of respondents Agriculture Products Non Agriculture Products Total
Stakeholders N % N % N % Govt. Dept./Agencies dealing with product 30 15.46 34 14.47 64 14.92Govt. Dept./Agencies responsible for GI registration 25 12.89 26 11.06 51 11.89Govt. supported apex bodies 27 13.92 28 11.91 55 12.82Private institutions (NGO, SHG, intermediaries) 22 11.34 29 12.34 51 11.89Govt./ Pvt. Marketing institutions 22 11.34 32 13.62 54 12.59Producers association / formal & informal groups 20 10.31 27 11.49 47 10.96Scientific Institutions / knowledgeable persons 24 12.37 28 11.91 52 12.12Banks and financial institutions 24 12.37 31 13.19 55 12.82Total 194 100 235 100 429 100
Table-9.2: Method of inspection and quality control of agricultural products as advised by institutional stakeholders
Responses – No. (%) GI Type
Methods of inspection
I II III IV All No formal method of inspection and quality control 0(0.00)
(0.00) 15(68.18) (40.54)
4(18.18) (8.00)
3(13.64) (33.33)
22 (14.86)
In-situ methods by producers 4(100) (7.69)
0(0.00) (0.00)
0(0.00) (0.00)
0(0.00) (0.00)
4 (2.70)
Maintenance of voluntary and mandatory standards 14(77.78) (26.92)
0(0.00) (0.00)
4(22.22) (8.00)
0(0.00) (0.00)
18 (12.16)
Extension, training and group communication 10 (37.04) (19.23)
5(18.52) (13.51)
10(37.04) (20.00)
2(7.41) (22.22)
27 (18.24)
On-site advice and inspection 24(35.14) (46.15)
17(25.37) (45.95)
22(32.84) (44.00)
4(5.97) (44.44)
67 (45.27)
Scientific evidences 0(0.00) (0.00)
0(0.00) (0.00)
10(100) (20.00)
0(0.00) (0.00)
10 (6.76)
Total 52(35.14) 37(25.00) 50(33.78) 9(6.08) 148
Table-9.3: Method of inspection and quality control of non-agricultural products as advised by institutional stakeholders
Responses – No. (%) GI Type
Methods of inspection
V VI VII VIII All No formal method of inspection and quality control 6(18.18)
(27.27) 9(27.27) (27.27)
10(30.30) (23.81)
8(24.24) (10.39)
33 (18.97)
In-situ methods by producers 4(15.38) (18.18)
3(11.54) (9.09)
5(19.23) (11.90)
14(53.85) (18.18)
26 (14.94)
Inspection by producer at level of purchase of raw material
0(0.00) (0.00)
0(0.00) (0.00)
0(0.00) (0.00)
12(100) (15.58)
12 (6.90)
Inspection by producer at level of manufacturing process 0(0.00) (0.00)
0(0.00) (0.00)
0(0.00) (0.00)
24(100) (31.17)
24 (13.79)
Inspection by producer at level of grading and maintaining voluntary standards
0(0.00) (0.00)
0(0.00) (0.00)
0(0.00) (0.00)
19(100) (24.68)
19 (10.92)
Maintenance of voluntary and mandatory standards 0(0.00) 0(0.00) 7(100) 0(0.00) 7

418
Responses – No. (%) GI Type
Methods of inspection
V VI VII VIII All (0.00) (0.00) (16.67) (0.00) (4.02)
Extension, training and group communication 0(0.00) (0.00)
8(61.54) (24.24)
5(38.46) (11.90)
0(0.00) (0.00)
13 (7.47)
On-site advice and inspection 12(48) (54.55)
13(52) (39.39)
0(0.00) (0.00)
0(0.00) (0.00)
25 (14.37)
Scientific evidences 0(0.00) (0.00)
0(0.00) (0.00)
15(100) (35.71)
0(0.00) (0.00)
15 (8.62)
Total 22(12.64) 33(18.97) 42(24.14) 77(44.25) 174
Table-9.4: Comparative account of method of inspection & quality control in agricultural and non-agricultural products as adviced by institutional stakeholders
Respondents – No. (%) Methods of inspection Agriculture Products
Non Agriculture Products
All
No formal method of inspection and quality control 22(40.00) (14.86)
33(60.00) (18.97)
55 (17.08)
In-situ methods by producers 4(13.33) (2.7)
26(86.67) (14.94)
30 (9.32)
Inspection by producer at level of purchase of raw material - 12(100) (6.9)
12 (3.73)
Inspection by producer at level of manufacturing process - 24(100) (13.79)
24 (7.45)
Inspection by producer at level of grading and maintaining voluntary standards
- 19(100) (10.92)
19 (5.90)
Maintenance of voluntary and mandatory standards 18(72.00) (12.16)
7(28.00) (4.02)
25 (7.76)
Extension, training and group communication 27(67.50) (18.24)
13(32.50) (7.47)
40 (12.42)
On-site advice and inspection 67(72.83) (45.27)
25(27.17) (14.37)
92 (28.57)
Scientific evidences 10(40.00) (6.76)
15(60.00) (8.62)
25 (7.76)
Total 148(45.96) 174(54.04) 322
Table-9.5: Methods of government defined quality assurance in agricultural products Respondents – No. (%)
GI Type Methods of government defined quality assurance
I II III IV All No formal quality assurance 0(0.00)
(0.00) 19(82.61) (40.43)
0(0.00) (0.00)
4(17.39) (40.00)
23 (16.08)
Producers’ regulated raw material testing 0(0.00) (0.00)
0(0.00) (0.00)
0(0.00) (0.00)
6(100) (60.00)
6 (4.20)
Quality check for exports 4(100) (11.43)
0(0.00) (0.00)
0(0.00) (0.00)
0(0.00) (0.00)
4 (2.80)
Regulating compliance for certification standards 0(0.00) (0.00)
6(100) (12.77)
0(0.00) (0.00)
0(0.00) (0.00)
6 (4.20)
Regulating compliance for mandatory and voluntary standards 12(63.16) (34.29)
0(0.00) (0.00)
7(36.84) (13.73)
0(0.00) (0.00)
19 (13.29)
Regulating post harvest practices and processes 11(20.00) (31.43)
13(23.64) (27.66)
31(56.36) (60.78)
0(0.00) (0.00)
55 (38.46)
Regulating production practices and inputs 8(26.67) (22.86)
9(30.00) (19.15)
13(43.33) (25.49)
0(0.00) (0.00)
30 (20.98)
Total 35(24.48) 47(32.87) 51(35.66) 10(6.99) 143

419
Table-9.6: Methods of government defined quality assurance in non-agricultural products Respondents – No. (%)
GI Type Methods of Government defined quality assurance
V VI VII VIII All No formal quality assurance 8(24.24)
(36.36) 7(21.21) (18.91)
10(30.30) (21.74)
8(24.24) (11.59)
33 (18.97)
Producers’ regulated raw material testing 14(16.09) (63.63)
30(34.48) (81.08)
0(0.00) (0.00)
43(49.43) (62.32)
87 (50.00)
Regulating compliance for certification standards 0(0.00) (0.00)
0(0.00) (0.00)
0(0.00) (0.00)
18(100) (26.09)
18 (10.34)
Regulating compliance for mandatory and voluntary standards 0(0.00) (0.00)
0(0.00) (0.00)
13(100) (28.26)
0(0.00) (0.00)
13 (7.47)
Regulating production practices and inputs 0(0.00) (0.00)
0(0.00) (0.00)
23(100) (50.00)
0(0.00) (0.00)
23 (13.22)
Total 22(12.64) 37(21.26) 46(26.44) 69(39.66) 174
Table-9.7: Comparative account of methods of government defined quality assurance in agricultural and non-agricultural products
Respondents – No. (%) Methods of government defined quality assurance Agriculture Products
Non Agriculture Products
All
No formal quality assurance 23(41.07) (16.08)
33(58.93) (18.97)
56 (17.67)
Producers’ regulated raw material testing 6(6.45) (4.20)
87(93.55) (50.00)
93 (29.34)
Quality check for exports 4(100) (2.80)
- 4 (1.26)
Regulating compliance for certification standards 6(25.00) (4.20)
18(75.00) (10.34)
24 (7.57)
Regulating compliance for mandatory and voluntary standards
19(59.38) (13.29)
13(40.63) (7.47)
32 (10.09)
Regulating post harvest practices and processes 55(100) (38.46)
- 55 (17.35)
Regulating production practices and inputs 30(56.60) (20.98)
23(43.40) (13.22)
53 (16.72)
Total 143(45.11) 174(54.89) 317
Table-9.8: Technical advice and training deliveries by institutional stakeholders for improvement quality of agricultural products
Respondents – No. (%) GI Type
Advice given to the producers
I II III IV All No advice/training 3(12.5)
(6.52) 16(66.67) (37.21)
5(20.83) (8.93)
0(0.00) (0.00)
24 (15.78)
Advice/training facilitated through public organizations 27(40.30) (58.70)
18(26.87) (41.86)
22(32.84) (39.29)
0(0.00) (0.00)
67 (44.08)
Advice/training given directly on production aspects 16(26.23) (34.78)
9(14.75) (20.93)
29(47.54) (51.79)
7(11.48) (100)
61 (40.13)
Total 46(30.26) 43(28.29) 56(36.84) 7(4.61) 152

420
Table-9.9: Technical advice & training deliveries by institutional stakeholders for improvement quality of non-agricultural products
Respondents – No. (%) GI Type
Advice given to the producers
V VI VII VIII All No advice/training 12(36.36)
(57.14) 3(9.09) (7.69)
10(30.30) (21.27)
8(24.24) (10.95)
33 (18.33)
Advice/training facilitated through public organizations
0(0.00) (0.00)
14(25.45) (35.89)
22(40.00) (46. 80)
19(34.55) (26.02)
55 (30.55)
Advice/training given directly on production aspects
9(9.78) (42.86)
22(23.91) (56.41)
15(16.30) (31.91)
46(50.00) (63.01)
92 (51.11)
Total 21(11.66) 39(21.67) 47(26.12) 73(40.55) 180 Table-9.10: Comparative account of technical advice and training deliveries by institutional stakeholders for improvement of quality of agricultural and non-agricultural products
Respondents – No. (%) Advice given to the producers Agriculture Products Non Agriculture Products All
No advice/training 24 (42.10) (15.78)
33 (57.89) (18.33)
57 (17.16)
Advice/training facilitated through public organizations 67(54.92) (44.08)
55 (45.08) (30.55)
122 (36.75)
Advice/training given directly on production aspects 61 (39.87) (40.13)
92 (60.13) (51.11)
153 (46.08)
Total 152 (45.78) 180 (54.21) 332 Table-9.11: Average price increments in supply chain of agricultural products
Average percentage increase of price at different levels GI Type Producer’s selling
over costs Intermediaries supply over purchase
Wholesaler’s selling over purchase
Retailers selling over purchase
I 16.54 17.61 17.13 31.90 II 10.10 32.22 30.23 19.64 III 17.60 19.17 19.03 20.21 IV 12.44 23.75 17.61 20.38 All 14.17 23.18 21.00 23.03
Table-9.12: Average price increments in supply chain of non-agricultural products
Average percentage increase of price at different levels GI Type Producer’s selling
over costs Intermediaries supply over purchase
Wholesaler’s selling over purchase
Retailers selling over purchase
V 20.00 12.95 11.5 9.50 VI 10.70 23.57 14.39 25.3 VII 16.04 12.11 13.11 13.98 VIII 20.89 21.56 22.02 28.27 All 16.90 17.54 15.25 19.26
Table-9.13: Average percent value of spatial distribution of sale of agricultural products 2004 2005 2006 GI
Type Within the region where G.I. is claimed
In other parts of India
As exports
Within the region where G.I. is claimed
In other parts of India
As exports
Within the region where G.I. is claimed
In other parts of India
As exports
I 47.5 24.0 20.93 46.7 27.05 22.5 44.62 13.84 21.70 II 86.65 23.3 10.0 77.9 21.65 10.0 76.25 13.32 12.0 III 51.75 78.68 39.18 51.10 75.70 30.7 52.13 80.4 38.6 IV 84.66 16.67 0.0 64.00 15.67 0.0 70.0 17.67 0.0 All 67.64 35.66 17.52 59.92 35.01 15.8 60.75 31.30 18.07
Note: The combined total of all the three categories in a year will not be 100% because these figures are average of large no. of people where many have given there input for one or two categories only.

421
Table-9.14: Average percent value of spatial distribution of sale of non-agricultural products
2004 2005 2006 GI Type Within the
region where G.I. is claimed
In other parts of India
As exports
Within the region where G.I. is claimed
In other parts of India
As exports
Within the region where G.I. is claimed
In other parts of India
As exports
V 80.0 26.0 10.0 85.0 20.0 15.0 78.45 28.0 16.78 VI 53.36 43.73 16.50 53.10 43.5 18.17 52.92 45.62 17.2 VII 57.68 36.14 21.18 58.57 38.20 17.55 67.88 40.09 22.34 VIII 72.44 38.84 33.18 70.56 47.19 29.22 77.84 46.38 27.05 All
non-agri
65.87 36.17 20.21 66.80 37.22 19.98 69.27 40.02 18.34
Note: The combined total of all the three categories in a year will not be 100% because these figures are average of large no. of people where many have given there input for one or two categories only.
Table-9.15: Trend of volume and value of marketing of products in last three years Respondents – No. (%) GI Type
Increasing-1 Stationary-2 Declining-3 Total I 19 (70.37)
(36.53) 7 (25.92) (26.92)
1 (3.70) (7.69)
27 (29.67)
II 10 (37.03) (19.23)
10 (37.03) (38.46)
7 (25.92) (53.84)
27 (29.67)
III 18 (60.0) (34.61)
7 (23.34) (26.92)
5 (16.66) (38.46)
30 (32.96)
IV 5 (71.42) (9.61)
2 (28.57) (7.69)
0 (0.0) (0.0)
7 (7.69)
All Agric. products 52 (57.14) 26 (28.57) 13 (14.28) 91 V 9 (64.28)
(11.11) 3 (21.42) (13.04)
2 (14.28) (7.69)
14 (10.76)
VI 16 (64.0) (19.75)
6 (24.0) (26.08)
3 (12.0) (11.53)
25 (19.23)
VII 29 (78.37) (35.80)
4 (10.81) (17.39)
4 (10.81) (15.38)
37 (28.46)
VIII 27 (50.0) (33.34)
10 (18.51) (43.47)
17 (31.48) (65.38)
54 (41.53)
All non-agriculture Products 81 (62.30) 23 (17.69) 26 (20.0) 130
Table-9.16: Institutional stakeholders’ views on significant competition to products Respondents – No. (%) Competition
Agriculture Products Non Agriculture Products All Facing (yes) 73 (38.42)
(64.60) 117 (61.57) (82.97)
190 (74.80)
Not Facing (No) 40 (62.5) (35.39)
24 (37.5) (17.02)
64 (25.19)
Total 113 (44.58) 141 (55.52) 254

422
Table-9.17: Institutional stakeholders’ views about major type of competition faced by agricultural and non-agricultural products
Response to various forms of competition – No. (%) GI type 1 2 3 4 Total
I 24(53.34) (38.09)
11(24.45) (33.33)
4(8.88) (40.0)
6(13.33) (26.08)
45 (34.88)
II 14(48.27) (22.23)
10(34.48) (30.30)
2(6.89) (20.0)
3(10.34) (13.04)
29 (24.48)
III 20(42.55) (31.74)
9(19.14) (27.27)
4(8.51) (40.0)
14(29.78) (60.86)
47 (36.43)
IV 5(62.5) (7.93)
3(37.5) (9.09)
0(0.0) (0.0)
0(0.0) (0.0)
8 (6.20)
Total-agriculture products * 63 (48.83) 33 (25.58) 10(7.75) 23 (17.82) 129 V 7(41.17)
(9.72) 10(58.82) (14.70)
0(0.0) (0.0)
0(0.0) (0.0)
17 (9.34)
VI 8(22.85) (11.11)
11(31.42) (16.17)
8(22.85) (38.09)
8(22.85) (36.76)
35 (19.23)
VII 26(38.80) (36.11)
22(32.83) (32.35)
9(13.43) (42.85)
10(14.92) (42.85)
67 (36.81)
VIII 31(49.20) (43.05)
25(39.68) (36.76)
4(6.34) (36.76)
3(4.76) (19.04)
63 (34.61)
Total- non Agriculture Products 72 (39.56) 68(37.36) 21(11.53) 21(11.53) 182 Note: Code [1.Same product produced in other areas of the country, 2. Similar duplicates in the country, 3. Similar products imported into the country, 4. Competition in the export market from other countries producing similar products]
Table-9.18: Institutional stakeholders’ views about supplementary types of competition faced by agricultural and non-agricultural products
Response to various forms of competition – No. (%) GI type 1 2 3 4 Total
Agriculture products 63(48.83) (46.67)
33 (25.58) (32.67)
10 (7.75) (32.25)
23 (17.82) (52.27)
129 (41.47)
Non Agriculture Products 72(39.56) (53.33)
68 (37.36) (67.32)
21 (11.53) (67.74)
21 (11.53) (47.72)
182 (58.52)
All products 135 (43.40) 101(32.47) 31(9.96) 44(14.14) 311
Note : Code [1.Competition from other products, 2. Consumer’s preference, 3. Less availability of the same produce, 4. Competition from Producers group within]
Table-9.19: Institutional stakeholders views about import of products Product List of
Importing countries (Formal channel)
List of Importing countries (Informal channel)
Price -Formal channel Rs/Kg
Price -Informal channel Rs/Kg
Volume of import -Formal channel (Tonnes)
Volume of import -Informal channel (Tonnes)
Entry point - Formal channel
Entry point - Informal channel
GI Type 1: Fruits Nasik grapes California
Australia Israel France Italy Chile South Africa
China 150* 200 100-120 2500 Mumbai Mumbai
Himachal apple
America 50-60
Ramnagar litchi
China China Comparatively less
Comparatively less

423
Product List of Importing countries (Formal channel)
List of Importing countries (Informal channel)
Price -Formal channel Rs/Kg
Price -Informal channel Rs/Kg
Volume of import -Formal channel (Tonnes)
Volume of import -Informal channel (Tonnes)
Entry point - Formal channel
Entry point - Informal channel
GI Type 2: Grains & Potato No imports GI Type 3: Spices & Plantation crops Alleppy cardamom
Gautemala Gautemala 150-160 150-200 Don’t know
Don’t know
Mumbai Calcutta (Via Nepal)
Nilgiri tea Srilanka GI Type 4: Unexploited indigenous Products No imports GI Type 5: Confectionary No imports GI Type 6: Handicrafts Chennapatna toys
China Less Bombay
Saharanpur furniture
Italy, Indonesia, Turkey, Malaysia, China
No Idea Bombay, Kolkatha
All shipyards
GI Type 7: Manufactured products with organized trade Mysore sandal soap
Australia China
Nilgiri oil China China *Rs 260/lt Rs 160/lt 3 -20 t/ month
Ferozabad chundia & Glassware
Japan
Khurja pottery
China Indonesia Bangladesh
China No idea No idea Shipyards of India, Mumbai
Mumbai Calcutta
GI Type 8: Textiles Ludhiana hosiery
China
Banarasi saree
China China Rs 500 per piece
*Average Price from all the countries
Table-9.20: Institutional stakeholders’ views about major methods to face competition Responses for methods to face competition – No. (%) GI type 1 2 3 4 5 6 7 8 Total
I 24(15.68) (30.76)
14(9.15) (41.17)
23(15.03) (33.34)
15(9.80) (38.46)
26(16.99) (48.14)
12(7.84) (31.57)
17(11.11) (50.0)
22(14.37) (32.35)
153 (36.95)
II 20(22.47) (25.64)
7(7.86) (20.58)
19(21.34) (27.53)
7 (7.86) (17.94)
9 (10.11) (16.66)
7 (7.86) (18.42)
5 (5.61) (14.70)
15(16.85) (22.05)
89 (21.49)
III 32(20.64) (41.02)
12(7.74) (35.29)
24(15.48) (34.78)
12(7.74) (30.76)
19(12.25) (35.18)
19(12.25) (50.0)
10 (6.45) (29.41)
27(17.41) (39.70)
155 (37.45)
IV 2 (11.76) (2.56)
1 (5.88) (2.94)
3(17.64) (4.34)
5(29.41) (12.82)
0 (0.0) (0.0)
0 (0.0) (0.0)
2 (11.76) (5.88)
4 (23.32) (5.88)
17 (4.10)
Total-agric products
78(18.84)
34(8.21)
69(16.67)
39(9.42)
54(13.04)
38 (9.17)
34 (8.21)
68(16.42)
414
V 9 (13.84) (14.28)
10(15.38) (13.69)
11(16.92) (16.41)
10(15.38) (16.12)
9 (13.84) (14.06)
3 (4.61) (6.12)
4 (6.15) (5.55)
9 (13.84) (13.84)
65 (12.62)
VI 14(10.93) (22.23)
19(14.84) (26.02)
17(13.28) (25.37)
15(11.71) (24.19)
19(14.93) (29.68)
9 (7.03) (18.36)
15(11.71) (20.83)
20(15.62) (30.76)
128 (24.85)

424
Responses for methods to face competition – No. (%) GI type 1 2 3 4 5 6 7 8 Total
VII 22(13.25) (34.92)
22(13.25) (30.13)
21(12.65) (31.34)
19(11.44) (30.64)
25(15.06) (39.06)
18(10.84) (36.73)
25(15.06) (34.72)
14 (8.43) (21.53)
166 (32.23)
VIII 18(11.53) (28.57)
22(14.10) (30.13)
18(11.53) (26.86)
18(11.53) (29.03)
11 (7.05) (17.18)
19(12.17) (38.77)
28(17.94) (38.88)
22(14.10) (33.84)
156 (30.29)
Total –non Agriculture
Products
63(12.23)
73(14.17) 67 (13.0) 62(12.03) 64(12.42) 49 (9.51) 72(13.98) 65(12.62) 515
Note: Code [1.Production quality control and inspection quality assurance methods to be effectively introduced, 2.Through design and technological development, 3. Improvement of marketing methods, 4. Intensive publicity, 5. Export-oriented development, 6. Cutting down production and marketing costs, 7. Organizing exhibitions, expos, and market complexes etc., 8. Seeking GI Registration]
Table – 9.21: Supplementary views of institutional stakeholders about methods to face competition
Responses for methods to face competition – No. (%) GI type 1 2 3 4 5 6 Total
Agriculture products 1(6.25) 3(18.75) 1(6.25) 2(12.50) 7(43.75) 2(12.50) 16 Non Agriculture Products -- -- -- -- -- -- --
All Note: Code [1. Not much can be done, 2. Neat show room/ Small & big outlets dealing/ Proper location of showroom, 3. Grading & Value added products, 4. Established mandi/ Organized marketing, 5. Government recognition/Government intervention, 6.Provide Standardization]
Table-9.22: Institutional stakeholders’ views on presence of duplicate / copy type of the agricultural products in the market
Responses to various GI types – No. (%) Views I II III IV All
No duplicates 10(21.73) (35.71)
17(36.95) (77.27)
15(32.60) (37.5)
4 (8.69) (40.0)
46 (46.0)
Duplicates present in market 3(17.64) (10.71)
3(17.64) (13.63)
7(41.17) (17.5)
4(23.52) (40.0)
17 (17.0)
Inferior quality of duplicates 8(38.09) (28.57)
1(4.76) (4.54)
12(57.14) (30.0)
0 (0.0) (0.0)
21 (21.0)
Duplicate from other area/ states are threat 3(42.85) (10.71)
0(0.0) (0.0)
4(57.15) (10.0)
0 (0.0) (0.0)
7 (7.00)
Consumers prefer original products only 4(44.45) (14.28)
1(11.11) (4.54)
2(22.22) (5.00)
2(22.22) (20.0)
9 (9.00)
Total 28 (28.0) 22 (22.0) 40 (40.0) 10(10.0) 100
Table-9.23: Institutional stakeholders’ views on presence of duplicate / copy type of the non-agricultural products in the market
Responses to various GI types – No. (%) Views V VI VII VIII All
No duplicates 6 (15.0) (25.0)
10 (25.0) (37.03)
9 (22.5) (20.45)
15 (37.5) (36.58)
40 (29.41)
Duplicates present in market 5 (22.72) (20.83)
2 (9.09) (7.40)
8 (36.36) (18.18)
7 (31.81) (17.07)
22 (16.17)
Inferior quality of duplicates 1 (7.69) (4.16)
5 (38.46) (18.51)
1 (7.69) (2.27)
6 (46.15) (14.63)
13 (9.55)
Duplicate from other area/ states are threat 9 (18.0) (37.5)
9 (18.0) (33.33)
21 (42.0) (47.72)
11 (22.0) (26.82)
50 (36.76)
Consumers prefer original products only 3 (22.27) (62.5)
1 (9.09) (3.70)
5 (45.45) (11.36)
2 (18.18) (4.87)
11 (8.08)
Total 24(17.64) 27(19.85) 44(32.35) 41(30.14) 136

425
Table- 9.24: Institutional stakeholders’ suggested ways & means to face presence of duplicates/copy type agricultural products in market
Responses to various GI types – No. (%) Ways and means I II III IV All
Administrative measures 2(10.53) (11.11)
13(68.42) (81.25)
2(10.53) (20)
2(10.53) (100)
19 (41.30)
Branding and labeling 5(100) (27.78)
0(0.00) (0.00)
0(0.00) (0.00)
0(0.00) (0.00)
5 (10.87)
Consumers discourage duplicates 0(0.00) (0.00)
2(100) (12.5)
0(0.00) (0.00)
0(0.00) (0.00)
2 (4.35)
High quality standards 0(0.00) (0.00)
0(0.00) (0.00)
4(100) (40)
0(0.00) (0.00)
4 (8.70)
IP protection 2(66.67) (11.11)
1(33.33) (6.25)
0(0.00) (0.00)
0(0.00) (0.00)
3 (6.52)
Legal enforcement 4(50) (22.22)
0(0.00) (0.00)
4(50) (40)
0(0.00) (0.00)
8 (17.39)
Promoting originals 1(100) (5.56)
0(0.00) (0.00)
0(0.00) (0.00)
0(0.00) (0.00)
1 (2.17)
Public awareness 4(100) (22.22)
0(0.00) (0.00)
0(0.00) (0.00)
0(0.00) (0.00)
4 (8.70)
Total 18(39.13) 16(34.78) 10(21.74) 2(4.35) 46
Table-9.25: Institutional stakeholders’ suggested ways & means to face presence of duplicates/copy type non-agricultural products in market
Responses to various GI types – No. (%) Ways and means V VI VII VIII All
Administrative measures 9(15.52) (56.25)
9(15.52) (47.37)
22(37.93) (59.46)
18(31.03) (69.23)
58 (59.18)
Consumers prefer original products only 0(0.00) (0.00)
0(0.00) (0.00)
0(0.00) (0.00)
3(100) (11.54)
3 (3.6)
High quality standards 3(25) (18.75)
3(25) (15.79)
5(41.67) (13.51)
1(8.33) (3.85)
12 (12.24)
IP protection 1(6.25) (6.25)
6(37.5) (31.58)
5(31.25) (13.51)
4(25) (15.38)
16 (16.33)
Legal enforcement 0(0.00) (0.00)
1(16.67) (5.26)
5(83.33) (13.51)
0(0.00) (0.00)
6 (6.12)
Public awareness 3(100) (18.75)
0(0.00) (0.00)
0(0.00) (0.00)
0(0.00) (0.00)
3 (3.06)
Total 16(16.33) 19(19.39) 37(37.76) 26(26.53) 98
Table-9.26: Opinoin of institutional stakeholders about difference between imported and domestic agricultural products
Responses – No. (%) GI Type
Aspect of difference
I II III IV All No imports 3(27.27)
(13.04) 2(18.18) (13.33)
1(9.09) (4.17)
5(45.45) (100)
11 (16.42)
Non-awareness of producers 7(41.18) (30.43)
5(29.41) (33.33)
5(29.41) (20.83)
0(0.00) (0.00)
17 (25.37)
Imported product price cheaper 0(0.00) (0.00)
0(0.00) (0.00)
5(100) (20.83)
0(0.00) (0.00)
5 (7.46)
Imported product quality better 2(66.67) (8.70)
0(0.00) (0.00)
1(33.33) (4.17)
0(0.00) (0.00)
3 (4.48)
Imported product quality inferior 11(34.38) (47.83)
8(25) (53.33)
13(40.63) (54.17)
0(0.00) (0.00)
32 (47.76)
Total 23(34.33) 15(22.39) 24(35.82) 5(7.46) 67

426
Table-9.27: Opinoin of institutional stakeholders about difference between imported and domestic non-agricultural products
Responses – No. (%) GI Type
Difference
V VI VII VIII All No imports 10(55.56)
(83.33) 3(16.67) (20.00)
0(0.00) (0.00)
5(27.78) (13.16)
18 (19.15)
Non-awareness of producers 0(0.00) (0.00)
0(0.00) (0.00)
5(50.00) (17.24)
5(50.00) (13.16)
10 (10.64)
Imported product price cheaper 0(0.00) (0.00)
3(14.29) (20.00)
7(33.33) (24.14)
11(52.38) (28.95)
21 (22.34)
Processing of imported product 0(0.00) (0.00)
0(0.00) (0.00)
4(100) (13.79)
0(0.00) (0.00)
4 (4.26)
Imported product quality inferior 2(100) (16.67)
0(0.00) (0.00)
0(0.00) (0.00)
0(0.00) (0.00)
2 (2.13)
Quality difference 0(0.00) (0.00)
9(23.08) (60.00)
13(33.33) (44.83)
17(43.59) (44.74)
39 (41.49)
Total 12(12.77) 15(15.96) 29(30.85) 38(40.43) 94
Table-9.28: Suggestions of institutional stakeholders about measures to make production economic viable and improve future prospects of agricultural products
Responses – No. (%) GI Type
Suggestion
I II III IV All Production level improvements 22(27.85)
(34.38) 22(27.85) (55)
29(36.71) (41.43)
6(7.59) (40)
79 (41.80)
Post harvest level improvements ((64.29) (14.06)
0(0.00) (0.00)
5(35.71) (7.14)
0(0.00) (0.00)
14 (7.41)
Quality standardization, maintenance and assurance 6(28.57) (9.38)
5(23.81) (12.5)
9(42.86) (12.86)
1(4.76) (6.67)
21 (11.11)
Government policy support 9(32.14) (14.06)
8(28.57) (20)
8(28.57) (11.43)
3(10.71) (20)
28 (14.81)
Good transport facilities 3(100) (4.69)
0(0.00) (0.00)
0(0.00) (0.00)
0(0.00) (0.00)
3 (1.59)
Good market practices 8(38.10) (12.50)
5(23.81) (12.5)
8(38.10) (11.43)
0(0.00) (0.00)
21 (11.11)
Publicity of the product 4(26.67) (6.25)
0(0.00) (0.00)
6(40) (8.57)
5(33.33) (33.33)
15 (7.94)
GI registration 3(37.5) (4.69)
0(0.00) (0.00)
5(62.5) (7.14)
0(0.00) (0.00)
8 (4.23)
Total 64(33.86) 40(21.16) 70(37.04) 15(7.94) 189
Table-9.29: Suggestion of institutional stakeholders about measures to make production economic viable and improve future prospects of non-agricultural products
Responses – No. (%) GI Type
Suggestion
V VI VII VIII All Production level improvements 8(9.52)
(32) 18(21.43) (50)
24(28.57) (43.64)
34(40.48) (42.5)
84 (42.86)
Quality standardization, maintenance and assurance 0(0.00) (0.00)
6(30.00) (16.67)
9(45.00) (16.36)
5(17.86) (6.25)
20 (10.20)
Government policy support 7(24.14) (28)
7(24.14) (19.44)
10(34.48) (18.18)
5(17.24) (6.25)
29 (14.80)
Good marketing practices 4(17.39) (16)
2(8.70) (5.56)
1(4.35) (1.82)
16(69.57) (20)
23 (11.73)
Publicity of the product 2(11.76) (8)
0(0.00) (0.00)
7(41.18) (12.73)
8(47.06) (10)
17 (8.67)
GI registration 2(40) 3(60) 0(0.00) 0(0.00) 5
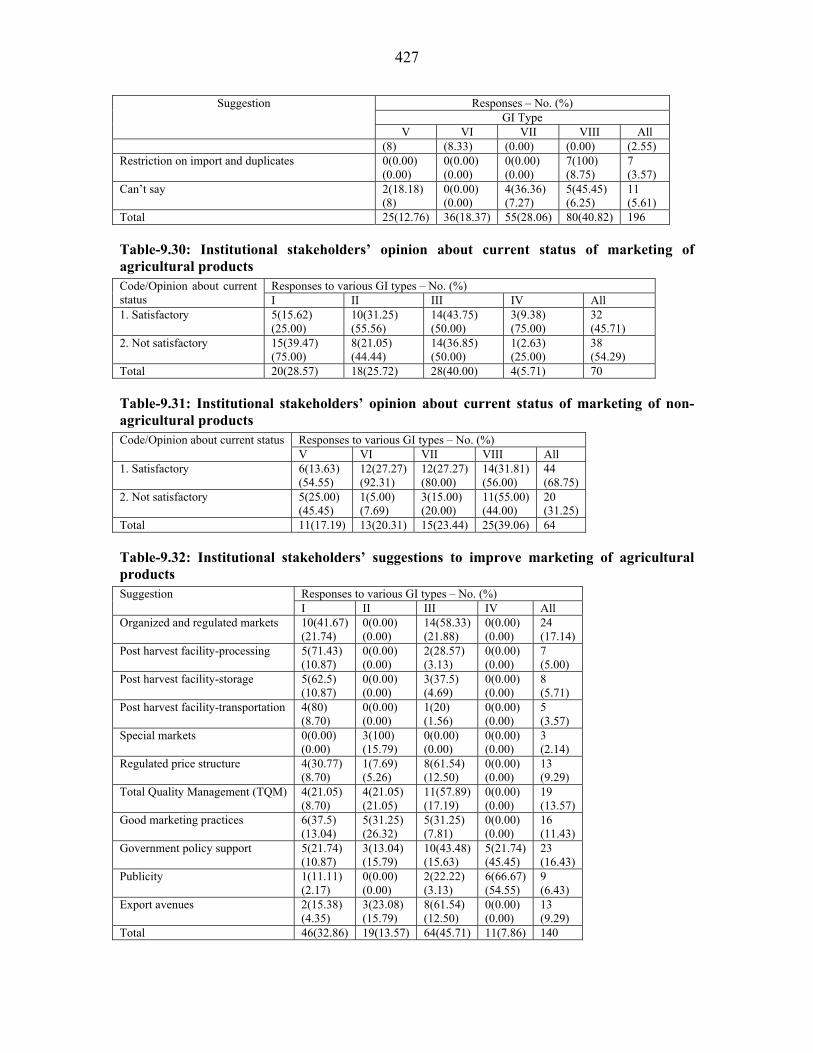
427
Responses – No. (%) GI Type
Suggestion
V VI VII VIII All (8) (8.33) (0.00) (0.00) (2.55)
Restriction on import and duplicates 0(0.00) (0.00)
0(0.00) (0.00)
0(0.00) (0.00)
7(100) (8.75)
7 (3.57)
Can’t say 2(18.18) (8)
0(0.00) (0.00)
4(36.36) (7.27)
5(45.45) (6.25)
11 (5.61)
Total 25(12.76) 36(18.37) 55(28.06) 80(40.82) 196
Table-9.30: Institutional stakeholders’ opinion about current status of marketing of agricultural products
Responses to various GI types – No. (%) Code/Opinion about current status I II III IV All 1. Satisfactory 5(15.62)
(25.00) 10(31.25) (55.56)
14(43.75) (50.00)
3(9.38) (75.00)
32 (45.71)
2. Not satisfactory 15(39.47) (75.00)
8(21.05) (44.44)
14(36.85) (50.00)
1(2.63) (25.00)
38 (54.29)
Total 20(28.57) 18(25.72) 28(40.00) 4(5.71) 70
Table-9.31: Institutional stakeholders’ opinion about current status of marketing of non-agricultural products
Responses to various GI types – No. (%) Code/Opinion about current status V VI VII VIII All
1. Satisfactory 6(13.63) (54.55)
12(27.27) (92.31)
12(27.27) (80.00)
14(31.81) (56.00)
44 (68.75)
2. Not satisfactory 5(25.00) (45.45)
1(5.00) (7.69)
3(15.00) (20.00)
11(55.00) (44.00)
20 (31.25)
Total 11(17.19) 13(20.31) 15(23.44) 25(39.06) 64
Table-9.32: Institutional stakeholders’ suggestions to improve marketing of agricultural products
Responses to various GI types – No. (%) Suggestion I II III IV All
Organized and regulated markets 10(41.67) (21.74)
0(0.00) (0.00)
14(58.33) (21.88)
0(0.00) (0.00)
24 (17.14)
Post harvest facility-processing 5(71.43) (10.87)
0(0.00) (0.00)
2(28.57) (3.13)
0(0.00) (0.00)
7 (5.00)
Post harvest facility-storage 5(62.5) (10.87)
0(0.00) (0.00)
3(37.5) (4.69)
0(0.00) (0.00)
8 (5.71)
Post harvest facility-transportation 4(80) (8.70)
0(0.00) (0.00)
1(20) (1.56)
0(0.00) (0.00)
5 (3.57)
Special markets 0(0.00) (0.00)
3(100) (15.79)
0(0.00) (0.00)
0(0.00) (0.00)
3 (2.14)
Regulated price structure 4(30.77) (8.70)
1(7.69) (5.26)
8(61.54) (12.50)
0(0.00) (0.00)
13 (9.29)
Total Quality Management (TQM) 4(21.05) (8.70)
4(21.05) (21.05)
11(57.89) (17.19)
0(0.00) (0.00)
19 (13.57)
Good marketing practices 6(37.5) (13.04)
5(31.25) (26.32)
5(31.25) (7.81)
0(0.00) (0.00)
16 (11.43)
Government policy support 5(21.74) (10.87)
3(13.04) (15.79)
10(43.48) (15.63)
5(21.74) (45.45)
23 (16.43)
Publicity 1(11.11) (2.17)
0(0.00) (0.00)
2(22.22) (3.13)
6(66.67) (54.55)
9 (6.43)
Export avenues 2(15.38) (4.35)
3(23.08) (15.79)
8(61.54) (12.50)
0(0.00) (0.00)
13 (9.29)
Total 46(32.86) 19(13.57) 64(45.71) 11(7.86) 140
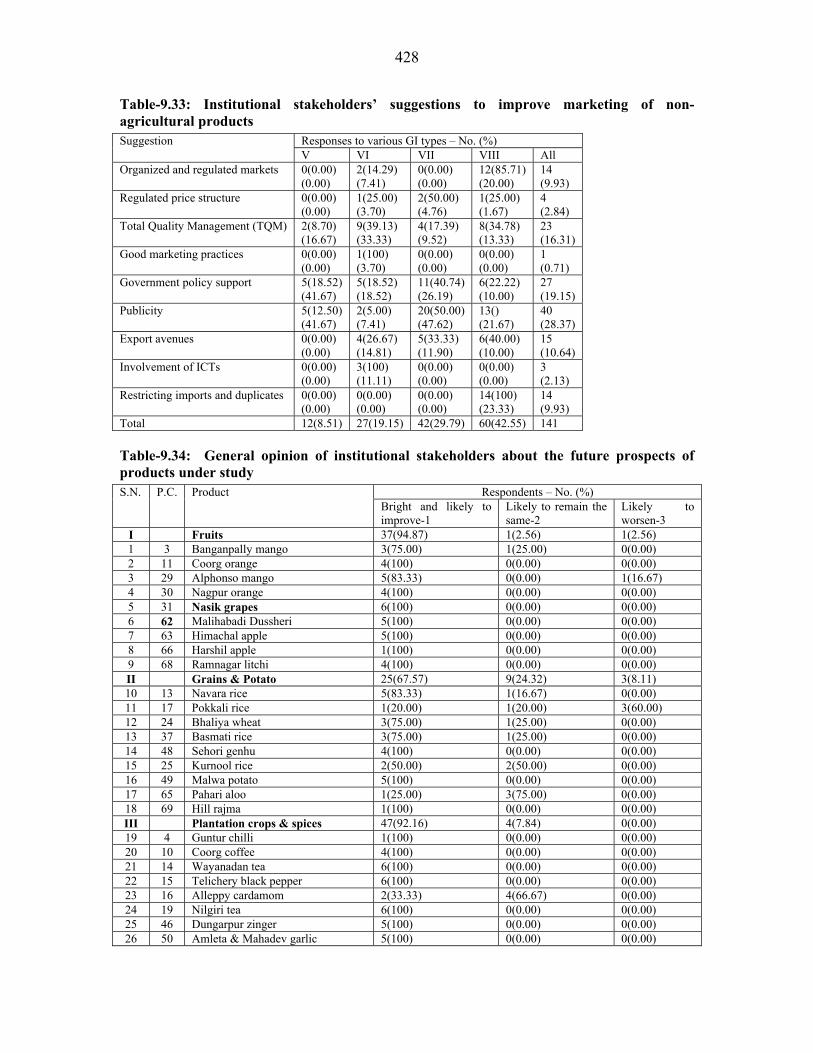
428
Table-9.33: Institutional stakeholders’ suggestions to improve marketing of non-agricultural products
Responses to various GI types – No. (%) Suggestion V VI VII VIII All
Organized and regulated markets 0(0.00) (0.00)
2(14.29) (7.41)
0(0.00) (0.00)
12(85.71) (20.00)
14 (9.93)
Regulated price structure 0(0.00) (0.00)
1(25.00) (3.70)
2(50.00) (4.76)
1(25.00) (1.67)
4 (2.84)
Total Quality Management (TQM) 2(8.70) (16.67)
9(39.13) (33.33)
4(17.39) (9.52)
8(34.78) (13.33)
23 (16.31)
Good marketing practices 0(0.00) (0.00)
1(100) (3.70)
0(0.00) (0.00)
0(0.00) (0.00)
1 (0.71)
Government policy support 5(18.52) (41.67)
5(18.52) (18.52)
11(40.74) (26.19)
6(22.22) (10.00)
27 (19.15)
Publicity 5(12.50) (41.67)
2(5.00) (7.41)
20(50.00) (47.62)
13() (21.67)
40 (28.37)
Export avenues 0(0.00) (0.00)
4(26.67) (14.81)
5(33.33) (11.90)
6(40.00) (10.00)
15 (10.64)
Involvement of ICTs 0(0.00) (0.00)
3(100) (11.11)
0(0.00) (0.00)
0(0.00) (0.00)
3 (2.13)
Restricting imports and duplicates 0(0.00) (0.00)
0(0.00) (0.00)
0(0.00) (0.00)
14(100) (23.33)
14 (9.93)
Total 12(8.51) 27(19.15) 42(29.79) 60(42.55) 141
Table-9.34: General opinion of institutional stakeholders about the future prospects of products under study
Respondents – No. (%) S.N. P.C. Product Bright and likely to improve-1
Likely to remain the same-2
Likely to worsen-3
I Fruits 37(94.87) 1(2.56) 1(2.56) 1 3 Banganpally mango 3(75.00) 1(25.00) 0(0.00) 2 11 Coorg orange 4(100) 0(0.00) 0(0.00) 3 29 Alphonso mango 5(83.33) 0(0.00) 1(16.67) 4 30 Nagpur orange 4(100) 0(0.00) 0(0.00) 5 31 Nasik grapes 6(100) 0(0.00) 0(0.00) 6 62 Malihabadi Dussheri 5(100) 0(0.00) 0(0.00) 7 63 Himachal apple 5(100) 0(0.00) 0(0.00) 8 66 Harshil apple 1(100) 0(0.00) 0(0.00) 9 68 Ramnagar litchi 4(100) 0(0.00) 0(0.00) II Grains & Potato 25(67.57) 9(24.32) 3(8.11) 10 13 Navara rice 5(83.33) 1(16.67) 0(0.00) 11 17 Pokkali rice 1(20.00) 1(20.00) 3(60.00) 12 24 Bhaliya wheat 3(75.00) 1(25.00) 0(0.00) 13 37 Basmati rice 3(75.00) 1(25.00) 0(0.00) 14 48 Sehori genhu 4(100) 0(0.00) 0(0.00) 15 25 Kurnool rice 2(50.00) 2(50.00) 0(0.00) 16 49 Malwa potato 5(100) 0(0.00) 0(0.00) 17 65 Pahari aloo 1(25.00) 3(75.00) 0(0.00) 18 69 Hill rajma 1(100) 0(0.00) 0(0.00) III Plantation crops & spices 47(92.16) 4(7.84) 0(0.00) 19 4 Guntur chilli 1(100) 0(0.00) 0(0.00) 20 10 Coorg coffee 4(100) 0(0.00) 0(0.00) 21 14 Wayanadan tea 6(100) 0(0.00) 0(0.00) 22 15 Telichery black pepper 6(100) 0(0.00) 0(0.00) 23 16 Alleppy cardamom 2(33.33) 4(66.67) 0(0.00) 24 19 Nilgiri tea 6(100) 0(0.00) 0(0.00) 25 46 Dungarpur zinger 5(100) 0(0.00) 0(0.00) 26 50 Amleta & Mahadev garlic 5(100) 0(0.00) 0(0.00)

429
Respondents – No. (%) S.N. P.C. Product Bright and likely to improve-1
Likely to remain the same-2
Likely to worsen-3
27 51 Kumbhraj dhania 4(100) 0(0.00) 0(0.00) 28 52 Fenugreek 5(100) 0(0.00) 0(0.00) 29 54 Mahoba paan 3(100) 0(0.00) 0(0.00) IV Unexploited indigenous products 29(85.29) 5(14.71) 0(0.00) 30 6 Nannari sharbat 5(100) 0(0.00) 0(0.00) 31 12 Kokum fruit juice 2(50.00) 2(50.00) 0(0.00) 32 67 Buraansh juice 2(100) 0(0.00) 0(0.00) V Confectionery 20 (86.9) 3 (13.1) 0(0.00) 1 22 Tirunelveli halwa 4(66.67) 2(33.33) 0(0.00) 2 38 Dodha 1(100) 0(0.00) 0(0.00) 3 44 Bikaneri bhujia 5(83.33) 1(16.67) 0(0.00) 4 45 Bikaneri rasgolla 6(100) 0(0.00) 0(0.00) 5 58 Agra petha 4(100) 0(0.00) 0(0.00) 6 70 Bal mithai - - -
VI Handicrafts 30(83.3) 3(8.33) 3(8.33) 7 5 Kondapalli bommalu (toys) 6(100) 0(0.00) 0(0.00) 8 8 Chennapatana toys 3(100) 0(0.00) 0(0.00) 9 23 Thanjaur art plate 5(100) 0(0.00) 0(0.00) 10 32 Kolhapuri chappal 6(100) 0(0.00) 0(0.00) 11 33 Warli paintings 3(100) 0(0.00) 0(0.00) 12 35 Punjabi jooti 0(0.00) 2(100) 0(0.00) 13 57 Moradabad brass material 4(100) 0(0.00) 0(0.00) 14 60 Saharanpur furniture 3(50.00) 1(16.67) 2(33.33) VII Manufactured products with
organized trade 39(88.64) 4(9.09) 1(2.27)
15 1 Hyderabad pearls 2(33.33) 3(50.00) 1(16.67) 16 9 Mysore sandal soap 5(100) 0(0.00) 0(0.00) 17 20 Nilgiri oil 5(100) 0(0.00) 0(0.00) 18 21 Sivakasi patakha 3(100) 0(0.00) 0(0.00) 19 39 Harambha thresher 6(100) 0(0.00) 0(0.00) 20 42 Makrana marble 5(100) 0(0.00) 0(0.00) 21 47 Jaipur blue pottery 4(80.00) 1(20.00) 0(0.00) 22 55 Ferozabad chundia and glassware 3(100) 0(0.00) 0(0.00) 23 61 Khurja pottery 6(100) 0(0.00) 0(0.00)
VIII Textiles 58(90.63) 6(9.38) 0(0.00) 24 2 Gadwal saree 4(100) 0(0.00) 0(0.00) 25 7 Srikalahasti kalamkari 6(100) 0(0.00) 0(0.00) 26 18 Kancheepuram silk 2(40.00) 3(60.00) 0(0.00) 27 26 Bandhani saree 0(0.00) 0(0.00) 0(0.00) 28 27 Patola saree 1(50.00) 1(50.00) 0(0.00) 29 28 Kutch embroidery 4(100) 0(0.00) 0(0.00) 30 34 Paithani saree 5(100) 0(0.00) 0(0.00) 31 36 Phulkari 2(100) 0(0.00) 0(0.00) 32 40 Ludhiana hosiery 4(80.00) 1(20.00) 0(0.00) 33 41 Jaipuri rajai 6(100) 0(0.00) 0(0.00) 34 43 Sanganeri print 5(100) 0(0.00) 0(0.00) 35 53 Banarasi saree 5(83.33) 1(16.67) 0(0.00) 36 56 Lucknavi chikan 4(100) 0(0.00) 0(0.00) 37 59 Bhadoi carpet 6(100) 0(0.00) 0(0.00) 38 64 Kullu shawl 4(100) 0(0.00) 0(0.00)

430
Table-9.35: Institutional stakeholders’ response to product’s unique quality, reputation and other characteristics attributing to geographical origin
Respondents – No. (%) Sl.No. Product code Product Yes-1 No-2
I Fruits 38(90.48) 4(9.52) 1 3 Banganpally mango 6(100) 0(0.00) 2 11 Coorg orange 4(100) 0(0.00) 3 29 Alphonso mango 6(100) 0(0.00) 4 30 Nagpur orange 4(100) 0(0.00) 5 31 Nasik grapes 6(100) 0(0.00) 6 62 Malihabadi Dussheri 3(50.00) 3(50.00) 7 63 Himachal apple 4(80.00) 1(20.00) 8 66 Harshil apple 1(100) 0(0.00) 9 68 Ramnagar litchi 4(100) 0(0.00) II Grains & Potato 34(94.44) 2(5.56) 10 13 Navara rice 6(100) 0(0.00) 11 17 Pokkali rice 6(100) 0(0.00) 12 24 Bhaliya wheat 4(100) 0(0.00) 13 37 Basmati rice 3(100) 0(0.00) 14 48 Sehori genhu 4(100) 0(0.00) 15 25 Kurnool rice 4(100) 0(0.00) 16 49 Malwa potato 5(100) 0(0.00) 17 65 Pahari aloo 2(50.00) 2(50.00) 18 69 Hill rajma 0(0.00) 0(0.00) III Plantation crops & spices 50(96.15) 2(3.85) 19 4 Guntur chilli 0(0.00) 1(100) 20 10 Coorg coffee 4(100) 0(0.00) 21 14 Wayanadan tea 5(83.33) 1(16.67) 22 15 Telichery black pepper 6(100) 0(0.00) 23 16 Alleppy cardamom 6(100) 0(0.00) 24 19 Nilgiri tea 6(100) 0(0.00) 25 46 Dungarpur zinger 5(100) 0(0.00) 26 50 Amleta & Mahadev garlic 5(100) 0(0.00) 27 51 Kumbhraj dhania 5(100) 0(0.00) 28 52 Fenugreek 5(100) 0(0.00) 29 54 Mahoba paan 3(100) 0(0.00) IV Unexploited indigenous products 10(100) 0(0.00) 30 6 Nannari sharbat 5(100) 0(0.00) 31 12 Kokum fruit juice 3(100) 0(0.00) 32 67 Buraansh juice 2(100) 0(0.00) V Confectionery 22(95.65) 1(4.35) 1 22 Tirunelveli halwa 6(100) 0(0.00) 2 38 Dodha 1(100) 0(0.00) 3 44 Bikaneri bhujia 6(100) 0(0.00) 4 45 Bikaneri rasgolla 6(100) 0(0.00) 5 58 Agra petha 3(75.00) 1(25.00) 6 70 Bal mithai 0(0.00) 0(0.00)
VI Handicrafts 33(94.29) 2(5.71) 7 5 Kondapalli bommalu (toys) 6(100) 0(0.00) 8 8 Chennapatana toys 3(100) 0(0.00) 9 23 Thanjaur art plate 5(100) 0(0.00) 10 32 Kolhapuri chappal 6(100) 0(0.00) 11 33 Warli paintings 3(100) 0(0.00) 12 35 Punjabi jooti 2(100) 0(0.00) 13 57 Moradabad brass material 3(60.00) 2(40.00) 14 60 Saharanpur furniture 5(100) 0(0.00) VII Manufactured products with organized trade 28(66.67) 14(33.33) 15 1 Hyderabad pearls 6(100) 0(0.00) 16 9 Mysore sandal soap 4(100) 0(0.00)

431
Respondents – No. (%) Sl.No. Product code Product Yes-1 No-2
17 20 Nilgiri oil 5(100) 0(0.00) 18 21 Sivakasi patakha 1(33.33) 2(66.67) 19 39 Harambha thresher 6(100) 0(0.00) 20 42 Makrana marble 0(0.00) 4(100) 21 47 Jaipur blue pottery 0(0.00) 5(100) 22 55 Ferozabad chundia and glassware 1(33.33) 2(66.67) 23 61 Khurja pottery 5(83.33) 1(16.67)
VIII Textiles 48(72.73) 18(27.27) 24 2 Gadwal saree 5(83.33) 1(16.67) 25 7 Srikalahasti kalamkari 6(100) 0(0.00) 26 18 Kancheepuram silk 4(80.00) 1(20.00) 27 26 Bandhani saree 0(0.00) 0(0.00) 28 27 Patola saree 2(100) 0(0.00) 29 28 Kutch embroidery 6(100) 0(0.00) 30 34 Paithani saree 6(100) 0(0.00) 31 36 Phulkari 2(100) 0(0.00) 32 40 Ludhiana hosiery 4(100) 0(0.00) 33 41 Jaipuri rajai 6(100) 0(0.00) 34 43 Sanganeri print 0(0.00) 3(100) 35 53 Banarasi saree 1(16.67) 5(83.33) 36 56 Lucknavi chikan 1(25.00) 3(75.00) 37 59 Bhadoi carpet 1(16.67) 5(83.33) 38 64 Kullu shawl 4(100) 0(0.00)
Table-9.36: Response for description of uniqueness of characteristics found in the product being produced in the particular region, which cannot be achieved if, produced in other geographical regions
Respondents – No. (%) Commodity Some response No response Total
Agriculture products 158 (82.29) (50.15)
34 (17.70) (34.34)
192 (46.37)
Non-agriculture products 157 (70.72) (49.85)
65 (29.27) (65.65)
222 (53.62)
All 315 (76.08) 99 (53.62) 414 (100)
Table-9.37: Opinion of institutional stakeholders about awareness of producers/sellers that their product can be protected as community patent known as geographical indication
Respondents – No. (%) GI Type Yes-1 No-2 Cant say-3
I 9(28.13) 16(50.00) 7(21.87) II 3(11.11) 16(59.26) 8(29.63) III 5(14.70) 22(64.71) 7(20.59) IV 2(28.57) 5(71.43) 0(0.00)
All Agriculture products 19(19.00) 59(59.00) 22(22.00) V 7(50.00) 6(42.86) 1(7.14) VI 11(42.31) 4(15.38) 11(42.31) VII 7(20.59) 23(67.65) 4(11.76) VIII 24(50.00) 16(33.33) 8(16.67)
All non Agriculture products 49(40.16) 49(40.16) 24(19.68) Total Agri+ Non Agri Products 68(30.63) 108(48.65) 46(20.72)

432
Table-9.38: Awareness of institutional stakeholders’ whether the product under study is registered under GI
Respondents – No. (%) GI Type Yes-1 No-2 Cant say-3 Total
I 8 (19.51) (50.0)
26 (63.41) (30.23)
7 (17.07) (20.58)
41 (30.14)
II 2 (5.56) (12.5)
25 (69.44) (29.06)
9 (25.0) (26.47)
36 (26.47)
III 5 (10.20) (31.25)
29 (59.18) (33.72)
15 (30.61) (44.11)
49 (36.02)
IV 1 (10.0) (6.25)
6 (60.0) (6.97)
3 (30.0) (8.82)
10 (7.35)
All Agriculture products 16(11.76) 86(63.24) 34(25.0) 136
V 12 (54.54) (27.27)
9 (40.90) (7.89)
1 (4.54) (10.0)
22 (13.09)
VI 10 (27.77) (22.72)
25 (69.44) (21.92)
1 (2.78) (10.0)
36 (21.42)
VII 6 (13.63) (13.63)
35 (79.54) (30.70)
3 (6.81) (30.0)
44 (26.19)
VIII 16 (24.24) (36.36)
45 (68.18) (39.47)
5 (7.57) (50.0)
66 (39.28)
All non Agriculture products 44(26.19) 114(67.85) 10(5.95) 168
Total Agri+ Non Agri Products 60 (19.73)
200 (65.78) 44 (14.47) 304
Table-9.39: Institutional stakeholders’ view about expected post-registration changes in production and marketing of various types of agricultural products
Respondents to GI Types – No. (%) I II III IV *EC
Y N C Y N C Y N C Y N C
1 37(94.87) (11.17)
0(0.00) (0.0)
2(5.13) (4.76)
34(89.47) (11.88)
0(0.0) (0.0)
4(10.53) (5.55)
45(88.24) (12.32)
0 (0.0) (0.0)
6(11.76) (5.0)
8(88.89) (10.52)
0 (0.0) (0.0)
1(11.11) (11.11)
2 39(97.50) (11.78)
1(2.50) (3.33)
0(0.00) (0.0)
31(81.58) (10.83)
1(2.63) (7.14)
6(15.79) (8.34)
43(86.00) (11.78)
1(2.00) (5.0)
6(12.00) (5.0)
8(88.89) (10.52)
0(0.0) (0.0)
1(11.11) (11.11)
3 33(82.50) (9.96)
3 (7.50) (10.0)
4 (10.00) (9.52)
27(72.97) (9.44)
1 (2.70) (7.14)
9 (24.33) (12.5)
37(74.00) (10.13)
1(2.00) (5.0)
12(24.0) (10.0)
8(88.89) (10.52)
0 (0.0) (0.0)
1(11.11) (11.11)
4 36(90.00) (10.87)
0(0.0) (0.0)
4(10.00) (9.52)
33(89.19) (11.53)
0 (0.0) (0.0)
4 (10.81) (5.55)
36(70.59) (9.86)
1(1.96) (5.0)
14(27.45) (11.6)
9(100.0) (11.84)
0 (0.0) (0.0)
0(0.0) (0.0)
5 31(77.5) (9.36)
3(7.5) (10.0)
6(15.00) (14.28)
29(78.38) (10.13)
0 (0.0) (0.0)
8(21.62) (11.1)
41(80.39) (11.23)
1(1.96) (5.0)
9(17.65) (7.5)
9(100.0) (11.84)
0 (0.00) (0.0)
0(0.00) (0.0)
6 29(70.73) (8.76)
4 (9.76) (13.3)
8(19.51) (19.04)
28(75.68) (9.79)
1(2.70) (7.14)
8(21.62) (11.1)
37(72.55) (10.13)
2 (3.92) (10.0)
12(23.53) (10.0)
8(88.89) (10.52)
0 (0.0) (0.00)
1(11.11) (11.11)
7 31(75.60) (9.36)
5 (12.20) (16.66)
5(12.20) (11.90)
28(75.68) (9.79)
1 (2.70) (7.14)
8 (21.62) (11.1)
26(50.98) (7.12)
4(7.84) (20.0)
21(41.18) (17.5)
8(88.89) (10.52)
0 (0.0) (0.0)
1(11.11) (11.11)
8 38(95.00) (11.48)
0(0.00) (0.0)
2(5.00) (4.76)
29(78.38) (10.13)
0(0.0) (0.0)
8 (21.62) (11.1)
41(80.40) (11.23)
1 (1.96) (5.0)
9(17.65) (7.5)
8(88.89) (10.52)
1(11.11) (50.0)
0(0.00) (0.0)
9 18(43.90) (5.43)
14(34.15) (46.67)
9 (21.95) (21.42)
18(50.00) (6.29)
((25.00) (64.28)
9 (25.00) (12.5)
24(48.00) (6.57)
9(18.00) (45.0)
17(34.00) (14.16)
4(44.45) (5.26)
3(33.33) (8.57)
2(22.22) (22.22)
10 39(95.12) (11.78)
0(0.00) (0.0)
2 (4.88) (4.76)
29(76.32) (10.13)
1 (2.63) (7.14)
8 (21.05) (11.1)
35(71.43) (9.58)
0 (0.0) (0.0)
14(28.57) (11.66)
6(75.00) (7.89)
0 (0.0) (0.0)
2(25.00) (22.22)
*T 331(82.13)
30 (7.44)
42(10.42)
286(76.88)
14(3.76)
72(19.35) 365(72.28)
20(3.96)
120(23.76) 76(85.40) 4(4.49)
9(10.11)
Note: *EC= Expected changes after GI Registration, T= Total number of respondents, Y = yes, N =- No, C = Can’t say. Code [1. Product Quality has standardized/will become standard, 2.Product grading has improved /will improve, 3.Traders are purchasing/will purchase from actual and authorized producers only, 4.Income of producers has increased/will increase, 5.Income of traders has increased/will increase, 6. Number of producers has increased/will increase, 7. Producers are producing/will produce more, 8. Price of the product has increased/will increase, 9. Producers have shifted/will shift from other livelihood activities, 10.Overall improvement in socio-eco conditions of producers]

433
Table-9.40: Institutional stakeholders’ view about expected post-registration changes in production and marketing of various types of agricultural products in general
Total Agriculture Products Expected changes after GI Registration Yes No. Can’t say Product Quality has standardized/will become standard 124(90.51)
(11.72) 0(0.0) (0.0)
13(9.49) (5.34)
Product grading has improved /will improve 121(88.32) (11.43)
3 (2.19) (4.41)
13(9.49) (5.34)
Traders are purchasing/will purchase from actual and authorized producers only
105(77.21) (9.92)
5 (3.68) (7.35)
26(19.12) (10.69)
Income of producers has increased/will increase 114(83.21) (10.77)
1(0.73) (1.47)
22(16.06) (9.05)
Income of traders has increased/will increase 110(80.29) (10.39)
4 (2.92) (5.88)
23(16.79) (9.46)
Number of producers has increased/will increase 102(73.91) (9.64)
7(5.07) (10.29)
29(21.01) (11.93)
Producers are producing/will produce more 93(67.39) (8.79)
10(7.25) (14.70)
35(25.36) (14.40)
Price of the product has increased/will increase 116(84.67) (10.96)
2 (1.46) (2.94)
19(13.87) (7.81)
Producers have shifted/will shift from other livelihood activities 64(47.06) (6.04)
35(25.73) (51.47)
37(27.2) (15.22)
Overall improvement in socio-eco conditions of producers 109(80.15) (10.30)
1 (0.74) (1.47)
26(19.11) (10.69)
Total no. of responses 1058(77.28) 68 (4.97) 243(17.75)
Table-9.41: Institutional stakeholders’ view about expected post-registration changes in production and marketing of various types of non-agricultural products
Respondents to GI Types – No. (%) V VI VII VIII *EC
Y N C Y N C Y N C Y N C
1 19(86.36) (12.34)
3(13.64) (6.98)
0(0.00) (0.00)
32(91.43) (10.96)
0(0.00) (0.00)
3(8.57) (8.57)
37(90.24) (13.26)
0(0.00) (0.00)
4(9.76) (3.70)
57(87.69) (11.20)
1(1.54) (3.23)
7(10.77) (6.48)
2 18(81.82) (11.69)
3(13.64) (6.98)
1(4.54) (4.76)
28(80.00) (9.59)
1(2.86) (4.55)
6(17.14) (17.14)
35(87.50) (12.55)
2(5.00) (15.38)
3(7.50) (2.78)
56(86.15) (11.00)
1(1.54) (3.23)
8(12.31) (7.41)
3 21(95.45) (13.64)
0(0.00) (0.00)
1(4.55) (4.76)
30(88.24) (10.27)
2(5.88) (9.09)
2(5.88) (5.71)
29(72.50) (10.39)
2(5.00) (15.38)
9(22.50) (8.33)
53(82.81) (10.41)
2(3.13) (6.45)
9(14.06) (8.33)
4 18(81.82) (11.69)
4(18.18) (9.30)
0(0.00) (0.00)
31(88.57) (10.62)
3(8.57) (13.63)
1(2.86) (2.86)
30(75.00) (10.75)
1(2.50) (7.69)
9(22.50) (8.33)
55(84.62) (10.81)
2(3.07) (6.45)
8(12.31) (7.41)
5 17(77.27) (11.04)
5(22.73) (11.63)
0(0.00) (0.00)
31(88.57) (10.62)
2(5.71) (9.09)
2(5.71) (5.71)
29(72.50) (10.39)
0(0.00) (0.00)
11(27.50) (10.19)
55(84.62) (10.81)
3(4.61) (9.68)
7(10.77) (6.48)
6 18(85.72) (11.69)
1(4.76) (2.33)
2(9.52) (9.52)
32(88.88) (10.96)
2(5.56) (9.09)
1(2.86) (2.86)
22(55.00) (7.89)
1(2.50) (7.69)
17(42.50) (15.74)
53(81.54) (10.41)
4(6.15) (12.90)
8(12.31) (7.41)
7 14(66.67) (9.09)
5(23.81) (11.62)
2(9.52) (9.52)
32(91.43) (10.96)
1(2.86) (4.55)
2(5.71) (5.71)
27(67.50) (9.68)
0(0.00) (0.00)
13(32.50) (12.04)
52(80.00) (10.22)
1(1.54) (3.23)
12(18.46) (11.11)
8 13(59.09) (8.44)
6(27.27) (13.95)
3(13.64) (14.29)
26(74.28) (8.90)
1(2.86) (4.55)
8(22.86) (22.86)
30(75.00) (10.75)
3(7.50) (23.08)
7(17.50) (6.48)
53(81.54) (10.41)
2(3.07) (6.45)
10(15.39) (9.26)
9 2(9.09) (1.29)
13(59.09) (30.23)
7(31.82) (33.34)
16(45.71) (5.48)
9(25.71) (40.90)
10(28.58) (28.58)
14(35.90) (5.02)
3(7.69) (23.08)
22(56.41) (20.37)
23(35.38) (4.51)
15(23.08) (48.38)
27(41.54) (25.00)
10 14(63.64) (9.09)
3(13.64) (6.98)
5(22.72) (23.81)
34(97.14) (11.64)
1(2.86) (4.55)
0(0.00) (0.00)
26(65.00) (9.32)
1(2.50) (7.69)
13(32.50) (12.04)
52(81.25) (10.22)
0(0.00) (0.00)
12(18.75) (11.11)
*T 154(70.64) (100)
43(19.73) (100)
21(9.63) (100)
292(83.67) (100)
22(6.30) (100)
35(10.03) (100)
279(69.75) (100)
13(3.25) (100)
108(27.00) (100)
509(78.55) (100)
31(4.78) (100)
108(16.67) (100)
Note: *EC= Expected changes after GI Registration, T= Total number of respondents, Y = yes, N =- No, C = Can’t say. Code [1. Product Quality has standardized/will become standard, 2.Product grading has improved /will improve, 3.Traders are purchasing/will purchase from actual and authorized producers only, 4.Income of producers has increased/will increase, 5.Income of traders has increased/will increase, 6. Number of producers has increased/will increase, 7. Producers are producing/will produce more, 8. Price of the product has increased/will increase, 9. Producers have shifted/will shift from other livelihood activities, 10.Overall improvement in socio-eco conditions of producers]

434
Table-9.42: Institutional stakeholders’ view about expected post-registration changes in production and marketing of various types of non-agricultural products in general
Total non-agriculture products Expected changes after GI registration Yes No Can’t say Product Quality has standardized/will become standard 145(88.96)
(11.75) 4(2.45) (3.67)
14(8.59) (5.15)
Product grading has improved /will improve 137(84.57) (11.10)
7(4.32) (6.42)
18(11.11) (6.62)
Traders are purchasing/will purchase from actual and authorized producers only
133(83.13) (10.78)
6(3.75) (5.50)
21(13.12) (7.72)
Income of producers has increased/will increase 134(82.72) (10.86)
10(6.17) (9.18)
18(11.11) (6.62)
Income of traders has increased/will increase 132(81.48) (10.69)
10(6.17) (9.18)
20(12.35) (7.35)
Number of producers has increased/will increase 125(77.64) (10.13)
8(4.97) (7.34)
28(17.39) (10.29)
Producers are producing/will produce more 125(77.64) (10.13)
7(4.35) (6.42)
29(18.01) (10.66)
Price of the product has increased/will increase 122(75.31) (9.89)
12(7.41) (11.00)
28(17.28) (10.29)
Producers have shifted/will shift from other livelihood activities 55(34.16) (4.46)
40(24.84) (36.70)
66(41.00) (24.26)
Overall improvement in socio-eco conditions of producers 126(78.26) (10.21)
5(3.11) (4.59)
30(18.63) (11.02)
Total number of responses 1234(76.41) 109(6.75) 272(16.84)
Table-9.43: Responsibility and functions of respondent’s office in relation to G.I. registration in the State
Responses – No. (%) Responsibility Agriculture Products Non-Agriculture Products
No responsibility taken 7 (21.88)
9 (31.03)
Hiring IPR consultants 8 (25.00)
14 (48.28)
Creating awareness 8 (25.00)
6 (20.69)
Conventional activities 9 (28.12)
0 (0.00)
Total 32 29
Table-9.44: Concerned officers/ staffs undergone training to perform the duties assigned to them in relation to G.I. registration
Respondents – No. (%) Product Yes No No Answer Agriculture Products 14(43.75) 12(37.50) 6(18.75) Non-Agriculture Products 11(29.73) 10(27.03) 16(43.24) All agric+non agric. 25(36.24) 22(31.88) 22(31.88)
Table-9.45: Average percentage of staff trained in GI registration Agriculture Products Non-Agriculture Products All Agri+Non-Agri 44.25 47.5 45.88

435
Table-9.46: Information on proactive steps taken by institutional stakeholders for activating awareness on and facilitating G.I. registration
Responses – No. (%) Agriculture Products Non-Agriculture Products All Agri+ non- agri products Question
Y IP NP Y IP NP Y IP NP Have you distributed book-lets, leaflets, posters etc.?
14(51.85) (11.02)
4(14.81) (21.05)
9(33.33) (6.92)
11(47.83) (9.91)
6(26.09) (12.77)
6(26.09) (8.00)
25(50.00) (10.50)
10(20.00) (15.5)
15(30.00) (7.32)
Have you communicated the information through TV/ Radio?
10(37.04) (7.87)
2(7.41) (10.53)
15(55.56) (11.54)
8(36.36) (7.21)
4(18.18) (8.51)
10(45.45) (13.33)
18(36.73) (7.56)
6(12.24) (9.09)
25(51.02) (12.20)
Have you addressed group/ public meeting for the purpose?
18(66.67) (14.17)
1(3.70) (5.26)
8(29.63) (6.15)
13(59.09) (11.71)
3(13.64) (6.38)
6(27.27) (8.00)
31(63.27) (13.03)
4(8.16) (6.06)
14(28.57) (6.83)
Have you imparted the needed training to individuals/ groups?
17(62.96) (13.39)
1(3.70) (5.26)
9(33.33) (6.92)
12(54.55) (10.81)
4(18.18) (8.51)
6(27.27) (8.00)
29(59.18) (12.18)
5(10.20) (7.58)
15(30.61) (7.32)
Have you engaged NGOs/ Consultants to do the job on your behalf?
9(36) (7.09)
2(8) (10.53)
14(56) (10.77)
8(34.78) (7.21)
5(21.74) (10.64)
10(43.48) (13.33)
17(35.42) (7.14)
7(14.58) (10.61)
24(50.00) (11.7)
Have you assisted in preparing and submitting application with all details
12(48) (9.45)
2(8) (10.53)
11(44) (8.46)
12(57.14) (10.81)
2(9.52) (4.26)
7(33.33) (9.33)
24(52.17) (10.08)
4(8.70) (6.06)
18(39.13) (8.78)
Have you analyzed the cost of GI registration in advance
9(37.5) (7.09)
0(0.00) (0.00)
15(62.5) (11.54)
10(45.45) (9.01)
4(18.18) (8.51)
8(36.36) (10.67)
19(41.30) (7.98)
4(8.70) (6.06)
23(50.00) (11.22)
Have you analyzed the expected benefits of GI prior to its registration
10(41.67) (7.87)
1(4.17) (5.26)
13(54.17) (10.00)
12(54.55) (10.81)
5(22.73) (10.64)
5(22.73) (6.67)
22(47.83) (9.24)
6(13.04) (9.09)
18(39.13) (8.78)
Whether the product has a database
13(52) (10.24)
3(12) (15.79)
9(36) (6.92)
8(40.00) (7.21)
5(25.00) (10.64)
7(35.00) (9.33)
21(46.67) (8.82)
8(17.78) (12.12)
16(35.56) (7.80)
Have you done the analysis of threat by Mills or import from other countries
8(34.78) (6.30)
0(0.00) (0.00)
15(65.22) (11.54)
10(47.62) (9.01)
5(23.81) (10.64)
6(28.57) (8.00)
18(40.91) (7.56)
5(11.36) (7.58)
21(47.73) (10.24)
Have you taken any initiative to stop infringement of your GI
7(31.82) (5.51)
3(13.64) (15.79)
12(54.55) (9.23)
7(46.67) (6.31)
4(26.67) (8.51)
4(26.67) (5.33)
14(29.79) (5.88)
7(14.89) (10.61)
26(55.32) (12.68)
Total number of respondents
127(46.01)
19(6.88)
130(47.10) 111(47.64)
47(20.17)
75(32.19)
238(46.76) 66(12.97) 205(40.28)
Note: Code [Y = Yes, IP = in pipeline, NP = Not planned]

436
Table – 9.47: Sources fom which money was provided for GI registration Respondents – No. (%) Stakeholders
Agriculture Products Non-Agriculture Products Government 4
(30.77) 4
(28.57) Public financial institution 3
(23.08) 2
(14.29) Producers’ association 4
(30.77) 5
(35.71) Producers individually 2
(15.38) 2
(14.29) NGO 0
(0.00) 1
(7.14) Total 13 14
Table-9.48: Information regarding GI registration Issue Agriculture products Non-agriculture products All Average cost (in Rs.) 83200 50000 66600 % of respondents not responding to this question 6.75(49.09) 7(50.91) 13.75(100) Average contribution per person (in Rs.) 367 390 378 Total no.of infringement cases 2(25.00) 6(75.00) 8(100)
Table-9.49: Method of identification of producers for the purpose as co-applicant in GI application Method of identification Response (%) Through Survey 8
(42.10) Through discussions and interactions 5
(26.32) Through awareness camps 1
(5.26) Through community registration in a society 2
(10.53) Through producers association 3
(15.79) Total 19
Table-9.50: Major problems in identifying the producers located at various places Responses – No. (%) Problem Agric Non-agric. All
No problem 3(60.00) (27.28)
2(40.00) (12.50)
5 (18.52)
Lack of awareness of GI registration 4(50.00) (36.36)
4(50.00) (25.00)
8 (29.63)
Non-awareness, mass organization, institutional constraints and attitude of producers
1(20.00) (9.09)
4(80.00) (25.00)
5 (18.52)
Lack of product specific associations and variation in area under it 2(40.00) (18.18)
3(60.00) (18.75)
5 (18.52)
Lack of organized marketing organization 1(25.00) (9.09)
3(75.00) (18.75)
4 (14.81)
Total 11(40.74) 16(59.26) 27

437
Table-9.51: Visualised expected benefits at the time of making application for GI registration
Responses – No. (%) Expected benefits Agric Non-agric. All
Can’t say 3(75.00) (17.65)
1(25.00) (3.45)
4 (8.70)
Market organization 5(45.45) (29.42)
6(54.55) (20.69)
11 (23.91)
Enhancing production and productivity 0(0.00) (0.00)
5(100) (17.24)
5 (10.87)
Economic and social welfare of producers 2(50.00) (11.76)
2(50.00) (6.90)
4 (8.70)
Enhancing regional, social and cultural benefits 3(27.27) (17.65)
8(72.73) (27.59)
11 (23.91)
Protection of production/sale rights 2(33.33) (11.76)
4(66.67) (13.79)
6 (13.04)
Enhancing profit 2(40.00) (11.76)
3(60.00) (10.34)
5 (10.87)
Total 17(36.96) 29(63.04) 46
Table-9.52: Actions taken to stop infringement of GI Responses – No. (%) Action Agric Non-agric. All
Can’t say 3(60.00) (27.27)
2(40.00) (13.33)
5 (19.23)
Pre-infringement legal enforcement actions 1(20.00) (9.09)
4(80.00) (26.67)
5 (19.23)
Administrative action at producers organization level 1(33.33) (9.09)
2(66.67) (13.33)
3 (11.54)
Post infringement legal enforcement actions 6(46.15) (54.55)
7(53.85) (46.67)
13 (50.00)
Total 11(42.31) 15(57.69) 26
Table-9.53: Deficiencies / difficulties found in getting G.I. registration Responses – No. (%) Deficiencies / difficulties
Agric Non-agric. All Deficiencies with respect to government departments 2(25.00)
(14.29) 6(75.00) (46.15)
8 (29.63)
Deficiencies with respect to producers and collectivism 7(53.85) (50.00)
6(46.15) (46.15)
13 (48.15)
No deficiency reported 5(83.33) (35.71)
1(16.67) (7.70)
6 (22.22)
Total 14(51.85) 13(48.15) 27
Table-9.54: Month wise sale activity of agriculture products as mentioned by institutional stakeholders
Month wise activity schedule S. N. P.C Product Name Jan. Feb. Mar April May June July Aug Sept. Oct. Nov. Dec.I Fruits 1 3 Banganpally mango 3 3 4 4 4 4 4 2 2 3 4 4 2 11 Coorg orange 4 3 3 2 2 2 3 3 3 2 4 4 3 29 Alphonso mango 1 2 4 4 4 1 1 1 1 1 1 1 4 30 Nagpur orange 4 4 4 4 2 1 1 1 1 2 3 4 5 31 Nasik grapes 3 4 4 4 3 4 4 4 4 4 4 4 6 62 Malihabadi Dussheri 1 1 2 3 4 4 4 3 2 1 1 1 7 63 Himachal apple 1 1 1 1 1 1 4 4 4 4 2 1 8 66 Harshil apple 2 2 3 4 4 4 4 4 4 3 2 2

438
Month wise activity schedule S. N. P.C Product Name Jan. Feb. Mar April May June July Aug Sept. Oct. Nov. Dec.9 68 Ramnagar litchi 2 3 3 4 3 1 1 1 1 1 2 2 II Grains & Potato 10 13 Navara rice 3 3 3 3 3 4 3 1 4 3 3 4 11 17 Pokkali rice 1 1 1 2 3 4 4 1 1 4 1 1 12 24 Bhaliya wheat 3 3 3 3 1 1 1 1 1 4 4 3 13 37 Basmati rice 1 1 1 1 1 3 4 4 4 4 2 2 14 48 Sehori genhu 1 1 2 4 4 3 2 2 2 2 2 2 15 25 Kurnool rice 3 3 4 4 3 3 3 2 4 4 3 3 16 49 Malwa potato 1 1 1 1 1 1 3 3 4 4 1 1 17 65 Pahari aloo 2 2 2 3 3 3 4 4 4 3 1 1 18 69 Hill rajma 0 0 0 0 0 0 0 0 0 0 0 0 III Plantation crops & spices 19 4 Guntur chilli 4 4 4 4 1 2 3 3 2 2 3 3 20 10 Coorg coffee 3 4 4 3 2 2 3 3 4 4 3 3 21 14 Wayanadan tea 2 2 2 3 4 4 4 3 3 2 2 2 22 15 Telichery black pepper 3 4 4 3 2 1 1 1 1 1 1 1 23 16 Alleppy cardamom 3 2 2 2 2 2 3 3 4 4 3 3 24 19 Nilgiri tea 2 3 3 4 4 4 3 3 3 4 4 4 25 46 Dungarpur zinger 1 2 2 3 4 4 2 2 2 3 3 3 26 50 Amleta & Mahadev garlic 1 1 4 4 4 3 3 3 3 2 2 2 27 51 Kumbhraj dhania 3 3 3 3 4 2 2 2 1 1 1 1 28 52 Fenugreek 1 1 4 4 4 3 3 3 3 2 2 2 29 54 Mahoba paan 2 2 2 2 2 2 4 4 4 4 3 3 IV Unexploited indigenous products 30 6 Nannari sharbat 2 3 4 4 4 2 2 1 1 1 1 2 31 12 Kokum fruit juice 3 4 4 4 3 2 2 2 1 1 1 1 32 67 Buraansh juice 1 2 4 3 1 1 1 1 1 1 1 1
Note : Codes [ No Activity –1, Lean Activity –2, Normal Activity – 3, Peak Activity – 4] obtained on the basis of highest frequency of respondents.
Table-9.55: Month wise sale activity of non-agriculture products as mentioned by institutional stakeholders
Month wise activity schedule S. N.
P.C. Product Name Jan. Feb. Mar April May June July Aug Sept. Oct. Nov. Dec.V Confectionery 1 22 Tirunelveli halwa 4 3 4 4 4 4 3 3 3 3 3 4 2 38 Dodha 0 0 0 0 0 0 0 0 0 0 0 0 3 44 Bikaneri bhujia 3 3 3 3 3 3 3 3 3 3 3 3 4 45 Bikaneri rasgolla 3 3 3 3 3 2 3 3 3 4 4 4 5 58 Agra petha 2 2 3 4 4 4 4 3 4 4 4 2 6 70 Bal mithai 0 0 0 0 0 0 0 0 0 0 0 0
VI Handicrafts 7 5 Kondapalli bommalu (toys) 4 4 3 3 3 3 3 3 3 3 3 3 8 8 Chennapatana toys 3 3 3 3 3 3 3 3 4 4 4 4 9 23 Thanjaur art plate 4 3 3 3 4 4 3 3 4 2 2 3 10 32 Kolhapuri chappal 3 3 4 4 3 2 2 2 2 3 3 3 11 33 Warli paintings 3 4 4 4 4 1 1 1 1 1 3 3 12 35 Punjabi jooti 3 3 3 2 2 2 2 2 3 3 3 3 13 57 Moradabad brass material 3 3 3 3 4 4 4 4 4 3 3 3 14 60 Saharanpur furniture 4 4 4 4 4 3 3 4 4 4 3 4 VII Manufactured products with organized trade 15 1 Hyderabad pearls 4 4 4 2 3 3 3 3 4 4 4 3 16 9 Mysore sandal soap 3 3 3 3 3 3 3 4 4 4 3 3 17 20 Nilgiri oil 1 1 2 4 4 4 3 3 3 4 4 4 18 21 Sivakasi patakha 3 3 3 3 3 3 4 4 4 4 3 2 19 39 Harambha thresher 3 3 4 4 4 3 1 1 2 1 1 1 20 42 Makrana marble 3 3 4 4 4 4 4 3 3 3 2 3

439
Month wise activity schedule S. N.
P.C. Product Name Jan. Feb. Mar April May June July Aug Sept. Oct. Nov. Dec.21 47 Jaipur blue pottery 4 4 4 2 3 3 3 3 4 4 4 3 22 55 Ferozabad chundia and
glassware 4 4 4 4 4 4 4 4 4 4 4 4
23 61 Khurja pottery 4 4 4 3 3 2 1 3 3 4 4 4 VIII Textiles 24 2 Gadwal saree 4 3 3 3 3 3 3 4 4 4 4 4 25 7 Srikalahasti kalamkari 3 4 4 4 3 3 3 3 3 2 3 3 26 18 Kancheepuram silk 4 3 3 3 2 3 3 3 4 3 3 4 27 26 Bandhani saree 0 0 0 0 0 0 0 0 0 0 0 0 28 27 Patola saree 3 4 4 3 3 3 3 3 3 4 4 4 29 28 Kutch embroidery 4 3 4 3 3 2 2 2 3 4 4 4 30 34 Paithani saree 3 3 3 3 4 2 2 2 3 4 4 3 31 36 Phulkari 1 1 1 1 1 1 1 1 1 1 1 1 32 40 Ludhiana hosiery 3 3 3 3 3 3 4 4 4 4 4 4 33 41 Jaipuri rajai 4 3 2 2 1 1 2 2 3 4 4 4 34 43 Sanganeri print 4 4 3 3 3 2 2 2 3 4 4 4 35 53 Banarasi saree 3 3 3 3 3 2 2 2 2 3 3 3 36 56 Lucknavi chikan 2 2 3 4 4 4 3 3 3 2 2 2 37 59 Bhadoi carpet 4 4 4 2 2 2 2 2 2 3 4 4 38 64 Kullu shawl 4 4 4 3 2 3 3 3 2 3 4 4
Note : Codes [ No Activity –1, Lean Activity –2, Normal Activity – 3, Peak Activity – 4] obtained on the basis of highest frequency of respondents
Table-9.56: Comparative statement of month wise production and sale activity of agricultural products as mentioned by respondents
Month wise activity schedule S. N.
P.C. Product Name Factor Jan. Feb. Mar April May June July Aug Sept. Oct. Nov. Dec.I Fruits
Production 3 3 4 4 4 1 1 2 2 2 3 3 1 3 Banganpally mango Sale 3 3 4 4 4 4 4 2 2 3 4 4
Production 4 4 3 3 2 2 2 2 3 4 4 4 2 11 Coorg orange Sale 4 3 3 2 2 2 3 3 3 2 4 4
Production 3 4 4 4 4 3 3 1 1 3 3 3 3 29 Alphonso mango Sale 1 2 4 4 4 1 1 1 1 1 1 1
Production 4 4 3 2 1 1 1 1 1 4 4 4 4 30 Nagpur orange Sale 4 4 4 4 2 1 1 1 1 2 3 4
Production 4 4 4 2 2 1 1 1 2 4 4 4 5 31 Nasik grapes Sale 3 4 4 4 3 4 4 4 4 4 4 4
Production 2 2 4 4 4 4 4 3 2 2 1 1 6 62 Malihabadi Dussheri Sale 1 1 2 3 4 4 4 3 2 1 1 1
Production 2 2 3 3 2 2 4 4 4 3 2 1 7 63 Himchal apple Sale 1 1 1 1 1 1 4 4 4 4 2 1
Production 2 2 3 3 4 4 4 4 3 3 2 2 8 66 Harshil apple Sale 2 2 3 4 4 4 4 4 4 3 2 2
Production 2 3 3 4 3 1 1 1 1 1 2 2 9 68 Ramnagar litchi Sale 2 3 3 4 3 1 1 1 1 1 2 2
II Grains & Potato Production 2 2 1 1 3 4 2 3 4 2 3 4 10 13
Njvara rice Sale 3 3 3 3 3 4 3 1 4 3 3 4 Production 1 1 1 2 3 4 4 1 4 4 1 1 11 17
Pokkali rice Sale 1 1 1 2 3 4 4 1 1 4 1 1 Production 3 3 3 3 1 1 1 1 1 4 4 3 12 24
Bhaliya wheat Sale 3 3 3 3 1 1 1 1 1 4 4 3 Production 2 2 2 4 3 4 4 3 2 4 4 2 13 37
Basmati rice Sale 1 1 1 1 1 3 4 4 4 4 2 2 Production 0 0 0 0 0 0 0 0 0 0 0 0 14 48
Sehori genhu Sale 1 1 2 4 4 3 2 2 2 2 2 2

440
Month wise activity schedule S. N.
P.C. Product Name Factor Jan. Feb. Mar April May June July Aug Sept. Oct. Nov. Dec.Production 4 2 2 4 1 2 4 4 3 2 2 4 15 25
Kurnool rice Sale 3 3 4 4 3 3 3 2 4 4 3 3 Production 0 0 0 0 0 0 0 0 0 0 0 0 16 49
Malwa potato Sale 1 1 1 1 1 1 3 3 4 4 1 1 Production 4 4 4 3 4 4 4 4 3 3 2 2 17 65
Pahari aloo Sale 2 2 2 3 3 3 4 4 4 3 1 1 Production 1 2 3 4 4 4 4 3 2 1 2 2 18 69
Hill rajma Sale 0 0 0 0 0 0 0 0 0 0 0 0 III Plantation crops & spices
Production 4 4 4 4 4 1 2 3 3 4 4 3 19 4 Guntur chilli Sale 4 4 4 4 1 2 3 3 2 2 3 3
Production 4 3 3 2 2 2 3 3 2 2 3 4 20 10 Coorg coffee Sale 3 4 4 3 2 2 3 3 4 4 3 3
Production 3 3 2 2 4 4 3 3 3 3 3 3 21 14 Wayanadan tea Sale 2 2 2 3 4 4 4 3 3 2 2 2
Production 4 4 3 1 4 4 1 1 1 4 2 4 22 15 Telichery black pepper Sale 3 4 4 3 2 1 1 1 1 1 1 1
Production 3 2 2 2 2 2 3 3 4 4 3 3 23 16 Alleppy cardamom Sale 3 2 2 2 2 2 3 3 4 4 3 3
Production 3 2 2 2 1 4 4 3 3 4 4 3 24 19 Nilgiri tea Sale 2 3 3 4 4 4 3 3 3 4 4 4
Production 3 2 3 3 4 4 2 3 2 3 4 4 25 46 Dungarpur zinger Sale 1 2 2 3 4 4 2 2 2 3 3 3
Production 3 4 4 4 2 2 1 1 1 1 3 3 26 50 Amleta & Mahadev garlic Sale 1 1 4 4 4 3 3 3 3 2 2 2
Production 3 3 4 4 4 3 2 2 1 1 1 3 27 51 Kumbhraj dhania Sale 3 3 3 3 4 2 2 2 1 1 1 1
Production 2 3 4 4 4 3 1 1 1 1 1 2 28 52 Fenugreek Sale 1 1 4 4 4 3 3 3 3 2 2 2
Production 4 4 4 4 3 3 1 1 2 2 3 3 29 54 Mahoba paan Sale 2 2 2 2 2 2 4 4 4 4 3 3
IV Unexploited indigenous products Production 1 2 4 4 4 3 2 2 2 1 1 1 30 6 Nannari sharbat Sale 2 3 4 4 4 2 2 1 1 1 1 2 Production 3 3 4 4 3 2 2 1 1 1 1 1 31 12 Kokum fruit juice Sale 3 4 4 4 3 2 2 2 1 1 1 1 Production 1 2 3 4 4 4 4 3 2 1 2 2 32 67 Buraansh juice Sale 1 2 4 3 1 1 1 1 1 1 1 1
Note: Codes [ No Activity –1, Lean Activity –2, Normal Activity – 3, Peak Activity – 4] obtained on the basis of highest frequency of respondents
Table-9.57: Comparative statement of month wise production and sale activity of non-agricultural products as mentioned by respondents
Month wise activity schedule S. N.
P.C. Product Name Factor Jan. Feb. Mar April May June July Aug Sept. Oct. Nov. Dec.
I Confectionary Production 4 3 3 4 4 4 3 3 3 3 3 4 1 22 Tirunelveli halwa Sale 4 3 4 4 4 4 3 3 3 3 3 4 Production 4 4 4 3 3 2 2 2 3 3 4 4 2 38 Dodha Sale 0 0 0 0 0 0 0 0 0 0 0 0 Production 3 3 3 3 3 3 3 3 3 3 3 3 3 44 Bikaneri bhujia Sale 3 3 3 3 3 3 3 3 3 3 3 3 Production 3 3 3 4 3 3 3 4 3 4 3 3 4 45 Bikaneri rasgolla Sale 3 3 3 3 3 2 3 3 3 4 4 4 Production 3 3 3 3 3 4 4 4 4 4 4 2 5 58 Agra petha Sale 2 2 3 4 4 4 4 3 4 4 4 2
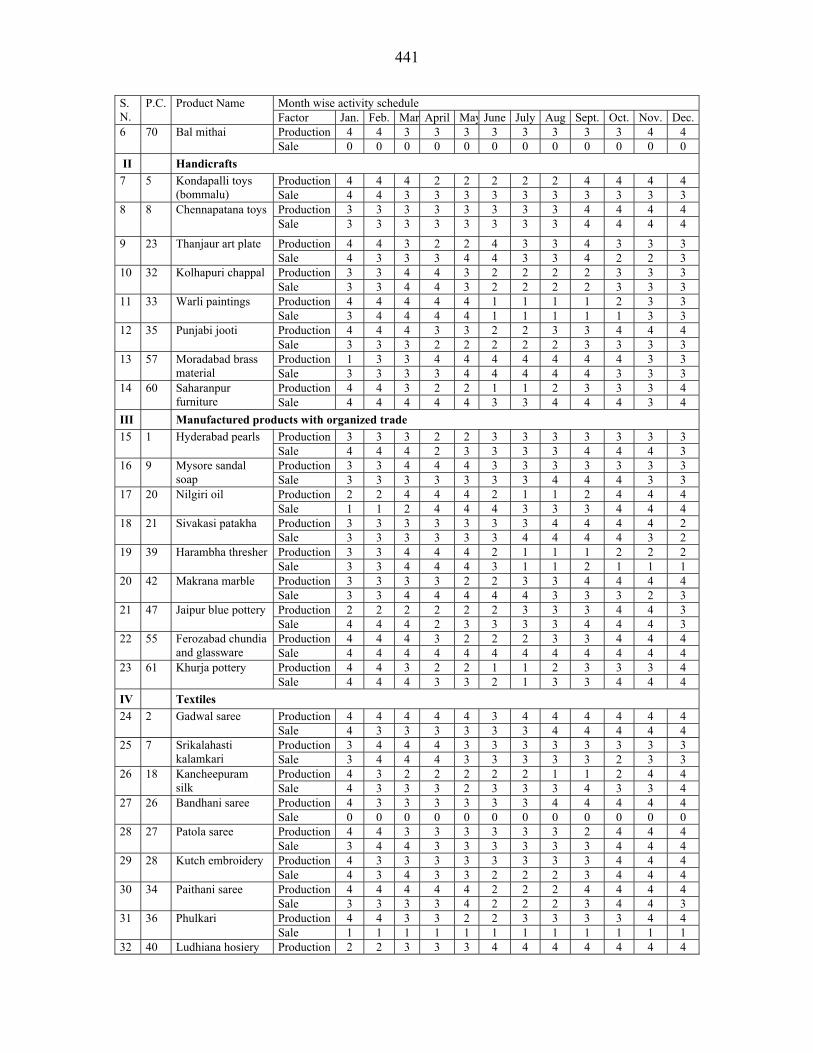
441
Month wise activity schedule S. N.
P.C. Product Name Factor Jan. Feb. Mar April May June July Aug Sept. Oct. Nov. Dec.Production 4 4 3 3 3 3 3 3 3 3 4 4 6 70 Bal mithai Sale 0 0 0 0 0 0 0 0 0 0 0 0
II Handicrafts Production 4 4 4 2 2 2 2 2 4 4 4 4 7 5 Kondapalli toys
(bommalu) Sale 4 4 3 3 3 3 3 3 3 3 3 3 Production 3 3 3 3 3 3 3 3 4 4 4 4 8 8 Chennapatana toys Sale 3 3 3 3 3 3 3 3 4 4 4 4
Production 4 4 3 2 2 4 3 3 4 3 3 3 9 23 Thanjaur art plate Sale 4 3 3 3 4 4 3 3 4 2 2 3 Production 3 3 4 4 3 2 2 2 2 3 3 3 10 32 Kolhapuri chappal Sale 3 3 4 4 3 2 2 2 2 3 3 3 Production 4 4 4 4 4 1 1 1 1 2 3 3 11 33 Warli paintings Sale 3 4 4 4 4 1 1 1 1 1 3 3 Production 4 4 4 3 3 2 2 3 3 4 4 4 12 35 Punjabi jooti Sale 3 3 3 2 2 2 2 2 3 3 3 3 Production 1 3 3 4 4 4 4 4 4 4 3 3 13 57 Moradabad brass
material Sale 3 3 3 3 4 4 4 4 4 3 3 3 Production 4 4 3 2 2 1 1 2 3 3 3 4 14 60 Saharanpur
furniture Sale 4 4 4 4 4 3 3 4 4 4 3 4 III Manufactured products with organized trade
Production 3 3 3 2 2 3 3 3 3 3 3 3 15 1 Hyderabad pearls Sale 4 4 4 2 3 3 3 3 4 4 4 3 Production 3 3 4 4 4 3 3 3 3 3 3 3 16 9 Mysore sandal
soap Sale 3 3 3 3 3 3 3 4 4 4 3 3 Production 2 2 4 4 4 2 1 1 2 4 4 4 17 20 Nilgiri oil Sale 1 1 2 4 4 4 3 3 3 4 4 4 Production 3 3 3 3 3 3 3 4 4 4 4 2 18 21 Sivakasi patakha Sale 3 3 3 3 3 3 4 4 4 4 3 2 Production 3 3 4 4 4 2 1 1 1 2 2 2 19 39 Harambha thresher Sale 3 3 4 4 4 3 1 1 2 1 1 1 Production 3 3 3 3 2 2 3 3 4 4 4 4 20 42 Makrana marble Sale 3 3 4 4 4 4 4 3 3 3 2 3 Production 2 2 2 2 2 2 3 3 3 4 4 3 21 47 Jaipur blue pottery Sale 4 4 4 2 3 3 3 3 4 4 4 3 Production 4 4 4 3 2 2 2 3 3 4 4 4 22 55 Ferozabad chundia
and glassware Sale 4 4 4 4 4 4 4 4 4 4 4 4 Production 4 4 3 2 2 1 1 2 3 3 3 4 23 61 Khurja pottery Sale 4 4 4 3 3 2 1 3 3 4 4 4
IV Textiles Production 4 4 4 4 4 3 4 4 4 4 4 4 24 2 Gadwal saree Sale 4 3 3 3 3 3 3 4 4 4 4 4 Production 3 4 4 4 3 3 3 3 3 3 3 3 25 7 Srikalahasti
kalamkari Sale 3 4 4 4 3 3 3 3 3 2 3 3 Production 4 3 2 2 2 2 2 1 1 2 4 4 26 18 Kancheepuram
silk Sale 4 3 3 3 2 3 3 3 4 3 3 4 Production 4 3 3 3 3 3 3 4 4 4 4 4 27 26 Bandhani saree Sale 0 0 0 0 0 0 0 0 0 0 0 0 Production 4 4 3 3 3 3 3 3 2 4 4 4 28 27 Patola saree Sale 3 4 4 3 3 3 3 3 3 4 4 4 Production 4 3 3 3 3 3 3 3 3 4 4 4 29 28 Kutch embroidery Sale 4 3 4 3 3 2 2 2 3 4 4 4 Production 4 4 4 4 4 2 2 2 4 4 4 4 30 34 Paithani saree Sale 3 3 3 3 4 2 2 2 3 4 4 3 Production 4 4 3 3 2 2 3 3 3 3 4 4 31 36 Phulkari Sale 1 1 1 1 1 1 1 1 1 1 1 1
32 40 Ludhiana hosiery Production 2 2 3 3 3 4 4 4 4 4 4 4
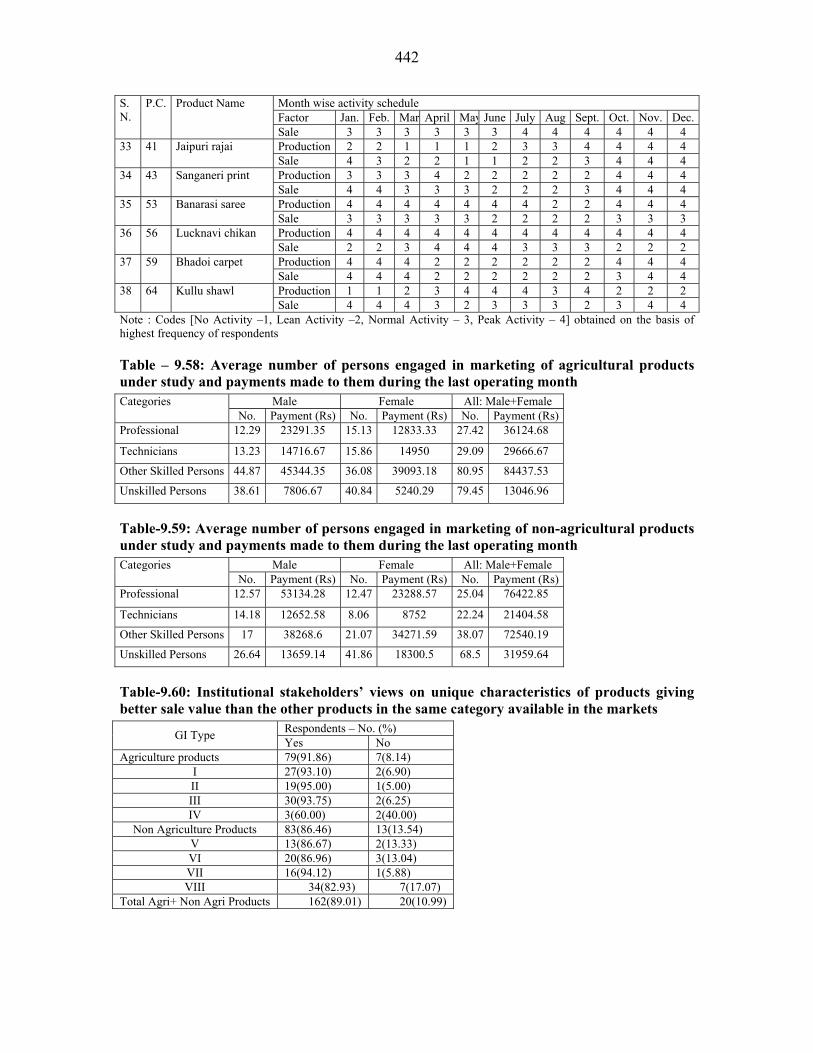
442
Month wise activity schedule S. N.
P.C. Product Name Factor Jan. Feb. Mar April May June July Aug Sept. Oct. Nov. Dec.Sale 3 3 3 3 3 3 4 4 4 4 4 4 Production 2 2 1 1 1 2 3 3 4 4 4 4 33 41 Jaipuri rajai Sale 4 3 2 2 1 1 2 2 3 4 4 4 Production 3 3 3 4 2 2 2 2 2 4 4 4 34 43 Sanganeri print Sale 4 4 3 3 3 2 2 2 3 4 4 4 Production 4 4 4 4 4 4 4 2 2 4 4 4 35 53 Banarasi saree Sale 3 3 3 3 3 2 2 2 2 3 3 3 Production 4 4 4 4 4 4 4 4 4 4 4 4 36 56 Lucknavi chikan Sale 2 2 3 4 4 4 3 3 3 2 2 2 Production 4 4 4 2 2 2 2 2 2 4 4 4 37 59 Bhadoi carpet Sale 4 4 4 2 2 2 2 2 2 3 4 4 Production 1 1 2 3 4 4 4 3 4 2 2 2 38 64 Kullu shawl Sale 4 4 4 3 2 3 3 3 2 3 4 4
Note : Codes [No Activity –1, Lean Activity –2, Normal Activity – 3, Peak Activity – 4] obtained on the basis of highest frequency of respondents
Table – 9.58: Average number of persons engaged in marketing of agricultural products under study and payments made to them during the last operating month
Male Female All: Male+Female Categories No. Payment (Rs) No. Payment (Rs) No. Payment (Rs)
Professional 12.29 23291.35 15.13 12833.33 27.42 36124.68
Technicians 13.23 14716.67 15.86 14950 29.09 29666.67
Other Skilled Persons 44.87 45344.35 36.08 39093.18 80.95 84437.53
Unskilled Persons 38.61 7806.67 40.84 5240.29 79.45 13046.96
Table-9.59: Average number of persons engaged in marketing of non-agricultural products under study and payments made to them during the last operating month
Male Female All: Male+Female Categories No. Payment (Rs) No. Payment (Rs) No. Payment (Rs)
Professional 12.57 53134.28 12.47 23288.57 25.04 76422.85
Technicians 14.18 12652.58 8.06 8752 22.24 21404.58
Other Skilled Persons 17 38268.6 21.07 34271.59 38.07 72540.19
Unskilled Persons 26.64 13659.14 41.86 18300.5 68.5 31959.64
Table-9.60: Institutional stakeholders’ views on unique characteristics of products giving better sale value than the other products in the same category available in the markets
Respondents – No. (%) GI Type Yes No Agriculture products 79(91.86) 7(8.14)
I 27(93.10) 2(6.90) II 19(95.00) 1(5.00) III 30(93.75) 2(6.25) IV 3(60.00) 2(40.00)
Non Agriculture Products 83(86.46) 13(13.54) V 13(86.67) 2(13.33) VI 20(86.96) 3(13.04) VII 16(94.12) 1(5.88) VIII 34(82.93) 7(17.07)
Total Agri+ Non Agri Products 162(89.01) 20(10.99)
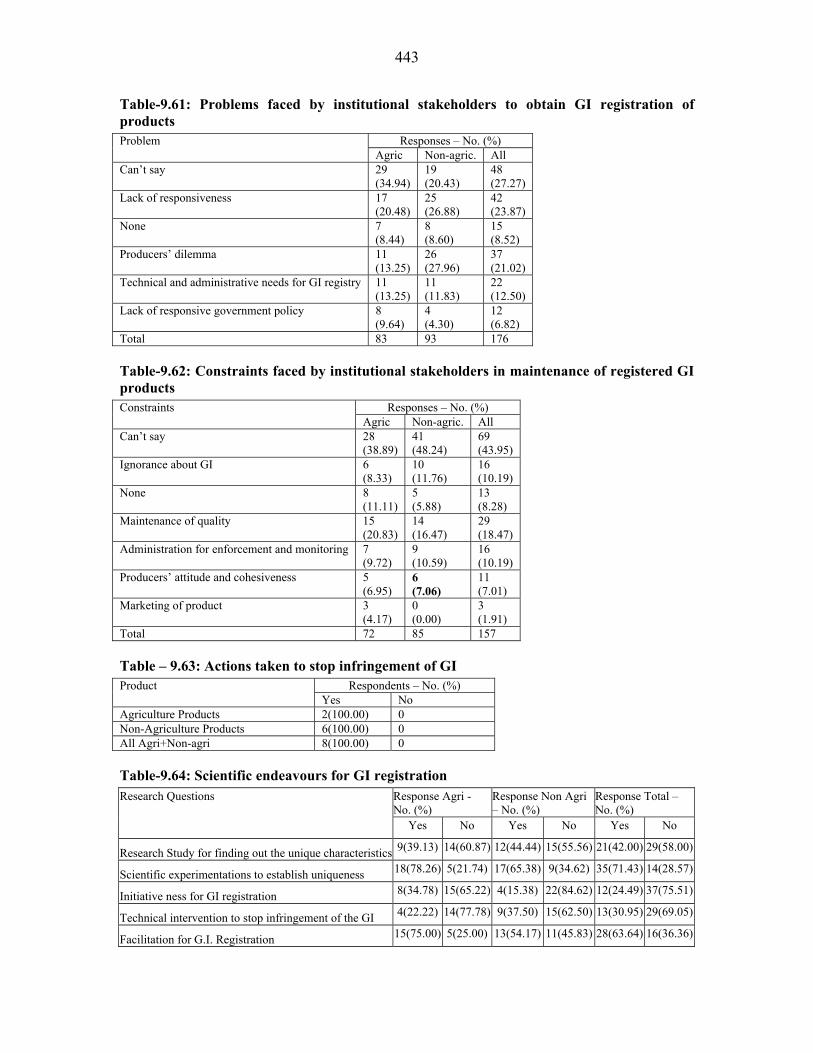
443
Table-9.61: Problems faced by institutional stakeholders to obtain GI registration of products
Responses – No. (%) Problem Agric Non-agric. All
Can’t say 29 (34.94)
19 (20.43)
48 (27.27)
Lack of responsiveness 17 (20.48)
25 (26.88)
42 (23.87)
None 7 (8.44)
8 (8.60)
15 (8.52)
Producers’ dilemma 11 (13.25)
26 (27.96)
37 (21.02)
Technical and administrative needs for GI registry 11 (13.25)
11 (11.83)
22 (12.50)
Lack of responsive government policy 8 (9.64)
4 (4.30)
12 (6.82)
Total 83 93 176
Table-9.62: Constraints faced by institutional stakeholders in maintenance of registered GI products
Responses – No. (%) Constraints Agric Non-agric. All
Can’t say 28 (38.89)
41 (48.24)
69 (43.95)
Ignorance about GI 6 (8.33)
10 (11.76)
16 (10.19)
None 8 (11.11)
5 (5.88)
13 (8.28)
Maintenance of quality 15 (20.83)
14 (16.47)
29 (18.47)
Administration for enforcement and monitoring 7 (9.72)
9 (10.59)
16 (10.19)
Producers’ attitude and cohesiveness 5 (6.95)
6 (7.06)
11 (7.01)
Marketing of product 3 (4.17)
0 (0.00)
3 (1.91)
Total 72 85 157
Table – 9.63: Actions taken to stop infringement of GI Respondents – No. (%) Product
Yes No Agriculture Products 2(100.00) 0 Non-Agriculture Products 6(100.00) 0 All Agri+Non-agri 8(100.00) 0
Table-9.64: Scientific endeavours for GI registration Response Agri - No. (%)
Response Non Agri – No. (%)
Response Total – No. (%)
Research Questions
Yes No Yes No Yes No
Research Study for finding out the unique characteristics 9(39.13) 14(60.87) 12(44.44) 15(55.56) 21(42.00) 29(58.00)
Scientific experimentations to establish uniqueness 18(78.26) 5(21.74) 17(65.38) 9(34.62) 35(71.43) 14(28.57)
Initiative ness for GI registration 8(34.78) 15(65.22) 4(15.38) 22(84.62) 12(24.49) 37(75.51)
Technical intervention to stop infringement of the GI 4(22.22) 14(77.78) 9(37.50) 15(62.50) 13(30.95) 29(69.05)
Facilitation for G.I. Registration 15(75.00) 5(25.00) 13(54.17) 11(45.83) 28(63.64) 16(36.36)
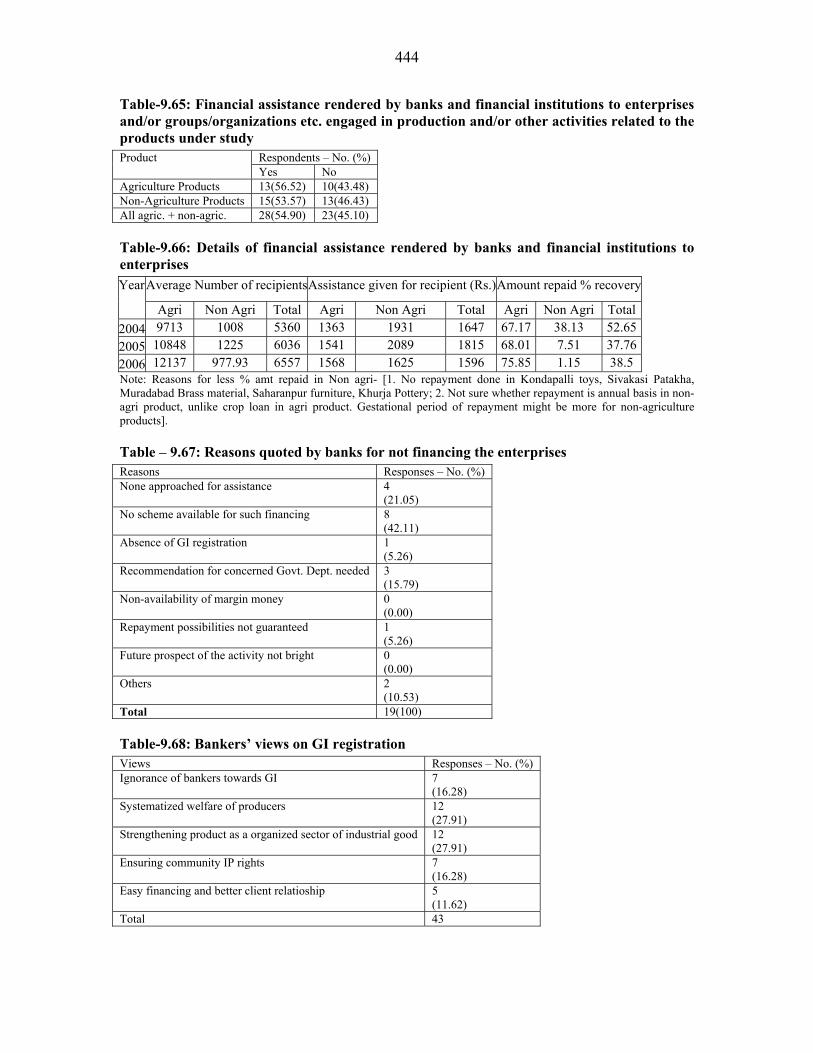
444
Table-9.65: Financial assistance rendered by banks and financial institutions to enterprises and/or groups/organizations etc. engaged in production and/or other activities related to the products under study
Respondents – No. (%) Product Yes No Agriculture Products 13(56.52) 10(43.48) Non-Agriculture Products 15(53.57) 13(46.43) All agric. + non-agric. 28(54.90) 23(45.10)
Table-9.66: Details of financial assistance rendered by banks and financial institutions to enterprises
Average Number of recipients Assistance given for recipient (Rs.)Amount repaid % recoveryYear
Agri Non Agri Total Agri Non Agri Total Agri Non Agri Total 2004 9713 1008 5360 1363 1931 1647 67.17 38.13 52.65 2005 10848 1225 6036 1541 2089 1815 68.01 7.51 37.76 2006 12137 977.93 6557 1568 1625 1596 75.85 1.15 38.5 Note: Reasons for less % amt repaid in Non agri- [1. No repayment done in Kondapalli toys, Sivakasi Patakha, Muradabad Brass material, Saharanpur furniture, Khurja Pottery; 2. Not sure whether repayment is annual basis in non-agri product, unlike crop loan in agri product. Gestational period of repayment might be more for non-agriculture products].
Table – 9.67: Reasons quoted by banks for not financing the enterprises Reasons Responses – No. (%) None approached for assistance 4
(21.05) No scheme available for such financing 8
(42.11) Absence of GI registration 1
(5.26) Recommendation for concerned Govt. Dept. needed 3
(15.79) Non-availability of margin money 0
(0.00) Repayment possibilities not guaranteed 1
(5.26) Future prospect of the activity not bright 0
(0.00) Others 2
(10.53) Total 19(100)
Table-9.68: Bankers’ views on GI registration Views Responses – No. (%) Ignorance of bankers towards GI 7
(16.28) Systematized welfare of producers 12
(27.91) Strengthening product as a organized sector of industrial good 12
(27.91) Ensuring community IP rights 7
(16.28) Easy financing and better client relatioship 5
(11.62) Total 43
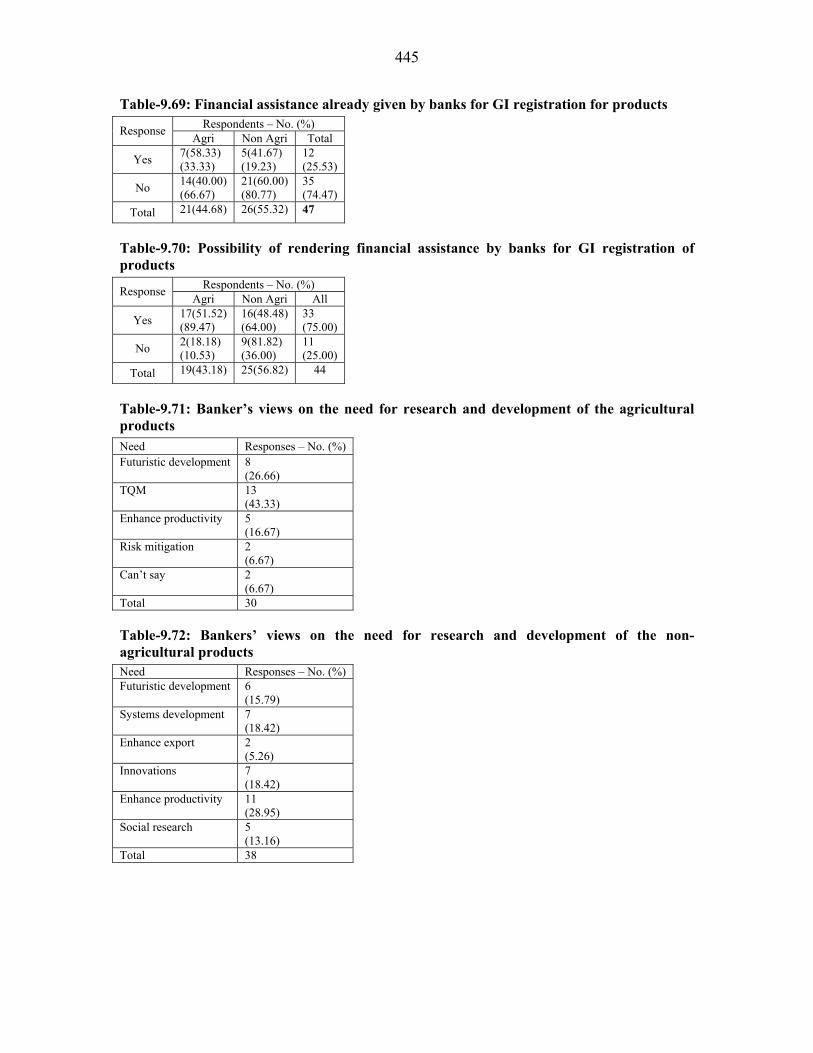
445
Table-9.69: Financial assistance already given by banks for GI registration for products Respondents – No. (%) Response Agri Non Agri Total
Yes 7(58.33) (33.33)
5(41.67) (19.23)
12 (25.53)
No 14(40.00) (66.67)
21(60.00) (80.77)
35 (74.47)
Total 21(44.68) 26(55.32) 47
Table-9.70: Possibility of rendering financial assistance by banks for GI registration of products
Respondents – No. (%) Response Agri Non Agri All
Yes 17(51.52) (89.47)
16(48.48) (64.00)
33 (75.00)
No 2(18.18) (10.53)
9(81.82) (36.00)
11 (25.00)
Total 19(43.18) 25(56.82) 44
Table-9.71: Banker’s views on the need for research and development of the agricultural products Need Responses – No. (%) Futuristic development 8
(26.66) TQM 13
(43.33) Enhance productivity 5
(16.67) Risk mitigation 2
(6.67) Can’t say 2
(6.67) Total 30
Table-9.72: Bankers’ views on the need for research and development of the non-agricultural products Need Responses – No. (%) Futuristic development 6
(15.79) Systems development 7
(18.42) Enhance export 2
(5.26) Innovations 7
(18.42) Enhance productivity 11
(28.95) Social research 5
(13.16) Total 38

446
Annexure – X: Opinion, knowledge and suggestions of consumers about agricultural and non-agricultural products
Table-10.0: Profile of consumers Respondents – No. (%)
Male Female Total Average age 258((69.73) 112(30.27) 370 39 years Urban Rural Total -- 259(70.00) 111(30.00) 370 --
Table-10.1: Comparative statement of awareness of consumers about GI implications in agricultural products
Percent respondents agree Observations I II III IV
Quality, reputation & traditional characteristics attributable to geographical origin 96.36 97.83 94.55 100 Are consumers aware of GI Act? 17.31 22.22 22.64 33.33 If consumers are aware of GI Act, would they like to get product registered as GI 74.20 75.00 61.11 71.43 Quality assurance led consumers to purchase the product 60.78 39.54 54.00 16.67 Expected post registration changes: Product quality will become standard 80.39 81.82 75.00 100 Expected post registration changes: Product grading will improve 80.39 84.85 60.87 86.67 Expected post registration changes: Number of consumers will increase 82.00 72.73 54.17 93.33
Table-10.2: Comparative statement of awareness of consumers about GI implications in non-agricultural products
Percent respondents agree Observations V VI VII VIII
Quality, reputation & traditional characteristics attributable to geographical origin 100 87.50 91.30 86.42 Are consumers aware of GI Act? 27.59 47.37 16.28 85.33 If consumers are aware of GI Act, would they like to get product registered as GI 40.00 66.67 44.44 60.61 Quality assurance led consumers to purchase the product 46.43 26.47 56.10 17.74 Expected post registration changes: Product quality will become standard 89.65 100 76.74 70.83 Expected post registration changes: Product grading will improve 82.76 60.00 76.74 59.72 Expected post registration changes: Number of consumers will increase 72.42 71.43 54.76 48.61
Table-10.3: Awareness of consumers about GI implications in agricultural product: Fruits Respondents- No. (%) Observations for GI type-I Q. no. 1 2 3 Total
Quality, reputation & traditional characteristics attributable to geographical origin
Q 2.01 53(96.36) 2(3.64) --- 55
Are consumers aware of GI Act? Q 2.02 9(17.31) 43(82.69) --- 52 If consumers are aware of GI Act, would they like to get product registered as GI*
Q 2.03* 23(74.20) 4(12.90) 4(12.90) 31
What led consumers to purchase the product# Q 2.04# 31(60.78) 17(33.34) 3(5.88) 51 Expected post registration changes: Product quality will become standard*
Q 2.11.1*
41(80.39) 2(3.92) 8(15.69) 51
Expected post registration changes: Product grading will improve*
Q 2.11.2*
41(80.39) 1(1.96) 9(17.65) 51
Expected post registration changes: Number of consumers will increase*
Q 2.11.3*
41(82.00) 0(0.00) 9(18.00) 50
*For: Yes-1, No-2, Cant say-3. # For: Quality assurance-1, Traditional character-2, Reasonable price-3

447
Table-10.4: Awareness of consumers about GI implications in agricultural product: Grains, potato
Respondents- No. (%) Observations for GI type-II 1 2 3 Total
Quality, reputation & traditional characteristics attributable to geographical origin
45(97.83) 1(2.17) --- 46
Are consumers aware of GI Act? 10(22.22) 35(77.78) --- 45 If consumers are aware of GI Act, would they like to get product registered as GI*
15(75.00) 1(5.00) 4(20.00) 20
What led consumers to purchase the product# 17(39.54) 22(51.16) 4(9.30) 43 Expected post registration changes: Product quality will become standard*
27(81.82) 0(0.00) 6(18.18) 33
Expected post registration changes: Product grading will improve* 28(84.85) 0(0.00) 5(15.15) 33 Expected post registration changes: Number of consumers will increase* 24(72.73) 1(3.03) 8(24.24) 33
*For: Yes-1, No-2, Cant say-3. # For: Quality assurance-1, Traditional character-2, Reasonable price-3
Table-10.5: Awareness of consumers about GI implications in agricultural product: Plantation crops and spices
Respondents- No. (%) Observations for GI type-III 1 2 3 Total
Quality, reputation & traditional characteristics attributable to geographical origin
52(94.55) 3(5.45) --- 55
Are consumers aware of GI Act? 12(22.64) 41(77.36) --- 53 If consumers are aware of GI Act, would they like to get product registered as GI*
11(61.11) 2(11.11) 5(27.78) 18
What led consumers to purchase the product# 27(54.00) 14(28.00) 9(18.00) 50 Expected post registration changes: Product quality will become standard*
36(75.00) 0(0.00) 12(25.00) 48
Expected post registration changes: Product grading will improve* 28(60.87) 2(4.35) 16(34.78) 46 Expected post registration changes: Number of consumers will increase* 26(54.17) 2(4.16) 20(41.67) 48
*For: Yes-1, No-2, Cant say-3. # For: Quality assurance-1, Traditional character-2, Reasonable price-3
Table-10.6: Awareness of consumers about GI implications in agricultural product: Unexploited indigenous products
Respondents- No. (%) Observations for GI type-IV 1 2 3 Total
Quality, reputation & traditional characteristics attributable to geographical origin
15(100) 0(0.00) --- 15
Are consumers aware of GI Act? 5(33.33) 10(66.67) --- 15 If consumers are aware of GI Act, would they like to get product registered as GI*
5(71.43) 0(0.00) 2(28.57) 7
What led consumers to purchase the product# 2(16.67) 8(66.66) 2(16.67) 12 Expected post registration changes: Product quality will become standard*
15(100) 0(0.00) 0(0.00) 15
Expected post registration changes: Product grading will improve* 13(86.67) 0(0.00) 2(13.33) 15 Expected post registration changes: Number of consumers will increase* 14(93.33) 0(0.00) 1(6.67) 15
*For: Yes-1, No-2, Cant say-3. # For: Quality assurance-1, Traditional character-2, Reasonable price-3
Table-10.7: Awareness of consumers about GI implications in non-agricultural product: Confectionary
Respondents- No. (%) Observations for GI type-V 1 2 3 Total
Quality, reputation & traditional characteristics attributable to geographical origin
29(100) 0(0.00) --- 29
Are consumers aware of GI Act? 8(27.59) 21(72.41) --- 29 If consumers are aware of GI Act, would they like to get product registered as GI*
6(40.00) 1(6.67) 8(53.33) 15

448
Respondents- No. (%) Observations for GI type-V 1 2 3 Total
What led consumers to purchase the product# 13(46.43) 12(42.86) 3(10.71) 28 Expected post registration changes: Product quality will become standard*
26(89.65) 2(6.90) 1(3.45) 29
Expected post registration changes: Product grading will improve* 24(82.76) 3(10.34) 2(6.90) 29 Expected post registration changes: Number of consumers will increase* 21(72.42) 4(13.79) 4(13.79) 29
*For: Yes-1, No-2, Cant say-3. # For: Quality assurance-1, Traditional character-2, Reasonable price-3
Table-10.8: Awareness of consumers about GI implications in non-agricultural product: Handicrafts
Respondents- No. (%) Observations for GI type-VI 1 2 3 Total
Quality, reputation & traditional characteristics attributable to geographical origin
35(87.50) 5(12.50) --- 40
Are consumers aware of GI Act? 18(47.37) 20(52.63) --- 38 If consumers are aware of GI Act, would they like to get product registered as GI*
16(66.67) 1(4.16) 7(29.17) 24
What led consumers to purchase the product# 9(26.47) 25(73.53) 0(0.00) 34 Expected post registration changes: Product quality will become standard*
35(100) 0(0.00) 0(0.00) 35
Expected post registration changes: Product grading will improve* 21(60.00) 1(2.86) 13(37.1) 35 Expected post registration changes: Number of consumers will increase* 25(71.43) 0(0.00) 10(28.5) 35
*For: Yes-1, No-2, Cant say-3. # For: Quality assurance-1, Traditional character-2, Reasonable price-3
Table-10.9: Awareness of consumers about GI implications in non-agricultural product: Manufactured products with organized trade
Respondents- No. (%) Observations for GI type-VII 1 2 3 Total
Quality, reputation & traditional characteristics attributable to geographical origin
42(91.30) 4(8.70) --- 46
Are consumers aware of GI Act? 7(16.28) 36(83.72) --- 43 If consumers are aware of GI Act, would they like to get product registered as GI*
8(44.44) 2(11.12) 8(44.44) 18
What led consumers to purchase the product# 23(56.10) 16(39.02) 2(4.88) 41 Expected post registration changes: Product quality will become standard*
33(76.74) 1(2.33) 9(20.93) 43
Expected post registration changes: Product grading will improve* 33(76.74) 1(2.33) 9(20.93) 43 Expected post registration changes: Number of consumers will increase* 23(54.76) 2(4.76) 17(40.4) 42
*For: Yes-1, No-2, Cant say-3. # For: Quality assurance-1, Traditional character-2, Reasonable price-3
Table-10.10: Awareness of consumers about GI implications in non-agricultural product: Textiles
Respondents- No. (%) Observations for GI type-VIII 1 2 3 Total
Quality, reputation & traditional characteristics attributable to geographical origin
70(86.42) 11(13.58) --- 81
Are consumers aware of GI Act? 64(85.33) 11(14.67) --- 75 If consumers are aware of GI Act, would they like to get product registered as GI*
20(60.61) 0(0.00) 13(39.3) 33
What led consumers to purchase the product# 11(17.74) 44(70.97) 7(11.29) 62 Expected post registration changes: Product quality will become standard*
51(70.83) 2(2.78) 19(26.3) 72
Expected post registration changes: Product grading will improve* 43(59.72) 5(6.94) 24(33.3) 72 Expected post registration changes: Number of consumers will increase* 35(48.61) 3(4.17) 34(47.2) 72
*For: Yes-1, No-2, Cant say-3. # For: Quality assurance-1, Traditional character-2, Reasonable price-3

449
Table-10.11: Consumers’ suggestions for the areas of improvement in agricultural products under study
Responses – No. (%) GI Type
Suggestions for improvement
I II III IV All Quality to be standardized 24(24.74)
(19.05) 33(34.02) (28.45)
34(35.05) (27.64)
6(6.19) (15.79)
97 (24.07)
Innovative changes to be made keeping traditional base
17(25.00) (13.49)
24(35.29) (20.69)
21(30.88) (17.07)
6(8.82) (15.79)
68 (16.87)
Price to be controlled and kept within reasonable limits
27(36.00) (21.43)
14(18.67) (12.07)
33(44.00) (26.83)
1(1.33) (2.63)
75 (18.61)
Easy availability assured 30(37.97) (23.81)
20(25.32) (17.24)
19(24.05) (15.45)
10(12.66) (26.32)
79 (19.60)
More publicity required 24(32.00) (19.05)
22(29.33) (18.97)
15(20.00) (12.20)
14(18.67) (36.84)
75 (18.61)
Others 4(44.45) (3.17)
3(33.33) (2.58)
1(11.11) (0.81)
1(11.11) (2.63)
9 (2.24)
Total 126(31.27) 116(28.78) 123(30.52) 38(9.43) 403 Table-10.12: Consumers’ suggestions for the areas of improvement in non-agricultural products under study
Responses – No. (%) GI Type
Suggestions for improvement
V VI VII VIII All Quality to be standardized 11(11.34)
(20.00) 19(19.59) (19.39)
28(28.86) (24.78)
39(40.21) (26.72)
97 (23.54)
Innovative changes to be made keeping traditional base
6(6.52) (10.91)
25(27.17) (25.51)
22(23.91) (19.47)
39(42.40) (26.72)
92 (22.33)
Price to be controlled and kept within reasonable limits
13(13.54) (23.64)
23(23.96) (23.47)
25(26.04) (22.12)
35(36.46) (23.97)
96 (23.30)
Easy availability assured 11(18.03) (20.00)
12(19.67) (12.24)
21(34.43) (18.58)
17(27.87) (11.64)
61 (14.81)
More publicity required 14(22.95) (25.45)
16(26.23) (16.33)
16(26.23) (14.16)
15(24.59) (10.27)
61 (14.81)
Others 0(0.00) (0.00)
3(60.00) (3.06)
1(20.00) (0.89)
1(20.00) (0.68)
5 (1.21)
Total 55(13.35) 98(23.79) 113(27.43) 146(35.43) 412 Table-10.13: Consumers’ preferential purchase of genuine agricultural products and their willingness to pay extra for GI registered product
Respondents in agreement- No.(%) for each GI Type Observation I II III IV All
At the time of purchase of products, whether consumers are sure that product is genuine
44(84.62) 30(90.91) 40(85.11) 14(93.33) 128(87.07)
Whether consumers make any special effort to purchase genuine product
24(46.15) 18(45.45) 26(55.32) 11(73.33) 79(53.74)
As a post registration effect, whether consumers are willing to pay more for the product
30(57.69) 21(63.64) 29(61.70) 9(60.00) 89(60.14)
Table-10.14: Consumers’ preferential purchase of genuine non-agricultural products and their willingness to pay extra for GI registered product
Respondents in agreement- No.(%) for each GI Type Observation V VI VII VIII All
At the time of purchase of products, whether consumers are sure that product is genuine
29(100.00) 33(94.28) 41(95.39) 72(94.74) 175(95.63)
Whether consumers make any special effort to purchase genuine product
17(58.62) 25(71.43) 32(74.42) 66(88.00) 140(76.92)
As a post registration effect, whether consumers are willing to pay more for the product
19(65.52) 24(68.57) 27(62.79) 41(55.41) 111(61.33)
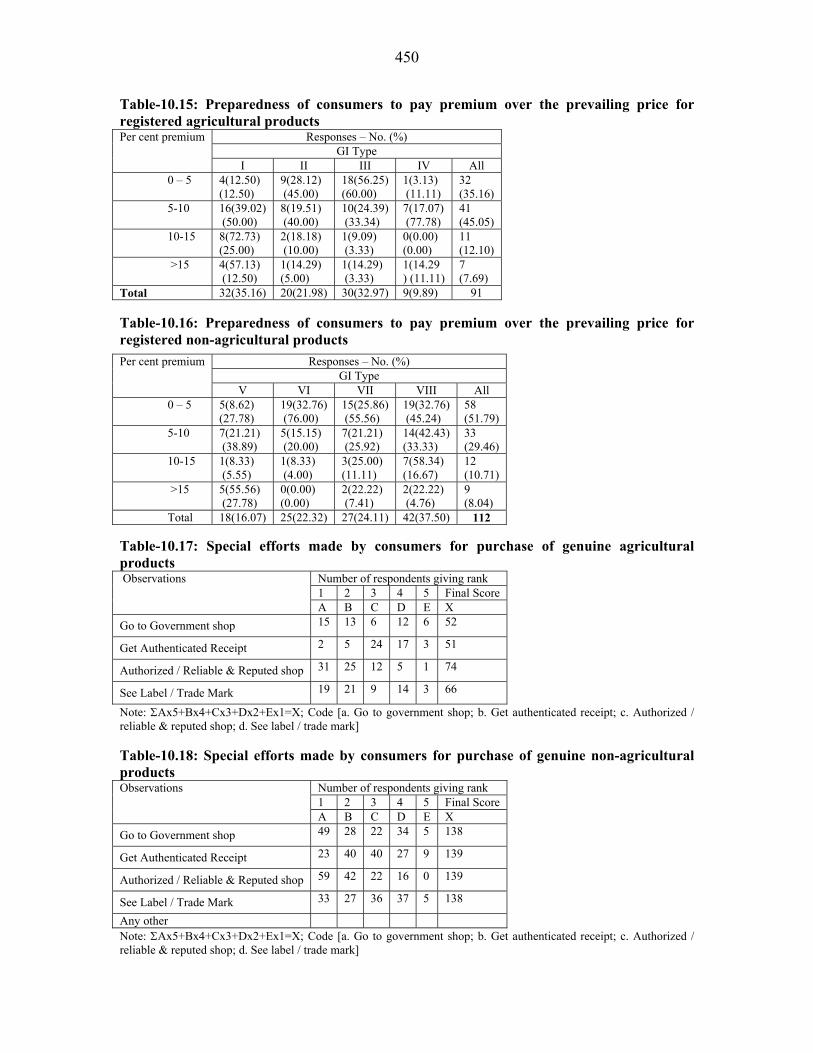
450
Table-10.15: Preparedness of consumers to pay premium over the prevailing price for registered agricultural products
Responses – No. (%) GI Type
Per cent premium
I II III IV All 0 – 5 4(12.50)
(12.50) 9(28.12) (45.00)
18(56.25) (60.00)
1(3.13) (11.11)
32 (35.16)
5-10 16(39.02) (50.00)
8(19.51) (40.00)
10(24.39) (33.34)
7(17.07) (77.78)
41 (45.05)
10-15 8(72.73) (25.00)
2(18.18) (10.00)
1(9.09) (3.33)
0(0.00) (0.00)
11 (12.10)
>15 4(57.13) (12.50)
1(14.29) (5.00)
1(14.29) (3.33)
1(14.29 ) (11.11)
7 (7.69)
Total 32(35.16) 20(21.98) 30(32.97) 9(9.89) 91 Table-10.16: Preparedness of consumers to pay premium over the prevailing price for registered non-agricultural products
Responses – No. (%) GI Type
Per cent premium
V VI VII VIII All 0 – 5 5(8.62)
(27.78) 19(32.76) (76.00)
15(25.86) (55.56)
19(32.76) (45.24)
58 (51.79)
5-10 7(21.21) (38.89)
5(15.15) (20.00)
7(21.21) (25.92)
14(42.43) (33.33)
33 (29.46)
10-15 1(8.33) (5.55)
1(8.33) (4.00)
3(25.00) (11.11)
7(58.34) (16.67)
12 (10.71)
>15 5(55.56) (27.78)
0(0.00) (0.00)
2(22.22) (7.41)
2(22.22) (4.76)
9 (8.04)
Total 18(16.07) 25(22.32) 27(24.11) 42(37.50) 112 Table-10.17: Special efforts made by consumers for purchase of genuine agricultural products
Number of respondents giving rank 1 2 3 4 5 Final Score
Observations
A B C D E X Go to Government shop 15 13 6 12 6 52
Get Authenticated Receipt 2 5 24 17 3 51
Authorized / Reliable & Reputed shop 31 25 12 5 1 74
See Label / Trade Mark 19 21 9 14 3 66
Note: ΣAx5+Bx4+Cx3+Dx2+Ex1=X; Code [a. Go to government shop; b. Get authenticated receipt; c. Authorized / reliable & reputed shop; d. See label / trade mark] Table-10.18: Special efforts made by consumers for purchase of genuine non-agricultural products
Number of respondents giving rank 1 2 3 4 5 Final Score
Observations
A B C D E X Go to Government shop 49 28 22 34 5 138
Get Authenticated Receipt 23 40 40 27 9 139
Authorized / Reliable & Reputed shop 59 42 22 16 0 139
See Label / Trade Mark 33 27 36 37 5 138
Any other Note: ΣAx5+Bx4+Cx3+Dx2+Ex1=X; Code [a. Go to government shop; b. Get authenticated receipt; c. Authorized / reliable & reputed shop; d. See label / trade mark]
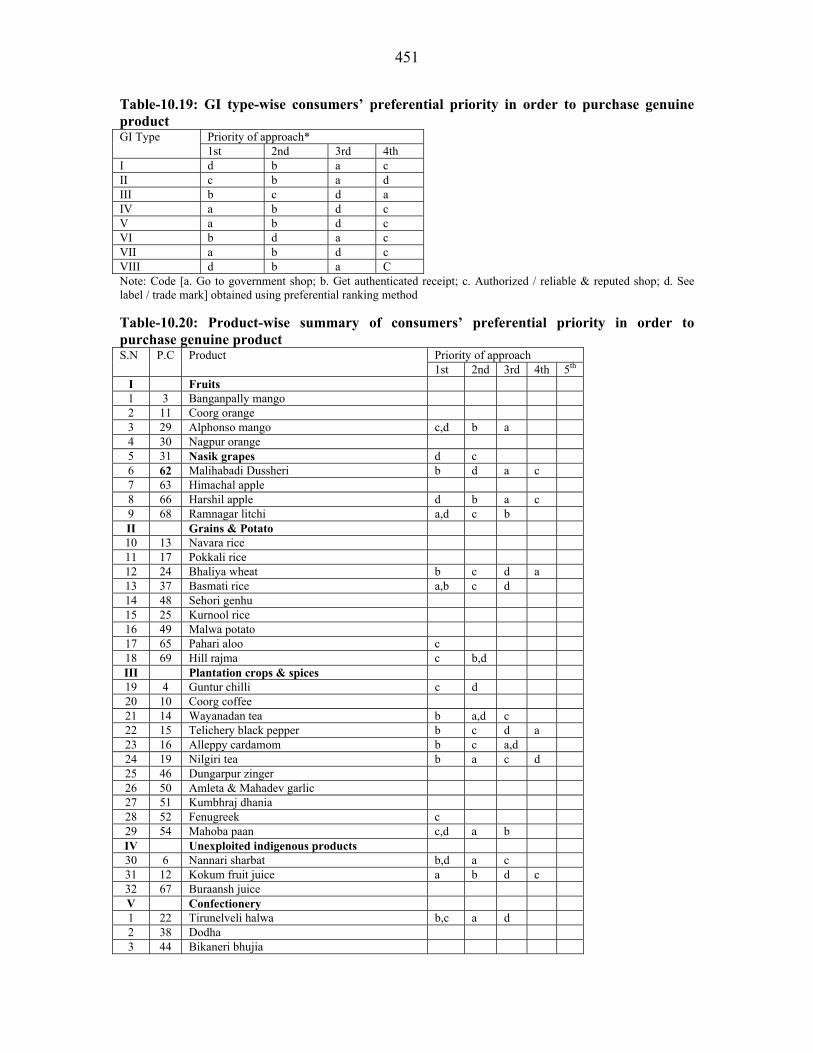
451
Table-10.19: GI type-wise consumers’ preferential priority in order to purchase genuine product
Priority of approach* GI Type 1st 2nd 3rd 4th
I d b a c II c b a d III b c d a IV a b d c V a b d c VI b d a c VII a b d c VIII d b a C Note: Code [a. Go to government shop; b. Get authenticated receipt; c. Authorized / reliable & reputed shop; d. See label / trade mark] obtained using preferential ranking method Table-10.20: Product-wise summary of consumers’ preferential priority in order to purchase genuine product
Priority of approach S.N P.C Product 1st 2nd 3rd 4th 5th
I Fruits 1 3 Banganpally mango 2 11 Coorg orange 3 29 Alphonso mango c,d b a 4 30 Nagpur orange 5 31 Nasik grapes d c 6 62 Malihabadi Dussheri b d a c 7 63 Himachal apple 8 66 Harshil apple d b a c 9 68 Ramnagar litchi a,d c b II Grains & Potato 10 13 Navara rice 11 17 Pokkali rice 12 24 Bhaliya wheat b c d a 13 37 Basmati rice a,b c d 14 48 Sehori genhu 15 25 Kurnool rice 16 49 Malwa potato 17 65 Pahari aloo c 18 69 Hill rajma c b,d III Plantation crops & spices 19 4 Guntur chilli c d 20 10 Coorg coffee 21 14 Wayanadan tea b a,d c 22 15 Telichery black pepper b c d a 23 16 Alleppy cardamom b c a,d 24 19 Nilgiri tea b a c d 25 46 Dungarpur zinger 26 50 Amleta & Mahadev garlic 27 51 Kumbhraj dhania 28 52 Fenugreek c 29 54 Mahoba paan c,d a b IV Unexploited indigenous products 30 6 Nannari sharbat b,d a c 31 12 Kokum fruit juice a b d c 32 67 Buraansh juice V Confectionery 1 22 Tirunelveli halwa b,c a d 2 38 Dodha 3 44 Bikaneri bhujia
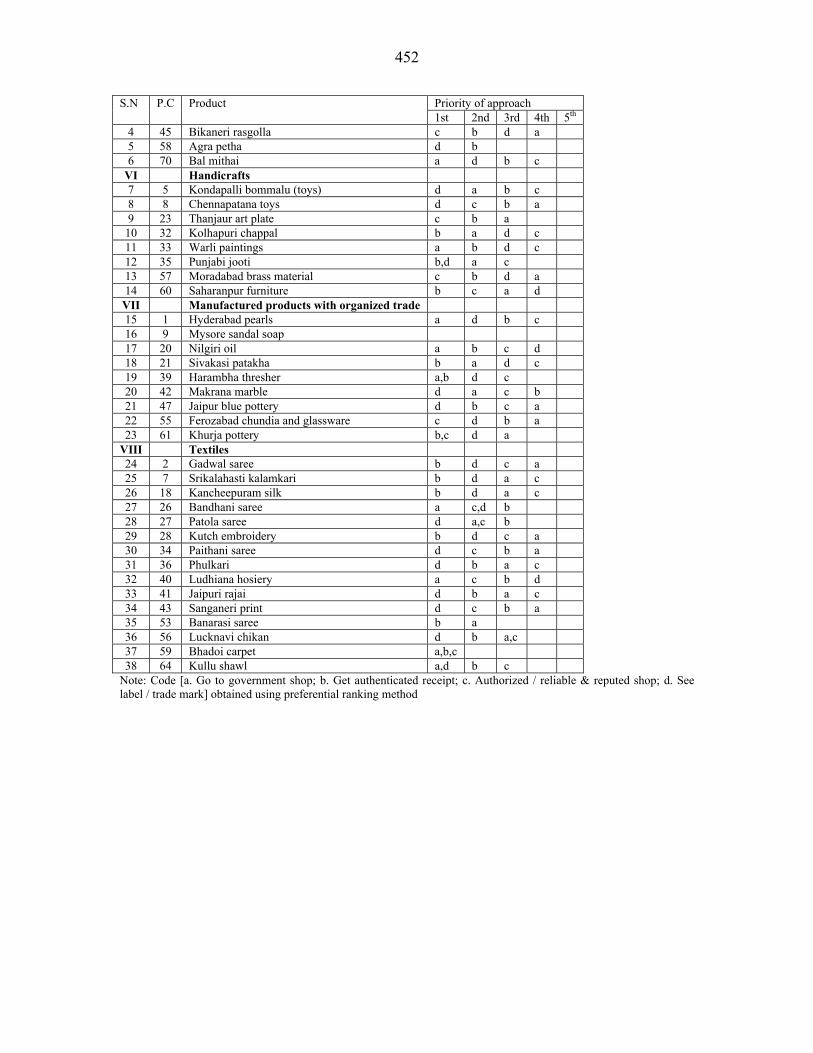
452
Priority of approach S.N P.C Product 1st 2nd 3rd 4th 5th
4 45 Bikaneri rasgolla c b d a 5 58 Agra petha d b 6 70 Bal mithai a d b c
VI Handicrafts 7 5 Kondapalli bommalu (toys) d a b c 8 8 Chennapatana toys d c b a 9 23 Thanjaur art plate c b a 10 32 Kolhapuri chappal b a d c 11 33 Warli paintings a b d c 12 35 Punjabi jooti b,d a c 13 57 Moradabad brass material c b d a 14 60 Saharanpur furniture b c a d VII Manufactured products with organized trade 15 1 Hyderabad pearls a d b c 16 9 Mysore sandal soap 17 20 Nilgiri oil a b c d 18 21 Sivakasi patakha b a d c 19 39 Harambha thresher a,b d c 20 42 Makrana marble d a c b 21 47 Jaipur blue pottery d b c a 22 55 Ferozabad chundia and glassware c d b a 23 61 Khurja pottery b,c d a
VIII Textiles 24 2 Gadwal saree b d c a 25 7 Srikalahasti kalamkari b d a c 26 18 Kancheepuram silk b d a c 27 26 Bandhani saree a c,d b 28 27 Patola saree d a,c b 29 28 Kutch embroidery b d c a 30 34 Paithani saree d c b a 31 36 Phulkari d b a c 32 40 Ludhiana hosiery a c b d 33 41 Jaipuri rajai d b a c 34 43 Sanganeri print d c b a 35 53 Banarasi saree b a 36 56 Lucknavi chikan d b a,c 37 59 Bhadoi carpet a,b,c 38 64 Kullu shawl a,d b c
Note: Code [a. Go to government shop; b. Get authenticated receipt; c. Authorized / reliable & reputed shop; d. See label / trade mark] obtained using preferential ranking method
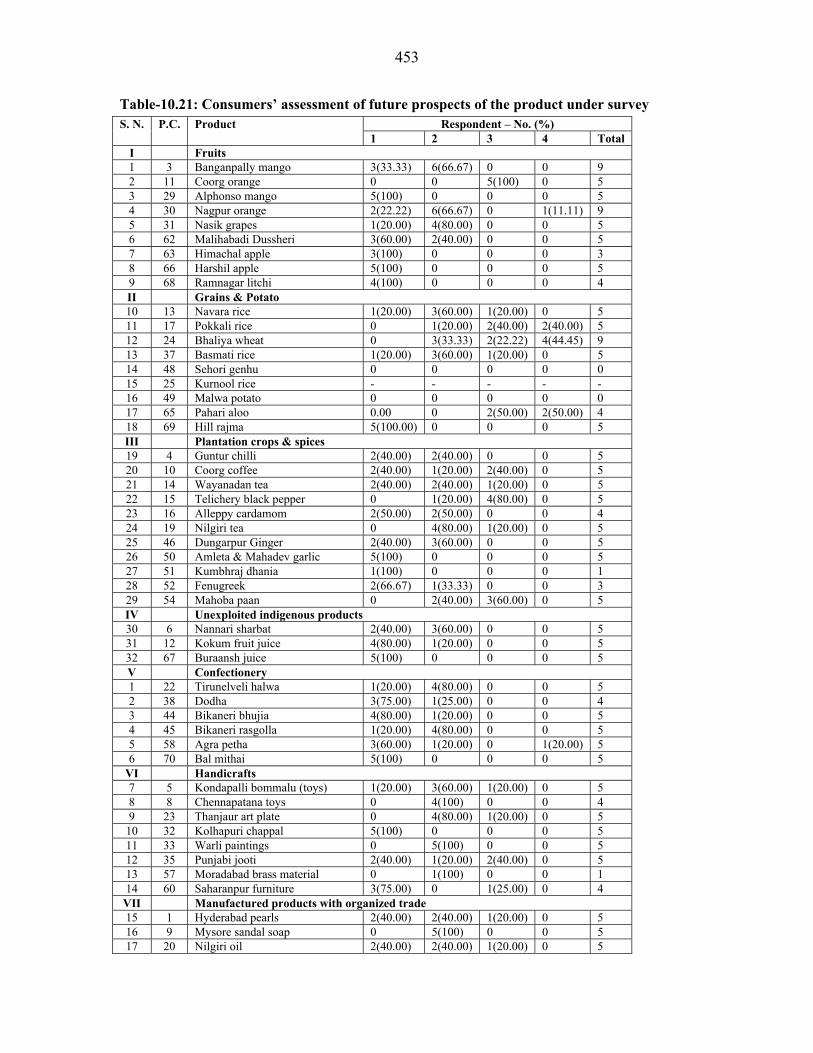
453
Table-10.21: Consumers’ assessment of future prospects of the product under survey Respondent – No. (%) S. N. P.C. Product
1 2 3 4 Total I Fruits 1 3 Banganpally mango 3(33.33) 6(66.67) 0 0 9 2 11 Coorg orange 0 0 5(100) 0 5 3 29 Alphonso mango 5(100) 0 0 0 5 4 30 Nagpur orange 2(22.22) 6(66.67) 0 1(11.11) 9 5 31 Nasik grapes 1(20.00) 4(80.00) 0 0 5 6 62 Malihabadi Dussheri 3(60.00) 2(40.00) 0 0 5 7 63 Himachal apple 3(100) 0 0 0 3 8 66 Harshil apple 5(100) 0 0 0 5 9 68 Ramnagar litchi 4(100) 0 0 0 4 II Grains & Potato 10 13 Navara rice 1(20.00) 3(60.00) 1(20.00) 0 5 11 17 Pokkali rice 0 1(20.00) 2(40.00) 2(40.00) 5 12 24 Bhaliya wheat 0 3(33.33) 2(22.22) 4(44.45) 9 13 37 Basmati rice 1(20.00) 3(60.00) 1(20.00) 0 5 14 48 Sehori genhu 0 0 0 0 0 15 25 Kurnool rice - - - - - 16 49 Malwa potato 0 0 0 0 0 17 65 Pahari aloo 0.00 0 2(50.00) 2(50.00) 4 18 69 Hill rajma 5(100.00) 0 0 0 5 III Plantation crops & spices 19 4 Guntur chilli 2(40.00) 2(40.00) 0 0 5 20 10 Coorg coffee 2(40.00) 1(20.00) 2(40.00) 0 5 21 14 Wayanadan tea 2(40.00) 2(40.00) 1(20.00) 0 5 22 15 Telichery black pepper 0 1(20.00) 4(80.00) 0 5 23 16 Alleppy cardamom 2(50.00) 2(50.00) 0 0 4 24 19 Nilgiri tea 0 4(80.00) 1(20.00) 0 5 25 46 Dungarpur Ginger 2(40.00) 3(60.00) 0 0 5 26 50 Amleta & Mahadev garlic 5(100) 0 0 0 5 27 51 Kumbhraj dhania 1(100) 0 0 0 1 28 52 Fenugreek 2(66.67) 1(33.33) 0 0 3 29 54 Mahoba paan 0 2(40.00) 3(60.00) 0 5 IV Unexploited indigenous products 30 6 Nannari sharbat 2(40.00) 3(60.00) 0 0 5 31 12 Kokum fruit juice 4(80.00) 1(20.00) 0 0 5 32 67 Buraansh juice 5(100) 0 0 0 5 V Confectionery 1 22 Tirunelveli halwa 1(20.00) 4(80.00) 0 0 5 2 38 Dodha 3(75.00) 1(25.00) 0 0 4 3 44 Bikaneri bhujia 4(80.00) 1(20.00) 0 0 5 4 45 Bikaneri rasgolla 1(20.00) 4(80.00) 0 0 5 5 58 Agra petha 3(60.00) 1(20.00) 0 1(20.00) 5 6 70 Bal mithai 5(100) 0 0 0 5
VI Handicrafts 7 5 Kondapalli bommalu (toys) 1(20.00) 3(60.00) 1(20.00) 0 5 8 8 Chennapatana toys 0 4(100) 0 0 4 9 23 Thanjaur art plate 0 4(80.00) 1(20.00) 0 5
10 32 Kolhapuri chappal 5(100) 0 0 0 5 11 33 Warli paintings 0 5(100) 0 0 5 12 35 Punjabi jooti 2(40.00) 1(20.00) 2(40.00) 0 5 13 57 Moradabad brass material 0 1(100) 0 0 1 14 60 Saharanpur furniture 3(75.00) 0 1(25.00) 0 4 VII Manufactured products with organized trade 15 1 Hyderabad pearls 2(40.00) 2(40.00) 1(20.00) 0 5 16 9 Mysore sandal soap 0 5(100) 0 0 5 17 20 Nilgiri oil 2(40.00) 2(40.00) 1(20.00) 0 5

454
Respondent – No. (%) S. N. P.C. Product 1 2 3 4 Total
18 21 Sivakasi patakha 3(100) 0 0 0 3 19 39 Harambha thresher 1(20.00) 2(40.00) 2(40.00) 0 5 20 42 Makrana marble 4(80.00) 1(20.00) 0 0 5 21 47 Jaipur blue pottery 6(85.71) 1(14.29) 0 0 7 22 55 Ferozabad chundia and glassware 2(100) 0 0 0 2 23 61 Khurja pottery 5(100) 0 0 0 5
VIII Textiles 24 2 Gadwal saree 0 5(100) 0 0 5 25 7 Srikalahasti kalamkari 5(100) 0 0 0 5 26 18 Kancheepuram silk 1(20.00) 4(80.00) 0 0 5 27 26 Bandhani saree 2(40.00) 2(40.00) 1(20.00) 0 5 28 27 Patola saree 0 3(60.00) 2(40.00) 0 5 29 28 Kutch embroidery 5(100) 0 0 0 5 30 34 Paithani saree 4(80.00) 0 0 1(20.00) 5 31 36 Phulkari 2(40.00) 3(60.00) 0 0 5 32 40 Ludhiana hosiery 2(40.00) 3(60.00) 0 0 5 33 41 Jaipuri rajai 5(100) 0 0 0 5 34 43 Sanganeri print 5(55.56) 4(44.44) 0 0 9 35 53 Banarasi saree 0 5(100) 0 0 5 36 56 Lucknavi chikan 2(100) 0 0 0 2 37 59 Bhadoi carpet 2(40.00) 1(20.00) 2(40.00) 0 5 38 64 Kullu shawl 3(60.00) 2(40.00) 0 0 5
Note: Code [Very bright-1, Bright which could improve with changes-2, Stationary-3, Not bright-4]
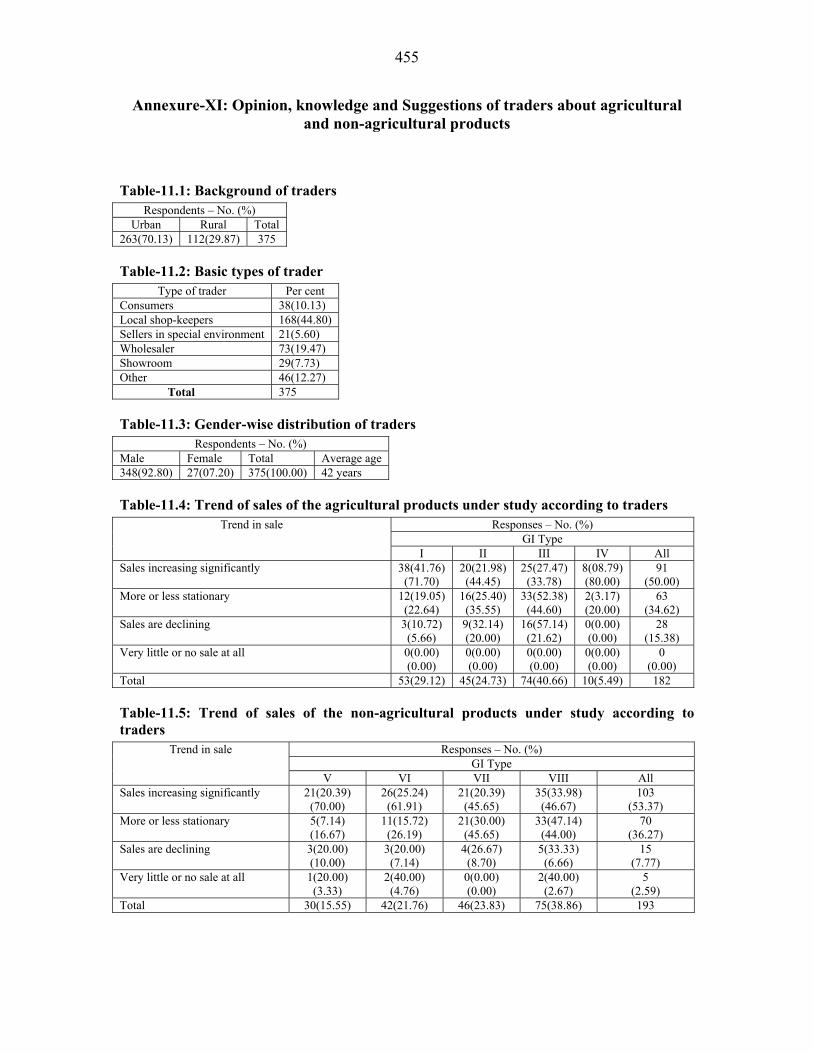
455
Annexure-XI: Opinion, knowledge and Suggestions of traders about agricultural and non-agricultural products
Table-11.1: Background of traders
Respondents – No. (%) Urban Rural Total
263(70.13) 112(29.87) 375
Table-11.2: Basic types of trader
Type of trader Per cent Consumers 38(10.13) Local shop-keepers 168(44.80) Sellers in special environment 21(5.60) Wholesaler 73(19.47) Showroom 29(7.73) Other 46(12.27)
Total 375
Table-11.3: Gender-wise distribution of traders Respondents – No. (%)
Male Female Total Average age 348(92.80) 27(07.20) 375(100.00) 42 years
Table-11.4: Trend of sales of the agricultural products under study according to traders Responses – No. (%)
GI Type Trend in sale
I II III IV All Sales increasing significantly 38(41.76)
(71.70) 20(21.98) (44.45)
25(27.47) (33.78)
8(08.79) (80.00)
91 (50.00)
More or less stationary 12(19.05) (22.64)
16(25.40) (35.55)
33(52.38) (44.60)
2(3.17) (20.00)
63 (34.62)
Sales are declining 3(10.72) (5.66)
9(32.14) (20.00)
16(57.14) (21.62)
0(0.00) (0.00)
28 (15.38)
Very little or no sale at all 0(0.00) (0.00)
0(0.00) (0.00)
0(0.00) (0.00)
0(0.00) (0.00)
0 (0.00)
Total 53(29.12) 45(24.73) 74(40.66) 10(5.49) 182
Table-11.5: Trend of sales of the non-agricultural products under study according to traders
Responses – No. (%) GI Type
Trend in sale
V VI VII VIII All Sales increasing significantly 21(20.39)
(70.00) 26(25.24) (61.91)
21(20.39) (45.65)
35(33.98) (46.67)
103 (53.37)
More or less stationary 5(7.14) (16.67)
11(15.72) (26.19)
21(30.00) (45.65)
33(47.14) (44.00)
70 (36.27)
Sales are declining 3(20.00) (10.00)
3(20.00) (7.14)
4(26.67) (8.70)
5(33.33) (6.66)
15 (7.77)
Very little or no sale at all 1(20.00) (3.33)
2(40.00) (4.76)
0(0.00) (0.00)
2(40.00) (2.67)
5 (2.59)
Total 30(15.55) 42(21.76) 46(23.83) 75(38.86) 193

456
Table-11.6: Traders’ suggestions to improve sales of agricultural products Responses – No. (%)
GI Type Suggestions to improve sale
I II III IV All Quality to be standardized 38(29.23)
(27.54) 38(29.23) (29.92)
46(35.38) (30.46)
8(6.16) (22.87)
130 (28.82)
Innovative changes to be made keeping traditional base
18(26.87) (13.04)
22(32.83) (17.32)
20(29.85) (13.25)
7(10.45) (20.00)
67 (14.86)
Price to be controlled and kept within reasonable limits
26(35.14) (18.84)
15(20.27) (11.81)
31(41.89) (20.53)
2(2.70) (5.71) 74 (16.41)
Easy availability assured 28(40.00) (20.29)
22(31.43) (17.32)
15(21.43) (9.93)
5(7.14) (14.28)
70 (15.52)
More publicity required 25(26.04) (18.12)
27(28.12) (21.26)
34(35.42) (22.52)
10(10.42) (28.57)
96 (21.29)
Others 3(21.43) (2.17)
3(21.43) (2.37)
5(35.71) (3.31)
3(21.43) (8.57)
14 (3.10)
Total 138(30.60) 127(28.16) 151(33.48) 35(7.76) 451
Table-11.7: Traders’ suggestions to improve sales of non-agricultural products Responses – No. (%)
GI Type Suggestions to improve sale
V VI VII VIII All Quality to be standardized 10(10.00)
(17.25) 27(27.00) (22.31)
25(25.00) (24.51)
38(38.00) (25.50)
100 (23.26)
Innovative changes to be made keeping traditional base
11(12.50) (18.96)
20(22.73) (16.53)
17(19.32) (16.67)
40(45.45) (26.85)
88 (20.47)
Price to be controlled and kept within reasonable limits
10(13.16) (17.25)
22(28.95) (18.19)
21(27.63) (20.59)
23(30.26) (15.44)
76 (17.67)
Easy availability assured 6(10.34) (10.34)
18(31.04) (14.87)
15(25.86) (14.70)
19(32.76) (12.75)
58 (13.49)
More publicity required 20(21.74) (34.48)
26(28.26) (21.49)
21(22.83) (20.59)
25(27.17) (16.78)
92 (21.39)
Others 1(6.25) (1.72)
8(50.00) (6.61)
3(18.75) (2.94) 4(25.00) (2.68)
16 (3.72)
Total 58(13.49) 121(28.14) 102(23.72) 149(34.65) 430
Table-11.8: Traders’ views on agricultural products under study Respondents agree – No. (%)
GI Type Question-observation
I II III IV All Unique characteristics of this product give better market value than the other products in the same category available in the markets
51(32.28) 41(25.95) 56(35.44) 10(6.33) 158
Due to unique characteristics, the sale of this product is better than the other products in the same category available in the markets
47(32.19) 41(28.08) 49(33.56) 9(6.16) 146
Satisfaction with the current earnings from the product under study
32(37.65) 13(15.29) 30(35.29) 10(11.76) 85
As a registered GI, it should provide enhanced premium to the producers and traders
41(34.17) 38(31.67) 34(28.33) 7(5.83) 120
Do the customers bargain the prices of these products 33(37.5) 26(29.55) 29(32.95) 0(0.00) 88
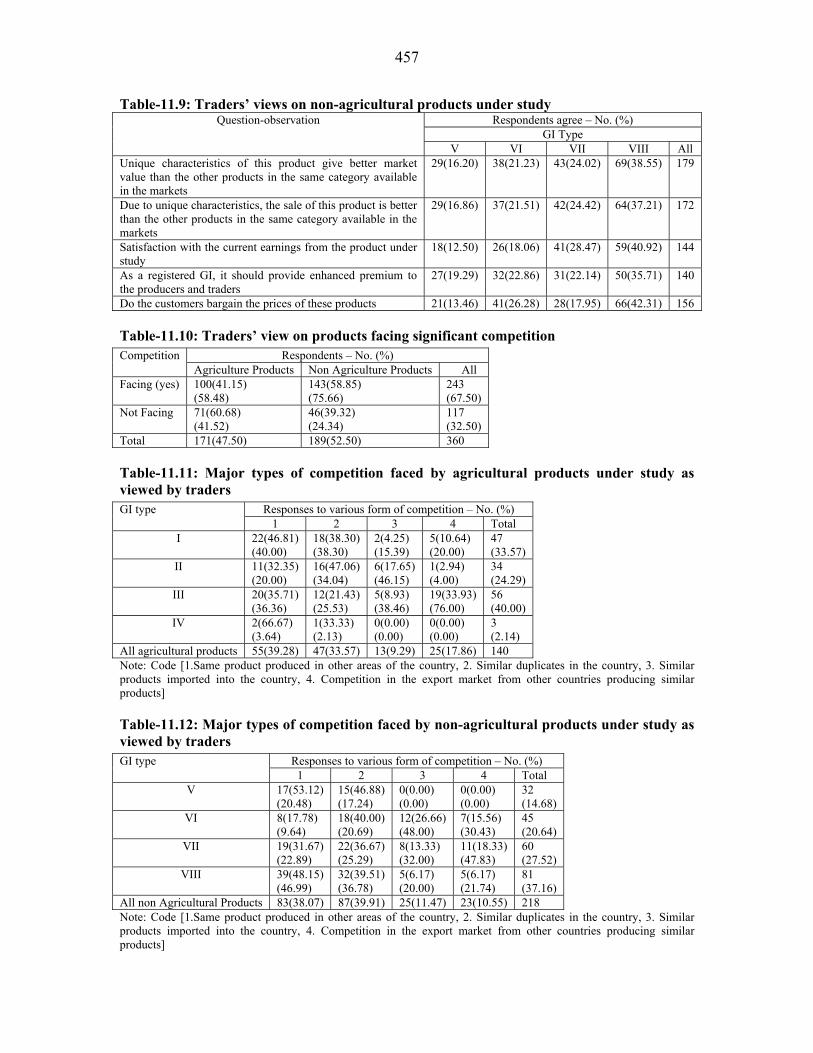
457
Table-11.9: Traders’ views on non-agricultural products under study Respondents agree – No. (%)
GI Type Question-observation
V VI VII VIII All Unique characteristics of this product give better market value than the other products in the same category available in the markets
29(16.20) 38(21.23) 43(24.02) 69(38.55) 179
Due to unique characteristics, the sale of this product is better than the other products in the same category available in the markets
29(16.86) 37(21.51) 42(24.42) 64(37.21) 172
Satisfaction with the current earnings from the product under study
18(12.50) 26(18.06) 41(28.47) 59(40.92) 144
As a registered GI, it should provide enhanced premium to the producers and traders
27(19.29) 32(22.86) 31(22.14) 50(35.71) 140
Do the customers bargain the prices of these products 21(13.46) 41(26.28) 28(17.95) 66(42.31) 156
Table-11.10: Traders’ view on products facing significant competition Respondents – No. (%) Competition
Agriculture Products Non Agriculture Products All Facing (yes) 100(41.15)
(58.48) 143(58.85) (75.66)
243 (67.50)
Not Facing 71(60.68) (41.52)
46(39.32) (24.34)
117 (32.50)
Total 171(47.50) 189(52.50) 360
Table-11.11: Major types of competition faced by agricultural products under study as viewed by traders
Responses to various form of competition – No. (%) GI type 1 2 3 4 Total
I 22(46.81) (40.00)
18(38.30) (38.30)
2(4.25) (15.39)
5(10.64) (20.00)
47 (33.57)
II 11(32.35) (20.00)
16(47.06) (34.04)
6(17.65) (46.15)
1(2.94) (4.00)
34 (24.29)
III 20(35.71) (36.36)
12(21.43) (25.53)
5(8.93) (38.46)
19(33.93) (76.00)
56 (40.00)
IV 2(66.67) (3.64)
1(33.33) (2.13)
0(0.00) (0.00)
0(0.00) (0.00)
3 (2.14)
All agricultural products 55(39.28) 47(33.57) 13(9.29) 25(17.86) 140 Note: Code [1.Same product produced in other areas of the country, 2. Similar duplicates in the country, 3. Similar products imported into the country, 4. Competition in the export market from other countries producing similar products]
Table-11.12: Major types of competition faced by non-agricultural products under study as viewed by traders
Responses to various form of competition – No. (%) GI type 1 2 3 4 Total
V 17(53.12) (20.48)
15(46.88) (17.24)
0(0.00) (0.00)
0(0.00) (0.00)
32 (14.68)
VI 8(17.78) (9.64)
18(40.00) (20.69)
12(26.66) (48.00)
7(15.56) (30.43)
45 (20.64)
VII 19(31.67) (22.89)
22(36.67) (25.29)
8(13.33) (32.00)
11(18.33) (47.83)
60 (27.52)
VIII 39(48.15) (46.99)
32(39.51) (36.78)
5(6.17) (20.00)
5(6.17) (21.74)
81 (37.16)
All non Agricultural Products 83(38.07) 87(39.91) 25(11.47) 23(10.55) 218 Note: Code [1.Same product produced in other areas of the country, 2. Similar duplicates in the country, 3. Similar products imported into the country, 4. Competition in the export market from other countries producing similar products]

458
Table-11.13: Other types of competition faced by agricultural and non-agricultural products as viewed by traders
Response to various forms of competition – No. (%) GI type 1 2 3 4 Total
Agriculture products 7(70.00) (53.85)
1(10.00) (33.33)
2(20.00) (50.00)
0(0.00) (0.00)
10 (40.00)
Non Agriculture Products 6(40.00) (46.15)
2(13.33) (66.67)
2(13.33) (50.00)
5(33.33) (100)
15 (60.00)
All 13(52.00) 3(12.00) 4(16.00) 5(20.00) 25 Note: Code [1.Competition from other products, 2. Consumer’s preference, 3. Less Availability of the same produce, 4. Competition from Producers group within]
Table-11.14: Traders’ opinion about difference of imported and domestically produced agricultural product
Responses – No. (%) GI Type
Aspects of difference
I II III IV All No imports 0 (0.00)
(0.00) 0 (0.00) (0.00)
1(50.00) (3.23)
1(50.00) (100)
2 (3.23)
Non-awareness of producers 2(100) (13.33)
0 (0.00) (0.00)
0 (0.00) (0.00)
0 (0.00) (0.00)
2 (3.23)
Imported product price cheaper 0 (0.00) (0.00)
0 (0.00) (0.00)
1(100) (3.23)
0 (0.00) (0.00)
1 (1.61)
Imported product quality better 4(50.00) (26.67)
0 (0.00) (0.00)
4(50.00) (16.00)
0 (0.00) (0.00)
8 (12.90)
Imported product quality inferior 9(18.37) (60.00)
15(30.61) (100)
25(51.02) (80.65)
0 (0.00) (0.00)
49 (79.03)
Total 15(24.19) 15(24.19) 31(50.00) 1(1.61) 62
Table-11.15: Traders’ opinion about difference of imported and domestically produced non-agricultural product
Responses – No. (5) GI Type
Aspects of difference
V VI VII VIII All No imports 3(30.00)
(100.00) 7(70.00) (21.88)
0(0.00) (0.00)
0(0.00) (0.00)
10 (11.63)
Imported product price cheaper 0(0.00) (0.00)
5(22.73) (15.63)
4(18.18) (17.39)
13(59.09) (46.43)
22 (25.58)
Processing of imported product 0(0.00) (0.00)
0(0.00) (0.00)
5(100) (21.74)
0(0.00) (0.00)
5 (5.81)
Quality difference 0(0.00) (0.00)
16(37.21) (50.00)
14(32.56) (60.87)
13(30.23) (46.43)
43 (50.00)
Traditional nature of indigenous products highly valued 0(0.00) (0.00)
4(66.67) (12.5)
0(0.00) (0.00)
2(33.33) (7.14)
6 (6.98)
Total 3(3.49) 32(37.21) 23(26.74) 28(32.56) 86
Table-11.16: Traders’ opinion about methods to face competition in agricultural products Responses for methods to face competition – No. (%) GI type
1 2 3 4 5 6 7 8 All I 35(17.24)
(35.35) 18(8.87) (34.62)
34(16.75) (37.77)
18(8.87) (38.30)
29(14.28) (44.62)
18(8.87) (40.00)
31(15.27) (63.27)
20(9.85) (31.74)
20) (39.80)
II 18(21.17) (18.18)
8(9.41) (15.38)
15(17.65) (16.67)
10(11.76) (21.27)
9(10.59) (13.85)
7(8.24) (15.56)
6(7.06) (12.24)
12(14.12) (19.05)
85 (16.67)
III 41(20.50) (41.42)
25(12.50) (48.07)
36(18.00) (40.00)
15(7.50) (31.92)
24(12.00) (36.92)
20(10.00) (44.44)
12(6.00) (24.49)
27(13.50) (42.86)
200 (39.22)
IV 5(22.73) (5.05)
1(4.54) (1.92)
5(22.73) (5.56)
4(18.18) (8.51)
3(13.64) (4.61)
0(0.00) (0.00)
0(0.00) (0.00)
4(18.18) (6.35)
22 (4.31)
Total 99(19.41) 52(10.20) 90(17.65) 47(9.21) 65(12.75) 45(8.82) 49(9.61) 63(12.35) 510 Note: Code [1.Production quality control and inspection quality assurance methods to be effectively introduced, 2.Through design and technological development, 3. Improvement of marketing methods, 4. Intensive publicity, 5. Export-oriented development, 6. Cutting down production and marketing costs, 7. Organizing exhibitions, expos, and market complexes etc., 8. Seeking GI Registration]
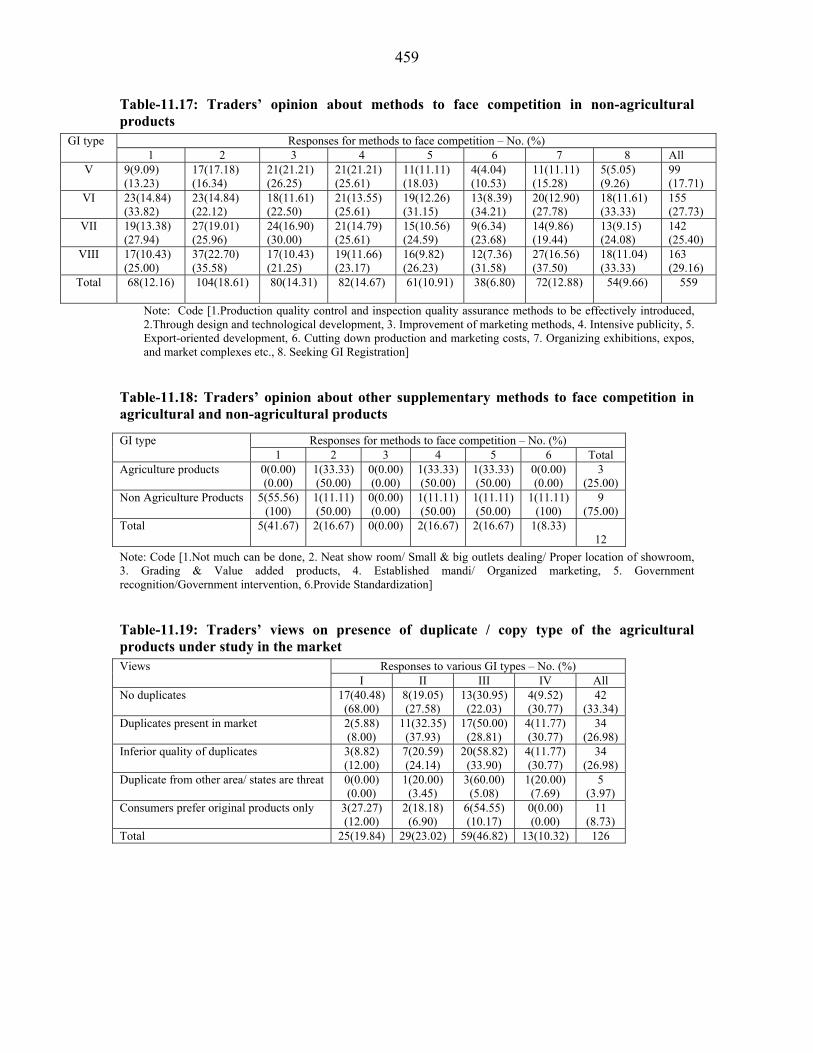
459
Table-11.17: Traders’ opinion about methods to face competition in non-agricultural products
Responses for methods to face competition – No. (%) GI type 1 2 3 4 5 6 7 8 All
V 9(9.09) (13.23)
17(17.18) (16.34)
21(21.21) (26.25)
21(21.21) (25.61)
11(11.11) (18.03)
4(4.04) (10.53)
11(11.11) (15.28)
5(5.05) (9.26)
99 (17.71)
VI 23(14.84) (33.82)
23(14.84) (22.12)
18(11.61) (22.50)
21(13.55) (25.61)
19(12.26) (31.15)
13(8.39) (34.21)
20(12.90) (27.78)
18(11.61) (33.33)
155 (27.73)
VII 19(13.38) (27.94)
27(19.01) (25.96)
24(16.90) (30.00)
21(14.79) (25.61)
15(10.56) (24.59)
9(6.34) (23.68)
14(9.86) (19.44)
13(9.15) (24.08)
142 (25.40)
VIII 17(10.43) (25.00)
37(22.70) (35.58)
17(10.43) (21.25)
19(11.66) (23.17)
16(9.82) (26.23)
12(7.36) (31.58)
27(16.56) (37.50)
18(11.04) (33.33)
163 (29.16)
Total 68(12.16)
104(18.61)
80(14.31)
82(14.67)
61(10.91)
38(6.80)
72(12.88)
54(9.66)
559
Note: Code [1.Production quality control and inspection quality assurance methods to be effectively introduced, 2.Through design and technological development, 3. Improvement of marketing methods, 4. Intensive publicity, 5. Export-oriented development, 6. Cutting down production and marketing costs, 7. Organizing exhibitions, expos, and market complexes etc., 8. Seeking GI Registration]
Table-11.18: Traders’ opinion about other supplementary methods to face competition in agricultural and non-agricultural products
Note: Code [1.Not much can be done, 2. Neat show room/ Small & big outlets dealing/ Proper location of showroom, 3. Grading & Value added products, 4. Established mandi/ Organized marketing, 5. Government recognition/Government intervention, 6.Provide Standardization]
Table-11.19: Traders’ views on presence of duplicate / copy type of the agricultural products under study in the market
Responses to various GI types – No. (%) Views I II III IV All
No duplicates 17(40.48) (68.00)
8(19.05) (27.58)
13(30.95) (22.03)
4(9.52) (30.77)
42 (33.34)
Duplicates present in market 2(5.88) (8.00)
11(32.35) (37.93)
17(50.00) (28.81)
4(11.77) (30.77)
34 (26.98)
Inferior quality of duplicates 3(8.82) (12.00)
7(20.59) (24.14)
20(58.82) (33.90)
4(11.77) (30.77)
34 (26.98)
Duplicate from other area/ states are threat 0(0.00) (0.00)
1(20.00) (3.45)
3(60.00) (5.08)
1(20.00) (7.69)
5 (3.97)
Consumers prefer original products only 3(27.27) (12.00)
2(18.18) (6.90)
6(54.55) (10.17)
0(0.00) (0.00)
11 (8.73)
Total 25(19.84) 29(23.02) 59(46.82) 13(10.32) 126
Responses for methods to face competition – No. (%) GI type 1 2 3 4 5 6 Total
Agriculture products 0(0.00) (0.00)
1(33.33) (50.00)
0(0.00) (0.00)
1(33.33) (50.00)
1(33.33) (50.00)
0(0.00) (0.00)
3 (25.00)
Non Agriculture Products 5(55.56) (100)
1(11.11) (50.00)
0(0.00) (0.00)
1(11.11) (50.00)
1(11.11) (50.00)
1(11.11) (100)
9 (75.00)
Total 5(41.67)
2(16.67)
0(0.00)
2(16.67)
2(16.67)
1(8.33) 12

460
Table-11.20: Traders’ views on presence of duplicate / copy type of the non-agricultural products under study in the market
Responses to various GI types – No. (%) Code/Views V VI VII VIII All
No duplicates 0(0.00) (0.00)
10(24.39) (26.32)
15(36.59) (37.50)
16(39.02) (25.81)
41 (23.84)
Duplicates present in market 9(28.13) (28.13)
1(3.12) (2.63)
8(25.00) (20.00)
14(43.75) (22.58)
32 (18.60)
Inferior quality of duplicates 10(30.30) (31.25)
9(27.28) (23.68)
6(18.18) (15.00)
8(24.24) (12.90)
33 (19.19)
Duplicate from other area/ states are threat 12(24.49) (37.50)
12(24.49) (31.58)
8(16.33) (20.00)
17(34.69) (27.42)
49 (28.49)
Consumers prefer original products only 1(5.88) (3.12)
6(35.29) (15.79)
3(17.65) (7.50)
7(41.17) (11.29)
17 (9.88)
Total 32(18.60) 38(22.09) 40(23.26) 62(36.05) 172
Table-11.21: Ways and means to face competition: Opinion of traders about agricultural products
Responses to various GI types – No. (%) Ways and means I II III IV All
Public awareness 5(83.33) (41.67)
1(16.67) (7.69)
0(0.00) (0.00)
0(0.00) (0.00)
6 (15.79)
Legal enforcement 3(42.86) (25.00)
0(0.00) (0.00)
4(57.14) (33.34)
0(0.00) (0.00)
7 (18.42)
Administrative measures 0(0.00) (0.00)
9(60.00) (69.23)
6(40.00) (50.00)
0(0.00) (0.00)
15 (39.47)
Consumers discourage duplicates 0(0.00) (0.00)
2(66.67) (15.39)
0(0.00) (0.00)
1(33.33) (100)
3 (7.89)
High quality standards 0(0.00) (0.00)
0(0.00) (0.00)
1(100) (8.33)
0(0.00) (0.00)
1 (2.63)
Branding and labeling 2(100) (16.67)
0(0.00) (0.00)
0(0.00) (0.00)
0(0.00) (0.00)
2 (5.26)
IP protection 1(33.33) (8.33)
1(33.33) (7.69)
1(33.33) (8.33)
0(0.00) (0.00)
3 (7.89)
Promoting originals 1(100) (8.33)
0(0.00) (0.00)
0(0.00) (0.00)
0(0.00) (0.00)
1 (2.63)
Total 12(31.58) 13(34.21) 12(31.58) 1(2.63) 38
Table-11.22: Ways and means to face competition: Opinion of traders about non-agricultural products
Responses to various GI types – No. (%) Ways and means V VI VII VIII All Public awareness 1(100)
(6.25) 0(0.00) (0.00)
0(0.00) (0.00)
0(0.00) (0.00)
1 (1.23)
Legal enforcement 0(0.00) (0.00)
6(66.67) (27.27)
3(33.33) (20.00)
0(0.00) (0.00)
9 (11.11)
Administrative measures 12(27.27) (75.00)
12(27.27) (54.54)
0(0.00) (0.00)
20(45.45) (71.43)
44 (54.32)
High quality standards 1(20.00) (6.25)
1(20.00) (4.55)
0(0.00) (0.00)
3(60.00) (10.71)
5 (6.17)
IP protection 2(20.00) (12.50)
3(30.00) (13.64)
0(0.00) (0.00)
5(50.00) (17.86)
10 (12.35)
Administrative procedures 0(0.00) (0.00)
0(0.00) (0.00)
8(100) (53.33)
0(0.00) (0.00)
8 (9.88)
Administrative action 0(0.00) (0.00)
0(0.00) (0.00)
4(100) (26.67)
0(0.00) (0.00)
4 (4.94)
Total 16(19.75) 22(27.16) 15(18.52) 28(34.57) 81

461
Table-11.23: Traders’ opinion about current status of marketing of agricultural products Responses to various GI types – No. (%) Code/Opinion about current status
I II III IV All 1. Satisfactory 4(10.53)
(30.77) 9(23.68) (56.25)
20(52.63) (54.05)
5(13.16) (62.50)
38 (51.35)
2. Not satisfactory 9(25.00) (69.23)
7(19.44) (43.75)
17(47.22) (45.95)
3(8.33) (37.50)
36 (48.65)
Total 13(17.57) 16(21.62) 37(50.00) 8(10.81) 74
Table-11.24: Traders’ opinion about current status of marketing of non-agricultural products
Responses to various GI types – No. (%) Code/Opinion about current status V VI VII VIII All
1. Satisfactory 8(14.29) (50.00)
13(23.21) (56.52)
17(30.36) (80.95)
18(32.13) (51.43)
56 (58.95)
2. Not satisfactory 8(20.51) (50.00)
10(25.64) (43.48)
4(10.26) (19.05)
17(43.59) (48.57)
39 (41.05)
Total 16(16.84) 23(24.21) 21(22.11) 35(36.84) 95
Table-11.25: Suggestions of traders to improve marketing of agricultural products Responses to various GI types – No. (%) Suggestion
I II III IV All Organized and regulated markets 13(46.43)
(30.95) 0(0.00) (0.00)
15(53.57) (19.23)
0(0.00) (0.00)
28 (19.87)
Post harvest facility-processing 4(57.14) (9.52)
0(0.00) (0.00)
3(42.86) (3.85)
0(0.00) (0.00)
7 (4.64)
Post harvest facility-storage 0(0.00) (0.00)
0(0.00) (0.00)
3(100) (3.85)
0(0.00) (0.00)
3 (1.98)
Post harvest facility-transportation 0(0.00) (0.00)
1(16.67) (4.76)
5(83.33) (6.41)
0(0.00) (0.00)
6 (3.97)
Export avenues 4(44.44) (9.52)
0(0.00) (0.00)
5(55.56) (6.41)
0(0.00) (0.00)
9 (5.96)
Regulated price structure 3(23.07) (7.14)
4(30.77) (19.05)
6(46.15) (7.69)
0(0.00) (0.00)
13 (8.61)
Good marketing practices 1(14.29) (2.38)
1(14.29) (4.76)
5(71.42) (6.41)
0(0.00) (0.00)
7 (4.64)
Total Quality Management (TQM) 6(20.69) (14.29)
7(24.14) (33.34)
16(55.17) (20.51)
0(0.00) (0.00)
29 (19.21)
Government policy support 5(25.00) (11.91)
5(25.00) (23.81)
6(30.00) (7.69)
4(20.00) (40.00)
20 (13.24)
Publicity 6(22.22) (14.29)
1(3.71) (4.76)
14(51.85) (17.95)
6(22.22) (60.00)
27 (17.88)
Special market 0(0.00) (0.00)
2(100) (9.52)
0(0.00) (0.00)
0(0.00) (0.00)
2 (1.32)
Total 42(27.81) 21(13.91) 78(51.66) 10(6.62) 151
Table-11.26: Suggestions of traders to improve marketing of non-agricultural products Responses to various GI types – No. (%) Suggestion
V VI VII VIII All Organized and regulated markets 0(0.00)
(0.00) 2(18.18) (5.71)
6(54.55) (17.14)
3(27.27) (4.00)
11 (6.67)
Government policy support 5(14.71) (25.00)
10(29.41) (28.57)
3(8.82) (8.57)
16(47.06) (21.33)
34 (20.61)
Publicity 12(25.00) (60.00)
12(25.00) (34.30)
9(18.75) (25.72)
15(31.25) (20.00)
48 (29.10)
Good marketing practices 0(0.00) (0.00)
2(100.00) (5.71)
0(0.00) (0.00)
0(0.00) (0.00)
2 (1.21)
Export avenues 0(0.00) 2(13.33) 0(0.00) 13(86.67) 15

462
(0.00) (5.71) (0.00) (17.33) (9.09) Total Quality Management (TQM) 3(10.00)
(15.00) 5(16.66) (14.29)
11(36.67) (31.43)
11(36.67) (14.67)
30 (18.18)
Regulated price structure 0(0.00) (0.00)
0(0.00) (0.00)
6(66.67) (17.14)
3(33.33) (4.00)
9 (5.45)
Involvement of ICTs 0(0.00) (0.00)
2(100) (5.71)
0(0.00) (0.00)
0(0.00) (0.00)
2 (1.21)
Restricting imports and duplicates 0(0.00) (0.00)
0(0.00) (0.00)
0(0.00) (0.00)
14(100) (18.67)
14 (8.48)
Total 20(12.12) 35(21.21) 35(21.21) 75(45.46) 165
Table-11.27: Traders’ opinion about future prospects of products under study Respondents – No. (%) S.
N. Product Name Bright and likely to improve-1
Likely to remain the same-2
Likely to worsen-3
I Fruits 1 Banganpally mango 9(100.00) 0(0.00) 0(0.00) 2 Coorg orange 1(20.00) 4(80.00) 0(0.00) 3 Alphonso mango 4(100) 0(0.00) 0(0.00) 4 Nagpur orange 6(75.00) 2(25.00) 0(0.00) 5 Nasik grapes 3(60.00) 2(40.00) 0(0.00) 6 Malihabadi Dussheri 5(100.00) 0(0.00) 0(0.00) 7 Himachal apple 4(80.00) 0(0.00) 1(20.00) 8 Harshil apple 5(100.00) 0(0.00) 0(0.00) 9 Ramnagar litchi 5(100.00) 0(0.00) 0(0.00) II Grains & Potato 10 Navara rice 1(20.00) 4(80.00) 0(0.00) 11 Pokkali rice 0(0.00) 0(0.00) 5(100.00) 12 Bhaliya wheat 1(12.50) 3(37.50) 4(50.00) 13 Basmati rice 4(80.00) 0(0.00) 1(20.00) 14 Sehori genhu -- -- -- 15 Kurnool rice -- -- -- 16 Malwa potato -- -- -- 17 Pahari aloo 4(100.00) -- -- 18 Hill rajma 5(100.00) -- -- III Plantation crops & spices 19 Guntur chilli 5(100.00) -- -- 20 Coorg coffee 1(20.00) 4(80.00) 0(0.00) 21 Wayanadan tea 2(40.00) 3(60.00) 0(0.00) 22 Telichery black pepper 0(0.00) 5(100.00) 0(0.00) 23 Alleppy cardamom 3(60.00) 2(40.00) 0(0.00) 24 Nilgiri tea 3(75.00) 1(25.00) 0(0.00) 25 Dungarpur zinger 6(75.00) 2(25.00) 0(0.00) 26 Amleta & Mahadev garlic 5(100.00) 0(0.00) 0(0.00) 27 Kumbhraj dhania -- -- -- 28 Fenugreek 9(100.00) 0(0.00) 0(0.00) 29 Mahoba paan 5(55.56) 1(11.11) 3(33.33) IV Unexploited indigenous products 30 Nannari sharbat 5(100.00) 0(0.00) 0(0.00) 31 Kokum fruit juice 4(80.00) 1(20.00) 0(0.00) 32 Buraansh juice 0(0.00) 0(0.00) 0(0.00) V Confectionery 1 Tirunelveli halwa 5(100.00) 0(0.00) 0(0.00) 2 Dodha 3(75.00) 1(25.00) 0(0.00) 3 Bikaneri bhujia 4(100.00) 0(0.00) 0(0.00) 4 Bikaneri rasgolla 4(100.00) 0(0.00) 0(0.00) 5 Agra petha 4(80.00) 0(0.00) 1(20.00) 6 Bal mithai 4(100.00) 0(0.00) 0(0.00) VI Handicrafts

463
Respondents – No. (%) S. N. Product Name Bright and likely to
improve-1 Likely to remain the
same-2 Likely to worsen-
3 7 Kondapalli bommalu (toys) 4(100.00) 0(0.00) 0(0.00) 8 Chennapatana toys 5(100.00) 0(0.00) 0(0.00) 9 Thanjaur art plate 5(100.00) 0(0.00) 0(0.00) 10 Kolhapuri chappal 5(100.00) 0(0.00) 0(0.00) 11 Warli paintings 4(66.67) 2(33.33) 0(0.00) 12 Punjabi jooti 1(20.00) 2(40.00) 2(40.00) 13 Moradabad brass material 2(40.00) 2(40.00) 1(20.00) 14 Saharanpur furniture 4(80.00) 0(0.00) 1(20.00) VII Manufactured products with organized trade 15 Hyderabad pearls 2(40.00) 0(0.00) 3(60.00) 16 Mysore sandal soap 3(60.00) 2(40.00) 0(0.00) 17 Nilgiri oil 3(60.00) 2(40.00) 0(0.00) 18 Sivakasi patakha 5(100.00) 0(0.00) 0(0.00) 19 Harambha thresher 3(60.00) 2(40.00) 0(0.00) 20 Makrana marble 6(100.00) 0(0.00) 0(0.00) 21 Jaipur blue pottery 2(50.00) 2(50.00) 0(0.00) 22 Ferozabad chundia and
glassware 3(75.00) 1(25.00) 0(0.00)
23 Khurja pottery 5(100.00) 0(0.00) 0(0.00) VIII Textiles 25 Gadwal saree 5(100.00) 0(0.00) 0(0.00) 26 Srikalahasti kalamkari 5(100.00) 0(0.00) 0(0.00) 27 Kancheepuram silk 1(20.00) 3(60.00) 1(20.00) 28 Bandhani saree 3(60.00) 1(20.00) 1(20.00) 29 Patola saree 2(40.00) 3(60.00) 0(0.00) 30 Kutch embroidery 5(100.00) 0(0.00) 0(0.00) 31 Paithani saree 1(25.00) 2(50.00) 1(25.00) 32 Phulkari 2(40.00) 3(60.00) 0(0.00) 33 Ludhiana hosiery 1(20.00) 3(60.00) 1(20.00) 34 Jaipuri rajai 5(100.00) 0(0.00) 0(0.00) 35 Sanganeri print 0(0.00) 5(100.00) 0(0.00) 36 Banarasi saree 5(100.00) 0(0.00) 0(0.00) 37 Lucknavi chikan 5(100.00) 0(0.00) 0(0.00) 38 Bhadoi carpet 5(100.00) 0(0.00) 0(0.00)
Table-11.28: Traders’ suggestions for constructive measures to improve economic viability and future prospects of agricultural products
Responses – No. (%) GI Type
Measures
I II III IV All Production level improvements 14(30.44)
(23.73) 16(34.78) (31.37)
11(23.91) (11.23)
5(10.87) (27.78)
46 (20.35)
Quality standardization, maintenance and assurance 11(25.00) (18.65)
11(25.00) (21.57)
19(43.18) (19.39)
3(6.82) (16.66)
44 (19.47)
Post harvest level improvements 7(33.33) (11.86)
0(0.00) (0.00)
14(66.67) (14.28)
0(0.00) (0.00)
21 (9.30)
Good transport facilities 0(0.00) (0.00)
0(0.00) (0.00)
6(100.00) (6.12)
0(0.00) (0.00)
6 (2.65)
Government policy support 3(11.11) (5.08)
11(40.74) (21.57)
8(29.63) (8.16)
5(18.52) (27.78)
27 (11.95)
Good market practices 11(32.35) (18.65)
6(17.65) (11.76)
17(50.00) (17.35)
0(0.00) (0.00)
34 (15.04)
Publicity of the product 12(36.36) (20.34)
0(0.00) (0.00)
16(48.49) (16.33)
5(15.15) (27.78)
33 (14.60)
GI registration 1(6.66) (1.69)
7(46.67) (13.73)
7(46.67) (7.14)
0(0.00) (0.00)
15 (6.64)
Total 59(26.11) 51(22.57) 98(43.36) 18(7.96) 226

464
Table-11.29: Traders’ suggestions for constructive measures to improve economic viability and future prospects of non-agricultural products
Responses – No. (%) GI Type
Measures
V VI VII VIII All Can’t say 3(37.50)
(9.09) 0(0.00) (0.00)
2(25.00) (3.85)
3(37.50) (3.33)
8 (3.48)
Production level improvements 8(9.30) (24.24)
29(33.72) (52.73)
14(16.28) (26.92)
35(40.70) (38.89)
86 (37.39)
Quality standardization, maintenance and assurance 0(0.00) (0.00)
7(29.17) (12.73)
10(41.66) (19.23)
7(29.17) (7.78)
24 (10.44)
Good marketing practices 3(12.50) (9.10)
5(20.84) (9.09)
8(33.33) (15.38)
8(33.33) (8.89)
24 (10.44)
Government policy support 9(16.67) (27.27)
14(25.93) (25.45)
12(22.22) (23.08)
19(35.18) (21.11)
54 (23.48)
Publicity of the product 7(31.82) (21.21)
0(0.00) (0.00)
6(27.27) (11.54)
9(40.91) (10.00)
22 (9.56)
GI registration 3(42.86) (9.09)
0(0.00) (0.00)
0(0.00) (0.00)
4(57.14) (4.44)
7 (3.04)
Restriction on import and duplicates 0(0.00) (0.00)
0(0.00) (0.00)
0(0.00) (0.00)
5(100) (5.56)
5 (2.17)
Total 33(14.35) 55(23.91) 52(22.61) 90(39.13) 230
Table-11.30: Sources of purchase of agricultural products by traders Responses – No. (%)
GI Type Source of purchase for traders
I II III IV All Direct 27(29.35)
(25.47) 25(27.17) (40.32)
35(38.04) (36.84)
5(5.44) (33.33)
92 (33.10)
Local middlemen 25(44.64) (23.58)
10(17.86) (16.13)
17(30.36) (17.90)
4(7.14) (26.67)
56 (20.14)
Producers Group 26(65.00) (24.53)
5(12.50) (8.07)
9(22.50) (9.47)
0(0.00) (0.00)
40 (14.39)
Mandi 20(35.71) (18.87)
10(17.86) (16.13)
25(44.64) (26.32)
1(1.79) (6.67)
56 (20.14)
Local shop 8(38.10) (7.55)
8(38.10) (12.90)
5(23.80) (5.26)
0(0.00) (0.00)
21 (7.55)
Any Other 0(0.00) (0.00)
4(30.77) (6.45)
4(30.77) (4.21)
5(38.46) (33.33)
13 (4.68)
Total 106(38.13) 62(22.30) 95(34.17) 15(5.40) 278 Table-11.31: Sources of purchase of non-agricultural products by traders
Responses – No. (%) GI Type
Source of purchase for traders
V VI VII VIII All Direct 5(4.81)
(14.71) 23(22.12) (42.60)
28(26.92) (49.12)
48(46.15) (49.48)
104 (42.97)
Local middlemen 5(15.62) (14.71)
3(9.38) (5.56)
11(34.37) (19.30)
13(40.63) (13.40)
32 (13.22)
Producers Group 15(21.13) (44.12)
22(30.98) (40.74)
11(15.50) (19.30)
23(32.39) (23.71)
71 (29.34)
Mandi 4(50.00) (11.76)
0(0.00) (0.00)
2(25.00) (3.51)
2(25.00) (2.06)
8 (3.31)
Local shop 0(0.00) (0.00)
2(40.00) (3.70)
1(20.00) (1.75)
2(40.00) (2.06)
5 (2.07)
Any Other 5(22.73) (14.70)
4(18.18) (7.40)
4(18.18) (7.02)
9(40.91) (9.28)
22 (9.09)
Total 34(14.05) 54(22.32) 57(23.55) 97(40.08) 242
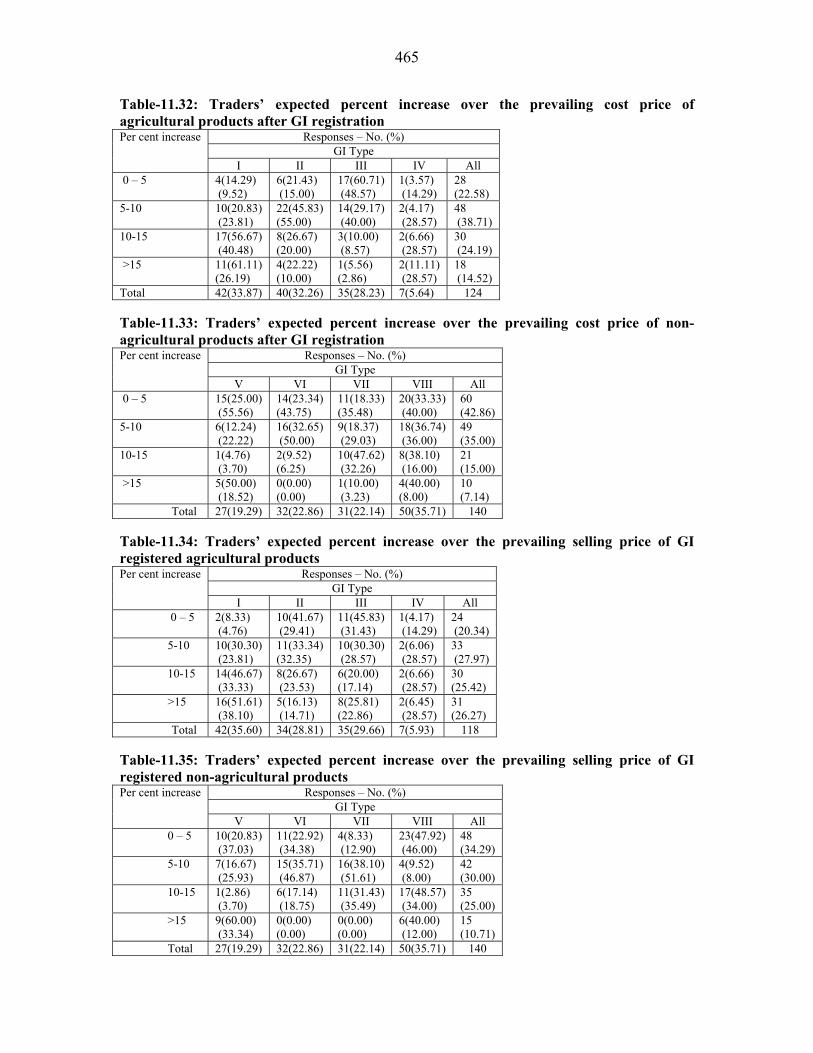
465
Table-11.32: Traders’ expected percent increase over the prevailing cost price of agricultural products after GI registration
Responses – No. (%) GI Type
Per cent increase
I II III IV All 0 – 5 4(14.29)
(9.52) 6(21.43) (15.00)
17(60.71) (48.57)
1(3.57) (14.29)
28 (22.58)
5-10 10(20.83) (23.81)
22(45.83) (55.00)
14(29.17) (40.00)
2(4.17) (28.57)
48 (38.71)
10-15 17(56.67) (40.48)
8(26.67) (20.00)
3(10.00) (8.57)
2(6.66) (28.57)
30 (24.19)
>15 11(61.11) (26.19)
4(22.22) (10.00)
1(5.56) (2.86)
2(11.11) (28.57)
18 (14.52)
Total 42(33.87) 40(32.26) 35(28.23) 7(5.64) 124 Table-11.33: Traders’ expected percent increase over the prevailing cost price of non-agricultural products after GI registration
Responses – No. (%) GI Type
Per cent increase
V VI VII VIII All 0 – 5 15(25.00)
(55.56) 14(23.34) (43.75)
11(18.33) (35.48)
20(33.33) (40.00)
60 (42.86)
5-10 6(12.24) (22.22)
16(32.65) (50.00)
9(18.37) (29.03)
18(36.74) (36.00)
49 (35.00)
10-15 1(4.76) (3.70)
2(9.52) (6.25)
10(47.62) (32.26)
8(38.10) (16.00)
21 (15.00)
>15 5(50.00) (18.52)
0(0.00) (0.00)
1(10.00) (3.23)
4(40.00) (8.00)
10 (7.14)
Total 27(19.29) 32(22.86) 31(22.14) 50(35.71) 140 Table-11.34: Traders’ expected percent increase over the prevailing selling price of GI registered agricultural products
Responses – No. (%) GI Type
Per cent increase
I II III IV All 0 – 5 2(8.33)
(4.76) 10(41.67) (29.41)
11(45.83) (31.43)
1(4.17) (14.29)
24 (20.34)
5-10 10(30.30) (23.81)
11(33.34) (32.35)
10(30.30) (28.57)
2(6.06) (28.57)
33 (27.97)
10-15 14(46.67) (33.33)
8(26.67) (23.53)
6(20.00) (17.14)
2(6.66) (28.57)
30 (25.42)
>15 16(51.61) (38.10)
5(16.13) (14.71)
8(25.81) (22.86)
2(6.45) (28.57)
31 (26.27)
Total 42(35.60) 34(28.81) 35(29.66) 7(5.93) 118 Table-11.35: Traders’ expected percent increase over the prevailing selling price of GI registered non-agricultural products
Responses – No. (%) GI Type
Per cent increase
V VI VII VIII All 0 – 5 10(20.83)
(37.03) 11(22.92) (34.38)
4(8.33) (12.90)
23(47.92) (46.00)
48 (34.29)
5-10 7(16.67) (25.93)
15(35.71) (46.87)
16(38.10) (51.61)
4(9.52) (8.00)
42 (30.00)
10-15 1(2.86) (3.70)
6(17.14) (18.75)
11(31.43) (35.49)
17(48.57) (34.00)
35 (25.00)
>15 9(60.00) (33.34)
0(0.00) (0.00)
0(0.00) (0.00)
6(40.00) (12.00)
15 (10.71)
Total 27(19.29) 32(22.86) 31(22.14) 50(35.71) 140

466
Table-11.36: Trade suitability of GI type I: Fruits No of respondents giving rank 4 3 2 1
Final Priority Score
Observations
A B C D X It is suited for the local consumption only 8 3 9 28 87 It is suited for the consumption in this state only 4 18 20 7 117 It is suited for the domestic consumption including other states also
19 21 8 3 158
It is suited for export to other countries 26 4 2 18 138 ΣAx4+Bx3+Cx2+Dx1 =X
Table-11.37: Trade suitability of GI type II: Grains & Potato No of respondents giving rank 4 3 2 1
Final Priority Score
Observations
A B C D X It is suited for the local consumption only 14 3 5 16 91 It is suited for the consumption in this state only 7 10 18 3 97 It is suited for the domestic consumption including other states also
14 14 8 4 118
It is suited for export to other countries 23 6 2 12 126 ΣAx4+Bx3+Cx2+Dx1 =X
Table-11.38: Trade suitability of GI type III: Plantation crops & spices No of respondents giving rank
4 3 2 1 Final Priority Score
Observations
A B C D X It is suited for the local consumption only 7 9 8 33 104 It is suited for the consumption in this state only 4 17 27 9 130 It is suited for the domestic consumption including other states also
16 16 14 9 149
It is suited for export to other countries 38 3 4 13 182 ΣAx4+Bx3+Cx2+Dx1 =X
Table-11.39: Trade suitability of GI type IV: Unexploited indigenous products No of respondents giving rank
4 3 2 1 Final Priority Score
Observations
A B C D X It is suited for the local consumption only 1 5 1 3 24 It is suited for the consumption in this state only 4 1 5 0 29 It is suited for the domestic consumption including other states also
3 4 3 0 30
It is suited for export to other countries 2 0 1 7 17 ΣAx4+Bx3+Cx2+Dx1 =X
Table-11.40: Trade suitability of GI type V: Confectionary No of respondents giving rank
4 3 2 1 Final Priority Score
Observations
A B C D X It is suited for the local consumption only 15 2 1 12 80 It is suited for the consumption in this state only 1 9 15 5 66 It is suited for the domestic consumption including other states also
1 12 7 10 64
It is suited for export to other countries 13 2 2 13 75 ΣAx4+Bx3+Cx2+Dx1 =X

467
Table-11.41: Trade suitability of GI type VI: Handicrafts No of respondents giving rank
4 3 2 1 Final Priority Score
Observations
A B C D X It is suited for the local consumption only 3 6 6 26 68 It is suited for the consumption in this state only 1 8 24 8 84 It is suited for the domestic consumption including other states also
13 17 4 7 118
It is suited for export to other countries 26 6 7 2 138 ΣAx4+Bx3+Cx2+Dx1 =X
Table-11.42: Trade suitability of GI type VII: Manufactured products with organized trade No of respondents giving rank
4 3 2 1 Final Priority Score
Observations
A B C D X It is suited for the local consumption only 20 5 7 13 112 It is suited for the consumption in this state only 7 16 16 6 114 It is suited for the domestic consumption including other states also
8 16 16 6 118
It is suited for export to other countries 7 13 9 17 102 ΣAx4+Bx3+Cx2+Dx1 =X
Table-11.43: Trade suitability of GI type VIII: Textiles No of respondents giving rank
4 3 2 1 Final Priority Score
Observations
A B C D X It is suited for the local consumption only 11 11 9 44 139 It is suited for the consumption in this state only 20 13 24 17 184 It is suited for the domestic consumption including other states also
31 22 4 17 215
It is suited for export to other countries 30 8 16 20 196 ΣAx4+Bx3+Cx2+Dx1 =X
Table-11.44: Comparative analysis of traders’ preferential priority with suitability of consumption (trade) of the products
Priority of suitability* GI Type 1st 2nd 3rd 4th
I c d b a II d c b a III d c b a IV c b a d V a d b c VI d c b a VII a c b d VIII c d b a Note: Code [a-It is suited for the local consumption only, b-It is suited for the consumption in this state only, c-It is suited for the domestic consumption including other states also, d-It is suited for export to other countries]. The results are obtained using preferential ranking method. Table-11.45: Product-wise explanation of traders’ preferential priority with suitability of consumption (trade) of the products
Priority of suitability* S.N P.C Product 1st 2nd 3rd 4th
I Fruits 1 3 Banganpally mango d b c a 2 11 Coorg orange c b a d 3 29 Alphonso mango d b,c a

468
Priority of suitability* S.N P.C Product 1st 2nd 3rd 4th
4 30 Nagpur orange c d b a 5 31 Nasik grapes c b a d 6 62 Malihabadi Dussheri d a b c 7 63 Himachal apple c d a b 8 66 Harshil apple c d b a 9 68 Ramnagar litchi c b d a II Grains & Potato 10 13 Navara rice a b d c 11 17 Pokkali rice d c a b 12 24 Bhaliya wheat a,b c d 13 37 Basmati rice d c b a 14 48 Sehori genhu c d b a 15 25 Kurnool rice -- -- -- -- 16 49 Malwa potato c d a b 17 65 Pahari aloo c b d a 18 69 Hill rajma c b d a III Plantation crops & spices 19 4 Guntur chilli a b c d 20 10 Coorg coffee c b d a 21 14 Wayanadan tea b d a c 22 15 Telichery black pepper d b a c 23 16 Alleppy cardamom d c b a 24 19 Nilgiri tea d c b c 25 46 Dungarpur zinger c b a d 26 50 Amleta & Mahadev garlic -- -- -- -- 27 51 Kumbhraj dhania b a c d 28 52 Fenugreek c a b d 29 54 Mahoba paan c a b d IV Unexploited indigenous products 30 6 Nannari sharbat c a b d 31 12 Kokum fruit juice b c a d 32 67 Buraansh juice -- -- -- -- V Confectionery 1 22 Tirunelveli halwa a b c d 2 38 Dodha b c a d 3 44 Bikaneri bhujia d c b a 4 45 Bikaneri rasgolla a b d c 5 58 Agra petha c b d a 6 70 Bal mithai b c d a
VI Handicrafts 7 5 Kondapalli bommalu (toys) c d b a 8 8 Chennapatana toys c d b a 9 23 Thanjaur art plate c b a d 10 32 Kolhapuri chappal d a b c 11 33 Warli paintings d b c a 12 35 Punjabi jooti d c b a 13 57 Moradabad brass material d c b a 14 60 Saharanpur furniture c d b a VII Manufactured products with organized trade 15 1 Hyderabad pearls c b a d 16 9 Mysore sandal soap b,c a d 17 20 Nilgiri oil c b d a 18 21 Sivakasi patakha c d b a 19 39 Harambha thresher b c a d 20 42 Makrana marble a b c d 21 47 Jaipur blue pottery c d b a 22 55 Ferozabad chundia and glassware a b d c

469
Priority of suitability* S.N P.C Product 1st 2nd 3rd 4th
23 61 Khurja pottery c d b a VIII Textiles 24 2 Gadwal saree b a c d 25 7 Srikalahasti kalamkari c d b a 26 18 Kancheepuram silk c d b a 27 26 Bandhani saree c b a d 28 27 Patola saree c b a d 29 28 Kutch embroidery a c b d 30 34 Paithani saree b d c a 31 36 Phulkari d c b a 32 40 Ludhiana hosiery c b d a 33 41 Jaipuri rajai d c b a 34 43 Sanganeri print c b a d 35 53 Banarasi saree d c b a 36 56 Lucknavi chikan a b c d 37 59 Bhadoi carpet d a b c 38 64 Kullu shawl b c d a
Note: Code [a-It is suited for the local consumption only, b-It is suited for the consumption in this state only, c-It is suited for the domestic consumption including other states also, d-It is suited for export to other countries]. The results are obtained using preferential ranking method. Table-11.46: Comparative analysis of opinion of traders about preferred efforts for trade of products
Priority for preference GI Type 1st 2nd 3rd 4th
I d a b c II d a b c III d b a IV d a V d a c VI d b,c a VII d a b c VIII d b a c Note: Code [a - For this product preference must be given to the domestic sale than export; b - For this product preference must be given to export than the domestic sale; c - It is neither suited for export nor domestic trade at national level; d - Equal preference for both domestic and export]. The results are obtained using preferential ranking method. Table-11.47: Product-wise explanation of opinion of traders about preferred efforts for trade of products
Priority for preference S.N P.C Product 1st 2nd 3rd 4th
I Fruits 1 3 Banganpally mango d a b 2 11 Coorg orange c 3 29 Alphonso mango d c b a 4 30 Nagpur orange c d b a 5 31 Nasik grapes d b 6 62 Malihabadi Dussheri d b a,c 7 63 Himachal apple d 8 66 Harshil apple d 9 68 Ramnagar litchi b c d II Grains & Potato 10 13 Navara rice d b c 11 17 Pokkali rice b d 12 24 Bhaliya wheat b d c 13 37 Basmati rice d c
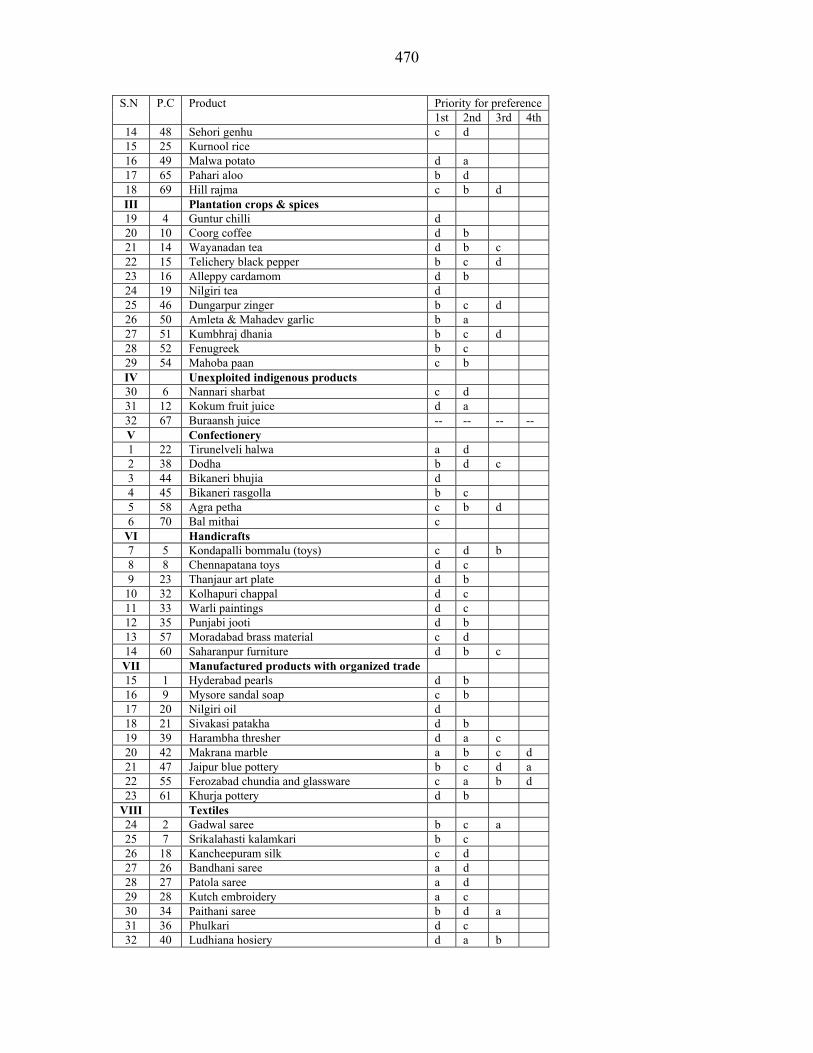
470
Priority for preference S.N P.C Product 1st 2nd 3rd 4th
14 48 Sehori genhu c d 15 25 Kurnool rice 16 49 Malwa potato d a 17 65 Pahari aloo b d 18 69 Hill rajma c b d III Plantation crops & spices 19 4 Guntur chilli d 20 10 Coorg coffee d b 21 14 Wayanadan tea d b c 22 15 Telichery black pepper b c d 23 16 Alleppy cardamom d b 24 19 Nilgiri tea d 25 46 Dungarpur zinger b c d 26 50 Amleta & Mahadev garlic b a 27 51 Kumbhraj dhania b c d 28 52 Fenugreek b c 29 54 Mahoba paan c b IV Unexploited indigenous products 30 6 Nannari sharbat c d 31 12 Kokum fruit juice d a 32 67 Buraansh juice -- -- -- -- V Confectionery 1 22 Tirunelveli halwa a d 2 38 Dodha b d c 3 44 Bikaneri bhujia d 4 45 Bikaneri rasgolla b c 5 58 Agra petha c b d 6 70 Bal mithai c
VI Handicrafts 7 5 Kondapalli bommalu (toys) c d b 8 8 Chennapatana toys d c 9 23 Thanjaur art plate d b 10 32 Kolhapuri chappal d c 11 33 Warli paintings d c 12 35 Punjabi jooti d b 13 57 Moradabad brass material c d 14 60 Saharanpur furniture d b c VII Manufactured products with organized trade 15 1 Hyderabad pearls d b 16 9 Mysore sandal soap c b 17 20 Nilgiri oil d 18 21 Sivakasi patakha d b 19 39 Harambha thresher d a c 20 42 Makrana marble a b c d 21 47 Jaipur blue pottery b c d a 22 55 Ferozabad chundia and glassware c a b d 23 61 Khurja pottery d b
VIII Textiles 24 2 Gadwal saree b c a 25 7 Srikalahasti kalamkari b c 26 18 Kancheepuram silk c d 27 26 Bandhani saree a d 28 27 Patola saree a d 29 28 Kutch embroidery a c 30 34 Paithani saree b d a 31 36 Phulkari d c 32 40 Ludhiana hosiery d a b

471
Priority for preference S.N P.C Product 1st 2nd 3rd 4th
33 41 Jaipuri rajai d a b c 34 43 Sanganeri print a c b d 35 53 Banarasi saree d c 36 56 Lucknavi chikan a c b d 37 59 Bhadoi carpet d c 38 64 Kullu shawl d b a c
Note: Code [a - For this product preference must be given to the domestic sale than export; b - For this product preference must be given to export than the domestic sale; c - It is neither suited for export nor domestic trade at national level; d - Equal preference for both domestic and export]. The results are obtained using preferential ranking method. Table-11.48: Traders’ view about maintenance of quality of agricultural products
Responses – No. (%) GI Type
Methods for quality maintenance
I II III IV All High quality production practices and inputs 20(26.67)
(27.78) 18(24.00) (33.96)
30(40.00) (35.30)
7(9.33) (35.00)
75 (32.61)
Good practices at market yard 28(40.58) (38.89)
14(20.29) (26.41)
18(26.09) (21.18)
9(13.04) (45.00)
69 (30.00)
Good practices at processing units 5(26.32) (6.94)
0(0.00) (0.00)
10(52.63) (11.76)
4(21.05) (20.00)
19 (8.26)
Proper handling in supply chain 12(52.17) (16.67)
0(0.00) (0.00)
11(47.83) (12.94)
0(0.00) (0.00)
23 (10.00)
Publicity, training and awareness 7(46.67) (9.72)
0(0.00) (0.00)
8(53.33) (9.41)
0(0.00) (0.00)
15 (6.52)
Purchasing through authorized dealers 0(0.00) (0.00)
0(0.00) (0.00)
8(100) (9.41)
0(0.00) (0.00)
8 (3.48)
Removing market malpractices 0(0.00) (0.00)
10(100) (18.87)
0(0.00) (0.00)
0(0.00) (0.00)
10 (4.35)
Developing quality standards 0(0.00) (0.00)
4(100) (7.55)
0(0.00) (0.00)
0(0.00) (0.00)
4 (1.74)
Facilitation and enforcement of quality standards 0(0.00) (0.00)
7(100) (13.21)
0(0.00) (0.00)
0(0.00) (0.00)
7 (3.04)
Total 72(31.30) 53(23.04) 85(36.96) 20(8.70) 230 Table-11.49: Traders’ view about maintenance of quality of non-agricultural products
Responses – No. (%) GI Type
Methods for quality maintenance
V VI VII VIII All High quality production practices and inputs 15(21.3)
(37.50) 19(26.76) (28.78)
16(22.54) (38.10)
21(29.58) (22.58)
71 (29.46)
Good practices at market yard 3(15) (7.50)
12(60.00) (18.18)
5(25.00) (11.90)
0(0.00) (0.00)
20 (8.30)
Good practices at processing units 0(0.00) (0.00)
0(0.00) (0.00)
0(0.00) (0.00)
28(100) (30.11)
28 (11.62)
Facilitation and enforcement of quality standards 0(0.00) (0.00)
5(14.29) (7.58)
11(31.43) (26.19)
19(54.29) (20.43)
35 (14.52)
Inspection and monitoring 6(100) (15.00)
0(0.00) (0.00)
0(0.00) (0.00)
0(0.00) (0.00)
6 (2.49)
Publicity, training and awareness 0(0.00) (0.00)
4(23.53) (6.06)
0(0.00) (0.00)
13(76.47) (13.98)
17 (7.05)
Involvement of technically efficient human resource 13(28.89) (32.50)
26(57.78) (39.40)
6(13.33) (14.29)
0(0.00) (0.00)
45 (18.67)
Motivation through incentives 0(0.00) (0.00)
0(0.00) (0.00)
0(0.00) (0.00)
12(100) (12.90)
12 (4.98)
Quality already good 3(42.86) (7.50)
0(0.00) (0.00)
4(57.14) (9.52)
0(0.00) (0.00)
7 (2.90)
Total 40(16.60) 66(27.39) 42(17.43) 93(38.59) 241
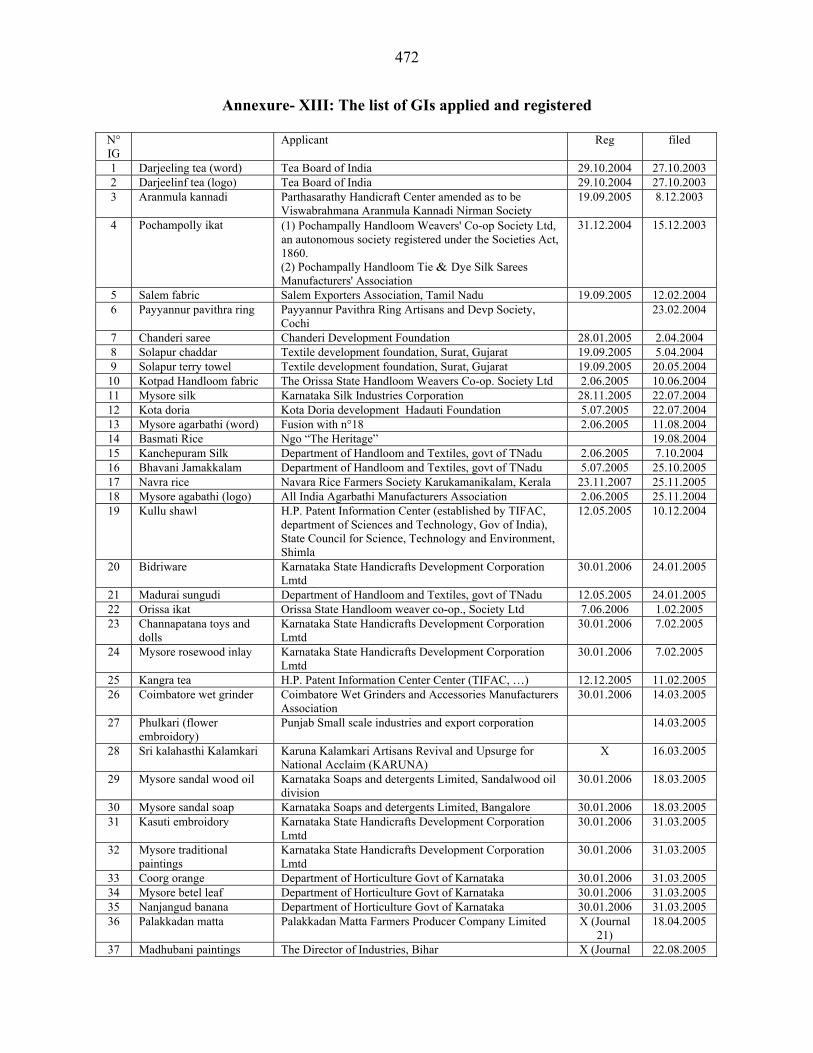
472
Annexure- XIII: The list of GIs applied and registered
N° IG
Applicant Reg filed
1 Darjeeling tea (word) Tea Board of India 29.10.2004 27.10.2003 2 Darjeelinf tea (logo) Tea Board of India 29.10.2004 27.10.2003 3 Aranmula kannadi Parthasarathy Handicraft Center amended as to be
Viswabrahmana Aranmula Kannadi Nirman Society 19.09.2005 8.12.2003
4 Pochampolly ikat (1) Pochampally Handloom Weavers' Co-op Society Ltd, an autonomous society registered under the Societies Act, 1860. (2) Pochampally Handloom Tie & Dye Silk Sarees Manufacturers' Association
31.12.2004 15.12.2003
5 Salem fabric Salem Exporters Association, Tamil Nadu 19.09.2005 12.02.2004 6 Payyannur pavithra ring Payyannur Pavithra Ring Artisans and Devp Society,
Cochi 23.02.2004
7 Chanderi saree Chanderi Development Foundation 28.01.2005 2.04.2004 8 Solapur chaddar Textile development foundation, Surat, Gujarat 19.09.2005 5.04.2004 9 Solapur terry towel Textile development foundation, Surat, Gujarat 19.09.2005 20.05.2004 10 Kotpad Handloom fabric The Orissa State Handloom Weavers Co-op. Society Ltd 2.06.2005 10.06.2004 11 Mysore silk Karnataka Silk Industries Corporation 28.11.2005 22.07.2004 12 Kota doria Kota Doria development Hadauti Foundation 5.07.2005 22.07.2004 13 Mysore agarbathi (word) Fusion with n°18 2.06.2005 11.08.2004 14 Basmati Rice Ngo “The Heritage” 19.08.2004 15 Kanchepuram Silk Department of Handloom and Textiles, govt of TNadu 2.06.2005 7.10.2004 16 Bhavani Jamakkalam Department of Handloom and Textiles, govt of TNadu 5.07.2005 25.10.2005 17 Navra rice Navara Rice Farmers Society Karukamanikalam, Kerala 23.11.2007 25.11.2005 18 Mysore agabathi (logo) All India Agarbathi Manufacturers Association 2.06.2005 25.11.2004 19 Kullu shawl H.P. Patent Information Center (established by TIFAC,
department of Sciences and Technology, Gov of India), State Council for Science, Technology and Environment, Shimla
12.05.2005 10.12.2004
20 Bidriware Karnataka State Handicrafts Development Corporation Lmtd
30.01.2006 24.01.2005
21 Madurai sungudi Department of Handloom and Textiles, govt of TNadu 12.05.2005 24.01.2005 22 Orissa ikat Orissa State Handloom weaver co-op., Society Ltd 7.06.2006 1.02.2005 23 Channapatana toys and
dolls Karnataka State Handicrafts Development Corporation Lmtd
30.01.2006 7.02.2005
24 Mysore rosewood inlay Karnataka State Handicrafts Development Corporation Lmtd
30.01.2006 7.02.2005
25 Kangra tea H.P. Patent Information Center Center (TIFAC, …) 12.12.2005 11.02.2005 26 Coimbatore wet grinder Coimbatore Wet Grinders and Accessories Manufacturers
Association 30.01.2006 14.03.2005
27 Phulkari (flower embroidory)
Punjab Small scale industries and export corporation 14.03.2005
28 Sri kalahasthi Kalamkari Karuna Kalamkari Artisans Revival and Upsurge for National Acclaim (KARUNA)
X 16.03.2005
29 Mysore sandal wood oil Karnataka Soaps and detergents Limited, Sandalwood oil division
30.01.2006 18.03.2005
30 Mysore sandal soap Karnataka Soaps and detergents Limited, Bangalore 30.01.2006 18.03.2005 31 Kasuti embroidory Karnataka State Handicrafts Development Corporation
Lmtd 30.01.2006 31.03.2005
32 Mysore traditional paintings
Karnataka State Handicrafts Development Corporation Lmtd
30.01.2006 31.03.2005
33 Coorg orange Department of Horticulture Govt of Karnataka 30.01.2006 31.03.2005 34 Mysore betel leaf Department of Horticulture Govt of Karnataka 30.01.2006 31.03.2005 35 Nanjangud banana Department of Horticulture Govt of Karnataka 30.01.2006 31.03.2005 36 Palakkadan matta Palakkadan Matta Farmers Producer Company Limited X (Journal
21) 18.04.2005
37 Madhubani paintings The Director of Industries, Bihar X (Journal 22.08.2005
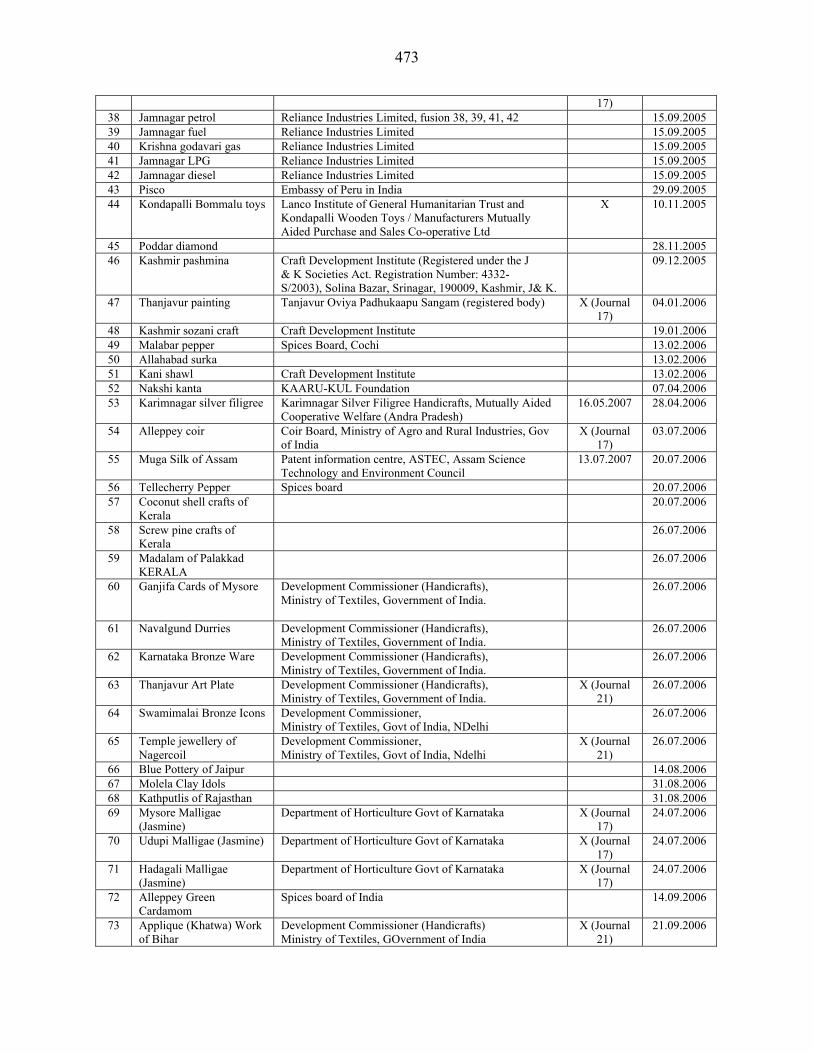
473
17) 38 Jamnagar petrol Reliance Industries Limited, fusion 38, 39, 41, 42 15.09.2005 39 Jamnagar fuel Reliance Industries Limited 15.09.2005 40 Krishna godavari gas Reliance Industries Limited 15.09.2005 41 Jamnagar LPG Reliance Industries Limited 15.09.2005 42 Jamnagar diesel Reliance Industries Limited 15.09.2005 43 Pisco Embassy of Peru in India 29.09.2005 44 Kondapalli Bommalu toys Lanco Institute of General Humanitarian Trust and
Kondapalli Wooden Toys / Manufacturers Mutually Aided Purchase and Sales Co-operative Ltd
X 10.11.2005
45 Poddar diamond 28.11.2005 46 Kashmir pashmina Craft Development Institute (Registered under the J
& K Societies Act. Registration Number: 4332- S/2003), Solina Bazar, Srinagar, 190009, Kashmir, J& K.
09.12.2005
47 Thanjavur painting Tanjavur Oviya Padhukaapu Sangam (registered body) X (Journal 17)
04.01.2006
48 Kashmir sozani craft Craft Development Institute 19.01.2006 49 Malabar pepper Spices Board, Cochi 13.02.2006 50 Allahabad surka 13.02.2006 51 Kani shawl Craft Development Institute 13.02.2006 52 Nakshi kanta KAARU-KUL Foundation 07.04.2006 53 Karimnagar silver filigree Karimnagar Silver Filigree Handicrafts, Mutually Aided
Cooperative Welfare (Andra Pradesh) 16.05.2007 28.04.2006
54 Alleppey coir Coir Board, Ministry of Agro and Rural Industries, Gov of India
X (Journal 17)
03.07.2006
55 Muga Silk of Assam Patent information centre, ASTEC, Assam Science Technology and Environment Council
13.07.2007 20.07.2006
56 Tellecherry Pepper Spices board 20.07.2006 57 Coconut shell crafts of
Kerala 20.07.2006
58 Screw pine crafts of Kerala
26.07.2006
59 Madalam of Palakkad KERALA
26.07.2006
60 Ganjifa Cards of Mysore Development Commissioner (Handicrafts), Ministry of Textiles, Government of India.
26.07.2006
61 Navalgund Durries Development Commissioner (Handicrafts), Ministry of Textiles, Government of India.
26.07.2006
62 Karnataka Bronze Ware Development Commissioner (Handicrafts), Ministry of Textiles, Government of India.
26.07.2006
63 Thanjavur Art Plate Development Commissioner (Handicrafts), Ministry of Textiles, Government of India.
X (Journal 21)
26.07.2006
64 Swamimalai Bronze Icons Development Commissioner, Ministry of Textiles, Govt of India, NDelhi
26.07.2006
65 Temple jewellery of Nagercoil
Development Commissioner, Ministry of Textiles, Govt of India, Ndelhi
X (Journal 21)
26.07.2006
66 Blue Pottery of Jaipur 14.08.2006 67 Molela Clay Idols 31.08.2006 68 Kathputlis of Rajasthan 31.08.2006 69 Mysore Malligae
(Jasmine) Department of Horticulture Govt of Karnataka X (Journal
17) 24.07.2006
70 Udupi Malligae (Jasmine) Department of Horticulture Govt of Karnataka X (Journal 17)
24.07.2006
71 Hadagali Malligae (Jasmine)
Department of Horticulture Govt of Karnataka X (Journal 17)
24.07.2006
72 Alleppey Green Cardamom
Spices board of India 14.09.2006
73 Applique (Khatwa) Work of Bihar
Development Commissioner (Handicrafts) Ministry of Textiles, GOvernment of India
X (Journal 21)
21.09.2006
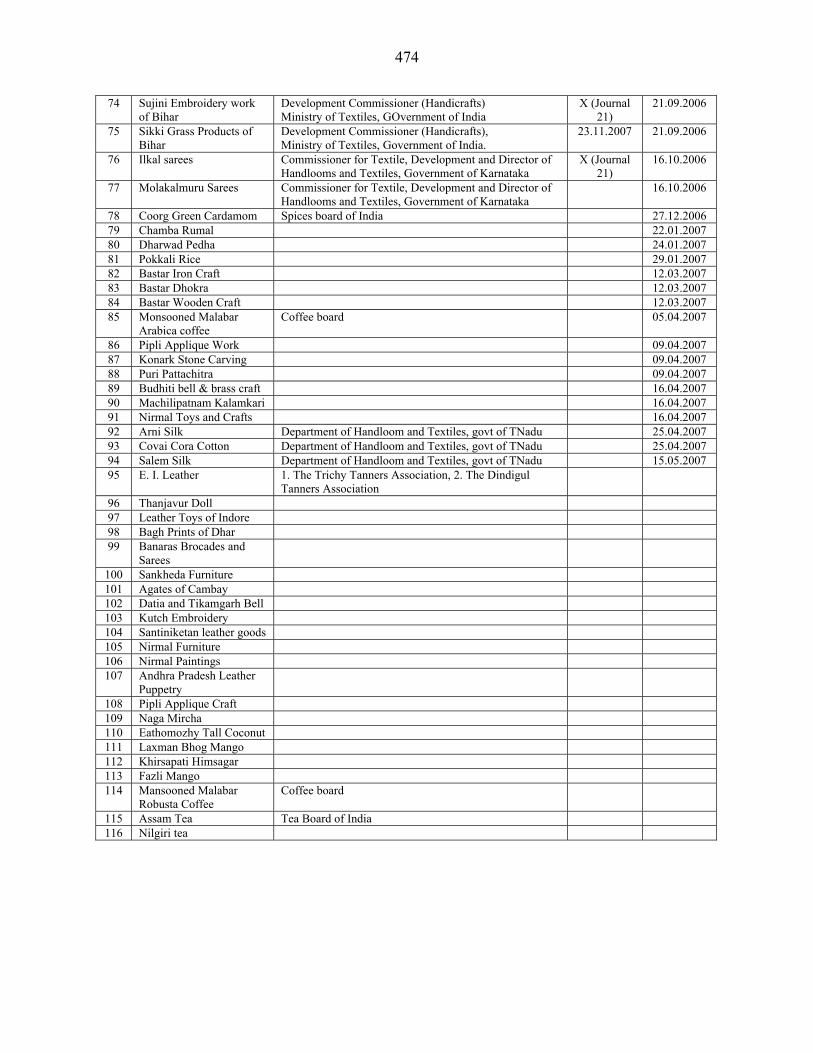
474
74 Sujini Embroidery work of Bihar
Development Commissioner (Handicrafts) Ministry of Textiles, GOvernment of India
X (Journal 21)
21.09.2006
75 Sikki Grass Products of Bihar
Development Commissioner (Handicrafts), Ministry of Textiles, Government of India.
23.11.2007 21.09.2006
76 Ilkal sarees Commissioner for Textile, Development and Director of Handlooms and Textiles, Government of Karnataka
X (Journal 21)
16.10.2006
77 Molakalmuru Sarees Commissioner for Textile, Development and Director of Handlooms and Textiles, Government of Karnataka
16.10.2006
78 Coorg Green Cardamom Spices board of India 27.12.2006 79 Chamba Rumal 22.01.2007 80 Dharwad Pedha 24.01.2007 81 Pokkali Rice 29.01.2007 82 Bastar Iron Craft 12.03.2007 83 Bastar Dhokra 12.03.2007 84 Bastar Wooden Craft 12.03.2007 85 Monsooned Malabar
Arabica coffee Coffee board 05.04.2007
86 Pipli Applique Work 09.04.2007 87 Konark Stone Carving 09.04.2007 88 Puri Pattachitra 09.04.2007 89 Budhiti bell & brass craft 16.04.2007 90 Machilipatnam Kalamkari 16.04.2007 91 Nirmal Toys and Crafts 16.04.2007 92 Arni Silk Department of Handloom and Textiles, govt of TNadu 25.04.2007 93 Covai Cora Cotton Department of Handloom and Textiles, govt of TNadu 25.04.2007 94 Salem Silk Department of Handloom and Textiles, govt of TNadu 15.05.2007 95 E. I. Leather 1. The Trichy Tanners Association, 2. The Dindigul
Tanners Association
96 Thanjavur Doll 97 Leather Toys of Indore 98 Bagh Prints of Dhar 99 Banaras Brocades and
Sarees
100 Sankheda Furniture 101 Agates of Cambay 102 Datia and Tikamgarh Bell 103 Kutch Embroidery 104 Santiniketan leather goods 105 Nirmal Furniture 106 Nirmal Paintings 107 Andhra Pradesh Leather
Puppetry
108 Pipli Applique Craft 109 Naga Mircha 110 Eathomozhy Tall Coconut 111 Laxman Bhog Mango 112 Khirsapati Himsagar 113 Fazli Mango 114 Mansooned Malabar
Robusta Coffee Coffee board
115 Assam Tea Tea Board of India 116 Nilgiri tea

475
Annexure-XIV: Action framework- Facts as per agricultural GI Types Observation GI type High lights of
opinion of producers
Highlights of opinion of institutional stakeholders
Highlights of opinion of consumers (C) / traders (T)
Marketing operations
I No particular method used II Packing through the gunny or jute bag III Packing through the gunny or jute bag IV Packing through the gunny or jute bag
Packing methods and problems (Opinion of producers)
All agricultural products
Majority of producers do not use any packing. Packing through the gunny or jute bag is most popular. Most of them do not have any problems, those who have mostly complained about deterioration of packing material. Knowledge of the newer technology meager.
I Physical traits used II Physical traits used III Physical traits used IV Physical traits used; no scientific procedures
Grading methods (Opinion of producers) All
agricultural products
Grading is done but mostly its grading is based on physical traits. Therefore, challenge is to initiate some grading, wherever it is not there and convert physical traits based grading to qualitative traits based grading.
I Sale is mostly to middle-men or wholesalers, In this category, there is a need encourage sale through cooperative society for processing agency and export.
II Mostly the sale is direct to wholesaler, middlemen, local market, and Mahajans. Mahajans have highest influence in this category. Sale through government agency and cooperative is very low, which need to be increased mainly for processing agency.
III Sale through government agency and cooperative in this category is best among all the GI types but the major mode of sale is still direct to wholesalers, middlemen and local shops. There is a need to enhance share to exporters through strengthening sale through cooperative society.
IV The sale is mostly direct to local market followed by moderate sale to middle men and processing agency and least sale is to wholesalers
Mode of sale and satisfaction level (Opinion of producers)
All agricultural products
Various modes of sales are there, mostly it is so wholesalers or local shops, comparatively less to processing agency, and very less to mahajans or experts.
I Direct, producers group, local middlemen with equal emphasis II 40% direct, 17% local middle-men III 37% direct, 18% local middle-men IV 33% direct, 27% local middle-men
Mode of purchase by traders
All agricultural products
33% direct, 20% local middle-men, 20% mandi. In agricultural products middle-men are more than in non-agricultural products
I 48% sale within area of GI claim II 87% sale within area of GI claim III 78% sale in other parts, 52% sale within area of GI claim IV 85% sale within area of GI claim
Spectrum of region-wise sale of product (Opinion of institutional stakeholders)
All agricultural products
68% sale within area of GI claim. Export 17%
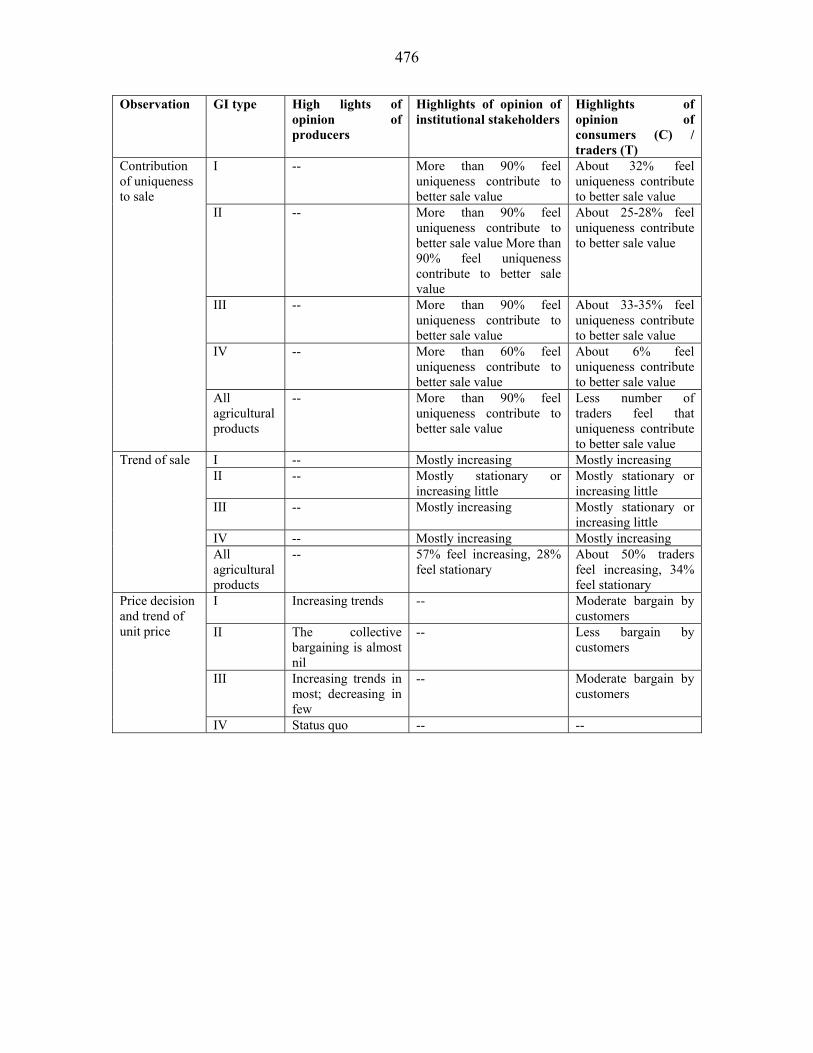
476
Observation GI type High lights of opinion of producers
Highlights of opinion of institutional stakeholders
Highlights of opinion of consumers (C) / traders (T)
I -- More than 90% feel uniqueness contribute to better sale value
About 32% feel uniqueness contribute to better sale value
II -- More than 90% feel uniqueness contribute to better sale value More than 90% feel uniqueness contribute to better sale value
About 25-28% feel uniqueness contribute to better sale value
III -- More than 90% feel uniqueness contribute to better sale value
About 33-35% feel uniqueness contribute to better sale value
IV -- More than 60% feel uniqueness contribute to better sale value
About 6% feel uniqueness contribute to better sale value
Contribution of uniqueness to sale
All agricultural products
-- More than 90% feel uniqueness contribute to better sale value
Less number of traders feel that uniqueness contribute to better sale value
I -- Mostly increasing Mostly increasing II -- Mostly stationary or
increasing little Mostly stationary or increasing little
III -- Mostly increasing Mostly stationary or increasing little
IV -- Mostly increasing Mostly increasing
Trend of sale
All agricultural products
-- 57% feel increasing, 28% feel stationary
About 50% traders feel increasing, 34% feel stationary
I Increasing trends -- Moderate bargain by customers
II The collective bargaining is almost nil
-- Less bargain by customers
III Increasing trends in most; decreasing in few
-- Moderate bargain by customers
Price decision and trend of unit price
IV Status quo -- --

477
Observation GI type High lights of opinion of producers
Highlights of opinion of institutional stakeholders
Highlights of opinion of consumers (C) / traders (T)
All agricultural products
The prices of product for sale are mostly decided either through individual bargain or purchaser offer a price to which producers had to agree and there is no other choice; The collective bargaining and process of minimum agreed price between an association and purchaser is very-very weak. The trend of unit price is almost of increasing side during 2004-06 except few products
-- Customers moderately bargain while purchasing from the trader
I Retailers increment-32% II Intermediaries-32% III Retailers-20% IV Intermediaries-24%
Price increments in supply chain (Opinion of institutional stakeholders)
All agricultural products
Producers increment-14% Wholesaler- 21% Retailer & middle-men- 23%
I Improper marketing services is a severe constraint II Improper marketing services, insecurity in market III Lack of quality inputs, high competition IV Improper marketing services is a severe constraint
Constraints in production and marketing (Opinion of producers) All
agricultural products
Hindrances from agronomic/natural factors, market insecurity leading to low profitability, labour scarcity and low marketing infrastructure. In GI type IV ‘difficulty in getting quality input’ is acute constraint; ‘no organized producers association’
Inspection, quality control & quality assurance
I Few instances of inspection
Mostly on-site advice, mandatory standards exist
--
II Inspection by producers
Mostly on-site advice or no formal method exist
--
III Inspection done by associations; more regulated
Mostly on-site advice, mandatory standards exist, scientific evidences available
--
Inspection, quality control at various stages of production
IV No or little attempts Mostly on-site advice or no formal method exist
--
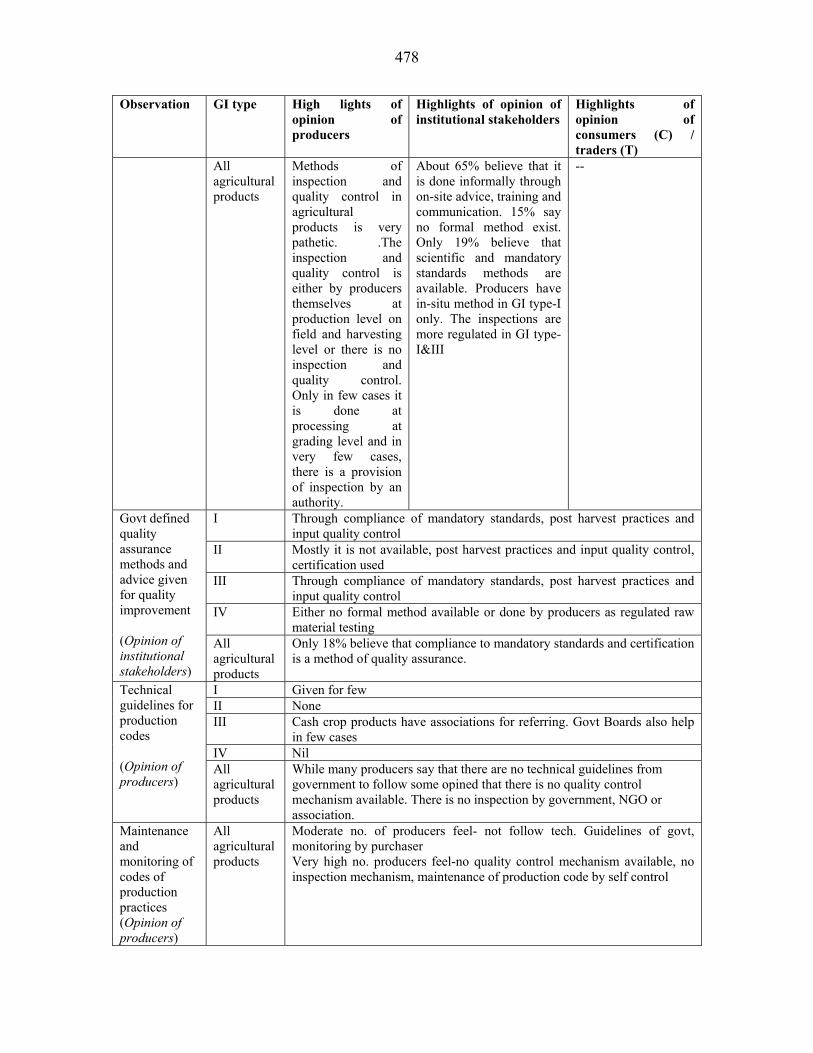
478
Observation GI type High lights of opinion of producers
Highlights of opinion of institutional stakeholders
Highlights of opinion of consumers (C) / traders (T)
All agricultural products
Methods of inspection and quality control in agricultural products is very pathetic. .The inspection and quality control is either by producers themselves at production level on field and harvesting level or there is no inspection and quality control. Only in few cases it is done at processing at grading level and in very few cases, there is a provision of inspection by an authority.
About 65% believe that it is done informally through on-site advice, training and communication. 15% say no formal method exist. Only 19% believe that scientific and mandatory standards methods are available. Producers have in-situ method in GI type-I only. The inspections are more regulated in GI type-I&III
--
I Through compliance of mandatory standards, post harvest practices and input quality control
II Mostly it is not available, post harvest practices and input quality control, certification used
III Through compliance of mandatory standards, post harvest practices and input quality control
IV Either no formal method available or done by producers as regulated raw material testing
Govt defined quality assurance methods and advice given for quality improvement (Opinion of institutional stakeholders)
All agricultural products
Only 18% believe that compliance to mandatory standards and certification is a method of quality assurance.
I Given for few II None III Cash crop products have associations for referring. Govt Boards also help
in few cases IV Nil
Technical guidelines for production codes (Opinion of producers)
All agricultural products
While many producers say that there are no technical guidelines from government to follow some opined that there is no quality control mechanism available. There is no inspection by government, NGO or association.
Maintenance and monitoring of codes of production practices (Opinion of producers)
All agricultural products
Moderate no. of producers feel- not follow tech. Guidelines of govt, monitoring by purchaser Very high no. producers feel-no quality control mechanism available, no inspection mechanism, maintenance of production code by self control

479
Observation GI type High lights of opinion of producers
Highlights of opinion of institutional stakeholders
Highlights of opinion of consumers (C) / traders (T)
I Good market yard practices and high quality production practice and inputs II High quality production practice and inputs and good market yard practices III High quality production practice and inputs and good market yard practices IV Good market yard practices and high quality production practice and inputs
Traders’ view to maintain product quality
All agricultural products
Almost equal emphasis to high quality production practice and inputs and good market yard practices
Perceived changes after registration
I Low wages, sale II Low profit III Low sale, profit, difficult to compete IV Low sale
Presumed results of non-registration (Opinion of producers) All
agricultural products
Majority agreed non registration will be disadvantageous to them
I Better price Improvement in product grading, overall socio-economic conditions
--
II More sale Improvement in product standardization, enhanced income
--
III Profits enhanced, competition from spurious material wiped
Improvement in product standardization/grading
--
IV More market opportunities
Rise in income of producers/ traders and standardization and grading of product
--
Expected changes after registration- on market
All agricultural products
Expect good market, better price and less threat from spurious material
Improved product quality standardization/ grading and enhancement in income
--
I High –10-15% or more
-- --
II Moderate- up to 15%
-- --
III Mostly up to 10% -- -- IV Moderate- up to
15% -- --
Expected changes after registration- enhanced premium as expected by producers and traders All
agricultural products
Mostly expect mostly between 5 to 15%.
-- --

480
Observation GI type High lights of opinion of producers
Highlights of opinion of institutional stakeholders
Highlights of opinion of consumers (C) / traders (T)
I About 37% feel that producers will shift from other livelihood activities. And 71% feel that there will be overall improvement in socio-economic conditions of producers, if other protection system followed
About 43% feel that producers will shift from other livelihood activities. And 95% feel that there will be overall improvement in socio-economic conditions of producers
--
II About 35% feel that producers will shift from other livelihood activities. And 76% feel that there will be overall improvement in socio-economic conditions of producers, if other protection system followed
About 50% feel that producers will shift from other livelihood activities. And 76% feel that there will be overall improvement in socio-economic conditions of producers
--
III About 46% feel that producers will shift from other livelihood activities. And 71% feel that there will be overall improvement in socio-economic conditions of producers, if other protection system followed
About 48% feel that producers will shift from other livelihood activities. And 71% feel that there will be overall improvement in socio-economic conditions of producers
--
Expected changes after registration- livelihoods & overall socio-economic conditions
IV About 35% feel that producers will shift from other livelihood activities. And 79% feel that there will be overall improvement in socio-economic conditions of producers, if other protection system followed
About 44% feel that producers will shift from other livelihood activities. And 75% feel that there will be overall improvement in socio-economic conditions of producers
--

481
Observation GI type High lights of opinion of producers
Highlights of opinion of institutional stakeholders
Highlights of opinion of consumers (C) / traders (T)
All agricultural products
About 39% feel that producers will shift from other livelihood activities. And 73% feel that there will be overall improvement in socio-economic conditions of producers, if other protection system followed
About 47% feel that producers will shift from other livelihood activities. And 80% feel that there will be overall improvement in socio-economic conditions of producers. Stakeholders are more enthusiastic than producers
--
Expected changes after registration- consumers’ expectations
All agricultural products
Product standardization, grading and increase in number of consumers is expected extremely (GI type-IV), highly (I&II) and moderately (III)
Visualized benefits at time of GI registration
All agricultural products
-- Market organization was the main motivation factor, followed by enhancing regional social and cultural benefits
--
Perceived impact on market
I Present Moderate number feel that duplicates are not in the market
T- Large number feel that duplicates are not in the market C-moderate no. feel quality assurance led to purchase
II Present Most feel that duplicates are not in the market
T- Moderate number feel that duplicates are not in the market C-less no. feel quality assurance led to purchase
III Divided on presence of duplicates
Moderate number feel that duplicates are not in the market
T- Moderate number feel that duplicates are not in the market C-moderate no. feel quality assurance led to purchase
Duplicates and similar products
IV Feel there are no duplicates
Moderate number feel that duplicates are not in the market
T-Moderate number feel that duplicates are not in the market C-very less no. feel quality assurance led to purchase

482
Observation GI type High lights of opinion of producers
Highlights of opinion of institutional stakeholders
Highlights of opinion of consumers (C) / traders (T)
All agricultural products
Mixed reaction to duplicates. While some believe that there cannot be any, some producers are aware of other products being passed as theirs
Moderate number feel that duplicates are not in the market. In GI type-I &III, there is a threat from similar products from other areas.
Moderate number of traders feel that duplicates are not in the market but other similar kind of products put competition Consumers feel- quality assurance is not the main reason of purchase
I 85% confident about originality of purchased product but less than 50% make any effort to purchase genuine product
II >90% confident about originality of purchased product and <50% make any effort to purchase genuine product
III 85% confident about originality of purchased product but 55% make any effort to purchase genuine product
IV >90% confident about originality of purchased product and 73% make any effort to purchase genuine product
Consumers’ efforts to purchase genuine product
All agricultural products
87% confident about originality of purchased product but 54% make any effort to purchase genuine product
I Produced elsewhere and passed off
Same product produced elsewhere in the country and similar duplicates in the country
Same product produced elsewhere in the country and similar duplicates in the country is the major competition
II Produced elsewhere in country
Same product produced elsewhere in the country and similar duplicates in the country
Similar duplicates in the country and same product produced elsewhere in the country is the major competition
III Imports Same product produced elsewhere in the country and competition in export market
Same product produced elsewhere in the country and competitive export from other countries is the major competition
Competition- types and sources
IV Nil Not much competition Same product produced elsewhere in the country is the major competition

483
Observation GI type High lights of opinion of producers
Highlights of opinion of institutional stakeholders
Highlights of opinion of consumers (C) / traders (T)
All agricultural products
Around 72% producers feel that main competition is domestic. Some producers feel that their products face competition. Like from being produced elsewhere in the country, or there are different products but sold with the same name with the deceptive similarity. Some others voiced on competition from similar products imported in the country.
About 62% feel that products face competition but main competition is domestic. The import and export market is in few products under GI type-I &III. Across the products, also these two groups face most competition
About 59% traders feel that products face competition but main competition is domestic. Same product produced elsewhere in the country and similar duplicates in the country is the major competition
I Producers not much aware
Not aware. But mostly feel that imported product is of inferior quality
Traders are not aware. But mostly feel that imported product is of inferior quality
II Producers not much aware
Not aware. But mostly feel that imported product is of inferior quality
Traders are not aware. But mostly feel that imported product is of inferior quality
III Producers not much aware
Not aware. But mostly feel that imported product is of inferior quality
Traders are little aware. Except few, all feel that imported product is of inferior quality
IV No import No import No import
Import of similar product and difference between imported and domestic product
All agricultural products
About 50% producers responded to difference between domestic and imported product. But mostly feel that imported product is of inferior quality
Institutional stakeholders are not aware. But mostly feel that imported product is of inferior quality
About 80% traders feel that imported products are inferior in quality
I -- Import of grapes and apple from various developed nations. Litchi from china
No information available
Import of the products
II -- No import usually No information available
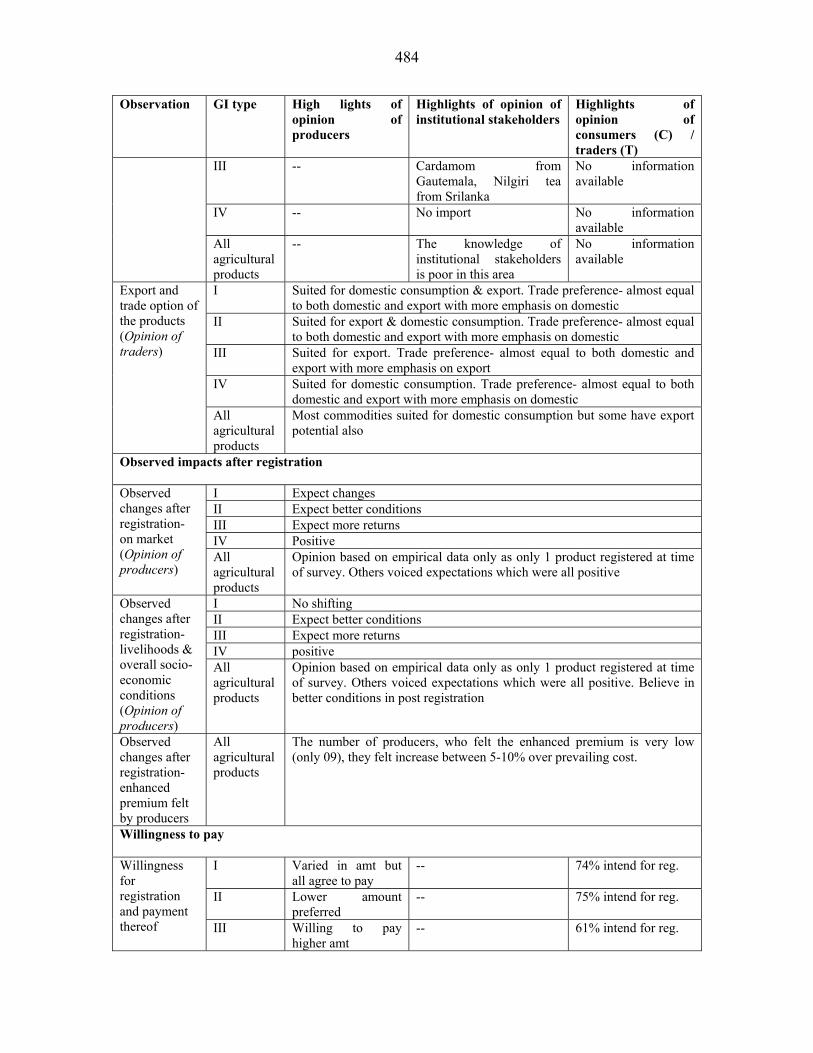
484
Observation GI type High lights of opinion of producers
Highlights of opinion of institutional stakeholders
Highlights of opinion of consumers (C) / traders (T)
III -- Cardamom from Gautemala, Nilgiri tea from Srilanka
No information available
IV -- No import No information available
All agricultural products
-- The knowledge of institutional stakeholders is poor in this area
No information available
I Suited for domestic consumption & export. Trade preference- almost equal to both domestic and export with more emphasis on domestic
II Suited for export & domestic consumption. Trade preference- almost equal to both domestic and export with more emphasis on domestic
III Suited for export. Trade preference- almost equal to both domestic and export with more emphasis on export
IV Suited for domestic consumption. Trade preference- almost equal to both domestic and export with more emphasis on domestic
Export and trade option of the products (Opinion of traders)
All agricultural products
Most commodities suited for domestic consumption but some have export potential also
Observed impacts after registration
I Expect changes II Expect better conditions III Expect more returns IV Positive
Observed changes after registration- on market (Opinion of producers)
All agricultural products
Opinion based on empirical data only as only 1 product registered at time of survey. Others voiced expectations which were all positive
I No shifting II Expect better conditions III Expect more returns IV positive
Observed changes after registration- livelihoods & overall socio-economic conditions (Opinion of producers)
All agricultural products
Opinion based on empirical data only as only 1 product registered at time of survey. Others voiced expectations which were all positive. Believe in better conditions in post registration
Observed changes after registration- enhanced premium felt by producers
All agricultural products
The number of producers, who felt the enhanced premium is very low (only 09), they felt increase between 5-10% over prevailing cost.
Willingness to pay
I Varied in amt but all agree to pay
-- 74% intend for reg.
II Lower amount preferred
-- 75% intend for reg.
Willingness for registration and payment thereof III Willing to pay
higher amt -- 61% intend for reg.

485
Observation GI type High lights of opinion of producers
Highlights of opinion of institutional stakeholders
Highlights of opinion of consumers (C) / traders (T)
IV Not willing to pay very high price
-- 71% intend for reg.
All agricultural products
Willing to pay. The funding for GI registration has come from different sources. Producers also contributed. Banks also agree to pay for it
Comparatively intention of registration is more in agricultural products probably because chances of getting genuine product are lesser in comparison to non-agricultural products. Consumers have lesser willingness for GI type-III
Money paid by producers for registration
All agricultural products
Out of 08 respondents, 7 opine of payment, but it is between Rs 250-500
-- --
I High –10-15% or more
-- About 60% consumers are ready to pay. Mostly agree for 10% premium or below. 25% ready to pay 10-15% also. About 30% traders agree for enhanced premium, mostly 10-15% more than prevailing price
II Moderate- up to 15%
-- About 60% consumers are ready to pay. Mostly agree for 10% premium or below. About 30% traders agree for enhanced premium, mostly 5-10% more than prevailing price
Willingness to pay for expected enhanced premium
III Mostly up to 10% -- About 60% consumers are ready to pay. Mostly agree for 10% premium or below. About 30% traders agree for enhanced premium, mostly <10% more than prevailing price
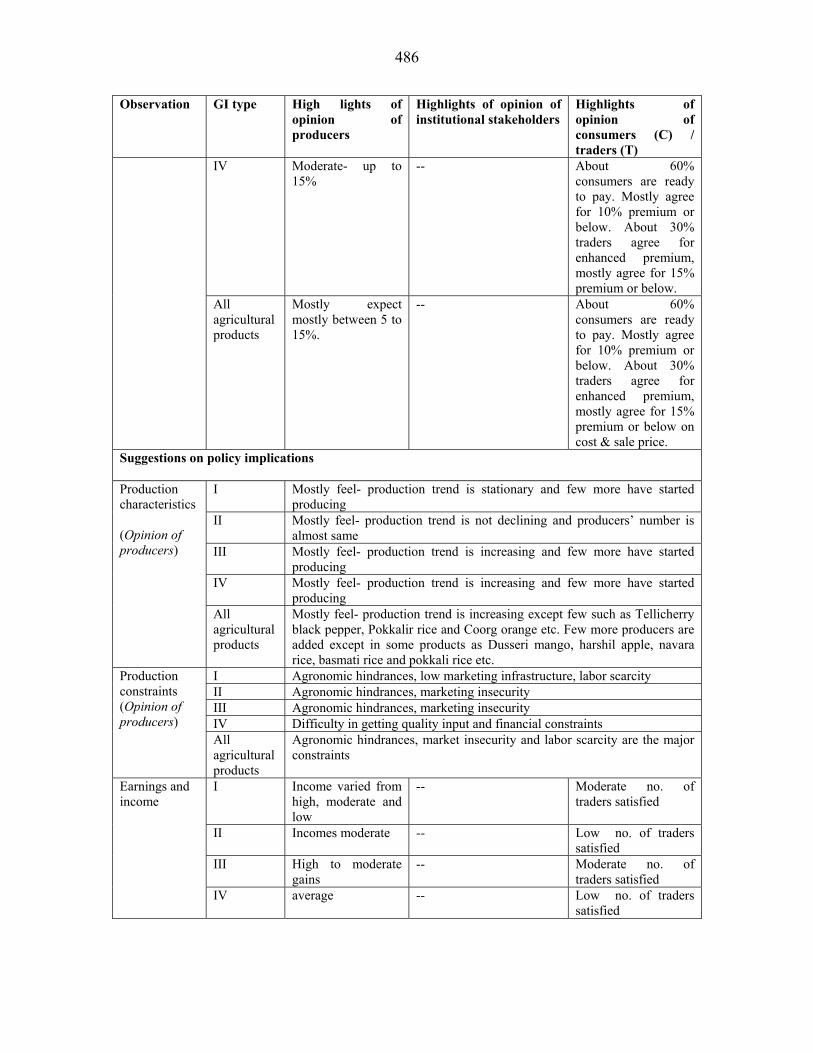
486
Observation GI type High lights of opinion of producers
Highlights of opinion of institutional stakeholders
Highlights of opinion of consumers (C) / traders (T)
IV Moderate- up to 15%
-- About 60% consumers are ready to pay. Mostly agree for 10% premium or below. About 30% traders agree for enhanced premium, mostly agree for 15% premium or below.
All agricultural products
Mostly expect mostly between 5 to 15%.
-- About 60% consumers are ready to pay. Mostly agree for 10% premium or below. About 30% traders agree for enhanced premium, mostly agree for 15% premium or below on cost & sale price.
Suggestions on policy implications
I Mostly feel- production trend is stationary and few more have started producing
II Mostly feel- production trend is not declining and producers’ number is almost same
III Mostly feel- production trend is increasing and few more have started producing
IV Mostly feel- production trend is increasing and few more have started producing
Production characteristics (Opinion of producers)
All agricultural products
Mostly feel- production trend is increasing except few such as Tellicherry black pepper, Pokkalir rice and Coorg orange etc. Few more producers are added except in some products as Dusseri mango, harshil apple, navara rice, basmati rice and pokkali rice etc.
I Agronomic hindrances, low marketing infrastructure, labor scarcity II Agronomic hindrances, marketing insecurity III Agronomic hindrances, marketing insecurity IV Difficulty in getting quality input and financial constraints
Production constraints (Opinion of producers)
All agricultural products
Agronomic hindrances, market insecurity and labor scarcity are the major constraints
I Income varied from high, moderate and low
-- Moderate no. of traders satisfied
II Incomes moderate -- Low no. of traders satisfied
III High to moderate gains
-- Moderate no. of traders satisfied
Earnings and income
IV average -- Low no. of traders satisfied
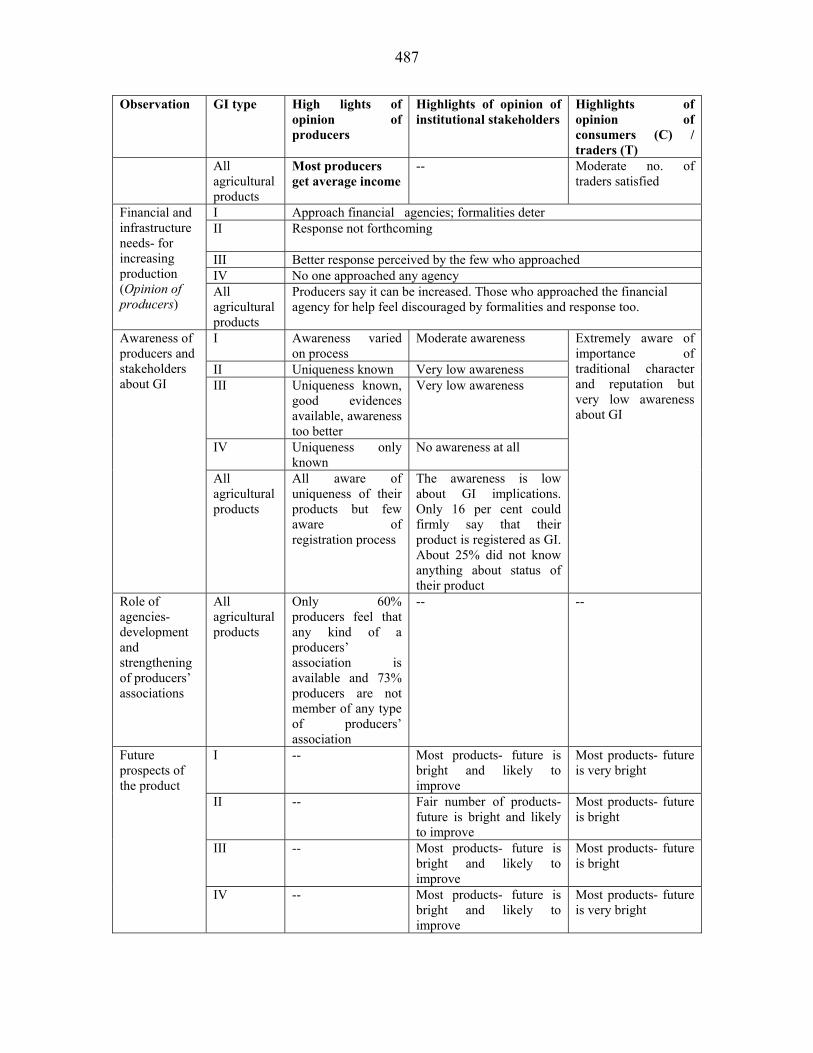
487
Observation GI type High lights of opinion of producers
Highlights of opinion of institutional stakeholders
Highlights of opinion of consumers (C) / traders (T)
All agricultural products
Most producers get average income
-- Moderate no. of traders satisfied
I Approach financial agencies; formalities deter II Response not forthcoming
III Better response perceived by the few who approached IV No one approached any agency
Financial and infrastructure needs- for increasing production (Opinion of producers)
All agricultural products
Producers say it can be increased. Those who approached the financial agency for help feel discouraged by formalities and response too.
I Awareness varied on process
Moderate awareness
II Uniqueness known Very low awareness III Uniqueness known,
good evidences available, awareness too better
Very low awareness
IV Uniqueness only known
No awareness at all
Awareness of producers and stakeholders about GI
All agricultural products
All aware of uniqueness of their products but few aware of registration process
The awareness is low about GI implications. Only 16 per cent could firmly say that their product is registered as GI. About 25% did not know anything about status of their product
Extremely aware of importance of traditional character and reputation but very low awareness about GI
Role of agencies- development and strengthening of producers’ associations
All agricultural products
Only 60% producers feel that any kind of a producers’ association is available and 73% producers are not member of any type of producers’ association
-- --
I -- Most products- future is bright and likely to improve
Most products- future is very bright
II -- Fair number of products- future is bright and likely to improve
Most products- future is bright
III -- Most products- future is bright and likely to improve
Most products- future is bright
Future prospects of the product
IV -- Most products- future is bright and likely to improve
Most products- future is very bright

488
Observation GI type High lights of opinion of producers
Highlights of opinion of institutional stakeholders
Highlights of opinion of consumers (C) / traders (T)
All agricultural products
-- Moderately products have bright future and which is likely to improve
Moderately products have bright future and which is likely to improve
I -- Production level improvements, post-harvest level improvements
Production level improvements. Publicity of product
II -- Production level improvements. Govt. policy support
Production level improvements. TQM
III -- Production level improvements, quality standardization
TQM, product publicity
IV -- Production level improvements. Govt. policy support
Equal emphasis on production level improvements, govt. policy support, publicity of product
Constructive measures to make production viable and improve future prospects
All agricultural products
-- Improvement in production and post harvest, government policy support alongwith standardization would bring change
Most traders feel that production level improvements and TQM (standardization, maintenance and assurance of quality) required
I -- Highly not satisfactory Highly not satisfactory
II -- Moderately satisfactory Moderately satisfactory
III -- Moderately not satisfactory
Moderately satisfactory
IV -- Highly satisfactory Moderately satisfactory
Status of marketing and suggestions for improvement
All agricultural products
-- More than half of respondents are not satisfied with the present mode. The GI type IV are with low income but satisfied with mode because no middle-men in the supply chain. Suggestion to improve include organized market and marketing institutional support from government
Approximately half of the traders are not satisfied with the present mode. Organized and regulated markets with TQM are highly required.
I C-Easy availability and wide publicity T- Quality standardization, easy availability
Suggestions for improvement to increase
II C-Quality standardization and innovative changes keeping traditional basis T- Easy availability and wide publicity

489
Observation GI type High lights of opinion of producers
Highlights of opinion of institutional stakeholders
Highlights of opinion of consumers (C) / traders (T)
III C-Quality standardization and reasonable price T- Quality standardization and reasonable price
IV C- Wide publicity and easy availability T- Quality standardization, wide publicity with innovative changes
sale (Opinion of Consumers-C, traders-T)
All agricultural products
C-Quality standardization, wide publicity, easy availability in reasonable price T- Quality standardization & wide publicity required most
Scientific endeavors in product development
All agricultural products
Opinion of institutional stakeholders - Scientific experimentations are required to establish uniqueness. Very less has been done for technical intervention to reduce or stop infringement and also to take initiatives for GI facilitation.
Endeavors by depts. and agencies responsible or concerned with GI registration
All agricultural products
Opinion of institutional stakeholders - The concerned departments and agencies have not normally taken the responsibility in a proactive manner. The process was mostly individual’s efforts, the institutionalized system has not been developed.
Endeavors by financial institutions
All agricultural products
Opinion of institutional stakeholders- Biggest reason for not financing is lack of a designated scheme and also absence of institutional efforts from producers’ and link organizations. Banks clearly for TQM probably that will lead to good recovery. In almost all products institutionalized system has not been evolved that lead to fair availability of credit and finance

490
Annexure-XIV: Action framework- Facts as per non-agricultural GI Types
Observation GI type High lights of opinion of producers
Highlights of opinion of institutional stakeholders
Highlights of opinion of consumers (C)/ traders (T)
Marketing operations
V Most products made daily and not stored for long; even if stored these are not for too long and in simple cartons with no special methods; products have short shelf- life
VI Storage in most is not a problem as they are made on order; in other cases products are stored in card boxes; producers in general do not face much problem. Problems of space or wet weather faced in some cases
VII No special requirements for storing ; space a constraint in some VIII Most products in this category stored in simple paper containers or wrapped in
papers; problems of ensuring moisture and dust free conditions
Storage methods and problems (Opinion of producers)
All non-agricultural products
Storage for most products are simple methods. Most of producers were not aware of major problems. This is because the production in most products is demand driven. However, some of producers voiced space as a problem with lack of accessible space or facilities leading to deterioration of packing material.
V No particular method for packaging; products packed usually for short term. Only one product, Bikeneri bhujjia, rasagula is packed for international market conforming to requirements for exporting.
VI Conventional methods most popular. Few products like thanjavur plate are packed in glass containers
VII Most producers had standard packaging devices and used them for their products VIII Most producers pack their products to ensure the longevity of their produce in terms
of keeping quality of colors and designs. Recent attempts to reach urban markets have necessitated the producers to invest in more attractive packaging material enhancing their input costs
Packing methods and problems (Opinion of producers)
All non-agricultural products
Most producers opined that they face no problems. This is to be viewed keeping the fact that producers are not aware of latest trends in packaging technology as the products cater to local market. If the products are to reach international markets, the producers need to become aware of more modern trends in packing technology and the increase in costs for those
V Not much of grading done VI Grading done on physical or qualitative traits VII Grading done on quality traits VIII Grading done on quality traits
Grading methods (Opinion of producers)
All non-agricultural products
Knowledge and awareness on importance of qualitative traits was high despite the fact that most of products are traditional and of small scale nature. Grading of products if done is mostly on qualitative traits. Grading in rest of the cases is done based on other parameters like physical traits. But the area of concern is on those products where no grading is done Therefore, challenge is to initiate some grading mode which would help bring more professional level to the products and also maintain the traditional attributes
V Sale is mostly to local markets or wholesalers with 12 percent also selling to mahajan. The other avenues like exporters, govt, processing agencies are very negligible. Encouraging sale through cooperative society or processing agency might help build more market and induce strict quality parameters
Mode of sale and satisfaction level (Opinion of producers) VI Mostly the sale is direct to wholesalers, middlemen, local market, and exporters in
this category. Sale through government agency and cooperative is very low, which needs attention considering the type of products like handicrafts in this group.

491
Observation GI type High lights of opinion of producers
Highlights of opinion of institutional stakeholders
Highlights of opinion of consumers (C)/ traders (T)
VII Sale through local market, wholesalers, middlemen, exporters is most prevalent in this category. There is a need to enhance share to exporters through strengthening sale through cooperative society
VIII Producers aware of need of strategy for sale. With demand in market, need to explore profitable routes of sale.
All non-agricultural products
Various modes of sales being adopted. Direct sale to local shops most preferred. Wholesalers are other source for sales. Govt agencies or cooperative societies need to more visible as buying centers.
V Mostly producers group, other sources with equal emphasis VI Either direct or producers group with equal emphasis VII Mostly direct but also middle-men and producers group with equal emphasis VIII Mostly direct followed by producers group
Mode of purchase by traders
All non-agricultural products
Mostly direct followed by producers group and middle-men. In non-agricultural products direct purchase is more than in agricultural products.
V 80% sale within area of GI claim VI 53% sale within area of GI claim, 44% in other parts VII 58% sale within area of GI claim, 36% in other parts VIII 72% sale within area of GI claim
Spectrum of region-wise sale of product (Opinion of institutional stakeholders)
All non-agricultural products
66% sale within area of GI claim, 20% exports
V -- More than 85% feel uniqueness contribute to better sale value
About 16% feel uniqueness contribute to better sale value
VI -- More than 85% feel uniqueness contribute to better sale value
About 21% feel uniqueness contribute to better sale value
VII -- More than 85% feel uniqueness contribute to better sale value
About 24% feel uniqueness contribute to better sale value
VIII -- More than 90% feel uniqueness contribute to better sale value
About 38% feel uniqueness contribute to better sale value
Contribution of uniqueness to sale
All non-agricultural products
-- More than 86% feel uniqueness contribute to better sale value
Less number of traders (even lesser than in agricultural products) feel that uniqueness contribute to better sale value
V -- Mostly increasing Mostly increasing VI -- Mostly increasing Mostly increasing VII -- Mostly increasing Mostly stationary or
increasing little VIII -- Moderately increasing Mostly stationary or
increasing little
Trend of sale
All non-agricultural products
-- 62% increasing, 20% declining
About 53% traders feel increasing, 36% feel stationary
V No collective bargaining -- Very less bargain by customers
Price decision and trend of unit price VI Most producers sell
individually -- Moderate bargain by
customers

492
Observation GI type High lights of opinion of producers
Highlights of opinion of institutional stakeholders
Highlights of opinion of consumers (C)/ traders (T)
VII More organized in comparison to other groups.
-- Less bargain by customers
VIII Most producers sell individually and take price offered.
-- Very high bargain by customers
All non-agricultural products
The prices of product for sale are mostly decided either through individual bargain or purchasers offer a price to which producers had to agree. The trend of unit price is almost of increasing side during 2004-06 except few products like paithani saree, kutch embroidery, Srikalahasti saree, etc.
-- Customers moderately bargain while purchasing from the trader. Except textiles, the bargaining is lesser in non-agricultural products in comparison to agricultural products
V Producers increment-32% VI Retailers-25% VII Producer-16% VIII Retailer-28%
Price increments in supply chain (Opinion of institutional stakeholders)
All non-agricultural products
Producers increment-16%; Wholesaler- 15%; Retailer-19%; Middle-men- 17%
V Difficulty in quality inputs, competition VI High competition VII High competition VIII improper transportation is acute constraint
Constraints in production and marketing (Opinion of producers) All non-
agricultural products
The most important constraints are hindrances from high competition, finance, difficulty in getting inputs, scarcity of skilled workers, insecure markets, lack of govt policy, agronomic/natural factors, market insecurity leading to low profitability, labour scarcity and low marketing infrastructure.
Inspection, quality control & quality assurance
V Inspection by producers in informal manner; only in two products, strict code developed and being adhered through professional standards
Informally on-site advice, no formal method exist
--
VI Inspection informal in most cases
Informally on-site advice, communication, no formal method exist
--
VII Quality assurance methods being now adopted
Formal methods, scientific evidences and mandatory standards available
--
Inspection, quality control at various stages of production
VIII Inspection done in semi-formal manner
Informally done by mostly producers
--

493
Observation GI type High lights of opinion of producers
Highlights of opinion of institutional stakeholders
Highlights of opinion of consumers (C)/ traders (T)
All non-agricultural products
There are methods of inspection and quality control in non-agricultural products but needs to be more professional to help better quality production. Inspection by qualified personnel rare and difficult to be undertaken due to lack of trained personnel
About 23 % that it is done informally through on-site advice, training and communication. 19% say no formal methods are available. Through semi-formal method the inspections are done by the producers.
--
V Either no formal method or done by producers at raw material acquisition VI Either no formal method or done by producers at raw material acquisition VII Regulation of production practices & inputs, or compliance to standards VIII Either no formal method or done by producers at raw material acquisition
Govt defined quality assurance methods and advice given for quality improvement (Opinion of institutional stakeholders)
All non-agricultural products
Producers’ regulated raw material testing is major method of quality assurance
V The producers do not have any formalized practices. Rather most have their code developed through years of practice or by tradition. There are no maintenance and monitoring systems.
VI Phulkari products have specific code developed by efforts of producers themselves. VII The producers do not have any formalized practices. Rather most have their code
developed through years of practice or by tradition. There are no maintenance and monitoring systems.
VIII The producers do not have any formalized practices. Rather most have their code developed through years of practice or by tradition. There are no maintenance and monitoring systems.
Technical guidelines for production codes (Opinion of producers)
All non-agricultural products
The producers do not have any formalized practices. Rather most have their code developed through years of practice or by tradition. There are no maintenance and monitoring systems.
Maintenance and monitoring of codes of production practices
All non-agricultural products
Moderate no. of producers feel- not follow tech. Guidelines of govt, monitoring by purchaser High no. producers feel-no quality control mechanism available, no inspection mechanism, Very high no. producers feel -maintenance of production code by self control
V High quality production practice and inputs and involvement of technically efficient human resources
VI Involvement of technically efficient human resources and High quality production practice and inputs
VII High quality production practice and inputs and facilitation & enforcement of quality standards
VIII Good practices at processing units and high quality production practice and inputs, and also facilitation & enforcement of quality standards
Traders’ view to maintain product quality
All non-agricultural products
Special emphasis on high quality production practice and inputs. Fairly well importance to the involvement of technically efficient human resources

494
Observation GI type High lights of opinion of producers
Highlights of opinion of institutional stakeholders
Highlights of opinion of consumers (C)/ traders (T)
Perceived changes after registration
V Most producers feel that non registration can lead to sale of spurious products under same name or to losses
VI Most producers feel that non registration can lead to sale of spurious products under same name or to losses
VII Most producers feel that non registration can lead to sale of spurious products under same name or to losses
VIII Most producers feel that non registration can lead to sale of spurious products under same name or to losses
Presumed results of non-registration (Opinion of producers)
All non-agricultural products
Most producers feel that non registration can lead to sale of spurious products under same name or to losses
V Producers believe that there would be significant increase in sale, or unit price, expansion in markets and less competition
Improvement in product standardization, grading and producers’ income
--
VI Producers believe that there would be significant increase in sale, or unit price, expansion in markets and less competition
Overall socio-economic improvement of producers, increase in number of producers and production
--
VII Producers believe that there would be significant increase in sale, or unit price, expansion in markets and less competition
Improvement in product standardization, grading
--
VIII Producers believe that there would be significant increase in sale, or unit price, expansion in markets and less competition
Improvement in product standardization, grading and producers’ and traders’ income
--
Expected changes after registration- on market
All non-agricultural products
Most producers believe that there would be significant increase in sale, or unit price, expansion in markets and less competition.
Improvement in product standardization, grading and producers’ and traders’ income
--
V <15% -- -- VI <10% -- -- VII Mostly <10% -- -- VIII Mostly 10-15% -- --
Expected changes after registration- enhanced premium as expected by producers and traders
All non-agricultural products
Mostly <10% -- --
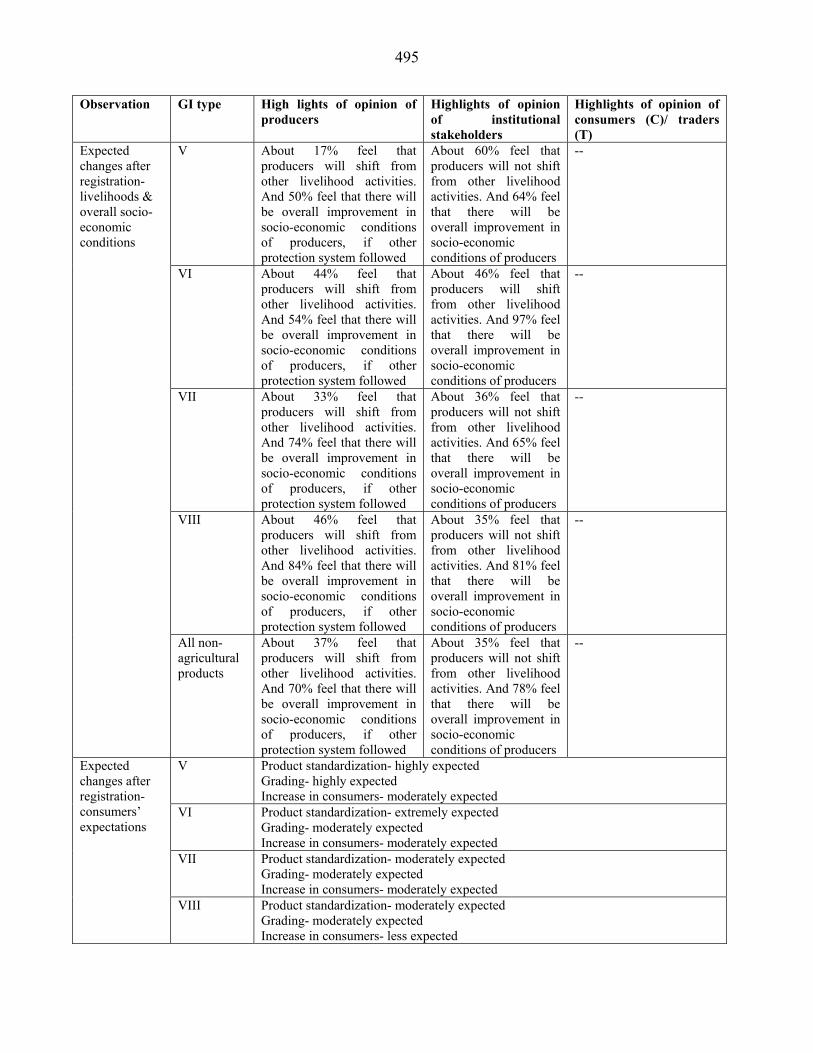
495
Observation GI type High lights of opinion of producers
Highlights of opinion of institutional stakeholders
Highlights of opinion of consumers (C)/ traders (T)
V About 17% feel that producers will shift from other livelihood activities. And 50% feel that there will be overall improvement in socio-economic conditions of producers, if other protection system followed
About 60% feel that producers will not shift from other livelihood activities. And 64% feel that there will be overall improvement in socio-economic conditions of producers
--
VI About 44% feel that producers will shift from other livelihood activities. And 54% feel that there will be overall improvement in socio-economic conditions of producers, if other protection system followed
About 46% feel that producers will shift from other livelihood activities. And 97% feel that there will be overall improvement in socio-economic conditions of producers
--
VII About 33% feel that producers will shift from other livelihood activities. And 74% feel that there will be overall improvement in socio-economic conditions of producers, if other protection system followed
About 36% feel that producers will not shift from other livelihood activities. And 65% feel that there will be overall improvement in socio-economic conditions of producers
--
VIII About 46% feel that producers will shift from other livelihood activities. And 84% feel that there will be overall improvement in socio-economic conditions of producers, if other protection system followed
About 35% feel that producers will not shift from other livelihood activities. And 81% feel that there will be overall improvement in socio-economic conditions of producers
--
Expected changes after registration- livelihoods & overall socio-economic conditions
All non-agricultural products
About 37% feel that producers will shift from other livelihood activities. And 70% feel that there will be overall improvement in socio-economic conditions of producers, if other protection system followed
About 35% feel that producers will not shift from other livelihood activities. And 78% feel that there will be overall improvement in socio-economic conditions of producers
--
V Product standardization- highly expected Grading- highly expected Increase in consumers- moderately expected
VI Product standardization- extremely expected Grading- moderately expected Increase in consumers- moderately expected
VII Product standardization- moderately expected Grading- moderately expected Increase in consumers- moderately expected
Expected changes after registration- consumers’ expectations
VIII Product standardization- moderately expected Grading- moderately expected Increase in consumers- less expected
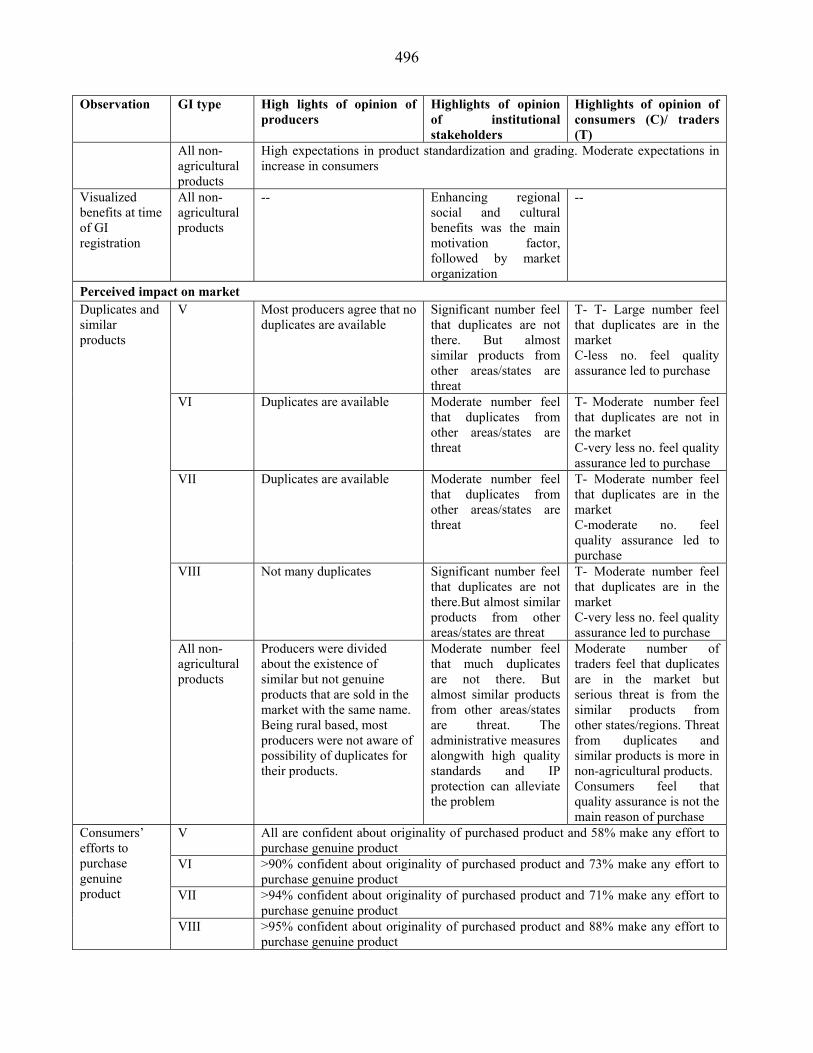
496
Observation GI type High lights of opinion of producers
Highlights of opinion of institutional stakeholders
Highlights of opinion of consumers (C)/ traders (T)
All non-agricultural products
High expectations in product standardization and grading. Moderate expectations in increase in consumers
Visualized benefits at time of GI registration
All non-agricultural products
-- Enhancing regional social and cultural benefits was the main motivation factor, followed by market organization
--
Perceived impact on market V Most producers agree that no
duplicates are available Significant number feel that duplicates are not there. But almost similar products from other areas/states are threat
T- T- Large number feel that duplicates are in the market C-less no. feel quality assurance led to purchase
VI Duplicates are available Moderate number feel that duplicates from other areas/states are threat
T- Moderate number feel that duplicates are not in the market C-very less no. feel quality assurance led to purchase
VII Duplicates are available Moderate number feel that duplicates from other areas/states are threat
T- Moderate number feel that duplicates are in the market C-moderate no. feel quality assurance led to purchase
VIII Not many duplicates Significant number feel that duplicates are not there.But almost similar products from other areas/states are threat
T- Moderate number feel that duplicates are in the market C-very less no. feel quality assurance led to purchase
Duplicates and similar products
All non-agricultural products
Producers were divided about the existence of similar but not genuine products that are sold in the market with the same name. Being rural based, most producers were not aware of possibility of duplicates for their products.
Moderate number feel that much duplicates are not there. But almost similar products from other areas/states are threat. The administrative measures alongwith high quality standards and IP protection can alleviate the problem
Moderate number of traders feel that duplicates are in the market but serious threat is from the similar products from other states/regions. Threat from duplicates and similar products is more in non-agricultural products. Consumers feel that quality assurance is not the main reason of purchase
V All are confident about originality of purchased product and 58% make any effort to purchase genuine product
VI >90% confident about originality of purchased product and 73% make any effort to purchase genuine product
VII >94% confident about originality of purchased product and 71% make any effort to purchase genuine product
Consumers’ efforts to purchase genuine product
VIII >95% confident about originality of purchased product and 88% make any effort to purchase genuine product

497
Observation GI type High lights of opinion of producers
Highlights of opinion of institutional stakeholders
Highlights of opinion of consumers (C)/ traders (T)
All non-agricultural products
Around 96% are confident about originality of purchased product and 77% make any effort to purchase genuine product. In comparison to agricultural products more consumers are confident about the originality of product and also more consumers make any special effort to purchase genuine
V Little aware of competition faced by them in international or domestic markets.
Similar duplicates in the country and same product produced elsewhere in the country
Same product produced elsewhere in the country and similar duplicates in the country is the major competition
VI Aware of competition faced by them in international or domestic markets.
Similar duplicates in the country and same product produced elsewhere in the country along-with imported products
Similar duplicates in the country and similar products imported is the major competition
VII Little aware of competition faced by them in international or domestic markets.
Same product produced elsewhere in the country and similar duplicates in the country
Similar duplicates in the country and same product produced elsewhere in the country is the major competition
VIII Aware of competition faced by them in international or domestic markets.
Same product produced elsewhere in the country and similar duplicates in the country
Same product produced elsewhere in the country and similar duplicates in the country is the major competition
Competition- types and sources
All non-agricultural products
Very few producers are aware of competition faced by them in international or domestic markets. Some voiced concern on spurious material being sold as their product or entry of imported products
About 82% feel that products face competition but main competition is domestic. The imported product main competition in GI type VII, VI & VIII. Export market is competition for GI Type- VII, VI and also VIII for some extant. Competition in non-agricultural products is more than agricultural
About 76% feel that products face competition but main competition is domestic. Same product produced elsewhere in the country and similar duplicates in the country is the major competition Competition in non-agricultural products is more than agricultural
V Threat perceived from competition from similar products imported in the country is fairly low
Mostly feel no import No import Import of similar product and difference between imported and domestic product
VI Threat perceived from competition from similar products imported in the country is fairly high
Imported product differ in quality and cheaper
Traders are little aware. But mostly feel that imported product is of different quality but indigenous product’s traditional nature is highly valued

498
Observation GI type High lights of opinion of producers
Highlights of opinion of institutional stakeholders
Highlights of opinion of consumers (C)/ traders (T)
VII Threat perceived from competition from similar products imported in the country is fairly high
Imported product differ in quality and cheaper
Traders are little aware. But mostly feel that imported product is of different quality
VIII Threat perceived from competition from similar products imported in the country is fairly high
Imported product differ in quality and cheaper
Traders are little aware. But mostly feel that imported product is of different quality and cheaper also
All non-agricultural products
The threat perceived from competition from similar products imported in the country is fairly high. Most producers’ (33%) believe that imported products are of inferior quality, the other reasons including less price of imports and their quality are of less significance.
About 20% feel no import. Some feel that processing of imported is different. Imported product differ in quality and cheaper
Traders are little aware. But mostly feel that imported product is of different quality and cheaper also
V -- No import No information available VI -- Toys from China,
furniture from Italy, Indonesia, Turkey, Malaysia
No information available
VII -- Soap, manufacturing oil and clay pottery from China. Glass ware from Japan. Pottery from Indonesia and Bangladesh
No information available
VIII -- Clothing from China No information available
Import of the products
All non-agricultural products
-- The import from various countries is a real threat
No information available
V Suited for local consumption, few products for export also. Trade preference- almost equal to both domestic and export with more emphasis on domestic
VI Suited for export & domestic consumption. Trade preference- almost equal to both domestic and export with more emphasis on export
VII Suited for domestic consumption. Trade preference- almost equal to both domestic and export with more emphasis on domestic
VIII Suited for domestic consumption & Export. Trade preference - almost equal to both domestic and export with more emphasis on export
Export and trade option of the products (Opinion of traders)
All non-agricultural products
Most commodities suited for domestic consumption but some have export potential also
Observed impacts after registration
V Change has been observed by several producers with increase in production in post GI registration
Observed changes after registration- on market
VI Change has been observed by several producers with increase in production in post GI registration

499
Observation GI type High lights of opinion of producers
Highlights of opinion of institutional stakeholders
Highlights of opinion of consumers (C)/ traders (T)
VII Change has been observed by several producers with increase in production in post GI registration
VIII Change has been observed by several producers with increase in production in post GI registration
(Opinion of producers)
All non-agricultural products
Post registration change has been observed by several producers with increase in production in post GI registration. Most producers also felt respondents that there will be increase in price and profit after GI registration
V Registration had brought important or would ring change in socio-economic conditions of producers
VI Registration had brought important or would ring change in socio-economic conditions of producers
VII Registration had brought important or would ring change in socio-economic conditions of producers
VIII Registration had brought important or would ring change in socio-economic conditions of producers
Observed changes after registration- livelihoods & overall socio-economic conditions (Opinion of producers) All non-
agricultural products
About 50% of producers said that they have shifted from other livelihood activities to production of RGI. Almost all believe that registration had brought important or would ring change in socio-economic conditions of producers
V Enhanced premium to the product. VI Enhanced premium to the product. VII Not much enhanced premium to the product. VIII Enhanced premium to the product.
Observed changes after registration- enhanced premium felt by producers (Opinion of producers)
All non-agricultural products
There was a mixed reaction to enhanced premium to the product. While 50% felt it enhanced, others felt it did not as of now
V Prefer to pay upto Rs 500 as fees for registration VI Prefer to pay upto Rs 500 as fees for registration VII Prefer to pay even Rs 1000 but not more VIII Prefer to pay upto Rs 500 as fees for registration
Other observed changes (Opinion of producers)
All non-agricultural products
Prefer to pay; varied amount but mostly Rs 500/-
Willingness to pay
V Producers intended for registration. Very
-- 40% intend for reg.
VI Producers intended for registration. Very
-- 67% intend for reg.
VII Producers intended for registration. Very
-- 45% intend for reg.
VIII Producers intended for registration. Very
-- 61% intend for reg.
Willingness for registration and payment thereof
All non-agricultural products
Large number of producers intended for registration. Very small fraction was unwilling for registration). Most producers willing to pay for registration though high fees were not favored.
The funding for GI registration has come from different sources. Producers also contributed. Banks also agree to pay for it
Consumers’ intention for registration is more in handicraft and textile

500
Observation GI type High lights of opinion of producers
Highlights of opinion of institutional stakeholders
Highlights of opinion of consumers (C)/ traders (T)
Money paid by producers for registration
All non-agricultural products
Out of 09 respondents, 5 opine of payment, but it is between Rs 250-500
-- --
V <15% -- About 60% consumers are ready to pay. Mostly agree for 10% premium or below. About 20% traders agree for enhanced premium, mostly agree for 10% premium
VI <10% -- About 71% consumers are ready to pay. Mostly agree for 05% premium or below. About 23% traders agree for enhanced premium, mostly agree for 10% premium
VII Mostly <10% -- About 75% consumers are ready to pay. Mostly agree for 05% premium or below. About 22% traders agree for enhanced premium, mostly agree for 10% premium
VIII Mostly 10-15% -- About 88% consumers are ready to pay. Mostly agree for 10% premium or below. About 35% traders agree for enhanced premium, mostly agree for 10% premium
Willingness to pay for expected enhanced premium
All non-agricultural products
Mostly <10% -- About 77% consumers are ready to pay. Mostly agree for 10% premium or below preferably below 5%. Comparative to agric. products, more consumers are willing to pay but lesser premium amount. About 80% traders agree for enhanced premium, mostly agree for 15% or less premium on cost and sale price.
Suggestions on policy implications
V Increasing trends showing above 50%. VI Increasing trends showing above 60%. VII Increasing trends showing above 60%.
Production characteristics (Opinion of producers) VIII Increasing trends showing above 60%.
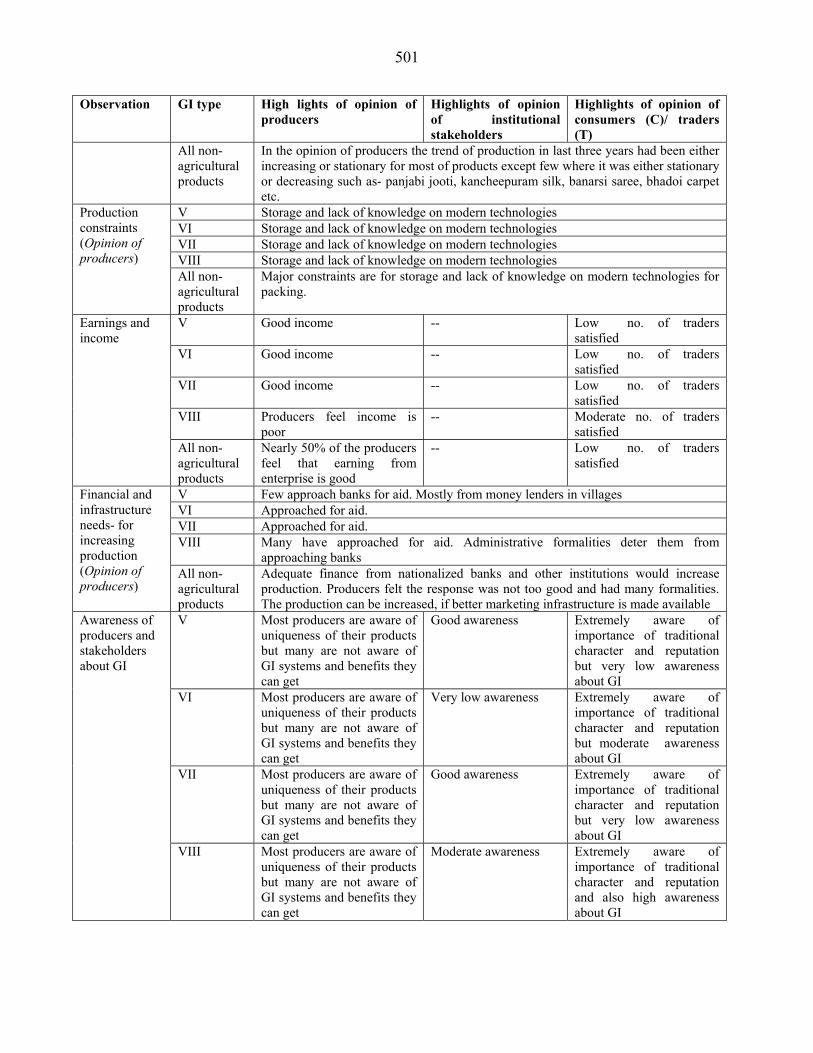
501
Observation GI type High lights of opinion of producers
Highlights of opinion of institutional stakeholders
Highlights of opinion of consumers (C)/ traders (T)
All non-agricultural products
In the opinion of producers the trend of production in last three years had been either increasing or stationary for most of products except few where it was either stationary or decreasing such as- panjabi jooti, kancheepuram silk, banarsi saree, bhadoi carpet etc.
V Storage and lack of knowledge on modern technologies VI Storage and lack of knowledge on modern technologies VII Storage and lack of knowledge on modern technologies VIII Storage and lack of knowledge on modern technologies
Production constraints (Opinion of producers)
All non-agricultural products
Major constraints are for storage and lack of knowledge on modern technologies for packing.
V Good income -- Low no. of traders satisfied
VI Good income -- Low no. of traders satisfied
VII Good income -- Low no. of traders satisfied
VIII Producers feel income is poor
-- Moderate no. of traders satisfied
Earnings and income
All non-agricultural products
Nearly 50% of the producers feel that earning from enterprise is good
-- Low no. of traders satisfied
V Few approach banks for aid. Mostly from money lenders in villages VI Approached for aid. VII Approached for aid. VIII Many have approached for aid. Administrative formalities deter them from
approaching banks
Financial and infrastructure needs- for increasing production (Opinion of producers)
All non-agricultural products
Adequate finance from nationalized banks and other institutions would increase production. Producers felt the response was not too good and had many formalities. The production can be increased, if better marketing infrastructure is made available
V Most producers are aware of uniqueness of their products but many are not aware of GI systems and benefits they can get
Good awareness Extremely aware of importance of traditional character and reputation but very low awareness about GI
VI Most producers are aware of uniqueness of their products but many are not aware of GI systems and benefits they can get
Very low awareness Extremely aware of importance of traditional character and reputation but moderate awareness about GI
VII Most producers are aware of uniqueness of their products but many are not aware of GI systems and benefits they can get
Good awareness Extremely aware of importance of traditional character and reputation but very low awareness about GI
Awareness of producers and stakeholders about GI
VIII Most producers are aware of uniqueness of their products but many are not aware of GI systems and benefits they can get
Moderate awareness Extremely aware of importance of traditional character and reputation and also high awareness about GI
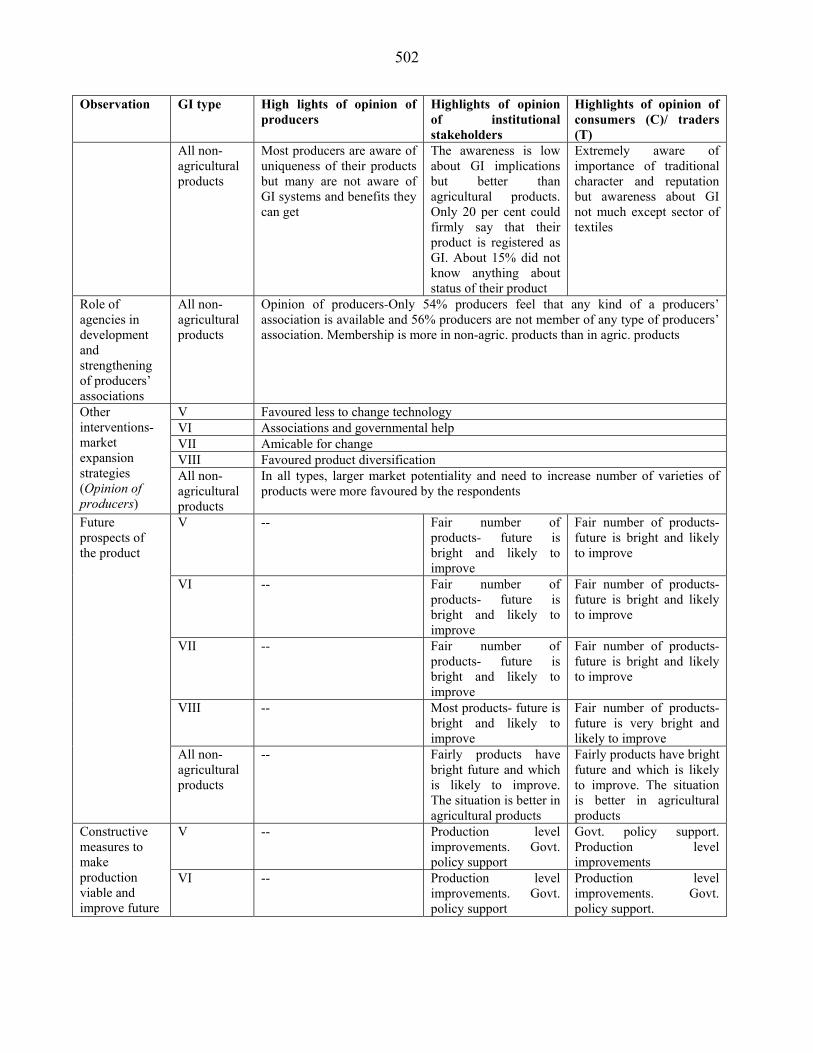
502
Observation GI type High lights of opinion of producers
Highlights of opinion of institutional stakeholders
Highlights of opinion of consumers (C)/ traders (T)
All non-agricultural products
Most producers are aware of uniqueness of their products but many are not aware of GI systems and benefits they can get
The awareness is low about GI implications but better than agricultural products. Only 20 per cent could firmly say that their product is registered as GI. About 15% did not know anything about status of their product
Extremely aware of importance of traditional character and reputation but awareness about GI not much except sector of textiles
Role of agencies in development and strengthening of producers’ associations
All non-agricultural products
Opinion of producers-Only 54% producers feel that any kind of a producers’ association is available and 56% producers are not member of any type of producers’ association. Membership is more in non-agric. products than in agric. products
V Favoured less to change technology VI Associations and governmental help VII Amicable for change VIII Favoured product diversification
Other interventions- market expansion strategies (Opinion of producers)
All non-agricultural products
In all types, larger market potentiality and need to increase number of varieties of products were more favoured by the respondents
V -- Fair number of products- future is bright and likely to improve
Fair number of products- future is bright and likely to improve
VI -- Fair number of products- future is bright and likely to improve
Fair number of products- future is bright and likely to improve
VII -- Fair number of products- future is bright and likely to improve
Fair number of products- future is bright and likely to improve
VIII -- Most products- future is bright and likely to improve
Fair number of products- future is very bright and likely to improve
Future prospects of the product
All non-agricultural products
-- Fairly products have bright future and which is likely to improve. The situation is better in agricultural products
Fairly products have bright future and which is likely to improve. The situation is better in agricultural products
V -- Production level improvements. Govt. policy support
Govt. policy support. Production level improvements
Constructive measures to make production viable and improve future
VI -- Production level improvements. Govt. policy support
Production level improvements. Govt. policy support.

503
Observation GI type High lights of opinion of producers
Highlights of opinion of institutional stakeholders
Highlights of opinion of consumers (C)/ traders (T)
VII -- Production level improvements. Govt. policy support with quality assurance
Production level improvements. Govt. policy support.
VIII -- Production level improvements. Good marketing practices
Production level improvements. Govt. policy support.
prospects
All non-agricultural products
-- Improvement in production and government policy support alongwith good marketing practices would bring change
Most traders feel that production level improvements and govt. policy support required. The requirements felt are different than agric products
V -- Moderately satisfactory Moderately satisfactory VI -- Highly satisfactory Moderately satisfactory VII -- Fairly satisfactory Highly satisfactory VIII -- Moderately satisfactory Moderately satisfactory
Status of marketing and suggestions for improvement
All non-agricultural products
-- A little less than half of respondents are not satisfied with the present mode. They want effective publicity and TQM
A little less than half of traders not satisfied with the present mode. They want effective publicity and policy support
V C-Wide publicity, reasonable price T- Wide publicity, innovative changes
VI C- Innovative changes, reasonable price T-TQM, Wide publicity
VII C- Quality standardization, reasonable price T- TQM, wide publicity with reasonable price
VIII C- Quality standardization, innovative changes T- Quality standardization, innovative changes
Suggestions for improvement to increase sale (Opinion of Consumers-C, traders-T)
All non-agricultural products
C- Quality standardization, reasonable price & innovative changes T- Quality standardization, wide publicity & innovative changes
Scientific endeavors in product dev.
All non-agricultural products
Opinion of institutional stakeholders- Scientific experimentations are required to establish uniqueness. Very less has been done for technical intervention to reduce or stop infringement and also to take initiatives for GI facilitation.
Endeavors by agencies responsible or concerned with GI registration
All non-agricultural products
Opinion of institutional stakeholders- In few states, the concerned departments and agencies have taken initiatives. Various central government supported organizations have taken proactive manner. The process was institutionalized to some extent.
Endeavors by financial institutions
All non-agricultural products
Opinion of institutional stakeholders- Biggest reason for not financing is lack of a designated scheme and also absence of institutional efforts from producers’ and link organizations. Banks clearly for TQM probably that will lead to good recovery. In some products and GI types such as type VIII the financial system has been institutionalized.