social security benefits and interregional income inequalities
TRANSCRIPT

Ann Peg Sci (1989) 23:223-240 - - T h e Annals o f - -
Regi0nal Science @ Springer-Verlag 1989
Social security benefits and interregional income inequalities The case of the Netherlands
Ronald J. Stoffelsma and Jan Oosterhaven*
Department of Economics, University of Groningen, Postbus 800, 9700 AV Groniugen, The Netherlands
Received February 1989 / Accepted in revised form June 1989
Abstract. In affluent mixed economies, social security programs are often the single most effective instrument to teach a minimal level of interregional in- come inequality. This paper extensively investigates the spatial structure and the interregional impacts of these programs in The Netherlands, using a mix- ture of decomposition techniques, factor analysis and cluster analysis.
1. Introduction
In most developed countries public spending on social insurance and welfare pro- grams (i.e. social security) has increased rapidly. For example, Dutch social securi- ty benefits as a percentage of gross domestic product rose from 12% in 1960 to 30% in 1985. These programs have two main objectives. First, they replace in- come losses from events that are outside an individual's control (e.g. sickness, disability, unemployment); second, they assure a minimum level of economic sup- port to those who have insufficient income (e.g. widows with children, the aged).
In addition to these intended effects at the individual level, social security pro- grams may have various more or less unintended impacts at the micro, the region- al and the macro levels of the economy. From a policy point of view the most im- portant effect at the regional level relates to the spatial income redistribution ef- fects of social security. Although a host of policy factors have been mentioned (cf. Richardson 1979) to explain the long run downturn in the Williamson-curve for spatial income inequalities (Williamson 1965), the gradual establishment of a social security system is not among them.
In the Dutch case, the impact of official regional policy appears to be marginal (cf. Folmer and Oosterhaven 1983). Given the rapid growth in the size of the social security sector, its potential impact is very large. Because systematic empirical research into this issue is lacking, we have decided to examine the situa- tion for the case of the Netherlands.
* The authors thank Professor Flip de Kam for his appreciated support and helpful advice.

224 R.J. Stoffelsma and J. Oosterhaven
A brief sketch of the Dutch social security system is given in the next section. In Sect. 3 the main results of regionalizing the data with regard to 23 social securi- ty programs are presented. There does seen to be a strong redistributive effect due to social security benefits. The separate programs, however, lead to rather dif- ferent spatial patterns.
To investigate this heterogeneity, the total average benefit per capita is decom- posed into five price and volume components, using a variant of the shift and share technique (see Sect. 4). The average benefit per capita is then further analyz- ed, so as to find more homogeneous groups of programs that are characterized by comparable spatial patterns. This is done by an integrated factor and cluster analysis (see Sect. 5).
In the last section some conclusions from our explorative statistical data analyses are drawn with special reference to the formulation of specific hypothe- ses for more explanatory analyses.
2. Dutch social security: A bird eye's view
In The Netherlands, the Constitution (article 20) guarantees every critizen a fair minimum standard of living. The most important means to reach this goal are the various social security programs. These programs are commonly divided into four groups: (1) Employee Insurance Regulations, (2) National Insurance Regulations, (3) Social Provisions and (4) Private Pension Plans. This grouping is based on three principles: (1) how the schemes are financed, (2) who is eligible for each scheme and (3) the objectives of the schemes.
Employee Insurance Regulations are funds which provide an employee with means of support in the case of sickness (ZW), partial or total disablement (WAO), medical expenses (ZFWw, ZFWv, IZA, IZR, DGPV), unemployment (WW) or early retirement (VUT).
National Insurance Regulations are intended for all Dutch inhabitants in the case of partial or total disablement (AAW), exceptional medical costs (AWBZ), retirement (AOW), children (AKW) or widows and orphans (AWW). The Employee and National Insurance Regulations are funds which are financed by social contributions, which are earmarked for specific benefits. This is not the case with the Social Provisions. These arrangements are financed by public funds and within these schemes the central concept is "the human want".
Social Provision Arrangements constitute the safety net of the Dutch social security system. They assume a minimum living standard to those who have insuf- ficient income. The most important schemes within this group are the unemploy- ment schemes (WWV, RWW), the General Assistance Act (ABWo, ABWr), the In- dividual Rent Allowance (IHS) and the Social Workshop Act (WSW). The prima- ry goal of this last scheme is to create jobs for citizens who have very few job op- portunities under normal circumstances. 1
1 A n appendix with a detailed description of all these social security programs is available upon request (cf. also CBS 1985).

Social security benefits and interregional income inequalities 225
T a b l e 1. The size of the Dutch social security sector 1960- 1985
1960 1970 1980 1985
Size ( x 1000 recipients): Aged, widows, orphans (AOW,AWW) 915 1200 1495 1625 Disabled (AAW/WAO) 160 285 660 775 Unemployed (WW/WWV/RWW) 20 60 240 665 Sickness Benefit Act (ZW) 90 205 270 230 General Assistance Act (ABW) 40 100 125 170
Expenses as % of GDP 12 20 30 30
Index (1960 = 100) - size 100 151 228 283 - expenses 100 657 255 260
Source: SOZAWE 1987
T a b l e 2. Functional structure of social security benefits in 1982
FRG France Netherl. UK Denmark EC-10
1 Sickness 28.6% 2 5 . 4 % 2 7 . 8 % 2 1 . 2 % 25.6% 25.2% 2 Invalidity, disability, 11.2% 8.9% 19.8% 9.6% 9.0% 12.3%
employment injury 3 Old age 29.3% 34.3°70 27.7070 40.2% 35.6% 32.9% 4 Survivors 13.5% 6.9% 4.7% 2.0% 0.5070 8.4% 5 Maternity and family 8 .4% 12.1070 9.2% 1 2 . 6 % 11.2% 10.4% 6 Unemployment 5.0% 8.5% 8 .8% 1 1 . 1 % 14.0070 7.5% 7 Other functions 4.0% 3.9% 2.2% 3.2% 4.1% 3.3% Total benefits 100.0% 100.0% 100.0% 100.0% 100 .0% 100.0% Total as % of GNP 29.4% 2 7 . 5 % 3 1 . 4 % 23.5070 29.9% 27.2% Total per capita at current 2924 2618 2807 1907 3021 2271 prices and exchange rates (ECU)
Source: Eurostat 1984
Pr i va t e Pens ion P l a n s are no t dealt with in this paper because the control of the central government over these regulations is very weak and indirect, which means that they canno t be used as a policy ins t rument .
The Dutch Social Security System has grown very rapidly in terms of the n u m - ber of recipients and the public spending involved. F rom 1960 to 1985 the n u m b e r of recipients increased by 183% and the expenditures by 160% (see Table 1). Similar developments have taken place in other EC-countries. Total outlays as a percentage of G N P are more less comparable, except for the UK on the lower side and The Nether lands on the upper side (see Table 2). A funct ional grouping of the different programs within each count ry shows the differences in structure. Compared with other EC countries, the Dutch func t ion Inval idi ty is most voluminous . This is explained by the large n u m b e r of benefi t recipients unde r the Wage Earners Disablement Insurance Act (WAO) and the General Disablement Act (AAW),

226 R.J. Stoffelsma and J. Oosterhaven
Table 3. Regional deviation from national average over the period 1979 - 1986
Province (1) % Rank (2) % Rank (3) % Rank
Groningen - 13.43 10 8.58 2 - 5.62 9 Friesland -14.29 11 -0.19 5 -9.29 10 Drenthe - 10.79 7 10.39 1 - 3.29 5 Overijssel - 11.97 9 - 5.24 10 - 9.58 I 1 Gelderland - 4.50 6 - 3.87 8 - 4.32 7 Utrecht 8.13 2 - 1.51 7 4.70 3 Noord-Holland 7.99 3 3.99 4 6.61 1 Zuid-Holland 9.88 1 - 4.37 9 4.83 2 Zeeland -0.70 4 -12.58 11 -4.90 8 Noord-Brabant - 1.84 5 -0.73 6 - 1.45 4 Limburg - t 1.20 8 8.25 3 - 4.30 6 M.A. DEV. 8.61 5,43 5.35 M.A. DIF. 10.80 8.18 6.41
(I) Primary income per capita without social security arrangements; (2) Total average benefit per capita; (3) Primary income per capita, social security ar- rangements included; M.A. DEV. Mean absolute deviation from the national average; M.A. DIF. Mean absolute interprovincial difference
3. Social security benefits and the interregional distribution of income
The regional iza t ion of Dutch social security benefi ts involved a large a m o u n t of data collection and data processing. The procedures used will be described in detail elsewhere (Stoffelsma, for thcoming) . We chose to analyze the eleven Dutch Provinces over the 1 9 7 9 - 1 9 8 6 period, in order to be able to detect the effects o f major f luc tuat ions in the level of regional and na t iona l u n e m p l o y m e n t that occur- red dur ing this period. 2 The regions selected form the middle level of public au thor i ty in The Nether lands . Table 3 and Fig. 1 present the m a i n results of our
analysis. The first co lumn of Table 3 shows interregional differences in taxable p r imary
income per capita by Province. It shows a clear spatial pat tern of three groups of Provinces. First, we see the u rban ized core regions of The Netherlands, com- prising the "Rands t ad" of Amsterdam, Rotterdam, The Hague and Utrecht. They have a 8% - 10% higher average p r imary income per capita than the n a t i o n as a whole. Second, we see a group of in termediate regions ad jacent to this core, which have average incomes of only 1 0 /0 -4% below the na t iona l average. Thirdly, we see five peripheral regions (one in the South and four in the Nor th) all having an 110/0 - 14% below average per capita income. Hence, the average difference be- tween the core and the per iphery a m o u n t s to roughly 21°/0.
The second co lumn of Table 3 shows the differences in the average benefi t per capita. Here no clear spatial pa t te rn emerges. The core region N o o r d - H o l l a n d jo ins the t radi t ional p roblem regions of Drenthe, Gron ingen and Limburg, whereas the t radi t ional p roblem region Overijssel and the intermediate region of
2 An analysis of the time pattern of the outcomes will be published later on. Presently, the unweighted averages of the outcomes of the period 1976-1986 are analysed.
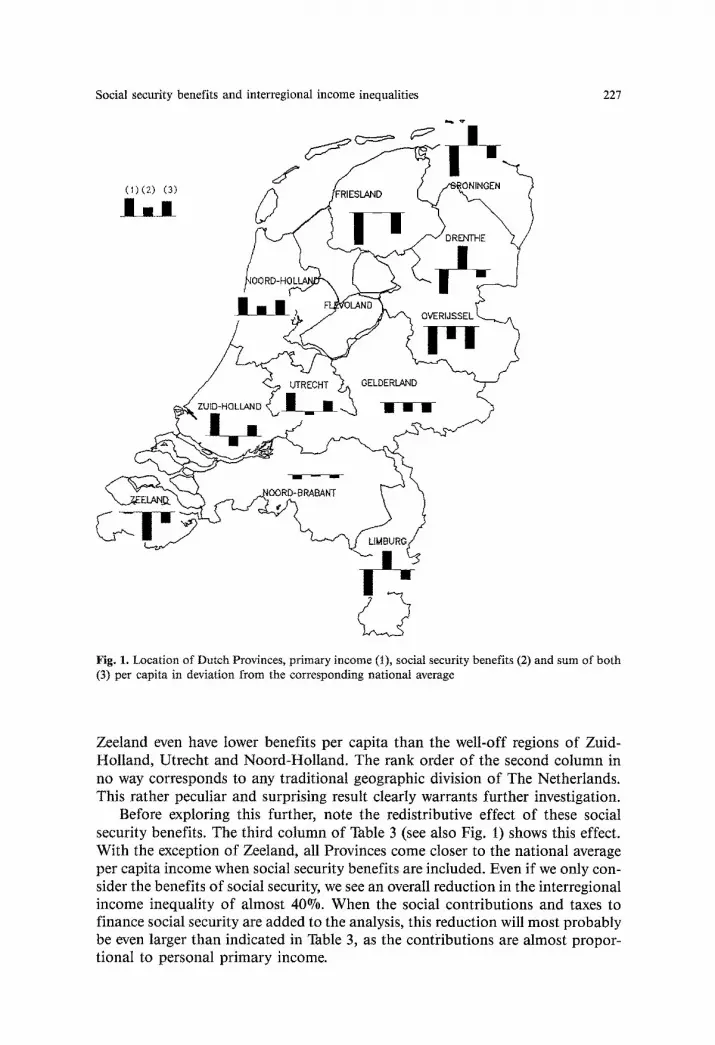
Social security benefits and interregional income inequalities 227
(1)(2) (3)
I IJI
J
.IL I
I-I !ONINGEN
"" DRENTHE
l L OVERIJSSEL
UTRECHT ~ GELDERLAND
EtANR
C? Fig. 1. Location of Dutch Provinces, primary income (I), social security benefits (2) and sum of both (3) per capita in deviation from the corresponding national average
Zeeland even have lower benefits per capita than the well-off regions of Zuid- Holland, Utrecht and Noord-Holland. The rank order of the second column in no way corresponds to any traditional geographic division of The Netherlands. This rather peculiar and surprising result clearly warrants further investigation.
Before exploring this further, note the redistributive effect of these social security benefits. The third column of Table 3 (see also Fig. 1) shows this effect. With the exception of Zeeland, all Provinces come closer to the national average per capita income when social security benefits are included. Even if we only con- sider the benefits of social security, we see an overall reduction in the interregional income inequality of almost 40%. When the social contributions and taxes to finance social security are added to the analysis, this reduction will most probably be even larger than indicated in Table 3, as the contidbutions are almost propor- tional to personal primary income.

228 R.J. Stoffelsma and J. Oosterhaven
It should, however, be noted that the decrease in overall inequality coincides with some important changes in the relative position of Provinces. At the top end of the scale we see the position of Zuid-Holland being taken over by Noord- Holland, which benefits considerably more from social security than its two neighbouring core regions (Zuid-Holland and Utrecht). At the lower end of the scale the position of Friesland is taken over by Overijssel. Both provinces benefit significantly less than the other three peripheral regions. Furthermore, one of the three intermediate Provinces, viz. Zeeland, also shows a remarkable change in position. It gets considerably less social security benefits per capita than the other two and even ends up below Limburg and Drenthe, two peripheral problem regions.
An interesting consequence of the changes in extreme positions is that the dif- ference between the "richest" and the "poorest" Province (the maximum range) only decreases with 33o70 from 24% to 16°70 of the national average, whereas the average difference decreases with 40%.
Hence, Dutch social security benefits not only have a significant equalizing ef- fect on the interregional income distribution, they also affect the position of various regions in quite different ways.
The obvious next question is whether these variations may be explained by dif- ferences in the spatial patterns of the benefits paid through social security pro- grams. Table 4 traces the effect of individual programs on the interregional equali- ty of income per capita. This is done again by means of the change in the mean deviation from the national average and by means of the change in the mean in- terprovincial difference (see Bartels 1977, for the arguments to select these in- dicators out of a total of 34 to compare interregional inequality).
The mean interprovincial difference (column 4) seems to be the most policy relevant one. Hence, the programs are ranked with regard to their equalizing effect according to this statistic. From Table 4 is it clear that almost all programs have a net equalizing effect. The size of this effect, however, is evaluated somewhat dif- ferently if we look at the mean deviation instead of the mean difference. Especial- ly the Exceptional Medical Expenses Act (AWBZ) appears to have a much stronger effect if measured by the mean deviation statistic.
The pattern becomes even more diverse when looking at the sign and the significance of the slopes (fl) of the regression lines between the level of benefits per capita and the levels of primary income per capita (column 2). In that case only four programs (WW, WWV, WSW and ZW) show a significant negative slope, whereas three other programs (POOR, ABWo and VUT) have a significant positive slope. One of these (VUT) even has a net equalizing effect, according to the other two statistics.
Furthermore, we note that the expected relation between the quantitative im- portance of programs and the size of their equalizing effect is indeed present (cf. column 1 and 4 of Table 4), but also that the relation is rather weak. The second factor that influences this equalizing effect is obviously the significance of the negative slope (cf. column 2 of Table 4).
Finally, note that the most important programs, the disability acts (WAO and AAW) and the old age pension act (AOW), do have the strongest net income equalizing effect, but that the spatial pattern of this effect is not even significant

Social security benefits and interregional income inequalities
Table 4. Social security benefits and their impact on the spatial differences in income per capita, average over 1979- 1986
Program (1) (2) (3) (4)
WAO and AAW 15 423.4 - 1.40 - 1.09% - t .41% AOW 21 103.9 0.53 -0 .54% - 0.99% WW 2896.3 -4.72** -0.57070 -0 .67% ZW 6552.8 - 1,93' -0 .57% -0 .66% WWV 4426.9 -2.46** -0 .38% -0 .53% ZFWw 11 197.2 0.14 -0 .17% -0.49070 AKW 7088.9 -0 .70 -0 .38% -0 .48% WSW 1786.3 - 4.45** - 0.39% - 0.46% RWW 3931.6 -0 .37 -0 .11% -0 .31% AWW 2565.0 - 1.76 -0 .12% -0 .20% IHS 1269.8 -0 .82 -0 .06% -0 .12% ZFWv 1787.0 0.04 -0 .02% -0 .11% GG 1 132.4 - 1.56 -0 .08% -0 .10% WBP 748.5 0.01 - 0.04% - 0.05% IZA 1032.0 0.71 -0 .03% -0 .04% WEU 297.9 - 0.50 - 0.01% - 0.02% VUT 572.8 1.92* - 0.01% - 0.01% AWBZ 7 698.0 0.48 - 0.32% - 0.01% ABWr 118.8 -0 .55 -0 .01% -0 .01% IW 177.9 1.t0 -0 .01% -0 .01% BKR 104.2 0.62 0.01% 0.00% ABWo 4663.8 1.88" 0.19% 0.01070 POOR 177.4 3.91'* 0.02% 0.02%
Total 96 672.8 - 1.20 - 3.26% - 4.38%
(l) Average total benefit in period '79 - '86 in million guilders; (2) T-value of the fl-coefficient. The 9507o (**) and 90% (*) significance levels with 9 degrees of freedom are, respectively, 2.26 and 1.83; (3) Change in the relative mean deviation from the national average caused by the introduc- tion social security benefits; (4) Change in the relative mean interprovincial difference caused by the introduction social security benefits
229
a t t h e 9 0 % - l e v e l . A m a z i n g l y , we see o p p o s i t e r e su l t s a t t h e b o t t o m o f Tab le 4. T h e
l a rges t p r o g r a m w i t h a d i s e q u a l i z i n g e f f ec t ( A B W o ) d o e s p a y s i g n i f i c a n t l y h i g h e r
b e n e f i t s i n P r o v i n c e s w i t h h i g h e r p e r c a p i t a i n c o m e s , w h e r e a s i t s n e t d i s e q u a l i z i n g
e f f ec t i t s e l f is r a t h e r sma l l , a t l e a s t w h e n m e a s u r e d w i t h t h e m e a n d i f f e r e n c e
s ta t i s t ic . T h e m e a n d e v i a t i o n s ta t i s t ic , however , s h o w s a m u c h l a r g e r e f f ec t o f + 0 . 1 9 % ,
M o r e genera l ly , t h e a b o v e f i n d i n g s i m p l y t h a t m o s t o f t h e s e p a r a t e p r o g r a m s
o n l y h a v e a s m a l l i n c o m e e q u a l i z i n g e f f ec t a n d a w e a k o r even reverse r e l a t i o n
w i t h p r i m a r y i n c o m e p e r c ap i t a . T h i s l a s t o b s e r v a t i o n even app l i e s to m o s t o f t h e
p r o g r a m s t h a t h a v e a s t r o n g e r i n c o m e e q u a l i z i n g e f f e c t (see t h e t o p t e n o f Tab le 4).
T h e l a rge g r o u p o f p r o g r a m s t h a t h a s h a r d l y a n y i n c o m e e q u a l i z i n g e f fec t , i n
fac t , c o n s i s t s o f t w o s u b g r o u p s . F i rs t , t h e r e is a s u b g r o u p t h a t d o e s n o t h a v e a
net e f f ec t o n t h e s p a t i a l i n c o m e i n e q u a l i t y , b u t t h a t m i g h t s h o w c o n s i d e r a b l e
s p a t i a l v a r i a t i o n in t h e level o f b e n e f i t s p e r c a p i t a a n d t h e r e f o r e m a y e x p l a i n t h e

230 R.J. Stoffetsma and J. Oosterhaven
change in the rank order of the Provinces. Second, there are programs that show no spatial differences with regard to the level of benefits per capita, although there might be underlying compensating differences in the number of recipients per capita and the level of benefits per recipient. Anyhow, it is clear that in- dividual regions are influenced in quite different ways. Further investigation into the use of social security by region is therefore required.
4. The average benefit per capita decomposed by region
Variations in average benefits per capita by Province may be attributed to the following underlying variation in the use of social security arrangements:
- differences in the number o f recipients per capita by Province, - differences in the composition of the group o f recipients by Province and - differences in the levels of benefits per recipient per programs by Province.
The last two factors are typical ingredients of a standardization approach. Ex- amples of this approach are "shift and share analysis" in the area of regional employment growth (e.g. Mackay 1968), and "constant market share analyses" in the area of export growth (e.g. Jepma 1986). In our analysis we will develop a variant that integrates all three factors into one decomposition.
4.L The decomposition method
The analysis starts with the difference between the provincial average total benefits per capita and the corresponding national figure:
b P / i P - b n / i n , (1)
where the total of benefits relates to the sum over all 23 programs analyzed, i.e. bP= ~ ab p and b n = ~ abe. The symbols used, have the following meaning:
Variables: Indices."
b = amount of benefits n = nation r = number of recipients p = province i = number of inhabitants a = arrangement
Next, the difference (1) wil be split up into three components, viz. First, a reci- pient per capita effect:
(rP / i p - rn / i ~). bn /r n (2)
This component describes the contribution of the difference between the provin- cial and the national number of recipients per capita to the variation in the total benefits per capita. Second, a benefits per recipient effect:
(bP/r p - b n/rn )" rn/i n • (4)

Social security benefits and interregional income inequalities 231
This component describes the contribution of the variation in the average benefit level per recipient between Provinces and the country as a whole. Third, an a g g r e g a t e i n t e r a c t i o n e f f ec t :
( b P / r p - b n / r n ) ( rP / i p - r n / i n ) . (3)
This "combined differences" component indicates whether or not the first two components strengthen or weaken each other.
It is easily proven that the three components sum to the total difference that we intended to divide, i.e. (1) = (2)+(3)+(4).
At this aggregate level, other decompositions of (i) are also possible. The pre- sent decomposition is chosen for two reasons. First and most importantly, a con- sistent interregional comparison of the two most important effects, viz. (2) and (4), is only possible if the differences are measured or scaled by the same (na- tional) norm. Second, the interaction effect is also of interest itself (cf. Oosterhaven and Van Loon 1979, for a comparable argument in case of desag- gregated decomposition analyses).
The second step of our decomposition relates to the disaggregated level of the separate social security programs. Here the question is whether regions are char- acterized by the take up of the programs with relatively high levels of benefits and/or use programs with levels of benefits per recipient that are regionally higher than nationally. Hence, this second step divides the benefit per recipient effect (4) into three separate components. First, a s t r u c t u r a l c o m p o n e n t :
a ( r J r - r J r ) n , , . , • t J r ~ l ' r / i , (5)
which indicates whether the Province concerned predominantly takes up pro- grams with nationally high benefits per recipient, or programs with nationally low benefits. The last term in (5) scales this component back to benefits per capita as in (4). Secondly, a p r i c e c o m p o n e n t . "
[ 2 P P n n n n n . n a ( b a / r a - b a / r a ) ' r a / t ] . r / t , (6)
which indicates whether the nationally weighted average program pays a higher or a lower benefit per recipient in the region concerned than in the country as a whole. Thirdly, a d i s a g g r e g a t e i n t e r a c t i o n c o m p o n e n t :
[ ~ p p n n a ( r a / r _ r a / r )(bPa/r p n n n . n , - b a / r a ) ] "r / t (7)
which indicates whether it is worth while to specialize. This component is positive if regionally overrepresented programs pay regionally higher benefits than na- tionally and/or if underrepresented programs pay regionally lower benefits than nationally.
It is easily proven that the total of these three components is equal to the ag- gregate benefit per recipient effect: (4) = (5) + (6) + (7).
As before we might combine the interaction term (7) with either (5) or (6) which will result in, respectively, a structural component measured with varying

232 R.J. Stoffelsma and J. Oosterhaven
regional levels of benefits per recipient, or a price component that is weighted with varying regional shares of recipients per program. Hence, for the same two reasons mentioned above, we have chosen the decomposition already indicated.
Before presenting the empirical results, a few remarks with regard to the overall decomposition, viz. (1) = (2) + (3) + (5) + (6) + (7), need to be made. First of all it should be noted that standardization techniques, in general, are highly sen- sitive to the classification and aggregation of the activities at hand (StilwelI 1970). In our case this classical problem plays a relatively small role, since the classifica- tion and aggregation of social security programs is more or less institutionally determined.
Nevertheless, we still face two problems that are related to this issue. First, for six programs data on benefits per recipient are lacking, which means that (6) and (7) are per definition equal to zero. For the smaller three of these programs, viz. WPB, POOR and VUT, real differences in the levels of benefits per recipient are present. The result is that the structural component (5) is slightly overestimated.
Second, for the larger three of these programs, viz. AOW, AWW and AKW, the level of benefits depends on demographic factors. Hence, one might argue that the analysis ought to be desaggregated to the demographically determined sub-program level where the benefits per recipient are uniform. If one holds this view it is clear that both (6) and (7) will be overestimated since they hide elements that may be attributed to structural factors. However, we have chosen to consider these elements as price differences caused by underlying demographic factors, in much the same way as the programs where price differences are caused by underlying regional differences in wage levels (e.g. with WW, WWV and WAO) or levels of cost of living (e.g. with ZW, AWBZ and IHS).
4.2. Empirical results
In the presentation of the empirical results all terms (1)- (7) will be multiplied by 100 and divided by bn/i n. In this way all the outcomes are expressed in percent- ages of the national total average benefit per capita. Table 5 shows the results of the decomposition analysis. It should be noted that these outcomes are very dependent on the programs that are included in the analyses. In preliminary analyses we worked with 7 unemployment related programs and with 17 pro- grams, which excluded the major demographic programs (AOW, AKW and AWW). In both cases the outcomes were rather different from the present ones, which include all social security programs. Hence in this area of research it is not allowed to generalize results from partial analyses.
The most remarkable result of the decomposition is that the variation in the underlying components is far larger than the variation in the average total benefits per capita shown in the first column. This means, of course, that a fair amount of these underlying differences are of a compensating nature.
The second most remarkable finding is the dominating importance of the volume components found in the second and the fifth column. The second col- umn illustrates the importance of the total number of recipients per capita, whereas the fifth column indicates the effect of the composition of the group of recipients of social security benefits.

Social secur i ty benef i ts and in te r reg ional i ncome inequal i t ies 233
Tab le 5. Empi r i ca l decompos i t i on results : averages over the per iod 1 9 7 9 - 1986 as a % of the na t iona l ave rage benef i t per cap i ta
P r o v i n c e (1) % (2) % (3) % (4) % (5) % (6) % (7) %
G r o n i n g e n 8.58 7.43 0.08 1.08 2.03 - 0.95 0.00 Fr ies land - 0 . 1 9 3.54 - 0 . 1 3 - 3 . 6 1 - 2 . 9 0 - 0 . 6 7 .- 0.04 Dren the 10,39 24.37 - 2.74 - 11.24 - 14.43 6.25 - 3.06 Over i jsse l - 5.24 - 3.04 0.07 - 2.27 1.40 - 3.28 - 0.39 Ge lde r l and - 3 , 8 7 - I 1 . 5 1 - 0 . 9 9 8.63 5.28 3.17 0.19 Ut rech t - 1.51 - 1.21 0.00 - 0 . 3 1 - 2 . 5 6 2.08 0.17 N o o r d - H o l l a n d 3.99 3.76 0.01 0.22 - 0.09 0.45 - 0.14 Z u i d - H o l l a n d - 4 . 3 7 - 2 . 2 4 0.05 - 2 . 1 8 - 0 . 6 0 - 1.55 - 0 . 0 3 Zee land - 12.58 - 23.49 - 3.35 14.25 12.86 0.93 0.46 N o o r d - B r a b a n t - 0 . 7 3 3.50 - 0 . 1 4 - 4 . 0 9 - 6 . 9 2 3.19 ..... 0.35 L i m b u r g 8.25 2.20 0.13 5.92 3.66 2.98 - 0 . 7 2
(1) Di f fe rence f r o m average na t iona l benef i t per cap i t a 1 9 7 9 - t986; (2) Recip ient per cap i t a effect; (3) A g g r e g a t e in te rac t ion effect; (4) Benefi t per recipient effect; (5) S t ruc tu ra l c o m p o n e n t ; (6) Pr ice c o m p o n e n t ; (7) Desaggrega te in te rac t ion effect
The regions of Drenthe and Zeeland show the most extreme results, followed by Geldertand. In six out of the eleven regions, including the above three, we see that the aggregated recipient per capita effect is compensated to a large extent by the desaggregate structural effect.
The desaggregate price component, as shown in the sixth column is relatively small, although certainly not negligible. This relative insignificance is to be ex- pected if two specific characteristics of the (Dutch) social security system are taken into consideration. First, its design is entirely national in character and even its execution is almost entirely on the national or sectoral level. Only a very few arrangements (ABW) are administrated by the local authorities. Second, only a few programs (WW, WW¥, WAO, ZFWw, ZFWv, IHS and ABW) allow for real price differences, i.e. for differences in benefit levels per recipient.
Next, we summarize the results per province per group of regions. First, the economic core regions. Noord-Holland benefits from social security
and increases its ranking order primarily because it has a relatively large amount of recipients per capita. We expect them to be found primarily in the urban prob- lem areas of the larger cities, Amsterdam in particular. Utrecht and particularly Zuid-Holland benefit less from social security than the average region because these Provinces have less recipients and their recipients more often take up pro- grams with relatively low benefits. The outcome for Utrecht is compensated somewhat because the benefit per recipient for the weighted average program, i.e. its price component, is 2% higher than national.
Second, the intermediate regions. Zeeland and Gelderland show a similar pat- tern, although Zeeland profits considerably less than Gelderland which itself al- ready has an average benefit per capita of 3.9% below the national average. This is explained primarily because both regions have less recipients per capita, which results in the case of Zeeland in a downward effect of -26.8% if the recipient per capita effect and the aggregate interaction effect are added. In both regions this downward effect is partly compensated by an overrepresentation of programs

234 R.J. Stoffelsma and J. Oosterhaven
with higher benefits per recipient. This compensation is further strengthened because of a positive price component, in particular in Gelderland. Noord-Bra- bant shows an entirely different pattern. It has more recipients than nationally, which, however, are using programs with lower benefits. It only behaves in a com- parable fashion with regard to the price component which is + 3.2%, just like that of Gelderland.
Third, we consider the five peripheral regions with low taxable primary in- comes. Here we find a rather diverse pattern, with three regions that clearly benefit from social security. Firstly, Limburg benefits because of both the volume and the price component. Second, Groningen profits primarily because it has much more recipients per capita than the national average. Thirdly, Drenthe, benefits most of all provinces. Here we find an extremely large aggregate volume component of q-21.7%, again by adding column 2 and 3. It is, however, compen- sated by a negative structural component of -14.4°/0. Finally, Drenthe is par- ticular because it has the largest price component, which in turn is compensated again as Drenthe also has the largest desaggregate interaction component of - 3.1%. This means that programs which are used relatively more in Drenthe pay in Drenthe less than the national average.
The other two regions with low primary incomes per capita benefit less from social security than average. In Friesland, benefits per capita are almost equal to the national average. Although it has more recipients per capita, they predominantly use programs with nationally low benefits. Benefits per capita in Overijssel are 5.2°70 below the national average; Overijssel falls to the bot tom of the ranking order because it has less recipients in the aggregate and because they get lower benefits per program than the national average.
5. A closer look at the regional benefits per capita
In this section we look more closely at the average benefit per capita per program. Our main aim is to find common factors in the spatial patterns of the benefits per capita of all 23 programs. Such common patterns may be instrumental in two ways. First, they may suggest explanatory variables for the complex and different ways in which the regions profit from social security benefits as shown in the last section. Second, they may be used to find a small number of groups of programs that show comparable spatial patterns of benefits per capita. This last analysis is done by an integrated factor and cluster analysis.
Table 6 presents results of a factor analysis with a varimax rotation (Amick and Waldberg 1975). The raw data used are the average benefits per capita per program for each region. The dataset is standardized by recalculating the data as a percentage of the national average. 3 Through this standardization average benefits per capita per program are mutually comparable. A consequence of this standardization is that separate programs have the same weight in the factor or cluster analysis.
3 This standardized dataset is available upon request.

Soc ia l s ecu r i ty benef i t s a n d i n t e r r eg iona l i n c o m e inequal i t ies
T a b l e 6 . R o t a t e d a n d s o r t e d Ioad ings o f t he 23 a r r a n g e m e n t s o f f ive p r i n c i p a l c o m -
p o n e n t s
235
P r o g r a m (1) (2) (3) (4) (5)
W B P 0 .948 a 0 .018 0 .132 - 0 . 0 8 5 0 .085 A O W 0 . 9 3 4 a - 0 . 1 2 2 - 0 . 0 9 0 0 .013 - 0 . 0 0 4
I Z A 0 .838 a 0 .003 0 .023 - 0 .033 - 0 . 2 0 0 A B W r - 0 . 8 1 1 a - 0 . 1 6 0 0 .095 - 0 . 3 2 1 0 .279 V U T 0.801 a - 0 . 0 5 9 - 0 . 5 1 5 - 0 . 0 2 6 0 .155 I W 0.771 a 0 .267 - 0 .269 - 0 ,385 0 . 1 2 0 G G 0 .619 b - 0 . 1 5 9 0 .689 b 0 ,076 0 .207 Z W - 0 . 6 1 7 b - 0 . 0 0 7 0 .504 b 0 .413 0 .233
W W V - 0 .551 b 0 .485 0 .603 b 0 .196 0 .017
R W W - 0 .295 0 .896 a - 0 .049 0 . 1 3 4 0 . 2 5 0 W E U - 0 .105 0 .893 a 0 .076 0 .261 0 . 0 9 2 I H S 0 ,009 0 .808 a 0 .062 - 0 . 2 3 0 0 .319 B K R 0 .312 0 .739 a - 0 . 2 6 7 0 .230 0 .090 A B W o 0 .408 0 .704 a - 0 .521 0 . 1 2 0 - 0 .081 A B W Z - 0 . 0 9 0 - 0 .667 b -- 0 . 1 1 2 0 .338 0 .567 b
W W - 0 .199 0 .018 0 .925 a 0 .249 - 0 .008 P O O R - 0 . I 1 9 0 .336 - 0 . 8 8 4 a 0 . 1 7 0 0 .055
W S W - 0 . 3 7 9 0 .293 0 .714 a - 0 , 1 9 0 0 .454 Z F W v 0 .214 0 .088 0 .091 0.961 a 0 .043 Z F W w - 0 . 3 3 1 0 .157 - 0 . 0 4 3 0 ,873 a 0 .195
A W W - 0 .039 0 .363 0 .345 0 .302 0 ,700 a W A O - 0 .497 0 .239 0 .167 0 .327 0 .653 a A K W - 0 . 4 3 3 - 0 . 3 8 2 0 . 2 t 0 0 .178 - 0 .653 a
% o f e x p l a i n e d 28.6o/0 2 0 . 4 % I8.2070 1 2 . 3 % 1 0 . 3 % v a r i a n c e
a H i g h pos i t ive o r nega t ive f a c t o r l o a d i n g s o n one c o m p o n e n t ( > 0 . 6 5 ) b H i g h pos i t ive o r nega t ive f a c t o r l o a d i n g s o n m o r e t h a n o n e c o m p o n e n t
Table 6 shows the loadings of the 23 programs on the rotated first five prin- cipal components. These five principal components together explain 88.3 °70 of the total variance of the raw data. The first five were chosen because the sixth eigen- value was the first to be smaller than one, while the function of the ranked eigen- values also showed a kink at the sixth one. Considering the high positive and negative loadings (marked with an asterisk) and the contents of the corresponding social security programs, these five components may be interpreted and named.
The WBP, AOW, IZA, VUT and IW have high positive factor loadings on component 1. These programs, except IZA and VUT, have in common that they are intended for recipients older than 64. Hence, component 1 may be labelled as old age. The relatively high factor loading of the Home Help Services (GG) supports this conclusion, as about 70% of Home Help Services is taken up by the aged.
The RWW, WEU, IHS, BKR and ABWo have high scores on component 2. These programs have in common that the recipients are almost always people with minimum subsistence incomes. Hence, component 2 may be labelled as minimum subsistence.

236 R.J. Stoffelsma and J. Oosterhaven
The WW, WSW and POOR have high scores on component 3. The first two arrangements have in common, that they are related to unemployment. When we also consider the relatively high score of the WWV, another unemployment pro- gram, this component may be labelled as unemployment.
The meaning of component 4 is very clear. The voluntary and mandatory Health Insurance (ZFWv and ZFWw) have high loadings on this component. Although the other sickness programs (ZW and AWBZ) have relatively small positive loadings on this component, this component may be labelled as sickness.
The fifth component with positive loadings on the disablement programs (WAO and AWW) and a negative loading on the General Childs's Allowance Act (AKW) and may be denoted as continuous age.
Programs which are not mentioned above and marked in the table with b (GG, ZW, WWV and AWBZ) have high factor loadings on more than one compo- nent. The spatial variance in the benefit per capita of these programs has to be explained by more than one of the above mentioned components.
From the above findings we conclude that a model which tries to explain the spatial differences in benefits per capita should include the following independent variables:
1. Old age: Relative number of individuals older than 64 2. Minimum subsistence: Relative number of income recipients with average year-
ly primary income below a specific level 3. Unemployment: Percentage of unemployed in the labour force 4. Sickness: An approximation for regional medical cost differences 5. Continuous age: Average age of the population below 65.
Although the above observations make it possible to group the separate social security programs on the base of the above five components, a better insight into the grouping of these programs can be reached by means of cluster analysis, a set of techniques that is especially designed for this purpose. To combine the advan- tages of the two approaches we present the results in an integrated way as shown in Fig. 2.
The axes of this figure represent the first two, and therefore largest, com- ponents of the original unrotated factor analysis of the standardized benefits per capita of the 23 programs. In this way the maximum amount of variance (i.e. 56.2°70) can be explained in a two-dimensional figure. The horizontal axis still shows a close resemblance with the old age component described above, whereas the vertical axis resembles the minimum subsistence component. The five-dimen- sional rotation, obviously, only slightly changed the loadings on the first two fac- tors.
Next, two types of cluster analysis are used to link programs with comparable spatial patterns of benefits per capita. First, the lines between the programs result from an elementary cluster analysis in which each program is linked to the pro- gram with which it shows the largest similarity in spatial pattern. The values in- dicate for each program its largest correlation coefficient, which is used as the measure of similarity.
Second, the circles around the programs result from a so-called hierarchical clustering (Everitt 1980). The number of clusters is determined by the level of

Social security benefits and interregional income inequalities 237
Mini~ iubsistence
\ ./ /
s A~krW / - f " ~ . 0.72 ' 4 /"
../I .~"-1!//--ZFw~ z~wv" -- / ~, Ill A 0.80 ._._.~
i ji '-.. -
i / 0 .7~ , °~ / i '.
iV ~ 4 - . ~ i '-..o 32
\.,~ 0-5# 1 "i'. "". \'~'~ AtWr l i '''0"27 " " .
' ~ , ~ - I "', AWBZ
AKW
l / .~, ,o.76 . . . . . . Ii I • \ - - - _ ¢ A ~ W o
\ / /0 .65 . / /
\ / "POOR /¢ ~ ' ' - ~ ~,
• 'k / / \ vu~ i
.~ "" ' IZA I"
/ /
GG
....... I
Old Age
Fig. 2. Results of a factor loading plot with a elementary linkage and hierarchical cluster analysis
similarity between the programs within each cluster. Two natural cut-off levels presented themselves. They are shown by the two levels of circles drawn in Fig. 2. The smallest circle represents a distance level of 0.4 and the largest one a dis- tance level of 0.6 (maximum range 0-2) . Within this hierarchical clustering pro- cess, correlation coefficients are used as distance metrics and the average linkage method is chosen as the linking method.
The results of both clustering techniques do not differ very much. Five clusters are distinguished. The differences in the clustering process only relate to the allocation of some relatively unique programs (viz. AWW, GG, AWBZ and AKW). The clusters are"

238 R.J. Stoffelsma and J. Oosterhaven
(1) Old age, including the programs AOW and WBP as the central linkage. The IW, VUT and IZA join this cluster. Cluster I has a high score on the x-axis "old age" and a small positive score on the y-axis "minimum subsistence level". Except for the Health Insurance for Civil Servants (IZA) all these programs are intended for elderly people. The Home Help Services (GG) can possibly be added to this cluster. (2) The second cluster contains almost all programs which offer employee com- pensation in the case of sickness, disablement or unemployment. This cluster may be labelled as inactive employee regulations. It scores highly negative on the x-axis (old age) and scores neutrally on y-axis. It can be divided into the subgroup Unemployment (WW, WWV and WSW) and the subgroup Sickness and disable- ment (ZW and WAO). Surprisingly this subgrouping divides the second cluster in- to two parts on the central linkage between WW and ZW. The ABWr can be add- ed to this cluster following the results of the elementary linkage cluster analysis. (3) and (4). In the top of the figure there are two clusters with high scores on y- axis (minimum subsistence level) and average scores on the x-axis. Both clusters can be denoted as minimum subsistence clusters. Except for the BKR, cluster 3 includes programs, which provide a minimum living standard for elderly people (POOR and ABWo). Cluster 4, with a negative score on the x-axis, includes com- parable programs for younger citizens. According to the hierarchical cluster analysis the General Widows' and Orphans' pensions (AWW) must be added to cluster 4 and according to the elementary linkage cluster analysis to cluster 3. (5) The last cluster includes the obligatory and voluntary Health Insurance (ZFWw and ZFWv) and may therefore be labelled as the Sickness-cluster, how- ever, without either the adjective "old age" or "minimum subsistence" as this cluster shows relatively low scores on both factors.
Finally two programs, the Exceptional Medical Expenses Act (AWBZ) and the General Child's Allowance Act (AKW) do not cluster with any other program. Although the AWBZ and AKW may not be added to any cluster, the highest cor- relation with a cluster, i.e. the elementary linkage, is drawn in Fig. 2. The AWBZ has the highest correlation coefficient with the cluster "Sickness" and the AKW with the cluster "Inactive employee regulations".
The integrated factor and cluster analysis on the base of spatial differences in benefits per capita per arrangements, results in five clusters of programs. These programs group themselves around the function of the programs which is dif- ferent from the more institutionally determined grouping that is used traditionally (see Sect. 2). The results of this analysis and the rotated factor analysis (Table 6) do not differ very much. The two analyses are complementary approaches.
6. Conclusions
This paper investigates the impact of social security benefits on interregional in- come inequalities, using data for The Netherlands for the 1979-1986 period. Within the European Community the Dutch social security system is one of the largest in terms of outlays (% of GNP) and number of recipients (% of popula- tion). Its impact on interregional income inequalities is considerable.

Social security benefits and interregional income inequalities 239
Social security benefits reduce interregional income inequalities by almost 40%. This reduction will most probably be larger if social security contributions are also taken into account. Almost all individual programs contribute to a greater equality of incomes. The strength of the equalizing effect depends on the size of the program and the significance of its relation with regional pr imary in- come per capita.
Besides the net equalizing effect, some remarkable changes in the rank order of the income per capita per region occm; To further analyse the benefits per capita per region an extended variant of shift and share analyses is developed. The most remarkable result of the decomposition is that the underlying spatial dif- ferences of the components are far larger than those of the total (benefit per capita). Of the components, the number of recipients per capita is the most im- portant. When the results of the decomposition are summarized spatially, three groups of regions can be distinguished. The core regions have less benefit reci- pients per capita and a lower average benefit per recipient than the Netherlands as a whole. The peripheral regions, on the other hand, have relatively more reci- pients and higher benefit levels than the national average. The intermediate regions show a more diverse pattern.
Finally, we tried to find underlying factors and tried to group programs with an integrated factor and cluster analysis. Five factors have been identified. They explain about 88% of the variance of the raw data concerning spatial differences in benefit per capita. Furthermore we found five clusters of programs, which show a comparable spatial pattern in the total benefit per capita. These five clusters may be labelled as: old age, inactive employee, minimum subsistence for elderly people, minimum subsistence for younger people and sickness. The pro- grams group themselves around the social function of the regulations instead of the traditional grouping according to institutional criteria.
In a model which tries to explain the spatial differences, the following five in- dependent variables are the obvious candidates for a successful explanation: (1) number of individuals older than 64 per capita, (2) number of income recipients with average yearly pr imary income below a specific level per capita, (3) percen- tage of unemployed people, (4) an approximation for regional medical cost dif- ferences and (5) average age of the population below 65.
References
Amick DJ, Waldberg HJ (eds) (1975) Introductionary multivariate analysis for educational, psychological, and social research. McCutthan, Berkeley, CA
Bartels CPA (1977) Economic aspects of regional welfare. Martinus Nijhoff, Leiden CBS (1985) Social security, pension funds and life insurance 1980-1984. Netherlands Central Bureau
of Statistics, The Hague Everitt BS (1980) Cluster analysis. Heineman, London Eurostat (1984) Social indicators for the European community; selected series. Statistical Office of
the European Community, Luxembourg Folmer H, Oosterhaven J (I983) Measurement of employment effects of Dutch regional socio-
economic policy. In: Kuklinski A, Lambooy JG (eds) Dilemmas in regional policy, Mouton, Berlin New York Amsterdam, pp 245- 270

240 R.J. Stoffelsma and J. Oosterhaven
Jepma CJ (1986) Extension and application possibilities of the constant market share analysis. The case of the developing countries exports. University of Groningen, Department of Economics, Groningen
Mackey D (1968) Industrial structure and regional growth: a methodological problem. Scott J Polit Econ 15:129-143
Oosterhaven J, Loon J van (1979) Sectoral structure and regional wage differentials; a shift and share analysis on 40 dutch regions for 1973. Tijdschr Econ Soc Geogr 70(1):3-16
Richardson HW (1979) Aggregate efficiency and interregional equity. In: Folmer H, Oosterhaven J (eds) Spatial inequalities and regional development. Martinus Nijhoff, Boston, pp 161-184
Sozawe (1987) Financiele nota sociale zekerheid 1987. Tweede Kamer, vergaderjaar 1986-1987, 19708. nrs 1 -2 , Den Haag
Stillwel FBJ (1970) Further thoughts on the shift and share approach. Reg Stud 4:451-458 Stoffelsma RJ (1989) Social security and its impact on interregional income inequalities: the Dutch
case. Research memorandum, Department of Economics, University of Groningen, Groningen Williamson JG (1965) Regional inequalities in the process of national development: a description of
patterns. Econ Dev Cult Change 13:3-45