social and spatial relationships of capybaras in a semi-confined production system
TRANSCRIPT
243J.R. Moreira et al. (eds.), Capybara: Biology, Use and Conservation of an Exceptional Neotropical Species, DOI 10.1007/978-1-4614-4000-0_14, © Springer Science+Business Media New York 2013
14.1 Introduction
Social and spatial relationships between individuals have been used to describe the social structure of animal species (Hinde 1983 ; Lee 1994 ) , which can be de fi ned as the organizational pattern of social relationships among group members (Lusseau et al. 2008 ) . Understanding the relationship of an individual with conspeci fi cs can be important in determining its social position in the dominance hierarchy (Beacham 2003 ) . As most de fi nitions refer to dominance as an attribute of a pattern of repeated agonistic interactions, i.e., aggression (Bernstein 1981 ; Drews 1993 ) , dominance hierarchies have been extensively analyzed by quantifying dyadic agonistic interac-tions (Gauthreaux 1978 ; de Vries and Appleby 2000 ) .
The capybara ( Hydrochoerus hydrochaeris ) has a rich repertoire of agonistic and af fi liative social interactions, both most often seen in con fi ned conditions due to the limitation of resources. Quantifying social interactions allows group social structure to be described, which is fundamental for both effective management and conservation.
K. M. P.M.B. Ferraz (*) Departamento de Ciências Florestais, Escola Superior de Agricultura “Luiz de Queiroz” , Universidade de São Paulo , Av. Pádua Dias 11 , 13418-900 , Piracicaba, São Paulo , Brazil e-mail: [email protected]
P. Izar • T. Sato Departamento de Psicologia Experimental , Instituto de Psicologia, Universidade de São Paulo , Av.Prof.Mello Moraes 1721, Cidade Universitaria , 05508-030 , São Paulo , Brazil e-mail: [email protected] ; [email protected]
S. M. Nishida Departamento de Fisiologia , Instituto de Biociências, Universidade Estadual Paulista “Júlio de Mesquita Filho” , Campus de Botucatu Distrito de Rubião Jr., s/nº , 18618-970 Botucatu , São Paulo , Brazil e-mail: [email protected]
Chapter 14 Social and Spatial Relationships of Capybaras in a Semi-con fi ned Production System
Katia Maria P.M.B. Ferraz , Patrícia Izar , Takechi Sato , and Sílvia M. Nishida
244 K.M.P.M.B. Ferraz et al.
This chapter describes the social interactions of capybaras evaluated in a semi-con fi ned system. Capybaras were kept in a fenced enclosure (about 8 ha) containing an arti fi cial lake, bushy vegetation, open area of grassland, and a small corral with two feeding troughs (10 × 3 m) inside it. Two different groups had been captured in the wild and introduced at different moments. The capybara groups were not submitted to any intervention in this area apart from feeding. Data were quanti fi ed from members of only one group (3 males and 12 females), all of which were individually marked. Data were registered for 8 months and analyzed by graph theory methods (Box 14.1 ) to reveal the strongest dyadic relationships established among the members of a social group (Busacker and Saaty 1965 ; Sato 1996 ; Izar et al. 2005, 2006 ) .
Box 14.1 Graph Theory in the Analysis of Social Structures
Graph theory has been used for the analysis of natural and social phenomena. Methods from the theory, such as the Minimum Spanning Tree, Directed Tree, and Dominance Tree allow analysis of the social structure of groups through the graphical representation of dyadic relationships established among the strongest members of the group (Izar et al. 2005 ) . A graph G is a set V of vertices and a set A of arcs, denoted as G = (V, A). Vertices can be individuals in a social group, behaviors, things, groups, positions in a hierarchy, cities, etc. Thus, vertices correspond to elements of set theory. Vertices can be con-nected by arcs that represent relationships such as “like to,” “hit,” “together with,” “communicate with,” “hate,” etc. The arcs of a graph correspond to ordered pairs of a relation of set theory (Sato 1996 ) . Thus, the social structure is de fi ned by a set of vertices that are the individuals of the group and a set of arcs that are the dyadic relationships established between them. By this de fi nition, the social structure is a graph.
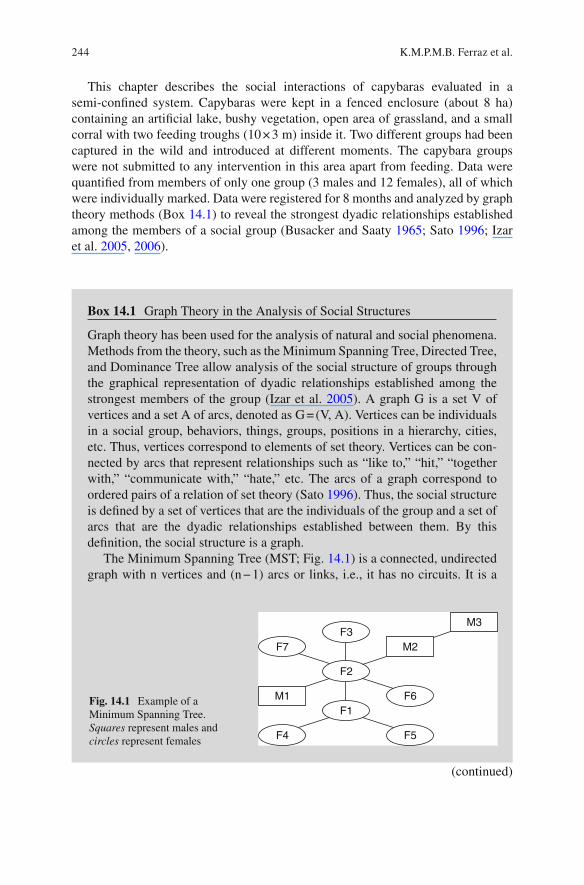
The Minimum Spanning Tree (MST; Fig. 14.1 ) is a connected, undirected graph with n vertices and (n − 1) arcs or links, i.e., it has no circuits. It is a
F6
F4
F3
F5
F2
M1F1
M3
M2F7
Fig. 14.1 Example of a Minimum Spanning Tree. Squares represent males and circles represent females
(continued)
24514 Social and Spatial Relationships of Capybaras…
Box 14.1 (continued)
symmetric graph, where arcs represent nondirectional relationships between the vertices (e.g., F1 and F2 are in contact). The graphic structure of minimum spanning trees tends to represent the strongest relationships in the matrix of relationships between group members and allows the identi fi cation, for example, of subgroups characterized by gender and/or age. Or, assuming that certain group members form small distinct subgroups, the members of a sub-group will appear on branches near the tree, linked to another subgroup through a larger branch (Izar et al. 2005 ) .
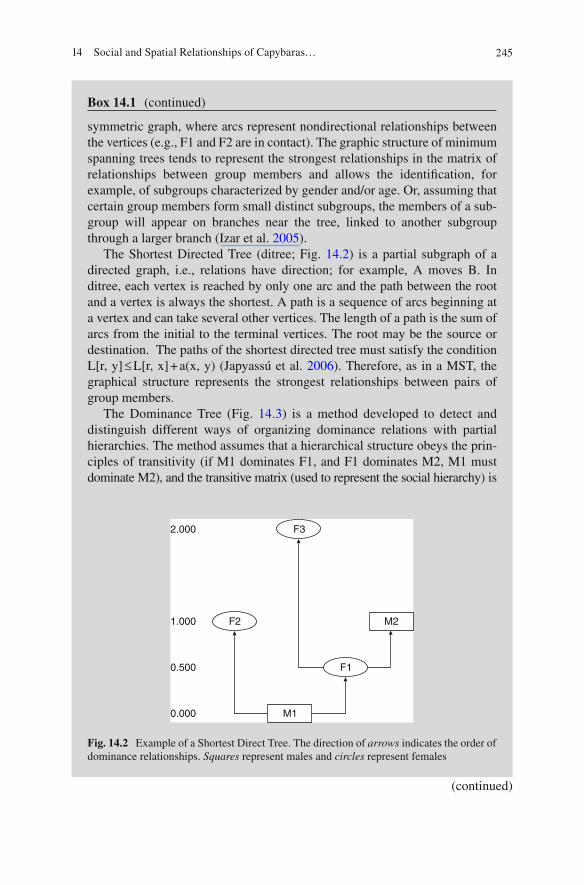
The Shortest Directed Tree (ditree; Fig. 14.2 ) is a partial subgraph of a directed graph, i.e., relations have direction; for example, A moves B. In ditree, each vertex is reached by only one arc and the path between the root and a vertex is always the shortest. A path is a sequence of arcs beginning at a vertex and can take several other vertices. The length of a path is the sum of arcs from the initial to the terminal vertices. The root may be the source or destination. The paths of the shortest directed tree must satisfy the condition L[r, y] £ L[r, x] + a(x, y) (Japyassú et al. 2006 ) . Therefore, as in a MST, the graphical structure represents the strongest relationships between pairs of group members.
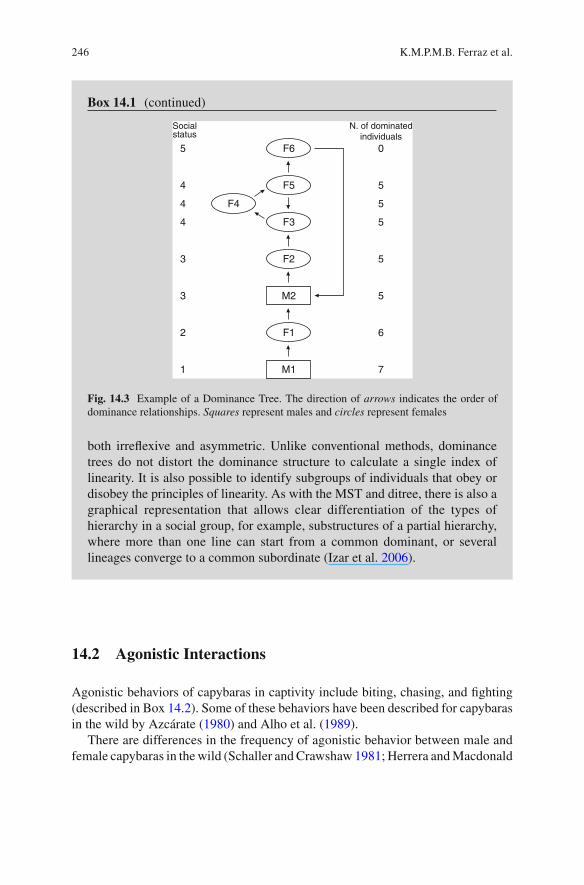
The Dominance Tree (Fig. 14.3 ) is a method developed to detect and distinguish different ways of organizing dominance relations with partial hierarchies. The method assumes that a hierarchical structure obeys the prin-ciples of transitivity (if M1 dominates F1, and F1 dominates M2, M1 must dominate M2), and the transitive matrix (used to represent the social hierarchy) is
F3
F2
M1
M2
F1
0.000
0.500
1.000
2.000
Fig. 14.2 Example of a Shortest Direct Tree. The direction of arrows indicates the order of dominance relationships. Squares represent males and circles represent females
(continued)
246 K.M.P.M.B. Ferraz et al.
Box 14.1 (continued)
both irre fl exive and asymmetric. Unlike conventional methods, dominance trees do not distort the dominance structure to calculate a single index of linearity. It is also possible to identify subgroups of individuals that obey or disobey the principles of linearity. As with the MST and ditree, there is also a graphical representation that allows clear differentiation of the types of hierarchy in a social group, for example, substructures of a partial hierarchy, where more than one line can start from a common dominant, or several lineages converge to a common subordinate (Izar et al. 2006 ) .
14.2 Agonistic Interactions
Agonistic behaviors of capybaras in captivity include biting, chasing, and fi ghting (described in Box 14.2 ). Some of these behaviors have been described for capybaras in the wild by Azcárate ( 1980 ) and Alho et al. ( 1989 ) .
There are differences in the frequency of agonistic behavior between male and female capybaras in the wild (Schaller and Crawshaw 1981 ; Herrera and Macdonald
Fig. 14.3 Example of a Dominance Tree. The direction of arrows indicates the order of dominance relationships. Squares represent males and circles represent females
F6
F4
F3
F5
F2
M2
F1
M1
Socialstatus
N. of dominatedindividuals
5
4
4
3
3
2
1
0
5
5
5
5
6
7
54
24714 Social and Spatial Relationships of Capybaras…
1993 ; Salas 1999 ) . Males interact more with each other (Schaller and Crawshaw 1981 ) , whereas female-male and female-female aggressive interactions are rarely observed (Herrera and Macdonald 1993 ; Lord 1994 ) . Total aggression rates correlate with the number of males in the group (Macdonald 1981 ; Herrera and Macdonald 1993 ) . According to Azcárate ( 1980 ) , aggressive dominance among the classes fl ows in the direction of adult male – adult female – young and infants, representing a gradient of decreasing overall aggressiveness and increasing group cohesiveness.
Agonistic interactions can be intense and frequent among group individuals or between individuals of different groups when con fi ned in the same space. These interactions are typically associated with a limitation of essential resources such as food, shelter, and/or space. In addition to the agonistic interactions between adult males, there is a frequent occurrence of aggression between adult females and between males and females, behaviors rarely observed in natural environments (Herrera and Macdonald 1993 ; Lord 1994 ) .
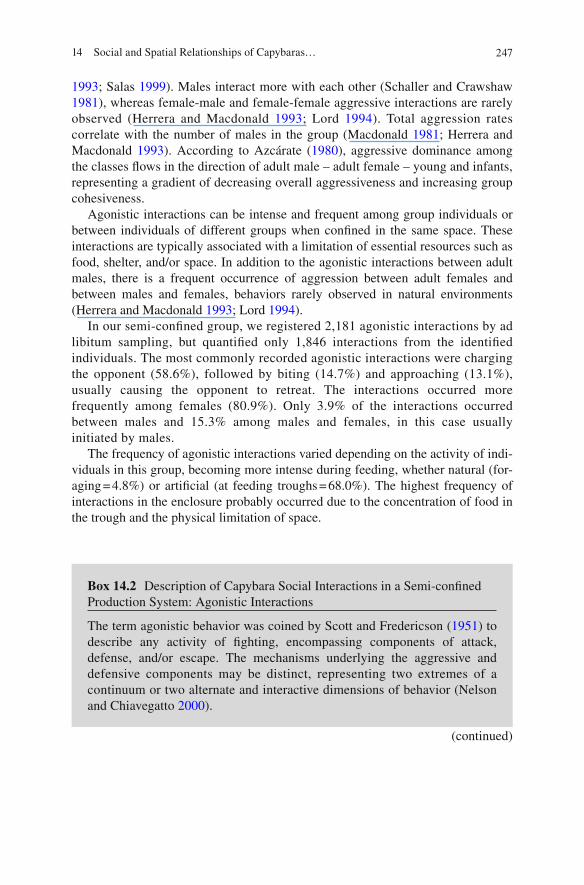
In our semi-con fi ned group, we registered 2,181 agonistic interactions by ad libitum sampling, but quanti fi ed only 1,846 interactions from the identi fi ed individuals. The most commonly recorded agonistic interactions were charging the opponent (58.6%), followed by biting (14.7%) and approaching (13.1%), usually causing the opponent to retreat. The interactions occurred more frequently among females (80.9%). Only 3.9% of the interactions occurred between males and 15.3% among males and females, in this case usually initiated by males.
The frequency of agonistic interactions varied depending on the activity of indi-viduals in this group, becoming more intense during feeding, whether natural (for-aging = 4.8%) or arti fi cial (at feeding troughs = 68.0%). The highest frequency of interactions in the enclosure probably occurred due to the concentration of food in the trough and the physical limitation of space.
(continued)
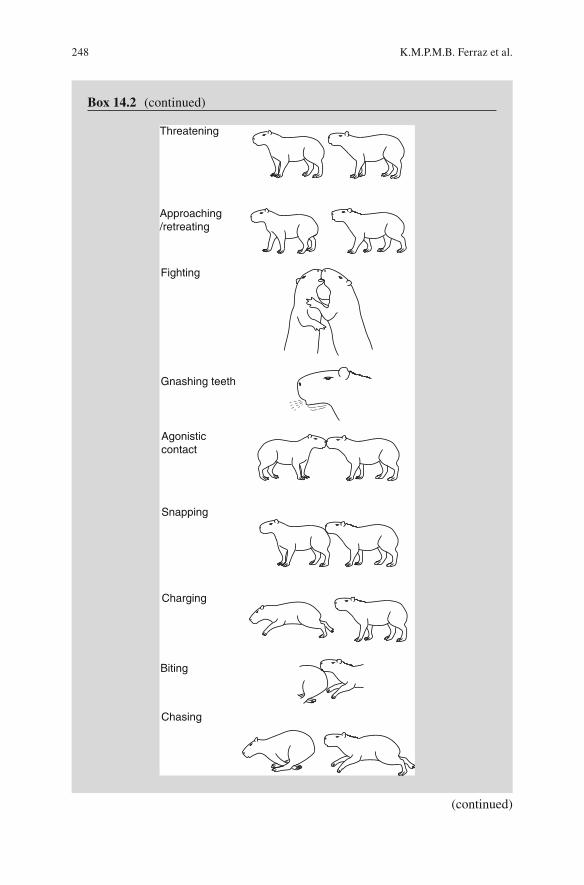
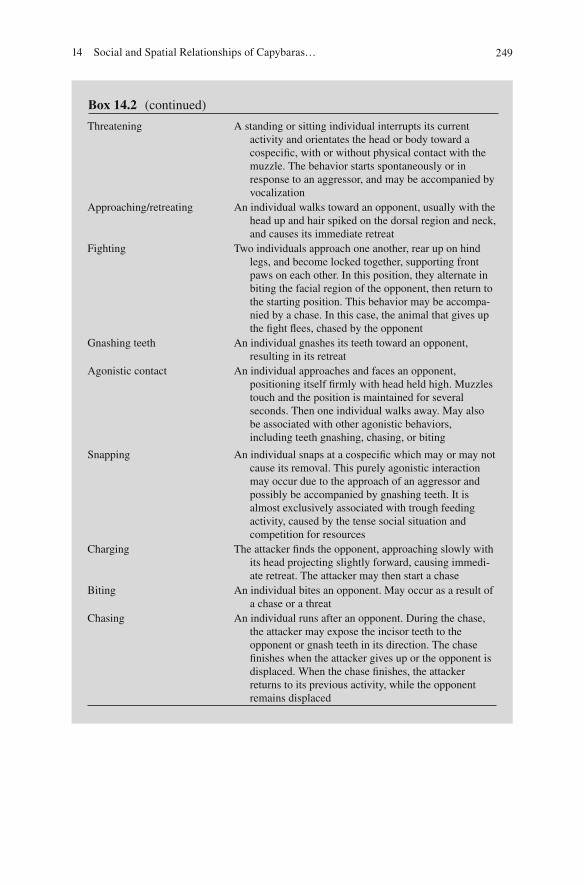
Box 14.2 Description of Capybara Social Interactions in a Semi-con fi ned Production System: Agonistic Interactions
The term agonistic behavior was coined by Scott and Fredericson ( 1951 ) to describe any activity of fi ghting, encompassing components of attack, defense, and/or escape. The mechanisms underlying the aggressive and defensive components may be distinct, representing two extremes of a continuum or two alternate and interactive dimensions of behavior (Nelson and Chiavegatto 2000 ) .
248 K.M.P.M.B. Ferraz et al.
Box 14.2 (continued)
Approaching/retreating
Fighting
Gnashing teeth
Agonisticcontact
Charging
Biting
Chasing
Snapping
Threatening
(continued)
24914 Social and Spatial Relationships of Capybaras…
Threatening A standing or sitting individual interrupts its current activity and orientates the head or body toward a cospeci fi c, with or without physical contact with the muzzle. The behavior starts spontaneously or in response to an aggressor, and may be accompanied by vocalization
Approaching/retreating An individual walks toward an opponent, usually with the head up and hair spiked on the dorsal region and neck, and causes its immediate retreat
Fighting Two individuals approach one another, rear up on hind legs, and become locked together, supporting front paws on each other. In this position, they alternate in biting the facial region of the opponent, then return to the starting position. This behavior may be accompa-nied by a chase. In this case, the animal that gives up the fi ght fl ees, chased by the opponent
Gnashing teeth An individual gnashes its teeth toward an opponent, resulting in its retreat
Agonistic contact An individual approaches and faces an opponent, positioning itself fi rmly with head held high. Muzzles touch and the position is maintained for several seconds. Then one individual walks away. May also be associated with other agonistic behaviors, including teeth gnashing, chasing, or biting
Snapping An individual snaps at a cospeci fi c which may or may not cause its removal. This purely agonistic interaction may occur due to the approach of an aggressor and possibly be accompanied by gnashing teeth. It is almost exclusively associated with trough feeding activity, caused by the tense social situation and competition for resources
Charging The attacker fi nds the opponent, approaching slowly with its head projecting slightly forward, causing immedi-ate retreat. The attacker may then start a chase
Biting An individual bites an opponent. May occur as a result of a chase or a threat
Chasing An individual runs after an opponent. During the chase, the attacker may expose the incisor teeth to the opponent or gnash teeth in its direction. The chase fi nishes when the attacker gives up or the opponent is displaced. When the chase fi nishes, the attacker returns to its previous activity, while the opponent remains displaced
Box 14.2 (continued)
250 K.M.P.M.B. Ferraz et al.
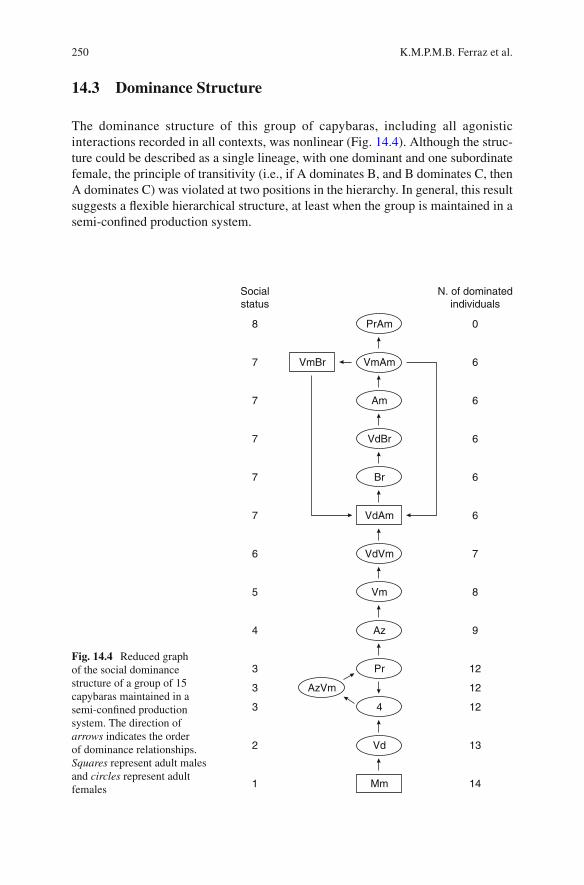
14.3 Dominance Structure
The dominance structure of this group of capybaras, including all agonistic interactions recorded in all contexts, was nonlinear (Fig . 14.4 ). Although the struc-ture could be described as a single lineage, with one dominant and one subordinate female, the principle of transitivity (i.e., if A dominates B, and B dominates C, then A dominates C) was violated at two positions in the hierarchy. In general, this result suggests a fl exible hierarchical structure, at least when the group is maintained in a semi-con fi ned production system.
PrAm
VmAm
Am
VdBr
Br
VdAm
VdVm
Vm
Az
Pr
4
Vd
Mm
AzVm
VmBr
Socialstatus
N. of dominatedindividuals
8
7
7
7
7
7
6
5
4
3
3
2
1
3
0
6
6
6
6
6
7
8
9
12
12
13
14
12
Fig. 14.4 Reduced graph of the social dominance structure of a group of 15 capybaras maintained in a semi-con fi ned production system. The direction of arrows indicates the order of dominance relationships. Squares represent adult males and circles represent adult females
25114 Social and Spatial Relationships of Capybaras…
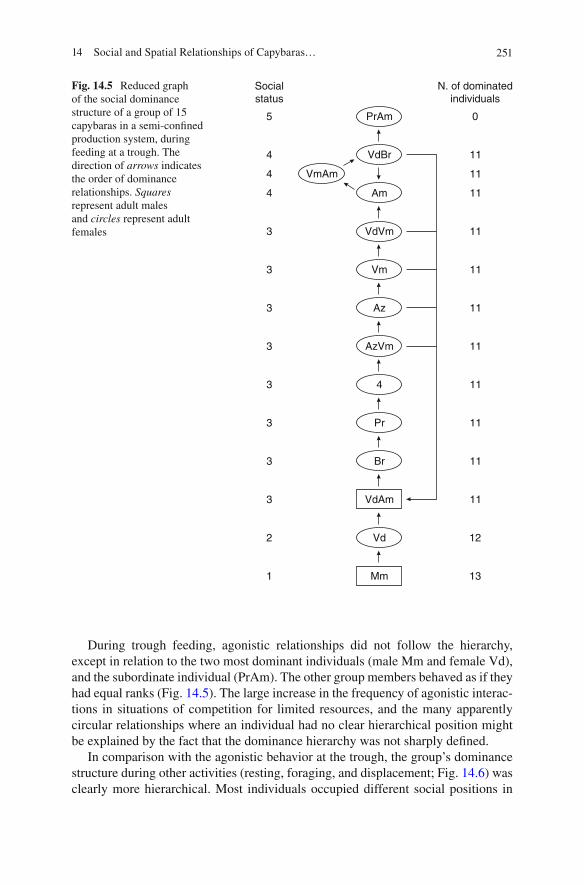
During trough feeding, agonistic relationships did not follow the hierarchy, except in relation to the two most dominant individuals (male Mm and female Vd), and the subordinate individual (PrAm). The other group members behaved as if they had equal ranks (Fig. 14.5 ). The large increase in the frequency of agonistic interac-tions in situations of competition for limited resources, and the many apparently circular relationships where an individual had no clear hierarchical position might be explained by the fact that the dominance hierarchy was not sharply de fi ned.
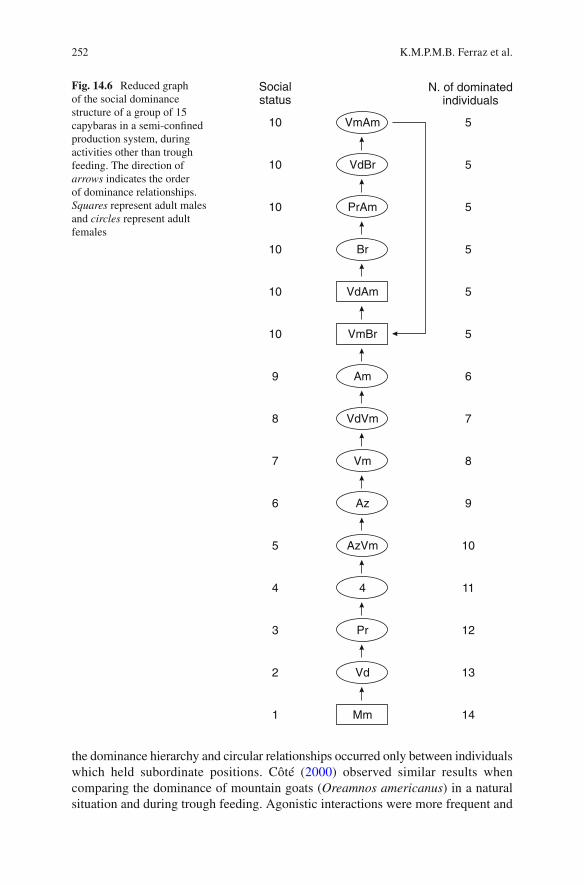
In comparison with the agonistic behavior at the trough, the group’s dominance structure during other activities (resting, foraging, and displacement; Fig. 14.6 ) was clearly more hierarchical. Most individuals occupied different social positions in
PrAm
VmAm
Am
VdBr
Br
VdAm
VdVm
Vm
Az
Pr
4
Vd
Mm
AzVm
Socialstatus
N. of dominatedindividuals
5
4
4
3
3
3
3
3
3
3
3
2
1
0
11
11
11
11
11
11
11
11
11
11
12
13
114
Fig. 14.5 Reduced graph of the social dominance structure of a group of 15 capybaras in a semi-con fi ned production system, during feeding at a trough. The direction of arrows indicates the order of dominance relationships. Squares represent adult males and circles represent adult females
252 K.M.P.M.B. Ferraz et al.
the dominance hierarchy and circular relationships occurred only between individuals which held subordinate positions. Côté ( 2000 ) observed similar results when comparing the dominance of mountain goats ( Oreamnos americanus ) in a natural situation and during trough feeding. Agonistic interactions were more frequent and
PrAm
VmAm
Am
VdBr
Br
VdAm
VdVm
Vm
Az
Pr
4
Vd
Mm
AzVm
10
10
10
10
9
8
7
6
5
4
3
2
1
5
5
5
5
6
7
8
9
10
11
12
13
14
VmBr
Socialstatus
N. of dominatedindividuals
10
10
5
5
Fig. 14.6 Reduced graph of the social dominance structure of a group of 15 capybaras in a semi-con fi ned production system, during activities other than trough feeding. The direction of arrows indicates the order of dominance relationships. Squares represent adult males and circles represent adult females
25314 Social and Spatial Relationships of Capybaras…
the dominance order was broken during feeding. Côté ( 2000 ) suggested that inconsistencies in the hierarchy arose because individual recognition was hampered by the spatial concentration at the trough and the increased agonistic events.
We suggest, instead, that the linear capybara hierarchy “bends” during feeding time in captivity due to competition for food resources, the bene fi ts of which may offset the potential costs associated with fi ghting with an individual of slightly higher status. Note that individuals with the highest social status were not challenged, unlike those of intermediate status. Probably, without the bene fi t of obtaining immediate food resources, subordinate individuals have less incentive to run the risk of injury in an agonistic interaction with higher ranked individuals.
PrAm
VmAm
Am
VdBr
Br
VdVm
Vm
Az
Pr
4
Vd
AzVm
Socialstatus
a
bSocialstatus
N. of dominatedindividuals
N. of dominatedindividuals
3
2
2
2
2
2
2
2
2
2
2
1
0
10
10
10
10
10
10
10
10
10
10
11
PrAm
VmAm
Am VdBr
Br
VdVm
Vm
Az
Pr
4
Vd
AzVm
11
10
9
8
7
6
5
4
3
2
1
0
1
2
3
5
6
7
8
8
10
11
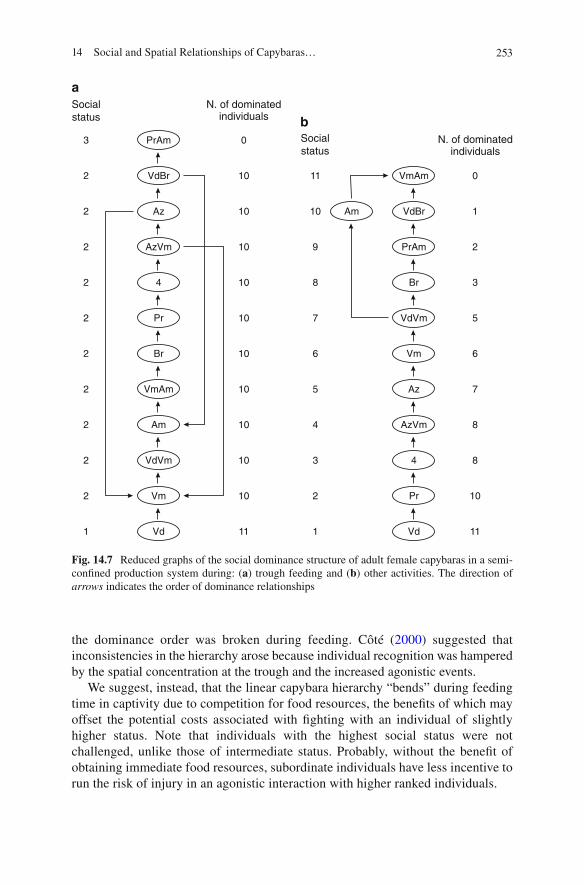
Fig. 14.7 Reduced graphs of the social dominance structure of adult female capybaras in a semi-con fi ned production system during: ( a ) trough feeding and ( b ) other activities. The direction of arrows indicates the order of dominance relationships
254 K.M.P.M.B. Ferraz et al.
14.3.1 Dominance Relationships Among Females
Female social structure, including either all agonistic interactions or with the removal of males, proved to be nonlinear, with some females occupying the same social position, shown by circular relationships (Fig. 14.7 ). Considering that agonis-tic interactions between females occurred only during trough feeding, dominance does not appear clearly de fi ned, since almost all females occupied equivalent positions in the social hierarchy (regarding the number of individuals dominated by each one). The exception was the dominant female and one subordinate. The domi-nance relationships of females in activities other than feeding at the trough were more organized and hierarchical.
14.3.2 Dominance Relationships Among Males
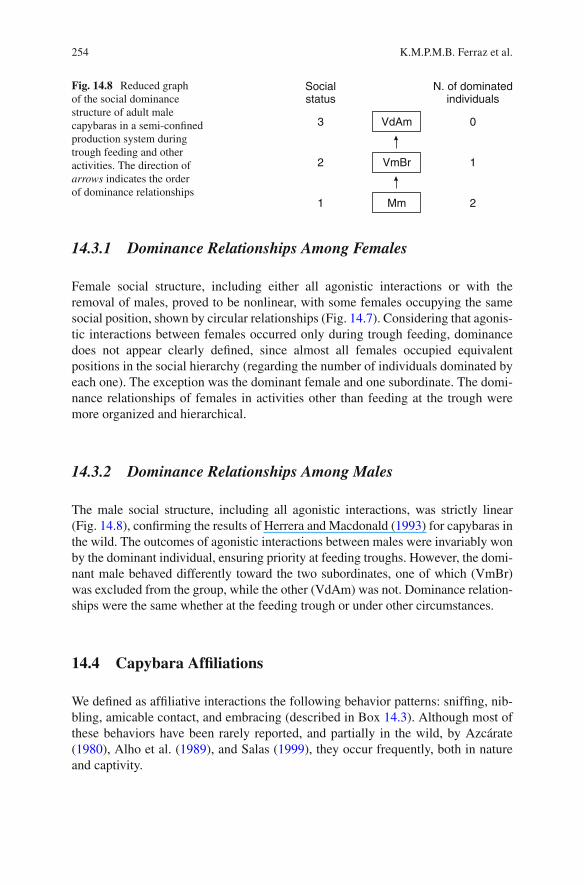
The male social structure, including all agonistic interactions, was strictly linear (Fig. 14.8 ), con fi rming the results of Herrera and Macdonald ( 1993 ) for capybaras in the wild. The outcomes of agonistic interactions between males were invariably won by the dominant individual, ensuring priority at feeding troughs. However, the domi-nant male behaved differently toward the two subordinates, one of which (VmBr) was excluded from the group, while the other (VdAm) was not. Dominance relation-ships were the same whether at the feeding trough or under other circumstances.
14.4 Capybara Af fi liations
We de fi ned as af fi liative interactions the following behavior patterns: snif fi ng, nib-bling, amicable contact, and embracing (described in Box 14.3 ). Although most of these behaviors have been rarely reported, and partially in the wild, by Azcárate ( 1980 ) , Alho et al. ( 1989 ) , and Salas ( 1999 ) , they occur frequently, both in nature and captivity.
VdAm
Mm
VmBr
Socialstatus
N. of dominatedindividuals
3
2
1
0
1
2
Fig. 14.8 Reduced graph of the social dominance structure of adult male capybaras in a semi-con fi ned production system during trough feeding and other activities. The direction of arrows indicates the order of dominance relationships
25514 Social and Spatial Relationships of Capybaras…
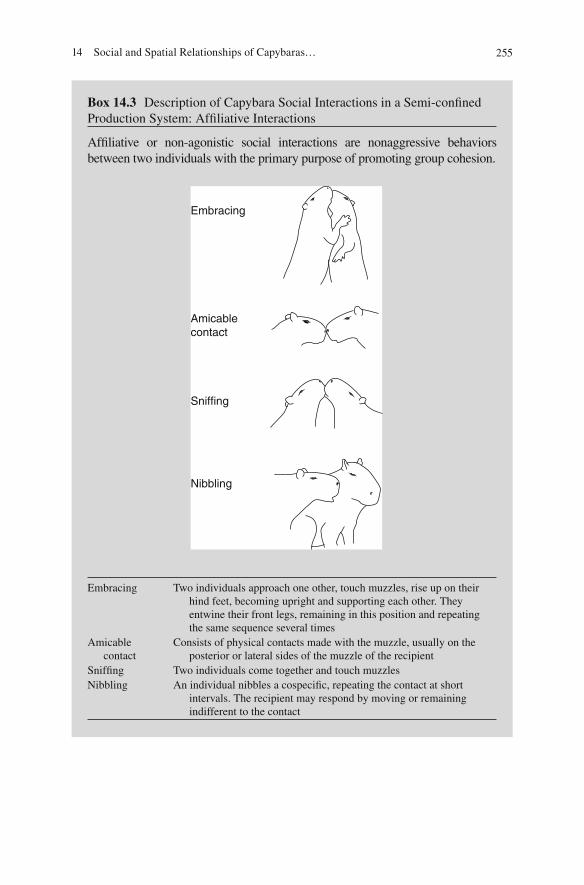
Box 14.3 Description of Capybara Social Interactions in a Semi-con fi ned Production System: Af fi liative Interactions
Af fi liative or non-agonistic social interactions are nonaggressive behaviors between two individuals with the primary purpose of promoting group cohesion.
Embracing Two individuals approach one other, touch muzzles, rise up on their hind feet, becoming upright and supporting each other. They entwine their front legs, remaining in this position and repeating the same sequence several times
Amicable contact
Consists of physical contacts made with the muzzle, usually on the posterior or lateral sides of the muzzle of the recipient
Snif fi ng Two individuals come together and touch muzzles Nibbling An individual nibbles a cospeci fi c, repeating the contact at short
intervals. The recipient may respond by moving or remaining indifferent to the contact
Embracing
Amicablecontact
Sniffing
Nibbling
256 K.M.P.M.B. Ferraz et al.
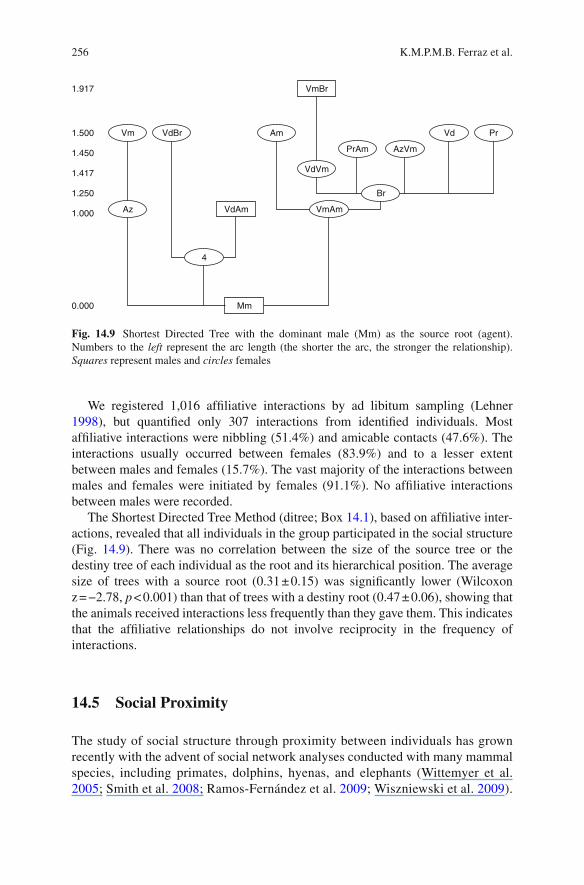
We registered 1,016 af fi liative interactions by ad libitum sampling (Lehner 1998 ) , but quanti fi ed only 307 interactions from identi fi ed individuals. Most af fi liative interactions were nibbling (51.4%) and amicable contacts (47.6%). The interactions usually occurred between females (83.9%) and to a lesser extent between males and females (15.7%). The vast majority of the interactions between males and females were initiated by females (91.1%). No af fi liative interactions between males were recorded.
The Shortest Directed Tree Method (ditree; Box 14.1 ), based on af fi liative inter-actions, revealed that all individuals in the group participated in the social structure (Fig. 14.9 ). There was no correlation between the size of the source tree or the destiny tree of each individual as the root and its hierarchical position. The average size of trees with a source root (0.31 ± 0.15) was signi fi cantly lower (Wilcoxon z = −2.78, p < 0.001) than that of trees with a destiny root (0.47 ± 0.06), showing that the animals received interactions less frequently than they gave them. This indicates that the af fi liative relationships do not involve reciprocity in the frequency of interactions.
14.5 Social Proximity
The study of social structure through proximity between individuals has grown recently with the advent of social network analyses conducted with many mammal species, including primates, dolphins, hyenas, and elephants (Wittemyer et al. 2005 ; Smith et al. 2008 ; Ramos-Fernández et al. 2009 ; Wiszniewski et al. 2009 ) .
AmVdBr
Br
VdAm
VdVm
Vm
Az
Pr
4
Vd
Mm
AzVm
VmBr
VmAm
PrAm
0.000
1.000
1.250
1.417
1.450
1.500
1.917
Fig. 14.9 Shortest Directed Tree with the dominant male (Mm) as the source root (agent). Numbers to the left represent the arc length (the shorter the arc, the stronger the relationship). Squares represent males and circles females
25714 Social and Spatial Relationships of Capybaras…
Social proximity can help de fi ne the social status of individuals because it results from individual tendencies to approach or avoid conspeci fi cs, thereby allowing the description of a network of social relationships within a group (Tiddi et al. 2011 ) .
During daily activities in captivity, individuals in a group of capybaras are organized in small clusters whose interindividual distance apparently varies depending on the type of activity, on the individuals involved, and on the dyadic social interactions. The composition of small clusters was registered every 5 min, resulting in 3,399 scans. Data were analyzed using Minimum Spanning Trees (Box 14.1 ).
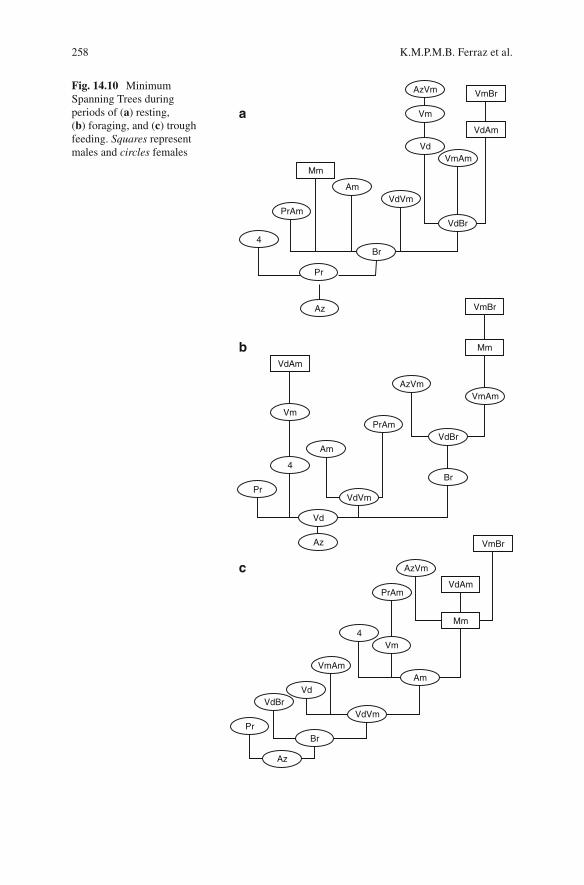
The spatial structure of capybaras in the group varied according to the situation and activity (Fig. 14.10 ): pairs of individuals were more frequently observed within the same subgroup during displacement and at the feeding trough, indicating a higher degree of organization in interindividual spatial relationships in these more tense social contexts. The displacements occurred in single fi le with an apparently organized line of individuals moving along preexisting trails.
Some individuals were always in central locations (e.g., Br and VdVm), whereas others were located in positions peripheral to the group structure (e.g., AzVm, 4 and VdAm). The central position indicates that the animal maintains close relationships with several individuals in the group, which may involve transition between sub-groups. This transition can result from different phenomena, depending on the hier-archical position of an individual. It can result from intolerance shown by other individuals, or from the freedom of a dominant animal to visit the various subgroups in search of food resources.
14.5.1 Social Proximity Among Males
Spatial proximity between males was much less frequent than among females. The three males were located at the extremities of the structures in all periods of activity (Fig. 14.10 ) and in distant locations in all structures except during displacement. This position suggests a role in patrolling females, thereby excluding potential competitors.
Males maintained greater distances between one another than in relation to the group of females in most situations, except in the most rigidly organized activities (feeding at the trough and displacements). In such activities, the proximity was characterized by strictly agonistic behaviors.
14.5.2 Social Proximity Among Females
Spatial relationships varied among females (Fig. 14.10 ), in terms of the numbers of other females with whom they maintained proximity, and the stability of their
258 K.M.P.M.B. Ferraz et al.
Am
VdBr
Br
VdAm
VdVm
Vm
Az
Pr
4
Vd
Mm
a
b
c
AzVm VmBr
VmAm
PrAm
Vm
Az
VdBr
4
VdAm
Mm
PrAm
Am
VdVm
VmBr
Vd
VmAm
PrBr
AzVm
Am
VdBr
Br
VdAm
VdVm
Vm
Az
Pr
4
Vd
Mm
AzVm
VmBr
VmAm
PrAm
Fig. 14.10 Minimum Spanning Trees during periods of ( a ) resting, ( b ) foraging, and ( c ) trough feeding. Squares represent males and circles females
25914 Social and Spatial Relationships of Capybaras…
af fi liations. Some never interacted with other females, and some formed particularly stable af fi liations although the biological basis for such behavior was unknown.
14.5.3 Social Proximity Between Males and Females
Males did not maintain any preferential relations with females (Fig. 14.10 ). Similarly, the intersexual spatial geometry was variable: some females were never close to males; others af fi liated with only one male and, if this was the dominant one, they were inevitably distanced from the subordinate.
14.6 Implications for Capybara Management in Captivity
Concentration of resources in captivity may intensify social tensions around water, food, and shelter. Therefore, we recommend that these resources should be provided widely spread. Providing food at various dispersed points within the area and the use of larger troughs may enable individuals to distribute naturally during feeding, lessening the chances of con fl ict and consequently social tension.
It is important to remember that con fi nement, however large the containment area, directly interferes with the natural dynamics of groups, altering the age struc-ture and sex ratio over time. Management actions must remove surplus individuals, keeping the original group structure, similar to the process that occurs in natural populations. Moreover, con fi nement also interferes in hierarchical relationships, since the animals are forced to live together and share the same resources. Thus, any procedure to minimize encounter rates and the frequency of aggressive behavior should be prioritized.
Acknowledgments We thank the Coordenação de Aperfeiçoamento de Pessoal de Nível Superior (CAPES), Brazil, for fi nancial support. We also thank José Roberto Moreira for illustrations of capybara behavior and for his valuable contribution for improving the chapter. We thank Paulo Bezerra for logistic support and the Buana Parque Farm, Guareí, São Paulo state, Brazil.
References
Alho CJR, Campos ZM, Gonçalves HC (1989) Ecology, social behavior and management of the capybara in the Pantanal of Brazil. In: Redford KH, Eisenberg F (eds) Advances in neotropical mammalogy. Sandhill Crane Press, Gainesville, pp 163–194
Azcárate TA (1980) Sociobiología y manejo del capibara ( Hydrochoerus hydrochaeris ). Doñana Acta Vertebrata 7(6):228
Beacham JL (2003) Models of dominance hierarchy formation: effects of prior experience and intrinsic traits. Behaviour 140:1275–1303
Bernstein IS (1981) Dominance: the baby and the bathwater. Behav Brain Sci 3:419–458
260 K.M.P.M.B. Ferraz et al.
Busacker RG, Saaty TL (1965) Finite graphs and networks. McGraw-Hill, New York Côté SD (2000) Determining social rank in ungulates: a comparison of aggressive interactions
recorded at a bait site and under natural conditions. Ethology 106:945–955 De Vries H, Appleby MC (2000) Finding an appropriate order for a hierarchy: a comparison of the
I&SI and the BBS methods. Anim Behav 59:239–245 Drews C (1993) The concept and de fi nition of dominance in animal behaviour. Behaviour
125(3–4):283–313 Gauthreaux SA Jr (1978) The ecological signi fi cance of behavioral dominance. In: Bateson PPG,
Klopfer PH (eds) Perspectives in ethology. Social behaviour. Plenun, New York, pp 17–54 Herrera EA, Macdonald DW (1993) Aggression, dominance, and mating success among capybara
males ( Hydrochaeris hydrochaeris ). Behav Ecol 4(2):114–119 Hinde RA (1983) Primate social relationships: an integrated approach. Blackwell, London Izar P, Japyassú HF, Alberts CC (2005) Métodos da Teoria dos Grafos para Análise Quantitativa
do Comportamento. In: Garcia A, Tokumaru RS, Borloti EB (eds) Etologia: uma perspectiva histórica e tendências contemporâneas. Multiplicidade, Vitória, pp 249–258
Izar P, Ferreira RG, Sato T (2006) Describing the organization of dominance relationships by dominance-directed tree method. Am J Primatol 68:189–207
Japyassú HF, Alberts CC, Izar P, Sato T (2006) EthoSeq: a tool for phylogenetic analysis and data mining on behavioural sequences. Behav Res Methods 38(4):549–556
Lee PC (1994) Social structure and evolution. In: Slater PJB, Halliday TR (eds) Behaviour and evolution. Cambridge University Press, Cambridge, MA, pp 266–303
Lehner PN (1998) Handbook of ethological methods. Garland STPM Press, New York Lord D (1994) A descriptive account of capybara behaviour. Stud Neotrop Fauna Environ
29:11–22 Lusseau D, Whitehead H, Gero S (2008) Incorporating uncertainty into the study of animal social
networks. Anim Behav 75(5):1809–1815 Macdonald DW (1981) Dwindling resources and the social behaviour of capybara, ( Hydrochoerus
hydrochaeris ) (Mammalia). J Zool Lond 194:371–391 Nelson RJ, Chiavegatto S (2000) Aggression in knockout mice. Mouse Behav Mod Biomed Res
41(3). http://dels.nas.edu:80/ilar_n/ilarjournal/41_3/Aggression.shtml Ramos-Fernández G, Boyer D, Aureli F, Vick lG (2009) Association networks in spider monkeys
( Ateles geoffroyi ). Behav Ecol Sociobiol 63:999–1013 Salas V (1999) Social organization of capybaras in the Venezuelan Llanos. University of
Cambridge, Cambridge, UK Sato T (1996) Relatório Técnico CNPq Schaller GS, Crawshaw PG (1981) Social organization in a capybara population. Saugetierkundliche
Mitteilungen 29:3–16 Scott JP, Fredericson E (1951) The causes of fi ghting in mice and rats. Physiol Zool 24:273–309 Smith JE, Kolowski JM, Graham KE, Dawes SE, Holekamp KE (2008) Social and ecological
determinants of fi ssion-fusion dynamics in the spotted hyaena. Anim Behav 76:619–636 Tiddi B, Aureli F, Schino G, Voelkl B (2011) Social relationships between adult females and the
alpha male in wild tufted capuchin monkeys. Am J Primatol 73:812–820 Wiszniewski J, Allen SJ, Möller lM (2009) Social cohesion in a hierarchically structured embay-
ment population of Indo-Paci fi c bottlenose dolphins. Anim Behav 77:1449–1457 Wittemyer G, Douglas-Hamilton I, Getz M (2005) The socioecology of elephants: analysis of the
processes creating multitiered social structures. Anim Behav 69:1357–1371