sino biopharmaceutical (1177 hk) trailblazer and innovator
TRANSCRIPT

Please refer to page 27 for important disclosures and analyst certification, or on our website www.macquarie.com/research/disclosures.
23 November 2018 Hong Kong
EQUITIES
1177 HK Outperform
Price (at 12:01, 22 Nov 2018 GMT) HK$7.07
Valuation HK$ 3.55 - NAV
12-month target HK$ 10.22
Upside/Downside % +44.6
12-month TSR % +45.3
GICS sector
Pharmaceuticals, Biotechnology & Life Sciences
Market cap HK$bn 89
Market cap US$bn 12
Free float % 51
30-day avg turnover US$m 47.2
Number shares on issue bn 12.64
Investment fundamentals
Year end 31 Dec 2017A 2018E 2019E 2020E
Revenue m 14,819 19,596 25,215 31,460
EBIT m 3,232 5,031 6,575 8,138
EBIT growth % 7.9 55.7 30.7 23.8
Reported profit m 2,171 2,770 3,416 4,213
Adjusted profit m 2,074 2,770 3,416 4,213
EPS rep ¢ 13.0 22.2 27.0 33.3
EPS rep growth % 32.6 70.6 21.7 23.3
EPS adj ¢ 12.4 22.2 27.0 33.3
EPS adj growth % 20.8 78.6 21.7 23.3
PER rep x 54.3 31.8 26.2 21.2
PER adj x 56.9 31.8 26.2 21.2
Total DPS ¢ 2.9 5.3 6.5 8.0
Total div yield % 0.4 0.7 0.9 1.1
ROA % 16.4 18.4 18.4 20.4
ROE % 24.2 18.0 14.9 16.2
EV/EBITDA x 28.2 15.2 12.1 9.9
Net debt/equity % -38.3 -9.7 -18.7 -26.6
P/BV x 12.8 4.1 3.7 3.2
Source: FactSet, Macquarie Research, November 2018
(all figures in HKD unless noted)
Analysts
Macquarie Capital Limited
David Ng, CFA +852 3922 1291 [email protected]
Xiang Gao, PhD +86 21 2412 9006 [email protected]
Kyler Lei +852 3922 1322 [email protected]
Sino Biopharmaceutical (1177 HK) Trailblazer and innovator
Key points
Innovative drug pioneer, supported by smart and experienced management.
Beijing Tide to contribute 44% of the company’s earnings growth in 2018.
Initiating coverage with Outperform rating and TP of HK$10.22, 45% upside.
Earlier adopter of innovative drugs in China
Sino Biopharmaceutical (SINO) is an early adopter of innovative drugs, with
Runzhong one of the ten best-selling prescription drugs in 2017 in China. It has a
good M&A track record, significantly improving sales of acquired assets and
disposing at great profit. It has the largest sales force among manufacturers and
the second-highest R&D spending, with 178 drugs under development: 25% from
innovative drugs and 9% from biologics. Anlotinib (安 替尼) is a Class 1.1
oncology drug, making SINO one of the few able to develop small-molecule
target drugs. The drug was launched in May 2018 and achieved Rmb0.3bn sales
in just two months. We target Rmb0.76bn sales for 2018 and 89% growth in
2019. Most of its biologics target launch in 2020.
Beijing Tide pivotal this year
Beijing Tide, a 57.6%-owned subsidiary, accounts for 26% of our target price. We
estimate the subsidiary to account for 44% of SINO’s core earnings growth in
2018, followed by 33% in 2019. During 2017, SINO’s 33.6% stake in Beijing Tide
accounted for 17% of the former’s core profits, which we expect will rise to 24% in
2018 due to organic growth of Beijing Tide and an increase of SINO’s stake to
57.6% on 1 March 2018. Beijing Tide produces sustained release formulations
through the use of microscopic spheres. It was one of SINO’s smartest
investments and highlights its ability to access products and technology.
Family ties: the good and bad
SINO is a family business. Chairlady Theresa Tse (aged 26) was appointed in
2015. She is the daughter of founders and major shareholders Mr. Tse Ping
(CEO aged 67) and Ms. Cheng Cheung Ling (Vice Chairlady aged 55). Tse Ping
represents the third generation of the founding Chia Tai (正大集 ) family, Asia’s
fourth richest, reputed for its entrepreneurship, long history in China and strong
ties with authorities. We believe the DNA will not change and SINO will remain an
adventurous and opportunistic trailblazer. Its subsidiaries are on average 60%-
owned, which leads to a much larger minority interest than peers. In 2018, the
company bought a 24% stake of Beijing Tide from the chairlady for Rmb11.4bn at
37x 18E PER, a full valuation considering the stock currently trades at 33x. The
deal was funded by shares and diluted earnings by 12%.
Valuation
We apply 30x PE on 2019E EPS of all therapeutical areas to arrive at our target
price of HK$10.22, implying 45.3% TSR. We believe the multiple is justified in
view of the strong earnings growth (34% in 2018 and 23% in 2019), versus peers
trading at 27.9x (12% growth in 2019).
Key risk
A family business with connected transactions might lead to governance issues.

Macquarie Research Sino Biopharmaceutical (1177 HK)
23 November 2018 2
Inside
Trailblazer and innovator 3
Valuation, recommendation, risks 7
Product analysis 10
Financial analysis 20
Appendices 24
1177-HK vs MSCI CH and MSCI CH A (HK$)
Source: FactSet, Macquarie Research, Nov. 2018
MQ forecast vs Consensus forecast (Rmb bn)
Source: FactSet, November 2018 MQ: Macquarie forecast, Cons: FactSet consensus
Events after listing in 2003:
A 2005: Founded Jiangsu Chia Tai Fenghai Pharma & Yancheng Suhai Pharma and sold Shandong Chia Tai Freda Pharma
B 2007: Founded Jiangsu Chia Tai Qingjiang Pharma
C 2008: Founded Qingdao Chia Tai Haier Pharma
D 2010: Runzhong was launched
Admitted into HSI-Consumer Goods and HSI SmallCap constituent stock
E 2011: Founded Chia Tai Shaoyang Orthopaedic Hospital
F 2013: Imatinib Mesylate and Zhiruo were launched
G 2014: Acquired of Karolinska Development and became the largest shareholder
H 2015: Acquired LifeBond, an Israel based medical device company, and became the second largest shareholder
Invest US$200mn in Pitango Venture Capital, the largest VC in Israel
I 2017: Acquired 42% stake of Qingdao Chia Tai Haier with Rmb352mn, total interest amount up to 93%
J 2018: Acquired 24% stake of Beijing Tide with total interest up to 57.6%
Admitted into HSI constituent stock
Anlotinib Hydrochloride was launched
Company profile
Sino Biopharmaceutical Limited (SINO) is a leading pharmaceutical group in
China, with business encompassing an integrated cycle from research &
development, manufacturing, to sales & marketing. Major subsidiaries include
Chia Tai Tianqing (products: Runzhong and Tianqingganmei), Nanjing Chia
Tai Tianqing (Tuotuo and Tianqingning), Beijing Tide (Kaishi and Kaina),
Jiangsu Chia Tai Fenghai (Xinhaineng and Fenghaineng), Qingdao Chia Tai
Haier (Gaisanchun), and Jiangsu Chia Tai Qingjiang (Jiuli).
SINO runs a diversified portfolio of products ,with therapeutical areas across
hepatitis, cardio-cerebral, oncology, analgesic, orthopaedics, and infectious,
respiratory and anorectal diseases as well as parenteral nutrition. Blockbusters
include Runzhong ( ) which hit Rmb3.2bn sales in FY17 and showed 7%
YoY growth in 1H18. Tianqingganmei ( ), Kaifen ( ) and Kaishi (
) are also blockbusters, with over Rmb1bn sales in FY17, followed by
another five with sales over Rmb0.5bn and 23 over Rmb0.1bn.
SINO is proactive in M&A, with the latest acquisition in November 2017 when it
acquired a 42% stake in Qingdao Chia Tai Haier from Haier Group for
Rmb352m, increasing its stake to 93%. In March 2018, it acquired 24% of
Beijing Tide for HK$12.9bn and consolidated the entity as a subsidiary with
57.6% stake.
Chairwoman Theresa Tse is the fourth generation of the Tse (Chearavanont in
Thailand) family and is the daughter of Mr. Tse Ping (CEO) and Ms. Cheng
Cheung Lin (Vice Chairwoman), founders and major shareholders of the
company. She graduated with a Bachelor Degree of Science in Economics
from the Wharton School of University of Pennsylvania and became
Chairwoman and Executive Director in 2015 and a major shareholder in 2018.
SINO was listed on GEM Board in 2000, moving to the Main Board in 2003. It
has grown rapidly throughout the last 20 years from revenue of Rmb250m and
net profits of Rmb20m in 1998 to an estimated Rmb19.6bn and Rmb2.77bn in
2018. Moving forward, SINO has ambitious plans, with a strong pipeline of
products, promising growth potential.
From 2014 to 2017, revenue and earnings CAGR were 15% and 21%,
respectively. The hepatitis, oncology and cardiovascular segments contributed
44%, 11% and 10% of 2017 revenue. We expect revenue and earnings to
increase by 32% and 34% in 2018, due to consolidation of Beijing Tide as well
new product launches such as anlotinib ( ) and lidocaine cataplasms
(利 ).
Fig 1 Company History
Source: FactSet, Macquarie Research, November 2018, priced as of 22 November 2018
5
7
9
11
13
15
2,500
3,000
3,500
4,000
4,500
5,000
5,500
Nov 17 Feb 18 May 18 Aug 18 Nov 18
MSCI Chinax50 (LHS)MSCI CH A (LHS)Stock (RHS)
2015A 2016A 2017A 2018E 2019E
MQ 19.6 25.2
Cons 20.6 24.7
Dif% -5% 2%
MQ 2.77 3.42
Cons 2.96 3.66
Dif% -6% -7%
Revenue 11.8 13.5 14.8
Net profit 2.85 2.82 3.48
0
3
6
9
12
15
2004 2005 2006 2007 2008 2009 2010 2011 2012 2013 2014 2015 2016 2017 2018
Events before listing in 2003:• 2000 Listed on the GEM of Hong Kong Stock Exchange (HK827)• 2001 Nanjing Chia Tai Tianqing Pharmaceutical Co., Ltd. was founded• 2002 Beijing Chai Tai Green Continent Pharmaceutical Co., Ltd. was founded• 2003 Beijing Tide Pharmaceutical Co., Ltd. was founded• 2003 Listed on the Main Board of the Hong Kong Stock Exchange (HK1177)
Stock price (HKD)
A
B
C
D
E
F
G
I
H
J

Macquarie Research Sino Biopharmaceutical (1177 HK)
23 November 2018 3
Trailblazer and innovator
Earlier adopter of innovative drugs in China
Management has very good vision on where the healthcare industry is heading in terms of both
policies and product development. In the 1990s, when most drug companies were still busy with
traditional Chinese medicines (TCM) and the manufacture of active pharmaceutical ingredients
and intermediates of western drugs, SINO management was prowling for differentiated products
and business models. Compared to foreign drug companies or some domestic biotechnology start-
ups these days, SINO can hardly be called technology-intensive. However, it has been ahead of
peers almost all the time. It is one of the very few Chinese drug companies able to develop a
chemical product through acquisition of a domestic company, market it successfully in China and
sell it to a foreign company for global sales, which attests to its vision, execution and commercial
prowess.
It bought a 55% stake in CTF in 1994 for Rmb6m, which made eye drops with active ingredients
plus hyaluronan (approved in 1993). The advantages of hyaluronan, now commonly used, are its
viscosity and long retention time on the surface of the eyes, making it suitable for dry eyes, would
healing and lubricating joints. SINO sold its stake to Bausch & Lomb in 2005 for US$200m at 18.6x
trailing PE. In 2003, it bought a 35% stake in Beijing Tide for Rmb80m and grew its net profits to
an estimated Rmb1.29bn in 2018. It produces sustained release formulations through the use of
microscopic spheres that encapsulate active ingredients and control their release into the blood
stream. The technology is useful in converting well-known drugs with poor characteristics such as
short half-life and high toxicity into user-friendly products.
Tianqingganmei (天晴甘美) and Tianqingganping (天晴甘 ) are good examples where SINO
(through acquisition) successfully develops and markets modernized Chinese medicine. The two
products and their previous versions are extracts from liquorice, a common ingredient present in
many Chinese drug formulas targeting various disorders. In western pharmacology, liquorice
interferes with the secretion of corticosteroids, which regulate bodily functions. In Chinese
medicine, liquorice is considered to help protect liver cells from injuries caused by hepatitis B virus
but it does not directly eliminate the virus. However, its relatively low side effects make it more
tolerable than western drugs. The company’s technology is in the extraction, separation and
purification processes. It makes sense to combine its use with the anti-viral western drugs.
Seeing the big potential in the hepatitis B market in China (90m patients, among which 28m need
immediate treatment), the company ran ahead of peers to launch the first-to-market generic of
entecavir and branded it Tianding ( ). Together with its other dosage forms (same active
ingredient): Tianding and Ganze, we estimate close to Rmb4bn sales in 2018, making it one of the
ten best-selling non-TCM prescription drugs in China. The advantages of first-to-market
generics are fewer competition, higher margins and longer stays in the market. In the past, first-to-
market generics were treated as new drugs in the approval process, but, under the new
classification, they only need the qualification of a generic drug.
We also like SINO’s R&D capability. Fukewei’s (福可 ) active ingredient is anlotinib (安 替尼).
This is a Class 1.1 drug in oncology. SINO is one of the few companies able to develop small-
molecule target drugs in this field. The successful development and launch of anlotinib is very
important in showing the company’s capability to develop innovative drugs and adapt to
new drug development procedures after a series of reforms with the regulators. The project was
launched in May 2018 and achieved Rmb0.3bn sales in just two months. We target sales of
Rmb0.76bn for 2018 and up 90% to Rmb1.44bn in 2019.
The company is also working on biological drugs. We believe a potential surprise to the market
is that most of their biologics are already in Phase 3 and target launch in 2020. They cover
most of the targets of existing blockbuster biological drugs on the market such as Rituxan,
Herceptin and Avastin. While development of biologics is more difficult than and very different from
that of chemical drugs, it shows how SINO is able stay abreast of the latest trend. Management is
smart in catching the right patient demographics, as shown by their picks of early-to-market
generics. Ticagrelor in the cardiovascular field, budesonide in the respiratory field and bortezomib
in the oncology filed are just a few examples. When these future products are combined with one
of the largest and most experienced sales force, their market impact should be huge. The ability to
develop and market generics as well as the capability to launch the right generics quickly to the
market are key strengths for SINO down the road, differentiating the company from its competitors.
One of the very few
Chinese drug
companies able to
develop a chemical
product, market it
successfully in China
and sell it to a foreign
company for global
sales
Runzhong ( )
Tianqingganmei
( )
Tianqingganping
(天晴甘平)
Source: Company website (authorized by management), November 2018

Macquarie Research Sino Biopharmaceutical (1177 HK)
23 November 2018 4
Beijing Tide the biggest driver in 2018
We forecast 32% and 34% growth in revenue and earnings in 2018 for SINO, driven by new
launches and an increase in stake of Beijing Tide. 1H18 YoY growth achieved was 30% for
revenue and 42% for core earnings. During 2017, SINO’s 33.6% stake in Beijing Tide accounted
for 17% of the former’s core profits, which we expect will rise to 24% in 2018 due to organic growth
of Beijing Tide and an increase of SINO’s stake to 57.6% on 1 March, 2018. Beijing Tide was one
of the smartest investments by the company’s management and highlights their ability to access
products and technology through good connection with authorities.
We estimate Beijing Tide to account for 44% of SINO’s core earnings growth in 2018, followed by
33% in 2019. Its three key drugs in multiple dosage forms face different fates in 2018. Flubiprofen
injections (Kaifen) and its patch (Zepolas) should generate Rmb2.75bn sales, up over 35% YoY.
Its cardiovascular drug Kaina ( 那) should see 20% growth to reach Rmb0.45bn in 2018, but we
expect a decline for Kaishi ( ) by 30% to Rmb0.76bn. The most-watched event should be the
launch and performance of Debaining (得百宁) with active ingredient Lidocaine. We expect Beijing
Tide earnings attributable to SINO to grow 32% in 2019 and 23% in 2020. It accounts for 26% of
our target price.
Fig 2 Contribution of Beijing Tide before and after consolidation (Rmb in thousand)
Source: Company data, Macquarie Research, November 2018
We expect more exciting launches in coming years, driven by huge R&D investments and strong
DNA in the development of innovative and first-to-market generic drugs. SINO currently has 2,000
R&D staff working in ten research centers. Some 4% of the R&D team have PhD degrees, and
59% have master’s degrees. Of the 178 drugs under development, 25% are innovative drugs, 9%
are biologicals and 65% are generics. In terms of therapeutic fields, oncology drugs account for
41%, followed by 12% in liver disorders, 10% in antibiotics.
More than just a pharmaceutical company
SINO is a family-owned business. Chairwoman Theresa Tse (aged 26) was appointed in 2015.
She is the daughter of founders and major shareholders Mr. Tse Ping (aged 67) and Ms. Cheng
Cheung Ling (aged 55). Executive Director Mr. Tse Hsin (aged 49) is a first cousin of Mr. Tse Ping.
Other senior management includes family members such as Miss Tse Wun (aged 52), sister of
Tse Hsin; Ms. Chia Fai (aged 61), sister of Mr. Tse Ping; Mr. Tse Hsuan, Johnny (aged 49), also
first cousin of Mr. Tse Ping. Most have professional education and have been working with the
company for a long time. The key shareholders are Ms. Cheng Cheung Ling (18%) through holding
companies Chai Tai Bainian and Remarkable Industries, Mr. Tse Ping (12%) through holding
company Validated Profits and Miss Theresa Tse (10%), through holding company France
Investment. The strong management team, bonded by close family relationships, good
connections with authorities and long experience in the healthcare industry help the chairwoman
execute efficiently and plan future strategies.
2014 2015 2016 2017 2018F 2019F 2020F
Tide profit 686,345 783,048 928,787 1,067,742 1,290,509 1,531,097 1,739,000
Sino Bio profit 1,173,999 1,437,083 1,637,378 2,073,820 2,769,845 3,415,978 4,213,054
Profit attributable to Tide 230,612 263,104 312,072 358,761 665,903 881,912 1,001,664
% of profit attributable to Tide 20% 18% 19% 17% 24% 26% 24%
Sino Bio profit incremental NA 263,084 200,295 436,442 696,025 646,133 797,075
Profit incremental of Sino Bio
attributatble to TideNA 32,492 48,968 46,689 307,142 216,009 119,752
% of profit incremental of Sino
Bio attributable to TideNA 12% 24% 11% 44% 33% 15%
Beijing Tide accounts
for 26% of our
target price
The strong management
team with close
relationships with each
other, good connection
with authorities and
long experience in
healthcare industry help
the chairlady execute
Macquarie Research Sino Biopharmaceutical (1177 HK)
23 November 2018 5
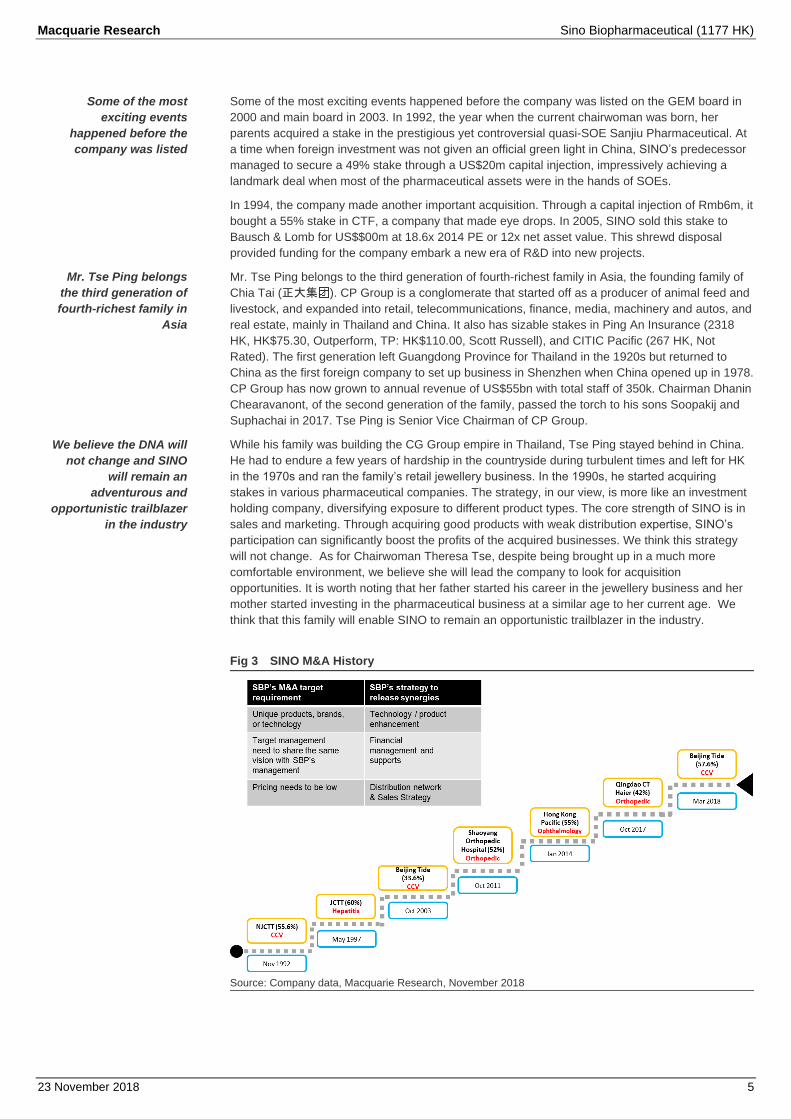
Some of the most exciting events happened before the company was listed on the GEM board in
2000 and main board in 2003. In 1992, the year when the current chairwoman was born, her
parents acquired a stake in the prestigious yet controversial quasi-SOE Sanjiu Pharmaceutical. At
a time when foreign investment was not given an official green light in China, SINO’s predecessor
managed to secure a 49% stake through a US$20m capital injection, impressively achieving a
landmark deal when most of the pharmaceutical assets were in the hands of SOEs.
In 1994, the company made another important acquisition. Through a capital injection of Rmb6m, it
bought a 55% stake in CTF, a company that made eye drops. In 2005, SINO sold this stake to
Bausch & Lomb for US$$00m at 18.6x 2014 PE or 12x net asset value. This shrewd disposal
provided funding for the company embark a new era of R&D into new projects.
Mr. Tse Ping belongs to the third generation of fourth-richest family in Asia, the founding family of
Chia Tai (正大集 ). CP Group is a conglomerate that started off as a producer of animal feed and
livestock, and expanded into retail, telecommunications, finance, media, machinery and autos, and
real estate, mainly in Thailand and China. It also has sizable stakes in Ping An Insurance (2318
HK, HK$75.30, Outperform, TP: HK$110.00, Scott Russell), and CITIC Pacific (267 HK, Not
Rated). The first generation left Guangdong Province for Thailand in the 1920s but returned to
China as the first foreign company to set up business in Shenzhen when China opened up in 1978.
CP Group has now grown to annual revenue of US$55bn with total staff of 350k. Chairman Dhanin
Chearavanont, of the second generation of the family, passed the torch to his sons Soopakij and
Suphachai in 2017. Tse Ping is Senior Vice Chairman of CP Group.
While his family was building the CG Group empire in Thailand, Tse Ping stayed behind in China.
He had to endure a few years of hardship in the countryside during turbulent times and left for HK
in the 1970s and ran the family’s retail jewellery business. In the 1990s, he started acquiring
stakes in various pharmaceutical companies. The strategy, in our view, is more like an investment
holding company, diversifying exposure to different product types. The core strength of SINO is in
sales and marketing. Through acquiring good products with weak distribution expertise, SINO’s
participation can significantly boost the profits of the acquired businesses. We think this strategy
will not change. As for Chairwoman Theresa Tse, despite being brought up in a much more
comfortable environment, we believe she will lead the company to look for acquisition
opportunities. It is worth noting that her father started his career in the jewellery business and her
mother started investing in the pharmaceutical business at a similar age to her current age. We
think that this family will enable SINO to remain an opportunistic trailblazer in the industry.
Fig 3 SINO M&A History
Source: Company data, Macquarie Research, November 2018
Some of the most
exciting events
happened before the
company was listed
Mr. Tse Ping belongs
the third generation of
fourth-richest family in
Asia
We believe the DNA will
not change and SINO
will remain an
adventurous and
opportunistic trailblazer
in the industry

Macquarie Research Sino Biopharmaceutical (1177 HK)
23 November 2018 6
Fig 4 Major subsidiaries of SINP as of 1H2018
Source: Company data, Macquarie Research, November 2018
Company Name Business Shareholdings%
Chia Tai Pharmaceutical Investment (Beijing) Co., Ltd. Investment 100
Jiangsu Runji Investment Co., Ltd. Investment 60
Jiangsu Chia Tai Qingjiang Pharmaceutical Co., Ltd. R&D, Manufacture, Sales 55.588
Jiangsu Chia Tai Qingjiang Medicines Co., Ltd. Sales & Distribution 55.588
China Biotech & Drug Development Limited R&D 51
Qingdao Chia Tai Haier Pharmaceutical Co., Ltd. R&D, Manufacture, Sales 93
Qingdao Heng Seng Tang Pharmacy Co., Ltd. Retail 93
Qingdao Chia Tai Haier Medicines Co., Ltd. Sales & Distribution 93
Tianjin Zhenwutang Food Co., Ltd. Manufacture & Sales 51
Shanghai Tongyong Pharmaceutical Co. R&D, Manufacture, Sales 81.786
Shanghai Tongzheng Import Export Co., Ltd. Sales & Distribution 81.786
Jiangsu Chia Tai Fenghai Pharmaceutical Co., Ltd. R&D, Manufacture, Sales 60.898
Jiangsu Chia Tai Fenghai Medicines Co., Ltd. Sales & Distribution 60.898
Nanjing Chia Tai Fenghai Medicines Technology Co., Ltd.Sales & Distribution 60.898
Chia Tai-Tianqing Pharmaceutical Holdings Co., Ltd. R&D, Mnufacture, Sales 60
Lianyungang Chia Tai Tianqing Medicines Co., Ltd. Sales & Distribution 60
Lianyungang Tianrun Pharmacy Ltd. Retail 60
Lianyungang Runzhong Pharmaceutical Co., Ltd. Manufacture & Sales 60
Nanjing Shunxin Pharmaceutical Co., Ltd. Manufacture & Sales 60
Nanjing Chia Tai Tianqing Pharmaceutical Co., Ltd. R&D, Manufacture, Sales 55.6
Beijing Tide Pharmaceutical Co. Ltd. R&D, Manufacture, Sales 57.6
Macquarie Research Sino Biopharmaceutical (1177 HK)
23 November 2018 7
Valuation, recommendation, risks
We base our target price on 2019E PE multiples, but we differ from our peers in providing 1) free
cash flow analysis on each product and business, 2) a breakdown of revenue and earnings into
individual products or subsidiaries and associates, with respective margin/SGA/tax assumptions,
plus 3) major products under development, as far as into the pre-clinical stage if meaningful,
associated with estimated probability of each event, R&D of each stage, and sales trajectory.
The discounted free cash flows will result in a gross asset value, which, after adding the net cash
(or minus net debt) and working capital, will become net asset value (NAV). Currently, we use end-
2019 to calculate our NAV estimates. NAV estimates are important in two important aspects:
evaluating the present value of projects under development, which may not be able to
contribute to earnings in the next three years;
considering the impact on balance sheet after acquisitions and disposals, which may not be
captured when just using a PE multiple to value a company.
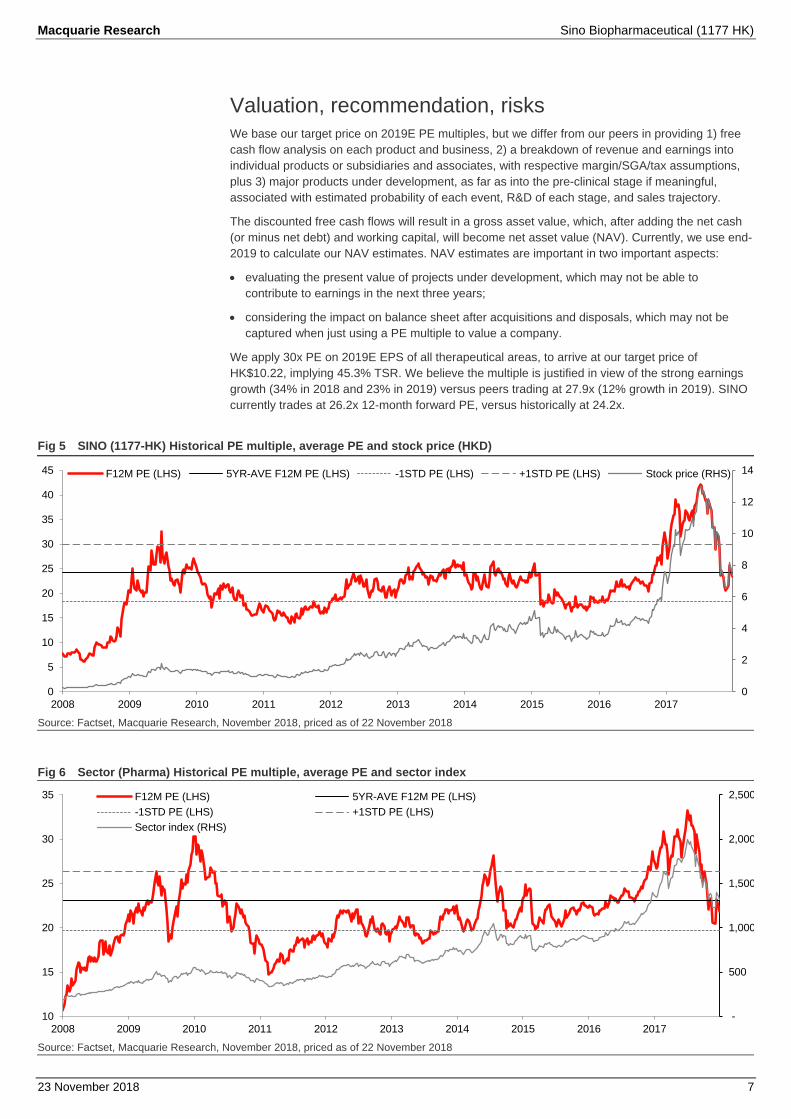
We apply 30x PE on 2019E EPS of all therapeutical areas, to arrive at our target price of
HK$10.22, implying 45.3% TSR. We believe the multiple is justified in view of the strong earnings
growth (34% in 2018 and 23% in 2019) versus peers trading at 27.9x (12% growth in 2019). SINO
currently trades at 26.2x 12-month forward PE, versus historically at 24.2x.
Fig 5 SINO (1177-HK) Historical PE multiple, average PE and stock price (HKD)
Source: Factset, Macquarie Research, November 2018, priced as of 22 November 2018
Fig 6 Sector (Pharma) Historical PE multiple, average PE and sector index
Source: Factset, Macquarie Research, November 2018, priced as of 22 November 2018
0
2
4
6
8
10
12
14
0
5
10
15
20
25
30
35
40
45
2008 2009 2010 2011 2012 2013 2014 2015 2016 2017
F12M PE (LHS) 5YR-AVE F12M PE (LHS) -1STD PE (LHS) +1STD PE (LHS) Stock price (RHS)
-
500
1,000
1,500
2,000
2,500
10
15
20
25
30
35
2008 2009 2010 2011 2012 2013 2014 2015 2016 2017
F12M PE (LHS) 5YR-AVE F12M PE (LHS)
-1STD PE (LHS) +1STD PE (LHS)
Sector index (RHS)

Macquarie Research Sino Biopharmaceutical (1177 HK)
23 November 2018 8
We estimate NAV of HK$3.55, using a discount rate of 8.70%. Cost of equity is calculated using a
risk-free rate of 3.5% and risk-free premium of 7%, which are the same across all healthcare
companies under coverage. We assign a beta of 1.13 versus MSCI China, as compared to latest
two-year weekly beta of 1.24 versus MSCI China-A (1.31 if versus Hang Seng Index).
Our NAV can be broken down into HK$1.15/share from oncology, HK$0.73 from hepatitis,
HK$0.41 from analgesic, HK$0.34 from orthopaedic, HK$0.31 from Cardio-cerebral, HK$0.19 from
Digestive, HK$0.31 from Anti-infectious, Respiratory & Parenteral nutritious, Vitamin C & caffeine,
HK$-0.88 from others and HK$0.99 from working capital.
We project five years of total R&D expenditure of Rmb16.4bn. This is compared to about
Rmb1.3bn spent during 1H18, or 13.7% of revenue. Such expenditure is supposed to go into
preclinical and clinical drug development as well as bioequivalence studies for generic drugs. Not
all of their revenue impact down the road has been fully captured in our model.
YTD, SINO has been a median performer among the pharmaceutical manufacturers, down 19%,
exactly the sector median of our pharmaceutical index portfolio. We believe there is opportunity to
bottom fish, given SINO’s strong growing outlook.
Fig 7 YTD stock performance among peers
Source: Factset, Macquarie Research, November 2018, priced as of 22 November 2018
Fig 8 Comparables (Price in trading currency)
OP: Outperform, N: Neutral, UP: Underperform, NR: Non-rated; Rated forecasts by Macquarie Research and non-rated forecasts by FactSet Consensus.
Source: FactSet, Macquarie Research, November 2018, priced as of 22 November 2018
21%
5% 2% 2%
-0% -2%-10%
-19% -19%-25%
-34%-40%
-44% -44% -45% -47%
Ticker Company Mkt. Cap. P/BV Yield
(US$ bn) TP Price Rating 2018F 2019F 2020F 2018F 2019F 2020F 2018F 2018F Revenue Profits
600276-CN Hengrui 34.0 NR 63.32 NR 58.1 45.8 36.4 50.0 12.2 0.2% 25.6% 27.0%
1093-HK CSPC 13.2 25.39 16.00 OP 27.4 20.1 16.1 18.0 13.6 11.1 5.5 1.2% 26.1% 36.6%
1177-HK Sino Biopharm 12.0 10.22 7.07 OP 31.8 26.2 21.2 15.2 12.1 9.9 4.1 0.7% 28.7% 23.3%
2196-HK Fosun Pharm-H 10.4 NR 27.55 NR 22.7 18.2 15.8 16.7 13.5 11.9 2.2 1.6% 18.1% 24.7%
000963-CN Huadong Med 7.4 NR 34.54 NR 22.8 18.2 14.8 17.5 14.0 11.7 5.1 1.7% 12.9% 25.3%
002422-CN Sichuan Kelun P 5.1 NR 24.59 NR 28.6 22.7 18.4 12.5 10.4 9.3 2.8 1.2% 17.4% 26.3%
002001-CN ZJ NHU 4.6 NR 16.23 NR 9.3 13.0 14.0 7.5 8.1 7.6 2.2 5.8% 19.6% -28.5%
000661-CN Changchun High 4.6 NR 187.95 NR 32.6 24.8 19.0 20.7 15.4 11.8 6.1 0.6% 28.0%
600867-CN Tonghua Dongbao 4.2 NR 14.44 NR 29.0 25.2 19.8 22.6 18.2 14.6 5.8 1.3% 18.9% 15.2%
1530-HK 3SBio 4.0 NR 12.34 NR 24.6 19.8 15.6 20.6 16.7 14.0 3.3 0.0% 21.9% 24.6%
002294-CN Salubris 3.7 40.06 25.22 OP 16.1 12.9 10.8 12.6 10.1 8.5 3.8 3.6% 21.9% 25.1%
000999-CN CR Sanjiu 3.5 NR 24.72 NR 16.9 15.2 13.7 12.0 10.6 9.6 2.2 1.3% 13.1% 11.5%
1513-HK Livzon Pharm-H 3.2 37.61 29.05 OP 17.2 14.4 13.5 7.8 6.9 6.3 1.7 1.7% 14.5% 19.9%
867-HK CMS 3.1 NR 9.52 NR 10.7 9.3 8.3 7.4 6.6 6.1 2.4 3.5% 9.7% 15.2%
2186-HK Luye 2.6 8.76 6.46 OP 15.4 13.4 12.2 10.4 9.0 8.3 2.4 1.0% 21.0% 15.8%
600521-CN ZJ Huahai Pharm 2.5 NR 14.03 NR 76.8 150.0 49.0 20.2 15.0 15.9 3.3 1.1% 19.7% -48.8%
Median 23.7 19.0 15.7 17.1 13.5 11.7 3.3 1.3% 19% 16%
Average 27.0 27.9 18.6 18.1 13.0 11.3 4.2 1.7% 18% 12%
Listed Curr. P/E EV/EBITDA 2018/19 growth
SINO stock and volume
Source: FactSet, Macquarie Research, November 2018 (HKD)
-
20
40
60
80
100
120
140
160
180
Nov 15 Mar 15 Jul 15 Nov 15
10
15Daily turnover (LHS)Price (RHS)

Macquarie Research Sino Biopharmaceutical (1177 HK)
23 November 2018 9
Key Risks
The strong family ties, support from authorities and connected transactions among family
members’ holdings, sister companies and SINO may raise corporate governance risks. With a
gigantic family tree covering diverse businesses in China and Thailand, we do not have full
disclosure of the latest fundamentals of the assets of non-listed family assets.
Before SINO was listed on the GEM Board in 2000 (HKEX in 2003), according to Tse Ping, during
the financial crisis in the late 1990s he had to sell off eight pharmaceutical companies to raise
capital for the family to repay its debt. These were stakes in drug manufacturers which he acquired
between 1991 and 1997 and improved through strengthening their sales and marketing. Then, by
investing his own money, he gained control of the remaining businesses and founded SINO.
In January 2018, SINO bought a 24% stake in Beijing Tide from the chairwoman through the
issuance of shares at HK$12.73. The purchase price was about 27% of our estimated 2018
earnings. After the acquisition, SINO will own 57.6% of Beijing Tide and consolidate its operations.
Beijing Tide contributed 24% of SINO’s earnings in 2018, according to our estimates; and the
former’s attributable growth contributed 44% of SINO’s earnings growth in 2018. While the deal is
crucial in supporting 2018 earnings growth, it was purchased at an expensive price, in our opinion.
The deal was valued at 37x 2018 or 30x 2020 PE multiples based on our estimates. The
chairlady’s stake in the company increased from 0% to 12%, diluting the interests of the rest.
There may be more such transactions down the road, causing concerns to some investors. In
addition to the 42% shareholding of SINO, the company's founding family has strong incentive to
get key operating subsidiaries on track, as they also directly hold respective 5%/9.4%/27% equity
shares in key subsidiaries Jiangsu Chia Tai Tianqing, Nanjing Chia Tai Tianqing and Beijing Tide.
The current major revenue contributors have been in the market for many years and are facing the
problem of sales almost peaking, such as Runzhong, Tianqingganmei, Kaishi and Kaina, which
accounted for almost half of the company’s revenue in 2017. The oncology segment has been
growing quickly. However, if the traditional segment is slowing down faster than expected, there is
risk SINO will suffer a gap in growth. A new drug for hepatitis, Qingzhong, may erode the market
share of Runzhong, considering their similarity. The growth in the next two years depends heavily
on the performance of blockbuster drugs, like anlotinib, tenofovir and budesonide.
Most of the subsidiaries are owned 60% or so by SINO, which generates a large minority interest.
The company increased the shareholding of its associate Beijing Tide and consolidated it.
According to management, they would like to acquire more shareholding in their subsidiaries if
there is an opportunity. We are keen to see what it is going to happen in this aspect.
Fig 9 Sales and weight change of key drugs (Rmb bn)
Source: Company Data, Macquarie Research, November 2018
0.1 0.5
1.1 1.7 2.3 2.5 3.0 3.2 0.5
0.9
1.4 1.7 1.9
1.8 1.9 1.9 1.1
1.4
1.7 1.6 1.6
1.3 1.2 1.1
0.3 0.4
0.5
0.4 0.5 0.6
0.3
0.4
0.6 0.8
1.0
1.0 1.2 1.6
0.2
0.3
0.4 0.6
0.7
0.6 0.7 0.8
0.4 0.4
0.5
1.0 1.3 1.4
1.4 1.4
0.2 0.7 1.3
3.2 3.7 4.2
0%
10%
20%
30%
40%
50%
60%
70%
80%
90%
100%
2010 2011 2012 2013 2014 2015 2016 2017
Runzhong Tianqingganmei Kaishi Yilunping Kaifen Haidewei Oncology drugs Other drugs
There may be more of
the above transactions
down the road, causing
concerns to some
investors.
The current major
revenue contributors
have been on the
market for a while and
are facing the problem
of sales almost peaking
or slowing down

Macquarie Research Sino Biopharmaceutical (1177 HK)
23 November 2018 10
Product analysis
The company has been specialized in the hepatitis B market for more than a decade, with their
blockbuster innovative drug Tianqingganmei launched in 2005 and the first-to-market generic
entecavir launched in 2010. These two drugs contributed 34% of the company’s revenue in 2017.
Beginning 2012, the company entered the oncology field and launched a couple of early-to-market
generics, such as antimetabolites including Saiweijian, Shoufu and Qingweike, and target drugs
such as imatinib and gefitinib. In 2018, they launched their innovative target drug anlotinib, which
could achieve an estimated sales of Rmb0.8bn in 2018. Oncology drugs would become No. 1
revenue contributor by 2020. Other drugs need to be noted include Aisuping, with its chemical of
esomerprazole, would record a revenue of Rmb0.8bn in 2018.
One major associate of the company is Beijing Tide, specialized in extended drug delivery system
in the CCV and analgesic fields; blockbuster drugs such as Kaifen, Kaishi and Kaina, combined
with Kaifen’s cataplasm form Zepusi, have been growing fast at a CAGR of 23% in the past three
years. Tide has been consolidated with Sino Biopharm since March 2018.
Pipeline analysis
In its traditionally advantageous hepatitis filed, Qingzhong, the new generation hepatitis B drug, is
scheduled to launch in 2019. Similar to Runzhong, Qingzhong is also the first-to-market generic,
and we believe it will accelerate growing after launch and record sales of Rmb0.6bn in 2019.
In the CCV field, a couple of high potential generics are schedule to launch in 2019, including
ticagrelor, apixaban and rivaroxaban. In the oncology filed, blockbuster generics, bortezomib and
lenalidomide, were launched in 2018 and will launch in 2019, respectively. In the respiratory field,
budesonide is scheduled to launch in 2019, with our estimated peak sales of Rmb3bn.
The company is also developing biological drugs, covering almost all of the popular drug targets.
Most of the biologics are supposed to launch in 2020, and we estimate biologics will record sales
of Rmb1.5bn that year and become the main growth driver the following five.
Fig 10 Major market and pipeline drugs with estimated launch date and peak sales (Rmb)
Source: Macquarie Research, November 2018
MARKET <0.1bn 0.1-0.3bn 0.3-0.5bn 0.5bn-1bn >1bnInnovative
Class 1 Tianqingganmei 1.8>>3.0
Fukewei 0.8>>4.0
Class 2 Kaifen 2.0>>2.5
Generic
Class 3Qingzhong 0.1>>2.5
Debaining 0.2>>1.0
Runzhong 3.4>> 3.5
Class 4
Tuotuo 0.7>>1.0
Yilunping 0.8>>1.0
Aisuping 0.8>>2.0
Gansanchun1.1>>1.5
In-licensed
PIPELINE Pre-clinical Phase 1 Phase 2 Phase 3 NDA/ANDAInnovative
Class 1 Adalimumab 2020
Bevacizumab 2020
PD-L1 2020
Trastuzumab 2020
Rituximab 2020
Class 2
Generic
Class 3
Apixaban 2019
Rivaroxaban 2020
Budesonide 2019
Lenalidomide 2019
Class 4 Ticagrelor 2019
Estimated 2018 sales >> Estimated peak sales in the future
Estimated year of launch

Macquarie Research Sino Biopharmaceutical (1177 HK)
23 November 2018 11
Fig 11 Tianqingganmei Fig 12 Market breakdown of liver protection drugs
Sales trend: Tianqingganmei recorded sales of Rmb1.9bn in
2017, accounting for 13% of total revenue, with a growth
CAGR of 2.4% in 2013-2017. As a Class 1.1 innovative drug, it
faced little pricing pressure. In the future, we estimate it will
grow at a single digit and achieve a peak sales of Rmb3bn.
Market size: according to WHO data, there are 90m HBV
patients and 28m of them need immediate treatment. Based on
Menet data, the drugs market is over Rmb50bn, among which
55% are liver protection drugs.
Growth potential: Tianqingganmei is an innovative drug with
patent protection lasting until 2022. Future growth could come
from increasing treatment rates and intensified pressure on
use of adjuvant drugs.
Source: Company Data, Macquarie Research, November 2018 Source: Company Data, Macquarie Research, November 2018
Fig 13 Tianqingganmei
Fig 14 Market share change of liver protection drugs
Mechanism of action (MOA): its active ingredient is
isoglycyrrhizinate, an isomer of glycyrrhizinate, an effective
chemical extracted from liquorice. In a clinical trial with 400
patients, ALT and AST level decreased by more than 90%
after treatment. It is believed to reduce inflammatory effects by
inhibiting related enzymes.
History: Tianqingganmei launched in 2005 and before that, the
company introduced a series of glycyrrhizinate drugs. There
are four major drugs in the liver protection drug market; beside
the two talked previously, there are phosphatidylcholine and
aspartate/ornithine.
Potential risk: the specific mechanism of Tianqingganmei is not
yet very clear and it faces competition from normal
glycyrrhizinate drugs.
Source: Company Data, Macquarie Research, November 2018 Source: PDB, Macquarie Research, November 2018
Fig 15 Runzhong
Fig 16 Market breakdown of anti HBV drugs and entecavir
Sales trend: Runzhong recorded sales of Rmb3.2bn in 2017,
accounting for 21% of total revenue, with a growth CAGR of
17% in 2013-2017. The price change is c. -30% between the
most two recent procurement. In the future, we believe it would
grow at a high single-digit and achieve peak sales of
Rmb3.5bn.
Market size: according to WHO data, there are 90m HBV
patients and 28m of them need immediate treatment. Based on
Menet data, the drugs market is over Rmb50bn, among which
45% are anti-virus drugs.
Growth potential: there are eight entecavir drugs in the market
and another three are under ANDA review. According to CDC,
less than 10% of hepatitis B patients got treated in 2015,
indicating a huge growth potential.
Source: Company Data, Macquarie Research, November 2018 Source: Company Data, Macquarie Research, November 2018
Magnesium isoglycyrrhizinate
, 20%
Glycyrrhizin, 15%
Polyene phosphatidylcholine
, 13%Aspartate
ornithine, 9%
Adenosylmethionine, 11%
BicycloI, 8%
Others, 25%
2017, 20%
0%
10%
20%
30%
40%
50%
60%
70%
80%
90%
100%
2013 2014 2015 2016 2017
Magnesium isoglycyrrhizinate Glycyrrhizin
Polyene phosphatidylcholine Aspartate ornithine
Adenosylmethionine Others
Telbivudine, 11%
Adefovir, 9%
Others, 0.1%
Sino Biopharm,
44%BMS, 40%
Jiangxi Qingfeng, 5%
Others11%
Enticavir, 80%

Macquarie Research Sino Biopharmaceutical (1177 HK)
23 November 2018 12
Fig 17 Runzhong Fig 18 Market share change of Runzhong
MOA: active ingredient of Runzhong is entecavir. Entecavir is a
deoxyguanosine analogue that belongs to a class of
carbocyclic nucleoside drugs, which act by inhibiting reverse
transcription, DNA replication and transcription in the viral
replication process.
History: Runzhong was brought to the market in 2010 as a
first-to-market generic of the innovator drug Baraclude
developed by BMS. Nucleotide analogue drugs dominate the
anti-HBV drug market, among which entecavir and tenofovir
are the best choices.
Potential risk: the price cut was sharp during the last round of
tendering, and also, Runzhong needs to face the competition
from tenofovir with even lower resistance rate during use.
Source: Company Data, Macquarie Research, November 2018 Source: PDB, Macquarie Research, November 2018
Fig 19 Kashi
Fig 20 Market breakdown of hypertension drugs
Sales trend: Kashi recorded sales of Rmb1.1bn in 2017,
accounting for 7.4% of total revenue, with a growth CAGR of -
9.3% in 2013-2017. The price change is negligible in recent
years. In the future, we believe it would decrease gradually
with a single-digit growth rate.
Market size: there are more than 200m hypertension patients
in China, and the drug market size is c. Rmb30bn. The market
size specifically for peripheral vasodilators is around Rmb4bn.
Growth potential: there are seven alprostadil drugs in the
market and another seven are under ANDA review. Kaishi has
been listed on the 2009 and 2017 NRDL and is sold in more 30
provinces. Due to the crowded market, upside potential is
limited and sales may decline.
Source: Company Data, Macquarie Research, November 2018 Source: Company Data, Macquarie Research, November 2018
Fig 21 Kashi
Fig 22 Market share change of Kashi within alprostadil
MOA: alprostadil is a naturally occurring prostaglandin, which
belongs to the vasodilator drug family. It works by opening
blood vessels by relaxing smooth muscles.
History: Kaishi was brought to market by Beijing Tide in 1998
and is the first alprostadil liposome approved by CFDA, which
could extend the release of alprostadil. Current market has
been dominated by Sino Biopharm and Yao Pharma,
combined together, accounting for more than 50% of the
market.
Potential risk: the weight of peripheral vasodilator drugs within
the CCV drugs has been decreasing and Kaishi has peaked on
sales and faces fierce competition from new generation of
vasodilator drugs.
Source: Company Data, Macquarie Research, November 2018 Source: PDB, Macquarie Research, November 2018
2017, 44%
0%
10%
20%
30%
40%
50%
60%
70%
80%
90%
100%
2013 2014 2015 2016 2017
BMS Sino Biopharm Dawnrays Jiangxi Qingfeng Others
Cinepazide, 23%
Others, 9%
Sino Biopharm,
38%
Yao Pharma, 18% Harbin
Pharma, 15%
Others, 30%
Alprostadil, 68%
2017, 38%
0%
10%
20%
30%
40%
50%
60%
70%
80%
90%
100%
2013 2014 2015 2016 2017
Sino Biopharm Yao Pharma Harbin Pharma Others
Macquarie Research Sino Biopharmaceutical (1177 HK)
23 November 2018 13
Fig 23 Yilunping Fig 24 Market breakdown of compound hypertension drugs
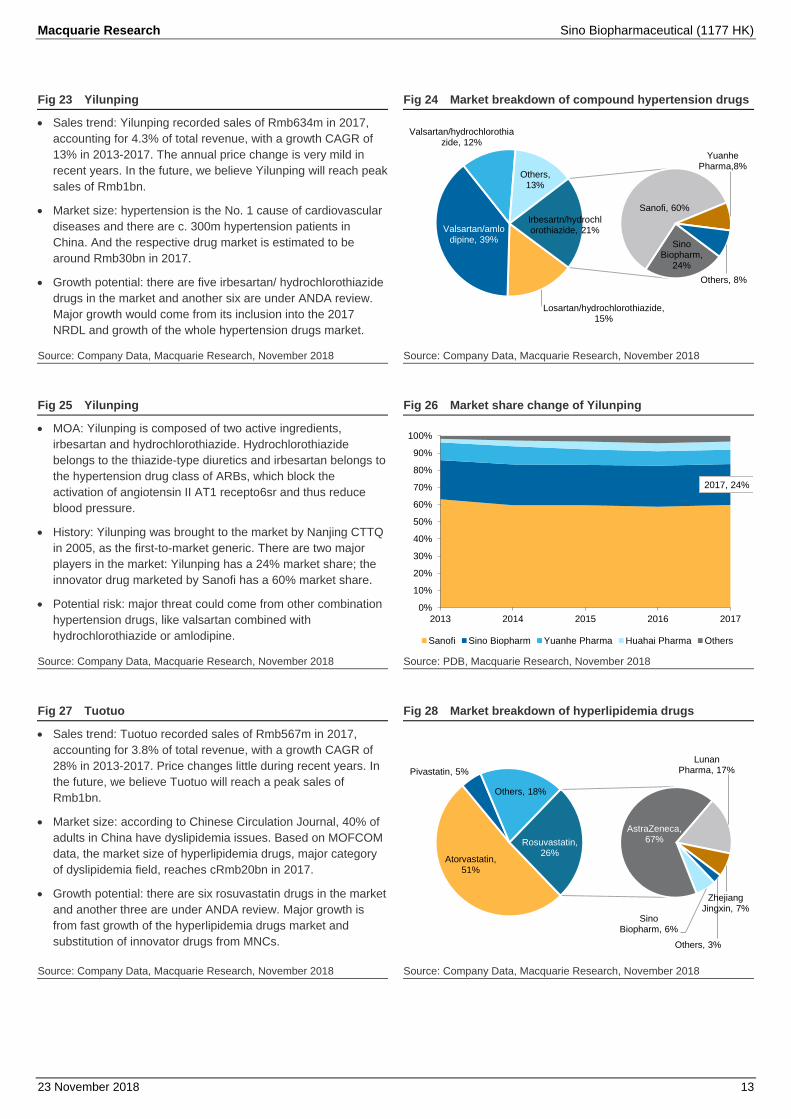
Sales trend: Yilunping recorded sales of Rmb634m in 2017,
accounting for 4.3% of total revenue, with a growth CAGR of
13% in 2013-2017. The annual price change is very mild in
recent years. In the future, we believe Yilunping will reach peak
sales of Rmb1bn.
Market size: hypertension is the No. 1 cause of cardiovascular
diseases and there are c. 300m hypertension patients in
China. And the respective drug market is estimated to be
around Rmb30bn in 2017.
Growth potential: there are five irbesartan/ hydrochlorothiazide
drugs in the market and another six are under ANDA review.
Major growth would come from its inclusion into the 2017
NRDL and growth of the whole hypertension drugs market.
Source: Company Data, Macquarie Research, November 2018 Source: Company Data, Macquarie Research, November 2018
Fig 25 Yilunping
Fig 26 Market share change of Yilunping
MOA: Yilunping is composed of two active ingredients,
irbesartan and hydrochlorothiazide. Hydrochlorothiazide
belongs to the thiazide-type diuretics and irbesartan belongs to
the hypertension drug class of ARBs, which block the
activation of angiotensin II AT1 recepto6sr and thus reduce
blood pressure.
History: Yilunping was brought to the market by Nanjing CTTQ
in 2005, as the first-to-market generic. There are two major
players in the market: Yilunping has a 24% market share; the
innovator drug marketed by Sanofi has a 60% market share.
Potential risk: major threat could come from other combination
hypertension drugs, like valsartan combined with
hydrochlorothiazide or amlodipine.
Source: Company Data, Macquarie Research, November 2018 Source: PDB, Macquarie Research, November 2018
Fig 27 Tuotuo
Fig 28 Market breakdown of hyperlipidemia drugs
Sales trend: Tuotuo recorded sales of Rmb567m in 2017,
accounting for 3.8% of total revenue, with a growth CAGR of
28% in 2013-2017. Price changes little during recent years. In
the future, we believe Tuotuo will reach a peak sales of
Rmb1bn.
Market size: according to Chinese Circulation Journal, 40% of
adults in China have dyslipidemia issues. Based on MOFCOM
data, the market size of hyperlipidemia drugs, major category
of dyslipidemia field, reaches cRmb20bn in 2017.
Growth potential: there are six rosuvastatin drugs in the market
and another three are under ANDA review. Major growth is
from fast growth of the hyperlipidemia drugs market and
substitution of innovator drugs from MNCs.
Source: Company Data, Macquarie Research, November 2018 Source: Company Data, Macquarie Research, November 2018
Losartan/hydrochlorothiazide, 15%
Valsartan/amlodipine, 39%
Valsartan/hydrochlorothiazide, 12%
Others, 13%
Sino Biopharm,
24%
Sanofi, 60%
Yuanhe Pharma,8%
Others, 8%
Irbesartn/hydrochlorothiazide, 21%
2017, 24%
0%
10%
20%
30%
40%
50%
60%
70%
80%
90%
100%
2013 2014 2015 2016 2017
Sanofi Sino Biopharm Yuanhe Pharma Huahai Pharma Others
Atorvastatin, 51%
Pivastatin, 5%
Others, 18%
Sino Biopharm, 6%
AstraZeneca, 67%
Lunan Pharma, 17%
Zhejiang Jingxin, 7%
Others, 3%
Rosuvastatin, 26%
Macquarie Research Sino Biopharmaceutical (1177 HK)
23 November 2018 14
Fig 29 Tuotuo Fig 30 Market share change of Tuotuo
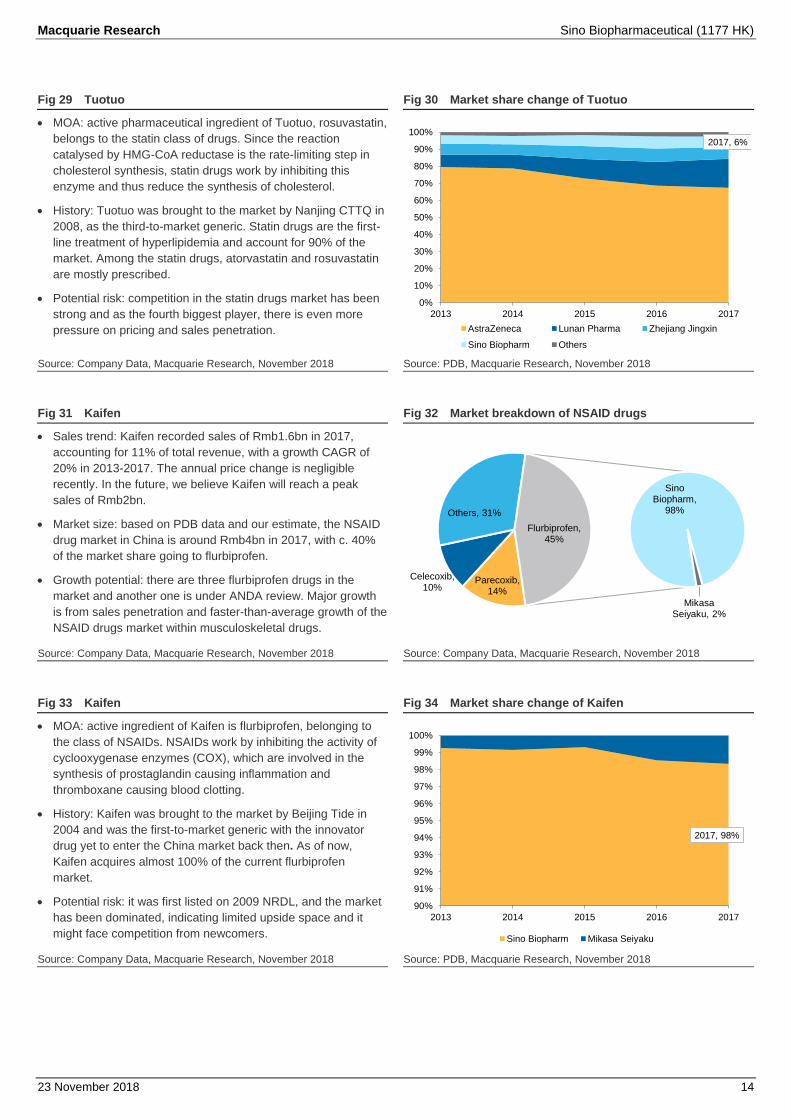
MOA: active pharmaceutical ingredient of Tuotuo, rosuvastatin,
belongs to the statin class of drugs. Since the reaction
catalysed by HMG-CoA reductase is the rate-limiting step in
cholesterol synthesis, statin drugs work by inhibiting this
enzyme and thus reduce the synthesis of cholesterol.
History: Tuotuo was brought to the market by Nanjing CTTQ in
2008, as the third-to-market generic. Statin drugs are the first-
line treatment of hyperlipidemia and account for 90% of the
market. Among the statin drugs, atorvastatin and rosuvastatin
are mostly prescribed.
Potential risk: competition in the statin drugs market has been
strong and as the fourth biggest player, there is even more
pressure on pricing and sales penetration.
Source: Company Data, Macquarie Research, November 2018 Source: PDB, Macquarie Research, November 2018
Fig 31 Kaifen
Fig 32 Market breakdown of NSAID drugs
Sales trend: Kaifen recorded sales of Rmb1.6bn in 2017,
accounting for 11% of total revenue, with a growth CAGR of
20% in 2013-2017. The annual price change is negligible
recently. In the future, we believe Kaifen will reach a peak
sales of Rmb2bn.
Market size: based on PDB data and our estimate, the NSAID
drug market in China is around Rmb4bn in 2017, with c. 40%
of the market share going to flurbiprofen.
Growth potential: there are three flurbiprofen drugs in the
market and another one is under ANDA review. Major growth
is from sales penetration and faster-than-average growth of the
NSAID drugs market within musculoskeletal drugs.
Source: Company Data, Macquarie Research, November 2018 Source: Company Data, Macquarie Research, November 2018
Fig 33 Kaifen
Fig 34 Market share change of Kaifen
MOA: active ingredient of Kaifen is flurbiprofen, belonging to
the class of NSAIDs. NSAIDs work by inhibiting the activity of
cyclooxygenase enzymes (COX), which are involved in the
synthesis of prostaglandin causing inflammation and
thromboxane causing blood clotting.
History: Kaifen was brought to the market by Beijing Tide in
2004 and was the first-to-market generic with the innovator
drug yet to enter the China market back then. As of now,
Kaifen acquires almost 100% of the current flurbiprofen
market.
Potential risk: it was first listed on 2009 NRDL, and the market
has been dominated, indicating limited upside space and it
might face competition from newcomers.
Source: Company Data, Macquarie Research, November 2018 Source: PDB, Macquarie Research, November 2018
2017, 6%
0%
10%
20%
30%
40%
50%
60%
70%
80%
90%
100%
2013 2014 2015 2016 2017
AstraZeneca Lunan Pharma Zhejiang Jingxin
Sino Biopharm Others
Parecoxib, 14%
Celecoxib, 10%
Others, 31%
Sino Biopharm,
98%
Mikasa Seiyaku, 2%
Flurbiprofen, 45%
2017, 98%
90%
91%
92%
93%
94%
95%
96%
97%
98%
99%
100%
2013 2014 2015 2016 2017
Sino Biopharm Mikasa Seiyaku

Macquarie Research Sino Biopharmaceutical (1177 HK)
23 November 2018 15
Fig 35 Saiweijian/Shoufu/Qingweike Fig 36 Breakdown of antimetabolite oncology drugs
Sales trend: Saiweijian/Shoufu/Qingweike recorded sales of
Rmb665 in 2017, accounting for 4.5% of total revenue, with a
growth CAGR of 24% in the last three years. In the future, we
believe these three drugs combined together, could ramp up
sales fast and record a peak sales of Rmb1.5bn.
Market size: as a major segment of oncology drugs in China,
we estimate the antimetabolite drugs market is around
Rmb25bn and would grow slowly in the future.
Growth potential: these drugs are in the early stage, with
Saiweijian and Qingweike being first-to-market generics and
Shoufu being third-to-market. Qingweike was included onto the
2017 NRDL, expecting fast growth.
Source: Company Data, Macquarie Research, November 2018 Source: Company Data, Macquarie Research, November 2018
Fig 37 Saiweijian/Shoufu/Qingweike
Fig 38 Market share change of antimetabolite drugs
MOA: these three drugs belong to the drug category of
antimetabolites, which interfere with synthesis or replication of
DNA/RNA within cancer cells. Raltitrexed is folate
antimetabolite, inhibiting pyrimidine formation; capecitabine
works by inhibiting thymidine synthesis; decitabine is a
hypomethylating agent and inhibiting DNA replication.
History: Saiweijian, Shoufu and Qingweike got approved by
CFDA, respectively, in 2009, 2014, and 2012.
Potential risk: the current oncology drug market structure in
China is outdated, with more than 50% being traditional
chemotherapy drugs. Expecting the fast growth of target
therapy drugs, we estimate the antimetabolite drugs market will
grow slowly.
Source: Company Data, Macquarie Research, November 2018 Source: PDB, Macquarie Research, November 2018
Fig 39 Genike/Yinishu
Fig 40 Market breakdown of rhG-CSF and PEG-rhG-CSF
Sales trend: Genike and Yinishu recorded sales of Rmb174m
and Rmb109m, respectively, in 2017, combined accounting for
1.9% of total revenue. In the future, we believe these two drugs
will ramp up sales rapidly and reach a peak sales of
Rmb1.5bn.
Market size: these two drugs are mainly used for acute
lymphoblastic leukemia (ALL) and chronic myelogenous
leukaemia (CML) with Philadelphia Chromosome (Ph+), adding
to c. 13k new cases per year in China. Based on the drug cost,
the market size is around Rmb3.5bn.
Growth potential: there are four imatinib and two dasatinib
drugs in the market. Major growth could come from their
inclusion onto 2017 NRDL and market acquisition from MNCs.
Source: Company Data, Macquarie Research, November 2018 Source: Company Data, Macquarie Research, November 2018
Plant alkaloids,
18%
TCM finished drugs, 17%
Small molecule
target drugs, 9%
Others, 35%
Sino Biopharm, 5%
Roche, 14%
Hansoh, 20%
Qilu Pharma, 15%
Others, 46%
Antimetabolites, 20%
2017, 5%
0%
10%
20%
30%
40%
50%
60%
70%
80%
90%
100%
2013 2014 2015 2016 2017
Roche Hansoh Lilly Qilu Pharma
Hengrui Lunan Sino Biopharm Others
Plant alkaloids, 18%
TCM finished drugs, 17%
Antimetabolites, 20%
Others, 35%
Novartis, 31%
AstraZeneca, 17%
Betta, 13%
Sino Biopharm, 3%
Others, 35%
Small molecule target drugs, 9%

Macquarie Research Sino Biopharmaceutical (1177 HK)
23 November 2018 16
Fig 41 Genike/Yinishu Fig 42 Market share change of Jinyouli within PEG-rh-GCSF
MOA: 25% ALL patients and 95% CML patients have the
special Philadelphia Chromosome and forms a tyrosine kinase
called bcl-abl, which constitutively activates and makes cells
continuously grow and proliferate. These two target drugs
could bind to the active site of the enzyme and inhibit its
activity.
History: Genike launched in 2013, as the first-to-market
generic, for first-line treatment of Ph+ CML and ALL. Yinishu
also launched in 2013 as the first-to-market generic, for
second-line treatment of imatinib-resistant Ph+ CML and ALL.
Potential risk: it might face strong competition from domestic
players, especially for imatinib, which was also developed and
marketed by Hansoh and CSPC.
Source: Company Data, Macquarie Research, November 2018 Source: PDB, Macquarie Research, November 2018
Fig 43 Bortezomib
Fig 44 Sales forecast simulation of bortezomib (Rmb bn)
Sales potential: the innovative drug of bortezomib was Velcade
and it recorded a peak sales of US$1.9bn globally in 2015. We
estimate the current market size for bortezomib is around
Rmb2bn in China. As the potential first-to-market generic, it
could reach a potential peak sales of Rmb1bn.
MOA: bortezomib is the first proteasome inhibitor to be used
on human bodies. Bortezomib works by inhibiting proteasome,
and prevent it degrading pro-apoptotic factors, which would
trigger programmed cell death in cancer cells.
Competitive landscape: there are four bortezomib in the
market, 25 are either under ANDA review or in clinical trials.
Source: Company Data, Macquarie Research, November 2018 Source: Macquarie Research, November 2018
Fig 45 Tenofovir
Fig 46 Sales forecast simulation of tenofovir (Rmb bn)
Sales potential: the innovative drug of tenofovir is Viread
developed by Gilead and it recorded peak sales of US$1.5bn
globally in 2017. There are 28m HBV patients need immediate
treatment in China. Based on Menet data, the anti-HBV drugs
market is over Rmb20bn. We estimate the peak sales of this
first-to-market generic could reach Rmb2.5bn.
MOA: tenofovir belongs to the class of carbocyclic nucleoside
drugs, which act by inhibiting reverse transcription, DNA
replication and transcription in the viral replication process.
Competitive landscape: there are seven tenofovir drugs in the
market, 18 are under ANDA review and another 28 are in
clinical trials.
Source: Company Data, Macquarie Research, November 2018 Source: Macquarie Research, November 2018
2017, 3%
0%
10%
20%
30%
40%
50%
60%
70%
80%
90%
100%
2013 2014 2015 2016 2017
AstraZeneca Novartis Bayer Roche
Pfizer Betta Hansoh Hengrui
Sino Biopharm Others
0.020.06
0.14
0.45
0.69
0.86
0.971.00 1.00
0.81
0.64
0.490.46
-
0.20
0.40
0.60
0.80
1.00
1.20
18 20 22 24 26 28 30
Qianping ( )
Psales/1.00 Rsales/0.00 RiseT/2018 RiseY/8 RiseP/VEXAVE RVexY/3 PlatY/1 PlatG/0% DecayY/10 DecayP/VEXAVE
-
0.59
1.09
1.52
1.88
2.15
2.342.46 2.50 2.50
2.03
1.60
1.23
-
0.50
1.00
1.50
2.00
2.50
3.00
18 20 22 24 26 28 30
Qingzhong ( )
Psales/2.50 Rsales/0.00 RiseT/2019 RiseY/8 RiseP/CAVE RVexY/0 PlatY/1 PlatG/0% DecayY/10 DecayP/VEXAVE
Macquarie Research Sino Biopharmaceutical (1177 HK)
23 November 2018 17
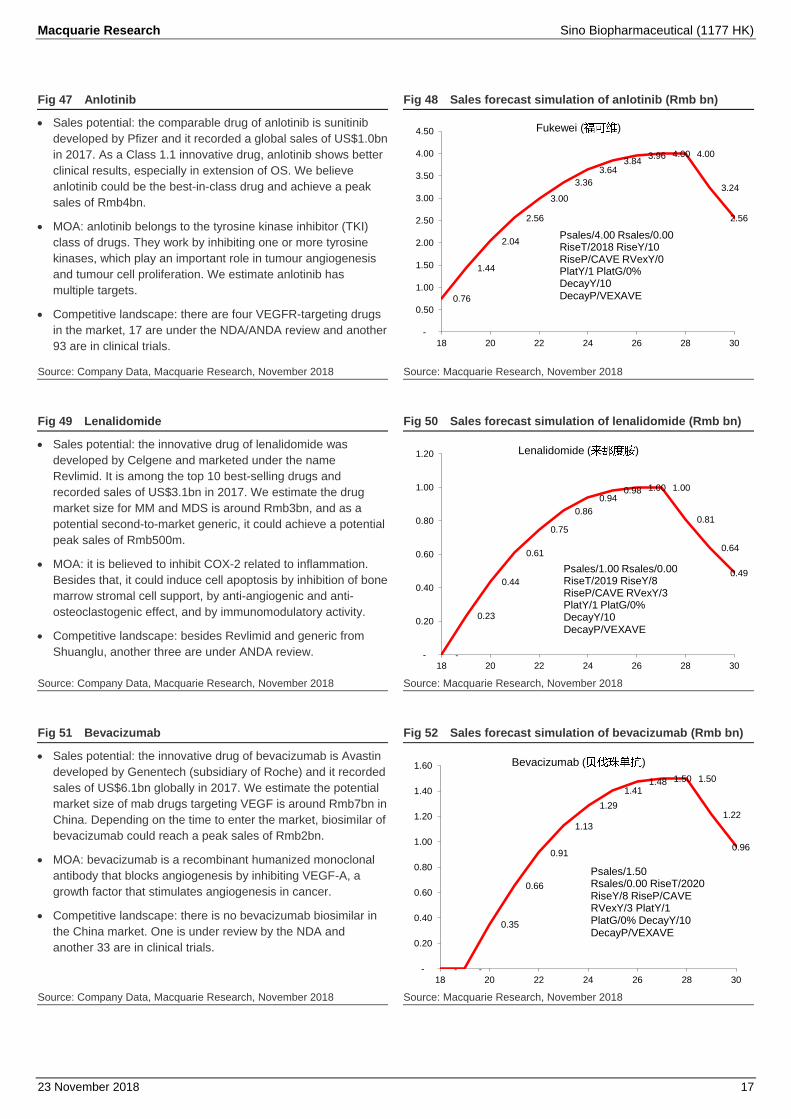
Fig 47 Anlotinib Fig 48 Sales forecast simulation of anlotinib (Rmb bn)
Sales potential: the comparable drug of anlotinib is sunitinib
developed by Pfizer and it recorded a global sales of US$1.0bn
in 2017. As a Class 1.1 innovative drug, anlotinib shows better
clinical results, especially in extension of OS. We believe
anlotinib could be the best-in-class drug and achieve a peak
sales of Rmb4bn.
MOA: anlotinib belongs to the tyrosine kinase inhibitor (TKI)
class of drugs. They work by inhibiting one or more tyrosine
kinases, which play an important role in tumour angiogenesis
and tumour cell proliferation. We estimate anlotinib has
multiple targets.
Competitive landscape: there are four VEGFR-targeting drugs
in the market, 17 are under the NDA/ANDA review and another
93 are in clinical trials.
Source: Company Data, Macquarie Research, November 2018 Source: Macquarie Research, November 2018
Fig 49 Lenalidomide
Fig 50 Sales forecast simulation of lenalidomide (Rmb bn)
Sales potential: the innovative drug of lenalidomide was
developed by Celgene and marketed under the name
Revlimid. It is among the top 10 best-selling drugs and
recorded sales of US$3.1bn in 2017. We estimate the drug
market size for MM and MDS is around Rmb3bn, and as a
potential second-to-market generic, it could achieve a potential
peak sales of Rmb500m.
MOA: it is believed to inhibit COX-2 related to inflammation.
Besides that, it could induce cell apoptosis by inhibition of bone
marrow stromal cell support, by anti-angiogenic and anti-
osteoclastogenic effect, and by immunomodulatory activity.
Competitive landscape: besides Revlimid and generic from
Shuanglu, another three are under ANDA review.
Source: Company Data, Macquarie Research, November 2018 Source: Macquarie Research, November 2018
Fig 51 Bevacizumab
Fig 52 Sales forecast simulation of bevacizumab (Rmb bn)
Sales potential: the innovative drug of bevacizumab is Avastin
developed by Genentech (subsidiary of Roche) and it recorded
sales of US$6.1bn globally in 2017. We estimate the potential
market size of mab drugs targeting VEGF is around Rmb7bn in
China. Depending on the time to enter the market, biosimilar of
bevacizumab could reach a peak sales of Rmb2bn.
MOA: bevacizumab is a recombinant humanized monoclonal
antibody that blocks angiogenesis by inhibiting VEGF-A, a
growth factor that stimulates angiogenesis in cancer.
Competitive landscape: there is no bevacizumab biosimilar in
the China market. One is under review by the NDA and
another 33 are in clinical trials.
Source: Company Data, Macquarie Research, November 2018 Source: Macquarie Research, November 2018
0.76
1.44
2.04
2.56
3.00
3.36
3.643.84
3.96 4.00 4.00
3.24
2.56
-
0.50
1.00
1.50
2.00
2.50
3.00
3.50
4.00
4.50
18 20 22 24 26 28 30
Fukewei ( )
Psales/4.00 Rsales/0.00 RiseT/2018 RiseY/10 RiseP/CAVE RVexY/0 PlatY/1 PlatG/0% DecayY/10 DecayP/VEXAVE
-
0.23
0.44
0.61
0.75
0.86
0.940.98 1.00 1.00
0.81
0.64
0.49
-
0.20
0.40
0.60
0.80
1.00
1.20
18 20 22 24 26 28 30
Lenalidomide ( )
Psales/1.00 Rsales/0.00 RiseT/2019 RiseY/8 RiseP/CAVE RVexY/3 PlatY/1 PlatG/0% DecayY/10 DecayP/VEXAVE
- -
0.35
0.66
0.91
1.13
1.29
1.411.48 1.50 1.50
1.22
0.96
-
0.20
0.40
0.60
0.80
1.00
1.20
1.40
1.60
18 20 22 24 26 28 30
Bevacizumab ( )
Psales/1.50 Rsales/0.00 RiseT/2020 RiseY/8 RiseP/CAVE RVexY/3 PlatY/1 PlatG/0% DecayY/10 DecayP/VEXAVE

Macquarie Research Sino Biopharmaceutical (1177 HK)
23 November 2018 18
Fig 53 Trastuzumab Fig 54 Sales forecast simulation of trastuzumab (Rmb bn)
Sales potential: the innovative drug of trastuzumab is
Herceptin developed by Genentech (subsidiary of Roche) and
it recorded sales of US$5.6bn globally in 2017. We estimate
the potential market size of mab drugs targeting HER2 is
around Rmb5bn in China. Depending on the time to launch,
first-to-market biosimilar could achieve a peak sales of
Rmb2bn.
MOA: trastuzumab is a mab drug targeting HER2 receptor.
HER2 belongs the EGF pathway, when it is overexpressed,
cells would become overly active in proliferation and become
cancer cells.
Competitive landscape: there is no Herceptin biosimilar in the
market, one is under NDA review and another 17 are in clinical
trials.
Source: Company Data, Macquarie Research, November 2018 Source: Macquarie Research, November 2018
Fig 55 Rituximab
Fig 56 Sales forecast simulation of rituximab (Rmb bn)
Sales potential: the innovative drug of rituximab is Rituxan
developed by Genentech (subsidiary of Roche) and it recorded
sales of US$7.1bn globally in 2017. We estimate the potential
market size of mab drugs targeting CD20 is around Rmb6bn in
China. Depending on the time to launch, first-to-market
biosimilar could achieve a peak sales of Rmb2bn.
MOA: rituximab is a mab drug against the protein CD20, which
is primarily expressed on the surface of B cells. When binding
to B cells, it would modify the protein structure and let natural
killer cells eliminate the B cells.
Competitive landscape: there is no Rituxan biosimilar in the
China market, one is under NDA review and another 16 are in
clinical trials.
Source: Company Data, Macquarie Research, November 2018 Source: Macquarie Research, November 2018
Fig 57 Adalimumab
Fig 58 Market breakdown of Adalimumab (Rmb bn)
Sales potential: the innovative drug of adalimumab is Humira
developed by Abbvie and it recorded sales of US$18bn
globally in 2017. We estimate the potential market size of mab
drugs targeting TNFα is around Rmb10bn in China. Depending
on the time to launch, first-to-market biosimilar could achieve a
peak sales of Rmb3bn.
MOA: adalimumab is a mab drug binding to tumour necrosis
factor-alpha (TNFα), a cytokine mainly binding to TNFα
receptors and leading to inflammatory response of
autoimmune diseases.
Competitive landscape: there is no Humira biosimilar in the
market, four are under NDA review and another 30 are in
clinical trials.
Source: Company Data, Macquarie Research, November 2018 Source: Macquarie Research, November 2018
- -
0.35
0.66
0.91
1.13
1.29
1.411.48 1.50 1.50
1.22
0.96
-
0.20
0.40
0.60
0.80
1.00
1.20
1.40
1.60
18 20 22 24 26 28 30
Trastuzumab ( )
Psales/1.50 Rsales/0.00 RiseT/2020 RiseY/8 RiseP/CAVE RVexY/3 PlatY/1 PlatG/0% DecayY/10 DecayP/VEXAVE
- -
0.35
0.66
0.91
1.13
1.29
1.411.48 1.50 1.50
1.22
0.96
-
0.20
0.40
0.60
0.80
1.00
1.20
1.40
1.60
18 20 22 24 26 28 30
Rituximab ( )
Psales/1.50 Rsales/0.00 RiseT/2020 RiseY/8 RiseP/CAVE RVexY/3 PlatY/1 PlatG/0% DecayY/10 DecayP/VEXAVE
- -
0.47
0.88
1.22
1.50
1.72
1.881.97 2.00 2.00
1.62
1.28
-
0.50
1.00
1.50
2.00
2.50
18 20 22 24 26 28 30
Adalimumab ( )
Psales/2.00 Rsales/0.00 RiseT/2020 RiseY/8 RiseP/CAVE RVexY/3 PlatY/1 PlatG/0% DecayY/10 DecayP/VEXAVE

Macquarie Research Sino Biopharmaceutical (1177 HK)
23 November 2018 19
Fig 59 TQB-2450 Fig 60 Market breakdown of TQB-2450 (Rmb bn)
Sales potential: the comparable drug is atezolizumab,
developed by Genentech and marketed under the name
Tecentriq. It launched in 2016 and in 2017 recorded sales of
US$487m. We estimate the potential market size for PD-1/PD-
L1 drugs is over Rmb100bn in China and depending on the
launch schedule, first-to-market biosimilar could achieve a
peak sales of Rmb3bn.
MOA: Tecentriq is a mab drug targeting programmed cell
death-ligand 1 (PD-L1), which is overexpressed in some
tumour cells and could inhibit T cells through binding to the
PD-1 and CD80 receptors on the surface.
Competitive landscape: besides the innovator drug, there is no
PD-L1 drug in China market and there are seven in clinical
trials.
Source: Company Data, Macquarie Research, November 2018 Source: Macquarie Research, November 2018
- -
0.47
0.88
1.22
1.50
1.72
1.881.97 2.00 2.00
1.62
1.28
-
0.50
1.00
1.50
2.00
2.50
18 20 22 24 26 28 30
PD-L1 mAb (PD-L1 )
Psales/2.00 Rsales/0.00 RiseT/2020 RiseY/8 RiseP/CAVE RVexY/3 PlatY/1 PlatG/0% DecayY/10 DecayP/VEXAVE

Macquarie Research Sino Biopharmaceutical (1177 HK)
23 November 2018 20
Financial analysis
The company has achieved c. 17% revenue growth CAGR in the last five years and in the next five
years, we believe it will maintain an organic growth rate of between 15-20%, while changing the
drug mix dramatically. Most of the current revenue comes from its traditional advantage treatment
field, hepatitis, accounting for 44% of its 2017 revenue. Oncology drugs and CCV drugs account
for 11% and 10% of revenue in 2017, respectively. The contribution of hepatitis drugs is
decreasing from 48% in 2015 to 44% in 2017, due to sales ramp up of other treatment fields.
According to our estimate, oncology would become the No. 1 revenue contributor by 2022,
accounting for 29% of revenue by then. In 2018, the company launched the innovative VEGFR
target drug anlotinib, which could record estimated sales of Rmb8bn in 2018.
In 2018, the company increased its shareholding in Beijing Tide and consolidate it since March
2018. Based on our forecast, Tide will account for 24% and 26% of net profit, respectively, in 2018
and 2019. And 44% and 33% of the profit growth would be attributable to Tide in 2018 and 2019.
Gross margin of the company has been stable at c. 80%, higher than industry average of c. 70%.
In the future, we believe this ratio would increase slightly due to launch of more innovative drugs.
Sino Biopharm has a R&D to revenue ratio of 14% in 1H18, much higher than industry average of
c. 6%. In the next five years, we believe this ratio would keep current high level as the
development of biologics enter later stage. SG&A ratio is around 45%, in line with sector average.
Fig 61 Revenue and growth of 1177-HK (Rmb bn)
Fig 62 Net profit and growth of 1177-HK (Rmb bn)
aaSource: Factset, Macquarie Research, November 2018 Source: Factset, Macquarie Research, November 2018
Fig 63 Revenue breakdown of 1177-HK (Rmb bn)
Fig 64 Gross margin breakdown 2018F of 1177-HK
Source: Factset, Macquarie Research, November 2018 Source: Factset, Macquarie Research, November 2018
7.89.8
11.813.5
14.8
19.6
25.2
31.5
36.4
40.8
0
5
10
15
20
25
30
35
2013 2014 2015 2016 2017 2018F 2019F 2020F 2021F 2022F
0
5
10
15
20
25
30
35
40
45Revenue bn (LHS)
Revenue growth % (RHS)
0.8
1.21.4
1.6
2.1
2.8
3.4
4.2
4.8
5.6
0
5
10
15
20
25
30
35
40
45
2013 2014 2015 2016 2017 2018F 2019F 2020F 2021F 2022F
0.0
1.0
2.0
3.0
4.0
5.0
6.0 Adjusted net profit bn (LHS)
Net profit growth % (RHS)
34%
12%9%13%6%13%
14%
1%
0
10
20
30
40
50
2013 2014 2015 2016 2017 2018F 2019F 2020F 2021F 2022F
OthersOncologyAnti-infectious & Respiratory & Parenteral nutritiousDigestiveCardio-cerebralOrthopedicAnalgesicHepatitis
Hepatitis, Digestive,
Anti-infectious, Respiratory, Oncology,
Others, 80.0%
Analgesic, 85.0%
Orthopedic, 80.3%
Cardio-cerebral, 81.7%
77%
78%
79%
80%
81%
82%
83%
84%
85%
86%
Organic earnings
growth of 15-25% in
three years while expect
dramatic shift within
treatment fields
Oncology drugs would
become No. 1 revenue
contributor by 2022
44% and 33% of net
profit growth would be
attributable to Tide in
2018 and 2019

Macquarie Research Sino Biopharmaceutical (1177 HK)
23 November 2018 21
Fig 65 Gross margin of 1177-HK vs peers – 1H18 (%) Fig 66 Gross margin trend of 1177-HK (%)
Source: Factset, Macquarie Research, November 2018 Source: Factset, Macquarie Research, November 2018
Fig 67 SGA ratio of 1177-HK vs peers – 1H18 (%)
Fig 68 SGA ratio trend of 1177-HK (%)
Source: Factset, Macquarie Research, November 2018 Source: Factset, Macquarie Research, November 2018
Fig 69 R&D ratio of 1177-HK vs peers - 1H18 (%)
Fig 70 R&D ratio trend of 1177-HK (%)
Source: Company Data, Macquarie Research, November 2018 Source: Company Data, Macquarie Research, November 2018
-
10
20
30
40
50
60
70
80
90
100
77.1 78.2 78.5 79.9 79.0 79.3 80.9 80.8 81.0 80.9 80.8 80.6
0
10
20
30
40
50
60
70
80
90
2015H1 2016H1 2017H1 2018H1 2019F 2021F
SINO
Sector median
-
10
20
30
40
50
60
70
48.449.6
48.0 47.945.8
47.445.7
44.2 44.0 44.1 44.2 44.3
0
10
20
30
40
50
60
2015H1 2016H1 2017H1 2018H1 2019 2021
SINO
Sector median
F F
-
5
10
15
20
25
30
13.7
4.1
13.5
6.7
15.4
6.0
13.7
11.0 11.0 11.0 11.0
9.8
0
2
4
6
8
10
12
14
16
18
2015H1 2016H1 2017H1 2018H1 2019F 2021F
SINO
Sector median
Macquarie Research Sino Biopharmaceutical (1177 HK)
23 November 2018 22
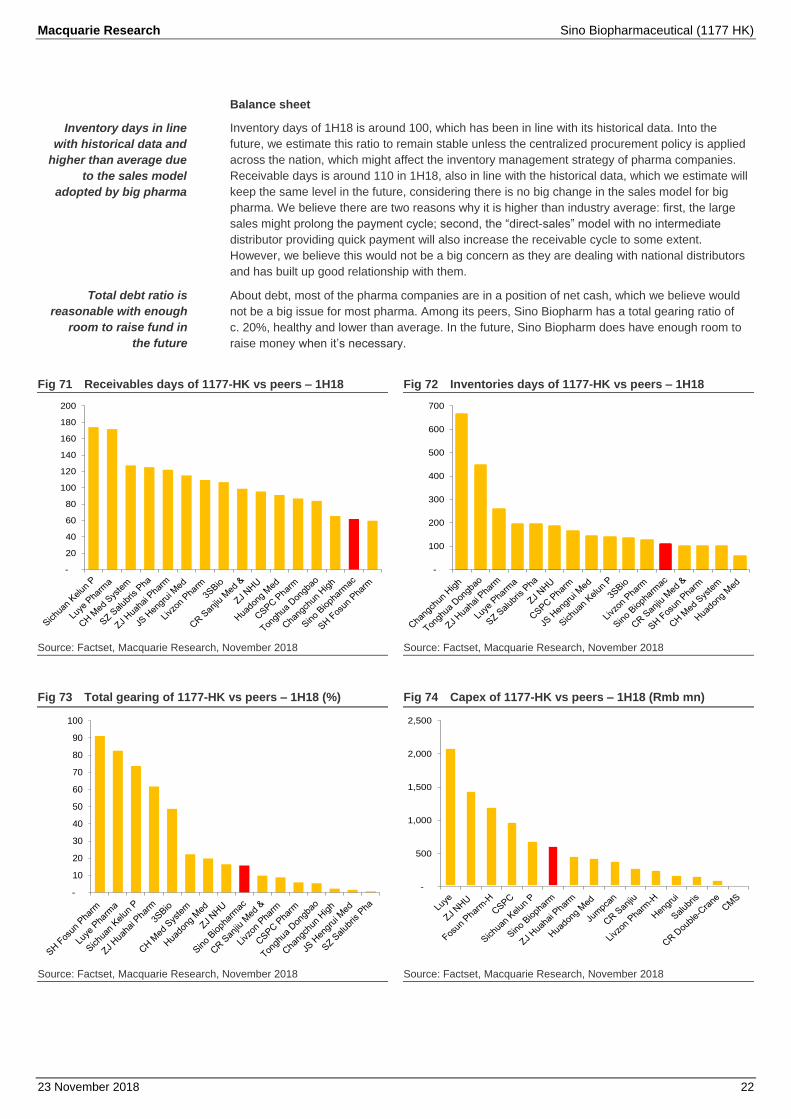
Balance sheet
Inventory days of 1H18 is around 100, which has been in line with its historical data. Into the
future, we estimate this ratio to remain stable unless the centralized procurement policy is applied
across the nation, which might affect the inventory management strategy of pharma companies.
Receivable days is around 110 in 1H18, also in line with the historical data, which we estimate will
keep the same level in the future, considering there is no big change in the sales model for big
pharma. We believe there are two reasons why it is higher than industry average: first, the large
sales might prolong the payment cycle; second, the “direct-sales” model with no intermediate
distributor providing quick payment will also increase the receivable cycle to some extent.
However, we believe this would not be a big concern as they are dealing with national distributors
and has built up good relationship with them.
About debt, most of the pharma companies are in a position of net cash, which we believe would
not be a big issue for most pharma. Among its peers, Sino Biopharm has a total gearing ratio of
c. 20%, healthy and lower than average. In the future, Sino Biopharm does have enough room to
raise money when it’s necessary.
Fig 71 Receivables days of 1177-HK vs peers – 1H18
Fig 72 Inventories days of 1177-HK vs peers – 1H18
Source: Factset, Macquarie Research, November 2018 Source: Factset, Macquarie Research, November 2018
Fig 73 Total gearing of 1177-HK vs peers – 1H18 (%)
Fig 74 Capex of 1177-HK vs peers – 1H18 (Rmb mn)
Source: Factset, Macquarie Research, November 2018 Source: Factset, Macquarie Research, November 2018
-
20
40
60
80
100
120
140
160
180
200
-
100
200
300
400
500
600
700
-
10
20
30
40
50
60
70
80
90
100
-
500
1,000
1,500
2,000
2,500
Inventory days in line
with historical data and
higher than average due
to the sales model
adopted by big pharma
Total debt ratio is
reasonable with enough
room to raise fund in
the future
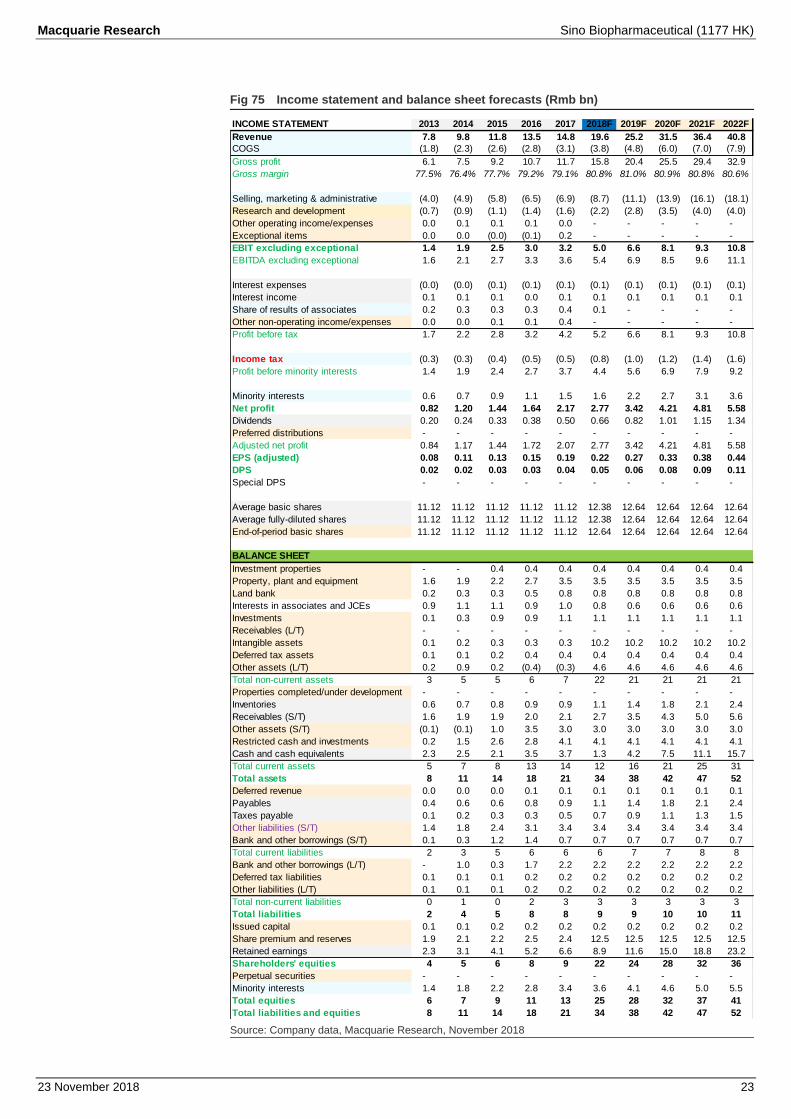
Macquarie Research Sino Biopharmaceutical (1177 HK)
23 November 2018 23
Fig 75 Income statement and balance sheet forecasts (Rmb bn)
Source: Company data, Macquarie Research, November 2018
INCOME STATEMENT 2013 2014 2015 2016 2017 2018F 2019F 2020F 2021F 2022F
Revenue 7.8 9.8 11.8 13.5 14.8 19.6 25.2 31.5 36.4 40.8
COGS (1.8) (2.3) (2.6) (2.8) (3.1) (3.8) (4.8) (6.0) (7.0) (7.9)
Gross profit 6.1 7.5 9.2 10.7 11.7 15.8 20.4 25.5 29.4 32.9
Gross margin 77.5% 76.4% 77.7% 79.2% 79.1% 80.8% 81.0% 80.9% 80.8% 80.6%
Selling, marketing & administrative (4.0) (4.9) (5.8) (6.5) (6.9) (8.7) (11.1) (13.9) (16.1) (18.1)
Research and development (0.7) (0.9) (1.1) (1.4) (1.6) (2.2) (2.8) (3.5) (4.0) (4.0)
Other operating income/expenses 0.0 0.1 0.1 0.1 0.0 - - - - -
Exceptional items 0.0 0.0 (0.0) (0.1) 0.2 - - - - -
EBIT excluding exceptional 1.4 1.9 2.5 3.0 3.2 5.0 6.6 8.1 9.3 10.8
EBITDA excluding exceptional 1.6 2.1 2.7 3.3 3.6 5.4 6.9 8.5 9.6 11.1
Interest expenses (0.0) (0.0) (0.1) (0.1) (0.1) (0.1) (0.1) (0.1) (0.1) (0.1)
Interest income 0.1 0.1 0.1 0.0 0.1 0.1 0.1 0.1 0.1 0.1
Share of results of associates 0.2 0.3 0.3 0.3 0.4 0.1 - - - -
Other non-operating income/expenses 0.0 0.0 0.1 0.1 0.4 - - - - -
Profit before tax 1.7 2.2 2.8 3.2 4.2 5.2 6.6 8.1 9.3 10.8
Income tax (0.3) (0.3) (0.4) (0.5) (0.5) (0.8) (1.0) (1.2) (1.4) (1.6)
Profit before minority interests 1.4 1.9 2.4 2.7 3.7 4.4 5.6 6.9 7.9 9.2
Minority interests 0.6 0.7 0.9 1.1 1.5 1.6 2.2 2.7 3.1 3.6
Net profit 0.82 1.20 1.44 1.64 2.17 2.77 3.42 4.21 4.81 5.58
Dividends 0.20 0.24 0.33 0.38 0.50 0.66 0.82 1.01 1.15 1.34
Preferred distributions - - - - - - - - - -
Adjusted net profit 0.84 1.17 1.44 1.72 2.07 2.77 3.42 4.21 4.81 5.58
EPS (adjusted) 0.08 0.11 0.13 0.15 0.19 0.22 0.27 0.33 0.38 0.44
DPS 0.02 0.02 0.03 0.03 0.04 0.05 0.06 0.08 0.09 0.11
Special DPS - - - - - - - - - -
Average basic shares 11.12 11.12 11.12 11.12 11.12 12.38 12.64 12.64 12.64 12.64
Average fully-diluted shares 11.12 11.12 11.12 11.12 11.12 12.38 12.64 12.64 12.64 12.64
End-of-period basic shares 11.12 11.12 11.12 11.12 11.12 12.64 12.64 12.64 12.64 12.64
BALANCE SHEET
Investment properties - - 0.4 0.4 0.4 0.4 0.4 0.4 0.4 0.4
Property, plant and equipment 1.6 1.9 2.2 2.7 3.5 3.5 3.5 3.5 3.5 3.5
Land bank 0.2 0.3 0.3 0.5 0.8 0.8 0.8 0.8 0.8 0.8
Interests in associates and JCEs 0.9 1.1 1.1 0.9 1.0 0.8 0.6 0.6 0.6 0.6
Investments 0.1 0.3 0.9 0.9 1.1 1.1 1.1 1.1 1.1 1.1
Receivables (L/T) - - - - - - - - - -
Intangible assets 0.1 0.2 0.3 0.3 0.3 10.2 10.2 10.2 10.2 10.2
Deferred tax assets 0.1 0.1 0.2 0.4 0.4 0.4 0.4 0.4 0.4 0.4
Other assets (L/T) 0.2 0.9 0.2 (0.4) (0.3) 4.6 4.6 4.6 4.6 4.6
Total non-current assets 3 5 5 6 7 22 21 21 21 21
Properties completed/under development - - - - - - - - - -
Inventories 0.6 0.7 0.8 0.9 0.9 1.1 1.4 1.8 2.1 2.4
Receivables (S/T) 1.6 1.9 1.9 2.0 2.1 2.7 3.5 4.3 5.0 5.6
Other assets (S/T) (0.1) (0.1) 1.0 3.5 3.0 3.0 3.0 3.0 3.0 3.0
Restricted cash and investments 0.2 1.5 2.6 2.8 4.1 4.1 4.1 4.1 4.1 4.1
Cash and cash equivalents 2.3 2.5 2.1 3.5 3.7 1.3 4.2 7.5 11.1 15.7
Total current assets 5 7 8 13 14 12 16 21 25 31
Total assets 8 11 14 18 21 34 38 42 47 52
Deferred revenue 0.0 0.0 0.0 0.1 0.1 0.1 0.1 0.1 0.1 0.1
Payables 0.4 0.6 0.6 0.8 0.9 1.1 1.4 1.8 2.1 2.4
Taxes payable 0.1 0.2 0.3 0.3 0.5 0.7 0.9 1.1 1.3 1.5
Other liabilities (S/T) 1.4 1.8 2.4 3.1 3.4 3.4 3.4 3.4 3.4 3.4
Bank and other borrowings (S/T) 0.1 0.3 1.2 1.4 0.7 0.7 0.7 0.7 0.7 0.7
Total current liabilities 2 3 5 6 6 6 7 7 8 8
Bank and other borrowings (L/T) - 1.0 0.3 1.7 2.2 2.2 2.2 2.2 2.2 2.2
Deferred tax liabilities 0.1 0.1 0.1 0.2 0.2 0.2 0.2 0.2 0.2 0.2
Other liabilities (L/T) 0.1 0.1 0.1 0.2 0.2 0.2 0.2 0.2 0.2 0.2
Total non-current liabilities 0 1 0 2 3 3 3 3 3 3
Total liabilities 2 4 5 8 8 9 9 10 10 11
Issued capital 0.1 0.1 0.2 0.2 0.2 0.2 0.2 0.2 0.2 0.2
Share premium and reserves 1.9 2.1 2.2 2.5 2.4 12.5 12.5 12.5 12.5 12.5
Retained earnings 2.3 3.1 4.1 5.2 6.6 8.9 11.6 15.0 18.8 23.2
Shareholders' equities 4 5 6 8 9 22 24 28 32 36
Perpetual securities - - - - - - - - - -
Minority interests 1.4 1.8 2.2 2.8 3.4 3.6 4.1 4.6 5.0 5.5
Total equities 6 7 9 11 13 25 28 32 37 41
Total liabilities and equities 8 11 14 18 21 34 38 42 47 52

Macquarie Research Sino Biopharmaceutical (1177 HK)
23 November 2018 24
Appendices
Fig 76 Management
Source: Company Data, Macquarie Research, November 2018
Fig 77 Ownership Structure
Source: FactSet, Macquarie Research, November 2018
Tse, Theresa Y Y( ) Tse Ping( ) Cheng Cheungling( ) Tse Hsin ( ) Zhang Xiquan ( )
Management
• Chairlady
• Executive Director
• CEO
• Founder
• Executive Director
• Vice Chairlady
• Executive Director
• Vice President
• Executive Director
• Spokesman
• Vice President
• Director of R&D
Age &
Relationship
• Age 25
• Daughter of Tse Ping and
Cheng Cheung Ling
• Niece of Tse Hsin
• Age 66
• Father of Tse, Therasa
• Age 54
• Mother of Tse, Therasa
• Age 48
• Uncle of Tse, Therasa
• Age 48
Scientific &
Education
• Bachelor of Economics,
Wharton School
of Business, University of
Pennsylvania
• Previously worked in the
investment, finance and
business development
departments of several
companies.
N/A • Clinician
• MBA, Peking University
• Bachelor’s Degree in
Industrial Engineering,
University of Hong Kong
• Master of Science,
Nankai University
• National Technology
Advancement
Second Honour Award
• Jiangsu Province
Technology Advancement
Second Honour Award
• Shanghai Technology
Advancement Second and
Third Honour Awards.
History &
Experience
2015-now Chairlady, Sino
Biopharma
2011-15 Wharton School,
University of Pennsylvania
2015-now CEO, Sino
Biopharma
2000-15 Chairman and
founder, Sino Biopharma
• Vice Chairman of Charoen
Pokphand
1985-96 Technician,
Workshop Director, Sales
Manager at Lianyungang
Medicine Factory
1995 Joined the Group as
assitant to the president
Currently:
Director of CT
Tianqing, NJCTT, and
Qingdao CT and the
president of Chia Tai
Shaoyang Orthopedic
Hospital
1994 Graduated from
Nankai University
1997 Joined the Group as
research scientist
Compensation
& Stock
position (Rmb)
• Annual salary: 2017
8.87mn, 2016 5.96mn
• Annual salary: 2017
36.7mn, 2016 28.3mn
• 2017 hold 16.49%
shareholding
• Annual salary: 2017
11.1mn
• 2017 hold 25.14%
shareholding
• Annual salary: 2017
2.18mn, 2016 1.59mn
• 2017 hold 0.83%
shareholding
N/A
Special notes
• “Most Outstanding
Business Women in China
for 2018” by Forbe China
online
• Responsible for the overall
operations of the Group
• Wealth ranking 232 in
China by Forbes
• "Top 10 Innovative Firgues
in China" in 2018
• Responsible for
the acquisition and merger
activities of the Group
• Lead R&D of new drugs
with expertise in drug
candidate selection and
joint development with
collaborators
Cheng Cheung Ling18%
Tse Ping12%
Tse, Theresa Y Y10%
Tse Hsin1%
Top 15 institutions
8%
Others51%
Top 5 institutions:Institution A 1.73%Institution B 1.42%Institution C 1.10%Institution D 0.99%Institution E 0.78%
Southbound stakewas 3.86% at Nov.8, 2018

Macquarie Research Sino Biopharmaceutical (1177 HK)
23 November 2018 25
Macquarie Quant View
The Quant View page below has been derived from models that are developed and maintained by Sales and Trading
personnel at Macquarie. The models are not a product of the Macquarie Research Department.
The quant model currently holds a neutral view on Sino Biopharmaceutical.
The strongest style exposure is Profitability, indicating this stock is efficiently
converting investments to earnings; proxied by ratios like ROE or ROA. The
weakest style exposure is Valuations, indicating this stock is over-priced in
the market relative to its peers.
Displays where the
company’s ranked based on
the fundamental consensus
Price Target and
Macquarie’s Quantitative
Alpha model.
Two rankings: Local market
(Hong Kong) and Global
sector (Pharma, Biotech &
Life Sciences)
338/948 Global rank in
Pharma, Biotech & Life Sciences
% of BUY recommendations 76% (16/21)
Number of Price Target downgrades 2
Number of Price Target upgrades 1
Macquarie Alpha Model ranking Factors driving the Alpha Model
A list of comparable companies and their Macquarie Alpha model score
(higher is better).
For the comparable firms this chart shows the key underlying styles and their
contribution to the current overall Alpha score.
Macquarie Earnings Sentiment Indicator Drivers of Stock Return
The Macquarie Sentiment Indicator is an enhanced earnings revisions
signal that favours analysts who have more timely and higher conviction
revisions. Current score shown below.
Breakdown of 1 year total return (local currency) into returns from dividends, changes
in forward earnings estimates and the resulting change in earnings multiple.
What drove this Company in the last 5 years How it looks on the Alpha model
Which factor score has had the greatest correlation with the company’s
returns over the last 5 years.
A more granular view of the underlying style scores that drive the alpha (higher is
better) and the percentile rank relative to the sector and market.
Source (all charts): FactSet, Thomson Reuters, and Macquarie Quant. For more details on the Macquarie Alpha model or for more customised analysis and screens, please contact the Macquarie Global Quantitative/Custom Products Group ([email protected])
Fu
nd
am
en
tals
Quant
Local market rank Global sector rank
Attractive
-0.4
-0.2
0.0
1.1
-3.0 -2.0 -1.0 0.0 1.0 2.0 3.0
Luye Pharma Group
CSPC Pharmaceutical
Sino Biopharmaceutical
Jiangsu Hengrui Medicine …
-100% -80% -60% -40% -20% 0% 20% 40% 60% 80% 100%
Luye Pharma Group
CSPC Pharmaceutical
Sino Biopharmaceutical
Jiangsu Hengrui Medicine …
Valuations Growth Profitability Earnings
Momentum
Price
Momentum
Quality
1.3
-0.2
0.0
0.9
-3.0 -2.0 -1.0 0.0 1.0 2.0 3.0
Luye Pharma Group
CSPC Pharmaceutical
Sino Biopharmaceutical
Jiangsu Hengrui Medicine …
-40% -30% -20% -10% 0% 10% 20% 30% 40%
Luye Pharma Group
CSPC Pharmaceutical
Sino Biopharmaceutical
Jiangsu Hengrui Medicine …
Dividend Return Multiple Return Earnings Outlook 1Yr Total Return
-37%
-34%
-33%
-32%
21%
22%
24%
34%
-40% -20% 0% 20% 40%
⇐ Negatives Positives ⇒
Volatility 250 Day
Return on Assets NTM
Return on Assets FY1
CFROI
Operating Accruals
Altman Z-Score
Price to Cash FY1
Working Capital Inc.
0 1
Technicals & TradingRisk
LiquidityCapital & Funding
QualityPrice Momentum
Earnings MomentumProfitability
Growth
ValuationAlpha Model Score
0.92-0.03
-1.26 0.06
0.47-0.23
-0.19 0.91 0.48
-0.50 0.04
0 1
Normalized
Score
0 50 100
Percentile relative
to sector(/948)
0 50 100
Percentile relative
to market(/556)

Macquarie Research Sino Biopharmaceutical (1177 HK)
23 November 2018 26
Sino Biopharmaceutical (1177 HK) Interim Results 1H/18A 2H/18E 1H/19E 2H/19E Profit & Loss 2017A 2018E 2019E 2020E
Revenue m 9,725 9,871 12,607 12,607 Revenue m 14,819 19,596 25,215 31,460 Gross Profit m 7,867 7,976 10,216 10,216 Gross Profit m 11,729 15,843 20,431 25,460 Cost of Goods Sold m 1,859 1,895 2,392 2,392 Cost of Goods Sold m 3,091 3,753 4,784 5,999 EBITDA m 2,363 3,003 3,455 3,455 EBITDA m 3,567 5,366 6,910 8,473 Depreciation m 200 135 168 168 Depreciation m 335 335 335 335 Amortisation of Goodwill m 0 0 0 0 Amortisation of Goodwill m 0 0 0 0 Other Amortisation m 0 0 0 0 Other Amortisation m 0 0 0 0 EBIT m 2,163 2,868 3,287 3,287 EBIT m 3,232 5,031 6,575 8,138 Net Interest Income m 14 -8 3 3 Net Interest Income m 5 5 5 5 Associates m 63 75 0 0 Associates m 409 138 0 0 Exceptionals m 69 -69 0 0 Exceptionals m 161 0 0 0 Forex Gains / Losses m 0 0 0 0 Forex Gains / Losses m 0 0 0 0 Other Pre-Tax Income m 88 -88 0 0 Other Pre-Tax Income m 389 0 0 0 Pre-Tax Profit m 2,398 2,777 3,290 3,290 Pre-Tax Profit m 4,196 5,174 6,580 8,144 Tax Expense m -429 -327 -493 -494 Tax Expense m -542 -755 -987 -1,222 Net Profit m 1,969 2,450 2,797 2,796 Net Profit m 3,654 4,419 5,593 6,922 Minority Interests m -603 -1,046 -1,088 -1,088 Minority Interests m -1,483 -1,649 -2,177 -2,709
Reported Earnings m 1,366 1,404 1,708 1,708 Reported Earnings m 2,171 2,770 3,416 4,213 Adjusted Earnings m 1,366 1,404 1,708 1,708 Adjusted Earnings m 2,074 2,770 3,416 4,213
EPS (rep) ¢ 11.1 11.1 13.5 13.5 EPS (rep) ¢ 13.0 22.2 27.0 33.3 EPS (adj) ¢ 11.1 11.1 13.5 13.5 EPS (adj) ¢ 12.4 22.2 27.0 33.3 EPS Growth yoy (adj) % 71.9 85.7 21.8 21.6 EPS Growth (adj) % 20.8 78.6 21.7 23.3
PE (rep) x 54.3 31.8 26.2 21.2 PE (adj) x 56.9 31.8 26.2 21.2
EBITDA Margin % 24.3 30.4 27.4 27.4 Total DPS ¢ 2.9 5.3 6.5 8.0 EBIT Margin % 22.2 29.1 26.1 26.1 Total Div Yield % 0.4 0.7 0.9 1.1 Earnings Split % 49.3 50.7 50.0 50.0 Basic Shares Outstanding m 16,677 12,638 12,638 12,638 Revenue Growth % 30.0 34.5 29.6 27.7 Diluted Shares Outstanding m 16,677 12,474 12,640 12,640 EBIT Growth % 60.3 52.4 52.0 14.6
Profit and Loss Ratios 2017A 2018E 2019E 2020E Cashflow Analysis 2017A 2018E 2019E 2020E
Revenue Growth % 9.4 32.2 28.7 24.8 EBITDA m 3,766 3,520 4,398 5,429 EBITDA Growth % 8.2 50.5 28.8 22.6 Tax Paid m -464 -755 -987 -1,222 EBIT Growth % 7.9 55.7 30.7 23.8 Chgs in Working Cap m 431 -451 -559 -642 Gross Profit Margin % 79.1 80.8 81.0 80.9 Net Interest Paid m -12 5 5 5 EBITDA Margin % 24.1 27.4 27.4 26.9 Other m 948 -4,881 0 0 EBIT Margin % 21.8 25.7 26.1 25.9 Operating Cashflow m 4,669 -2,563 2,857 3,571 Net Profit Margin % 14.0 14.1 13.5 13.4 Acquisitions m -288 271 138 0 Payout Ratio % 23.3 23.7 24.0 24.0 Capex m 0 0 0 0 EV/EBITDA x 28.2 15.2 12.1 9.9 Asset Sales m -1,091 -9,844 0 0 EV/EBIT x 30.8 16.2 12.7 10.3 Other m -1,614 0 0 0
Investing Cashflow m -2,993 -9,573 138 0 Balance Sheet Ratios Dividend (Ordinary) m -450 -501 -665 -820 ROE % 24.2 18.0 14.9 16.2 Equity Raised m 0 10,090 0 0 ROA % 16.4 18.4 18.4 20.4 Debt Movements m -97 0 0 0 ROIC % 37.9 55.2 24.6 29.9 Other m -939 166 528 532 Net Debt/Equity % -38.3 -9.7 -18.7 -26.6 Financing Cashflow m -1,486 9,755 -137 -288 Interest Cover x nmf nmf nmf nmf Price/Book x 12.8 4.1 3.7 3.2 Net Chg in Cash/Debt m 190 -2,381 2,858 3,283 Book Value per Share 0.6 1.7 1.9 2.2
Free Cashflow m 4,669 -2,563 2,857 3,571
Balance Sheet 2017A 2018E 2019E 2020E Cash m 7,779 5,399 8,257 11,540 Receivables m 2,051 2,684 3,454 4,310 Inventories m 919 1,131 1,442 1,808 Investments m 370 370 370 370 Fixed Assets m 3,483 3,483 3,483 3,483 Intangibles m 308 10,152 10,152 10,152 Other Assets m 6,024 10,635 10,497 10,497 Total Assets m 20,935 33,854 37,655 42,160 Payables m 1,030 1,229 1,539 1,904 Short Term Debt m 741 741 741 741 Long Term Debt m 2,210 2,210 2,210 2,210 Provisions m 680 875 1,087 1,301 Other Liabilities m 3,663 3,663 3,663 3,663 Total Liabilities m 8,324 8,718 9,240 9,819 Shareholders' Funds m 9,209 21,567 24,318 27,712 Minority Interests m 3,402 3,569 4,096 4,629 Other m 0 0 0 0 Total S/H Equity m 12,611 25,136 28,415 32,340 Total Liab & S/H Funds m 20,935 33,854 37,655 42,160
All figures in HKD unless noted. Source: Company data, Macquarie Research, November 2018

Macquarie Research Sino Biopharmaceutical (1177 HK)
23 November 2018 27
Important disclosures:
Recommendation definitions
Macquarie - Australia/New Zealand Outperform – return >3% in excess of benchmark return Neutral – return within 3% of benchmark return Underperform – return >3% below benchmark return Benchmark return is determined by long term nominal GDP growth plus 12 month forward market dividend yield, which is currently around 9%.
Macquarie – Asia/Europe Outperform – expected return >+10% Neutral – expected return from -10% to +10% Underperform – expected return <-10%
Mazi Macquarie – South Africa Outperform – expected return >+10% Neutral – expected return from -10% to +10% Underperform – expected return <-10%
Macquarie - Canada Outperform – return >5% in excess of benchmark return Neutral – return within 5% of benchmark return Underperform – return >5% below benchmark return
Macquarie - USA Outperform (Buy) – return >5% in excess of Russell 3000 index return Neutral (Hold) – return within 5% of Russell 3000 index return Underperform (Sell)– return >5% below Russell 3000 index return
Volatility index definition*
This is calculated from the volatility of historical price movements. Very high–highest risk – Stock should be expected to move up or down 60–100% in a year – investors should be aware this stock is highly speculative. High – stock should be expected to move up or down at least 40–60% in a year – investors should be aware this stock could be speculative. Medium – stock should be expected to move up or down at least 30–40% in a year. Low–medium – stock should be expected to move up or down at least 25–30% in a year. Low – stock should be expected to move up or down at least 15–25% in a year. * Applicable to Asia/Australian/NZ/Canada stocks only
Recommendations – 12 months Note: Quant recommendations may differ from Fundamental Analyst recommendations
Financial definitions
All "Adjusted" data items have had the following adjustments made: Added back: goodwill amortisation, provision for catastrophe reserves, IFRS derivatives & hedging, IFRS impairments & IFRS interest expense Excluded: non recurring items, asset revals, property revals, appraisal value uplift, preference dividends & minority interests EPS = adjusted net profit / efpowa* ROA = adjusted ebit / average total assets ROA Banks/Insurance = adjusted net profit /average total assets ROE = adjusted net profit / average shareholders funds Gross cashflow = adjusted net profit + depreciation *equivalent fully paid ordinary weighted average number of shares All Reported numbers for Australian/NZ listed stocks are modelled under IFRS (International Financial Reporting Standards).
Recommendation proportions – For quarter ending 30 September 2018
AU/NZ Asia RSA USA CA EUR Outperform 51.56% 59.51% 45.05% 46.88% 67.86% 46.70% (for global coverage by Macquarie, 3.70% of stocks followed are investment banking clients)
Neutral 33.20% 28.92% 37.36% 47.70% 25.00% 42.73% (for global coverage by Macquarie, 2.04% of stocks followed are investment banking clients)
Underperform 15.23% 11.57% 17.58% 5.42% 7.14% 10.57% (for global coverage by Macquarie, 0.47% of stocks followed are investment banking clients)
1177 HK vs HSI, & rec history
(all figures in HKD currency unless noted)
2318 HK vs HSI, & rec history
(all figures in HKD currency unless noted)
Note: Recommendation timeline – if not a continuous line, then there was no Macquarie coverage at the time or there was an embargo period. Source: FactSet, Macquarie Research, November 2018
12-month target price methodology
1177 HK: HK$10.22 based on a PER methodology
2318 HK: HK$110.00 based on a Sum of Parts methodology
Company-specific disclosures: 1177 HK: Macquarie Capital Limited makes a market in the securities of Sino Biopharmaceutical Ltd. 2318 HK: Macquarie Capital Limited makes a market in the securities of Ping An Insurance (Group) Co. of China, Ltd. Macquarie Group Limited together with its affiliates beneficially owns 1% or more of the equity securities of Ping An Insurance Group Co of China Ltd. Important disclosure information regarding the subject companies covered in this report is available at www.macquarie.com/research/disclosures.
Date Stock Code (BBG code) Recommendation Target Price 17-Nov-2018 1177 HK Outperform HK$10.22 15-Mar-2017 1177 HK Outperform HK$5.13 24-Sep-2016 1177 HK Outperform HK$5.33
Target price risk disclosures: 1177 HK: Any inability to compete successfully in their markets may harm the business. This could be a result of many factors which may include geographic mix and introduction of improved products or service offerings by competitors. The results of operations may be materially affected by global economic conditions generally, including conditions in financial markets. The company is exposed to market risks, such as changes in interest rates, foreign exchange rates and input prices. From time to time, the company will enter into transactions, including transactions in derivative instruments, to manage certain of these exposures. 2318 HK: Any inability to compete successfully in their markets may harm the business. This could be a result of many factors which may include geographic mix and introduction of improved products or service offerings by competitors. The results of operations may be materially affected by global economic conditions generally, including conditions in financial markets. The company is exposed to market risks, such as changes in interest rates, foreign exchange rates and input prices. From time to time, the company will enter into transactions, including transactions in derivative instruments, to manage certain of these exposures.
Analyst certification: We hereby certify that all of the views expressed in this report accurately reflect our personal views about the subject company or companies and its or their securities. We also certify that no part of our compensation was, is or will be, directly or indirectly, related to the specific recommendations or views expressed in this report. The Analysts responsible for preparing this report receive compensation from Macquarie that is based upon various factors including Macquarie Group Ltd total revenues, a portion of which are generated by Macquarie Group’s Investment Banking activities.
Macquarie Research Sino Biopharmaceutical (1177 HK)
23 November 2018 28
General disclaimers: Macquarie Securities (Australia) Ltd; Macquarie Capital (Europe) Ltd; Macquarie Capital Markets Canada Ltd; Macquarie Capital Markets North America Ltd; Macquarie Capital (USA) Inc; Macquarie Capital Limited, Taiwan Securities Branch; Macquarie Capital Securities (Singapore) Pte Ltd; Macquarie Securities (NZ) Ltd; Mazi Macquarie Securities (RF) (Pty) Ltd; Macquarie Capital Securities (India) Pvt Ltd; Macquarie Capital Securities (Malaysia) Sdn Bhd; Macquarie Securities Korea Limited and Macquarie Securities (Thailand) Ltd are not authorized deposit-taking institutions for the purposes of the Banking Act 1959 (Commonwealth of Australia), and their obligations do not represent deposits or other liabilities of Macquarie Bank Limited ABN 46 008 583 542 (MBL) or MGL. MBL does not guarantee or otherwise provide assurance in respect of the obligations of any of the above mentioned entities. MGL provides a guarantee to the Monetary Authority of Singapore in respect of the obligations and liabilities of Macquarie Capital Securities (Singapore) Pte Ltd for up to SGD 35 million. This research has been prepared for the general use of the wholesale clients of the Macquarie Group and must not be copied, either in whole or in part, or distributed to any other person. If you are not the intended recipient you must not use or disclose the information in this research in any way. If you received it in error, please tell us immediately by return e-mail and delete the document. We do not guarantee the integrity of any e-mails or attached files and are not responsible for any changes made to them by any other person. MGL has established and implemented a conflicts policy at group level (which may be revised and updated from time to time) (the "Conflicts Policy") pursuant to regulatory requirements (including the FCA Rules) which sets out how we must seek to identify and manage all material conflicts of interest. Nothing in this research shall be construed as a solicitation to buy or sell any security or product, or to engage in or refrain from engaging in any transaction. In preparing this research, we did not take into account your investment objectives, financial situation or particular needs. Macquarie salespeople, traders and other professionals may provide oral or written market commentary or trading strategies to our clients that reflect opinions which are contrary to the opinions expressed in this research. Macquarie Research produces a variety of research products including, but not limited to, fundamental analysis, macro-economic analysis, quantitative analysis, and trade ideas. Recommendations contained in one type of research product may differ from recommendations contained in other types of research, whether as a result of differing time horizons, methodologies, or otherwise. Before making an investment decision on the basis of this research, you need to consider, with or without the assistance of an adviser, whether the advice is appropriate in light of your particular investment needs, objectives and financial circumstances. There are risks involved in securities trading. The price of securities can and does fluctuate, and an individual security may even become valueless. International investors are reminded of the additional risks inherent in international investments, such as currency fluctuations and international stock market or economic conditions, which may adversely affect the value of the investment. This research is based on information obtained from sources believed to be reliable but we do not make any representation or warranty that it is accurate, complete or up to date. We accept no obligation to correct or update the information or opinions in it. Opinions expressed are subject to change without notice. No member of the Macquarie Group accepts any liability whatsoever for any direct, indirect, consequential or other loss arising from any use of this research and/or further communication in relation to this research. Clients should contact analysts at, and execute transactions through, a Macquarie Group entity in their home jurisdiction unless governing law permits otherwise. The date and timestamp for above share price and market cap is the closed price of the price date. #CLOSE is the final price at which the security is traded in the relevant exchange on the date indicated. Members of the Macro Strategy team are Sales & Trading personnel who provide desk commentary that is not a product of the Macquarie Research department or subject to FINRA Rule 2241 or any other regulation regarding independence in the provision of equity research. Country-specific disclaimers: Australia: In Australia, research is issued and distributed by Macquarie Securities (Australia) Ltd (AFSL No. 238947), a participating organization of the Australian Securities Exchange. Macquarie Securities (Australia) Limited staff involved with the preparation of research have regular interaction with companies they cover. Additionally, Macquarie Group Limited does and seeks to do business with companies covered by Macquarie Research. There are robust information barriers in place to protect the independence of Macquarie Research’s product. However, recipients of Macquarie Research should be aware of this potential conflict of interest. New Zealand: In New Zealand, research is issued and distributed by Macquarie Securities (NZ) Ltd, a NZX Firm. Canada: In Canada, research is prepared, approved and distributed by Macquarie Capital Markets Canada Ltd., a (i) member of the Investment Industry Regulatory Organization of Canada and the Canadian Investor Protection Fund, and (ii) participating organisation of the Toronto Stock Exchange, TSX Venture Exchange & Montréal Exchange. This research is distributed in the United States, as third party research by Macquarie Capital Markets North America Ltd., which is a registered broker-dealer and member of Financial Industry Regulatory Authority and the Securities Investor Protection Corporation. Macquarie Capital Markets North America Ltd. accepts responsibility for the contents of reports issued by Macquarie Capital Markets Canada Ltd. in the United States and sent to US persons. Any US person wishing to effect transactions in the securities described in the reports issued by Macquarie Capital Markets Canada Ltd. should do so with Macquarie Capital Markets North America Ltd. This research is intended for distribution in the United States only to major Institutional Investors (as such term is defined in SEC 15a-6 and Section 15 of the Securities Exchange Act of 1934, as amended) and is not intended for the use of any person or entity that is not a major institutional investor. Research analysts of Macquarie Capital Markets Canada Ltd. are not registered/qualified as research analysts with FINRA. The Research Distribution Policy of Macquarie Capital Markets Canada Ltd. is to allow all clients that are entitled to have equal access to our research. United Kingdom: In the United Kingdom, research is issued and distributed by Macquarie Capital (Europe) Ltd, which is authorised and regulated by the Financial Conduct Authority (No. 193905). Germany: In Germany, this research is issued and/or distributed by Macquarie Capital (Europe) Limited, Niederlassung Deutschland, which is authorised and regulated by the UK Financial Conduct Authority (No. 193905). and in Germany by BaFin. France: In France, research is issued and distributed by Macquarie Capital (Europe) Ltd, which is authorised and regulated in the United Kingdom by the Financial Conduct Authority (No. 193905). Hong Kong & Mainland China: In Hong Kong, research is issued and distributed by Macquarie Capital Limited, which is licensed and regulated by the Securities and Futures Commission. In Mainland China, Macquarie Securities (Australia) Limited Shanghai Representative Office only engages in non-business operational activities excluding issuing and distributing research. Only non-A share research is distributed into Mainland China by Macquarie Capital Limited. Japan: In Japan, research is Issued and distributed by Macquarie Capital Securities (Japan) Limited, a member of the Tokyo Stock Exchange, Inc. and Osaka Exchange, Inc. (Financial Instruments Firm, Kanto Financial Bureau (kin-sho) No. 231, a member of Japan Securities Dealers Association). India: In India, research is issued and distributed by Macquarie Capital Securities (India) Pvt. Ltd. (CIN: U65920MH1995PTC090696), 92, Level 9, 2 North Avenue, Maker Maxity, Bandra Kurla Complex, Bandra (East), Mumbai – 400 051, India, which is a SEBI registered Research Analyst having registration no. INH000000545. Malaysia: In Malaysia, research is issued and distributed by Macquarie Capital Securities (Malaysia) Sdn. Bhd. (Company registration number: 463469-W) which is a Participating Organisation of Bursa Malaysia Berhad and a holder of Capital Markets Services License issued by the Securities Commission. Taiwan: In Taiwan, research is issued and distributed by Macquarie Capital Limited, Taiwan Securities Branch, which is licensed and regulated by the Financial Supervisory Commission. No portion of the report may be reproduced or quoted by the press or any other person without authorisation from Macquarie. Nothing in this research shall be construed as a solicitation to buy or sell any security or product. The recipient of this report shall not engage in any activities which may give rise to potential conflicts of interest to the report. Research Associate(s) in this report who are registered as Clerks only assist in the preparation of research and are not engaged in writing the research. Macquarie may be in past one year or now being an Issuer of Structured Warrants on securities mentioned in this report. Thailand: In Thailand, research is produced, issued and distributed by Macquarie Securities (Thailand) Ltd. Macquarie Securities (Thailand) Ltd. is a licensed securities company that is authorized by the Ministry of Finance, regulated by the Securities and Exchange Commission of Thailand and is an exchange member of the Stock Exchange of Thailand. The Thai Institute of Directors Association has disclosed the Corporate Governance Report of Thai Listed Companies made pursuant to the policy of the Securities and Exchange Commission of Thailand. Macquarie Securities (Thailand) Ltd does not endorse the result of the Corporate Governance Report of Thai Listed Companies but this Report can be accessed at: http://www.thai-iod.com/en/publications.asp?type=4. South Korea: In South Korea, unless otherwise stated, research is prepared, issued and distributed by Macquarie Securities Korea Limited, which is regulated by the Financial Supervisory Services. Information on analysts in MSKL is disclosed at http://dis.kofia.or.kr/websquare/index.jsp?w2xPath=/wq/fundMgr/DISFundMgrAnalystStut.xml&divisionId=MDIS03002001000000&serviceId=SDIS03002001000. South Africa: In South Africa, research is issued and distributed by Mazi Macquarie Securities (RF) (Pty) Ltd, a member of the JSE Limited. Singapore: In Singapore, research is issued and distributed by Macquarie Capital Securities (Singapore) Pte Ltd (Company Registration Number: 198702912C), a Capital Markets Services license holder under the Securities and Futures Act to deal in securities and provide custodial services in Singapore. Pursuant to the Financial Advisers (Amendment) Regulations 2005, Macquarie Capital Securities (Singapore) Pte Ltd is exempt from complying with sections 25, 27 and 36 of the Financial Advisers Act. All Singapore-based recipients of research produced by Macquarie Capital (Europe) Limited, Macquarie Capital Markets Canada Ltd, Mazi Macquarie Securities (RF) (Pty) Ltd and Macquarie Capital (USA) Inc. represent and warrant that they are institutional investors as defined in the Securities and Futures Act. United States: In the United States, research is issued and distributed by Macquarie Capital (USA) Inc., which is a registered broker-dealer and member of FINRA. Macquarie Capital (USA) Inc, accepts

Macquarie Research Sino Biopharmaceutical (1177 HK)
23 November 2018 29
responsibility for the content of each research report prepared by one of its non-US affiliates when the research report is distributed in the United States by Macquarie Capital (USA) Inc. Macquarie Capital (USA) Inc.’s affiliate’s analysts are not registered as research analysts with FINRA, may not be associated persons of Macquarie Capital (USA) Inc., and therefore may not be subject to FINRA rule restrictions on communications with a subject company, public appearances, and trading securities held by a research analyst account. Information regarding futures is provided for reference purposes only and is not a solicitation for purchases or sales of futures. Any persons receiving this report directly from Macquarie Capital (USA) Inc. and wishing to effect a transaction in any security described herein should do so with Macquarie Capital (USA) Inc. Important disclosure information regarding the subject companies covered in this report is available at www.macquarie.com/research/disclosures, or contact your registered representative at 1-888-MAC-STOCK, or write to the Supervisory Analysts, Research Department, Macquarie Securities, 125 W.55th Street, New York, NY 10019. © Macquarie Group

Equities
Asia Research Head of Equity Research
Jake Lynch (Asia – Head) (852) 3922 3583
Hiroyuki Sakaida (Japan – Head) (813) 3512 6695
Conrad Werner (ASEAN – Head) (65) 6601 0182
Automobiles, Auto Parts
Janet Lewis (China, Japan) (813) 3512 7856
Allen Yuan (China) (8621) 2412 9009
James Hong (Korea) (822) 3705 8661
Amit Mishra (India) (9122) 6720 4084
Banks and Financials
Scott Russell (Asia) (852) 3922 3567
Dexter Hsu (China, Taiwan) (8862) 2734 7530
Keisuke Moriyama (Japan) (813) 3512 7476
Chan Hwang (Korea) (822) 3705 8643
Suresh Ganapathy (India) (9122) 6720 4078
Jayden Vantarakis (Indonesia) (6221) 2598 8310
Anand Pathmakanthan (Malaysia) (603) 2059 8833
Gilbert Lopez (Philippines) (632) 857 0892
Peach Patharavanakul (Thailand) (662) 694 7753
Basic Materials, Commodities
David Ching (China, Hong Kong) (852) 3922 1823
Harunobu Goroh (Japan) (813) 3512 7886
Yasuhiro Nakada (Japan) (813) 3512 7862
Anna Park (Korea) (822) 3705 8669
Sumangal Nevatia (India) (9122) 6720 4093
Jayden Vantarakis (Indonesia) (6221) 2598 8310
Farrah Aqlima (Malaysia) (603) 2059 8987
Conglomerates
David Ng (China, Hong Kong) (852) 3922 1291
Gilbert Lopez (Philippines) (632) 857 0892
Conrad Werner (Singapore) (65) 6601 0182
Consumer, Gaming
Linda Huang (Asia) (852) 3922 4068
Terence Chang (China, Hong Kong) (852) 3922 3581
Sunny Chow (China, Hong Kong) (852) 3922 3768
Leon Rapp (Japan) (813) 3512 7879
Kwang Cho (Korea) (822) 3705 4953
Amit Sinha (India) (9122) 6720 4085
Robert Pranata (Indonesia) (6221) 2598 8366
Richardo Walujo (Indonesia) (6221) 2598 8369
Denise Soon (Malaysia) (603) 2059 8845
Karisa Magpayo (Philippines) (632) 857 0899
Chalinee Congmuang (Thailand) (662) 694 7993
Emerging Leaders
Jake Lynch (Asia) (852) 3922 3583
Kwang Cho (Korea) (822) 3705 4953
Corinne Jian (Greater China) (8862) 2734 7522
Conrad Werner (ASEAN) (65) 6601 0182
Bo Denworalak (Thailand) (662) 694 7774
Infrastructure, Industrials, Transportation
Patrick Dai (China) (8621) 2412 9082
Eric Zong (China, Hong Kong) (852) 3922 4749
Kunio Sakaida (Japan) (813) 3512 7873
James Hong (Korea) (822) 3705 8661
Corinne Jian (Taiwan) (8862) 2734 7522
Inderjeetsingh Bhatia (India) (9122) 6720 4087
Internet, Media and Software
Wendy Huang (Asia) (852) 3922 3378
Marcus Yang (Greater China) (8862) 2734 7532
John Wang (China, Hong Kong) (852) 3922 3578
Ellie Jiang (China, Hong Kong) (852) 3922 4110
Frank Chen (China, Hong Kong) (852) 3922 1433
Alankar Garude (India) (9122) 6720 4134
Oil, Gas and Petrochemicals
Aditya Suresh (Asia) (852) 3922 1265
Anna Park (Asia) (822) 3705 8669
Yasuhiro Nakada (Japan) (813) 3512 7862
Corinne Jian (Taiwan) (8862) 2734 7522
Ben Shane Lim (Malaysia) (603) 2059 8868
Yupapan Polpornprasert (Thailand) (662) 694 7729
Pharmaceuticals and Healthcare
David Ng (China, Hong Kong) (852) 3922 1291
Xiang Gao (China, Hong Kong) (8621) 2412 9006
Corinne Jian (China) (8862) 2734 7522
Alankar Garude (India) (9122) 6720 4134
Richardo Walujo (Indonesia) (6221) 259 88 369
Property, REIT
David Ng (China, Hong Kong) (852) 3922 1291
Kelvin Tam (China) (852) 3922 1181
Keisuke Moriyama (Japan) (813) 3512 7476
Tomoyoshi Omuro (Japan) (813) 3512 7474
Abhishek Bhandari (India) (9122) 6720 4088
Richard Danusaputra (Indonesia) (6221) 2598 8368
Aiman Mohamad (Malaysia) (603) 2059 8986
Kervin Sisayan (Philippines) (632) 857 0893
Bo Denworalak (Thailand) (662) 694 7774
Technology
Damian Thong (Asia, Japan) (813) 3512 7877
Allen Chang (Greater China) (852) 3922 1136
Jeffrey Ohlweiler (Greater China) (8862) 2734 7512
Kaylin Tsai (Greater China) (8862) 2734 7523
Lynn Luo (Greater China) (8862) 2734 7534
Patrick Liao (Greater China) (8862) 2734 7515
Verena Jeng (Greater China) (852) 3922 3766
Jin Guo (Greater China) (8621) 2412 9054
Daniel Kim (Korea) (822) 3705 8641
Abhishek Bhandari (India) (9122) 6720 4088
Farrah Aqlima (Malaysia) (603) 2059 8987
Telecoms
Allen Chang (Greater China) (852) 3922 1136
Prem Jearajasingam (ASEAN) (603) 2059 8989
Nathania Nurhalim (Indonesia) (6221) 2598 8365
Kervin Sisayan (Philippines) (632) 857 0893
Utilities, Renewables
Hiroyuki Sakaida (Japan) (813) 3512 6695
Patrick Dai (China) (8621) 2412 9082
Inderjeetsingh Bhatia (India) (9122) 6720 4087
Karisa Magpayo (Philippines) (632) 857 0899
Strategy, Country
Viktor Shvets (Asia, Global) (852) 3922 3883
David Ng (China, Hong Kong) (852) 3922 1291
Hiroyuki Sakaida (Japan) (813) 3512 6695
Chan Hwang (Korea) (822) 3705 8643
Jeffrey Ohlweiler (Taiwan) (8862) 2734 7512
Inderjeetsingh Bhatia (India) (9122) 6720 4087
Conrad Werner (ASEAN, Singapore) (65) 6601 0182
Jayden Vantarakis (Indonesia) (6221) 2598 8310
Anand Pathmakanthan (Malaysia) (603) 2059 8833
Gilbert Lopez (Philippines) (632) 857 0892
Peach Patharavanakul (Thailand) (662) 694 7753
Find our research at Macquarie: www.macquarieresearch.com Thomson: www.thomson.com/financial Reuters: www.knowledge.reuters.com Bloomberg: MAC GO Factset: http://www.factset.com/home.aspx CapitalIQ www.capitaliq.com Email [email protected] for access
Asia Sales Regional Heads of Sales
Miki Edelman (Global) (1 212) 231 6121
Amelia Mehta (Asia) (65) 6601 0211
Alan Chen (Asia) (852) 3922 2019
Sandeep Bhatia (India) (9122) 6720 4101
Tim Huang (Indonesia) (6221) 2598 8303
Thomas Renz (Geneva) (41 22) 818 7712
Tomohiro Takahashi (Japan) (813) 3512 7823
John Jay Lee (Korea) (822) 3705 9988
Nik Hadi (Malaysia) (603) 2059 8888
Gino C Rojas (Philippines) (632) 857 0861
Regional Heads of Sales cont’d
Paul Colaco (San Francisco) (1 415) 762 5003
Eric Lin (Taiwan) (8862) 2734 7590
Angus Kent (Thailand) (662) 694 7601
Mothlib Miah (UK/Europe) (44 20) 3037 4893
Christina Lee (US) (44 20) 3037 4873
Sales Trading
Mark Weekes (Asia) (852) 3922 2084
Stanley Dunda (Indonesia) (6221) 515 1555
Sales Trading cont’d
Suhaida Samsudin (Malaysia) (603) 2059 8888
Michael Santos (Philippines) (632) 857 0813
Chris Reale (New York) (1 212) 231 2555
Marc Rosa (New York) (1 212) 231 2555
Justin Morrison (Singapore) (65) 6601 0288
Brendan Rake (Thailand) (662) 694 7707
Mike Keen (UK/Europe) (44 20) 3037 4905
This publication was disseminated on 23 November 2018 at 16:43 UTC.