single-breath xenon polarization transfer contrast (sb-xtc): implementation and initial results in...
TRANSCRIPT

Original Research
Single-Breath Xenon Polarization Transfer Contrast(SB-XTC): Implementation and Initial Results inHealthy Humans
Iga Muradyan, PhD,1,2* James P. Butler, PhD,1,3 Mikayel Dabaghyan, PhD,1 Mirko Hrovat, PhD,4
Isabel Dregely, PhD,2 Iulian Ruset, PhD,5 George P. Topulos, MD,6 Eric Frederick, MS,1,7
Hiroto Hatabu, MD, PhD,1 William F. Hersman, PhD,2,5 and Samuel Patz, PhD1
Purpose: To implement and characterize a single-breathxenon transfer contrast (SB-XTC) method to assess thefractional diffusive gas transport F in the lung: to studythe dependence of F and its uniformity as a function oflung volume; to estimate local alveolar surface area perunit gas volume SA/VGas from multiple diffusion timemeasurements of F; to evaluate the reproducibility of themeasurements and the necessity of B1 correction in casesof centric and sequential encoding.
Materials and Methods: In SB-XTC three or four gradientecho images separated by inversion/saturation pulseswere collected during a breath-hold in eight healthy vol-unteers, allowing the mapping of F (thus SA/VGas) andcorrection for other contributions such as T1 relaxation,RF depletion and B1 inhomogeneity from inherently regis-tered data.
Results: Regional values of F and its distribution wereobtained; both the mean value and heterogeneity of Fincreased with the decrease of lung volume. Higher valuesof F in the bases of the lungs in supine position were
observed at lower volumes in all volunteers. Local SA/VGas (with a mean 6 standard deviation of SA=VGas ¼89630 cm�1) was estimated in vivo near functional resid-ual capacity. Calibration of SB-XTC on phantoms high-lighted the necessity for B1 corrections when k-space istraversed sequentially; with centric ordering B1 distribu-tion correction is dispensable.
Conclusion: The SB-XTC technique is implemented andvalidated for in vivo measurements of local SA/VGas.
Key Words: hyperpolarized 129Xe MRI; XTC; SB-XTC;human pulmonary gas exchange; lung volume depend-ence; centric vs. sequentialJ. Magn. Reson. Imaging 2013;37:457–470.VC 2012 Wiley Periodicals, Inc.
PROTON MAGNETIC RESONANCE IMAGING (MRI)has severe limitations in the lung due to its low tissuedensity and short transverse relaxation time (T�
2)owing to the extremely large area of gas–tissue inter-faces present in the lungs (�100 m2). Introduction ofhyperpolarized gas MRI (1–4) offers new possibilitiesfor pulmonary imaging. 129Xe is lipophilic, sensitive toits surroundings due to its sizable electronic cloud,and shows a nuclear magnetic resonance (NMR) spec-trum that undergoes a large range of frequency shifts(�200 ppm) (5) when placed in different environ-ments, thus facilitating the separate studies of pulmo-nary air-sacs, septa, and blood (6–8). In one suchstudy the chemical shift saturation recovery (CSSR)technique was developed (9), where the 129Xe magnet-ization in the dissolved phase was initially destroyedby a selective radiofrequency (RF) pulse. Then duringa diffusion time tdiff the 129Xe magnetization in thedissolved phase was replenished by diffusion of polar-ized xenon from the alveolar gas spaces into septaltissue and blood. For porous materials in whichxenon is soluble, at short diffusion times the frac-tional diffusive gas transport F(t), defined as the ratioof the 129Xe magnetization in the dissolved phase attime t relative to that in the gas phase at t ¼ 0, is pro-portional to the surface area available for diffusionper unit gas volume (SA/VGas) (8–10). However, since
1Center for Pulmonary Functional Imaging, Department of Radiology,Brigham and Women’s Hospital, Boston, Massachusetts, USA.2Department of Physics, University of New Hampshire, Durham, NewHampshire, USA.3Department of Environmental Health, Harvard School of PublicHealth, Boston, MA 02115 and Division of Sleep Medicine,Department of Medicine, Harvard Medical School, Boston,Massachusetts, USA.4Mirtech, Inc., Brockton, Massachusetts, USA.5Xemed LLC, Durham, New Hampshire, USA.6Department of Anesthesiology, Perioperative and Pain Medicine,Brigham and Women’s Hospital, Boston, Massachusetts, USA.7Department of Physics, University of Massachusetts – Lowell, Lowell,Massachusetts, USA.
Contract grant sponsor: National Institutes of Health (NIH); Contractgrant numbers: HL073632, P41RR14075, RC1HL00606; Contractgrant sponsor: Martinos Center for Biomedical Research NCRR;Contract grant number: P41RR14075; Contract grant sponsor:FAMRI Clinical Innovator Award.
*Address reprint requests to: Iga M., Center for Pulmonary FunctionalImaging, Department of Radiology, Brigham and Women’s Hospital,LMRC, 221 Longwood Ave., LM-010E, Boston, MA 02115.E-mail: [email protected]
Received July 26, 2011; Accepted August 14, 2012.
DOI 10.1002/jmri.23823View this article online at wileyonlinelibrary.com.
JOURNAL OF MAGNETIC RESONANCE IMAGING 37:457–470 (2013)
CME
VC 2012 Wiley Periodicals, Inc. 457

only �2% of gaseous xenon dissolves into the lung pa-renchyma, direct regional SA/VGas measurements usingtechniques like the Dixon method (11–13) are very chal-lenging and suffer from low signal-to-noise ratio (SNR).
Ruppert et al (14,15) developed a magnetizationtransfer technique, xenon polarization transfer con-trast (XTC), that estimates a fractional depolarizationFXTC from the measurement of the hyperpolarized gasdepolarization in the lungs. In contrast to the CSSRand Dixon techniques, this is an indirect measurementof diffusive gas transport to the tissue and blood. FXTC
is fundamentally different from FCSSR except for a spe-cial case where XTC RF pulses are 90� pulses (10,16).Ruppert et al demonstrated the feasibility of XTC inanesthetized animals during a two-breath protocol; anextension of XTC to human subjects would require ei-ther an application of image registration methods or adevelopment of a single-breath technique to avoidthese issues altogether. Previously, there were briefreports on the development of an in vivo application ofa single-breath XTC (SB-XTC) method (8,10,17). Veryrecently, Dregely et al (18) reported on another imple-mentation of single-breath multiple exchange timeXTC measurements and initial results in vivo. In thisarticle we report the mean F, the variance in F due tophysiological heterogeneity sPhysiol and the dependenceon lung volume of these two parameters in eighthealthy volunteers. We also calculate the local SA/VGas
map from the measurements of F performed at threediffusion times. Further, we present the details of tech-nical implementation, calibration, and reproducibilityevaluation of SB-XTC measurements. Finally, we showthat the k-space trajectory influences the need to cor-rect the data for B1 inhomogeneity.
MATERIALS AND METHODS
Human Subjects
All human subject experiments were conducted incompliance with Institutional Review Board (IRB) andFood and Drug Administration (FDA) IND-approved pro-tocols (for details, see Ref. (19)). Informed consent wasobtained from all volunteers as a prerequisite to partici-pation in the study. Pulmonary functional tests (PFT)were obtained on all subjects (Table 1). The gas volumesinhaled by each subject to achieve a particular lung vol-ume were calculated based on either the measured val-ues of residual volume (RV) and total lung capacity(TLC) or, if the MRI experiments occurred before thePFT’s were obtained, on the predicted values.
A total of eight healthy subjects participated in thestudy. Two of them were world-class deep divers,trained to perform glossopharyngeal exsufflation(GE)—a maneuver used to extract air from the lungs.Performed repeatedly, this maneuver can lower lungvolume (VL) by several hundred mL below (RV)(20,21). These two subjects provided a unique opportu-nity to study ventilation and gas exchange at extremelylow VL otherwise unattainable for in vivo studies inintact lungs (22). All subjects followed the samebreathing protocol to standardize the ventilation: whileinside the magnet, they were instructed to inhale toTLC and exhale to RV twice, then inhale the gas
mixture and hold their breath. Both divers performedGE to reach sub-RV after their second exhalation toRV, and then inhaled the gas mixture and held theirbreaths. For all subjects and breath-holds, theapproved protocol requires inhaled gas mixtures tocontain at least 21% oxygen and no more than 70% xe-non. In addition, the estimated alveolar xenon concen-tration cannot exceed 35% (19). Additional air, if neces-sary, was added to the inhaled gas mixture to allowsubjects to reach a desired lung volume. The details onthe number of experiments and lung volumes at whichthey were performed are presented in Table 2.
Hardware
Measurements were performed on two scanners: a0.2T GE Signa Profile MRI magnet interfaced with abroadband Tecmag Apollo research console and a 3TSiemens Tim Trio scanner. A Mirtech whole bodytransmit/receive coil, consisting of two square, planarloops in near Helmholtz configuration was used at0.2T, while a birdcage coil transmitter and 32-channelreceiver were used at 3T (23). All coils were tuned tothe 129Xe frequency at the respective field strengths(2.361 MHz at 0.2T and 34.073 MHz at 3T).
For all runs 129Xe was hyperpolarized on site (24).Gas polarization levels were verified after most experi-ments using the xenon remaining in the freeze-outcell after thawing. The signal from this cell was com-pared to the signal from a thermal xenon cell. Polar-ization values of �30 6 10% at a xenon accumulationrate of 1.3L/hr were typical.
XTC Experiments
In XTC (14) the gas signal is measured before and aftermultiple consecutive applications of spectrally selec-tive inversion (180�) pulses at the dissolved state fre-quency (þ205 ppm) separated by a time tdiff. The origi-nal XTC requires two breath-holds. During the firstbreath-hold, two images are collected measuring thecumulative attenuation from four sources not relatedto interphase diffusion of xenon magnetization: the RF
Table 1
Subject Data
Subject Sex age
Measured
RV, L TLC, L DLCO FEV1
HS1 male 55 1.85 7.02 38.38 3.93
HS2 male 31 1.94 7.54 34.72 4.86
HS3 male 31 1.33 6.2 26.79 4.41
HS4** female 25 1.25 4.44 20.74 2.65
HS5 female 35 1.11 4.96 21.24 3.09
HS6* male 28 2.02 9.78 — 6.19
HS7* male 28 1.45 8.88 — 5.82
HS8*** male 26 1.42 7.57 39.65 4.96
*These subjects are the competitive world-class deep divers who
are able to perform GE and reach lung volumes below RV. Both of
them for experiments reached these volumes (RVGE). For HS8,
RVGE¼1.71 L, and for HS9, RVGE¼1.14 L.
**This subject participated in experiments at 3T.
***Optimization of the number of inversion pulses was performed
with this subject.
458 Muradyan et al.

pulses used in the gradient echo images; T1 decay (pri-marily from oxygen present) during image acquisition;the effect on the gas phase magnetization of the inver-sion pulses applied off resonance (�205 ppm), and T1
relaxation during the application of off-resonanceinversion pulses. During the second breath-hold, againtwo images are collected separated by XTC generatingpulses: during the time tdiff allowed for diffusion someof the gaseous xenon dissolves into the tissue andblood. This magnetization is then inverted by the pulseapplied at þ205 ppm. Each pulse of the XTC sequenceallows further interphase diffusion and depolarizationof the gas phase magnetization. This process isrepeated multiple times attenuating the gas signal inthe second image due to the diffusive gas transport Fin addition to the four sources present in the firstbreath-hold. Essentially by subtracting the two meas-urements the attenuation caused only by F is derived.In the SB-XTC technique reported here we combinedboth steps of the original technique into a single
breath-hold, thus avoiding issues of image registrationand VL control.
In earlier whole lung studies with healthy subjects (8)using the CSSR technique (9) it was determined thatthe Htdiff regime holds for diffusion times up to �100msec. This corresponds to an rms diffusion distance ofnearly 8.7 mm based on a diffusivity constant of xenonin tissue of 3.8�10�6 cm2/s (which corresponds to xe-non dissolved into liver tissue of a rabbit measured at37�C (25)). Thus, diffusion times of 20 and 44 msec(both used only at 3T) and 62 msec (used at both fieldstrengths) lie safely within the Htdiff regime.
At 0.2T we collected three 2D gradient echo coronalprojection images separated by a number of inversionpulses applied a diffusion time tdiff apart (Fig. 1a). Theinitial number of inversion pulses for a given diffusiontime was chosen such that it provides �30% gas sig-nal attenuation, while the data matrix size and flipangles were determined by numerical simulation tooptimize the image SNR under the constraints that the
Table 2
Experimental Results
Subject Exp. No. VL* VL/TLC
<F>Sham background Physiol.
Mean SD SD SD
HS1 1 5.75 0.82 0.8 0.39 0.13 0.37
2 3.2 0.46 1.5 0.42 0.14 0.40
3 3.15 0.45 1.5 0.42 0.14 0.40
HS2 1 3.19 0.42 1.7 0.42 0.12 0.40
2 3.24 0.43 1.4 0.58 0.24 0.53
3 3.29 0.44 1.8 0.48 0.2 0.44
4 4.94 0.66 1.0 0.35 0.14 0.32
HS3 1 2.89 0.47 1.7 0.38 0.12 0.36
2 2.91 0.47 1.3 0.48 0.14 0.46
3 2.93 0.47 1.7 0.38 0.09 0.37
4 3.93 0.63 1.3 0.29 0.12 0.26
HS4 1 1.51 0.41 2.1 0.74 0.35 0.65
2 1.96 0.53 1.8 0.51 0.28 0.43
3 1.91 0.52 1.9 0.41 0.25 0.32
4 1.88 0.51 1.7 0.54 0.22 0.49
1þþ 1.51 0.41 0.2 0.1 0.08 0.06
2 1.51 0.41 0.7 0.3 0.02 0.3
3 1.51 0.41 1.0 0.4 0.05 0.4
HS5 1 1.91 0.39 2.4 0.6 0.35 0.49
2 1.88 0.38 2.2 0.61 0.19 0.58
3 2.61 0.53 1.4 0.27 0.08 0.26
4 1.93 0.39 1.9 0.54 0.14 0.52
5 1.68 0.34 2.1 0.53 0.37 0.38
6 2.61 0.53 1.5 0.29 0.08 0.28
7 1.71 0.34 1.6 0.8 0.22 0.77
HS6 1 2.58 0.26 2.97 0.72 0.1 0.71
2 3.01 0.31 2.22 0.45 0.12 0.43
HS7 1 2.01 0.23 3.41 0.68 0.08 0.68
2 1.57 0.18 3.74 1.16 0.11 1.15
HS8 1 2.92 0.39 2.2 0.69 0.15 0.67
2 2.97 0.39 2.3 0.72 0.19 0.69
3 4.46 0.59 1.7 0.41 0.1 0.40
*VL is the estimated lung volume at which the experiment was performed. It is the sum of RV (or sub-RV in the case of the divers), xenon
and corresponding oxygen and air. SD, standard deviation. In case of F it corresponds to the total standard deviation stotal, in the case of
the sham background – it is the contribution of the noise to the total heterogeneity, snoise, and finally the SD physiological, sphysiol, refers
to the contribution of physiological heterogeneity to stotal and is calculated using Eqn 27. For HS6 and HS7 (the world-class divers) the
sham SD was estimated from the part of the images where there was no signal from the lung (corners of the FOV) because at the time
we did not collect extra data for the noise estimation. þþ The data in bold was collected at 3T at tdiff of 20 (exp. #1), 44 (exp. #2), and 62
(exp. #3) msec. Note that F parameter in this case should be approximately one half of the value measured at 0.2T because of the satu-
ration (3T) and inversion (0.2T) pulses used during contrast generation.
SB-XTC Initial Results in Humans 459

first and third images have comparable SNRs, first andsecond images have equal flip angles and assuming T1
¼ 16 sec in vivo (this is the value measured in one of thesubjects after inhalation of xenon-oxygen gas mixture,resulting in 35% of xenon and 21% of oxygen in thelung). The number of inversion pulses for a particulardiffusion time was further optimized in a series of invivo experiments where the number of the inversionpulses was varied while keeping the rest of the parame-ters (subject, VL, etc.) constant. The pulse sequence pa-rameters are presented in the Table 3. Due to severeeddy current artifacts in the 0.2T permanent magnet,sequential phase encoding was used while traversingk-space. The raw data were zero-filled by a factor of 2and then Fourier transformed to obtain MR imageswith apparent in-plane resolution of 2.4 � 4.7 mm2.
At 3T we collected 3D GRE images instead of 2Dprojections, as the pulse sequences are faster athigher field and we could afford to collect full 3Ddatasets in less time than the in vivo T1. Further, the3T scans were performed at a later time than the 0.2Tscans and by that time we realized that only XTC withsaturation pulses could be used to obtain SA/VGas in-formation. Therefore, at 3T we used saturation pulsesinstead of inversion pulses to create XTC weighting.Later we changed the protocol to collect four 3D GREimages with the first three images separated by satu-ration (90�) pulses applied at 6205 ppm from the gasphase (Fig. 1b), while the last image served for estima-tion of B1 distribution. With this, we evaluated thenecessity of a pixel-wise B1 distribution correction forthe cases of sequential and centric encoding k-spaceacquisition (see Data Analysis for details). Similar to0.2T runs, the first two images had the same flipangle, while that for the third one was higher. For thefourth image we used the same flip angle as in the thirdfor the sake of simplicity. Similar to 0.2T runs, SNR
optimization provided the flip angles for 3T runs (seeTable 3 for the pulse sequence parameters). The rawdata were zero-filled by a factor of 2 in all dimensionsand then Fourier transformed, resulting in an apparent5 � 5 � 10 mm3 voxel size. To match the protocol imple-mented at 0.2T we used 44 saturation pulses for tdiff ¼62 msec run, while the number of saturation pulses fortdiff ¼ 20 and 44 msec was calculated to be such thatattenuation due to F would match that of 62 msec. This
was done as follows: if RDepoltdiff
is the attenuation due to
gas transfer for a particular diffusion time, then from
F tdiff� �
¼ 1 �ffiffiffiffiffiffiffiffiffiffiffiffiffiffiRDepoltdiff
n
q(n is the number of contrast
generating pulses (14)) it follows that:
n tdiff ¼ 20 or 44ms� �
¼ n tdiff ¼ 62ms� �
� Log 1 � F ð62msÞ1 � F ð20 or 44msÞ
� �½1�
In these calculations we used the values of F previ-ously measured with CSSR on the same subject at thesame lung volume. The resulting number of
Figure 1. a: At lower magnetic field three images are collected, where Gas and Control are separated by 180� pulses appliedoff-resonance, while the pulses between Control and XTC images are applied at dissolved state xenon frequency. The firsttwo images are used for calibration purposes, and the last two provide a 2D map of the fractional gas transport F. At 0.2Tthe loading of the coil did not change its Q significantly, allowing B1 calibrations be performed independently. b: At highermagnetic fields the RF coils are sensitive to the load, making it essential to implement a B1 calibration routine for each run.We collected four 3D gradient echo images, the first pair of images are used as before for calibration of other attenuationsources, second and third images to estimate F, and last two to obtain the B1 distribution or flip angle map (FAM). Performingall calibrations during the same breath-hold avoids image registration and lung volume control issues.
Table 3
Pulse Sequence Parameters
Field strength [T] 0.2 3
Data matrix 64 � 32 32 � 32 � 8
TE [msec] 5.3 0.9
TR [msec] 24 2.1
Diffusion time [msec] 62 20/44/62
Flip angles (1st, 2nd, 3rd images)
[degrees]
4, 4, 12 3, 3, 8
Inversion/saturation pulses 44 110/56/44
FOV [mm] 300 300
Resolution (after zero filling) [mm] 2.4 � 4.7 5 � 5 � 10
Total acquisition time [sec] 13 9.8
460 Muradyan et al.

saturation pulses used was 110/56 for 20/44 msecdiffusion times, respectively.
The zero offsets on F were checked in experimentson phantoms, where there is no gas transfer into adissolved state. A number of phantom experimentswere performed at both field strengths. These experi-ments were analyzed in a manner identical to thehuman subject experiments.
RF Pulses and Flip Angle Calibrations
The xenon spectrum in the lungs consists of a gas peak(at 0 ppm) and two dissolved state peaks: erythrocytesand nonblood tissue and plasma located at �205 ppm(�0.5 kHz at 0.2T and �7 kHz at 3T) and spans over�10 ppm (�25 Hz at 0.2T and �340 Hz at 3T). Whenexciting the dissolved state, the gas phase should beminimally disturbed, as the magnetization is nonrenew-able. This is imperative at 0.2T since the frequency sep-aration between the phases is small. To address this, wenumerically constructed a 3-lobe RF pulse shape with atrapezoidal spectrum such that when the dissolvedstate is inverted using a 10-msec long pulse with abandwidth of 100 Hz, the gas phase experiences an ex-citation of less than 1�. Since the separation betweenthe two phases at 3T is much larger, this did not pose aproblem and a 0.75 msec rectangular RF pulse shapewas used. Also, as the bandwidth of this pulse is over1.3 kHz, it excited both dissolved state peaks.
At low field we performed flip angle calibrations ona number of phantoms filled with hyperpolarized xe-non and in vivo for most of the subjects studied (fiveout of eight) to verify that sample loading of the coil isnot significant. Standard techniques for hyperpolar-ized gases were employed, where a number of consec-utive free induction decay signals are acquired, eachfollowed by a set of spoiler gradients to dephase anyresidual transverse magnetization prior to the next RFpulse. The data were fit to Sn ¼ S1 cosn�1 að Þ, where ais the flip angle, Sn and S1 are the nth and initial sig-nals, respectively, and n is the number of repetitions.TR (0.25 sec) was kept very short compared to T1 ofthe gas (40–120 min in phantoms and 16 sec in vivo)to mitigate the longitudinal relaxation effects. The pe-ripheral portion of the lungs is located close to the
coil windings where the RF field is inhomogeneous;therefore, the spatial distribution of the B1 field wasalso investigated. We used the same approach asabove and collected FIDs on a small gas cell on a 5-by-5 grid over the field of view (FOV). Since B1 distri-bution is a slowly changing function of a position, weinterpolated the data to the SB-XTC data matrix size.Then the images collected in the SB-XTC runs werepixelwise-corrected for B1 distribution.
At high field, however, the coil is affected by the sam-ple loading. We used two methods to acquire B1 maps forcalibrations. First, during a separate breath-hold priorto the actual SB-XTC experiment we collected six low-re-solution 3D GRE images with the same flip angle but dif-ferent delay times between the images (we used 0, 8, 6,4, and 2 sec delay times). We used this dataset to fit on a
pixel-by-pixel basis to Sn ¼ S1 cosN� n�1ð Þ að Þ � e�t=T1,where a is the flip angle, S1 and Sn are the pixel signalsin the first and nth images, respectively, N and n arethe number of phase encodings in an image and num-ber of images, respectively. We obtained flip angle andT1 (not used here) distributions from the fit. Further,we interpolated the B1 map to the SB-XTC data sizeand used it in a pixelwise flip angle correction outlinedin Data Analysis (Eq. 13a). In the second approach, B1
map acquisition was incorporated into the SB-XTCexperiment, thus avoiding any registration and lungvolume matching issues. Later we also implemented 4-image SB-XTC with centric phase encoding to estimatewhether B1 distribution correction in this case is dis-pensable, as suggested by theoretical considerations(see Data Analysis for details). We compared F calcu-lated with and without B1 corrections applied.
Data Analysis
In SB-XTC the decay of the gas phase magnetizationoccurs due to three main mechanisms: diffusive gastransport from gas to dissolved phase, RF depletionand T1 decay. Let S1, S2, S3, and S4 be pixel signalintensities for consecutively acquired images during abreath-hold (Fig. 1). If S0 represents the initial signalfrom gaseous xenon, N is the number of phase encod-ing lines in an image, TR is the repetition time and ai
is the flip angle used for the ith image, then for the sig-nal intensity at k ¼ 0 in the images, we can write:
S1 ¼ S0 � cosN2ða1Þ � e�N
2�TRT1 � sinða1Þ; if sequential encoding
S0 � sinða1Þ; if centric encoding
(
S2 ¼S1 � cosN
2ða1Þ � cosN2ða2Þ � e� N
2þN2ð Þ�TRT1 � sinða2Þ � R�
XTC; if sequential encoding
S1 � cosN ða1Þ � e�NTRT1 � sinða2Þ � R�
XTC; if centric encoding
(
S3 ¼S2 � cosN
2ða2Þ � cos�N2ða3Þ � e� N
2þN2ð Þ�TRT1 � sinða3Þ � Rþ
XTC; if sequential encoding
S2 � cosN ða2Þ � e�NTRT1 � sinða3Þ � Rþ
XTC; if centric encoding
(
S4 ¼ S3 � cosN2ða3Þ � cos�
N2ða4Þ � e� N
2þN2ð Þ�TRT1 � sinða4Þ�; if sequential encoding
S3 � cosN ða3Þ � e�NTRT1 � sinða4Þ; if centric encoding
(½2�
Here R�XTC and Rþ
XTC are the total signal attenuationsexperienced during the XTC generating intervalsbetween images 1-2 and 2-3, respectively (Fig. 1).
Each of them has a contribution from the T1 relaxa-tion denoted RT1
XTC and from the effect the contrastgenerating RF pulses have on the gas signal Rrf
XTC
SB-XTC Initial Results in Humans 461

(although these pulses are applied at +205 ppm,there still could be some, albeit small, excitation atthe gas frequency); RDepol
XTC is the attenuation of the sig-nal due to the pulses applied at the dissolved statefrequency (þ205 ppm) that invert/saturate the dis-solved state signal:
R�XTC ¼ R�;rf
XTC � R�;T1
XTC and RþXTC ¼ Rþ;rf
XTC � Rþ;T1
XTC � RDepolXTC
½3�
The relaxation effects will be the same for bothcases since the same number of pulses with the samediffusion time were applied at þ and � 205 ppm:R�;T1
XTC ¼ Rþ;T1
XTC � RT1XTC denotes this T1 relaxation contri-
bution. Further, since the RF pulses applied to gener-ate the contrast have a symmetric frequency profile,they will affect the gas phase 6205 ppm away identi-cally: R�;rf
XTC ¼ Rþ;rfXTC � Rrf
XTC. Hence we obtain:
RþXTC ¼ Rrf
XTC � RT1XTC � RDepol
XTC ¼ R�XTC � RDepol
XTC ½4�
Let us introduce the following parameters:
RT1 ¼ eNTR
T1 and Rai ¼ cosm ai�1ð Þ � cosN�m aið Þ � sin aið Þ½5�
here i ¼ 1, 2, 3, 4 is the image number, N is the num-ber of phase encoding lines in an image, and wedefine a0 ¼ 0; further, let us define m as:
m ¼N2; if sequentialN ; is centric
�½6�
After plugging Eqs. [4–6] back into [2], the imageintensities become:
S1 ¼ S0 � Ra1 �ffiffiffiffiffiffiffiffiRT1
p;
S0 � Ra1 ;
�if sequential encodingif centric encoding
S2 ¼ S1 � Ra2 � Ra1 � RrfXTC � RT1
XTC; independent of encoding
S3 ¼ S2 � Ra3 � RT1 � RrfXTC � RT1
XTC � RDepolXTC ; independent of encoding
S4 ¼ S3 � Sa4 � RT1 ; independent of encoding
½7�
Then for RDepolXTC we have:
RDepolXTC ¼ S3
S2 � Ra3 � RT1 � RrfXTC � RT1
XTC
½8�
and using
RT1 � Rrf
XTC � RT1XTC ¼ S2
S1 � Ra2
½9�
we get:
RDepolXTC ¼ S3
S2� S1
S2� Ra2
Ra3
½10�
The flip angle maps were obtained from [2] with a3
¼ a4 and neglecting T1 relaxation during the image ac-quisition (TA < 0.5 sec T1 ¼ 16 sec):
bmeas ¼ cos�1ffiffiffiffiffiffiffiffiRa4
Np� �
¼ cos�1
ffiffiffiffiffiffiS4
S3
N
s !½11�
In three-image experiments at 0.2T and 3T we seta1 ¼ a2 : a and a3 : b and used a sequential phaseencoding trajectory, resulting in:
RDepolXTC ¼ S3
S2� S1
S2� cos
N2 að Þ
cosN2 bð Þ
� sin að Þsin bð Þ ½12a�
while in four-image experiments at 3T we used centricencoding trajectory and a1 ¼ a2 : a and a3 ¼ a4 : b
RDepolXTC ¼ S3
S2� S1
S2� sin að Þsin bð Þ ½12b�
Here N is the number of phase-encoding steps usedin the images. With flip angle correction implementedon a pixel-by-pixel basis Eq. [12a,b] becomes:
RDepolXTC ¼ S3
S2� S1
S2�cos
N2 a
bbmeas
� �cos
N2 bmeasð Þ
�sin a
bbmeas
� �cos bmeasð Þ ½13a�
RDepolXTC ¼ S3
S2� S1
S2�sin a
bbmeas
� �sin bmeasð Þ ½13b�
The presence of the cosN/2 factor in [13a] suggeststhat the sequential encoding is more sensitive to inho-mogeneous B1 fields.
Finally, for a voxel the fractional gas transport F,which at short diffusion times represents a parameterproportional to the locally averaged functional SA/VGas is (14):
F tdiff� �
¼ 1 �ffiffiffiffiffiffiffiffiffiffiffiffiffiffiRDepolXTC
n
q½14�
with tdiff being the time allowed for diffusion and n thenumber of inversion/saturation pulses. Performinganalysis in this fashion we mapped the fractional gastransport distribution. It should be reiterated herethat because at 0.2T we used inversion pulses asopposed to saturation pulses used at 3T, the values ofF measured for the same tdiff should be different (16).We then calculated the mean (F) and the standarddeviation (stotal) of F, with the latter being a measureof heterogeneity in the fractional gas transport. Wealso averaged F in the right/left dimension to obtainthe dependence of F on the cranial/caudal axis. Forshort diffusion times (8,9):
462 Muradyan et al.

F tdiff<100ms� �
¼ F0 þ l � SA
VGas�ffiffiffiffiffiffiffi4D
p
r� tdiff ½15�
where l is the partition coefficient, D is xenon diffu-sion coefficient in tissue, and F0 is an offset (see Ref.(8) for details). By measuring F at different diffusiontimes we estimated SA/VGas from the slope ofF vs:
ffiffiffiffiffiffiffiffiffitdiff
p.
Heterogeneity Analysis
The heterogeneity in measured F (stotal) has two sour-ces: the physiological heterogeneity (sphysiol) of thelungs and the system noise (snoise). In order to sepa-rate the two, we estimated the error in F due to thenoise only in the images by obtaining additional data-sets (sham background runs, Table 2) before and/orafter each SB-XTC experiment, in which the subjectinhaled air only. If s1, s2, and s3 are the standarddeviations of the noise calculated from correspondingimages we could write:
�F S1;S2;S3
� �6stotal ¼ 1 �
ffiffiffiffiffiffiffiffiffiffiffiffiffiffiffiffiffiffiffiffiffiffiffiffiffiffiffiffiffiffiffiffiffiffiS16s1
S16s2
� S36s3
S26s2
n
s� Ra2
Ra3
½16�
Then under an assumption that noise adds incoher-ently we can estimate and separate the contributionof the noise in the images to the total uncertainty inF, thus providing a measure of heterogeneity in F dueto only physiological sources:
stotal ¼ffiffiffiffiffiffiffiffiffiffiffiffiffiffiffiffiffiffiffiffiffiffiffiffiffiffiffiffiffiffiffiffiffis2physiol þ s2
noise
q½17�
In order to do that we need to propagate the error inF due to s1, s2, and s3:
s2noise ¼ @F
@S1
� s1
2
þ @F
@S2
� s2
2
þ @F
@S3
� s3
2
½18�
For the derivatives in each element of the sum wehave:
@F
@S1
¼ �1
n� 1
S1� S1
S2
� S3
S2
� Ra2
Ra3
� 1
n
;
@F
@S2
¼ þ2
n� 1
S2� S1
S2
� S3
S2
� Ra2
Ra3
� 1
n
;
@F
@S3
¼ �1
n� 1
S3
� S1
S2
� S3
S2
� Ra2
Ra3
� 1
n
;
½19�
Hence we get:
snoise ¼ 1
n�
ffiffiffiffiffiffiffiffiffiffiffiffiffiffiffiffiffiffiffiffiffiffiffiffiffiffiS1
S2
� S3
S2
� Ra2
Ra3
n
s�
ffiffiffiffiffiffiffiffiffiffiffiffiffiffiffiffiffiffiffiffiffiffiffiffiffiffiffiffiffiffiffiffiffiffiffiffiffiffiffiffiffiffiffiffiffiffiffiffiffiffiffiffiffiffiffiffiffiffiffis1
S1
2
þ4 � s2
S2
2
þ s3
S3
2s
½20�
and sphysiol will be:
sphysiol ¼ffiffiffiffiffiffiffiffiffiffiffiffiffiffiffiffiffiffiffiffiffiffiffiffiffiffiffiffiffis2total � s2
noise
q½21�
RESULTS
At 0.2T the variation between the flip angles meas-ured in phantoms and subjects was �3%. This wastaken as sufficient evidence that the loading of thecoil by the subjects is insignificant and we concludedthat different subjects would not affect the B1 distri-bution within the FOV and that a single map derivedfrom a phantom would be valid for all human sub-jects. When mapping the B1 field at 0.2T a slightasymmetry was observed between the sides of thecoil. Also, there was a significant variation of the flipangle within the FOV (Fig. 2a), which in light of thesequentially encoded trajectory (Eq. 13a) necessitateda pixelwise B1 correction of the data. The results ofthe flip angle distribution mapping at 3T are shown inFig. 2b.
The SB-XTC sequence was validated via a numberof experiments at both field strengths performed onxenon gas phantoms in the absence of gas exchange:Fexpected ¼ 0. The mean value of F from six phantom
Figure 2. Flip angle maps. a: FAM collected at 0.2T using a small spherical cell filled with hyperpolarized xenon gas. Thedata are interpolated to a larger matrix size to match the size of SB-XTC data matrix, and normalized to the flip angle settingused in the run. b: FAM collected in vivo during a breath-hold as part of the SB-XTC experiment. The map is calculated usingimages #3 and 4, following the routine outlined in data analysis. Again, the values are normalized to the flip angle settingused in the run.
SB-XTC Initial Results in Humans 463

experiments at 0.2T is 0.01%, while the standarddeviation between them is 0.02%, which is well belowthe values seen in the subjects and is negligible. How-
ever, these were found only after correcting for the B1
distribution (for example, in one of the cases beforethe correction F ¼ �0.560.1%, which in absolutevalue is comparable with the amount of gas transportone expects to measure in vivo, while after correctionF ¼ 0.0360.08%). The corresponding numbers fromthe four experiments performed at 3T are: mean ¼0.01%, standard deviation ¼ 0.01%.
For SB-XTC studies at 3T we selected tdiff ¼ 20/44/62 msec, all within the Htdiff behavior region. Thesediffusion time values make our measurements sensi-tive to regions 3.5–7-mm thick, which would includetissue and vasculature. Based on F values measuredwith CSSR for times near 62 msec we predicted that30–50 inversion pulses would produce sufficient con-trast for the measurement. The further optimization ofthe number of inversion pulses in a series of in vivoexperiments (Fig. 3) provided 44 as the optimal
Figure 3. hF(t)i as a function of the number of inversionpulses. Based on these results, 44 inversion pulses wereused in the studies.
Figure 4. Sample of 3D SB-XTC images collected at highfield. a: Data from the 20msec delay time run. Six outof 12 slices are presented topreserve space. Four imagesin each row correspond to Gasimage (collected before theapplication of the saturationpulses), Control image (col-lected after the application ofthe saturation pulses at �205ppm), XTC image (collected af-ter the application of the satu-ration pulses at þ205 ppm),and finally FAM image col-lected with the same flip angleas the XTC image. b: A singleslice data (from the four con-secutive images) correspond-ing to three different delaytimes are presented for com-parison. To minimize differen-ces in the images, the subjectremained inside the scannerbetween the experiments,while bags with gas mixturewere prepared (�5 min).
464 Muradyan et al.

number of inversion pulses that balanced signalattenuation and SNR of the measurement. The errorbars at the limits of the range are expected to be rela-tively large: for a low number of inversions, the result-ing change in the signal due to F will be small andtherefore subject to a large variance; similarly, for alarge number of inversions the large attenuationwould result in poor SNR for the XTC image.
A set of sample images from an SB-XTC experimentis presented in Fig. 4: (a) presents the dataset fromSB-XTC run with 20 msec diffusion time (six of 12 sli-ces are presented), while (b) shows four images fromone of the slices for all three diffusion times. Follow-ing the outlined data analysis routine, we produced aspatial map of F(tdiff) in the lungs: Fig. 5a–c displaysthe F-maps calculated for each of three diffusiontimes. Note that if the effect of the inversion/satura-tion RF pulse (applied at �205 ppm) on the gas signalis well known (either correctable or negligible) thenone can translate R�
XTC into a map of the local oxygenpartial pressure (19).
As a function of VL, alveolar surface area increasesslower than the gas volume (26). Therefore SA/VGas
and hence F are expected to decrease as VL increases.Additionally, as VL approaches TLC the regional het-
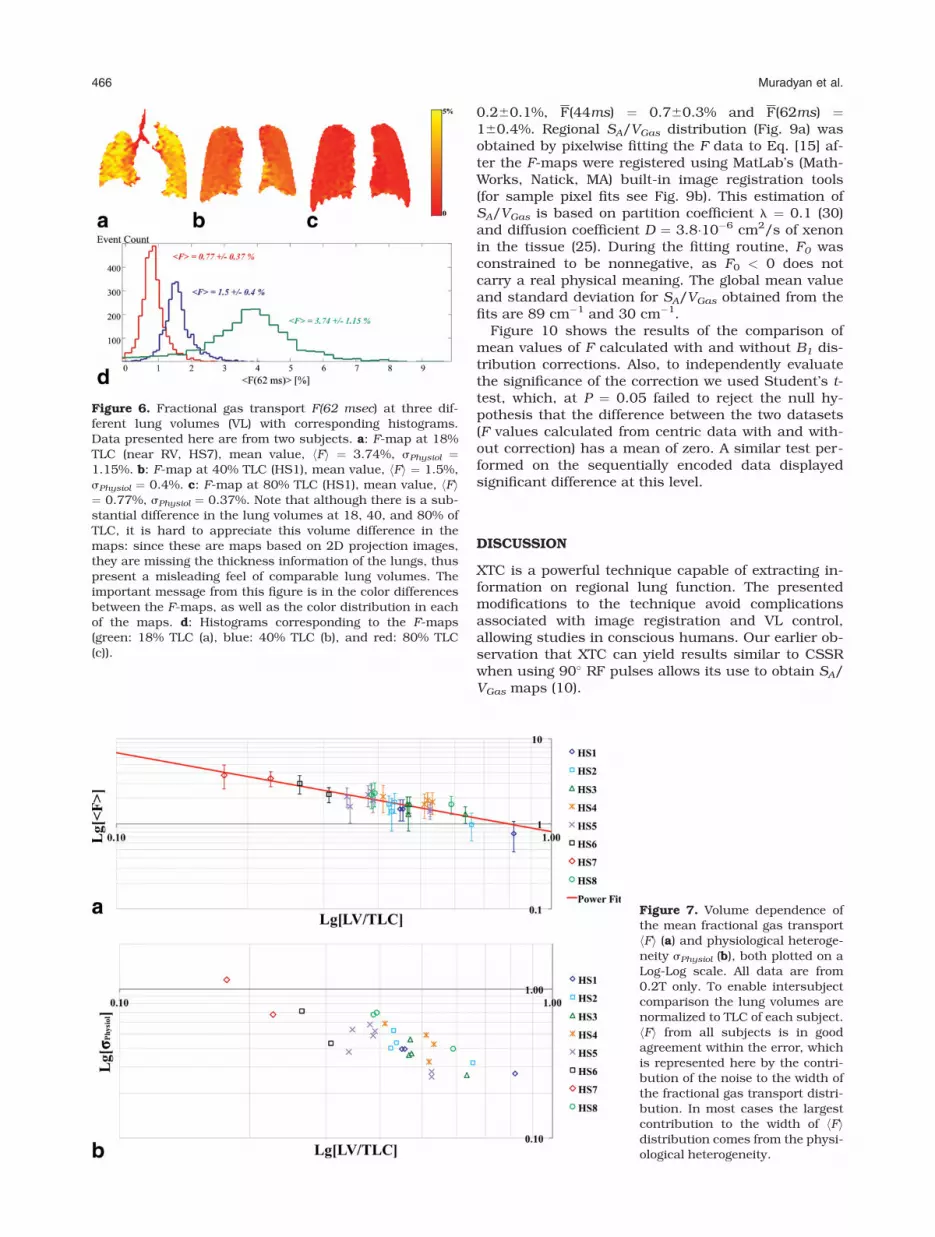
erogeneity is known to decrease (27). Depolarizationmaps at three VLs and their corresponding histo-grams in Fig. 6a–d demonstrate both features: notonly the mean value of F but also the width of the dis-tribution has decreased with the increasing VL. Simi-lar behavior was observed in all subjects: Fig. 7 sum-marizes the dependence of the mean fractional gastransport and the calculated physiological heterogene-ity on the lung volume. The red trend line in Fig. 7a isthe fit of the data to a power function. This particularfunctional form was selected based on earlier histolog-ical works by Gil et al (26), Weibel (28), and Thurlbeck(29). The fit revealed the following relationship: F ¼0.8�V�0:9
gas , R2 ¼ 0.8.Although the data were collected in the supine posi-
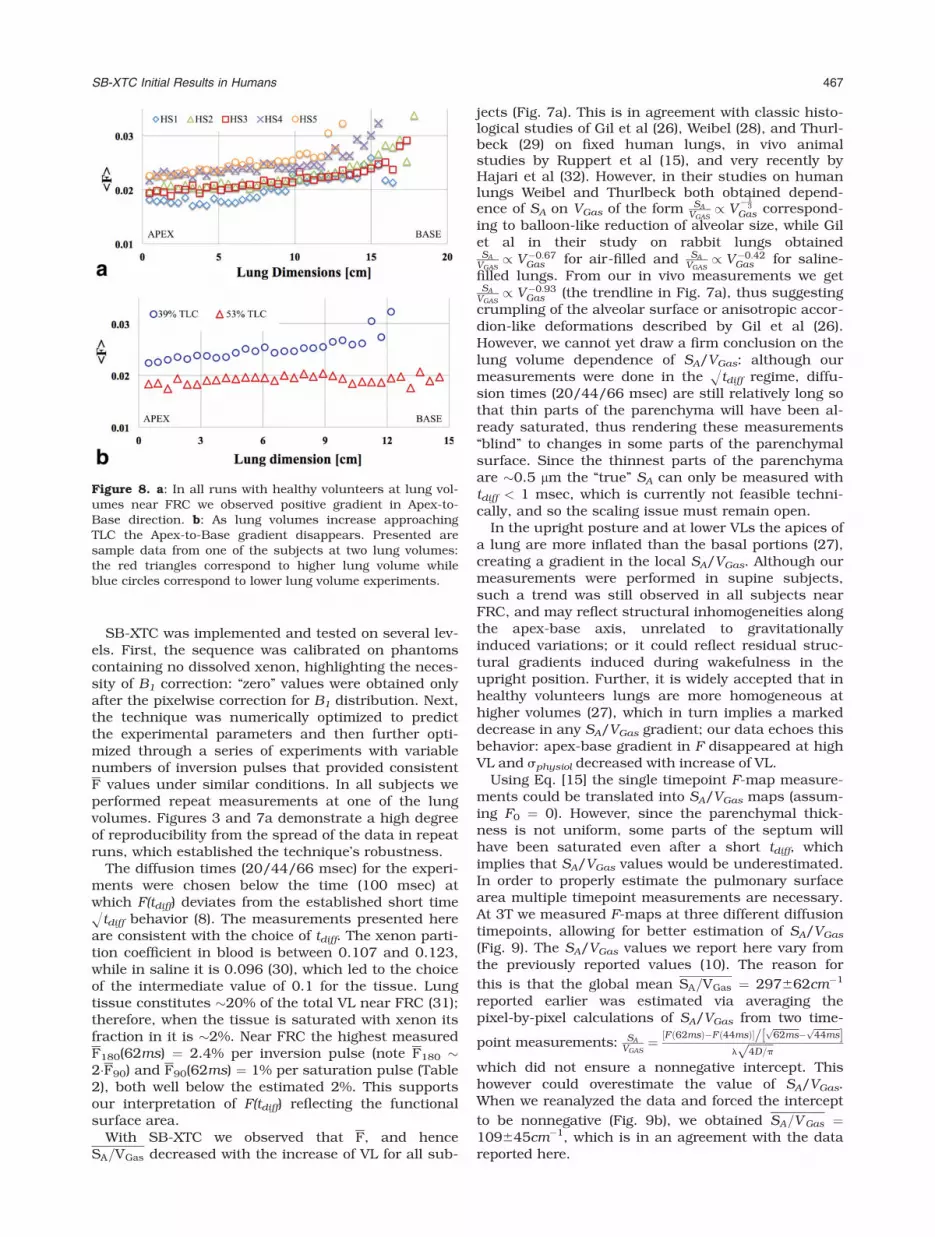
tion, at lower VLs we observed higher F values at thebases compared to the apices for all subjects (Fig. 8a).Closer to TLC these differences in the craniocaudaldirection evened out in all subjects (Fig. 8b, sampleplot from one subject).
At 3T we obtained 3D distributions of F for threedifferent diffusion times (20/44/62 msec) in the samesubject after inhalation of similar volumes of gas. Fig-ure 5 shows the F-maps with the following globalmean values and standard deviations: F(20ms) ¼
Figure 5. F-maps calculatedfor diffusion times of (a) 20, (b)44, and (c) 62 msec. One curi-ous feature of the data is thechange in the gradient direc-tion of the F values from ante-rior to posterior slices: in 20msec Fmaps the anterior sliceshave lower F compared to pos-terior, as expected from gravi-tational dependence. However,this gradient direction isreversed in 44 and 62 msec F-maps. This could be explainedby an effect of different thick-ness contributions to F0 offset.
SB-XTC Initial Results in Humans 465
0.260.1%, F(44ms) ¼ 0.760.3% and F(62ms) ¼160.4%. Regional SA/VGas distribution (Fig. 9a) wasobtained by pixelwise fitting the F data to Eq. [15] af-ter the F-maps were registered using MatLab’s (Math-Works, Natick, MA) built-in image registration tools(for sample pixel fits see Fig. 9b). This estimation ofSA/VGas is based on partition coefficient l ¼ 0.1 (30)and diffusion coefficient D ¼ 3.8�10�6 cm2/s of xenonin the tissue (25). During the fitting routine, F0 wasconstrained to be nonnegative, as F0 < 0 does notcarry a real physical meaning. The global mean valueand standard deviation for SA/VGas obtained from thefits are 89 cm�1 and 30 cm�1.
Figure 10 shows the results of the comparison ofmean values of F calculated with and without B1 dis-tribution corrections. Also, to independently evaluatethe significance of the correction we used Student’s t-test, which, at P ¼ 0.05 failed to reject the null hy-pothesis that the difference between the two datasets(F values calculated from centric data with and with-out correction) has a mean of zero. A similar test per-formed on the sequentially encoded data displayedsignificant difference at this level.
DISCUSSION
XTC is a powerful technique capable of extracting in-formation on regional lung function. The presentedmodifications to the technique avoid complicationsassociated with image registration and VL control,allowing studies in conscious humans. Our earlier ob-servation that XTC can yield results similar to CSSRwhen using 90� RF pulses allows its use to obtain SA/VGas maps (10).
Figure 6. Fractional gas transport F(62 msec) at three dif-ferent lung volumes (VL) with corresponding histograms.Data presented here are from two subjects. a: F-map at 18%TLC (near RV, HS7), mean value, hFi ¼ 3.74%, sPhysiol ¼1.15%. b: F-map at 40% TLC (HS1), mean value, hFi ¼ 1.5%,sPhysiol ¼ 0.4%. c: F-map at 80% TLC (HS1), mean value, hFi¼ 0.77%, sPhysiol ¼ 0.37%. Note that although there is a sub-stantial difference in the lung volumes at 18, 40, and 80% ofTLC, it is hard to appreciate this volume difference in themaps: since these are maps based on 2D projection images,they are missing the thickness information of the lungs, thuspresent a misleading feel of comparable lung volumes. Theimportant message from this figure is in the color differencesbetween the F-maps, as well as the color distribution in eachof the maps. d: Histograms corresponding to the F-maps(green: 18% TLC (a), blue: 40% TLC (b), and red: 80% TLC(c)).
Figure 7. Volume dependence ofthe mean fractional gas transporthFi (a) and physiological heteroge-neity sPhysiol (b), both plotted on aLog-Log scale. All data are from0.2T only. To enable intersubjectcomparison the lung volumes arenormalized to TLC of each subject.hFi from all subjects is in goodagreement within the error, whichis represented here by the contri-bution of the noise to the width ofthe fractional gas transport distri-bution. In most cases the largestcontribution to the width of hFidistribution comes from the physi-ological heterogeneity.
466 Muradyan et al.
SB-XTC was implemented and tested on several lev-els. First, the sequence was calibrated on phantomscontaining no dissolved xenon, highlighting the neces-sity of B1 correction: ‘‘zero’’ values were obtained onlyafter the pixelwise correction for B1 distribution. Next,the technique was numerically optimized to predictthe experimental parameters and then further opti-mized through a series of experiments with variablenumbers of inversion pulses that provided consistentF values under similar conditions. In all subjects weperformed repeat measurements at one of the lungvolumes. Figures 3 and 7a demonstrate a high degreeof reproducibility from the spread of the data in repeatruns, which established the technique’s robustness.
The diffusion times (20/44/66 msec) for the experi-ments were chosen below the time (100 msec) atwhich F(tdiff) deviates from the established short timeHtdiff behavior (8). The measurements presented hereare consistent with the choice of tdiff. The xenon parti-tion coefficient in blood is between 0.107 and 0.123,while in saline it is 0.096 (30), which led to the choiceof the intermediate value of 0.1 for the tissue. Lungtissue constitutes �20% of the total VL near FRC (31);therefore, when the tissue is saturated with xenon itsfraction in it is �2%. Near FRC the highest measuredF180(62ms) ¼ 2.4% per inversion pulse (note F180 �2�F90) and F90(62ms) ¼ 1% per saturation pulse (Table2), both well below the estimated 2%. This supportsour interpretation of F(tdiff) reflecting the functionalsurface area.
With SB-XTC we observed that F, and henceSA=VGas decreased with the increase of VL for all sub-
jects (Fig. 7a). This is in agreement with classic histo-logical studies of Gil et al (26), Weibel (28), and Thurl-beck (29) on fixed human lungs, in vivo animalstudies by Ruppert et al (15), and very recently byHajari et al (32). However, in their studies on humanlungs Weibel and Thurlbeck both obtained depend-ence of SA on VGas of the form SA
VGAS/ V
�13
Gas correspond-ing to balloon-like reduction of alveolar size, while Gilet al in their study on rabbit lungs obtainedSA
VGAS/ V�0:67
Gas for air-filled and SA
VGAS/ V�0:42
Gas for saline-filled lungs. From our in vivo measurements we getSA
VGAS/ V�0:93
Gas (the trendline in Fig. 7a), thus suggestingcrumpling of the alveolar surface or anisotropic accor-dion-like deformations described by Gil et al (26).However, we cannot yet draw a firm conclusion on thelung volume dependence of SA/VGas: although ourmeasurements were done in the Htdiff regime, diffu-sion times (20/44/66 msec) are still relatively long sothat thin parts of the parenchyma will have been al-ready saturated, thus rendering these measurements‘‘blind’’ to changes in some parts of the parenchymalsurface. Since the thinnest parts of the parenchymaare �0.5 lm the ‘‘true’’ SA can only be measured withtdiff < 1 msec, which is currently not feasible techni-cally, and so the scaling issue must remain open.
In the upright posture and at lower VLs the apices ofa lung are more inflated than the basal portions (27),creating a gradient in the local SA/VGas. Although ourmeasurements were performed in supine subjects,such a trend was still observed in all subjects nearFRC, and may reflect structural inhomogeneities alongthe apex-base axis, unrelated to gravitationallyinduced variations; or it could reflect residual struc-tural gradients induced during wakefulness in theupright position. Further, it is widely accepted that inhealthy volunteers lungs are more homogeneous athigher volumes (27), which in turn implies a markeddecrease in any SA/VGas gradient; our data echoes thisbehavior: apex-base gradient in F disappeared at highVL and sphysiol decreased with increase of VL.
Using Eq. [15] the single timepoint F-map measure-ments could be translated into SA/VGas maps (assum-ing F0 ¼ 0). However, since the parenchymal thick-ness is not uniform, some parts of the septum willhave been saturated even after a short tdiff, whichimplies that SA/VGas values would be underestimated.In order to properly estimate the pulmonary surfacearea multiple timepoint measurements are necessary.At 3T we measured F-maps at three different diffusiontimepoints, allowing for better estimation of SA/VGas
(Fig. 9). The SA/VGas values we report here vary fromthe previously reported values (10). The reason for
this is that the global mean SA=VGas ¼ 297662cm�1
reported earlier was estimated via averaging thepixel-by-pixel calculations of SA/VGas from two time-
point measurements: SA
VGAS¼ F ð62msÞ�F ð44msÞ½ �=
ffiffiffiffiffiffiffiffiffi62ms
p�ffiffiffiffiffiffiffiffiffi44ms
p½ �lffiffiffiffiffiffiffiffiffi4D=p
p
which did not ensure a nonnegative intercept. Thishowever could overestimate the value of SA/VGas.When we reanalyzed the data and forced the intercept
to be nonnegative (Fig. 9b), we obtained SA=VGas ¼109645cm�1, which is in an agreement with the datareported here.
Figure 8. a: In all runs with healthy volunteers at lung vol-umes near FRC we observed positive gradient in Apex-to-Base direction. b: As lung volumes increase approachingTLC the Apex-to-Base gradient disappears. Presented aresample data from one of the subjects at two lung volumes:the red triangles correspond to higher lung volume whileblue circles correspond to lower lung volume experiments.
SB-XTC Initial Results in Humans 467

We implemented SB-XTC with sequential and cen-tric k-space trajectories. We showed that in the caseof sequential encoding it is necessary to correct forthe B1 distribution within the FOV. At the same time,the use of centric phase encoding, given relatively uni-form B1 distribution, rendered the flip angle correc-tions unnecessary. Fundamentally in sequentiallyencoded experiments the cos
N=2 bð Þ factor, unless cor-rected, skews the signal attenuation, thus affectingthe value of F. It needs to be noted, however, that herewe corrected for the effect of the RF pulses used inthe image acquisitions only and neglected the effect ofimperfections of the saturation/inversion pulses.
Very recently, Dregely et al (18) implemented gen-eral SB-XTC approach (17) to collect two different dif-fusion time measurements during a single breath-hold. This extension of the technique to include morediffusion time measurements to obtain the local septalthickness along with surface area available for diffu-sion is one avenue by which a noninvasive assay ismade that specifically differentiates the separate con-tributions of the septal area and thickness to the
mean local tissue density (as can be measured withcomputed tomography). However, in such measure-ments one needs to be extremely careful with thechoice of imaging protocol and parameters. As wehave demonstrated in this study, if no explicit B1 dis-tribution correction is implemented one needs to usecentric encoding to traverse the k-space. Further,since there is only a single control experiment formultiple diffusion times, one needs to ensure that thetotal time for XTC creation for both timepoints is thesame, so that the T1 effect for both XTC parts is iden-tical. And finally, since for different diffusion timesthe number of XTC RF pulses will be different, whilethe control part will match only one of these numbers,one has to ensure that the RF pulse applied at 6208ppm does not have any effect on the gas phasemagnetization.
Further, measurements at longer diffusion times,when the full xenon uptake model must be used todescribe the data, will allow estimation of parenchy-mal surface area, septal thickness, and capillarytransit time, representing an important tool in the
Figure 9. a: The S/V-map in units of inverse cm calculated from a pixelwise linear model fit of F to Htdiff (see Data Analysis).The global mean value for S/V is 89 6 30 cm�1 (mean 6 standard deviation). b: Representative voxel-wise fits of F to theshort-time model from four different voxels measured at three diffusion times.
468 Muradyan et al.

differential diagnosis and management of pulmonarydiseases affecting each of those parameters. Initialsteps have been taken by (1) comparing F measuredusing SB-XTC spectroscopy with the values fromdirect CSSR measurements at several different diffu-sion times (8,33); (2) studying these parameters glob-ally in healthy subject and subjects with chronic ob-structive pulmonary disease (COPD) and interstitiallung disease using CSSR (10); and (3) comparing mul-tiple time XTC generated regional parameters betweenhealthy volunteers and patients with COPD andasthma (18).
A confounding issue for this study is its implementa-tion at different field strengths with a wide range of pa-rameters. This had to do with infrastructure changesbeyond our control, such as decommissioning of the0.2T scanner we used for the studies. However, thisforced us to obtain F using different systems at differ-ent field strengths, and allowed us to obtain insightinto one very important question: whether measure-ment of these important physiological parameters (Fand SA/VGas) is field-dependent, namely, whether sus-ceptibility plays an important role in the measure-ments. In the earlier measurements at 0.2T where weexpect susceptibility to be of minimal importance, wecompared the slope K of F vs. Htdiff obtained from spec-troscopic SB-XTC (using inversion pulses, KXTC) andCSSR (KCSSR): KXTC=KCSSR
¼ 2:5 (8). Measurements onthe same subject presented here with F obtainedusing SB-XTC first with inversion pulses at 0.2T(F0.2T) and then with saturation pulses (in which caseresults are comparable with CSSR data) at 3T (F3T),show that K0:2T=K3T
¼ 2:1. Further, Ruppert et al (14)estimated that for long diffusion times KXTC=KCSSR
¼ 2.This initial comparison is very encouraging, as allthese ratios are fairly close to each other. If suscepti-bility at 3T did play an important role in the value ofF3T measured, these ratios would not be similar.
These data therefore provide initial evidence that mea-surement of F, and thus S/V, is field-independent andcan be compared across the field strengths.
In conclusion, we implemented SB-XTC at both lowand high magnetic fields, obtained F-maps and physi-ological heterogeneity from eight volunteers to studylung volume dependence of F, thus SA/VGas, and itshomogeneity in vivo. We found that both the meanvalue and the heterogeneity of the fractional diffusivexenon transport F increased with the decreasing VL. Asystematic regional increase in F in the lung baseswas observed at lower VLs in all volunteers. Weobtained 3D F-maps in one subject at three differentdiffusion times within the validity regime of the Htdiffbehavior of F and estimated the local functional alveo-lar surface area per unit gas volume (with a mean 6
standard deviation of SA=VGas ¼ 89630 cm�1). Weshowed that if centric k-space encoding is used, smallvariations in the B1 over the field of view can beneglected, while in the case of sequential encoding, B1
correction of the data is necessary.
REFERENCES
1. Bouchiat M, Carver T, Varnum C. Nuclear polarization in 3He gasinduced by optical pumping and dipolar exchange. Phys Rev Lett1960;5:373–375.
2. Albert MS, Cates GD, Driehuys B, et al. Biological magnetic reso-nance imaging using laser-polarized 129Xe. Nature 1994;370:199–201.
3. Driehuys B, Cates aGD, Miron E, Sauer K, Walter DK, Happer W.High-volume production of laser-polarized 129Xe. Appl Phys Lett1996;69:1668–1670.
4. Ruset I, Ketel S, Hersman F. Optical pumping system design forlarge production of hyperpolarized 129Xe. Phys Rev Lett 2006;96:53002.
5. Mugler JP, Driehuys B, Brookeman JR, et al. MR imaging andspectroscopy using hyperpolarized 129Xe gas: preliminary humanresults. Magn Reson Med 1997;37:809–815.
6. Mansson S, Wolber J, Driehuys B, Wollmer P, Golman K. Charac-terization of diffusing capacity and perfusion of the rat lung in alipopolysaccharide disease model using hyperpolarized 129Xe.Magn Reson Med 2003;50:1170–1179.
7. Driehuys B, Cofer G, Pollaro J, Mackel J, Hedlund L, Johnson G.Imaging alveolar-capillary gas transfer using hyperpolarized129Xe MRI. Proc Natl Acad Sci U S A 2006;103:18278–18283.
8. Patz S, Muradian I, Hrovat MI, et al. Human pulmonary imagingand spectroscopy with hyperpolarized 129Xe at 0.2T. Acad Radiol2008;15:713–727.
9. Butler JP, Mair RW, Hoffmann D, et al. Measuring surface-area-to-volume ratios in soft porous materials using laser-polarizedxenon interphase exchange nuclear magnetic resonance. J PhysCondensed Matter 2002;14:L297–304.
10. Patz S, Muradyan I, Hrovat MI, et al. Diffusion of hyperpolarized129Xe in the lung: a simplified model of 129Xe septal uptake andexperimental results. N J Phys 2011;13:015009.
11. Muradian I, Patz S, Butler J, Topulos G. Hyperpolarized 129Xehuman pulmonary gas exchange with 3-point Dixon technique.In: Proc 14th Annual Meeting ISMRM, Seattle; 2006:1297.
12. Muradyan I. Structural and functional pulmonary imaging usinghyperpolarized 129Xe. Thesis 2007:1–223.
13. Mugler JP, Altes TA, Ruset IC, et al. Simultaneous magnetic reso-nance imaging of ventilation distribution and gas uptake in thehuman lung using hyperpolarized xenon-129. Proc Natl Acad SciU S A 2010;107:21707–21712.
14. Ruppert K, Brookeman JR, Hagspiel KD, Mugler JP. Probing lungphysiology with xenon polarization transfer contrast (XTC). MagnReson Med 2000;44:349–357.
15. Ruppert K, Mata JF, Brookeman JR, Hagspiel KD, Mugler JP.Exploring lung function with hyperpolarized (129)Xe nuclearmagnetic resonance. Magn Reson Med 2004;51:676–687.
Figure 10. Comparison of F obtained from images with cen-tric (3T only) and sequential encoding of k-space. It is evi-dent from the data that in the case of centrically encoded k-space the B1 correction of the data does not significantlyaffect the value of F and might be omitted (circles in theplot). However, in the case of sequentially encoded k-spacethe implementation of the B1 correction (preferably duringthe same breath-hold as in the case of four-image SB-XTC)might be necessary (squares and rhombi in the plot), even inthe case of small variation in the flip angle (less than 10%variation in the flip angle over the FOV, 3T data).
SB-XTC Initial Results in Humans 469

16. Hrovat MI, Muradian I, Frederick E, Butler JP, Hatabu H, Patz S.Theoretical model for XTC (xenon transfer contrast) experimentswith hyperpolarized 129Xe. In: Proc 18th Annual Meeting ISMRM,Stockholm; 2010:2556.
17. Muradian I, Butler J, Hrovat M, et al. Human regional pulmonarygas exchange with xenon polarization transfer (XTC). In: Proc15th Annual Meeting ISMRM, Berlin; 2007:454.
18. Dregely I, Mugler JP, Ruset IC, et al. Hyperpolarized xenon-129gas-exchange imaging of lung microstructure: first case studiesin subjects with obstructive lung disease. J Magn Reson Imaging2011;33:1052–1062.
19. Patz S, Hersman FW, Muradian I, et al. Hyperpolarized (129)XeMRI: a viable functional lung imaging modality? Eur J Radiol2007;64:335–344.
20. Lindholm P, Lundgren CEG. The physiology and pathophysiol-ogy of human breath-hold diving. J Appl Physiol 2009;106:284–292.
21. Lindholm P, Norris CM, Braver JM, Jacobson F, Ferrigno M. Afluoroscopic and laryngoscopic study of glossopharyngeal insuf-flation and exsufflation. Respir Physiol Neurobiol 2009;167:189–194.
22. Muradyan I, Loring SH, Ferrigno M, et al. Inhalation heterogene-ity from subresidual volumes in elite divers. J Appl Physiol 2010;109:1969.
23. Dregely IM, Wiggins GC, Ruset IC, et al. A 32 channel phasedarray lung coil for parallel imaging with hyperpolarized xenon129 at 3T. In: Proc 17th Annual Meeting ISMRM, Honolulu;2009:2203.
24. Hersman FW, Ruset IC, Ketel S, et al. Large production systemfor hyperpolarized 129Xe for human lung imaging studies. AcadRadiol 2008;15:683–692.
25. Maria N, Eckmann D. Model predictions of gas embolism growth andreabsorption during xenon anesthesia. Anesthesiology 2003;99:638.
26. Gil J, Bachofen H, Gehr P, Weibel ER. Alveolar volume-surfacearea relation in air- and saline-filled lungs fixed by vascular per-fusion. J Appl Physiol 1979;47:990–1001.
27. Kaneko K, Milic-Emili J, Dolovich M, Dawson A, Bates D. Re-gional distribution of ventilation and perfusion as a function ofbody position. J Appl Physiol 1966;21:767–777.
28. Weibel ER. Morphometry of the human lungs. New York: Aca-demic Press; 1963.
29. Thurlbeck WM. The internal surface area of nonemphysematouslungs. Am Rev Respir Dis 1967;95:765–773.
30. Goto T, Suwa K, Uezono S, Ichinose F, Uchiyama M, Morita S.The blood-gas partition coefficient of xenon may be lower thangenerally accepted. Br J Anaesth 1998;80:255.
31. Armstrong JD, Gluck EH, Crapo RO, Jones HA, Hughes JM.Lung tissue volume estimated by simultaneous radiographic andhelium dilution methods. Thorax 1982;37:676–679.
32. Hajari AJ, Quirk JD, Sukstanskii AL, et al. Imaging alveolar-ductgeometry during expiration via 3He lung morphometry. J ApplPhysiol 2011;110:1448–1454.
33. Muradian I, Hrovat M, Butler J, Johnson C, Hersman FW, Patz S.Comparison of 129Xe pulmonary gas exchange measured by twotechniques: XTC and CSSR. In: Proc 15th Annual MeetingISMRM, Berlin; 2007:1271.
470 Muradyan et al.