simulation of energy consumption in typical finnish detached house
TRANSCRIPT
Teknillinen korkeakoulu. Konetekniikan osasto. LVI-tekniikan laboratorio. Helsinki University of Technology. Department of Mechanical Engineering. Laboratory of Heating, Ventilating and Air Conditioning. Espoo 2002 SIMULATION OF ENERGY CONSUMPTION IN TYPICAL FINNISH DETACHED HOUSE Preliminary report Juha Jokisalo, Jarek Kurnitski
Helsinki University of Technology Department of Mechanical Engineering Laboratory of Heating, Ventilating and Air Conditioning

ABSTRACT Preliminary simulations of heat energy consumption in a typical Finnish detached house were done. The preliminary study consists of simulations of the thermal behaviour in the building during one year in Helsinki, Finland. A few cases were also simulated with Central European structures and weather data of Nice. The aim of the preliminary study was to investigate the effect of the thermal inertia and tightness of the building on heat energy consumption. The effect of other factors on heat energy consumption, such as ventilation system, heating system, heat insulation and windows, was simulated in a few cases. Those simulations of other factors were not meant to be comprehensive but indicative. The simulations were done using IDA Indoor Climate and Energy 3.0 software. Four different types of building structures were used in the study. The thermal inertia of the chosen building structures differed but the steady state thermal transmittance (U-value) of an envelope was the same. In the simulations, the tightness of the building was stud-ied by changing air leakage at 50 Pa between 1 and 10 1/h. According to the simulations, the thermal inertia has an insignificant effect on heat en-ergy consumption of the typical Finnish detached house. Tightness of the building has a significant effect on heat energy consumption, at 10 1/h leakage value even increase of 12%. All studied factors such as ventilation, heating systems, size of windows and posi-tion of intermediate doors have more significant effect on energy consumption than thermal inertia, which has an effect of less than 1%. In the case with extra large win-dows, thermal inertia has a slightly higher effect of 1.4% on heating energy consump-tion. The effect of thermal inertia seems to be climate dependent as it increased from 0.6% to 4.4% in warmer climate.

TABLE OF CONTENTS ABSTRACT TABLE OF CONTENTS 1. Introduction................................................................................................................... 4 2. Building description...................................................................................................... 6
2.1.1 Building ........................................................................................................... 6 2.1.2 Environment..................................................................................................... 6 2.1.3 Air handling unit .............................................................................................. 7 2.1.4 Heating............................................................................................................. 8 2.1.5 Heat gains ........................................................................................................ 9 2.1.6 Windows ........................................................................................................ 10 2.1.7 Furniture......................................................................................................... 11
2.2 The building structures in cases 1-4 ..................................................................... 11 2.2.1 Theoretical lightweight (case 1) and wooden frame (case 2) ........................ 11 2.2.2 Wooden surfaces (case 3) .............................................................................. 12 2.2.3 Concrete (case 4) ........................................................................................... 13
2.3 The building structures in cases 1-4 with the additional thermal insulation ........ 14 2.3.1 Theoretical lightweight (case 1) and wooden frame (case 2) ........................ 14 2.3.2 Wooden surfaces (case 3) .............................................................................. 15 2.3.3 Concrete (case 4) ........................................................................................... 15
2.4 The building envelope in cases 2 and 4 (Nice, less insulated structures) ............. 16 2.4.1 Wooden frame, less insulated (case 2)........................................................... 16 2.4.2 Brick, less insulated (case 4).......................................................................... 16
3. Results......................................................................................................................... 18 3.1 Summary table .................................................................................................. 19 3.2 Air infiltration ................................................................................................... 20 3.3 Thermal insulation ............................................................................................ 26 3.4 Floor heating ..................................................................................................... 30 3.5 Ventilation system ............................................................................................ 34 3.6 Location and weather conditions ...................................................................... 38 3.7 Windows ........................................................................................................... 43 3.8 Intermediate doors ............................................................................................ 47
4. Discussion................................................................................................................... 51 ACKNOWLEDGEMENTS BIBLIOGRAPHY

4 Introduction ______________________________________________________________________
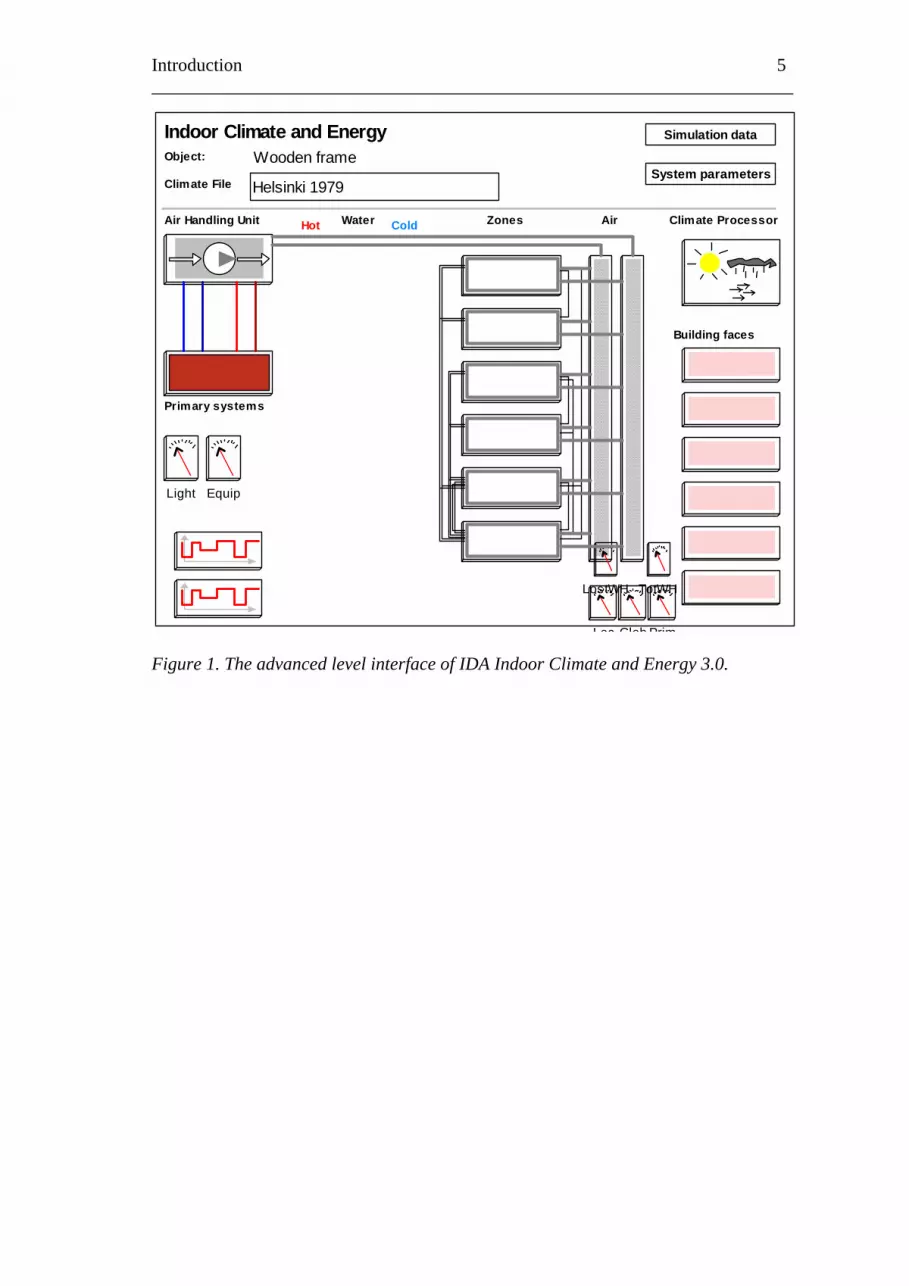
1. Introduction After fifteen years, discussion about the effect of thermal inertia on heat energy con-sumption has come up again in Finland. [1,2,3] On a fifteen-year time scale the devel-opment of computers, advanced programming techniques and numerical methods allow dynamic simulation to become practical. Now physical models of a building are more sophisticated but they are more easy to use, however. The calculations are carried out using IDA Indoor Climate and Energy 3.0 software. The software is an advanced tool for simulation of thermal comfort, indoor air quality and energy consumption in buildings. A modular simulation environment, IDA, has been developed by the Division of Building Services Engineering, KTH, and the Swed-ish Institute of Applied Mathematics, ITM. [4,5] The mathematical models are described in terms of equations in formal language, NMF. The models are well validated against measurements. Several independent intermodel comparisons have been made [6] as well as tests against measurements. [7,8]
Introduction 5 ______________________________________________________________________
Primary systems
Building faces
Air Handling Unit Zones AirWater ColdHot Climate Processor
Simulation data
System parametersHelsinki 1979Climate File
Indoor Climate and EnergyWooden frameObject:
Light Equip
LostWH TotWH
Loc Glob Prim Figure 1. The advanced level interface of IDA Indoor Climate and Energy 3.0.

6 Building description ______________________________________________________________________
2. Building description
2.1.1 Building The simulated building comprises one floor with six rooms, see Figure 2. The net floor area of the building is approximately 130m². Room height is 2.6 m. All the intermediate doors are open in the basic cases. In Figure 2, an air leak between zone and environment is marked by the arrow. Internal dimensions 9×14.4m are kept constant in all simulated cases, independently of wall thickness.
14.4 m
N 9 m
Bedroom 1 18 m²
Bedroom 318 m²
Kitchen 28.8 m²
Bedroom 2 18 m²
Living room 28.8 m² Bathroom
18 m²
Figure 2. Plan of the building
2.1.2 Environment The simulated building is located in Helsinki. The used hourly weather data is Helsinki 1979, which is commonly used as a test data of energy calculation in Finland. The effect of a warmer climate is considered by weather data of Nice. The air leak is calculated for every facade. The wind profile is from an urban environ-ment where the height of the adjacent buildings are equal to the height of the house. The values of the pressure coefficients [-0.38, 0.18] are defined at intervals 45°, see Table 1 [10]. The wind profile is defined as equation
25.0m 67.0UU ⋅= (1)
where is measured wind speed at weather station. mU

Building description 7 ______________________________________________________________________
Table 1. Wind pressure coefficients of the facades. Angle Facade
1 2 3 40 -0.30 -0.30 0.06 -0.3045 -0.38 -0.32 -0.12 0.1590 -0.20 -0.20 -0.20 0.13
135 -0.12 -0.32 -0.38 0.15180 0.06 -0.30 -0.30 -0.30225 -0.12 0.15 -0.38 -0.32270 -0.20 0.18 -0.20 -0.20315 -0.38 0.15 -0.12 -0.32
2.1.3 Air handling unit In the simulations two different ventilation systems are compared. The basic air han-dling unit is the mechanical supply and exhaust ventilation system. An alternative venti-lation system is the mechanical exhaust ventilation. The air change rate is set to be approximately 0.5 1/h. The efficiency of heat recovery in the air unit is 60%. In the air handling unit, a reheat coil is included and set point of sup-ply air is 17°C. There is no cooling in the building. Table 2. Air flow rate of the building with the balanced ventilation system.
Zone Air flow rate l/sSupply Exhaust
Bedroom 1 16 0Bedroom 2 8 0Bedroom 3 8 0Living room 12 0
Kitchen 0 22.5Bathroom 0 22.5
Total 44 45 With the mechanical exhaust ventilation system an air inlet is set into the bedrooms and the living room of the building. In the model inlet (slot vent in window frame) is de-fined by the following equation:
npCm Δ⋅=& (2) Where m& mass flow rate, kg/s
C 0.00215 (constant) Δp pressure difference between inside air and outdoors, Pa n 0.5 (constant).
8 Building description ______________________________________________________________________
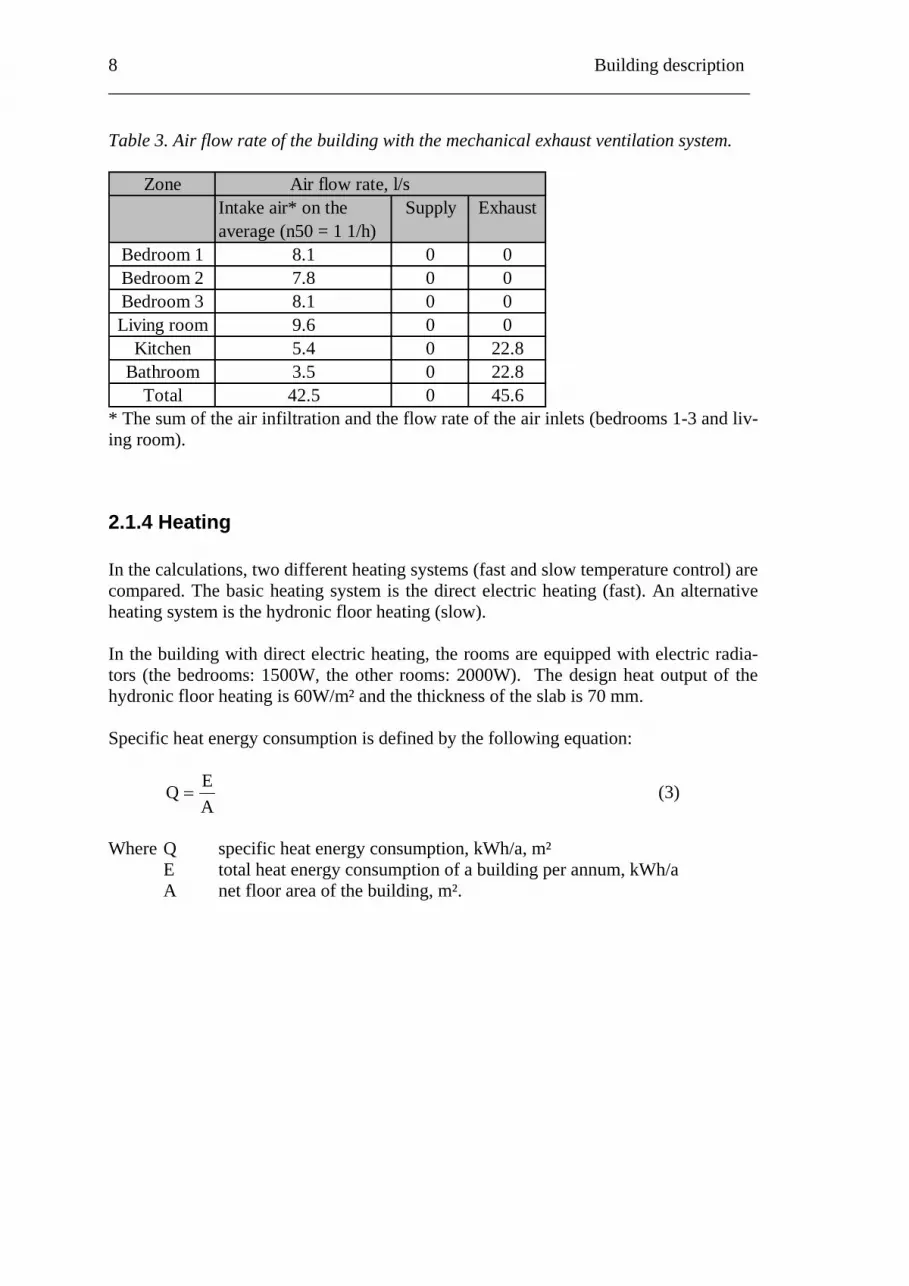
Table 3. Air flow rate of the building with the mechanical exhaust ventilation system.
Zone Air flow rate, l/s
Intake air* on the Supply Exhaustaverage (n50 = 1 1/h)
Bedroom 1 8.1 0 0Bedroom 2 7.8 0 0Bedroom 3 8.1 0 0Living room 9.6 0 0
Kitchen 5.4 0 22.8Bathroom 3.5 0 22.8
Total 42.5 0 45.6 * The sum of the air infiltration and the flow rate of the air inlets (bedrooms 1-3 and liv-ing room).
2.1.4 Heating
In the calculations, two different heating systems (fast and slow temperature control) are compared. The basic heating system is the direct electric heating (fast). An alternative heating system is the hydronic floor heating (slow). In the building with direct electric heating, the rooms are equipped with electric radia-tors (the bedrooms: 1500W, the other rooms: 2000W). The design heat output of the hydronic floor heating is 60W/m² and the thickness of the slab is 70 mm. Specific heat energy consumption is defined by the following equation:
AEQ = (3)
Where Q specific heat energy consumption, kWh/a, m² E total heat energy consumption of a building per annum, kWh/a A net floor area of the building, m².
Building description 9 ______________________________________________________________________
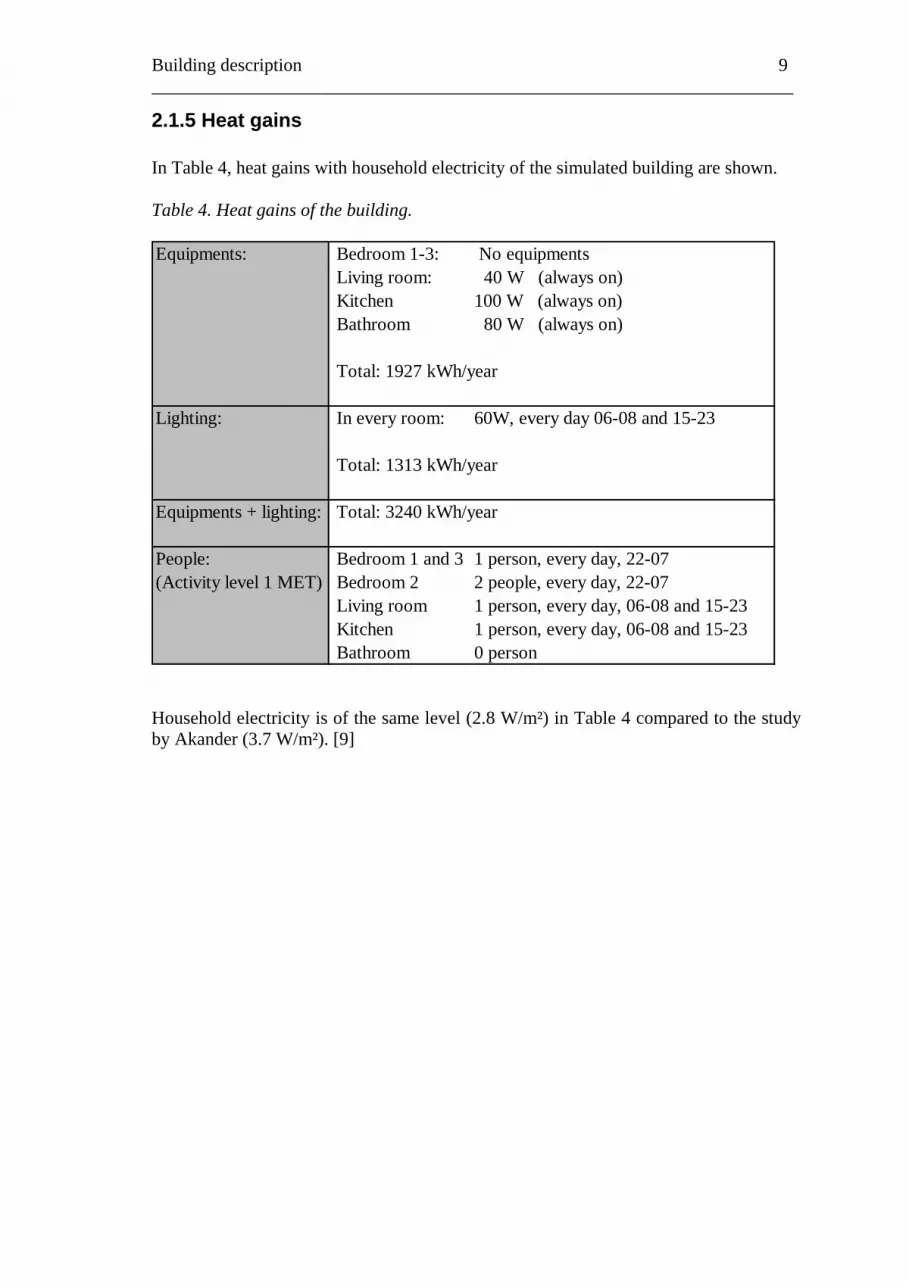
2.1.5 Heat gains In Table 4, heat gains with household electricity of the simulated building are shown. Table 4. Heat gains of the building. Equipments: Bedroom 1-3: No equipments
Living room: 40 W (always on) Kitchen 100 W (always on) Bathroom 80 W (always on)
Total: 1927 kWh/year
Lighting: In every room: 60W, every day 06-08 and 15-23
Total: 1313 kWh/year
Equipments + lighting: Total: 3240 kWh/year
People: Bedroom 1 and 3 1 person, every day, 22-07(Activity level 1 MET) Bedroom 2 2 people, every day, 22-07
Living room 1 person, every day, 06-08 and 15-23 Kitchen 1 person, every day, 06-08 and 15-23 Bathroom 0 person
Household electricity is of the same level (2.8 W/m²) in Table 4 compared to the study by Akander (3.7 W/m²). [9]
10 Building description ______________________________________________________________________
2.1.6 Windows
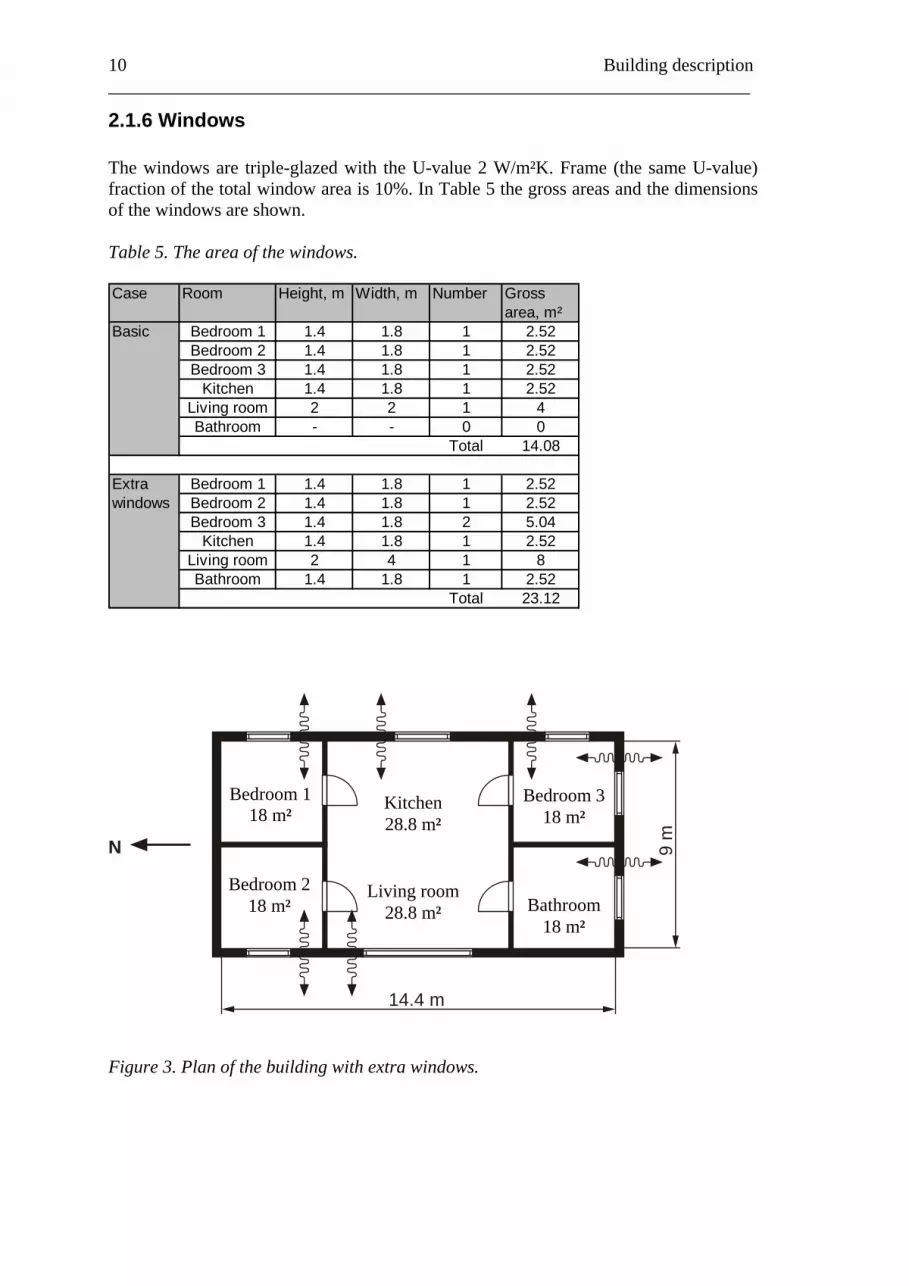
The windows are triple-glazed with the U-value 2 W/m²K. Frame (the same U-value) fraction of the total window area is 10%. In Table 5 the gross areas and the dimensions of the windows are shown. Table 5. The area of the windows.
Case Room Height, m Width, m Number Gross
area, m²Basic Bedroom 1 1.4 1.8 1 2.52
Bedroom 2 1.4 1.8 1 2.52Bedroom 3 1.4 1.8 1 2.52
Kitchen 1.4 1.8 1 2.52Living room 2 2 1 4Bathroom - - 0 0
Total 14.08
Extra Bedroom 1 1.4 1.8 1 2.52windows Bedroom 2 1.4 1.8 1 2.52
Bedroom 3 1.4 1.8 2 5.04Kitchen 1.4 1.8 1 2.52
Living room 2 4 1 8Bathroom 1.4 1.8 1 2.52
Total 23.12
14.4 m
9 m
N
Bedroom 1 18 m²
Bedroom 318 m²
Kitchen 28.8 m²
Bedroom 2 18 m²
Living room 28.8 m² Bathroom
18 m²
Figure 3. Plan of the building with extra windows.
Building description 11 ______________________________________________________________________
2.1.7 Furniture The mass of furniture can have influence on fast temperature variations. The area is given to estimate the total area of furniture exposed to the zone air. The area of furniture in bathroom is 1 m² and in other rooms 2 m².
2.2 The building structures in cases 1-4 The building is simulated with the following types of construction, on condition that each building component of the envelope has the same U-value, see Table 6. The ther-mal inertia of the basic structures differs as follows. Table 6. Types of construction in cases 1-4.
Case Type of construction
1 Theoretical lightweight2 Wooden frame3 Wooden surfaces4 Concrete
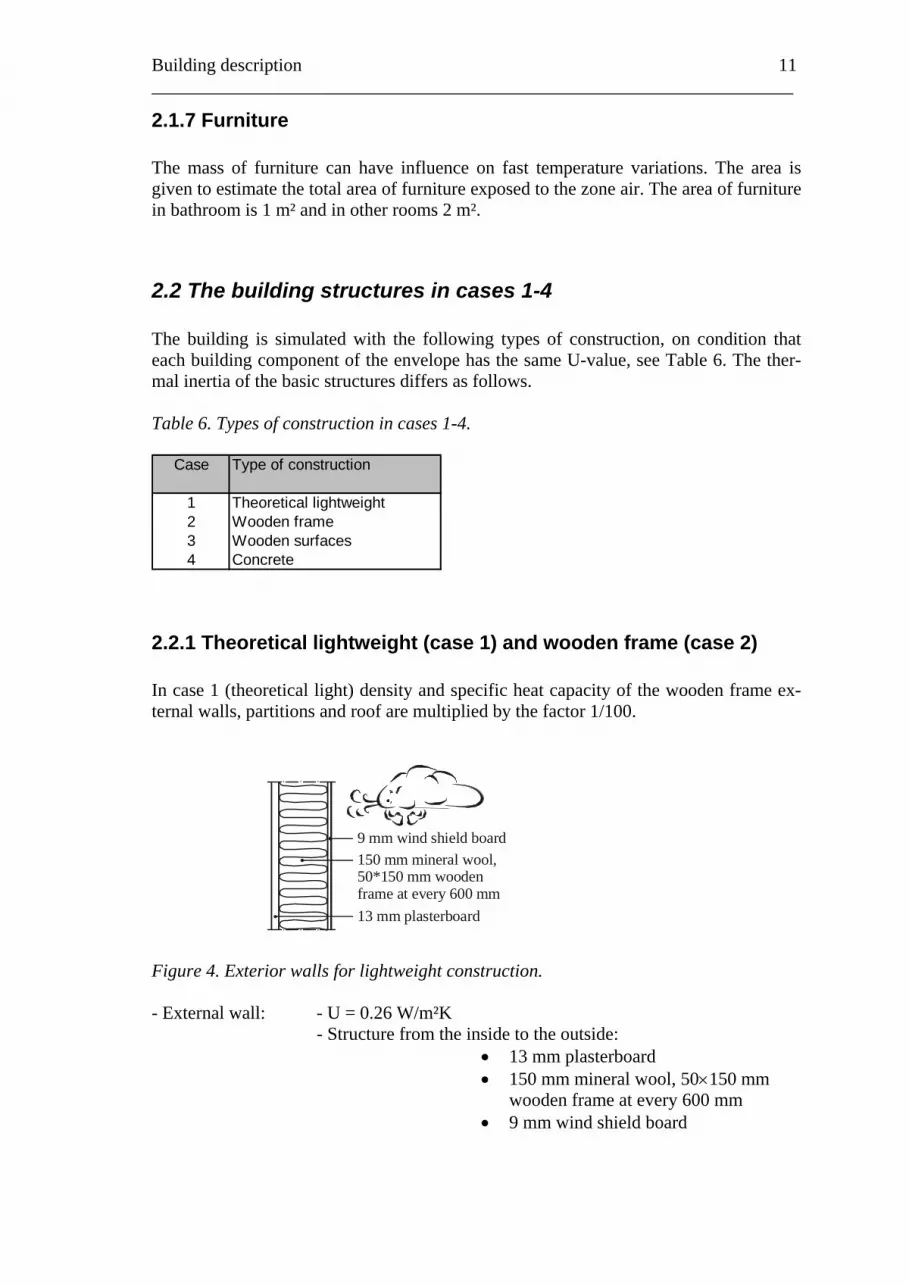
2.2.1 Theoretical lightweight (case 1) and wooden frame (case 2) In case 1 (theoretical light) density and specific heat capacity of the wooden frame ex-ternal walls, partitions and roof are multiplied by the factor 1/100.
13 mm plasterboard
150 mm mineral wool,50*150 mm woodenframe at every 600 mm
9 mm wind shield board
Figure 4. Exterior walls for lightweight construction. - External wall: - U = 0.26 W/m²K
- Structure from the inside to the outside: • 13 mm plasterboard • 150 mm mineral wool, 50×150 mm
wooden frame at every 600 mm • 9 mm wind shield board
12 Building description ______________________________________________________________________
- Separating walls: - U= 0.40 W/m²K - Structure:
• 13 mm plasterboard • 97 mm mineral wool, 50×150 mm wooden
frame at every 600 mm • 13 mm plasterboard
- Roof: - U = 0.23 W/m²K - Structure from the inside to the outside:
• 13 mm plasterboard • 22 mm air gap • 185 mm mineral wool
- Base floor: - U = 0.25 W/m²K - Structure from the inside to the outside:
• 10 mm parquetry • 70 mm concrete • 100 mm insulation • 1000 mm soil with constant temperature of
10°C at bottom
2.2.2 Wooden surfaces (case 3)
20 mm wooden panel
150 mm mineral wool,50*150 mm woodenframe at every 600 mm
9 mm wind shield board
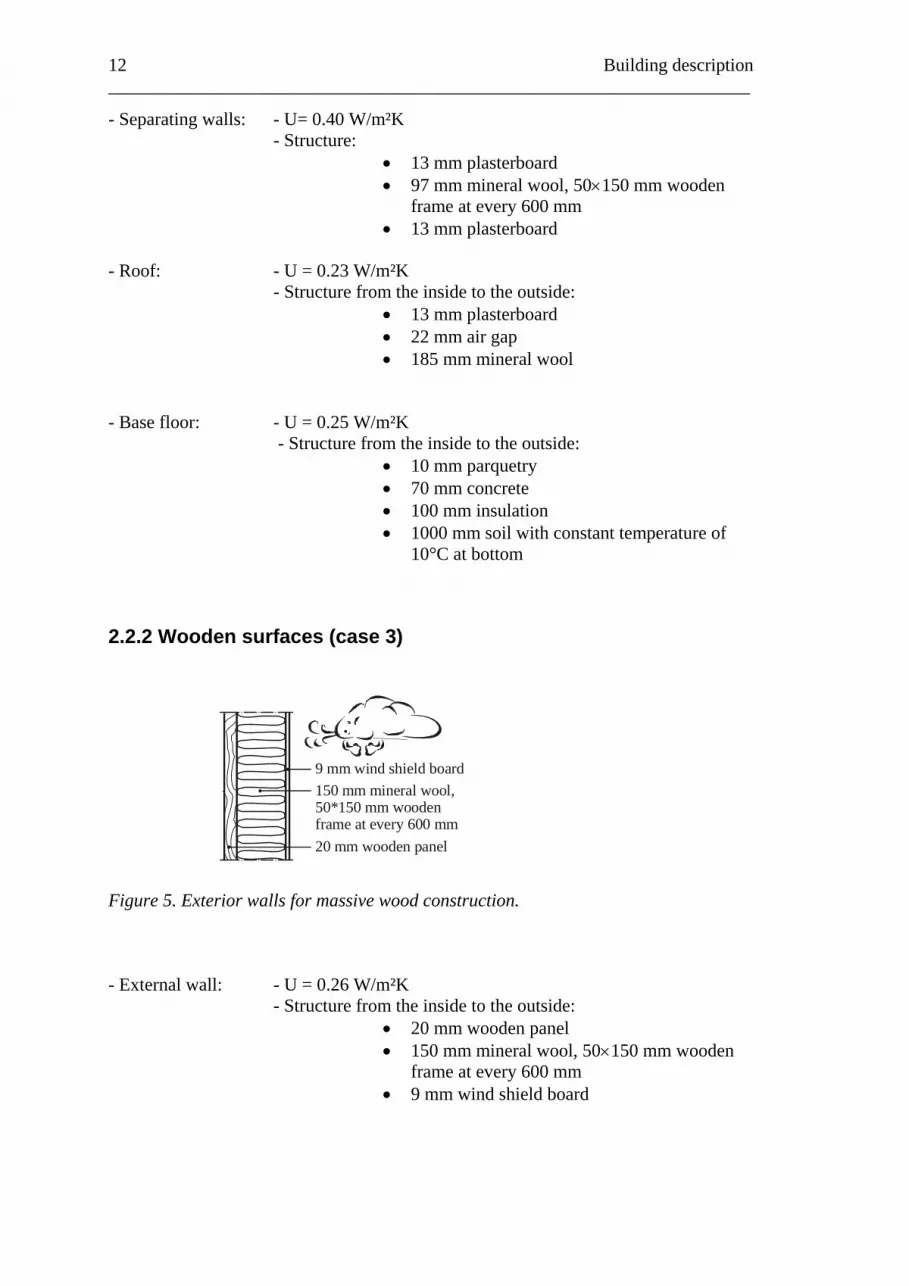
Figure 5. Exterior walls for massive wood construction. - External wall: - U = 0.26 W/m²K
- Structure from the inside to the outside: • 20 mm wooden panel • 150 mm mineral wool, 50×150 mm wooden
frame at every 600 mm • 9 mm wind shield board

Building description 13 ______________________________________________________________________
- Separating walls: - U = 0.38 W/m²K - Structure:
• 20 mm wooden panel • 97 mm mineral wool, 50×150 mm wooden
frame at every 600 mm • 20 mm wooden panel
- Roof: - U = 0.22 W/m²K - Structure from the inside to the outside:
• 20 mm wooden panel • 22 mm air gap • 185 mm mineral wool
- Base floor: - The same structure as in cases 1 and 2.
2.2.3 Concrete (case 4)
100 mm concrete
150 mm mineral wool, 50*150 mm wooden frame at every 600 mm
9 mm wind shield board
Figure 6. Exterior walls for heavyweight construction. - External wall: - U = 0.26 W/m²K
- Structure from the inside to the outside: • 100 mm concrete • 150 mm mineral wool, 50×150 mm wooden
frame at every 600 mm • 9 mm wind shield board
- Separating walls: - U = 4.37 W/m²K
- Structure: • 100 mm concrete
- Roof: - U = 0.23 W/m²K
- Structure from the inside to the outside: • 100 mm concrete • 22 mm air gap • 185 mm mineral wool
14 Building description ______________________________________________________________________
- Base floor: - The same structure as in cases 1 and 2.
2.3 The building structures in cases 1-4 with the additional thermal insulation Insulation material is added to the basic structures. Thickness of the thermal insulation material of the external walls and the base floor is added by 50 mm. The thermal insula-tion material of the roof is also added by 65mm.
2.3.1 Theoretical lightweight (case 1) and wooden frame (case 2)
In case 1 (theoretical lightweight) density and specific heat capacity of the wooden frame external walls, partitions and roof are multiplied by the factor 1/100. - External wall: - U = 0.20 W/m²K
- Structure from the inside to the outside: • 13 mm plasterboard • 200 mm mineral wool, 50×150 mm wooden
frame at every 600 mm • 9 mm wind shield board
- Separating walls: - U = 0.40 W/m²K
- Structure: • 13 mm plasterboard • 97 mm mineral wool, 50×150 mm wooden
frame at every 600 mm • 13 mm plasterboard
- Roof: - U = 0.17 W/m²K - Structure from the inside to the outside:
• 13 mm plasterboard • 22 mm air gap • 250 mm mineral wool
- Base floor: - U = 0.18 W/m²K - Structure from the inside to the outside:
• 10 mm parquetry • 70 mm concrete • 150 mm insulation • 1000 mm soil with constant temperature of
10°C at bottom
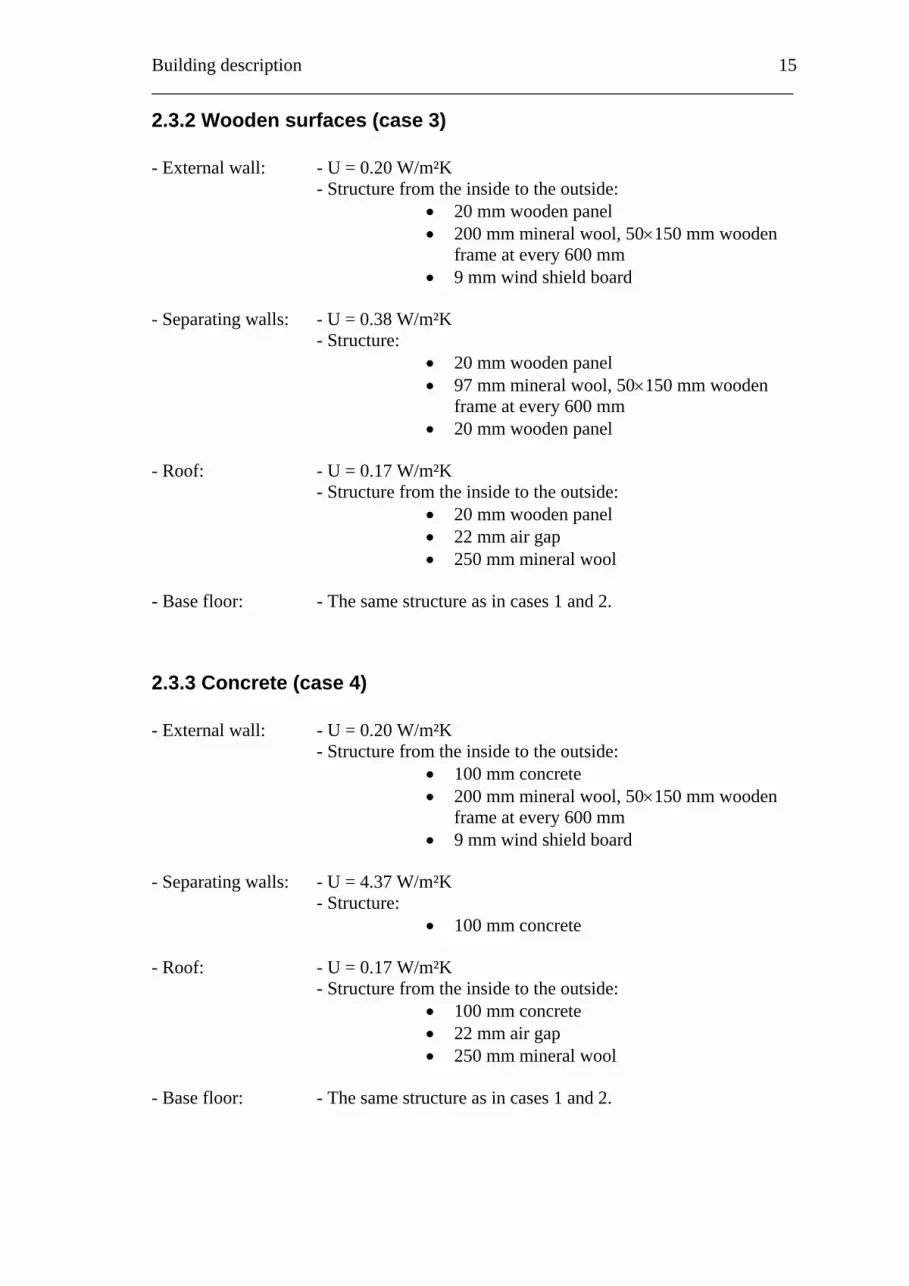
Building description 15 ______________________________________________________________________
2.3.2 Wooden surfaces (case 3)
- External wall: - U = 0.20 W/m²K - Structure from the inside to the outside:
• 20 mm wooden panel • 200 mm mineral wool, 50×150 mm wooden
frame at every 600 mm • 9 mm wind shield board
- Separating walls: - U = 0.38 W/m²K
- Structure: • 20 mm wooden panel • 97 mm mineral wool, 50×150 mm wooden
frame at every 600 mm • 20 mm wooden panel
- Roof: - U = 0.17 W/m²K - Structure from the inside to the outside:
• 20 mm wooden panel • 22 mm air gap • 250 mm mineral wool
- Base floor: - The same structure as in cases 1 and 2.
2.3.3 Concrete (case 4) - External wall: - U = 0.20 W/m²K
- Structure from the inside to the outside: • 100 mm concrete • 200 mm mineral wool, 50×150 mm wooden
frame at every 600 mm • 9 mm wind shield board
- Separating walls: - U = 4.37 W/m²K
- Structure: • 100 mm concrete
- Roof: - U = 0.17 W/m²K - Structure from the inside to the outside:
• 100 mm concrete • 22 mm air gap • 250 mm mineral wool
- Base floor: - The same structure as in cases 1 and 2.
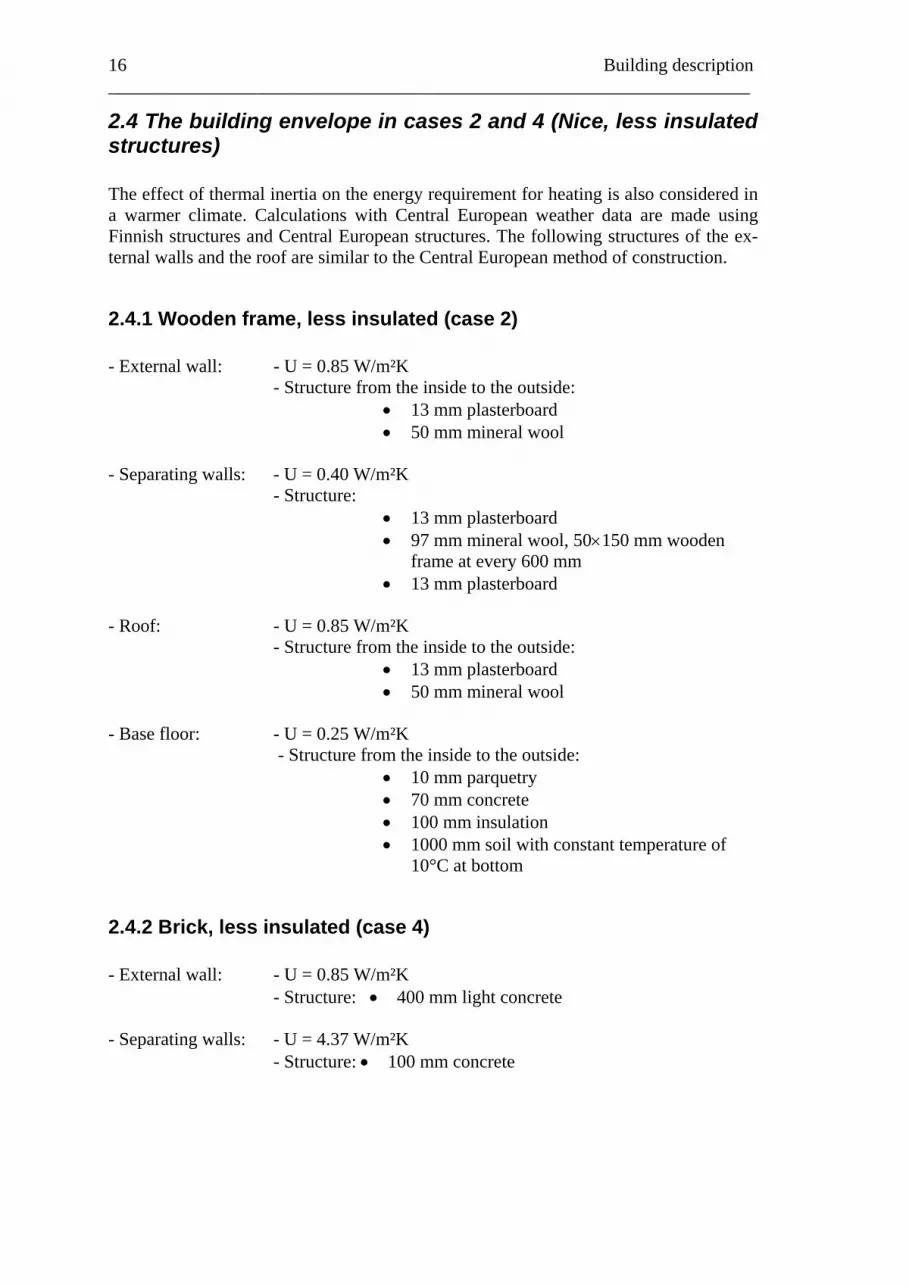
16 Building description ______________________________________________________________________
2.4 The building envelope in cases 2 and 4 (Nice, less insulated structures) The effect of thermal inertia on the energy requirement for heating is also considered in a warmer climate. Calculations with Central European weather data are made using Finnish structures and Central European structures. The following structures of the ex-ternal walls and the roof are similar to the Central European method of construction.
2.4.1 Wooden frame, less insulated (case 2) - External wall: - U = 0.85 W/m²K
- Structure from the inside to the outside: • 13 mm plasterboard • 50 mm mineral wool
- Separating walls: - U = 0.40 W/m²K
- Structure: • 13 mm plasterboard • 97 mm mineral wool, 50×150 mm wooden
frame at every 600 mm • 13 mm plasterboard
- Roof: - U = 0.85 W/m²K - Structure from the inside to the outside:
• 13 mm plasterboard • 50 mm mineral wool
- Base floor: - U = 0.25 W/m²K - Structure from the inside to the outside:
• 10 mm parquetry • 70 mm concrete • 100 mm insulation • 1000 mm soil with constant temperature of
10°C at bottom
2.4.2 Brick, less insulated (case 4) - External wall: - U = 0.85 W/m²K
- Structure: • 400 mm light concrete
- Separating walls: - U = 4.37 W/m²K - Structure: • 100 mm concrete

Building description 17 ______________________________________________________________________
- Roof: - U = 0.85 W/m²K - Structure from the inside to the outside:
• 13 mm plasterboard • 50 mm mineral wool
- Base floor: - The same structure as in case 2.
18 Results ______________________________________________________________________
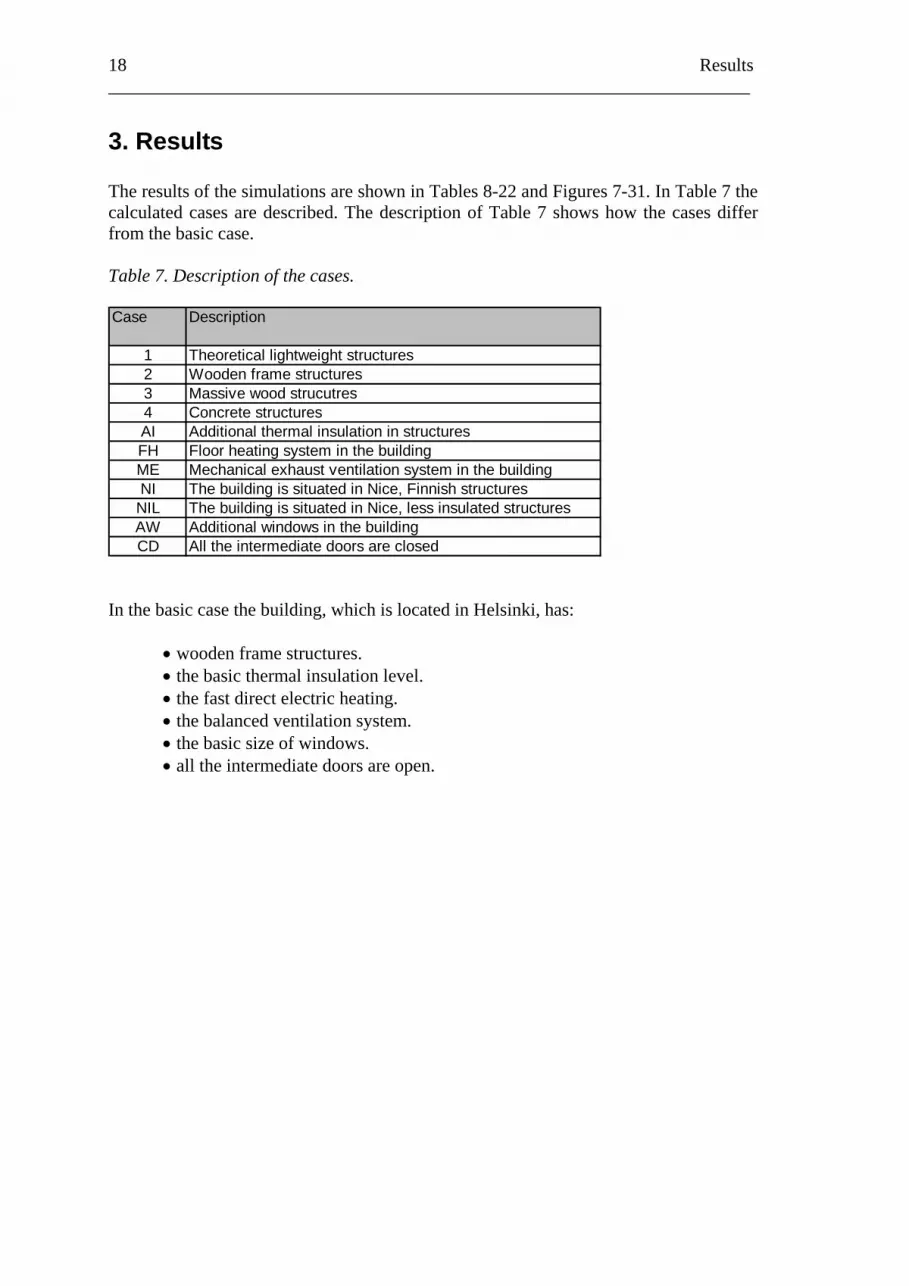
3. Results The results of the simulations are shown in Tables 8-22 and Figures 7-31. In Table 7 the calculated cases are described. The description of Table 7 shows how the cases differ from the basic case. Table 7. Description of the cases. Case Description
1 Theoretical lightweight structures2 Wooden frame structures3 Massive wood strucutres4 Concrete structuresAI Additional thermal insulation in structuresFH Floor heating system in the buildingME Mechanical exhaust ventilation system in the buildingNI The building is situated in Nice, Finnish structures
NIL The building is situated in Nice, less insulated structuresAW Additional windows in the buildingCD All the intermediate doors are closed
In the basic case the building, which is located in Helsinki, has: • wooden frame structures.
• the basic thermal insulation level. • the fast direct electric heating. • the balanced ventilation system. • the basic size of windows. • all the intermediate doors are open.
Results 19 ______________________________________________________________________
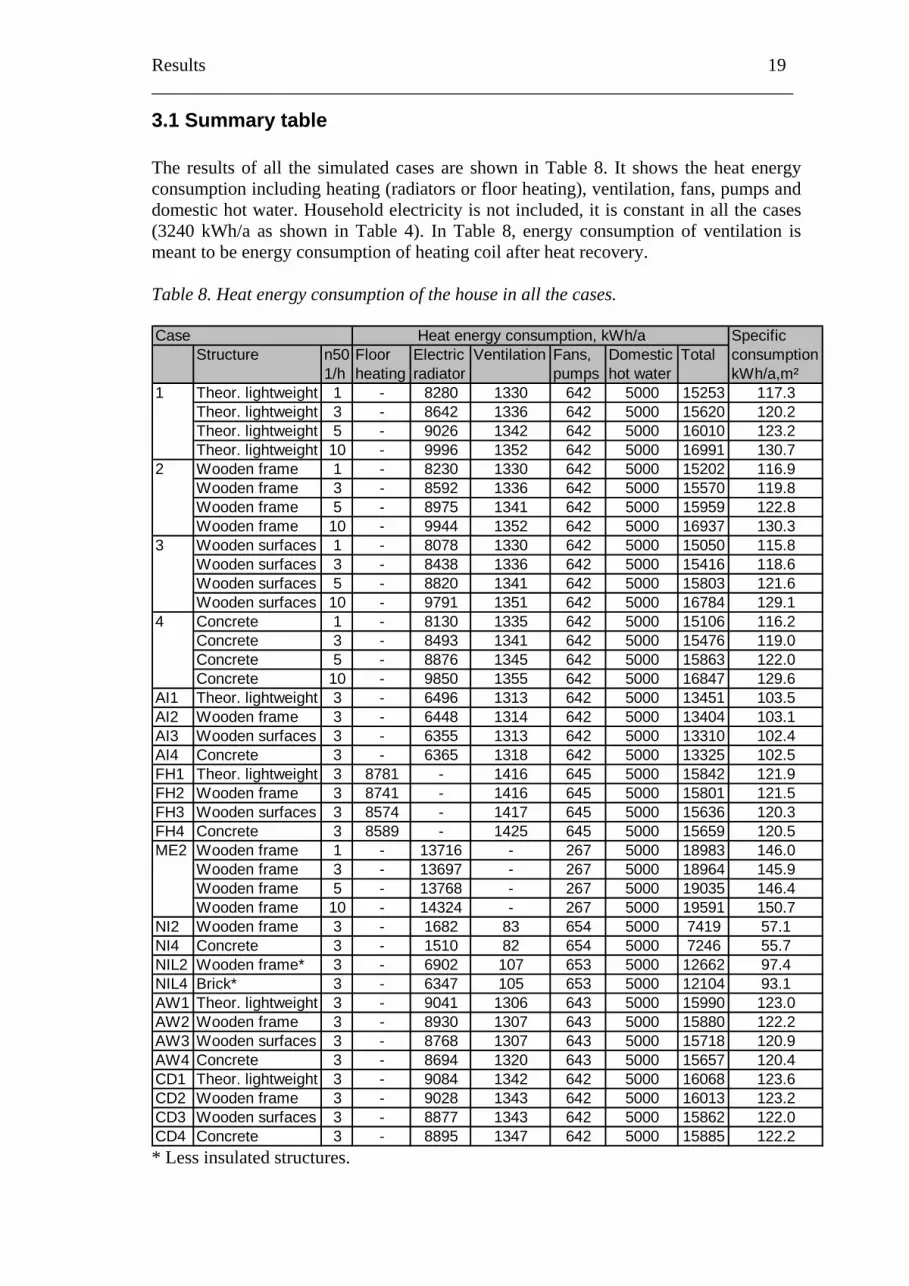
3.1 Summary table The results of all the simulated cases are shown in Table 8. It shows the heat energy consumption including heating (radiators or floor heating), ventilation, fans, pumps and domestic hot water. Household electricity is not included, it is constant in all the cases (3240 kWh/a as shown in Table 4). In Table 8, energy consumption of ventilation is meant to be energy consumption of heating coil after heat recovery. Table 8. Heat energy consumption of the house in all the cases. Case Heat energy consumption, kWh/a Specific
Structure n50 Floor Electric Ventilation Fans, Domestic Total consumption1/h heating radiator pumps hot water kWh/a,m²
1 Theor. lightweight 1 - 8280 1330 642 5000 15253 117.3Theor. lightweight 3 - 8642 1336 642 5000 15620 120.2Theor. lightweight 5 - 9026 1342 642 5000 16010 123.2Theor. lightweight 10 - 9996 1352 642 5000 16991 130.7
2 Wooden frame 1 - 8230 1330 642 5000 15202 116.9Wooden frame 3 - 8592 1336 642 5000 15570 119.8Wooden frame 5 - 8975 1341 642 5000 15959 122.8Wooden frame 10 - 9944 1352 642 5000 16937 130.3
3 Wooden surfaces 1 - 8078 1330 642 5000 15050 115.8Wooden surfaces 3 - 8438 1336 642 5000 15416 118.6Wooden surfaces 5 - 8820 1341 642 5000 15803 121.6Wooden surfaces 10 - 9791 1351 642 5000 16784 129.1
4 Concrete 1 - 8130 1335 642 5000 15106 116.2Concrete 3 - 8493 1341 642 5000 15476 119.0Concrete 5 - 8876 1345 642 5000 15863 122.0Concrete 10 - 9850 1355 642 5000 16847 129.6
AI1 Theor. lightweight 3 - 6496 1313 642 5000 13451 103.5AI2 Wooden frame 3 - 6448 1314 642 5000 13404 103.1AI3 Wooden surfaces 3 - 6355 1313 642 5000 13310 102.4AI4 Concrete 3 - 6365 1318 642 5000 13325 102.5FH1 Theor. lightweight 3 8781 - 1416 645 5000 15842 121.9FH2 Wooden frame 3 8741 - 1416 645 5000 15801 121.5FH3 Wooden surfaces 3 8574 - 1417 645 5000 15636 120.3FH4 Concrete 3 8589 - 1425 645 5000 15659 120.5ME2 Wooden frame 1 - 13716 - 267 5000 18983 146.0
Wooden frame 3 - 13697 - 267 5000 18964 145.9Wooden frame 5 - 13768 - 267 5000 19035 146.4Wooden frame 10 - 14324 - 267 5000 19591 150.7
NI2 Wooden frame 3 - 1682 83 654 5000 7419 57.1NI4 Concrete 3 - 1510 82 654 5000 7246 55.7NIL2 Wooden frame* 3 - 6902 107 653 5000 12662 97.4NIL4 Brick* 3 - 6347 105 653 5000 12104 93.1AW1 Theor. lightweight 3 - 9041 1306 643 5000 15990 123.0AW2 Wooden frame 3 - 8930 1307 643 5000 15880 122.2AW3 Wooden surfaces 3 - 8768 1307 643 5000 15718 120.9AW4 Concrete 3 - 8694 1320 643 5000 15657 120.4CD1 Theor. lightweight 3 - 9084 1342 642 5000 16068 123.6CD2 Wooden frame 3 - 9028 1343 642 5000 16013 123.2CD3 Wooden surfaces 3 - 8877 1343 642 5000 15862 122.0CD4 Concrete 3 - 8895 1347 642 5000 15885 122.2* Less insulated structures.
20 Results ______________________________________________________________________
3.2 Air infiltration The effect of tightness of a building on heat energy consumption is calculated with four different air leakage rates. Leakage air change rate per hour at 50 Pa of pressure differ-ence ( ) is changed between 1 and 10 1/h. Calculations are made with structures of different thermal inertia. The results of the simulations are shown in Figures 7-11 and Tables 9-10.
50n
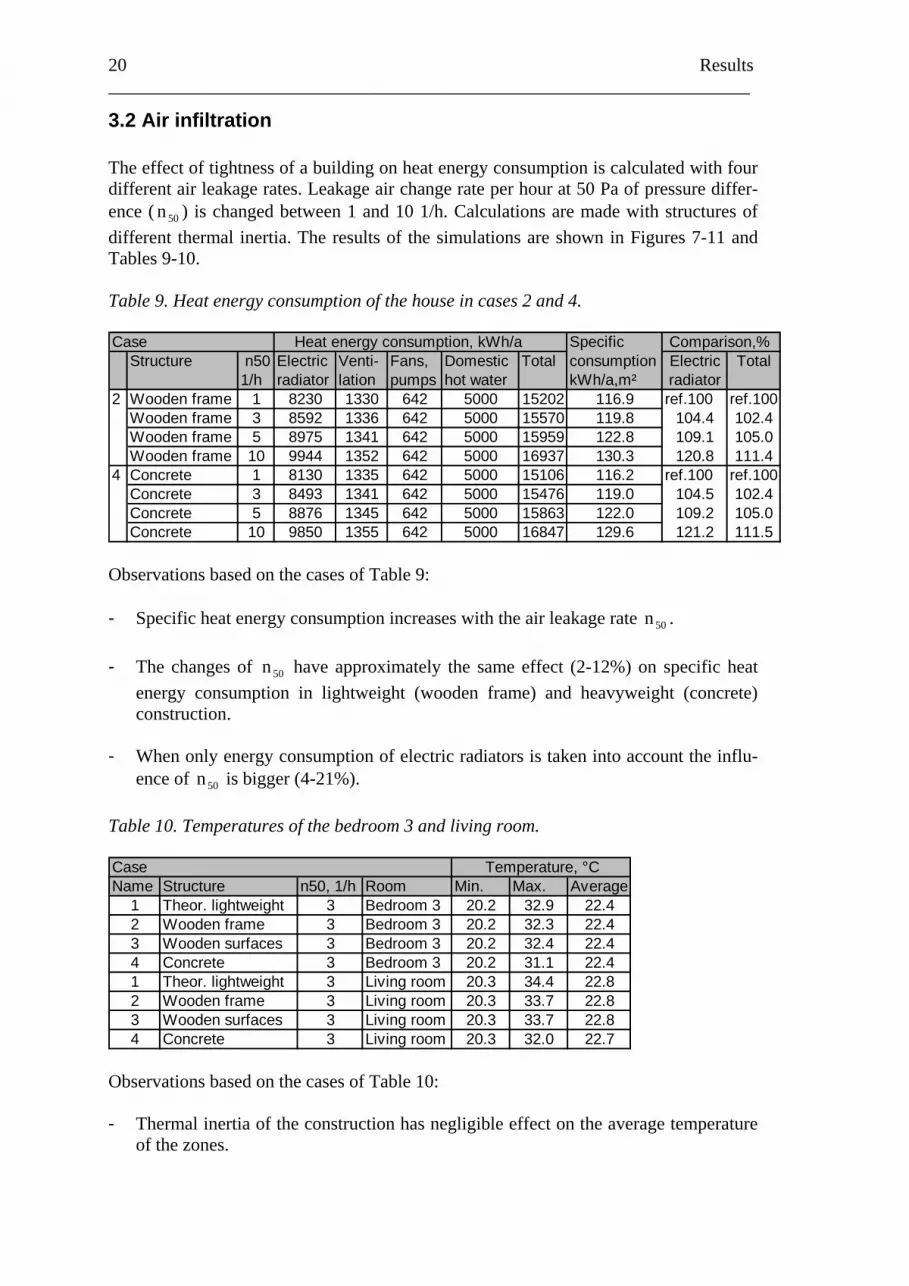
Table 9. Heat energy consumption of the house in cases 2 and 4. Case Heat energy consumption, kWh/a Specific Comparison,%
Structure n50 Electric Venti- Fans, Domestic Total consumption Electric Total1/h radiator lation pumps hot water kWh/a,m² radiator
2 Wooden frame 1 8230 1330 642 5000 15202 116.9 ref.100 ref.100Wooden frame 3 8592 1336 642 5000 15570 119.8 104.4 102.4Wooden frame 5 8975 1341 642 5000 15959 122.8 109.1 105.0Wooden frame 10 9944 1352 642 5000 16937 130.3 120.8 111.4
4 Concrete 1 8130 1335 642 5000 15106 116.2 ref.100 ref.100Concrete 3 8493 1341 642 5000 15476 119.0 104.5 102.4Concrete 5 8876 1345 642 5000 15863 122.0 109.2 105.0Concrete 10 9850 1355 642 5000 16847 129.6 121.2 111.5
Observations based on the cases of Table 9: - Specific heat energy consumption increases with the air leakage rate 50n . - The changes of have approximately the same effect (2-12%) on specific heat
energy consumption in lightweight (wooden frame) and heavyweight (concrete) construction.
50n
- When only energy consumption of electric radiators is taken into account the influ-
ence of is bigger (4-21%). 50n Table 10. Temperatures of the bedroom 3 and living room. Case Temperature, °CName Structure n50, 1/h Room Min. Max. Average
1 Theor. lightweight 3 Bedroom 3 20.2 32.9 22.42 Wooden frame 3 Bedroom 3 20.2 32.3 22.43 Wooden surfaces 3 Bedroom 3 20.2 32.4 22.44 Concrete 3 Bedroom 3 20.2 31.1 22.41 Theor. lightweight 3 Living room 20.3 34.4 22.82 Wooden frame 3 Living room 20.3 33.7 22.83 Wooden surfaces 3 Living room 20.3 33.7 22.84 Concrete 3 Living room 20.3 32.0 22.7
Observations based on the cases of Table 10: - Thermal inertia of the construction has negligible effect on the average temperature
of the zones.
Results 21 ______________________________________________________________________
- The maximum temperatures of the bedroom 3 and living room are 1.2 - 1.7°C higher in the building with wooden frame than in the building with concrete struc-tures. (cases: 2, 4)
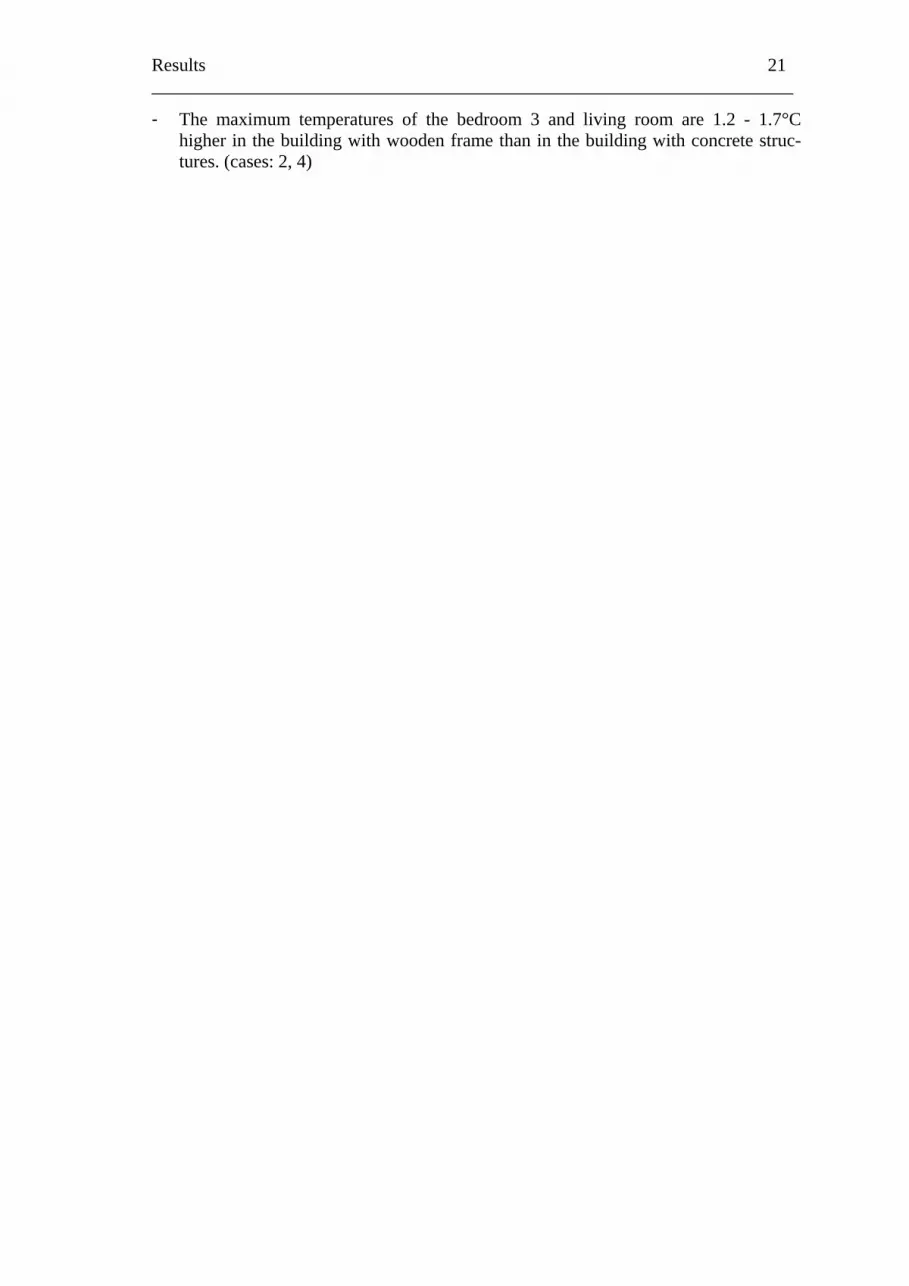
igure 7. Specific heat energy consumption with different air leak rate, wood and concrete structures. Columns of the same colour are compared with
Specific consumption with two different structures (n50 = 1-10 1h)
110
113
115
118
120
123
125
128
130
133
135
Wooden framen50 = 1 1/h
Concrete n50 = 11/h
Wooden framen50 = 3 1/h
Concrete n50 = 31/h
Wooden framen50 = 5 1/h
Concrete n50 = 51/h
Wooden framen50 = 10 1/h
Concrete n50 =10 1/h
Spec
ific
cons
umpt
ion,
kW
h/a,
m²
100%
102.4%
105%
111.4%
100%
102.4%
105%
111.5%
Feach other.
Air infiltration in the building with the balanced ventilation system (n50 = 1-10 1/h), (moving average, period = 5 days)
0.00
0.05
0.10
0.15
0.20
0.25
0.30
0.35
0.40
0.45
0.50
1 2 3 4 5 6 7 8 9 10 11 12
Month
Infil
tratio
n ai
r cha
nge,
1/h
n50 = 10 1/hn50 = 5 1/hn50 = 3 1/hn50 = 1 1/h
Average infiltration air change during one year:n50, 1/h Air infiltration, 1/h 1 0.02 3 0.04 5 0.0610 0.12
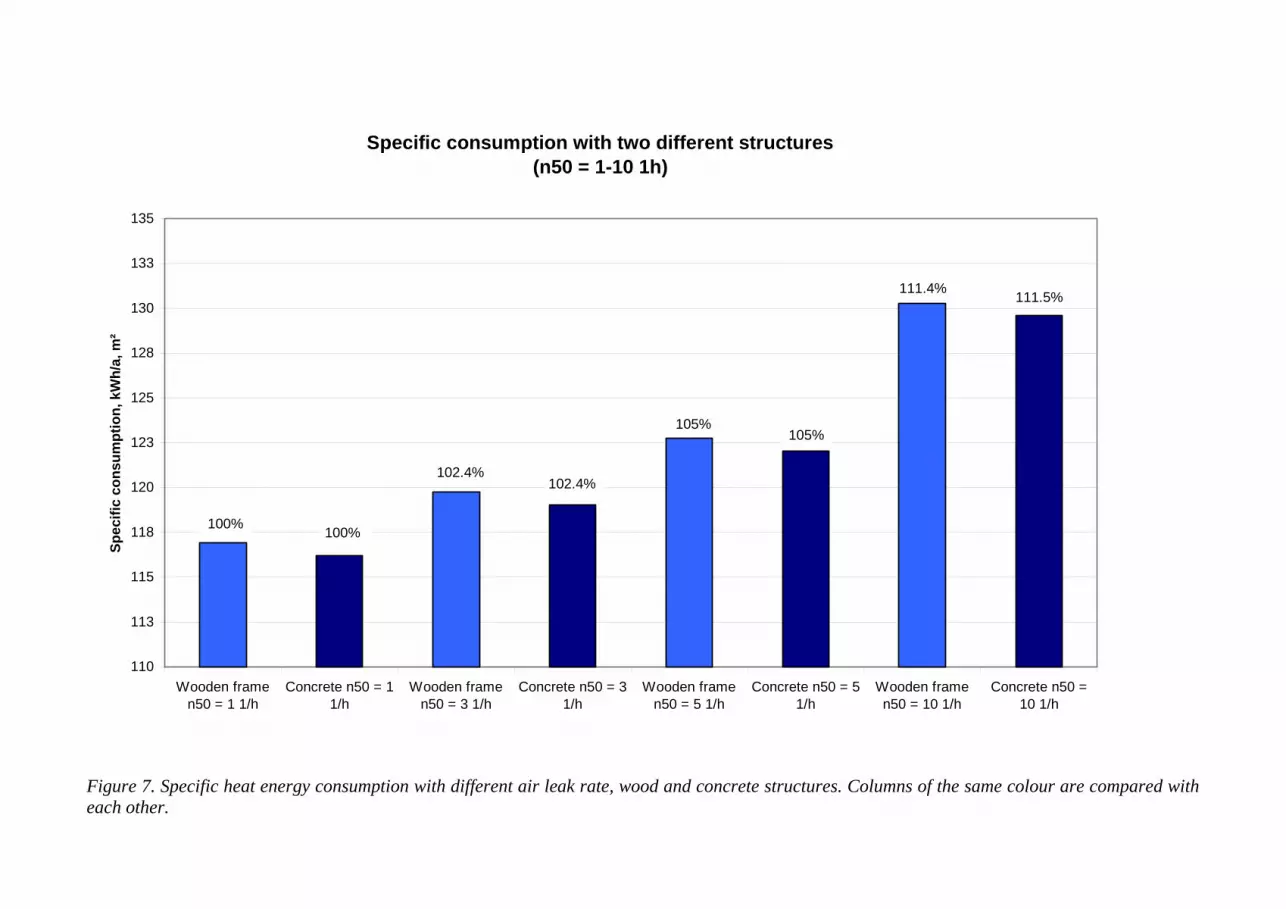
Figure 8. Infiltration air change with the balanced ventilation system ( . 50n = 1-10 1/h)
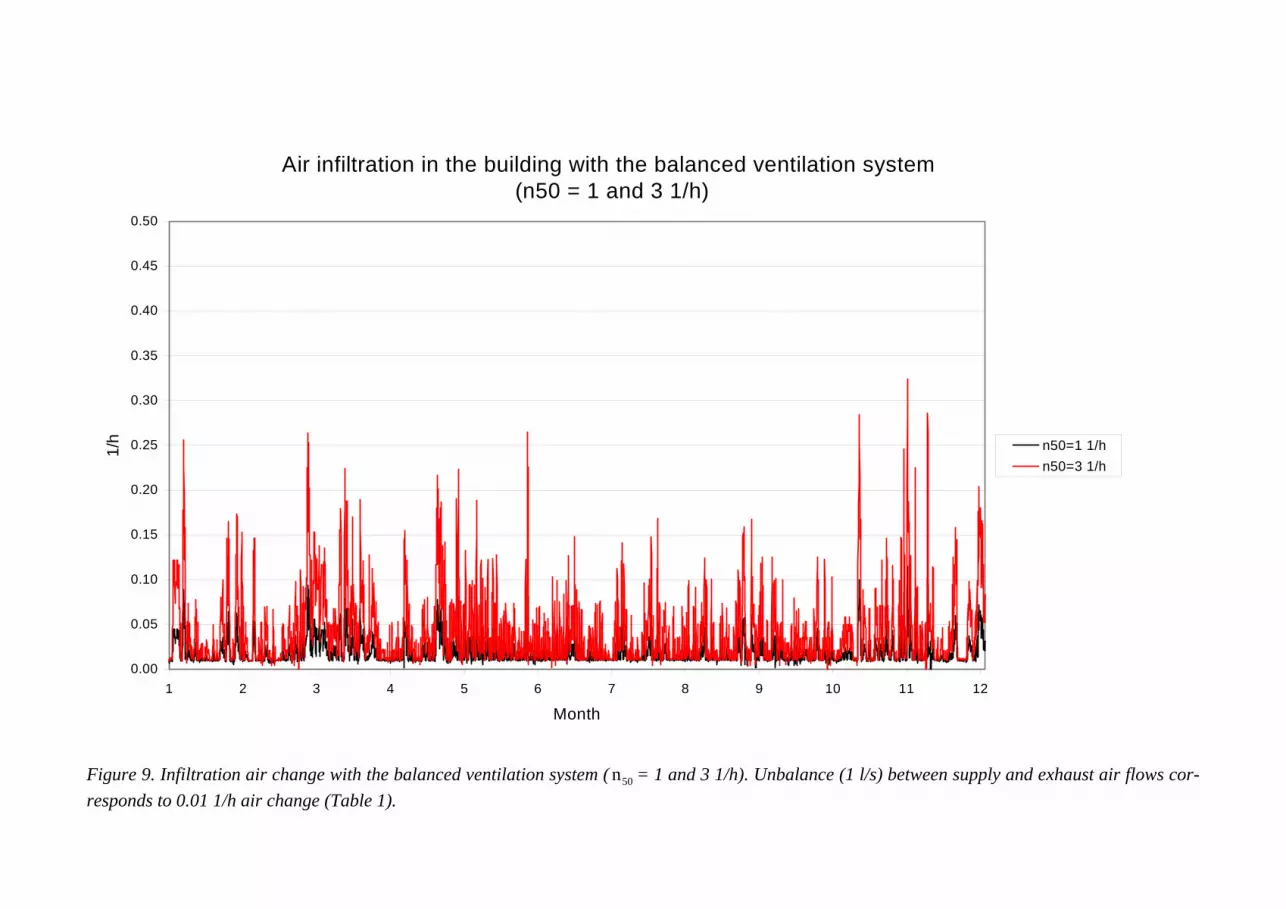
Air infiltration in the building with the balanced ventilation system (n50 = 1 and 3 1/h)
0.00
0.05
0.10
0.15
0.20
0.25
0.30
0.35
0.40
0.45
0.50
1 2 3 4 5 6 7 8 9 10 11 12
Month
1/h n50=1 1/h
n50=3 1/h
igure 9. Infiltration air change with the balanced ventilation system ( between supply and exhaust air flows cor-F 50n = 1 and 3 1/h). Unbalance (1 l/s)
responds to 0.01 1/h air change (Table 1).
Results 25 ______________________________________________________________________
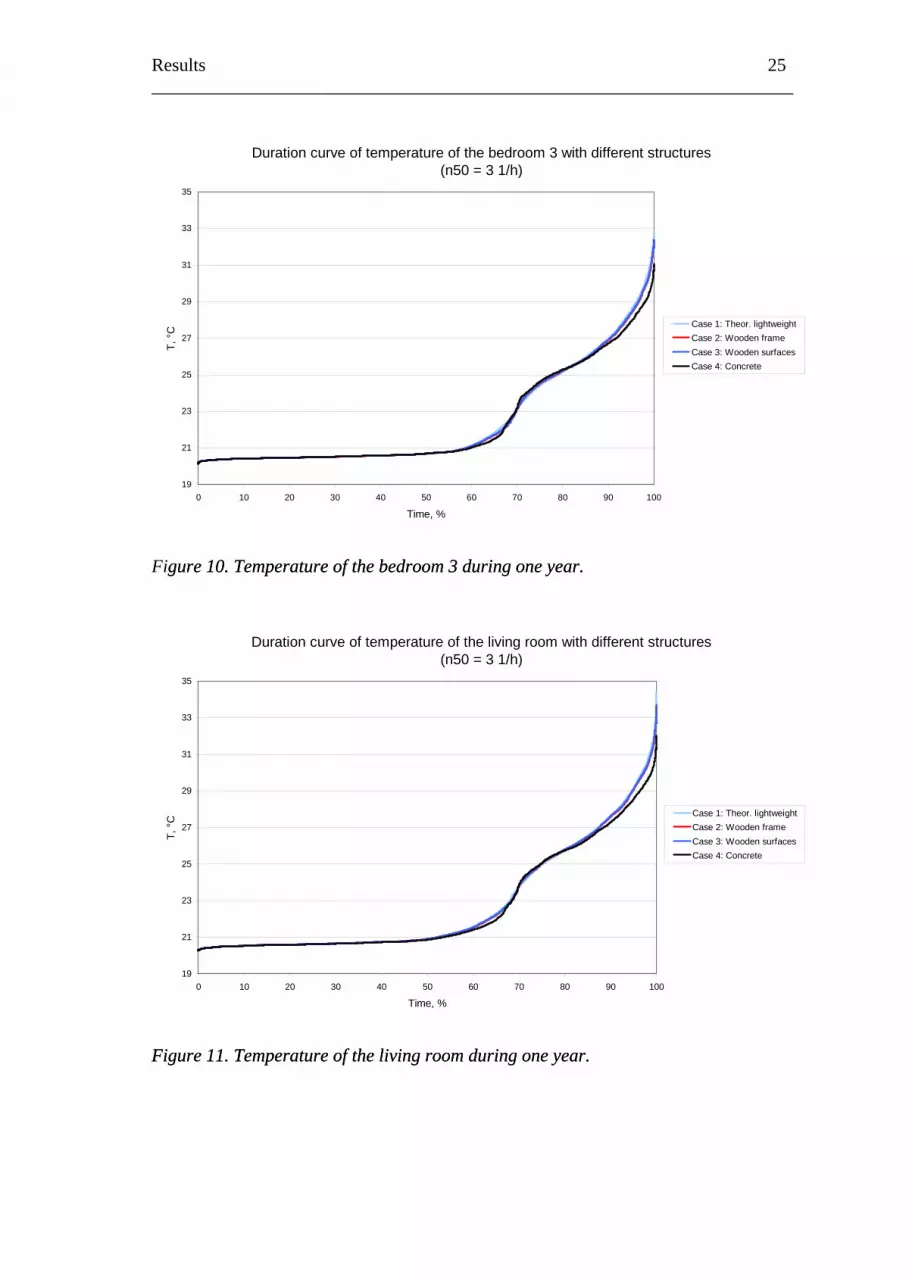
igure 10. Temperature of the bedroom 3 during one year.
igure 11. Temperature of the living room during one year.
gure 10. Temperature of the bedroom 3 during one year.
igure 11. Temperature of the living room during one year.
Duration curve of temperature of the bedroom 3 with different structures(n50 = 3 1/h)
19
21
23
25
27
29
31
33
35
0 10 20 30 40 50 60 70 80 90 100
Time, %
T, °
C Case 1: Theor. lightweightCase 2: Wooden frameCase 3: Wooden surfacesCase 4: Concrete
F
Duration curve of temperature of the living room with different structures(n50 = 3 1/h)
19
21
23
25
27
29
31
33
35
0 10 20 30 40 50 60 70 80 90 100
Time, %
T, °
C Case 1: Theor. lightweightCase 2: Wooden frameCase 3: Wooden surfacesCase 4: Concrete
FF
26 Results ______________________________________________________________________
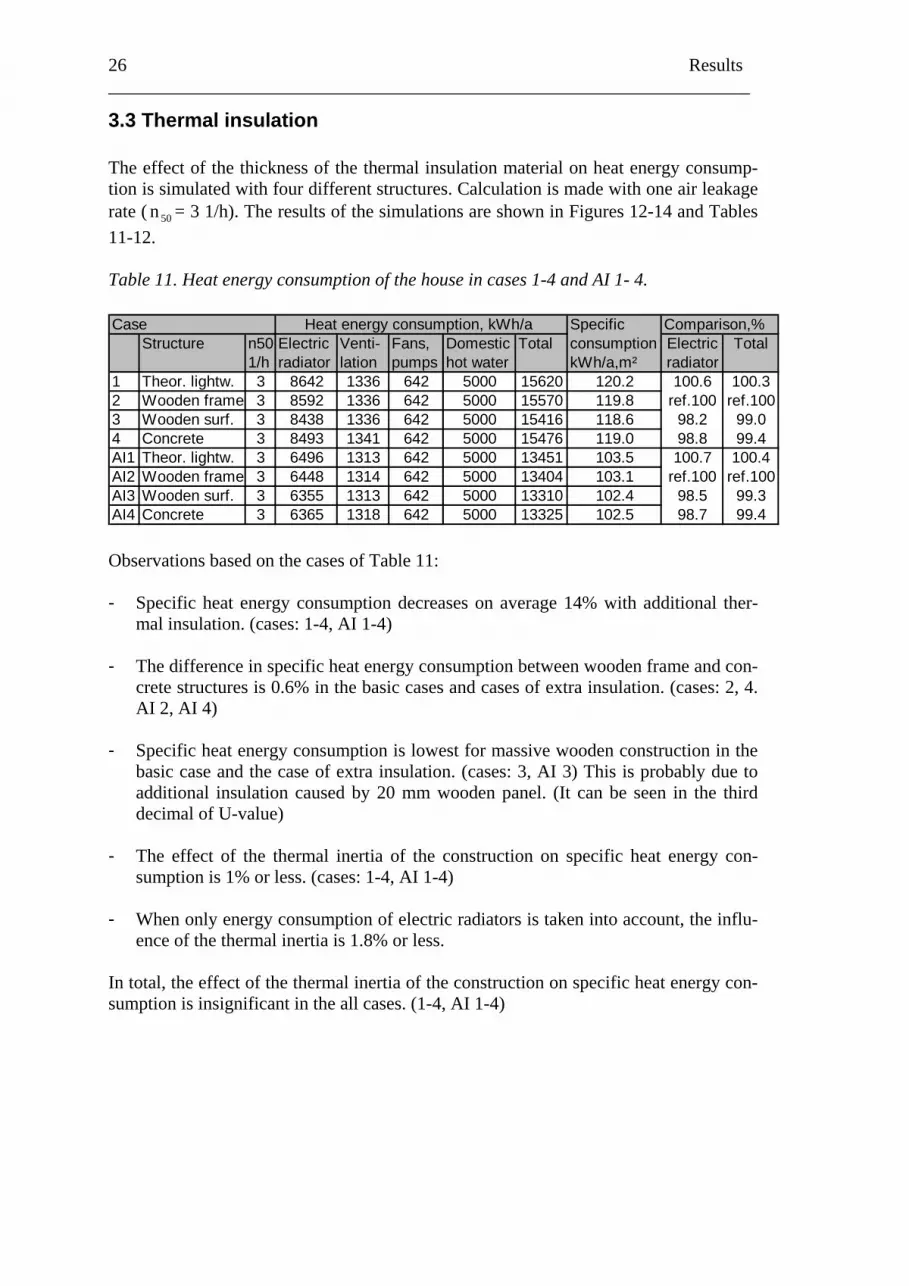
3.3 Thermal insulation
the thermal insulation material on heat energy consump-on is simulated with four different structures. Calculation is made with one air leakage
. Heat energy consumption of the house in cases 1-4 and AI 1- 4.
The effect of the thickness oftirate ( 50n = 3 1/h). The results of the simulations are shown in Figures 12-14 and Tables 11-12. Table 11 Case Heat energy consumption, kWh/a Specific Comparison,%
Structure n50 Electric Venti- Fans, Domestic Total consumption Electric Total1/h radiator lation pumps hot water kWh/a,m² radiator
1 Theor. lightw. 3 8642 1336 642 5000 15620 120.2 100.6 100.32 Wooden frame 3 8592 1336 642 5000 15570 119.8 ref.100 ref.1003 Wooden surf. 3 8438 1336 642 5000 15416 118.6 98.2 99.04 Concrete 3 8493 1341 642 5000 15476 119.0 98.8 99.4AI1 Theor. lightw. 3 6496 1313 642 5000 13451 103.5 100.7 100.4AI2 Wooden frame 3 6448 1314 642 5000 13404 103.1 ref.100 ref.100AI3 Wooden surf. 3 6355 1313 642 5000 13310 102.4 98.5 99.3AI4 Concrete 3 6365 1318 642 5000 13325 102.5 98.7 99.4
es on average 14% with additional ther-mal insulation. (cases: 1-4, AI 1-4)
- y consumption between wooden frame and con-crete structures is 0.6% in the basic cases and cases of extra insulation. (cases: 2, 4.
- t energy consumption is lowest for massive wooden construction in the
basic case and the case of extra insulation. (cases: 3, AI 3) This is probably due to
- rmal inertia of the construction on specific heat energy con-
sumption is 1% or less. (cases: 1-4, AI 1-4)
- adiators is taken into account, the influ-ence of the thermal inertia is 1.8% or less.
In t onstruction on specific heat energy con-umption is insignificant in the all cases. (1-4, AI 1-4)
Observations based on the cases of Table 11: - Specific heat energy consumption decreas
The difference in specific heat energ
AI 2, AI 4)
Specific hea
additional insulation caused by 20 mm wooden panel. (It can be seen in the third decimal of U-value)
The effect of the the
When only energy consumption of electric r
otal, the effect of the thermal inertia of the c
s

Results 27 ______________________________________________________________________
Table 12. Temperatures of the bedroom 3 and living room. Case Temperature, °C
e Structure n50, 1/h Room Min. Max. AverageAI 1 Theor. lightweight 3 Bedroom 3 20.1 35.5 22.4AI 2 Wooden frame 3 Bedroom 3 20.2 33.6 22.3AI 3 Wooden surfaces 3 Bedroom 3 20.2 33.3 22.3AI 4 Concrete 3 Bedroom 3 20.2 31.1 22.3AI 1 Theor. lightweight 3 Living room 20.2 37.3 22.6AI 2 Wooden frame 3 Living room 20.2 35.0 22.5AI 3 Wooden surfaces 3 Living room 20.2 34.5 22.5AI 4 Concrete 3 Living room 20.2 31.9 22.4
Nam
Observations based on the cases of Table 12:
mperatures of the building with wooden frame and concrete structures increases with extra heat insulation. (cases: 2,4 (Table
- emperatures of the bedroom 3 and living room are 2.5 - 3.1°C
higher in the building with wooden frame than in the building with concrete struc-
- The difference between the maximum te
10), AI 2, AI 4)
The maximum t
tures. (cases: AI 2, AI 4)

gure 12. Specific heat energy consumption with extra thermal insulation, cases 1-4. Columns of the same colour are compared with each other.
Specific consumption with various structures and additional thermal insulation (n50 = 3 1/h)
90
95
100
105
110
115
120
125
Theor. lightweight Theor.lightweight, extra
insulation
Wooden frame Wooden frame,extra insulation
Wooden surfaces Woodensurfaces, extra
insulation
Concrete Concrete, extrainsulation
Spec
ific
cons
umpt
ion,
kW
h/a,
m²
100.3%
100.4%
100%
100%
99%
99.3%
99.4%
99.4%
Fi

Results 29 ______________________________________________________________________
igure 13. Temperature of the bedroom 3 during one year. ure 13. Temperature of the bedroom 3 during one year.
Figure 14. Temperature of the living room during one year.
Duration curve of temperature of the bedroom 3 with different structures(n50 = 3 1/h, additional insulation)
19
21
23
25
27
29
31
33
35
37
39
0 10 20 30 40 50 60 70 80 90 100
Time, %
T, °
C
Case 1: Theor. lightweightCase 2: Wooden frameCase 3: Wooden surfacesCase 4: Concrete
F
Duration curve of temperature of the living room with different structures(n50 = 3 1/h, additional insulation)
19
21
23
25
27
29
31
33
35
37
39
0 10 20 30 40 50 60 70 80 90 100
Time, %
T, °
C Case 1: Theor. lightweightCase 2: Wooden frameCase 3: Wooden surfacesCase 4: Concrete
Figure 14. Temperature of the living room during one year.
30 Results ______________________________________________________________________
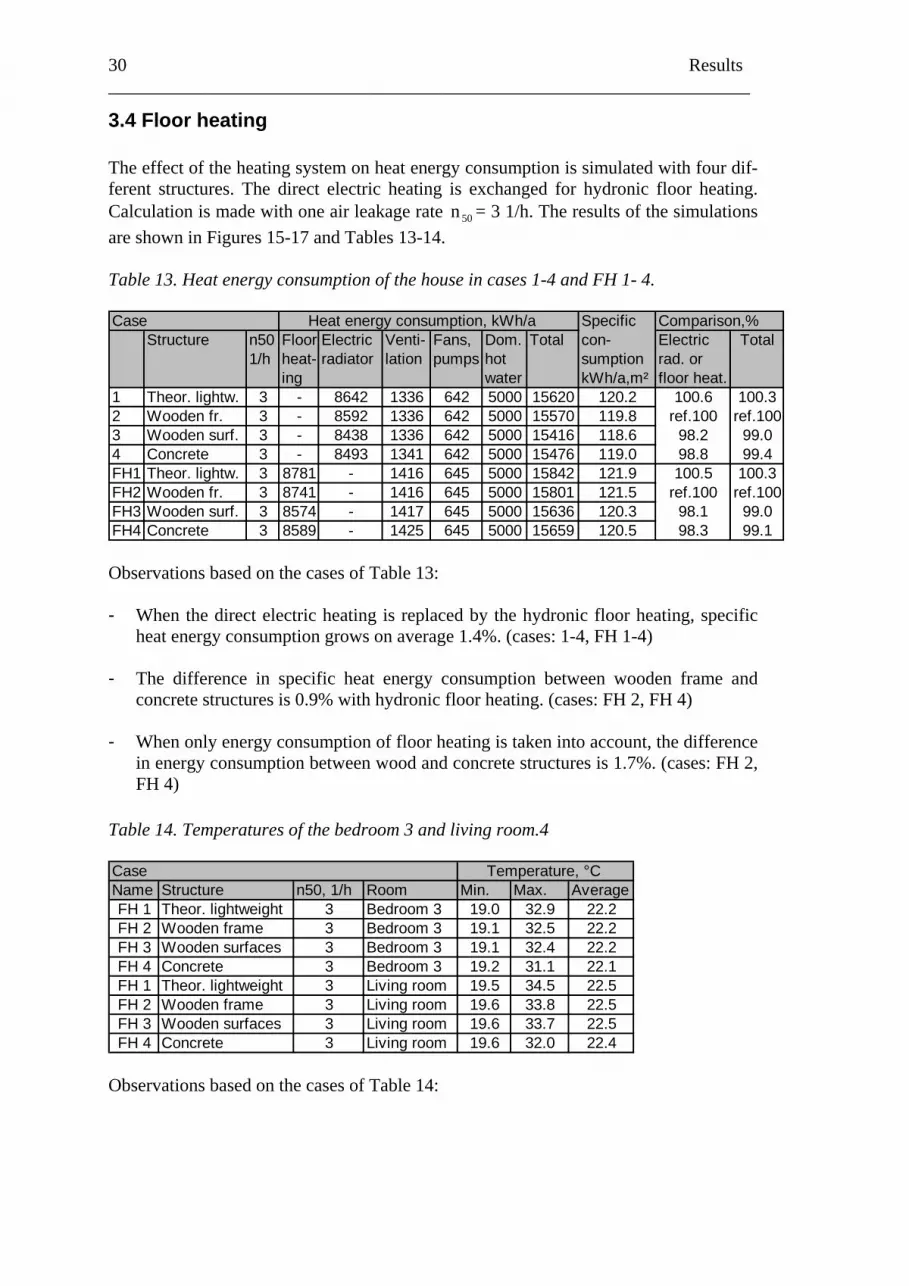
3.4 Floor heating
g system on heat energy consumption is simulated with four dif-rent structures. The direct electric heating is exchanged for hydronic floor heating.
in cases 1-4 and FH 1- 4.
The effect of the heatinfeCalculation is made with one air leakage rate 50n = 3 1/h. The results of the simulations are shown in Figures 15-17 and Tables 13-14. Table 13. Heat energy consumption of the house Case Heat energy consumption, kWh/a Specific Comparison,%
Structure n50 Floor Electric Venti- Fans, Dom. Total con- Electric Total1/h heat- radiator lation pumps hot sumption rad. or
ing water kWh/a,m² floor heat.1 Theor. lightw. 3 - 8642 1336 642 5000 15620 120.2 100.6 100.32 Wooden fr. 3 - 8592 1336 642 5000 15570 119.8 ref.100 ref.1003 Wooden surf. 3 - 8438 1336 642 5000 15416 118.6 98.2 99.04 Concrete 3 - 8493 1341 642 5000 15476 119.0 98.8 99.4FH1 Theor. lightw. 3 8781 - 1416 645 5000 15842 121.9 100.5 100.3FH2 Wooden fr. 3 8741 - 1416 645 5000 15801 121.5 ref.100 ref.100FH3 Wooden surf. 3 8574 - 1417 645 5000 15636 120.3 98.1 99.0FH4 Concrete 3 8589 - 1425 645 5000 15659 120.5 98.3 99.1 Observations based on the cases of Table 13:
d by the hydronic floor heating, specific heat energy consumption grows on average 1.4%. (cases: 1-4, FH 1-4)
- n frame and concrete structures is 0.9% with hydronic floor heating. (cases: FH 2, FH 4)
- ference in energy consumption between wood and concrete structures is 1.7%. (cases: FH 2,
- When the direct electric heating is replace
The difference in specific heat energy consumption between woode
When only energy consumption of floor heating is taken into account, the dif
FH 4)
Table 14. Temperatures of the bedroom 3 and living room.4 Case Temperature, °C
e Structure n50, 1/h Room Min. Max. AverageFH 1 Theor. lightweight 3 Bedroom 3 19.0 32.9 22.2FH 2 Wooden frame 3 Bedroom 3 19.1 32.5 22.2FH 3 Wooden surfaces 3 Bedroom 3 19.1 32.4 22.2FH 4 Concrete 3 Bedroom 3 19.2 31.1 22.1FH 1 Theor. lightweight 3 Living room 19.5 34.5 22.5FH 2 Wooden frame 3 Living room 19.6 33.8 22.5FH 3 Wooden surfaces 3 Living room 19.6 33.7 22.5FH 4 Concrete 3 Living room 19.6 32.0 22.4
Nam
Observations based on the cases of Table 14:
Results 31 ______________________________________________________________________
- The mean temperatures of the zones decrease by 0.3°C on the average when direct electric heating is replaced by the hydronic floor heating. (cases: 1-4 (table 10), FH 1-4)
- The maximum temperatures of the bedroom 3 and living room are 1.4 - 1.8°C
higher in the building with wooden frame than in the building with concrete struc-tures. (cases: FH 2, FH 4)
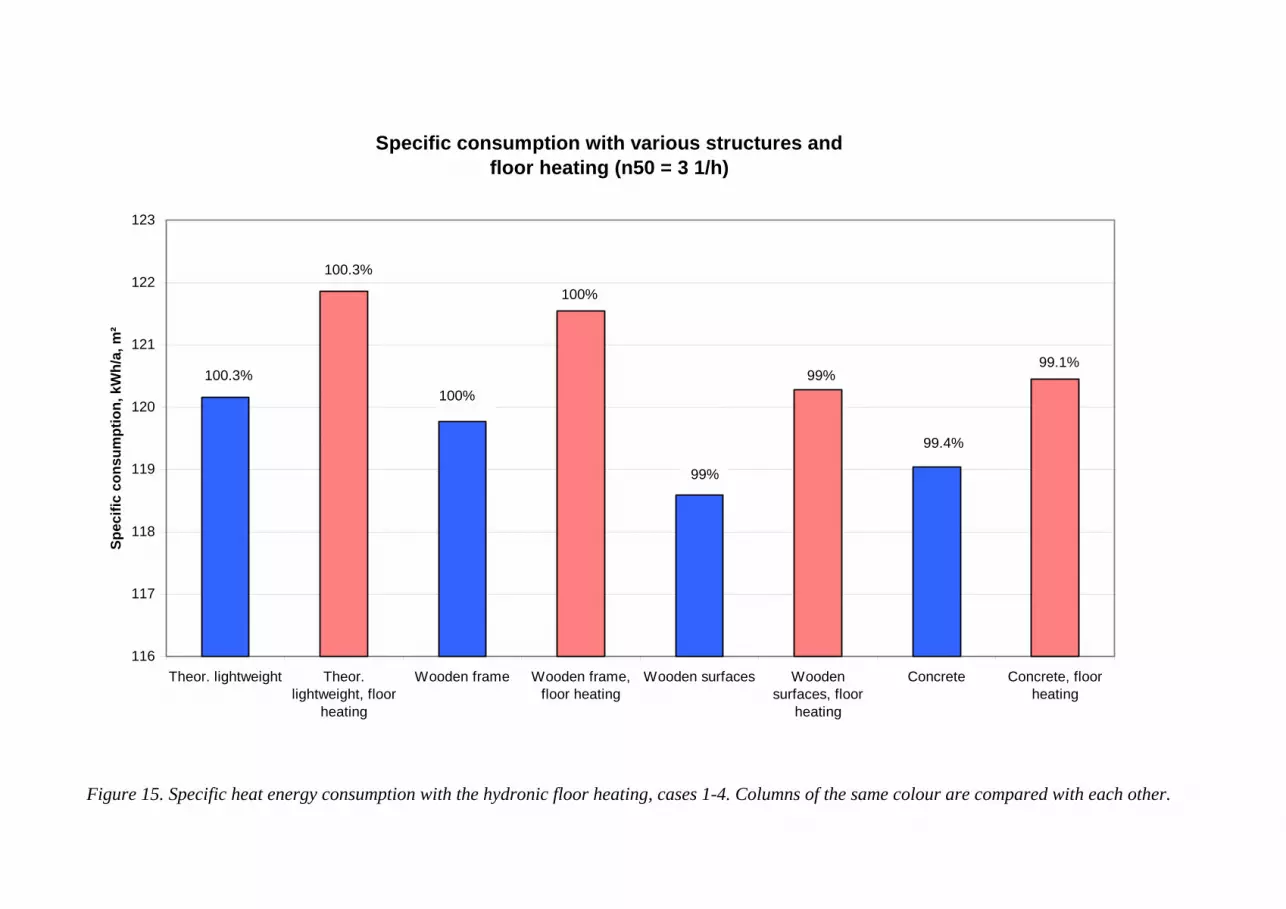
igure 15. Specific heat energy consumption with the hydronic floor heating, cases 1-4. Columns of the same colour are compared with each other.
Specific consumption with various structures and floor heating (n50 = 3 1/h)
116
117
118
119
120
121
122
123
Theor. lightweight Theor.lightweight, floor
heating
Wooden frame Wooden frame,floor heating
Wooden surfaces Woodensurfaces, floor
heating
Concrete Concrete, floorheating
Spec
ific
cons
umpt
ion,
kW
h/a,
m²
100.3%
100.3%
100%
99%
99.4%
100%
99%99.1%
F
Results 33 ______________________________________________________________________
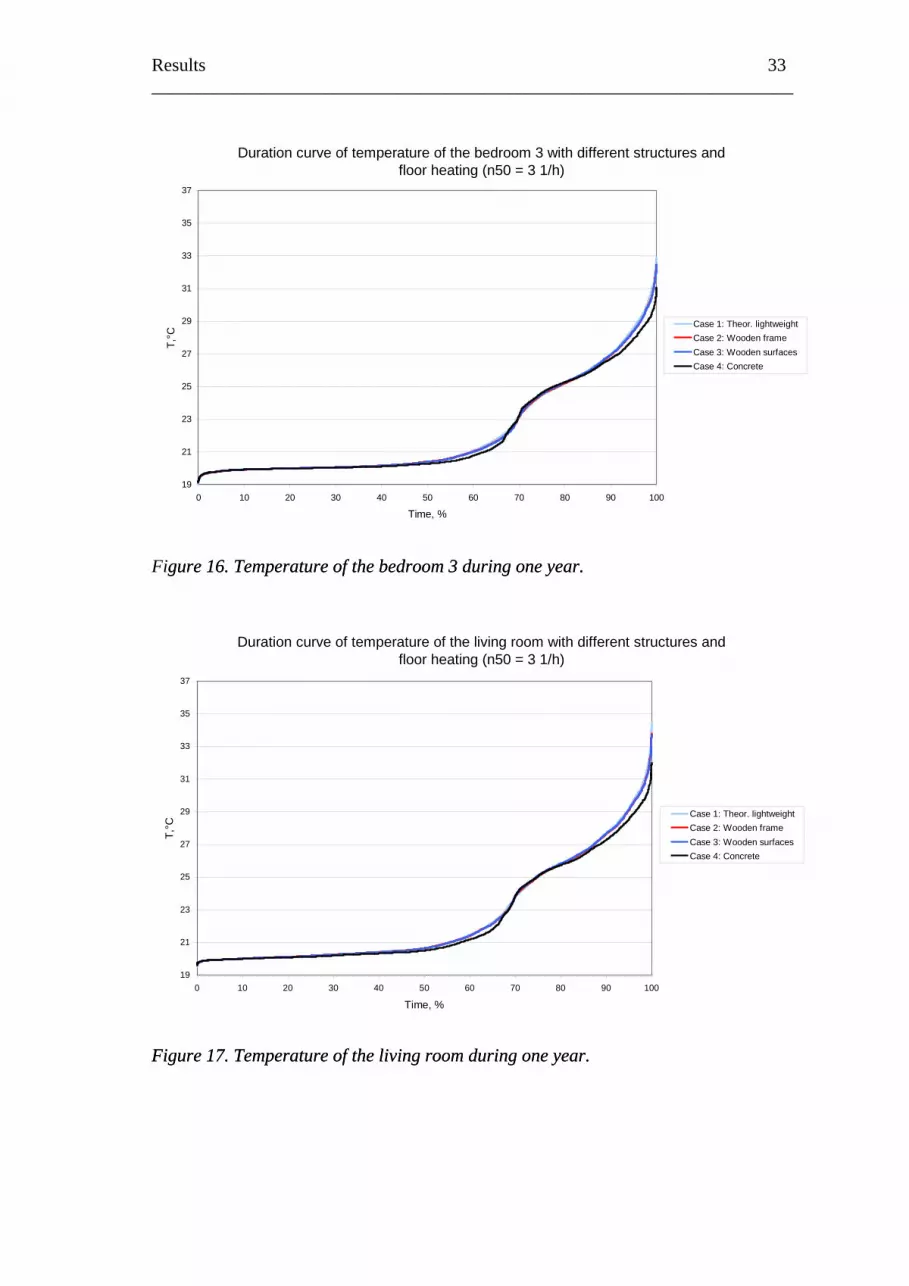
igure 16. Temperature of the bedroom 3 during one year.
igure 17. Temperature of the living room during one year.
gure 16. Temperature of the bedroom 3 during one year.
igure 17. Temperature of the living room during one year.
Duration curve of temperature of the bedroom 3 with different structures and floor heating (n50 = 3 1/h)
19
21
23
25
27
29
31
33
35
37
0 10 20 30 40 50 60 70 80 90 100
Time, %
T,°C
Case 1: Theor. lightweightCase 2: Wooden frameCase 3: Wooden surfacesCase 4: Concrete
F
Duration curve of temperature of the living room with different structures and floor heating (n50 = 3 1/h)
19
21
23
25
27
29
31
33
35
37
0 10 20 30 40 50 60 70 80 90 100
Time, %
T,°C
Case 1: Theor. lightweightCase 2: Wooden frameCase 3: Wooden surfacesCase 4: Concrete
FF
34 Results ______________________________________________________________________
3.5 Ventilation system
ystem on heat energy consumption is simulated with two The basic ventilation system of the simulated building is
echanical supply and exhaust system. The basic ventilation system is replaced by me-
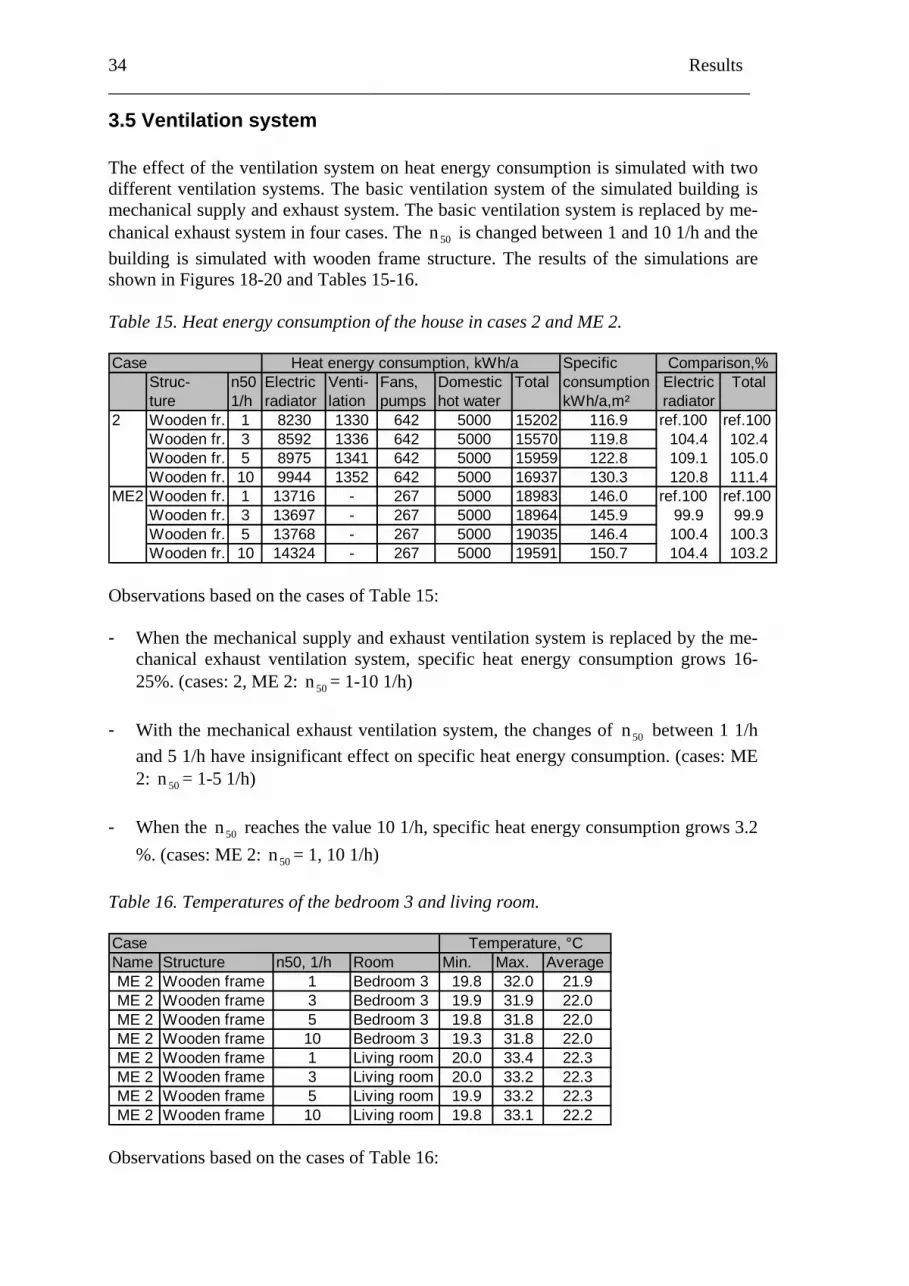
The effect of the ventilation sdifferent ventilation systems. mchanical exhaust system in four cases. The 50n is changed between 1 and 10 1/h and the building is simulated with wooden frame structure. The results of the simulations are shown in Figures 18-20 and Tables 15-16. Table 15. Heat energy consumption of the house in cases 2 and ME 2. Case Heat energy consumption, kWh/a Specific Comparison,%
Struc- n50 Electric Venti- Fans, Domestic Total consumption Electric Totalture 1/h radiator lation pumps hot water kWh/a,m² radiator
2 Wooden fr. 1 8230 1330 642 5000 15202 116.9 ref.100 ref.100Wooden fr. 3 8592 1336 642 5000 15570 119.8 104.4 102.4Wooden fr. 5 8975 1341 642 5000 15959 122.8 109.1 105.0Wooden fr. 10 9944 1352 642 5000 16937 130.3 120.8 111.4
ME2 Wooden fr. 1 13716 - 267 5000 18983 146.0 ref.100 ref.100Wooden fr. 3 13697 - 267 5000 18964 145.9 99.9 99.9Wooden fr. 5 13768 - 267 5000 19035 146.4 100.4 100.3Wooden fr. 10 14324 - 267 5000 19591 150.7 104.4 103.2
Observations based on the cases of Table 15:
When the mechanical supply and exhaust ventilation system is replaced by the me-ific heat energy consumption grows 16-
25%. (cases: 2, ME 2: = 1-10 1/h)
- eat energy consumption. (cases: ME
- %. (cas = 1, 10 1/h)
- chanical exhaust ventilation system, spec
50
With the mechanical exhaust ventilation system, the changes of n between 1 1/h and 5 1/h have insignificant effect on specific h
n
50
2: 50n = 1-5 1/h)
When the 50n reaches the value 10 1/h, specific heat energy consumption grows 3.2 es: ME 2: 50n
Table 16. Temperatures of the bedroom 3 and living room.
Case Temperature, °CName Structure n50, 1/h Room Min. Max. AverageME 2 Wooden frame 1 Bedroom 3 19.8 32.0 21.9ME 2 Wooden frame 3 Bedroom 3 19.9 31.9 22.0ME 2 Wooden frame 5 Bedroom 3 19.8 31.8 22.0ME 2 Wooden frame 10 Bedroom 3 19.3 31.8 22.0ME 2 Wooden frame 1 Living room 20.0 33.4 22.3ME 2 Wooden frame 3 Living room 20.0 33.2 22.3ME 2 Wooden frame 5 Living room 19.9 33.2 22.3ME 2 Wooden frame 10 Living room 19.8 33.1 22.2
Observations based on the cases of Table 16:
Results 35 ______________________________________________________________________
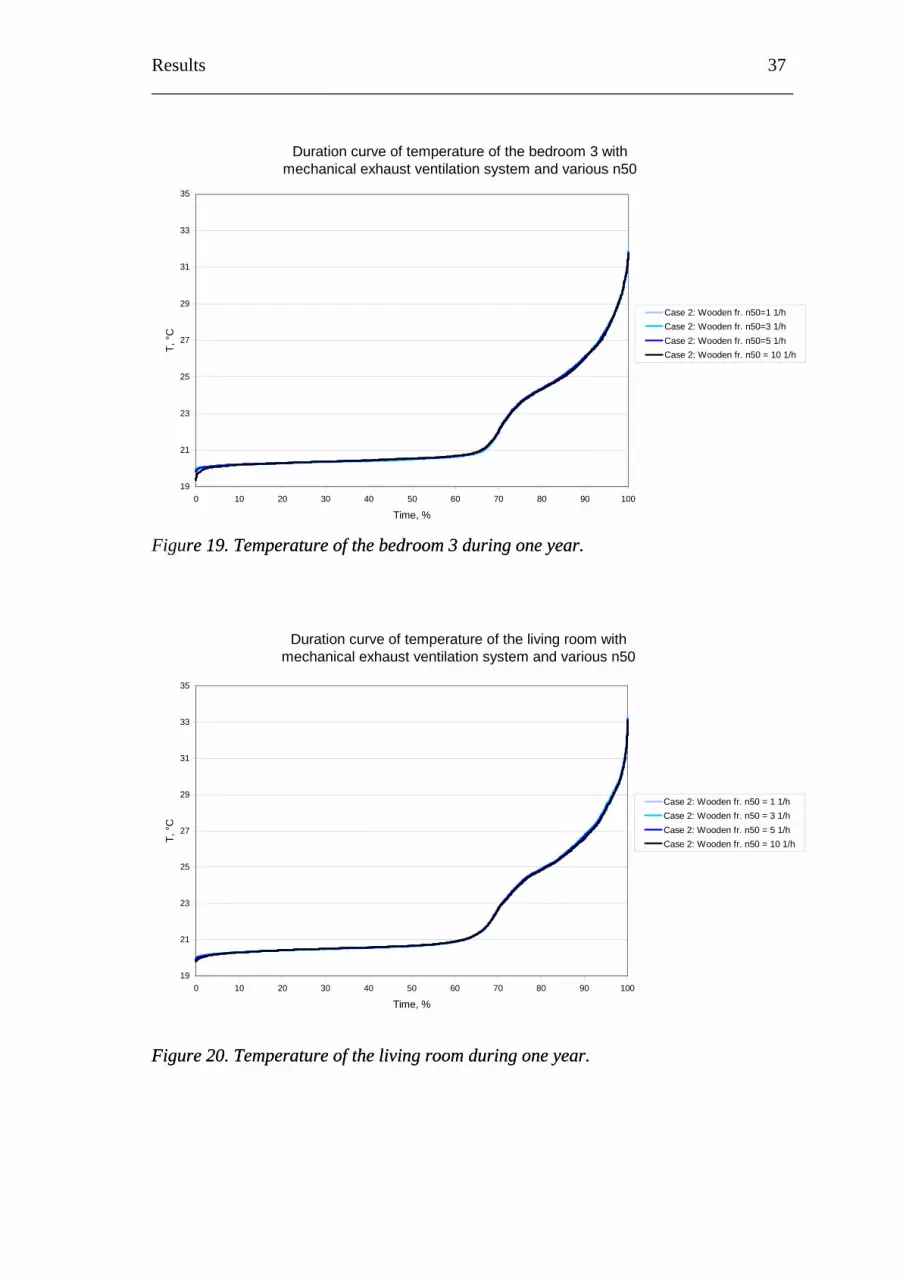
- The has negligible effect on the temperatures of the zones in the building with
mechanical exhaust ventilation system. (case: ME 2) - The mean temperatures of the zones decrease by 0.5°C on average when balanced
ventilation system is replaced by mechanical exhaust ventilation system. (cases: 2 (table 10), ME 2 = 3 1/h)
50n
50n

= The balanced ventilation system. = The mechanical exhaust ventilation system.
igure 18. Spe umption with the balanced and the m = 1-10 1/h). Columns of the same
Specific consumption w
F cific heat energy cons echanical exhaust ventilation system, ( n50
colour are compared with each other.
ith various ventilation systems and n50 (Wooden frame)
100
105
110
115
120
125
130
135
140
145
150
155
n50 = 1 1/h ME, n50 = 1 1/h n50 = 3 1/h ME, n50 = 3 1/h n50 = 5 1/h ME, n50 = 5 1/h n50 = 10 1/h ME, n50 = 10 1/h
Spec
ific
cons
umpt
ion
kWh/
a, m
²
100%
100%
102.4%
99.9% 100.3%
103.2%
105%
111.4%
Results 37 ______________________________________________________________________
igure 19. Temperature of the bedroom 3 during one year.
igure 20. Temperature of the living room during one year.
re 19. Temperature of the bedroom 3 during one year.
igure 20. Temperature of the living room during one year.
Duration curve of temperature of the bedroom 3 with mechanical exhaust ventilation system and various n50
19
21
23
25
27
29
31
33
35
0 10 20 30 40 50 60 70 80 90 100
Time, %
T, °
C
Case 2: Wooden fr. n50=1 1/hCase 2: Wooden fr. n50=3 1/hCase 2: Wooden fr. n50=5 1/hCase 2: Wooden fr. n50 = 10 1/h
F
Duration curve of temperature of the living room with mechanical exhaust ventilation system and various n50
19
21
23
25
27
29
31
33
35
0 10 20 30 40 50 60 70 80 90 100
Time, %
T, °
C
Case 2: Wooden fr. n50 = 1 1/hCase 2: Wooden fr. n50 = 3 1/hCase 2: Wooden fr. n50 = 5 1/hCase 2: Wooden fr. n50 = 10 1/h
FF

38 Results ______________________________________________________________________
3.6 Location and weather conditions
consumption is calculated with weather onditions of Nice. The structures of the simulated building are Finnish wooden frame
7. Heat energy consumption of the house in the Finnish and Central European ases.
The effect of the thermal inertia on heat energy cand concrete structures and less insulated Central European lightweight and heavy-weight structures. The results of the simulations are shown in Figures 21-25 and Tables 17-18. Table 1c Case Heat energy consumption, kWh/a Specific Comparison,%
Structure n50 Electric Venti- Fans, Domestic Total consumption Electric Total1/h radiator lation pumps hot water kWh/a,m² radiator
2 Wooden fr. 3 8592 1336 642 5000 15570 119.8 ref.100 ref.1004 Concrete 3 8493 1341 642 5000 15476 119.0 98.8 99.4NI 2 Wooden fr. 3 1682 83 654 5000 7419 57.1 ref.100 ref.100NI 4 Concrete 3 1510 82 654 5000 7246 55.7 89.8 97.7NIL2 Wooden fr.* 3 6902 107 653 5000 12662 97.4 ref.100 ref.100NIL4 Brick * 3 6347 105 653 5000 12104 93.1 92.0 95.6*Less insulated structures.
ases of Table 17:
onsumption between wooden frame and
concrete structures is 0.6% in Helsinki. (cases: 2, 4)
- oncrete structures is calculated with weather data of Nice, the difference in specific heat energy consumption be-
- uctures is simu-
lated with weather data of Nice, the difference in specific heat energy consumption
Observations based on the c
- The difference in specific heat energy c
When the building with Finnish wooden frame and c
tween light- and heavyweight structures is 2.3%. (cases: NI 2, NI 4)
When the building with Central European light- and heavyweight str
between the structures is 4.4%. (cases: NIL 2, NIL 4)
Results 39 ______________________________________________________________________
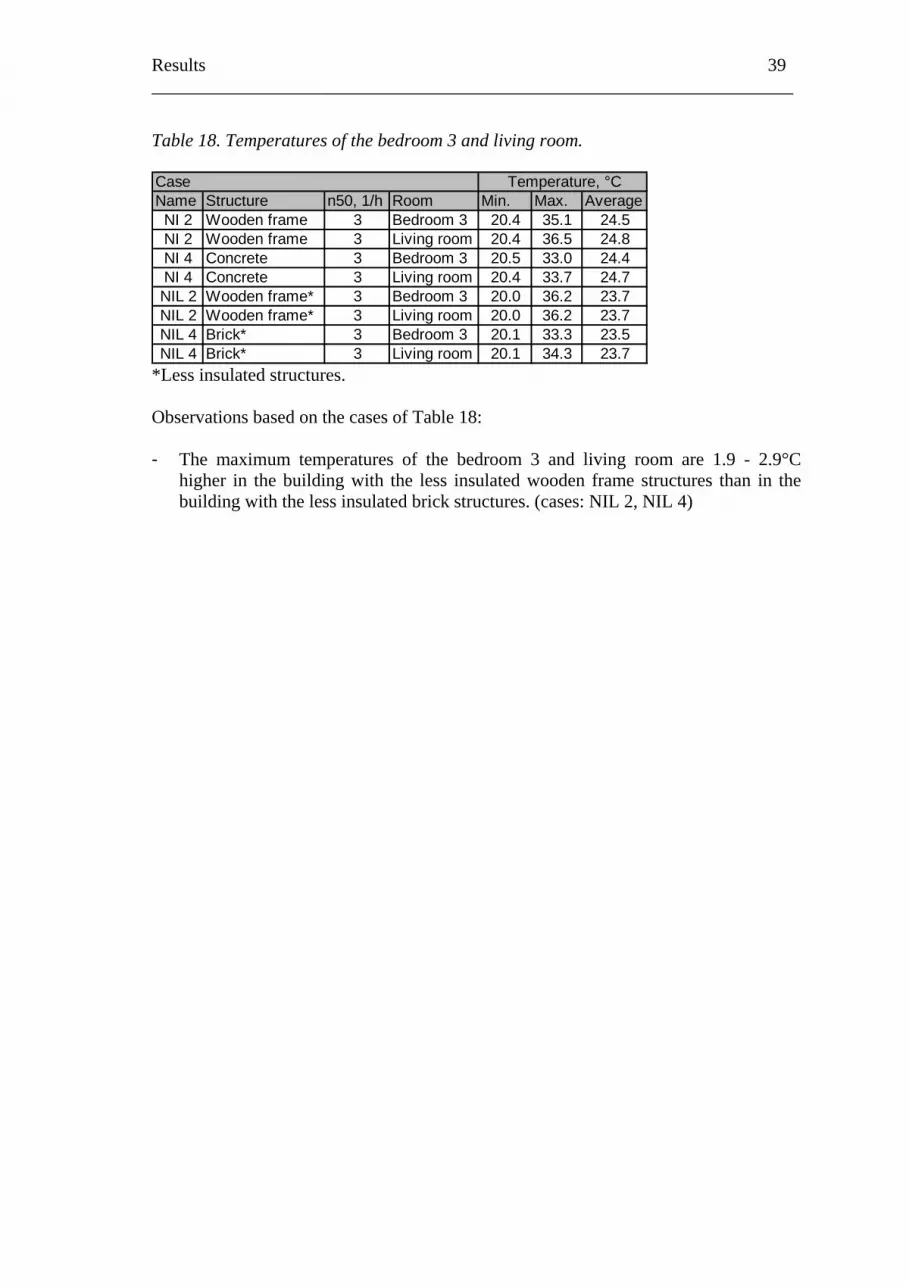
Table 18. Temperatures of the bedroom 3 and living room. Case Temperature, °C
e Structure n50, 1/h Room Min. Max. AverageNI 2 Wooden frame 3 Bedroom 3 20.4 35.1 24.5NI 2 Wooden frame 3 Living room 20.4 36.5 24.8NI 4 Concrete 3 Bedroom 3 20.5 33.0 24.4NI 4 Concrete 3 Living room 20.4 33.7 24.7NIL 2 Wooden frame* 3 Bedroom 3 20.0 36.2 23.7NIL 2 Wooden frame* 3 Living room 20.0 36.2 23.7NIL 4 Brick* 3 Bedroom 3 20.1 33.3 23.5NIL 4 Brick* 3 Living room 20.1 34.3 23.7
Nam
*Less insulated structures.
ases of Table 18:
oom 3 and living room are 1.9 - 2.9°C higher in the building with the less insulated wooden frame structures than in the
Observations based on the c - The maximum temperatures of the bedr
building with the less insulated brick structures. (cases: NIL 2, NIL 4)
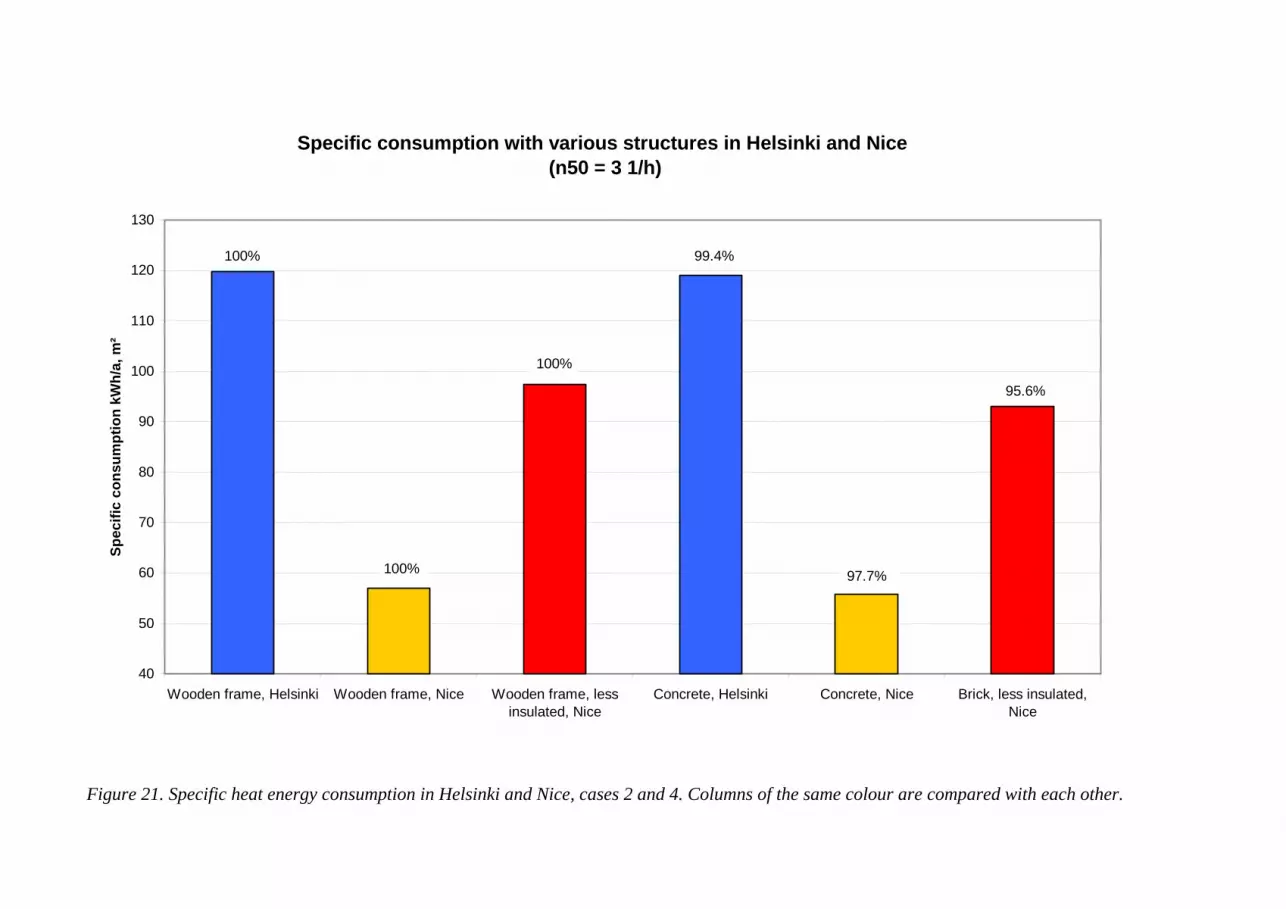
igure 21. Specific heat energy consumption in Helsinki and Nice, cases 2 and 4. Columns of the same colour are compared with each other.
Specific consumption with various structures in Helsinki and Nice (n50 = 3 1/h)
40
50
60
70
80
90
100
110
120
130
Wooden frame, Helsinki Wooden frame, Nice Wooden frame, lessinsulated, Nice
Concrete, Helsinki Concrete, Nice Brick, less insulated,Nice
Spec
ific
cons
umpt
ion
kWh/
a, m
²
100%
100%
100%
99.4%
97.7%
95.6%
F
Results 41 ______________________________________________________________________
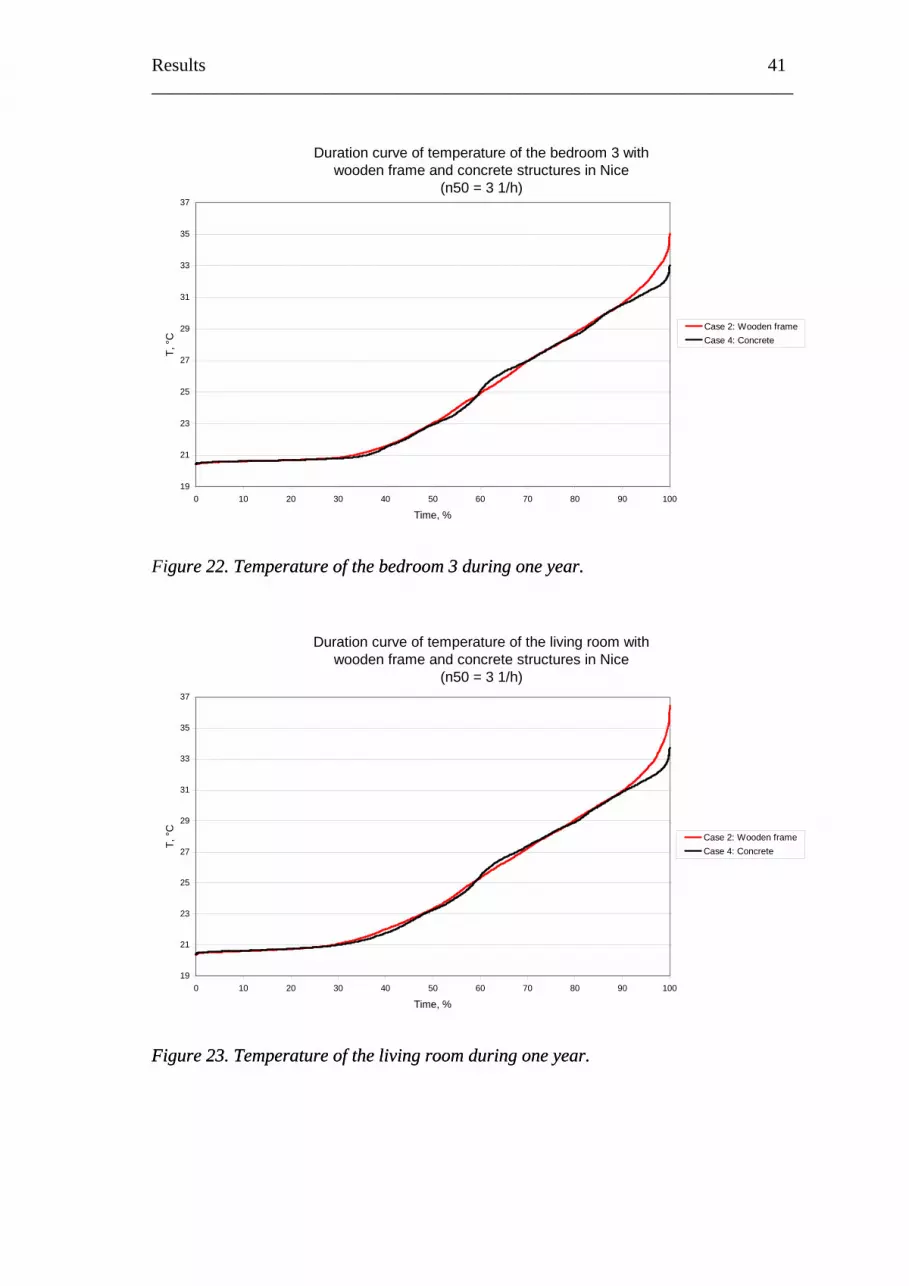
igure 22. Temperature of the bedroom 3 during one year.
igure 23. Temperature of the living room during one year.
gure 22. Temperature of the bedroom 3 during one year.
igure 23. Temperature of the living room during one year.
Duration curve of temperature of the bedroom 3 with wooden frame and concrete structures in Nice
(n50 = 3 1/h)
19
21
23
25
27
29
31
33
35
37
0 10 20 30 40 50 60 70 80 90 100
Time, %
T, °
C
Case 2: Wooden frameCase 4: Concrete
F
Duration curve of temperature of the living room with wooden frame and concrete structures in Nice
(n50 = 3 1/h)
19
21
23
25
27
29
31
33
35
37
0 10 20 30 40 50 60 70 80 90 100
Time, %
T, °
C
Case 2: Wooden frameCase 4: Concrete
FF
42 Results ______________________________________________________________________
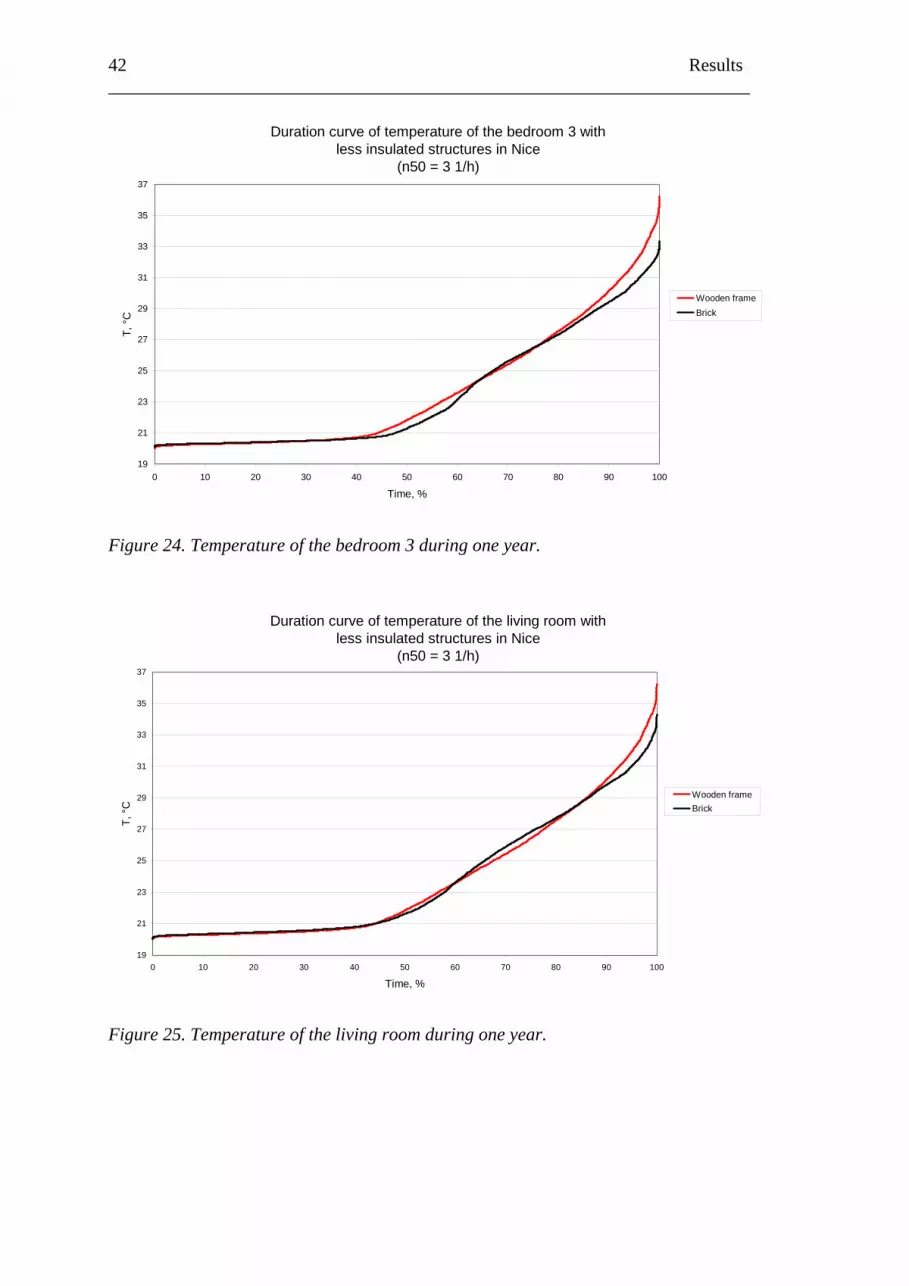
Duration curve of temperature of the bedroom 3 with less insulated structures in Nice
(n50 = 3 1/h)
19
21
23
25
27
29
31
33
35
37
0 10 20 30 40 50 60 70 80 90 100
Time, %
T, °
C
Wooden frameBrick
Figure 24. Temperature of the bedroom 3 during one year.
Duration curve of temperature of the living room with less insulated structures in Nice
(n50 = 3 1/h)
19
21
23
25
27
29
31
33
35
37
0 10 20 30 40 50 60 70 80 90 100
Time, %
T, °
C
Wooden frameBrick
Figure 25. Temperature of the living room during one year.
Results 43 ______________________________________________________________________
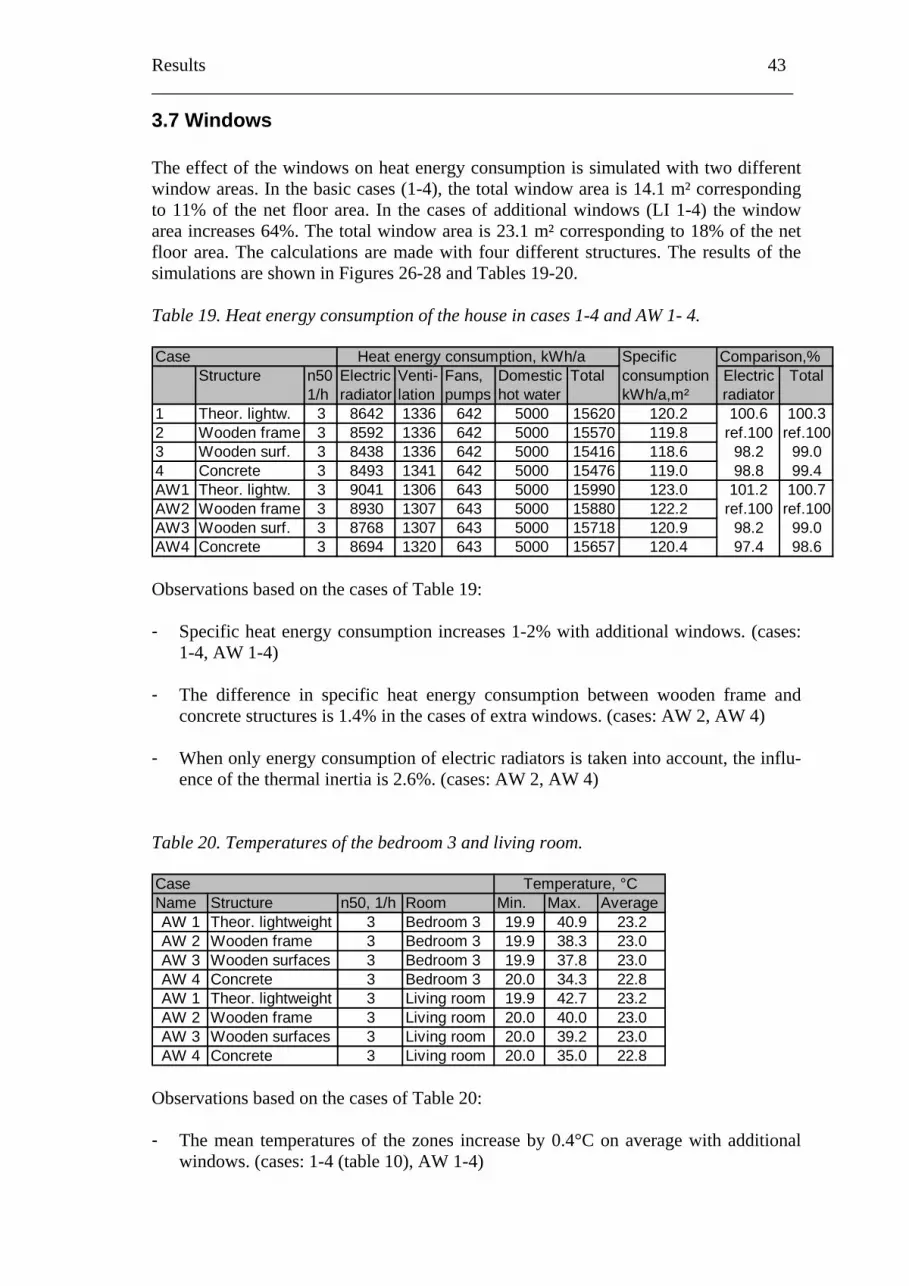
3.7 Windows
windows on heat energy consumption is simulated with two different the basic cases (1-4), the total window area is 14.1 m² corresponding
11% of the net floor area. In the cases of additional windows (LI 1-4) the window
The effect of the window areas. Intoarea increases 64%. The total window area is 23.1 m² corresponding to 18% of the net floor area. The calculations are made with four different structures. The results of the simulations are shown in Figures 26-28 and Tables 19-20. Table 19. Heat energy consumption of the house in cases 1-4 and AW 1- 4. Case Heat energy consumption, kWh/a Specific Comparison,%
Electric Total1/h radiator lation pumps hot water kWh/a,m² radiator
1 Theor. lightw. 3 8642 1336 642 5000 15620 120.2 100.6 100.32 Wooden frame 3 8592 1336 642 5000 15570 119.8 ref.100 ref.1003 Wooden surf. 3 8438 1336 642 5000 15416 118.6 98.2 99.04 Concrete 3 8493 1341 642 5000 15476 119.0 98.8 99.4AW1 Theor. lightw. 3 9041 1306 643 5000 15990 123.0 101.2 100.7AW2 Wooden frame 3 8930 1307 643 5000 15880 122.2 ref.100 ref.100AW3 Wooden surf. 3 8768 1307 643 5000 15718 120.9 98.2 99.0AW4 Concrete 3 8694 1320 643 5000 15657 120.4 97.4 98.6
Structure n50 Electric Venti- Fans, Domestic Total consumption
Observations based on the cases of Table 19:
Specific heat energy consumption increases 1-2% with additional windows. (cases:
ures is 1.4% in the cases of extra windows. (cases: AW 2, AW 4)
Tab
- 1-4, AW 1-4)
- The difference in specific heat energy consumption between wooden frame and
concrete struct - When only energy consumption of electric radiators is taken into account, the influ-
ence of the thermal inertia is 2.6%. (cases: AW 2, AW 4)
le 20. Temperatures of the bedroom 3 and living room. Case Temperature, °C
AverageAW 1 Theor. lightweight 3 Bedroom 3 19.9 40.9 23.2AW 2 Wooden frame 3 Bedroom 3 19.9 38.3 23.0AW 3 Wooden surfaces 3 Bedroom 3 19.9 37.8 23.0AW 4 Concrete 3 Bedroom 3 20.0 34.3 22.8AW 1 Theor. lightweight 3 Living room 19.9 42.7 23.2AW 2 Wooden frame 3 Living room 20.0 40.0 23.0AW 3 Wooden surfaces 3 Living room 20.0 39.2 23.0AW 4 Concrete 3 Living room 20.0 35.0 22.8
Name Structure n50, 1/h Room Min. Max.
Observations based on the cases of Table 20:
The mean temperatures of the zones increase by 0.4°C on average with additional - windows. (cases: 1-4 (table 10), AW 1-4)
44 Results ______________________________________________________________________
- The maximum temperatures of the bedroom 3 and living room are 4 - 5°C higher in
the building with wooden frame structures than in the building with concrete struc-tures. (cases: AW 2, AW 4)
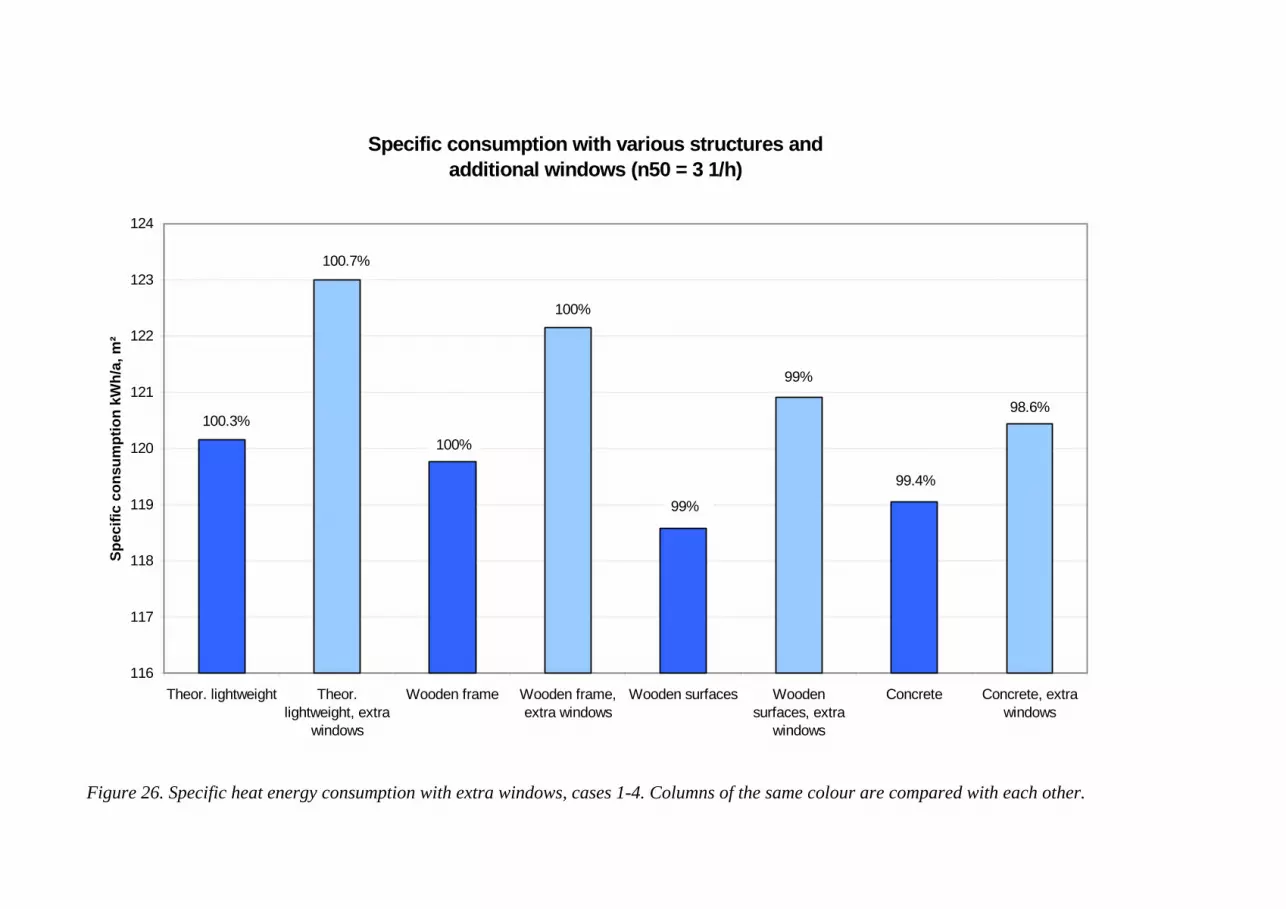
igure 26. Specific heat energy consumption with extra windows, cases 1-4. Columns of the same colour are compared with each other.
Specific consumption with various structures and additional windows (n50 = 3 1/h)
116
117
118
119
120
121
122
123
124
Theor. lightweight Theor.lightweight, extra
windows
Wooden frame Wooden frame,extra windows
Wooden surfaces Woodensurfaces, extra
windows
Concrete Concrete, extrawindows
Spec
ific
cons
umpt
ion
kWh/
a, m
²
100.3%
100.7%
100%
100%
99%
99%
99.4%
98.6%
F
46 Results ______________________________________________________________________
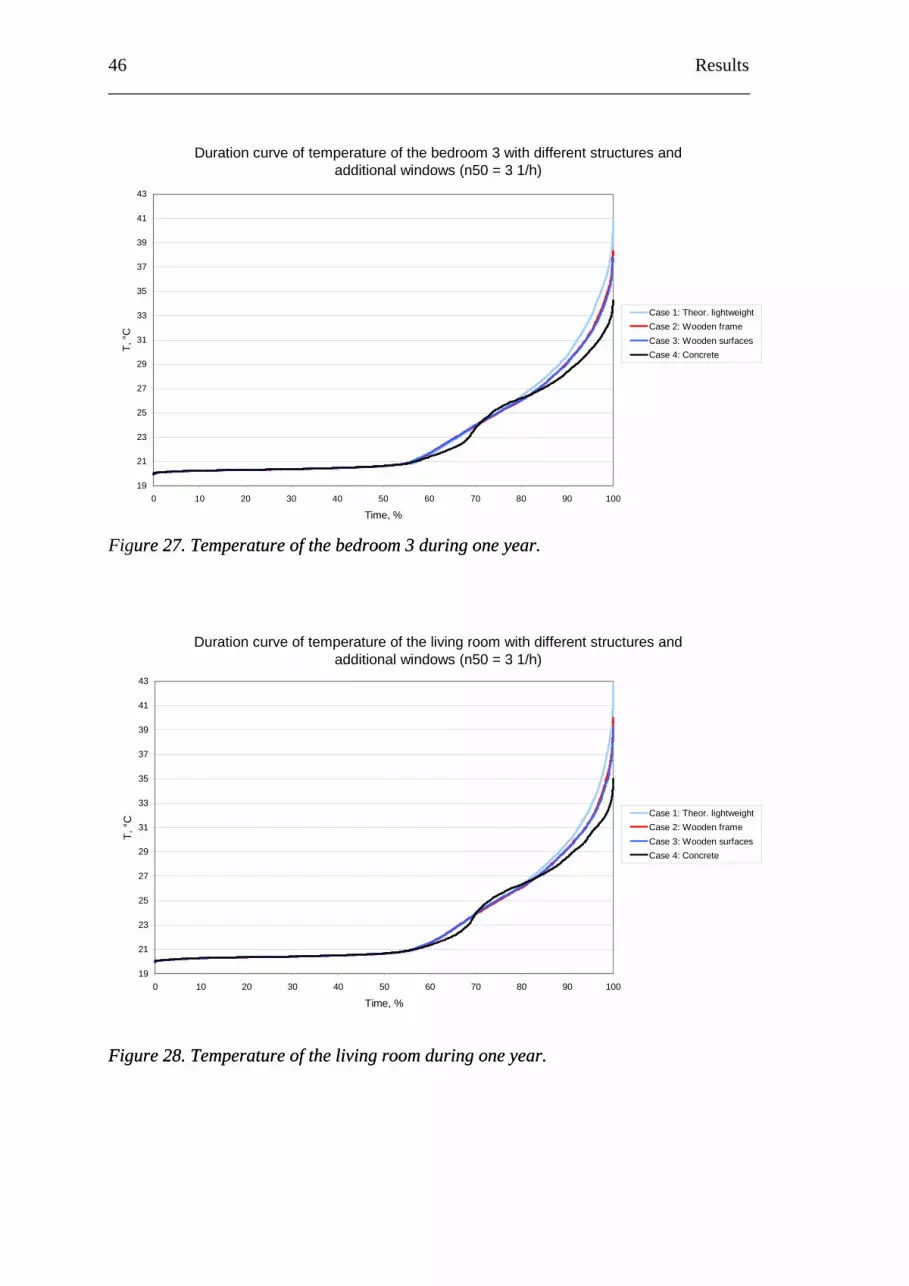
igure 27. Temperature of the bedroom 3 during one year.
igure 28. Temperature of the living room during one year.
ure 27. Temperature of the bedroom 3 during one year.
igure 28. Temperature of the living room during one year.
Duration curve of temperature of the bedroom 3 with different structures and additional windows (n50 = 3 1/h)
19
21
23
25
27
29
31
33
35
37
39
41
43
0 10 20 30 40 50 60 70 80 90 100
Time, %
T, °
C
Case 1: Theor. lightweightCase 2: Wooden frameCase 3: Wooden surfacesCase 4: Concrete
F
Duration curve of temperature of the living room with different structures and additional windows (n50 = 3 1/h)
19
21
23
25
27
29
31
33
35
37
39
41
43
0 10 20 30 40 50 60 70 80 90 100
Time, %
T, °
C Case 1: Theor. lightweightCase 2: Wooden frameCase 3: Wooden surfacesCase 4: Concrete
FF
Results 47 ______________________________________________________________________
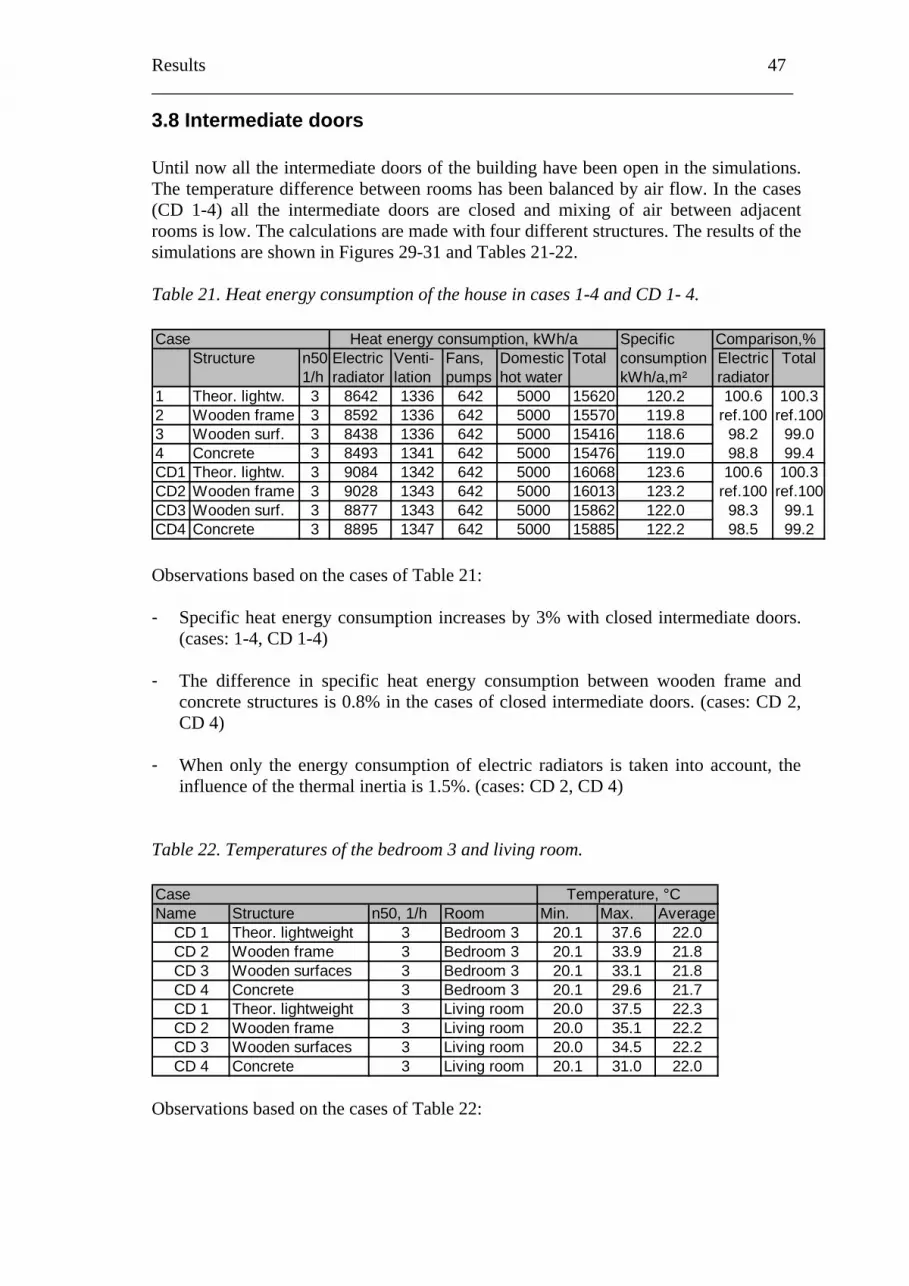
3.8 Intermediate doors
doors of the building have been open in the simulations. tween rooms has been balanced by air flow. In the cases
D 1-4) all the intermediate doors are closed and mixing of air between adjacent
Until now all the intermediateThe temperature difference be(Crooms is low. The calculations are made with four different structures. The results of the simulations are shown in Figures 29-31 and Tables 21-22. Table 21. Heat energy consumption of the house in cases 1-4 and CD 1- 4. Case Heat energy consumption, kWh/a Specific
Structure n50 Electric Venti- Fans, Domestic Total consumptionComparison,%Electric Total
1/h radiator lation pumps hot water kWh/a,m² radiator1 Theor. lightw. 3 8642 1336 642 5000 15620 120.2 100.6 100.32 Wooden frame 3 8592 1336 642 5000 15570 119.8 ref.100 ref.1003 Wooden surf. 3 8438 1336 642 5000 15416 118.6 98.2 99.04 Concrete 3 8493 1341 642 5000 15476 119.0 98.8 99.4CD1 Theor. lightw. 3 9084 1342 642 5000 16068 123.6 100.6 100.3CD2 Wooden frame 3 9028 1343 642 5000 16013 123.2 ref.100 ref.100CD3 Wooden surf. 3 8877 1343 642 5000 15862 122.0 98.3 99.1CD4 Concrete 3 8895 1347 642 5000 15885 122.2 98.5 99.2 Observations based on the cases of Table 21:
Specific heat energy consumption increases by 3% with closed intermediate doors.
0.8% in the cases of closed intermediate doors. (cases: CD 2, CD 4)
- ce of the thermal inertia is 1.5%. (cases: CD 2, CD 4)
Tab
-
(cases: 1-4, CD 1-4) - The difference in specific heat energy consumption between wooden frame and
concrete structures is
When only the energy consumption of electric radiators is taken into account, the influen
le 22. Temperatures of the bedroom 3 and living room. Case TemName Structure n50, 1/h Room Min.
perature, °CMax. Average
CD 1 Theor. lightweight 3 Bedroom 3 20.1 37.6 22.0CD 2 Wooden frame 3 Bedroom 3 20.1 33.9 21.8CD 3 Wooden surfaces 3 Bedroom 3 20.1 33.1 21.8CD 4 Concrete 3 Bedroom 3 20.1 29.6 21.7CD 1 Theor. lightweight 3 Living room 20.0 37.5 22.3CD 2 Wooden frame 3 Living room 20.0 35.1 22.2CD 3 Wooden surfaces 3 Living room 20.0 34.5 22.2CD 4 Concrete 3 Living room 20.1 31.0 22.0
Observations based on the cases of Table 22:
48 Results ______________________________________________________________________
- The mean temperatures of the zones decrease by 0.6°C on average with the closed intermediate doors. (cases: 1-4 (Table 10), CD 1-4)
- d living room are 4.1 – 4.3°C higher in the building with wooden frame structures than in the building with con-
The maximum temperatures of the bedroom 3 an
crete structures. (cases: CD 2, CD 4)
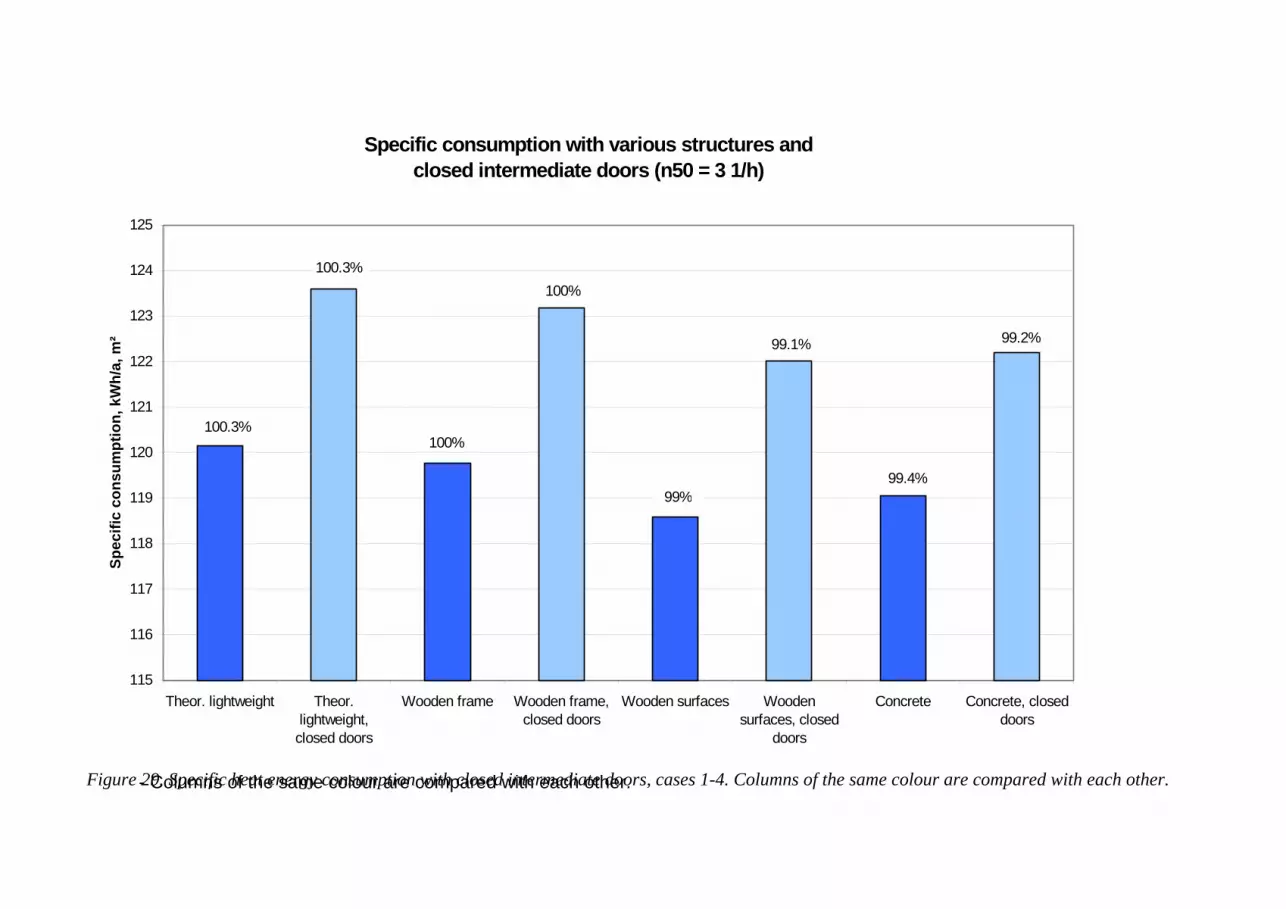
igure 29. Specific heat energy consumption with closed intermediate doors, cases 1-4. Columns of the same colour are compared with each other. - Columns of the same colour are compared with each other.
Specific consumption with various structures and closed intermediate doors (n50 = 3 1/h)
115
116
117
118
119
120
121
122
123
124
125
Theor. lightweight Theor.lightweight,
closed doors
Wooden frame Wooden frame,closed doors
Wooden surfaces Woodensurfaces, closed
doors
Concrete Concrete, closeddoors
Spec
ific
cons
umpt
ion,
kW
h/a,
m²
100.3%
100.3%
100%
100%
99%
99.1%
99.4%
99.2%
F
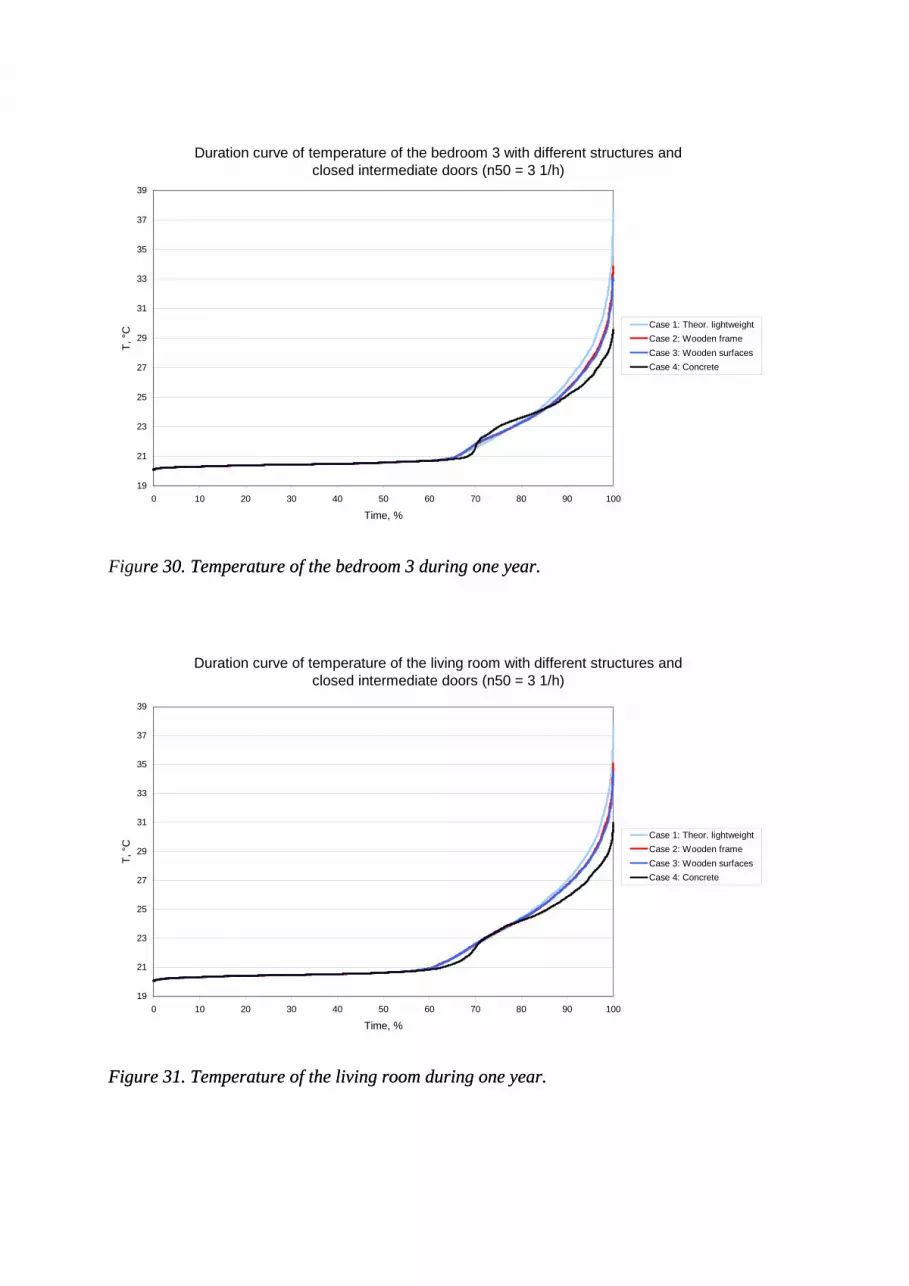
igure 30. Temperature of the bedroom 3 during one year.
igure 31. Temperature of the living room during one year.
re 30. Temperature of the bedroom 3 during one year.
igure 31. Temperature of the living room during one year.
Duration curve of temperature of the bedroom 3 with different structures and closed intermediate doors (n50 = 3 1/h)
19
21
23
25
27
29
31
33
35
37
39
0 10 20 30 40 50 60 70 80 90 100
Time, %
T, °
C Case 1: Theor. lightweightCase 2: Wooden frameCase 3: Wooden surfacesCase 4: Concrete
F
Duration curve of temperature of the living room with different structures and closed intermediate doors (n50 = 3 1/h)
19
21
23
25
27
29
31
33
35
37
39
0 10 20 30 40 50 60 70 80 90 100
Time, %
T, °
C
Case 1: Theor. lightweightCase 2: Wooden frameCase 3: Wooden surfacesCase 4: Concrete
FF

Discussion 51 ______________________________________________________________________
4. Discussion The preliminary study indicates that the thermal inertia has an insignificant influence on heat energy consumption of a detached house located in a northern climate. Tightness of the building has even 12% effect on heat energy consumption while the effect of ther-mal inertia is less than 1%. The effect of other factors, such as thermal insulation, heat-ing system, ventilation system, windows and climate, was also simulated in some pre-liminary cases. Those simulations of other factors were not comprehensive but indica-tive. According to the preliminary study, the ventilation system has a major role in the heat energy consumption of a detached house. When the mechanical supply and exhaust ven-tilation system was replaced by the mechanical exhaust ventilation system, heat energy consumption increased by 16-25%. When thickness of the thermal insulation material was added by 50-65mm, heat energy consumption decreased an average 14%. When the direct electric heating was replaced by the hydronic floor heating, heat energy consump-tion grew an average 1.4%. When the area of windows was increased by 64% heat energy consumption grew 1-2%. At the same time, the difference in heat energy consumption between lightweight and heavyweight construction slightly increased. Then the heat energy consumption of a building with concrete structures was 1.4% lower. Still the thermal inertia seems to have negligible effect on heat energy consumption, although the calculations were carried out without any shading by trees and solar protection. The effect of closed intermediate doors on heat energy consumption was also studied. When the doors were open in the simulated building, the temperature difference be-tween the rooms was balanced through an open door by air flow. According to the simulations, heat energy consumption increased by 3% when intermediate doors were closed. According to the results, all the other investigated factors have greater effect on heat energy consumption than thermal inertia of structures. The conclusion seems to be valid for a typical Finnish detached house in a Nordic climate. When the building with Fin-nish wooden frame and concrete structures was calculated with weather data of Nice, the difference in heat energy consumption between light- and heavyweight structures was 2.3%. When the Finnish structures were replaced by the less insulated Central European structures and the case was simulated with weather data of Nice, the differ-ence in heat energy consumption between the structures was 4.4%. Thus, a climatic zone seems to have an effect on the situation. In the Nordic climate the thermal mass has negligible effect on heat energy consumption while it seems to have some effect on heat energy consumption in the Central European climate. In the past years, the influence of the thermal inertia on heat energy consumption has been studied for example at Tampere University of Technology and Technical Research Centre of Finland. According to the study by Aittomäki et al. in 1981 [3] the energy saving of the thermal inertia of structures was 1-5%. The simulation programme EN-TER was used in the study. According to the research by Kalema and Martikainen in 1987 [1] the calculated annual energy saving of the building mass was 1-2%. In the
52 Discussion ______________________________________________________________________
study by Laitinen and Korhonen in 1988 [2] the energy consumption with heavy- and lightweight building construction was of the same order. The simulation programme TASE was used in the both studies. The simulation programme BRIS was used in the study by Akander at Royal Institute of Technology in Sweden in 2000 [9]. The first working version of BRIS was developed in 1963. The present version of the programme was completed in 1982. According to the study by Akander, the difference in the heat energy consumption between light- and heavyweight structures was 6%. Compared to this preliminary study U-values of the envelope were lower in the study by Akander. Heat gains from lighting and equipment were 32.4 kWh/a, m² in the study by Akander while it was 24.9 kWh/a, m² in this pre-liminary study. Also, heat energy consumption did not include the heating of domestic hot water in the study by Akander. In the study by Akander the total window area was 12 m² corresponding to 17% of the net floor area. The part of the total window area cor-responds to the additional window case of this preliminary study. In the study by Akander, 42% of the total window area was facing south. In the additional window case of this study, only 22% of the total window area was facing south. The choice of the boundary conditions, for example window area and especially the facing of the win-dows, have a certain effect on the result of the simulation. Thus, the results of BRIS are quite equal to the result of this preliminary study. Percentages are used in comparison all the time. Percentages might be misleading be-cause they can be calculated in many ways. In this preliminary study the comparisons were made with total heat energy consumption and with energy consumption of heating system. For example, the difference in heat energy consumption between light and mas-sive structures was 0.6% in Helsinki if the total heat energy consumption was used. When only the energy consumption of the heating system was taken into account, the difference was 1.2%. Further, the annual energy saving of the building mass was 4.4% in Nice when the total heat energy consumption was used. If the percentage was calcu-lated only with the energy consumption of the heating system the energy saving was 8% in Nice. It is obvious that the total consumption is the primary key figure, as energy consumption of building stock is based on that total consumption of each building. And from the viewpoint of occupant, the total consumption is the only correct figure, which becomes clear when paying the invoices.

Acknowledgements 53 ______________________________________________________________________
ACKNOWLEDGEMENTS Financial support from Wood Focus Finland is gratefully acknowledged.
54 References ______________________________________________________________________
REFERENCES [1] Kalema, T. Martikainen, H. Rakenteiden massiivisuuden ja lämmönjakojärjes-
telmän vaikutus pientalon energian kulutukseen. Valtion teknillinen tutkimus-keskus, LVI-tekniikan laboratorio. Helsinki 1987. pp. 91 (in Finnish)
[2] Laitinen, A. Korhonen, R. Lämpötilan säätö vesikeskuslämmitysjärjestelmissä.
Valtion teknillinen tutkimuskeskus, LVI-tekniikan laboratorio. Espoo 1988. pp. 91 (Temperature Control in Water Heating Systems) (in Finnish)
[3] Aittomäki, A. Karttunen, P. Katajisto, K. Koivisto, H. Massan vaikutus raken-
nusten eristystarpeeseen. Tampereen teknillinen korkeakoulu, säätötekniikka. Tampere 1981. pp. 66 (in Finnish)
[4] Björsell, N. Bring, A. Eriksson, L. Grozman, P. Lindgren, M. Sahlin, P.
Shapovalov, A. Vuolle, M. “IDA Indoor Climate and Energy”. Proceedings of the IBPSA Building Simulation ‘99 conference. Kyoto, Japan. 1999
[5] Shalin, P. Modelling and Simulation Methods for Modular Continuous System
in Buildings. Doctoral Dissertation. KTH, Stockholm, 1996. [6] Kropf, S. Zweifel, G. Validation of the Building Simulation Program IDA-ICE
According to CEN 13791 “ Thermal Performance of Buildings – Calculation of Internal Temperatures of a Room in Summer Without Mechanical Cooling – General Criteria and Validation Procedures”. pp. 24
[7] Travesi, J. et al. Empirical Validation of Iowa Energy Resource Station Building
Energy Analysis Simulation Models, IEA Task 22, Subtask A, June 2001 [8] Moinard, S. Guyon, G. (Ed.), “Empirical Validation of EDF ETNA and GENEC
Test-Cell Models. Subtask A.3. A Report of IEA Task 22. Building Energy Analysis Tools.” 1999.
[9] Akander, J. The ORC Method – Effective Modelling of Thermal Performance of
Multilayer Building Components, Paper 5. Doctoral Dissertation. KTH, Stock-holm. 2000. pp. 142-157
[10] Liddament, M. Air Infiltration Calculation Techniques - An Application Guide.
AIVC. Great Britain. 1986.