silicone oil impregnated nano silica modified glass surface
TRANSCRIPT
RSC Advances
PAPER
Ope
n A
cces
s A
rtic
le. P
ublis
hed
on 0
7 Ju
ne 2
017.
Dow
nloa
ded
on 5
/27/
2022
10:
41:3
3 PM
. T
his
artic
le is
lice
nsed
und
er a
Cre
ativ
e C
omm
ons
Attr
ibut
ion-
Non
Com
mer
cial
3.0
Unp
orte
d L
icen
ce.
View Article OnlineView Journal | View Issue
Silicone oil impre
aCenter of Excellence in Renewable Energy
Minerals, Dhahran, Saudi Arabia. E-mail: bbMechanical Engineering Department, King
Dhahran, Saudi ArabiacChemistry Department, King Fahd Univer
Saudi Arabia
† Electronic supplementary informa10.1039/c7ra03392c
Cite this: RSC Adv., 2017, 7, 29762
Received 23rd March 2017Accepted 1st June 2017
DOI: 10.1039/c7ra03392c
rsc.li/rsc-advances
29762 | RSC Adv., 2017, 7, 29762–2977
gnated nano silica modified glasssurface and influence of environmental dustparticles on optical transmittance†
Bekir Sami Yilbas, *ab Muhammad Rizwan Yousaf,b Abdullah Al-Sharafi,b Haider Ali,b
Fahad Al-Sulaiman,ab Numan Abu-Dheir,b Mazen Khaledc and Nasser Al-Aqeelib
The behavior of environmental dust particles on a silicone oil impregnated glass surface is examined in
relation to optical transparent surfaces for self-cleaning applications. The characteristics of
environmental dust, collected in the local area, are analyzed using analytical tools. Functional silica
particles are synthesized and deposited on the glass surface prior to silicone oil impregnation. Optical
properties of functionalized silica particle deposited glass surfaces are examined prior to and after oil
impregnation. Further tests are conducted in the open environment to assess dust settlement in silicone
oil and dust particle sedimentation on the glass surface. It is found that dust particles have various sizes
and shapes, and they are composed of various metallic, alkaline, and alkaline earth metallic compounds.
The average size of the dust particles is of the order of 1.2 mm. Silicone oil impregnation considerably
improves the optical transmittance of functionalized silica particle deposited glass. A high spreading rate
gives rise to a cloaking of dust particles on the oil surface, which gradually reduces the surface tension
force and modifies the vertical force balance. Consequently, dust particles immerse into the oil film and
sediment on the glass surface. This, in turn, lowers the optical transmittance of the oil impregnated glass
surfaces greatly.
Introduction
Self-cleaning of optically transparent wafer surfaces is criticallyimportant for solar energy harvesting devices. Recent changesin climate have given rise to an increased rate of dust stormsaround the globe, particularly in the Middle East. Climatechange has a signicant impact on the performance of energyharvesting devices, particularly for solar photovoltaic and solarconcentrated power applications.1 Dust settlement on opticaltransparent surfaces lowers the transmittance of incidentoptical radiation reaching active elements of solar energydevices such as photovoltaic cells. This, in turn, lowers thedevice performance, in terms of efficiency and output power,and shortens the device operational life.2 Dust removal andcleaning of transparent surfaces involves a high cost as thesurface area increases, such as those of solar photovoltaicfarms, and increases the solar energy harvesting costs. The
, King Fahd University of Petroleum &
Fahd University of Petroleum & Minerals,
sity of Petroleum & Minerals, Dhahran,
tion (ESI) available. See DOI:
1
environmental dust has various particle shapes and sizes and,in general, they comprise of metallic oxides, alkaline (Na, K) andearth alkaline (Ca) compounds in addition to silicon and otherrelated elements.3 The water condensates onto the dust parti-cles in the humid ambient air and gives rise to the dissolutionof alkaline and earth alkaline compounds of the dust. Thisforms a chemically active liquid mud solution with high pH onthe surface, where the dust settles, because of liquid ow underthe gravity. As ambient temperature increases, mud solutiondries and forms an interfacial layer between the surface anddust particles, which in turn increases adhesion between dustparticles and the surface. Furthermore, this raises the effortsrequired for dust removal from the surfaces and increases thecleaning costs. Consequently, investigation of dust settlementon optically transparent surfaces becomes essential.
Hydrophobic surfaces demonstrate better performance interms of effort requirements for dust removal from the surfaces.This is because of the weak adhesion of dust particles onto thesurfaces.4 In general, hydrophobic characteristics of surfacesare closely related to the surface texture, comprising of micro/nano pillars, and low surface free energy of the substratematerial. However, several methods are introduced and strate-gies are adopted to improve surface hydrophobicity of thesubstrate materials.5–11 These methods, in general, are related tomulti-step processes in harsh conditions, require specializedreagents, and involved with a high cost. Some of these methods
This journal is © The Royal Society of Chemistry 2017
Paper RSC Advances
Ope
n A
cces
s A
rtic
le. P
ublis
hed
on 0
7 Ju
ne 2
017.
Dow
nloa
ded
on 5
/27/
2022
10:
41:3
3 PM
. T
his
artic
le is
lice
nsed
und
er a
Cre
ativ
e C
omm
ons
Attr
ibut
ion-
Non
Com
mer
cial
3.0
Unp
orte
d L
icen
ce.
View Article Online
are phase separation,5 electrochemical deposition,6 plasmatreatment,7 sol–gel processing,8 electrospinning,9 lasertexturing,10 and solution immersion.11 The main focus of thesestudies is to reduce free energy of the surfaces by changingcompositions through chemical and/or physical reactions. Thecost-effective one-step process is preferable to create hydro-phobic characteristics at the surface. Since surface texture andsurface free energy are modied during processing, surfacecharacteristics, such as optical reection, scratch resistance,topology, etc. undergo changes. The textural distortion athydrophobic surface alters the optical transmittance of thehydrophobized surface.10 Consequently, this limits the practicalapplication of the hydrophobic surface when the transmittanceof UV-visible spectrum becomes critically important.
On the other hand, considerable research studies werecarried out to examine the inuence of environmental dustparticles on the performance of solar energy harvesting systems.The main focus was to assess the dust effect on the deviceefficiency and output power.12–14 The ndings revealed that thephotovoltaic device efficiency and output power reduced greatlybecause of environmental dust settlement on the opticallyactive surface. However, the studies on prevention of dustaccumulation on surfaces, in particular on solar energy devicesare still in progress, despite the importance of self-cleaning ondevice performance as reported in the previous studies.15
Generating lotus effect on surfaces via forming hierarchicalstructures received considerable attention for self-cleaningapplications.16–20 The rolling of water droplets on suchsurfaces could generate self-cleaning effect through pickingdust particles from the surfaces by the droplets.21 This consid-eration might solve the dust accumulation problem and couldease the requirements of a large quantity of distilled water forcleaning. In some locations of the globe, water scarcity is one ofthe main problems yet to be met. The use of a lesser quantity ofwater, such as generating small size of water droplets forcleaning purposes, reduces the cleaning cost and lowers theload on the available clean water resources. Many challenges areto be met for self-cleaning applications, such as uniformcleaning of large of surfaces, cost-effective processing, thedurability of treated surfaces in harsh environments, etc.Specically, minimization of local adhesion of water droplet onsurfaces and improvement of optical characteristics of treatedsurfaces are some of the main focuses of research.22,23 Largewater droplet contact angle hysteresis could cause attachmentof the water droplet and causes ceasing of droplet rolling on thetreated surface. Moreover, the optical characteristics of surfacesare critical for photovoltaic applications and surface texturingtowards generating lotus effect causes scattering and reectionof incident UV-visible radiation while reducing optical trans-mittance of the substrate material.24 The antireection coatingof the textured surface offers improvement in optical trans-mittance;25 however, the coating process is costly and coversover the nano-size whiskers like structures on the texturedsurface while lowering the lotus effect and increasing dropletadhesion at the surface. One of the solutions to overcome thetransmittance problem is to introduce the correction layer ofuid with a similar refractive index of treated substrate in terms
This journal is © The Royal Society of Chemistry 2017
of liquid impregnation.23 Although several challenges are stillwaiting to be met, such as achieving high water droplet contactangle on impregnated liquid surface and hydrodynamicstability of impregnated liquid lm in harsh environments,some successful results are reported for solid particle mobilityon the impregnated surfaces.26 In some instances, spreadingrate of oil on foreign solid particles can cause cloaking andinuences particle mobility on the impregnated surface.27 Inaddition, a liquid ridge formed around these particles can affectthe motion of particles on impregnated liquid surface. Hence,the effort required to remove these particles from impregnatedliquid surface increases, which has an adverse effect on the self-cleaning process and the cleaning cost. The liquid cloaking ofsolid particles lowers the surface tension force because ofreducing the soil–air interface; in which case, the force balanceamong surface tension, gravity and buoyancy forces worksagainst the suspension of these particles on the oil surface. Thiscan cause accelerating immersion of these particles intoimpregnated uid interior. These particles further lower theoptical transmittance and are difficult to clean from theimpregnated uid beds. In addition, some of these particlesmay dissolve in impregnated uid. This further modies opticalcharacteristics of impregnated uid and can cause an adverseeffect on its optical transmittance. Consequently, investigationof the behavior of dust particles on impregnated uid oftransparent substrate becomes necessary.
Although the effect of dust particles and mud formed, fromdust particles, on hydrophobic surfaces were studied previ-ously,2,28 the main focus was to examine chemo-mechanics ofdust particles2 and dry mud solution adhesion on opticallytransparent surfaces.28 Since oil impregnated surfaces offerimproved optical transmittance to textured surfaces with highdroplet mobility,23,26 they have a potential to be utilized asprotective covers, with self-cleaning ability, for the photovoltaicsurfaces. Consequently, the inuence of environmental dustparticles on oil impregnated surfaces need to be examined priorto practical applications of oil impregnated transparentsurfaces in solar energy harvesting devices. In the present study,characteristics of the optically transparent hydrophobic surfaceare studied and properties of silicone oil impregnated hydro-phobic surfaces are investigated. Chemical and physical prop-erties of environmental dust particles are assessed using theanalytical tools. Effect of environmental dust settlement on theproperties of the oil impregnated transparent substrate surfaceis examined.
Experimental
Glass samples with dimensions of 30 mm � 40 mm � 2 mm(width � length � thickness) were used as workpieces. Thechemical composition of the glass was 76.5% SiO2, 9.9% CaO,1.2 MgO and 12.4% Na2O. The silica nanoparticles weresynthesized and deposited on the glass surface. The procedureadopted for synthesizing of silica nanoparticles was similar tothat reported in the previous study.29 The process is brieydescribed herein. Tetraethyl orthosilicate (TEOS) and iso-butyltrimethoxysilane (OTES), ethanol, and ammonium
RSC Adv., 2017, 7, 29762–29771 | 29763
RSC Advances Paper
Ope
n A
cces
s A
rtic
le. P
ublis
hed
on 0
7 Ju
ne 2
017.
Dow
nloa
ded
on 5
/27/
2022
10:
41:3
3 PM
. T
his
artic
le is
lice
nsed
und
er a
Cre
ativ
e C
omm
ons
Attr
ibut
ion-
Non
Com
mer
cial
3.0
Unp
orte
d L
icen
ce.
View Article Online
hydroxide were used in the synthesizing process. In this case,14.4 mL of ethanol, 1 mL of ultrapure water, and 25 mL ofammonium hydroxide were mixed and stirred for 12 minutes.Later, 1 mL of TEOS was diluted with 4mL of ethanol and addedto the mixture. Following 30 minutes aer this process, 0.5 mLof TEOS diluted in 4 mL ethanol was added. Aer 5 minutes,a modied silane molecule was added in a molar ratio of 3 : 4with respect to the second edition of TEOS. The nal mixturewas stirred for 20 hours at room temperature, and later centri-fuged and washed with ethanol for removal of reactants. Thesolvent casting was applied to deposit the solution onto glasssurfaces. Before coating glass surfaces were cleaned by piranhasolution and later distilled water was used further cleaning thesurfaces. Upon vacuum drying, until all solvent was evaporated,characterization of resulting surfaces was carried out. AFM/SPMMicroscope in contact mode was used to analyze the surfacetexture. The tip was made of silicon nitride probes (r ¼ 20–60nm) with a manufacturer specied force constant, k, of 0.12 Nm�1. A linear micro-scratch tester (MCTX-S/N: 01-04300,Manufacture: CMS Solutions, Switzerland) was used to measurethe tangential force on the treated surface. The equipment wasset at the contact load of 0.003 N and end load of 0.75 N. Thescanning speed was 1 mm min�1 and loading rate was 0.75 Nmin�1. The total length for the scratch tests was 1 mm.
Silicone oil was used for the impregnation of the functional-ized silica particles deposited glass surface. Silicone oil hasdynamic viscosity 10 cst, density 935 kg m�3, and lower interfa-cial tension 35 mN m�1. The uniform oil lm encapsulating thetextured surface was assured during the oil lm formation.Deposition of functionalized silica nanoparticles provided strongadhesion between the textured surface and impregnating siliconeoil. Silicone oil lm thickness at the surfaces wasmeasured usingan ellipsometer (Model: M-2000 Manufacture: J. A. Woolam Co.,USA). The liquid lm thickness measurement relies on thechange in polarization state as described by two quantities: (i)amplitude ratio or Psi (J), and (ii) phase difference or delta (D),i.e. tan JeiD ¼ Rp/Rs Rp and Rs are the Fresnel reection coeffi-cients for the p- and s-polarized light, respectively. A spectro-scopic ellipsometer provided the measured data for psi (J) anddelta (D) value for each wavelength of incident light and gener-ated the spectrum accordingly. The measured surface roughnessand thickness of oil lm was 0.42 nm and 700 � 2 nm. Later, airjet of 6 m s�1 nozzle jet velocity and 2 mm diameter was used toremove excessive oil on the surface of functionalized silicaparticles deposited surface. The oil lm thickness was measured.The ndings revealed that the oil lm thickness became 56.2 �2 nm while surface roughness remained same.
Water droplet contact angle for functionalized silica parti-cles deposited and oil impregnated surfaces were measured.During the measurements, droplet volume was controlled withan automatic dispensing system having a volume step resolu-tion of 0.1 mL. Still images were captured, and contact anglemeasurements were performed aer one second of depositionof a water droplet on the surface. The optical transmittance offunctionalized silica particles deposited and silicone oilimpregnated surfaces was measured using a UV spectrometer(Model: 67 Series spectrophotometer, Manufacture: Jenway,
29764 | RSC Adv., 2017, 7, 29762–29771
UK), and Fourier transform infrared spectroscopy (Model:VERTEX70, Manufacture: Bruker, USA) was performed to collectthe infrared absorption spectrum of the glass.
Dust particles were collected over a period of 12 months fromthe Solar Energy Laboratory of a Research Institute at King FahdUniversity of Petroleum and Minerals, which is located close tothe city of Dammam in Saudi Arabia. Dust, accumulated on thesurface of the protective glass of photovoltaic panels, wasremoved by a so brush and stored in an airtight container.Initially, dust particles collected were analyzed in terms ofweight, size, shape, and elemental composition using theanalytical tools. The ndings revealed that dust particlescollected over one-week period within 12 months had similarcharacteristics in terms of elemental composition, size distribu-tion, and shape. The amount of dust particles accumulated onthe surface of the photovoltaic protective layer was 5 gm�2 withinone week; however, it varied within 15% (by weight) over 12months. This was attributed to wind speed and its direction.Although wind speed and direction changed over the time, theaverage wind speed remained about 4 m s�1 over the year. Dustparticles were characterized using SEM and EDS (Model: 6460,Manufacture: JEOL Japan) with tungsten lament and specica-tions of beam voltage 0.4–40 kV, resolution 10 nm, and magni-cation �10 to �300 000. EDS consisted of INCA Micsmicroscope image capture system including INCA X-stream X-rayacquisition and detector control unit. XRD (Model: D8 Advanceddiffractometer, Manufacture: Bruker, USA). CuKa radiation wasused for XRD analysis and a typical setting of XRD was 40 kV and30mA. Porous structures of dust particles were determined usingMicro-CT scanner (Model: Skyscan 1172, Manufacture: Bruker,USA). The dust particles were mixed with desalinated water andthe liquid solution that was extracted from dust was analyzedusing a quadrupole inductively coupled plasma mass spectrom-eter (Model: XSeries 2, Manufacture: Thermo Scientic, USA).Silicone oil cloaking of dust particles was monitored and cloak-ing velocity was measured by using a high-speed camera (Model:SpeedSense 9040, Manufacture: Dantec Dynamic, Denmark).
Results and discussion
Environmental dust effect on the properties of silicone oilimpregnated glass surfaces is examined. Functionalized silicaparticles are deposited on the glass surface to improve thespreading rate of silicone oil on the glass surface. Analyticaltools are incorporated to examine the properties of the envi-ronmental dust particles and the characteristics of the oilimpregnated surfaces when exposed to the outdoor environ-ment for one week.
Assessment of environmental dust particles
Scanning electron microscope (SEM) micrographs of environ-mental dust particles are shown in Fig. 1. Dust particles havevarious geometric features with varying sizes (Fig. 1a). Dustparticles geometric congurations can be categorized by theshape factor and the aspect ratio. The shape factor can bedened by the ratio of the square of wetted perimeter over the
This journal is © The Royal Society of Chemistry 2017
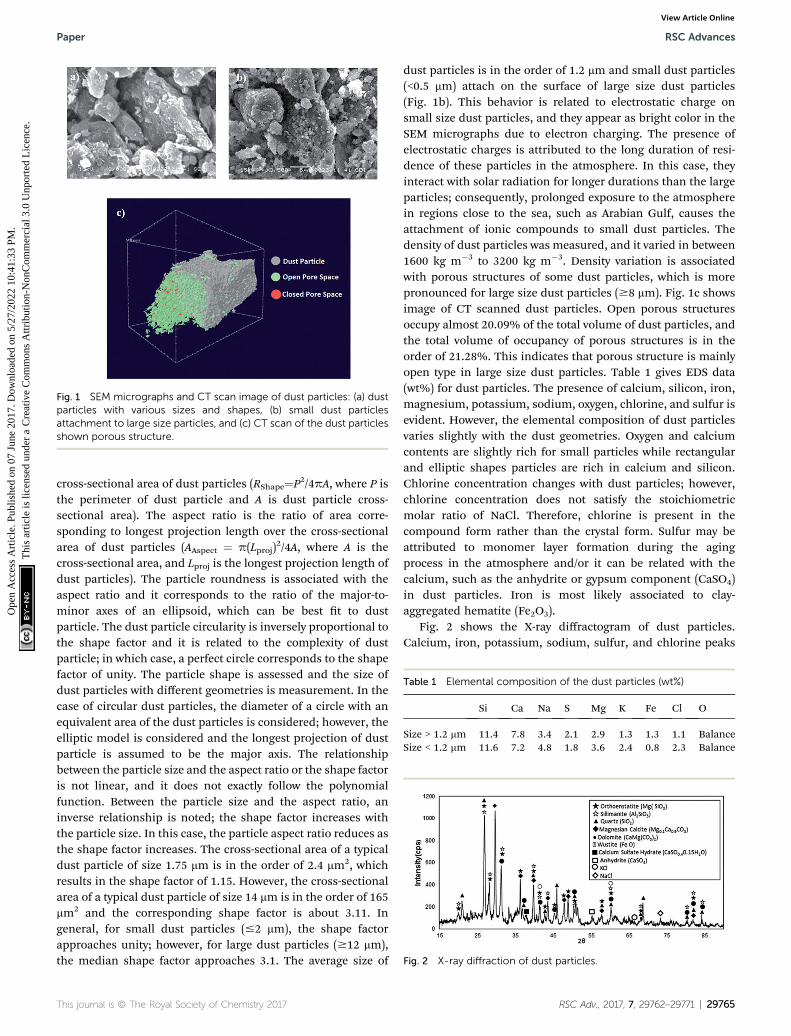
Fig. 1 SEM micrographs and CT scan image of dust particles: (a) dustparticles with various sizes and shapes, (b) small dust particlesattachment to large size particles, and (c) CT scan of the dust particlesshown porous structure.
Table 1 Elemental composition of the dust particles (wt%)
Si Ca Na S Mg K Fe Cl O
Size > 1.2 mm 11.4 7.8 3.4 2.1 2.9 1.3 1.3 1.1 BalanceSize < 1.2 mm 11.6 7.2 4.8 1.8 3.6 2.4 0.8 2.3 Balance
Fig. 2 X-ray diffraction of dust particles.
Paper RSC Advances
Ope
n A
cces
s A
rtic
le. P
ublis
hed
on 0
7 Ju
ne 2
017.
Dow
nloa
ded
on 5
/27/
2022
10:
41:3
3 PM
. T
his
artic
le is
lice
nsed
und
er a
Cre
ativ
e C
omm
ons
Attr
ibut
ion-
Non
Com
mer
cial
3.0
Unp
orte
d L
icen
ce.
View Article Online
cross-sectional area of dust particles (RShape¼P2/4pA, where P isthe perimeter of dust particle and A is dust particle cross-sectional area). The aspect ratio is the ratio of area corre-sponding to longest projection length over the cross-sectionalarea of dust particles (AAspect ¼ p(Lproj)
2/4A, where A is thecross-sectional area, and Lproj is the longest projection length ofdust particles). The particle roundness is associated with theaspect ratio and it corresponds to the ratio of the major-to-minor axes of an ellipsoid, which can be best t to dustparticle. The dust particle circularity is inversely proportional tothe shape factor and it is related to the complexity of dustparticle; in which case, a perfect circle corresponds to the shapefactor of unity. The particle shape is assessed and the size ofdust particles with different geometries is measurement. In thecase of circular dust particles, the diameter of a circle with anequivalent area of the dust particles is considered; however, theelliptic model is considered and the longest projection of dustparticle is assumed to be the major axis. The relationshipbetween the particle size and the aspect ratio or the shape factoris not linear, and it does not exactly follow the polynomialfunction. Between the particle size and the aspect ratio, aninverse relationship is noted; the shape factor increases withthe particle size. In this case, the particle aspect ratio reduces asthe shape factor increases. The cross-sectional area of a typicaldust particle of size 1.75 mm is in the order of 2.4 mm2, whichresults in the shape factor of 1.15. However, the cross-sectionalarea of a typical dust particle of size 14 mm is in the order of 165mm2 and the corresponding shape factor is about 3.11. Ingeneral, for small dust particles (#2 mm), the shape factorapproaches unity; however, for large dust particles ($12 mm),the median shape factor approaches 3.1. The average size of
This journal is © The Royal Society of Chemistry 2017
dust particles is in the order of 1.2 mm and small dust particles(<0.5 mm) attach on the surface of large size dust particles(Fig. 1b). This behavior is related to electrostatic charge onsmall size dust particles, and they appear as bright color in theSEM micrographs due to electron charging. The presence ofelectrostatic charges is attributed to the long duration of resi-dence of these particles in the atmosphere. In this case, theyinteract with solar radiation for longer durations than the largeparticles; consequently, prolonged exposure to the atmospherein regions close to the sea, such as Arabian Gulf, causes theattachment of ionic compounds to small dust particles. Thedensity of dust particles was measured, and it varied in between1600 kg m�3 to 3200 kg m�3. Density variation is associatedwith porous structures of some dust particles, which is morepronounced for large size dust particles ($8 mm). Fig. 1c showsimage of CT scanned dust particles. Open porous structuresoccupy almost 20.09% of the total volume of dust particles, andthe total volume of occupancy of porous structures is in theorder of 21.28%. This indicates that porous structure is mainlyopen type in large size dust particles. Table 1 gives EDS data(wt%) for dust particles. The presence of calcium, silicon, iron,magnesium, potassium, sodium, oxygen, chlorine, and sulfur isevident. However, the elemental composition of dust particlesvaries slightly with the dust geometries. Oxygen and calciumcontents are slightly rich for small particles while rectangularand elliptic shapes particles are rich in calcium and silicon.Chlorine concentration changes with dust particles; however,chlorine concentration does not satisfy the stoichiometricmolar ratio of NaCl. Therefore, chlorine is present in thecompound form rather than the crystal form. Sulfur may beattributed to monomer layer formation during the agingprocess in the atmosphere and/or it can be related with thecalcium, such as the anhydrite or gypsum component (CaSO4)in dust particles. Iron is most likely associated to clay-aggregated hematite (Fe2O3).
Fig. 2 shows the X-ray diffractogram of dust particles.Calcium, iron, potassium, sodium, sulfur, and chlorine peaks
RSC Adv., 2017, 7, 29762–29771 | 29765
RSC Advances Paper
Ope
n A
cces
s A
rtic
le. P
ublis
hed
on 0
7 Ju
ne 2
017.
Dow
nloa
ded
on 5
/27/
2022
10:
41:3
3 PM
. T
his
artic
le is
lice
nsed
und
er a
Cre
ativ
e C
omm
ons
Attr
ibut
ion-
Non
Com
mer
cial
3.0
Unp
orte
d L
icen
ce.
View Article Online
are evident in the diffractogram. The peaks of silicon and ironcoincide with each other. Sodium and potassium peaks areassociated with the sea salt because of the regional effects, i.e.dust particles are collected from the close region of ArabianGulf. The metal compounds in dust particles are associatedwith metal oxides such as Fe2O3, FeO, and MgO. To furtherassess the characteristics of dust particles, desalinated water aremixed with dust particles with a mass ratio of one to ten (tenbeing desalinated water) and, later, the mixture is placed ona mechanical shaker for one hour. pH of resulting mud solution(a mixture of water and dust particles) is measured, and thendings revealed that pH increases to 7.5 within ten hours. Inthis case, OH� ions in mud liquid solution give rise to theattainment of high pH level because of the dissolution of thealkaline and alkaline earth metallic compounds in water.
Characteristics of functionalized silica deposited and oilimpregnated glass surface
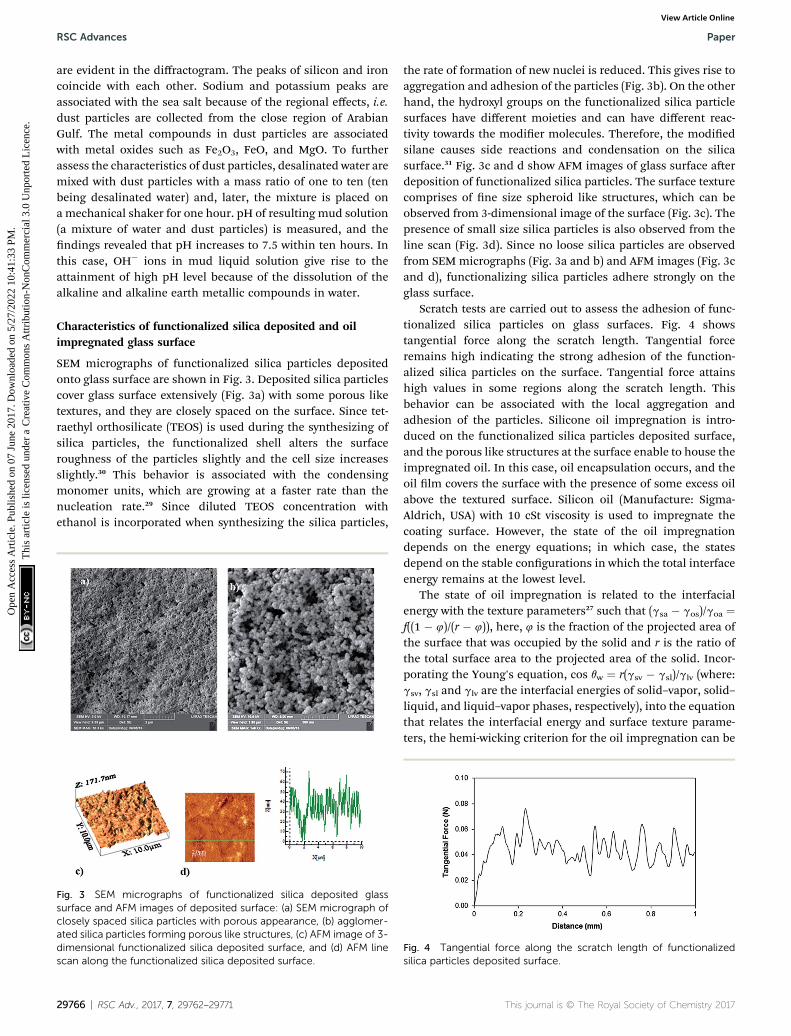
SEM micrographs of functionalized silica particles depositedonto glass surface are shown in Fig. 3. Deposited silica particlescover glass surface extensively (Fig. 3a) with some porous liketextures, and they are closely spaced on the surface. Since tet-raethyl orthosilicate (TEOS) is used during the synthesizing ofsilica particles, the functionalized shell alters the surfaceroughness of the particles slightly and the cell size increasesslightly.30 This behavior is associated with the condensingmonomer units, which are growing at a faster rate than thenucleation rate.29 Since diluted TEOS concentration withethanol is incorporated when synthesizing the silica particles,
Fig. 3 SEM micrographs of functionalized silica deposited glasssurface and AFM images of deposited surface: (a) SEM micrograph ofclosely spaced silica particles with porous appearance, (b) agglomer-ated silica particles forming porous like structures, (c) AFM image of 3-dimensional functionalized silica deposited surface, and (d) AFM linescan along the functionalized silica deposited surface.
29766 | RSC Adv., 2017, 7, 29762–29771
the rate of formation of new nuclei is reduced. This gives rise toaggregation and adhesion of the particles (Fig. 3b). On the otherhand, the hydroxyl groups on the functionalized silica particlesurfaces have different moieties and can have different reac-tivity towards the modier molecules. Therefore, the modiedsilane causes side reactions and condensation on the silicasurface.31 Fig. 3c and d show AFM images of glass surface aerdeposition of functionalized silica particles. The surface texturecomprises of ne size spheroid like structures, which can beobserved from 3-dimensional image of the surface (Fig. 3c). Thepresence of small size silica particles is also observed from theline scan (Fig. 3d). Since no loose silica particles are observedfrom SEM micrographs (Fig. 3a and b) and AFM images (Fig. 3cand d), functionalizing silica particles adhere strongly on theglass surface.
Scratch tests are carried out to assess the adhesion of func-tionalized silica particles on glass surfaces. Fig. 4 showstangential force along the scratch length. Tangential forceremains high indicating the strong adhesion of the function-alized silica particles on the surface. Tangential force attainshigh values in some regions along the scratch length. Thisbehavior can be associated with the local aggregation andadhesion of the particles. Silicone oil impregnation is intro-duced on the functionalized silica particles deposited surface,and the porous like structures at the surface enable to house theimpregnated oil. In this case, oil encapsulation occurs, and theoil lm covers the surface with the presence of some excess oilabove the textured surface. Silicon oil (Manufacture: Sigma-Aldrich, USA) with 10 cSt viscosity is used to impregnate thecoating surface. However, the state of the oil impregnationdepends on the energy equations; in which case, the statesdepend on the stable congurations in which the total interfaceenergy remains at the lowest level.
The state of oil impregnation is related to the interfacialenergy with the texture parameters27 such that (gsa � gos)/goa ¼f((1 � 4)/(r � 4)), here, 4 is the fraction of the projected area ofthe surface that was occupied by the solid and r is the ratio ofthe total surface area to the projected area of the solid. Incor-porating the Young's equation, cos qw ¼ r(gsv � gsl)/glv (where:gsv, gsl and glv are the interfacial energies of solid–vapor, solid–liquid, and liquid–vapor phases, respectively), into the equationthat relates the interfacial energy and surface texture parame-ters, the hemi-wicking criterion for the oil impregnation can be
Fig. 4 Tangential force along the scratch length of functionalizedsilica particles deposited surface.
This journal is © The Royal Society of Chemistry 2017
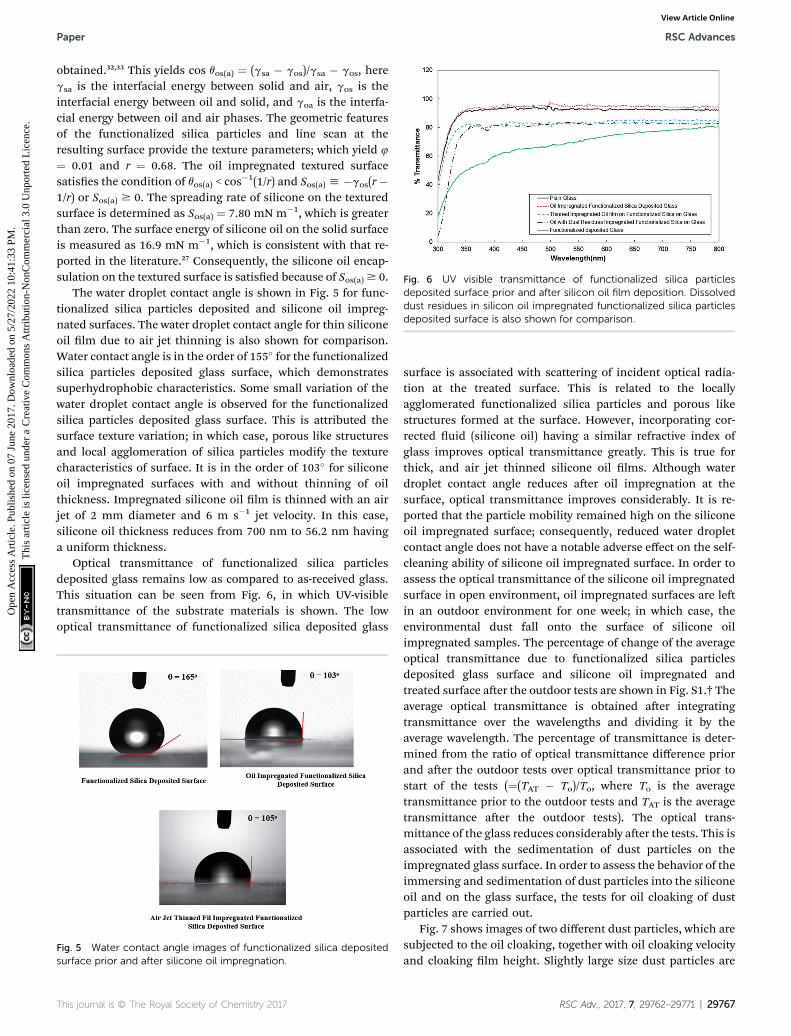
Fig. 6 UV visible transmittance of functionalized silica particlesdeposited surface prior and after silicon oil film deposition. Dissolveddust residues in silicon oil impregnated functionalized silica particlesdeposited surface is also shown for comparison.
Paper RSC Advances
Ope
n A
cces
s A
rtic
le. P
ublis
hed
on 0
7 Ju
ne 2
017.
Dow
nloa
ded
on 5
/27/
2022
10:
41:3
3 PM
. T
his
artic
le is
lice
nsed
und
er a
Cre
ativ
e C
omm
ons
Attr
ibut
ion-
Non
Com
mer
cial
3.0
Unp
orte
d L
icen
ce.
View Article Online
obtained.32,33 This yields cos qos(a) ¼ (gsa � gos)/gsa � gos, heregsa is the interfacial energy between solid and air, gos is theinterfacial energy between oil and solid, and goa is the interfa-cial energy between oil and air phases. The geometric featuresof the functionalized silica particles and line scan at theresulting surface provide the texture parameters; which yield 4
¼ 0.01 and r ¼ 0.68. The oil impregnated textured surfacesatises the condition of qos(a) < cos�1(1/r) and Sos(a) h �gos(r �1/r) or Sos(a) $ 0. The spreading rate of silicone on the texturedsurface is determined as Sos(a) ¼ 7.80 mN m�1, which is greaterthan zero. The surface energy of silicone oil on the solid surfaceis measured as 16.9 mN m�1, which is consistent with that re-ported in the literature.27 Consequently, the silicone oil encap-sulation on the textured surface is satised because of Sos(a)$ 0.
The water droplet contact angle is shown in Fig. 5 for func-tionalized silica particles deposited and silicone oil impreg-nated surfaces. The water droplet contact angle for thin siliconeoil lm due to air jet thinning is also shown for comparison.Water contact angle is in the order of 155� for the functionalizedsilica particles deposited glass surface, which demonstratessuperhydrophobic characteristics. Some small variation of thewater droplet contact angle is observed for the functionalizedsilica particles deposited glass surface. This is attributed thesurface texture variation; in which case, porous like structuresand local agglomeration of silica particles modify the texturecharacteristics of surface. It is in the order of 103� for siliconeoil impregnated surfaces with and without thinning of oilthickness. Impregnated silicone oil lm is thinned with an airjet of 2 mm diameter and 6 m s�1 jet velocity. In this case,silicone oil thickness reduces from 700 nm to 56.2 nm havinga uniform thickness.
Optical transmittance of functionalized silica particlesdeposited glass remains low as compared to as-received glass.This situation can be seen from Fig. 6, in which UV-visibletransmittance of the substrate materials is shown. The lowoptical transmittance of functionalized silica deposited glass
Fig. 5 Water contact angle images of functionalized silica depositedsurface prior and after silicone oil impregnation.
This journal is © The Royal Society of Chemistry 2017
surface is associated with scattering of incident optical radia-tion at the treated surface. This is related to the locallyagglomerated functionalized silica particles and porous likestructures formed at the surface. However, incorporating cor-rected uid (silicone oil) having a similar refractive index ofglass improves optical transmittance greatly. This is true forthick, and air jet thinned silicone oil lms. Although waterdroplet contact angle reduces aer oil impregnation at thesurface, optical transmittance improves considerably. It is re-ported that the particle mobility remained high on the siliconeoil impregnated surface; consequently, reduced water dropletcontact angle does not have a notable adverse effect on the self-cleaning ability of silicone oil impregnated surface. In order toassess the optical transmittance of the silicone oil impregnatedsurface in open environment, oil impregnated surfaces are lein an outdoor environment for one week; in which case, theenvironmental dust fall onto the surface of silicone oilimpregnated samples. The percentage of change of the averageoptical transmittance due to functionalized silica particlesdeposited glass surface and silicone oil impregnated andtreated surface aer the outdoor tests are shown in Fig. S1.† Theaverage optical transmittance is obtained aer integratingtransmittance over the wavelengths and dividing it by theaverage wavelength. The percentage of transmittance is deter-mined from the ratio of optical transmittance difference priorand aer the outdoor tests over optical transmittance prior tostart of the tests (¼(TAT � To)/To, where To is the averagetransmittance prior to the outdoor tests and TAT is the averagetransmittance aer the outdoor tests). The optical trans-mittance of the glass reduces considerably aer the tests. This isassociated with the sedimentation of dust particles on theimpregnated glass surface. In order to assess the behavior of theimmersing and sedimentation of dust particles into the siliconeoil and on the glass surface, the tests for oil cloaking of dustparticles are carried out.
Fig. 7 shows images of two different dust particles, which aresubjected to the oil cloaking, together with oil cloaking velocityand cloaking lm height. Slightly large size dust particles are
RSC Adv., 2017, 7, 29762–29771 | 29767
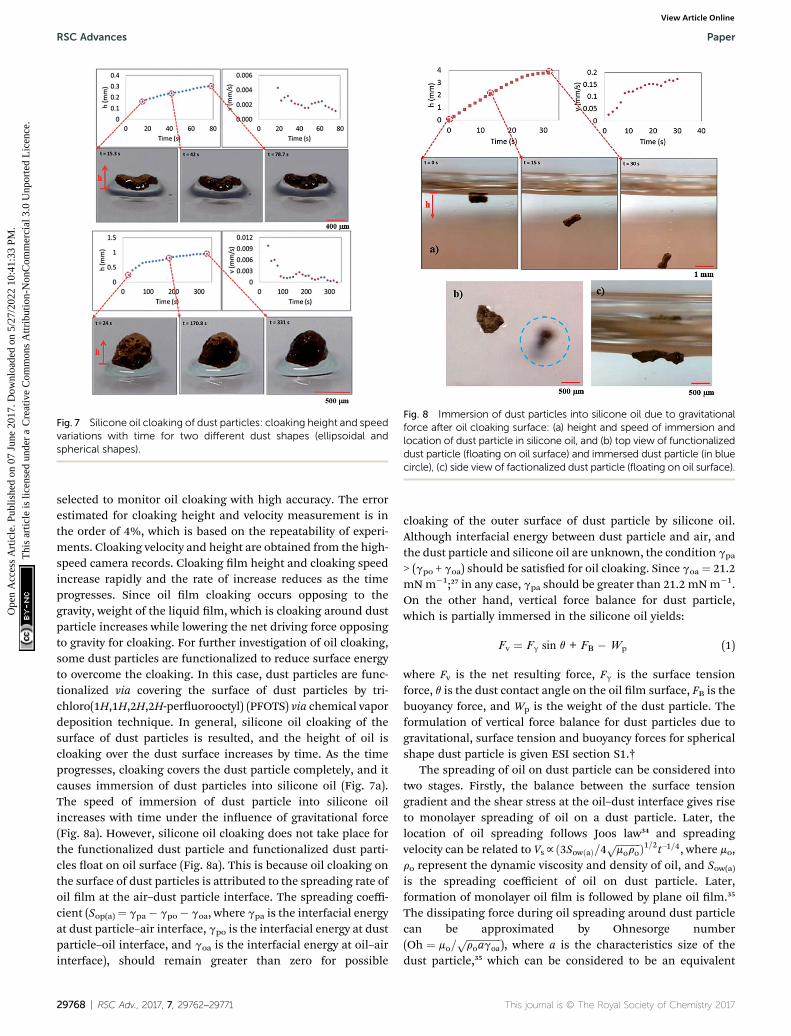
Fig. 7 Silicone oil cloaking of dust particles: cloaking height and speedvariations with time for two different dust shapes (ellipsoidal andspherical shapes).
Fig. 8 Immersion of dust particles into silicone oil due to gravitationalforce after oil cloaking surface: (a) height and speed of immersion andlocation of dust particle in silicone oil, and (b) top view of functionalizeddust particle (floating on oil surface) and immersed dust particle (in bluecircle), (c) side view of factionalized dust particle (floating on oil surface).
RSC Advances Paper
Ope
n A
cces
s A
rtic
le. P
ublis
hed
on 0
7 Ju
ne 2
017.
Dow
nloa
ded
on 5
/27/
2022
10:
41:3
3 PM
. T
his
artic
le is
lice
nsed
und
er a
Cre
ativ
e C
omm
ons
Attr
ibut
ion-
Non
Com
mer
cial
3.0
Unp
orte
d L
icen
ce.
View Article Online
selected to monitor oil cloaking with high accuracy. The errorestimated for cloaking height and velocity measurement is inthe order of 4%, which is based on the repeatability of experi-ments. Cloaking velocity and height are obtained from the high-speed camera records. Cloaking lm height and cloaking speedincrease rapidly and the rate of increase reduces as the timeprogresses. Since oil lm cloaking occurs opposing to thegravity, weight of the liquid lm, which is cloaking around dustparticle increases while lowering the net driving force opposingto gravity for cloaking. For further investigation of oil cloaking,some dust particles are functionalized to reduce surface energyto overcome the cloaking. In this case, dust particles are func-tionalized via covering the surface of dust particles by tri-chloro(1H,1H,2H,2H-peruorooctyl) (PFOTS) via chemical vapordeposition technique. In general, silicone oil cloaking of thesurface of dust particles is resulted, and the height of oil iscloaking over the dust surface increases by time. As the timeprogresses, cloaking covers the dust particle completely, and itcauses immersion of dust particles into silicone oil (Fig. 7a).The speed of immersion of dust particle into silicone oilincreases with time under the inuence of gravitational force(Fig. 8a). However, silicone oil cloaking does not take place forthe functionalized dust particle and functionalized dust parti-cles oat on oil surface (Fig. 8a). This is because oil cloaking onthe surface of dust particles is attributed to the spreading rate ofoil lm at the air–dust particle interface. The spreading coeffi-cient (Sop(a)¼ gpa� gpo� goa, where gpa is the interfacial energyat dust particle–air interface, gpo is the interfacial energy at dustparticle–oil interface, and goa is the interfacial energy at oil–airinterface), should remain greater than zero for possible
29768 | RSC Adv., 2017, 7, 29762–29771
cloaking of the outer surface of dust particle by silicone oil.Although interfacial energy between dust particle and air, andthe dust particle and silicone oil are unknown, the condition gpa
> (gpo + goa) should be satised for oil cloaking. Since goa¼ 21.2mNm�1;27 in any case, gpa should be greater than 21.2 mNm�1.On the other hand, vertical force balance for dust particle,which is partially immersed in the silicone oil yields:
Fv ¼ Fg sin q + FB � Wp (1)
where Fv is the net resulting force, Fg is the surface tensionforce, q is the dust contact angle on the oil lm surface, FB is thebuoyancy force, and Wp is the weight of the dust particle. Theformulation of vertical force balance for dust particles due togravitational, surface tension and buoyancy forces for sphericalshape dust particle is given ESI section S1.†
The spreading of oil on dust particle can be considered intotwo stages. Firstly, the balance between the surface tensiongradient and the shear stress at the oil–dust interface gives riseto monolayer spreading of oil on a dust particle. Later, thelocation of oil spreading follows Joos law34 and spreadingvelocity can be related to Vsfð3SowðaÞ=4 ffiffiffiffiffiffiffiffiffiffi
morop Þ1=2t�1=4, where mo,
ro represent the dynamic viscosity and density of oil, and Sow(a)is the spreading coefficient of oil on dust particle. Later,formation of monolayer oil lm is followed by plane oil lm.35
The dissipating force during oil spreading around dust particlecan be approximated by Ohnesorge number(Oh ¼ mo=
ffiffiffiffiffiffiffiffiffiffiffiffiffiffi
roagoap
), where a is the characteristics size of thedust particle,35 which can be considered to be an equivalent
This journal is © The Royal Society of Chemistry 2017
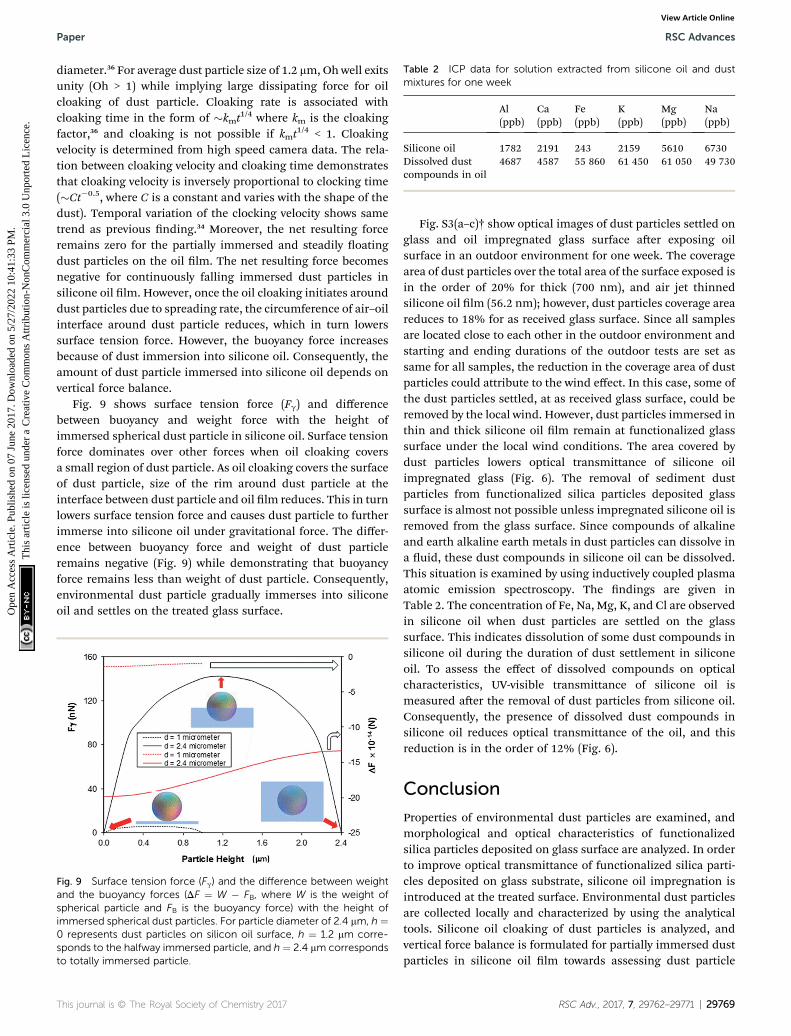
Table 2 ICP data for solution extracted from silicone oil and dustmixtures for one week
Al(ppb)
Ca(ppb)
Fe(ppb)
K(ppb)
Mg(ppb)
Na(ppb)
Silicone oil 1782 2191 243 2159 5610 6730Dissolved dustcompounds in oil
4687 4587 55 860 61 450 61 050 49 730
Paper RSC Advances
Ope
n A
cces
s A
rtic
le. P
ublis
hed
on 0
7 Ju
ne 2
017.
Dow
nloa
ded
on 5
/27/
2022
10:
41:3
3 PM
. T
his
artic
le is
lice
nsed
und
er a
Cre
ativ
e C
omm
ons
Attr
ibut
ion-
Non
Com
mer
cial
3.0
Unp
orte
d L
icen
ce.
View Article Online
diameter.36 For average dust particle size of 1.2 mm, Oh well exitsunity (Oh > 1) while implying large dissipating force for oilcloaking of dust particle. Cloaking rate is associated withcloaking time in the form of �kmt
1/4 where km is the cloakingfactor,36 and cloaking is not possible if kmt
1/4 < 1. Cloakingvelocity is determined from high speed camera data. The rela-tion between cloaking velocity and cloaking time demonstratesthat cloaking velocity is inversely proportional to clocking time(�Ct�0.5, where C is a constant and varies with the shape of thedust). Temporal variation of the clocking velocity shows sametrend as previous nding.34 Moreover, the net resulting forceremains zero for the partially immersed and steadily oatingdust particles on the oil lm. The net resulting force becomesnegative for continuously falling immersed dust particles insilicone oil lm. However, once the oil cloaking initiates arounddust particles due to spreading rate, the circumference of air–oilinterface around dust particle reduces, which in turn lowerssurface tension force. However, the buoyancy force increasesbecause of dust immersion into silicone oil. Consequently, theamount of dust particle immersed into silicone oil depends onvertical force balance.
Fig. 9 shows surface tension force (Fg) and differencebetween buoyancy and weight force with the height ofimmersed spherical dust particle in silicone oil. Surface tensionforce dominates over other forces when oil cloaking coversa small region of dust particle. As oil cloaking covers the surfaceof dust particle, size of the rim around dust particle at theinterface between dust particle and oil lm reduces. This in turnlowers surface tension force and causes dust particle to furtherimmerse into silicone oil under gravitational force. The differ-ence between buoyancy force and weight of dust particleremains negative (Fig. 9) while demonstrating that buoyancyforce remains less than weight of dust particle. Consequently,environmental dust particle gradually immerses into siliconeoil and settles on the treated glass surface.
Fig. 9 Surface tension force (Fg) and the difference between weightand the buoyancy forces (DF ¼ W � FB, where W is the weight ofspherical particle and FB is the buoyancy force) with the height ofimmersed spherical dust particles. For particle diameter of 2.4 mm, h ¼0 represents dust particles on silicon oil surface, h ¼ 1.2 mm corre-sponds to the halfway immersed particle, and h ¼ 2.4 mm correspondsto totally immersed particle.
This journal is © The Royal Society of Chemistry 2017
Fig. S3(a–c)† show optical images of dust particles settled onglass and oil impregnated glass surface aer exposing oilsurface in an outdoor environment for one week. The coveragearea of dust particles over the total area of the surface exposed isin the order of 20% for thick (700 nm), and air jet thinnedsilicone oil lm (56.2 nm); however, dust particles coverage areareduces to 18% for as received glass surface. Since all samplesare located close to each other in the outdoor environment andstarting and ending durations of the outdoor tests are set assame for all samples, the reduction in the coverage area of dustparticles could attribute to the wind effect. In this case, some ofthe dust particles settled, at as received glass surface, could beremoved by the local wind. However, dust particles immersed inthin and thick silicone oil lm remain at functionalized glasssurface under the local wind conditions. The area covered bydust particles lowers optical transmittance of silicone oilimpregnated glass (Fig. 6). The removal of sediment dustparticles from functionalized silica particles deposited glasssurface is almost not possible unless impregnated silicone oil isremoved from the glass surface. Since compounds of alkalineand earth alkaline earth metals in dust particles can dissolve ina uid, these dust compounds in silicone oil can be dissolved.This situation is examined by using inductively coupled plasmaatomic emission spectroscopy. The ndings are given inTable 2. The concentration of Fe, Na, Mg, K, and Cl are observedin silicone oil when dust particles are settled on the glasssurface. This indicates dissolution of some dust compounds insilicone oil during the duration of dust settlement in siliconeoil. To assess the effect of dissolved compounds on opticalcharacteristics, UV-visible transmittance of silicone oil ismeasured aer the removal of dust particles from silicone oil.Consequently, the presence of dissolved dust compounds insilicone oil reduces optical transmittance of the oil, and thisreduction is in the order of 12% (Fig. 6).
Conclusion
Properties of environmental dust particles are examined, andmorphological and optical characteristics of functionalizedsilica particles deposited on glass surface are analyzed. In orderto improve optical transmittance of functionalized silica parti-cles deposited on glass substrate, silicone oil impregnation isintroduced at the treated surface. Environmental dust particlesare collected locally and characterized by using the analyticaltools. Silicone oil cloaking of dust particles is analyzed, andvertical force balance is formulated for partially immersed dustparticles in silicone oil lm towards assessing dust particle
RSC Adv., 2017, 7, 29762–29771 | 29769
RSC Advances Paper
Ope
n A
cces
s A
rtic
le. P
ublis
hed
on 0
7 Ju
ne 2
017.
Dow
nloa
ded
on 5
/27/
2022
10:
41:3
3 PM
. T
his
artic
le is
lice
nsed
und
er a
Cre
ativ
e C
omm
ons
Attr
ibut
ion-
Non
Com
mer
cial
3.0
Unp
orte
d L
icen
ce.
View Article Online
settlement. Silicone oil impregnated surfaces are le in anoutdoor environment for one week and dust particles settled onsilicone oil impregnated surface are characterized. Inuence ofdust settlement on optical transmittance of silicone oilimpregnated surface is evaluated. Silicone oil lm is thinned byan air jet, and effect of dust accumulation on optical trans-mittance of impregnated thinned oil lm is also assessed. It isfound that dust particles compose of various compoundsincluding compounds of alkaline and alkaline earth metals.Some of these compounds dissolve in water while enhancingwater pH level. Average dust particle size is in the order of 1.2mmand they have various shapes with an average shape factor of1.15. Small dust particles (#1.2 mm) have a tendency to attach tolarge size particles because of electrostatic forces, and they havethe shape factor of almost unity. However, the shape factor is inthe order of 3.11 for the large size particles ($1.2 mm). Depo-sition of functionalized silica particles improves surfacehydrophobicity of glass greatly; however, the optical trans-mittance of glass sample reduces considerably. Silicone oilimpregnation of functionalized silica particles deposited glasssurface improved optical transmittance for thick (700 nm) andthin (56.2 nm) silicone oil lms. When oil impregnated surfacesare tested in an outdoor environment, optical transmittancereduces considerably because of sedimentation of dust particlesin silicone oil lm, which is particularly true for thick siliconeoil lm. Cloaking of dust particles takes place by silicone oil dueto high spreading rate. This becomes the main cause forimmersion of dust particles into silicone lm. Dust particlesimmersed into silicone oil settles on the glass surface. Althoughsurface tension force remains high prior to silicone oilspreading and cloaking of dust particles, once silicone oilcloaking covers dust particle surface, surface tension forcedecreases and gravity dominates over buoyancy force. Hence,dust sedimentation on silicone oil impregnated glass surfacesbecomes unavoidable. Air jet thinning of silicone oil lm on thesurface does not prevent silicone oil cloaking of dust particlesand gives rise to a negligible improvement in optical trans-mittance. The present study provides a fundamental under-standing of dust sedimentation on silicone oil impregnatedglass surface. It also includes useful information towards self-cleaning applications of oil impregnated surfaces and theiroptical characteristics in outdoor environments.
Acknowledgements
The authors acknowledge the nancial support of the Deanshipof Research at King Fahd University of Petroleum and Minerals(KFUPM) and King Abdulaziz City for Science and Technology(KACST) through project #11-ADV2134-04.
Notes and references
1 J. A. Crook, L. A. Jones, P. M. Forstera and R. Crook, EnergyEnviron. Sci., 2011, 4, 3101–3109.
2 J. Son, S. Kundu, L. K. Verma, M. Sakhuja, A. J. Danner,C. S. Bhatia and H. Yang, Sol. Energy Mater. Sol. Cells,2012, 98, 46–51.
29770 | RSC Adv., 2017, 7, 29762–29771
3 H. Ghassan, B. S. Yilbas, S. Said, N. Al-Aqeeli and A. Matin,Sci. Rep., 2016, 6, 30253.
4 B. S. Yilbas, H. Ali, N. Al-Aqeeli, M. Khaled, S. Said, N. Abu-Dheir, N. Merah, K. Youcef-Toumi and K. K. Varanasi, Sci.Rep., 2016, 6, 24308.
5 J. T. Han, X. R. Xu and K. W. Cho, Langmuir, 2005, 21, 6662–6665.
6 N. J. Shirtcliffe, G. McHale, M. I. Newton, G. Chabrol andC. C. Perry, Adv. Mater., 2004, 16, 1929–1932.
7 H. Kinoshita, A. Ogasahara, Y. Fukuda and N. Ohmae,Carbon, 2010, 48, 4403–4408.
8 S. S. Latthe, H. Imai, V. Ganesan and A. V. Rao, Appl. Surf.Sci., 2009, 256, 217–222.
9 M. Ma, Y. Mao, M. Gupta, K. K. Gleason and G. C. Rutledge,Macromolecules, 2005, 38, 9742–9748.
10 B. S. Yilbas, M. Khaled, N. Abu-Dheir, N. Al-Aqeeli,S. A. M. Said, A. O. M. Ahmed, K. K. Varanasi andY. K. Toumi, Appl. Surf. Sci., 2014, 320, 21–29.
11 X. Zhang, Y. Guo, P. Zhang, Z. Wu and Z. Zhang,Mater. Lett.,2010, 64, 1200–1203.
12 B. Abhilash and A. K. Panchal, Advances in Electrical,Electronics, Information, Communication and Bio-Informatics,2nd International Conference (AEEICB), 2016, pp. 27–28.
13 K.-H. Tsui, Q. Lin, H. Chou, Q. Zhang, H. Fu, P. Qi andZ. Fan, Adv. Mater., 2014, 26, 2805–2811.
14 M. M. Tavakoli, K.-H. Tsui, Q. Zhang, J. He, Y. Yao, D. Li andZ. Fan, ACS Nano, 2015, 9, 10287–10295.
15 U. Mehmood, F. A. Al-Sulaiman and B. S. Yilbas, Sol. EnergyMater. Sol. Cells, 2016, 157, 604–623.
16 B. Bhushan and Y. C. Jung, Prog. Mater. Sci., 2011, 56, 1–108.17 Y. Liua, A. Dasb, Z. Lina, I. B. Cooperb, A. Rohatgib and
C. P. Wong, Nano Energy, 2014, 3, 127–133.18 A. P. Amalathas and M. M. Alkaisi, J. Phys. D: Appl. Phys.,
2016, 49, 465601.19 D. Liu, Q. Wang, W. Shen and D. Wang, J. Mater. Chem. C,
2017, 5, 103–109.20 D. M. Giolando, Sol. Energy, 2016, 124, 76–81.21 A. Al-Shara, B. S. Yilbas, A. Z. Sahin, H. Ali and H. Al-
Qahtani, Appl. Therm. Eng., 2016, 108, 628–640.22 Y. Y. Quan, L. Z. Zhang, R. H. Qi and R. R. Cai, Sci. Rep., 2016,
6, 38239.23 S. Anand, A. T. Paxson, R. Dhiman, J. D. Smith and
K. K. Varanasi, ACS Nano, 2012, 6, 10122–10129.24 H.-G. Park and D.-Y. Khang, Polymer, 2016, 99, 1–6.25 H. Hanaei, M. Khalaji Assadi and R. Saidur, Renewable
Sustainable Energy Rev., 2016, 59, 620–635.26 K. S. Khalil, S. R. Mahmoudi, N. Abu-dheir and
K. K. Varanasi, Appl. Phys. Lett., 2014, 105, 041604.27 J. D. Smith, R. Dhiman, S. Anand, E. Reza-Garduno,
R. E. Cohen, G. H. McKinley and K. K. Varanasi, SoMatter, 2013, 9, 1772–1780.
28 B. S. Yilbas, H. Ali, M. Khaled, N. Al-Aqeeli, N. Abu-Dheir andK. K. Varanasi, Sci. Rep., 2015, 5, 15833.
29 W. Y. D. Yong, Z. Zhang, G. Cristobal and W. S. Chin,Colloids Surf., A, 2014, 460, 151–157.
30 A. van Blaaderen and A. P. M. Kentgens, J. Non-Cryst. Solids,1992, 149, 161–178.
This journal is © The Royal Society of Chemistry 2017
Paper RSC Advances
Ope
n A
cces
s A
rtic
le. P
ublis
hed
on 0
7 Ju
ne 2
017.
Dow
nloa
ded
on 5
/27/
2022
10:
41:3
3 PM
. T
his
artic
le is
lice
nsed
und
er a
Cre
ativ
e C
omm
ons
Attr
ibut
ion-
Non
Com
mer
cial
3.0
Unp
orte
d L
icen
ce.
View Article Online
31 J. Lin, H. Chen, Y. Ji and Y. Zhang, Colloids Surf., A, 2012,411, 111–121.
32 A. Lafuma and D. Quere, Eur. Biophys. J., 2011, 96, 56001.33 N. J. Shirtcliffe, G. McHale and M. I. Newton, J. Polym. Sci.,
Part B: Polym. Phys., 2011, 49, 1203–1217.
This journal is © The Royal Society of Chemistry 2017
34 V. V. Bergeron and D. Langevin, Phys. Rev. Lett., 1996, 76,3152–3155.
35 A. Carlson, P. Kim, G. Amberg and H. A. Stone, Europhys.Lett., 2013, 104, 34008.
36 S. Anand, K. Rykaczewski, S. B. Subramanyam, D. Beysensand K. K. Varanasi, So Matter, 2015, 11, 69–80.
RSC Adv., 2017, 7, 29762–29771 | 29771