silica aerogels and hyperbranched polymers as drug
TRANSCRIPT
Silica Aerogels and Hyperbranched Polymers as Drug
Delivery Systems
Der Technischen Fakultät der
Universität Erlangen-Nürnberg
zur Erlangung des Grades
DOKTOR-INGENIEUR
vorgelegt von
M.Sc. Supakij Suttiruengwong
aus Bangkok, Thailand
Erlangen - 2005
Als Dissertation genehmigt von
der Technischen Fakultät der
Universität Erlangen-Nürnberg
Tag der Einreichung: 17.06.2005
Tag der Promotion: 03.08.2005
Dekan: Prof. Dr. A. Winnacker
Vorsitzender: Prof. Dr. rer. nat. A. König
1. Berichterstatter: Prof. Dr.-Ing. W. Arlt
2. Berichterstatter: PD Dr.-Ing. habil. M. Türk
weiteres prüfungsberechtigtes Mitglied: Prof. Ph.D. G. Lee

III
Acknowledgements
This work was carried out at the Institute of Verfahrenstechnik, FG Thermodynamik und
Thermische Verfahrenstechnik, Technical University of Berlin and Institut of Chemie- und
Bioingenieurwesen, Lehrstuhl für Thermische Verfahrenstechnik, Friedrich-Alexander-
Universität Erlangen-Nürnberg, during the years 2001-2005.
I would like to warmly thank my Doktorvater, Prof. Wolfgang Arlt for giving me the opportunity for this work, for his optimism and generosity. I am extraordinarily grateful to Docent Dr. Ing. Irina Smirnova, who has always been very kind, supportive, positive, energetic and has never been tired of bringing me up. I would like to thank for her contribution during my research and write-up. I would like to thank Dr. Liudmilla Mokrushina for the fruitful discussion of my work. I would like to express my sincere gratitude to the industrial staff, past and present, of Technical University of Berlin, especially Mrs. Susanna Hoffmann for technical assistance, and sharing almost everyday lab-worries and -joys and Mrs. Sigrid Imme at the Institute of chemistry for the IR and elemental analysis measurements. I also wish to thank Mrs. Edelgard Schumann and Mrs. Petra Kiefer in the new Institute (Thermische Verfahrenstechnik) at FAU Erlangen-Nürnberg for their enthusiasm, supportiveness and for providing such a friendly atmosphere. I am lucky to have worked with you all. I also want to thank many other technical staff in Berlin and Erlangen for making my experiments possible and being so patient with my broken german. I am also grateful to my kind colleagues and at the TU Berlin and FAU Erlangen-Nürnberg during my stay in Germany. I have rarely felt left alone. I would like to thank my former roommate Ms. Stefanie Herzog, who has been very helpful and kind even though we shared an office for a short time. I wish to thank Mr. Jörn Rolker and Mr. Matthias Buggert for their friendliness and sympathy. I appreciate my roommate in Erlangen Ms. Marta Cimlerova who shared laughter and foods. Not forget to mention Mr. Oliver Spuhl and Mr. Dirk Uwe-Astrath, who have given lively and friendly atmosphere at the new Institute. I would like to thank a former TU Berlin student, Mr. Jozo Mamić, who was very helpful during my first year in Berlin. We could have won a kicker tournament of Prof. Arlt together. I want to thank another industrious student, Mrs. Liset Lüderitz for her hard work on the part of hyperbranched polymers. I also wish to thank all other staff and collegues, who are not mentioned here.
IV
All friends in Thailand and in Germany are acknowledged although I am not mentioning all of them (3 more pages would not be enough to put down their names), I would also like to thank all students in Thailändische Studenten Verein in Deutschland (TSVD), who I used to work with. I really enjoyed every activity of TSVD. DAAD is gratefully acknowledged for giving me such an opportunity not only to do the research in Germany, but also to experience European cultures and traditions. I wish to thank Mrs. Elke Burbach and many other DAAD staff in Germany and Thailand, who have taken care of me. I wish to thank DAAD for the financial support during my stay in Germany. An exclusive thank should go to Prof. Volker Rossbach, who encouraged me at the very beginning to apply for the DAAD grant. I would never forget my fiancée, Ms. Girawadee Khao-Orn who always stay during my tough time, but also the pleasant time. She has been tremendously supportive and has given me all I could ever ask for. If we only could skip everything else and just always be together, all the time, every day. Finally and especially, I would like to thank my mother, Supaporn Suttiruengwong. I would not have today without her support and care. I would like to dedicate my work to her. A billion thanks would not be enough. “I wish my father were here.”
V Inhaltsverzeichnis
Inhaltsverzeichnis DANKSAGUNG…………………………………………………………………………….III
INHALTSVERZEICHNIS (GERMAN)…………………………………………………....V
INHALTSVERZEICHNIS (ENGLISH)...…..…………………………………………..VIII
SYMBOLVERZEICHNIS…………………………………………………………………..X
DEUTSCHER TITEL (GERMAN)…..………………………………………………….XIII
KURZFASSUNG (GERMAN)..……………………………………………………….....XIII
EINLEITUNG (GERMAN)..……………………………………………………………..XIV
1. ABSTRACT…………………………………………………………………………......1
2. EINLEITUNG UND ZIELSETZUNG………………………………………………...2 2.1 EINLEITUNG….………………………………………………………………………...2 2.2 ZIELSETZUNG………….………………………………………………………………4
3. GRUNDLAGEN………………………………………………………………………...6 3.1 SILICA-AEROGELE...………….………………………………………………………6 3.1.1 GESCHICHTE DER SILICA-AEROGELE………………………….………….……6 3.1.2 SYNTHESE DER SILICA-AEROGELE………………………………..…………….8 3.1.3 EIGENSCHAFTEN DER SILICA-AEROGELE UND IHRE ANWENDUNGEN....18 3.1.4 SILICA-AEROGELE IN DER BIOWISSENSCHAFT (LIFE SCIENCE).………....21 3.1.5 EINLAGERUNG VON CHEMIKALIEN IN SILICA-AEROGELEN……………...25 3.1.6 ANWENDUNGEN VON ÜBERKRITISCHEN GASEN IM LIFE-SCIENCE BEREICH…………………………………………………………………………….…….26 3.2. HYPERVERZWEIGTE POLYMERE…………………………….…………………..30 3.2.1 GESCHICHTE DER HYPERVERZWEIGTEN MAKROMOLEKÜLE…….……...30 3.2.2 SYNTHESE UND ANWENDUNGEN VON HYPERVERZWEIGTEN POLYMEREN………………………………………………….…………………………..33 3.3 IN VITRO FREISETZUNGSKINETIKEN……………………………………………39 3.3.1 GRUNDLAGEN……………………………………………………………………..39 3.3.2 MESSUNG DER AUFLÖSUNGSRATE…………………………………………....41 3.3.3 STRÖMUNGSPROFIL DER MODIFIZIERTEN FREISETZUNGSAPPARATUR ………………………………….…………………………………………………………..46 3.3.4 EINFLUSSFAKTOREN DER AUFLÖSUNGSRATE……………………………...46 3.3.5 ANSATZ ZUR BESCHREIBUNG DER AUFLÖSUNGSRATE VON FESTEN ARZNEISTOFFEN………………………………………………………………………...47
4. MATERIALIEN, APPARATUR, EXPERIMENTE UND METHODEN………...50
4.1 MATERIALIEN………………………….…………………………………………….50 4.1.1 MATERIALIEN FÜR DIE UNTERSUCHUNGEN DER SILICA-AEROGELE.….50 4.1.2 MATERIALIEN FÜR DIE UNTERSUCHUNGEN DER HYPERVERZWEIGTEN POLYMERE………………………………………………………………….…………….50 4.1.3 MEDIKAMENTE.……………………………………...…………………………….51 4.1.4 ORGANISCHE LÖSUNGEN FÜR DIE UNTERSUCHUNG DER FREISETZUNGSKINETIKEN……………………………….……………………………54 4.2 APPARATUR UND VERSUCHSAUFBAU……………………………….………….55 4.2.1 SYNTHESE DER SILICA-AEROGELE…………………………………….………55 4.2.2 HYDROPHOBIZIERUNG………………………………………….………………..56
VI Inhaltsverzeichnis
4.2.3 BESTIMMUNG DER LÖSLICHKEIT VON PHARMAZEUTISCHEN WIRKSTOFFEN IN ÜBERKRITISCHEM CO2…………………………………………..57 4.2.4 ADSORPTION VON PHARMAZEUTISCHEN WIRKSTOFFEN IN ÜBERKRITISCHEM CO2…………………………………………………………….……58 4.2.5 WIRKSTOFFVERKAPSELUNG IN HYPERVERZWEIGTEN POLYMEREN…...59 4.2.6 FREISETZUNGSVERSUCHE……………….……………………………………...59 4.3 CHARAKTERISIERUNGSMETHODEN……………………………..………………62 4.3.1 BULKDICHTE………………………………………………………….……………63 4.3.2 UV-VIS SPEKTROSKOPIE………………………………………………….……...63 4.3.3 IR SPEKTROSKOPIE……………………………………………………….……….64 4.3.4 C/H/N/O/S ELEMENTARANALYSE..……………………………………….……..65 4.3.5 SCANNING ELEKTRON MIKROSKOP…………………………………………...66 4.3.6 GASCHROMATOGRAPHIE……………….……………………………………….66 4.3.7 DIFFERENZ-SCANNING-KALORIMETRIE (DSC) UND DIFFERENZ- THERMOANALYSE (DTA) ……………….……………………………………………..67 4.3.8 N2 ADSORPTION-DESORPTION (NAD) ……………………………….………...70 4.3.9 RÖNTGENBEUGUNG……………………………………………………………....75 4.4 FEHLERFORTPFLANZUNG………………………………………………………….76
5. ERGEBNISSE UND DISKUSSION………..………………………………………...78 5.1 ERGEBNISSE DER SILICA-AEROGELE SYNTHESE UND IHRE ANWENDUNG ALS MEDIKAMENTENTRÄGER………………………………………………………..78 5.1.1 HYDROPHILE SILICA-AEROGELE…….……………………………………..…..78 5.1.2 HYDROPHOBE SILICA-AEROGELE……………………….……………………..84 5.1.3 ADSORPTION VON MEDIKAMENTEN AUF SILICA-AEROGELEN…….…….87 5.1.4 RELEASE KINETICS OF DRUGS FROM SILICA AEROGELS…………….......113 5.1.5 CHEMISCHE UND PHYSIKALISCHE LANGZEITSTABILITÄT DER WIRKSTOFF-AEROGEL-FORMULIERUNGEN…………………………………….....127 5.2 ERGEBNISSE VON WIRKSTOFFVERKAPSELUNG IN HYPERVERZWEIGTEN POLYMEREN…………………………………………………………………………….127 5.2.1 CHARAKTERISIERUNG VON BELADENEN MIKROPARTIKELN…………..127 5.2.2 FREISETZUNGSKINETIKEN VON BELADENEN MIKROPARTIKELN……...137 5.2.3 ZUSAMMENFASSUNG DER UNTERSUCHUNG DER WIRKSTOFFVERKAPSELUNG IN HYPERVERZWEIGTEN POLYMEREN……….142
6. ZUSAMMENFASSUNG UND AUSBLICK……………………………………......144
7. ANHANG……………………………………………………………………...……...148
ANHANG A. ……………………………………………………………………………….148 A1 VORBEREITUNG DER PHOSPHAT PUFFER…………………………………...148 ANHANG B. ……………………………………………………………………………….149 B1 NAD ISOTHERME DER UNTERSUCHTEN SILICA-AEROGELE……………..149 B2 FREISETZUNGSAPPARATUR…………………………………………………....151 B3 EXPERIMENTELLE ERGEBNISSE DER ADSORPTION (40±1 °C, 18.0±0.2 MPA) ……………………………………………………………………………………………….152 B4 LÖSLICHKEIT DER PHARMAZEUTISCHEN WIRKSTOFFEN IM LÖSEMEDIEN ……………………………………………………………………………………………….155 B5 EXPERIMENTELLE ERGEBNISSE VON FREISETZUNGSVERSUCHEN BEIM 37.0±0.5 °C, 100 MIN-1……………………………………………………………………..155 ANHANG C.……………………...…………………………….…………………………..160 C1 STABILITÄT DER PHARMAZEUTISCHEN WIRKSTOFFE VOR UND NACH DER BELADUNG………………………………………………………………………......160

VII Inhaltsverzeichnis
C2 CHEMISCHE UND PHYSIKALISCHE LANGZEITSTABILITÄT DER WIRKSTOFF-AEROGEL-FORMULIERUNGEN…………………………………………166 LITERATUR…………………...…………………………………………………………..170
VIII Tables of Contents
Table of Contents
ACKNOWLEDGEMENTS..................................................................................................... III
INHALTSVERZEICHNIS..................................................................................................... V
TABLE OF CONTENTS....................................................................................................VIII
NOMENCLATURE ................................................................................................................ X
DEUTSCHER TITEL.........................................................................................................XIII
KURZFASSUNG.................................................................................................................XIII
EINLEITUNG .....................................................................................................................XIV
1. ABSTRACT ....................................................................................................................... 1
2. INTRODUCTION AND OBJECTIVE ........................................................................... 2 2.1 INTRODUCTION................................................................................................................... 2 2.2 OBJECTIVE ......................................................................................................................... 4
3. THEORETICAL BACKGROUND ................................................................................. 6 3.1 SILICA AEROGELS .............................................................................................................. 6 3.1.1 HISTORY OF SILICA AEROGELS ........................................................................................ 6 3.1.2 PREPARATION OF SILICA AEROGELS ................................................................................ 8 3.1.3 PROPERTIES OF SILICA AEROGELS AND THEIR APPLICATIONS ........................................ 18 3.1.4 SILICA AEROGELS IN LIFE SCIENCE ................................................................................ 21 3.1.5 DEPOSITION OF CHEMICAL COMPOUNDS INTO SILICA AEROGELS ................................... 25 3.1.6 USE OF SUPERCRITICAL FLUIDS (SCFS) IN LIFE SCIENCE ............................................... 26 3.2. HYPERBRANCHED POLYMERS ......................................................................................... 30 3.2.1 HISTORY OF HYPERBRANCHED MACROMOLECULES....................................................... 30 3.2.2 SYNTHETIC METHODOLOGY AND APPLICATIONS OF HYPERBRANCHED POLYMERS ........ 33 3.3 IN VITRO RELEASE KINETIC ............................................................................................. 39 3.3.1 THEORY ........................................................................................................................ 39 3.3.2 MEASUREMENT OF DISSOLUTION RATE ......................................................................... 41 3.3.3 FLOW PATTERNS IN A MIXING TANK .............................................................................. 46 3.3.4 FACTORS AFFECTING IN VITRO DISSOLUTION RATE ....................................................... 46 3.3.5 RELEASE KINETICS MODELS .......................................................................................... 47
4. MATERIALS, APPARATUS, EXPERIMENT AND METHODS............................. 50
4.1 MATERIALS...................................................................................................................... 50 4.1.1 MATERIALS USED FOR SILICA AEROGELS....................................................................... 50 4.1.2 MATERIALS USED FOR INVESTIGATION OF HYPERBRANCHED POLYMERS....................... 50 4.1.3 DRUGS .......................................................................................................................... 51 4.1.4 SOLUTIONS USED FOR INVESTIGATION OF IN VITRO RELEASE ........................................ 54 4.2 APPARATUS AND EXPERIMENTAL PROCEDURES................................................................ 55 4.2.1 PREPARATION OF SILICA AEROGELS .............................................................................. 55 4.2.2 HYDROPHOBIZATION..................................................................................................... 56 4.2.3 MEASUREMENTS OF DRUG SOLUBILITY IN SUPERCRITICAL CARBON DIOXIDE................ 57 4.2.4 ADSORPTION OF DRUGS FROM SUPERCRITICAL CARBON DIOXIDE.................................. 58 4.2.5 DRUG-ENCAPSULATED HYPERBRANCHED POLYMERS.................................................... 59 4.2.6 IN VITRO RELEASE EXPERIMENTS .................................................................................. 59 4.3 CHARACTERISATION METHODS ........................................................................................ 62 4.3.1 BULK DENSITY .............................................................................................................. 63 4.3.2 UV-VIS SPECTROSCOPY................................................................................................ 63
IX Table of Contents
4.3.3 IR SPECTROSCOPY ........................................................................................................ 64 4.3.4 ELEMENTAL ANALYSIS FOR C H N S AND O ................................................................. 65 4.3.5 SCANNING ELECTRON MICROSCOPY ............................................................................. 66 4.3.6 GAS CHROMATOGRAPHY .............................................................................................. 66 4.3.7 DIFFERENTIAL SCANNING CALORIMETRY (DSC) AND DIFFERENTIAL THERMAL ANALYSIS (DTA)................................................................................................................... 67 4.3.8 N2 ADSORPTION/DESORPTION (NAD)............................................................................ 70 4.3.9 X-RAY DIFFRACTION ..................................................................................................... 75 4.4 ERROR PROPAGATIONS..................................................................................................... 76
5. RESULTS AND DISCUSSION...................................................................................... 78 5.1 EXPERIMENTAL RESULTS ON SILICA AEROGELS PREPARATION AND THEIR APPLICATION AS DRUG CARRIERS ..................................................................................................................... 78 5.1.1 HYDROPHILIC SILICA AEROGELS ................................................................................... 78 5.1.2 HYDROPHOBIC SILICA AEROGELS .................................................................................. 84 5.1.3 ADSORPTION OF DRUGS ON SILICA AEROGELS ............................................................... 87 5.1.4 RELEASE KINETICS OF DRUGS FROM SILICA AEROGELS................................................ 113 5.1.5 LONG-TERM PHYSICAL AND CHEMICAL STABILITY ANALYSIS OF DRUG-LOADED AEROGELS ............................................................................................................................ 127 5.2 EXPERIMENTAL RESULTS FOR ACETAMINOPHEN-ENCAPSULATED HYPERBRANCHED POLYMERS............................................................................................................................ 127 5.2.1 CHARACTERISATION OF DRUG-LOADED MICROPARTICLES .......................................... 127 5.2.2 RELEASE KINETICS OF ACETAMINOPHEN-LOADED HYPERBRANCHED POLYMERS......... 137 5.2.3 SUMMARY OF INVESTIGATION OF DRUG-ENCAPSULATED HYPERBRANCHED POLYMER 142
6. CONCLUSIONS AND PERSPECTIVE ..................................................................... 144
7. APPENDIX..................................................................................................................... 148
APPENDIX A. ...................................................................................................................... 148 A1 PREPARATION OF PHOSPHATE BUFFER........................................................................ 148
APPENDIX B........................................................................................................................ 149
B1 NAD ISOTHERMS OF INVESTIGATED SILICA AEROGELS .............................................. 149 B2 AGITATOR SYSTEM FOR DISSOLUTION APPARATUS.................................................... 151 B3 EXPERIMENTAL RESULTS OF DRUG ADSORPTION (40±1 °C, 18.0±0.2 MPA) .............. 152 B4 SOLUBILITY OF INVESTIGATED DRUGS IN DISSOLUTION MEDIA .................................. 155 B5 EXPERIMENTAL RESULTS OF DISSOLUTION TESTS AT 37.0±0.5 °C, 100 MIN-1............. 155
APPENDIX C. ...................................................................................................................... 160 C1 DRUG STABILITY DURING THE LOADING PROCEDURE................................................. 160 C2 LONG-TERM PHYSICAL AND CHEMICAL STABILITY ANALYSIS OF DRUG-LOADED AEROGELS ............................................................................................................................ 166
BIBLIOGRAPHY ................................................................................................................ 170
X Nomenclature
Nomenclature Abbreviations
asym Asymmetric bis-MPA 2,2-bis-hydroxymethyl propionic acid BET Brunauer-Emmett-Teller BJH Barret-Joyner-Halenda BP British Pharmacopoeia CAS/MC casein microcapsules CMM Couple-Monomer Methodology CS Condensed Silica CVI Chemical Vapour Infiltration DAB Deutsches Arzneibuch DB Degree of Branching DDS Drug Delivery System DMM Double-Monomer Methodology DSC Differential Scanning Calorimetry DTA Differential Thermal Analysis Eur Ph European Pharmacopoeia FTIR-ATR Fourier Transform Infrared Attenuated Total Reflectance GAS Gas anti-solvent GC Gas Chromatography GFP Green fluorescent protein HMDSO hexamethyldisiloxane IR Infrared spectroscopy IUPAC International Union of Pure and Applied Chemistry MCM Mobile Crystalline Material M(OR)n Metal alkoxides MXn metallic salts NAD Nitrogen Adsorption/Desorption NSAID Non-Steroidal Anti-Inflammatory Drug p-HBA para-hydroxybenzoic acid PAMAM poly amido amide PEDS polyethoxydisiloxane PGSS Particles from Gas Saturated Solutions PM3 Parameter Model 3 PP50 ethoxylated Pentaerythritol PTP Proton-Transfer Polymerization QSAR Quantitative Structure Activity Relationship RESS Rapid Expansion of Supercritical Solutions RF resorcinol-formaldehyde RLCA Reaction Limited Cluster Aggregation rpm Round per minute
XI Nomenclature
RSCE Rapid Supercritical Extraction Process SCROP Self-Condensing Ring-Opening Polymerization SCVP Self-Condensing Vinyl Polymerization SEM Scanning electron microscopy SFE Supercritical fluid extraction SMM Single-Monomer Methodology SCC Supercritical Carbon dioxide SCF Supercritical Fluid sym Symmetric TAM tris(hydroxymethyl)aminomethane TEM Transmission Electron Microscopy TEOS tetraethylorthosilicate TGA Thermogravimetric Analysis THF tetrahydrofuran TMCS trimethylchlorosilane TMOS tetramethylorthosilicate TMS trimethylsilyl USP United States Pharmacopoeia UV–Vis Ultraviolet–Visible Spectroscopy XRD X-ray Diffraction
Greek letters
ν [m2s-1] kinematic viscosity η [-] refractive index ε [L mol-1 cm-1] constant of proportionality ρbulk [g cm-3] bulk density of aerogel ρtarget [g cm-3] target density of aerogel λ [nm] wavelength γ [N m-1] surface tension of the liquid adsorbate
Latin letters
A [-] Absorbance Adrug [Å2] surface area of a molecule drug a1 [mm] distance of baffles from wall of the reactor b1 [mm] baffles width C [mol L-1] concentration in the bulk of the liquid Cs [mol L-1] saturation solubility of the solute in bulk D [m2 s-1] diffusion coefficient d2 [mm] turbine diameter h [m] thickness of the boundary (diffusion) layer h0 [mm] liquid height h1 [mm] blade height

XII Nomenclature
h2 [mm] distance of turbine from bottom h3 [mm] baffles length h3U [mm] distance between bottom and baffles k0 [min-1] zero- order release constant k1 [min-1] first-order release constant kh [min-1/2] higuchi rate constant KB [-] correction of a round bottom reactor mSiO2 [g] mass of SiO2 produced by given amount of precursor msample [g] mass of aerogel sample Mn [kg kmol-1] number average molecular weight Mw [kg kmol-1] weight average molecular weight n [min-1] stirring speed Qt [wt%] amount of drug dissolved at time t Q0 [wt%] initial amount of the drug in the solution Pc [Pa] critical pressure SBET [m2 g-1] specific surface area of aerogel obtained from BET t [s] time Tc [°C] critical temperature Tg [°C] glass transition temperature Tm [°C] melting point V [mL] volume Vp [cm3 g-1] pore volume of aerogel X [g/g] loading
Dimensionless
Re [-] Reynolds number
XIII Deutscher Titel, Kurzfassung und Einleitung
Deutscher Titel
“Die Anwendung von Silica-Aerogelen und hyperverzweigten Polymeren als Medikamententräger”
Kurzfassung
In der vorliegenden Arbeit wird die Anwendung von Silica-Aerogelen und hyperverzweigten Polymeren als Medikamententräger experimentell untersucht und diskutiert. Der erste Teil der Arbeit beschäftigt sich mit der Untersuchung des Einflusses von Silica-Aerogel-Eigenschaften auf die Adsorption und die Freisetzungskinetik von sechs Medikamenten (drei Profene: Ketoprofen, Flurbiprofen und Ibuprofen und drei Nichtprofene: Miconazol, Griseofulvin und Dithranol). Die Beladung der Aerogele mit einem der Wirkstoffe erfolgt durch Adsorption aus überkritischem Kohlendioxid. Es kann gezeigt werden, dass die Freisetzung von Wirkstoffen mit niedriger und mittlerer Beladung aus Medikament-Aerogel Formulierungen schneller als die Freisetzung von (feinst) kristallinen Wirkstoffen ist. Die Ursache für die schnelle Freisetzung liegt in der vergrößerten Oberfläche der Wirkstoffe, die auf dem Aerogel molekular adsorbiert sind. Außerdem führt der sofortige Zerfall der hydrophilen Aerogelstruktur im Auflösungsmedium (Wasser bzw. simulierter Magensaft) zu einem schnellen Auflösen der Wirkstoffmoleküle. Aufbauend auf den experimentellen Ergebnissen wird die Verwendung von hydrophilen Aerogelen als Träger für die sehr schnelle Freisetzung vorgeschlagen. Die Freisetzungskinetik der Wirkstoffe aus hydrophilen Aerogelen kann vorhergesagt werden, wenn die anfängliche Beladung des Aerogels mit Wirkstoff bekannt ist. Im Vergleich zu kristallinen Wirkstoffen lässt sich bei niedrigen und mittleren Beladungen eine schnelle, bei höherer Beladung eine langsamere Freisetzung des Wirkstoffes beobachten. Im zweiten Teil der Arbeit wird die Beladung eines Wirkstoffes (Acetaminophen) auf einem hyperverzweigten Polyester (Boltorn H 3200) und auf hyperverzweigten Polyesteramiden (Hybrane H1690, H1200, H1500) sowie dessen Freisetzung aus beladenen Mikropartikeln gemessen und diskutiert. Für den hyperverzweigten Polyester Boltorn wurden mittels verschiedener Verfahren (Gas Anti-Solvent Precipitation (GAS), Koazervation und Partikel aus gasgesättigten Lösungen (PGSS)) Mikropartikeln hergestellt. Für die hyperverzweigten Polyesteramide wurden im Rahmen dieser Arbeit beladene Mikropartikel mithilfe der Solvent-Methode hergestellt. Es wird der Einfluss der Beladungsverfahren, von Polymereigenschaften und von Medikamentenkonzentrationen in den Mikropartikeln auf die
XIV Deutscher Titel, Kurzfassung und Einleitung
Freisetzungskinetik untersucht. Dabei kann gezeigt werden, dass die hyperverzweigten Polymere die Freisetzungsrate entweder erhöhen oder verzögern können. Dies hängt von der chemischen Struktur des Polymers und vom Beladungsverfahren ab.
Einleitung
Polymere haben wegen ihrer vielseitigen Eigenschaften vielen Forschern in verschiedenen Gebieten im Laufe der Jahre gedient. Die Flexibilität der Synthese und große Auswahl der Monomere erlaubt es, die gewünschten Eigenschaften der Polymere gezielt zu erreichen. In der vorliegenden Arbeit wird das Potenzial von zwei vielversprechenden Polymeren, Silica-Aerogelen und hyperverzweigte Polymeren, als Medikamententräger untersucht. Sowohl Silica-Aerogele als auch hyperverzweigte Polymere sind maßgeschneiderte Materialien, die einzigartige Eigenschaften besitzen und in verschiedenen Gebieten verwendet werden. Silica-Aerogele haben sehr niedrige Dichte und hohe Porositäten. Sie sind für viele technische Anwendungen einsetzbar. Diese Anwendungen sind in der Abb. 2.1 (siehe Fig. 2.1) zusammengefasst. Die Mikrostruktur von Aerogel besteht aus primären Partikeln, die ein dreidimensionales Netz formen. Ihre Eigenschaften können im Sol-Gel-Prozess maßgeschneidert werden. Aerogele mit einem breiten Spektrum von Eigenschaften können zurzeit aus verschiedenen metallischen, hybriden anorganisch-organischen und organischen Substanzen hergestellt werden. Silica-Aerogele sind am besten bekannt und gut untersucht. Obwohl kommerzielle Verwendung von Aerogelen wegen der teuren Rohstoffe und der überkritischen Trocknung erschwert ist, zeigt die große Zahl den Veröffentlichungen bereits das unbegrenzte Potential von Aerogelen. Deshalb hat die Forschung in den letzten 20 Jahren sich auf neue Anwendungen und preiswertere Herstellungswege konzentriert. Obwohl die ersten Aerogel-Produkte als die Verdickungs- und Zusatzstoffe in Zahnpasta und Kosmetik verwendet wurden (Montano Produkt, seit dem 60er Jahren des vergangen Jahrhunderts), wurde der weitere Gebrauch von Aerogelen in täglichen Produkten seit ein paar Jahrzehnten nie erwähnt. Seit dem Ende der 1990er Jahre rückten jedoch Silica-Aerogele erneut ins Licht der Life-Science, u.a. aufgrund ihrer günstigen biologischen Eigenschaften, wie Biokompatibilität und geringe Toxizität für menschlichen Körper. Darüber hinaus sind sie in der Lebensmittelindustrie, Pharmazie und Landwirtschaft angewandt worden. Die offene Porenstruktur, hohe spezifische Oberfläche und Porosität (großes Adsorptionspotential) machen ein Aerogel zu dem idealen Medium um kleine organische Moleküle zu deponieren oder Komposite herzustellen. Daraus resultieren mehrere potenzielle Prozesse und Anwendungen der Aerogele wie Herstellung von Aerogel-Kompositen mithilfe der chemischen Gasphaseninfiltration (CVI) (Hunt et al, 1995), die Verkapselung des Enzyms
XV Deutscher Titel, Kurzfassung und Einleitung
Lipase für Biokatalyse (Buisson et al, 2001), die Verkapselung von Bakterien (makroporöse Silica-Aerogele als Biosensoren) (Power et al, 2001) etc. In dieser Arbeit wird die Adsorption von Medikamenten auf Silica-Aerogele untersucht. Die zweite Klasse der Polymere, die in dieser Arbeit untersucht wird, sind hyperverzweigte Polymere. Hyperverzweigte Polymere sind hoch verzweigte Makromoleküle mit einer dreidimensionalen dendritischen Struktur. Das hyperverzweigte Polymer ist eine relativ junge, aber schnell wachsende Klasse von Polymeren, da sie einzigartige chemische und physikalische Eigenschaften im Vergleich zu traditionellen linear Polymeren besitzen. Die aus diesen Eigenschaften resultierenden Anwendungen sind breit und vielseitig (Abb. 2.2). Zurzeit ist die Entwicklung von hyperverzweigten Polymeren ein schnell wachsendes und vielversprechendes Feld im Bereich der Polymer Wissenschaften. Hyperverzweigte Polymere bieten ähnlich wie Dendrimere (Materialien in derselben Klasse) vielseitige und maßschneiderbare Eigenschaften, aber die vergleichsweise Einfachheit der Synthese macht sie attraktiver für Forscher und Hersteller. Deshalb sind diese Polymere ideale Kandidaten, um Dendrimere in den Gebieten zu ersetzen, wo eine perfekte dendritische Struktur weniger erforderlich ist (Gao, Yan, 2004; Seiler, 2002; Voit, 2000; Voit, 2003; Yates, Hayes, 2004). Obwohl zurzeit große Fortschritte in der Entwicklung hyperverzweigter Polymere innerhalb des Gebiets der Life-Science gemacht wurden, sind deren Anwendungen wie kontrollierte Wirkstoffträger, komposite Materialien und Nanopartikel-Träger noch in der Anfangsphase. Hyperverzweigte Polymere können als potenzielle Medikamententräger wie folgt verwendet werden: (1) Wirkstoffmoleküle können innerhalb der dendritischen Struktur (d. h. innerhalb des inneren Raums) physikalisch eingeschlossen werden; und (2) Wirkstoffmoleküle können kovalent mit der Oberfläche des Polymers oder mit den anderen funktionellen Gruppen verbunden sein, um Polymer-Wirkstoff-Konjugate zu bilden. Die meisten Polymere, die als Medikamententrägersysteme untersucht worden sind, sind entweder linear (nicht-verzweigt) oder crosslinked (hoch verzweigt). Die hyperverzweigte Polymere haben ein großes Potential als makromolekulare Medikamententräger, die es erlauben, die Konzentration der Wirkstoffe effektiv zu kontrollieren, um Medikamente, Gene oder Proteine zu den spezifischen Stellen im Körper zu transportieren. Das Ziel dieser Arbeit ist es, das Potential von zwei Polymeren, Silica-Aerogelen und hyperverzweigten Polymeren als Medikamententräger (DDS) zu bewerten. Der erste Teil befasst sich mit der Anwendung der Silica-Aerogele als Medikamententräger. Hydrophile Silica-Aerogele sind als Medikamententräger an unserem Lehrstuhl untersucht worden, und die grundsatzlische Anwendbarkeit der resultierenden Wirkstoff-Aerogel-Formulierungen (Smirnova, 2002) wurde demonstriert. Jedoch wurden bisher keine systematischen Untersuchungen des Einflusses der physikochemischen Eigenschaften der Silica-Aerogele auf
XVI Deutscher Titel, Kurzfassung und Einleitung
die Eigenschaften der Wirkstoff-Aerogel Formulierungen durchgeführt. In dieser Arbeit wird der Einfluss der Silica-Aerogel-Eigenschaften auf die Adsorption und die Freisetzungskinetik von sechs Medikamenten diskutiert. Silica-Aerogele mit verschiedenen Dichten, spezifischen Oberflächen, Porengrößen, und Hydrophobizität wurden hergestellt, und die Adsorption der Medikamente aus überkritischem Kohlendioxid auf diesen Aerogelen wurde untersucht. Die Adsorption von sechs verschiedenen Medikamenten wurde untersucht, um den Einfluss der Wirkstoffstruktur auf den Adsorptionsprozess zu demonstrieren. Drei Profene (Ketoprofen, Flurbiprofen und Ibuprofen) und drei Nicht-profene (Dithranol, Griseofulvin und Miconazol) wurden zu diesem Zweck ausgewählt. Ein weiteres Ziel waren, den Einfluss der Eigenschaften der Wirkstoff-Aerogel-Formulierungen auf die Freisetzungskinetiken von Wirkstoffen zu untersuchen. Alle ausgewählten Medikamente sind schlecht wasserlöslich, woraus eine schlechtere Bioverfügbarkeit und eine langsame Freisetzung resultiert. Die Verbesserung der Auflösungsgeschwindigkeit würde die Bioverfügbarkeit solcher Wirkstoffe verbessern. Entsprechend wird das Potential der Wirkstoff-Aerogel-Formulierungen in diesem Gebiet bewertet und mit dem der anderen Mikronisationstechniken verglichen. Zu diesem Zweck wird die Freisetzungskinetik der verschiedenen Wirkstoff-Aerogel-Formulierungen in einer zu diesem Zweck konstruierten Freisetzungsanlage vermessen und miteinander verglichen. Der zweite Teil der vorliegenden Arbeit konzentriert sich auf die Untersuchung der Wirkstoffverkapselung in hyperverzweigten Mikropartikeln, die aus dem Wirkstoff Acetaminophen und dem hyperverzweigtem Polyester Boltorn® H3200 oder dem Polyesteramide Hybrane® bestehen. Die Eigenschaften der resultierenden Mikropartikeln wurden charakterisiert. Der Einfluss von Verkapselungsmethoden auf die Freisetzungskinetik des Wirkstoffes aus den beladenen Mikropartikeln wurde experimentell untersucht.
1 Abstract
1. Abstract In this work the potential use of silica aerogels and hyperbranched polymers as drug delivery systems (DDS) is investigated and discussed. The first part of this work deals with the investigation of the influence of physicochemical properties of silica aerogels (e.g. density, specific surface area, pore sizes and hydrophobicity) on the adsorption of six poorly water-soluble drugs (profens: ketoprofen, flurbiprofen, and ibuprofen, and non-profens: miconazole, griseofulvin and dithranol) and on their in vitro release. The adsorption of drugs on aerogels takes place from supercritical CO2. It is demonstrated that the release of drugs with low and moderate adsorption on aerogels (griseofulvin, dithranol, ketoprofen, flurbiprofen) is faster than that of crystalline drugs. The reason is the enlarged surface of drugs adsorbed on aerogels, the immediate collapse of aerogels in the dissolution medium and the loss of the crystallinity of drugs. Based on experimental findings, a novel method for dissolution enhancement of these drugs using hydrophilic aerogels as host matrices is suggested. It is shown that the release kinetics of drugs from hydrophilic aerogels can be initially predicted when the adsorption of drugs on aerogels is known. The low or moderate adsorption on silica aerogels implies a very fast release of drugs from drug-aerogel formulations. Therefore, the dissolution rate can be enhanced. If the drugs have a very high affinity to silica aerogels (high adsorption), the slow release kinetic is observed. In the second part of this work, the encapsulation of the model drug, acetaminophen, in hyperbranched polyester (Boltorn H3200), polyesteramides (Hybrane H1690, H1200, H1500) and the in vitro release of the drug from drug-loaded microparticles are discussed. For Boltorn, drug-loaded microparticles prepared by gas antisolvent precipitation (GAS), coacervation, and particles from gas saturated solutions (PGSS) were supplied. Hybrane microparticles were prepared by the solvent method in this work. The influence of encapsulation methods and polymer properties on the release kinetics of the drug is studied. It is shown that hyperbranched polymers can increase or delay the drug release depending on their chemical structure and the encapsulation methods used.
2 Introduction und Objective
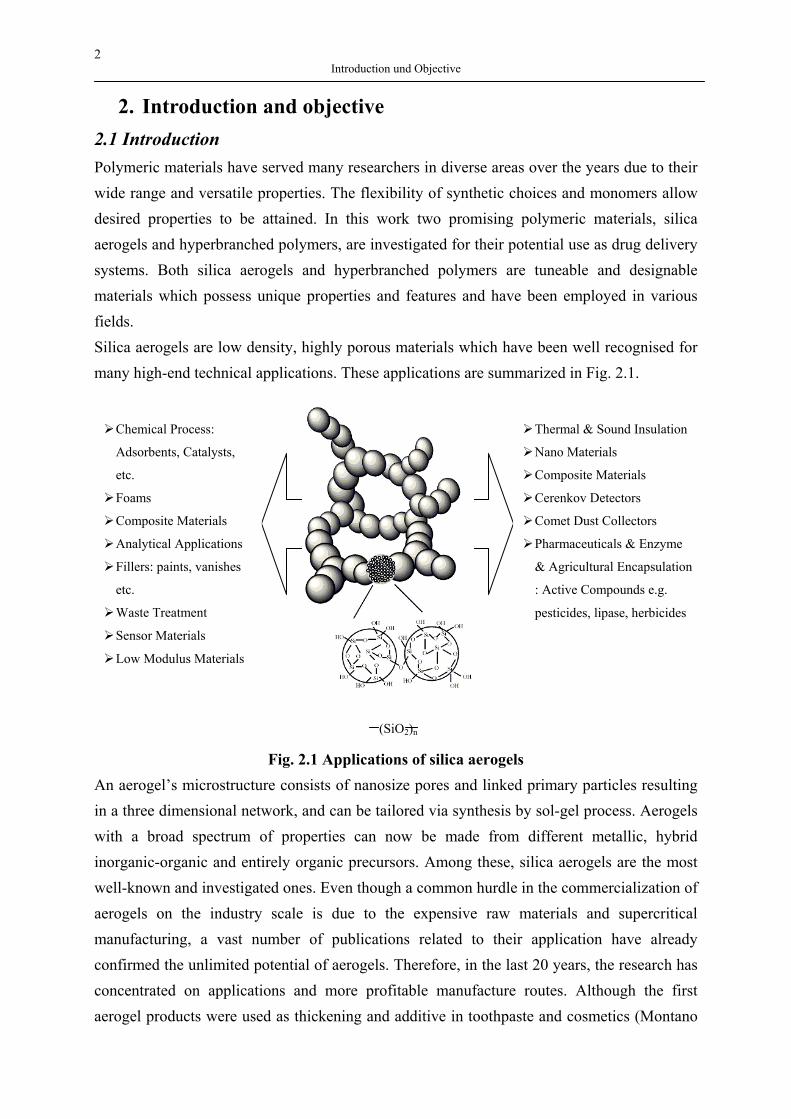
2. Introduction and objective 2.1 Introduction Polymeric materials have served many researchers in diverse areas over the years due to their wide range and versatile properties. The flexibility of synthetic choices and monomers allow desired properties to be attained. In this work two promising polymeric materials, silica aerogels and hyperbranched polymers, are investigated for their potential use as drug delivery systems. Both silica aerogels and hyperbranched polymers are tuneable and designable materials which possess unique properties and features and have been employed in various fields. Silica aerogels are low density, highly porous materials which have been well recognised for many high-end technical applications. These applications are summarized in Fig. 2.1.
Fig. 2.1 Applications of silica aerogels An aerogel’s microstructure consists of nanosize pores and linked primary particles resulting in a three dimensional network, and can be tailored via synthesis by sol-gel process. Aerogels with a broad spectrum of properties can now be made from different metallic, hybrid inorganic-organic and entirely organic precursors. Among these, silica aerogels are the most well-known and investigated ones. Even though a common hurdle in the commercialization of aerogels on the industry scale is due to the expensive raw materials and supercritical manufacturing, a vast number of publications related to their application have already confirmed the unlimited potential of aerogels. Therefore, in the last 20 years, the research has concentrated on applications and more profitable manufacture routes. Although the first aerogel products were used as thickening and additive in toothpaste and cosmetics (Montano
(SiO2)n
Chemical Process:
Adsorbents, Catalysts,
etc.
Foams
Composite Materials
Analytical Applications
Fillers: paints, vanishes
etc.
Waste Treatment
Sensor Materials
Low Modulus Materials
Thermal & Sound Insulation
Nano Materials
Composite Materials
Cerenkov Detectors
Comet Dust Collectors
Pharmaceuticals & Enzyme
& Agricultural Encapsulation
: Active Compounds e.g.
pesticides, lipase, herbicides
3 Introduction and Objective
Rheology modifier
Coatings
Forms
Crosslinkers
Tougheners
Polymer composites
Polymer additives
Carriers
Catalysts
Distillation Entrainers
Micellar application & Encapsulation
Layers & Sensors
Optical Waveguides
Electrolytes
Electroluminescent
Devices
Biocompatible Materials
Dispersing Agents
Analytical Applications
Selective Components in
Chemical Engineering
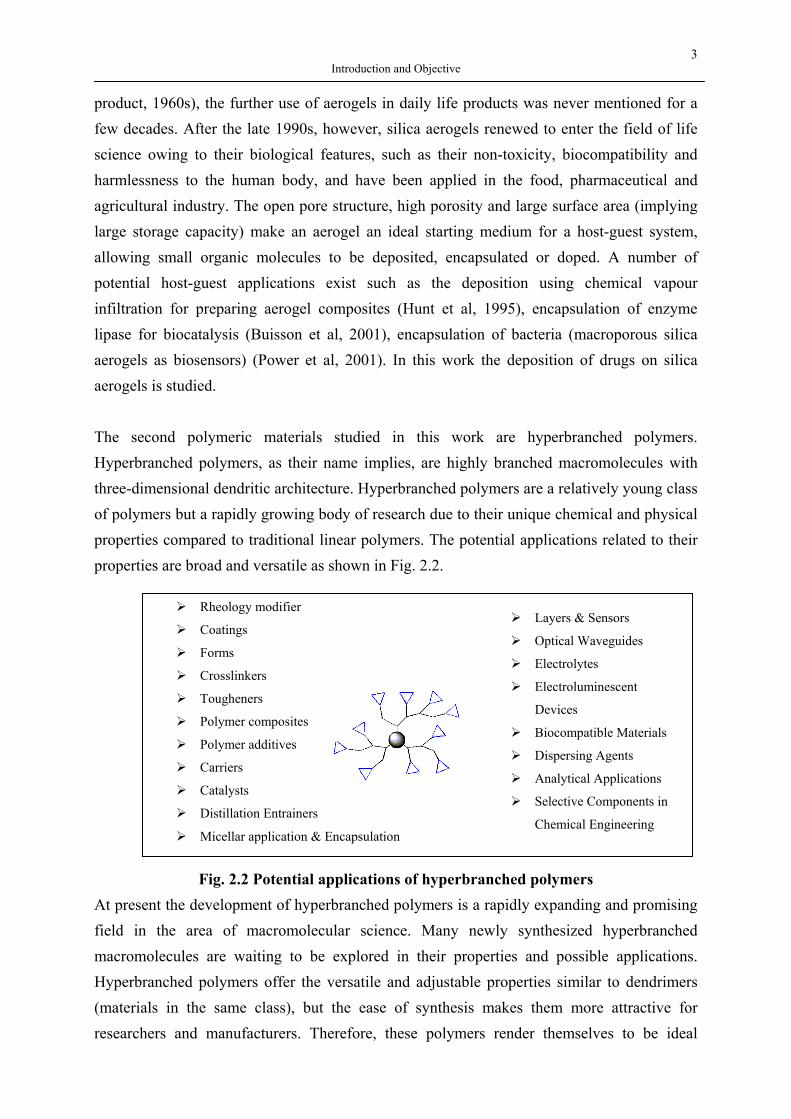
product, 1960s), the further use of aerogels in daily life products was never mentioned for a few decades. After the late 1990s, however, silica aerogels renewed to enter the field of life science owing to their biological features, such as their non-toxicity, biocompatibility and harmlessness to the human body, and have been applied in the food, pharmaceutical and agricultural industry. The open pore structure, high porosity and large surface area (implying large storage capacity) make an aerogel an ideal starting medium for a host-guest system, allowing small organic molecules to be deposited, encapsulated or doped. A number of potential host-guest applications exist such as the deposition using chemical vapour infiltration for preparing aerogel composites (Hunt et al, 1995), encapsulation of enzyme lipase for biocatalysis (Buisson et al, 2001), encapsulation of bacteria (macroporous silica aerogels as biosensors) (Power et al, 2001). In this work the deposition of drugs on silica aerogels is studied. The second polymeric materials studied in this work are hyperbranched polymers. Hyperbranched polymers, as their name implies, are highly branched macromolecules with three-dimensional dendritic architecture. Hyperbranched polymers are a relatively young class of polymers but a rapidly growing body of research due to their unique chemical and physical properties compared to traditional linear polymers. The potential applications related to their properties are broad and versatile as shown in Fig. 2.2.
Fig. 2.2 Potential applications of hyperbranched polymers At present the development of hyperbranched polymers is a rapidly expanding and promising field in the area of macromolecular science. Many newly synthesized hyperbranched macromolecules are waiting to be explored in their properties and possible applications. Hyperbranched polymers offer the versatile and adjustable properties similar to dendrimers (materials in the same class), but the ease of synthesis makes them more attractive for researchers and manufacturers. Therefore, these polymers render themselves to be ideal
4 Introduction und Objective
candidates for replacing dendrimers in some areas where less structural perfection is required (Gao, Yan, 2004; Seiler, 2002; Voit, 2000; Voit, 2003; Yates, Hayes, 2004). Although current advances in polymers with highly branched architectures have released new opportunities for developments within the area of life science, the research of hyperbranched polymers for their use as bioactive compounds carrier for controlled delivery, composite materials and nano-carriers, is still in its infancy. Hyperbranched polymers can be evaluated as potential drug delivery agents in one of two following ways: (1) drug molecules can be physically entrapped inside the dendritic structure (i.e. within internal cavity); and (2) drug molecules can be covalently attached onto surface or other functionalities to afford polymer–drug conjugates. Since most polymers investigated for drug delivery applications were either linear (nonbranched) or crosslinked (highly branched) in nature, the potential of hyperbranched polymers as macromolecular carriers for drugs presents an intriguing option for effectively controlling bioactive compounds concentration and for targeting specific regions in the body, particularly for drug, gene and protein delivery.
2.2 Objective The aim of the work is to evaluate the potential of two polymeric materials, silica aerogels and hyperbranched polymers as a drug delivery system (DDS). The first part deals with the application of silica aerogels as drug carriers. Hydrophilic silica aerogels have preliminarily been proposed as drug carriers at our Institute and their principle applicability of the resulting drug-aerogel formulations was demonstrated (Smirnova, 2002). However, no systematic studies concerning the relationship between physicochemical properties of silica aerogels and characteristics of the drug-aerogels formulations were performed. In this work, the influence of silica aerogel properties on loading process and in vitro release kinetics is discussed. Silica aerogels of different density, specific surface area, pore size, and hydrophobicity are synthesized and the adsorption of drugs from supercritical carbon dioxide on these aerogels is then studied. Adsorption was studied for six poorly water-soluble pharmaceuticals in order to prove the effect of the drug structure on the adsorption process. Three profens (ketoprofen, flurbiprofen and ibuprofen) and three non-profen drugs (dithranol, griseofulvin and miconazole) were selected for this purpose. Another goal was to investigate the influence of the characteristics of the drug-aerogel formulations on the release rate of drugs. Poorly water-soluble drugs are problematic for drug delivery; especially for oral administration, because of their slow release characteristics. Improving their dissolution rate would enhance the bioavailability of such drugs. Accordingly the potential of drug-aerogel formulation in this area is evaluated and compared with that of other micronization techniques. For this purpose the release kinetic of various drug-loaded silica aerogels formulations is measured using the dissolution apparatus, which is
5 Introduction and Objective
appropriately designed to use for the dissolution test of the powdered crystalline drug and the powdered drug-loaded silica aerogel. The second part of the present work concentrates on the investigation of drug-encapsulated hyperbranched microparticles prepared from the drug acetaminophen and commercially available hyperbranched polyester Boltorn® H3200 and polyesteramides Hybrane®. The drug-encapsulated microparticles are first characterised for thermal, physical and chemical properties. Special attention is given to the characteristics of drugs and polymers obtained from different encapsulation methods. Therefore, the influence of encapsulation methods on in vitro release kinetics of resulting drug-encapsulated microparticles is discussed based on experimental results.
6 Theoretical Background
3. Theoretical Background 3.1 Silica Aerogels The term aerogel refers to a dried gel with a very light weight and a high pore volume. A silica aerogel, an aerogel made from silica sources, is one of the most fascinating inorganic polymers. Since Kistler’s innovation of silica aerogels in 1931, the process of making aerogels has undergone two key breakthroughs. During that time, inorganic salt ‘water glass’ was used as a precursor in the sol-gel base process, which involved first forming an aquagel, then an alcogel, then supercritically drying it to produce an inorganic aerogel. In the late 1960’s organic precursors were introduced, which allowed a much shorter method for obtaining the aerogel by eliminating the aquagel-orga(alco)gel procedure. These two methods are generally considered high temperature methods. In the mid 1980’s, a low temperature process was proposed that involved a supercritical drying of a liquid carbon dioxide. Finally in the late 1980s this last process was modified to produce the organic polymeric aerogels. Today’s aerogels are made from inorganic, hybrid organic-inorganic, or even entirely organic precursors, as well as ambient and supercritical drying techniques.
3.1.1 History of silica aerogels 3.1.1.1 Silica aerogels in the early 1930 In 1931 Steven S. Kistler (Kistler, 1931) of the College of the Pacific in Stockton, California attempted to remove the liquid from the resulting gel without destroying the gel network structure in order to prove that a gel contained a continuous solid network of the same size and shape as the wet gel. The first gels investigated by Kistler were silica aerogels prepared by the acidic condensation of aqueous sodium silicate or waterglass as show in Eq. 3.1.
NaClOxHSiOOHxHClSiONa 2)1(2 22232 +•→−++ Eq. 3.1
At the onset of Kistler’s experiment, efforts to produce aerogels by converting water in these gels to a supercritical fluid failed because the supercritical water (Pc=22.1 MPa, Tc=374°C) redissolved the silica instead of obtaining a silica aerogel. Kistler then proceeded by washing the gels carefully with water to remove the foreign ions and then exchanging the water for alcohol. The first silica aerogels were formed by converting the alcohol to a supercritical fluid and venting it. It is presumed that Kistler’s aerogels were similar to the silica aerogels produced today. Several years after Kistler’s discovery, aerogels were prepared from many other materials, including alumina, ferric oxide, tungsten oxide, tin oxide, nickel tartarate, cellulose, gelatine, agar, egg albumen, and rubber (Hunt, Ayers, 2004). In the 1950’s Kistler went on to take a position at the Company Monsanto. Monsanto started to commercialise the product under trade name Santocel® (Fricke, Tillotson, 1997). Even though little is known about the manufacture of Monsanto’s aerogel, it is presumed that its production followed Kistler’s recipes. Monsanto’s aerogel was used as an additive or a thixotropic agent in
7 Theoretical Background
cosmetics and toothpastes. Three decades following Kistler’s discovery, there was a little work in the field of aerogels research, most likely due to their laborious and time-consuming productions and tedious dialysis and high temperature drying steps. In the 1960s, Monsanto halted their aerogel production due to the development and marketing of lower cost fumed silica using silicon tetrachloride. In fact, from an economic point of view, the cost of aerogel production has limited the potential of an extensive commercial exploitation.
3.1.1.2 Rediscovery of aerogels and the start of the alkoxide sol-gel method In 1962 the French government approached Stanislas Teichner at the University of Lyon to seek a method for storing oxygen and rocket fuels in highly porous media. As Kistler’s method to preparing an aerogel requires time-consuming laborious solvent exchange steps, the desire to eliminate these disadvantages has resulted in new synthetic methodologies such as the synthesis of an aerogel by Peri (Peri, 1966) using tetraethylorthosilicate (TEOS), followed by the use of different tetrafunctional siliconalkoxide precursors (Si(OR)4) by Nicoloan et al (Nicoloan, 1968). This novel method of synthesis by use of organosilanes resulted in a major breakthrough in synthetic procedure for the gel preparation and the modern day sol-gel method was introduced (Teichner, Nicoloan, 1972). In the French group’s recipe, the sodium silicate was replaced by an alkoxysilane, tetramethoxysilane (TMOS). First hydrolysing TMOS in a solution of methanol and a presence of either acid or base catalyst produced a gel in one step (called an alcogel). The TMOS hydrolyses producing silicic acid which then condenses to SiO2. The overall net reaction is as follows;
OHCHSiOOHOCHSi 32243 4)( +→+ Eq. 3.2
A sol was formed from small nanometer size silica particles. The viscosity of the sol increases as the particles link and then cross-linking to form a three dimensional silica network, resulting in an alcogel. This method eliminated the washing of the alcogel as no impurities were formed in the hydrolysis. The alcogel could be directly supercritically dried. The production process was accelerated by this new method. In subsequent years Teichner’s group, as well as other groups, used this procedure to prepare a wide variety of inorganic aerogels.
3.1.1.3 Major milestones of silica aerogels after 1980 and beyond After years of new developments in the field of aerogel productions, the research body of aerogel science and technology has grown drastically. This includes the first application of silica aerogels as Cherenkov detectors in high energy physics in the 1960s. The detection of fast pions, kaons, or protons requires a medium with the index of refraction (η)≈1. The refractive index of aerogels (η≈1.006-1.1) with corresponding densities from 3-500 kg/m3 happens to match this requirement. The subsequent demand for aerogels led to two industrial

8 Theoretical Background
scale productions in the early 1980s. D. Poelz produced 1.5 m3 (15cm×15cm×2.5cm) of silica aerogel tiles for the Deutsches Elektronen Synchrotron (DESY) in Hamburg, Germany (Poelz, 1986), while S.V. Henning and G.V. Dardel, at Lund University, supplied the European laboratory for particle physics, CERN, with 1.0 m3 of Aerogel (Henning, Svensson, 1981). Airglass AB was later founded by the Swedish group. Aerogel researches flourished in the 1980s. In 1983 the Microstructure Group at Berkeley Lab replaced toxic tetramethoxysilane (TMOS) with tetraethoxysilane (TEOS) for aerogels preparation. At the same time another advance in aerogel research by Hunt and his group, the new drying scheme using supercritical carbon dioxide, was developed by Hunt and Tewari (Tewari et al, 1985) to make silica aerogels from TEOS precursors. A drying process involves the use of liquid carbon dioxide. A gel can be replaced with liquid carbon dioxide before it is supercritically dried without destroying the gel structure. This method illustrates the safer process due to milder supercritical condition of carbon dioxide (Tc=31°C, Pc=7.37MPa) compared with critical point of methanol (Tc=239.4°C, Pc=8.09MPa). Another major advance in the research body of aerogels took place when the International Symposium on Aerogels (ISA) was first held in Wuerzburg, Germany in 1985. This event since takes place every 3 years and draws in an increasing number of participants. The German company BASF marketed silica aerogel beads derived from sodium silicate until 1996 under the trade name BASOGEL. In late 1985 Hrubesh and Tillotson (Tillotson, Hrubesh, 1992) at Lawrence Livermore National Laboratory (LLNL) prepared ultralow-density silica aerogels (as low as 0.003 g/cm3) by adapting the two-step sol-gel method first described by Brinker (Brinker et al, 1982) (see also section 3.1.4.2.). This aerogel is currently being used in NASA space shuttle fights (Tsou, 1995). Later, Pekala at LLNL (Pekala, 1989) applied the techniques used to prepare inorganic aerogels in the preparation of organic aerogels. The first organic aerogels were prepared from the polycondensation of resorcinol with formaldehyde. These organic aerogels, also called RF aerogels, were claimed to have lowest thermal conductivity, 0.012 Wm-1K, of any solid material ever tested (Fricke, Tillotson, 1997). Another breakthrough in the area of silica aerogel preparation is the direct formation of silica aerogel microparticles through the use of supercritical solvents (i.e. acetone) by Girona and coworkers (Moner-Girona et al, 2003). Using the power processing techniques, e.g. rapid expansion from supercritical solution, spherical and fibre silica aerogel microparticles were produced.
3.1.2 Preparation of silica aerogels 3.1.2.1 Sol-gel processing Sol-gel processing is a type of solid materials synthesis procedure which is performed in a liquid and at low temperature (T<100°C). The solids referred to here are inorganic oxides or hydroxides, also termed precursors. The solid is formed as a result of a polymerization
9 Theoretical Background
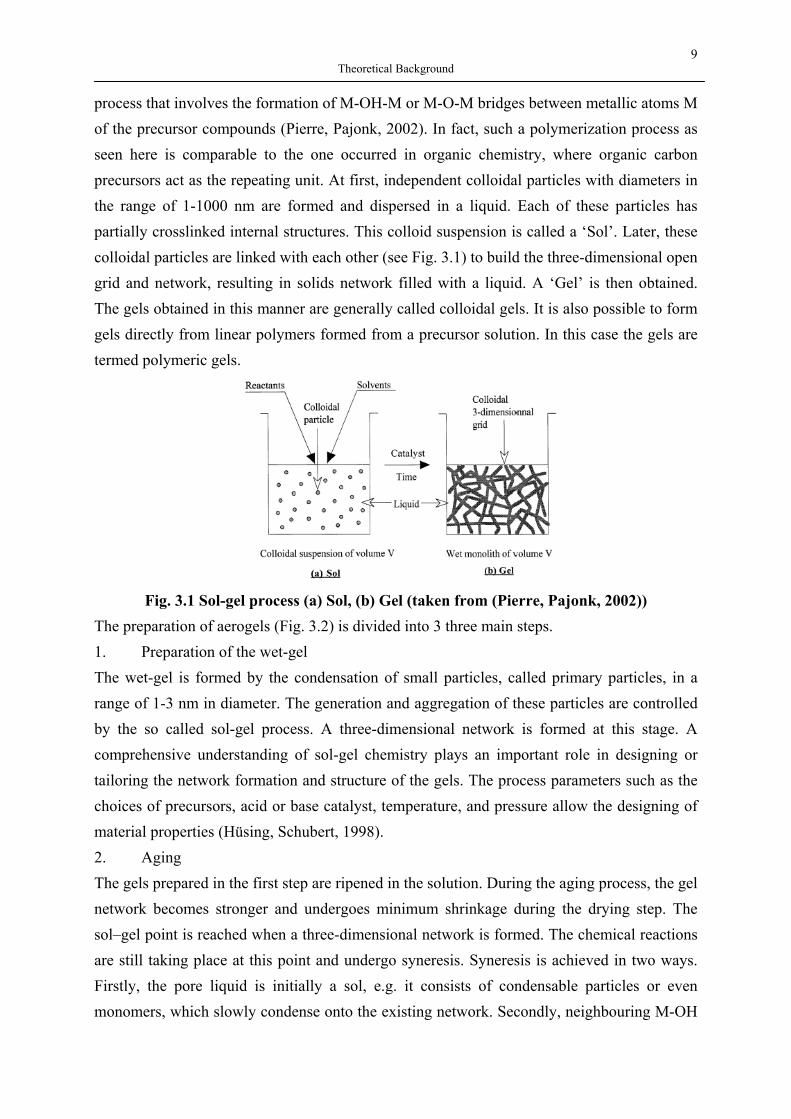
process that involves the formation of M-OH-M or M-O-M bridges between metallic atoms M of the precursor compounds (Pierre, Pajonk, 2002). In fact, such a polymerization process as seen here is comparable to the one occurred in organic chemistry, where organic carbon precursors act as the repeating unit. At first, independent colloidal particles with diameters in the range of 1-1000 nm are formed and dispersed in a liquid. Each of these particles has partially crosslinked internal structures. This colloid suspension is called a ‘Sol’. Later, these colloidal particles are linked with each other (see Fig. 3.1) to build the three-dimensional open grid and network, resulting in solids network filled with a liquid. A ‘Gel’ is then obtained. The gels obtained in this manner are generally called colloidal gels. It is also possible to form gels directly from linear polymers formed from a precursor solution. In this case the gels are termed polymeric gels.
Fig. 3.1 Sol-gel process (a) Sol, (b) Gel (taken from (Pierre, Pajonk, 2002))
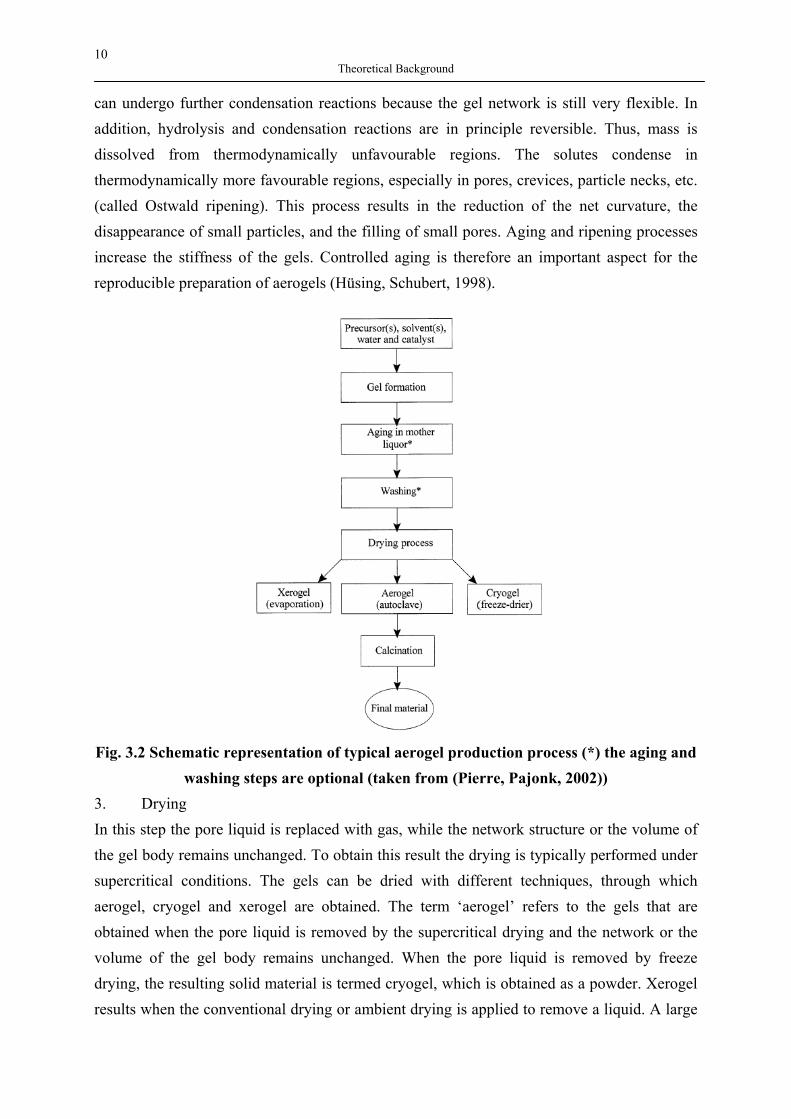
The preparation of aerogels (Fig. 3.2) is divided into 3 three main steps. 1. Preparation of the wet-gel The wet-gel is formed by the condensation of small particles, called primary particles, in a range of 1-3 nm in diameter. The generation and aggregation of these particles are controlled by the so called sol-gel process. A three-dimensional network is formed at this stage. A comprehensive understanding of sol-gel chemistry plays an important role in designing or tailoring the network formation and structure of the gels. The process parameters such as the choices of precursors, acid or base catalyst, temperature, and pressure allow the designing of material properties (Hüsing, Schubert, 1998). 2. Aging The gels prepared in the first step are ripened in the solution. During the aging process, the gel network becomes stronger and undergoes minimum shrinkage during the drying step. The sol–gel point is reached when a three-dimensional network is formed. The chemical reactions are still taking place at this point and undergo syneresis. Syneresis is achieved in two ways. Firstly, the pore liquid is initially a sol, e.g. it consists of condensable particles or even monomers, which slowly condense onto the existing network. Secondly, neighbouring M-OH
10 Theoretical Background
can undergo further condensation reactions because the gel network is still very flexible. In addition, hydrolysis and condensation reactions are in principle reversible. Thus, mass is dissolved from thermodynamically unfavourable regions. The solutes condense in thermodynamically more favourable regions, especially in pores, crevices, particle necks, etc. (called Ostwald ripening). This process results in the reduction of the net curvature, the disappearance of small particles, and the filling of small pores. Aging and ripening processes increase the stiffness of the gels. Controlled aging is therefore an important aspect for the reproducible preparation of aerogels (Hüsing, Schubert, 1998).
Fig. 3.2 Schematic representation of typical aerogel production process (*) the aging and
washing steps are optional (taken from (Pierre, Pajonk, 2002)) 3. Drying In this step the pore liquid is replaced with gas, while the network structure or the volume of the gel body remains unchanged. To obtain this result the drying is typically performed under supercritical conditions. The gels can be dried with different techniques, through which aerogel, cryogel and xerogel are obtained. The term ‘aerogel’ refers to the gels that are obtained when the pore liquid is removed by the supercritical drying and the network or the volume of the gel body remains unchanged. When the pore liquid is removed by freeze drying, the resulting solid material is termed cryogel, which is obtained as a powder. Xerogel results when the conventional drying or ambient drying is applied to remove a liquid. A large
11 Theoretical Background
shrinkage and the destruction of the gel network is a major drawback of this process. Gels dried by ambient drying are sometimes aerogels. The terms xerogel and aerogel are interchangeably used depending on the structures and features of the final dried materials. However, ambient pressure drying techniques have been developed to circumvent this problem, resulting in the large scale production and reduced cost of aerogel products.
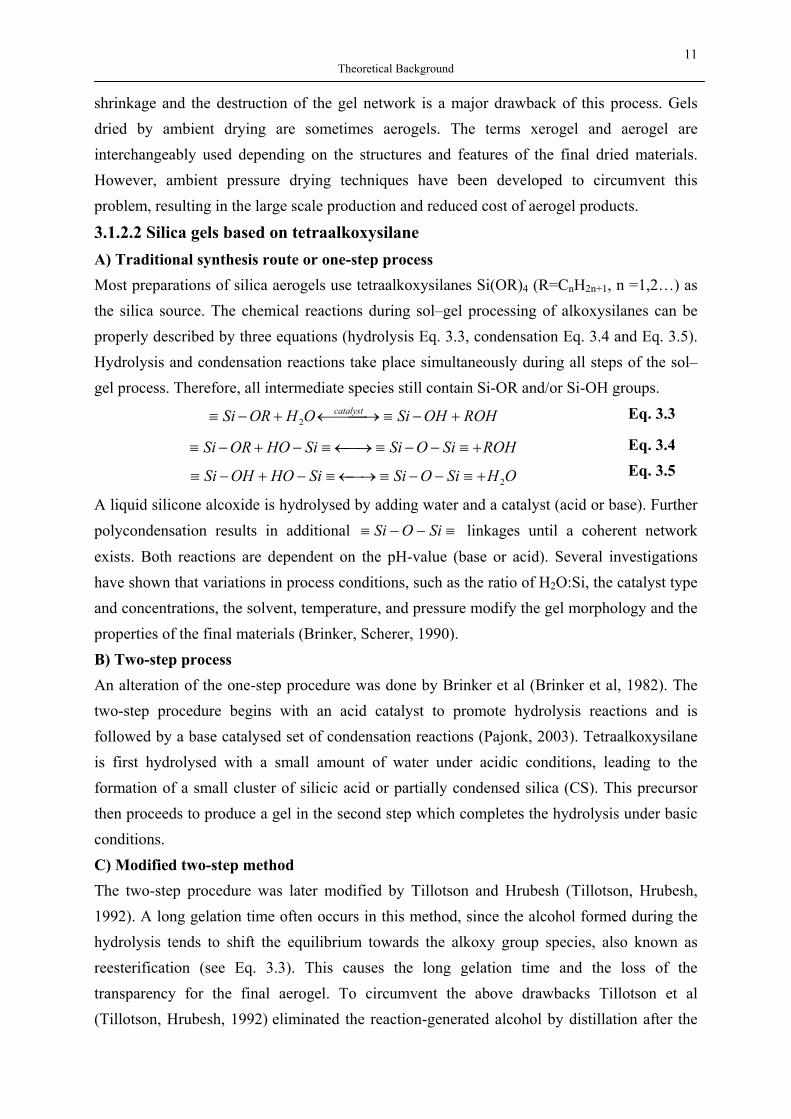
3.1.2.2 Silica gels based on tetraalkoxysilane A) Traditional synthesis route or one-step process Most preparations of silica aerogels use tetraalkoxysilanes Si(OR)4 (R=CnH2n+1, n =1,2…) as the silica source. The chemical reactions during sol–gel processing of alkoxysilanes can be properly described by three equations (hydrolysis Eq. 3.3, condensation Eq. 3.4 and Eq. 3.5). Hydrolysis and condensation reactions take place simultaneously during all steps of the sol–gel process. Therefore, all intermediate species still contain Si-OR and/or Si-OH groups.
ROHOHSiOHORSi catalyst +−≡ →←+−≡ 2 Eq. 3.3
ROHSiOSiSiHOORSi +≡−−≡→←≡−+−≡
OHSiOSiSiHOOHSi 2+≡−−≡→←≡−+−≡
Eq. 3.4 Eq. 3.5
A liquid silicone alcoxide is hydrolysed by adding water and a catalyst (acid or base). Further polycondensation results in additional ≡−−≡ SiOSi linkages until a coherent network exists. Both reactions are dependent on the pH-value (base or acid). Several investigations have shown that variations in process conditions, such as the ratio of H2O:Si, the catalyst type and concentrations, the solvent, temperature, and pressure modify the gel morphology and the properties of the final materials (Brinker, Scherer, 1990). B) Two-step process An alteration of the one-step procedure was done by Brinker et al (Brinker et al, 1982). The two-step procedure begins with an acid catalyst to promote hydrolysis reactions and is followed by a base catalysed set of condensation reactions (Pajonk, 2003). Tetraalkoxysilane is first hydrolysed with a small amount of water under acidic conditions, leading to the formation of a small cluster of silicic acid or partially condensed silica (CS). This precursor then proceeds to produce a gel in the second step which completes the hydrolysis under basic conditions. C) Modified two-step method The two-step procedure was later modified by Tillotson and Hrubesh (Tillotson, Hrubesh, 1992). A long gelation time often occurs in this method, since the alcohol formed during the hydrolysis tends to shift the equilibrium towards the alkoxy group species, also known as reesterification (see Eq. 3.3). This causes the long gelation time and the loss of the transparency for the final aerogel. To circumvent the above drawbacks Tillotson et al (Tillotson, Hrubesh, 1992) eliminated the reaction-generated alcohol by distillation after the
12 Theoretical Background
first step and replaced the alcohol with an aprotic solvent (e.g. acetonitrile). The complete hydrolysis in the second step was done under basic conditions (e.g. ammonium hydroxide) with a large excess of non-alcohol solvent. Transparent monolithic silica aerogels produced by this approach have a density as low as 0.003 g/cm3 (99.8% porous). The drawback of this approach is the laborious and tedious purification of TMOS (16 hours) and the removal of alcohol by distillation after the first step. Based on the two-step method, a group of Pajonk (Pajonk et al, 1995; Pajonk, 2003) reported the synthesis of oligomeric polyethoxydisiloxane (PEDS-Px), where x represents half the value of the molar water to TEOS ratio. These defined oligomeric PEDS-Px precursors, currently sold by the French company (PCAS), were obtained by the reaction of tetraethoxysilane (TEOS) and water (water to TEOS molar fraction, n, ranging between 0.8 and 1.8) in the presence of sulfuric acid. Monolith silica gels can be prepared using partially condensed silica as precursors in acidic condition (e.g. HF) (Einarsrud et al, 2001). Many efforts have been made to improve the preparation of silica aerogels with different densities. Smirnova et al (Smirnova et al, 2003) used the two-step method to prepare silica aerogels with a target density of 0.03 g/cm3. After carbon dioxide gas (CO2) was added to a sol at 25 and 40°C, the geletion time decreased drastically as compared to a method without additional CO2 (e.g. at 25°C decreasing from 161 hrs. to 60 hrs.). D) Gels from other inorganic compounds Other metallic salts and alkoxides can also undergo sol-gel processing. The principles for network formation of these inorganic gels are the same as for SiO2 gels (Hüsing, Schubert, 1998). The non-silicate metal alkoxides are much more reactive to water than alkoxysilanes. This is due to the lower electronegativity and higher Lewis acidity as well as the possibility of increasing the coordination number (Campbell et al, 1992). For instance, the reactivity of tetravalent alkoxides in hydrolysis reactions decreases in the order Si(OR)4<<<Sn(OR)4, Ti(OR)4<Zr(OR)4<Ce(OR)4. The high reactivity of some metal alkoxides leads to spontaneous precipitates formed upon addition of water. Both the hydrolysis and condensation reactions of these precursors are fast, so that it is difficult to experimentally measure them separately. In the case of siliconalkoxides, Si atoms carry reduced partial positive charge (Pierre, Pajonk, 2002), causing the gelation kinetics to be very slow. The hydrolysis and condensation reactions need to be catalyzed as the mechanism described in section 3.1.2.2 A. Therefore, siliconalkoxides have been much more extensively studied.
3.1.2.3 Converting wet-gels to aerogels Problems involving the conversion of wet-gels to aerogels, such as the shrinkage, the transparency, drying conditions, and etc., have been addressed well between researchers. Strategies have been developed to prevent cracking and preserve the pore structure in order to obtain the desired aerogels.
13 Theoretical Background
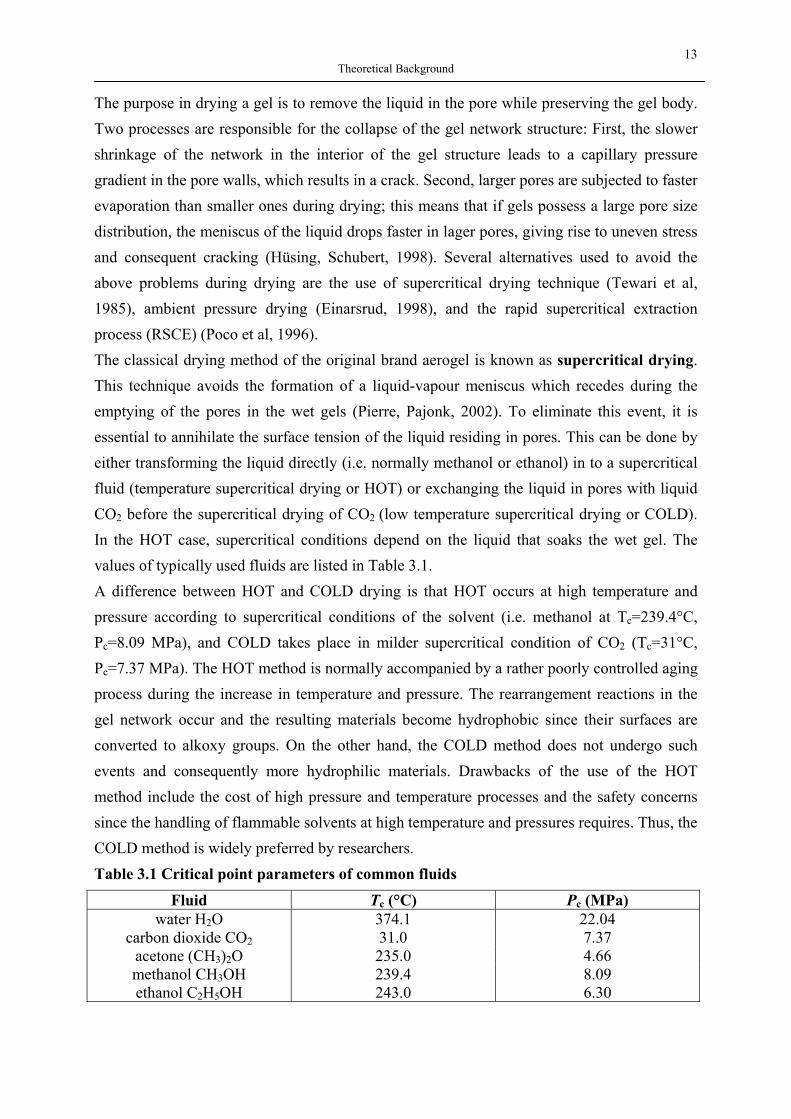
The purpose in drying a gel is to remove the liquid in the pore while preserving the gel body. Two processes are responsible for the collapse of the gel network structure: First, the slower shrinkage of the network in the interior of the gel structure leads to a capillary pressure gradient in the pore walls, which results in a crack. Second, larger pores are subjected to faster evaporation than smaller ones during drying; this means that if gels possess a large pore size distribution, the meniscus of the liquid drops faster in lager pores, giving rise to uneven stress and consequent cracking (Hüsing, Schubert, 1998). Several alternatives used to avoid the above problems during drying are the use of supercritical drying technique (Tewari et al, 1985), ambient pressure drying (Einarsrud, 1998), and the rapid supercritical extraction process (RSCE) (Poco et al, 1996). The classical drying method of the original brand aerogel is known as supercritical drying. This technique avoids the formation of a liquid-vapour meniscus which recedes during the emptying of the pores in the wet gels (Pierre, Pajonk, 2002). To eliminate this event, it is essential to annihilate the surface tension of the liquid residing in pores. This can be done by either transforming the liquid directly (i.e. normally methanol or ethanol) in to a supercritical fluid (temperature supercritical drying or HOT) or exchanging the liquid in pores with liquid CO2 before the supercritical drying of CO2 (low temperature supercritical drying or COLD). In the HOT case, supercritical conditions depend on the liquid that soaks the wet gel. The values of typically used fluids are listed in Table 3.1. A difference between HOT and COLD drying is that HOT occurs at high temperature and pressure according to supercritical conditions of the solvent (i.e. methanol at Tc=239.4°C, Pc=8.09 MPa), and COLD takes place in milder supercritical condition of CO2 (Tc=31°C, Pc=7.37 MPa). The HOT method is normally accompanied by a rather poorly controlled aging process during the increase in temperature and pressure. The rearrangement reactions in the gel network occur and the resulting materials become hydrophobic since their surfaces are converted to alkoxy groups. On the other hand, the COLD method does not undergo such events and consequently more hydrophilic materials. Drawbacks of the use of the HOT method include the cost of high pressure and temperature processes and the safety concerns since the handling of flammable solvents at high temperature and pressures requires. Thus, the COLD method is widely preferred by researchers. Table 3.1 Critical point parameters of common fluids
Fluid Tc (°C) Pc (MPa) water H2O 374.1 22.04
carbon dioxide CO2 31.0 7.37 acetone (CH3)2O 235.0 4.66 methanol CH3OH 239.4 8.09 ethanol C2H5OH 243.0 6.30
14 Theoretical Background
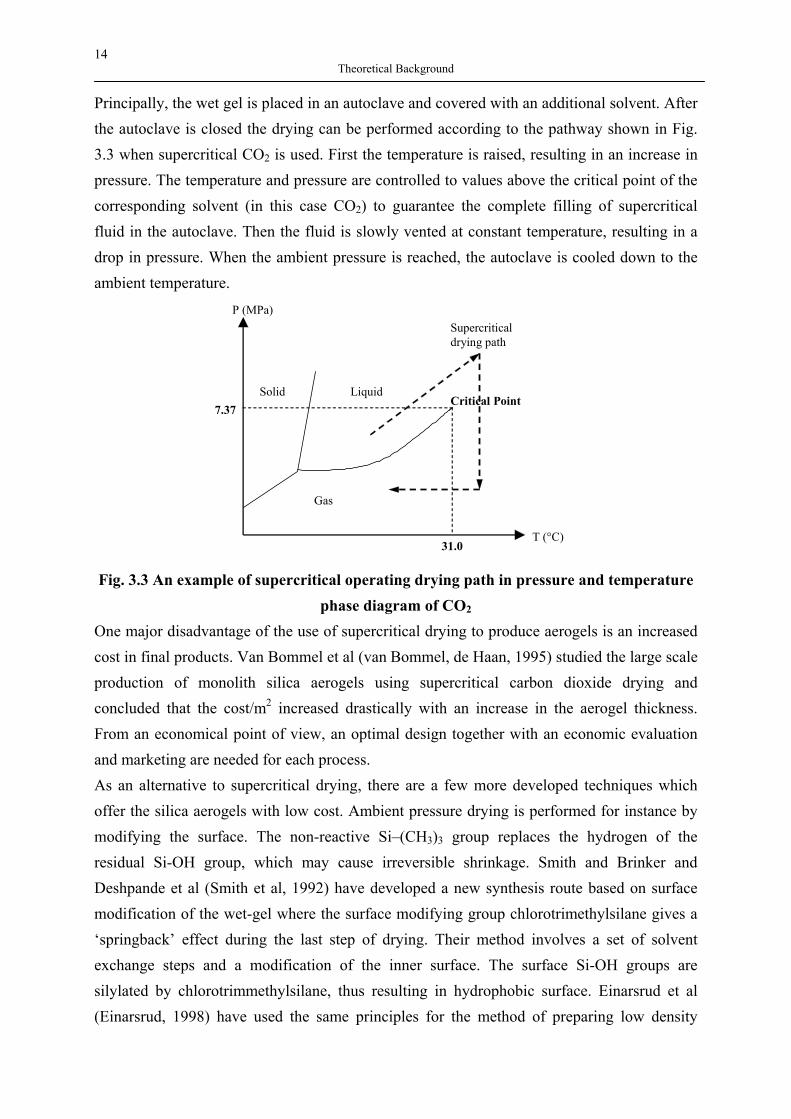
Principally, the wet gel is placed in an autoclave and covered with an additional solvent. After the autoclave is closed the drying can be performed according to the pathway shown in Fig. 3.3 when supercritical CO2 is used. First the temperature is raised, resulting in an increase in pressure. The temperature and pressure are controlled to values above the critical point of the corresponding solvent (in this case CO2) to guarantee the complete filling of supercritical fluid in the autoclave. Then the fluid is slowly vented at constant temperature, resulting in a drop in pressure. When the ambient pressure is reached, the autoclave is cooled down to the ambient temperature.
Solid Liquid
Gas
7.37
P (MPa)
T (°C) 31.0
Critical Point
Supercritical drying path
Fig. 3.3 An example of supercritical operating drying path in pressure and temperature
phase diagram of CO2 One major disadvantage of the use of supercritical drying to produce aerogels is an increased cost in final products. Van Bommel et al (van Bommel, de Haan, 1995) studied the large scale production of monolith silica aerogels using supercritical carbon dioxide drying and concluded that the cost/m2 increased drastically with an increase in the aerogel thickness. From an economical point of view, an optimal design together with an economic evaluation and marketing are needed for each process. As an alternative to supercritical drying, there are a few more developed techniques which offer the silica aerogels with low cost. Ambient pressure drying is performed for instance by modifying the surface. The non-reactive Si–(CH3)3 group replaces the hydrogen of the residual Si-OH group, which may cause irreversible shrinkage. Smith and Brinker and Deshpande et al (Smith et al, 1992) have developed a new synthesis route based on surface modification of the wet-gel where the surface modifying group chlorotrimethylsilane gives a ‘springback’ effect during the last step of drying. Their method involves a set of solvent exchange steps and a modification of the inner surface. The surface Si-OH groups are silylated by chlorotrimmethylsilane, thus resulting in hydrophobic surface. Einarsrud et al (Einarsrud, 1998) have used the same principles for the method of preparing low density
15 Theoretical Background
xerogels by increasing the strength and stiffness of wet-gels, mainly by aging them in a monomer solution. Recently Lee et al (Lee et al, 2003) have invented the methods of producing aerogel products by means of a rapid solvent exchange. Supercritical CO2, rather than liquid CO2 was injected into an extractor to remove a solvent inside wet gels, which has been previously heated and pressurized to substantially supercritical conditions or above. This method greatly reduces the time for forming aerogel products.
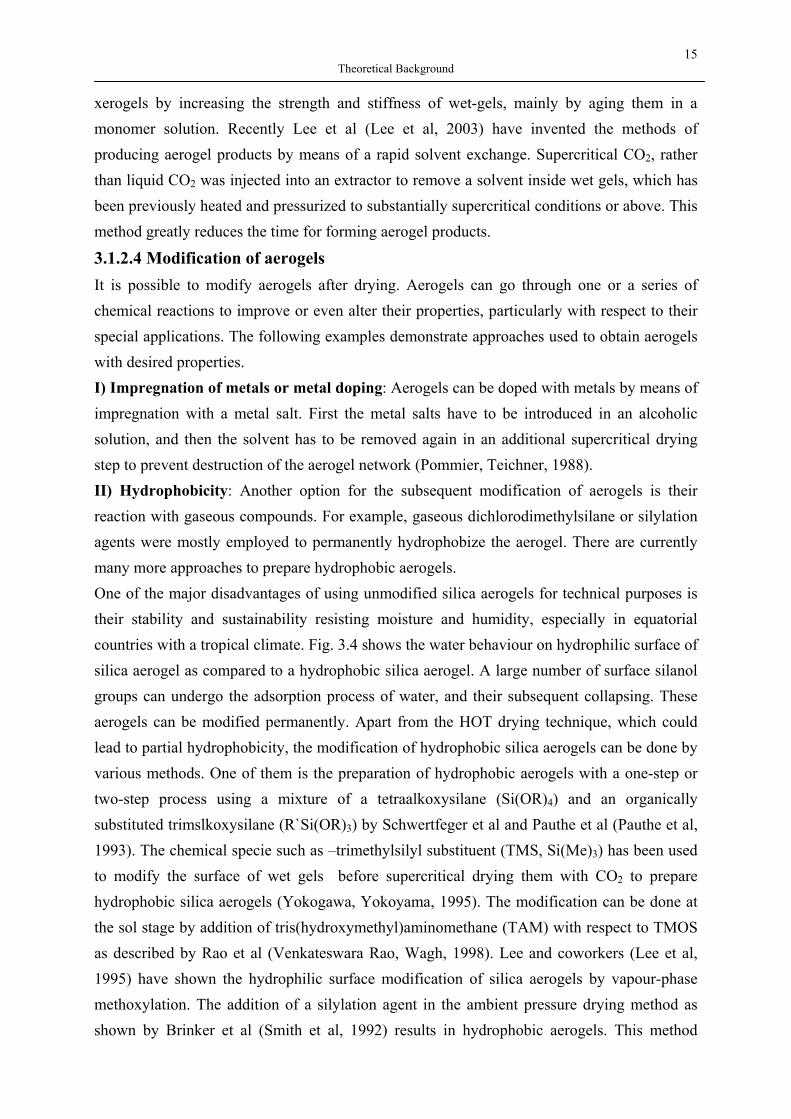
3.1.2.4 Modification of aerogels It is possible to modify aerogels after drying. Aerogels can go through one or a series of chemical reactions to improve or even alter their properties, particularly with respect to their special applications. The following examples demonstrate approaches used to obtain aerogels with desired properties. I) Impregnation of metals or metal doping: Aerogels can be doped with metals by means of impregnation with a metal salt. First the metal salts have to be introduced in an alcoholic solution, and then the solvent has to be removed again in an additional supercritical drying step to prevent destruction of the aerogel network (Pommier, Teichner, 1988). II) Hydrophobicity: Another option for the subsequent modification of aerogels is their reaction with gaseous compounds. For example, gaseous dichlorodimethylsilane or silylation agents were mostly employed to permanently hydrophobize the aerogel. There are currently many more approaches to prepare hydrophobic aerogels. One of the major disadvantages of using unmodified silica aerogels for technical purposes is their stability and sustainability resisting moisture and humidity, especially in equatorial countries with a tropical climate. Fig. 3.4 shows the water behaviour on hydrophilic surface of silica aerogel as compared to a hydrophobic silica aerogel. A large number of surface silanol groups can undergo the adsorption process of water, and their subsequent collapsing. These aerogels can be modified permanently. Apart from the HOT drying technique, which could lead to partial hydrophobicity, the modification of hydrophobic silica aerogels can be done by various methods. One of them is the preparation of hydrophobic aerogels with a one-step or two-step process using a mixture of a tetraalkoxysilane (Si(OR)4) and an organically substituted trimslkoxysilane (R`Si(OR)3) by Schwertfeger et al and Pauthe et al (Pauthe et al, 1993). The chemical specie such as –trimethylsilyl substituent (TMS, Si(Me)3) has been used to modify the surface of wet gels before supercritical drying them with CO2 to prepare hydrophobic silica aerogels (Yokogawa, Yokoyama, 1995). The modification can be done at the sol stage by addition of tris(hydroxymethyl)aminomethane (TAM) with respect to TMOS as described by Rao et al (Venkateswara Rao, Wagh, 1998). Lee and coworkers (Lee et al, 1995) have shown the hydrophilic surface modification of silica aerogels by vapour-phase methoxylation. The addition of a silylation agent in the ambient pressure drying method as shown by Brinker et al (Smith et al, 1992) results in hydrophobic aerogels. This method
16 Theoretical Background
exploits the reaction of methanol with surface –OH groups of unmodified silica aerogels. The reaction time used was 10 h. Ziegler (Ziegler et al, 1998) patents a preparation of hydrophobic silica aerogels by reacting a waterglass solution with an acid at basic conditions (pH=7.5-11). This approach requires laborious dialysis step and is time-consuming due to the solvent exchange.
Fig. 3.4 Interaction between water and backbone of hydrophilic and hydrophobic
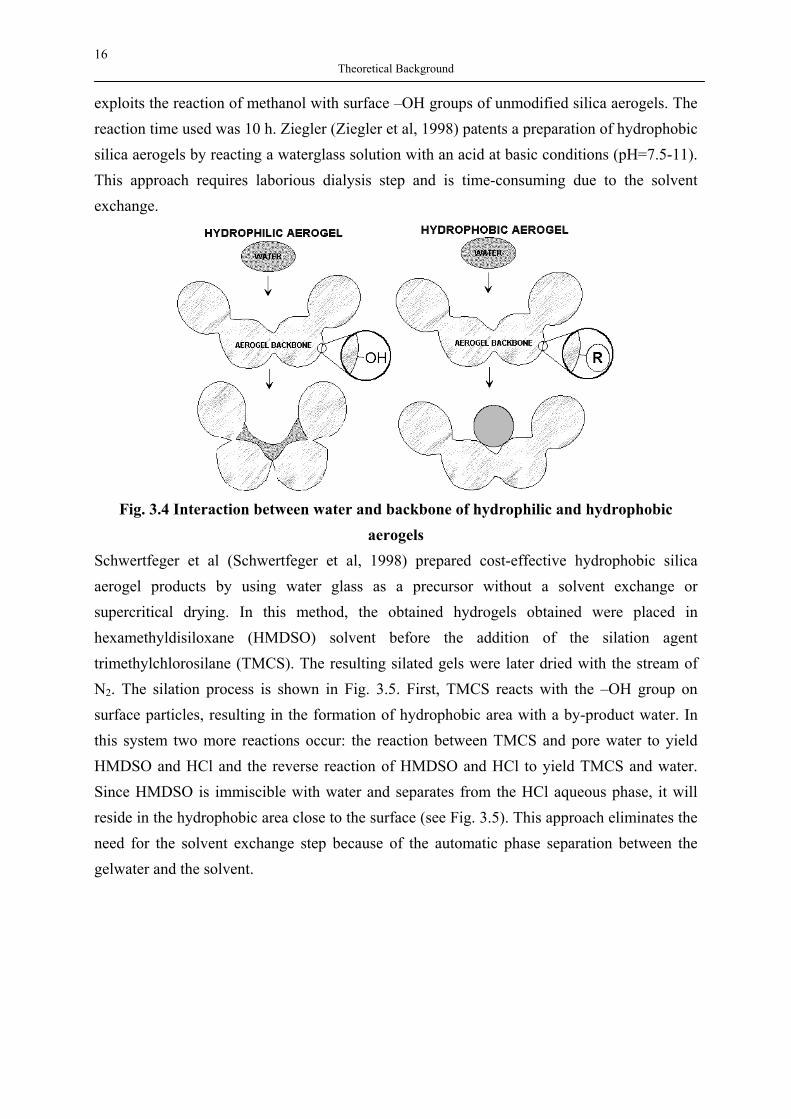
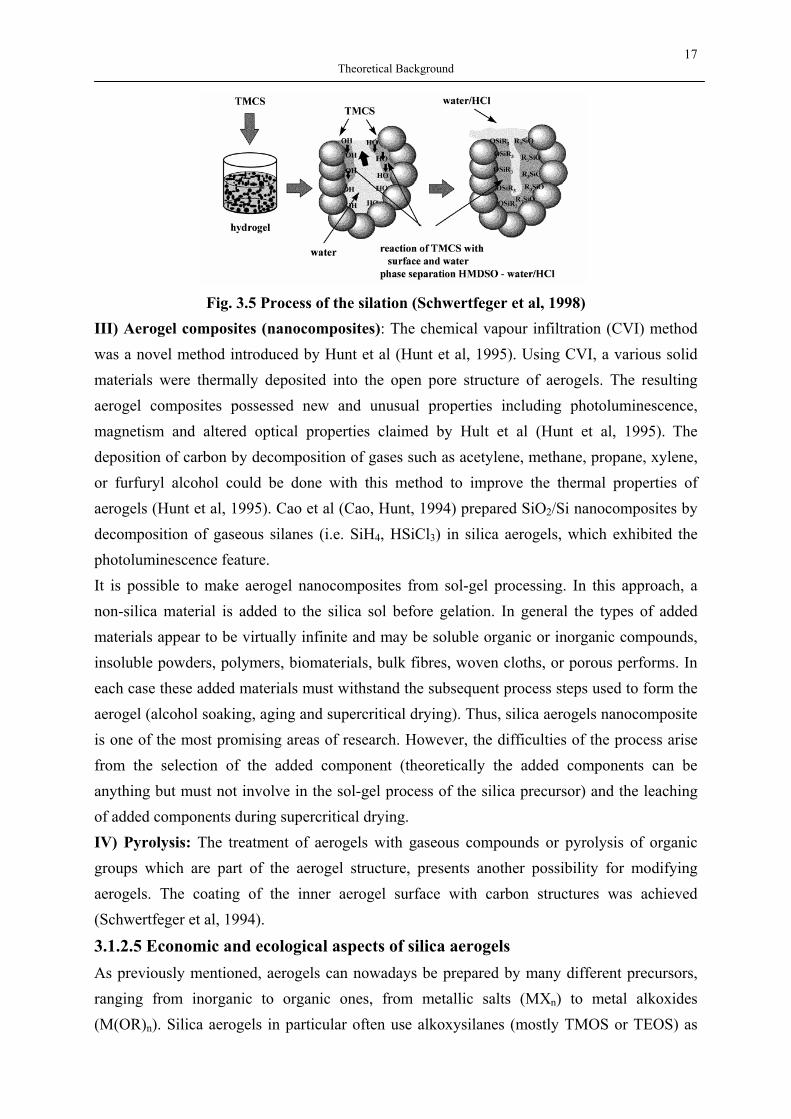
aerogels Schwertfeger et al (Schwertfeger et al, 1998) prepared cost-effective hydrophobic silica aerogel products by using water glass as a precursor without a solvent exchange or supercritical drying. In this method, the obtained hydrogels obtained were placed in hexamethyldisiloxane (HMDSO) solvent before the addition of the silation agent trimethylchlorosilane (TMCS). The resulting silated gels were later dried with the stream of N2. The silation process is shown in Fig. 3.5. First, TMCS reacts with the –OH group on surface particles, resulting in the formation of hydrophobic area with a by-product water. In this system two more reactions occur: the reaction between TMCS and pore water to yield HMDSO and HCl and the reverse reaction of HMDSO and HCl to yield TMCS and water. Since HMDSO is immiscible with water and separates from the HCl aqueous phase, it will reside in the hydrophobic area close to the surface (see Fig. 3.5). This approach eliminates the need for the solvent exchange step because of the automatic phase separation between the gelwater and the solvent.
17 Theoretical Background
Fig. 3.5 Process of the silation (Schwertfeger et al, 1998)
III) Aerogel composites (nanocomposites): The chemical vapour infiltration (CVI) method was a novel method introduced by Hunt et al (Hunt et al, 1995). Using CVI, a various solid materials were thermally deposited into the open pore structure of aerogels. The resulting aerogel composites possessed new and unusual properties including photoluminescence, magnetism and altered optical properties claimed by Hult et al (Hunt et al, 1995). The deposition of carbon by decomposition of gases such as acetylene, methane, propane, xylene, or furfuryl alcohol could be done with this method to improve the thermal properties of aerogels (Hunt et al, 1995). Cao et al (Cao, Hunt, 1994) prepared SiO2/Si nanocomposites by decomposition of gaseous silanes (i.e. SiH4, HSiCl3) in silica aerogels, which exhibited the photoluminescence feature. It is possible to make aerogel nanocomposites from sol-gel processing. In this approach, a non-silica material is added to the silica sol before gelation. In general the types of added materials appear to be virtually infinite and may be soluble organic or inorganic compounds, insoluble powders, polymers, biomaterials, bulk fibres, woven cloths, or porous performs. In each case these added materials must withstand the subsequent process steps used to form the aerogel (alcohol soaking, aging and supercritical drying). Thus, silica aerogels nanocomposite is one of the most promising areas of research. However, the difficulties of the process arise from the selection of the added component (theoretically the added components can be anything but must not involve in the sol-gel process of the silica precursor) and the leaching of added components during supercritical drying. IV) Pyrolysis: The treatment of aerogels with gaseous compounds or pyrolysis of organic groups which are part of the aerogel structure, presents another possibility for modifying aerogels. The coating of the inner aerogel surface with carbon structures was achieved (Schwertfeger et al, 1994).
3.1.2.5 Economic and ecological aspects of silica aerogels As previously mentioned, aerogels can nowadays be prepared by many different precursors, ranging from inorganic to organic ones, from metallic salts (MXn) to metal alkoxides (M(OR)n). Silica aerogels in particular often use alkoxysilanes (mostly TMOS or TEOS) as
18 Theoretical Background
silica source precursors. On an industrial scale, however, alkoxysilanes are too expensive. The supercritical drying also plays a part in the cost of the final materials. Aerogel manufacturers prefer to use another silica source, such as the use of sodium silicate during 1990s by BASF. Carlson et al (Carlson et al, 1995) conducted an extensive economic analysis of the aerogels market and concluded that the dominant factor in the cost of aerogel materials is the cost of the starting materials. Even though many exploitations and preparation techniques (sol-gel technology and drying techniques) have been emerged over the last few decades, the aerogels can currently be cost-competitive in the higher end of the insulation materials market as shown by Carlson et al (Carlson et al, 1995). Apart from the economic concerns of silica aerogel productions above, the ecological aspects play an important role at present. An enormous potential in energy cost savings is one of the major advantages in the use of aerogels. While economic and ecological aspects are non-separable factors for decision making for both manufacturer and end-users, as well as all options and available technologies are still open, aerogels will be more mature in the coming decades to excel their rivals in many high-end applications.
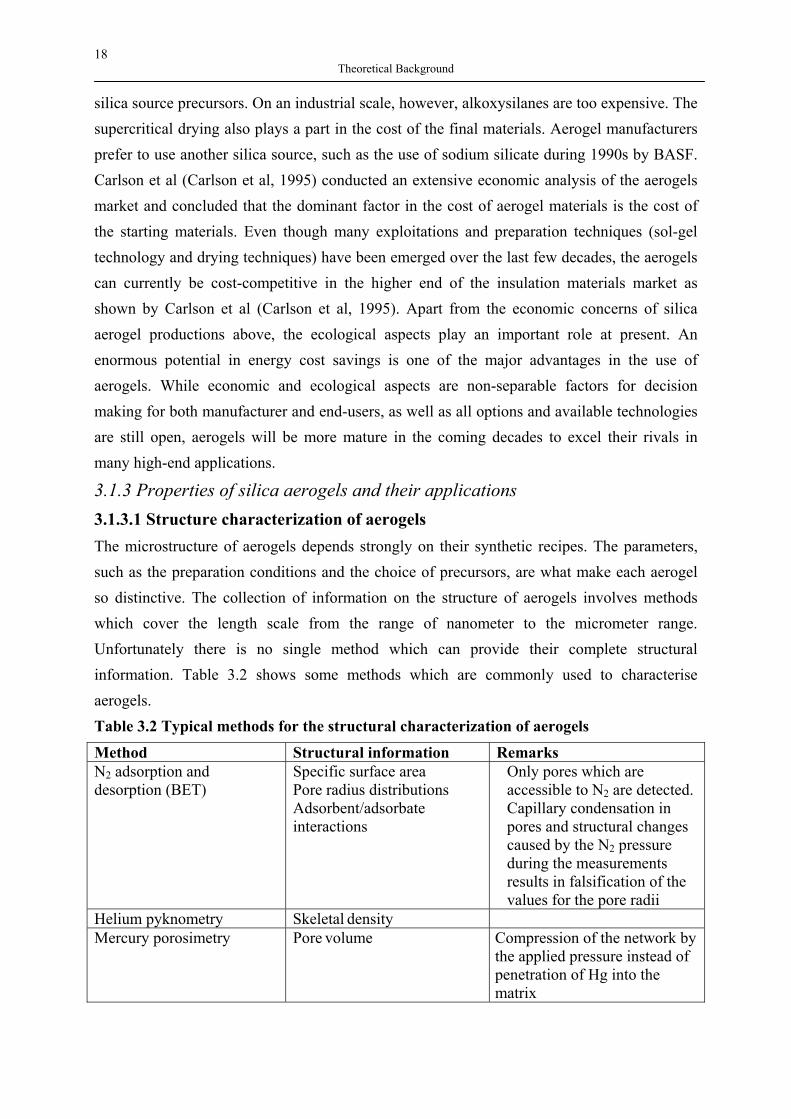
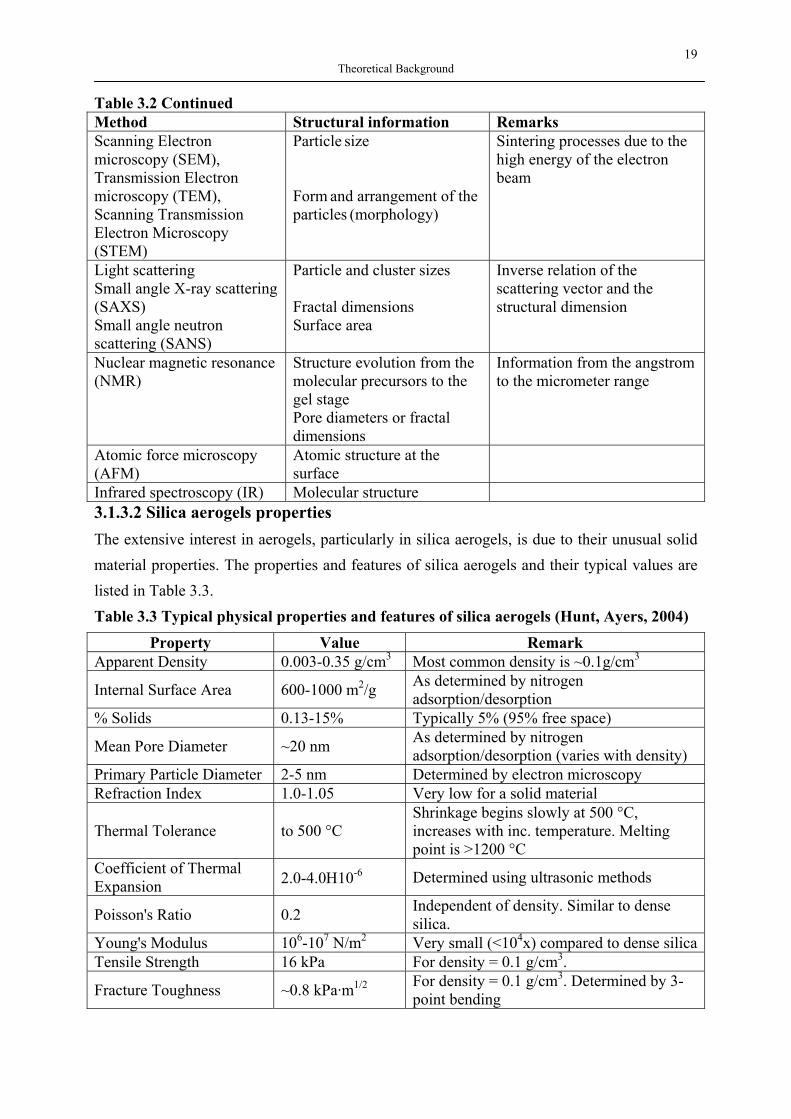
3.1.3 Properties of silica aerogels and their applications 3.1.3.1 Structure characterization of aerogels The microstructure of aerogels depends strongly on their synthetic recipes. The parameters, such as the preparation conditions and the choice of precursors, are what make each aerogel so distinctive. The collection of information on the structure of aerogels involves methods which cover the length scale from the range of nanometer to the micrometer range. Unfortunately there is no single method which can provide their complete structural information. Table 3.2 shows some methods which are commonly used to characterise aerogels. Table 3.2 Typical methods for the structural characterization of aerogels
Method Structural information Remarks N2 adsorption and desorption (BET)
Specific surface area Pore radius distributions Adsorbent/adsorbate interactions
Only pores which are accessible to N2 are detected. Capillary condensation in pores and structural changes caused by the N2 pressure during the measurements results in falsification of the values for the pore radii
Helium pyknometry Skeletal density Mercury porosimetry Pore volume Compression of the network by
the applied pressure instead of penetration of Hg into the matrix
19 Theoretical Background
Table 3.2 Continued Method Structural information Remarks Scanning Electron microscopy (SEM), Transmission Electron microscopy (TEM), Scanning Transmission Electron Microscopy (STEM)
Particle size Form and arrangement of the particles (morphology)
Sintering processes due to the high energy of the electron beam
Light scattering Small angle X-ray scattering (SAXS) Small angle neutron scattering (SANS)
Particle and cluster sizes Fractal dimensions Surface area
Inverse relation of the scattering vector and the structural dimension
Nuclear magnetic resonance (NMR)
Structure evolution from the molecular precursors to the gel stage Pore diameters or fractal dimensions
Information from the angstrom to the micrometer range
Atomic force microscopy (AFM)
Atomic structure at the surface
Infrared spectroscopy (IR) Molecular structure 3.1.3.2 Silica aerogels properties The extensive interest in aerogels, particularly in silica aerogels, is due to their unusual solid material properties. The properties and features of silica aerogels and their typical values are listed in Table 3.3. Table 3.3 Typical physical properties and features of silica aerogels (Hunt, Ayers, 2004)
Property Value Remark Apparent Density 0.003-0.35 g/cm3 Most common density is ~0.1g/cm3
Internal Surface Area 600-1000 m2/g As determined by nitrogen adsorption/desorption
% Solids 0.13-15% Typically 5% (95% free space)
Mean Pore Diameter ~20 nm As determined by nitrogen adsorption/desorption (varies with density)
Primary Particle Diameter 2-5 nm Determined by electron microscopy Refraction Index 1.0-1.05 Very low for a solid material
Thermal Tolerance to 500 °C Shrinkage begins slowly at 500 °C, increases with inc. temperature. Melting point is >1200 °C
Coefficient of Thermal Expansion 2.0-4.0Η10-6 Determined using ultrasonic methods
Poisson's Ratio 0.2 Independent of density. Similar to dense silica.
Young's Modulus 106-107 N/m2 Very small (<104x) compared to dense silica Tensile Strength 16 kPa For density = 0.1 g/cm3.
Fracture Toughness ~0.8 kPa·m1/2 For density = 0.1 g/cm3. Determined by 3-point bending
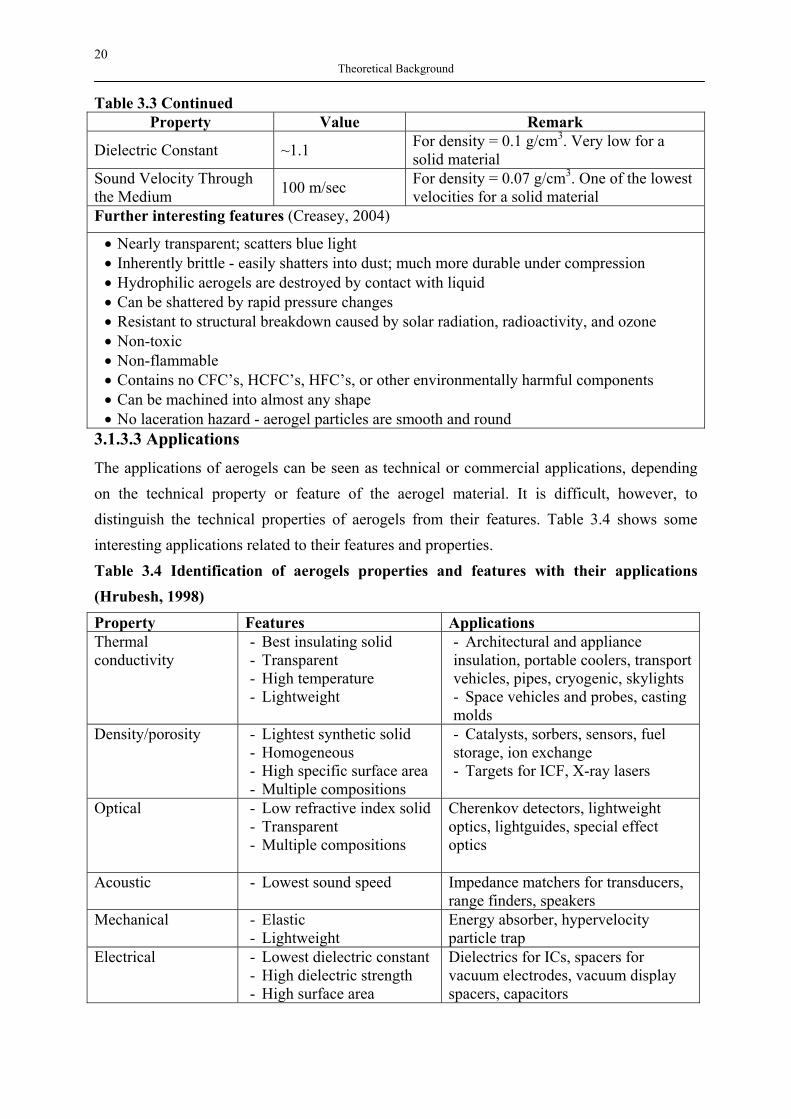
20 Theoretical Background
Table 3.3 Continued Property Value Remark
Dielectric Constant ~1.1 For density = 0.1 g/cm3. Very low for a solid material
Sound Velocity Through the Medium 100 m/sec For density = 0.07 g/cm3. One of the lowest
velocities for a solid material Further interesting features (Creasey, 2004)
• Nearly transparent; scatters blue light • Inherently brittle - easily shatters into dust; much more durable under compression • Hydrophilic aerogels are destroyed by contact with liquid • Can be shattered by rapid pressure changes • Resistant to structural breakdown caused by solar radiation, radioactivity, and ozone • Non-toxic • Non-flammable • Contains no CFC’s, HCFC’s, HFC’s, or other environmentally harmful components • Can be machined into almost any shape • No laceration hazard - aerogel particles are smooth and round
3.1.3.3 Applications
The applications of aerogels can be seen as technical or commercial applications, depending on the technical property or feature of the aerogel material. It is difficult, however, to distinguish the technical properties of aerogels from their features. Table 3.4 shows some interesting applications related to their features and properties. Table 3.4 Identification of aerogels properties and features with their applications (Hrubesh, 1998)
Property Features Applications Thermal conductivity
- Best insulating solid - Transparent - High temperature - Lightweight
- Architectural and appliance insulation, portable coolers, transport vehicles, pipes, cryogenic, skylights - Space vehicles and probes, casting molds
Density/porosity - Lightest synthetic solid - Homogeneous - High specific surface area - Multiple compositions
- Catalysts, sorbers, sensors, fuel storage, ion exchange - Targets for ICF, X-ray lasers
Optical - Low refractive index solid - Transparent - Multiple compositions
Cherenkov detectors, lightweight optics, lightguides, special effect optics
Acoustic - Lowest sound speed Impedance matchers for transducers, range finders, speakers
Mechanical - Elastic - Lightweight
Energy absorber, hypervelocity particle trap
Electrical - Lowest dielectric constant - High dielectric strength - High surface area
Dielectrics for ICs, spacers for vacuum electrodes, vacuum display spacers, capacitors
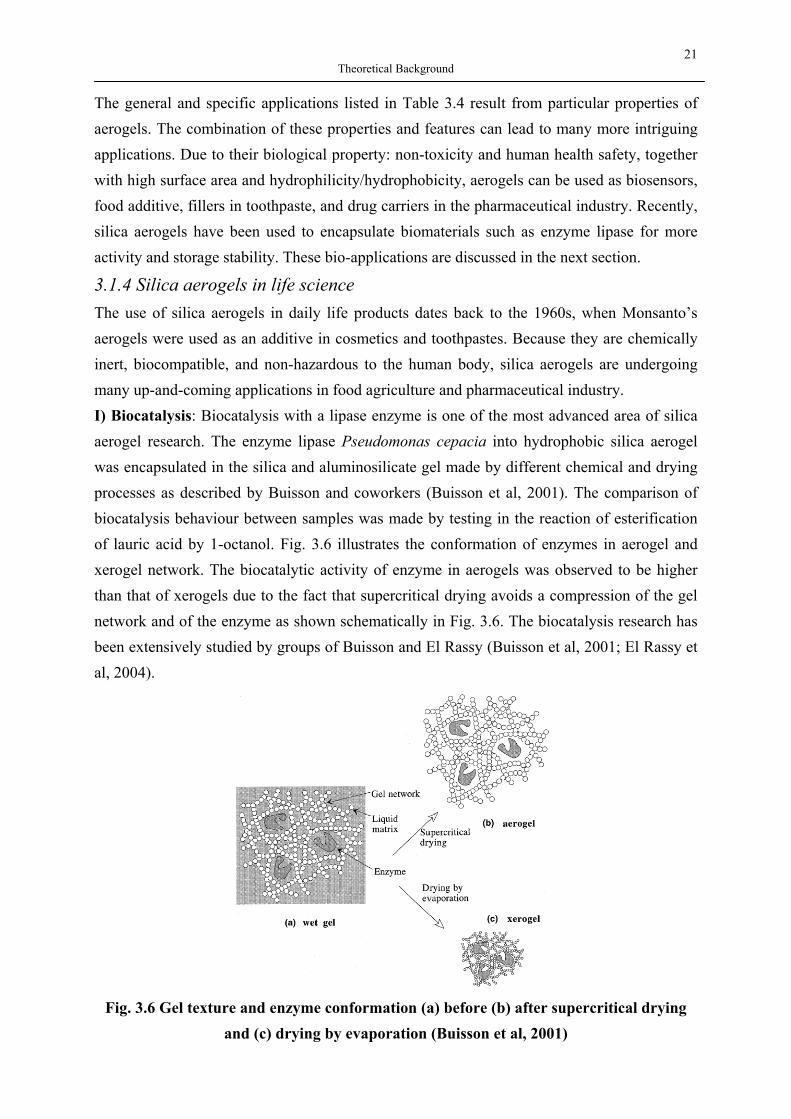
21 Theoretical Background
The general and specific applications listed in Table 3.4 result from particular properties of aerogels. The combination of these properties and features can lead to many more intriguing applications. Due to their biological property: non-toxicity and human health safety, together with high surface area and hydrophilicity/hydrophobicity, aerogels can be used as biosensors, food additive, fillers in toothpaste, and drug carriers in the pharmaceutical industry. Recently, silica aerogels have been used to encapsulate biomaterials such as enzyme lipase for more activity and storage stability. These bio-applications are discussed in the next section.
3.1.4 Silica aerogels in life science The use of silica aerogels in daily life products dates back to the 1960s, when Monsanto’s aerogels were used as an additive in cosmetics and toothpastes. Because they are chemically inert, biocompatible, and non-hazardous to the human body, silica aerogels are undergoing many up-and-coming applications in food agriculture and pharmaceutical industry. I) Biocatalysis: Biocatalysis with a lipase enzyme is one of the most advanced area of silica aerogel research. The enzyme lipase Pseudomonas cepacia into hydrophobic silica aerogel was encapsulated in the silica and aluminosilicate gel made by different chemical and drying processes as described by Buisson and coworkers (Buisson et al, 2001). The comparison of biocatalysis behaviour between samples was made by testing in the reaction of esterification of lauric acid by 1-octanol. Fig. 3.6 illustrates the conformation of enzymes in aerogel and xerogel network. The biocatalytic activity of enzyme in aerogels was observed to be higher than that of xerogels due to the fact that supercritical drying avoids a compression of the gel network and of the enzyme as shown schematically in Fig. 3.6. The biocatalysis research has been extensively studied by groups of Buisson and El Rassy (Buisson et al, 2001; El Rassy et al, 2004).
Fig. 3.6 Gel texture and enzyme conformation (a) before (b) after supercritical drying
and (c) drying by evaporation (Buisson et al, 2001)
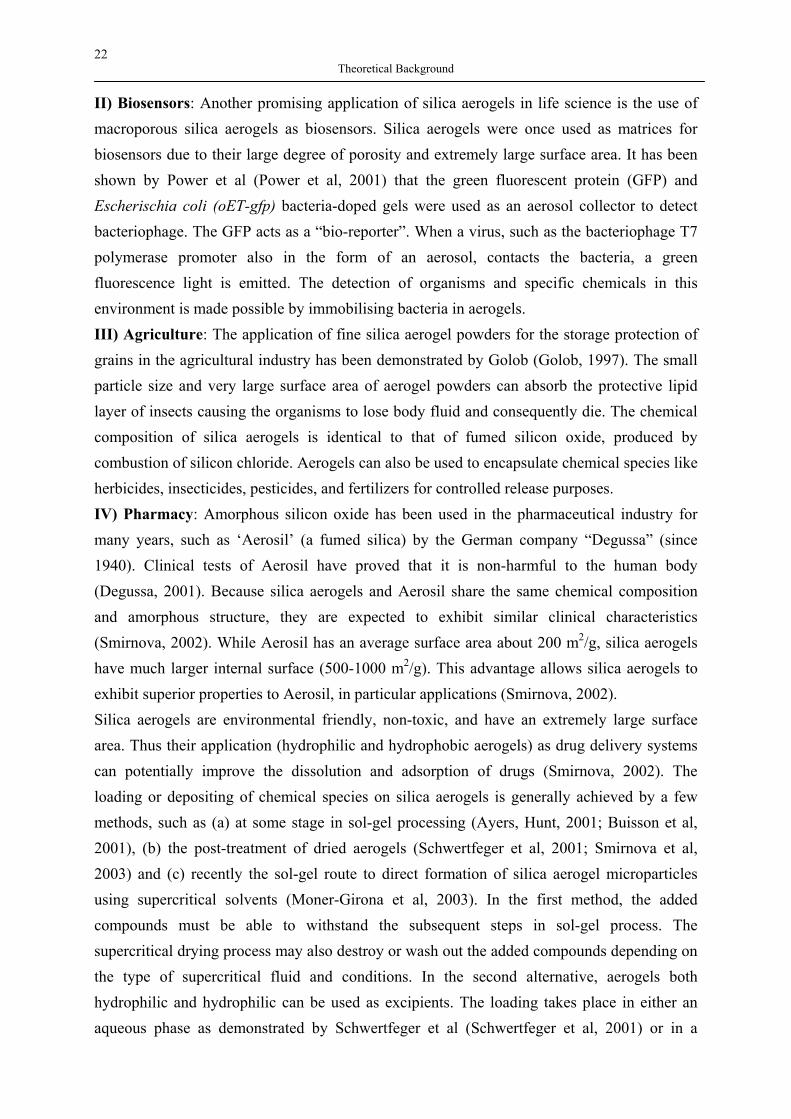
22 Theoretical Background
II) Biosensors: Another promising application of silica aerogels in life science is the use of macroporous silica aerogels as biosensors. Silica aerogels were once used as matrices for biosensors due to their large degree of porosity and extremely large surface area. It has been shown by Power et al (Power et al, 2001) that the green fluorescent protein (GFP) and Escherischia coli (oET-gfp) bacteria-doped gels were used as an aerosol collector to detect bacteriophage. The GFP acts as a “bio-reporter”. When a virus, such as the bacteriophage T7 polymerase promoter also in the form of an aerosol, contacts the bacteria, a green fluorescence light is emitted. The detection of organisms and specific chemicals in this environment is made possible by immobilising bacteria in aerogels. III) Agriculture: The application of fine silica aerogel powders for the storage protection of grains in the agricultural industry has been demonstrated by Golob (Golob, 1997). The small particle size and very large surface area of aerogel powders can absorb the protective lipid layer of insects causing the organisms to lose body fluid and consequently die. The chemical composition of silica aerogels is identical to that of fumed silicon oxide, produced by combustion of silicon chloride. Aerogels can also be used to encapsulate chemical species like herbicides, insecticides, pesticides, and fertilizers for controlled release purposes. IV) Pharmacy: Amorphous silicon oxide has been used in the pharmaceutical industry for many years, such as ‘Aerosil’ (a fumed silica) by the German company “Degussa” (since 1940). Clinical tests of Aerosil have proved that it is non-harmful to the human body (Degussa, 2001). Because silica aerogels and Aerosil share the same chemical composition and amorphous structure, they are expected to exhibit similar clinical characteristics (Smirnova, 2002). While Aerosil has an average surface area about 200 m2/g, silica aerogels have much larger internal surface (500-1000 m2/g). This advantage allows silica aerogels to exhibit superior properties to Aerosil, in particular applications (Smirnova, 2002). Silica aerogels are environmental friendly, non-toxic, and have an extremely large surface area. Thus their application (hydrophilic and hydrophobic aerogels) as drug delivery systems can potentially improve the dissolution and adsorption of drugs (Smirnova, 2002). The loading or depositing of chemical species on silica aerogels is generally achieved by a few methods, such as (a) at some stage in sol-gel processing (Ayers, Hunt, 2001; Buisson et al, 2001), (b) the post-treatment of dried aerogels (Schwertfeger et al, 2001; Smirnova et al, 2003) and (c) recently the sol-gel route to direct formation of silica aerogel microparticles using supercritical solvents (Moner-Girona et al, 2003). In the first method, the added compounds must be able to withstand the subsequent steps in sol-gel process. The supercritical drying process may also destroy or wash out the added compounds depending on the type of supercritical fluid and conditions. In the second alternative, aerogels both hydrophilic and hydrophilic can be used as excipients. The loading takes place in either an aqueous phase as demonstrated by Schwertfeger et al (Schwertfeger et al, 2001) or in a
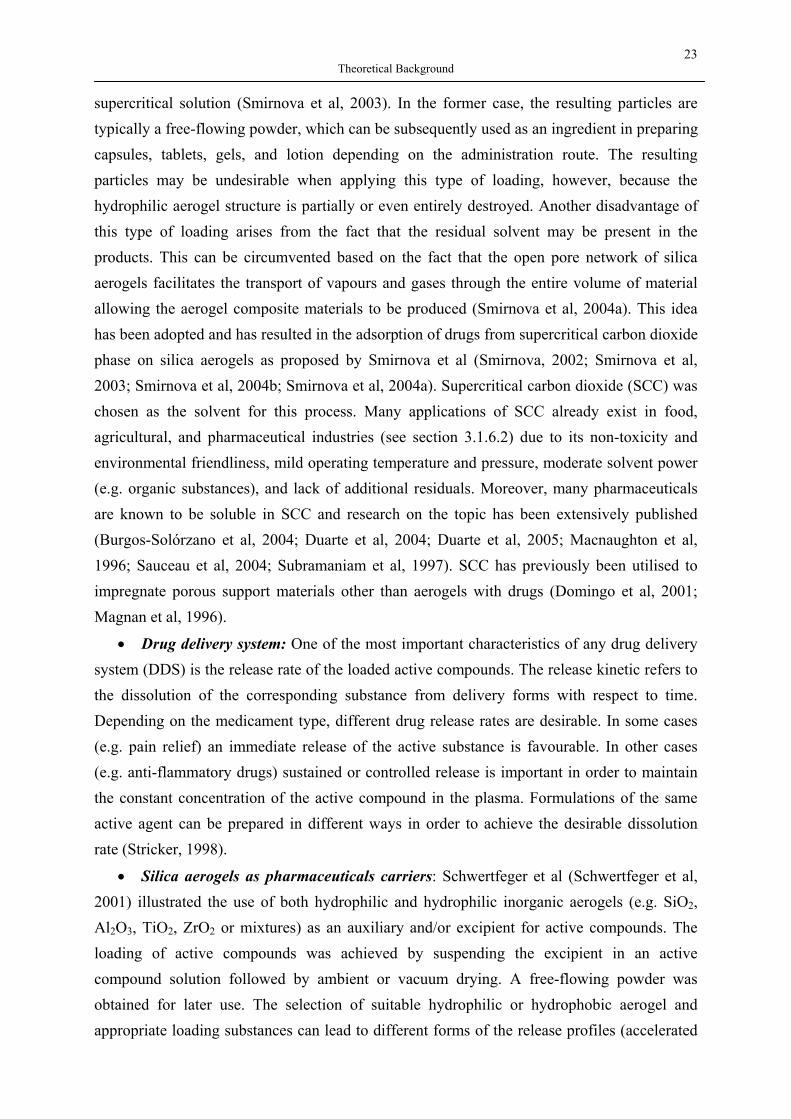
23 Theoretical Background
supercritical solution (Smirnova et al, 2003). In the former case, the resulting particles are typically a free-flowing powder, which can be subsequently used as an ingredient in preparing capsules, tablets, gels, and lotion depending on the administration route. The resulting particles may be undesirable when applying this type of loading, however, because the hydrophilic aerogel structure is partially or even entirely destroyed. Another disadvantage of this type of loading arises from the fact that the residual solvent may be present in the products. This can be circumvented based on the fact that the open pore network of silica aerogels facilitates the transport of vapours and gases through the entire volume of material allowing the aerogel composite materials to be produced (Smirnova et al, 2004a). This idea has been adopted and has resulted in the adsorption of drugs from supercritical carbon dioxide phase on silica aerogels as proposed by Smirnova et al (Smirnova, 2002; Smirnova et al, 2003; Smirnova et al, 2004b; Smirnova et al, 2004a). Supercritical carbon dioxide (SCC) was chosen as the solvent for this process. Many applications of SCC already exist in food, agricultural, and pharmaceutical industries (see section 3.1.6.2) due to its non-toxicity and environmental friendliness, mild operating temperature and pressure, moderate solvent power (e.g. organic substances), and lack of additional residuals. Moreover, many pharmaceuticals are known to be soluble in SCC and research on the topic has been extensively published (Burgos-Solórzano et al, 2004; Duarte et al, 2004; Duarte et al, 2005; Macnaughton et al, 1996; Sauceau et al, 2004; Subramaniam et al, 1997). SCC has previously been utilised to impregnate porous support materials other than aerogels with drugs (Domingo et al, 2001; Magnan et al, 1996).
• Drug delivery system: One of the most important characteristics of any drug delivery system (DDS) is the release rate of the loaded active compounds. The release kinetic refers to the dissolution of the corresponding substance from delivery forms with respect to time. Depending on the medicament type, different drug release rates are desirable. In some cases (e.g. pain relief) an immediate release of the active substance is favourable. In other cases (e.g. anti-flammatory drugs) sustained or controlled release is important in order to maintain the constant concentration of the active compound in the plasma. Formulations of the same active agent can be prepared in different ways in order to achieve the desirable dissolution rate (Stricker, 1998).
• Silica aerogels as pharmaceuticals carriers: Schwertfeger et al (Schwertfeger et al, 2001) illustrated the use of both hydrophilic and hydrophilic inorganic aerogels (e.g. SiO2, Al2O3, TiO2, ZrO2 or mixtures) as an auxiliary and/or excipient for active compounds. The loading of active compounds was achieved by suspending the excipient in an active compound solution followed by ambient or vacuum drying. A free-flowing powder was obtained for later use. The selection of suitable hydrophilic or hydrophobic aerogel and appropriate loading substances can lead to different forms of the release profiles (accelerated
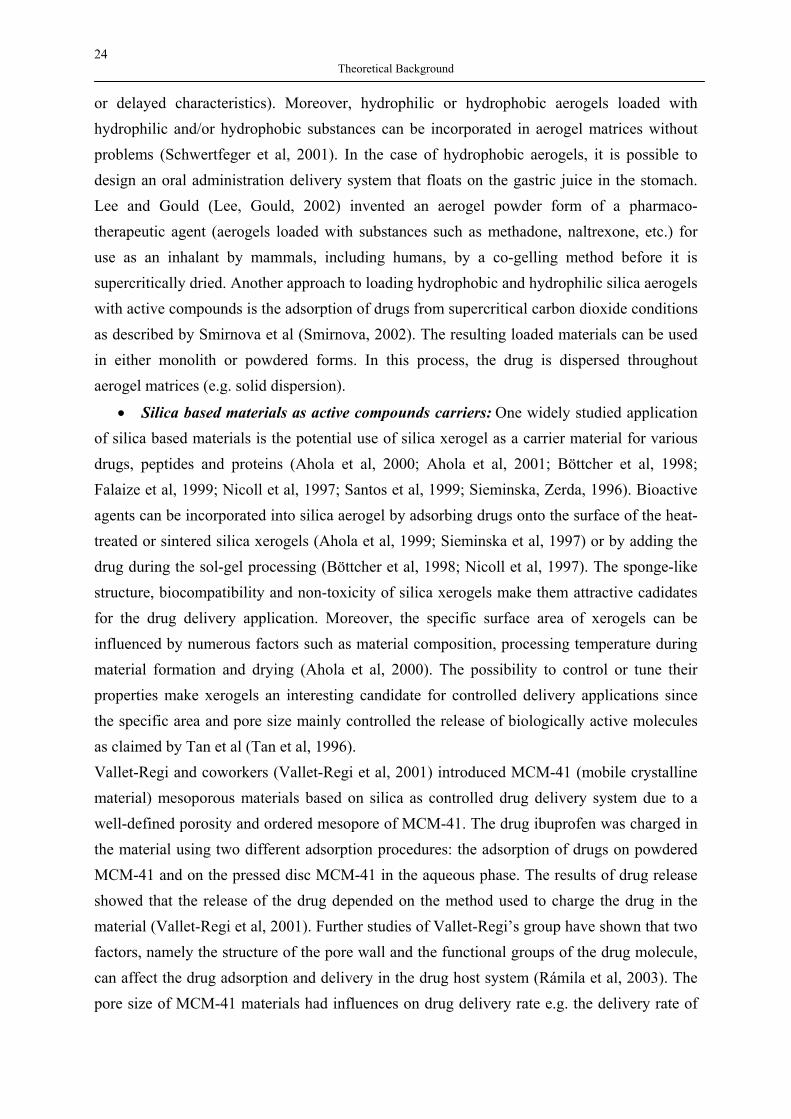
24 Theoretical Background
or delayed characteristics). Moreover, hydrophilic or hydrophobic aerogels loaded with hydrophilic and/or hydrophobic substances can be incorporated in aerogel matrices without problems (Schwertfeger et al, 2001). In the case of hydrophobic aerogels, it is possible to design an oral administration delivery system that floats on the gastric juice in the stomach. Lee and Gould (Lee, Gould, 2002) invented an aerogel powder form of a pharmaco-therapeutic agent (aerogels loaded with substances such as methadone, naltrexone, etc.) for use as an inhalant by mammals, including humans, by a co-gelling method before it is supercritically dried. Another approach to loading hydrophobic and hydrophilic silica aerogels with active compounds is the adsorption of drugs from supercritical carbon dioxide conditions as described by Smirnova et al (Smirnova, 2002). The resulting loaded materials can be used in either monolith or powdered forms. In this process, the drug is dispersed throughout aerogel matrices (e.g. solid dispersion).
• Silica based materials as active compounds carriers: One widely studied application of silica based materials is the potential use of silica xerogel as a carrier material for various drugs, peptides and proteins (Ahola et al, 2000; Ahola et al, 2001; Böttcher et al, 1998; Falaize et al, 1999; Nicoll et al, 1997; Santos et al, 1999; Sieminska, Zerda, 1996). Bioactive agents can be incorporated into silica aerogel by adsorbing drugs onto the surface of the heat-treated or sintered silica xerogels (Ahola et al, 1999; Sieminska et al, 1997) or by adding the drug during the sol-gel processing (Böttcher et al, 1998; Nicoll et al, 1997). The sponge-like structure, biocompatibility and non-toxicity of silica xerogels make them attractive cadidates for the drug delivery application. Moreover, the specific surface area of xerogels can be influenced by numerous factors such as material composition, processing temperature during material formation and drying (Ahola et al, 2000). The possibility to control or tune their properties make xerogels an interesting candidate for controlled delivery applications since the specific area and pore size mainly controlled the release of biologically active molecules as claimed by Tan et al (Tan et al, 1996). Vallet-Regi and coworkers (Vallet-Regi et al, 2001) introduced MCM-41 (mobile crystalline material) mesoporous materials based on silica as controlled drug delivery system due to a well-defined porosity and ordered mesopore of MCM-41. The drug ibuprofen was charged in the material using two different adsorption procedures: the adsorption of drugs on powdered MCM-41 and on the pressed disc MCM-41 in the aqueous phase. The results of drug release showed that the release of the drug depended on the method used to charge the drug in the material (Vallet-Regi et al, 2001). Further studies of Vallet-Regi’s group have shown that two factors, namely the structure of the pore wall and the functional groups of the drug molecule, can affect the drug adsorption and delivery in the drug host system (Rámila et al, 2003). The pore size of MCM-41 materials had influences on drug delivery rate e.g. the delivery rate of
25 Theoretical Background
ibuprofen in a simulating body fluid solution decreased as the pore size decreased in the range of 3.6-2.5 nm (Horcajada et al, 2004).
• Biocompatibility of silica based glasses: Biocompatibility is of particular importance in applying silica based matrices to human tissues. Biomaterials are expected to perform without any adverse effects such as toxic, carcinogenic, immunogenic, and inflammatory responses. Biocompatibility of a material is defined as the appropriate effects, either local or systematic, of a biomaterial on a host (Williams, 1988). Silicon has been recognised as an essential trace in the body and for its participation in collective tissue, especially cartilage and bone formation (Carlisle 1986). Sol-gel derived glasses are biocompatible and bioactive according to Hench et al (Hench, Wilson, 1986), Li et al (Li et al, 1992), and Klein et al (Klein et al, 1995). Wilson and coworkers (Wilson et al, 1981) performed a series of in vivo and in vitro tests to evaluate the toxicity of glasses containing silica and found that silica-containing glasses were non-toxic and biocompatible. The elimination of silica based material was found to follow the degradation through hydrolysis of siloxane bonds to Si(OH)4 (Brinker, Scherer, 1990), which then diffuses into local tissue and around, enters the blood stream or lymphic circulation and is finally excreted in the urine through the kidneys or is actively phagocytised by macrophages (Lai et al, 1998). It can thus be concluded that sol-gel derived glass is considered a non-toxic material.
3.1.5 Deposition of chemical compounds into silica aerogels Despite the fact that approaches such as CVI, pyrolysis, and suspension on an aqueous phase are available to prepare aerogel composites and to encapsulate compounds, as alternative routes small organic molecules can be doped, entrapped into, deposited to, or attached to aerogels by means of direct sol-gel processing, the drying stage or the adsorption from gas and supercritical fluids. Each approach has its drawbacks and its advantages. In the case of the doping during sol-gel processing, the added materials range from soluble organic or inorganic compounds to bacteria, peptides, and enzyme. As these added species have to withstand many stages of the aerogel production, the degradation, decomposition and denaturisation, especially of protein and enzyme, may occur. Thus, the selection of process conditions and added material are likely to be a drawback of this method. When compounds are added at the drying stage, the time-consuming and tedious steps are eliminated. However, added compounds may be washed out or leached out with a solvent, resulting in a low yield. In the case of adsorption, an aerogel can behave as a host to adsorb small guest organic molecules by taking advantage of the high surface area and small pore size of aerogels. The adsorption of different gases (Ahmed, Attia, 1998) such as SO2, CO, NO and H2S in multi-metal oxide aerogels has been investigated. The CaO-SiO2, MgO-SiO2 aerogel nanocomposite sorbents could well be used to adsorb and capture waste gases through both physical and chemical sorption mechanisms (Ahmed, Attia, 1998). The authors suggested the use of these
26 Theoretical Background
aerogels as filters in the workplace and in indoor living spaces. Yoda et al (Yoda et al, 2000) used titania-impregnated silica aerogels to remove VOC’s (i.e. benzene) from air. The exceptional adsorption capacities of water vapour (up to 100 wt%) on CaCl2-SiO2 and LiBr-SiO2 hybrid aerogels was reported by Mrowiec-Bialon et al (Mrowiec-Bialon et al, 1998). Similar results using different aerogels (pure silica and mixed SiO2-Al2O3 aerogels) were obtained by Knez et al (Knez, Novak, 2001). Hrubesh et al (Hrubesh et al, 2001) have studied the adsorption of different organic solvents by hydrophobic silica aerogels. It was found that the adsorption capacity of these materials exceeds that of activated carbon by 30 times (Hrubesh et al, 2001). Thus hydrophobic silica aerogels can be used in the removal of solvents like toluene, ethyl alcohol, trichloroethylene and chlorobenzene from water. For more complex molecules and active compounds, the adsorption of these molecules on silica aerogels is made possible by the use of supercritical solvents. Compounds with a slight vapour pressure can be deposited into silica aerogels. The use of supercritical solvents in the area of life science is discussed in the next section.
3.1.6 Use of supercritical fluids (SCFs) in life science Supercritical fluids (SCFs) are currently employed in many sectors such as the food (Sihvonen et al, 1999), pharmaceutical (Subramaniam et al, 1997), petroleum (Knowles et al, 2000) industries as well as in processes such as in polymerisations, biocatalysis and supercritical water oxidation for the destruction of organic hazardous wastes (Barner et al, 1992) and the particles and powder processing (Weidner et al, 2003). SCFs are widely used as solvents due to their environmental friendliness, easy separation, and absence of residues on the treated medium. The advantage of using SCFs has been observed in pharmaceutical technology in the last ten years. A trend moving away from traditional solvents towards environmentally benign carbon dioxide (e.g. supercritical carbon dioxide) has gained an increasing attention in pharmaceutical manufacturing. Among reported applications, micronisation and particle size reduction, the use of supercritical carbon dioxide in preparative and analytical chromatography of drug compounds and as an extraction medium is an attractive area in pharmaceutical technology. In conventional pharmaceutical processing an extensive use of organic solvents as either antisolvents for recrystallising drugs from solutions, reaction media in the synthesis of drugs, or extracting agents for selectively isolating drugs from solid matrices is involved (Subramaniam et al, 1997). Because health concerns and solvents residues are major problems in this conventional pharmaceutical processing, the development of supercritical fluids in pharmaceutical processing has received much attention to overcome mentioned problems. For every substance there is a temperature above which it can no longer exist as a liquid, regardless of how much pressure is being applied. Similarly, there is a pressure above which a substance can no longer exist as a gas despite how high the temperature is being raised. These
27 Theoretical Background
points are called critical temperature and pressure, respectively (see Fig. 3.3). Beyond these points the substance is defined as supercritical fluid and has properties intermediate between a liquid and a gas. In this region, supercritical fluids are highly compressible with densities (commonly 0.2-0.9 g/cm3) that are liquid-like and transport properties that are gas-like. Small changes in pressure or temperature near the critical point can largely alter the density and consequently the solubilising power of the supercritical fluid.
3.1.6.1 Supercritical carbon dioxide Carbon dioxide is a commonly used supercritical fluid due to its mild supercritical conditions (Tc=31°C, Pc=7.37MPa). The low critical temperature and pressure of CO2 makes it an attractive choice for processing heat-sensity flavours and compounds, pharmaceuticals, proteins and lipids. Furthermore, CO2 is non-toxic, inexpensive and its non-flammability prevents oxidative degradation. Supercritical carbon dioxide is experiencing an increased use in the pharmaceutical industry, especially for the solution of difficult processing problems. Like other substances, supercritical carbon dioxide exhibits a tuneable dissolving power as it possesses a liquid-like density (and thus a high solvent strength), and a gas-like transport property. This unique combination of properties is practically appropriate for developing processes to extract, purify, and recrystallize fine chemicals and pharmaceuticals and even for producing new product forms that cannot be obtained by traditional processing technologies. The only major drawback of using carbon dioxide is the lack of polarity and the associated deficiency of specific solvent-solute interactions. For most of the high molecular weight substances, the solubility in supercritical carbon dioxide is quite low. To improve solvent polarity and selectivity, a small amount of entrainer or cosolvent (usually polar compounds) is added to supercritical carbon dioxide.
3.1.6.2 Applications of supercritical fluids (predominantly carbon dioxide) Since the 1960s, supercritical fluids (SCFs) have entered food researches for developing 'advanced' extraction processes, especially botanical substrates, for example, spices, herbs, coffee, and tea, using predominantly supercritical carbon dioxide. The primary motivation for developing these SCF processes was the elimination of residual toxic solvents, especially methylene chloride in the products. Solvent residues in pharmacy and food products have been cautiously restricted over the years. Even today strict regulations for health, environment and hazard concerns are another driving force to find an alternative to eliminate solvent residues caused by traditional solvent extraction processes. Furthermore, the flavour and aroma of such compounds can be preserved.
• Application of supercritical carbon dioxide in pharmaceutical manufacturing: In the 1980s other industrial applications of SCFs, especially of supercritical carbon dioxide, were introduced, among them the extraction of undesired by-products from pharmaceuticals, the purification of medical polymers, and the separation of complex synthesis mixtures. More

28 Theoretical Background
applications such as the recrystallization of materials via SCF processing and 'simple' extraction processes of residuals from medical polymers, of impurities from surfactants, and of active components or nutraceutical mixtures from botanical and biological substrates have already been used in the pharmaceutical industry (Krukonis, 2004). The use of SCF in pharmaceutical industries can be summarized as follows;
(a) SCF Extraction or SFE for extraction of active pharmaceutical agents from natural sources and extraction of pharmaceuticals from solid dosage forms (Dean et al, 1998; Lawrence et al, 1994; Liu et al, 1995)
(b) SCF Chromatography for purification of pharmaceuticals and separation of enantiomers of pharmaceuticals (Johannsen, 2001).
(c) SCF in drug delivery: this recent technique is being used for (1) crystallisation of polar/nonpolar drugs/excipients to achieve desired shape, size distribution, and polymorphism, (2) encapsulation of drugs in drug carrier systems, (3) coating of solid dosage forms, (4) micronisation of drugs, and (5) product sterilization.
Carbon dioxide is mostly employed for the use of SCF in drug delivery due to the aforementioned reasons. The design of chemical or pharmaceutical processes based on supercritical fluid technology and optimum operating conditions relies on knowledge of phase equilibria and drug solubility in fluid. In the last two decades, attempts (Burgos-Solórzano et al, 2004; Duarte et al, 2004; Li et al, 2003; Macnaughton et al, 1996; Sauceau et al, 2004) have been made to measure the solubility of a large number of different low-volatility compounds in SCFs (mostly pharmaceuticals in supercritical carbon dioxide) over various ranges of pressure and temperature. Despite a large body of drug solubility data available in scientific literatures, there is still a continuous need for new solubility measurements due to a growing attention in pharmaceutical research and technology.
• Supercritical carbon dioxide for particles formation and design: Particle formation and design are presently a major development of supercritical fluids applications, mainly in pharmaceutical, cosmetic, nutraceutical and specialty chemistry industries (Jung, Perrut, 2001). The key objectives of particles formation with supercritical fluids, particularly in pharmacy, are:
• To avoid the solvent residues used by traditional processing.
• To enhance the dissolution of pharmaceuticals by size reduction (micronisation); improving bioavailability (e.g. increasing the rate at which the active drug enters systematic circulation).
• To achieve desired particles size and form.
• To combine with an auxiliary or excipient (i.e. polymers, aerogels, protein, etc.).
29 Theoretical Background
• To encapsulate active compounds into polymers (microcapsule or microspheres) for controlled release delivery application.
In order to fulfil the above objectives, many supercritical methods have been developed in the last two decades. There are various methods of manufacturing particles using supercritical fluids: the rapid expansion of supercritical solutions (RESS), the gas antisolvent (GAS) and its derived processes, the particles from gas saturated solutions (PGSS) (Bungert et al, 1998; Jung, Perrut, 2001). The selection of the method depends on the solubility of the material of interest in the suitable supercritical fluid. Among these processes, the GAS and PGSS process are discussed in this work. The GAS process is a technique, initially created for the precipitation or crystallization of solutes dissolved in a liquid phase by the addition of a gaseous or supercritical antisolvent, which decreases the solubility of the target solute in the liquid phase (Randolph et al, 1993). After the antisolvent has been added, the solute precipitates and the particles can be washed and collected. If the initial solution also contains a dissolved polymeric carrier, the formation of drug-loaded microparticles during adding the antisolvent is observed. The GAS process enables the control of the kinetics of the phase transition as well as the degree of supersaturation by controlling the gas pressure. Hence, the particle size distribution and the particle size can be tailored (Bungert et al, 1998). Modifications of this process have led to related processes such as ASES, PCA, and SEDS (Jung, Perrut, 2001; Shariati, Peters, 2003). The essential advantages of the GAS process are the processing of solids which are difficult to dissolve in supercritical fluids, or are sensitive to shear stress such as proteins or peptides. The addition of a carrier to the active solution results in the formation of substance-loaded micro or nanoparticles (Jung, Perrut, 2001). In one case, Catalase and insulin particles ranging from 1-5 µm were formed by using supercritical CO2 as a gas anti-solvent (GAS) (Tom et al, 1993). Other alternative approach to encapsulating drug in excipients or preparing microparticles is the particles from gas saturated solutions process (PGSS) (Weidner et al, 1994). In the PGSS process, a compressed gas is dissolved into a solution consisting of a solute and a solvent or into a melted material, leading to a gas-saturated solution/suspension that is further expanded through a nozzle with formation of solid particles. The PGSS method demonstrates some advantages over the GAS process. Compared to the GAS process no organic solvent is needed in PGSS process (Kerc et al, 1999). Both GAS and PGSS can be applied to various compounds as reviewed by Jung and Perrut (Jung, Perrut, 2001), and Shariati and Peters (Shariati, Peters, 2003). The micronisation of active compounds allows a more convenient and/or appropriate administration route (Tu et al, 2002), such as oral, subcutaneous, intramuscular, topical and intestinal modes of administration, to reduce the required dosage and to increase the drug
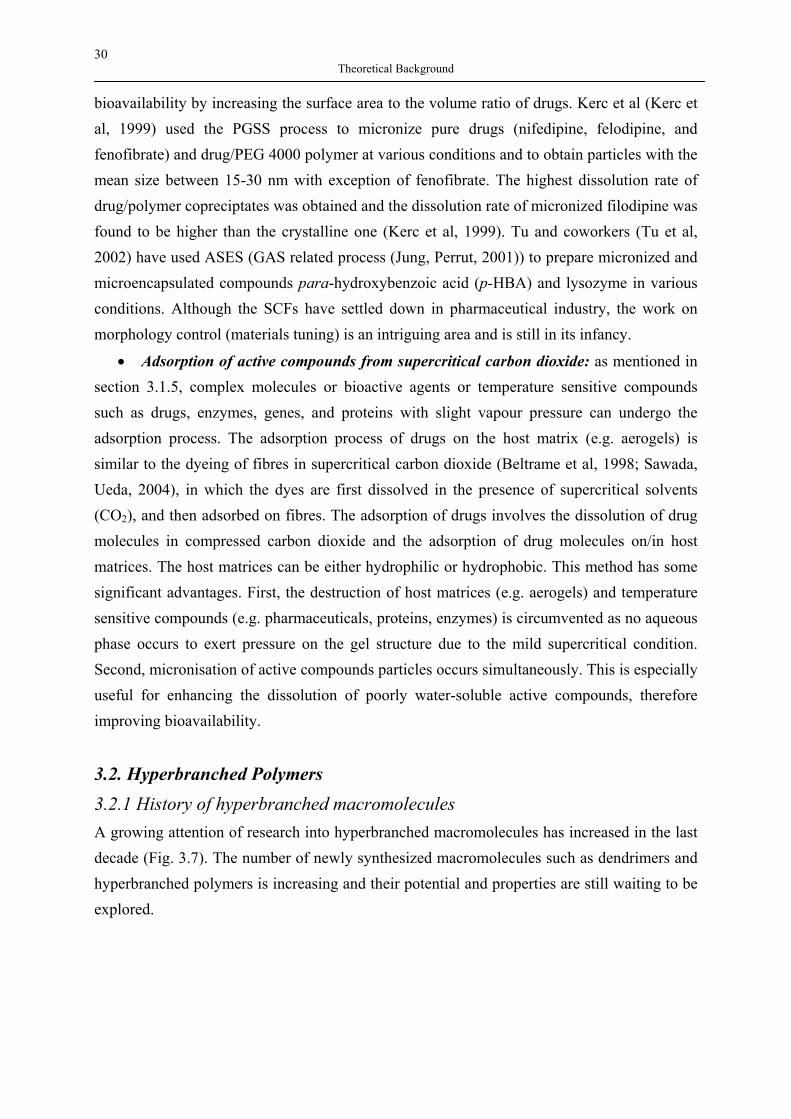
30 Theoretical Background
bioavailability by increasing the surface area to the volume ratio of drugs. Kerc et al (Kerc et al, 1999) used the PGSS process to micronize pure drugs (nifedipine, felodipine, and fenofibrate) and drug/PEG 4000 polymer at various conditions and to obtain particles with the mean size between 15-30 nm with exception of fenofibrate. The highest dissolution rate of drug/polymer copreciptates was obtained and the dissolution rate of micronized filodipine was found to be higher than the crystalline one (Kerc et al, 1999). Tu and coworkers (Tu et al, 2002) have used ASES (GAS related process (Jung, Perrut, 2001)) to prepare micronized and microencapsulated compounds para-hydroxybenzoic acid (p-HBA) and lysozyme in various conditions. Although the SCFs have settled down in pharmaceutical industry, the work on morphology control (materials tuning) is an intriguing area and is still in its infancy.
• Adsorption of active compounds from supercritical carbon dioxide: as mentioned in section 3.1.5, complex molecules or bioactive agents or temperature sensitive compounds such as drugs, enzymes, genes, and proteins with slight vapour pressure can undergo the adsorption process. The adsorption process of drugs on the host matrix (e.g. aerogels) is similar to the dyeing of fibres in supercritical carbon dioxide (Beltrame et al, 1998; Sawada, Ueda, 2004), in which the dyes are first dissolved in the presence of supercritical solvents (CO2), and then adsorbed on fibres. The adsorption of drugs involves the dissolution of drug molecules in compressed carbon dioxide and the adsorption of drug molecules on/in host matrices. The host matrices can be either hydrophilic or hydrophobic. This method has some significant advantages. First, the destruction of host matrices (e.g. aerogels) and temperature sensitive compounds (e.g. pharmaceuticals, proteins, enzymes) is circumvented as no aqueous phase occurs to exert pressure on the gel structure due to the mild supercritical condition. Second, micronisation of active compounds particles occurs simultaneously. This is especially useful for enhancing the dissolution of poorly water-soluble active compounds, therefore improving bioavailability.
3.2. Hyperbranched Polymers 3.2.1 History of hyperbranched macromolecules A growing attention of research into hyperbranched macromolecules has increased in the last decade (Fig. 3.7). The number of newly synthesized macromolecules such as dendrimers and hyperbranched polymers is increasing and their potential and properties are still waiting to be explored.
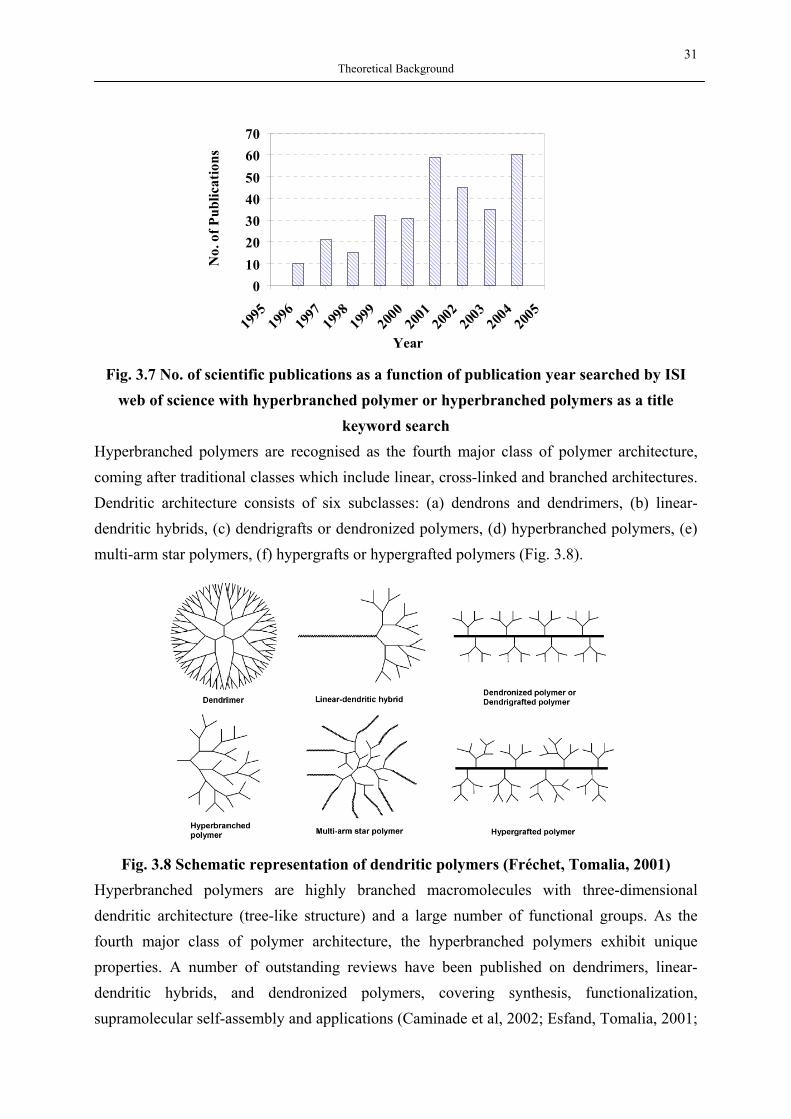
31 Theoretical Background
010203040506070
2005
2004
2003
2002
2001
2000
1999
1998
1997
1996
1995
Year
No.
of P
ublic
atio
ns
Fig. 3.7 No. of scientific publications as a function of publication year searched by ISI
web of science with hyperbranched polymer or hyperbranched polymers as a title keyword search
Hyperbranched polymers are recognised as the fourth major class of polymer architecture, coming after traditional classes which include linear, cross-linked and branched architectures. Dendritic architecture consists of six subclasses: (a) dendrons and dendrimers, (b) linear-dendritic hybrids, (c) dendrigrafts or dendronized polymers, (d) hyperbranched polymers, (e) multi-arm star polymers, (f) hypergrafts or hypergrafted polymers (Fig. 3.8).
Fig. 3.8 Schematic representation of dendritic polymers (Fréchet, Tomalia, 2001)
Hyperbranched polymers are highly branched macromolecules with three-dimensional dendritic architecture (tree-like structure) and a large number of functional groups. As the fourth major class of polymer architecture, the hyperbranched polymers exhibit unique properties. A number of outstanding reviews have been published on dendrimers, linear-dendritic hybrids, and dendronized polymers, covering synthesis, functionalization, supramolecular self-assembly and applications (Caminade et al, 2002; Esfand, Tomalia, 2001;
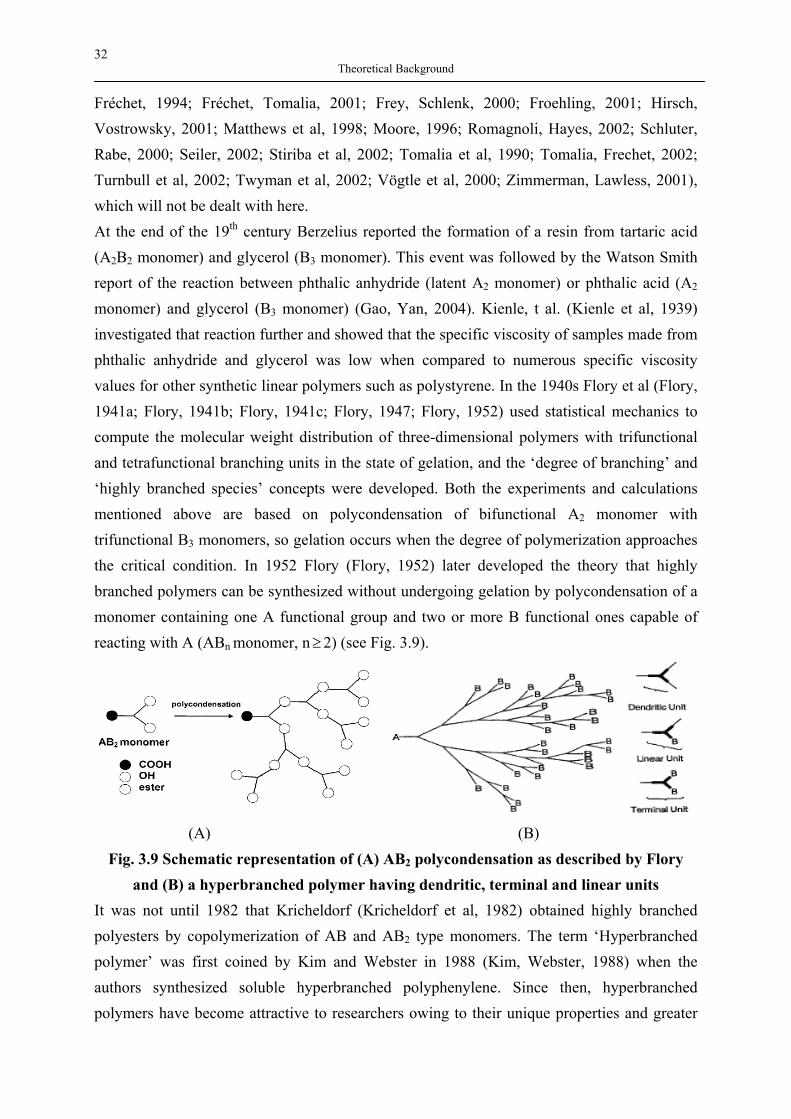
32 Theoretical Background
Fréchet, 1994; Fréchet, Tomalia, 2001; Frey, Schlenk, 2000; Froehling, 2001; Hirsch, Vostrowsky, 2001; Matthews et al, 1998; Moore, 1996; Romagnoli, Hayes, 2002; Schluter, Rabe, 2000; Seiler, 2002; Stiriba et al, 2002; Tomalia et al, 1990; Tomalia, Frechet, 2002; Turnbull et al, 2002; Twyman et al, 2002; Vögtle et al, 2000; Zimmerman, Lawless, 2001), which will not be dealt with here. At the end of the 19th century Berzelius reported the formation of a resin from tartaric acid (A2B2 monomer) and glycerol (B3 monomer). This event was followed by the Watson Smith report of the reaction between phthalic anhydride (latent A2 monomer) or phthalic acid (A2 monomer) and glycerol (B3 monomer) (Gao, Yan, 2004). Kienle, t al. (Kienle et al, 1939) investigated that reaction further and showed that the specific viscosity of samples made from phthalic anhydride and glycerol was low when compared to numerous specific viscosity values for other synthetic linear polymers such as polystyrene. In the 1940s Flory et al (Flory, 1941a; Flory, 1941b; Flory, 1941c; Flory, 1947; Flory, 1952) used statistical mechanics to compute the molecular weight distribution of three-dimensional polymers with trifunctional and tetrafunctional branching units in the state of gelation, and the ‘degree of branching’ and ‘highly branched species’ concepts were developed. Both the experiments and calculations mentioned above are based on polycondensation of bifunctional A2 monomer with trifunctional B3 monomers, so gelation occurs when the degree of polymerization approaches the critical condition. In 1952 Flory (Flory, 1952) later developed the theory that highly branched polymers can be synthesized without undergoing gelation by polycondensation of a monomer containing one A functional group and two or more B functional ones capable of reacting with A (ABn monomer, n ≥ 2) (see Fig. 3.9).
(A) (B)
Fig. 3.9 Schematic representation of (A) AB2 polycondensation as described by Flory and (B) a hyperbranched polymer having dendritic, terminal and linear units
It was not until 1982 that Kricheldorf (Kricheldorf et al, 1982) obtained highly branched polyesters by copolymerization of AB and AB2 type monomers. The term ‘Hyperbranched polymer’ was first coined by Kim and Webster in 1988 (Kim, Webster, 1988) when the authors synthesized soluble hyperbranched polyphenylene. Since then, hyperbranched polymers have become attractive to researchers owing to their unique properties and greater
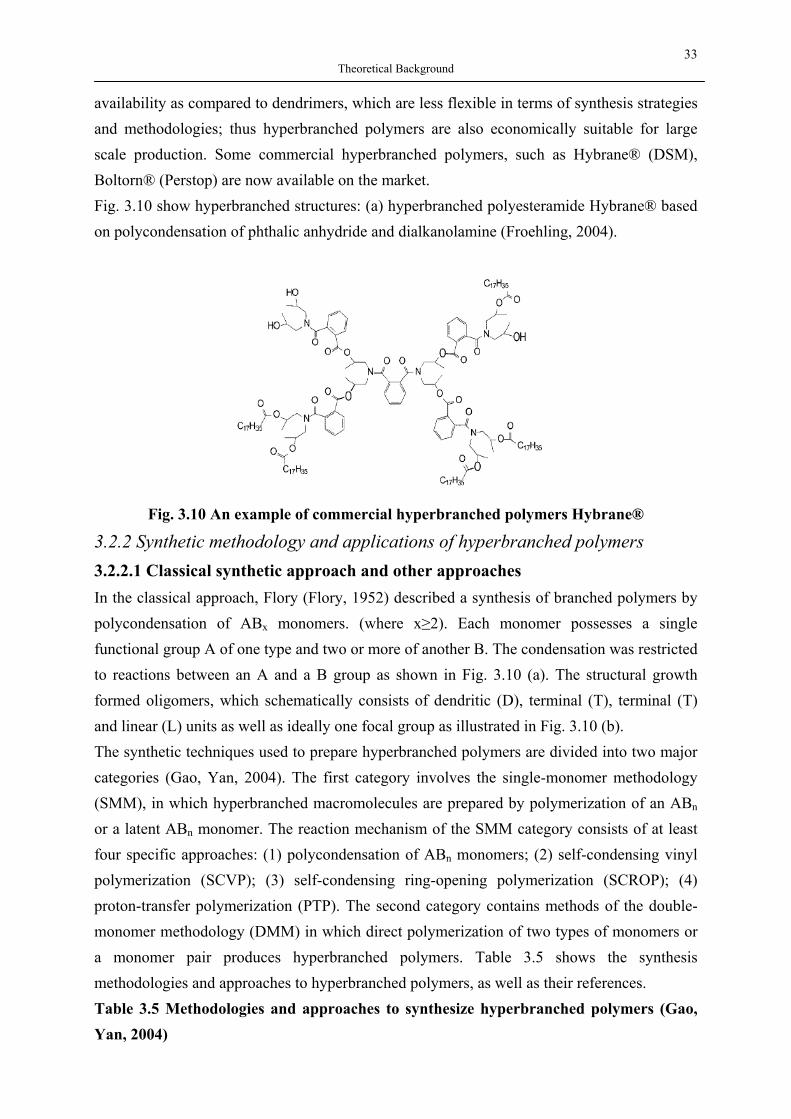
33 Theoretical Background
availability as compared to dendrimers, which are less flexible in terms of synthesis strategies and methodologies; thus hyperbranched polymers are also economically suitable for large scale production. Some commercial hyperbranched polymers, such as Hybrane® (DSM), Boltorn® (Perstop) are now available on the market. Fig. 3.10 show hyperbranched structures: (a) hyperbranched polyesteramide Hybrane® based on polycondensation of phthalic anhydride and dialkanolamine (Froehling, 2004).
Fig. 3.10 An example of commercial hyperbranched polymers Hybrane®
3.2.2 Synthetic methodology and applications of hyperbranched polymers 3.2.2.1 Classical synthetic approach and other approaches In the classical approach, Flory (Flory, 1952) described a synthesis of branched polymers by polycondensation of ABx monomers. (where x≥2). Each monomer possesses a single functional group A of one type and two or more of another B. The condensation was restricted to reactions between an A and a B group as shown in Fig. 3.10 (a). The structural growth formed oligomers, which schematically consists of dendritic (D), terminal (T), terminal (T) and linear (L) units as well as ideally one focal group as illustrated in Fig. 3.10 (b). The synthetic techniques used to prepare hyperbranched polymers are divided into two major categories (Gao, Yan, 2004). The first category involves the single-monomer methodology (SMM), in which hyperbranched macromolecules are prepared by polymerization of an ABn or a latent ABn monomer. The reaction mechanism of the SMM category consists of at least four specific approaches: (1) polycondensation of ABn monomers; (2) self-condensing vinyl polymerization (SCVP); (3) self-condensing ring-opening polymerization (SCROP); (4) proton-transfer polymerization (PTP). The second category contains methods of the double-monomer methodology (DMM) in which direct polymerization of two types of monomers or a monomer pair produces hyperbranched polymers. Table 3.5 shows the synthesis methodologies and approaches to hyperbranched polymers, as well as their references. Table 3.5 Methodologies and approaches to synthesize hyperbranched polymers (Gao, Yan, 2004)
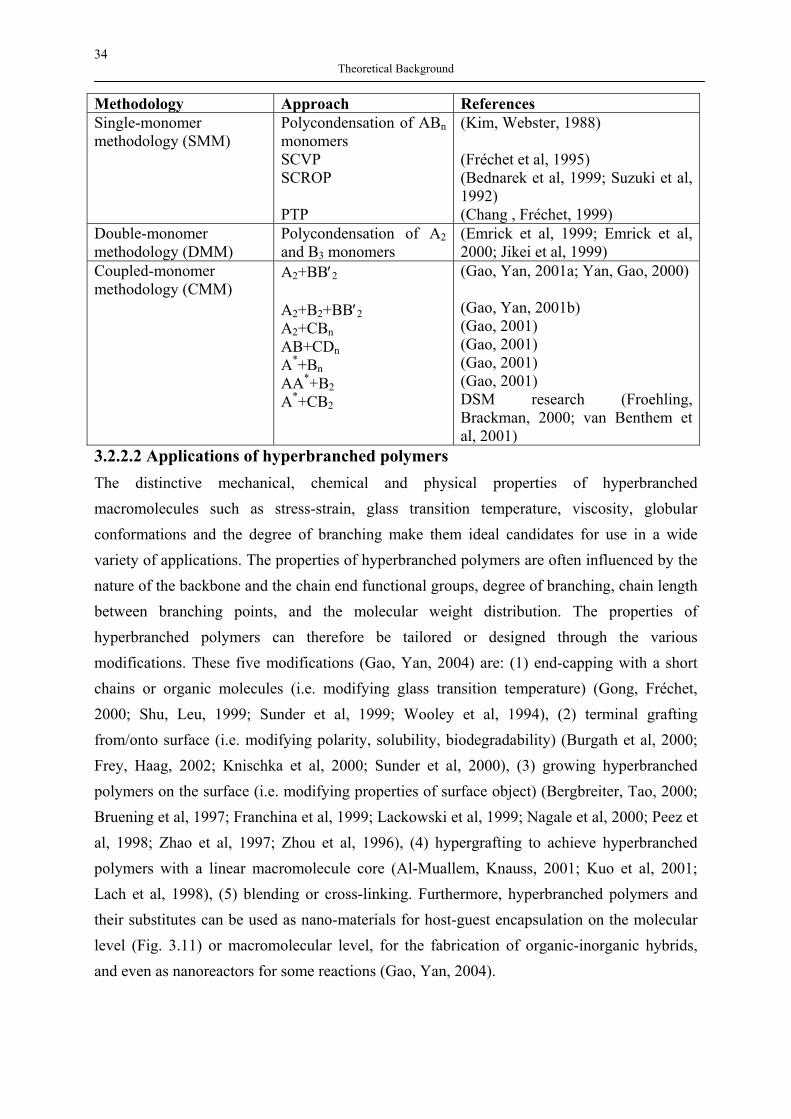
34 Theoretical Background
Methodology Approach References Single-monomer methodology (SMM)
Polycondensation of ABn monomers SCVP SCROP PTP
(Kim, Webster, 1988) (Fréchet et al, 1995) (Bednarek et al, 1999; Suzuki et al, 1992) (Chang , Fréchet, 1999)
Double-monomer methodology (DMM)
Polycondensation of A2 and B3 monomers
(Emrick et al, 1999; Emrick et al, 2000; Jikei et al, 1999)
Coupled-monomer methodology (CMM)
A2+BB′2 A2+B2+BB′2 A2+CBn AB+CDn A*+Bn AA*+B2 A*+CB2
(Gao, Yan, 2001a; Yan, Gao, 2000) (Gao, Yan, 2001b) (Gao, 2001) (Gao, 2001) (Gao, 2001) (Gao, 2001) DSM research (Froehling, Brackman, 2000; van Benthem et al, 2001)
3.2.2.2 Applications of hyperbranched polymers The distinctive mechanical, chemical and physical properties of hyperbranched macromolecules such as stress-strain, glass transition temperature, viscosity, globular conformations and the degree of branching make them ideal candidates for use in a wide variety of applications. The properties of hyperbranched polymers are often influenced by the nature of the backbone and the chain end functional groups, degree of branching, chain length between branching points, and the molecular weight distribution. The properties of hyperbranched polymers can therefore be tailored or designed through the various modifications. These five modifications (Gao, Yan, 2004) are: (1) end-capping with a short chains or organic molecules (i.e. modifying glass transition temperature) (Gong, Fréchet, 2000; Shu, Leu, 1999; Sunder et al, 1999; Wooley et al, 1994), (2) terminal grafting from/onto surface (i.e. modifying polarity, solubility, biodegradability) (Burgath et al, 2000; Frey, Haag, 2002; Knischka et al, 2000; Sunder et al, 2000), (3) growing hyperbranched polymers on the surface (i.e. modifying properties of surface object) (Bergbreiter, Tao, 2000; Bruening et al, 1997; Franchina et al, 1999; Lackowski et al, 1999; Nagale et al, 2000; Peez et al, 1998; Zhao et al, 1997; Zhou et al, 1996), (4) hypergrafting to achieve hyperbranched polymers with a linear macromolecule core (Al-Muallem, Knauss, 2001; Kuo et al, 2001; Lach et al, 1998), (5) blending or cross-linking. Furthermore, hyperbranched polymers and their substitutes can be used as nano-materials for host-guest encapsulation on the molecular level (Fig. 3.11) or macromolecular level, for the fabrication of organic-inorganic hybrids, and even as nanoreactors for some reactions (Gao, Yan, 2004).
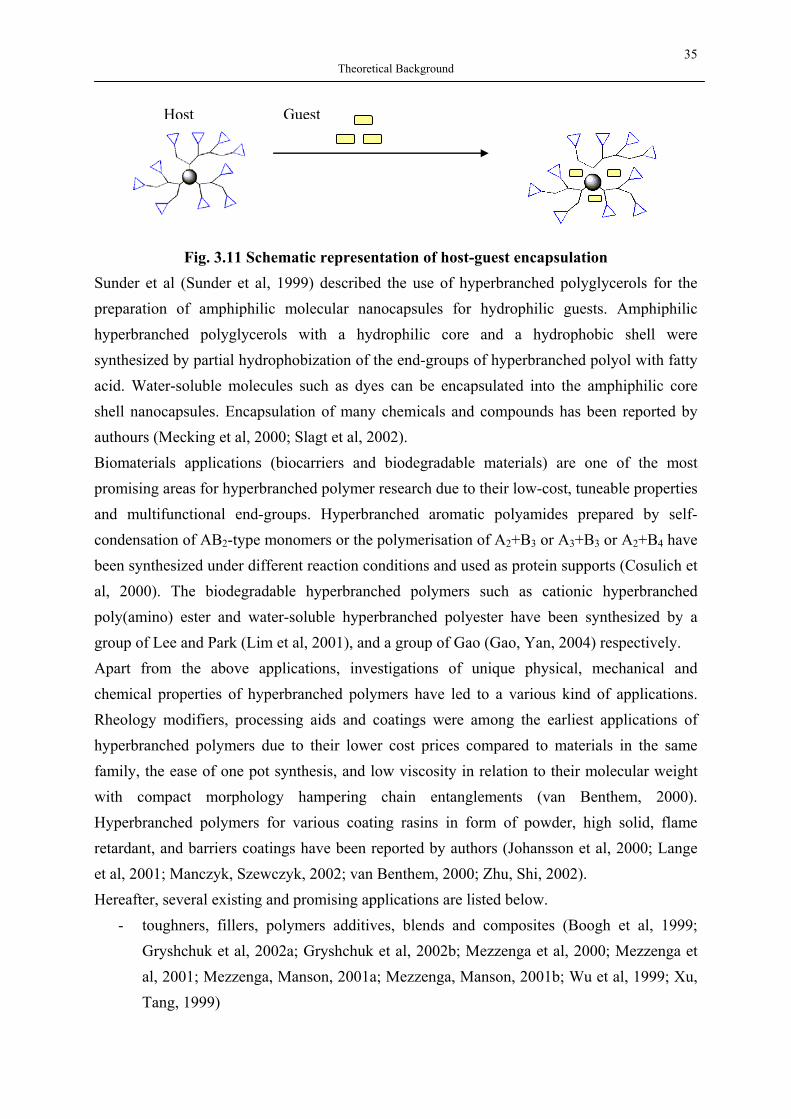
35 Theoretical Background
Fig. 3.11 Schematic representation of host-guest encapsulation Sunder et al (Sunder et al, 1999) described the use of hyperbranched polyglycerols for the preparation of amphiphilic molecular nanocapsules for hydrophilic guests. Amphiphilic hyperbranched polyglycerols with a hydrophilic core and a hydrophobic shell were synthesized by partial hydrophobization of the end-groups of hyperbranched polyol with fatty acid. Water-soluble molecules such as dyes can be encapsulated into the amphiphilic core shell nanocapsules. Encapsulation of many chemicals and compounds has been reported by authours (Mecking et al, 2000; Slagt et al, 2002). Biomaterials applications (biocarriers and biodegradable materials) are one of the most promising areas for hyperbranched polymer research due to their low-cost, tuneable properties and multifunctional end-groups. Hyperbranched aromatic polyamides prepared by self-condensation of AB2-type monomers or the polymerisation of A2+B3 or A3+B3 or A2+B4 have been synthesized under different reaction conditions and used as protein supports (Cosulich et al, 2000). The biodegradable hyperbranched polymers such as cationic hyperbranched poly(amino) ester and water-soluble hyperbranched polyester have been synthesized by a group of Lee and Park (Lim et al, 2001), and a group of Gao (Gao, Yan, 2004) respectively. Apart from the above applications, investigations of unique physical, mechanical and chemical properties of hyperbranched polymers have led to a various kind of applications. Rheology modifiers, processing aids and coatings were among the earliest applications of hyperbranched polymers due to their lower cost prices compared to materials in the same family, the ease of one pot synthesis, and low viscosity in relation to their molecular weight with compact morphology hampering chain entanglements (van Benthem, 2000). Hyperbranched polymers for various coating rasins in form of powder, high solid, flame retardant, and barriers coatings have been reported by authors (Johansson et al, 2000; Lange et al, 2001; Manczyk, Szewczyk, 2002; van Benthem, 2000; Zhu, Shi, 2002). Hereafter, several existing and promising applications are listed below.
- toughners, fillers, polymers additives, blends and composites (Boogh et al, 1999; Gryshchuk et al, 2002a; Gryshchuk et al, 2002b; Mezzenga et al, 2000; Mezzenga et al, 2001; Mezzenga, Manson, 2001a; Mezzenga, Manson, 2001b; Wu et al, 1999; Xu, Tang, 1999)
GuestHost
36 Theoretical Background
- biocompatible materials for medical applications (Frey, Haag, 2002; Hult et al, 1999; Klee et al, 2001; Saltzman, 2001)
- selective components in chemical process (Seiler et al, 2002; Seiler et al, 2003a) - sensor materials (Albrecht, van Koten, 1999; Crooks, 2005; Fang et al, 2000; Heil et
al, 1999) The application of hyperbranched polymers as polymeric drug delivery system will be further discussed.
3.2.2.3 Polymeric drug delivery system The improvement of drug efficacy is an important aspect in pharmaceutical practice. In order to improve drug targeting and therapeutic efficacy, two following options are mainly taken into considerations: (1) drug modification and (2) the development of a drug carrier system. An ideal device or carrier must be biochemically inert and non-toxic, while protecting drug until it reaches the desired action site (Patri et al, 2002). In the last few decades, research involving polymeric drug delivery system has grown rapidly as polymers offer a wide spectrum of properties and flexibility to be implemented in many different purposes. In addition, the included active compounds can be released in a controlled, sustained, prolonged or stepwise manner. The drawbacks of using polymers include their toxicity, biocompatibility and the surgery removal that is required in some cases (Patri et al, 2002). A drug delivery system usually consists of a polymeric matrix from which the drug is released under appropriate conditions. A wide number of materials have been implemented, including pure inorganic and organic polymers, mixtures of polymers, and polymer-based composites with different materials such as ceramic and glasses. 3.2.2.3.1 Hyperbranched polymers as active compounds carriers A vast number of polymer classes such as linear polymers, blocked copolymers, and grafted polymers, have been previously investigated and applied as drug carriers or containers with various kinds of encapsulation methods. Many new polymers have been synthesised and used to convey nutrients, pesticides, proteins and bioactive compounds. The use of polymers as drug carriers has indeed shown a great impact in the field of life science in many ways. A number of new polymers have been synthesised and used to convey nutrients, pesticides, proteins and bioactive compounds. Recently there has been an increasing interest in the potential of the dendritic polymer. A large number of interdisciplinary research activities on both dendrimers and hyperbranched polymers has emerged and a wide variety of new applications have been explored (Hult et al, 1999; Kim, Webster, 1988; Matthews et al, 1998; Seiler, 2002; Seiler et al, 2003a; Voit, 2000). The interest in these polymers arises from such unique features of dendrimers as monodispersity, highly branched structure and functionalized end groups, a well-defined globular architecture, and the possibility to tailor their physical and chemical properties. The surface end groups of poly(propylene imine)
37 Theoretical Background
dendrimers were modified for the pH-sensitive controlled release system (Sideratou et al, 1999). Both Tomalia-type polyamidoamine (PAMAM) and Fréchet-type dendrimers have been widely studied as drug delivery applications (Gao et al, 2003). Yet the preparation of dendrimers is costly due to the synthesis and purification steps. Contrary to dendrimers, hyperbranched polymers offer less structural perfection and are polydisperse. They can also be prepared in single step synthesis, which results in cheaper products and make the large scale production possible. Their detailed synthesis and applications have been previously reviewed by several authors (Gao, Yan, 2004; Seiler, 2002; Voit, 2000; Voit, 2003; Yates, Hayes, 2004). Although a number of applications of hyperbranched polymers have been recognized by many groups (Fang et al, 2000; Froehling, 2004; Gao, Yan, 2004; Seiler, 2002; Uhrich, 1997; Voit, 2000; Voit, 2003; Yates, Hayes, 2004), the research of hyperbranched polymers in areas of life science such as controlled delivery devices, composite materials and ‘nano-carriers’ is still in its infancy. Hyperbranched polymers are possible ideal candidates to replace dendrimers in many applications where less structural perfection is required, such as certain drug delivery applications. Depending on the desired release kinetics, the hydrophilicity/hydrophobicity and thus the solubility behaviour of the hyperbranched polymer can be adjusted via the nature of the polymer functionalities (Seiler, 2002; Seiler et al, 2003b). The potential of the hyperbranched polymer as a drug carrier was studied by a few research groups (Gao et al, 2003; Kolhe et al, 2003; Uhrich, 1997). Most commonly studied hyperbranched polymers include hyperbranched polyesters because of the degradation of their ester units. Nevertheless, in order to put them into practise interdisciplinary research into the physics, chemistry and biology of hyperbranched polymers are required to obtain more information such as biodegradability, biostability, toxicity, and biocompatibility. This would then enable engineers to design a proper delivery stem or modify an existing one for specific purpose (i.e. administration routes). In the last decade many research groups have introduced and investigated the potential of hyperbranched as drug delivery devices or systems. Gao and coworkers (Gao et al, 2003) have introduced the synthesized water-soluble hyperbranched polyester as a novel polymer for drug delivery. Klee and coworkers (Klee et al, 2001) have investigated the use of hyperbranched polyesters as dental composites. The Kolhe group (Kolhe et al, 2003) has studied the ability of PAMAM dendrimers and hyperbranched Polyol to form complex and encapsulate the drug ibuprofen. In the previous studies regarding the encapsulation of acetaminophen, the anionic acrylic resin microspheres were used to prepared acetaminophen-loaded microspheres by a w/o/o double emulsion-solvent diffusion method as reported (Lee et al, 2000) and the microencapsulation of acetaminophen in poly(L-lactide) was studied using the oil-in-water solvent evaporation technique (Lai, Tsiang, 2004).
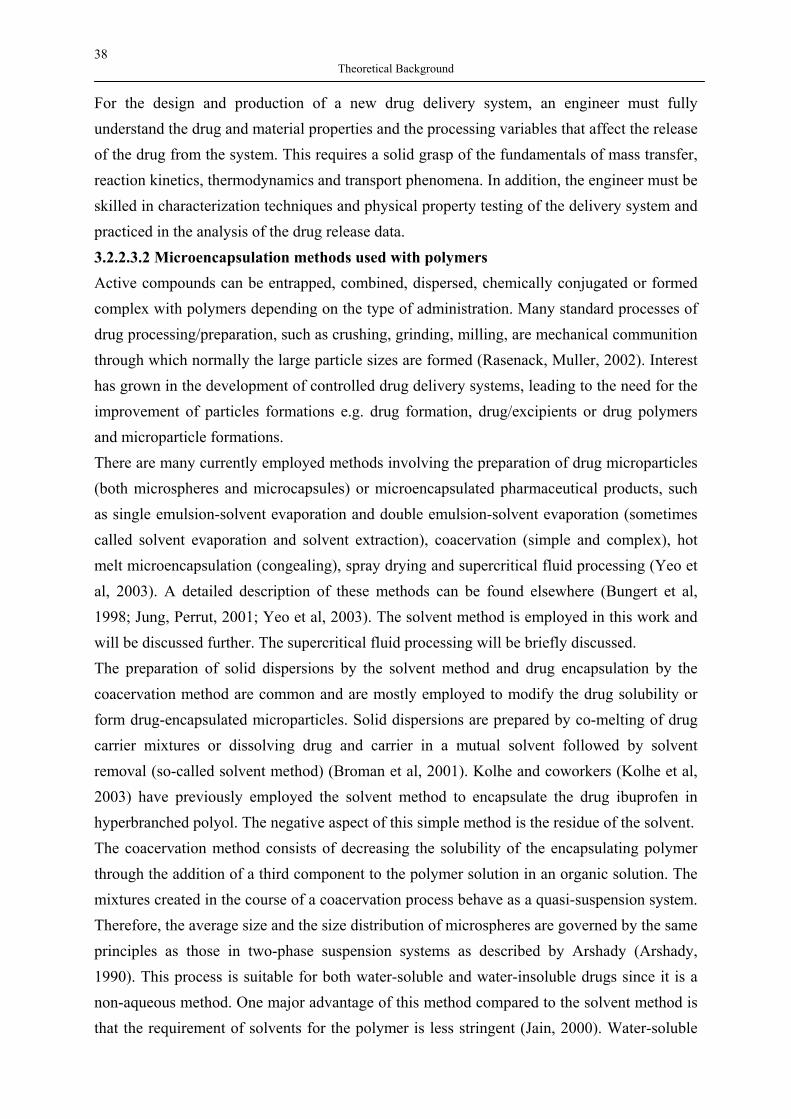
38 Theoretical Background
For the design and production of a new drug delivery system, an engineer must fully understand the drug and material properties and the processing variables that affect the release of the drug from the system. This requires a solid grasp of the fundamentals of mass transfer, reaction kinetics, thermodynamics and transport phenomena. In addition, the engineer must be skilled in characterization techniques and physical property testing of the delivery system and practiced in the analysis of the drug release data. 3.2.2.3.2 Microencapsulation methods used with polymers Active compounds can be entrapped, combined, dispersed, chemically conjugated or formed complex with polymers depending on the type of administration. Many standard processes of drug processing/preparation, such as crushing, grinding, milling, are mechanical communition through which normally the large particle sizes are formed (Rasenack, Muller, 2002). Interest has grown in the development of controlled drug delivery systems, leading to the need for the improvement of particles formations e.g. drug formation, drug/excipients or drug polymers and microparticle formations. There are many currently employed methods involving the preparation of drug microparticles (both microspheres and microcapsules) or microencapsulated pharmaceutical products, such as single emulsion-solvent evaporation and double emulsion-solvent evaporation (sometimes called solvent evaporation and solvent extraction), coacervation (simple and complex), hot melt microencapsulation (congealing), spray drying and supercritical fluid processing (Yeo et al, 2003). A detailed description of these methods can be found elsewhere (Bungert et al, 1998; Jung, Perrut, 2001; Yeo et al, 2003). The solvent method is employed in this work and will be discussed further. The supercritical fluid processing will be briefly discussed. The preparation of solid dispersions by the solvent method and drug encapsulation by the coacervation method are common and are mostly employed to modify the drug solubility or form drug-encapsulated microparticles. Solid dispersions are prepared by co-melting of drug carrier mixtures or dissolving drug and carrier in a mutual solvent followed by solvent removal (so-called solvent method) (Broman et al, 2001). Kolhe and coworkers (Kolhe et al, 2003) have previously employed the solvent method to encapsulate the drug ibuprofen in hyperbranched polyol. The negative aspect of this simple method is the residue of the solvent. The coacervation method consists of decreasing the solubility of the encapsulating polymer through the addition of a third component to the polymer solution in an organic solution. The mixtures created in the course of a coacervation process behave as a quasi-suspension system. Therefore, the average size and the size distribution of microspheres are governed by the same principles as those in two-phase suspension systems as described by Arshady (Arshady, 1990). This process is suitable for both water-soluble and water-insoluble drugs since it is a non-aqueous method. One major advantage of this method compared to the solvent method is that the requirement of solvents for the polymer is less stringent (Jain, 2000). Water-soluble

39 Theoretical Background
drugs such as metropolol have been successfully incorporated in polymeric microparticles by the use of this method (Brachais et al, 1998; Sanders et al, 1984). The preparation of microcapsules containing acetaminophen and casein microcapsules (CAS/MC) has also been investigated using this method (Santinho et al, 2002). The encapsulation of bioactive compounds like peptides, proteins and vaccines were reported as well (Jain, 2000). However, particles prepared by this method are subject to agglomeration since no emulsion stabilizer is used. Since conventional pharmaceutical processing involves the extensive use of organic solvents, human health concern caused by some solvents in the product has propelled research efforts intended to develop environmentally benign processing techniques (Subramaniam et al, 1997). The use of supercritical fluids to manufacture particles, microspheres, microcapsules, or other dispersed materials has grown rapidly. Among the gases, carbon dioxide is the most widely utilized supercritical fluid. There are various methods of manufacturing particles using supercritical fluids: the rapid expansion of supercritical solutions (RESS), the gas antisolvent (GAS) and its derived processes and the particles from gas saturated solutions (PGSS). The GAS and PGSS methods as dicussed in section 3.1.6.2 can be used for particles formation of pure substances and for encapsulating active ingredients in excipients. The selection of methods lies on the solubility of the material of interest in the suitable supercritical fluid. None of these processes however have been applied for hyperbranched polymers.
3.3 In vitro Release Kinetic 3.3.1 Theory Drug absorption from a solid oral dosage in the body depends on the release of the drug substance from the drug product (dissolution test), its solubility, and permeability across the gastrointestinal tract. The first feature of the tablets is determined by the manufacture of the product. The next two features are determined by the properties of the active pharmaceutical. All oral solid forms can be characterized according to these three properties. The dissolution information serves as the principal data for (a) designing the dosage forms, (b) quality control, and (c) correlating in vivo and in vitro relationship and predicting human dose/drug solubility relationship. In solid drugs there are two mechanisms involved in the release of the effective drug, disintegration and dissolution (see Fig. 3.12). The disintegration and dissolution has been introduced and recognised by a national level such as Deutsches Arzneibuch (DAB), British Pharmacopoeia (BP) and an international level such as European Pharmacopoeia (Eur. Ph.) to control the quality of the drugs.
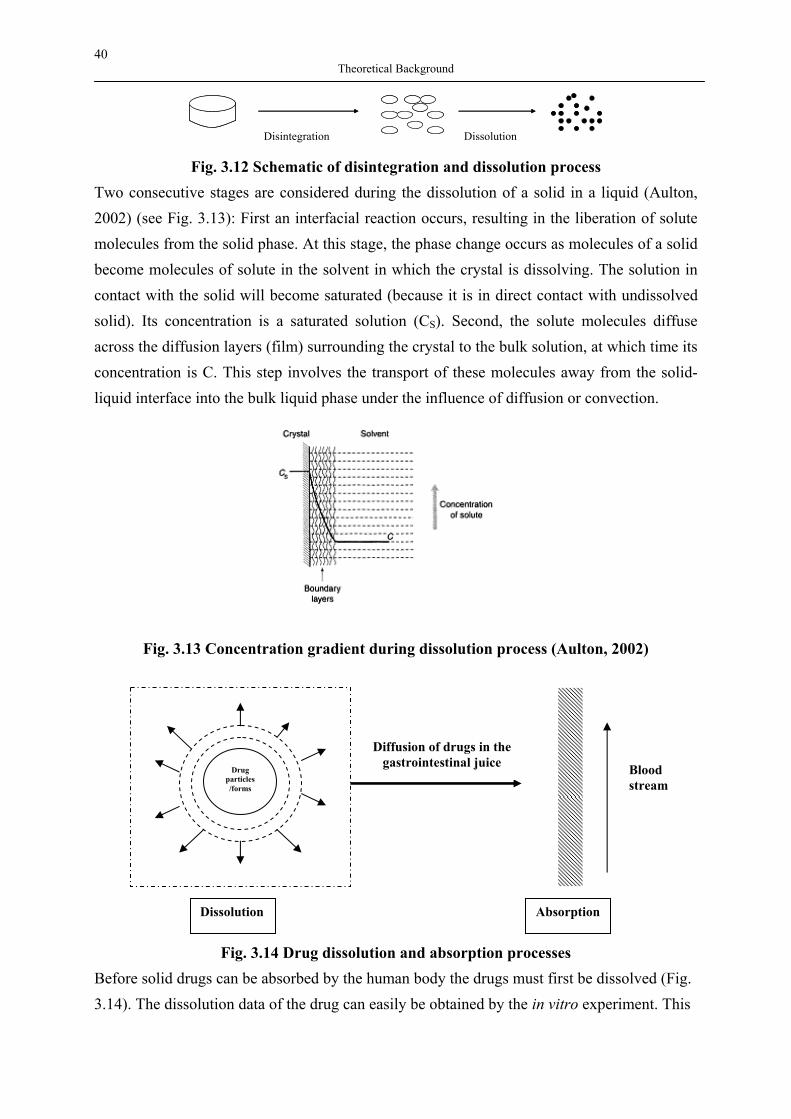
40 Theoretical Background
Disintegration DissolutionDisintegration Dissolution Fig. 3.12 Schematic of disintegration and dissolution process
Two consecutive stages are considered during the dissolution of a solid in a liquid (Aulton, 2002) (see Fig. 3.13): First an interfacial reaction occurs, resulting in the liberation of solute molecules from the solid phase. At this stage, the phase change occurs as molecules of a solid become molecules of solute in the solvent in which the crystal is dissolving. The solution in contact with the solid will become saturated (because it is in direct contact with undissolved solid). Its concentration is a saturated solution (CS). Second, the solute molecules diffuse across the diffusion layers (film) surrounding the crystal to the bulk solution, at which time its concentration is C. This step involves the transport of these molecules away from the solid-liquid interface into the bulk liquid phase under the influence of diffusion or convection.
Fig. 3.13 Concentration gradient during dissolution process (Aulton, 2002)
Fig. 3.14 Drug dissolution and absorption processes Before solid drugs can be absorbed by the human body the drugs must first be dissolved (Fig. 3.14). The dissolution data of the drug can easily be obtained by the in vitro experiment. This
Drug particles/forms
Blood stream
Diffusion of drugs in the gastrointestinal juice
Dissolution Absorption
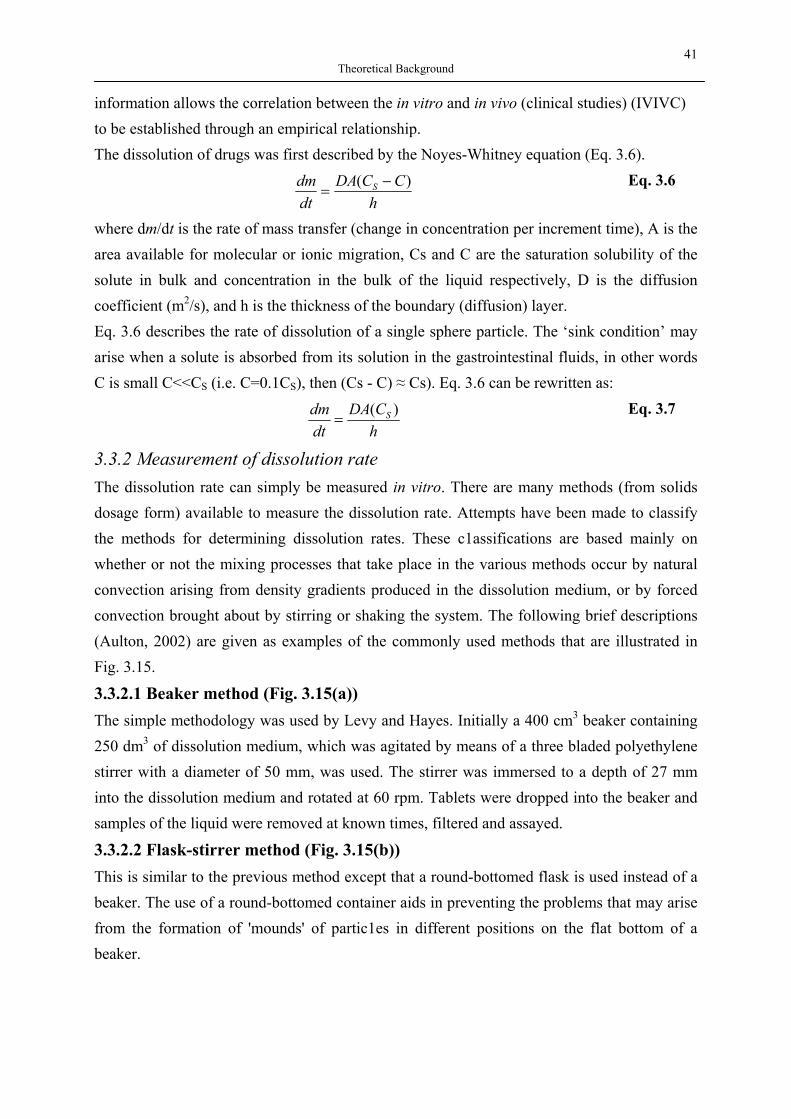
41 Theoretical Background
information allows the correlation between the in vitro and in vivo (clinical studies) (IVIVC) to be established through an empirical relationship. The dissolution of drugs was first described by the Noyes-Whitney equation (Eq. 3.6).
hCCDA
dtdm S )( −
= Eq. 3.6
where dm/dt is the rate of mass transfer (change in concentration per increment time), A is the area available for molecular or ionic migration, Cs and C are the saturation solubility of the solute in bulk and concentration in the bulk of the liquid respectively, D is the diffusion coefficient (m2/s), and h is the thickness of the boundary (diffusion) layer. Eq. 3.6 describes the rate of dissolution of a single sphere particle. The ‘sink condition’ may arise when a solute is absorbed from its solution in the gastrointestinal fluids, in other words C is small C<<CS (i.e. C=0.1CS), then (Cs - C) ≈ Cs). Eq. 3.6 can be rewritten as:
hCDA
dtdm S )(
= Eq. 3.7
3.3.2 Measurement of dissolution rate The dissolution rate can simply be measured in vitro. There are many methods (from solids dosage form) available to measure the dissolution rate. Attempts have been made to classify the methods for determining dissolution rates. These c1assifications are based mainly on whether or not the mixing processes that take place in the various methods occur by natural convection arising from density gradients produced in the dissolution medium, or by forced convection brought about by stirring or shaking the system. The following brief descriptions (Aulton, 2002) are given as examples of the commonly used methods that are illustrated in Fig. 3.15.
3.3.2.1 Beaker method (Fig. 3.15(a)) The simple methodology was used by Levy and Hayes. Initially a 400 cm3 beaker containing 250 dm3 of dissolution medium, which was agitated by means of a three bladed polyethylene stirrer with a diameter of 50 mm, was used. The stirrer was immersed to a depth of 27 mm into the dissolution medium and rotated at 60 rpm. Tablets were dropped into the beaker and samples of the liquid were removed at known times, filtered and assayed.
3.3.2.2 Flask-stirrer method (Fig. 3.15(b)) This is similar to the previous method except that a round-bottomed flask is used instead of a beaker. The use of a round-bottomed container aids in preventing the problems that may arise from the formation of 'mounds' of partic1es in different positions on the flat bottom of a beaker.

42 Theoretical Background
Fig. 3.15 Dissolution rate methods (Aulton, 2002)
3.3.2.3 Rotating basket method (Fig. 3.15 (c)) This method is described in most pharmacopoeias (e.g. Deutsches Arzneibuch (DAB), the United States Pharmacopoeia (USP), British Pharmacopoeia (BP), European Pharmacopoeia (Eur. Ph.)) for the determination of the dissolution rates of drugs from tablets and capsules. Details of the apparatus and methods of operation are given in these official compendia. Principally these methods involve placing the tablet or capsule inside a stainless steel wire basket, which is rotated at a fixed speed (e.g. 50, 75, 100, 150 rpm) while immersed in the dissolution medium, which is contained in a wide-mouthed cylindrical vessel, the bottom of which is either flat or spherical. Samples of the dissolution medium are withdrawn at specified times, filtered and assayed. In accordance with the pharmacopoeias, the standard basket apparatus (or Apparatus I) consists of (BP, 2001): (a) A cylindrical vessel, C, made of borosilicate glass or other suitable transparent material, with a hemispherical bottom and with a nominal capacity of 1000 mL. The vessel has a flanged upper rim and is fitted with a cover that has a number of openings, one of which is central. (b) A motor with a speed regulator capable of maintaining the speed of rotation of the basket within ±4% of that specified in the individual monograph. The motor is fitted with a stirring element which consists of a drive shaft, A, and a cylindrical basket, B (Fig. 3.16A). The basket consists of two components. The top part, with a vent, is attached to the shaft. It is fitted with three spring clips or other suitable ways, that permits removal of the lower part for introduction of the preparation being examined and that firmly hold the lower part of the basket concentric with the axis of the vessel during rotation. The lower separable part of the
(a) (b)
(c) (d)
(e)
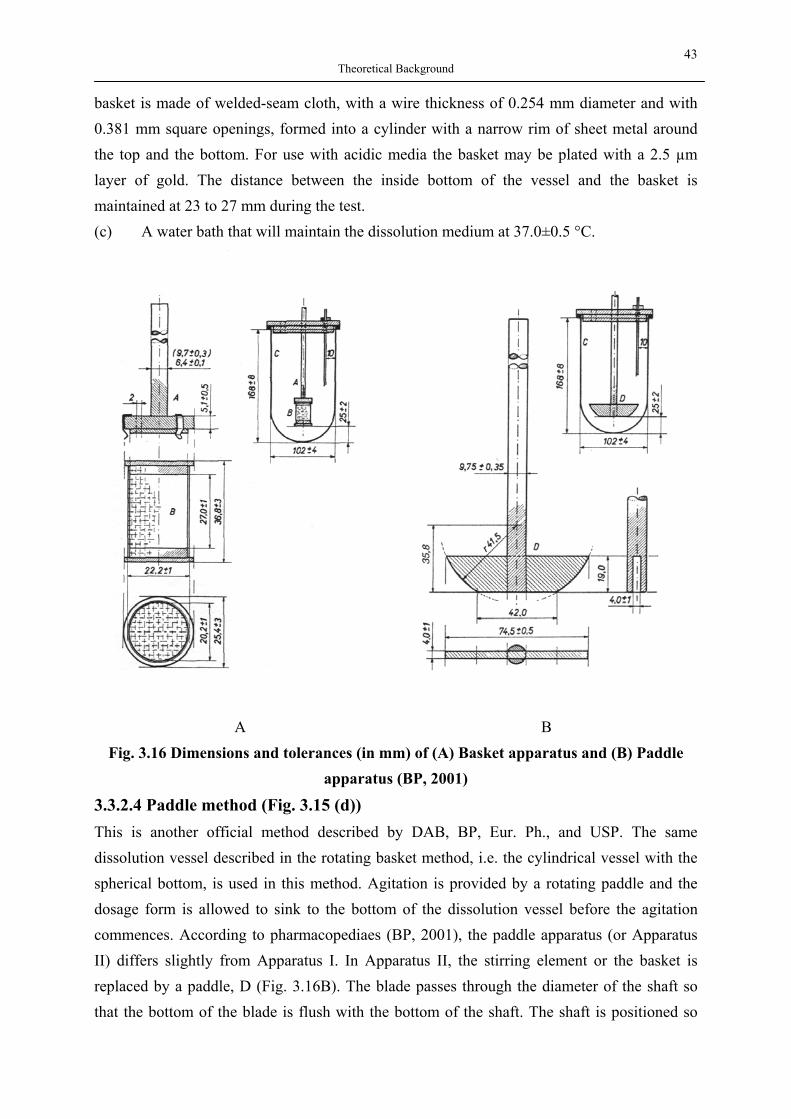
43 Theoretical Background
basket is made of welded-seam cloth, with a wire thickness of 0.254 mm diameter and with 0.381 mm square openings, formed into a cylinder with a narrow rim of sheet metal around the top and the bottom. For use with acidic media the basket may be plated with a 2.5 µm layer of gold. The distance between the inside bottom of the vessel and the basket is maintained at 23 to 27 mm during the test. (c) A water bath that will maintain the dissolution medium at 37.0±0.5 °C.
A B
Fig. 3.16 Dimensions and tolerances (in mm) of (A) Basket apparatus and (B) Paddle apparatus (BP, 2001)
3.3.2.4 Paddle method (Fig. 3.15 (d)) This is another official method described by DAB, BP, Eur. Ph., and USP. The same dissolution vessel described in the rotating basket method, i.e. the cylindrical vessel with the spherical bottom, is used in this method. Agitation is provided by a rotating paddle and the dosage form is allowed to sink to the bottom of the dissolution vessel before the agitation commences. According to pharmacopediaes (BP, 2001), the paddle apparatus (or Apparatus II) differs slightly from Apparatus I. In Apparatus II, the stirring element or the basket is replaced by a paddle, D (Fig. 3.16B). The blade passes through the diameter of the shaft so that the bottom of the blade is flush with the bottom of the shaft. The shaft is positioned so
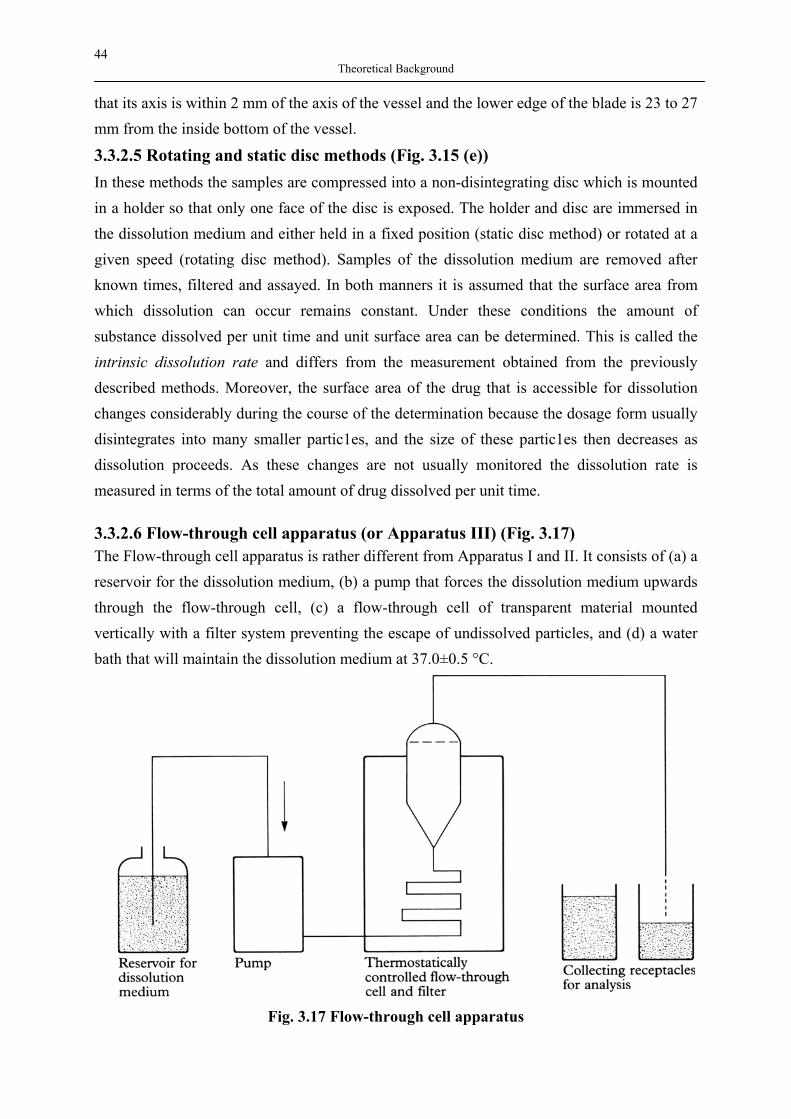
44 Theoretical Background
that its axis is within 2 mm of the axis of the vessel and the lower edge of the blade is 23 to 27 mm from the inside bottom of the vessel.
3.3.2.5 Rotating and static disc methods (Fig. 3.15 (e)) In these methods the samples are compressed into a non-disintegrating disc which is mounted in a holder so that only one face of the disc is exposed. The holder and disc are immersed in the dissolution medium and either held in a fixed position (static disc method) or rotated at a given speed (rotating disc method). Samples of the dissolution medium are removed after known times, filtered and assayed. In both manners it is assumed that the surface area from which dissolution can occur remains constant. Under these conditions the amount of substance dissolved per unit time and unit surface area can be determined. This is called the intrinsic dissolution rate and differs from the measurement obtained from the previously described methods. Moreover, the surface area of the drug that is accessible for dissolution changes considerably during the course of the determination because the dosage form usually disintegrates into many smaller partic1es, and the size of these partic1es then decreases as dissolution proceeds. As these changes are not usually monitored the dissolution rate is measured in terms of the total amount of drug dissolved per unit time.
3.3.2.6 Flow-through cell apparatus (or Apparatus III) (Fig. 3.17) The Flow-through cell apparatus is rather different from Apparatus I and II. It consists of (a) a reservoir for the dissolution medium, (b) a pump that forces the dissolution medium upwards through the flow-through cell, (c) a flow-through cell of transparent material mounted vertically with a filter system preventing the escape of undissolved particles, and (d) a water bath that will maintain the dissolution medium at 37.0±0.5 °C.
Fig. 3.17 Flow-through cell apparatus
45 Theoretical Background
The choice of the apparatus to be used depends on the physicochemical characteristics of the dosage form. The individual tablet and capsule monographs, the use of apparatus types, dissolution medium and test conditions are normally provided in these pharmacopoeias. Construction of Apparatus: For the apparatus used in the test it is important that all parts of the apparatus that may come into contact with the preparation being examined or with the dissolution medium are chemically inert and do not adsorb, react with or interfere with the preparation being examined or with the dissolution medium. No part of the assembly, including the environment in which the assembly is placed, may contribute to significant motion, agitation or vibration beyond that due to the smoothly rotating element or from the flow-through system (BP, 2001). In addition, an apparatus that allows observation of the preparation being examined and the stirrer during the test is preferable. Test conditions: Pharmacopoeial tests using either the basket or the paddle are based on the principle of operating under 'sink conditions', or in a manner such that material already in solution does not exert a modifying effect on the rate of dissolution of the remainder. In other words, the sink condition assures that the dissolution process is not significantly affected by solubility characteristics. “Sink conditions” normally occur in a volume of dissolution medium that is at least 5 to 10 times the saturation volume. Sometimes “Sink” was defined in different ways, for example, 10 - 2 0 % (FIP, 1981) or approximately 30% (USP, 1995) of solubility concentration of this drug in the dissolution medium (FIP, 1996). A dissolution medium volume of 900 mL instead of 1000 mL has been adopted as the norm and for the test 6 individual tablets or capsules are generally required. Other standardised conditions include the rotation speed of 100 rpm (basket), 50 rpm (paddle), the dissolution medium composition; aqueous, 0.1 M HCl or phosphate buffer pH 6.8-7.6. The utilized dissolution medium is recommended as specified in the individual monograph. However, where it is not specified, a suitable dissolution medium may be properly selected. When the test of fine particles or powder is involved, the use of the standard is apparently insufficient due to their agitator forms (e.g. basket and paddle) and their associated flow patterns, which are not recognised by the norm design of the agitator system. The low rotation speed (100 rpm) of the test condition would result in non-ideal mixing (inhomogeneity of mixing species). One example of the poor mass transfer is the use of the basket apparatus to determine the dissolution profile of drug powdered forms or fine particles. In this case, the solid particles can either float on the dissolution medium or remain in the bottom of the vessel, which leads to strong inhomogeneity and can develop a stagnant or dead zone could be developed. A better mass mixing is achieved through the use of the paddle apparatus due to its shape and construction; it is impossible, however, to estimate the laminar or turbulent region described in the norm. In the next section, the flow behaviour in mixing tank will be discussed according to the chemical engineering norm.

46 Theoretical Background
3.3.3 Flow patterns in a mixing tank The flow patterns in a mixing tank depend on the fluid properties, the geometry of the tank, types of the baffles in the tank, and the agitator itself (Geankoplis, 1993). When a propeller or a turbine is mounted at the centre of the tank without baffles, a swirling flow patterns usually develops at the high speed of mixing. This swirling is undesirable due to an excessive air entrainment, development of a large vortex, and surging. To avoid this, baffles are generally used. The arrangement and the type of a mixer can generate different flow patterns within the agitator system. A typical axial and a radial flow pattern of a turbine type mixer with baffles are illustrated in Fig. 3.18.
Fig. 3.18 Flow patterns and arrangements of turbine type agitator (Coulson,
Richardson, 1999) Turbulent mixing is vital in operations concerning mass and heat transfer. The dimensionless number Reynolds (Re) (see Eq. 3.8) is generally used to characterise flow regions; laminar, transition or turbulent.
ννπ
222Re dndu ⋅
=⋅
⋅=
Eq. 3.8
where u is the velocity, d2 is the diameter of a turbine , and ν is kinematic viscosity.
Flow in the tank is turbulent when Re>10,000. Thus viscosity alone is not a valid indication of the type of flow to be expected. Between Reynolds numbers of 10 and 10,000 is a transition range in which flow is turbulent at the impeller and laminar in remote parts of the
vessel; when Re<10, flow is laminar only (Perry, Green, 1999).
3.3.4 Factors affecting in vitro dissolution rate There are many physicochemical factors which can affect the dissolution rate. These factors can be best described by the use of the Noyes-Whitney equation as shown in Table 3.6.
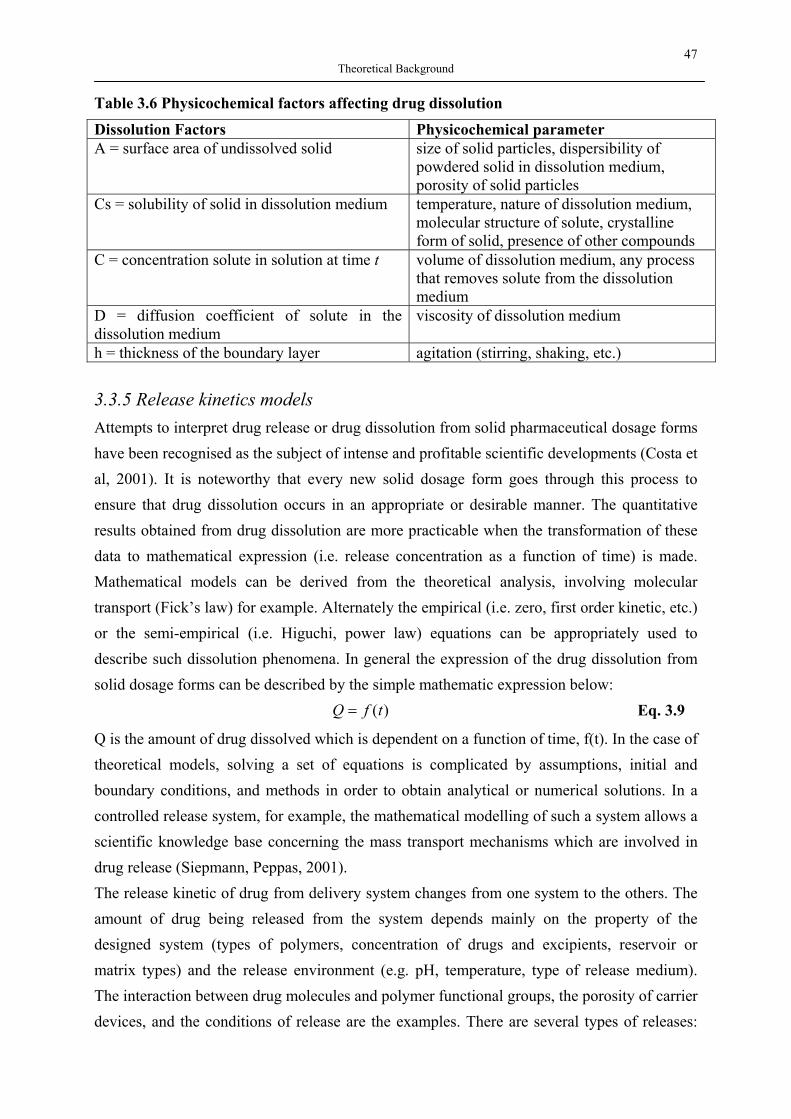
47 Theoretical Background
Table 3.6 Physicochemical factors affecting drug dissolution
Dissolution Factors Physicochemical parameter A = surface area of undissolved solid
size of solid particles, dispersibility of powdered solid in dissolution medium, porosity of solid particles
Cs = solubility of solid in dissolution medium
temperature, nature of dissolution medium, molecular structure of solute, crystalline form of solid, presence of other compounds
C = concentration solute in solution at time t
volume of dissolution medium, any process that removes solute from the dissolution medium
D = diffusion coefficient of solute in the dissolution medium
viscosity of dissolution medium
h = thickness of the boundary layer agitation (stirring, shaking, etc.)
3.3.5 Release kinetics models Attempts to interpret drug release or drug dissolution from solid pharmaceutical dosage forms have been recognised as the subject of intense and profitable scientific developments (Costa et al, 2001). It is noteworthy that every new solid dosage form goes through this process to ensure that drug dissolution occurs in an appropriate or desirable manner. The quantitative results obtained from drug dissolution are more practicable when the transformation of these data to mathematical expression (i.e. release concentration as a function of time) is made. Mathematical models can be derived from the theoretical analysis, involving molecular transport (Fick’s law) for example. Alternately the empirical (i.e. zero, first order kinetic, etc.) or the semi-empirical (i.e. Higuchi, power law) equations can be appropriately used to describe such dissolution phenomena. In general the expression of the drug dissolution from solid dosage forms can be described by the simple mathematic expression below:
)(tfQ = Eq. 3.9
Q is the amount of drug dissolved which is dependent on a function of time, f(t). In the case of theoretical models, solving a set of equations is complicated by assumptions, initial and boundary conditions, and methods in order to obtain analytical or numerical solutions. In a controlled release system, for example, the mathematical modelling of such a system allows a scientific knowledge base concerning the mass transport mechanisms which are involved in drug release (Siepmann, Peppas, 2001). The release kinetic of drug from delivery system changes from one system to the others. The amount of drug being released from the system depends mainly on the property of the designed system (types of polymers, concentration of drugs and excipients, reservoir or matrix types) and the release environment (e.g. pH, temperature, type of release medium). The interaction between drug molecules and polymer functional groups, the porosity of carrier devices, and the conditions of release are the examples. There are several types of releases:
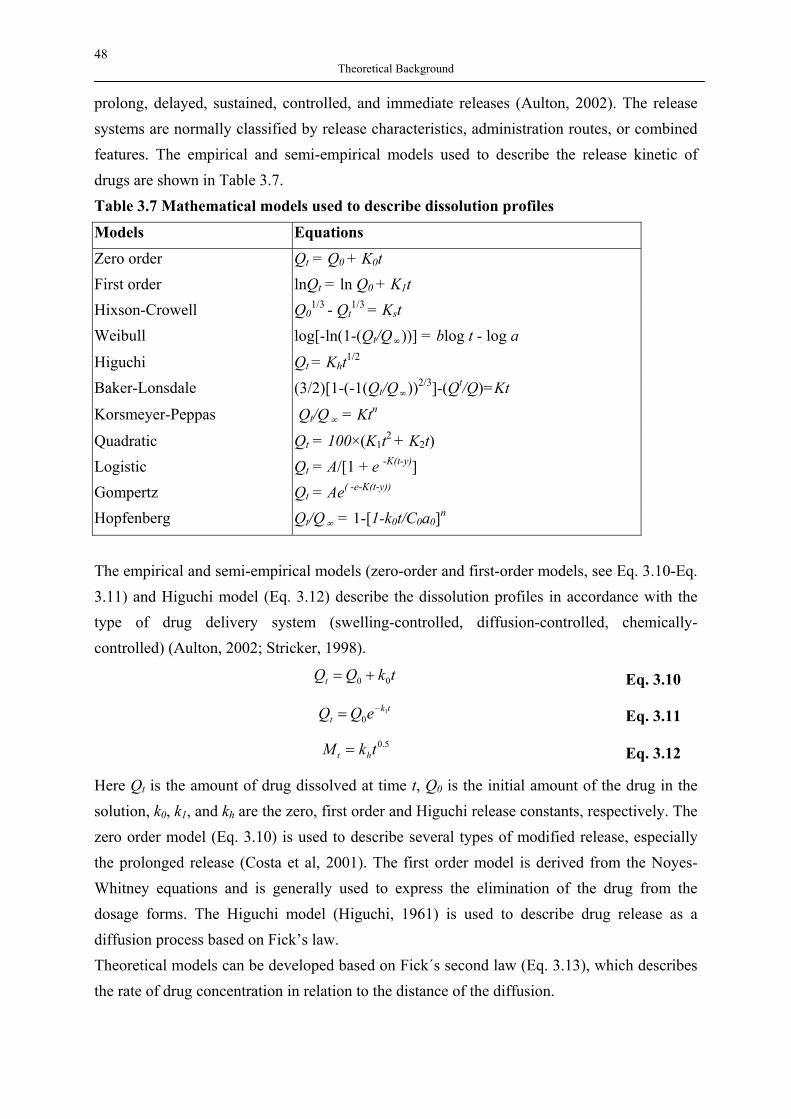
48 Theoretical Background
prolong, delayed, sustained, controlled, and immediate releases (Aulton, 2002). The release systems are normally classified by release characteristics, administration routes, or combined features. The empirical and semi-empirical models used to describe the release kinetic of drugs are shown in Table 3.7. Table 3.7 Mathematical models used to describe dissolution profiles
Models Equations
Zero order Qt = Q0 + K0t First order lnQt = ln Q0 + K1t Hixson-Crowell Q0
1/3 - Qt1/3 = Kst
Weibull log[-ln(1-(Qt/Q∞))] = blog t - log a
Higuchi Qt = Kht1/2 Baker-Lonsdale (3/2)[1-(-1(Qt/Q∞))2/3]-(Qt/Q)=Kt
Korsmeyer-Peppas Qt/Q∞ = Ktn
Quadratic Qt = 100×(K1t2 + K2t) Logistic Qt = A/[1 + e -K(t-y)] Gompertz Qt = Ae( -e-K(t-y)) Hopfenberg Qt/Q∞ = 1-[1-k0t/C0a0]n
The empirical and semi-empirical models (zero-order and first-order models, see Eq. 3.10-Eq. 3.11) and Higuchi model (Eq. 3.12) describe the dissolution profiles in accordance with the type of drug delivery system (swelling-controlled, diffusion-controlled, chemically-controlled) (Aulton, 2002; Stricker, 1998).
tkQQt 00 += Eq. 3.10
tkt eQQ 1
0−= Eq. 3.11
5.0tkM ht = Eq. 3.12
Here Qt is the amount of drug dissolved at time t, Q0 is the initial amount of the drug in the solution, k0, k1, and kh are the zero, first order and Higuchi release constants, respectively. The zero order model (Eq. 3.10) is used to describe several types of modified release, especially the prolonged release (Costa et al, 2001). The first order model is derived from the Noyes-Whitney equations and is generally used to express the elimination of the drug from the dosage forms. The Higuchi model (Higuchi, 1961) is used to describe drug release as a diffusion process based on Fick’s law. Theoretical models can be developed based on Fick´s second law (Eq. 3.13), which describes the rate of drug concentration in relation to the distance of the diffusion.
49 Theoretical Background
2
2
xCD
tC AA
∂∂
=∂
∂ Eq. 3.13
A large number of literatures have reported on some models derived from Fick´s second law, where the infinite mass transfer coefficient in boundary layer, perfect sink condition and uniform initial drug concentration are assumed, with the appropriate initial and boundary conditions and different geometries. The resulting analytical solution can be obtained.
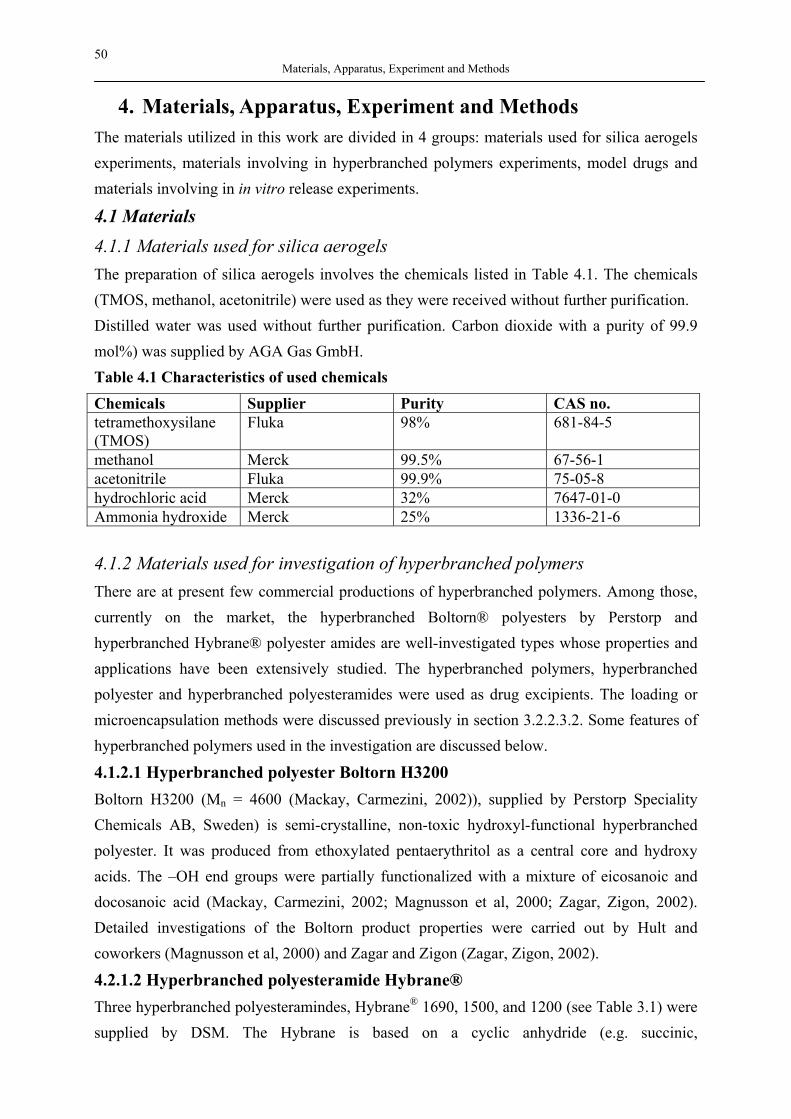
50 Materials, Apparatus, Experiment and Methods
4. Materials, Apparatus, Experiment and Methods The materials utilized in this work are divided in 4 groups: materials used for silica aerogels experiments, materials involving in hyperbranched polymers experiments, model drugs and materials involving in in vitro release experiments.
4.1 Materials 4.1.1 Materials used for silica aerogels The preparation of silica aerogels involves the chemicals listed in Table 4.1. The chemicals (TMOS, methanol, acetonitrile) were used as they were received without further purification. Distilled water was used without further purification. Carbon dioxide with a purity of 99.9 mol%) was supplied by AGA Gas GmbH. Table 4.1 Characteristics of used chemicals
Chemicals Supplier Purity CAS no. tetramethoxysilane (TMOS)
Fluka 98% 681-84-5
methanol Merck 99.5% 67-56-1 acetonitrile Fluka 99.9% 75-05-8 hydrochloric acid Merck 32% 7647-01-0 Ammonia hydroxide Merck 25% 1336-21-6
4.1.2 Materials used for investigation of hyperbranched polymers There are at present few commercial productions of hyperbranched polymers. Among those, currently on the market, the hyperbranched Boltorn® polyesters by Perstorp and hyperbranched Hybrane® polyester amides are well-investigated types whose properties and applications have been extensively studied. The hyperbranched polymers, hyperbranched polyester and hyperbranched polyesteramides were used as drug excipients. The loading or microencapsulation methods were discussed previously in section 3.2.2.3.2. Some features of hyperbranched polymers used in the investigation are discussed below.
4.1.2.1 Hyperbranched polyester Boltorn H3200 Boltorn H3200 (Mn = 4600 (Mackay, Carmezini, 2002)), supplied by Perstorp Speciality Chemicals AB, Sweden) is semi-crystalline, non-toxic hydroxyl-functional hyperbranched polyester. It was produced from ethoxylated pentaerythritol as a central core and hydroxy acids. The –OH end groups were partially functionalized with a mixture of eicosanoic and docosanoic acid (Mackay, Carmezini, 2002; Magnusson et al, 2000; Zagar, Zigon, 2002). Detailed investigations of the Boltorn product properties were carried out by Hult and coworkers (Magnusson et al, 2000) and Zagar and Zigon (Zagar, Zigon, 2002).
4.2.1.2 Hyperbranched polyesteramide Hybrane® Three hyperbranched polyesteramindes, Hybrane® 1690, 1500, and 1200 (see Table 3.1) were supplied by DSM. The Hybrane is based on a cyclic anhydride (e.g. succinic,
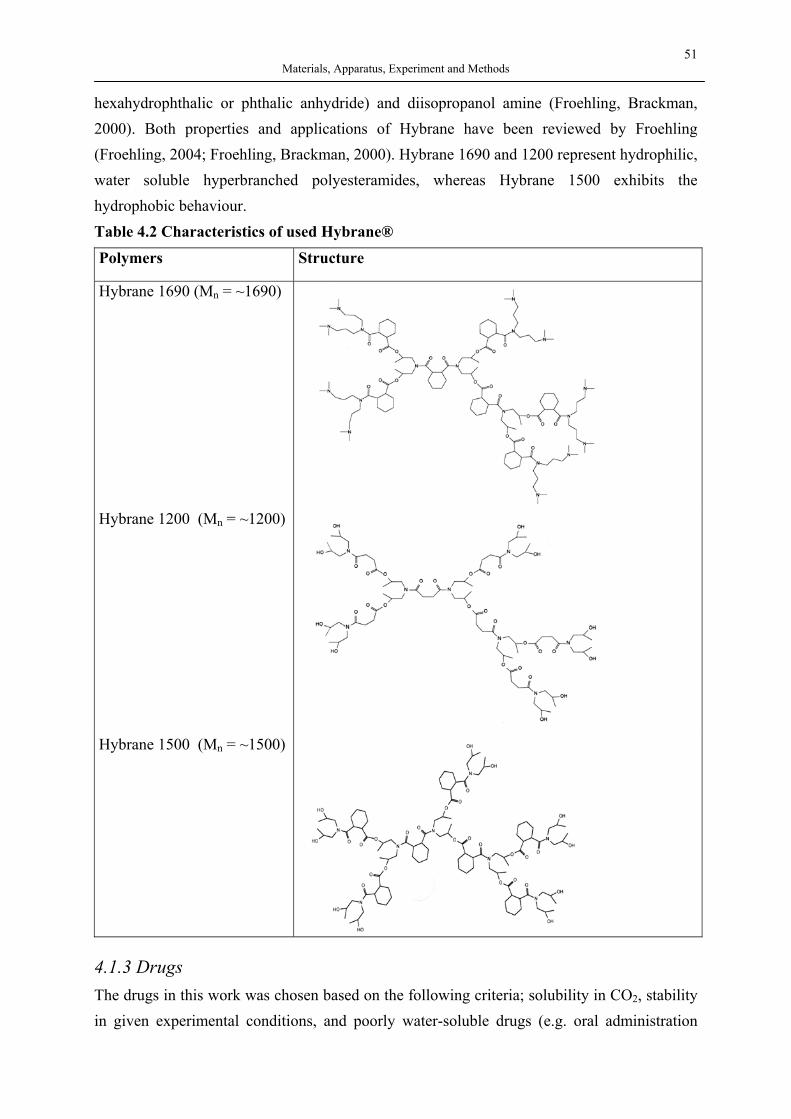
51 Materials, Apparatus, Experiment and Methods
hexahydrophthalic or phthalic anhydride) and diisopropanol amine (Froehling, Brackman, 2000). Both properties and applications of Hybrane have been reviewed by Froehling (Froehling, 2004; Froehling, Brackman, 2000). Hybrane 1690 and 1200 represent hydrophilic, water soluble hyperbranched polyesteramides, whereas Hybrane 1500 exhibits the hydrophobic behaviour. Table 4.2 Characteristics of used Hybrane®
Polymers Structure
Hybrane 1690 (Mn = ~1690)
Hybrane 1200 (Mn = ~1200)
Hybrane 1500 (Mn = ~1500)
4.1.3 Drugs The drugs in this work was chosen based on the following criteria; solubility in CO2, stability in given experimental conditions, and poorly water-soluble drugs (e.g. oral administration
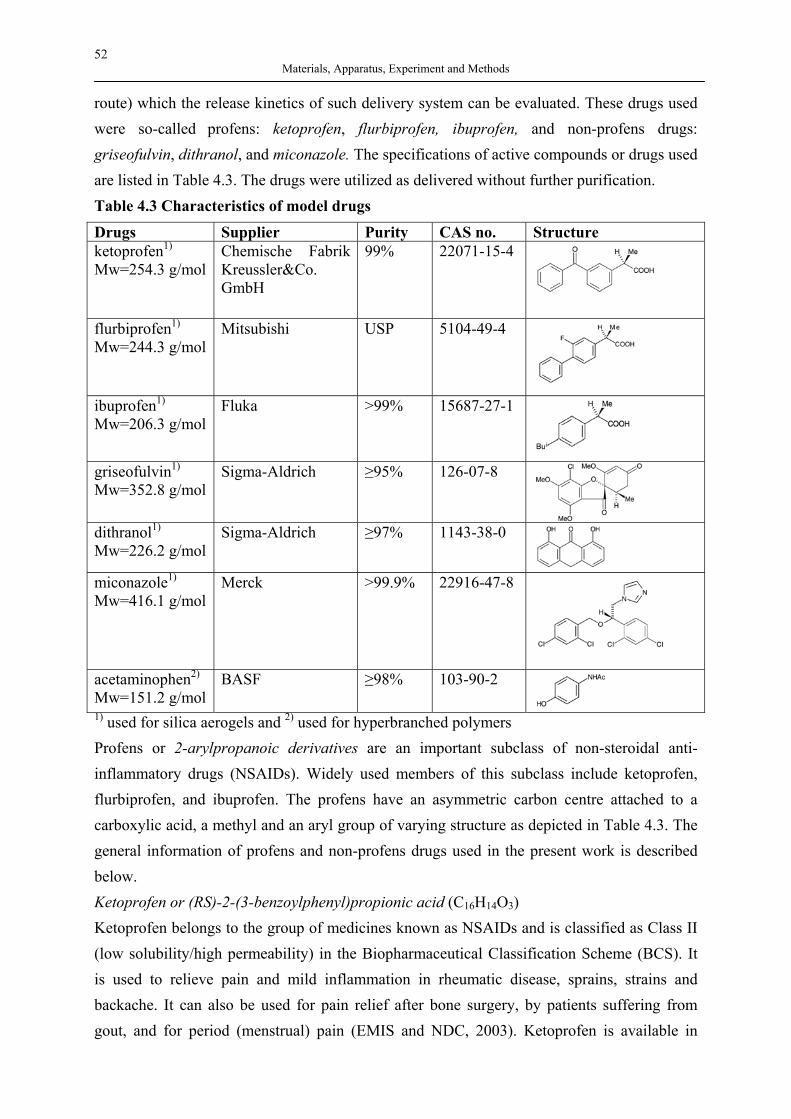
52 Materials, Apparatus, Experiment and Methods
route) which the release kinetics of such delivery system can be evaluated. These drugs used were so-called profens: ketoprofen, flurbiprofen, ibuprofen, and non-profens drugs: griseofulvin, dithranol, and miconazole. The specifications of active compounds or drugs used are listed in Table 4.3. The drugs were utilized as delivered without further purification. Table 4.3 Characteristics of model drugs
Drugs Supplier Purity CAS no. Structure ketoprofen1) Mw=254.3 g/mol
Chemische Fabrik Kreussler&Co. GmbH
99% 22071-15-4
flurbiprofen1) Mw=244.3 g/mol
Mitsubishi USP 5104-49-4
ibuprofen1) Mw=206.3 g/mol
Fluka >99% 15687-27-1
griseofulvin1) Mw=352.8 g/mol
Sigma-Aldrich ≥95% 126-07-8
dithranol1) Mw=226.2 g/mol
Sigma-Aldrich ≥97% 1143-38-0
miconazole1) Mw=416.1 g/mol
Merck >99.9% 22916-47-8
acetaminophen2) Mw=151.2 g/mol
BASF ≥98% 103-90-2
1) used for silica aerogels and 2) used for hyperbranched polymers Profens or 2-arylpropanoic derivatives are an important subclass of non-steroidal anti-inflammatory drugs (NSAIDs). Widely used members of this subclass include ketoprofen, flurbiprofen, and ibuprofen. The profens have an asymmetric carbon centre attached to a carboxylic acid, a methyl and an aryl group of varying structure as depicted in Table 4.3. The general information of profens and non-profens drugs used in the present work is described below. Ketoprofen or (RS)-2-(3-benzoylphenyl)propionic acid (C16H14O3) Ketoprofen belongs to the group of medicines known as NSAIDs and is classified as Class II (low solubility/high permeability) in the Biopharmaceutical Classification Scheme (BCS). It is used to relieve pain and mild inflammation in rheumatic disease, sprains, strains and backache. It can also be used for pain relief after bone surgery, by patients suffering from gout, and for period (menstrual) pain (EMIS and NDC, 2003). Ketoprofen is available in
53 Materials, Apparatus, Experiment and Methods
capsule, suppository, gel and injection form and is also sometimes known as Ketocid, Ketovail, Orudis, Oruvail, Tiloket. It is offered in different forms of delivery such as 100 mg, 200 mg capsules, 100 mg tablets, 100 mg suppository or as a 2.5% w/v gel. Ibuprofen or (RS)-2-(4-isobutylphenyl)propionic acid (C13H18O2) Ibuprofen is another NSAID. It usage is to relieve pain and inflammation caused by rheumatic and muscular pain, headaches, migraine, back ache, period (menstrual) pain, pain after surgery and dental pain. In addition it can be used to relieve cold and 'flu-like' like symptoms including fever (high temperature) in adults and children. It is available in tablet, oral liquid and effervescent granule form, and as modified release preparations (EMIS and NDC, 2003). It is sometimes known as Advil, Anadin Ibuprofen, Arthrofen, Brufen, Brufen Retard, Care Ibuprofen, Cuprofen, Fenbid, Fleximex, Galprofen, Hedex Ibuprofen, Ibufem, Librofem, Mandafen, Manorfen, Migrafen, Motrin, Novaprin, Nucare Ibuprofen, Nurofen, Obifen, Pacifene, Relcofen, Taylors Ibuprofen (Madsafe, 2004). Flurbiprofen or (2RS)-2-(2-fluorobiphenyl-4-yl)propanoic acid (C15H13FO 2) Flurbiprofen is another drug in the NSAIDs group. Similar to ketoprofen and ibuprofen, it is classified as Class II (low solubility/high permeability) in the Biopharmaceutical Classification Scheme (BCS). It can be used to relieve mild to moderate pain and inflammation in rheumatic disease, sprains, strains, backache, period (menstrual) pain and pain after an operation. It is also known as Froben, Froben SR and is available in tablets, suppository form, and eye drops (EMIS and NDC, 2003). Flurbiprofen is also available in modified release forms, which allow a slow release over the day for an even effect. Griseofulvin or (1´S,6´R)-7-chloro-2´,4,6-trimethoxy-6´-methylspiro[benzofuran-2(3 H´), 1´-[2]cyclohexene]-3,4´-dione (C17H17ClO6) Griseofulvin, also known as Grisovin, is in the same group of medicines as miconazole. It is classified as Class II (low solubility/high permeability) in the Biopharmaceutical Classification Scheme (BCS). It is taken orally to treat fungal infections of the hair, skin, fingernails and toenails (EMIS and NDC, 2003). It is available in tablet and liquid form e.g. griseofulvin microsize in the form of a capsule: 250 mg; suspension: 125 mg/5 mL; tablet: 250 mg, 500 mg, griseofulvin ultramicrosize in the form of a tablet: 125 mg; 165 mg; 250 mg; 330 mg. Dithranol or anthrarine or 1,8-dihydroxyanthracen-9(10H)-one (C14H10O3) Dithranol belongs to the group of medicines known as antipsoriatics. Dithranol is applied to the skin to treat psoriasis. Psoriasis is a skin disorder caused when cells in the outer layer of the skin multiply too quickly. As new skin cells are produced, old ones are shed. If this process takes place too quickly old skin cells build up on the skin surface causing red, scaly patches. Dithranol helps control psoriasis by slowing down the production of new skin cells.
54 Materials, Apparatus, Experiment and Methods
Dithranol is available in cream, ointment paste and scalp gel form. It is also sometimes known as: Dithrocream; Micanol (EMIS and NDC, 2003). Miconazole or (RS)-1-[2-(2,4-dichlorobenzyloxy)-2-(2,4-dichlorophenyl)-ethyl]-1 H- imidazole (C18H14Cl4N2 O) Miconazole belongs to the group of medicines known as antifungals. It is used to treat tinea (fungal) infections (also known as ringworm) of the skin and nails. It can also be used to treat oral and vaginal thrush. It is available in cream, oral gel, powder, spray powder and pessary form. It is also known as Daktarin, Daktarin Dual Action, Daktarin Oral Gel (EMIS and NDC, 2003). Acetaminophen or N-(4-hydroxyphenyl) acetamide (C8H9NO2) Acetaminophen is also recognized as paracetamol and is classified into the group of medicines known as analgesics and antipyreti. It is used to relieve mild to moderate pain and is also useful in controlling fever (high temperature). Paracetamol is available in tablet, capsule, soluble and dispersible tablet, oral liquid and suppository form. It is also available as Alvedon, Anadin Paracetamol, Calpol Fast Melts, Calpol Infant, Calpol Paed, Calpol Six Plus, Disprol, Disprol Infant, Fennings, Galpamol, Hedex, Infadrops, Mandanol, Mandanol Infant, Medinol Over, Medinol Paed, Medinol Under, Miradol, Nucare Paracetamol, Obimol, Panadol (EMIS and NDC, 2003).
4.1.4 Solutions used for investigation of in vitro release The dissolution media used for the dissolution test experiment are listed in Table 4.4. To simulate gastric fluid, 0.1 M HCl (pH 1.2) was prepared from the stock solution listed in Table 4.1. To simulate intestinal fluid, a dissolution medium of Phosphate buffer pH 5.8-8.0 consisting of dibasic sodium phosphate (i.e. Na2HPO4·2H2O) and monobasic sodium phosphate (i.e. NaH2PO4·H2O) was prepared according to the recipe given in the appendix. Table 4.4 Corresponding drugs and dissolution media
Drugs Dissolution media/Remarks ketoprofen 0.1 M HCl, pH 1.2 or/and phosphate buffer pH 7.4 miconazole 0.1 M HCl, pH 1.2 griseofulvin 0.1 M HCl, pH 1.2 or/and phosphate buffer pH 7.4 ibuprofen 0.1 M HCl, pH 1.2 or/and phosphate buffer pH 7.2 dithranol* Membrane penetration and FTIR-ATR-technique acetaminophen 0.1 M HCl, pH 1.2 or/and phosphate buffer pH 5.8 flubiprofen phosphate buffer pH 7.2 *in vitro release experiments were conducted by U. Günther (Günther, 2005).
55 Materials, Apparatus, Experiment and Methods
4.2 Apparatus and experimental procedures 4.2.1 Preparation of silica aerogels Silica aerogels with different bulk densities were prepared using the modified two-step sol-gel process (Tillotson, Hrubesh, 1992). First, tetramethoxysilane (TMOS), methanol, water, and hydrochloric acid were mixed in the ratio of 1mol TMOS:2.4mol MeOH:1.3mol H2O:10-5mol HCl. The mixture was stirred for 30 min before the additional water and ammonia solution were added to achieve the mole ratio of 1mol TMOS:2.4mol MeOH:4mol H2O:10-5mol HCl:10-2mol NH4OH. The mixture or the sol was then diluted with acetonitrile to obtain the desired target density of the aerogel and stirred rigorously for 1-2 min. In this work, a high pressure autoclave was used for the aerogel production. The detailed descriptions of the autoclave and its assembly have been given by Simirnova (Smirnova, 2002). For the preparation of silica aerogels with the target density of 0.03 g/cm3
( solSiOett Vm2arg =ρ ), the sol was poured into the autoclave heated to 40°C. After the
temperature was reached, carbon dioxide (2-3 g) was added to the sol. This action was repeated every 5 min until the gel was formed. The addition of carbon dioxide helps accelerate the gelation time as described by Smirnova (Smirnova, Arlt, 2003). The resulting gel was then aged for 24 hours. Finally the aged gel was supercritically dried by carbon dioxide. The process flow sheet for drying the aerogels is illustrated in Fig. 4.1. First, the CO2 gas from tank (1) was preheated to the temperature of 40°C by a heat exchanger (5) before being introduced into the autoclave. After the pressure in the autoclave and CO2 tank were equal, CO2 gas was slowly added using a compressor (3) until the pressure reached 10 MPa. Then the outlet valves (12-14) were slowly opened to allow the continuous flow of supercritical CO2 through the gel. The gas flow was maintained constant at ~100 NL/h. The extraction of pore liquid continued for 24 hours as the solvents were collected in a condenser (15). Thereafter, the compressor was switched off and the pressure decreased to ambient pressure. The resulting silica aerogels obtained were further characterised and used for hydrophobization and adsorption experiments. When silica aerogels with the target density between 0.05-0.27 g/cm3 were prepared, the sols were transferred immediately to the moulds (e.g. 2ml or 5 ml syringes) due to shorter gelation time. The syringes were left in an ambient environment for 48 hours before the supercritical drying with carbon dioxide. Both gelation and aging processes occur at this period. The aged gels from syringes were cylindrical. In order to dry the cylindrical gels, the autoclave was previously filled with 60-80 ml acetonitrile. Then the gels were transferred to the autoclave and supercritically dried as described previously. The resulting monolith silica aerogels were further characterised and used for hydrophobization and adsorption experiments. The bulk
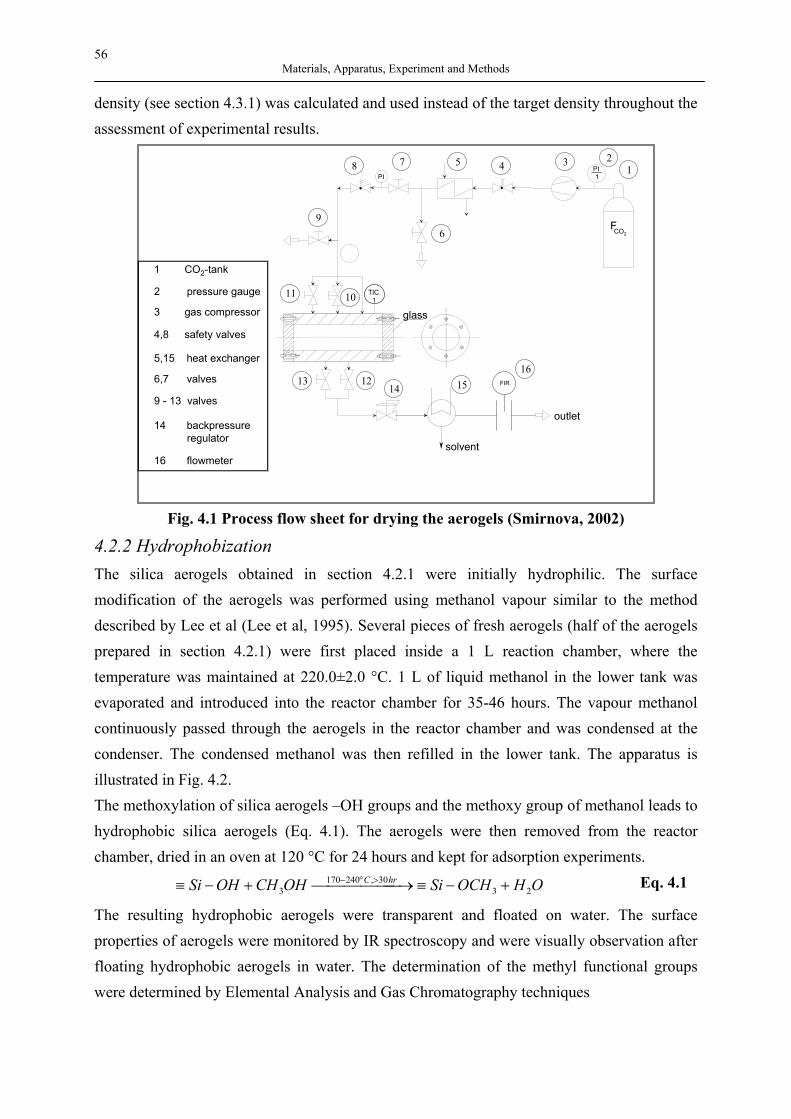
56 Materials, Apparatus, Experiment and Methods
density (see section 4.3.1) was calculated and used instead of the target density throughout the assessment of experimental results.
PI
outlet
PI1
TIC1
FIR
solvent
FCO2
2
glass
1 CO2-tank
2 pressure gauge
3 gas compressor
4,8 safety valves
5,15 heat exchanger
6,7 valves
14 backpressure regulator
16 flowmeter
1 3 4 5 7
6
8
9
11 10
13 1214 15
16
9 - 13 valves
Fig. 4.1 Process flow sheet for drying the aerogels (Smirnova, 2002)
4.2.2 Hydrophobization The silica aerogels obtained in section 4.2.1 were initially hydrophilic. The surface modification of the aerogels was performed using methanol vapour similar to the method described by Lee et al (Lee et al, 1995). Several pieces of fresh aerogels (half of the aerogels prepared in section 4.2.1) were first placed inside a 1 L reaction chamber, where the temperature was maintained at 220.0±2.0 °C. 1 L of liquid methanol in the lower tank was evaporated and introduced into the reactor chamber for 35-46 hours. The vapour methanol continuously passed through the aerogels in the reactor chamber and was condensed at the condenser. The condensed methanol was then refilled in the lower tank. The apparatus is illustrated in Fig. 4.2. The methoxylation of silica aerogels –OH groups and the methoxy group of methanol leads to hydrophobic silica aerogels (Eq. 4.1). The aerogels were then removed from the reactor chamber, dried in an oven at 120 °C for 24 hours and kept for adsorption experiments.
OHOCHSiOHCHOHSi hrC23
30,2401703 +−≡ →+−≡ >°− Eq. 4.1
The resulting hydrophobic aerogels were transparent and floated on water. The surface properties of aerogels were monitored by IR spectroscopy and were visually observation after floating hydrophobic aerogels in water. The determination of the methyl functional groups were determined by Elemental Analysis and Gas Chromatography techniques
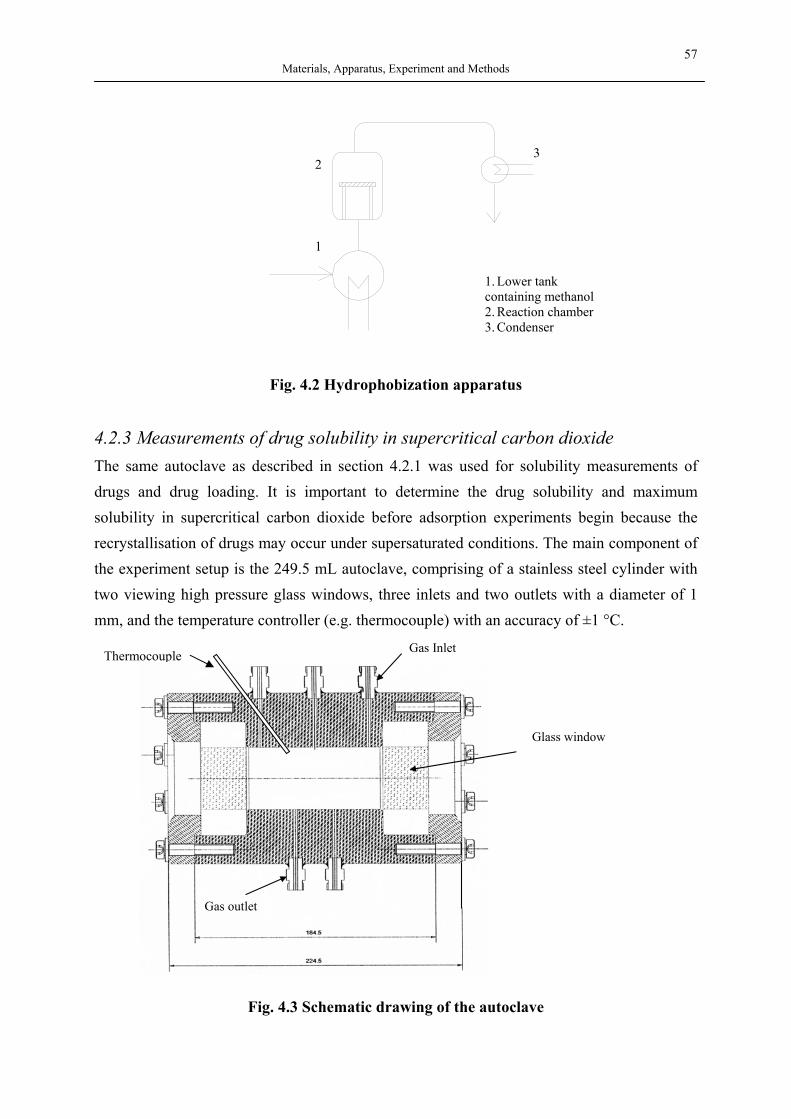
57 Materials, Apparatus, Experiment and Methods
Fig. 4.2 Hydrophobization apparatus
4.2.3 Measurements of drug solubility in supercritical carbon dioxide The same autoclave as described in section 4.2.1 was used for solubility measurements of drugs and drug loading. It is important to determine the drug solubility and maximum solubility in supercritical carbon dioxide before adsorption experiments begin because the recrystallisation of drugs may occur under supersaturated conditions. The main component of the experiment setup is the 249.5 mL autoclave, comprising of a stainless steel cylinder with two viewing high pressure glass windows, three inlets and two outlets with a diameter of 1 mm, and the temperature controller (e.g. thermocouple) with an accuracy of ±1 °C.
Glass window
Gas Inlet
Gas outlet
Fig. 4.3 Schematic drawing of the autoclave
1. Lower tank containing methanol 2. Reaction chamber 3. Condenser
1
2 3
Thermocouple
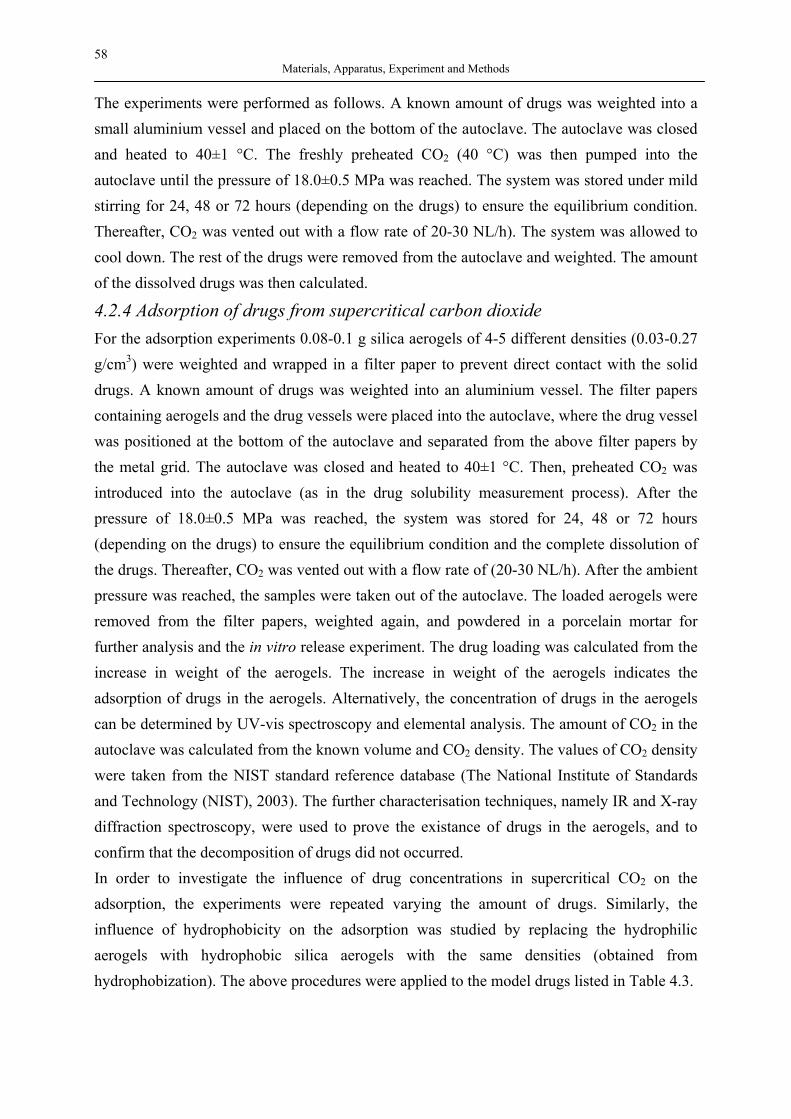
58 Materials, Apparatus, Experiment and Methods
The experiments were performed as follows. A known amount of drugs was weighted into a small aluminium vessel and placed on the bottom of the autoclave. The autoclave was closed and heated to 40±1 °C. The freshly preheated CO2 (40 °C) was then pumped into the autoclave until the pressure of 18.0±0.5 MPa was reached. The system was stored under mild stirring for 24, 48 or 72 hours (depending on the drugs) to ensure the equilibrium condition. Thereafter, CO2 was vented out with a flow rate of 20-30 NL/h). The system was allowed to cool down. The rest of the drugs were removed from the autoclave and weighted. The amount of the dissolved drugs was then calculated.
4.2.4 Adsorption of drugs from supercritical carbon dioxide For the adsorption experiments 0.08-0.1 g silica aerogels of 4-5 different densities (0.03-0.27 g/cm3) were weighted and wrapped in a filter paper to prevent direct contact with the solid drugs. A known amount of drugs was weighted into an aluminium vessel. The filter papers containing aerogels and the drug vessels were placed into the autoclave, where the drug vessel was positioned at the bottom of the autoclave and separated from the above filter papers by the metal grid. The autoclave was closed and heated to 40±1 °C. Then, preheated CO2 was introduced into the autoclave (as in the drug solubility measurement process). After the pressure of 18.0±0.5 MPa was reached, the system was stored for 24, 48 or 72 hours (depending on the drugs) to ensure the equilibrium condition and the complete dissolution of the drugs. Thereafter, CO2 was vented out with a flow rate of (20-30 NL/h). After the ambient pressure was reached, the samples were taken out of the autoclave. The loaded aerogels were removed from the filter papers, weighted again, and powdered in a porcelain mortar for further analysis and the in vitro release experiment. The drug loading was calculated from the increase in weight of the aerogels. The increase in weight of the aerogels indicates the adsorption of drugs in the aerogels. Alternatively, the concentration of drugs in the aerogels can be determined by UV-vis spectroscopy and elemental analysis. The amount of CO2 in the autoclave was calculated from the known volume and CO2 density. The values of CO2 density were taken from the NIST standard reference database (The National Institute of Standards and Technology (NIST), 2003). The further characterisation techniques, namely IR and X-ray diffraction spectroscopy, were used to prove the existance of drugs in the aerogels, and to confirm that the decomposition of drugs did not occurred. In order to investigate the influence of drug concentrations in supercritical CO2 on the adsorption, the experiments were repeated varying the amount of drugs. Similarly, the influence of hydrophobicity on the adsorption was studied by replacing the hydrophilic aerogels with hydrophobic silica aerogels with the same densities (obtained from hydrophobization). The above procedures were applied to the model drugs listed in Table 4.3.
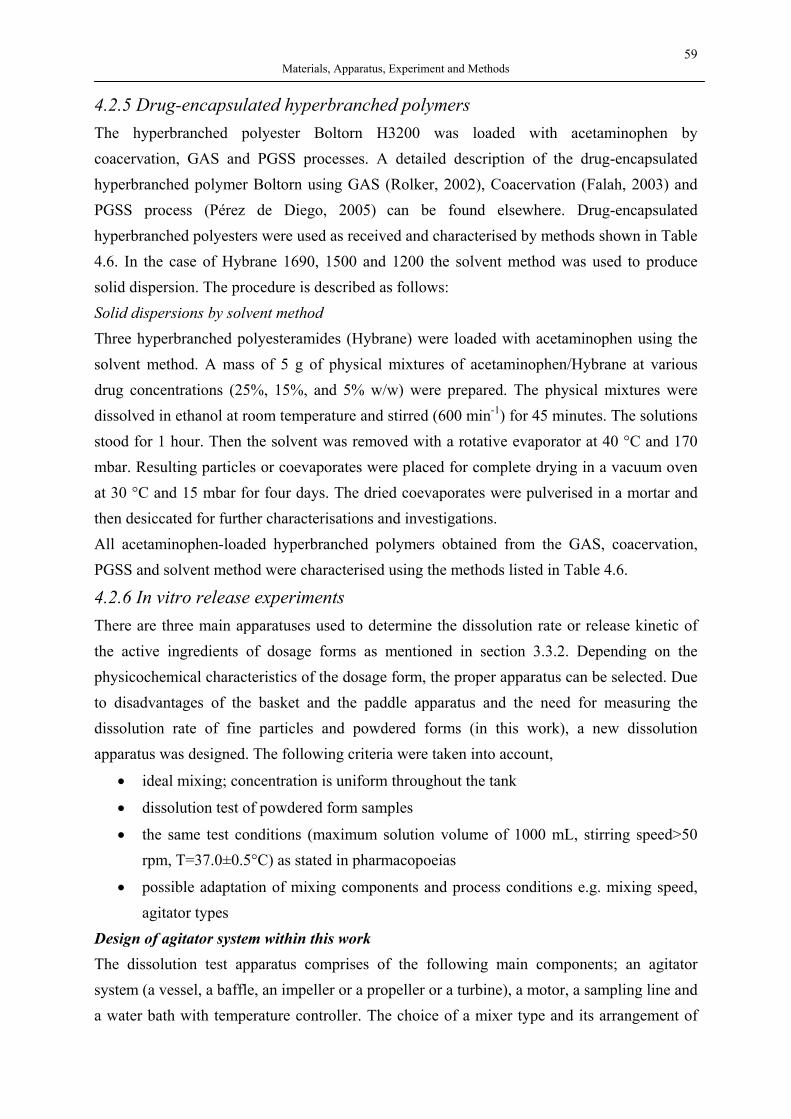
59 Materials, Apparatus, Experiment and Methods
4.2.5 Drug-encapsulated hyperbranched polymers The hyperbranched polyester Boltorn H3200 was loaded with acetaminophen by coacervation, GAS and PGSS processes. A detailed description of the drug-encapsulated hyperbranched polymer Boltorn using GAS (Rolker, 2002), Coacervation (Falah, 2003) and PGSS process (Pérez de Diego, 2005) can be found elsewhere. Drug-encapsulated hyperbranched polyesters were used as received and characterised by methods shown in Table 4.6. In the case of Hybrane 1690, 1500 and 1200 the solvent method was used to produce solid dispersion. The procedure is described as follows: Solid dispersions by solvent method Three hyperbranched polyesteramides (Hybrane) were loaded with acetaminophen using the solvent method. A mass of 5 g of physical mixtures of acetaminophen/Hybrane at various drug concentrations (25%, 15%, and 5% w/w) were prepared. The physical mixtures were dissolved in ethanol at room temperature and stirred (600 min-1) for 45 minutes. The solutions stood for 1 hour. Then the solvent was removed with a rotative evaporator at 40 °C and 170 mbar. Resulting particles or coevaporates were placed for complete drying in a vacuum oven at 30 °C and 15 mbar for four days. The dried coevaporates were pulverised in a mortar and then desiccated for further characterisations and investigations. All acetaminophen-loaded hyperbranched polymers obtained from the GAS, coacervation, PGSS and solvent method were characterised using the methods listed in Table 4.6.
4.2.6 In vitro release experiments There are three main apparatuses used to determine the dissolution rate or release kinetic of the active ingredients of dosage forms as mentioned in section 3.3.2. Depending on the physicochemical characteristics of the dosage form, the proper apparatus can be selected. Due to disadvantages of the basket and the paddle apparatus and the need for measuring the dissolution rate of fine particles and powdered forms (in this work), a new dissolution apparatus was designed. The following criteria were taken into account,
• ideal mixing; concentration is uniform throughout the tank
• dissolution test of powdered form samples
• the same test conditions (maximum solution volume of 1000 mL, stirring speed>50 rpm, T=37.0±0.5°C) as stated in pharmacopoeias
• possible adaptation of mixing components and process conditions e.g. mixing speed, agitator types
Design of agitator system within this work The dissolution test apparatus comprises of the following main components; an agitator system (a vessel, a baffle, an impeller or a propeller or a turbine), a motor, a sampling line and a water bath with temperature controller. The choice of a mixer type and its arrangement of
60 Materials, Apparatus, Experiment and Methods
the mixer and baffles in a stirred tank (Friedrich, 1988) was systematically designed for given conditions.
- Selection of a mixer type and agitator system design By assuming an ideal mixing (the concentration in the reactor is uniform throughout the reactor), the following criteria were taken into account before the choice of a mixer type and the equipment design were made. 1. A round bottom vessel has a volume (V) of 900 mL and a diameter of 100 mm. 2. The choice of a mixer type depends on the characteristics of the system. In this case, an intensive axial flow pattern was required for a solid suspension system with fairly good dispersion. Thus a pitched bladed turbine (six-bladed turbine) was selected. 3. The agitator system covered turbulent mixing.
- Design of the six-bladed turbine and baffles arrangement According to the recommended design of an agitator system consisting of a six-bladed turbine with 45°, the correction of a round bottom reactor (KB) was taken to be 0.09. Having given
the diameter of a vessel (d1=100mm), the ratio of 10 dh was calculated from the relationship
below (Eq. 4.2). Hence the height of the liquid level (h0) was obtained.
BKdV
dh
+= 311
0 4π
Eq. 4.2
The further design of the dimension and arrangement of a turbine and baffles was made as recommended in Vefahrenstechnische Berechnungsmethoden (Friedrich, 1988) and DIN 28131 (Fig. 4.4).
Fig. 4.4 Schematic presentation of a recommended agitator system design
A B
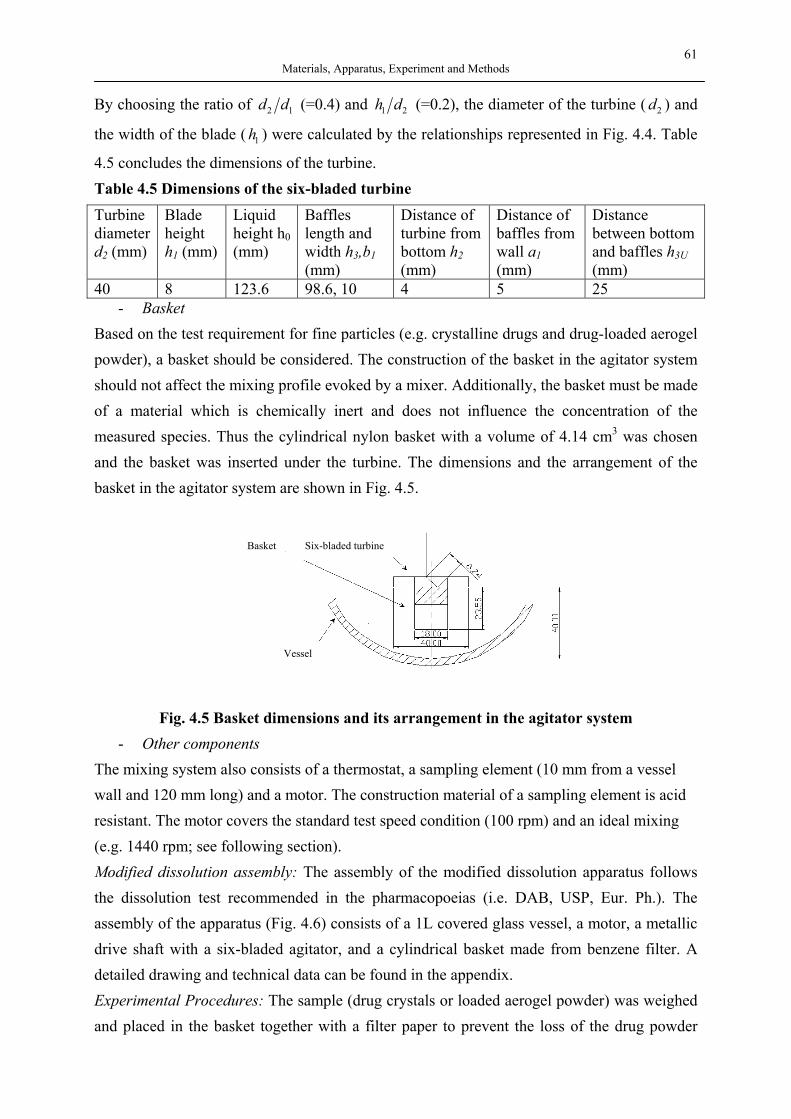
61 Materials, Apparatus, Experiment and Methods
By choosing the ratio of 12 dd (=0.4) and 21 dh (=0.2), the diameter of the turbine ( 2d ) and
the width of the blade ( 1h ) were calculated by the relationships represented in Fig. 4.4. Table
4.5 concludes the dimensions of the turbine. Table 4.5 Dimensions of the six-bladed turbine Turbine diameter d2 (mm)
Blade height h1 (mm)
Liquid height h0 (mm)
Baffles length and width h3,b1 (mm)
Distance of turbine from bottom h2 (mm)
Distance of baffles from wall a1 (mm)
Distance between bottom and baffles h3U (mm)
40 8 123.6 98.6, 10 4 5 25 - Basket
Based on the test requirement for fine particles (e.g. crystalline drugs and drug-loaded aerogel powder), a basket should be considered. The construction of the basket in the agitator system should not affect the mixing profile evoked by a mixer. Additionally, the basket must be made of a material which is chemically inert and does not influence the concentration of the measured species. Thus the cylindrical nylon basket with a volume of 4.14 cm3 was chosen and the basket was inserted under the turbine. The dimensions and the arrangement of the basket in the agitator system are shown in Fig. 4.5.
Fig. 4.5 Basket dimensions and its arrangement in the agitator system - Other components
The mixing system also consists of a thermostat, a sampling element (10 mm from a vessel wall and 120 mm long) and a motor. The construction material of a sampling element is acid resistant. The motor covers the standard test speed condition (100 rpm) and an ideal mixing (e.g. 1440 rpm; see following section). Modified dissolution assembly: The assembly of the modified dissolution apparatus follows the dissolution test recommended in the pharmacopoeias (i.e. DAB, USP, Eur. Ph.). The assembly of the apparatus (Fig. 4.6) consists of a 1L covered glass vessel, a motor, a metallic drive shaft with a six-bladed agitator, and a cylindrical basket made from benzene filter. A detailed drawing and technical data can be found in the appendix. Experimental Procedures: The sample (drug crystals or loaded aerogel powder) was weighed and placed in the basket together with a filter paper to prevent the loss of the drug powder
Six-bladed turbineBasket
Vessel
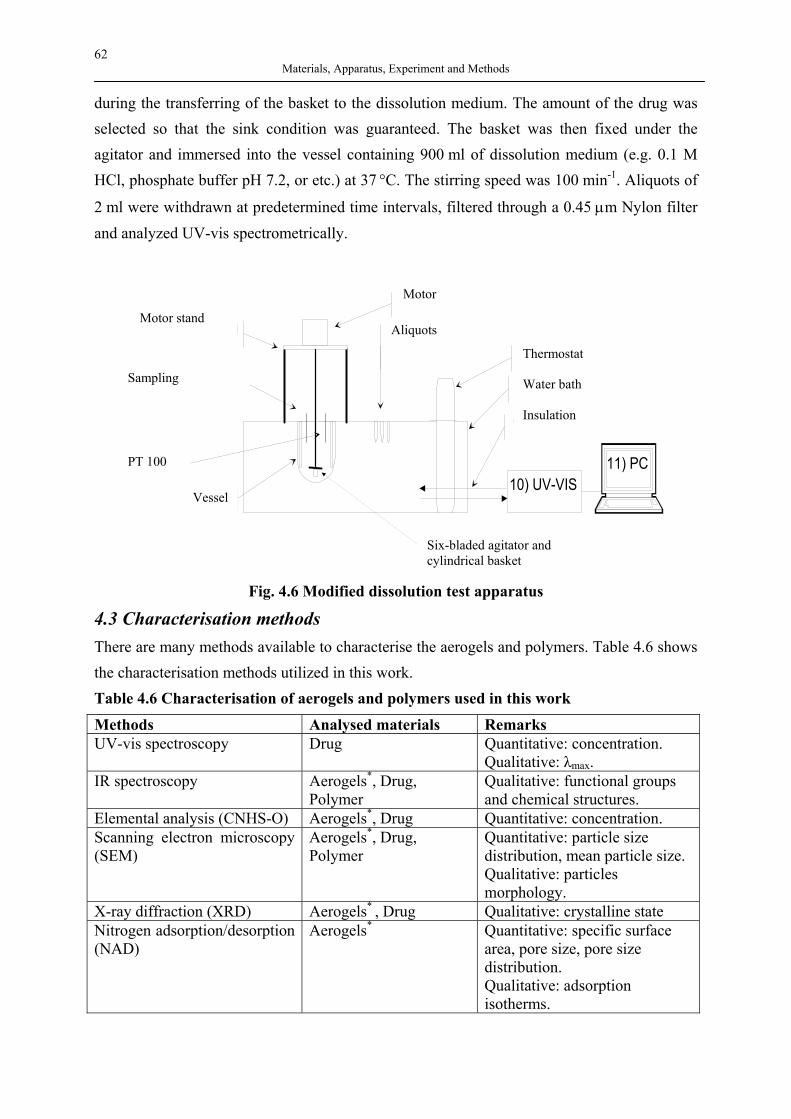
62 Materials, Apparatus, Experiment and Methods
during the transferring of the basket to the dissolution medium. The amount of the drug was selected so that the sink condition was guaranteed. The basket was then fixed under the agitator and immersed into the vessel containing 900 ml of dissolution medium (e.g. 0.1 M HCl, phosphate buffer pH 7.2, or etc.) at 37 °C. The stirring speed was 100 min-1. Aliquots of
2 ml were withdrawn at predetermined time intervals, filtered through a 0.45 µm Nylon filter and analyzed UV-vis spectrometrically.
3) Thermostat
4) Wasserbad
1) Motor
2) Proben- staender
5) Ruehrbehaelter
8) Aufhaengung
6) PT100
7) Probenentnahme
10) UV-VIS11) PC
9) Temperierung
Fig. 4.6 Modified dissolution test apparatus
4.3 Characterisation methods There are many methods available to characterise the aerogels and polymers. Table 4.6 shows the characterisation methods utilized in this work. Table 4.6 Characterisation of aerogels and polymers used in this work
Methods Analysed materials Remarks UV-vis spectroscopy Drug Quantitative: concentration.
Qualitative: λmax. IR spectroscopy Aerogels*, Drug,
Polymer Qualitative: functional groups and chemical structures.
Elemental analysis (CNHS-O) Aerogels*, Drug Quantitative: concentration. Scanning electron microscopy (SEM)
Aerogels*, Drug, Polymer
Quantitative: particle size distribution, mean particle size. Qualitative: particles morphology.
X-ray diffraction (XRD) Aerogels* , Drug Qualitative: crystalline state Nitrogen adsorption/desorption (NAD)
Aerogels* Quantitative: specific surface area, pore size, pore size distribution. Qualitative: adsorption isotherms.
Aliquots
Thermostat Water bath Insulation
Motor
Motor stand
Sampling
PT 100
Vessel
Six-bladed agitator and cylindrical basket
63 Materials, Apparatus, Experiment and Methods
Table 4.6 Continued Methods Analysed materials Remarks Thermal analysis (DSC, DTA) Drug, Polymer Quantitative: only possible for
DSC e.g. determination of heat capacity, heat of formation Qualitative: detection of transition temperatures i.e. Tg, Tm, Tc.
Gas chromatography (GC) CH3OH (transesterification of hydrophobic aerogels)
Quantitative: peak area Qualitative: retention time of substances
*referred to both hydrophilic and hydrophobic aerogels
4.3.1 Bulk density The bulk density of aerogels was determined by measuring the volume and the mass of the aerogels. For the aerogels gelified in the autoclave, the aerogel was cautiously cut into a small piece with either a metal ring or a blade in order to obtain a measurable dimension. The aerogels aged in syringes have a well defined dimension; hence the volume of the aerogels was calculated after measuring the length and the diameter of each aerogel piece. The bulk density was then obtained by dividing the mass of the aerogel with the volume of the aerogel. In all cases, the aerogel pieces were heated in an oven at 120 °C for 1 hour and then desiccated before their weights were measured. This process was repeated until the weight of aerogel piece was constant. For the measurement of the aerogel dimension, an accurate vernier calliper was used.
4.3.2 UV-Vis Spectroscopy Many molecules absorb ultraviolet or visible light. The absorption of UV or visible radiation corresponds to the excitation of outer electrons. When the molecule is irradiated with electromagantic radiation, energy absorption can result in a transition to one of the higher levels. The adsorption of radiant energy by matter is described quantitatively through the general rule known as Beer’s law (Eq. 4.3)
cbA ε= Eq. 4.3
Absorbance (A) is directly proportional to the path length, b, and the concentration, c, of the absorbing species, ε is a constant of proportionality, called the absorbtivity. Experimental procedures: Before determining the drug concentration in the sample (loaded aerogels and polymers), a standard curve (plot between absorbance and concentration of drug in a solvent) of each drug in a defined solvent was constructed by dissolving a series of the known amount of the drug in a solvent wished to be measured. Then a known amount of samples was weighted and dispersed in a solvent. The solution was stirred for at least 60 min to ensure a complete dissolution of the drug. The concentration of the drug in the solution was determined using UV-vis spectrometry (UV-vis spectrometer Specord 2000, Analytic Jena
64 Materials, Apparatus, Experiment and Methods
(Technical University of Berlin) and LAMBDA 650, Perkin Elmer (Institute of Thermische Verfahrenstechnik, Friedrich-Alexander Universität Erlangen-Nürnberg)). The drugs with corresponding maximum wavelengths in particular solvents are shown in Table 4.7. Table 4.7 Drugs with corresponding maximum wavelength at room temperature
Drugs Ketoprofen Griseofulvin Miconazole Ibuprofen Flurbiprofen* Acetaminophen λ (nm) in
ACN 252 290 280 220 246.5 -
λ (nm) in 0.1 M HCl
259 293 280 221 - 243
λ (nm) in phosphate buffer 7.4
- 296 - - - -
λ (nm) in phosphate buffer 7.2
- - - 222 - -
λ (nm) in phosphate buffer 5.8
- - - - - 243
λ (nm) in THF
- - - - - 294
(In the case of dithranol 0.1 M NaOH was used as a solvent at λ (nm) = 276) *measured at the Institute of Thermische Verfahrenstechnik, Friedrich-Alexander Universität Erlangen-Nürnberg
4.3.3 IR Spectroscopy The shape of a spectrum can be qualitatively interpreted into the compound responsible for the spectrum. Ultraviolet and Visible spectra of solutions contain generally featureless information for identifying the compound, but infrared spectra show a great deal of peak characteristics of the compound, which allows the identification by matching known spectra of the compound (Mannahan, 1986). It is known that infrared radiation excites various vibrational transitions in the molecules (e.g. stretching, distortion, bending) and that these transitions take place in distinct energies (wavelengths). The absorption of infrared radiation at a particular region, for instance, is caused by C-H stretching vibration at 3200-2700 cm-1; a band at 2400-2000 cm-1 results from the C≡N stretching. Many reference spectra are now available to help identify unknown compounds and chemical interactions between compounds. Experimental procedures: The samples in the powdered form, drugs, aerogels, loaded aerogels, polymers and loaded polymers, were compressed with wax and KBr. IR spectrometer Magna System 750 (Institute of inorganic chemistry, Technical University of Berlin) and Spectrum One , Perkin Elmer (Institute of Thermische Verfahrenstechnik, Friedrich-Alexander Universität Erlangen-Nürnberg) were used for the measurements. The adsorption spectra were recorded in the region of 400-4000 cm-1.
65 Materials, Apparatus, Experiment and Methods
4.3.4 Elemental Analysis for C H N S and O In this method the sample is burned at a temperature of >900 °C in flowing oxygen. The sample material is weighed to a tin capsule. Normally as little as 2 to 3 mg are required. After folding and wrapping the capsule, the sample is placed into the auto sampler. The tin capsule including the sample material falls into an oven where a defined volume of pure oxygen is added. The first step of mineralization takes place at about 1020 °C within 1 to 2 seconds (Theiner, 2004). The combustion elevates the temperature to well above 1800 °C. At this temperature the sample is vaporised and then undergoes complete combustion to form CO2, N2, NxOy, H2O and other by-products. Undesirable products such as halogens, phosphorus are removed by scrubbing chemicals inside the combustion tube. After combustion the sample gases flow through a reduction tube which removes any unused oxygen and converts the oxide of nitrogen to N2. Highest purity helium is used as a carrier gas. Separation is performed by gas chromatography. Finally, the detection and quantification are done using thermal conductivity detector (TCD). Main advantages of this method are the simultaneous analysis of C/H/N/S in a single run and the use of a small amount of samples. Sample preparation: The sample must be homogeneous because of the small weighed quantity. Granular samples must be very finely pulverized in a mortar. The elemental analysis experiments were performed at the Institute of inorganic chemistry at the Technical University of Berlin. The percent of CH3 in hydrophobic aerogels was determined and reported when the precision of sample duplicates was within ±0.2%. Otherwise the measurements had to be repeated until the measured values were within the range of the uncertainties. Regarding an elemental analysis for CHNSO, CHNSO weight percentages are accurate and reproducible to within ±0.3% and the precision of sample duplicates is within ±0.2%. This method may provoke inaccurate results when:
• The sample is not homogeneous, which means that duplicate runs will not agree to within 0.2%. This problem can be solved in the step of sample preparation (pulverisation) and/or during sampling technique. In addition, a series of runs may be required.
• A sample is extremely volatile; it may lose mass due to evaporation after it has been weighed out, even if it is crimp-sealed in a special volatile sample pan.
• Incomplete combustion of some compounds can also cause inaccurate results. In this case, the sample can be re-run under different conditions with an added oxygen boost, or with the addition of a chemical combustion aid such as vanadium pentoxide.
66 Materials, Apparatus, Experiment and Methods
4.3.5 Scanning Electron Microscopy Electron microscopy exploits the wave nature of rapidly moving electrons. Where visible light has wavelengths from 4,000 to 7,000 Å, electrons accelerated to 10,000 KeV have a wavelength of 0.12 Å. Optical microscopes have their resolution limited by the diffraction of light to about 1000 diameters magnification whereas Electron microscopes are limited to magnifications of around 1,000,000 diameters. In fact the scanning electron microscope (SEM) does not display a true image of the specimen, but rather produces an electronic map of the specimen. The principle of the method is the use of a beam of electrons in a vacuum generated by the scanning electron microscope. The beam is collected by electromagnetic condenser lenses, focussed by an objective lens, and scanned across the surface of the sample by electromagnetic deflection coils. The primary imaging method is created by collecting secondary electrons that are released by the sample. The secondary electrons are then detected by a scintillation material that produces flashes of light from the electrons. The light flashes are detected and amplified by a photomultiplier tube. By correlating the sample scan position with the resulting signal an image is formed that is strikingly similar to what would be seen through an optical microscope. The illumination and shadowing shows a surface topography. In this work scanning electron microscopy (Hitachi S-4000) was used to obtain information such as particle size distribution and morphology. The experiments were performed at the central electron microscopic department (ZELMI) at the Technical University of Berlin. Samples (e.g. polymers) were gold coated with (Hitachi S 2700) in order to make the particles conductive.
4.3.6 Gas Chromatography Gas chromatography is a remarkably sensitive and selective method for the qualitative and quantitative determination of substances which are stable in the vapour phase (Mannahan, 1986). This technique is based on the fact that when a mixture of volatile substances is transported by a carrier gas eluent through a column containing a stationary phase, each volatile component is separated and partitioned between a stationary phase and a carrier gas. The length of time required for a volatile analyte to move across the column depends on its retention in the stationary phase. The selection of different operating conditions and columns allows the retention time of volatile substances to be varied and the separation of heavily mixed substances is possible. Experimental procedures: A reaction between hydrophobic silica aerogels and 2-ethylhexanol-1 in a presence of basic catalyst results in the exchange of alkoxy groups, which is called trans-esterification (Eq. 4.4). Methyl alcohol as a product can be determined using gas chromatography.
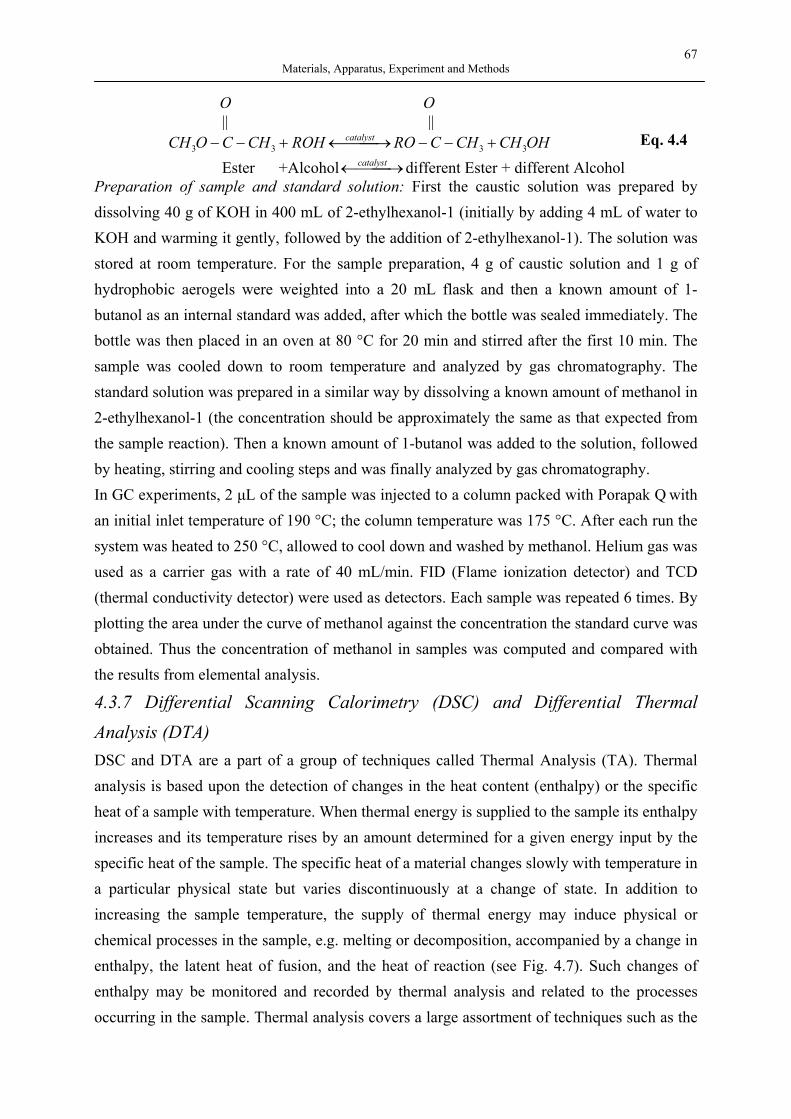
67 Materials, Apparatus, Experiment and Methods
O O || || OHCHCHCROROHCHCOCH catalyst
3333 +−− →←+−− Ester +Alcohol →←catalyst different Ester + different Alcohol
Eq. 4.4
Preparation of sample and standard solution: First the caustic solution was prepared by dissolving 40 g of KOH in 400 mL of 2-ethylhexanol-1 (initially by adding 4 mL of water to KOH and warming it gently, followed by the addition of 2-ethylhexanol-1). The solution was stored at room temperature. For the sample preparation, 4 g of caustic solution and 1 g of hydrophobic aerogels were weighted into a 20 mL flask and then a known amount of 1-butanol as an internal standard was added, after which the bottle was sealed immediately. The bottle was then placed in an oven at 80 °C for 20 min and stirred after the first 10 min. The sample was cooled down to room temperature and analyzed by gas chromatography. The standard solution was prepared in a similar way by dissolving a known amount of methanol in 2-ethylhexanol-1 (the concentration should be approximately the same as that expected from the sample reaction). Then a known amount of 1-butanol was added to the solution, followed by heating, stirring and cooling steps and was finally analyzed by gas chromatography. In GC experiments, 2 µL of the sample was injected to a column packed with Porapak Q with an initial inlet temperature of 190 °C; the column temperature was 175 °C. After each run the system was heated to 250 °C, allowed to cool down and washed by methanol. Helium gas was used as a carrier gas with a rate of 40 mL/min. FID (Flame ionization detector) and TCD (thermal conductivity detector) were used as detectors. Each sample was repeated 6 times. By plotting the area under the curve of methanol against the concentration the standard curve was obtained. Thus the concentration of methanol in samples was computed and compared with the results from elemental analysis.
4.3.7 Differential Scanning Calorimetry (DSC) and Differential Thermal Analysis (DTA) DSC and DTA are a part of a group of techniques called Thermal Analysis (TA). Thermal analysis is based upon the detection of changes in the heat content (enthalpy) or the specific heat of a sample with temperature. When thermal energy is supplied to the sample its enthalpy increases and its temperature rises by an amount determined for a given energy input by the specific heat of the sample. The specific heat of a material changes slowly with temperature in a particular physical state but varies discontinuously at a change of state. In addition to increasing the sample temperature, the supply of thermal energy may induce physical or chemical processes in the sample, e.g. melting or decomposition, accompanied by a change in enthalpy, the latent heat of fusion, and the heat of reaction (see Fig. 4.7). Such changes of enthalpy may be monitored and recorded by thermal analysis and related to the processes occurring in the sample. Thermal analysis covers a large assortment of techniques such as the
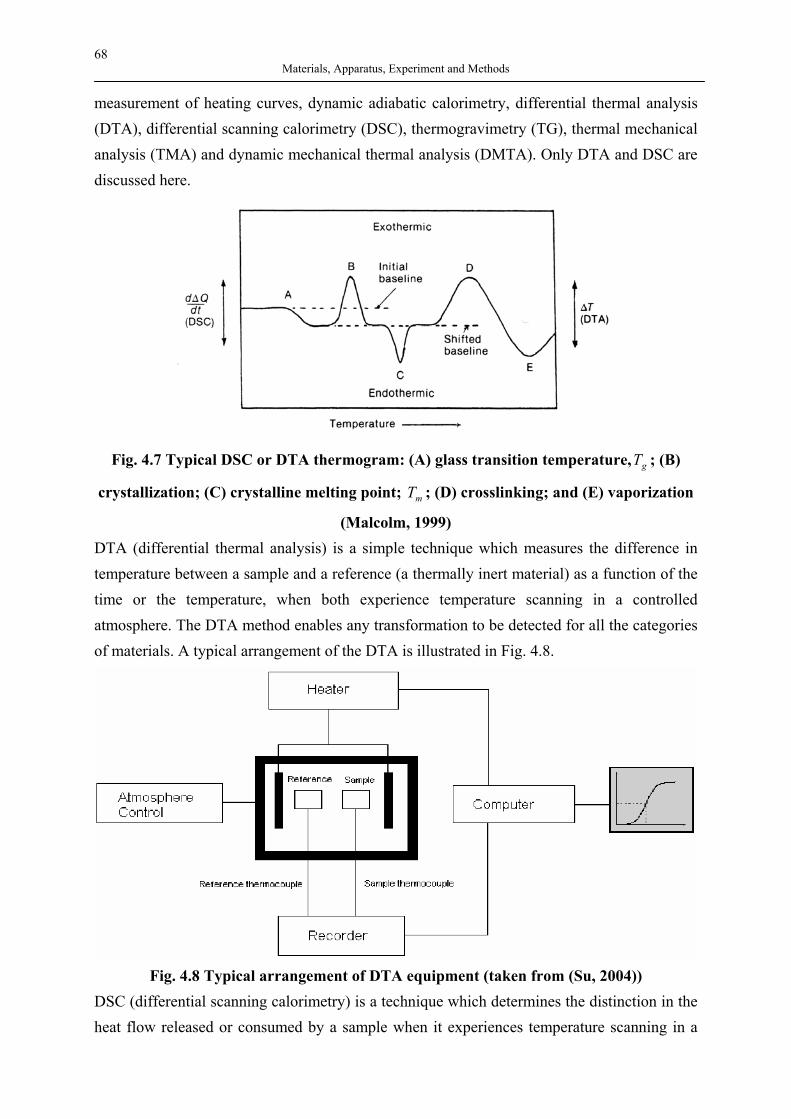
68 Materials, Apparatus, Experiment and Methods
measurement of heating curves, dynamic adiabatic calorimetry, differential thermal analysis (DTA), differential scanning calorimetry (DSC), thermogravimetry (TG), thermal mechanical analysis (TMA) and dynamic mechanical thermal analysis (DMTA). Only DTA and DSC are discussed here.
Fig. 4.7 Typical DSC or DTA thermogram: (A) glass transition temperature, gT ; (B)
crystallization; (C) crystalline melting point; mT ; (D) crosslinking; and (E) vaporization
(Malcolm, 1999) DTA (differential thermal analysis) is a simple technique which measures the difference in temperature between a sample and a reference (a thermally inert material) as a function of the time or the temperature, when both experience temperature scanning in a controlled atmosphere. The DTA method enables any transformation to be detected for all the categories of materials. A typical arrangement of the DTA is illustrated in Fig. 4.8.
Fig. 4.8 Typical arrangement of DTA equipment (taken from (Su, 2004))
DSC (differential scanning calorimetry) is a technique which determines the distinction in the heat flow released or consumed by a sample when it experiences temperature scanning in a
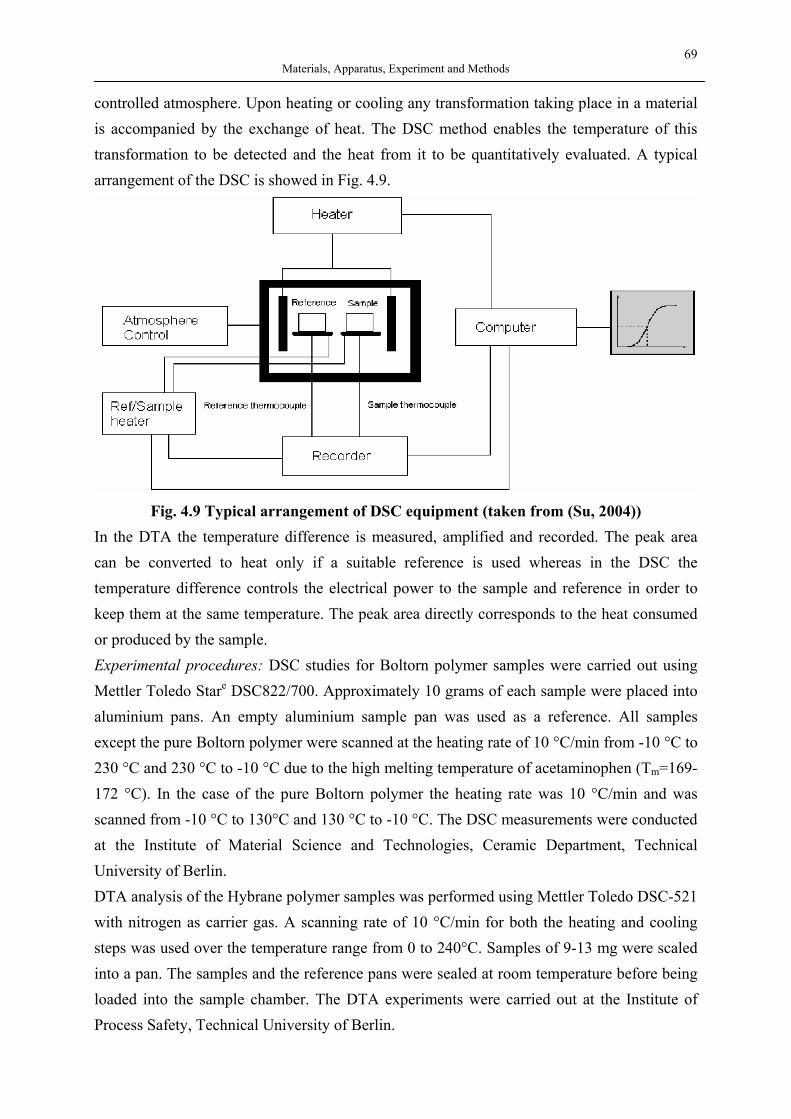
69 Materials, Apparatus, Experiment and Methods
controlled atmosphere. Upon heating or cooling any transformation taking place in a material is accompanied by the exchange of heat. The DSC method enables the temperature of this transformation to be detected and the heat from it to be quantitatively evaluated. A typical arrangement of the DSC is showed in Fig. 4.9.
Fig. 4.9 Typical arrangement of DSC equipment (taken from (Su, 2004))
In the DTA the temperature difference is measured, amplified and recorded. The peak area can be converted to heat only if a suitable reference is used whereas in the DSC the temperature difference controls the electrical power to the sample and reference in order to keep them at the same temperature. The peak area directly corresponds to the heat consumed or produced by the sample. Experimental procedures: DSC studies for Boltorn polymer samples were carried out using Mettler Toledo Stare DSC822/700. Approximately 10 grams of each sample were placed into aluminium pans. An empty aluminium sample pan was used as a reference. All samples except the pure Boltorn polymer were scanned at the heating rate of 10 °C/min from -10 °C to 230 °C and 230 °C to -10 °C due to the high melting temperature of acetaminophen (Tm=169-172 °C). In the case of the pure Boltorn polymer the heating rate was 10 °C/min and was scanned from -10 °C to 130°C and 130 °C to -10 °C. The DSC measurements were conducted at the Institute of Material Science and Technologies, Ceramic Department, Technical University of Berlin. DTA analysis of the Hybrane polymer samples was performed using Mettler Toledo DSC-521 with nitrogen as carrier gas. A scanning rate of 10 °C/min for both the heating and cooling steps was used over the temperature range from 0 to 240°C. Samples of 9-13 mg were scaled into a pan. The samples and the reference pans were sealed at room temperature before being loaded into the sample chamber. The DTA experiments were carried out at the Institute of Process Safety, Technical University of Berlin.
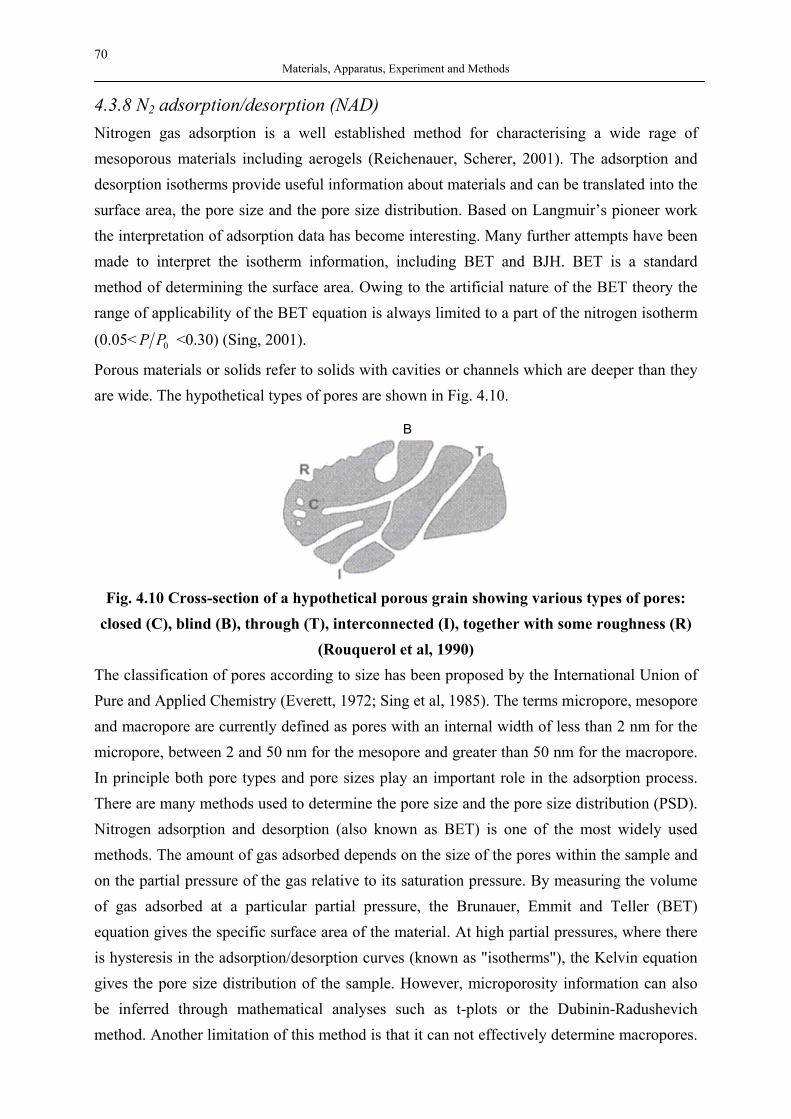
70 Materials, Apparatus, Experiment and Methods
4.3.8 N2 adsorption/desorption (NAD) Nitrogen gas adsorption is a well established method for characterising a wide rage of mesoporous materials including aerogels (Reichenauer, Scherer, 2001). The adsorption and desorption isotherms provide useful information about materials and can be translated into the surface area, the pore size and the pore size distribution. Based on Langmuir’s pioneer work the interpretation of adsorption data has become interesting. Many further attempts have been made to interpret the isotherm information, including BET and BJH. BET is a standard method of determining the surface area. Owing to the artificial nature of the BET theory the range of applicability of the BET equation is always limited to a part of the nitrogen isotherm
(0.05< 0PP <0.30) (Sing, 2001).
Porous materials or solids refer to solids with cavities or channels which are deeper than they are wide. The hypothetical types of pores are shown in Fig. 4.10.
Fig. 4.10 Cross-section of a hypothetical porous grain showing various types of pores:
closed (C), blind (B), through (T), interconnected (I), together with some roughness (R) (Rouquerol et al, 1990)
The classification of pores according to size has been proposed by the International Union of Pure and Applied Chemistry (Everett, 1972; Sing et al, 1985). The terms micropore, mesopore and macropore are currently defined as pores with an internal width of less than 2 nm for the micropore, between 2 and 50 nm for the mesopore and greater than 50 nm for the macropore. In principle both pore types and pore sizes play an important role in the adsorption process. There are many methods used to determine the pore size and the pore size distribution (PSD). Nitrogen adsorption and desorption (also known as BET) is one of the most widely used methods. The amount of gas adsorbed depends on the size of the pores within the sample and on the partial pressure of the gas relative to its saturation pressure. By measuring the volume of gas adsorbed at a particular partial pressure, the Brunauer, Emmit and Teller (BET) equation gives the specific surface area of the material. At high partial pressures, where there is hysteresis in the adsorption/desorption curves (known as "isotherms"), the Kelvin equation gives the pore size distribution of the sample. However, microporosity information can also be inferred through mathematical analyses such as t-plots or the Dubinin-Radushevich method. Another limitation of this method is that it can not effectively determine macropores.
B
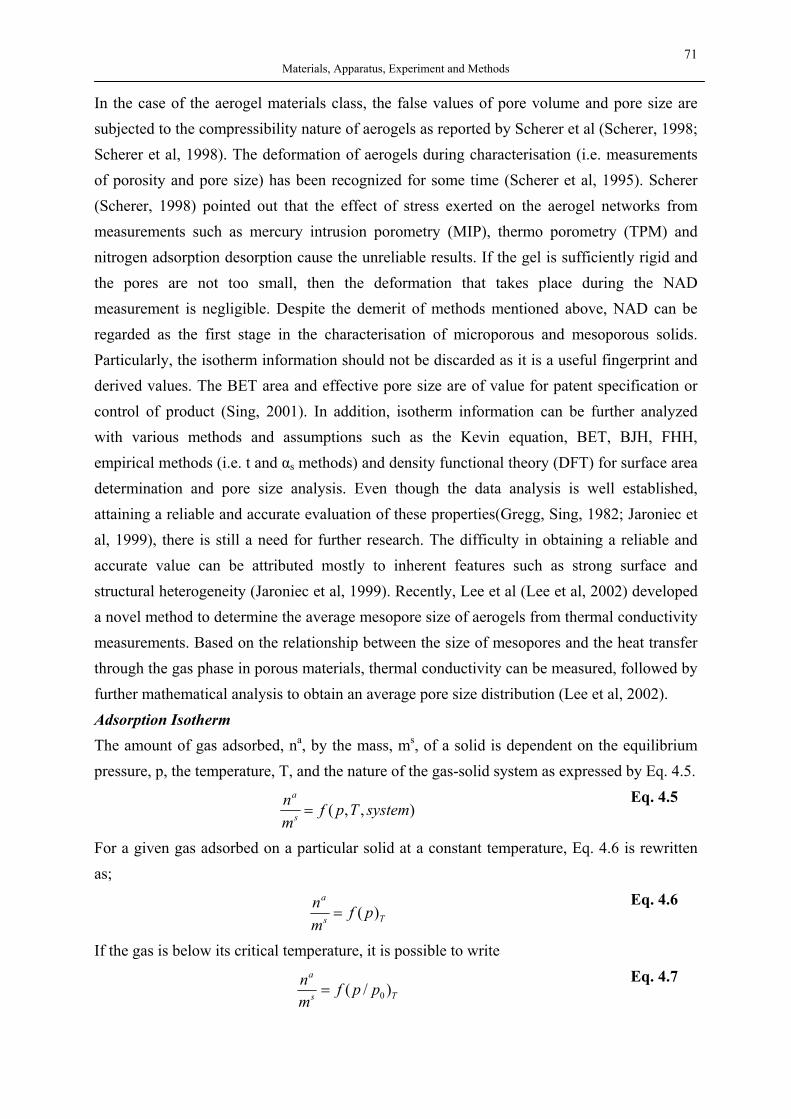
71 Materials, Apparatus, Experiment and Methods
In the case of the aerogel materials class, the false values of pore volume and pore size are subjected to the compressibility nature of aerogels as reported by Scherer et al (Scherer, 1998; Scherer et al, 1998). The deformation of aerogels during characterisation (i.e. measurements of porosity and pore size) has been recognized for some time (Scherer et al, 1995). Scherer (Scherer, 1998) pointed out that the effect of stress exerted on the aerogel networks from measurements such as mercury intrusion porometry (MIP), thermo porometry (TPM) and nitrogen adsorption desorption cause the unreliable results. If the gel is sufficiently rigid and the pores are not too small, then the deformation that takes place during the NAD measurement is negligible. Despite the demerit of methods mentioned above, NAD can be regarded as the first stage in the characterisation of microporous and mesoporous solids. Particularly, the isotherm information should not be discarded as it is a useful fingerprint and derived values. The BET area and effective pore size are of value for patent specification or control of product (Sing, 2001). In addition, isotherm information can be further analyzed with various methods and assumptions such as the Kevin equation, BET, BJH, FHH, empirical methods (i.e. t and αs methods) and density functional theory (DFT) for surface area determination and pore size analysis. Even though the data analysis is well established, attaining a reliable and accurate evaluation of these properties(Gregg, Sing, 1982; Jaroniec et al, 1999), there is still a need for further research. The difficulty in obtaining a reliable and accurate value can be attributed mostly to inherent features such as strong surface and structural heterogeneity (Jaroniec et al, 1999). Recently, Lee et al (Lee et al, 2002) developed a novel method to determine the average mesopore size of aerogels from thermal conductivity measurements. Based on the relationship between the size of mesopores and the heat transfer through the gas phase in porous materials, thermal conductivity can be measured, followed by further mathematical analysis to obtain an average pore size distribution (Lee et al, 2002). Adsorption Isotherm The amount of gas adsorbed, na, by the mass, ms, of a solid is dependent on the equilibrium pressure, p, the temperature, T, and the nature of the gas-solid system as expressed by Eq. 4.5.
),,( systemTpfmn
s
a
= Eq. 4.5
For a given gas adsorbed on a particular solid at a constant temperature, Eq. 4.6 is rewritten as;
Ts
a
pfmn )(=
Eq. 4.6
If the gas is below its critical temperature, it is possible to write
Ts
a
ppfmn )/( 0=
Eq. 4.7

72 Materials, Apparatus, Experiment and Methods
where the standard pressure p0 is equal to the vapour pressure of the adsorptive at T and P/P0 is called the relative pressure. The Eq. 4.6 and Eq. 4.7 represent the adsorption isotherm, which is the relationship between the amount adsorbed by the unit mass of a solid and the equilibrium pressure (or relative pressure), at a known temperature. The experimental isotherm is usually presented in a form of graph. According to IUPAC, the isotherms are classified into 6 isotherms types and their subclasses and hysteresis types. The Type I is a typical for microporous solids and chemisorption isotherms. Type II is shown by finely divided nonporous solids. Type III and V are typical of vapours (e.g. water on hydrophobic solids). Type IV and V feature a hysteresis loop generated by the capillary condensation in mesopores. Type IV is a typical for mesoporous solids such as silica aerogels, MCM-41, activated carbon. Two characteristic types of hysteresis loops can be distinguished for this Type IV. In the first case (a Type H1 loop), the loop is relatively narrow and the adsorption and desorption branches are almost vertical and nearly parallel; in the second case (a Type H2 loop), the loop is broad and the desorption branch is much steeper than the adsorption branch. The rare Type VI, the steps-like isotherm (or a stepwise layer-by-layer adsorption), is shown with a simple non-polar molecules (e.g. argon, krypton and xenon) on uniform surfaces (e.g. the basal plane of graphite). The detailed description of these six isotherms are extensively reviewed by Rouquerol and Sing (Rouquerol et al, 1990). The Langmuir isotherm: The adsorption process between gas phase molecules, A, vacant surface sites, S, and occupied surface sites, SA, can be represented by the equation:
SA + ⇔ AS Eq. 4.8 Three following assumptions were made as follows:
1. Adsorption cannot proceed beyond monolayer coverage. 2. All surface sites are equivalent and can accommodate, at most, one adsorbed atom. 3. The ability of a molecule to adsorb at a given site is independent of the occupation of
its neighbouring sites. At equilibrium, the coverage is independent of time and thus the adsorption (ka) and desorption (kd) rates are equal. Based on these assumptions and the equilibrium considerations the following so-called Langmuir isotherm was derived:
bPbP+
=1
θ Eq. 4.9
where d
a
kkb = . In these equations, θ is defined as the fractional coverage of a surface
(sitespossibleofnumberTotal
sitesadsorptionoccupiedofNumber ), ka and kd are the rate constants for adsorption and
desorption respectively and P is the pressure of the adsorbate gas.
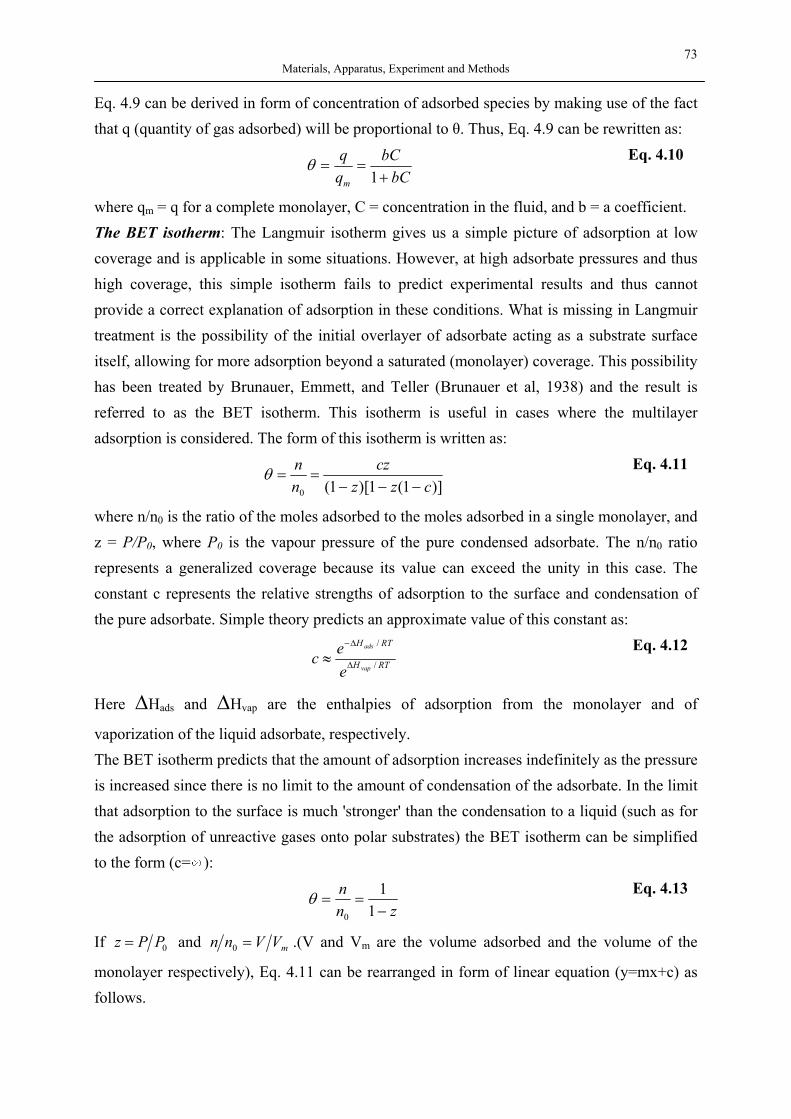
73 Materials, Apparatus, Experiment and Methods
Eq. 4.9 can be derived in form of concentration of adsorbed species by making use of the fact that q (quantity of gas adsorbed) will be proportional to θ. Thus, Eq. 4.9 can be rewritten as:
bCbC
m +==
1θ Eq. 4.10
where qm = q for a complete monolayer, C = concentration in the fluid, and b = a coefficient. The BET isotherm: The Langmuir isotherm gives us a simple picture of adsorption at low coverage and is applicable in some situations. However, at high adsorbate pressures and thus high coverage, this simple isotherm fails to predict experimental results and thus cannot provide a correct explanation of adsorption in these conditions. What is missing in Langmuir treatment is the possibility of the initial overlayer of adsorbate acting as a substrate surface itself, allowing for more adsorption beyond a saturated (monolayer) coverage. This possibility has been treated by Brunauer, Emmett, and Teller (Brunauer et al, 1938) and the result is referred to as the BET isotherm. This isotherm is useful in cases where the multilayer adsorption is considered. The form of this isotherm is written as:
)]1(1)[1(0 czzcz
nn
−−−==θ Eq. 4.11
where n/n0 is the ratio of the moles adsorbed to the moles adsorbed in a single monolayer, and z = P/P0, where P0 is the vapour pressure of the pure condensed adsorbate. The n/n0 ratio represents a generalized coverage because its value can exceed the unity in this case. The constant c represents the relative strengths of adsorption to the surface and condensation of the pure adsorbate. Simple theory predicts an approximate value of this constant as:
RTH
RTH
vap
ads
eec /
/
∆
∆−
≈ Eq. 4.12
Here ∆Hads and ∆Hvap are the enthalpies of adsorption from the monolayer and of
vaporization of the liquid adsorbate, respectively. The BET isotherm predicts that the amount of adsorption increases indefinitely as the pressure is increased since there is no limit to the amount of condensation of the adsorbate. In the limit that adsorption to the surface is much 'stronger' than the condensation to a liquid (such as for the adsorption of unreactive gases onto polar substrates) the BET isotherm can be simplified to the form (c= ):
znn
−==
11
0
θ Eq. 4.13
If 0PPz = and mVVnn =0 .(V and Vm are the volume adsorbed and the volume of the
monolayer respectively), Eq. 4.11 can be rearranged in form of linear equation (y=mx+c) as follows.
74 Materials, Apparatus, Experiment and Methods
mm cVPP
cVc
PPP
V1)()1()(1
00
+−
=−
Eq. 4.14
A plot of )( 0 PPVP − versus 0PP yields a straight line with intercept cVm1 and slope
cVc m1− . The Vm and c values can be solved. If the volume of the monolayer is known, the
surface area of the sample can be determined using the area occupied by the single nitrogen molecule 16.2 Å2 at 77K. Average pore diameter or BET pore size The average pore diameter can be calculated from the following equation.
BET
p
SV
d4
= Eq. 4.15
where Vp is the total pore volume determined from the highest point of relative pressure of the isotherm (cm3/g) and SBET is the specific surface area of materials (m2/g). Since the capillary condensation is responsible for mesopore and micropore filling, the Kelvin equation is applied to explain this phenomenon. A gas condensation on the surface of a cylindrical pore follows the law below:
θγ cos2ln0 rRT
MPP
−= Eq. 4.16
where γ is the surface tension of the liquid adsorbate, r is the curvature of the menicus and θ is
the contact angle. If the liquid perfectly wets the surface cosθ = 1. Therefore, at a given Pi there is a pore radius ri. All the pores with r < ri are filled and all the pores with r > ri are empty. For the pore size analysis, the Barrett, Joyner and Halenda (BJH) model completes the Kelvin approach by considering also the variation of the number of adsorbed layers. The pore radius is the sum of the Kelvin radius rK plus the multilayer thickness(r = t+rK). For each desorption step the average diameter of the pore, which undergoes capillary evaporation is calculated from the Kevin equation and the t-plot equation: r = t+rK
KrPP
tPP
14.4log
99.130034.0log
0
20
−=
−=
Eq. 4.17 Eq. 4.18
The pore radius distribution can be calculated along the desorption isotherm. A plot of pore volume against pore radius is obtained. Even though it was claimed (Scherer, 1998; Scherer et al, 1998) that for silica aerogels with porosities above 80-90%, nitrogen sorption did not detect the full pore volume, nitrogen sorption is still regarded as the first stage in the characterisation of micro- and mesoporous materials (Sing, 2001). It is worth nothing that the method should not be expected to give more than a semi-quantitative estimation of micropore size distribution (Sing, 2001), but the isotherms provide useful information for further

75 Materials, Apparatus, Experiment and Methods
assessments, including the newly developed methods for interpreting the isotherm data. Their major challenge lies in accommodating more reliable and accurate models for isotherm evaluation. Experimental procedures: The NAD experiments were performed using the Gemini device
(Gemini 2375 V5.00) from Micromeritrics Corporation. A defined amount (∼10-15mg) of
aerogel was weighed and heated at 120 °C under vacuum (200 mbar) for 24 hours to remove adsorbed gases and moisture. The samples were weighted again before the measurements began. The measurements were repeated 3 times for each sample. The adsorption and desorption information obtained from each run was used to determine the specific surface area (m2/g), pore size distribution and pore size (nm) using the BET and BJH models. The specific surface area was calculated using the BET method from the adsorption isotherm within the relative pressure (P=P0) range 0–0.35. The nitrogen molecule is assumed to cover an area of 16.4 Å2. Adsorption measurement can also be used to estimate the porous volume corresponding to P/P0 =1. The pore size distribution in the mesoporous range (2–50 nm) was evaluated according to the BJH method.
4.3.9 X-ray diffraction The concept of crystals consisting of periodically repeating identical units is one that has long been recognized. The development of X-ray diffraction aids the science of structural crystallography to observe the diffraction phenomenon that occurs in crystalline material. The X-ray is of great interest when applied to gain information about the structure of crystalline materials producing the diffraction (Ewing, 1985). A primary use of this technique is the identification and characterization of compounds based on their diffraction pattern. The prevailing effect that occurs when an incident beam of monochromatic x-rays interacts with a target material is the scattering of those x-rays from atoms within the target material. In materials with regular structure (e.g. crystalline), the scattered x-rays undergo constructive and destructive interference. This is the process of diffraction. The direction of possible diffractions depends on the size and shape of the unit cell of the measured material. The intensities of the diffracted waves depend on the kind and arrangement of atoms in the crystal structure. The diffraction of X-rays by crystals is described by Bragg’s Law (Eq. 4.19).
θλ sin2dn = Eq. 4.19 where n is an integer, λ is a wavelength in angstroms, d is the interatomic spacing in angstroms, and θ is the diffraction angle in degrees. The angle between the transmitted and Bragg diffracted beams (see Fig. 4.11) is always equal to 2θ as a consequence of the geometry of the Bragg condition. This angle is obtained in experiments; hence the results of X-ray diffraction are commonly given in terms of 2θ.
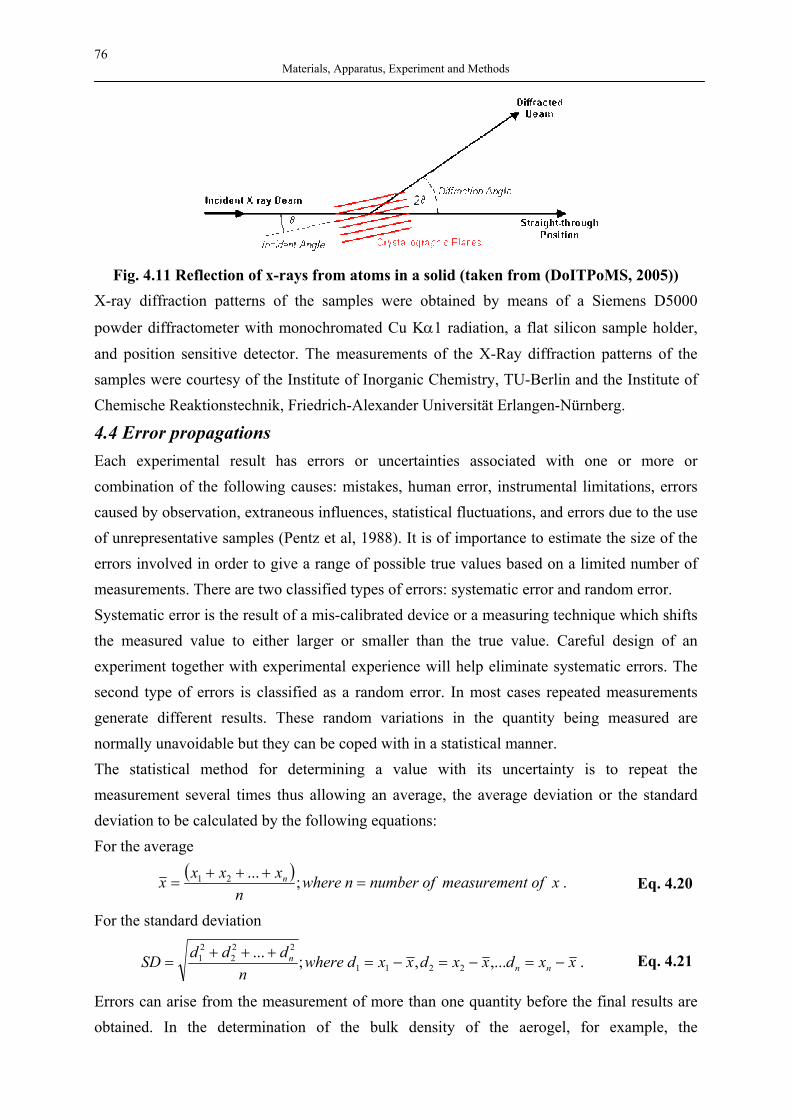
76 Materials, Apparatus, Experiment and Methods
Fig. 4.11 Reflection of x-rays from atoms in a solid (taken from (DoITPoMS, 2005))
X-ray diffraction patterns of the samples were obtained by means of a Siemens D5000
powder diffractometer with monochromated Cu Kα1 radiation, a flat silicon sample holder, and position sensitive detector. The measurements of the X-Ray diffraction patterns of the samples were courtesy of the Institute of Inorganic Chemistry, TU-Berlin and the Institute of Chemische Reaktionstechnik, Friedrich-Alexander Universität Erlangen-Nürnberg.
4.4 Error propagations Each experimental result has errors or uncertainties associated with one or more or combination of the following causes: mistakes, human error, instrumental limitations, errors caused by observation, extraneous influences, statistical fluctuations, and errors due to the use of unrepresentative samples (Pentz et al, 1988). It is of importance to estimate the size of the errors involved in order to give a range of possible true values based on a limited number of measurements. There are two classified types of errors: systematic error and random error. Systematic error is the result of a mis-calibrated device or a measuring technique which shifts the measured value to either larger or smaller than the true value. Careful design of an experiment together with experimental experience will help eliminate systematic errors. The second type of errors is classified as a random error. In most cases repeated measurements generate different results. These random variations in the quantity being measured are normally unavoidable but they can be coped with in a statistical manner. The statistical method for determining a value with its uncertainty is to repeat the measurement several times thus allowing an average, the average deviation or the standard deviation to be calculated by the following equations: For the average
( ) xoftmeasuremenofnumbernwheren
xxxx n =+++
= ;...21 . Eq. 4.20
For the standard deviation
xxdxxdxxdwheren
dddSD nnn −=−=−=
+++= ,...,;...
2211
222
21 . Eq. 4.21
Errors can arise from the measurement of more than one quantity before the final results are obtained. In the determination of the bulk density of the aerogel, for example, the
77 Materials, Apparatus, Experiment and Methods
measurements of masses and volumes (e.g. cubic form a1Ηa2Ηa3) are required but the value of
density ( samplesamplebulk Vm=ρ ) has to be calculated. The following equations (Eq. 4.22-Eq.
4.26) show how few independent sources of error can be combined.
22
2
3
3
2
2
2
2
1
1
3332211 )()()()(
)(
∆
+
∆
=∆
=
∆+
∆+
∆=
∆
∆±⋅∆±⋅∆±=
∆±=
VV
xx
Vm
ll
ll
ll
VV
cmllllllVVolumegxxmmass
bulk
bulk
sample
samplebulk
sample
sample
ρρ
ρ
Eq. 4.22 Eq. 4.23 Eq. 4.24 Eq. 4.25 Eq. 4.26
The method of combining few or several independent sources of random errors is called error propagation. There are general rules for error propagation which are universally applied as depicted in Eq. 4.27-Eq. 4.34 (Pentz et al, 1988).
Assuming that independent measurements A and B, which have total errors of ∆A and ∆B
respectively, are combined to give the result X which has an error ∆X then:
( ) ( )22 BAXBAXBAX
∆+∆=∆→
−=+=
Eq. 4.27
22
∆
+
∆
=∆
→
=
=
BB
AA
XX
BAX
ABX
Eq. 4.28
AAn
XXAX n ∆
=∆
→= Eq. 4.29
AA
XXalsobut
AkXkAX∆
=∆
∆=∆→=
Eq. 4.30 Eq. 4.31
( ) ( )22 BAkXBkAXBkAX
∆+∆=∆→
−=+=
Eq. 4.32
22
∆
+
∆
=∆
→
==
BB
AA
XX
BAkXkABX
Eq. 4.33
AAn
XXkAX n ∆
=∆
→= Eq. 4.34
78 Results and Discussion
5. Results and Discussion In this chapter the results of the investigation of silica aerogels and hyperbranched polymers as drug carriers are discussed. In the case of silica aerogels, this section focuses on the influence of physicochemical properties such as specific surface area, pore size distribution and hydrophobicity on the adsorption and the release behaviour of active compounds, since these properties can be controlled through the synthetic strategies and methods. For hyperbranched polymers, the characteristics of each drug-encapsulated polymer prepared from different encapsulation methods are evaluated in detail.
5.1 Experimental results on silica aerogels preparation and their application as drug carriers 5.1.1 Hydrophilic silica aerogels The silica aerogels of different target densities ranging from 0.03-0.15 g/cm3 were synthesized using the two-step method as described in section 4.2.1. Synthesized aerogel samples were split into two sets; the first set referred to S11-S15 and the second set referred to S21-S26. The silica aerogels were hydrophilic, transparent, and light. The hydrophilic characteristic of aerogels was exemplified by the adsorption of water in a humid atmosphere (Smirnova, 2002).
5.1.1.1 Target density and bulk density The target density of aerogels is not equal to their real bulk density. The target density of silica aerogels is defined in Eq. 5.1. The bulk density is calculated by the ratio between the dry sample mass and the external sample volume as expressed in Eq. 5.2.
sol
SiOett V
m2
arg =ρ Eq. 5.1
sample
samplebulk V
m=ρ
Eq. 5.2
where 2SiOm and samplem are the mass of the SiO2 that can be produced by the given amount of
the precursor and the mass of the aerogel sample respectively. solV and sampleV are the volume
of the sol solution and the measured volume of the aerogel sample respectively. The target density and the bulk density of synthesized aerogels are listed in Table 5.1. The errors shown in Table 5.1 represent deviations as determined by the error propagation technique. The technique takes into account sources of error as follows: Errors of the apparatus
- mass aerogels: imprecision of balance scale ±0.0002 g - volume aerogels: imprecision of a vernier calliper ±0.05 mm
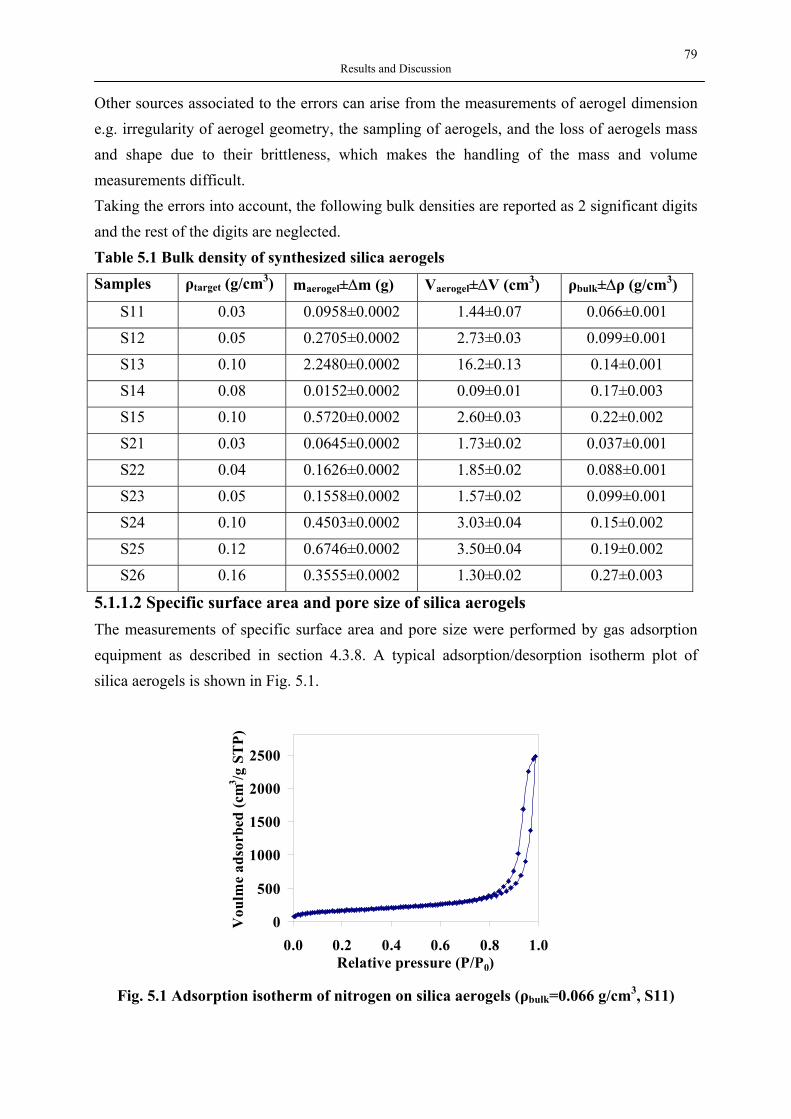
79 Results and Discussion
Other sources associated to the errors can arise from the measurements of aerogel dimension e.g. irregularity of aerogel geometry, the sampling of aerogels, and the loss of aerogels mass and shape due to their brittleness, which makes the handling of the mass and volume measurements difficult. Taking the errors into account, the following bulk densities are reported as 2 significant digits and the rest of the digits are neglected. Table 5.1 Bulk density of synthesized silica aerogels
Samples ρtarget (g/cm3) maerogel±∆m (g) Vaerogel±∆V (cm3) ρbulk±∆ρ (g/cm3)
S11 0.03 0.0958±0.0002 1.44±0.07 0.066±0.001
S12 0.05 0.2705±0.0002 2.73±0.03 0.099±0.001
S13 0.10 2.2480±0.0002 16.2±0.13 0.14±0.001
S14 0.08 0.0152±0.0002 0.09±0.01 0.17±0.003
S15 0.10 0.5720±0.0002 2.60±0.03 0.22±0.002
S21 0.03 0.0645±0.0002 1.73±0.02 0.037±0.001
S22 0.04 0.1626±0.0002 1.85±0.02 0.088±0.001
S23 0.05 0.1558±0.0002 1.57±0.02 0.099±0.001
S24 0.10 0.4503±0.0002 3.03±0.04 0.15±0.002
S25 0.12 0.6746±0.0002 3.50±0.04 0.19±0.002
S26 0.16 0.3555±0.0002 1.30±0.02 0.27±0.003
5.1.1.2 Specific surface area and pore size of silica aerogels The measurements of specific surface area and pore size were performed by gas adsorption equipment as described in section 4.3.8. A typical adsorption/desorption isotherm plot of silica aerogels is shown in Fig. 5.1.
0
500
1000
1500
2000
2500
0.0 0.2 0.4 0.6 0.8 1.0Relative pressure (P/P0)
Vou
lme
adso
rbed
(cm
3 /g S
TP)
Fig. 5.1 Adsorption isotherm of nitrogen on silica aerogels (ρbulk=0.066 g/cm3, S11)
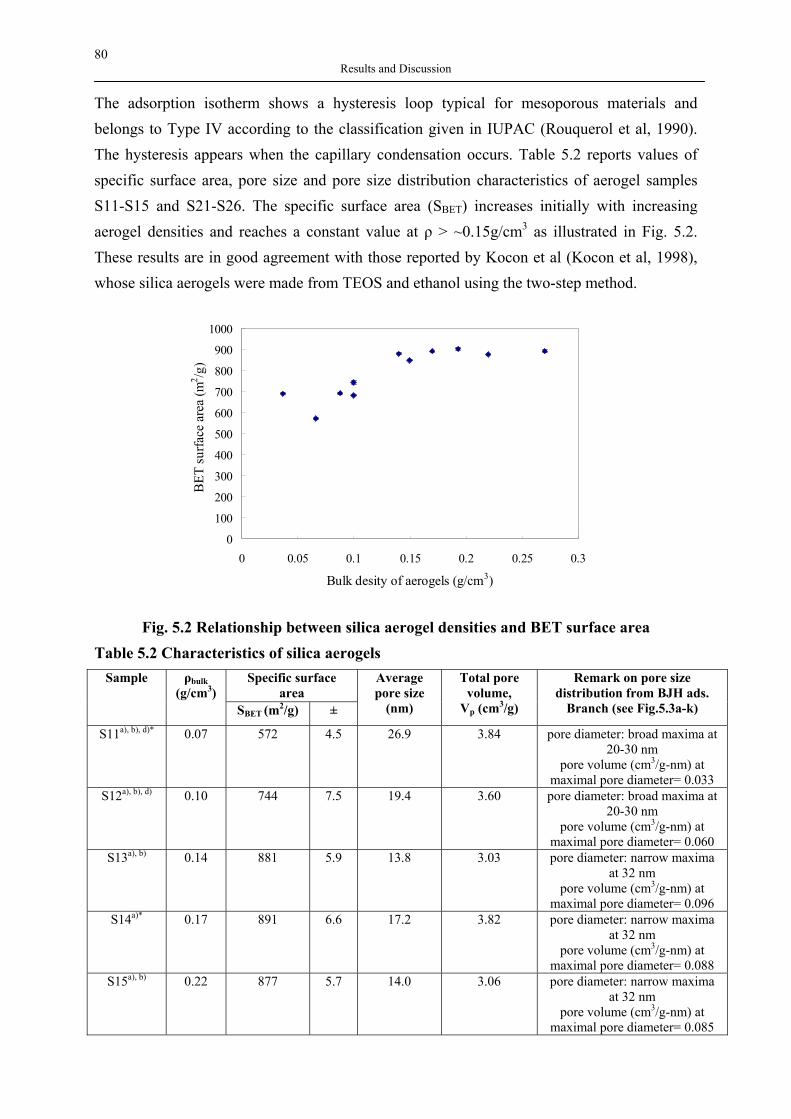
80 Results and Discussion
The adsorption isotherm shows a hysteresis loop typical for mesoporous materials and belongs to Type IV according to the classification given in IUPAC (Rouquerol et al, 1990). The hysteresis appears when the capillary condensation occurs. Table 5.2 reports values of specific surface area, pore size and pore size distribution characteristics of aerogel samples S11-S15 and S21-S26. The specific surface area (SBET) increases initially with increasing aerogel densities and reaches a constant value at ρ > ~0.15g/cm3 as illustrated in Fig. 5.2. These results are in good agreement with those reported by Kocon et al (Kocon et al, 1998), whose silica aerogels were made from TEOS and ethanol using the two-step method.
0
100
200
300
400
500
600
700
800
900
1000
0 0.05 0.1 0.15 0.2 0.25 0.3
Bulk desity of aerogels (g/cm3)
BET
surfa
ce a
rea
(m2 /g
)
Fig. 5.2 Relationship between silica aerogel densities and BET surface area
Table 5.2 Characteristics of silica aerogels Specific surface
area Sample ρbulk
(g/cm3) SBET (m2/g) ±
Average pore size
(nm)
Total pore volume,
Vp (cm3/g)
Remark on pore size distribution from BJH ads.
Branch (see Fig.5.3a-k)
S11a), b), d)* 0.07 572 4.5 26.9 3.84 pore diameter: broad maxima at 20-30 nm
pore volume (cm3/g-nm) at maximal pore diameter= 0.033
S12a), b), d) 0.10 744 7.5 19.4 3.60 pore diameter: broad maxima at 20-30 nm
pore volume (cm3/g-nm) at maximal pore diameter= 0.060
S13a), b) 0.14 881 5.9 13.8 3.03 pore diameter: narrow maxima at 32 nm
pore volume (cm3/g-nm) at maximal pore diameter= 0.096
S14a)* 0.17 891 6.6 17.2 3.82 pore diameter: narrow maxima at 32 nm
pore volume (cm3/g-nm) at maximal pore diameter= 0.088
S15a), b) 0.22 877 5.7 14.0 3.06 pore diameter: narrow maxima at 32 nm
pore volume (cm3/g-nm) at maximal pore diameter= 0.085
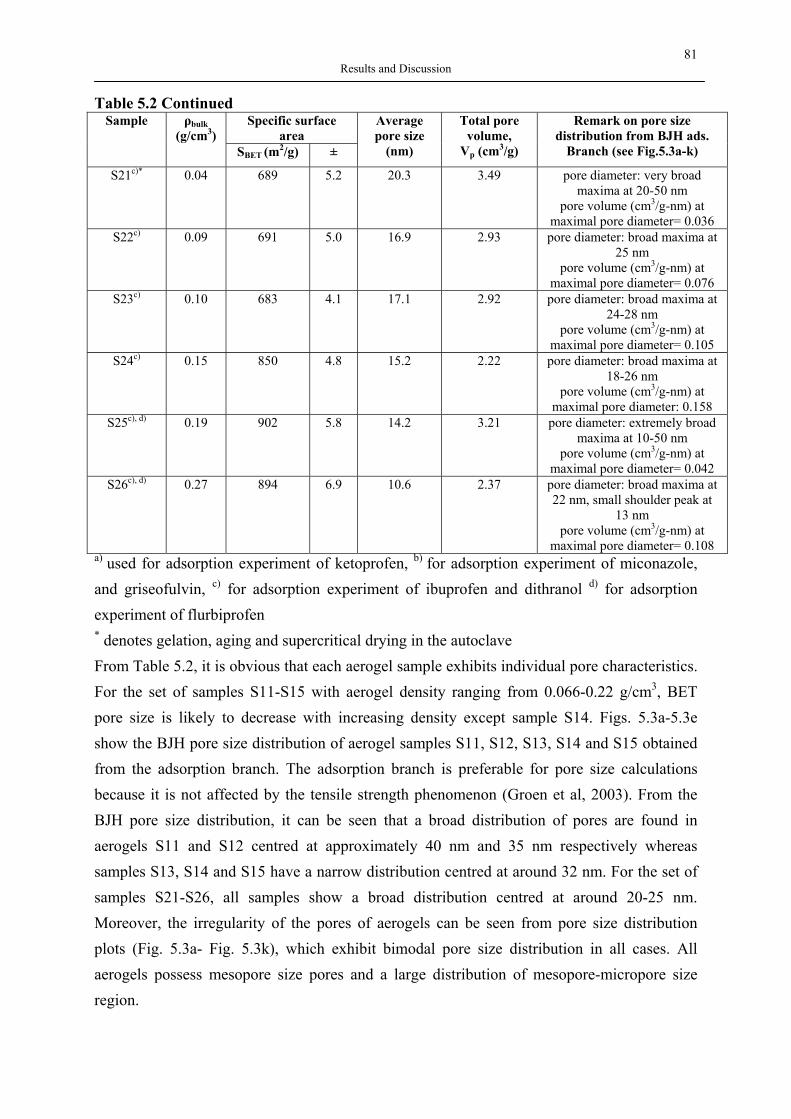
81 Results and Discussion
Table 5.2 Continued Specific surface
area Sample ρbulk
(g/cm3) SBET (m2/g) ±
Average pore size
(nm)
Total pore volume,
Vp (cm3/g)
Remark on pore size distribution from BJH ads.
Branch (see Fig.5.3a-k)
S21c)* 0.04 689 5.2 20.3 3.49 pore diameter: very broad maxima at 20-50 nm
pore volume (cm3/g-nm) at maximal pore diameter= 0.036
S22c) 0.09 691 5.0 16.9 2.93 pore diameter: broad maxima at 25 nm
pore volume (cm3/g-nm) at maximal pore diameter= 0.076
S23c) 0.10 683 4.1 17.1 2.92 pore diameter: broad maxima at 24-28 nm
pore volume (cm3/g-nm) at maximal pore diameter= 0.105
S24c) 0.15 850 4.8 15.2 2.22 pore diameter: broad maxima at 18-26 nm
pore volume (cm3/g-nm) at maximal pore diameter: 0.158
S25c), d) 0.19 902 5.8 14.2 3.21 pore diameter: extremely broad maxima at 10-50 nm
pore volume (cm3/g-nm) at maximal pore diameter= 0.042
S26c), d) 0.27 894 6.9 10.6 2.37 pore diameter: broad maxima at 22 nm, small shoulder peak at
13 nm pore volume (cm3/g-nm) at
maximal pore diameter= 0.108 a) used for adsorption experiment of ketoprofen, b) for adsorption experiment of miconazole, and griseofulvin, c) for adsorption experiment of ibuprofen and dithranol d) for adsorption experiment of flurbiprofen * denotes gelation, aging and supercritical drying in the autoclave From Table 5.2, it is obvious that each aerogel sample exhibits individual pore characteristics. For the set of samples S11-S15 with aerogel density ranging from 0.066-0.22 g/cm3, BET pore size is likely to decrease with increasing density except sample S14. Figs. 5.3a-5.3e show the BJH pore size distribution of aerogel samples S11, S12, S13, S14 and S15 obtained from the adsorption branch. The adsorption branch is preferable for pore size calculations because it is not affected by the tensile strength phenomenon (Groen et al, 2003). From the BJH pore size distribution, it can be seen that a broad distribution of pores are found in aerogels S11 and S12 centred at approximately 40 nm and 35 nm respectively whereas samples S13, S14 and S15 have a narrow distribution centred at around 32 nm. For the set of samples S21-S26, all samples show a broad distribution centred at around 20-25 nm. Moreover, the irregularity of the pores of aerogels can be seen from pore size distribution plots (Fig. 5.3a- Fig. 5.3k), which exhibit bimodal pore size distribution in all cases. All aerogels possess mesopore size pores and a large distribution of mesopore-micropore size region.
82 Results and Discussion
(a) S11 (b) S12
(c) S13 (d) S14
(e) S15 (f) S21
Fig. 5.3 Pore size distributions of aerogels S11-S15 (a)-(e) and S21-S26 (f)-(k)
Pore
Vol
ume
(cm
3/g-
nm)
Pore Diameter (nm)
10
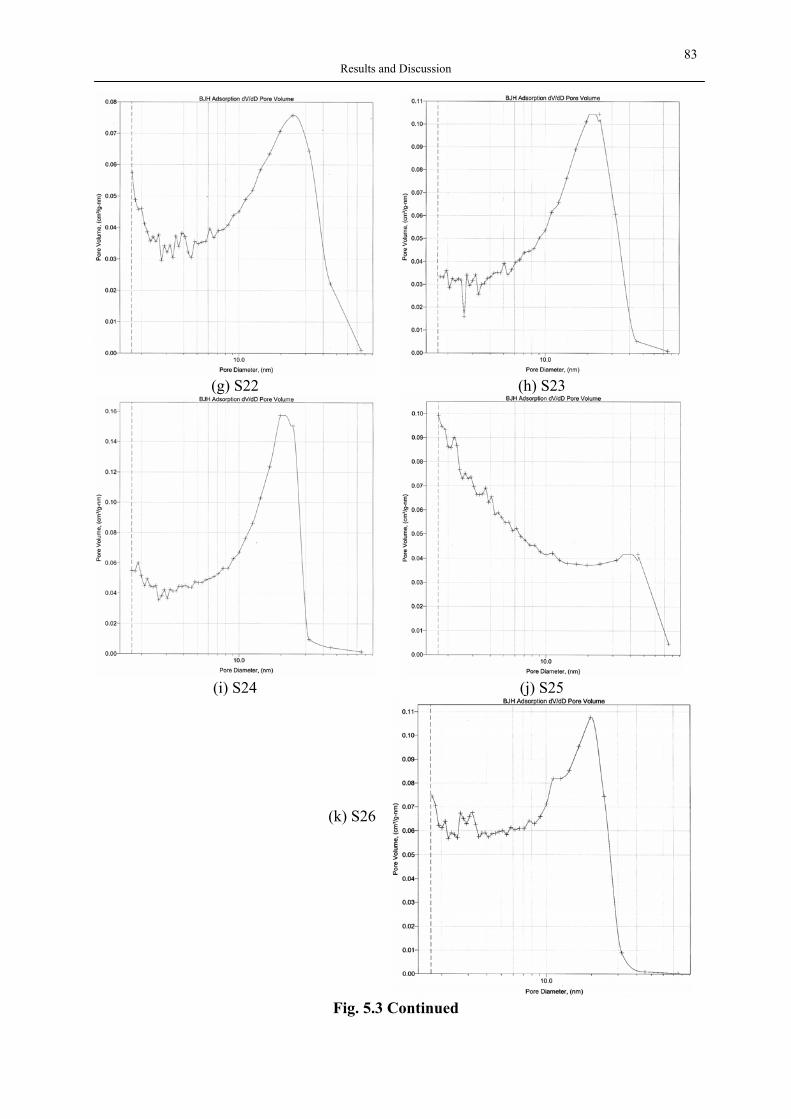
83 Results and Discussion
(g) S22 (h) S23
(i) S24 (j) S25
(k) S26
Fig. 5.3 Continued
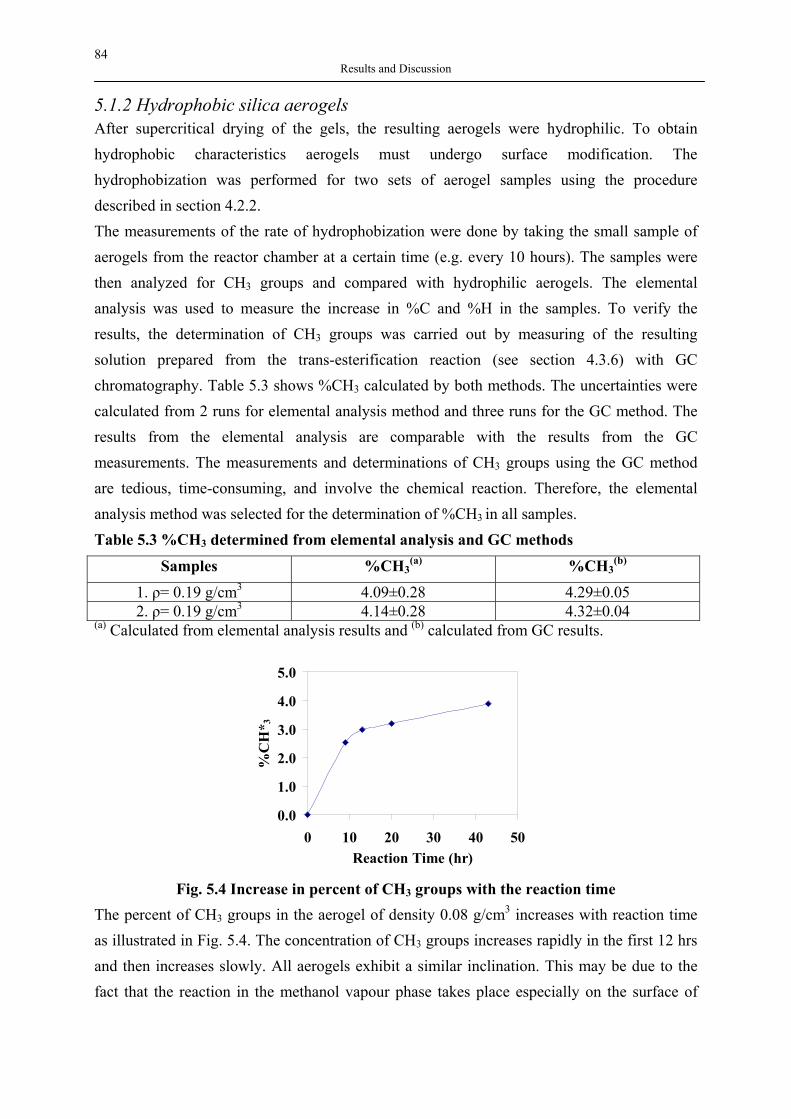
84 Results and Discussion
5.1.2 Hydrophobic silica aerogels After supercritical drying of the gels, the resulting aerogels were hydrophilic. To obtain hydrophobic characteristics aerogels must undergo surface modification. The hydrophobization was performed for two sets of aerogel samples using the procedure described in section 4.2.2. The measurements of the rate of hydrophobization were done by taking the small sample of aerogels from the reactor chamber at a certain time (e.g. every 10 hours). The samples were then analyzed for CH3 groups and compared with hydrophilic aerogels. The elemental analysis was used to measure the increase in %C and %H in the samples. To verify the results, the determination of CH3 groups was carried out by measuring of the resulting solution prepared from the trans-esterification reaction (see section 4.3.6) with GC chromatography. Table 5.3 shows %CH3 calculated by both methods. The uncertainties were calculated from 2 runs for elemental analysis method and three runs for the GC method. The results from the elemental analysis are comparable with the results from the GC measurements. The measurements and determinations of CH3 groups using the GC method are tedious, time-consuming, and involve the chemical reaction. Therefore, the elemental analysis method was selected for the determination of %CH3 in all samples. Table 5.3 %CH3 determined from elemental analysis and GC methods
Samples %CH3(a) %CH3
(b) 1. ρ= 0.19 g/cm3 4.09±0.28 4.29±0.05 2. ρ= 0.19 g/cm3 4.14±0.28 4.32±0.04
(a) Calculated from elemental analysis results and (b) calculated from GC results.
0.0
1.0
2.0
3.0
4.0
5.0
0 10 20 30 40 50Reaction Time (hr)
%C
H* 3
Fig. 5.4 Increase in percent of CH3 groups with the reaction time
The percent of CH3 groups in the aerogel of density 0.08 g/cm3 increases with reaction time as illustrated in Fig. 5.4. The concentration of CH3 groups increases rapidly in the first 12 hrs and then increases slowly. All aerogels exhibit a similar inclination. This may be due to the fact that the reaction in the methanol vapour phase takes place especially on the surface of
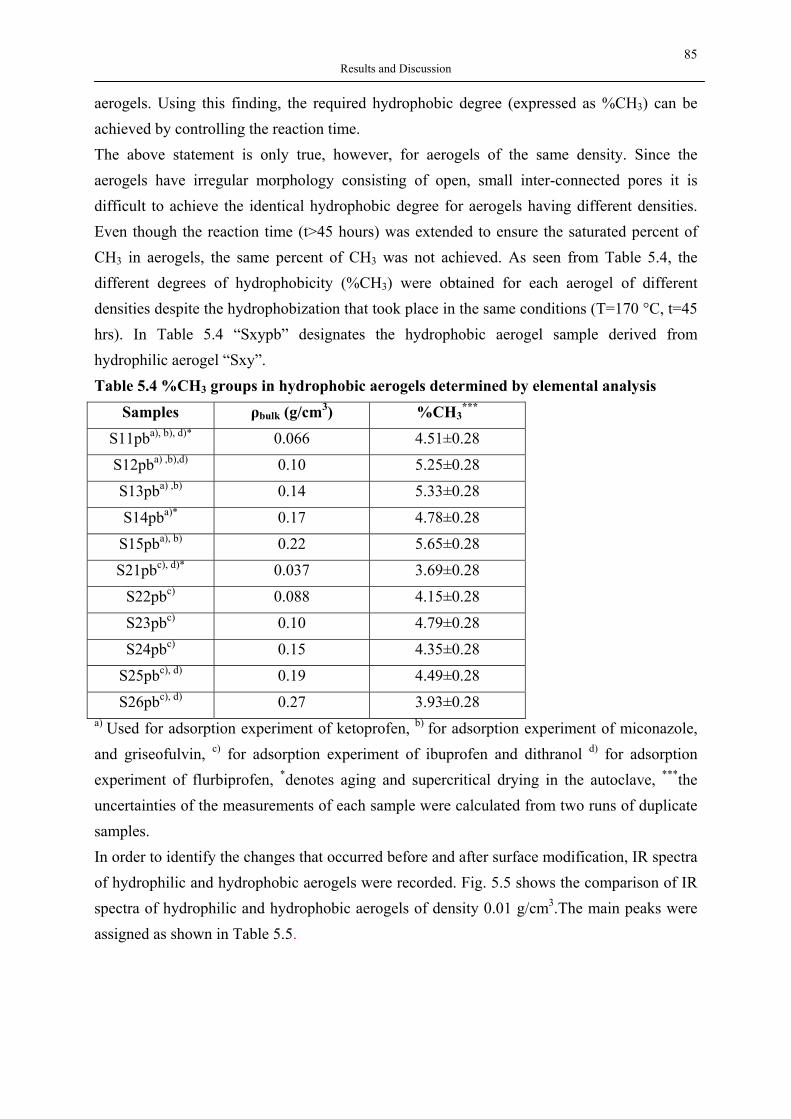
85 Results and Discussion
aerogels. Using this finding, the required hydrophobic degree (expressed as %CH3) can be achieved by controlling the reaction time. The above statement is only true, however, for aerogels of the same density. Since the aerogels have irregular morphology consisting of open, small inter-connected pores it is difficult to achieve the identical hydrophobic degree for aerogels having different densities. Even though the reaction time (t>45 hours) was extended to ensure the saturated percent of CH3 in aerogels, the same percent of CH3 was not achieved. As seen from Table 5.4, the different degrees of hydrophobicity (%CH3) were obtained for each aerogel of different densities despite the hydrophobization that took place in the same conditions (T=170 °C, t=45 hrs). In Table 5.4 “Sxypb” designates the hydrophobic aerogel sample derived from hydrophilic aerogel “Sxy”. Table 5.4 %CH3 groups in hydrophobic aerogels determined by elemental analysis
Samples ρbulk (g/cm3) %CH3***
S11pba), b), d)* 0.066 4.51±0.28
S12pba) ,b),d) 0.10 5.25±0.28
S13pba) ,b) 0.14 5.33±0.28
S14pba)* 0.17 4.78±0.28
S15pba), b) 0.22 5.65±0.28
S21pbc), d)* 0.037 3.69±0.28
S22pbc) 0.088 4.15±0.28
S23pbc) 0.10 4.79±0.28
S24pbc) 0.15 4.35±0.28
S25pbc), d) 0.19 4.49±0.28
S26pbc), d) 0.27 3.93±0.28 a) Used for adsorption experiment of ketoprofen, b) for adsorption experiment of miconazole, and griseofulvin, c) for adsorption experiment of ibuprofen and dithranol d) for adsorption experiment of flurbiprofen, *denotes aging and supercritical drying in the autoclave, ***the uncertainties of the measurements of each sample were calculated from two runs of duplicate samples. In order to identify the changes that occurred before and after surface modification, IR spectra of hydrophilic and hydrophobic aerogels were recorded. Fig. 5.5 shows the comparison of IR spectra of hydrophilic and hydrophobic aerogels of density 0.01 g/cm3.The main peaks were assigned as shown in Table 5.5.
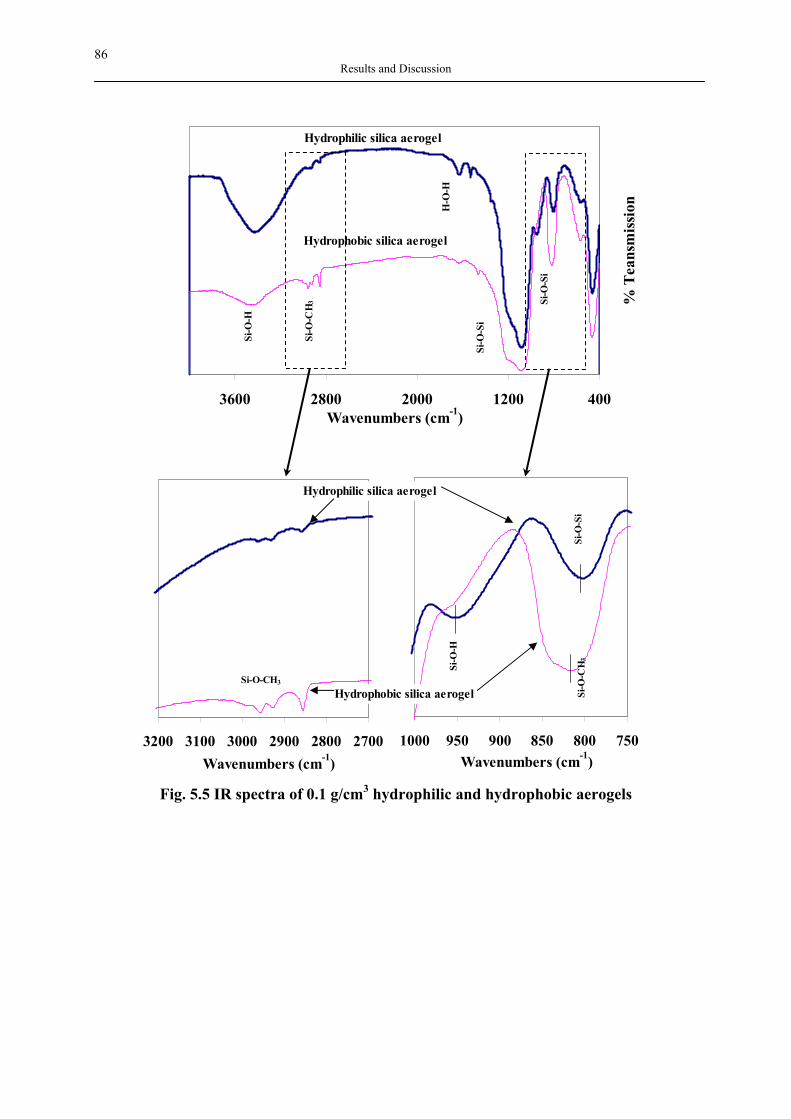
86 Results and Discussion
4001200200028003600Wavenumbers (cm-1)
% T
eans
mis
sionH
-O-H
Si-O
-CH
3
Si-O
-H
Si-O
-Si
Si-O
-Si
Hydrophobic silica aerogel
Hydrophilic silica aerogel
270028002900300031003200Wavenumbers (cm-1)
7508008509009501000Wavenumbers (cm-1)
Si-O
-Si
Si-O
-H
Si-O
-CH
3
Si-O-CH3
Hydrophobic silica aerogel
Hydrophilic silica aerogel
Fig. 5.5 IR spectra of 0.1 g/cm3 hydrophilic and hydrophobic aerogels
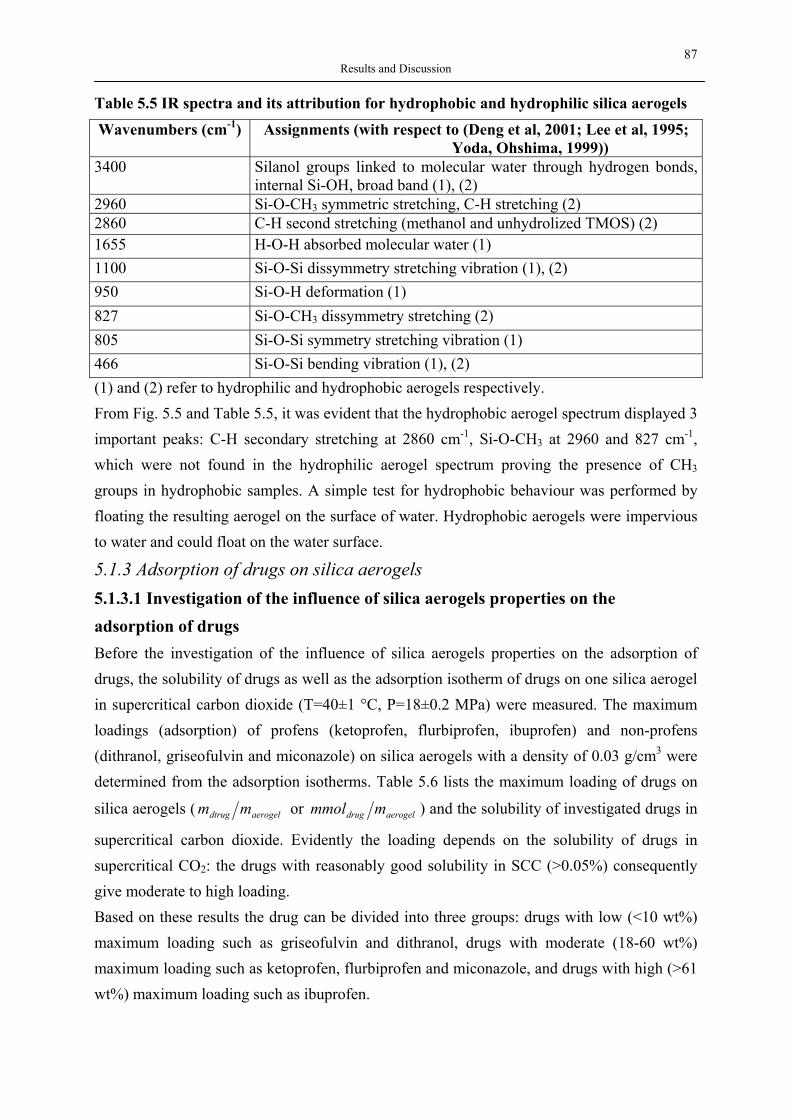
87 Results and Discussion
Table 5.5 IR spectra and its attribution for hydrophobic and hydrophilic silica aerogels
Wavenumbers (cm-1) Assignments (with respect to (Deng et al, 2001; Lee et al, 1995; Yoda, Ohshima, 1999))
3400 Silanol groups linked to molecular water through hydrogen bonds, internal Si-OH, broad band (1), (2)
2960 Si-O-CH3 symmetric stretching, C-H stretching (2) 2860 C-H second stretching (methanol and unhydrolized TMOS) (2) 1655 H-O-H absorbed molecular water (1) 1100 Si-O-Si dissymmetry stretching vibration (1), (2) 950 Si-O-H deformation (1) 827 Si-O-CH3 dissymmetry stretching (2) 805 Si-O-Si symmetry stretching vibration (1) 466 Si-O-Si bending vibration (1), (2) (1) and (2) refer to hydrophilic and hydrophobic aerogels respectively. From Fig. 5.5 and Table 5.5, it was evident that the hydrophobic aerogel spectrum displayed 3 important peaks: C-H secondary stretching at 2860 cm-1, Si-O-CH3 at 2960 and 827 cm-1, which were not found in the hydrophilic aerogel spectrum proving the presence of CH3 groups in hydrophobic samples. A simple test for hydrophobic behaviour was performed by floating the resulting aerogel on the surface of water. Hydrophobic aerogels were impervious to water and could float on the water surface.
5.1.3 Adsorption of drugs on silica aerogels 5.1.3.1 Investigation of the influence of silica aerogels properties on the adsorption of drugs Before the investigation of the influence of silica aerogels properties on the adsorption of drugs, the solubility of drugs as well as the adsorption isotherm of drugs on one silica aerogel in supercritical carbon dioxide (T=40±1 °C, P=18±0.2 MPa) were measured. The maximum loadings (adsorption) of profens (ketoprofen, flurbiprofen, ibuprofen) and non-profens (dithranol, griseofulvin and miconazole) on silica aerogels with a density of 0.03 g/cm3 were determined from the adsorption isotherms. Table 5.6 lists the maximum loading of drugs on
silica aerogels ( aerogeldtrug mm or aerogeldrug mmmol ) and the solubility of investigated drugs in
supercritical carbon dioxide. Evidently the loading depends on the solubility of drugs in supercritical CO2: the drugs with reasonably good solubility in SCC (>0.05%) consequently give moderate to high loading. Based on these results the drug can be divided into three groups: drugs with low (<10 wt%) maximum loading such as griseofulvin and dithranol, drugs with moderate (18-60 wt%) maximum loading such as ketoprofen, flurbiprofen and miconazole, and drugs with high (>61 wt%) maximum loading such as ibuprofen.
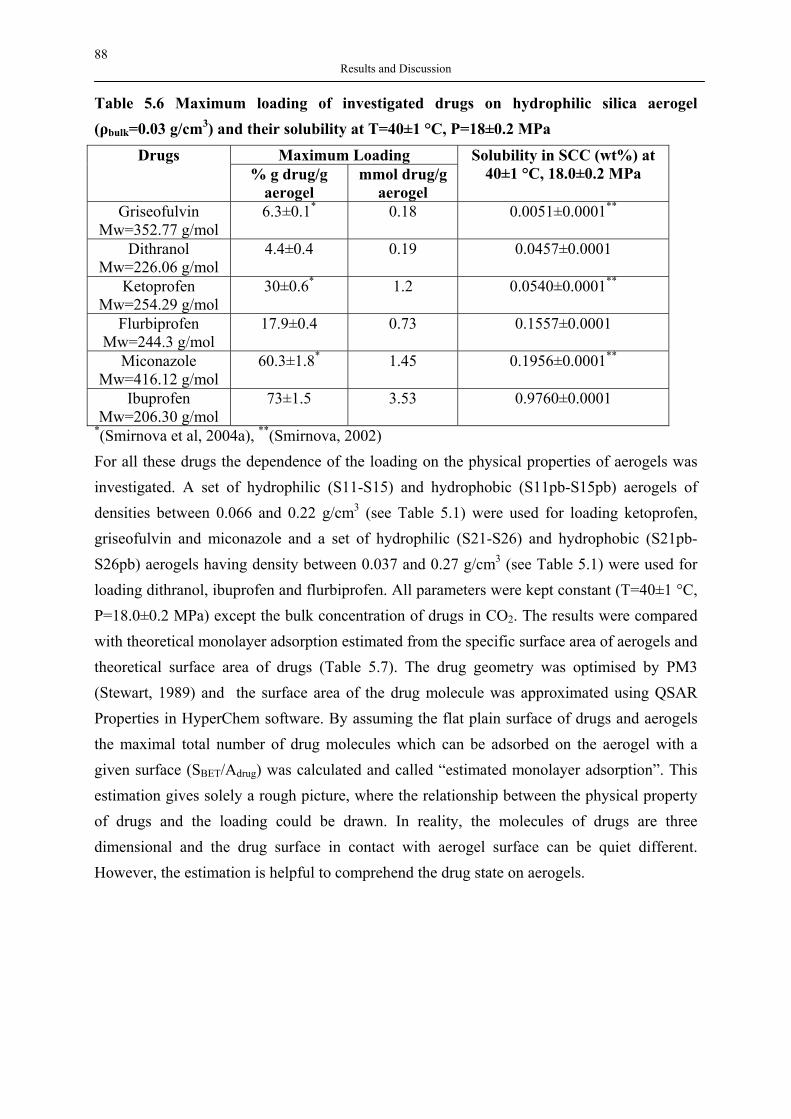
88 Results and Discussion
Table 5.6 Maximum loading of investigated drugs on hydrophilic silica aerogel (ρbulk=0.03 g/cm3) and their solubility at T=40±1 °C, P=18±0.2 MPa
Maximum Loading Drugs % g drug/g
aerogel mmol drug/g
aerogel
Solubility in SCC (wt%) at 40±1 °C, 18.0±0.2 MPa
Griseofulvin Mw=352.77 g/mol
6.3±0.1* 0.18 0.0051±0.0001**
Dithranol Mw=226.06 g/mol
4.4±0.4 0.19 0.0457±0.0001
Ketoprofen Mw=254.29 g/mol
30±0.6* 1.2 0.0540±0.0001**
Flurbiprofen Mw=244.3 g/mol
17.9±0.4 0.73 0.1557±0.0001
Miconazole Mw=416.12 g/mol
60.3±1.8* 1.45 0.1956±0.0001**
Ibuprofen Mw=206.30 g/mol
73±1.5 3.53 0.9760±0.0001
*(Smirnova et al, 2004a), **(Smirnova, 2002) For all these drugs the dependence of the loading on the physical properties of aerogels was investigated. A set of hydrophilic (S11-S15) and hydrophobic (S11pb-S15pb) aerogels of densities between 0.066 and 0.22 g/cm3 (see Table 5.1) were used for loading ketoprofen, griseofulvin and miconazole and a set of hydrophilic (S21-S26) and hydrophobic (S21pb-S26pb) aerogels having density between 0.037 and 0.27 g/cm3 (see Table 5.1) were used for loading dithranol, ibuprofen and flurbiprofen. All parameters were kept constant (T=40±1 °C, P=18.0±0.2 MPa) except the bulk concentration of drugs in CO2. The results were compared with theoretical monolayer adsorption estimated from the specific surface area of aerogels and theoretical surface area of drugs (Table 5.7). The drug geometry was optimised by PM3 (Stewart, 1989) and the surface area of the drug molecule was approximated using QSAR Properties in HyperChem software. By assuming the flat plain surface of drugs and aerogels the maximal total number of drug molecules which can be adsorbed on the aerogel with a given surface (SBET/Adrug) was calculated and called “estimated monolayer adsorption”. This estimation gives solely a rough picture, where the relationship between the physical property of drugs and the loading could be drawn. In reality, the molecules of drugs are three dimensional and the drug surface in contact with aerogel surface can be quiet different. However, the estimation is helpful to comprehend the drug state on aerogels.
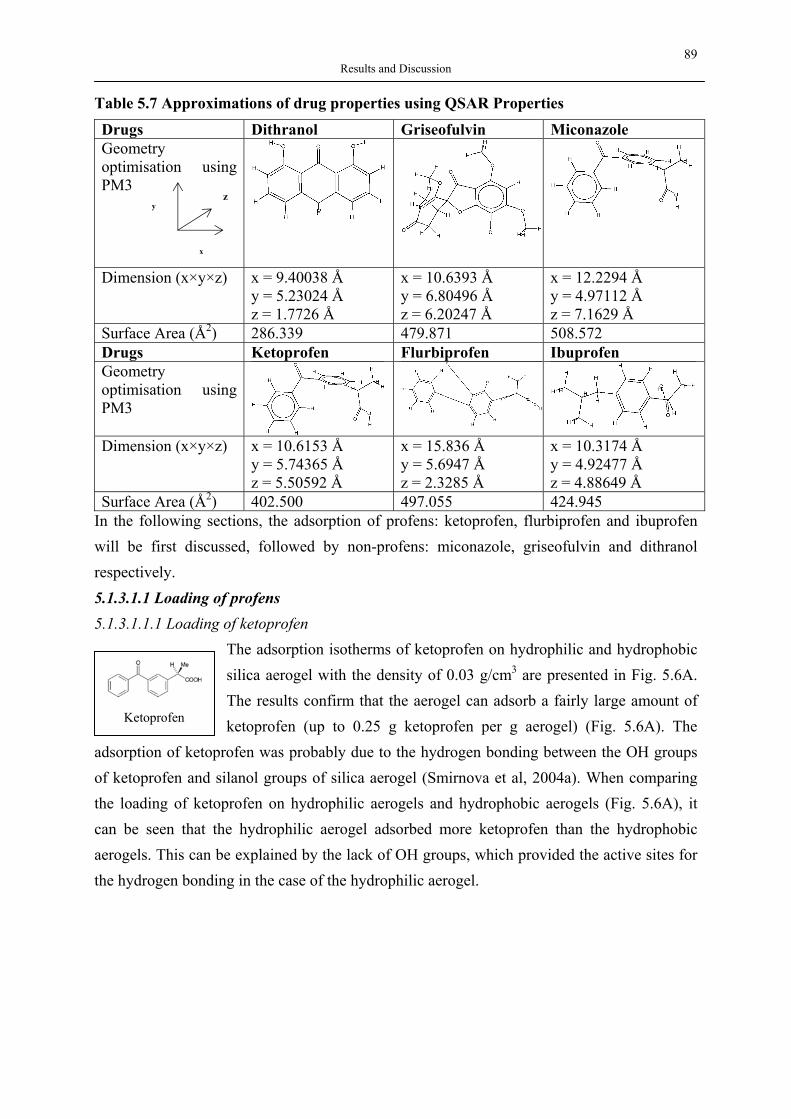
89 Results and Discussion
Table 5.7 Approximations of drug properties using QSAR Properties
Drugs Dithranol Griseofulvin Miconazole Geometry optimisation using PM3
Dimension (x×y×z) x = 9.40038 Å y = 5.23024 Å z = 1.7726 Å
x = 10.6393 Å y = 6.80496 Å z = 6.20247 Å
x = 12.2294 Å y = 4.97112 Å z = 7.1629 Å
Surface Area (Å2) 286.339 479.871 508.572 Drugs Ketoprofen Flurbiprofen Ibuprofen Geometry optimisation using PM3 Dimension (x×y×z) x = 10.6153 Å
y = 5.74365 Å z = 5.50592 Å
x = 15.836 Å y = 5.6947 Å z = 2.3285 Å
x = 10.3174 Å y = 4.92477 Å z = 4.88649 Å
Surface Area (Å2) 402.500 497.055 424.945 In the following sections, the adsorption of profens: ketoprofen, flurbiprofen and ibuprofen will be first discussed, followed by non-profens: miconazole, griseofulvin and dithranol respectively. 5.1.3.1.1 Loading of profens 5.1.3.1.1.1 Loading of ketoprofen
The adsorption isotherms of ketoprofen on hydrophilic and hydrophobic silica aerogel with the density of 0.03 g/cm3 are presented in Fig. 5.6A. The results confirm that the aerogel can adsorb a fairly large amount of ketoprofen (up to 0.25 g ketoprofen per g aerogel) (Fig. 5.6A). The
adsorption of ketoprofen was probably due to the hydrogen bonding between the OH groups of ketoprofen and silanol groups of silica aerogel (Smirnova et al, 2004a). When comparing the loading of ketoprofen on hydrophilic aerogels and hydrophobic aerogels (Fig. 5.6A), it can be seen that the hydrophilic aerogel adsorbed more ketoprofen than the hydrophobic aerogels. This can be explained by the lack of OH groups, which provided the active sites for the hydrogen bonding in the case of the hydrophilic aerogel.
x
y z
Ketoprofen

90 Results and Discussion
A
0.00
0.10
0.20
0.30
0.40
0.50
0.00 0.01 0.02 0.03 0.04 0.05
Bulk concentration of ketoprofen in CO2 (wt%)
Loa
ding
(g k
etop
rofe
n/g
aero
gel) Hydrophilic silica aerogel
Langmuir;qm=0.51;b=40.9Hydrophobic silica aerogelLangmuir;qm=0.31;b=34.8
B
0.00
0.10
0.20
0.30
0.40
0.50
0.60
0.00 0.01 0.02 0.03 0.04 0.05Bulk concentration of ketoprofen in CO2 (wt%)
Load
ing(
g ke
topr
ofen
/g a
erog
el)
aerogel density=0.03 g/cm3Langmiur;qm=0.51;b=40.9aerogel density=0.08 g/cm3Langmiur;qm=0.73;b=30.5
Fig. 5.6 Adsorption of ketoprofen on (A) hydrophilic and hydrophobic aerogel (ρ=0.03 g/cm3) and (B) two hydrophilic aerogels having density 0.03 and 0.08 g/cm3 at 40±1 °C
The adsorption isotherm was fitted using the Langmuir equation (Eq. 4.10).
bCbCqq m
+=
1 Eq. 4.10
where C is the bulk concentration of ketoprofen in CO2, q is the adsorbed amount of drug per gram aerogel and qm and b are fitting constants. For all measurements, the relative error due to systematic equipment errors varied within 4.5-5% (Fig. 5.6). Table 5.8 shows qm and b parameters which were determined by the fitting of the experimental data. Table 5.8 qm and b values of adsorption isotherms of ketoprofen
Fitting Parameter Adsorption Isotherms (40±1 °C) qm b
Ketoprofen on aerogels (ρ=0.03 g/cm3) 0.51 40.9 Ketoprofen on hydrophobic aerogels (ρ=0.03 g/cm3) 0.31 34.8 Ketoprofen on aerogels (ρ=0.08 g/cm3) 0.73 30.5
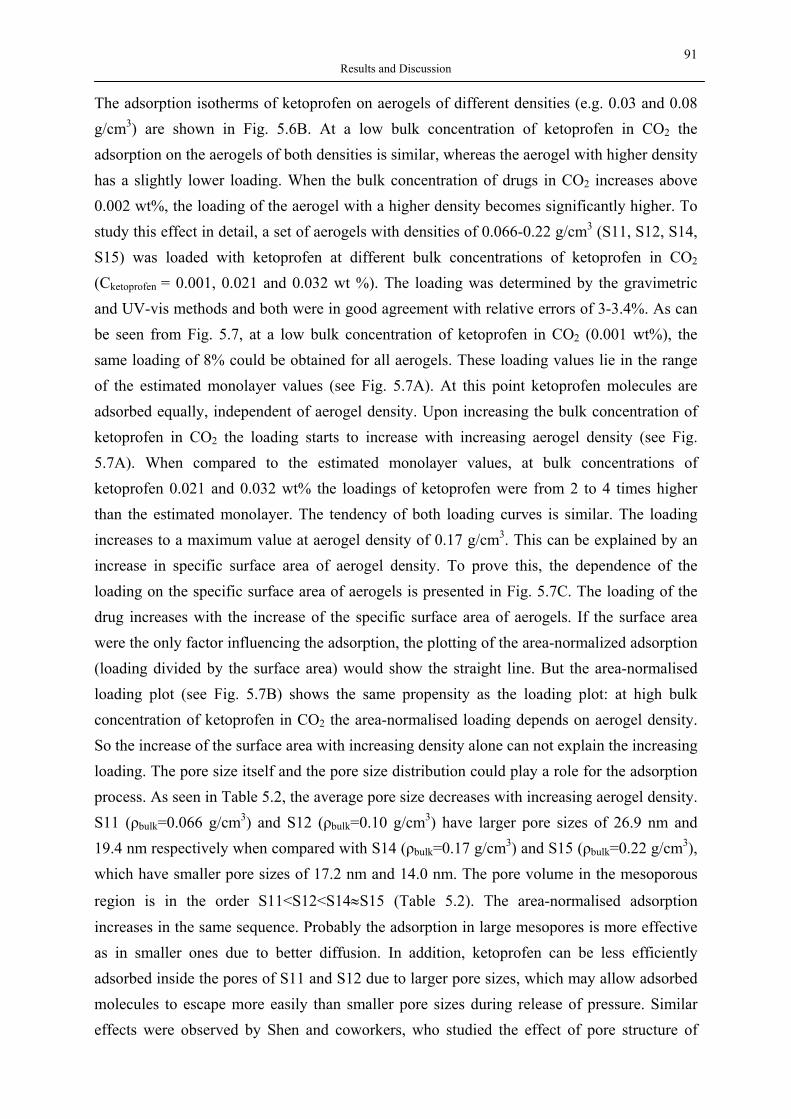
91 Results and Discussion
The adsorption isotherms of ketoprofen on aerogels of different densities (e.g. 0.03 and 0.08 g/cm3) are shown in Fig. 5.6B. At a low bulk concentration of ketoprofen in CO2 the adsorption on the aerogels of both densities is similar, whereas the aerogel with higher density has a slightly lower loading. When the bulk concentration of drugs in CO2 increases above 0.002 wt%, the loading of the aerogel with a higher density becomes significantly higher. To study this effect in detail, a set of aerogels with densities of 0.066-0.22 g/cm3 (S11, S12, S14, S15) was loaded with ketoprofen at different bulk concentrations of ketoprofen in CO2
(Cketoprofen = 0.001, 0.021 and 0.032 wt %). The loading was determined by the gravimetric and UV-vis methods and both were in good agreement with relative errors of 3-3.4%. As can be seen from Fig. 5.7, at a low bulk concentration of ketoprofen in CO2 (0.001 wt%), the same loading of 8% could be obtained for all aerogels. These loading values lie in the range of the estimated monolayer values (see Fig. 5.7A). At this point ketoprofen molecules are adsorbed equally, independent of aerogel density. Upon increasing the bulk concentration of ketoprofen in CO2 the loading starts to increase with increasing aerogel density (see Fig. 5.7A). When compared to the estimated monolayer values, at bulk concentrations of ketoprofen 0.021 and 0.032 wt% the loadings of ketoprofen were from 2 to 4 times higher than the estimated monolayer. The tendency of both loading curves is similar. The loading increases to a maximum value at aerogel density of 0.17 g/cm3. This can be explained by an increase in specific surface area of aerogel density. To prove this, the dependence of the loading on the specific surface area of aerogels is presented in Fig. 5.7C. The loading of the drug increases with the increase of the specific surface area of aerogels. If the surface area were the only factor influencing the adsorption, the plotting of the area-normalized adsorption (loading divided by the surface area) would show the straight line. But the area-normalised loading plot (see Fig. 5.7B) shows the same propensity as the loading plot: at high bulk concentration of ketoprofen in CO2 the area-normalised loading depends on aerogel density. So the increase of the surface area with increasing density alone can not explain the increasing loading. The pore size itself and the pore size distribution could play a role for the adsorption process. As seen in Table 5.2, the average pore size decreases with increasing aerogel density. S11 (ρbulk=0.066 g/cm3) and S12 (ρbulk=0.10 g/cm3) have larger pore sizes of 26.9 nm and 19.4 nm respectively when compared with S14 (ρbulk=0.17 g/cm3) and S15 (ρbulk=0.22 g/cm3), which have smaller pore sizes of 17.2 nm and 14.0 nm. The pore volume in the mesoporous
region is in the order S11<S12<S14≈S15 (Table 5.2). The area-normalised adsorption increases in the same sequence. Probably the adsorption in large mesopores is more effective as in smaller ones due to better diffusion. In addition, ketoprofen can be less efficiently adsorbed inside the pores of S11 and S12 due to larger pore sizes, which may allow adsorbed molecules to escape more easily than smaller pore sizes during release of pressure. Similar effects were observed by Shen and coworkers, who studied the effect of pore structure of
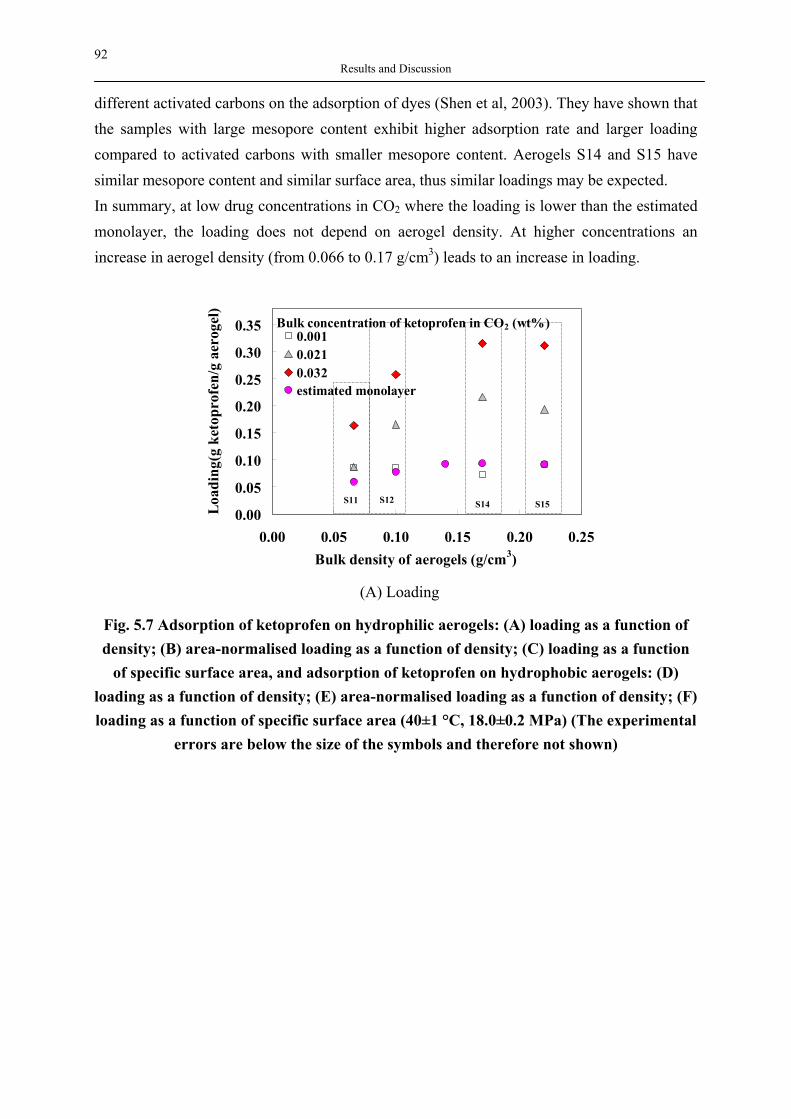
92 Results and Discussion
different activated carbons on the adsorption of dyes (Shen et al, 2003). They have shown that the samples with large mesopore content exhibit higher adsorption rate and larger loading compared to activated carbons with smaller mesopore content. Aerogels S14 and S15 have similar mesopore content and similar surface area, thus similar loadings may be expected. In summary, at low drug concentrations in CO2 where the loading is lower than the estimated monolayer, the loading does not depend on aerogel density. At higher concentrations an increase in aerogel density (from 0.066 to 0.17 g/cm3) leads to an increase in loading.
0.00
0.05
0.10
0.15
0.20
0.25
0.30
0.35
0.00 0.05 0.10 0.15 0.20 0.25Bulk density of aerogels (g/cm3)
Load
ing(
g ke
topr
ofen
/g a
erog
el)
0.0010.0210.032estimated monolayer
Bulk concentration of ketoprofen in CO2 (wt%)
(A) Loading
Fig. 5.7 Adsorption of ketoprofen on hydrophilic aerogels: (A) loading as a function of density; (B) area-normalised loading as a function of density; (C) loading as a function
of specific surface area, and adsorption of ketoprofen on hydrophobic aerogels: (D) loading as a function of density; (E) area-normalised loading as a function of density; (F) loading as a function of specific surface area (40±1 °C, 18.0±0.2 MPa) (The experimental
errors are below the size of the symbols and therefore not shown)
S11
S12
S14
S15
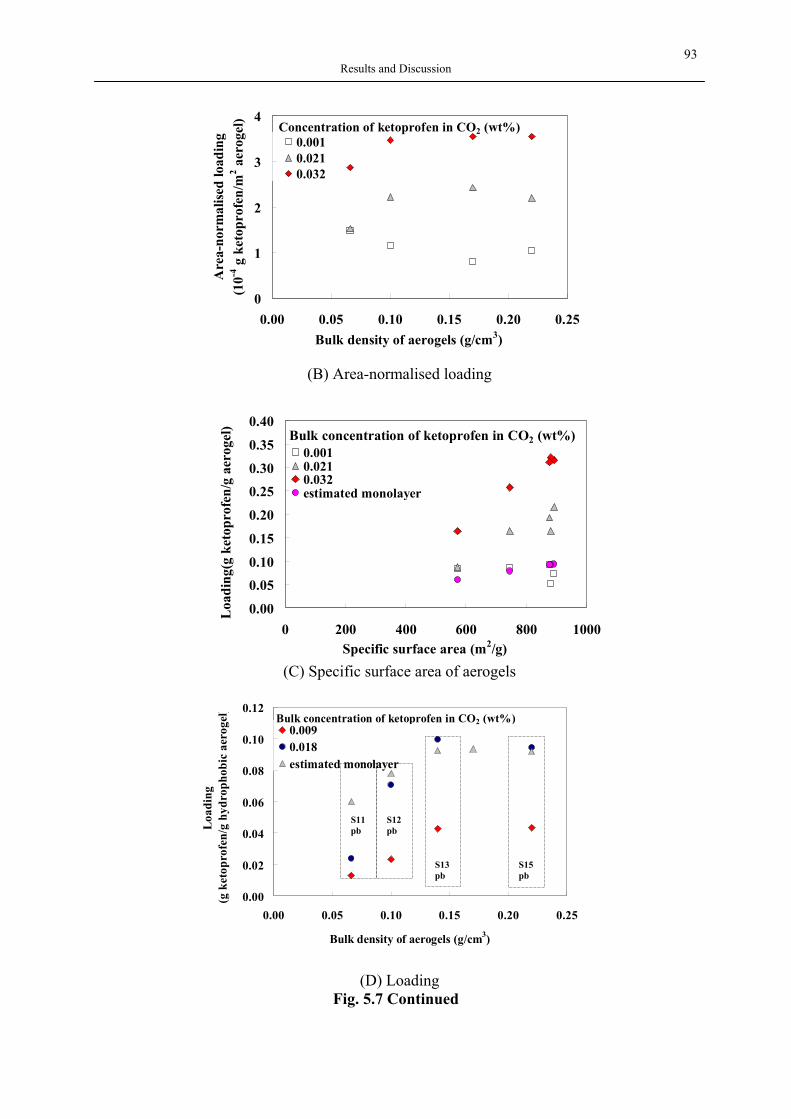
93 Results and Discussion
0
1
2
3
4
0.00 0.05 0.10 0.15 0.20 0.25Bulk density of aerogels (g/cm3)
Are
a-no
rmal
ised
load
ing
(10-4
g k
etop
rofe
n/m
2 aer
ogel
)
0.0010.0210.032
Concentration of ketoprofen in CO2 (wt%)
(B) Area-normalised loading
0.00
0.05
0.10
0.15
0.20
0.25
0.30
0.35
0.40
0 200 400 600 800 1000Specific surface area (m2/g)
Loa
ding
(g k
etop
rofe
n/g
aero
gel)
0.0010.0210.032estimated monolayer
Bulk concentration of ketoprofen in CO2 (wt%)
(C) Specific surface area of aerogels
0.00
0.02
0.04
0.06
0.08
0.10
0.12
0.00 0.05 0.10 0.15 0.20 0.25
Bulk density of aerogels (g/cm3)
Loa
ding
(g k
etop
rofe
n/g
hydr
opho
bic
aero
gel)
0.0090.018estimated monolayer
Bulk concentration of ketoprofen in CO2 (wt%)
(D) Loading
Fig. 5.7 Continued
S11pb
S12pb
S13pb
S15pb
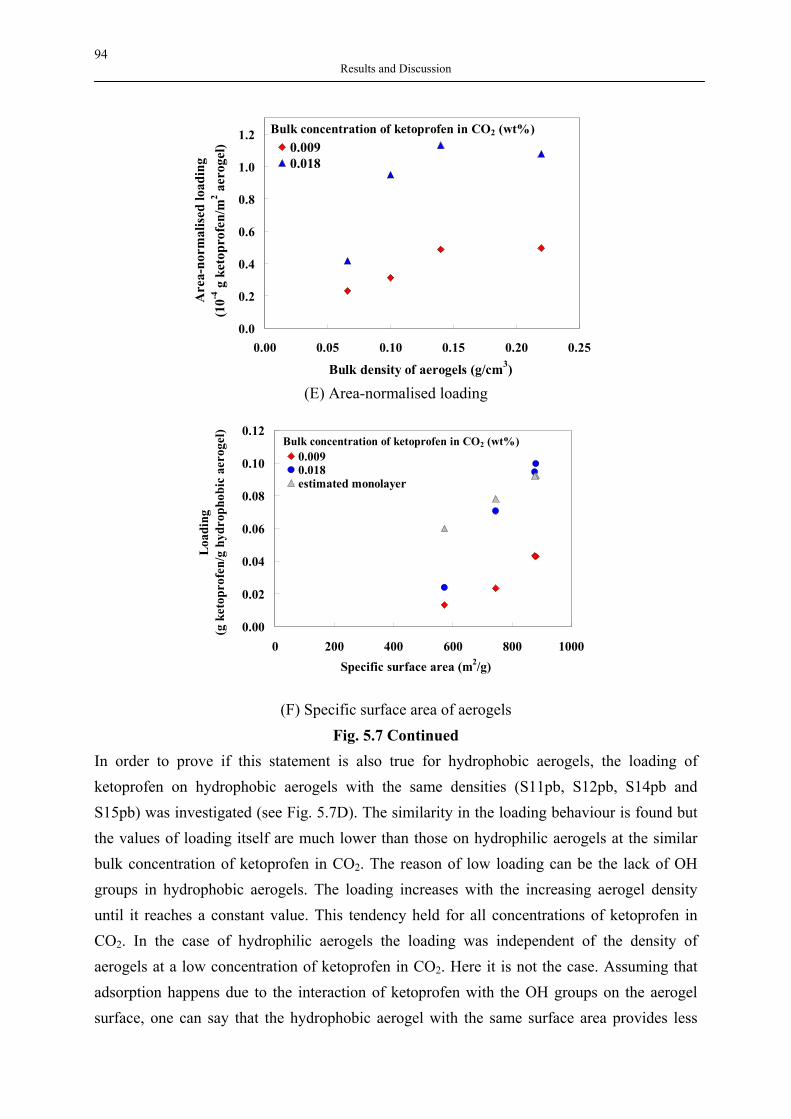
94 Results and Discussion
0.0
0.2
0.4
0.6
0.8
1.0
1.2
0.00 0.05 0.10 0.15 0.20 0.25
Bulk density of aerogels (g/cm3)
Are
a-no
rmal
ised
load
ing
(10-4
g k
etop
rofe
n/m
2 aer
ogel
) 0.0090.018
Bulk concentration of ketoprofen in CO2 (wt%)
(E) Area-normalised loading
0.00
0.02
0.04
0.06
0.08
0.10
0.12
0 200 400 600 800 1000Specific surface area (m2/g)
Loa
ding
(g k
etop
rofe
n/g
hydr
opho
bic
aero
gel)
0.0090.018estimated monolayer
Bulk concentration of ketoprofen in CO2 (wt%)
(F) Specific surface area of aerogels
Fig. 5.7 Continued In order to prove if this statement is also true for hydrophobic aerogels, the loading of ketoprofen on hydrophobic aerogels with the same densities (S11pb, S12pb, S14pb and S15pb) was investigated (see Fig. 5.7D). The similarity in the loading behaviour is found but the values of loading itself are much lower than those on hydrophilic aerogels at the similar bulk concentration of ketoprofen in CO2. The reason of low loading can be the lack of OH groups in hydrophobic aerogels. The loading increases with the increasing aerogel density until it reaches a constant value. This tendency held for all concentrations of ketoprofen in CO2. In the case of hydrophilic aerogels the loading was independent of the density of aerogels at a low concentration of ketoprofen in CO2. Here it is not the case. Assuming that adsorption happens due to the interaction of ketoprofen with the OH groups on the aerogel surface, one can say that the hydrophobic aerogel with the same surface area provides less
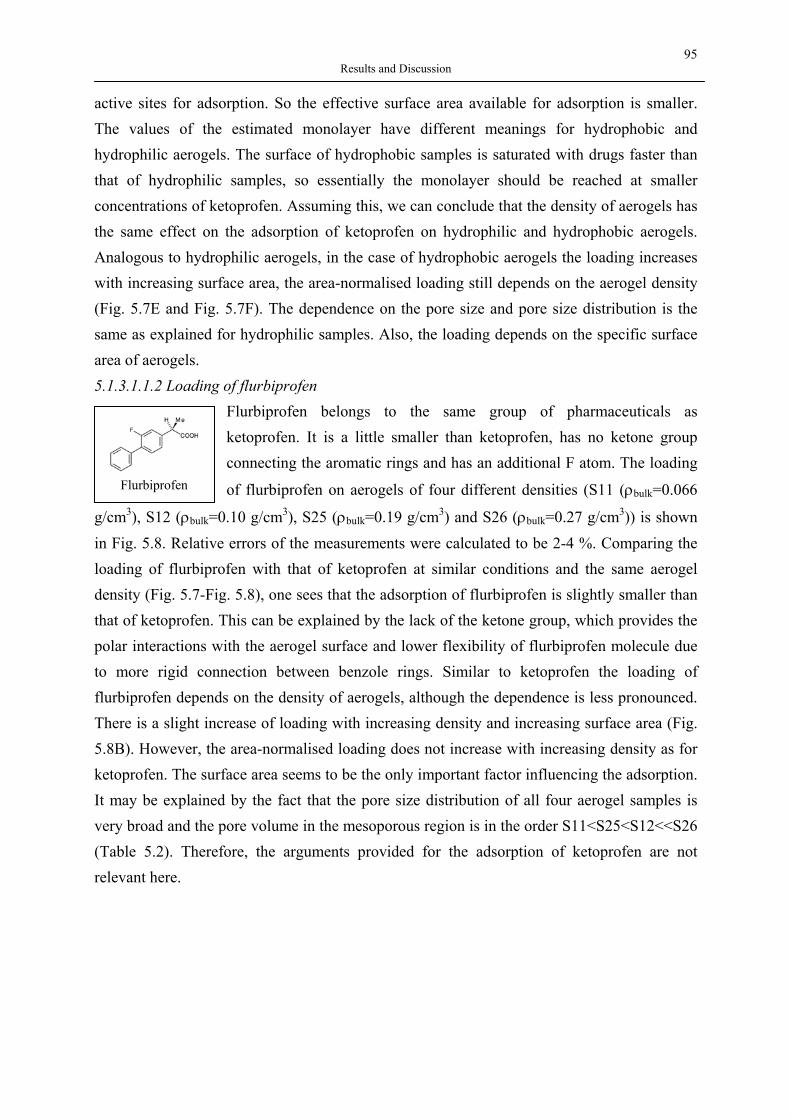
95 Results and Discussion
active sites for adsorption. So the effective surface area available for adsorption is smaller. The values of the estimated monolayer have different meanings for hydrophobic and hydrophilic aerogels. The surface of hydrophobic samples is saturated with drugs faster than that of hydrophilic samples, so essentially the monolayer should be reached at smaller concentrations of ketoprofen. Assuming this, we can conclude that the density of aerogels has the same effect on the adsorption of ketoprofen on hydrophilic and hydrophobic aerogels. Analogous to hydrophilic aerogels, in the case of hydrophobic aerogels the loading increases with increasing surface area, the area-normalised loading still depends on the aerogel density (Fig. 5.7E and Fig. 5.7F). The dependence on the pore size and pore size distribution is the same as explained for hydrophilic samples. Also, the loading depends on the specific surface area of aerogels. 5.1.3.1.1.2 Loading of flurbiprofen
Flurbiprofen belongs to the same group of pharmaceuticals as ketoprofen. It is a little smaller than ketoprofen, has no ketone group connecting the aromatic rings and has an additional F atom. The loading
of flurbiprofen on aerogels of four different densities (S11 (ρbulk=0.066
g/cm3), S12 (ρbulk=0.10 g/cm3), S25 (ρbulk=0.19 g/cm3) and S26 (ρbulk=0.27 g/cm3)) is shown in Fig. 5.8. Relative errors of the measurements were calculated to be 2-4 %. Comparing the loading of flurbiprofen with that of ketoprofen at similar conditions and the same aerogel density (Fig. 5.7-Fig. 5.8), one sees that the adsorption of flurbiprofen is slightly smaller than that of ketoprofen. This can be explained by the lack of the ketone group, which provides the polar interactions with the aerogel surface and lower flexibility of flurbiprofen molecule due to more rigid connection between benzole rings. Similar to ketoprofen the loading of flurbiprofen depends on the density of aerogels, although the dependence is less pronounced. There is a slight increase of loading with increasing density and increasing surface area (Fig. 5.8B). However, the area-normalised loading does not increase with increasing density as for ketoprofen. The surface area seems to be the only important factor influencing the adsorption. It may be explained by the fact that the pore size distribution of all four aerogel samples is very broad and the pore volume in the mesoporous region is in the order S11<S25<S12<<S26 (Table 5.2). Therefore, the arguments provided for the adsorption of ketoprofen are not relevant here.
Flurbiprofen
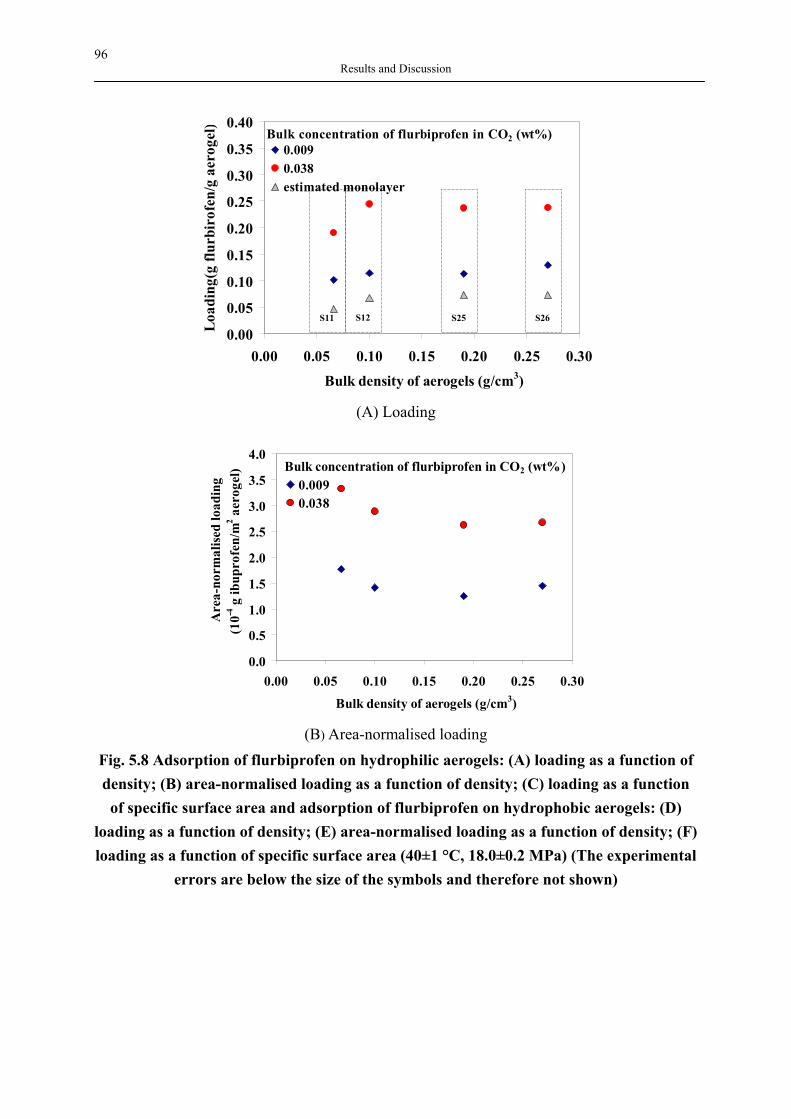
96 Results and Discussion
0.00
0.05
0.10
0.15
0.20
0.25
0.30
0.35
0.40
0.00 0.05 0.10 0.15 0.20 0.25 0.30
Bulk density of aerogels (g/cm3)
Load
ing(
g flu
rbir
ofen
/g a
erog
el)
0.0090.038estimated monolayer
Bulk concentration of flurbiprofen in CO2 (wt%)
(A) Loading
0.0
0.5
1.0
1.5
2.0
2.5
3.0
3.5
4.0
0.00 0.05 0.10 0.15 0.20 0.25 0.30
Bulk density of aerogels (g/cm3)
Are
a-no
rmal
ised
load
ing
(10-4
g ib
upro
fen/
m2 a
erog
el)
0.0090.038
Bulk concentration of flurbiprofen in CO2 (wt%)
(B) Area-normalised loading
Fig. 5.8 Adsorption of flurbiprofen on hydrophilic aerogels: (A) loading as a function of density; (B) area-normalised loading as a function of density; (C) loading as a function of specific surface area and adsorption of flurbiprofen on hydrophobic aerogels: (D)
loading as a function of density; (E) area-normalised loading as a function of density; (F) loading as a function of specific surface area (40±1 °C, 18.0±0.2 MPa) (The experimental
errors are below the size of the symbols and therefore not shown)
S11
S12
S25
S26
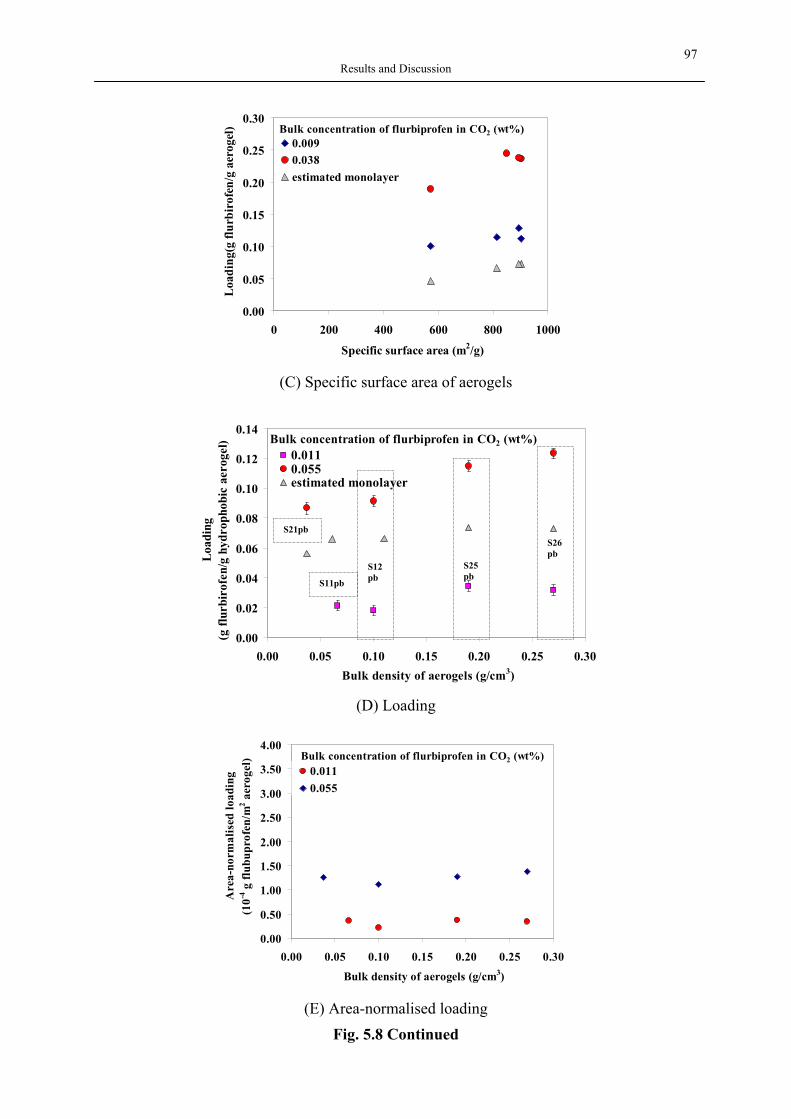
97 Results and Discussion
0.00
0.05
0.10
0.15
0.20
0.25
0.30
0 200 400 600 800 1000
Specific surface area (m2/g)
Loa
ding
(g fl
urbi
rofe
n/g
aero
gel)
0.0090.038estimated monolayer
Bulk concentration of flurbiprofen in CO2 (wt%)
(C) Specific surface area of aerogels
0.00
0.02
0.04
0.06
0.08
0.10
0.12
0.14
0.00 0.05 0.10 0.15 0.20 0.25 0.30Bulk density of aerogels (g/cm3)
Load
ing
(g fl
urbi
rofe
n/g
hydr
opho
bic
aero
gel)
0.0110.055estimated monolayer
Bulk concentration of flurbiprofen in CO2 (wt%)
(D) Loading
0.00
0.50
1.00
1.50
2.00
2.50
3.00
3.50
4.00
0.00 0.05 0.10 0.15 0.20 0.25 0.30
Bulk density of aerogels (g/cm3)
Are
a-no
rmal
ised
load
ing
(10-4
g fl
ubup
rofe
n/m
2 aer
ogel
)
0.0110.055
Bulk concentration of flurbiprofen in CO2 (wt%)
(E) Area-normalised loading
Fig. 5.8 Continued
S21pb
S11pb
S12pb
S25pb
S26 pb
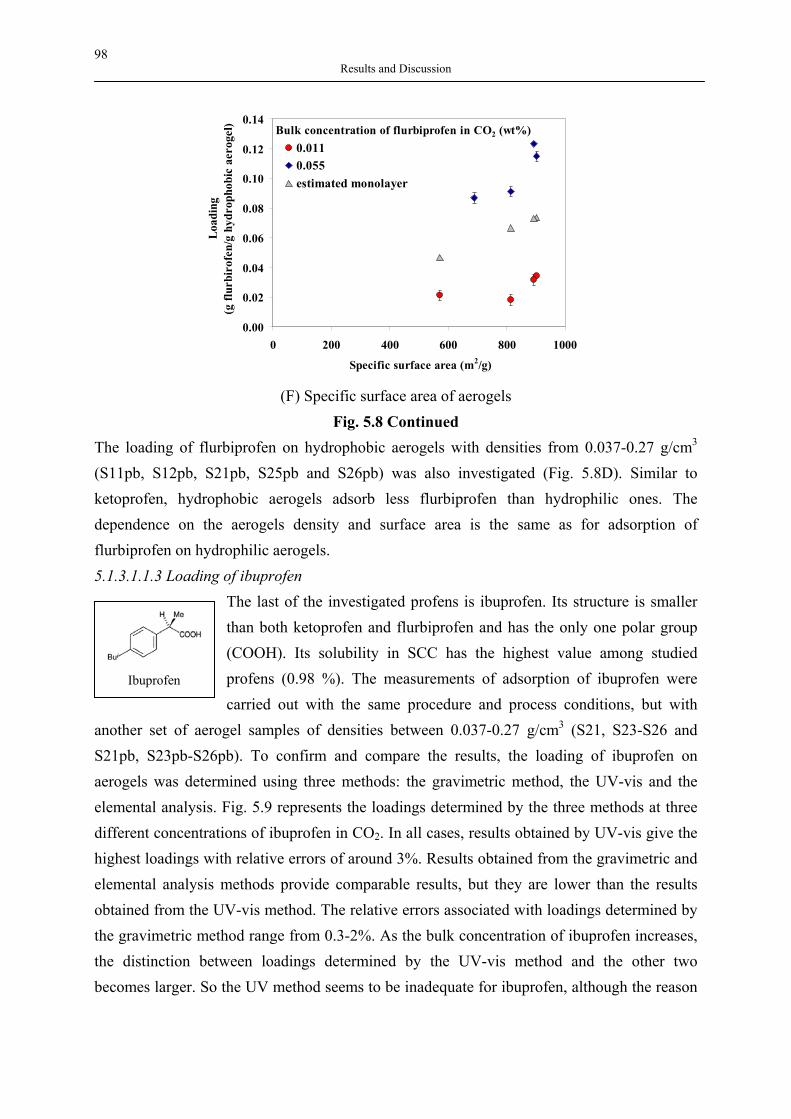
98 Results and Discussion
0.00
0.02
0.04
0.06
0.08
0.10
0.12
0.14
0 200 400 600 800 1000
Specific surface area (m2/g)
Load
ing
(g fl
urbi
rofe
n/g
hydr
opho
bic
aero
gel)
0.0110.055estimated monolayer
Bulk concentration of flurbiprofen in CO2 (wt%)
(F) Specific surface area of aerogels
Fig. 5.8 Continued The loading of flurbiprofen on hydrophobic aerogels with densities from 0.037-0.27 g/cm3 (S11pb, S12pb, S21pb, S25pb and S26pb) was also investigated (Fig. 5.8D). Similar to ketoprofen, hydrophobic aerogels adsorb less flurbiprofen than hydrophilic ones. The dependence on the aerogels density and surface area is the same as for adsorption of flurbiprofen on hydrophilic aerogels. 5.1.3.1.1.3 Loading of ibuprofen
The last of the investigated profens is ibuprofen. Its structure is smaller than both ketoprofen and flurbiprofen and has the only one polar group (COOH). Its solubility in SCC has the highest value among studied profens (0.98 %). The measurements of adsorption of ibuprofen were carried out with the same procedure and process conditions, but with
another set of aerogel samples of densities between 0.037-0.27 g/cm3 (S21, S23-S26 and S21pb, S23pb-S26pb). To confirm and compare the results, the loading of ibuprofen on aerogels was determined using three methods: the gravimetric method, the UV-vis and the elemental analysis. Fig. 5.9 represents the loadings determined by the three methods at three different concentrations of ibuprofen in CO2. In all cases, results obtained by UV-vis give the highest loadings with relative errors of around 3%. Results obtained from the gravimetric and elemental analysis methods provide comparable results, but they are lower than the results obtained from the UV-vis method. The relative errors associated with loadings determined by the gravimetric method range from 0.3-2%. As the bulk concentration of ibuprofen increases, the distinction between loadings determined by the UV-vis method and the other two becomes larger. So the UV method seems to be inadequate for ibuprofen, although the reason
Ibuprofen
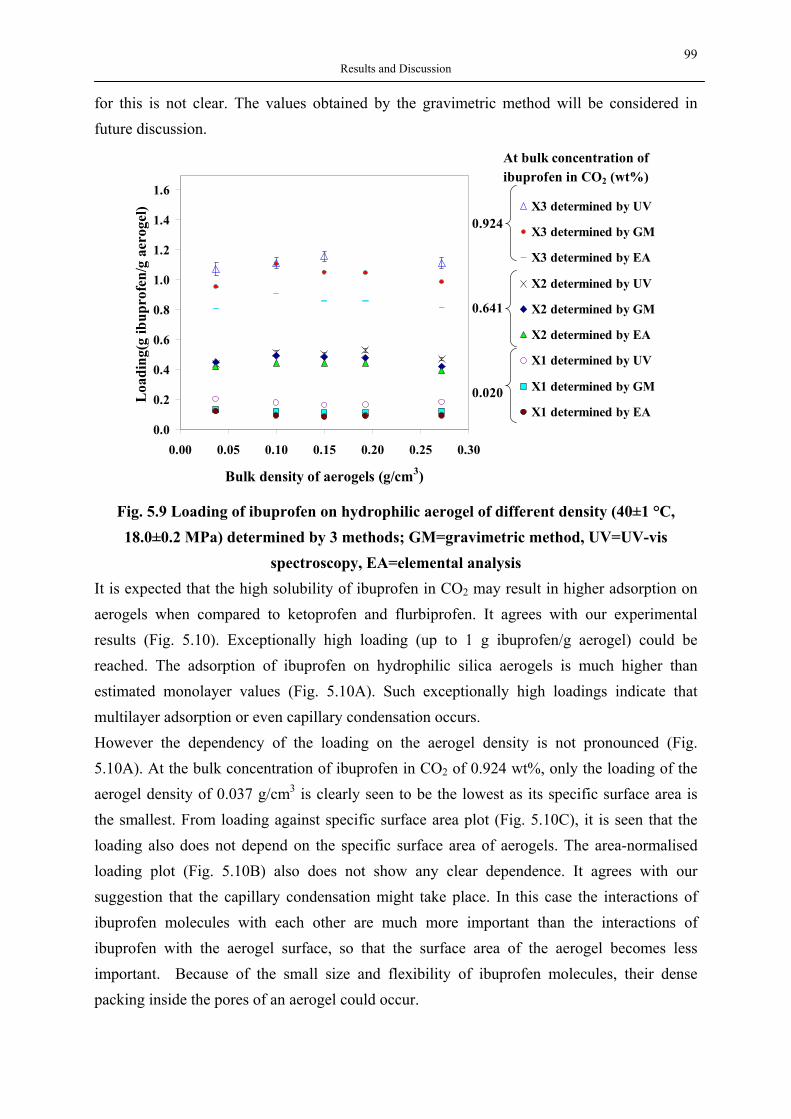
99 Results and Discussion
for this is not clear. The values obtained by the gravimetric method will be considered in future discussion.
0.0
0.2
0.4
0.6
0.8
1.0
1.2
1.4
1.6
0.00 0.05 0.10 0.15 0.20 0.25 0.30
Bulk density of aerogels (g/cm3)
Loa
ding
(g ib
upro
fen/
g ae
roge
l) X3 determined by UV
X3 determined by GM
X3 determined by EA
X2 determined by UV
X2 determined by GM
X2 determined by EA
X1 determined by UV
X1 determined by GM
X1 determined by EA
At bulk concentration of ibuprofen in CO2 (wt%)
0.924
0.641
0.020
Fig. 5.9 Loading of ibuprofen on hydrophilic aerogel of different density (40±1 °C, 18.0±0.2 MPa) determined by 3 methods; GM=gravimetric method, UV=UV-vis
spectroscopy, EA=elemental analysis It is expected that the high solubility of ibuprofen in CO2 may result in higher adsorption on aerogels when compared to ketoprofen and flurbiprofen. It agrees with our experimental results (Fig. 5.10). Exceptionally high loading (up to 1 g ibuprofen/g aerogel) could be reached. The adsorption of ibuprofen on hydrophilic silica aerogels is much higher than estimated monolayer values (Fig. 5.10A). Such exceptionally high loadings indicate that multilayer adsorption or even capillary condensation occurs. However the dependency of the loading on the aerogel density is not pronounced (Fig. 5.10A). At the bulk concentration of ibuprofen in CO2 of 0.924 wt%, only the loading of the aerogel density of 0.037 g/cm3 is clearly seen to be the lowest as its specific surface area is the smallest. From loading against specific surface area plot (Fig. 5.10C), it is seen that the loading also does not depend on the specific surface area of aerogels. The area-normalised loading plot (Fig. 5.10B) also does not show any clear dependence. It agrees with our suggestion that the capillary condensation might take place. In this case the interactions of ibuprofen molecules with each other are much more important than the interactions of ibuprofen with the aerogel surface, so that the surface area of the aerogel becomes less important. Because of the small size and flexibility of ibuprofen molecules, their dense packing inside the pores of an aerogel could occur.
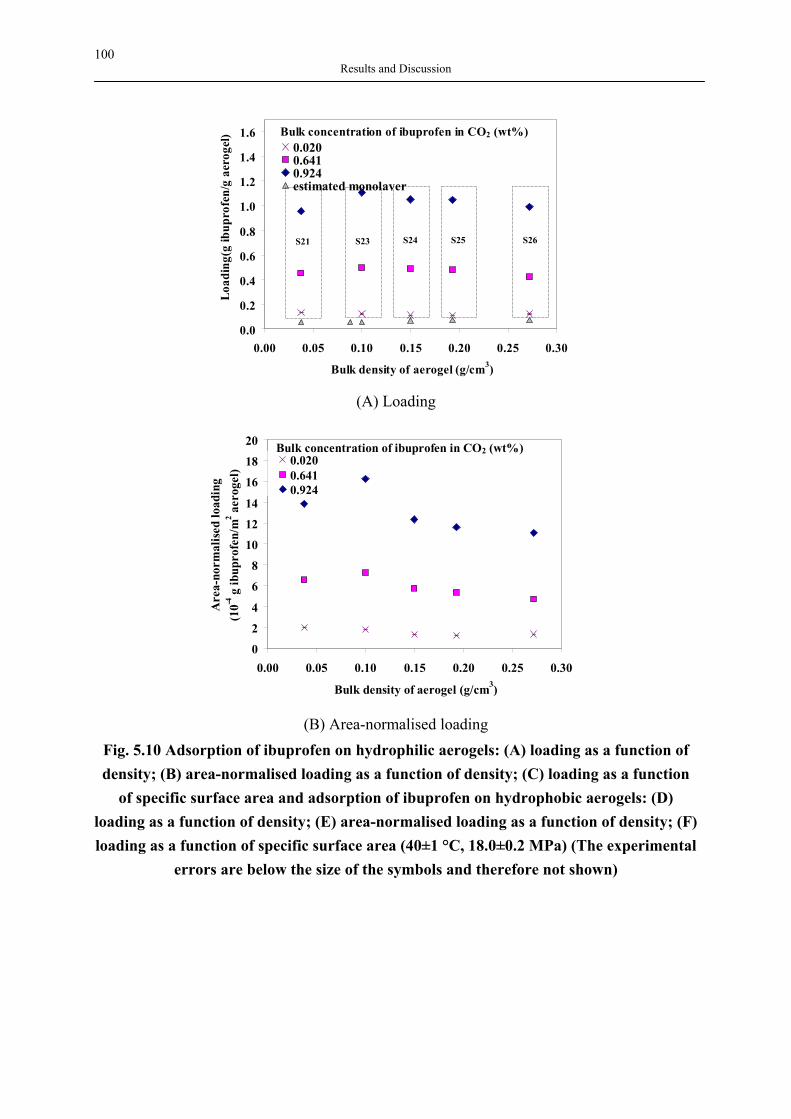
100 Results and Discussion
0.0
0.2
0.4
0.6
0.8
1.0
1.2
1.4
1.6
0.00 0.05 0.10 0.15 0.20 0.25 0.30
Bulk density of aerogel (g/cm3)
Load
ing(
g ib
upro
fen/
g ae
roge
l)
0.0200.6410.924estimated monolayer
Bulk concentration of ibuprofen in CO2 (wt%)
(A) Loading
0
2
4
6
8
10
12
14
16
18
20
0.00 0.05 0.10 0.15 0.20 0.25 0.30
Bulk density of aerogel (g/cm3)
Are
a-no
rmal
ised
load
ing
(10-4
g ib
upro
fen/
m2 a
erog
el)
0.0200.6410.924
Bulk concentration of ibuprofen in CO2 (wt%)
(B) Area-normalised loading
Fig. 5.10 Adsorption of ibuprofen on hydrophilic aerogels: (A) loading as a function of density; (B) area-normalised loading as a function of density; (C) loading as a function
of specific surface area and adsorption of ibuprofen on hydrophobic aerogels: (D) loading as a function of density; (E) area-normalised loading as a function of density; (F) loading as a function of specific surface area (40±1 °C, 18.0±0.2 MPa) (The experimental
errors are below the size of the symbols and therefore not shown)
S21
S23
S25
S26
S24
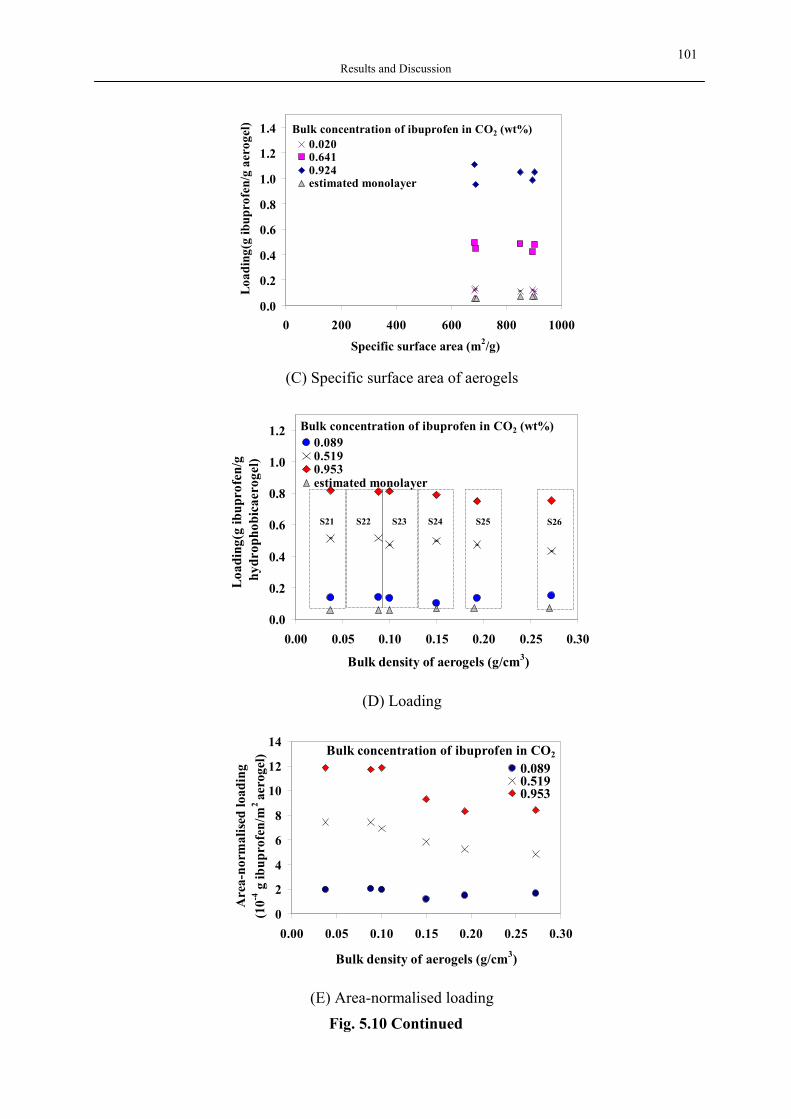
101 Results and Discussion
0.0
0.2
0.4
0.6
0.8
1.0
1.2
1.4
0 200 400 600 800 1000
Specific surface area (m2/g)
Load
ing(
g ib
upro
fen/
g ae
roge
l)
0.0200.6410.924estimated monolayer
Bulk concentration of ibuprofen in CO2 (wt%)
(C) Specific surface area of aerogels
0.0
0.2
0.4
0.6
0.8
1.0
1.2
0.00 0.05 0.10 0.15 0.20 0.25 0.30
Bulk density of aerogels (g/cm3)
Loa
ding
(g ib
upro
fen/
g hy
drop
hobi
caer
ogel
)
0.0890.5190.953estimated monolayer
Bulk concentration of ibuprofen in CO2 (wt%)
(D) Loading
0
2
4
6
8
10
12
14
0.00 0.05 0.10 0.15 0.20 0.25 0.30
Bulk density of aerogels (g/cm3)
Are
a-no
rmal
ised
load
ing
(10-4
g ib
upro
fen/
m2 ae
roge
l)
0.0890.5190.953
Bulk concentration of ibuprofen in CO2
(E) Area-normalised loading
Fig. 5.10 Continued
S21
S22
S25
S26
S24
S23
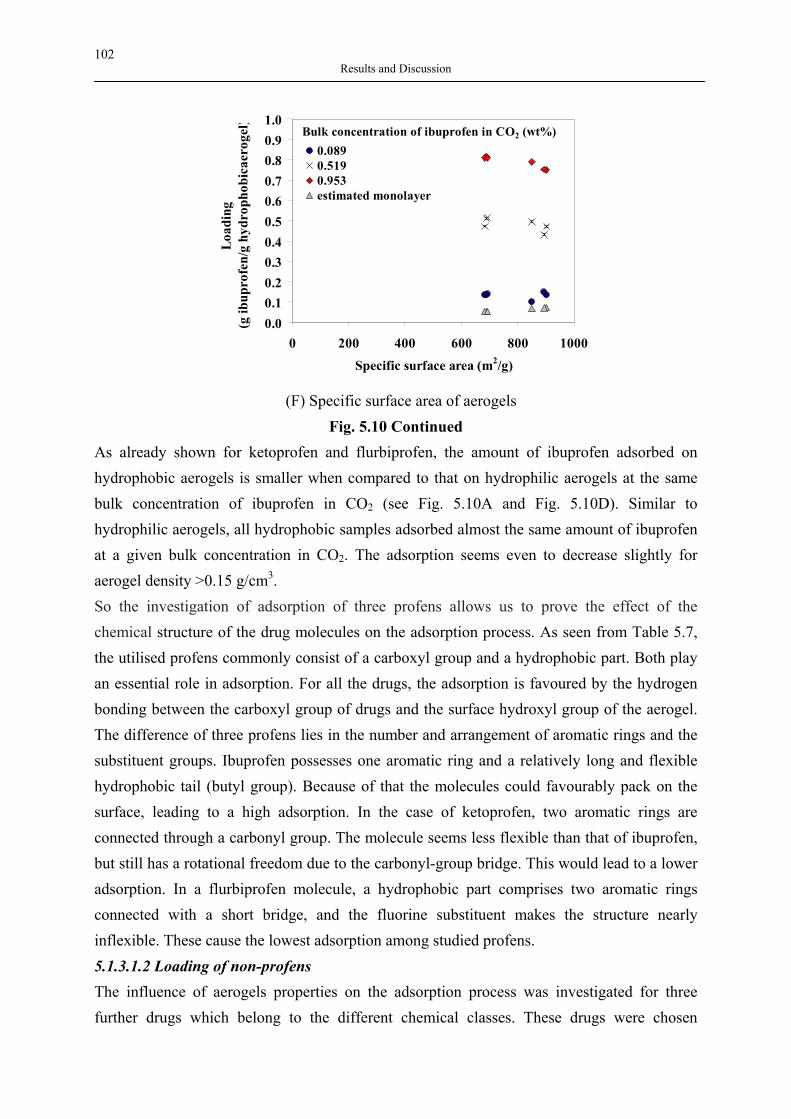
102 Results and Discussion
0.00.10.20.30.40.50.60.70.80.91.0
0 200 400 600 800 1000
Specific surface area (m2/g)
Load
ing
(g ib
upro
fen/
g hy
drop
hobi
caer
ogel
)
0.0890.5190.953estimated monolayer
Bulk concentration of ibuprofen in CO2 (wt%)
(F) Specific surface area of aerogels
Fig. 5.10 Continued As already shown for ketoprofen and flurbiprofen, the amount of ibuprofen adsorbed on hydrophobic aerogels is smaller when compared to that on hydrophilic aerogels at the same bulk concentration of ibuprofen in CO2 (see Fig. 5.10A and Fig. 5.10D). Similar to hydrophilic aerogels, all hydrophobic samples adsorbed almost the same amount of ibuprofen at a given bulk concentration in CO2. The adsorption seems even to decrease slightly for aerogel density >0.15 g/cm3. So the investigation of adsorption of three profens allows us to prove the effect of the chemical structure of the drug molecules on the adsorption process. As seen from Table 5.7, the utilised profens commonly consist of a carboxyl group and a hydrophobic part. Both play an essential role in adsorption. For all the drugs, the adsorption is favoured by the hydrogen bonding between the carboxyl group of drugs and the surface hydroxyl group of the aerogel. The difference of three profens lies in the number and arrangement of aromatic rings and the substituent groups. Ibuprofen possesses one aromatic ring and a relatively long and flexible hydrophobic tail (butyl group). Because of that the molecules could favourably pack on the surface, leading to a high adsorption. In the case of ketoprofen, two aromatic rings are connected through a carbonyl group. The molecule seems less flexible than that of ibuprofen, but still has a rotational freedom due to the carbonyl-group bridge. This would lead to a lower adsorption. In a flurbiprofen molecule, a hydrophobic part comprises two aromatic rings connected with a short bridge, and the fluorine substituent makes the structure nearly inflexible. These cause the lowest adsorption among studied profens. 5.1.3.1.2 Loading of non-profens The influence of aerogels properties on the adsorption process was investigated for three further drugs which belong to the different chemical classes. These drugs were chosen
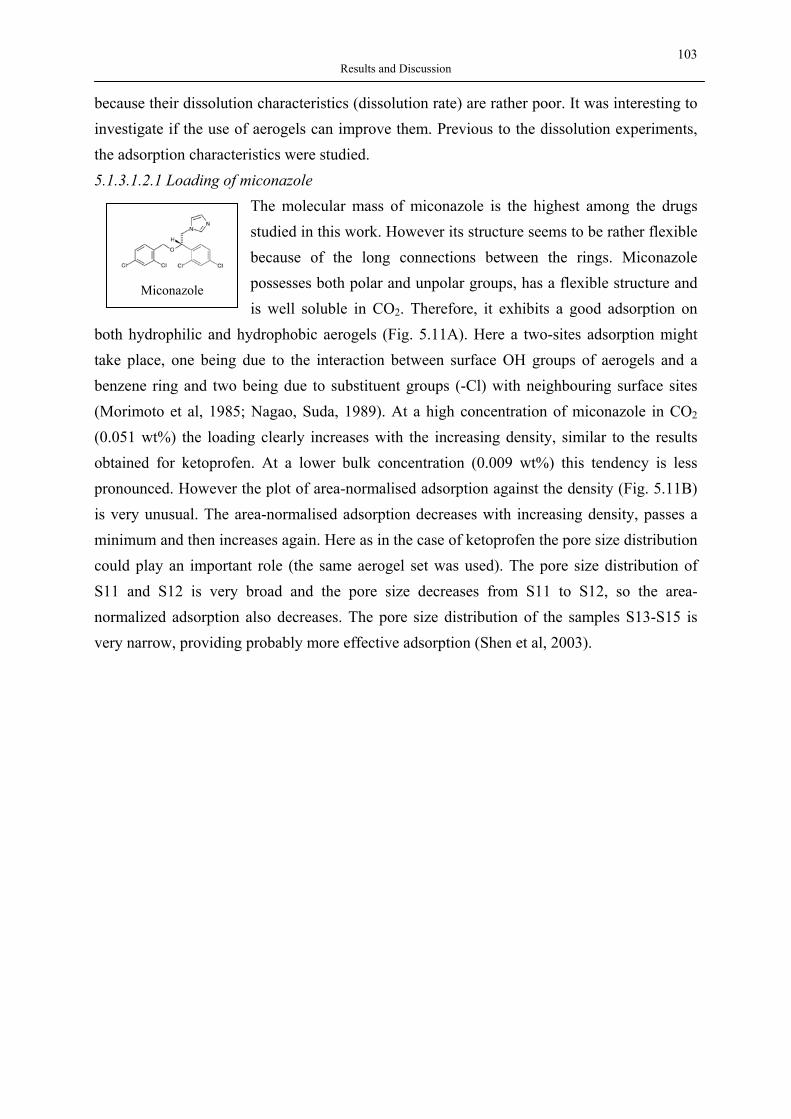
103 Results and Discussion
because their dissolution characteristics (dissolution rate) are rather poor. It was interesting to investigate if the use of aerogels can improve them. Previous to the dissolution experiments, the adsorption characteristics were studied. 5.1.3.1.2.1 Loading of miconazole
The molecular mass of miconazole is the highest among the drugs studied in this work. However its structure seems to be rather flexible because of the long connections between the rings. Miconazole possesses both polar and unpolar groups, has a flexible structure and is well soluble in CO2. Therefore, it exhibits a good adsorption on
both hydrophilic and hydrophobic aerogels (Fig. 5.11A). Here a two-sites adsorption might take place, one being due to the interaction between surface OH groups of aerogels and a benzene ring and two being due to substituent groups (-Cl) with neighbouring surface sites (Morimoto et al, 1985; Nagao, Suda, 1989). At a high concentration of miconazole in CO2 (0.051 wt%) the loading clearly increases with the increasing density, similar to the results obtained for ketoprofen. At a lower bulk concentration (0.009 wt%) this tendency is less pronounced. However the plot of area-normalised adsorption against the density (Fig. 5.11B) is very unusual. The area-normalised adsorption decreases with increasing density, passes a minimum and then increases again. Here as in the case of ketoprofen the pore size distribution could play an important role (the same aerogel set was used). The pore size distribution of S11 and S12 is very broad and the pore size decreases from S11 to S12, so the area-normalized adsorption also decreases. The pore size distribution of the samples S13-S15 is very narrow, providing probably more effective adsorption (Shen et al, 2003).
Miconazole
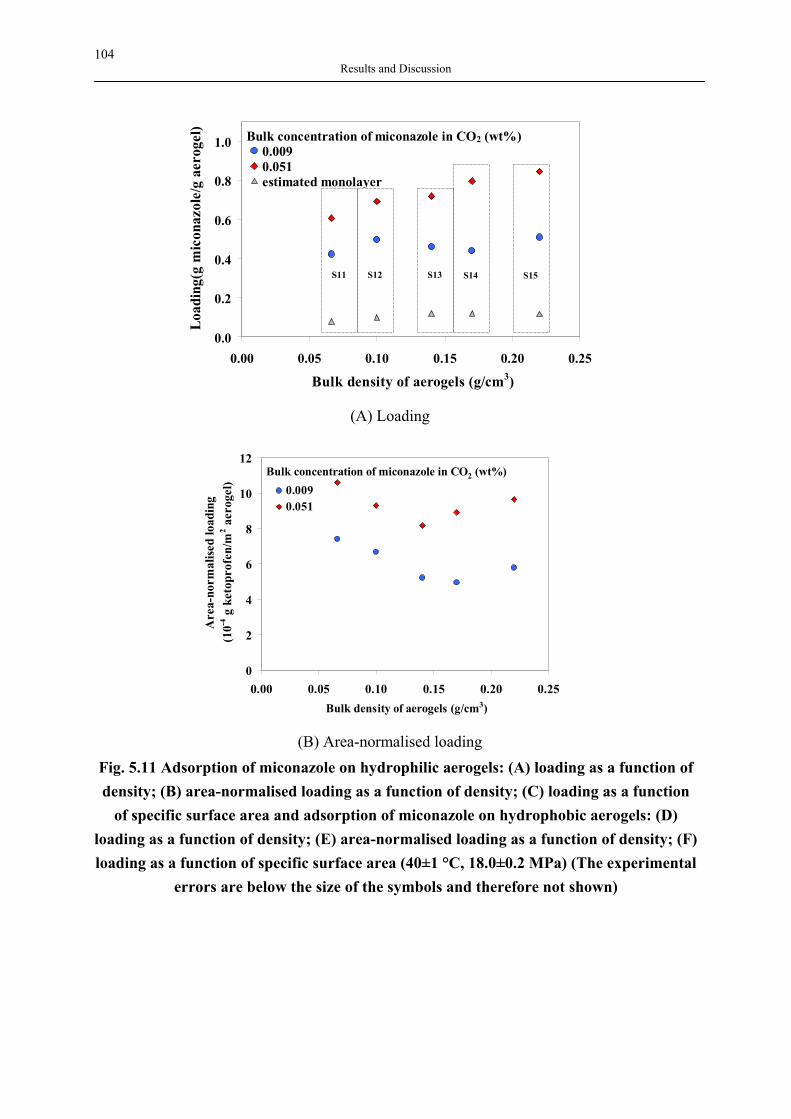
104 Results and Discussion
0.0
0.2
0.4
0.6
0.8
1.0
0.00 0.05 0.10 0.15 0.20 0.25
Bulk density of aerogels (g/cm3)
Load
ing(
g m
icon
azol
e/g
aero
gel)
0.0090.051estimated monolayer
Bulk concentration of miconazole in CO2 (wt%)
(A) Loading
0
2
4
6
8
10
12
0.00 0.05 0.10 0.15 0.20 0.25Bulk density of aerogels (g/cm3)
Are
a-no
rmal
ised
load
ing
(10-4
g k
etop
rofe
n/m
2 aer
ogel
)
0.0090.051
Bulk concentration of miconazole in CO2 (wt%)
(B) Area-normalised loading
Fig. 5.11 Adsorption of miconazole on hydrophilic aerogels: (A) loading as a function of density; (B) area-normalised loading as a function of density; (C) loading as a function
of specific surface area and adsorption of miconazole on hydrophobic aerogels: (D) loading as a function of density; (E) area-normalised loading as a function of density; (F) loading as a function of specific surface area (40±1 °C, 18.0±0.2 MPa) (The experimental
errors are below the size of the symbols and therefore not shown)
S11
S12
S14
S15
S13
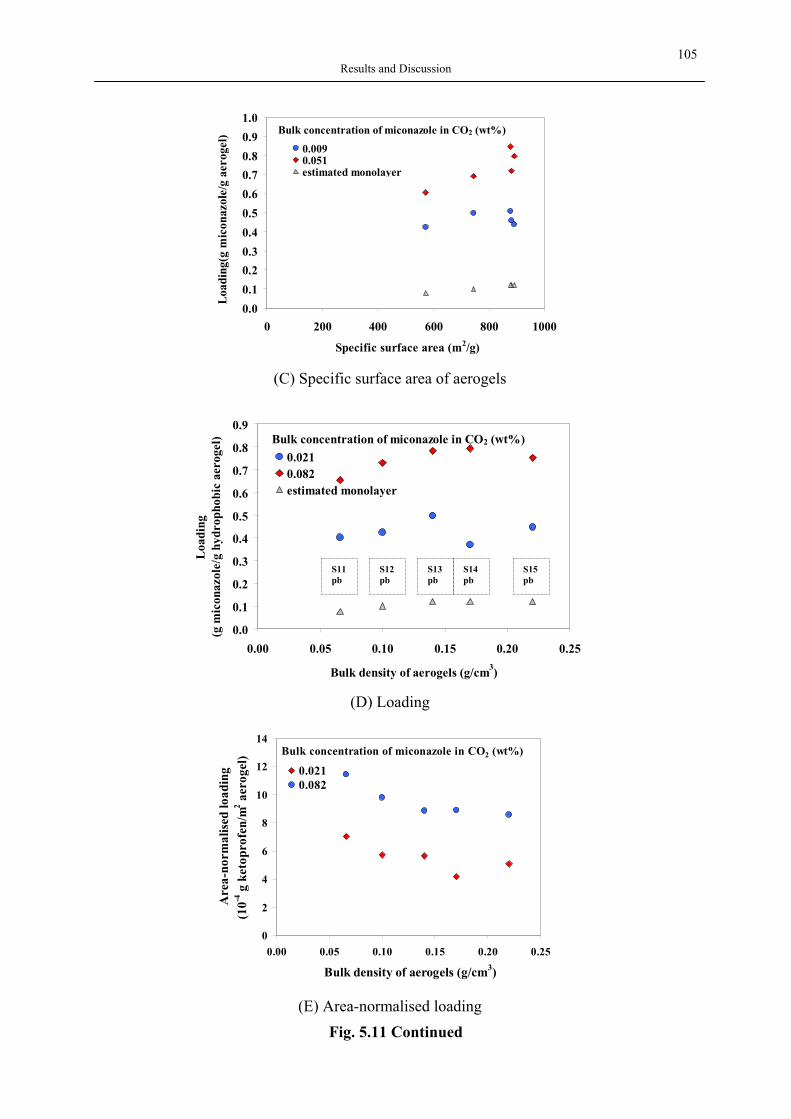
105 Results and Discussion
0.00.10.20.30.40.50.60.70.80.91.0
0 200 400 600 800 1000
Specific surface area (m2/g)
Loa
ding
(g m
icon
azol
e/g
aero
gel)
0.0090.051estimated monolayer
Bulk concentration of miconazole in CO2 (wt%)
(C) Specific surface area of aerogels
0.0
0.1
0.2
0.3
0.4
0.5
0.6
0.7
0.8
0.9
0.00 0.05 0.10 0.15 0.20 0.25
Bulk density of aerogels (g/cm3)
Loa
ding
(g m
icon
azol
e/g
hydr
opho
bic
aero
gel)
0.0210.082estimated monolayer
Bulk concentration of miconazole in CO2 (wt%)
(D) Loading
0
2
4
6
8
10
12
14
0.00 0.05 0.10 0.15 0.20 0.25
Bulk density of aerogels (g/cm3)
Are
a-no
rmal
ised
load
ing
(10-4
g k
etop
rofe
n/m
2 aer
ogel
)
0.0210.082
Bulk concentration of miconazole in CO2 (wt%)
(E) Area-normalised loading
Fig. 5.11 Continued
S11pb
S12pb
S14pb
S15pb
S13pb
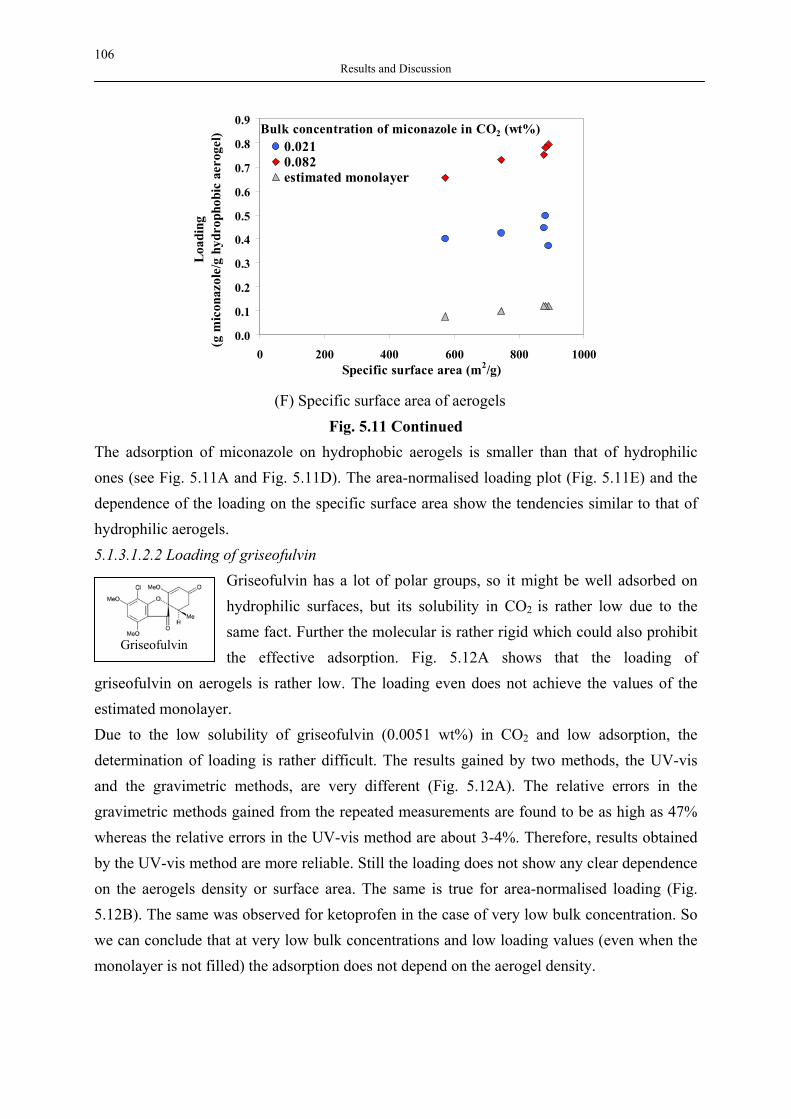
106 Results and Discussion
0.0
0.1
0.2
0.3
0.4
0.5
0.6
0.7
0.8
0.9
0 200 400 600 800 1000Specific surface area (m2/g)
Load
ing
(g m
icon
azol
e/g
hydr
opho
bic
aero
gel)
0.0210.082estimated monolayer
Bulk concentration of miconazole in CO2 (wt%)
(F) Specific surface area of aerogels
Fig. 5.11 Continued The adsorption of miconazole on hydrophobic aerogels is smaller than that of hydrophilic ones (see Fig. 5.11A and Fig. 5.11D). The area-normalised loading plot (Fig. 5.11E) and the dependence of the loading on the specific surface area show the tendencies similar to that of hydrophilic aerogels. 5.1.3.1.2.2 Loading of griseofulvin
Griseofulvin has a lot of polar groups, so it might be well adsorbed on hydrophilic surfaces, but its solubility in CO2 is rather low due to the same fact. Further the molecular is rather rigid which could also prohibit the effective adsorption. Fig. 5.12A shows that the loading of
griseofulvin on aerogels is rather low. The loading even does not achieve the values of the estimated monolayer. Due to the low solubility of griseofulvin (0.0051 wt%) in CO2 and low adsorption, the determination of loading is rather difficult. The results gained by two methods, the UV-vis and the gravimetric methods, are very different (Fig. 5.12A). The relative errors in the gravimetric methods gained from the repeated measurements are found to be as high as 47% whereas the relative errors in the UV-vis method are about 3-4%. Therefore, results obtained by the UV-vis method are more reliable. Still the loading does not show any clear dependence on the aerogels density or surface area. The same is true for area-normalised loading (Fig. 5.12B). The same was observed for ketoprofen in the case of very low bulk concentration. So we can conclude that at very low bulk concentrations and low loading values (even when the monolayer is not filled) the adsorption does not depend on the aerogel density.
Griseofulvin
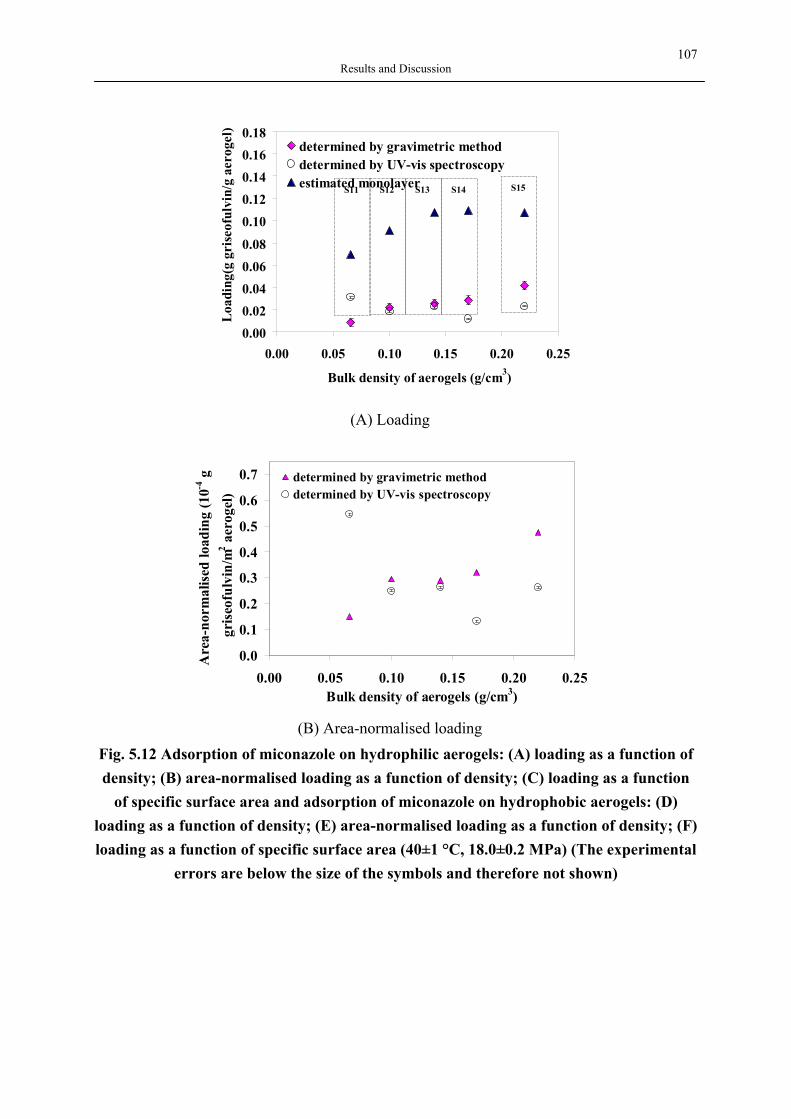
107 Results and Discussion
0.000.020.040.060.08
0.100.120.140.160.18
0.00 0.05 0.10 0.15 0.20 0.25
Bulk density of aerogels (g/cm3)
Loa
ding
(g g
rise
oful
vin/
g ae
roge
l)
determined by gravimetric methoddetermined by UV-vis spectroscopyestimated monolayer
(A) Loading
0.0
0.1
0.2
0.3
0.4
0.5
0.6
0.7
0.00 0.05 0.10 0.15 0.20 0.25Bulk density of aerogels (g/cm3)
Are
a-no
rmal
ised
load
ing
(10 -4
g
gris
eofu
lvin
/m2 a
erog
el)
determined by gravimetric methoddetermined by UV-vis spectroscopy
(B) Area-normalised loading
Fig. 5.12 Adsorption of miconazole on hydrophilic aerogels: (A) loading as a function of density; (B) area-normalised loading as a function of density; (C) loading as a function
of specific surface area and adsorption of miconazole on hydrophobic aerogels: (D) loading as a function of density; (E) area-normalised loading as a function of density; (F) loading as a function of specific surface area (40±1 °C, 18.0±0.2 MPa) (The experimental
errors are below the size of the symbols and therefore not shown)
S12S11 S13 S14 S15
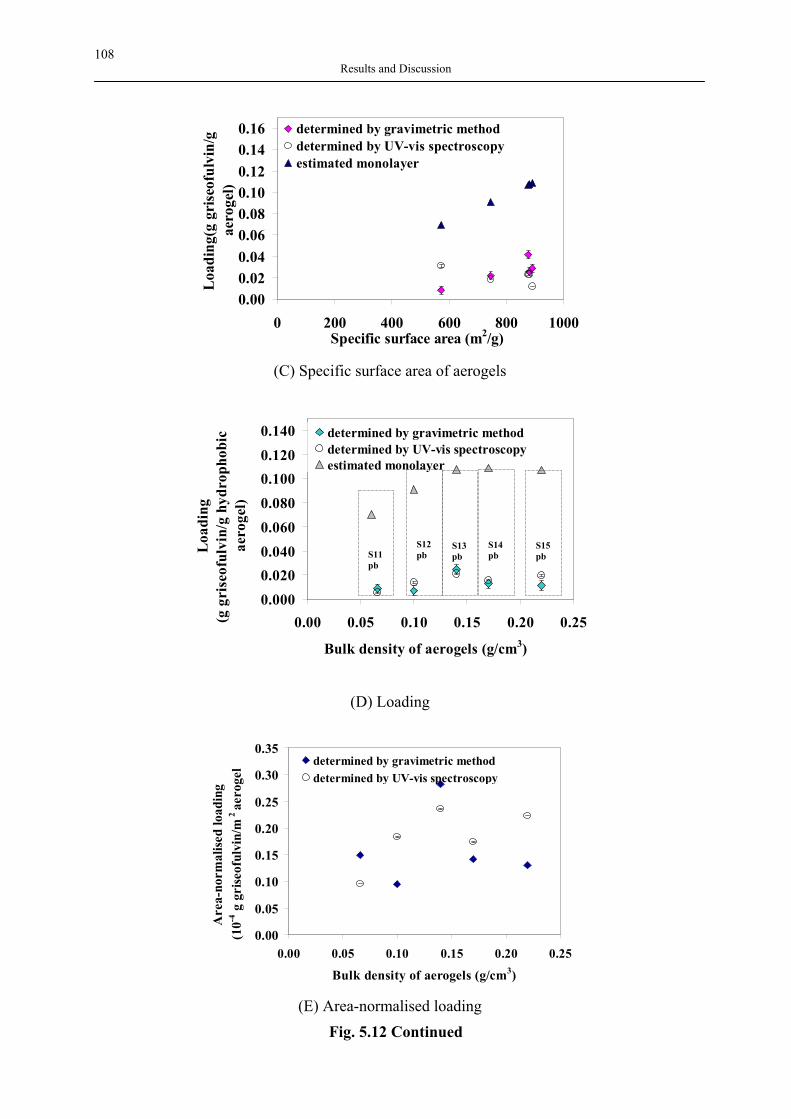
108 Results and Discussion
0.000.020.040.060.080.100.120.140.16
0 200 400 600 800 1000Specific surface area (m2/g)
Loa
ding
(g g
rise
oful
vin/
g ae
roge
l)
determined by gravimetric methoddetermined by UV-vis spectroscopyestimated monolayer
(C) Specific surface area of aerogels
0.0000.0200.0400.0600.0800.1000.1200.140
0.00 0.05 0.10 0.15 0.20 0.25
Bulk density of aerogels (g/cm3)
Loa
ding
(g g
rise
oful
vin/
g hy
drop
hobi
c ae
roge
l)
determined by gravimetric methoddetermined by UV-vis spectroscopyestimated monolayer
(D) Loading
0.00
0.05
0.10
0.15
0.20
0.25
0.30
0.35
0.00 0.05 0.10 0.15 0.20 0.25
Bulk density of aerogels (g/cm3)
Are
a-no
rmal
ised
load
ing
(10-4
g g
rise
oful
vin/
m2 ae
roge
l determined by gravimetric methoddetermined by UV-vis spectroscopy
(E) Area-normalised loading
Fig. 5.12 Continued
S12pb
S11pb
S13pb
S14pb
S15pb
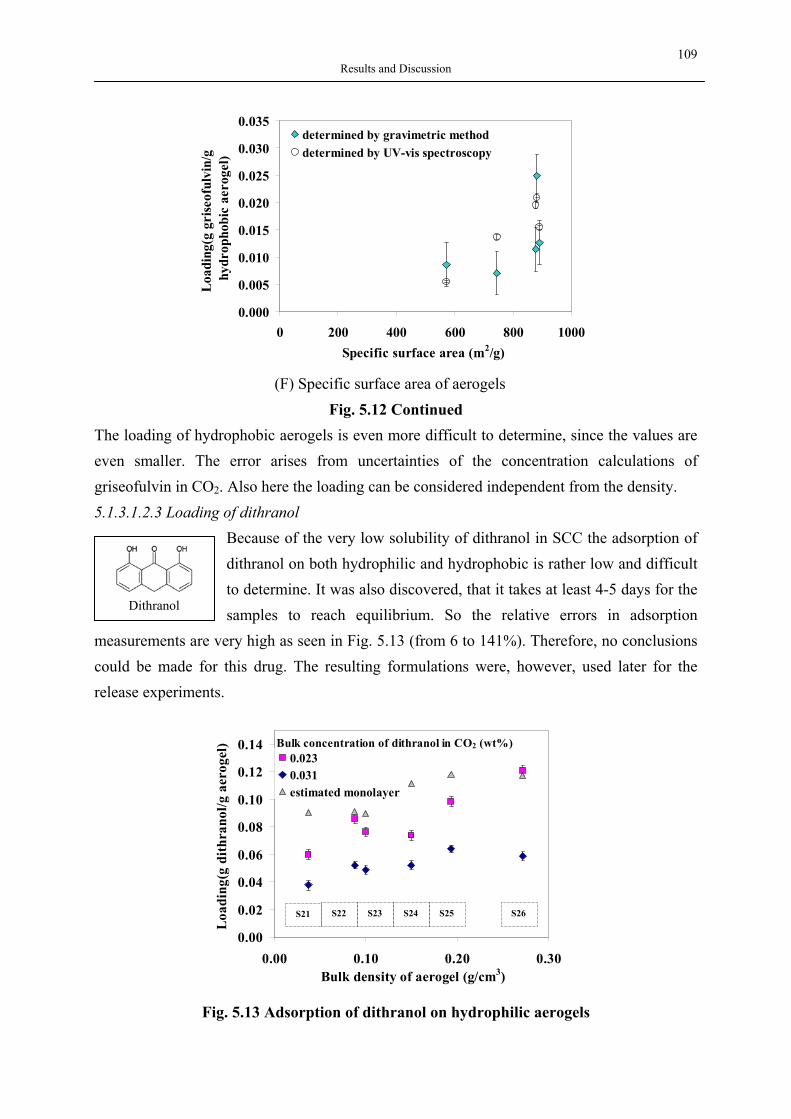
109 Results and Discussion
0.000
0.005
0.010
0.015
0.020
0.025
0.030
0.035
0 200 400 600 800 1000Specific surface area (m2/g)
Load
ing(
g gr
iseof
ulvi
n/g
hydr
opho
bic
aero
gel)
determined by gravimetric methoddetermined by UV-vis spectroscopy
(F) Specific surface area of aerogels
Fig. 5.12 Continued The loading of hydrophobic aerogels is even more difficult to determine, since the values are even smaller. The error arises from uncertainties of the concentration calculations of griseofulvin in CO2. Also here the loading can be considered independent from the density. 5.1.3.1.2.3 Loading of dithranol
Because of the very low solubility of dithranol in SCC the adsorption of dithranol on both hydrophilic and hydrophobic is rather low and difficult to determine. It was also discovered, that it takes at least 4-5 days for the samples to reach equilibrium. So the relative errors in adsorption
measurements are very high as seen in Fig. 5.13 (from 6 to 141%). Therefore, no conclusions could be made for this drug. The resulting formulations were, however, used later for the release experiments.
0.00
0.02
0.04
0.06
0.08
0.10
0.12
0.14
0.00 0.10 0.20 0.30Bulk density of aerogel (g/cm3)
Loa
ding
(g d
ithra
nol/g
aer
ogel
)
0.0230.031estimated monolayer
Bulk concentration of dithranol in CO2 (wt%)
Fig. 5.13 Adsorption of dithranol on hydrophilic aerogels
Dithranol
S22S21 S23 S24 S25 S26
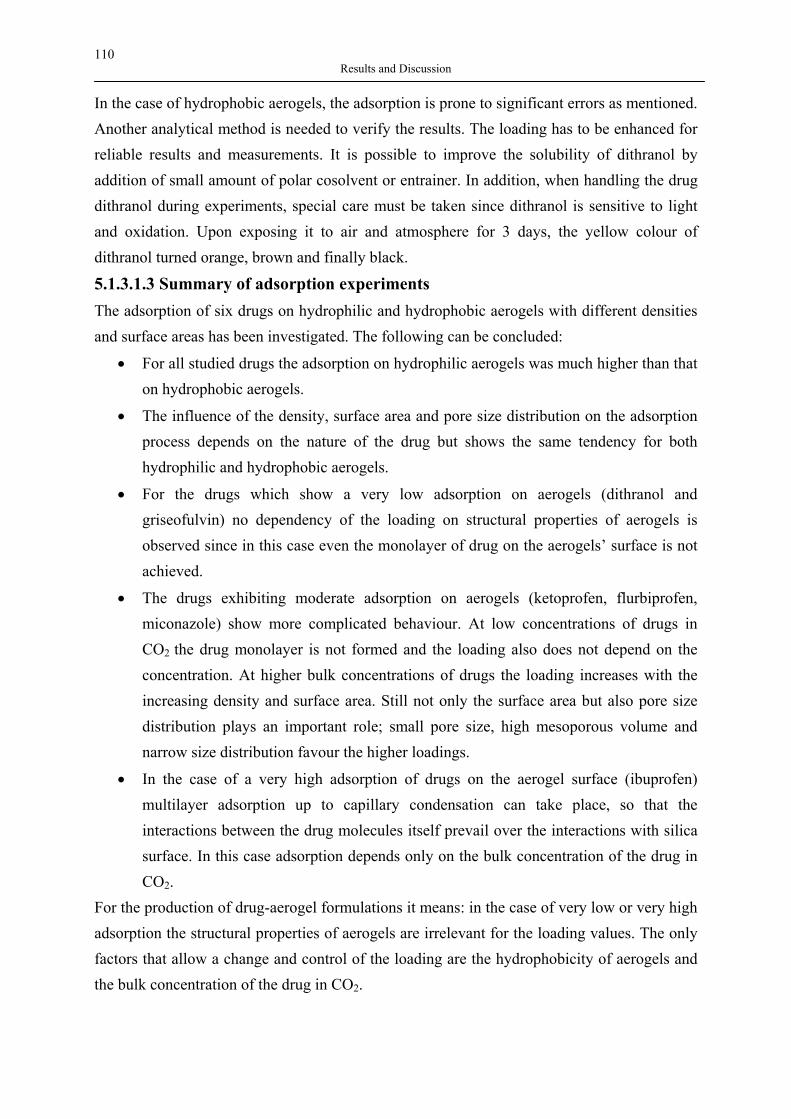
110 Results and Discussion
In the case of hydrophobic aerogels, the adsorption is prone to significant errors as mentioned. Another analytical method is needed to verify the results. The loading has to be enhanced for reliable results and measurements. It is possible to improve the solubility of dithranol by addition of small amount of polar cosolvent or entrainer. In addition, when handling the drug dithranol during experiments, special care must be taken since dithranol is sensitive to light and oxidation. Upon exposing it to air and atmosphere for 3 days, the yellow colour of dithranol turned orange, brown and finally black.
5.1.3.1.3 Summary of adsorption experiments The adsorption of six drugs on hydrophilic and hydrophobic aerogels with different densities and surface areas has been investigated. The following can be concluded:
• For all studied drugs the adsorption on hydrophilic aerogels was much higher than that on hydrophobic aerogels.
• The influence of the density, surface area and pore size distribution on the adsorption process depends on the nature of the drug but shows the same tendency for both hydrophilic and hydrophobic aerogels.
• For the drugs which show a very low adsorption on aerogels (dithranol and griseofulvin) no dependency of the loading on structural properties of aerogels is observed since in this case even the monolayer of drug on the aerogels’ surface is not achieved.
• The drugs exhibiting moderate adsorption on aerogels (ketoprofen, flurbiprofen, miconazole) show more complicated behaviour. At low concentrations of drugs in CO2 the drug monolayer is not formed and the loading also does not depend on the concentration. At higher bulk concentrations of drugs the loading increases with the increasing density and surface area. Still not only the surface area but also pore size distribution plays an important role; small pore size, high mesoporous volume and narrow size distribution favour the higher loadings.
• In the case of a very high adsorption of drugs on the aerogel surface (ibuprofen) multilayer adsorption up to capillary condensation can take place, so that the interactions between the drug molecules itself prevail over the interactions with silica surface. In this case adsorption depends only on the bulk concentration of the drug in CO2.
For the production of drug-aerogel formulations it means: in the case of very low or very high adsorption the structural properties of aerogels are irrelevant for the loading values. The only factors that allow a change and control of the loading are the hydrophobicity of aerogels and the bulk concentration of the drug in CO2.
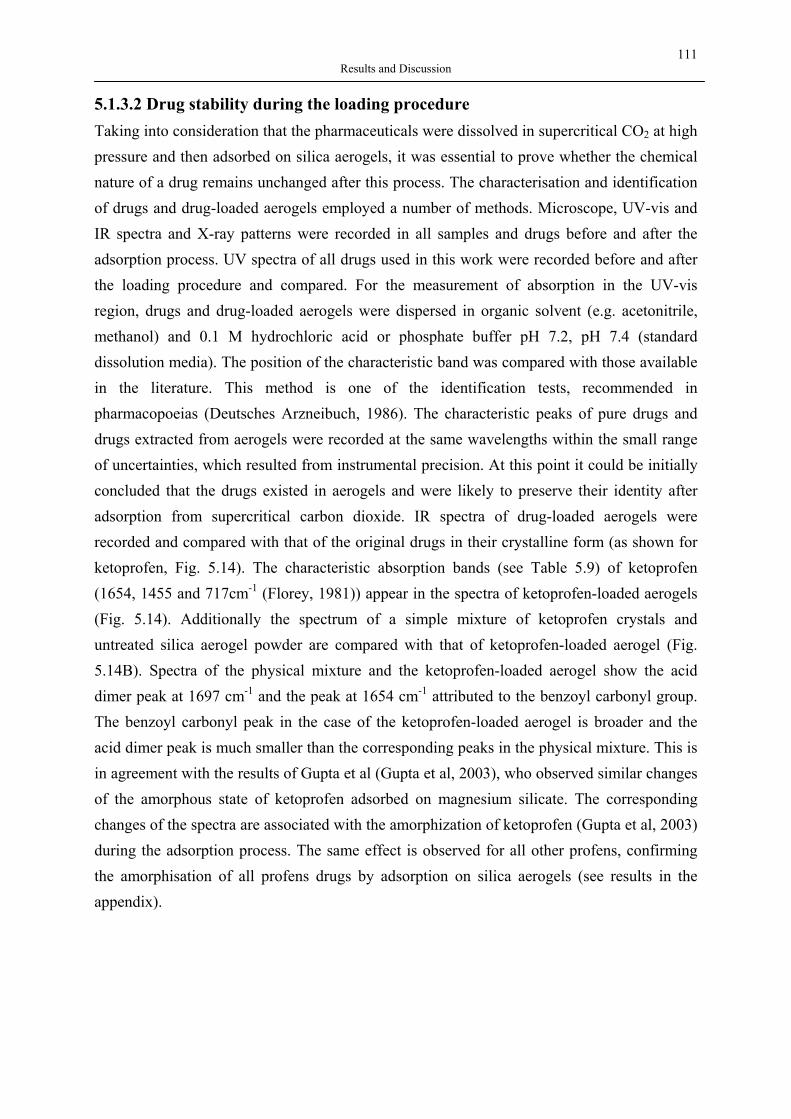
111 Results and Discussion
5.1.3.2 Drug stability during the loading procedure Taking into consideration that the pharmaceuticals were dissolved in supercritical CO2 at high pressure and then adsorbed on silica aerogels, it was essential to prove whether the chemical nature of a drug remains unchanged after this process. The characterisation and identification of drugs and drug-loaded aerogels employed a number of methods. Microscope, UV-vis and IR spectra and X-ray patterns were recorded in all samples and drugs before and after the adsorption process. UV spectra of all drugs used in this work were recorded before and after the loading procedure and compared. For the measurement of absorption in the UV-vis region, drugs and drug-loaded aerogels were dispersed in organic solvent (e.g. acetonitrile, methanol) and 0.1 M hydrochloric acid or phosphate buffer pH 7.2, pH 7.4 (standard dissolution media). The position of the characteristic band was compared with those available in the literature. This method is one of the identification tests, recommended in pharmacopoeias (Deutsches Arzneibuch, 1986). The characteristic peaks of pure drugs and drugs extracted from aerogels were recorded at the same wavelengths within the small range of uncertainties, which resulted from instrumental precision. At this point it could be initially concluded that the drugs existed in aerogels and were likely to preserve their identity after adsorption from supercritical carbon dioxide. IR spectra of drug-loaded aerogels were recorded and compared with that of the original drugs in their crystalline form (as shown for ketoprofen, Fig. 5.14). The characteristic absorption bands (see Table 5.9) of ketoprofen (1654, 1455 and 717cm-1 (Florey, 1981)) appear in the spectra of ketoprofen-loaded aerogels (Fig. 5.14). Additionally the spectrum of a simple mixture of ketoprofen crystals and untreated silica aerogel powder are compared with that of ketoprofen-loaded aerogel (Fig. 5.14B). Spectra of the physical mixture and the ketoprofen-loaded aerogel show the acid dimer peak at 1697 cm-1 and the peak at 1654 cm-1 attributed to the benzoyl carbonyl group. The benzoyl carbonyl peak in the case of the ketoprofen-loaded aerogel is broader and the acid dimer peak is much smaller than the corresponding peaks in the physical mixture. This is in agreement with the results of Gupta et al (Gupta et al, 2003), who observed similar changes of the amorphous state of ketoprofen adsorbed on magnesium silicate. The corresponding changes of the spectra are associated with the amorphization of ketoprofen (Gupta et al, 2003) during the adsorption process. The same effect is observed for all other profens, confirming the amorphisation of all profens drugs by adsorption on silica aerogels (see results in the appendix).
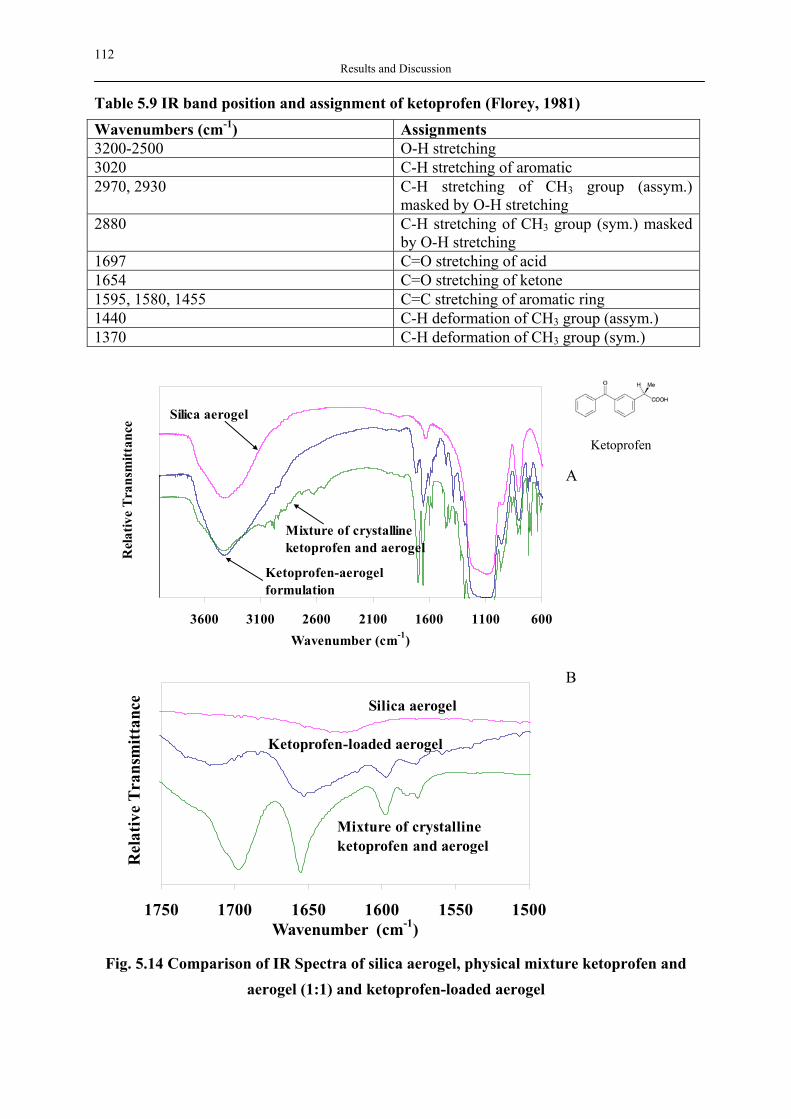
112 Results and Discussion
Table 5.9 IR band position and assignment of ketoprofen (Florey, 1981)
Wavenumbers (cm-1) Assignments 3200-2500 O-H stretching 3020 C-H stretching of aromatic 2970, 2930 C-H stretching of CH3 group (assym.)
masked by O-H stretching 2880 C-H stretching of CH3 group (sym.) masked
by O-H stretching 1697 C=O stretching of acid 1654 C=O stretching of ketone 1595, 1580, 1455 C=C stretching of aromatic ring 1440 C-H deformation of CH3 group (assym.) 1370 C-H deformation of CH3 group (sym.)
600110016002100260031003600Wavenumber (cm-1)
Rel
ativ
e Tr
ansm
ittan
ce
Ketoprofen-aerogel formulation
Silica aerogel
Mixture of crystalline ketoprofen and aerogel
A
150015501600165017001750Wavenumber (cm-1)
Rel
ativ
e Tr
ansm
ittan
ce
Ketoprofen-loaded aerogel
Silica aerogel
Mixture of crystalline ketoprofen and aerogel
B
Fig. 5.14 Comparison of IR Spectra of silica aerogel, physical mixture ketoprofen and aerogel (1:1) and ketoprofen-loaded aerogel
Ketoprofen

113 Results and Discussion
Amorphisation was also proved by X-ray patterns. Silica aerogel has an amorphous structure (Fricke, Tillotson, 1997), which can be observed from the XRD pattern. The only peak, at 28 degrees in all patterns, originated from the silicon sample holder and has nothing to do with the sample. Both drugs show several diffraction peaks typical for crystalline powder. In contrast no corresponding diffraction peaks could be found in drug-loaded aerogels, indicating that no crystallites of both drugs are present in both formulations. The X-ray spectra of all other drugs show similar results (corresponding XRD patterns can be found in the appendix).
0
1000
2000
3000
4000
5000
6000
7000
10 20 30 40 50 60 702 Theta, degree
Inte
nsity
/ A
rb. u
nits
Silica aerogel
Ketoprofen-Aerogel formulation
0
5000
10000
15000
20000
25000
30000
35000
10 20 30 40 50 60 702 Theta, degree
Inte
nsity
/ A
rb.u
nits
Ketoprofen
Fig. 5.15 X-Ray diffraction patterns of ketoprofen, silica aerogel and ketoprofen-aerogel
formulation Taking into account all these facts we conclude that intact drugs adsorb on aerogels in non-crystalline form.
5.1.4 Release kinetics of drugs from silica aerogels The drug-aerogel formulations gained from adsorption experiments were used for the investigation of drug release kinetics. Before the in vitro release experiments were carried out, the modified agitator system which is designed according to section 4.2.6 was evaluated for flow patterns. The dissolution profiles of pure griseofulvin in 0.1 M HCl, 37 °C, 100 min-1
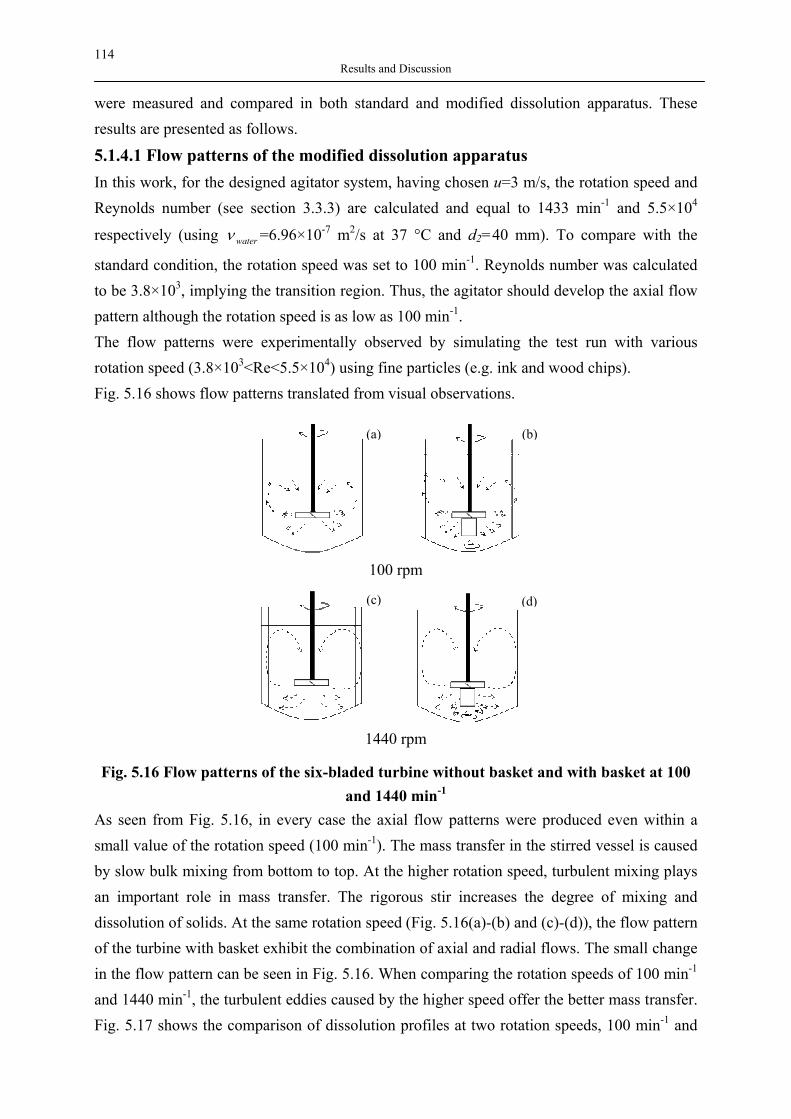
114 Results and Discussion
were measured and compared in both standard and modified dissolution apparatus. These results are presented as follows.
5.1.4.1 Flow patterns of the modified dissolution apparatus In this work, for the designed agitator system, having chosen u=3 m/s, the rotation speed and Reynolds number (see section 3.3.3) are calculated and equal to 1433 min-1 and 5.5×10⁴
respectively (using waterν =6.96×10⁻⁷ m2/s at 37 °C and d2=40 mm). To compare with the
standard condition, the rotation speed was set to 100 min-1. Reynolds number was calculated to be 3.8×10³, implying the transition region. Thus, the agitator should develop the axial flow pattern although the rotation speed is as low as 100 min-1. The flow patterns were experimentally observed by simulating the test run with various rotation speed (3.8×10³<Re<5.5×10⁴) using fine particles (e.g. ink and wood chips). Fig. 5.16 shows flow patterns translated from visual observations.
100 rpm
1440 rpm
(a)
(c)
(b)
(d)
Fig. 5.16 Flow patterns of the six-bladed turbine without basket and with basket at 100
and 1440 min-1 As seen from Fig. 5.16, in every case the axial flow patterns were produced even within a small value of the rotation speed (100 min-1). The mass transfer in the stirred vessel is caused by slow bulk mixing from bottom to top. At the higher rotation speed, turbulent mixing plays an important role in mass transfer. The rigorous stir increases the degree of mixing and dissolution of solids. At the same rotation speed (Fig. 5.16(a)-(b) and (c)-(d)), the flow pattern of the turbine with basket exhibit the combination of axial and radial flows. The small change in the flow pattern can be seen in Fig. 5.16. When comparing the rotation speeds of 100 min-1 and 1440 min-1, the turbulent eddies caused by the higher speed offer the better mass transfer. Fig. 5.17 shows the comparison of dissolution profiles at two rotation speeds, 100 min-1 and
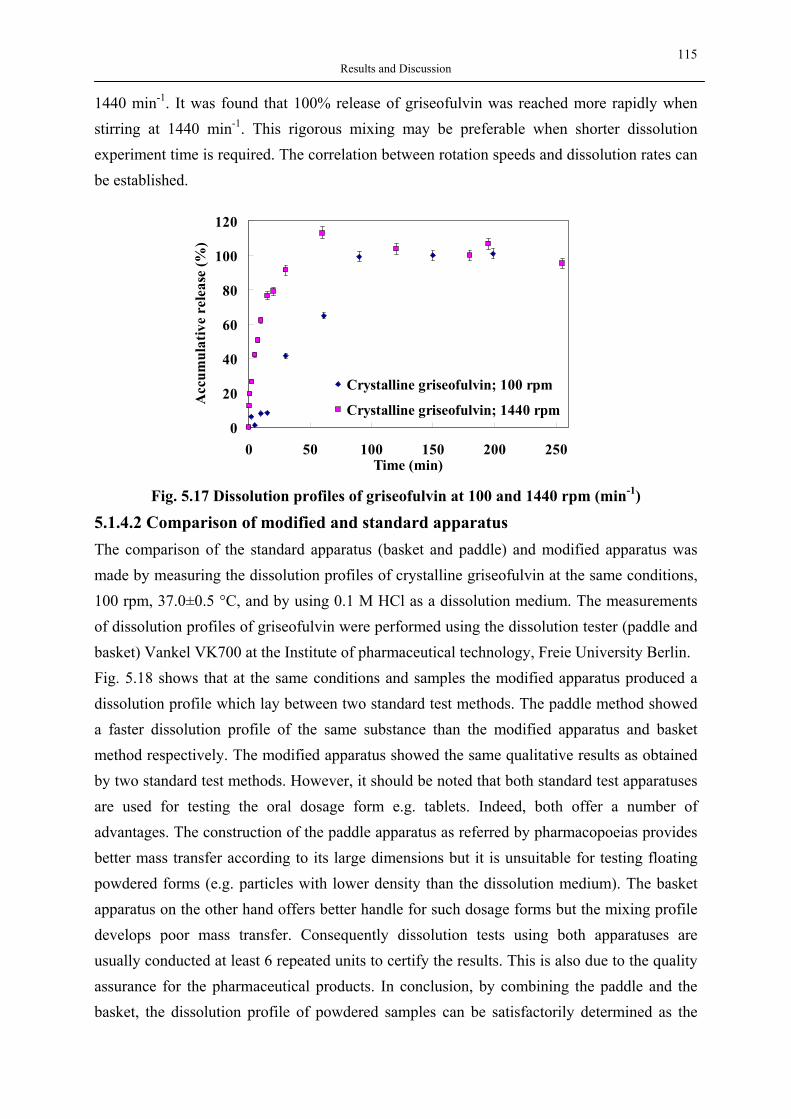
115 Results and Discussion
1440 min-1. It was found that 100% release of griseofulvin was reached more rapidly when stirring at 1440 min-1. This rigorous mixing may be preferable when shorter dissolution experiment time is required. The correlation between rotation speeds and dissolution rates can be established.
0
20
40
60
80
100
120
0 50 100 150 200 250Time (min)
Acc
umul
ativ
e re
leas
e (%
)
Crystalline griseofulvin; 100 rpm
Crystalline griseofulvin; 1440 rpm
Fig. 5.17 Dissolution profiles of griseofulvin at 100 and 1440 rpm (min-1)
5.1.4.2 Comparison of modified and standard apparatus The comparison of the standard apparatus (basket and paddle) and modified apparatus was made by measuring the dissolution profiles of crystalline griseofulvin at the same conditions, 100 rpm, 37.0±0.5 °C, and by using 0.1 M HCl as a dissolution medium. The measurements of dissolution profiles of griseofulvin were performed using the dissolution tester (paddle and basket) Vankel VK700 at the Institute of pharmaceutical technology, Freie University Berlin. Fig. 5.18 shows that at the same conditions and samples the modified apparatus produced a dissolution profile which lay between two standard test methods. The paddle method showed a faster dissolution profile of the same substance than the modified apparatus and basket method respectively. The modified apparatus showed the same qualitative results as obtained by two standard test methods. However, it should be noted that both standard test apparatuses are used for testing the oral dosage form e.g. tablets. Indeed, both offer a number of advantages. The construction of the paddle apparatus as referred by pharmacopoeias provides better mass transfer according to its large dimensions but it is unsuitable for testing floating powdered forms (e.g. particles with lower density than the dissolution medium). The basket apparatus on the other hand offers better handle for such dosage forms but the mixing profile develops poor mass transfer. Consequently dissolution tests using both apparatuses are usually conducted at least 6 repeated units to certify the results. This is also due to the quality assurance for the pharmaceutical products. In conclusion, by combining the paddle and the basket, the dissolution profile of powdered samples can be satisfactorily determined as the
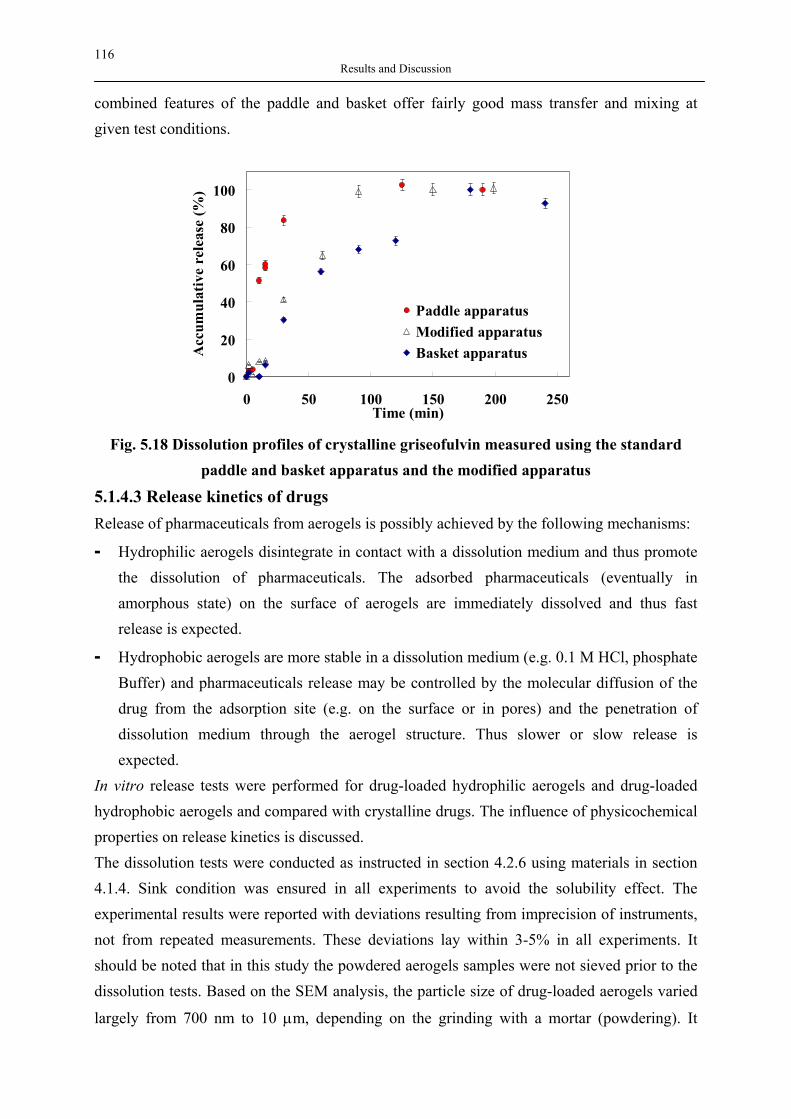
116 Results and Discussion
combined features of the paddle and basket offer fairly good mass transfer and mixing at given test conditions.
0
20
40
60
80
100
0 50 100 150 200 250Time (min)
Acc
umul
ativ
e re
leas
e (%
)
Paddle apparatusModified apparatusBasket apparatus
Fig. 5.18 Dissolution profiles of crystalline griseofulvin measured using the standard
paddle and basket apparatus and the modified apparatus
5.1.4.3 Release kinetics of drugs Release of pharmaceuticals from aerogels is possibly achieved by the following mechanisms:
- Hydrophilic aerogels disintegrate in contact with a dissolution medium and thus promote the dissolution of pharmaceuticals. The adsorbed pharmaceuticals (eventually in amorphous state) on the surface of aerogels are immediately dissolved and thus fast release is expected.
- Hydrophobic aerogels are more stable in a dissolution medium (e.g. 0.1 M HCl, phosphate Buffer) and pharmaceuticals release may be controlled by the molecular diffusion of the drug from the adsorption site (e.g. on the surface or in pores) and the penetration of dissolution medium through the aerogel structure. Thus slower or slow release is expected.
In vitro release tests were performed for drug-loaded hydrophilic aerogels and drug-loaded hydrophobic aerogels and compared with crystalline drugs. The influence of physicochemical properties on release kinetics is discussed. The dissolution tests were conducted as instructed in section 4.2.6 using materials in section 4.1.4. Sink condition was ensured in all experiments to avoid the solubility effect. The experimental results were reported with deviations resulting from imprecision of instruments, not from repeated measurements. These deviations lay within 3-5% in all experiments. It should be noted that in this study the powdered aerogels samples were not sieved prior to the dissolution tests. Based on the SEM analysis, the particle size of drug-loaded aerogels varied
largely from 700 nm to 10 µm, depending on the grinding with a mortar (powdering). It
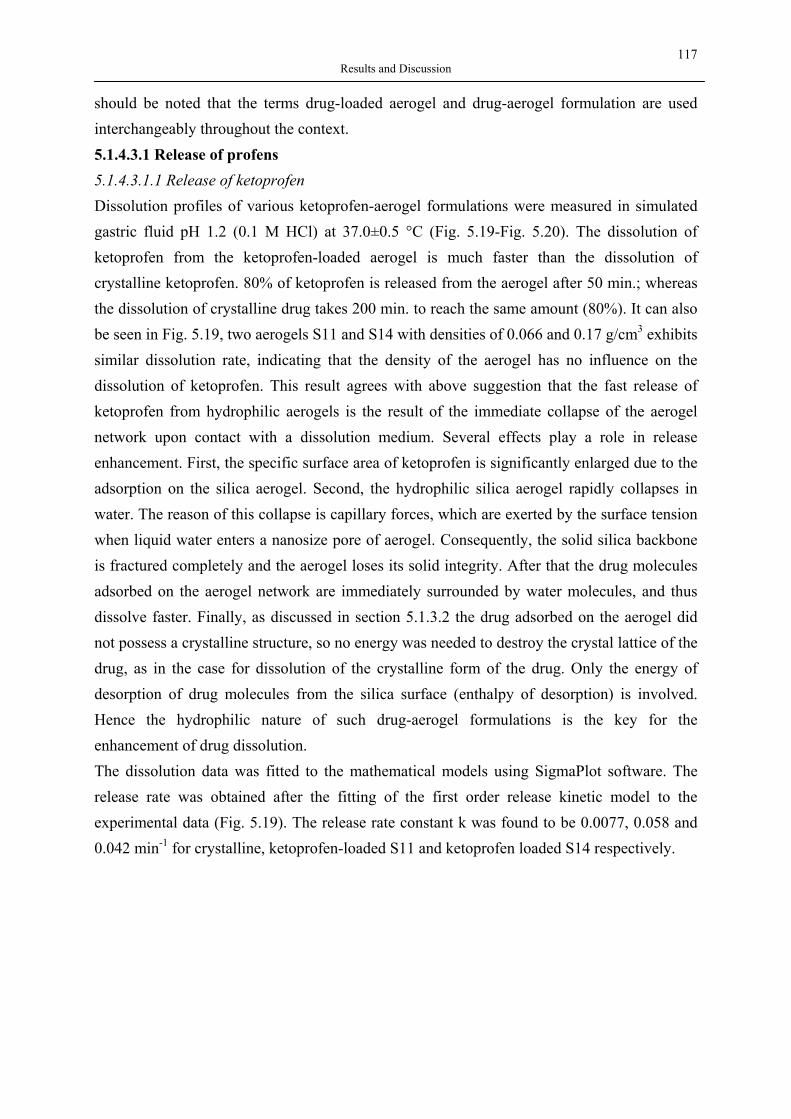
117 Results and Discussion
should be noted that the terms drug-loaded aerogel and drug-aerogel formulation are used interchangeably throughout the context. 5.1.4.3.1 Release of profens 5.1.4.3.1.1 Release of ketoprofen Dissolution profiles of various ketoprofen-aerogel formulations were measured in simulated gastric fluid pH 1.2 (0.1 M HCl) at 37.0±0.5 °C (Fig. 5.19-Fig. 5.20). The dissolution of ketoprofen from the ketoprofen-loaded aerogel is much faster than the dissolution of crystalline ketoprofen. 80% of ketoprofen is released from the aerogel after 50 min.; whereas the dissolution of crystalline drug takes 200 min. to reach the same amount (80%). It can also be seen in Fig. 5.19, two aerogels S11 and S14 with densities of 0.066 and 0.17 g/cm3 exhibits similar dissolution rate, indicating that the density of the aerogel has no influence on the dissolution of ketoprofen. This result agrees with above suggestion that the fast release of ketoprofen from hydrophilic aerogels is the result of the immediate collapse of the aerogel network upon contact with a dissolution medium. Several effects play a role in release enhancement. First, the specific surface area of ketoprofen is significantly enlarged due to the adsorption on the silica aerogel. Second, the hydrophilic silica aerogel rapidly collapses in water. The reason of this collapse is capillary forces, which are exerted by the surface tension when liquid water enters a nanosize pore of aerogel. Consequently, the solid silica backbone is fractured completely and the aerogel loses its solid integrity. After that the drug molecules adsorbed on the aerogel network are immediately surrounded by water molecules, and thus dissolve faster. Finally, as discussed in section 5.1.3.2 the drug adsorbed on the aerogel did not possess a crystalline structure, so no energy was needed to destroy the crystal lattice of the drug, as in the case for dissolution of the crystalline form of the drug. Only the energy of desorption of drug molecules from the silica surface (enthalpy of desorption) is involved. Hence the hydrophilic nature of such drug-aerogel formulations is the key for the enhancement of drug dissolution. The dissolution data was fitted to the mathematical models using SigmaPlot software. The release rate was obtained after the fitting of the first order release kinetic model to the experimental data (Fig. 5.19). The release rate constant k was found to be 0.0077, 0.058 and 0.042 min-1 for crystalline, ketoprofen-loaded S11 and ketoprofen loaded S14 respectively.
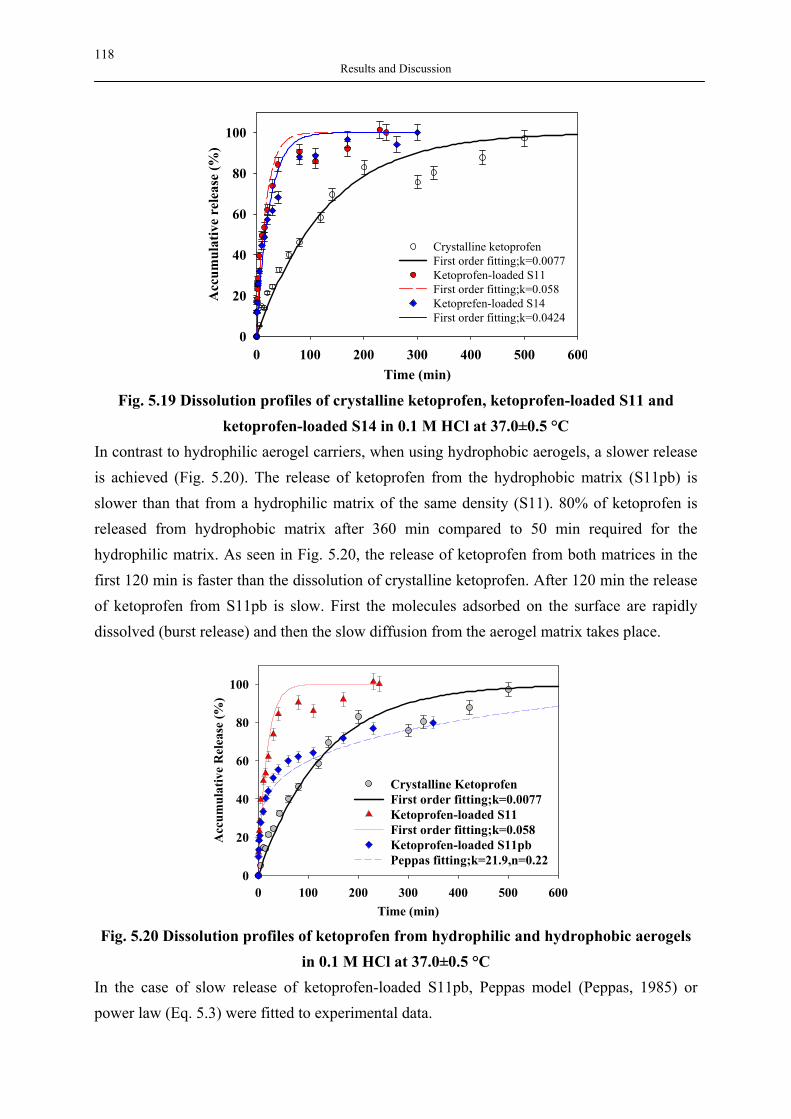
118 Results and Discussion
Time (min)0 100 200 300 400 500 600
Acc
umul
ativ
e re
leas
e (%
)
0
20
40
60
80
100
Crystalline ketoprofenFirst order fitting;k=0.0077Ketoprofen-loaded S11 First order fitting;k=0.058Ketoprefen-loaded S14 First order fitting;k=0.0424
Fig. 5.19 Dissolution profiles of crystalline ketoprofen, ketoprofen-loaded S11 and
ketoprofen-loaded S14 in 0.1 M HCl at 37.0±0.5 °C In contrast to hydrophilic aerogel carriers, when using hydrophobic aerogels, a slower release is achieved (Fig. 5.20). The release of ketoprofen from the hydrophobic matrix (S11pb) is slower than that from a hydrophilic matrix of the same density (S11). 80% of ketoprofen is released from hydrophobic matrix after 360 min compared to 50 min required for the hydrophilic matrix. As seen in Fig. 5.20, the release of ketoprofen from both matrices in the first 120 min is faster than the dissolution of crystalline ketoprofen. After 120 min the release of ketoprofen from S11pb is slow. First the molecules adsorbed on the surface are rapidly dissolved (burst release) and then the slow diffusion from the aerogel matrix takes place.
Time (min)0 100 200 300 400 500 600
Acc
umul
ativ
e R
elea
se (%
)
0
20
40
60
80
100
Crystalline KetoprofenFirst order fitting;k=0.0077Ketoprofen-loaded S11First order fitting;k=0.058Ketoprofen-loaded S11pbPeppas fitting;k=21.9,n=0.22
Fig. 5.20 Dissolution profiles of ketoprofen from hydrophilic and hydrophobic aerogels
in 0.1 M HCl at 37.0±0.5 °C In the case of slow release of ketoprofen-loaded S11pb, Peppas model (Peppas, 1985) or power law (Eq. 5.3) were fitted to experimental data.
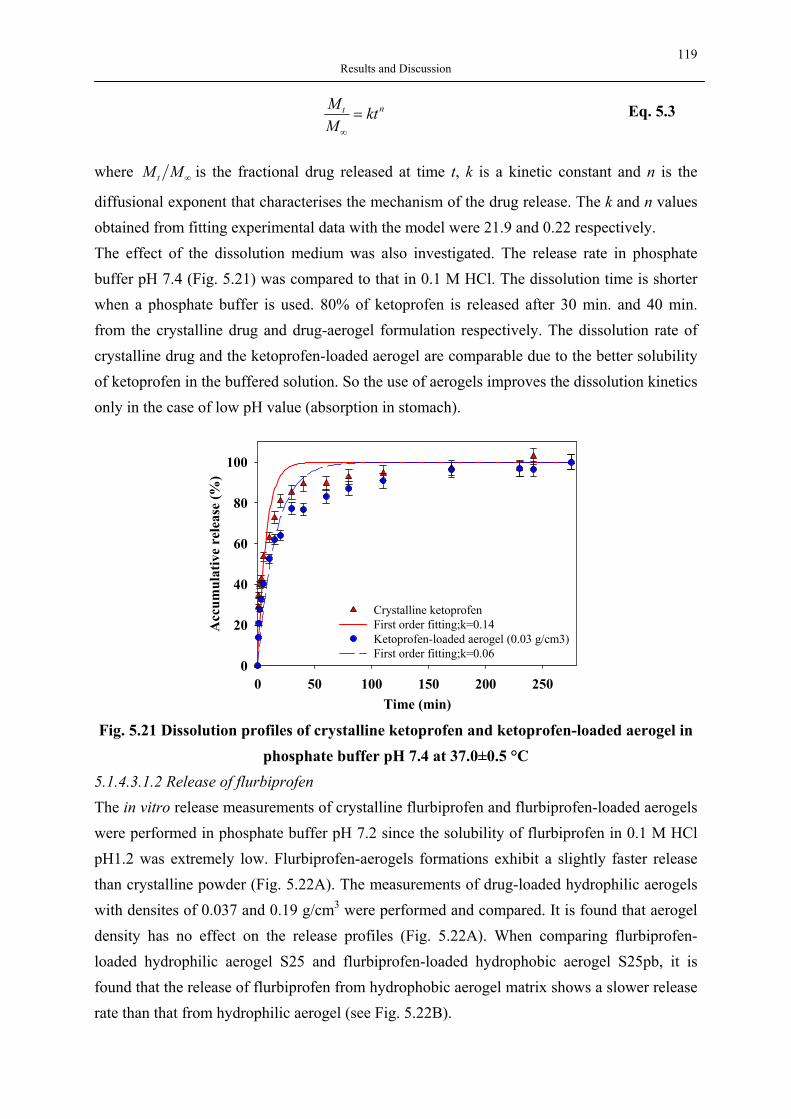
119 Results and Discussion
nt ktMM
=∞
Eq. 5.3
where ∞MM t is the fractional drug released at time t, k is a kinetic constant and n is the
diffusional exponent that characterises the mechanism of the drug release. The k and n values obtained from fitting experimental data with the model were 21.9 and 0.22 respectively. The effect of the dissolution medium was also investigated. The release rate in phosphate buffer pH 7.4 (Fig. 5.21) was compared to that in 0.1 M HCl. The dissolution time is shorter when a phosphate buffer is used. 80% of ketoprofen is released after 30 min. and 40 min. from the crystalline drug and drug-aerogel formulation respectively. The dissolution rate of crystalline drug and the ketoprofen-loaded aerogel are comparable due to the better solubility of ketoprofen in the buffered solution. So the use of aerogels improves the dissolution kinetics only in the case of low pH value (absorption in stomach).
Time (min)0 50 100 150 200 250
Acc
umul
ativ
e re
leas
e (%
)
0
20
40
60
80
100
Crystalline ketoprofenFirst order fitting;k=0.14Ketoprofen-loaded aerogel (0.03 g/cm3) First order fitting;k=0.06
Fig. 5.21 Dissolution profiles of crystalline ketoprofen and ketoprofen-loaded aerogel in
phosphate buffer pH 7.4 at 37.0±0.5 °C 5.1.4.3.1.2 Release of flurbiprofen The in vitro release measurements of crystalline flurbiprofen and flurbiprofen-loaded aerogels were performed in phosphate buffer pH 7.2 since the solubility of flurbiprofen in 0.1 M HCl pH1.2 was extremely low. Flurbiprofen-aerogels formations exhibit a slightly faster release than crystalline powder (Fig. 5.22A). The measurements of drug-loaded hydrophilic aerogels with densites of 0.037 and 0.19 g/cm3 were performed and compared. It is found that aerogel density has no effect on the release profiles (Fig. 5.22A). When comparing flurbiprofen-loaded hydrophilic aerogel S25 and flurbiprofen-loaded hydrophobic aerogel S25pb, it is found that the release of flurbiprofen from hydrophobic aerogel matrix shows a slower release rate than that from hydrophilic aerogel (see Fig. 5.22B).
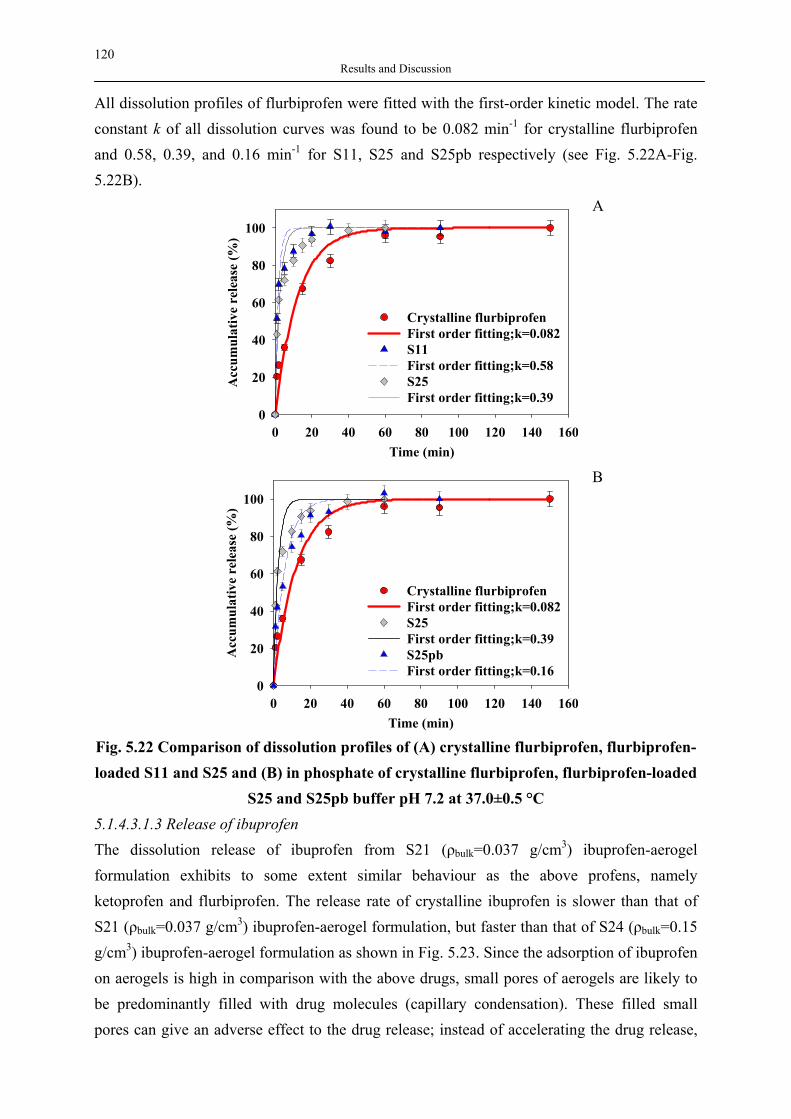
120 Results and Discussion
All dissolution profiles of flurbiprofen were fitted with the first-order kinetic model. The rate constant k of all dissolution curves was found to be 0.082 min-1 for crystalline flurbiprofen and 0.58, 0.39, and 0.16 min-1 for S11, S25 and S25pb respectively (see Fig. 5.22A-Fig. 5.22B).
Time (min)0 20 40 60 80 100 120 140 160
Acc
umul
ativ
e re
leas
e (%
)
0
20
40
60
80
100
Crystalline flurbiprofenFirst order fitting;k=0.082S11First order fitting;k=0.58S25First order fitting;k=0.39
A
Time (min)0 20 40 60 80 100 120 140 160
Acc
umul
ativ
e re
leas
e (%
)
0
20
40
60
80
100
Crystalline flurbiprofenFirst order fitting;k=0.082S25First order fitting;k=0.39S25pbFirst order fitting;k=0.16
B
Fig. 5.22 Comparison of dissolution profiles of (A) crystalline flurbiprofen, flurbiprofen-loaded S11 and S25 and (B) in phosphate of crystalline flurbiprofen, flurbiprofen-loaded
S25 and S25pb buffer pH 7.2 at 37.0±0.5 °C 5.1.4.3.1.3 Release of ibuprofen The dissolution release of ibuprofen from S21 (ρbulk=0.037 g/cm3) ibuprofen-aerogel formulation exhibits to some extent similar behaviour as the above profens, namely ketoprofen and flurbiprofen. The release rate of crystalline ibuprofen is slower than that of S21 (ρbulk=0.037 g/cm3) ibuprofen-aerogel formulation, but faster than that of S24 (ρbulk=0.15 g/cm3) ibuprofen-aerogel formulation as shown in Fig. 5.23. Since the adsorption of ibuprofen on aerogels is high in comparison with the above drugs, small pores of aerogels are likely to be predominantly filled with drug molecules (capillary condensation). These filled small pores can give an adverse effect to the drug release; instead of accelerating the drug release,
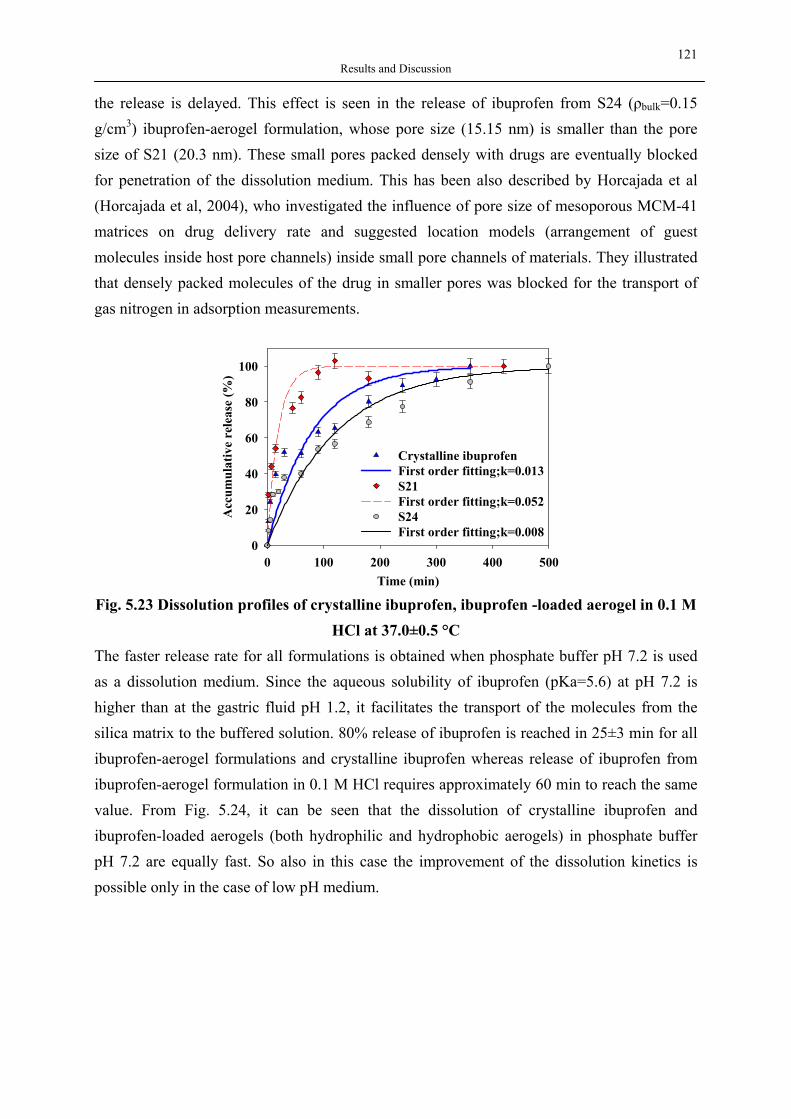
121 Results and Discussion
the release is delayed. This effect is seen in the release of ibuprofen from S24 (ρbulk=0.15 g/cm3) ibuprofen-aerogel formulation, whose pore size (15.15 nm) is smaller than the pore size of S21 (20.3 nm). These small pores packed densely with drugs are eventually blocked for penetration of the dissolution medium. This has been also described by Horcajada et al (Horcajada et al, 2004), who investigated the influence of pore size of mesoporous MCM-41 matrices on drug delivery rate and suggested location models (arrangement of guest molecules inside host pore channels) inside small pore channels of materials. They illustrated that densely packed molecules of the drug in smaller pores was blocked for the transport of gas nitrogen in adsorption measurements.
Time (min)0 100 200 300 400 500
Acc
umul
ativ
e re
leas
e (%
)
0
20
40
60
80
100
Crystalline ibuprofenFirst order fitting;k=0.013S21 First order fitting;k=0.052S24 First order fitting;k=0.008
Fig. 5.23 Dissolution profiles of crystalline ibuprofen, ibuprofen -loaded aerogel in 0.1 M
HCl at 37.0±0.5 °C The faster release rate for all formulations is obtained when phosphate buffer pH 7.2 is used as a dissolution medium. Since the aqueous solubility of ibuprofen (pKa=5.6) at pH 7.2 is higher than at the gastric fluid pH 1.2, it facilitates the transport of the molecules from the silica matrix to the buffered solution. 80% release of ibuprofen is reached in 25±3 min for all ibuprofen-aerogel formulations and crystalline ibuprofen whereas release of ibuprofen from ibuprofen-aerogel formulation in 0.1 M HCl requires approximately 60 min to reach the same value. From Fig. 5.24, it can be seen that the dissolution of crystalline ibuprofen and ibuprofen-loaded aerogels (both hydrophilic and hydrophobic aerogels) in phosphate buffer pH 7.2 are equally fast. So also in this case the improvement of the dissolution kinetics is possible only in the case of low pH medium.
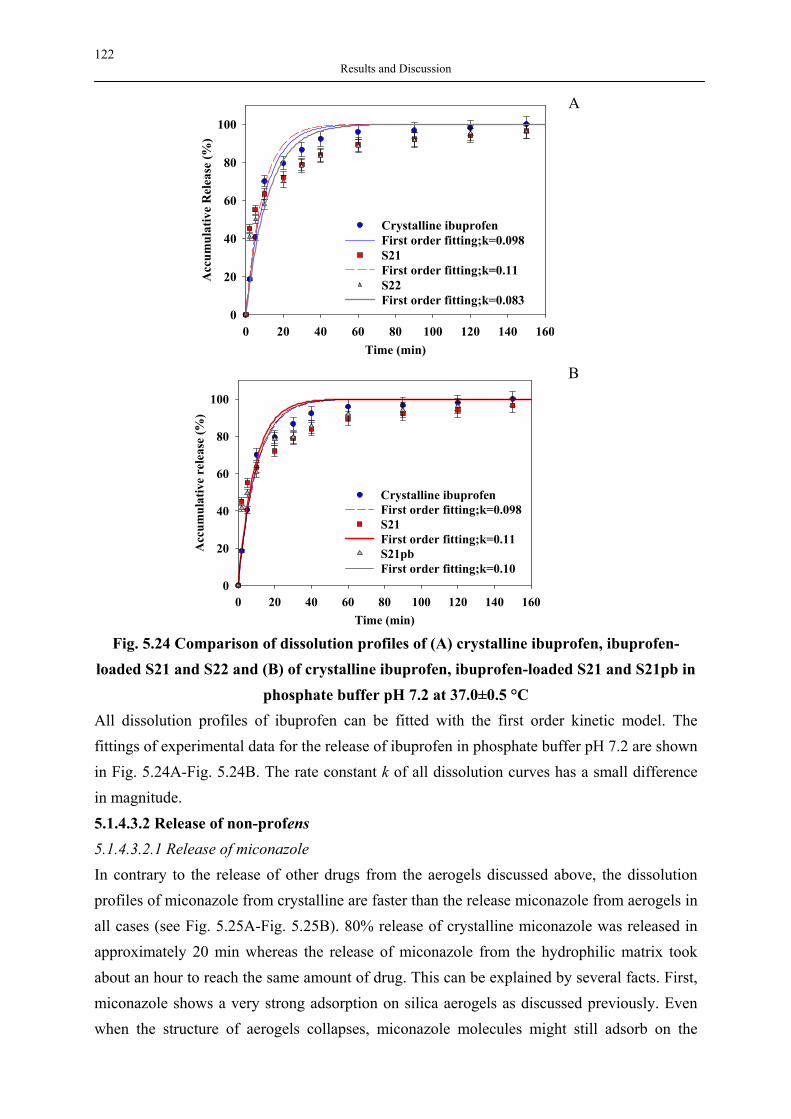
122 Results and Discussion
Time (min)0 20 40 60 80 100 120 140 160
Acc
umul
ativ
e R
elea
se (%
)
0
20
40
60
80
100
Crystalline ibuprofenFirst order fitting;k=0.098S21First order fitting;k=0.11S22First order fitting;k=0.083
A
Time (min)0 20 40 60 80 100 120 140 160
Acc
umul
ativ
e re
leas
e (%
)
0
20
40
60
80
100
Crystalline ibuprofenFirst order fitting;k=0.098S21First order fitting;k=0.11S21pbFirst order fitting;k=0.10
B
Fig. 5.24 Comparison of dissolution profiles of (A) crystalline ibuprofen, ibuprofen-loaded S21 and S22 and (B) of crystalline ibuprofen, ibuprofen-loaded S21 and S21pb in
phosphate buffer pH 7.2 at 37.0±0.5 °C All dissolution profiles of ibuprofen can be fitted with the first order kinetic model. The fittings of experimental data for the release of ibuprofen in phosphate buffer pH 7.2 are shown in Fig. 5.24A-Fig. 5.24B. The rate constant k of all dissolution curves has a small difference in magnitude. 5.1.4.3.2 Release of non-profens 5.1.4.3.2.1 Release of miconazole In contrary to the release of other drugs from the aerogels discussed above, the dissolution profiles of miconazole from crystalline are faster than the release miconazole from aerogels in all cases (see Fig. 5.25A-Fig. 5.25B). 80% release of crystalline miconazole was released in approximately 20 min whereas the release of miconazole from the hydrophilic matrix took about an hour to reach the same amount of drug. This can be explained by several facts. First, miconazole shows a very strong adsorption on silica aerogels as discussed previously. Even when the structure of aerogels collapses, miconazole molecules might still adsorb on the
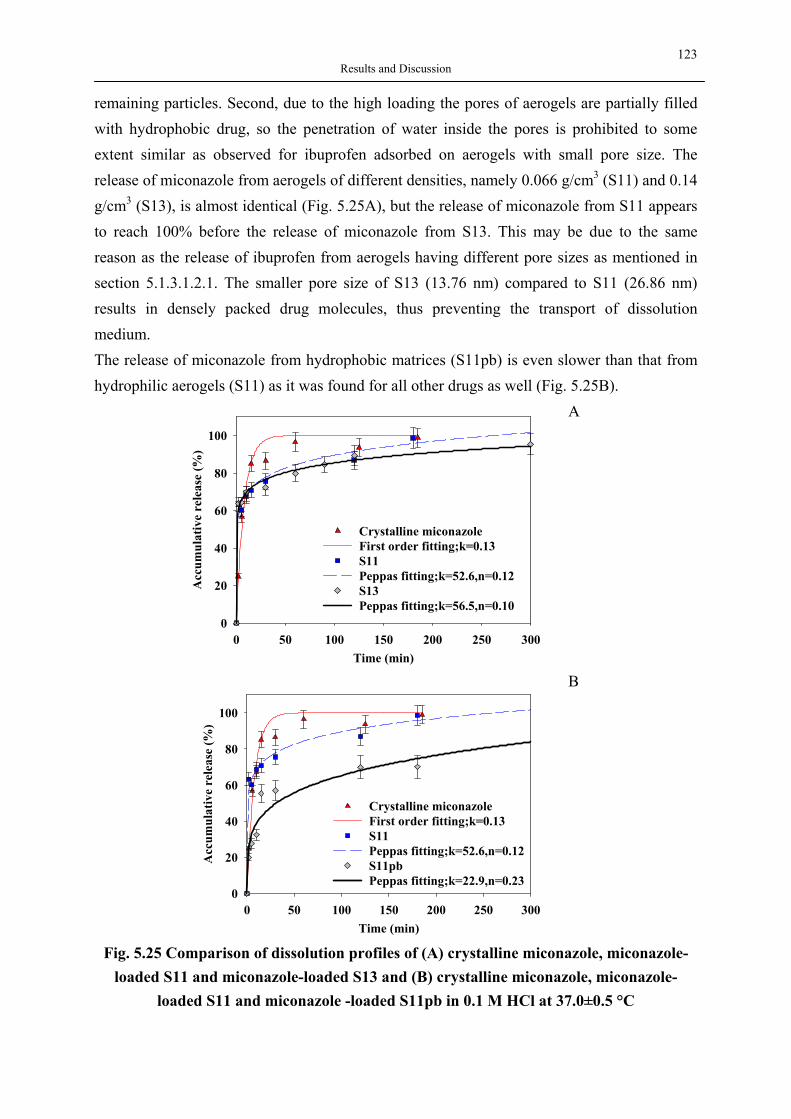
123 Results and Discussion
remaining particles. Second, due to the high loading the pores of aerogels are partially filled with hydrophobic drug, so the penetration of water inside the pores is prohibited to some extent similar as observed for ibuprofen adsorbed on aerogels with small pore size. The release of miconazole from aerogels of different densities, namely 0.066 g/cm3 (S11) and 0.14 g/cm3 (S13), is almost identical (Fig. 5.25A), but the release of miconazole from S11 appears to reach 100% before the release of miconazole from S13. This may be due to the same reason as the release of ibuprofen from aerogels having different pore sizes as mentioned in section 5.1.3.1.2.1. The smaller pore size of S13 (13.76 nm) compared to S11 (26.86 nm) results in densely packed drug molecules, thus preventing the transport of dissolution medium. The release of miconazole from hydrophobic matrices (S11pb) is even slower than that from hydrophilic aerogels (S11) as it was found for all other drugs as well (Fig. 5.25B).
Time (min)0 50 100 150 200 250 300
Acc
umul
ativ
e re
leas
e (%
)
0
20
40
60
80
100
Crystalline miconazoleFirst order fitting;k=0.13S11Peppas fitting;k=52.6,n=0.12S13Peppas fitting;k=56.5,n=0.10
A
Time (min)0 50 100 150 200 250 300
Acc
umul
ativ
e re
leas
e (%
)
0
20
40
60
80
100
Crystalline miconazoleFirst order fitting;k=0.13S11Peppas fitting;k=52.6,n=0.12S11pbPeppas fitting;k=22.9,n=0.23
B
Fig. 5.25 Comparison of dissolution profiles of (A) crystalline miconazole, miconazole-loaded S11 and miconazole-loaded S13 and (B) crystalline miconazole, miconazole-
loaded S11 and miconazole -loaded S11pb in 0.1 M HCl at 37.0±0.5 °C
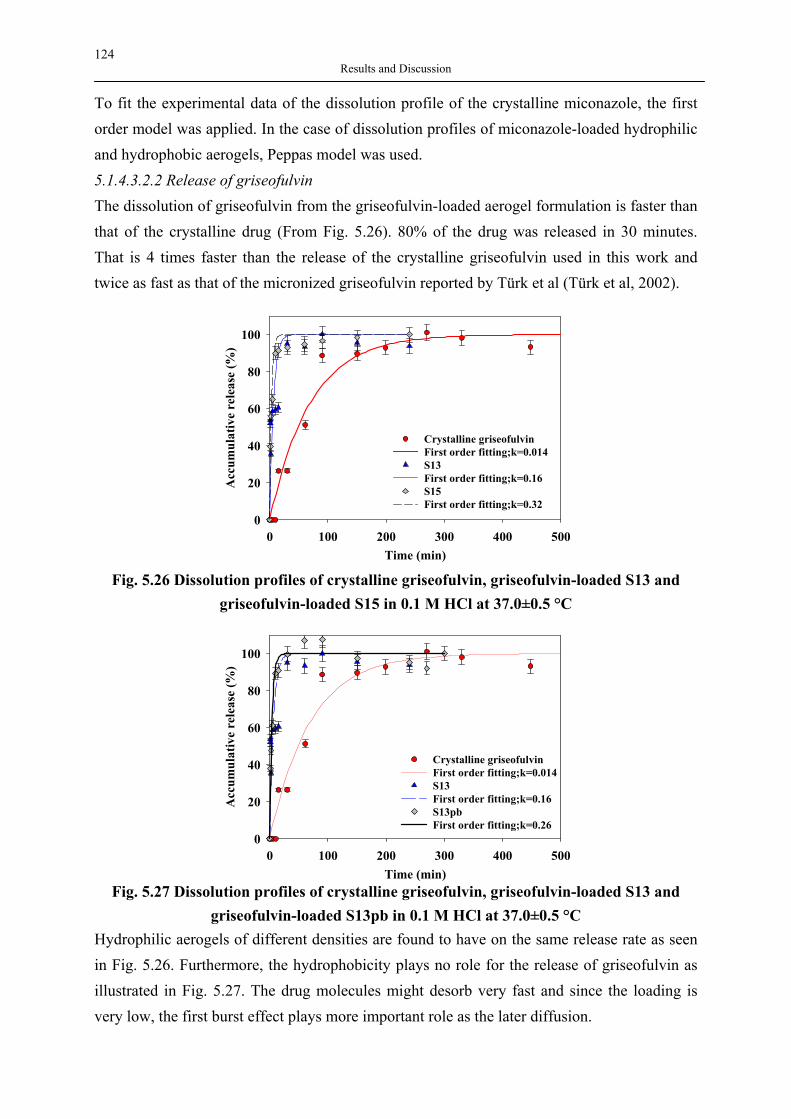
124 Results and Discussion
To fit the experimental data of the dissolution profile of the crystalline miconazole, the first order model was applied. In the case of dissolution profiles of miconazole-loaded hydrophilic and hydrophobic aerogels, Peppas model was used. 5.1.4.3.2.2 Release of griseofulvin The dissolution of griseofulvin from the griseofulvin-loaded aerogel formulation is faster than that of the crystalline drug (From Fig. 5.26). 80% of the drug was released in 30 minutes. That is 4 times faster than the release of the crystalline griseofulvin used in this work and twice as fast as that of the micronized griseofulvin reported by Türk et al (Türk et al, 2002).
Time (min)0 100 200 300 400 500
Acc
umul
ativ
e re
leas
e (%
)
0
20
40
60
80
100
Crystalline griseofulvinFirst order fitting;k=0.014S13First order fitting;k=0.16S15First order fitting;k=0.32
Fig. 5.26 Dissolution profiles of crystalline griseofulvin, griseofulvin-loaded S13 and
griseofulvin-loaded S15 in 0.1 M HCl at 37.0±0.5 °C
Time (min)0 100 200 300 400 500
Acc
umul
ativ
e re
leas
e (%
)
0
20
40
60
80
100
Crystalline griseofulvinFirst order fitting;k=0.014S13First order fitting;k=0.16S13pbFirst order fitting;k=0.26
Fig. 5.27 Dissolution profiles of crystalline griseofulvin, griseofulvin-loaded S13 and
griseofulvin-loaded S13pb in 0.1 M HCl at 37.0±0.5 °C Hydrophilic aerogels of different densities are found to have on the same release rate as seen in Fig. 5.26. Furthermore, the hydrophobicity plays no role for the release of griseofulvin as illustrated in Fig. 5.27. The drug molecules might desorb very fast and since the loading is very low, the first burst effect plays more important role as the later diffusion.
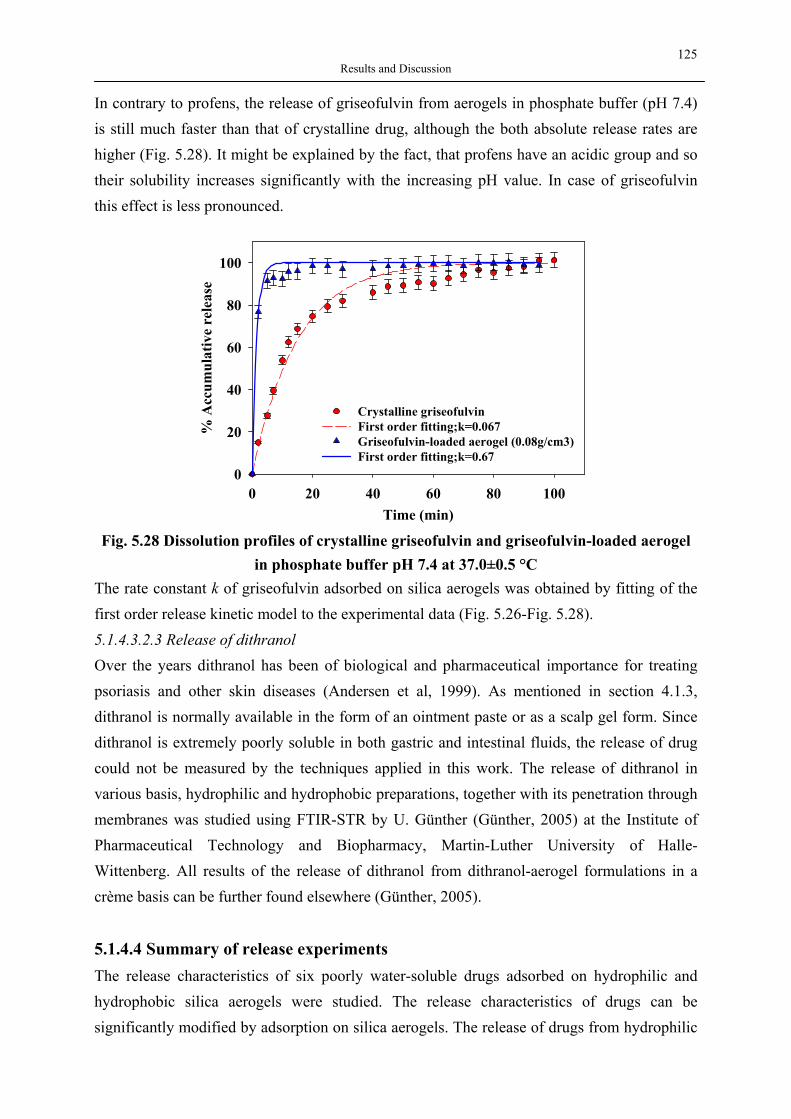
125 Results and Discussion
In contrary to profens, the release of griseofulvin from aerogels in phosphate buffer (pH 7.4) is still much faster than that of crystalline drug, although the both absolute release rates are higher (Fig. 5.28). It might be explained by the fact, that profens have an acidic group and so their solubility increases significantly with the increasing pH value. In case of griseofulvin this effect is less pronounced.
Time (min)0 20 40 60 80 100
% A
ccum
ulat
ive
rele
ase
0
20
40
60
80
100
Crystalline griseofulvinFirst order fitting;k=0.067Griseofulvin-loaded aerogel (0.08g/cm3)First order fitting;k=0.67
Fig. 5.28 Dissolution profiles of crystalline griseofulvin and griseofulvin-loaded aerogel
in phosphate buffer pH 7.4 at 37.0±0.5 °C The rate constant k of griseofulvin adsorbed on silica aerogels was obtained by fitting of the first order release kinetic model to the experimental data (Fig. 5.26-Fig. 5.28). 5.1.4.3.2.3 Release of dithranol Over the years dithranol has been of biological and pharmaceutical importance for treating psoriasis and other skin diseases (Andersen et al, 1999). As mentioned in section 4.1.3, dithranol is normally available in the form of an ointment paste or as a scalp gel form. Since dithranol is extremely poorly soluble in both gastric and intestinal fluids, the release of drug could not be measured by the techniques applied in this work. The release of dithranol in various basis, hydrophilic and hydrophobic preparations, together with its penetration through membranes was studied using FTIR-STR by U. Günther (Günther, 2005) at the Institute of Pharmaceutical Technology and Biopharmacy, Martin-Luther University of Halle-Wittenberg. All results of the release of dithranol from dithranol-aerogel formulations in a crème basis can be further found elsewhere (Günther, 2005).
5.1.4.4 Summary of release experiments The release characteristics of six poorly water-soluble drugs adsorbed on hydrophilic and hydrophobic silica aerogels were studied. The release characteristics of drugs can be significantly modified by adsorption on silica aerogels. The release of drugs from hydrophilic
126 Results and Discussion
aerogels depends on the nature of the drugs, the pH of the medium and aerogel properties as follows:
1. If the drugs exhibiting low and moderate adsorption on aerogels (dithranol, griseofulvin, ketoprofen and flurbiprofen) are adsorbed on hydrophilic silica aerogels, a very fast release of drugs is observed. The release rate is higher than that of the corresponding crystalline drugs and does not depend on the density and pore size of the aerogels. This effect can be explained by the fast collapse of aerogels structure in an aqueous medium and weak interactions of drugs with aerogels’ surface.
2. If the drugs with high affinity to aerogels (miconazole, ibuprofen) are adsorbed on hydrophilic silica aerogels, the release is close to that of a crystalline drug (ibuprofen, excepting the large pore samples) or even slower (miconazole). The slower release kinetics may be due to two reasons: first the strong interaction between silanol groups of aerogel and functional groups of drugs and second the densely packed molecules of hydrophobic drugs in aerogel pores, which prevent for the penetration of the dissolution medium.
3. If the drugs with high affinity to aerogels (miconazole, ibuprofen) are adsorbed on hydrophilic silica aerogels, the release depends on the pore size of aerogels. The smaller the pore size is, the slower the release.
4. The release of drugs from hydrophobic silica aerogels is slower than that from hydrophilic aerogels. It includes the burst release followed by the slow diffusion from the aerogel matrix due to the stability of hydrophobic aerogels in an aqueous medium. In the case of griseofulvin the loading is so small and the interaction of drugs with aerogels so weak that only the burst effect is observed.
5. The effect of aerogels on the dissolution rate depends on the dissolution medium. Faster release for both the drug-aerogel formulation and crystalline drug is observed at higher pH values, since the solubility of all studied drugs increases with the increasing pH. At pH = 7.4 the dissolution profiles of aerogels and crystalline drugs come closer to each other and the aerogel effect becomes less pronounced.
Based on the above findings, a novel method for dissolution enhancement of drugs with low and moderate adsorption (griseofulvin, dithranol, ketoprofen and flurbiprofen) by adsorption on hydrophilic silica aerogels is suggested. In practise, the release kinetics of drugs from hydrophilic aerogels can be initially predicted when the adsorption of drugs on aerogels is known. The low or moderate adsorption on silica aerogels implies the faster release of drugs from drug-aerogel formulations. In this case, the dissolution rate can be enhanced. If the drugs have very high adsorption on silica aerogels, the slow release kinetic is observed. The dissolution rate can not be improved.
127 Results and Discussion
5.1.5 Long-term physical and chemical stability analysis of drug-loaded aerogels The long-term stability of dosage formulation is important for the drug registration, the shelf-life and storage conditions. The analysis of drug-aerogel formulations during storage at ambient pressure and temperature is studied using XRD, UV-vis, IR spectroscopy and visual observation. Visual observation of powdered drug-loaded aerogels shows that some samples have become slightly opaque due to the adsorption of water on aerogels. In any case, no changes in IR and X-ray spectra of any formulations were observed after 1 year and 2 year storage. The corresponding spectra can be found in the appendix.
5.2 Experimental results for acetaminophen-encapsulated hyperbranched polymers In the following part the potential of hyperbranched polymers as the encapsulation medium for drugs is discussed. Using a model drug, acetaminophen, the possibility of preparing a delivery system with hyperbranched polymers which may provide the sustained or controlled release of drug was studied. The acetaminophen-encapsulated polymers prepared by various methods in our Institute (Falah, 2003; Pérez de Diego, 2005; Rolker, 2002; Suttiruengwong et al, 2005) (e.g. GAS, PGSS, coacervation, solvent method) were characterised using SEM for observing the morphology of polymers and drug-loaded microparticles, using IR spectroscopy for monitoring the change that occurred in molecular levels, using DSC and DTA for
investigating the physical change of these samples, and using UV-vis spectrometry for confirming the presence of drug and quantitative analysis.
5.2.1 Characterisation of drug-loaded microparticles Acetaminophen-loaded hyperbranched polyester (Boltorn H3200) and hyperbranched polyesteramides (Hybrane H1690, H1500 and H1200) were successfully produced using GAS (Rolker, 2002), the coacervation (Falah, 2003) and the PGSS (Pérez de Diego, 2005) methods as well as the solvent method (this work). The concentration of acetaminophen in each of the drug-loaded microparticles (% Loading) was determined using UV-vis method. When hyperbranched polyester Boltorn H3200 was used as a carrier, drug-loaded microparticles were dissolved in the solvent THF. The characteristic wavelength of acetaminophen in THF corresponded to 294 nm (λmax). This peak was seen in all microparticles. Thus, the drug acetaminophen was not influenced by the loading procedures (coacervation, GAS and PGSS). Similarly, the identity of the drug acetaminophen was proved by dispersing drug-loaded Hybrane microparticles in ethanol since both compounds were soluble in ethanol. The corresponding acetaminophen peak was found at 250 nm (λmax) for pure drug and microparticles. When the dissolution experiments were
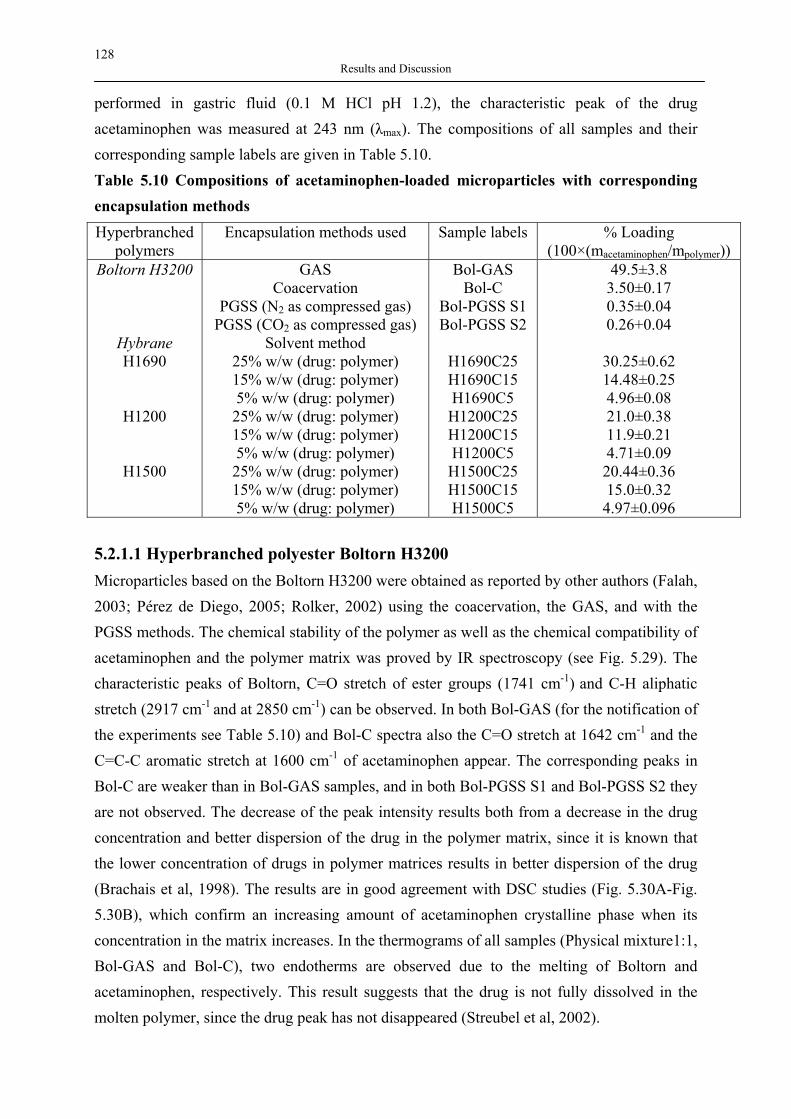
128 Results and Discussion
performed in gastric fluid (0.1 M HCl pH 1.2), the characteristic peak of the drug acetaminophen was measured at 243 nm (λmax). The compositions of all samples and their corresponding sample labels are given in Table 5.10. Table 5.10 Compositions of acetaminophen-loaded microparticles with corresponding encapsulation methods Hyperbranched
polymers Encapsulation methods used Sample labels % Loading
(100×(macetaminophen/mpolymer)) Boltorn H3200
Hybrane H1690
H1200
H1500
GAS Coacervation
PGSS (N2 as compressed gas) PGSS (CO2 as compressed gas)
Solvent method 25% w/w (drug: polymer) 15% w/w (drug: polymer) 5% w/w (drug: polymer) 25% w/w (drug: polymer) 15% w/w (drug: polymer) 5% w/w (drug: polymer) 25% w/w (drug: polymer) 15% w/w (drug: polymer) 5% w/w (drug: polymer)
Bol-GAS Bol-C
Bol-PGSS S1 Bol-PGSS S2
H1690C25 H1690C15 H1690C5 H1200C25 H1200C15 H1200C5 H1500C25 H1500C15 H1500C5
49.5±3.8 3.50±0.17 0.35±0.04 0.26+0.04
30.25±0.62 14.48±0.25 4.96±0.08 21.0±0.38 11.9±0.21 4.71±0.09 20.44±0.36 15.0±0.32 4.97±0.096
5.2.1.1 Hyperbranched polyester Boltorn H3200 Microparticles based on the Boltorn H3200 were obtained as reported by other authors (Falah, 2003; Pérez de Diego, 2005; Rolker, 2002) using the coacervation, the GAS, and with the PGSS methods. The chemical stability of the polymer as well as the chemical compatibility of acetaminophen and the polymer matrix was proved by IR spectroscopy (see Fig. 5.29). The characteristic peaks of Boltorn, C=O stretch of ester groups (1741 cm-1) and C-H aliphatic stretch (2917 cm-1 and at 2850 cm-1) can be observed. In both Bol-GAS (for the notification of the experiments see Table 5.10) and Bol-C spectra also the C=O stretch at 1642 cm-1 and the C=C-C aromatic stretch at 1600 cm-1 of acetaminophen appear. The corresponding peaks in Bol-C are weaker than in Bol-GAS samples, and in both Bol-PGSS S1 and Bol-PGSS S2 they are not observed. The decrease of the peak intensity results both from a decrease in the drug concentration and better dispersion of the drug in the polymer matrix, since it is known that the lower concentration of drugs in polymer matrices results in better dispersion of the drug (Brachais et al, 1998). The results are in good agreement with DSC studies (Fig. 5.30A-Fig. 5.30B), which confirm an increasing amount of acetaminophen crystalline phase when its concentration in the matrix increases. In the thermograms of all samples (Physical mixture1:1, Bol-GAS and Bol-C), two endotherms are observed due to the melting of Boltorn and acetaminophen, respectively. This result suggests that the drug is not fully dissolved in the molten polymer, since the drug peak has not disappeared (Streubel et al, 2002).
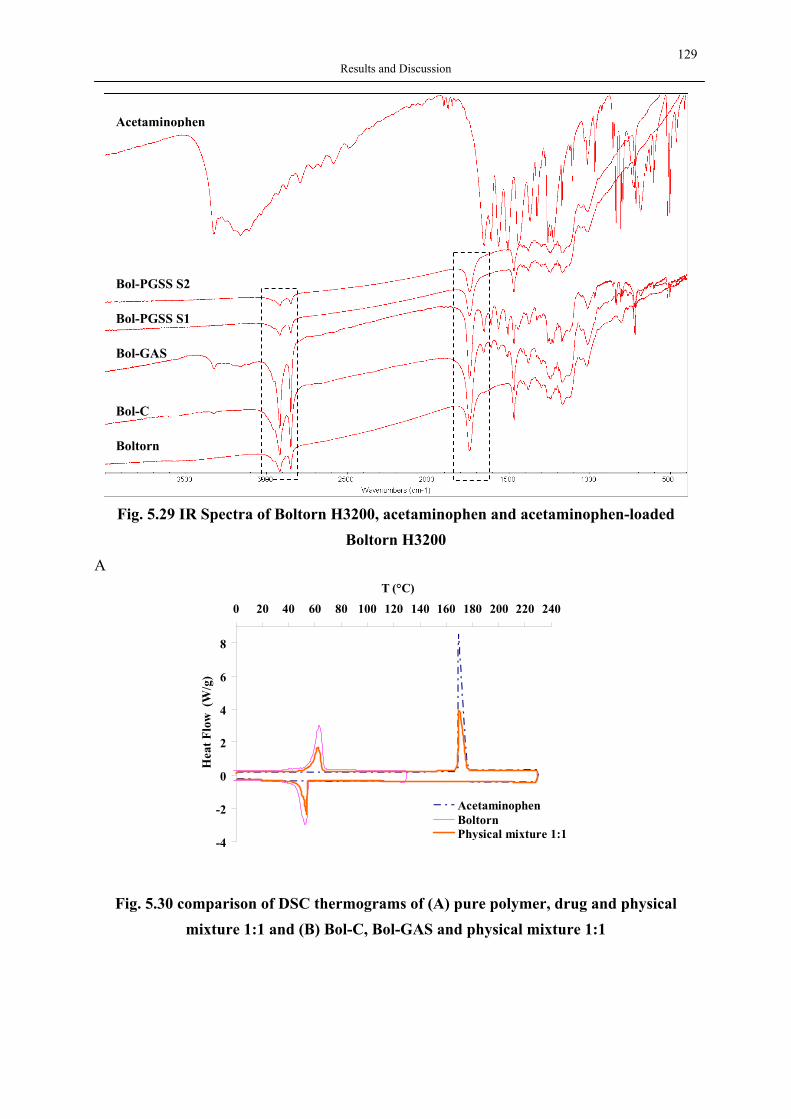
129 Results and Discussion
Fig. 5.29 IR Spectra of Boltorn H3200, acetaminophen and acetaminophen-loaded
Boltorn H3200 A
-4
-2
0
2
4
6
8
0 20 40 60 80 100 120 140 160 180 200 220 240
T (°C)
Hea
t Flo
w (
W/g
)
AcetaminophenBoltornPhysical mixture 1:1
Fig. 5.30 comparison of DSC thermograms of (A) pure polymer, drug and physical mixture 1:1 and (B) Bol-C, Bol-GAS and physical mixture 1:1
Boltorn
Bol-C
Bol-GAS
Bol-PGSS S1
Bol-PGSS S2
Acetaminophen
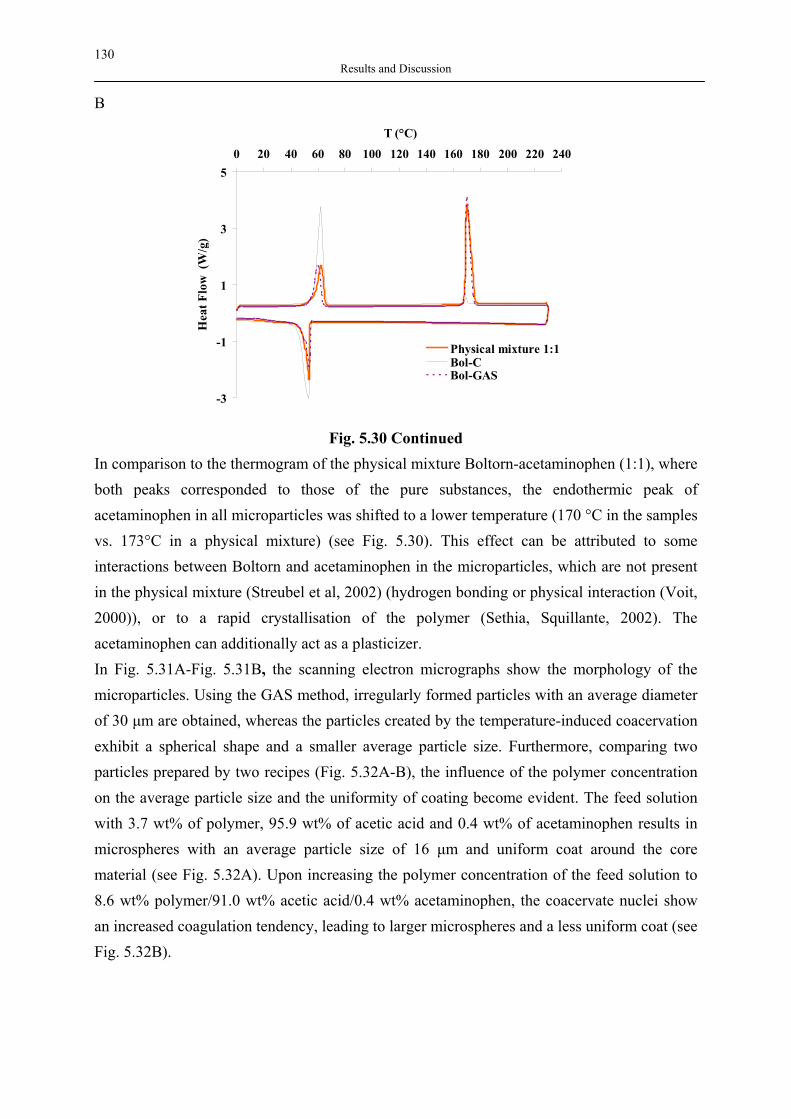
130 Results and Discussion
B
-3
-1
1
3
50 20 40 60 80 100 120 140 160 180 200 220 240
T (°C)
Hea
t Flo
w (
W/g
)
Physical mixture 1:1Bol-CBol-GAS
Fig. 5.30 Continued
In comparison to the thermogram of the physical mixture Boltorn-acetaminophen (1:1), where both peaks corresponded to those of the pure substances, the endothermic peak of acetaminophen in all microparticles was shifted to a lower temperature (170 °C in the samples vs. 173°C in a physical mixture) (see Fig. 5.30). This effect can be attributed to some interactions between Boltorn and acetaminophen in the microparticles, which are not present in the physical mixture (Streubel et al, 2002) (hydrogen bonding or physical interaction (Voit, 2000)), or to a rapid crystallisation of the polymer (Sethia, Squillante, 2002). The acetaminophen can additionally act as a plasticizer. In Fig. 5.31A-Fig. 5.31B, the scanning electron micrographs show the morphology of the microparticles. Using the GAS method, irregularly formed particles with an average diameter of 30 µm are obtained, whereas the particles created by the temperature-induced coacervation exhibit a spherical shape and a smaller average particle size. Furthermore, comparing two particles prepared by two recipes (Fig. 5.32A-B), the influence of the polymer concentration on the average particle size and the uniformity of coating become evident. The feed solution with 3.7 wt% of polymer, 95.9 wt% of acetic acid and 0.4 wt% of acetaminophen results in microspheres with an average particle size of 16 µm and uniform coat around the core material (see Fig. 5.32A). Upon increasing the polymer concentration of the feed solution to 8.6 wt% polymer/91.0 wt% acetic acid/0.4 wt% acetaminophen, the coacervate nuclei show an increased coagulation tendency, leading to larger microspheres and a less uniform coat (see Fig. 5.32B).
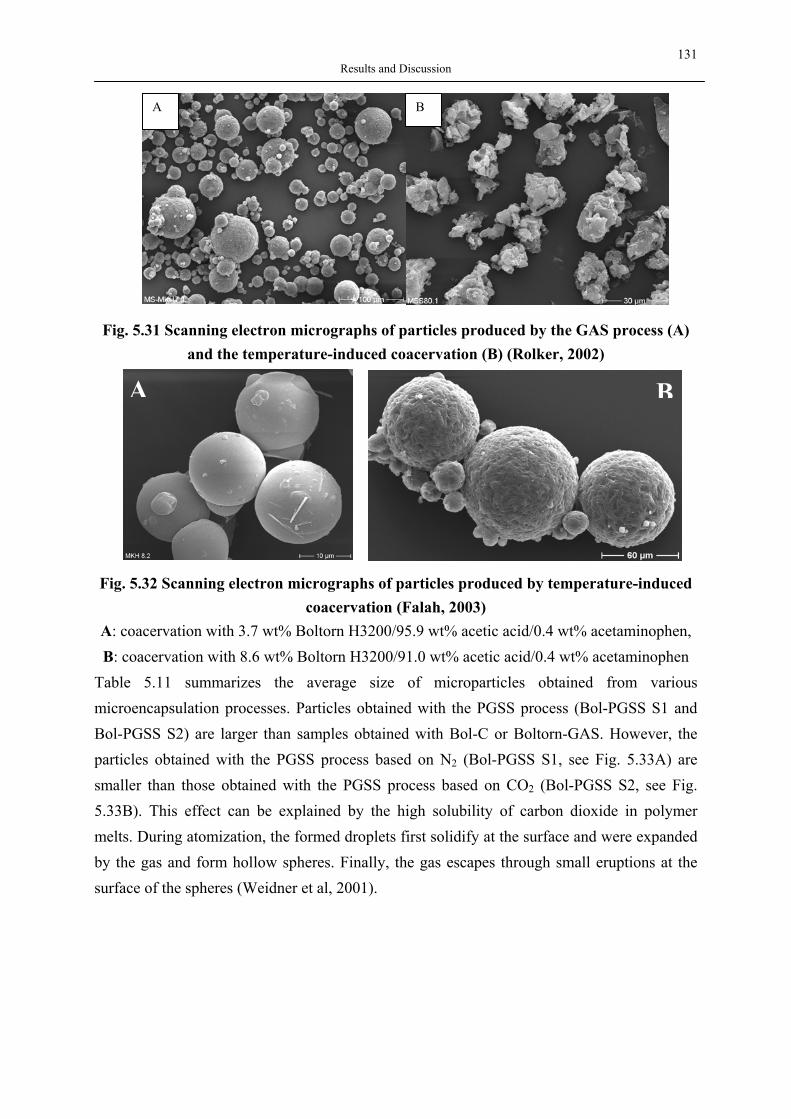
131 Results and Discussion
Fig. 5.31 Scanning electron micrographs of particles produced by the GAS process (A) and the temperature-induced coacervation (B) (Rolker, 2002)
Fig. 5.32 Scanning electron micrographs of particles produced by temperature-induced
coacervation (Falah, 2003) A: coacervation with 3.7 wt% Boltorn H3200/95.9 wt% acetic acid/0.4 wt% acetaminophen, B: coacervation with 8.6 wt% Boltorn H3200/91.0 wt% acetic acid/0.4 wt% acetaminophen
Table 5.11 summarizes the average size of microparticles obtained from various microencapsulation processes. Particles obtained with the PGSS process (Bol-PGSS S1 and Bol-PGSS S2) are larger than samples obtained with Bol-C or Boltorn-GAS. However, the particles obtained with the PGSS process based on N2 (Bol-PGSS S1, see Fig. 5.33A) are smaller than those obtained with the PGSS process based on CO2 (Bol-PGSS S2, see Fig. 5.33B). This effect can be explained by the high solubility of carbon dioxide in polymer melts. During atomization, the formed droplets first solidify at the surface and were expanded by the gas and form hollow spheres. Finally, the gas escapes through small eruptions at the surface of the spheres (Weidner et al, 2001).
A B
A B
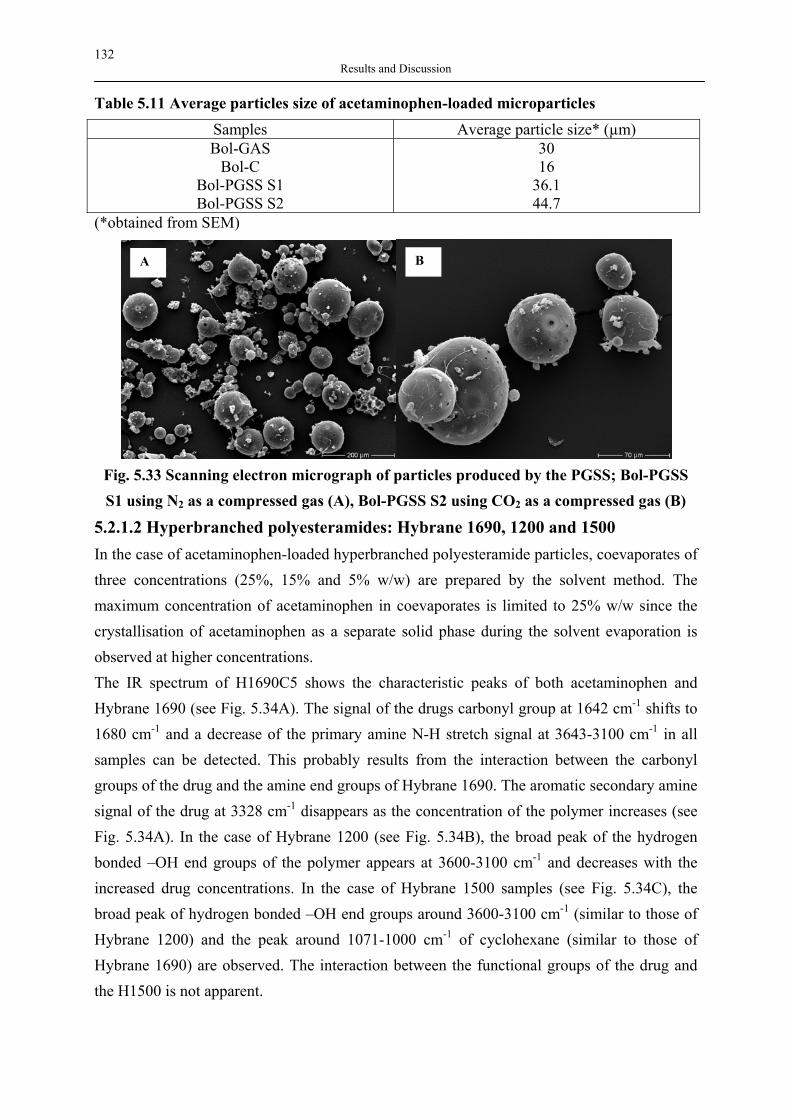
132 Results and Discussion
Table 5.11 Average particles size of acetaminophen-loaded microparticles Samples Average particle size* (µm) Bol-GAS
Bol-C Bol-PGSS S1 Bol-PGSS S2
30 16
36.1 44.7
(*obtained from SEM)
Fig. 5.33 Scanning electron micrograph of particles produced by the PGSS; Bol-PGSS S1 using N2 as a compressed gas (A), Bol-PGSS S2 using CO2 as a compressed gas (B)
5.2.1.2 Hyperbranched polyesteramides: Hybrane 1690, 1200 and 1500 In the case of acetaminophen-loaded hyperbranched polyesteramide particles, coevaporates of three concentrations (25%, 15% and 5% w/w) are prepared by the solvent method. The maximum concentration of acetaminophen in coevaporates is limited to 25% w/w since the crystallisation of acetaminophen as a separate solid phase during the solvent evaporation is observed at higher concentrations. The IR spectrum of H1690C5 shows the characteristic peaks of both acetaminophen and Hybrane 1690 (see Fig. 5.34A). The signal of the drugs carbonyl group at 1642 cm-1 shifts to 1680 cm-1 and a decrease of the primary amine N-H stretch signal at 3643-3100 cm-1 in all samples can be detected. This probably results from the interaction between the carbonyl groups of the drug and the amine end groups of Hybrane 1690. The aromatic secondary amine signal of the drug at 3328 cm-1 disappears as the concentration of the polymer increases (see Fig. 5.34A). In the case of Hybrane 1200 (see Fig. 5.34B), the broad peak of the hydrogen bonded –OH end groups of the polymer appears at 3600-3100 cm-1 and decreases with the increased drug concentrations. In the case of Hybrane 1500 samples (see Fig. 5.34C), the broad peak of hydrogen bonded –OH end groups around 3600-3100 cm-1 (similar to those of Hybrane 1200) and the peak around 1071-1000 cm-1 of cyclohexane (similar to those of Hybrane 1690) are observed. The interaction between the functional groups of the drug and the H1500 is not apparent.
A B
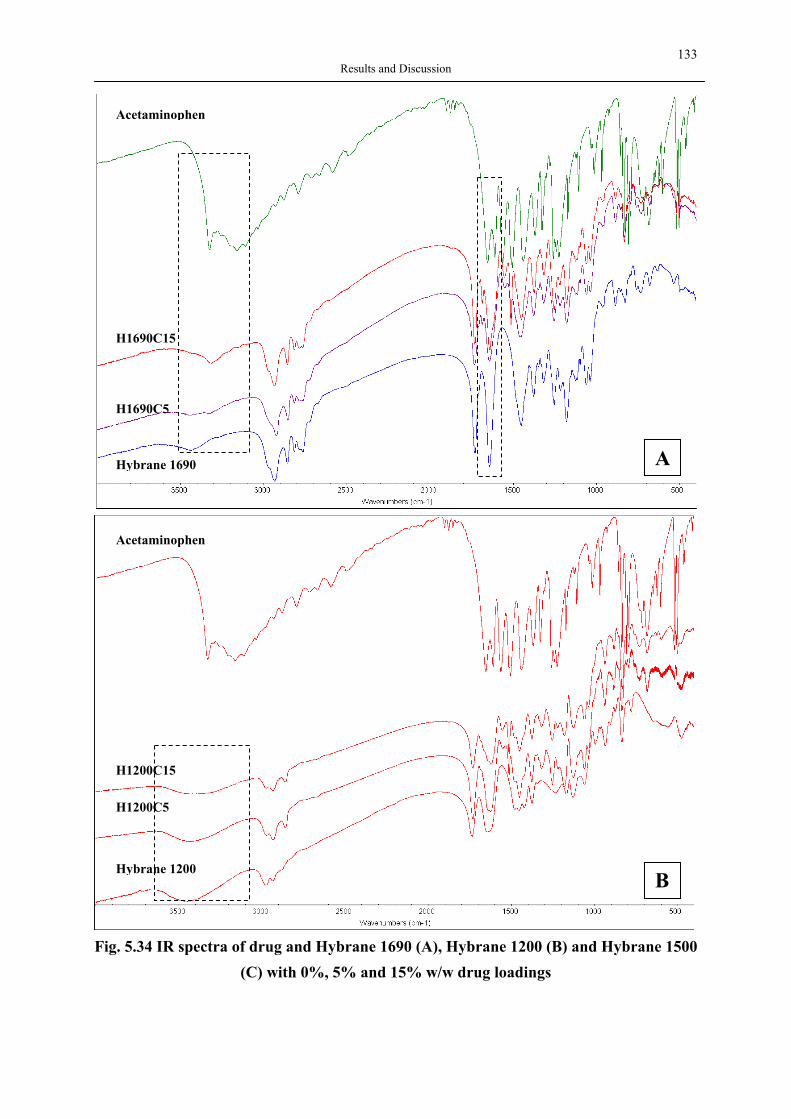
133 Results and Discussion
Fig. 5.34 IR spectra of drug and Hybrane 1690 (A), Hybrane 1200 (B) and Hybrane 1500
(C) with 0%, 5% and 15% w/w drug loadings
Hybrane 1690
H1690C5
H1690C15
Acetaminophen
A
Hybrane 1200
H1200C5
H1200C15
Acetaminophen
B
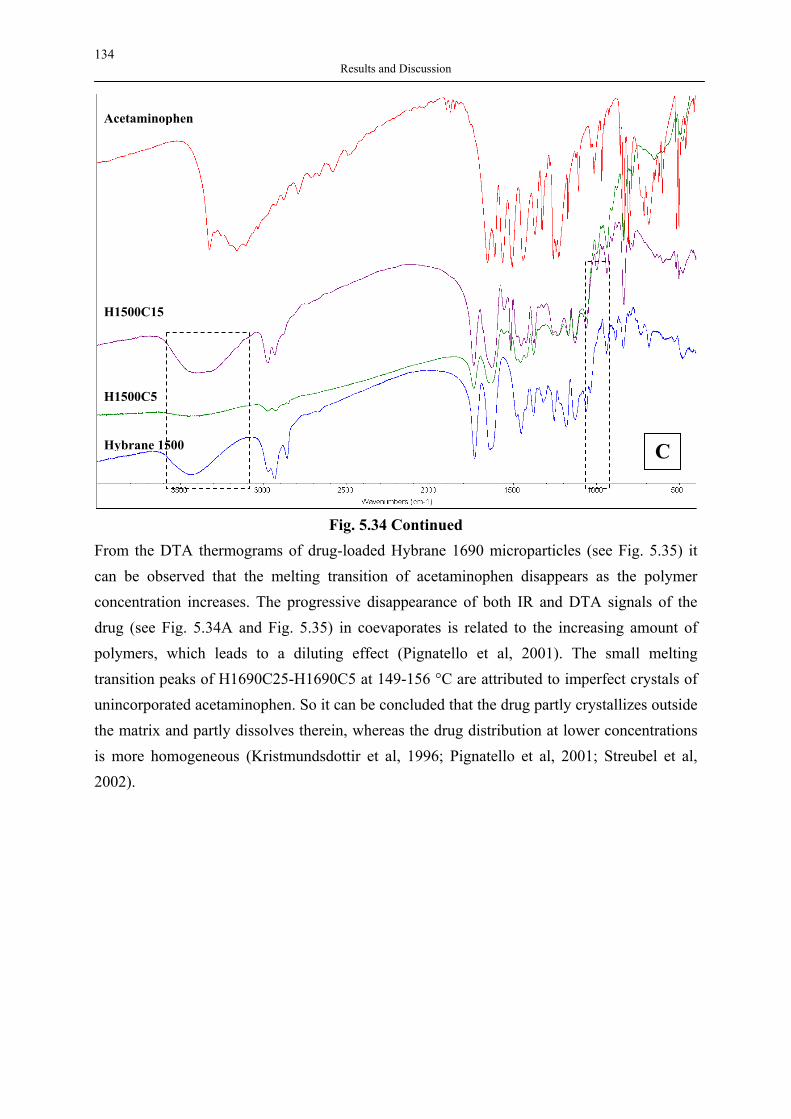
134 Results and Discussion
Fig. 5.34 Continued
From the DTA thermograms of drug-loaded Hybrane 1690 microparticles (see Fig. 5.35) it can be observed that the melting transition of acetaminophen disappears as the polymer concentration increases. The progressive disappearance of both IR and DTA signals of the drug (see Fig. 5.34A and Fig. 5.35) in coevaporates is related to the increasing amount of polymers, which leads to a diluting effect (Pignatello et al, 2001). The small melting transition peaks of H1690C25-H1690C5 at 149-156 °C are attributed to imperfect crystals of unincorporated acetaminophen. So it can be concluded that the drug partly crystallizes outside the matrix and partly dissolves therein, whereas the drug distribution at lower concentrations is more homogeneous (Kristmundsdottir et al, 1996; Pignatello et al, 2001; Streubel et al, 2002).
Hybrane 1500
H1500C5
H1500C15
Acetaminophen
C
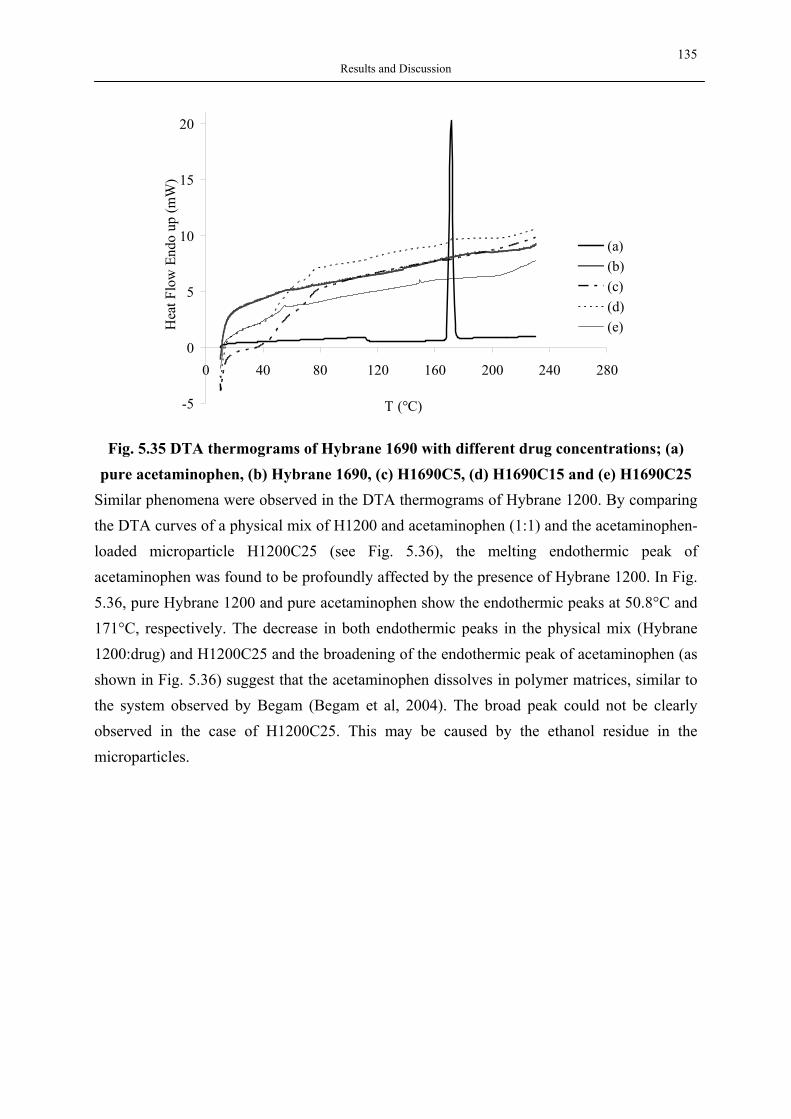
135 Results and Discussion
-5
0
5
10
15
20
0 40 80 120 160 200 240 280
T (°C)
Hea
t Flo
w E
ndo
up (m
W)
(a)(b)(c)(d)(e)
Fig. 5.35 DTA thermograms of Hybrane 1690 with different drug concentrations; (a)
pure acetaminophen, (b) Hybrane 1690, (c) H1690C5, (d) H1690C15 and (e) H1690C25 Similar phenomena were observed in the DTA thermograms of Hybrane 1200. By comparing the DTA curves of a physical mix of H1200 and acetaminophen (1:1) and the acetaminophen-loaded microparticle H1200C25 (see Fig. 5.36), the melting endothermic peak of acetaminophen was found to be profoundly affected by the presence of Hybrane 1200. In Fig. 5.36, pure Hybrane 1200 and pure acetaminophen show the endothermic peaks at 50.8°C and 171°C, respectively. The decrease in both endothermic peaks in the physical mix (Hybrane 1200:drug) and H1200C25 and the broadening of the endothermic peak of acetaminophen (as shown in Fig. 5.36) suggest that the acetaminophen dissolves in polymer matrices, similar to the system observed by Begam (Begam et al, 2004). The broad peak could not be clearly observed in the case of H1200C25. This may be caused by the ethanol residue in the microparticles.

136 Results and Discussion
0
5
10
15
20
0 20 40 60 80 100 120 140 160 180 200 220 240 260 280
T (°C)
Hea
t Flo
w E
ndo
up (m
W)
(a)(b)(c)(d)
Fig. 5.36 DTA thermograms of Hybrane 1200 with different drug concentrations; (a) pure acetaminophen, (b) Hybrane 1200, (c) H1200C25, and (d) physical mix of H1200
and acetaminophen (1:1). In the case of Hybrane 1500, two broad endothermic peaks at 68 °C and 245.5 °C can be observed. The second endothermic peak may be attributed to the decomposition of the polymer. In the case of H1500C25 (see Fig. 5.37), two separated endothermic peaks at 54.5 °C (Hybrane 1500) and at 234.5 °C (decomposition of polymers) were observed. Unlike H1500C25, H1500C15 and H1500C5 exhibited similar results as obtained for Hybrane 1690 and Hybrane 1200 microparticles. An increase in the polymer concentration leads to the better dispersion and dissolution of drug in the polymer matrix. In order to account for the effect of solvent deposited in coevaporates, the control samples were prepared by dissolving the polymer in pure ethanol and subsequent drying. The comparison of the DTA thermograms of the controlled samples with those of pure polymers shows that the presence of small amount of residual ethanol causes the broadening of endothermic peaks in all DTA thermograms.
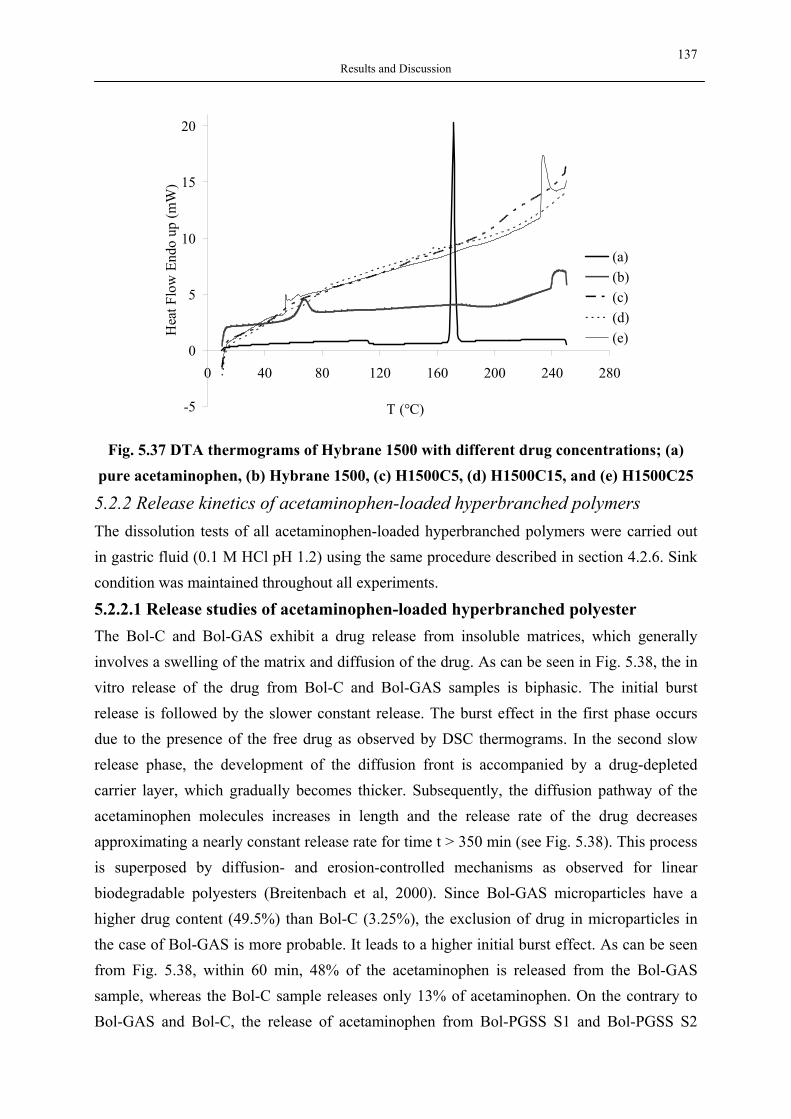
137 Results and Discussion
-5
0
5
10
15
20
0 40 80 120 160 200 240 280
T (°C)
Hea
t Flo
w E
ndo
up (m
W)
(a)(b)(c)(d)(e)
Fig. 5.37 DTA thermograms of Hybrane 1500 with different drug concentrations; (a)
pure acetaminophen, (b) Hybrane 1500, (c) H1500C5, (d) H1500C15, and (e) H1500C25
5.2.2 Release kinetics of acetaminophen-loaded hyperbranched polymers The dissolution tests of all acetaminophen-loaded hyperbranched polymers were carried out in gastric fluid (0.1 M HCl pH 1.2) using the same procedure described in section 4.2.6. Sink condition was maintained throughout all experiments.
5.2.2.1 Release studies of acetaminophen-loaded hyperbranched polyester The Bol-C and Bol-GAS exhibit a drug release from insoluble matrices, which generally involves a swelling of the matrix and diffusion of the drug. As can be seen in Fig. 5.38, the in vitro release of the drug from Bol-C and Bol-GAS samples is biphasic. The initial burst release is followed by the slower constant release. The burst effect in the first phase occurs due to the presence of the free drug as observed by DSC thermograms. In the second slow release phase, the development of the diffusion front is accompanied by a drug-depleted carrier layer, which gradually becomes thicker. Subsequently, the diffusion pathway of the acetaminophen molecules increases in length and the release rate of the drug decreases approximating a nearly constant release rate for time t > 350 min (see Fig. 5.38). This process is superposed by diffusion- and erosion-controlled mechanisms as observed for linear biodegradable polyesters (Breitenbach et al, 2000). Since Bol-GAS microparticles have a higher drug content (49.5%) than Bol-C (3.25%), the exclusion of drug in microparticles in the case of Bol-GAS is more probable. It leads to a higher initial burst effect. As can be seen from Fig. 5.38, within 60 min, 48% of the acetaminophen is released from the Bol-GAS sample, whereas the Bol-C sample releases only 13% of acetaminophen. On the contrary to Bol-GAS and Bol-C, the release of acetaminophen from Bol-PGSS S1 and Bol-PGSS S2
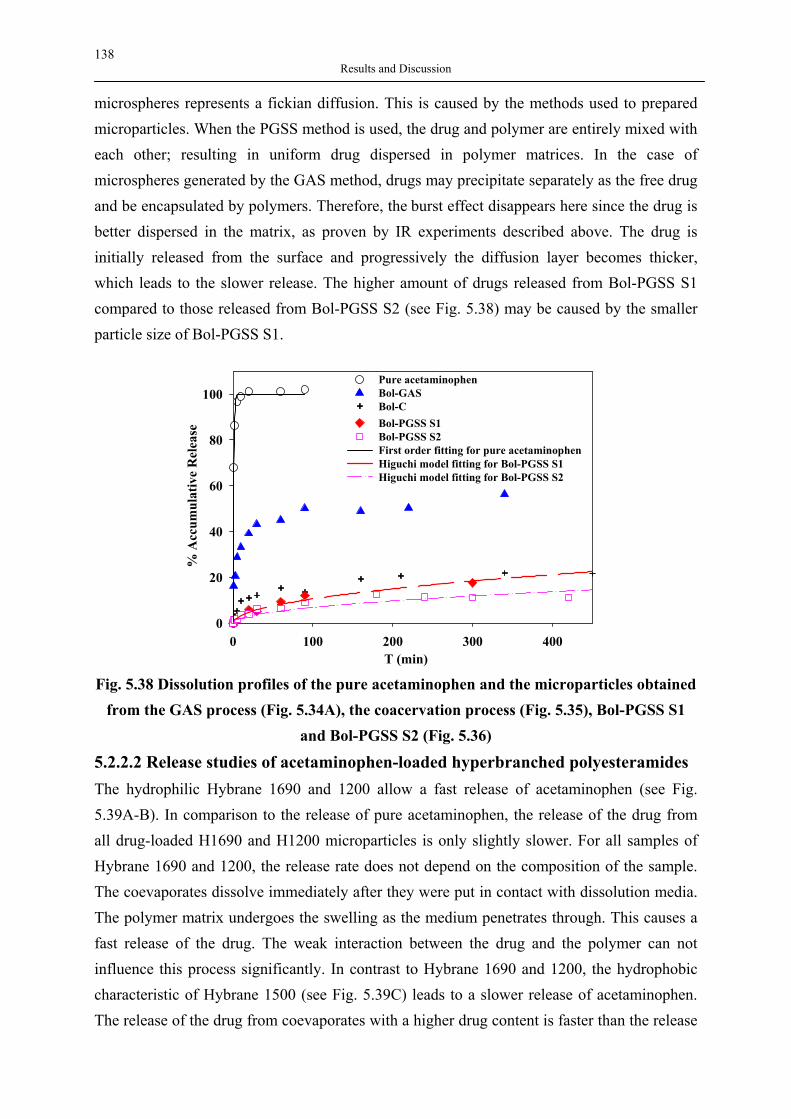
138 Results and Discussion
microspheres represents a fickian diffusion. This is caused by the methods used to prepared microparticles. When the PGSS method is used, the drug and polymer are entirely mixed with each other; resulting in uniform drug dispersed in polymer matrices. In the case of microspheres generated by the GAS method, drugs may precipitate separately as the free drug and be encapsulated by polymers. Therefore, the burst effect disappears here since the drug is better dispersed in the matrix, as proven by IR experiments described above. The drug is initially released from the surface and progressively the diffusion layer becomes thicker, which leads to the slower release. The higher amount of drugs released from Bol-PGSS S1 compared to those released from Bol-PGSS S2 (see Fig. 5.38) may be caused by the smaller particle size of Bol-PGSS S1.
T (min)0 100 200 300 400
% A
ccum
ulat
ive
Rel
ease
0
20
40
60
80
100Pure acetaminophenBol-GASBol-CBol-PGSS S1Bol-PGSS S2First order fitting for pure acetaminophen Higuchi model fitting for Bol-PGSS S1Higuchi model fitting for Bol-PGSS S2
Fig. 5.38 Dissolution profiles of the pure acetaminophen and the microparticles obtained
from the GAS process (Fig. 5.34A), the coacervation process (Fig. 5.35), Bol-PGSS S1 and Bol-PGSS S2 (Fig. 5.36)
5.2.2.2 Release studies of acetaminophen-loaded hyperbranched polyesteramides The hydrophilic Hybrane 1690 and 1200 allow a fast release of acetaminophen (see Fig. 5.39A-B). In comparison to the release of pure acetaminophen, the release of the drug from all drug-loaded H1690 and H1200 microparticles is only slightly slower. For all samples of Hybrane 1690 and 1200, the release rate does not depend on the composition of the sample. The coevaporates dissolve immediately after they were put in contact with dissolution media. The polymer matrix undergoes the swelling as the medium penetrates through. This causes a fast release of the drug. The weak interaction between the drug and the polymer can not influence this process significantly. In contrast to Hybrane 1690 and 1200, the hydrophobic characteristic of Hybrane 1500 (see Fig. 5.39C) leads to a slower release of acetaminophen. The release of the drug from coevaporates with a higher drug content is faster than the release
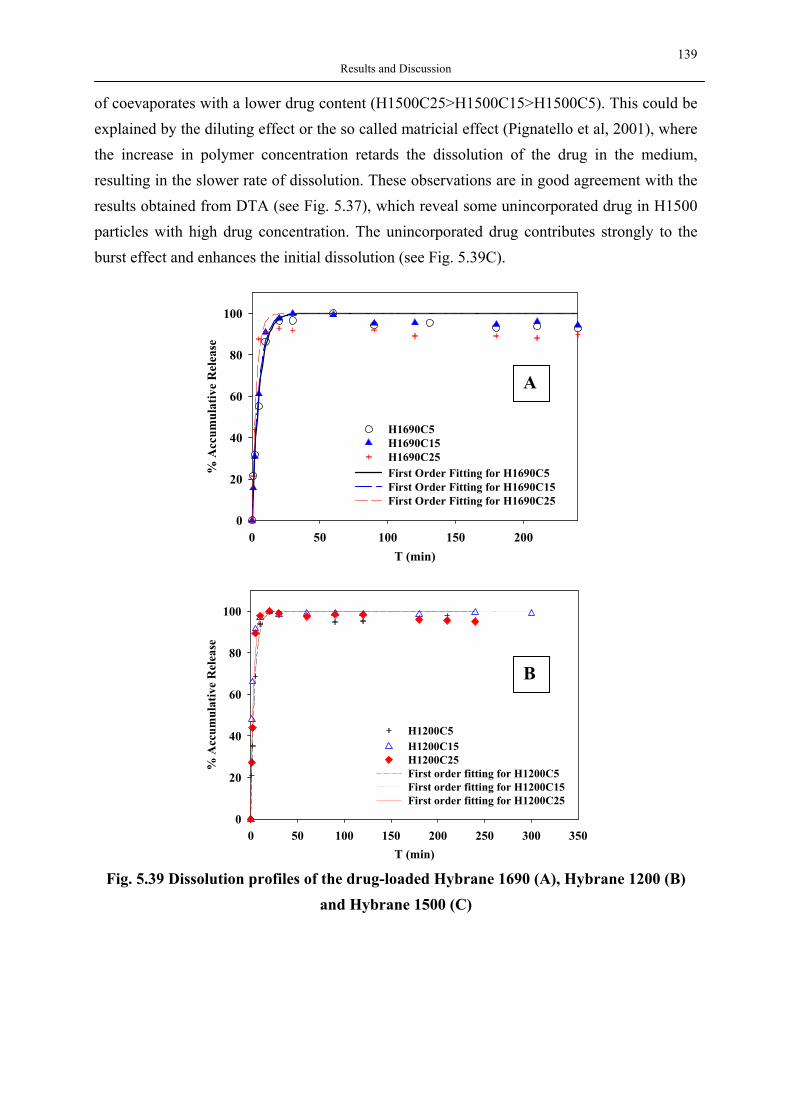
139 Results and Discussion
of coevaporates with a lower drug content (H1500C25>H1500C15>H1500C5). This could be explained by the diluting effect or the so called matricial effect (Pignatello et al, 2001), where the increase in polymer concentration retards the dissolution of the drug in the medium, resulting in the slower rate of dissolution. These observations are in good agreement with the results obtained from DTA (see Fig. 5.37), which reveal some unincorporated drug in H1500 particles with high drug concentration. The unincorporated drug contributes strongly to the burst effect and enhances the initial dissolution (see Fig. 5.39C).
T (min)0 50 100 150 200
% A
ccum
ulat
ive
Rel
ease
0
20
40
60
80
100
H1690C5 H1690C15 H1690C25 First Order Fitting for H1690C5 First Order Fitting for H1690C15 First Order Fitting for H1690C25
T (min)0 50 100 150 200 250 300 350
% A
ccum
ulat
ive
Rel
ease
0
20
40
60
80
100
H1200C5 H1200C15 H1200C25 First order fitting for H1200C5First order fitting for H1200C15First order fitting for H1200C25
Fig. 5.39 Dissolution profiles of the drug-loaded Hybrane 1690 (A), Hybrane 1200 (B)
and Hybrane 1500 (C)
A
B
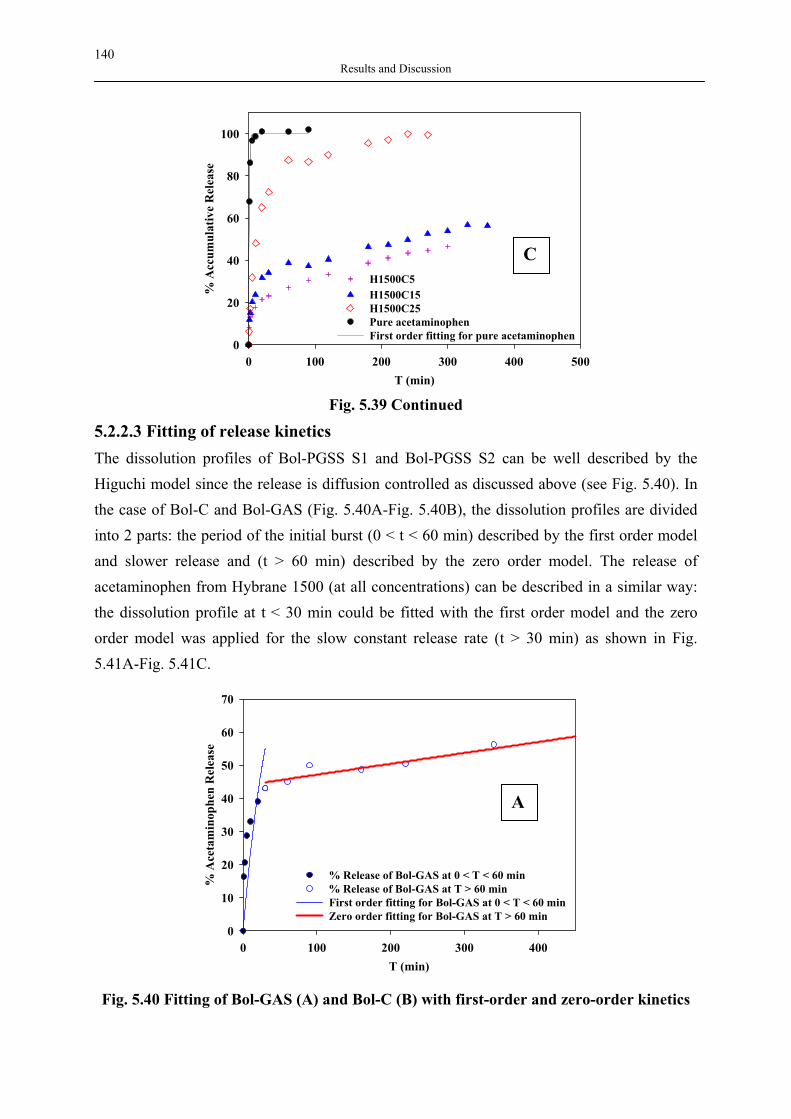
140 Results and Discussion
T (min)0 100 200 300 400 500
% A
ccum
ulat
ive
Rel
ease
0
20
40
60
80
100
H1500C5 H1500C15H1500C25Pure acetaminophen First order fitting for pure acetaminophen
Fig. 5.39 Continued
5.2.2.3 Fitting of release kinetics The dissolution profiles of Bol-PGSS S1 and Bol-PGSS S2 can be well described by the Higuchi model since the release is diffusion controlled as discussed above (see Fig. 5.40). In the case of Bol-C and Bol-GAS (Fig. 5.40A-Fig. 5.40B), the dissolution profiles are divided into 2 parts: the period of the initial burst (0 < t < 60 min) described by the first order model and slower release and (t > 60 min) described by the zero order model. The release of acetaminophen from Hybrane 1500 (at all concentrations) can be described in a similar way: the dissolution profile at t < 30 min could be fitted with the first order model and the zero order model was applied for the slow constant release rate (t > 30 min) as shown in Fig. 5.41A-Fig. 5.41C.
T (min)0 100 200 300 400
% A
ceta
min
ophe
n R
elea
se
0
10
20
30
40
50
60
70
% Release of Bol-GAS at 0 < T < 60 min% Release of Bol-GAS at T > 60 minFirst order fitting for Bol-GAS at 0 < T < 60 minZero order fitting for Bol-GAS at T > 60 min
Fig. 5.40 Fitting of Bol-GAS (A) and Bol-C (B) with first-order and zero-order kinetics
C
A
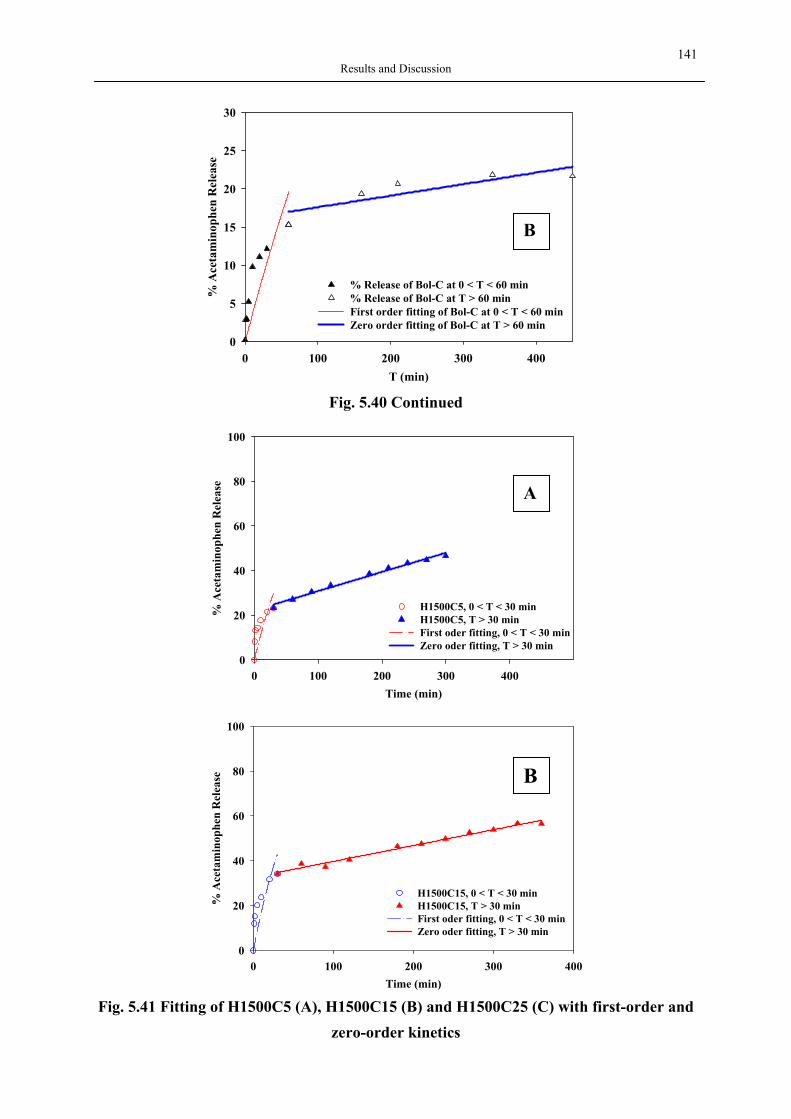
141 Results and Discussion
T (min)0 100 200 300 400
% A
ceta
min
ophe
n R
elea
se
0
5
10
15
20
25
30
% Release of Bol-C at 0 < T < 60 min% Release of Bol-C at T > 60 minFírst order fitting of Bol-C at 0 < T < 60 minZero order fitting of Bol-C at T > 60 min
Fig. 5.40 Continued
Time (min)0 100 200 300 400
% A
ceta
min
ophe
n R
elea
se
0
20
40
60
80
100
H1500C5, 0 < T < 30 min H1500C5, T > 30 minFirst oder fitting, 0 < T < 30 minZero oder fitting, T > 30 min
Time (min)0 100 200 300 400
% A
ceta
min
ophe
n R
elea
se
0
20
40
60
80
100
H1500C15, 0 < T < 30 minH1500C15, T > 30 minFirst oder fitting, 0 < T < 30 minZero oder fitting, T > 30 min
Fig. 5.41 Fitting of H1500C5 (A), H1500C15 (B) and H1500C25 (C) with first-order and
zero-order kinetics
B
B
A
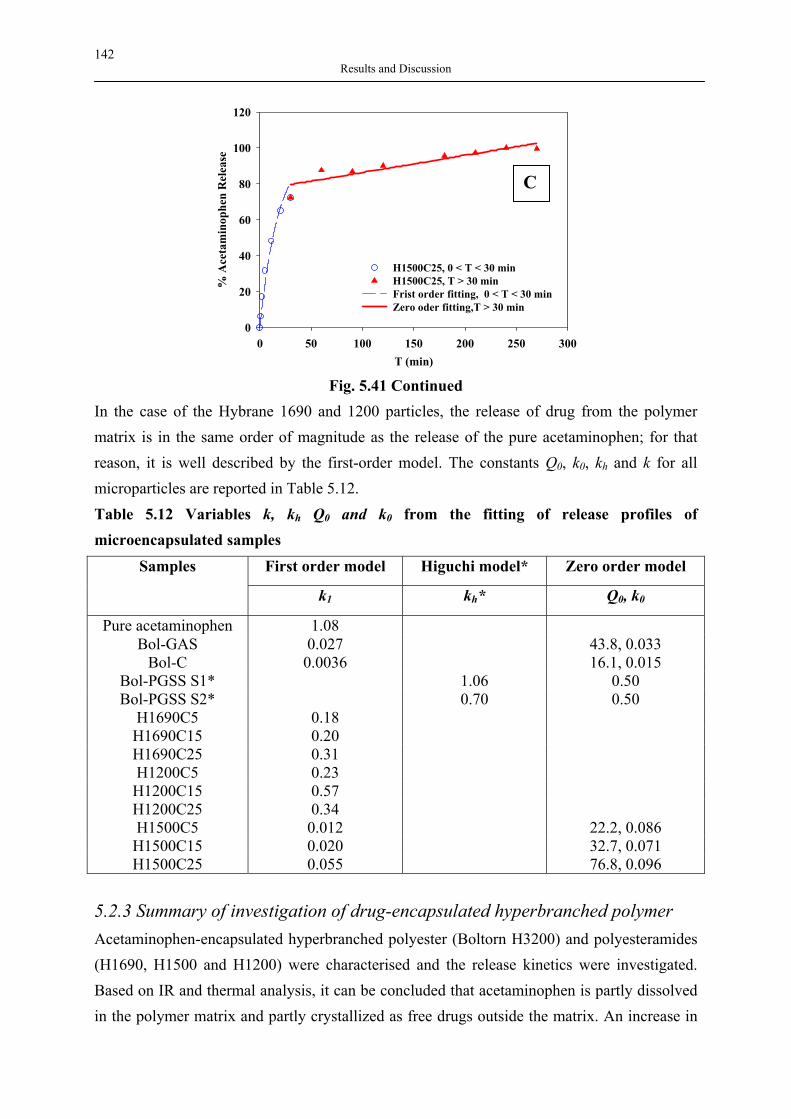
142 Results and Discussion
T (min)0 50 100 150 200 250 300
% A
ceta
min
ophe
n R
elea
se
0
20
40
60
80
100
120
H1500C25, 0 < T < 30 minH1500C25, T > 30 minFrist order fitting, 0 < T < 30 minZero oder fitting,T > 30 min
Fig. 5.41 Continued
In the case of the Hybrane 1690 and 1200 particles, the release of drug from the polymer matrix is in the same order of magnitude as the release of the pure acetaminophen; for that reason, it is well described by the first-order model. The constants Q0, k0, kh and k for all microparticles are reported in Table 5.12. Table 5.12 Variables k, kh Q0 and k0 from the fitting of release profiles of microencapsulated samples
First order model Higuchi model* Zero order model Samples
k1 kh* Q0, k0
Pure acetaminophen 1.08 Bol-GAS 0.027 43.8, 0.033
Bol-C 0.0036 16.1, 0.015 Bol-PGSS S1* 1.06 0.50 Bol-PGSS S2* 0.70 0.50
H1690C5 0.18 H1690C15 0.20 H1690C25 0.31 H1200C5 0.23 H1200C15 0.57 H1200C25 0.34 H1500C5 0.012 22.2, 0.086 H1500C15 0.020 32.7, 0.071 H1500C25 0.055 76.8, 0.096
5.2.3 Summary of investigation of drug-encapsulated hyperbranched polymer Acetaminophen-encapsulated hyperbranched polyester (Boltorn H3200) and polyesteramides (H1690, H1500 and H1200) were characterised and the release kinetics were investigated. Based on IR and thermal analysis, it can be concluded that acetaminophen is partly dissolved in the polymer matrix and partly crystallized as free drugs outside the matrix. An increase in
C
143 Results and Discussion
polymer concentration of microparticles leads to the diluting effect and to an apparently more well-dispersed system. It has been shown that the release behaviour of acetaminophen-loaded hyperbranched polyester (Boltorn H3200) microparticles depends on the microencapsulation methods employed. Particles produced by GAS and coacervation processes show biphasic release: the predominated burst release due to unincorporated drugs and the slower constant release rate. This is in agreement with the results obtained by IR and thermal analysis. The release behaviour of acetaminophen from particles obtained by PGSS is governed by the diffusion process. In the case of acetaminophen-loaded Hybrane, the fast release of the microparticles is observed in all samples prepared of hydrophilic, water soluble polymers H1690 and H1200. In contrast, the hydrophobic H1500 samples show the biphasic release similar to those of the Bol-GAS and the Bol-C.
144 Conclusions and Prerespective
6. Conclusions and Perspective In the present work, the potential use of two polymeric materials, silica aerogels and hyperbranched polymers as drug delivery systems were studied and evaluated. Systematic investigations of the influence of physicochemical properties of aerogels such as density, specific surface area, pore sizes, and hydrophobicity on the loading process and the in vitro release kinetics have been conducted. The hydrophilic silica aerogels with different bulk densities (ranging from 0.03 to 0.27 g/cm3) were synthesized by the two-step method. The hydrophobic silica aerogels were produced by the surface modification of the corresponding hydrophilic silica aerogels. The adsorption of 6 poorly water soluble drugs (3 profens: ketoprofen, flurbiprofen, ibuprofen, and 3 non-profens: miconazole, griseofulvin, dithranol) on hydrophilic and hydrophobic aerogels with different densities and surface areas at different bulk concentration of drugs in CO2 has been investigated. The characterization of drug-loaded aerogels has shown that drugs impregnated in aerogels exist in amorphous state as observed by SEM and XRD and preserve their chemical identity as observed by the UV-vis and IR methods. From the experimental results the following can be concluded:
• For all studied drugs the adsorption on hydrophilic aerogels was much higher than that on hydrophobic ones.
• The influence of the density, the surface area and the PSD on the adsorption process depends on the nature of the drug but shows the same tendency for both hydrophilic and hydrophobic aerogels.
• For the drugs which show a very low adsorption on aerogels (dithranol and griseofulvin), no dependency of the loading on physicochemical properties of aerogels is observed since the loading of drugs on the aerogels surface is so low, that even the monolayer adsorption is not achieved.
• The drugs with moderate adsorption on aerogels (ketoprofen, flurbiprofen, miconazole) show more complicated behaviour. At low bulk concentrations of drugs in CO2 the drug monolayer is not completely formed and the loading does not depend on the concentration as discussed previously. At higher bulk concentrations of drugs the loading increases with the increasing density and surface area of aerogels. Still not only the surface area but also PSD plays an important role: small pore size, narrow size distribution and large mesopore volume favour the higher loadings.
• For very high adsorption of drugs on the aerogel surface (ibuprofen), multilayer adsorption up to capillary condensation can occur, so that the interactions between the drug molecules itself prevail over the interactions with the surface of silica aerogels. In this case adsorption depends only on the bulk concentration of the drug in CO2.
145 Conclusion and Perspective
For the manufacture of drug-aerogel formulations it means: in case of very low or very high adsorption the structural properties of aerogels are irrelevant to the loading values. The only factors allowing for changing and controlling the loading are hydrophobicity of aerogels and bulk concentration of the drug in CO2. Another goal of this work was to investigate the influence of the characteristics of the pulverized drug-aerogel formations on the in vitro release rate of drugs. It has been shown that the release of drugs from hydrophilic aerogels depends on the nature of the drugs and on the pH of the dissolution medium:
• If the drugs with low and moderate adsorption on aerogels (dithranol, griseofulvin, ketoprofen and flurbiprofen) are adsorbed on hydrophilic silica aerogels, a very fast release of drugs is observed. The release rate is higher than that of the corresponding crystalline drugs. This effect can be explained by fast collapse of aerogels structure in an aqueous medium and the weak interactions of drugs with aerogels surface. Furthermore, the release of drugs from the hydrophilic matrix is not affected by the change in the density of aerogels.
• If the drugs with higher affinity to aerogels (miconazole, ibuprofen) are adsorbed on hydrophilic silica aerogels, the release is close to that of crystalline drug (ibuprofen, excepting the large pore samples) or even slower (miconazole). The slower release kinetics are due to 2 reasons: first the strong interaction between aerogel and functional groups of drugs and second the dense packing of drug molecules in aerogel pores, which prevent for the penetration of the dissolution medium. This explanation is supported by the fact that the release rate decreases with decreasing pore sizes of aerogels in this case.
• The release of drugs from hydrophobic silica aerogels is slower that that from hydrophilic aerogels. It includes the burst release followed by the slow diffusion from aerogel matrix due to the stability of hydrophobic aerogels in aqueous medium. However, in the case of griseofulvin the loading is so small and the interaction of drugs with aerogels so weak that only the burst effect is observed.
• The increase in pH value of dissolution medium leads to faster release of all studied drugs and the dissolution profiles of aerogels and crystalline drugs come closer to each other. The aerogel effect is then less pronounced.
Based on the above findings, a novel method for dissolution enhancement of drugs with low and moderate adsorption (griseofulvin, dithranol, ketoprofen and flurbiprofen) by adsorption on hydrophilic silica aerogels is suggested. In practise, the release kinetics of drugs from hydrophilic aerogels can be initially predicted when the adsorption of drugs on aerogels is known. The low or moderate adsorption on silica aerogels implies the faster release of drugs from drug-aerogel formulations. In this case, the dissolution rate can be enhanced. If the drugs
146 Conclusions and Prerespective
have very high adsorption on silica aerogels, the slow release kinetic is observed. The dissolution rate can not be improved. Finally, the long-term physical and chemical stability analysis shows that there are no significant changes of drug-loaded aerogels samples after 1 year and 2 years. The drugs inside drug-loaded aerogels can preserve their identity and characteristics. In terms of applications, the drug-loaded aerogel powder can be filled into a gelatin capsule or a compress tablet (e.g. oral administration). The hydrophilic or hydrophobic aerogels can be selected depending on the delivery purpose (e.g. immediate, sustained, etc.). In case of delayed or sustained drug delivery application, hydrophobic aerogels may be suggested. Another interesting area of an oral administration is the floating oral delivery system. This application is of interest for drugs which are locally active in the stomach, are adsorbed in the stomach, are unstable in the intestinal or colonic environment and have low solubility at high pH values (e.g. intestine fluids). In this case, the carrier must have a low density. Aerogels can be candidates due to their very low density, since they can float on the gastric fluids. Although it is known that sol-gel derived silica is considered a non-toxic material, the information about the in vivo compatibility of hydrophilic and hydrophobic silica aerogels as delivery based system are still lacking. In this regard, the studies of the in vivo biocompatibility and adverse effects in the body have to be conducted and approved. The second part of the dissertation focuses on the investigation of drug-encapsulated hyperbranched microparticles prepared from the drug acetaminophen and commercial hyperbranched polyester Boltorn H3200 and polyesteramides Hybrane H1690, H1200, H1500. Based on IR and DTA analysis, it can be concluded that acetaminophen is partly dissolved in the polymer matrix and partly crystallized outside the matrix. An increase in polymer concentration of microparticles leads to the diluting effect and to an apparently more well-dispersed system. The release behaviour of acetaminophen-loaded hyperbranched polyester (Boltorn 3200) microparticles depends on the microencapsulation methods employed. Particles produced by GAS and coacervation processes show biphasic release: the predominated burst release due to unincorporated drugs and the slower constant release rate. The release behaviour of acetaminophen from particles obtained by PGSS is characterised by the diffusion process since the drug is better dispersed in polymer matrices. In case of acetaminophen-loaded Hybrane, the fast release of the microparticles is observed in all samples prepared from hydrophilic, water soluble polymers H1690 and H1200. The hydrophobic H1500 samples show the biphasic release similar to those of the Bol-GAS and the Bol-C. When applying the same encapsulation method, the release kinetics of polymeric microparticles can be quite different depending on the property of hyperbranched polymer. Therefore, in terms of applications, hyperbranched polyester Boltorn H3200 and
147 Conclusion and Perspective
hyperbranched polyesteramides Hybrane 1500 could be feasible candidates for controlled release applications depending on the delivery strategies (types of release, encapsulation, and degradability). Hybrane 1690 and 1200 can offer another emerging application such as in polymer blend system to increase the hydrophilic characteristic of the drug excipients, thus improving wettability of the drugs. However, a number of important factors for applying these hyperbranched polymers in the field of life science such as toxicity and biocompatibility are a matter of future research.
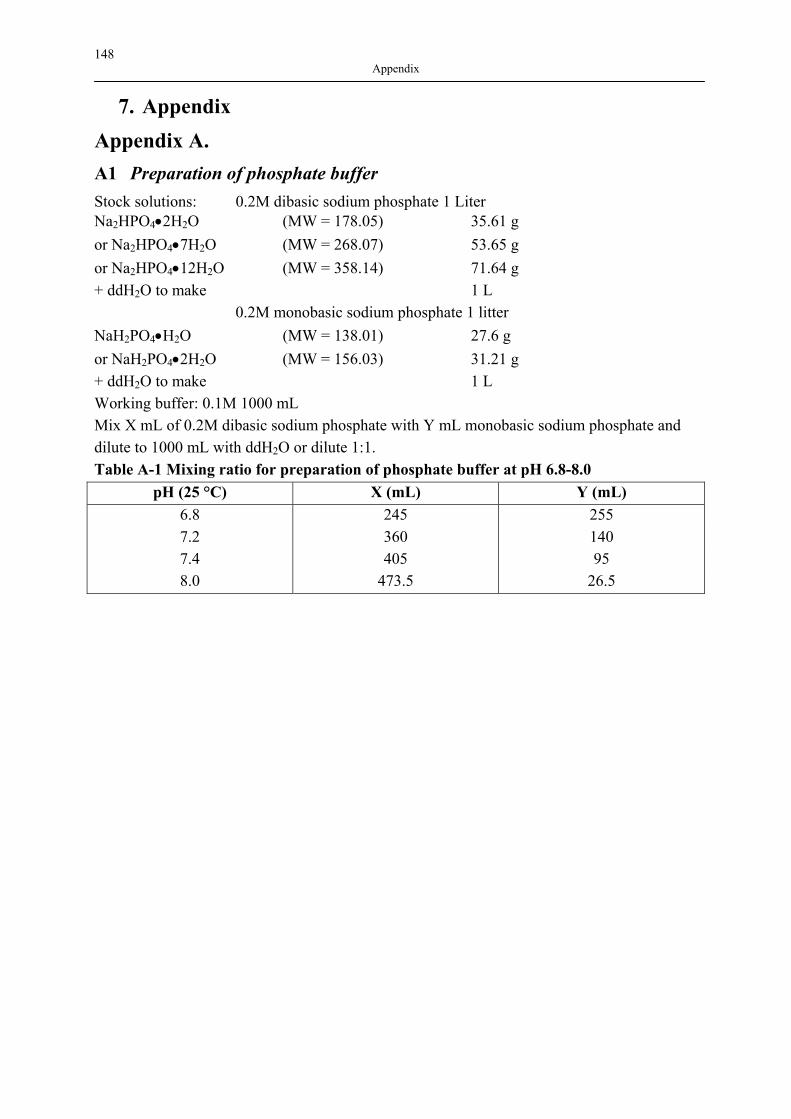
148 Appendix
7. Appendix Appendix A. A1 Preparation of phosphate buffer Stock solutions: 0.2M dibasic sodium phosphate 1 Liter Na2HPO4•2H2O (MW = 178.05) 35.61 g or Na2HPO4•7H2O (MW = 268.07) 53.65 g or Na2HPO4•12H2O (MW = 358.14) 71.64 g + ddH2O to make 1 L
0.2M monobasic sodium phosphate 1 litter NaH2PO4•H2O (MW = 138.01) 27.6 g or NaH2PO4•2H2O (MW = 156.03) 31.21 g + ddH2O to make 1 L Working buffer: 0.1M 1000 mL Mix X mL of 0.2M dibasic sodium phosphate with Y mL monobasic sodium phosphate and dilute to 1000 mL with ddH2O or dilute 1:1. Table A-1 Mixing ratio for preparation of phosphate buffer at pH 6.8-8.0
pH (25 °C) X (mL) Y (mL) 6.8 245 255 7.2 360 140 7.4 405 95 8.0 473.5 26.5
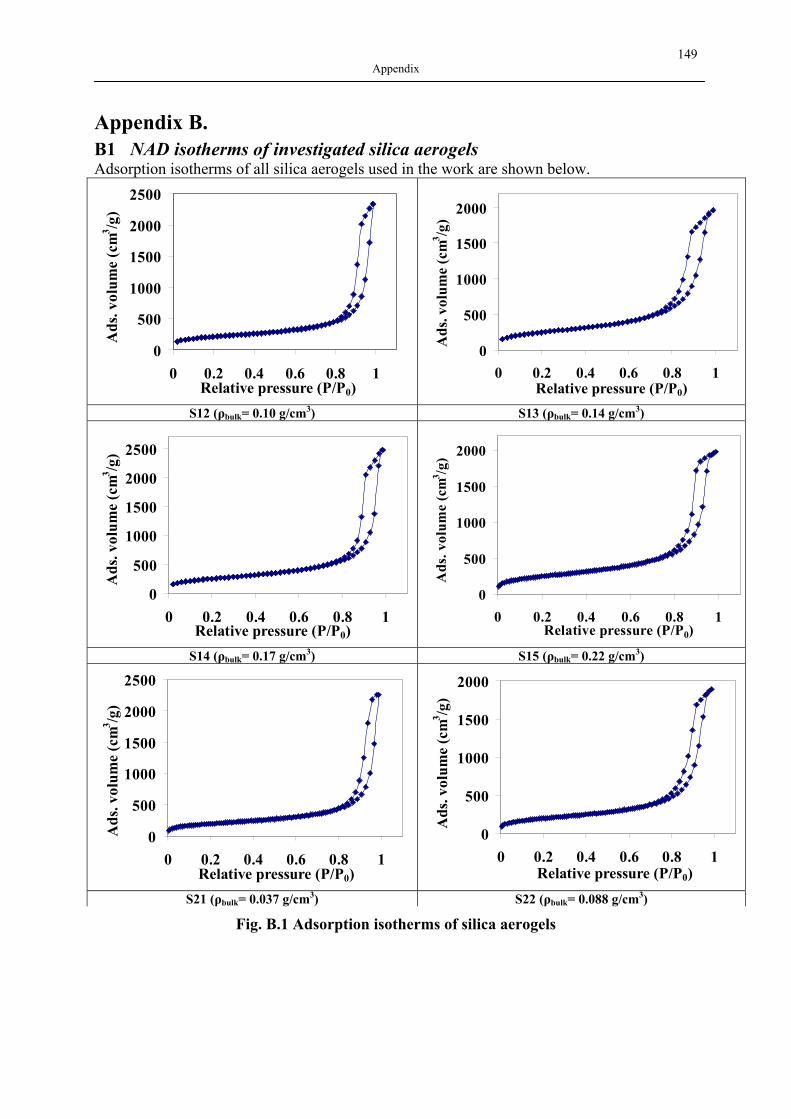
149 Appendix
Appendix B. B1 NAD isotherms of investigated silica aerogels Adsorption isotherms of all silica aerogels used in the work are shown below.
0
500
1000
1500
2000
2500
0 0.2 0.4 0.6 0.8 1Relative pressure (P/P0)
Ads
. vol
ume
(cm
3 /g)
0
500
1000
1500
2000
0 0.2 0.4 0.6 0.8 1Relative pressure (P/P0)
Ads
. vol
ume
(cm
3 /g)
S12 (ρbulk= 0.10 g/cm3) S13 (ρbulk= 0.14 g/cm3)
0
500
1000
1500
2000
2500
0 0.2 0.4 0.6 0.8 1Relative pressure (P/P0)
Ads
. vol
ume
(cm
3 /g)
0
500
1000
1500
2000
0 0.2 0.4 0.6 0.8 1Relative pressure (P/P0)
Ads
. vol
ume
(cm
3 /g)
S14 (ρbulk= 0.17 g/cm3) S15 (ρbulk= 0.22 g/cm3)
0
500
1000
1500
2000
2500
0 0.2 0.4 0.6 0.8 1Relative pressure (P/P0)
Ads
. vol
ume
(cm
3 /g)
0
500
1000
1500
2000
0 0.2 0.4 0.6 0.8 1Relative pressure (P/P0)
Ads
. vol
ume
(cm
3 /g)
S21 (ρbulk= 0.037 g/cm3) S22 (ρbulk= 0.088 g/cm3)
Fig. B.1 Adsorption isotherms of silica aerogels
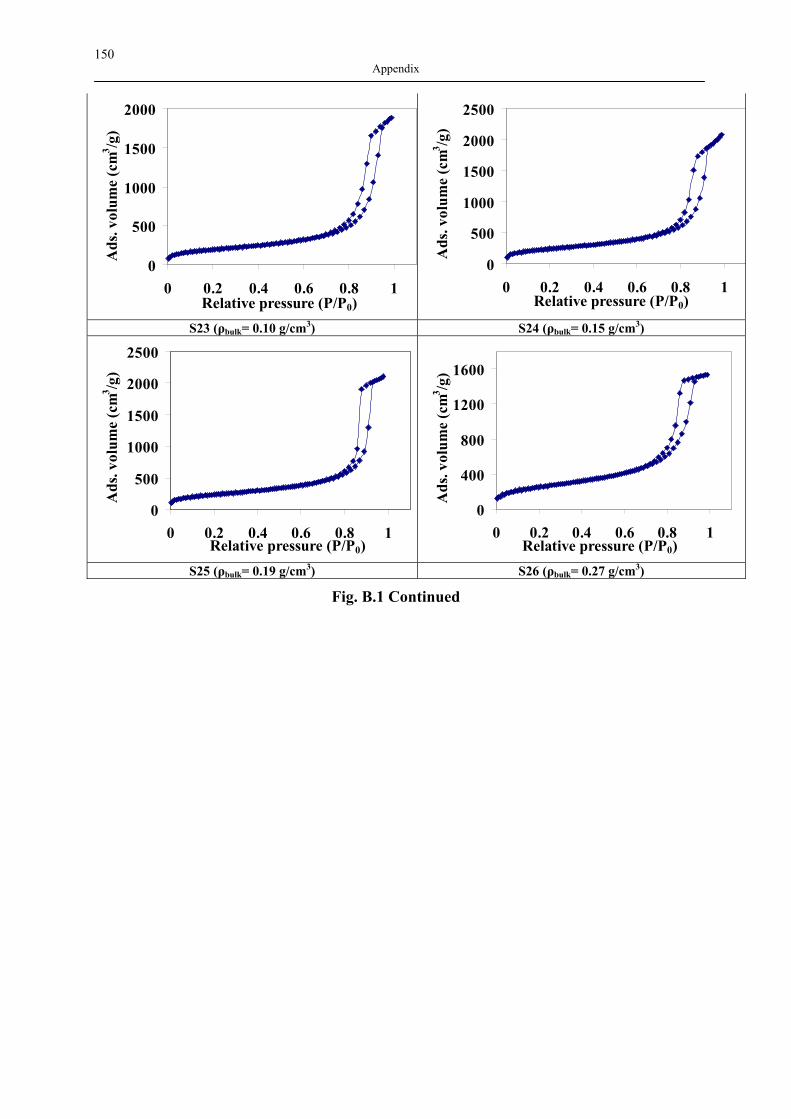
150 Appendix
0
500
1000
1500
2000
0 0.2 0.4 0.6 0.8 1Relative pressure (P/P0)
Ads
. vol
ume
(cm
3 /g)
0
500
1000
1500
2000
2500
0 0.2 0.4 0.6 0.8 1Relative pressure (P/P0)
Ads
. vol
ume
(cm
3 /g)
S23 (ρbulk= 0.10 g/cm3) S24 (ρbulk= 0.15 g/cm3)
0
500
1000
1500
2000
2500
0 0.2 0.4 0.6 0.8 1Relative pressure (P/P0)
Ads
. vol
ume
(cm
3 /g)
0
400
800
1200
1600
0 0.2 0.4 0.6 0.8 1Relative pressure (P/P0)
Ads
. vol
ume
(cm
3 /g)
S25 (ρbulk= 0.19 g/cm3) S26 (ρbulk= 0.27 g/cm3)
Fig. B.1 Continued
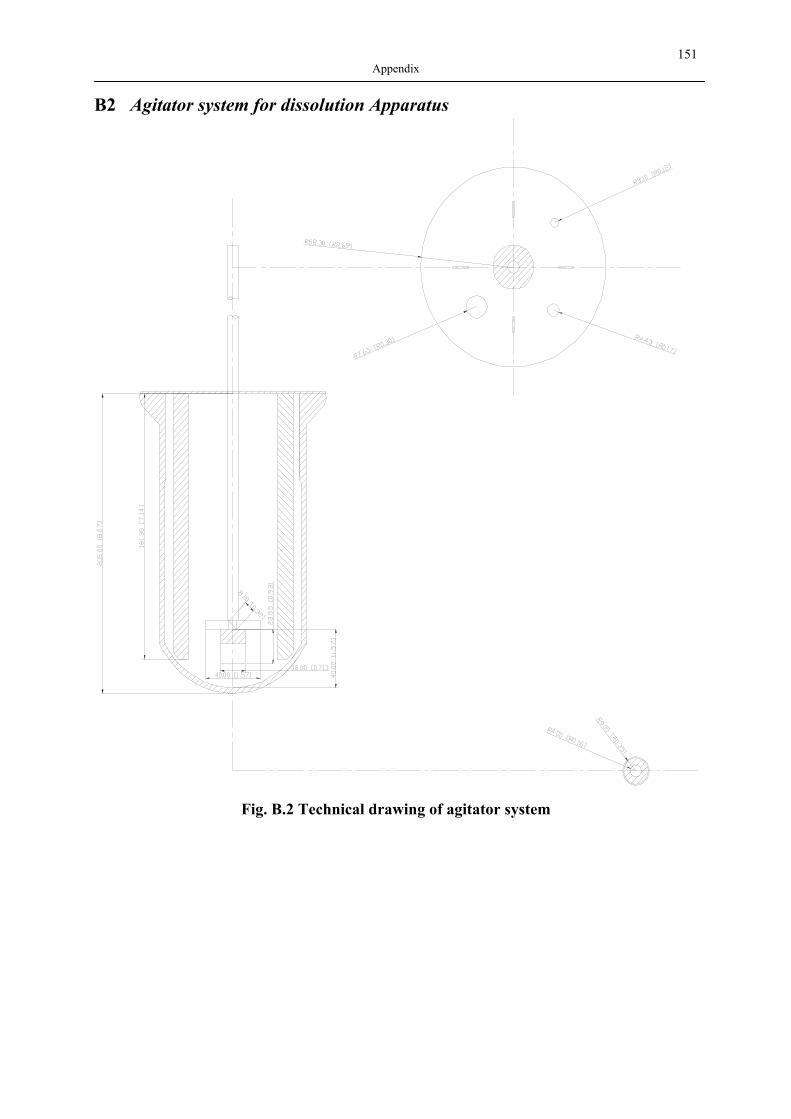
151 Appendix
B2 Agitator system for dissolution Apparatus
Fig. B.2 Technical drawing of agitator system
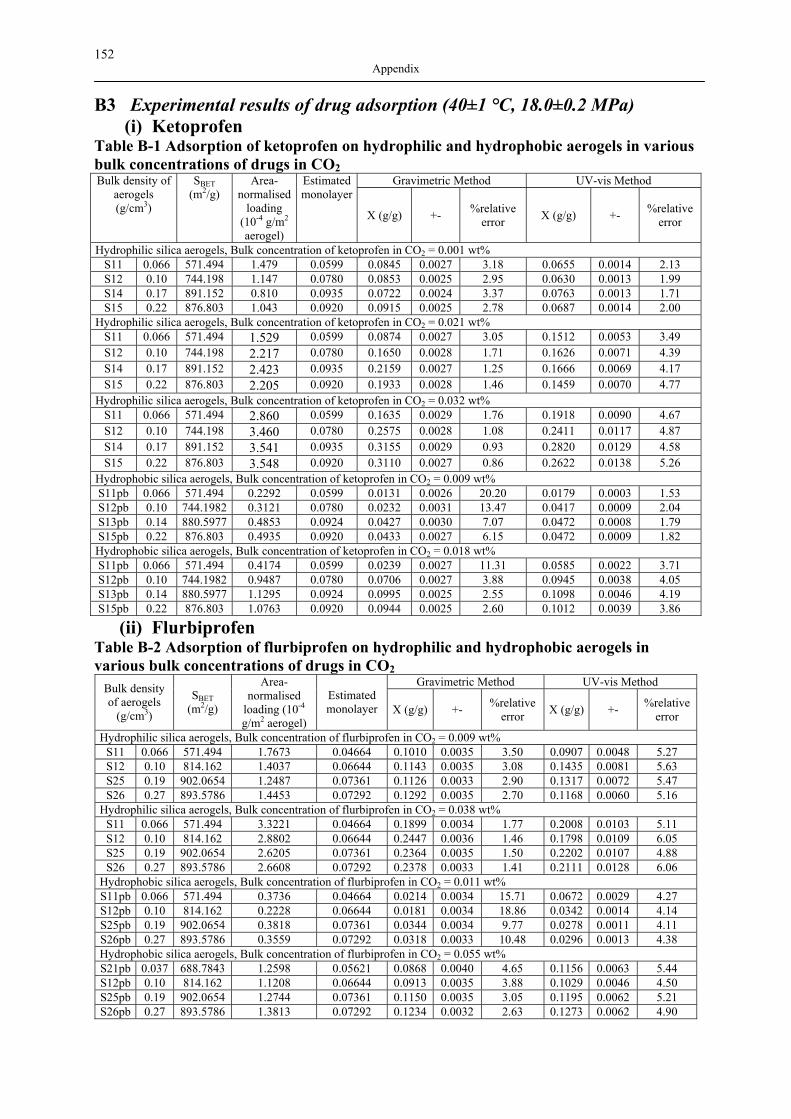
152 Appendix
B3 Experimental results of drug adsorption (40±1 °C, 18.0±0.2 MPa) (i) Ketoprofen
Table B-1 Adsorption of ketoprofen on hydrophilic and hydrophobic aerogels in various bulk concentrations of drugs in CO2
Gravimetric Method UV-vis Method Bulk density of aerogels (g/cm3)
SBET (m2/g)
Area-normalised
loading (10-4 g/m2 aerogel)
Estimated monolayer
X (g/g) +- %relative error X (g/g) +- %relative
error
Hydrophilic silica aerogels, Bulk concentration of ketoprofen in CO2 = 0.001 wt% S11 0.066 571.494 1.479 0.0599 0.0845 0.0027 3.18 0.0655 0.0014 2.13 S12 0.10 744.198 1.147 0.0780 0.0853 0.0025 2.95 0.0630 0.0013 1.99 S14 0.17 891.152 0.810 0.0935 0.0722 0.0024 3.37 0.0763 0.0013 1.71 S15 0.22 876.803 1.043 0.0920 0.0915 0.0025 2.78 0.0687 0.0014 2.00
Hydrophilic silica aerogels, Bulk concentration of ketoprofen in CO2 = 0.021 wt% S11 0.066 571.494 1.529 0.0599 0.0874 0.0027 3.05 0.1512 0.0053 3.49 S12 0.10 744.198 2.217 0.0780 0.1650 0.0028 1.71 0.1626 0.0071 4.39 S14 0.17 891.152 2.423 0.0935 0.2159 0.0027 1.25 0.1666 0.0069 4.17 S15 0.22 876.803 2.205 0.0920 0.1933 0.0028 1.46 0.1459 0.0070 4.77
Hydrophilic silica aerogels, Bulk concentration of ketoprofen in CO2 = 0.032 wt% S11 0.066 571.494 2.860 0.0599 0.1635 0.0029 1.76 0.1918 0.0090 4.67 S12 0.10 744.198 3.460 0.0780 0.2575 0.0028 1.08 0.2411 0.0117 4.87 S14 0.17 891.152 3.541 0.0935 0.3155 0.0029 0.93 0.2820 0.0129 4.58 S15 0.22 876.803 3.548 0.0920 0.3110 0.0027 0.86 0.2622 0.0138 5.26
Hydrophobic silica aerogels, Bulk concentration of ketoprofen in CO2 = 0.009 wt% S11pb 0.066 571.494 0.2292 0.0599 0.0131 0.0026 20.20 0.0179 0.0003 1.53 S12pb 0.10 744.1982 0.3121 0.0780 0.0232 0.0031 13.47 0.0417 0.0009 2.04 S13pb 0.14 880.5977 0.4853 0.0924 0.0427 0.0030 7.07 0.0472 0.0008 1.79 S15pb 0.22 876.803 0.4935 0.0920 0.0433 0.0027 6.15 0.0472 0.0009 1.82 Hydrophobic silica aerogels, Bulk concentration of ketoprofen in CO2 = 0.018 wt% S11pb 0.066 571.494 0.4174 0.0599 0.0239 0.0027 11.31 0.0585 0.0022 3.71 S12pb 0.10 744.1982 0.9487 0.0780 0.0706 0.0027 3.88 0.0945 0.0038 4.05 S13pb 0.14 880.5977 1.1295 0.0924 0.0995 0.0025 2.55 0.1098 0.0046 4.19 S15pb 0.22 876.803 1.0763 0.0920 0.0944 0.0025 2.60 0.1012 0.0039 3.86
(ii) Flurbiprofen Table B-2 Adsorption of flurbiprofen on hydrophilic and hydrophobic aerogels in various bulk concentrations of drugs in CO2
Gravimetric Method UV-vis Method Bulk density of aerogels
(g/cm3)
SBET (m2/g)
Area-normalised
loading (10-4 g/m2 aerogel)
Estimated monolayer X (g/g) +- %relative
error X (g/g) +- %relative error
Hydrophilic silica aerogels, Bulk concentration of flurbiprofen in CO2 = 0.009 wt% S11 0.066 571.494 1.7673 0.04664 0.1010 0.0035 3.50 0.0907 0.0048 5.27 S12 0.10 814.162 1.4037 0.06644 0.1143 0.0035 3.08 0.1435 0.0081 5.63 S25 0.19 902.0654 1.2487 0.07361 0.1126 0.0033 2.90 0.1317 0.0072 5.47 S26 0.27 893.5786 1.4453 0.07292 0.1292 0.0035 2.70 0.1168 0.0060 5.16
Hydrophilic silica aerogels, Bulk concentration of flurbiprofen in CO2 = 0.038 wt% S11 0.066 571.494 3.3221 0.04664 0.1899 0.0034 1.77 0.2008 0.0103 5.11 S12 0.10 814.162 2.8802 0.06644 0.2447 0.0036 1.46 0.1798 0.0109 6.05 S25 0.19 902.0654 2.6205 0.07361 0.2364 0.0035 1.50 0.2202 0.0107 4.88 S26 0.27 893.5786 2.6608 0.07292 0.2378 0.0033 1.41 0.2111 0.0128 6.06
Hydrophobic silica aerogels, Bulk concentration of flurbiprofen in CO2 = 0.011 wt% S11pb 0.066 571.494 0.3736 0.04664 0.0214 0.0034 15.71 0.0672 0.0029 4.27 S12pb 0.10 814.162 0.2228 0.06644 0.0181 0.0034 18.86 0.0342 0.0014 4.14 S25pb 0.19 902.0654 0.3818 0.07361 0.0344 0.0034 9.77 0.0278 0.0011 4.11 S26pb 0.27 893.5786 0.3559 0.07292 0.0318 0.0033 10.48 0.0296 0.0013 4.38 Hydrophobic silica aerogels, Bulk concentration of flurbiprofen in CO2 = 0.055 wt% S21pb 0.037 688.7843 1.2598 0.05621 0.0868 0.0040 4.65 0.1156 0.0063 5.44 S12pb 0.10 814.162 1.1208 0.06644 0.0913 0.0035 3.88 0.1029 0.0046 4.50 S25pb 0.19 902.0654 1.2744 0.07361 0.1150 0.0035 3.05 0.1195 0.0062 5.21 S26pb 0.27 893.5786 1.3813 0.07292 0.1234 0.0032 2.63 0.1273 0.0062 4.90
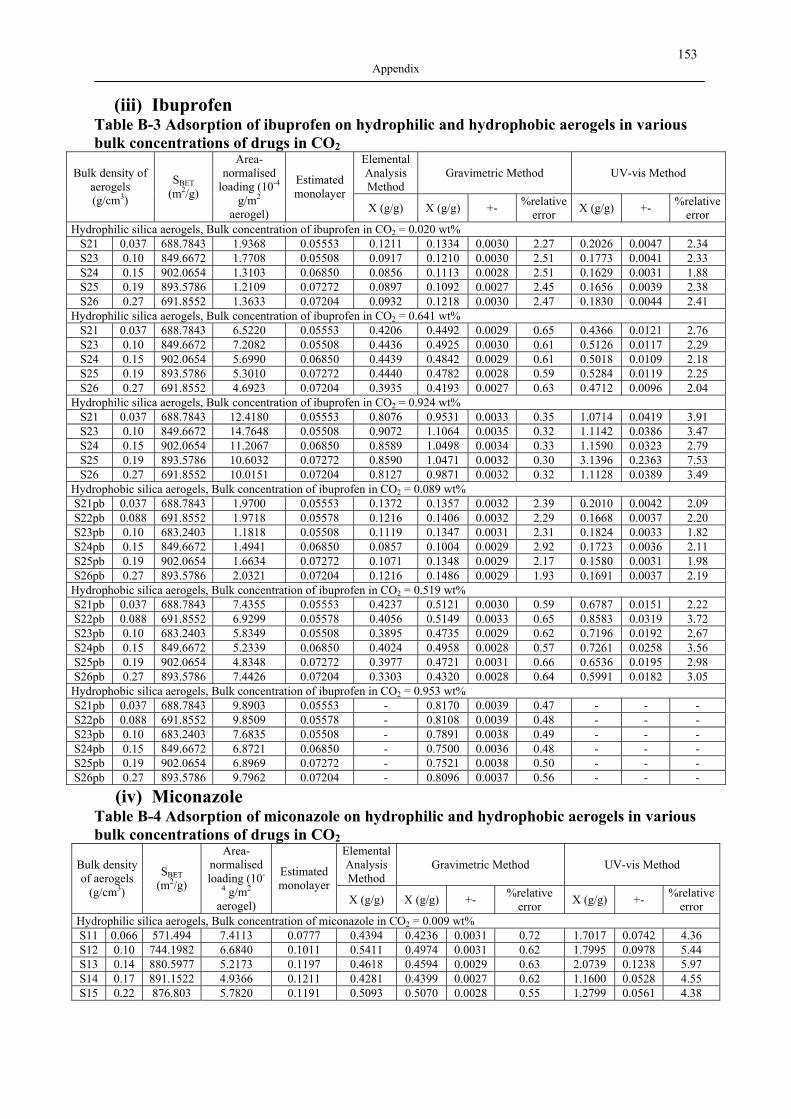
153 Appendix
(iii) Ibuprofen Table B-3 Adsorption of ibuprofen on hydrophilic and hydrophobic aerogels in various bulk concentrations of drugs in CO2
Elemental Analysis Method
Gravimetric Method UV-vis Method Bulk density of aerogels (g/cm3)
SBET (m2/g)
Area-normalised
loading (10-4 g/m2
aerogel)
Estimated monolayer
X (g/g) X (g/g) +- %relative error X (g/g) +- %relative
error Hydrophilic silica aerogels, Bulk concentration of ibuprofen in CO2 = 0.020 wt%
S21 0.037 688.7843 1.9368 0.05553 0.1211 0.1334 0.0030 2.27 0.2026 0.0047 2.34 S23 0.10 849.6672 1.7708 0.05508 0.0917 0.1210 0.0030 2.51 0.1773 0.0041 2.33 S24 0.15 902.0654 1.3103 0.06850 0.0856 0.1113 0.0028 2.51 0.1629 0.0031 1.88 S25 0.19 893.5786 1.2109 0.07272 0.0897 0.1092 0.0027 2.45 0.1656 0.0039 2.38 S26 0.27 691.8552 1.3633 0.07204 0.0932 0.1218 0.0030 2.47 0.1830 0.0044 2.41
Hydrophilic silica aerogels, Bulk concentration of ibuprofen in CO2 = 0.641 wt% S21 0.037 688.7843 6.5220 0.05553 0.4206 0.4492 0.0029 0.65 0.4366 0.0121 2.76 S23 0.10 849.6672 7.2082 0.05508 0.4436 0.4925 0.0030 0.61 0.5126 0.0117 2.29 S24 0.15 902.0654 5.6990 0.06850 0.4439 0.4842 0.0029 0.61 0.5018 0.0109 2.18 S25 0.19 893.5786 5.3010 0.07272 0.4440 0.4782 0.0028 0.59 0.5284 0.0119 2.25 S26 0.27 691.8552 4.6923 0.07204 0.3935 0.4193 0.0027 0.63 0.4712 0.0096 2.04
Hydrophilic silica aerogels, Bulk concentration of ibuprofen in CO2 = 0.924 wt% S21 0.037 688.7843 12.4180 0.05553 0.8076 0.9531 0.0033 0.35 1.0714 0.0419 3.91 S23 0.10 849.6672 14.7648 0.05508 0.9072 1.1064 0.0035 0.32 1.1142 0.0386 3.47 S24 0.15 902.0654 11.2067 0.06850 0.8589 1.0498 0.0034 0.33 1.1590 0.0323 2.79 S25 0.19 893.5786 10.6032 0.07272 0.8590 1.0471 0.0032 0.30 3.1396 0.2363 7.53 S26 0.27 691.8552 10.0151 0.07204 0.8127 0.9871 0.0032 0.32 1.1128 0.0389 3.49
Hydrophobic silica aerogels, Bulk concentration of ibuprofen in CO2 = 0.089 wt% S21pb 0.037 688.7843 1.9700 0.05553 0.1372 0.1357 0.0032 2.39 0.2010 0.0042 2.09 S22pb 0.088 691.8552 1.9718 0.05578 0.1216 0.1406 0.0032 2.29 0.1668 0.0037 2.20 S23pb 0.10 683.2403 1.1818 0.05508 0.1119 0.1347 0.0031 2.31 0.1824 0.0033 1.82 S24pb 0.15 849.6672 1.4941 0.06850 0.0857 0.1004 0.0029 2.92 0.1723 0.0036 2.11 S25pb 0.19 902.0654 1.6634 0.07272 0.1071 0.1348 0.0029 2.17 0.1580 0.0031 1.98 S26pb 0.27 893.5786 2.0321 0.07204 0.1216 0.1486 0.0029 1.93 0.1691 0.0037 2.19
Hydrophobic silica aerogels, Bulk concentration of ibuprofen in CO2 = 0.519 wt% S21pb 0.037 688.7843 7.4355 0.05553 0.4237 0.5121 0.0030 0.59 0.6787 0.0151 2.22 S22pb 0.088 691.8552 6.9299 0.05578 0.4056 0.5149 0.0033 0.65 0.8583 0.0319 3.72 S23pb 0.10 683.2403 5.8349 0.05508 0.3895 0.4735 0.0029 0.62 0.7196 0.0192 2.67 S24pb 0.15 849.6672 5.2339 0.06850 0.4024 0.4958 0.0028 0.57 0.7261 0.0258 3.56 S25pb 0.19 902.0654 4.8348 0.07272 0.3977 0.4721 0.0031 0.66 0.6536 0.0195 2.98 S26pb 0.27 893.5786 7.4426 0.07204 0.3303 0.4320 0.0028 0.64 0.5991 0.0182 3.05
Hydrophobic silica aerogels, Bulk concentration of ibuprofen in CO2 = 0.953 wt% S21pb 0.037 688.7843 9.8903 0.05553 - 0.8170 0.0039 0.47 - - - S22pb 0.088 691.8552 9.8509 0.05578 - 0.8108 0.0039 0.48 - - - S23pb 0.10 683.2403 7.6835 0.05508 - 0.7891 0.0038 0.49 - - - S24pb 0.15 849.6672 6.8721 0.06850 - 0.7500 0.0036 0.48 - - - S25pb 0.19 902.0654 6.8969 0.07272 - 0.7521 0.0038 0.50 - - - S26pb 0.27 893.5786 9.7962 0.07204 - 0.8096 0.0037 0.56 - - -
(iv) Miconazole Table B-4 Adsorption of miconazole on hydrophilic and hydrophobic aerogels in various bulk concentrations of drugs in CO2
Elemental Analysis Method
Gravimetric Method UV-vis Method Bulk density of aerogels
(g/cm3)
SBET (m2/g)
Area-normalised loading (10-
4 g/m2 aerogel)
Estimated monolayer
X (g/g) X (g/g) +- %relative error X (g/g) +- %relative
error Hydrophilic silica aerogels, Bulk concentration of miconazole in CO2 = 0.009 wt% S11 0.066 571.494 7.4113 0.0777 0.4394 0.4236 0.0031 0.72 1.7017 0.0742 4.36 S12 0.10 744.1982 6.6840 0.1011 0.5411 0.4974 0.0031 0.62 1.7995 0.0978 5.44 S13 0.14 880.5977 5.2173 0.1197 0.4618 0.4594 0.0029 0.63 2.0739 0.1238 5.97 S14 0.17 891.1522 4.9366 0.1211 0.4281 0.4399 0.0027 0.62 1.1600 0.0528 4.55 S15 0.22 876.803 5.7820 0.1191 0.5093 0.5070 0.0028 0.55 1.2799 0.0561 4.38

154 Appendix
Table B-4 Continued
Bulk density of aerogels
(g/cm3)
SBET (m2/g)
Area-normalised
loading (10-4 g/m2
aerogel)
Estimated monolayer
Elemental Analysis Method
Gravimetric Method UV-vis Method
Hydrophilic silica aerogels, Bulk concentration of miconazole in CO2 = 0.051 wt% S11 0.066 571.494 10.6054 0.0777 - 0.6061 0.0029 0.48 - - - S12 0.10 744.1982 9.2864 0.1011 - 0.6911 0.0029 0.42 - - - S13 0.14 880.5977 8.1532 0.1197 - 0.7180 0.0029 0.41 - - - S14 0.17 891.1522 8.9288 0.1211 - 0.7957 0.0030 0.38 - - - S15 0.22 876.803 9.6371 0.1191 - 0.8450 0.0030 0.35 - - -
Hydrophobic silica aerogels, Bulk concentration of miconazole in CO2 = 0.021 wt% S11 0.066 571.494 7.0168 0.0777 0.3148 0.4010 0.0030 0.74 0.4692 0.0141 3.00 S12 0.10 744.1982 5.7011 0.1011 0.3107 0.4243 0.0030 0.70 0.4192 0.0124 2.96 S13 0.14 880.5977 5.6324 0.1197 0.3585 0.4960 0.0030 0.61 0.5141 0.0164 3.19 S14 0.17 891.1522 4.1524 0.1211 0.2975 0.3700 0.0029 0.79 0.2764 0.0070 2.53 S15 0.22 876.803 5.0828 0.1191 0.3281 0.4457 0.0030 0.66 0.9150 0.0347 3.79
Hydrophobic silica aerogels, Bulk concentration of miconazole in CO2 = 0.082 wt% S11 0.066 571.494 11.4496 0.0777 - 0.6543 0.0036 0.55 0.2979 0.0010 0.32 S12 0.10 744.1982 9.7977 0.1011 - 0.7291 0.0036 0.50 0.4489 0.0016 0.36 S13 0.14 880.5977 8.8670 0.1197 - 0.7808 0.0034 0.44 0.4910 0.0018 0.37 S14 0.17 891.1522 8.8985 0.1211 - 0.7930 0.0036 0.45 0.3445 0.0011 0.31 S15 0.22 876.803 8.5694 0.1191 - 0.7514 0.0035 0.47 0.4873 0.0031 0.63
(v) Griseofulvin Table B-5 Adsorption of griseofulvin on hydrophilic and hydrophobic aerogels in various bulk concentrations of drugs in CO2
Gravimetric Method UV-vis Method Bulk density of aerogels (g/cm3)
SBET (m2/g)
Area-normalised
loading (10-4 g/m2 aerogel)
Estimated monolayer X (g/g) +- %relative
error X (g/g) +- %relative
error
Hydrophilic silica aerogels, Bulk concentration of griseofulvin in CO2 = 0.0005 wt% S11 0.066 571.494 0.1485 0.0698 0.0085 0.0040 47.14 0.0311 0.0012 3.75 S12 0.10 744.1982 0.2945 0.0908 0.0219 0.0039 17.68 0.0185 0.0007 3.84 S13 0.14 880.5977 0.2888 0.1075 0.0254 0.0038 14.89 0.0232 0.0008 3.41 S14 0.17 891.1522 0.3220 0.1088 0.0287 0.0041 14.14 0.0118 0.0004 2.98 S15 0.22 876.803 0.6327 0.1070 0.0416 0.0039 7.08 0.0230 0.0007 3.10
Hydrophobic silica aerogels, Bulk concentration of griseofulvin in CO2 = 0.031 wt% S11pb 0.066 571.494 0.1496 0.0698 0.0085 0.0040 47.14 0.0055 0.0002 2.96 S12pb 0.10 744.1982 0.0946 0.0908 0.0070 0.0040 56.57 0.0137 0.0005 3.50 S13pb 0.14 880.5977 0.2823 0.1075 0.0249 0.0039 15.72 0.0208 0.0008 3.78 S14pb 0.17 891.1522 0.1418 0.1088 0.0126 0.0040 31.43 0.0155 0.0004 2.45 S15pb 0.22 876.803 0.1303 0.1070 0.0114 0.0040 35.36 0.0196 0.0007 3.46
(vi) Dithranol Table B-6 Adsorption of dithranol on hydrophilic and hydrophobic aerogels in various bulk concentrations of drugs in CO2
Bulk density of aerogels (g/cm3)
SBET (m2/g)
Area-normalised
loading (10-4 g/m2 aerogel)
Estimated monolayer
X (g/g) +- %relative error
Hydrophilic silica aerogels, Bulk concentration of dithranol in CO2 = 0.023 wt% S21 0.037 688.7843 0.8668 0.0904 0.0597 0.0035 5.90 S22 0.088 691.8552 1.2394 0.0908 0.0857 0.0033 3.83 S23 0.10 683.2403 1.1178 0.0896 0.0764 0.0034 4.43 S24 0.15 849.6672 0.8677 0.1115 0.0737 0.0034 4.57 S25 0.19 902.0654 1.0893 0.1184 0.0983 0.0035 3.59 S26 0.27 893.5786 1.3518 0.1172 0.1208 0.0033 2.73
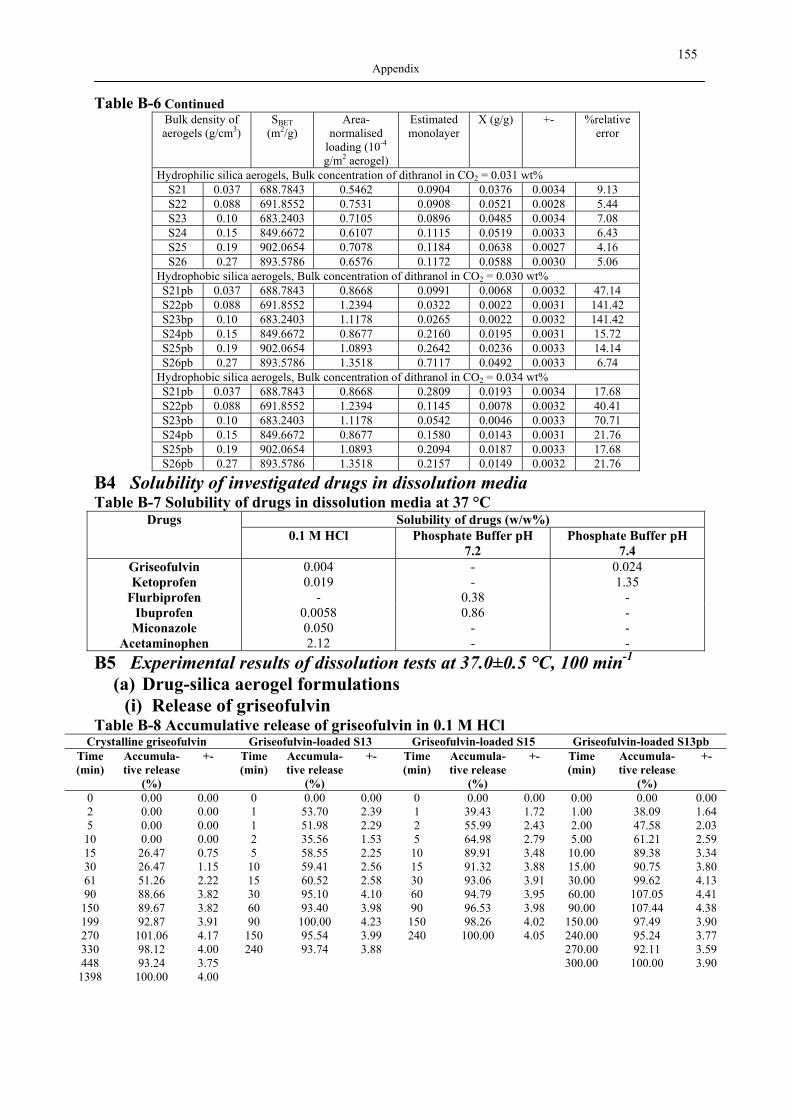
155 Appendix
Table B-6 Continued Bulk density of aerogels (g/cm3)
SBET (m2/g)
Area-normalised
loading (10-4 g/m2 aerogel)
Estimated monolayer
X (g/g) +- %relative error
Hydrophilic silica aerogels, Bulk concentration of dithranol in CO2 = 0.031 wt% S21 0.037 688.7843 0.5462 0.0904 0.0376 0.0034 9.13 S22 0.088 691.8552 0.7531 0.0908 0.0521 0.0028 5.44 S23 0.10 683.2403 0.7105 0.0896 0.0485 0.0034 7.08 S24 0.15 849.6672 0.6107 0.1115 0.0519 0.0033 6.43 S25 0.19 902.0654 0.7078 0.1184 0.0638 0.0027 4.16 S26 0.27 893.5786 0.6576 0.1172 0.0588 0.0030 5.06
Hydrophobic silica aerogels, Bulk concentration of dithranol in CO2 = 0.030 wt% S21pb 0.037 688.7843 0.8668 0.0991 0.0068 0.0032 47.14 S22pb 0.088 691.8552 1.2394 0.0322 0.0022 0.0031 141.42 S23bp 0.10 683.2403 1.1178 0.0265 0.0022 0.0032 141.42 S24pb 0.15 849.6672 0.8677 0.2160 0.0195 0.0031 15.72 S25pb 0.19 902.0654 1.0893 0.2642 0.0236 0.0033 14.14 S26pb 0.27 893.5786 1.3518 0.7117 0.0492 0.0033 6.74
Hydrophobic silica aerogels, Bulk concentration of dithranol in CO2 = 0.034 wt% S21pb 0.037 688.7843 0.8668 0.2809 0.0193 0.0034 17.68 S22pb 0.088 691.8552 1.2394 0.1145 0.0078 0.0032 40.41 S23pb 0.10 683.2403 1.1178 0.0542 0.0046 0.0033 70.71 S24pb 0.15 849.6672 0.8677 0.1580 0.0143 0.0031 21.76 S25pb 0.19 902.0654 1.0893 0.2094 0.0187 0.0033 17.68 S26pb 0.27 893.5786 1.3518 0.2157 0.0149 0.0032 21.76
B4 Solubility of investigated drugs in dissolution media Table B-7 Solubility of drugs in dissolution media at 37 °C
Solubility of drugs (w/w%) Drugs 0.1 M HCl Phosphate Buffer pH
7.2 Phosphate Buffer pH
7.4 Griseofulvin 0.004 - 0.024 Ketoprofen 0.019 - 1.35
Flurbiprofen - 0.38 - Ibuprofen 0.0058 0.86 -
Miconazole 0.050 - - Acetaminophen 2.12 - -
B5 Experimental results of dissolution tests at 37.0±0.5 °C, 100 min-1 (a) Drug-silica aerogel formulations
(i) Release of griseofulvin Table B-8 Accumulative release of griseofulvin in 0.1 M HCl
Crystalline griseofulvin Griseofulvin-loaded S13 Griseofulvin-loaded S15 Griseofulvin-loaded S13pb Time (min)
Accumula-tive release
(%)
+-
Time (min)
Accumula-tive release
(%)
+-
Time (min)
Accumula-tive release
(%)
+-
Time (min)
Accumula-tive release
(%)
+-
0 0.00 0.00 0 0.00 0.00 0 0.00 0.00 0.00 0.00 0.00 2 0.00 0.00 1 53.70 2.39 1 39.43 1.72 1.00 38.09 1.64 5 0.00 0.00 1 51.98 2.29 2 55.99 2.43 2.00 47.58 2.03 10 0.00 0.00 2 35.56 1.53 5 64.98 2.79 5.00 61.21 2.59 15 26.47 0.75 5 58.55 2.25 10 89.91 3.48 10.00 89.38 3.34 30 26.47 1.15 10 59.41 2.56 15 91.32 3.88 15.00 90.75 3.80 61 51.26 2.22 15 60.52 2.58 30 93.06 3.91 30.00 99.62 4.13 90 88.66 3.82 30 95.10 4.10 60 94.79 3.95 60.00 107.05 4.41
150 89.67 3.82 60 93.40 3.98 90 96.53 3.98 90.00 107.44 4.38 199 92.87 3.91 90 100.00 4.23 150 98.26 4.02 150.00 97.49 3.90 270 101.06 4.17 150 95.54 3.99 240 100.00 4.05 240.00 95.24 3.77 330 98.12 4.00 240 93.74 3.88 270.00 92.11 3.59 448 93.24 3.75 300.00 100.00 3.90 1398 100.00 4.00
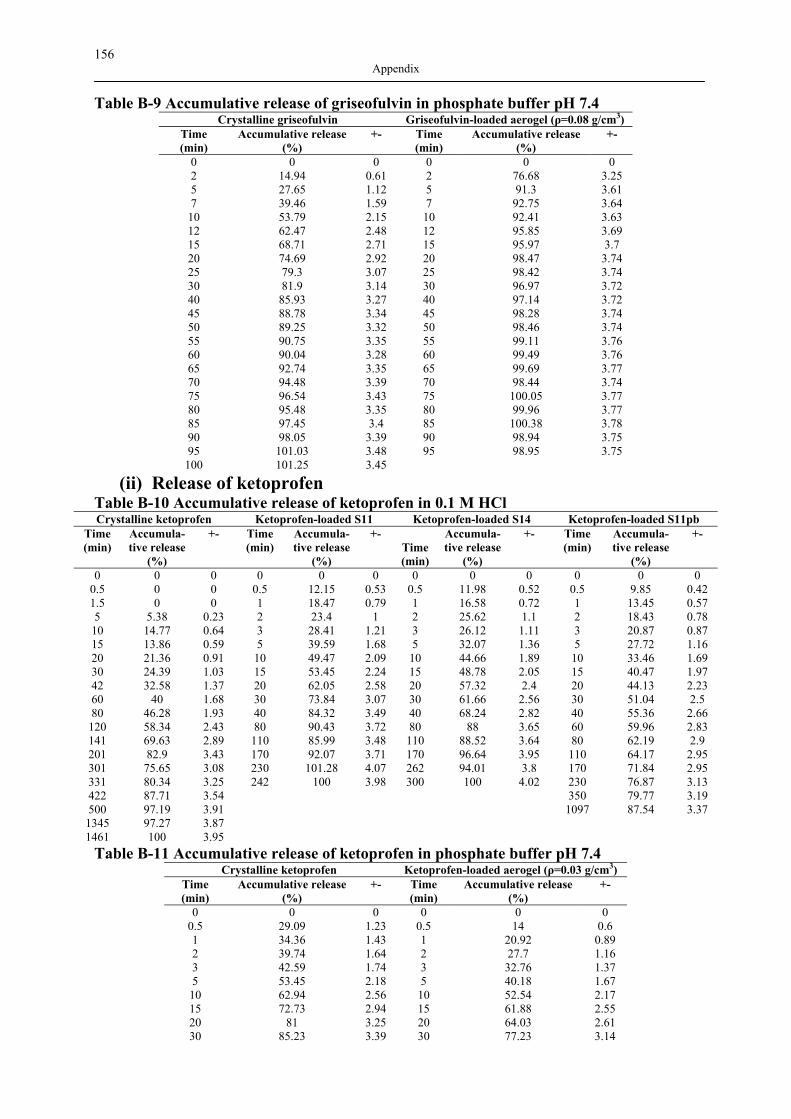
156 Appendix
Table B-9 Accumulative release of griseofulvin in phosphate buffer pH 7.4 Crystalline griseofulvin Griseofulvin-loaded aerogel (ρ=0.08 g/cm3)
Time (min)
Accumulative release (%)
+-
Time (min)
Accumulative release (%)
+-
0 0 0 0 0 0 2 14.94 0.61 2 76.68 3.25 5 27.65 1.12 5 91.3 3.61 7 39.46 1.59 7 92.75 3.64 10 53.79 2.15 10 92.41 3.63 12 62.47 2.48 12 95.85 3.69 15 68.71 2.71 15 95.97 3.7 20 74.69 2.92 20 98.47 3.74 25 79.3 3.07 25 98.42 3.74 30 81.9 3.14 30 96.97 3.72 40 85.93 3.27 40 97.14 3.72 45 88.78 3.34 45 98.28 3.74 50 89.25 3.32 50 98.46 3.74 55 90.75 3.35 55 99.11 3.76 60 90.04 3.28 60 99.49 3.76 65 92.74 3.35 65 99.69 3.77 70 94.48 3.39 70 98.44 3.74 75 96.54 3.43 75 100.05 3.77 80 95.48 3.35 80 99.96 3.77 85 97.45 3.4 85 100.38 3.78 90 98.05 3.39 90 98.94 3.75 95 101.03 3.48 95 98.95 3.75
100 101.25 3.45
(ii) Release of ketoprofen Table B-10 Accumulative release of ketoprofen in 0.1 M HCl Crystalline ketoprofen Ketoprofen-loaded S11 Ketoprofen-loaded S14 Ketoprofen-loaded S11pb
Time (min)
Accumula-tive release
(%)
+-
Time (min)
Accumula-tive release
(%)
+-
Time (min)
Accumula-tive release
(%)
+-
Time (min)
Accumula-tive release
(%)
+-
0 0 0 0 0 0 0 0 0 0 0 0 0.5 0 0 0.5 12.15 0.53 0.5 11.98 0.52 0.5 9.85 0.42 1.5 0 0 1 18.47 0.79 1 16.58 0.72 1 13.45 0.57 5 5.38 0.23 2 23.4 1 2 25.62 1.1 2 18.43 0.78 10 14.77 0.64 3 28.41 1.21 3 26.12 1.11 3 20.87 0.87 15 13.86 0.59 5 39.59 1.68 5 32.07 1.36 5 27.72 1.16 20 21.36 0.91 10 49.47 2.09 10 44.66 1.89 10 33.46 1.69 30 24.39 1.03 15 53.45 2.24 15 48.78 2.05 15 40.47 1.97 42 32.58 1.37 20 62.05 2.58 20 57.32 2.4 20 44.13 2.23 60 40 1.68 30 73.84 3.07 30 61.66 2.56 30 51.04 2.5 80 46.28 1.93 40 84.32 3.49 40 68.24 2.82 40 55.36 2.66
120 58.34 2.43 80 90.43 3.72 80 88 3.65 60 59.96 2.83 141 69.63 2.89 110 85.99 3.48 110 88.52 3.64 80 62.19 2.9 201 82.9 3.43 170 92.07 3.71 170 96.64 3.95 110 64.17 2.95 301 75.65 3.08 230 101.28 4.07 262 94.01 3.8 170 71.84 2.95 331 80.34 3.25 242 100 3.98 300 100 4.02 230 76.87 3.13 422 87.71 3.54 350 79.77 3.19 500 97.19 3.91 1097 87.54 3.37 1345 97.27 3.87 1461 100 3.95
Table B-11 Accumulative release of ketoprofen in phosphate buffer pH 7.4 Crystalline ketoprofen Ketoprofen-loaded aerogel (ρ=0.03 g/cm3)
Time (min)
Accumulative release (%)
+-
Time (min)
Accumulative release (%)
+-
0 0 0 0 0 0 0.5 29.09 1.23 0.5 14 0.6 1 34.36 1.43 1 20.92 0.89 2 39.74 1.64 2 27.7 1.16 3 42.59 1.74 3 32.76 1.37 5 53.45 2.18 5 40.18 1.67 10 62.94 2.56 10 52.54 2.17 15 72.73 2.94 15 61.88 2.55 20 81 3.25 20 64.03 2.61 30 85.23 3.39 30 77.23 3.14
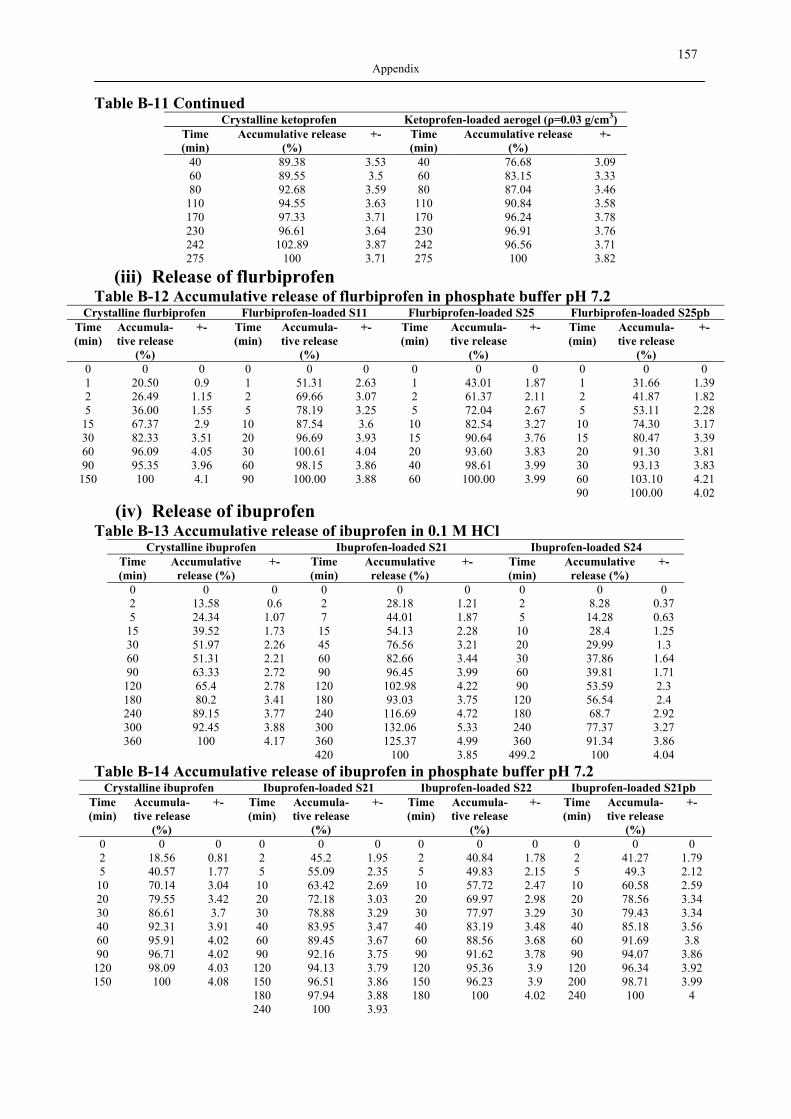
157 Appendix
Table B-11 Continued Crystalline ketoprofen Ketoprofen-loaded aerogel (ρ=0.03 g/cm3)
Time (min)
Accumulative release (%)
+-
Time (min)
Accumulative release (%)
+-
40 89.38 3.53 40 76.68 3.09 60 89.55 3.5 60 83.15 3.33 80 92.68 3.59 80 87.04 3.46
110 94.55 3.63 110 90.84 3.58 170 97.33 3.71 170 96.24 3.78 230 96.61 3.64 230 96.91 3.76 242 102.89 3.87 242 96.56 3.71 275 100 3.71 275 100 3.82
(iii) Release of flurbiprofen Table B-12 Accumulative release of flurbiprofen in phosphate buffer pH 7.2
Crystalline flurbiprofen Flurbiprofen-loaded S11 Flurbiprofen-loaded S25 Flurbiprofen-loaded S25pb Time (min)
Accumula-tive release
(%)
+-
Time (min)
Accumula-tive release
(%)
+-
Time (min)
Accumula-tive release
(%)
+-
Time (min)
Accumula-tive release
(%)
+-
0 0 0 0 0 0 0 0 0 0 0 0 1 20.50 0.9 1 51.31 2.63 1 43.01 1.87 1 31.66 1.39 2 26.49 1.15 2 69.66 3.07 2 61.37 2.11 2 41.87 1.82 5 36.00 1.55 5 78.19 3.25 5 72.04 2.67 5 53.11 2.28 15 67.37 2.9 10 87.54 3.6 10 82.54 3.27 10 74.30 3.17 30 82.33 3.51 20 96.69 3.93 15 90.64 3.76 15 80.47 3.39 60 96.09 4.05 30 100.61 4.04 20 93.60 3.83 20 91.30 3.81 90 95.35 3.96 60 98.15 3.86 40 98.61 3.99 30 93.13 3.83
150 100 4.1 90 100.00 3.88 60 100.00 3.99 60 103.10 4.21 90 100.00 4.02
(iv) Release of ibuprofen Table B-13 Accumulative release of ibuprofen in 0.1 M HCl
Crystalline ibuprofen Ibuprofen-loaded S21 Ibuprofen-loaded S24 Time (min)
Accumulative release (%)
+-
Time (min)
Accumulative release (%)
+-
Time (min)
Accumulative release (%)
+-
0 0 0 0 0 0 0 0 0 2 13.58 0.6 2 28.18 1.21 2 8.28 0.37 5 24.34 1.07 7 44.01 1.87 5 14.28 0.63
15 39.52 1.73 15 54.13 2.28 10 28.4 1.25 30 51.97 2.26 45 76.56 3.21 20 29.99 1.3 60 51.31 2.21 60 82.66 3.44 30 37.86 1.64 90 63.33 2.72 90 96.45 3.99 60 39.81 1.71 120 65.4 2.78 120 102.98 4.22 90 53.59 2.3 180 80.2 3.41 180 93.03 3.75 120 56.54 2.4 240 89.15 3.77 240 116.69 4.72 180 68.7 2.92 300 92.45 3.88 300 132.06 5.33 240 77.37 3.27 360 100 4.17 360 125.37 4.99 360 91.34 3.86
420 100 3.85 499.2 100 4.04 Table B-14 Accumulative release of ibuprofen in phosphate buffer pH 7.2
Crystalline ibuprofen Ibuprofen-loaded S21 Ibuprofen-loaded S22 Ibuprofen-loaded S21pb Time (min)
Accumula-tive release
(%)
+-
Time (min)
Accumula-tive release
(%)
+-
Time (min)
Accumula-tive release
(%)
+-
Time (min)
Accumula-tive release
(%)
+-
0 0 0 0 0 0 0 0 0 0 0 0 2 18.56 0.81 2 45.2 1.95 2 40.84 1.78 2 41.27 1.79 5 40.57 1.77 5 55.09 2.35 5 49.83 2.15 5 49.3 2.12 10 70.14 3.04 10 63.42 2.69 10 57.72 2.47 10 60.58 2.59 20 79.55 3.42 20 72.18 3.03 20 69.97 2.98 20 78.56 3.34 30 86.61 3.7 30 78.88 3.29 30 77.97 3.29 30 79.43 3.34 40 92.31 3.91 40 83.95 3.47 40 83.19 3.48 40 85.18 3.56 60 95.91 4.02 60 89.45 3.67 60 88.56 3.68 60 91.69 3.8 90 96.71 4.02 90 92.16 3.75 90 91.62 3.78 90 94.07 3.86
120 98.09 4.03 120 94.13 3.79 120 95.36 3.9 120 96.34 3.92 150 100 4.08 150 96.51 3.86 150 96.23 3.9 200 98.71 3.99
180 97.94 3.88 180 100 4.02 240 100 4 240 100 3.93
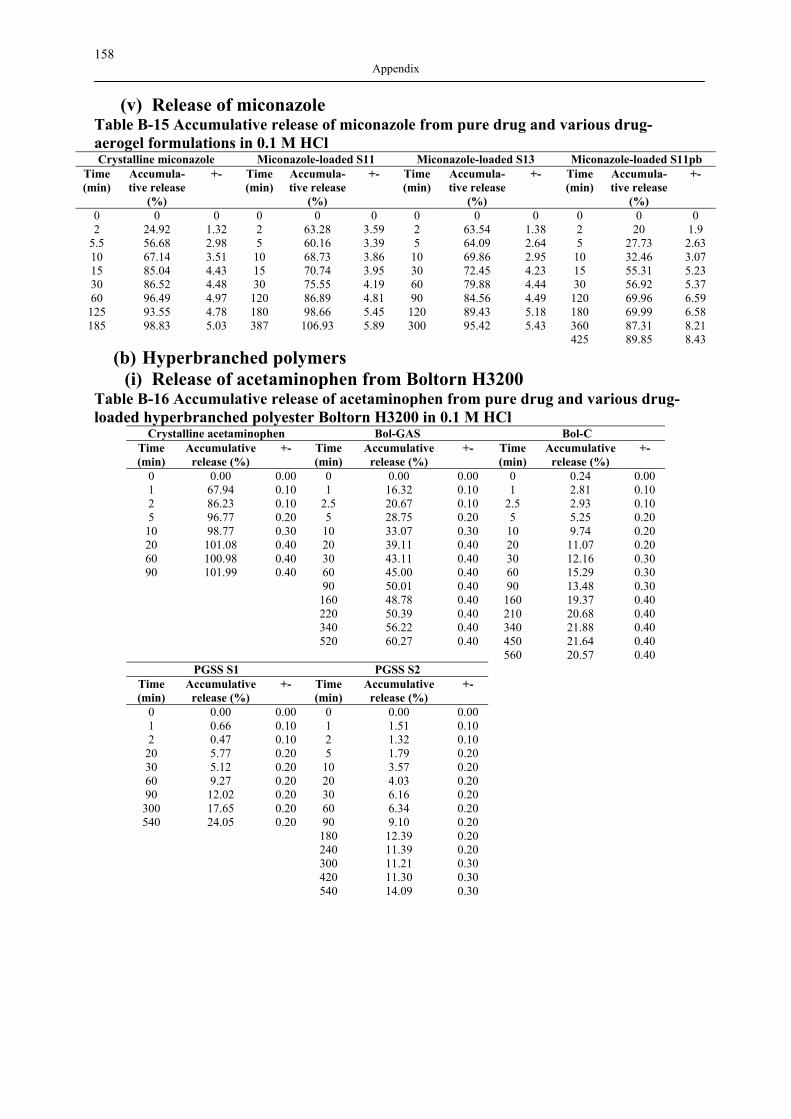
158 Appendix
(v) Release of miconazole Table B-15 Accumulative release of miconazole from pure drug and various drug- aerogel formulations in 0.1 M HCl Crystalline miconazole Miconazole-loaded S11 Miconazole-loaded S13 Miconazole-loaded S11pb
Time (min)
Accumula-tive release
(%)
+-
Time (min)
Accumula-tive release
(%)
+-
Time (min)
Accumula-tive release
(%)
+-
Time (min)
Accumula-tive release
(%)
+-
0 0 0 0 0 0 0 0 0 0 0 0 2 24.92 1.32 2 63.28 3.59 2 63.54 1.38 2 20 1.9
5.5 56.68 2.98 5 60.16 3.39 5 64.09 2.64 5 27.73 2.63 10 67.14 3.51 10 68.73 3.86 10 69.86 2.95 10 32.46 3.07 15 85.04 4.43 15 70.74 3.95 30 72.45 4.23 15 55.31 5.23 30 86.52 4.48 30 75.55 4.19 60 79.88 4.44 30 56.92 5.37 60 96.49 4.97 120 86.89 4.81 90 84.56 4.49 120 69.96 6.59 125 93.55 4.78 180 98.66 5.45 120 89.43 5.18 180 69.99 6.58 185 98.83 5.03 387 106.93 5.89 300 95.42 5.43 360 87.31 8.21
425 89.85 8.43
(b) Hyperbranched polymers (i) Release of acetaminophen from Boltorn H3200
Table B-16 Accumulative release of acetaminophen from pure drug and various drug-loaded hyperbranched polyester Boltorn H3200 in 0.1 M HCl
Crystalline acetaminophen Bol-GAS Bol-C Time (min)
Accumulative release (%)
+-
Time (min)
Accumulative release (%)
+-
Time (min)
Accumulative release (%)
+-
0 0.00 0.00 0 0.00 0.00 0 0.24 0.00 1 67.94 0.10 1 16.32 0.10 1 2.81 0.10 2 86.23 0.10 2.5 20.67 0.10 2.5 2.93 0.10 5 96.77 0.20 5 28.75 0.20 5 5.25 0.20
10 98.77 0.30 10 33.07 0.30 10 9.74 0.20 20 101.08 0.40 20 39.11 0.40 20 11.07 0.20 60 100.98 0.40 30 43.11 0.40 30 12.16 0.30 90 101.99 0.40 60 45.00 0.40 60 15.29 0.30 90 50.01 0.40 90 13.48 0.30 160 48.78 0.40 160 19.37 0.40 220 50.39 0.40 210 20.68 0.40 340 56.22 0.40 340 21.88 0.40 520 60.27 0.40 450 21.64 0.40 560 20.57 0.40
PGSS S1 PGSS S2 Time (min)
Accumulative release (%)
+-
Time (min)
Accumulative release (%)
+-
0 0.00 0.00 0 0.00 0.00 1 0.66 0.10 1 1.51 0.10 2 0.47 0.10 2 1.32 0.10
20 5.77 0.20 5 1.79 0.20 30 5.12 0.20 10 3.57 0.20 60 9.27 0.20 20 4.03 0.20 90 12.02 0.20 30 6.16 0.20 300 17.65 0.20 60 6.34 0.20 540 24.05 0.20 90 9.10 0.20
180 12.39 0.20 240 11.39 0.20 300 11.21 0.30 420 11.30 0.30 540 14.09 0.30
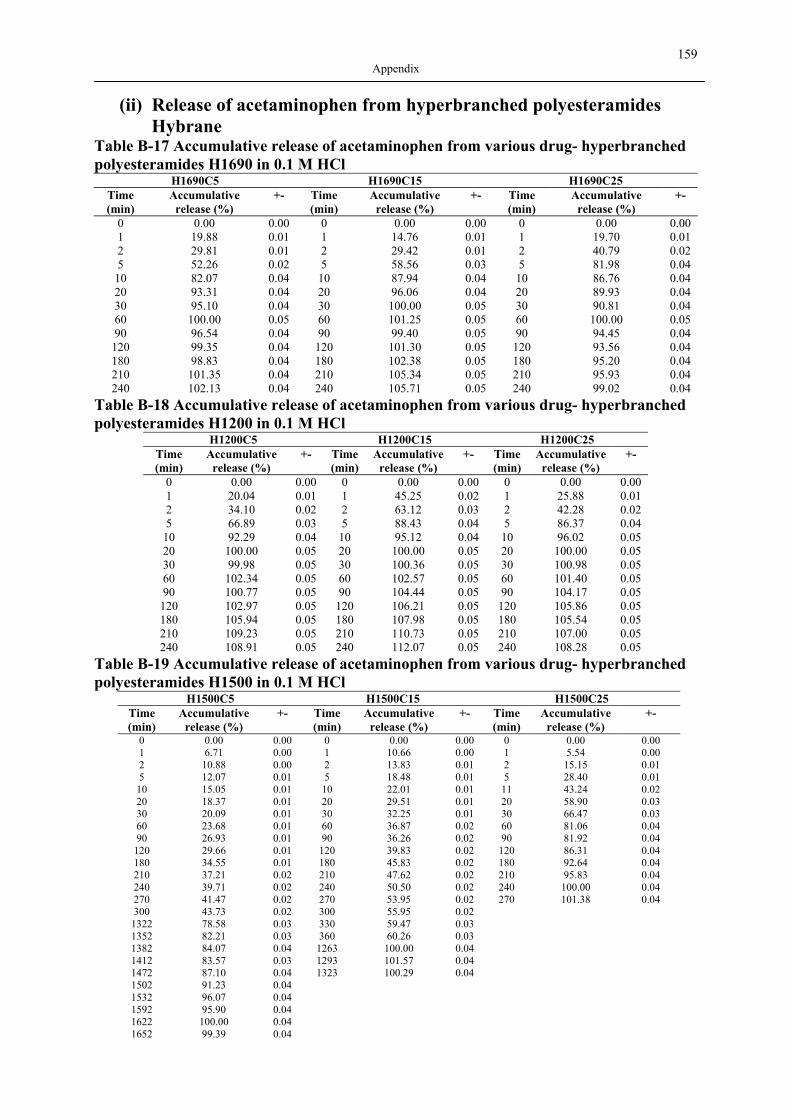
159 Appendix
(ii) Release of acetaminophen from hyperbranched polyesteramides Hybrane
Table B-17 Accumulative release of acetaminophen from various drug- hyperbranched polyesteramides H1690 in 0.1 M HCl
H1690C5 H1690C15 H1690C25 Time (min)
Accumulative release (%)
+-
Time (min)
Accumulative release (%)
+-
Time (min)
Accumulative release (%)
+-
0 0.00 0.00 0 0.00 0.00 0 0.00 0.00 1 19.88 0.01 1 14.76 0.01 1 19.70 0.01 2 29.81 0.01 2 29.42 0.01 2 40.79 0.02 5 52.26 0.02 5 58.56 0.03 5 81.98 0.04
10 82.07 0.04 10 87.94 0.04 10 86.76 0.04 20 93.31 0.04 20 96.06 0.04 20 89.93 0.04 30 95.10 0.04 30 100.00 0.05 30 90.81 0.04 60 100.00 0.05 60 101.25 0.05 60 100.00 0.05 90 96.54 0.04 90 99.40 0.05 90 94.45 0.04 120 99.35 0.04 120 101.30 0.05 120 93.56 0.04 180 98.83 0.04 180 102.38 0.05 180 95.20 0.04 210 101.35 0.04 210 105.34 0.05 210 95.93 0.04 240 102.13 0.04 240 105.71 0.05 240 99.02 0.04
Table B-18 Accumulative release of acetaminophen from various drug- hyperbranched polyesteramides H1200 in 0.1 M HCl
H1200C5 H1200C15 H1200C25 Time (min)
Accumulative release (%)
+-
Time (min)
Accumulative release (%)
+-
Time (min)
Accumulative release (%)
+-
0 0.00 0.00 0 0.00 0.00 0 0.00 0.00 1 20.04 0.01 1 45.25 0.02 1 25.88 0.01 2 34.10 0.02 2 63.12 0.03 2 42.28 0.02 5 66.89 0.03 5 88.43 0.04 5 86.37 0.04
10 92.29 0.04 10 95.12 0.04 10 96.02 0.05 20 100.00 0.05 20 100.00 0.05 20 100.00 0.05 30 99.98 0.05 30 100.36 0.05 30 100.98 0.05 60 102.34 0.05 60 102.57 0.05 60 101.40 0.05 90 100.77 0.05 90 104.44 0.05 90 104.17 0.05 120 102.97 0.05 120 106.21 0.05 120 105.86 0.05 180 105.94 0.05 180 107.98 0.05 180 105.54 0.05 210 109.23 0.05 210 110.73 0.05 210 107.00 0.05 240 108.91 0.05 240 112.07 0.05 240 108.28 0.05
Table B-19 Accumulative release of acetaminophen from various drug- hyperbranched polyesteramides H1500 in 0.1 M HCl
H1500C5 H1500C15 H1500C25 Time (min)
Accumulative release (%)
+-
Time (min)
Accumulative release (%)
+-
Time (min)
Accumulative release (%)
+-
0 0.00 0.00 0 0.00 0.00 0 0.00 0.00 1 6.71 0.00 1 10.66 0.00 1 5.54 0.00 2 10.88 0.00 2 13.83 0.01 2 15.15 0.01 5 12.07 0.01 5 18.48 0.01 5 28.40 0.01 10 15.05 0.01 10 22.01 0.01 11 43.24 0.02 20 18.37 0.01 20 29.51 0.01 20 58.90 0.03 30 20.09 0.01 30 32.25 0.01 30 66.47 0.03 60 23.68 0.01 60 36.87 0.02 60 81.06 0.04 90 26.93 0.01 90 36.26 0.02 90 81.92 0.04
120 29.66 0.01 120 39.83 0.02 120 86.31 0.04 180 34.55 0.01 180 45.83 0.02 180 92.64 0.04 210 37.21 0.02 210 47.62 0.02 210 95.83 0.04 240 39.71 0.02 240 50.50 0.02 240 100.00 0.04 270 41.47 0.02 270 53.95 0.02 270 101.38 0.04 300 43.73 0.02 300 55.95 0.02 1322 78.58 0.03 330 59.47 0.03 1352 82.21 0.03 360 60.26 0.03 1382 84.07 0.04 1263 100.00 0.04 1412 83.57 0.03 1293 101.57 0.04 1472 87.10 0.04 1323 100.29 0.04 1502 91.23 0.04 1532 96.07 0.04 1592 95.90 0.04 1622 100.00 0.04 1652 99.39 0.04
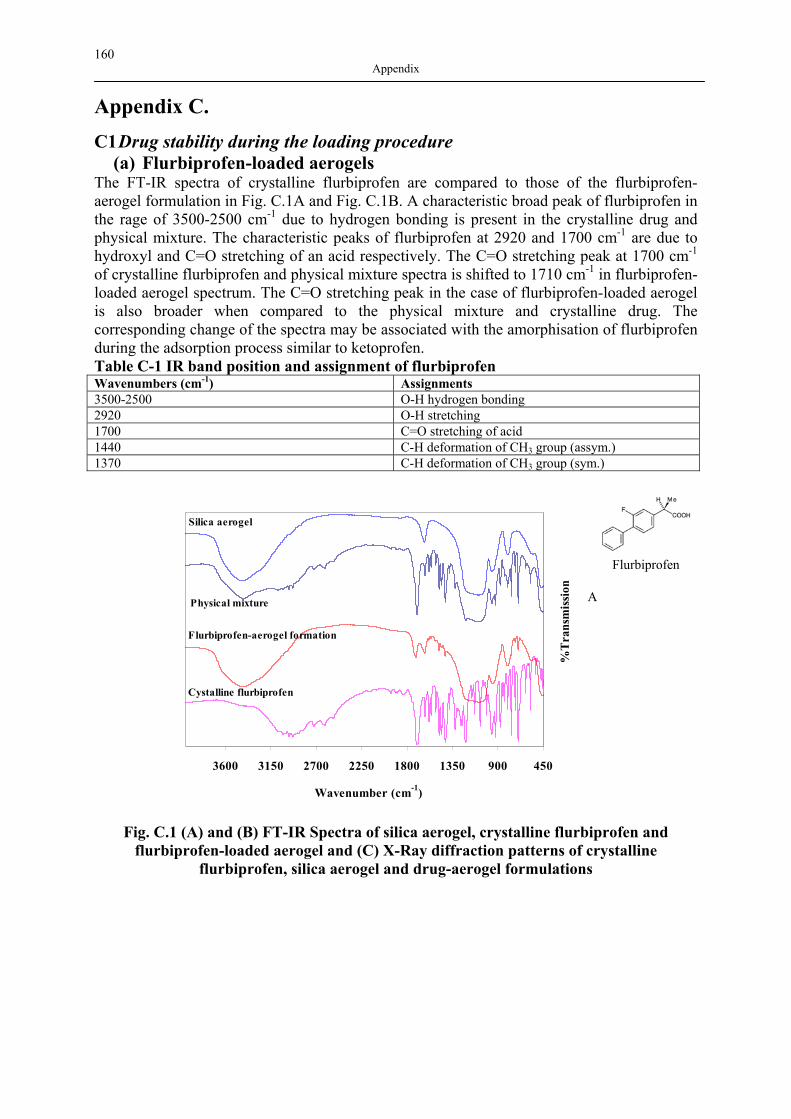
160 Appendix
Appendix C. C1 Drug stability during the loading procedure
(a) Flurbiprofen-loaded aerogels The FT-IR spectra of crystalline flurbiprofen are compared to those of the flurbiprofen-aerogel formulation in Fig. C.1A and Fig. C.1B. A characteristic broad peak of flurbiprofen in the rage of 3500-2500 cm-1 due to hydrogen bonding is present in the crystalline drug and physical mixture. The characteristic peaks of flurbiprofen at 2920 and 1700 cm-1 are due to hydroxyl and C=O stretching of an acid respectively. The C=O stretching peak at 1700 cm-1 of crystalline flurbiprofen and physical mixture spectra is shifted to 1710 cm-1 in flurbiprofen-loaded aerogel spectrum. The C=O stretching peak in the case of flurbiprofen-loaded aerogel is also broader when compared to the physical mixture and crystalline drug. The corresponding change of the spectra may be associated with the amorphisation of flurbiprofen during the adsorption process similar to ketoprofen. Table C-1 IR band position and assignment of flurbiprofen Wavenumbers (cm-1) Assignments 3500-2500 O-H hydrogen bonding 2920 O-H stretching 1700 C=O stretching of acid 1440 C-H deformation of CH3 group (assym.) 1370 C-H deformation of CH3 group (sym.)
450900135018002250270031503600
Wavenumber (cm-1)
%T
rans
mis
sion
Silica aerogel
Physical mixture
Flurbiprofen-aerogel formation
Cystalline flurbiprofen
A
Fig. C.1 (A) and (B) FT-IR Spectra of silica aerogel, crystalline flurbiprofen and flurbiprofen-loaded aerogel and (C) X-Ray diffraction patterns of crystalline
flurbiprofen, silica aerogel and drug-aerogel formulations
Flurbiprofen
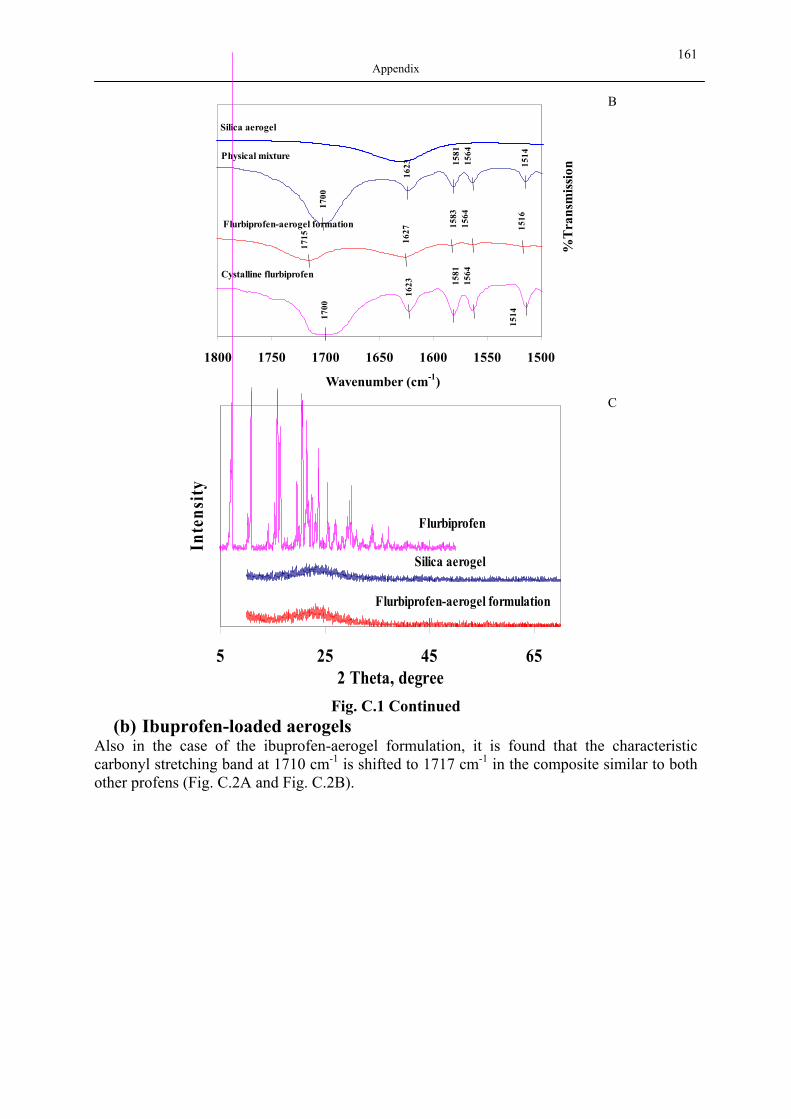
161 Appendix
1500155016001650170017501800
Wavenumber (cm-1)
%T
rans
mis
sion
Silica aerogel
Physical mixture
Flurbiprofen-aerogel formation
Cystalline flurbiprofen
1700
1715
1700
1623
1581
1564
1623 15
1415
1415
16
1627
1581
1564
1583
1564
B
5 25 45 652 Theta, degree
Inte
nsity
Silica aerogel
Flurbiprofen
Flurbiprofen-aerogel formulation
C
Fig. C.1 Continued (b) Ibuprofen-loaded aerogels
Also in the case of the ibuprofen-aerogel formulation, it is found that the characteristic carbonyl stretching band at 1710 cm-1 is shifted to 1717 cm-1 in the composite similar to both other profens (Fig. C.2A and Fig. C.2B).
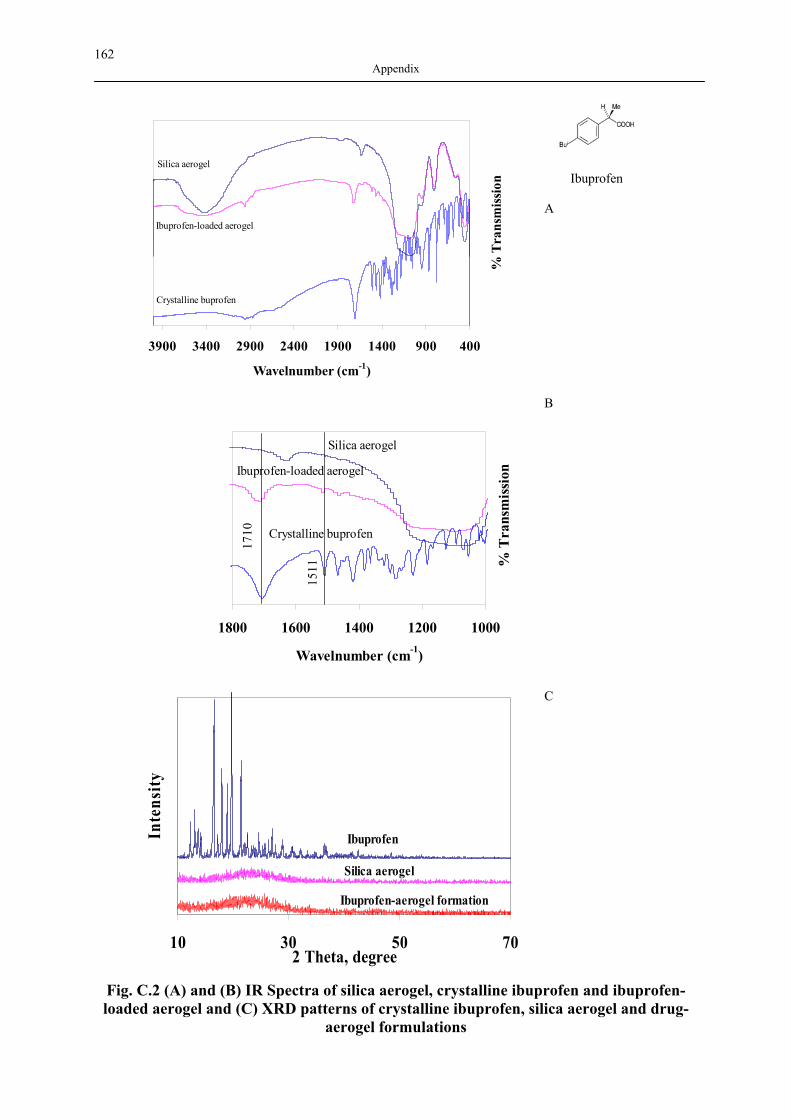
162 Appendix
400900140019002400290034003900
Wavelnumber (cm-1)
% T
rans
miss
ion
Ibuprofen-loaded aerogel
Silica aerogel
Crystalline buprofen
A
10001200140016001800
Wavelnumber (cm-1)
% T
rans
mis
sionIbuprofen-loaded aerogel
Silica aerogel
Crystalline buprofen
1511
1710
B
10 30 50 702 Theta, degree
Inte
nsity
Ibuprofen-aerogel formation
Silica aerogel
Ibuprofen
C
Fig. C.2 (A) and (B) IR Spectra of silica aerogel, crystalline ibuprofen and ibuprofen-loaded aerogel and (C) XRD patterns of crystalline ibuprofen, silica aerogel and drug-
aerogel formulations
Ibuprofen
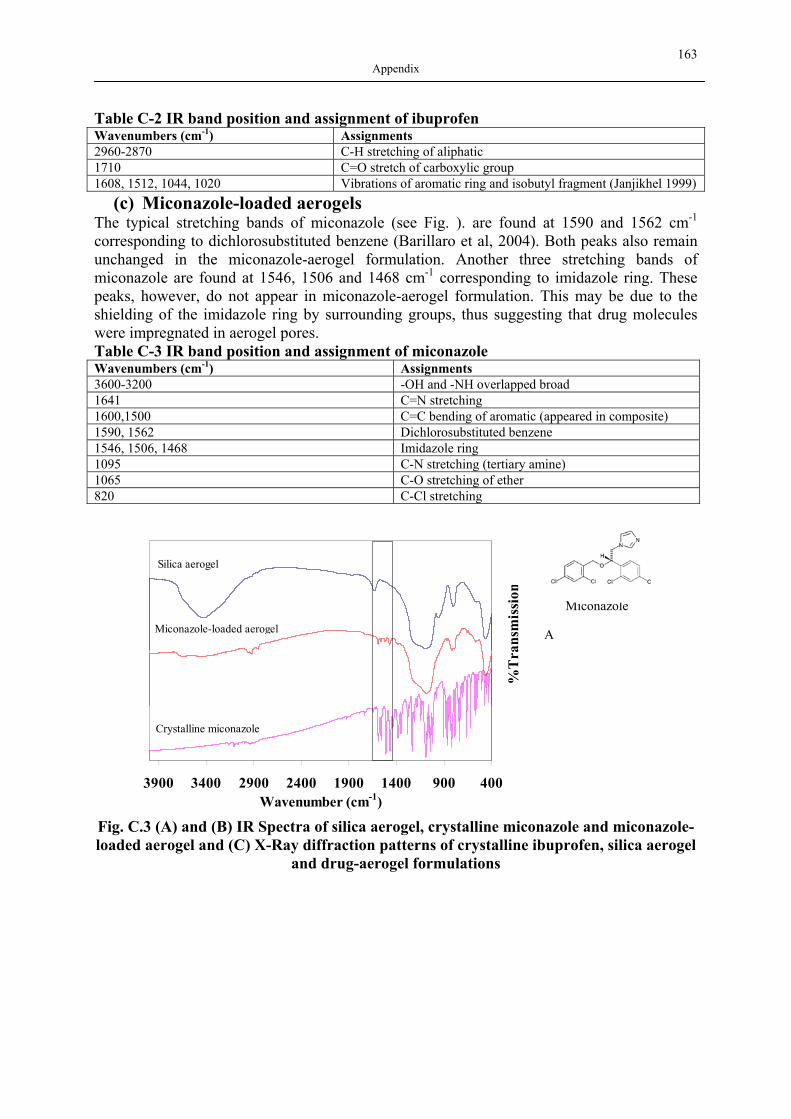
163 Appendix
Table C-2 IR band position and assignment of ibuprofen Wavenumbers (cm-1) Assignments 2960-2870 C-H stretching of aliphatic 1710 C=O stretch of carboxylic group 1608, 1512, 1044, 1020 Vibrations of aromatic ring and isobutyl fragment (Janjikhel 1999)
(c) Miconazole-loaded aerogels The typical stretching bands of miconazole (see Fig. ). are found at 1590 and 1562 cm-1 corresponding to dichlorosubstituted benzene (Barillaro et al, 2004). Both peaks also remain unchanged in the miconazole-aerogel formulation. Another three stretching bands of miconazole are found at 1546, 1506 and 1468 cm-1 corresponding to imidazole ring. These peaks, however, do not appear in miconazole-aerogel formulation. This may be due to the shielding of the imidazole ring by surrounding groups, thus suggesting that drug molecules were impregnated in aerogel pores. Table C-3 IR band position and assignment of miconazole Wavenumbers (cm-1) Assignments 3600-3200 -OH and -NH overlapped broad 1641 C=N stretching 1600,1500 C=C bending of aromatic (appeared in composite) 1590, 1562 Dichlorosubstituted benzene 1546, 1506, 1468 Imidazole ring 1095 C-N stretching (tertiary amine) 1065 C-O stretching of ether 820 C-Cl stretching
400900140019002400290034003900Wavenumber (cm-1)
%T
rans
mis
sion
Silica aerogel
Crystalline miconazole
Miconazole-loaded aerogel
A
Fig. C.3 (A) and (B) IR Spectra of silica aerogel, crystalline miconazole and miconazole-loaded aerogel and (C) X-Ray diffraction patterns of crystalline ibuprofen, silica aerogel
and drug-aerogel formulations
Miconazole
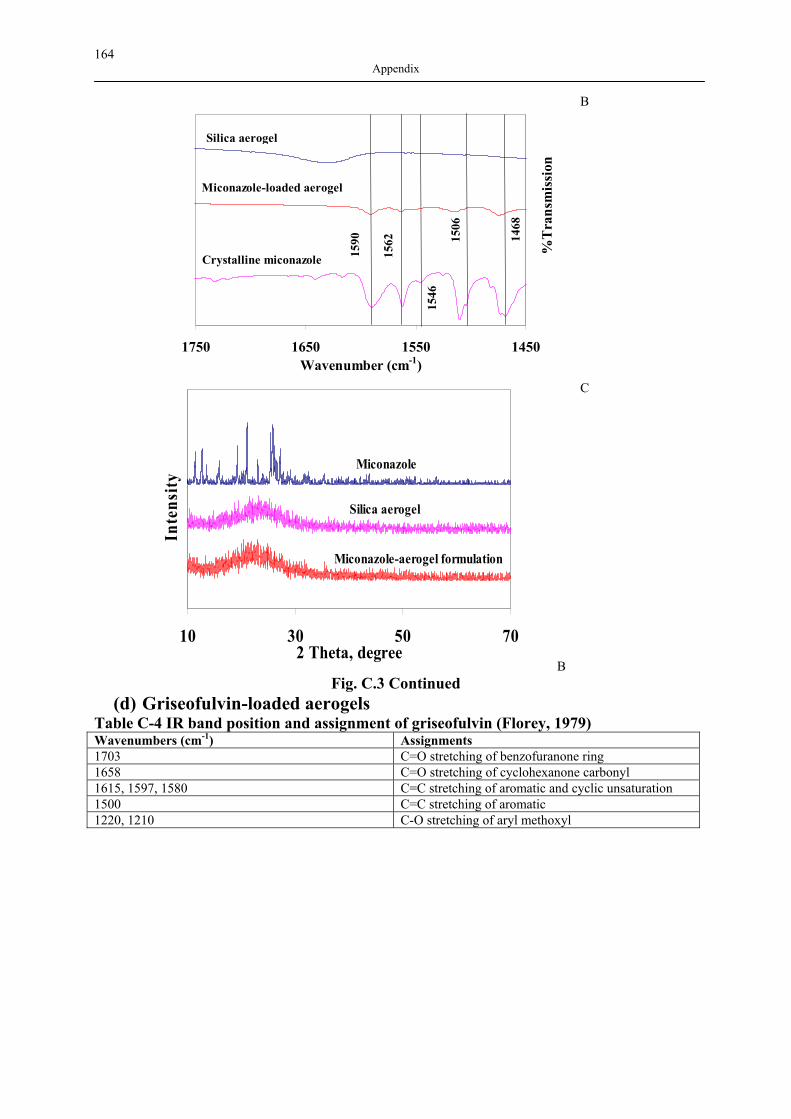
164 Appendix
1450155016501750Wavenumber (cm-1)
%T
rans
mis
sion
Silica aerogel
Crystalline miconazole
Miconazole-loaded aerogel
1590
1562 14
68
1506
1546
B
10 30 50 702 Theta, degree
Inte
nsity
Miconazole
Miconazole-aerogel formulation
Silica aerogel
B
C
Fig. C.3 Continued (d) Griseofulvin-loaded aerogels
Table C-4 IR band position and assignment of griseofulvin (Florey, 1979) Wavenumbers (cm-1) Assignments 1703 C=O stretching of benzofuranone ring 1658 C=O stretching of cyclohexanone carbonyl 1615, 1597, 1580 C=C stretching of aromatic and cyclic unsaturation 1500 C=C stretching of aromatic 1220, 1210 C-O stretching of aryl methoxyl
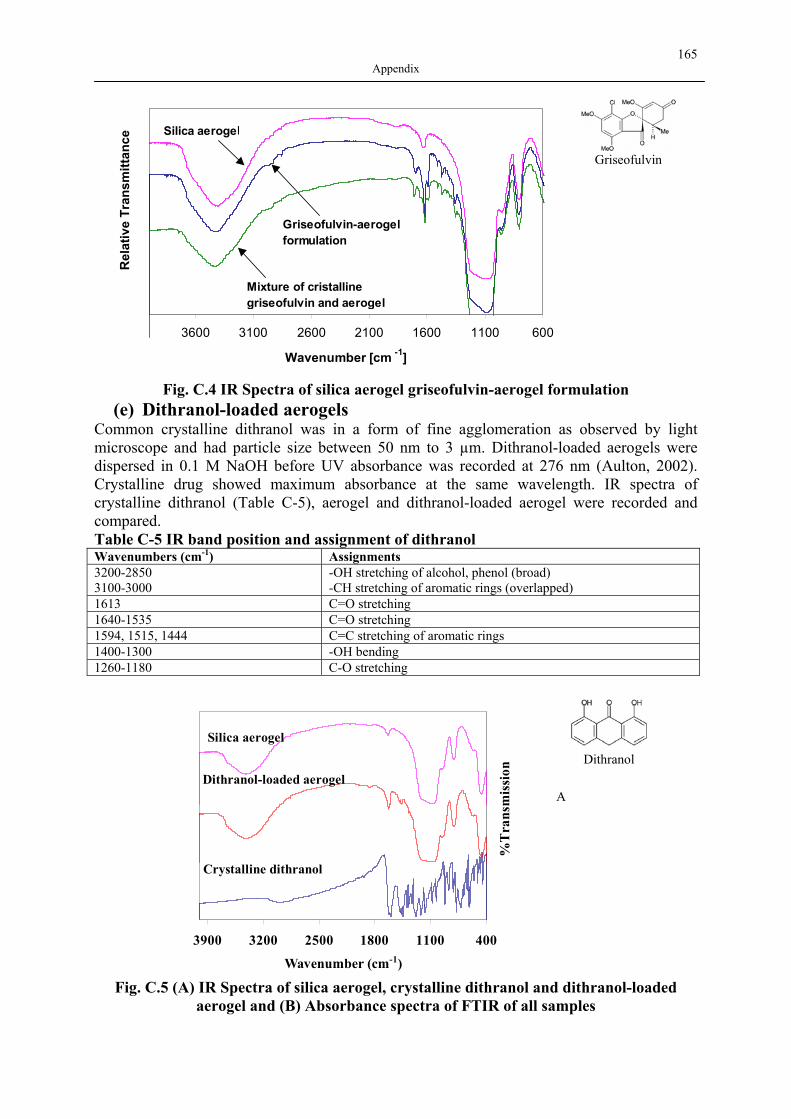
165 Appendix
600110016002100260031003600
Wavenumber [cm -1]
Rel
ativ
e Tr
ansm
ittan
ce
Griseofulvin-aerogel formulation
Mixture of cristalline griseofulvin and aerogel
Silica aerogel
Fig. C.4 IR Spectra of silica aerogel griseofulvin-aerogel formulation (e) Dithranol-loaded aerogels
Common crystalline dithranol was in a form of fine agglomeration as observed by light microscope and had particle size between 50 nm to 3 µm. Dithranol-loaded aerogels were dispersed in 0.1 M NaOH before UV absorbance was recorded at 276 nm (Aulton, 2002). Crystalline drug showed maximum absorbance at the same wavelength. IR spectra of crystalline dithranol (Table C-5), aerogel and dithranol-loaded aerogel were recorded and compared. Table C-5 IR band position and assignment of dithranol Wavenumbers (cm-1) Assignments 3200-2850 3100-3000
-OH stretching of alcohol, phenol (broad) -CH stretching of aromatic rings (overlapped)
1613 C=O stretching 1640-1535 C=O stretching 1594, 1515, 1444 C=C stretching of aromatic rings 1400-1300 -OH bending 1260-1180 C-O stretching
40011001800250032003900
Wavenumber (cm-1)
%T
rans
mis
sion
Silica aerogel
Crystalline dithranol
Dithranol-loaded aerogel
A
Fig. C.5 (A) IR Spectra of silica aerogel, crystalline dithranol and dithranol-loaded aerogel and (B) Absorbance spectra of FTIR of all samples
Griseofulvin
Dithranol
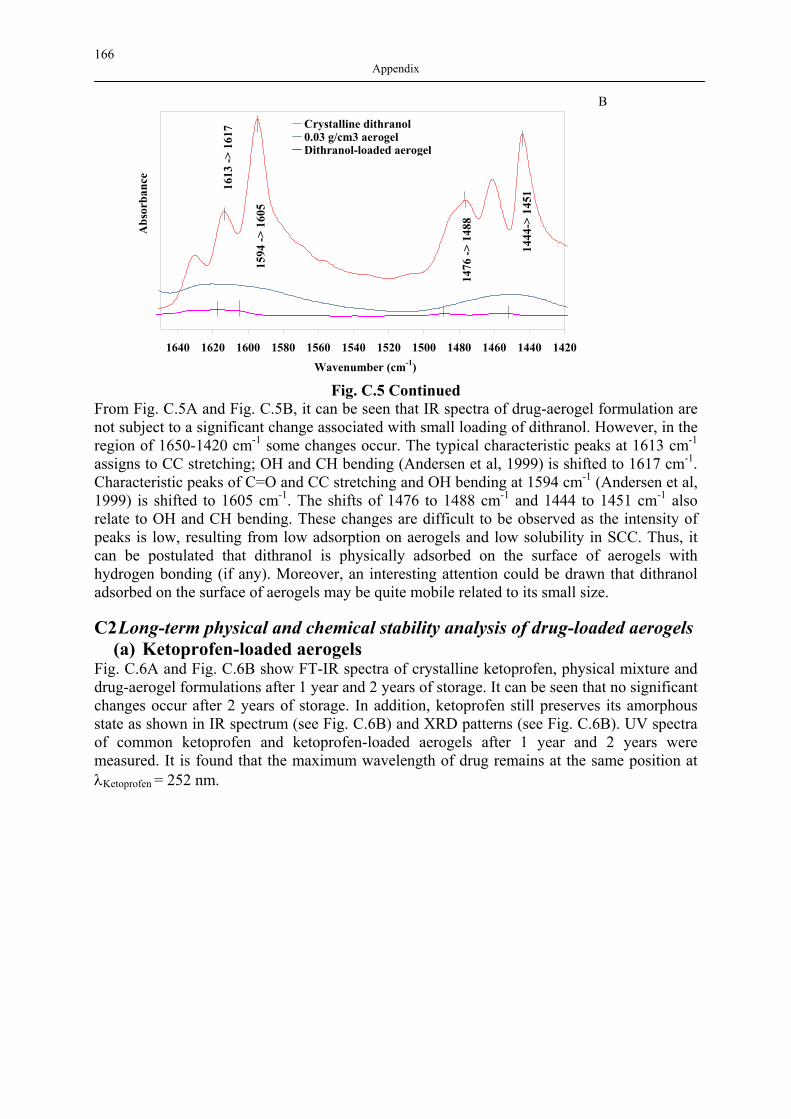
166 Appendix
142014401460148015001520154015601580160016201640
Wavenumber (cm-1)
Abs
orba
nce
Crystalline dithranol0.03 g/cm3 aerogelDithranol-loaded aerogel
1594
-> 1
605
1613
-> 1
617
1476
-> 1
488
1444
-> 1
451
B
Fig. C.5 Continued From Fig. C.5A and Fig. C.5B, it can be seen that IR spectra of drug-aerogel formulation are not subject to a significant change associated with small loading of dithranol. However, in the region of 1650-1420 cm-1 some changes occur. The typical characteristic peaks at 1613 cm-1 assigns to CC stretching; OH and CH bending (Andersen et al, 1999) is shifted to 1617 cm-1. Characteristic peaks of C=O and CC stretching and OH bending at 1594 cm-1 (Andersen et al, 1999) is shifted to 1605 cm-1. The shifts of 1476 to 1488 cm-1 and 1444 to 1451 cm-1 also relate to OH and CH bending. These changes are difficult to be observed as the intensity of peaks is low, resulting from low adsorption on aerogels and low solubility in SCC. Thus, it can be postulated that dithranol is physically adsorbed on the surface of aerogels with hydrogen bonding (if any). Moreover, an interesting attention could be drawn that dithranol adsorbed on the surface of aerogels may be quite mobile related to its small size. C2 Long-term physical and chemical stability analysis of drug-loaded aerogels
(a) Ketoprofen-loaded aerogels Fig. C.6A and Fig. C.6B show FT-IR spectra of crystalline ketoprofen, physical mixture and drug-aerogel formulations after 1 year and 2 years of storage. It can be seen that no significant changes occur after 2 years of storage. In addition, ketoprofen still preserves its amorphous state as shown in IR spectrum (see Fig. C.6B) and XRD patterns (see Fig. C.6B). UV spectra of common ketoprofen and ketoprofen-loaded aerogels after 1 year and 2 years were measured. It is found that the maximum wavelength of drug remains at the same position at λKetoprofen = 252 nm.
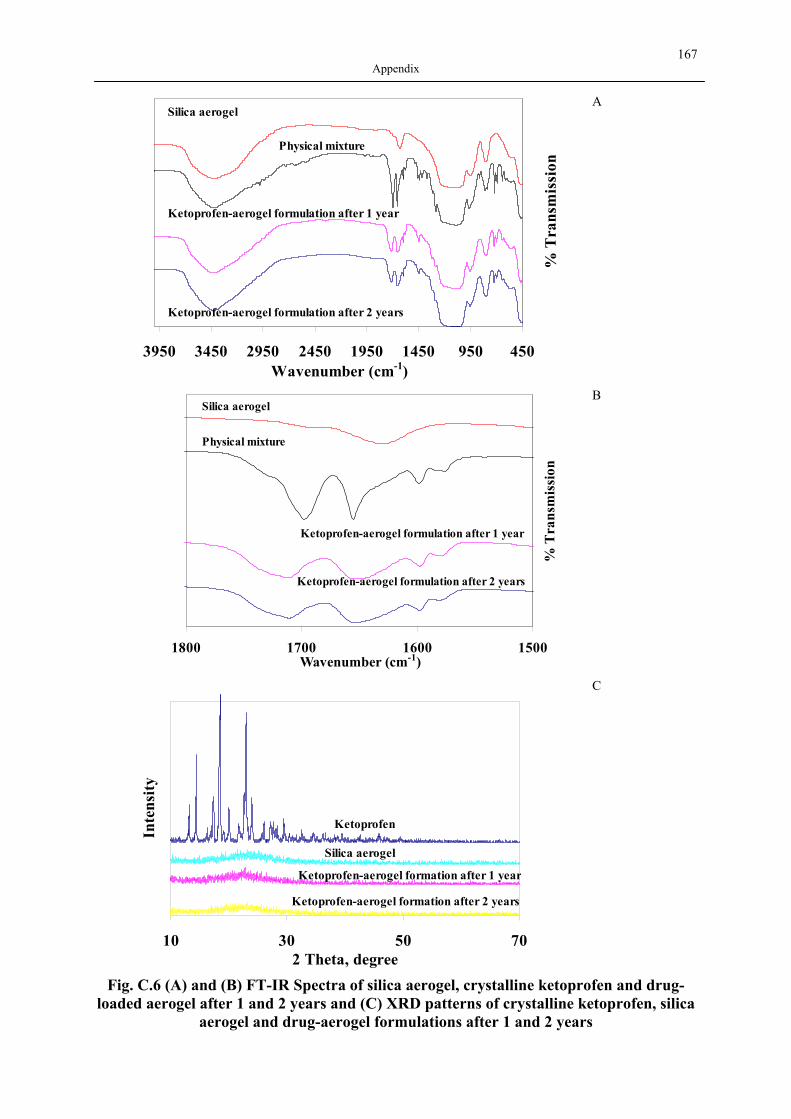
167 Appendix
450950145019502450295034503950Wavenumber (cm-1)
% T
rans
mis
sion
Silica aerogel
Physical mixture
Ketoprofen-aerogel formulation after 1 year
Ketoprofen-aerogel formulation after 2 years
A
1500160017001800Wavenumber (cm-1)
% T
rans
mis
sion
Silica aerogel
Physical mixture
Ketoprofen-aerogel formulation after 1 year
Ketoprofen-aerogel formulation after 2 years
B
10 30 50 702 Theta, degree
Inte
nsity
Ketoprofen
Silica aerogel
Ketoprofen-aerogel formation after 1 year
Ketoprofen-aerogel formation after 2 years
C
Fig. C.6 (A) and (B) FT-IR Spectra of silica aerogel, crystalline ketoprofen and drug-loaded aerogel after 1 and 2 years and (C) XRD patterns of crystalline ketoprofen, silica
aerogel and drug-aerogel formulations after 1 and 2 years

168 Appendix
(b) Griseofulvin-loaded aerogels In the case of griseofulvin, there are also no significant changes after 2 years of storage as shown in FT-IR spectra (Fig. C.7A). The crystallity of griseofulvin is confirmed by XRD patterns in Fig. C.7B. This suggests that griseofulvin preserves its identity within the aerogel environment. UV spectra of common griseofulvin and griseofulvin-loaded aerogels after 1 year and 2 years were recorded by dispersing powered samples in acetonitrile. It is found that the maximum wavelength of drug remains constant at λGriseofulvin = 290 nm.
450950145019502450295034503950
Wavenumber (cm-1)%
Tra
nsm
issio
n
Griseofulvin-aerogel formation after 2 years
Griseofulvin-aerogel formation after 1 year
Physical mixtureSilica aerogel
A
10 20 30 40 50 60 702 Theta, degree
Inte
nsity
Griseofulvin-aerogel formation after 1 year
Griseofulvin-aerogel formation after 2 years
Griseofulvin
Silica aerogel
B
Fig. C.7 (A) and (B) FT-IR Spectra of silica aerogel, crystalline griseofulvin and drug-loaded aerogel after 1 and 2 years and (C) X-Ray diffraction patterns of crystalline
griseofulvin, silica aerogel and drug-aerogel formulations after 1 and 2 years (c) Miconazole-loaded aerogels
Likewise, miconazole-aerogel formulations have no major changes upon storage for 1 and 2 years. This is verified by FT-IR spectra and XRD patterns in Fig. C.8A and Fig. C.8B. UV spectra of common miconazole and miconazole-loaded aerogels after 1 year and 2 years were measured and compared. It was found that all spectra show maximum absorbance at λMiconazole = 280 nm.
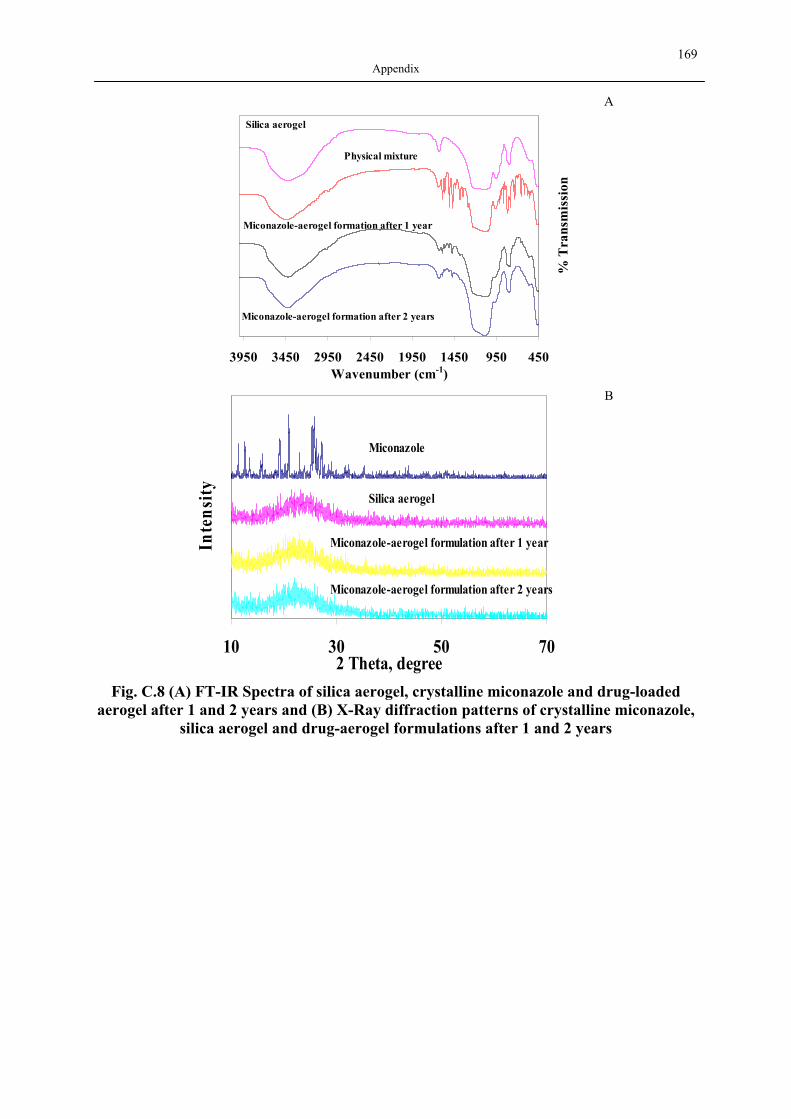
169 Appendix
450950145019502450295034503950Wavenumber (cm-1)
% T
rans
mis
sion
Miconazole-aerogel formation after 2 years
Miconazole-aerogel formation after 1 year
Physical mixture
Silica aerogel
A
10 30 50 702 Theta, degree
Inte
nsity
Miconazole
Miconazole-aerogel formulation after 1 year
Silica aerogel
Miconazole-aerogel formulation after 2 years
B
Fig. C.8 (A) FT-IR Spectra of silica aerogel, crystalline miconazole and drug-loaded aerogel after 1 and 2 years and (B) X-Ray diffraction patterns of crystalline miconazole,
silica aerogel and drug-aerogel formulations after 1 and 2 years
Bibliography Ahmed M.S., Attia Y.A. Multi-metal oxide aerogel for capture of pollution gases from air. Appl Therm Eng. 18 (1998) 787-797.
Ahola M., Kortesuo P., Kangasniemi I., Kiesvaara J., Yli-Urpo A. In vitro release behaviour of toremifene citrate from sol-gel processed sintered silica xerogels. Drug Dev Ind Pharm. 25 (1999) 955-959.
Ahola M., Kortesuo P., Kangasniemi I., Kiesvaara J., Yli-Urpo A. Silica xerogel carrier material for controlled release of toremifene citrate. Int J Pharm. 195 (2000) 219-227.
Ahola M., Säilynoja E., Raitavuo M., Vaahtio M., Salonen J., Yli-Urpo A. In vitro release of heparin from silica xerogels. Biomaterials. 22 (2001) 2163-2170.
Al-Muallem H.A., Knauss D.M. Graft copolymers from starshaped and hyperbranched polystyrene macromonomers. J Polym Sci A1. 39 (2001) 3547-3555.
Albrecht M., van Koten G. Gas Sensor Materials Based on Metallodendrimers. Adv Mater. 11 (1999) 171-174.
Andersen K.B., Langgard M., Spanget-Larsen J. Molecular and vibrational structure of anthralin. Infrared linear dichroism spectroscopy and quantum chemical calculations. J Mol Struct. 475 (1999) 131-140.
Arshady R. Microspheres and microcapsules, a survey of manufacturing techniques Part II: Coacervation. Polym Eng Sci. 30 (1990) 905-914.
Aulton M.E. Modified-release peroral dosage form. Harcourt Publishers Ltd.: London, 2002.
Ayers M.R., Hunt A.J. Synthesis and properties of chitosan-silica hybrid aerogels. J Non-Cryst Solids. 285 (2001) 123-127.
Barillaro V., Bertholet P., de Hassonville S.H., Ziemons E., Evrard B., Delattre L., Piel G. Effect of acidic ternary compounds on the formation of miconazole/cyclodextrin inclusion complexes by means of supercritical carbon dioxide. J Pharm Pharm Sci. 7 (2004) 378-388.
Barner H.E., Huang C.Y., Johnson T., Jacobs G., Martch M.A., Killilea W.R. Supercritical water oxidation: An emerging technology. J Hazard Mater. 31 (1992) 1-17.
Bednarek M., Biedron T., Helinski J., Kaluzynski K., Kubisa P., Penczek S. Branched polyether with multiple primary hydroxyl groups: polymerization of 3-ethyl-3-hydroxymethyloxetane. Macromol Rapid Comm. 20 (1999) 369-372.
Begam T., Tomar R.S., Nagpal A.K., Singhal R.
171 Bibliography
Synthesis of poly(acrylamide-co-methyl methacrylate-co-vinyl amine-co-acrylic acid) hydrogels by Hoffman degradation and their interactions with acetaminophen. J Appl Polym Sci. 94 (2004) 40-52.
Beltrame P.L., Castelli A., Selli E., Mossa A., Testa G., Bonfatti A.M., Seves A. Dyeing of cotton in supercritical carbon dioxide. Dyes Pigments. 39 (1998) 335-340.
Bergbreiter D.E., Tao G. Chemical modification of hyperbranched ultrathin films on gold and polyethylene. J Polym Sci A1. 38 (2000) 3944-3953.
Boogh L., Pettersson B., Manson J.A. Dendritic hyperbranched polymers as tougheners for epoxy resins. Polymer. 40 (1999) 2249-2261.
Böttcher H., Slowik P., Suss W. Sol-gel carrier systems for controlled drug delivery. J Sol-Gel Sci Techn. 13 (1998) 277-281.
BP British Pharmacopoeia 2001: British Pharmacopoeia 2001. British Pharmacopoeia Commission. 2001.
Brachais C.H., Duclos R., Vaugelade C., Huguet J., Capelle-Hue M.L., Bunel C. Poly(methylglyoxylate), a biodegradable polymeric material for new drug delivery systems. Int J Pharm. 169 (1998) 23-31.
Breitenbach A., Li Y.X., Kissel T. Branched biodegradable polyesters for parenteral drug delivery systems. J Control Release. 64 (2000) 167-178.
Brinker C.J., Keefer K.D., Schaefer D.W., Ashley C.S. Sol-gel transition in simple silicates. J Non-Cryst Solids. 48 (1982) 47-64.
Brinker C.J., Scherer G.W. Sol - Gel - Science. Academic Press: New York, 1990.
Broman E., Khoo C., Taylor L.S. A comparison of alternative polymer excipients and processing methods for making solid dispersions of a poorly water soluble drug. Int J Pharm. 222 (2001) 139-151.
Bruening M.L., Zhou Y.F., Aguilar G., Agee R., Bergbreiter D.E., Crooks R.M. Synthesis and characterization of surface-grafted, hyperbranched polymer films containing fluorescent, hydrophobic, ion-binding, biocompatible, and electroactive groups. Langmuir. 13 (1997) 770-778.
Brunauer S., Emmett P.H., Teller E. Adsorption of Gases in Multimolecular Layers. J Am Chem Soc. 60 (1938) 309-319.
Buisson P., Hernandez C., Pierre M., Pierre A.C. Encapsulation of lipases in aerogels. J Non-Cryst Solids. 285 (2001) 295-302.
Bungert B., Sadowski G., Arlt W.
Separations and material processing in solutions with dense gases. Ind Eng Chem Res. 37 (1998) 3208-3220.
Burgath A., Sunder A., Neuner I., Mülhaupt R., Frey H. Multiarm star block copolymers based on 1 -caprolactone with hyperbranched polyglycerol core. Macromol Chem Phys. 201 (2000) 792-797.
Burgos-Solórzano G.I., Brennecke J.F., Stadtherr M.A. Solubility measurements and modeling of molecules of biological and pharmaceutical interest with supercritical CO2. Fluid Phase Equilibr. 220 (2004) 55-67.
Caminade A.M., Maraval V., Laurent R., Majoral J.P. Organometallic derivatives of phosphorus-containing dendrimers. Synthesis, properties and applications in catalysis. Curr Org Chem. 6 (2002) 739-774.
Campbell L.K., Na B.K., Ko L.I. Synthesis and characterization of titania aerogels. Chem Mater. 4 (1992) 1329-1333.
Cao W., Hunt A.J. Thermal annealing of photoluminescent Si deposited on silica aerogels. Solid State Commun. 91 (1994) 645-648.
Carlson G., Lewis D., McKinley K., Richardson J., Tillotson T. Aerogel commercialization: technology, markets and costs. J Non-Cryst Solids. 186 (1995) 372-379.
Chang H.T., Fréchet J.M.J. Proton-transfer polymerization: a new approach to hyperbranched polymers. J Am Chem Soc. 121 (1999) 2313-2314.
Costa P., Manuel J., Lobo S. Modeling and comparison of dissolution profiles. Eur J Pharm Sci. 13 (2001) 123-133.
Cosulich M.E., Russo S., Pasquale S., Mariani A. Performance evaluation of hyperbranched aramids as potential supports for protein immobilization. Polymer. 41 (2000) 4951-4956.
Coulson, Richardson J.F. Chemical Engineering Volume 1 (Coulson and Richardson's Chemical Engineering Series). Butterworth-Heinemann: London, 1999.
Creasey J. Aerogels and applications for thermal insulation. http://www.colorado.edu/engineering/ASEN/asen5519/1999-Files/presentations/john-creasey.pdf. 9 Dec. 1999.
Crooks R.M. Patterning of Hyperbranched Polymer Films. ChemPhysChem. 2 (2005) 644-654.
Dean J.R., Liu B., Price R. Extraction of magnolol from Magnolia officinalis using supercritical fluid extraction and phytosol solvent extraction. Phytochemical Analysis. 9 (1998) 248-252.
173 Bibliography
Degussa Technical Bulletin Aerosil & Silanes. Degussa, Germany: Düsselsorf, Germany, 2001.
Deng Z.S., Wei J.D., Xue X.S., Wang J., Chen L.Y. Surface modification of silica aerogels dried with 2-methyl-1-propanol in the sub-critical pressure. J Porous Mat. 8 (2001) 37-42.
Deutsches Arzneibuch DAB 9. Govi-Verlag GmbH Frankfurt. 1986.
DoITPoMS X-ray diffraction. http://www.doitpoms.ac.uk/tlplib/xray-diffraction/index.php. 2 Feb. 2005.
Domingo C., Garcia-Carmona J., Fanovich M.A., Llibre J., Rodriguez-Clemente R. Single or two-solute adsorption processes at supercritical conditions: an experimental study. J Supercrit Fluid. 21 (2001) 147-157.
Duarte A.R.C., Coimbra P., Sousa H.C.D., Duarte C.M.M. Solubility of Flurbiprofen in Supercritical Carbon Dioxide. J Chem Eng Data. 49 (2004) 449-452.
Duarte A.R.C., Santiago S., Sousa H.C.D., Duarte C.M.M. Solubility of Acetazolamide in Supercritical Carbon Dioxide in the Presence of Ethanol as a Cosolvent. J Chem Eng Data. 50 (2005) 216-220.
Einarsrud M.A. Light gels by conventional drying. J Non-Cryst Solids. 225 (1998) 1-7.
Einarsrud M.A., Nilsen E., Rigacci A. et al. Strengthening of silica gels and aerogels by washing and aging processes. J Non-Cryst Solids. 285 (2001) 1-7.
El Rassy H., Perrard A., Pierre A.C. Application of lipase encapsulated in silica aerogels to a transesterification reaction in hydrophobic and hydrophilic solvents: Bi-Bi Ping-Pong kinetics. Journal of Molecular Catalysis B: Enzymatic. 30 (2004) 137-150.
EMIS and NDC http://www.patient.co.uk/showdoc/30002919/. 2 Mar. 2004.
Emrick T., Chang H.T., Fréchet J.M.J. An A2+B3 approach to hyperbranched aliphaic polyethers containing chain end epoxy substituents. Macromolecules. 32 (1999) 6380-6382.
Emrick T., Chang H.T., Frechet J.M.J. The preparation of hyperbranched aromatic and aliphatic polyether epoxies by chloride-catalyzed proton transfer polymerization from AB(n) and A(2)+B-3 monomers. J Polym Sci A1. 38 (2000) 4850-4869.
Esfand R., Tomalia D.A. Poly(amidoamine) (PAMAM) dendrimers: from biomimicry to drug delivery and biomedical applications. Drug Discov Today. 6 (2001) 427-436.
Everett D.H.
Manual of Symbols and Terminology for Physicochemical Quantities and Units: Appendix II: Definitions, terminology and symbols in colloid and surface chemistry - part 1: Colloid and surface chemistry. Pure Appl Chem. 31 (1972) 577-638.
Ewing G.W. Instrumental methods of chemical analysis. McGraw-Hill Book Company: New York, 1985.
Falah M.Y., Flüssigmembranpermeation und Mikrokapselherstellung mit hyperverzweigten Polymeren, Studienarbeit. Institut für Verfahrenstechnik, Fachgebiet Thermodynamik und thermische Trennverfahren, Technische Universität Berlin, Berlin. 2003.
Falaize S., Radin S., Ducheyne P. In vitro behaviour of silica-based xerogels intended as controlled release carriers. J Am Ceram Soc. 82 (1999) 969-976.
Fang J.H., Kita H., Okamoto K. Hyperbranched polyimides for gas separation applications. 1. Synthesis and characterization. Macromolecules. 33 (2000) 4639-4646.
FIP. FIP Guidelines for Dissolution testing of solids oral Products. Pharm Ind. 43 (1981) 334-343.
FIP. FIP Guidelines for Dissolution testing of solids oral Products (Final draft, 1995). Drug Inf J. 30 (1996) 1071-1084.
Florey K. Analytical Profiles of Drug Substances: Griseofulvin. Academic Press. 1979.218-249.
Florey K. Analytical Profiles of Drug Substances: Ketoprofen. Academic Press. 1981.443-471.
Flory P.J. Molecular size distribution in three dimensional polymers. I. Gelation. J Am Chem Soc. 63 (1941a) 3083-3090.
Flory P.J. Molecular size distribution in three dimensional polymers. II. Trifunctional branching units. J Am Chem Soc. 63 (1941b) 3091-3096.
Flory P.J. Molecular size distribution in three dimensional polymers. III. Tetrafunctional branching units. J Am Chem Soc. 63 (1941c) 3096-3100.
Flory P.J. Molecular size distribution in three dimensional polymers. V. Post-gelation relationships. J Am Chem Soc. 69 (1947) 30-35.
Flory P.J. Molecular size distribution in three dimensionalpolymers. IV. Branched polymers containing A-R-Bf-1 type units . J Am Chem Soc. 74 (1952) 2718-2723.
175 Bibliography
Franchina J.G., Lackowski W.M., Dermody D.L., Crooks R.M., Bergbreiter D.E., Sirkar K., Russell R.J., Pishko M.V. Electrostatic immobilization of glucose oxidase in a weak acid, polyelectrolyte hyperbranched ultrathin film on gold: Fabrication, characterization, and enzymatic activity. Anal Chem. 71 (1999) 3133-3139.
Fréchet J.M.J. Functional polymers and dendrimers: reactivity, molecular architecture, and interfacial energy. Science. 263 (1994) 1710-1715.
Fréchet J.M.J., Henmi M., Gitsov I., Aoshima S., Leduc M., Grubbs R.B. Self-condensing vinyl polymerization: an approach to dendritic materials. Science. 269 (1995) 1083.
Fréchet J.M.J., Tomalia D.A. Dendrimers and Other Dendritic Polymers. John Wiley & Sons, Ltd.: 2001.
Frey H., Haag R. Dendritic polyglycerol: a new versatile biocompatible material. Reviews in Molecular Biotechnology. 90 (2002) 257-267.
Frey H., Schlenk C. Silicon-based dendrimers. Dendrimers II (In: Top Curr Chem). 210 (2000) 69-129.
Fricke J., Tillotson T. Aerogels: Production, characterization, and applications. Thin Solid Films. 297 (1997) 212-223.
Friedrich L.Verfahrenstechnische Berechnungsmethoden Teil 4. VCH-Verlag. 1988.
Froehling P. Development of DSM's Hybrane((R)) hyperbranched polyesteramides. J Polym Sci A1. 42 (2004) 3110-3115.
Froehling P., Brackman J. Properties and applications of poly(propylene imine) dendrimers and poly(esteramide) hyperbranched polymers. Macromol Symp. 151 (2000) 581-589.
Froehling P.E. Dendrimers and dyes -- a review. Dyes Pigments. 48 (2001) 187-195.
Gao C., Molecular design, preparation, characterization and functionalization of hyperbranched polymers. Shanghai Jiao Tong University. 2001.
Gao C., Xu Y.M., Yan D.Y., Chen W. Water-soluble degradable hyperbranched polyesters: Novel candidates for drug delivery? Biomacromolecules. 4 (2003) 704-712.
Gao C., Yan D. Hyperbranched polymers made from commercially available A2 and BB´2 type monomers. Chem Commun. 1 (2001a) 107-108.
Gao C., Yan D. Polyaddition of B2 and BB'2 Type Monomers to A2 Type Monomer. 1. Synthesis of Highly Branched Copoly(sulfone-amine)s. Macromolecules. 34 (2001b) 156-161.
Gao C., Yan D. Hyperbranched polymers: from synthesis to applications. Prog Polym Sci. 29 (2004) 183-275.
Geankoplis C.J. Transport processes and unit operations. Prentice-Hall International(UK), Ltd.: London, 1993.
Golob P. Current status and future perspectives for inert dusts for control of stored product insects. J Stored Prod Res. 33 (1997) 69-79.
Gong C.G., Fréchet J.M.J. Proton transfer polymerization in the preparation of hyperbranched polyesters with epoxide chainends and internal hydroxyl functionalities. Macromolecules. 33 (2000) 4997-4999.
Gregg S.J., Sing K.S.W. Adsorption, Surface Area and Porosity. Academic Press: London, 1982.
Groen J.C., Peffer L.A.A., Perez-Ramirez J. Pore size determination in modified micro- and mesoporous materials. Pitfalls and limitations in gas adsorption data analysis. Micropor Mesopor Mat. 60 (2003) 1-17.
Gryshchuk O., Jost N., Karger-Kocsis J. Toughening of vinylester-urethane hybrid resins by functional liquid nitrile rubbers and hyperbranched polymers. Polymer. 43 (2002a) 4763-4768.
Gryshchuk O., Jost N., Karger-Kocsis J. Toughening of vinylester-urethane hybrid resins through functionalized polymers. J Appl Polym Sci. 84 (2002b) 672-680.
Günther U., Freisetzung von Dithranol aus hydrophilen Silica-Aerogelen und Penetration von dithranol- und aerogelhaltigen halbfesten Zubereitungen in Dodecanol-Collodium-Modellmembranen. Institut für Pharmazeutische Technologie und Biopharmazie, Martin-Luther-Universität Halle-Wittenberg. 2005.
Gupta M.K., Vanwert A., Bogner R.H. Formation of physically stable amorphous drugs by milling with neusilin. J Pharm Sci. 92 (2003) 536-551.
Heil C., Windscheif G.R., Braschohs S. et al. Highly selective sensor materials for discriminating carbonyl compounds in the gas phase using quartz microbalances. Sensor Actuat B-Chem. 61 (1999) 51-58.
Hench L.L., Wilson J. In Silicon Biochemistry. Ciba Foundation Symposium. 121 (1986) 231-246.
Henning S., Svensson L.
177 Bibliography
A production facility for silica [7631-86-9] aerogel has been set up in Lund. Aerogel is now produced in large quantities with the n of 1.03 and 1.05. The standard block size is 18 × 18 × 3 cm3. Phys Scripta. 23 (1981) 697-702.
Higuchi T. Rate of release of medicaments from ointment bases containing drugs in suspension. J Pharm Sci. 50 (1961) 874-875.
Hirsch A., Vostrowsky O. Dendrimers with carbon rich-cores. Dendrimers Iv (In: Top Curr Chem). 217 (2001) 51-93.
Horcajada P., Ramila A., Pérez-Pariente J., Vallet-Regi M. Influence of pore size of MCM-41 matrices on drug delivery rate. Micropor Mesopor Mat. 68 (2004) 105-109.
Hrubesh L.W. Aerogel applications. J Non-Cryst Solids. 225 (1998) 335-342.
Hrubesh L.W., Coronado P.R., Satcher J.H. Solvent removal from water with hydrophobic aerogels. J Non-Cryst Solids. 285 (2001) 328-332.
Hult A., Johansson M., Malmstrom E. Hyperbranched polymers. Branched Polymers II (In: Adv Polym Sci). 143 (1999) 1-34.
Hunt A., Ayers M. Silica Aerogels. http://eande.lbl.gov/ECS/aerogels/satoc.htm. 1 Nov. 2 A.D.
Hunt A.J., Ayers M.R., Cao W. Aerogel composites using chemical vapor infiltration. J Non-Cryst Solids. 185 (1995) 227-232.
Hüsing N., Schubert U. Aerogels - Airy Materials: Chemistry, Structure, and Properties. Angew Chem Int Edit. 37 (1998) 22-45.
Jain R.A. The manufacturing techniques of various drug loaded biodegradable poly(lactide-co-glycolide) (PLGA) devices. Biomaterials. 21 (2000) 2475-2490.
Jaroniec M., Kruk M., Olivier J.P. Standard Nitrogen Adsorption Data for Characterization of Nanoporous Silicas. Langmiur. (1999) 5410-5413.
Jikei M., Chon S.H., Kakimoto M., Kawauchi S., Imase T., Watanebe J. Synthesis of hyperbranched aromatic polyamide from aromatic diamines and trimesic acid. Macromolecules. 32 (1999) 2061-2064.
Johannsen M. Separation of enantiomers of ibuprofen on chiral stationary phases by packed column supercritical fluid chromatography. J Chromatogr A. 937 (2001) 135-138.
Johansson M., Malmstom E., Jansson A., Hult A.
Novel concept for low temperature curing powder coatings based on hyperbranched polyesters. J Coating Technol. 72 (2000) 49-54.
Jung J., Perrut M. Particle design using supercritical fluids: Literature and patent survey. J Supercrit Fluid. 20 (2001) 179-219.
Kerc J., Srcic S., Knez Z., Sencar-Bozic P. Micronization of drugs using supercritical carbon dioxide. Int J Pharm. 182 (1999) 33-39.
Kienle R.H., van der Meulen P.A., Petke F.E. The polyhydric alcohol–polybasic acid reactions. III. Further studies of the glycerol–phthalic anhydride reaction. J Am Chem Soc. 61 (1939) 2258-2268.
Kim Y.H., Webster O.W. Hyperbranched polyphenylenes. Polymer Preprints (American Chemical Society, Division of Polymer Chemistry). 29 (1988) 310-311.
Kistler S.S. Coherent expanded aerogels and jellies. Nature. 127 (1931) 741.
Klee J.E., Schneider C., Holter D., Burgath A., Frey H., Mulhaupt R. Hyperbranched polyesters and their application in dental composites: Monomers for low shrinking composites. Polym Advan Technol. 12 (2001) 346-354.
Klein C.P.A.T., Li P., Blieck-hogervorst J.M.A., de Groot K. Effect of sintering temperature on silica gels and their bone bonding ability. Biomaterials. 16 (1995) 715-719.
Knez Z., Novak Z. Adsorption of water vapor on silica, alumina, and their mixed oxide aerogels. J Chem Eng Data. 46 (2001) 858-860.
Knischka R., Lutz P.J., Sunder A., Mülhaupt R., Frey H. Functional poly(ethylene oxide) multiarm star polymers: core-first synthesis using hyperbranched polyglycerol initiators . Macromolecules. 33 (2000) 315-320.
Knowles D.E., Felix W.D., Porter N.L., Jones B.A., and Knowles D.L. Supercritical fluid chromatography applications for the petroleum industry. In Proceedings of the International Symposium on Fuels and Lubricants. (2000) 367.
Kocon L., Despetis F., Phalippou J. Ultralow density silica aerogels by alcohol supercritical drying. J Non-Cryst Solids. 225 (1998) 96-100.
Kolhe P., Misra E., Kannan R.M., Kannan S., Lieh-Lai M. Drug complexation, in vitro release and cellular entry of dendrimers and hyperbranched polymers. Int J Pharm. 259 (2003) 143-160.
Kricheldorf H.R., Zang Q.Z., Schwarx G. New polymer syntheses. 6. Linear and branched poly(3-hydroxy-benzoates). Polymer. 23 (1982) 1821-1829.
179 Bibliography
Kristmundsdottir T., Gudmundsson O.S., Ingvarsdottir K. Release of diltiazem from Eudragit microparticles prepared by spray-drying. Int J Pharm. 137 (1996) 159-165.
Krukonis V. Supercritical Fluids: Their Proliferation in the Pharma Industry. http://www.phasex4scf.com/supercritical_fluids/about_supercritical_fluids.htm. 11 Jan. 2005.
Kuo P.L., Ghosh S.K., Liang W.J., Hsieh Y.T. Hyperbranched polyethyleneimine architecture onto poly(allylamine) by simple synthetic approach and chelating characters. J Polym Sci A1. 39 (2001) 3023.
Lach C., Hanselmann R.H., Frey H., Mülhaupt R. Hyperbranched carbosilane oxazoline-macromonomers: polymerization and coupling to a trimesic acid core. Macromol Rapid Comm. 19 (1998) 461-465.
Lackowski W.M., Franchina J.G., Bergbreiter D.E., Crooks R.M. Atomic force microscopy study of the surface morphology of hyperbranched poly(acrylic acid) thin films. Adv Mater. 11 (1999) 1368-1371.
Lai M.K., Tsiang R.C. Encapsulating acetaminophen into poly(L-lactide) microcapsules by solvent evaporation technique in an O/W emulsion. J Microencapsul. 21 (2004) 307-316.
Lai W., Ducheyne P., and Garino J. Bioceramics: Removal pathway of silicon released from bioactive glass granules in vivo. Proceeding of the 11th International Symposium on Ceramics in Medicine. 11 (1998) 383-386.
Lange J., Stenroos E., Johansson M., Malmstrom E. Barrier coatings for flexible packaging based on hyperbranched resins. Polymer. 42 (2001) 7403-7410.
Lawrence J.K., Larsen J., Tebbett I.R. Supercritical fluid extraction of benzodiazepines in solid dosage forms. Analytica Chimica Acta. 288 (1994) 123-130.
Lee J., Park T.G., Choi H. Effect of formulation and processing variables on the characteristics of microspheres for water-soluble drugs prepared by w/o/o double emulsion solvent diffusion method. Int J Pharm. 196 (2000) 75-83.
Lee K., Gould G., WO02051389; Aerogel Powder Therapeutic Agents. (2002).
Lee K.H., Kim S.Y., Yoo K.P. Low-density, hydrophobic aerogels. J Non-Cryst Solids. 186 (1995) 18-22.
Lee K.P., Begag R., and Altiparmakov Z., US 6,670,402; Rapid aerogel production process. (2003).
Lee O.J., Lee K.H., Jin Yim T., Young Kim S., Yoo K.P.
Determination of mesopore size of aerogels from thermal conductivity measurements. J Non-Cryst Solids. 298 (2002) 287-292.
Li P., Ohtsuki C., Kokubo T., Nakanishi K., Soga N. Apatite formation induced by silica gel in simulated body fluid. J Am Ceram Soc. 75 (1992) 2094-2097.
Li Q., Zhang Z., Zhong C., Liu Y., Zhou Q. Solubility of solid solutes in supercritical carbon dioxide with and without cosolvents. Fluid Phase Equilibr. 207 (2003) 183-192.
Lim Y.B., Kim S.M., Lee Y., Yang T.G., Lee M.J., Park J.S. Cationic hyperbranched polymer as an anionic DNA condensing molecule. Abstr Pap Am Chem S. 221 (2001) U417.
Liu B., Lockwood G.B., Gifford L.A. Supercritical fluid extraction of diosgenin from tubers of Dioscorea nipponica. J Chromatogr A. 690 (1995) 250-253.
Mackay M.E., Carmezini G. Manipulation of hyperbranched polymers' conformation. Chem Mater. 14 (2002) 819-825.
Macnaughton S.J., Kikic I., Foster N.R., Alessi P., Cortesi A. Solubility of Anti-Inflammatory Drugs in Supercritical Carbon Dioxide. J Chem Eng Data. 41 (1996) 1083-1086.
Madsafe http://www.medsafe.govt.nz/DatasheetPage.htm. 1 Dec. 2004.
Magnan C., Bazan C., Charbit F., Joachim J., and Charbit G. Impregnation of porous supports with active substances by means of supercritical fluids. Process Technology Proceedings. (1996) 509-514.
Magnusson H., Malmstrom E., Hult A. Structure buildup in hyperbranched polymers from 2,2-bis(hydroxymethyl)propionic acid. Macromolecules. 33 (2000) 3099-3104.
Malcolm P.S. Polymer Chemistry: an Introduction. Oxford University Press,Inc.: London, 1999.
Manczyk K., Szewczyk P. Highly branched high solids alkyd resins. Prog Org Coat. 44 (2002) 99-109.
Mannahan S.E. Quantitative Chemical Analysis. Brooks/Cole Publishing Company: Monterey, California, 1986.
Matthews O.A., Shipway A.N., Stoddart J.F. Dendrimers - Branching out from curiosities into new technologies. Prog Polym Sci. 23 (1998) 1-56.
Mecking S., Thomann R., Frey H., Sunder A. Preparation of catalytically active palladium nanoclusters in compartments of amphiphilic hyperbranched polyglycerols. Macromolecules. 33 (2000) 3958-3960.
181 Bibliography
Mezzenga R., Boogh L., Manson J.A.E. A thermodynamic model for thermoset polymer blends with reactive modifiers. J Polym Sci A2. 38 (2000) 1893-1902.
Mezzenga R., Boogh L., Manson J.A.E. A review of dendritic hyperbranched polymer as modifiers in epoxy composites. Compos Sci Technol. 61 (2001) 787-795.
Mezzenga R., Manson J.A. Novel modifiers for thermoset resins: Dendritic hyperbranched polymers. Abstr Pap Am Chem S. 221 (2001a) U438.
Mezzenga R., Manson J.A.E. Thermo-mechanical properties of hyperbranched polymer modified epoxies. J Mater Sci. 36 (2001b) 4883-4891.
Moner-Girona M., Roig A., Molins E., Llibre J. Sol-gel route to direct formation of silica aerogel microparticles using supercritical solvents. J Sol-Gel Sci Techn. 26 (2003) 645-649.
Moore J.S. Molecular architecture and supramolecular chemistry. Curr Opin Solid St M. 1 (1996) 777-788.
Morimoto T., Suda Y., Nagao M. Heat of immersion of zinc oxide in organic liquids. 3. Immersion in benzene, toluene, and chlorobenzene. J Phys Chem-US. 89 (1985) 4881-4883.
Mrowiec-Bialon J., Jarzebski A.B., Lachowski A.I., Malinowski J.J. Two-component aerogel adsorbents of water vapour. J Non-Cryst Solids. 225 (1998) 184-187.
Nagale M., Kim B.Y., Bruening M.L. Ultrathin, hyperbranched poly(acrylic acid) membranes on porous alumina supports. J Am Chem Soc. 122 (2000) 11670-11678.
Nagao M., Suda Y. Adsorption of benzene, toluene, and chlorobenzene on titanium dioxide. Langmuir. 5 (1989) 42-47.
Nicoll S.B., Radin S., Santos E.M., Tuan R.S., Ducheyne P. In vitro release kinetics of biologically active transforming growth factor-1 from a novel porous glass carrier. Biomaterials. 18 (1997) 853-885.
Nicoloan G.A., Contribution on l'etude des aerogels des silice. University of Lyon. 1968.
Pajonk G.M. Some applications of silica aerogels. Colloid Polym Sci. 281 (2003) 637-651.
Pajonk G.M., Elaloui E., Achard P., Chevalier B., Chevalier J.L., Durant M. Physical properties of silica gels and aerogels prepared with new polymeric precursors. J Non-Cryst Solids. 186 (1995) 1-8.
Patri A.K., Majoros I.J., Baker J.R. Dendritic polymer macromolecular carriers for drug delivery. Curr Opin Chem Biol. 6 (2002) 466-471.
Pauthe M., Despetis F., Phalippou J. Hydrophobic silica CO2 aerogels. J Non-Cryst Solids. 155 (1993) 110-114.
Peez R.F., Dermody D.L., Franchina J.G., Jones S.J., Bruening M.L., Bergbreiter D.E., Crooks R.M. Aqueous solvation and functionalization of weak-acid polyelectrolyte thin films. Langmuir. 14 (1998) 4232-4237.
Pekala R.W. Organic aerogels from the polycondensation of resorcinol with formaldehyde. J Mater Sci. 24 (1989) 3221-3227.
Pentz M., Shott M., Aprahamian F. Handeling Experimental Data. Open University Press: London, 1988.
Peppas N.A. Analysis of Fickian and non-Fickian drug release from polymers. Pharm Acta Helv. 60 (1985) 110-111.
Pérez de Diego Y., Production of controlled drug delivery microparticles using supercritical carbon dioxide. Laboratory for Process Equipment, TU Delft. 2005.
Peri J.B. Infrared study of OH and NH2 groups on the surface of a dry silica aerogel . J Phy Chem-US. 70 (1966) 2937.
Perry R.H., Green D.W. Liquid-solid operation and equipment. Perry's Chemical Engineers' Handbbok (CD-ROM). 1999.
Pierre A.C., Pajonk G.M. Chemistry of aerogels and their applications. Chem Rev. 102 (2002) 4243-4265.
Pignatello R., Ferro M., De Guidi G. et al. Preparation, characterisation and photosensitivity studies of solid dispersions of diflunisal and Eudragit RS100 (R) and RL100 (R). Int J Pharm. 218 (2001) 27-42.
Poco J.F., Coronado P.R., Pekala R.W., and Hrubesh L.W. A rapid supercritical extraction process for the production of silica aerogels. Materials Research Society Symposium. 431 (1996) 297.
Poelz G. Aerogel cherenkov counters at DESY. Nucl Instrum Meth A. 248 (1986) 118-129.
Pommier B., Teichner S.J. In Proc. Int. Congr. Catal. 9th. Proc Int Congr Catal 9th. 2 (1988) 610.
Power M., Hosticka B., Black E., Daitch C., Norris P.
183 Bibliography
Aerogels as biosensors: viral particle detection by bacteria immobilized on large pore aerogel. J Non-Cryst Solids. 285 (2001) 303-308.
Rámila A., Muñoz B., Pérez-Pariente J., Vallet-Regi M. Mesoporous MCM-41 as Drug Host System. J Sol-Gel Sci Techn. 26 (2003) 1199-1202.
Randolph T.W., Randolph A.D., Mebes M., Yeung S. Sub-Micrometer-Sized Biodegradable Particles of Poly @-Lactic Acid) via the Gas Antisolvent Spray Precipitation Process. Biotechnol Progr. 9 (1993) 429-435.
Rasenack N., Muller B.W. Dissolution rate enhancement by in situ micronization of poorly water-soluble drugs. Pharm Res. 19 (2002) 1894-1900.
Reichenauer G., Scherer G.W. Nitrogen sorption in aerogels. J Non-Cryst Solids. 285 (2001) 167-174.
Rolker J., Hochdruckphasenverhalten gasexpandierter hyperverzweigter Polyesterlösungen und Herstellung wirkstoffbeladener Mikropartikel, Studienarbeit. Institut für Verfahrenstechnik, Fachgebiet Thermodynamik und thermische Trennverfahren, Technische Universität Berlin, Berlin. 2002.
Romagnoli B., Hayes W. Chiral dendrimers - from architecturally interesting hyperbranched macromolecules to functional materials. J Mater Chem. 12 (2002) 767-799.
Rouquerol F., Rouquerol J., Sing K. Adsorption by powders and porous solids. Acadmic Press: London, 1990.
Saltzman W.M. Drug Delivery. Oxford University Press: New York, 2001.
Sanders L.M., Kent J.S., McRae G.I., Vickery B.H., Tice T.R., Lewis D.H. Controlled release of a luteinizing hormone-releasing hormone analogue from poly(d,l-lactide-co-glycolide) microspheres. J Pharm Sci. 73 (1984) 1294-1297.
Santinho A.J., Ueta J.M., Freitas O., Pereira N.L. Physicochemical characterization and enzymatic degradation of casein microcapsules prepared by aqueous coacervation. J Microencapsul. 19 (2002) 549-558.
Santos E.M., Radin S., Ducheyne P. Sol-gel derived carrier for controlled release of proteins. Biomaterials. 20 (1999) 1695-1700.
Sauceau M., Letourneau J.-J., Freiss B., Richon D., Fages J. Solubility of eflucimibe in supercritical carbon dioxide with or without a co-solvent. J Supercrit Fluid. 31 (2004) 133-140.
Sawada K., Ueda M. Evaluation of the dyeing mechanism of an acid dye on protein fibers in supercritical CO2. Dyes Pigments. 63 (2004) 77-81.
Scherer G.W.
Adsorption in aerogel networks. J Non-Cryst Solids. 225 (1998) 192-199.
Scherer G.W., Calas S., Sempere R. Adsorption in sparse networks - II. Silica aerogels. J Colloid Interf Sci. 202 (1998) 411-416.
Scherer G.W., Smith D.M., Stein D. Deformation of aerogels during characterization. J Non-Cryst Solids. 186 (1995) 309-315.
Schluter A.D., Rabe J.P. Dendronized polymers: Synthesis, characterization, assembly at interfaces, and manipulation. Angew Chem Int Edit. 39 (2000) 864-883.
Schwertfeger F., Frank D., Schmidt M. Hydrophobic waterglass based aerogels without solvent exchange or supercritical drying. J Non-Cryst Solids. 225 (1998) 24-29.
Schwertfeger F., Kuhn J., Bock V., Arduini-Schuster M.C., Seyfried E., Schubert U., Fricke J. Infrared opacification of organically modified SiO2-aerogels via pyrolysis. Thermal Conductivity. 22 (1994) 598.
Schwertfeger F., Zimmermann A., and Krempel H., US 6,280,744; Use of inorganic aerogels in pharmacy. (2001).
Seiler M. Dendritic polymers - Interdisciplinary research and emerging applications from unique structural properties. Chem Eng Technol. 25 (2002) 237-253.
Seiler M., Kohler D., Arlt W. Hyperbranched polymers: new selective solvents for extractive distillation and solvent extraction. Sep Purif Technol. 29 (2002) 245-263.
Seiler M., Kohler D., Arlt W. Hyperbranched polymers: new selective solvents for extractive distillation and solvent extraction (vol 29, pg 245, 2002). Sep Purif Technol. 30 (2003a) 177-179.
Seiler M., Rolker J., Arlt W. Phase behavior and thermodynamic phenomena of hyperbranched polymer solutions. Macromolecules. 36 (2003b) 2085-2092.
Sethia S., Squillante E. Physicochemical characterization of solid dispersions of carbamazepine formulated by supercritical carbon dioxide and conventional solvent evaporation method. J Pharm Sci. 91 (2002) 1948-1957.
Shariati A., Peters C.J. Recent developments in particle design using supercritical fluids. Curr Opin Solid St M. 7 (2003) 371-383.
Shen W.Z., Zheng J.T., Zhang Y.L., Wang J.G., Qin Z.F. The effect of pore structure of activated carbon on the adsorption of Congo red and vitamin B12. Stud Surf Sci Catal. 146(Nanotechnology in Mesostructured Materials) (2003) 779-782.
Shu C.F., Leu C.M.
185 Bibliography
Hyperbranched poly(ether ketone) with carboxylic acid terminal groups: synthesis, characterization, and derivatization. Macromolecules. 32 (1999) 100-105.
Sideratou Z., Tsiourvas D., Paleos C.M. Quaternized Poly(propylene imine) Dendrimers as Novel pH-Sensitive Controlled-Release Systems . Langmuir. 16 (1999) 1766-1769.
Sieminska L., Ferguson M., Zerda T.W., Cough E. Diffusion of steroids in porous sol-gel glass: application in slow drug delivery. J Sol-Gel Sci Tehn. 8 (1997) 1105-1109.
Sieminska L., Zerda T.W. Diffusion of steroids from sol-gel glass. J Phy Chem-US. 100 (1996) 4591-4597.
Siepmann J., Peppas N.A. Mathematical modeling of controlled drug delivery. Adv Drug Deliver Rev. 48 (2001) 137-138.
Sihvonen M., Jarvenpaa E., Hietaniemi V., Huopalahti R. Advances in supercritical carbon dioxide technologies. Trends Food Sci Tech. 10 (1999) 217-222.
Sing K. The use of nitrogen adsorption for the characterisation of porous materials. Colloid Surface A. 187 (2001) 3-9.
Sing K.S.W., Everett D.H., Haul R.A.W., Moscou L., Pierotti R.A., Rouquerol J., Siemieniewska T. Reporting physisorption data for gas/solid systems with special reference to the determination of surface area and porosity. Pure Appl Chem. 57 (1985) 603-619.
Slagt M.Q., Stiriba S.E., Gebbink R.J.M.K., Kautz H., Frey H., von Koten G. Encapsulation of hydrophilic pincer-platinum(II) complexes in amphiphilic hyperbranched polyglycerol nanocapsules. Macromolecules. 35 (2002) 5737.
Smirnova I., Synthesis of silica aerogels and their applications as a drug delivery system. Institut für Verfahrenstechnik, Fachgebiet Thermodynamik und thermische Trennverfahren, Technische Universität Berlin. 2002.
Smirnova I., Arlt W. Synthesis of silica aerogels: Influence of the supercritical CO2 on the sol-gel process. J Sol-Gel Sci Techn. 28 (2003) 175-184.
Smirnova I., Mamic J., Arlt W. Adsorption of drugs on silica aerogels. Langmuir. 19 (2003) 8521-8525.
Smirnova I., Suttiruengwong S., Arlt W. Feasibility study of hydrophilic and hydrophobic silica aerogels as drug delivery systems. J Non-Cryst Solids. 350 (2004a) 54-60.
Smirnova I., Suttiruengwong S., Seiler M., Arlt W.
Dissolution rate enhancement by adsorption of poorly soluble drugs on hydrophilic silica aerogels. Pharm Dev Technol. 9 (2004b) 443-452.
Smith D.M., Deshpande R., and Brinker C.J. Better Ceramics Through Chemistry V. Mat Res Soc Symp Proc. 271 (1992) 567.
Stewart J.J.P. Optimization of parameters for semiempirical methods I. Method. J Comput Chem. 10 (1989) 209-220.
Stiriba S.E., Frey H., Haag R. Dendritic polymers in biomedical applications: from potential to clinical use in diagnostics and therapy. Angew Chem Int Edit. 41 (2002) 1329-1334.
Streubel A., Siepmann J., Bodmeier R. Floating microparticles based on low density foam powder. Int J Pharm. 241 (2002) 279-292.
Stricker H. Physikalische Pharmazie. Wissenschaftliche Verlagsgesellschaft mbH: Stuttgart, 1998.
Su H.-N. Introduction to TG/DTA/DSC. http://mmae.iit.edu/~ning/DSC.pdf. 22 Dec. 2004.
Subramaniam B., Rajewski R.A., Snavely K. Pharmaceutical processing with supercritical carbon dioxide. J Pharm Sci. 86 (1997) 885-890.
Sunder A., Bauer T., Mülhaupt R., Frey H. Synthesis and thermal behavior of estified aliphatic hyperbranched polyether polyols . Macromolecules. 33 (2000) 1330-1337.
Sunder A., Quincy M.F., Mülhaupt R., Frey H. Hyperbranched polyether polyols with liquid crystalline properties. Angew Chem Int Edit. 38 (1999) 2928-2930.
Suttiruengwong S., Seiler M., Rolker J., Lüderitz L., Pérez de Diego Y., Jansens P.J., Smirnova I., Arlt W. Hyperbranched polymers as drug carriers: microencapsulation and release kinetics. Pharm Dev Technol. (2005) in press.
Suzuki M., Li A., Saegusa T. Multibranching polymerization: palladium-catalyzed ring-opening polymerization of cyclic carbamate to produce hyperbranched dendritic polyamine. Macromolecules. 25 (1992) 7071-7072.
Tan B.H., Santos E.M., and Ducheyne P. Ultramicroscopic pore size and porosity of xerogels for controlled release of biological molecules. In: Fifth World Biomaterials Congress. vol. 2 (1996) 191.
Teichner S.J., Nicoloan G.A., US 3,672,833; Method of preparing inorganic aerogels. (1972).
Tewari P.H., Hunt A.J., Lofftus K.D.
187 Bibliography
Ambient-temperature supercritical drying of transparent silica aerogels. Mate Lett. 3 (1985) 363-367.
The National Institute of Standards and Technology (NIST) NIST Standard Reference Database Number 69. http://webbook.nist.gov/chemistry/. 2003.
Theiner J. Elemental C/H/N/S Analysis. http://www.univie.ac.at/Mikrolabor/CHNS_eng.htm. 12 Dec. 2004.
Tillotson T.M., Hrubesh L.W. Transparent ultralow-density silica aerogels prepared by a two-step sol-gel process. J Non-Cryst Solids. 145 (1992) 44-50.
Tom J.W., Lim G.B., Debendetti P.G., and Prod'homme R.K. Applications of supercritical fluids in controlled release of drugs. ACS Sym Ser. Supercritical Fluid Engineering Science. 514 (1993) 238.
Tomalia D.A., Frechet J.M.J. Discovery of dendrimers and dendritic polymers: A brief historical perspective. J Polym Sci A1. 40 (2002) 2719-2728.
Tomalia D.A., Naylor A.M., Goddard W.A. Starburst Dendrimers: Molecular-Level Control of Size, Shape, Surface Chemistry, Topology, and Flexibility from Atoms to Macroscopic Matter. Angew Chem Int Edit. 29 (1990) 138-175.
Tsou P. Silica Aerogel Captures Cosmic Dust Intact. J Non-Cryst Solids. 186 (1995) 415-427.
Tu L.S., Dehghani F., Foster N.R. Micronisation and microencapsulation of pharmaceuticals using a carbon dioxide antisolvent. Powder Technol. 126 (2002) 134-149.
Türk M., Helfgen B., Hils P., Lietzow R., Schaber K. Micronization of Pharmaceutical Substances by Rapid Expansion of Supercritical Solutions (RESS): Experiments and Modeling. Part Part Syst Char. 19 (2002) 327-335.
Turnbull W.B., Kalovidouris S.A., Stoddart J.F. Large oligosaccharide-based glycodendrimers. Chem-Eur J. 8 (2002) 2988-3000.
Twyman L.J., King A.S.H., Martin I.K. Catalysis inside dendrimers. Chem Soc Rev. 31 (2002) 69-82.
Uhrich K. Hyperbranched polymers for drug delivery. Trends Polym Sci. 5 (1997) 388-393.
USP US Pharmacopoeia: <1088> In-vitro and in-vivo evaluation of dosage forms. USP. 1995.
Vallet-Regi M., Rámila A., del Real R.P., Pérez-Pariente J. A new property of MCM-41: drug delivery system. Chem Mater. 13 (2001) 308-311.
van Benthem R.A.T.M.
Novel hyperbranched resins for coating applications. Prog Org Coat. 40 (2000) 203-214.
van Benthem R.A.T.M., Meijerink N., Geladé E. et al. Synthesis and characterization of bis(2-hydroxypropyl)amide-based hyperbranched polyesteramides. Macromolecules. 34 (2001) 3559-3566.
van Bommel M.J., de Haan A.B. Drying of silica aerogel with supercritical carbon dioxide. J Non-Cryst Solids. 186 (1995) 78-82.
Venkateswara Rao V., Wagh P.B. Preparation and characterization of hydrophobic silica aerogels. Mater Chem Phys. 53 (1998) 13-18.
Vögtle F., Gestermann S., Hesse R., Schwierz H., Windisch B. Functional dendrimers. Prog Polym Sci. 25 (2000) 987-1041.
Voit B. New developments in hyperbranched polymers. J Polym Sci A1. 38 (2000) 2505-2525.
Voit B.I. Hyperbranched polymers: a chance and a challenge. C R Chim. 6 (2003) 821-832.
Weidner E., Knez Z., and Novak Z. PGSS (Particles from Gas Saturated Solutions) - A new Process for Powder Generation. 3rd Int Symp on Supercritical Fluids. Proc Tome 3 (1994) 229-235.
Weidner E., Petermann M., Blatter K., Rekowski V. Manufacture of powder coatings by spraying of gas-enriched melts. Chem Eng Technol. 24 (2001) 529-533.
Weidner E., Petermann M., Knez Z. Multifunctional composites by high-pressure spray processes. Curr Opin Solid St M. 7 (2003) 385-390.
Williams D.F. Implant materials in biofunction, Advances in biomaterials . Elsevier Science Publishers: Amsterdam, 1988.
Wilson J., Pigott G.H., Schoen F.J., Hench L.L. Toxicology and biocompatibility of bioglasses. J Biomed Mater Res. 15 (1981) 805-817.
Wooley K.L., Hawker C.J., Lee R., Fréchet J.M.J. One-pot synthesis of hyperbranched polyesters. Polym J. 26 (1994) 187-197.
Wu H., Xu J., Heiden P. Investigation of readily processable thermoplastic- toughened thermosets. V. Epoxy resin toughened with hyperbranched polyester. J Appl Polym Sci. 72 (1999) 151-163.
Xu K.T., Tang B.Z. Polycyclotrimerization of diynes, a new approach to hyperbranched polyphenylenes. Chinese J Polym Sci. 17 (1999) 397-402.
189 Bibliography
Yan D., Gao C. Hyperbranched polymers made from A2 and BB´2 type monomers. 1. Polyaddition of 1-(2-aminoethyl)piperazine to divinyl sulfone. Macromolecules. 33 (2000) 7693-7699.
Yates C.R., Hayes W. Synthesis and applications of hyperbranched polymers. Eur Polym J. 40 (2004) 1257-1281.
Yeo Y., Chen A.U., Basaran O.A., and Park K., US 6,599,627; Microencapsulation of drugs by solvent exchange. (2003).
Yoda S., Ohshima S. Supercritical drying media modification for silica aerogel preparation. J Non-Cryst Solids. 248 (1999) 224-234.
Yoda S., Ohtake K., Takebayashi Y., Sugeta T., Sako T., Sato T. Preparation of titania-impregnated silica aerogels and their application to removal of benzene in air. J Mater Chem. 10 (2000) 2151-2156.
Yokogawa H., Yokoyama M. Hydrophobic silica aerogels. J Non-Cryst Solids. 186 (1995) 23-29.
Zagar E., Zigon M. Characterization of a commercial hyperbranched aliphatic polyester based on 2,2-bis(methylol)propionic acid. Macromolecules. 35 (2002) 9913-9925.
Zhao M.Q., Zhou Y.F., Bruening M.L., Bergbreiter D.E., Crooks R.M. Inhibition of electrochemical reactions at gold surfaces by grafted, highly fluorinated, hyperbranched polymer films. Langmuir. 13 (1997) 1388-1391.
Zhou Y., Bruening M.L., Liu Y., Crooks R.M., Bergbreiter D.E. Synthesis of hyperbranched, hydrophilic fluorinated surface grafts. Langmuir. 12 (1996) 5519-5521.
Zhu S.W., Shi W.F. Flame retardant mechanism of hyperbranched polyurethane acrylates used for UV curable flame retardant coatings. Polym Degrad Stabil. 75 (2002) 543-547.
Ziegler B., Mronga N., Teich F., and Herrmann G., US 5,738,801; Hydrophobic silica aerogels. (1998).
Zimmerman S.C., Lawless L.J. Supramolecular chemistry of dendrimers. Dendrimers Iv (In: Top Curr Chem). 217 (2001) 95-120.
Lebenslauf Persönliche Daten Name: Supakij Suttiruengwong Geburtsdaten: 01.05.1973 in Bangkok Familienstand: ledig Staatsangehörigkeit: Thai Anschrift: 161/72 Charunsanitwong Road, Soi 27 Bangkok Noi, Bangkok Thailand 10700 Schulbildung 1976 - 1984 Grundschule in Bangkok, Thailand 1984 - 1990 Wat Pradoonaithongtham Gymnasium in Bangkok, Thailand Abschluss: Abitur Hochschulbildung 05/1990 - 03/1994 Studium der Chemie an der Silpakorn Universität, Nakorn
Phathom Campus, Thailand Abschluss: BSc in Chemie 10/1995 - 09/1997 Studium an der Wales Universität Swansea, UK Abschluss: MSc in Chemical Engineering zum Thema „Program Integration for Process Engineering Design“ 10/2001 - 07/2004 Wissenschaftlicher Mitarbeiter bei Prof. Dr.-Ing. W. Arlt, FG Thermodynamik und Thermische Verfahrenstechnik, TU Berlin Seit 08/2004 Wissenschaftlicher Mitarbeiter bei Prof. Dr.-Ing. W. Arlt, Institut für Chemie- und Bioingenieurwesen, Lehrstuhl für Thermische Verfahrenstechnik, Friedrich-Alexander- Universität Erlangen-Nürnberg Praktika 04/1992 - 06/1992 Praktikum bei der Electricity Generating Authority of Thailand, Bangkok Berufstätigkeit 06/1998 - 03/2001 Lektor an der Silpakorn Universität, Fakultät für Industrielle Technologie, Thailand Außer universitäre Aktivitäten 1993 - 1994 Jahrgangsvorsitzender des Instituts der Chemie, Silpakorn Universität, Thailand 1996 - 1997 Mitglied der Chemical Engineering Society UK 2002 - 2003 Mitglied des Ausschusses des Thailändischen Studenten Vereins in Deutschland (TSVD) 2003 - 2004 Vizepräsident des Thailändischen Studenten Vereins in Deutschland (TSVD) Fremdsprachen:
• Deutsch • Englisch