shabbir tiles and ceramics limited - financials
TRANSCRIPT
2019Shabbir Tiles and Ceramics Limited
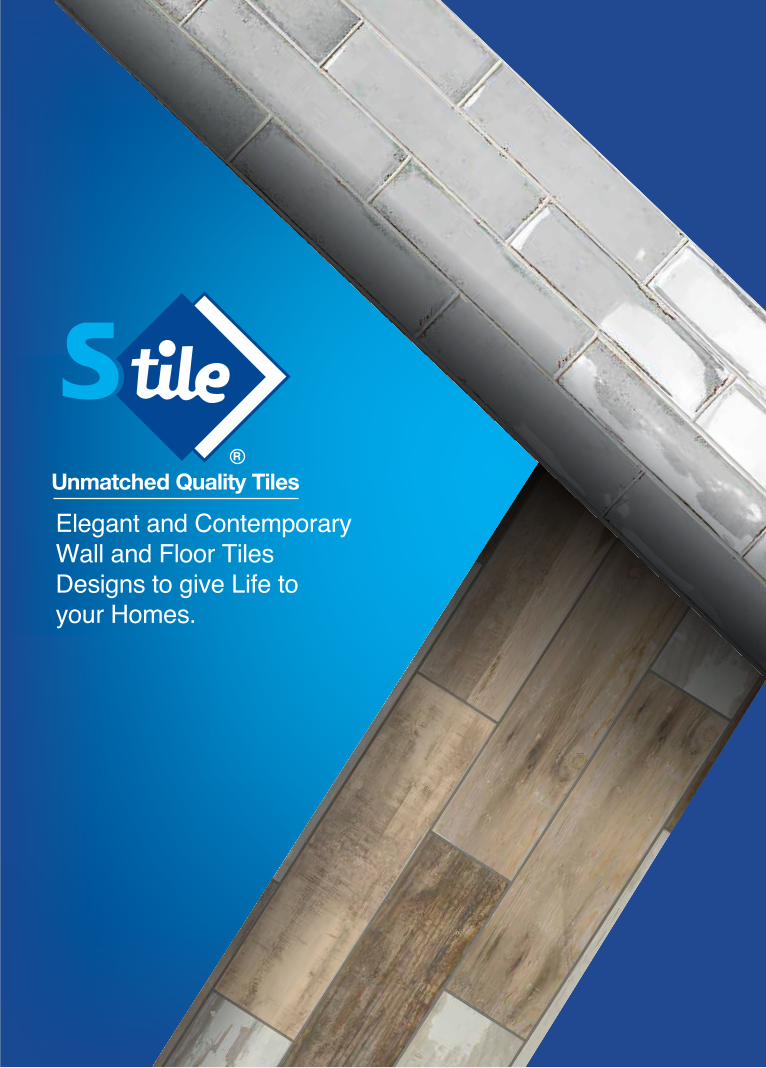
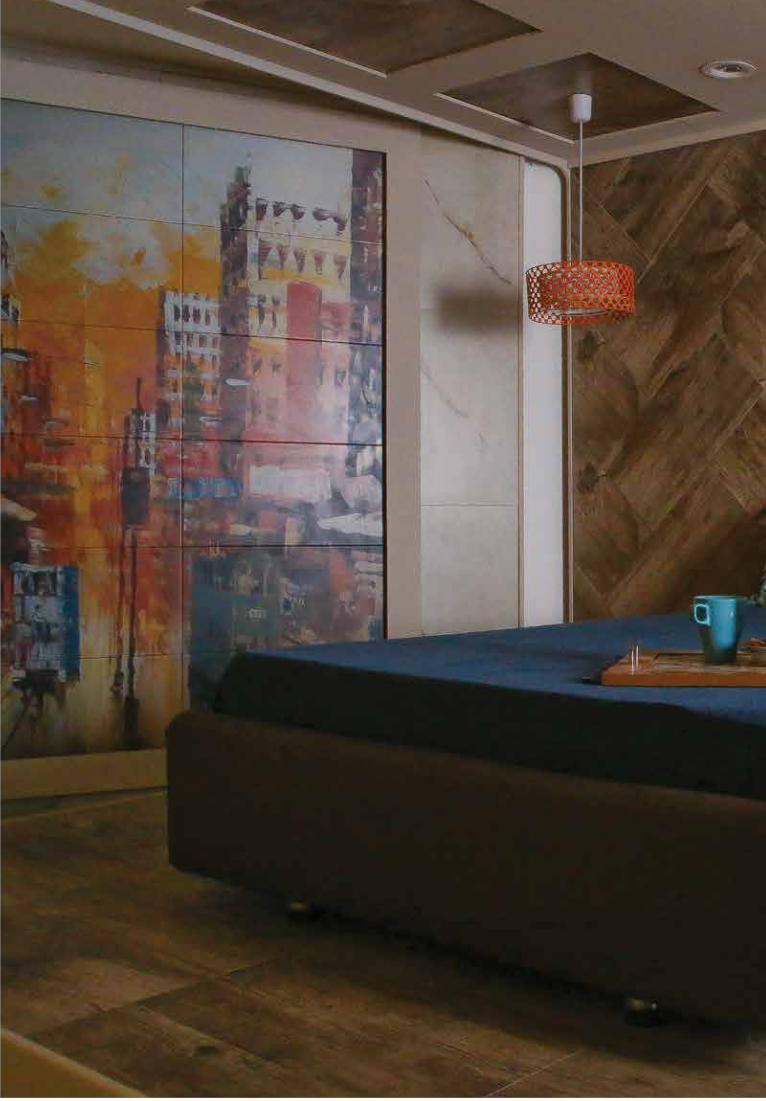
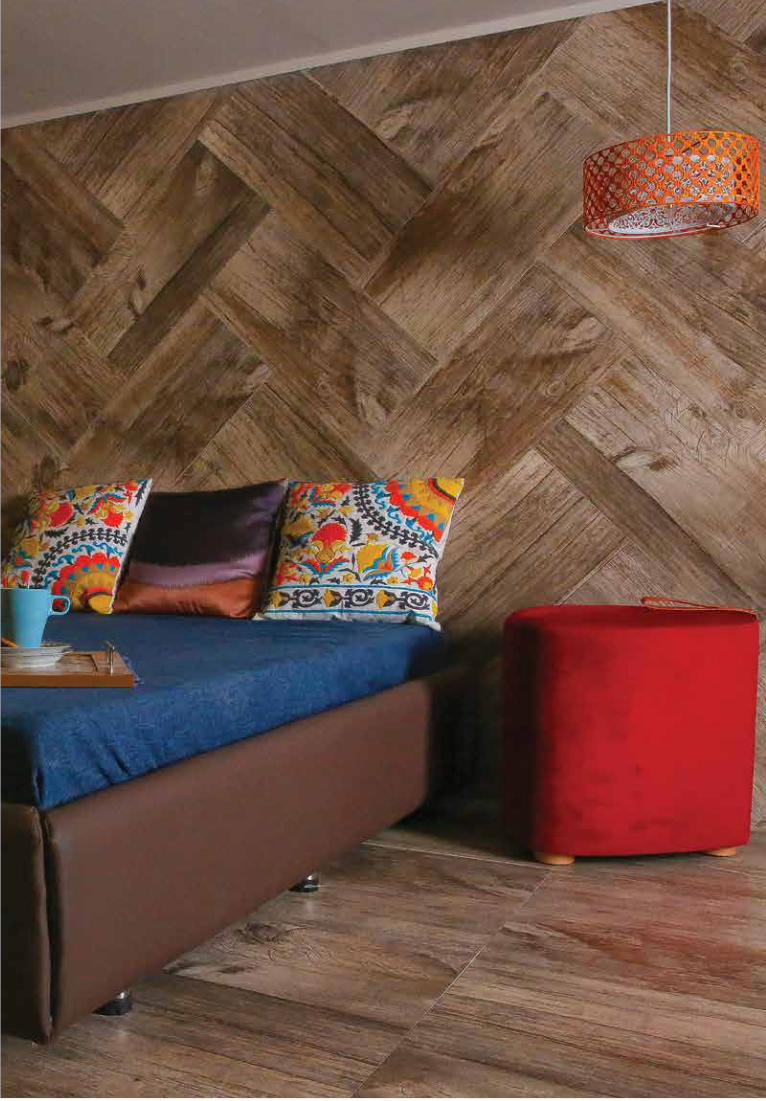
Elegant and Contemporary Wall and Floor Tiles Designs to give Life to your Homes.
03
04
05
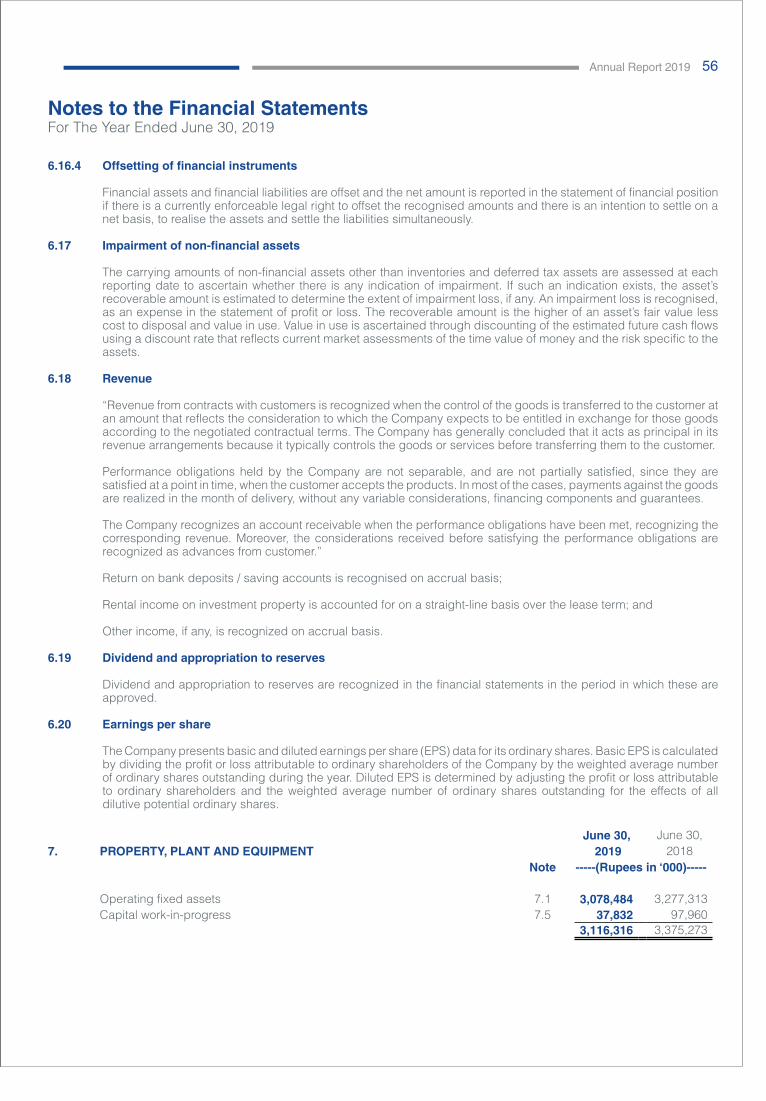
09
12
19
29
30
31
32
36
39
76
77
03 Shabbir Tiles and Ceramics Limited
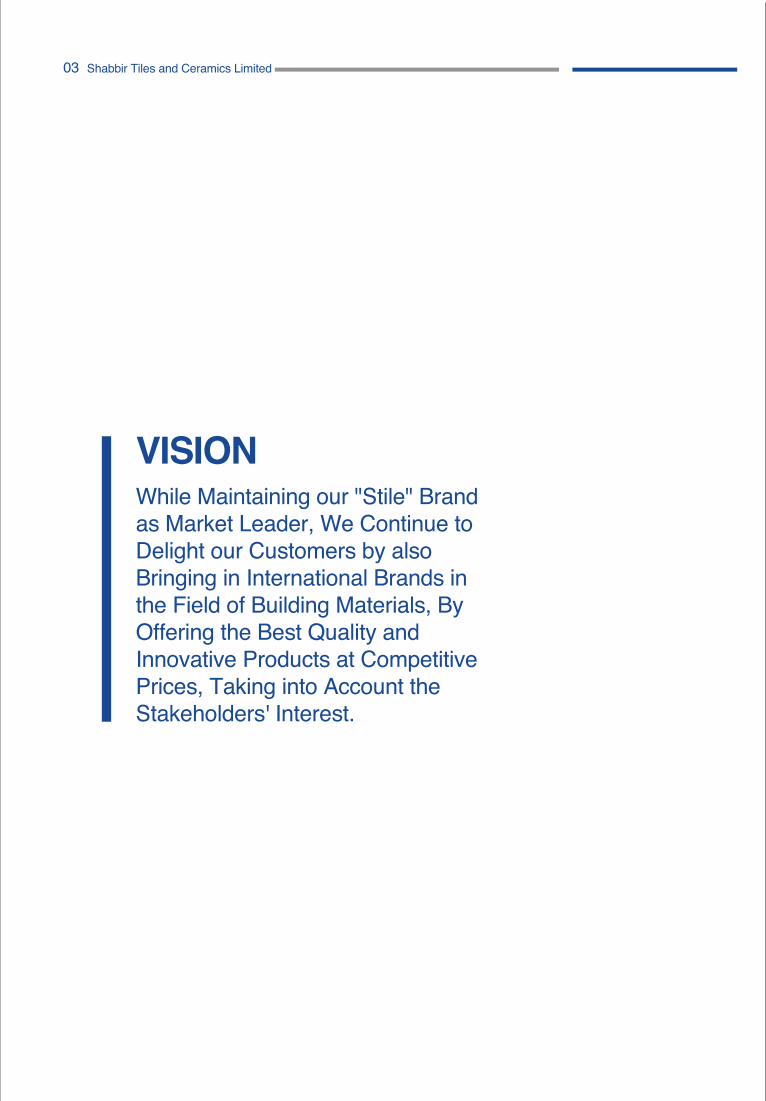
VISIONWhile Maintaining our "Stile" Brand as Market Leader, We Continue to Delight our Customers by also Bringing in International Brands in the Field of Building Materials, By Offering the Best Quality and Innovative Products at Competitive Prices, Taking into Account the Stakeholders' Interest.
Annual Report 2019 04
MISSIONOur Mission is to Maintain our Position as the Leader in the tile Industry in Pakistan and for this Purpose we will Continue to Focus on:
• We are Committed to Quality Products and will Provide our Customers with Innovative Sizes, Designs and Color Scheme that they will be Delighted to have and Shall Provide them with Excellent Services to Earn their Loyalty.
• We Shall Treat our Employees Fairly and shall Provide Conducive Working Environment for them to Learn and to Grow with the Company.
• The Company shall Earn Adequate Profits for its Progress and Growth and for Providing Reasonable Return to its Shareholders.
COMPANY INFORMATIONBOARD OF DIRECTORS
AUDIT COMMITTEE
HUMAN RESOURCE ANDREMUNERATION COMMITTEE
CHIEF FINANCIAL OFFICER
COMPANY SECRETARY
AUDITORS
LEGAL ADVISOR
BANKERS
REGISTERED OFFICE& FACTORY UNIT-1
FACTORY UNIT-2
REGISTRAR AND SHARE TRANSFEROFFICE
ISLAMABAD (BUILDING MATERIAL PRODUCTS)
LAHORE (BUILDING MATERIAL PRODUCTS)
Rafiq M. HabibAli. Suleman HabibSyed Masood Abbas JafferyMuhammad Salman BurneyAbdul Hai M. BhaimiaFeroze Jehangir CawasjiFarhana Mowjee Khan
Feroze Jehangir CawasjiAbdul Hai M. BhaimiaFarhana Mowjee Khan
Feroze Jehangir CawasjiMuhammad Salman BurneySyed Masood Abbas Jaffery
Waquas Ahmed
Ovais Jamani
EY Ford RhodesChartered Accountants
Munawar Malik & Co.Advocate Supreme Court
Habib Metropolitan Bank LimitedHabib Bank LimitedDubai Islamic Bank Pakistan LimitedFaysal Bank LimitedAllied Bank LimitedMeezan Bank Limited
15th Milestone, National HighwayLandhi, Karachi-75120Phone: (021) 38183610-3Fax: (021) 38183615E-mail: [email protected]: http://www.stile.com.pk
Deh Khanto, Tappo Landhi, District Malir, Bin Qasim Town,Karachi.Phone: (021) 34102702Fax: (021) 34102709
CDC Share Registrar Services LimitedCDC House, 99-B, Block ‘B’, S.M.C.H.SMain Shahrah-e-Faisal, Karachi-74400Phone: 0800 23275URL: www.cdcsrsl.comEmail: [email protected]
Plot No 01, ANF Road, Yamaha ChowkRoad, Model Town, Humak, Islamabad
21 K.M , Ferozpur Road, Opposite Ahmed CNG Pump, Lahore
ChairmanDirectorChief Executive OfficerDirectorDirectorDirectorDirector
ChairmanMemberMember
ChairmanMemberMember
05 Shabbir Tiles and Ceramics Limited
STAR GATE KARACHI
FACTORY OUTLET
DHA, BUKHARI COMMERCIAL
DHA, 26TH STREET
DHA, LAHORE
RAWALPINDI
FAISALABAD
HYDERABAD
SALES OFFICE - PESHAWAR
SALES OFFICE - SUKKUR
SALES OFFICE - MULTAN
Metro Cash & Carry, CAANear Star Gate,Main Shahrah-e-Faisal, KarachiPhone: (021) 34601372-74 Fax: (021) 34601375
15th Milestone, National HighwayLandhi, Karachi-75120Phone: (021) 38183610-3Fax: (021) 38183615
Plot 22-C, Lane 4, Bukhari CommercialDHA, Karachi. Phone: (021) 37249564
26th Street Plot C-8-C, DHA Phase 5,Karachi. Phone: (021) 37228922
Plot 90-CCA, DHA-4, LahorePhone: (042) 37185710-12
Al Shareef Plaza, First Floor,Shamsabad, Murree Road, RawalpindiPhone: (051) 4935521-23Fax: (051) 4935524
Talha Heights , Main Susan Road,P-243, 2A, FaisalabadPhone: (041) 8758899 / 8739988
Shop No. 11-12 at Ground Floor andSop No. 9 at Mezzanine FloorAuto Bhaan Tower, Opp: Breeze Fish Point, Auto Bhaan Road, Latifabad No 03Hyderabad. Phone: (022) 6112857
Main Ring Road, Near Kohat Road,Opp: Mujaddid CNG, PeshawarPhone: (091) 2325012
Tooba Tower, Mezzanine Floor, Opposite Hira Medical Centre, SukkurPhone: (071) 5615560
Jalil Centre, 2nd Floor, Abdali Road,Multan.Phone: (061) 4546439/4783097
STILE EMPORIUM ANDDESIGN STUDIO
Annual Report 2019 06
NOTICE OF THE ANNUAL GENERAL MEETINGNOTICE is hereby given that the Forty First Annual General Meeting of the Members of the Company will be held on October 21, 2019 at 11:30 a.m. at Institute of Chartered Accountants of Pakistan (ICAP) to transact the following business:
ORDINARY BUSINESS
1. To receive, consider and adopt the Audited Accounts of the Company for the year ended June 30, 2019, together with the Chairman’s Review Report, Directors’ and Auditors’ Report thereon.
2. To approve Final Cash Dividend of Rs. 0.25 per share (5%) for the year 2018-19 as recommended by the Board of Directors.
3. To appoint Auditors for the year 2019-2020 and to fix their remuneration. The present auditors – Messrs EY Ford Rhodes, Chartered Accountants, being eligible offer themselves for reappointment.
By Order of the Board
OVAIS JAMANI Karachi: September 30, 2019 Company Secretary
NOTES:
1. Closure of Share Transfer Books The Share Transfer Books of the Company will remain closed from October 15, 2019 to October 21, 2019 (both days
inclusive) and the dividend will be paid to the Members whose names will appear in the Register of Members on October 14, 2019. Members (Non-CDC) are requested to promptly notify the Company’s Registrar of any change in their addresses and submit, if applicable to them, the Non–deduction of Zakat Form CZ-50 with the Registrar of the Company M/s. CDC Share Registrar Services Limited (CDCSRSL), CDC House, 99-B, Block ‘B’, S.M.C.H.S., Main Shahrah-e-Faisal, Karachi-74400, Telephone # (021) 111-111-500. All the Members holding the shares through the CDC are requested to please update their addresses and Zakat status with their Participants.
2. Appointment of Proxy and Participation in AGM A member entitled to attend and vote at this meeting may appoint another member as his/her proxy to attend and
vote for him / her. Proxies in order to be effective must be received at the Registered Office of the Company not less than 48 hours before the time of holding the meeting. A proxy must be a member of the Company.
3. Changes in Members Addresses Members holding shares in physical form are requested to promptly notify Share Registrar of the Company of any
change in their addresses. Shareholders maintaining their shares in electronic form should have their addresses updated with their participant or CDC Investor Accounts Service.
4. Availability of Financial Statements and Reports on Website The Annual Audited Financial statements for the year ended June 30, 2019 has been uploaded on the website of
the Company.
5. Further Guidelines for Members
A. For Attending the Meeting a) In case of individuals, the account holder or sub-account holder and / or the person whose securities are
in group account and their registration detail is uploaded as per the Regulations, shall authenticate their identity by showing his/ her original National Identity Card (“CNIC”) or original passport at the time of attending the meeting.
b) In case of corporate entity, Board of Directors’ resolution/power of attorney with specimen signature of the nominee shall be produced (unless provided earlier) at the time of the meeting.
Shabbir Tiles and Ceramics Limited 09
B. For Appointing Proxies a) In case of individuals, the account holder or sub-account holder is and / or the person whose securities
are in group account and their registration detail is uploaded as per the CDC Regulations, shall submit the proxy form as per the above requirement.
b) The proxy form shall be witnessed by two persons whose names, addresses and CNIC numbers shall be mentioned on the form.
c) Attested copies of the CNIC or passport of the beneficial owners and the proxy shall be furnished with the proxy form.
d) The proxy shall produce his/her original CNIC or original passport at the time of the meeting.
e) In case of corporate entities, board of directors’ resolution/power of attorney with specimen signature of the nominee shall be submitted (unless provided earlier) along with the proxy form to Company.
CDC Accounts Holders will further have to follow the guidelines as laid down in Circular 1 dated the January 26, 2000 issued by the Securities & Exchange Commission of Pakistan.
6. CNIC and NTN number on Electronic Dividend (Mandatory) a) The provisions of Section 242 of the Companies Act 2017 require the listed companies that any dividend
payable in cash shall only be paid through electronic mode directly into the bank account designated by the entitled shareholder. Therefore, all Shareholders are hereby advised to provide details of their bank mandate specifying: (i) title of account, (ii) IBAN (iii) bank name, (iv) branch name, code and address to Company’s Share Registrar, at the address given herein above. Shareholders who hold shares with Participants / Central Depository Company of Pakistan (CDC) are advised to provide the mandate to the concerned Broker / CDC.
b) As per SRO 831 (1) / 2012 dated July 5, 2012 and other relevant rules, the electronic dividend shall also bear the CNIC Number of the registered shareholder or the authorized person, except in case of minor(s) and corporate shareholders(s).
c) As per Regulation no. 4 & 6 of SRO 1145 (1)/2017 dated November 6, 2017, the Company shall be constrained to withhold the payment of dividend to the shareholders, in case of non-availability of identification number (CNIC or National Tax Number) of the shareholder or authorized person.
7. Withholding Tax on Dividend Government of Pakistan through Finance Act, 2017 has made certain amendments in the withholding tax
provisions of the Income Tax Ordinance, 2001 by substituting the definition of “Filers” with “Active Taxpayer List (ATL)” whereby the company is required to collect tax on dividend under Section 150 of the Income Tax Ordinance, 2001 from the persons not appearing in the ATL at the rates specified in the Ordinance as increased by 100%. These tax rates are as under:
Shareholders who are filers, are advised to make sure that their names are entered into latest Active Tax Payers List (ATL) provided on the website of FBR at the time of dividend payment, otherwise they shall be treated as person not appearing in ATL and tax on their cash dividend will be deducted at the rate of 30% instead of 15%.
(a) For persons appearing in Active Taxpayer List
(b) For persons not appearing in Active Taxpayer List
15%
30%
Annual Report 2019 10Annual Report 2019
8. Withholding Tax on Dividend in case of Joint Account Holders For shareholders holding their shares jointly as per the clarification issued by the Federal Board of Revenue,
withholding tax will be determined separately as per the status of their names appearing in the ATL for principal shareholder as well as join-holder(s) based on their shareholding proportions. Therefore, all shareholders who hold shares jointly are required to provide shareholding proportions of principal shareholder and join-holder(s) in respect of shares held by them to our Share Registrar in writing as follows:
The required information must reach our Share Registrar by the close of business (5:00 pm) on October 14, 2019, otherwise it will be assumed that the shares are equally held by Principal Shareholder and Joint-holder(s).
9. Transmission of Audited Financial Statements / Notices Through Email Members are hereby informed that pursuant to SECP SRO 787(1)/2014 dated September 8, 2014, and under
section 223(6) of the Companies Act 2017, circulation of Audited Financial Statements and Notice of Annual General Meeting has been allowed in electronic format through email.
In compliance with the above requirements, members who wish to receive the Annual Report 2019 in electronic form may file an application as per the form provided on the Company’s website in compliance with the subject SRO. The members who have provided consent to receive Annual Report 2019 can subsequently request hard copy which shall be provided free of cost within seven days.
10. Transmission of Audited Financial Statements Through CD SECP through its SRO.470(I)/2016 dated May 31, 2016 have allowed companies to circulate their annual balance
sheet, profit and loss account, auditor’s report and directors’ report to its members through CD at their registered addresses. In view of the above the Company has sent its Annual Report to the shareholders in the form of CD. Any Member can send request for printed copy of the Annual Report to the Company on standard request form placed under the Investor Information section on its website.
11. Unclaimed /Unpaid Shares and Dividends Shareholders, who may by any reason, could not claim their dividends/shares, if any, are advised to contact our
Share Registrar at the address mentioned herein above, to collect/enquire about their unclaimed dividend/shares, if any.
In compliance with Section 244 of the Companies Act 2017 after having completed the stipulated procedure, all such dividend outstanding for a period of 3 years or more from the date due and payable shall be deposited to the Federal Government in case of unclaimed dividend and incase of shares, shall be delivered to SECP.
12. Postal Ballot / E-Voting In accordance with the Companies (Postal Ballot) Regulations, 2018, for the purpose of election of directors and for
any other agenda item subject to the requirements of section 143 and 144 of the Companies Act 2017, members will be allowed to exercise their right of vote through postal ballot i.e. by post or e-voting, in the manner and subject to conditions contained in the aforesaid regulations.
13. Video-link facility Pursuant to the provisions of the Companies Act 2017, the company may on the demand of members at least 7
days before the general meeting, residing in a city, who hold at least 10% of the total paid up capital of the Company, provide the facility of video-link (Optional) to the such members enabling them to participate in its annual general meeting. If you wish to take the benefit of this facility, please fill the form available on the Company’s Website and submit it to the Company at its registered address at least 10 days prior to the date of meeting.
The Company will intimate the members the venue of the video conference facility, if required criteria have been fulfilled, at least 7 days before the date of general meeting along with complete information necessary to enable them to access such facility.
14. Zakat Declaration Zakat will be deducted from the dividends at source at the rate of 2.5% and will be deposited within the prescribed
period with the relevant authority. In case of claiming exemption, please submit your Zakat Declaration under Zakat and Ushr Ordinance, 1980 and Rule 4 of Zakat (Deduction and Refund) Rules, 1981, CZ-50 Form with our Share Registrar. Physical shareholders are requested to submit the said declaration to our Share Registrar in the proper manner. The shareholders must write Shabbir Tiles and Ceramics Limited’s name and their respective CDS A/c # or Folio numbers on Zakat Declarations at relevant place.
Folio / CDC
Account No.
Total Shares
Principal Shareholder Joint Shareholder
Name & CNIC
Shareholding proportion (No. of
Shares
Name & CNIC
Shareholding proportion
(No. of Shares)
11 Shabbir Tiles and Ceramics Limited
CHAIRMAN’S REVIEW REPORTOn behalf of the Board, it is my pleasure to present the Chairman’s review report for the year ended June 30, 2019.
BUSINESS OVERVIEWDuring the fiscal year 2018-19 your company delivered a successful performance with achievement of challenging objectives for growth and profit. This was primarily driven by the Company’s improved product range, market penetration, and cost management & continuous productivity improvement. The enhanced capacity commissioned during the year together with planned capital investments for quality improvements and innovative marketing strengthened the Company’s ability to grow further.
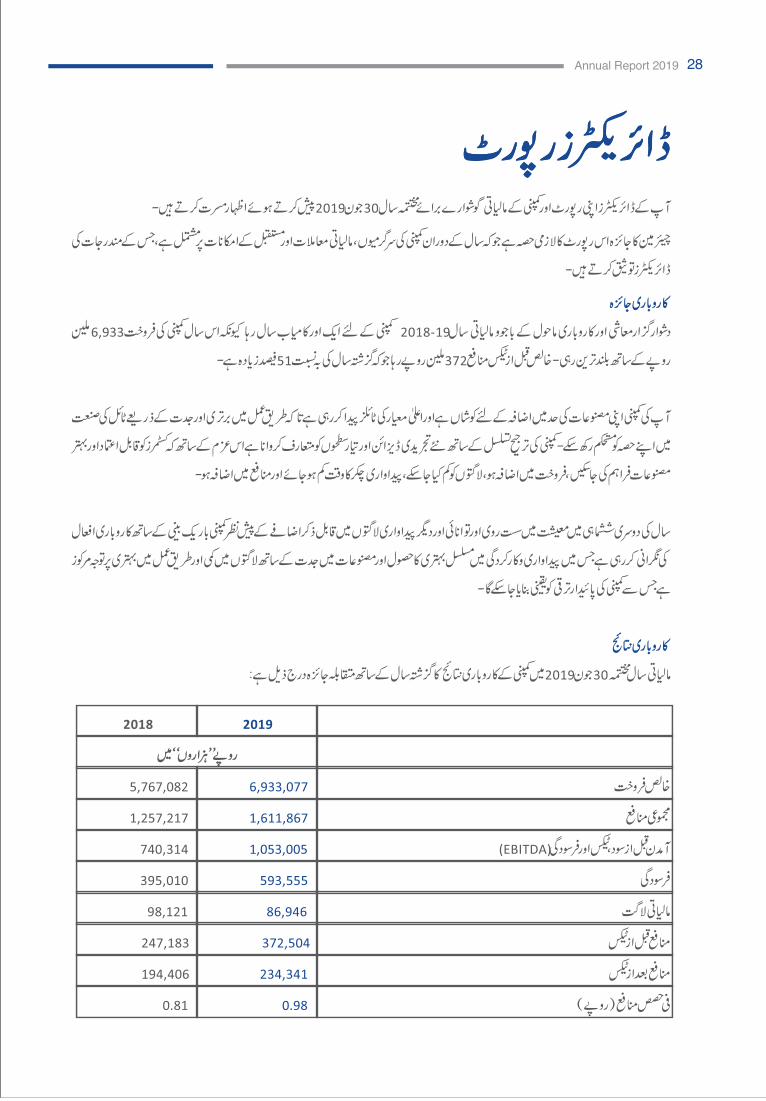
PERFORMANCE SCORECARDThe Company remains committed & strongly believes that it is now on a path of sustainable growth and maximizing value creation. These objectives are being achieved by focusing resources to develop operational efficiency, optimize cost structures, implement growth projects and strengthen business foundations. As a result of these efforts, the Company registered net sales of Rs. 6.9 billion during the year, showing 20% growth over the previous year. This improvement in sales together with strong contributions from cost efficiencies, better product mix and other operational efficiencies translated in improving margins for the year. Sales and marketing investment & expenses on promotional campaigns to support the core business and new emporiums increased by 24% to Rs. 927 million. Other income net of financial charges also contributed to the bottom line through effective treasury measurement and improved liquidity. As a result, the Company registered its highest net profit before tax of Rs. 372 million. Net profit after tax of Rs. 234 million, showed an increase of 20% over last year. This translated to earning per share (EPS) of Rs. 0.98 as against Rs. 0.81 of last year.
TREASURY MANAGEMENTThe Company was able to generate Rs. 671 million from operating activities during the year. In 2018-19, we maintained our disciplined and balanced approach to capital allocation and used our cash flow generation and financial strength to invest in the highest return opportunities. We deployed Rs. 343 million in capital expenditures to fund new product development as well as to maintain and improve the performance and safety of our facilities. We used another portion of our cash to pay down Rs. 406 million of long-term debt. In addition, we returned Rs.119.6 million to our shareholders through dividends.
BRAND DEVELOPMENTOur marketing strategy is focused on maintaining and building relationships with our traditional customers, while establishing new customers in markets where we anticipate long-term growth in tile consumption and demand. Having recently opened showrooms in Hyderabad and Faisalabad, a new emporium in Karachi is a continuation of the company's move to expand its presence throughout Pakistan. Our emporiums showcase numerous choices & the latest trends of porcelain and ceramic tiles at a variety of price points. Our inhouse design consultants are experts at demonstrating how the latest tile trends and designs can be realistically incorporated in our client’s design projects at affordable & competitive costs .
HUMAN CAPITALWe believe our people are our greatest asset. Empowering employees with meaningful roles, stimulating projects and continuous learning platforms, has paved the way for a more purpose driven organization. Honest communications, training and counselling continue to prepare our people to grow and drive the business. Diversity and inclusion remain at the heart of our business. Our female employees form an integral & vital part of our teams across different functions in the Company. We aim to follow good practices in industrial relations, ensure compliance with the prevailing labor laws, and ensure a productive and constructive work environment for all.
BOARD EVALUATIONThe Board played a fundamental role in taking the Company forward through its commitment to the development & support for a robust business strategy. The Board also performed its essential role and responsibilities for the overall management and supervision of the businesses of the Company and of its fiduciary responsibilities.
An annual evaluation of the Board of Directors’ (the Board) overall performance is conducted in compliance with the requirements of the Listed Companies (Code of Corporate Governance) Regulations, 2017 and the Companies Act, 2017. The purpose of this evaluation is to ensure that the Board performance is measured in the context of overall corporate objectives and governance structure of the Company. For the financial year ended June 30 2019, the Board’s overall performance and effectiveness has been assessed as ‘Satisfactory’ in achieving Company’s objectives. We are committed towards further development of the Board in terms of efficiency. It is also important to highlight the key role played by the Committees (Audit Committee and Human Resource and Remuneration Committee) in emphasizing and guiding the company towards areas of improvements and recommending solutions.
Annual Report 2019 12
BUSINESS RISKS AND CHALLENGESThe Construction industry is a major driver of a countries’ economy & creates new jobs, builds housing and infrastructure and is a key driver of economic growth. Presently, the construction industry and the related important linkages such as cement, steel, tiles sectors, are all experiencing a slow down due to the economic challenges being faced by the economy. We also observe that there is unrest in the trade channels post budget 2019 with difficulty in understanding many changes in the ways of doing business. Many retailers, wholesalers and distributors are still unaware of new processes to be followed due to the limited availability of tax experts operating in the market.
The rise in gas cost by a further 31% since July 2019 (in addition to the earlier 30% gas cost increase in the last 9 months of year 2018-19) has put immense pressure on costs and market prices. In addition, the imposition of axle load restrictions in absence of a proper road infrastructure master plan and a transportation regulatory body has significantly raised costs of transportation for raw materials and finished goods.
Whilst imports have reduced, this has to an extent been replaced by heavy smuggling from bordering countries and also new local entrants. Your Company believes that local competition is always healthy for the economy and for the business & consumers both and should be encouraged. However, the Government should safeguard the provision of a level playing field for all the stakeholders, reducing factors that cause market disruption.
FUTURE OUTLOOKOverall the outlook for the first half of the coming year appears very challenging due to the factors mentioned above. Despite a complex market environment, the Company is working to respond to the rapidly changing dynamics of the market. Looking ahead, the Company aims to improve its manufacturing capabilities, strengthening research and development and further expand market presence. We trust that the Government will work to provide stability to the business environment and create a stimulus to improve the growth rate, whilst combating inflation and currency pressures through constructive economic policies.
ACKNOWLEDGEMENTAs always, I would like to thank our employees for their commitment to delivering a successful year in very challenging circumstances. Following a turnaround performance like last year is not easy, but they did and exceeded expectations by most measures. I would also like to acknowledge the leadership of our board of directors, who continue to be a valuable resource for our company & most of all, I would like to thank our shareholders. Our investment in the business reflects our commitment to its future & to generating value growth for shareholders. We are grateful to shareholders for their continued confidence in the management team and the future success of our company
Rafiq M. HabibChairman
13 Shabbir Tiles and Ceramics Limited
Annual Report 2019 14
15 Shabbir Tiles and Ceramics Limited
Annual Report 2019 16
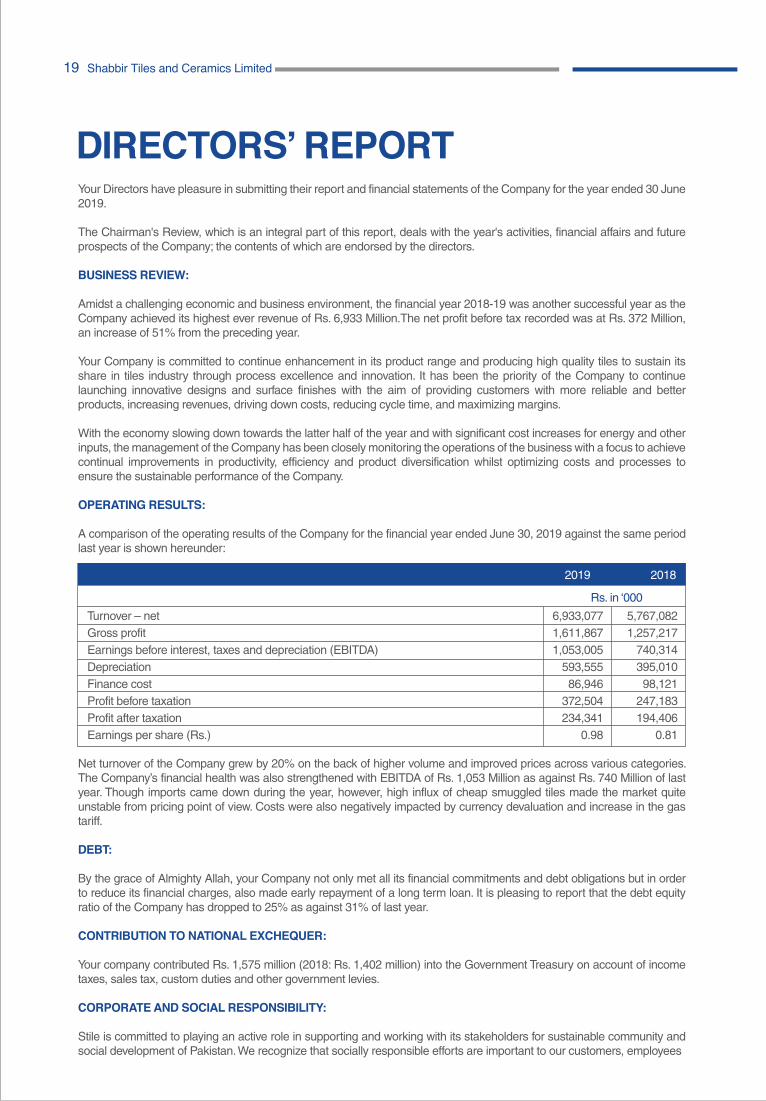
DIRECTORS’ REPORTYour Directors have pleasure in submitting their report and financial statements of the Company for the year ended 30 June 2019.
The Chairman's Review, which is an integral part of this report, deals with the year's activities, financial affairs and future prospects of the Company; the contents of which are endorsed by the directors.
BUSINESS REVIEW:
Amidst a challenging economic and business environment, the financial year 2018-19 was another successful year as the Company achieved its highest ever revenue of Rs. 6,933 Million.The net profit before tax recorded was at Rs. 372 Million, an increase of 51% from the preceding year.
Your Company is committed to continue enhancement in its product range and producing high quality tiles to sustain its share in tiles industry through process excellence and innovation. It has been the priority of the Company to continue launching innovative designs and surface finishes with the aim of providing customers with more reliable and better products, increasing revenues, driving down costs, reducing cycle time, and maximizing margins.
With the economy slowing down towards the latter half of the year and with significant cost increases for energy and other inputs, the management of the Company has been closely monitoring the operations of the business with a focus to achieve continual improvements in productivity, efficiency and product diversification whilst optimizing costs and processes to ensure the sustainable performance of the Company.
OPERATING RESULTS:
A comparison of the operating results of the Company for the financial year ended June 30, 2019 against the same period last year is shown hereunder:
Net turnover of the Company grew by 20% on the back of higher volume and improved prices across various categories. The Company’s financial health was also strengthened with EBITDA of Rs. 1,053 Million as against Rs. 740 Million of last year. Though imports came down during the year, however, high influx of cheap smuggled tiles made the market quite unstable from pricing point of view. Costs were also negatively impacted by currency devaluation and increase in the gas tariff.
DEBT:
By the grace of Almighty Allah, your Company not only met all its financial commitments and debt obligations but in order to reduce its financial charges, also made early repayment of a long term loan. It is pleasing to report that the debt equity ratio of the Company has dropped to 25% as against 31% of last year.
CONTRIBUTION TO NATIONAL EXCHEQUER:
Your company contributed Rs. 1,575 million (2018: Rs. 1,402 million) into the Government Treasury on account of income taxes, sales tax, custom duties and other government levies.
CORPORATE AND SOCIAL RESPONSIBILITY:
Stile is committed to playing an active role in supporting and working with its stakeholders for sustainable community and social development of Pakistan. We recognize that socially responsible efforts are important to our customers, employees
2019
Rs. in ‘000
2018
Turnover – net Gross profitEarnings before interest, taxes and depreciation (EBITDA)Depreciation Finance cost Profit before taxation Profit after taxation Earnings per share (Rs.)
6,933,0771,611,8671,053,005
593,55586,946
372,504234,341
0.98
5,767,0821,257,217
740,314395,01098,121
247,183194,406
0.81
19 Shabbir Tiles and Ceramics Limited
and stakeholders. Our CSR program is currently focusing on improvement of healthcare, advancement of education and community support in general.
HEALTH, SAFETY & ENVIRONMENT:
Safety is a core value at Stile and the Company is committed to continued advancement of safety culture with strong programs of personal safety, accident and injury prevention, wellness promotion and compliance with applicable environmental and health and safety laws and regulations.
PRINCIPAL RISKS AND UNCERTAINTIES
The Company is exposed to certain inherent risks and uncertainties. However, we consider the following as key risks:
• Energy costs, being doubled as compared to last fiscal year;• Market disruption due to recent changes in tax laws and regulations.• Adverse movement in foreign exchange rates and commodity prices;• Highly price sensitive market;
ADEQUACY OF INTERNAL CONTROL
The Board of the Company is responsible for the establishment and maintenance of the Company's system of internal control in order to identify and manage risks faced by the Company. The Board is confident that the system of internal control is sound in design and has been effectively implemented and monitored.
AUDITORS:
The present auditors M/s EY Ford Rhodes, Chartered Accountants, retire and being eligible, have offered themselves for re-appointment. The Board has recommended the re-appointment of the retiring auditors for the year ending 30 June 2020, for approval of the shareholders in the forthcoming Annual General Meeting.
COMPLIANCE WITH LISTED COMPANIES (CODE OF CORPORATE GOVERNANCE) REGULATIONS, 2017:
As required under the Listed Companies (Code of Corporate Governance) Regulations, 2017 and the Rule Book of the Pakistan Stock Exchange Limited (PSX), the Directors are pleased to state as follows:
1) The financial statements, prepared by the management of the Company, present fairly its state of affairs, the result of its operations, cash flows and changes in equity;
2) Proper books of account have been maintained by the Company;
3) Appropriate accounting policies have been consistently applied in preparation of these financial statements and accounting estimates are based on reasonable and prudent judgment;
4) International Financial Reporting Standards (IFRS), as applicable in Pakistan, have been followed in preparation of these financial statements;
5) The system of internal control is sound in design and has been effectively implemented and monitored. The process of monitoring internal controls will continue with the objective to further strengthen the controls and improve the system;
6) There are no significant doubts upon the Company's ability to continue as a growing concern;
7) A summary of key operating and financial data of the Company of the last six years is annexed in the report on page No. 29.
8) There has been no material departure from the best practices of Listed Companies (Code of Corporate Governance) Regulations, 2017.
9) The value of Provident Fund Investments as per the unaudited accounts of STCL Provident Fund Trust for the year ended June 30, 2019 was Rs. 201.477 million (2017: Rs. 172.936 million).
10) There are no outstanding statutory payments due on account of taxes, levies and charges except as those disclosed in these financial statements.
Annual Report 2019 20
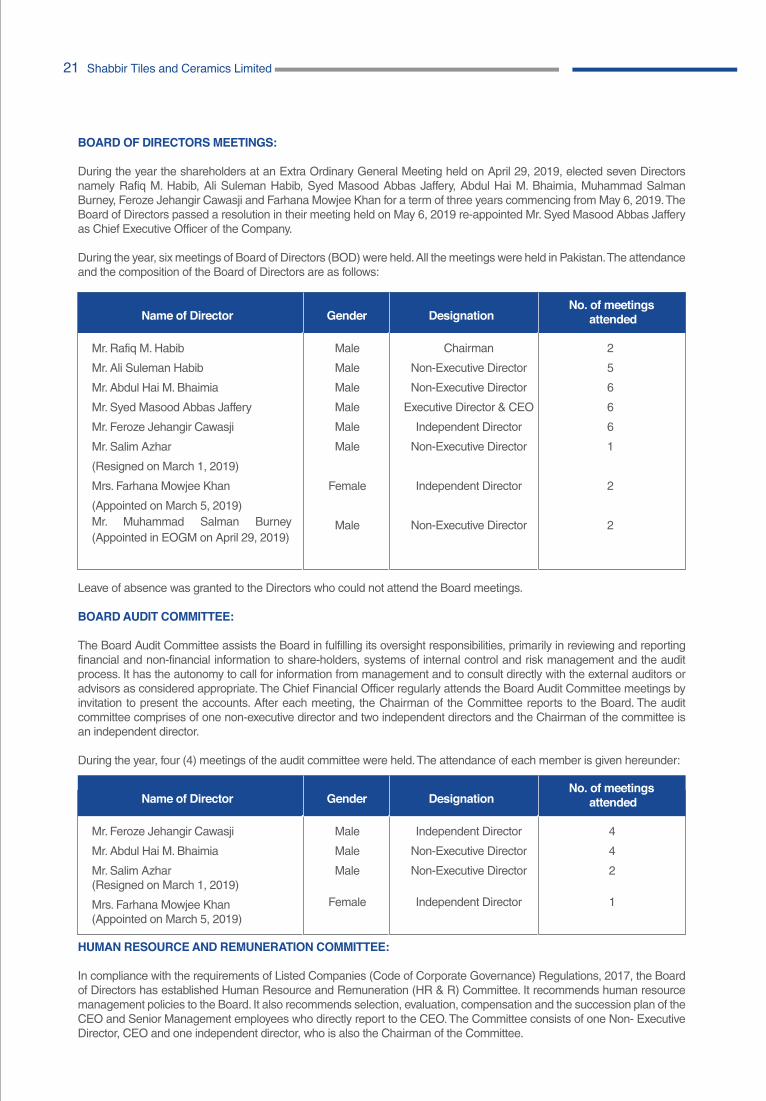
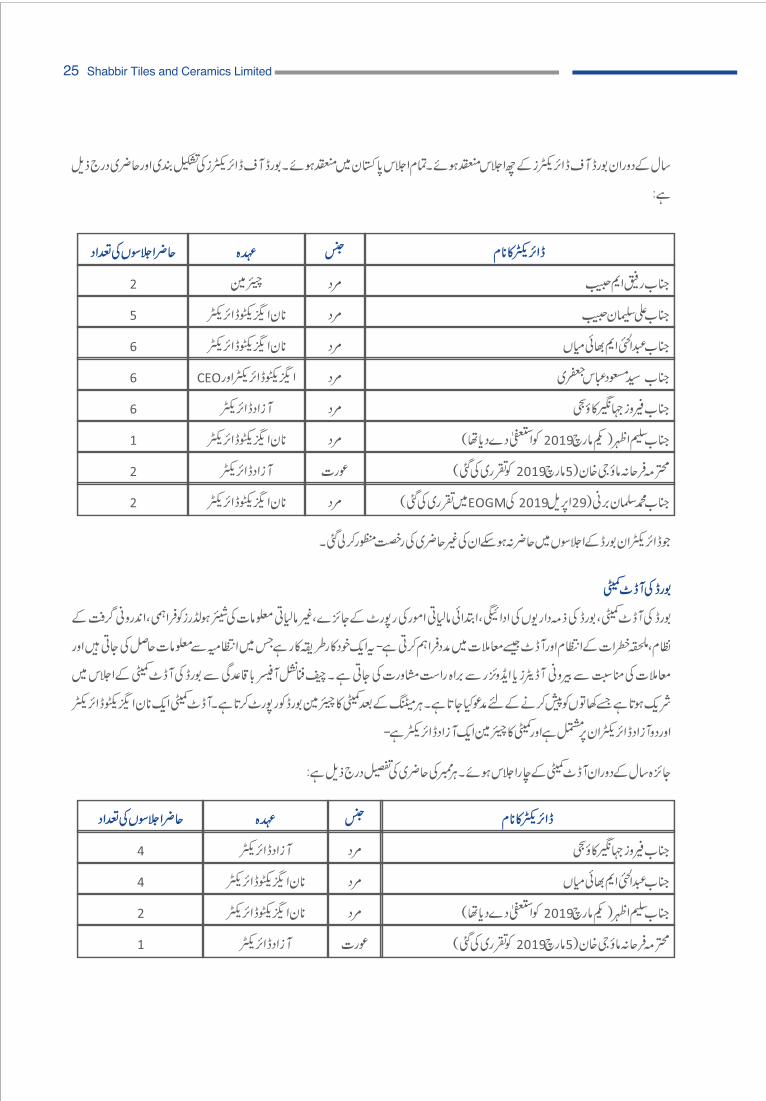
BOARD OF DIRECTORS MEETINGS:
During the year the shareholders at an Extra Ordinary General Meeting held on April 29, 2019, elected seven Directors namely Rafiq M. Habib, Ali Suleman Habib, Syed Masood Abbas Jaffery, Abdul Hai M. Bhaimia, Muhammad Salman Burney, Feroze Jehangir Cawasji and Farhana Mowjee Khan for a term of three years commencing from May 6, 2019. The Board of Directors passed a resolution in their meeting held on May 6, 2019 re-appointed Mr. Syed Masood Abbas Jaffery as Chief Executive Officer of the Company.
During the year, six meetings of Board of Directors (BOD) were held. All the meetings were held in Pakistan. The attendance and the composition of the Board of Directors are as follows:
Leave of absence was granted to the Directors who could not attend the Board meetings.
BOARD AUDIT COMMITTEE:
The Board Audit Committee assists the Board in fulfilling its oversight responsibilities, primarily in reviewing and reporting financial and non-financial information to share-holders, systems of internal control and risk management and the audit process. It has the autonomy to call for information from management and to consult directly with the external auditors or advisors as considered appropriate. The Chief Financial Officer regularly attends the Board Audit Committee meetings by invitation to present the accounts. After each meeting, the Chairman of the Committee reports to the Board. The audit committee comprises of one non-executive director and two independent directors and the Chairman of the committee is an independent director.
During the year, four (4) meetings of the audit committee were held. The attendance of each member is given hereunder:
HUMAN RESOURCE AND REMUNERATION COMMITTEE:
In compliance with the requirements of Listed Companies (Code of Corporate Governance) Regulations, 2017, the Board of Directors has established Human Resource and Remuneration (HR & R) Committee. It recommends human resource management policies to the Board. It also recommends selection, evaluation, compensation and the succession plan of the CEO and Senior Management employees who directly report to the CEO. The Committee consists of one Non- Executive Director, CEO and one independent director, who is also the Chairman of the Committee.
Mr. Rafiq M. Habib
Mr. Ali Suleman Habib
Mr. Abdul Hai M. Bhaimia
Mr. Syed Masood Abbas Jaffery
Mr. Feroze Jehangir Cawasji
Mr. Salim Azhar
(Resigned on March 1, 2019)
Mrs. Farhana Mowjee Khan
(Appointed on March 5, 2019)Mr. Muhammad Salman Burney (Appointed in EOGM on April 29, 2019)
Male
Male
Male
Male
Male
Male
Female
Male
Chairman
Non-Executive Director
Non-Executive Director
Executive Director & CEO
Independent Director
Non-Executive Director
Independent Director
Non-Executive Director
2
5
6
6
6
1
2
2
Name of Director Gender DesignationNo. of meetings
attended
Mr. Feroze Jehangir Cawasji
Mr. Abdul Hai M. Bhaimia
Mr. Salim Azhar(Resigned on March 1, 2019)
Mrs. Farhana Mowjee Khan(Appointed on March 5, 2019)
Male
Male
Male
Female
Independent Director
Non-Executive Director
Non-Executive Director
Independent Director
4
4
2
1
Name of Director Gender DesignationNo. of meetings
attended
21 Shabbir Tiles and Ceramics Limited
TRAINING PROGRAM OF DIRECTORS:
In terms of clause 9 of the Listed Companies (Code of Corporate Governance) Regulations, 2017, the Board of your Company has taken requisite steps to comply with the requirements of this clause within the time specified in the CCG. During the year, two of our Directors have also completed the Director’s Training Program from PICG.
APPROPRIATION:
The Board of Directors is pleased to announce dividend of Rs. 0.25 per share (i.e 5%) to the shareholders for the financial year ended June 30, 2019.
PATTERN OF SHAREHOLDING:
Statements showing the pattern of shareholding as at June 30, 2019 required under the Companies Act 2017 and the Listed Companies (Code of Corporate Governance) Regulations, 2017 as given in page number 77.
The Directors, CEO, CFO, Company Secretary, Head of Internal Audit and their spouses or minor children did not carry out any trade in the shares of the Company during the year.
SUBSEQUENT EVENTS
No material changes or commitments affecting the financial position of the Company have taken place between the end of the financial year and the date of the Report.
PERFORMANCE EVALUATION OF THE BOARD OF DIRECTORS AND ITS COMMITTEES:
As required by the Listed Companies (Code of Corporate Governance) Regulations, 2017, the Board of the Company annually undertakes a formal process of self-evaluation of performance of the Board as a whole and its committees. The purpose of this evaluation is to ensure that the Board’s overall performance and effectiveness is measured and bench-marked against expectations in the context of objectives set for the Company.
The evaluation of Board’s role of oversight and its effectiveness is continual process. The core areas of focus are:
• Alignment of corporate goals and objectives with the vision and mission of the Company;• Strategy formulation for sustainable operation;• Board’s independence; and• Evaluation of Board’s Committees performance in relation to discharging their responsibilities set out in respective terms of reference.
ACKNOWLEDGEMENT:
We acknowledge and are thankful for the continued support of our shareholders, customers, suppliers and employees.
On behalf of the Board
SYED MASOOD ABBAS JAFFERY FEROZE JEHANGIR CAWASJI Chief Executive Officer Director
Karachi: September 17, 2019
Annual Report 2019 22
23 Shabbir Tiles and Ceramics Limited
Annual Report 2019 24
77
5%
25 Shabbir Tiles and Ceramics Limited
Annual Report 2019 26
29
27 Shabbir Tiles and Ceramics Limited
Annual Report 2019 28
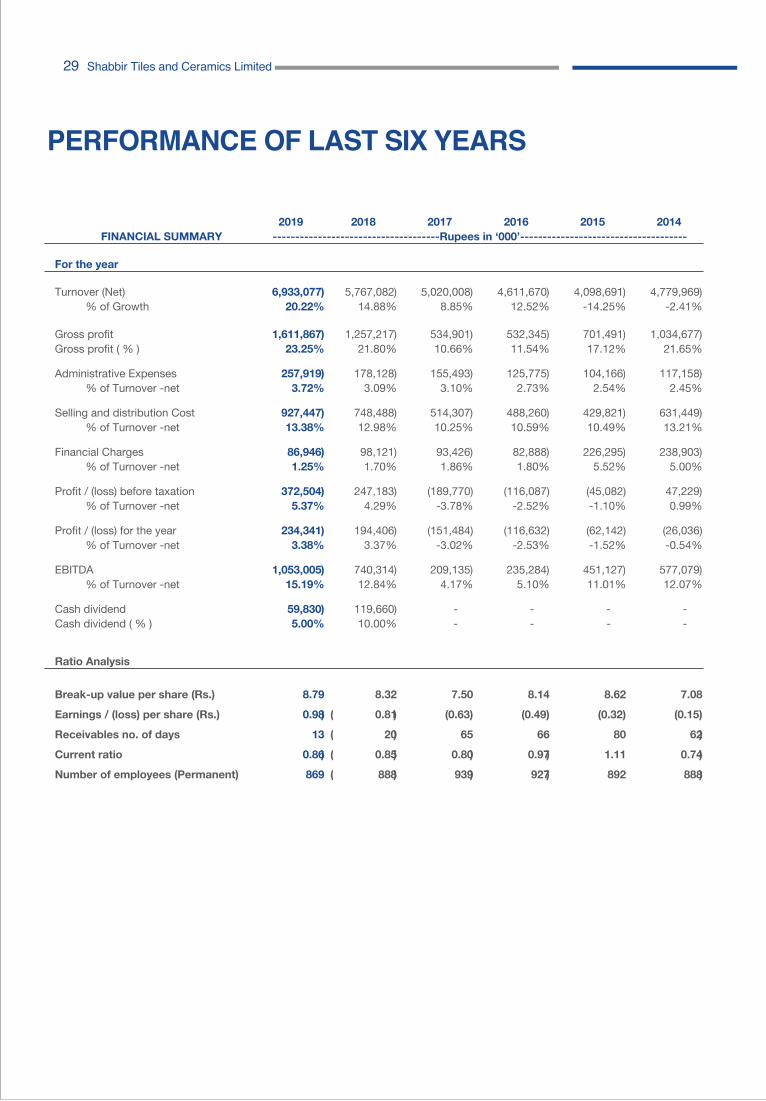
PERFORMANCE OF LAST SIX YEARS
FINANCIAL SUMMARY2019 2018 2017 2016 2015 2014
-------------------------------------Rupees in ‘000’-------------------------------------
For the year
Turnover (Net) 6,933,077) 5,767,082) 5,020,008) 4,611,670) 4,098,691) 4,779,969) % of Growth 20.22% 14.88% 8.85% 12.52% -14.25% -2.41%
Gross profit 1,611,867) 1,257,217) 534,901) 532,345) 701,491) 1,034,677)Gross profit ( % ) 23.25% 21.80% 10.66% 11.54% 17.12% 21.65%
Administrative Expenses 257,919) 178,128) 155,493) 125,775) 104,166) 117,158) % of Turnover -net 3.72% 3.09% 3.10% 2.73% 2.54% 2.45%
Selling and distribution Cost 927,447) 748,488) 514,307) 488,260) 429,821) 631,449) % of Turnover -net 13.38% 12.98% 10.25% 10.59% 10.49% 13.21%
Financial Charges 86,946) 98,121) 93,426) 82,888) 226,295) 238,903) % of Turnover -net 1.25% 1.70% 1.86% 1.80% 5.52% 5.00%
Profit / (loss) before taxation 372,504) 247,183) (189,770) (116,087) (45,082) 47,229) % of Turnover -net 5.37% 4.29% -3.78% -2.52% -1.10% 0.99%
Profit / (loss) for the year 234,341) 194,406) (151,484) (116,632) (62,142) (26,036) % of Turnover -net 3.38% 3.37% -3.02% -2.53% -1.52% -0.54%
EBITDA 1,053,005) 740,314) 209,135) 235,284) 451,127) 577,079) % of Turnover -net 15.19% 12.84% 4.17% 5.10% 11.01% 12.07%
Cash dividend 59,830) 119,660) - - - -Cash dividend ( % ) 5.00% 10.00% - - - -
Ratio Analysis
Break-up value per share (Rs.) 8.79 8.32 7.50 8.14 8.62 7.08Earnings / (loss) per share (Rs.) 0.98) ( 0.81) (0.63) (0.49) (0.32) (0.15)Receivables no. of days 13 ( 20) 65 66 80 62)Current ratio 0.86) ( 0.85) 0.80) 0.97) 1.11 0.74)Number of employees (Permanent) 869 ( 888) 939) 927) 892 888)
29 Shabbir Tiles and Ceramics Limited
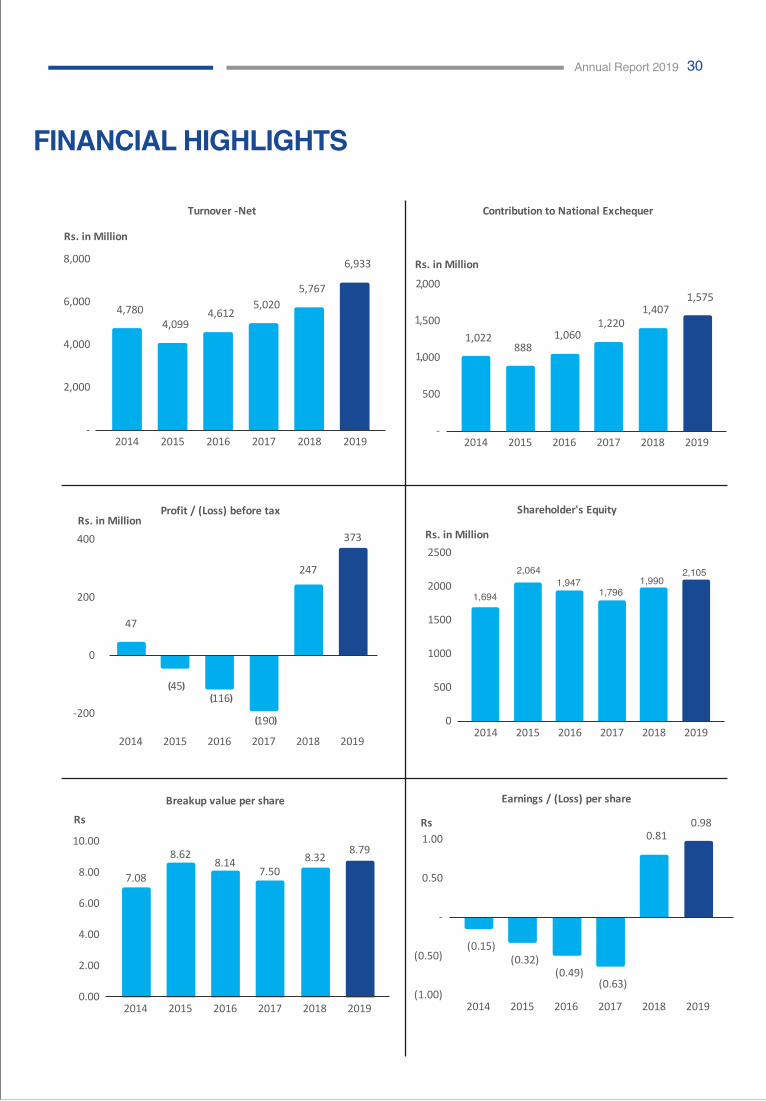
FINANCIAL HIGHLIGHTS
Annual Report 2019 30
1,694
2,064
1,947
1,796
1,9902,105
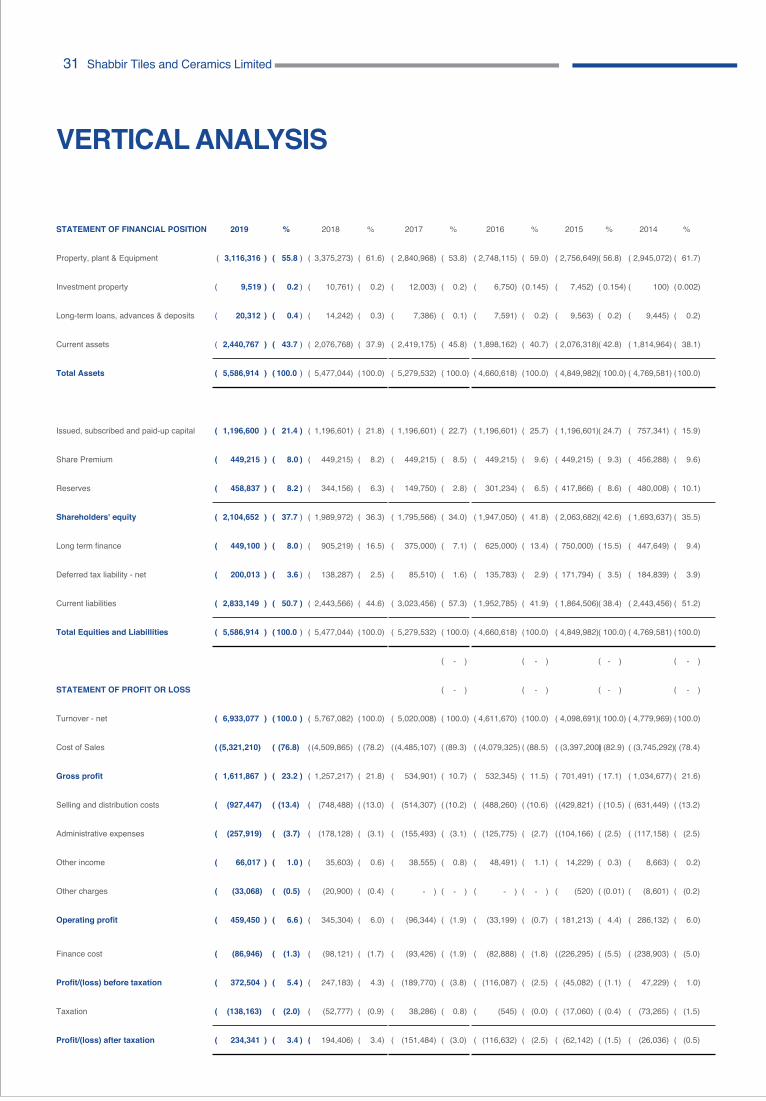
VERTICAL ANALYSIS
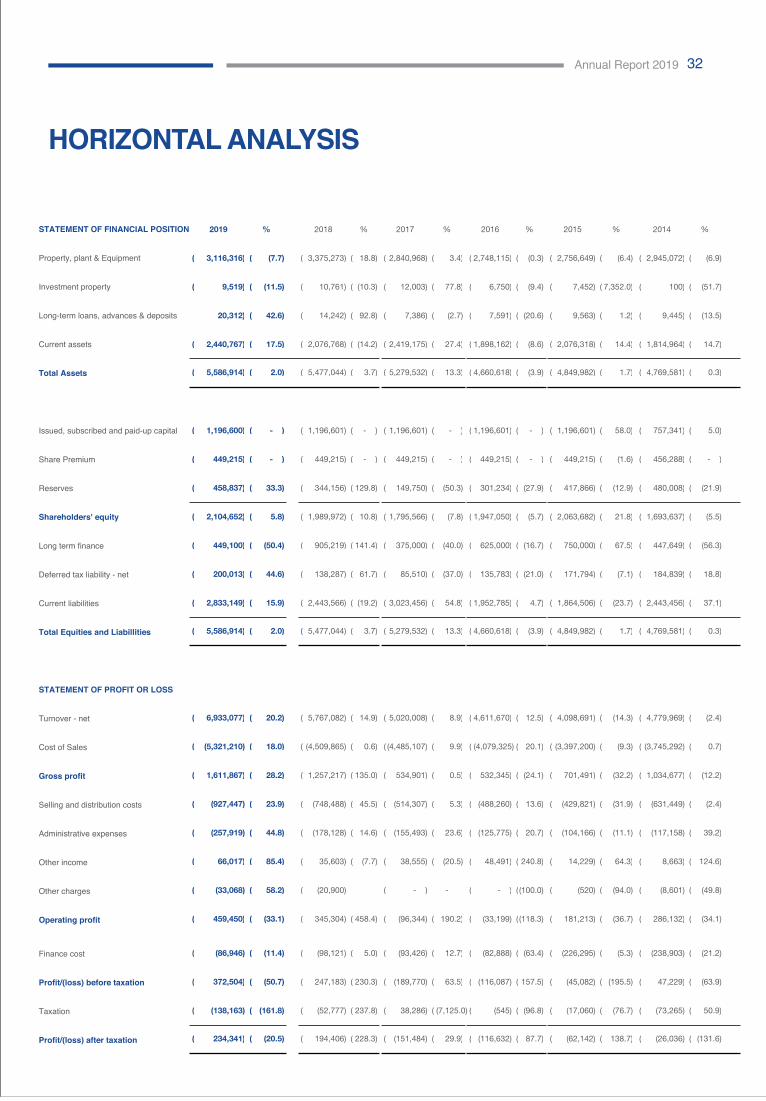
STATEMENT OF FINANCIAL POSITION 2019 % 2018 % 2017 % 2016 % 2015 % 2014 %
Property, plant & Equipment ( 3,116,316 ) ( 55.8 ) ( 3,375,273) ( 61.6) ( 2,840,968) ( 53.8) ( 2,748,115) ( 59.0) ( 2,756,649)( 56.8) ( 2,945,072) ( 61.7)
Investment property ( 9,519 ) ( 0.2 ) ( 10,761) ( 0.2) ( 12,003) ( 0.2) ( 6,750) (0.145) ( 7,452) ( 0.154) ( 100) (0.002)
Long-term loans, advances & deposits ( 20,312 ) ( 0.4 ) ( 14,242) ( 0.3) ( 7,386) ( 0.1) ( 7,591) ( 0.2) ( 9,563) ( 0.2) ( 9,445) ( 0.2)
Current assets ( 2,440,767 ) ( 43.7 ) ( 2,076,768) ( 37.9) ( 2,419,175) ( 45.8) ( 1,898,162) ( 40.7) ( 2,076,318)( 42.8) ( 1,814,964) ( 38.1)
Total Assets ( 5,586,914 ) ( 100.0 ) ( 5,477,044) (100.0) ( 5,279,532) ( 100.0) ( 4,660,618) (100.0) ( 4,849,982)( 100.0) ( 4,769,581) (100.0)
Issued, subscribed and paid-up capital ( 1,196,600 ) ( 21.4 ) ( 1,196,601) ( 21.8) ( 1,196,601) ( 22.7) ( 1,196,601) ( 25.7) ( 1,196,601)( 24.7) ( 757,341) ( 15.9)
Share Premium ( 449,215 ) ( 8.0 ) ( 449,215) ( 8.2) ( 449,215) ( 8.5) ( 449,215) ( 9.6) ( 449,215) ( 9.3) ( 456,288) ( 9.6)
Reserves ( 458,837 ) ( 8.2 ) ( 344,156) ( 6.3) ( 149,750) ( 2.8) ( 301,234) ( 6.5) ( 417,866) ( 8.6) ( 480,008) ( 10.1)
Shareholders' equity ( 2,104,652 ) ( 37.7 ) ( 1,989,972) ( 36.3) ( 1,795,566) ( 34.0) ( 1,947,050) ( 41.8) ( 2,063,682)( 42.6) ( 1,693,637) ( 35.5)
Long term finance ( 449,100 ) ( 8.0 ) ( 905,219) ( 16.5) ( 375,000) ( 7.1) ( 625,000) ( 13.4) ( 750,000) ( 15.5) ( 447,649) ( 9.4)
Deferred tax liability - net ( 200,013 ) ( 3.6 ) ( 138,287) ( 2.5) ( 85,510) ( 1.6) ( 135,783) ( 2.9) ( 171,794) ( 3.5) ( 184,839) ( 3.9)
Current liabilities ( 2,833,149 ) ( 50.7 ) ( 2,443,566) ( 44.6) ( 3,023,456) ( 57.3) ( 1,952,785) ( 41.9) ( 1,864,506)( 38.4) ( 2,443,456) ( 51.2)
Total Equities and Liabillities ( 5,586,914 ) ( 100.0 ) ( 5,477,044) (100.0) ( 5,279,532) ( 100.0) ( 4,660,618) (100.0) ( 4,849,982)( 100.0) ( 4,769,581) (100.0)
( - ) ( - ) ( - ) ( - )
STATEMENT OF PROFIT OR LOSS ( - ) ( - ) ( - ) ( - )
Turnover - net ( 6,933,077 ) ( 100.0 ) ( 5,767,082) (100.0) ( 5,020,008) ( 100.0) ( 4,611,670) (100.0) ( 4,098,691)( 100.0) ( 4,779,969) (100.0)
Cost of Sales ( (5,321,210) ( (76.8) ((4,509,865) ( (78.2) ((4,485,107) ( (89.3) ( (4,079,325) ( (88.5) ( (3,397,200)( (82.9) ( (3,745,292)( (78.4)
Gross profit ( 1,611,867 ) ( 23.2 ) ( 1,257,217) ( 21.8) ( 534,901) ( 10.7) ( 532,345) ( 11.5) ( 701,491) ( 17.1) ( 1,034,677) ( 21.6)
Selling and distribution costs ( (927,447) ( (13.4) ( (748,488) ( (13.0) ( (514,307) ( (10.2) ( (488,260) ( (10.6) ((429,821) ( (10.5) ( (631,449) ( (13.2)
Administrative expenses ( (257,919) ( (3.7) ( (178,128) ( (3.1) ( (155,493) ( (3.1) ( (125,775) ( (2.7) ((104,166) ( (2.5) ( (117,158) ( (2.5)
Other income ( 66,017 ) ( 1.0 ) ( 35,603) ( 0.6) ( 38,555) ( 0.8) ( 48,491) ( 1.1) ( 14,229) ( 0.3) ( 8,663) ( 0.2)
Other charges ( (33,068) ( (0.5) ( (20,900) ( (0.4) ( - ) ( - ) ( - ) ( - ) ( (520) ( (0.01) ( (8,601) ( (0.2)
Operating profit ( 459,450 ) ( 6.6 ) ( 345,304) ( 6.0) ( (96,344) ( (1.9) ( (33,199) ( (0.7) ( 181,213) ( 4.4) ( 286,132) ( 6.0)
Finance cost ( (86,946) ( (1.3) ( (98,121) ( (1.7) ( (93,426) ( (1.9) ( (82,888) ( (1.8) ((226,295) ( (5.5) ( (238,903) ( (5.0)
Profit/(loss) before taxation ( 372,504 ) ( 5.4 ) ( 247,183) ( 4.3) ( (189,770) ( (3.8) ( (116,087) ( (2.5) ( (45,082) ( (1.1) ( 47,229) ( 1.0)
Taxation ( (138,163) ( (2.0) ( (52,777) ( (0.9) ( 38,286) ( 0.8) ( (545) ( (0.0) ( (17,060) ( (0.4) ( (73,265) ( (1.5)
Profit/(loss) after taxation ( 234,341 ) ( 3.4 ) ( 194,406) ( 3.4) ( (151,484) ( (3.0) ( (116,632) ( (2.5) ( (62,142) ( (1.5) ( (26,036) ( (0.5)
31 Shabbir Tiles and Ceramics Limited
STATEMENT OF FINANCIAL POSITION
Property, plant & Equipment
Investment property
Long-term loans, advances & deposits
Current assets
Total Assets
Issued, subscribed and paid-up capital
Share Premium
Reserves
Shareholders' equity
Long term finance
Deferred tax liability - net
Current liabilities
Total Equities and Liabillities
STATEMENT OF PROFIT OR LOSS
Turnover - net
Cost of Sales
Gross profit
Selling and distribution costs
Administrative expenses
Other income
Other charges
Operating profit
Finance cost
Profit/(loss) before taxation
Taxation
Profit/(loss) after taxation
HORIZONTAL ANALYSIS
Annual Report 2019 32
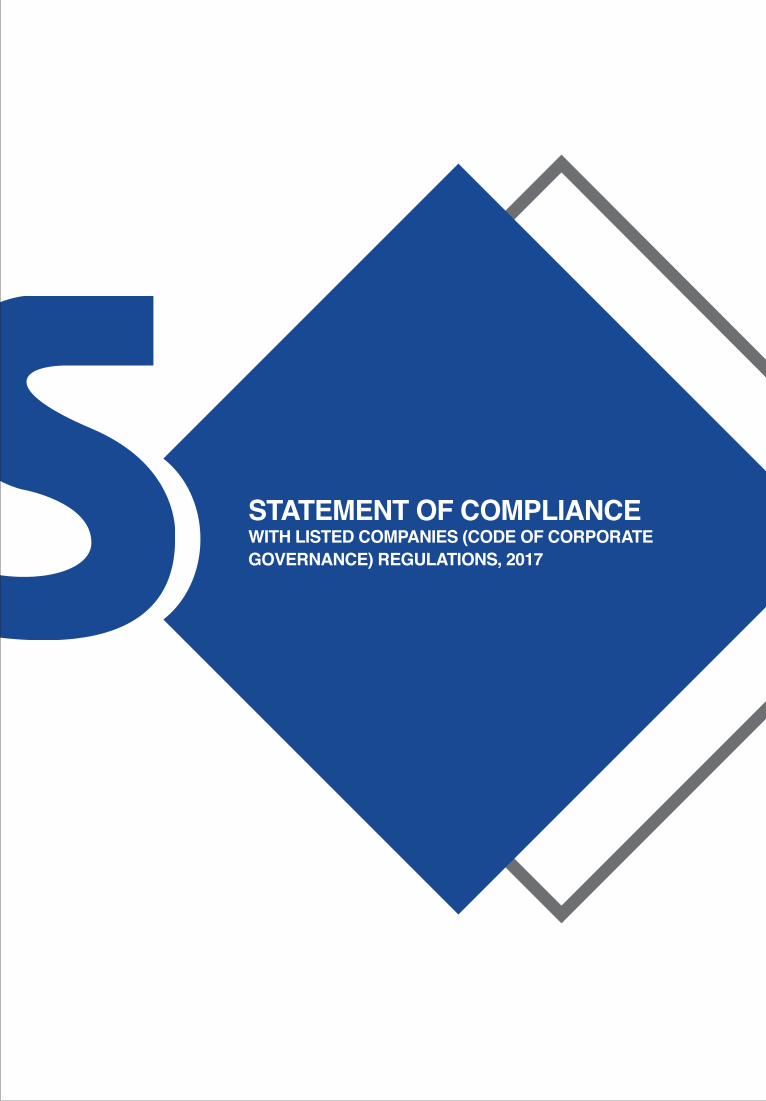
STATEMENT OF COMPLIANCEWITH LISTED COMPANIES (CODE OF CORPORATE GOVERNANCE) REGULATIONS, 2017
STATEMENT OF COMPLIANCE WITH LISTED COMPANIES (CODE OF CORPORATE GOVERNANCE) REGULATIONS, 2017Shabbir Tiles and Ceramics Limited (the Company) has complied with the requirements of the Regulations, 2017 in the following manner:
1) The total number of directors are seven as per following: a. Male: 6 b. Female: 1
2) The composition of board of directors (the Board) is as follows: a) Independent Director : Mr. Feroze Jahangir Cawasji Mrs. Farhana Mowjee Khan
b) Executive Director : Mr. Syed Masood Abbas Jaffery
c) Non-Executive Directors : Mr. Rafiq M. Habib Mr. Ali Suleman Habib Mr. Muhammad Salman Burney Mr. Abdul Hai M. Bhaimia
3) The Directors have confirmed that none of them is serving as a director on more than five listed companies, including this Company.
4) The company has prepared a Code of Conduct and has ensured that appropriate steps have been taken to disseminate it throughout the company along with its supporting policies and procedures.
5) The Board has developed a vision/mission statement, overall corporate strategy and significant policies of the company. A complete record of particulars of significant policies along with the dates on which they were approved or amended has been maintained.
6) All the powers of the Board have been duly exercised and decisions on relevant matters have been taken by board/shareholders as empowered by the relevant provisions of the Companies Act 2017 (the Act) and these Regulations.
7) The meetings of the Board were presided over by the Chairman and in his absence, by a director elected by the Board for this purpose. The Board has complied with the requirements of Act and the Regulations with respect to frequency, recording and circulating minutes of board.
8) The board of directors has a formal policy and transparent procedures for remuneration of directors in accordance with the Act and these Regulations.
9) The Board has arranged Directors’ Training Programs for Mr. Feroze Jehangir Cawasji and Mr. Masood Jaffery during the year ended June 30, 2019.
10) The Board has approved change in remuneration and terms and condition of employment of CFO, Company Secretary and Head of Internal Audit and complied with relevant requirements of the Regulations.
11) CFO and CEO duly endorsed the financial statements before approval of the board.
12) The board has formed committees comprising of members given below:
a) Audit Committee Mr. Feroze Jehangir Cawasji Chairman Mr. Abdul Hai M. Bhaimia Member Mrs. Farhana Mowjee Khan Member
b) HR and Remuneration Committee Mr. Feroze Jehangir Cawasji Chairman Mr. Salman Burney Member Mr. Syed Masood Abbas Jaffery Member
37 Shabbir Tiles and Ceramics Limited
13) The terms of reference of the aforesaid committees have been formed, documented and advised to the committee for compliance.
14) The frequency of meetings of the committees were as per following:
a) Audit Committee: Four quarterly meetings were held during the year ended June 30, 2019.
b) HR and Remuneration Committee: One meeting was held during the year ended June 30, 2019.
15) The board has outsourced the internal audit function to M/s. Noble Computer Services (Pvt.) Ltd. who are considered suitably qualified and experienced for the purpose and are conversant with the policies and procedures of the Company.
16) The statutory auditors of the company have confirmed that they have been given a satisfactory rating under the quality control review program of the Institute of Chartered Accountants of Pakistan (ICAP) and registered with Audit Oversight Board of Pakistan, that they or any of the partners of the firm, their spouses and minor children do not hold shares of the Company and that the firm and all its partners are in compliance with International Federation of Accountants (IFAC) guidelines on code of ethics as adopted by the ICAP.
17) The statutory auditors or the persons associated with them have not been appointed to provide other services except in accordance with the Act, these regulations or any other regulatory requirement and the auditors have confirmed that they have observed IFAC guidelines in this regard.
18) We confirm that all other requirements of the Regulations have been complied with.
SYED MASOOD ABBAS JAFFERY RAFIQ M. HABIB Chief Executive Officer Chairman
Date: September 17, 2019
Annual Report 2019 38
40
45
46
47
48
49
50
Shabbir Tiles and Ceramics Limited Annual Report 201945
Statement of Financial PositionAs At June 30, 2019
June 30, June 30,2019 2018
Note --------(Rupees in ‘000)--------
ASSETS
NON-CURRENT ASSETS
Property, plant and equipment 7 3,116,316 3,375,273Investment property 8 9,519 10,761Long-term loans 9 20 10Long-term security deposits 10 20,292 14,232
3,146,147 3,400,276CURRENT ASSETS
Stores and spare parts 11 322,695 364,876Stock-in-trade 12 1,494,300 1,107,933Trade debts 13 148,251 243,365Loans and advances 14 10,551 13,383 Deposits and prepayments 15 21,018 8,115 Taxation - net 316,825 234,622Cash and bank balances 16 127,127 104,474
2,440,767 2,076,768 5,586,914 5,477,044
EQUITY AND LIABILITIESSHARE CAPITAL AND RESERVESAuthorised capital240,000,000 (2018: 240,000,000) ordinary shares of Rs.5/- each 1,200,000 1,200,000
Issued, subscribed and paid-up capital 17 1,196,600 1,196,600Reserves 908,052 793,371
2,104,652 1,989,971
NON-CURRENT LIABILITIESLong-term financing 18 449,100 905,219 Deferred tax liability - net 19 200,013 138,287
649,113 1,043,506CURRENT LIABILITIES
Trade and other payables 20 2,469,461 2,163,702Unclaimed dividends 2,812 3,324Unpaid dividend 2,450 - Accrued mark-up 9,860 28,476Current maturity of long-term financing 18 49,900 - Short-term borrowings 21 191,381 - Sales tax payable 107,285 248,065
2,833,149 2,443,567CONTINGENCIES AND COMMITMENTS 22
5,586,914 5,477,044
The annexed notes from 1 to 41 form an integral part of these financial statements.
WAQUAS AHMEDChief Financial Officer
SYED MASOOD ABBASJAFFERYChief Executive Officer
FEROZE JEHANGIR CAWASJIDirector
Shabbir Tiles and Ceramics Limited Annual Report 2019 46
Statement of Profit or LossFor The Year Ended June 30, 2019
June 30, June 30,2019 2018
Note --------(Rupees in ‘000)--------
Turnover - net 23 6,933,077 5,767,082 Cost of sales 24 (5,321,210) (4,509,865)
Gross profit 1,611,867 1,257,217
Selling and distribution costs 25 (927,447) (748,488)Administrative expenses 26 (257,919) (178,128)
(1,185,366) (926,616)
Other income 27 66,017 35,603
Operating profit 492,518 366,204
Finance costs 28 (86,946) (98,121)Other expenses 29 (33,068) (20,900)
(120,014) (119,021)
Profit before taxation 372,504 247,183
Taxation 30 (138,163) (52,777)
Profit after taxation 234,341 194,406
-------- Rupee --------
Earnings per share - basic and diluted 31 0.98 0.81
The annexed notes from 1 to 41 form an integral part of these financial statements.
WAQUAS AHMEDChief Financial Officer
SYED MASOOD ABBASJAFFERYChief Executive Officer
FEROZE JEHANGIR CAWASJIDirector
Shabbir Tiles and Ceramics Limited Annual Report 201947
Statement of Cash FlowsFor The Year Ended June 30, 2019
June 30, June 30,2019 2018
Note --------(Rupees in ‘000)--------
CASH FLOWS FROM OPERATING ACTIVITIESProfit before taxation 372,504 247,183
Adjustments for non-cash and other itemsDepreciation on
operating fixed assets 7.3 592,313 393,768 investment property 8 1,242 1,242
Finance costs 28 86,946 98,121 Increase in allowance for expected credit loss 13.2 7,259 20,364 Provision for slow moving stores and spare parts 11.1 32,296 6,030 (Reversal) / provision for slow moving stock-in-trade 12.2 (3,795) 13,243 Gain on disposal of property, plant and equipment 27 (17,460) (1,697)
698,801 531,071 Operating profit before working capital changes 1,071,305 778,254
(Increase) / decrease in current assetsStores and spare parts 9,885 (117,710)Stock-in-trade (382,572) (144,818)Trade debts 87,855 684,974 Loans and advances 2,832 4,192 Deposits and prepayments (12,903) 990
(294,903) 427,628 Increase / (decrease) in current liabilitiesTrade and other payables 305,759 542,432 Sales tax payable (140,780) 103,503
164,979 645,935
Cash generated from operations 941,381 1,851,817
Income tax paid (158,640) (83,699)Finance costs paid (105,562) (83,680)Long-term loans - net (10) 29 Long-term security deposits - net (6,060) (6,885)Net cash generated from operating activities 671,109 1,677,582
CASH FLOWS FROM INVESTING ACTIVITIESCapital expenditure (343,419) (933,317)Proceeds from disposal of operating fixed assets 27,523 6,940 Net cash used in investing activities (315,896) (926,377)
CASH FLOWS FROM FINANCING ACTIVITIES(Repayment) / receipts of long-term financing - net (406,219) 280,219 Dividend paid (117,722) - Net cash (used in) / generated from financing activities (523,941) 280,219
Net (decrease) / increase in cash and cash equivalents (168,728) 1,031,424
Cash and cash equivalents at the beginning of the year 104,474 (926,950)
Cash and cash equivalents at the end of the year 32 (64,254) 104,474
The annexed notes from 1 to 41 form an integral part of these financial statements.
WAQUAS AHMEDChief Financial Officer
SYED MASOOD ABBASJAFFERYChief Executive Officer
FEROZE JEHANGIR CAWASJIDirector
Shabbir Tiles and Ceramics Limited Annual Report 2019 48
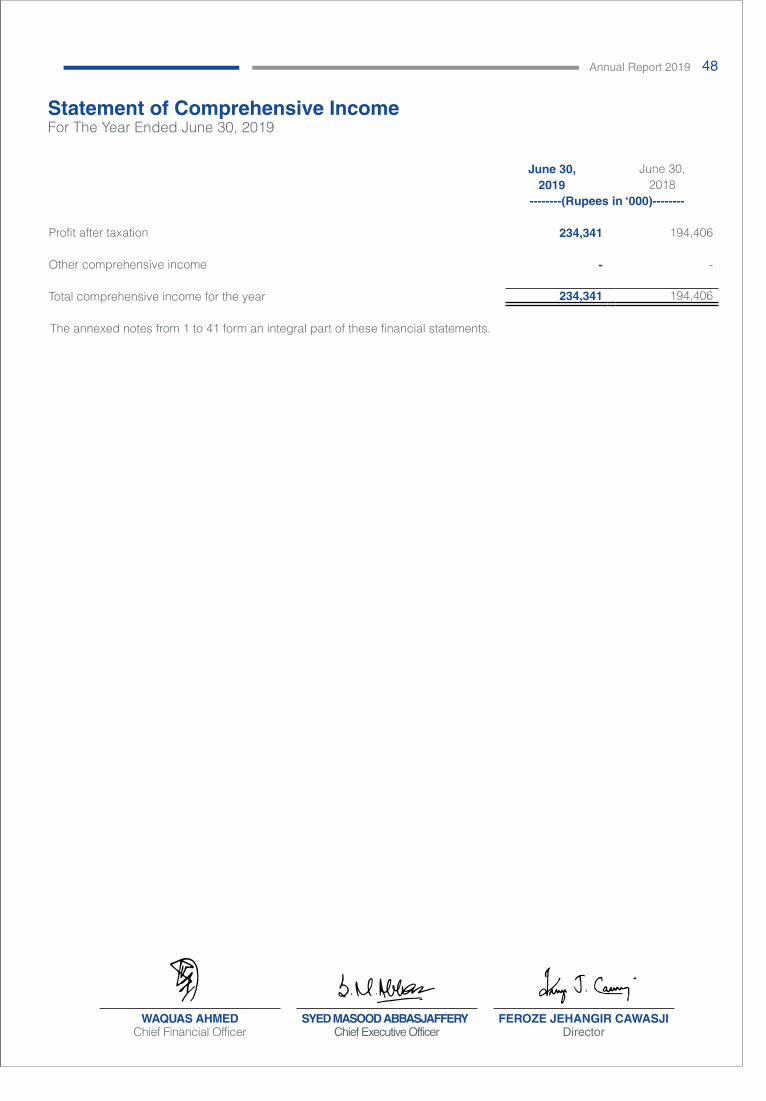
Statement of Comprehensive IncomeFor The Year Ended June 30, 2019
June 30, June 30,2019 2018
--------(Rupees in ‘000)--------
Profit after taxation 234,341 194,406
Other comprehensive income - -
Total comprehensive income for the year 234,341 194,406
The annexed notes from 1 to 41 form an integral part of these financial statements.
WAQUAS AHMEDChief Financial Officer
SYED MASOOD ABBASJAFFERYChief Executive Officer
FEROZE JEHANGIR CAWASJIDirector
Shabbir Tiles and Ceramics Limited Annual Report 201949
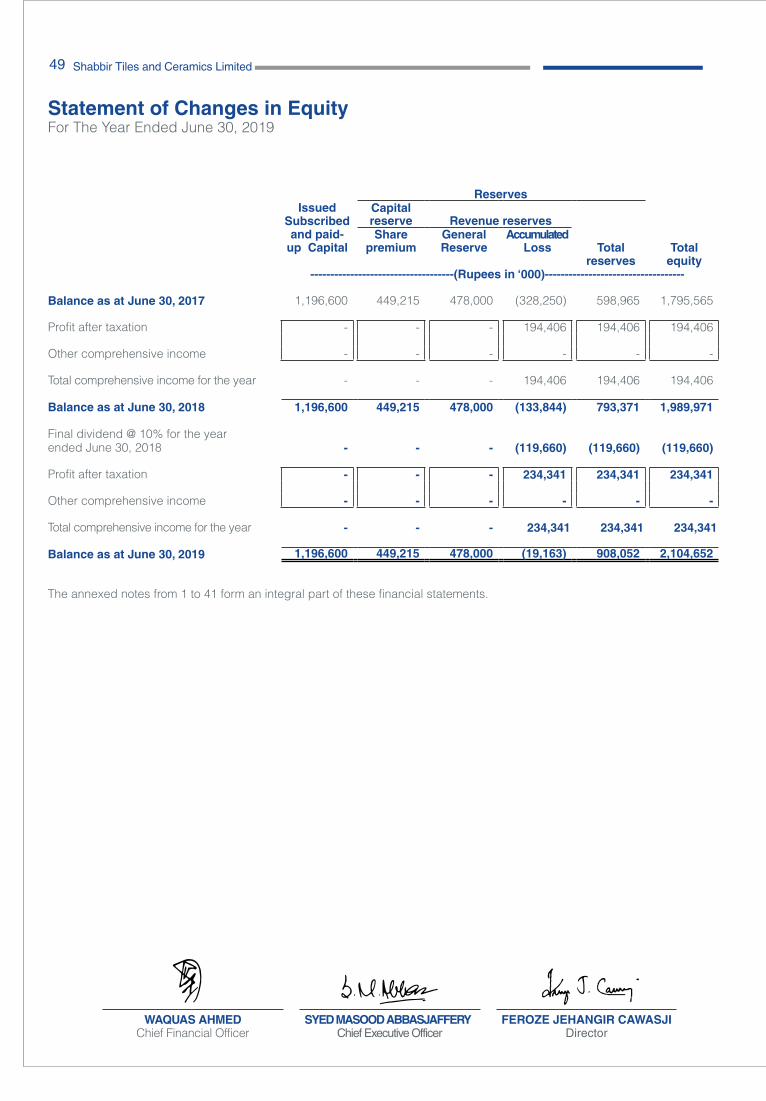
Statement of Changes in EquityFor The Year Ended June 30, 2019
ReservesIssued Capital
Subscribed reserve Revenue reservesand paid- Share General Accumulated
up Capital premium Reserve Loss Total Total reserves equity
------------------------------------(Rupees in ‘000)-----------------------------------
Balance as at June 30, 2017 1,196,600 449,215 478,000 (328,250) 598,965 1,795,565
Profit after taxation - - - 194,406 194,406 194,406
Other comprehensive income - - - - - -
Total comprehensive income for the year - - - 194,406 194,406 194,406
Balance as at June 30, 2018 1,196,600 449,215 478,000 (133,844) 793,371 1,989,971
Final dividend @ 10% for the year ended June 30, 2018 - - - (119,660) (119,660) (119,660)
Profit after taxation - - - 234,341 234,341 234,341
Other comprehensive income - - - - - -
Total comprehensive income for the year - - - 234,341 234,341 234,341
Balance as at June 30, 2019 1,196,600 449,215 478,000 (19,163) 908,052 2,104,652
The annexed notes from 1 to 41 form an integral part of these financial statements.
WAQUAS AHMEDChief Financial Officer
SYED MASOOD ABBASJAFFERYChief Executive Officer
FEROZE JEHANGIR CAWASJIDirector
Shabbir Tiles and Ceramics Limited Annual Report 2019 50
Notes to the Financial Statements For The Year Ended June 30, 2019
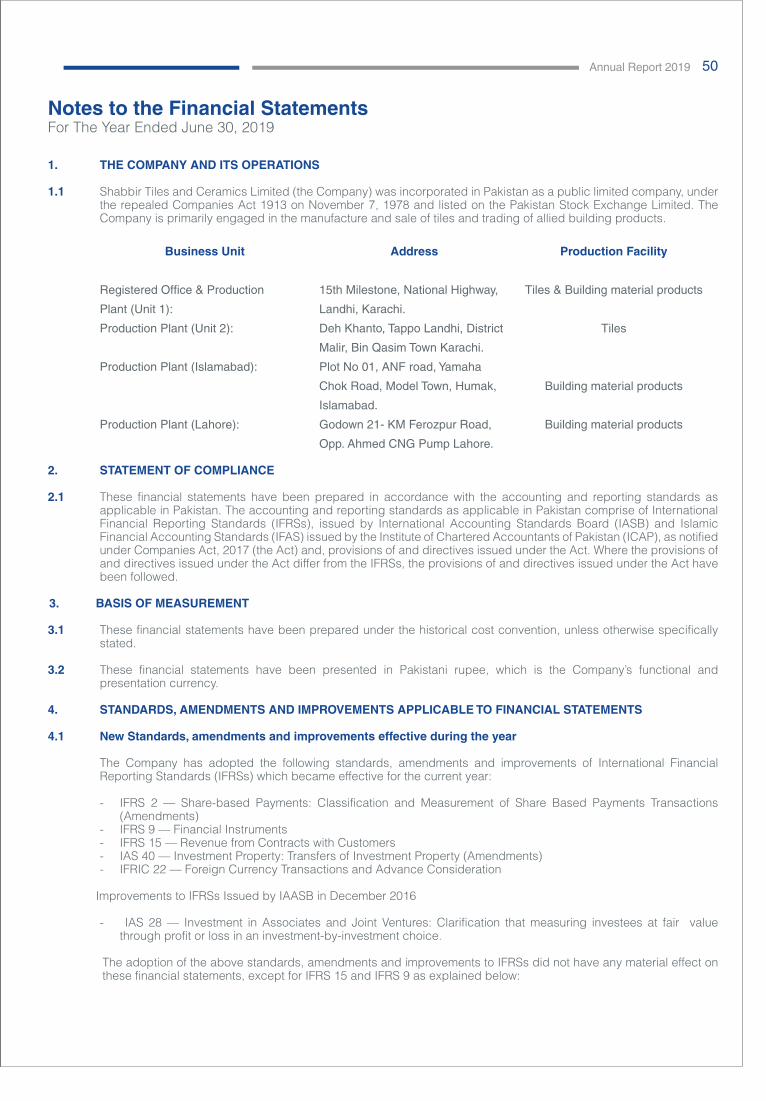
1. THE COMPANY AND ITS OPERATIONS
1.1 Shabbir Tiles and Ceramics Limited (the Company) was incorporated in Pakistan as a public limited company, under the repealed Companies Act 1913 on November 7, 1978 and listed on the Pakistan Stock Exchange Limited. The Company is primarily engaged in the manufacture and sale of tiles and trading of allied building products.
Business Unit Address Production Facility
Registered Office & Production 15th Milestone, National Highway, Tiles & Building material products
Plant (Unit 1): Landhi, Karachi.
Production Plant (Unit 2): Deh Khanto, Tappo Landhi, District Tiles
Malir, Bin Qasim Town Karachi.
Production Plant (Islamabad): Plot No 01, ANF road, Yamaha
Chok Road, Model Town, Humak, Building material products
Islamabad.
Production Plant (Lahore): Godown 21- KM Ferozpur Road, Building material products
Opp. Ahmed CNG Pump Lahore. 2. STATEMENT OF COMPLIANCE
2.1 These financial statements have been prepared in accordance with the accounting and reporting standards as
applicable in Pakistan. The accounting and reporting standards as applicable in Pakistan comprise of International Financial Reporting Standards (IFRSs), issued by International Accounting Standards Board (IASB) and Islamic Financial Accounting Standards (IFAS) issued by the Institute of Chartered Accountants of Pakistan (ICAP), as notified under Companies Act, 2017 (the Act) and, provisions of and directives issued under the Act. Where the provisions of and directives issued under the Act differ from the IFRSs, the provisions of and directives issued under the Act have been followed.
3. BASIS OF MEASUREMENT 3.1 These financial statements have been prepared under the historical cost convention, unless otherwise specifically
stated. 3.2 These financial statements have been presented in Pakistani rupee, which is the Company’s functional and
presentation currency. 4. STANDARDS, AMENDMENTS AND IMPROVEMENTS APPLICABLE TO FINANCIAL STATEMENTS
4.1 New Standards, amendments and improvements effective during the year
The Company has adopted the following standards, amendments and improvements of International Financial
Reporting Standards (IFRSs) which became effective for the current year:
- IFRS 2 — Share-based Payments: Classification and Measurement of Share Based Payments Transactions (Amendments)
- IFRS 9 — Financial Instruments - IFRS 15 — Revenue from Contracts with Customers - IAS 40 — Investment Property: Transfers of Investment Property (Amendments) - IFRIC 22 — Foreign Currency Transactions and Advance Consideration
Improvements to IFRSs Issued by IAASB in December 2016
- IAS 28 — Investment in Associates and Joint Ventures: Clarification that measuring investees at fair value through profit or loss in an investment-by-investment choice.
The adoption of the above standards, amendments and improvements to IFRSs did not have any material effect on these financial statements, except for IFRS 15 and IFRS 9 as explained below:
Shabbir Tiles and Ceramics Limited Annual Report 201951
Notes to the Financial Statements For The Year Ended June 30, 2019
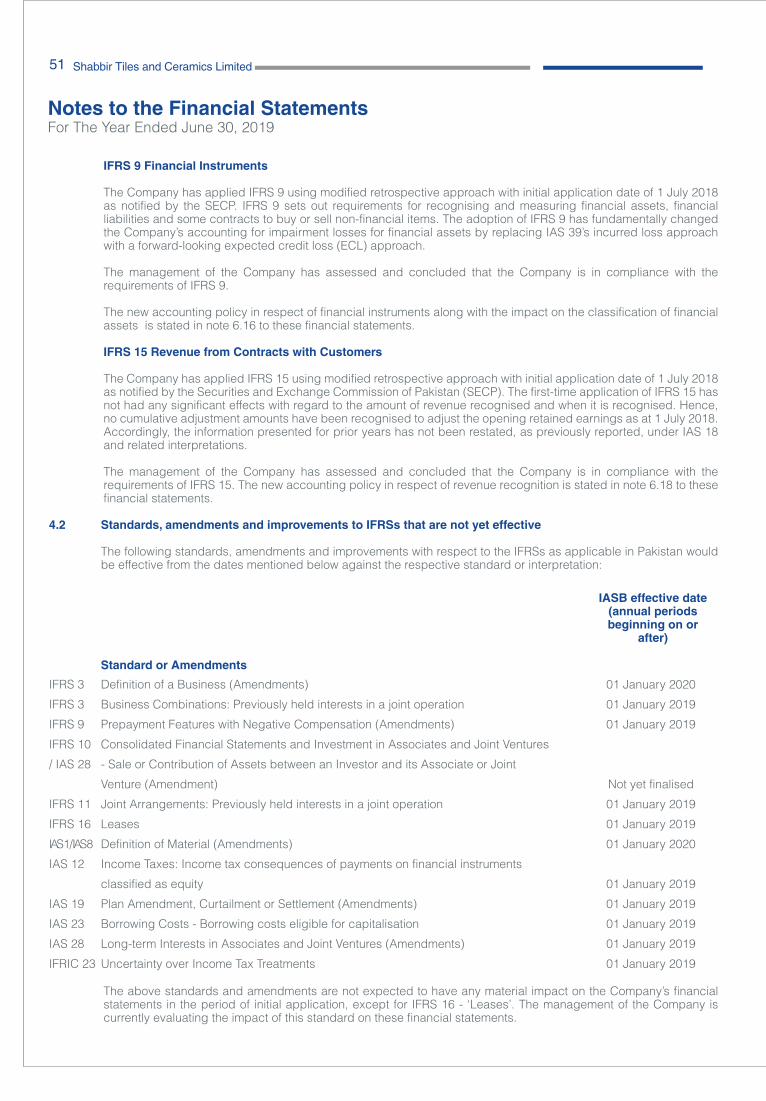
IFRS 9 Financial Instruments The Company has applied IFRS 9 using modified retrospective approach with initial application date of 1 July 2018
as notified by the SECP. IFRS 9 sets out requirements for recognising and measuring financial assets, financial liabilities and some contracts to buy or sell non-financial items. The adoption of IFRS 9 has fundamentally changed the Company’s accounting for impairment losses for financial assets by replacing IAS 39’s incurred loss approach with a forward-looking expected credit loss (ECL) approach.
The management of the Company has assessed and concluded that the Company is in compliance with the requirements of IFRS 9.
The new accounting policy in respect of financial instruments along with the impact on the classification of financial assets is stated in note 6.16 to these financial statements.
IFRS 15 Revenue from Contracts with Customers
The Company has applied IFRS 15 using modified retrospective approach with initial application date of 1 July 2018 as notified by the Securities and Exchange Commission of Pakistan (SECP). The first-time application of IFRS 15 has not had any significant effects with regard to the amount of revenue recognised and when it is recognised. Hence, no cumulative adjustment amounts have been recognised to adjust the opening retained earnings as at 1 July 2018. Accordingly, the information presented for prior years has not been restated, as previously reported, under IAS 18 and related interpretations.
The management of the Company has assessed and concluded that the Company is in compliance with the
requirements of IFRS 15. The new accounting policy in respect of revenue recognition is stated in note 6.18 to these financial statements.
4.2 Standards, amendments and improvements to IFRSs that are not yet effective
The following standards, amendments and improvements with respect to the IFRSs as applicable in Pakistan would be effective from the dates mentioned below against the respective standard or interpretation:
IASB effective date (annual periods beginning on or
after)
Standard or Amendments
IFRS 3 Definition of a Business (Amendments) 01 January 2020
IFRS 3 Business Combinations: Previously held interests in a joint operation 01 January 2019
IFRS 9 Prepayment Features with Negative Compensation (Amendments) 01 January 2019
IFRS 10 Consolidated Financial Statements and Investment in Associates and Joint Ventures
/ IAS 28 - Sale or Contribution of Assets between an Investor and its Associate or Joint
Venture (Amendment) Not yet finalised
IFRS 11 Joint Arrangements: Previously held interests in a joint operation 01 January 2019
IFRS 16 Leases 01 January 2019
IAS 1 / IAS 8 Definition of Material (Amendments) 01 January 2020
IAS 12 Income Taxes: Income tax consequences of payments on financial instruments
classified as equity 01 January 2019
IAS 19 Plan Amendment, Curtailment or Settlement (Amendments) 01 January 2019
IAS 23 Borrowing Costs - Borrowing costs eligible for capitalisation 01 January 2019
IAS 28 Long-term Interests in Associates and Joint Ventures (Amendments) 01 January 2019
IFRIC 23 Uncertainty over Income Tax Treatments 01 January 2019
The above standards and amendments are not expected to have any material impact on the Company’s financial statements in the period of initial application, except for IFRS 16 - ‘Leases’. The management of the Company is currently evaluating the impact of this standard on these financial statements.
Shabbir Tiles and Ceramics Limited Annual Report 2019 52
Notes to the Financial Statements For The Year Ended June 30, 2019
In addition to the above standards and amendments, improvements to various IFRSs have also been issued by the IASB in December 2017. Such improvements are generally effective for accounting periods beginning on or after 01 January 2019. The Company expects that such improvements to the standards will not have any material impact on the Company’s financial statements in the period of initial application.
The IASB has also issued the revised Conceptual Framework for Financial Reporting (the Conceptual Framework) in March 2018 which is effective for annual periods beginning on or after 1 January 2020 for preparers of financial statements who develop accounting policies based on the Conceptual Framework. The revised Conceptual Framework is not a standard, and none of the concepts override those in any standard or any requirements in a standard. The purpose of the Conceptual Framework is to assist IASB in developing standards, to help preparers develop consistent accounting policies if there is no applicable standard in place and to assist all parties to understand and interpret the standards.
Further, following new standards have been issued by IASB which are yet to be notified by the SECP for the purpose of applicability in Pakistan. The management of the Company expects that below new standards will not have any material impact on the Company’s financial statements in the period of initial application.
IASB effective date (annual periods beginning on or
after)
Standard or Amendments
IFRS 1— First time adoption of IFRSs 01 January 2004
IFRS 14— Regulatory Deferral Accounts 01 January 2016
IFRS 17— Insurance Contracts 01 January 2021
5. SIGNIFICANT ACCOUNTING JUDGEMENTS AND ESTIMATES
The preparation of financial statements in conformity with approved accounting standards requires the use of certain critical accounting estimates. It also requires management to exercise its judgment in the process of applying the Company’s accounting policies. Estimates and judgments are continually evaluated and are based on historical experience and other factors, including expectations of future events that are believed to be reasonable under the circumstances. Revisions to accounting estimates are recognised in the period in which the estimate is revised and in any future periods affected. In the process of applying the Company’s accounting policies, management has made the following estimates and judgments which are significant to the financial statements:
Notes
a) determining the method of depreciation, residual values and useful lives of operating fixed assets and investment property
6.1.1, 6.2, 7.1, 7.4 & 8
b) determining the provision for slow moving stores and spare parts and stock-in-trade and adjustment of stock-in-trade to their net realizable value (NRV) 6.5, 6.6, 11 & 12
c) determining the allowance for expected credit loss 6.7 & 13
d) recognition of current and deferred taxation 6.12, 19 & 30 6. SUMMARY OF SIGNIFICANT ACCOUNTING POLICIES
6.1 Property, plant and equipment 6.1.1 Operating fixed assets These are stated at cost less accumulated depreciation and accumulated impairment losses, if any except for
freehold land, which are stated at cost less any impairment in value. Cost in relation to certain fixed assets, including capital work-in-progress, signifies historical cost and financial
charges on borrowings for financing the projects until such time as the projects are substantially ready for their intended use.
Depreciation is charged on straight line basis, other than freehold land which is determined to have an indefinite life,
Shabbir Tiles and Ceramics Limited Annual Report 201953
Notes to the Financial Statements For The Year Ended June 30, 2019
at the rates specified in note 7.1 to the financial statements. Depreciation on additions is charged from the month in which the asset is available for use and on disposals upto the month immediately preceding the month of deletion. No depreciation is charged if asset’s residual value exceeds its carrying amount.
Residual values and useful lives are reviewed at each reporting date, and adjusted if expectations differ significantly from previous estimates (refer note 7.4 for change in the useful live and residual value of Polishing line (plant and machinery), which is applied prospectively in accordance with IAS 8 ‘ Accounting policies, changes in accounting astimates and errors’).
Repairs and maintenance are charged to the statement of profit or loss as and when incurred. Major renewals and improvements, if any, are capitalized when it is probable that respective future economic benefits will flow to the Company and the assets so replaced, if any, are retired.
An item of operating fixed assets is derecognised upon disposal or when no future economic benefits are expected from its use. Gains and losses on disposals of operating fixed assets are recognized in the statement of profit or loss in the period in which they arise.
6.1.2 Capital work-in-progress These are stated at cost less any impairment in value. All expenditure connected with specific assets incurred
during installation and construction period including advances to suppliers and contractors are carried under this head. These are transferred to operating fixed assets as and when these assets are available for use.
6.2 Investment property These are stated at cost less accumulated depreciation and accumulated impairment losses, if any.
Depreciation is charged to the statement of profit or loss applying the straight line method at the rate specified in
note 8 to the financial statements. Depreciation on additions is charged from the month in which an asset is put to use and on deletions up to the month immediately preceding the deletion.
Repairs and maintenance are charged to the statement of profit or loss as and when incurred. Major renewals and improvements are capitalized and the assets so replaced, if any, are retired. Gain or loss on disposals is taken to the statement of profit or loss for the year.
6.3 Borrowing costs Borrowing costs directly attributable to the acquisition, construction or production of qualifying assets, which
necessarily take a substantial period of time to get ready for their intended use, are added to the cost of those assets, until such time as the assets are substantially ready for their intended use. All other borrowing costs are recognized as an expense in the statement of profit or loss in the period in which they are incurred.
6.4 Research and development costs Research and development costs are charged to the statement of profit or loss in the period in which they are
incurred, except for development costs that relate to design of new or improved products which are recognised as an asset to the extent that it is expected that such asset will meet the recognition criteria mentioned in International Accounting Standard (IAS) - 38 “Intangible Assets”.
6.5 Stores and spare parts These are valued at the lower of weighted average cost and net realizable value (NRV). Provision is made for slow
moving items, if any. Items in transit and bonded warehouse are valued at cost comprising invoice value plus other charges incurred
thereon accumulated to the reporting date. 6.6 Stock-in-trade These are valued at the lower of cost and NRV determined as follows:
Raw and packing material weighted average cost. Work-in-process and finished goods cost of direct materials and labour plus attributable overheads.
Stock in transit invoice price plus other charges paid thereon.
Provision is made for slow moving items, if any.
Shabbir Tiles and Ceramics Limited Annual Report 2019 54
Notes to the Financial Statements For The Year Ended June 30, 2019
6.7 Trade debts, loans, deposits, long term loans, long term security deposits
Trade debts, loans, advances and other receivables are stated initially at fair value and subsequently measured at amortised cost using the effective interest rate (EIR) method less an allowance for expected credit losses, if any. Allowance for expected credit losses is based on lifetime ECLs that result from all possible default events over the expected life of the trade debts, loans, advances and other receivables. Bad debts, if any, are written off when considered irrecoverable.
6.8 Ijarah rentals Ijarah payments for assets under Ijarah arrangements are recognised as an expense in the statement of profit or loss
on a straight line basis over the Ijarah term. 6.9 Cash and cash equivalents These are stated at cost. For the purpose of cash flow statement, cash and cash equivalents comprise of cash and
bank balances net of short-term borrowings. 6.10 Trade and other payables Liabilities for trade and other payables are carried at cost which is the fair value of the consideration to be paid in
future for goods and services received, whether or not billed to the Company.
6.11 Provisions Provisions are recognized in the statement of financial position when the Company has a present legal or constructive
obligation as a result of past event and it is probable that an outflow of resources embodying economic benefits will be required to settle the obligation and a reliable estimate of the amount of the obligation can be made. Provisions are reviewed at each reporting date and adjusted to reflect current best estimate.
6.12 Taxation 6.12.1 Current Provision for current taxation is based on the taxable income for the year determined in accordance with Income Tax
Ordinance, 2001. The charge for current tax is calculated using prevailing tax rates. The charge for current tax also includes adjustments for prior years or otherwise considered necessary for such years. Current tax is charged to the statement of profit or loss except to the extent it relates to items recognised directly in other comprehensive income in which case it is recognised in statement of other comprehensive income.
6.12.2 Deferred Deferred taxation is provided, proportionate to local sales, on all temporary differences at the reporting date between
the tax bases of assets and liabilities and their carrying amounts for financial reporting purposes. Deferred tax liabilities are recognized for all taxable temporary differences. Deferred tax assets are recognized for all deductible temporary differences to the extent it is probable that taxable profits will be available against which the deductible temporary differences can be utilized. Deferred tax assets and liabilities are measured at the tax rates that are expected to apply to the period when the asset is realized or the liability is settled, based on the tax rates that have been enacted or substantively enacted at the reporting date.
6.13 Staff retirement benefit - Defined contribution plan The Company operates a recognised provident fund for all eligible employees. Equal monthly contributions are made
to the fund both by the Company and the employees in accordance with the rules of the scheme. The contributions from the Company are charged to the statement of profit or loss for the year.
6.14 Employees’ compensated absences The Company provides for its estimated liability towards unavailed earned leaves accumulated by employees on an
accrual basis using current salary levels. 6.15 Foreign currency translation Transactions in foreign currencies are recorded at the rates ruling at the date of transaction. Monetary assets and liabilities
denominated in foreign currencies are retranslated at the rate of exchange ruling at the reporting date. Exchange differences on foreign currency translations are taken to the statement of profit or loss in the period in which they occur.
Shabbir Tiles and Ceramics Limited Annual Report 201955
Notes to the Financial Statements For The Year Ended June 30, 2019
6.16 Financial Instruments 6.16.1 Financial assets The financial assets of the company mainly include trade debts, loans, deposits, long term loans, long term security
deposits and cash and bank balances. Under IFRS 9, on initial recognition, a financial asset is classified as measured at: amortised cost; Fair Value through
Other Comprehensive Income (FVOCI) – debt investment; FVOCI – equity investment; or Fair Value through Profit or Loss (FVTPL). The classification of financial assets under IFRS 9 is generally based on the business model in which a financial asset is managed and its contractual cash flow characteristics. Based on the business model of the Company, the financial assets of the Company are measured and classified under IFRS-9 as follows;
Trade debts and other financial assets previously classified as ‘loans and receivables’ are now classified as ‘amortised
cost’. These assets are measured at amortised cost using the effective interest rate method less an allowance for expected credit losses, if any.
6.16.2 Financial Liabilities There are no changes in classification and measurement for the Company’s financial liabilities on the adoption of
IFRS-9. Financial liabilities at fair value through profit or loss Financial liabilities at fair value through profit or loss include financial liabilities held for trading and financial liabilities
designated upon initial recognition as at fair value through profit or loss. Gains or losses on liabilities held for trading are recognised in the statement of profit or loss. Financial liabilities designated upon initial recognition at fair value through profit or loss are designated at the initial date of recognition, and only if the criteria in IFRS 9 are satisfied. The Company has not designated any financial liability as at fair value through profit or loss.
Loans and borrowings After initial recognition, interest-bearing loans and borrowings are subsequently measured at amortised cost using
the effective interest rate (EIR) method. Gains and losses are recognised in statement of profit or loss when the liabilities are derecognised as well as through the EIR amortisation process.
Amortised cost is calculated by taking into account any discount or premium on acquisition and fees or costs that are an integral part of the EIR. The EIR amortisation is included as finance costs in the statement of profit or loss. This category applies to long-term financing and short term borrowings of the Company as disclosed in note 18 and note 21 to the financial statements respectively.
6.16.3 Impairment of financial assets IFRS 9 replaces the ‘incurred loss’ model in IAS 39 with an ‘expected credit loss’ (ECL) model. The new impairment
model applies to financial assets measured at amortised cost, contract assets and debt investments at FVOCI, but not to investments in equity instruments.
ECLs are based on the difference between the contractual cash flows due in accordance with the contract and all the
cash flows that the Company expects to receive. The shortfall is then discounted at an approximation to the asset’s original effective interest rate. The expected cash flows will include cash flows from the sale of collateral held or other credit enhancements that are integral to the contractual terms.
A financial asset is written off when there is no reasonable expectation of recovering the contractual cash flows. However, in certain cases, the Company may also consider a financial asset to be in default when internal or external information indicates that the Company is unlikely to receive the outstanding contractual amounts in full before taking into account any credit enhancements held by the Company.
At each reporting date, the Company assesses whether financial assets are credit-impaired. A financial asset is
‘credit-impaired’ when one or more events that have a detrimental impact on the estimated future cash flows of the financial asset have occurred. Loss allowances for financial assets measured at amortised cost are deducted from the gross carrying amount of the respective asset.
The Company uses the standard’s simplified approach and calculates ECL based on life time ECL on its financial
assets. The Company has established a provision matrix that is based on the Company’s historical credit loss experience, adjusted for forward-looking factors specific to the financial assets and the economic environment.
Shabbir Tiles and Ceramics Limited Annual Report 2019 56
Notes to the Financial Statements For The Year Ended June 30, 2019
6.16.4 Offsetting of financial instruments Financial assets and financial liabilities are offset and the net amount is reported in the statement of financial position
if there is a currently enforceable legal right to offset the recognised amounts and there is an intention to settle on a net basis, to realise the assets and settle the liabilities simultaneously.
6.17 Impairment of non-financial assets The carrying amounts of non-financial assets other than inventories and deferred tax assets are assessed at each
reporting date to ascertain whether there is any indication of impairment. If such an indication exists, the asset’s recoverable amount is estimated to determine the extent of impairment loss, if any. An impairment loss is recognised, as an expense in the statement of profit or loss. The recoverable amount is the higher of an asset’s fair value less cost to disposal and value in use. Value in use is ascertained through discounting of the estimated future cash flows using a discount rate that reflects current market assessments of the time value of money and the risk specific to the assets.
6.18 Revenue “Revenue from contracts with customers is recognized when the control of the goods is transferred to the customer at
an amount that reflects the consideration to which the Company expects to be entitled in exchange for those goods according to the negotiated contractual terms. The Company has generally concluded that it acts as principal in its revenue arrangements because it typically controls the goods or services before transferring them to the customer.
Performance obligations held by the Company are not separable, and are not partially satisfied, since they are satisfied at a point in time, when the customer accepts the products. In most of the cases, payments against the goods are realized in the month of delivery, without any variable considerations, financing components and guarantees.
The Company recognizes an account receivable when the performance obligations have been met, recognizing the corresponding revenue. Moreover, the considerations received before satisfying the performance obligations are recognized as advances from customer.”
Return on bank deposits / saving accounts is recognised on accrual basis;
Rental income on investment property is accounted for on a straight-line basis over the lease term; and
Other income, if any, is recognized on accrual basis. 6.19 Dividend and appropriation to reserves Dividend and appropriation to reserves are recognized in the financial statements in the period in which these are
approved. 6.20 Earnings per share The Company presents basic and diluted earnings per share (EPS) data for its ordinary shares. Basic EPS is calculated
by dividing the profit or loss attributable to ordinary shareholders of the Company by the weighted average number of ordinary shares outstanding during the year. Diluted EPS is determined by adjusting the profit or loss attributable to ordinary shareholders and the weighted average number of ordinary shares outstanding for the effects of all dilutive potential ordinary shares.
June 30, June 30,
7. PROPERTY, PLANT AND EQUIPMENT 2019 2018Note -----(Rupees in ‘000)-----
Operating fixed assets 7.1 3,078,484 3,277,313 Capital work-in-progress 7.5 37,832 97,960
3,116,316 3,375,273
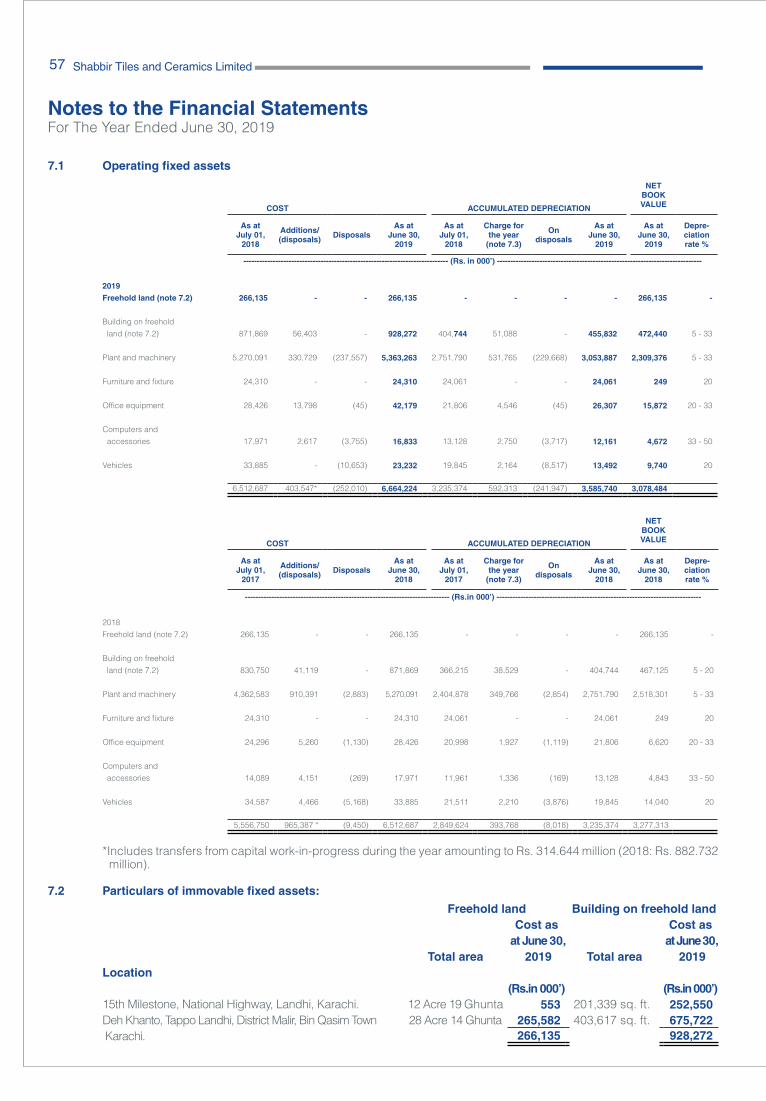
Shabbir Tiles and Ceramics Limited Annual Report 201957
Notes to the Financial Statements For The Year Ended June 30, 2019
7.1 Operating fixed assets NET
BOOK VALUECOST ACCUMULATED DEPRECIATION
As atJuly 01,
2018
Additions/(disposals) Disposals
As atJune 30,
2019
As atJuly 01,
2018
Charge forthe year
(note 7.3)
Ondisposals
As atJune 30,
2019
As atJune 30,
2019
Depre- ciation rate %
----------------------------------------------------------------------------- (Rs. in 000’) -----------------------------------------------------------------------------
2019Freehold land (note 7.2) 266,135 - - 266,135 - - - - 266,135 -
Building on freehold land (note 7.2) 871,869 56,403 - 928,272 404,744 51,088 - 455,832 472,440 5 - 33
Plant and machinery 5,270,091 330,729 (237,557) 5,363,263 2,751,790 531,765 (229,668) 3,053,887 2,309,376 5 - 33
Furniture and fixture 24,310 - - 24,310 24,061 - - 24,061 249 20
Office equipment 28,426 13,798 (45) 42,179 21,806 4,546 (45) 26,307 15,872 20 - 33
Computers and accessories 17,971 2,617 (3,755) 16,833 13,128 2,750 (3,717) 12,161 4,672 33 - 50
Vehicles 33,885 - (10,653) 23,232 19,845 2,164 (8,517) 13,492 9,740 20
6,512,687 403,547* (252,010) 6,664,224 3,235,374 592,313 (241,947) 3,585,740 3,078,484
NET
BOOK VALUECOST ACCUMULATED DEPRECIATION
As atJuly 01,
2017
Additions/(disposals) Disposals
As atJune 30,
2018
As atJuly 01,
2017
Charge forthe year
(note 7.3)
Ondisposals
As atJune 30,
2018
As atJune 30,
2018
Depre- ciation rate %
----------------------------------------------------------------------------- (Rs.in 000’) -----------------------------------------------------------------------------
2018Freehold land (note 7.2) 266,135 - - 266,135 - - - - 266,135 -
Building on freehold land (note 7.2) 830,750 41,119 - 871,869 366,215 38,529 - 404,744 467,125 5 - 20
Plant and machinery 4,362,583 910,391 (2,883) 5,270,091 2,404,878 349,766 (2,854) 2,751,790 2,518,301 5 - 33
Furniture and fixture 24,310 - - 24,310 24,061 - - 24,061 249 20
Office equipment 24,296 5,260 (1,130) 28,426 20,998 1,927 (1,119) 21,806 6,620 20 - 33
Computers and accessories 14,089 4,151 (269) 17,971 11,961 1,336 (169) 13,128 4,843 33 - 50
Vehicles 34,587 4,466 (5,168) 33,885 21,511 2,210 (3,876) 19,845 14,040 20
5,556,750 965,387 * (9,450) 6,512,687 2,849,624 393,768 (8,018) 3,235,374 3,277,313
*Includes transfers from capital work-in-progress during the year amounting to Rs. 314.644 million (2018: Rs. 882.732
million). 7.2 Particulars of immovable fixed assets:
Freehold land Building on freehold landCost as Cost as
at June 30, at June 30,Total area 2019 Total area 2019
Location(Rs.in 000’) (Rs.in 000’)
15th Milestone, National Highway, Landhi, Karachi. 12 Acre 19 Ghunta 553 201,339 sq. ft. 252,550 Deh Khanto, Tappo Landhi, District Malir, Bin Qasim Town 28 Acre 14 Ghunta 265,582 403,617 sq. ft. 675,722 Karachi. 266,135 928,272
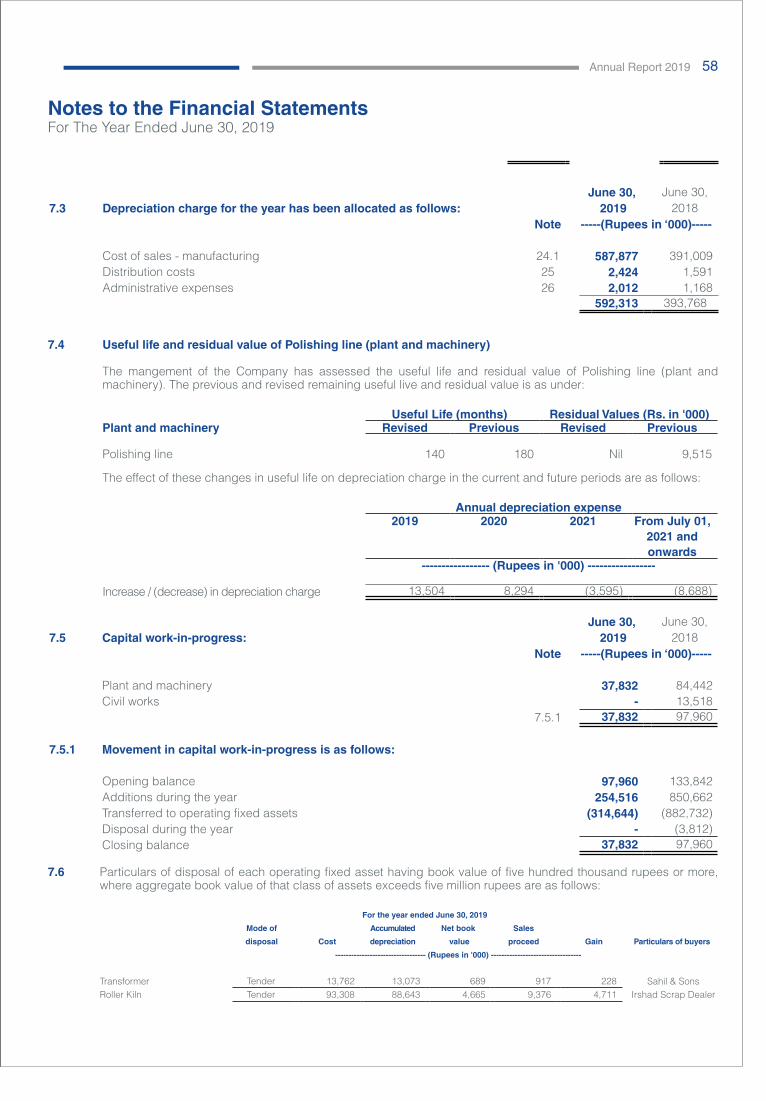
Shabbir Tiles and Ceramics Limited Annual Report 2019 58
Notes to the Financial Statements For The Year Ended June 30, 2019
June 30, June 30,7.3 Depreciation charge for the year has been allocated as follows: 2019 2018
Note -----(Rupees in ‘000)-----
Cost of sales - manufacturing 24.1 587,877 391,009 Distribution costs 25 2,424 1,591 Administrative expenses 26 2,012 1,168
592,313 393,768
7.4 Useful life and residual value of Polishing line (plant and machinery)
The mangement of the Company has assessed the useful life and residual value of Polishing line (plant and
machinery). The previous and revised remaining useful live and residual value is as under:
Useful Life (months) Residual Values (Rs. in '000) Plant and machinery Revised Previous Revised Previous
Polishing line 140 180 Nil 9,515
The effect of these changes in useful life on depreciation charge in the current and future periods are as follows:
Annual depreciation expense2019 2020 2021 From July 01,
2021 andonwards
----------------- (Rupees in '000) -----------------
Increase / (decrease) in depreciation charge 13,504 8,294 (3,595) (8,688)
June 30, June 30,7.5 Capital work-in-progress: 2019 2018
Note -----(Rupees in ‘000)-----
Plant and machinery 37,832 84,442 Civil works - 13,518
7.5.1 37,832 97,960
7.5.1 Movement in capital work-in-progress is as follows:
Opening balance 97,960 133,842 Additions during the year 254,516 850,662 Transferred to operating fixed assets (314,644) (882,732)Disposal during the year - (3,812)Closing balance 37,832 97,960
7.6 Particulars of disposal of each operating fixed asset having book value of five hundred thousand rupees or more, where aggregate book value of that class of assets exceeds five million rupees are as follows:
For the year ended June 30, 2019
Mode of Accumulated Net book Sales
disposal Cost depreciation value proceed Gain Particulars of buyers
---------------------------------- (Rupees in '000) ----------------------------------
Transformer Tender 13,762 13,073 689 917 228 Sahil & Sons Roller Kiln Tender 93,308 88,643 4,665 9,376 4,711 Irshad Scrap Dealer
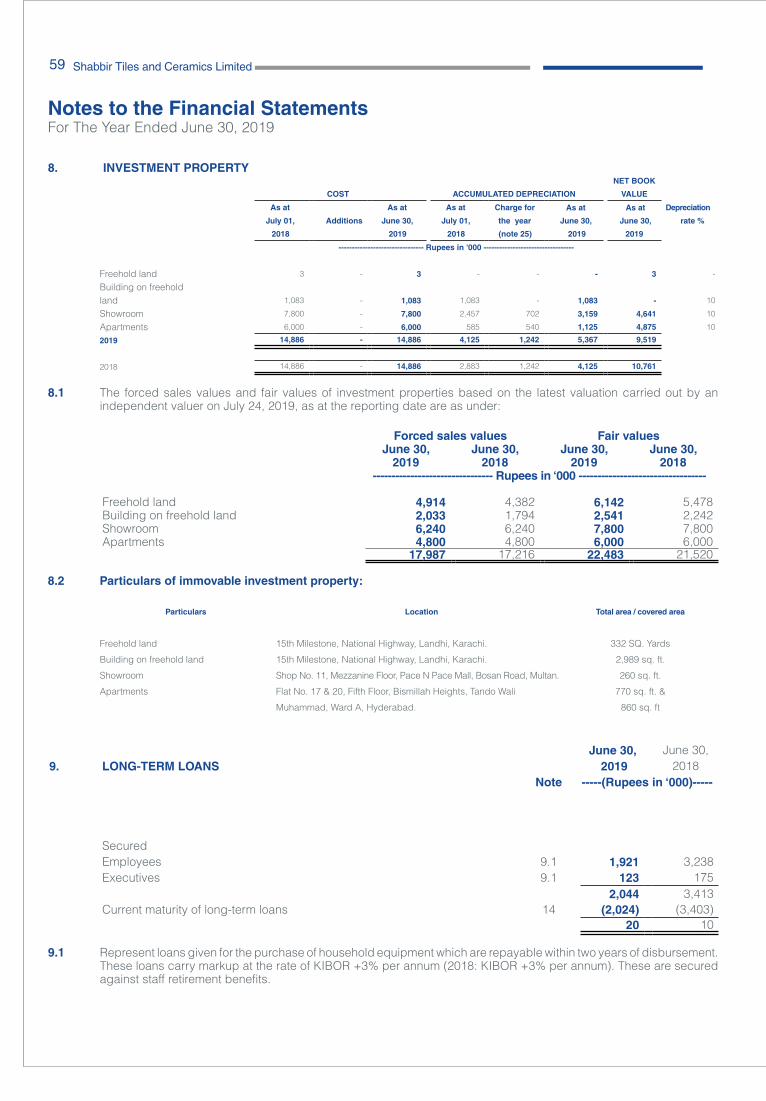
Shabbir Tiles and Ceramics Limited Annual Report 201959
Notes to the Financial Statements For The Year Ended June 30, 2019
8. INVESTMENT PROPERTYNET BOOK
COST ACCUMULATED DEPRECIATION VALUE
As at As at As at Charge for As at As at Depreciation
July 01, Additions June 30, July 01, the year June 30, June 30, rate %
2018 2019 2018 (note 25) 2019 2019
-------------------------------- Rupees in '000 ----------------------------------
Freehold land 3 - 3 - - - 3 -
Building on freeholdland 1,083 - 1,083 1,083 - 1,083 - 10
Showroom 7,800 - 7,800 2,457 702 3,159 4,641 10
Apartments 6,000 - 6,000 585 540 1,125 4,875 10
2019 14,886 - 14,886 4,125 1,242 5,367 9,519
2018 14,886 - 14,886 2,883 1,242 4,125 10,761
8.1 The forced sales values and fair values of investment properties based on the latest valuation carried out by an independent valuer on July 24, 2019, as at the reporting date are as under:
Forced sales values Fair valuesJune 30, June 30, June 30, June 30,
2019 2018 2019 2018-------------------------------- Rupees in ‘000 ----------------------------------
Freehold land 4,914 4,382 6,142 5,478 Building on freehold land 2,033 1,794 2,541 2,242 Showroom 6,240 6,240 7,800 7,800 Apartments 4,800 4,800 6,000 6,000
17,987 17,216 22,483 21,520
8.2 Particulars of immovable investment property:
Particulars Location Total area / covered area
Freehold land 15th Milestone, National Highway, Landhi, Karachi. 332 SQ. Yards
Building on freehold land 15th Milestone, National Highway, Landhi, Karachi. 2,989 sq. ft.
Showroom Shop No. 11, Mezzanine Floor, Pace N Pace Mall, Bosan Road, Multan. 260 sq. ft.
Apartments Flat No. 17 & 20, Fifth Floor, Bismillah Heights, Tando Wali 770 sq. ft. &
Muhammad, Ward A, Hyderabad. 860 sq. ft
June 30, June 30,9. LONG-TERM LOANS 2019 2018
Note -----(Rupees in ‘000)-----
SecuredEmployees 9.1 1,921 3,238 Executives 9.1 123 175
2,044 3,413 Current maturity of long-term loans 14 (2,024) (3,403)
20 10
9.1 Represent loans given for the purchase of household equipment which are repayable within two years of disbursement. These loans carry markup at the rate of KIBOR +3% per annum (2018: KIBOR +3% per annum). These are secured against staff retirement benefits.
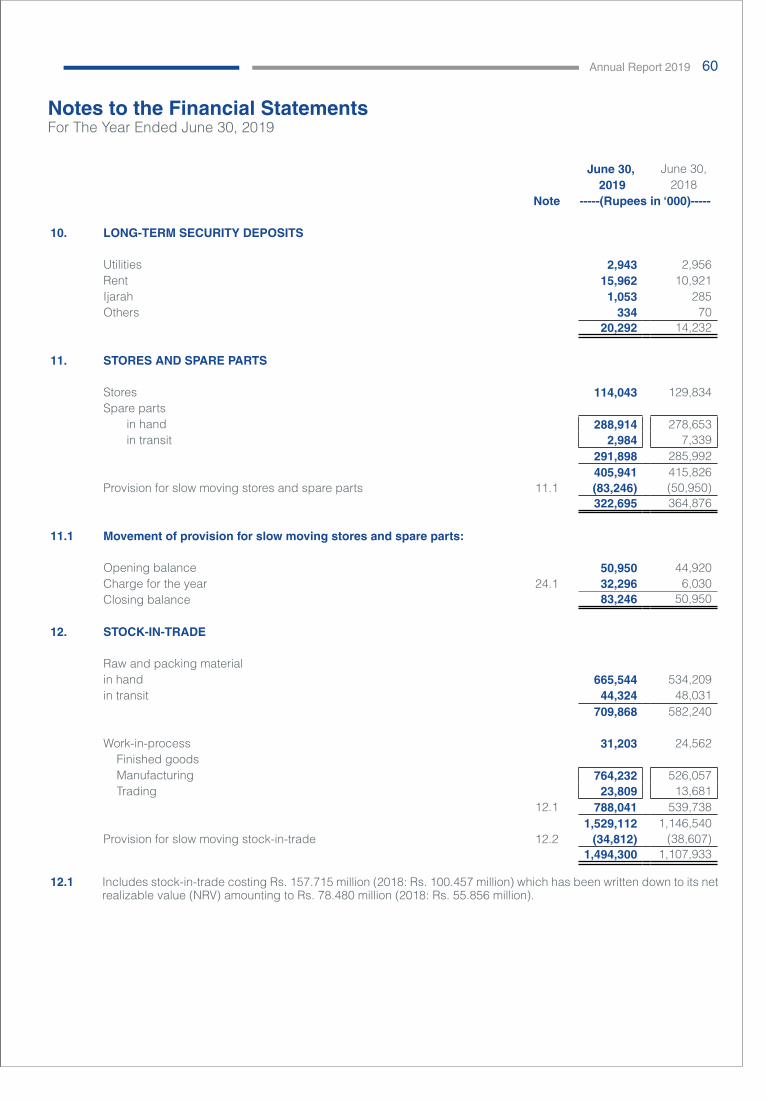
Shabbir Tiles and Ceramics Limited Annual Report 2019 60
Notes to the Financial Statements For The Year Ended June 30, 2019
June 30, June 30, 2019 2018
Note -----(Rupees in ‘000)-----
10. LONG-TERM SECURITY DEPOSITS
Utilities 2,943 2,956 Rent 15,962 10,921 Ijarah 1,053 285 Others 334 70
20,292 14,232
11. STORES AND SPARE PARTS
Stores 114,043 129,834 Spare parts
in hand 288,914 278,653 in transit 2,984 7,339
291,898 285,992 405,941 415,826
Provision for slow moving stores and spare parts 11.1 (83,246) (50,950) 322,695 364,876
11.1 Movement of provision for slow moving stores and spare parts:
Opening balance 50,950 44,920 Charge for the year 24.1 32,296 6,030 Closing balance 83,246 50,950
12. STOCK-IN-TRADE
Raw and packing materialin hand 665,544 534,209 in transit 44,324 48,031
709,868 582,240
Work-in-process 31,203 24,562 Finished goodsManufacturing 764,232 526,057 Trading 23,809 13,681
12.1 788,041 539,738 1,529,112 1,146,540
Provision for slow moving stock-in-trade 12.2 (34,812) (38,607) 1,494,300 1,107,933
12.1 Includes stock-in-trade costing Rs. 157.715 million (2018: Rs. 100.457 million) which has been written down to its net
realizable value (NRV) amounting to Rs. 78.480 million (2018: Rs. 55.856 million).
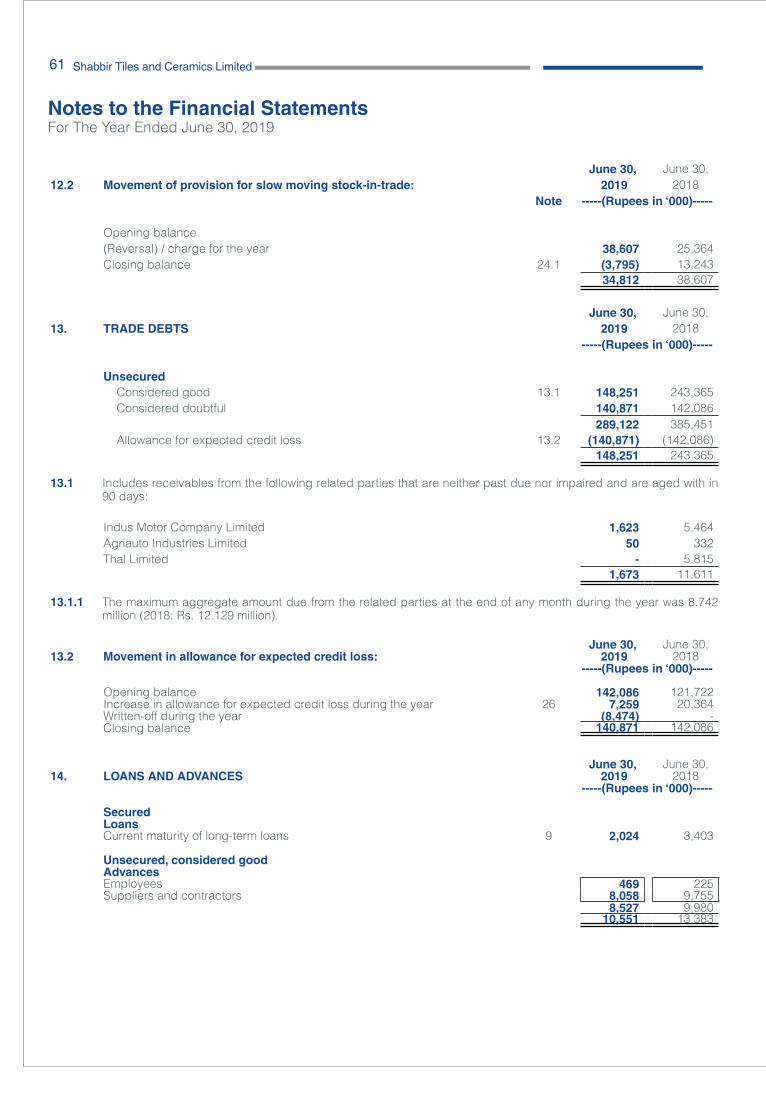
Shabbir Tiles and Ceramics Limited Annual Report 201961
Notes to the Financial Statements For The Year Ended June 30, 2019
June 30, June 30,12.2 Movement of provision for slow moving stock-in-trade: 2019 2018
Note -----(Rupees in ‘000)-----
Opening balance(Reversal) / charge for the year 38,607 25,364 Closing balance 24.1 (3,795) 13,243
34,812 38,607
June 30, June 30,13. TRADE DEBTS 2019 2018
-----(Rupees in ‘000)-----
UnsecuredConsidered good 13.1 148,251 243,365 Considered doubtful 140,871 142,086
289,122 385,451 Allowance for expected credit loss 13.2 (140,871) (142,086)
148,251 243,365 13.1 Includes receivables from the following related parties that are neither past due nor impaired and are aged with in
90 days:
Indus Motor Company Limited 1,623 5,464 Agriauto Industries Limited 50 332 Thal Limited - 5,815
1,673 11,611
13.1.1 The maximum aggregate amount due from the related parties at the end of any month during the year was 8.742 million (2018: Rs. 12.129 million).
June 30, June 30,
13.2 Movement in allowance for expected credit loss: 2019 2018-----(Rupees in ‘000)-----
Opening balance 142,086 121,722 Increase in allowance for expected credit loss during the year 26 7,259 20,364 Written-off during the year (8,474) - Closing balance 140,871 142,086
June 30, June 30,14. LOANS AND ADVANCES 2019 2018
-----(Rupees in ‘000)-----
SecuredLoans Current maturity of long-term loans 9 2,024 3,403
Unsecured, considered goodAdvancesEmployees 469 225 Suppliers and contractors 8,058 9,755
8,527 9,980 10,551 13,383
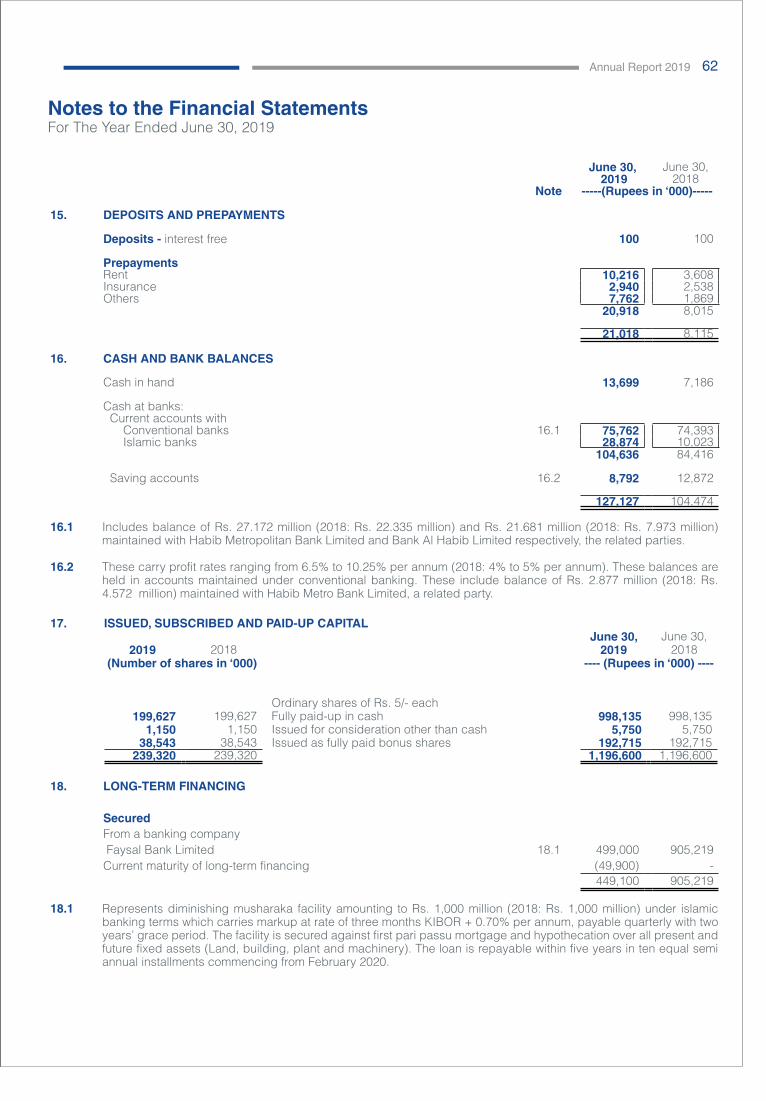
Shabbir Tiles and Ceramics Limited Annual Report 2019 62
Notes to the Financial Statements For The Year Ended June 30, 2019
June 30, June 30, 2019 2018
Note -----(Rupees in ‘000)-----
15. DEPOSITS AND PREPAYMENTS
Deposits - interest free 100 100
PrepaymentsRent 10,216 3,608 Insurance 2,940 2,538 Others 7,762 1,869
20,918 8,015
21,018 8,115
16. CASH AND BANK BALANCES
Cash in hand 13,699 7,186
Cash at banks: Current accounts with Conventional banks 16.1 75,762 74,393 Islamic banks 28,874 10,023
104,636 84,416
Saving accounts 16.2 8,792 12,872
127,127 104,474 16.1 Includes balance of Rs. 27.172 million (2018: Rs. 22.335 million) and Rs. 21.681 million (2018: Rs. 7.973 million)
maintained with Habib Metropolitan Bank Limited and Bank Al Habib Limited respectively, the related parties.
16.2 These carry profit rates ranging from 6.5% to 10.25% per annum (2018: 4% to 5% per annum). These balances are held in accounts maintained under conventional banking. These include balance of Rs. 2.877 million (2018: Rs. 4.572 million) maintained with Habib Metro Bank Limited, a related party.
17. ISSUED, SUBSCRIBED AND PAID-UP CAPITALJune 30, June 30,
2019 2018 2019 2018 (Number of shares in ‘000) ---- (Rupees in ‘000) ----
Ordinary shares of Rs. 5/- each 199,627 199,627 Fully paid-up in cash 998,135 998,135
1,150 1,150 Issued for consideration other than cash 5,750 5,750 38,543 38,543 Issued as fully paid bonus shares 192,715 192,715
239,320 239,320 1,196,600 1,196,600 18. LONG-TERM FINANCING
SecuredFrom a banking company Faysal Bank Limited 18.1 499,000 905,219 Current maturity of long-term financing (49,900) -
449,100 905,219 18.1 Represents diminishing musharaka facility amounting to Rs. 1,000 million (2018: Rs. 1,000 million) under islamic
banking terms which carries markup at rate of three months KIBOR + 0.70% per annum, payable quarterly with two years’ grace period. The facility is secured against first pari passu mortgage and hypothecation over all present and future fixed assets (Land, building, plant and machinery). The loan is repayable within five years in ten equal semi annual installments commencing from February 2020.
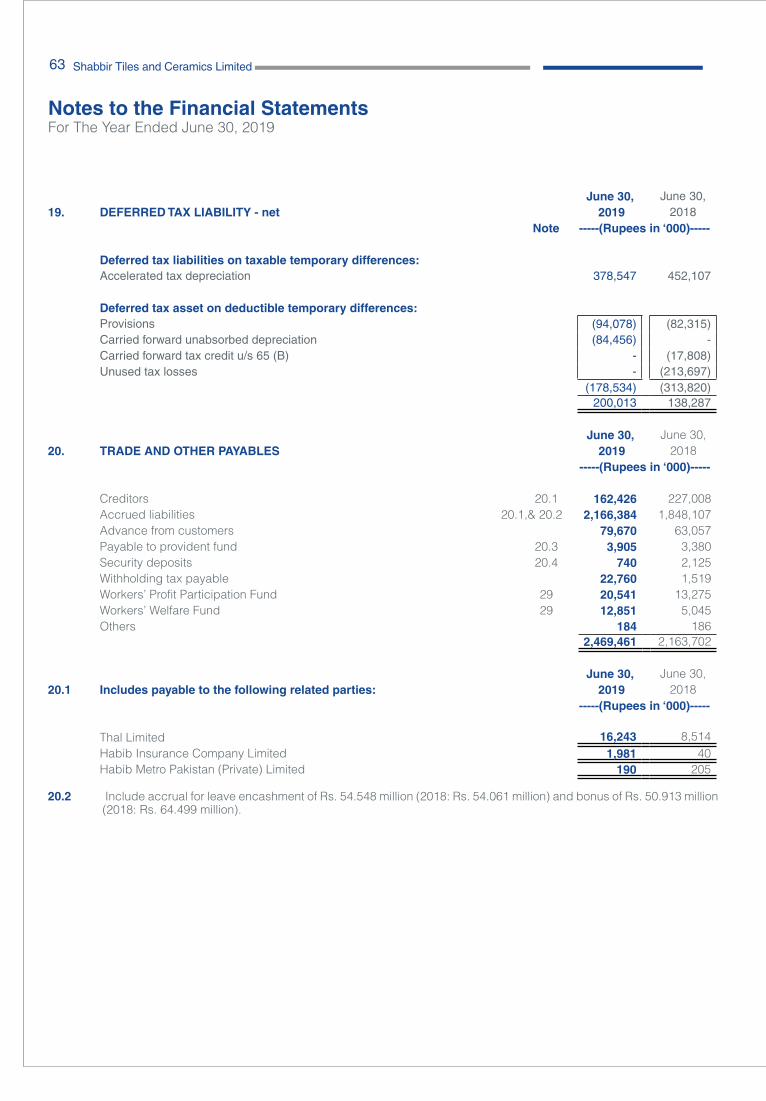
Shabbir Tiles and Ceramics Limited Annual Report 201963
Notes to the Financial Statements For The Year Ended June 30, 2019
June 30, June 30,
19. DEFERRED TAX LIABILITY - net 2019 2018Note -----(Rupees in ‘000)-----
Deferred tax liabilities on taxable temporary differences:Accelerated tax depreciation 378,547 452,107
Deferred tax asset on deductible temporary differences:Provisions (94,078) (82,315)Carried forward unabsorbed depreciation (84,456) - Carried forward tax credit u/s 65 (B) - (17,808)Unused tax losses - (213,697)
(178,534) (313,820) 200,013 138,287
June 30, June 30,
20. TRADE AND OTHER PAYABLES 2019 2018-----(Rupees in ‘000)-----
Creditors 20.1 162,426 227,008 Accrued liabilities 20.1,& 20.2 2,166,384 1,848,107 Advance from customers 79,670 63,057 Payable to provident fund 20.3 3,905 3,380 Security deposits 20.4 740 2,125 Withholding tax payable 22,760 1,519 Workers’ Profit Participation Fund 29 20,541 13,275 Workers’ Welfare Fund 29 12,851 5,045 Others 184 186
2,469,461 2,163,702
June 30, June 30,20.1 Includes payable to the following related parties: 2019 2018
-----(Rupees in ‘000)-----
Thal Limited 16,243 8,514 Habib Insurance Company Limited 1,981 40 Habib Metro Pakistan (Private) Limited 190 205
20.2 Include accrual for leave encashment of Rs. 54.548 million (2018: Rs. 54.061 million) and bonus of Rs. 50.913 million
(2018: Rs. 64.499 million).
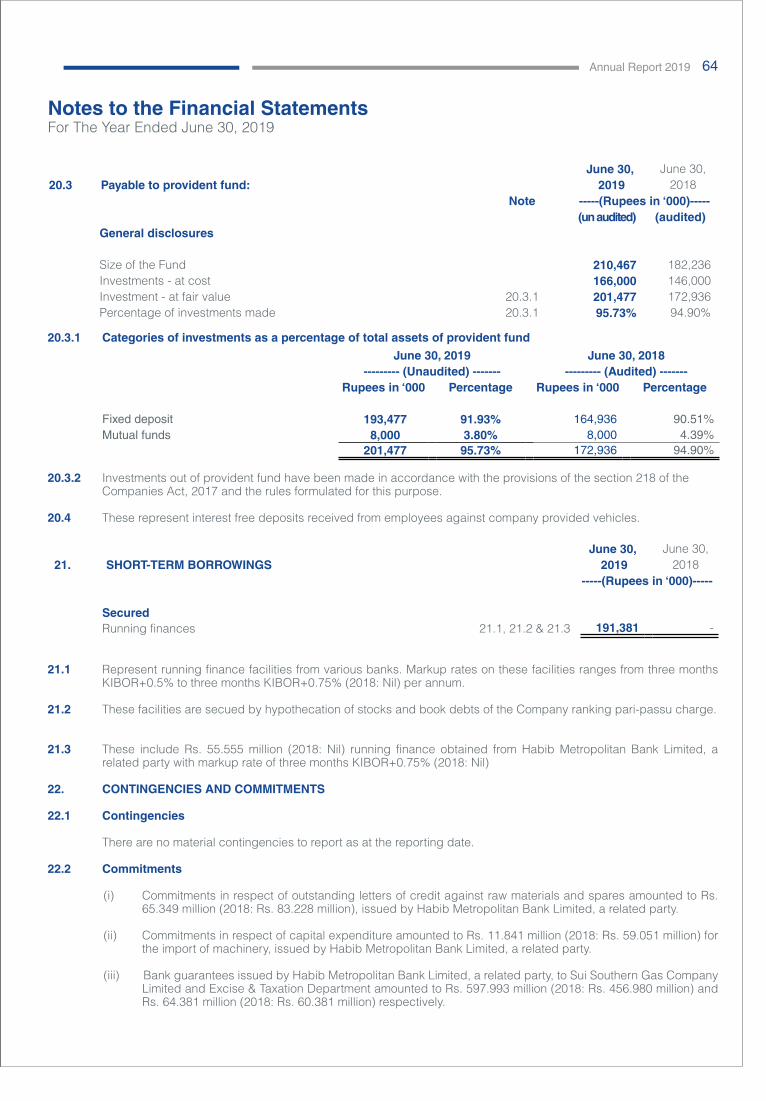
Shabbir Tiles and Ceramics Limited Annual Report 2019 64
Notes to the Financial Statements For The Year Ended June 30, 2019
June 30, June 30,20.3 Payable to provident fund: 2019 2018
Note -----(Rupees in ‘000)----- (un audited) (audited)
General disclosures
Size of the Fund 210,467 182,236 Investments - at cost 166,000 146,000 Investment - at fair value 20.3.1 201,477 172,936 Percentage of investments made 20.3.1 95.73% 94.90%
20.3.1 Categories of investments as a percentage of total assets of provident fund
June 30, 2019 June 30, 2018--------- (Unaudited) ------- --------- (Audited) -------
Rupees in ‘000 Percentage Rupees in ‘000 Percentage
Fixed deposit 193,477 91.93% 164,936 90.51%Mutual funds 8,000 3.80% 8,000 4.39%
201,477 95.73% 172,936 94.90%
20.3.2 Investments out of provident fund have been made in accordance with the provisions of the section 218 of the Companies Act, 2017 and the rules formulated for this purpose.
20.4 These represent interest free deposits received from employees against company provided vehicles.
June 30, June 30,21. SHORT-TERM BORROWINGS 2019 2018
-----(Rupees in ‘000)-----
SecuredRunning finances 21.1, 21.2 & 21.3 191,381 -
21.1 Represent running finance facilities from various banks. Markup rates on these facilities ranges from three months
KIBOR+0.5% to three months KIBOR+0.75% (2018: Nil) per annum.
21.2 These facilities are secued by hypothecation of stocks and book debts of the Company ranking pari-passu charge.
21.3 These include Rs. 55.555 million (2018: Nil) running finance obtained from Habib Metropolitan Bank Limited, a
related party with markup rate of three months KIBOR+0.75% (2018: Nil)
22. CONTINGENCIES AND COMMITMENTS 22.1 Contingencies There are no material contingencies to report as at the reporting date.
22.2 Commitments (i) Commitments in respect of outstanding letters of credit against raw materials and spares amounted to Rs.
65.349 million (2018: Rs. 83.228 million), issued by Habib Metropolitan Bank Limited, a related party.
(ii) Commitments in respect of capital expenditure amounted to Rs. 11.841 million (2018: Rs. 59.051 million) for the import of machinery, issued by Habib Metropolitan Bank Limited, a related party.
(iii) Bank guarantees issued by Habib Metropolitan Bank Limited, a related party, to Sui Southern Gas Company Limited and Excise & Taxation Department amounted to Rs. 597.993 million (2018: Rs. 456.980 million) and Rs. 64.381 million (2018: Rs. 60.381 million) respectively.
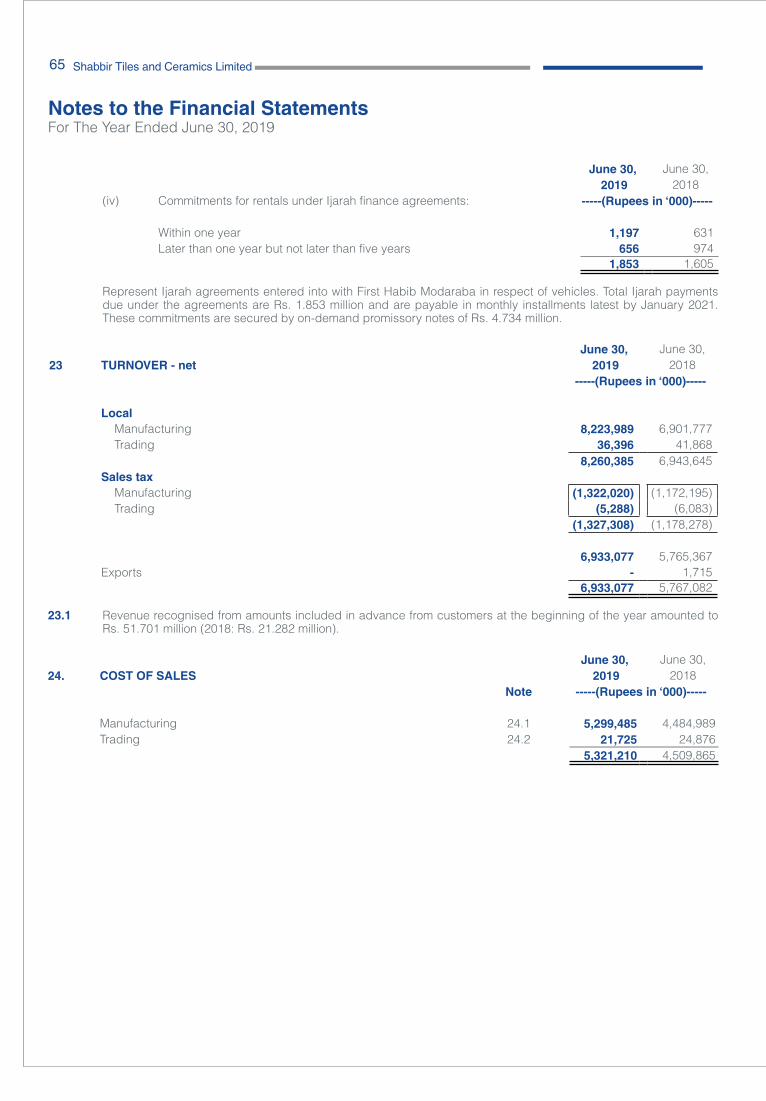
Shabbir Tiles and Ceramics Limited Annual Report 201965
Notes to the Financial Statements For The Year Ended June 30, 2019
June 30, June 30, 2019 2018
(iv) Commitments for rentals under Ijarah finance agreements: -----(Rupees in ‘000)-----
Within one year 1,197 631 Later than one year but not later than five years 656 974
1,853 1,605
Represent Ijarah agreements entered into with First Habib Modaraba in respect of vehicles. Total Ijarah payments due under the agreements are Rs. 1.853 million and are payable in monthly installments latest by January 2021. These commitments are secured by on-demand promissory notes of Rs. 4.734 million.
June 30, June 30,23 TURNOVER - net 2019 2018
-----(Rupees in ‘000)-----
Local Manufacturing 8,223,989 6,901,777 Trading 36,396 41,868
8,260,385 6,943,645 Sales tax Manufacturing (1,322,020) (1,172,195) Trading (5,288) (6,083)
(1,327,308) (1,178,278)
6,933,077 5,765,367 Exports - 1,715
6,933,077 5,767,082 23.1 Revenue recognised from amounts included in advance from customers at the beginning of the year amounted to
Rs. 51.701 million (2018: Rs. 21.282 million).
June 30, June 30,24. COST OF SALES 2019 2018
Note -----(Rupees in ‘000)-----
Manufacturing 24.1 5,299,485 4,484,989 Trading 24.2 21,725 24,876
5,321,210 4,509,865
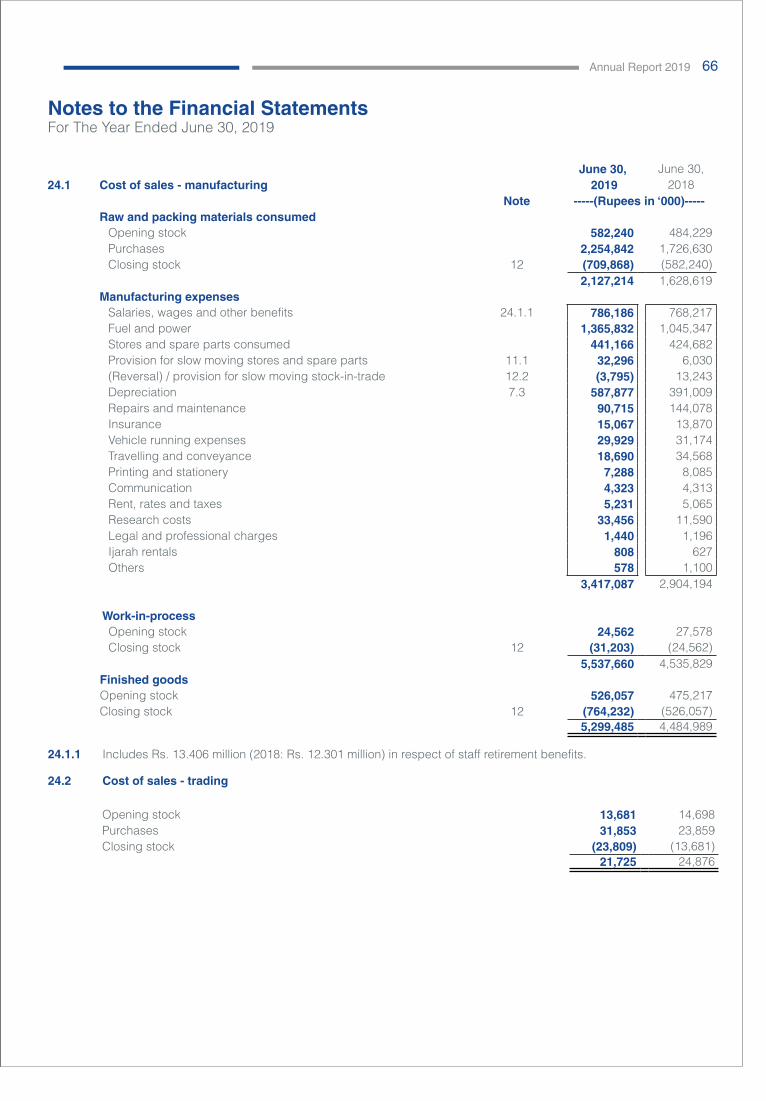
Shabbir Tiles and Ceramics Limited Annual Report 2019 66
Notes to the Financial Statements For The Year Ended June 30, 2019
June 30, June 30,24.1 Cost of sales - manufacturing 2019 2018
Note -----(Rupees in ‘000)----- Raw and packing materials consumed Opening stock 582,240 484,229 Purchases 2,254,842 1,726,630 Closing stock 12 (709,868) (582,240)
2,127,214 1,628,619 Manufacturing expenses Salaries, wages and other benefits 24.1.1 786,186 768,217 Fuel and power 1,365,832 1,045,347 Stores and spare parts consumed 441,166 424,682 Provision for slow moving stores and spare parts 11.1 32,296 6,030 (Reversal) / provision for slow moving stock-in-trade 12.2 (3,795) 13,243 Depreciation 7.3 587,877 391,009 Repairs and maintenance 90,715 144,078 Insurance 15,067 13,870 Vehicle running expenses 29,929 31,174 Travelling and conveyance 18,690 34,568 Printing and stationery 7,288 8,085 Communication 4,323 4,313 Rent, rates and taxes 5,231 5,065 Research costs 33,456 11,590 Legal and professional charges 1,440 1,196 Ijarah rentals 808 627 Others 578 1,100
3,417,087 2,904,194
Work-in-process Opening stock 24,562 27,578 Closing stock 12 (31,203) (24,562)
5,537,660 4,535,829 Finished goodsOpening stock 526,057 475,217 Closing stock 12 (764,232) (526,057)
5,299,485 4,484,989 24.1.1 Includes Rs. 13.406 million (2018: Rs. 12.301 million) in respect of staff retirement benefits. 24.2 Cost of sales - trading
Opening stock 13,681 14,698 Purchases 31,853 23,859Closing stock (23,809) (13,681)
21,725 24,876
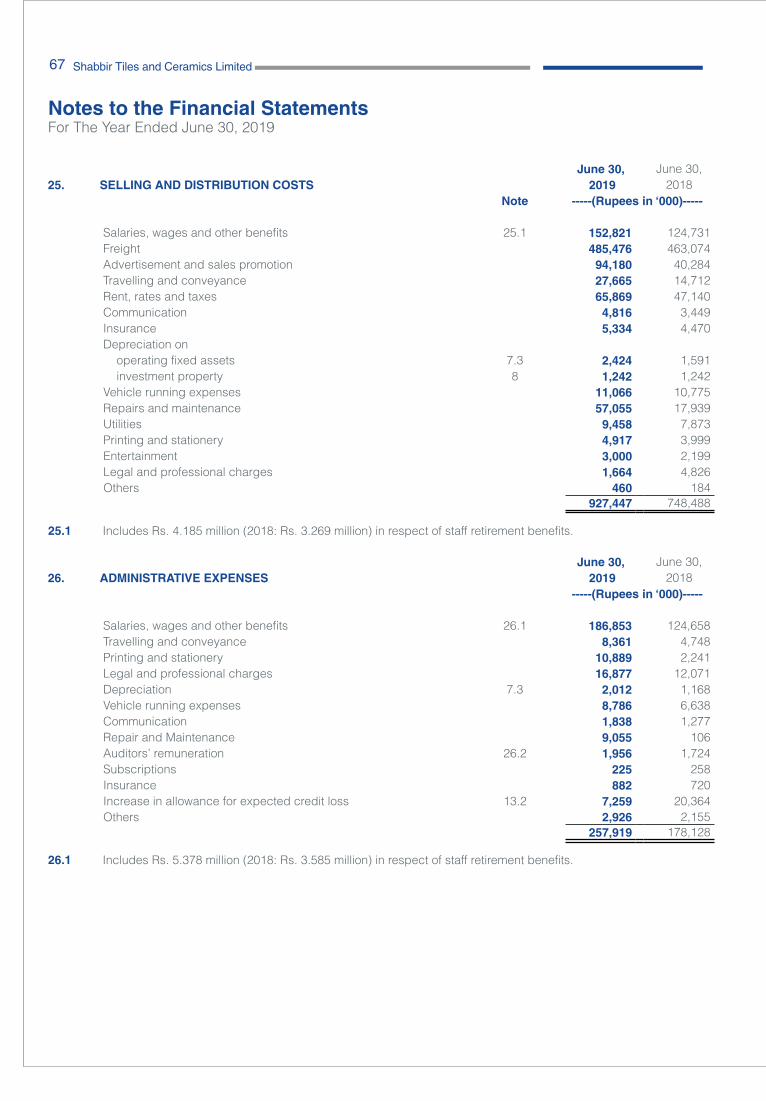
Shabbir Tiles and Ceramics Limited Annual Report 201967
Notes to the Financial Statements For The Year Ended June 30, 2019
June 30, June 30,25. SELLING AND DISTRIBUTION COSTS 2019 2018
Note -----(Rupees in ‘000)-----
Salaries, wages and other benefits 25.1 152,821 124,731 Freight 485,476 463,074 Advertisement and sales promotion 94,180 40,284 Travelling and conveyance 27,665 14,712 Rent, rates and taxes 65,869 47,140 Communication 4,816 3,449 Insurance 5,334 4,470 Depreciation on
operating fixed assets 7.3 2,424 1,591 investment property 8 1,242 1,242
Vehicle running expenses 11,066 10,775 Repairs and maintenance 57,055 17,939 Utilities 9,458 7,873 Printing and stationery 4,917 3,999 Entertainment 3,000 2,199 Legal and professional charges 1,664 4,826 Others 460 184
927,447 748,488 25.1 Includes Rs. 4.185 million (2018: Rs. 3.269 million) in respect of staff retirement benefits.
June 30, June 30,26. ADMINISTRATIVE EXPENSES 2019 2018
-----(Rupees in ‘000)-----
Salaries, wages and other benefits 26.1 186,853 124,658 Travelling and conveyance 8,361 4,748 Printing and stationery 10,889 2,241 Legal and professional charges 16,877 12,071 Depreciation 7.3 2,012 1,168 Vehicle running expenses 8,786 6,638 Communication 1,838 1,277 Repair and Maintenance 9,055 106 Auditors’ remuneration 26.2 1,956 1,724 Subscriptions 225 258 Insurance 882 720 Increase in allowance for expected credit loss 13.2 7,259 20,364 Others 2,926 2,155
257,919 178,128
26.1 Includes Rs. 5.378 million (2018: Rs. 3.585 million) in respect of staff retirement benefits.
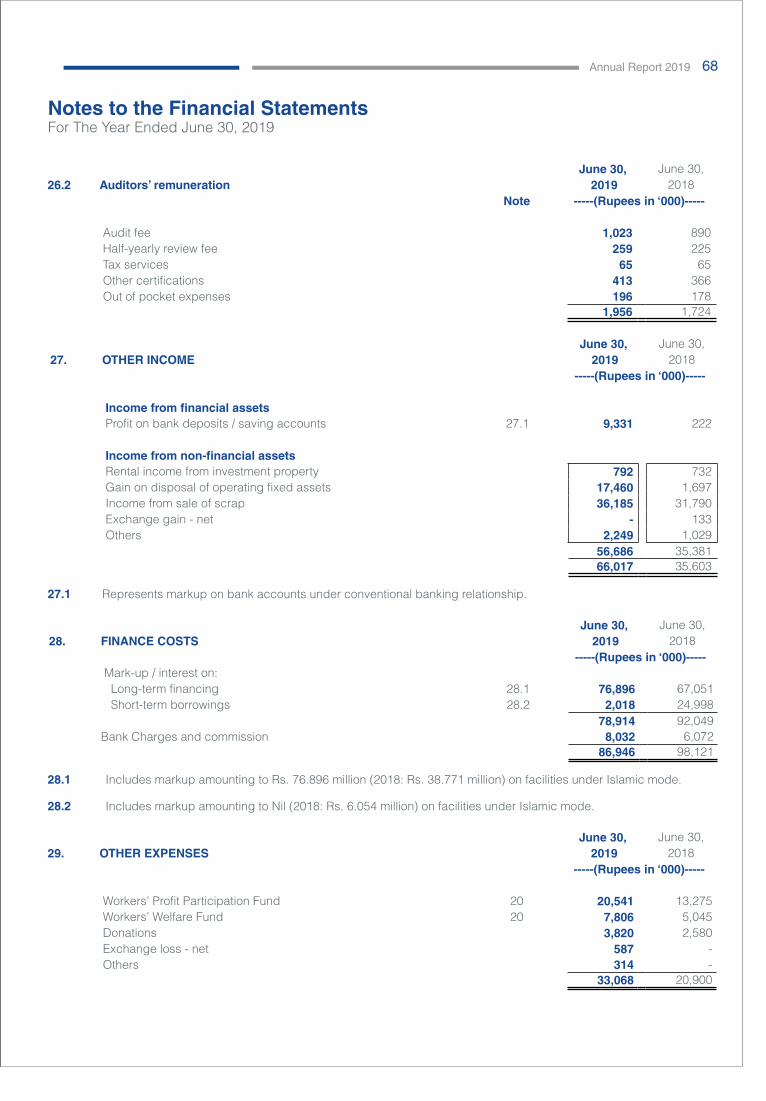
Shabbir Tiles and Ceramics Limited Annual Report 2019 68
Notes to the Financial Statements For The Year Ended June 30, 2019
June 30, June 30,26.2 Auditors’ remuneration 2019 2018
Note -----(Rupees in ‘000)-----
Audit fee 1,023 890 Half-yearly review fee 259 225 Tax services 65 65 Other certifications 413 366 Out of pocket expenses 196 178
1,956 1,724
June 30, June 30,27. OTHER INCOME 2019 2018
-----(Rupees in ‘000)-----
Income from financial assets Profit on bank deposits / saving accounts 27.1 9,331 222
Income from non-financial assets Rental income from investment property 792 732 Gain on disposal of operating fixed assets 17,460 1,697 Income from sale of scrap 36,185 31,790 Exchange gain - net - 133 Others 2,249 1,029
56,686 35,381 66,017 35,603
27.1 Represents markup on bank accounts under conventional banking relationship.
June 30, June 30,28. FINANCE COSTS 2019 2018
-----(Rupees in ‘000)----- Mark-up / interest on: Long-term financing 28.1 76,896 67,051 Short-term borrowings 28.2 2,018 24,998
78,914 92,049 Bank Charges and commission 8,032 6,072
86,946 98,121
28.1 Includes markup amounting to Rs. 76.896 million (2018: Rs. 38.771 million) on facilities under Islamic mode.
28.2 Includes markup amounting to Nil (2018: Rs. 6.054 million) on facilities under Islamic mode.
June 30, June 30,29. OTHER EXPENSES 2019 2018
-----(Rupees in ‘000)-----
Workers’ Profit Participation Fund 20 20,541 13,275 Workers’ Welfare Fund 20 7,806 5,045 Donations 3,820 2,580 Exchange loss - net 587 - Others 314 -
33,068 20,900
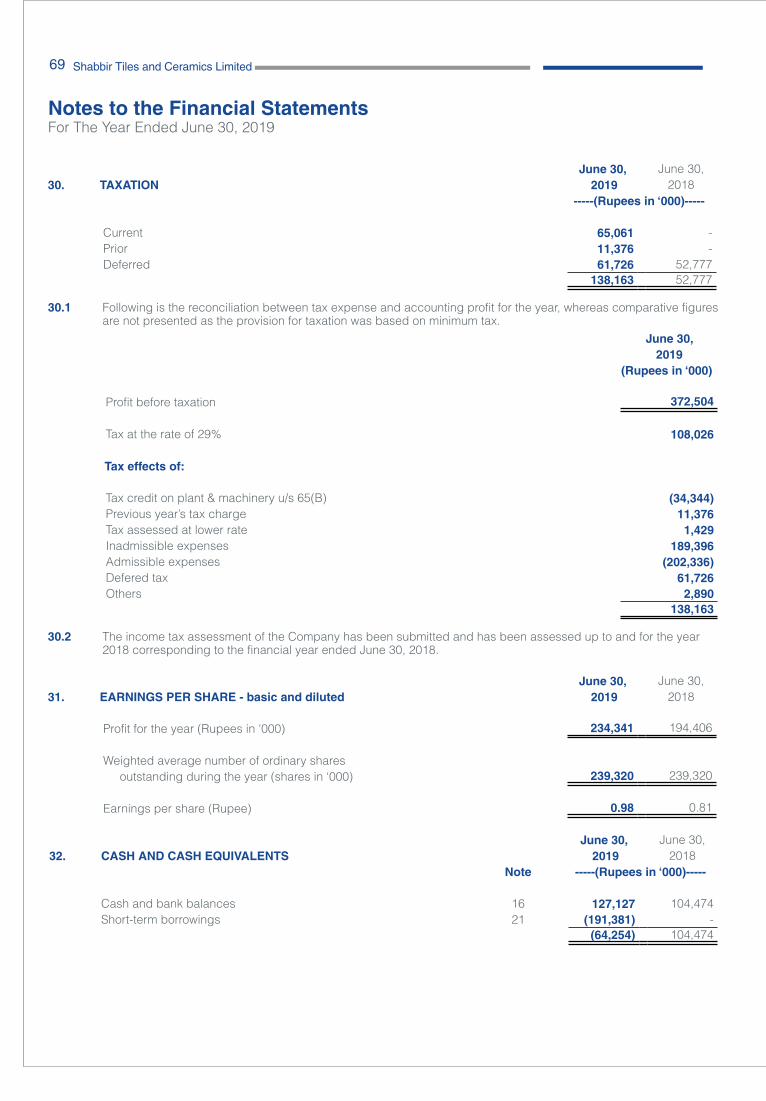
Shabbir Tiles and Ceramics Limited Annual Report 201969
Notes to the Financial Statements For The Year Ended June 30, 2019
June 30, June 30,30. TAXATION 2019 2018
-----(Rupees in ‘000)-----
Current 65,061 - Prior 11,376 - Deferred 61,726 52,777
138,163 52,777
30.1 Following is the reconciliation between tax expense and accounting profit for the year, whereas comparative figures are not presented as the provision for taxation was based on minimum tax.
June 30,2019
(Rupees in ‘000)
Profit before taxation 372,504
Tax at the rate of 29% 108,026
Tax effects of:
Tax credit on plant & machinery u/s 65(B) (34,344) Previous year’s tax charge 11,376 Tax assessed at lower rate 1,429 Inadmissible expenses 189,396 Admissible expenses (202,336) Defered tax 61,726 Others 2,890
138,163
30.2 The income tax assessment of the Company has been submitted and has been assessed up to and for the year 2018 corresponding to the financial year ended June 30, 2018.
June 30, June 30,31. EARNINGS PER SHARE - basic and diluted 2019 2018
Profit for the year (Rupees in '000) 234,341 194,406
Weighted average number of ordinary shares outstanding during the year (shares in ‘000) 239,320 239,320
Earnings per share (Rupee) 0.98 0.81
June 30, June 30,32. CASH AND CASH EQUIVALENTS 2019 2018
Note -----(Rupees in ‘000)-----
Cash and bank balances 16 127,127 104,474 Short-term borrowings 21 (191,381) -
(64,254) 104,474
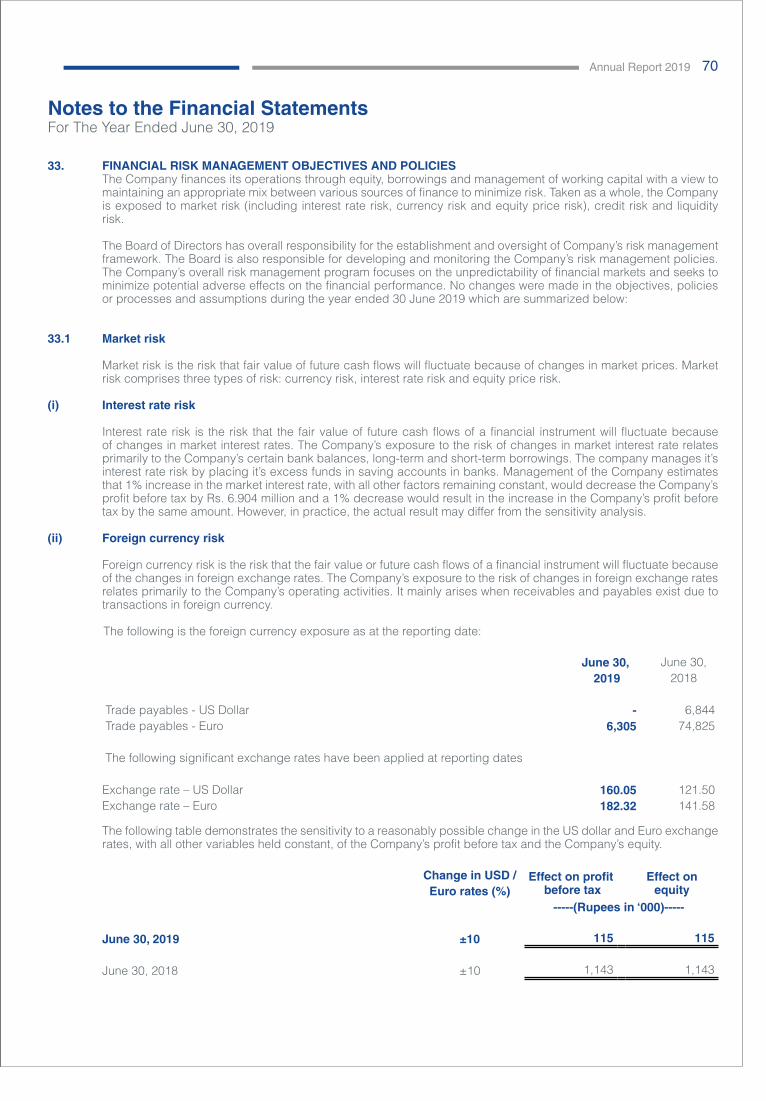
Shabbir Tiles and Ceramics Limited Annual Report 2019 70
Notes to the Financial Statements For The Year Ended June 30, 2019
33. FINANCIAL RISK MANAGEMENT OBJECTIVES AND POLICIES The Company finances its operations through equity, borrowings and management of working capital with a view to
maintaining an appropriate mix between various sources of finance to minimize risk. Taken as a whole, the Company is exposed to market risk (including interest rate risk, currency risk and equity price risk), credit risk and liquidity risk.
The Board of Directors has overall responsibility for the establishment and oversight of Company’s risk management
framework. The Board is also responsible for developing and monitoring the Company’s risk management policies. The Company’s overall risk management program focuses on the unpredictability of financial markets and seeks to minimize potential adverse effects on the financial performance. No changes were made in the objectives, policies or processes and assumptions during the year ended 30 June 2019 which are summarized below:
33.1 Market risk Market risk is the risk that fair value of future cash flows will fluctuate because of changes in market prices. Market
risk comprises three types of risk: currency risk, interest rate risk and equity price risk.
(i) Interest rate risk Interest rate risk is the risk that the fair value of future cash flows of a financial instrument will fluctuate because
of changes in market interest rates. The Company’s exposure to the risk of changes in market interest rate relates primarily to the Company’s certain bank balances, long-term and short-term borrowings. The company manages it’s interest rate risk by placing it’s excess funds in saving accounts in banks. Management of the Company estimates that 1% increase in the market interest rate, with all other factors remaining constant, would decrease the Company’s profit before tax by Rs. 6.904 million and a 1% decrease would result in the increase in the Company’s profit before tax by the same amount. However, in practice, the actual result may differ from the sensitivity analysis.
(ii) Foreign currency risk Foreign currency risk is the risk that the fair value or future cash flows of a financial instrument will fluctuate because
of the changes in foreign exchange rates. The Company’s exposure to the risk of changes in foreign exchange rates relates primarily to the Company’s operating activities. It mainly arises when receivables and payables exist due to transactions in foreign currency.
The following is the foreign currency exposure as at the reporting date:
June 30, June 30, 2019 2018
Trade payables - US Dollar - 6,844 Trade payables - Euro 6,305 74,825
The following significant exchange rates have been applied at reporting dates
Exchange rate – US Dollar 160.05 121.50 Exchange rate – Euro 182.32 141.58
The following table demonstrates the sensitivity to a reasonably possible change in the US dollar and Euro exchange
rates, with all other variables held constant, of the Company’s profit before tax and the Company’s equity.
Change in USD / Effect on profit before tax
Effect on equityEuro rates (%)
-----(Rupees in ‘000)-----
June 30, 2019 ±10 115 115
June 30, 2018 ±10 1,143 1,143
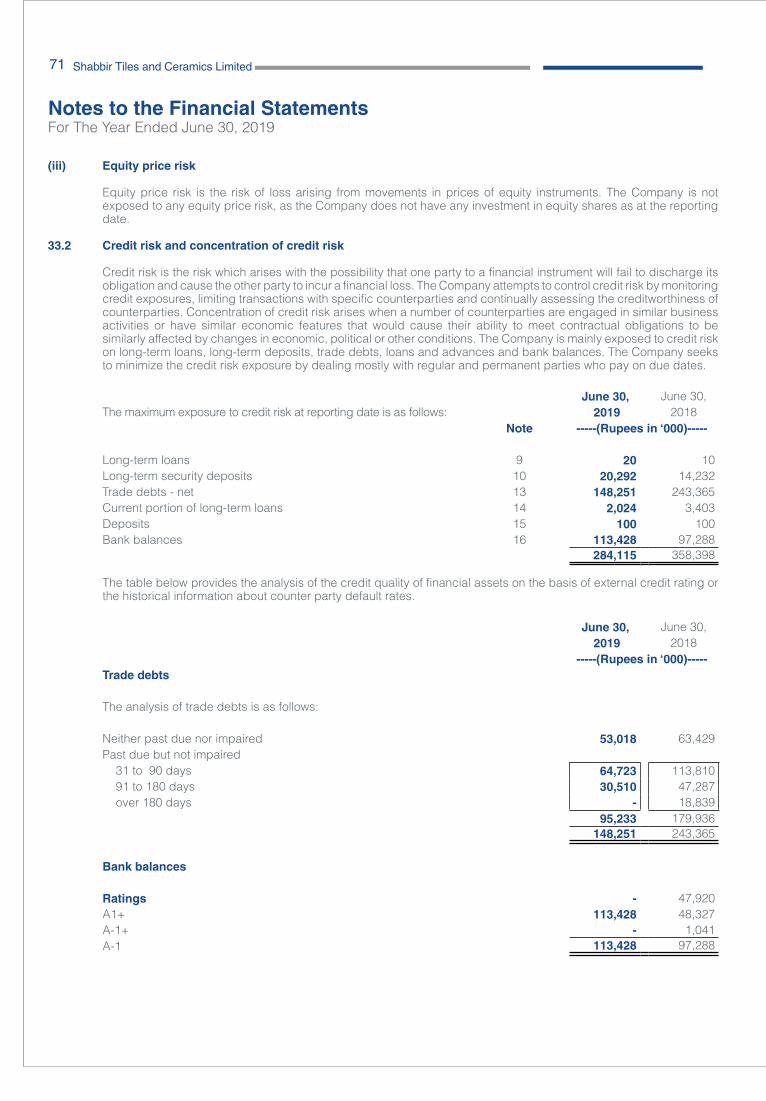
Shabbir Tiles and Ceramics Limited Annual Report 201971
Notes to the Financial Statements For The Year Ended June 30, 2019
(iii) Equity price risk Equity price risk is the risk of loss arising from movements in prices of equity instruments. The Company is not
exposed to any equity price risk, as the Company does not have any investment in equity shares as at the reporting date.
33.2 Credit risk and concentration of credit risk
Credit risk is the risk which arises with the possibility that one party to a financial instrument will fail to discharge its obligation and cause the other party to incur a financial loss. The Company attempts to control credit risk by monitoring credit exposures, limiting transactions with specific counterparties and continually assessing the creditworthiness of counterparties. Concentration of credit risk arises when a number of counterparties are engaged in similar business activities or have similar economic features that would cause their ability to meet contractual obligations to be similarly affected by changes in economic, political or other conditions. The Company is mainly exposed to credit risk on long-term loans, long-term deposits, trade debts, loans and advances and bank balances. The Company seeks to minimize the credit risk exposure by dealing mostly with regular and permanent parties who pay on due dates.
June 30, June 30,The maximum exposure to credit risk at reporting date is as follows: 2019 2018
Note -----(Rupees in ‘000)-----
Long-term loans 9 20 10 Long-term security deposits 10 20,292 14,232 Trade debts - net 13 148,251 243,365 Current portion of long-term loans 14 2,024 3,403 Deposits 15 100 100 Bank balances 16 113,428 97,288
284,115 358,398
The table below provides the analysis of the credit quality of financial assets on the basis of external credit rating or the historical information about counter party default rates.
June 30, June 30, 2019 2018
-----(Rupees in ‘000)----- Trade debts
The analysis of trade debts is as follows:
Neither past due nor impaired 53,018 63,429 Past due but not impaired 31 to 90 days 64,723 113,810 91 to 180 days 30,510 47,287 over 180 days - 18,839
95,233 179,936 148,251 243,365
Bank balances
Ratings - 47,920 A1+ 113,428 48,327 A-1+ - 1,041 A-1 113,428 97,288
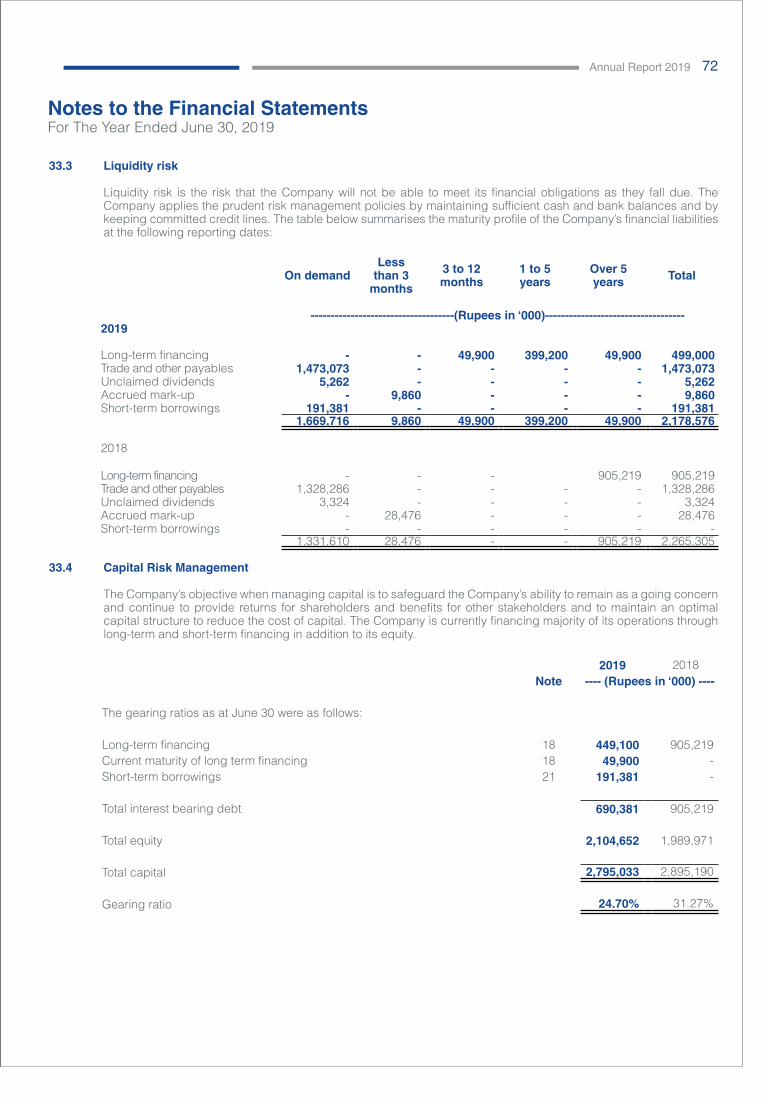
Shabbir Tiles and Ceramics Limited Annual Report 2019 72
Notes to the Financial Statements For The Year Ended June 30, 2019
33.3 Liquidity risk
Liquidity risk is the risk that the Company will not be able to meet its financial obligations as they fall due. The Company applies the prudent risk management policies by maintaining sufficient cash and bank balances and by keeping committed credit lines. The table below summarises the maturity profile of the Company’s financial liabilities at the following reporting dates:
On demandLess
than 3months
3 to 12months
1 to 5years
Over 5years Total
------------------------------------(Rupees in ‘000)-----------------------------------2019
Long-term financing - - 49,900 399,200 49,900 499,000 Trade and other payables 1,473,073 - - - - 1,473,073 Unclaimed dividends 5,262 - - - - 5,262 Accrued mark-up - 9,860 - - - 9,860 Short-term borrowings 191,381 - - - - 191,381
1,669,716 9,860 49,900 399,200 49,900 2,178,576
2018
Long-term financing - - - 905,219 905,219 Trade and other payables 1,328,286 - - - - 1,328,286 Unclaimed dividends 3,324 - - - - 3,324 Accrued mark-up - 28,476 - - - 28,476 Short-term borrowings - - - - - -
1,331,610 28,476 - - 905,219 2,265,305
33.4 Capital Risk Management
The Company’s objective when managing capital is to safeguard the Company’s ability to remain as a going concern and continue to provide returns for shareholders and benefits for other stakeholders and to maintain an optimal capital structure to reduce the cost of capital. The Company is currently financing majority of its operations through long-term and short-term financing in addition to its equity.
2019 2018Note ---- (Rupees in ‘000) ----
The gearing ratios as at June 30 were as follows:
Long-term financing 18 449,100 905,219 Current maturity of long term financing 18 49,900 - Short-term borrowings 21 191,381 -
Total interest bearing debt 690,381 905,219
Total equity 2,104,652 1,989,971
Total capital 2,795,033 2,895,190
Gearing ratio 24.70% 31.27%
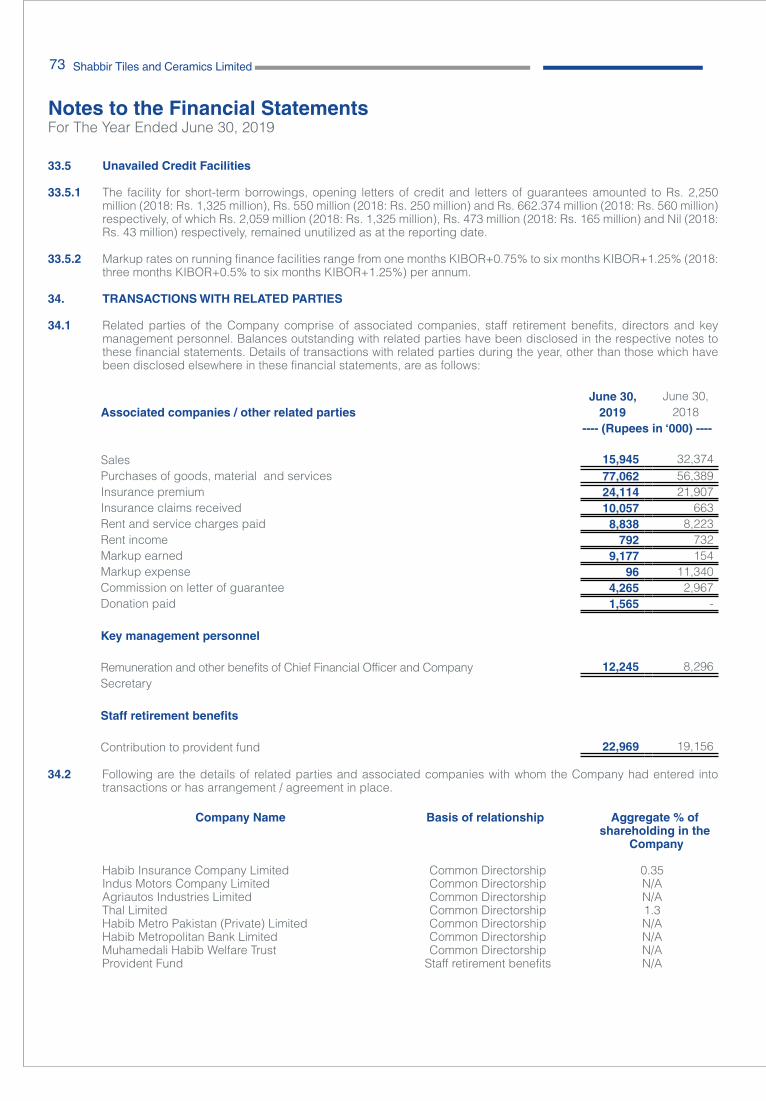
Shabbir Tiles and Ceramics Limited Annual Report 201973
Notes to the Financial Statements For The Year Ended June 30, 2019
33.5 Unavailed Credit Facilities
33.5.1 The facility for short-term borrowings, opening letters of credit and letters of guarantees amounted to Rs. 2,250 million (2018: Rs. 1,325 million), Rs. 550 million (2018: Rs. 250 million) and Rs. 662.374 million (2018: Rs. 560 million) respectively, of which Rs. 2,059 million (2018: Rs. 1,325 million), Rs. 473 million (2018: Rs. 165 million) and Nil (2018: Rs. 43 million) respectively, remained unutilized as at the reporting date.
33.5.2 Markup rates on running finance facilities range from one months KIBOR+0.75% to six months KIBOR+1.25% (2018:
three months KIBOR+0.5% to six months KIBOR+1.25%) per annum. 34. TRANSACTIONS WITH RELATED PARTIES
34.1 Related parties of the Company comprise of associated companies, staff retirement benefits, directors and key
management personnel. Balances outstanding with related parties have been disclosed in the respective notes to these financial statements. Details of transactions with related parties during the year, other than those which have been disclosed elsewhere in these financial statements, are as follows:
June 30, June 30,Associated companies / other related parties 2019 2018
---- (Rupees in ‘000) ----
Sales 15,945 32,374 Purchases of goods, material and services 77,062 56,389Insurance premium 24,114 21,907Insurance claims received 10,057 663 Rent and service charges paid 8,838 8,223 Rent income 792 732 Markup earned 9,177 154 Markup expense 96 11,340 Commission on letter of guarantee 4,265 2,967 Donation paid 1,565 -
Key management personnel
Remuneration and other benefits of Chief Financial Officer and Company 12,245 8,296 Secretary
Staff retirement benefits
Contribution to provident fund 22,969 19,156
34.2 Following are the details of related parties and associated companies with whom the Company had entered into transactions or has arrangement / agreement in place.
Company Name Basis of relationship Aggregate % ofshareholding in the
Company
Habib Insurance Company Limited Common Directorship 0.35Indus Motors Company Limited Common Directorship N/AAgriautos Industries Limited Common Directorship N/AThal Limited Common Directorship 1.3Habib Metro Pakistan (Private) Limited Common Directorship N/AHabib Metropolitan Bank Limited Common Directorship N/AMuhamedali Habib Welfare Trust Common Directorship N/AProvident Fund Staff retirement benefits N/A
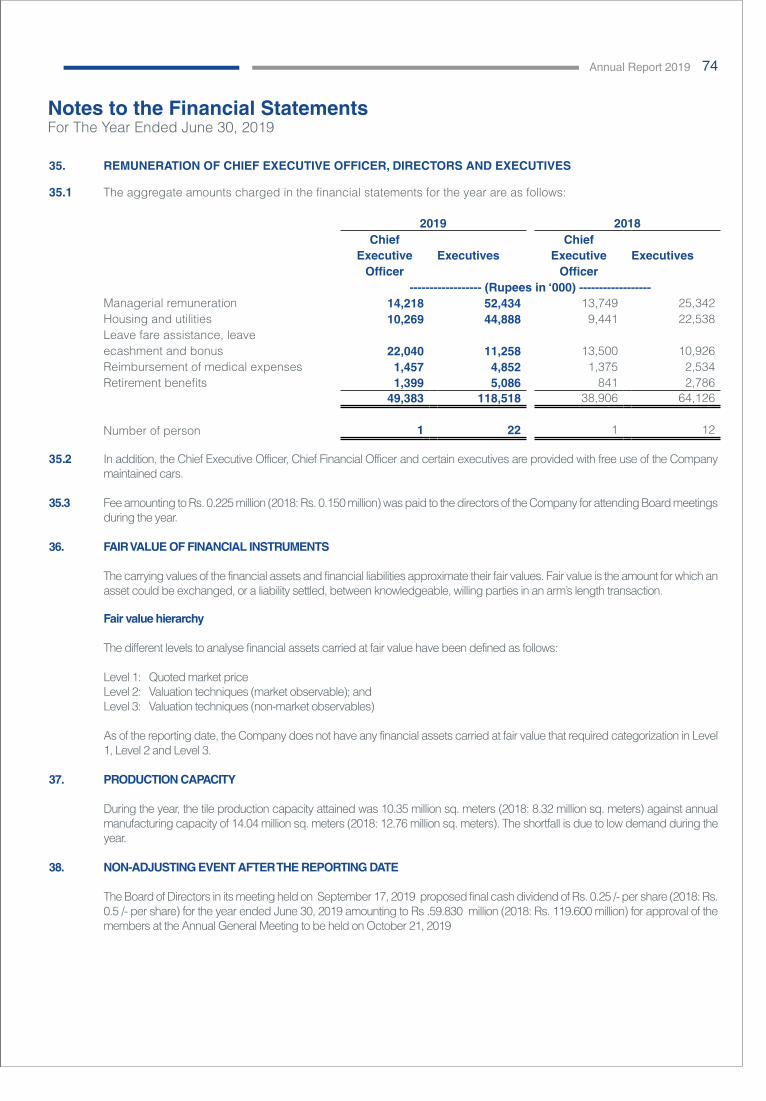
Shabbir Tiles and Ceramics Limited Annual Report 2019 74
Notes to the Financial Statements For The Year Ended June 30, 2019
35. REMUNERATION OF CHIEF EXECUTIVE OFFICER, DIRECTORS AND EXECUTIVES
35.1 The aggregate amounts charged in the financial statements for the year are as follows:
2019 2018Chief Chief
Executive Executives Executive ExecutivesOfficer Officer
------------------ (Rupees in ‘000) ------------------Managerial remuneration 14,218 52,434 13,749 25,342 Housing and utilities 10,269 44,888 9,441 22,538 Leave fare assistance, leave ecashment and bonus 22,040 11,258 13,500 10,926 Reimbursement of medical expenses 1,457 4,852 1,375 2,534 Retirement benefits 1,399 5,086 841 2,786
49,383 118,518 38,906 64,126
Number of person 1 22 1 12
35.2 In addition, the Chief Executive Officer, Chief Financial Officer and certain executives are provided with free use of the Company maintained cars.
35.3 Fee amounting to Rs. 0.225 million (2018: Rs. 0.150 million) was paid to the directors of the Company for attending Board meetings during the year.
36. FAIR VALUE OF FINANCIAL INSTRUMENTS
The carrying values of the financial assets and financial liabilities approximate their fair values. Fair value is the amount for which an
asset could be exchanged, or a liability settled, between knowledgeable, willing parties in an arm’s length transaction. Fair value hierarchy
The different levels to analyse financial assets carried at fair value have been defined as follows:
Level 1: Quoted market price Level 2: Valuation techniques (market observable); and Level 3: Valuation techniques (non-market observables) As of the reporting date, the Company does not have any financial assets carried at fair value that required categorization in Level
1, Level 2 and Level 3.
37. PRODUCTION CAPACITY During the year, the tile production capacity attained was 10.35 million sq. meters (2018: 8.32 million sq. meters) against annual
manufacturing capacity of 14.04 million sq. meters (2018: 12.76 million sq. meters). The shortfall is due to low demand during the year.
38. NON-ADJUSTING EVENT AFTER THE REPORTING DATE
The Board of Directors in its meeting held on September 17, 2019 proposed final cash dividend of Rs. 0.25 /- per share (2018: Rs.
0.5 /- per share) for the year ended June 30, 2019 amounting to Rs .59.830 million (2018: Rs. 119.600 million) for approval of the members at the Annual General Meeting to be held on October 21, 2019
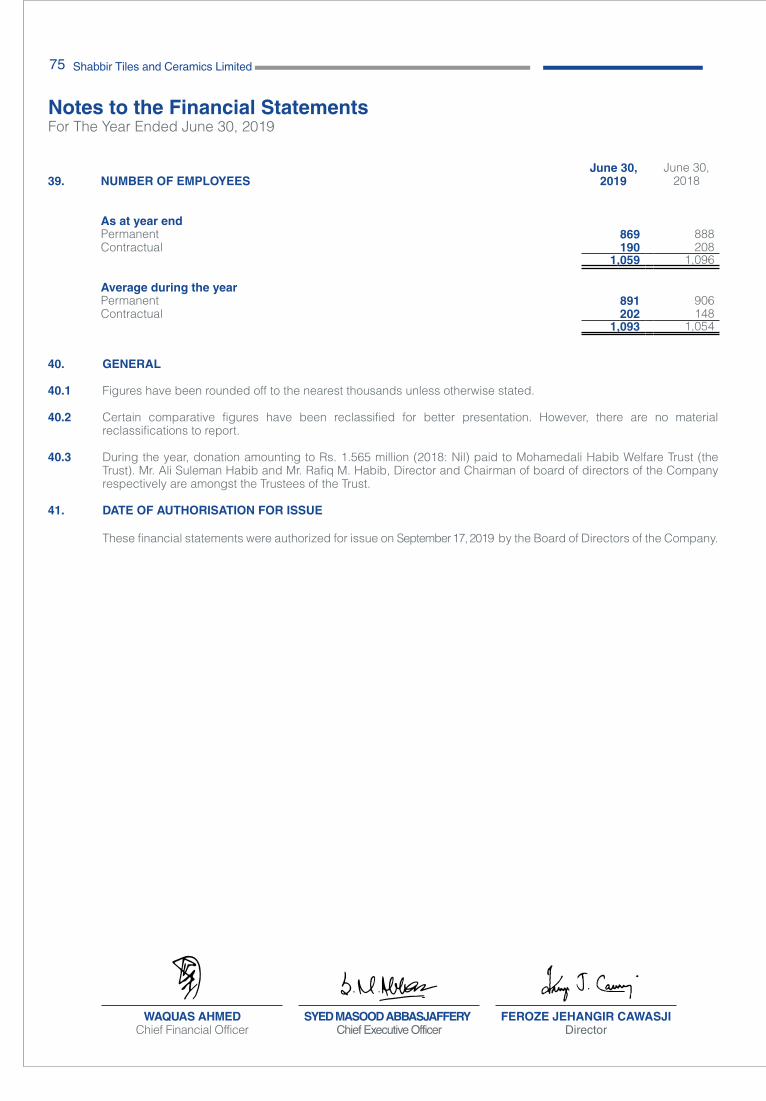
Shabbir Tiles and Ceramics Limited Annual Report 201975
Notes to the Financial Statements For The Year Ended June 30, 2019
June 30, June 30,39. NUMBER OF EMPLOYEES 2019 2018
As at year endPermanent 869 888 Contractual 190 208
1,059 1,096
Average during the yearPermanent 891 906 Contractual 202 148
1,093 1,054
40. GENERAL 40.1 Figures have been rounded off to the nearest thousands unless otherwise stated.
40.2 Certain comparative figures have been reclassified for better presentation. However, there are no material
reclassifications to report. 40.3 During the year, donation amounting to Rs. 1.565 million (2018: Nil) paid to Mohamedali Habib Welfare Trust (the
Trust). Mr. Ali Suleman Habib and Mr. Rafiq M. Habib, Director and Chairman of board of directors of the Company respectively are amongst the Trustees of the Trust.
41. DATE OF AUTHORISATION FOR ISSUE
These financial statements were authorized for issue on September 17, 2019 by the Board of Directors of the Company.
WAQUAS AHMEDChief Financial Officer
SYED MASOOD ABBASJAFFERYChief Executive Officer
FEROZE JEHANGIR CAWASJIDirector
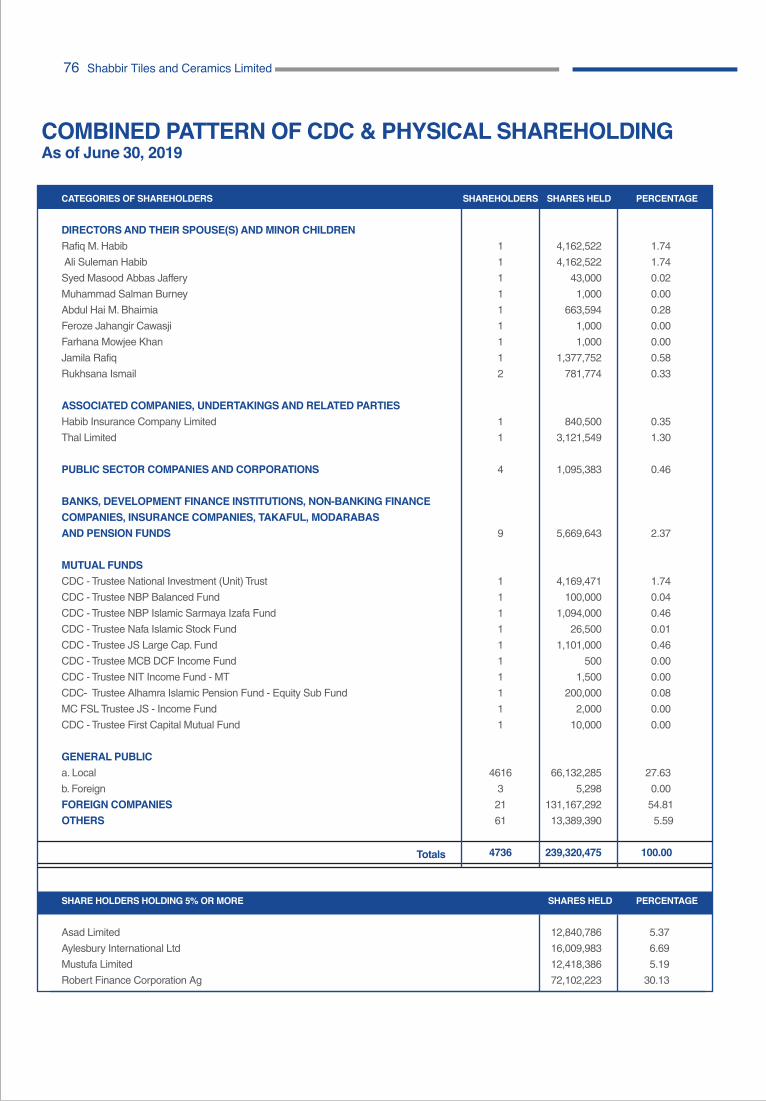
CATEGORIES OF SHAREHOLDERS SHAREHOLDERS SHARES HELD PERCENTAGE
DIRECTORS AND THEIR SPOUSE(S) AND MINOR CHILDREN Rafiq M. Habib 1 4,162,522 1.74 Ali Suleman Habib 1 4,162,522 1.74 Syed Masood Abbas Jaffery 1 43,000 0.02 Muhammad Salman Burney 1 1,000 0.00 Abdul Hai M. Bhaimia 1 663,594 0.28 Feroze Jahangir Cawasji 1 1,000 0.00 Farhana Mowjee Khan 1 1,000 0.00 Jamila Rafiq 1 1,377,752 0.58 Rukhsana Ismail 2 781,774 0.33 ASSOCIATED COMPANIES, UNDERTAKINGS AND RELATED PARTIES Habib Insurance Company Limited 1 840,500 0.35 Thal Limited 1 3,121,549 1.30 PUBLIC SECTOR COMPANIES AND CORPORATIONS 4 1,095,383 0.46 BANKS, DEVELOPMENT FINANCE INSTITUTIONS, NON-BANKING FINANCECOMPANIES, INSURANCE COMPANIES, TAKAFUL, MODARABASAND PENSION FUNDS 9 5,669,643 2.37 MUTUAL FUNDS CDC - Trustee National Investment (Unit) Trust 1 4,169,471 1.74 CDC - Trustee NBP Balanced Fund 1 100,000 0.04 CDC - Trustee NBP Islamic Sarmaya Izafa Fund 1 1,094,000 0.46 CDC - Trustee Nafa Islamic Stock Fund 1 26,500 0.01 CDC - Trustee JS Large Cap. Fund 1 1,101,000 0.46 CDC - Trustee MCB DCF Income Fund 1 500 0.00 CDC - Trustee NIT Income Fund - MT 1 1,500 0.00 CDC- Trustee Alhamra Islamic Pension Fund - Equity Sub Fund 1 200,000 0.08 MC FSL Trustee JS - Income Fund 1 2,000 0.00 CDC - Trustee First Capital Mutual Fund 1 10,000 0.00
GENERAL PUBLIC a. Local 4616 66,132,285 27.63b. Foreign 3 5,298 0.00FOREIGN COMPANIES 21 131,167,292 54.81OTHERS 61 13,389,390 5.59
4736 239,320,475 100.00
SHARE HOLDERS HOLDING 5% OR MORE SHARES HELD PERCENTAGE Asad Limited 12,840,786 5.37 Aylesbury International Ltd 16,009,983 6.69 Mustufa Limited 12,418,386 5.19 Robert Finance Corporation Ag 72,102,223 30.13
COMBINED PATTERN OF CDC & PHYSICAL SHAREHOLDINGAs of June 30, 2019
Totals
91992163012453611489068442519132412139101115445165212111611111232121211242111
1101501
10015001
100011500120001250013000135001400014500150001550016000165001700017500180001850019000195001
100001105001110001115001130001135001140001145001150001155001160001165001170001175001180001185001190001195001210001220001225001230001240001245001250001255001260001265001
100500
10005000
100001500020000250003000035000400004500050000550006000065000700007500080000850009000095000
100000105000110000115000120000135000140000145000150000155000160000165000170000175000180000185000190000195000200000215000225000230000235000245000250000255000260000265000270000
23,958308,103546,972
3,453,2662,838,3821,882,6951,657,4301,581,0081,229,935
844,712737,587563,938
1,174,453629,801757,305569,000693,877815,000
1,169,050332,619350,704461,920
1,597,500513,845220,000115,000234,773131,500137,932140,500890,500151,000156,000160,816166,712172,500355,032546,528373,960195,000400,000212,000445,000230,000230,500485,216
1,000,000501,947258,000263,500265,900
217211311111121111111111111111111111111111111114131
280001285001295001300001310001320001325001335001340001350001355001360001365001420001425001440001480001530001655001660001690001695001720001745001780001830001840001920001995001
1045001108000110900011100001112000111300011190001129500113750011450001167500118150012310001244000125050012570001261000127750012985001312000134500013460001
285000290000300000305000315000325000330000340000345000355000360000365000370000425000430000445000485000535000660000665000695000700000725000750000785000835000845000925000
10000001050000108500010950001105000112500011350001195000130000013800001455000168000018200002315000244500025100002575000261500027800002990000312500034550003465000
564,500287,239
2,098,500608,500312,836320,763987,411339,433341,500354,928356,000362,500366,500843,000426,846441,558480,500531,500658,386663,594692,500700,000723,500750,000785,000832,000840,500925,000
1,000,0001,050,0001,083,4891,094,0001,101,0001,122,6311,131,4071,192,0001,300,0001,377,7521,455,0001,675,6951,817,5002,311,1682,440,1522,509,6022,574,6602,610,5002,775,015
11,953,3313,121,549
10,364,6673,460,497
111121111111
4736
3520001366000138250013955001416000141650014170001620500162400017030001
1600500160895001
3525000366500038300003960000416500041700004175000621000062450007035000
1601000060900000
3,523,0003,663,9933,829,4683,957,4228,325,0444,169,4714,174,6416,207,7886,243,0987,030,157
16,009,98360,897,425
239,320,475
76 Shabbir Tiles and Ceramics Limited
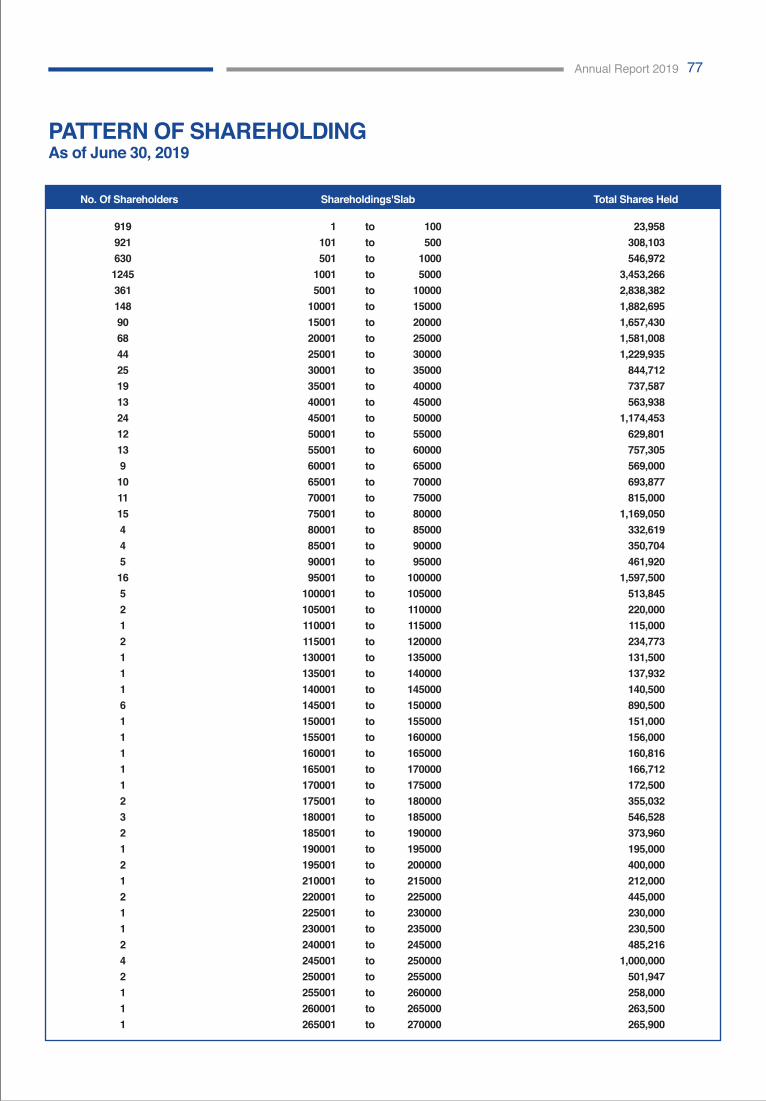
PATTERN OF SHAREHOLDING As of June 30, 2019
No. Of Shareholders Shareholdings'Slab Total Shares Held
91992163012453611489068442519132412139101115445165212111611111232121211242111
1101501
10015001
100011500120001250013000135001400014500150001550016000165001700017500180001850019000195001
100001105001110001115001130001135001140001145001150001155001160001165001170001175001180001185001190001195001210001220001225001230001240001245001250001255001260001265001
100500
10005000
100001500020000250003000035000400004500050000550006000065000700007500080000850009000095000
100000105000110000115000120000135000140000145000150000155000160000165000170000175000180000185000190000195000200000215000225000230000235000245000250000255000260000265000270000
23,958308,103546,972
3,453,2662,838,3821,882,6951,657,4301,581,0081,229,935
844,712737,587563,938
1,174,453629,801757,305569,000693,877815,000
1,169,050332,619350,704461,920
1,597,500513,845220,000115,000234,773131,500137,932140,500890,500151,000156,000160,816166,712172,500355,032546,528373,960195,000400,000212,000445,000230,000230,500485,216
1,000,000501,947258,000263,500265,900
tototototototototototototototototototototototototototototototototototototototototototototototototototo
217211311111121111111111111111111111111111111114131
280001285001295001300001310001320001325001335001340001350001355001360001365001420001425001440001480001530001655001660001690001695001720001745001780001830001840001920001995001
1045001108000110900011100001112000111300011190001129500113750011450001167500118150012310001244000125050012570001261000127750012985001312000134500013460001
285000290000300000305000315000325000330000340000345000355000360000365000370000425000430000445000485000535000660000665000695000700000725000750000785000835000845000925000
10000001050000108500010950001105000112500011350001195000130000013800001455000168000018200002315000244500025100002575000261500027800002990000312500034550003465000
564,500287,239
2,098,500608,500312,836320,763987,411339,433341,500354,928356,000362,500366,500843,000426,846441,558480,500531,500658,386663,594692,500700,000723,500750,000785,000832,000840,500925,000
1,000,0001,050,0001,083,4891,094,0001,101,0001,122,6311,131,4071,192,0001,300,0001,377,7521,455,0001,675,6951,817,5002,311,1682,440,1522,509,6022,574,6602,610,5002,775,015
11,953,3313,121,549
10,364,6673,460,497
111121111111
4736
3520001366000138250013955001416000141650014170001620500162400017030001
1600500160895001
3525000366500038300003960000416500041700004175000621000062450007035000
1601000060900000
3,523,0003,663,9933,829,4683,957,4228,325,0444,169,4714,174,6416,207,7886,243,0987,030,157
16,009,98360,897,425
239,320,475
Annual Report 2019 77
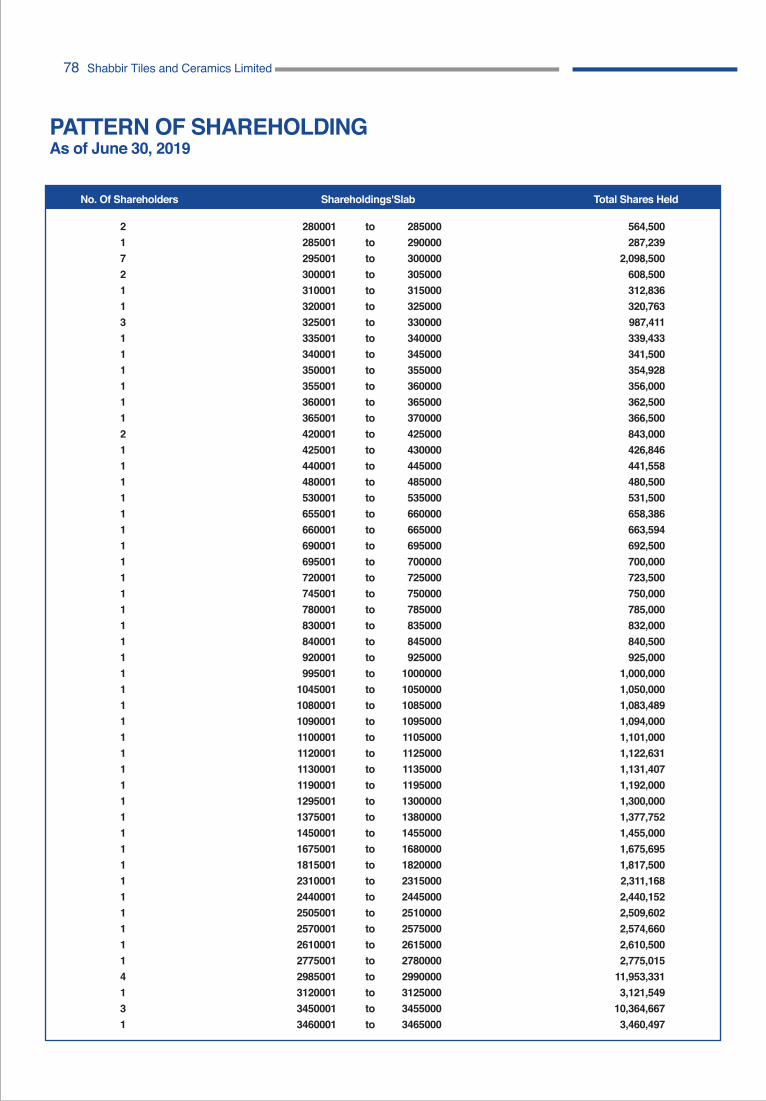
PATTERN OF SHAREHOLDING As of June 30, 2019
91992163012453611489068442519132412139101115445165212111611111232121211242111
1101501
10015001
100011500120001250013000135001400014500150001550016000165001700017500180001850019000195001
100001105001110001115001130001135001140001145001150001155001160001165001170001175001180001185001190001195001210001220001225001230001240001245001250001255001260001265001
100500
10005000
100001500020000250003000035000400004500050000550006000065000700007500080000850009000095000
100000105000110000115000120000135000140000145000150000155000160000165000170000175000180000185000190000195000200000215000225000230000235000245000250000255000260000265000270000
23,958308,103546,972
3,453,2662,838,3821,882,6951,657,4301,581,0081,229,935
844,712737,587563,938
1,174,453629,801757,305569,000693,877815,000
1,169,050332,619350,704461,920
1,597,500513,845220,000115,000234,773131,500137,932140,500890,500151,000156,000160,816166,712172,500355,032546,528373,960195,000400,000212,000445,000230,000230,500485,216
1,000,000501,947258,000263,500265,900
No. Of Shareholders Shareholdings'Slab Total Shares Held
217211311111121111111111111111111111111111111114131
280001285001295001300001310001320001325001335001340001350001355001360001365001420001425001440001480001530001655001660001690001695001720001745001780001830001840001920001995001
1045001108000110900011100001112000111300011190001129500113750011450001167500118150012310001244000125050012570001261000127750012985001312000134500013460001
285000290000300000305000315000325000330000340000345000355000360000365000370000425000430000445000485000535000660000665000695000700000725000750000785000835000845000925000
10000001050000108500010950001105000112500011350001195000130000013800001455000168000018200002315000244500025100002575000261500027800002990000312500034550003465000
564,500287,239
2,098,500608,500312,836320,763987,411339,433341,500354,928356,000362,500366,500843,000426,846441,558480,500531,500658,386663,594692,500700,000723,500750,000785,000832,000840,500925,000
1,000,0001,050,0001,083,4891,094,0001,101,0001,122,6311,131,4071,192,0001,300,0001,377,7521,455,0001,675,6951,817,5002,311,1682,440,1522,509,6022,574,6602,610,5002,775,015
11,953,3313,121,549
10,364,6673,460,497
tototototototototototototototototototototototototototototototototototototototototototototototototototo
111121111111
4736
3520001366000138250013955001416000141650014170001620500162400017030001
1600500160895001
3525000366500038300003960000416500041700004175000621000062450007035000
1601000060900000
3,523,0003,663,9933,829,4683,957,4228,325,0444,169,4714,174,6416,207,7886,243,0987,030,157
16,009,98360,897,425
239,320,475
78 Shabbir Tiles and Ceramics Limited
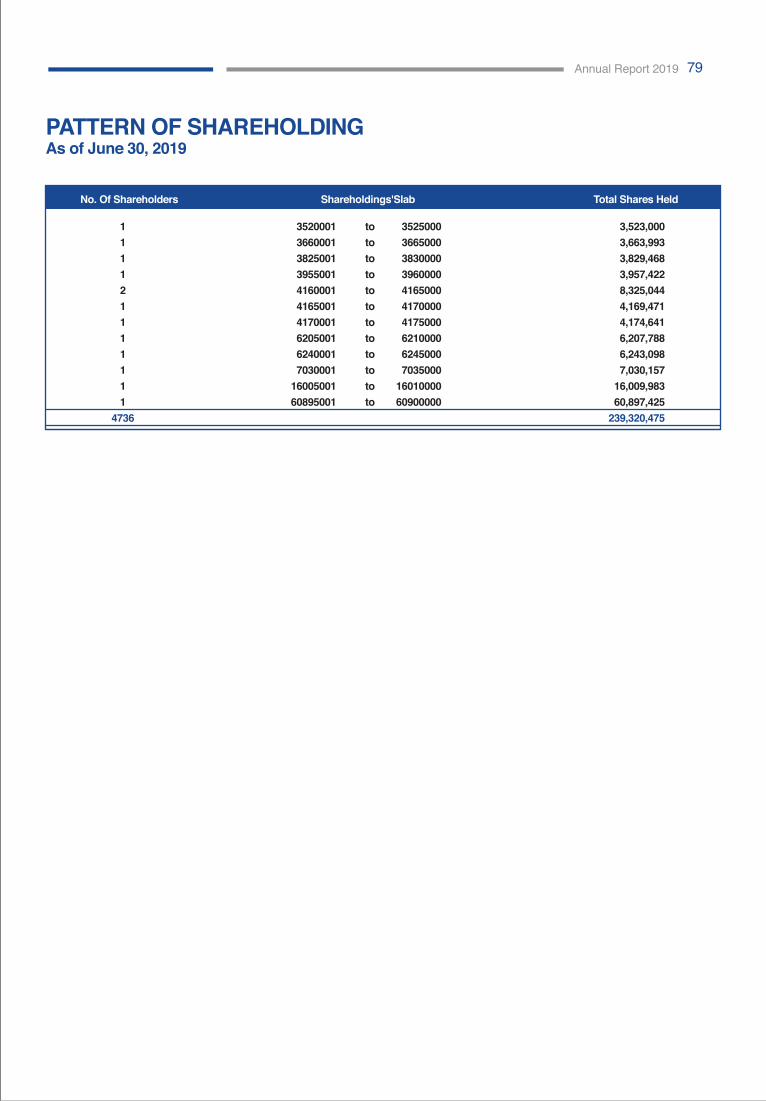
PATTERN OF SHAREHOLDING As of June 30, 2019
91992163012453611489068442519132412139101115445165212111611111232121211242111
1101501
10015001
100011500120001250013000135001400014500150001550016000165001700017500180001850019000195001
100001105001110001115001130001135001140001145001150001155001160001165001170001175001180001185001190001195001210001220001225001230001240001245001250001255001260001265001
100500
10005000
100001500020000250003000035000400004500050000550006000065000700007500080000850009000095000
100000105000110000115000120000135000140000145000150000155000160000165000170000175000180000185000190000195000200000215000225000230000235000245000250000255000260000265000270000
23,958308,103546,972
3,453,2662,838,3821,882,6951,657,4301,581,0081,229,935
844,712737,587563,938
1,174,453629,801757,305569,000693,877815,000
1,169,050332,619350,704461,920
1,597,500513,845220,000115,000234,773131,500137,932140,500890,500151,000156,000160,816166,712172,500355,032546,528373,960195,000400,000212,000445,000230,000230,500485,216
1,000,000501,947258,000263,500265,900
217211311111121111111111111111111111111111111114131
280001285001295001300001310001320001325001335001340001350001355001360001365001420001425001440001480001530001655001660001690001695001720001745001780001830001840001920001995001
1045001108000110900011100001112000111300011190001129500113750011450001167500118150012310001244000125050012570001261000127750012985001312000134500013460001
285000290000300000305000315000325000330000340000345000355000360000365000370000425000430000445000485000535000660000665000695000700000725000750000785000835000845000925000
10000001050000108500010950001105000112500011350001195000130000013800001455000168000018200002315000244500025100002575000261500027800002990000312500034550003465000
564,500287,239
2,098,500608,500312,836320,763987,411339,433341,500354,928356,000362,500366,500843,000426,846441,558480,500531,500658,386663,594692,500700,000723,500750,000785,000832,000840,500925,000
1,000,0001,050,0001,083,4891,094,0001,101,0001,122,6311,131,4071,192,0001,300,0001,377,7521,455,0001,675,6951,817,5002,311,1682,440,1522,509,6022,574,6602,610,5002,775,015
11,953,3313,121,549
10,364,6673,460,497
No. Of Shareholders Shareholdings'Slab Total Shares Held
111121111111
4736
3520001366000138250013955001416000141650014170001620500162400017030001
1600500160895001
3525000366500038300003960000416500041700004175000621000062450007035000
1601000060900000
3,523,0003,663,9933,829,4683,957,4228,325,0444,169,4714,174,6416,207,7886,243,0987,030,157
16,009,98360,897,425
239,320,475
totototototototototototo
Annual Report 2019 79

Shabbir Tiles and Ceramics Limited
PROXY FORM I/We of being a member(s) of SHABBIR TILES AND CERAMICS LIMITED and a holder of
ordinary shares as per Share Register Folio No.
or CDC Participant ID No. Account No.
hereby appoint of
who is also member of SHABBIR TILES AND CERAMICS LIMITED Vide Folio No.
or CDC Participant ID No. Account No.
or failing him/her of
who is also member of SHABBIR TILES AND CERAMICS LIMITED vide Folio No.
or CDC Participant ID No. Account No.
as my / our proxy in my / our absence to attend and vote for me / us and on my / our behalf at the Annual
General Meeting of the Company to be held on Monday, 21st day of October 2019, and at any adjournment
thereof.
As witness my / our hand / seal this day of 2019
signed by the said
Witness Witness (Signature) (Signature) Name Name
Address Address
CNIC No. CNIC No.
SIGNATURE OF MEMBER(S) NOTES:
1. This proxy form duly completed and signed must be received at the Registered Office of the Company, 15th Milestone, National Highway, Landhi, Karachi, not less than 48 hours before the time of holding the Annual General Meeting.
P.T.O.
Please affix Rs. 5/- Revenue Stamp
Shabbir Tiles and Ceramics Limited 2. No person shall act as proxy unless he / she himself / herself is a member of the Company. Except that
a corporation may appoint a person who is not a member.
3. If a member appoints more than one proxy and more than one instruments of proxy are deposited by a member with the Company, all such instruments of proxy shall be rendered invalid.
FOR CDC ACCOUNT HOLDERS / CORPORATE ENTITIES In addition to the above the following requirements have to be met: a) The proxy form shall be witnessed by two persons whose names, addresses and CNIC numbers shall be
mentioned on the form.
b) Attested copy of CNIC or the passport of the beneficial owners shall be furnished with the proxy form. c) The proxy shall produce his / her original CNIC or original passport at the time of the meeting. d) In case of corporate entity, the Board of Directors’ resolution / power of attorney with specimen
signature shall be submitted (unless it has been provided earlier) along with proxy form to the Company.

15th Milestone,National Highway,Landhi, Karachi-75120+92-213 - 818 3610 -13Website: www.stile.com.pkEmail: [email protected]