seyfert's sextet: a slowly dissolving stephan's quintet
TRANSCRIPT
arX
iv:0
709.
4511
v1 [
astr
o-ph
] 2
8 Se
p 20
07
Seyfert’s Sextet: A Slowly Dissolving Stephan’s Quintet?
A. Durbala1, A. del Olmo2, M. S. Yun3, M. Rosado4, J. W. Sulentic1, H. Plana5, A.
Iovino6, J. Perea2, L. Verdes-Montenegro2, I. Fuentes-Carrera7
ABSTRACT
We present a multiwavelength study of the highly evolved compact galaxy
group known as Seyfert’s Sextet (HCG79: SS). We interpret SS as a 2-3 Gyr
more evolved analog of Stephan’s Quintet (HCG92: SQ). We postulate that SS
formed by sequential acquisition of 4-5 primarily late-type field galaxies. Four
of the five galaxies show an early-type morphology which is likely the result
of secular evolution driven by gas stripping. Stellar stripping has produced a
massive/luminous halo and embedded galaxies that are overluminous for their
size. These are interpreted as remnant bulges of the accreted spirals. H79d could
be interpreted as the most recent intruder being the only galaxy with an intact
ISM and uncertain evidence for tidal perturbation. In addition to stripping
activity we find evidence for past accretion events. H79b (NGC6027) shows
a strong counter-rotating emission line component interpreted as an accreted
dwarf spiral. H79a shows evidence for an infalling component of gas representing
feedback or possible cross fueling by H79d. The biggest challenge to this scenario
involves the low gas fraction in the group. If SS formed from normal field spirals
then much of the gas is missing. Finally, despite its advanced stage of evolution,
we find no evidence for major mergers and infer that SS (and SQ) are telling us
that such groups coalesce via slow dissolution.
1Department of Physics and Astronomy, University of Alabama, Box 870324, Tuscaloosa, AL 35487-0324,
USA; [email protected]
2Instituto de Astrofısica de Andalucıa, CSIC, Apdo. 3004, 18080 Granada, Spain
3Department of Astronomy, University of Massachusetts, Amherst, MA 01003, USA
4Instituto de Astronomıa, Universidad Nacional Autonoma de Mexico (UNAM), Apdo. Postal 70-264,
04510, Mexico, D.F., Mexico
5Laboratorio de Astrofisica Teorica e Observacional, Universidade Estadual de Santa Cruz, Brazil
6INAF–Osservatorio Astronomico di Brera, via Brera 28, 20121 Milano, Italy
7GEPI, Observatoire de Paris, CNRS, Universite Paris Diderot, Place Jules Janssen 92190, Meudon,
France
– 2 –
Subject headings: galaxies: active — galaxies: elliptical and lenticular,cD —
galaxies: interactions — galaxies: spiral
1. Introduction
Compact groups (CG) are an intriguing component of the large scale structure (e.g.
Hickson 1997). They can be described as contradictions in terms involving very high-
density galaxy aggregates (typical projected separation ∼ 30-40 kpc) found in some of the
lowest galaxy density environments. In some ways they mimic a cluster-like environment
(galaxy harassment/stripping/secular evolution). Early models (e.g. Mamon 1987; Barnes
1989) found them to be gravitationally unstable and therefore candidates for rapid collapse
into “fossil” ellipticals. Unfortunately very few fossil elliptical candidates have been found
(Sulentic & Rabaca 1994; Zabludoff & Mulchaey 1998) except in denser and, especially, clus-
ter environments. Very few CG show signs of advanced merging (only ∼10% contain a
first ranked elliptical; Sulentic 1997). Dynamical models, taking into account massive dark
matter (DM) haloes (Athanassoula et al. 1997) or formation from a diffuse configuration
(Aceves & Velazquez 2002) now suggest that such groups can survive for even a Hubble
time.
One can study CG both statistically and individually. Each approach has strengths and
weaknesses. In either case, but especially the former, this requires a clear definition of the
compact group phenomenon. The most local samples (Iovino 2002; Hickson 1982, hereafter
H1982) suggest that CG can be defined as physically dense aggregates of 4-8 galaxies with
separations on the order of a few component diameters. Quartets are by far the most common
while systems of 6-8 galaxies are rarely found. It is of course easier to identify numerical
populations of such aggregates than to establish true physical density, however first attempts
based on redshift concordance and evidence for interaction (Mendes de Oliveira & Hickson
1994) suggest that 60/100 of the aggregates in the Hickson Compact Groups (HCG) are
bona fide compact groups (see e.g. table 2 in Sulentic 1997). It is assumed that triplets are
dynamically distinct (inherently unstable) entities and should not be included in a compact
group sample.
Above considerations suggest that CG will be found in a wide range of evolutionary
states (e.g. Ribeiro et al. 1998; Verdes-Montenegro et al. 2001) and that detailed study of
individual CG might be best accomplished within the context of an assumed evolutionary
stage. Relatively unstripped, but interacting groups should be very young while aggregates
– 3 –
of early-type galaxies embedded in a common stellar halo should be highly evolved. All or
most of the CG that have formed in the local Universe may still exist as CG. SQ and SS, two
of the densest and best known groups, might be viewed as young/middle aged (few Gyr) and
highly evolved (many Gyr) examples, respectively. We considered SQ earlier (Sulentic et al.
2001) and focus on SS in this paper. The best examples for detailed study involve those
compact groups with abundant multiwavelength data and SS certainly qualifies by that
criterion. As one of the most evolved groups we have a further motivation for detailed study.
Seyfert’s Sextet (HCG 79, VV 115) is probably the densest (most compact) galaxy ag-
gregate in the local Universe (the systemic recession velocity is vR∼ 4400 km s−1 implying a
distance D ∼ 60 Mpc assuming H0 = 75 km s−1 Mpc−1). It is also one of the most isolated
systems (H1982; Sulentic 1987; Iovino 2002). In this paper we present new multiwavelength
data (optical, IR and radio) including line and continuum imagery, Fabry-Perot and slit
spectroscopy. In addition to these datasets the paper harvests previously published mul-
tiwavelength data for the group in an attempt to give a clear and coherent picture of the
phenomena involved and the current evolutionary state. Much of our interpretation of SS
will be within the context of our observations and ideas about SQ.
The paper is organized as follows: § 2 basic observations and reduction information; § 3
data analysis and presentation with minimal interpretation and § 4: Inferences about the
evolutionary history of SS using new and old observations and interpreted in the light of
what we have learned about SQ. Within § 2 and § 3 we organize into subsections according
to wavelength and/or date type (e.g. IR, radio, optical and imaging, spectroscopy, line,
continuum). Discussion in § 4 contains frequent citations of the relevant parts of § 3 that
support specific inferences.
2. New Observations of SS
2.1. Broad-band Optical Images
SDSS: Optical properties (e.g. magnitudes, morphologies, geometry) of SS and its
neighbors were derived from Sloan Digital Sky Survey (Data Release 5: SDSS DR5 –
Adelman-McCarthy et al. 2007) images1. We downloaded g and r band FITS format images
1This study has made use of SDSS Data Release 5. Funding for the SDSS and SDSS-II has been pro-
vided by the Alfred P. Sloan Foundation, the Participating Institutions, the National Science Foundation,
the U.S. Department of Energy, the National Aeronautics and Space Administration, the Japanese Mon-
bukagakusho, the Max Planck Society, and the Higher Education Funding Council for England. The SDSS
– 4 –
of night sky (“corrected”) frames using the Catalog Archive Server2. The corrected frames
are flat-field, bias, cosmic-ray, and pixel-defect corrected (Stoughton et al. 2002). Sky back-
ground fitting and subtraction were performed using IRAF3 task IMSURFIT. IRAF task
ELLIPSE was used to derive surface brightness, deviation of isophotes from pure ellipses
(Fourier coefficient b4 - fourth cosine coefficient of the Fourier expansion), position angle
(PAs) and ellipticity as functions of the semimajor axis. Positive and negative values of b4
indicates disky and boxy isophotes respectively. Photometric calibration4 of SDSS images
was accomplished using the aa, kk and airmass coefficients (zeropoint, extinction coefficient
and airmass) from the TsField files. The surface brightness zeropoint was calculated as:
2.5 × log(exptime × 0.3962) − 2.5 × 0.4 × (aa + kk × airmass), using the exposure time
exptime of 53.907456 seconds and pixel size of 0.′′396. Our magnitudes are conventional
(“Pogson”) magnitudes.
NOT: We also obtained deep B and R filter CCD images of SS with the 2.5 m Nordic
Optical Telescope (NOT) of the Observatorio del Roque de los Muchachos (La Palma),
using the ALFOSC5 spectrograph. The detector was a Loral/Lesser 2048× 2048 pixels with
a spatial scale of 0.′′19 which gives a field of view of 6.′5× 6.′5. The broad band images of SS
were obtained on a single night of a three night observing run with ALFOSC. A summary of
the main characteristics of the images can be found in Table 1. Atmospheric conditions were
photometric. Photometric calibration was accomplished with observations of 10 different
Web Site is http://www.sdss.org/. The SDSS is managed by the Astrophysical Research Consortium for
the Participating Institutions. The Participating Institutions are the American Museum of Natural History,
Astrophysical Institute Potsdam, University of Basel, University of Cambridge, Case Western Reserve Uni-
versity, University of Chicago, Drexel University, Fermilab, the Institute for Advanced Study, the Japan
Participation Group, Johns Hopkins University, the Joint Institute for Nuclear Astrophysics, the Kavli Insti-
tute for Particle Astrophysics and Cosmology, the Korean Scientist Group, the Chinese Academy of Sciences
(LAMOST), Los Alamos National Laboratory, the Max-Planck-Institute for Astronomy (MPIA), the Max-
Planck-Institute for Astrophysics (MPA), New Mexico State University, Ohio State University, University of
Pittsburgh, University of Portsmouth, Princeton University, the United States Naval Observatory, and the
University of Washington.
2http://www.sdss.org/dr5/access/index.html
3Image Reduction and Analysis Facility (IRAF) is distributed by the National Optical Astronomy Ob-
servatories, which are operated by the Association of Universities for Research in Astronomy, Inc., under
cooperative agreement with the National Science Foundation - http://iraf.noao.edu/
4http://www.sdss.org/dr5/algorithms/fluxcal.html
5The data presented here have been taken using ALFOSC, which is owned by the Instituto de Astrofisica
de Andalucia (IAA) and operated at the Nordic Optical Telescope under agreement between IAA and the
NBIfAFG of the Astronomical Observatory of Copenhagen
– 5 –
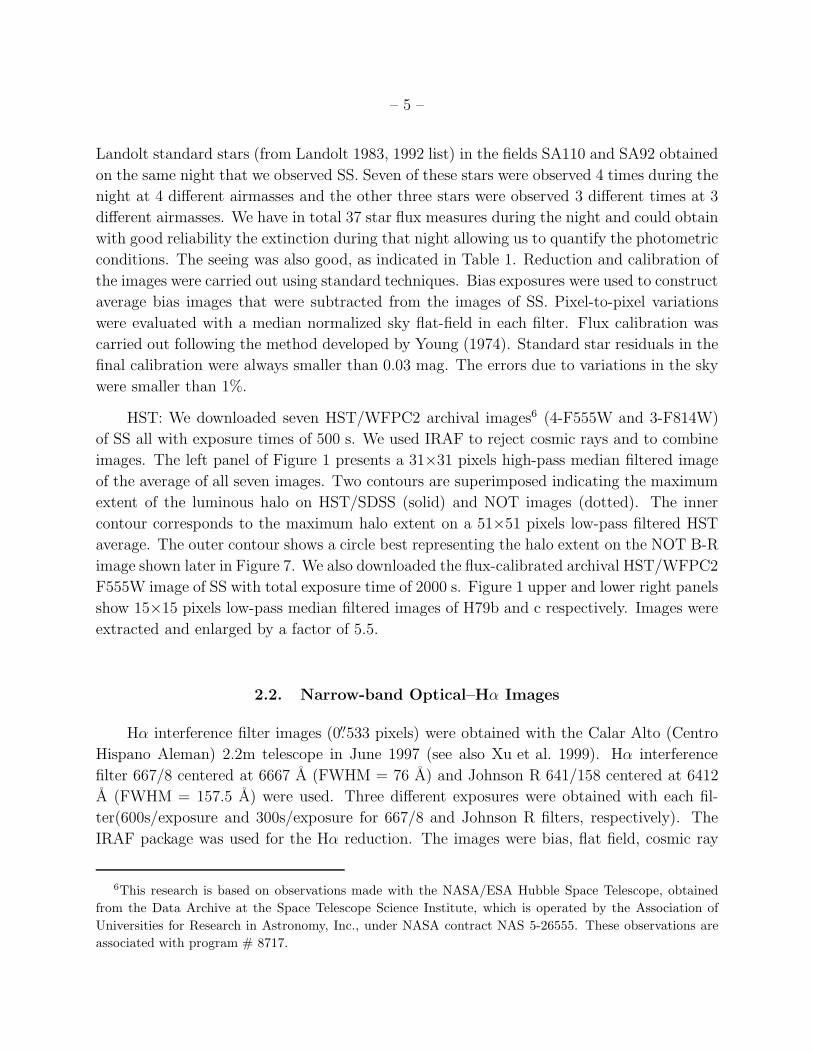
Landolt standard stars (from Landolt 1983, 1992 list) in the fields SA110 and SA92 obtained
on the same night that we observed SS. Seven of these stars were observed 4 times during the
night at 4 different airmasses and the other three stars were observed 3 different times at 3
different airmasses. We have in total 37 star flux measures during the night and could obtain
with good reliability the extinction during that night allowing us to quantify the photometric
conditions. The seeing was also good, as indicated in Table 1. Reduction and calibration of
the images were carried out using standard techniques. Bias exposures were used to construct
average bias images that were subtracted from the images of SS. Pixel-to-pixel variations
were evaluated with a median normalized sky flat-field in each filter. Flux calibration was
carried out following the method developed by Young (1974). Standard star residuals in the
final calibration were always smaller than 0.03 mag. The errors due to variations in the sky
were smaller than 1%.
HST: We downloaded seven HST/WFPC2 archival images6 (4-F555W and 3-F814W)
of SS all with exposure times of 500 s. We used IRAF to reject cosmic rays and to combine
images. The left panel of Figure 1 presents a 31×31 pixels high-pass median filtered image
of the average of all seven images. Two contours are superimposed indicating the maximum
extent of the luminous halo on HST/SDSS (solid) and NOT images (dotted). The inner
contour corresponds to the maximum halo extent on a 51×51 pixels low-pass filtered HST
average. The outer contour shows a circle best representing the halo extent on the NOT B-R
image shown later in Figure 7. We also downloaded the flux-calibrated archival HST/WFPC2
F555W image of SS with total exposure time of 2000 s. Figure 1 upper and lower right panels
show 15×15 pixels low-pass median filtered images of H79b and c respectively. Images were
extracted and enlarged by a factor of 5.5.
2.2. Narrow-band Optical–Hα Images
Hα interference filter images (0.′′533 pixels) were obtained with the Calar Alto (Centro
Hispano Aleman) 2.2m telescope in June 1997 (see also Xu et al. 1999). Hα interference
filter 667/8 centered at 6667 A (FWHM = 76 A) and Johnson R 641/158 centered at 6412
A (FWHM = 157.5 A) were used. Three different exposures were obtained with each fil-
ter(600s/exposure and 300s/exposure for 667/8 and Johnson R filters, respectively). The
IRAF package was used for the Hα reduction. The images were bias, flat field, cosmic ray
6This research is based on observations made with the NASA/ESA Hubble Space Telescope, obtained
from the Data Archive at the Space Telescope Science Institute, which is operated by the Association of
Universities for Research in Astronomy, Inc., under NASA contract NAS 5-26555. These observations are
associated with program # 8717.
– 6 –
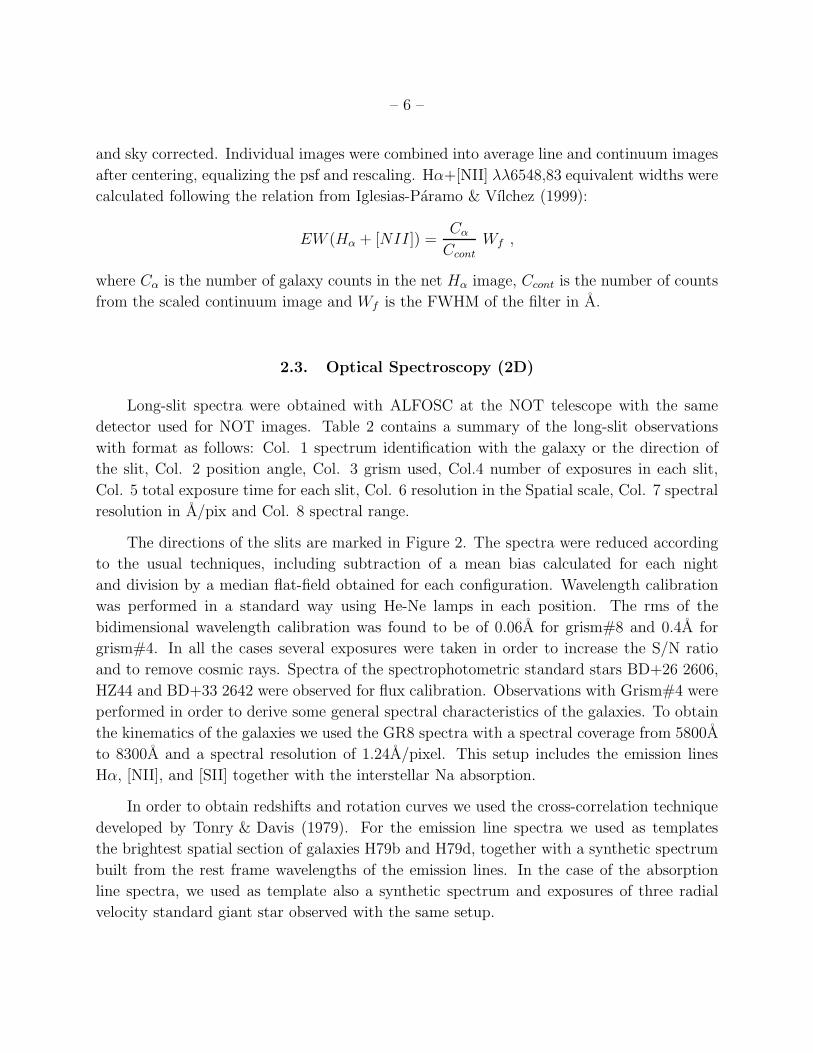
and sky corrected. Individual images were combined into average line and continuum images
after centering, equalizing the psf and rescaling. Hα+[NII] λλ6548,83 equivalent widths were
calculated following the relation from Iglesias-Paramo & Vılchez (1999):
EW (Hα + [NII]) =Cα
Ccont
Wf ,
where Cα is the number of galaxy counts in the net Hα image, Ccont is the number of counts
from the scaled continuum image and Wf is the FWHM of the filter in A.
2.3. Optical Spectroscopy (2D)
Long-slit spectra were obtained with ALFOSC at the NOT telescope with the same
detector used for NOT images. Table 2 contains a summary of the long-slit observations
with format as follows: Col. 1 spectrum identification with the galaxy or the direction of
the slit, Col. 2 position angle, Col. 3 grism used, Col.4 number of exposures in each slit,
Col. 5 total exposure time for each slit, Col. 6 resolution in the Spatial scale, Col. 7 spectral
resolution in A/pix and Col. 8 spectral range.
The directions of the slits are marked in Figure 2. The spectra were reduced according
to the usual techniques, including subtraction of a mean bias calculated for each night
and division by a median flat-field obtained for each configuration. Wavelength calibration
was performed in a standard way using He-Ne lamps in each position. The rms of the
bidimensional wavelength calibration was found to be of 0.06A for grism#8 and 0.4A for
grism#4. In all the cases several exposures were taken in order to increase the S/N ratio
and to remove cosmic rays. Spectra of the spectrophotometric standard stars BD+26 2606,
HZ44 and BD+33 2642 were observed for flux calibration. Observations with Grism#4 were
performed in order to derive some general spectral characteristics of the galaxies. To obtain
the kinematics of the galaxies we used the GR8 spectra with a spectral coverage from 5800A
to 8300A and a spectral resolution of 1.24A/pixel. This setup includes the emission lines
Hα, [NII], and [SII] together with the interstellar Na absorption.
In order to obtain redshifts and rotation curves we used the cross-correlation technique
developed by Tonry & Davis (1979). For the emission line spectra we used as templates
the brightest spatial section of galaxies H79b and H79d, together with a synthetic spectrum
built from the rest frame wavelengths of the emission lines. In the case of the absorption
line spectra, we used as template also a synthetic spectrum and exposures of three radial
velocity standard giant star observed with the same setup.
– 7 –
2.4. Hα Fabry-Perot Spectroscopy (3D)
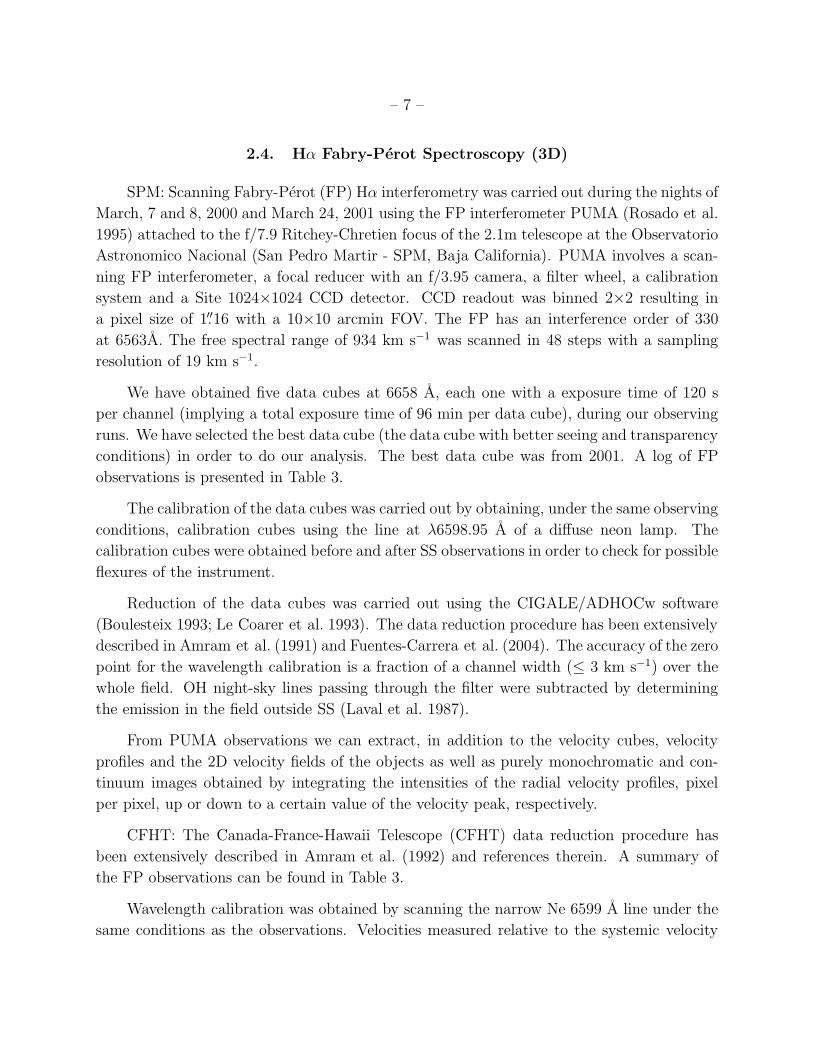
SPM: Scanning Fabry-Perot (FP) Hα interferometry was carried out during the nights of
March, 7 and 8, 2000 and March 24, 2001 using the FP interferometer PUMA (Rosado et al.
1995) attached to the f/7.9 Ritchey-Chretien focus of the 2.1m telescope at the Observatorio
Astronomico Nacional (San Pedro Martir - SPM, Baja California). PUMA involves a scan-
ning FP interferometer, a focal reducer with an f/3.95 camera, a filter wheel, a calibration
system and a Site 1024×1024 CCD detector. CCD readout was binned 2×2 resulting in
a pixel size of 1.′′16 with a 10×10 arcmin FOV. The FP has an interference order of 330
at 6563A. The free spectral range of 934 km s−1 was scanned in 48 steps with a sampling
resolution of 19 km s−1.
We have obtained five data cubes at 6658 A, each one with a exposure time of 120 s
per channel (implying a total exposure time of 96 min per data cube), during our observing
runs. We have selected the best data cube (the data cube with better seeing and transparency
conditions) in order to do our analysis. The best data cube was from 2001. A log of FP
observations is presented in Table 3.
The calibration of the data cubes was carried out by obtaining, under the same observing
conditions, calibration cubes using the line at λ6598.95 A of a diffuse neon lamp. The
calibration cubes were obtained before and after SS observations in order to check for possible
flexures of the instrument.
Reduction of the data cubes was carried out using the CIGALE/ADHOCw software
(Boulesteix 1993; Le Coarer et al. 1993). The data reduction procedure has been extensively
described in Amram et al. (1991) and Fuentes-Carrera et al. (2004). The accuracy of the zero
point for the wavelength calibration is a fraction of a channel width (≤ 3 km s−1) over the
whole field. OH night-sky lines passing through the filter were subtracted by determining
the emission in the field outside SS (Laval et al. 1987).
From PUMA observations we can extract, in addition to the velocity cubes, velocity
profiles and the 2D velocity fields of the objects as well as purely monochromatic and con-
tinuum images obtained by integrating the intensities of the radial velocity profiles, pixel
per pixel, up or down to a certain value of the velocity peak, respectively.
CFHT: The Canada-France-Hawaii Telescope (CFHT) data reduction procedure has
been extensively described in Amram et al. (1992) and references therein. A summary of
the FP observations can be found in Table 3.
Wavelength calibration was obtained by scanning the narrow Ne 6599 A line under the
same conditions as the observations. Velocities measured relative to the systemic velocity
– 8 –
are very accurate, with an error of a fraction of a channel width (< 3 km s−1) over the
whole field.
Subtraction of bias, flat fielding of the data and cosmic-ray removal have been performed
for each image of the data cube for the CFHT observations. To minimize seeing variation,
each scan image was smoothed with a gaussian function of full-width at half maximum equal
to the worse-seeing data of the data cube. Transparency and sky foreground fluctuations
have also been corrected using field star fluxes and galaxy-free windows for the observations.
The signal measured along the scanning sequence was separated into two parts: (1)
an almost constant level produced by the continuum light in a narrow passband around Hα
(continuum map), and (2) a varying part produced by the Hα line (Hα integrated flux map).
The continuum level was taken to be the mean of the three faintest channels, to avoid channel
noise effects. The Hα integrated flux map was obtained by integrating the monochromatic
profile in each pixel. The velocity sampling was 11 km s−1 at CFHT. Profiles were spatially
binned to 3×3 or 5×5 pixels in the outer parts, in order to increase the signal-to-noise ratio.
Strong OH night sky lines passing through the filters were subtracted by determining the
level of emission from extended regions away from the galaxies (Laval et al. 1987).
2.5. Mid- and Far-Infrared
Mid Infrared (MIR) observations for SS were obtained in the raster imaging mode
(AOT:ISOCAM01) with the mid-infrared camera ISOCAM (Cesarsky et al. 1996) on board
the satellite ISO (Infrared Space Observatory, Kessler et al. 1996).
We observed our group using the filter LW10, centered at 11.5 µm, and the configuration
with a PFOV = 6′′ for the 32×32 infrared array. We adopted a raster mode 2×2, with a
raster step of 9′′, for a total exposure time of 450 seconds on target (each single exposure
had 10 sec integration).
The data were reduced using the software CIA (CAM Interactive Analysis, v. 3) and
included standard steps like dark subtraction, removal of cosmic rays events (deglitching),
correction for the transient of the detector (stabilization), averaging the frames at each
raster position and flat-field correction and, finally combining the frames at each position
into one mosaic image taking into account the instrument distortions (projecting; for a
detailed description of these steps see Siebenmorgen et al. 1996).
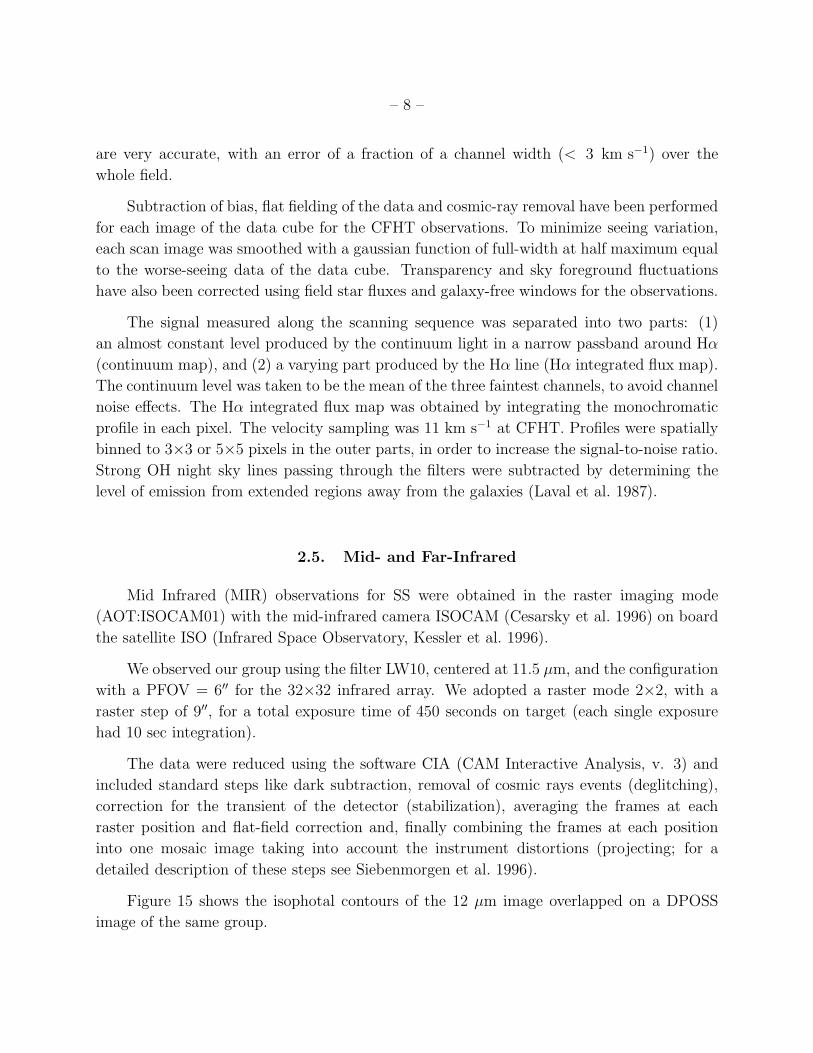
Figure 15 shows the isophotal contours of the 12 µm image overlapped on a DPOSS
image of the same group.
– 9 –
In ISOCAM images a major source of photometric error are due to variation of the sky
background, correction for the transient (memory) effect and undersampling of the objects.
In our case the near blending of galaxies H79b and e is a further source of error. A conserva-
tive estimate for the accuracy of our measured fluxes is ∼25% (see also Siebenmorgen et al.
1996; Biviano 1998).
2.6. Radio Line and Continuum
Observations of SS using the Very Large Array (VLA7) were conducted in its 3 km (C)
and 1 km (D) configuration on August 2, 1997 and February 6, 1998, respectively, using
all 27 telescopes. Shortest baselines at the shadowing limit of 25 meter are present, and
structures as large as 15′ in size should be visible in each channel maps. The spectrometer
was configured in the dual polarization 2IF mode to have 64 spectral channels at a frequency
resolution of 48.8 kHz (∼ 10.5 km s−1) to cover a total bandwidth of 3.125 MHz (∼ 660
km s−1). All of the data are calibrated following the standard VLA calibration procedure in
AIPS and imaged using IMAGR. Absolute uncertainty in the resulting flux scaling is about
15%, and this is the formal uncertainty we quote for all physical parameters derived from
the flux density.
The synthesized beam produced using a robust weight of R = 1 is 27.′′0 × 16.′′4. The
resulting spectral-line maps have an rms noise level of 0.5 mJy beam−1. The 3σ HI flux limit
in each map is about 0.016 Jy km s−1, corresponding to an HI column density limit of 4×10¹⁹
atoms cm−2. At the adopted distance of the compact group (60 Mpc), the corresponding
mass detection limit is 1.4 × 10⁷M⊙.8
A line-free continuum image constructed by averaging the 14 line-free channels is shown
in Figure 16. This continuum image has an effective bandwidth of 1.37 MHz centered on
an effective frequency of 1399 MHz. The rms noise level achieved in Figure 16 is 0.20 mJy
beam−1.
In addition, we also produced a higher resolution 1.4 GHz continuum image of SS using
the data from the archive. The B-configuration snapshot image with ∼ 5′′ resolution is
obtained in the continuum mode with a total bandwidth of 200 MHz, and the rms noise in
7The Very Large Array is a facility of the National Radio Astronomy Observatory which is operated by
Associated Universities, Inc. under cooperative agreement with the National Science Foundation.
8The atomic gas mass has been calculated as MHI = 2.36× 10⁵ D2Mpc
∫SV dV , where SV dV is in Jy km
s−1.
– 10 –
the image is ∼ 0.06 mJy beam−1.
3. Data Analysis
3.1. Broad Band Optical
3.1.1. SS Environment
One of the characteristics of the best known local examples of compact groups (H1982;
Iovino 2002) involves the low galaxy surface density environments in which they are found.
Since they are usually selected with an isolation criterion it is not surprising that they are
at least locally isolated but they are often so compact that this does not necessarily mean
very much in the context of loose group scales. Attempts have been made to estimate
the galaxy surface density near H1982 groups over a larger area/volume (Sulentic 1987;
Rood & Williams 1989) and a redshift survey has also identified accordant redshift neighbors
around 17 Hickson groups (de Carvalho et al 1997). Many were found to be quite isolated
even on Mpc scales where they are often found on the periphery of nearby superclusters
in stark contrast to their implied space densities that can exceed those of cluster cores.
SS is arguably the most compact group in the local Universe showing the largest surface
density enhancement of any Hickson group. A little reconnaissance usually allows one to
identify the component of large scale structure with which a compact group is associated.
SS can be assigned to group LGG403 (Garcia 1993; Rood & Struble 1994) whose identified
members span several Mpc. NED9 reveals only one accordant redshift (3400-5400km/s)
neighbor (UGC10127) within 30′ (∼ 0.5 Mpc) radius. Only four additional accordant (within
±1000 km s−1) galaxies are found within 60′ (CGCG137-004, UGC 10117, CGCG137-019,
NGC6032). This radius corresponds to crossing time tc∼ 5 Gyr assuming a random velocity
on the plane of sky of 200 km s−1.
Table 4 provides a census of the 17 known accordant redshift neighbors within 2 Mpc (an
Abell radius) of SS and within 1000 km s−1 of the mean group recession velocity. This census
is based upon SDSS images of the field and includes all galaxies brighter than g magnitude
of the faintest member of SS (H79d with g∼15.5; redshift implied luminosity similar to
LMC). Redshifts were taken from NED because SDSS does not provide spectroscopy for
this field. The g band survey also found twelve galaxies beyond 5500 km s−1 (many near
9This research has made use of the NASA/IPAC Extragalactic Database (NED) which is operated by the
Jet Propulsion Laboratory, California Institute of Technology, under contract with the National Aeronautics
and Space Administration.
– 11 –
10-11000 km s−1 associated with the Hercules Cluster), one galaxy near 2000 km s−1 and
three without redshift measures. An equivalent r-band census to r=15.8 (r-band magnitude
of H79d) yields many more galaxies (without redshifts) but visual inspection suggest that
all/most of these are likely to be much more distant. We adopted g-band census because: 1)
it shows higher redshift completeness, 2) we wanted to minimize background contamination
and 3) we regard late-type field galaxies as the principal source of infalling intruders as
suggested by NGC7318b in SQ and H79d in SS. The census yields a surface density of 1.3
galaxies Mpc−2, or 1.6 galaxies Mpc−2 if all three bright neighbors with unmeasured redshift
show accordant measures. Some recent surface density estimates range from ∼ 1 Mpc−2 for
the sparsest environments up to ∼ 6 Mpc−2 in the poorer cluster cores (Goto et al. 2003a).
SS shows a surface density of ∼7-8000 galaxies Mpc−2 and a surface density enhancement
of ∼5-6000 in agreement with Sulentic (1987). SS shows the highest density enhancement
of any compact group in the local Universe and one of the lowest galaxy surface densities in
its Mpc-scale environment.
3.1.2. SS Component/Neighbor Morphologies and Geometries
SS involves four or five accordant redshift (H79abcdf) galaxies plus one discordant
redshift galaxy (H79e). H79f on the NE edge of the group can be described either as
a tidal tail or as the remnants of a tidally stripped galaxy. The mean separation be-
tween the galaxies is about 7.2 kpc and the mean velocity dispersion σV = 121 km s−1
(Da Rocha & Mendes de Oliveira 2005, hereafter D2005). Figure 1 identifies specific com-
ponents of the group following designations in Hickson (1982, 1993a) with the addition of
H79f.
Table 4 gives estimated Hubble types for assumed members of SS as well as all neighbors
within a radius of ∼2 Mpc. Positions and recession velocities are given for all galaxies along
with projected separations in arcmin and kpc for the neighbors. SS members show unusual
and sometimes ambiguous structure. Figures 3 and 4 present the most interesting standard
geometric profiles for the brightest two member galaxies (H79ab). We derived these measures
from r-band SDSS images. Results for g-band were very similar. Several sets of geometric
profiles and derived parameters have already been given for galaxies in SS: Hickson et al.
(1989a, hereafter H1989a); Rubin et al. (1991, hereafter R1991); Bettoni & Fasano (1993,
hereafter B1993); Nishiura et al. (2000a, hereafter N2000a). A serious problem with deriv-
ing standard parameters for SS components involves the fact that they are embedded in a
luminous halo. For example the r-band surface brightness of the last concentric isophotes in
H79abc are 21.7, 21.0 and 21.2 mag arcsec−2 respectively.
– 12 –
The three brightest members (H79abc) all show early-type morphologies in the simple
sense that they are axially symmetric with no obvious spiral arms or visible emission regions.
H79a (NGC6027a) shows a very smooth light distribution and an ellipticity consistent with
Hubble type E3-4 although it has been classified E0, S0 and Sa in the past. It is bisected
by a prominent dust lane adding to the confusion in assigning a type and in determining
the position of the nucleus. The relaxed appearance (i.e. flatness) of the dust lane forces
us to consider the possibility that H79a might be an edge-on S0 with a weak stellar disk
component. The alternative interpretations are that the dust lane: 1) hints that H79a was
originally a spiral galaxy or 2) is the relaxed signature of a past accretion event. “Relaxed”
is perhaps an overstatement because the dust lane shows a pronounced bend (see Figure
1) in the direction towards the center of the group. Figure 3 shows azimuthally averaged
surface brightness and b4 profiles for this galaxy derived with fixed position angle (68◦) and
ellipticity (ǫ=0.36). In the figures amax indicates the semimajor axis of the last concentric
isophote. Isophotal boxiness is observed in the center and is probably induced by the dust
lane (see also B1993). No surface photometric study of this galaxy has revealed a stellar
disk component that might be a counterpart to the dust disk.
The unusual shape and internal structure of H79b revealed by HST images (Figure 1)
do not lend themselves to a standard geometric analysis. Figure 4 shows evidence for two
disk components (centered at ≈ 2-3′′and 5-8′′) in both surface brightness and b4 parameter.
Seeing in the SDSS r-band image is ∼2.5 pixels corresponding to ∼1′′. The above mentioned
WFPC2 images show signs of highly inclined internal (spiral?) structure (see Figure 1 upper
right where a tightly wrapped spiral dust lane is seen). Earlier WFPC1 images revealed
the presence of a twisted dust lane oriented approximately diagonally across the galaxy
(Sulentic et al. 1994). The axial ratios of H79b and c suggest that both are highly inclined
to our line of sight. The surface brightness and b4 profiles for H79c also indicate considerable
complexity. The WFPC2 images suggest that the tidal tail extending to the NW originates
near this galaxy. It crosses the disk at an angle of about 20◦ forming an apparent “X”
structure (see Figure 1 lower right).
H79d is the only member that shows a late-type (spiral) morphology with numerous
condensations resembling HII regions detected on many images but most dramatically with
WFPC2. It is highly inclined with an axial ratio of 0.18 suggesting an inclination of 80◦.
H79d appears to be projected on H79a because a few dusty condensations can be seen in
silhouette against the halo light of that galaxy on the WFPC2 images (Palma et al. 2002).
Some published studies suggest a link between galaxies H79ad (R1991; Plana et al. 2002).
H79e shows a much higher redshift and is assumed to be a near face-on high luminosity
ScI spiral at approximately 4.5× greater distance. H79f lies to the NE of H79b and is either
– 13 –
a tidal filament or another early-type member. It was not included as a member by Hickson
(1982, 1993a) yet the RC3 catalog (de Vaucouleurs et al. 1991, herafter RC3) lists it as a
galaxy with designation NGC6027e. The surface brightness profile for this galaxy follows
an exponential law. The position angle and ellipticity profiles in the outer part of H79f
are constant (∼50◦ and ∼0.57, respectively). The surface brightness of the last concentric
isophote in H79f is 21.6 mag arcsec−2 in r-band and 22.3 mag arcsec−2 in g-band. The
central concentration and elliptical isophotes argue that it is a member galaxy however
in this interpretation it has likely been heavily stripped given the weakness of the central
concentration for an apparently early-type morphology (lacking any signs of gas or dust).
Perhaps more unusual than their internal peculiarities are the small measured sizes of
all members of SS. Table 5 presents different estimates for the sizes of the galaxies in SS.
We compare our SDSS based measurements with four previous studies (H1989a, B1993,
RC3 and N2000a). We find a large scatter among the measures consistent with the difficult
task of extracting discrete diameters from galaxies embedded in a luminous halo. Measured
diameters exceed 10 kpc only if one attempts to apply a standard model of the galaxy
that extends beyond the last concentric isophote. We used SDSS g and r band images to
determine the last concentric major/minor axis isophotes in each galaxy. We think that
attempts to measure standard diameters (e.g. 25 mag arcsec−2) have little or no meaning
in the context of individual galaxy properties since this level is three magnitudes below
the surface brightness level of the last concentric isophote. The luminous halo of SS likely
contains a significant fraction of the stellar mass of galaxies H79abc and especially H79f.
Attempts at model-based (e.g. exponential and r1/4) galaxy subtraction of H79abcdf suggest
that the halo is not a product of isophotal overlap (Sulentic & Lorre 1983, N2000a). Galaxy
H79d is the only component of SS that shows little sign of tidal stripping and appears to be
a recently arrived low luminosity late type spiral.
The shape and extent of the luminous halo in SS is indicated by two contours in Figure
1. The inner very irregular contour shows the extent of the halo on HST and SDSS images.
In the latter case this correspond to 24.7 and 24.2 mag arcsec−2 in g and r-bands respectively.
The outer more symmetric contour shows the the circle best fitting the halo extent on more
sensitive NOT B-band images (see also Figure 7) and corresponds to 27 mag arcsec−2. The
radius of the outer circle is 1.3 arcmin (∼ 23 kpc). The SDSS sky levels at that radius are
26.4 and 26.2 arcsec−2 for g and r-bands respectively.
Seventeen accordant redshift neighbors brighter than g=15.5 lie within ±1000 km s−1
and r=2 Mpc of SS. Table 4 lists the assigned Hubble types for the galaxies with 75-80% of
SS members (3/4 or 4/5 depending on whether H79f is considered) and 30-40% of neighbors
showing early-type (E/S0 or E/S0/Sa) morphologies. Recent morphological reevaluation of
– 14 –
a sample of about 1000 very isolated field galaxies (Sulentic et al. 2006) leads us to predict a
∼14% early-type fraction in SS and in its neighborhood. The SS environment shows a 2-3×
higher early-type fraction so this prediction is likely too low. A recent quantification of the
morphology-density relation (Goto et al. 2003a) finds 16% E plus 30% S0 for environments
with surface density similar to the SS neighborhood suggesting that the observed early-type
galaxies are overrepresented in SS if we accept H79abc, and possibly f, as bona fide E/S0
galaxies.
Table 6 provides g-band major axis diameters at the 25 mag arcsec−2 isophote derived
from the SDSS images for thirteen accordant redshift neighbors. Comparison of these di-
ameters with those for SS components leads to the conclusion that the galaxies in SS are
3-4 times smaller. A similar conclusion was found by Williams et al. (1991) where they
noted that the individual galaxies in SS are on average one third the size of a typical normal
galaxy. We estimated the diameters of neighboring S0-Sb galaxies truncated to the same
surface brightness level as the last concentric isophotes in H79abc. We find neighbor diam-
eters in the range 4-7 kpc at µg=21.5 mag arcsec−2 and 4-12 kpc at µg=21.8 mag arcsec−2
compared to 5-8 kpc for H79abc at their last concentric isophotes. The SS members are
therefore more similar in size to the bulge components of neighboring spiral galaxies. The
galaxies in SS are either: a) intrinsically dwarf or b) normal galaxies that have undergone
severe tidal stripping. The angular size of the entire group is ∼1.3 arcmin (H1982) ∼23
kpc which is comparable to the size of some of the neighboring disk galaxies. The massive
common halo in SS implies significant stripping and disfavors the hypothesis that most SS
members are intrinsically dwarf galaxies.
3.1.3. SS Component and Neighbor Luminosities
Table 7 presents apparent magnitudes for members of SS in different filters. We compare
our g and r-band SDSS based measurements to H1989a, R1991, RC3 and N2000a. Our
apparent magnitudes measure the light within the last concentric isophote corrected for
galactic and internal extinction as well as K-corrected. Extinction corrections were performed
using The York Extinction Solver (YES)10 (McCall 2004). YES allows a user to determine
the optical depth at 1µm from an estimate of the color excess, and then to determine the
extinction of the target from the optical depth. Color excess is estimated using Schlegel et al.
(1998) extinction maps employing a Fitzpatrick (1999) reddening law.
Table 8 presents our g and r-band absolute magnitudes and luminosities for SS galaxies.
10The York Extinction Solver (YES) at http://cadcwww.hia.nrc.ca/yes
– 15 –
As noted earlier the galaxies appear to be remarkably luminous for their small sizes which are
more similar to the size of the bulges of late-type neighbors. Along with diameters, Table 6
presents absolute magnitudes, total luminosities and bulge luminosities for the accordant red-
shift neighboring galaxies. Overlapping structure in the close spiral pair NGC6052 prevents
precise determination of their sizes and magnitudes. Other late-type neighbors (NGC6028
and CGCG108-085) lack any SDSS imaging data. Apparent magnitudes are corrected model
magnitudes (modelMag- better of exponential/deVaucouleurs fit) given by the SDSS DR5
pipeline. The total luminosities in each filter were calculated using the formulae:
LgT = 100.4(Mg⊙−gTC+5logD−5)(Lg⊙)
LrT = 100.4(Mr⊙−rTC+5logD−5)(Lr⊙)
where Mg⊙ = 5.12 and Mr⊙ = 4.68 are adopted for g and r absolute magnitudes of the Sun
respectively. To express the luminosities in terms of bolometric solar luminosity we used
M⊙ = 4.76 which implies ratios L⊙/Lg⊙ = 1.39 and L⊙/Lr⊙ = 0.93. The assumed distance
is D= 60 Mpc. Bulge luminosities are estimated considering a bulge to disk ratio (B/D) ∼ 1
for Sa, ∼ 0.65 for Sab, ∼ 0.4 for Sb, ∼ 0.1 for Sc and ∼ 0.01 for Sd morphological type (Kent
1985; Koppen & Arimoto 1990) and the equation: B/T = 1/(1 + D/B), where T is total
luminosity. B/T is assumed to be 0.68 for SO morphological type (Kent 1985). Inspection
of Tables 6 and 8 shows that the total luminosities of galaxies H79abc are comparable to the
bulge luminosities of the Sb-Sc and SO neighbors.
Figure 5 plots apparent diameter versus g-band magnitude for SS galaxies (open circles)
and thirteen accordant redshift neighbors (filled squares): 1) within ±1000 km s−1, 2) within
2 Mpc radius and 3) brighter than g=15.5. Measured diameters for the neighbors correspond
to the 25 mag arcsec−2 g-band isophote. We used the corrected modelMag values from SDSS.
We also plot the bulges for SO and Sb-Sc neighbors with sizes and magnitudes corresponding
to the 21.8 mag arcsec−2 g-band isophote. Diameters and magnitudes for SS components
correspond to the last concentric g-band isophote. The plot shows the expected correlation
between angular diameter and apparent magnitude for the accordant neighbors. It is rea-
sonably well fit by the indicated linear regression line. The brightest neighbor NGC6060 is
similar in luminosity to M31 (Mg ∼ −21.5) while H79d is similar to the LMC (Mg ∼ −18.2).
H79f, considered as a galaxy, would be 0.4 magnitudes fainter than the SMC (Mg ∼ −16.9).
Apparent g-band magnitudes for M31, LMC and SMC were estimated from V magnitude and
B-V color using the transformation equation: g = V +0.6(B−V )−0.12 (Jester et al. 2005).
Conversion to absolute magnitudes assumed distances of ∼ 750 kpc for M31 (Ribas et al.
2005), ∼ 50 kpc for LMC and ∼ 60 kpc for SMC (Keller & Wood 2006). SS members are
smaller than all of the galaxies in our neighborhood sample.
– 16 –
Figure 5 shows that H79abc are similar in apparent brightness to the faintest neigh-
bors, but they show much higher mean surface brightness. H79abc show g-band mean
surface brightness within the last concentric isophote µg=19.9-21.1 mag arcsec−2 compared
to µg=22.5-23.5 mag arcsec−2 calculated within the 25 mag arcsec−2 isophote for neighbors.
The two neighbors with most similar size and apparent brightness show µg=22.5-22.9 mag
arcsec−2. Galaxies in SS show much higher mean surface brightness and are embedded in a
luminous halo. Their sizes and surface brightness are more similar to the bulge components
of neighboring spiral and SO neighbors. The mean surface brightness of one of the brightest
neighboring Sb galaxies (NGC6008) would increase from 22.9 to 20.8 mag arcsec−2, while
the diameter would decrease from 1.5 to 0.2 arcmin if we consider only the central bulge.
The overall mean surface brightness of SS is also high. It is by far the highest observed (20.5
mag arcsec−2) for any H1982 group. Only three other groups (HCG8, 40 and 95) shows
values within one magnitude (21.3-21.4 mag arcsec−2). Allowing for a different zero point in
the surface brightness scale suggests that none of the 121 southern compact groups (Iovino
2002) approaches the surface brightness of SS.
Figure 6 is a composite of the B and R images showing the extension of the diffuse
halo. According to D2005 the halo contributes ∼ 46% of the total light in B band (see also
Sulentic & Lorre 1983). We get a similar result with g and r band SDSS images. The halo
is a fraction of 46 ± 10% and 45 ± 10% of the total light in g and r band, respectively, if
we don’t include galaxy H79f as part of the halo. This corresponds to a corrected apparent
magnitude of g = 13.4 ± 0.1 and r = 12.9 ± 0.1. If we included H79f, the halo contribution
would raise by 2% in both g and r band. We estimated the diffuse light in SQ using the
magnitudes of the halo and component galaxies given in Moles et al. (1998). The diffuse
light component represents ∼ 13% of the total light, suggesting that SQ is a less evolved
compact group, younger than SS. The early-type fraction in SQ is about 40 − 50%.
A diffuse light image was derived for SS using the wavelet technique (Figure 6 in D2005).
The symmetry and smoothness of the halo light distribution in Figure 6 suggests a reasonable
degree of relaxation compared to e.g. SQ. There are two peaks in the halo light distribution
of SS. One is coincident with the NW tidal tail marked in that figure. The other, which
does not coincide with a galaxy or tail, lies much closer to the center of the diffuse light
distribution. We attempted to model the radial profile of the CFHT B-band halo image
(D2005) and find that an exponential yields the best fit. We get disk scale lengths Rd= 23
and 28 kpc, centered, respectively, on an approximate outer halo contour (circle in Figure
1 left) and on the SE condensation. We also attempted de Vaucouleurs and Sersic fits on
the surface brightness profile of the halo. However, they could be applied only for the outer
part and even so we obtained unphysical results, namely extreme values for the effective
radii. While the overall halo is smooth and roughly circular, consistent with relaxation, the
– 17 –
condensation connected with the tidal tail indicates that the halo is still growing.
3.1.4. Group Morphology and Colors
We supplement published color information on SS with our SDSS g-r and our NOT
B-R measures. Table 9 lists new and old color measures for group members as well as the
halo while Figure 7 shows our best attempt at a 2D B-R color image. Tabular results are
consistent with Figure 7. The central region of H79a shows the reddest color (B-R∼1.6-
1.8) due to the presence of the strong dust lane. The inner parts of galaxies H79a/b show
B-R∼1.5 which is typical of an early-type or bulge stellar population. The outer parts of
galaxies H79a/b as well as H79f show B-R∼1.3-1.4. The color of galaxy H79f is in good
agreement with Nishiura et al. (2002). Galaxy H79c, much of the diffuse halo as the NW
tidal tail show B-R∼1.2-1.3 while the outer halo is distinctly bluer at B-R∼0.8-1.1. All results
indicate that galaxy H79c is bluer than galaxies H79a/b with complex color structure. It
is bluest on the side towards the center of the group. The bluest colors are seen in galaxy
H79d with B-R∼0.7-0.9 which is typical of a late type spiral. We see a slight color difference
∆(B − R)=0.3 along the major axis with reddest color in the direction of galaxy H79a.
Color measures for the halo component are the most complex. We find a mean halo
color that is bluer than galaxies H79a/b and more similar to galaxies H79c/f. D2005 also
reported a much bluer color for the halo B-R=0.9 compared to B-R=1.5 for the galaxies.
We derived halo properties after subtracting galaxies at their last concentric isophote which
might leave a significant red galaxy component in our halo measures. The wavelet technique
employed for the D2005 estimates more effectively removes the galaxies leaving a much
flatter halo. The resultant galaxy color will be dominated by red galaxies H79a/b. The
wavelet derived halo color is similar to galaxy H79d. Figure 7 suggests that the halo shows
a significant color gradient and that the outer parts are as blue as those of a late-type
spiral. If the mean color of H79d is B-R=0.8 then we can adopt a mean halo color of B-
R=1.0±0.2 as a best estimate. B-R colors were only corrected for galactic extinction using
Burstein & Heiles (1982). Other corrections are very dependent on the morphological type,
which is uncertain for some members of the group. An internal extinction correction for
galaxy H79d (morphological type Sd) would make it 0.2 B-R magnitudes brighter. The
color of the outermost halo isophotes will be sensitive to the S/N match between the B and
R frames; our estimate based on the intermediate halo color is likely to be more robust.
– 18 –
3.2. Optical Line (Hα Emission)
Figure 8 presents a continuum subtracted Hα image derived from the CFHT Fabry-Perot
observations. Figure 9 shows a similar continuum subtracted interference filter (IF) image
obtained with the Calar Alto 2.2m telescope that confirms all features seen in Figure 8. The
former provides higher sensitivity and resolution while the latter image gives a much larger
field of view that allows a search to be made for stripped warm gas or gas rich companions.
In this section we use the 3D CFHT data only as the source of an additional 2D Hα map.
Hα emission is detected from galaxies H79a, b and d. Emission is detected over the full
optical extent of galaxy H79d while emission from H79a and b is detected only in the central
regions. The weak emission signature associated with H79c is not confirmed with our slit
spectra and is likely an artifact of the strong Balmer absorption detected in that galaxy.
Table 10 summarizes new and published Hα fluxes for these galaxies including both IF
and slit spectral measures. The former include a contribution from [NII] λ6548,83 emission.
Our flux measures have an uncertainty lower than ±10%, computed as Poissonian error. We
find a large scatter among published EW Hα(+[NII]λ6548,83) measures: 1-7A, 4-8A and
13-116A (Iglesias-Paramo & Vılchez 1999; Coziol et al. 2004, N2000a) for galaxies H79a,b
and d respectively. We measure 10A, 9A and 36A, respectively, for the three galaxies. [NII]
contamination could not be avoided with the IF filter employed (FWHM= 76A). Typical
EW for E/SO galaxies range from -3 to 4A (Kennicutt 1998). Our EW measure for H79d
is similar to published values for normal Sd galaxies (Kennicutt 1998; James et al. 2004). A
mean EW Hα=36A was found in a recent study involving Sd galaxies (James et al. 2004).
Hα flux measures for H79d tabulated in Table 10 show much less scatter than EW estimates
reflecting the uncertainty of the continuum normalization for this late-type edge-on galaxy.
We estimate a star formation rate (SFR= 0.07 M⊙ yr−1) which is smaller than the mean
value (0.6 M⊙ yr−1) found for normal Sd spirals (Kennicutt 1983; James et al. 2004). SFR
is computed using the formula derived for normal disk galaxies:
SFR(M⊙ yr−1) = 7.9 × 10−42 L(Hα) (ergs s−1)
assuming a Salpeter (1955) initial mass function (IMF) with mass limits 0.1 and 100 M⊙
(Kennicutt 1998). We derived the net Hα luminosities using the [NII]λ6583/Hα line ratios
from N2000a. The SFR for H79d increases to ∼0.11 if we apply the same (1.1 magnitude)
extinction correction as used in James et al. (2004). Hα flux and derived SFR values for
H79d therefore show no evidence for an interaction induced enhancement.
Using the same formula we estimate SFR ∼ 0.05 and 0.06 M⊙ yr−1 for galaxies H79a
and b, respectively. The [NII]λ6583/Hα line ratio is ∼ 0.5 for both galaxies (N2000a) which
is at the lower limit of the typical values (0.5-3) found for early-type galaxies (Phillips et al.
– 19 –
1986). Hα emission in galaxies H79a and b shows an extension on a scale of 3-4 kpc, larger
than the typical size of Hα emission regions in early type galaxies(< 3 kpc) (Phillips et al.
1986). Apparently there is too much gas in H79a/b if they are interpreted as normal SO
galaxies. The emission in H79a shows two condensations separated by 3′′ superimposed on
weaker more extended emission. One component (NE) is coincident with or slightly E of the
position of the optical nucleus and lies at the end of an apparent emission “bridge” between
H79d and H79a that can be seen in Figure 8. The other component (SW) is about 0.74× the
intensity of the NE component. Galaxy H79b shows a compact central emission component
with diameter D ∼ 5′′ superimposed on a weak elongated diffuse component with major axis
diameter D ∼ 15′′. The latter component shows distinct curvature or warping. The central
component appears to be slightly offset towards the N on Figure 8.
We estimated the mass of ionized gas following Phillips et al. (1986) where:
Mionized gas = (LHαmH/Ne)/(4πjHα
/NeNp)
where LHαis the Hα luminosity, mH is the mass of the hydrogen atom, jHα
is the Hα
emissivity, Ne and Np are the electron and proton densities, respectively. The assumed
electron temperature was 104 K. [SII] λ6717/λ6731 line ratio was used as an electron density
indicator (Osterbrock & Ferland 2006). [SII] λ6717/λ6731 line ratios for galaxies H79b and
d are estimated from our slit spectra and are tabulated in Table 11 along with other line
ratios. No [SII] λ6717/λ6731 line ratio exists for galaxy H79a so we adopted the same ratio
as galaxy H79b. The value for 4πjHα/NeNp was derived using the HI recombination line
tables of Osterbrock & Ferland (2006). The computed ionized gas masses are 7.5×10⁴M⊙,
9.2×10⁴M⊙, 3.5×10⁵M⊙ for galaxies H79a, b and d, respectively. The ionized gas masses
for galaxies H79a and b are within the range of values (between 103 and 105 M⊙) found
by Macchetto et al. (1996) for luminous elliptical and lenticular galaxies. On the other
hand Phillips et al. (1986), using a larger sample of early-type galaxies, report a mean value
between 103 and 104 M⊙. This would place galaxies H79a and b at the upper end of the
distribution of ionized gas masses for early-type galaxies. Emission line diagnostic diagrams
of Kewley et al. (2006) suggest that much of the gas in H79a may be related to the AGN
rather than to star formation so the already uncertain estimated mass may be too high.
[OIII]/Hβ line ratio of Coziol et al. (2004) is used.
We used the larger field of view of our PUMA (10′×10′) and Calar Alto (13′×5′) ob-
servations to search for Hα emission from other galaxies in the field that might represent
previously unknown neighbors of SS. The search was performed two different ways: using
ADHOCw software and IRAF task DAOFIND imposing a threshold of 4σ. No candidates
were found implying that no gas rich dwarf systems similar to H79d lie within ∼ 90 kpc.
We also looked for discrete Hα condensations similar to the ones found in the debris field of
– 20 –
SQ (Sulentic et al. 2001). We required confirmation on at least two independent Hα images
with agreement within a few arcsec to allow for field distortion.
3.3. Optical Spectroscopy
3.3.1. Hα emission
H79d is the only galaxy in SS that shows a normal late-type ISM. Figure 10 compares
new Fabry-Perot (FP) and slit Hα line of sight velocity curves. They show good agreement
(also with R1991, Mendes de Oliveira et al. 2003 and Nishiura et al. 2000b) when differing
spatial/spectral resolutions are taken into account. The rotation curves are not strongly
distorted suggesting (along with gas content) that H79d is a relatively recent arrival without
evidence of strong perturbation. Figure 10 suggests a reasonable estimate for the maximum
rotation velocity vmax for galaxy H79d is ∼ 100 km s−1 after correction for 80◦ inclina-
tion. Using vmax we derive a mass within 13′′ radius (R ∼ 3.8 kpc) of ∼ 9 × 10⁹M⊙
thus (M/Lr)H79d ∼ 6 M⊙/L⊙. R1991 find the mass to R25 for H79d ∼ 3 × 10¹⁰M⊙ and
(M/LB)H79d ∼ 3.7 M⊙/L⊙, using the mass and luminosity within R25, radius corresponding
to 25 mag arcsec−2 in B-band.
Figure 11 presents the line of sight velocity curve for H79a. We plot the heliocentric ve-
locity along the major axis of the Hα emission from FP interferometry using CFHT-MOS/SIS
data. Our PUMA measures were indispensable in interpreting the higher resolution and S/N
CFHT ones. PUMA has more than three times the free spectral range of CFHT and was able
to resolve the order overlap that affected the higher resolution and S/N CFHT measures.
The larger free spectral range of our PUMA data was used to resolve velocity redundancy
inherent in the higher sensitivity CFHT FP data. A published stellar velocity curve based
on long slit observations (Bonfanti et al. 1999) is superimposed on this plot. In order to
match the long slit data, we mimic a slit through our FP data at PA=65◦. We find two
Hα velocity components: 1) a weak and compact (∼ 5′′) nuclear component with velocities
(∼ 4180 km s−1) very similar to stellar values in the nuclear region (this is part of the NE
spatial component in Figure 8) and 2) a more extended (at least ∼ 8′′) higher velocity (∼
4360 km s−1) component (part of NE and all of SW components in Figure 8). The NE spatial
component is more intense because it involves Hα emission from both velocity components.
The infalling emission shows almost constant velocity that, at the center, is ∼150 km s−1
higher velocity than the starlight. The match with the stellar velocity curve suggests that
velocity component 1 is nuclear gas and that velocity component 2 can be interpreted as an
infalling sheet of gas.
– 21 –
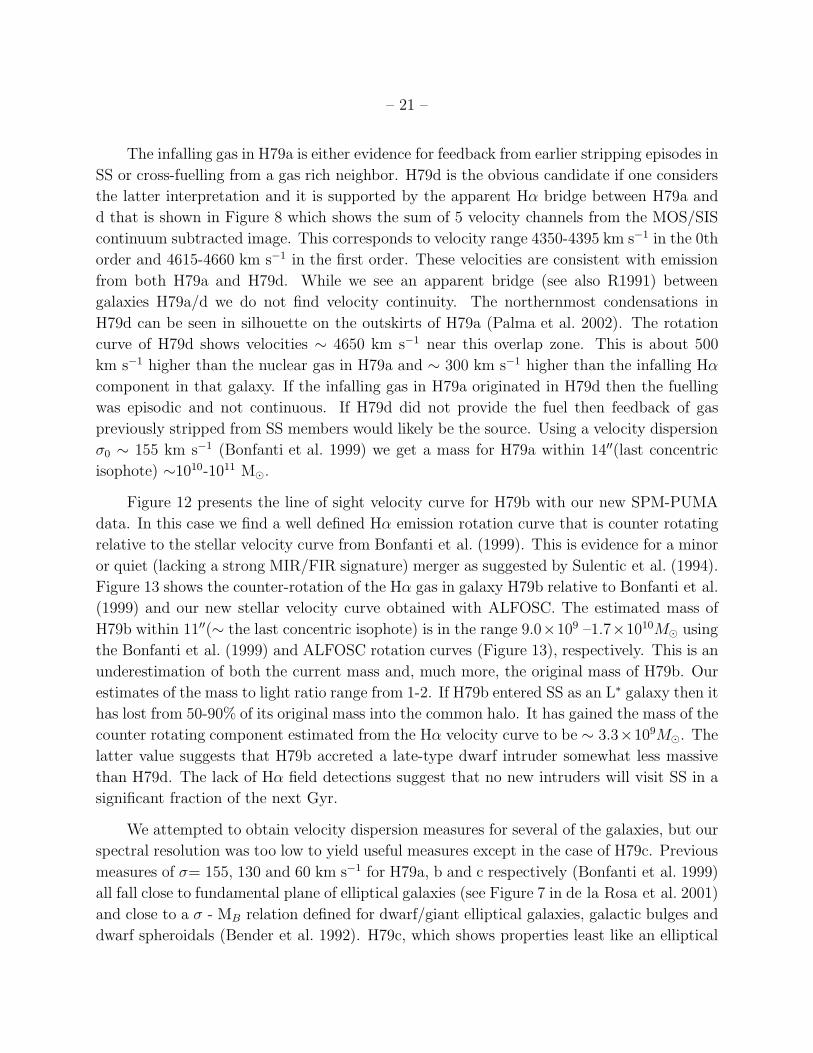
The infalling gas in H79a is either evidence for feedback from earlier stripping episodes in
SS or cross-fuelling from a gas rich neighbor. H79d is the obvious candidate if one considers
the latter interpretation and it is supported by the apparent Hα bridge between H79a and
d that is shown in Figure 8 which shows the sum of 5 velocity channels from the MOS/SIS
continuum subtracted image. This corresponds to velocity range 4350-4395 km s−1 in the 0th
order and 4615-4660 km s−1 in the first order. These velocities are consistent with emission
from both H79a and H79d. While we see an apparent bridge (see also R1991) between
galaxies H79a/d we do not find velocity continuity. The northernmost condensations in
H79d can be seen in silhouette on the outskirts of H79a (Palma et al. 2002). The rotation
curve of H79d shows velocities ∼ 4650 km s−1 near this overlap zone. This is about 500
km s−1 higher than the nuclear gas in H79a and ∼ 300 km s−1 higher than the infalling Hα
component in that galaxy. If the infalling gas in H79a originated in H79d then the fuelling
was episodic and not continuous. If H79d did not provide the fuel then feedback of gas
previously stripped from SS members would likely be the source. Using a velocity dispersion
σ0 ∼ 155 km s−1 (Bonfanti et al. 1999) we get a mass for H79a within 14′′(last concentric
isophote) ∼1010-1011 M⊙.
Figure 12 presents the line of sight velocity curve for H79b with our new SPM-PUMA
data. In this case we find a well defined Hα emission rotation curve that is counter rotating
relative to the stellar velocity curve from Bonfanti et al. (1999). This is evidence for a minor
or quiet (lacking a strong MIR/FIR signature) merger as suggested by Sulentic et al. (1994).
Figure 13 shows the counter-rotation of the Hα gas in galaxy H79b relative to Bonfanti et al.
(1999) and our new stellar velocity curve obtained with ALFOSC. The estimated mass of
H79b within 11′′(∼ the last concentric isophote) is in the range 9.0×10⁹ –1.7×10¹⁰M⊙ using
the Bonfanti et al. (1999) and ALFOSC rotation curves (Figure 13), respectively. This is an
underestimation of both the current mass and, much more, the original mass of H79b. Our
estimates of the mass to light ratio range from 1-2. If H79b entered SS as an L∗ galaxy then it
has lost from 50-90% of its original mass into the common halo. It has gained the mass of the
counter rotating component estimated from the Hα velocity curve to be ∼ 3.3×10⁹M⊙. The
latter value suggests that H79b accreted a late-type dwarf intruder somewhat less massive
than H79d. The lack of Hα field detections suggest that no new intruders will visit SS in a
significant fraction of the next Gyr.
We attempted to obtain velocity dispersion measures for several of the galaxies, but our
spectral resolution was too low to yield useful measures except in the case of H79c. Previous
measures of σ= 155, 130 and 60 km s−1 for H79a, b and c respectively (Bonfanti et al. 1999)
all fall close to fundamental plane of elliptical galaxies (see Figure 7 in de la Rosa et al. 2001)
and close to a σ - MB relation defined for dwarf/giant elliptical galaxies, galactic bulges and
dwarf spheroidals (Bender et al. 1992). H79c, which shows properties least like an elliptical
– 22 –
galaxy, also shows the largest deviation from σ - MB relation in the sense that the velocity
dispersion is too low. Our corrected estimate for H79c is slightly higher at σ=89 km s−1.
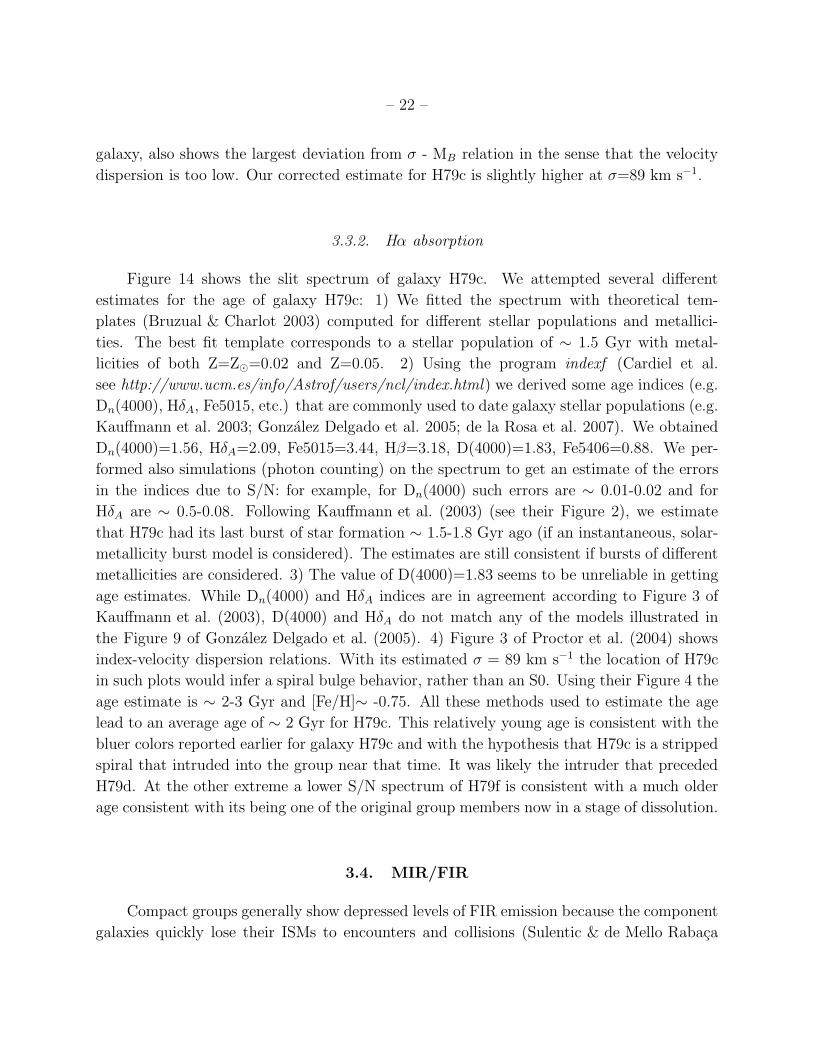
3.3.2. Hα absorption
Figure 14 shows the slit spectrum of galaxy H79c. We attempted several different
estimates for the age of galaxy H79c: 1) We fitted the spectrum with theoretical tem-
plates (Bruzual & Charlot 2003) computed for different stellar populations and metallici-
ties. The best fit template corresponds to a stellar population of ∼ 1.5 Gyr with metal-
licities of both Z=Z⊙=0.02 and Z=0.05. 2) Using the program indexf (Cardiel et al.
see http://www.ucm.es/info/Astrof/users/ncl/index.html) we derived some age indices (e.g.
Dn(4000), HδA, Fe5015, etc.) that are commonly used to date galaxy stellar populations (e.g.
Kauffmann et al. 2003; Gonzalez Delgado et al. 2005; de la Rosa et al. 2007). We obtained
Dn(4000)=1.56, HδA=2.09, Fe5015=3.44, Hβ=3.18, D(4000)=1.83, Fe5406=0.88. We per-
formed also simulations (photon counting) on the spectrum to get an estimate of the errors
in the indices due to S/N: for example, for Dn(4000) such errors are ∼ 0.01-0.02 and for
HδA are ∼ 0.5-0.08. Following Kauffmann et al. (2003) (see their Figure 2), we estimate
that H79c had its last burst of star formation ∼ 1.5-1.8 Gyr ago (if an instantaneous, solar-
metallicity burst model is considered). The estimates are still consistent if bursts of different
metallicities are considered. 3) The value of D(4000)=1.83 seems to be unreliable in getting
age estimates. While Dn(4000) and HδA indices are in agreement according to Figure 3 of
Kauffmann et al. (2003), D(4000) and HδA do not match any of the models illustrated in
the Figure 9 of Gonzalez Delgado et al. (2005). 4) Figure 3 of Proctor et al. (2004) shows
index-velocity dispersion relations. With its estimated σ = 89 km s−1 the location of H79c
in such plots would infer a spiral bulge behavior, rather than an S0. Using their Figure 4 the
age estimate is ∼ 2-3 Gyr and [Fe/H]∼ -0.75. All these methods used to estimate the age
lead to an average age of ∼ 2 Gyr for H79c. This relatively young age is consistent with the
bluer colors reported earlier for galaxy H79c and with the hypothesis that H79c is a stripped
spiral that intruded into the group near that time. It was likely the intruder that preceded
H79d. At the other extreme a lower S/N spectrum of H79f is consistent with a much older
age consistent with its being one of the original group members now in a stage of dissolution.
3.4. MIR/FIR
Compact groups generally show depressed levels of FIR emission because the component
galaxies quickly lose their ISMs to encounters and collisions (Sulentic & de Mello Rabaca
– 23 –
1993). Only recently formed groups or transient systems would be expected to show normal
or above normal emission. SQ revealed low levels of star formation igniting in the tidal debris
(Sulentic et al. 2001) with very little emission in the component galaxies. The expectation
for SS, viewed as significantly more evolved than SQ, would be that only recent unstripped
intruders might show significant FIR emission with a possible component from the debris
field. Our Hα search failed to turn up evidence for the latter component. The situation
is different for MIR emission where quasi-continuous interactions might efficiently channel
any residual unstripped gas into component nuclei. Thus MIR emission from a warm ISM
(HII regions) would not be expected while nuclear sources–sometimes connected with AGN
could be common. SQ tells us that warmer emission from large scale shocks or debris field
starbursts can also occur. We must rely upon the IRAS survey for information about FIR
emission in SS while a new ISO map provides insights into the MIR emission.
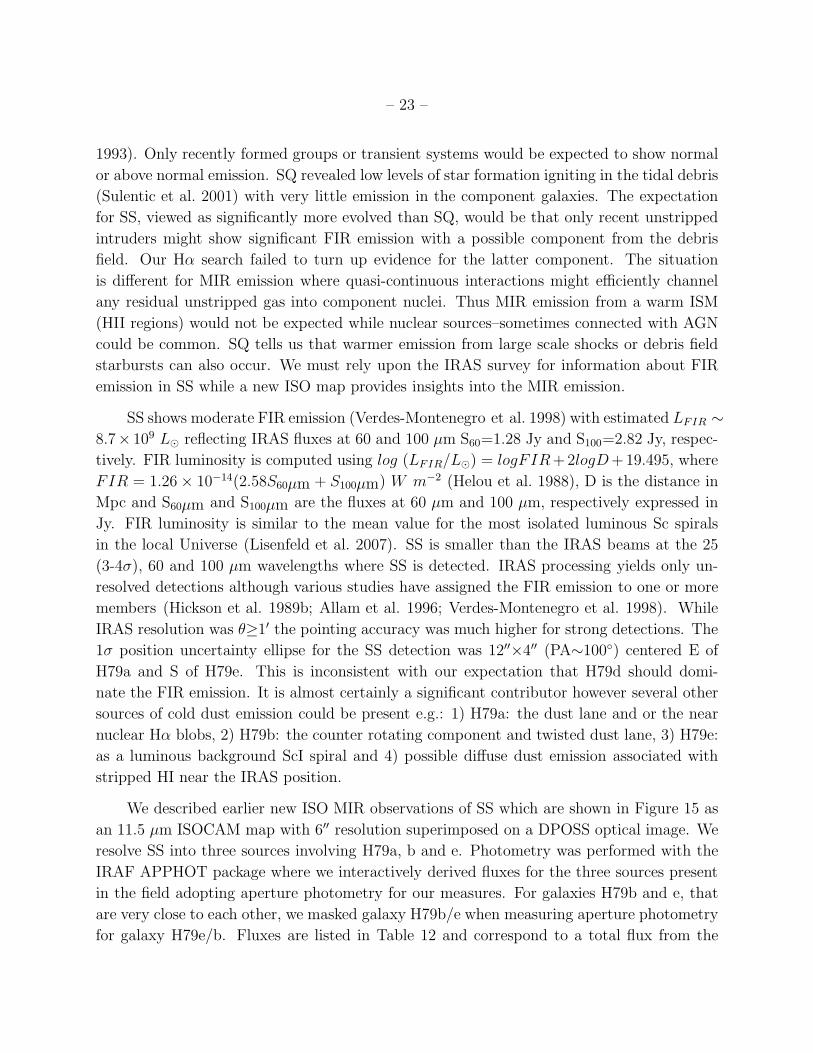
SS shows moderate FIR emission (Verdes-Montenegro et al. 1998) with estimated LFIR ∼
8.7× 10⁹ L⊙ reflecting IRAS fluxes at 60 and 100 µm S60=1.28 Jy and S100=2.82 Jy, respec-
tively. FIR luminosity is computed using log (LFIR/L⊙) = logFIR+2logD +19.495, where
FIR = 1.26 × 10⁻¹⁴(2.58S60µm + S100µm) W m−2 (Helou et al. 1988), D is the distance in
Mpc and S60µm and S100µm are the fluxes at 60 µm and 100 µm, respectively expressed in
Jy. FIR luminosity is similar to the mean value for the most isolated luminous Sc spirals
in the local Universe (Lisenfeld et al. 2007). SS is smaller than the IRAS beams at the 25
(3-4σ), 60 and 100 µm wavelengths where SS is detected. IRAS processing yields only un-
resolved detections although various studies have assigned the FIR emission to one or more
members (Hickson et al. 1989b; Allam et al. 1996; Verdes-Montenegro et al. 1998). While
IRAS resolution was θ≥1′ the pointing accuracy was much higher for strong detections. The
1σ position uncertainty ellipse for the SS detection was 12′′×4′′ (PA∼100◦) centered E of
H79a and S of H79e. This is inconsistent with our expectation that H79d should domi-
nate the FIR emission. It is almost certainly a significant contributor however several other
sources of cold dust emission could be present e.g.: 1) H79a: the dust lane and or the near
nuclear Hα blobs, 2) H79b: the counter rotating component and twisted dust lane, 3) H79e:
as a luminous background ScI spiral and 4) possible diffuse dust emission associated with
stripped HI near the IRAS position.
We described earlier new ISO MIR observations of SS which are shown in Figure 15 as
an 11.5 µm ISOCAM map with 6′′ resolution superimposed on a DPOSS optical image. We
resolve SS into three sources involving H79a, b and e. Photometry was performed with the
IRAF APPHOT package where we interactively derived fluxes for the three sources present
in the field adopting aperture photometry for our measures. For galaxies H79b and e, that
are very close to each other, we masked galaxy H79b/e when measuring aperture photometry
for galaxy H79e/b. Fluxes are listed in Table 12 and correspond to a total flux from the
– 24 –
group that is roughly a factor of two below the IRAS upper limit of 90 mJy quoted in
Moshir et al. (1990), while each galaxy flux is again a factor of two/three below the flux
limit estimated from the 12 µm MaxEnt IRAS map of Allam et al. (1996). The lack of an
11.5 µm detection for H79d is not surprising because late-type spirals tend to show a colder
ISM. At the same time a massive and 4.5× more distant ScI spiral like H79e was detected
by ISOCAM. MIR emission might be attributed to the active nucleus in H79a and to the
accretion event in H79b.
The blue and FIR luminosities of the neighbors detected by IRAS are presented in Table
13. All of them fall on the LB vs. LFIR correlation defined for isolated galaxies (Perea et al.
1997; Lisenfeld et al. 2007), except the pair UGC10197-8 which shows enhanced FIR emission
as expected. If we assume that all of the FIR emission (log (LFIR/L⊙) = 9.93) belongs to
H79d that would imply that it is about 27× brighter than the isolated galaxy expectation
(∼ 8.5) for sources of similar morphology and optical luminosity. There are two possible
scenarios: either the emission in galaxy H79d is enhanced by interaction with the rest of SS
or the FIR emission arises from several of the sources listed above.
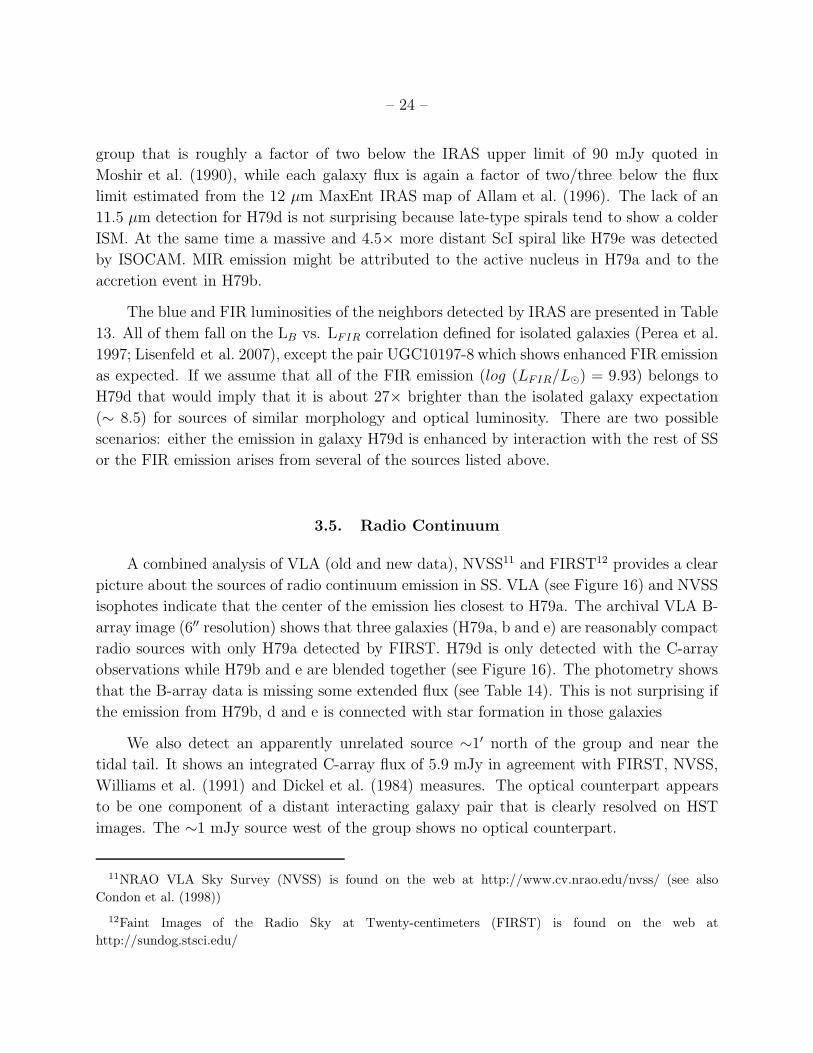
3.5. Radio Continuum
A combined analysis of VLA (old and new data), NVSS11 and FIRST12 provides a clear
picture about the sources of radio continuum emission in SS. VLA (see Figure 16) and NVSS
isophotes indicate that the center of the emission lies closest to H79a. The archival VLA B-
array image (6′′ resolution) shows that three galaxies (H79a, b and e) are reasonably compact
radio sources with only H79a detected by FIRST. H79d is only detected with the C-array
observations while H79b and e are blended together (see Figure 16). The photometry shows
that the B-array data is missing some extended flux (see Table 14). This is not surprising if
the emission from H79b, d and e is connected with star formation in those galaxies
We also detect an apparently unrelated source ∼1′ north of the group and near the
tidal tail. It shows an integrated C-array flux of 5.9 mJy in agreement with FIRST, NVSS,
Williams et al. (1991) and Dickel et al. (1984) measures. The optical counterpart appears
to be one component of a distant interacting galaxy pair that is clearly resolved on HST
images. The ∼1 mJy source west of the group shows no optical counterpart.
11NRAO VLA Sky Survey (NVSS) is found on the web at http://www.cv.nrao.edu/nvss/ (see also
Condon et al. (1998))
12Faint Images of the Radio Sky at Twenty-centimeters (FIRST) is found on the web at
http://sundog.stsci.edu/
– 25 –
We explore the well-known radio-FIR correlation (Dickey & Salpeter 1984) in order to
estimate/resolve the FIR flux from galaxies in SS. A complete sample of 250 normal spiral
galaxies brighter than B = 12 (Condon et al. 1991) shows the following strong correlation:
log (L1.4GHz [W Hz−1]) = 1.29 log (LFIR [L⊙]) + 8.76
(we adapted the coefficients for H◦ = 75 km s−1 Mpc−1). If we assume that radio emission
from H79b, d, e is dominated by star formation related processes then we expect that H79b
and d each account for 25% of the total FIR flux with galaxy H79e accounting for 15%. The
residual FIR emission is attributed to H79a (25-35%) involving perhaps emission from the
AGN, star formation and the strong dust lane. Using the predicted FIR fluxes we find that
all galaxies fall close to the FIR-optical correlation found by Lisenfeld et al. (2007) for very
isolated galaxies.
We also explore the radio continuum-MIR correlation using ISO MIR and C-array radio
continuum fluxes from Tables 11 and 13, respectively. Galaxies H79b and H79e closely
follow the correlation found in Gruppioni et al. (2003). Galaxy H79a falls somewhat above
the correlation showing excess radio continuum flux likely associated with the AGN.
3.6. Radio Line (21cm)
Williams et al. (1991) presented HI velocity channel maps for SS. The emission was
centered on H79d with weak emission extending to the E and NE apparently overlapping
H79f. Our new 21cm observations cover a wider velocity range (4275-4880 km s−1) with
detections in the range 4470-4680 km s−1 (see Figure 18). While most of the emission
originates in H79d, the new observations (see Figure 17) clarify the structure of the HI
tail towards the east. We do not confirm an overlap with H79f and find all the eastward
emission to be S of that galaxy. The velocities for the eastward emission are continuous
with the emission from H79d. This is either a coincidence or evidence that we are seeing
the first stages in the ISM stripping of H79d. The latter interpretation would exacerbate
the problem of the missing gas in SS (Verdes-Montenegro et al. 2001) leaving no residual gas
from galaxies H79a, b, c or f.
The velocities in the eastern tidal tail are similar to the velocities in the southern part
of galaxy H79d (see Figure 18–channel map at 4503 km s−1). Long one-sided HI tails have
been found in Virgo cluster spirals (Chung et al. 2007). Simulations of one of these galaxies,
NGC 4654, suggests that ram-pressure stripping may be the cause of such HI tails (Vollmer
2003). These galaxies are interpreted as recent arrivals into the Virgo cluster (Chung et al.
2007). If this interpretation applies to H79d then the tail may be telling us that it entered the
– 26 –
group from the NE. This does not provide additional support for the hypothesis that H79d
is crossfuelling H79a because the lowest velocity HI that falls near H79a shows a velocity
∼4550 km s−1 (see Figure 18) which is ∼200 km s−1 higher than the infalling gas.
Verdes-Montenegro et al. (2001) argued that SS as a group was very deficient in cold gas,
traced by HI emission. They estimated the HI deficiency in the range of 30-50% depending
on whether one assumes that HCG79bc are intrinsically S0 galaxies or were originally spirals.
Similar numbers were obtained for SQ. The most extreme estimates are motivated by the
possibility that all E and S0 galaxies in CG are the product of spiral galaxy “harassment”
(disk destruction and ISM stripping) as proposed to explain the S0 population in galaxy
clusters (Moore et al. 1996). This assumption is further supported by the very high fraction
(∼80-85%) of late-type galaxies found in low density environments (Sulentic et al. 2006)
that we argue are typical of CG environments. If we assumed that H79 a and f were also
originally spirals then we would obtain an even more extreme deficiency (∼70%). Velocity
ranges sampled by old and new 21cm observations of SS unfortunately do not include the full
range of possible velocities implied by optical measures. It is reasonable to expect HI with
velocities as low as ∼4000 km s−1. The mean velocity of galaxy H79c is close to 4000 km s−1,
so stripped gas might reasonably be expected down to ∼3800 km s−1. Comparison of the new
VLA HI spectrum with single dish Arecibo (Biermann et al. 1979; Gallagher et al. 1981) and
GBT (Borthakur et al., in preparation) HI velocity profiles suggest extended emission (∼20%
of total) might exist between 3900-4800 km s−1. An unpublished position-velocity plot that
includes the region north of H79d shows evidence for another HI component beginning at
4250 km s−1 near the edge of our velocity range. We suggest a conservative estimate of 30%
HI deficiency for both SQ and SS.
The observed HI mass of galaxy H79d agrees with the mass predicted for its blue lumi-
nosity (Verdes-Montenegro et al. 2001). On the other hand, the HI mass for H79d is lower
than the mean value for Sd galaxies (Roberts & Haynes 1994). The position-velocity (PV)
plot for H79d (Figure 19) shows an almost solid-body rotation curve as expected for a low
mass disk galaxy. One can see four fairly equally spaced peaks in the PV plot, which likely
correspond to spiral arms in the disk. The corresponding local peaks can be seen in the Hα
image as well (see Figures 8 and 9).
No molecular gas has been detected in SS although, again, only part of the plausible
velocity range has been sampled. H2 masses traced by CO emission have upper limits of
∼ 5 × 10⁸ M⊙, 6 × 10⁸ M⊙, 6 × 10⁸ M⊙ for H79a,b and c, respectively (Leon et al. 1998;
Verdes-Montenegro et al. 1998).
– 27 –
3.7. X-ray
While the general process producing HI deficiency in a large number of CG is yet to be
clarified, their results suggest that gas heating may play a role and that very sensitive X-ray
maps and flux measurements could be a way to look for hot gas. In the case of SS the soft
X-ray emission has un upper limit of LX < 2.3 × 1041 ergs s−1 (Ponman et al. 1996), using
ROSAT PSPC (Position Sensitive Proportional Counter) data. According to Pildis et al.
(1995a), using the same data, this estimate is a 2.6 σ detection. Thus, there is no massive
soft X-ray emitting halo of hot gas. This might indicate a dynamical old system where gas
has cooled. On the other hand, N2000a have argued that the 2.6 σ photon excess in SS is
consistent with an extended halo component that follows the diffuse optical light.
4. Discussion
We report multiwavelength observations of SS that seek to explore the evolutionary
history of the group especially in the context of previous work on SQ. We assume SS and SQ
are representative of the CG phenomenon (H1982; Sulentic 1997) and that SS is considerably
more evolved than SQ. The first assumption is based on the fact that both groups show n=4
or more accordant redshift members with evidence that virtually all are interacting. The
second assumption is based upon the much higher luminosity fraction contained in the SS
halo (§§§ 3.1.3). SQ is unusual at this time because a new intruder is entering the group
at unusually high velocity. Our inferences about SQ as a typical compact group were only
marginally affected by this transient event. That collision is generating excess X-ray, optical
emission line and radio radiation. The closest equivalent in the southern CG sample (Iovino
2002) would likely involve the “Cartwheel” system where we are observing the aftermath of
a disk penetrating collision. The frequency of occurrence of such spectacular events depends
upon: 1) the density of high velocity neighbors near compact groups and/or 2) the number of
groups with high enough mass concentration capable of accelerating neighbors into a group
with suitably high velocity. Most compact groups are not found in regions of high enough
density for high velocity ∆V∼103 km s−1 intruders to be common. Yet SQ is certainly not
the only group with such a potential intruder (see Figure 2 in Sulentic 1997). The important
point to emphasize is that groups like SQ that are currently undergoing a spectacular event
are not less typical because of it.
Specific considerations involve: 1) the age of the group, 2) the nature of its tidally
truncated members, 3) the nature and origin of its luminous halo, 4) the evidence for
merger/accretion events and, in view of its HI deficiency, 5) the fate of the missing gas.
CG can provide valuable insights into the role of extreme interactions on galaxy evolution
– 28 –
and may be useful for interpreting results at higher redshift. It was once thought that unsta-
ble systems like CG had very short evolutionary lifetimes that ended in a merger catastrophe
(e.g. Mamon 1987; Barnes 1989), however observations do not support that view (Sulentic
1987, 1997) and hypothesized dark matter halos appear able to extend CG lifetimes indefi-
nitely (e.g. Athanassoula et al. 1997).
SQ is the most studied compact group with published studies spanning the electro-
magnetic spectrum: Sulentic et al. (2001) and references therein plus subsequent: X-ray
(Trinchieri et al. 2003, 2005), UV (Xanthopoulos et al. 2004; Xu et al. 2005), optical (Gutierrez et al.
2002; Xu et al. 2003), MIR (Appleton at al. 2006), CO (Yun et al. 1997; Lisenfeld at al.
2002, 2004), HI (Williams et al. 2002) and radio continuum (Xu et al. 2003; Xanthopoulos et al.
2004) observations. If SQ can be viewed as a currently hyperactive prototype of the compact
group phenomenon then we infer the following:
1. Compact groups form by slow sequential acquisition of neighbors from surrounding
larger scale structure. Nucleation points around which the process might begin could
involve dark matter density fluctuations. Baryonic (primordial merger) fluctuations
(Governato et al. 1996) are disfavored by the rarity (∼10%) of first-ranked early-type
galaxies in CG (Sulentic 1997). Random continuous formation from more diffuse galaxy
aggregates (e.g. Diaferio et al. 1994) is also disfavored for several reasons (see also
Sulentic 1997): 1) local environmental densities are too low to make this process im-
portant, 2) few of the predicted majority population of transient groups is observed
and 3) observations indicate that compact group formation is slow and sequential.
2. New intruders are usually captured and quickly lose most of their ISM leading to: a)
suppression of star formation within the galaxies: b) possible stimulation of active
nuclei due to infall of residual unstripped gas, c) morphological transformation from
primarily spiral intruders into spiral bulges or into early-type E-S0 members. While
brief episodes of enhanced star formation are expected and observed in compact groups
they are likely associated with the sequential arrival of new gas rich intruders. This
activity is unlikely to be long lived if new arrivals are also rapidly stripped. SQ suggests
that any star formation activity that arises in the resultant debris field of stripped gas
will be weak and will not approach the level expected from a single unstripped L∗ spiral
galaxy.
3. In addition to ISM stripping, which can create a multiphase gaseous debris field, the
outer parts of the stellar components are stripped leading to the growth of a massive
diffuse halo akin to what is now observed in some clusters. Some diffuse X-ray emission
can be associated with this halo but this component is likely to be overestimated with
– 29 –
low resolution observations if: a) high velocity intrusions take place, b) AGN are
common (e.g. HCG16) and c) major mergers occur (yet rarely).
4. The major components of the groups persist as discrete (gas poor early-type) conden-
sations in a diffuse stellar halo for many Gyr. SQ is mute on the fate of these long
lived components but SS, viewed as a more evolved SQ, suggests that they may slowly
dissolve into the hypergalactic halo before major merging can take place. The rarity
of massive fossil ellipticals outside of cluster cores (Sulentic & Rabaca 1994) attests to
the rarity of major mergers and the long timescale for the dissolution process. Groups
like SQ and SS disfavor hierarchical collapse scenarios.
Our new, as well as older published, measures for SS show many consistencies with what
has been inferred from SQ. A complication in the case of SS may involve an unfavorable ori-
entation where the principal plane of most components lies near edge-on to our line of sight.
H79a, b, c and d show morphological features, or axial ratios, consistent with the interpre-
tation that they are highly inclined disky systems. Following the same numbering/lettering
scheme above we evaluate the empirical clues available for SS. We refer to relevant subsec-
tions of § 3 whenever our inferences are supported by particular observations or previously
published work.
1) CG formation: Galaxy H79d in SS is an example of the sequential acquisition pro-
cess. Such acquisitions are likely to be rare given the low galaxy surface density environment
(Sulentic 1987; Rood & Williams 1989) in which SS is found. H79d could be regarded either
as a simple projection along the same line of sight or as a galaxy that is entering the group
for the first time. Yet, the low surface density of accordant and/or discordant galaxies near
SS would justify the latter possibility. This highly inclined late-type (Sd) spiral shows HI
(§§ 3.6) and Hα (§§ 3.2, 3.3) distributions consistent with the notion that all or most of the
cold and warm ISM gas components are intact. New and old Hα rotation curves (§§ 3.3)
also show little or no evidence for significant dynamical disruption. The slight “integral
sign” shape of the galaxy can be argued to be the result of viewing a disky spiral at high
inclination rather than the product of tidal deformation. HI emission extending towards
NE (see Figure 17; see also Williams et al. 1991) could be interpreted as debris from earlier
acquisitions although velocity continuity with the gas within H79d (Figure 18) makes this
assumption uncertain and can also be argued to be the beginning of the stripping process
for that intruder. Hα emission appears to link H79d with H79a (Figure 8; cross-fuelling?),
although we do not find velocity continuity between emission on the side of H79d nearest
H79a and the gas detected in its nuclear region (§§ 3.3). We cannot unambiguously establish
interaction of H79d with the rest of the group. Typical timescales for significant dynamical
response and/or tidal stripping are ∼108 years (Iono et al. 2004) coupled with the unequivo-
– 30 –
cal evidence for lack of tidal perturbation suggests that, if H79d is an intruder, it must have
joined SS within this time frame.
H79c is the best candidate for the intrusion that preceded H79d into SS. It is the bluest
(§§§ 3.1.4) member after H79d and also shows spectroscopic evidence (§§§ 3.3.2) for a reason-
ably young (∼2 Gyr) stellar population perhaps generated just before it lost its ISM upon
joining SS. H79f is the obvious candidate for the oldest, or one of the oldest members of SS.
It is sometimes described as a tidal tail (Nishiura et al. 2002) but its morphology (§§§ 3.1.2)
and lack of nonstellar component (§§ 3.2–3.6) are more consistent with the hypothesis that
it is a remnant disk galaxy slowly dissolving into the common stellar halo (see also R1991,
B1993, Bonfanti et al. 1999).
2a) HI Stripping and SF suppression:
A statistical study of HI content in CG showed that HI deficiencies are common (Verdes-Montenegro et
2001). Both SQ and SS have estimated deficiencies in the range 30-70% depending on how
many of the early-type components entered the groups as spirals (§§ 3.6). All presently
observed E and S0 components of SQ (3) and SS(4) are candidates because the environ-
ments which supply intruders are spiral rich. Two recently stripped spirals and, therefore
now proto-lenticulars, (NGC7319 and 7320c; Sulentic et al. 2001) can be identified in SQ.
We suggest that H79d will likely suffer a similar fate. The reality of such gas deficiencies
virtually guarantees a star formation deficit. FIR (§§ 3.4) and Hα (§§ 3.2) observations are
regarded as useful star formation diagnostics. Both are quite consistent with a normal (for
its type and luminosity) level of star formation H79d. The lack of star formation suppression
argues that it is the most recent SS intruder or a projected field galaxy. If H79d is viewed as
a recent arrival into SS, this is apparently a much slower intrusion (∆V ∼ 200 km s−1) than
the ongoing one observed in SQ and is closer to the expectation for a low velocity random
capture in a low density environment. A recent and low velocity intrusion into SS can be
also used to argue that no strong star formation enhancement would be expected at this
time. In CG such disk starbursts are likely short lived if rapid ISM stripping immediately
follows the onset of the enhanced activity. Residual gas channeled into the nuclei of galaxies
might give rise to low level star formation or AGN activity. Nuclear fuelling might be par-
ticularly efficient in CG because of the quasi continuous nature of the tidal perturbations.
The excess of compact nuclear radio sources (Menon & Hickson 1985) and low luminosity
AGN (Coziol et al. 2004) in CG members supports this suggestion.
Little additional emission related to star formation is observed in the obviously more
evolved members of SS which reflects the observed deficit of gas in the group. Apart from
H79d then SS shows a much more extreme level of star formation suppression than SQ
which is consistent with it being older and more evolved. Hα observations indicate low
– 31 –
level star formation is likely present in H79b, probably connected with an accretion event
and H79a possibly connected with a feedback event (§§§ 3.3.1). Line emission from H79b
shows a reasonably symmetric rotation curve and may originate entirely from the counter-
rotating component. This is consistent with star formation in a recently accreted dwarf
companion (§§§ 3.3.1), although quoted [NII]/Hα ratios are close to those for H79a (N2000a,
Coziol et al. 2004, see also Table 11) and lie between the HII and Seyfert domains in emission
line diagnostic diagrams (Kewley et al. 2006). The extended Hα rotation curve (Figure 12)
argues strongly in favor of star formation in this galaxy.
H79a shows evidence for both nuclear and near nuclear emission components. The Hα
image in Figure 8 and velocity decoupling (Figure 11) are consistent with the near nuclear
gas as a feedback event, possibly the result of cross fueling of gas stripped from H79d.
Our Fabry-Perot measures (§§§ 3.3.1) support this interpretation because the extranuclear
component is redshifted relative to the H79a nucleus by about 150 km s−1, which is consistent
with the extranuclear gas viewed as infalling onto the side of H79a closest (in projection)
to H79d (§§§ 3.3.1). However no evidence for velocity continuity is found (§§§ 3.3.1) and
emission on the side of H79d closest to H79a shows a velocity ∼300 km s−1 higher than that
of the extranuclear emission feature (see Figures 10 and 11). The observations would require
a discrete infall or fueling event rather than a continuous flow of gas from H79d to H79a.
All emission line measures for the gas in H79a should be treated with caution because the
two emission components are separated by only ∼3′′ (§§ 3.2). This, and confusion in the
literature between members of the group, explains the large scatter among redshifts quoted
for this galaxy in NED.
Table 15 provides an interesting comparison of integrated optical, IR and radio prop-
erties for SQ and SS along with corresponding data for the well studied L∼L* Sb spiral
NGC7331. This provides an alternate demonstration of the HI and star formation deficits.
SQ is ∼ two integrated B magnitudes brighter than NGC7331 while SS shows approximately
the same value as that galaxy, but with half of the luminosity in a diffuse halo (§§§ 3.1.3).
SQ contains the same mass of HI as NGC7331 although it originally contained, at least,
three spirals with similar luminosity to that galaxy. SS currently shows little more than
the HI expected from a late-type spiral like H79d (Verdes-Montenegro et al. 2001). Perhaps
20% more remains to be mapped using wider frequency coverage (§§ 3.6). SQ and NGC7331
show similar integrated star formation measures. However this is an overestimate of star
formation activity in SQ because Hα (via enhanced [NII]) and radio continuum emission in
SQ are boosted by a large scale shock (Moles et al. 1997; Sulentic et al. 2001), while those
measures and FIR luminosity are boosted by the luminous AGN NGC7319. SS shows much
lower levels of activity in all measures with H79d contributing most of the HI and about
60% of the Hα emission (§§ 3.2). While composed of less luminous galaxies, if formed from
– 32 –
a largely spiral field, then SS represents an extreme example of star formation suppression.
SQ is clearly evolving in that direction.
Another way to characterize the star formation suppression involves comparison of in-
tegrated colors and/or population synthesis measures for CG members. Our color measures
(§§§ 3.1.4) indicate a dominance of older populations in H79abf and c (with a more re-
cent component with age ∼2 Gyr; §§§ 3.3.2). Other recent spectroscopic synthesis studies
(de la Rosa et al. 2007; Proctor et al. 2004) suggest systematically older populations (com-
pared to field galaxies) in larger samples of compact group members. An earlier photometric
study of elliptical members in CG showed typical red colors and little or no evidence for a
recent merger population (Zepf et al. 1991; Zepf 1993).
Hα surveys of compact group members (Vılchez & Iglesias-Paramo 1998; Iglesias-Paramo & Vılchez
1999) reveal a wide range of inferred star formation activity. Taken galaxy by galaxy this is
unsurprising. However galaxies in the most evolved CG (like SS) will show very low levels of
star formation activity in most members except for the occasional unstripped new intruder.
These inferences will be confused if triplets are included in a CG sample. Less evidence of
dynamical evolution is expected in these more intrinsically unstable configurations. This is
especially true for the most studied samples like HCG where hierarchical systems are rare.
2b) AGN: Gas that is not stripped from CG members will likely suffer angular momen-
tum dissipation leading to efficient channeling into component nuclei. There is accumulating
evidence that galaxies in CG show a higher frequency of, generally low level, AGN activ-
ity (Coziol et al. 2004; Martınez et al. 2006). This activity can take at least three forms:
Seyfert, LINER and HII nuclei – the latter not really an AGN in the classical sense although
it has been argued to be a precursor to Seyfert activity (e.g. Barth & Shields 2000). Re-
cently stripped NGC7319 in SQ hosts a luminous Seyfert 2 nucleus that is a strong source
from radio to X-ray wavelengths. Both H79 a and b show evidence for nuclear activity at
radio (§§ 3.5), MIR (§§ 3.4) and optical (§§ 3.1) wavelengths. All Hα emission outside of
H79d is found near the centers of these two galaxies. Line ratios in H79a ([NII]/Hα and
[OIII]/Hβ) (N2000a, Coziol et al. 2004) are consistent with LINER activity according to
emission line diagnostic diagrams of Kewley et al. (2006) if the derived ratios involve the nu-
clear gas. Emission from H79b (NGC6027, VIIZw631) shows well defined counter-rotation
in the emission component (§§§ 3.3.1) and is likely dominated by star forming gas in an ac-
creted neighbor perhaps coupled with some weakly shocked gas. Radio continuum emission
from H79a involves a point source at all VLA resolutions while H79b shows weaker and more
extended emission (§§ 3.5) which supports our inference that only H79a hosts an AGN at this
time. Unless CG members host unusually low mass black holes, the weakness of most AGN
activity must be due to low accretion rates where only residual gas remains to fuel nuclei.
– 33 –
In systems where there is a quasi-continuous perturbation there is perhaps less opportunity
to build up a reservoir of gas that episodically might fuel more intense AGN activity. The
CG alternative might well involve longer phases of low level activity.
2c) Morphological transformation: SQ contains two recently stripped spirals and
another spiral intruder in the process of being stripped (Sulentic et al. 2001). The remaining
two members in SQ are either elliptical galaxies or remnant bulges of spirals. SS galaxies
H79a, b, c and f show early-type (albeit peculiar) morphologies (§§§ 3.1.2). In analogy with
SQ we argue that most of these galaxies entered SS as spirals because the environment of SS
is spiral rich (§§§ 3.1.1); they were subsequently stripped and transformed into E/S0 systems.
In the case of SQ some of the stripping events must have taken place recently because we can
still recognize spiral structure (NGC 7319 and NGC7320c; Sulentic et al. 2001) while in SS
the disks and associated spiral structure have been largely destroyed leaving remnant bulges
imbedded in a stellar halo partly or mostly composed of the stripped disks. We also argue
that the galaxies were considerably more luminous when they first entered SS. This is self
evident because the massive halo must have formed from stars that originated in existing
and/or now disrupted members. The fraction of early-type members in SS (∼0.7-0.8) is larger
than expected if SS was formed from random infall of galaxies from its environment. The
observed early-type fraction in SS environment is ∼0.3-0.4 (§§§ 3.1.2) above the expectation
from the low density environment of extremely isolated galaxies ∼0.14 (Sulentic et al. 2006).
All known accordant redshift neighbors around SS are larger and brighter than members
of the group (§§§ 3.1.2, 3.1.3). Of course the tabulation is likely biased towards the brightest
members in the neighborhood if for no other reason that we are tabulating neighbors with
measured redshift. All members of SS are smaller and most are fainter than this neighboring
population. Taken at face value SS is a compact group of sub-L∗ galaxies. Few tabulated
compact groups of dwarf galaxies are observed (Hickson et al. 1992; Iovino 2002) and there
may be dynamical stability and hierarchical structural reasons for a paucity of dwarf compact
groups. The brightest four accordant members of most tabulated groups tend to show similar
L≥L∗ luminosities (i.e. they are not hierarchical systems). Thus we argue SS was formed
by sequential accretion of luminous spiral galaxies that have undergone: 1) gas stripping
that transformed them into E/S0 morphologies and 2) stellar stripping that has significantly
reduced their sizes. This stellar harassment process might be similar to, but even more
efficient (because of lower systemic velocity dispersions), than the one proposed to explain
the existence of S0 galaxies in clusters (Moore et al. 1996). In CG a significant population
of spiral bulges may exist as “early-type” members.
The early-type members of SS are too bright for their sizes and this can be explained
if disks are stripped leaving the higher M/L bulge region of each galaxy relatively in-
– 34 –
tact. Comparison of the size and brightness of bulges in some of the bright neighboring
spirals indeed show values similar to those measured for the early-type members of SS
(§§§ 3.1.3). The early-type members of SS are embedded in a relatively blue massive stellar
halo (§§§ 3.1.3, 3.1.4). It is reasonable to assume that this luminous halo was generated by
stripping/dissipation processes involving the existing member galaxies. The relatively blue
color of the halo supports the idea that much of it came from a disk stellar population. The
excess brightness for their size (i.e. compactness) of SS members will also be abetted by
minor accretion events of the kind that we observe in H79b.
If most SS members began as spiral intruders then we are faced with a serious deficit of
stripped hot/warm/cold gas in and around SS (§§ 3.2–3.7; see also Verdes-Montenegro et al.
2001). In the case of SQ we found all three components in the IGM although little was
found within the group members. Part of the HI deficit in SQ is now shocked to X-ray
emitting temperatures (Trinchieri et al. 2003, 2005) some of which may have cooled and
condensed into HII regions (Xu et al. 1999; Sulentic et al. 2001). In SS we observe only
logMHI(M⊙)=9.3 (Verdes-Montenegro et al. 2001) most of which is concentrated in H79d.
The existence of “passive spirals” (Goto et al. 2003b) could possibly help solving the
problem of “missing gas” (gas deficit) in CG. For example, one could envision a scenario
in which the members of SS entered the group as extremely poor gas spiral galaxies. As
Goto et al. (2003b) suggests, such galaxies seem to prefer environments density ∼1-2 Mpc−2,
similar to SS neighborhood (§§§ 3.1.1). On the other hand, these gas deficient spiral galaxies
are very rare (∼0.28%, i.e. they found 73 cases from a sample of 25813) and quite red (almost
as red as elliptical galaxies). The members of SS seem to be bluer (see our Table 9) than
those “passive spirals” (see Figure 9 in Goto et al. 2003b). A search (dedicated study) for
potential “passive spirals” among the neighbors of CG merits further attention.
Compact groups pose a problem for radio line (and often Fabry-Perot) studies because
the velocity range over which gas might be present can be large. In the case of SQ optical
emission and absorption line velocities span almost 2000 km s−1 (1200 km s−1 in detected HI).
Optical velocities in SS span a range close to 700 km s−1 with at least two condensations in HI
at 4400-4700 km s−1 (H79d and tail towards E) and ∼4200 km s−1 possibly associated with
H79a and not well defined in our new or in previous observations (§§ 3.6). Earlier single dish
measures (Biermann et al. 1979; Gallagher et al. 1981; Gordon & Gottesman 1981) already
raised the possibility of HI at velocities both higher and lower than H79d. We confirm
the latter, but given the scatter among previous single dish mass estimates it is difficult
to estimate how much HI we may have missed. We cannot rule out the possibility that
significant HI stripped more than 1.5 Gyr ago remains undetected. This is required in
assuming that most of the galaxies H79abcf entered SS as spirals. A conservative estimate
– 35 –
for the total HI content within SS (logMHI(M⊙)∼9.4-9.5) is based on the single dish HI
measures. The same comments apply to previous searches for molecular gas in SS (Leon et al.
1998; Verdes-Montenegro et al. 1998). At the other extreme only a small hot X-ray emitting
component was detected by ROSAT (§§ 3.7) which may be associated with the diffuse stellar
halo (N2000a).
Either our assumption that SS was formed from spirals is incorrect or we must account
for considerable (30-70%) missing gas (§§ 3.6). We have no evidence for extreme starbursts
in less evolved compact groups that should be viewed as the precursors of an SS system.
In fact as dynamically hyperactive systems CG are surprisingly deficient in FIR emission
(e.g. Verdes-Montenegro et al. 1998). Thus gas depletion via star formation seems unlikely
to explain such a large deficit. Both HI/CO mapping of a wider spatial/velocity field and
deeper searches for a warm gas component (OSIRIS-GTC?) might yield interesting results.
3) Diffuse halo formation: After an initial period of negative results (Rose 1977;
Sulentic & Lorre 1983; Pildis et al. 1995b) luminous optical halos are now found in many
compact groups (Sulentic 1987; Pildis et al. 1995b; Sulentic 1997; White et al. 2003; Aguerri et al.
2006, D2005). Estimated diffuse light fractions ranges from a few percent up to 50% suggest-
ing that this measure might be a useful diagnostic for the dynamical age of a compact group.
Recent studies of the SQ halo show it to be very complex with an integrated luminosity of
∼L∗ (∼average luminosity of one L∗ galaxy) (Moles et al. 1998) and therefore representing
about 20% of the total group luminosity. A more sensitive study (Gutierrez et al. 2002)
suggests that 20% might be underestimated. VR/I measures (N2000a) yielded an estimate
of 12-13% for the halo in SS. More recent wavelet processing of deep CCD images (D2005)
suggest that the halo luminosity fraction is ∼46% in B band which agrees with our own
estimate (§§§ 3.1.3). We reduce the D2005 estimate to 40% because we cannot confirm an
apparent extension towards the east which we suggest may be an artifact induced by some
relatively bright stars about one group diameter in that direction (see Figure 6 in D2005).
We conclude that the halo fraction in SS is approximately twice that in SQ. On this basis
alone we conclude that SS is much older group than SQ.
Sommer-Larsen (2006) studied the diffuse light in “fossil” groups (FG) (e.g., hierarchical
groups with a very bright central galaxy) and non-fossil groups (non-FG)(e.g., groups with
galaxies of similar brightness, i.e. non-hierarchical). Their models predict halo contributions
of ∼12-45% with a higher fraction of diffuse light in FG. Most CG (up to 90%) tend to
be non-hierarchical which is a long standing argument against a major merger evolutionary
scenario to account for them (Sulentic 1997; see also Proctor et al. 2004; de la Rosa et al.
2007 for a different form of evidence). SQ and SS are certainly non-hierarchical configura-
tions with halo fractions that appear to exceed the above model expectations. SS provides
– 36 –
the strongest challenges to formation models with a very massive halo that is also somewhat
bluer than the galaxies embedded within it (see Table 9). It points towards a slow sequen-
tial “dissolution” process without significant major merger activity. Additional support for
this conclusion comes from the fact that highly evolved SS is a very weak X-ray emitter
compared to many detected compact and loose groups (Helsdon & Ponman 2000) with es-
timates for any soft halo component near LX∼1040 ergs s−1 (N2000a). Before dismissing SS
as atypical it is worth pointing out that the X-ray luminosity of SQ is strongly boosted by a
transient shock component (Trinchieri et al. 2005). The X-ray weak halo component in SQ
(Helsdon & Ponman 2000) appears to be about 1dex higher than any equivalent component
in SS.
4) Long lived system: We earlier estimated a minimum age for SQ of 2-3 Gyr
based upon encounter events that we could identify over the past 1-2 Gyr (Sulentic et al.
2001). Various studies have identified a sequence of compact group ages, or evolutionary
stages, using HI morphology/deficiency (Verdes-Montenegro et al. 2001), diffuse light frac-
tion (Aguerri et al. 2006) and dynamical inferences (Ribeiro et al. 1998). The fraction of
early-type galaxies normalized by local environmental density (Goto et al. 2003a) offers an
additional measure (§§§ 3.1.2). All measures suggest that SQ is reasonably evolved and
that SS is significantly more evolved than SQ. If we assume that the halo age is directly
proportional to the luminosity fraction then we can assume a minimum age for SS of 4-
6 Gyr. The episodic accretion rate in SS appears to be slower than for SQ and this will
slow down the evolutionary process. If nothing precludes compact group formation in richer
environments one expect many to form but with a large fraction that are transient (e.g.
Diaferio et al. 1994, 1995). No more than 10% of HCG fall in this category (Sulentic 1987;
Rood & Williams 1989). This would not be the slow sequential process that characterizes
SQ and SS.
In the case of SS one could identify H79d as the most recent arrival while H79c likely
arrived more than 1.5 Gyr ago. Both the new intruder and the accreted object in H79b are
relatively low mass galaxies (§§§ 3.3.1). Our optical and Hα reconnaissance of the SS neigh-
borhood reveals no other prospective intruders for the next ∼ Gyr (§§§ 3.1.1). Apparently
after acquiring the nearest 4-5 neighbors a “typical” CG (in lower density environments) like
SQ or SS creates a local void after which it very rarely acquires additional members.
A possible new way to estimate dynamical ages in CG is provided by the HST search for
young blue star clusters (BSC) thought to form via interactions. A large number of candidate
BSC have been identified in SQ (Gallagher et al. 2001) although their true nature remains
unconfirmed. A contradiction is provided by the almost total absence of BSC candidates in
SS (Palma et al. 2002) which at 2/3 the distance should have been easier to detect. Numerous
– 37 –
red star cluster candidates were found around SS galaxies. Our own high pass filtering
of archival WFPC images of H79a appears to show a halo of assumed globular clusters
surrounding that galaxy. If we assume that the condensations in SQ are BSC and that
they are a signature of major accretion/interaction events then SQ has undergone significant
activity in the past Gyr which is well confirmed by numerous observations (Sulentic et al.
2001, and more recent references cited earlier). HST imaging analysis shows the candidate
star cluster color distributions for SQ peak at B-V∼0.1 and V-I∼0.4 (Gallagher et al. 2001)
while corresponding average colors in SS are B-V∼0.5 and V-I∼1.0 (Palma et al. 2002). This
suggests no SS star cluster population with an age of less than 1 Gyr roughly consistent with
our suggestion that H79c was the last major intruder about 2 Gyr ago. We interpret galaxies
H79abcf as old arrivals and this is supported by the degree of tidal stripping evidenced
through their surface photometric properties and the luminosity fraction in the halo. Any
BSC associated with these past intrusions have now become significantly redder.
Galaxies H79abcf are assumed to be the stripped cores of old spiral intruders. The some-
what bluer color of the diffuse light (§§§ 3.1.4, D2005) is then consistent with the hypothesis
that much of the halo mass came from stripped spiral disks. This bluer halo color is also
evidence that SS formed long ago from a largely spiral population that has been strongly
secularly evolved. Galaxy H79f is interpreted as the most extreme example of this process.
It has been extensively studied (Nishiura et al. 2002) and has been interpreted both as a
tidal feature (Nishiura et al. 2002) and as the remnant of a disrupted galaxy (Bonfanti et al.
1999). The central brightness concentration and concentric luminosity isophotes about the
center of this feature argue for the second interpretation. We suggest that this is the most
evolved member of the group and offers an empirical insight into the dynamical evolution of
compact group members via dissolution rather than merging. The more remnant cores we
identify in SS, the lower the average initial luminosity of the intruders. If lower luminosity
spirals have a higher average gas fraction then inclusion of H79f as an intruder remnant
actually exacerbates the HI deficit.
We used rotation curves (H79bd) and velocity dispersion measures (H79a) to estimate
masses for different components of SS (§§§ 3.3.1). Masses for H79c and f are estimated via
an assumed M/L ratio ∼10 (Bacon et al. 1985). Galaxies H79b, c and d are each estimated
to be ∼1010 M⊙ with H79a ∼5×10¹⁰ M⊙ and H79f ∼5×10⁹ M⊙. We must add almost 1010
M⊙ for the HI mass. Given truncated luminosity estimates for the galaxies and perturbed or
truncated rotation curves these values are likely underestimates. The total mass of discrete
components probably lies in the range of 1011 M⊙ which is similar to our estimate for the
halo mass. While likely not as massive as SQ, SS was not formed from a dwarf population
although most of the members may have entered as slightly sub L∗ galaxies.
– 38 –
The lack of major mergers and first-ranked ellipticals in compact groups (Mendes de Oliveira & Hickson
1991; Sulentic & Rabaca 1994) as well as the rarity of fossil ellipticals in low density galaxy
environments (Sulentic & Rabaca 1994; Zabludoff & Mulchaey 1998) make clear that such
groups evolve very slowly and likely require massive DM halos (Athanassoula et al. 1997;
Aceves & Velazquez 2002). Thus hierarchical collapse models (Baugh et al. 1996; Kauffmann
1996; Kauffmann & Charlot 1998) are strongly disfavored. SQ and SS further support these
conclusions with no evidence for major mergers. In one sense there is agreement star forma-
tion is rapidly quenched/truncated in compact groups (de la Rosa et al. 2007). This appears
to contradict predictions of monolithic collapse models (Chiosi & Carraro 2002) where star
formation continues for a much longer time. It is important to point out that none of these
models makes predictions about structure at such high spatial frequencies as typified by SQ
and SS. SS offers one striking example of a minor merger while none has been identified in
SQ.
If the majority of SS members are correctly interpreted as cores of stripped spiral then
it is clear that this group, and perhaps most groups, dynamically evolve via dissolution
rather than major mergers. Rather than the “beginning of the end” (Palma et al. 2002) SS
is engaged in a slow process that has already persisted for a significant fraction of Hubble
time. If: 1) fossil ellipticals are rare (Mulchaey & Zabludoff 1999; Sulentic & Rabaca 1994),
and, concomitantly, 2) major mergers in CG are rare (Sulentic 1997) and 3) groups with
more than five members are rare, then we are forced to conclude –without resorting to magic
dark substances–that most CG like SQ and SS that ever formed are still in existence.
One of us (A. D.) acknowledges support from a Graduate Council Research/Creative
Fellowship offered by the Graduate School of the University of Alabama for the 2006/2007
academic year. A. D. also thanks R.J. Buta and W.C. Keel for helpful discussions. M. R.
acknowledges grants 46054-F from CONACYT and IN100606 from DGAPA-UNAM, Mex-
ico. A. dO. and J. P. are partially supported by Spanish research projects AYA2006-1325,
AYA2006-1213 and Junta de Andalucıa TIC114. We thank C. Da Rocha for providing the
CFHT images of the diffuse light component in SS. We acknowledge V. Avila-Reese for
helpful comments. We also acknowledge P. Amram and C. Balkowski for making the run to
obtain the CFHT Hα F-P images. The new radio data presented in this paper were obtained
with NRAO instrument–VLA. The National Radio Astronomy Observatory is a facility of
the National Science Foundation operated under cooperative agreement by Associated Uni-
versities, Inc.
– 39 –
REFERENCES
Aceves, H. & Velazquez, H. 2002, Rev. Mexicana Astron. Astrofis., 38, 199
Adelman-McCarthy, J.K. et al. - arXiv:0707.3380
Aguerri, J. A. L. et al. 2006, A&A, 457, 771
Allam, S. et al. 1996, A&AS, 117, 39
Amram, P., Boulesteix, J., Georgelin, Y. M., Laval, A., Le Coarer, E., Marcelin, M., Rosado,
M. 1991, ESO Messenger (ISSN 0722-6691), no. 64, p. 44
Amram, P., Le Coarer, E., Marcelin, M., Balkowski, C., Sullivan, W. T. III, Cayatte, V.
1992, A&AS, 94, 175
Appleton, P. N. et al. 2006, ApJ, 639, L51
Athanassoula, L., Makino, J. & Bosma, A. 1997, MNRAS, 286, 825
Bacon, R., Monnet, G., Simien, F. 1985, A&A, 152, 315
Barmby, P. & Huchra, J. P. 1998, AJ, 115, 6
Barnes, J. E. 1989, Nature, 338, 123
Barth, A. J. & Shields, J. C. 2000, PASP, 112, 753
Baugh, C. M., Cole, S., Frenk, C. S. 1996, MNRAS, 283, 1361
Beers, T. C. et al. 1995, AJ, 109, 874
Bender, R., Burstein, D., Faber, S. M. 1992, ApJ, 399, 462
Bettoni, D. & Fasano, G. 1993, AJ, 105, 1291 (B1993)
Biermann, P., Clarke, J. N., Fricke, K. J. 1979, A&A, 75, 19
Biviano, A. 1998, The ISOCAM Calibration Error Budget Report, ver. 3.1
Bonfanti, P., Simien, F., Rampazzo, R., Prugniel, Ph. 1999, A&AS, 139, 483
Boulesteix, J., Manual of the ADHOC software, 1993
Bruzual, G. & Charlot, S. 2003, MNRAS, 344, 1000
Burstein, D., Heiles, C. 1982, AJ, 87, 1165
– 40 –
Carnevali, P., Cavaliere, A., & Santangelo, P. 1981, ApJ, 249, 449
Cesarsky, C. J. et al. 1996, A&A, 315, 32
Chiosi, C. & Carraro, G. 2002, MNRAS, 335, 335
Chung, A., van Gorkom, J. H., Kenney, J. D. P., Vollmer, B. 2007, ApJ, 659, L115
Condon, J. J., Anderson, M. L., Helou, G. 1991, ApJ, 376, 95
Condon, J. J., Cotton, W. D., Greisen, E. W., Yin, Q. F., Perley, R. A., Taylor, G. B., &
Broderick, J. J. 1998, AJ, 115, 1693
Coziol, R., Brinks, E. & Bravo-Alfaro, H. 2004, AJ, 128, 68
Da Rocha, C. & Mendes de Oliveira, C. 2005, MNRAS, 364, 1069 (D2005)
de la Rosa, I. G., de Carvalho, R. R., Zepf, S. E. 2001, AJ, 122, 93
de la Rosa, I. G., de Carvalho, R. R., Vazdekis, A., Barbuy, B. 2007, AJ, 133, 330
de Carvalho, R. R., Ribeiro, A. L. B., Capelato, H. V., Zepf, S. E. 1997, ApJS, 110, 1
de Vaucouleurs, G. et al. 1991, Third Reference Catalog of Bright Galaxies (New York:
Springer) (RC3)
Diaferio, A., Geller, M. J., Ramella, M. 1994, AJ, 107, 868
Diaferio, A., Geller, M. J., Ramella, M. 1995, AJ, 109, 2293
Dickel, J. R., Rood, H. J. & Williams, B. A. 1984, in Clusters and Groups of Galaxies, edited
by F. Mardirossian, G. Giuricin and M. Mezzetti (Reidel, Boston), p.389
Dickey, J. M. & Salpeter, E. E. 1984, ApJ, 284, 461
Faber, S. M. & Jackson, R. E. 1976, ApJ, 204, 668
Falco, E. E. et al. 1999, PASP, 111, 438
Fitzpatrick, E. L. 1999, PASP, 111, 63
Freudling, W. 1995, A&AS, 112, 429
Fuentes-Carrera, I., Rosado, M., Amram, P. et al. 2004, A&A, 415, 451
Gallagher, J. S., Knapp, G. R., Faber, S. M. 1981, AJ, 86, 1781
– 41 –
Gallagher, S. C. et al. 2001, AJ, 122, 163
Garcia, A. M. 1993, A&AS, 100, 47
Gonzalez Delgado, R. M. , Cervino, M., Martins, L. P., Leitherer, C., Hauschildt, P. H. 2005,
MNRAS, 357, 945
Gordon, D. & Gottesman, S. T. 1981, AJ, 86, 161
Governato, F., Tozzi, P., Cavaliere, A. 1996, ApJ, 458, 18
Goto, T. et al. 2003a, MNRAS, 346, 601
Goto, T. et al. 2003b, PASJ, 55, 757
Gruppioni, C., Pozzi, F., Zamorani, G., Ciliegi, P., Lari, C., Calabrese, E., La Franca, F.,
Matute, I. 2003, MNRAS, 341, 1
Gutierrez, C. M., Lopez-Corredoira, M., Prada, F., Eliche, M. C. 2002, ApJ, 579, 592
Helsdon, S. F. & Ponman, T. J. 2000, MNRAS, 319, 933
Helou, G., Khan, I. R., Malek, L., Boehmer, L. 1988, ApJS, 68, 151
Hickson, P. 1982, ApJ, 255, 382 (H1982)
Hickson, P., Kindl , E., Auman , J. 1989a, ApJS, 70, 687 (H1989a)
Hickson, P., Menon, T. K., Palumbo, G. G. C., Persic, M. 1989b, ApJ, 341, 679
Hickson, P., Mendes de Oliveira, C., Huchra, J.P., Palumbo, G.G. 1992, ApJ, 399, 353
Hickson, P. 1993a, Astrophys. Lett., 29, 1
Hickson, P. 1993b, Atlas of compact groups of galaxies (New York: Gordon and Breach
Science Publishers)
Hickson, P. 1997, ARA&A, 35, 357
Holtzman, J. A. et al. 1992, AJ, 103, 691
Iglesias-Paramo, J. & Vılchez, J. M. 1999, ApJ, 518, 94
Iono, D., Yun, M. S., Mihos, J. C. 2004, ApJ, 616, 199
Iovino, A. 2002, AJ, 124, 2471
– 42 –
James, P. A. et al. 2004, A&A, 414, 23
Jester, S. et al. 2005, AJ, 130, 873
Kauffmann, G. 1996, MNRAS, 281, 487
Kauffmann, G. & Charlot, S. 1998, MNRAS, 294, 705
Kauffmann, G. et al 2003, MNRAS, 341, 33
Keller, S. C. & Wood, P. R. 2006, ApJ, 642, 834
Kennicutt, R. C., Jr. 1983, ApJ, 272, 54
Kennicutt, R. C., Jr., Tamblyn, Peter, Congdon, Charles E. 1994, ApJ, 435, 22
Kennicutt, R. C., Jr. 1998, ARA&A, 36, 189
Kent, S. M. 1985, ApJS, 59, 115
Kessler, M. F. et al. 1996, A&A, 315, 27
Kewley, L. J., Groves, B., Kauffmann, G., Heckman, T. 2006, MNRAS, 372, 961
Koppen, J. & Arimoto, N. 1990, A&A, 240, 22
Kormendy, J. & Djorgovski, S. 1989, ARA&A, 27, 235
Landolt, A. U. 1983 AJ, 88, 439
Landolt, A. U. 1992 AJ, 104, 340
Laval, A., Boulesteix, J., Georgelin, Y. P., Georgelin, Y. M., Marcelin, M. 1987, A&A, 175,
199
Le Coarer, E., Rosado, M., Georgelin, Y., et al. 1993, A&A, 280, 365
Leon, S., Combes, F., Menon, T. K. 1998, A&A, 330, 37
Lisenfeld, U. et al. 2002, A&A, 394, 823
Lisenfeld, U. et al. 2004, A&A, 426, 471
Lisenfeld, U. et al. 2007, A&A, 462, 507
Macchetto, F. et al. 1996, A&AS, 120, 463
– 43 –
Mamon, G. A. 1987, ApJ, 321, 622
Martınez, M. A., del Olmo, A., Perea, J. & Coziol, R. 2006, in Groups of Galaxies in the
Nearby Universe, edited by I. Saviane, V. Ivanov & J. Borissova, astro-ph/0611098
(in press)
McCall, M. L. 2004, AJ, 128, 2144
Mendes de Oliveira, C. & Hickson, P. 1991, ApJ, 380, 30
Mendes de Oliveira, C. & Hickson, P. 1994, ApJ, 427, 684
Mendes de Oliveira, C., Amram, P., Plana, H., Balkowski, C. 2003, AJ, 126, 2635
Menon, T. K. & Hickson, P. 1985, ApJ, 296, 60
Moles, M., Sulentic, J. W., Marquez, I. 1997, ApJ, 485, L69
Moles, M., Marquez, I., Sulentic, J. W. 1998, A&A, 334, 473
Moore, B., Katz, N., Lake, G., Dressler, A., Oemler, A. 1996, Nature, 379, 613
Moshir, M. et al. 1990, IRAS Faint Source Catalogue, version 2.0 (1990)
Mulchaey, J. S. & Zabludoff, A. I. 1999, ApJ, 514, 133
Muller, K. R. et al. 1999, A&AS, 140, 327
Nishiura, S. et al. 2000a, AJ, 120, 2355 (N2000a)
Nishiura, S. et al. 2000b, AJ, 120, 1691
Nishiura, S. et al. 2002, PASJ, 54, 21
Osterbrock, D. E. & Ferland, G. J. 2006, Astrophysics of Gaseous Nebulae and Active Galac-
tic Nuclei, 2nd. ed., University Science Books, Sausalito, California
Palma, C. et al. 2002, AJ, 124, 2425
Perea, J., del Olmo, A., Verdes-Montenegro, L. & Yun, M. S. 1997, ApJ, 490, 166
Phillips, M. M. et al. 1986, AJ, 91, 1062
Pildis, R. A., Bregman, J. N., Evrard, A. E. 1995a, ApJ, 443, 514
Pildis, R. A., Bregman, J. N., Schombert, J. M. 1995b, AJ, 110, 1498
– 44 –
Plana, H. et al. 2002, In proceedings of Galaxies: The Third Dimension, Eds. M. Rosado,
L. Binette & L. Arias, ASP Conf. Ser., 282, 282
Ponman, T. J., Bourner, P. D. J., Ebeling, H., Bohringer, H 1996, MNRAS, 283, 690
Proctor, R. N., Forbes, D. A., Hau, G. K. T., Beasley, M. A., De Silva, G. M., Contreras,
R., Terlevich, A. I. 2004, MNRAS, 349, 1381
Ribas, I. et al. 2005, ApJ, 635, L37
Ribeiro, A. L. B., de Carvalho, R. R., Capelato, H. V., Zepf, S. E. 1998, ApJ, 497, 72
Roberts, M. S. & Haynes, M. P. 1994, ARA&A, 32, 115
Rood, H. & Williams, B. 1989, ApJ, 339, 772
Rood, H. J. & Struble, M. F. 1994, PASP, 106, 413
Rosado, M. et al. 1995, Rev. Mex. Astron. Astrofis. Ser. Conf., 3, 263
Rose, J. A. 1977, ApJ, 211, 311
Rubin, V. C., Hunter, D. A., Ford, W. K., Jr. 1991, ApJS, 76, 153 (R1991)
Salpeter, E. E 1955, ApJ, 121, 161
Sanders, D. B., Mazzarella, J. M., Kim, D.-C., Surace, J. A., Soifer, B. T. 2003, AJ, 126,
1607
Schlegel, D. J., Finkbeiner, D. P., Davis, M. 1998, ApJ, 500, 525
Severgnini, P., Garilli, B., Saracco, P., Chincarini, G. 1999, A&AS, 137, 495
Shimada, M., Ohyama, Y., Nishiura, S., Murayama, T., Taniguchi, Y. 2000, AJ, 119, 2664
(S2000)
Siebenmorgen, R., Starck, J. L., Cesarsky, D. A., Guest, S., Sauvage, M., 1996. ISOCAM
Data Users Manual, SAI/95-222/Dc
Sommer-Larsen, J. 2006, MNRAS, 369, 958
Stoughton, C. et al. 2002, AJ, 123, 485
Sulentic, J. W. & Lorre, J. J. 1983, A&A, 120, 36
Sulentic, J. W. 1987, ApJ, 322, 605
– 45 –
Sulentic, J. W. & de Mello Rabaca, D. F. 1993, ApJ, 410, 520
Sulentic, J. W. & Rabaca, C. 1994, ApJ, 429, 531
Sulentic, J. W., Rabaca, C. R., Arp, H. 1994, in proceedings of Mass-Transfer Induced
Activity in Galaxies, edited by Isaac Shlosman (Cambridge: Cambridge University
Press), 377
Sulentic, J. W. 1997, ApJ, 482, 640
Sulentic, J. W. et al. 2001, AJ, 122, 2993
Sulentic, J. W. et al. 2006, A&A, 449, 937
Tarenghi, M., Garilli, B., Maccagni, D. 1994, AJ, 107, 1629
Tonry, J. & Davis, M. 1979, AJ, 84, 1511
Trinchieri, G., Sulentic, J., Breitschwerdt, D., Pietsch, W. 2003, A&A, 401, 173
Trinchieri, G., Sulentic, J., Pietsch, W., Breitschwerdt, D. 2005, A&A, 444, 697
Verdes-Montenegro, L., Yun, M. S., Perea, J., del Olmo, A., Ho, P. T. P. 1998, ApJ, 497, 89
Verdes-Montenegro et al. 2001, A&A, 377, 812
Vılchez, J. M. & Iglesias-Paramo, J. 1998, ApJS, 117, 1
Vollmer, B. 2003, A&A, 398, 525
White, P. M., Bothun, G., Guerrero, M. A., West, M. J., Barkhouse, W. A. 2003, ApJ, 585,
739
Williams, B. A., McMahon, P. M., van Gorkom, J. H. 1991, AJ, 101, 1957
Williams, B. A., Yun, M. S., Verdes-Montenegro, L. 2002,AJ, 123, 2417
Xanthopoulos, E., Muxlow, T. W. B., Thomasson, P., Garrington, S. T. 2004, MNRAS, 353,
1117
Xu, C., Sulentic, J. W. & Tuffs, R. 1999, ApJ, 512, 178
Xu, C. K., Lu, N., Condon, J. J., Dopita, M., Tuffs, R. J. 2003, ApJ, 595, 665
Xu, C. K. et al. 2005, ApJ, 619, L95
– 46 –
Young, A. T. 1974, ApJ, 189, 587
Yun, M. S., Verdes-Montenegro, L., del Olmo, A., Perea, J. 1997, ApJ, 475, L21
Zabludoff, A. I. & Mulchaey, J. S. 1998, ApJ, 496, 39
Zepf, S. E., Whitmore, B. C., Levison, H. F. 1991, ApJ, 383, 524
Zepf, S. E. 1993, ApJ, 407, 448
This preprint was prepared with the AAS LATEX macros v5.2.
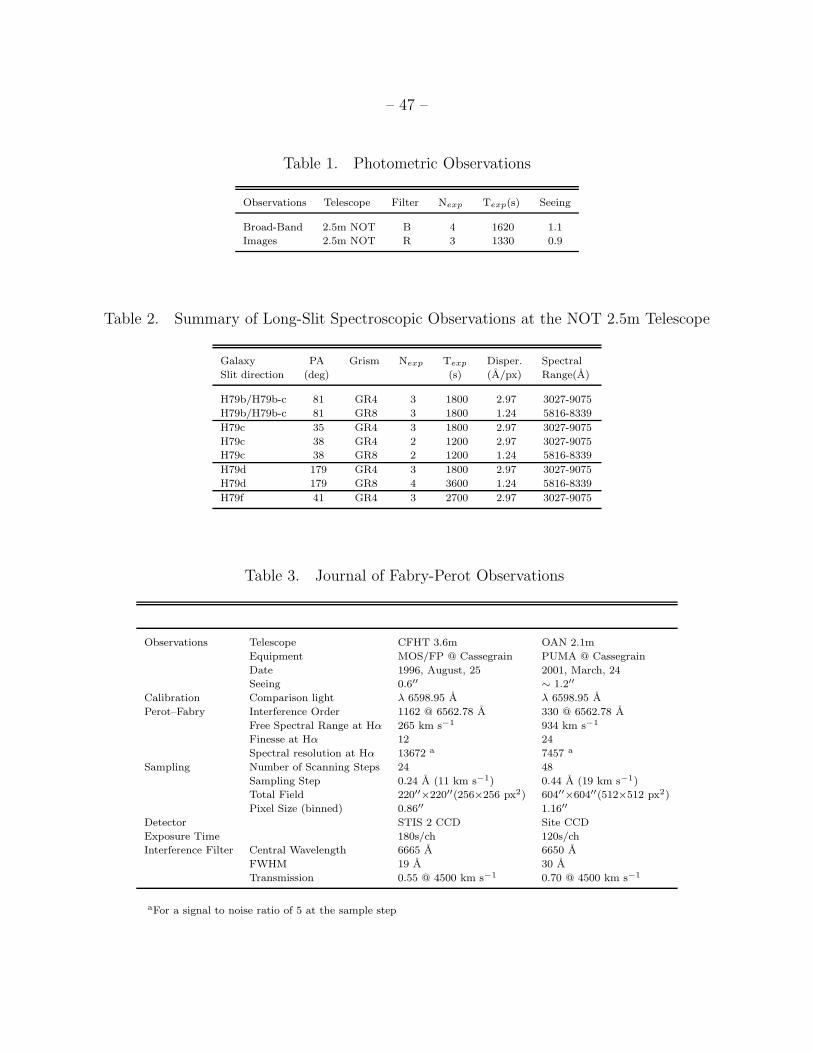
– 47 –
Table 1. Photometric Observations
Observations Telescope Filter Nexp Texp(s) Seeing
Broad-Band 2.5m NOT B 4 1620 1.1
Images 2.5m NOT R 3 1330 0.9
Table 2. Summary of Long-Slit Spectroscopic Observations at the NOT 2.5m Telescope
Galaxy PA Grism Nexp Texp Disper. Spectral
Slit direction (deg) (s) (A/px) Range(A)
H79b/H79b-c 81 GR4 3 1800 2.97 3027-9075
H79b/H79b-c 81 GR8 3 1800 1.24 5816-8339
H79c 35 GR4 3 1800 2.97 3027-9075
H79c 38 GR4 2 1200 2.97 3027-9075
H79c 38 GR8 2 1200 1.24 5816-8339
H79d 179 GR4 3 1800 2.97 3027-9075
H79d 179 GR8 4 3600 1.24 5816-8339
H79f 41 GR4 3 2700 2.97 3027-9075
Table 3. Journal of Fabry-Perot Observations
Observations Telescope CFHT 3.6m OAN 2.1m
Equipment MOS/FP @ Cassegrain PUMA @ Cassegrain
Date 1996, August, 25 2001, March, 24
Seeing 0.6′′ ∼ 1.2′′
Calibration Comparison light λ 6598.95 A λ 6598.95 A
Perot–Fabry Interference Order 1162 @ 6562.78 A 330 @ 6562.78 A
Free Spectral Range at Hα 265 km s−1 934 km s−1
Finesse at Hα 12 24
Spectral resolution at Hα 13672 a 7457 a
Sampling Number of Scanning Steps 24 48
Sampling Step 0.24 A (11 km s−1) 0.44 A (19 km s−1)
Total Field 220′′×220′′(256×256 px2) 604′′×604′′(512×512 px2)
Pixel Size (binned) 0.86′′ 1.16′′
Detector STIS 2 CCD Site CCD
Exposure Time 180s/ch 120s/ch
Interference Filter Central Wavelength 6665 A 6650 A
FWHM 19 A 30 A
Transmission 0.55 @ 4500 km s−1 0.70 @ 4500 km s−1
aFor a signal to noise ratio of 5 at the sample step
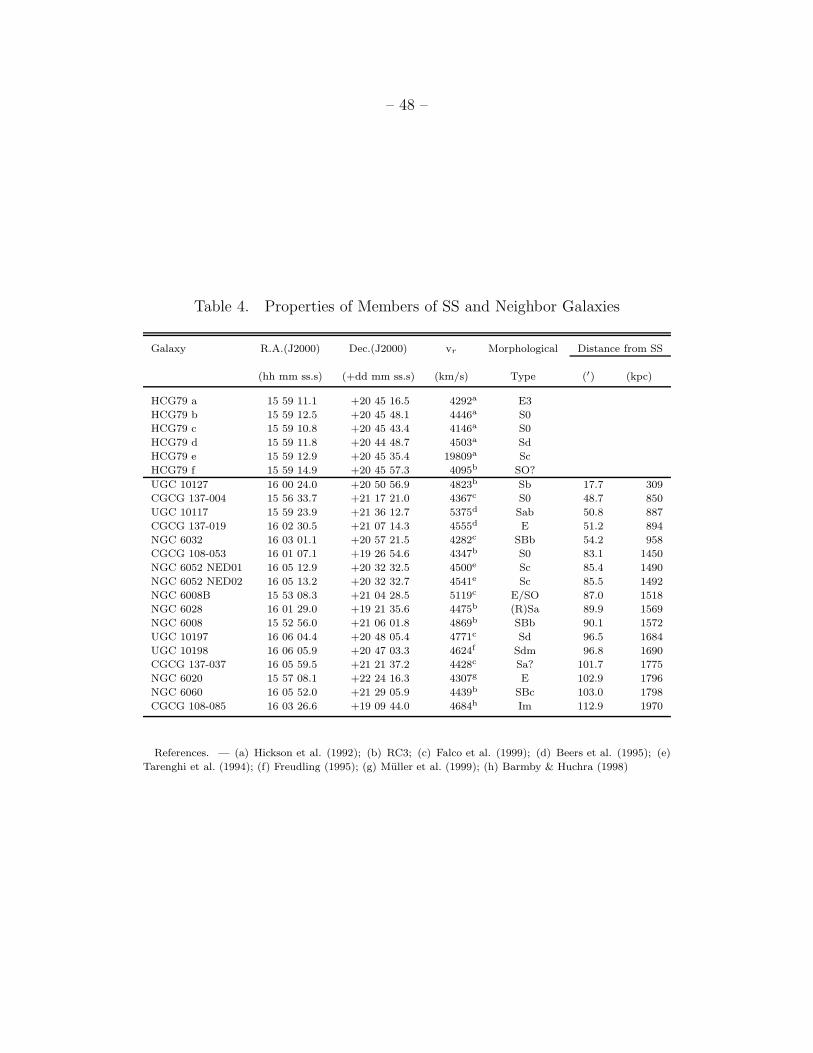
– 48 –
Table 4. Properties of Members of SS and Neighbor Galaxies
Galaxy R.A.(J2000) Dec.(J2000) vr Morphological Distance from SS
(hh mm ss.s) (+dd mm ss.s) (km/s) Type (′) (kpc)
HCG79 a 15 59 11.1 +20 45 16.5 4292a E3
HCG79 b 15 59 12.5 +20 45 48.1 4446a S0
HCG79 c 15 59 10.8 +20 45 43.4 4146a S0
HCG79 d 15 59 11.8 +20 44 48.7 4503a Sd
HCG79 e 15 59 12.9 +20 45 35.4 19809a Sc
HCG79 f 15 59 14.9 +20 45 57.3 4095b SO?
UGC 10127 16 00 24.0 +20 50 56.9 4823b Sb 17.7 309
CGCG 137-004 15 56 33.7 +21 17 21.0 4367c S0 48.7 850
UGC 10117 15 59 23.9 +21 36 12.7 5375d Sab 50.8 887
CGCG 137-019 16 02 30.5 +21 07 14.3 4555d E 51.2 894
NGC 6032 16 03 01.1 +20 57 21.5 4282c SBb 54.2 958
CGCG 108-053 16 01 07.1 +19 26 54.6 4347b S0 83.1 1450
NGC 6052 NED01 16 05 12.9 +20 32 32.5 4500e Sc 85.4 1490
NGC 6052 NED02 16 05 13.2 +20 32 32.7 4541e Sc 85.5 1492
NGC 6008B 15 53 08.3 +21 04 28.5 5119c E/SO 87.0 1518
NGC 6028 16 01 29.0 +19 21 35.6 4475b (R)Sa 89.9 1569
NGC 6008 15 52 56.0 +21 06 01.8 4869b SBb 90.1 1572
UGC 10197 16 06 04.4 +20 48 05.4 4771c Sd 96.5 1684
UGC 10198 16 06 05.9 +20 47 03.3 4624f Sdm 96.8 1690
CGCG 137-037 16 05 59.5 +21 21 37.2 4428c Sa? 101.7 1775
NGC 6020 15 57 08.1 +22 24 16.3 4307g E 102.9 1796
NGC 6060 16 05 52.0 +21 29 05.9 4439b SBc 103.0 1798
CGCG 108-085 16 03 26.6 +19 09 44.0 4684h Im 112.9 1970
References. — (a) Hickson et al. (1992); (b) RC3; (c) Falco et al. (1999); (d) Beers et al. (1995); (e)
Tarenghi et al. (1994); (f) Freudling (1995); (g) Muller et al. (1999); (h) Barmby & Huchra (1998)
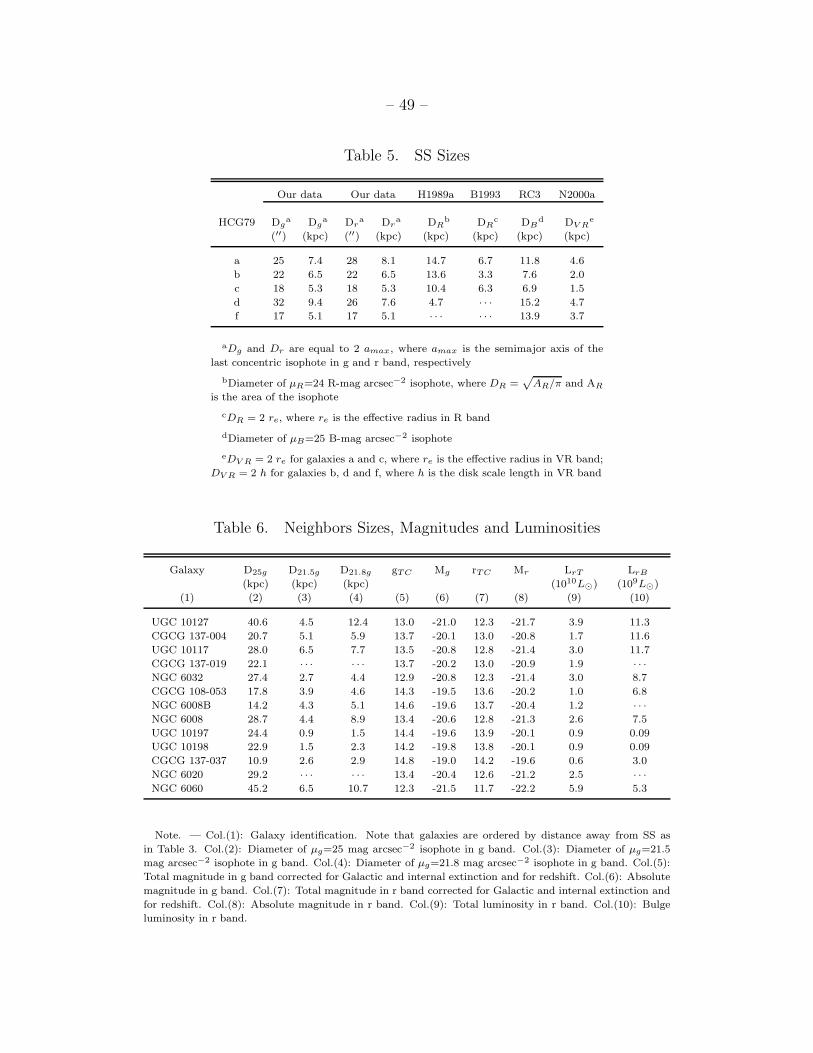
– 49 –
Table 5. SS Sizes
Our data Our data H1989a B1993 RC3 N2000a
HCG79 Dga Dg
a Dra Dr
a DRb DR
c DBd DV R
e
(′′) (kpc) (′′) (kpc) (kpc) (kpc) (kpc) (kpc)
a 25 7.4 28 8.1 14.7 6.7 11.8 4.6
b 22 6.5 22 6.5 13.6 3.3 7.6 2.0
c 18 5.3 18 5.3 10.4 6.3 6.9 1.5
d 32 9.4 26 7.6 4.7 · · · 15.2 4.7
f 17 5.1 17 5.1 · · · · · · 13.9 3.7
aDg and Dr are equal to 2 amax, where amax is the semimajor axis of the
last concentric isophote in g and r band, respectively
bDiameter of µR=24 R-mag arcsec−2 isophote, where DR =p
AR/π and AR
is the area of the isophote
cDR = 2 re, where re is the effective radius in R band
dDiameter of µB=25 B-mag arcsec−2 isophote
eDV R = 2 re for galaxies a and c, where re is the effective radius in VR band;
DV R = 2 h for galaxies b, d and f, where h is the disk scale length in VR band
Table 6. Neighbors Sizes, Magnitudes and Luminosities
Galaxy D25g D21.5g D21.8g gTC Mg rTC Mr LrT LrB
(kpc) (kpc) (kpc) (1010L⊙) (109L⊙)
(1) (2) (3) (4) (5) (6) (7) (8) (9) (10)
UGC 10127 40.6 4.5 12.4 13.0 -21.0 12.3 -21.7 3.9 11.3
CGCG 137-004 20.7 5.1 5.9 13.7 -20.1 13.0 -20.8 1.7 11.6
UGC 10117 28.0 6.5 7.7 13.5 -20.8 12.8 -21.4 3.0 11.7
CGCG 137-019 22.1 · · · · · · 13.7 -20.2 13.0 -20.9 1.9 · · ·
NGC 6032 27.4 2.7 4.4 12.9 -20.8 12.3 -21.4 3.0 8.7
CGCG 108-053 17.8 3.9 4.6 14.3 -19.5 13.6 -20.2 1.0 6.8
NGC 6008B 14.2 4.3 5.1 14.6 -19.6 13.7 -20.4 1.2 · · ·
NGC 6008 28.7 4.4 8.9 13.4 -20.6 12.8 -21.3 2.6 7.5
UGC 10197 24.4 0.9 1.5 14.4 -19.6 13.9 -20.1 0.9 0.09
UGC 10198 22.9 1.5 2.3 14.2 -19.8 13.8 -20.1 0.9 0.09
CGCG 137-037 10.9 2.6 2.9 14.8 -19.0 14.2 -19.6 0.6 3.0
NGC 6020 29.2 · · · · · · 13.4 -20.4 12.6 -21.2 2.5 · · ·
NGC 6060 45.2 6.5 10.7 12.3 -21.5 11.7 -22.2 5.9 5.3
Note. — Col.(1): Galaxy identification. Note that galaxies are ordered by distance away from SS as
in Table 3. Col.(2): Diameter of µg=25 mag arcsec−2 isophote in g band. Col.(3): Diameter of µg=21.5
mag arcsec−2 isophote in g band. Col.(4): Diameter of µg=21.8 mag arcsec−2 isophote in g band. Col.(5):
Total magnitude in g band corrected for Galactic and internal extinction and for redshift. Col.(6): Absolute
magnitude in g band. Col.(7): Total magnitude in r band corrected for Galactic and internal extinction and
for redshift. Col.(8): Absolute magnitude in r band. Col.(9): Total luminosity in r band. Col.(10): Bulge
luminosity in r band.
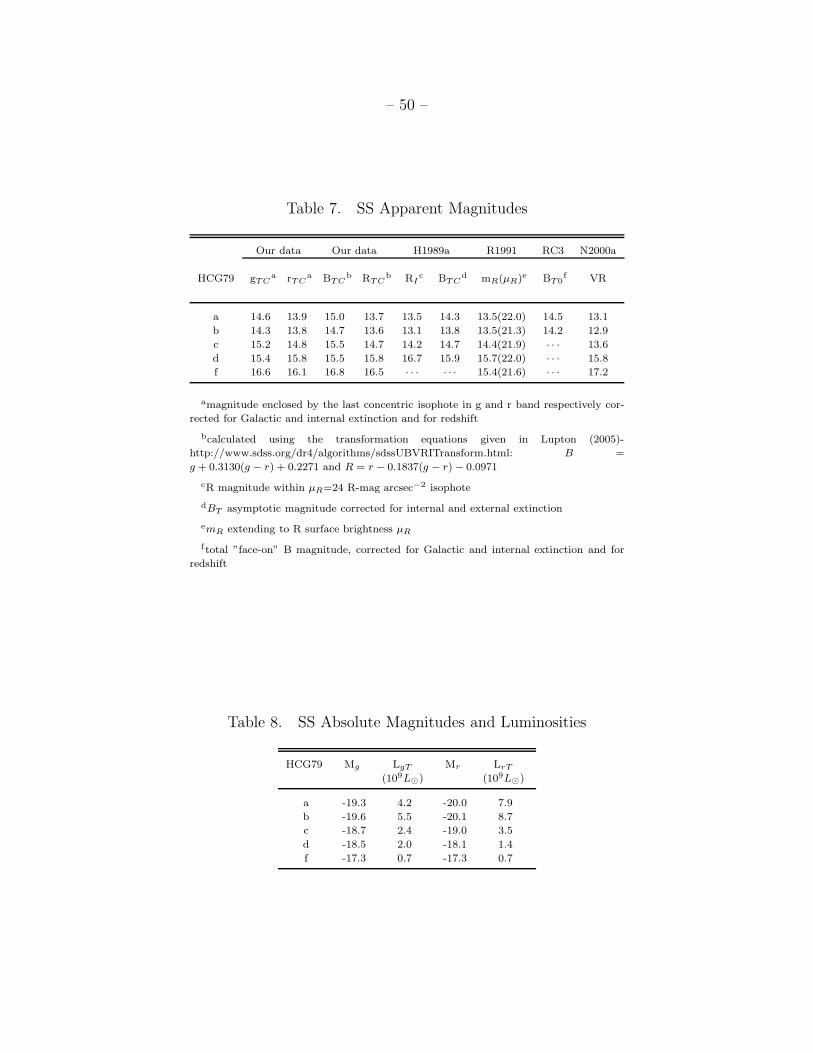
– 50 –
Table 7. SS Apparent Magnitudes
Our data Our data H1989a R1991 RC3 N2000a
HCG79 gTCa rTC
a BTCb RTC
b RIc BTC
d mR(µR)e BT0f VR
a 14.6 13.9 15.0 13.7 13.5 14.3 13.5(22.0) 14.5 13.1
b 14.3 13.8 14.7 13.6 13.1 13.8 13.5(21.3) 14.2 12.9
c 15.2 14.8 15.5 14.7 14.2 14.7 14.4(21.9) · · · 13.6
d 15.4 15.8 15.5 15.8 16.7 15.9 15.7(22.0) · · · 15.8
f 16.6 16.1 16.8 16.5 · · · · · · 15.4(21.6) · · · 17.2
amagnitude enclosed by the last concentric isophote in g and r band respectively cor-
rected for Galactic and internal extinction and for redshift
bcalculated using the transformation equations given in Lupton (2005)-
http://www.sdss.org/dr4/algorithms/sdssUBVRITransform.html: B =
g + 0.3130(g − r) + 0.2271 and R = r − 0.1837(g − r) − 0.0971
cR magnitude within µR=24 R-mag arcsec−2 isophote
dBT asymptotic magnitude corrected for internal and external extinction
emR extending to R surface brightness µR
ftotal ”face-on” B magnitude, corrected for Galactic and internal extinction and for
redshift
Table 8. SS Absolute Magnitudes and Luminosities
HCG79 Mg LgT Mr LrT
(109L⊙) (109L⊙)
a -19.3 4.2 -20.0 7.9
b -19.6 5.5 -20.1 8.7
c -18.7 2.4 -19.0 3.5
d -18.5 2.0 -18.1 1.4
f -17.3 0.7 -17.3 0.7
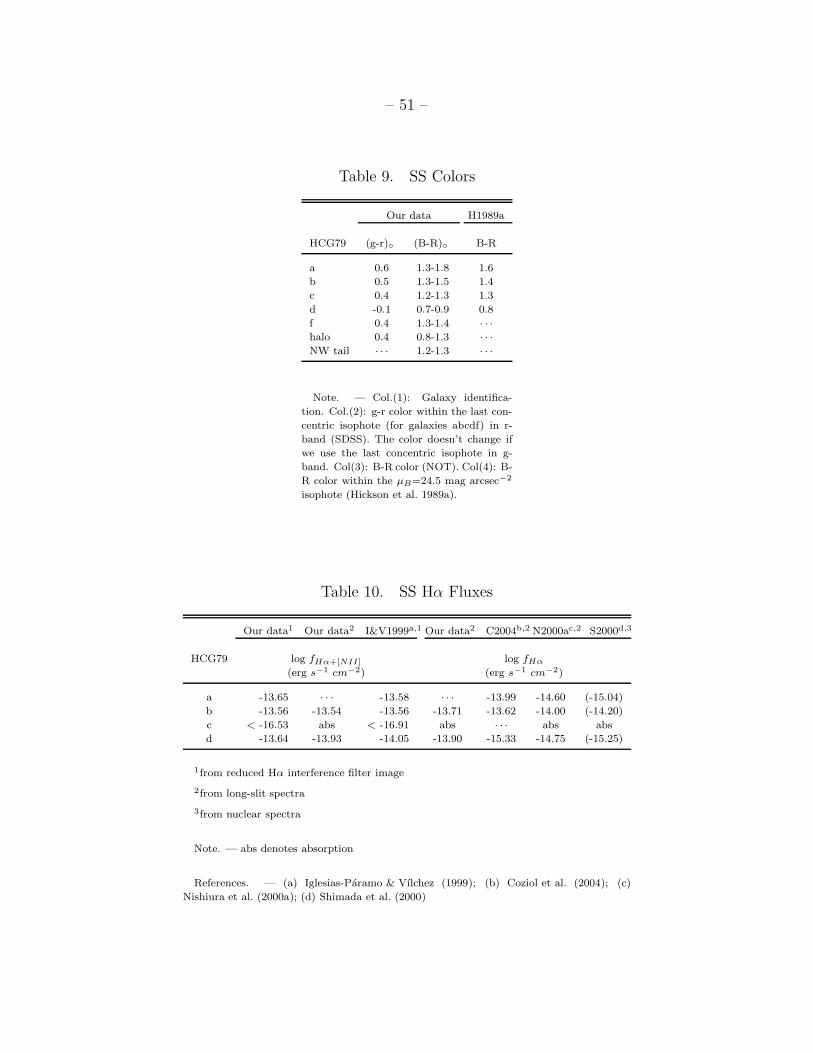
– 51 –
Table 9. SS Colors
Our data H1989a
HCG79 (g-r)◦ (B-R)◦ B-R
a 0.6 1.3-1.8 1.6
b 0.5 1.3-1.5 1.4
c 0.4 1.2-1.3 1.3
d -0.1 0.7-0.9 0.8
f 0.4 1.3-1.4 · · ·
halo 0.4 0.8-1.3 · · ·
NW tail · · · 1.2-1.3 · · ·
Note. — Col.(1): Galaxy identifica-
tion. Col.(2): g-r color within the last con-
centric isophote (for galaxies abcdf) in r-
band (SDSS). The color doesn’t change if
we use the last concentric isophote in g-
band. Col(3): B-R color (NOT). Col(4): B-
R color within the µB=24.5 mag arcsec−2
isophote (Hickson et al. 1989a).
Table 10. SS Hα Fluxes
Our data1 Our data2 I&V1999a,1 Our data2 C2004b,2 N2000ac,2 S2000d,3
HCG79 log fHα+[NII] log fHα
(erg s−1 cm−2) (erg s−1 cm−2)
a -13.65 · · · -13.58 · · · -13.99 -14.60 (-15.04)
b -13.56 -13.54 -13.56 -13.71 -13.62 -14.00 (-14.20)
c < -16.53 abs < -16.91 abs · · · abs abs
d -13.64 -13.93 -14.05 -13.90 -15.33 -14.75 (-15.25)
1from reduced Hα interference filter image
2from long-slit spectra
3from nuclear spectra
Note. — abs denotes absorption
References. — (a) Iglesias-Paramo & Vılchez (1999); (b) Coziol et al. (2004); (c)
Nishiura et al. (2000a); (d) Shimada et al. (2000)
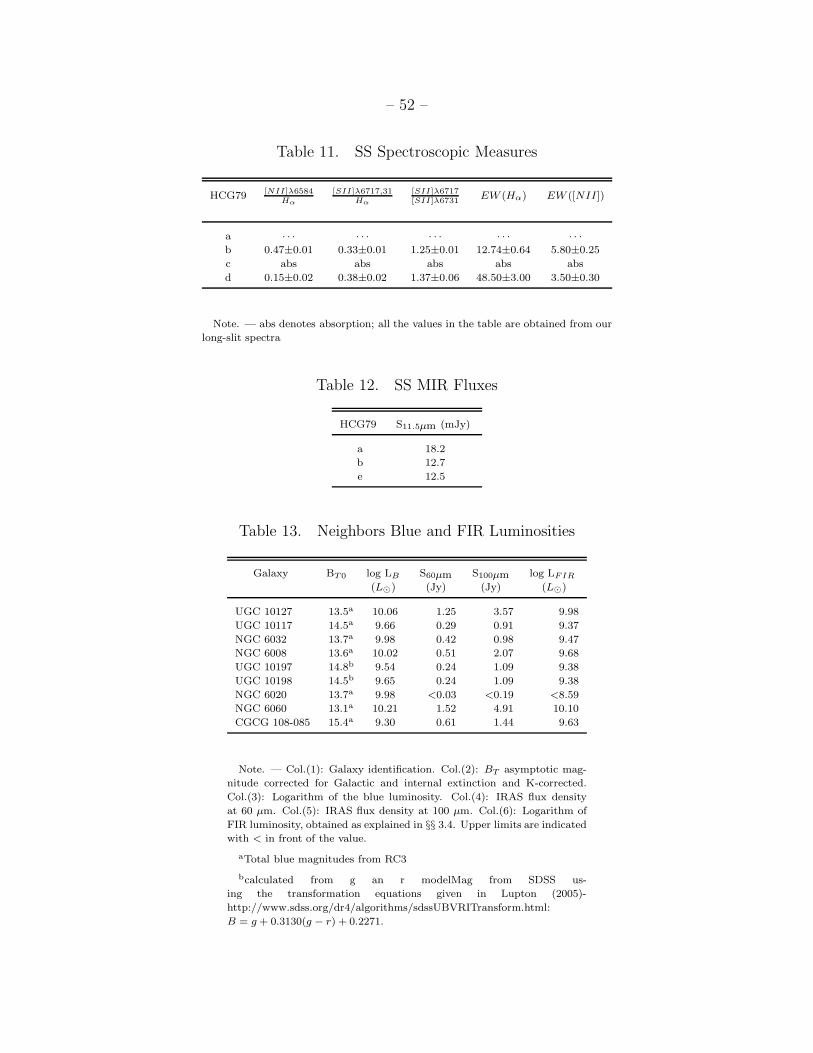
– 52 –
Table 11. SS Spectroscopic Measures
HCG79 [NII]λ6584Hα
[SII]λ6717,31Hα
[SII]λ6717[SII]λ6731
EW (Hα) EW ([NII])
a · · · · · · · · · · · · · · ·
b 0.47±0.01 0.33±0.01 1.25±0.01 12.74±0.64 5.80±0.25
c abs abs abs abs abs
d 0.15±0.02 0.38±0.02 1.37±0.06 48.50±3.00 3.50±0.30
Note. — abs denotes absorption; all the values in the table are obtained from our
long-slit spectra
Table 12. SS MIR Fluxes
HCG79 S11.5µm (mJy)
a 18.2
b 12.7
e 12.5
Table 13. Neighbors Blue and FIR Luminosities
Galaxy BT0 log LB S60µm S100µm log LF IR
(L⊙) (Jy) (Jy) (L⊙)
UGC 10127 13.5a 10.06 1.25 3.57 9.98
UGC 10117 14.5a 9.66 0.29 0.91 9.37
NGC 6032 13.7a 9.98 0.42 0.98 9.47
NGC 6008 13.6a 10.02 0.51 2.07 9.68
UGC 10197 14.8b 9.54 0.24 1.09 9.38
UGC 10198 14.5b 9.65 0.24 1.09 9.38
NGC 6020 13.7a 9.98 <0.03 <0.19 <8.59
NGC 6060 13.1a 10.21 1.52 4.91 10.10
CGCG 108-085 15.4a 9.30 0.61 1.44 9.63
Note. — Col.(1): Galaxy identification. Col.(2): BT asymptotic mag-
nitude corrected for Galactic and internal extinction and K-corrected.
Col.(3): Logarithm of the blue luminosity. Col.(4): IRAS flux density
at 60 µm. Col.(5): IRAS flux density at 100 µm. Col.(6): Logarithm of
FIR luminosity, obtained as explained in §§ 3.4. Upper limits are indicated
with < in front of the value.
aTotal blue magnitudes from RC3
bcalculated from g an r modelMag from SDSS us-
ing the transformation equations given in Lupton (2005)-
http://www.sdss.org/dr4/algorithms/sdssUBVRITransform.html:
B = g + 0.3130(g − r) + 0.2271.
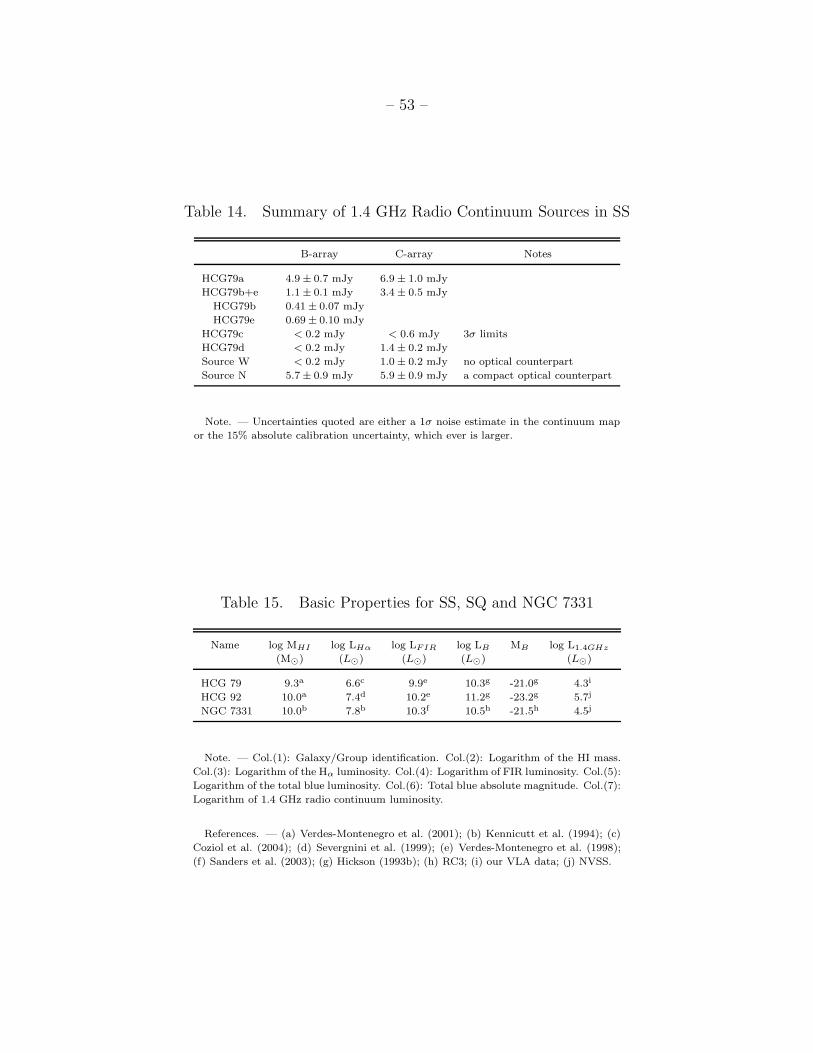
– 53 –
Table 14. Summary of 1.4 GHz Radio Continuum Sources in SS
B-array C-array Notes
HCG79a 4.9 ± 0.7 mJy 6.9 ± 1.0 mJy
HCG79b+e 1.1 ± 0.1 mJy 3.4 ± 0.5 mJy
HCG79b 0.41 ± 0.07 mJy
HCG79e 0.69 ± 0.10 mJy
HCG79c < 0.2 mJy < 0.6 mJy 3σ limits
HCG79d < 0.2 mJy 1.4 ± 0.2 mJy
Source W < 0.2 mJy 1.0 ± 0.2 mJy no optical counterpart
Source N 5.7 ± 0.9 mJy 5.9 ± 0.9 mJy a compact optical counterpart
Note. — Uncertainties quoted are either a 1σ noise estimate in the continuum map
or the 15% absolute calibration uncertainty, which ever is larger.
Table 15. Basic Properties for SS, SQ and NGC 7331
Name log MHI log LHα log LF IR log LB MB log L1.4GHz
(M⊙) (L⊙) (L⊙) (L⊙) (L⊙)
HCG 79 9.3a 6.6c 9.9e 10.3g -21.0g 4.3i
HCG 92 10.0a 7.4d 10.2e 11.2g -23.2g 5.7j
NGC 7331 10.0b 7.8b 10.3f 10.5h -21.5h 4.5j
Note. — Col.(1): Galaxy/Group identification. Col.(2): Logarithm of the HI mass.
Col.(3): Logarithm of the Hα luminosity. Col.(4): Logarithm of FIR luminosity. Col.(5):
Logarithm of the total blue luminosity. Col.(6): Total blue absolute magnitude. Col.(7):
Logarithm of 1.4 GHz radio continuum luminosity.
References. — (a) Verdes-Montenegro et al. (2001); (b) Kennicutt et al. (1994); (c)
Coziol et al. (2004); (d) Severgnini et al. (1999); (e) Verdes-Montenegro et al. (1998);
(f) Sanders et al. (2003); (g) Hickson (1993b); (h) RC3; (i) our VLA data; (j) NVSS.
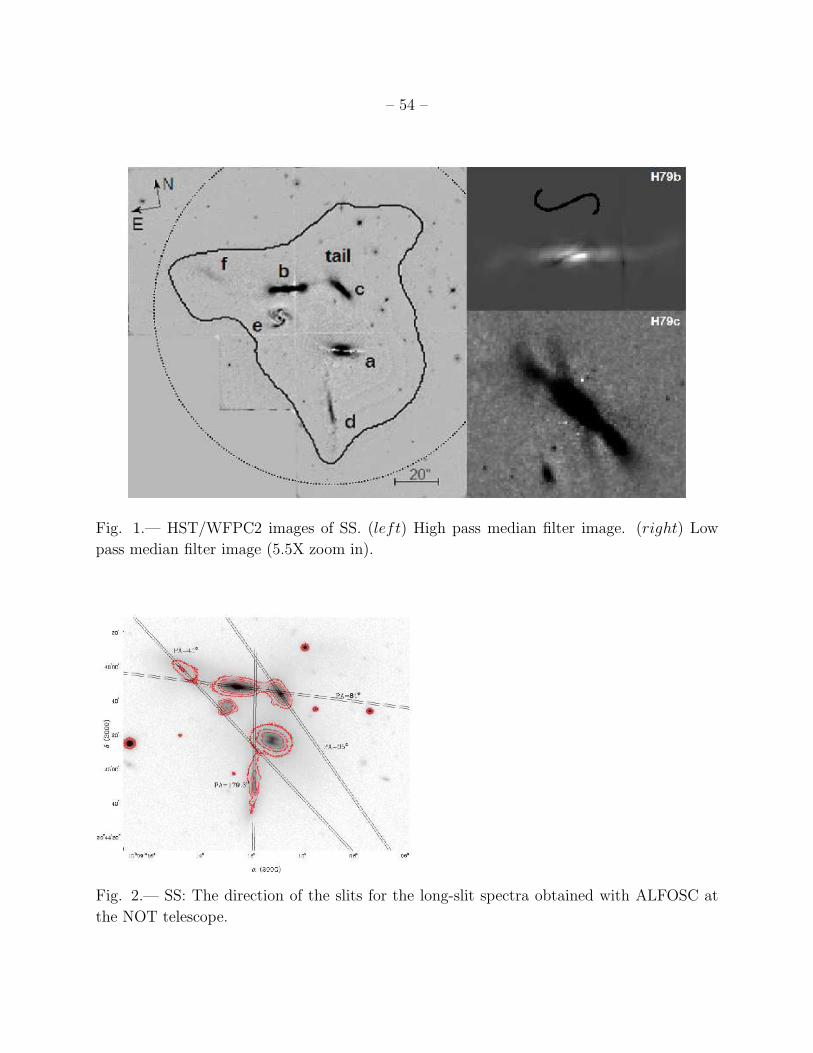
– 54 –
Fig. 1.— HST/WFPC2 images of SS. (left) High pass median filter image. (right) Low
pass median filter image (5.5X zoom in).
Fig. 2.— SS: The direction of the slits for the long-slit spectra obtained with ALFOSC at
the NOT telescope.
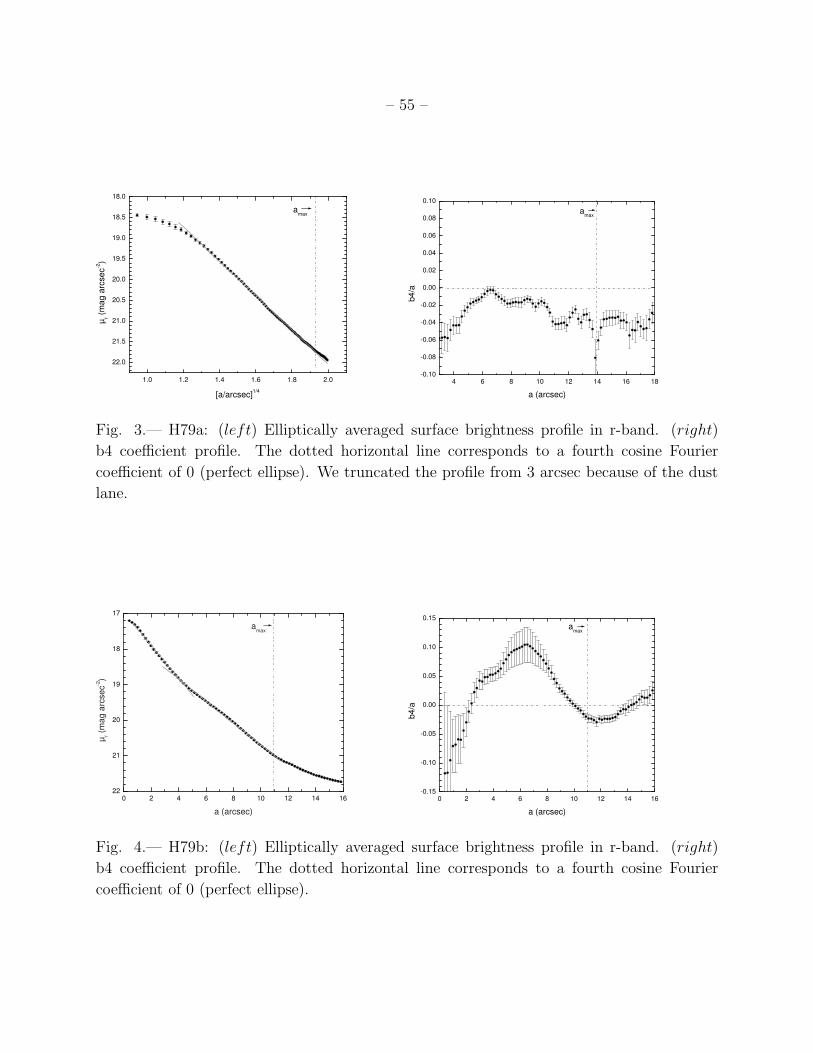
– 55 –
1.0 1.2 1.4 1.6 1.8 2.0
22.0
21.5
21.0
20.5
20.0
19.5
19.0
18.5
18.0
amax
µ r (m
ag
arc
se
c-2)
[a/arcsec]1/4
4 6 8 10 12 14 16 18-0.10
-0.08
-0.06
-0.04
-0.02
0.00
0.02
0.04
0.06
0.08
0.10
amax
b4
/a
a (arcsec)
Fig. 3.— H79a: (left) Elliptically averaged surface brightness profile in r-band. (right)
b4 coefficient profile. The dotted horizontal line corresponds to a fourth cosine Fourier
coefficient of 0 (perfect ellipse). We truncated the profile from 3 arcsec because of the dust
lane.
0 2 4 6 8 10 12 14 1622
21
20
19
18
17
amax
µ r (m
ag
arc
se
c-2)
a (arcsec)
0 2 4 6 8 10 12 14 16-0.15
-0.10
-0.05
0.00
0.05
0.10
0.15
amax
b4
/a
a (arcsec)
Fig. 4.— H79b: (left) Elliptically averaged surface brightness profile in r-band. (right)
b4 coefficient profile. The dotted horizontal line corresponds to a fourth cosine Fourier
coefficient of 0 (perfect ellipse).
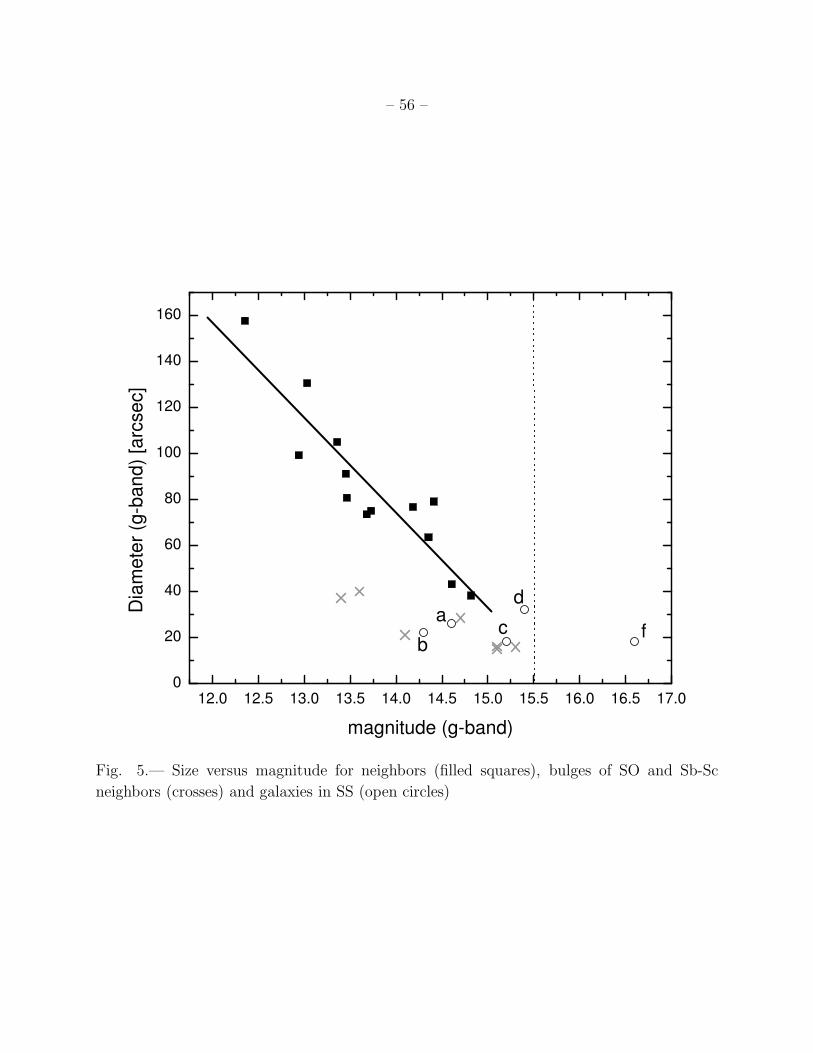
– 56 –
12.0 12.5 13.0 13.5 14.0 14.5 15.0 15.5 16.0 16.5 17.00
20
40
60
80
100
120
140
160
f
d
cb
a
Dia
me
ter
(g-b
an
d)
[arc
se
c]
magnitude (g-band)
Fig. 5.— Size versus magnitude for neighbors (filled squares), bulges of SO and Sb-Sc
neighbors (crosses) and galaxies in SS (open circles)
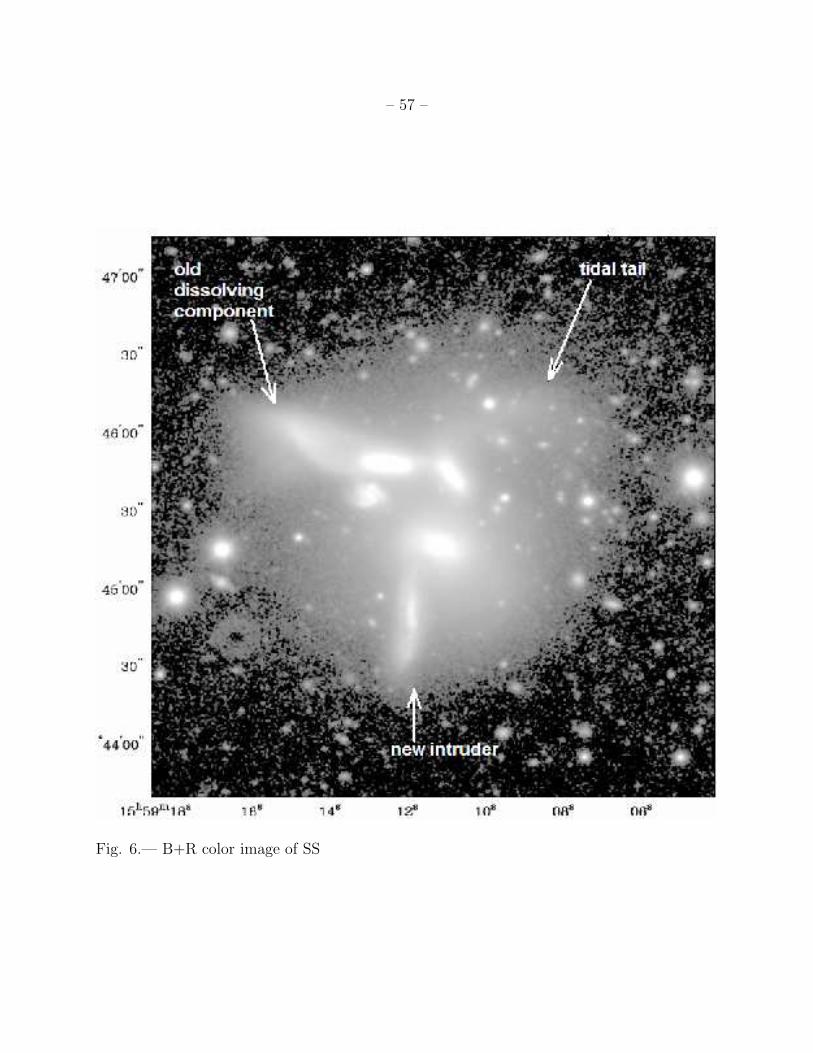
– 57 –
Fig. 6.— B+R color image of SS
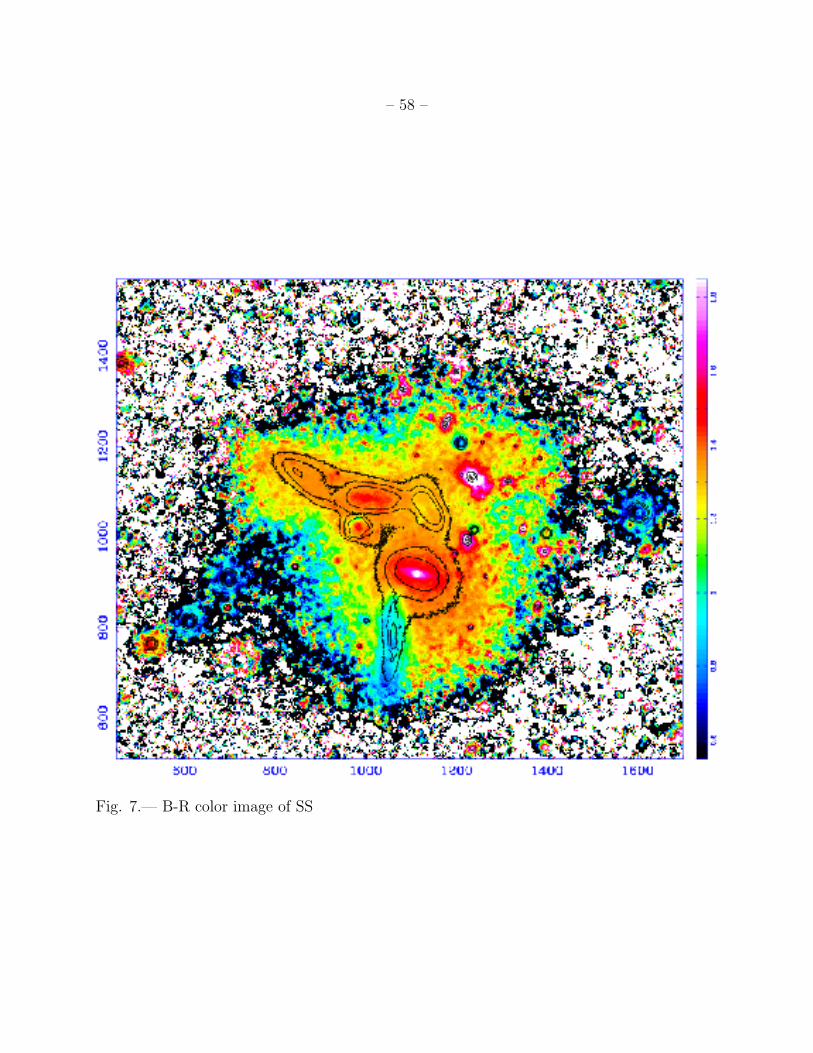
– 58 –
Fig. 7.— B-R color image of SS
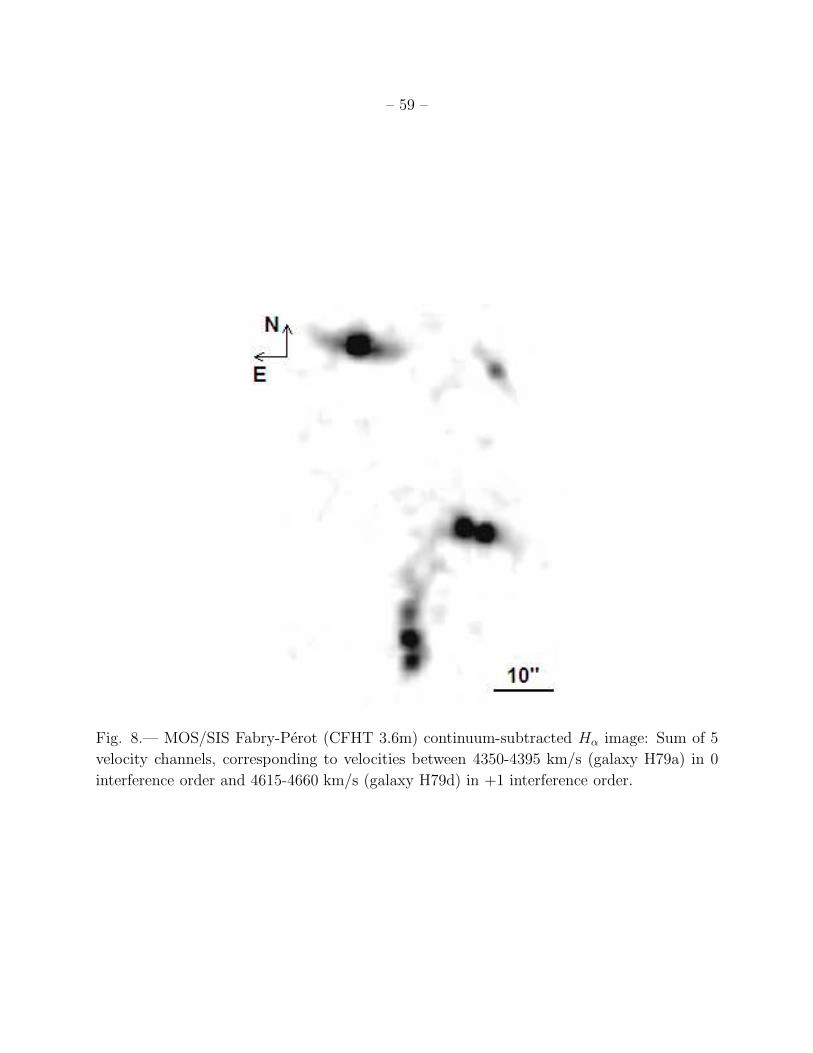
– 59 –
Fig. 8.— MOS/SIS Fabry-Perot (CFHT 3.6m) continuum-subtracted Hα image: Sum of 5
velocity channels, corresponding to velocities between 4350-4395 km/s (galaxy H79a) in 0
interference order and 4615-4660 km/s (galaxy H79d) in +1 interference order.
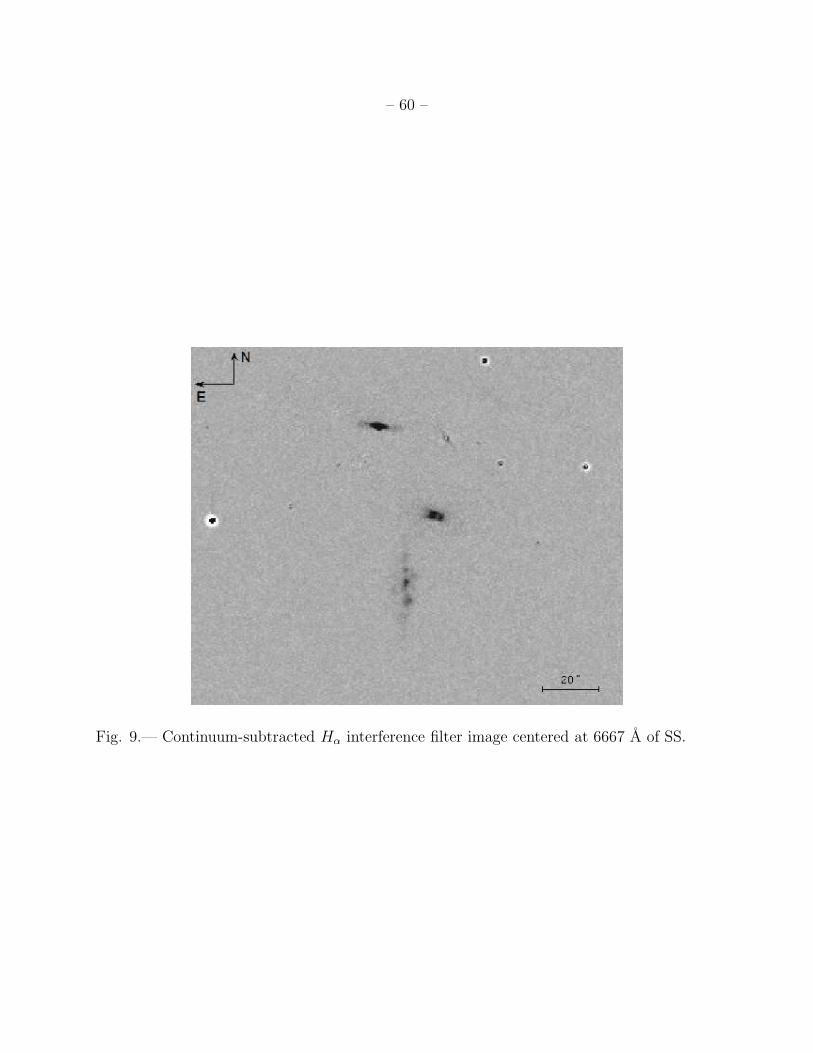
– 60 –
Fig. 9.— Continuum-subtracted Hα interference filter image centered at 6667 A of SS.
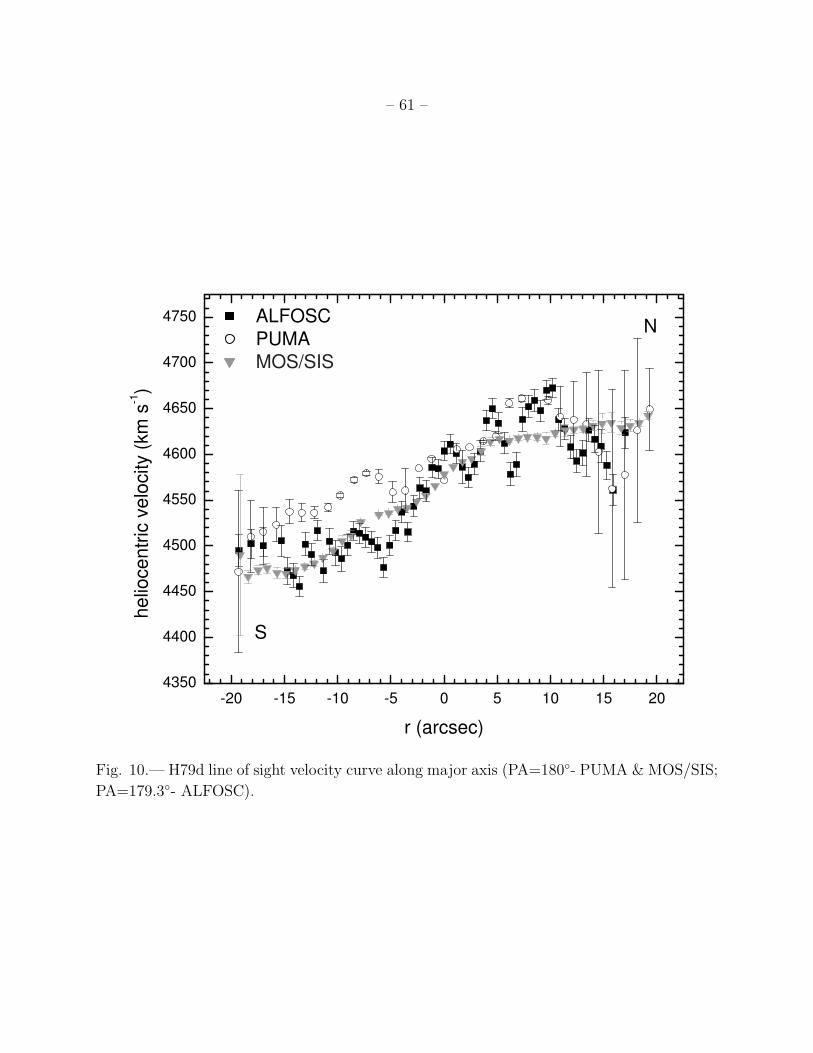
– 61 –
-20 -15 -10 -5 0 5 10 15 204350
4400
4450
4500
4550
4600
4650
4700
4750N
S
he
lioce
ntr
ic v
elo
city (
km
s-1)
r (arcsec)
ALFOSC
PUMA
MOS/SIS
Fig. 10.— H79d line of sight velocity curve along major axis (PA=180◦- PUMA & MOS/SIS;
PA=179.3◦- ALFOSC).
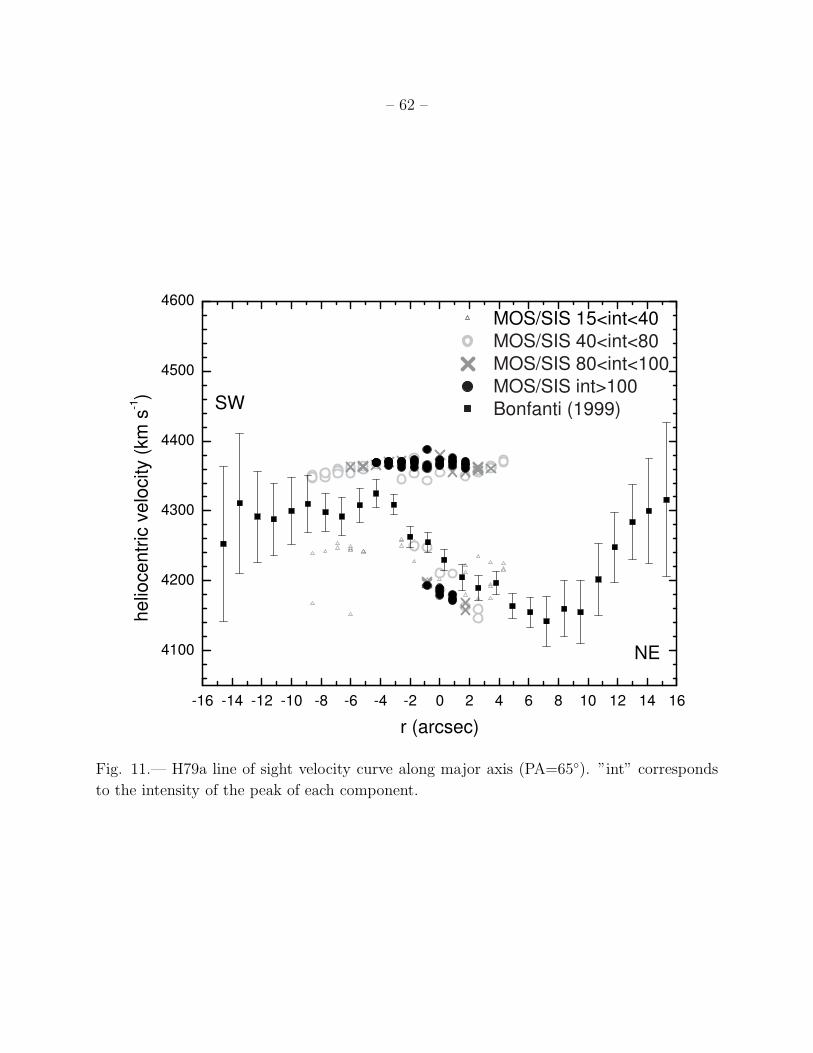
– 62 –
-16 -14 -12 -10 -8 -6 -4 -2 0 2 4 6 8 10 12 14 16
4100
4200
4300
4400
4500
4600
NE
SW
he
lioce
ntr
ic v
elo
city (
km
s-1)
r (arcsec)
MOS/SIS 15<int<40
MOS/SIS 40<int<80
MOS/SIS 80<int<100
MOS/SIS int>100
Bonfanti (1999)
Fig. 11.— H79a line of sight velocity curve along major axis (PA=65◦). ”int” corresponds
to the intensity of the peak of each component.
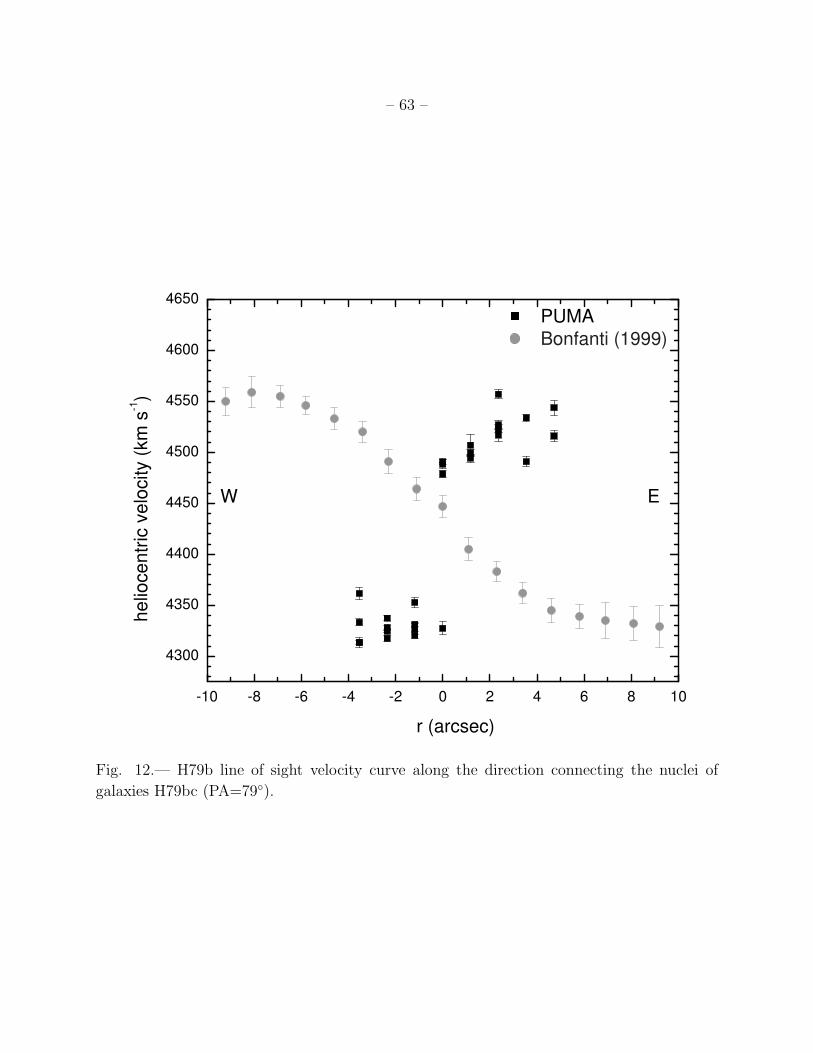
– 63 –
-10 -8 -6 -4 -2 0 2 4 6 8 10
4300
4350
4400
4450
4500
4550
4600
4650
EW
r (arcsec)
he
lioce
ntr
ic v
elo
city (
km
s-1)
PUMA
Bonfanti (1999)
Fig. 12.— H79b line of sight velocity curve along the direction connecting the nuclei of
galaxies H79bc (PA=79◦).
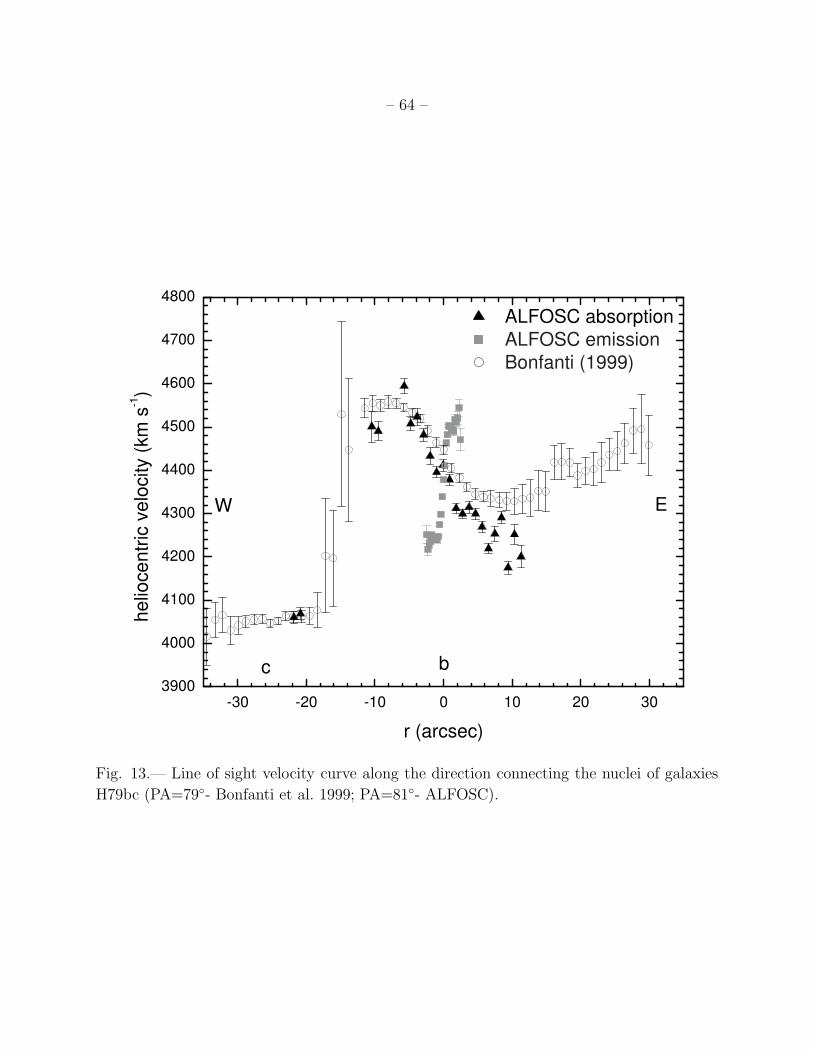
– 64 –
-30 -20 -10 0 10 20 303900
4000
4100
4200
4300
4400
4500
4600
4700
4800
c b
W E
he
lioce
ntr
ic v
elo
city (
km
s-1)
r (arcsec)
ALFOSC absorption
ALFOSC emission
Bonfanti (1999)
Fig. 13.— Line of sight velocity curve along the direction connecting the nuclei of galaxies
H79bc (PA=79◦- Bonfanti et al. 1999; PA=81◦- ALFOSC).
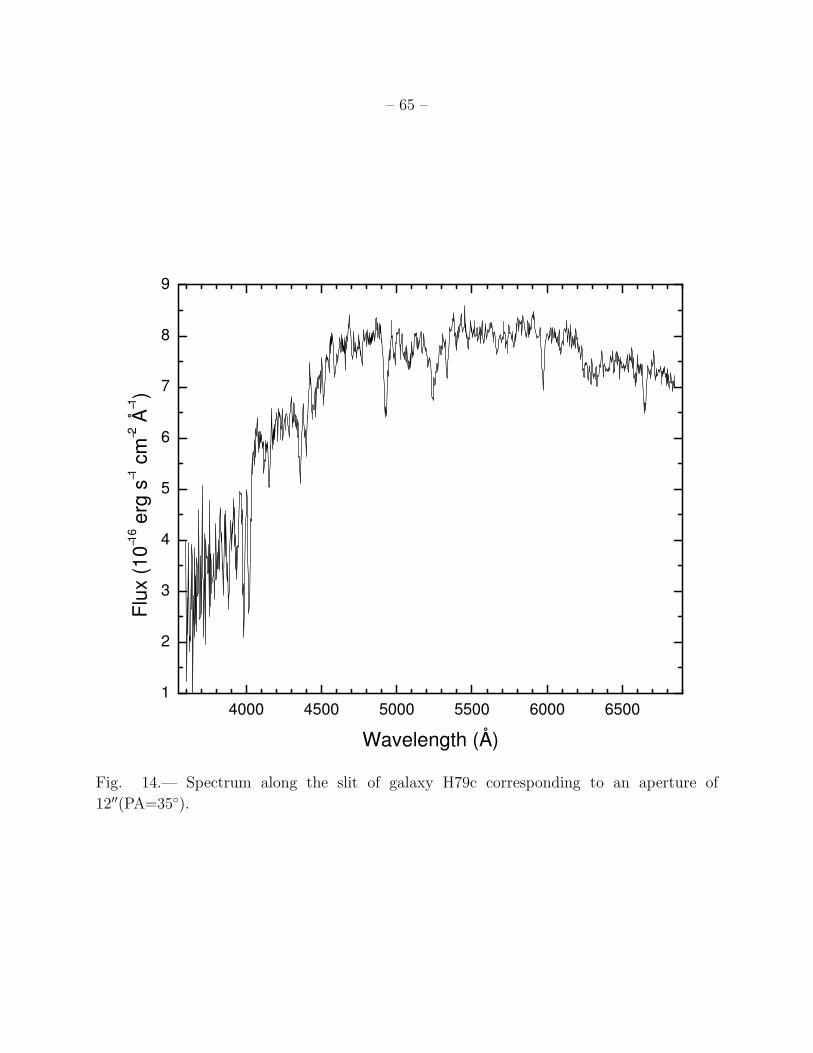
– 65 –
4000 4500 5000 5500 6000 65001
2
3
4
5
6
7
8
9
Flu
x (
10
−16 e
rg s
−1 c
m−2 Å
−1)
Wavelength (Å)
Fig. 14.— Spectrum along the slit of galaxy H79c corresponding to an aperture of
12′′(PA=35◦).
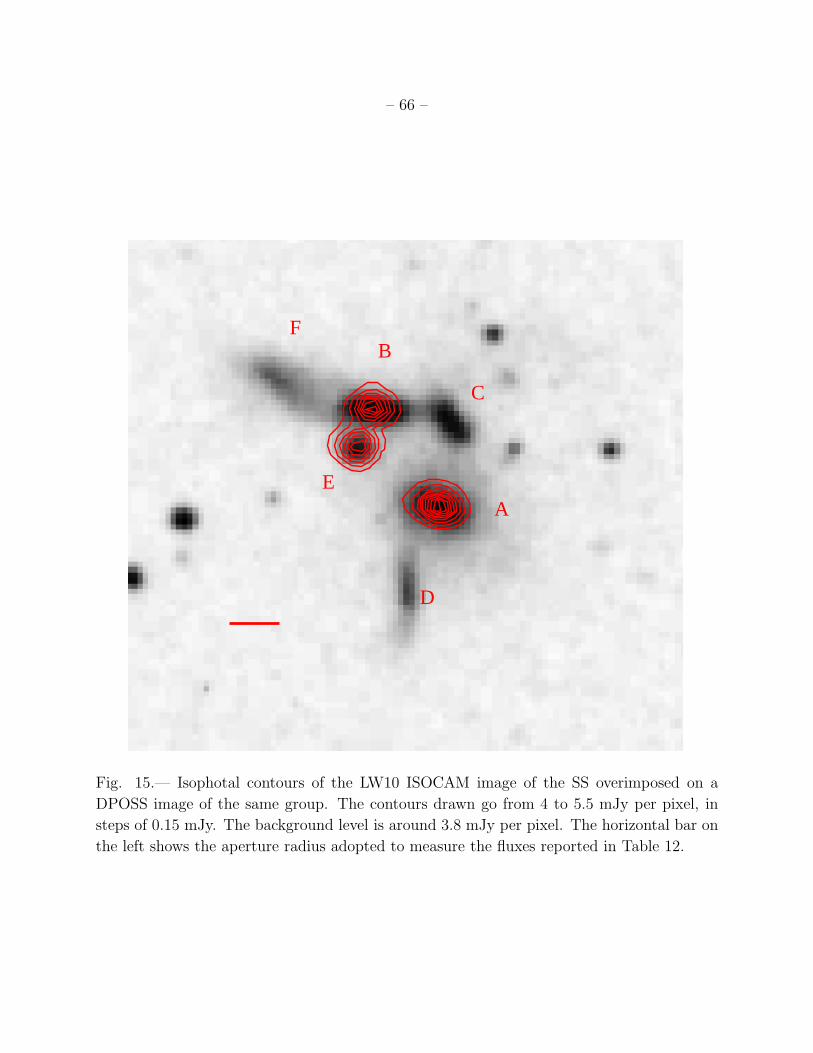
– 66 –
FB
C
A
D
E
Fig. 15.— Isophotal contours of the LW10 ISOCAM image of the SS overimposed on a
DPOSS image of the same group. The contours drawn go from 4 to 5.5 mJy per pixel, in
steps of 0.15 mJy. The background level is around 3.8 mJy per pixel. The horizontal bar on
the left shows the aperture radius adopted to measure the fluxes reported in Table 12.
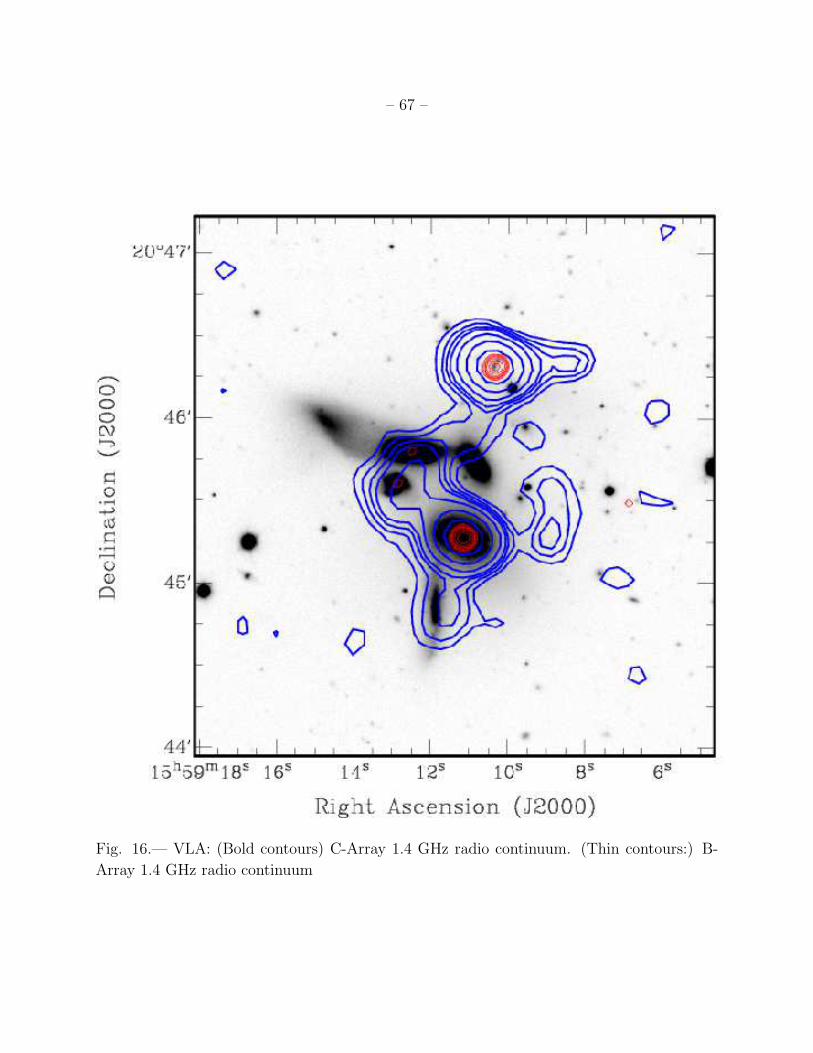
– 67 –
Fig. 16.— VLA: (Bold contours) C-Array 1.4 GHz radio continuum. (Thin contours:) B-
Array 1.4 GHz radio continuum
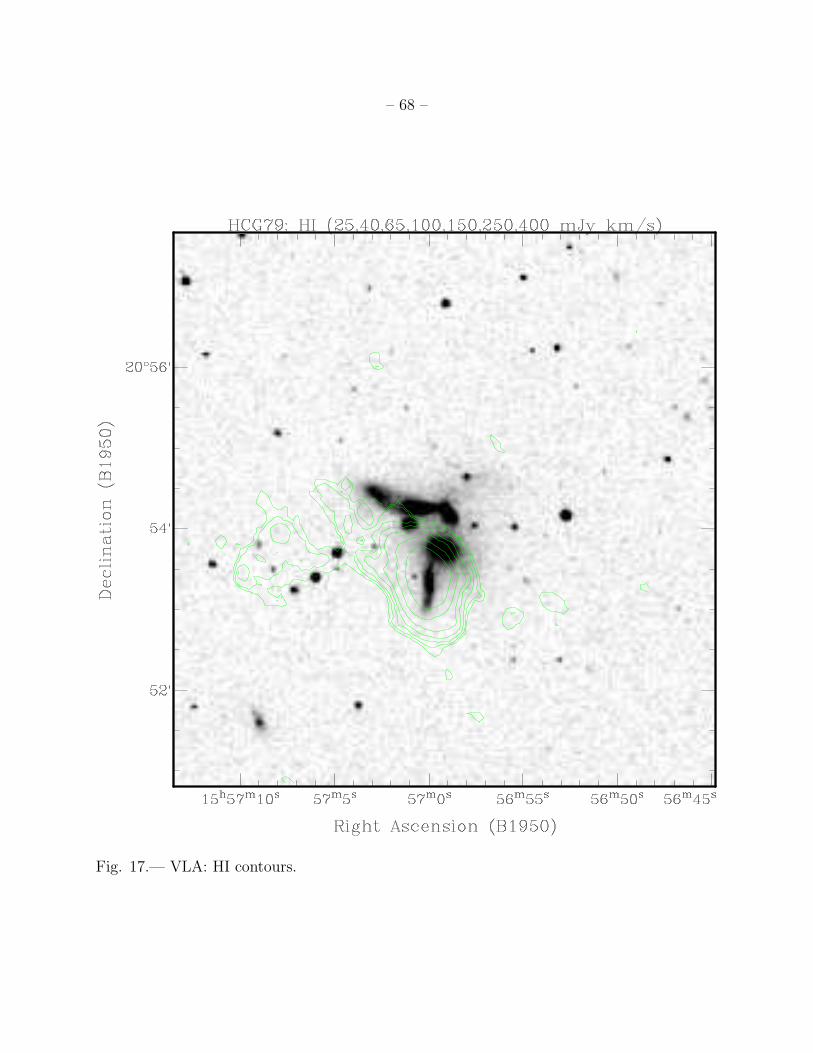
– 68 –
Fig. 17.— VLA: HI contours.
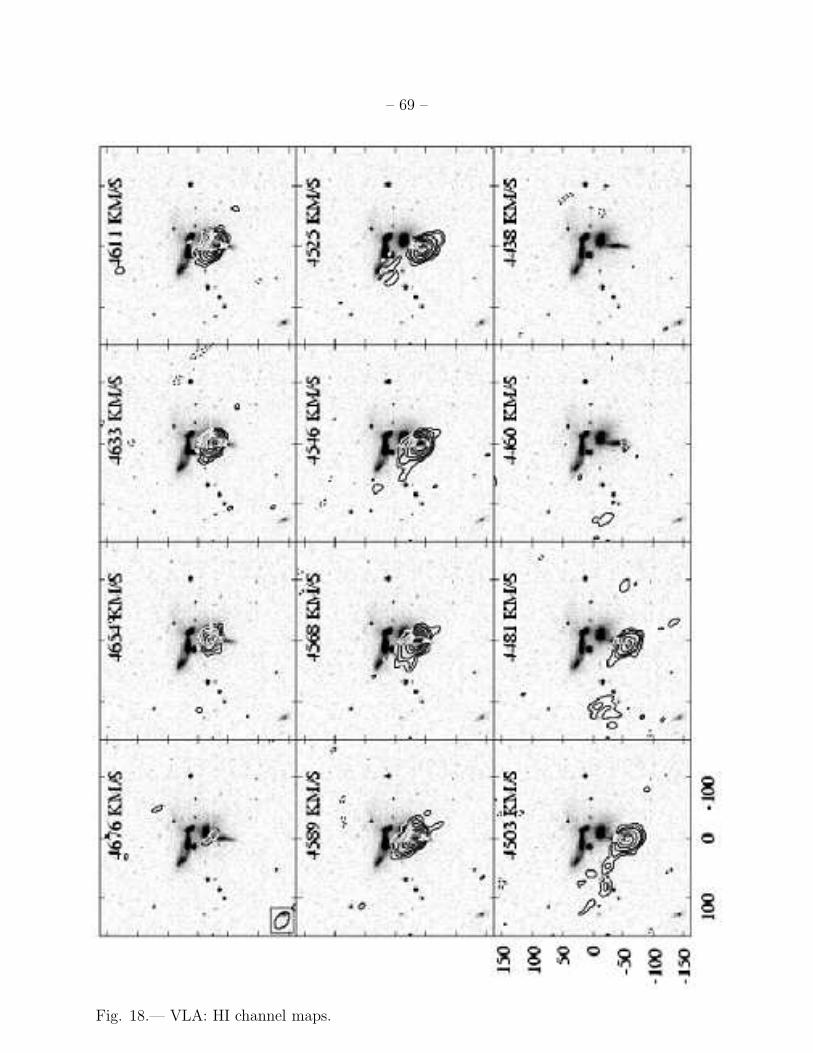
– 69 –
Fig. 18.— VLA: HI channel maps.
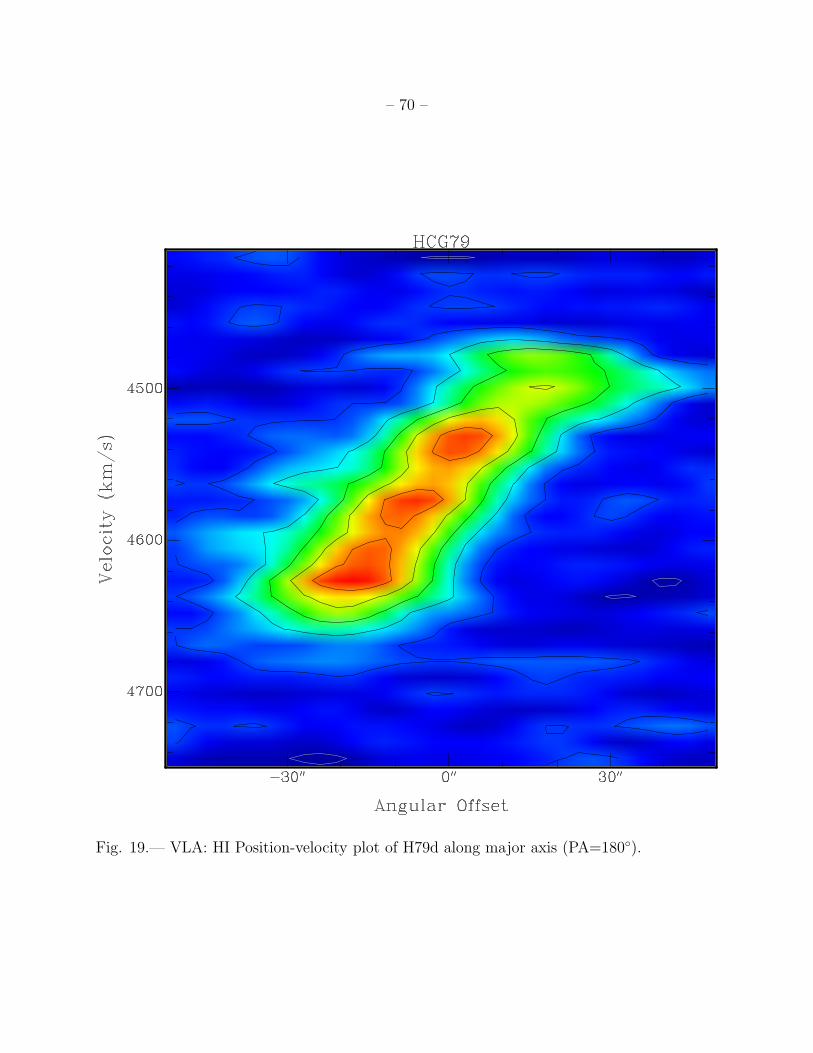
– 70 –
Fig. 19.— VLA: HI Position-velocity plot of H79d along major axis (PA=180◦).