seventh grade students' conceptions of global warming and climate change
TRANSCRIPT
Seventh Grade Students’ Conceptions of Global Warming and Climate Change
Daniel P. Shepardson,1,2 Dev Niyogi2,3, Soyoung Choi1, and Umarporn Charusombat 2 1 Department of Curriculum and Instruction, Purdue University, West Lafayette, IN 47907 2 Department of Earth and Atmospheric Sciences, Purdue University, West Lafayette, IN 47907 3 State Climate Office of Indiana, Department of Agronomy, Purdue University, West Lafayette
IN 47907 Contact Information: Dan Shepardson Dept of C&I 100 North University Street Purdue University West Lafayette, IN 47907-2098 [email protected]
Running Head: Global Warming and Climate Change
The work reported in this manuscript was supported by the National Science Foundation (NSF), award number Geo 0606922. The opinions, findings, and conclusions or recommendations expressed in this paper are those of the authors and do not necessarily reflect the views of the NSF.
Global Warming and Climate Change 1
Abstract
The purpose of this study was to investigate seventh grade students’ conceptions of global warming and climate change. The study was descriptive in nature and involved the collection of qualitative data from 91 seventh grade students from three different schools in the Midwest, USA. These data were analyzed for content in an inductive manner to identify students’ concepts. The categories that emerged from the students’ responses reflected different degrees of sophistication or conceptualization about global warming and climate change. Based on these findings we make curricular recommendations that build on the students’ conceptions and the NRC (1996) science education standards.
Global Warming and Climate Change 2
Introduction
As human activities continue to add greenhouse gases—carbon dioxide, methane, and
nitrous oxides—to the Earth’s atmosphere, global temperatures are expected to rise, causing the
Earth’s climates to change. These climate changes may affect precipitation patterns, severe and
extreme weather events, and over time environmental systems. Furthermore, human health and
agriculture may be sensitive to climate change. The Intergovernmental Panel on Climate Change
(IPCC) has concluded that global warming is inevitable and that human activity is likely to be
the main cause. The National Research Council’s Grand Challenges in Environmental Sciences
(NRC, 2000) identified eight "grand challenges," four of which are directly linked to climate and
climate change. Thus, it is vital that students learn about global warming and climate change.
Teaching about global warming and climate change is essential for developing well
rounded students, and for overcoming a critical deficiency in atmospheric science and
climatology curricula (Serafin et al. 1991). Furthermore, teaching about global warming and
climate change provides a natural context for studying science through personal and social
applications. An understanding that is essential if future citizens are to assume responsibility for
the management and policymaking decisions facing our planet (Brown, 1992; Bybee, 1993).
Therefore, if science education is to promote a citizenry that is knowledgeable about global
warming and climate change it is essential to determine what students’ conceptions are about
global warming and climate change (Osborne & Freyberg, 1985) in order to plan curriculum and
design instruction that builds on students’ conceptions (Driver et al., 1994).
The purpose of this study was to investigate seventh grade students’ conceptions about
global warming and climate change, add to the extant literature base on students’ geoscience and
environmental science learning, and provide guidance to curricular development. We selected
Global Warming and Climate Change 3
seventh grade as this is the grade level at which students begin to learn about global climate,
weather, and related phenomena (e.g., hydrologic cycle), developing an understanding of the
Earth as a system—the interrelationship among the physical, chemical, and biological processes
that shape and change the Earth (NRC, 1996). Specifically, the research question guiding this
study was: What are seventh grade students’ conceptions of global warming and climate
change?
Based on these findings we make curricular recommendations that build on students’
conceptions and the National Research Council (NRC) science education standards (NRC,
1996). Furthermore our study expands on past research, providing a historical perspective on
students’ conceptions as well as providing new insights into students’ conceptions about the
potential environmental impact of global warming and climate change.
Background
We reviewed 14 international studies published between 1993 and 2005 that investigated
secondary students’ conceptions of global warming and climate change. Because of the limited
number of studies that specifically investigated seventh grade students’ conceptions of global
warming and climate change; we expanded our literature review to secondary students, grades 6-
12. Instead of individually describing each of the studies, we report our interpretation and
categorization of the findings in tabular form (Tables 1-4). We grouped the findings from these
studies into four themes and 20 categories. The four themes are: conceptions about global
warming, the greenhouse effect (Table 1), causes of global warming and climate change (Table
2), environmental impact of global warming and climate change (Table 3), and resolutions
(Table 4). Within each theme we identified categories that reflect the students’ conceptions. For
each category we identify specific findings that make up the category along with the authors.
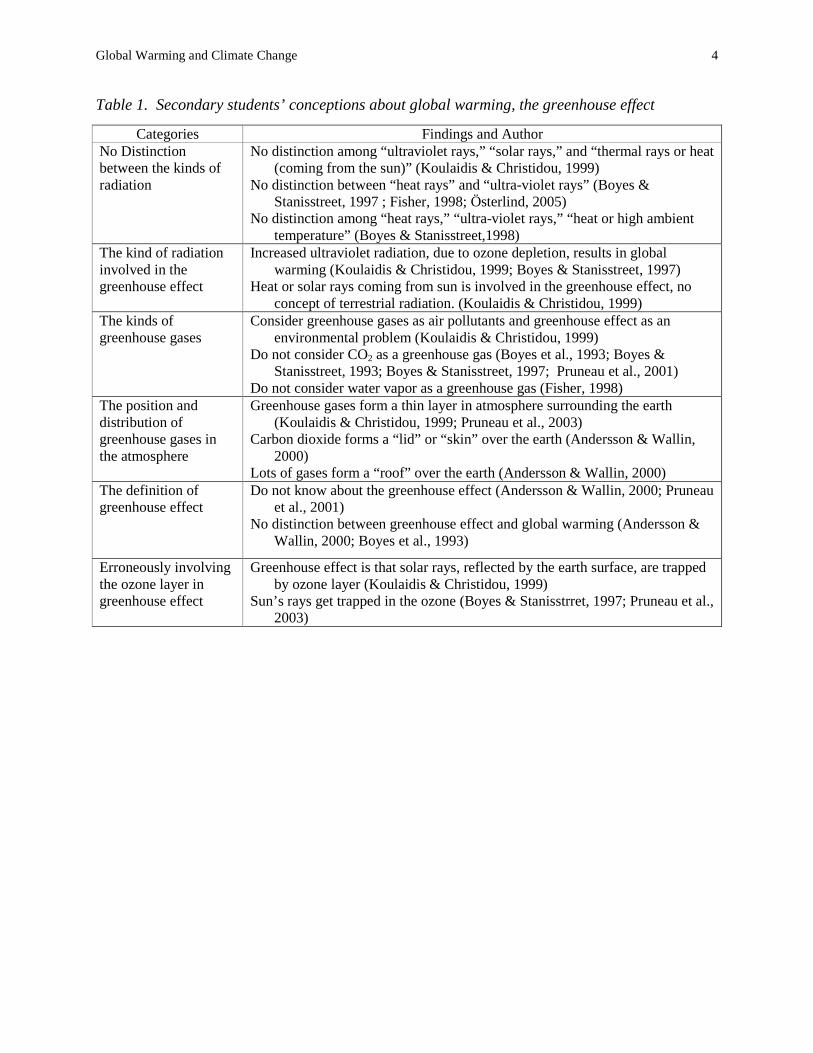
Global Warming and Climate Change 4
Table 1. Secondary students’ conceptions about global warming, the greenhouse effect
Categories Findings and Author No Distinction between the kinds of radiation
No distinction among “ultraviolet rays,” “solar rays,” and “thermal rays or heat (coming from the sun)” (Koulaidis & Christidou, 1999)
No distinction between “heat rays” and “ultra-violet rays” (Boyes & Stanisstreet, 1997 ; Fisher, 1998; Österlind, 2005)
No distinction among “heat rays,” “ultra-violet rays,” “heat or high ambient temperature” (Boyes & Stanisstreet,1998)
The kind of radiation involved in the greenhouse effect
Increased ultraviolet radiation, due to ozone depletion, results in global warming (Koulaidis & Christidou, 1999; Boyes & Stanisstreet, 1997)
Heat or solar rays coming from sun is involved in the greenhouse effect, no concept of terrestrial radiation. (Koulaidis & Christidou, 1999)
The kinds of greenhouse gases
Consider greenhouse gases as air pollutants and greenhouse effect as an environmental problem (Koulaidis & Christidou, 1999)
Do not consider CO2 as a greenhouse gas (Boyes et al., 1993; Boyes & Stanisstreet, 1993; Boyes & Stanisstreet, 1997; Pruneau et al., 2001)
Do not consider water vapor as a greenhouse gas (Fisher, 1998) The position and distribution of greenhouse gases in the atmosphere
Greenhouse gases form a thin layer in atmosphere surrounding the earth (Koulaidis & Christidou, 1999; Pruneau et al., 2003)
Carbon dioxide forms a “lid” or “skin” over the earth (Andersson & Wallin, 2000)
Lots of gases form a “roof” over the earth (Andersson & Wallin, 2000) The definition of greenhouse effect
Do not know about the greenhouse effect (Andersson & Wallin, 2000; Pruneau et al., 2001)
No distinction between greenhouse effect and global warming (Andersson & Wallin, 2000; Boyes et al., 1993)
Erroneously involving the ozone layer in greenhouse effect
Greenhouse effect is that solar rays, reflected by the earth surface, are trapped by ozone layer (Koulaidis & Christidou, 1999)
Sun’s rays get trapped in the ozone (Boyes & Stanisstrret, 1997; Pruneau et al., 2003)
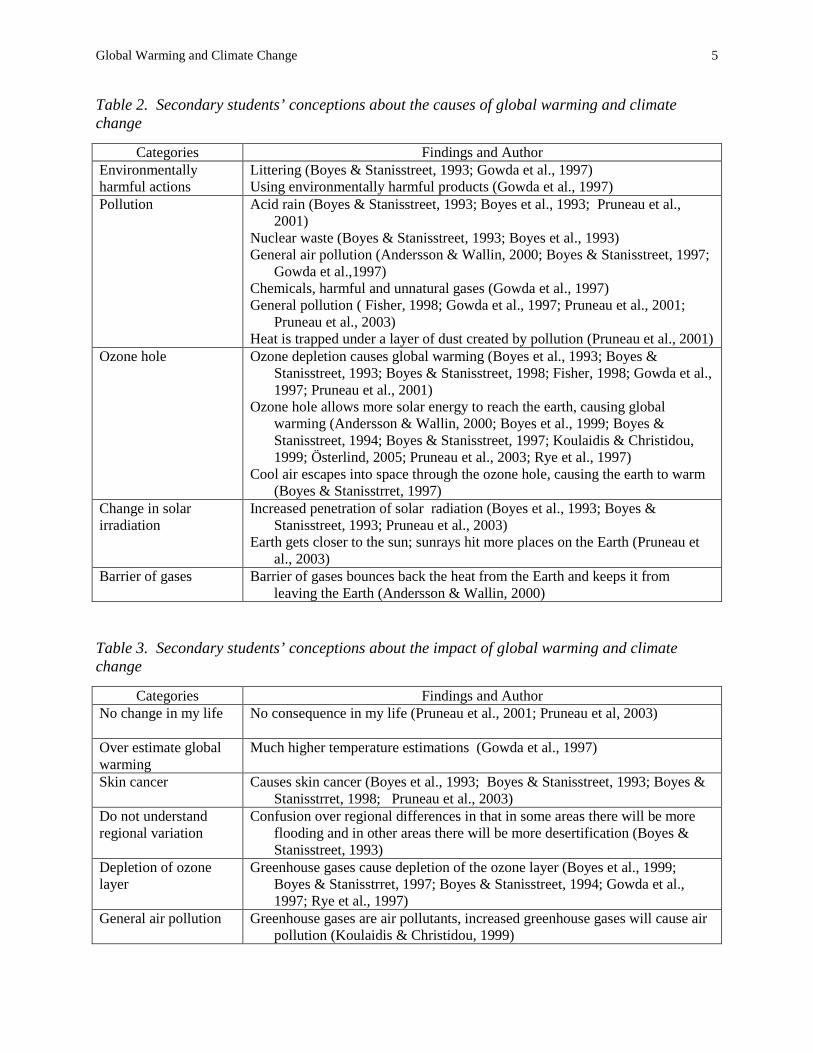
Global Warming and Climate Change 5
Table 2. Secondary students’ conceptions about the causes of global warming and climate change
Table 3. Secondary students’ conceptions about the impact of global warming and climate change
Categories Findings and Author Environmentally harmful actions
Littering (Boyes & Stanisstreet, 1993; Gowda et al., 1997) Using environmentally harmful products (Gowda et al., 1997)
Pollution Acid rain (Boyes & Stanisstreet, 1993; Boyes et al., 1993; Pruneau et al., 2001)
Nuclear waste (Boyes & Stanisstreet, 1993; Boyes et al., 1993) General air pollution (Andersson & Wallin, 2000; Boyes & Stanisstreet, 1997;
Gowda et al.,1997) Chemicals, harmful and unnatural gases (Gowda et al., 1997) General pollution ( Fisher, 1998; Gowda et al., 1997; Pruneau et al., 2001;
Pruneau et al., 2003) Heat is trapped under a layer of dust created by pollution (Pruneau et al., 2001)
Ozone hole Ozone depletion causes global warming (Boyes et al., 1993; Boyes & Stanisstreet, 1993; Boyes & Stanisstreet, 1998; Fisher, 1998; Gowda et al., 1997; Pruneau et al., 2001)
Ozone hole allows more solar energy to reach the earth, causing global warming (Andersson & Wallin, 2000; Boyes et al., 1999; Boyes & Stanisstreet, 1994; Boyes & Stanisstreet, 1997; Koulaidis & Christidou, 1999; Österlind, 2005; Pruneau et al., 2003; Rye et al., 1997)
Cool air escapes into space through the ozone hole, causing the earth to warm (Boyes & Stanisstrret, 1997)
Change in solar irradiation
Increased penetration of solar radiation (Boyes et al., 1993; Boyes & Stanisstreet, 1993; Pruneau et al., 2003)
Earth gets closer to the sun; sunrays hit more places on the Earth (Pruneau et al., 2003)
Barrier of gases Barrier of gases bounces back the heat from the Earth and keeps it from leaving the Earth (Andersson & Wallin, 2000)
Categories Findings and Author No change in my life
No consequence in my life (Pruneau et al., 2001; Pruneau et al, 2003)
Over estimate global warming
Much higher temperature estimations (Gowda et al., 1997)
Skin cancer Causes skin cancer (Boyes et al., 1993; Boyes & Stanisstreet, 1993; Boyes & Stanisstrret, 1998; Pruneau et al., 2003)
Do not understand regional variation
Confusion over regional differences in that in some areas there will be more flooding and in other areas there will be more desertification (Boyes & Stanisstreet, 1993)
Depletion of ozone layer
Greenhouse gases cause depletion of the ozone layer (Boyes et al., 1999; Boyes & Stanisstrret, 1997; Boyes & Stanisstreet, 1994; Gowda et al., 1997; Rye et al., 1997)
General air pollution Greenhouse gases are air pollutants, increased greenhouse gases will cause air pollution (Koulaidis & Christidou, 1999)
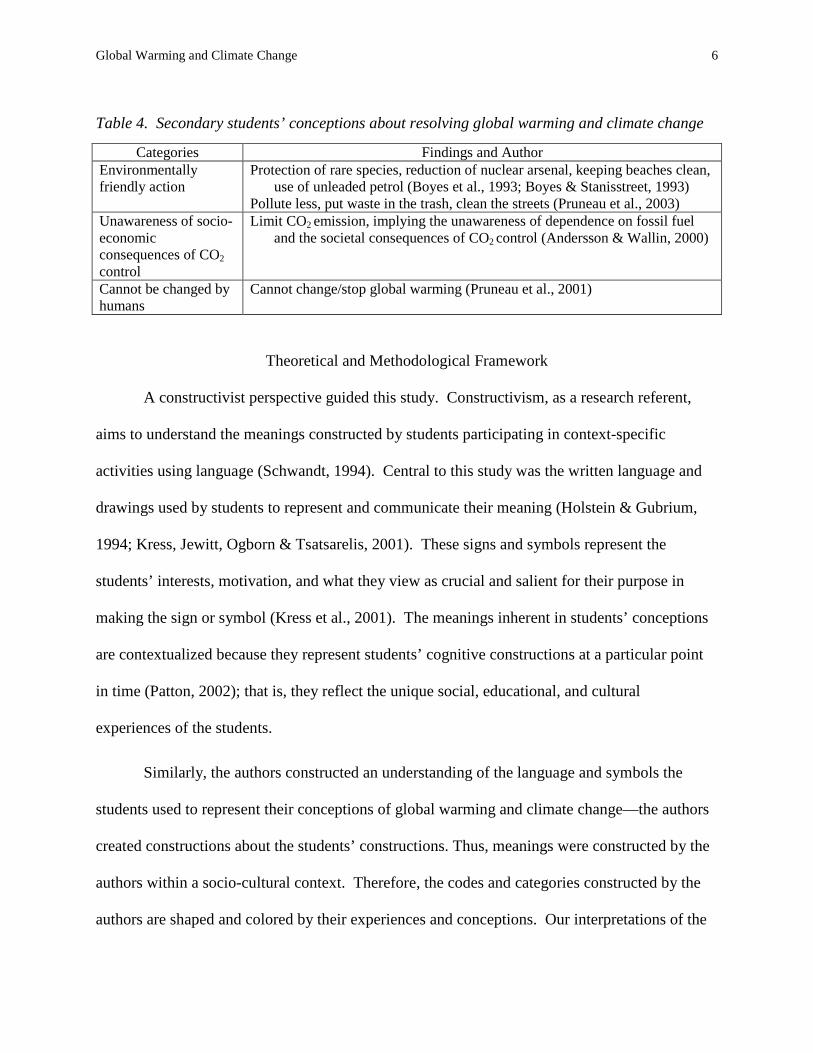
Global Warming and Climate Change 6
Table 4. Secondary students’ conceptions about resolving global warming and climate change
Theoretical and Methodological Framework
A constructivist perspective guided this study. Constructivism, as a research referent,
aims to understand the meanings constructed by students participating in context-specific
activities using language (Schwandt, 1994). Central to this study was the written language and
drawings used by students to represent and communicate their meaning (Holstein & Gubrium,
1994; Kress, Jewitt, Ogborn & Tsatsarelis, 2001). These signs and symbols represent the
students’ interests, motivation, and what they view as crucial and salient for their purpose in
making the sign or symbol (Kress et al., 2001). The meanings inherent in students’ conceptions
are contextualized because they represent students’ cognitive constructions at a particular point
in time (Patton, 2002); that is, they reflect the unique social, educational, and cultural
experiences of the students.
Similarly, the authors constructed an understanding of the language and symbols the
students used to represent their conceptions of global warming and climate change—the authors
created constructions about the students’ constructions. Thus, meanings were constructed by the
authors within a socio-cultural context. Therefore, the codes and categories constructed by the
authors are shaped and colored by their experiences and conceptions. Our interpretations of the
Categories Findings and Author Environmentally friendly action
Protection of rare species, reduction of nuclear arsenal, keeping beaches clean, use of unleaded petrol (Boyes et al., 1993; Boyes & Stanisstreet, 1993)
Pollute less, put waste in the trash, clean the streets (Pruneau et al., 2003) Unawareness of socio-economic consequences of CO2
control
Limit CO2 emission, implying the unawareness of dependence on fossil fuel and the societal consequences of CO2 control (Andersson & Wallin, 2000)
Cannot be changed by humans
Cannot change/stop global warming (Pruneau et al., 2001)
Global Warming and Climate Change 7
students’ responses, then, are interpretations grounded in our experiences, conceptions, and
perspectives that are grounded in both environmental education and the geosciences (Patton,
2002).
This study was descriptive in nature, involving the collection of qualitative data (i.e.,
student written and drawn responses). These qualitative data were then analyzed for their
content in an inductive manner to identify concepts and patterns in student responses. The study
was conducted with limited information about the social, cultural, and educational experiences of
the students and how these might influence students’ responses. The intent was not to
investigate factors influencing students’ responses but to explore their conceptions about global
warming and climate change. The benefit of a survey was that it allowed us to collect data from a
large number of students with varying degrees of experience, thereby providing us access to a
breadth of student conceptions with different degrees of sophistication (Driver et al., 1996).
This permitted the characterization of students’ concepts and allowed us to identify trends or
patterns in students’ concepts and to compare these to past research.
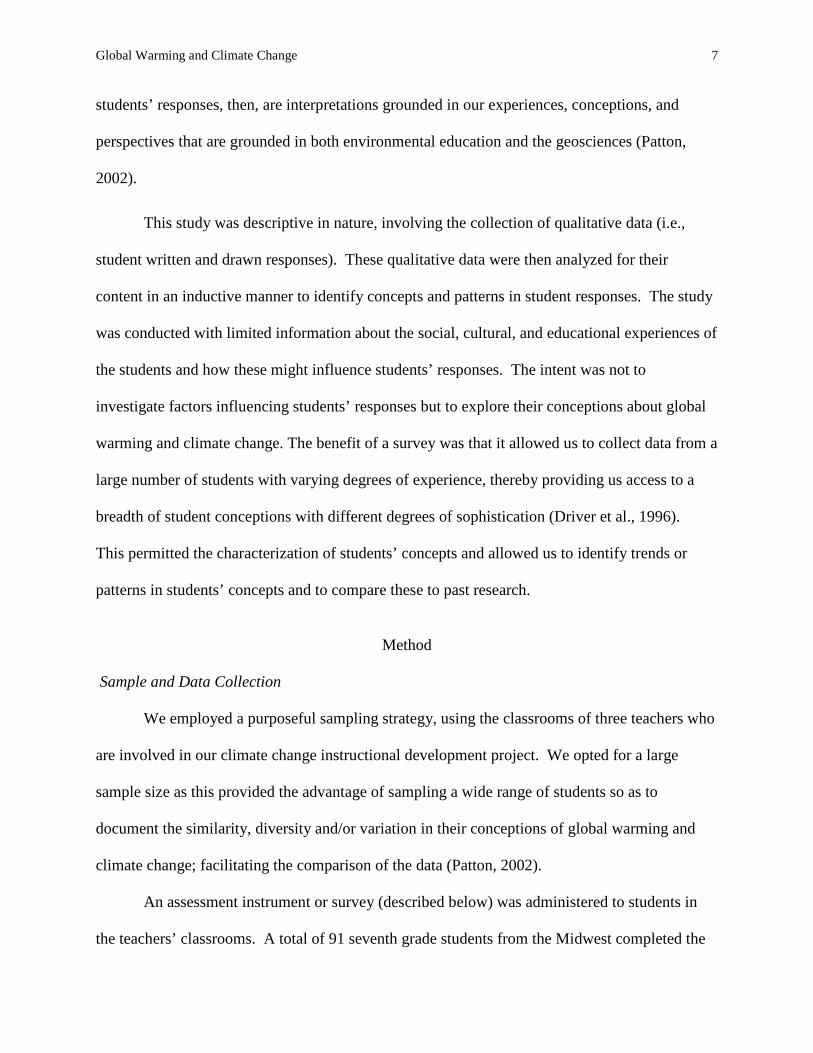
Method
Sample and Data Collection
We employed a purposeful sampling strategy, using the classrooms of three teachers who
are involved in our climate change instructional development project. We opted for a large
sample size as this provided the advantage of sampling a wide range of students so as to
document the similarity, diversity and/or variation in their conceptions of global warming and
climate change; facilitating the comparison of the data (Patton, 2002).
An assessment instrument or survey (described below) was administered to students in
the teachers’ classrooms. A total of 91 seventh grade students from the Midwest completed the
Global Warming and Climate Change 8
assessment. Students completed the assessment during their regularly scheduled science class.
Each teacher was familiar with the assessment and its administration, and they had reviewed and
critiqued the assessment. A pilot version was administered to different students and revised
based on their responses. The assessment was administered by the teachers prior to any
classroom instruction on global warming and climate change. It is unknown what formal or
informal educational experiences these students had prior to completing the assessment.
The Global Warming and Climate Change Assessment Instrument
The assessment instrument consisted of five items: four open-response items and one
draw-and-explain item. The instrument was designed as an idea eliciting task (Osborne &
Freyberg, 1985) and based on the draw and explain protocol (White & Gunstone, 1992).
Therefore, student responses were not scored as “right” or “wrong” but were analyzed for their
content. The assessment used written prompts to elicit student responses. A number of
researchers have used similar tasks to elicit students’ concepts about environmental and
geoscience phenomena (e.g., Alerby, 2000; Anderson & Moss, 1993; Barraza, 1999; Bonnett &
Williams, 1998; Payne, 1998; Simmons, 1994). The students’ written words and drawings are
conceptual visualizations or representations of their understandings that contain a number of
individual concepts that are embodied with meaning (Alerby, 2000; Kress et al., 2001). Thus,
students’ conceptions may be constructed from their graphic representations (Vosniadou &
Brewer, 1992).
The first item required students to interpret a scientific graph commonly used as evidence
for global warming (i.e., ice core data relating temperature and carbon dioxide). The second
item probed students’ ideas about the relationship between carbon dioxide and global warming
by asking students to explain what would happen to the Earth’s climate if carbon dioxide levels
Global Warming and Climate Change 9
do not increase in the future. The third item was based on the NAEP grade 8 released item,
“Some scientists think that the Earth’s climate is getting warmer.” This item asked students to
explain how a warming climate might affect the oceans, weather, plants and animals, and people
and society. The fourth item required students to draw and explain the greenhouse effect. The
last item probed students’ ideas about how natural processes and human activities might cause
carbon dioxide levels to change and what they could do to lower the level of carbon dioxide in
the atmosphere.
The five items ensured credibility (Erlandson, Harris, Skipper & Allen, 1993) in the data
collection and analysis process. It also provided synchronic reliability (Kirk & Miller, 1986) in
that the different items allowed us to interpret the consistency in student responses. Each item is
equivalent in its content focus yet different in the manner by which it elicits students’
conceptions. This allowed students’ conceptions to be checked against each other, providing a
degree of triangulation.
Data Analysis
Data analysis involved a content analysis of student responses resulting in the
identification of student concepts and this process was inductive in nature. The interpretive
nature of the assessment instrument required an inductive approach; that is, instead of searching
for pre-determined patterns, themes were allowed to emerge from the data as the authors
constructed meaning from student responses (Patton, 2002). The process followed that described
by Rubin and Rubin (1995). From the first reading of the assessment, core concepts (codes)
were identified. These initial codes were revised after a second reading. The codes with
common/overlapping themes were grouped into categories that reflected the students’
conceptions. From these we constructed a category matrix that linked each code to a category
Global Warming and Climate Change 10
(Erickson, 1986) and that reflected the final categories of student conceptions. This enabled us
to organize and check the data for saturation of categories and to eliminate redundant categories
(Erickson, 1986; Lincoln & Guba, 1985). This process of independently constructing categories
and then reaching consensus provided a degree of triangulation, reducing the influence of bias
and subjectivity and increasing the validity of our analysis and interpretation of the results
(Patton, 2002; Strauss, 1987). The data were also analyzed for confirming and discrepant
situations in order to enhance the authenticity of the interpretations and the credibility of the
findings (Patton, 2002). To ensure consistency in coding, an inter-rater reliability coefficient
was calculated by comparing two of the authors’ coding of 41 randomly selected assessments.
The inter-rater reliability coefficient was 0.88. Coding was monitored throughout to ensure
consistency and reliability.
Results
We present the content analysis and descriptive statistics for the five items of the
assessment instrument. Our presentation emphasizes the main concepts from the student
responses. For each student quote we share the teacher code, grade level, and student number
(e.g., M-7th-8).
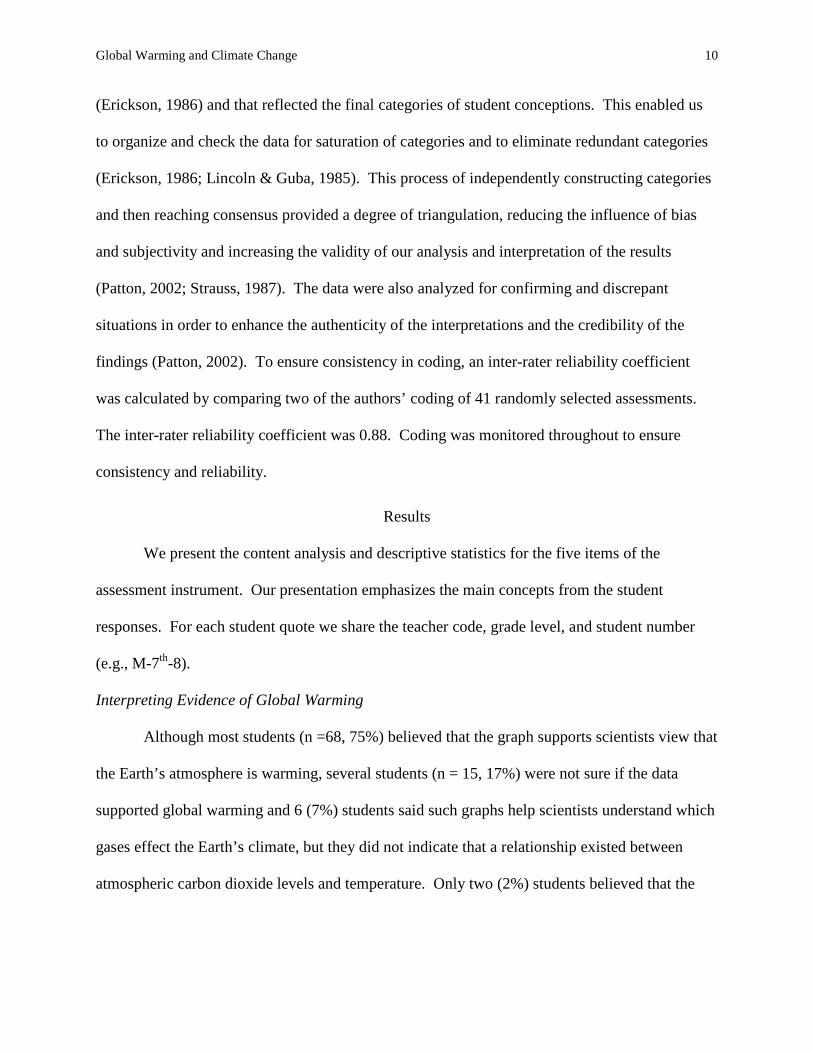
Interpreting Evidence of Global Warming
Although most students (n =68, 75%) believed that the graph supports scientists view that
the Earth’s atmosphere is warming, several students (n = 15, 17%) were not sure if the data
supported global warming and 6 (7%) students said such graphs help scientists understand which
gases effect the Earth’s climate, but they did not indicate that a relationship existed between
atmospheric carbon dioxide levels and temperature. Only two (2%) students believed that the
Global Warming and Climate Change 11
data (graph) did not support global warming and climate change. The remaining 4 students held
various views about the graph.
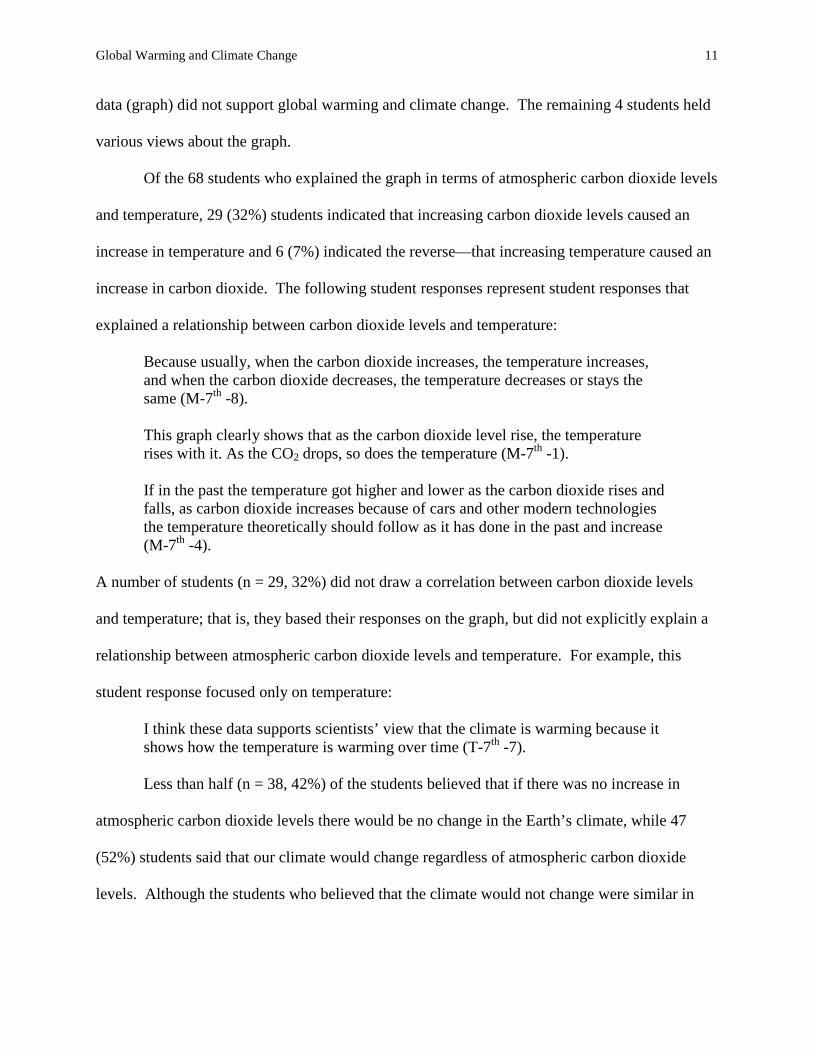
Of the 68 students who explained the graph in terms of atmospheric carbon dioxide levels
and temperature, 29 (32%) students indicated that increasing carbon dioxide levels caused an
increase in temperature and 6 (7%) indicated the reverse—that increasing temperature caused an
increase in carbon dioxide. The following student responses represent student responses that
explained a relationship between carbon dioxide levels and temperature:
Because usually, when the carbon dioxide increases, the temperature increases, and when the carbon dioxide decreases, the temperature decreases or stays the same (M-7th -8). This graph clearly shows that as the carbon dioxide level rise, the temperature rises with it. As the CO2 drops, so does the temperature (M-7th -1).
If in the past the temperature got higher and lower as the carbon dioxide rises and falls, as carbon dioxide increases because of cars and other modern technologies the temperature theoretically should follow as it has done in the past and increase (M-7th -4).
A number of students (n = 29, 32%) did not draw a correlation between carbon dioxide levels
and temperature; that is, they based their responses on the graph, but did not explicitly explain a
relationship between atmospheric carbon dioxide levels and temperature. For example, this
student response focused only on temperature:
I think these data supports scientists’ view that the climate is warming because it shows how the temperature is warming over time (T-7th -7). Less than half (n = 38, 42%) of the students believed that if there was no increase in
atmospheric carbon dioxide levels there would be no change in the Earth’s climate, while 47
(52%) students said that our climate would change regardless of atmospheric carbon dioxide
levels. Although the students who believed that the climate would not change were similar in
Global Warming and Climate Change 12
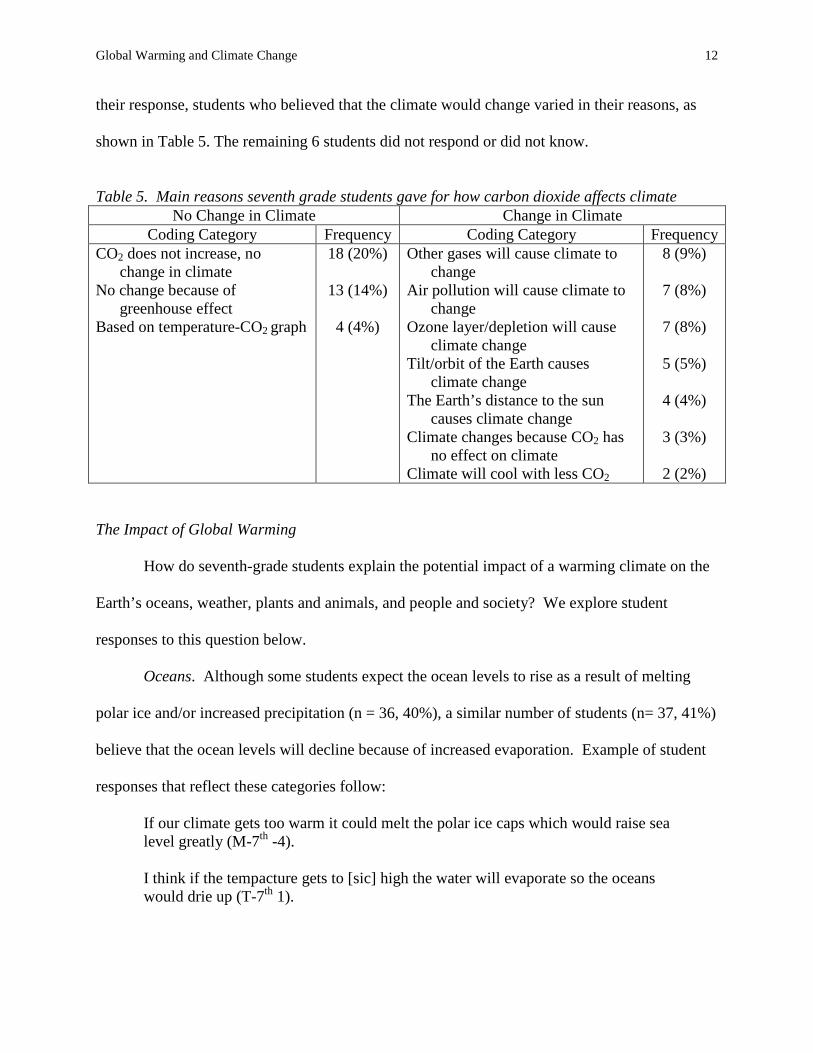
their response, students who believed that the climate would change varied in their reasons, as
shown in Table 5. The remaining 6 students did not respond or did not know.
Table 5. Main reasons seventh grade students gave for how carbon dioxide affects climate
No Change in Climate Change in Climate Coding Category Frequency Coding Category Frequency
CO2 does not increase, no change in climate
No change because of greenhouse effect
Based on temperature-CO2 graph
18 (20%)
13 (14%)
4 (4%)
Other gases will cause climate to change
Air pollution will cause climate to change
Ozone layer/depletion will cause climate change
Tilt/orbit of the Earth causes climate change
The Earth’s distance to the sun causes climate change
Climate changes because CO2 has no effect on climate
Climate will cool with less CO2
8 (9%)
7 (8%)
7 (8%)
5 (5%)
4 (4%)
3 (3%)
2 (2%)
The Impact of Global Warming
How do seventh-grade students explain the potential impact of a warming climate on the
Earth’s oceans, weather, plants and animals, and people and society? We explore student
responses to this question below.
Oceans. Although some students expect the ocean levels to rise as a result of melting
polar ice and/or increased precipitation (n = 36, 40%), a similar number of students (n= 37, 41%)
believe that the ocean levels will decline because of increased evaporation. Example of student
responses that reflect these categories follow:
If our climate gets too warm it could melt the polar ice caps which would raise sea level greatly (M-7th -4). I think if the tempacture gets to [sic] high the water will evaporate so the oceans would drie up (T-7th 1).
Global Warming and Climate Change 13
Of the remaining students, 7 (8%) believed that the oceans would only become warmer, 5 (5%)
thought there would be no change in the oceans, and 6 (7%) did not know or did not answer.
None of the students explained the potential impact of global warming on ocean life or coral
reefs or how the oceans affect weather (e.g. El Niño and La Niña). The students focused on the
physical state of the oceans, not on the biological components or their influence on weather,
perhaps a factor of living in the Midwest, which is largely landlocked.
Weather. Not surprising, 83 (91%) of the students thought that the weather would get
warmer and that this would result in: hotter days (n = 32, 35%), shorter winters and longer
summers (n = 6, 7%), less rain (n = 22, 24%) and snow (n=17, 19%), more rain (n=12, 13%),
more evaporation (n=8, 9%), and higher humidity (n=7, 8%). Examples of student responses
that reflect the impact of global warming on weather:
Winters might be milder and the summers hotter just because the temperature will rise if it happens (T-7th -12). It would snow less often because most places wouldn’t be cold enough and it would probably rain more because of the warmer and more humid (because of the rise in ocean level) climate (M-7th -4).
Four students did not answer and four students had various responses. Perhaps what is more
interesting is that only 1 of these Midwestern students identified the potential impact of global
warming on the frequency or severity of tornados; yet, 5 students believed there would be more
hurricanes. This could be a scale issue, where students think about climate change on a global
scale versus on a local scale; that is, small scale changes are not affected by changes in climate.
Plants and Animals. Overwhelmingly students (n = 70, 77%) expect that global warming
would have a negative impact on plants and animals, that plants and animals would die or
decrease in numbers. A few students (n = 9, 10%) believed that some plants would thrive
because of more sun, warmer temperatures, and longer growing season and 6 (7%) students
Global Warming and Climate Change 14
indicated that some plants would survive by adapting to warmer temperatures. One student
believed that there would be no impact on plants or animals and the remaining 5 students did not
know.
Although the student responses varied, the majority of students believed that plants and
animals would die or decrease in number because of hotter temperatures (n = 27, 30%) and/or
because of less rain/drinking water—drought—(n = 21, 23%); 17 (19%) students indicated that
animals would die because of a loss of habitat, describing the impact in terms of plant-animal
interactions: “plants die, leading to starving of herbivores”, and 4 (4%) students explained the
impact of melting polar ice on animals, including polar bears. It is interesting that none of the
student responses described the impact on agriculture—crops and livestock, especially given
their Midwest locale. Their responses focused only on “wild” animals and plants. Although
students did not describe the direct impact of global warming on crops and livestock, they did
describe how global warming would impact humans by disrupting the food supply (see people
and society), an indirect impact of global warming on agriculture.
People and Society. A third of the students (n = 32, 35%) believed that global warming
would cause more human deaths because of heat exposure, lack of drinking water, and loss of
food—both crops and livestock:
People will die because the heat will dry up the water, so we have nothing to drink (T-7th-13).
Although 30 (33%) students believed that global warming would have a negative impact on
humans’ food and water supply and living space (from floods/rising oceans), they did not
indicate that this would cause more human deaths. Finally, 20 (22%) students believed that there
would be no impact on humans because of technological advances and/or because humans would
solve the problem or adapt to the change; 9 students did not know or did not answer the question.
Global Warming and Climate Change 15
Understanding the Greenhouse Effect
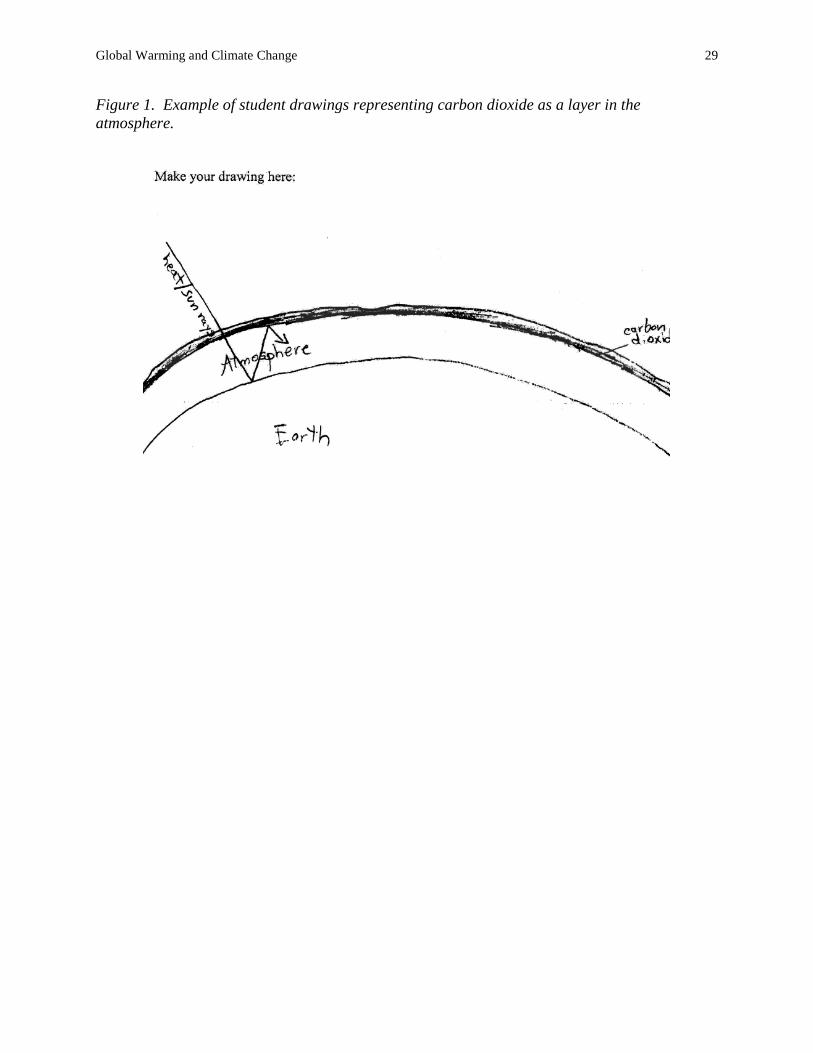
From a scientific perspective, only 12 (13%) students held a more developed or scientific
understanding of the greenhouse effect. These students identified carbon dioxide as a
greenhouse gas and explained its role as a greenhouse gas. Even these students, however, did
not identify other greenhouse gases (e.g., water vapor and methane). Half of these students
(n=6) drew carbon dioxide as a layer in the atmosphere (Figure 1) versus as a dispersed gas
explaining:
Keeps the heat in as an insulator, sun rays try to escape the atmosphere but are bounced back to Earth (M-7th-1). The CO2 levels in the atmosphere are high enough to let rays in, but not out (M-7th-2).
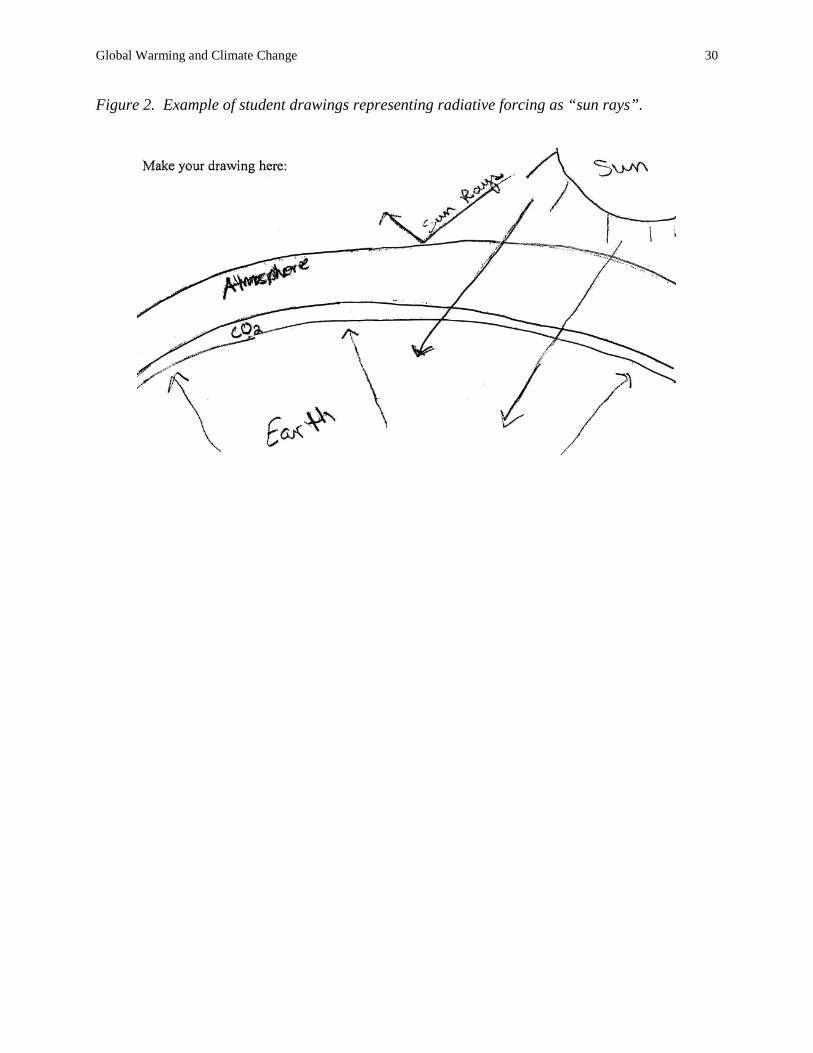
They identified infrared radiation as being re-emitted by the Earth’s surface and clouds causing
the Earth’s atmosphere to heat up, and 2 students explained that some infrared radiation escaped
the Earth’s atmosphere, “keeping the earth’s heat balance”. Even these students explained the
greenhouse effect in terms of the “sun’s rays” versus differentiating the radiative energy (Figure
2). For example:
The sun rays come down to Earth, bounce off, try to escape the atmosphere, but are bounced back to Earth (M-7th-2).
As illustrated in the above student quote, most students believed that the greenhouse gases
trapped all of the heat. Four of the students identified sources of carbon dioxide emissions (e.g.,
cars and factories).
---------- Figure 1 about here
---------- ----------
Figure 2 about here ----------
Global Warming and Climate Change 16
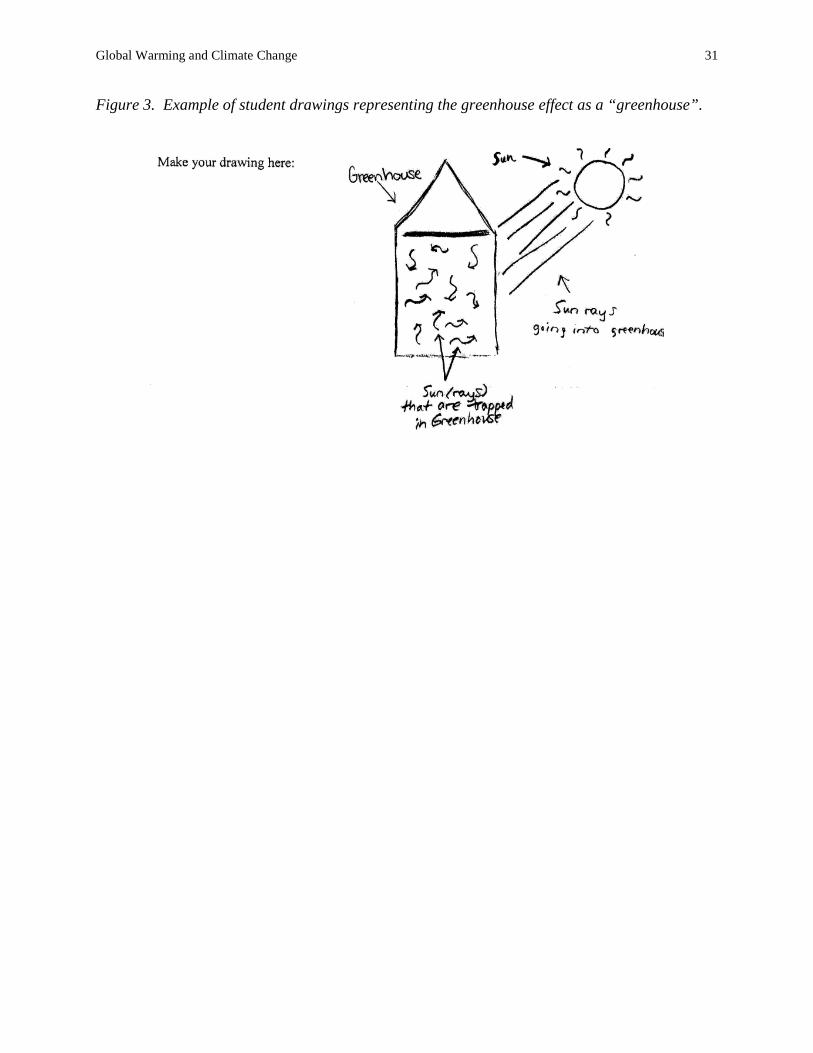
The remaining 79 (87%) students held various degrees of understanding. For example,
76 students referred to “greenhouse gas”, but did not identify a specific gas. Furthermore, only
25 (27%) of these students explained the greenhouse effect in terms of atmospheric heating.
These explanations varied, but the most common explanation (n=12) was that the “sun’s rays” or
“hot air” get trapped in the atmosphere. Finally, 17 students explained the greenhouse effect
using a “greenhouse” analogy (Figure 3) and 8 students confused greenhouse effect, in some
way, with ozone depletion and the ozone layer. Although these students’ drawing varied, 9 drew
a “greenhouse gas” layer in the atmosphere and 29 drew a “greenhouse”.
---------- Figure 3 about here
---------- In sum, most students did not understand the greenhouse effect or that carbon dioxide is a
greenhouse gas or that other naturally occurring and human produced greenhouse gases exist
(e.g., methane and water vapor). They lacked an understanding of infrared radiation and
radiative forcing.
Explaining the Change in Atmospheric Carbon Dioxide Levels
Students were asked to explain how natural processes and human activities might cause
atmospheric carbon dioxide levels to change and what could be done to lower carbon dioxide
levels.
Natural Processes. The students provided a number of wide ranging explanations about
natural processes that might affect atmospheric carbon dioxide levels. The four most common
explanations centered on:
• animals/people, respiration (n = 27, 30%) • volcanic eruptions (n = 15, 16%) • number of plants, photosynthesis (n = 12, 13%) • seasonal/weather changes (n = 7, 8%)
Global Warming and Climate Change 17
Human Processes/Resolutions. Again students identified a number of human activities
that cause atmospheric carbon dioxide levels to rise, but overwhelmingly attributed the increase
to vehicles (n = 39, 43%), air pollution (n = 31, 34%), factories (n = 29, 32%), and 9 (10%)
students described deforestation. A number of different solutions were described by students,
with the most common responses reflecting:
• drive less, using less energy/fossil fuels (n = 26, 29%) • plant trees/stop cutting down trees (n = 20, 22%) • reduce pollution in general (n = 10, 11%) • use alternative energy, solar/hydro/electric car (n = 10, 11%) If you live close enough to your work/school, you can ride a bike or walk to work instead of driving (M-7th -3). None of the students associated agriculture, waste management, and landfills (methane
production) as a source of greenhouse gases and that waste reduction and the re-use and
recycling of materials would reduce energy use and waste production—the generation of
greenhouse gases. Finally, beyond driving less, students offered general resolutions, such as use
less energy or fossil fuels. They did not identify other actions they or their families could take to
reduce their carbon footprint.
Discussion
These students’ conceptions about global warming and climate change in many ways are
similar to previous findings. For example: these students indicated that global warming is
caused by greenhouse gases (i.e., carbon dioxide) and air pollution in general (e.g., Boyes, &
Stanisstrret, 1997; Gowda, Fox, & Magelky, 1997; Boyes, & Stanisstreet, 1993; Pruneau, et al.,
2001) and that carbon dioxide or greenhouse gases form a layer in the atmosphere that traps and
reflects the sun’s energy (Koulaidis & Christidou, 1999; Pruneau, Gravel, Courque & Langis,
2003; Andersson & Wallin, 2000). Students overwhelmingly attribute the increase in
Global Warming and Climate Change 18
atmospheric carbon dioxide levels to vehicles and factories. Thus, for these students solutions to
global warming involve driving or using the car less, reducing pollution in general, and reducing
the number of factories that pollute. Like Andersson and Wallin’s (2000) findings, these students
emphasized carbon dioxide emission limits, seemingly unaware of society’s dependence on
fossil fuels and the societal consequences of controlling carbon dioxide emissions.
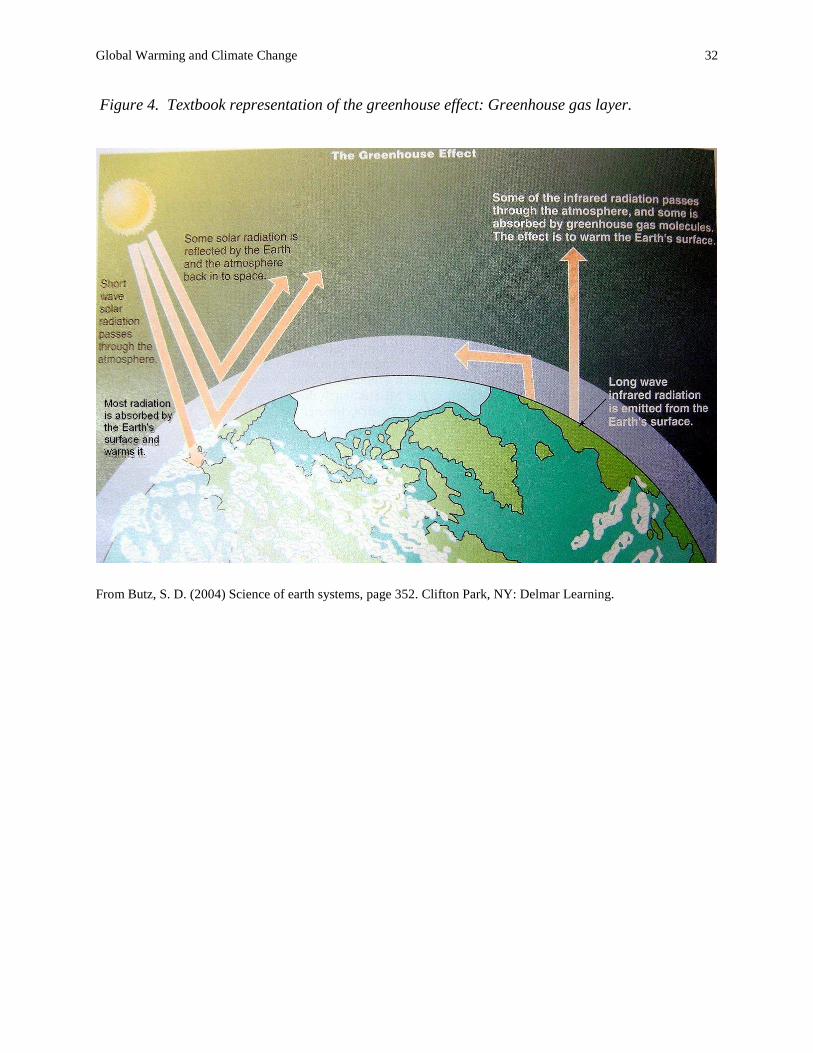
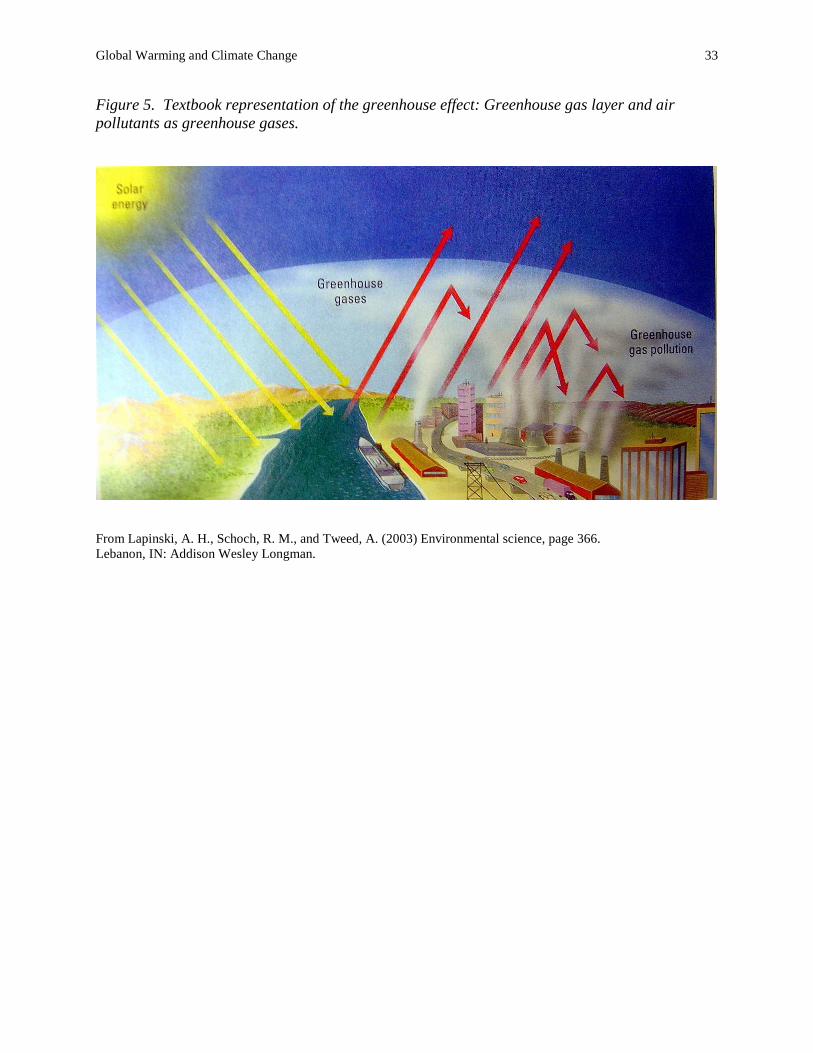
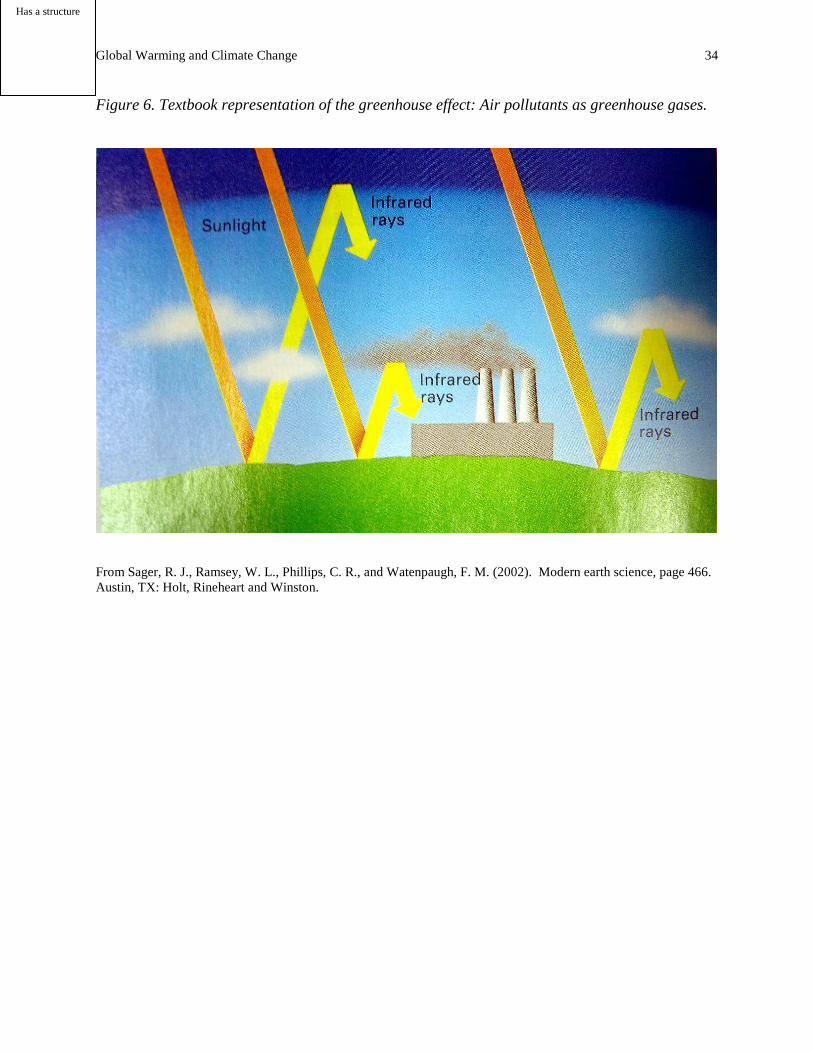
These conceptions of the “greenhouse effect” are re-enforced or even built on the images
and diagrams used in many earth and environmental science textbooks. For example, the
greenhouse effect represented in Figures 4 and 5 implies the existence of a “greenhouse gas”
layer above the Earth’s surface that traps and reflects the sun’s energy. Thus, greenhouse gases
cause the Earth’s temperature to rise. At the same time, Figures 5 and 6 represent factories
discharging smoke (air pollutants) into the “greenhouse gas” layer of the atmosphere. Therefore,
air pollution in general is a greenhouse gas and factories in particular are the major source of
“greenhouse” gas. These diagrams put forward the notion that in order to resolve global warming
humans need to pollute the air less, build fewer factories, or require factories to use “filters”.
The impression that science textbook diagrams can have on students may be seen in the students’
drawing (Figures 1, 2, & 3), where the greenhouse effect drawn is very similar to the textbook
diagrams (Figures 4, 5, & 6).
---------- Figure 4 about here
---------- ----------
Figure 5 about here ---------- ----------
Figure 6 about here ----------
Global Warming and Climate Change 19
These students conceptions about the impact of global warming and climate change on
humans is also similar to previous findings, where many students do not believe that global
warming and climate change will have a major impact on people or society. There is no
perceived consequence in the students’ life (Pruneau et al. 2001 & 2003). Many students
believed that humans would develop new technologies or that people would find ways to survive
or adjust to the environmental changes caused by global warming and climate change. For some
students, however, global warming would cause human deaths as a result of floods, heat, and the
lack of drinking water (drought).
Unlike previous studies, however, most of these students did not link the ozone hole
(stratospheric ozone depletion) to global warming and climate change, suggesting that students
are becoming more knowledgeable about the difference between global warming and
stratospheric ozone depletion. Furthermore, students in this study expect that global warming
would cause plants and animals to die or decrease in number as a result of warmer weather or
less precipitation, drought conditions. Most students, however, did not consider the impact of
global warming and climate change on the complex interdependence of plants and animals. The
impact on agriculture—crops and livestock—was not considered; the students focused only on
“wild” animals and plants. For the most part, these students thought that global warming and
climate change would only affect temperature and precipitation. Few students considered the
possibility that global warming and climate change would cause an increase in the frequency and
severity of weather events. In essence, these students hold a simple conception of an earth
climate system. Geographical variation of climate change, as a result of global warming, was not
considered. Similar to past studies, about a third of the students expect that global warming will
result in sea level rise as a result of melting polar ice or because of increased precipitation.
Global Warming and Climate Change 20
Unlike other studies, however, about a third of the students expect the oceans to contract because
of increased evaporation. The impact of global warming on the world’s oceans (e.g., El Niño and
La Niña) and weather or climate were not identified or explained.
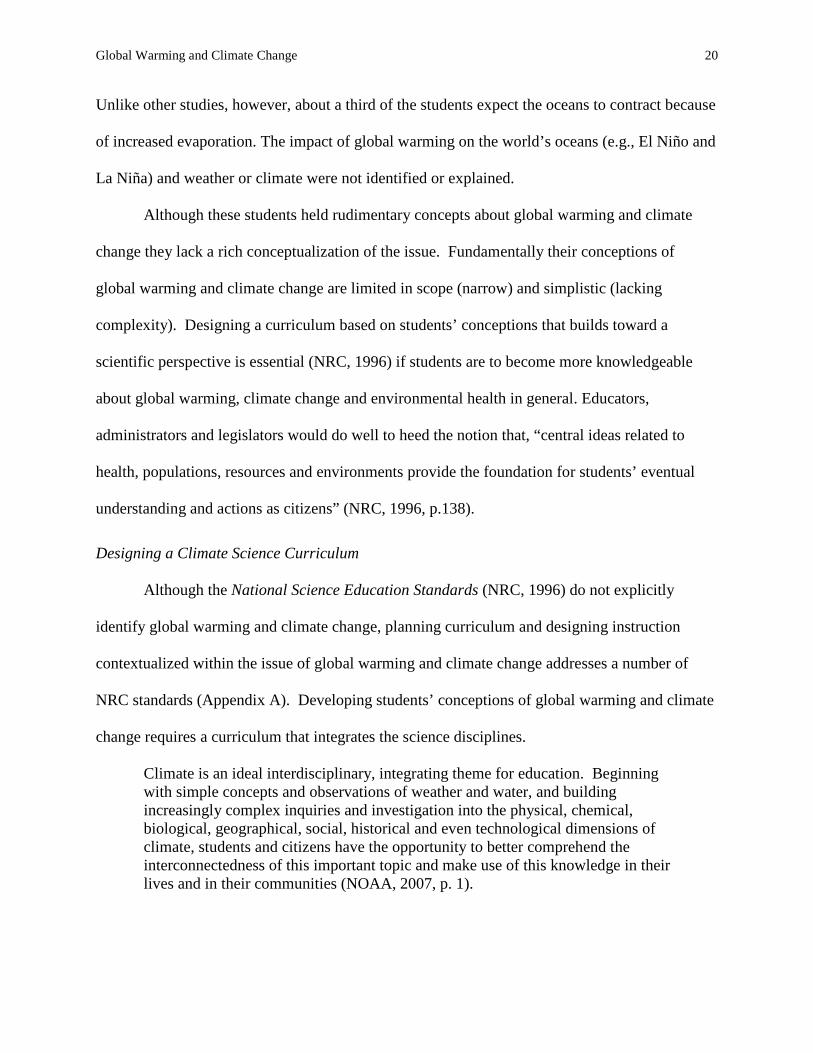
Although these students held rudimentary concepts about global warming and climate
change they lack a rich conceptualization of the issue. Fundamentally their conceptions of
global warming and climate change are limited in scope (narrow) and simplistic (lacking
complexity). Designing a curriculum based on students’ conceptions that builds toward a
scientific perspective is essential (NRC, 1996) if students are to become more knowledgeable
about global warming, climate change and environmental health in general. Educators,
administrators and legislators would do well to heed the notion that, “central ideas related to
health, populations, resources and environments provide the foundation for students’ eventual
understanding and actions as citizens” (NRC, 1996, p.138).
Designing a Climate Science Curriculum
Although the National Science Education Standards (NRC, 1996) do not explicitly
identify global warming and climate change, planning curriculum and designing instruction
contextualized within the issue of global warming and climate change addresses a number of
NRC standards (Appendix A). Developing students’ conceptions of global warming and climate
change requires a curriculum that integrates the science disciplines.
Climate is an ideal interdisciplinary, integrating theme for education. Beginning with simple concepts and observations of weather and water, and building increasingly complex inquiries and investigation into the physical, chemical, biological, geographical, social, historical and even technological dimensions of climate, students and citizens have the opportunity to better comprehend the interconnectedness of this important topic and make use of this knowledge in their lives and in their communities (NOAA, 2007, p. 1).
Global Warming and Climate Change 21
Unfortunately, many teachers and school administrators inappropriately view the NRC standards
as a curriculum—the preverbal standards-based instruction. Simply following the NRC
standards as a curriculum, however, leads to a discipline-based and conceptually fragmented
program of science learning. Planning curriculum and designing instruction is a difficult and
challenging process made even more taxing by the scientific complexity of global warming and
climate change and the necessity to build from students’ conceptions. This presents an even
more daunting task of developing conceptually rich and personally relevant learning experiences.
Based on the results of this study and others, it would appear that a curriculum built from
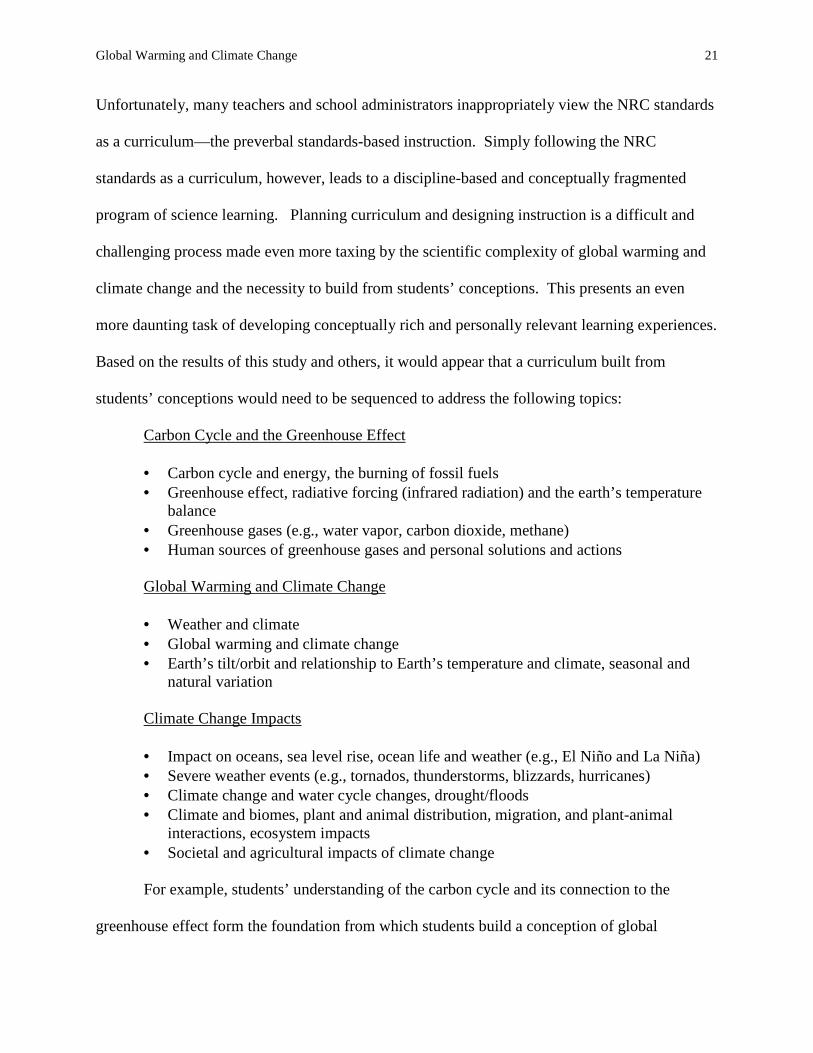
students’ conceptions would need to be sequenced to address the following topics:
Carbon Cycle and the Greenhouse Effect
• Carbon cycle and energy, the burning of fossil fuels • Greenhouse effect, radiative forcing (infrared radiation) and the earth’s temperature
balance • Greenhouse gases (e.g., water vapor, carbon dioxide, methane) • Human sources of greenhouse gases and personal solutions and actions Global Warming and Climate Change
• Weather and climate • Global warming and climate change • Earth’s tilt/orbit and relationship to Earth’s temperature and climate, seasonal and
natural variation Climate Change Impacts
• Impact on oceans, sea level rise, ocean life and weather (e.g., El Niño and La Niña) • Severe weather events (e.g., tornados, thunderstorms, blizzards, hurricanes) • Climate change and water cycle changes, drought/floods • Climate and biomes, plant and animal distribution, migration, and plant-animal
interactions, ecosystem impacts • Societal and agricultural impacts of climate change For example, students’ understanding of the carbon cycle and its connection to the
greenhouse effect form the foundation from which students build a conception of global
Global Warming and Climate Change 22
warming. Students’ understanding of global warming provides the basis for conceptualizing
climate change. Students’ conceptualization of climate change progresses to understanding the
impacts of climate change on weather, oceans, and the biosphere. At the same time, the
interdisciplinary nature of climate promotes curricular linkages within the NRC (1996) science
education standards as shown in Appendix A. Although the appendix presents a condensed
version of the 5-8 science standards, it demonstrates that the development of a curriculum
grounded in climate science can provide opportunities for students and teachers to explore and
analyze the natural world from a systems-based perspective rather than in isolated segments
(Table 6). Teaching students about global warming and climate change provides an ideal context
for introducing students to complex and messy systems of the real world (Dahlberg, 2001).
Thinking about climate in such a holistic manner creates a more meaningful context for learning
and doing science because it requires that students use and apply concepts from the science
disciplines.
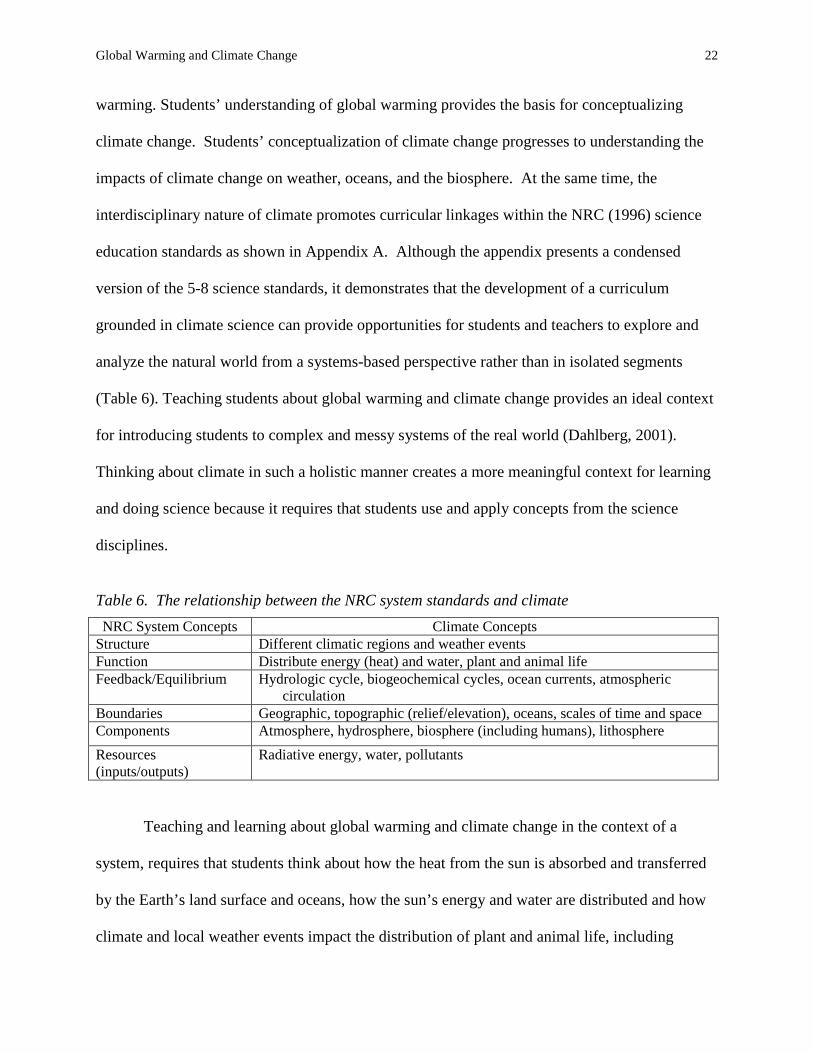
Table 6. The relationship between the NRC system standards and climate
NRC System Concepts Climate Concepts Structure Different climatic regions and weather events Function Distribute energy (heat) and water, plant and animal life Feedback/Equilibrium Hydrologic cycle, biogeochemical cycles, ocean currents, atmospheric
circulation Boundaries Geographic, topographic (relief/elevation), oceans, scales of time and space Components Atmosphere, hydrosphere, biosphere (including humans), lithosphere
Resources (inputs/outputs)
Radiative energy, water, pollutants
Teaching and learning about global warming and climate change in the context of a
system, requires that students think about how the heat from the sun is absorbed and transferred
by the Earth’s land surface and oceans, how the sun’s energy and water are distributed and how
climate and local weather events impact the distribution of plant and animal life, including

Global Warming and Climate Change 23
humans. How different geographic regions have different climates because of topography and
oceans. It requires students to think about how the hydrologic and biogeochemical cycles are
influenced by humans and climate and how climate shapes the atmosphere, hydrosphere,
biosphere, and lithosphere. It requires students to think in terms of scales of time and space.
Global Warming and Climate Change 24
References
Alerby, E. (2000). A way of visualizing children’s and young people’s thoughts about the environment: a study of drawings. Environmental Education Research, 6(3): 205-222.
Anderson, S. & Moss, B. (1993). How wetland habitats are perceived by children: consequences
for children’s education and wetland conservation. International Journal of Science Education, 15(5): 473-485.
Andersson, B., & Wallin, A. (2000). Students’ understanding of the greenhouse effect, the
societal consequences of reducing CO2 Emissions and the problem of ozone layer depletion. Journal of Research in Science Teaching, 37(10):.1096-1111.
Barraza, L. (1999). Children’s drawings about the environment. Environmental Education
Research, 5(1): 49-67. Bonnett, M. & Williams, J. (1998). Environmental education and primary children’s attitudes
towards nature and the environment. Cambridge Journal of Education, 28(2): 159-174. Boyes, E., Chuckran, D., & Stanisstreet, M. (1993). How do high school students perceive global
climate change: What are its manifestations? What are its origins? What corrective action can be taken? Journal of Science Education and Technology, 2(4): 541-557.
Boyes, E., & Stanisstreet, M. (1993). The greenhouse effect – Children’s perception of causes,
consequences and cures. International Journal of science education, 15(5): 531-552. Boyes, E., & Stanisstreet, M. (1994). The idea of secondary school children concerning ozone
layer damage. Global Environmental Change, 4(4): 311-324. Boyes, E., & Stanisstreet, M. (1997). Children’s models of understanding of two major global
environmental issues (ozone layer and greenhouse effect). Research in Science & Technological Education, 15(1): 19-28.
Boyes, E., & Stanisstreet, M. (1998). High school students’ perceptions of how major global
environmental effects might cause skin cancer. Journal of Environmental Education, 29(2): 31-36.
Boyes, E., Stanisstreet, M., & Papantoniou, V. S. (1999). The ideas of Greek high school
students about the ozone layer. Science Education, 83(6): 724-737. Boyes, E. & Stanisstreet, M. (2001). School students’ ideas about the “greenhouse effect” a
decade on. Canadian Journal of Environmental Education, 6(1): 77-101. Brown, L. (1992). Overview (pp. 15-19), in L. R. Brown, C. Flavin and H. Kane (eds.), Vital
signs 1992. New York: W.W. Norton & Company.
Global Warming and Climate Change 25
Bybee, R.W. (1993). Reforming science education: Social perspectives and personal reflections. New York: Teachers College Press.
Dahlberg, S. (2001). Using climate change as a teaching tool. Canadian Journal of
Environmental Education, 6(1): 9-17. Driver, R., Squires, A., Rushworth, R. and Wood-Robinson, V. (1994). Making sense of
secondary science: research into children’s ideas. London, England: Routledge. Driver, R., Leach, J., Millar, R., & Scott, P. (1996). Young people’s images of science.
Buckingham, England: Open University Press. Erickson, F. (1986). Qualitative methods in research teaching. In M. C. Wittrock (Ed.),
Handbook of research on teaching (3rd ed.). New York: Macmillan. Erlandson, D.A., Harris, E.L., Skipper, B.L., & Allen, S.D. (1993). Doing naturalistic inquiry: A
guide to methods. Newbury Park, CA: Sage Publications. Fisher, B. (1998). Australian students’ appreciation of the greenhouse effect and the ozone hole.
Australian Science Journal, 44(33): 46-55. Gowda, M.V. R., Fox, J.C., & Magelky, R.D. (1997). Students’ understanding of climate change:
Insights for scientists and educators. Bulletin of the American Meteorological Society, 78(1): 2232-2240.
Holstein, J.A. & Gubrium, J.F. (1994). Phenomenology, ethnomethodology, and interpretive
practice (pp. 262-272). In N.K. Denzin and Y.S. Lincoln (eds.), Handbook of Qualitative Research. Thousand Oaks, CA: Sage.
Kirk, J. & Miller, M. (1986). Reliability and Validity in qualitative Research, Qualitative
Research Methods Series Number 1. London: Sage. Koulaidis, V., & Christidou, V. (1999). Models of students' thinking concerning the greenhouse
effect and teaching implications. Science Education, 83(5): 559-576. Kress, G., Jewitt, C., Ogborn, J., & Tsatsarelis, C. (2001). Multimodal Teaching and Learning:
The Rhetorics of the Science Classroom. London: Continuum. Lincoln, Y.S. & Guba, E.G. (1985). Naturalistic inquiry. Beverly Hills, CA: Sage. National Research Council (1996). National Science Education Standards. Washington, DC:
National Academy Press. National Research Council (2000a) Grand Challenges in Environmental Sciences, Committee on
Grand Challenges in Environmental Sciences, Oversight Commission for the Committee
Global Warming and Climate Change 26
on Grand Challenges in Environmental Sciences, National Academy Press, Washington DC.
National Oceanic and Atmospheric Administration (2007). Climate Literacy: Essential
Principles and Fundamental Concepts. Climate Program Office’s Education site, http://www.climate.noaa.gov/education/.
Osborne, R. & Freyberg, P. (1985). Children’s science (pp. 5-14). In R. Osborne & P. Freyberg
(Eds.), Learning in science: The implications of children’s science. Auckland, New Zealand: Heinemann Publishers.
Österlind, K. (2005). Concept formation in environmental education: 14-year olds’ work on the
intensified greenhouse effect and the depletion of the ozone layer. International Journal of Science Education, 27(8): 891-908.
Patton, M.Q. (2002). Qualitative Research and Evaluation (3rd ed.). Thousand Oaks, CA:
SAGE. Payne, P. (1998). Children’s conceptions of nature. Australian Journal of Environmental
Education, 14(1): 19-26. Pruneau, D., Gravel, H., Courque, W., & Langis, J. (2003). Experimentation with a socio-
constructivist process for climate change education. Environmental Education Research, 9(4): 429-446.
Pruneau, D., Moncton, U., Liboiron, L., and Vrain, E. (2001). People’s idea about climate
change: a source of inspiration for the creation of educational programs. Canadian Journal of Environmental Education, 6(1): 58-76
Rye, J., Rubba, P., & Wiesenmayer, R. (1997). An Investigation of middle school students’
alternative conceptions of global warming. International Journal of Science Education, 19(5): 527-551.
Rubin, H.J. & Rubin, I.S. (1995). Qualitative Interviewing: The Art of Hearing Data. Thousand
Oaks, CA: Sage. Schwandt, T.A. (1994). Constructivist, interpretivist approaches to human inquiry (pp. 118-
137). In N.K. Denzin and Y.S. Lincoln (eds.), Handbook of Qualitative Research. Thousand Oaks, CA: Sage.
Serafin, R., Heikes, B., Sargeant, D., Smith, W., Takle, E., Thomson, D., Wakimoto, R. (1991)
Study on observational systems: A review of meteorological and oceanographic education in observational techniques and the relationship to national facilities and needs, Bull. Amer. Meteorol. Soc., 72, 815.
Global Warming and Climate Change 27
Simmons, D.A. (1994). Urban children’s preferences for nature: lessons for environmental education. Children’s Environments, 11(3): 194-203.
Strauss, A. (1987). Qualitative analysis for social scientists. Cambridge, UK: Cambridge
University Press. Vosniadou, S. & Brewer, W. (1992). Mental models of the Earth. Cognitive Psychology, 24(4)
535-585. White, R. & Gunstone, R. (1992). Probing Understanding. London, England: The Falmer
Press.
Global Warming and Climate Change 28
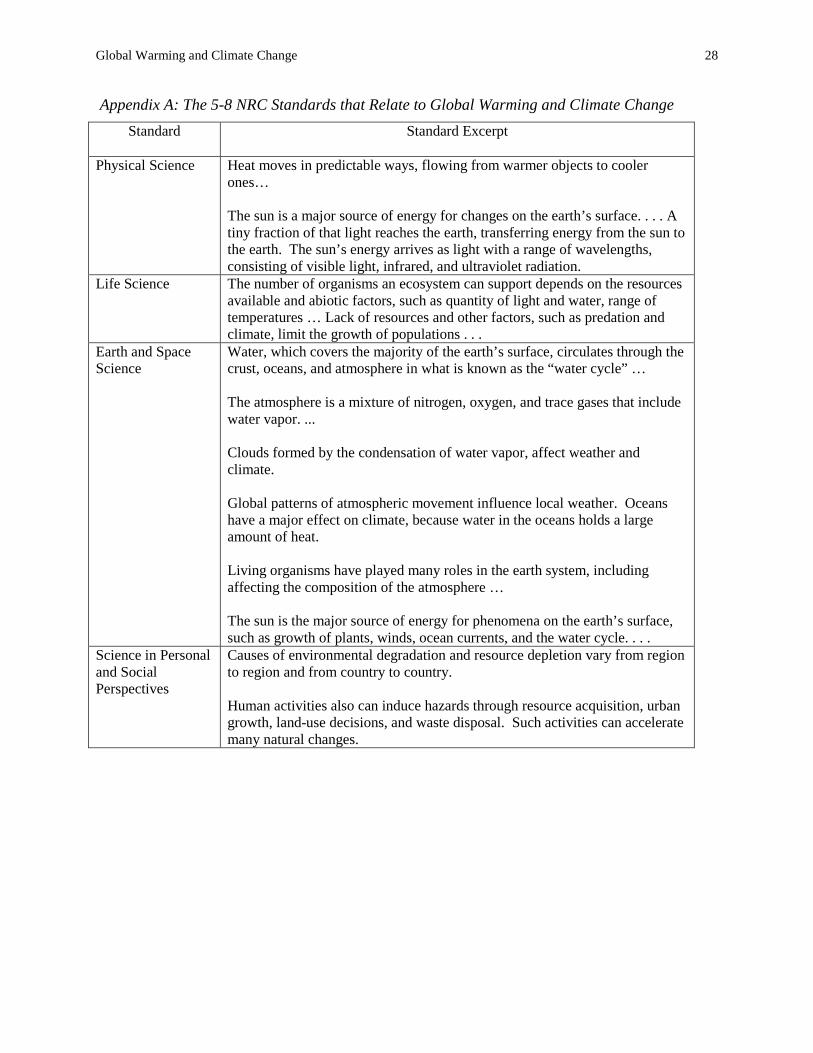
Appendix A: The 5-8 NRC Standards that Relate to Global Warming and Climate Change
Standard Standard Excerpt
Physical Science Heat moves in predictable ways, flowing from warmer objects to cooler ones… The sun is a major source of energy for changes on the earth’s surface. . . . A tiny fraction of that light reaches the earth, transferring energy from the sun to the earth. The sun’s energy arrives as light with a range of wavelengths, consisting of visible light, infrared, and ultraviolet radiation.
Life Science The number of organisms an ecosystem can support depends on the resources available and abiotic factors, such as quantity of light and water, range of temperatures … Lack of resources and other factors, such as predation and climate, limit the growth of populations . . .
Earth and Space Science
Water, which covers the majority of the earth’s surface, circulates through the crust, oceans, and atmosphere in what is known as the “water cycle” … The atmosphere is a mixture of nitrogen, oxygen, and trace gases that include water vapor. ... Clouds formed by the condensation of water vapor, affect weather and climate. Global patterns of atmospheric movement influence local weather. Oceans have a major effect on climate, because water in the oceans holds a large amount of heat. Living organisms have played many roles in the earth system, including affecting the composition of the atmosphere … The sun is the major source of energy for phenomena on the earth’s surface, such as growth of plants, winds, ocean currents, and the water cycle. . . .
Science in Personal and Social Perspectives
Causes of environmental degradation and resource depletion vary from region to region and from country to country. Human activities also can induce hazards through resource acquisition, urban growth, land-use decisions, and waste disposal. Such activities can accelerate many natural changes.
Global Warming and Climate Change 29
Figure 1. Example of student drawings representing carbon dioxide as a layer in the atmosphere.
Global Warming and Climate Change 30
Figure 2. Example of student drawings representing radiative forcing as “sun rays”.
Global Warming and Climate Change 31
Figure 3. Example of student drawings representing the greenhouse effect as a “greenhouse”.
Global Warming and Climate Change 32
Figure 4. Textbook representation of the greenhouse effect: Greenhouse gas layer.
From Butz, S. D. (2004) Science of earth systems, page 352. Clifton Park, NY: Delmar Learning.
Global Warming and Climate Change 33
Figure 5. Textbook representation of the greenhouse effect: Greenhouse gas layer and air pollutants as greenhouse gases.
From Lapinski, A. H., Schoch, R. M., and Tweed, A. (2003) Environmental science, page 366. Lebanon, IN: Addison Wesley Longman.
Global Warming and Climate Change 34
Figure 6. Textbook representation of the greenhouse effect: Air pollutants as greenhouse gases.
From Sager, R. J., Ramsey, W. L., Phillips, C. R., and Watenpaugh, F. M. (2002). Modern earth science, page 466. Austin, TX: Holt, Rineheart and Winston.
Has a structure