service quality and business competitiveness
TRANSCRIPT
0
Masaryk Univers i ty Faculty of Economics and Administration
Field of study: Business Management
SERVICE QUALITY AND BUSINESS
COMPETITIVENESS
Diplomawork
Thesis Supervisor: Author: doc. Ing. Alena KLAPALOVÁ, Ph.D. Alexander TERESHCHENKO
Brno, 2016
Abstract The objective of the diploma thesis was set to analyze the chosen problem in relation to value, quality and value creation in a business-to-business market with its impact on business competitiveness. The author performed a literature review on all relevant topics, providing an account of such within the Parts 1 and 2 of the thesis. Furthermore, the author had chosen two global enterprises as to describe the current situation and (market) analyses needed for the problem, and as to conduct an exploratory research aimed at measuring the perceived service quality for a set of services delivered by one of the enterprises to another. This research is covered within the Part 3 of the work. The names of the chosen companies will stay undisclosed to public, while the additional details of the chosen companies, as well as the greater level of the research details, are described in the non-published Part 4 of the diploma thesis. Customers’ perceived service quality, as a measure of service quality and an antecedent to customers’ satisfaction and customers’ perceived value, plays a pivotal role in the author’s work, similarly as it does in a firm’s survival. Within the exploratory research performed by the author, the construct of perceived service quality is measured and analyzed from various perspectives, and a set of conclusions is drawn in regards to new possibilities of looking into this construct. The author explores and measures a set of antecedents impacting perceived service quality and it is via the measurement and understanding of both, perceived service quality and its antecedents, that the author is drawing his recommendations of how companies can increase the value they deliver to their customers by improving the underlying quality of the services they deliver. Keywords Perceived service quality, quality, quality of services, service marketing, services, value creation, value.

1
Author’s Statement I hereby declare that I worked out the Diploma work Service Quality and Business Competitiveness myself, under the supervision of Ing. Alena Klapalova, Ph.D., and that I stated in it all the literary resources and other specialist sources used according to legislation, internal regulations of Masaryk University and internal management acts of Masaryk University and the Faculty of Economics and Administration. In Brno _____________ ________________________________________________________ signature
2
Table of Contents Introduction ................................................................................................................................... 4PART 1 ........................................................................................................................................... 7Service Orientation, Customer Focus and Quality .................................................................... 7
Historical Perspective.................................................................................................................7Redefining a Business as a Service Business.............................................................................8Hidden Services.........................................................................................................................9Services Aimed at the Customer..............................................................................................10Defining Service.......................................................................................................................10Services are Processes..............................................................................................................10Customer Orientation...............................................................................................................11A Value-Based View of Business Strategy..............................................................................11Quality......................................................................................................................................12
Research into Service Quality, Perceived Value and Customer Satisfaction ........................ 12Defining Service Quality..........................................................................................................13
Service Quality as Antecedent of Customer Satisfaction.....................................................15Service Quality as Antecedent of Perceived Value..............................................................15
Perceived Value.......................................................................................................................15Price as Antecedent of Perceived Value...............................................................................17
Customer Satisfaction..............................................................................................................17Profitability and Competitive Advantage ................................................................................. 19PART 2 ......................................................................................................................................... 21Measuring Service Quality ......................................................................................................... 21OnaQuestforaMeasurementMethodology.........................................................................21QualitativeInquiriesintoServiceQuality.................................................................................21QuantitativeApproach.............................................................................................................22QualityDimensionsasperChristianGrönroos....................................................................23TechnicalandFunctionalQualityModel(TheNordicModel)..............................................24SevenCriteriaofGoodPerceivedServiceQuality................................................................25QualityDimensionsasperA.Parasuraman,L.BerryandV.Zeithaml.................................26SERVQUALInstrument.........................................................................................................26TheGapsModel...................................................................................................................28SERVQUAL–ExtensionsandCriticism..................................................................................34
Other Quality Measurement Instruments.................................................................................36PART 3 ......................................................................................................................................... 37Exploratory Research ................................................................................................................. 37
Background..............................................................................................................................37Questions and Purposes............................................................................................................38Methods....................................................................................................................................39Results......................................................................................................................................41Discussion................................................................................................................................43Implications and Future Research............................................................................................43
Part 4 ............................................................................................................................................ 44

3
Non-Publication Agreement ....................................................................................................... 44Conclusion ................................................................................................................................... 45

4
Thispageintentionallyleftblank
5
Introduction The topic of service quality and the related topics of customer perceived value, customer satisfaction and their relationship to the behavioral intentions of a customer have been widely discussed and researched in the marketing literature during the three-and-a-half decades. The works, such as Oliver’s (1980), proposing a cognitive model of the antecedents and consequences of satisfaction decisions, technical and functional service quality model proposed by Grönroos (1984), and Parasuraman’s conceptual model of service quality (the gaps model) and a multiple-item SERVQUAL tool designed for measuring consumer perceptions of service quality (Parasuraman et al., 1985; 1988), acted as a foundation for the academia and practitioners in many industries to continue studying perceptions of customers in B2C as well as a B2B environments. Motivated by the growing body of the research, showing the importance of service quality, customer perceived value and customer satisfaction, where these constructs have been closely linked with a company’s profitability, the author of this paper had ventured to apply the existing methodology to practice, adapting and extending the elements of the existing framework. It is the works of Parasuraman et al. (1985; 1988) and Cronin and Taylor (1992, 1994), who criticized and extended the SERVQUAL tool, that acted as a set of guidelines for the author to define a framework extending the existing approaches in measuring the client’s perception of the service quality and client’s satisfaction. The exploratory research performed by the author and described in the paper takes place in a B2B environment within the Information Technology service industry. A number of thought-provoking limitations were encountered during the research phase, where the author aimed to define the methodology for conducting an assessment of perceived service quality in such a way that would allow for an organization to use the results in its effort to run quality and continues improvements initiatives.
The opinions stated in the paper are author’s alone, and are not endorsed by the professional organizations that the author is a member of, or the companies that the author is or was employed by.
As a practitioner, author had spent over 20 years working in various customer service settings. The first-hand experience of being a service provider, either individually or by being a part of a larger organization, has taught author of the importance of understanding the customer’s perception of the service, and inevitability of clarifying the customer’s expectations whenever a problem or a dissatisfaction is in place. Understanding of what the customer is expecting and what the firm is delivering to the client, and working to minimize the gap between the two, were a part of the author’s recipe for success. Several professional quality and recognition awards, that the author is a recipient of, serve as a validation of this approach.
It is thus not without a bias that the author relied on the works of Parasuraman et al. (1985, 1988) in his attempt to create a methodology for measuring of the customer’s perception of service quality and to establish a framework for service quality improvements. With this ambitious goal author not only intended to find a meaningful representation of the state of quality of a service as seen by the customer, but also to establish the process of isolating and reducing the gaps resulting the state of undesirable or low quality. Understanding the issues and where one must focus is essential for an efficient use of the scarce resources on individual and organizational levels. The

6
focus areas, as per author’s proposal, are the types of gaps that have the largest contribution towards the gap of customer’s perception against his or her expectations. By clearly understanding the focus areas, an organization can look for the root causes as to prevent and minimize these gaps, thus minimizing the discrepancy between customer’s expectations and perception of the service.
7
PART 1
Service Orientation, Customer Focus and Quality Historical Perspective As of the early 1950s, there was a new marketing concept that started to gain in popularity. It was driven by a highly critical realization that profit is not the final objective of a firm, but rather is an outcome from the business activities that create a satisfied customer. The two core ideas behind the implementation of the new marketing concept were a company’s continued focus on innovation, and customer-oriented decision-making. Value proposition was defined by a company’s ability to position itself within a specific targeted market based on the company’s distinctive competencies. There had been a number of challenges to fully implement this marketing concept, some of which continue to play an unfavorable role even today. The short-term interests of company shareholders continue to dominate companies’ strategies, and resource allocation and management focus continue to deviate from client-centricity. Strategic planning was one of the management concepts that quickly came to dominate the scene. Professor I. Ansoff and his Corporate Strategy, published in 1965, popularized this process-driven methodology. Unlike the marketing concept, which was mainly an idea, a set of values and beliefs, strategic planning gave managers a set of hands-on tools. In its nature, however, strategic planning was profit oriented versus customer oriented and viewed market as a set of competitors verses customers. Profit Impact of Market Strategy (PIMS) analysis, as a continuous need to further understand the variables that impact companies’ profitability, was originated by the General Electric Company in 1969. Based on the core strategic planning concept, market share was one of the variables that was believed to be directly related to a company’s profit; however, as the study outgrew its confines within GE, the findings discovered quality to be one of the critical variables that affected both the market share and profitability. Consistent with Michael Porter’s analysis (1980), the margin strategy was effectively the quality strategy. Quality was said to induce both the high price and high margins as well as the high market share, and thus the high volume and low production costs, with a combined outcome of increased profits. Quality became the new management focus as a source of competitive advantage, and continues to stay an unchallenged strategy at this current time as well.
The newly discovered importance of quality in products and services as the source of competitive advantage had allowed for a better understanding of value creation for the customer. Unlike the previously understood concepts of value distribution, where the product was created in the factory and sold in the market place, the new mindset enabled companies to solve customers’ problems instead of simply selling them products and services. To be able to effectively respond to a set of customers’ needs, a company had to balance its strategic focus among the “Three C’s” – Customer, Company, and Competitors. Being able to respond to customers’ needs meant to know the specific set of customers that the company could deliver the value to, and to have a distinctive competence and be able to do what the competitors cannot. In its aim to provide a total commitment to the
8
customer, a company had to have a total commitment to the quality. Disciplines such as total quality management (TQM) gained a crucial significance in a company’s survival. Such was the world of the 1950s through 1970s as described by Webster (1994).
The ever increasing demands and expectations of the customers, and the customer’s customers (for the B2B markets), continued to force the companies to invest in relationships with customers so as to better understand their customers’ needs and when needed, to adjust towards satisfying these needs. Quality continued to be critical. Disciplines in measuring and understanding quality became widely discussed in academia and utilized by practitioners. In parallel, the value-based view of the business caused all businesses to be redefined as a service business. The well-established metrics of the total quality management practices had to be reinvented for the service business. This task, however, had proven to be difficult.
The difficulties that most companies were running into were originated from the basics, such as being able to define the quality of service. Many of the firms had a number of internal measurements, but the outcome of those had a questionable end-value for the customer. On the other hand, many of the services were curtained from the management’s attention due to being considered as hidden or internal, and thus thought of as having no outcome for a client. The most important fact remained, however, in the way of defining quality as the company’s ability to meet and exceed the customers’ expectations.
Redefining a Business as a Service Business The new marketing concept, which was emerging during the late 1950s, as defined by Webster (1994), was pegged on the definition of the purpose of a business, which was to create a customer. The concept was aimed at making businesses customer oriented, dictating that marketing should not be a separate business function. In this light, the new marketing concept was a statement of organizational culture, an agreed-on set of shared values among the employees of a company representing a commitment to put the customer first in all management and operations decision making (Webster, 1994). Creating value for customers brought the effect of both profit maximization and an increase of shareholders’ value. In pursuit of the customer satisfaction, customers’ satisfaction being one of the main metric measure of the customers’ value, disciplines such as total quality management and reengineering took a hold of the management scene. Consistent with the global marketplace realities and its stringent requirements for competitiveness, stronger links were developed between customer orientation and business efficiency and effectiveness. This gave way to the emergence of new marketing and business strategies such as distinctive competence, relationship management, interactive marketing, management of customer loyalty, and the defining of every business as a service business (Webster, 1994).
Despite the main business line of the organization, services are crucial for any and every business organization. The basic businesses are categorized broadly into service or physical products; however, organizations cannot depend solely on the core business without other affiliated services.
9
For this reason, services are crucial in value creation as they support the daily operations of the business (Grönroos, 2007).
The service sector, being one of three economic sectors as per commonly accepted economic definitions, is now the largest sector of the economy in terms of nominal GDP and percent of the workforce in most of the Western world countries. It also continues to be the fastest-growing sector. Wikipedia.org (2015) shows the 5 top countries being France, United States, Greece, United Kingdom and Belgium, whose service sector proportion of 2014 nominal GDP starting to reach 80% of the total economy, while the rest of not that far behind at 63.6% as average proportion.
Over the last 100 years, the sector has replaced the agricultural and industrialization sectors to become the top tier sector in the world, including a great number of industries such as entertainment, telecommunication, healthcare, information technology, financial services, consulting, real estate, education, and many others. What’s important to acknowledge is that besides the businesses that clearly fall within these industries, any other firm is also heavily relying on the concept of services, some of them being internal (or so-called hidden) and others being customer-facing.
As an example, Grönroos (2007) identified five different stages in the manufacturing industry where the service component is always incorporated:
• Before manufacturing (e.g. research and development, design, financing). • During manufacturing (e.g. financing, quality control, safety, maintenance). • Selling (e.g. logistics, distribution networks, information). • During the consumption and usage (e.g. maintenance, leasing, information, customer
training, software upgrading, complaints handling, invoicing). • After consumption and usage (e.g. waste management, recycling) (Grönroos, 2007).
The service components listed above as examples may be managed by the business itself or outsourced through a value chain in a complex business-to-business relationship. The magnitude of the impact of service-related aspects such as quality of services should not be limited by looking at companies within the broadly defined scope of service sector, especially given the understanding that the services play a pivotal role in the development of competitiveness of the firm as well as in creation of value for the firm’s customers and shareholders. We are to look at every firm and consider the service elements of its operations. Hidden Services A firm may consider a service to be hidden when it cannot be differentiated from the cost of conducting the company’s core function. Firms may not consider such services to be delivered directly to customers, but rather to be of an administrative nature. An example of such could be billing or complaint handling activities (Grönroos, 2007). If these services, however, are implemented and managed without the customer focus, they will inevitably lead to inefficiencies and customer dissatisfaction. The effectiveness of such non-billable services is concealed by the
10
fact that these services are not viewed as such by the decision makers. Like the billable services, such hidden services are essential to the creation and sustainability of a competitive advantage. Services Aimed at the Customer Customers don't buy products; they buy a set of benefits and solutions to problems. This changes how companies view their clients’ activities; that is, view the customers in terms of what they are buying as opposed to what the company is making and selling. Different customers expect and derive different benefits from the same product (Webster, 1994). This difference results in customers identifying with distinct market segments with different strategic requirements. Such insights are not possible if the business is defined in terms of its products or services that it offers. Instead, emphasis should be given to solutions that will create value for the customers. In this regard, it can be said that customers look for solutions that serve their value-generating processes (Grönroos, 2007). Defining Service A service is a process consisting of a series of more or less intangible activities that normally, but not necessarily always, takes place in interactions between the customer and service employees and/or physical resources or goods and/or systems of the service provider, which are provided as solutions to customer problems (Grönroos, 2007). For instance, successful marketing models require the inclusion of the interactions between the service provider and the customer during the consumption process as an integrated part of marketing. Service management and marketing depend on the inclusion and participation of the customer in the service process. Services feature are mainly specific to the type of the service, but in general services have three basic characteristics: 1. Services are processes consisting of activities or a series of activities. 2. Services are at least to some extent produced and consumed simultaneously. 3. The customer participates as a co-producer in the service production process at least to some extent (Grönroos, 2007). Services are Processes The most important feature of services is their process nature, especially where the customers’ participation is part of the process. Service is a process of a series of activities that are produced and consumed simultaneously (Grönroos, 2007). Unlike goods that are value-supporting resources, services are value-supporting processes, i.e. processes that support customers' value generation. This analogy leads to the definition of service logic, where service logic means to facilitate processes that support customers' value creation in their daily activities and processes (Grönroos, 2007). Services are categorized using different grouping forms. Based on the nature of the relationship with customers, services can be divided into (1) continuously rendered services, and (2) discrete
11
transactions. As a result, firms offering services on a continuous basis should mainly use a relationship oriented approach towards customers as they cannot afford to lose customers (Grönroos, 2007). Thus, the form of their customers’ service consumption must be understood by the business. The consumption of the service process is a critical part of the service experience and as such service consumption is a process consumption. Service production and consumption are continuous processes with interactions between the consumer and the service provider's production resources (Grönroos, 2007). Firms are often required to readjust their resources to match the customer’s needs, with the firm’s resources being, for example, personnel, technology, knowledge or even the customer’s time. Although all resources are important in the service process, the value that the firm offers is not embedded exclusively in any of the specific resources used during the service process, but rather it emerges in customer’s consumption of the service process. Customer Orientation The running of businesses has changed drastically over the past century. This change has brought about a new emphasis on the customers. The emphasis is brought by the fact that the supply side of the market outweighs the demand side of the market. In this regard, businesses have understood that in the current economic world, customers are the single determinants of the success of the business (Webster, 1994). The need to understand and satisfy the customers has led to the shift in the main objective of any firm. Customer orientation was a new idea brought about by Peter Drucker in his famous book, The Practice of Management, published in 1954. Prior to that it was the profit maximization that was traditionally considered to be the main goal of a firm (Webster, 1994), with a simple rationale that the increased profits result in an increase of shareholders’ value. The paradigm-shift jumpstarted by the Drucker (1954) resulted in moving from the strategies aimed at maximization of the shareholders’ value towards the maximization of customers’ defined value. Simply said, profit was understood as a reward for creating a satisfied customer (Webster, 1994), instead of the goal by itself, with companies continues strive at putting the customers first. Customers are the reason for the existence of businesses; businesses are mainly established to serve the customer. Visionaries such as IBM’s chairman Thomas Watson, Jr., had said in 1962: "The relationship between the [company] and the customer, their mutual trust, the importance of reputation, the idea of putting the customer first -- always -- all these things, if carried out with real conviction by a company, can make a great deal of difference in its destiny."
A Value-Based View of Business Strategy For effective implementation of the value-based view of the business strategy, companies should critically analyze the market in terms of customer needs and wants; that is, the company has to be customer oriented (Webster, 1994). Being customer-oriented is more than a mindset; it is, more specifically, having current, correct, and complete information about customers, carefully
12
analyzed with regard to their value perceptions and their assessments of competitors' product offerings. A firm’s value proposition must be based on skills and resources that deliver value as perceived by the customer. All of its employees must understand how customers define value, based on their needs, wants, and product use systems, and how they evaluate the firm's offering relative to those of competitors (Webster, 1994). Under service and relationship perspective, customers’ value is created throughout the process by the customer, partly in interactions between the customer and the supplier or service provider (Grönroos, 2007). Quality is dependent on the entire process. Companies with a mature commitment to total quality management have a quality process that extends back into vendors' processes. The process of creating value is then referred to as the value chain (Webster, 1994). Quality As mentioned, the PIMS study performed by GE in 1969 found quality to be one of the most important single factors affecting a business unit's performance. It is important to specify that quality was measured as relative to that of its competitors, and it’s one of the main purposes of this paper to clearly define and specify the concept related to quality definition, measurement and delivery. The most successful quality programs define quality not in terms of products, but in terms of a total way of doing business, a total commitment to the customer. The company must view themselves as partners with their customers. The partnership is based on a thorough understanding of the customer's processes and how they interact with the seller's processes, and careful management of their integration (Webster, 1994). The effort is focused on making the business partners more competitive in their markets and goes well beyond simply offering good products or services. Understanding how the customers perceive and evaluate the services will make it possible to identify ways of managing and influence the services in a desired direction. Grönroos (2007) advocates that customers mainly evaluate the services using the quality metrics, thus leading to an evaluation approach known as perceived service quality. He then goes on to state that customers’ perception of quality of the services acts as the basic foundation of the measurement of their satisfaction.
Research into Service Quality, Perceived Value and Customer Satisfaction
Fisk, Brown and Bitner (1993) published a thoroughly researched work describing the origins and evolution of the Services Marketing literature. The authors attribute the period between years of 1953 and 1980 as a stage where the service marketing literature did not exist as such, and was developed by a small subset of authors, many of whom became and continue to stay prominent even today. Most of the works during this phase were conceptual, with very few empirical investigations. The need for the service marketing knowledge, however, was evident. U.S. national economy was confidently moving from the goods economy towards the service economy, and the marketing discipline was behind (Fisk et al., 1993).
13
Fisk et al. (1993) defines the second important stage in the development of service marketing domain, a transition stage, to be between 1980 and 1985, marked by the U.S. deregulation within the services industries. Service firms, faced with a fierce competition, were desperate for service marketing methodologies, as to gain and maintain a competitive advantage. Simultaneously, a wave of dialogs between practitioners and academia, as well as various inputs from European academic community (e.g. Bateson, Blois, Grönroos, Gummesson, Lehtinen, Normann) contributed to a firm establishment of the field. Significantly, the period of 1980-85 gave origins to the important works covering issues that are unique to the service marketing field, such as the topic of service quality, which grew to become “a core topic for service marketing” (Fisk et al., 1993, p.72). The prominent authors of this historic stage include Christopher Lovelock, Anantharanthan Parasuraman, Valarie Zeithaml, Leonard Berry and Christian Grönroos. Clearly, the topic of service quality, as an area of importance, and the list of significant authors during these years are far from complete. Other topics included service design, service encounters, customer’s satisfaction, marketing intangibles and service economy, as well as industry specific works. The consecutive period in the development of the service marketing thought, as per Fisk et al. (1993), takes place after the year 1986. This era is distinct with a growing amount of theoretical and empirical findings and an increased depth of the explored topics. During the early 1990s the field continued to gain international and cross-functional dimensions via a number of global seminars, conferences and new journals dedicated to service marketing. While the pioneers of service quality research (Cronin & Taylor, 1992, 1994; Grönroos, 1984; Lehtinen & Lehtinen 1982; Oliver 1980; Parasuraman et al. 1985, 1988, 1991) mostly focused on the B2C service markets, a number of succeeding researchers were applying the laid forward principles in the B2B industries such as information technology and systems (Pitt et a., 1995; Peppard & Ward, 1999; Kettinger & Lee, 1995), manufacturing (Zeithaml et al., 1996), audit services (De Ruyter & Wetzels, 1999), and others such as distribution (Bienstock et al., 1996), logistics (Mentzer et al., 2001) and supply chain management (Min & Mentzer, 2004). Other researchers, as summarized in the upcoming sections of the thesis, have contributed to the topic of service quality with empirical studies on closely related topics of customer satisfaction and customer perceived value, and helped to further explore the interrelationship between the three and their connection to customers’ behavioral intentions. The bottom-line of many of the works was unanimous: service quality improves business competitiveness and company’s profitability.
Defining Service Quality Parasuraman, Zeithaml and Berry (1985) defined service quality as an overall customer evaluation that results from comparison between a customer's expectation and a perception of service received from a provider. Authors defined service quality as a degree and a direction of gaps between a consumer's expectations and perceptions, and thus the term of perceived service quality had been adapted and used in academia and by practitioners over the past three decades.
14
The same approach of defining service quality as the difference between service expectations and perception of service performance, as evaluated or judged by a customer, has been applied by other authors, such as Grönroos, 1984, 1994, 2007; Bolton & Drew, 1991; Caruana et al., 2000; Lehtinen & Lehtinen, 1982; Lewis & Booms, 1983; Shonk & Chelladurai, 2008, 2009; Woodside et al., 1989 and others. In their effort to capture such "a global judgment or attitude relating to the overall excellence or superiority of the service", Parasuraman et al., (1988) proposed a multiple-item scale instrument for measuring consumers’ perceptions of service quality, providing an early observation that it is not a single dimensional but rather a multidimensional construct. Grönroos (2007) proposed to distinguish the two broad dimensions of quality of a service: a technical or outcome dimension and a functional or process-related dimension. While the outcome of a customer’s interaction with a business may have more of a tangible and objective nature as a comparison to the process of interaction, which is subjective in its nature, Grönroos does not deviate from the definition of the quality of services being a perceived quality. The perception of quality is not fully embedded in the quality dimensions. Quality is highly subjective, and this complicates the measurement of quality. Good perceived quality is obtained when the experienced quality meets the expectations of the customer; that is, the expected quality. The complexity arises because the expected quality is a function of a number of factors, such as marketing communication, word of mouth, company/local image, price, customer needs and values. The same applies to customer’s expectation. Webster (1994) described how brand name and image of a business are acting as the factors influencing the customer’s definition of quality. The brand name, in creating a set of expectations for product or service performance, becomes part of the definition of quality by the customer. A strong brand creates high expectations. Daniel & Berinyuy (2010) discuss a few additional factors that influence customer’s expectations, such as past experience with the firm, personal needs, firm’s communication and word-of-mouth. The level of total perceived quality is not determined simply by the level of technical and functional quality dimensions, but rather by the gap between the expected and experienced quality. For this reason, firms should take due diligence in managing customer expectations to secure the perception of quality. Companies should give realistic promises to their customers to avoid the likelihood of creating a mismatch of customer expectations and experiences (Grönroos, 2007). Webster (1994) argues that total quality management and value delivery concept are highly related as they have similar characteristics. It is important to note that not all views of quality put the customer first. Many companies are internally focused and use product-oriented and technical definitions of quality. Other internal definitions of quality may focus on the people of the organization, processes for managing those people, their obligations to one another and their teams in the pursuit of organizational excellence. However, the true definition of quality is meeting and exceeding customer expectations. Webster (1994) states three forces that drive customer expectations: the customer's dynamic needs and wants, the company's promise and delivery of superior performance and competitors' promises that they can do even better.
15
Moreover, Webster (1994) argues that quality goes beyond customer expectations. The company must work with customers and look at its own capabilities to apply them in new areas, not just doing what the customer says, but continuously innovating and looking to the future. To keep customers satisfied, companies have to continuously improve in order to offer new and better solutions to customer problems (Webster, 1994).
Service Quality as Antecedent of Customer Satisfaction It is not uncommon to define service quality through customer satisfaction. A number of studies (e.g. Anderson & Sullivan, 1993; Brady & Robertson, 2001, Cronin et al., 2000; Johnson and Fornell, 1991; Woodside et al., 1989) have found that service quality is an antecedent of customer satisfaction, while some studies (Anderson and Sullivan, 1993; Bitner, 1990; Cronin and Taylor, 1992) have tried to show the opposite relation. Both types of research, however, do show a strong correlation between service quality and customer satisfaction.
Service Quality as Antecedent of Perceived Value Similar to customer satisfaction, a number of studies (e.g. Andreassen & Lindestad, 1998; Angur et al., 1999; Cronin et al., 2000; Grewal et al., 1998; McDougall & Levesque, 2000) show perceived quality to be an antecedent of perceived value, defined by Zeithaml (1988, p.14) as “the consumers' overall assessment of the utility of a product based on perceptions of what is received and what is given”. In their research Chen and Dubinsky (2003) show a positive relationship between both, where consumer perception of a greater product quality is associated with perception of gains in value. Perceived value was found to be a derivative from a trade-off between quality of a product or a service and its price (DeSarbo et al., 2001; Chen and Dubinsky, 2003). Perceived Value As discussed, value should be the guiding star in any business undertaking. Customer value is the basis through which a business unit strategy is developed. The platform on which a company should compete is built around this concept of customer value. This indicates that the fundamental culture of any organization and the shared values, as well as the beliefs, is based on delivery of superior value to customers (Webster, 1994). In this regard, the mission statement of the company should entail the definition of customer value and the accompanying aspects of customer value. The concept of customer value and value delivery had taken the central stage in the works of many authors (e.g. Boksberger & Melsen, 2011; Chang & Wildt, 1994; Cronin et al., 2000; Gallarza et al., 2011; LeBlanc & Nguyen, 1999; Smith & Colgate, 2007; Terho et al., 2012; Woodruff, 1997) as opposed to stand-alone concepts of service quality or customer satisfaction. As the positive relationship between perceived quality and perceived value (Cronin et al., 2000; Zins, 2001), as well as a positive relationship between perceived value and customer satisfaction (Cronin et al., 2000; Fornell et al., 1996; Chen & Dubinsky, 2003; Danaher & Mattsson, 1994; Hallowell, 1996; Holbrook, 1999; Kuo et al., 2009; McDougall and Levesque, 2000; Tam, 2004; Woodruff & Gardial 1996; Yang and Peterson, 2004) were identified and confirmed, it was natural for many researchers to focus their efforts on the perceived value as the basis for their work. A category of empirical research investigated the impact of consumer’s perceived value on behavioral intention

16
(Anderson & Srinivasan, 2003; Baker et al., 2002; Cronin et al., 2000; Duman & Mattila, 2005; Dodds et al., 1991; Ha & Jang, 2010; Swait & Sweeney, 2000; Sweeney & Soutar, 2001; Wakefield & Blodgett, 1999). A related type of a research considers how value influences customer loyalty (Ailawadi et al. 2008; Chen & Quester, 2006; Costabile, 2000; Cronin et al., 2000; Gallarza & Saura, 2006; Lam et al., 2004; Parasuraman & Grewal, 2000; Petrick & Backman, 2002; Van Birgelen et al., 2006; Zeithaml, 1988), often measured by means of 'intention to repeat purchase' and 'intention to recommend the firm', based on the work of Zeithaml et al. (1996). While value is linked to customer behavioral intentions, many authors conclude that this relationship is likely to be mediated by customer satisfaction (Bolton & Drew, 1991; Brady & Robertson, 1999; Chen & Dubinsky, 2003; Cronin et al., 1997; Sweeney et al., 1999).
From the practical perspective, given the close relationship between the constructs of customer perceived quality and perceived value, the orientation and the approaches to research of both subjects are often similar. For example, the correspondence between the constructs allowed some authors (e.g. Cronin et al., 2000; Grewal et al., 1998; Heinonen, 2004) to define perceived value as a multidimensional construct formed via technical, functional, temporal and spatial dimensions, where each can have benefit and sacrifice components. Other authors prefer an approach aggregate evaluation, where on top of the above mentioned functional values of quality and price a number of additional values, such as social and emotional values, as well as the convenience and pleasure, are to be considered in the measurement of the total customer perceived value (Chen and Dubinsky 2003; Petrick, 2004; Prebensen et al., 2013). To an addition, it is not to be ignored that the perceived value is context-specific and can change depending on consumption situation of the customer (Chen & Dubinsky, 2003; Normann & Ramírez, 1993; Zeithaml, 1988).
Perceived risk is considered to be a part of the price paid by a consumer for a product or service or a sacrifices associated with it, however gained enough importance to be considered as a stand-alone antecedent of the perceived value (Agarwal & Teas, 2001; Chen & Dubinsky, 2003; Sweeney et al. 1999), having a negative effect on the value. The price can signal the quality of a product or a service, as well as influence the perception of the risk associated with it (Sabiote et al., 2012). As with tangible goods, but even more so in the service industry, customer is a co-creator of value (Dominici & Guzzo, 2010; Vargo & Lusch, 2004). It is argued that value is co-created during the consumption or use of a product or a service by the customer (Edvardsson et al 2005; Vargo & Lusch 2004), and that at difference stages of a purchase (such as before the purchase, during the purchase or after the purchase) customer thinks about value differently (Chen and Dubinsky, 2003; Holbrook, 1999; McDougall & Levesque, 2000; Van der Haar et al., 2001; Ulaga & Chacour, 2001; Woodruff, 1997; Sánchez and Iniesta, 2006). The effect of customer involvement has been studied and linked to perceived value and customer satisfaction (Chen and Tsai, 2007; Lee and Beeler, 2009; Prebensen et al., 2013). Similarly, customers’ experiential quality and experiential satisfaction have been studied and positively linked to customers’ perceived value (Cronin et al., 2000; Chen & Tsai, 2007; Petrick & Backman,
17
2002). Finally, Ravald and Grönroos (1996) suggest that value is the most important construct of relationship marketing. The interest in perceived value construct continues to remain high over the past three decades. As a predictor of consumer future intentions and customer loyalty it is employed by marketers with an aim to achieve a sustainable competitive advantage (Chen & Dubinsky, 2003).
Price as Antecedent of Perceived Value The perceived value and the overall evaluation of the services does not solely depend on quality of services, but also on price (DeSarbo et al., 2001; Zeithaml, 1988). By definition, the perceived customer value captures the mental comparison between the benefits and sacrifices for the consumer, and is taking into account the nature of the competitive environment and costs associated with transaction (Woodruff and Gardial, 1996). These costs extend to non-monetary costs for the customer, such as effort, time and opportunity cost (Cronin et al. 2000; Lapierre, 2000). Price and the quality of offering form customer’s value, which after a process of mental evaluation result in customer’s satisfaction with a particular transaction, experience or the firm overall. If consumer’s expectations were greater than the perceived value, then it is the perceived quality is less than satisfactory for the given price, and the consumer is dissatisfied (Cronin et al., 2000; Parasuraman et al, 1985; Reichheld, 1996; Zeithaml, 1988). Alternatively, price can also influence the customer’s satisfaction, as shown in a number of studies both in B2C and B2B environments (Anderson & Sullivan, 1993; Bolton and Lemon, 1999; Fornell, 1992). Hallowell (1996, p. 29) also defined customer satisfaction in terms of quality and price, as “the result of a customer’s perception of the value received in a transaction or relationship – where value equals perceived service quality relative to price and customer acquisition costs”. Price is also a factor for forming consumer expectations, often serving as an indicator of quality of a product or a service (Chen and Dubinsky, 2003; Dodds et al., 1991; Rao and Monroe, 1989; Scitovszky, 1944). A common consumer rationale dictates that the resources that are more valued are scarce due to a higher demand and thus are priced higher. Price is also positively influences the expectation of a higher quality. It also negatively influences the perception of risk associated with the purchase (Shimp and Bearden, 1982; Sweeney et al. 1999). Both have an effect on consumer’s purchase intention, as well as the consumer’s satisfaction after the purchase. Customer Satisfaction The importance of service quality as an antecedent to customer satisfaction has been researched and supported by a number of authors including Anderson & Sullivan (1993), Baker & Crompton (2000), Bolton & Drew (1991), Brady & Robertson (2001), Caruana et al., (1998), Caruana et al., (2000), Caruana (2002), Carman (1990), Cronin and Taylor (1992; 1994), Cronin et al. (2000), Dagger & Sweeney (2006), Fornell et al. (1996); McDougall & Levesque (2000); Oliver (1980; 1993), Parasuraman et al. (1985; 1988; 1991; 1994a; 1994b), Spreng & Mackoy (1996) and many others (e.g. Amin & Isa, 2008; Amin et al., 2013; Chen & Tsai, 2007; Ekinci et al., 2008;
18
Jayasankaraprasad & Kumar, 2012; Kitapci et al., 2013; Landrum & Prybutok, 2004; Lymperopoulos & Chaniotakis, 2008; Kim, 2011; Patterson & Johnson, 1993; Shin & Kim, 2008; Yang et al., 2009; Zaibaf et al., 2013). Customer satisfaction, being one of the main measures of the value customers derive from solutions offered by a firm (Webster, 1994), has been considered as a direct antecedent of customer behavioral intentions (Aliman & Mohamad, 2013; Brady et al., 2001, 2005; Caruana, 2002; Cass, 2010; Clemes et al., 2008; Cronin & Taylor, 1992; Cronin et al, 2000; Platonova et al., 2008; Taylor & Baker, 1994; Yu et al, 2006; Zarei et al., 2014) which include positive word of mouth and recommendations to others (Cronin et al., 2000; Saha & Theingi, 2009; Park et al., 2004, 2006; Qin & Prybutok, 2009; Qin et al., 2010; Ryu et al., 2008, 2012), repurchase intentions (Anderson & Sullivan, 1993; Cronin et al., 2000), customer loyalty (Anderson & Sullivan, 1993; Bloemer & de Ruyter, 1998; Bontis et al., 2007; Buttle, 1996; Caruana, 2002; Chen, 2008; Cronin et al., 2000; McDougall & Levesque, 2000; Oliver, 1999; Olsen, 2002; Parasuraman et al., 1985, 1988, 1991; Patterson & Spreng, 1997; Suh and Yi, 2006; Yoon & Uysal, 2005) and customer retention (Anderson & Sullivan, 1993; Bansal and Taylor, 1999; Cronin et al, 2000; Kotler, 1994; Mittal & Kamakura, 2001; Gonzalez et al., 2007; Guo et al., 2009). While the results of empirical studies show that these constructs have both similar and distinct characteristics (Anderson & Sullivan 1993; Bolton and Drew 1991; Carman, 1990; Oliver, 1993; 1997; Parasuraman et al., 1988; Taylor 1993; Taylor & Baker, 1994; Zeithaml et al. 1993), both, perceived service quality and customer satisfaction, are viewed as evaluation variables that express customers' judgment about a product or a service (Ograjenšek and Gal, 2012). The relationship between constructs is somewhat reciprocal (Brady et al., 2002; Ranaweera & Neely, 2003). As mentioned, a body of research argues that service quality is an antecedent to a customer satisfaction, however some (e.g. Bolton and Drew, 1991), propose that a satisfied customer has a positive perception on service quality, i.e. an opposite relation where customer satisfaction is an antecedent to service quality. A strong correlation, however, between the two constructs is unarguable and often the two constructs, service quality and customer satisfaction, are used interchangeably (Baker & Cromptonm, 2000), with many authors approaching the subject of the measurement of service quality through the customer satisfaction (Manning, 1986; Parasuraman et al., 1994a). Similarly to the disconfirmation theory providing for a definition of the service quality (Zeithaml, 1993; 1996), Oliver (1980, p. 460) defined satisfaction as “a function of an initial standard and some perceived discrepancy from the initial reference point”. While a number of scholars (Brandy & Robertson, 2001; Oliver, 1999; Lovelock et al., 2001; Tse & Wilton, 1988) including Parasuraman et al. (1985) conceptualized customer satisfaction to be a function of the disconfirmation of performance from expectation, Cronin & Taylor (1992) signify the attribute performance associated with the consumption experience expressed as a subjective customer evaluation leading to customer satisfaction. On top of two main school of thoughts looking into satisfaction as a performance based evaluation or a gap between perception and expectations, additional two conceptualizations distinguish satisfaction being transaction-specific satisfaction (Boshoff & Gray, 2004; Cronin & Taylor, 1992; 1994) and as a cumulative satisfaction (Boulding & Zeithaml, 1993; Jones & Suh, 2000; Yi & La, 2004).
19
Oliver (1993), in his aim to show the service quality to be an antecedent to customer satisfaction, did not consider it relevant whether both constructs were measured for a given experience or over time. Cronin et al., (2000) had also arrived at an opinion that satisfaction with a transaction is mostly consistent with satisfaction with the service provider. The complex nature of the construct had forced the discussions on measurement of customer satisfaction to branch, where one group of scholars conceptualized the measurement to be uni-dimensional expressed as customer’s overall feeling about the services provider (e.g. Cronin and Taylor, 1992) and another group (e.g. Anderson et al., 1994; Ali and Amin, 2013; Amin et al., 2013; Bolton & Drew, 1994; Fornell, 1992; Hu et al., 2009; Lee et al., 2009; Sureshchander et al., 2002), proposing a multiple item scales or multidimensional approach given the construct’s richness and dynamic nature. Customer satisfaction is an important for gaining insights into the perception of customers on business performance and is a desirable outcome for any competitive firm (Parasuraman et al., 1985; 1988; 1991). It has been studied as an important construct in customer behavior models. It was found to be a reliable predictor of repurchase intentions, loyalty (Cronin and Taylor, 1992; Cronin et al., 2000; Heskett et al. 1997; Kim et al., 2008; Selnes, 1998) and perceived value (Cronin, Brady, and Hult, 2000; Spiteri and Dion, 2004: Lee et al., 2007; Uddin and Akhter, 2012).
Profitability and Competitive Advantage As discussed earlier, profitability aspect arises when implementing the marketing concept. Companies should manage for profitability and not for sales volume. Profit is a measure of the value that the firm has created for the customer; that is, profit shows the efficiency of a firm to deliver value and the firm’s ability to understand customer value. By definition, profit is the ratio of customer benefits to the costs of the product offering. This means that profit is a metric measure of the difference between the value produced in the marketplace and the costs of acquiring the resources used to create and deliver that value (Webster, 1994). Customer orientation, innovation, quality and market targeting are the essential forces that result in both sales volume and above-average pricing, resulting in superior profit margins and better return on investment. Thus, companies should concentrate on creating value for customers rather than focusing on profit maximization through increasing sales volume; profit is a reward for creating value for customers. Nowadays, service quality is established to be a company’s key success factor and the basis for a sustainable competitive advantage due to several reasons, such as: increased customer satisfaction, higher levels of customer loyalty as well as attraction of new clients, lower costs, higher market share, and profitability (Cronin et al. 2000; Kang and James 2004; Parasuraman et al., 1985; Yoon and Suh 2004; Zeithaml et al., 1988). Industry and market specific research show how quality, customer value and customer satisfaction significantly influence customer retention, market share, profitability and accordingly company’s competitive advantage (Chen & Dubinsky, 2003; Han & Han, 2001; Lee & Lin, 2005; Parasuraman, 2005; Srinivasan et al., 2002). Customer perceived value was shown to influence customer retention in the online shopping environment by several authors such as Chen & Dubinsky (2003), Han & Han (2001), Keeney (1999), Ku & Fan (2009), Mathwick et al. (2001), Srinivasan et al. (2002), Wang et al., 2005.

20
Similar observations were made in offline retail channels (Eggert & Ulaga, 2002; Lapierre, 2000; Ulaga & Chacour, 2001; Vandenbosch & Dawar, 2002), tourism and hospitality industry (Bowen & Shoemaker, 1998; Pizam & Ellis, 1999), healthcare industry with a focus on hospital patient experience (Ettinger, 1998; Fottler et al., 2006; Parasuraman et al., 1988), and overall in a broader business context (Antony et al., 2004; Bloemer, 1998; Zeithaml et al., 1996). As discussed, customers are likely to be satisfied with a firm providing superior service quality and value creation. A number of authors (eg. Hennig-Thurau & Klee, 1997; Hogan et al., 1984; Lytle, 1994; Lytle et al., 1998; Parasuraman et al., 1988; Schneider et al., 1980) describe customer satisfaction as a key factor for a successful organization, being a significant determinant of repeat business, positive word-of-mouth and overall customer loyalty – all leading to a stronger competitive position.
21
PART 2
Measuring Service Quality
OnaQuestforaMeasurementMethodology As stated in the introduction, author aims to establish a framework for measuring and improving a customer’s perception of the quality of services delivered by a firm. The commitment to this aim is reinforced by the author’s understanding that services are crucial in the creation of value in a business. A declining profitability shows that the company's product offering is becoming less effective, relative to substitutes and competitive product offerings, in delivering value and satisfying customer needs. The product concept offers that a product must rise beyond the physical product and the customer’s expectations. An offering must be augmented with additional features and services that exceed the customer's expectations in important ways (Webster, 1994). As discussed in Part 1 of the paper, the overall strategic position of a business is more highly dependent on the service perspective than the others. The service perspective explains the role of service quality and customer perceived value in customer satisfaction, while all three were researched and confirmed to influence customers’ behavioral intentions and thus company’s profitability. Quality was discussed to be the basis of ensuring competitive advantage. The upcoming Part 2 of the paper will look beyond the commonly accepted definitions of service quality and will discuss the methodologies used for measuring the perceived service quality, highlighting several important works that shaped the author’s understanding and helped to set a direction for conducting a research on his own. QualitativeInquiriesintoServiceQuality Listening to individual customers, through a discussion of a critical incident or a focus group discussion, allows the companies to understand customers’ perceptions, expectations, needs and wants. Webster (1994), among many others, advocates that a company should always seek opportunities that will enable it to listen to customers, listening to both positive and negative feedback. Complaints offer important information that assists the company in determining how customers define value and the areas in which the company fails to deliver value. Also, customer complaints give an insight into some aspects the company didn’t know about its competitors. In their book, Delivering quality service: Balancing customer perceptions and expectations, published in 1990, Valarie Zeithaml and her co-authors A. Parasuraman and Leonard L. Berry, present 7 qualitative methods for understanding customers’ perceptions and expectations. Strategic use of complaints is listed as a first item, with other methods being research of customers’ desires in similar industries, research on intermediate moderate customers, key client studies, customer panels, transaction-based studies, and comprehensive customers’ expectations studies (Zeithaml et al., 1990).
22
Zeithaml et al. (1990) quote Maryanne Rasmussen, VP of worldwide quality at American Express company: “The formula I use is: Better complaint handling equals higher customer satisfaction equals higher brand loyalty equals higher profitability”. The authors also mention that a research performed by Technical Assistance Research Programs, Inc. (TARP), a consulting firm specializing in the study of customers’ complaints, concluded that the average return from investments made to satisfactorily handled customers’ complaints ranges from 100 to 170 percent, however TARP also came up with an evidence of an unfortunately low 4 percent of customers with problems that actually complain to companies, while the other 96 percent stay dissatisfied, and often spread the word-of-mouth of their dissatisfaction to other people (Zeithaml et al., 1990). Still, customer complaints are a part of customer feedback and a great value in determining the success of a business. The complaints enable the company to make corrections on various aspects of their services. Complaints are essential in understanding the ever dynamic customer expectations as well as in providing the management with key information that might not reach them through the normal channel. Also, complaints are essential in maintaining customers. The cost of satisfying an unhappy customer is usually much less than the cost of acquiring a new customer (Peters, 1987). Another qualitative instruments used as an inquiry into service quality is a critical incident approach (Grönroos, 2007). It is a methodological approach where respondents, customers with experiences of a given service, are asked to think of situations where the service, or any part of the service process including the outcome of that process, clearly deviated from the normal, either in a favorable or unfavorable way. Such situations are denoted as critical incidents. Then the descriptions of the critical incidents and the reasons for them are analyzed, in order to find out what kinds of quality problems exist and why these problems occur. The use of other methods, listed by Zeithaml et al. (1990) for collecting information about the customers’ perceptions and expectations, vary depending on the industry, companies’ resources and service-quality objectives. In summary, a qualitative type of measurement of service quality, including the inquiry into customers’ perceptions and expectations is usually a combination of complaint analysis, focus groups, roundtables, customer panels, and face-to-face discussions with the customers and personnel in the service delivery organization. It is not impossible, however, for the methods such as complaint analysis, if proper tooling and methodology are employed, to bridge into a quantitative approach. Moreover, if a systematic approach is used for collecting inputs from the customers during a feedback session, the set of data from one and more customers is usable for quantitative purposes in the same way as would be survey’s data. Similarly, as with conducting a survey, it is important to understand the kind of inputs that are to be collected from the customer and what a company can learn from analyzing the collected data. We will return to these topics at a later stage. QuantitativeApproach
23
A qualitative measurement of service quality is challenging. Unlike with product quality, where objective measurements, such as an observation of physical defects or deviation from a product’s specifications, are possible, services are intangible (Bateson 1977; Berry 1980; Lovelock 1981; Shostak 1977). Because of intangibility, service quality is mainly a perceived service quality (Zeithaml, 1981). The second defining characteristics of a service, its heterogeneity (Parasuraman et al., 1985), deems each service episode to be unique, due to different people and circumstances surrounding service production and consumption. Finally, the third characteristic, services’ inseparability (Carmen & Langeard 1980, Grönroos 1978, Parasuraman et al., 1985) from the moment when they are produced and consumed, while it is not only the service firm, but also a customer, as well as other customers that may be in vicinity of where the service may be provided, that play a role affecting customer’s final perception of the service quality. To overcome the complexity of measurement of the perceived service quality, most researches dealing with the topic break down the construct into several factors and dimensions (Brady & Cronin Jr 2001, Fitzsimmons & Fitzsimmons 2011). While there is no final agreement among researchers about the number of quality dimensions (Zeithaml et al. 2009), the notable works of Christian Grönroos and A.Parasuraman,L.BerryandV.Zeithamlprovideagenerallyagreedsetofdefinitionsforservicequalitydimensions.Whiledimensionsofservicequalityhelptobreakdowntheconstructforpurposesofassessment,commonlyacceptedmethodologyofmeasurementalongtheservicequalitydimensionsconsistsofanevaluator’scomparisonofexpectationsandperceptionswiththeservice,wheretheroleofevaluatorismostcommonlyplayedbyacustomer.Thismethodologywasproposedandusedasapartofdefinitionof theservicequalityconceptbyacademicians suchasLewis and Booms (1983), who postulated that good quality service is a measure of how well the service level delivered matches consumer expectations; Grönroos (1984), who indicated that the perceived quality of service is dependent on a comparison between expected and perceived service, and is an outcome of a comparative evaluation process; Cronin and Taylor (1992) and Oliver (1999), who proposed an assessment by probing whether perceived service delivery meets, exceeds or fails to meet customer expectations; and Parasuraman et al. (1988, p.17 ) who defined perceived service quality as “the degree and direction of discrepancy between consumers’ perceptions and expectations”. Finally, defining services as processes (see ‘Services are Processes’ section of Part 1 of the current work) is dictating that a service delivery process evaluation (Parasuraman et al., 1985) should take place as a part of service quality evaluation. Such perspective, however, is taken into account by researches such as Grönroos, who see services’ process nature to be incorporated into dimensionality of the service quality, being a part of functional dimension. The other dimensions, an outcome or output of service, Grönroos (1984) refers to as technical dimension. QualityDimensionsasperChristianGrönroos Grönroos (1984; 2007) distinguishes tree quality dimensions: technical, functional and servicescape. The technical dimension, sometimes referred to as an outcome dimension, indicates what the customer receives at the end of the interaction with a firm. This dimension is important in measuring outcome quality, which results from the service production process and its buyer–
24
seller interactions. The technical dimension measures the quality of the result. This dimension can objectively be measured by customers due to its characteristic as a technical solution to a problem. Thus, the technical dimension relates to what the customer receives. The functional or process-related dimension carries much weight in establishing the quality of a service. The technical dimension rarely counts in the measurement of the total quality of a service process. Customers measure total quality through the experience that results in technical quality. Thus, the technical dimension relates to what the customer receives, while the functional dimension relates to how the customer receives it (Grönroos, 2007). These two basic dimensions are highly dependent on the image of the firm. A good image makes a company favorable to customers, and small errors are likely to be ignored; hence, as far as the quality perception is concerned, image can be viewed as a filter. There are some extensional dimensions that are essential to the quality of a service. The main additional dimension relates to the environment and thus explains where the service was acquired. This dimension is referred to as the servicescape dimension and ranks as the third basic dimension. The servicescape consists of the physical resources, technology and other physical elements surrounding the service process. It helps to create the ambiance of the service process. Thus, it is expected to have an impact on the way service employees and customers behave and interact in service encounters (Grönroos, 2007). However, this dimension can also be viewed as part of the how or process-related dimension. Grönroos (1984) had adapted his model for the service quality dimensions from an earlier research performed by Swan and Comb (1976), who suggested a similar set of dimensions for the product performance: instrumental performance and expressive performance. Both researches advocate for companies’ management to establish what dimension is essential for improving the competitive advantage of the firm. TechnicalandFunctionalQualityModel(TheNordicModel1) In his technical and functional quality model shown in Figure 1, Grönroos (1984; 2007) presents the perceived service quality to be a function dependent on expected service and perceived service, where the two quality dimensions, technical and functional, and company’s image, as the third variable, are affecting the customers’ perception of the service quality. He merges the technical quality gap and functional service gap into total service quality gap. The customer experiences influencing these gaps are divided into experiences of a technical service package and a functional service package, respectively. The model also encompasses the main features that impact the expectations. These features are company’s image, branding as well as the word-of-mouth. Grönroos (1984, p.43) sees an image of a company as mainly a result of the perceived service and not just the “traditional marketing 1 The name The Nordic Model as a reference to the model presented by Grönroos in 1984, appears to have been popularized by the work of Brady and Cronin (2001), where authors referenced the model as one of four key conceptual models measuring perceived service quality.
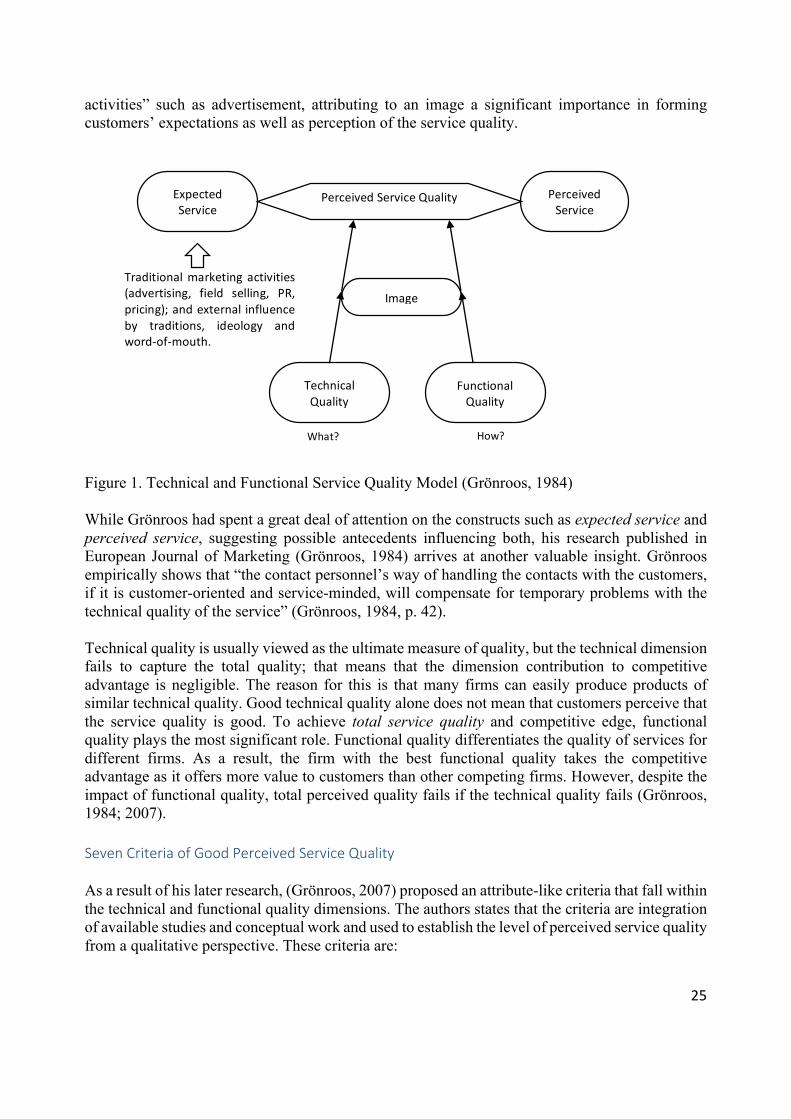
25
activities” such as advertisement, attributing to an image a significant importance in forming customers’ expectations as well as perception of the service quality. Figure 1. Technical and Functional Service Quality Model (Grönroos, 1984) While Grönroos had spent a great deal of attention on the constructs such as expected service and perceived service, suggesting possible antecedents influencing both, his research published in European Journal of Marketing (Grönroos, 1984) arrives at another valuable insight. Grönroos empirically shows that “the contact personnel’s way of handling the contacts with the customers, if it is customer-oriented and service-minded, will compensate for temporary problems with the technical quality of the service” (Grönroos, 1984, p. 42). Technical quality is usually viewed as the ultimate measure of quality, but the technical dimension fails to capture the total quality; that means that the dimension contribution to competitive advantage is negligible. The reason for this is that many firms can easily produce products of similar technical quality. Good technical quality alone does not mean that customers perceive that the service quality is good. To achieve total service quality and competitive edge, functional quality plays the most significant role. Functional quality differentiates the quality of services for different firms. As a result, the firm with the best functional quality takes the competitive advantage as it offers more value to customers than other competing firms. However, despite the impact of functional quality, total perceived quality fails if the technical quality fails (Grönroos, 1984; 2007). SevenCriteriaofGoodPerceivedServiceQuality As a result of his later research, (Grönroos, 2007) proposed an attribute-like criteria that fall within the technical and functional quality dimensions. The authors states that the criteria are integration of available studies and conceptual work and used to establish the level of perceived service quality from a qualitative perspective. These criteria are:
Traditionalmarketingactivities(advertising, field selling, PR,pricing);andexternalinfluenceby traditions, ideology andword-of-mouth.
ExpectedService
PerceivedService
FunctionalQuality
TechnicalQuality
PerceivedServiceQuality
Image
How?What?
26
1. Professionalism and Skills: The criterion is based on the belief that the service provider has adequate resources that are essential to solving their problems in a proficient way. 2. Attitudes and Behavior: The criterion relates to customers’ contact with the employees and how the employees are concerned about them and interested in solving their problems in a friendly and spontaneous way. 3. Accessibility and Flexibility: The criterion dictates that the service provider should set their system in a manner that would it would be easy for customers to get access to the service and that they are prepared to adjust to the demands and wishes of the customer in a flexible way. 4. Reliability and Trustworthiness: The service provider’s employees and systems should help the provider to keep promises and perform with the best interest of the customers at heart. 5. Service Recovery: Whenever something goes wrong or something unpredictable happens, the service provider will immediately and actively take action to keep them in control of the situation and find a new, acceptable solution. 6. Servicescape: The physical surroundings and other aspects of the environment of the service encounter support a positive experience of the service process. 7. Reputation and Credibility: The service provider's business can be trusted and gives adequate value for money, and that it stands for good performance and values that can be shared by customers and the service provider (Grönroos, 2007). It is important to note that only the first criterion is outcome related (technical), and the following five criteria are process related (functional), while the last criterion is image related. Parasuraman et al. (1985) was able to take the topics of quality attributes and dimensionality on a quantitative level. QualityDimensionsasperA.Parasuraman,L.BerryandV.Zeithaml Parasuraman et al. (1985) had undergone a qualitative phase of their research before arriving to a conceptual model allowing for a quantitative set of measurements, which they then tested in subsequent empirical studies. The authors conducted twelve extensive focus group discussions with customers from four different service industries, as well as with the executive management from the selected companies, as to determine what customers consider when evaluating the service quality, and how the employees of the firms understand their customers’ expectations. The result of this study were the Service Quality Gaps Model and the 22-item SERVQUAL instrument (Parasuraman et al., 1985, 1988) – a service quality model and a measurement tool that continue today to be the most cited and applied in a numerous empirical studies across various service industries around the globe (Ali et al., 2012;Ladhari, 2008; Sohail, 2003). SERVQUALInstrument Via their exploratory research, Parasuraman et al. (1985) came up to a conclusion that customers judged quality by using the same general criteria, regardless of the type of quality or industry. Parasuraman et al. (1985) captured these criteria using a scale which was composed of 97-item questions and distributed them among ten dimensions of service quality; these dimensions were subsequently tested and refined to 22 questions and five dimensions (Parasuraman et al., 1988).
27
The five dimensions found by the authors to influence customer perceived service quality are: 1. Tangibles: Physical facilities, equipment, and appearance of personnel. 2. Reliability: Ability to perform the promised service dependably and accurately. 3. Responsiveness: Willingness to help customers and provide prompt service. 4. Assurance: Knowledge and courtesy of employees and their ability to inspire trust and confidence. 5. Empathy: Caring, individualized attention the firm provides its customers (Parasuraman et al., 1988). By continuously testing and refining the scale, the authors were able to eliminate any of the overlapping among the dimensions (Parasuraman et al., 1988), however having the last two dimensions, assurance and empathy, being complexly composed by sub-dimensions, as follows: Assurance: - Communication - Credibility - Security - Competence - Courtesy Empathy: - Understanding/knowing customers - Access As mentioned, the final refinement of the tool contained 22-items, where each of the dimensions contained a number of carefully crafted and thoroughly tested questions. Tangibles, responsiveness, and assurance dimensions were probed with 4 questions, while reliability and empathy dimensions with 5 questions. For illustration purposes, the following 4 questions were used for the assessment of the perceived service quality for the assurance dimension: Q14. You can trust employees of XYZ2. Q15. You feel safe in your transactions with XYZ’s employees. Q16. Employees of XYZ are polite. Q17. Employees get adequate support from XYZ to do their job well. In other words, the dimension of assurance, composed of sub-dimensions of communication, credibility, security, competence and courtesy, was assessed via the questions Q14 to Q17.
2The XYZ stands for a fictional name of a service company, as shown in original work of (Parasuraman et al., 1988). It is to be replaced with the name service company that is being surveyed.
28
The assessment proposed by the authors assumed a shape of survey, where each of the 22-items had two sets, first set of questions asking respondents to evaluate their expectations (E) and the second set of questions evaluating the perceptions (P) of the respondents. An example of each set of phrasing for Q14 would be as follows: E14. Customers should be able to trust employees of these firms. P14. You can trust employees of XYZ. A 7-point scale ranging from “Strongly Agree” (7) to “Strongly Disagree” (1), without verbal labels for scale points 2 through 6, accompanied each statement, with the instructions asking customers to “show expectations” (Parasuraman et al., 1988, p. 38) for the first set of questions, and “extent to which” the respondents “believe the XYZ has the features described in the statements” (p. 39) for the second set of questions. The methodology for surveying both, customers’ expectations and perceptions, was motivated by an earlier proposed Service Quality Model (Parasuraman et al., 1985), which is sometimes referred by the name of Gaps Model of Service Quality or simply The Gaps Model (Parasuraman et al., 1990). Before proceeding to discuss The Gap Model, there is one last observation, which is important to highlight in regards to the process of SERVQUAL tool development and its applications. In process of the research and refinement of the tool, Parasuraman et al. (1988) had tested relative importance of the five dimensions in influencing customers’ overall quality perceptions by regressing the overall quality perception scores on the SERVQUAL scores for the individual dimensions (p. 31), with quality being a dependent variable. The authors found that in terms of the relative importance of the five dimensions in predicting the overall quality, a certain consistently is observed for all industries tested within the scope of their research. Reliability was found to the most the critical dimension for all cases. Assurance was found to be second most important dimension and empathy to be the least important, with tangibles and responsiveness taking either the third or the fourth place, depending on the industry being surveyed. TheGapsModel The SERVQUAL tool and the associated Gaps Model of Service Quality are undoubtedly the most discussed service quality model in academia and in practice as of today. As of spring 2016, Google Scholar (www.scholar.google.com) shows over 42,500 academic citations for the two works of A. Parasuraman, L. Berry and V. Zeithaml of 1985 and 1988, and a regular Google (www.google.com) search for SERVQUAL identifies over 443,000 web results. Let us, however, go back in time once again and to discuss the humble beginnings of both SERVQUAL and the Gaps Models of Service Quality. In 1983 the team of researchers, Anantharanthan Parasuraman, Leonard L. Berry and Valarie A. Zeithaml, submitted their first proposal to the Marketing Science Institute (MSI) for funds to do an exploratory research study on the subject of service quality (Zeithaml et. al, 1990). As of early 1980s, the Service Marketing field was literally non-existent, and the available literature on the topic of service quality was extremely scarce. And thus the team of researchers ventured to perform
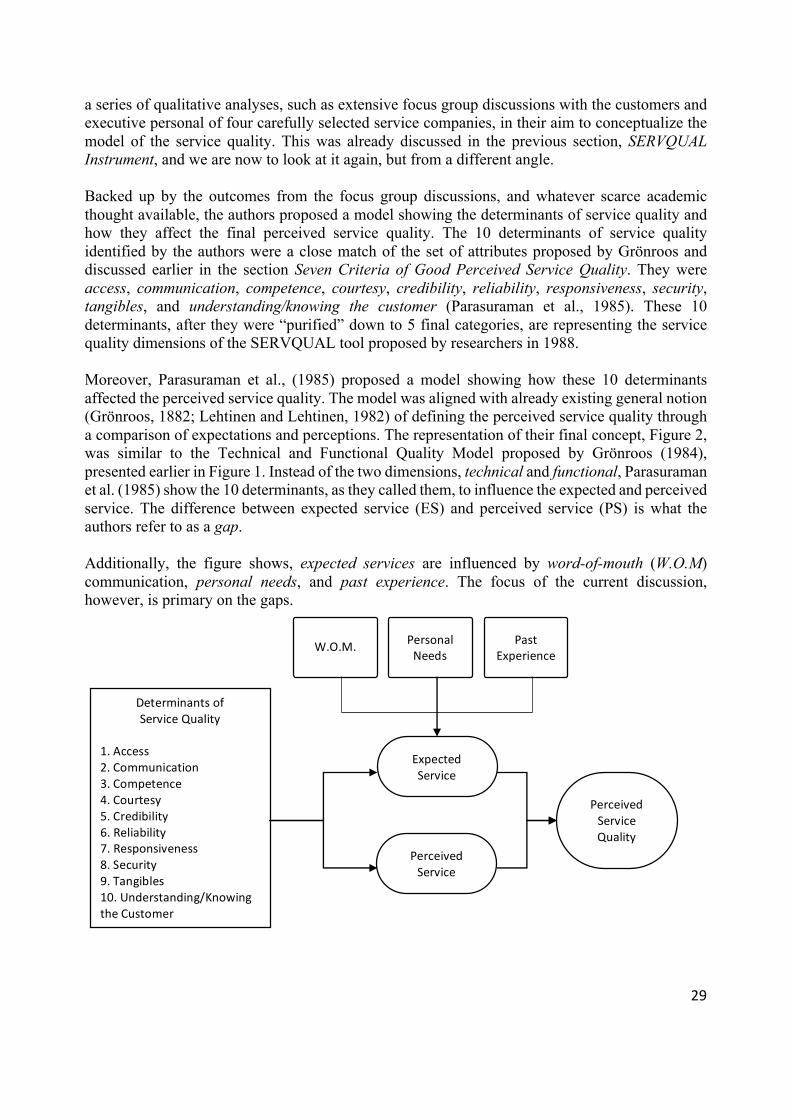
29
a series of qualitative analyses, such as extensive focus group discussions with the customers and executive personal of four carefully selected service companies, in their aim to conceptualize the model of the service quality. This was already discussed in the previous section, SERVQUAL Instrument, and we are now to look at it again, but from a different angle. Backed up by the outcomes from the focus group discussions, and whatever scarce academic thought available, the authors proposed a model showing the determinants of service quality and how they affect the final perceived service quality. The 10 determinants of service quality identified by the authors were a close match of the set of attributes proposed by Grönroos and discussed earlier in the section Seven Criteria of Good Perceived Service Quality. They were access, communication, competence, courtesy, credibility, reliability, responsiveness, security, tangibles, and understanding/knowing the customer (Parasuraman et al., 1985). These 10 determinants, after they were “purified” down to 5 final categories, are representing the service quality dimensions of the SERVQUAL tool proposed by researchers in 1988. Moreover, Parasuraman et al., (1985) proposed a model showing how these 10 determinants affected the perceived service quality. The model was aligned with already existing general notion (Grönroos, 1882; Lehtinen and Lehtinen, 1982) of defining the perceived service quality through a comparison of expectations and perceptions. The representation of their final concept, Figure 2, was similar to the Technical and Functional Quality Model proposed by Grönroos (1984), presented earlier in Figure 1. Instead of the two dimensions, technical and functional, Parasuraman et al. (1985) show the 10 determinants, as they called them, to influence the expected and perceived service. The difference between expected service (ES) and perceived service (PS) is what the authors refer to as a gap. Additionally, the figure shows, expected services are influenced by word-of-mouth (W.O.M) communication, personal needs, and past experience. The focus of the current discussion, however, is primary on the gaps.
DeterminantsofServiceQuality
1.Access2.Communication3.Competence4.Courtesy5.Credibility6.Reliability7.Responsiveness8.Security9.Tangibles10.Understanding/KnowingtheCustomer
ExpectedService
PerceivedService
PerceivedServiceQuality
W.O.M. PersonalNeeds
PastExperience
30
Figure 2: Determinants of Perceived Service Quality (Parasuraman et al., 1985) Throughout both works of 1985 and 1988, the authors use the words discrepancies and gaps interchangeably, however nowhere the definition of a gap is explicitly provided, but rather always implied that a gap is a difference between expected service (ES) and perceived service (PS). There are, however, definitions of the specifics gaps, Gap 1-5, which make up the essence of the Service Quality Model or The Gaps Model, as it was later known to be called.
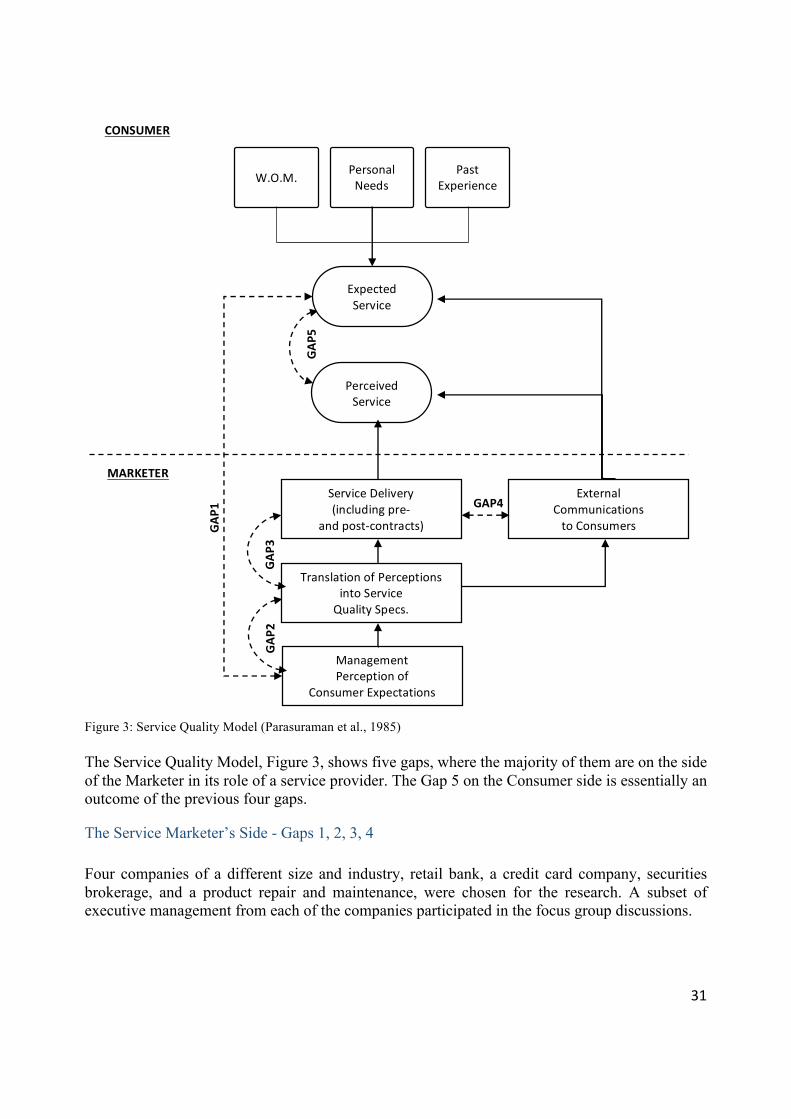
31
Figure 3: Service Quality Model (Parasuraman et al., 1985) The Service Quality Model, Figure 3, shows five gaps, where the majority of them are on the side of the Marketer in its role of a service provider. The Gap 5 on the Consumer side is essentially an outcome of the previous four gaps.
The Service Marketer’s Side - Gaps 1, 2, 3, 4 Four companies of a different size and industry, retail bank, a credit card company, securities brokerage, and a product repair and maintenance, were chosen for the research. A subset of executive management from each of the companies participated in the focus group discussions.
GAP5
MARKETER
GAP1
GAP2
GA
P3
W.O.M. PersonalNeeds
PastExperience
CONSUMER
ExpectedService
PerceivedService
ExternalCommunicationstoConsumers
ServiceDelivery(includingpre-
andpost-contracts)
ManagementPerceptionof
ConsumerExpectations
TranslationofPerceptionsintoServiceQualitySpecs.
GAP4
32
The Gaps 1 through 4 were generalized and documented by the researchers as an outcome of the executive interviews. An important hint of antecedents, the possible reasons for the gaps existence, is observable in some of the definitions. Gap 1: Consumer expectation-management perception gap was explained by the authors as the lack of understanding on the firm’s management side about of customers’ required features or the level of performance on these features. “In essence, service firm executives may not always understand what features connote high quality to consumers in advance, what features a service must have in order to meet consumer needs, and what levels of performance on those features are needed to deliver high quality service” (Parasuraman et al., 1985, p.44). Gap 2: Management perception – service quality specification gap was explained as the lack of perceived means as to deliver based on the knowledge of consumer expectations, which may also be combined with a lack of service specifications management system. Besides the resource constrains as to deliver a good quality service, be it real or perceived, the authors state that one possible underlying reason for the existing of the gap is a lack of commitment to service quality on behalf of company’s top management (Parasuraman et al., 1985). Gap 3: Service quality specifications – service delivery gap was attributed to variability of performance of service contact-employees in adherence to company’s standards or service specifications. Authors have not spent a great deal on the antecedents of the gap in their original work, leaving the reader with a quote from one of the interviewed executive, “Everything involves a person..!” (Parasuraman et al., 1985, p. 45), however in their later book, Delivering quality service: Balancing customer perceptions and expectations, the authors provide a rich account of possible reasons for this gap, such as: teamwork, employee-job fit, role conflict and others (Zeithaml et. al, 1990). The complete list of authors’ defined antecedents for all four gaps is shown below in a Figure 4. Gap 4: Service delivery – external communications gap is referring to the possible issues with communication, which a firm may do incorrectly or omit doing completely. The information, or the lack of such, influences both the expectations of the customers and the perception with the current service. The communication, as per author’s definition, includes marketing and promotional materials, as well as informing and educating customers in firm’s service delivery aspects and service related standards (Parasuraman et al., 1985). For each of the gaps, the authors make an associated proposition. The first proposition pertaining to Gap 1 states that the gap “will have an impact on the consumer’s evaluation of service quality”, while the subsequent three propositions associated with the Gaps 2,3,4 state that these gaps “will affect service quality from the consumer’s standpoint”.
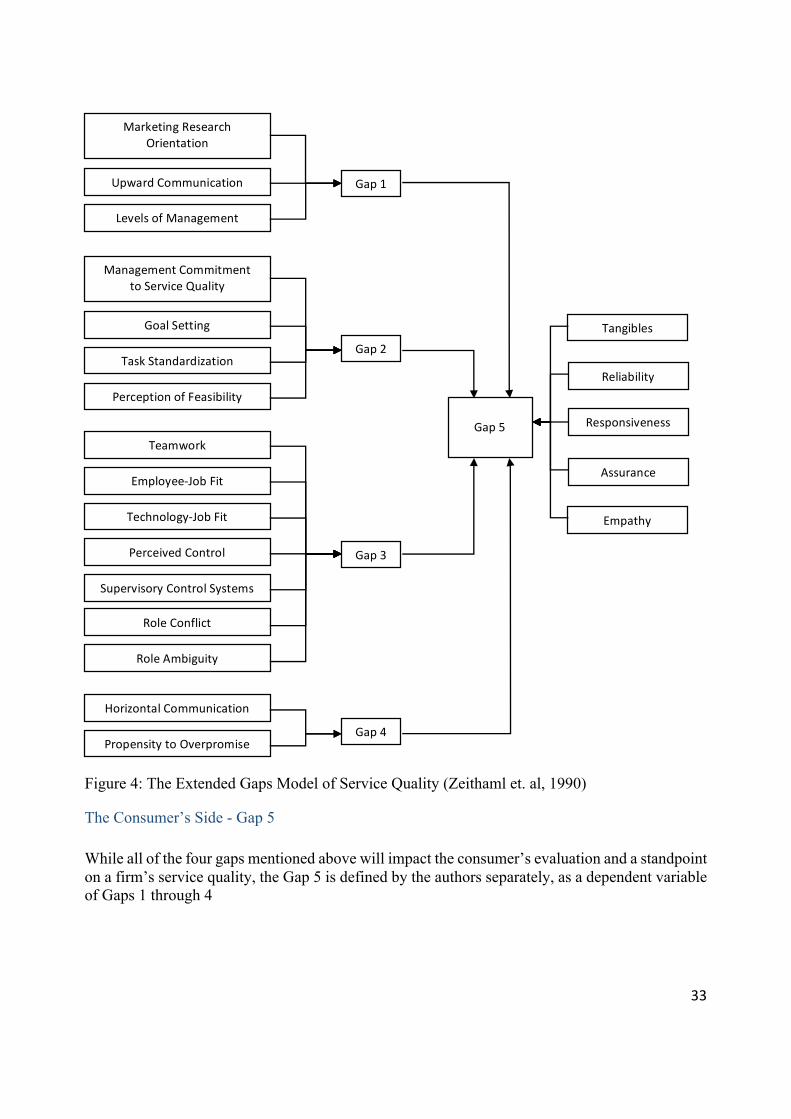
33
Figure 4: The Extended Gaps Model of Service Quality (Zeithaml et. al, 1990)
The Consumer’s Side - Gap 5 While all of the four gaps mentioned above will impact the consumer’s evaluation and a standpoint on a firm’s service quality, the Gap 5 is defined by the authors separately, as a dependent variable of Gaps 1 through 4
MarketingResearchOrientation
UpwardCommunication
ManagementCommitmenttoServiceQuality
LevelsofManagement
GoalSetting
TaskStandardization
PerceptionofFeasibility
Teamwork
Employee-JobFit
Technology-JobFit
PerceivedControlSupervisoryControlSystems
RoleConflict
RoleAmbiguity
HorizontalCommunicationPropensitytoOverpromise
Gap1
Gap2
Gap3
Gap4
Gap5
Tangibles
Reliability
Responsiveness
Assurance
Empathy
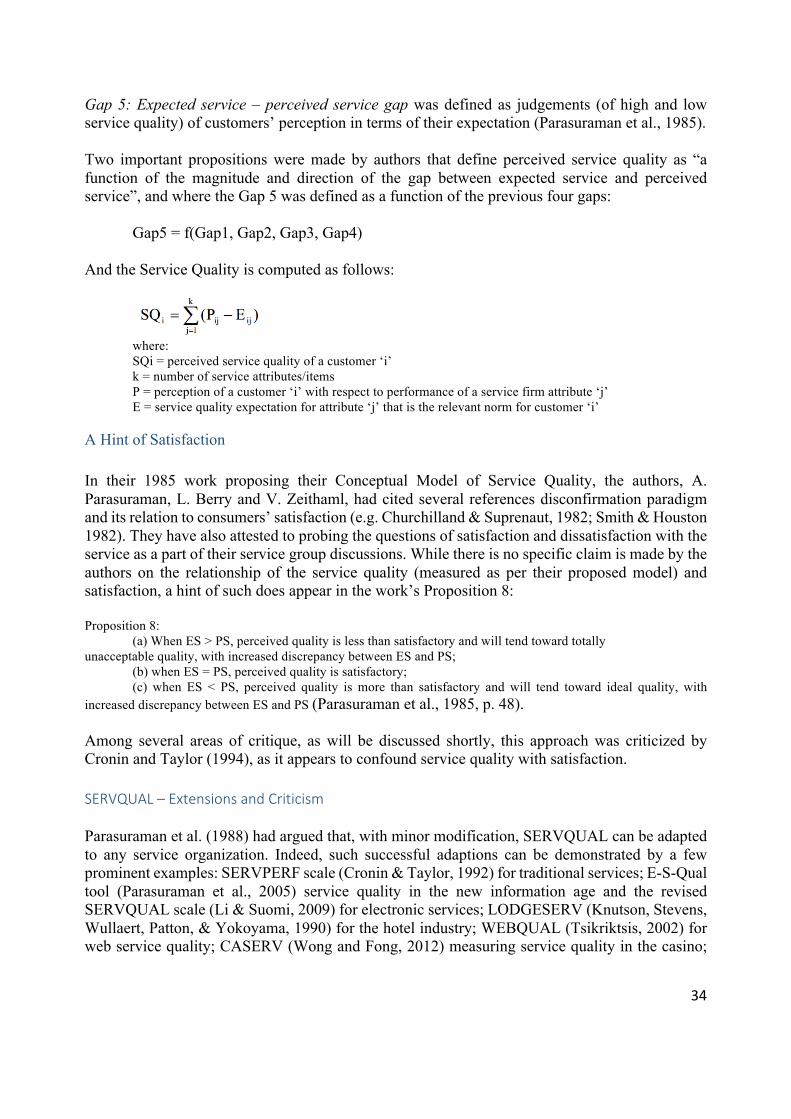
34
Gap 5: Expected service – perceived service gap was defined as judgements (of high and low service quality) of customers’ perception in terms of their expectation (Parasuraman et al., 1985). Two important propositions were made by authors that define perceived service quality as “a function of the magnitude and direction of the gap between expected service and perceived service”, and where the Gap 5 was defined as a function of the previous four gaps: Gap5 = f(Gap1, Gap2, Gap3, Gap4) And the Service Quality is computed as follows:
where: SQi = perceived service quality of a customer ‘i’ k = number of service attributes/items P = perception of a customer ‘i’ with respect to performance of a service firm attribute ‘j’ E = service quality expectation for attribute ‘j’ that is the relevant norm for customer ‘i’
A Hint of Satisfaction In their 1985 work proposing their Conceptual Model of Service Quality, the authors, A. Parasuraman, L. Berry and V. Zeithaml, had cited several references disconfirmation paradigm and its relation to consumers’ satisfaction (e.g. Churchilland & Suprenaut, 1982; Smith & Houston 1982). They have also attested to probing the questions of satisfaction and dissatisfaction with the service as a part of their service group discussions. While there is no specific claim is made by the authors on the relationship of the service quality (measured as per their proposed model) and satisfaction, a hint of such does appear in the work’s Proposition 8: Proposition 8:
(a) When ES > PS, perceived quality is less than satisfactory and will tend toward totally unacceptable quality, with increased discrepancy between ES and PS;
(b) when ES = PS, perceived quality is satisfactory; (c) when ES < PS, perceived quality is more than satisfactory and will tend toward ideal quality, with
increased discrepancy between ES and PS (Parasuraman et al., 1985, p. 48). Among several areas of critique, as will be discussed shortly, this approach was criticized by Cronin and Taylor (1994), as it appears to confound service quality with satisfaction. SERVQUAL–ExtensionsandCriticism Parasuraman et al. (1988) had argued that, with minor modification, SERVQUAL can be adapted to any service organization. Indeed, such successful adaptions can be demonstrated by a few prominent examples: SERVPERF scale (Cronin & Taylor, 1992) for traditional services; E-S-Qual tool (Parasuraman et al., 2005) service quality in the new information age and the revised SERVQUAL scale (Li & Suomi, 2009) for electronic services; LODGESERV (Knutson, Stevens, Wullaert, Patton, & Yokoyama, 1990) for the hotel industry; WEBQUAL (Tsikriktsis, 2002) for web service quality; CASERV (Wong and Fong, 2012) measuring service quality in the casino;
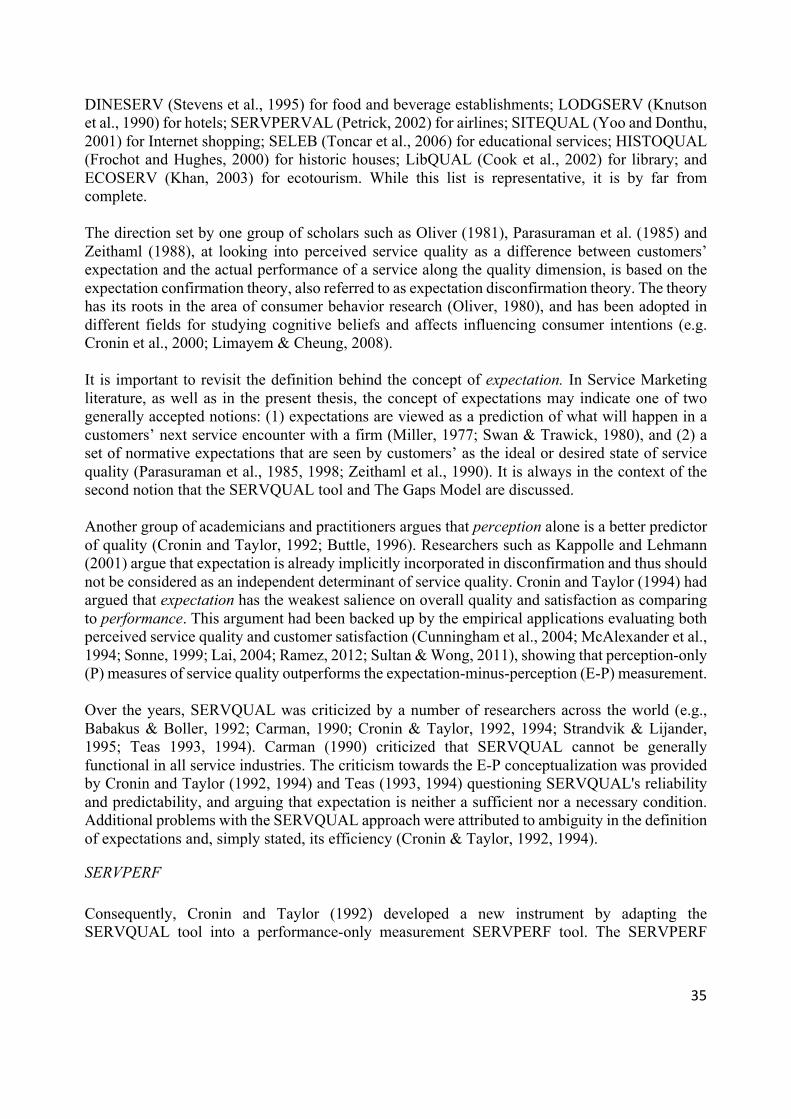
35
DINESERV (Stevens et al., 1995) for food and beverage establishments; LODGSERV (Knutson et al., 1990) for hotels; SERVPERVAL (Petrick, 2002) for airlines; SITEQUAL (Yoo and Donthu, 2001) for Internet shopping; SELEB (Toncar et al., 2006) for educational services; HISTOQUAL (Frochot and Hughes, 2000) for historic houses; LibQUAL (Cook et al., 2002) for library; and ECOSERV (Khan, 2003) for ecotourism. While this list is representative, it is by far from complete. The direction set by one group of scholars such as Oliver (1981), Parasuraman et al. (1985) and Zeithaml (1988), at looking into perceived service quality as a difference between customers’ expectation and the actual performance of a service along the quality dimension, is based on the expectation confirmation theory, also referred to as expectation disconfirmation theory. The theory has its roots in the area of consumer behavior research (Oliver, 1980), and has been adopted in different fields for studying cognitive beliefs and affects influencing consumer intentions (e.g. Cronin et al., 2000; Limayem & Cheung, 2008). It is important to revisit the definition behind the concept of expectation. In Service Marketing literature, as well as in the present thesis, the concept of expectations may indicate one of two generally accepted notions: (1) expectations are viewed as a prediction of what will happen in a customers’ next service encounter with a firm (Miller, 1977; Swan & Trawick, 1980), and (2) a set of normative expectations that are seen by customers’ as the ideal or desired state of service quality (Parasuraman et al., 1985, 1998; Zeithaml et al., 1990). It is always in the context of the second notion that the SERVQUAL tool and The Gaps Model are discussed. Another group of academicians and practitioners argues that perception alone is a better predictor of quality (Cronin and Taylor, 1992; Buttle, 1996). Researchers such as Kappolle and Lehmann (2001) argue that expectation is already implicitly incorporated in disconfirmation and thus should not be considered as an independent determinant of service quality. Cronin and Taylor (1994) had argued that expectation has the weakest salience on overall quality and satisfaction as comparing to performance. This argument had been backed up by the empirical applications evaluating both perceived service quality and customer satisfaction (Cunningham et al., 2004; McAlexander et al., 1994; Sonne, 1999; Lai, 2004; Ramez, 2012; Sultan & Wong, 2011), showing that perception-only (P) measures of service quality outperforms the expectation-minus-perception (E-P) measurement. Over the years, SERVQUAL was criticized by a number of researchers across the world (e.g., Babakus & Boller, 1992; Carman, 1990; Cronin & Taylor, 1992, 1994; Strandvik & Lijander, 1995; Teas 1993, 1994). Carman (1990) criticized that SERVQUAL cannot be generally functional in all service industries. The criticism towards the E-P conceptualization was provided by Cronin and Taylor (1992, 1994) and Teas (1993, 1994) questioning SERVQUAL's reliability and predictability, and arguing that expectation is neither a sufficient nor a necessary condition. Additional problems with the SERVQUAL approach were attributed to ambiguity in the definition of expectations and, simply stated, its efficiency (Cronin & Taylor, 1992, 1994).
SERVPERF Consequently, Cronin and Taylor (1992) developed a new instrument by adapting the SERVQUAL tool into a performance-only measurement SERVPERF tool. The SERVPERF
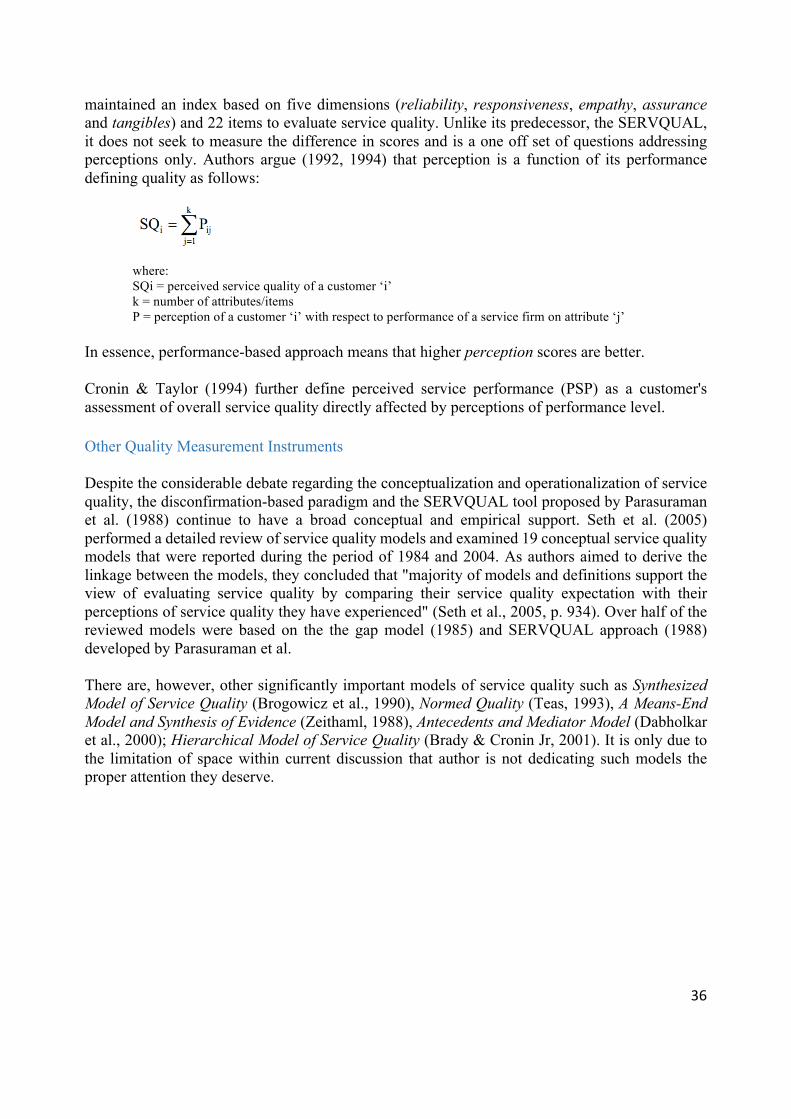
36
maintained an index based on five dimensions (reliability, responsiveness, empathy, assurance and tangibles) and 22 items to evaluate service quality. Unlike its predecessor, the SERVQUAL, it does not seek to measure the difference in scores and is a one off set of questions addressing perceptions only. Authors argue (1992, 1994) that perception is a function of its performance defining quality as follows:
where: SQi = perceived service quality of a customer ‘i’ k = number of attributes/items P = perception of a customer ‘i’ with respect to performance of a service firm on attribute ‘j’
In essence, performance-based approach means that higher perception scores are better. Cronin & Taylor (1994) further define perceived service performance (PSP) as a customer's assessment of overall service quality directly affected by perceptions of performance level. Other Quality Measurement Instruments Despite the considerable debate regarding the conceptualization and operationalization of service quality, the disconfirmation-based paradigm and the SERVQUAL tool proposed by Parasuraman et al. (1988) continue to have a broad conceptual and empirical support. Seth et al. (2005) performed a detailed review of service quality models and examined 19 conceptual service quality models that were reported during the period of 1984 and 2004. As authors aimed to derive the linkage between the models, they concluded that "majority of models and definitions support the view of evaluating service quality by comparing their service quality expectation with their perceptions of service quality they have experienced" (Seth et al., 2005, p. 934). Over half of the reviewed models were based on the the gap model (1985) and SERVQUAL approach (1988) developed by Parasuraman et al. There are, however, other significantly important models of service quality such as Synthesized Model of Service Quality (Brogowicz et al., 1990), Normed Quality (Teas, 1993), A Means-End Model and Synthesis of Evidence (Zeithaml, 1988), Antecedents and Mediator Model (Dabholkar et al., 2000); Hierarchical Model of Service Quality (Brady & Cronin Jr, 2001). It is only due to the limitation of space within current discussion that author is not dedicating such models the proper attention they deserve.
37
PART 3
Exploratory Research Background Three sets of exploratory studies were performed by the author in his aim to test and operationalize the concepts discussed in the work. The first study focused on quantitative measurement of a customers’ perceived service quality. Subsequently, within the second study, the author measured the antecedents to the gaps of service quality on the service provider’s side. And the third study aimed to qualitatively unite all three. Within a business-to-business (B2B) service environment, a market segment selected by the author for the research purposes, a further selection of two business firms took place for the purposes of a research – a business firm delivering Information Technology (IT) services to a wide range of other business organizations in a role of a Service Provider (SP) and a business firm in a role of a customer (Customer Account or CA) of a particular SP. While the nature of the market, e.g. business-to-business, business-to-consumer, consumer-to-consumer, may significantly impact the nature of a research on topics such as customer perceived value, since such constructs themselves represent a composition of other complex constructs such as service quality and price, studies into service quality, on the other hand, within B2B and B2C markets are not significantly different in methodologies applied (De Ruyter & Wetzels, 1999; Min & Mentzer, 2004; Pitt et a., 1995; Zeithaml et al., 1996), as discussed in the Research into Service Quality, Perceived Value and Customer Satisfaction section above. The focus of service quality research is often on the service contact-employees, where in a B2B setting, contact-employees represent both, employees of a service provider firm and employees of a customer firm. Service contact-employees are viewed primarily as responsible for the customers’ perception of the service quality (Cronin et a., 2000; Kelley, 1992; Lovelock, 1983; Zeithaml & Bitner, 2000). The author of the work attempts to approach the topic of Service Marketing holistically. While conducting a research, when selecting a business firm, the author aims to first look into a firm’s customer-orientation position. Such information is not always publicly available, however the word-of-mouth communication, often expressed and recorded on internet forums, social media sites, as well as news coverage, may give an insight of the firm’s strategic orientation and various market indications of how such firm’s strategy is expressed. What the author aimed to identify is how the subset of selected customer employees of the selected CA firm perceive the quality of services delivered by the SP firm. By applying the methodologies discussed in the previous chapters, such as SERVQUAL and SERVPERF instruments, the study looks into customers’ perception of service quality, the associated gap values, and the values for categories of gap antecedents.
38
The selection criteria of both firms, their identity and the specifics of the research are not revealed within a public section of the document, and the Service Provider firm continued to be referred as SP and its customer is referred to as CA. A detailed account on the research performed within the two organizations, SP and CA, is available in the work’s Part 4, which, however, is marked for non-publication. The author aims to provide a meaningful summary of the research in the upcoming section of Part 3 without compromising either the quality of academic writing or the confidentiality of the data related to the research that was performed within an actual business setting. Questions and Purposes The research itself represents an inquiry into perceptions of service quality, as a measure of service quality, delivered by a Service Provider (SP) firm to one of its customers (CA), within a context of B2B environment. The author expects to obtain a set of meaningful data by running a series of surveys aimed at assessing the quality of services provided. The scope of the discussed services is Information Technology (IT) services, delivered in an Outsourcing/Offshoring model, commonly referred to as Information Technology Outsourcing (Rohde, 2004). While the SERVQUAL instrument had been empirically tested within the Information Technology section, either with set of of minor modification (e.g. Pitt et a., 1995; Peppard & Ward, 1999; Kettinger & Lee, 1995) or adaptations resulting changes in the model (e.g. E-S-Qual tool by Parasuraman et al., 2005), the main criticism applicable to the methodology remains to all that were used. Carman (1990), Teas (1993,1994) and Cronin Jr. and Taylor (1992, 1994) criticized the applicability and validity of five service quality dimensions laid by Parasuraman et al. (1988), the usefulness of the perceptions measurement, and the overall length of the 22-item instrument, which in the case of SERVQUAL tool has to be duplicated to measure both expectations and perceptions, ending up with a final set of 44-items per customer survey. Two associated hypothesis are proposed and subsequently tested by the author within a first study: H1: An adaptation of the SERVQUAL instrument by reducing the number of items from 22 to 5, one for each service quality dimension, will provide a sufficiently meaningful indication of customers’ perceived service quality. H2: An adaptation of the SERVQUAL instrument for application within Information Technology Outsourcing industry by eliminating the ‘tangibles’ dimension will provide a sufficiently meaningful indication of customers’ perceived service quality. The first hypothesis, H1, proposes an implementation of a light version of SERVQUAL tool, where the survey respondents are requested to assess each of the service quality dimensions (reliability, responsiveness, empathy, assurance and tangibles) via just one survey item per each dimension. The author argues that such reduction is possible and meaningful within an ongoing business relationship typically associated with a B2B setting.
39
The second hypothesis, H2, does not depend on H1 being confirmed. Whether a light version of SERVQUAL being employed, or a full 44-item scale is to be used, the author argues that the tangibles dimensions of service quality is practically insignificant for measuring the perceptions of service quality within the scope of Information Technology Outsourcing industry. Customer contact-employees of a firm receiving ITO set of services from a Service Provider (SP) are rarely impacted in their perception of the quality of service with the “tangibles” of their SP, being, as identified by Parasuraman et al. (1985) the elements such as physical facilities, appearance of personnel, tools or equipment used to provide the service, or physical representations of the service, etc. The second study designed by the author within the boundaries of a SP organization is aiming to explore the antecedents impacting the origination of gaps, which further impact the perception of service quality. An exploratory research designed by the author attempts to answer the question as to whether an application of the methodologies (Parasuraman et al. 1985, 1888; Zeithaml et al, 1990) on the side of service provider results in a meaningful identification of antecedents of the issues resulting the gaps in service delivery as perceived by a customer. Such findings, if produced, would be a valuable input for any managerial efforts aimed at service improvement. The third study, a qualitative research, was meant to supplement the first two studies, in their aim to assess the service quality of the selected SP. Methods There are three questions raised by the author setting the purpose of the exploratory research, two in a form of hypotheses, asking as to whether the methodology proposed by Parasuraman et al. (1985, 1988) will allow for a reduction in a number items and whether all five service quality dimensions are equally significant in determining the perceived service quality for ITO industry. The third question that the author aims to find an answer to is whether the expectation disconfirmation theory and the gap analyses methodology, including the analyses of gaps’ antecedents, can give an insight of where a firm is underperforming and needs to improve. An approach chosen by the author was to complete and analyze the results of the customer study before designing and completing a study on the service provider side. Thus, the results of responses from the Customer Survey made an impact on the design of the Service Provider Survey. The design of these surveys, their content and the associated response data are descried in the Part 4 and remain non-public as per request of the involved organizations. The study containing Customer Survey was based on a light version of SERVQUAL tool, proposed by the author, where instead of 44 items measuring the associated expectations and perceptions for the five service quality dimensions, only the 10 items (5 measuring for expectations and 5 measuring for perceptions) were presented.
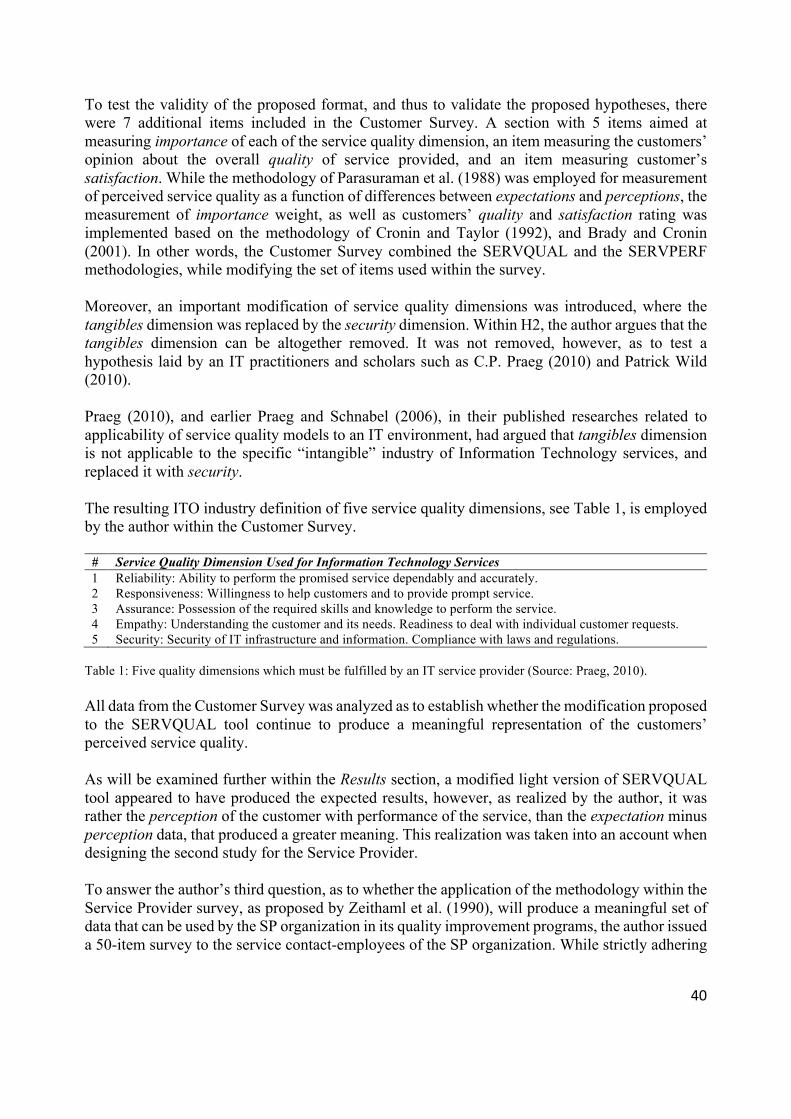
40
To test the validity of the proposed format, and thus to validate the proposed hypotheses, there were 7 additional items included in the Customer Survey. A section with 5 items aimed at measuring importance of each of the service quality dimension, an item measuring the customers’ opinion about the overall quality of service provided, and an item measuring customer’s satisfaction. While the methodology of Parasuraman et al. (1988) was employed for measurement of perceived service quality as a function of differences between expectations and perceptions, the measurement of importance weight, as well as customers’ quality and satisfaction rating was implemented based on the methodology of Cronin and Taylor (1992), and Brady and Cronin (2001). In other words, the Customer Survey combined the SERVQUAL and the SERVPERF methodologies, while modifying the set of items used within the survey. Moreover, an important modification of service quality dimensions was introduced, where the tangibles dimension was replaced by the security dimension. Within H2, the author argues that the tangibles dimension can be altogether removed. It was not removed, however, as to test a hypothesis laid by an IT practitioners and scholars such as C.P. Praeg (2010) and Patrick Wild (2010). Praeg (2010), and earlier Praeg and Schnabel (2006), in their published researches related to applicability of service quality models to an IT environment, had argued that tangibles dimension is not applicable to the specific “intangible” industry of Information Technology services, and replaced it with security. The resulting ITO industry definition of five service quality dimensions, see Table 1, is employed by the author within the Customer Survey.
# Service Quality Dimension Used for Information Technology Services 1 Reliability: Ability to perform the promised service dependably and accurately. 2 Responsiveness: Willingness to help customers and to provide prompt service. 3 Assurance: Possession of the required skills and knowledge to perform the service. 4 Empathy: Understanding the customer and its needs. Readiness to deal with individual customer requests. 5 Security: Security of IT infrastructure and information. Compliance with laws and regulations.
Table 1: Five quality dimensions which must be fulfilled by an IT service provider (Source: Praeg, 2010). All data from the Customer Survey was analyzed as to establish whether the modification proposed to the SERVQUAL tool continue to produce a meaningful representation of the customers’ perceived service quality. As will be examined further within the Results section, a modified light version of SERVQUAL tool appeared to have produced the expected results, however, as realized by the author, it was rather the perception of the customer with performance of the service, than the expectation minus perception data, that produced a greater meaning. This realization was taken into an account when designing the second study for the Service Provider. To answer the author’s third question, as to whether the application of the methodology within the Service Provider survey, as proposed by Zeithaml et al. (1990), will produce a meaningful set of data that can be used by the SP organization in its quality improvement programs, the author issued a 50-item survey to the service contact-employees of the SP organization. While strictly adhering
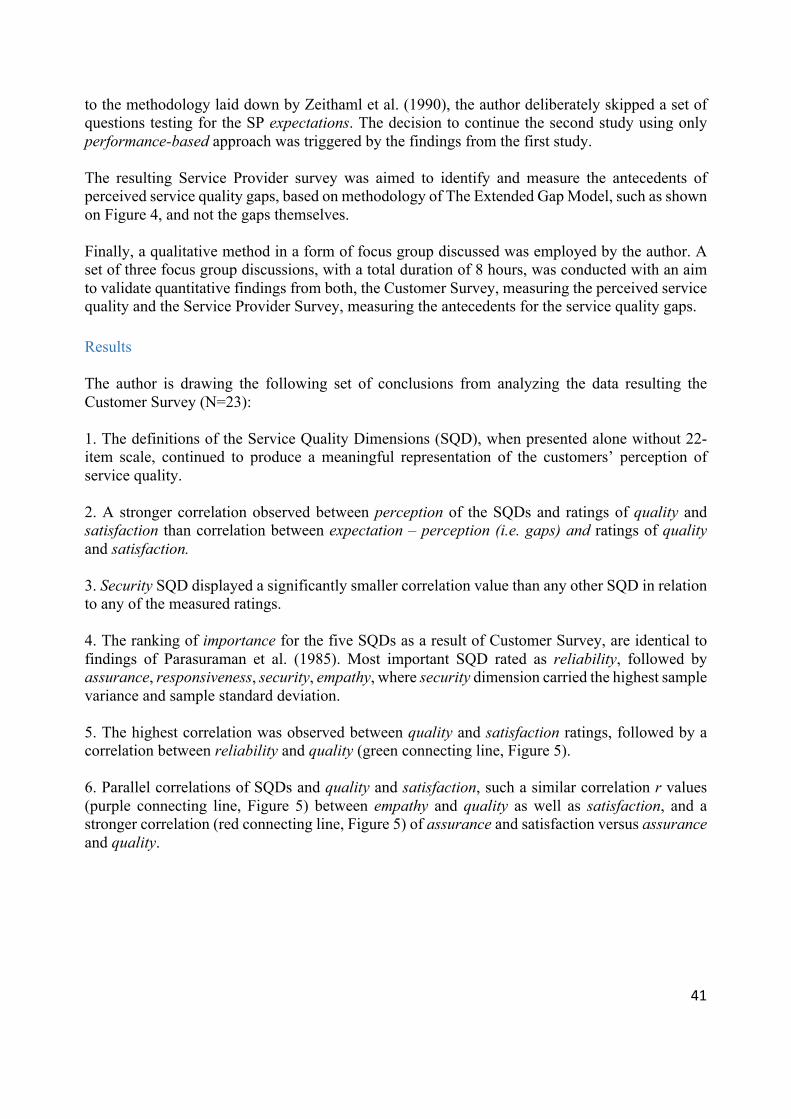
41
to the methodology laid down by Zeithaml et al. (1990), the author deliberately skipped a set of questions testing for the SP expectations. The decision to continue the second study using only performance-based approach was triggered by the findings from the first study. The resulting Service Provider survey was aimed to identify and measure the antecedents of perceived service quality gaps, based on methodology of The Extended Gap Model, such as shown on Figure 4, and not the gaps themselves. Finally, a qualitative method in a form of focus group discussed was employed by the author. A set of three focus group discussions, with a total duration of 8 hours, was conducted with an aim to validate quantitative findings from both, the Customer Survey, measuring the perceived service quality and the Service Provider Survey, measuring the antecedents for the service quality gaps. Results The author is drawing the following set of conclusions from analyzing the data resulting the Customer Survey (N=23): 1. The definitions of the Service Quality Dimensions (SQD), when presented alone without 22-item scale, continued to produce a meaningful representation of the customers’ perception of service quality. 2. A stronger correlation observed between perception of the SQDs and ratings of quality and satisfaction than correlation between expectation – perception (i.e. gaps) and ratings of quality and satisfaction. 3. Security SQD displayed a significantly smaller correlation value than any other SQD in relation to any of the measured ratings. 4. The ranking of importance for the five SQDs as a result of Customer Survey, are identical to findings of Parasuraman et al. (1985). Most important SQD rated as reliability, followed by assurance, responsiveness, security, empathy, where security dimension carried the highest sample variance and sample standard deviation. 5. The highest correlation was observed between quality and satisfaction ratings, followed by a correlation between reliability and quality (green connecting line, Figure 5). 6. Parallel correlations of SQDs and quality and satisfaction, such a similar correlation r values (purple connecting line, Figure 5) between empathy and quality as well as satisfaction, and a stronger correlation (red connecting line, Figure 5) of assurance and satisfaction versus assurance and quality.
42
Figure 5: Results from the Customer Survey: Customer perceptions with the SQDs. Note: The values above the connecting lines represent the associated correlation r values. Additional conclusions and observations following the analyses of data from the Service Provider Survey (N=43): 7. A significantly large room for all four gaps was discovered, and the survey data appeared to be meaningful without having to test for expectations on the side of the Service Provider. The biggest areas presenting an issue were the managerial Gaps 1 and 4, Consumer expectation-management perception gap and Service delivery – external communications gap. While the group of antecedents for Gaps 2 and 3 presented a relatively better set of ratings, the mean scores representing the issues within the Service Provider’s organization provide a strong signal of a need of improvement. For instance, one of the worst scores was shown for a group of antecedents labeled as Management's Commitment to Service Quality, within a Gap 2 category. 8. A mean range of rating on the SP for the cumulative Gap 5 was within close proximity to the cumulative perception rating from the Customer Survey. Finally, two additional results from focus group discussion are listed below, and provoke a considerable thought for possibilities of future research: 9. While all service quality dimensions appear to have been touched by the customer during the series of focus group discussion, the main theme appeared to always pertain to the reliability dimension. 10. A deeper analyses of a particular service component within the scope of the discussion group, and the customers’ continues reference to the reliability of the services revealed that within the top layer defined reliability there are additional layer of all five service quality dimensions that interact within each other.
Reliability
Responsiveness
Assurance
Empathy
Security
Quality Satisfaction
0.910
0.8214
0.4852
0.55900.6206
0.3090
0.7808
0.4643
0.6903
0.6208
0.4427
43
Discussion The author’s first hypothesis that a reduced set of items for a set of tools such as SERVQUAL or SERVPERF will continue to produce a meaningful set of results appears to have validity. Such conclusion is drawn based on the observed correlation of the constructs, that is consistent with the past studies drawn in the field. The second hypothesis specified by the author proposing to eliminate the tangibles dimension could not fully be confirmed, however the author appears to have rejected a hypothesis set by Praeg (2010), proposing to replace the tangibles dimension with security dimension, showing a minimum significance of the dimensions rating towards the ratings of quality, satisfaction or importance. A consistently high importance of reliability dimension within the past studies performed in the field were also noted within the current research. The complexity of this dimension, however, appears to require additional research. A study on the side of the Service Provider appear to have produced a set of meaningful results. The values for antecedent categories were obtained, and fully distinguishable areas of antecedents provide a clear opportunity for a SP to run an improvement program. For instance, the study identified that some of the biggest gaps are due to the Service Provider’s Levels of Management or the Management's Commitment to Service Quality, while some of the best results are in the areas such as Teamwork. Implications and Future Research When it comes to measuring the service quality, the author’s opinion is that the tools and methodology aimed at data collection from the customer should be simplified and streamlined. While it is imperative to continue collecting regular customer feedback, and one such method of data collection are the surveys, if a questionnaire is too long or poorly designed, then the response rate and the quality of input will suffer significantly. A smaller, yet a more meaningfully constructed instrument will provide a meaningful set of signals in relation to service quality of service provider. Continues research and testing such “light” scales is a worthy direction, in author’s opinion. Having proposed to simplify and reduce the surveys instruments aimed at the customer, the author proposes an opposite direction for a service provider. A carefully designed methodology, such as the one proposed by Zeithaml et al. (1990) and tested in within the scope of the descried research, will help a firm to identify the areas where the biggest gaps exists – the gaps the have a strongest contribution towards the negative perception of the service quality. Additional quantitative studies, however, are required, as per author’s opinion, in order to understand the relationship of the gap antecedents and their final impact to the perceived service quality.
44
Part 4
Non-Publication Agreement Theselectioncriteriaofbothfirmsparticipatingintheresearch,aServiceProvider(SP)firmanditscustomer(CustomerAccountorCA),theiridentityandthespecificsoftheassociatedresearcharediscussedinthefollowingsection.Thissection,Part4,ismarkedfornon-publication,andwillbepresentedonlytoasetofselectedmembersoftheMasarykUniversityFacultyofEconomicsandAdministration.Anon-disclosureagreementmustbemaintainedbyallpartiesastoavoidanypossibledistributionofthecurrentdocumentoutsideoftheuniversityexaminationcommittee.Thereasonfornon-publication,asdiscussedearlier,followstheparticipatingcompanies’requesttowithdrawanypossibleincriminatinginformationfromtheeyesofthepublic.
45
Conclusion The growth and development of the Service Marketing field within the last three-and-a-half decades, and the focus within the field on the topics of Service Quality, were motivated by the evolution of the marketing thought itself, jump-started by the visionaries such as Peter Drucker in early 1950s and forced to be taken into account by the geo-economic challenges of 1980s. A firm is inevitably gaining an edge over its competition when putting its customers’ interests first. In aiming to understand and satisfy the customers’ needs and wants, a firm is applying its strategic resources in producing value oriented offerings towards its clients. It is a perception of gained value that motivates individuals and organization to enter into a transaction with a firm and continue repurchasing after the initial transaction. When benefits of such a transaction outweigh the costs and risks of doing business with a firm, such firm enjoys its customers’ loyalty. A firm’s loyal and satisfied customers contribute to its profitability by engaging in a repeat business and spreading a positive word-of-mouth within a marketplace, thus causing a firm to acquire new customers. The concepts of value and satisfaction, however, had proven to be difficult to understand and to measure. Within the service industry, each individual transaction is unique. A colossal body of research on topics of perceived value and customer satisfaction consistently reveal a set of positive consequences expressed in a form of consumer behavioral intensions, such as repurchase decisions. A set of antecedents to both, value and satisfaction, also appear to be consistently confirmed. Perceived service quality, defined variously, but most often as “a global judgment, or attitude, relating to the superiority of the service'' (Parasuraman et al. 1988, p.16) and a sacrifice on behalf of a consumer, connected to an offering’s price as well as other nonmaterial expenses, were confirmed to have a strongest influence on the perceived value. Perceived service quality was also confirmed to have a direct and a positive relation with satisfaction. While academicians appear to agree on the definition of service quality, a notion that is highly dependent on an individual evaluating the quality, measurement and operationalization of the construct continue to be widely debated. Some prominent works that laid a strong foundation for numerous conceptual and empirical studies are the ones of Christian Grönroos and A. Parasuraman, L. Berry and V. Zeithaml. By balancing the findings from their qualitative and quantitative studies, A. Parasuraman et al. (1985, 1988) conceptualized a service quality model and a SERVQUAL tool to measure perceived service quality. While A. Parasuraman et al. (1985, p. 48) proposes to measure the perceived service quality as a function of differences “between the expected service (ES) and perceived service (PS)” and the notable scholars such as Cronin and Taylor (1992) argue that perception of the performance is sufficient to quantitatively assess the construct, both approaches are used to objectively assess customers’ perceived service quality. The research conducted by the author had shown that the set of tools available to both academicians and practitioners is useful indeed, however can be improved and optimized further. One such optimization was successfully attempted by the author, where a set of items within a SERVQUAL tool used for measuring the customer’s perceived service quality were dramatically reduced from 22 items to 5 items without a loss of such survey’s value.
46
Obtaining the perceived service quality for a selected scope of the research was not the only aim of the research. It was imperative for the author to be able to understand the causes of the quality gaps, as to position the organizational and individual efforts towards the service improvement initiatives within the appropriate focus areas. Such causes were discovered by applying The Extended Gap Model (Zeithaml et al., 1990) methodology and identifying the categories of antecedents and their appropriate values, where a low value would indicate a high possibility for a service gap. Finally, a set of focus group discussions bridged the data from the quantitative studies into, what an author would call, an objective representation of the service quality for the scope of the research described.
47
References Agarwal, S., & Teas, R. K. (2001). Perceived value: mediating role of perceived risk. Journal of Marketing theory and Practice, 9(4), 1-14. Ailawadi, K. L., Pauwels, K., & Steenkamp, J. B. E. (2008). Private-label use and store loyalty. Journal of Marketing, 72(6), 19-30. de Almeida, A. R., Medeiros, P. Y., & Halpern, E. E. (2015). Why Internal Clients are Dissatisfied with the Quality of Information Technology Services Provided by their Organizations?. Procedia Computer Science, 55, 922-930. Anderson, E. W., & Sullivan, M. W. (1993). The antecedents and consequences of customer satisfaction for firms. Marketing science, 12(2), 125-143. Anderson, R. E., & Srinivasan, S. S. (2003). E-satisfaction and e-loyalty: A contingency framework. Psychology & marketing, 20(2), 123-138. Andreassen, T. W., & Lindestad, B. (1998). Customer loyalty and complex services: The impact of corporate image on quality, customer satisfaction and loyalty for customers with varying degrees of service expertise. International Journal of service Industry management, 9(1), 7-23. Angur, M. G., Nataraajan, R., & Jahera Jr, J. S. (1999). Service quality in the banking industry: an assessment in a developing economy. International journal of bank marketing, 17(3), 116-125. Ansoff, I. H. (1965). Corporate Strategy: An Analytic Approach to Business Policy for Growthand Expansion. McGraw-Hill. Appiah-Adu, K., & Singh, S. (1998). Customer orientation and performance: a study of SMEs. Management decision, 36(6), 385-394. Atuahene-Gima, K. (1996). Market orientation and innovation. Journal of Business Research, 35(2), 93-103. Baker, D. A., & Crompton, J. L. (2000). Quality, satisfaction and behavioral intentions. Annals of tourism research, 27(3), 785-804. Baker, J., Parasuraman, A., Grewal, D., & Voss, G. B. (2002). The influence of multiple store environment cues on perceived merchandise value and patronage intentions. Journal of marketing, 66(2), 120-141. Bearden, W. O., & Netemeyer, R. G. (1999). Handbook of marketing scales: Multi-item measures for marketing and consumer behavior research. Sage. Berthon, P., Hulbert, J. M., & Pitt, L. F. (1999). To serve or create? Strategic orientations toward customers and innovation. California Management Review, 42(1), 37-58. Berthon, P., Mac Hulbert, J., & Pitt, L. (2004). Innovation or customer orientation? An empirical investigation. European Journal of Marketing, 38(9/10), 1065-1090. Bienstock, C. C., Mentzer, J. T., & Bird, M. M. (1996). Measuring physical distribution service quality. Journal of the Academy of Marketing Science, 25(1), 31-44. Bitner, M. J. (1990). Evaluating service encounters: the effects of physical surroundings and employee responses. the Journal of Marketing, 69-82. Blocker, C. P., Flint, D. J., Myers, M. B., & Slater, S. F. (2011). Proactive customer orientation and its role for creating customer value in global markets. Journal of the Academy of Marketing Science, 39(2), 216-233. Boksberger, P. E., & Melsen, L. (2011). Perceived value: a critical examination of definitions, concepts and measures for the service industry. Journal of Services Marketing, 25(3), 229-240. Bolton, R. N., & Drew, J. H. (1991). A multistage model of customers' assessments of service quality and value. Journal of consumer research, 375-384. Bolton, R. N., & Lemon, K. N. (1999). A dynamic model of customers' usage of services: Usage as an antecedent and consequence of satisfaction. Journal of marketing research, 171-186. Brady, M. K., & Cronin Jr, J. J. (2001). Some new thoughts on conceptualizing perceived service quality: a hierarchical approach. Journal of marketing, 65(3), 34-49. Brady, M. K., & Robertson, C. J. (2001). Searching for a consensus on the antecedent role of service quality and satisfaction: an exploratory cross-national study. Journal of Business research, 51(1), 53-60. Braunsberger, K., & Gates, R. (2009). Developing inventories for satisfaction and Likert scales in a service environment. Journal of Services Marketing, 23(4), 219-225. Buttle, F. (1996). SERVQUAL: review, critique, research agenda. European Journal of marketing, 30(1), 8-32. Carman, J. M. (1990). Consumer Perceptions Of Service Quality: An Assessment Of T. Journal of retailing, 66(1), 33. "Caruana, A. (2002). Service loyalty: The effects of service quality and the mediating role of customer satisfaction. European journal of marketing, 36(7/8), 811-828. Caruana, A., & Calleya, P. (1998). The effect of internal marketing on organisational commitment among retail bank managers. International Journal of bank marketing, 16(3), 108-116. Caruana, A., Money, A. H., & Berthon, P. R. (2000). Service quality and satisfaction-the moderating role of value. European Journal of marketing, 34(11/12), 1338-1353. Chang, T. Z., & Wildt, A. R. (1994). Price, product information, and purchase intention: An empirical study. Journal of the Academy of Marketing science, 22(1), 16-27. Chen, C. F., & Tsai, D. (2007). How destination image and evaluative factors affect behavioral intentions?. Tourism management, 28(4), 1115-1122. Chen, S. C., & Quester, P. G. (2006). Modeling store loyalty: perceived value in market orientation practice. Journal of Services Marketing, 20(3), 188-198. Chen, Z., & Dubinsky, A. J. (2003). A conceptual model of perceived customer value in e-commerce: A preliminary investigation. Psychology & Marketing, 20(4), 323-347. Chen, C. F., & Tsai, D. (2007). How destination image and evaluative factors affect behavioral intentions?. Tourism management, 28(4), 1115-1122. Ya-lun Chou, 1969. Statistical Analysis, Holt International. ISBN 0030730953. Chrisman, J. J., Hofer, C. W., & Boulton, W. B. (1988). Toward a system for classifying business strategies. Academy of Management Review, 13(3), 413-428. Costabile, M. (2000, September). A dynamic model of customer loyalty. In 16th Annual IMP Conference, Bath, England. Cronin Jr, J. J., & Taylor, S. A. (1992). Measuring service quality: a reexamination and extension. The journal of marketing, 55-68. Cronin Jr, J. J., & Taylor, S. A. (1994). SERVPERF versus SERVQUAL: reconciling performance-based and perceptions-minus-expectations measurement of service quality. The Journal of Marketing, 125-131. "Cronin, J. J., Brady, M. K., & Hult, G. T. M. (2000). Assessing the effects of quality, value, and customer satisfaction on consumer behavioral intentions in service environments.
48
Journal of retailing, 76(2), 193-218." Danaher, P. J., & Mattsson, J. (1994). Customer satisfaction during the service delivery process. European journal of Marketing, 28(5), 5-16. Daniel, C., & Berinyuy, L. (2010). Using the SERVQUAL model to assess service quality and customer satisfaction. An Empirical study of grocery stores in Umea. Retrieved April, 14, 2014. De Ruyter, K., & Wetzels, M. (1999). Commitment in auditor–client relationships: antecedents and consequences. Accounting, organizations and society, 24(1), 57-75. De Wit, B., & Meyer, R. (2010). Strategy synthesis: Resolving strategy paradoxes to create competitive advantage: Text and readings. Cengage Learning EMEA. Desarbo, W. S., Jedidi, K., & Sinha, I. (2001). Customer value analysis in a heterogeneous market. Strategic Management Journal, 22(9), 845-857. Di Palo, M. T. (1997). Rating satisfaction research: is it poor, fair, good, very good, or excellent?. Arthritis & Rheumatism, 10(6), 422-430. Dodds, W. B., Monroe, K. B., & Grewal, D. (1991). Effects of price, brand, and store information on buyers' product evaluations. Journal of marketing research, 307-319. Dominici, G., & Guzzo, R. (2010). Customer satisfaction in the hotel industry: a case study from Sicily. International Journal of Marketing Studies, 2(2), 3-12. Drucker, P. F. (1954). The Practice oj Management. Duman, T., & Mattila, A. S. (2005). The role of affective factors on perceived cruise vacation value. Tourism Management, 26(3), 311-323. Edvardsson, B., Enquist, B., & Johnston, R. (2005). Cocreating customer value through hyperreality in the prepurchase service experience. Journal of service research, 8(2), 149-161. Fisk, R. P., Brown, S. W., & Bitner, M. J. (1993). Tracking the evolution of the services marketing literature. Journal of retailing, 69(1), 61-103. Fornell, C., Johnson, M. D., Anderson, E. W., Cha, J., & Bryant, B. E. (1996). The American customer satisfaction index: nature, purpose, and findings. the Journal of Marketing, 7-18. Fornell, C. (1992). A national customer satisfaction barometer: The Swedish experience. the Journal of Marketing, 6-21. Gallarza, M. G., & Saura, I. G. (2006). Value dimensions, perceived value, satisfaction and loyalty: an investigation of university students’ travel behaviour. Tourism management, 27(3), 437-452. Gallarza, M. G., Gil-Saura, I., & Holbrook, M. B. (2011). The value of value: further excursions on the meaning and role of customer value. Journal of consumer behaviour, 10(4), 179-191. Goldsmith, R. E. (1999). The personalised marketplace: beyond the 4Ps. Marketing Intelligence & Planning, 17(4), 178-185. Gounaris, S. (2005). Measuring service quality in b2b services: an evaluation of the SERVQUAL scale vis-à-vis the INDSERV scale. Journal of Services Marketing, 19(6), 421-435. Grewal, D., Monroe, K. B., & Krishnan, R. (1998). The effects of price-comparison advertising on buyers' perceptions of acquisition value, transaction value, and behavioral intentions. The Journal of Marketing, 46-59. Grewal, D., Krishnan, R., Baker, J., & Borin, N. (1998). The effect of store name, brand name and price discounts on consumers' evaluations and purchase intentions. Journal of retailing, 74(3), 331-352. Grönroos, C. (1984). A service quality model and its marketing implications. European Journal of marketing, 18(4), 36-44. Grönroos, C. (1994). From marketing mix to relationship marketing: towards a paradigm shift in marketing. Management decision, 32(2), 4-20. Grönroos, C. (2007). Service management and marketing: customer management in service competition. John Wiley & Sons. Ha, J., & Jang, S. S. (2010). Perceived values, satisfaction, and behavioral intentions: The role of familiarity in Korean restaurants. International Journal of Hospitality Management, 29(1), 2-13. Hallowell, R. (1996). The relationships of customer satisfaction, customer loyalty, and profitability: an empirical study. International journal of service industry management, 7(4), 27-42. Hambrick, D. C., & Fredrickson, J. W. (2001). Are you sure you have a strategy?. The Academy of Management Executive, 15(4), 48-59. Heinonen, K. (2004). Reconceptualizing customer perceived value: the value of time and place. Managing Service Quality: An International Journal, 14(2/3), 205-215. Hemmasi, M., Strong, K. C., & Taylor, S. A. (1994). Measuring service quality for strategic planning and analysis in service firms. Journal of Applied Business Research, 10(4), 24. Hemmasi, M., Strong, K. C., & Taylor, S. A. (1994). Measuring service quality for strategic planning and analysis in service firms. Journal of Applied Business Research, 10(4), 24. Hoekstra, J. C., Leeflang, P. S., & Wittink, D. R. (1999). The customer concept: the basis for a new marketing paradigm. Journal of market-focused management, 4(1), 43-76. Holbrook, M. B. (1999). Consumer value: a framework for analysis and research. Psychology Press. Im, H., & Ha, Y. (2015). Is this mobile coupon worth my private information? Consumer evaluation of acquisition and transaction utility in a mobile coupon shopping context. Journal of Research in Interactive Marketing, 9(2), 92-109. Jain, S. K., & Gupta, G. (2004). Measuring service quality: SERVQUAL vs. SERVPERF scales. Vikalpa, 29(2), 25-37. Johnson, M. D., & Fornell, C. (1991). A framework for comparing customer satisfaction across individuals and product categories. Journal of economic psychology, 12(2), 267-286. Kettinger, W. J., & Lee, C. C. (1995). Exploring a “gap” model of information services quality. Information Resources Management Journal (IRMJ), 8(3), 5-17. Kuo, Y. F., Wu, C. M., & Deng, W. J. (2009). The relationships among service quality, perceived value, customer satisfaction, and post-purchase intention in mobile value-added services. Computers in human behavior, 25(4), 887-896. Lam, S. Y., Shankar, V., Erramilli, M. K., & Murthy, B. (2004). Customer value, satisfaction, loyalty, and switching costs: an illustration from a business-to-business service context. Journal of the academy of marketing science, 32(3), 293-311. Landrum, H., Prybutok, V., Zhang, X., & Peak, D. (2009). Measuring IS system service quality with SERVQUAL: Users’ perceptions of relative importance of the five SERVPERF dimensions. Informing science: the international journal of an emerging transdiscipline, 12(1), 17-35. Lapierre, J. (2000). Customer-perceived value in industrial contexts. Journal of Business & Industrial Marketing, 15(2/3), 122-145. Leblanc, G., & Nguyen, N. (1999). Listening to the customer's voice: examining perceived service value among business college students. International Journal of Educational Management, 13(4), 187-198. Lee, J., & Beeler, C. (2009). An investigation of predictors of satisfaction and future intention: links to motivation, involvement, and service quality in a local festival. Event Management, 13(1), 17-29. Lehtinen, U., & Lehtinen, J. R. (1982). Service quality: a study of quality dimensions. Service Management Institute.
49
"Leigh, T. W., & Marshall, G. W. (2001). Research priorities in sales strategy and performance. Journal of Personal Selling & Sales Management, 21(2), 83-93. Lewis, R. C., & Booms, B. H. (1983). The marketing aspects of service quality. Emerging perspectives on services marketing, 65(4), 99-107. Christopher H.. Lovelock, & Wirtz, J. (2011). Services marketing: people, technology, strategy. Pearson. Mahoney, J. T., & Pandian, J. R. (1992). The resource-based view within the conversation of strategic management. Strategic management journal, 13(5), 363-380. "Massnick, F. (1997). The customer is CEO: how to measure what your customers want--and make sure they get it. AMACOM/American Management Association. Mauri, A. G., Minazzi, R., & Muccio, S. (2013). A review of literature on the gaps model on service quality: A 3-decades period: 1985-2013. International Business Research, 6(12), 134. McDougall, G. H., & Levesque, T. (2000). Customer satisfaction with services: putting perceived value into the equation. Journal of services marketing, 14(5), 392-410. Mentzer, J. T., Flint, D. J., & Hult, G. T. M. (2001). Logistics service quality as a segment-customized process. Journal of marketing, 65(4), 82-104. Min, S., & Mentzer, J. T. (2004). Developing and measuring supply chain management concepts. Journal of business logistics, 25(1), 63-99. Normann, R., & Ramirez, R. (1993). From value chain to value constellation. Harvard business review, 71(4), 65-77. Oh, H. (2001). Revisiting importance–performance analysis. Tourism management, 22(6), 617-627. Oliver, R. L. (1980). A cognitive model of the antecedents and consequences of satisfaction decisions. Journal of marketing research, 460-469. Oliver, R. L. (1993). Cognitive, affective, and attribute bases of the satisfaction response. Journal of consumer research, 418-430. Parasuraman, A., & Grewal, D. (2000). The impact of technology on the quality-value-loyalty chain: a research agenda. Journal of the academy of marketing science, 28(1), 168-174. Parasuraman, A., Berry, L. L., & Zeithaml, V. A. (1990). An empirical test of the extended gaps model of service quality. Marketing Science Institute Working paper, 90-122. Parasuraman, A., Berry, L. L., & Zeithaml, V. A. (1991). Understanding customer expectations of service. Sloan Management Review, 32(3), 39-48. "Parasuraman, A., Zeithaml, V. A., & Berry, L. L. (1985). A conceptual model of service quality and its implications for future research. The Journal of Marketing, 41-50." "Parasuraman, A., Zeithaml, V. A., & Berry, L. L. (1988). SERVQUAL: A multiple-item scale for measuring consumer perceptions of service quality. Journal of retailing, 64(1), 12-40." Peppard, J., & Ward, J. (1999). ‘Mind the Gap’: diagnosing the relationship between the IT organisation and the rest of the business. The Journal of Strategic Information Systems, 8(1), 29-60. Petrick, J. F., & Backman, S. J. (2002). An examination of the construct of perceived value for the prediction of golf travelers’ intentions to revisit. Journal of Travel Research, 41(1), 38-45. Petrick, J. F. (2004). The roles of quality, value, and satisfaction in predicting cruise passengers’ behavioral intentions. Journal of travel research, 42(4), 397-407. Pitt, L. F., Watson, R. T., & Kavan, C. B. (1995). Service quality: a measure of information systems effectiveness. MIS quarterly, 173-187. Porter, M. E. (1980). Competitive strategy: techniques for analyzing industries and competitors. Praeg, C. P. (Ed.). (2010). Quality Management for IT Services: Perspectives on Business and Process Performance: Perspectives on Business and Process Performance. IGI Global. Praeg, C. P., & Schnabel, U. (2006, January). IT-service cachet-managing IT-service performance and IT-service quality. In System Sciences, 2006. HICSS'06. Proceedings of the 39th Annual Hawaii International Conference on (Vol. 2, pp. 34a-34a). IEEE. Prebensen, N. K., Vittersø, J., & Dahl, T. I. (2013). Value co-creation significance of tourist resources. Annals of Tourism Research, 42, 240-261. Ramseook-Munhurrun, P., Naidoo, P., & Lukea-Bhiwajee, S. D. (2009). Employee perceptions of service quality in a call centre. Managing Service Quality: An International Journal, 19(5), 541-557. Rao, A. R., & Monroe, K. B. (1989). The effect of price, brand name, and store name on buyers' perceptions of product quality: An integrative review. Journal of marketing Research, 351-357. Ravald, A., & Grönroos, C. (1996). The value concept and relationship marketing. European journal of marketing, 30(2), 19-30. Reichheld, F. F. (1996). Learning from customer defections. Rintamäki, T., Kuusela, H., & Mitronen, L. (2007). Identifying competitive customer value propositions in retailing. Managing Service Quality: An International Journal, 17(6), 621-634. Rohde, F. H. (2004). IS/IT outsourcing practices of small-and medium-sized manufacturers. International Journal of Accounting Information Systems, 5(4), 429-451. Roszkowski, M. J., & Spreat, S. (2010). Weighing the difference: the validity of multiplicative and subtractive approaches to item weights in an instrument assessing college choice decisions. Journal of Marketing for Higher Education, 20(2), 209-239. Sabiote, C. M., Frías, D. M., & Castañeda, J. A. (2012). The moderating effect of uncertainty-avoidance on overall perceived value of a service purchased online. Internet Research, 22(2), 180-198. Sánchez-Fernández, R., & Iniesta-Bonillo, M. Á. (2006). Consumer perception of value: literature review and a new conceptual framework. Journal of Consumer Satisfaction, Dissatisfaction and Complaining Behavior, 19, 40. Scitovszky, T. (1944). Some consequences of the habit of judging quality by price. The Review of Economic Studies, 12(2), 100-105. Shimp, T. A., & Bearden, W. O. (1982). Warranty and other extrinsic cue effects on consumers' risk perceptions. Journal of Consumer research, 38-46. Shonk, D. J., & Chelladurai, P. (2008). Service quality, satisfaction, and intent to return in event sport tourism. Journal of sport management, 22(5), 587-602. Shonk, D. J., & Chelladurai, P. (2009). Model of service quality in event sport tourism: Development of a scale. International Journal of Sport Management and Marketing, 6(3), 292-307. Simon, H. A. (1993). Strategy and organizational evolution. Strategic Management Journal, 14(S2), 131-142. Smith, J. B., & Colgate, M. (2007). Customer value creation: a practical framework. Journal of marketing Theory and Practice, 15(1), 7-23. Sochalski, J. (2004). Is more better?: the relationship between nurse staffing and the quality of nursing care in hospitals. Medical care, 42(2), II-67.
50
Swait, J., & Sweeney, J. C. (2000). Perceived value and its impact on choice behavior in a retail setting. Journal of Retailing and Consumer Services, 7(2), 77-88. Swan, J. E., & Combs, L. J. (1976). Product performance and consumer satisfaction: A new concept. Journal of marketing, 40(2), 25-33. Sweeney, J. C., & Soutar, G. N. (2001). Consumer perceived value: The development of a multiple item scale. Journal of retailing, 77(2), 203-220. Sweeney, J. C., Soutar, G. N., & Johnson, L. W. (1999). The role of perceived risk in the quality-value relationship: a study in a retail environment. Journal of retailing, 75(1), 77-105. Tam, J. L. (2004). Customer satisfaction, service quality and perceived value: an integrative model. Journal of marketing management, 20(7-8), 897-917. Terho, H., Haas, A., Eggert, A., & Ulaga, W. (2012). ‘It's almost like taking the sales out of selling’—towards a conceptualization of value-based selling in business markets. Industrial Marketing Management, 41(1), 174-185. Terwee, C. B., Mokkink, L. B., Knol, D. L., Ostelo, R. W., Bouter, L. M., & de Vet, H. C. (2012). Rating the methodological quality in systematic reviews of studies on measurement properties: a scoring system for the COSMIN checklist. Quality of Life Research, 21(4), 651-657. Ulaga, W., & Chacour, S. (2001). Measuring customer-perceived value in business markets: a prerequisite for marketing strategy development and implementation. Industrial marketing management, 30(6), 525-540. Van Birgelen, M., De Jong, A., & De Ruyter, K. (2006). Multi-channel service retailing: The effects of channel performance satisfaction on behavioral intentions. Journal of Retailing, 82(4), 367-377. "Van der Haar, J. W., Kemp, R. G., & Omta, O. (2001). Creating value that cannot be copied. Industrial Marketing Management, 30(8), 627-636. Vargo, S. L., & Lusch, R. F. (2004). Evolving to a new dominant logic for marketing. Journal of marketing, 68(1), 1-17. Velsen, L. S., Steehouder, M. F., & Jong, M. D. (2007). Evaluation of user support: Factors that affect user satisfaction with helpdesks and helplines. IEEE Transactions on Professional Communication, 50(3), 219-231. Wakefield, K. L., & Blodgett, J. G. (1999). Customer response to intangible and tangible service factors. Psychology & Marketing, 16(1), 51-68. Webster, F. E. (1994). Market-driven management: using the new marketing concept to create a customer-oriented company (Vol. 21). John Wiley & Sons. Williams, M. R. (1998). The influence of salespersons' customer orientation on buyer-seller relationship development. Journal of business & industrial Marketing, 13(3), 271-287. Woodruff, R. B. (1997). Customer value: the next source for competitive advantage. Journal of the academy of marketing science, 25(2), 139-153. Woodruff, R. B., & Gardial, S. (1996). Know your customer: New approaches to understanding customer value and satisfaction. Wiley. Woodside, A. G., Frey, L. L., & Daly, R. T. (1989). Linking Sort/iceanlity, Customer Satisfaction, and Behavioral Intention. Journal of health care marketing, 9(4), 5-17. http://www.pcmag.com/article2/0,2817,2494737,00.asp Xia, D. F., Xu, S. L., & Qi, F. (1999). A proof of the arithmetic mean-geometric mean-harmonic mean inequalities. RGMIA Res. Rep. Coll, 2(1), 99-102. Yang, Z., & Peterson, R. T. (2004). Customer perceived value, satisfaction, and loyalty: The role of switching costs. Psychology & Marketing, 21(10), 799-822. Yap, K. B., & Sweeney, J. C. (2007). Zone-of-tolerance moderates the service quality-outcome relationship. Journal of Services Marketing, 21(2), 137-148. Zeithaml, V. A. (1988). Consumer perceptions of price, quality, and value: a means-end model and synthesis of evidence. The Journal of marketing, 2-22. Zeithaml, V. A., Berry, L. L., & Parasuraman, A. (1996). The behavioral consequences of service quality. the Journal of Marketing, 31-46. Zeithaml, V. A., Parasuraman, A., & Berry, L. L. (1990). Delivering quality service: Balancing customer perceptions and expectations. Simon and Schuster. Zins, A. H. (2001). Relative attitudes and commitment in customer loyalty models: Some experiences in the commercial airline industry. International Journal of Service Industry Management, 12(3), 269-294. List of Figures Figure 1. Technical and Functional Service Quality Model (Grönroos, 1984) Figure 2: Determinants of Perceived Service Quality (Parasuraman et al., 1985) Figure 3: Service Quality Model (Parasuraman et al., 1985) Figure 4: The Extended Gaps Model of Service Quality (Zeithaml et. al, 1990) List of Tables Table 1: Five quality dimensions which must be fulfilled by an IT service provider (Source: Praeg, 2010).