semantics-aware advanced olap visualization of multidimensional data cubes
TRANSCRIPT

International Journal of Data Warehousing & Mining, 3(4), 1-30, October-December 2007 1
Copyright © 2007, IGI Global. Copying or distributing in print or electronic forms without written permission of IGI Global is prohibited.
AbSTrACT
Efficiently supporting advanced OLAP visualization of multidimensional data cubes is a novel and chal-lenging research topic, which results to be of interest for a large family of data warehouse applications relying on the management of spatio-temporal (e.g., mobile) data, scientific and statistical data, sensor network data, biological data, etc. On the other hand, the issue of visualizing multidimensional data do-mains has been quite neglected from the research community, since it does not belong to the well-founded conceptual-logical-physical design hierarchy inherited from relational database methodologies. Inspired from these considerations, in this article we propose an innovative advanced OLAP visualization technique that meaningfully combines (i) the so-called OLAP dimension flattening process, which allows us to extract two-dimensional OLAP views from multidimensional data cubes, and (ii) very efficient data compression techniques for such views, which allow us to generate “semantics-aware” compressed representations where data are grouped along OLAP hierarchies.
Keywords: approximate query answering; data cube compression; OLAP; OLAP visualization
INTrODUCTIONOLAP systems (Chaudhuri & Dayal, 1997; Codd, Codd, & Salley, 1993; Inmon, 1996; Kimball, 1996) have rapidly gained momentum in both the academic and research communities, mainly due to their capability of exploring and querying huge amounts of data sets according to a multidimensional and multi-resolution vision. Research-wise, three relevant challenges of OLAP have captured the attention of researchers
during the last years: (i) the data querying prob-lem, which concerns with how data are accessed and queried to support summarized knowledge extraction from massive data cubes; (ii) the data modeling problem, which concerns with how data are represented and, thus, processed inside OLAP servers (e.g., during query evaluation); and (iii) the data visualization problem, which concerns with how data are presented to OLAP users and decision makers in data warehouse environments. Indeed, research communities
Semantics-Aware Advanced OLAP Visualization of
Multidimensional Data CubesAlfredoCuzzocrea,UniversityofCalabria,Italy
DomenicoSaccà,UniversityofCalabria,Italy
PaoloSerafino,UniversityofCalabria,Italy
IGI PUBLISHING
This paper appears in the publication, International Journal of Data Warehousing and Mining, Volume 3, Issue 4edited by David Taniar© 2007, IGI Global
701 E. Chocolate Avenue, Suite 200, Hershey PA 17033-1240, USATel: 717/533-8845; Fax 717/533-8661; URL-http://www.igi-pub.com
ITJ3902

2 International Journal of Data Warehousing & Mining, 3(4), 1-30, October-December 2007
Copyright © 2007, IGI Global. Copying or distributing in print or electronic forms without written permission of IGI Globalis prohibited.
have mainly studied and investigated the first two problems, whereas the last one, even if important-with-practical-applications, has been very often neglected.
Approximate query answering (AQA) techniques address the first challenge, and can be reasonably considered as one of the most important topics in OLAP research. The main proposal of AQA techniques consists in providing approximate answers to resource-consuming OLAP queries (e.g., range- (Ho, Agrawal, Megiddo, & Srikant, 1997), top-k (Fang, Shivakumar, Garcia-Molina, Motwani, & Ullman, 1998), and iceberg (Xin, Han, Cheng, & Li, 2006) queries) instead of computing exact answers, as decimal precision is usually negligible in OLAP query and report activities (e.g., see Cuzzocrea, 2005). Due to a relevant interest from the data warehouse research community, AQA techniques have been inten-sively investigated during the last years with the achievement of important results. Among the others, histograms (e.g., Acharya, Poosala, & Ramaswamy, 1999; Bruno, Chaudhuri, & Gravano, 2001; Gunopulos, Kollios, Tsotras, & Domeniconi, 2000; Muralikrishna & DeWitt, 1998; Poosala & Ioannidis, 1997), wavelets (Vitter, Wang, & Iyer, 1998), and sampling (e.g., Babcock, Chaudhuri, & Das, 2003; Chaud-huri, Das, Datar, Motwani, & Rastogi, 2001; Cuzzocrea & Wang, 2007; Gibbons & Matias 1998) are the most successful techniques, and they have also inducted several applications in contexts even different from OLAP, like P2P data management (e.g., Gupta, Agrawal, & El Abbadi, 2003). Summarizing, with respect to the OLAP context, AQA techniques propose (i) computing compressed representations of multidimensional data cubes, and (ii) evaluating (approximate) answers against such represen-tations via ad-hoc query algorithms that, usu-ally, meaningfully take advantages from their hierarchical nature, which, in turn, is inherited from the one of input data cubes.
Conceptual data models for OLAP are widely recognized as based on data cube con-cepts like dimension, hierarchy, level, member, and measure, first introduced by Gray et al.
(1997), which inspired various models for multidimensional databases and data cubes (e.g., Agrawal et al., 1997; Hacid & Sattler, 1998; Thanh Binh, Min Tjoa, & Wagner, 2000; Tsois, Karayannidis, & Sellis, 2001; Vassiliadis, 1998; Vassiliadis & Sellis, 1999)). Neverthe-less, despite this effort, several papers have recently put in evidence some formal limita-tions of accepted conceptual models for OLAP (e.g., Cabibbo & Torlone, 1998), or theoretical failures of popular data cube operations, like aggregation functions (e.g., Lehner, Albrecht, & Wedekind, 1998; Lenz & Shoshani, 1997; Lenz & Thalheim, 2001).
Contrarily to data querying and modeling issues, since data presentation models do not properly belong to the well-founded conceptual-logical-physical design hierarchy for relational databases (which has also been inherited from multidimensional models (Vassiliadis et al., 1999)), the problem of OLAP data visualization has been studied and investigated so far only (Gebhardt, Jarke, & Jacobs, 1997; Inselberg, 2001; Keim, 1997; Maniatis, Vassiliadis, Skiadopoulos, & Vassiliou, 2003a, 2003b). On the other hand, being OLAP a technology focused at supporting decision making, thus based on (sensitive) information exploration and browsing, it is easy to understand that, in future years, tools for advanced visualization of multidimensional data cubes will quickly conquest the OLAP research scene.
Starting from fundamentals of data cube compression techniques and OLAP data vi-sualization research issues, in this article we argue to meaningfully exploit the main results coming from the former and the goals of the latter in a combined manner, and propose a novel technique for supporting advanced OLAP visualization of multidimensional data cubes. The basic motivation of such an ap-proach is realizing that (i) compressing data is an efficient way of visualizing data, and (ii) this intuition is well-founded at large (i.e., for any data-intensive system relying on massive data repositories), and, more specifically, it is particularly targeted to the OLAP context where

International Journal of Data Warehousing & Mining, 3(4), 1-30, October-December 2007 3
Copyright © 2007, IGI Global. Copying or distributing in print or electronic forms without written permission of IGI Global is prohibited.
accessing multidimensional data cubes can be-come a realistic bottleneck for data warehouse systems and applications. For instance, as we better motivate in Section 2, this is the case of mobile OLAP, which, recently, has attracted considerable attention from the data warehouse research community.
Another contribution of our work is rep-resented by the wide experimental analysis we conducted in order to test the effectiveness of our proposed technique. To this end, we performed various kinds of experiments with respect to several metrics, and against different classes of data cubes; specifically, we have taken into consideration synthetic, benchmark, and real data cubes. Results of these experiments confirm that our proposed technique outperforms similar state-of-the-art initiatives with respect to both the accuracy and visualization goals.
Technique OverviewBriefly, our proposed technique relies on two steps. The first one consists of generating a two-dimensional OLAP view D from the input multidimensional data cube A by means of an innovative approach that allows us to flatten OLAP dimensions (of A), and, as a consequence, effectively support exploration and browsing activities against A (via D), by overcoming the natural disorientation and refractoriness of human beings in dealing with hyper-spaces. Specifically, the (two) OLAP dimensions on which D is defined are built from the dimen-sions of A according to the analysis goals of the target OLAP user/application. The idea of using views to tame computational overheads due to data management and query processing tasks against massive data warehouses is not novel in literature, and it has been extensively investigated across the last decade (e.g., (Ezeife, 2001; Harinarayan, Rajaraman, & Ullman, 1996), with relevant results. The second step consists of generating a bucket-based com-pressed representation of D, namely hierarchy-driven indexed quad-tree summary (H-IQTS), denoted by H-IQTS(D), which meaningfully extends the compression technique for two-di-
mensional summary data domains presented by us in Buccafurri, Furfaro, Saccà, and Sirangelo (2003), via introducing the amenity of gener-ating semantics-aware buckets (i.e., buckets that “follow” groups of the OLAP hierarchies of D). In other words, we use the OLAP hi-erarchies defined on the dimensions of D to drive the compression process. This allows us to achieve space efficiency, while, at the same time, support approximate query answering and advanced OLAP visualization features against multidimensional data cubes.
Article OutlineThe remaining part of this article is organized as follows. In the second section, we describe mobile OLAP application scenarios where the advanced visualization technique for multidi-mensional data cubes we propose assumes a critical role in the vest of enabling technology. In the third section, we outline the background of our proposal, which is represented by the compression techniques presented in Buccafurri et al. (2003). In the fourth section, we provide a motivating example stating the goodness of our idea of making use of semantics-aware compressed representations of two-dimensional OLAP views. In the fifth section, we provide fun-damentals and basic definitions used throughout the article. The sixth section is devoted to the description of our innovative OLAP dimension flattening process. In the seventh section, we illustrate the hierarchy-driven two-dimensional OLAP view compression algorithm we propose. The eighth section focuses on a comprehen-sive experimental evaluation of our technique against different classes of data cubes. Finally, the ninth section we derive conclusions of our work, and draw future directions for further research in this field.
APPLICATION SCENArIOSThe technique we propose in this article can be successfully applied to all those scenarios in which accessing and exploring massive multi-dimensional data cubes is a critical requirement. For instance, this is the case of mobile OLAP systems and applications, where users access
4 International Journal of Data Warehousing & Mining, 3(4), 1-30, October-December 2007
Copyright © 2007, IGI Global. Copying or distributing in print or electronic forms without written permission of IGI Globalis prohibited.
corporate OLAP servers via handheld devices. In fact, mobile devices are usually characterized by specific properties (e.g., small storage space, small size of the display screen, discontinuance of the connection to the WLAN, etc) that are often incompatible with the need of browsing and querying summarized information extracted from massive multidimensional data cubes made accessible through wireless networks.
In such application scenarios, flattening multidimensional data cubes into two-dimen-sional OLAP views represents an effective solution yet an enabling technology for mobile OLAP environments, as, contrarily to what happens for hyper-spaces, handheld devices can easily visualize two-dimensional spaces on conventional (e.g., 2D) screens. This property, along with the realistic need of compress-ing data to be transmitted and processed by handheld devices, makes perfect sense to our idea of using data compression techniques as a way of visualizing OLAP data. Moreover, the amenity of driving the compression process by means of OLAP hierarchies, thus meaningfully generating semantics-aware buckets, further corroborates the application of our proposed technique to mobile OLAP environments, as the limited computational capabilities of handheld devices impose us to definitively process useful
knowledge, by discarding the useless one, being resource-consuming transactions infeasible to be processed by such kind of devices.
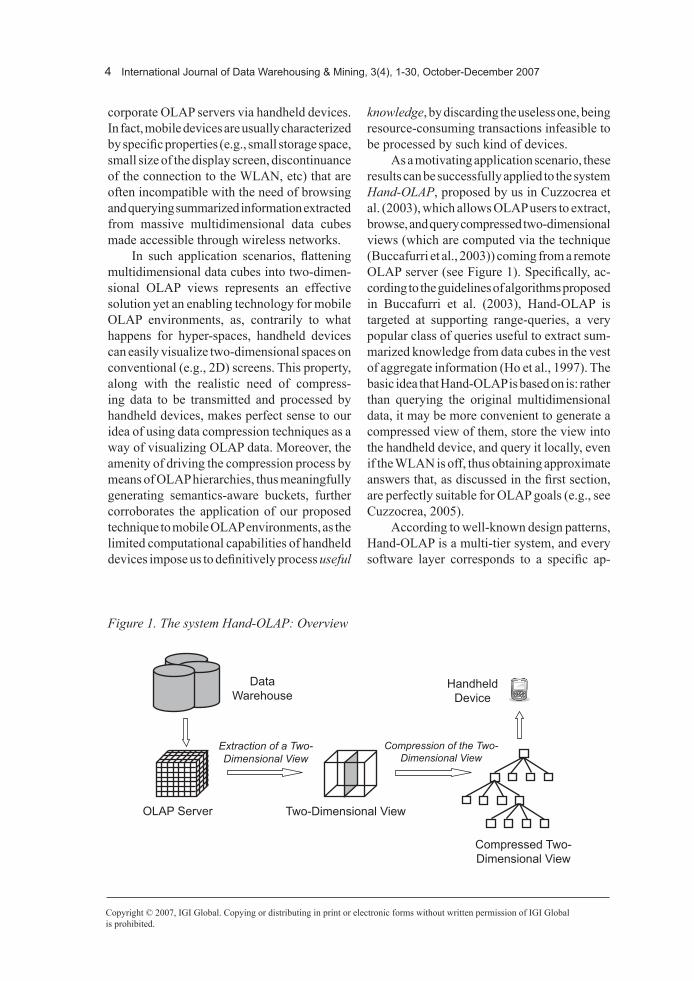
As a motivating application scenario, these results can be successfully applied to the system Hand-OLAP, proposed by us in Cuzzocrea et al. (2003), which allows OLAP users to extract, browse, and query compressed two-dimensional views (which are computed via the technique (Buccafurri et al., 2003)) coming from a remote OLAP server (see Figure 1). Specifically, ac-cording to the guidelines of algorithms proposed in Buccafurri et al. (2003), Hand-OLAP is targeted at supporting range-queries, a very popular class of queries useful to extract sum-marized knowledge from data cubes in the vest of aggregate information (Ho et al., 1997). The basic idea that Hand-OLAP is based on is: rather than querying the original multidimensional data, it may be more convenient to generate a compressed view of them, store the view into the handheld device, and query it locally, even if the WLAN is off, thus obtaining approximate answers that, as discussed in the first section, are perfectly suitable for OLAP goals (e.g., see Cuzzocrea, 2005).
According to well-known design patterns, Hand-OLAP is a multi-tier system, and every software layer corresponds to a specific ap-
OLAP Server
DataWarehouse
Two-Dimensional View
Compressed Two-Dimensional View
HandheldDevice
ExtractionofaTwo-DimensionalView
CompressionoftheTwo-DimensionalView
Figure 1. The system Hand-OLAP: Overview

International Journal of Data Warehousing & Mining, 3(4), 1-30, October-December 2007 �
Copyright © 2007, IGI Global. Copying or distributing in print or electronic forms without written permission of IGI Global is prohibited.
plication logic (see Figure 2). Specifically, the following software layers can be identified in the Hand-OLAP logical architecture:
• Data Sources Layer: It is the collection of (i) OLAP servers from which the desired information can be retrieved, and (ii) wrap-pers that extract meta-information about the available data cubes as well as the actual data;
• Application Server Layer: It is the layer that (i) elaborates OLAP-users’ requests, (ii) interacts with OLAP servers, (iii) com-putes the compressed representation of the extracted OLAP view, and (iv) sends it to the handheld device;
• User’s Layer: It includes the client-side tool that allows a handheld device to acquire and elaborate the desired information, by enabling useful functionalities such as connectivity services, metadata querying and browsing, range-query managing (e.g., editing, executing, browsing, refreshing etc).
The application server layer, which is the most interesting component of Hand-OLAP
with respect to the Data Engineering point of view, consists of three components which cooperate to fulfill OLAP-users’ requests:
• Request Manager: It is the component that receives the request of OLAP users, and translates it either into a request to the Metadata Manager for retrieving meta-information about the content of the target data cube, or into a request to the View Manager for retrieving a compressed rep-resentation of the two-dimensional OLAP view defined by OLAP users: Metadata Manager: It is the com-
ponent that extracts meta-information about the OLAP server it is connected to, and returns them in a XML for-mat;
• View Manager: It is the component that (i) extracts from the selected data cube the two-dimensional view defined by OLAP users, (ii) uses the compression agent for summarizing it, and (iii) returns the compressed representation to the handheld device;
• Compression Agent: It is the component that receives a two-dimensional view from
Data Sources Layer Application Server Layer User s Layer
METADATAMANAGER
QUERY MANAGER
VIEWMANAGER
COMPRESSIONAGENT
REQUESTMANAGER
wrapper
wrapper
wrapper
wrapper
Figure 2. The system Hand-OLAP: Logical architecture

� International Journal of Data Warehousing & Mining, 3(4), 1-30, October-December 2007
Copyright © 2007, IGI Global. Copying or distributing in print or electronic forms without written permission of IGI Globalis prohibited.
the view manager and returns its com-pressed representation to it--in particular, the view manager sends the extracted two-dimensional view to the compression agent together with the value of the desired compression ratio, which depends on both the amount of storage space available at the handheld device and the size of the view;
• Query Manager: It is the component that is in charge of supporting range-query evalu-ation on the compressed two-dimensional view, and visualizing the results on the handheld device according to a partitioned hierarchical representation.
Indeed, as we discuss next, the actual capa-bilities of Hand-OLAP can be further improved by integrating inside its core layer advanced OLAP visualization features developed on top of the technique we propose in this article.
bACKGrOUNDGiven a two-dimensional summary data domain D, the technique proposed in Buccafurri et al. (2003) allows us to obtain a compact data struc-ture called quad-tree summary (QTS), which founds on a quad-tree-based partitioned repre-sentation of D, denoted by QTS(D), where, at each iteration of the generating partition process, (i) the current bucket b in QTS(D) to be split is greedily chosen by selecting the one having maximum sum of the squared errors (SSE), and (ii) b is split in four equal-size square sub-buckets that are added to the current partition. Specifically, given a bucket b, the SSE of b, denoted by SSE(b), is defined as follows:
( )2( ) [ ] ( )k b
SSE b D k AVG b∈
= −∑ (1)
such that: (i) k denotes a position inside b, (ii) D[k] is the value of D at position k, and (iii) AVG(b) is the average of values inside b.
This task is iterated until the storage space B available for housing QTS(D) is consumed. The “natural” representation of QTS(D) is like a quad-tree, such that nodes are corresponding to buckets of the partition and store the sum of
all the items contained within such buckets. As shown in Buccafurri et al. (2003), due to its hierarchical nature, QTS is particularly suit-able for evaluating range-queries. To further improve query capabilities, the leaf buckets of QTS having non-uniform data distribution, on which traditional interpolation techniques would fail, are equipped with very compact data structures called indexes. Indexes can be efficiently represented in few bytes, and provide succinct descriptions of data distributions of buckets they summarize. This approach leads to the definition of an extended version of QTS called indexed quad-tree summary (IQTS). Indexes allow us to definitively augment the quality of intra-bucket query estimation, thus overcoming general-purpose state-of-the-art compression techniques like histograms and wavelets (Buccafurri et al., 2003).
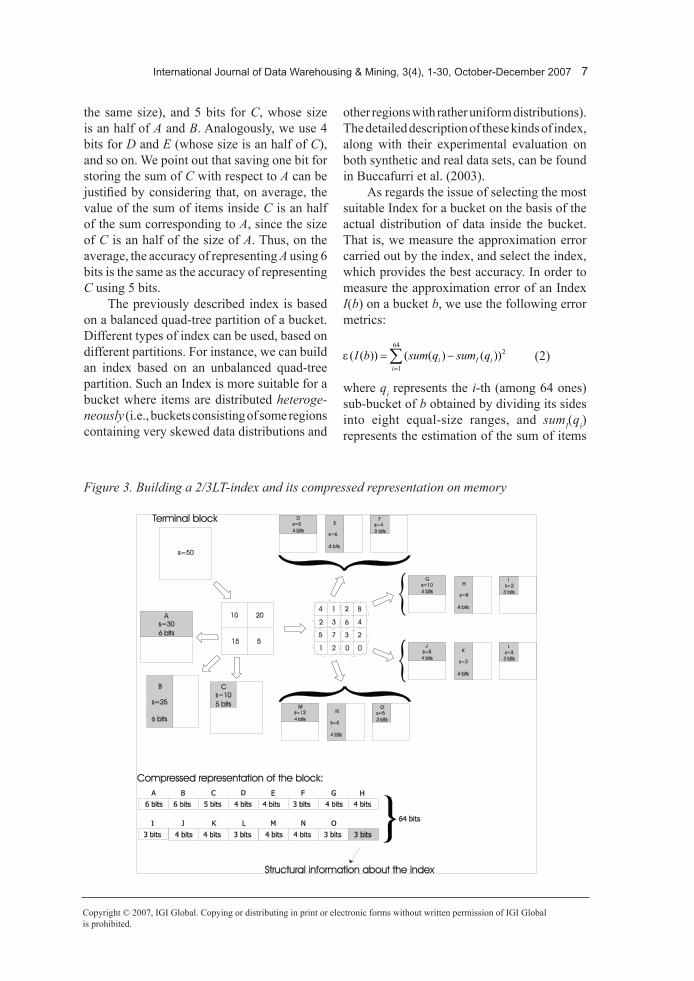
In Buccafurri et al. (2003), we define three index types with different organization of sub-buckets, so that we select the index, which better approximates the data distribution inside a given bucket: (i) the 2/3LT-Index, which is suitable for distributions with no strong asymmetry; (ii) the 2/4LT-Index, which is oriented to biased distributions; (iii) the 2/p(eak)LT-Index, which is designed for capturing distributions having a few high density peaks. As an example, here we focus on an instance of Index, the 2/3LT-index (see Figure 3), which is built for a leaf bucket of a compressed two-dimensional OLAP view. The sum of all the items contained in such bucket is equal to 50. The index is obtained as follows: the bucket is partitioned into four equal-size sub-buckets and, in turn, each of the four sub-buckets into other four equal-size sub-sub-buckets. The index stores approximate aggregate data about both the generated sub-buckets and sub-sub-buckets. Such aggregate data consist of the sums of items contained in the regions, which are colored in grey (see Figure 3). The values of the sums are stored using less than 32 bits, introducing some approximation. The number of bits used for each stored value depends on the size of the corresponding sub-bucket. That is, referring to Figure 3, we use 6 bits for both the regions A and B (which have
International Journal of Data Warehousing & Mining, 3(4), 1-30, October-December 2007 7
Copyright © 2007, IGI Global. Copying or distributing in print or electronic forms without written permission of IGI Global is prohibited.
the same size), and 5 bits for C, whose size is an half of A and B. Analogously, we use 4 bits for D and E (whose size is an half of C), and so on. We point out that saving one bit for storing the sum of C with respect to A can be justified by considering that, on average, the value of the sum of items inside C is an half of the sum corresponding to A, since the size of C is an half of the size of A. Thus, on the average, the accuracy of representing A using 6 bits is the same as the accuracy of representing C using 5 bits.
The previously described index is based on a balanced quad-tree partition of a bucket. Different types of index can be used, based on different partitions. For instance, we can build an index based on an unbalanced quad-tree partition. Such an Index is more suitable for a bucket where items are distributed heteroge-neously (i.e., buckets consisting of some regions containing very skewed data distributions and
other regions with rather uniform distributions). The detailed description of these kinds of index, along with their experimental evaluation on both synthetic and real data sets, can be found in Buccafurri et al. (2003).
As regards the issue of selecting the most suitable Index for a bucket on the basis of the actual distribution of data inside the bucket. That is, we measure the approximation error carried out by the index, and select the index, which provides the best accuracy. In order to measure the approximation error of an Index I(b) on a bucket b, we use the following error metrics:
642
1( ( )) ( ( ) ( ))i I i
iI b sum q sum q
=
= −∑ (2)
where qi represents the i-th (among 64 ones) sub-bucket of b obtained by dividing its sides into eight equal-size ranges, and sumI(qi) represents the estimation of the sum of items
Figure 3. Building a 2/3LT-index and its compressed representation on memory

� International Journal of Data Warehousing & Mining, 3(4), 1-30, October-December 2007
Copyright © 2007, IGI Global. Copying or distributing in print or electronic forms without written permission of IGI Globalis prohibited.
occurring in qi which can be done by using I(b) and the knowledge of sum(b). Given a bucket b, we choose the 2/nLT-Index which “originates” the minimum value of ε(I(b)) (see Buccafurri et al., 2003) for further details).
With respect to the results achieved in Buc-cafurri et al. (2003), in this article we investigate the problem of providing a compressed repre-sentation of a given two-dimensional OLAP view D, being D extracted from the target data cube A by means of the previously mentioned OLAP dimension flattening process instead of processing two-dimensional summary data domains (like in Buccafurri et al., 2003). This imposes us to handle OLAP hierarchies defined on the dimensions of D, thus achieving an innovative contribution with respect to goals of Buccafurri et al. (2003). Indeed, summary data considered in Buccafurri et al. (2003) re-semble OLAP data in the application scenario we address in this article, but summary data do not expose hierarchies and do not impose us to handle and deal with the semantics of hierarchies.
Due to the need of handling OLAP hi-erarchies, H-IQTS(D) adds to IQTS(D) the amenity of generating a quad-tree based par-titioned representation of D according to the semantics provided by hierarchies defined on the dimensions of D (i.e., as highlighted in the first section, using the hierarchies to drive the compression process). In fact, in the presence of hierarchies on the dimensions, neglecting such information (as would happen by adopt-ing the quad-tree based partitioning scheme (Buccafurri et al., 2003)) could involve in the wrong condition of obtaining buckets storing aggregate values computed over OLAP data related to items belonging to different groups within a same hierarchy. To go in further details, due to its generating process and contrarily to IQTS(D), H-IQTS(D) can also house rectan-gular buckets instead of square buckets only, since an arbitrary data cube exposes, without any loss of generality, arbitrary groups in the hierarchies. Similarly to IQTS(D), H-IQTS(D) is shaped as a quad-tree, and the information stored in its buckets is still the sum of items
contained within them. Just like IQTS(D), leaf nodes of H-IQTS(D) are equipped with Indexes in order to improve query capabilities.
MOTIVATING EXAMPLETo become convinced of the benefits coming from the idea of using OLAP hierarchies to drive the compression process, consider the following example. Let A be a two-dimensional data cube defined on top of relational data sources storing sale data, and having as measure the total amount of Sales (e.g., 15,000 €) of a given product (e.g., t-shirt), belonging to the dimension product, in a given city (e.g., Lisbon), belonging to the dimension zone. Consider the quad-tree-based partitioning scheme for A depicted in the left side of Figure 4. This scheme presents “wrong” buckets as items related to Chicago (belonging to the dimension zone) are aggregated in the left-down bucket along with items related to cities located in Europe (i.e., Prague, Berlin, Munich, etc), instead of being aggregated in the left-up bucket along with items related to cities located in America (i.e., New York, Vancouver, Toronto, etc). The same happens with Raincoat (belonging to the dimension product), whose items are aggregated in the right-down bucket along with items related to summer clothes (i.e., sunglasses, bikini, t-shirt etc), instead of being aggregated in the left-down bucket along with items related to winter clothes (i.e., gloves, hat, scarf, etc). On the contrary, consider the hierar-chy-driven partitioning scheme for A depicted in the right side of Figure 4. As an alternative to the previous one, this scheme follows the hierarchies defined on the dimensions, and, as a consequence, buckets are computed on top of measures related to the same semantic domain. It should be note that this condition is desirable at large, but it assumes a more relevant role for the context we address, as, typically, the compres-sion process causes the loss of the structure (in terms of OLAP schemas) of data cubes.
Now, consider the benefits due to the de-scribed approach in a mobile OLAP setting like the one drawn by the system Hand-OLAP. In Hand-OLAP, compressed views extracted from remote OLAP servers are mainly explored and

International Journal of Data Warehousing & Mining, 3(4), 1-30, October-December 2007 �
Copyright © 2007, IGI Global. Copying or distributing in print or electronic forms without written permission of IGI Global is prohibited.
browsed via popular DRILL-DOWN OLAP operations (i.e., increasing the level of detail of OLAP data) implemented via splits over buck-ets of the view. Nevertheless, since each split partitions the current bucket into four equal-size sub-buckets, OLAP users could be required to perform many splits before to access the sum-marized knowledge he/she is interested in, as “wrong” buckets could be accessed during the exploration task. On the contrary, by admitting semantics-aware buckets, since OLAP analysis is subject-oriented (Han & Kamber, 2000), OLAP users access the summarized knowl-edge of interest in a faster manner rather than the previous case, as each split partitions the current bucket into four sub-buckets computed over semantically-related OLAP data.
FOUNDAMENTALS AND bASIC DEFINITIONSIn order to better understand our proposal, it is needed to introduce some fundamentals and basic definitions regarding the constructs of OLAP conceptual data model we adopt, along with the notation we use in the rest of the article. These definitions are compatible with main results of previous popular models (e.g., Gray
et al., 1997)—a complete survey can be found in Vassiliadis et al. (1999).
Hierarchy, Member, Level, and OLAP MetadataGiven an OLAP dimension di and its domain of members Ψ(di), each of them denoted by ρj, a hierarchy defined on di, denoted by H(di) can be represented as a general tree (i.e., such that each node of the tree has a number n ≥ 0 of child nodes) built on top of Ψ(di). H(di) is usually obtained according to a bottom-up strategy by (i) setting as leaf nodes of H(di) members in Ψ(di), and (ii) iteratively aggregating sets of members in Ψ(di) to obtain other (internal) members, each of them denoted by σj, which correspond to internal nodes in H(di). In turn, internal members in Ψ(di) (equally, nodes in H(di)) can be further aggregated to form other super-members until a unique aggregation of members is obtained; the latter corresponds to the root node of H(di), and it is known in literature as the aggregation ALL. More precisely, ALL is only an artificial aggregation introduced to obtain a tree (i.e., H(di)) instead of a list of trees, each of them rooted in the second-level-internal-nodes σj, which should be the “effective” highest-level
Figure 4. Equal-size quad-tree based partition (left) and hierarchy-driven quad-tree based parti-tion (right) of the product-zone data cube

10 International Journal of Data Warehousing & Mining, 3(4), 1-30, October-December 2007
Copyright © 2007, IGI Global. Copying or distributing in print or electronic forms without written permission of IGI Globalis prohibited.
partition of members in Ψ(di). Each member in H(di) is characterized by a level (of the hi-erarchy), denoted by Lj, such that Lj ≥ 0 (note that, when Lj = 0, σj ≡ ρj); as a consequence, we can define a level Lj in H(di) as a collection of members. For each level Lj, the ordering of Lj, denoted by O(Lj), is the one exposed by the OLAP server platform for the target data cube. Note that such ordering depends on how knowledge held in (OLAP) data is produced, processed, and delivered.
Given a multidimensional data cube A such that Dim(A) = {d0, d1, …, dn-1} is the set of dimensions of A, and Hie(A) = {H(d0), H(d1), …, H(dn-1)} the set of hierarchies defined on the latter dimensions, the collection of members σj at level Lj of each hierarchy H(di) in Hie(A) univocally refers, in a multidimensional fashion, a certain (OLAP) data cell Cj,h in A at level Lj. In other words, Cj,h is the OLAP aggregation of data cells in A at level Lj. We name such collection as j-level OLAP Metadata (for Cj,h), and denote them as M(Cj,h). Given a level Lj, the data cell Cj,h at Lj and the corresponding col-lection of OLAP metadata M(Cj,h), if we move up towards the level Lj+1 (i.e., by performing a roll-up (OLAP) operation on the hierarchy H(di)), we increase the level of abstraction and decrease the level of detail of both Cj,h and M(Cj,h), thus accessing the upper-level components Cj+1,m and M(Cj+1,m), with m ≠ h. Contrarily to this, if we move down towards the level Lj-1 (i.e., by performing a drill-down (OLAP) operation on the hierarchy H(di)), we decrease the level of abstraction and increase the level of detail of both Cj,h and M(Cj,h), thus accessing the lower-level components Cj-1,m and M(Cj-1,m), with m ≠ h.
For instance, consider a four-dimensional data cube A defined on the top of relational data sources containing insurance data and having as measure the average value of the refunds (e.g., 12,000 €) allocated in a given region (e.g., Seattle), during a given time interval (e.g., 2005), for a given employment class (e.g., bank clerk), and for a given kind of accident (e.g., car crash), such that city, year, employ-ment, and kindofaccident are the members of
the third level of the hierarchies defined on the dimensions zone, time, userclass, and ac-cidentclass respectively. Under the described OLAP schema, given the data cell C3,h in A with value Val(C3,h) = 2,000 € at third level L3, the metadata set M(C3,h) could be defined as follows: M(C3,h) = {IL, 1,500, Accountant, AccidentsInIL}; by rolling-up, we could access the upper-level components C2,m with value Val(C2,m) = 3,500 € and M(C2,m) = {USA, 2,000, AdministrativeManager, AccidentsInUSA}; by drilling-down, we could access the lower-level components C4,m with value Val(C4,m) = 1,000 € and M(C4,m) = {Chicago, 900, Administrati-veOfficer, WorkAccidents}.
Left boundary Member (LbM) and right boundary Member (rbM)Given a member σj at level Lj of the hierarchy H(di) defined on an OLAP dimension di and the set of its child nodes Child(σj), which are members at level Lj+1, we define as the Left Boundary Member (LBM) of σj the child node of σj in Child(σj) that is the first in the ordering O(Lj+1). Analogously, we define as the Right Boundary Member (RBM) of σj the child node of σj in Child(σj) that is the last in the ordering O(Lj+1). As an example, consider the hierarchy H(di) depicted in Figure 5; here, (i) e is the LBM of b, (ii) f is the RBM of b, (iii) b is the LBM of a, (iv) d is the RBM of a etc.
H(d )j
a
b c d
e f g h i j k
Figure 5. An OLAP hierarchy

International Journal of Data Warehousing & Mining, 3(4), 1-30, October-December 2007 11
Copyright © 2007, IGI Global. Copying or distributing in print or electronic forms without written permission of IGI Global is prohibited.
OLAP DIMENSION FLATTENINGOLAP dimension flattening process is the first step of our technique for supporting advanced OLAP visualization of multidimensional data cubes. In more detail, we flatten dimensions of the input multidimensional data cube A into two specialized dimensions called visualization dimensions (VD) that support advanced OLAP visualization of A via constructing an ad-hoc two-dimensional OLAP view D defined on the VDs.
The process that allows us to obtain the two VDs from the dimensions of A works as follows. Let Dim(A) and Hie(A) be the set of dimensions and the set of hierarchies of A, re-spectively. Each VD is a tuple vi = ⟨di, H*(di)⟩ such that (i) di is the dimension selected by the target OLAP user/application, (ii) H*(di) is a hierarchy built from meaningfully merging the “original” hierarchy H(di) of di with the
hierarchies of other dimensions in A according to an ordered definition set D(vi), defined as follows D(vi) = {⟨HLi, dj, Pj⟩, ⟨HLj, dj+1, Pj+1⟩, …, ⟨HLj+K-1, dj+K, Pj+K⟩}, where K = |D(vi)| – 1. In more detail, for each pair of consecutive tuples ⟨⟨HLj, dj+1, Pj+1⟩, ⟨HLj+1, dj+2, Pj+2⟩⟩ in D(vi), the sub-tree of H(dj+2) rooted in the root node of H(dj+2) and having depth equal to Pj+2, denoted by 2
2( )jPS jH d+
+ , is merged to H(dj+1) by appending a clone of it to each member σj+1 of level HLj+1, named as hooking level, in H(dj+1). From the described approach, it follows that: (i) the ordering of items in D(vi) defines the way of building H*(di); (ii) the first hierarchy to be processed is just H(di). As an example of the flattening process of two OLAP dimensions into a new one, consider Figure 6, where the hierarchy H*(dj) is obtained by merging H(dj+1) to H(dj) via setting Pj+1 = 1 and HLj = 1.
As regards data processing issues, it should be noted that, in order to finally compute D, due to the OLAP dimension flattening task above,
U
H(d )j
a
b c d
e f g h i j k
H(d )j+1
m n
o p q r
i
a
b dc
m n m n m n
H*(d )j
Figure 6. Merging OLAP hierarchies

12 International Journal of Data Warehousing & Mining, 3(4), 1-30, October-December 2007
Copyright © 2007, IGI Global. Copying or distributing in print or electronic forms without written permission of IGI Globalis prohibited.
it is needed to re-aggregate multidimensional data in A according to the new VDs.
Algorithm build2DOLAPViewViaFlattening (see Figure 7) implements the OLAP dimension flattening process. It takes as input the follow-ing parameters: (i) the multidimensional data cube A; (ii) the dimension di of A selected as first VD; (iii) the dimension dj of A selected as second VD; (iv) the definition set for the first output VD vi, D(vi); (v) the definition set for the second output VD vj, D(vj). It returns as output the two-dimensional OLAP view D extracted from A via flattening dimensions of A into the VDs according to the input definition sets. Specifically, build2DOLAPViewViaFlat-tening makes use of the following procedures: (i) buildVisualizationDimension, which takes as input the data cube A, a dimension d of A and the definition set D(v), and returns as output the VD v built on top of d according to the guide-lines previous given above; (ii) getHierarchy, belonging to the utility package OLAPTools, which, applied to a VisualizationDimension object v, returns the modified hierarchy H* of v; (iii) aggregate2DOLAPView, belonging to the utility package OLAPTools, which takes as
input a data cube A and two OLAP hierarchies Hi and Hj of A, and returns as output the two-dimensional OLAP view D extracted from A by re-aggregating multidimensional data in A according to Hi and Hj.
HIErArCHY-DrIVEN COMPrESSION OF TWO-DIMENSIONAL OLAP VIEWSCompressing the two-dimensional OLAP view D (extracted from A according to the OLAP dimension flattening process described in the sixth section) is the second step of our proposed technique. Given D, for each step j of our compression algorithm, we need to (i) greedily select the leaf bucket b of H-IQTS(D) having maximum SSE (see the third Section), and (ii) split b in four sub-buckets through in-vestigating, for each dimension dk of D, levels of the hierarchy H(dk). The first task is similar to what proposed in Buccafurri et al. (2003) for two-dimensional summary data domains, whereas the novelty proposed in this article
ALGORITHM build2DOLAPViewViaFlattening
Input: The multidimensional data cube A; the dimension of A selected as first VD, di; the dimension of A selected as second VD, dj; the definition set for the first output VD vi, D(vi); the definition set for the second output VD vj, D(vj).Output: The two-dimensional OLAP view D.import OLAPTools.*;begin OLAPTools.OLAPView D ← null; OLAPTools.VisualizationDimension vi ← null; OLAPTools.VisualizationDimension vj ← null; OLAPTools.Hierarchy H*i ← null; OLAPTools.Hierarchy H*j ← null; vi ← buildVisualizationDimension(A,di, D(vi)); vj ← buildVisualizationDimension(A,dj,D(vj)); H*i ← vi.getHierarchy(); H*j ← vj.getHierarchy(); D ← OLAPTools.aggregate2DOLAPView(A,H*i,H*j); return D;end;
Figure 7. Algorithm build2DOLAPViewViaFlattening

International Journal of Data Warehousing & Mining, 3(4), 1-30, October-December 2007 13
Copyright © 2007, IGI Global. Copying or distributing in print or electronic forms without written permission of IGI Global is prohibited.
consists in the second task properly.Formally, given the current bucket bj =
D[lj,0:uj,0][lj,1:uj,1] to be split at step j of our compression algorithm, such that [lj,k:uj,k] is the range of bj on the dimension dk of D, the problem is finding, for each dimension dk of D, a splitting position Sj,k belonging to [lj,k:uj,k], i.e. lj,k ≤ Sj,k ≤ uj,k. To this end, for each dimension dk of D, our splitting strategy aims at (i) grouping items into buckets related to the same semantic domain, and (ii) maintaining the hierarchy H(dk) balanced as more as possible. Particularly, the first aspect allows us to achieve the benefits highlighted in the fourth section; the second aspect allows us to sensitively improve query estimation capabilities as, on the basis of this approach, we finally obtain buckets with bal-anced “numerousness” (of items) that introduce a smaller approximation error in the evaluation of (OLAP) queries involving several buckets rather than the contrary case (see Buccafurri et al., 2003) for further investigations). On the other hand, this evidence has been already rec-ognized in the context of Equi-Width histograms (Piatetsky-Shapiro & Connell, 1984).
A Hierarchy-Driven Algorithm for Compressing Two-Dimensional OLAP ViewsFor the sake of simplicity, we will present our hierarchy-driven compression algorithm for two-dimensional OLAP views through show-ing how to handle the hierarchy of an OLAP dimension dk (i.e., how to determine a splitting position Sj,k on dk). Obviously, this technique must be performed for both the dimensions of the target (two-dimensional) OLAP view D, thus obtaining, for each pair of splits at step j of our algorithm (i.e., Sj,0 and Sj,1), four two-dimensional buckets to be added to the current partition of D (i.e., H-IQTS(D)).
Let D be a two-dimensional data cube, and D[0:|dk| – 1] be a one-dimensional OLAP view of D obtained by projecting D with respect to dk (see Figure 8). Let bj = D[lj,k:uj,k] be the cur-rent (one-dimensional) bucket of D[0:|dk| – 1] to be split at step j. To determine Sj,k on [lj,k:uj,k], we denote as Tj,k(lj,k:uj,k) the sub-tree of H(dk) whose (i) leaf nodes are the members of the sets M(C0,h) defined on data cells C0,h in D[lj,k:uj,k] with lj,k ≤ h ≤ uj,k, and (ii) the root node is the (singleton) member of the set M(Cp,r) defined on the data cell Cp,r that is the aggregation of
A
D E F
B
G H I
C
T
TT1
0
2
j,kS
D[0:17]7 7 7 7332 111 ��� 4�� �0
H(d )k
Figure 8. Modeling the splitting strategy

14 International Journal of Data Warehousing & Mining, 3(4), 1-30, October-December 2007
Copyright © 2007, IGI Global. Copying or distributing in print or electronic forms without written permission of IGI Globalis prohibited.
D[lj,k:uj,k] at level Lp of H(dk), being p the depth of Tj,k(lj,k:uj,k). To give an example, consider Figure 8. Here, tree T0, properly denoted by Tj,k(0:17), is related to the whole OLAP view D[0:17], and corresponds to the whole H(dk). At step j, dk is split in the position Sj,k = 11, thus generating the buckets D[0:11] and D[12:17]. In consequence of this, tree T1, properly denoted by Tj+1,k(0:11), is related to D[0:11], whereas tree T2, properly denoted by Tj+1,k(12:17), is related to D[12:17].
Let (i) dk be the dimension of D to be pro-cessed, (ii) H(dk) the hierarchy defined on dk, (iii) bj = D[lj,k:uj,k] the current (one-dimensional) bucket to be split at step j of our algorithm, (iv) Tj,k(lj,k:uj,k) the tree related to bj, (v) T1
j,k(lj,k:uj,k) be the second level of Tj,k(lj,k:uj,k). In order to select the splitting position Sj,k on [lj,k:uj,k], we initially consider the data cell C0,k in D[lj,k:uj,k] whose indexer is in the middle of D[lj,k:uj,k], denoted by Xj,D, which is defined as follows:
, , ,1 [ : ]2j D j k j kX D l u = ⋅
(3)
It should be noted that processing the sec-ond level of Tj,k(lj,k:uj,k) (i.e., T1
j,k(lj,k:uj,k)) derives from the usage of the aggregation ALL in OLAP conceptual models, which, in total, introduces an additional level in the general tree modeling an OLAP hierarchy (see the fifth section).
Then, starting from ρk, being ρk the (single-ton--see the fifth section) member in the set M(C0,k), we go up on H(dk) until the parent of ρk at level T1
j,k(lj,k:uj,k), denoted by σk, is reached, and we decide how to determine Sj,k on the basis of the nature of σk. If σk is the LBM of the root node of Tj,k(lj,k:uj,k), denoted by Rj,k, then we have:
, , ,1 [ : ] 12j k j k j kS D l u = ⋅ −
(4)
and, as a consequence, we obtain the follow-ing two (one-dimensional) buckets as child buckets of bj:
1 , , ,1: [ : ] 12j j k j k j kb D l D l u+
′ = ⋅ − (5)
and:
1 , , ,1 [ : ] :2j j k j k j kb D D l u u+
′′ = ⋅ (6)
Otherwise, if σk is the RBM of Rj,k, then we have:
, , ,1 [ : ]2j k j k j kS D l u = ⋅
(7)
and, as a consequence, we obtain the follow-ing buckets:
1 , , ,1: [ : ]2j j k j k j kb D l D l u+
′ = ⋅ (8)
and:
1 , , ,1 [ : ] 1:2j j k j k j kb D D l u u+
′′ = ⋅ + (9)
Finally, if σk is different from both the LBM and the RBM of Rj,k (i.e. it follows the LBM of Rj,k in the ordering O(T1
j,k(lj,k:uj,k)) and precedes the RBM of Rj,k in the ordering O(T1
j,k(lj,k:uj,k)), we perform a finite number of shift operations on the indexers of D[lj,k:uj,k] starting from the middle indexer Xj,D and within the range:
, , ,,lo upj k j k j k Γ = (10)
such that:
, , , , ,1 1[ : ] [ : ]2 3
loj k j k j k j k j kD l u D l u = ⋅ − ⋅
(11)
and:
, , , , ,1 1[ : ] [ : ]2 3
loj k j k j k j k j kD l u D l u = ⋅ + ⋅
(12)
These shift operations are repeated until a data cell Vj,k in D[lj,k:uj,k] such that the corre-sponding member σk at level T1
j,k(lj,k:uj,k) is the LBM or the RBM of Rj,k. It should be noted that admitting a maximum offset of , ,
1 [ : ]3
kj k j kD l u ± ⋅
with respect to the middle of the current bucket is coherent with the aim of maintaining the

International Journal of Data Warehousing & Mining, 3(4), 1-30, October-December 2007 1�
Copyright © 2007, IGI Global. Copying or distributing in print or electronic forms without written permission of IGI Global is prohibited.
hierarchy H(dk) balanced as more as possible, which allows us to take advantages from the previously highlighted benefits (see the fourth section).
To this end, starting from the middle of Γj,k (which is equal to the one of D[lj,k:uj,k], Xj,D), we search for the data cell Vj,k by iteratively considering indexers Ij,q within Γj,k defined by the following function:
,,
, 1
0( 1) 1j D
qj qj q
X qI
I q q−
== + − ⋅ >
(13)
If such data cell Vj,k exists, then Sj,k is set as equal to the so-determined indexer I*
j,q , and, as a consequence, we obtain the pairs of buckets:
*1 , ,: 1j j k j kb D l I+′ = − (14)
and:
*1 , ,:j j q j kb D I u+′′ = (15)
if I*j,q is the LBM of Rj,k, or, alternatively, the
pairs of buckets:
*1 , ,:j j k j qb D l I+′ = (16)
and:
*1 , ,1:j j q j kb D I u+′′ = + (17)
if I*j,q is the RBM of Rj,k. On the contrary, if
such data cell Vj,k does not exist, then we do not perform any split on D[lj,k:uj,k], and we “remand” the splitting at the next step of the algorithm (i.e., j + 1) where the splitting posi-tion Sj+1,k is determined by processing the third level T2
j+1,k(lj+1,k:uj+1,k) of the tree Tj+1,k(lj+1,k:uj+1,k) (i.e., by decreasing the aggregation level of OLAP data with respect to the previous step). The latter approach is iteratively repeated until a data cell Vj,k verifying the condition above is found; otherwise, if the leaf level of Tj,k(lj,k:uj,k) is reached without finding any admissible split-ting point, then D[lj,k:uj,k] is added to the current partition of the OLAP view without being split. We point out that this way to do still pursues
the aim of obtaining balanced partitions of the input OLAP view.
The described approach is implemented by algorithm compress2DOLAPView (see Figure 9), which takes as input the two-dimensional OLAP view D and the amount of storage space B available for housing the compressed repre-sentation of D, and returns as output the data structure H-IQTS(D).
compress2DOLAPView makes use of the following procedures: (i) computeBucketSum, belonging to the utility package OLAPTools, which takes as input an OLAP view D and a Bucket object b (which implements a bucket of the partition of D), and returns as output the sum of the items contained in b; (ii) setSum, belonging to the utility package Compression-Toolkit, which takes as input a Bucket object b and an integer Sum, and sets the sum stored in b to the value Sum; (iii) add, belonging to the utility package Sets, which takes as input an item a and, applied to a Set object s, adds a to s; (iv) computeOccupancy, belonging to the utility package CompressionToolkit, which takes as input the (current) compressed data structure H-IQTS(D), and returns as output its occupancy in KB; (v) findLeafBucketWithMaxSSE, belong-ing to the utility package CompressionToolkit, which takes as input an array of (current) leaf buckets V, and returns as output the bucket hav-ing maximum SSE among them; (vi) getLevel, belonging to the utility package OLAPTools, which takes as input a bucket b and a hierarchy H, and returns as output the level L of b in H; (vii) computeSplittingPosition, belonging to the utility package CompressionToolkit, which takes as input a bucket b, a hierarchy H and a level L, and returns as output the splitting posi-tion S of b at level L, according to the guidelines given above; (viii) getDepth, belonging to the utility package OLAPTools, which takes as input a hierarchy H, and returns as output the depth p of H; (ix) hasIndex, belonging to the utility package CompressionToolkit, which, ap-plied to a Bucket object b, returns TRUE if b is equipped with an index I(b), otherwise FALSE; (x) removeIndex, belonging to the utility package CompressionToolkit, which takes as input a Bucket

1� International Journal of Data Warehousing & Mining, 3(4), 1-30, October-December 2007
Copyright © 2007, IGI Global. Copying or distributing in print or electronic forms without written permission of IGI Globalis prohibited.
ALGORITHM compress2DOLAPView
Input: The two-dimensional OLAP view D; the storage space available for housing H-IQTS(D), B.Output: The compressed representation of D, H-IQTS(D).import Sets.*;import CompressionToolkit.*;import OLAPTools.*;begin Sets.Set H-IQTS(D) ← new Sets.Set(); CompressionToolkit.Bucket bj ← null; CompressionToolkit.Bucket bj+1 ← null; Sets.Set bucketsToBeProcessed ← null; int SUM ← 0; int ℓj,0 ← 0; int ℓj,1 ← 0; int Sj,0 ← 0; int Sj,1 ← 0; int k ← 0; bj ← new CompressionToolkit.Bucket(0,|d0| - 1,0,|d1| - 1); SUM ← OLAPTools.computeBucketSum(D,bj); CompressionToolkit.setSum(bj,SUM); H-QTS(D).add(bj); bucketsToBeProcessed ← new Sets.Set(); bucketsToBeProcessed.add(bj); B ← B - CompressionToolkit.computeOccupancy(H-IQTS(D)); while (B > 0 && bucketsToBeProcessed.size() > 0) do bj ← CompressionToolkit.findLeafBucketWithMaxSSE(bucketsToBeProcessed); ℓj,0 ← OLAPTools.getLevel(bj,H(d0)); ℓj,1 ← OLAPTools.getLevel(bj,H(d1)); Sj,0 ← computeSplittingPosition(bj,H(d0),ℓj,0); Sj,1 ← computeSplittingPosition(bj,H(d1),ℓj,1); while (Sj,0 = -1 && Sj,1 = -1 && ℓj,0 < OLAPTools.getDepth(H(d0)) && ℓj,1 < OLAPTools.getDepth(H(d1)) do ℓj,0 ← ℓj,0 + 1; ℓj,1 ← ℓj,1 + 1; Sj,0 ← computeSplittingPosition(bj,H(d0),ℓj,0); Sj,1 ← computeSplittingPosition(bj,H(d1),ℓj,1); endwhile if (Sj,0 <> -1 || Sj,1 <> -1) then if (CompressionToolkit.hasIndex(bj) = true) then B ← B + CompressionToolkit.computeOccupancy(bj.getIndex()); CompressionToolkit.removeIndex(bj); endif endif while (k < 4) do bj+1 ← CompressionToolkit.getSubBucket(bj,Sj,0,Sj,1,ℓj,0,ℓj,1,k); if (bj+1 <> null) then Ij+1 ← CompressionToolkit.computeIndex(bj+1); if (Ij+1 <> null) then CompressionToolkit.equipeWith(bj+1,Ij+1); endif H-IQTS(D).add(bj+1); B ← B – CompressionToolkit.computeOccupancy(H-IQTS(D)); bucketsToBeProcessed.add(bj+1); endif endwhile bucketsToBeProcessed.remove(bj); endwhile return H-IQTS(D);end;
Figure 9. Algorithm compress2DOLAPView

International Journal of Data Warehousing & Mining, 3(4), 1-30, October-December 2007 17
Copyright © 2007, IGI Global. Copying or distributing in print or electronic forms without written permission of IGI Global is prohibited.
object b, and removes the Index I(b) which b is equipped with; (xi) getSubBucket, belonging to the utility package CompressionToolkit, which takes as input a Bucket object bj, two splitting positions Si and Sj defined on bj along the two dimensions di and dj at depths ℓi and ℓj of levels Li and Lj of bj in H(di) and H(dj), respectively, and an integer k ranging in [0:3], and returns as output the sub-bucket bj+1 of bj by (xi.i) splitting bj on Si and Sj, thus obtaining four sub-buckets, and (xi.ii) selecting among the latter the bucket bj+1 on the basis of the value of k – (i.e., if k = 0, then the left up sub-bucket of bj is selected) and so on; (xii) computeIndex, belonging to the utility package CompressionToolkit, which takes as input a Bucket object b, and returns as output the “best” index I(b) built on it if the accuracy provided by linear interpolation is not higher than that provided by I(b) – otherwise, it returns the Null object; (xiii) equipWith, belonging to the utility package CompressionToolkit, which takes as input a Bucket object b and an Index I(b), and equips b with I(b); (xiv) remove, belong-ing to the utility package Sets, which takes as input an item a and, applied to a Set object s, removes a from s.
ExampleConsider a three-dimensional data cube A de-fined on top of relational data sources storing sale data, and having (i) as measure the total amount of sales (i.e., the SQL aggregation operator SUM is exploited), and (ii) as dimen-sions the set: Dim(A) = {Product, Zone, Time}. The hierarchies H(Product), H(Zone), and H(Time) are depicted in Figure 10, Figure 11, and Figure 12, respectively. Here, we provide a compression process example, where the VDs are (i) Product/Time, whose hierarchy H(Product/Time) is obtained by merging the hierarchies H(Product) and H(Time) using PProduct = 2 and HLTime = 1 (see Figure 13), and (ii) Zone, which is the same as the one defined on the target data cube A. Figure 14 shows the two-dimensional OLAP view D extracted from A by re-aggregating multidimensional data in A according to the (new) VDs Product/Time and
Zone. Finally, Figure 15 shows the steps of the compression process of D.
EXPErIMENTAL STUDYIn order to test the effectiveness of our proposed technique, we defined two kinds of experiments. The first one is oriented to probe the data cube compression performance (or, equally, the ac-curacy) of our technique, whereas the second one is instead oriented to probe the visualization capabilities of our technique in meaningfully supporting advanced OLAP visualization of multidimensional data cubes.
Data LayerIns regards the data layer of our experimental framework, we engineered three kinds of data cubes and we extracted from them two-dimen-sional OLAP views by means of a random flattening process on the data cube dimensions. The usage of different classes of data cubes allowed us to submit our proposed technique to a comprehensive and “rich” experimental analysis, and, as a consequence, carefully test its performance. Data cube classes we con-sidered are the following: (i) synthetic data cubes, which allow us to completely control the variation of input parameters determining the nature of OLAP data distributions as well as the one of the OLAP hierarchies (e.g., act-ing on the topology of the hierarchies etc); (ii) benchmark data cubes, which allow us to test the effectiveness of our technique under the stressing of an in-laboratory-built input, and to evaluate our technique against competitor ones on “well-referred” data sets that have been widely used in similar research experi-ences; (iii) real data cubes, which allow us to probe the efficiency of our technique against real-life data sets.
For what regards synthetic data sets, we finally obtained two kinds of two-dimensional OLAP views: (i) the view DC(L1,L2), for which data are uniformly distributed on a given range [L1,L2], with L1 < L2, (i.e., the well-known Continuous Values Assumption (CVA) (Colliat, 1996) holds), and (ii) the view DZ(zmin,zmax), for which data are distributed according to a Zipf

1� International Journal of Data Warehousing & Mining, 3(4), 1-30, October-December 2007
Copyright © 2007, IGI Global. Copying or distributing in print or electronic forms without written permission of IGI Globalis prohibited.
(Zipf, 1949) distribution whose parameter z is randomly chosen on a given range [zmin,zmax], with zmin < zmax. Uniform and Zipf-based views allow us to probe the benefits of our technique under two “opposite” cases of (OLAP) data distributions, being the latter, due to its gener-ating process, closer to real-life instances. In both views, we generated, for each dimension, an artificial hierarchy having depth equal to 15, which is a reasonable value to be considered with respect to the goals of our experimental analysis. In more detail, each artificial hierarchy has been generated by means of a bottom-up approach that, starting from the lowest-level members of the view, progressively aggregates members in internal members until the desired depth is obtained. It should be noted that these artificial hierarchies implicitly define the se-mantics of the (synthetic) view.
For what regards benchmark data sets, we considered two popular benchmarks: TPC-H
(Transaction Processing Council, 2006) and APB-1 (OLAP Council, 1998). By exploiting data generation routines made available at the respective benchmark Web sites, we built benchmark databases and, based on the latter, multidimensional (benchmark) data cubes from which we extracted two-dimensional OLAP views. In more detail, from the benchmark data set TPC-H, we extracted a two-dimensional OLAP view (see Figure 16) having as dimen-sions the attributes (i) C_Address, belonging to the dimensional table dbo.Customer and linked to the fact table dbo.Lineitem through the di-mensional table dbo.Orders, and (ii) S_Address, belonging to the dimensional table dbo.Supplier. Since the original hierarchies in TPC-H have limited depth, thus being inappropriate to the scope of our experimental analysis, we equipped the dimensions C_Address and S_Address with artificial hierarchies having depth equal to 15, similarly to what done with synthetic data
Figure 10. Hierarchy H(Product)
Product /
Clothes
WinterClothes
SummerClothes
Accessories Scientific
Books
Humanistic Manuals
Foodstuff
Dairy Drink Baked
Gor
gonz
ola
Gei
tost
But
ter
Cha
i
Win
e
Bee
r
Bre
ad
Bag
el
Muf
fin
Sho
rts
Bik
ini
T-S
hirt
Rai
ncoa
t
Pul
love
r
Glo
ves
Sto
ckin
g
Bag
Bel
t
Mat
hs
Psy
chol
ogy
Phy
sics
Nov
els
His
tory
Lite
ratu
re
Com
pute
r Sci
ence
Coo
king
Gar
deni
ng
Zone
Asia
Southeast South NorthEast
Europe
MediterraneanCentralNorth
America
Central
Lim
a
South
Bra
silia
San
Pau
lo
Bue
nos
Aire
s
Gua
tem
ala
Pan
ama
City
San
Jos
e
Man
agua
Toro
nto
Vanc
ouve
r
New
Yor
k
Chi
cago
Bom
bay
Cal
cutta
Kar
achi
Kat
hman
du
Sai
gon
Jaka
rta
Ban
gkok
Kua
la L
umpu
r
Sha
ngha
i
Hon
g K
ong
Toky
o
Seo
ul
Rom
e
Ath
ens
Nic
e
Vale
ncia
Pra
gue
Ber
lin
Mun
ich
Gen
eva
Lond
on
Dub
lin
Osl
o
Hel
sink
i
Figure 11. Hierarchy H(Zone)

International Journal of Data Warehousing & Mining, 3(4), 1-30, October-December 2007 1�
Copyright © 2007, IGI Global. Copying or distributing in print or electronic forms without written permission of IGI Global is prohibited.
Product / Time
Clothes
WinterClothes
SummerClothes
Accessories Scientific
Books
Humanistic Manuals
Foodstuff
Dairy Drink Baked
Q1 Q2 Q3 Q4 Q1 Q2 Q3 Q4 Q1 Q2 Q3 Q4 Q1 Q2 Q3 Q4 Q1 Q2 Q3 Q4 Q1 Q2 Q3 Q4 Q1 Q2 Q3 Q4 Q1 Q2 Q3 Q4 Q1 Q2 Q3 Q4
Figure 13. Hierarchy H(Product/Time)
Time
Jan Feb Mar Apr May Jun Jul Aug Sep Oct Nov Dec
Q4Q3Q2Q1
Figure 12. Hierarchy H(Time)
Figure 14. Product/time-zone OLAP view D

20 International Journal of Data Warehousing & Mining, 3(4), 1-30, October-December 2007
Copyright © 2007, IGI Global. Copying or distributing in print or electronic forms without written permission of IGI Globalis prohibited.
sets. From the benchmark data set APB-1, we extracted a two-dimensional OLAP view (see Figure 17) having as dimensions the attributes (i) Class, belonging to the dimensional table dbo.Product, and (ii) Month, belonging to the dimensional table dbo.Time. Just like the TPC-H case, we equipped the dimensions Class and Month with 15-depth artificial hierarchies.
Finally, for what regards real-life data sets, we considered the popular data set US-Census1990 (University of California, Irvine, 2001) made available from UCI KDD Archive
(University of California, Irvine, 2005), and we built a two-dimensional OLAP view (see Figure 18) by defining two new dimensional tables dbo.dAncestry and dbo.dAncestry_1, which both store data on the origin regions of parents of each person whose data are stored in the fact table dbo.usCensus. dbo.dAncestry and dbo.dAncestry_1 have been built starting from the definition of USCensus1990 attributes available at (University of California, Irvine, 2001), and populated with tuples coming from dbo.usCensus. Then, they have been linked to
Foodstuffs
Books
Eur
ope
Am
eric
a
��174
D
ALL
ALL
{Foodstuffs, Clothes}
Books
ALL
Dairy
Accessories
Scientific
Manuals
Nor
thE
urop
e
Sou
thA
sia
Nor
thA
mer
ica
Sou
thA
mer
ica
America{Europe,
Asia}
ALL
D.3 D.4
D.1 D.2
2�12� 14��4
144�4 ����
{Foodstuffs, Clothes}
Books
ALL
Nor
thE
urop
e
Sou
thAs
ia{N
orth
Am
eric
a,
Cen
tral
Am
eric
a}
Sou
thA
mer
ica
America{Europe,
Asia}
ALL
Bra
silia
Bue
nos
Aire
s
Gua
tem
ala
Chi
cago
{Dairy,Drink,
Baked}
{Summer Clothes,Winter Clothes,
Accessories}Accessories. Q4
Manuals
Summer Clothes.Q1
Dairy.Q1
Backed.Q4
Scientific
2�12�
3�7� 374�
3�07 3733
144�� ����
D.4D.3
D.1 D.2.4D.2.3
D.2.1 D.2.2
Nor
thE
urop
e
Sou
thAs
ia{N
orth
Am
eric
a,
Cen
tral
Am
eric
a}
Sou
thA
mer
ica
America
Europe
ALL
Bra
silia
Bue
nos
Aire
s
Gua
tem
ala
Chi
cago
Asia
{Foodstuffs, Clothes}
Books
ALL
{Dairy,Drink,
Baked}
{Summer Clothes,Winter Clothes,
Accessories}
Accessories. Q4
Summer Clothes.Q1
Dairy.Q1
Backed.Q4
Scientific.Q1
Humanistic.Q4Manuals.Q1
Manuals.Q4
{Scientific,Humanistic}
Manuals
D.2.4D.2.3
D.2.2D.2.1
D.4
D.1
D.3.4
D.3.2
D.3.3
D.3.3 ����
3�7� 374�
3�07 3733
4��� �20�
230�22��
2�12�
(a)
Figure 15. Compression process of the product/time-zone OLAP view D
(b)
(c) (d)

International Journal of Data Warehousing & Mining, 3(4), 1-30, October-December 2007 21
Copyright © 2007, IGI Global. Copying or distributing in print or electronic forms without written permission of IGI Global is prohibited.
dbo.usCensus via simple ID-based relation-ships (i.e., dbo.usCensus.dAncstry1 ↔ dbo.dAncestry.Id and dbo.usCensus.dAncstry2 ↔ dbo.dAncestry_1.Id). The resulting two-di-mensional OLAP view has as dimensions the attributes (i) Id, belonging to the dimensional table dbo.dAncestry_1, and (ii) Id, belonging to the dimensional table dbo.dAncestry. Finally, 15-depth artificial hierarchies have been embed-ded to the latter dimensions.
MetricsAs regards the outcomes of our experimental study, we defined the following metrics. For the first kind of experiments (i.e., that focused on the accuracy), given a population of synthetic range-SUM queries QS, we measure the aver-age relative error (ARE) between exact and approximate answers to queries in QS, defined as follows:
ALGORITHM compress2DOLAPViewInput: The two-dimensional OLAP view D; the storage space available for housing H-IQTS(D), B.Output: The compressed representation of D, H-IQTS(D).import Sets.*;import CompressionToolkit.*;import OLAPTools.*;begin Sets.Set H-IQTS(D) ← new Sets.Set(); CompressionToolkit.Bucket bj ← null; CompressionToolkit.Bucket bj+1 ← null; Sets.Set bucketsToBeProcessed ← null; int SUM ← 0; int ℓj,0 ← 0; int ℓj,1 ← 0; int Sj,0 ← 0; int Sj,1 ← 0; int k ← 0; bj ← new CompressionToolkit.Bucket(0,|d0| - 1,0,|d1| - 1); SUM ← OLAPTools.computeBucketSum(D,bj); CompressionToolkit.setSum(bj,SUM); H-QTS(D).add(bj); bucketsToBeProcessed ← new Sets.Set(); bucketsToBeProcessed.add(bj); B ← B - CompressionToolkit.computeOccupancy(H-IQTS(D)); while (B > 0 && bucketsToBeProcessed.size() > 0) do bj ← CompressionToolkit.findLeafBucketWithMaxSSE(bucketsToBeProcessed); ℓj,0 ← OLAPTools.getLevel(bj,H(d0)); ℓj,1 ← OLAPTools.getLevel(bj,H(d1)); Sj,0 ← computeSplittingPosition(bj,H(d0),ℓj,0); Sj,1 ← computeSplittingPosition(bj,H(d1),ℓj,1); while (Sj,0 = -1 && Sj,1 = -1 && ℓj,0 < OLAPTools.getDepth(H(d0)) && ℓj,1 < OLAPTools.getDepth(H(d1)) do ℓj,0 ← ℓj,0 + 1; ℓj,1 ← ℓj,1 + 1; Sj,0 ← computeSplittingPosition(bj,H(d0),ℓj,0); Sj,1 ← computeSplittingPosition(bj,H(d1),ℓj,1); endwhile if (Sj,0 <> -1 || Sj,1 <> -1) then if (CompressionToolkit.hasIndex(bj) = true) then B ← B + CompressionToolkit.computeOccupancy(bj.getIndex()); CompressionToolkit.removeIndex(bj); endif endif while (k < 4) do bj+1 ← CompressionToolkit.getSubBucket(bj,Sj,0,Sj,1,ℓj,0,ℓj,1,k); if (bj+1 <> null) then Ij+1 ← CompressionToolkit.computeIndex(bj+1); if (Ij+1 <> null) then CompressionToolkit.equipeWith(bj+1,Ij+1); endif H-IQTS(D).add(bj+1); B ← B – CompressionToolkit.computeOccupancy(H-IQTS(D)); bucketsToBeProcessed.add(bj+1); endif endwhile bucketsToBeProcessed.remove(bj); endwhile return H-IQTS(D);end;
Figure 16. Two-dimensional OLAP view extracted from the benchmark data set TPC-H
Figure 17. Two-dimensional OLAP view extracted from the benchmark data set APB-1

22 International Journal of Data Warehousing & Mining, 3(4), 1-30, October-December 2007
Copyright © 2007, IGI Global. Copying or distributing in print or electronic forms without written permission of IGI Globalis prohibited.
| | 1
0
1 ( )| |
SQ
rel rel kkS
E E QQ
−
=
= ⋅ ∑ (18)
such that, for each query Qk in QS, we have:
| ( ) ( ) |( )( )
k krel k
k
A Q A QE QA Q−
=
(19)
where (i) A(Qk) is the exact answer to Qk, and (ii) Ã(Qk) is the approximate answer to Qk. Specifically, having fixed a range size ∆k for each dimension dk of the target synthetic OLAP view D, we generated queries in QS through spanning D by means of the “seed” ∆0 × ∆1 query Qs whose left-up corner moves across two-dimensional references ⟨i, j⟩ of D.
For the second kind of experiments, we have been inspired from hierarchical range queries (HRQ) introduced by Koudas, Mu-thukrishnan and & Srivastava (2000). In our implementation, a HRQ QH(WH,PH) is a full tree such that: (i) the depth of such tree is equal to PH; (ii) each internal node Ni has a fan-out degree equal to WH; (iii) each node Ni stores the definition of a (“traditional”) range-SUM query Qi; (iv) for each node Ni in QH(WH,PH),
there not exists any sibling node Nj of Ni such that Qi ∩ Qj <> ∅.
As an example, consider Figure 19, where a HRQ having depth equal to 2 is depicted. This query could model a typical business intelli-gence (BI) scenario where two local companies which are joined to a common main company pose queries to specialized sub-domains of the data cube sales according to their business goals. Also following the previous simple yet effective example, it should be noted that HRQs have a wide range of applications in OLAP systems (as also highlighted in Koudas et al. (2000)), since they allow us to extract “hierarchically-shaped” summarized knowledge from massive data cubes.
Similarly to the previous kind of ex-periments, for each node Ni in QH(WH,PH), the population of queries QS,i to be used as input query set has been generated by means of the above-described spanning technique (i.e., based on the seed query s
iQ ). In more detail, since, due the nature of HRQs, the selectivity of seed queries ,
si kQ of nodes Ni at level k of
QH(WH,PH) must decreases as the depth Pk of QH(WH,PH) increases, we first imposed that the selectivity of the seed query of the root node
Figure 18. Two-dimensional OLAP view built on top of the real-life data set USCensus1990

International Journal of Data Warehousing & Mining, 3(4), 1-30, October-December 2007 23
Copyright © 2007, IGI Global. Copying or distributing in print or electronic forms without written permission of IGI Global is prohibited.
N0 in QH(WH,PH), denoted by 0,0|| ||sQ , is equal to the γ % of ||D||, being γ an input parameter and ||D|| the selectivity of the target OLAP view D, respectively. Then, for each internal node Ni in QH(WH,PH) at level k, we randomly determined the seed queries of the child nodes of Ni by checking the following constraint:
1|( ) | 1
, 1 ,0
|| || || ||k
HWs si k i k
iQ Q
+ −
+=
≤∑ (20)
with:
, 1 , 1s si k j kQ Q+ +∩ = ∅ (21)
for each i and j in [0, |(WH)k+1|–1], with i <> j, and adopting the criterion of maximizing each || ,
si kQ ||.
Given a HRB QH(WH,PH), we measure the average accessed bucket number (AABN), which models the average number of buckets accessed during the evaluation of QH(WH,PH), and it is defined as follows:
|( ) | 1
0 0
1( ( , )) ( )( )
kH HP W
H H H kk H
AABN Q W P AABN NW
−
= =
= ⋅∑ ∑
(22)
where, in turn, AABN(Nℓ) is the average number of buckets accessed during the evaluation of the population of queries QS,ℓ of the node Nℓ in QH(WH,PH), defined as follows:
,| | 1
0,
1( ) ( )| |
SQ
kkS
AABN N ABN QQ
−
=
= ⋅ ∑
(23)
Figure 19. A HRB (left) and its implementation on the data cube sales (right)
Q Q
Q
Q
Q
A
A1 1
0
1
2
3
1
6
5
4
0
0ZZ
Sales
Figure 20. Experimental results for the accuracy metrics with respect to the query selectivity ||Q|| on the 1,000 × 1,000 two-dimensional synthetic OLAP views DC(25,70) (left) and DZ(0.5,1.5) (right) with r = 10 %
HRQQ =([B , U ], [D , Z ])0 0 0 1 1
Q =([N , T ], [P , U ])
Q =([R , S ], [S , T ])
Q =([P , Q ], [Q , R ])Q =([I , L ], [L , M ])
Q =([D , M ], [G , N ])
Q =([F , H ], [H , I ])
0 0 1 1
0 0 1 1
0 0 1 1
2
6
50 0 1 14
3
1 0 1 1
0 0 1 1
0

24 International Journal of Data Warehousing & Mining, 3(4), 1-30, October-December 2007
Copyright © 2007, IGI Global. Copying or distributing in print or electronic forms without written permission of IGI Globalis prohibited.
such that, for each query Qk in QS,ℓ, ABN(Qk) is the number of buckets accessed during the evaluation of Qk.
Summarizing, given a compression tech-nique T, AABN allows us to measure the capa-bilities of T in supporting advanced OLAP visu-alization of multidimensional data cubes as the number of buckets accessed can be reasonably considered as a measure of the computational cost needed to extract summarized knowledge. This resembles a sort of measure of the entropy of the overall knowledge extraction process. As stated in the fourth Section, this aspect assumes a leading role in mobile OLAP settings (e.g., Hand-OLAP).
COMPArISON TECHNIqUESIn our experimental study, we compared the performance of our proposed technique (under the two metrics previously defined) against the following well-known histogram-based techniques for compressing data cubes: Min-Skew by Acharya et al. (1999), GenHist by Gunopulos et al. (2000), and STHoles by Bruno et al. (2001). In more detail, having fixed the space budget B (i.e., the storage space available for housing the compressed representation of the input OLAP view), we derived, for each comparison technique, the configuration of the input parameters that respective authors consider the best in their papers. This ensures a fair experimental analysis (i.e., an analysis such that each comparison technique provides
Figure 21. Experimental results for the accuracy metrics with respect to the compression ratio r on the 1,000 × 1,000 two-dimensional synthetic OLAP views DC(25,70) (left) and DZ(0.5,1.5) (right) with ||Q|| = 350 × 300
Figure 22. Experimental results for the visualization metrics with respect to the depth of HRQs P on the 1,000 × 1,000 two-dimensional synthetic OLAP views DC(25,70) (left) and DZ(0.5,1.5) (right) with WH = 5, r = 10 %, and γ = 70 %

International Journal of Data Warehousing & Mining, 3(4), 1-30, October-December 2007 2�
Copyright © 2007, IGI Global. Copying or distributing in print or electronic forms without written permission of IGI Global is prohibited.
its best performance). Furthermore, for all the comparison techniques, we set the space budget B as equal to the r % of size(D), being r the compression ratio and size(D) the total occupancy of the input OLAP view D. As an example, r = 10 % (i.e., B is equal to the 10 % of size(D)) is widely recognized as a reasonable setting (e.g., see Bruno et al., 2001)).
Experimental resultsFigure 20 shows our experimental results for what regards the accuracy of the compression techniques with respect to the selectivity of que-ries in QS on the 1,000 × 1,000 two-dimensional synthetic OLAP views DC(25,70) (left side) and DZ(0.5,1.5) (right side), respectively. Figure 21 shows the results of the same experiment when ranging r on the interval [5, 20] (i.e., B
on the interval [5, 20] % of size(D)), and fixing the selectivity of queries ||Q||. This allows us to measure the scalability of the compression techniques, which is a critical aspect in OLAP systems (e.g., see Cuzzocrea, 2005). Finally, Figure 22 shows our experimental results for what regards the “visualization capabilities” of the comparison techniques (according to the guidelines drawn through the article) with respect to the depth of HRQs (i.e., PH) having fan-out degree WH equal to 5 and the parameter γ equal to 70 %. The input two-dimensional OLAP views and the value of the parameter r are the same of the previous experiments.
Figure 23, 24, and 25 show the results of the same experiment set described above when 1,000 × 1,000 two-dimensional bench-mark OLAP views extracted from the data sets
Figure 23. Experimental results for the accuracy metrics with respect to the query selectivity ||Q|| on the 1,000 × 1,000 two-dimensional benchmark OLAP views extracted from the data sets TPC-H (left) and APB-1 (right) with r = 10 %
Figure 24. Experimental results for the accuracy metrics with respect to the compression ratio r on the 1,000 × 1,000 two-dimensional benchmark OLAP views extracted from the data sets TPC-H (left) and APB-1 (right) with ||Q|| = 350 × 300

International Journal of Data Warehousing & Mining, 3(4), 1-30, October-December 2007 1
Copyright © 2007, IGI Global. Copying or distributing in print or electronic forms without written permission of IGI Global is prohibited.
AbSTrACT
Efficiently supporting advanced OLAP visualization of multidimensional data cubes is a novel and chal-lenging research topic, which results to be of interest for a large family of data warehouse applications relying on the management of spatio-temporal (e.g., mobile) data, scientific and statistical data, sensor network data, biological data, etc. On the other hand, the issue of visualizing multidimensional data do-mains has been quite neglected from the research community, since it does not belong to the well-founded conceptual-logical-physical design hierarchy inherited from relational database methodologies. Inspired from these considerations, in this article we propose an innovative advanced OLAP visualization technique that meaningfully combines (i) the so-called OLAP dimension flattening process, which allows us to extract two-dimensional OLAP views from multidimensional data cubes, and (ii) very efficient data compression techniques for such views, which allow us to generate “semantics-aware” compressed representations where data are grouped along OLAP hierarchies.
Keywords: approximate query answering; data cube compression; OLAP; OLAP visualization
INTrODUCTIONOLAP systems (Chaudhuri & Dayal, 1997; Codd, Codd, & Salley, 1993; Inmon, 1996; Kimball, 1996) have rapidly gained momentum in both the academic and research communities, mainly due to their capability of exploring and querying huge amounts of data sets according to a multidimensional and multi-resolution vision. Research-wise, three relevant challenges of OLAP have captured the attention of researchers
during the last years: (i) the data querying prob-lem, which concerns with how data are accessed and queried to support summarized knowledge extraction from massive data cubes; (ii) the data modeling problem, which concerns with how data are represented and, thus, processed inside OLAP servers (e.g., during query evaluation); and (iii) the data visualization problem, which concerns with how data are presented to OLAP users and decision makers in data warehouse environments. Indeed, research communities
Semantics-Aware Advanced OLAP Visualization of
Multidimensional Data CubesAlfredoCuzzocrea,UniversityofCalabria,Italy
DomenicoSaccà,UniversityofCalabria,Italy
PaoloSerafino,UniversityofCalabria,Italy

2� International Journal of Data Warehousing & Mining, 3(4), 1-30, October-December 2007
Copyright © 2007, IGI Global. Copying or distributing in print or electronic forms without written permission of IGI Globalis prohibited.
TPC-H (left sides of figures) and APB-1 (right sides of figures), respectively, are considered as input. Finally, Figure 26, 27, and 28 show the experimental results when a 1,000 × 1,000 two-dimensional real-life OLAP view built on top of the data set USCensus1990 is considered as input.
From the analysis of the set of experimental results on two-dimensional synthetic, bench-mark and real-life OLAP views, it follows that, with respect to the accuracy metrics, our pro-posed technique is comparable with MinSkew, which represents the best on two-dimensional views (indeed, as well-recognized-in-literature, MinSkew presents severe limitations on mul-
tidimensional domains); instead, with respect to the visualization metrics, our proposed tech-nique overcomes the comparison techniques, thus confirming its suitability in efficiently supporting advanced OLAP visualization of multidimensional data cubes.
CONCLUSION AND FUTUrE WOrKIn this article, we have presented an innova-tive technique for supporting advanced OLAP visualization of multidimensional data cubes, which is particularly suitable for mobile OLAP scenarios (like, for instance, those addressed
Figure 25. Experimental results for the visualization metrics with respect to the depth of HRQs P on the 1,000 × 1,000 two-dimensional benchmark OLAP views extracted from the data sets TPC-H (left) and APB-1 (right) with WH = 5, r = 10 %, and γ = 70 %
Figure 26. Experimental results for the accuracy metrics with respect to the query selectivity ||Q|| on the 1,000 × 1,000 two-dimensional real-life OLAP view built on top of the data set USCensus1990 with r = 10 %
Figure 27. Experimental results for the accu-racy metrics with respect to the compression ratio r on the 1,000 × 1,000 two-dimensional real-life OLAP view built on top of the data set USCensus1990 with ||Q|| = 350 × 300

International Journal of Data Warehousing & Mining, 3(4), 1-30, October-December 2007 27
Copyright © 2007, IGI Global. Copying or distributing in print or electronic forms without written permission of IGI Global is prohibited.
by the system Hand-OLAP). Founding on very efficient two-dimensional summary data domain compression solutions (Buccafurri et al., 2003), our technique meaningfully exploits the data compression paradigm that, in this ar-ticle, has been proposed as a way of visualizing multidimensional OLAP domains to overcome the natural disorientation and refractoriness of human beings in dealing with hyper-spaces. In this direction, the OLAP dimension flat-tening process and the amenity of computing semantics-aware buckets are, to the best of our knowledge, innovative contributions to the state-of-the-art OLAP research. Finally, various experimental results performed on different kinds of two-dimensional OLAP views extracted from synthetic, benchmark, and real-life multidimensional data cubes have clearly confirmed the benefits of our proposed technique in the OLAP visualization context, also in comparison with well-known data cube compression techniques.
Future work is mainly focused on making the proposed technique capable of building m-dimensional OLAP views over massive n-dimensional data cubes, with m << n and m > 2, by extending the algorithms presented in this article. A possible solution could be found in
the results coming from the high-dimensional data and information visualization research area (e.g., see University of Hannover, Germany, 2005), which are already suitable to be applied to the problem of visualizing multidimensional databases and data cubes.
ACKNOWLEDGMENTAuthors are very grateful to Francesco Cris-tofaro for having developed and performed the experimental section on benchmark and real-life data sets.
rEFErENCESAgrawal, R., Gupta, A., & Sarawagi, S. (1997). Mod-
eling multidimensional databases. Proceedings of 13th IEEE ICDE International Conference (pp. 232-243), Bangalore, India.
Acharya, S., Poosala, V., & Ramaswamy, S. (1999). Selectivity estimation in spatial databases. Proceedings of 1999 ACM SIGMOD Interna-tional Conference (pp. 13-24), Philadelphia, PA, USA.
Babcock, B., Chaudhuri, S., & Das, G. (2003). Dy-namic sample selection for approximate query answers. Proceedings of 2003 ACM SIGMOD International Conference (pp. 539-550), San Diego, CA, USA.
Buccafurri, F., Furfaro, F., Saccà, D., & Sirangelo, C. (2003). A quad-tree based multiresolution approach for two-dimensional summary data. Proceedings of 15th IEEE SSDBM International Conference (pp. 127-140), Cambridge, MA, USA.
Bruno, N., Chaudhuri, S., & Gravano, L. (2001). STHoles: A multidimensional workload-aware histogram. Proceedings of 2001 ACM SIGMOD International Conference (pp. 211-222), Santa Barbara, CA, USA.
Cabibbo, L., & Torlone, R. (1998). From a proce-dural to a visual query language for OLAP. Proceedings of 10th IEEE SSDBM International Conference (pp. 74-83), Capri, Italy.
Chaudhuri, S., & Dayal, U. (1997). An overview of data warehousing and OLAP technology. ACM SIGMOD Record, 26(1), 65-74.
Figure 28. Experimental results for the visu-alization metrics with respect to the depth of HRQs P on the 1,000 × 1,000 two-dimensional real-life OLAP view built on top of the data set USCensus1990 with WH = 5, r = 10 %, and γ = 70 %
2� International Journal of Data Warehousing & Mining, 3(4), 1-30, October-December 2007
Copyright © 2007, IGI Global. Copying or distributing in print or electronic forms without written permission of IGI Globalis prohibited.
Chaudhuri, S., Das, G., Datar, M., Motwani, R., & Rastogi, R. (2001). Overcoming limitations of sampling for aggregation queries. Proceedings of 17th IEEE ICDE International Conference (pp. 534-542), Heidelberg, Germany.
Codd, E. F., Codd, S. B., & Salley, C. T. (1993). Pro-viding OLAP to user-analysts: An IT mandate. E. F. Codd and Associates Technical Report.
Colliat, G. (1996). OLAP, relational, and multidi-mensional database systems. SIGMOD Record, 25(3), 64-69.
Cuzzocrea, A. (2005). Overcoming limitations of approximate query answering in OLAP. Proceedings of 9th IEEE IDEAS International Conference (pp. 200-209), Montreal, Canada.
Cuzzocrea, A., & Wang, W. (2007). Approximate range-sum query answering on data cubes with probabilistic guarantees. Journal of Intelligent Information Systems, 28(2), 161-197.
Cuzzocrea, A., Furfaro, F., & Saccà, D. (2003). Hand-OLAP: A system for delivering OLAP services on handheld devices. Proceedings of 6th IEEE ISADS International Conference (pp. 80-87), Pisa, Italy.
Ezeife, C. I. (2001). Selecting and materializing horizontally partitioned warehouse views. Data & Knowledge Engineering, 36(2), 185-210.
Fang, M., Shivakumar, N., Garcia-Molina, H., Mot-wani, R., & Ullman, J.D., (1998). Computing iceberg queries efficiently. Proceedings of 24th VLDB International Conference (pp. 299-310), New York City, NY, USA.
Gebhardt, M., Jarke, M., & Jacobs, S. (1997). A toolkit for negotiation support interfaces to multi-dimensional data. Proceedings of 1997 ACM SIGMOD International Conference (pp. 348-356), Tucson, AZ, USA.
Gibbons, P. B., & Matias, Y. (1998). New sam-pling-based summary statistics for improving approximate query answers. Proceedings of 1998 ACM SIGMOD International Conference (pp. 331-342), Seattle, WA, USA.
Gray, J., Chaudhuri, S., Bosworth, A., Layman, A., Reichart, D., & Venkatrao, M. (1997). Data cube: A relational aggregation operator gen-eralizing group-by, cross-tab, and sub-totals.
Data Mining and Knowledge Discovery, 1(1), 29-53.
Gunopulos, D., Kollios, G., Tsotras, V. J., & Do-meniconi, C. (2000). Approximating multi-dimensional aggregate range queries over real attributes. Proceedings of 2000 ACM SIGMOD International Conference (pp. 463-474), Dal-las, TX, USA.
Gupta, A., Agrawal, D., & El Abbadi, A. (2003). Approximate range selection queries in peer-to-peer systems. Proceedings of 1st CIDIR International Conference, Asilomar, CA, USA. Retrieved from http://www-db.cs.wisc.edu/cidr/cidr2003/program/p13.pdf
Hacid, M. S., & Sattler, U. (1998). Modeling multidimensional databases: A formal object-centered approach. Proceedings of 6th ECIS International Conference (pp. 1-15), Aix-en-provence, France.
Han, J., & Kamber, M. (2000). Data mining: Con-cepts and techniques. Morgan Kauffmann Publishers.
Harinarayan, V., Rajaraman, A., & Ullman, J. (1996). Implementing data cubes efficiently. Proceed-ings of 1996 ACM SIGMOD International Conference (pp. 205-216), Montreal, Canada.
Ho, C. T., Agrawal, R., Megiddo, N., & Srikant, R. (1997). Range queries in OLAP data cubes. Pro-ceedings of 1997 ACM SIGMOD International Conference (pp. 73-88), Tucson, AZ, USA.
Inmon, W. H. (1996). Building the data warehouse. John Wiley & Sons.
Inselberg, A. (2001). Visualization and knowledge discovery for high dimensional data. Proceed-ings of 2nd IEEE UIDIS International Workshop (pp. 5-24), Zurich, Switzerland.
Keim, D. A. (1997). Visual data mining. Tutorial at 23rd VLDB International Conference, Ath-ens, Greece. Retrieved from http://www.dbs.informatik.uni-muenchen.de/daniel/VLDB-Tutorial.ps
Kimball, R. (1996). The data warehouse toolkit. John Wiley & Sons.
Koudas N., Muthukrishnan S., & Srivastava D. (2000). Optimal histograms for hierarchical

International Journal of Data Warehousing & Mining, 3(4), 1-30, October-December 2007 2�
Copyright © 2007, IGI Global. Copying or distributing in print or electronic forms without written permission of IGI Global is prohibited.
range queries. Proceedings of 19th ACM PODS International Symposium (pp. 196-204), Dal-las, TX, USA.
Lehner, W., Albrecht, J., & Wedekind, H. (1998). Normal forms for multivariate databases. Pro-ceedings of 10th IEEE SSDBM International Conference (pp. 63-72), Capri, Italy.
Lenz, H. J., & Shoshani, A. (1997). Summarizability in OLAP and statistical databases. Proceedings of 9th IEEE SSDBM International Conference (pp. 132-143), Olympia, WA, USA.
Lenz, H. J., & Thalheim, B. (2001). OLAP databases and aggregation functions. Proceedings of 13th IEEE SSDBM International Conference (pp. 91-100), Fairfax, VA, USA.
Maniatis, A., Vassiliadis, P., Skiadopoulos, S., & Vassiliou, Y. (2003a). CPM: A cube presentation model for OLAP. Proceedings of 5th DaWaK International Conference (pp. 4-13), Prague, Czech Republic.
Maniatis, A., Vassiliadis, P., Skiadopoulos, & S., Vassiliou, Y. (2003b). Advanced visualization for OLAP. Proceedings of 6th ACM DOLAP International Workshop (pp. 9-16), New Or-leans, LO, USA.
Muralikrishna, M., & DeWitt, D.J. (1998). Equi-depth histograms for estimating selectivity factors for multi-dimensional queries. Proceedings of 1998 ACM SIGMOD International Conference (pp. 28-36), Seattle, WA, USA.
OLAP Council. (1998). Analytical processing bench-mark 1, Release II. Retrieved from http://www.symcorp.com/downloads/OLAP_Council-WhitePaper.pdf
Piatetsky-Shapiro, G., & Connell, C. (1984). Accurate estimation of the number of tuples satisfying a condition. Proceedings of 1984 ACM SIGMOD International Conference (pp. 265-275), Bos-ton, MA, USA.
Poosala, V., & Ioannidis, Y. (1997). Selectivity estimation without the attribute value indepen-dence assumption. Proceedings of 23rd VLDB International Conference (pp. 486-495), Ath-ens, Greece.
Thanh Binh, N., Min Tjoa, A., & Wagner, R. (2000). An object oriented multidimensional data model for OLAP. Proceedings of 1st WAIM International Conference (pp. 69-82), Shang-hai, China.
Transaction Processing Council. (2006). TPC benchmark H. Retrieved from http://www.tpc.org/tpch/
Tsois, A., Karayannidis, N., & Sellis, T. (2001). MAC: Conceptual data modeling for OLAP. Proceedings of 3rd DMDW International Work-shop, Interlaken, Switzerland. Retrieved from http://sunsite.informatik.rwth-aachen.de/Publi-cations/CEUR-WS/Vol-39/paper5.pdf
University of California, Irvine. (2001). 1990 US Census Data. Retrieved from http://kdd.ics.uci.edu/databases/census1990/USCensus1990.html
University of California, Irvine. (2005). Knowledge discovery in databases archive. Retrieved from http://kdd.ics.uci.edu/
University of Hannover, Germany. (2005). 2D, 3D, and high-dimensional data and information visualization research group. Retrieved from http://www.iwi.uni-hannover.de/lv/seminar_ss05/bartke/home.htm
Vassiliadis, P. (1998). Modeling multidimensional databases, cubes, and cube operations. Pro-ceedings of 10th IEEE SSDBM International Conference (pp. 53-62), Capri, Italy.
Vassiliadis, P., & Sellis, T. (1999). A survey of logical models for OLAP databases. SIGMOD Record, 28(4), 64-69.
Vitter, J. S., Wang, M. & Iyer, B. (1998). Data cube approximation and histograms via wavelets. Proceedings of 7th ACM CIKM International Conference (pp. 96-104), Bethesda, MD, USA.
Xin, D., Han, J., Cheng, H., & Li, X. (2006). Answer-ing top-k queries with multi-dimensional selec-tions: The ranking cube approach. Proceedings of 32nd VLDB International Conference (pp. 463-475), Cairo, Egypt.
Zipf, G. K. (1949). Human behaviour and the prin-ciple of least effort. Addison-Wesley.

30 International Journal of Data Warehousing & Mining, 3(4), 1-30, October-December 2007
Copyright © 2007, IGI Global. Copying or distributing in print or electronic forms without written permission of IGI Globalis prohibited.
Alfredo Cuzzocrea received the Laurea Degree in computer science engineering on April 2001 and the PhD degree in computer science and system engineering on February 2005 both from the University of Calabria. Presently, he is a research fellow at the Department of Electronics, Computer Science and Systems of the University of Calabria, where is a member of the Database Research Group. He also actively collaborates with the Institute of High Performance Computing and Networking of the Italian National Research Council. His research interests include multidimensional data modeling and querying, data stream modeling and querying, data warehousing and OLAP, XML data management, Web information systems modeling and engineering, knowledge representation and management models and techniques, Grid and P2P computing. He is author or co-author of more than 60 papers in referred international conferences (including SSDBM, DEXA, DaWaK, DOLAP, IDEAS, SEKE, WISE, FQAS, SAC) and international journals (including JIIS, DKE, WIAS). He serves as program committee member of referred international conferences (including ICDM, CIKM, PAKDD, DaWaK, SAC) and as review board member of international journals (including TODS, TKDE, INS, IJSEKE, FGCS).
Domenico Saccà was born in Catanzaro (Italy) on November 5, 1950, and he received a Doctoral degree in Engineering from the University of Rome on 1975. Since 1987, he is full professor of Computer Engi-neering at the University of Calabria and, since 2002, he is also Director of the CNR (the Italian National Research Council) Research Institute ICAR (Institute for High Performance Computing and Networking), located in Rende (CS) and branches in Naples and Palermo. Previously, from 1995 on, he was director of the CNR Institute on System and Computer Sciences (Istituto per la Sistemistica e l’Informatica, ISI-CNR). In the past he was visiting scientist at IBM Laboratory of San Jose, at the Computer Science Department of UCLA and at the ICSI Institute of Berkeley; furthermore, he was a scientific consultant of MCC, Austin, and manager of the Research Division of CRAI. His current research interests focus on advanced issues on database such as: scheme integration in data warehousing, compressed representation of datacubes, workflow and process mining, logic-based database query languages. His list of publications contains more than 100 papers on journals (including Journal of the ACM, SIAM Journal on Computing, ACM Transac-tions on Database Systems, IEEE Transactions on Knowledge and Data Engineering, IEEE Transactions on Software Engineering, Theoretical Computer Science, Journal of Computer and System Sciences, Acta Informatica) and on proceedings of international conferences. He has been member of the program com-mittees of several international conferences, director of international schools and seminars and leader of many national and international research projects.
Paolo Serafino received the Laurea Degree in Computer Science Engineering on July 2006. Presently, he is research collaborator at Department of Electronics, Computer Science and Systems of the University of Calabria.

2� International Journal of Data Warehousing & Mining, 3(4), 1-30, October-December 2007
Copyright © 2007, IGI Global. Copying or distributing in print or electronic forms without written permission of IGI Globalis prohibited.
TPC-H (left sides of figures) and APB-1 (right sides of figures), respectively, are considered as input. Finally, Figure 26, 27, and 28 show the experimental results when a 1,000 × 1,000 two-dimensional real-life OLAP view built on top of the data set USCensus1990 is considered as input.
From the analysis of the set of experimental results on two-dimensional synthetic, bench-mark and real-life OLAP views, it follows that, with respect to the accuracy metrics, our pro-posed technique is comparable with MinSkew, which represents the best on two-dimensional views (indeed, as well-recognized-in-literature, MinSkew presents severe limitations on mul-
tidimensional domains); instead, with respect to the visualization metrics, our proposed tech-nique overcomes the comparison techniques, thus confirming its suitability in efficiently supporting advanced OLAP visualization of multidimensional data cubes.
CONCLUSION AND FUTUrE WOrKIn this article, we have presented an innova-tive technique for supporting advanced OLAP visualization of multidimensional data cubes, which is particularly suitable for mobile OLAP scenarios (like, for instance, those addressed
Figure 25. Experimental results for the visualization metrics with respect to the depth of HRQs P on the 1,000 × 1,000 two-dimensional benchmark OLAP views extracted from the data sets TPC-H (left) and APB-1 (right) with WH = 5, r = 10 %, and γ = 70 %
Figure 26. Experimental results for the accuracy metrics with respect to the query selectivity ||Q|| on the 1,000 × 1,000 two-dimensional real-life OLAP view built on top of the data set USCensus1990 with r = 10 %
Figure 27. Experimental results for the accu-racy metrics with respect to the compression ratio r on the 1,000 × 1,000 two-dimensional real-life OLAP view built on top of the data set USCensus1990 with ||Q|| = 350 × 300

International Journal of Data Warehousing & Mining, 3(4), 1-30, October-December 2007 27
Copyright © 2007, IGI Global. Copying or distributing in print or electronic forms without written permission of IGI Global is prohibited.
by the system Hand-OLAP). Founding on very efficient two-dimensional summary data domain compression solutions (Buccafurri et al., 2003), our technique meaningfully exploits the data compression paradigm that, in this ar-ticle, has been proposed as a way of visualizing multidimensional OLAP domains to overcome the natural disorientation and refractoriness of human beings in dealing with hyper-spaces. In this direction, the OLAP dimension flat-tening process and the amenity of computing semantics-aware buckets are, to the best of our knowledge, innovative contributions to the state-of-the-art OLAP research. Finally, various experimental results performed on different kinds of two-dimensional OLAP views extracted from synthetic, benchmark, and real-life multidimensional data cubes have clearly confirmed the benefits of our proposed technique in the OLAP visualization context, also in comparison with well-known data cube compression techniques.
Future work is mainly focused on making the proposed technique capable of building m-dimensional OLAP views over massive n-dimensional data cubes, with m << n and m > 2, by extending the algorithms presented in this article. A possible solution could be found in
the results coming from the high-dimensional data and information visualization research area (e.g., see University of Hannover, Germany, 2005), which are already suitable to be applied to the problem of visualizing multidimensional databases and data cubes.
ACKNOWLEDGMENTAuthors are very grateful to Francesco Cris-tofaro for having developed and performed the experimental section on benchmark and real-life data sets.
rEFErENCESAgrawal, R., Gupta, A., & Sarawagi, S. (1997). Mod-
eling multidimensional databases. Proceedings of 13th IEEE ICDE International Conference (pp. 232-243), Bangalore, India.
Acharya, S., Poosala, V., & Ramaswamy, S. (1999). Selectivity estimation in spatial databases. Proceedings of 1999 ACM SIGMOD Interna-tional Conference (pp. 13-24), Philadelphia, PA, USA.
Babcock, B., Chaudhuri, S., & Das, G. (2003). Dy-namic sample selection for approximate query answers. Proceedings of 2003 ACM SIGMOD International Conference (pp. 539-550), San Diego, CA, USA.
Buccafurri, F., Furfaro, F., Saccà, D., & Sirangelo, C. (2003). A quad-tree based multiresolution approach for two-dimensional summary data. Proceedings of 15th IEEE SSDBM International Conference (pp. 127-140), Cambridge, MA, USA.
Bruno, N., Chaudhuri, S., & Gravano, L. (2001). STHoles: A multidimensional workload-aware histogram. Proceedings of 2001 ACM SIGMOD International Conference (pp. 211-222), Santa Barbara, CA, USA.
Cabibbo, L., & Torlone, R. (1998). From a proce-dural to a visual query language for OLAP. Proceedings of 10th IEEE SSDBM International Conference (pp. 74-83), Capri, Italy.
Chaudhuri, S., & Dayal, U. (1997). An overview of data warehousing and OLAP technology. ACM SIGMOD Record, 26(1), 65-74.
Figure 28. Experimental results for the visu-alization metrics with respect to the depth of HRQs P on the 1,000 × 1,000 two-dimensional real-life OLAP view built on top of the data set USCensus1990 with WH = 5, r = 10 %, and γ = 70 %

2� International Journal of Data Warehousing & Mining, 3(4), 1-30, October-December 2007
Copyright © 2007, IGI Global. Copying or distributing in print or electronic forms without written permission of IGI Globalis prohibited.
Chaudhuri, S., Das, G., Datar, M., Motwani, R., & Rastogi, R. (2001). Overcoming limitations of sampling for aggregation queries. Proceedings of 17th IEEE ICDE International Conference (pp. 534-542), Heidelberg, Germany.
Codd, E. F., Codd, S. B., & Salley, C. T. (1993). Pro-viding OLAP to user-analysts: An IT mandate. E. F. Codd and Associates Technical Report.
Colliat, G. (1996). OLAP, relational, and multidi-mensional database systems. SIGMOD Record, 25(3), 64-69.
Cuzzocrea, A. (2005). Overcoming limitations of approximate query answering in OLAP. Proceedings of 9th IEEE IDEAS International Conference (pp. 200-209), Montreal, Canada.
Cuzzocrea, A., & Wang, W. (2007). Approximate range-sum query answering on data cubes with probabilistic guarantees. Journal of Intelligent Information Systems, 28(2), 161-197.
Cuzzocrea, A., Furfaro, F., & Saccà, D. (2003). Hand-OLAP: A system for delivering OLAP services on handheld devices. Proceedings of 6th IEEE ISADS International Conference (pp. 80-87), Pisa, Italy.
Ezeife, C. I. (2001). Selecting and materializing horizontally partitioned warehouse views. Data & Knowledge Engineering, 36(2), 185-210.
Fang, M., Shivakumar, N., Garcia-Molina, H., Mot-wani, R., & Ullman, J.D., (1998). Computing iceberg queries efficiently. Proceedings of 24th VLDB International Conference (pp. 299-310), New York City, NY, USA.
Gebhardt, M., Jarke, M., & Jacobs, S. (1997). A toolkit for negotiation support interfaces to multi-dimensional data. Proceedings of 1997 ACM SIGMOD International Conference (pp. 348-356), Tucson, AZ, USA.
Gibbons, P. B., & Matias, Y. (1998). New sam-pling-based summary statistics for improving approximate query answers. Proceedings of 1998 ACM SIGMOD International Conference (pp. 331-342), Seattle, WA, USA.
Gray, J., Chaudhuri, S., Bosworth, A., Layman, A., Reichart, D., & Venkatrao, M. (1997). Data cube: A relational aggregation operator gen-eralizing group-by, cross-tab, and sub-totals.
Data Mining and Knowledge Discovery, 1(1), 29-53.
Gunopulos, D., Kollios, G., Tsotras, V. J., & Do-meniconi, C. (2000). Approximating multi-dimensional aggregate range queries over real attributes. Proceedings of 2000 ACM SIGMOD International Conference (pp. 463-474), Dal-las, TX, USA.
Gupta, A., Agrawal, D., & El Abbadi, A. (2003). Approximate range selection queries in peer-to-peer systems. Proceedings of 1st CIDIR International Conference, Asilomar, CA, USA. Retrieved from http://www-db.cs.wisc.edu/cidr/cidr2003/program/p13.pdf
Hacid, M. S., & Sattler, U. (1998). Modeling multidimensional databases: A formal object-centered approach. Proceedings of 6th ECIS International Conference (pp. 1-15), Aix-en-provence, France.
Han, J., & Kamber, M. (2000). Data mining: Con-cepts and techniques. Morgan Kauffmann Publishers.
Harinarayan, V., Rajaraman, A., & Ullman, J. (1996). Implementing data cubes efficiently. Proceed-ings of 1996 ACM SIGMOD International Conference (pp. 205-216), Montreal, Canada.
Ho, C. T., Agrawal, R., Megiddo, N., & Srikant, R. (1997). Range queries in OLAP data cubes. Pro-ceedings of 1997 ACM SIGMOD International Conference (pp. 73-88), Tucson, AZ, USA.
Inmon, W. H. (1996). Building the data warehouse. John Wiley & Sons.
Inselberg, A. (2001). Visualization and knowledge discovery for high dimensional data. Proceed-ings of 2nd IEEE UIDIS International Workshop (pp. 5-24), Zurich, Switzerland.
Keim, D. A. (1997). Visual data mining. Tutorial at 23rd VLDB International Conference, Ath-ens, Greece. Retrieved from http://www.dbs.informatik.uni-muenchen.de/daniel/VLDB-Tutorial.ps
Kimball, R. (1996). The data warehouse toolkit. John Wiley & Sons.
Koudas N., Muthukrishnan S., & Srivastava D. (2000). Optimal histograms for hierarchical

International Journal of Data Warehousing & Mining, 3(4), 1-30, October-December 2007 2�
Copyright © 2007, IGI Global. Copying or distributing in print or electronic forms without written permission of IGI Global is prohibited.
range queries. Proceedings of 19th ACM PODS International Symposium (pp. 196-204), Dal-las, TX, USA.
Lehner, W., Albrecht, J., & Wedekind, H. (1998). Normal forms for multivariate databases. Pro-ceedings of 10th IEEE SSDBM International Conference (pp. 63-72), Capri, Italy.
Lenz, H. J., & Shoshani, A. (1997). Summarizability in OLAP and statistical databases. Proceedings of 9th IEEE SSDBM International Conference (pp. 132-143), Olympia, WA, USA.
Lenz, H. J., & Thalheim, B. (2001). OLAP databases and aggregation functions. Proceedings of 13th IEEE SSDBM International Conference (pp. 91-100), Fairfax, VA, USA.
Maniatis, A., Vassiliadis, P., Skiadopoulos, S., & Vassiliou, Y. (2003a). CPM: A cube presentation model for OLAP. Proceedings of 5th DaWaK International Conference (pp. 4-13), Prague, Czech Republic.
Maniatis, A., Vassiliadis, P., Skiadopoulos, & S., Vassiliou, Y. (2003b). Advanced visualization for OLAP. Proceedings of 6th ACM DOLAP International Workshop (pp. 9-16), New Or-leans, LO, USA.
Muralikrishna, M., & DeWitt, D.J. (1998). Equi-depth histograms for estimating selectivity factors for multi-dimensional queries. Proceedings of 1998 ACM SIGMOD International Conference (pp. 28-36), Seattle, WA, USA.
OLAP Council. (1998). Analytical processing bench-mark 1, Release II. Retrieved from http://www.symcorp.com/downloads/OLAP_Council-WhitePaper.pdf
Piatetsky-Shapiro, G., & Connell, C. (1984). Accurate estimation of the number of tuples satisfying a condition. Proceedings of 1984 ACM SIGMOD International Conference (pp. 265-275), Bos-ton, MA, USA.
Poosala, V., & Ioannidis, Y. (1997). Selectivity estimation without the attribute value indepen-dence assumption. Proceedings of 23rd VLDB International Conference (pp. 486-495), Ath-ens, Greece.
Thanh Binh, N., Min Tjoa, A., & Wagner, R. (2000). An object oriented multidimensional data model for OLAP. Proceedings of 1st WAIM International Conference (pp. 69-82), Shang-hai, China.
Transaction Processing Council. (2006). TPC benchmark H. Retrieved from http://www.tpc.org/tpch/
Tsois, A., Karayannidis, N., & Sellis, T. (2001). MAC: Conceptual data modeling for OLAP. Proceedings of 3rd DMDW International Work-shop, Interlaken, Switzerland. Retrieved from http://sunsite.informatik.rwth-aachen.de/Publi-cations/CEUR-WS/Vol-39/paper5.pdf
University of California, Irvine. (2001). 1990 US Census Data. Retrieved from http://kdd.ics.uci.edu/databases/census1990/USCensus1990.html
University of California, Irvine. (2005). Knowledge discovery in databases archive. Retrieved from http://kdd.ics.uci.edu/
University of Hannover, Germany. (2005). 2D, 3D, and high-dimensional data and information visualization research group. Retrieved from http://www.iwi.uni-hannover.de/lv/seminar_ss05/bartke/home.htm
Vassiliadis, P. (1998). Modeling multidimensional databases, cubes, and cube operations. Pro-ceedings of 10th IEEE SSDBM International Conference (pp. 53-62), Capri, Italy.
Vassiliadis, P., & Sellis, T. (1999). A survey of logical models for OLAP databases. SIGMOD Record, 28(4), 64-69.
Vitter, J. S., Wang, M. & Iyer, B. (1998). Data cube approximation and histograms via wavelets. Proceedings of 7th ACM CIKM International Conference (pp. 96-104), Bethesda, MD, USA.
Xin, D., Han, J., Cheng, H., & Li, X. (2006). Answer-ing top-k queries with multi-dimensional selec-tions: The ranking cube approach. Proceedings of 32nd VLDB International Conference (pp. 463-475), Cairo, Egypt.
Zipf, G. K. (1949). Human behaviour and the prin-ciple of least effort. Addison-Wesley.

30 International Journal of Data Warehousing & Mining, 3(4), 1-30, October-December 2007
Copyright © 2007, IGI Global. Copying or distributing in print or electronic forms without written permission of IGI Globalis prohibited.
Alfredo Cuzzocrea received the Laurea Degree in computer science engineering on April 2001 and the PhD degree in computer science and system engineering on February 2005 both from the University of Calabria. Presently, he is a research fellow at the Department of Electronics, Computer Science and Systems of the University of Calabria, where is a member of the Database Research Group. He also actively collaborates with the Institute of High Performance Computing and Networking of the Italian National Research Council. His research interests include multidimensional data modeling and querying, data stream modeling and querying, data warehousing and OLAP, XML data management, Web information systems modeling and engineering, knowledge representation and management models and techniques, Grid and P2P computing. He is author or co-author of more than 60 papers in referred international conferences (including SSDBM, DEXA, DaWaK, DOLAP, IDEAS, SEKE, WISE, FQAS, SAC) and international journals (including JIIS, DKE, WIAS). He serves as program committee member of referred international conferences (including ICDM, CIKM, PAKDD, DaWaK, SAC) and as review board member of international journals (including TODS, TKDE, INS, IJSEKE, FGCS).
Domenico Saccà was born in Catanzaro (Italy) on November 5, 1950, and he received a Doctoral degree in Engineering from the University of Rome on 1975. Since 1987, he is full professor of Computer Engi-neering at the University of Calabria and, since 2002, he is also Director of the CNR (the Italian National Research Council) Research Institute ICAR (Institute for High Performance Computing and Networking), located in Rende (CS) and branches in Naples and Palermo. Previously, from 1995 on, he was director of the CNR Institute on System and Computer Sciences (Istituto per la Sistemistica e l’Informatica, ISI-CNR). In the past he was visiting scientist at IBM Laboratory of San Jose, at the Computer Science Department of UCLA and at the ICSI Institute of Berkeley; furthermore, he was a scientific consultant of MCC, Austin, and manager of the Research Division of CRAI. His current research interests focus on advanced issues on database such as: scheme integration in data warehousing, compressed representation of datacubes, workflow and process mining, logic-based database query languages. His list of publications contains more than 100 papers on journals (including Journal of the ACM, SIAM Journal on Computing, ACM Transac-tions on Database Systems, IEEE Transactions on Knowledge and Data Engineering, IEEE Transactions on Software Engineering, Theoretical Computer Science, Journal of Computer and System Sciences, Acta Informatica) and on proceedings of international conferences. He has been member of the program com-mittees of several international conferences, director of international schools and seminars and leader of many national and international research projects.
Paolo Serafino received the Laurea Degree in Computer Science Engineering on July 2006. Presently, he is research collaborator at Department of Electronics, Computer Science and Systems of the University of Calabria.