selenium and other trace element in phosphorites: a comparison between those of the bayovar-sechura...
TRANSCRIPT

Journal of Geochemical Exploration 107 (2010) 146–160
Contents lists available at ScienceDirect
Journal of Geochemical Exploration
j ourna l homepage: www.e lsev ie r.com/ locate / jgeoexp
Selenium and other trace element in phosphorites: A comparison between those ofthe Bayovar-Sechura and other provenances
J. Bech a,⁎, M. Suarez a, F. Reverter b, P. Tume c, P. Sánchez b, N. Roca a, A. Lansac a
a Faculty of Biology, University of Barcelona, Avda. Diagonal 645 (08028) Barcelona, Spainb Department of Statistics, Faculty of Biology, University of Barcelona, Avda. Diagonal 645 (08028) Barcelona, Spainc Facultad de Ingeniería, Universidad Católica de la Santisima Concepción, Casilla 297, Concepción, Chile
⁎ Corresponding author.E-mail address: [email protected] (J. Bech).
0375-6742/$ – see front matter © 2010 Elsevier B.V. Adoi:10.1016/j.gexplo.2010.04.002
a b s t r a c t
a r t i c l e i n f oArticle history:Received 23 December 2009Accepted 6 April 2010Available online 24 April 2010
Keywords:PhosphoriteSeleniumTrace elementsChemical analysisStatistical analysisBayovar-SechuraPeruProvenance
Data of trace element composition of phosphorites are scarce and incomplete. Phosphorites of different originscan vary substantially in trace element contents. In this paper 20 trace element concentrations of 35 samplephosphorites are reported. The geographical provenance is: Bayovar-Sechura (Peru), Khouribga, Youssoufiaand Boucraa (Morocco), Gafsa (Tunisia), Florida (USA), Idaho and Phosphoria Formation (USA), North Carolina(USA), Algeria, Israel, Senegal, Syria and Togo. Aqua regia extracts were used to estimate the “pseudototal”values, following standard procedures (ISO 11466, 2002) and measured by ICP-AES and ICP-MS.The ratio of medians of trace elements from Sechura versus other provenances, decreases in the followingsequence: Co(9)NMo (3.5)NMn (2.75)NAs (1.65)NSn (1.21)NSr (1.16)NCr, Cu, Ni, Pb (1.02)NTl (0.86)NSe (0.67)NU (0.53)NCd, Th (0.5)NV (0.44)NSb (0.38)NZn (0.29)NAg (0.25)NB (0.24). Using multivariatemethods we have seen that there are three main clusters: a first group with Phosphoria Formation, Idaho,Youssoufia and Senegal samples; a second group with Sechura phosphorites, enriched in Co and Mo and thethird consisting of the remaining samples.The highest trace element enrichment factors in decreasing order are: Cd, 386 (Idaho, USA)NAg, 78.5 (Idaho,USA)NSe, 73.3 (Youssoufia,Morocco)NU, 46.5 (Israel)NMo, 43 (Sechura II, Peru)NCr, 41 (Tobene, Senegal)NB,11.6 (Khouribga KIIC, Morocco)NSr, 10.4 (Israel)NZn, 10.2 (Idaho, USA). Mo enrichment is peculiar toPhosphorites of Sechura. The Permian phosphorites from Idaho and Phosphoria Formation, accumulate Cd, Ag,Se, Zn Sb, V, As, Tl and Cu. The depleted trace element assemblages of Sechura phosphorites are different fromthe other provenance phosphorites. Selenium and B normality is the main difference between Sechuraphosphorites versus the other provenance.Thewholeof thenormal, enrichedanddepleted traceelement inphosphorites, both individually and in assemblages,can be a useful tool such as a discriminating fingerprint in the research of the origin of the phosphorites.
ll rights reserved.
© 2010 Elsevier B.V. All rights reserved.
1. Introduction
Phosphorites contain a great variability of heavy metals and traceelements, which upon dissolution in the soil may be harmful at certainconcentrations. Special concern is given to the contents of Cd, As, U,Th, Pb, Cr, Se and Tl.
The composition of the phosphorites depends on the genesisconditions, lithology, stratigraphy and geographical provenance.There exists a general agreement concerning the enrichment oftrace elements in phosphorites (Krauskopf, 1955; Gulbrandsen, 1966;Tooms et al., 1969; Altschuler, 1980; Weissberg and Singers, 1982;Nathan, 1984; Sauerbeck, 1992; Van Kauwenberg, 1997; Gnandi andTobschall, 1999; Samb, 2002; Sattouf, 2007; Bech et al., 2009).
It is not only important to know the phosphorite trace elementassemblages for reasons of agronomic or fertilizer technology, but also
for environmental issues. Therefore the knowledge of the geograph-ical provenance of the phosphorite used is determinant in avoidingenvironmental and health problems. This is due to the fact that severalphosphorite deposits have significant concentrations of hazardoustrace elements.
Even given the extremely variable chemical composition ofphosphorites, several workers carried out research into trace elementassemblage or pattern related to origin (Swain, 1962; Gulbrandsen,1966; Toomset al., 1969; Senesi et al., 1979;Altschuler, 1980;Weissbergand Singers, 1982; Nathan, 1984; Sauerbeck, 1992; Kpomblekou andTabatabai, 1994; Van Kauwenberg, 1997; Samb, 2002; Chien, 2004,Presser et al., 2004; Sattouf, 2007, and Bech et al., 2009).
The aim of the present paper is the estimation of Se, Ag, As, B, Cd,Co, Cr, Cu, Mn, Mo, Ni, Pb, Sb, Sn, Sr, Th, Tl, U, V and Zn of thephosphorites of different provenances, in comparison with those ofBayovar-Sechura (Peru). A complementary objective is an approach toobtain a hypothetical “fingerprint” of the phosphorite origin based onthe Se and trace element concentration, statistical analysis and
147J. Bech et al. / Journal of Geochemical Exploration 107 (2010) 146–160
enrichment, depletion or normality, including individual and assem-blage patterns.
2. Material and methods
2.1. Studied samples
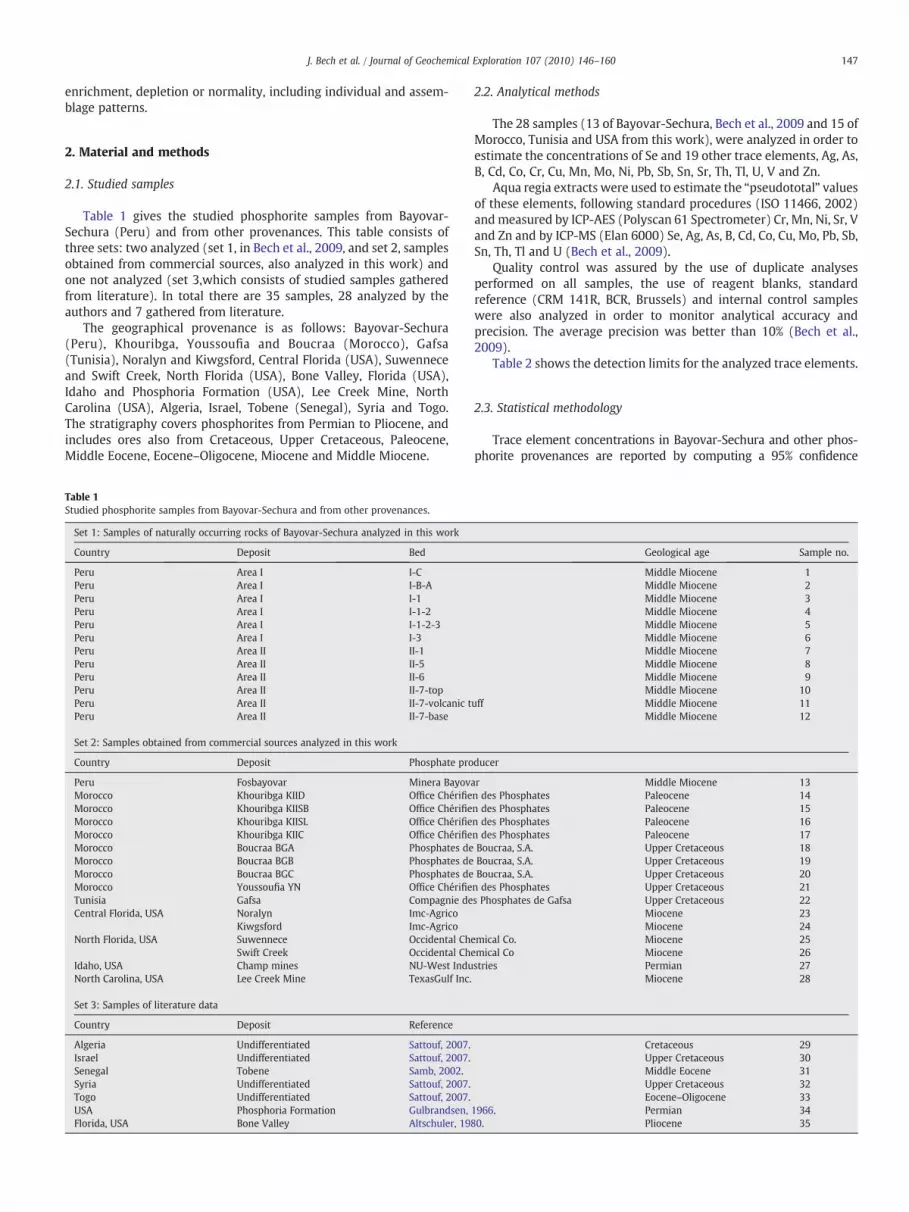
Table 1 gives the studied phosphorite samples from Bayovar-Sechura (Peru) and from other provenances. This table consists ofthree sets: two analyzed (set 1, in Bech et al., 2009, and set 2, samplesobtained from commercial sources, also analyzed in this work) andone not analyzed (set 3,which consists of studied samples gatheredfrom literature). In total there are 35 samples, 28 analyzed by theauthors and 7 gathered from literature.
The geographical provenance is as follows: Bayovar-Sechura(Peru), Khouribga, Youssoufia and Boucraa (Morocco), Gafsa(Tunisia), Noralyn and Kiwgsford, Central Florida (USA), Suwenneceand Swift Creek, North Florida (USA), Bone Valley, Florida (USA),Idaho and Phosphoria Formation (USA), Lee Creek Mine, NorthCarolina (USA), Algeria, Israel, Tobene (Senegal), Syria and Togo.The stratigraphy covers phosphorites from Permian to Pliocene, andincludes ores also from Cretaceous, Upper Cretaceous, Paleocene,Middle Eocene, Eocene–Oligocene, Miocene and Middle Miocene.
Table 1Studied phosphorite samples from Bayovar-Sechura and from other provenances.
Set 1: Samples of naturally occurring rocks of Bayovar-Sechura analyzed in this work
Country Deposit Bed
Peru Area I I-CPeru Area I I-B-APeru Area I I-1Peru Area I I-1-2Peru Area I I-1-2-3Peru Area I I-3Peru Area II II-1Peru Area II II-5Peru Area II II-6Peru Area II II-7-topPeru Area II II-7-volcanic tPeru Area II II-7-base
Set 2: Samples obtained from commercial sources analyzed in this work
Country Deposit Phosphate pro
Peru Fosbayovar Minera BayovMorocco Khouribga KIID Office ChérifieMorocco Khouribga KIISB Office ChérifieMorocco Khouribga KIISL Office ChérifieMorocco Khouribga KIIC Office ChérifieMorocco Boucraa BGA Phosphates deMorocco Boucraa BGB Phosphates deMorocco Boucraa BGC Phosphates deMorocco Youssoufia YN Office ChérifieTunisia Gafsa Compagnie deCentral Florida, USA Noralyn Imc-Agrico
Kiwgsford Imc-AgricoNorth Florida, USA Suwennece Occidental Ch
Swift Creek Occidental ChIdaho, USA Champ mines NU-West InduNorth Carolina, USA Lee Creek Mine TexasGulf Inc.
Set 3: Samples of literature data
Country Deposit Reference
Algeria Undifferentiated Sattouf, 2007.Israel Undifferentiated Sattouf, 2007.Senegal Tobene Samb, 2002.Syria Undifferentiated Sattouf, 2007.Togo Undifferentiated Sattouf, 2007.USA Phosphoria Formation Gulbrandsen,Florida, USA Bone Valley Altschuler, 19
2.2. Analytical methods
The 28 samples (13 of Bayovar-Sechura, Bech et al., 2009 and 15 ofMorocco, Tunisia and USA from this work), were analyzed in order toestimate the concentrations of Se and 19 other trace elements, Ag, As,B, Cd, Co, Cr, Cu, Mn, Mo, Ni, Pb, Sb, Sn, Sr, Th, Tl, U, V and Zn.
Aqua regia extracts were used to estimate the “pseudototal” valuesof these elements, following standard procedures (ISO 11466, 2002)andmeasured by ICP-AES (Polyscan 61 Spectrometer) Cr, Mn, Ni, Sr, Vand Zn and by ICP-MS (Elan 6000) Se, Ag, As, B, Cd, Co, Cu, Mo, Pb, Sb,Sn, Th, Tl and U (Bech et al., 2009).
Quality control was assured by the use of duplicate analysesperformed on all samples, the use of reagent blanks, standardreference (CRM 141R, BCR, Brussels) and internal control sampleswere also analyzed in order to monitor analytical accuracy andprecision. The average precision was better than 10% (Bech et al.,2009).
Table 2 shows the detection limits for the analyzed trace elements.
2.3. Statistical methodology
Trace element concentrations in Bayovar-Sechura and other phos-phorite provenances are reported by computing a 95% confidence
Geological age Sample no.
Middle Miocene 1Middle Miocene 2Middle Miocene 3Middle Miocene 4Middle Miocene 5Middle Miocene 6Middle Miocene 7Middle Miocene 8Middle Miocene 9Middle Miocene 10
uff Middle Miocene 11Middle Miocene 12
ducer
ar Middle Miocene 13n des Phosphates Paleocene 14n des Phosphates Paleocene 15n des Phosphates Paleocene 16n des Phosphates Paleocene 17Boucraa, S.A. Upper Cretaceous 18Boucraa, S.A. Upper Cretaceous 19Boucraa, S.A. Upper Cretaceous 20n des Phosphates Upper Cretaceous 21s Phosphates de Gafsa Upper Cretaceous 22
Miocene 23Miocene 24
emical Co. Miocene 25emical Co Miocene 26stries Permian 27
Miocene 28
Cretaceous 29Upper Cretaceous 30Middle Eocene 31Upper Cretaceous 32Eocene–Oligocene 33
1966. Permian 3480. Pliocene 35

Table 2Detection limits for the analyzed trace elements (mg kg−1).
Element Detection limits
Se 0.5Ag 0.2As 0.3B 33Cd 0.1Co 1Cr 2Cu 0.1Mn 0.8Mo 0.07Ni 1.7Pb 0.1Sb 0.07Sn 0.7Sr 0.8Th 0.1Tl 0.1U 0.1V 3Zn 0.8
148 J. Bech et al. / Journal of Geochemical Exploration 107 (2010) 146–160
interval for the mean. To complete the data description several orderstatistics such as: minimum, 25th, 50th and 75th percentiles and themaximum, are also summarized.
In order to compare trace element content among Bayovar-Sechura and other phosphorite provenances the Wilcoxon test forcomparison of medians and the Kolmogorov–Smirnov test for thehomogeneity of the distributions were performed.
Correlations between the trace element concentrations wereinvestigated by using Spearman's correlations based on rangeswithout any distribution assumption.
Multivariate relationships between trace element and sampleunits were analyzed by performing a principal component analysisbiplot (Gower and Hand, 1996) and cluster analysis. We used theEuclidean distance as a distance measure and the Ward's method as alinkage rule. This method uses an analysis of variance approach toevaluate the distances between clusters. In short, this methodattempts to minimize the sum of squares of any two (hypothetical)clusters that can be formed at each step.
In order to include in this analysis the third sample sets (literaturedata) the undetermined values of this set were filled with the globalaverage of each element.
Data analysis was performed using standard packages of the Rstatistical computing project (R, 2009).
3. Results and discussion
3.1. Selenium and other trace elements of phosphorites from Sechura andother provenances
Table 3 gives the concentrations of Se and nineteen trace elementsof Sechura (Peru) and other phosphorite provenances. Data below thedetection limit were replaced by values of half this limit (Sanfordet al., 1993). The most significant data are as follows.
Selenium: the lowest concentration (0.11 mg kg−1) was detectedin phosphorites fromTobene, Senegal, while the highest (44 mg kg−1)was found in Youssoufia, Morocco. Other high concentrations weredetected in Algeria (27.9 mg kg−1) and Champ mines, Idaho, USA(23 mg kg−1), Phosphoria Formation, USA (12 mg kg−1) and Gafsa,Tunisia (11 mg kg−1).
Silver: the lowest concentration (0.1 mg kg−1) was detected inphosphorites from Bayovar-Sechura, Area II, Peru, while the highest(5.5 mg kg−1) was found in Idaho, USA. Other significant concentra-tions were detected in Phosphoria Formation, USA (3 mg kg−1) andTobene, Senegal (2.5 mg kg−1).
Arsenic: the lowest concentration (0.7 mg kg−1) was detected inphosphorites from Tobene, Senegal and the highest (40 mg kg−1) inthose the Phosphoria Formation, USA. Also there are some significantconcentrations in Bayovar-Sechura, Peru (36 mg kg−1 in Sechura II,5and 23 mg kg−1 in Sechura I,1). Therefore the content of Fosbayovaris 21 mg kg−1.
Boron: the lowest concentration (13 mg kg−1) was detected inPhosphoria Formation, USA, and the highest (1157 mg kg−1) inKhouribga KIIC, Morocco. Other Morocco deposits, Youssoufia YNand Khouribga KIISL, show significant concentrations (Table 3). Alsothe phosphorites of Tobene, Senegal, Israel and North Carolina, USA,have concentrations over 800 mg kg−1.
Cadmium: the lowest concentration (2 mg kg−1)wasdetected in thevolcanic tuff, bed 7, Sechura II, Peru, and the highest (116 mg kg−1) inChamp mines, Idaho, USA. Deposits with Cd concentration over40 mg kg−1 were found in Youssoufia YN, Morocco (63 mg kg−1),Gafsa, Tunisia (53 mg kg−1), Sechura I,C, Peru (42 mg kg−1) andPhosphoria Formation, USA (40 mg kg−1).
Cobalt: the lowest concentration (0.5 mg kg−1) was detected inphosphorites of Morocco, Tunisia and North Carolina, USA, and thehighest (73 mg kg−1) in the volcanic tuff of Sechura II,7, Peru. Alsophosphorites of Sechura I,1-2, Peru, have a notable concentration(39 mg kg−1). Likewise a significant concentration (16.3 mg kg−1)was found in phosphorites from Tobene, Senegal.
Chromium: the lowest concentration (15 mg kg−1) was detectedin Sechura I,1-2, Peru and the highest (1000 mg kg−1) in PhosphoriaFormation, USA. Concentrations over 250 mg kg−1 were found inTobene, Senegal, Youssoufia YN and Khouribga KIISB, Morocco andSyria.
Copper: the lowest concentration (5 mg kg−1) was detected inKiwgsford, Central Florida, and Swift Creek, North Florida, USA, andthe highest (100 mg kg−1) in Phosphoria Formation, USA. Othersignificant concentrations, over 35 mg kg−1, were found in Idaho,USA, Tobene, Senegal and Togo.
Manganese: the lowest concentration (7 mg kg−1) was detected inKhouribga KIIC and Youssoufia YN, Morocco, and the highest(643 mg kg−1) in Sechura I, C, Peru. Concentrations over 230 mg kg−1
were found in Suwennece and Swift Creek, North Florida, Noralyn,Central Florida (USA), and “Fosbayovar” concentrate, Sechura, Peru, andBone Valley, Florida, USA.
Molybdenum: the lowest concentration (0.6 mg kg−1) wasdetected in Tobene, Senegal, and the highest (112 mg kg−1) inSechura II, 1, Peru. There are scarce deposits with Mo concentrationsover 30 mg kg−1: Phosphoria Formation, USA, several beds inSechura, Peru, and therefore the commercial concentrate Fosbayovaris rich in Mo (34 mg kg−1), as has been related by Sinclair et al.(1990), Charter et al. (1995) and Bech et al., 2009.
Nickel: the lowest concentration (3 mg kg−1) was detected inSechura II,1, Peru, and the highest (109 mg kg−1) in Tobene, Senegal.Over 45 mg kg−1 concentration can be mentioned: PhosphoriaFormation and Champ mines, Idaho, USA, Israel and Youssoufia YN,Morocco.
Lead: the lowest concentration (2.9 mg kg−1) was detected inSyria and the highest (55 mg kg−1) in Bone Valley, Florida, USA.Concentrations higher than 10 mg kg−1 were found in North andCentral Florida and Phosphoria Formation (USA), Sechura II,1, Peruand Togo.
Antimony: the lowest concentration (0.2 mg kg−1) was detectedin Sechura, Peru, and the highest (7 mg kg−1) in PhosphoriaFormation, USA. Values up to 3 mg kg−1 were detected in Khouribga,Morocco, and Champ mines, Idaho, USA.
Tin: the lowest concentration (0.3 mg kg−1) was detected inSechura II, Peru, and the highest (3.7 mg kg−1) in Tobene, Senegal.Concentrations up to 1.2 mg kg−1 were found in Boucraa BGB,Morocco, Idaho, and Suwennece, North Florida, USA, and Sechura Iand II, Peru.

Table 3Selenium and other trace element data in phosphorites from Sechura and other provenances (mg kg−1).
Sample no. Country Bed Ag As B Cd Co Cr Cu Mn Mo Ni Pb Sb Se Sn Sr Th Tl U V Zn
1 Peru Sechura I, C 0.2 22 81 42 4 242 17 643 40 17 7 0.6 2 1 1527 3 1 62 71 902 Peru Sechura I, B-A 0.3 3 59 4 8 73 20 52 7 18 4 0.2 0.5 1 332 1 1 3 51 583 Peru Sechura I, 1 0.2 23 89 33 3 154 10 165 29 12 7 0.6 2 0.8 1711 2 0.4 48 57 844 Peru Sechura I,1-2 0.3 2 16 17 39 15 11 95 2 9 9 0.5 0.5 1 76 1 1 0.2 40 775 Peru Sechura I, 2-3 0.3 5 58 27 4 88 16 60 13 19 3 0.4 0.5 0.8 513 1 0.2 15 41 706 Peru Sechura I, 3 0.5 21 94 53 8 185 22 70 47 30 6 1.4 3 1.2 1876 3 0.4 75 46 1537 Peru Sechura II, 1 0.1 5 84 8 4 236 10 52 112 3 11 0.4 5 0.3 2250 2 0.05 71 79 638 Peru Sechura II, 5 0.1 36 110 9 2 153 19 29 47 15 4 0.8 4 0.3 1557 2 0.1 78 41 339 Peru Sechura II, 6 0.1 18 133 4 15 150 18 42 31 22 5 0.9 6 0.3 1310 3 0.2 74 38 4910 Peru Sechura II, 7-top 0.2 17 81 4 14 129 30 53 14 21 5 0.8 2 0.9 861 3 0.3 30 49 4411 Peru Sechura II,7-volcanic tuff 0.2 3 16 2 73 20 6 98 3 9 3 0.2 0.5 1.4 165 1 0.3 2 22 2412 Peru Sechura II, 7-base 0.1 16 100 5 11 159 25 64 20 26 5 0.8 3 0.7 1222 4 0.2 80 55 4013 Peru Fosbayovar 0.2 21 99 38 3 133 10 243 34 3 7 0.7 2 0.7 1834 3 0.5 74 58 5214 Morocco Khouribga KIID 2.1 14 554 22 0.5 225 23 17 6 37 3 4.3 4 0.35 1076 5 0.2 116 222 33115 Morocco Khouribga KIISB 1.6 16 350 17 0.5 261 26 18 3 32 3 3.2 3 0.35 791 3 0.05 121 204 20916 Morocco Khouribga KIISL 1.8 16 1112 16 0.5 116 22 15 3 17 3 2.9 3 0.35 886 3 0.05 123 109 17517 Morocco Khouribga KIIC 2.1 13 1157 17 0.5 106 19 7 4 12 3 2.8 3 0.35 1030 4 0.05 116 107 23418 Morocco Boucraa BGA 0.4 7 57 3 0.5 148 9 13 2 13 3 0.8 2 0.35 1046 3 0.2 104 94 11619 Morocco Boucraa BGB 0.4 10 97 4 0.5 151 17 22 7 17 4 1.1 2 1.7 1092 3 0.2 141 119 17020 Morocco Boucraa BGC 0.2 11 135 4 0.5 159 18 17 5 29 3 1.2 2 0.8 1177 2 0.1 152 177 15521 Morocco Youssoufia YN 2.2 4 1128 63 0.5 331 20 7 28 45 4 2.1 44 0.35 1598 2 3 99 235 71622 Tunisia Gafsa 0.8 2 609 53 0.5 195 8 20 5 17 3 0.5 11 0.7 1940 8 1 29 33 38523 Central Florida, USA Noralyn 0.8 13 608 9 2 70 8 260 10 10 12 2.3 4 0.9 1095 5 1 138 105 8924 Central Florida, USA Kiwgsford 0.5 10 351 3 2 73 5 225 8 15 11 1.9 3 1 1046 6 1 84 75 6525 North Florida, USA Suwennece 0.5 7 340 6 1.5 80 7 274 11 3 14 1.6 3 1.2 1157 6 1 64 82 6826 North Florida, USA Swift Creek 0.7 8 161 4 2 71 5 245 15 9 11 2 3 0.8 1072 5 1 70 64 5827 Idaho, USA Champ mines 5.5 7 52 116 1 197 66 34 10 78 7 3.9 23 1.4 845 2 3 131 591 122628 North Carolina, USA Lee Creek Mine 0.8 13 815 39 0.5 130 8 55 10 13 3 1.2 5 0.7 2301 5 2 66 21 33329 Algeria Undifferentiated na 3.9 293 25.5 0.74 189 8.2 17.5 3.2 14.8 7.5 1.1 27.9 na 1876 na 3 62 na 15430 Israel Undifferentiated na 6.4 822 12.3 0.88 130 29.7 9.3 21.1 59 4.9 1.6 5 na 3123 na 0.27 172 na 41431 Senegal Tobene 2.5 0.7 867 37.1 16.3 371 58.8 197 0.6 109 5.7 1.9 0.11 3.7 392 1.5 na 67.9 488 51532 Syria Undifferentiated na 4.3 442 6.1 0.89 266 8.3 22.5 6 31.4 2.9 1 2 na 1238 na 0.13 58.6 na 32233 Togo Undifferentiated na 13.5 557 50 2.5 101 37.7 157 8.5 32.8 10 1 2 na 544 na 0.69 116 na 22034 USA Phosphoria Formationa 3 40 13 40 2 1000 100 30 30 100 10 7 12 na 1000 7 na 90 300 30035 Florida, USA Bone Valleyb 1.4 12 18 16 4.5 60 13 230 2.8 9 55 na 2.5 na 1400 6 na 140 70 180
na = not available.a Gulbrandsen.b Altschuler.
149J.Bech
etal./
Journalof
Geochem
icalExploration
107(2010)
146–160

−1)from
Sech
uraan
dothe
rprov
enan
ceph
osph
orites.
UMin
p25
Med
p75
Max
chura
Other
Sech
ura
Other
Sech
ura
Other
Sech
ura
Other
Sech
ura
Other
Sech
ura
Other
Sech
ura
Other
0.14
0.82
0.30
2.1
0.1
0.20
0.1
0.5
0.2
0.80
0.3
2.1
0.5
5.5
7.5
7.5
21.1
14.5
2.0
0.70
4.0
6.4
16.5
10.0
21.5
13.5
36.0
40.0
4.6
270
99.0
638
16.0
13.0
58.5
98.0
82.5
351
97.0
712
133
1157
6.4
14.6
28.2
37.6
2.0
3.0
4.0
6.0
8.5
17.0
30.0
39.0
53.0
116
2.2
0.50
28.6
3.4
2.0
0.50
4.0
0.50
8.0
0.88
14.5
2.0
73.0
16.3
7.0
114
181
282
15.0
60.0
80.5
101
152
148
172
225
242
1000
2.6
12.8
21.4
33.0
6.0
5.0
10.5
8.0
17.5
17.0
21.0
26.0
30.0
100
1.3
47.8
226
138
297.0
52.0
17.0
6222
.596
.522
564
327
41.2
6.1
49.6
14.2
2.0
0.60
10.0
3.2
24.5
7.0
43.5
11.0
112
34.0
1.9
17.9
21.6
43.5
3.0
3.0
10.5
12.0
17.5
17.0
21.5
37.0
30.0
109
4.2
3.6
7.4
12.9
3.0
2.9
4.0
3.0
5.0
4.9
7.0
10.0
11.0
55.0
0.42
1.4
0.85
2.7
0.2
0.50
0.4
1.1
0.60
1.6
0.80
2.8
1.4
7.0
1.2
2.8
3.6
11.9
0.5
0.11
0.5
2.0
2.0
3.0
3.5
5.0
6.0
44.0
0.60
0.50
1.0
1.4
0.3
0.35
0.5
0.35
0.85
0.70
1.0
1.0
1.4
3.7
110
2415
7215
4676
.039
242
310
0012
6610
9216
3415
9822
5031
231.5
3.3
2.8
5.1
1.0
1.5
1.0
3.0
2.0
4.0
3.0
6.0
4.0
8.0
0.20
0.43
0.66
1.3
0.05
0.05
0.05
0.20
0.30
0.35
0.70
1.0
1.0
3.0
4.1
85.8
65.7
117
0.2
29.0
0.2
67.9
55.0
104
74.5
131
80.0
172
9.5
92.8
58.9
239
22.0
21.0
22.0
70.0
47.5
107
56.0
222
79.0
591
3.6
162
87.2
410
24.0
52.0
42.0
116
60.5
209
80.5
333
153
1226
e95
%co
nfide
nceinterval
forthemea
n(L),up
perlim
itof
the95
%co
nfide
nceinterval
forthemea
n(U
),minim
um(m
in),25
thpe
rcen
tile
(p25
),med
ian(M
ed),75
thpe
rcen
tile
150 J. Bech et al. / Journal of Geochemical Exploration 107 (2010) 146–160
Strontium: the lowest concentration (76 mg kg−1) was detected inSechura I, Peru, and the highest (3123 mg kg−1) in Israel. Concentra-tions over 1800 mg kg−1 were found in Lee Creek Mine, NorthCarolina, USA, Sechura I and II and in the “Fosbayovar” concentrate,Peru, Gafsa, Tunisia, and Algeria.
Thorium: the lowest concentration (1 mg kg−1) was detected inSechura I, Peru, and the highest (8 mg kg−1) in Gafsa, Tunisia.Concentrations over 5 mg kg−1 were found in Phosphoria Formationand Florida, USA, and Khouribga KIID, Morocco.
Thallium: the lowest concentration (0.2 mg kg−1) was detectedin Khouribga, Morocco, and the highest (3 mg kg−1) in Youssoufia,Morocco, Algeria and Idaho, USA. In a phosphorite from Lee CreekMine, North Carolina, USA, was measured a concentration of2 mg kg−1.
Uranium: the lowest concentration (0.2 mg kg−1) was detected inSechura I,1-2, Peru, and the highest (172 mg kg−1) in Israel. In Table 3we can see some phosphorites with a content higher than 120 mg kg−1
(an usual level for industrial recovering of U) such as: Khouribga KIISBand KIISL, Boucraa BGB and BGC, Morocco, Noralyn and Bone Valley,Florida, and Idaho, USA.
Vanadium: the lowest concentration (21 mg kg−1) was detected inNorth Carolina, USA, and the highest (591 mg kg−1) in Idaho, USA.Other very high concentration (488 mg kg−1) was found in Tobene,Senegal. The deposits with a concentration greater than 200 mg kg−1
are Khouribga KIID, KIISB and Youssoufia, Morocco, and PhosphoriaFormation, USA.
Zinc: the lowest concentration (24 mg kg−1) was detected inSechura II, Peru, and the highest (1226 mg kg−1) in Idaho, USA. Alsovery high Zn concentration deposits are Youssoufia YN, Morocco(716 mg kg− 1), Tobene, Senegal (515 mg kg− 1) and Israel(414 mg kg−1). Likewise, concentrations higher than 300 mg kg−1
were found in Khouribga KIID, Morocco, Gafsa Tunisia, North Carolinaand Phosphoria Formation, USA, and Syria.
In summary:
• Some beds of Sechura (Peru) contain the highest concentration ofCo, Mn and Mo of this study.
• Khouribga KIIC and KIID (Morocco) show the highest concentra-tions of B and Sb, respectively.
• Youssoufia YN (Morocco) contains the highest concentration of Seand Tl.
• The highest concentration of Th was found in Gafsa (Tunisia).• Idaho (USA) contains the highest concentration of Ag, Cd, Tl, V andZn, and Phosphoria Formation (USA) has the highest concentrationof Ag, Cd, As, Cr and Cu.
• Israel contains the highest concentration of Sr and U.• Tobene, Senegal, contains the highest concentration of Ni and Sn.• Bone Valley, Florida (USA) contains the highest concentration of Pb.
Table4
Statistics
ofSe
lenium
andothe
rtraceelem
entco
nten
ts(m
gkg
Mea
nSE
L
Sech
ura
Other
Sech
ura
Other
Se
Ag
0.22
1.5
0.03
0.30
As
14.3
11.0
3.1
1.7
B76
.845
410
.187
.85
Cd17
.326
.14.5
5.6
Co15
.41.9
5.9
0.69
Cr13
419
821
.240
.48
Cu17
.022
.92.0
4.9
1Mn
119
92.8
48.8
21.7
1Mo
30.4
10.1
8.7
2.0
1Ni
16.8
30.7
2.2
6.2
1Pb
5.8
8.3
0.70
2.3
Sb0.63
2.0
0.10
0.31
Se2.4
7.3
0.54
2.2
Sn0.81
0.92
0.10
0.20
Sr11
1712
8520
712
666
Th2.2
4.2
0.30
0.43
Tl0.43
0.85
0.10
0.20
U44
.910
29.5
7.6
2V
49.2
166
4.4
34.8
3Zn
65.4
286
9.9
59.6
4
Mea
n(M
ean)
,stand
arderrorof
themea
n(SE),low
erlim
itof
th(p
75),max
imum
(Max
).
3.2. Statistics
3.2.1. Descriptive statisticsTable 4 shows a summary of statistics for Se and other trace
element concentrations (mg kg−1) from Sechura and other phospho-rite provenances. Fig. 1a and b shows the comparative Box-Plot of theconcentrations of 20 trace elements in Sechura versus the phosphor-ites from other provenances.
The Wilcoxon test for the comparison of medians among Sechuraand other provenance groups reveals that the medians of Ag(pb0.000), B (p=0.002), Co (pb0.000), Mo (p=0.017), Sb(pb0.000), Th (p=0.004), U (p=0.001), V (p=0.001) and Zn(pb0.000) are statistically different, and the medians of As, Cd, Cr,Cu, Mn, Ni, Pb, Se, Sn, Sr, Tl are not statistically different. We canaccept that the medians of Ag, B, Sb, Th, U, V and Zn from Sechura areless than the medians from other provenances. And we can admit that

Fig. 1. a. Comparative Box-Plot between Sechura and other provenance samples. b. Comparative Box-Plot between Sechura and other provenance samples.
151J. Bech et al. / Journal of Geochemical Exploration 107 (2010) 146–160
the medians of Co and Mo from Sechura are greater than the mediansfrom other provenances.
The Kolmogorov–Smirnov test for the comparison of two sampledistributions reveals that the distribution of Ag (pb0.000), As(p=0.041), B (pb0.000), Co (pb0.000), Mn (p=0.026), Mo(p=0.029), Sb (pb0.000), Se (p=0.020), Th (p=0.001), U(p=0.002), V (p=0.001) and Zn (pb0.000) is statistically differentfor Sechura than other provenances, and the distribution of Cd, Cr, Cu,Ni, Pb, Sn, Sr and Tl is not different for Sechura than other provenances.
Fig. 1a and b gives us the Box-Plot diagrams to explore thedistribution of the trace element contents. We observe in agreementwith above test that the medians of Ag, B, Co, Mo, Sb, Th, U, V and Znfrom Sechura and from other provenances are different. Also, we notethat the concentration distributions of Ag, As, B, Co, Mn, Mo, Sb, Se, Th,U, V and Zn show apparent differences.
In Table 4 we can see:The concentration (median) of the traceelements of Bayovar-Sechura phosphorites decreases in the followingobserved sequences:
1) SrNCr NBNMnNZnNUNVNMo NNi, Cu N AsNCdNCo NPbNSe,ThNSnNSbNTlNAg
The analogous sequence of median of trace elements for the otherprovenance phosphorites:
2) SrNBNZnNCrNVNUNMnNCd, Cu, NiNAsNMoNPbNThNSeNSbNCoNAgNSnNTl
It is seen that in Bayovar-Sechura and the other provenancephosphorites the first seven trace elements (independently of theorder) in sequences 1) and 2), are: Sr, Cr, B, Mn, Zn, U and V.
The ratio of medians of the trace elements for Sechura over otherprovenances, decreases in the following sequence:
3) Co(9)NMo (3.5)NMn (2.75)NAs (1.65)NSn (1.21)NSr (1.16)NCr,Cu, Ni, Pb (1.02)NTl (0.86)NSe (0.67)NU (0.53)NCd, Th (0.5)NV(0.44)NSb (0.38)NZn (0.29)NAg (0.25)NB (0.24)
From the exposed sequences, mainly by 3), the agronomical andenvironmental advantages of Bayovar-Sechura phosphorite seemobvious, enriched in Co, Mo and Mn, and low on Tl, Se, U, Cd andTh.

Table 5Positive inter-elemental correlations. The asterisk * indicate significance below 0.05.
Bayovar-Sechura Other provenances
High (N0.75) Medium (0.5 to 0.75) Low (b0.5) High (N0.75) Medium (0.5 to 0.75) Low (b0.5)
Ag Sn* Tl*, Zn Cd, Co, Cu, Mn, Ni Zn* (Cd, Cu, Ni, Sb, Se, V)* Cr*, As, B, Co, TlAs (B, Cr, Mo, Sb, Sr, U)*, Se, Th Cd, Cu, Ni, Pb, V, Zn Ag, Cd, Co, Cu, Mn,
Mo, Pb, Sb, Th, UB (Sb, Se, U)* (As, Cr, Mo, Sr, Th)* Cd, Cu, Ni, Pb, V Ag, Cd, Mo, Ni, Sb, Se, Sr, Tl, ZnCd Zn* Cr Ag, As, B, Mn, Mo, Ni, Pb, Sb,
Se, Sn, Sr, Th, Tl, U,V(Ag, Zn)* (Cr, Cu, Ni, Se)*, As,
B, Co, Mo, Sb, Tl, VCo Ag, Cu, Mn, Ni, Sn, Tl (Mn, Pb)* Sn* Ag, As, Cd, Cu, Mo, Th, TlCr (Mo, Sr, U)* (As, B, Se, Th, V)*, Cd, Pb Cu, Mn, Ni, Sb, Zn (Cu, Ni, V, Zn)* (Ag, Cd)*, Sb, SeCu Ni* (Sb, Th)* Ag, As, B, Co, Cr, Mo,
Se, Sr, Tl, U, V(Ni, V)* (Ag, Cr, Zn)* (Cd, U)*, As, Co, Sb, Se,
Mn (Sn, Tl)* Ag, Cd, Co, Cr, Pb, V, Zn (Co, Pb)* (Mo, Sn)* As, Sr, Th, TlMo (Cr, Se, Sr, U)* (As, B)*, Sb, Th Cd, Cu, Ni, Pb, V, Zn Mn* Tl*, As, B, Cd, Co, Pb,
Sb, Se, Sn, Sr, ThNi Cu* (Sb, Th)* Ag, As, B, Cd, Co, Cr, Mo,
Se, Sr, Tl, U, Zn(Cu, V, Zn)* (Ag, Cr)* Cd*, B, Sb, Se, Sn, U
Pb Zn*, Cr, V As, B, Cd, Mn, Mo, Sb,Se, Sr, Th, Tl, U
(Co, Mn)* (Sn, Tl)* As, Mo, Sb, Se, Th, U
Sb (B, Th)* (As, Cu, Ni, Se, U)*, Mo Cd, Cr, Pb, Sr, Zn Ag* As, B, Cd, Cr, Cu,Mo, Ni, Pb, Th, U, Zn
Se (B, Mo, Sr, U)* (Cr, Sb, Th)*, As, Cd, Cu, Ni, Pb, V (Ag, Tl, Zn)* Cd*, B, Cr, Cu, Mo,Ni, Pb, Sr, Th, V
Sn (Ag, Tl)* Mn Cd, Co, Zn (Co, Mn, Pb)* Mo, Ni, Tl, VSr (Cr, Mo, Se)* (As, B, U)*, Th Cd, Cu, Ni, Pb, Sb, V, Zn B, Mn, Mo, Se, Th, TlTh (Sb, U)* (B, Cr, Cu, Ni, Se)*, As, Mo, Sr Cd, Pb, V, Zn As, Co, Mn, Mo,
Pb, Sb, Se, Sr, TlTl Sn* (Ag, Mn)*, Zn Cd, Co, Cu, Ni, Pb, V (Pb, Se)* Mo*, Ag, B, Cd, Co,
Mn, Sn, Sr, Th, ZnU (B, Cr, Mo, Se, Th)* (As, Sb, Sr)* Cd, Cu, Ni, Pb, V Cu*, As, Ni, Pb, Sb, V, Zn
Cr*, Pb, Sr As, B, Cd, Cu, Mn, Mo,Se, Th, Tl, U, Zn
(Cu, Ni)* (Ag, Cr, Sb, Zn)* Cd, Se, Sn, U
Zn Cd* Pb*, Ag, As, Cr Mn, Mo, Ni, Sb, Sn,Sr, Th, Tl, V
(Ag, Ni)* (Cd, Cr, Cu, Se, V)* B, Sb, Tl, U
152 J. Bech et al. / Journal of Geochemical Exploration 107 (2010) 146–160
3.2.2. Inter-elemental correlationsTables 5 and 6 give us respectively the positive and negative
correlations between the trace elements from Sechura and otherprovenance deposits. Correlations are arranged in columns dependingon the strength of correlation. To measure the correlation we haveused the Spearman coefficient, which is a nonparametric statistic. Inthis manner we avoid any assumption of the statistical distribution ofthe data.
Table 6Negative inter-elemental correlations. The asterisk * indicate significance below 0.05.
Bayovar-Sechura
High (b−0.75) Medium (−0.75 To −0.5) Low (N−0.5)
Ag (B, Se)*, U As, Cr, Mo, Pb, Sb, Sr, Th, VAs Co* Ag, Mn, Sn, TlB (Ag, Sn)* Co, Mn, Tl, ZnCd Cd CuCo (As, Mo, Sr)*,Cd, Cr, V B, Pb, Sb, Se, Th, U, ZnCr Co Ag, Sn, TlCu Cd, Mn, Pb, Sn, ZnMn As, B, Cu, Mo, Ni, Sb, Se, Sr, Th, UMo Co*,Sn Ag, Mn, TlNi Mn, Pb, Sn, VPb Pb, Co, Cu, Ni, SnSb Ag, Co, Mn, Sn, Tl, VSe (Ag, Sn, Tl)* Co, Mn, ZnSn (B, Se)*,Mo, U As, Cr, Cu, Ni, Pb, Sb, Sr, Th, V
Sr Co* Ag, Mn, Sn, Tl
Th Ag, Co, Mn, Sn, TlTl Se*, U As, B, Cr, Mo, Sb, Sr, ThU Ag, Sn, Tl Co, Mn, Zn
V Co Ag, Ni, Sb, SnZn B, Co, Cu, Se, U
High significant positive correlations (greater or equal 0.75) werefound between the following pairs of elements:
a) 17 from Sechura phosphorites, Ag–Sn, B–Sb, B–Se, B–U, Cd–Zn, Cr–Mo, Cr–Sr, Cr–U, Cu–Ni, Mo–Se, Mo–Sr, Mo–U, Sb–Th, Se–Sr, Se–U,Sn–Tl and Th–U. Of these, only 7 pairs have geochemical affinities(Ag–Sn, Cd–Zn and Sn–Tl are chalcophilic and B–U, Cr–Sr, Cr–Uand Th–U are lithophilic, respectively).
Other provenances
High (b−0.75) Medium (−0.75 To −0.5) Low (N−0.5)
Mn, Mo, Pb, Sn, Sr, Th, UB, Cr, Ni, Se, Sn, Sr, Tl, V, Zn
Sn* As, Co, Cr, Cu, Mn, Pb, Th, U, VMn, Pb, Sn, Sr, Th, UB, Cr, Ni, Sb, Se, Sr, U, V, Zn
(Mn, Pb)* As, B, Co, Mo, Sn, Sr, Th, Tl, U(Mn)* (Sr, Th)*, B, Mo, Pb, Sn, Tl(Cr, Cu, Ni, Zn)* Ag, B, Cd, Sb, Se, U, V
Ag, Cr, Cu, Ni,U,V, ZnMn* As, Co, Mo, Pb, Sr, Th, TlCr* Ag, B, Cd, Cu, Ni, Sr, V, Zn
Se*, Co, Mn, Sn, Sr, TlSb*, As, Co, Mn, Sn, U
B* Ag, As, Cd, Cr, Cu, Sb, Se,Sr, Th, U, Zn
V* Cu*, Ag, As, Cd, Co, Cr, Ni, Pb,Sb, Sn, U, Zn
V* Cu*, Ag, B, Cd, Cr, Ni, Sn, U, ZnAs, Cr, Cu, Ni, Sb, U, VAg, B, Cd, Co, Cr, Mn, Mo,Se, Sn, Sr, Th, Tl
(Sr, Th)* As, B, Co, Mn, Mo, Pb, TlMn* As, Co, Mo, Pb, Sn, Sr, Th

Table 7Main principal components and their relative importance.
Trace element Main principal components
First Second Third
Ag 0.367 −0.056 0.032As 0.036 0.360 −0.363B 0.130 0.058 0.276Cd 0.282 −0.052 0.171Co −0.119 −0.398 −0.147Cr 0.255 0.168 −0.301Cu 0.316 −0.016 −0.336Mn −0.082 −0.001 −0.076Mo −0.051 0.254 −0.061Ni 0.336 −0.102 −0.215Pb −0.017 0.114 −0.011Sb 0.300 0.181 −0.203Se 0.227 0.043 0.371Sn 0.110 −0.379 −0.157Sr −0.001 0.402 0.259Th 0.058 0.343 0.013Tl 0.196 −0.104 0.395U 0.162 0.288 0.049V 0.355 −0.155 −0.059Zn 0.344 −0.100 0.219Standard deviation 2.5 1.7 1.6Proportion of variance 0.32 0.14 0.12Cumulative proportion 0.32 0.46 0.58
153J. Bech et al. / Journal of Geochemical Exploration 107 (2010) 146–160
b) 8 from other studied phosphorite provenances: Ag–Zn, Co–Mn,Co–Pb, Cu–Ni, Cu–V, Mn–Pb, Ni–V and Ni–Zn. Of these, only twopairs have geochemical affinities (Ag–Zn, chalcophile and Co–Mn,siderophile).
The only common pair is Cu–Ni and there are 16 couples fromSechura phosphorites, different from 7 other pairs of other phospho-rite provenances, which is probably indicative of different phospho-genesis conditions.
The couple Cu–Ni also presents a significant positive correlation intailings of Togo (Gnandi and Tobschall, 1999). The correlated pair B–Uof Sechura phosphorites also found by Sattouf (2007). The correlatedpair Cd–Zn of Sechura phosphorites, was cited by Altschuler (1980),Weissberg and Singers (1982) and Gnandi and Tobschall (1999) in theTogo tailings. The correlated pair Cr–Sr in Sechura was reported in theTogo tailings (Gnandi and Tobschall, 1999) and by Prévôt and Lucas(1980) in Morocco phosphorites.
The significant positive correlation of the pair Co–Mnwas found inother phosphorite provenances of this study as well as by Sattouf(2007). The positive correlation of the pair Cu–V, found inphosphorites of other provenances of this study, has also been citedby Prévôt and Lucas (1980) in Morocco phosphorites.
The positive correlation of the couple Ni–V found in thephosphorites of other provenances of this study, has also beendocumented by Lucas et al. (1980) and Prévôt and Lucas (1980). Thepositive significant correlation of the pair Ni–Zn of the phosphorites ofother provenances of this study has also been reported by Lucas et al.(1980), Prévôt and Lucas (1980) and Sattouf (2007).
Of all cited trace elements, Krauskopf (1955) observes thecorrelation between organic matter and the following trace elements:Ag, Cd, Cr, Cu, Mo, Ni, Se, V and Zn. Tooms et al. (1969) added to thislist Sr and U. The last cited authors found a correlation betweensulphide and Ag, Co, Cu, Mo, Sn, V and Zn.
Selenium has a highly significant positive correlation with B, Mo,Sr and U in Sechura desert but in contrast doesn't show a highlysignificant positive correlation with any trace element of otherprovenances.
Uranium is the trace elementmost positively correlatedwith othertrace elements in the Sechura deposits. It shows a highly significantpositive correlation with B, Cr, Mo, Se, Th. Nevertheless, it doesn'tshow a positive correlation with any trace element of otherprovenance.
Nickel is the trace element most positively correlated with othertrace elements in deposits of other provenances. It has a highlysignificant positive correlation with Cu, V and Zn.
The negative correlation both between the trace elements ofSechura and other provenances is almost non-existent: null at highstrength and at medium strength only B and Sn but in both types ofphosphorites. In the case of B–Sn, they are of a different geochemicalaffinity (lithophilic and siderophilic). So the statistics agree withGoldschmidt's geochemical classification.
In summary, there are few positive correlations between traceelements from Bayovar-Sechura and other provenances and thereexist almost no negative correlations between the trace elements ofboth origins. These statistical features are probably indicative of agreat specificity of the trace element assemblages of the phosphoritesof different deposits, each one a consequence not only of generalgeochemical rules, but also the results of numerous genetic factorssuch as pH, rH, type of organic matter, abundance of sulphides, ironoxides, clays, various parent rocks, diagenetic history, degree ofweathering and differential environments (shallow open shelf,platform sediments, geosynclines and geological age).
3.2.3. Principal component analysisThe principal component analysis results are reported in Table 7.
Fig. 2a gives the coordinates of the deposits and Fig. 2b gives the
coordinates of the trace elements. By combining the informationgiven in both plots we can deduce the relationships between depositsand trace elements. Deposits lying in the same direction of a givenelement from the origin will tend to have higher content of thiselement. In contrast, deposits lying on the opposite direction respectthe axis origin from a given element will tend to have a lower contentof this element.
The main dimension (Table 7 and Fig. 2b) is of Ag, Cu, Ni, Sb, V andZn contents in contrast with Co, Mn and Mo contents, accounting for32% of the variability. The second dimension was that of As, Sr and Thin contraposition with Co and Sn, accounting for 14% of the variability.The third dimension was that of Se and Tl in contrast with As, Cr andCu. This dimension accounts the 12% of the variability.
As we can see in Fig. 2a and b, deposit Champ Mines (Idaho, USA),sample 27, is associated with higher values of Ag, Cd, Cu, Ni, V and Zn.Deposit Phosphoria Formation (USA), sample 34, is related withhigher contents of U and lower content of Co. Deposit Youssoufia YN(Morocco), sample 21, is associated with higher contents of Se and B,and with lower contents of Mn. Deposit Tobene (Senegal), sample 31,is associated with lower contents of As, Mo, Sr and moderately highcontent of Sn. Deposits Sechura II, 7-volcanic tuff and Sechura I, 1-2(Peru), samples 11 and 4, are associated with higher content of Co andlower contents of U. Deposit Sechura II, 1 (Peru), sample 7, isassociated with higher contents of Mo. In summary, principalcomponent analysis reveals a group consisting of samples 34, 21, 27and 31 separated from other samples. Another group, as we can see inthe bottom left corner of Fig. 2a, consists of samples 4 and 11, and therest of the samples are located in a “cloud” around the axis origin(Fig. 2a). In respect to trace element plots (Fig. 2b) Mo points mainlyto Sechura deposits and Co points to samples 4 and 11 as having thehighest concentrations.
3.2.4. Cluster analysisIn order to describe underlying group similarities between
samples we have analyzed the three data sets with hierarchicalcluster analysis (Fig. 3). We observe that the samples from Bayovar-Sechura are distinguished and grouped mainly in the same cluster.This fact is in agreement with the component principal results. Forexample samples 4 and 11 are grouped in the sameway as was shownabove by principal components.

Fig. 2. a. Two leading principal components. Plot of sample deposits. b. Two leading principal components. Plot of trace elements.
154 J. Bech et al. / Journal of Geochemical Exploration 107 (2010) 146–160
The samples from Morocco, excluding the Youssoufia deposit, aregrouped in a cluster. This fact was also highlighted by principalcomponents.
The samples from Florida, USA, are grouped with homogeneity.The geological age is distinguished and grouped with homogene-
ity, except in few cases where the action of some other factors couldweaken the importance of geological age.
In general, the groups obtained by cluster analysis are inagreement with the principal component analysis results. Thisconcordance supports the evidence that the sets of trace element
concentrations provide a methodology for identifying the diverseorigins of phosphorite deposits.
3.3. Enrichment and depletion of trace elements: comparison betweenthose of Bayovar-Sechura with the other provenances
There is a general agreement on the enrichment of several traceelements in phosphorites (Krauskopf, 1955; Gulbrandsen, 1966;Tooms et al., 1969; Prevot et al., 1977; Prévôt and Lucas, 1980;Altschuler, 1980; Nathan, 1984; Mc Arthur, 1985; Kpomblekou and

Fig. 3. Hierarchical cluster of sample deposits.
155J. Bech et al. / Journal of Geochemical Exploration 107 (2010) 146–160
Tabatabai, 1994; Van Kauwenberg, 1997; Gnandi and Tobschall, 1999;Samb, 2002; Sattouf, 2007; Bech et al., 2009).
Tables 8–14 give us the ratio of trace element concentration of the35 studied phosphorites versus the average shale (adapted fromAlloway, 1995; Gromet et al., 1984 and Wedepohl, 1991) in order toexamine enrichment, depletion and normality. It is considered here,like in Bech et al. (2009), that there is enrichment for ratios N2, normalconcentrations are associated to ratios ranging from 0.5 to 2 and ratiosunder 0.5 indicate depletion. In the last cited work we can find themainly enriched, depleted and normal abundant trace elements ofSechura phosphorites.
3.3.1. EnrichmentTrace element enrichment factors are exposed, in decreasing
order, in Table 8.From Table 8 we have calculated the percentage of presence in the
studied deposits of the enriched trace element (ETE), which in adecreasing order is: Cd (100%)NU (91.4%)NSe (85.7%)NAg (77.1)NSr(74.3%)NMo (62.9%)NB(42.9%)NCr(28.6%)NZn(22.9%)NAs, Tl, V(8.6%)NCo(5.7%)NSb (5.7%)NCu, Pb, Th (2.9%).
The comparison between the percentage of presence of ETE inSechura versus other provenance of ETE presence deposits, indecreasing order, is (ratio between Sechura and other provenancepercentages): Mo (1.7)NCd (1)NSr (0.9)NAg, As, U (0.8)NCr, Se (0.7).The ratio of B, Cu, Pb, Tl, V, Zn, Sb and Th is equal to 0 because theseelements are not ETE in Sechura. On the contrary, Co is not an ETE inother provenance phosphorites.
In the latter ratios the presence of enriched Mo in Sechuraphosphorite stands out. There is an analogous presence of enriched Cdphosphorites and a lower presence of enriched Sr, Ag, As, U, Cr and Se,versus other provenance phosphorites.
Two complementary aspects are considered at once: a) theindividual trace element enrichment, and b) the “pattern” orassemblages of trace element enrichment.
a) Individual trace element enrichmentThe highest enrichment factors for every ETE, in decreasing orderof magnitude are given in Table 9, that shows also thecorresponding country, deposit and geological age.The most significant features of the trace element enrichment ofphosphorites (Tables 8 and 9) are:
• Selenium: besides the highest Se enrichment factor, 73.3, fromthe Youssoufia (Morocco) phosphorites, other significant valuesare: 46.5 (Algeria), 38.3 (Idaho, USA), 20 (Phosphoria Formation,USA), 18.3 (Gafsa, Tunisia), 10 (Sechura II, Peru) and 8.3 (alsoSechura II, Peru, N. Carolina, USA, and Israel). The detailedenrichment of Se and other trace elements from the Sechurabeds is shown in Bech et al. (2009).
• High enrichment in phosphorites of Permian age (Idaho andPhosphoria Formation, USA), which accumulate Cd, Ag, Se, Zn,Sb, V, As, Tl and Cu.
• Silver is enriched in Permian phosphorites from Idaho andPhosphoria Formation (USA), in Tobene (Senegal) and Youssou-fia and Khouribga (Morocco).
• The highest U enrichment is found in phosphorites of the UpperCretaceous from Israel and Boucraa (Morocco) and the Miocenefrom Florida (USA) and Permian from Idaho (USA).
• The molybdenum enrichment is peculiar to phosphorites ofSechura (Peru), with an also noteworthy presence in Youssoufia(Morocco) and the Phosphoria Formation (USA).
• The most significant Cr enrichment is found in Tobene (Senegal)and the Phosphoria Formation (USA).

Table 8Enrichment factor of trace elements of phosphorites.
Deposit Sample no. Geological age Decreasing order of enrichment factor
Sechura, I-Bed C 1 Middle Miocene Cd(140)NU(16.8)NMo(15.4)NSr(5.1)NSe(3.3)NAg(2.9)NCr(2.7)Sechura, I-Interlayer B-A 2 Middle Miocene Cd(13.3)NAg(4.3)NMo(2.7)Sechura, I-Bed 1 3 Middle Miocene Cd(110)NU(13)NMo(11.2)NSr(5.7)NSe(3.3)NAg(2.9)Sechura, I-Interlayer 1-2 4 Middle Miocene Cd(56.7)NAg(4.3)NCo(2.1)Sechura, I-Interlayer 2-3 5 Middle Miocene Cd(90)NMo(5)NAg(4.3)NU (4)Sechura, I-Bed 3 6 Middle Miocene Cd(176)NU(20.3)NMo(18.1)NAg(7.1)NSr(6.3)NSe(5)NCr(2.1)Sechura, II-Bed 1 7 Middle Miocene Mo(43)NCd(26.7)NU(19.2)NSe(8.3)NSr (7.5)NCr(2.6).Sechura, II-Bed 5 8 Middle Miocene Cd(30)NU(21.1)NMo(18)NSe(6.7)NSr(5.2)NAs(2.8)Sechura, II-Bed 6 9 Middle Miocene U(20)NCd (13.3)NMo (11.9)NSe (10)NSr (4.4)Sechura, II-Bed 7-top 10 Middle Miocene Cd(13.3)NU(8.1)NMo(5.4)NSe(3.3)NAg, Sr(2.9)Sechura, II-Bed 7-volcanic tuff 11 Middle Miocene Cd(6.7)NCo(3.8)NAg(2.9)Sechura, II-Bed 7-base 12 Middle Miocene U(21.6)NCd(16.7)NMo(7.7)NSe(5)NSr(4)Fosbayovar 13 Middle Miocene Cd(126)NAg(28)NU(20)NMo(13.1)NSr(6.1)NSe(3.3)Khouribga KIID 14 Paleocene Cd(73.3)NU(31.4)NAg(30)NSe(6.7)NB(5.5)NSr(3.6)Khouribga KIISB 15 Paleocene Cd(56.7)NU(32.7)NAg(22.9)NSe(5)NB(3.5)NCr(2.9)NSr(2.6)NSb(2.1)Khouribga KIISL 16 Paleocene Cd(53.3)NU(33.2)NAg(25.7)NB(11.1)NSe(5)NSr(3.0)Khouribga KIIC 17 Paleocene Cd(56.7)NU(31.4)NAg(30)NB(11.6)NSe(5)NTh(3.4)Boucraa BGA 18 Upper Cretaceous U(21.1)NCd(10)NAg(5.7)NSr(3.5)NSe(3.3)Boucraa BGB 19 Upper Cretaceous U(38.1)NCd(13.3)NAg(5.7)NSr(3.6)NSe(3.3)NMo(2.7)Boucraa BGC 20 Upper Cretaceous U(41)NCd(13.3)NSr(3.9)NSe(3.3)NAg(2.9)Youssoufia YN 21 Upper Cretaceous Cd(210)NSe(73.3)NAg(31.4)NU(26.7)NB(11.2)NMo(10.7)NZn(5.9)NSr(5.3)NCr(3.5)NTl(2.5)Gafsa 22 Upper Cretaceous Cd(176)NSe(18.3)NAg(11.4)NU(7.8)NSr(6.4)NB(6)NZn(3.2)NCr(2.1)C. Florida, Noralyn 23 Miocene U(37.3)NCd(30)NAg(11.4)NSe(6.7)NB(6.1)NSr(3.7)C. Florida, Kiwgsford 24 Miocene U(22.7)NCd(10)NAg(7.1)NSe(5)NSr, B(3.5)NMo(3)N. Florida, Suwennece 25 Miocene Cd(20)NU(17.3)NAg(7.1)NSe(5)NMo(4.2)NSr(3.8)NB(3.4)N. Florida, Swift Creek 26 Miocene U(18.9)NCd(13.3)NAg(10)NMo(5.8)NSe(5)NSr(3.6)Idaho, Champ mines 27 Permian Cd(386)NAg(78.5)NSe(38.3)NU(35.4)NZn(10.2)NV(4.5)NMo(3.8)NSr(2.8)NTl(2.5)NCr(2.1)N. Carolina, L. C. Mine 28 Miocene Cd(130)NU (17.8)NAg (11.4)NSe(8.3)NB(8.1)NMo(3.8)NZn(2.7)Algeria, Undifferentiated 29 Cretaceous Cd(85)NSe(46.5)NU(16.7)NSr(6.3)NB(2.9)NTl(2.5)NCr(2.1)Israel, Undifferentiated 30 Upper Cretaceous U(46.5)NCd(41)NSr(10.4)NSe(8.3)NB(8.2)NMo(8.1)NZn(3.5)Senegal, Tobene 31 Middle Eocene Cd(123)NCr(41)NAg(35.7)NU(18.3)NB(8.7)NZn(4.2)NV(3.6)Syria, Undifferentiated 32 Upper Cretaceous Cd(20.3)NU(15.8)NSr(4.1)NB(3.8)NSe(3.3)NAs(3.0)NZn(2.7)NMo(2.3)Togo, Undifferentiated 33 Eocene–Oligocene Cd(166)NU(31.3)NB(5.6)NSe, Mo(3.3)Phosphoria Formation 34 Permian Cd(133)NAg(42.8)NU(24.3)NSe(20)NMo(11.5)NCr(11.1)NSb(4.7)N
Sr(3.3)NAs(3)NZn(2.5)NV(2.3)NCu(2.2)Florida, Bone Valley 35 Pliocene Cd(53.3)NU(37.8)NAg(20)NSr(4.7)NSe(4.2)NPb(2.4)
156 J. Bech et al. / Journal of Geochemical Exploration 107 (2010) 146–160
• Higher enrichment factors of B are found in Khouribga andYoussoufia (Morocco) and Tobene (Senegal), Israel and N.Carolina (USA).
• Strontium enrichment predominate in the Upper Cretaceousfrom Israel, Gafsa (Tunisia), Algeria and Youssoufia (Morocco)and the Middle Miocene from Sechura (Peru).
b) The “pattern” or assemblages of enriched trace elementsGiven the data of Tables 8 and 9, it appears obvious that thesignificant enrichment of individual trace elements in phosphor-
Table 9Trace element enrichment (individual) in decreasing order of magnitude.
Trace element Enrichment factor Country
Cd 386 USAAg 78.5 USASe 73.3 MoroccoU 46.5 IsraelMo 43 PeruCr 41 SenegalB 11.6 MoroccoSr 10.4 IsraelZn 10.2 USASb 4.7 USAV 4.5 USACo 3.8 PeruTh 3.4 MoroccoAs 3 USA
3 SyriaTl 2.5 Morocco
USAAlgeria
Pb 2.4 USACu 2.2 USA
ites from different provenances, can be a useful indicator of theirorigin. However, it seems that to obtain a geographical andgeological fingerprint is a more useful assemblage of the five toseven (usually six) enriched trace elements in decreasing orderwith some eventual permutation of each of the differentphosphorites. Table 10 shows these assemblages, ordered bygeological and geographical provenance. These assemblages canfacilitate not only the knowledge of the presence and eventualawareness of the trace elements with potential toxicity, but also
Deposit Geological age
Idaho PermianIdaho PermianYoussoufia Upper CretaceousUndifferentiated Upper CretaceousSechura II, Middle MioceneTobene Middle EoceneKhouribga KIIC PaleoceneUndifferentiated Upper CretaceousIdaho PermianPhosphoria Formation PermianIdaho PermianSechura II Middle MioceneKhouribga KIIC PaleocenePhosphoria Formation PermianUndifferentiated Upper CretaceousYoussoufia Upper CretaceousIdaho PermianUndifferentiated Upper CretaceousFlorida, Bone Valley PliocenePhosphoria Formation Permian

Table 10Trace element enrichment (assemblages) arranged by geological age and geographicalprovenance.
Geological age Country Deposit Assemblage
Permian USA Idaho Cd, Ag, Se, U, Zn, V, MoPermian USA Phosphoria Formation Cd, Ag, U, Se, Mo, Cr, SbUpper Cretaceous Algeria Undifferentiated Cd, Se, U, Sr, Mo, Tl, CrUpper Cretaceous Morocco Boucraa BGA U, Cd, Ag, Sr, SeUpper Cretaceous Morocco Boucraa BGB U, Cd, Sr, Se, AgUpper Cretaceous Morocco Boucraa BGC U, Cd, Sr, Se, AgUpper Cretaceous Israel Undifferentiated U, Cd, Sr, Se, B, Mo, ZnUpper Cretaceous Syria Undifferentiated Cd, U, Sr, B, Se, As, ZnPaleocene Morocco Khouribga KIID Cd, U, Ag, Se, B, SrPaleocene Morocco Khouribga KIISB Cd, U, Ag, Se, B, CrPaleocene Morocco Khouribga KIISL Cd, U, Ag, B, Se, SrPaleocene Morocco Khouribga KIIC Cd, U, Ag, B, Se, ThMiddle Eocene Senegal Tobene Cd, Cr, Ag, U, B, ZnEocene–Oligocene Togo Undifferentiated Cd, U, B, Se, MoMiddle Miocene Peru Sechura I Cd, U, Mo, Sr, Se, Aga
Middle Miocene Peru Sechura II Cd, U, Mo, Se, Sr, Aga
Miocene USA C. Florida, Noralyn U, Cd, Ag, Se, B, SrMiocene USA C. Florida, Kiwgsford U, Cd, Ag, Se, Sr, MoMiocene USA N. Florida, Suwennece Cd, U, Ag, Se, Mo, Sr, BMiocene USA N. Florida, Swift Creek U, Cd, Ag, Mo, Se, SrMiocene USA N. Carolina, L.C. Mine Cd, U, Ag, Se, B, Mo, ZnPliocene USA Florida, Bone Valley Cd, U, Ag, Sr, Se, Pb
a At least 30% of deposits.
157J. Bech et al. / Journal of Geochemical Exploration 107 (2010) 146–160
the ascertainment of the origin or provenance of the differentphosphorites.
Some significant facts are:
• Cd and U are ETE in 100% of studied assemblages. Se are ETE in95.5%, Ag in 82%, Sr in 68%, Mo in 50%, Zn in 23% and Cr in 13.5%.
Table 11Depletion Factor of trace elements of phosphorites.
Deposit Sample no. Geological age Decreasing order of de
Sechura, I-Bed C 1 Middle Miocene Sn(6)NCo(4.8)NTh(4.1Sechura, I-Interlayer B-A 2 Middle Miocene Mn(16.3)NTh(12.3)NSSechura, I-Bed 1 3 Middle Miocene Sn(7.5)NCo(6.3)NTh(6Sechura, I-Interlayer 1-2 4 Middle Miocene U(18.5)NTh(12.3)NMnSechura, I-Interlayer 2-3 5 Middle Miocene Mn(14.2)NTh(12.3)NPSechura, I-Bed 3 6 Middle Miocene Mn(12.1)NSn(5)NTh(Sechura, II-Bed 1 7 Middle Miocene Tl(24)NNi(22.7)NSn(2Sechura, II-Bed 5 8 Middle Miocene Mn(29.3)NSn(20)NTl(Sechura, II-Bed 6 9 Middle Miocene Mn(20.2)NSn(20)NTl(Sechura, II-Bed 7-top 10 Middle Miocene Mn(16)NSn(6.7)NPb(4Sechura, II-Bed 7-volcanic tuff 11 Middle Miocene Th(12.3)NMn(8.7)NPbSechura, II-Bed 7-base 12 Middle Miocene Th(13.3)NSn(8.6)NTl(Fosbayovar 13 Middle Miocene Ni(22.7)NSn(8.6)NCo(Khouribga KIID 14 Paleocene Mn(50)NCo(38)NSn(1Khouribga KIISB 15 Paleocene Mn(47.2)NCo(38)NTl(Khouribga KIISL 16 Paleocene Mn(56.7)NCo(38)NTl(Khouribga KIIC 17 Paleocene Mn(121.4)NCo(38)NTBoucraa BGA 18 Upper Cretaceous Mn(65.4)NCo(38)NSnBoucraa BGB 19 Upper Cretaceous Mn(38.6)NCo(38)NTl(Boucraa BGC 20 Upper Cretaceous Mn(50)NCo(38)NTl(1Youssoufia YN 21 Upper Cretaceous Mn(121.4)NCo(38)NSGafsa 22 Upper Cretaceous Mn(42.5)NSn(8.5)NPbC. Florida, Noralyn 23 Miocene Co(9.5)NNi(6.8)NSn(6C. Florida, Kiwgsford 24 Miocene Cu(9)NCo(8.5)NSn(6)N. Florida, Suwennece 25 Miocene Ni(22.6)NCo(12.7)NCuN. Florida, Swift Creek 26 Miocene Co(9.5)NCu(9)NNi(7.6Idaho, Champ mines 27 Permian Mn(25)NCo(19)NTh(6N. Carolina, L.C. Mine 28 Miocene Co(38)NMn(15.5)NSnAlgeria, Undifferentiated 29 Cretaceous Mn(48.6)NCo(25.7)NCIsrael, Undifferentiated 30 Upper Cretaceous Mn(91.4)NCo(21.6)NPSenegal, Tobene 31 Middle Eocene As(17.1)NTh(8.2)NSn(Syria, Undifferentiated 32 Upper Cretaceous Mn(114.9)NCo(21.3)NTogo, Undifferentiated 33 Eocene–Oligocene Co(7.5)NMn(4.7)NPb(Phosphoria Formation 34 Permian Mn(28.3)NCo(9.5)NB(Florida, Bone Valley 35 Pliocene Ni(7.6)NB(5.6)NCo(4.
• Sechura I and Sechura II have six common ETE: Cd, U, Mo, Sr, Se andAg. The three first elements are arranged in the same order and onlySr and Se change the order in both deposits.
• Also Suwennece and Swift Creek (North Florida, USA) have sixcommon ETE (Cd, U, Ag, Se, Mo, and Sr). Only the different ordersequence distinguishes both deposits.
• Idaho and Phosphoria Formation have five common ETE (Cd, Ag, Se,U and Mo).
• Both the studied deposits of Central Florida have the same five ETE(U, Cd, Ag, Se, and Sr). Only the order is different, plus someuncommon ETE.
• Likewise the three studied Boucraa (Morocco) deposits have five 5common ETE (U, Cd, Ag, Sr, and Se), even in the same order asBoucraa BGB and BGC, different of BGA.
• The five studied Florida deposits have five common ETE (U, Cd, Ag,Se, and Sr).
• The phosphorites of the four different deposits of Khouribga(Morocco) have five common ETE (Cd, U, Ag, Se, and B).
Aswe can see in Table 10, the differences between deposit patternsconsist in the specific ETE of each deposit or in the different order ofthe ETE, in the assemblages. These peculiar patterns are a usefulapplied geochemical and environmental tool to research the origin ofa particular phosphorite.
3.3.2. DepletionTrace element depletion factors are given in Tables 11, 12 and 13.From Table 11 we have calculated the percentage of presence in
the studied deposits of this study of the depleted trace element (DTE),which in a decreasing order is: Mn (94.3%)NPb (88.6%)NSn, Ni(82.9%)NCo (80%)NTh (77.1%)NCu (68.6%)NTl (57%)NV (40%)NSb
pletion factor
)NNi(4)NPb(3.3)NCu(2.6)NSb(2.5)b(7.5)NSn(6)NPb(5.6)NAs(4.3)NNi(3.8)NV(2.5)NCo(2.4)NCu(2.3)NZn(2.1).2)NNi(5.7)NMn(5.2)NCu(4.5)NPb(3.3)NTl(3)NSb(2.5)NV(2.3)(8.9)NNi(7.6)NAs(6.5)NB(6.3)NCr,Sn(6)NCu(4.1)NSr(3.9)NV(3.3)NSb(3)NPb(2.6)b(7.7)NSn(7.5)NTl(6)NCo(4.8)NSb(3.8)NNi(3.6)NV(3.2)NCu(2.8)NAs(2.6)4.1)NPb(3.8)NTl(3)NV(2.8)NCo(2.4)NNi(2.3)0)NMn(16.3)NTh(6.2)NCo(4.8)NCu(4.5)NSb(3.8)NAs(2.6)NPb(2.1)12)NCo(9.5)NTh(6.2)NPb(5.8)NNi (4.5)NZn(3.6)NV(3.2)NCu(2.4)6)NPb(4.6)NTh(4.1)NV(3.4)NNi(3.1)NCu(2.5)NZn(2.4).6)NTh(4.1)NTl(4)NNi(3.2)NV, Zn(2.7)(7.7)NNi(7.6)NCu,Sb(7.5)NB(6.3)NV(5.9)NZn(5)NCr(4.5)NAs, Sn(4.3)NTl(4)6)NPb(4.6)NTh(3.1)NZn(3)NNi(2.6)NV(2.4)6.3)NCu(4.5)NTh(4.1)NMn(3.5)NPb(3.3)NTl(2.4)NZn(2.3)NV(2.2)NSb(2.1)7.1)NPb(7.7)NTl(6)NTh(2.5)24)NSn(17.1)NTh(4.1)NNi(2.1)24)NSn(15)NPb(7.7)NTh(4.1)NNi(4)l(24)NSn(17.1)NPb(7.7)NNi(5.7)NCu(2.4)(17.1)NPb(7.7)NTl(6)NNi(5.2)NCu(5)NTh(4.1)6)NPb(5.8)NTh(4.1)NNi(4)NSn(3.5)NCu(2.6)2)NPb(7.7)NSn(7.5)NTh(6.2)NCu(2.5)NNi(2.3)n(17.1)NTh(6.1)NPb(5.7)NAs(3.2)NCu(2.2)(7.6)NCu(7.3)NAs(6.5)NNi(4)NV(3.9)NSb(3).7)NCu(5.6)NMn(3.3)NTh(2.5)NNi(4.5)NMn(3.8)NPb, Tl(2.1)(6.4)NSn(5)NMn(3.1)NTh(2.1))NSn(7.5)NMn(3.5)NTh(2.5)NPb, Zn(2.1).1)NSn(4.2)NPb(3.2)(8.5)NPb(7.6)NV(6.1)NCu(5.6)NNi(5.2)NTh(2.4)u(5.5)NNi(4.6)NSb(3.3)NPb(3)b(4.7)NTl(4.4)6.1)NSe(5.4)NMo(4.3)NPb(4)Tl(9.2)NPb(7.9)NCu(5.4)NNi(2.2)2.3)NNi(2.1)7.7)NPb(2.3)2)NMn(3.7)NCu(3.5)NTh(2.1)
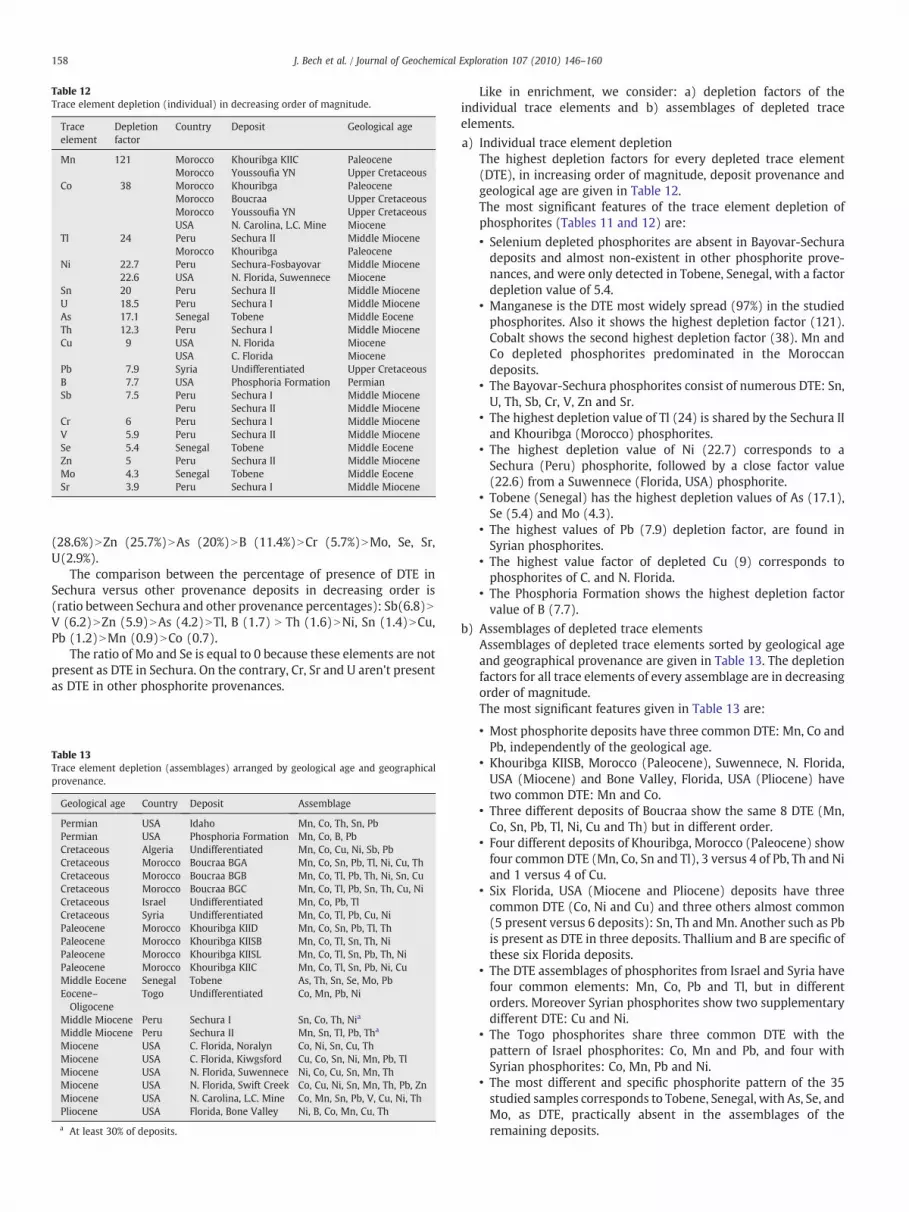
Table 12Trace element depletion (individual) in decreasing order of magnitude.
Traceelement
Depletionfactor
Country Deposit Geological age
Mn 121 Morocco Khouribga KIIC PaleoceneMorocco Youssoufia YN Upper Cretaceous
Co 38 Morocco Khouribga PaleoceneMorocco Boucraa Upper CretaceousMorocco Youssoufia YN Upper CretaceousUSA N. Carolina, L.C. Mine Miocene
Tl 24 Peru Sechura II Middle MioceneMorocco Khouribga Paleocene
Ni 22.7 Peru Sechura-Fosbayovar Middle Miocene22.6 USA N. Florida, Suwennece Miocene
Sn 20 Peru Sechura II Middle MioceneU 18.5 Peru Sechura I Middle MioceneAs 17.1 Senegal Tobene Middle EoceneTh 12.3 Peru Sechura I Middle MioceneCu 9 USA N. Florida Miocene
USA C. Florida MiocenePb 7.9 Syria Undifferentiated Upper CretaceousB 7.7 USA Phosphoria Formation PermianSb 7.5 Peru Sechura I Middle Miocene
Peru Sechura II Middle MioceneCr 6 Peru Sechura I Middle MioceneV 5.9 Peru Sechura II Middle MioceneSe 5.4 Senegal Tobene Middle EoceneZn 5 Peru Sechura II Middle MioceneMo 4.3 Senegal Tobene Middle EoceneSr 3.9 Peru Sechura I Middle Miocene
158 J. Bech et al. / Journal of Geochemical Exploration 107 (2010) 146–160
(28.6%)NZn (25.7%)NAs (20%)NB (11.4%)NCr (5.7%)NMo, Se, Sr,U(2.9%).
The comparison between the percentage of presence of DTE inSechura versus other provenance deposits in decreasing order is(ratio between Sechura and other provenance percentages): Sb(6.8)NV (6.2)NZn (5.9)NAs (4.2)NTl, B (1.7) N Th (1.6)NNi, Sn (1.4)NCu,Pb (1.2)NMn (0.9)NCo (0.7).
The ratio of Mo and Se is equal to 0 because these elements are notpresent as DTE in Sechura. On the contrary, Cr, Sr and U aren't presentas DTE in other phosphorite provenances.
Table 13Trace element depletion (assemblages) arranged by geological age and geographicalprovenance.
Geological age Country Deposit Assemblage
Permian USA Idaho Mn, Co, Th, Sn, PbPermian USA Phosphoria Formation Mn, Co, B, PbCretaceous Algeria Undifferentiated Mn, Co, Cu, Ni, Sb, PbCretaceous Morocco Boucraa BGA Mn, Co, Sn, Pb, Tl, Ni, Cu, ThCretaceous Morocco Boucraa BGB Mn, Co, Tl, Pb, Th, Ni, Sn, CuCretaceous Morocco Boucraa BGC Mn, Co, Tl, Pb, Sn, Th, Cu, NiCretaceous Israel Undifferentiated Mn, Co, Pb, TlCretaceous Syria Undifferentiated Mn, Co, Tl, Pb, Cu, NiPaleocene Morocco Khouribga KIID Mn, Co, Sn, Pb, Tl, ThPaleocene Morocco Khouribga KIISB Mn, Co, Tl, Sn, Th, NiPaleocene Morocco Khouribga KIISL Mn, Co, Tl, Sn, Pb, Th, NiPaleocene Morocco Khouribga KIIC Mn, Co, Tl, Sn, Pb, Ni, CuMiddle Eocene Senegal Tobene As, Th, Sn, Se, Mo, PbEocene–Oligocene
Togo Undifferentiated Co, Mn, Pb, Ni
Middle Miocene Peru Sechura I Sn, Co, Th, Nia
Middle Miocene Peru Sechura II Mn, Sn, Tl, Pb, Tha
Miocene USA C. Florida, Noralyn Co, Ni, Sn, Cu, ThMiocene USA C. Florida, Kiwgsford Cu, Co, Sn, Ni, Mn, Pb, TlMiocene USA N. Florida, Suwennece Ni, Co, Cu, Sn, Mn, ThMiocene USA N. Florida, Swift Creek Co, Cu, Ni, Sn, Mn, Th, Pb, ZnMiocene USA N. Carolina, L.C. Mine Co, Mn, Sn, Pb, V, Cu, Ni, ThPliocene USA Florida, Bone Valley Ni, B, Co, Mn, Cu, Th
a At least 30% of deposits.
Like in enrichment, we consider: a) depletion factors of theindividual trace elements and b) assemblages of depleted traceelements.
a) Individual trace element depletionThe highest depletion factors for every depleted trace element(DTE), in increasing order of magnitude, deposit provenance andgeological age are given in Table 12.The most significant features of the trace element depletion ofphosphorites (Tables 11 and 12) are:
• Selenium depleted phosphorites are absent in Bayovar-Sechuradeposits and almost non-existent in other phosphorite prove-nances, and were only detected in Tobene, Senegal, with a factordepletion value of 5.4.
• Manganese is the DTE most widely spread (97%) in the studiedphosphorites. Also it shows the highest depletion factor (121).Cobalt shows the second highest depletion factor (38). Mn andCo depleted phosphorites predominated in the Moroccandeposits.
• The Bayovar-Sechura phosphorites consist of numerous DTE: Sn,U, Th, Sb, Cr, V, Zn and Sr.
• The highest depletion value of Tl (24) is shared by the Sechura IIand Khouribga (Morocco) phosphorites.
• The highest depletion value of Ni (22.7) corresponds to aSechura (Peru) phosphorite, followed by a close factor value(22.6) from a Suwennece (Florida, USA) phosphorite.
• Tobene (Senegal) has the highest depletion values of As (17.1),Se (5.4) and Mo (4.3).
• The highest values of Pb (7.9) depletion factor, are found inSyrian phosphorites.
• The highest value factor of depleted Cu (9) corresponds tophosphorites of C. and N. Florida.
• The Phosphoria Formation shows the highest depletion factorvalue of B (7.7).
b) Assemblages of depleted trace elementsAssemblages of depleted trace elements sorted by geological ageand geographical provenance are given in Table 13. The depletionfactors for all trace elements of every assemblage are in decreasingorder of magnitude.The most significant features given in Table 13 are:
• Most phosphorite deposits have three common DTE: Mn, Co andPb, independently of the geological age.
• Khouribga KIISB, Morocco (Paleocene), Suwennece, N. Florida,USA (Miocene) and Bone Valley, Florida, USA (Pliocene) havetwo common DTE: Mn and Co.
• Three different deposits of Boucraa show the same 8 DTE (Mn,Co, Sn, Pb, Tl, Ni, Cu and Th) but in different order.
• Four different deposits of Khouribga, Morocco (Paleocene) showfour common DTE (Mn, Co, Sn and Tl), 3 versus 4 of Pb, Th and Niand 1 versus 4 of Cu.
• Six Florida, USA (Miocene and Pliocene) deposits have threecommon DTE (Co, Ni and Cu) and three others almost common(5 present versus 6 deposits): Sn, Th and Mn. Another such as Pbis present as DTE in three deposits. Thallium and B are specific ofthese six Florida deposits.
• The DTE assemblages of phosphorites from Israel and Syria havefour common elements: Mn, Co, Pb and Tl, but in differentorders. Moreover Syrian phosphorites show two supplementarydifferent DTE: Cu and Ni.
• The Togo phosphorites share three common DTE with thepattern of Israel phosphorites: Co, Mn and Pb, and four withSyrian phosphorites: Co, Mn, Pb and Ni.
• The most different and specific phosphorite pattern of the 35studied samples corresponds to Tobene, Senegal, with As, Se, andMo, as DTE, practically absent in the assemblages of theremaining deposits.

Table 14Normality factor of trace elements of phosphorites.
Deposit Sample no. Geological age Normal abundance
Sechura, I-Bed C 1 Middle Miocene As, B, Mn, Tl, V, ZnSechura,I-Interlayer B-A
2 Middle Miocene B, Cr, Se, Sr, Tl, U
Sechura, I-Bed 1 3 Middle Miocene As, B, Cr, ZnSechura, I-Interlayer 1-2 4 Middle Miocene Mo, Se, Tl, ZnSechura, I-Interlayer 2-3 5 Middle Miocene B, Cr, Se, Sr, ZnSechura, I-Bed 3 6 Middle Miocene As, B, Cu, Sb, ZnSechura, II-Bed 1 7 Middle Miocene Ag, B, V, ZnSechura, II-Bed 5 8 Middle Miocene Ag, B, Cr, SbSechura, II-Bed 6 9 Middle Miocene Ag, As, B, Co, Cr, SbSechura, II-Bed 7-top 10 Middle Miocene As, B, Co, Cr, Cu, SbSechura, II-Bed7-volcanic tuff
11 Middle Miocene Mo, Se, Sr, U
Sechura, II-Bed 7-base 12 Middle Miocene Ag, As, B, Co, Cr, Cu, SbFosbayovar 13 Middle Miocene As, B, CrKhouribga KIID 14 Paleocene As, Cu, Ni, VKhouribga KIISB 15 Paleocene As, Cu, Mo, V, ZnKhouribga KIISL 16 Paleocene As, Cr, Cu, Mo, Sb, V, ZnKhouribga KIIC 17 Paleocene As, Cr, Mo, Sb, V, ZnBoucraa BGA 18 Upper
CretaceousAs, B, Cr, Mo, Sb, V, Zn
Boucraa BGB 19 UpperCretaceous
As, B, Cr, Sb, V, Zn
Boucraa BGC 20 UpperCretaceous
As, B, Cr, Mo, Sb, V, Zn
Youssoufia YN 21 UpperCretaceous
Ni, Sb, V
Gafsa 22 UpperCretaceous
Mo, Th, Tl
C. Florida, Noralyn 23 Miocene As, Cr, Pb, Sb, Tl, V, ZnC. Florida, Kiwgsford 24 Miocene As, Cr, Sb, Tl, V, ZnN. Florida, Suwennece 25 Miocene As, Cr, Pb, Sb, Tl, V, ZnN. Florida, Swift Creek 26 Miocene As, B, Cr, Sb, Tl, VIdaho, Champ mines 27 Permian As, B, Cu, NiN. Carolina, L.C. Mine 28 Miocene As, Cr, Sb, TlAlgeria,Undifferentiated
29 Cretaceous Mo, Sb, Zn
Israel, Undifferentiated 30 UpperCretaceous
As, Cr, Cu, Ni, Sb
Senegal, Tobene 31 Middle Eocene Co, Cu, Mn, Ni, Sb, SrSyria, Undifferentiated 32 Upper
CretaceousSb
Togo, Undifferentiated 33 Eocene–Oligocene
As, Cr, Cu, Sb, Sr, Tl, Zn
Phosphoria Formation 34 Permian Ni, ThFlorida, Bone Valley 35 Pliocene As, Cr, Mo, V, Zn
159J. Bech et al. / Journal of Geochemical Exploration 107 (2010) 146–160
• The DTE assemblages of the Sechura phosphorites are differentfrom the other phosphorite provenances. Also the assemblagesof Sechura I and Sechura II are different from each other.
The groups of assemblages of DTE may be a useful complement ofthe assemblages of ETE in the research of phosphorite provenance.
3.3.4. Normal trace elementsTrace element normality factors (factor value between 0.5 and 2)
are given in Table 14.From Table 14 we have computed the percentage of presence in
the studied deposits of this study of the normal trace element (NTE) indecreasing order: As (65.7%)NCr (60%)NZn (51.4%)NSb (48.6%)NB(45.7%)NV(42.9%)NCu,Mo, Tl (28.6%)NSr (14.3%)NAg, Co, Se (11.4%)NMn, Th, U (5.7%).
The comparison between the percentage of presence of NTE inSechura versus other provenance deposits in decreasing order is (ratiobetween Sechura and other provenance percentages): Co (5.1)NB (3.7)NSr (2.5)NMn (1.7)NCr (1.1)NCu, Zn (0.8)NAs, Tl (0.7)NSb (0.5)NMo (0.4)NV (0.3).
The ratio of Th is equal to 0 because this element is not NTE inSechura. On the contrary Ag, Se and U are not NTE in other provenancephosphorites.
The main difference between Bayovar-Sechura phosphoritesversus the other provenances is the Se normality; only found inSechura, not in any of the other provenance deposits. Also thenormality of B is specific to mainly the Sechura beds, and thenormality of Co is significant in 50% of the beds of Sechura II.
The most representative assemblage of “normal” trace elements ofSechura I is: As, B, Cr, Se, Sr, Zn, and of the Sechura II: Ag, As, B, Co, Cr,Cu, Sb. Both assemblages differ essentially in Sr, Zn normality in thefirst and Ag, Co, Cu and Sb in the second.
In the Moroccan phosphorites, the normality assemblages indicatethat the Boucraa deposits are more homogeneous than the Khouribga.The Youssoufia's “normal” assemblage is different to that of the othersmentioned.
The phosphorites of theMiocene fromNoralyn, Central Florida andSuwennece, North Florida (USA) show the same assemblage of thenormality factor of trace elements (As, Cr, Pb, Sb, Tl, V, and Zn). Thefour analyzed deposits from Florida show almost the same normality.
The whole of the individual and assemblage patterns of NTEtogether with ETE and DTE can be a good discriminant tool as the“fingerprint” approach in establishing the origin or provenance ofphosphorites.
4. Conclusions
Some beds of Phosphorites of Sechura (Peru) contain the highestconcentration of Co, Mn and Mo of this study.
Khouribga and Youssoufia (Morocco) show the highest concen-tration of B and Sb, and Se and Tl, respectively.
The Th highest concentration was found in Gafsa (Tunisia). Thehighest concentration Sr and U was found in Israel, Ni and Sn inSenegal and Pb in Bone Valley, Floria (USA).
The comparison of medians among Sechura and other provenancegroups indicated that the medians of Ag, B, Sb, Th, U, V and Zn fromSechura are less than the medians from other provenances and themedians of Co and Mo from Sechura are greater than the mediansfrom other provenances.
High significant positive correlations were found between 17 pairsof elements from Sechura phosphorites: Ag–Sn, B–Sb, B–Se, B–U, Cd–Zn, Cr–Mo, Cr–Sr, Cr–U, Cu–Ni, Mo–Se, Mo–Sr, Mo–U, Sb–Th, Se–Sr,Se–U, Sn–Tl and Th–U, and between 8 pairs from other studiedphosphorite provenances: Ag–Zn, Co–Mn, Co–Pb, Cu–Ni, Cu–V, Mn–Pb, Ni–V and Ni–Zn. Observe that the only common pair is Cu–Ni.
Multivariate methods reveal the existence of sample clusters: agroup consisting of samples Phosphoria, Youssafia, Idaho and Tobene,another group consisting of samples from Sechura I and II,respectively with highest concentrations of Mo and Co. The rest ofthe samples can be grouped in the same cluster.
The percentage of presence of the enriched trace element (ETE),in a decreasing order, is: Cd (100%)NU (91.4%)NSe (85.7%)NAg (77.1)NSr (74.3%)NMo (62.9%)NB(42.9%)NCr(28.6%)NZn(22.9%)NAs, Tl, V (8.6%)NCo(5.7%)NSb (5.7%)NCu, Pb, Th (2.9%).
The highest trace element enrichment factors, in decreasing order(over 10) are: Cd, 386 (Idaho, USA)NAg, 78.5 (Idaho, USA)NSe, 73.3(Youssoufia, Morocco)NU, 46.5 (Israel)NMo, 43 (Sechura II, Peru)NCr,41 (Tobene, Senegal)NB, 11.6 (Khouribga KIIC, Morocco)NSr, 10.4(Israel)NZn, 10.2 (Idaho, USA).
Other significant Se enrichment factors are: 46.5 (Algeria), 38.3(Idaho, USA), 20 (Phosphoria Formation, USA), 18.3 (Gafsa, Tunisia)and 10 (Sechura II, Peru).
The Mo enrichment is peculiar to phosphorites of Sechura (Peru).The Permian phosphorites from Idaho and Phosphoria Formation,accumulate Cd, Ag, Se, Zn, Sb, V, As, Tl and Cu.
The different enrichment factors of trace elements in phosphoritesare useful to indicate the origin of these. But more approximateinformation for tracing the origin of the phosphorites can be gainedfrom considering the assemblages of five or six trace elements, sorted
160 J. Bech et al. / Journal of Geochemical Exploration 107 (2010) 146–160
descending mode and admitting any possible permutation. Thedifferences between deposit assemblages or patterns consist in thespecific set of enriched trace elements of each deposit or in thedifferent order of the enriched trace elements in the assemblages.These peculiar patterns are useful as a fingerprint to research theorigin of a particular phosphorite.
Selenium, As and Mo depleted phosphorites were almost onlyfound in Tobene (Senegal). The depleted trace element assemblagesof the Sechura phosphorites are different from the other phosphoriteprovenances.
The main difference between Sechura phosphorites versus theother provenances is the Se and B normality.
The whole of the normal, enriched and depleted trace element inphosphorites, both individually and in assemblages, can be a usefultool such as a discriminating fingerprint in the research of theprovenance of the phosphorites.
Acknowledgements
The authors are grateful to the University of Barcelona, Spain, forthe financial support in the preparation of this paper. The authors alsothank to Prof. Dr. B. De Vivo for his critical review and improvement ofthe manuscript.
References
Alloway, B.J., 1995. Heavy Metals in Soils, 2nd Ed. Blackie Academic and Professional.Altschuler, Z.S., 1980. The geochemistry of trace elements in marine phosphorites. Part
I. Characteristic abundances and enrichment. Society of Economic Paleontologistsand Mineralogists. Special Public. No 29 19–30.
Bech, J., Suarez, M., Reverter, F., Tume, P., Sanchez, P., Bech, J., Lansac, A., 2009. Seleniumand other trace elements in phosphate rock of Bayovar-Sechura (Peru). Journal ofGeochemical Exploration. Special Issue. doi:10.1016/j.gexplo.2009.08.004.
Charter, R.A., Tabatabai, M.A., Schafer, J.W., 1995. Arsenic, molybdenum, selenium andtungsten contents of fertilizers and phosphate rocks. Communications in SoilScience and Plant Analysis 26 (17–18), 3051–3062.
Chien, S.H., 2004. Secondary nutrients, micronutrients, liming effect and hazardouselements associated with phosphate rock use. In: Zapata, E., Roy, R.N. (Eds.), Chap.8 Use of phosphate rocks for sustainable agriculture. : FAO Fertilizer and PlantNutrition Bulletin, 13. Rome, pp. 73–83.
Gnandi, K., Tobschall, H.J., 1999. The pollution of marine sediments by trace elements inthe coastal region of Togo caused by dumping of cadmium-rich phosphorite tailinginto the sea. Environmental Geology 38 (1), 13–24.
Gower, J.C., Hand, D.J., 1996. Biplots. Chapman and Hall, London. UK.Gromet, L.P., Dymek, R.F., Haskin, L.A., Korotev, R.L., 1984. The “North American Shale
Composite”: its compilation, major and trace element characteristics. Geochimicaet Cosmochimica Acta 48, 2469–2482.
Gulbrandsen, R.A., 1966. Chemical composition of phosphorites of the PhosphoriaFormation. Geochimica et Cosmochimica Acta 30, 769–778.
Kpomblekou, A.K., Tabatabai, M.A., 1994. Metal contents of phosphate rocks.Communications in Soil Science and Plant Analysis 95 (17–18), 2871–2882.
Krauskopf, K.B., 1955. Sedimentary deposits of rare metals. Econ. Geol. 50thAnniversary, vol: 411-4.
Lucas, J., Flicoteaux, R., Nathan, Y., Prévôt, L., Shahar, Y., 1980. Different aspects ofphosphorite weathering. In: Bentor, Y.K. (Ed.), Marine Phosphorites: Society ofEconomic Paleontologists and Mineralogists, Special Publication, 29, pp. 41–51.
Mc Arthur, J.M., 1985. Francolite geochemistry: compositional controls duringformation, diagenesis, metamorphism and weathering. Geochimica et Cosmochi-mica Acta 49, 23–35.
Nathan, Y., 1984. In: Nriagu, J.O., Moore, P.B. (Eds.), Chapter 8. The Mineralogy andGeochemistry of Phosphorites in Phosphate Minerals. Springer-Verlag.
Presser, T.S., Piper, D.Z., Bird, K.J., Skorupa, J.P., Hamilton, S.J., Detwiler, S.J., Huebner, M.A.,2004. The Phosphoria Formation: a model forecasting global selenium sources to theenvironment Chap. 11:299–319. In: Hein, J.R. (Ed.), Life Cycle of the PhosphoriaFormation: From Deposition to the Post-Mining Environment, vol. 8. Elsevier.
Prévôt, L., Lucas, J., 1980. Behaviour of some trace elements in phosphatic sedimentaryformations. In: Bentor, Y.K. (Ed.), Marine Phosphorites: Society of EconomicPaleontologists and Mineralogists, Special Publication, 29, pp. 31–39.
R, 2009. R project for statistical computing. http://www.r-project.org/.Samb, M., 2002. Evolution geochimique des phosphates sedimentaires du gisement de
Tobene (Senegal) implications pour l'exploitation industrielle. Journal des Sciences2 (2), 68–74.
Sanford, R.F., Pierson, C.T., Crovelli, R.A., 1993. An objective replacement method forcensored geochemical data. Mathematical Geology 25 (1), 59–80.
Sattouf, M. (2007) Identifying the origin of rock phosphates and phosphorous fertilisersusing isotope ratio technique and heavy metal patterns. Doctoral Dissertation.Universität Carolo-Wilhelmina. Braunschweig. Digitale Bibliothek Braunschweig.On line Publishing at Braunschweig Technical University.
Sauerbeck, D., 1992. Conditions controlling the bioavailability of trace elements andheavy metals derived from phosphate fertilizers in soils. Proceedings of the FourthInternational IMPHOS Conference. Ghent, Belgium.
Senesi, N., Polemio, M., Lorusso, 1979. Content and distribution of arsenic, bismuth,lithium and selenium in mineral and synthetic fertilizers and their contribution tosoil. Communications in Soil Science and Plant Analysis 10, 1109–1126.
Sinclair, A.G., Shannon, P.W., Risk, W.H., 1990. Sechura phosphate rock supplies plant-available molybdenum for pastures. New Zealand Journal Agricultural Research 33,459–502.
Swain, D.J. (1962). The trace-element content of fertilizers Tech. Com. No. 52.Commonwealth Bureau of soils. Harpenden.
Tooms, S., Summerhayes, C.P., Cronan, D.S., 1969. Geochemistry of marine phosphateand manganese deposits. Annu. Rev. Oceanogr. Mar. Biol. 7, 49–100.
Van Kauwenberg, S.J., 1997. Cadmium and Other Minor Elements inWorld Resources ofPhosphate Rock. The Fertilizer Society London. 41 pp.
Weissberg, B.G., Singers, W.A., 1982. Trace elements and provenance of phosphaterocks. New Zealand Journal of Science 25, 149–154.
Wedepohl, K.H., 1991. The composition of the upper Earth's crust and the natural cyclesof selected metals. Metals in raw materials. Natural resources. In: Merian, E. (Ed.),Metals and Their Compounds in the Environment (Part I). VCH,Wenheim, pp. 1–10.