seagrass monitoring first 6 years
TRANSCRIPT
Port of Karumba
Seagrass Monitoring First 6 Years
• 1994 - 2000 M.A. Rasheed, A.J. Roelofs, R. Thomas & Coles, R.G. EcoPorts Monograph Series No.20 2001 Marine Plant Ecology Group, Northern Fisheries Centre Queensland Department of Primary Industries PO Box 5396, Cairns Qld 4870
©Ports Corporation of Queensland ISSN – 1326-4338 ISBN? Published 2001 by the Ports Corporation of Queensland GPO Box 409 Brisbane Qld 4001 Telephone 07 3224 7088 Facsimile 07 3224 7234

ii
ACKNOWLEDGMENTS
We thank Warren Lee Long, Chantal Roder, Leane Makey, Sampson Hollywood, Brandt Foster, Louise Johns & Paul Daniel for their assistance with fieldwork and production of interim reports; Wendy Baker for assistance processing laboratory samples and Len McKenzie for comments on the manuscript. Depth contours for Karumba were generated from information provided by Queensland Transport. This project was funded by the Ports Corporation of Queensland and the Queensland Department of Primary Industries. The Marine Plant Ecology Group is partially funded by the CRC Reef Research Centre. The correct citation of this document is: Rasheed, M.A., Roelofs, A.J., Thomas, R. and Coles, R.G. (2001). ‘Port of Karumba Seagrass Monitoring - First 6 Years.’ EcoPorts Monograph Series No 20. (Ports Corporation of Queensland, Brisbane) 38 pp.

Port of Karumba Seagrass Monitoring - First 6 Years
1
TABLE OF CONTENTS
ACKNOWLEDGMENTS.........................................................................................II
TABLE OF CONTENTS..........................................................................................1
EXECUTIVE SUMMARY .......................................................................................3
1. INTRODUCTION ................................................................................................4 1.1. Consultancy Brief ................................................................................................4
1.2. Site Description...................................................................................................5
1.3. General Seagrass Ecology ....................................................................................5
1.4. Karumba Seagrasses ............................................................................................6
2. METHODS ..........................................................................................................7 2.1. Design of Seagrass Monitoring Program ................................................................7
2.2. Seagrass Distribution and Abundance ....................................................................9
2.3. Alternate Monitoring Techniques ........................................................................10
2.4. Geographic Information System ..........................................................................11
2.5. Analysis ...........................................................................................................11
3. Results ...............................................................................................................13 3.1. Port of Karumba Seagrass Species.......................................................................13
3.2. Port of Karumba Seagrass Distribution and Abundance .........................................13 3.2.1 Surveys of all meadows within Karumba Port Limits ...........................................13 3.2.2. Meadows Selected for Monitoring ....................................................................16 Meadow Area ..........................................................................................................16 Above-ground Biomass.............................................................................................16 Species Composition ................................................................................................22 Dugong activity .......................................................................................................23
3.2.3 Alternate Monitoring Techniques ......................................................................24 Depth Transects.......................................................................................................24 Permanent Transects................................................................................................24 Permanent Sites .......................................................................................................24
3.3. Karumba Algae. ................................................................................................25
4. DISCUSSION & CONCLUSIONS ......................................................................27
5. REFERENCES...................................................................................................31
APPENDIX 1 - STATISTICAL ANALYSES ..........................................................36

Port of Karumba Seagrass Monitoring - First 6 Years
2

Port of Karumba Seagrass Monitoring - First 6 Years
3
EXECUTIVE SUMMARY
1. This report presents data from six years of seagrass monitoring for the Port of Karumba. 12 surveys (6 dry-season and 6 wet-season) were conducted between October 1994 and March 2000.
2. Large areas of seagrass were found on Alligator and Elbow Banks adjacent to the Norman River Mouth. Two meadows on Alligator Bank between the Norman and Bynoe Rivers were selected for monitoring, a high biomass core meadow and lower biomass fringing meadow.
3. Above-ground seagrass biomass was consistently higher in the core monitoring meadow than in the fringing meadow. The core meadow showed distinct seasonal differences with above-ground biomass significantly higher in wet-season surveys than each previous dry-season. This was different to seasonality in seagrass meadows that have been studied on the east-coast of Queensland where biomass was highest late in the dry-season. No seasonal patterns in biomass were evident for the fringing meadow.
4. Total area of seagrass for the monitoring meadows ranged from 954 to 1301 ha in the dry-season surveys and from 985 to 1311 ha in wet-season surveys. Area of the fringing monitoring meadow varied more than the core meadow. Seagrass distribution of the fringing meadow near the Bynoe River declined markedly during the monitoring period but partially recovered in the final survey (March 2000). There were no seasonal differences in area for either monitoring meadow.
5. Only 2 species of seagrass occurred in the monitoring area, Halophila ovalis and Halodule pinifolia. Both monitoring meadows were dominated by Halodule pinifolia with Halophila ovalis forming a minor component of the biomass.
6. Two major flooding events associated with severe tropical storms (cyclones) occurred during the monitoring period. Although widespread seagrass loss did not occur, changes in species composition, meadow area and biomass were recorded. The relatively minor changes indicate that Karumba seagrass meadows are well adapted to increased turbidity and salinity changes associated with flooding.
7. Results from the monitoring program indicate that dredging and other port activities have had no observable negative impact on Karumba seagrass meadows.
8. The six years of monitoring has provided a good range of natural annual changes in seagrass biomass and distribution across a broad range of climatic conditions that could be expected for the area. This information provides a good basis for comparison with future surveys of the Port of Karumba’s seagrass communities and will enable better interpretation of changes in seagrass meadows that may be associated with port activities or other anthropogenic impacts.
9. A long-term seagrass monitoring strategy based on biannual surveys of Alligator Bank would continue to provide an indication of the environmental health of the port and an indication of any impacts associated with maintenance dredging. Conducting these surveys annually would provide a valuable contribution to our knowledge of natural annual change in tropical seagrass communities.

Port of Karumba Seagrass Monitoring - First 6 Years
4
1. INTRODUCTION
1.1. Consultancy Brief
The Ports Corporation of Queensland (PCQ) is the port authority for the Port of Karumba. The PCQ has identified seagrass meadows as an important component in Karumba’s marine ecology. Capital and maintenance dredging of the Karumba port entrance and Norman River channel was required to allow the passage of ships associated with the Pasminco/Century Zinc Limited (CZL) lead and zinc export facility, and for live cattle export. PCQ is responsible for dredging in the port, and commissioned a number of environmental and engineering studies to assess and manage potential impacts on the marine environment by this and other future port developments.
Initial baseline surveys in October 1994 and March 1995 established that seagrasses and their associated faunal communities comprised an important component of the Port of Karumba marine environment and were suitable for monitoring the condition of the port’s environment (Rasheed et al.1996). As seagrasses have marked seasonal differences in their distribution and abundance it was decided that two surveys a year, wet and dry-season, would be performed and a 5 year monitoring program comparing seagrasses within seasons (ie dry/dry or wet/wet) was developed. This report presents the results of surveys conducted in the first 6 years (baseline and monitoring). For these surveys the following objectives were set:
1. Monitor the areal extent of seagrass meadows (identified as suitable for monitoring during the baseline surveys) in both the wet and dry season;
2. Monitor change in above-ground seagrass biomass and species composition for the selected meadows
This report summarises results of the following surveys: • Dry-season baseline survey (October 1994)(Rasheed et al. 1996) • Wet-season baseline survey (March 1995)(Rasheed et al. 1996) • Surveys each October and March between October 1996 and March 2000
PCQ plans to continue with a modified long-term seagrass monitoring program for the Port of Karumba following recommendations arising from this initial monitoring program. The first of the long-term monitoring surveys was conducted in October 2000.
PCQ will use the results of seagrass monitoring to help identify any possible detrimental effects of port operations and developments (eg. dredging) on seagrasses and assist in formulating management measures for the port.

Port of Karumba Seagrass Monitoring - First 6 Years
5
1.2. Site Description
Karumba is a small coastal community located in the south-eastern Gulf of Carpentaria, Queensland (map 1). Karumba has existing port facilities on the Norman River, which service recreational and commercial fishing industries, cargo shipment to other Gulf destinations, the export of livestock and a large ore offloading facility for the Pasminco/Century Zinc project. The coastal waters around Karumba support gillnet (including barramundi) and mud crab-fishing industries, and offshore there is commercial trawling for export quality banana and tiger prawns. The coastal plain surrounding the Karumba area is typically flat with low relief rising to approximately 10 m above sea level. Livestock grazing is the major land use for the Norman River catchment and there are no major secondary industries. Karumba has a tropical monsoon rainfall pattern with a mean annual rainfall of 922 mm of which the majority falls between December and March. Temperature ranges from 14.1-27.3°C in July to 24.6-32.2°C in December (Anon 1994).
1.3. General Seagrass Ecology
The importance of seagrass meadows as structural components of coastal ecosystems is well recognised. These marine angiosperms are important for stabilising coastal sediments; providing food and shelter for a diverse variety of organisms; as a nursery ground for many prawns and fish of commercial importance; and for nutrient trapping and recycling (Short 1987; Larkum et al. 1989; Edgar and Kirkman 1989). Seagrass/algae beds have been rated the third most valuable ecosystem globally (on a per hectare basis) for ecosystem services, preceded only by estuaries and swamps/flood-plains (Costanza et al. 1997).
Seagrasses are unique amongst flowering plants in that they can live entirely immersed in seawater. Several species are found at depths down to fifty metres (den Hartog 1977; Coles et al. 1995) although tropical species are most common in less than ten metres below mean sea level (MSL) (Lee Long et al. 1993). All seagrass species have a broadly similar morphology having rhizomes with each rhizome node bearing roots and shoots (Kuo McComb 1989). All seagrass species are clonal, capable of asexual reproduction through rhizome extension creating new ramets (Rasheed 2000a). All the tropical species are also capable of sexual reproduction and have developed a reliable means of underwater
17° 30'
BynoeRiver
AlligatorPoint
!
GULF OF CARPENTARIA
140° 45'
0 2 4kilometres
NormanRiver
Karumba
CAPEYORK
GULF OFCARPENTARIA
StudyArea
Map 1. Location of study area

Port of Karumba Seagrass Monitoring - First 6 Years
6
pollination (except Enhalus acoroides) leading to the production of fruits, seeds or viviparous seedlings (Kuo & Kirkman 1987; McConchie & Knox 1989).
Seagrass meadows in northern Queensland play a critical ecological role as a nursery habitat for commercial species of penaeid prawns and fish (Coles and Lee Long 1985; Coles et al. 1993). Watson et al. (1993) estimated that the landed value of the three major commercial penaeid prawns (Penaeus esculentus, P. semisulcatus and Metapenaeus endeavouri) averaged A$3,687 ha-1 yr-1 (1992 value) from seagrass meadows in western Cairns Harbour. Seagrasses are also essential food for vulnerable dugong, Dugong dugon (Miller), and endangered green sea turtles, Chelonia mydas (Linnaeus) (Lanyon et al. 1989).
The growth of seagrasses depends on several factors including the availability of light (Dennison 1987; Williams and Dennison 1990), nutrients (Orth 1977; Erftemeijer 1994) and water temperature (Bulthuis 1987). Seagrasses show measurable growth responses to changes in ambient water quality conditions and can therefore be used as effective ecological indicators of environmental impact (Dennison et al. 1993).
Tropical seagrass meadows vary seasonally and between years (Mellors et al. 1993; McKenzie et al. 1998). The potential for widespread seagrass loss has been well documented. The causes of loss can be natural such as cyclones and floods (Poiner et al. 1989), or due to human influences such as dredging (Onuf 1994), agricultural runoff (Preen et al. 1995), industrial runoff (Shepherd et al. 1989) or oil spills (Jackson et al. 1989).
The capacity of tropical seagrass meadows for recovery following disturbance is poorly understood. Experimental studies on tropical seagrass recovery in north Queensland found that small disturbances that created gaps (< 1m2) within meadows may recover fully within 12 months of disturbance for some meadow types but in other meadows species composition remained different 26 months after disturbance (Rasheed 1999; 2000a). Many of the meadows studied appear to rely on clonal reproduction for recovery with little or no recolonisation of disturbances by seed recruitment or germination (Rasheed 1999; 2000a). Larger disturbances where no adult plants are available for clonal reproduction may take significantly longer to recover especially for meadows that do not produce a “bank” of seeds stored in the sediments (Rasheed 2000a).
Destruction or loss of seagrasses has been reported from most parts of the world, often from natural causes, eg. "wasting disease" (den Hartog 1987), or high energy storms (Patriquin 1975; Poiner et al. 1989). More commonly destruction has resulted from human activities, eg. as a consequence of eutrophication (Bulthuis 1983; Orth and Moore 1983; Cambridge and McComb 1984) or land reclamation and changes in land use (Kemp 1983). Anthropogenic impacts on seagrass meadows are continuing to destroy or degrade coastal ecosystems and decrease their yield of natural resources (Walker 1989).
1.4. Karumba Seagrasses
An aerial seagrass survey of the Gulf of Carpentaria between 1982 and 1984 failed to locate any seagrass in the vicinity of Karumba and the Norman River (Poiner et al. 1987). Aerial surveys alone, however, are unlikely to reveal the full extent of seagrass meadows in this area as highly turbid water conditions limit the usefulness of aerial surveys to very

Port of Karumba Seagrass Monitoring - First 6 Years
7
low tides. Low density or patchy meadows of the fine-leaved Halodule species are also easily missed in aerial surveys, even at low tide. Seagrasses in the Karumba area were mapped by QDPI in October 1986 as part of a broadscale seagrass survey of the Gulf of Carpentaria (Coles et al. in prep.). They recorded three species of seagrass (Halodule uninervis (narrow), Halodule pinifolia and Halophila ovalis) on the mud banks to the east and west of the Norman River mouth. Four species of penaeid prawns were collected in beam trawls over this area, including Penaeus esculentus (brown tiger), Penaeus semisulcatus (grooved tiger) Penaeus latisulcatus (western king) and Penaeus merguiensis (banana). Reconnaissance aerial seagrass surveys conducted by Dames and Moore for Century Zinc Limited in October 1993 and April 1994 described an area of approximately 1000 ha of monogenic Halodule species (Hilliard et al. 1994a, 1994b). Numerous dugong feeding trails were also recorded.
The results of the seagrass monitoring program presented in this report and the baseline monograph (Rasheed et al. 1996) provide the most comprehensive data on seagrass distribution, abundance and seasonal differences collected for Karumba or any other Gulf of Carpentaria seagrass community.
2. METHODS
2.1. Design of Seagrass Monitoring Program
The sampling approach was based on the need to monitor changes in the above-ground biomass and areal extent of seagrass between the Norman and Bynoe River mouths in Karumba. The number of survey sites required for each monitoring meadow was based on information collected in the dry-season (October 1994) and wet-season (March 1995) baseline surveys (table 1). A complete background and description of the monitoring program and detailed methodology is presented in Rasheed et al. (1996).
Table 1. Estimate of the number of sites and quadrats per site, such that the percentage change in the mean will be detected at the 90% level with 90% assurance of detecting a true difference for each of the monitoring meadows in Port of Karumba for dry and wet season surveys.
Meadow Description Dry-season Wet-season
ID Detectable % change # Sites # Quads Detectable
% change # Sites # Quads
Core High biomass Halodule pinifolia / Halophila ovalis 30 25 5 30 35 3
Fringing Low biomass Halodule pinifolia / Halophila ovalis 100 30 5 50 15 3
Individual seagrass meadows were selected for monitoring, rather than considering seagrasses in Karumba as a whole. This allowed detection of finer changes in seagrass biomass and more detailed information on seagrass species composition changes within the available budget. Two meadows were selected for monitoring in wet and dry-season surveys. These meadows were located on Alligator Bank between the Norman and Bynoe Rivers. The two meadows were the “core meadow” which covered the majority of Alligator Bank and the lower biomass “fringing meadow” adjacent to the inshore and

Port of Karumba Seagrass Monitoring - First 6 Years
8
western boundaries of the core meadow (map 3). Meadows on Elbow Bank to the east of the Norman River mouth (mapped in the baseline surveys) were expected to be naturally ephemeral based on prior knowledge of species present and the results of the baseline surveys and were, therefore, not considered suitable for long-term monitoring.
The appropriate sampling strategy for each monitoring meadow depended on the overall size of the meadow, the number of sites possible (dependent on available time) and the number of replicate quadrats required per site. The monitoring program could detect 30% change in biomass for both the wet and dry seasons for the core Alligator Bank meadow and a 50% or 100% change for the wet and dry season respectively for the fringing Alligator Bank meadow. The design ensured that change in mean biomass would be detected at the 90% level (i.e. Type I error of 10%) with 90% assurance of detecting a true difference of this size (i.e. Type II error of 10%).
Monitoring of the two selected seagrass meadows in Karumba was conducted between October 1995 and March 2000 (table 2). The initial wet and dry-season baseline surveys detected no seagrass west of the Bynoe River or east of Elbow Bank and subsequent monitoring surveys were conducted between these boundaries.
Table 2. Survey dates and types for Port of Karumba seagrass monitoring program.
Survey Survey date Survey type Dry-season baseline 10-13 October 1994 all meadows Wet-season baseline 14-16 March 1995 all meadows
Dry-season interim #1 28-31 October 1995 monitoring meadows only Wet-season interim #1 16-18 March 1996 monitoring meadows only Dry-season interim #2 19-21 October 1996 monitoring meadows only Wet-season interim #2 7-9 March 1997 monitoring meadows only Dry-season interim #3 21-24 October 1997 all meadows (incl. monitoring meadows) Wet-season interim #3 9-11 March 1998 monitoring meadows only Dry-season interim #4 11-13 October 1998 monitoring meadows only Wet-season interim #4 26 February - 3 March 1999 monitoring meadows only
Dry-season final 2-5 October 1999 monitoring meadows only Wet-season final 17-21 March 2000 monitoring meadows only

Port of Karumba Seagrass Monitoring - First 6 Years
9
2.2. Seagrass Distribution and Abundance
Due to highly turbid water conditions common in the study area seagrass surveys were conducted during low tides (generally less than 0.8m above Australian height datum) when seagrass monitoring meadows were exposed or covered by less than 0.2m of water. Accessing sampling sites was difficult due to the soft muddy substrate and the large area to be covered. The initial baseline survey was conducted by walking through the mud. In later surveys a small hovercraft and helicopters were used for more efficient sampling (plate 1).
Plate 1(a) Biomass estimation and boundary mapping using a helicopter in Karumba.
Plate 1(b) Quadrat used for seagrass biomass estimation deployed from a hovering helicopter
Plate 1(c) Hovercraft used for Karumba seagrass monitoring.
Port of Karumba Seagrass Monitoring - First 6 Years
10
Survey sites (10 m radius) were haphazardly located within the two monitoring meadows. At each survey site estimates of above-ground seagrass biomass (3 - 5 replicates of a 0.25 m2 quadrat), seagrass species composition, % cover of algae and sediment characteristics were recorded at each site. The relative proportion of biomass for each seagrass species within each quadrat was also recorded.
Above-ground biomass was determined by a “visual estimates of biomass” technique described by Mellors (1991). At each site, observers recorded an estimated rank of seagrass biomass. To calculate above-ground biomass estimates each diver’s rank of seagrass biomass was calibrated against a set of quadrats which were harvested and the above-ground dry biomass measured in grams dry-weight per metre square (g DW m-2).
Seagrass species were identified according to Kuo and McComb (1989). Voucher specimens of seagrass were collected for taxonomic verification where necessary. Sediment characteristics were described at each site using visual estimates of grain size: shell grit, rock gravel, coarse sand, sand, fine sand and mud.
A differential Global Positioning System (dGPS) was used to record the location of each survey site (latitude and longitude) accurate to within 5 m.
The presence or absence of seagrass was defined by the above-ground biomass. Where above-ground biomass was absent, the presence of rhizome/root and seed bank material was not reported. Survey sites with no seagrass can be found within meadows because seagrass cover within meadows is not always uniform and may be patchy and contain bare gaps or scars.
Boundaries of seagrass meadows were determined in the field by observers using a helicopter, and recording dGPS position fixes around the meadow. The accuracy of this boundary method depended largely on the dGPS accuracy and errors associated with rectification of the GIS map. Taking these factors into account we have provided an ‘estimate of reliability’ (R) of the areal extent (ha) for both monitoring meadows in each survey. With the exception of the first baseline survey (up to ± 20m) the mapping error for monitoring meadows was set at ±10m. The area for the mapping error was calculated in the Geographic Information System (GIS) program Mapinfo®.
A depth profile for the monitoring area was constructed from data collected by the Department of Transport in April 1996. Depth measurements were converted to depth below Mean Sea Level (MSL). Bathymetry contours at 0.2 m depth intervals were created in Surfer® and interpolated from available depth data and knowledge of the local bathymetry. Depth contours were then imported into the seagrass GIS as a Mapinfo® layer (map 2).
2.3. Alternate Monitoring Techniques
Following the baseline surveys additional sampling methodologies for seagrass monitoring were trialed. Repeated measures techniques were suggested as a possible alternative methodology that may allow monitoring of temporal biomass changes in the meadow using fewer sites and less sampling effort. Two repeated measures techniques were trialed:
(i) Permanent Monitoring Transects, and

Port of Karumba Seagrass Monitoring - First 6 Years
11
(ii) Permanent Sites randomly selected throughout the meadow
Four 300metre transects, 3 starting from the edge of the meadow and 1 in the middle, were established. Transects were marked at each end with stakes and attached buoys. A total of 7 sites were located at 50 m intervals on the transects. Above-ground seagrass biomass, species composition, algae cover and sediment type were recorded from 3 replicate quadrats at each site.
12 random sites were selected across the meadow for repeated measures analysis. Information collected at each site was the same as for the transect sites. Sites were located in subsequent surveys using a real-time differential GPS.
The original monitoring strategy and the use of repeated measures were evaluated for differences in efficiency as tools to monitor seagrass biomass changes in the meadows.
External reviewers of the Karumba monitoring program also suggested measuring changes in depth limits of seagrasses as a possible alternative monitoring technique. This method has been used successfully to monitor the “health” of seagrass meadows in temperate southern Queensland (Abal & Dennison 1996). To evaluate this methodology in Karumba we established 3 transects perpendicular to the shoreline in the Alligator Bank meadow (map 2) and measured the upper and lower depth limits of seagrass distribution on the transects for each monitoring event.
2.4. Geographic Information System
All data from each survey were entered onto a Geographic Information System (GIS). A GIS base map was generated using an aerial photographic mosaic (1:25000: 15/09/1994) which was rectified and projected using Latitude/Longitude Australian Geodetic Datum 1984 (AGD 84).
When comparing post-March1995 monitoring surveys with the baseline surveys (October 1994 and March 1995), the conclusions should be treated with some caution. This is because the baseline surveys were essentially pilot studies, in which methodology was still being refined. Also, the first baseline survey used standard non-differential GPS (error for site positions ±20 m), while the monitoring surveys used differential GPS (error for site positions <5 m).
2.5. Analysis
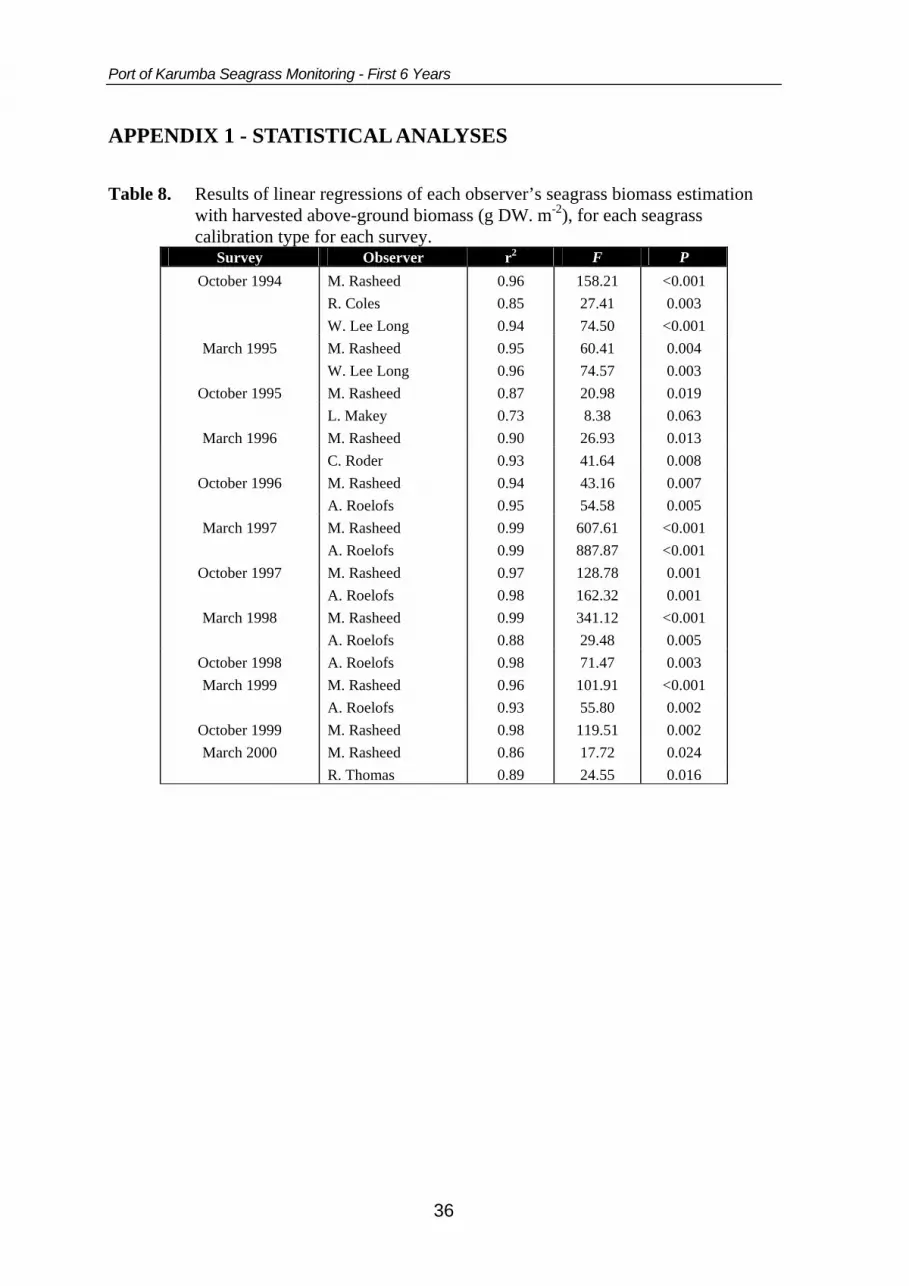
Standard parametric tests were used for analysis of data (Sokal and Rohlf 1987). All observers had significant linear regressions and r2 >0.73 when calibrating above-ground biomass estimates against a set of harvested quadrats (appendix 1, table 8).

Port of Karumba Seagrass Monitoring - First 6 Years
12
Map 2. Depth transects and contours for Port of Karumba

Port of Karumba Seagrass Monitoring - First 6 Years
13
3. Results
3.1. Port of Karumba Seagrass Species
Two seagrasses species in 2 families were found within the Port of Karumba survey area: Family Cymodoceaceae Halodule pinifolia (Miki) den Hartog Family Hydrocharitaceae Halophila ovalis (R. Br.) Hook.ƒ.
Halodule uninervis (narrow) and Halodule pinifolia are very similar in morphology and are difficult to distinguish in the field. Recent genetic data from the eastern coast of Queensland indicate there may be no distinctions between the two currently recognised species (M. Waycott. pers. comm.). They are considered as one species in this study and are referred to only as Halodule pinifolia.
3.2. Port of Karumba Seagrass Distribution and Abundance
Seagrass meadows within the Karumba port limits occurred on the shallow intertidal mud banks adjacent to the mouth of the Norman River (map 3). Large areas of seagrass were found on Alligator Bank between the mouths of the Norman and Bynoe Rivers and on Elbow Bank adjacent to Karumba Point. No seagrass occurred in the Norman River upstream from Karumba Point or west of the Bynoe River.
3.2.1 Surveys of all meadows within Karumba Port Limits
Three of the monitoring surveys included all meadows within Karumba port limits, the baseline surveys in October 1994 and March 1995 and the third dry season monitoring survey in October 1997. Seagrass meadows in all 3 surveys were confined to the shallow intertidal banks on both sides of the Norman River mouth (map 3). The largest area of seagrass occurred as a continuous meadow on Alligator Bank between the Norman and Bynoe Rivers (map 3). Several smaller meadows occurred on Elbow Bank (map 3). The total area of seagrass meadows was higher in the two dry season surveys (October 1994 & 1997) than in the wet-season survey (March 1995) (table 3). Total seagrass area was similar for the two dry-season surveys, the difference in area within estimated mapping errors (table 3).
In all three surveys seagrass meadows were dominated by Halodule pinifolia with Halophila ovalis contributing a minor component.
Mean above-ground biomass (all meadows pooled) was highest in the wet-season survey (table 3). With the exception of the October 1997 survey, biomass was higher for the Alligator Bank meadows than meadows occurring on Elbow Bank.

Port of Karumba Seagrass Monitoring - First 6 Years
14
Table 3. Mean above-ground biomass and meadow area ± R (estimate of reliability) for Karumba seagrass surveys that included all meadows within the port limits
Area (ha)
Mean Biomass ± SE (g dw m-2) Location
Oct 1994 March 1995 Oct 1997 Oct 1994 March 1995 Oct 1997
Alligator Bank
1265 (1246-1284)
1040 (1022-1058)
1114 (1092-1136) 5.01 ± 0.24 8.29 ± 0.31 4.69 ± 0.19
Elbow Bank
152 (87-219)
272 (242-302)
422 (286-557) 3.36 ± 0.30 1.43 ± 0.16
6.99 ± 0.46
Others Pooled
5 (3.6-6.7) - 2
(1.1-2.1) 2.02 ± 0.83 - 0.13
TOTAL
All meadows
1422 (1321-1526)
1312 (1259-1365)
1538 (1369-1707) 4.73 ± 0.30 6.10 ± 0.28
5.16 ± 0.18

Port of Karumba Seagrass Monitoring - First 6 Years
15
Map 3. Port of Karumba Seagrasses - all meadows within port limits.

Port of Karumba Seagrass Monitoring - First 6 Years
16
3.2.2. Meadows Selected for Monitoring
Meadow Area
The combined area of the two seagrass meadows selected for monitoring (core and fringing) ranged from 954 to 1301 ha in the dry-season surveys (table 4) and from 985 to 1311 ha in wet-season surveys (table 5). The area of the lower biomass fringing monitoring meadow varied more than the higher biomass core meadow (figures 1 & 2). There was a consecutive decline in area of the core meadow in each survey from October 1997 to October 1999 and a corresponding increase for the fringing meadow from October 1998 to March 2000 (figures 1 & 2). After October 1999 the decline in area for the core meadow abated and had increased by March 2000. This increase in area was primarily due to recovery of high biomass seagrass in a low-biomass “finger” that had developed in the meadow during 1998 and 1999 (map 4).
Seagrass area at the Bynoe River end of Alligator Bank declined markedly and fragmented in October 1997(map 4). By March 1998 no seagrass remained in the western region of the bank (map 4). In March 2000 seagrasses had begun to re-establish in this section (map 4).
There were no between-season trends in seagrass area for either monitoring meadow during the survey period (tables 4 & 5).
Above-ground Biomass
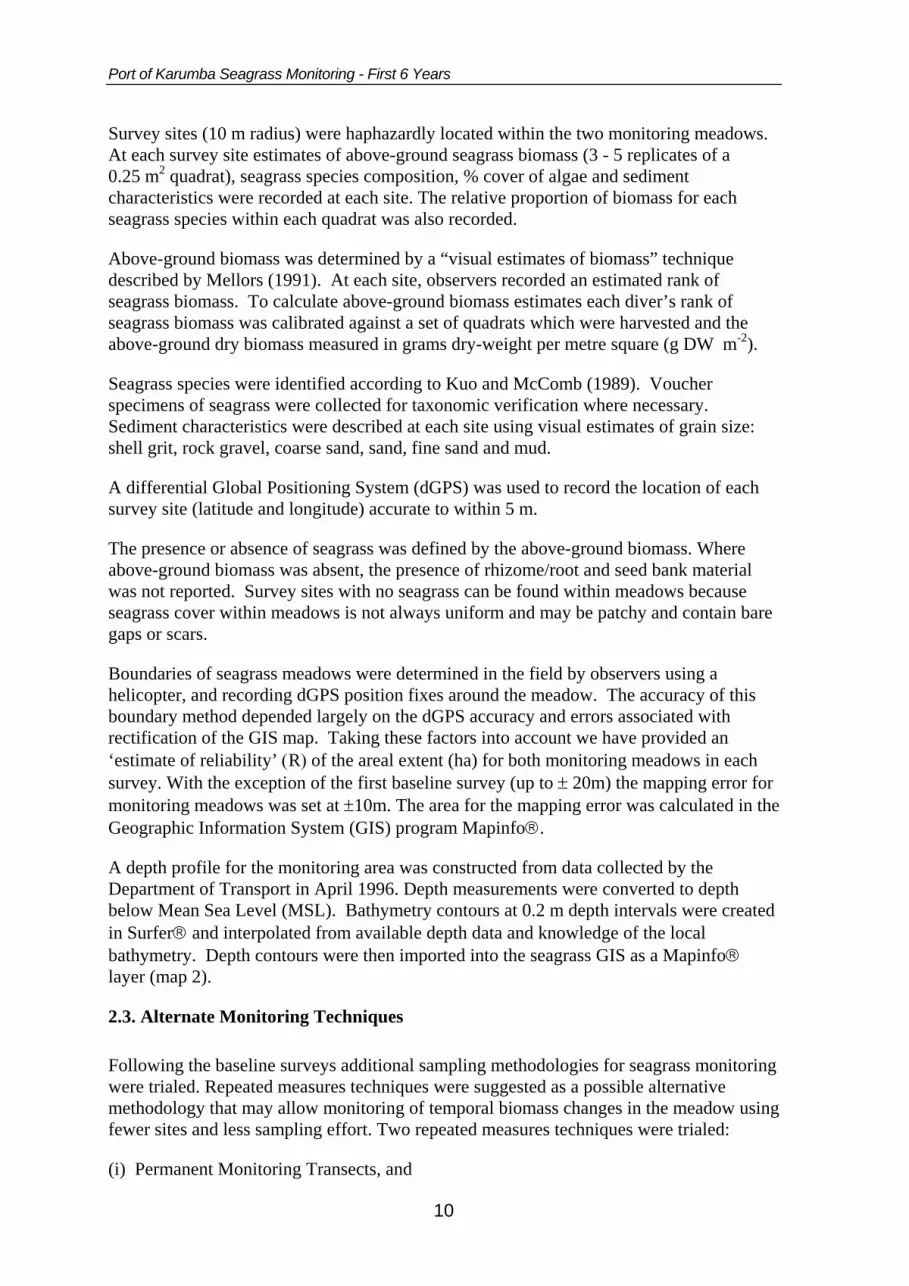
Above-ground biomass was consistently higher in the core monitoring meadow than in the fringing meadow (tables 4 & 5). The core meadow showed distinct seasonal differences with above-ground biomass significantly higher in all wet-season surveys than the preceding dry-season surveys apart from the fourth year of monitoring (October 1997 and March 1998) (figure 1; table 6; appendix 1, table 9). The March 1998 survey was conducted following prolonged, extensive flooding of the Norman River.
Mean above-ground biomass for the core meadow was variable between surveys of the same season (table 7; appendix 1, tables 10 & 11), ranging from 4.65 to 9.80 g DW m-2 for the dry-season and 7.87 to 13.97 g DW m-2 for wet-season surveys (tables 4 & 5; figure 1). The lowest biomass recorded for the core meadow was in October 1999, with the largest difference between consecutive surveys occurring from October 1998 to October 1999 for the dry-season and from March 1999 to March 2000 for the wet-season (figure 1). No consistent seasonal difference in above-ground biomass was apparent for the fringing meadow (figure 2). Above-ground biomass was significantly different between seasons for only one of the monitoring years (October 1998/ March 1999)(table 6; appendix 1, table 9). Above-ground biomass was particularly high in March 1999. This was largely due to the complete loss of an inshore strip of the fringing meadow where seagrass cover was extremely patchy in other surveys. With the exception of March 1999, above-ground biomass of the fringing meadow was less variable between seasons and years than the core meadow (table 7; appendix 1, tables 10 & 11)

Port of Karumba Seagrass Monitoring - First 6 Years
17
Table 4. Area and mean above-ground biomass for Karumba seagrass meadows in October (1994 to 1999). Values in brackets for area are the estimate of reliability (R) and for biomass is % change since the previous dry-season survey. TOTAL biomass is all sites pooled.
Meadow
Area (ha) Oct 1994 Oct 1995 Oct 1996 Oct 1997 Oct 1998 Oct 1999
Core
963
(952-974)
1072
(1058-1086)
922
(906-938)
964
(947-981)
879
(862-896)
759
(741-777)
Fringing
302
(285-319)
229
(207-252)
368
(352-384)
150
(135-165)
100
(88-112)
195
(177-213)
TOTAL monitoring
meadows pooled
1265
(1246-1284)
1301
(1279-1323)
1290
(1274-1306)
1114
(1092-1136)
979
(964-994)
954
(938-970)
Meadow
Mean Biomass ± SE (g DW m-2)
Oct 1994 Oct 1995 Oct 1996 Oct 1997 Oct 1998 Oct 1999
Core
6.15 ± 0.13
5.25 ± 0.12
(-15%)
9.42 ± 0.28
(+79%)
6.71 ± 0.23
(-29%)
9.80 ± 0.57
(+46%)
4.65 ± 0.24
(-53%)
Fringing
0.99 ± 0.18
0.64 ± 0.10
(-35%)
2.14 ± 0.24 (+234.4%)
2.11 ± 0.19 (no change)
2.41 ± 0.51
(+14%)
1.86 ± 0.29
(-23%)
TOTAL monitoring
meadows pooled
5.01 ± 0.24
4.11 ± 0.13
(-18%)
5.32 ± 0.25
(+29%)
4.69 ± 0.19
(-12%)
7.25 ± 0.56
(+54%)
3.31 ± 0.25
(-54%)
Table 5. Area and mean above-ground biomass for Karumba seagrass meadows in March (1995 to 2000). Values in brackets for area are the estimate of reliability (R) and for biomass is % change since the previous dry-season survey. TOTAL biomass is all sites pooled.
Meadow
Area (ha) Mar 1995 Mar 1996 Mar 1997 Mar 1998 Mar 1999 Mar 2000
Core
820 (800-840)
1111
(1094-1128)
957
(941-973)
942
(925-959)
822
(806-838)
914
(898-930)
Fringing
220 (206-234)
200 (185-215)
172 (158-196)
101 (90-122)
163 (147-179)
203
(183-223)
TOTAL monitoring
meadows pooled
1040 (1022-1058)
1311 (1290-1331)
1129 (1109-1149)
1043 (1026-1060)
985 (969-1001)
1117 (1095-1139)
Meadow
Mean Biomass ± SE (g DW m-2)
Mar 1995 Mar 1996 Mar 1997 Mar 1998 Mar 1999 Mar 2000
Core
9.24 ± 0.28
12.98 ± 0.49
(+41%)
13.16 ± 0.78
(+1%)
7.87 ± 0.58
(-40%)
13.97 ± 0.89
(+77%)
7.98 ± 0.32
(-43%)
Fringing
0.17 ± 0.09
0.72 ± 0.26 (+323%)
2.51 ± 0.57 (+248%)
1.02 ± 0.16
(-59%)
7.91 ± 1.45
(+675%)
1.59 ± 0.47
(-80%)
TOTAL monitoring
meadows pooled
8.29 ± 0.31
10.50 ± 0.53 (+27%)
10.62 ± 0.69 (+1%)
6.16± 0.55 (-42%)
11.89 ± 0.82 (+93%)
5.60 ± 1.71 (-53%)
Port of Karumba Seagrass Monitoring - First 6 Years
18
Figure 1. Mean above-ground biomass ± SE and Mean area ± R (estimate of reliability) for the core monitoring meadow in the Port of Karumba.
Figure 2. Mean above-ground biomass ± SE and Mean area ± R (estimate of reliability) for the fringing monitoring meadow in the Port of Karumba.
Fringing Meadow
0
1
2
3
4
5
6
7
8
9
10
Oct-1994
March-1995
Oct-1995
March-1996
Oct-1996
March-1997
Oct-1997
March-1998
Oct-1998
March-1999
Oct-1999
March-2000
Mea
n ab
ove-
grou
nd b
iom
ass
+/-S
E (g
DW
m-2
)
0
50
100
150
200
250
300
350
400
450
Mea
n ar
ea +
/- R
(ha)
Biomass
Area
Core Meadow
0
2
4
6
8
10
12
14
16
Oct-1994
March-1995
Oct-1995
March-1996
Oct-1996
March-1997
Oct-1997
March-1998
Oct-1998
March-1999
Oct-1999
March-2000
Mea
n ab
ove-
grou
nd b
iom
ass
+/-S
E (g
DW
m-2
)
0
200
400
600
800
1000
1200
Mea
n ar
ea +
/- R
(ha)
Area
Biomass

Port of Karumba Seagrass Monitoring - First 6 Years
19
Table 6. Comparisons of mean above-ground biomass between seasons for each monitoring year for Karumba seagrass meadows. * 4seasons significantly different (Least Significant Difference (LSD); P<0.001).
Core Meadow (g DW m-2) Fringing Meadow (g DW m-2) Monitoring Year sig. diff.* dry season wet season sig.
diff.* dry season wet season
94/95 4 6.01 9.24 6 1.07 0.17 95/96 4 5.12 12.98 6 0.80 0.58 96/97 4 9.61 13.29 6 2.98 3.41 97/98 6 6.60 7.87 6 2.04 1.02 98/99 4 9.80 13.97 4 2.41 7.91 99/00 4 4.66 7.98 6 1.86 1.60
Table 7. Within season comparisons of mean above-ground biomass between years for Karumba seagrass meadows. Years that share a common letter suffix are not significantly different (comparisons only within columns)(LSD).
Core Meadow (g DW m-2) Fringing Meadow (g DW m-2) Monitoring Year dry season wet season dry season wet season
94/95 6.01 b 9.24 a 1.07 ab 0.17 a 95/96 5.12 a 12.98 b 0.80 a 0.58 a 96/97 9.61 c 13.29 b 2.98 d 3.41 b 97/98 6.60 b 7.87 a 2.04 c 1.02 ab 98/99 9.80 c 13.97 b 2.41 cd 7.91 c 99/00 4.66 a 7.98 a 1.86 bc 1.60 ab

Port of Karumba Seagrass Monitoring - First 6 Years
20
Map 4a Changes in Port of Karumba seagrasses October 1994 to March 1997- meadows selected for monitoring only.

Port of Karumba Seagrass Monitoring - First 6 Years
21
Map 4b Changes in Port of Karumba seagrasses October 1997 to March 2000 - meadows selected for monitoring only.
Port of Karumba Seagrass Monitoring - First 6 Years
22
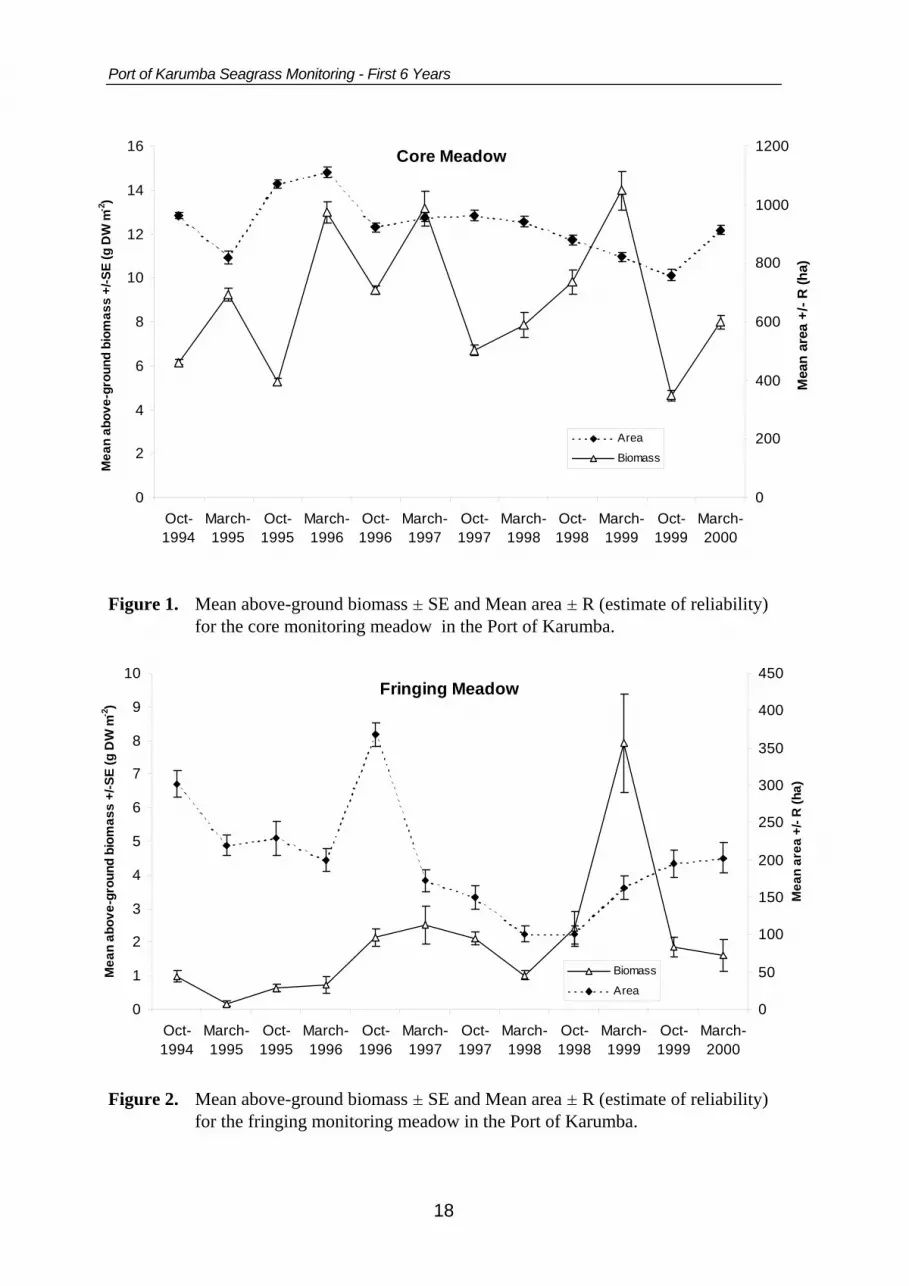
Species Composition Halodule pinifolia was the dominant seagrass species in both monitoring meadows for all surveys (figure 3). Halophila ovalis was less common in wet-season than dry-season surveys and was not found at all in the fringing meadow for wet-season surveys conducted in March 1996, 1997, 1998 and 2000 or in the core meadow in March 1998. Where Halophila ovalis occurred it tended to be present as an under-storey. After initially comprising over 20% of the biomass in October 1994, Halophila ovalis abundance decreased in the core meadow and was completely absent by March 1998 (figure 3). This trend was reversed in October 1998 when Halophila ovalis again comprised over 20% of the biomass for the core meadow (figure 3).
Figure 3. Percentage composition of above-ground biomass for each seagrass species in Port of Karumba monitoring meadows.
0%
10%
20%
30%
40%
50%
60%
70%
80%
90%
100%
Octo
ber-9
4M
arch
-95
Octo
ber-9
5M
arch
-96
Octo
ber-9
6M
arch
-97
Octo
ber-9
7M
arch
-98
Octo
ber-9
8M
arch
-99
Octo
ber-9
9M
arch
-00
Octo
ber-9
4M
arch
-95
Octo
ber-9
5M
arch
-96
Octo
ber-9
6M
arch
-97
Octo
ber-9
7M
arch
-98
Octo
ber-9
8M
arch
-99
Octo
ber-9
9M
arch
-00
% C
ompo
sitio
n of
abo
ve-g
roun
d se
agra
ss b
iom
ass
Halophila ovalis
Halodule pinifolia Core Meadow Fringing Meadow

Port of Karumba Seagrass Monitoring - First 6 Years
23
Dugong activity
Dugong feeding trails were recorded in the seagrass monitoring meadows in all monitoring surveys (plate 2; figure 4). Trails were recorded at a greater percentage of sites in the core meadow than in the fringing meadow (figure 4). The percentage of sites with evidence of dugong activity varied considerably between surveys with no seasonal or inter-annual trend (figure 4).
Figure 4. Percentage of sites with dugong feeding trails for Karumba monitoring meadows, for each survey.
Plate 2. Dugong feeding trails on Alligator Bank seagrass meadows (aerial photograph height approximately 200m).
0
5
10
15
20
25
30
35
Oct-1994
March-1995
Oct-1995
March-1996
Oct-1996
March-1997
Oct-1997
March-1998
Oct-1998
March-1999
Oct-1999
March-2000
% o
f site
s w
ith d
ugon
g fe
edin
g tr
ails
Core meadowFringing meadow
NO
T SA
MPL
ED

Port of Karumba Seagrass Monitoring - First 6 Years
24
3.2.3 Alternate Monitoring Techniques
Depth Transects
Depth transects were not a suitable monitoring alternative in Karumba as seagrass distribution did not occur over a wide depth range. Distribution of Alligator Bank seagrasses was confined to the shallow intertidal mud bank and did not extend to any sub-tidal areas. Consequently the mean depth distribution of Alligator Bank seagrasses did not vary significantly over the monitoring period. The mean depth of the meadow boundaries ranged from 0.8m to 0.87m for the inshore edge and from 1.67 to 2.0m for the offshore edge (figure 5).
Figure 5. Depth below mean sea level of inshore and offshore edges for Alligator Bank seagrasses for each monitoring survey.
Permanent Transects
Permanent transects established in October 1995 were abandoned as a methodology in March 1996 due to logistical problems. Relocating transects was difficult as some buoys and markers were lost between surveys. The time taken to lay out the transects was also prohibitive within the narrow tidal window available for effective sampling.
Permanent Sites
Monitoring above-ground biomass at permanent sites also proved to be an ineffective methodology for Karumba seagrass meadows. Real-time differential GPS equipment
-2.5
-2.0
-1.5
-1.0
-0.5
0.0
Oct-1994
Mar-1995
Oct-1995
Mar-1996
Oct-1996
Mar-1997
Oct-1997
Mar-1998
Oct-1998
Mar-1999
Oct-1999
Mar-2000
Dep
th B
elow
MSL
(m)
inshore
offshore
MSL
0.5
1.0
2.5
2.0
1.5

Port of Karumba Seagrass Monitoring - First 6 Years
25
available at the time of surveys was expensive and unreliable in the field for relocation of sites (unlike the post processing dGPS units used in the main surveys). Substantial site impact from observers occurred at permanent sites due to disturbing seagrasses in the soft muddy substrates while accessing the site. Observer related damage to seagrasses at the site had the potential to influence biomass in subsequent monitoring events. Monitoring at permanent sites was abandoned in March 1998 after 2 consecutive surveys with ineffective site relocation.
3.3. Karumba Algae.
Macro algae were uncommon in the survey area and formed a minor component of the seagrass monitoring meadows throughout the monitoring program (figure 6). The most common algal types recorded in Karumba were unidentified epiphytic brown and green algae growing on seagrass leaves.
Large areas of unidentified blue-green algae were found close to the Norman River channel in a reconnaissance survey conducted in July 1998 following flooding of the Norman River in March 1998. The algae differed from those found previously in the Karumba seagrass meadows (Plate 3). This area of algae had disappeared by the following October 1998 monitoring survey.
Plate 3. Unidentified blue-green algae found near the mouth of the Norman River in July 1998.

Port of Karumba Seagrass Monitoring - First 6 Years
26
Figure 6. Mean percent cover of algae (all types pooled) for each survey of Karumba monitoring meadows.
0
3
6
9
12
15
Oct-1994
March-1995
Oct-1995
March-1996
Oct-1996
March-1997
Oct-1997
March-1998
Oct-1998
March-1999
Oct-1999
March-2000
Mea
n %
alg
al c
over
Core meadowFringing meadow

Port of Karumba Seagrass Monitoring - First 6 Years
27
4. DISCUSSION & CONCLUSIONS
Seagrass was present in every survey of the Karumba intertidal mud-banks throughout the first 6 years of monitoring. While variations in area, biomass and species composition were recorded, the majority of Alligator Bank maintained a good cover of seagrass during the monitoring period. Distribution of the fringing seagrass meadow was more variable than the core monitoring meadow, particularly at the Bynoe River end. The distribution of seagrasses adjacent to the Bynoe River was patchy throughout the monitoring program and absent for several years.
During the monitoring period several major floods and severe tropical storms affected the survey area. There was no corresponding widespread loss of seagrasses in the Karumba area despite similar events having caused widespread loss in other areas of Queensland (eg. Poiner et al. 1989; Preen et al. 1995). The presence of seagrass in every survey during the monitoring program and in 1986 (Coles et al. in prep.) indicate that seagrasses on Alligator Bank are likely to be a relatively permanent feature of the Karumba marine environment. Absence of seagrass recorded for the Karumba area in a survey conducted between 1982 and 1984 (Poiner et al. 1987) may have been an artefact of the methodology used. The sampling was based on aerial surveys with limited ground-truthing (Poiner et al. 1987) and may have been ineffective at locating seagrasses in highly turbid water conditions common in the area. Aerial surveys were found to be ineffective during the present monitoring program when water depth over the bank was greater than 0.3m.
Although widespread loss of seagrass was not recorded during the monitoring period, some minor declines occurred following the flooding events associated with cyclone “Justin” in March 1998 and cyclone “Rona” in February 1999. Overall seagrasses on Alligator Bank became patchier with a decline in area of the high biomass core meadow in each survey from March 1998 until October 1999 and a corresponding increase in the lower biomass patchy fringing meadow. A low-biomass “finger” also began developing in the core meadow near the Norman River mouth in October 1998. This low biomass area expanded in subsequent surveys, completely bisecting the core meadow in October 1999 before recovering by the following March.
Other changes to Alligator Bank seagrasses also occurred following cyclone related flooding. Blue-green algae developed in an area adjacent to the Norman River mouth between March and July 1998. This algae had not been found in previous monitoring surveys and its development may be the result of water quality changes associated with floodwater runoff. Increased algal coverage has occurred in other seagrass meadows as a result of agricultural and urban runoff (Cambridge et al. 1986). The algae on Alligator Bank had largely disappeared by the following October 1998 survey and seagrass had begun to recolonise in the area. The presence of blue green algae was probably associated with the flood and is unlikely to be a long-term threat to seagrass distribution and abundance at Karumba in normal conditions.
Changes in seagrass species composition also occurred in the core monitoring meadow. Prior to October 1998 there had been a continual decline in Halophila ovalis abundance. This trend reversed in October 1998 and Halophila ovalis persisted in the meadow through to the last survey in March 2000. The October 1998 increase was the first time since monitoring began in 1994 that a large change in seagrass species composition was

Port of Karumba Seagrass Monitoring - First 6 Years
28
detected. The increase in Halophila ovalis abundance in the October 1998 survey may have been a direct result of disturbances from the March 1998 floods. Reductions in Halodule pinifolia abundance and areal extent recorded in the post-flood survey in July 1998 may have created conditions suitable for Halophila ovalis colonisation. Halophila ovalis is known to be a rapid coloniser following disturbance in other seagrass meadows in north Queensland (Rasheed 2000a; Birch & Birch 1984) and may have taken advantage of gaps created in the meadow. Changes in salinity associated with the flooding may also have triggered Halophila ovalis seed germination. A reduction in salinity is known to be a stimulus for germination in many seagrass species, including other species in the genus Halophila (McMillan 1981; 1988).
The relatively minor changes to Alligator Bank seagrasses following two consecutive years of flooding indicate their resilience to flooding and resulting reductions in available light. Changes in salinity and turbidity associated with prolonged flooding have been responsible for widespread losses of seagrass in other regions of Queensland (Preen et al. 1995). Seagrasses growing in the naturally turbid and variable salinity waters near the Norman River mouth may be better adapted to major flood events. Longstaff & Dennison (1999) demonstrated that biomass, shoot-density and canopy height of Halodule pinifolia on Alligator Bank remained unaffected by zero light levels for 38 days. After 38 days Halodule pinifolia biomass began to decline and complete loss of biomass was predicted to require 100 days of light depravation (Longstaff and Dennison (1999). Although morphological changes required 38 days to occur, changes to the plant’s physiology such as chlorophyll and amino-acid content indicated they became stressed much earlier. Halophila ovalis was less resilient to light depravation showing rapid decline in biomass and complete plant death after 38 days (Longstaff & Dennison 1999).
Seasonal changes in Halophila ovalis abundance and distribution recorded in the Karumba monitoring program are typical for the species in tropical north Queensland (Coles et al. 2001; McKenzie et al. 1998; Rasheed 2000a). Halophila ovalis abundance and distribution tends to peak late in the dry-season (October - November) and decline through the wet-season (Rasheed 2000a). Halophila ovalis persisted in the core meadow through most wet-season surveys but was annual in the fringing meadow where it was absent in all but one of the wet-season surveys. It is likely that Halophila ovalis re-established in the fringing meadow in dry-seasons through sexual recruitment from seeds produced in the core meadow. Halophila ovalis is capable of producing large quantities of seed and is a vigorous sexual coloniser (Rasheed 2000a). Flowers and fruits of Halophila ovalis were commonly observed during the dry-season surveys in Karumba.
This monitoring program provides some of the best information currently available for long-term monitoring of tropical seagrass with six years of biannual sampling conducted. Differences between wet and dry-season surveys were evident in biomass but not area of seagrass meadows and were only apparent in the core monitoring meadow. Highly patchy sections of the low-biomass fringing meadow tended to completely disappear in the wet-season surveys. This may have led to the absence of a clear seasonal trend in biomass for the fringing meadow as biomass was measured within the new meadow boundaries. Seagrass meadows in other tropical Queensland locations show large seasonal trends or changes in biomass, such as Mourilyan Harbour (McKenzie et al. 1998) Cairns Harbour (McKenzie 1994; Rasheed 1999) and Green Island (Mellors et al. 1993; Rasheed 2000a). Typically biomass was highest late in the dry-season (October- November) and lowest toward the end- of the wet-season (March-April). Seasonal changes in Karumba meadows were different to these east-coast examples with biomass in the Halodule pinifolia meadow

Port of Karumba Seagrass Monitoring - First 6 Years
29
consistently higher in the wet-season. All previous studies of seagrass seasonality in tropical Queensland have been conducted on east-coast meadows. On the east-coast higher seagrass biomass is correlated with calmer weather conditions and increased water clarity which occur late in the dry-season (McKenzie 1994, Mellors et al. 1993). Weather and sea conditions in the Gulf of Carpentaria are often different to those that occur on the east-coast, and differences in seagrass seasonality may be a reflection of these regional differences. Other factors may be more important in determining seagrass seasonality in Karumba. For example, wet-season flooding of the Norman and Bynoe Rivers may result in an increase in available nutrients and in turn lead to an increase in seagrass biomass. Further investigations would be required to determine the specific factors causing seagrass seasonality for Karumba.
Lack of seasonal differences in area for Karumba seagrass meadows may be due to the restriction of their distribution to the shallow intertidal banks. Even in the more favourable growth conditions that occurred in the dry-season surveys it is unlikely that seagrasses would have been able to expand into the deeper waters off the bank. Naturally high water turbidity and resulting low levels of light would continue to restrict seagrass distribution. Similar results were observed in Mourilyan Harbour where seagrass seasonality was measured over a 3-year period (McKenzie et al. 1998). Intertidal Zoster capricorni seagrass meadows in Mourilyan Harbour showed no seasonal trend in area but biomass did vary significantly (McKenzie et al. 1998).
The seagrass meadows in Karumba are substantially different in composition to those in which seasonality has typically been measured in tropical Queensland (eg. McKenzie 1994; Mellors et al. 1993; Rasheed 1999; 2000a). In comparison Karumba seagrass meadows were: (i) dominated by species that are often considered to be pioneering or early colonisers; (ii) relatively low in biomass; (iii) regularly exposed to seasonal flooding and severe storms; and (iv) growing in naturally highly turbid water conditions.
Meadows of this type are common in other locations within the Gulf of Carpentaria such as the Kirke and Love Rivers (Rasheed 2000b) and Weipa (Roelofs et al. 2001) and it is reasonable to expect that seasonality in these meadows would be similar.
Karumba seagrasses are an important food resource for dugong. There has been regular use of the Karumba seagrass meadows by dugong since monitoring began in 1994, with feeding trails recorded in every survey. The two seagrass species found in the surveys, Halophila ovalis and Halodule pinifolia, are known to be preferred food species for dugong (Preen 1995). Karumba seagrasses are isolated from other seagrass areas in the Gulf of Carpentaria and may be the only food source for dugongs in the region for 100 km to the west and 500 km to the north (Poiner et al. 1987).
The Karumba seagrass monitoring program is one of the longest-term seagrass monitoring programs established for tropical seagrass meadows in Australia. The information on how these seagrass meadows change naturally between seasons and over longer time periods has greatly increased our understanding of tropical seagrass dynamics and scales of temporal change. This information will enable scientists to better interpret changes in seagrass meadows that may be associated with port activities or other anthropogenic impacts. The first six years of monitoring have provided a good range of natural annual changes in seagrass biomass and distribution across a broad range of climatic conditions

Port of Karumba Seagrass Monitoring - First 6 Years
30
that could be expected for the area. This information gives a good basis for comparison of the Port of Karumba seagrass communities in future surveys.
Results from the monitoring program indicate that the dredging program and other port activity has had no observable negative impact on Karumba seagrass meadows. Measures adopted in the dredging program to protect seagrass meadows from disturbance appear to have been successful and should continue to be used for maintenance dredging. A long-term seagrass monitoring strategy based on annual surveys of Alligator Bank would continue to provide an indication of the environmental health of the port and an indication of any impacts associated with maintenance dredging. The first six years of monitoring have provided a good measure of seasonal change, and the subsequent program would only require dry-season surveys of seagrass when distribution is greatest and more favourable tide and weather conditions occur. In terms of Port management surveys every 2 years linked to the maintenance dredging would be adequate. DPI would prefer to see annual surveys continue however, as this would further increase our understanding of natural annual changes in tropical seagrasses. The first of these annual surveys was completed in October 2000 (Rasheed & Thomas 2000). PCQ and DPI are planning to conduct another survey in October 2001.

Port of Karumba Seagrass Monitoring - First 6 Years
31
5. REFERENCES
Abal, E.G. and Dennison, W.C. (1996). Seagrass depth range and water quality in southern Moreton Bay, Queensland, Australia. Marine and Freshwater Research 47(6), 763-771.
Anon (1994). The Century project: Draft impact assessment study report. Century Zinc,
compiled by Dames and Moore.
Birch, W.R. and Birch, M. (1984). Succession and pattern of tropical intertidal seagrasses in Cockle Bay, Queensland, Australia: a decade of observations. Aquatic Botany 19, 343-367.
Bulthuis, D.A. (1983). Effects of in situ light reduction on density and growth of the Australian seagrass, Heterozostera tasmanica (Martens ex Aschers) den Hartog in Western Port, Victoria, Australia. Journal of Experimental Marine Biology and Ecology 61, 91-103.
Bulthuis, D.A. (1987). Effects of temperature on photosynthesis and growth of seagrasses. Aquatic Botany 27, 27-40.
Cambridge, M.L. and McComb, A.J. (1984). The loss of seagrasses in Cockburn Sound, Western Australia. 1. The time, course, and magnitude of seagrass decline in relation to industrial development. Aquatic Botany 20, 229-243.
Cambridge, M.L., Chiffings, A.W., Brittan, C., Moore, L. and McComb, A.J. (1986). The
loss of seagrass in Cockburn Sound, Western Australia. II. Possible causes of seagrass decline. Aquatic Botany 24, 269-285.
Coles, R.G. and Lee Long, W.J. (1985). Juvenile prawn biology and the distribution of seagrass prawn nursery grounds in the south-eastern Gulf of Carpentaria, Queensland. In `Second Australian National Prawn Seminar'. (Eds P. C. Rothlisberg, B. J. Hill and D. J. Staples.) pp. 55-60. (NPS2: Cleveland, Australia.)
Coles, R. G., McKenzie, L.J., Bibby, J.M., Lee Long, W. J., Mellors, J. E. and Daniel, P.A.
(in prep.). Seagrass meadows of the eastern Gulf of Carpentaria. QDPI information series.
Coles, R.G. Lee Long, W.J., Watson, R.A. and Derbyshire, K.J. (1993). Distribution of seagrasses, and their fish and penaeid prawn communities, in Cairns Harbour, a tropical estuary, northern Queensland, Australia. In `Tropical Seagrass Ecosystems; Structure and Dynamics in the Indo-West Pacific.' Australian Journal of Marine and Freshwater Research 44, 193-210.

Port of Karumba Seagrass Monitoring - First 6 Years
32
Coles, R.G., Lee Long, W.J., McKenzie, L.J., Short, M., Rasheed, M.A. and Vidler, K.P. (1995). `Distribution of deep-water seagrass habitats between Cape Weymouth and Cape Tribulation, northeastern Queensland'. Report to the Great Barrier Reef Marine Park Authority and the Co-operative Research Centre for Reef Research. Published as Queensland Department of Primary Industries Information Series QI96043 (QDPI, NFC, Cns) 33pp.
Coles, R.G., Lee Long, W.J. and McKenzie, L,J. (Eds) (2001). Detailed surveys of seagrass resources in the Dugong Protection Areas of Upstart Bay, Newry Region/Sand Bay and Ince/Llewellyn Bays, Autumn (May) 1999 and Spring (October) 1999. Final report to Great Barrier Reef Marine Park Authority 104pp.
Costanza, R., d’Arge, R., de Groot, R., Farber, S., Grasso, M., Hannon, B., Limburg, K., Naeem, S., O’Neill, R.V., Paruelo, J., Raskin, R.G., Sutton, P. and van den Belt, M. (1997) The value of the world’s ecosystem services and natural capital. Nature 387: 253-260.
den Hartog, C. (1977). Structure, function and classification in seagrass communities. In. `Seagrass Ecosystems: A Scientific Perspective'. Chapter 3. (Marcel Dekker, Inc: New York).
den Hartog, C. (1987). `Wasting disease' and other dynamic phenomena in Zostera beds. Aquatic Botany. 27, 3-14.
Dennison, W.C. (1987). Effects of light on seagrass photosynthesis, growth and depth distribution. Aquatic Botany 27, 15-26.
Dennison, W.C., Orth, R.J., Moore, K.A., Stevenson, J.C., Carter, V., Kollar, S., Bergstrom, P.W. and Batiuk, R.A. (1993). Assessing water quality with submersed aquatic vegetation: Habitat requirements as barometers of Chesapeake Bay health. BioScience 42(2), 86-94.
Edgar, G. and Kirkman, H. (1989). Recovery and restoration of seagrass habitat of significance to commercial fisheries. Victorian Institute of Marine Science Working Paper No. 19, Melbourne
Erftemeijer, P.L.A. (1994). Differences in nutrient concentrations and resources between seagrass communities on carbonate and terrigenous sediments in South Sulawesi, Indonesia. Bulletin of Marine Science 54(2), 403-419.
Hilliard, R., Baxter, I. and LeProvost, I. (1994a). Marine ecology - Karumba (dry-season).
Century Project environmental studies, Dames and Moore, Brisbane. Hilliard, R., Gordon, D., Baxter, I. and LeProvost, I. (1994b). Marine ecology - Karumba
(wet-season). Century Project environmental studies, Dames and Moore, Brisbane.

Port of Karumba Seagrass Monitoring - First 6 Years
33
Jackson, J.B.C., Cubit, J.D., Keller, B.D., Batista, V., Burns, K., Caffey, H.M., Caldwell, R.L., Garrity, S.D., Getter, C.D., Gonzalez, C., Guzman, H.M., Kaufmann, K.W., Knap, A.H., Levings, S.C., Marshall, M.J., Steger, R., Thompson, R.C. and Weil, E. (1989). Ecological effects of a major oil spill on Panamanian Coastal marine Communities. Science 243, 37-44.
Kemp, W.M. (1983). Seagrass communities as a coastal resource. Journal of the Marine Technological Society. 17, 3-5.
Kuo, J. and Kirkman, H. (1987). Floral and seedling morphology and anatomy of Thalassodendron pachyrhizum den Hartog (Cymodoceaceae). Aquaic Botany 29, 1-17.
Kuo, J. and McComb, A.J. (1989). Seagrass taxonomy, structure and function. In `Biology of Seagrasses.' (Eds A. W. D. Larkum, A. J. McComb and S. A. Shepherd.) pp. 6-73. (Elsevier: New York.)
Lanyon, J., Limpus, C.J. and Marsh, H. (1989). Dugongs and turtles: grazers in the seagrass system. In `Biology of seagrasses: A treatise on the biology of seagrasses with special reference to the Australian region.' (Eds A.W.D. Larkum, A.J. McComb and S.A. Shepherd) Chpt.18. pp.610-634. (Elsevier, New York).
Larkum, A.W.D., McComb, A.J. and Shepherd, S.A. (1989). `Biology of Seagrasses. A Treatise on the biology of seagrasses with special reference to the Australian region'. (Eds. ) (Elsevier Science Publ., Amsterdam, New York.) 841pp.
Lee Long, W.J., Mellors, J.E. and Coles, R.G. (1993). Seagrasses between Cape York and Hervey Bay, Queensland, Australia. Australian Journal of Marine and Freshwater Research 44(1), 19-31.
Longstaff, B.J. and Dennison, W.C. (1999). Seagrass survival during pulsed turbidity events: the effects of light depivation on the seagrasses Halodule pinifolia and Halophila ovalis. Aquatic Botany 65, 105-121.
McConchie, C.A. and Knox, R.B. (1989). Pollination and reproductive biology of seagrasses. In `Biology of Seagrasses: A treatise on the biology of seagrasses with special reference to the Australian region.' (Eds A. W. D. Larkum, A. J. McComb and S. A. Shepherd.) Chapter 3, pp. 74-111. (Elsevier: New York.).
McKenzie, L. J. (1994). Seasonal changes in biomass and shoot characteristics of a Zostera capricorni Aschers. dominant meadow in Cairns Harbour, northern Queensland. Australian Journal of Marine and Freshwater Research 45, 1337-1352.
McKenzie, L.J., Lee Long, W.J., Roelofs, A.J., Roder, C.A. and Coles, R.G. (1998). “Port of Mourilyan Seagrass Monitoring - First 4 Years.” EcoPorts Monograph Series No 15. (Ports Corporation of Queensland, Brisbane) 34 pp.
McMillan, C. (1981). Seed reserves and seed germination for two seagrasses, Halodule wrightii and Syringodium filiforme, from the western Atlantic. Aquatic Botany 11, 279-296.

Port of Karumba Seagrass Monitoring - First 6 Years
34
McMillan, C. (1988). Seed germination and seedling development of Halophila decipiens Ostenfeld (Hydrocharitaceae) from Panama. Aquatic Botany 31, 169-176.
Mellors, J.E. (1991). An evaluation of a rapid visual technique for estimating seagrass biomass. Aquatic Botany 42, 67-73.
Mellors, J.E., Marsh, H. and Coles, R.G. (1993) Intra-annual changes in seagrass standing crop, Green Island, northern Queensland. In “Tropical Seagrass Ecosystems: Structure and Dynamics in the Indo-West Pacific. Australian Journal of Marine and Freshwater Research 44, 33-42.
Onuf, C.P. (1994). Seagrasses, dredging and light in Laguna Madre, Texas, U.S.A. Estuarine, Coastal and Shelf Science 39(1): 75-91.
Orth, R. J. (1977). Effect of nutrient enrichment on growth of eelgrass Zostera marina in the Chesapeake Bay, Virginia, USA. Marine Biology 44, 187-194.
Orth, R.J. and Moore, K.A. (1983). Chesapaeke Bay: An unprecedented decline in submerged aquatic vegetation. Science. 222, 51-53.
Patriquin, D.G. (1975). “Migration” of blowouts in seagrass beds at Barbados and Carriacou, West Indies, and its ecological implications. Aquatic Botany 1, 163-189.
Poiner, I. R., Staples, D.J. and Kenyon, R. (1987). Seagrass communities of the Gulf of
Carpentaria, Australia. Australian Journal of Marine and Freshwater Research 38, 121-131.
Poiner, I.R., Walker, D.I. and Coles, R.G. (1989). Regional studies - seagrasses of tropical Australia. In `Biology of Seagrasses: A treatise on the biology of seagrasses with special reference to the Australian region.' (Eds A. W. D. Larkum, A. J. McComb and S. A. Shepherd.) Chapter 10, pp. 279-296. (Elsevier: New York.)
Preen, A. (1995). Impacts of dugong foraging on seagrass habitats: Observation and experimental evidence for cultivation grazing. Marine Ecology Progress Series 124, pp 201-203.
Preen, A., Lee Long, W.J. and Coles, R.G. (1995). Flood and cyclone related loss, and partial recovery, of more than 1000 km2 of seagrasses in Hervey Bay, Qld, Australia. Aquatic Botany 52, 3-17.
Rasheed, M.A. (1999). Recovery of experimentally created gaps within a tropical Zostera capricorni (Aschers.) seagrass meadow, Queensland Australia. Journal of Experimental Marine Biology and Ecology 235, 183-200.
Rasheed, M.A. (2000 a). Recovery and succession in north Queensland tropical seagrass communities. PhD Thesis. James Cook University of North Queensland, Townsville.
Rasheed, M.A. (2000 b). Seagrass Survey of the Kirke & Love River Systems – August 1999. Report to the Cape York Natural Heritage Trust (Queensland Department of Primary Industries: Northern Fisheries Centre) 9pp.

Port of Karumba Seagrass Monitoring - First 6 Years
35
Rasheed, M.A. and Thomas, R. (2000). ‘Port of Karumba Long Term Seagrass Monitoring, Progress Report – October 2000. Report to the Ports Corporation of Queensland. (Queensland Department of Primary Industries: Northern Fisheries Centre, Cairns) 9 pp.
Rasheed, M.A., Lee Long, W.J., McKenzie, L.J., Roder, C.A., Roelofs, A.J. and Coles, R.G. (1996). Port of Karumba Seagrass Monitoring, Baseline Surveys - Dry-Season (October) 1994 and Wet-Season (March) 1995. ‘Ports Corporation Eco Ports Monograph Series 4 (PCQ Brisbane) 47pp.
Roelofs, A.J., Rasheed, M.A. and Thomas, R. (2001). Port of Weipa seagrass monitoring, baseline surveys - April & September 2000. Ports Corporation Queensland Eco Ports Monograph Series (PCQ Brisbane) (in prep).
Shepherd, S.A., McComb, A.J., Bulthuis, D.A., Neverauskas, V., Steffensen, D.A. and West, R. (1989). Decline of seagrass. In `Biology of Seagrasses.' (Eds A.W.D. Larkum, A.J. McComb and S.A. Shepherd) Chapter 12, pp. 346-393. (Elsevier: New York.)
Short, F.T. (1987). Effects of sediment nutrients on seagrasses: Literature review and mesocosm experiment. Aquatic Botany 27, 41-57.
Sokal, R.R. and Rohlf, F.J. (1987). `Introduction to Biostatistics'. (W.H. Freeman, New York) 363pp.
Walker, D.I. (1989). Methods for monitoring seagrass habitat. Victorian Institute of Marine Science Working Paper No 18 (VIMS: Melbourne).
Watson, R.A., Coles, R.G. and Lee Long, W.J. (1993). Simulation estimates of annual yield and landed value for commercial penaeid prawns from a tropical seagrass habitat, northern Queensland, Australia. Australian Journal of Marine and Freshwater Research. 44(1), 211-220.
Williams, S.L. and Dennison, W.C. (1990). Light availability and diurnal growth of a green macroalga (Caulerpa cupressolidas) and a seagrass (Halophila decipiens). Marine Biology 106(3), 437-443.
Port of Karumba Seagrass Monitoring - First 6 Years
36
APPENDIX 1 - STATISTICAL ANALYSES
Table 8. Results of linear regressions of each observer’s seagrass biomass estimation with harvested above-ground biomass (g DW. m-2), for each seagrass calibration type for each survey.
Survey Observer r2 F P October 1994 M. Rasheed 0.96 158.21 <0.001
R. Coles 0.85 27.41 0.003 W. Lee Long 0.94 74.50 <0.001
March 1995 M. Rasheed 0.95 60.41 0.004 W. Lee Long 0.96 74.57 0.003
October 1995 M. Rasheed 0.87 20.98 0.019 L. Makey 0.73 8.38 0.063
March 1996 M. Rasheed 0.90 26.93 0.013 C. Roder 0.93 41.64 0.008
October 1996 M. Rasheed 0.94 43.16 0.007 A. Roelofs 0.95 54.58 0.005
March 1997 M. Rasheed 0.99 607.61 <0.001 A. Roelofs 0.99 887.87 <0.001
October 1997 M. Rasheed 0.97 128.78 0.001 A. Roelofs 0.98 162.32 0.001
March 1998 M. Rasheed 0.99 341.12 <0.001 A. Roelofs 0.88 29.48 0.005
October 1998 A. Roelofs 0.98 71.47 0.003 March 1999 M. Rasheed 0.96 101.91 <0.001
A. Roelofs 0.93 55.80 0.002 October 1999 M. Rasheed 0.98 119.51 0.002 March 2000 M. Rasheed 0.86 17.72 0.024
R. Thomas 0.89 24.55 0.016

Port of Karumba Seagrass Monitoring - First 6 Years
37
Table 9. Results of ANOVA for above-ground biomass versus season for each year of sampling for each meadow selected for monitoring
MEADOW NAME DF SS MS VR P Core
season 1 3261.04 3621.04 167.46 <0.001 season.year 10 3756.08 375.61 19.29 <0.001
residual 735 14312.86 19.47 total 746 21329.97
Fringing
season 1 65.90 65.90 5.68 0.018 season.year 10 1326.73 132.67 11.43 <0.001
residual 335 3888.72 11.61 total 346 5281.34
Table 10. Results of ANOVA for above-ground biomass versus dry-season monitoring event for each meadow selected for monitoring
MEADOW NAME DF SS MS VR P Core Year 5 1312.00 262.40 34.45 <0.001
residual 365 2780.09 7.62 total 370 4092.09
Fringing
Year 5 109.82 21.96 3.97 0.002 residual 198 1094.39 5.53
total 203 1204.21
Table 11. Results of ANOVA for above-ground biomass versus wet-season monitoring event for each meadow selected for monitoring
MEADOW NAME DF SS MS VR P Core Year 5 2444.08 488.82 15.68 <0.001
residual 370 11532.77 31.17 total 375 13976.85
Fringing
Year 5 1216.91 243.38 11.93 <0.001 residual 137 2794.33 20.40
total 142 4011.24

Port of Karumba Seagrass Monitoring - First 6 Years
38
Notes:
.............................................................................................................................
.............................................................................................................................
.............................................................................................................................
.............................................................................................................................
.............................................................................................................................
.............................................................................................................................
.............................................................................................................................
.............................................................................................................................
.............................................................................................................................
.............................................................................................................................
.............................................................................................................................
.............................................................................................................................
.............................................................................................................................
.............................................................................................................................
.............................................................................................................................
.............................................................................................................................
.............................................................................................................................
.............................................................................................................................
.............................................................................................................................
.............................................................................................................................
.............................................................................................................................
.............................................................................................................................
.............................................................................................................................
.............................................................................................................................
.............................................................................................................................
.............................................................................................................................
.............................................................................................................................
.............................................................................................................................
.............................................................................................................................
.............................................................................................................................
.............................................................................................................................
.............................................................................................................................
.............................................................................................................................
.............................................................................................................................
.............................................................................................................................
.............................................................................................................................
.............................................................................................................................
.............................................................................................................................
.............................................................................................................................
.............................................................................................................................
.............................................................................................................................