science express logo report - embl heidelberg
TRANSCRIPT
/ www.sciencexpress.org / 9 October 2008 / Page 1 / 10.1126/science.1162493
A long-standing goal of biology is to map the behavior of all cells during vertebrate embryogenesis. We developed digital scanned laser light sheet fluorescence microscopy and recorded nuclei localization and movement in entire wild-type and mutant zebrafish embryos over the first 24 hours of development. Multiview in vivo imaging at 1.5 billion voxels per minute provides “digital embryos,” i.e., comprehensive databases of cell positions, divisions, and migratory tracks. Our analysis of global cell division patterns reveals a maternally defined initial morphodynamic symmetry break, which identifies the embryonic body axis. We further derive a model of germ layer formation and show that the mesendoderm forms from one-third of the embryo's cells in a single event. Our digital embryos, with 55 million nucleus entries, are provided as a resource.
Model systems such as Caenorhabditis elegans and Ciona intestinalis lend themselves well to comprehensive analyses at the cellular level, for example by conventional microscopy (1, 2). However, global studies of complex vertebrate species encounter technical limitations. Whereas the formation of single organs has been reconstructed by imaging and tracking nuclear fluorescent proteins for several hours (3–6), obtaining quantitative morphogenetic data representing the full embryos over the entire time course of embryogenesis remains a major challenge.
For comparison, 671 cells need to be followed during C. elegans embryogenesis, whereas the analysis of complex vertebrate embryos requires the simultaneous tracking of tens of thousands of cells. High spatio-temporal resolution, ultra-low photo-bleaching rates, and an excellent signal-to-noise ratio are crucial. In order to follow the nuclei of the 16,000 cells of an 18-hour-old zebrafish embryo, a volume of 1000 by 1000 by 1,000 µm3 must be recorded at least once every 90 s since nuclei move several µm per minute. In order to reliably detect all nuclei, the (x-y-) images must be acquired at a step size of no more than 3 µm along the z-axis,
resulting in ~350 images per time point. In addition, an image size of at least 1500 by 1500 pixels is necessary to elucidate nuclear morphologies. Thus, the observation must be performed at a continuous imaging speed of at least 10 million volume elements (voxels) per second. A dynamic range of at least 12 bit covers the varying expression levels of genetically encoded markers. At the same time, photo-bleaching and photo-toxicity (7) must be minimized to ensure the physiological development of the embryo. Finally, the embryo's central yolk cell is opaque at physiological wavelengths; therefore, imaging along multiple directions is needed to capture the development of the entire embryo.
The most widely applied advanced fluorescence imaging techniques rely on confocal and multi-photon microscopes, which provide three-dimensional resolution but lack the combination of high-speed imaging and low photo-toxicity required for the fast recording of entire embryos over long periods of time. They are also unsuited for multi-view imaging (8). To overcome some of these limitations, we recently introduced light sheet-based technologies to biological imaging (SPIM) (9). With these microscopes, the specimen is illuminated along a single plane with a sheet of light that is typically generated via a set of apertures and by focusing a collimated beam with a cylindrical lens. This arrangement provides three-dimensional optical sectioning and reduces the energy load on the specimen (9–11).
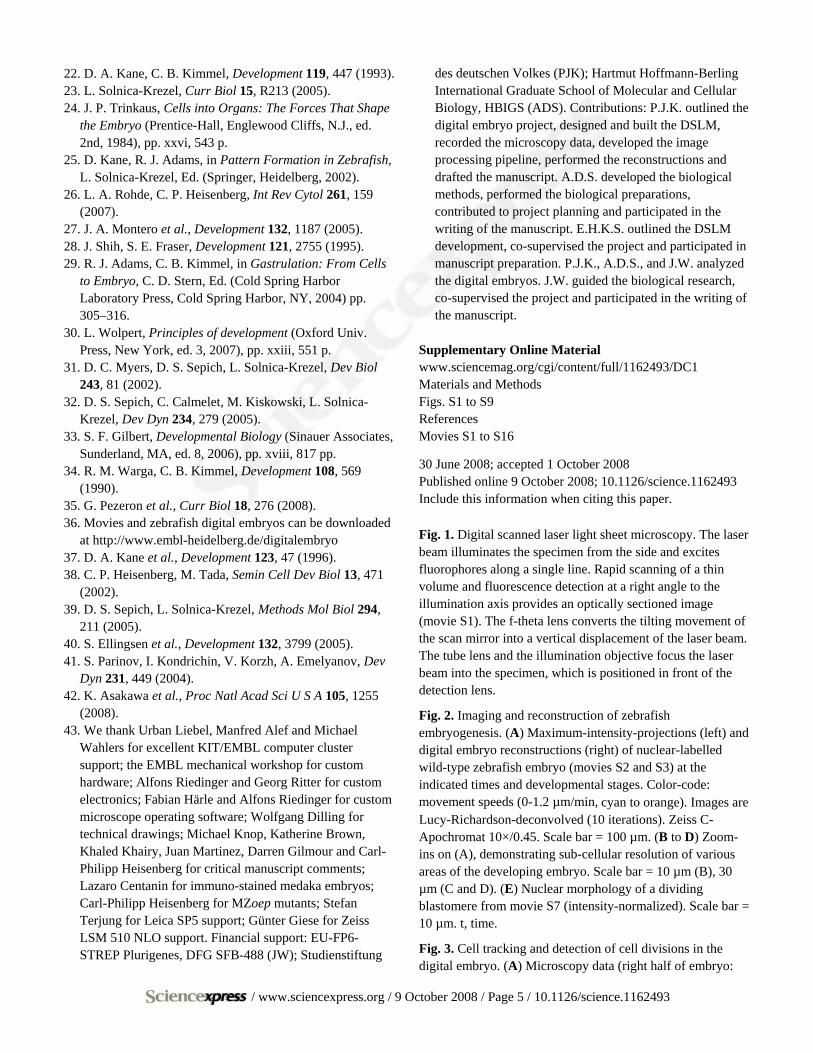
Digital scanned laser light sheet fluorescence microscopy. To achieve the imaging speed and quality for recording entire embryos, we developed digital scanned laser light sheet fluorescence microscopy (DSLM, fig. S1). The idea behind DSLM is to generate a “plane of light” with a laser scanner that rapidly moves a µm-thin beam of laser light vertically and horizontally through the specimen (Fig. 1; movie S1).
This approach has several advantages over standard light sheet microscopy. First, DSLM illuminates each line in the specimen with the same intensity, a crucial prerequisite for quantitative imaging of large specimens (fig. S2). Second, in
Reconstruction of Zebrafish Early Embryonic Development by Scanned Light Sheet Microscopy Philipp J. Keller,1,2* Annette D. Schmidt,2 Joachim Wittbrodt,1,2,3,4* Ernst H. K. Stelzer1 1Cell Biology and Biophysics Unit, European Molecular Biology Laboratory (EMBL), Meyerhofstrasse 1, D-69117 Heidelberg, Germany. 2Developmental Biology Unit, EMBL, Meyerhofstrasse 1, D-69117 Heidelberg, Germany. 3Institute of Zoology, Department for Developmental Physiology, University of Heidelberg, INF 230, D-69120 Heidelberg, Germany. 4Institute of Toxicology and Genetics, Karlsruhe Institute of Technology (KIT), Post Office Box 3640, D-76021 Karlsruhe, Germany. *To whom correspondence should be addressed. E-mail: [email protected] (P.J.K.), [email protected] (J.W.)
/ www.sciencexpress.org / 9 October 2008 / Page 2 / 10.1126/science.1162493
contrast to standard light sheet-based microscopy, DSLM does not rely on apertures to form the laser profile, thus reducing optical aberrations and thereby providing an exceptional image quality. Third, the entire illumination power of the light source is focused into a single line, resulting in an illumination efficiency of 95% as compared to ~3% in standard light sheet microscopy. Fourth, DSLM allows to generate intensity-modulated illumination patterns (structured illumination) (12), which can be used to enhance the image contrast in highly light-scattering specimens, such as large embryos. Furthermore, DSLM combines (i) an imaging speed of 63 million voxels/second, (ii) a signal-to-noise ratio of 1,000:1 at a lateral/axial resolution of 300/1,000 nm, and (iii) ultra-low excitation energies confined to a single plane (1.7 µJ at 488 nm per image in our zebrafish experiments) (8).
In order to analyze zebrafish embryonic development, we recorded stacks of ~400 images (2048 by 2048 pixels each) in intervals of 60 or 90 seconds and along two opposing directions (Fig. 2; movies S2 and S3). The embryos were embedded in agarose, kept at a constant temperature (26.5 °C) [see (13) for developmental stages] throughout the experiment and exhibited normal development (8). Nuclei were labeled at the one-cell stage by mRNA injection of H2B-eGFP, a fusion protein of human histone-2B and the GFP-reporter, which localizes to chromatin (14). This presents an effective marker for cell positions and cell divisions since changes in chromatin density can be directly observed. Imaging was performed for 24 hours, providing about 400,000 images per embryo.
We measured nuclear fluorescence intensities and found that steady-state GFP concentrations are reached at ~12 hours post fertilization (hpf), due to the limited stability of the injected mRNA. However, despite continuous imaging for another 12 hours the fluorescence intensity levels remained constant. This indicates a negligible photo-bleaching rate in DSLM high-speed live imaging (fig. S3). We applied comparable experimental settings in state-of-the-art confocal and two-photon fluorescence microscopes. The embryo was exposed to a factor of 5600 more energy in the confocal (9.6 mJ at 488 nm per image) and to a factor of one million more energy in the two-photon fluorescence microscope (1.7 J at 930 nm per image) (8). Thus, DSLM allows for a comprehensive, quantitative analysis of zebrafish embryonic development, over periods longer than 24 hours, with high spatio-temporal resolution and ultra-low photo-toxicity.
The digital embryo. To efficiently handle the large amounts of microscopy data, we developed a parallelized image segmentation pipeline, i.e. a set of software modules that automatically detects nuclei in the raw images using large-scale computer networks (at the European Molecular Biology Laboratory, EMBL; and Karlsruhe Institute of
Technology, KIT) (fig. S4). Image segmentation was performed by (i) recursive refinement of the three-dimensional shapes and internal structures of objects detected in the microscopy data (fig. S5), (ii) subsequent filtering of these objects according to the morphological characteristics expected for nuclei, and (iii) an analysis of the identification rate for each nucleus throughout time (8). Due to the high signal-to-noise ratio of the DSLM data, we obtained a robust average segmentation efficiency of 97% during the first ten hours of embryogenesis and an average of 90% during late gastrulation (8). The microscopy data acquired along the two opposing directions were segmented separately and subsequently combined into a complete data set by a fusion algorithm (8). A “digital embryo” was derived for each experiment and constitutes a comprehensive database of the positions, sizes, and fluorescence intensities of 92% of the nuclei in the entire embryo (determined by manual controls) (8) throughout early embryogenesis from early cleavage stages up to the beating-heart stage (Fig. 2; movie S3). The algorithms furthermore provide 99.5% efficiency in converting these nuclear positions into migratory tracks, corresponding to one tracking error per 200 time points or 5 hours (8). We processed seven 24 hours time-lapse recordings of zebrafish embryogenesis and obtained developmental blueprints with 55 million nucleus data entries, including a reconstruction of the zebrafish one-eyed pinhead mutant (MZoep) (15). Our data on zebrafish embryogenesis from 1.5-30 hpf are presented as time-lapse movies of the microscopy recordings (movies S2, S4, S7, and S12) and as movies of the reconstructions (movies S3, S5, S8, and S13). Further analysis of the digital embryos (8) provides a detailed description of morphogenetic and developmental processes at sub-cellular resolution (fig. S3), spatio-temporal coordinates and polarity of cell divisions (movie S10; Fig. 3B and fig. S6), global nuclear population statistics (figs. S3 and S6), embryo-to-embryo variability in morphogenetic key parameters (fig. S7) and cell tracking throughout development (movies S9, S11, S14, and S15; Fig. 3A).
The digital embryos provide direct quantitative access to a global analysis of cell and tissue behavior, as shown below. In order to visualize morphogenetic domains, we tracked individual cell movements up to somitogenesis stages and color-encoded the information of directionality (movies S9, S14, and S15; Fig. 3A). This analysis identifies morphogenetic movements during development (emboly, epiboly, convergence, and extension) and provides a global, quantitative perspective of their interplay.
Early morphodynamic symmetry breaking. Nuclear β-catenin is one of the earliest markers for the future dorsal side of the embryo (~512-cell-stage) (16, 17), which raises the question of whether morphodynamic symmetry breaking also occurs at this early time point. We mapped and analyzed the
/ www.sciencexpress.org / 9 October 2008 / Page 3 / 10.1126/science.1162493
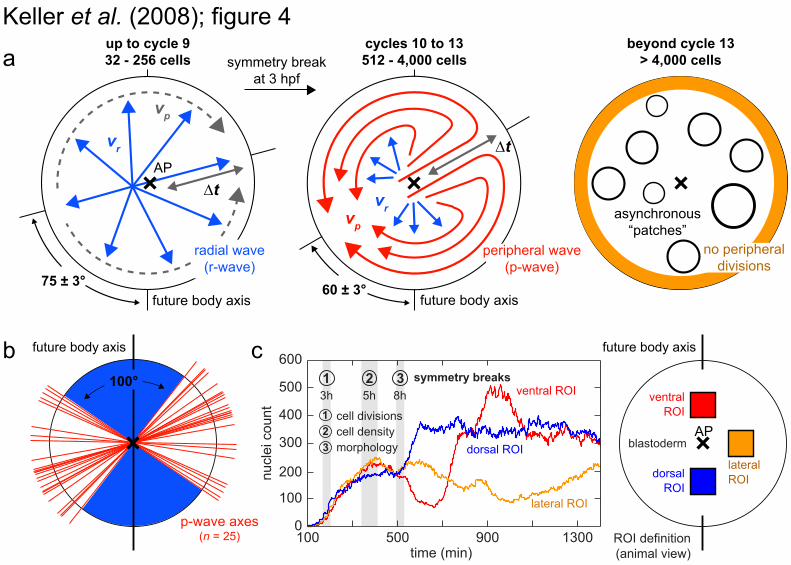
three-dimensional patterns and polarity of early cell divisions in five embryos during 1.5-7 hpf [all experiments were performed at 26.5°C (13)] (movie S10). Whereas planes of cell division are evenly distributed [fig. S6b; in contrast to the asymmetry in gastrulation (18, 19)], a symmetry break in the spatio-temporal pattern occurs at the 512-cell-stage (movie S10; Fig. 4A). Initially, cell divisions follow 3-min-long radial waves, originating in the embryonic center. After the 512-cell-stage, two circular peripheral waves break this radial symmetry (Fig. 4, A and B, and fig. S8; movie S6). They occur during division cycles 10 to 13 at an angle that correlates with the future body axis (Fig. 4B).
To investigate whether the break of radial symmetry can also be related to nuclear densities, we determined the nuclear counts in small volumes around the animal pole. This analysis indicates divergence commencing at 5 hpf, i.e. two hours after the symmetry break in cell division patterns, but still prior to the morphological signs of shield formation at the onset of convergence (8 hpf) (Fig. 4C). Between 5 hpf and 8 hpf, reduced cell proliferation rates in the future embryonic shield result in lower cell densities dorsally (rather than dorsal compaction) (20, 21) and thereby indicate the position of the future body axis.
Thus by dissecting the three-dimensional pattern of cell divisions in the entire embryo, we reveal an early morphodynamic symmetry break, concomitant with the nuclear localization of β-catenin, that allows an early prediction of the orientation of the body axis, preceding the mid-blastula-transition (22).
A model of hypoblast formation. In addition to enabling the analysis of global quantitative studies, the digital embryos allow us to focus on confined morphogenetic events. We investigated the formation of the hypoblast, the inner cell layer, which gives rise to mesoderm and endoderm. The formation of the hypoblast is known to result from internalization of cells (emboly) of the outer layer (epiblast) during gastrulation and stretching and thinning of cell sheets over the yolk (epiboly) (23). Our data reveal a pronounced “embolic wave” of internalization and regional differences in modes of internalization (Fig. 5 and fig. S9; movies S14 and S15).
Starting at 5.7 hpf (40% epiboly at 26.5°C) (13) and lasting for two hours, approximately 1,550 cells (34% of all cells), internalize around the perimeter of the blastopore to form the mesendoderm (Fig. 5 and fig. S9). After this time window, we did not observe any further cells moving from epiblast to hypoblast.
Internalizing cells follow the path of a wave, which stretches inwards toward the yolk cell, reaches a peak height of 50 µm before rolling over, touches the deep cells situated closer to the animal pole (Fig. 5, green cell population; movie S16) and completes emboly at 7.7 hpf. Whereas cells
internalize around the entire perimeter, the wave is most prominent dorsally. The onset of internalization is synchronized along the blastopore (fig. S9, c and d), but the folding-over at the dorsal shield takes 30 min longer than at other locations along the blastopore. As a consequence of this dorsally pronounced emboly, the dorsal leading edge of epiboly lags behind in its vegetal approach (movie S14).
Modes of internalization (24), either involution (synchronously flowing sheets like in amphibian gastrulation) or ingression (cells individually sinking inwards), have been subject to intense discussion (25, 26). To determine whether modes of internalization vary regionally, we generated “internalization maps” for the dorsal and ventral hemispheres (fig. S9a). An analysis of time shifts between internalization events around the blastopore reveals that asynchronous internalization and radial intercalation of single cells in the shield region disrupt the internalization pattern on the dorsal hemisphere [fig. S9, b and e; supporting previous single-cell tracking studies (27, 28)]. On the ventral hemisphere, however, mesendoderm internalization occurs exclusively in a synchronous manner (fig. S9b/e), reminiscent of involution (24) or an intermediate mechanism termed "synchronous ingression" (23, 29).
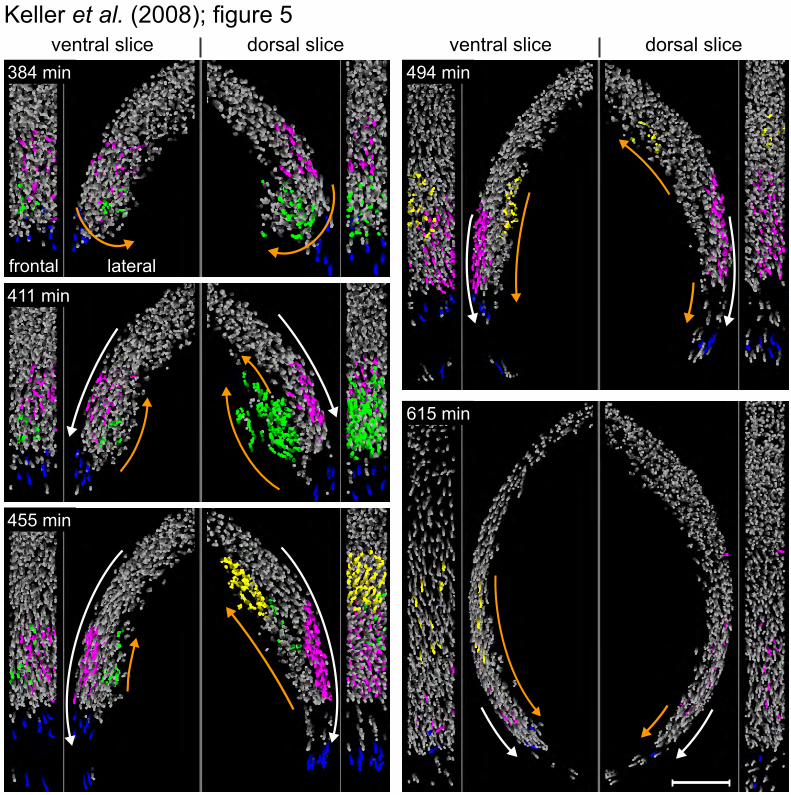
In dorso-anterior regions on the animal hemisphere, internalized cells move anti-parallel to epiblast cells toward the animal pole for ~100 minutes (Fig. 5, purple and yellow cell populations; movie S14). In contrast, internalized cells in the ventral hemisphere change direction within 30 min after internalization and migrate toward the vegetal pole (Fig. 5; movies S15 and S16).
Unlike gastrulation in Xenopus (30), a continuous rolling internalization with hypoblast cells moving toward the animal pole does not occur as epiboly proceeds to the vegetal hemisphere (movie S16). Instead, hypoblast cells follow a well-defined leading edge and move parallel to epiblast cells toward the vegetal pole (movie S14, x-z-slice).
A comparative reconstruction of the zebrafish MZoep mutant quantitatively describes its deficiency in forming mesendoderm (15, 27): Whereas ~1,550 cells internalize via the embolic wave in the wild-type embryo, the MZoep digital embryo (movies S4 and S5) reveals merely ~60 internalizing cells in the entire embryo during the same time period (movie S6). This visualization shows that the oversized epiblast (15) forms through convergence and absence of internalization and dorsal stretching (movies S5 and S6). Convergence is highly abnormal and prolonged, with ventral cells moving across the animal pole toward the epiblast’s center (movie S6).
In conclusion, we show that wild-type hypoblast cells are deposited in a single embolic wave that occurs before epiboly moves the blastopore to the vegetal hemisphere. The embryo is therefore split into a dorso-anterior domain characterized
/ www.sciencexpress.org / 9 October 2008 / Page 4 / 10.1126/science.1162493
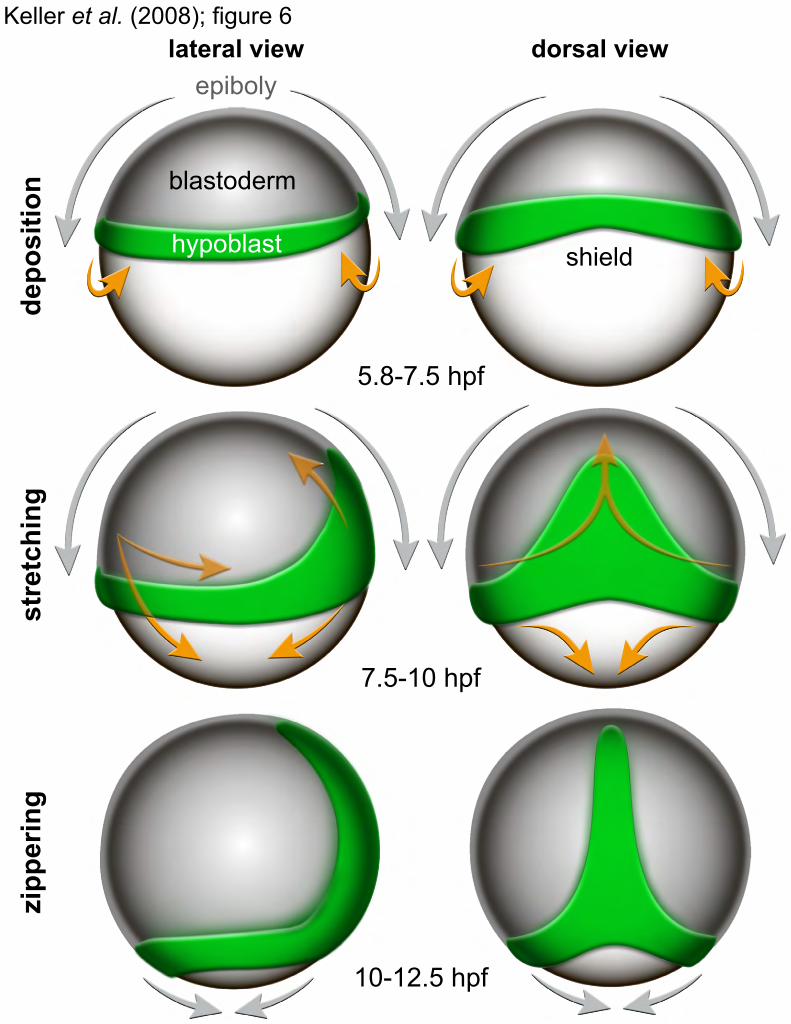
by anti-parallel movements of germ layers and a dorso-posterior domain, where the parallel migration of epi- and hypoblast stretches the hypoblast. In the trunk and tail region, parallel germ layer migration and convergence/extension move the mesendoderm, deposited in a ring around the blastopore, to an axial position, closing the blastopore dorsally from anterior to posterior like a zipper. Our analysis puts previous cell tracking studies (31, 32) into a global perspective. Regarding mesendoderm formation in zebrafish, a three-stage model is proposed (Fig. 6): mesendoderm forms by (i) global deposition in a single event, (ii) dorsal stretching, and (iii) antero-posterior “zippering.” Different modes of internalization characterize the initial deposition, with synchronous events (involution/synchronous ingression) occurring on the ventral side and disruption of synchrony (asynchronous ingression/radial intercalation) on the dorsal side. Our analysis of the entire embryo describes the migratory behavior of 92% of all cells throughout gastrulation, leading to a comprehensive model that complements and partially revises the general view of zebrafish gastrulation (30, 33). In particular, our finding of a single embolic event contradicts the current assumption of a continuous internalization during epiboly (30, 33–35).
Conclusions. We developed and applied DSLM as a fluorescence microscopy system for the high-speed in vivo observation of embryonic development at sub-cellular resolution, enabling cell tracking in the entire early zebrafish embryo. Applying the automated image segmentation pipeline provides a “digital embryo” that visualizes complex developmental events in a global context. We demonstrate application of the method to a quantitative reconstruction of early cell division patterns. This analysis reveals an initial morphodynamic symmetry break, prior to the onset of zygotic transcription, coinciding with the embryonic body axis. We also follow germ layer formation on a quantitative level and provide a comprehensive model of hypoblast formation in zebrafish embryos. We show that the mesendoderm forms from one third of the embryo’s cells in a single embolic event via regionally different modes of internalization. Our digital embryos constitute complex data sets with information about millions of nuclear positions as well as thousands of cell tracks and cell divisions per embryo. These data are publicly available in a central repository as a resource for further analyses (36).
Detailed recordings of embryonic development will allow the measurement and the modeling of the mechanical forces that drive morphogenesis, e.g. by complementing existing data with information about membrane dynamics. Further applications range from the construction of databases of organ development (using tissue-specific fluorescent lines) and the analysis of mutant phenotypes (37–39) to the quantification of the variability of vertebrate cell lineages.
Moreover, with its high-throughput and high-content capabilities DSLM presents a powerful tool for systems biology and enables complete in vivo reconstructions of gene expression dynamics that incorporate the steadily growing number of gene and enhancer trap lines (40–42). In addition, DSLM should be suitable for analyses of entire mouse, chicken, and Xenopus early embryogenesis—the latter’s unfavorable light-scattering tissue properties can partially be overcome by DSLM’s intrinsic structured illumination and multi-view imaging capabilities. The comparison of individuals within species and across species borders might allow us to reveal the conserved and emerging morphogenetic rules of embryogenesis.
References and Notes 1. J. E. Sulston, E. Schierenberg, J. G. White, J. N. Thomson,
Dev Biol 100, 64 (1983). 2. P. Lemaire, Science 312, 1145 (2006). 3. Y. Hirose, Z. M. Varga, H. Kondoh, M. Furutani-Seiki,
Development 131, 2553 (2004). 4. M. Rembold, F. Loosli, R. J. Adams, J. Wittbrodt, Science
313, 1130 (2006). 5. S. J. England, G. B. Blanchard, L. Mahadevan, R. J.
Adams, Development 133, 4613 (2006). 6. S. G. Megason, S. E. Fraser, Cell 130, 784 (2007). 7. R. Y. Tsien, L. Ernst, A. Waggoner, in Handbook of
Biological Confocal Microscopy J. B. Pawley, Ed. (Springer, New York, 2006).
8. Materials and methods are available as supporting material on Science Online.
9. J. Huisken, J. Swoger, F. Del Bene, J. Wittbrodt, E. H. Stelzer, Science 305, 1007 (2004).
10. P. J. Keller, F. Pampaloni, E. H. Stelzer, Curr Opin Cell Biol 18, 117 (2006).
11. P. J. Keller, F. Pampaloni, E. H. Stelzer, Nat Methods 4, 843 (2007).
12. M. A. Neil, R. Juskaitis, T. Wilson, Opt Lett 22, 1905 (1997).
13. K. K. Hisaoka, H. I. Battle, J. Morphol. 102, 311 (1958). 14. T. Kanda, K. F. Sullivan, G. M. Wahl, Curr Biol 8, 377
(1998). 15. K. Gritsman et al., Cell 97, 121 (1999). 16. S. Schneider, H. Steinbeisser, R. M. Warga, P. Hausen,
Mech Dev 57, 191 (1996). 17. S. T. Dougan, R. M. Warga, D. A. Kane, A. F. Schier, W.
S. Talbot, Development 130, 1837 (2003). 18. M. L. Concha, R. J. Adams, Development 125, 983
(1998). 19. Y. Gong, C. Mo, S. E. Fraser, Nature 430, 689 (2004). 20. R. M. Warga, C. Nusslein-volhard, Dev Biol 203, 116
(1998). 21. B. Schmitz, I. A. Campos-Ortega, Roux's Archives of
Developmental Biology, 374 (1994).
/ www.sciencexpress.org / 9 October 2008 / Page 5 / 10.1126/science.1162493
22. D. A. Kane, C. B. Kimmel, Development 119, 447 (1993). 23. L. Solnica-Krezel, Curr Biol 15, R213 (2005). 24. J. P. Trinkaus, Cells into Organs: The Forces That Shape
the Embryo (Prentice-Hall, Englewood Cliffs, N.J., ed. 2nd, 1984), pp. xxvi, 543 p.
25. D. Kane, R. J. Adams, in Pattern Formation in Zebrafish, L. Solnica-Krezel, Ed. (Springer, Heidelberg, 2002).
26. L. A. Rohde, C. P. Heisenberg, Int Rev Cytol 261, 159 (2007).
27. J. A. Montero et al., Development 132, 1187 (2005). 28. J. Shih, S. E. Fraser, Development 121, 2755 (1995). 29. R. J. Adams, C. B. Kimmel, in Gastrulation: From Cells
to Embryo, C. D. Stern, Ed. (Cold Spring Harbor Laboratory Press, Cold Spring Harbor, NY, 2004) pp. 305–316.
30. L. Wolpert, Principles of development (Oxford Univ. Press, New York, ed. 3, 2007), pp. xxiii, 551 p.
31. D. C. Myers, D. S. Sepich, L. Solnica-Krezel, Dev Biol 243, 81 (2002).
32. D. S. Sepich, C. Calmelet, M. Kiskowski, L. Solnica-Krezel, Dev Dyn 234, 279 (2005).
33. S. F. Gilbert, Developmental Biology (Sinauer Associates, Sunderland, MA, ed. 8, 2006), pp. xviii, 817 pp.
34. R. M. Warga, C. B. Kimmel, Development 108, 569 (1990).
35. G. Pezeron et al., Curr Biol 18, 276 (2008). 36. Movies and zebrafish digital embryos can be downloaded
at http://www.embl-heidelberg.de/digitalembryo 37. D. A. Kane et al., Development 123, 47 (1996). 38. C. P. Heisenberg, M. Tada, Semin Cell Dev Biol 13, 471
(2002). 39. D. S. Sepich, L. Solnica-Krezel, Methods Mol Biol 294,
211 (2005). 40. S. Ellingsen et al., Development 132, 3799 (2005). 41. S. Parinov, I. Kondrichin, V. Korzh, A. Emelyanov, Dev
Dyn 231, 449 (2004). 42. K. Asakawa et al., Proc Natl Acad Sci U S A 105, 1255
(2008). 43. We thank Urban Liebel, Manfred Alef and Michael
Wahlers for excellent KIT/EMBL computer cluster support; the EMBL mechanical workshop for custom hardware; Alfons Riedinger and Georg Ritter for custom electronics; Fabian Härle and Alfons Riedinger for custom microscope operating software; Wolfgang Dilling for technical drawings; Michael Knop, Katherine Brown, Khaled Khairy, Juan Martinez, Darren Gilmour and Carl-Philipp Heisenberg for critical manuscript comments; Lazaro Centanin for immuno-stained medaka embryos; Carl-Philipp Heisenberg for MZoep mutants; Stefan Terjung for Leica SP5 support; Günter Giese for Zeiss LSM 510 NLO support. Financial support: EU-FP6-STREP Plurigenes, DFG SFB-488 (JW); Studienstiftung
des deutschen Volkes (PJK); Hartmut Hoffmann-Berling International Graduate School of Molecular and Cellular Biology, HBIGS (ADS). Contributions: P.J.K. outlined the digital embryo project, designed and built the DSLM, recorded the microscopy data, developed the image processing pipeline, performed the reconstructions and drafted the manuscript. A.D.S. developed the biological methods, performed the biological preparations, contributed to project planning and participated in the writing of the manuscript. E.H.K.S. outlined the DSLM development, co-supervised the project and participated in manuscript preparation. P.J.K., A.D.S., and J.W. analyzed the digital embryos. J.W. guided the biological research, co-supervised the project and participated in the writing of the manuscript.
Supplementary Online Material www.sciencemag.org/cgi/content/full/1162493/DC1 Materials and Methods Figs. S1 to S9 References Movies S1 to S16
30 June 2008; accepted 1 October 2008 Published online 9 October 2008; 10.1126/science.1162493 Include this information when citing this paper.
Fig. 1. Digital scanned laser light sheet microscopy. The laser beam illuminates the specimen from the side and excites fluorophores along a single line. Rapid scanning of a thin volume and fluorescence detection at a right angle to the illumination axis provides an optically sectioned image (movie S1). The f-theta lens converts the tilting movement of the scan mirror into a vertical displacement of the laser beam. The tube lens and the illumination objective focus the laser beam into the specimen, which is positioned in front of the detection lens.
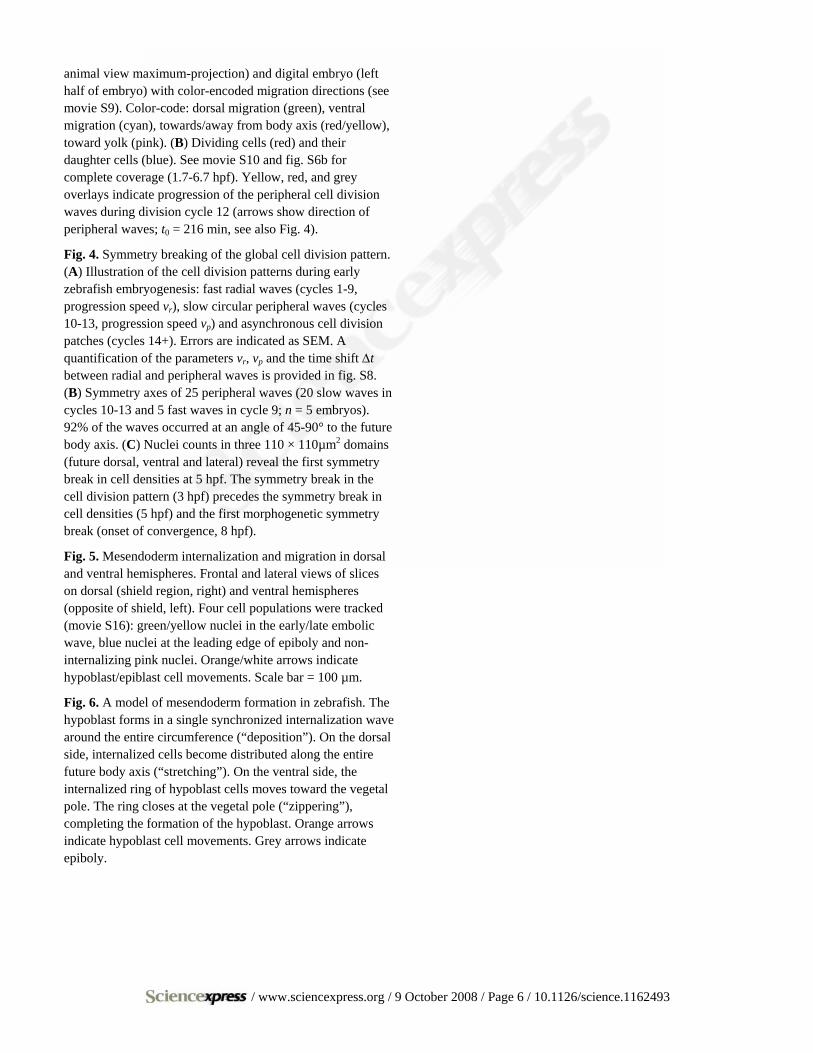
Fig. 2. Imaging and reconstruction of zebrafish embryogenesis. (A) Maximum-intensity-projections (left) and digital embryo reconstructions (right) of nuclear-labelled wild-type zebrafish embryo (movies S2 and S3) at the indicated times and developmental stages. Color-code: movement speeds (0-1.2 µm/min, cyan to orange). Images are Lucy-Richardson-deconvolved (10 iterations). Zeiss C-Apochromat 10×/0.45. Scale bar = 100 µm. (B to D) Zoom-ins on (A), demonstrating sub-cellular resolution of various areas of the developing embryo. Scale bar = 10 µm (B), 30 µm (C and D). (E) Nuclear morphology of a dividing blastomere from movie S7 (intensity-normalized). Scale bar = 10 µm. t, time.
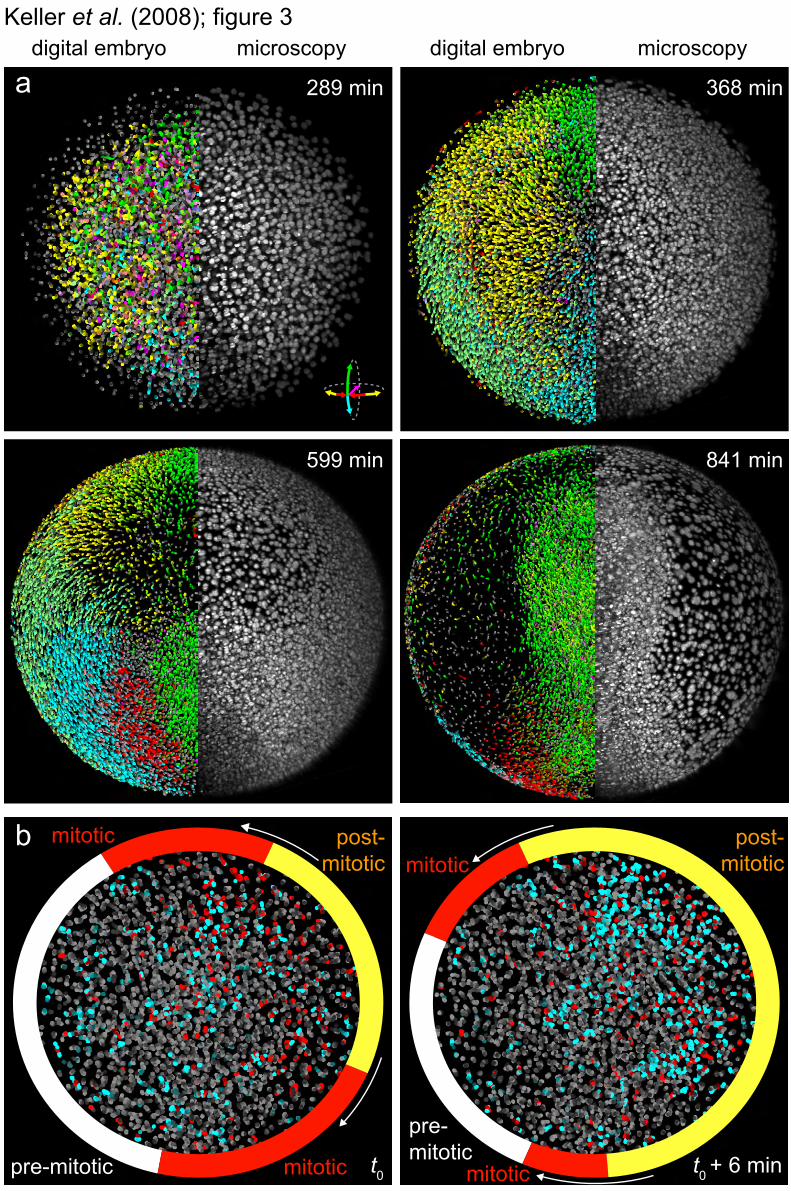
Fig. 3. Cell tracking and detection of cell divisions in the digital embryo. (A) Microscopy data (right half of embryo:
/ www.sciencexpress.org / 9 October 2008 / Page 6 / 10.1126/science.1162493
animal view maximum-projection) and digital embryo (left half of embryo) with color-encoded migration directions (see movie S9). Color-code: dorsal migration (green), ventral migration (cyan), towards/away from body axis (red/yellow), toward yolk (pink). (B) Dividing cells (red) and their daughter cells (blue). See movie S10 and fig. S6b for complete coverage (1.7-6.7 hpf). Yellow, red, and grey overlays indicate progression of the peripheral cell division waves during division cycle 12 (arrows show direction of peripheral waves; t0 = 216 min, see also Fig. 4).
Fig. 4. Symmetry breaking of the global cell division pattern. (A) Illustration of the cell division patterns during early zebrafish embryogenesis: fast radial waves (cycles 1-9, progression speed vr), slow circular peripheral waves (cycles 10-13, progression speed vp) and asynchronous cell division patches (cycles 14+). Errors are indicated as SEM. A quantification of the parameters vr, vp and the time shift Δt between radial and peripheral waves is provided in fig. S8. (B) Symmetry axes of 25 peripheral waves (20 slow waves in cycles 10-13 and 5 fast waves in cycle 9; n = 5 embryos). 92% of the waves occurred at an angle of 45-90° to the future body axis. (C) Nuclei counts in three 110 × 110µm2 domains (future dorsal, ventral and lateral) reveal the first symmetry break in cell densities at 5 hpf. The symmetry break in the cell division pattern (3 hpf) precedes the symmetry break in cell densities (5 hpf) and the first morphogenetic symmetry break (onset of convergence, 8 hpf).
Fig. 5. Mesendoderm internalization and migration in dorsal and ventral hemispheres. Frontal and lateral views of slices on dorsal (shield region, right) and ventral hemispheres (opposite of shield, left). Four cell populations were tracked (movie S16): green/yellow nuclei in the early/late embolic wave, blue nuclei at the leading edge of epiboly and non-internalizing pink nuclei. Orange/white arrows indicate hypoblast/epiblast cell movements. Scale bar = 100 µm.
Fig. 6. A model of mesendoderm formation in zebrafish. The hypoblast forms in a single synchronized internalization wave around the entire circumference (“deposition”). On the dorsal side, internalized cells become distributed along the entire future body axis (“stretching”). On the ventral side, the internalized ring of hypoblast cells moves toward the vegetal pole. The ring closes at the vegetal pole (“zippering”), completing the formation of the hypoblast. Orange arrows indicate hypoblast cell movements. Grey arrows indicate epiboly.
Keller et al. (2008); figure 1
laser scanner
illumination lens
detection lenssamplevertically scanned
“light sheet”
f-theta lens tube lens
Keller et al. (2008); figure 2animal view animal view
a
DSLM data digital embryo
animal view vegetal view animal view lateral view
animal view animal view100 min
64-cell stage
280 min
early blastula
550 min
80% epiboly1440 min
late somitogenesis
t = 0 min (interphase) t = 8 min (anaphase)
b c d
e
b
cd
blastomere nuclei eye somites
Keller et al. (2008); figure 3digital embryo microscopy digital embryo microscopy
368 mina 289 min
599 min 841 min
b post-mitotic
mitoticpre-mitotic
mitotic post-mitotic
mitotic
mitotic
pre-mitotict0 t0 + 6 min
AP
Keller et al. (2008); figure 4
AP
up to cycle 932 - 256 cells
cycles 10 to 13512 - 4,000 cells
beyond cycle 13> 4,000 cells
asynchronous“patches”
vr
vp
vp
∆t
∆t
symmetry breakat 3 hpf
vr
a
1000
100
200
300
400
500
600
nucl
ei c
ount
c
500 900 1300time (min)
ventral ROI
lateral ROI
dorsal ROI
symmetry breaksventral
ROI
lateralROIdorsal
ROI
b
p-wave axes(n = 25) ROI definition
(animal view)
100°
future body axis
future body axis future body axis60 ± 3°
peripheral wave(p-wave)
radial wave(r-wave)
75 ± 3°
no peripheraldivisions
1 2 3
cell divisionscell densitymorphology
3h 5h 8h123
future body axis
blastoderm
Keller et al. (2008); figure 5dorsal slice
frontal
384 minventral slice dorsal slice
lateral
455 min
494 min
615 min
411 min
ventral slice
Keller et al. (2008); figure 6dorsal viewlateral view
depo
sitio
n
5.8-7.5 hpf
stre
tchi
ng
epiboly
hypoblast
blastoderm
shield
7.5-10 hpf
zipp
erin
g
10-12.5 hpf