scalable self-organizing overlays
TRANSCRIPT

1
Scalable Self-Organizing OverlaysSushant Jain, Ratul Mahajan, David Wetherall, and Gaetano Borriello�
sushjain,ratul,djw,gaetano � @cs.washington.edu
Technical Report UW-CSE 02-06-04Computer Science and Engineering
University of Washington
Abstract—Recent developments including peer-to-peer networks
and application-level multicast have generated interest inoverlays, and by extension in algorithms for automaticallymaintaining overlay structures. In this paper, we present aself-organizing protocol for forming and managing overlaysthat scales to at least tens of thousands of nodes. Previousalgorithms target small scale overlays and do not scale wellin terms of protocol overhead with the number of nodes.Our key contribution is to show how to apply the conceptof hierarchy to overlay management to achieve scalability,without degrading the quality of the resulting overlay. Weprovide simulation results that show our hierarchical over-lays incur a low delay penalty, make effective use of networkbandwidth, and handle failures gracefully. We also demon-strate that there are significant advantages in using a self-organizing overlay as compared to the ad hoc techniquescurrently being used in peer-to-peer networking.
I. INTRODUCTION
Overlays are used as a mechanism to deploy new dis-tributed applications and protocols on top of the Inter-net. Examples include the MBone [1], the ABone [2], the6Bone [3] and Gnutella [4]. An overlay is formed by asubset of nodes drawn from an underlying network. Par-ticipating nodes communicate through tunnels, which arevirtual links between two nodes that may not be directlyconnected in the underlying network. These tunnels de-fine the topology of the overlay. A self-organizing over-lay protocol maintains an efficient and connected topologywhen the underlying network fails, performance changes,or nodes join and leave the network.
Most currently deployed overlays are statically config-ured. This is a straightforward technique, but possessesseveral disadvantages compared to automatic configura-tion using a self-organizing overlay protocol. Static con-figuration has a high management overhead that quicklybecomes unwieldy when the overlay grows beyond a smallnumber of nodes. Gnutella, in contrast, has grown to overa thousand nodes [5], because it is not statically config-ured. Static configuration can fail to provide connectivityin a dynamic environment where nodes are free to join and
leave the overlay at will, as is again the case in peer-to-peernetworks like Gnutella. Finally, static configuration missesthe opportunity to improve overlay performance by mea-suring and adapting to changing network conditions. Forthese reasons, self-organizing overlay protocols are likelyto displace static configuration methods in the near future.
Prior work like Narada [6], Gossamer [7], Overcast [8]has presented self-organizing protocols that are suitablefor overlays with up to a few hundred nodes. Yet the suc-cess of applications such as Gnutella demonstrates a clearneed for much larger overlays. The primary contributionof our work is a new self-organizing protocol that scalesto at least tens of thousands of nodes without sacrificingthe quality of the overlay. We achieve this scalability byexploiting the concept of hierarchy. Our overlay is orga-nized in a two-level hierarchy and we present mechanismsto create and manage this hierarchy dynamically. As a sec-ondary contribution we also present enhancements to theNarada algorithm [6], which is used by our protocol.
We demonstrate that using hierarchy has minimal effecton performance. At the same time hierarchy achieves scal-ability by drastically reducing the bandwidth requirementsfor overlay maintenance. We also show that hierarchyhelps in mitigating the effect of a dynamic environment;most changes are not seen beyond a small set of nodes.It is particularly well-suited to heterogenous environmentlike the Internet when the upper level nodes in hierarchyare chosen carefully.
We believe that using a two level hierarchy we canscale to tens of thousands of nodes, an order of magnitudemore than existing schemes. Given the size (of around athousand) of many overlay networks like the MBone, the6Bone, and Gnutella, scaling to tens of thousands of nodesis a reasonable first step towards more scalable overlayprotocols. The ideas presented here can be extended tomultiple levels of hierarchy to achieve further scalability.
Our overlay management protocol is broadly targetedat application level multicast, test-beds for new protocols,active network infrastructure, resource discovery, contentdistribution, and so forth, rather than a particular applica-

2
tion. That is, our intent is to provide an efficient and robustoverlay management protocol that can be used by varietyof applications. We believe that for many applications theadvantages of using the generic overlay protocol will out-weigh the cost of designing one for each application inthe same manner that shortest-path routing has proved tobe a suitable base for many different applications. Fur-thermore, the ideas presented in this paper - hierarchy andits evaluation - can be extended to design self-organizingoverlay protocols tuned towards a particular application.
The rest of the paper is organized as follows. In the nextsection, we describe classes of applications that use over-lays and survey the existing work in those classes. Sec-tion II discusses how to evaluate various overlay topolo-gies. Section IV describes our new protocol. In Sec-tion V, we evaluate our protocol using simulation. Sec-tion VI shows the performance of our overlays in the con-text of broadcast-based resource discovery application likeGnutella. We conclude in Section VII.
II. OVERLAY APPLICATIONS AND RELATED WORK
Overlays have been used/proposed for a variety of ap-plications. This section provides a brief overview of boththe applications and the existing overlay construction pro-posals, and talks about how they compare to the protocolproposed in this paper.
Application-level multicast is made possible through theuse of overlays. The proposed solutions can be dividedinto two classes based upon their approach. Using whatis called the tree-first approach, Yoid [9] and Overcast [8]form the multicast tree directly. In a mesh-first approachnodes are connected in a mesh (not a fully-connected one),and the multicast tree is formed by running a multicastrouting protocol like DVMRP [10] on top of the mesh. Ex-amples of this approach are Narada [6], and Gossamer [7].A single-level mesh does not scale beyond a few hundrednodes [6]. We use a two-level hierarchy to buy scalability,with a mesh-first approach at both levels.
Another class of applications use overlays for wide areabroadcast-based resource discovery. Gnutella [4] is onesuch large, completely decentralized overlay. It is primar-ily used to broadcast a search query from one member toall the other members of the overlay. Tunnels are selectedrandomly in Gnutella so the overlay formed is inefficient.In Section VI, we will compare overlays formed by ourprotocol with such overlays. The Intentional Naming Sys-tem (INS) [11] proposes a resource discovery solution us-ing an overlay in which a spanning tree is configured basedupon latency. A tree topology, for general purpose over-lays, can be fragile and inefficient. It also imposes highoverhead at nodes higher up in the tree, and hence is not
appropriate for a large scale dynamic overlays.Overlays are also used in content distribution networks.
Research in such overlays focuses on the problem of dis-tribution and location of content inside the overlay. Sev-eral distributed indexing approaches (CAN [12], Chord[13], Pastry [14], Tapestry [15]) have been proposed to ad-dress the problem of locating content in a large distributedsystem. These systems locate content by routing queriesacross a geometric structure. This is realized as an over-lay and the challenge is to efficiently map this overlay ontop of the Internet. These schemes are application (locat-ing a resource given its hash key) specific, and do not at-tempt to make efficient overlays usable for a large classof applications, a goal of our work. For instance, in aresource discovery application in which resources are notwell-specified (like Gnutella), one has to resort to broad-casting the query, an operation supported by our overlays.
Incremental deployment of new protocols was one ofthe first uses of overlays. Examples include the MBone[1], the ABone [2], and the 6Bone [3]. All of these over-lays are configured statically.
III. OVERLAY PERFORMANCE METRICS
We use multicast as a representative driving applicationto quantify the efficiency of an overlay. Several recentproposals have discussed overlay management in the con-text of application-level multicast [6], [8], [7]; the propos-als typically construct multicast distribution trees rootedat the source of a multicast transmission. Regardless ofthe specific details of each particular proposal, two met-rics that can be used to evaluate performance are relativedelay penalty (RDP) and stress.
RDP is a measure of the additional packet delay intro-duced by overlay on the delivery of a single packet be-tween a source and destination. More specifically, RDPis the ratio of the latency experienced when sending datausing the overlay to the latency experienced when sendingdata directly using the underlying network.
Stress is a measure of the excess bandwidth consump-tion induced by the overlay during a multicast transmis-sion. The stress of a physical link is defined as the numberof overlay tunnels that send traffic over that link. Note thatstress is both a function of the topology and the multicasttree used: flooding-style broadcasts cause more stress on aphysical link than multicasts. For efficient multicast trees,a multicast packet flows over each virtual overlay tunnel atmost once.
Ideally, an overlay should have both low RDP and lowstress. Unfortunately, these requirements can conflicting.To see this, consider Figure 1(a), which shows an exam-ple physical network with four hosts interested in forming
3
A B
D C
r1 r2 10
2 1 1
1
(a)
A
B D
C
13
12
3 2 13
12
(b1)
A B
D C
r1 r2
(b2)
Fully Connected
A
A
B D
C
12 3 2
B D
C
r1 r2
(d1)
(d2)
Good Overlay
Physical Topology
A B
D C
r1 r2
(c2)
Bad Overlay
A
B D
C
12
13
12
(c1)
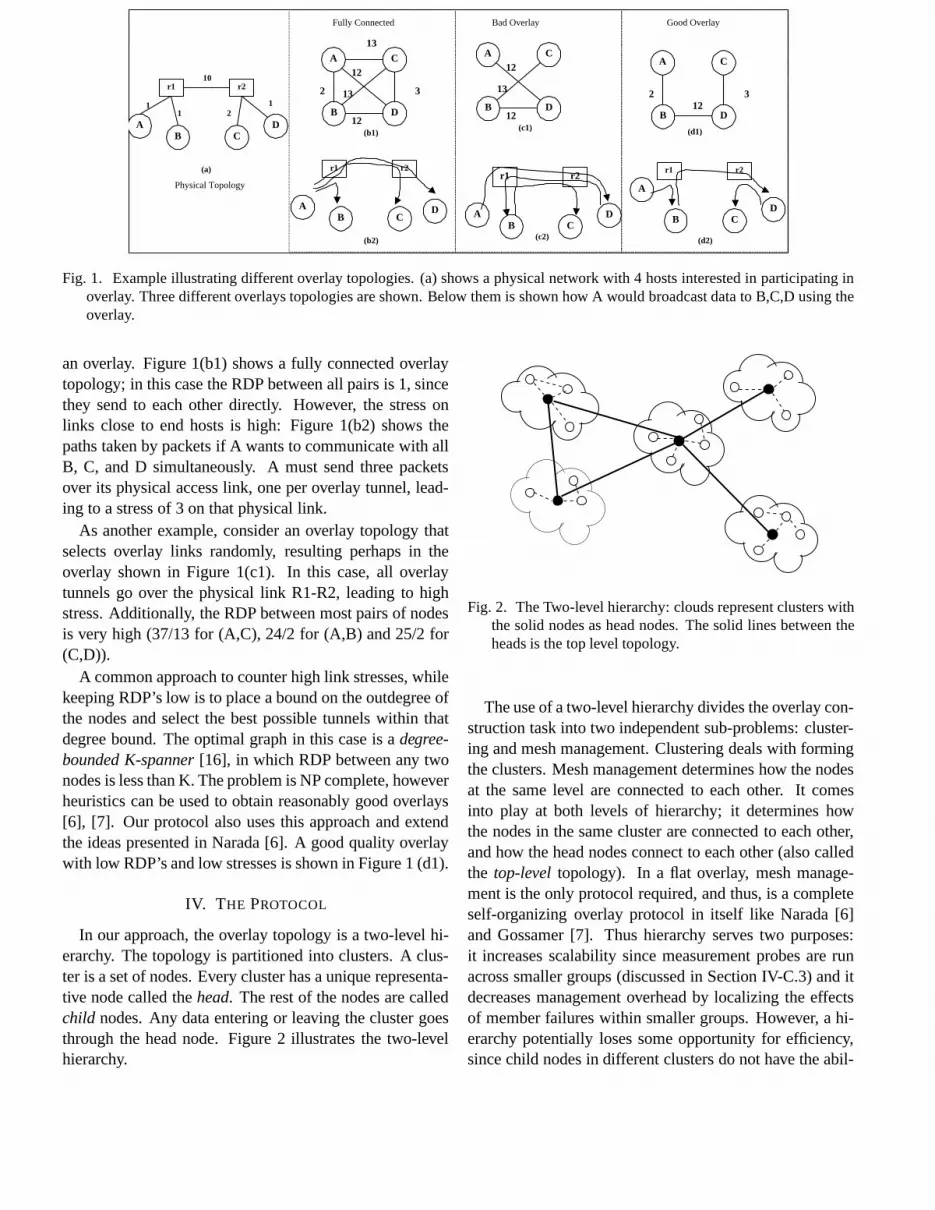
Fig. 1. Example illustrating different overlay topologies. (a) shows a physical network with 4 hosts interested in participating inoverlay. Three different overlays topologies are shown. Below them is shown how A would broadcast data to B,C,D using theoverlay.
an overlay. Figure 1(b1) shows a fully connected overlaytopology; in this case the RDP between all pairs is 1, sincethey send to each other directly. However, the stress onlinks close to end hosts is high: Figure 1(b2) shows thepaths taken by packets if A wants to communicate with allB, C, and D simultaneously. A must send three packetsover its physical access link, one per overlay tunnel, lead-ing to a stress of 3 on that physical link.
As another example, consider an overlay topology thatselects overlay links randomly, resulting perhaps in theoverlay shown in Figure 1(c1). In this case, all overlaytunnels go over the physical link R1-R2, leading to highstress. Additionally, the RDP between most pairs of nodesis very high (37/13 for (A,C), 24/2 for (A,B) and 25/2 for(C,D)).
A common approach to counter high link stresses, whilekeeping RDP’s low is to place a bound on the outdegree ofthe nodes and select the best possible tunnels within thatdegree bound. The optimal graph in this case is a degree-bounded K-spanner [16], in which RDP between any twonodes is less than K. The problem is NP complete, howeverheuristics can be used to obtain reasonably good overlays[6], [7]. Our protocol also uses this approach and extendthe ideas presented in Narada [6]. A good quality overlaywith low RDP’s and low stresses is shown in Figure 1 (d1).
IV. THE PROTOCOL
In our approach, the overlay topology is a two-level hi-erarchy. The topology is partitioned into clusters. A clus-ter is a set of nodes. Every cluster has a unique representa-tive node called the head. The rest of the nodes are calledchild nodes. Any data entering or leaving the cluster goesthrough the head node. Figure 2 illustrates the two-levelhierarchy.
Fig. 2. The Two-level hierarchy: clouds represent clusters withthe solid nodes as head nodes. The solid lines between theheads is the top level topology.
The use of a two-level hierarchy divides the overlay con-struction task into two independent sub-problems: cluster-ing and mesh management. Clustering deals with formingthe clusters. Mesh management determines how the nodesat the same level are connected to each other. It comesinto play at both levels of hierarchy; it determines howthe nodes in the same cluster are connected to each other,and how the head nodes connect to each other (also calledthe top-level topology). In a flat overlay, mesh manage-ment is the only protocol required, and thus, is a completeself-organizing overlay protocol in itself like Narada [6]and Gossamer [7]. Thus hierarchy serves two purposes:it increases scalability since measurement probes are runacross smaller groups (discussed in Section IV-C.3) and itdecreases management overhead by localizing the effectsof member failures within smaller groups. However, a hi-erarchy potentially loses some opportunity for efficiency,since child nodes in different clusters do not have the abil-

4
ity to form overlay links to each other.A node wishing to join the overlay obtains the address
of node(s) in the overlay through the DNS or some otherbootstrapping mechanism. It then randomly picks a clus-ter to join and becomes a part of the overlay immediately.Over time, the position of the node is improved by the pro-tocol. In the following sections, we describe in detail howmesh management and clustering work, followed by a dis-cussion of other aspects like scalability and behavior underdynamic conditions.
In our design we have chosen to optimize latency, theoverhead of transmitting data using the overlay. Band-width is another obvious metric of interest. The decisionto use latency was guided by the following observations.1) Measurement of bandwidth is less reliable; for instance,two overlays nodes see the same available bandwidth overa physical link when they measure, but each of them wouldactually get half of it if they send simultaneously. 2) Itis hard to evaluate the resulting bandwidth properties be-cause they are very application specific (unicast v.s. mul-ticast, for instance). As mentioned in Section II, to protectagainst overloading physical links in absence of bandwidthbased optimization we place a bound on the outdegree ofan overlay node.
A. Mesh Management
The mesh management protocol selects the tunnels thatconnect the nodes at the same level. When choosing thesetunnels, there is a tension between overlay performanceand efficient utilization of underlying network. Perfor-mance is determined by the latency overhead of routingdata using the overlay; a fully-connected mesh is most ef-ficient in this regard, but leads to an inefficient use of un-derlying network because several tunnels would go overthe same physical link.
Instead of designing a mesh management protocol fromscratch, we extend Narada [6]. In Narada, the participatingmembers periodically perform a set of operations, whichimproves the overlay over time and keeps it connected.We now describe these operations and point out our exten-sions. We evaluate the effect of our extensions to Naradain Section V-B.1.
A.1 Mesh Management Operations� Add: Nodes add tunnels to other nodes when the utilityof the tunnel exceeds a threshold. The utility of a tunnel,computed as shown in Figure 3, is dependent on the extentto which it improves the node’s latency to other nodes inthe overlay. Tunnels are not added by a node that has ahigh degree until it deletes some of its tunnels. This oper-ation is unchanged from Narada.
���������������� �������������������for each member � at the same level���
= current latency between � and � along mesh� �= new latency between � and � if the link �����
is addedif (� ��� �!�
)�"�#�#�$���#&%'�)(*��� � �,+-��� �return �"�#�#�$���#
Fig. 3. Utility of Link .0/�13254
� Delete: An existing tunnel is deleted when it is no longeruseful, which can happen with changing node membershipand network conditions. The principal idea behind this op-eration is that an existing tunnel that would not be addedby the add operation, if it was removed, should be deleted.To test whether an existing tunnel can be deleted, the nodefirst determines if there is an alternate path available tothe remote node. This is done by examining the existenceof a path to a neighbor of the remote node that does notgo through the remote node itself. In the absence of sucha path, the tunnel is not deleted, as it might partition theoverlay. If such a path exists, the utility of this tunnel isevaluated by assuming that the tunnel does not exist, andthen evaluating the utility of the tunnel just like in the addlink operation above. The tunnel is deleted if its utility islower than a threshold.The delete operation described above is different from thatin Narada. Narada estimates the deletion utility of a tunnelas the number of nodes the tunnel is used to reach and usesa lower threshold as a way to prevent partitions. Theseheuristics make the link deletion harder in Narada. Thesymmetry between delete and add operations in our modi-fied version of the delete operation leads to more effectivedeletion, making it easier to remove less useful tunnels.� Swap: With just the above two operations, new linkswith good utility may not be added because one of theinvolved nodes already has its maximum number of tun-nels, each of which is above the deletion threshold. Theswap operation exchanges a tunnel with lower utility forone with higher utility. Swapping helps nodes to pick thebest tunnels, independent of the order in which they jointhe overlay or the order in which they try adding tunnels toother overlay nodes. Swapping is not present in Narada.� Partition detection and repair: This operation maintainsthe connectivity of the overlay in the face of failures. Par-titions are detected using refresh messages. In a connectednetwork members send and receive refresh messages. Ifthe overlay is partitioned, then members will not be able tohear refresh messages from some node, indicating a parti-

5
tion. Once detected, the partition can be repaired by tryingto add links to such nodes. Details for this operation canbe found in [6].
B. Clustering
The objective of clustering is to maintain appropriateclusters, both in proximity of nodes inside a cluster, andthe cluster size. We use latency as the basis to form clustersby grouping together nodes that are close to the head ofthe cluster. Having a close head would induce minimalcommunication overhead on the child nodes. Moreover, ifthe children are close to the head, the children themselvesare expected to be close to each other, which leads to lowoverhead of maintaining the cluster overlay topology.
The appropriate size of clusters is dependent on the sizeof the overlay and the application. For example, for smalloverlays (say 100 nodes) no clustering might be required.However for an overlay with 10,000 nodes the protocolwould not scale without clustering. We specify the desir-able cluster size as expected cluster size �
��� ��� � , a func-tion of the overlay size � . Having a function of � is differ-ent from having a fixed parameter because it enables theprotocol to adjust the amount of clustering as the overlaysize grows or shrinks. We now describe the various clus-tering operations.
B.1 Clustering Operations
There are three clustering operations. The first one, mi-grate, helps a node to move to the cluster closest to it.The remaining two, split and diffuse, keep the cluster sizeswithin the desired range.
Migrate: This operation moves a child node from onecluster to another. Migrate tries to place a node in thecluster whose head is closest to that node. When a childjoins the cluster, it receives information about other clusterheads from its current cluster head. (Each cluster head pe-riodically broadcasts the list of other heads to its childrenusing the bottom level overlay). The child then period-ically probes a small number of carefully selected headsto determine its latency to them. Once the child detects ahead node which is significantly closer to it than its currenthead, it leaves its current cluster and joins the new clus-ter. To avoid multiple migrations immediately after a nodejoins the overlay (as the initial joining cluster is picked ran-domly), a new node does not migrate until it has measuredits latency to a significant fraction of other head nodes.
Migrate requires child nodes to probe all head nodes,which can overload head nodes in a large overlay. Heuris-tics can be used to reduce these probes. For example, inpractice a child does not need to probe a head node that is
more than ���� from the child’s head, where � is the la-tency between the child and its head 1. In our experiments,this heuristic reduces the number of probes sent by up to50%. Another possibility is to use landmark ordering [12]to choose appropriate cluster. In landmark ordering, everynode (both child and head) measures its latency to a prede-fined set of landmark nodes and orders them. A child joinsthe head whose ordering most closely matches its own.
When a child node migrates to a new cluster, all the pre-vious mesh management tunnels are deleted for that child.After joining the new cluster, the new head node randomlyassigns it a neighbor to bootstrap the lower level meshmanagement.
Split: A cluster that is more than twice as large as���� ��� � in size is broken into two. The decision to split
a cluster is taken by its head node. After a split, the oldcluster head remains as the head of one of the new clus-ters, but a new head must be selected for the second newcluster. The new cluster head is chosen to minimize the av-erage latency to all other child nodes in its cluster; this de-cision requires knowledge of the latency between all pairsof child nodes.
Fortunately, every child node knows its latency to allother child nodes as a side-effect of the mesh manage-ment protocol. Whenever a decision to split occurs, theold cluster head broadcasts its latency to its child nodes.On receiving this information, each child node computesthe number of other child nodes that are closer to than theold cluster head, and each child reports this number backto the old cluster head. After receiving enough reports,the old cluster head selects the new cluster head. The newhead creates a tunnel to the old head, and from there onmesh-management enables it to get an appropriate set oftunnels to other cluster heads. The child nodes closer tothe new head are informed of the split and they migrate tothe new cluster.
Head selection in our implementation is based upon la-tency, however one can imagine incorporating other crite-ria, such as stability or access link bandwidth.
Diffuse: Over time, clusters may diminish in size be-cause of node migrations and node deaths. Clusters thatare more than a factor of two smaller than �
��� ��� � aredisbanded altogether, i.e., are diffused. All of the nodes ina cluster undergoing diffusion are migrated to neighboringclusters. To avoid the possibility of partitioning the top-level topology when the head node of the diffusing clustermigrates, links from its new head are made to all of its pre-vious neighbors. Unnecessary links are eventually deleted
This is assuming absence of Detour[17] affect

6
by mesh management.
C. Discussion
C.1 Behavior under Dynamic Environment
Hierarchy has significant advantages when it comes tooperating in dynamic environments. Joining the overlayis a very simple operation, and does not effect nodes be-yond the cluster the new node joins in. Similarly, death ofa child node is of interest only within the cluster. Thus,the transient behavior of a child node has a very local-ized effect. Since most nodes are child nodes, the resultingoverlay structure is highly robust towards dynamic natureof the participating nodes. On the other hand, in a flatoverlay every change in membership is propagated to ev-ery other member and hence causes a lot more disruption.We present simulation results about this in Section V-C.2.
C.2 Exploiting Heterogeneity
Resilience of hierarchical overlays towards dynamic en-vironment can be multiplied manifold by exploiting het-erogeneity present among overlay nodes [5]. As discussedabove, the membership of child nodes have very limited ef-fect on the overlay. It is the head nodes that matter; chos-ing them carefully significantly increases the stability ofthe overlay as a whole.
When nodes inside a cluster are homogeneous, choice ofthe head node is not that important. When nodes are het-erogenous, the important factors include the access band-width (modem or broadband) of the node, as well as thestability of the node. Nodes that tend to remain in theoverlay for longer periods should be preferred. Well-connected head nodes can take the extra load imposedon them due to hierarchy (managing their cluster); sta-ble heads minimizes the effect of dynamic membership onthe overlay (Section IV-C.1); and the potentially poorly-connected or unstable participants are shielded from thebulk of overlay management tasks as they tend to remain aschild nodes (see Section V-C.1 for details on bandwidth re-quirement of control traffic of the two categories of nodes).
C.3 Scalability
By itself the mesh management protocol does not scalebeyond a few hundreds of nodes [6]. Mesh managementrequires every member of the overlay to probe and main-tain state for all the members of the overlay. This is inher-ently unscalable because: 1) traffic generated for protocolmaintenance grows significantly with overlay size (Sec-tion V-C.1); 2) time taken to adapt to changes increasesrapidly with the overlay size (Section V-C.2). Hierarchi-cal overlays avoid both penalties as a result of information
hiding achieved due to clustering.
V. EVALUATION
In this section we evaluate our protocol using simula-tion. The primary goal of the is to compare hierarchicaloverlays with flat ones along the dimensions of interest.The question we try to answer in this comparative evalua-tion are:1. Latency Overhead: There is a latency overhead in us-ing the overlay instead of the underlying network. Howdoes this overhead change when moving from a flat over-lay to a hierarchical overlay? (Sections V-B.2 & V-B.3)2. Protocol Overhead: What is control traffic overheadof maintaing a hierarchical overlay compared to a flat over-lay? To what extent does hierarchy help in this regard?(Section V-C.1)3. Dyanamic Environment: Which type of overlays aremore suited towards dynamic environment like unstableparticipation of nodes? (Section V-C.2)4. Load Balancing: In a hierarchy, there is greater re-sponsibility on head nodes. How is the overall responsi-bility divided among head nodes? (Section V-C.3)
Apart from the above, we also provide results on thefollowing:1. Improved Mesh Management: How much improve-ment do our extensions to Narada provide? (Section V-B.1)2. Recovery from failures: How is the connectivity ofthe overlay affected due to node failures and how quicklydoes the overlay recover? (Section V-D)3. Resource Discovery: In the context of a specific appli-cation of broadcast-based resource discovery, how muchbetter do our overlays perform compared to ad hoc tech-niques like Gnutella? (Section VI)
A. Simulation Setup
We have written a custom event driven simulator to sim-ulate our protocol. We have not simulated dynamic net-work conditions like queueing delay, packet losses, con-gestion or varying latencies. The first few nodes are madehead nodes, and the rest of the nodes bootstrap from thelist of these head nodes. Head nodes exchange routingmessages every 30 seconds. The frequency of the meshmanagement operations is 10 seconds. Child node probesother heads once every 10 seconds. In mesh managementoutdegree of a node is bounded by 8. Simulations are rununtil there are no topological changes for about 15 minutesof simulated time.
We use the Georgia Tech Internetwork Topology Mod-els[18] (GT-ITM) to generate the network topologies used

7
0
0.2
0.4
0.6
0.8
1
1 1.5 2 2.5 3 3.5 4
Cum
ulat
ive
fract
ion
of p
airs
of n
odes
RDP (Relative Delay Penalty)
Narada with enhancements
Narada
.95
Fig. 4. Effect of extensions to Narada on RDP
in our simulations.2 We use the “transit-stub” model to ob-tain graphs that more closely resemble the Internet hierar-chy than a pure random graph. Unless otherwise specified,a topology of 12,800 nodes is used for the simulations (wehave obtained similar results for other underlying topolo-gies). It consists of 4 transit domains, each with an averageof 8 stub networks. Each stub network has 4 stub domainseach with around 100 nodes. Latencies to links in the phys-ical topology are assigned by GT-ITM. Nodes that becomepart of the overlay are chosen randomly from those in thestub domain.
B. Latency
We quantify the latency overhead of using the overlayusing Relative Delay Penalty (RDP). Recall from SectionII that RDP is the ratio of the overlay latency to the physi-cal latency between two nodes. To summarize the simula-tion results for an overlay we will also use the 95% (per-centile) RDP, which is the penalty seen by the 95% of thepairs of nodes. In Section V-B.2, we show that extremelyhigh RDPs are mostly associated with pairs of nodes hav-ing small physical latency, hence the 95% RDP helps toremove these tail-effects. Another advantage of using the95% RDP is that it is fairly insensitive to simulation pa-rameters compared to the maximum RDP.
B.1 Improvement over Narada
In order to see the effect of extensions we made toNarada, we simulated a flat overlay (no hierarchy) with200 nodes, without and with our extensions (symmetricdeletion and swapping). An underlying topology of 3600
�
We have recently begun to re-run our simulations using ”power-law”topology generators such as Brite and Inet. While we have not com-pleted this task, our preliminary results show similar results.
1
10
100
1000
0 1 2 3 4 5 6-10 11-15 15-20 20-30 31-35
Num
ber o
f Phy
sica
l Lin
ks
Physical Link Stress
NaradaNarada with enhancements
Fig. 5. Effect of extensions to Narada on stress of a physicallink
nodes was used. Figure 4 shows that our extensions leadto significantly lower latency overhead. With originalNarada, the 95% RDP was 4.1; with extended Narada itwas reduced to 2.9. The maximum RDP in the former ismore than 7, while it is about 4 in the latter. Note that withclustering, the benefits of improvement at the top level aremagnified because child nodes route through their respec-tive head nodes.
Figure 5 shows that the improvements over Narada, donot come at the cost of excess load on underlying physicallinks. The graph compares the histograms of link stress,which is the number of overlay tunnels that go over a phys-ical link in the underlying topology. Physical links withhigh stress are more likely to be overloaded when the over-lay is being used. These results are from a single simula-tion run, but the qualitative comparison between the twohistograms is typical. There is slight overall improvementwith our extensions in the link stress, and in general weobserve lower worst case stress (20 compared to 27 in thiscase).
B.2 Overlay Size
To observe the effect of overlay size on RDP, we in-creased the overlay size from 300 to 10,000. The expectedcluster size is chosen so that the number of head nodes stayroughly the same across different overlay sizes, 300 in thiscase (the simulation with 300 nodes is a flat overlay).
Figure 6 shows the cumulative distribution of RDP ofoverlays of various sizes. There is very little degradationin RDP as the overlay size increases. Averaged over manysimulations, the 95% RDP for 300 nodes was 2.9, and for10,000 nodes was 3.05. This is very encouraging since itsuggests that with clustering one can scale to large over-lays without suffering on RDP. The primary reason behind

8
0
0.2
0.4
0.6
0.8
1
1 1.5 2 2.5 3 3.5 4
Cum
ulat
ive
fract
ion
of p
airs
of n
odes
RDP (Relative Delay Penalty)
.95
300 nodes1600 nodes6400 nodes
10000 nodes
Fig. 6. Cumulative distribution of RDP shown for various over-lay sizes.
1
2
3
4
5
6
0 200 400 600 800 1000 1200 1400 1600
RD
P (R
elat
ive
Del
ay P
enal
ty)
Physical latency (ms)
Fig. 7. RDP vs Physical Latency, Overlay size 10,000, ECS =30
this good performance is that children are very close totheir heads, which reduces the overhead for the child inrouting through the head.
For flat overlays, [6] observed that higher RDPs are as-sociated with pairs of nodes having small physical latencybetween them. Figure 7 shows the same behavior for ourhierarchical overlays.
B.3 Cluster Size
In this section, we study the impact of cluster size onlatency. We varied the expected cluster size for an overlaywith 400 nodes. Figure 8 shows that cumulative distri-bution of RDPs for flat and hierarchical overlays are verysimilar. To investigate the effect of cluster size on largeroverlays, we repeated the same experiment for a 3200-node overlay. Figure 9 shows 95% RDP as we increasethe expected cluster size and again we see very little vari-
0
0.2
0.4
0.6
0.8
1
1 1.5 2 2.5 3 3.5 4
Cum
ulat
ive
fract
ion
of p
airs
of n
odes
RDP (Relative Delay Penalty)
.95
ECS = 0 (flat) ECS = 5
ECS = 10
Fig. 8. Cumulative distribution of RDP shown for various ex-pected cluster sizes in a 400 node overlay
11.5
22.5
33.5
4
0 20 40 60 80 10095
% R
DP
(R
elat
ive
Del
ay P
enal
ty)
Expected Cluster Size
Average
00.00050.001
0.00150.002
0.00250.003
0.0035
0 20 40 60 80 100
Bad
Pat
hs F
ract
ion
Expected Cluster Size
Average
Fig. 9. Effect of (ECS) Expected Cluster Size in a 3200 nodesoverlay. The top graph shows the variation of 95% RDP. Thebottom graph shows variation of the fraction of bad paths(RDP � 5).
ation.3
The results above are counter intuitive: one would ex-pect the performance to degrade as bigger clusters areformed because the overhead of going through the headincreases. On deeper investigation, we found that degrada-tion in performance can be seen by looking at the numberof paths that suffer high RDP. To quantify this we defineBad Paths Fraction as the ratio of number of paths withRDP � 5 to total number of paths. The lower graph inFigure 9 shows that the Bad Paths Fraction increases withincreasing cluster size, but the fraction is too small to be
�Ideally, we would like to compare the results with flat overlays of
the same size, but we could not simulate flat overlays beyond a fewhundred nodes due to CPU limitations.

9
reflected in the 95% RDP. However, almost all of the “badpaths” are associated with nodes that are physically veryclose, as shown in Figure 7.
C. Other Effects of Hierarchy
Now we investigate the effect of hierarchy along thefollowing three dimensions, control overhead, time to re-spond to dynamic conditions, and load balancing in rout-ing.
C.1 Protocol Overhead
A fundamental benefit of hierarchy is that protocol over-head (bandwidth requirements for overlay maintenance) isreduced, because the mesh management protocol is runamong a smaller group of nodes. We discuss bandwidthrequirements for both head and child nodes in a hierarchi-cal overlay. The protocol overhead can be broken downinto the two components: mesh management and cluster-ing.1. Mesh management overhead: Nodes in the mesh haveto periodically exchange routing tables with their neigh-bors (number of neighbors is bounded by a small constant),and other nodes (to evaluate add/delete link operation).The exact number of exchanges is a constant dependingon the frequency at which these operations are done. If themesh management is operating among � nodes, the sizeof each exchange is � � � � since the routing table containsinformation about all the nodes. Therefore, bandwidth re-quirement for any node in the mesh is ��� � , for some con-stant � � .In a hierarchical overlay, mesh management protocol isrunning both at the top level, and with in each cluster. Inan overlay with � nodes and expected cluster size � , num-ber of head nodes are �
+ � . Overhead due to the top-levelmesh management on every head node is � � ��� + � � . Over-head due to the mesh management with in one cluster (ofsize � ) on every child node is � � � . Since head is also oper-ating in the mesh management protocol with in the cluster,overhead on a head node is ��� ��� + � % � � .2. Clustering overhead: Clustering requires a child toprobe its parent and other head nodes in the overlay toevaluate migration. Recall that in the protocol child probea small constant number of head nodes per unit time. Thisway every child generates constant number of messagesperiodically. Since each message is constant size, it causesan overhead of ��� on child nodes, for some constant ��� ( ���is much smaller than � � ). Additionally, each head node hasto respond to these probes. Assuming uniform distributionof child pings on head nodes, every head node has to re-spond to about � pings, which causes an overhead of � � �on them.
Therefore, the total overhead on head nodes is � � ��� + � %� ��% � � � , which is � � � + � % � � � % � � � � . For � much largerthan � (like � �)( � �-�-� � � � � ), the bandwidth overheadreduces roughly by a factor of � . Total overhead on childnodes is � � � % � � , which is much less than overhead onhead nodes.
Based on the above analysis and the parameters in oursimulations, the bandwidth requirement for every node ina flat overlay of 10,000 nodes is about 400 Kbps. On theother hand, for a hierarchical overlay of 10,000 nodes withcluster size 20 and 500 head nodes, overhead is much less.For head nodes its only about 20Kbps and for child nodesits less than 1Kbps. (The numbers for hierarchical overlayshave been confirmed using simulation.) Note that most ofthe nodes in the overlay are child nodes, hence the gain issubstantial.
C.2 Responding to Changes
Hierarchy is better suited to frequent changes becauseof information hiding, as a result of which the effect of achange is limited to only a few nodes. To demonstrate this,we injected events in an overlay of size 200 and observedhow much time it took for the overlay to stabilize to a newtopology and how many messages it generated in the pro-cess. The events induced were 20 nodes leaving, 20 nodesjoining, 40 nodes leaving and 40 nodes joining. Enoughtime was given for the overlay to stabilize between con-secutive events. We compare responses of three overlaysof size 200 - flat, cluster size of 20, and cluster size of40 - in Figure 10. The flat overlay responded with muchmore changes for a much longer period as compared to thehierarchical overlays, and the overlay with bigger clustersize is better than the one with smaller cluster size. Forinstance, when 20 nodes are brought down, the hierarchi-cal overlays took less than 10 minutes to settle down to thenew topology, while the flat overlay took about 40 min-utes. Because hierarchical overlays stabilize much faster,they are more suited towards large applications with dy-namic conditions.
C.3 Load Balancing
By definition, in a hierarchy all nodes are not equal. Inour overlays, management overhead is not shared equallyby all nodes. Head nodes have more responsibilities. Sec-tion V-C.1 showed how the control bandwidth requirementfor the two node types is different. Another dimension ofresponsibility is routing.
To characterize how evenly the responsibility of unicastrouting is distributed among the head nodes, we definenode stress as the ratio of number of unicast paths that gothrough this node to the total number of paths (all node-

10
0
200
400
600
800
1000
1200
1400
1600
1800
100 150 200 250 300 350 400
Cum
ulat
ive
num
ber o
f cha
nges
Simulation time in minutes
20 nodes down
20 nodes up
40 nodes down
40 nodes up
ECS = 1 (flat)ECS = 10ECS = 40
Fig. 10. Changes in the overlay topology (migrate + add link +delete link) vs Simulation time for different cluster sizes
0
0.1
0.2
0.3
0.4
0.5
0.6
0.7
0.8
0.9
1
0 0.02 0.04 0.06 0.08 0.1 0.12
Frac
tion
of n
odes
Node Stress
400 head nodes200 head nodes100 head nodes50 head nodes
Fig. 11. Node Stress on head nodes for different overlays.
pairs). Child nodes only forward traffic for child nodes inthe same cluster, and hence node stress on them would bevery low (close to ( + � , for all paths involving the nodeitself, because most paths cross cluster boundaries).
Figure 11 plots the node stress on head nodes for differ-ent clustering levels in an overlay size of 400. There aretwo things to be noted in the graph. First, the load distri-bution among the head nodes themselves is fairly uniform(a quickly rising vertical line in the plot). Second, andmore important, stress goes up as the levels of clusteringis increased. So the routing load on an individual headnode goes up as the number of head nodes is decreased.This provides a case against very big cluster sizes, unlessthe head nodes have enough resources to deal with the in-creased routing load presented. As described in SectionIV-C.2, in a heterogeneous environment this can be allevi-ated by picking the right head nodes.
D. Recovery From Failures
The protocol has built-in mechanisms to detect and re-cover from failures. We quantify the recovery performancein this section. Death of a child node is a simple case tohandle. Its effect is localized to the cluster it is in; it doesnot effect rest of the nodes in the overlay. Failure of headnodes is more critical, as it not only orphans the children,but can also partition the top-level topology. Hence, werestrict our attention to failure of head nodes only. Whena head node dies, its children migrate to another head assoon as they detect the head’s death. At the same time,any partitions at the top-level are detected and repaired.
The simulation in Figure 12 has 1600 nodes in the over-lay, with expected cluster size of 5. A fraction of the headnodes are chosen randomly, and killed. The figure showsthe disconnectivity in the overlay with time. Disconnec-tivity is defined as the ratio of pair of nodes that cannotreach each other to total pairs. Although the disconnectiv-ity level increases as more head nodes fail, the time takento recover to a connected topology remains about the same,3 minutes, which corresponds to the time out constantsused in simulation for detecting and repairing partitions.
An overlay robust to failures should have both fast de-tection and fast adaptation to changes. Figure 12 also plotsthe number of changes (in 10-second bins) that occur in theoverlay topology as a result of induced failure. A changeis occurrence of child migration, addition of a new link ordeletion of an existing link. This reflects how much time ittakes for the protocol to reach a new stable state. From thegraph, it is clear that there is a flurry of activity in the first5 minutes after detection, and then rate of changes comesdown significantly. The later events mainly lead to incre-mental improvements.
From this it is clear that the protocol is able to maintainconnectivity even at high failure rates of head nodes. Inpractice head nodes would be chosen based on their sta-ble participation which would reduce their failure rate andtherefore reduces the transient disconnectivity in the over-lay.
VI. RESOURCE DISCOVERY IN THE WIDE AREA
In this section we evaluate the performance of ourprotocol in context of broadcast based applications likeGnutella[4]. We would like to compare the overlay formedby our protocol with the existing Gnutella overlay. Weimplemented a Gnutella-like protocol to generate Gnutellaoverlays. It creates an overlay topology by randomly con-necting nodes taking into account a degree distributionfound in Gnutella overlays [19]. While this protocol mightnot yield overlay topologies identical to Gnutella (because

11
0
0.1
0.2
0.3
0.4
0.5
0.6
0.7
0.8
185 190 195 200 205 210 2150
4
8
12
16
20
24
28
Dis
conn
ectiv
ity
Num
ber o
f eve
nts
per 1
0 se
cond
Simulation time in minutes
1%
5%
10%
20%
DisconnectivityNumber of events per 10 second
Fig. 12. Disconnectivity and Total number of changes in theoverlay topology vs Simulation time. % value denotes % ofhead nodes failing.
0
0.1
0.2
0.3
0.4
0.5
0.6
0.7
0.8
0.9
1
0 2 4 6 8 10 12
Cum
ulat
ive
fract
ion
of n
odes
Query Delay Penalty (QDP)
Our protocolGnutella like protocol
Fig. 13. Comparison of our overlay with a Gnutella-like overlay
of the presence of several degrees of freedom involving hu-mans in the way the Gnutella network works), we believeit provides a reasonable comparison point.
We use two metrics for evaluation: the first measures thelatency overhand, and the second overhead on the network.
A. Query Delay Penalty
Query Delay Penalty (QDP) for a node is defined as theratio of broadcast latency using the overlay to broadcastlatency using the physical network. Broadcast latency isthe time taken for a query originating from that node toreach all other nodes of overlay, which is the same as themaximum latency from this node to any other node in theoverlay. QDP is a measure of latency overhead incurredby a broadcast-based application when using the overlay,just like RDP measures the latency overhead for unicastapplications.
Figure 13 compares the QDP for two overlays of 1600nodes, one formed by our protocol and other using theGnutella-like protocol. With our protocol QDP observedby all nodes was less than 2. On the other hand, for theGnutella-like overlays more than 90% of the nodes hadQDP more than 4, and the worst case QDP was more than8.
B. Resource Usage
In broadcast, a message traverses each overlay link onceor twice. Assuming cost of traversing a tunnel is propor-tional to its latency, an overlay with fewer low latency linksis more efficient for broadcast purposes than the one withmany large latency links. We define resource usage as sumof latencies of all links in the overlay. Note that good RDPdoes not imply low resource usage. For example an over-lay in which every node is connected to every other nodehas RDP 1, but has very high resource usage.
The resource usage of Gnutella-like overlay was morethan 10 times that of our overlay. Hence, we are able toachieve better performance using fewer resources.
VII. CONCLUSIONS AND FUTURE WORK
In this paper we have presented a protocol to form self-organizing overlays that scales to at least tens of thousandsof nodes. The protocol builds a two-level hierarchy usingtwo techniques: clustering and mesh-management. Clus-tering builds the hierarchy dynamically and mesh manage-ment forms the overlay at each level of hierarchy. Our keyconclusions are:� Hierarchy has minimal effect on performance metricsuch as Relative Delay Penalty (RDP).� At the same time, hierarchy reduces the bandwidth re-quirements of control traffic. Roughly, the gain is a factorof � for head nodes, and a factor of �
+ � for child nodes,where � is the overlay size, and � is the cluster size.� Hierarchical overlays absorb changes better than flatoverlays. They stabilize more quietly and with fewerchanges, and so are well-suited to dynamic environments.The stability of hierarchical overlays can be further in-creased by exploiting the heterogeneity among overlaynodes.� For broadcast-based applications, our hierarchical over-lays yield major performance benefits (more than a factorof 4 in our simulations) while cutting down on the resourceconsumption (by a factor of 10) compared to ad hoc tech-niques like Gnutella.� Our extensions to Narada lead to significant improve-ments in RDPs. In our simulations, the 95th percentileRDP was reduced by 25%.

12
It is important that a self-organizing overlay protocoldynamically adapt to the workload presented to it, to pre-clude performance bottlenecks (hotspots). While someof the means to alleviate hotspots would be application-specific, there are some measures that can be taken inde-pendent of the application being run on top of the overlay.For instance, if some node in the overlay is overwhelmedby traffic it forwards between two neighbors, it could re-quest its neighbors bypass it and to send data directly. Or,if some node observes an unacceptable level of congestionover a tunnel, it could either find an alternate tunnel to des-tination or divide the traffic that goes over that tunnel. Aspart of future work, we intend to investigate application-independent techniques to address the problem of hotspotsin overlays.
Large-scale overlays consisting of end-hosts in the In-ternet have to be able to operate under highly dynamicenvironment. We intend to measure the performance ofour overlay protocol under such conditions. This requiresmodeling the life time distributions of the overlay nodesand other dynamic conditions like physical link failures.On a related note, we also plan to investigate how hierar-chy can be used to exploit heterogeneity among the overlayparticipants.
The protocol presented in the paper, creates a two levelhierarchy. Creating multiple levels of hierarchy to achievefurther scalability is another interesting future direction.
ACKNOWLEDGEMENTS
We are grateful to Andy Collins and Andrew Whitakerfor extensive discussions during the design phase of theproject. Scott Shenker and Srinivasan Seshan providedvery useful feedback. We are also thankful to StefanSaroiu and Neil Spring for reviewing a draft version of thispaper.
REFERENCES
[1] H. Eriksson, “MBone: The Multicast Backbone,” in Communi-cations of the ACM, August 1994, vol. 37, pp. 54–60.
[2] “ABone Web Pages,” http://www.isi.edu/abone/.[3] “6Bone Web Pages,” http://www.6bone.net/.[4] “Gnutella Web Pages,” http://www.gnutella.com.[5] Stefan Saroiu, P. Krishna Gummadi, and Steven D. Gribble, “A
Measurement Study of Peer-to-Peer File Sharing Systems,” Tech.Rep. 01-06-02, UW-CSE, June 2001.
[6] Yang-hua Chu, Sanjay Rao, and Hui Zhang, “A Case for EndSystem Multicast,” in ACM SIGMETRICS, June 2000.
[7] Yatin Chawathe, S. McCanne, and Eric Brewer, “An Architecturefor Internet Content Distribution as an Infrastructure Service,”February 2000.
[8] John Jannoti, David K. Gifford, Kirk L. Johnson, M. FransKaashoek, and James W. O’Toole, “Overcast: Reliable Multi-casting with an Overlay Network,” in OSDI, 2000.
[9] Paul Francis, “Yoid: Your Own Internet Distribution,”http://www.aciri.org/yoid/.
[10] D. Waitzman, C. Partridge, and S. Deering, “Distance VectorMulticasting Routing Protocol,” RFC 1075, IETF, 1988.
[11] William Adjie-Winoto, Elliot Schwartz, Hari Balakrishnan, andJeremy Lilley, “The Design and Implementation of an IntentionalNaming System,” in SOSP, December 1999.
[12] Sylvia Ratnasamy, Paul Francis, Mark Handley, Richard Karp,and Scott Shenker, “A Scalable Content Addressable Network,”in ACM SIGCOMM, September 2001.
[13] Ion Stoica, Robert Morris, David Karger, Frans Kaashoek, andHari Balakrishnan, “Chord: A peer-to-peer lookup service forinternet applications,” in ACM SIGCOMM, September 2001.
[14] Anthony Rowstron and Peter Druschel, “Pastry: Scalable, Dis-tributed Object Location and Routing for Large-Scale Peer-to-Peer Systems,” in IFIP/ACM International Conference on Dis-tributed Systems Platforms (Middleware), November 2001.
[15] Ben Y. Zhao, John D. Kubiatowicz, and Anthony D. Joseph,“Tapestry: An Infrastructure for Fault-tolerant Wide-area Loca-tion and Routing,” Tech. Rep. UCB/CSD-01-1141, UCB, April2001.
[16] Kortsarz and Peleg, “Generating low-degree 2-spanners,” inSODA: ACM-SIAM Symposium on Discrete Algorithms (A Con-ference on Theoretical and Experimental Analysis of Discrete Al-gorithms), 1994.
[17] Stefan Savage, Tom Anderson, Amit Aggarwal, David Becker,Neal Cardwell, Andy Collins, Eric Hoffman, John Snell, AminVahdat, Geoff Voelker, and John Zahorjan, “Detour: a Case forInformed Internet Routing and Transport,” in IEEE Micro, Jan-uary 1999, vol. 19, pp. 50–59.
[18] “GT-ITM:Modeling Topology of Large Internetworks,”http://www.cc.gatech.edu/projects/gtitm/.
[19] DSS2 Clip System, “Gnutella: To the Bandwidth Barrier andBeyond,” ”http://dss.clip2.com/gnutella.html”.