saving energy in an office environment: a serious game intervention
TRANSCRIPT

S
Ba
b
c
d
e
a
ARRA
KSEEBPOV
1
1c
c7cheordcl
nn
h0
Energy and Buildings 74 (2014) 43–52
Contents lists available at ScienceDirect
Energy and Buildings
j ourna l ho me page: www.elsev ier .com/ locate /enbui ld
aving energy in an office environment: A serious game intervention
rian Orlanda,∗, Nilam Ramb, Dean Langc, Kevin Houserd, Nate Klinge, Michael Cocciae
Department of Landscape Architecture, Pennsylvania State University, 121 Stuckeman Building, University Park, PA 16802, USADepartment of Human Development and Family Studies, Pennsylvania State University, 422 Biobehavioral Health Building, University Park, PA 16802, USADepartment of Landscape Architecture, Pennsylvania State University, 121 Stuckeman Building, University Park, PA 16802, USADepartment of Architectural Engineering, Pennsylvania State University, 104 Engineering Unit A, University Park, PA 16802, USAStudioLab Pennsylvania State University, 16 Borland Building, University Park, PA 16802, USA
r t i c l e i n f o
rticle history:eceived 2 August 2013eceived in revised form 14 January 2014ccepted 23 January 2014
eywords:erious gamesnergy feedbacknergy savingsehavioral intervention
a b s t r a c t
Serious Games are virtual simulations of real-world activities that can both educate users and promptbehavioral change. This study evaluated the effectiveness of a virtual pet game in reducing plug-loadsin a mid-size commercial office. Participants were 61 resident workers. The energy consumption of 288appliances was monitored for 24 weeks using plug-load sensors. After 4-weeks of baseline, 42 participantswere introduced to the “Energy Chickens” serious game, which they played for 12 weeks. Within the game,daily energy consumption data for each individual’s devices were used to manipulate animated chickensliving on a personalized virtual farm. Changes in device-specific energy consumption were reflected in theimproving or declining “health” of the corresponding chickens. Healthy, energy-saving chickens laid eggsthat the user could collect and use to purchase accessories for their virtual farm. Across all intervention
lug-loadfficeirtual pet
days, average energy consumption declined by 13%. Participants achieved 23% reductions on non-workdays and 7% reductions on workdays. At the conclusion of the intervention, 69% of participants indicatedthat the game helped them be more energy conscious, with some indicating changes in their energy useoutside the office. Results highlight the effectiveness of behavioral interventions on plug-load energyconsumption within commercial office settings.
© 2014 Published by Elsevier B.V.
. Introduction
.1. The role of individuals in controlling energy use inommercial buildings
In the United States, residential and commercial buildingsonsume 40% of the total energy used and buildings account for2% of electricity used. Of that amount, 33% of electricity use isonsumed by plug and process loads; more than lighting, spaceeating and cooling, or ventilation [1]. By 2030 plug loads arexpected to account for 49% of total electricity use, in part becausef the increasing efficiency of building envelopes but also as aesult of the proliferation of office automation equipment, from
esktop computers to cellular telephone chargers [1]. Histori-ally lighting and heating and cooling have been viewed as thearge energy consumers whereas plug loads have been viewed∗ Corresponding author. Tel.: +1 814 865 6315.E-mail addresses: [email protected], [email protected] (B. Orland),
[email protected] (N. Ram), [email protected] (D. Lang), [email protected] (K. Houser),[email protected] (N. Kling), [email protected] (M. Coccia).
ttp://dx.doi.org/10.1016/j.enbuild.2014.01.036378-7788/© 2014 Published by Elsevier B.V.
as essential to the function of the organization, a necessary andunavoidable use. However, while much of the energy used byinterior climate control can be moderated by automatic controls,plug load energy use is usually directly under the control ofindividual office workers, and may be reduced through changes inindividual behavior.
1.2. Feedback on energy use to influence energy using behavior
Providing feedback to energy users has long been regarded asa key mechanism in persuading individual end users to voluntar-ily reduce their energy use. A wide variety of mechanisms fromeducation about energy use to financial incentives and competi-tions have been used and described in a number of surveys of thefield [2–6]. While the vast majority of the studies included in thesereviews focus on residential settings, those focusing on energy con-sumption in office settings report energy savings ranging from 4
to 10% [7–10]. Other studies have employed information provi-sion in combination with various social marketing tools such ascommitment, prompts, norms, and incentives in office settings andreport 2–9% energy reductions in office buildings [11,12]. Of these,
4 nd Bu
fthtf
tftcEftebbm
1
pi[ep
Wtbtedts
eGaeddetcl
teeecdrhbtcs
TS
4 B. Orland et al. / Energy a
ew examine the persistence of energy saving behaviors but wherehose do occur they are associated with the development of newabits over longer periods of time. When feedback included incen-ives, removal of the incentive tended to result in energy savingading away [2].
Among the numerous strategies employed to develop persis-ent energy-saving behaviors, common desirable characteristics foreedback have been identified–user friendliness; actual consump-ion; frequent feedback; interaction and choice; appliance-specific;omparative; and given over an extended time period [2,4,13].arly strategies comprised the use of explanatory billing and ofacility-level energy use dashboards. More recently and to addresshe strategies identified above, there has been an increasingmphasis on individual-level real-time and interactive feed-ack either explicitly or implicitly drawing on insights fromehavioral sciences, human-computer interface design and socialedia [14–19].
.3. Social media interventions in energy using behavior
In response to the evolution in thinking outlined above, com-uter games, real-time data visualizations (dashboards), and other
nteractive social media have emerged to address energy saving2,20], driven by the belief that actively engaging energy users innergy saving is more effective in changing behavior than simplyroviding information about energy conservation.
“Serious games”, emerging in 2002 as an initiative of theoodrow Wilson Center to encourage the development of games
o address policy and management issues [21], are a sub-set of theroad range of social media interventions that might be employedo bring about energy-saving behavior. The game-based mod-ls and simulations at the root of serious games enable users toevelop knowledge about the energy-saving strategies availableo them and then explore alternative means of achieving energyaving.
Among the various types of social media being used to promotenergy savings, the structured rules, goals and challenges of Seriousames in the context of virtual simulations of real-world activitiesnd events both educate users and prompt behavioral change. Fornergy-saving they can make energy use contextually relevant toaily life, engage users’ interest in saving energy, and provide airect means to influence their on-going energy use. Games thatngage the social bonds and affection that players develop for vir-ual “pets” have been effective in changing behavior in medical andommerce settings, such as in encouraging the adoption of healthyiving behaviors [22].
Applied towards reducing energy consumption in office set-ings, serious games may encourage personal responsibility fornergy use, provide an introduction to the issues associated withnergy saving, and prepare office workers for more informedngagement with energy issues—without any costly retro-fits orhanges to building fabric. As such, a few games have beeneveloped that focus on promoting energy saving behavior usingeal-time energy feedback [23,24]. Prior to the work reportedere, the effectiveness of games in reducing energy use had not
een tracked. The purpose of this study was to implement andest the effectiveness of a virtual pet game designed specifi-ally for reduction of plug-loads in a mid-size commercial officeetting.able 1tudy schedule and components.
Group N Baseline (5 weeks) Phase 1 (8 we
Game 41 Sensors only Sensors, PostNo-Game 16 Sensors only Sensors and P
ildings 74 (2014) 43–52
2. Methods
2.1. Participants and procedure
In this study, approved by Penn State’s Institutional ReviewBoard (IRB #s 39795 and 40020), 57 resident workers between23 and 82 years of age (MdnAge = 48, MAge = 47.4, SDAge = 13.0), 51%female, from a mid-size commercial office complex participatedin a serious games intervention trial. The majority indicated theywere White (82%) with some representation of Black (5%), Asian(11%), and Hispanic (2%). Energy consumption of 217 appliancesin these 57 individuals’ office spaces were monitored continuouslyfor ≈6 months using wireless plug-load sensors (between 1 and5 appliances per person, M = 3.81, SD = 1.13; ranging from desktopcomputers and monitors to coffee makers and shredders).
At the beginning of the study, all participants’ offices were out-fitted with up to five plug-load energy sensors. For the next 5 weeks,baseline energy use was monitored (without intervention) (Table 1).At Week 6, Phase 1 of the intervention began and included a postercampaign and the Energy Chickens serious game (see below). Of the57 participants, 41 consented to join a group that engaged in activeplay of the Energy Chickens game (Game group.) The remaining 16participants did not play the game but were exposed to the postersand potentially to co-workers that were playing the game (No-Game group). At Week 14, the intervention transitioned into Phase2. The posters were removed but participants in the Game groupcontinued to play the game. At Week 20, the game ended, and thestudy transitioned into an 8-week Follow-up period, where energyuse was monitored without intervention, as during baseline. Intotal, the 57 participants provided data on 173,437 quarter-days ofenergy use of 217 office appliances. All participants (Game and No-Game groups) were entered into drawings for five $100 gift cardsas compensation for the energy monitoring portion of the proto-col. Participants in the Game group were compensated up to anadditional $100 for completing the entire protocol, which includedpre-, post- and daily surveys to examine effects on participantwell-being and productivity during and after the energy-savingintervention. This report concentrates on the energy use resultsand also reports participants’ evaluations of the game. Findingsabout participant well-being and productivity are not reportedhere.
2.2. Intervention: Energy Chickens
2.2.1. Serious gameParticipants in the Game intervention group were provided
with a web-based game application, Energy Chickens, that could beaccessed from their desktop computers. Within the game, real-timedaily energy consumption data for each individual’s devices wereused to manipulate the characteristics of a set of animated chickensthat “lived” on a personalized virtual farm that each user main-tained. Following typical virtual-pet game mechanics [25], changesin device-specific energy consumption (relative to baseline levels)were reflected in the “health” of the corresponding chickens (Fig. 1).When energy consumption was reduced, the chicken representing
that device would grow larger and lay eggs (rewards) that the usercould use to purchase virtual accessories for their virtual farm (hatsfor chickens, bouncing balls, fences, flowers). When energy con-sumption was increased, the chicken would become smaller, noteks) Phase 2 (6 weeks) Follow-up (8 weeks)
ers and Game Sensors and Game Sensors onlyosters Sensors only Sensors only

B. Orland et al. / Energy and Bu
l(
2
ebekagpl
btpcE
2
rgetdctcitl
Fig. 1. Data collection protocol schematic.
ay as many eggs, and eventually become visibly ill (bilious green)Fig. 2).
.2.2. Energy use baselineEnergy Chicken game mechanics referenced a participant’s
nergy consumption during the baseline period to update chickenehavior and appearance. For each monitored device, a baselinenergy use reference was determined as the peak average dailyWh usage during the 5-week baseline period (separately for worknd non-work days, as indicated by weekly surveys). Within theame mechanics, participants’ energy use for the previous 24 houreriod (4:00 am to 3:59 am) was compared to the applicable base-
ine reference for work and non-work days.The intervention incorporated components of community-
ased social marketing such as commitment pledges and promptso encourage participation [26]. When introduced to the game,articipants were asked to sign a pledge to reduce their energyonsumption by a target amount of 15%, and were given a set ofnergy Chicken “Turn it Off” reminder stickers.
.2.3. Game mechanicsReducing or increasing energy consumption for a specific device
esulted in chickens gaining or declining in health. There were fiverowing/sick “levels” to the behavior and physical appearance ofach chicken and the size and health of the chicken influencedhe number of eggs that it laid (Fig. 2). A chicken moved up orown a level(s) after 3 consecutive days of energy saving or overonsumption. Each day when a participant logged into the game,he chickens’ status was updated, and their physical appearance
hanged accordingly. As each chicken appeared, the percent changen energy use (saved or over-used) during the previous day relativeo baseline was displayed and was also represented by a sad or smi-ey face below the chicken (Fig. 3a). Smiley faces at the bottom of theFig. 2. Energy Chickens lev
ildings 74 (2014) 43–52 45
information window indicated how many days in a row the partic-ipant has saved energy and sad faces indicated over-consumptiondays compared to baseline. Once all the chickens were present, thenumber of eggs that had been laid over the previous day was dis-played, based on average energy use. A summary screen displayedthe overall energy saved during the time since last login (Fig. 3b).
2.2.4. Game rewards and incentivesEggs were earned on a daily basis by chickens at level 0, +1,
or +2 but were only awarded if the participant logged into thegame (Fig. 2). Eggs were awarded at the rate of 1 egg for every1% average daily energy savings across a participant’s assignedappliances/equipment. Collected eggs were shown as a cumulativecount indicating the number available to buy accessories for theparticipant’s chickens and barnyard (Fig. 3c) and were redeemedby clicking a “shopping cart” button on the display. Both storesprovide a range of inventory costing from 5 eggs up to 200. Atthe start of the game both stores stocked a limited number ofless expensive items. As the game progressed, the store inven-tory expanded. Small hats, flowers and fence posts were modestlypriced; more elaborate hats, fruit bushes and gnomes were morecostly. As participants advance through the game, “Graph” and“Mountain View” buttons became active. The “Graph” button pro-vided participants with a graphical representation of their energyusage. The “Mountain View” button allowed the participants tozoom out to see a view of all the chickens from the farms ofother participants. There was no interaction with the chickensin this level, just the ability to view how other chickens weredoing.
2.2.5. PostersDuring Phase 1 of the intervention, a series of posters were
placed in multiple common-use locations throughout the building,accessible to participants in both Game and No-Game groups. Theposters were designed to increase awareness of plug load energyconsumption and phantom (vampire) loads, with characters fromthe Energy Chicken game encouraging viewers to “Turn it off” and“Unplug it”. Posters were changed weekly (2 per week) to serve asa reminder of the on-going intervention.
2.3. Measures
To assess the effects of the intervention we examined differ-ences in energy use as a function of several design variables.
2.4. Energy use
Energy use of each device was measured every 10 s using a
network of Plugwise® sensors positioned between the electricaloutlet (or power strip) and devices [27]. Sensors monitor the energydrawn by a single device (watts), send these quantifications tolocal servers (via Zigbee radio frequency communication protocol),els and appearance.

46 B. Orland et al. / Energy and Buildings 74 (2014) 43–52
icken
wasadttpcta
2
cetcwwvwpf
wd(crtph
2
oosr
2
euvpv
Fig. 3. Energy Ch
here it was sampled and sent to a MySQL® database located on university server. The Energy Chickens game engine queried andummarized the data daily, and used it to update chicken health andssociated dashboards within the game. Separate from the day-to-ay game mechanics, device-level energy use outcome data used inhe present analysis were summarized in quarter-day incrementshat corresponded to natural breaks in the building’s daily workatterns (1 am–7 am, 7 am–1 pm, 1 pm–7 pm, 7 pm–1 am). Out-ome device energy use is reported here as watt-hours (Wh) ratherhan the more common kilowatt-hour to facilitate interpretationnd tracking of both low and high power consumption devices.
.5. Design factors
Four design factors were of interest. Intervention Phase wasoded as a categorical variable with four levels. Each quarter-daynergy use value was classified as to whether it was obtained inhe Baseline, Phase 1, Phase 2, or Follow-up period. Each day wasoded, based on available data, as to whether the individual wasorking in the office (workday) or was away from the office (non-orkday). Non-workday coding primarily tracked weekends and
acations, but also occasionally included days where an individualas working off-site. Time-of-day was coded as day-time (7 am–1m and 1 pm–7 pm) or night-time (1 am–7 am and 7 pm–1 am),or most people coinciding with working and non-working hours.
Given differences in seasonal and daily usage patterns, and theork-essential nature of some appliances (e.g., computers), the 217evices were classified into 6 device types: (1) monitors (n = 58),2) computers (n = 54), (3) low-use (n = 47, answering machine,alculator, charger, fax, GPS, label maker, phone, picture frame,adio, scanner, shredder, speakers, stapler, stereo, USB port, walkie-alkie), (4) periodic-use (n = 42, coffee pot, external hard drive, hotot, microwave, printer, task lamp), (5) seasonal (n = 15, fan, spaceeater), and (6) refrigerator (n = 1).
.5.1. Post-study evaluationAt the conclusion of the study participants completed a 29 item
n-line questionnaire (6-point Likert scale) that assessed aspectsf their game experience, including ease of use, ease of learning,atisfaction with the game, display design, terminology and systemeliability.
.6. Data analysis
Our focal interest was to examine if and how participants’nergy use changed across the phases of the intervention. First,
sing repeated measures ANOVA with random effects on indi-iduals’ overall level of use (to accommodate the wide variety ofarticipants’ device configurations), we examined effects of inter-ention phase (Baseline, Phase 1, Phase 2, or Follow-up) and groups game screens.
(Game, No-Game). Subsequently, to better understand the specifickinds of behaviors that were changing over time we ran separateanalyses by workday (workday, non-workday), device-type, andtime-of-day (daytime, nighttime). In a final step, within the EnergyChickens Game group we examined whether measures of gameengagement moderated changes in energy use. All models werefit to the data using SAS 9.3 (Proc Mixed; [28]) with incompletedata treated as missing at random [29]. Effects in the initial modelswere evaluated for significance at = .05, with the substantial num-ber of follow-up tests probed with an = .001 correction. For thegame evaluation questionnaire, descriptive statistics determinedthe percent of favorable participant responses (ratings of 5, 6, or 7)from the 7-point Likert scale (Very strongly disagree to Very stronglyagree).
3. Results
3.1. Energy use
Participants’ baseline energy use varied between 1.83 and64.14 (M = 15.26, SD = 13.91) watt-hour (Wh), reflecting substan-tial differences across participants in both how many devices wereavailable for tracking (1–5), and the energy consumption of thosedevices (e.g., the typical computer averaged 64.53 Wh during thebaseline phase, while task lamps averaged 3.15 Wh). Average dailyenergy use of one individual, overlaid on the average daily energyuse for her five devices, across the four phases of the study isshown in Fig. 4. Differences in energy use between interventionphases, workdays and non-workdays, and devices are all apparent.For example, it can be seen that the energy use for the refrigeratorchanged between baseline and Phase 1, and that all other deviceswere turned off during Week 15 (while participant was on holiday).Using the model described above, we examined each of the designfactors in turn.
3.2. Intervention and energy use
Changes in energy use across the phases of the interven-tion differed by group, as indicated by a significant interventionphase (Baseline, Phase 1, Phase 2, or Follow-up) by group (Game[n = 16], No-Game [n = 41]) interaction, F(3,165 = 7.73, p < 0001).Least square estimates of phase-specific means are given inFig. 5a. Within the Energy Chickens Game group, energy usedecreased 12.7% from baseline (MBase = 15.21, SE = 2.04) to Phase 1(MPhase1 = 13.28, SE = 2.04; pdiff < .0001), with significant evidenceof persistence (10.1% saving) through Phase 2 (MPhase2 = 13.68,
SE = 2.04; pdiff < .0001), but not through the Follow-up phase(MFollow = 15.68, SE = 2.04; pdiff = .06). Within the No-Game group,there was also evidence of changes in energy use. Compared tobaseline (MBase = 15.39, SE = 3.26), energy use was not significantly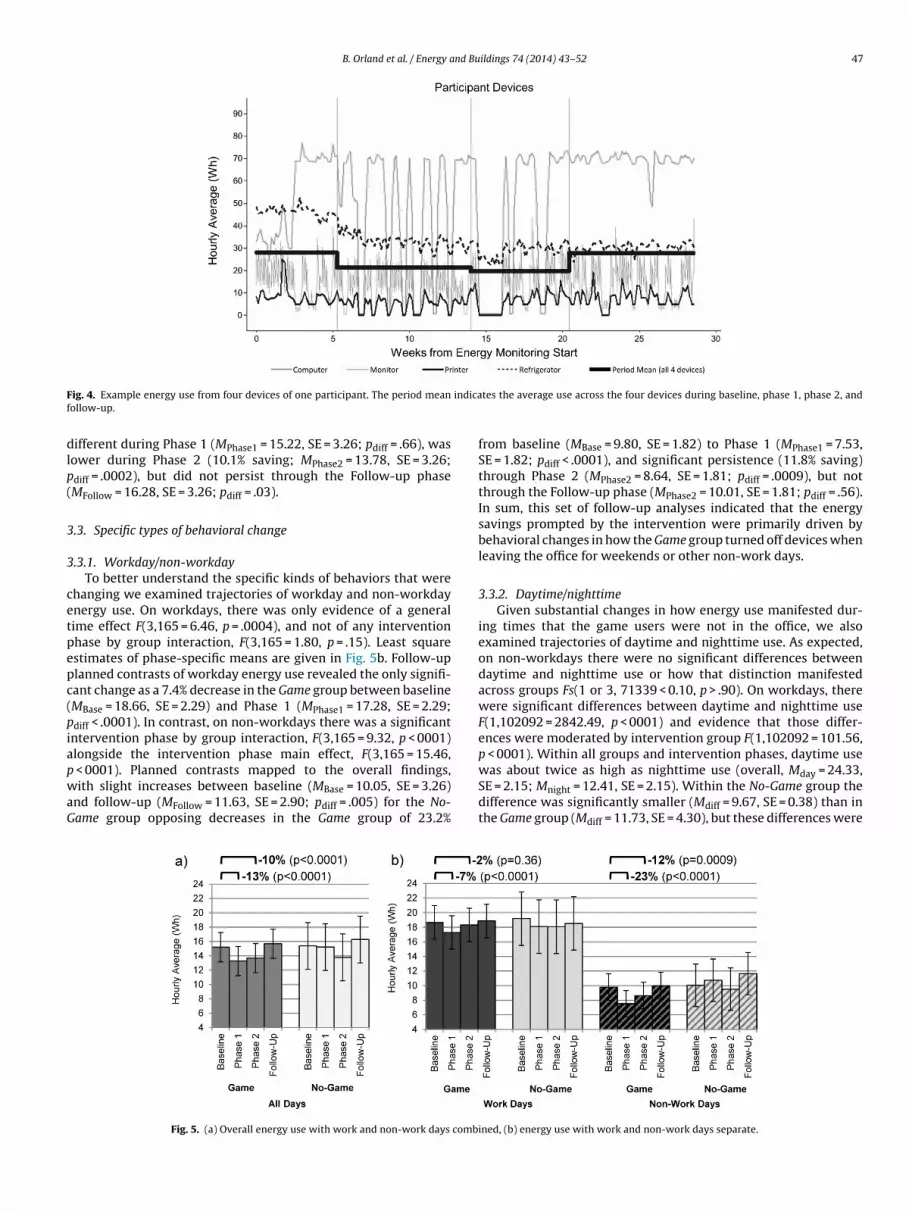
B. Orland et al. / Energy and Buildings 74 (2014) 43–52 47
F indicaf
dlp(
3
3
cetpepc(piapwaG
ig. 4. Example energy use from four devices of one participant. The period meanollow-up.
ifferent during Phase 1 (MPhase1 = 15.22, SE = 3.26; pdiff = .66), wasower during Phase 2 (10.1% saving; MPhase2 = 13.78, SE = 3.26;diff = .0002), but did not persist through the Follow-up phaseMFollow = 16.28, SE = 3.26; pdiff = .03).
.3. Specific types of behavioral change
.3.1. Workday/non-workdayTo better understand the specific kinds of behaviors that were
hanging we examined trajectories of workday and non-workdaynergy use. On workdays, there was only evidence of a generalime effect F(3,165 = 6.46, p = .0004), and not of any interventionhase by group interaction, F(3,165 = 1.80, p = .15). Least squarestimates of phase-specific means are given in Fig. 5b. Follow-uplanned contrasts of workday energy use revealed the only signifi-ant change as a 7.4% decrease in the Game group between baselineMBase = 18.66, SE = 2.29) and Phase 1 (MPhase1 = 17.28, SE = 2.29;diff < .0001). In contrast, on non-workdays there was a significantntervention phase by group interaction, F(3,165 = 9.32, p < 0001)longside the intervention phase main effect, F(3,165 = 15.46,
< 0001). Planned contrasts mapped to the overall findings,ith slight increases between baseline (MBase = 10.05, SE = 3.26)
nd follow-up (MFollow = 11.63, SE = 2.90; pdiff = .005) for the No-ame group opposing decreases in the Game group of 23.2%
Fig. 5. (a) Overall energy use with work and non-work days comb
tes the average use across the four devices during baseline, phase 1, phase 2, and
from baseline (MBase = 9.80, SE = 1.82) to Phase 1 (MPhase1 = 7.53,SE = 1.82; pdiff < .0001), and significant persistence (11.8% saving)through Phase 2 (MPhase2 = 8.64, SE = 1.81; pdiff = .0009), but notthrough the Follow-up phase (MPhase2 = 10.01, SE = 1.81; pdiff = .56).In sum, this set of follow-up analyses indicated that the energysavings prompted by the intervention were primarily driven bybehavioral changes in how the Game group turned off devices whenleaving the office for weekends or other non-work days.
3.3.2. Daytime/nighttimeGiven substantial changes in how energy use manifested dur-
ing times that the game users were not in the office, we alsoexamined trajectories of daytime and nighttime use. As expected,on non-workdays there were no significant differences betweendaytime and nighttime use or how that distinction manifestedacross groups Fs(1 or 3, 71339 < 0.10, p > .90). On workdays, therewere significant differences between daytime and nighttime useF(1,102092 = 2842.49, p < 0001) and evidence that those differ-ences were moderated by intervention group F(1,102092 = 101.56,p < 0001). Within all groups and intervention phases, daytime use
was about twice as high as nighttime use (overall, Mday = 24.33,SE = 2.15; Mnight = 12.41, SE = 2.15). Within the No-Game group thedifference was significantly smaller (Mdiff = 9.67, SE = 0.38) than inthe Game group (Mdiff = 11.73, SE = 4.30), but these differences wereined, (b) energy use with work and non-work days separate.

4 nd Buildings 74 (2014) 43–52
aatrt
3
mcw
lwpaibstddwoptd
bwdawwpiGgsi
etwFbe1pbwNNdFpdsst
lwnwd
8 B. Orland et al. / Energy a
lready present during baseline and did not change significantlycross the phases of the intervention F(3,165 = 0.31, p = .82). In sum,his set of follow-up analyses indicated that intervention phase-elated energy savings were not driven by changes in participants’ypical end-of-work shutdowns.
.3.3. Device typesAs noted earlier, individuals varied substantially in both how
any and what kind of devices they had. Prompted by the signifi-ant differences across groups in daytime/nighttime usage profilese examined changes by device-type category.
Low-use devices. For participants in the Game group who hadow-use devices (n = 26) there were significant differences between
orkdays and non-workdays, F(1,25 = 76.38, p < .0001), and acrosshases, F(3,75 = 46.54, p < .0001) but no phase by workday inter-ction F(3,75 = 0.68, p = .56). Examining the means, also shownn the top panel of Fig. 6, there were changes in energy useetween Baseline and Phase 1, with general persistence of thoseavings through Follow-up. This pattern of means suggests sys-ematic intervention phase-related behavior change related toevices such as calculators, chargers, etc. (e.g., turning off theevices when not in use). For participants in the No-Game groupho had low-use devices (n = 8), there were no significant phase
r workday/non-workday effects (or their interaction), Fs < 0.67,s > .50). The lack of any distinct pattern of changes suggestshat these individuals were not monitoring how they used theseevices.
Monitors. Within the Game group whose monitors wereeing tracked (n = 30), significant main effects for phase andorkday/non-workday were superseded by a phase by work-ay interaction F(3,87 = 4.77, p = .004). Examining the means,lso shown in the middle panel of Fig. 6, there were down-ard trends in energy use across phases. The same pattern oforkday/non-workday differences and decreases in use acrosshases F(3,30 = 37.70, p < .0001) were apparent (but not the
nteraction effect) for the monitors of participants in the No-ame group (n = 11; No-Game participant with monitor). Theeneral trends in both groups suggest that there was someystematic behavior change in monitor use related to thentervention.
Computers. For participants in the Game group whose comput-rs were being tracked (n = 32; Game participant with computer)here were significant main effects for phase and workday/non-orkday that were superseded by a phase by workday interaction
(3,87 = 4.77, p = .004). Examining the means, also shown in theottom panel of Fig. 6, there were changes in non-workdaynergy use between Baseline (MBase = 30.44, SE = 6.94) and Phase
(MPhase1 = 23.70, SE = 6.93; pdiff < .0001), but not thereafter. Thisattern of means suggests systematic intervention phase-relatedehavior change related to turning off the computers over theeekend or when going on holiday). For participants in theo-Game group whose computers were being tracked (n = 15;o-Game participant with computer), there were also significantifferences in energy use between workdays and non-workday,(1,14 = 483.72, p < .0001), and between phases, F(3,42 = 13.14,
< .0001), but not a significant interaction. As with the low-useevices, the computer-related energy use of this group was incon-istent across phases. The lack of any distinct pattern to the changesuggests that these individuals were not monitoring how they usedhese devices.
Other Devices. Examination of periodic-use devices (e.g., taskamps) showed significant differences between workday and non-
orkday energy use in both the Game and No-Game groups, witho systematic differences in how energy use or work-day/non-orkday differences manifests across phases beyond a smallecrease in workday energy use for the Game group between
Fig. 6. Energy use for select device categories; (a) low use equipment, (b) monitors,(c) computers.
Baseline (MBase = 9.02, SE = 2.77) and Phase 1 (MPhase1 = 7.98,SE = 2.77; pdiff < .0001) that suggests some intervention-relatedchanges in how these devices were used while these participants(n = 23) were actively playing the game. Even more prominently,the changes in energy use for the one refrigerator being tracked(which was controlled by a participant in the Game group) showed
significant intervention phase-related changes, F(3,796 = 143.89,p < .0001). The changes, which roughly coincided with the introduc-tion of the game are shown in Fig. 4. Anecdotally, the participantinformed the research staff that he had changed the temperature
B. Orland et al. / Energy and Buildings 74 (2014) 43–52 49
Table 2Behavior patterns of energy saving participants.
Work Days Non-Work Days
Phase 1 Phase 2 Follow-up Phase 1 Phase 2 Follow-up
Mean 11.9% 11.0% 12.1% 26.9% 22.4% 20.7%SE 1.3 1.6 1.7 3.7 4.2 4.5N 44 35 30 35 28 23
L
sestt
3
citePacad2(sgt
egend: Percent savings from baseline of energy saving participants.
etting on the device to help the chickens. In contrast, changes innergy use of seasonal devices (e.g., fans, space-heaters) was notystematically related to the phases of the intervention, suggestinghat the environmental conditions that prompt use or non-use ofhese devices were unrelated to the intervention.
.3.4. Behavior patterns of energy saving participantsTo examine the persistence of energy saving behaviors more
losely, we examined persistence at the individual level. Specif-cally we examined the extent to which the specific participantshat saved energy during Phase 1 of the study continued to savenergy during subsequent phases (Table 2.) On work days duringhase 1 of the game, 44 participants (77% of sample) saved anverage of 12% compared to baseline levels. Of those 44, 35 (80%)ontinued to save during Phase 2, and 30 (68%) continued to savet the same level during the follow-up phase. On non-work daysuring Phase 1, 35 participants (61% of sample) saved an average of7% compared to baseline levels. Of those non-work day savers, 28
80%) continued to save during Phase 2, and 23 (66%) continued toave during the post-game period. This suggests that although theroup-level data do not show statistical evidence of persistencehrough the follow-up, individual-level tracking indicates thatFig. 7. Energy Chickens
the interventions (posters only and posters + game) appear tohave had lasting effects on some individuals’ behavior more thanothers. In follow-up analyses with the limited demographicsavailable, we did not identify any specific characteristics (e.g.,gender) that were related to individuals’ persistence of energysavings.
3.4. User evaluation of game experience
Participants were asked to evaluate the Energy Chickens gameat the conclusion of the intervention. Of the participants thatresponded (n = 36), 69% of indicated that the game helped thembe more energy conscious, 54% indicated that the game providedaccurate information about their energy usage, 73% felt the gamewas easy to understand and 50% were satisfied with the game(Fig. 7).
Open-ended questions were also used to probe what individu-als liked/disliked about the game and to obtain general comments
about the game and its structure. Likes tended to address the overallgoal of the intervention: “Influenced my thinking about energy sav-ing”, “Made thinking about energy use fun” and “A clever approachto changing behavior.” Dislikes focused on shortcomings in thegame evaluation.

5 nd Bu
doitcntdcicshbhgi
4
4
ieavopeiatO2edosteonnwsSgEsqi
isftauimttaw
0 B. Orland et al. / Energy a
eployment of the game and included: “Chicken health changesften unexplained”, “Re-adjusts baseline every week—this is mislead-ng” and “Kind of silly.” General comments tended to expand uponhe Likes and Dislikes: “I am happy to have participated in the energyhicken game. Having to check on my chickens . . . increased my aware-ess of my energy usage. This made me mindful to turn things off athe end of the day which I did not do before, but now I will continue too.”, “I have to confess that - in an effort to earn eggs - I have stoppedonnecting to my desktop from home at night and also stopped work-ng during the weekend.” and “I feel that once I got to a point that Iould not turn off anything else to save electricity my chickens did nottay the same but would get sick. This does not make sense. When I amere I need to use my equipment and when I take time off that shoulde accounted for.” In sum, individuals in the Game group generallyad a positive experience. They reported being engaged with theame, acquiring new knowledge, and that the game affected theirntentions for and ability to change their behavior.
. Discussion
.1. Intervention
The Energy Chickens game addresses many of the areas formprovement in provision of energy-use feedback identified byarlier authors—user friendly, based on actual consumption, inter-ctive, appliance-specific [2,4,15,16]. Our results thus highlight theiability of deploying and using serious games within commercialffice settings and the effectiveness of serious games in reducinglug-load energy consumption. The 13% savings in overall plug loadnergy in Phase 1 of the Serious Game intervention is a signif-cant figure in the context of the US EPA’s National Action Planspirational goal of meeting an expected growth of 50% of elec-ricity load through implementing energy efficiency [30] and thebama administration’s challenge for building owners to achieve0% energy saving by 2020 [31]. While the 13% savings in plug loadnergy is impressive, it is even more instructive to examine work-ay vs. non-workday savings. Noted as a frustration by at leastne game participant was the observation that energy cannot beaved by turning off equipment essential to work tasks. Never-heless, the game intervention group was still able to achieve 7%lectricity saving, presumably by increasing diligence in turningff unused equipment. This effect is seen more dramatically foron-workday loads where 23% saving was achieved even thoughon-workday use was already only half of workday load. Futureork should target the behaviors that contributed to 23% energy
avings on non-work days to extend those behaviors to workdays.avings are not limited to only those in the game interventionroup. While the No-Game group chose not to participate in thenergy Chickens game, they nevertheless contributed to energyaving, presumably as a response to the posters or as a conse-uence of working among others talking about and participating
n the game.Examining device types reveals further important effects of the
ntervention. For both workdays and non-workdays 6% of energyavings was achieved with low-use devices (answering machine,ax, label maker, phone, etc.) While these savings are not large,hey were persistent and point to the value of the interventions a method to increase awareness about specific devices’ energyse. Participants were willing to turn these devices off when not
n use, but simply needed a reminder. The work-essential equip-ent, computers and monitors, tell a slightly different story. First,
he level of energy used by these devices plays a significant role inhe overall energy consumption. Referring to Fig. 6, low-use devicesre responsible for approximately 2.3 Wh of energy use per person,hereas monitors account for approximately 15 Wh on workdays
ildings 74 (2014) 43–52
and computers for 40 Wh. The latter are the devices where reduc-ing use accounts for large overall savings so that, for monitors, thePhase 1 savings during non-workdays of 62% represent substan-tial reductions. Computers, the highest energy using devices, showthe same general pattern, 22% savings during non-workdays. Sinceworkday-non-workday differences were much smaller for thesedevices, the overall savings were substantial.
4.2. Persistence
While the effects of the game intervention on energy-savingwere robust, our findings indicate that the behavioral changes didnot persist, despite the participant feedback indicating that individ-ual awareness of energy conservation was raised. Several sourcesof the return to baseline levels of use have been considered. Firstis the possibility that participants compensated for their time ofrelative deprivation of the use of devices by rebounding to a higherlevel of use. However, no rebound is seen for the low-use deviceswhere such a rebound is most likely; both Game and No-Gamegroups exhibited drops in low-use devices that persisted throughall phases. Second is the possibility of a seasonal effect as we movedfrom September through January. However, in follow-up analyseswhere seasonal devices such as heaters and fans were set asidethere was no change in the general pattern of changes in energyuse. Third, it is possible that Phases 1 and 2 of the game werenot long enough in duration to establish the habits of turning offdevices that would ensure persistence. Fourth, while non-gameparticipants were likely influenced by the posters and game partic-ipants to reduce their energy use during the game, influence fromthe non-game participants may have induced former game partic-ipants to return to using more energy once the game had finished.Although social influence seems plausible, other researchers havebeen unable to identify whether such influence can drive energysavings [17]. Finally, participants noted to the investigator that thesuccess of the game in leading to turning off computers causedthe IT support department to rule that computers must not beturned off at night and weekends so as not to interfere with on-line security and back-up management. This anecdotal response,while negatively impacting persistence, does support the successof the game in changing participant behavior and highlights dis-crepancies between the willingness of individuals to try to achieveenergy-saving goals and the desire of information technology staffto have continuous remote access to desktop devices.
4.3. Limitations and outlook
This study examined change in energy use through monitoringof 217 devices managed by 57 office workers over 6 months. Assuch, it is one of the most comprehensive evaluations of a behav-ioral intervention on plug-loads. However, it must be noted thatthe 57 participants in this study were still a convenience samplerecruited from a particular type of office environment and thusthe results may not generalize to workers in all middle-sized com-mercial offices. In part, our examination of how serious games canbe used for energy savings was constrained by the challenges ofobtaining access to owners, occupants, and physical environmentsreceptive to trying out an intervention that deliberately intrudes onthe status-quo of an office environment. However, the challengesof finding suitable study locations will diminish as building ownersbecome more familiar with these types of study and perceive therelatively low risk they pose for worker productivity and privacy.
In addition, while sensors are presently expensive and thus imposea limit on deployment, building energy management is movingtoward built-in monitoring of all plug receptacles. Thus, whilethis study provided an important first step, the coming changes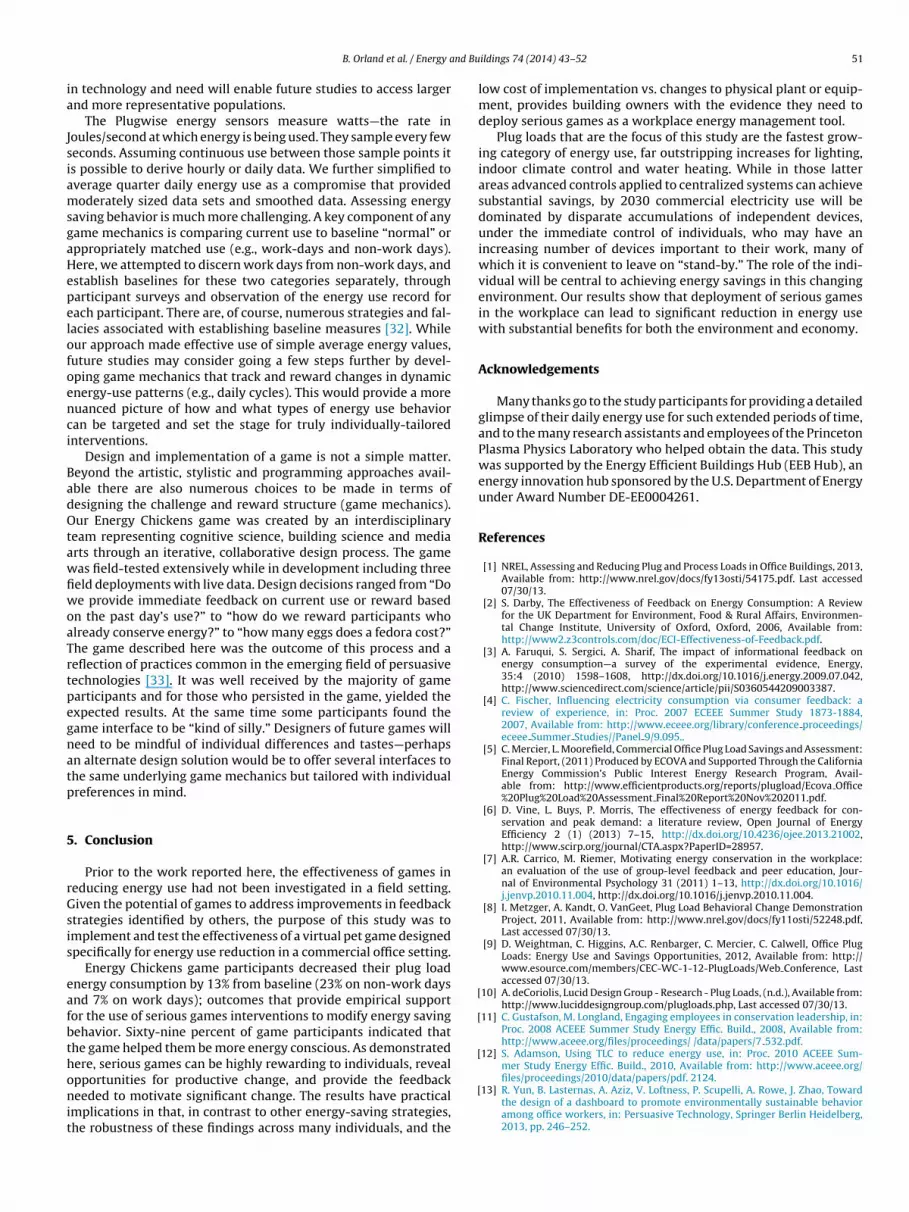
nd Bu
ia
JsiamsgaHepelofoenci
BadOtawfiwoaTrtpegnatp
5
rGsis
eafbthonit
[
[
[
B. Orland et al. / Energy a
n technology and need will enable future studies to access largernd more representative populations.
The Plugwise energy sensors measure watts—the rate inoules/second at which energy is being used. They sample every feweconds. Assuming continuous use between those sample points its possible to derive hourly or daily data. We further simplified toverage quarter daily energy use as a compromise that providedoderately sized data sets and smoothed data. Assessing energy
aving behavior is much more challenging. A key component of anyame mechanics is comparing current use to baseline “normal” orppropriately matched use (e.g., work-days and non-work days).ere, we attempted to discern work days from non-work days, andstablish baselines for these two categories separately, througharticipant surveys and observation of the energy use record forach participant. There are, of course, numerous strategies and fal-acies associated with establishing baseline measures [32]. Whileur approach made effective use of simple average energy values,uture studies may consider going a few steps further by devel-ping game mechanics that track and reward changes in dynamicnergy-use patterns (e.g., daily cycles). This would provide a moreuanced picture of how and what types of energy use behavioran be targeted and set the stage for truly individually-tailorednterventions.
Design and implementation of a game is not a simple matter.eyond the artistic, stylistic and programming approaches avail-ble there are also numerous choices to be made in terms ofesigning the challenge and reward structure (game mechanics).ur Energy Chickens game was created by an interdisciplinary
eam representing cognitive science, building science and mediarts through an iterative, collaborative design process. The gameas field-tested extensively while in development including threeeld deployments with live data. Design decisions ranged from “Doe provide immediate feedback on current use or reward based
n the past day’s use?” to “how do we reward participants wholready conserve energy?” to “how many eggs does a fedora cost?”he game described here was the outcome of this process and aeflection of practices common in the emerging field of persuasiveechnologies [33]. It was well received by the majority of gamearticipants and for those who persisted in the game, yielded thexpected results. At the same time some participants found theame interface to be “kind of silly.” Designers of future games willeed to be mindful of individual differences and tastes—perhapsn alternate design solution would be to offer several interfaces tohe same underlying game mechanics but tailored with individualreferences in mind.
. Conclusion
Prior to the work reported here, the effectiveness of games ineducing energy use had not been investigated in a field setting.iven the potential of games to address improvements in feedbacktrategies identified by others, the purpose of this study was tomplement and test the effectiveness of a virtual pet game designedpecifically for energy use reduction in a commercial office setting.
Energy Chickens game participants decreased their plug loadnergy consumption by 13% from baseline (23% on non-work daysnd 7% on work days); outcomes that provide empirical supportor the use of serious games interventions to modify energy savingehavior. Sixty-nine percent of game participants indicated thathe game helped them be more energy conscious. As demonstratedere, serious games can be highly rewarding to individuals, reveal
pportunities for productive change, and provide the feedbackeeded to motivate significant change. The results have practicalmplications in that, in contrast to other energy-saving strategies,he robustness of these findings across many individuals, and the
[
ildings 74 (2014) 43–52 51
low cost of implementation vs. changes to physical plant or equip-ment, provides building owners with the evidence they need todeploy serious games as a workplace energy management tool.
Plug loads that are the focus of this study are the fastest grow-ing category of energy use, far outstripping increases for lighting,indoor climate control and water heating. While in those latterareas advanced controls applied to centralized systems can achievesubstantial savings, by 2030 commercial electricity use will bedominated by disparate accumulations of independent devices,under the immediate control of individuals, who may have anincreasing number of devices important to their work, many ofwhich it is convenient to leave on “stand-by.” The role of the indi-vidual will be central to achieving energy savings in this changingenvironment. Our results show that deployment of serious gamesin the workplace can lead to significant reduction in energy usewith substantial benefits for both the environment and economy.
Acknowledgements
Many thanks go to the study participants for providing a detailedglimpse of their daily energy use for such extended periods of time,and to the many research assistants and employees of the PrincetonPlasma Physics Laboratory who helped obtain the data. This studywas supported by the Energy Efficient Buildings Hub (EEB Hub), anenergy innovation hub sponsored by the U.S. Department of Energyunder Award Number DE-EE0004261.
References
[1] NREL, Assessing and Reducing Plug and Process Loads in Office Buildings, 2013,Available from: http://www.nrel.gov/docs/fy13osti/54175.pdf. Last accessed07/30/13.
[2] S. Darby, The Effectiveness of Feedback on Energy Consumption: A Reviewfor the UK Department for Environment, Food & Rural Affairs, Environmen-tal Change Institute, University of Oxford, Oxford, 2006, Available from:http://www2.z3controls.com/doc/ECI-Effectiveness-of-Feedback.pdf.
[3] A. Faruqui, S. Sergici, A. Sharif, The impact of informational feedback onenergy consumption—a survey of the experimental evidence, Energy,35:4 (2010) 1598–1608, http://dx.doi.org/10.1016/j.energy.2009.07.042,http://www.sciencedirect.com/science/article/pii/S0360544209003387.
[4] C. Fischer, Influencing electricity consumption via consumer feedback: areview of experience, in: Proc. 2007 ECEEE Summer Study 1873-1884,2007, Available from: http://www.eceee.org/library/conference proceedings/eceee Summer Studies//Panel 9/9.095..
[5] C. Mercier, L. Moorefield, Commercial Office Plug Load Savings and Assessment:Final Report, (2011) Produced by ECOVA and Supported Through the CaliforniaEnergy Commission’s Public Interest Energy Research Program, Avail-able from: http://www.efficientproducts.org/reports/plugload/Ecova Office%20Plug%20Load%20Assessment Final%20Report%20Nov%202011.pdf.
[6] D. Vine, L. Buys, P. Morris, The effectiveness of energy feedback for con-servation and peak demand: a literature review, Open Journal of EnergyEfficiency 2 (1) (2013) 7–15, http://dx.doi.org/10.4236/ojee.2013.21002,http://www.scirp.org/journal/CTA.aspx?PaperID=28957.
[7] A.R. Carrico, M. Riemer, Motivating energy conservation in the workplace:an evaluation of the use of group-level feedback and peer education, Jour-nal of Environmental Psychology 31 (2011) 1–13, http://dx.doi.org/10.1016/j.jenvp.2010.11.004, http://dx.doi.org/10.1016/j.jenvp.2010.11.004.
[8] I. Metzger, A. Kandt, O. VanGeet, Plug Load Behavioral Change DemonstrationProject, 2011, Available from: http://www.nrel.gov/docs/fy11osti/52248.pdf,Last accessed 07/30/13.
[9] D. Weightman, C. Higgins, A.C. Renbarger, C. Mercier, C. Calwell, Office PlugLoads: Energy Use and Savings Opportunities, 2012, Available from: http://www.esource.com/members/CEC-WC-1-12-PlugLoads/Web Conference, Lastaccessed 07/30/13.
10] A. deCoriolis, Lucid Design Group - Research - Plug Loads, (n.d.), Available from:http://www.luciddesigngroup.com/plugloads.php, Last accessed 07/30/13.
11] C. Gustafson, M. Longland, Engaging employees in conservation leadership, in:Proc. 2008 ACEEE Summer Study Energy Effic. Build., 2008, Available from:http://www.aceee.org/files/proceedings/ /data/papers/7 532.pdf.
12] S. Adamson, Using TLC to reduce energy use, in: Proc. 2010 ACEEE Sum-mer Study Energy Effic. Build., 2010, Available from: http://www.aceee.org/
files/proceedings/2010/data/papers/pdf. 2124.13] R. Yun, B. Lasternas, A. Aziz, V. Loftness, P. Scupelli, A. Rowe, J. Zhao, Towardthe design of a dashboard to promote environmentally sustainable behavioramong office workers, in: Persuasive Technology, Springer Berlin Heidelberg,2013, pp. 246–252.
5 nd Bu
[
[
[
[
[
[
[
[
[
[
[
[
[
[
[
[
[
[
[
2012 Meaningful Play, 2012, Available from: http://meaningfulplay.msu.edu/proceedings2012/mp submission 72.pdf..
2 B. Orland et al. / Energy a
14] W. Abrahamse, L. Steg, C. Vlek, T. Rothengatter, The effect of tailoredinformation, goal setting, and tailored feedback on household energy use,energy-related behaviors, and behavioral antecedents, Journal of Envi-ronmental Psychology 27 (2007) 265–276, http://dx.doi.org/10.1016/j.jenvp.2007.08.002.
15] S. Houde, A. Todd, A. Sudarshan, J.A. Flora, K.C. Armel, Real-time feedback andelectricity consumption: a field experiment assessing the potential for savingsand persistence, Energy Journal 34 (1) (2013) 87–102.
16] R.K. Jain, J.E. Taylor, G. Peschiera, Assessing eco-feedback interface usage anddesign to drive energy efficiency in buildings, Energy and Buildings 48 (2012)8–17, http://dx.doi.org/10.1016/j.enbuild.12.033.2011.
17] R.K. Jain, R. Gulbinas, J.E. Taylor, P.J. Culligan, Can social influence drive energysavings? Detecting the impact of social influence on the energy consumptionbehavior of networked users exposed to normative eco-feedback, Energy andBuildings 66 (2013) 119–127, http://dx.doi.org/10.1016/j.enbuild.2013.06.029.
18] S.M. Schueller, R.F. Munoz, D.C. Mohr, Realizing the potential of behavioralintervention technologies, Current Directions in Psychological Science 22 (6)(2013) 478–483.
19] D. Webb, G.N. Soutar, T. Mazzarol, P. Saldaris, Self-determination theory andconsumer behavioural change: evidence from a household energy-savingbehaviour study, Journal of Environmental Psychology 35 (2013) 59–66,http://dx.doi.org/10.1016/j.jenvp.04.003.2013..
20] G. Liarakou, E. Sakka, C. Gavrilakis, C. Tsolakidis, Evaluation of seriousgames, as a tool for education for sustainable development, Euro-pean Journal of Open, Distance and E-Learning (2012), Available from:http://www.eurodl.org/?article=546.
21] E. Klopfer, Augmented Learning: Research and Design of Mobile EducationalGames, MIT Press, 2008.
22] K. Hieftje, E.J. Edelman, D.R. Camenga, L.E. Fiellin, Electronic media-based
health interventions promoting behavior change in youth: a systematicreview, JAMA Pediatrics 167 (2013) 574–580, http://dx.doi.org/10.1001/jamapediatrics.2013.1095.23] A. Gustafsson, C. Katzeff, M. Bang, Evaluation of a pervasive game fordomestic energy engagement among teenagers, Computers in Entertainment
[
ildings 74 (2014) 43–52
7 (4) (2010), http://dx.doi.org/10.1145/1658866.1658873, 54:1–54:19,http://doi.acm.org/10.1145/1658866.1658873.
24] M. Bang, M. Svahn, A. Gustafsson, Persuasive design of a mobile energyconservation game with direct feedback and social cues, in: Proc. DigitalGames Research Association, 2009, Available from: http://soda.swedish-ict.se/3927/1/Digra pdf.2009.
25] T.M. Connolly, E.A. Boyle, E. MacArthur, T. Hainey, J.M. Boyle, A sys-tematic literature review of empirical evidence on computer gamesand serious games, Computers and Education 59 (2012) 661–686,http://dx.doi.org/10.1016/j.compedu.2012.03.004, http://dx.doi.org/10.1016/j.compedu.03.004.2012.
26] D. McKenzie-Mohr, Fostering Sustainable Behavior: An Introduction toCommunity-Based Social Marketing, New Society Publishers, 2011.
27] Plugwise, Smart Wireless Solutions for Energy Saving, Energy Monitoringand Switching, Available from: http://www.plugwise.com/idplugtype-f/, Lastaccessed 07/30/13.
28] R.C. Littell, G.A. Millilken, W.W. Stroup, R.D. Wolfinger, The SAS System forMixed Models, First, SAS Institute Inc., Cary, N.C., 1996.
29] D.B. Rubin, R.J.A. Little, Statistical Analysis with Missing Data, Second, Wiley,New York, NY, USA, 2002.
30] US EPA, National Action Plan for Energy Efficiency, Vision for 2025: A Frame-work for Change, 2008, Available from: http://www.epa.gov/cleanenergy/documents/suca/vision.pdf, Last accessed 07/30/13.
31] US DOE, Better Buildings U.S. Department of Energy, 2011, Available from:http://energy.gov/better-buildings, Last accessed 07/30/13.
32] P.M. Johnson, Y. Xu, R.S. Brewer, G.E. Lee, M. Katchuck, C.A. Moore, BeyondkWh: myths and fixes for energy competition game design, in: Proc.
33] B.J. Fogg, Persuasive technology: using computers to change what we think anddo, Ubiquity 5 (2002), http://dx.doi.org/10.1145/764008.763957, 89-5:120,http://doi.acm.org/10.1145/764008.763957.