sas human capital management 5.2 administrator's guide
TRANSCRIPT

SAS® Human CapitalManagement 5.2Administrator's Guide
SAS® Documentation

The correct bibliographic citation for this manual is as follows: SAS Institute Inc. 2010. SAS® Human Capital Management 5.2: Administrator'sGuide. Cary, NC: SAS Institute Inc.
SAS® Human Capital Management 5.2: Administrator's Guide
Copyright © 2010, SAS Institute Inc., Cary, NC, USA
All rights reserved. Produced in the United States of America.
For a hardcopy book: No part of this publication may be reproduced, stored in a retrieval system, or transmitted, in any form or by any means,electronic, mechanical, photocopying, or otherwise, without the prior written permission of the publisher, SAS Institute Inc.
For a Web download or e-book:Your use of this publication shall be governed by the terms established by the vendor at the time you acquire thispublication.
U.S. Government Restricted Rights Notice: Use, duplication, or disclosure of this software and related documentation by the U.S. government issubject to the Agreement with SAS Institute and the restrictions set forth in FAR 52.227–19 Commercial Computer Software-Restricted Rights (June1987).
SAS Institute Inc., SAS Campus Drive, Cary, North Carolina 27513.
1st electronic book, November 2010
SAS ® Publishing provides a complete selection of books and electronic products to help customers use SAS software to its fullest potential. For moreinformation about our e-books, e-learning products, CDs, and hard-copy books, visit the SAS Publishing Web site at support.sas.com/publishing or call 1-800-727-3228.SAS ® and all other SAS Institute Inc. product or service names are registered trademarks or trademarks of SAS Institute Inc. in the USA and othercountries. ® indicates USA registration.
Other brand and product names are registered trademarks or trademarks of their respective companies.

Contents
About This Book . . . . . . . . . . . . . . . . . . . . . . . . . . . . . . . . . . . . . . . . . . . . . . . . . . . . . . . . vWhat's New in SAS Human Capital Management 5.2 . . . . . . . . . . . . . . . . . . . . . . . . . . viiAccessibility . . . . . . . . . . . . . . . . . . . . . . . . . . . . . . . . . . . . . . . . . . . . . . . . . . . . . . . . . . . ixRecommended Reading . . . . . . . . . . . . . . . . . . . . . . . . . . . . . . . . . . . . . . . . . . . . . . . . . . xi
Chapter 1 • About SAS Human Capital Management Administration . . . . . . . . . . . . . . . . . . . . . 1What Is SAS Human Capital Management? . . . . . . . . . . . . . . . . . . . . . . . . . . . . . . . . . . 1SAS Human Capital Management Administration . . . . . . . . . . . . . . . . . . . . . . . . . . . . . . 1
Chapter 2 • Managing the Data Sources . . . . . . . . . . . . . . . . . . . . . . . . . . . . . . . . . . . . . . . . . . . . . 3Opening the Administration Application . . . . . . . . . . . . . . . . . . . . . . . . . . . . . . . . . . . . . 4Refreshing the Cache . . . . . . . . . . . . . . . . . . . . . . . . . . . . . . . . . . . . . . . . . . . . . . . . . . . . 5Default Folder Locations . . . . . . . . . . . . . . . . . . . . . . . . . . . . . . . . . . . . . . . . . . . . . . . . . 5Working with Data Tables . . . . . . . . . . . . . . . . . . . . . . . . . . . . . . . . . . . . . . . . . . . . . . . . 5Working with Hierarchies . . . . . . . . . . . . . . . . . . . . . . . . . . . . . . . . . . . . . . . . . . . . . . . . 20Working with Cubes . . . . . . . . . . . . . . . . . . . . . . . . . . . . . . . . . . . . . . . . . . . . . . . . . . . . 23Working with Information Maps . . . . . . . . . . . . . . . . . . . . . . . . . . . . . . . . . . . . . . . . . . 30Working with HR Measures . . . . . . . . . . . . . . . . . . . . . . . . . . . . . . . . . . . . . . . . . . . . . . 30Working with Formats . . . . . . . . . . . . . . . . . . . . . . . . . . . . . . . . . . . . . . . . . . . . . . . . . . 32
Chapter 3 • Customizing the Display . . . . . . . . . . . . . . . . . . . . . . . . . . . . . . . . . . . . . . . . . . . . . . 41Customizing an Employee Profile . . . . . . . . . . . . . . . . . . . . . . . . . . . . . . . . . . . . . . . . . 41Customizing Geographic Analysis . . . . . . . . . . . . . . . . . . . . . . . . . . . . . . . . . . . . . . . . . 51Customizing Organization Analysis . . . . . . . . . . . . . . . . . . . . . . . . . . . . . . . . . . . . . . . . 55Working with Templates . . . . . . . . . . . . . . . . . . . . . . . . . . . . . . . . . . . . . . . . . . . . . . . . 56Select the General Search Default Columns . . . . . . . . . . . . . . . . . . . . . . . . . . . . . . . . . . 58
Chapter 4 • Securing Objects and Tables . . . . . . . . . . . . . . . . . . . . . . . . . . . . . . . . . . . . . . . . . . . 59Security in SAS Human Capital Management . . . . . . . . . . . . . . . . . . . . . . . . . . . . . . . . 60Importing Users . . . . . . . . . . . . . . . . . . . . . . . . . . . . . . . . . . . . . . . . . . . . . . . . . . . . . . . 60Securing Objects . . . . . . . . . . . . . . . . . . . . . . . . . . . . . . . . . . . . . . . . . . . . . . . . . . . . . . . 61Searching for Identities . . . . . . . . . . . . . . . . . . . . . . . . . . . . . . . . . . . . . . . . . . . . . . . . . . 67Securing Table Rows . . . . . . . . . . . . . . . . . . . . . . . . . . . . . . . . . . . . . . . . . . . . . . . . . . . 68Hierarchical Filters . . . . . . . . . . . . . . . . . . . . . . . . . . . . . . . . . . . . . . . . . . . . . . . . . . . . . 74Securing Table Columns . . . . . . . . . . . . . . . . . . . . . . . . . . . . . . . . . . . . . . . . . . . . . . . . . 77
Chapter 5 • Configuring SAS Human Capital Management . . . . . . . . . . . . . . . . . . . . . . . . . . . . 81Dashboards . . . . . . . . . . . . . . . . . . . . . . . . . . . . . . . . . . . . . . . . . . . . . . . . . . . . . . . . . . . 81The Diagnostic Utility . . . . . . . . . . . . . . . . . . . . . . . . . . . . . . . . . . . . . . . . . . . . . . . . . . 82About the Configuration Properties . . . . . . . . . . . . . . . . . . . . . . . . . . . . . . . . . . . . . . . . 88System Properties . . . . . . . . . . . . . . . . . . . . . . . . . . . . . . . . . . . . . . . . . . . . . . . . . . . . . . 88Application Properties . . . . . . . . . . . . . . . . . . . . . . . . . . . . . . . . . . . . . . . . . . . . . . . . . . 90Custom Properties . . . . . . . . . . . . . . . . . . . . . . . . . . . . . . . . . . . . . . . . . . . . . . . . . . . . . . 92The SAS_DEFAULT_PROPERTIES Table . . . . . . . . . . . . . . . . . . . . . . . . . . . . . . . . . 93
Chapter 6 • Customizing the Employee Profile Templates . . . . . . . . . . . . . . . . . . . . . . . . . . . . . 95Overview . . . . . . . . . . . . . . . . . . . . . . . . . . . . . . . . . . . . . . . . . . . . . . . . . . . . . . . . . . . . . 95A Look at the Available Templates . . . . . . . . . . . . . . . . . . . . . . . . . . . . . . . . . . . . . . . . 96Customizing a Template . . . . . . . . . . . . . . . . . . . . . . . . . . . . . . . . . . . . . . . . . . . . . . . . . 98
Making a Template Available . . . . . . . . . . . . . . . . . . . . . . . . . . . . . . . . . . . . . . . . . . . 106
Chapter 7 • Forecasting in SAS Human Capital Management . . . . . . . . . . . . . . . . . . . . . . . . . 107About Forecasting in SAS Human Capital Management . . . . . . . . . . . . . . . . . . . . . . . 107Preparing the Data . . . . . . . . . . . . . . . . . . . . . . . . . . . . . . . . . . . . . . . . . . . . . . . . . . . . 109Create a Stored Process Definition . . . . . . . . . . . . . . . . . . . . . . . . . . . . . . . . . . . . . . . . 112Customize HCM Forecasting . . . . . . . . . . . . . . . . . . . . . . . . . . . . . . . . . . . . . . . . . . . . 116
Chapter 8 • Retention Analysis . . . . . . . . . . . . . . . . . . . . . . . . . . . . . . . . . . . . . . . . . . . . . . . . . . 121Introduction to Retention Analysis . . . . . . . . . . . . . . . . . . . . . . . . . . . . . . . . . . . . . . . . 121Extracting the Data . . . . . . . . . . . . . . . . . . . . . . . . . . . . . . . . . . . . . . . . . . . . . . . . . . . . 123Generating the Scoring Table . . . . . . . . . . . . . . . . . . . . . . . . . . . . . . . . . . . . . . . . . . . . 129Working with the Results . . . . . . . . . . . . . . . . . . . . . . . . . . . . . . . . . . . . . . . . . . . . . . . 137
Chapter 9 • SAS for Workforce Planning & Budgeting . . . . . . . . . . . . . . . . . . . . . . . . . . . . . . . 141About SAS for Workforce Planning & Budgeting . . . . . . . . . . . . . . . . . . . . . . . . . . . . 141Administering SAS for Workforce Planning & Budgeting . . . . . . . . . . . . . . . . . . . . . 142Creating Planning Measures . . . . . . . . . . . . . . . . . . . . . . . . . . . . . . . . . . . . . . . . . . . . . 142Creating a Form Set with Supplemental Schedules . . . . . . . . . . . . . . . . . . . . . . . . . . . 148Managing Plans . . . . . . . . . . . . . . . . . . . . . . . . . . . . . . . . . . . . . . . . . . . . . . . . . . . . . . 150
Appendix 1 • Object Security: List of Objects . . . . . . . . . . . . . . . . . . . . . . . . . . . . . . . . . . . . . . 151About Object Security . . . . . . . . . . . . . . . . . . . . . . . . . . . . . . . . . . . . . . . . . . . . . . . . . 151Employee Profile Objects . . . . . . . . . . . . . . . . . . . . . . . . . . . . . . . . . . . . . . . . . . . . . . . 151Geographical Analysis Objects . . . . . . . . . . . . . . . . . . . . . . . . . . . . . . . . . . . . . . . . . . . 152Organization Analysis Objects . . . . . . . . . . . . . . . . . . . . . . . . . . . . . . . . . . . . . . . . . . . 153General Search Objects . . . . . . . . . . . . . . . . . . . . . . . . . . . . . . . . . . . . . . . . . . . . . . . . . 153Administrator Options: Data Tab . . . . . . . . . . . . . . . . . . . . . . . . . . . . . . . . . . . . . . . . . 154Administrator Objects: Customize Tab . . . . . . . . . . . . . . . . . . . . . . . . . . . . . . . . . . . . 157Administrator Objects: Security Tab . . . . . . . . . . . . . . . . . . . . . . . . . . . . . . . . . . . . . . 157Administrator Objects: Configuration Tab . . . . . . . . . . . . . . . . . . . . . . . . . . . . . . . . . . 159Home Page Objects . . . . . . . . . . . . . . . . . . . . . . . . . . . . . . . . . . . . . . . . . . . . . . . . . . . . 159Custom Objects . . . . . . . . . . . . . . . . . . . . . . . . . . . . . . . . . . . . . . . . . . . . . . . . . . . . . . . 160
Appendix 2 • Metrics in SAS Human Capital Management . . . . . . . . . . . . . . . . . . . . . . . . . . . . 161Introduction . . . . . . . . . . . . . . . . . . . . . . . . . . . . . . . . . . . . . . . . . . . . . . . . . . . . . . . . . . 161Organizational Effectiveness . . . . . . . . . . . . . . . . . . . . . . . . . . . . . . . . . . . . . . . . . . . . 162Human Resources Structure . . . . . . . . . . . . . . . . . . . . . . . . . . . . . . . . . . . . . . . . . . . . . 164Compensation . . . . . . . . . . . . . . . . . . . . . . . . . . . . . . . . . . . . . . . . . . . . . . . . . . . . . . . . 165Benefits . . . . . . . . . . . . . . . . . . . . . . . . . . . . . . . . . . . . . . . . . . . . . . . . . . . . . . . . . . . . . 167Separations . . . . . . . . . . . . . . . . . . . . . . . . . . . . . . . . . . . . . . . . . . . . . . . . . . . . . . . . . . 169Staffing . . . . . . . . . . . . . . . . . . . . . . . . . . . . . . . . . . . . . . . . . . . . . . . . . . . . . . . . . . . . . 173Training and Development . . . . . . . . . . . . . . . . . . . . . . . . . . . . . . . . . . . . . . . . . . . . . . 179
Appendix 3 • The Public API . . . . . . . . . . . . . . . . . . . . . . . . . . . . . . . . . . . . . . . . . . . . . . . . . . . . 183Overview . . . . . . . . . . . . . . . . . . . . . . . . . . . . . . . . . . . . . . . . . . . . . . . . . . . . . . . . . . . . 184Hierarchy for all Packages . . . . . . . . . . . . . . . . . . . . . . . . . . . . . . . . . . . . . . . . . . . . . . 185API Index . . . . . . . . . . . . . . . . . . . . . . . . . . . . . . . . . . . . . . . . . . . . . . . . . . . . . . . . . . . 186Packages . . . . . . . . . . . . . . . . . . . . . . . . . . . . . . . . . . . . . . . . . . . . . . . . . . . . . . . . . . . . 191Hierarchies . . . . . . . . . . . . . . . . . . . . . . . . . . . . . . . . . . . . . . . . . . . . . . . . . . . . . . . . . . 193Classes . . . . . . . . . . . . . . . . . . . . . . . . . . . . . . . . . . . . . . . . . . . . . . . . . . . . . . . . . . . . . 194Interface PublicAPIInterface . . . . . . . . . . . . . . . . . . . . . . . . . . . . . . . . . . . . . . . . . . . . 204Serialized Form . . . . . . . . . . . . . . . . . . . . . . . . . . . . . . . . . . . . . . . . . . . . . . . . . . . . . . . 211Index . . . . . . . . . . . . . . . . . . . . . . . . . . . . . . . . . . . . . . . . . . . . . . . . . . . . . . . . 213
iv Contents
About This Book
Audience
This book helps you use SAS Human Capital Management as an administrator. For anoverview of SAS Human Capital Management, see “What Is SAS Human CapitalManagement?” on page 1.
For related information that you might find useful in administering SAS Human CapitalManagement, see Recommended Reading and the administration guides for the SASIntelligence Platform, available at support.sas.com/92administration.
v

vi About This Book

What's New in SAS HumanCapital Management 5.2
Overview
SAS Human Capital Management 5.2 includes new features to help you analyze yourworkforce, measure performance, and produce reports based on regulatory ororganizational needs.
New and Enhanced Features
The following features are new or enhanced in SAS Human Capital Management 5.2:
• enhanced employee profiles, including multiple profiles, profile templates, externalactions, and search capabilities
• enhanced geographic analysis, with better performance and filtering support
• built-in content management, including the ability to manage permissions and registerfor alerts
• tighter integration with SAS BI Dashboard, including a new provider for SAS HumanCapital Management metrics
• tighter integration with SAS Strategy Management, SAS Web Report Studio, and theSAS Information Delivery Portal
• built-in support for single-variable forecasting
• support for workforce planning and budgeting (with SAS Financial Management)
• support for retention analysis using predictive analytics
• an enhanced Administration application, including the following new or enhancedfeatures:
• consolidated security administration (object-level security, row-level security, andcolumn-level security)
• employee profile management, which includes the ability to create and assigncustom profiles
• the ability to create cubes and information maps
• the ability to create and manage measures
• configuration management
• a public API for customizing employee profile templates
vii
• a diagnostic tool for SAS Human Capital Management, with these features:
• reports on critical configuration elements, SAS server connections, databaseconnections, and applications that are running on the managed servers
• accessibility from the Administration application or from the command line
Changes to Stored Processes
The following features have changed in SAS Human Capital Management:
• Stored processes cannot be executed within a Microsoft Office application. They canbe executed from the workspace, from a shortcut link, from SAS Web Report Studio,or from the action menu in the Employee Browser or a geographic analysis.
viii What's New in SAS Human Capital Management 5.2
Accessibility
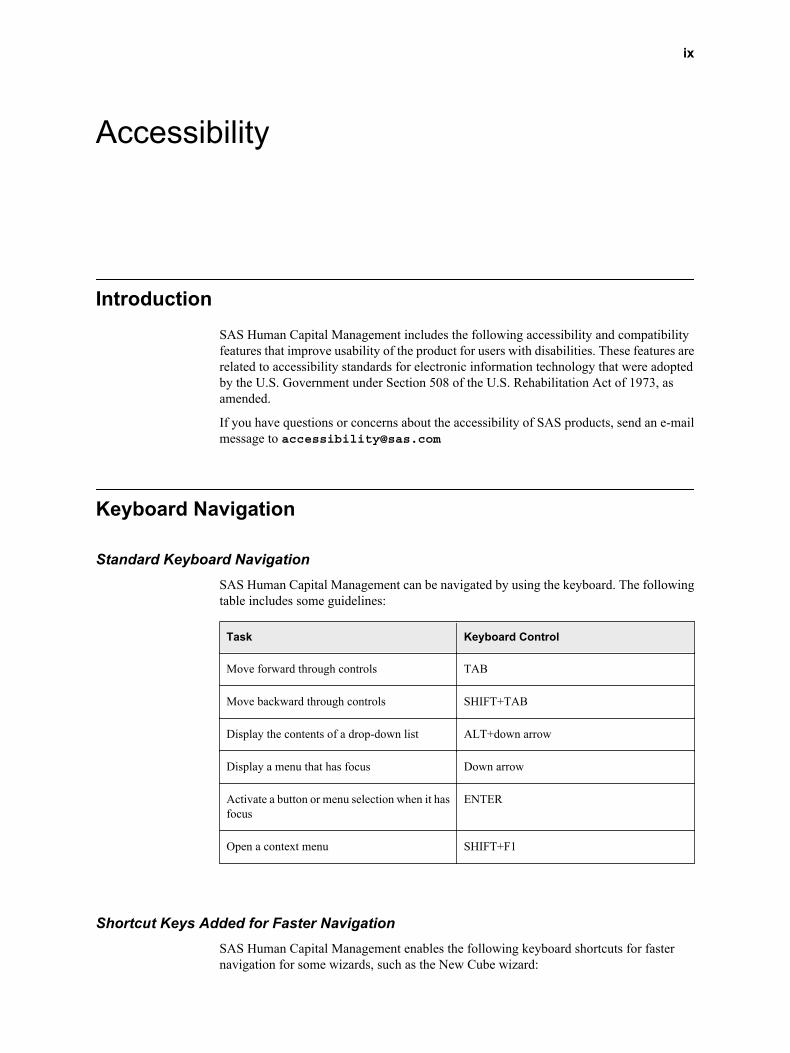
IntroductionSAS Human Capital Management includes the following accessibility and compatibilityfeatures that improve usability of the product for users with disabilities. These features arerelated to accessibility standards for electronic information technology that were adoptedby the U.S. Government under Section 508 of the U.S. Rehabilitation Act of 1973, asamended.
If you have questions or concerns about the accessibility of SAS products, send an e-mailmessage to [email protected]
Keyboard Navigation
Standard Keyboard NavigationSAS Human Capital Management can be navigated by using the keyboard. The followingtable includes some guidelines:
Task Keyboard Control
Move forward through controls TAB
Move backward through controls SHIFT+TAB
Display the contents of a drop-down list ALT+down arrow
Display a menu that has focus Down arrow
Activate a button or menu selection when it hasfocus
ENTER
Open a context menu SHIFT+F1
Shortcut Keys Added for Faster NavigationSAS Human Capital Management enables the following keyboard shortcuts for fasternavigation for some wizards, such as the New Cube wizard:
ix
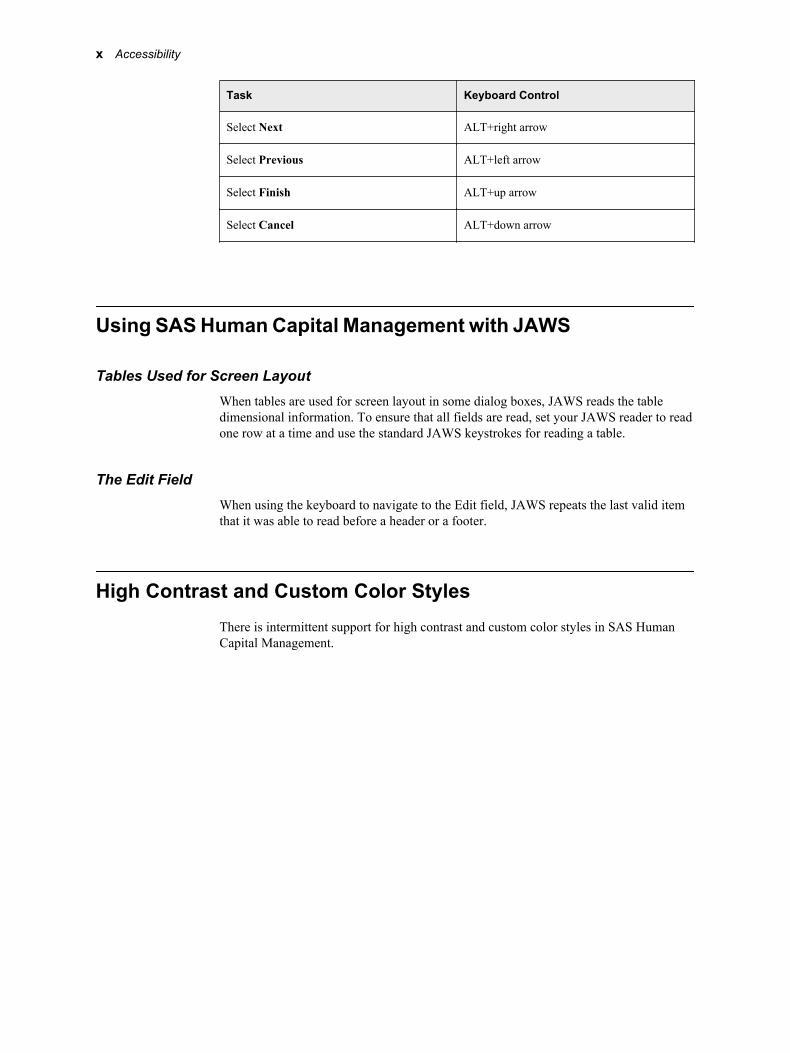
Task Keyboard Control
Select Next ALT+right arrow
Select Previous ALT+left arrow
Select Finish ALT+up arrow
Select Cancel ALT+down arrow
Using SAS Human Capital Management with JAWS
Tables Used for Screen LayoutWhen tables are used for screen layout in some dialog boxes, JAWS reads the tabledimensional information. To ensure that all fields are read, set your JAWS reader to readone row at a time and use the standard JAWS keystrokes for reading a table.
The Edit FieldWhen using the keyboard to navigate to the Edit field, JAWS repeats the last valid itemthat it was able to read before a header or a footer.
High Contrast and Custom Color StylesThere is intermittent support for high contrast and custom color styles in SAS HumanCapital Management.
x Accessibility
Recommended Reading
• SAS Human Capital Management: User's Guide
• SAS Solutions Services: System Administration Guide
• SAS Solutions Services: Data Administration Guide
• SAS Solutions Services: Data Model Reference
• SAS Solutions Services: Customization Guide
For a complete list of SAS publications, go to support.sas.com/bookstore. If you havequestions about which titles you need, please contact a SAS Publishing SalesRepresentative at:
SAS Publishing Sales SAS Campus Drive Cary, NC 27513 Telephone: 1-800-727-3228 Fax: 1-919-531-9439 E-mail: [email protected] Web address: support.sas.com/bookstore
xi

xii Recommended Reading

Chapter 1
About SAS Human CapitalManagement Administration
What Is SAS Human Capital Management? . . . . . . . . . . . . . . . . . . . . . . . . . . . . . . . . 1
SAS Human Capital Management Administration . . . . . . . . . . . . . . . . . . . . . . . . . . . 1
What Is SAS Human Capital Management?SAS Human Capital Management software integrates workforce data into a single sourceof information, enabling you to analyze your workforce, measure performance, andproduce reports based on regulatory or organizational needs. Using SAS Human CapitalManagement provides the following benefits:
• You can analyze the workforce and simulate organizational changes. Predefinedanalytics such as organization analysis display organizational hierarchies in a list ofgraphical views while surfacing critical data about the work force. You can alsosimulate organizational structure changes for workforce planning and modeling bymoving groups or people to see the effect.
• You can measure and improve workforce productivity. For the analysis of keyindicators, SAS Human Capital Management provides an extensive set of prepackagedmetrics as well as the ability for users to create their own measures. Combined with theSAS BI Dashboard (part of the SAS Intelligence Platform), SAS Human CapitalManagement enables you to view the status of key metrics, such as revenue peremployee, relative to goals.
• You can minimize risk by changing likely outcomes. SAS Human CapitalManagement provides advanced analytics and easy-to-use interfaces so business userscan identify and minimize risks by predicting workforce changes and analyzingassociated costs. Forecasting or analytic expertise is not needed.
• You can budget for future workforce needs. When integrated with SAS FinancialManagement, SAS Human Capital Management makes detailed employee informationavailable for planning and budgeting within a structured workflow.
SAS Human Capital Management AdministrationUsers with the HCM Administrator role can log on to SAS Human Capital Managementand perform these tasks:
• administer data sources
1

• import, view, copy, and export tables
• modify table and column attributes
• add hierarchy mappings
• create and rebuild cubes and information maps
• create and manage measures for metric analysis
• create and manage planning measures
• create and edit formats
• customize the user interface
• create and customize employee profiles
• set default values for geographic analysis
• set default values for organization analysis
• set default values for the general search
• manage security
• manage object security, which determines the actions that users can perform
• manage table security, by creating and assigning row-level filters
• assign column permissions
• manage the SAS Human Capital Management configuration, and view and editconfiguration properties
In addition, administrators and consultants can perform these tasks:
• generate single-variable forecasting data
• prepare and run ETL jobs that generate the forecasting data
• define stored processes to display the forecasting results
• prepare data for retention analysis
• prepare the data tables and properties files
• run the code that generates the scoring table
• create reports for viewing the results
• use SAS for Workforce Planning & Budgeting to create planning measures (in theAdministration application), and create form sets that managers can use for enteringbudget data (with SAS Financial Management).
2 Chapter 1 • About SAS Human Capital Management Administration
Chapter 2
Managing the Data Sources
Opening the Administration Application . . . . . . . . . . . . . . . . . . . . . . . . . . . . . . . . . . . 4Introduction . . . . . . . . . . . . . . . . . . . . . . . . . . . . . . . . . . . . . . . . . . . . . . . . . . . . . . . . . 4
Refreshing the Cache . . . . . . . . . . . . . . . . . . . . . . . . . . . . . . . . . . . . . . . . . . . . . . . . . . . 5
Default Folder Locations . . . . . . . . . . . . . . . . . . . . . . . . . . . . . . . . . . . . . . . . . . . . . . . . 5
Working with Data Tables . . . . . . . . . . . . . . . . . . . . . . . . . . . . . . . . . . . . . . . . . . . . . . . 5About Data Tables . . . . . . . . . . . . . . . . . . . . . . . . . . . . . . . . . . . . . . . . . . . . . . . . . . . 5About Importing and Exporting Tables . . . . . . . . . . . . . . . . . . . . . . . . . . . . . . . . . . . 7Add a Table . . . . . . . . . . . . . . . . . . . . . . . . . . . . . . . . . . . . . . . . . . . . . . . . . . . . . . . . . 9Perform a Custom Import . . . . . . . . . . . . . . . . . . . . . . . . . . . . . . . . . . . . . . . . . . . . . 11Modify Table Attributes . . . . . . . . . . . . . . . . . . . . . . . . . . . . . . . . . . . . . . . . . . . . . . 11Modify Column Attributes . . . . . . . . . . . . . . . . . . . . . . . . . . . . . . . . . . . . . . . . . . . . 12Modify the hcmtitles and hcmlabels Properties Files . . . . . . . . . . . . . . . . . . . . . . . . 14Copy a Table . . . . . . . . . . . . . . . . . . . . . . . . . . . . . . . . . . . . . . . . . . . . . . . . . . . . . . . 15View a Table . . . . . . . . . . . . . . . . . . . . . . . . . . . . . . . . . . . . . . . . . . . . . . . . . . . . . . . 16Create an Information Map from a Table . . . . . . . . . . . . . . . . . . . . . . . . . . . . . . . . . 18Export a Table . . . . . . . . . . . . . . . . . . . . . . . . . . . . . . . . . . . . . . . . . . . . . . . . . . . . . . 18Delete a Table . . . . . . . . . . . . . . . . . . . . . . . . . . . . . . . . . . . . . . . . . . . . . . . . . . . . . . 19Generate Search Symbols . . . . . . . . . . . . . . . . . . . . . . . . . . . . . . . . . . . . . . . . . . . . . 19
Working with Hierarchies . . . . . . . . . . . . . . . . . . . . . . . . . . . . . . . . . . . . . . . . . . . . . . 20What Is a Hierarchy? . . . . . . . . . . . . . . . . . . . . . . . . . . . . . . . . . . . . . . . . . . . . . . . . 20What Is a Hierarchy Mapping? . . . . . . . . . . . . . . . . . . . . . . . . . . . . . . . . . . . . . . . . . 20View Available Hierarchies . . . . . . . . . . . . . . . . . . . . . . . . . . . . . . . . . . . . . . . . . . . 20Add a Hierarchy Mapping . . . . . . . . . . . . . . . . . . . . . . . . . . . . . . . . . . . . . . . . . . . . 21View Hierarchy Mappings . . . . . . . . . . . . . . . . . . . . . . . . . . . . . . . . . . . . . . . . . . . . 21
Working with Cubes . . . . . . . . . . . . . . . . . . . . . . . . . . . . . . . . . . . . . . . . . . . . . . . . . . . 23Using Cubes in SAS Human Capital Management . . . . . . . . . . . . . . . . . . . . . . . . . 23Create a Cube . . . . . . . . . . . . . . . . . . . . . . . . . . . . . . . . . . . . . . . . . . . . . . . . . . . . . . 23Create a New Dimension for a Cube . . . . . . . . . . . . . . . . . . . . . . . . . . . . . . . . . . . . 26Managing Cubes . . . . . . . . . . . . . . . . . . . . . . . . . . . . . . . . . . . . . . . . . . . . . . . . . . . . 28Refresh or Rebuild Multiple Cubes . . . . . . . . . . . . . . . . . . . . . . . . . . . . . . . . . . . . . 28
Working with Information Maps . . . . . . . . . . . . . . . . . . . . . . . . . . . . . . . . . . . . . . . . 30
Working with HR Measures . . . . . . . . . . . . . . . . . . . . . . . . . . . . . . . . . . . . . . . . . . . . 30About HR Measures . . . . . . . . . . . . . . . . . . . . . . . . . . . . . . . . . . . . . . . . . . . . . . . . . 30Create an HR Measure . . . . . . . . . . . . . . . . . . . . . . . . . . . . . . . . . . . . . . . . . . . . . . . 30Manage HR Measures . . . . . . . . . . . . . . . . . . . . . . . . . . . . . . . . . . . . . . . . . . . . . . . . 32
Working with Formats . . . . . . . . . . . . . . . . . . . . . . . . . . . . . . . . . . . . . . . . . . . . . . . . . 32About Display Formats . . . . . . . . . . . . . . . . . . . . . . . . . . . . . . . . . . . . . . . . . . . . . . . 32
3
Add a Format . . . . . . . . . . . . . . . . . . . . . . . . . . . . . . . . . . . . . . . . . . . . . . . . . . . . . . 33Assign a Format to a Column . . . . . . . . . . . . . . . . . . . . . . . . . . . . . . . . . . . . . . . . . . 34Manage Formats . . . . . . . . . . . . . . . . . . . . . . . . . . . . . . . . . . . . . . . . . . . . . . . . . . . . 35Predefined Formats . . . . . . . . . . . . . . . . . . . . . . . . . . . . . . . . . . . . . . . . . . . . . . . . . . 35
Opening the Administration Application
IntroductionIn the SAS Human Capital Management Administration application, you can manage andcustomize SAS Human Capital Management, including data sources, employee profiles,application default values, security, and configuration settings.
To administer SAS Human Capital Management:
1. Log on to SAS Human Capital Management as a user with the HCM Administratorrole.
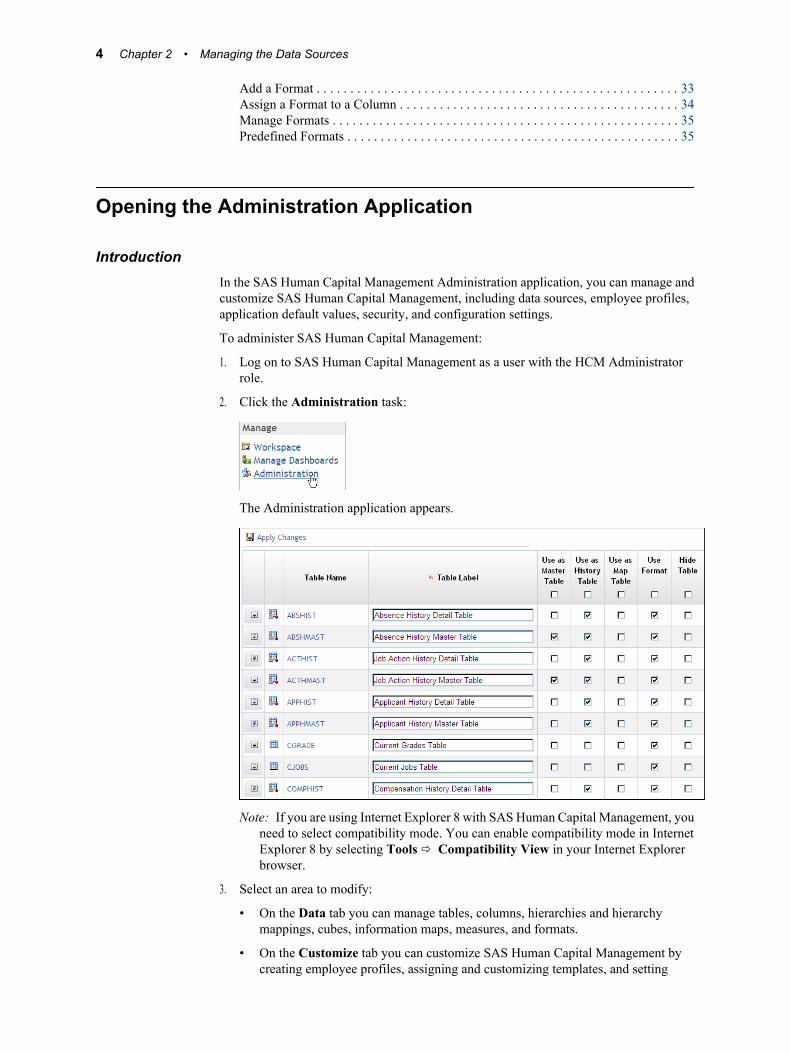
2. Click the Administration task:
The Administration application appears.
Note: If you are using Internet Explorer 8 with SAS Human Capital Management, youneed to select compatibility mode. You can enable compatibility mode in InternetExplorer 8 by selecting Tools ð Compatibility View in your Internet Explorerbrowser.
3. Select an area to modify:
• On the Data tab you can manage tables, columns, hierarchies and hierarchymappings, cubes, information maps, measures, and formats.
• On the Customize tab you can customize SAS Human Capital Management bycreating employee profiles, assigning and customizing templates, and setting
4 Chapter 2 • Managing the Data Sources

default properties for geographic analysis, organization analysis, and the generalsearch.
• On the Security tab you can control security for objects, tables, and columns.
• The Configuration tab displays information about the current configuration of SASHuman Capital Management. You can set some of the configuration properties.Other properties are read-only.
Refreshing the CacheAfter you make changes in the Administration application, SAS Human CapitalManagement often continues to use cached values rather than the new values you supply.Using cached values makes the application run faster; it also prevents data or the userinterface from changing while someone is using the application.
When you restart the Web application server, the cache is refreshed and your changes areavailable.
To make changes available without restarting the Web application server, make yourchanges for a session and then click Refresh Cache in the toolbar of the Administrationapplication. (Do not refresh the cache after every change.) An e-mail message is sent tothe administrator confirming that the cache has been refreshed.
Default Folder LocationsSAS Human Capital Management uses the following default folder locations:
• information maps: SAS Folders ð Products ð SAS Human Capital Management ðData Sources ð Information Maps
• cubes: SAS Folders ð Products ð SAS Human Capital Management ð DataSources ð Cubes
• stored processes: SAS Folders ð Products ð SAS Human Capital Management ðReports
• ETL jobs for imported tables: SAS Folders ð Products ð SAS Human CapitalManagement
Working with Data Tables
About Data Tables
Types of TablesOn the Data tab of the HCM Administration application, you can add a table or modify itsattributes, such as the table description or its use as a master table, a history table, or a maptable. You can add a column to a table or modify column attributes, such as the columnlabel or format.
Working with Data Tables 5

The HCM database contains these types of tables:
• Detail tables contain specific data, such as absence histories, open positions, or currentgrades.
• Master tables have been optimized for query and reporting. They contain data from oneor more detail tables and can also contain columns with calculated values.
• Summary tables contain summarized data from the master tables, with less historicaldetail.
• Cubes contain data from the master and summary tables that has been reorganized intoa multidimensional structure. In SAS Web Report Studio, an HCM cube can be viewedby means of an information map.
• Map tables contain data for image maps that can be used in a geographic analysis.
Both detail tables and master tables can also be history tables. A history table can containmultiple records per employee. In the standard HCM tables, the _LASTREC columnidentifies the current record for each employee. When a user views data from one of thefixed categories in the employee browser, the records are filtered to return only the currentrecord for an employee.
For information about the jobs that load the standard HCM tables, see the SAS SolutionsServices: Data Administration Guide.
Master TablesA master table contains fields that identify the hierarchical structure of the data, such aslevels of management or division and department levels.
The following master tables are provided on installation of SAS Human CapitalManagement. If necessary, you can add other master tables.
Table 2.1 Master Tables in SAS Human Capital Management
Table Description
Employee Master(EMPMAST)
Contains the most current information for each employee, includingjob action history, position history, jobs, pay grades, workgroup,employee general, and (optionally) open positions.
Sites can decide to include only active employees. By default, allemployees are included. Including only active employees wouldaffect any tables using EMPMAST for terminated employees.
Job Action History Master(ACTHMAST)
Contains all employee actions, denormalized by includingworkgroup, jobs, pay grade, position history, current employee.
Absence History Master(ABSHMAST)
Contains all employee absence records, denormalized by includingworkgroup, jobs, pay grade, position history, and current employee.
Applicant History Master(APPHMAST)
Contains all applicant tracked records, denormalized by includingworkgroup, jobs, pay grade, position history, current employee.
Open Position Master(OPOSMAST)
Contains all open position records, denormalized by includingworkgroup, position history, and jobs.
Termination Master(TERMMAST)
Contains all termination records from the Job Action History MasterTable.
6 Chapter 2 • Managing the Data Sources
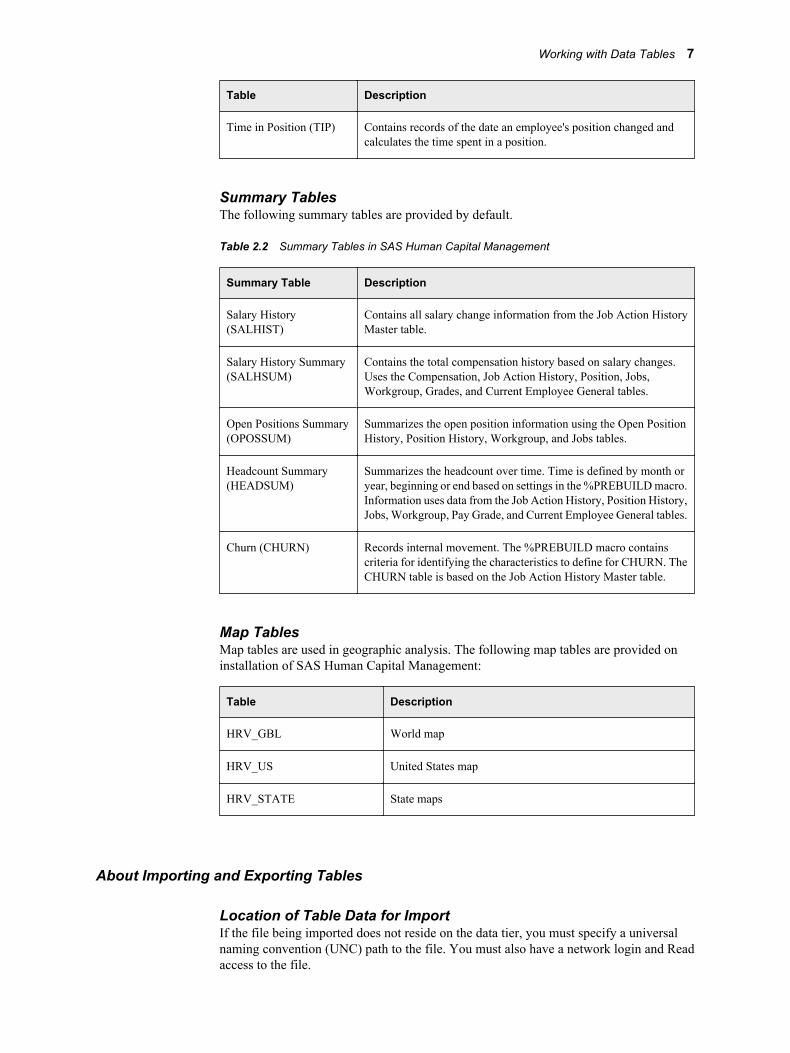
Table Description
Time in Position (TIP) Contains records of the date an employee's position changed andcalculates the time spent in a position.
Summary TablesThe following summary tables are provided by default.
Table 2.2 Summary Tables in SAS Human Capital Management
Summary Table Description
Salary History(SALHIST)
Contains all salary change information from the Job Action HistoryMaster table.
Salary History Summary(SALHSUM)
Contains the total compensation history based on salary changes.Uses the Compensation, Job Action History, Position, Jobs,Workgroup, Grades, and Current Employee General tables.
Open Positions Summary(OPOSSUM)
Summarizes the open position information using the Open PositionHistory, Position History, Workgroup, and Jobs tables.
Headcount Summary(HEADSUM)
Summarizes the headcount over time. Time is defined by month oryear, beginning or end based on settings in the %PREBUILD macro.Information uses data from the Job Action History, Position History,Jobs, Workgroup, Pay Grade, and Current Employee General tables.
Churn (CHURN) Records internal movement. The %PREBUILD macro containscriteria for identifying the characteristics to define for CHURN. TheCHURN table is based on the Job Action History Master table.
Map TablesMap tables are used in geographic analysis. The following map tables are provided oninstallation of SAS Human Capital Management:
Table Description
HRV_GBL World map
HRV_US United States map
HRV_STATE State maps
About Importing and Exporting Tables
Location of Table Data for ImportIf the file being imported does not reside on the data tier, you must specify a universalnaming convention (UNC) path to the file. You must also have a network login and Readaccess to the file.
Working with Data Tables 7

Effect on Data TypesBe aware that CSV files do not attach data types to columns, and exporting or importing atable as a CSV file can result in some columns being given the wrong data type (for example,character data that consists solely of numbers might be treated as numeric).
We recommend that you export and import tables in Microsoft Excel workbook formatrather than as CSV files. For greater control over tables and columns, use an ETL process.
Exporting Tables with Formatted ColumnsWhen you export a table, you must decide how you want to handle formatted columns. Forexample, by default the JOB_GROUP_CD column has a user-defined display formatassociated with it. In the sample data, a code of 2S is associated with a formatted value ofSales and Marketing. When you export the table, do you want to export the code (2S) orthe formatted value (Sales and Marketing)?
If a column is formatted, and Use Format is enabled for the table and column, then thedisplay format is exported, rather than the code for that column.
To export a column's unformatted value, follow these steps:
1. Temporarily disable formatting for the table:
a. On the Data tab, select Tables from the navigation tree.
b. Clear the Use Format check box for the table.
c. Click Apply Changes.
d. Click Refresh Cache.
See “Modify Table Attributes” on page 11.
2. Export the table.
For details, see “Export a Table” on page 18 or “View a Table” on page 16.
3. Re-enable formatting for the table.
a. Open the table attributes again (as in Step 1) and select the Use Format check box.
b. Click Apply Changes.
c. Click Refresh Cache.
For more information about table attributes, see “Export a Table” on page 18.
Importing SAS Data Sets with Formatted ColumnsIf you import a SAS data set, and any columns are associated with a display format, theformatted values are imported, rather than the underlying codes. TheSAS_HCMFORMATS table and the SAS formats catalog are not updated, and theSAS_HCMMETACOLUMN table does not contain a format attribute for the column.
If you want the table to include the underlying codes instead of the formatted values, removethe formatting before you import the SAS data set. After the import, you can create theappropriate formats and assign them to the table columns.
Warning MessagesWhen you export a file to Microsoft Excel, you might get a warning message that the fileis in a different format than the one that is specified by the file extension. The messageappears because the content is an XML stream rather than native Excel format. ClickYes to open the file. In Microsoft Excel, when you save the file, save it in Excel Workbookformat.
8 Chapter 2 • Managing the Data Sources

Add a TableThe Add Table function makes a table available to SAS Human Capital Management. Thetable can be one that already exists in the HCM database, or it can be an external sourcesuch as a Microsoft Excel workbook or CSV file.
When you add a table, its information is added to the SAS_HCMMETATABLE andSAS_HCMMETACOLUMN tables, and it is available as a source table in SAS HumanCapital Management. For example, the table can be mapped to a hierarchy, or it can bedisplayed in an employee profile.
To add a table, click the Data tab in the Administration application. Then follow thesesteps:
Note: For information about the View Code button, see “Perform a Custom Import” onpage 11.
1. Click New Table.
2. To add a table that already exists in the HCM database:
a. Select the Add Existing radio button.
b. Select a table from the drop-down list.
3. To add a table from an external source:
a. Select the External radio button.
b. From the Type drop-down list, select the source type.
For more information about source type considerations, see “About Importing andExporting Tables” on page 7.
Note: Available options can vary depending on your operating system. Importinga table using the Microsoft Excel 4 or Microsoft Excel 5 type can result intruncation of column names to 8 characters.
c. Provide a path to the external file in the Source field.
If the file does not reside on the data tier, you must specify a universal namingconvention (UNC) path to the file. You must also have a network login and Readaccess to the file.
d. In the Table Name field, type a name for this table.
The maximum length for the name is 32 characters.
e. To replace an existing table, select Replace table if the same name exists.
If you replace an existing table, the table attributes and column attributes arereplaced for this table. The row-level security settings and filters are deleted. If youspecify Allow security access for HCM roles, new settings and filters are created.
f. To create an ETL job that you can use to load this table on a regular basis, selectCreate an ETL job.
If you are replacing an existing table, checking this box replaces a previous ETLjob, if one existed. For the location of the ETL jobs, see “Default Folder Locations”on page 5.
4. Provide the following information in the General Settings section:
Working with Data Tables 9
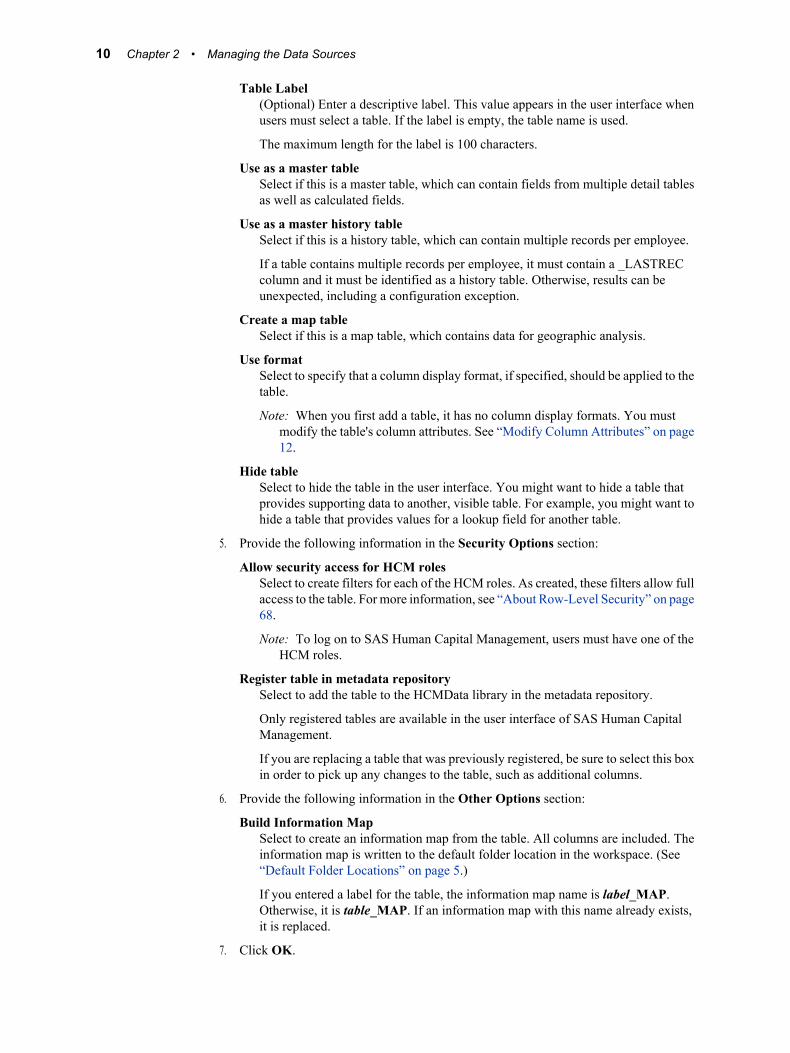
Table Label(Optional) Enter a descriptive label. This value appears in the user interface whenusers must select a table. If the label is empty, the table name is used.
The maximum length for the label is 100 characters.
Use as a master tableSelect if this is a master table, which can contain fields from multiple detail tablesas well as calculated fields.
Use as a master history tableSelect if this is a history table, which can contain multiple records per employee.
If a table contains multiple records per employee, it must contain a _LASTRECcolumn and it must be identified as a history table. Otherwise, results can beunexpected, including a configuration exception.
Create a map tableSelect if this is a map table, which contains data for geographic analysis.
Use formatSelect to specify that a column display format, if specified, should be applied to thetable.
Note: When you first add a table, it has no column display formats. You mustmodify the table's column attributes. See “Modify Column Attributes” on page12.
Hide tableSelect to hide the table in the user interface. You might want to hide a table thatprovides supporting data to another, visible table. For example, you might want tohide a table that provides values for a lookup field for another table.
5. Provide the following information in the Security Options section:
Allow security access for HCM rolesSelect to create filters for each of the HCM roles. As created, these filters allow fullaccess to the table. For more information, see “About Row-Level Security” on page68.
Note: To log on to SAS Human Capital Management, users must have one of theHCM roles.
Register table in metadata repositorySelect to add the table to the HCMData library in the metadata repository.
Only registered tables are available in the user interface of SAS Human CapitalManagement.
If you are replacing a table that was previously registered, be sure to select this boxin order to pick up any changes to the table, such as additional columns.
6. Provide the following information in the Other Options section:
Build Information MapSelect to create an information map from the table. All columns are included. Theinformation map is written to the default folder location in the workspace. (See“Default Folder Locations” on page 5.)
If you entered a label for the table, the information map name is label_MAP.Otherwise, it is table_MAP. If an information map with this name already exists,it is replaced.
7. Click OK.
10 Chapter 2 • Managing the Data Sources
The table is added to the SAS_HCMMETATABLE table, which contains informationabout table attributes, and its columns are added to the SAS_HCMMETACOLUMN table,which contains information about column attributes. For more information about theSAS_HCMMETATABLE table, see “Modify Table Attributes” on page 11, and for moreinformation about the SAS_HCMMETACOLUMN table, see “Modify ColumnAttributes” on page 12.
Note: If you add a table to the HCM database, you must use the Add Table function sothat the table is registered in SAS Human Capital Management.
If the table does not appear in the list of tables, click SAS Log to view the log from theAdd Table operation.
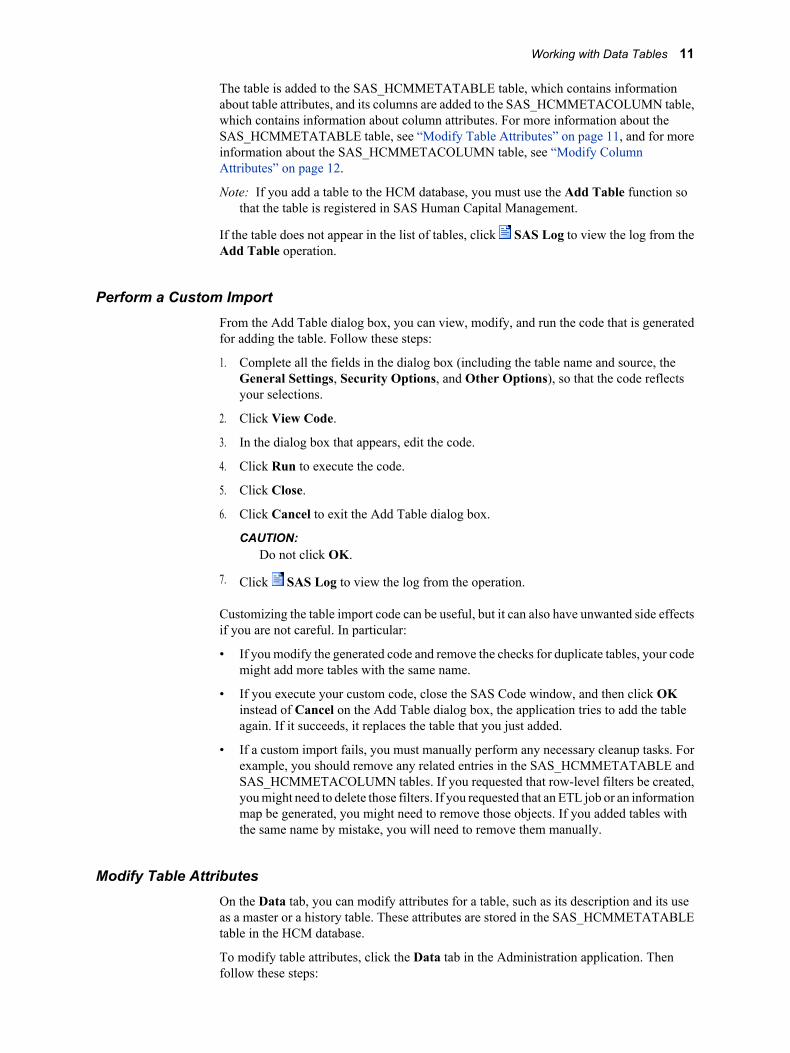
Perform a Custom ImportFrom the Add Table dialog box, you can view, modify, and run the code that is generatedfor adding the table. Follow these steps:
1. Complete all the fields in the dialog box (including the table name and source, theGeneral Settings, Security Options, and Other Options), so that the code reflectsyour selections.
2. Click View Code.
3. In the dialog box that appears, edit the code.
4. Click Run to execute the code.
5. Click Close.
6. Click Cancel to exit the Add Table dialog box.
CAUTION:Do not click OK.
7. Click SAS Log to view the log from the operation.
Customizing the table import code can be useful, but it can also have unwanted side effectsif you are not careful. In particular:
• If you modify the generated code and remove the checks for duplicate tables, your codemight add more tables with the same name.
• If you execute your custom code, close the SAS Code window, and then click OKinstead of Cancel on the Add Table dialog box, the application tries to add the tableagain. If it succeeds, it replaces the table that you just added.
• If a custom import fails, you must manually perform any necessary cleanup tasks. Forexample, you should remove any related entries in the SAS_HCMMETATABLE andSAS_HCMMETACOLUMN tables. If you requested that row-level filters be created,you might need to delete those filters. If you requested that an ETL job or an informationmap be generated, you might need to remove those objects. If you added tables withthe same name by mistake, you will need to remove them manually.
Modify Table AttributesOn the Data tab, you can modify attributes for a table, such as its description and its useas a master or a history table. These attributes are stored in the SAS_HCMMETATABLEtable in the HCM database.
To modify table attributes, click the Data tab in the Administration application. Thenfollow these steps:
Working with Data Tables 11
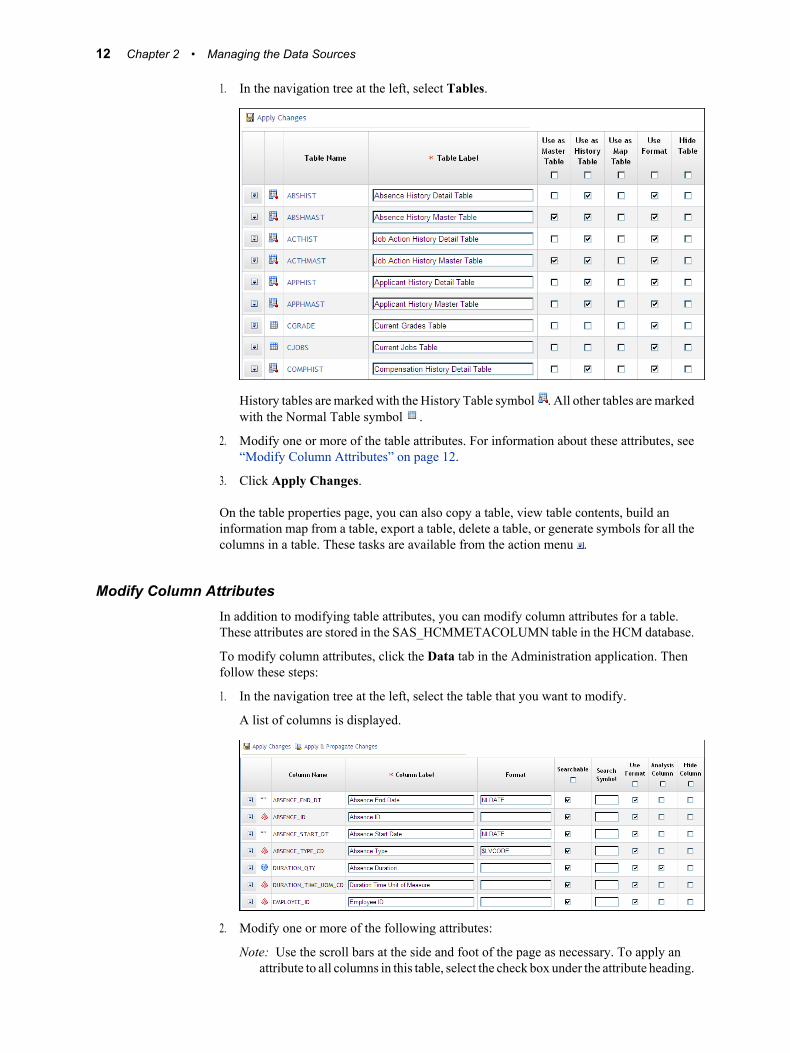
1. In the navigation tree at the left, select Tables.
History tables are marked with the History Table symbol . All other tables are markedwith the Normal Table symbol .
2. Modify one or more of the table attributes. For information about these attributes, see“Modify Column Attributes” on page 12.
3. Click Apply Changes.
On the table properties page, you can also copy a table, view table contents, build aninformation map from a table, export a table, delete a table, or generate symbols for all thecolumns in a table. These tasks are available from the action menu .
Modify Column AttributesIn addition to modifying table attributes, you can modify column attributes for a table.These attributes are stored in the SAS_HCMMETACOLUMN table in the HCM database.
To modify column attributes, click the Data tab in the Administration application. Thenfollow these steps:
1. In the navigation tree at the left, select the table that you want to modify.
A list of columns is displayed.
2. Modify one or more of the following attributes:
Note: Use the scroll bars at the side and foot of the page as necessary. To apply anattribute to all columns in this table, select the check box under the attribute heading.
12 Chapter 2 • Managing the Data Sources
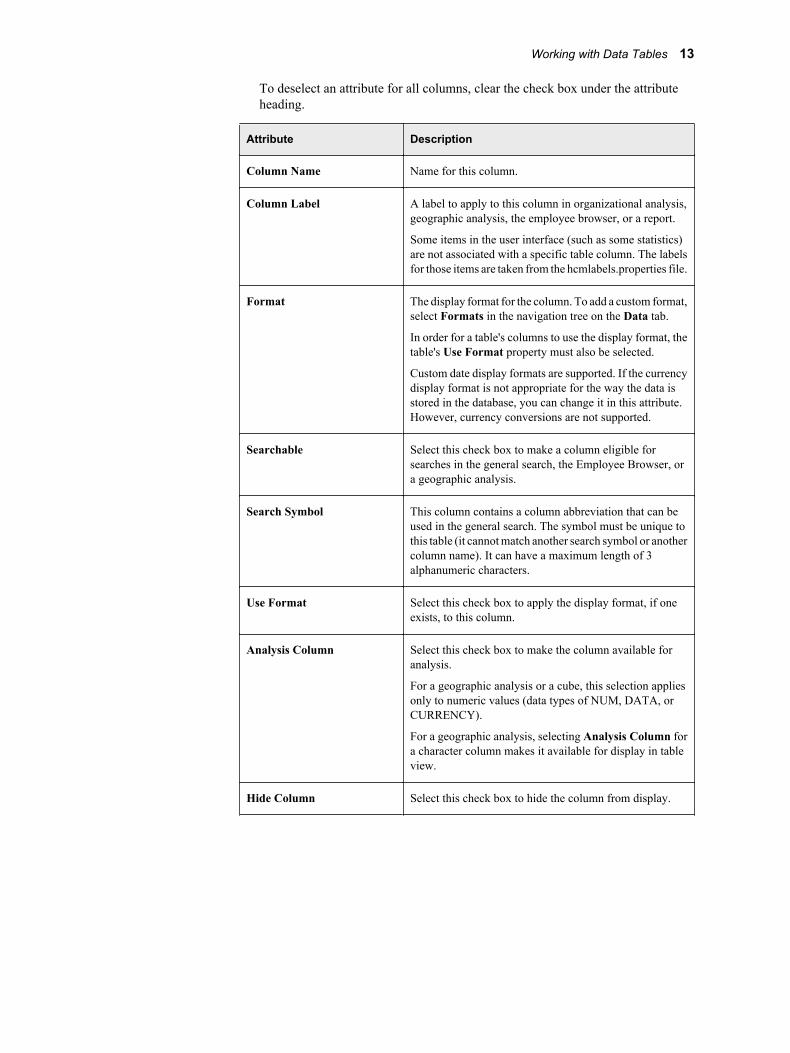
To deselect an attribute for all columns, clear the check box under the attributeheading.
Attribute Description
Column Name Name for this column.
Column Label A label to apply to this column in organizational analysis,geographic analysis, the employee browser, or a report.
Some items in the user interface (such as some statistics)are not associated with a specific table column. The labelsfor those items are taken from the hcmlabels.properties file.
Format The display format for the column. To add a custom format,select Formats in the navigation tree on the Data tab.
In order for a table's columns to use the display format, thetable's Use Format property must also be selected.
Custom date display formats are supported. If the currencydisplay format is not appropriate for the way the data isstored in the database, you can change it in this attribute.However, currency conversions are not supported.
Searchable Select this check box to make a column eligible forsearches in the general search, the Employee Browser, ora geographic analysis.
Search Symbol This column contains a column abbreviation that can beused in the general search. The symbol must be unique tothis table (it cannot match another search symbol or anothercolumn name). It can have a maximum length of 3alphanumeric characters.
Use Format Select this check box to apply the display format, if oneexists, to this column.
Analysis Column Select this check box to make the column available foranalysis.
For a geographic analysis or a cube, this selection appliesonly to numeric values (data types of NUM, DATA, orCURRENCY).
For a geographic analysis, selecting Analysis Column fora character column makes it available for display in tableview.
Hide Column Select this check box to hide the column from display.
Working with Data Tables 13

Attribute Description
statistics Select a check box to include the corresponding statistic.The selection applies only if Analysis Column is selectedand the column is numeric. The following statistics areavailable:
• Count: number of non-missing values
• Min: minimum value
• Max: maximum value
• Sum: sum of values
• Number Missing: number of missing values
• Uncorrected Sum Sq: uncorrected sum of squares
• Avg: arithmetic mean or average of values
• Range: range of values
3. To apply your changes only to this table, click Apply Changes.
To apply these attribute values to columns with the same name in all HCM tables, clickApply & Propagate Changes. All column attributes—not just the attributes that youchanged—are applied to all instances of this column.
Note: Search symbols are not propagated to other tables, to avoid possible duplication.(You might have already defined the identical search symbol for a different columnin another table.)
Modify the hcmtitles and hcmlabels Properties FilesIn addition to the labels that you can modify on the Data tab, SAS Human CapitalManagement maintains two property files: hcmlabels.properties and hcmtitles.properties.
The hcmlabels.properties file contains labels for tables, columns, statistics, metric factors,OLAP cubes, OLAP hierarchies, employee profile category tables, miscellaneous labelsfor reports, information maps, and the forecasting stored processes. During the installationprocess, these labels are used for seeding of the SAS_ tables (including theSAS_HCMMETATABLE and SAS_HCMMETACOLUMN tables). After that point,changes that you make to the table or column properties on the Data tab are used ratherthan the values in the properties files, with the following exceptions.
Column formats and labels in OLAP cubes are extracted fromSAS_HCMMETACOLUMN when the cube is built or rebuilt (both the physical cube andthe cube metadata). Any other labels that are related to OLAP cubes, such as hierarchycaptions, dimension captions, and cube labels, are extracted from the properties files whenthe cube is built or rebuilt.
Note: The Dimension captions use the labels of the associated columns from the propertiesfiles rather than the labels from SAS_HCMMETACOLUMN. If you change columnlabels on the Data tab, and they are used in cube dimensions, you should propagatethose changes to the hcmlabels.properties file.
To modify the hcmlabels.properties file:
1. Change your current directory to !sasroot\hrds\sasmisc (Windows).
2. Open the appropriate version of the file for editing.
14 Chapter 2 • Managing the Data Sources

The sasmisc folder contains localized versions of the file, in the formhcmlabels_locale.properties.
Note: We recommend that you make a backup copy of the file before proceeding.
3. Modify the values to the right of the equal sign.
4. Save the file.
The hcmtitles.properties file contains the titles of the standard stored process reports thatare available with SAS Human Capital Management. The titles can be modified to suitcustomer needs, as follows:
1. Change your current directory to !sasroot\hrds\sasmisc.
2. Open the appropriate version of the file for editing. The sasmisc folder containslocalized versions of the file, in the form hcmtitles_locale.properties.
Note: We recommend that you make a backup copy of the file before proceeding.
3. Modify the values to the right of the equal sign.
4. Save the file.
Copy a TableOn the Data tab of the Administration application, you can copy a table as a backup or forsome other purpose. Follow these steps:
1. From the navigation tree, select Tables.
2. Click the action menu at the left of the table and select Copy Table.
3. In the Copy dialog box, type a name for the table.
The name must conform to naming restrictions for MySQL tables.
4. Click OK.
Working with Data Tables 15
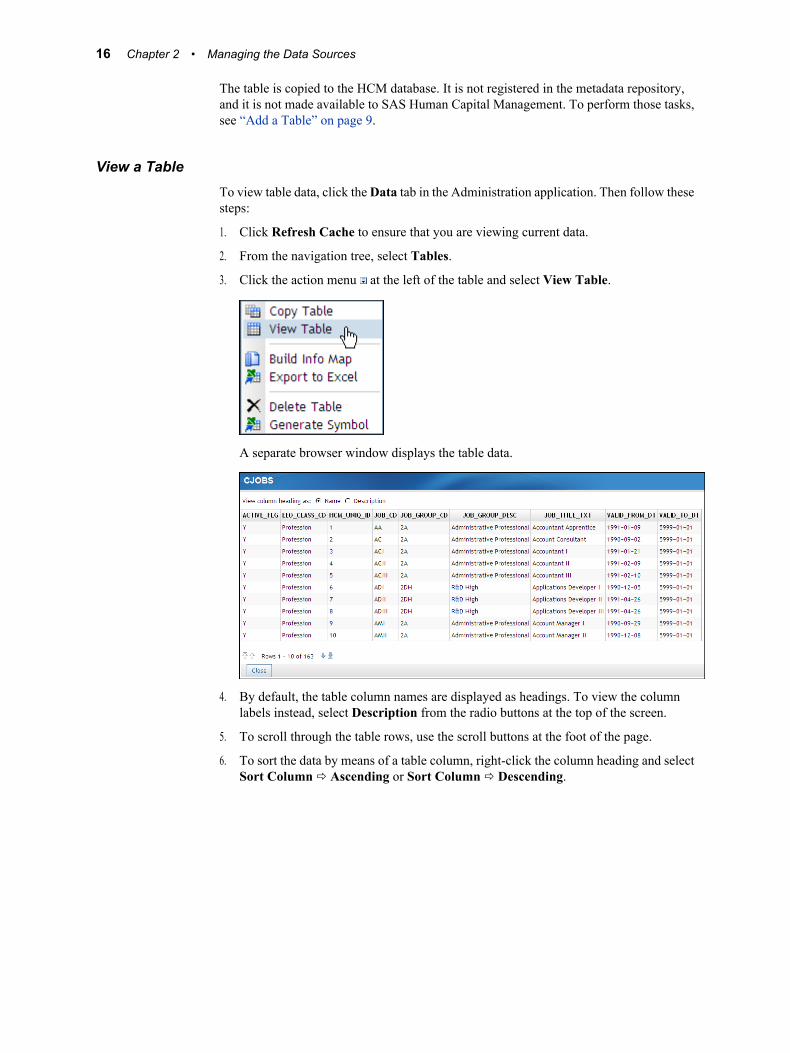
The table is copied to the HCM database. It is not registered in the metadata repository,and it is not made available to SAS Human Capital Management. To perform those tasks,see “Add a Table” on page 9.
View a TableTo view table data, click the Data tab in the Administration application. Then follow thesesteps:
1. Click Refresh Cache to ensure that you are viewing current data.
2. From the navigation tree, select Tables.
3. Click the action menu at the left of the table and select View Table.
A separate browser window displays the table data.
4. By default, the table column names are displayed as headings. To view the columnlabels instead, select Description from the radio buttons at the top of the screen.
5. To scroll through the table rows, use the scroll buttons at the foot of the page.
6. To sort the data by means of a table column, right-click the column heading and selectSort Column ð Ascending or Sort Column ð Descending.
16 Chapter 2 • Managing the Data Sources
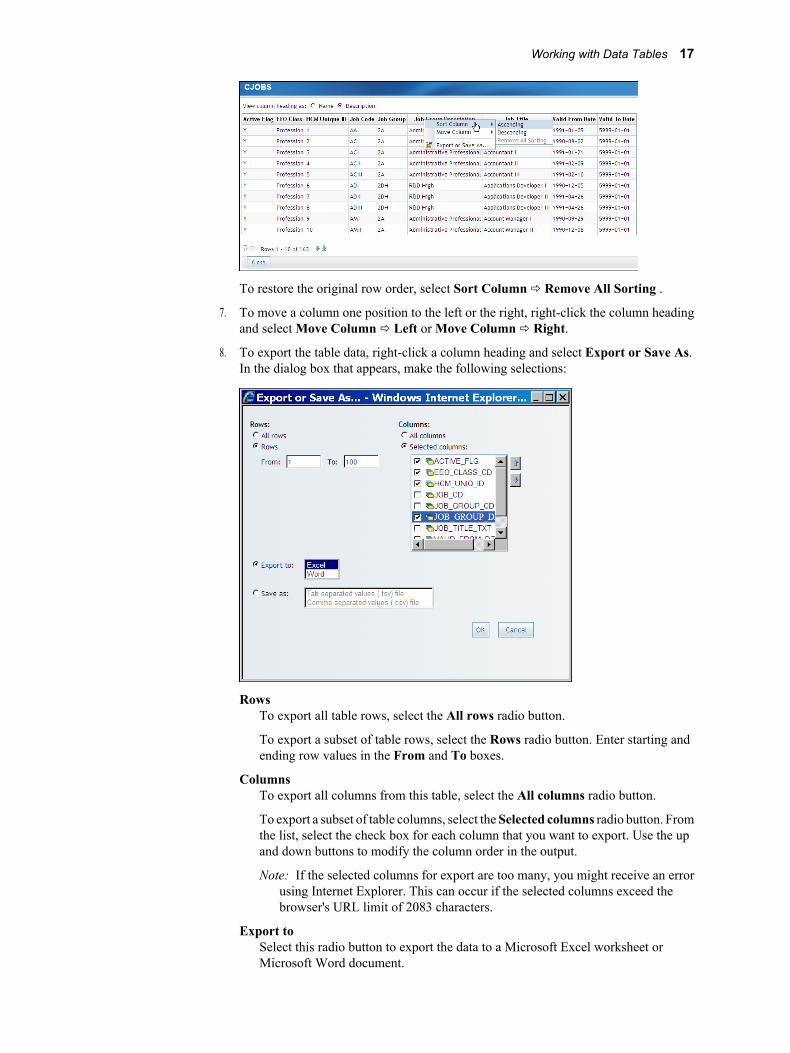
To restore the original row order, select Sort Column ð Remove All Sorting .
7. To move a column one position to the left or the right, right-click the column headingand select Move Column ð Left or Move Column ð Right.
8. To export the table data, right-click a column heading and select Export or Save As.In the dialog box that appears, make the following selections:
RowsTo export all table rows, select the All rows radio button.
To export a subset of table rows, select the Rows radio button. Enter starting andending row values in the From and To boxes.
ColumnsTo export all columns from this table, select the All columns radio button.
To export a subset of table columns, select the Selected columns radio button. Fromthe list, select the check box for each column that you want to export. Use the upand down buttons to modify the column order in the output.
Note: If the selected columns for export are too many, you might receive an errorusing Internet Explorer. This can occur if the selected columns exceed thebrowser's URL limit of 2083 characters.
Export toSelect this radio button to export the data to a Microsoft Excel worksheet orMicrosoft Word document.
Working with Data Tables 17

Save asSelect this radio button to save the data as a tab-separated values (TSV) file or asa comma-separated values (CSV) file.
Note: Be aware that if you are viewing formatted values in the table, then formatted valuesare exported. For more information about exporting table data, see “About Importingand Exporting Tables” on page 7.
Create an Information Map from a TableTo create an information map from a table, click the Data tab in the Administrationapplication. Then follow these steps:
1. From the navigation tree, select Tables.
2. Click the action menu at the left of the table and select Build Info Map.
3. On the Build Information Map dialog box, enter a name for the map and click OK.
Note: Take care in naming the information map. If the folder already contains aninformation map with this name, it will be replaced, and any dashboards or reportsthat are based on the old information map will now use the new version. If the newversion references a different data source, the dashboards and reports might notwork correctly.
All columns are included in the information map, which is written to the default folderlocation in the workspace.(See “Default Folder Locations” on page 5.)
Note: Users must have both ReadMetadata and Read permission for an information mapin order to access its data in SAS Web Report Studio. If the information map is builton a cube, users must also have Read permission for the cube.
Export a TableOn the Data tab of the Administration application, you can export table data to a MicrosoftExcel worksheet. Follow these steps:
1. Click Refresh Cache to ensure that you are exporting current data.
18 Chapter 2 • Managing the Data Sources

2. From the navigation tree, select Tables.
3. Click the action menu at the left of the table and select Export to Excel.
From the File Download dialog box you can choose whether to view the file inMicrosoft Excel or save the data to a file.
All rows are exported (subject to security provisions), and the column names are used asheadings. (To export a subset of table rows, see “View a Table” on page 16.)
For more information about exporting tables, see “About Importing and Exporting Tables”on page 7.
Delete a TableTo remove a table so that it is no longer available to SAS Human Capital Management,click the Data tab in the Administration application. Then follow these steps:
1. If you previously mapped the table to a hierarchy, remove the mapping. See “ViewHierarchy Mappings” on page 21.
2. In the navigation tree, select Tables.
3. Click the action menu at the left of the table and select Delete Table.
The table entry is removed from the SAS_HCMMETATABLE table, and its columns areremoved from the SAS_HCMMETACOLUMN table. The table definition is not removedfrom the metadata repository, and the table itself is not removed from the HCM database.
Generate Search SymbolsSearch symbols are abbreviations for columns that can be used in the general Search. Forexample, if the symbol for EMPLOYEE_ID was EI, you could use a search string such asEI=2973, instead of spelling out the column name.
You can enter a search symbol manually. See “Modify Column Attributes” on page 12.
Alternatively, SAS Human Capital Management can generate one or more search symbols.Generated symbols are taken from the column label and use the current language andencoding for that label.
Working with Data Tables 19

To generate symbols for all columns in a table, click the Data tab in the Administrationapplication. Then follow these steps:
1. From the navigation tree, select Tables.
2. Click the action menu at the left of the table and select Generate Symbol.
When you look at the Search Symbol attribute for the table, you will see symbols foreach column.
Note: The symbols are immediately written to the database. There is no need to clickApply Changes.
To create a symbol for a single column in a table:
1. From the navigation tree, select the table name.
2. Click the action menu at the left of the column and select Generate Symbol.
3. To apply your changes to this table, click Apply Changes.
Note: Search symbols are not propagated to other tables, to avoid possible duplication.(You might have already defined the identical search symbol for a different columnin another table.)
Working with Hierarchies
What Is a Hierarchy?A dimension is a set of elements (members) of a particular type. It can have one or morehierarchies, each of which includes some or all of the members of a dimension. Mosthierarchies are tree structures that consist of parent-child relationships, although it ispossible to have a flat hierarchy. The sample data contains two hierarchies within the ORGdimension: INTORG_HR, which represents the departmental structure of the organization;and INTORG_MGR, which represents the management structure of the organization.
What Is a Hierarchy Mapping?Hierarchy members are identified by their codes. For example, in the INTORG_HRhierarchy, the code represents a department within the organization. In the EmployeeBrowser, when a user selects a department, the Employee Browser displays a list of all theemployees that belong to that department.
The records are selected by matching the hierarchy code to values in an information table,such as the Employee Master table. The hierarchy mapping specifies which column of theinformation table contains the matching codes—in this case, the department code.
Hierarchy mappings are used in the Employee Browser and in an organization analysis.
View Available HierarchiesTo view the hierarchies that are available for use by the Employee Browser and in anorganization analysis, click the Data tab in the Administration application. Then followthese steps:
1. From the navigational tree, select Hierarchies. The list of available hierarchies appears.
20 Chapter 2 • Managing the Data Sources
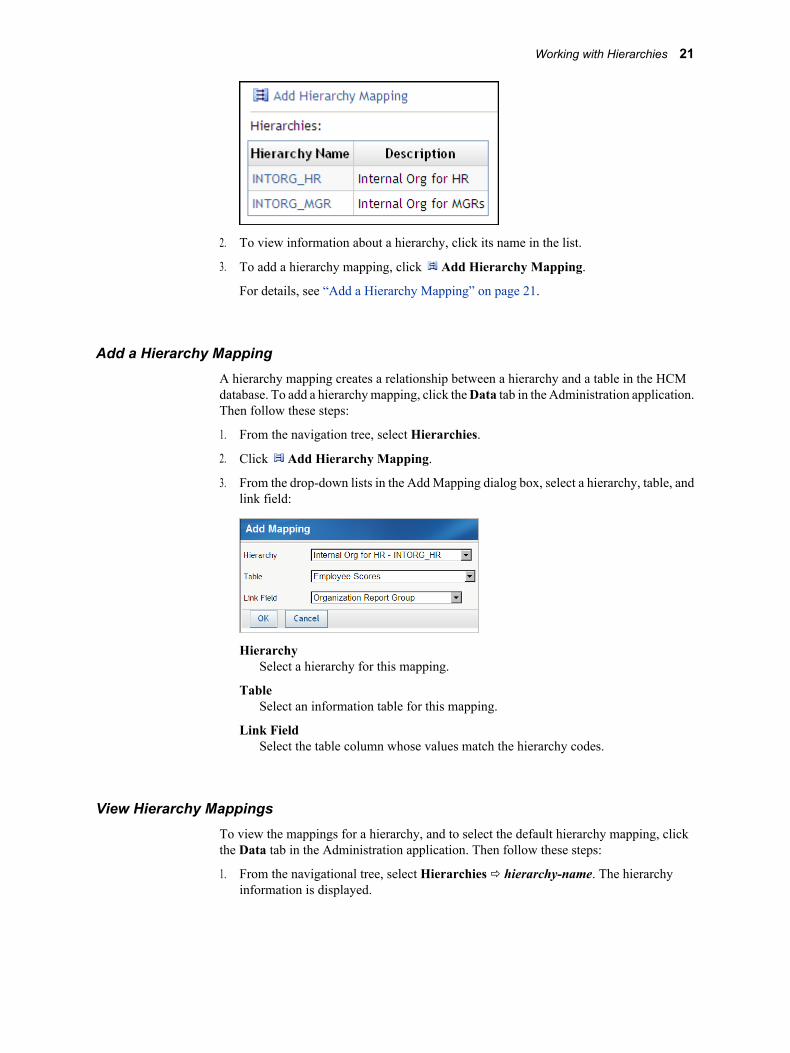
2. To view information about a hierarchy, click its name in the list.
3. To add a hierarchy mapping, click Add Hierarchy Mapping.
For details, see “Add a Hierarchy Mapping” on page 21.
Add a Hierarchy MappingA hierarchy mapping creates a relationship between a hierarchy and a table in the HCMdatabase. To add a hierarchy mapping, click the Data tab in the Administration application.Then follow these steps:
1. From the navigation tree, select Hierarchies.
2. Click Add Hierarchy Mapping.
3. From the drop-down lists in the Add Mapping dialog box, select a hierarchy, table, andlink field:
HierarchySelect a hierarchy for this mapping.
TableSelect an information table for this mapping.
Link FieldSelect the table column whose values match the hierarchy codes.
View Hierarchy MappingsTo view the mappings for a hierarchy, and to select the default hierarchy mapping, clickthe Data tab in the Administration application. Then follow these steps:
1. From the navigational tree, select Hierarchies ð hierarchy-name. The hierarchyinformation is displayed.
Working with Hierarchies 21
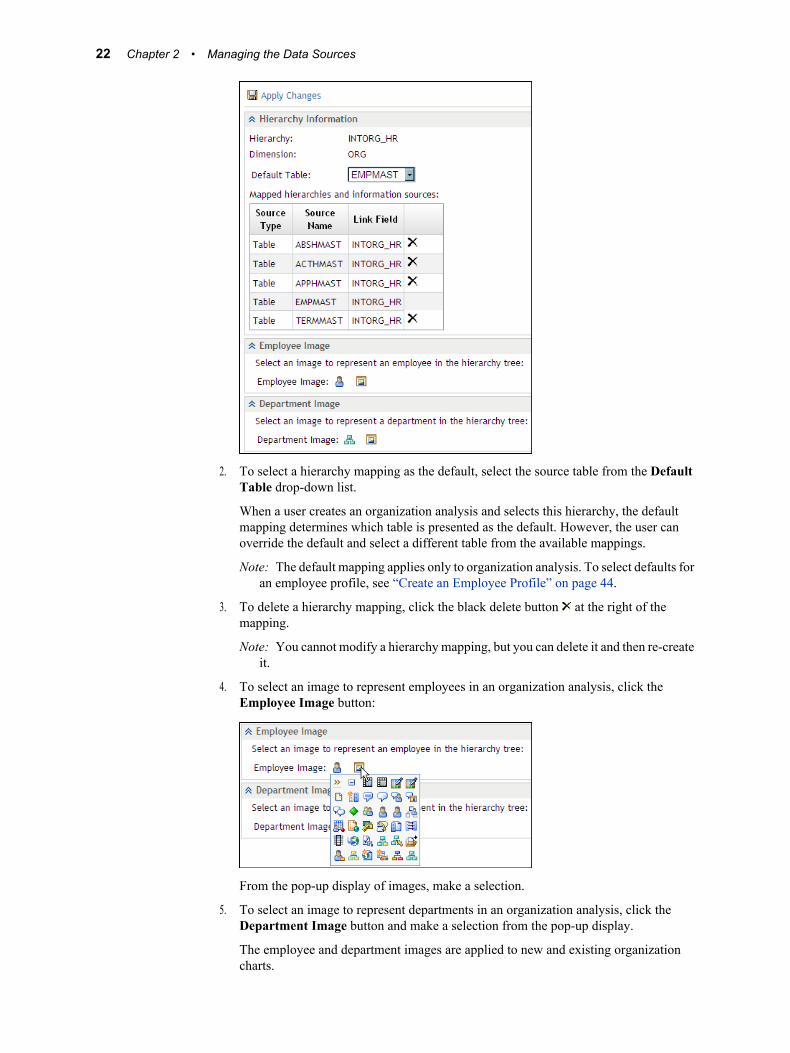
2. To select a hierarchy mapping as the default, select the source table from the DefaultTable drop-down list.
When a user creates an organization analysis and selects this hierarchy, the defaultmapping determines which table is presented as the default. However, the user canoverride the default and select a different table from the available mappings.
Note: The default mapping applies only to organization analysis. To select defaults foran employee profile, see “Create an Employee Profile” on page 44.
3. To delete a hierarchy mapping, click the black delete button at the right of themapping.
Note: You cannot modify a hierarchy mapping, but you can delete it and then re-createit.
4. To select an image to represent employees in an organization analysis, click theEmployee Image button:
From the pop-up display of images, make a selection.
5. To select an image to represent departments in an organization analysis, click theDepartment Image button and make a selection from the pop-up display.
The employee and department images are applied to new and existing organizationcharts.
22 Chapter 2 • Managing the Data Sources
6. After you have modified this page, click Apply Changes.
Working with Cubes
Using Cubes in SAS Human Capital ManagementA cube is a set of data that is organized and structured in a hierarchical, multidimensionalarrangement that provides more efficient access to data than traditional relational databases.SAS cubes are designed to offer fast data access and efficient data storage. In many cases,a basic cube without additional aggregations can be smaller than the input data, becausethe process of creating the cube consolidates records. A good rule of thumb is, the largeryour input data, the greater the storage gain by loading data into a cube.
In SAS Human Capital Management, you can create cubes from hierarchical data that isstored in the HCM tables, and you can refresh or rebuild cubes. Cubes can be used as inputfor information maps and can be explored directly in SAS Web Report Studio.
Create a CubeTo create a cube, click the Data tab in the Administration application. Then follow thesesteps:
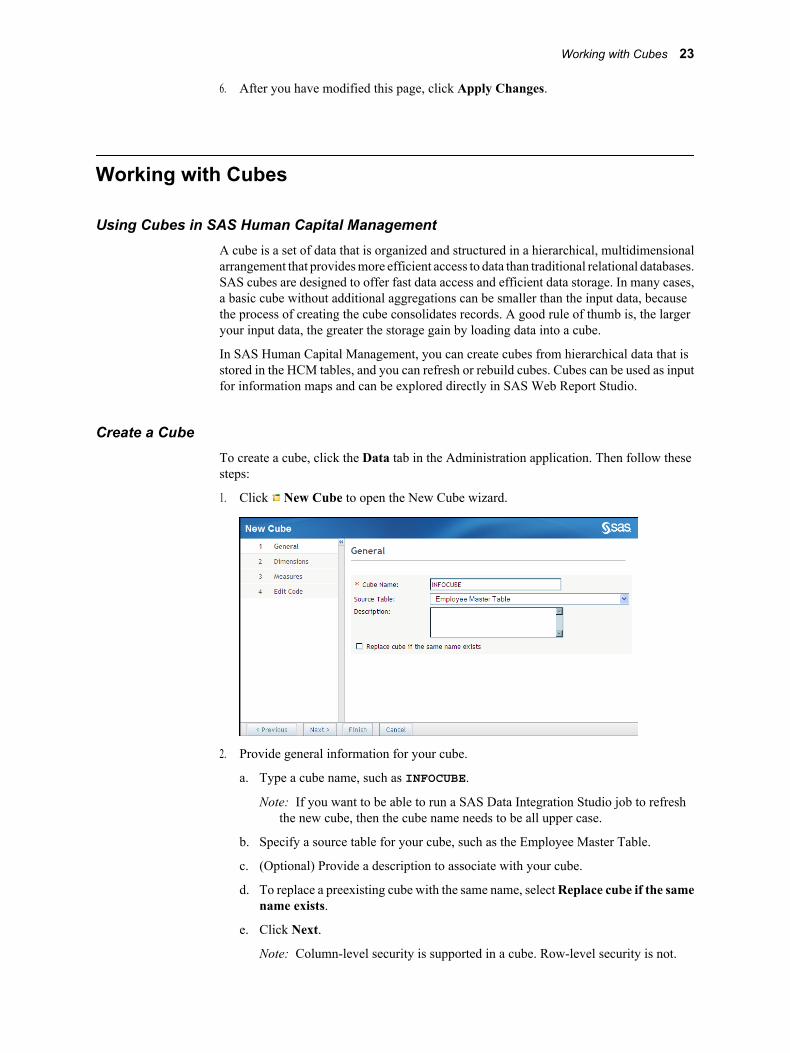
1. Click New Cube to open the New Cube wizard.
2. Provide general information for your cube.
a. Type a cube name, such as INFOCUBE.
Note: If you want to be able to run a SAS Data Integration Studio job to refreshthe new cube, then the cube name needs to be all upper case.
b. Specify a source table for your cube, such as the Employee Master Table.
c. (Optional) Provide a description to associate with your cube.
d. To replace a preexisting cube with the same name, select Replace cube if the samename exists.
e. Click Next.
Note: Column-level security is supported in a cube. Row-level security is not.
Working with Cubes 23
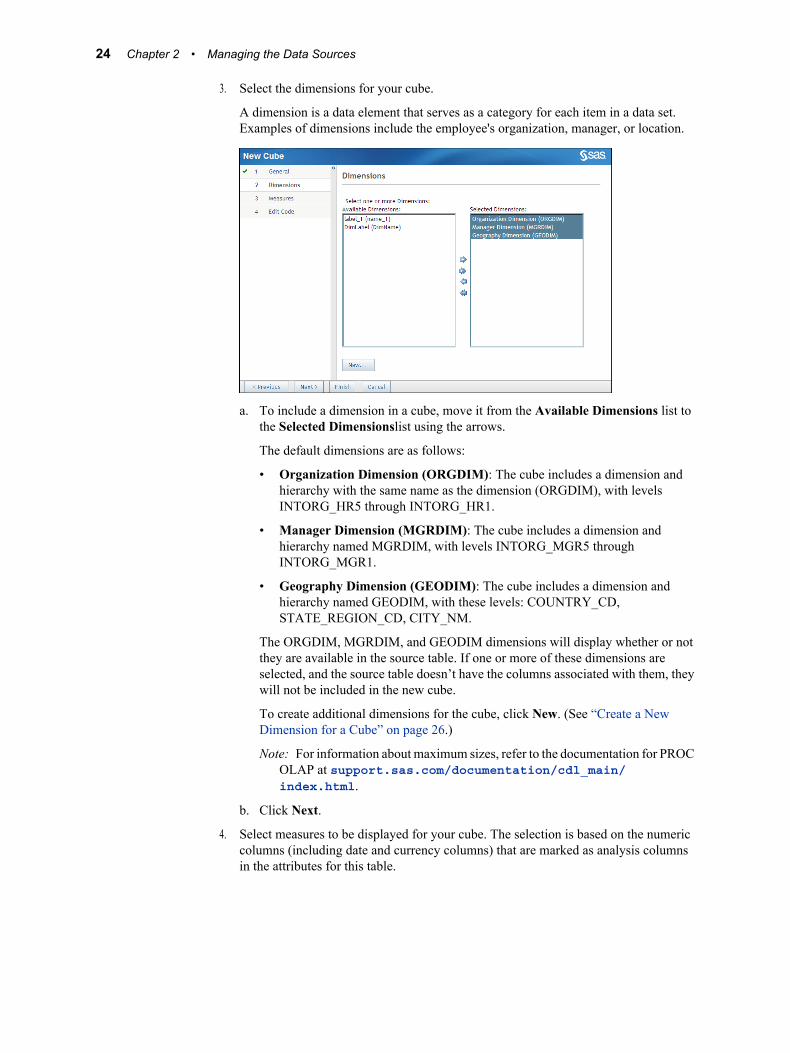
3. Select the dimensions for your cube.
A dimension is a data element that serves as a category for each item in a data set.Examples of dimensions include the employee's organization, manager, or location.
a. To include a dimension in a cube, move it from the Available Dimensions list tothe Selected Dimensionslist using the arrows.
The default dimensions are as follows:
• Organization Dimension (ORGDIM): The cube includes a dimension andhierarchy with the same name as the dimension (ORGDIM), with levelsINTORG_HR5 through INTORG_HR1.
• Manager Dimension (MGRDIM): The cube includes a dimension andhierarchy named MGRDIM, with levels INTORG_MGR5 throughINTORG_MGR1.
• Geography Dimension (GEODIM): The cube includes a dimension andhierarchy named GEODIM, with these levels: COUNTRY_CD,STATE_REGION_CD, CITY_NM.
The ORGDIM, MGRDIM, and GEODIM dimensions will display whether or notthey are available in the source table. If one or more of these dimensions areselected, and the source table doesn’t have the columns associated with them, theywill not be included in the new cube.
To create additional dimensions for the cube, click New. (See “Create a NewDimension for a Cube” on page 26.)
Note: For information about maximum sizes, refer to the documentation for PROCOLAP at support.sas.com/documentation/cdl_main/index.html.
b. Click Next.
4. Select measures to be displayed for your cube. The selection is based on the numericcolumns (including date and currency columns) that are marked as analysis columnsin the attributes for this table.
24 Chapter 2 • Managing the Data Sources

a. Select the Include check box for each measure you want to include in your cube.
b. For each included measure, select the check box for each statistic option you wanta user to be able to choose for that measure. Select a check box under a statisticheading to select or deselect that statistic's check boxes for each available measure.
Note: If you select a statistic that was not selected as one of the column attributes,then the column attributes are updated as well.
c. Click Next.
5. Based on your selections, the New Cube wizard generates SAS code to create yourcube.
a. If your site uses double-byte character sets (DBCS), you must modify the SAS codeso that the names and labels for the cube and any dimensions, measures, hierarchies,and columns do not use DBCS (DBCS are not supported in the creation ofcubes).
(Optional) You can make additional customizations to the SAS code for your cube.However, additional modifications are not recommended unless you are familiarwith SAS programming.
b. Select the View SAS Logs check box to open a pop-up dialog box that contains aSAS log of the cube's creation. Check this log to make sure that the cube was builtsuccessfully.
6. Click Finish to create your cube. If your cube is created successfully, a success messageappears at the top of the data tab, and the cube appears in the list when you selectCubes in the navigation tree.
Working with Cubes 25

Your cube is written to the default folder location in the workspace. (See “DefaultFolder Locations” on page 5.)
7. Rather than opening a cube directly, we recommend that you create an information mapfrom the cube in a shared folder. You (or your end users) can then create a SAS reportbased on that information map. For more information about creating an informationmap from a cube, see “Managing Cubes” on page 28.
Create a New Dimension for a CubeWhile you are creating a cube in the New Cube wizard, you can create additionaldimensions, as follows:
1. After you have provided general cube information, select New on the Dimensions pageof the New Cube wizard.
2. Provide information for the new dimension.
26 Chapter 2 • Managing the Data Sources
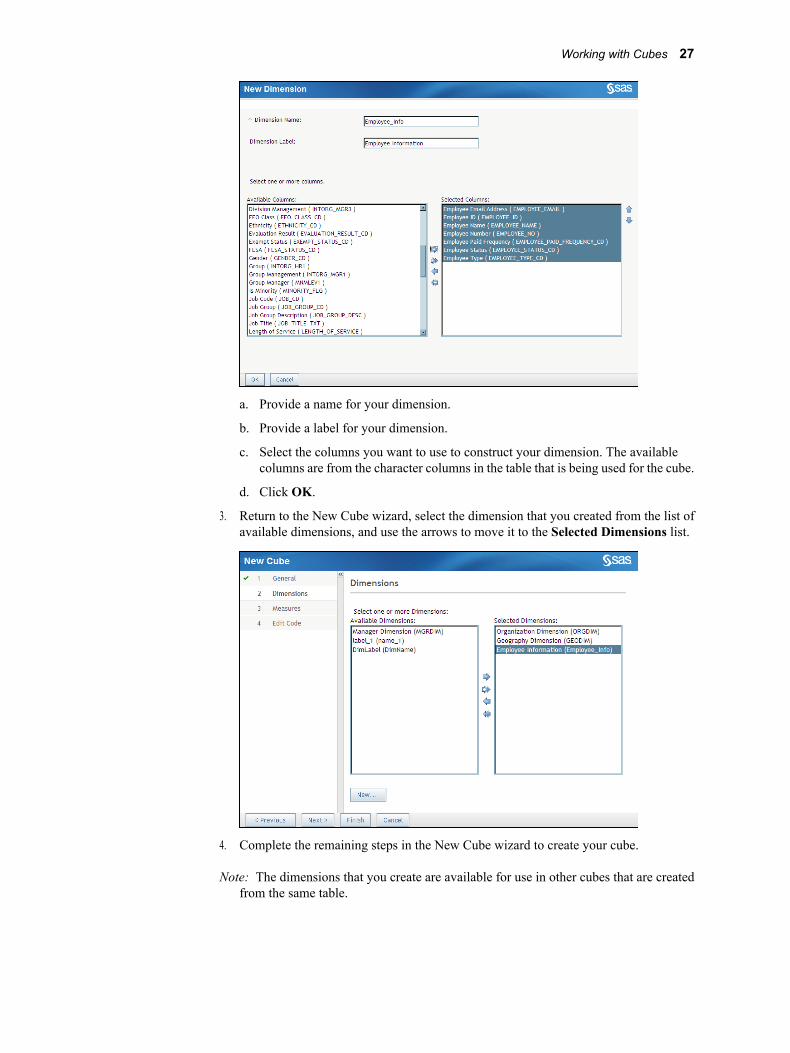
a. Provide a name for your dimension.
b. Provide a label for your dimension.
c. Select the columns you want to use to construct your dimension. The availablecolumns are from the character columns in the table that is being used for the cube.
d. Click OK.
3. Return to the New Cube wizard, select the dimension that you created from the list ofavailable dimensions, and use the arrows to move it to the Selected Dimensions list.
4. Complete the remaining steps in the New Cube wizard to create your cube.
Note: The dimensions that you create are available for use in other cubes that are createdfrom the same table.
Working with Cubes 27
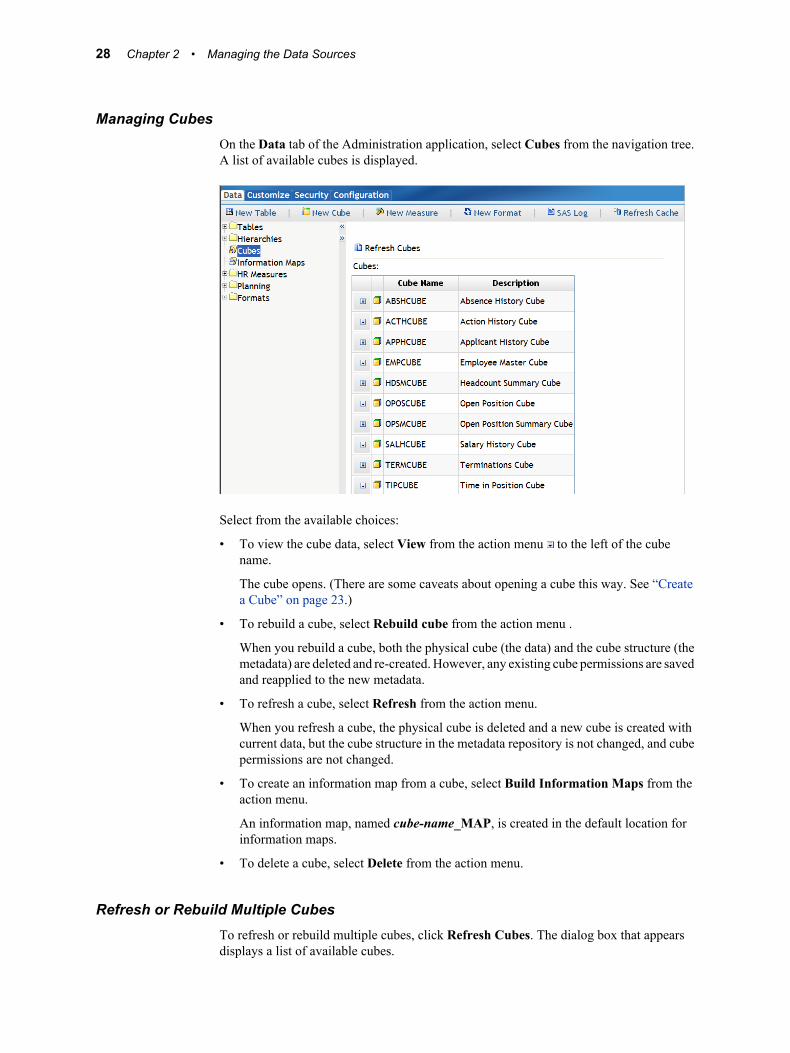
Managing CubesOn the Data tab of the Administration application, select Cubes from the navigation tree.A list of available cubes is displayed.
Select from the available choices:
• To view the cube data, select View from the action menu to the left of the cubename.
The cube opens. (There are some caveats about opening a cube this way. See “Createa Cube” on page 23.)
• To rebuild a cube, select Rebuild cube from the action menu .
When you rebuild a cube, both the physical cube (the data) and the cube structure (themetadata) are deleted and re-created. However, any existing cube permissions are savedand reapplied to the new metadata.
• To refresh a cube, select Refresh from the action menu.
When you refresh a cube, the physical cube is deleted and a new cube is created withcurrent data, but the cube structure in the metadata repository is not changed, and cubepermissions are not changed.
• To create an information map from a cube, select Build Information Maps from theaction menu.
An information map, named cube-name_MAP, is created in the default location forinformation maps.
• To delete a cube, select Delete from the action menu.
Refresh or Rebuild Multiple CubesTo refresh or rebuild multiple cubes, click Refresh Cubes. The dialog box that appearsdisplays a list of available cubes.
28 Chapter 2 • Managing the Data Sources

Follow these steps:
1. Select the check box next to each cube that you want to affect.
2. Select Rebuild selected cubes if you want to delete both the physical cube and themetadata.
If you do not select this check box, the cube is refreshed instead of being rebuilt. Foran explanation of the difference between refreshing and rebuilding a cube, see“Managing Cubes” on page 28.
3. If you select Create Information Maps for selected cubes, then an information mapis created for each cube that you checked.
4. If you select View SAS Logs, a separate window is opened to display the log file. Whenyou click OK, the log file displays the operation's progress. This feature can be helpfulif you are rebuilding a large number of cubes.
5. Click OK to begin the operation.
Working with Cubes 29
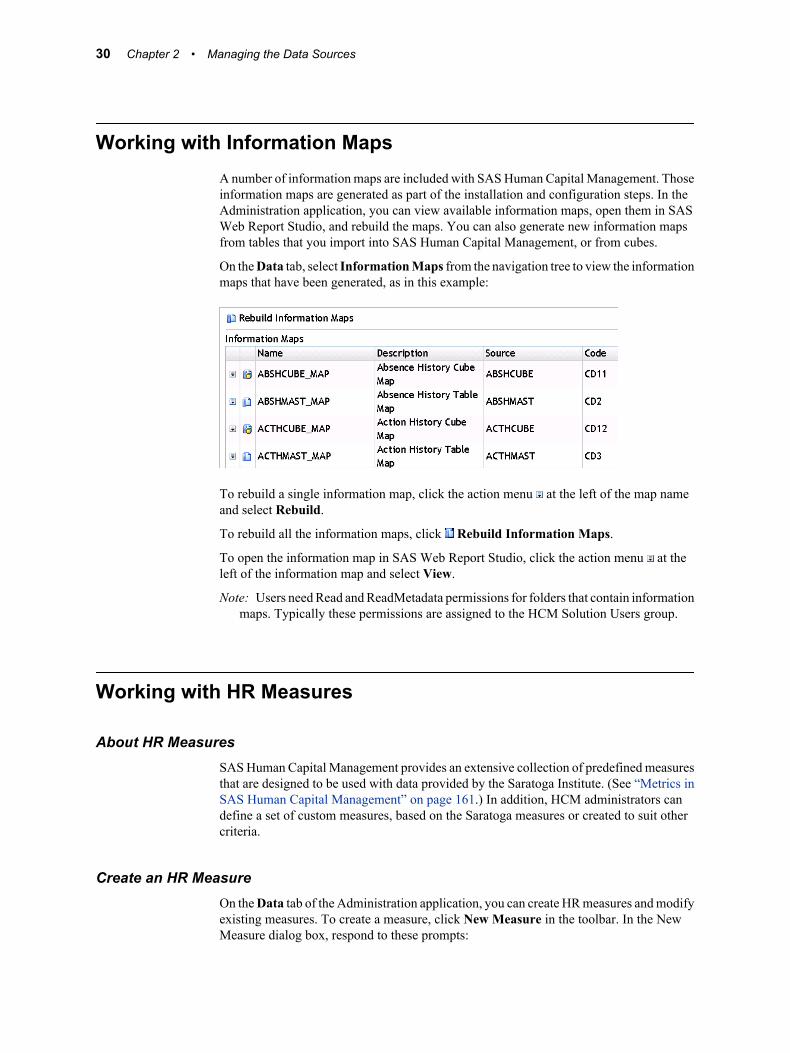
Working with Information MapsA number of information maps are included with SAS Human Capital Management. Thoseinformation maps are generated as part of the installation and configuration steps. In theAdministration application, you can view available information maps, open them in SASWeb Report Studio, and rebuild the maps. You can also generate new information mapsfrom tables that you import into SAS Human Capital Management, or from cubes.
On the Data tab, select Information Maps from the navigation tree to view the informationmaps that have been generated, as in this example:
To rebuild a single information map, click the action menu at the left of the map nameand select Rebuild.
To rebuild all the information maps, click Rebuild Information Maps.
To open the information map in SAS Web Report Studio, click the action menu at theleft of the information map and select View.
Note: Users need Read and ReadMetadata permissions for folders that contain informationmaps. Typically these permissions are assigned to the HCM Solution Users group.
Working with HR Measures
About HR MeasuresSAS Human Capital Management provides an extensive collection of predefined measuresthat are designed to be used with data provided by the Saratoga Institute. (See “Metrics inSAS Human Capital Management” on page 161.) In addition, HCM administrators candefine a set of custom measures, based on the Saratoga measures or created to suit othercriteria.
Create an HR MeasureOn the Data tab of the Administration application, you can create HR measures and modifyexisting measures. To create a measure, click New Measure in the toolbar. In the NewMeasure dialog box, respond to these prompts:
30 Chapter 2 • Managing the Data Sources
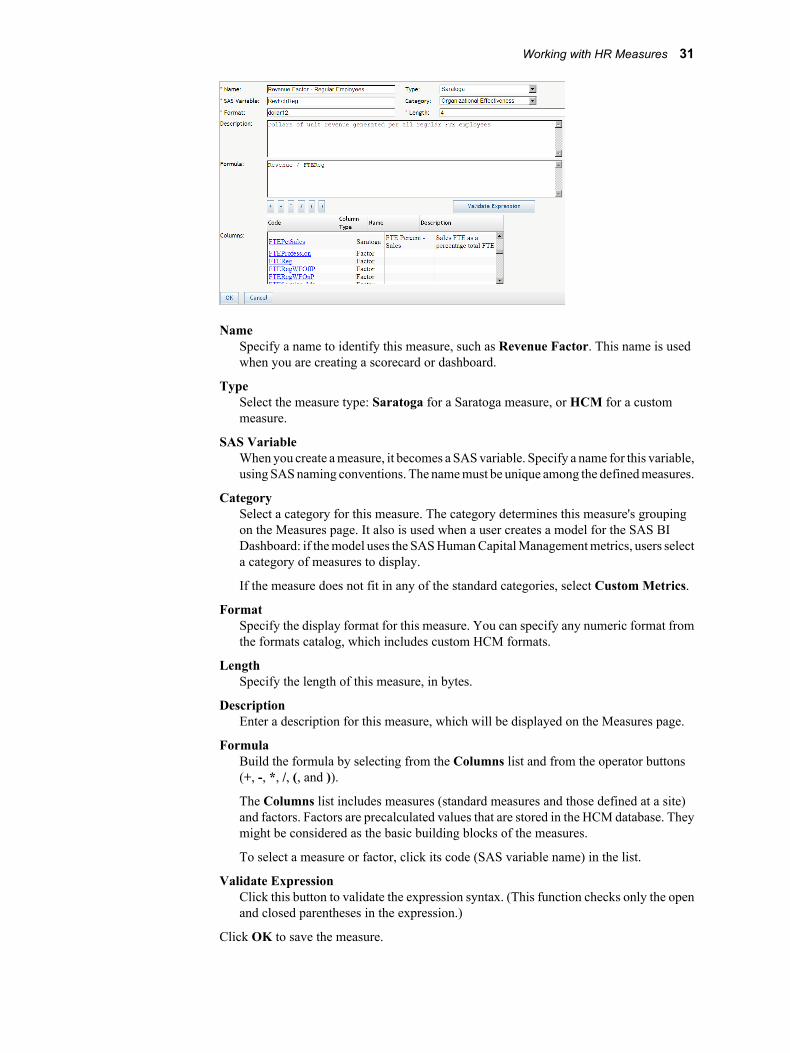
NameSpecify a name to identify this measure, such as Revenue Factor. This name is usedwhen you are creating a scorecard or dashboard.
TypeSelect the measure type: Saratoga for a Saratoga measure, or HCM for a custommeasure.
SAS VariableWhen you create a measure, it becomes a SAS variable. Specify a name for this variable,using SAS naming conventions. The name must be unique among the defined measures.
CategorySelect a category for this measure. The category determines this measure's groupingon the Measures page. It also is used when a user creates a model for the SAS BIDashboard: if the model uses the SAS Human Capital Management metrics, users selecta category of measures to display.
If the measure does not fit in any of the standard categories, select Custom Metrics.
FormatSpecify the display format for this measure. You can specify any numeric format fromthe formats catalog, which includes custom HCM formats.
LengthSpecify the length of this measure, in bytes.
DescriptionEnter a description for this measure, which will be displayed on the Measures page.
FormulaBuild the formula by selecting from the Columns list and from the operator buttons(+, -, *, /, (, and )).
The Columns list includes measures (standard measures and those defined at a site)and factors. Factors are precalculated values that are stored in the HCM database. Theymight be considered as the basic building blocks of the measures.
To select a measure or factor, click its code (SAS variable name) in the list.
Validate ExpressionClick this button to validate the expression syntax. (This function checks only the openand closed parentheses in the expression.)
Click OK to save the measure.
Working with HR Measures 31
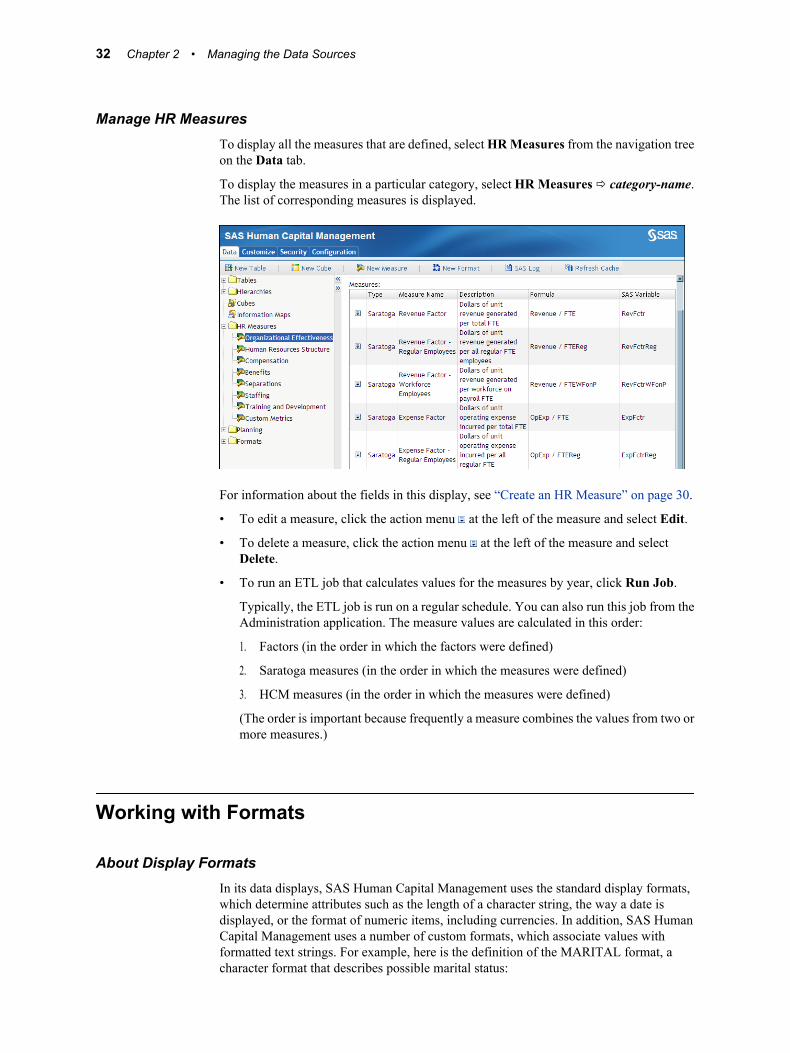
Manage HR MeasuresTo display all the measures that are defined, select HR Measures from the navigation treeon the Data tab.
To display the measures in a particular category, select HR Measures ð category-name.The list of corresponding measures is displayed.
For information about the fields in this display, see “Create an HR Measure” on page 30.
• To edit a measure, click the action menu at the left of the measure and select Edit.
• To delete a measure, click the action menu at the left of the measure and selectDelete.
• To run an ETL job that calculates values for the measures by year, click Run Job.
Typically, the ETL job is run on a regular schedule. You can also run this job from theAdministration application. The measure values are calculated in this order:
1. Factors (in the order in which the factors were defined)
2. Saratoga measures (in the order in which the measures were defined)
3. HCM measures (in the order in which the measures were defined)
(The order is important because frequently a measure combines the values from two ormore measures.)
Working with Formats
About Display FormatsIn its data displays, SAS Human Capital Management uses the standard display formats,which determine attributes such as the length of a character string, the way a date isdisplayed, or the format of numeric items, including currencies. In addition, SAS HumanCapital Management uses a number of custom formats, which associate values withformatted text strings. For example, here is the definition of the MARITAL format, acharacter format that describes possible marital status:
32 Chapter 2 • Managing the Data Sources
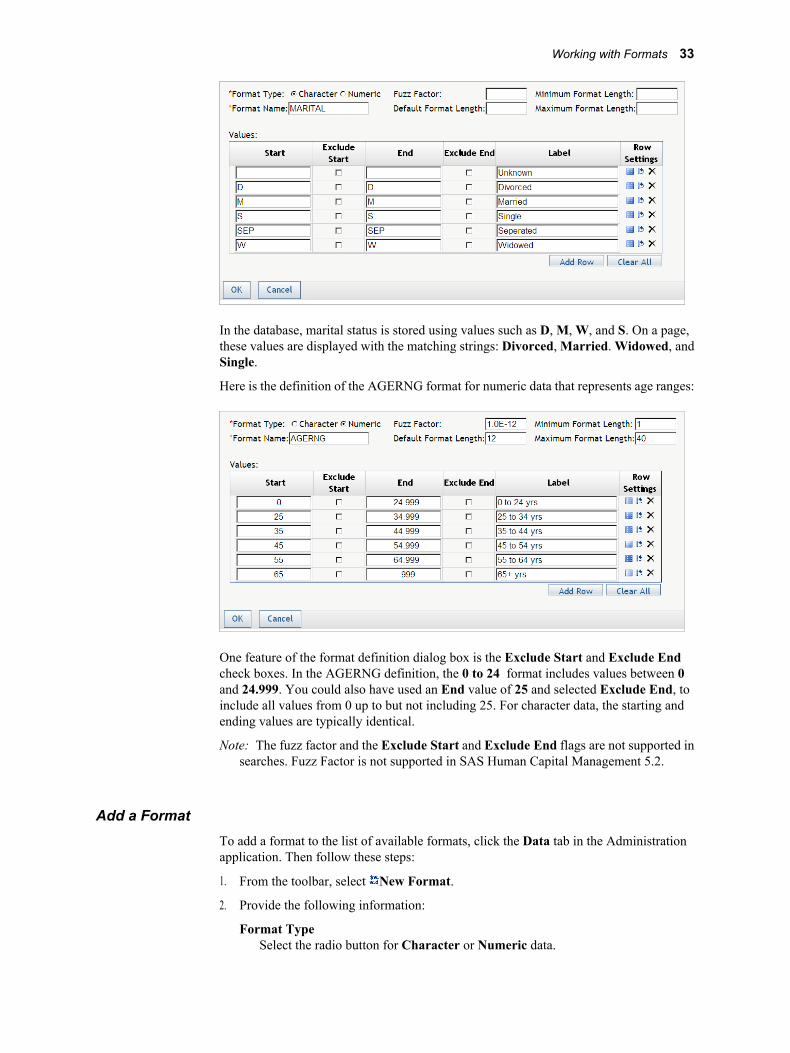
In the database, marital status is stored using values such as D, M, W, and S. On a page,these values are displayed with the matching strings: Divorced, Married. Widowed, andSingle.
Here is the definition of the AGERNG format for numeric data that represents age ranges:
One feature of the format definition dialog box is the Exclude Start and Exclude Endcheck boxes. In the AGERNG definition, the 0 to 24 format includes values between 0and 24.999. You could also have used an End value of 25 and selected Exclude End, toinclude all values from 0 up to but not including 25. For character data, the starting andending values are typically identical.
Note: The fuzz factor and the Exclude Start and Exclude End flags are not supported insearches. Fuzz Factor is not supported in SAS Human Capital Management 5.2.
Add a FormatTo add a format to the list of available formats, click the Data tab in the Administrationapplication. Then follow these steps:
1. From the toolbar, select New Format.
2. Provide the following information:
Format TypeSelect the radio button for Character or Numeric data.
Working with Formats 33

Minimum Format LengthEnter the minimum length of a label that represents a format value.
Format NameType a unique name for this format.
Default Format LengthEnter the default length of a label that represents a format value.
Maximum Format LengthEnter the maximum length of a label that represents a format value.
3. Enter the values and labels that define this format:
Start, EndThe starting and ending values that describe the range. To exclude the starting value,select the Exclude Start check box. To exclude the ending value, select the ExcludeEnd check box. (See “About Display Formats” on page 32.)
LabelEnter a string to display for this range.
4. To insert a keyword in place of a value, click the Rows button . A pop-up menu isdisplayed.
Select one of the following keywords:
• LOW represents the lowest value in the data.
• HIGH represents the highest value in the data.
• OTHER represents any value that does not fit into another range, including missingvalues.
5. To clear the contents of a row, click the Clear value button .
6. To delete a row, click the Delete row button .
7. To add a new row, click Add Row.
8. To clear the contents of all rows, click Clear All.
9. When you finish defining the format, click OK.
The format is written to the HCM database but not to the formats catalog. To add it to theformats catalog, click Rebuild Formats Catalog in the toolbar.
Assign a Format to a ColumnFormats are column attributes. To assign a format, see “Modify Column Attributes” onpage 12.
34 Chapter 2 • Managing the Data Sources

Manage FormatsTo manage formats, click the Data tab in the Administration application. Then follow thesesteps:
1. From the navigation tree, select Formats.
The list of formats is displayed. Use the up and down arrows to page through the list.
The Description field displays the label for the first range of values in the formatdefinition.
2. To delete a format, click the action menu and select Delete Format.
3. To view the definition for a format, click the action menu and select Properties.
4. Modify the format definition.
For information about the fields in a format definition, see “Add a Format” on page33.
5. To save your changes, click OK.
6. Update the formats catalog by clicking Rebuild Formats Catalog.
Predefined Formats
Display FormatsThe following table contains predefined display formats in SAS Human CapitalManagement. For more information, see the SAS_HCM_FORMATS table in the HCMdatabase. The following formats are not currently being used: EEOSHRT, INSTNM,MAJOR, MSAMSA, MSASTATE, RNGEFMT.
Note: Do not modify formats in SAS Human Capital Management that are maintainedthrough ETL jobs. Unless otherwise specified, the following display formats aremaintained through ETL jobs.
Working with Formats 35
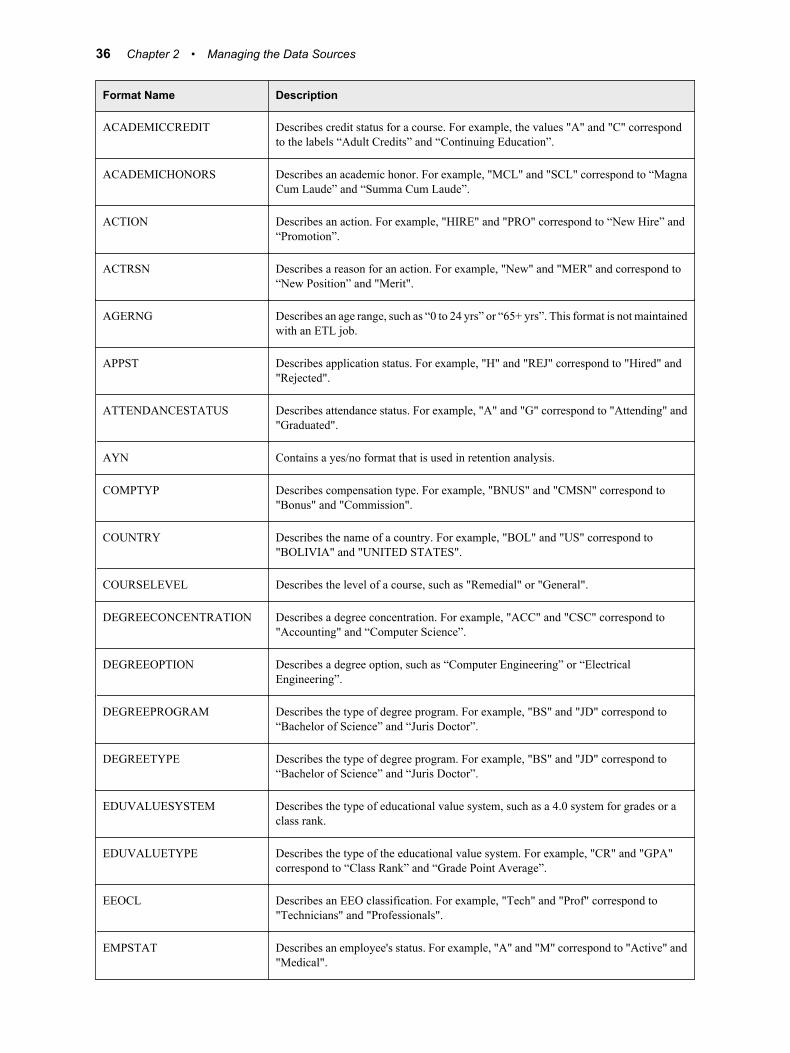
Format Name Description
ACADEMICCREDIT Describes credit status for a course. For example, the values "A" and "C" correspondto the labels “Adult Credits” and “Continuing Education”.
ACADEMICHONORS Describes an academic honor. For example, "MCL" and "SCL" correspond to “MagnaCum Laude” and “Summa Cum Laude”.
ACTION Describes an action. For example, "HIRE" and "PRO" correspond to “New Hire” and“Promotion”.
ACTRSN Describes a reason for an action. For example, "New" and "MER" and correspond to“New Position” and "Merit".
AGERNG Describes an age range, such as “0 to 24 yrs” or “65+ yrs”. This format is not maintainedwith an ETL job.
APPST Describes application status. For example, "H" and "REJ" correspond to "Hired" and"Rejected".
ATTENDANCESTATUS Describes attendance status. For example, "A" and "G" correspond to "Attending" and"Graduated".
AYN Contains a yes/no format that is used in retention analysis.
COMPTYP Describes compensation type. For example, "BNUS" and "CMSN" correspond to"Bonus" and "Commission".
COUNTRY Describes the name of a country. For example, "BOL" and "US" correspond to"BOLIVIA" and "UNITED STATES".
COURSELEVEL Describes the level of a course, such as "Remedial" or "General".
DEGREECONCENTRATION Describes a degree concentration. For example, "ACC" and "CSC" correspond to"Accounting" and “Computer Science”.
DEGREEOPTION Describes a degree option, such as “Computer Engineering” or “ElectricalEngineering”.
DEGREEPROGRAM Describes the type of degree program. For example, "BS" and "JD" correspond to“Bachelor of Science” and “Juris Doctor”.
DEGREETYPE Describes the type of degree program. For example, "BS" and "JD" correspond to“Bachelor of Science” and “Juris Doctor”.
EDUVALUESYSTEM Describes the type of educational value system, such as a 4.0 system for grades or aclass rank.
EDUVALUETYPE Describes the type of the educational value system. For example, "CR" and "GPA"correspond to “Class Rank” and “Grade Point Average”.
EEOCL Describes an EEO classification. For example, "Tech" and "Prof" correspond to"Technicians" and "Professionals".
EMPSTAT Describes an employee's status. For example, "A" and "M" correspond to "Active" and"Medical".
36 Chapter 2 • Managing the Data Sources
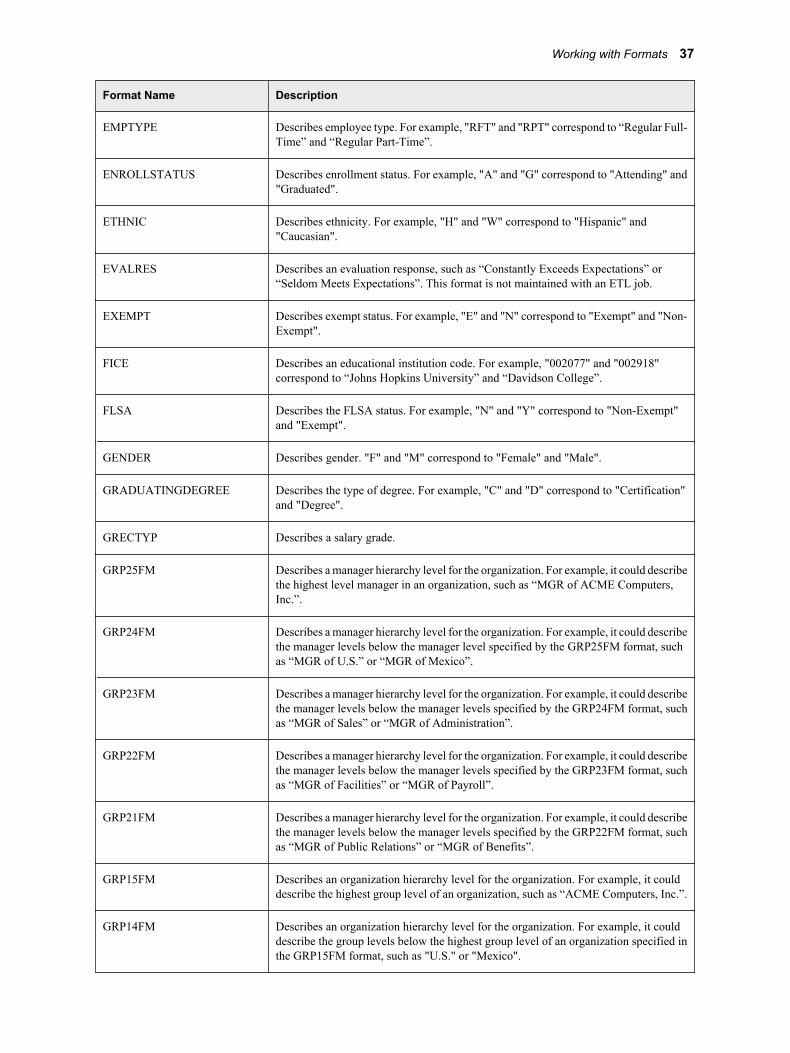
Format Name Description
EMPTYPE Describes employee type. For example, "RFT" and "RPT" correspond to “Regular Full-Time” and “Regular Part-Time”.
ENROLLSTATUS Describes enrollment status. For example, "A" and "G" correspond to "Attending" and"Graduated".
ETHNIC Describes ethnicity. For example, "H" and "W" correspond to "Hispanic" and"Caucasian".
EVALRES Describes an evaluation response, such as “Constantly Exceeds Expectations” or“Seldom Meets Expectations”. This format is not maintained with an ETL job.
EXEMPT Describes exempt status. For example, "E" and "N" correspond to "Exempt" and "Non-Exempt".
FICE Describes an educational institution code. For example, "002077" and "002918"correspond to “Johns Hopkins University” and “Davidson College”.
FLSA Describes the FLSA status. For example, "N" and "Y" correspond to "Non-Exempt"and "Exempt".
GENDER Describes gender. "F" and "M" correspond to "Female" and "Male".
GRADUATINGDEGREE Describes the type of degree. For example, "C" and "D" correspond to "Certification"and "Degree".
GRECTYP Describes a salary grade.
GRP25FM Describes a manager hierarchy level for the organization. For example, it could describethe highest level manager in an organization, such as “MGR of ACME Computers,Inc.”.
GRP24FM Describes a manager hierarchy level for the organization. For example, it could describethe manager levels below the manager level specified by the GRP25FM format, suchas “MGR of U.S.” or “MGR of Mexico”.
GRP23FM Describes a manager hierarchy level for the organization. For example, it could describethe manager levels below the manager levels specified by the GRP24FM format, suchas “MGR of Sales” or “MGR of Administration”.
GRP22FM Describes a manager hierarchy level for the organization. For example, it could describethe manager levels below the manager levels specified by the GRP23FM format, suchas “MGR of Facilities” or “MGR of Payroll”.
GRP21FM Describes a manager hierarchy level for the organization. For example, it could describethe manager levels below the manager levels specified by the GRP22FM format, suchas “MGR of Public Relations” or “MGR of Benefits”.
GRP15FM Describes an organization hierarchy level for the organization. For example, it coulddescribe the highest group level of an organization, such as “ACME Computers, Inc.”.
GRP14FM Describes an organization hierarchy level for the organization. For example, it coulddescribe the group levels below the highest group level of an organization specified inthe GRP15FM format, such as "U.S." or "Mexico".
Working with Formats 37

Format Name Description
GRP13FM Describes an organization hierarchy level for the organization. For example, it coulddescribe the group levels below the group levels of an organization specified in theGRP14FM format, such as "Sales" or "Administration".
GRP12FM Describes an organization hierarchy level for the organization. For example, it coulddescribe the group levels below the group levels of an organization specified in theGRP13FM format, such as "Facilities" or "Payroll".
GRP11FM Describes an organization hierarchy level for the organization. For example, it coulddescribe the group levels below the group levels of an organization specified in theGRP12FM format, such as "Auditing" or "Benefits".
HONORSPROGRAM Describes an honors program, such as “University Honors” or “University Scholars”.
INTORG Describes an institutional organization, such as "Contracts" or “Book Sales”.
IORGS Describes an institutional organization, such as "Contracts" or “Book Sales”.
JOBGRP Describes a job group, such as “Skilled Laborers” or “Administrative Professional”.
LANG Describes a language, such as "English".
LOS Describes a length of service range, such as “1+ to 3 yrs” or “10+ yrs”. This format isnot maintained with an ETL job.
LVCODE Describes a leave of absence code, such as “Death in Family” or “Jury Duty”.
MARITAL Describes marital status, such as "Married" or "Single".
MONEY Describes a currency denomination, such as "Schilling" or “US Dollar”.
OTHERHONORS Describes additional honorary designations, such as “Phi Beta Kappa (GeneralAcademics)” or “Tau Beta Pi (Engineering Excellence)”.
PAYPER Describes a pay schedule, such as "Hourly" or "Yearly".
POSTY Describes a position type, such as “Permanent Full-Time” or “Temporary Part-Time”.
PSTAT Describes a position status code, such as "Inactive".
RECSRC Describes a recruitment source code, such as “Chicago Tribune” or “Minneapolis Star”.
REGTEMP Describes employment status, such as “Regular Full-Time” or “Temporary Part-Time”.
REJRSN Describes a reason for rejection, such as “More Qualified Candidate” or “NotQualified”.
SCHOOLDEPTTYPE Describes a school department type, such as "Engineering" or "Music".
SCHOOLNAMETYPE Describes the type of school from a governmental perspective, such as “Private School”or “Public School”.
SCHOOLTYPE Describes the type of school, such as “High School” or "University".
38 Chapter 2 • Managing the Data Sources
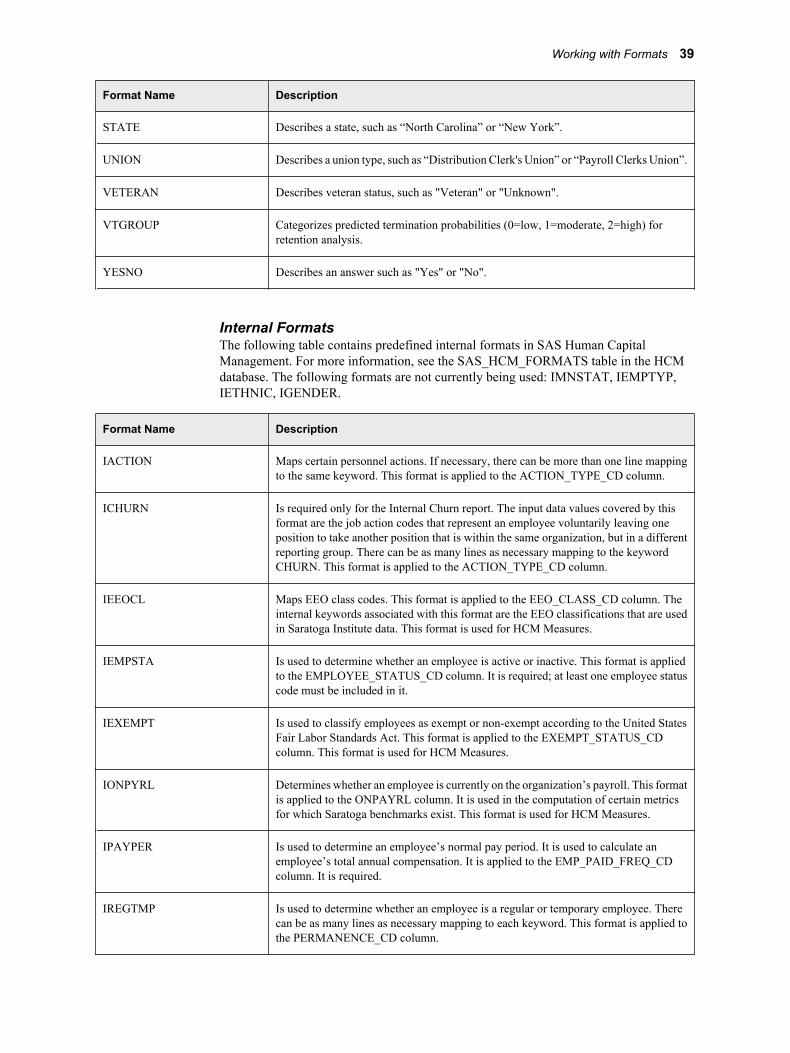
Format Name Description
STATE Describes a state, such as “North Carolina” or “New York”.
UNION Describes a union type, such as “Distribution Clerk's Union” or “Payroll Clerks Union”.
VETERAN Describes veteran status, such as "Veteran" or "Unknown".
VTGROUP Categorizes predicted termination probabilities (0=low, 1=moderate, 2=high) forretention analysis.
YESNO Describes an answer such as "Yes" or "No".
Internal FormatsThe following table contains predefined internal formats in SAS Human CapitalManagement. For more information, see the SAS_HCM_FORMATS table in the HCMdatabase. The following formats are not currently being used: IMNSTAT, IEMPTYP,IETHNIC, IGENDER.
Format Name Description
IACTION Maps certain personnel actions. If necessary, there can be more than one line mappingto the same keyword. This format is applied to the ACTION_TYPE_CD column.
ICHURN Is required only for the Internal Churn report. The input data values covered by thisformat are the job action codes that represent an employee voluntarily leaving oneposition to take another position that is within the same organization, but in a differentreporting group. There can be as many lines as necessary mapping to the keywordCHURN. This format is applied to the ACTION_TYPE_CD column.
IEEOCL Maps EEO class codes. This format is applied to the EEO_CLASS_CD column. Theinternal keywords associated with this format are the EEO classifications that are usedin Saratoga Institute data. This format is used for HCM Measures.
IEMPSTA Is used to determine whether an employee is active or inactive. This format is appliedto the EMPLOYEE_STATUS_CD column. It is required; at least one employee statuscode must be included in it.
IEXEMPT Is used to classify employees as exempt or non-exempt according to the United StatesFair Labor Standards Act. This format is applied to the EXEMPT_STATUS_CDcolumn. This format is used for HCM Measures.
IONPYRL Determines whether an employee is currently on the organization’s payroll. This formatis applied to the ONPAYRL column. It is used in the computation of certain metricsfor which Saratoga benchmarks exist. This format is used for HCM Measures.
IPAYPER Is used to determine an employee’s normal pay period. It is used to calculate anemployee’s total annual compensation. It is applied to the EMP_PAID_FREQ_CDcolumn. It is required.
IREGTMP Is used to determine whether an employee is a regular or temporary employee. Therecan be as many lines as necessary mapping to each keyword. This format is applied tothe PERMANENCE_CD column.
Working with Formats 39

Format Name Description
ISTECLS Is used to determine the Saratoga employee class. This format is applied to theSTECLASS column. It is required in order to compute certain metrics for whichSaratoga benchmarks exist. This format is used for HCM Measures.
ITERM Determines the job action codes that indicate that an employee has left the organization,whether voluntarily or involuntarily. This format is applied to the ACTION_TYPE_CDcolumn.
40 Chapter 2 • Managing the Data Sources
Chapter 3
Customizing the Display
Customizing an Employee Profile . . . . . . . . . . . . . . . . . . . . . . . . . . . . . . . . . . . . . . . . 41Working with Employee Profiles . . . . . . . . . . . . . . . . . . . . . . . . . . . . . . . . . . . . . . . 41Assign an Employee Profile to a User . . . . . . . . . . . . . . . . . . . . . . . . . . . . . . . . . . . 42Contents of an Employee Profile . . . . . . . . . . . . . . . . . . . . . . . . . . . . . . . . . . . . . . . 42Create an Employee Profile . . . . . . . . . . . . . . . . . . . . . . . . . . . . . . . . . . . . . . . . . . . 44Customize the Employee List, Profile Header, and Search Criteria . . . . . . . . . . . . . 46Add Fixed Categories . . . . . . . . . . . . . . . . . . . . . . . . . . . . . . . . . . . . . . . . . . . . . . . . 47Copy an Employee Profile . . . . . . . . . . . . . . . . . . . . . . . . . . . . . . . . . . . . . . . . . . . . 47Define an External Action . . . . . . . . . . . . . . . . . . . . . . . . . . . . . . . . . . . . . . . . . . . . 48Select the Default Employee Profile . . . . . . . . . . . . . . . . . . . . . . . . . . . . . . . . . . . . . 50Select a Default Category to Display for an Employee Profile . . . . . . . . . . . . . . . . 51Delete a Profile . . . . . . . . . . . . . . . . . . . . . . . . . . . . . . . . . . . . . . . . . . . . . . . . . . . . . 51
Customizing Geographic Analysis . . . . . . . . . . . . . . . . . . . . . . . . . . . . . . . . . . . . . . . 51About Geographic Analysis . . . . . . . . . . . . . . . . . . . . . . . . . . . . . . . . . . . . . . . . . . . 51Drilling Down into an Image Map . . . . . . . . . . . . . . . . . . . . . . . . . . . . . . . . . . . . . . 52Modify the Drill Level Hierarchy . . . . . . . . . . . . . . . . . . . . . . . . . . . . . . . . . . . . . . . 53Modify the Geographic Analysis Actions . . . . . . . . . . . . . . . . . . . . . . . . . . . . . . . . 54Create Maps for Geographic Analysis . . . . . . . . . . . . . . . . . . . . . . . . . . . . . . . . . . . 54
Customizing Organization Analysis . . . . . . . . . . . . . . . . . . . . . . . . . . . . . . . . . . . . . . 55About Organization Analysis . . . . . . . . . . . . . . . . . . . . . . . . . . . . . . . . . . . . . . . . . . 55Modify the Organization Analysis Defaults . . . . . . . . . . . . . . . . . . . . . . . . . . . . . . . 55
Working with Templates . . . . . . . . . . . . . . . . . . . . . . . . . . . . . . . . . . . . . . . . . . . . . . . 56About Templates . . . . . . . . . . . . . . . . . . . . . . . . . . . . . . . . . . . . . . . . . . . . . . . . . . . . 56Select Templates . . . . . . . . . . . . . . . . . . . . . . . . . . . . . . . . . . . . . . . . . . . . . . . . . . . . 56Add a Template . . . . . . . . . . . . . . . . . . . . . . . . . . . . . . . . . . . . . . . . . . . . . . . . . . . . . 57
Select the General Search Default Columns . . . . . . . . . . . . . . . . . . . . . . . . . . . . . . . 58
Customizing an Employee Profile
Working with Employee ProfilesAn employee profile provides a view into the employee data. It determines the tables andcolumns that are displayed in the Employee Browser when a user views information abouta single employee, views a list of employees in an organizational unit, or conducts anemployee search.
41
In the HCM Administration application, you can customize employee profiles in thefollowing ways:
• select the default employee profile
• create a new employee profile
• select or specify the following attributes of an employee profile:
• default template settings
• default information table settings
• default hierarchy settings
• actions
• select the columns to display in the following areas:
• the employee list
• the profile header
• the search criteria
• select the fixed categories, and the columns for each category, to be displayed in anemployee profile
• create and assign a template, which determines how the information is displayed (forexample, using tabs or drop-down lists for selection)
In the Employee Browser, users can further customize their profiles (for example, by addingtables to the display, or by selecting the columns to be displayed as the result of a search).However, these customizations affect only the individual user's version of a profile, not thesettings that you assign.
Assign an Employee Profile to a UserAs an HCM Administrator, you assign an employee profile to a user or group by grantingthem ReadMetadata access to the profile and to the folder that contains the profile.
You might determine that some employees require multiple profiles that display differentviews of employee information. For example, some profiles might focus on compensationinformation, while other profiles contain demographic data. In that case, you would grantthose users ReadMetadata access to more than one profile. The user can then select a profilefrom the Options page of the Employee Browser.
Contents of an Employee Profile
Employee ListIn an employee profile, Employee List specifies the default summary columns that aredisplayed when a user selects a management or departmental node in the hierarchy ordisplays the results of a search. In this example, the user has selected the TechnicalSupport node:
42 Chapter 3 • Customizing the Display
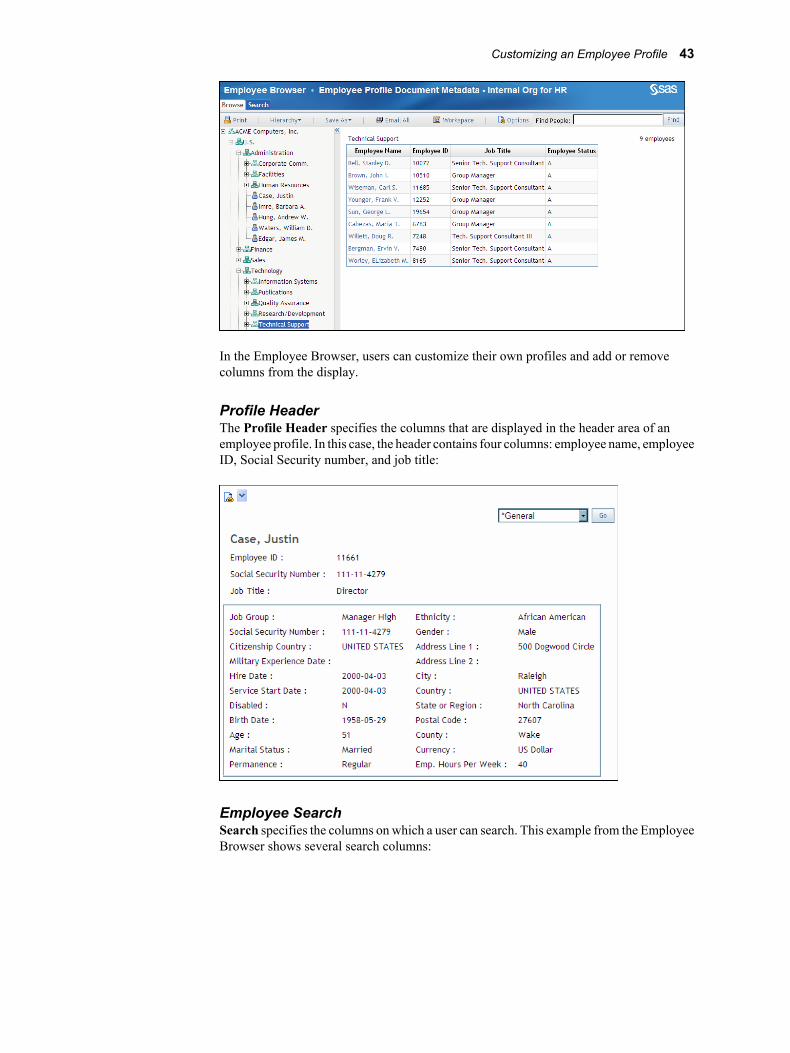
In the Employee Browser, users can customize their own profiles and add or removecolumns from the display.
Profile HeaderThe Profile Header specifies the columns that are displayed in the header area of anemployee profile. In this case, the header contains four columns: employee name, employeeID, Social Security number, and job title:
Employee SearchSearch specifies the columns on which a user can search. This example from the EmployeeBrowser shows several search columns:
Customizing an Employee Profile 43

The Fixed CategoriesThe fixed categories determine the columns that are displayed when a user views theinformation for a single employee. A profile must contain at least one fixed category thatincludes one or more columns. Categories are simply ways of grouping information fordisplay. Some common categories are general information, position information, andcompensation. In this example, the user is displaying a category containing informationsuch as the employee's job group, permanence status, and pay level:
Users cannot modify the fixed categories. However, on the Options page of the EmployeeBrowser, they can add other tables or information maps to the display.
Create an Employee ProfileThere are two approaches to creating an employee profile:
• You can copy an existing profile and customize it. (See “Copy an Employee Profile”on page 47.)
• You can create a new profile.
To create a new employee profile:
1. In the HCM Administration application, click the Customize tab.
2. Click New Employee Profile.
44 Chapter 3 • Customizing the Display

The New Employee Profile dialog box is displayed.
3. Enter a name and description for the profile.
If you enter a description, it is displayed at the top of the Employee Profile, along withthe hierarchy description. If the description is blank, the profile name is displayedinstead. (When you edit a profile, you can modify the description, if necessary.)
4. From the Save in box, select a location in which to store the profile. The profile appearsas a document in the workspace. You can move it or change its permissions if necessary.
In order to access a profile, a user must have ReadMetadata access to the folder and tothe profile itself. You can use this permission to restrict access to particular profiles.See “Assign an Employee Profile to a User” on page 42 for more information.
Administrators must have ReadMetadata and WriteMetadata access to this folder andits contents.
Note: Do not try to rename an employee profile (in the workspace or in SASManagement Console). Renaming an existing profile would prevent users frombeing able to access it. In addition, be aware that changing the profile descriptionin the workspace does not affect the description that is displayed in the profileproperties on this page.
5. From the Employee details template drop-down list, select a template for the profile.The template determines the way the information is displayed in the EmployeeBrowser. For example, categories might be displayed in a drop-down list, or on a setof tabs.
6. Provide the following information in the Default Information Table Settings section:
The Table selection determines the information table that is always used by this profile,regardless of which hierarchy is used. Only tables that have a hierarchy mapping areavailable in the drop-down list. A typical selection is the Employee Master table.
The Link attribute and Key attribute are used to index into the information table.The key attribute must contain a unique identifier. In the Employee Browser, when auser clicks the link attribute (such as employee name), the key attribute value (such asemployee ID) is used to select the correct record from the table.
7. Provide the following information in the Default Hierarchy Settings section:
The Employee browser hierarchy determines the hierarchy that is displayed bydefault in the Employee Browser. The user can override this default with anotherhierarchy selection.
If you select View employee nodes in hierarchies, then employees are displayed asseparate nodes in the hierarchical tree. Clear the check box to display only nodes thatrepresent entities such as managers, departments, and divisions, rather than individualemployees.
If you select View all department nodes, then users can view all nodes, even nodeswithout employees. (The department might not have any employees, or the user mightbe restricted from seeing employee information for those nodes.)
8. Click OK.
When you create an employee profile, no columns are selected for the profile header, searchcriteria, or fixed categories. You must edit the profile to assign these columns. Otherwise,no information will be displayed in the Employee Browser for this profile. You can alsocreate actions (links) that can appear at the department level or at the employee detail level.
Customizing an Employee Profile 45
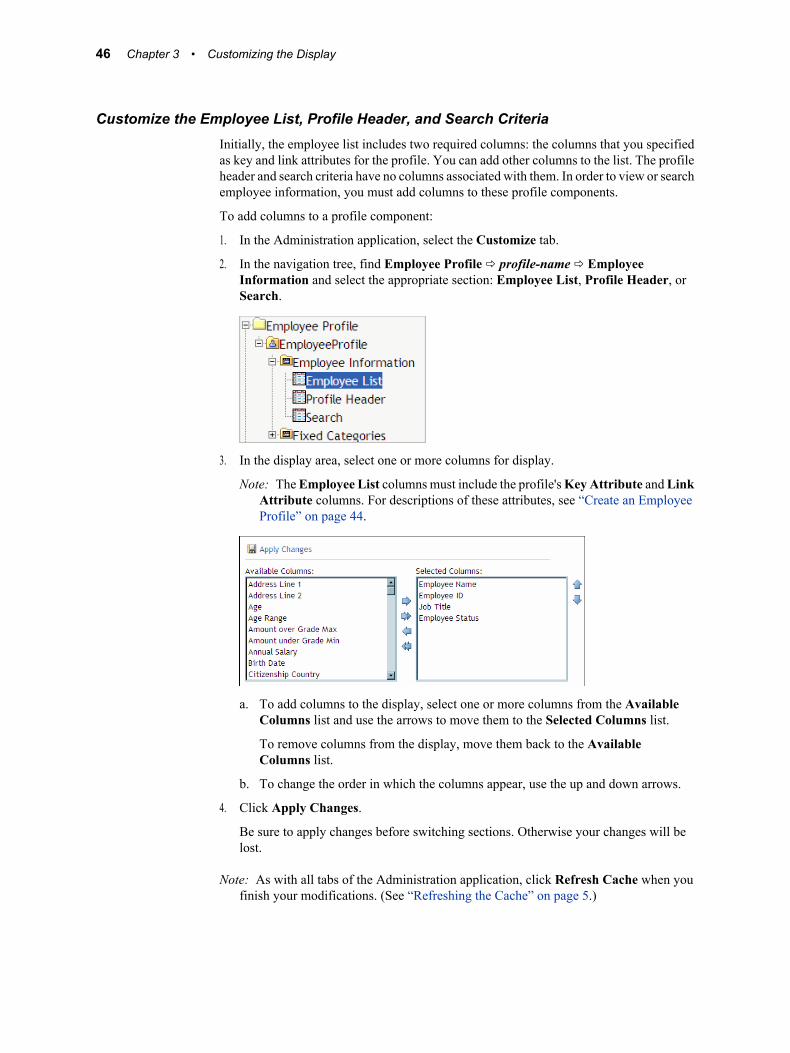
Customize the Employee List, Profile Header, and Search CriteriaInitially, the employee list includes two required columns: the columns that you specifiedas key and link attributes for the profile. You can add other columns to the list. The profileheader and search criteria have no columns associated with them. In order to view or searchemployee information, you must add columns to these profile components.
To add columns to a profile component:
1. In the Administration application, select the Customize tab.
2. In the navigation tree, find Employee Profile ð profile-name ð EmployeeInformation and select the appropriate section: Employee List, Profile Header, orSearch.
3. In the display area, select one or more columns for display.
Note: The Employee List columns must include the profile's Key Attribute and LinkAttribute columns. For descriptions of these attributes, see “Create an EmployeeProfile” on page 44.
a. To add columns to the display, select one or more columns from the AvailableColumns list and use the arrows to move them to the Selected Columns list.
To remove columns from the display, move them back to the AvailableColumns list.
b. To change the order in which the columns appear, use the up and down arrows.
4. Click Apply Changes.
Be sure to apply changes before switching sections. Otherwise your changes will belost.
Note: As with all tabs of the Administration application, click Refresh Cache when youfinish your modifications. (See “Refreshing the Cache” on page 5.)
46 Chapter 3 • Customizing the Display
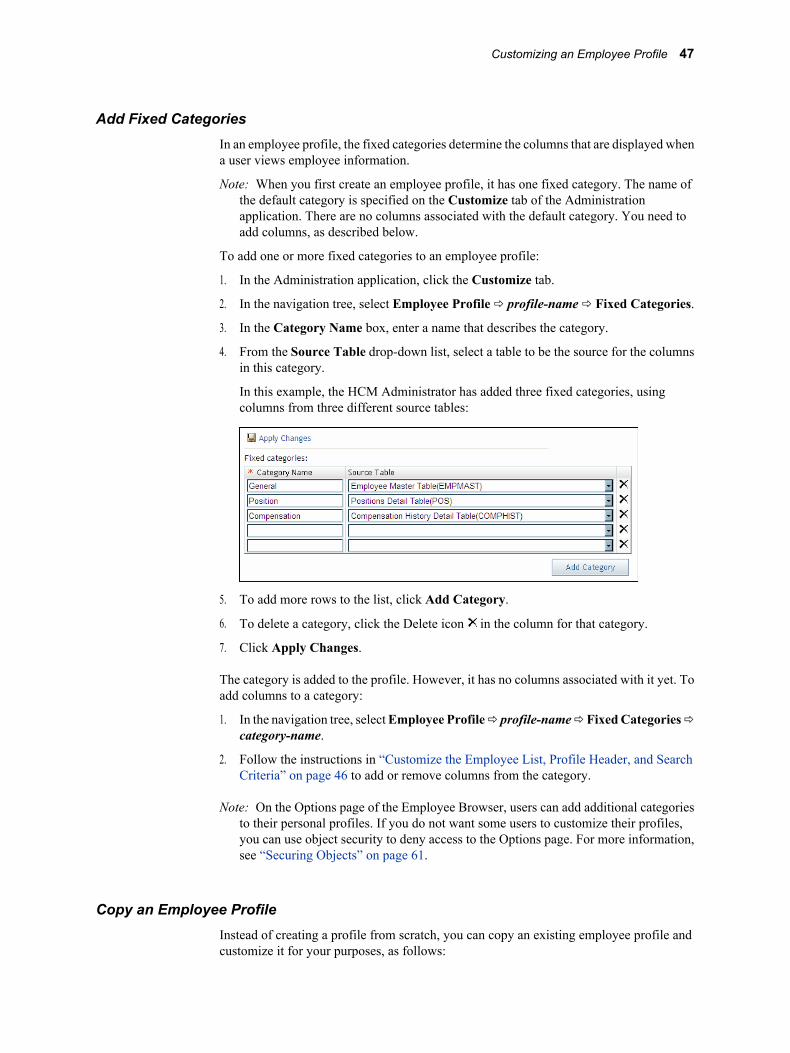
Add Fixed CategoriesIn an employee profile, the fixed categories determine the columns that are displayed whena user views employee information.
Note: When you first create an employee profile, it has one fixed category. The name ofthe default category is specified on the Customize tab of the Administrationapplication. There are no columns associated with the default category. You need toadd columns, as described below.
To add one or more fixed categories to an employee profile:
1. In the Administration application, click the Customize tab.
2. In the navigation tree, select Employee Profile ð profile-name ð Fixed Categories.
3. In the Category Name box, enter a name that describes the category.
4. From the Source Table drop-down list, select a table to be the source for the columnsin this category.
In this example, the HCM Administrator has added three fixed categories, usingcolumns from three different source tables:
5. To add more rows to the list, click Add Category.
6. To delete a category, click the Delete icon in the column for that category.
7. Click Apply Changes.
The category is added to the profile. However, it has no columns associated with it yet. Toadd columns to a category:
1. In the navigation tree, select Employee Profile ð profile-name ð Fixed Categories ðcategory-name.
2. Follow the instructions in “Customize the Employee List, Profile Header, and SearchCriteria” on page 46 to add or remove columns from the category.
Note: On the Options page of the Employee Browser, users can add additional categoriesto their personal profiles. If you do not want some users to customize their profiles,you can use object security to deny access to the Options page. For more information,see “Securing Objects” on page 61.
Copy an Employee ProfileInstead of creating a profile from scratch, you can copy an existing employee profile andcustomize it for your purposes, as follows:
Customizing an Employee Profile 47
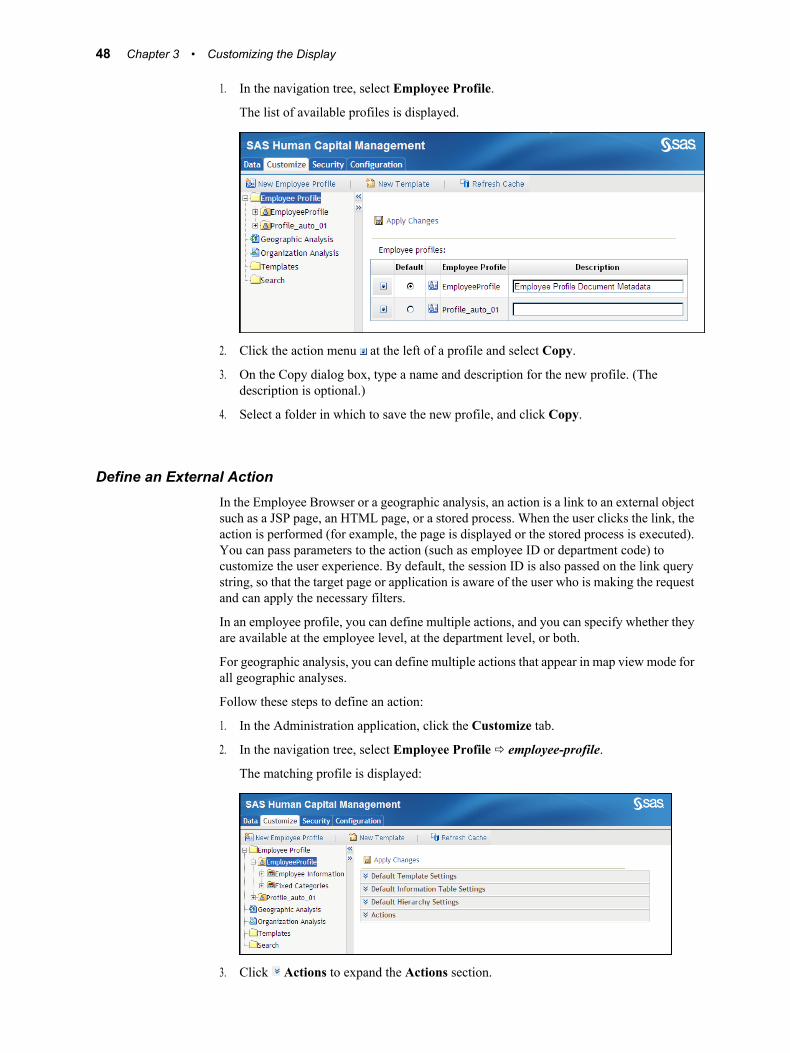
1. In the navigation tree, select Employee Profile.
The list of available profiles is displayed.
2. Click the action menu at the left of a profile and select Copy.
3. On the Copy dialog box, type a name and description for the new profile. (Thedescription is optional.)
4. Select a folder in which to save the new profile, and click Copy.
Define an External ActionIn the Employee Browser or a geographic analysis, an action is a link to an external objectsuch as a JSP page, an HTML page, or a stored process. When the user clicks the link, theaction is performed (for example, the page is displayed or the stored process is executed).You can pass parameters to the action (such as employee ID or department code) tocustomize the user experience. By default, the session ID is also passed on the link querystring, so that the target page or application is aware of the user who is making the requestand can apply the necessary filters.
In an employee profile, you can define multiple actions, and you can specify whether theyare available at the employee level, at the department level, or both.
For geographic analysis, you can define multiple actions that appear in map view mode forall geographic analyses.
Follow these steps to define an action:
1. In the Administration application, click the Customize tab.
2. In the navigation tree, select Employee Profile ð employee-profile.
The matching profile is displayed:
3. Click Actions to expand the Actions section.
48 Chapter 3 • Customizing the Display

4. Click New.
5. In the Action Name box, type a name for the action.
6. From the Type drop-down list, select the type of object that is the target of the hyperlink:
• External Link (JSP/HTML): a JavaServer page, HTML page, or other validMIME type such as an image or a PDF file. In the Employee Browser or in ageographic analysis, clicking the link opens the target page in a separate browserwindow.
• Information Map: a SAS Information Map. Clicking the link opens SAS WebReport Studio, with this map selected as the data source.
• Web Report: a SAS Web Report Studio report. Clicking the link opens this reportin SAS Web Report Studio.
• Web Service: a Web service such as Google.
• SAS Stored Process: a stored process. Clicking the link causes the stored processto be executed.
• BI Dashboard: a SAS BI dashboard object. Clicking the link opens the dashboard.
7. If the Select button is active, click Select to browse the SAS Folders for an informationmap, SAS Web Report Studio report, or stored process, or to select a dashboard.
Otherwise, type in the complete path (including http://) to an HTML page, JSP, or Webservice.
By default, HCM information maps are stored at Products ð SAS Human CapitalManagement ð Data Sources ð Information Maps. The SAS Human CapitalManagement standard reports are stored at Products ð SAS Human CapitalManagement ð Reports.
8. Select the levels at which the action is available:
• Employee detail
• Department
Note: These check boxes do not apply to geographic analysis.
9. If you do not want to pass any parameters on the link string, select Do not passparameters.
10. To define parameters to be passed on the link query string, select Pass parameters.
If you choose this option, the Add Parameter button is enabled.
11. (Optional) To add one or more parameters to an action, first select a source table fromthe Table drop-down list. The source table applies to all parameters for this action.
Customizing an Employee Profile 49
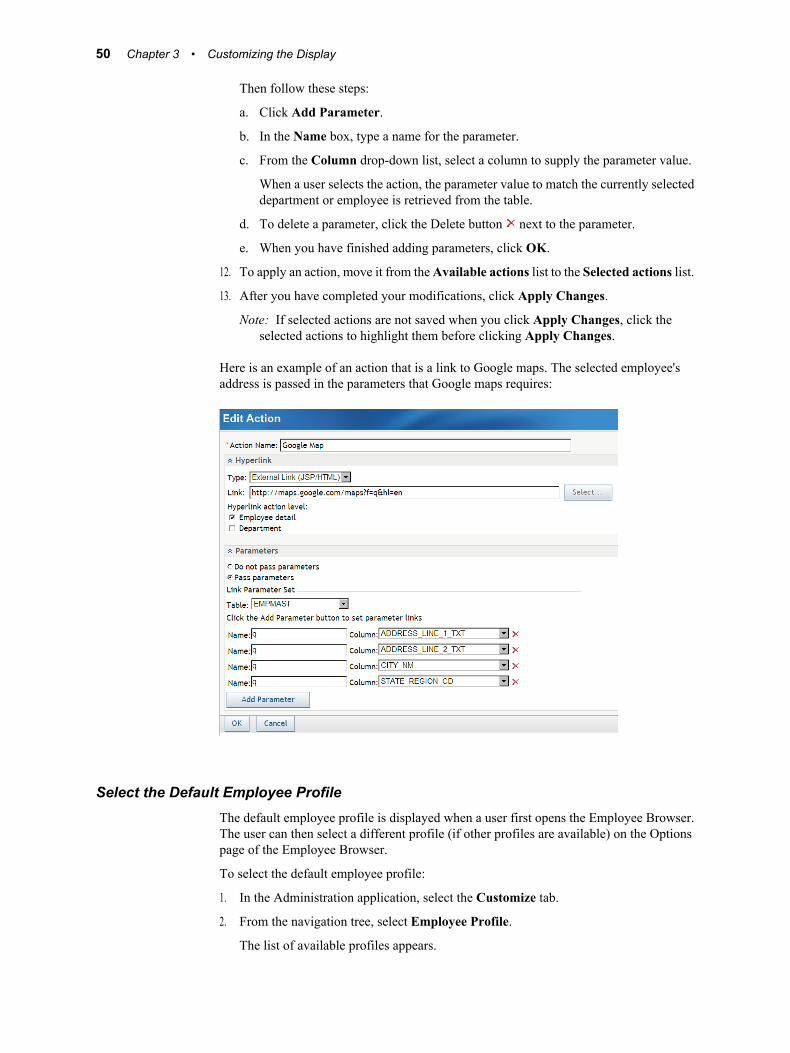
Then follow these steps:
a. Click Add Parameter.
b. In the Name box, type a name for the parameter.
c. From the Column drop-down list, select a column to supply the parameter value.
When a user selects the action, the parameter value to match the currently selecteddepartment or employee is retrieved from the table.
d. To delete a parameter, click the Delete button next to the parameter.
e. When you have finished adding parameters, click OK.
12. To apply an action, move it from the Available actions list to the Selected actions list.
13. After you have completed your modifications, click Apply Changes.
Note: If selected actions are not saved when you click Apply Changes, click theselected actions to highlight them before clicking Apply Changes.
Here is an example of an action that is a link to Google maps. The selected employee'saddress is passed in the parameters that Google maps requires:
Select the Default Employee ProfileThe default employee profile is displayed when a user first opens the Employee Browser.The user can then select a different profile (if other profiles are available) on the Optionspage of the Employee Browser.
To select the default employee profile:
1. In the Administration application, select the Customize tab.
2. From the navigation tree, select Employee Profile.
The list of available profiles appears.
50 Chapter 3 • Customizing the Display
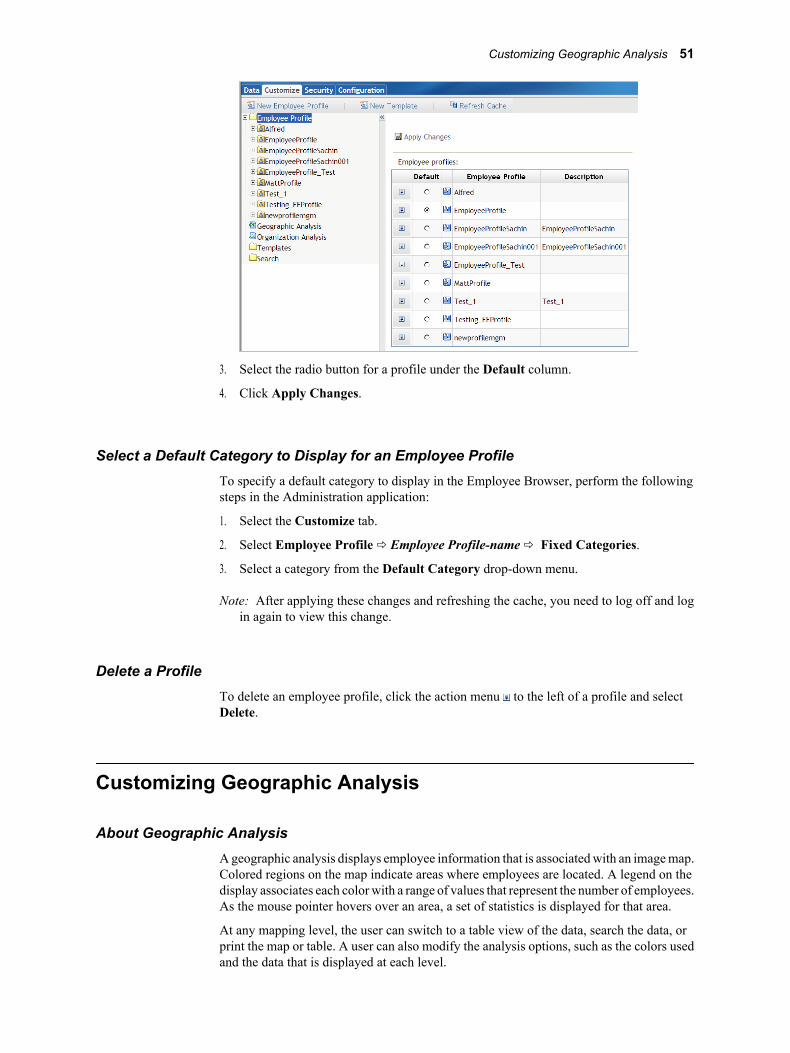
3. Select the radio button for a profile under the Default column.
4. Click Apply Changes.
Select a Default Category to Display for an Employee ProfileTo specify a default category to display in the Employee Browser, perform the followingsteps in the Administration application:
1. Select the Customize tab.
2. Select Employee Profile ð Employee Profile-name ð Fixed Categories.
3. Select a category from the Default Category drop-down menu.
Note: After applying these changes and refreshing the cache, you need to log off and login again to view this change.
Delete a ProfileTo delete an employee profile, click the action menu to the left of a profile and selectDelete.
Customizing Geographic Analysis
About Geographic AnalysisA geographic analysis displays employee information that is associated with an image map.Colored regions on the map indicate areas where employees are located. A legend on thedisplay associates each color with a range of values that represent the number of employees.As the mouse pointer hovers over an area, a set of statistics is displayed for that area.
At any mapping level, the user can switch to a table view of the data, search the data, orprint the map or table. A user can also modify the analysis options, such as the colors usedand the data that is displayed at each level.
Customizing Geographic Analysis 51

As an HCM Administrator, you define the drill level hierarchy and the actions that areavailable at each level.
Drilling Down into an Image MapThe image maps that are used in geographic analysis have link fields that allow a user todrill down to the next level. For example, here are three maps that are available in thedefault installation—a map of the world, a map of the U.S., and state map—showing thelink field values that were used to drill down to the next map:
In this example, the user clicked the outline of the United States on the world map to drilldown to the USA country map. On the country map, the user clicked the outline of NorthCarolina to drill down to the map for that state.
A geographic analysis requires two types of tables:
• map tables
• an information table
Map tables contain data for displaying image maps and drilling down to more detailedmaps. As the HCM administrator, you define a hierarchy of map tables. When users createa geographic analysis, they select the entire hierarchy or a subset of the hierarchy of mapsto display.
Each map table contains a SEGMENT column and X and Y columns that define areas ofthe map. A map table also contains link columns that are used to link from one map to thenext, and from the map to an information table.
These map tables are supplied by default:
Table 3.1 Default map tables
Level Map Table Link Columns
World HRV_GBL COUNTRY_CD
Country HRV_US COUNTRY_CD
STATE_REGION_CD
52 Chapter 3 • Customizing the Display
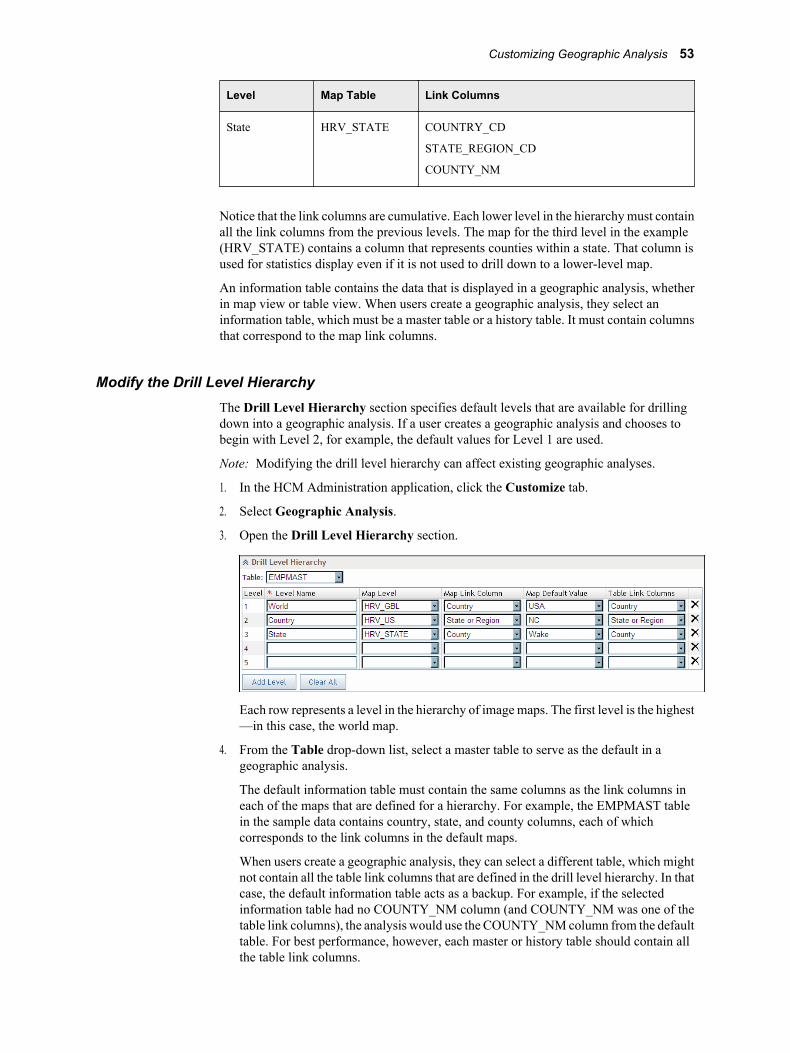
Level Map Table Link Columns
State HRV_STATE COUNTRY_CD
STATE_REGION_CD
COUNTY_NM
Notice that the link columns are cumulative. Each lower level in the hierarchy must containall the link columns from the previous levels. The map for the third level in the example(HRV_STATE) contains a column that represents counties within a state. That column isused for statistics display even if it is not used to drill down to a lower-level map.
An information table contains the data that is displayed in a geographic analysis, whetherin map view or table view. When users create a geographic analysis, they select aninformation table, which must be a master table or a history table. It must contain columnsthat correspond to the map link columns.
Modify the Drill Level HierarchyThe Drill Level Hierarchy section specifies default levels that are available for drillingdown into a geographic analysis. If a user creates a geographic analysis and chooses tobegin with Level 2, for example, the default values for Level 1 are used.
Note: Modifying the drill level hierarchy can affect existing geographic analyses.
1. In the HCM Administration application, click the Customize tab.
2. Select Geographic Analysis.
3. Open the Drill Level Hierarchy section.
Each row represents a level in the hierarchy of image maps. The first level is the highest—in this case, the world map.
4. From the Table drop-down list, select a master table to serve as the default in ageographic analysis.
The default information table must contain the same columns as the link columns ineach of the maps that are defined for a hierarchy. For example, the EMPMAST tablein the sample data contains country, state, and county columns, each of whichcorresponds to the link columns in the default maps.
When users create a geographic analysis, they can select a different table, which mightnot contain all the table link columns that are defined in the drill level hierarchy. In thatcase, the default information table acts as a backup. For example, if the selectedinformation table had no COUNTY_NM column (and COUNTY_NM was one of thetable link columns), the analysis would use the COUNTY_NM column from the defaulttable. For best performance, however, each master or history table should contain allthe table link columns.
Customizing Geographic Analysis 53
5. Complete the remaining fields as follows:
Level NameEnter a name to identify this level. This name is used in the bread crumbs at the topof a geographic analysis display.
Map LevelFrom the drop-down list, select the map table for this level.
Map Link ColumnFrom the drop-down list, select the link column in the map table.
Map Default ValueFrom the drop-down list, select the default value for the map link column (in otherwords, the default drill-down value). This value is applied in a geographic analysisthat starts with a level other than Level 1.
Table Link ColumnsFrom the drop-down list, select the column (in the master table) that correspondsto the map link column. For example, if the map link column contains state codes(such as NC), the table link column must contain state codes. If the map link columncontains formatted values (such as North Carolina), then the table link columnmust also contain formatted values.
Note: If the map link column and table link column do not match, a geographicanalysis displays an empty map, with no statistics or colored regions. However,the legend displays the employee population, to match what is displayed inTable view mode.
6. To create another level in the hierarchy, click Add Level.
7. To remove all levels from the hierarchy, click Clear All.
8. Click Apply Changes.
Modify the Geographic Analysis ActionsIn addition to setting the drill level hierarchy, the HCM Administrator can define externallinks, called actions, that are available to users in a geographic analysis. For instructions,see “Define an External Action” on page 48.
Create Maps for Geographic AnalysisThe default map tables are listed in Table 3.1 on page 52. You can import additional maptables if necessary. For example, to add a map of Poland, you would follow a procedurelike this:
1. Insert COUNTRY_CODE(POL) and its corresponding SEGMENT, X and Y into theworld map table.
Note: The country code will be the map link column for a geographic analysis. Thisvalue must match the table link column in the information table. Typically, theyare both codes that represent a country, but if one is a formatted value, the othermust be also.
2. Insert COUNTRY_CODE, PROVINCE_CODE and its corresponding SEGMENT, Xand Y into the Country map table.
3. Insert COUNTRY_CODE, PROVINCE_CODE, DISTRICT_CODE and itscorresponding SEGMENT, X, and Y into a Province map table.
54 Chapter 3 • Customizing the Display
4. Add employee records to the information table, which must containCOUNTRY_CODE, PROVINCE_CODE, and DISTRICT_CODE values for eachemployee added.
5. Import the map files with the following steps.
a. On the Data tab, select New Table.
b. Select the External radio button.
c. From the Type drop-down list, select SAS DataSet.
d. From the General Settings, select the following options:
• Create a map table
• Use format
• Allow security access for HCM roles
Do not select these options:
• Use as a master table
• Register table in metadata repository
For further instructions about importing tables, see “Add a Table” on page 9. If yourSAS data set contains columns with formats attached to them, see “Importing SAS DataSets with Formatted Columns” on page 8.
6. Refresh the cache.
7. On the Customize tab, modify the Drill Level Hierarchy section appropriately. (See“Modify the Drill Level Hierarchy” on page 53.)
8. Apply your changes and refresh the cache.
Customizing Organization Analysis
About Organization AnalysisIn an organization analysis, users can view the structure of an organization in a hierarchicaltable (analysis view) or a graphical organization chart (presentation view). An organizationanalysis displays employee statistics and reporting relationships. Users can simulate anorganization restructuring, creating what-if scenarios and exporting the results to aMicrosoft Excel worksheet.
Modify the Organization Analysis DefaultsThe default attribute determines the text that is displayed in the navigation tree for a neworganization analysis. Users can modify this attribute on the Options page of an analysis.
To modify the default attribute:
1. In the SAS Human Capital Management Administration application, click theCustomize tab.
2. In the navigation tree, click Organization Analysis.
3. In the list of attributes, select a radio button:
Customizing Organization Analysis 55
• Select Name to display the name of the manager or department.
• Select Description to display the description of the manager or department.
• Select Manager Name to display the hierarchy code for this member.
4. Click Apply Changes.
Working with Templates
About TemplatesOn the Customize tab of the Administration application, you can select templates that applyto the Home page and templates that apply to employee profiles.
The Home page template determines what a user sees in the display area after logging onto SAS Human Capital Management. There are two Home page templates:
• HcmHomeRight.jsp displays the general search user interface (see “The General SearchUtility” in the SAS Human Capital Management: User's Guide).
• HCM_BID_Template.jsp displays the general search user interface and a BI Dashboardportlet, from which users can select among available BI dashboards (see “DisplayingKey Metrics with SAS BI Dashboard” in the SAS Human Capital Management: User'sGuide).
The employee profile templates affect the display of employee detail information. They donot affect employee summaries or search results. For example, the employee display areamight contain drop-down lists for selecting categories of data (such as compensation orabsence information), or it might present that information in a set of tabs. It might displaya picture of the employee.
Both the Home page and the employee profile templates are stored as JSP files in thedeployed SAS Human Capital Management application, along with the standard JSPs. Theemployee profile templates use the HCM Public API to access HCM data, and they can becustomized. For information about the API and an example, see Chapter 6, “Customizingthe Employee Profile Templates,” on page 95.
Select TemplatesTo select a template, click the Customize tab of the Administration application. From thenavigation tree, select Templates. Then follow these steps:
56 Chapter 3 • Customizing the Display

1. Home Page Template Settings. From the Default template drop-down list in thissection, select a predefined template.
2. Employee Detail Template Settings. From the Default template drop-down list inthis section, select a predefined template.
When an administrator creates an employee profile, this template is presented as thedefault.
3. Click Apply Changes.
On this page, you can also modify the display name for a template or delete a template, asfollows:
• To modify the display name for a template, type a new name in the Display Name box,and click Apply Changes.
• To delete a template, click the Delete button to the right of the template.
Note: You cannot delete the template that is currently selected.
Add a TemplateTo add a template to the list of predefined templates, click New Template. In the NewTemplates dialog box, follow these steps for each template you want to define:
1. Enter a display name for the template.
2. (Optional) Enter a description.
3. Enter a filename for the template, including the .jsp suffix.
Note: The filename can contain only alphanumeric characters, underscores, periods,and the forward slash (/).
4. Select the template type: Home Page Template or Employee Profile Template.
5. Click OK.
Working with Templates 57
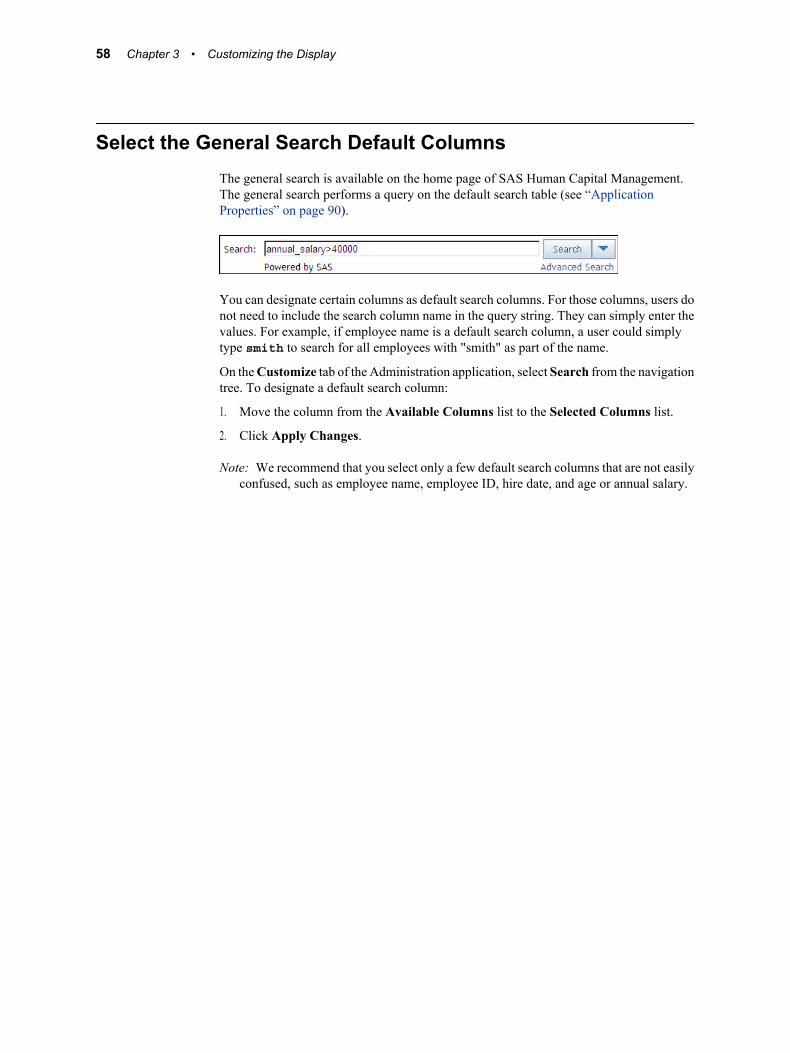
Select the General Search Default ColumnsThe general search is available on the home page of SAS Human Capital Management.The general search performs a query on the default search table (see “ApplicationProperties” on page 90).
You can designate certain columns as default search columns. For those columns, users donot need to include the search column name in the query string. They can simply enter thevalues. For example, if employee name is a default search column, a user could simplytype smith to search for all employees with "smith" as part of the name.
On the Customize tab of the Administration application, select Search from the navigationtree. To designate a default search column:
1. Move the column from the Available Columns list to the Selected Columns list.
2. Click Apply Changes.
Note: We recommend that you select only a few default search columns that are not easilyconfused, such as employee name, employee ID, hire date, and age or annual salary.
58 Chapter 3 • Customizing the Display
Chapter 4
Securing Objects and Tables
Security in SAS Human Capital Management . . . . . . . . . . . . . . . . . . . . . . . . . . . . . 60Managing Security in the Administration Application . . . . . . . . . . . . . . . . . . . . . . . 60Additional Security Measures . . . . . . . . . . . . . . . . . . . . . . . . . . . . . . . . . . . . . . . . . . 60
Importing Users . . . . . . . . . . . . . . . . . . . . . . . . . . . . . . . . . . . . . . . . . . . . . . . . . . . . . . 60
Securing Objects . . . . . . . . . . . . . . . . . . . . . . . . . . . . . . . . . . . . . . . . . . . . . . . . . . . . . . 61About Object Security . . . . . . . . . . . . . . . . . . . . . . . . . . . . . . . . . . . . . . . . . . . . . . . 61How Object Permissions Are Interpreted . . . . . . . . . . . . . . . . . . . . . . . . . . . . . . . . . 62Add Permissions for an Object . . . . . . . . . . . . . . . . . . . . . . . . . . . . . . . . . . . . . . . . . 64Modify Direct Permissions for an Object . . . . . . . . . . . . . . . . . . . . . . . . . . . . . . . . . 65Secure a Custom Object . . . . . . . . . . . . . . . . . . . . . . . . . . . . . . . . . . . . . . . . . . . . . . 66
Searching for Identities . . . . . . . . . . . . . . . . . . . . . . . . . . . . . . . . . . . . . . . . . . . . . . . . 67
Securing Table Rows . . . . . . . . . . . . . . . . . . . . . . . . . . . . . . . . . . . . . . . . . . . . . . . . . . 68About Row-Level Security . . . . . . . . . . . . . . . . . . . . . . . . . . . . . . . . . . . . . . . . . . . . 68Default Row-Level Filters . . . . . . . . . . . . . . . . . . . . . . . . . . . . . . . . . . . . . . . . . . . . 69How Row-Level Filters Are Applied . . . . . . . . . . . . . . . . . . . . . . . . . . . . . . . . . . . . 69Enable Row-Level Security . . . . . . . . . . . . . . . . . . . . . . . . . . . . . . . . . . . . . . . . . . . 71Add a Row-Level Filter . . . . . . . . . . . . . . . . . . . . . . . . . . . . . . . . . . . . . . . . . . . . . . 72Modify a Row-Level Filter . . . . . . . . . . . . . . . . . . . . . . . . . . . . . . . . . . . . . . . . . . . . 73Delete a Row-Level Filter . . . . . . . . . . . . . . . . . . . . . . . . . . . . . . . . . . . . . . . . . . . . 73
Hierarchical Filters . . . . . . . . . . . . . . . . . . . . . . . . . . . . . . . . . . . . . . . . . . . . . . . . . . . . 74About Hierarchical Filters . . . . . . . . . . . . . . . . . . . . . . . . . . . . . . . . . . . . . . . . . . . . 74Select a Hierarchy . . . . . . . . . . . . . . . . . . . . . . . . . . . . . . . . . . . . . . . . . . . . . . . . . . . 74How a Hierarchical Filter Is Applied . . . . . . . . . . . . . . . . . . . . . . . . . . . . . . . . . . . . 75Tables Without Hierarchical Filters . . . . . . . . . . . . . . . . . . . . . . . . . . . . . . . . . . . . . 75The Power User Group . . . . . . . . . . . . . . . . . . . . . . . . . . . . . . . . . . . . . . . . . . . . . . . 76
Securing Table Columns . . . . . . . . . . . . . . . . . . . . . . . . . . . . . . . . . . . . . . . . . . . . . . . 77About Column Security . . . . . . . . . . . . . . . . . . . . . . . . . . . . . . . . . . . . . . . . . . . . . . 77How Column Permissions Are Applied . . . . . . . . . . . . . . . . . . . . . . . . . . . . . . . . . . 77Modify Permissions for a Table Column . . . . . . . . . . . . . . . . . . . . . . . . . . . . . . . . . 78Add an Identity to Table Column Permissions . . . . . . . . . . . . . . . . . . . . . . . . . . . . . 79
59

Security in SAS Human Capital Management
Managing Security in the Administration ApplicationOn the Security tab of the Administration application, HCM administrators can managethese elements of security:
• Object security. Assign permissions for actions, such as creating a geographic analysisor opening the Employee Browser.
• Row-level security. Assign permissions for access to rows in a table. Row-levelsecurity can include filters that are associated with users, groups, or roles. It alwaysincludes filters that are associated with a hierarchy.
• Column security. Assign permissions for access to table columns.
Note: Any changes that you make to object security or row-level security are not effectiveuntil you click Refresh Cache or restart the managed server. Column security changesare effective immediately (because they are changes to the metadata repository,whereas object security changes and row-level security changes affect the HCMdatabase).
Additional Security MeasuresIn addition to administering security for HCM objects and tables, you will need toadminister security for the folders that hold content in SAS Human Capital Management.For example, you might need to create folders in which users can share content, and youmight need to restrict some folders to certain users or groups.
• Administrators, and users with the appropriate permissions, can modify document andfolder properties in the workspace.
Chapter 3 of the SAS Human Capital Management: User's Guide describes how theworkspace is organized and explains how to set permissions.
• If you have administrative privileges for SAS Management Console, you can createfolders and modify permissions via that mechanism.
The primary source for information about these permissions is the SAS IntelligencePlatform: Security Administration Guide. The book contains an in-depth look at SASsecurity features, including authentication and authorization. It also contains informationabout managing security for objects such as SAS repositories, libraries, and OLAP data.
The SAS Intelligence Platform: System Administration Guide contains information aboutimplementing operating-system protection at a site.
Both books are available at support.sas.com/92administration.
Importing UsersIn order to log on to SAS Human Capital Management, a user must meet the followingcriteria:
60 Chapter 4 • Securing Objects and Tables
• The user must belong to one of the three SAS Human Capital Management roles: HCMUser, HCM Analyst, or HCM Administrator.
Note: Users should belong to only one of these roles. If they belong to more than one,the role with the fewest privileges applies.
• The user must be a member of the HCM Solution Users group.
• The user must have a valid entry in the SAS_USER_EMPLOYEE table.
The SAS_USER_EMPLOYEE table associates user names that are defined in the metadatarepository with employee IDs for the employee population that you are analyzing with SASHuman Capital Management. This table, which is located in the HCM datamart, is part ofthe security structure that restricts each user’s view to an appropriate subset of employees.
The SAS_USER_EMPLOYEE table gets some of its values from the EMPGEN table, andthere are ETL jobs to load both the EMPGEN table and the SAS_USER_EMPLOYEEtable. Typically, a site runs both jobs on a regular schedule.
However, there are two occasions under which you might want to update theSAS_USER_EMPLOYEE table without waiting for the ETL jobs to be run:
• You add a user (who is already represented in the EMPGEN table) to the HCM SolutionUsers group, and you want the effects to be available immediately.
• You remove a user from the HCM Solution Users group, and you want the deletion tobe effective immediately.
In those situations, click Import Users on the Security tab of the Administrationapplication.
Import Users loads the SAS_USER_EMPLOYEE table with the user ID and employee IDof all active employees who are members of the HCM Solution Users group and who alsohave entries in the EMPGEN table. It does not reflect changes in employee status (fromactive to inactive, or vice versa). In addition, it does not reflect new employees who havenot yet been added to the EMPGEN table. In those cases, you must run the ETL jobs thatrebuild or refresh the HCM datamart.
Securing Objects
About Object SecurityObject security refers to actions such as exporting an employee summary to MicrosoftExcel, refreshing a cube, or creating an organization chart. If a user has permission for anobject, the user can perform that action, and the associated menu item is displayed in SASHuman Capital Management.
As an example, consider the Copy To feature in an organization analysis. Users with theHCM Administrator role or the HCM Analyst role have permission to perform this action.Users with the HCM User role do not. Assuming no user or group permissions apply, thepermissions for the Copy To object would look like this:
Securing Objects 61
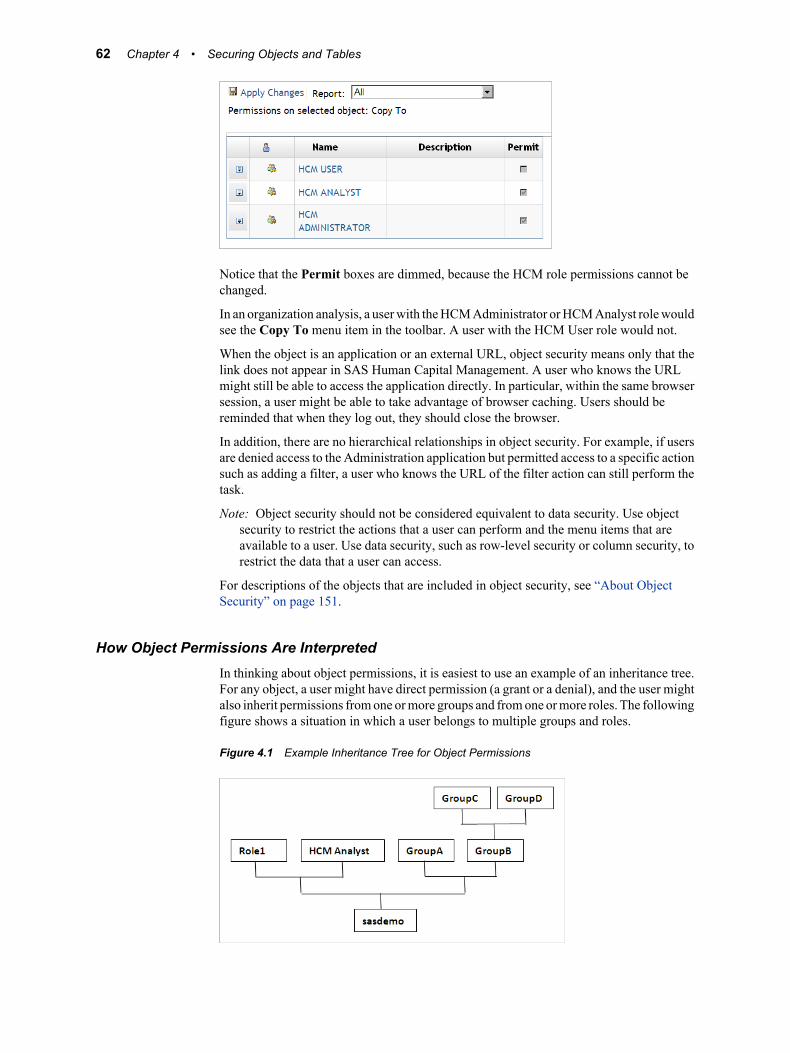
Notice that the Permit boxes are dimmed, because the HCM role permissions cannot bechanged.
In an organization analysis, a user with the HCM Administrator or HCM Analyst role wouldsee the Copy To menu item in the toolbar. A user with the HCM User role would not.
When the object is an application or an external URL, object security means only that thelink does not appear in SAS Human Capital Management. A user who knows the URLmight still be able to access the application directly. In particular, within the same browsersession, a user might be able to take advantage of browser caching. Users should bereminded that when they log out, they should close the browser.
In addition, there are no hierarchical relationships in object security. For example, if usersare denied access to the Administration application but permitted access to a specific actionsuch as adding a filter, a user who knows the URL of the filter action can still perform thetask.
Note: Object security should not be considered equivalent to data security. Use objectsecurity to restrict the actions that a user can perform and the menu items that areavailable to a user. Use data security, such as row-level security or column security, torestrict the data that a user can access.
For descriptions of the objects that are included in object security, see “About ObjectSecurity” on page 151.
How Object Permissions Are InterpretedIn thinking about object permissions, it is easiest to use an example of an inheritance tree.For any object, a user might have direct permission (a grant or a denial), and the user mightalso inherit permissions from one or more groups and from one or more roles. The followingfigure shows a situation in which a user belongs to multiple groups and roles.
Figure 4.1 Example Inheritance Tree for Object Permissions
62 Chapter 4 • Securing Objects and Tables
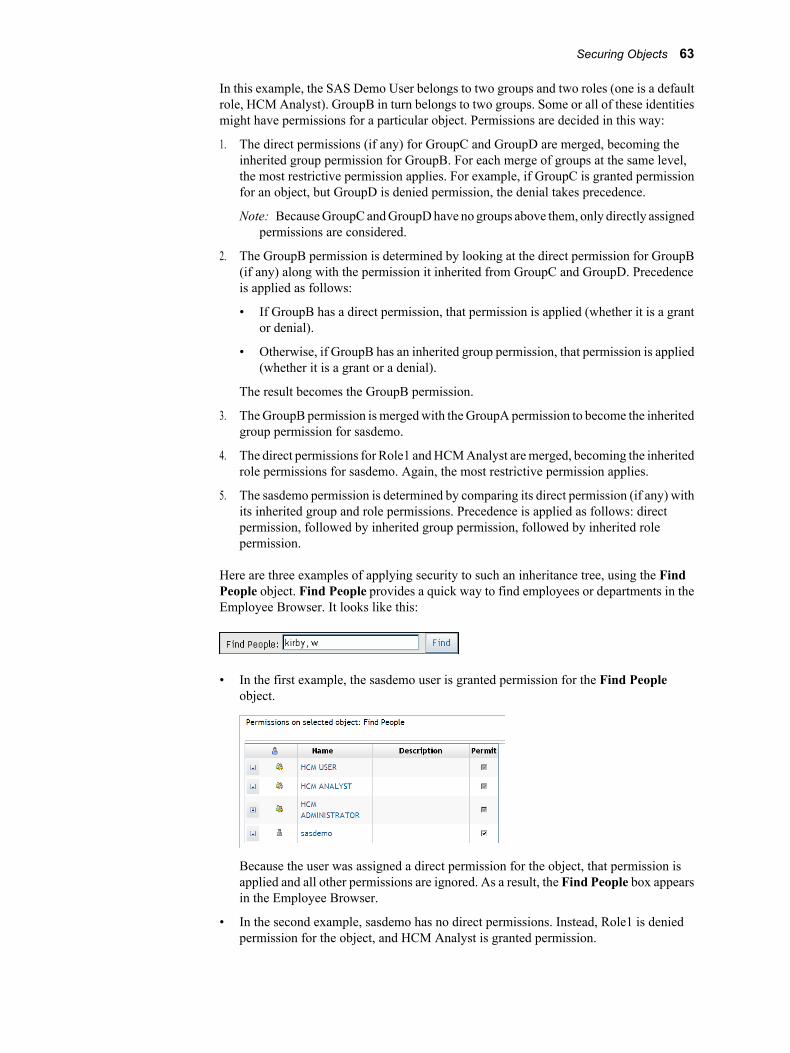
In this example, the SAS Demo User belongs to two groups and two roles (one is a defaultrole, HCM Analyst). GroupB in turn belongs to two groups. Some or all of these identitiesmight have permissions for a particular object. Permissions are decided in this way:
1. The direct permissions (if any) for GroupC and GroupD are merged, becoming theinherited group permission for GroupB. For each merge of groups at the same level,the most restrictive permission applies. For example, if GroupC is granted permissionfor an object, but GroupD is denied permission, the denial takes precedence.
Note: Because GroupC and GroupD have no groups above them, only directly assignedpermissions are considered.
2. The GroupB permission is determined by looking at the direct permission for GroupB(if any) along with the permission it inherited from GroupC and GroupD. Precedenceis applied as follows:
• If GroupB has a direct permission, that permission is applied (whether it is a grantor denial).
• Otherwise, if GroupB has an inherited group permission, that permission is applied(whether it is a grant or a denial).
The result becomes the GroupB permission.
3. The GroupB permission is merged with the GroupA permission to become the inheritedgroup permission for sasdemo.
4. The direct permissions for Role1 and HCM Analyst are merged, becoming the inheritedrole permissions for sasdemo. Again, the most restrictive permission applies.
5. The sasdemo permission is determined by comparing its direct permission (if any) withits inherited group and role permissions. Precedence is applied as follows: directpermission, followed by inherited group permission, followed by inherited rolepermission.
Here are three examples of applying security to such an inheritance tree, using the FindPeople object. Find People provides a quick way to find employees or departments in theEmployee Browser. It looks like this:
• In the first example, the sasdemo user is granted permission for the Find Peopleobject.
Because the user was assigned a direct permission for the object, that permission isapplied and all other permissions are ignored. As a result, the Find People box appearsin the Employee Browser.
• In the second example, sasdemo has no direct permissions. Instead, Role1 is deniedpermission for the object, and HCM Analyst is granted permission.
Securing Objects 63
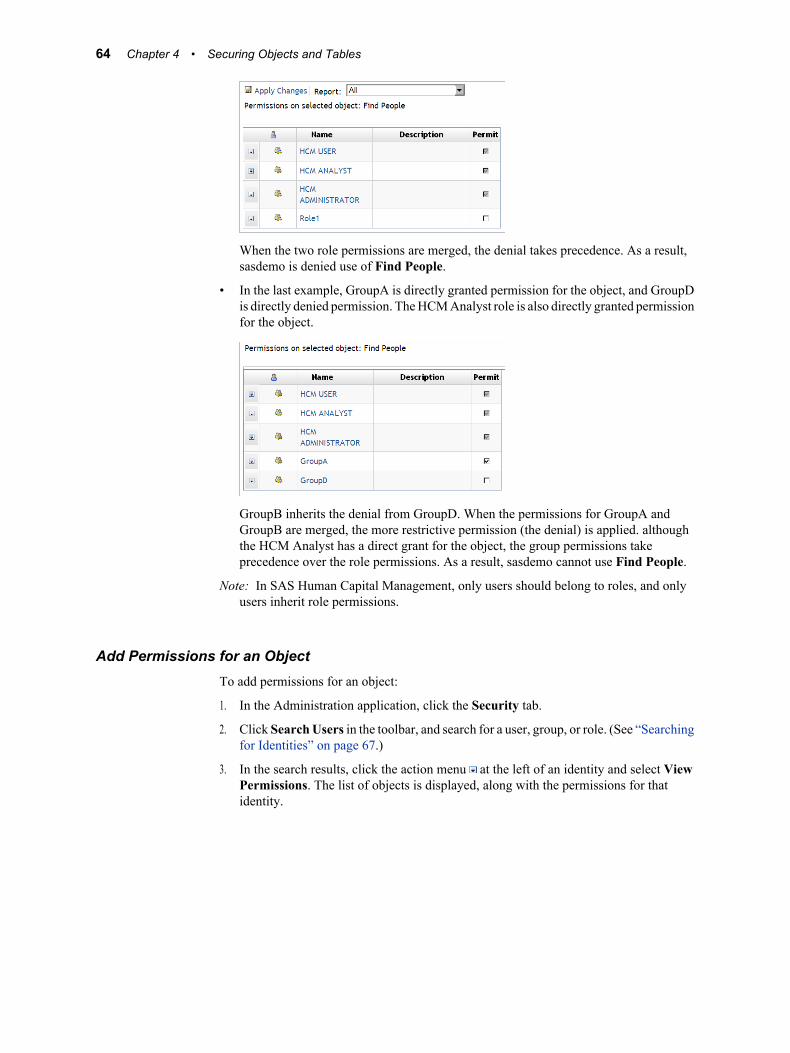
When the two role permissions are merged, the denial takes precedence. As a result,sasdemo is denied use of Find People.
• In the last example, GroupA is directly granted permission for the object, and GroupDis directly denied permission. The HCM Analyst role is also directly granted permissionfor the object.
GroupB inherits the denial from GroupD. When the permissions for GroupA andGroupB are merged, the more restrictive permission (the denial) is applied. althoughthe HCM Analyst has a direct grant for the object, the group permissions takeprecedence over the role permissions. As a result, sasdemo cannot use Find People.
Note: In SAS Human Capital Management, only users should belong to roles, and onlyusers inherit role permissions.
Add Permissions for an ObjectTo add permissions for an object:
1. In the Administration application, click the Security tab.
2. Click Search Users in the toolbar, and search for a user, group, or role. (See “Searchingfor Identities” on page 67.)
3. In the search results, click the action menu at the left of an identity and select ViewPermissions. The list of objects is displayed, along with the permissions for thatidentity.
64 Chapter 4 • Securing Objects and Tables
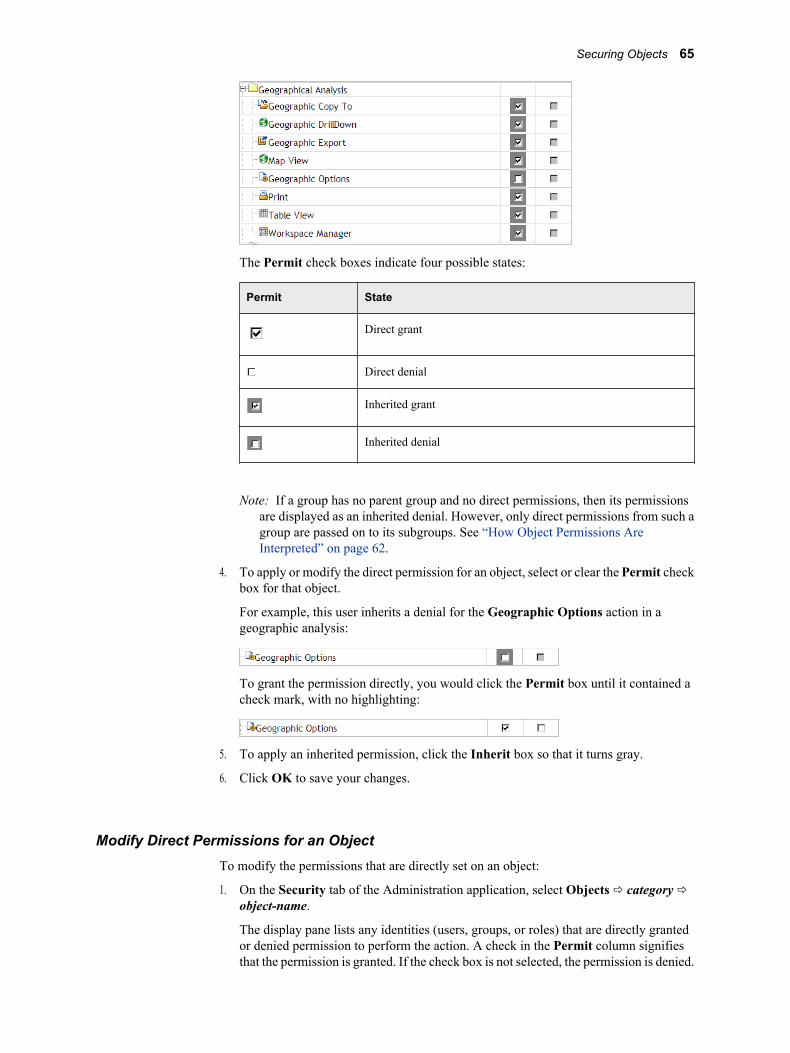
The Permit check boxes indicate four possible states:
Permit State
Direct grant
Direct denial
Inherited grant
Inherited denial
Note: If a group has no parent group and no direct permissions, then its permissionsare displayed as an inherited denial. However, only direct permissions from such agroup are passed on to its subgroups. See “How Object Permissions AreInterpreted” on page 62.
4. To apply or modify the direct permission for an object, select or clear the Permit checkbox for that object.
For example, this user inherits a denial for the Geographic Options action in ageographic analysis:
To grant the permission directly, you would click the Permit box until it contained acheck mark, with no highlighting:
5. To apply an inherited permission, click the Inherit box so that it turns gray.
6. Click OK to save your changes.
Modify Direct Permissions for an ObjectTo modify the permissions that are directly set on an object:
1. On the Security tab of the Administration application, select Objects ð category ðobject-name.
The display pane lists any identities (users, groups, or roles) that are directly grantedor denied permission to perform the action. A check in the Permit column signifiesthat the permission is granted. If the check box is not selected, the permission is denied.
Securing Objects 65

In this example, the sasdemo user and users with the HCM ANALYST or HCMADMINISTRATOR role are granted permission to modify the measures in anorganization analysis. However, users with the HCM USER role are denied thispermission:
Notice that the Permit boxes are dimmed for all three roles, signifying that you cannotchange those permissions.
2. To change the permission for an identity, select or clear the Permit check box for thatidentity.
3. Click Apply Changes to save your changes.
To delete a permission, select Remove from the action menu . (There is no need to clickApply Changes.)
If you delete a permission, the inherited permission for that identity applies.
Secure a Custom ObjectIn addition to the standard objects that are part of SAS Human Capital Management, a sitecan secure its own custom objects. Currently, the only custom objects that are supportedare in JavaServer Pages (JSPs).
Note: You can define an action that links to a JSP in the employee profile or a geographicanalysis. For details, see “Define an External Action” on page 48.
To secure a custom object:
1. In the Administration application, click the Security tab.
2. In the navigation tree, select Objects ð Custom.
3. On the Custom page, enter a name to identify the custom object. (The name does notneed to correspond to the JSP name.)
4. In the ID box, enter an ID that is unique to the HCM application.
5. You can add multiple custom objects. If there are no available rows, click Add Row.
6. Click Apply Changes.
7. The custom object now appears in the navigation tree for object permissions. However,no default permissions are set for this object. Add permissions by following theinstructions in “Add Permissions for an Object” on page 64.
Note: You cannot associate permissions for custom objects with the default HCMroles.
66 Chapter 4 • Securing Objects and Tables

8. If you are applying security to a link: In the JSP, embed the link in an IF block (JSPscriptlet) that is similar to the following:
<%if(SecurityUtil.isPermitted( custom-object-id, request)) { %> HTML code for the link <% } %>
The code to apply security to a button would be similar: embed the button code withinan IF block in the JSP.
To delete a custom object, click the Delete button next to its object ID.
One example of securing a custom object might be restricting the users who can viewemployee photographs in the Employee Browser. If you have an employee profile JSP thatdisplays employee photographs, you could embed the code that displays the photographsin the IF block.
Searching for IdentitiesOn the Security tab of the HCM Administration application, clicking Search Usersdisplays a dialog box for selecting users, groups, or roles.
To search for users, groups, or roles:
1. In the Search box, enter a search string.
The search string is not case-sensitive. You can enter the name of an identity (such assasdemo) or its display name (such as SAS Demo User), or a partial search string (suchas demo). Do not use quotation marks.
To search for all identities within the specified scope, leave the search string empty.
2. Limit the scope of the search by selecting one or more of the following: Users, Groups,Roles.
3. Click Search.
The search results display all matching identities.
Searching for Identities 67
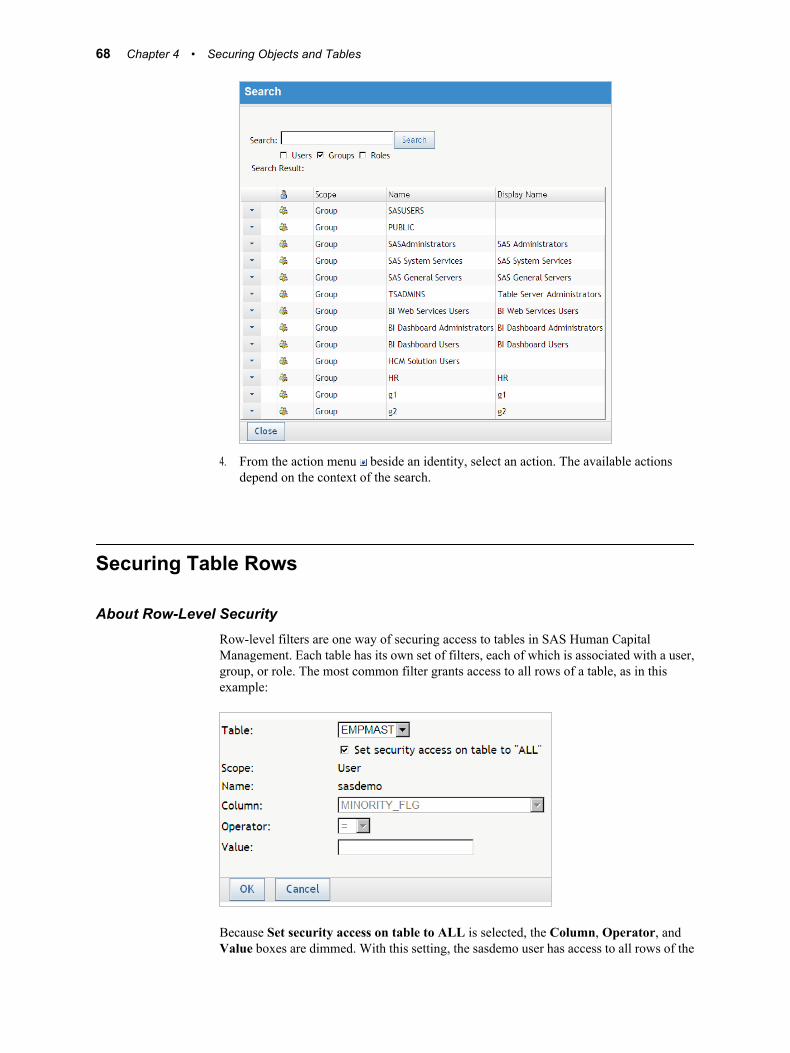
4. From the action menu beside an identity, select an action. The available actionsdepend on the context of the search.
Securing Table Rows
About Row-Level SecurityRow-level filters are one way of securing access to tables in SAS Human CapitalManagement. Each table has its own set of filters, each of which is associated with a user,group, or role. The most common filter grants access to all rows of a table, as in thisexample:
Because Set security access on table to ALL is selected, the Column, Operator, andValue boxes are dimmed. With this setting, the sasdemo user has access to all rows of the
68 Chapter 4 • Securing Objects and Tables
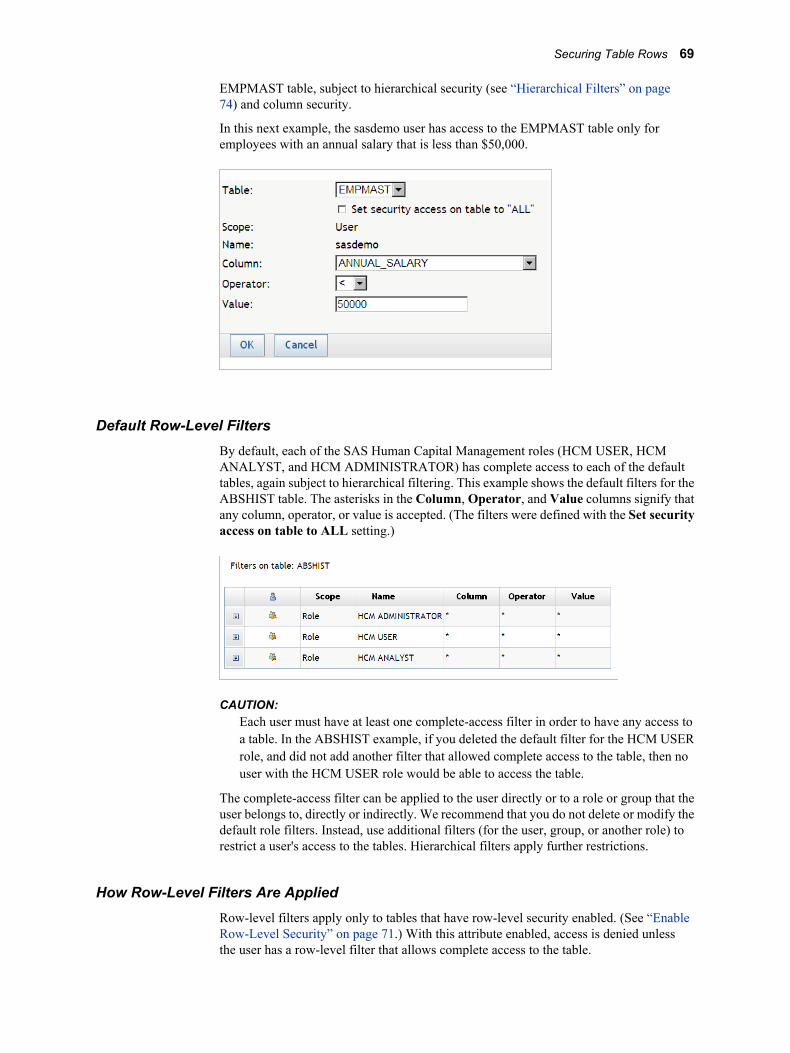
EMPMAST table, subject to hierarchical security (see “Hierarchical Filters” on page74) and column security.
In this next example, the sasdemo user has access to the EMPMAST table only foremployees with an annual salary that is less than $50,000.
Default Row-Level FiltersBy default, each of the SAS Human Capital Management roles (HCM USER, HCMANALYST, and HCM ADMINISTRATOR) has complete access to each of the defaulttables, again subject to hierarchical filtering. This example shows the default filters for theABSHIST table. The asterisks in the Column, Operator, and Value columns signify thatany column, operator, or value is accepted. (The filters were defined with the Set securityaccess on table to ALL setting.)
CAUTION:Each user must have at least one complete-access filter in order to have any access toa table. In the ABSHIST example, if you deleted the default filter for the HCM USERrole, and did not add another filter that allowed complete access to the table, then nouser with the HCM USER role would be able to access the table.
The complete-access filter can be applied to the user directly or to a role or group that theuser belongs to, directly or indirectly. We recommend that you do not delete or modify thedefault role filters. Instead, use additional filters (for the user, group, or another role) torestrict a user's access to the tables. Hierarchical filters apply further restrictions.
How Row-Level Filters Are AppliedRow-level filters apply only to tables that have row-level security enabled. (See “EnableRow-Level Security” on page 71.) With this attribute enabled, access is denied unlessthe user has a row-level filter that allows complete access to the table.
Securing Table Rows 69
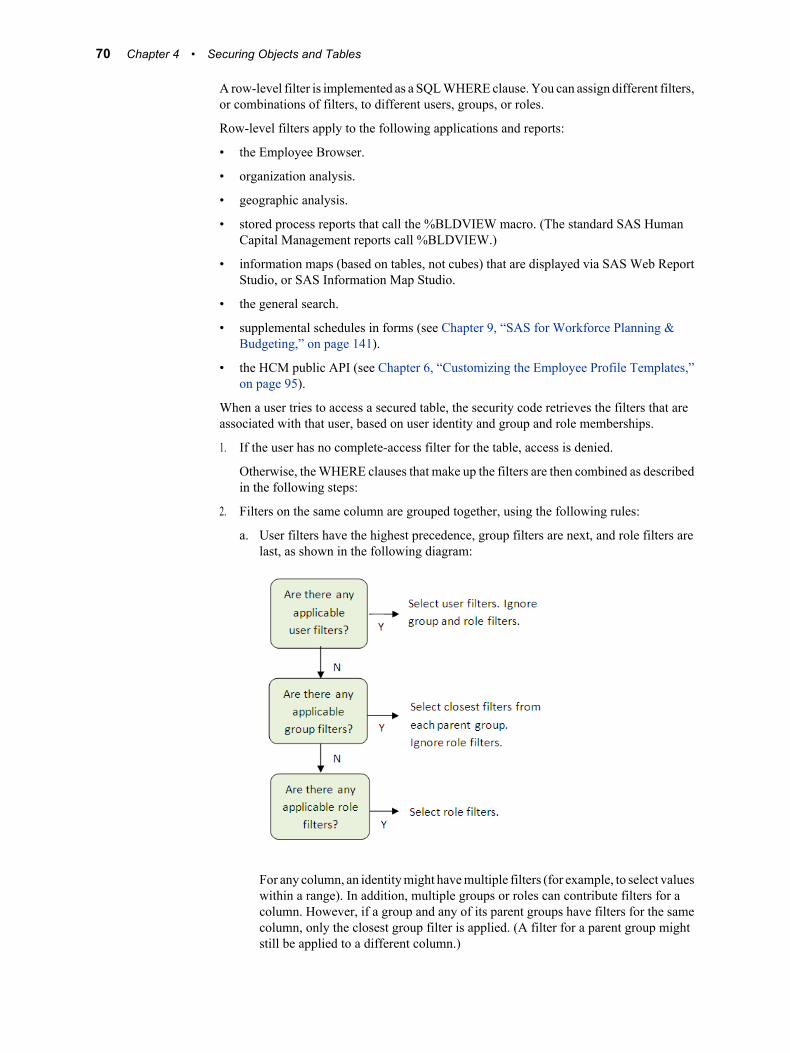
A row-level filter is implemented as a SQL WHERE clause. You can assign different filters,or combinations of filters, to different users, groups, or roles.
Row-level filters apply to the following applications and reports:
• the Employee Browser.
• organization analysis.
• geographic analysis.
• stored process reports that call the %BLDVIEW macro. (The standard SAS HumanCapital Management reports call %BLDVIEW.)
• information maps (based on tables, not cubes) that are displayed via SAS Web ReportStudio, or SAS Information Map Studio.
• the general search.
• supplemental schedules in forms (see Chapter 9, “SAS for Workforce Planning &Budgeting,” on page 141).
• the HCM public API (see Chapter 6, “Customizing the Employee Profile Templates,”on page 95).
When a user tries to access a secured table, the security code retrieves the filters that areassociated with that user, based on user identity and group and role memberships.
1. If the user has no complete-access filter for the table, access is denied.
Otherwise, the WHERE clauses that make up the filters are then combined as describedin the following steps:
2. Filters on the same column are grouped together, using the following rules:
a. User filters have the highest precedence, group filters are next, and role filters arelast, as shown in the following diagram:
For any column, an identity might have multiple filters (for example, to select valueswithin a range). In addition, multiple groups or roles can contribute filters for acolumn. However, if a group and any of its parent groups have filters for the samecolumn, only the closest group filter is applied. (A filter for a parent group mightstill be applied to a different column.)
70 Chapter 4 • Securing Objects and Tables

b. For the selected filters on the same column, if any operator is the equality operator(=) or the IN operator, then the WHERE clauses are combined with the OR operator.For example:
(EMPMAST.STATE_REGION_CD = 'NC' OR EMPMAST.STATE_REGION_CD = 'SC')
c. Otherwise, the clauses are combined with the AND operator. For example:
(EMPMAST.AGE > 35 AND EMPMAST.AGE < 65)
3. The AND operator is used to combine the group of filters on the same column with thenext filter, which could be another group of filters or a single filter; and so on. Forexample:
WHERE ((EMPMAST.STATE_REGION_CD = 'NC' OR EMPMAST.STATE_REGION_CD = 'SC') AND (EMPMAST.AGE > 35 AND EMPMAST.AGE < 65))
Note: If there are more restrictive filters than the required Set security access on tableto ALL filter, then the more restrictive filters apply.
4. The resulting filter string is combined with the hierarchical filter using the ANDoperator. For example:
WHERE ((EMPMAST.STATE_REGION_CD = 'NC' OR EMPMAST.STATE_REGION_CD = 'SC') AND (EMPMAST.AGE > 35 AND EMPMAST.AGE < 65) AND (EMPMAST.INTORG_MGR IN ('16407', '6917', '8272'))
5. Finally, the employee ID is added to the WHERE clause, using the OR operator:
WHERE ((EMPMAST.STATE_REGION_CD = 'NC' OR EMPMAST.STATE_REGION_CD = 'SC') AND (EMPMAST.AGE > 35 AND EMPMAST.AGE < 65) AND (EMPMAST.INTORG_MGR IN ('16407', '6917', '8272')) OR employee_id='8272')
Note: Each user is able to view all his or her own information. In this example, the ageand state restrictions do not apply to the user's own records.
Note: You cannot disable the hierarchical filter. If the table does not contain the link field(such as INTORG_MGR), then only the employee ID is considered. For moreinformation about hierarchical filters and the link field, see “Hierarchical Filters” onpage 74.
Enable Row-Level SecurityBy default, the standard HCM tables have row-level security enabled. When you add atable to SAS Human Capital Management, row-level security is enabled by default. Toenable or disable row-level security for a table:
1. In the Administration application, click the Security tab.
2. From the navigation tree at the left, select Tables.
The right pane lists the tables that are registered in SAS Human Capital Management,along with their row-level security settings:
Securing Table Rows 71
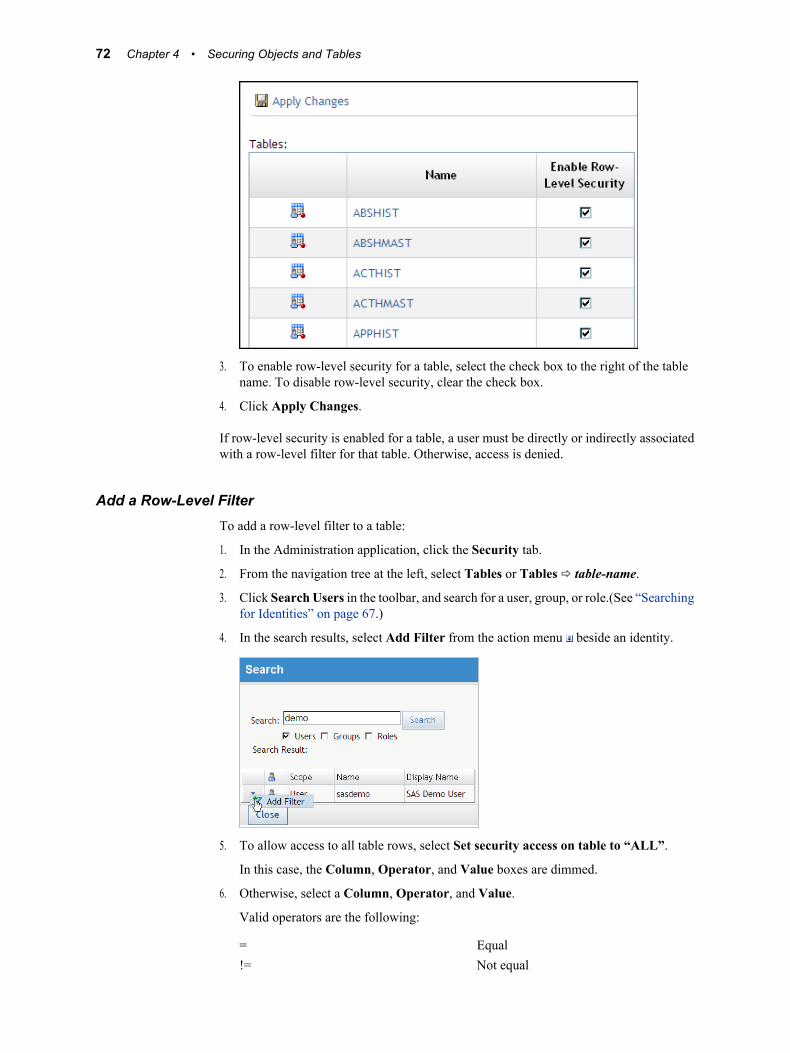
3. To enable row-level security for a table, select the check box to the right of the tablename. To disable row-level security, clear the check box.
4. Click Apply Changes.
If row-level security is enabled for a table, a user must be directly or indirectly associatedwith a row-level filter for that table. Otherwise, access is denied.
Add a Row-Level FilterTo add a row-level filter to a table:
1. In the Administration application, click the Security tab.
2. From the navigation tree at the left, select Tables or Tables ð table-name.
3. Click Search Users in the toolbar, and search for a user, group, or role.(See “Searchingfor Identities” on page 67.)
4. In the search results, select Add Filter from the action menu beside an identity.
5. To allow access to all table rows, select Set security access on table to “ALL”.
In this case, the Column, Operator, and Value boxes are dimmed.
6. Otherwise, select a Column, Operator, and Value.
Valid operators are the following:
= Equal!= Not equal
72 Chapter 4 • Securing Objects and Tables
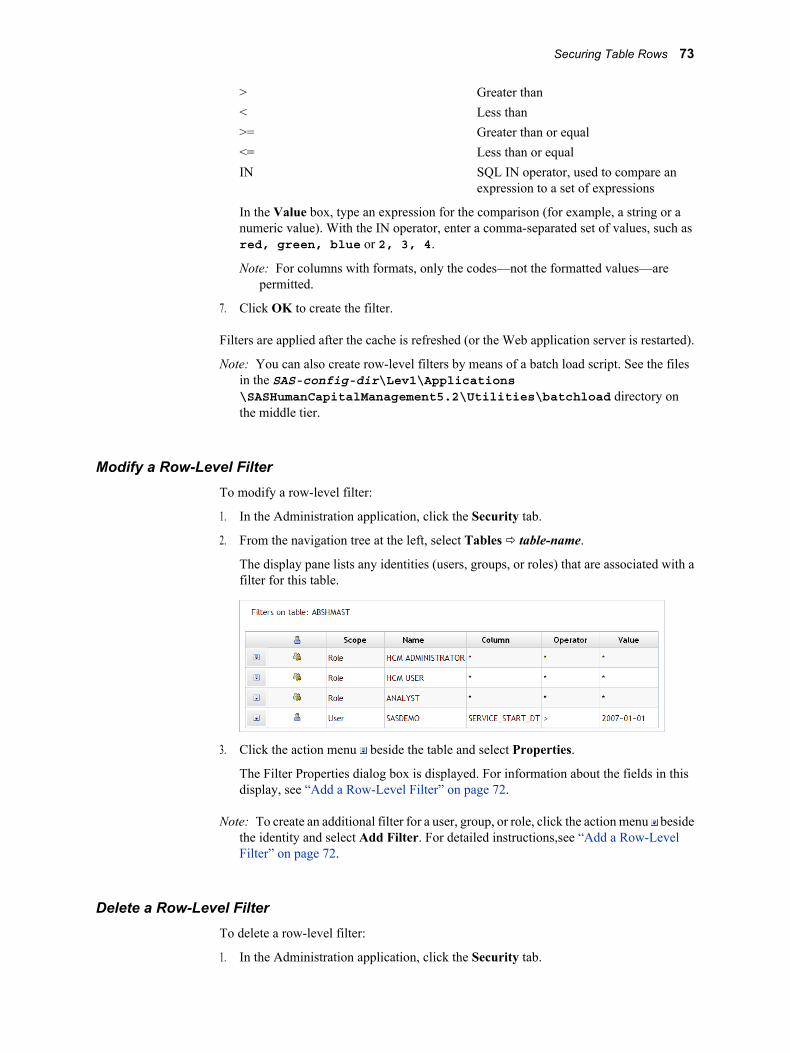
> Greater than< Less than>= Greater than or equal<= Less than or equalIN SQL IN operator, used to compare an
expression to a set of expressions
In the Value box, type an expression for the comparison (for example, a string or anumeric value). With the IN operator, enter a comma-separated set of values, such asred, green, blue or 2, 3, 4.
Note: For columns with formats, only the codes—not the formatted values—arepermitted.
7. Click OK to create the filter.
Filters are applied after the cache is refreshed (or the Web application server is restarted).
Note: You can also create row-level filters by means of a batch load script. See the filesin the SAS-config-dir\Lev1\Applications\SASHumanCapitalManagement5.2\Utilities\batchload directory onthe middle tier.
Modify a Row-Level FilterTo modify a row-level filter:
1. In the Administration application, click the Security tab.
2. From the navigation tree at the left, select Tables ð table-name.
The display pane lists any identities (users, groups, or roles) that are associated with afilter for this table.
3. Click the action menu beside the table and select Properties.
The Filter Properties dialog box is displayed. For information about the fields in thisdisplay, see “Add a Row-Level Filter” on page 72.
Note: To create an additional filter for a user, group, or role, click the action menu besidethe identity and select Add Filter. For detailed instructions,see “Add a Row-LevelFilter” on page 72.
Delete a Row-Level FilterTo delete a row-level filter:
1. In the Administration application, click the Security tab.
Securing Table Rows 73
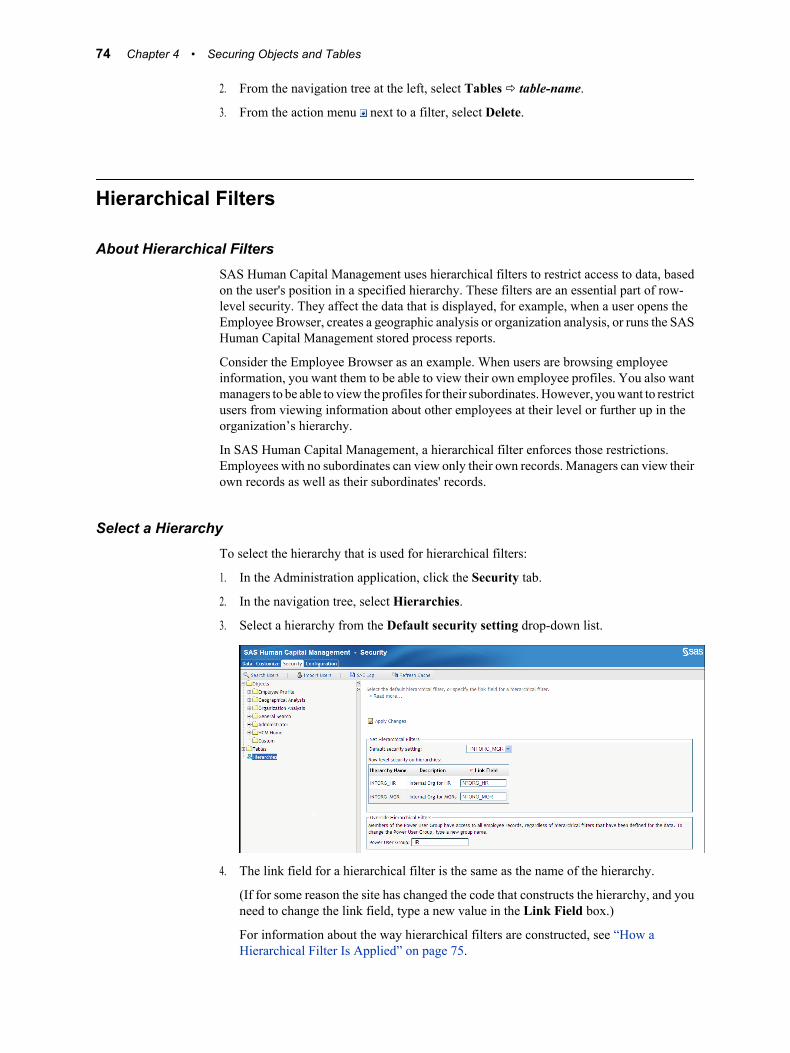
2. From the navigation tree at the left, select Tables ð table-name.
3. From the action menu next to a filter, select Delete.
Hierarchical Filters
About Hierarchical FiltersSAS Human Capital Management uses hierarchical filters to restrict access to data, basedon the user's position in a specified hierarchy. These filters are an essential part of row-level security. They affect the data that is displayed, for example, when a user opens theEmployee Browser, creates a geographic analysis or organization analysis, or runs the SASHuman Capital Management stored process reports.
Consider the Employee Browser as an example. When users are browsing employeeinformation, you want them to be able to view their own employee profiles. You also wantmanagers to be able to view the profiles for their subordinates. However, you want to restrictusers from viewing information about other employees at their level or further up in theorganization’s hierarchy.
In SAS Human Capital Management, a hierarchical filter enforces those restrictions.Employees with no subordinates can view only their own records. Managers can view theirown records as well as their subordinates' records.
Select a HierarchyTo select the hierarchy that is used for hierarchical filters:
1. In the Administration application, click the Security tab.
2. In the navigation tree, select Hierarchies.
3. Select a hierarchy from the Default security setting drop-down list.
4. The link field for a hierarchical filter is the same as the name of the hierarchy.
(If for some reason the site has changed the code that constructs the hierarchy, and youneed to change the link field, type a new value in the Link Field box.)
For information about the way hierarchical filters are constructed, see “How aHierarchical Filter Is Applied” on page 75.
74 Chapter 4 • Securing Objects and Tables

5. To change the name of the group that can override hierarchical filters, type a new namein the Power User Group box.
For details, see “The Power User Group” on page 76.
6. Click Apply Changes.
How a Hierarchical Filter Is AppliedHierarchical filters are automatically applied to all tables that have row-level securityenabled and that contain the link field for the hierarchical filter. For more about the linkfield, see “Select a Hierarchy” on page 74 and “Tables Without Hierarchical Filters” onpage 75.
The security code looks up the user’s place in the specified hierarchy and gathers up allchild members. It then generates a filter of the following form:
WHERE colName IN (child1, child2, child3, ...) OR employee_id=employee_id
• colName is the name of the column on which the filtering is applied, such asINTORG_MGR.
• child1, child2, and so on, represent the identification codes for all the subordinatemembers of the hierarchy.
Here is the WHERE clause for a hierarchical filter for the sample data. The user is thecompany CEO and has an employee ID of 10433. She can view her own data, as well asthe data for all the managers who report to her, as well as their descendants.
WHERE (EMPMAST.INTORG_MGR IN ('11988','11301','19516','4119','8346','977','10203','11850','16153','6978','10537','12739','13890','16371','5588','6572','7702','12273','12136','12586','16442','1754','7344','8883','15994','10035','17054','17443','17498','7219','9222','17130','11766','16945','16948','17518','5261','5473','6777','7885','3654','10072','10510','11081','11685','7248','7480','8165','3757','11490','12089','12679','16964','17559','1829','4837','7911','8012','4638','16875','3597','5431','9639','5469','10079','10314','11935','12284','12336','16059','16872','17180','5200','7590','774','12352','4134','8248','9369','10644','11938','18612','3414','6328','17191','11420','17208','7828','7602','16407','6917','8272','16074','1146','9600','11661','11778','13224','16838','17177','2681','7903','9713','8217','10327','10676','11726','11870','17320','4661','4845','5235','8977','9092','955','547','2973','9929','10433') OR EMPMAST.employee_id = '10433')
If there are any applicable row-level filters, those filters are combined with the hierarchicalfilter using the AND operator. (See “How Row-Level Filters Are Applied” on page 69.) Ifthe table does not have a complete-access filter that applies to this user (directly orindirectly), then access is denied, regardless of the hierarchical filters.
Users who are not managers can view only their own information (for example, their ownemployee profile, based on a match with their employee ID).
For users who belong to the group that is designated as the Power user group, thehierarchical filters are ignored. (See “The Power User Group” on page 76.)
Tables Without Hierarchical FiltersIf row-level security is enabled for a table and the link column for the hierarchical filter isnot present, the table is filtered by the user's employee ID. The user must still have at least
Hierarchical Filters 75

one complete-access filter (assigned directly or indirectly) in order to view the tablecontents.
CAUTION:If you define any additional row-level filters for the table (other than complete-accessfilters), then the user is able to view the table data unfiltered by employee ID, but subjectto the additional filters. (This caution applies only to tables without the hierarchicallink field.)
The POS table does not allow hierarchical filtering at all. If row-level security is enabled,that table is filtered by the employee ID. There are three additional tables (APPHMAST,OPOSMAST, and OPOSSUM) that are built based on the POS table and contain the linkfield for the hierarchy that is designated as the default in the %PREBUILD macro, but noother link fields. If you select a different hierarchy on the Security tab, those three tableswill not allow hierarchical filtering. They will be filtered by the employee ID. You can stillcreate additional row-level filters for any of these tables (subject to the caution above). Youcan also set permissions on table columns.(See “Securing Table Columns” on page 77.)
The Power User GroupAt a site, you might need some users to have access to all rows of employee data, regardlessof their position in the organization.
To override the hierarchical filters for all HCM tables, assign these users to the group thathas been designated as the Power user group (by default, the HR group). The users thenhave access to the entire hierarchy (in other words, the hierarchical filter does not apply).However, other row-level security filters and other forms of security (such as object securityand column security) still apply to these power users. For example, you might restrict accessto columns that contain salary data.
There is still a way to restrict power users to a subset of the hierarchy, by creating a row-level filter on one or more of the hierarchy link fields. In that case, the user is restricted tothe hierarchy members that meet the filter criteria, and subordinate members. Forinformation about the hierarchy link fields, see “Select a Hierarchy” on page 74.
For example, assume that INTORG_HR is a hierarchy link field. To restrict power usersto the department (which is represented in the INTORG_HR column), you might use afilter like this:
INTORG_HR = ‘QA’
At runtime, the user could view records for employees in the QA department, as well asany subordinate departments.
If you create filters on more than one hierarchy link field, the filters are combined usingthe AND operator. For example, assume that you created these two filters for theABSHMAST table in the sample data:
• INTORG_HR in (‘QA’, ‘COMP’)
• INTORG_MGR = ‘4638’The resulting filter would look like this:
(ABSHMAST.INTORG_HR IN ('QAC','QAE','QAF','QAG','QAO','QAQ','QAR','QAS','QAT','QA','COMP') AND ABSHMAST.INTORG_MGR IN ('11490','12089','12679','16964','17559','1829','4837','7911','8012','4638') OR ABSHMAST.employee_id = '10433')
Both the ‘QA’ and ‘4638’ hierarchy members would be expanded. The ‘COMP’ memberwould not. The INTORG_HR and INTORG_MGR filter clauses would be joined with the
76 Chapter 4 • Securing Objects and Tables
AND operator. The records would be filtered to include only members of the selecteddepartments who also have one of the selected managers (as well as the user’s own record).
Note: This use of filters with hierarchy link fields applies only to power users. Otherwise,filters on hierarchy link fields are treated just like any other column filters.
Securing Table Columns
About Column SecurityIn addition to securing table rows, you can secure access to specific columns in a table. Forexample, you might want to hide salary information from users who do not have theappropriate authorization. Or you might want to prevent most users from seeing employees'social security numbers.
In order for a user to view data in a column, the user must have ReadMetadata permissionfor the column. In order for a user to modify column permissions, the user must haveWriteMetadata permission for that column. These permissions can be directly granted tothe user or inherited from a group the user belongs to.
Note: Role permissions do not apply to columns.
Column permissions also apply to searches. In a search dialog box, a column does notappear unless the user has access to that column. Even if the user types in the column name,it is ignored in the search.
How Column Permissions Are AppliedReadMetadata and WriteMetadata authorization for columns is governed by the metadataserver. In evaluating column permissions, the metadata server begins with permissions thatare set directly on the column. Are there any direct permissions that are assigned to theuser, or to a group or role the user belongs to?
If there are no direct permissions for a column, the authorization process looks atpermissions for the table the column belongs to, and works its way up the inheritance tree,in the same way that it determines table permissions or folder permissions. For details, seethe SAS Intelligence Platform: Security Administration Guide.
If you encounter unexpected results—for example, if testing shows that users can view acolumn that you thought was restricted—reexamine your permission assignments.
Note: Occasionally you might restrict a column that was already selected for display orselected as a search criterion in the Employee Browser, in an organization analysis, orin a geographic analysis. In those cases, the column continues to appear. However,users cannot search on the column, and the column values are zero (for numeric data)or empty strings (for character data). If you want to hide the column entirely, set theHide Column attribute in the column properties on the Data tab. If you simply wantto restrict searching on a column, clear the Searchable attribute in the columnproperties.
Securing Table Columns 77

Modify Permissions for a Table ColumnCAUTION:
Do not restrict access to any columns that serve as key attributes or link attributes inan employee profile, in a hierarchy mapping, or in a geographic analysis, anorganization analysis, or the general search. If you restrict access to these columns, theapplications will not function correctly.
To modify permissions for a table column:
1. In the Administration application, select the Security tab.
2. From the navigation tree at the left, select Tables ð table-name ð column-name.
The column permissions are displayed.
A permission can have these states:
Permission State
Direct grant
Direct denial
Inherited grant
Inherited denial
When you add an identity to the list, it receives a direct grant for ReadMetadata andinherits all its other permissions.
3. To override an inherited permission, click its check box. To restore the inherited setting,click the check box again.
4. To delete permissions for an identity, click the action menu at the left of the identityand select Remove.
5. To apply your changes to this table only, click Apply Changes.
78 Chapter 4 • Securing Objects and Tables
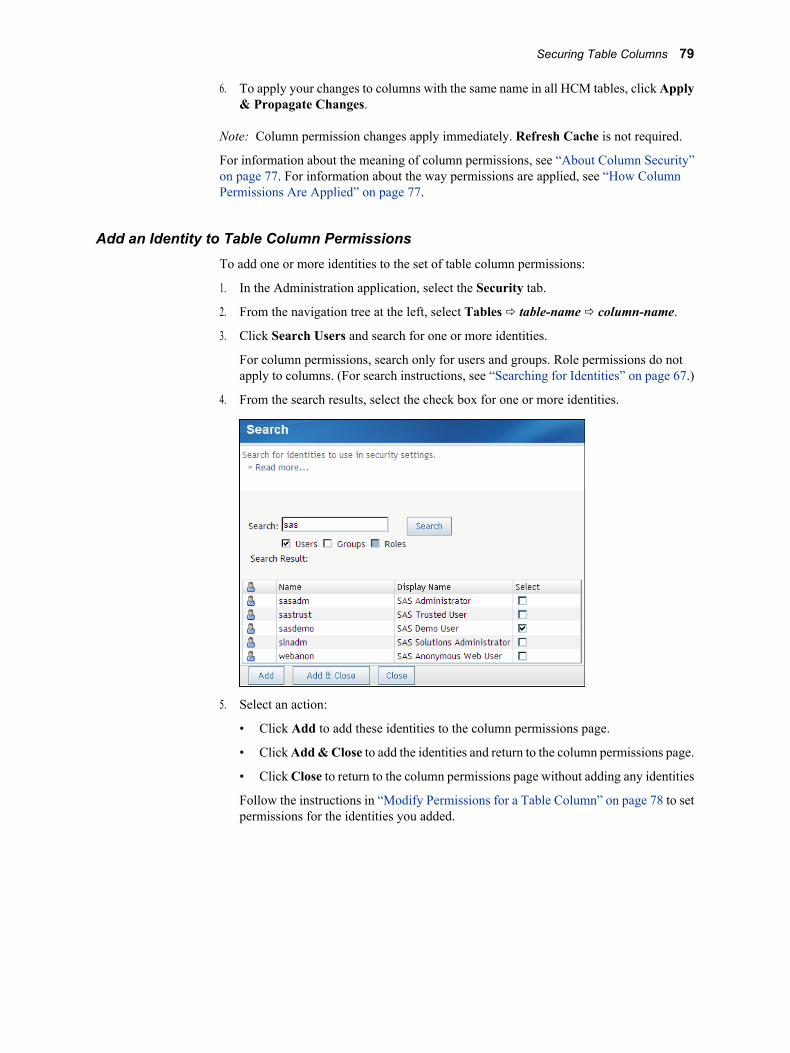
6. To apply your changes to columns with the same name in all HCM tables, click Apply& Propagate Changes.
Note: Column permission changes apply immediately. Refresh Cache is not required.
For information about the meaning of column permissions, see “About Column Security”on page 77. For information about the way permissions are applied, see “How ColumnPermissions Are Applied” on page 77.
Add an Identity to Table Column PermissionsTo add one or more identities to the set of table column permissions:
1. In the Administration application, select the Security tab.
2. From the navigation tree at the left, select Tables ð table-name ð column-name.
3. Click Search Users and search for one or more identities.
For column permissions, search only for users and groups. Role permissions do notapply to columns. (For search instructions, see “Searching for Identities” on page 67.)
4. From the search results, select the check box for one or more identities.
5. Select an action:
• Click Add to add these identities to the column permissions page.
• Click Add & Close to add the identities and return to the column permissions page.
• Click Close to return to the column permissions page without adding any identities
Follow the instructions in “Modify Permissions for a Table Column” on page 78 to setpermissions for the identities you added.
Securing Table Columns 79

80 Chapter 4 • Securing Objects and Tables
Chapter 5
Configuring SAS Human CapitalManagement
Dashboards . . . . . . . . . . . . . . . . . . . . . . . . . . . . . . . . . . . . . . . . . . . . . . . . . . . . . . . . . . 81
The Diagnostic Utility . . . . . . . . . . . . . . . . . . . . . . . . . . . . . . . . . . . . . . . . . . . . . . . . . . 82About the Diagnostic Utility . . . . . . . . . . . . . . . . . . . . . . . . . . . . . . . . . . . . . . . . . . . 82Summary of Diagnostic Tests . . . . . . . . . . . . . . . . . . . . . . . . . . . . . . . . . . . . . . . . . . 83Running the Diagnostic Utility in Stand-alone Mode . . . . . . . . . . . . . . . . . . . . . . . 85Running the Diagnostic Utility from the Administration Application . . . . . . . . . . . 86Viewing the Diagnostic Results . . . . . . . . . . . . . . . . . . . . . . . . . . . . . . . . . . . . . . . . 86
About the Configuration Properties . . . . . . . . . . . . . . . . . . . . . . . . . . . . . . . . . . . . . . 88
System Properties . . . . . . . . . . . . . . . . . . . . . . . . . . . . . . . . . . . . . . . . . . . . . . . . . . . . . 88
Application Properties . . . . . . . . . . . . . . . . . . . . . . . . . . . . . . . . . . . . . . . . . . . . . . . . . 90
Custom Properties . . . . . . . . . . . . . . . . . . . . . . . . . . . . . . . . . . . . . . . . . . . . . . . . . . . . 92
The SAS_DEFAULT_PROPERTIES Table . . . . . . . . . . . . . . . . . . . . . . . . . . . . . . . 93About the SAS_DEFAULT_PROPERTIES Table . . . . . . . . . . . . . . . . . . . . . . . . . 93Graph Property Defaults for the Search Results . . . . . . . . . . . . . . . . . . . . . . . . . . . . 93
DashboardsAfter you create a dashboard, you can add it to the SAS Human Capital Management homepage using the Administration application. Perform the following steps to add a dashboardto the home page:
1. Click Administration on the SAS Human Capital Management home page.
2. Click the Configuration tab.
3. Select Custom Properties ð Custom Property from the navigation tree.
4. Provide a path in the Value column for the HCM_HOME_DASHBOARD entry. Thefollowing is an example of a path:
/Users/sasdemo/My Folder/HCM_DASHBOARD.dcx
Note: You will need to modify the path depending on your user name, the location ofthe dashboard, and the name of the dashboard.
5. Click Apply Changes.
81
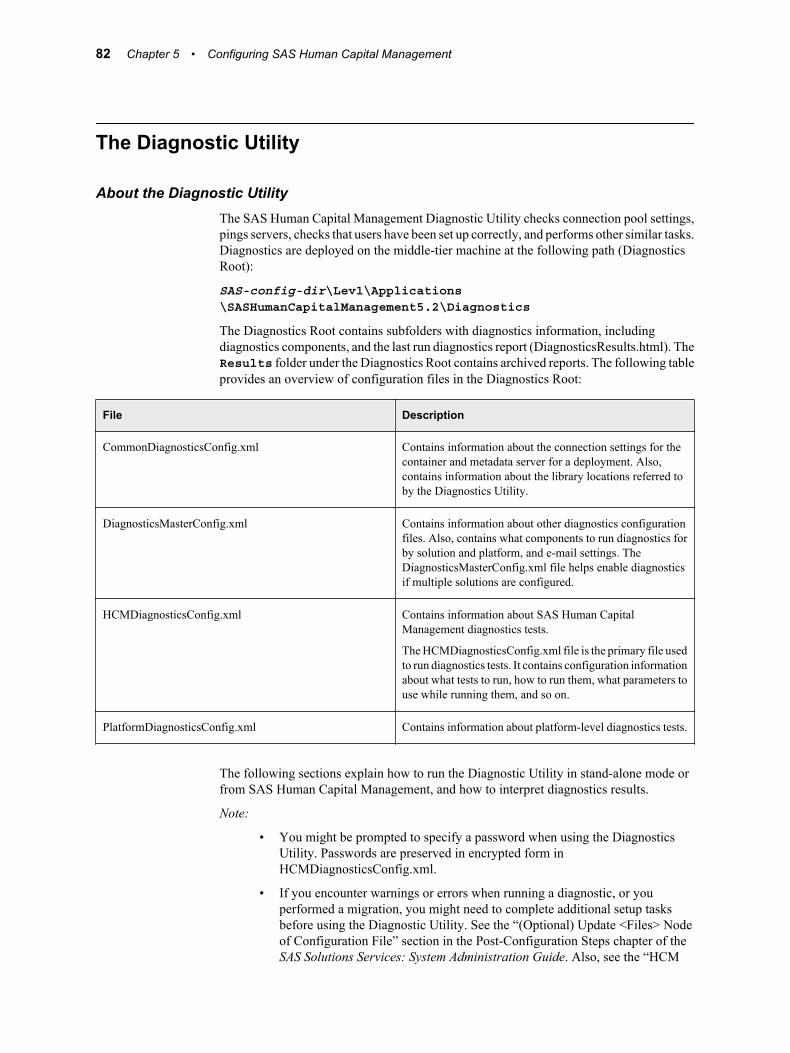
The Diagnostic Utility
About the Diagnostic UtilityThe SAS Human Capital Management Diagnostic Utility checks connection pool settings,pings servers, checks that users have been set up correctly, and performs other similar tasks.Diagnostics are deployed on the middle-tier machine at the following path (DiagnosticsRoot):
SAS-config-dir\Lev1\Applications\SASHumanCapitalManagement5.2\Diagnostics
The Diagnostics Root contains subfolders with diagnostics information, includingdiagnostics components, and the last run diagnostics report (DiagnosticsResults.html). TheResults folder under the Diagnostics Root contains archived reports. The following tableprovides an overview of configuration files in the Diagnostics Root:
File Description
CommonDiagnosticsConfig.xml Contains information about the connection settings for thecontainer and metadata server for a deployment. Also,contains information about the library locations referred toby the Diagnostics Utility.
DiagnosticsMasterConfig.xml Contains information about other diagnostics configurationfiles. Also, contains what components to run diagnostics forby solution and platform, and e-mail settings. TheDiagnosticsMasterConfig.xml file helps enable diagnosticsif multiple solutions are configured.
HCMDiagnosticsConfig.xml Contains information about SAS Human CapitalManagement diagnostics tests.
The HCMDiagnosticsConfig.xml file is the primary file usedto run diagnostics tests. It contains configuration informationabout what tests to run, how to run them, what parameters touse while running them, and so on.
PlatformDiagnosticsConfig.xml Contains information about platform-level diagnostics tests.
The following sections explain how to run the Diagnostic Utility in stand-alone mode orfrom SAS Human Capital Management, and how to interpret diagnostics results.
Note:
• You might be prompted to specify a password when using the DiagnosticsUtility. Passwords are preserved in encrypted form inHCMDiagnosticsConfig.xml.
• If you encounter warnings or errors when running a diagnostic, or youperformed a migration, you might need to complete additional setup tasksbefore using the Diagnostic Utility. See the “(Optional) Update <Files> Nodeof Configuration File” section in the Post-Configuration Steps chapter of theSAS Solutions Services: System Administration Guide. Also, see the “HCM
82 Chapter 5 • Configuring SAS Human Capital Management
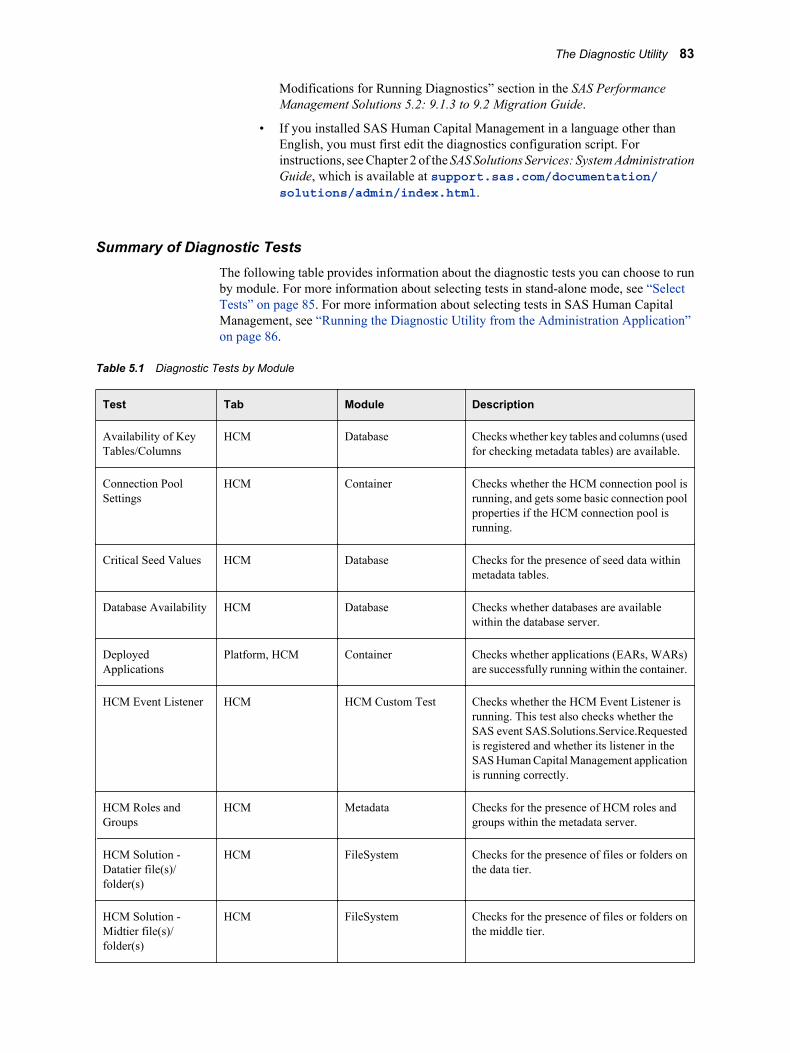
Modifications for Running Diagnostics” section in the SAS PerformanceManagement Solutions 5.2: 9.1.3 to 9.2 Migration Guide.
• If you installed SAS Human Capital Management in a language other thanEnglish, you must first edit the diagnostics configuration script. Forinstructions, see Chapter 2 of the SAS Solutions Services: System AdministrationGuide, which is available at support.sas.com/documentation/solutions/admin/index.html.
Summary of Diagnostic TestsThe following table provides information about the diagnostic tests you can choose to runby module. For more information about selecting tests in stand-alone mode, see “SelectTests” on page 85. For more information about selecting tests in SAS Human CapitalManagement, see “Running the Diagnostic Utility from the Administration Application”on page 86.
Table 5.1 Diagnostic Tests by Module
Test Tab Module Description
Availability of KeyTables/Columns
HCM Database Checks whether key tables and columns (usedfor checking metadata tables) are available.
Connection PoolSettings
HCM Container Checks whether the HCM connection pool isrunning, and gets some basic connection poolproperties if the HCM connection pool isrunning.
Critical Seed Values HCM Database Checks for the presence of seed data withinmetadata tables.
Database Availability HCM Database Checks whether databases are availablewithin the database server.
DeployedApplications
Platform, HCM Container Checks whether applications (EARs, WARs)are successfully running within the container.
HCM Event Listener HCM HCM Custom Test Checks whether the HCM Event Listener isrunning. This test also checks whether theSAS event SAS.Solutions.Service.Requestedis registered and whether its listener in theSAS Human Capital Management applicationis running correctly.
HCM Roles andGroups
HCM Metadata Checks for the presence of HCM roles andgroups within the metadata server.
HCM Solution -Datatier file(s)/folder(s)
HCM FileSystem Checks for the presence of files or folders onthe data tier.
HCM Solution -Midtier file(s)/folder(s)
HCM FileSystem Checks for the presence of files or folders onthe middle tier.
The Diagnostic Utility 83
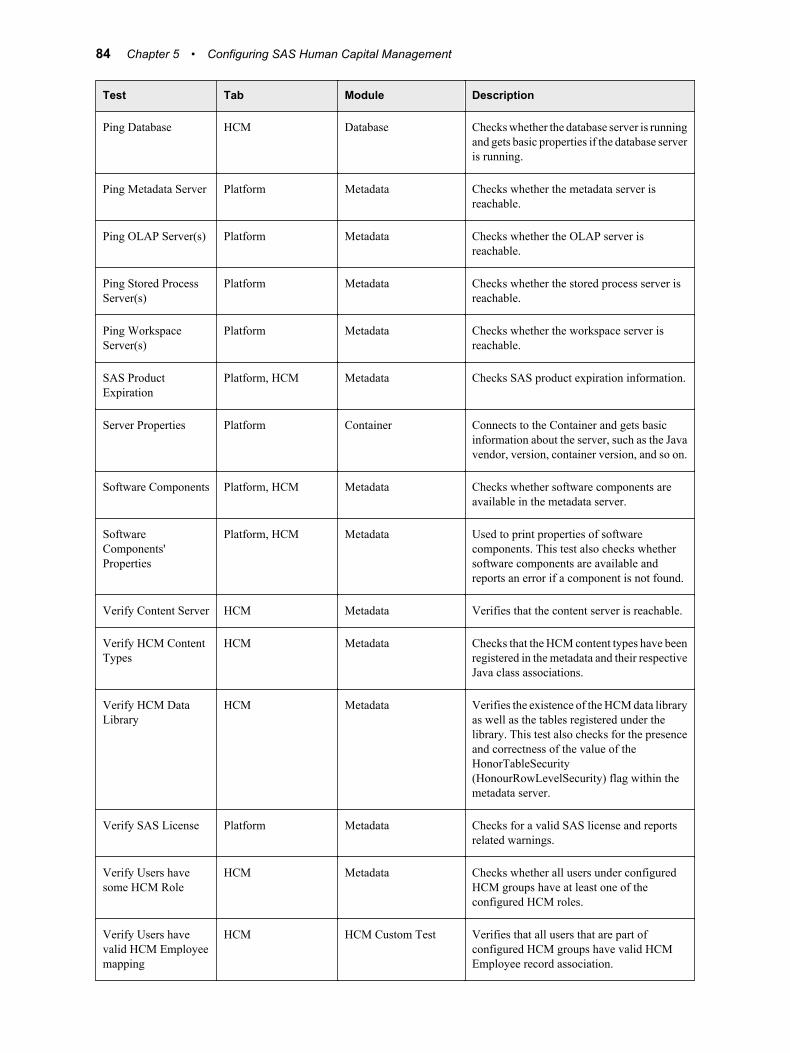
Test Tab Module Description
Ping Database HCM Database Checks whether the database server is runningand gets basic properties if the database serveris running.
Ping Metadata Server Platform Metadata Checks whether the metadata server isreachable.
Ping OLAP Server(s) Platform Metadata Checks whether the OLAP server isreachable.
Ping Stored ProcessServer(s)
Platform Metadata Checks whether the stored process server isreachable.
Ping WorkspaceServer(s)
Platform Metadata Checks whether the workspace server isreachable.
SAS ProductExpiration
Platform, HCM Metadata Checks SAS product expiration information.
Server Properties Platform Container Connects to the Container and gets basicinformation about the server, such as the Javavendor, version, container version, and so on.
Software Components Platform, HCM Metadata Checks whether software components areavailable in the metadata server.
SoftwareComponents'Properties
Platform, HCM Metadata Used to print properties of softwarecomponents. This test also checks whethersoftware components are available andreports an error if a component is not found.
Verify Content Server HCM Metadata Verifies that the content server is reachable.
Verify HCM ContentTypes
HCM Metadata Checks that the HCM content types have beenregistered in the metadata and their respectiveJava class associations.
Verify HCM DataLibrary
HCM Metadata Verifies the existence of the HCM data libraryas well as the tables registered under thelibrary. This test also checks for the presenceand correctness of the value of theHonorTableSecurity(HonourRowLevelSecurity) flag within themetadata server.
Verify SAS License Platform Metadata Checks for a valid SAS license and reportsrelated warnings.
Verify Users havesome HCM Role
HCM Metadata Checks whether all users under configuredHCM groups have at least one of theconfigured HCM roles.
Verify Users havevalid HCM Employeemapping
HCM HCM Custom Test Verifies that all users that are part ofconfigured HCM groups have valid HCMEmployee record association.
84 Chapter 5 • Configuring SAS Human Capital Management
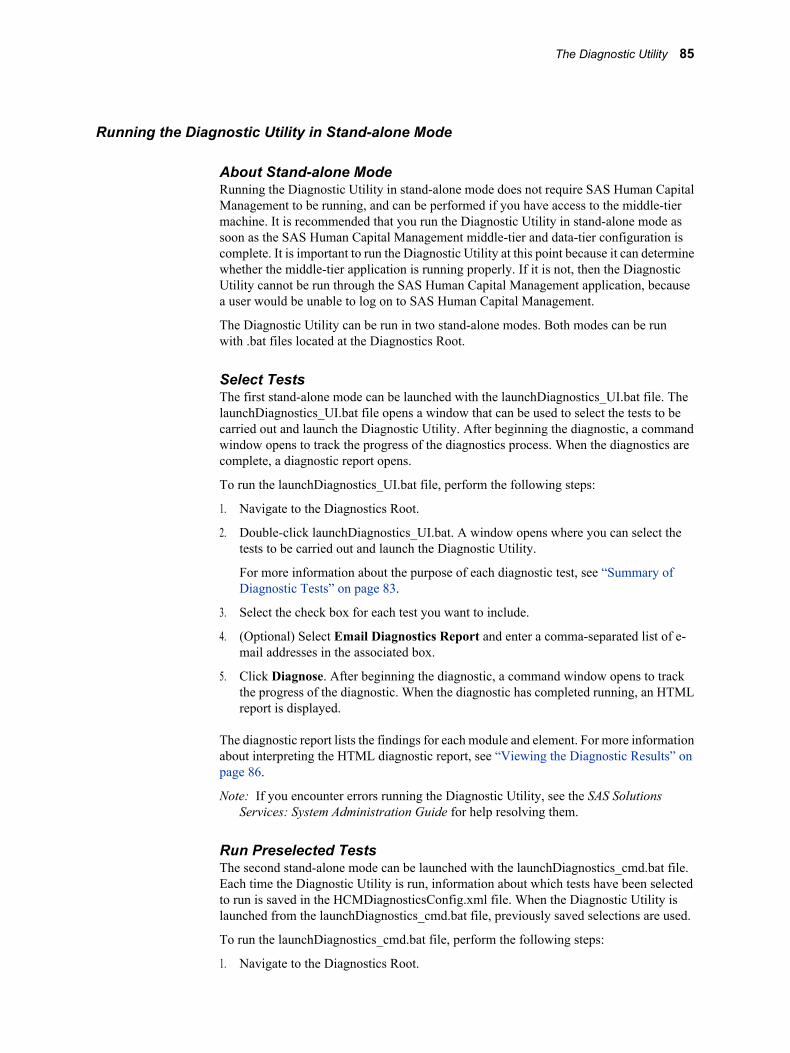
Running the Diagnostic Utility in Stand-alone Mode
About Stand-alone ModeRunning the Diagnostic Utility in stand-alone mode does not require SAS Human CapitalManagement to be running, and can be performed if you have access to the middle-tiermachine. It is recommended that you run the Diagnostic Utility in stand-alone mode assoon as the SAS Human Capital Management middle-tier and data-tier configuration iscomplete. It is important to run the Diagnostic Utility at this point because it can determinewhether the middle-tier application is running properly. If it is not, then the DiagnosticUtility cannot be run through the SAS Human Capital Management application, becausea user would be unable to log on to SAS Human Capital Management.
The Diagnostic Utility can be run in two stand-alone modes. Both modes can be runwith .bat files located at the Diagnostics Root.
Select TestsThe first stand-alone mode can be launched with the launchDiagnostics_UI.bat file. ThelaunchDiagnostics_UI.bat file opens a window that can be used to select the tests to becarried out and launch the Diagnostic Utility. After beginning the diagnostic, a commandwindow opens to track the progress of the diagnostics process. When the diagnostics arecomplete, a diagnostic report opens.
To run the launchDiagnostics_UI.bat file, perform the following steps:
1. Navigate to the Diagnostics Root.
2. Double-click launchDiagnostics_UI.bat. A window opens where you can select thetests to be carried out and launch the Diagnostic Utility.
For more information about the purpose of each diagnostic test, see “Summary ofDiagnostic Tests” on page 83.
3. Select the check box for each test you want to include.
4. (Optional) Select Email Diagnostics Report and enter a comma-separated list of e-mail addresses in the associated box.
5. Click Diagnose. After beginning the diagnostic, a command window opens to trackthe progress of the diagnostic. When the diagnostic has completed running, an HTMLreport is displayed.
The diagnostic report lists the findings for each module and element. For more informationabout interpreting the HTML diagnostic report, see “Viewing the Diagnostic Results” onpage 86.
Note: If you encounter errors running the Diagnostic Utility, see the SAS SolutionsServices: System Administration Guide for help resolving them.
Run Preselected TestsThe second stand-alone mode can be launched with the launchDiagnostics_cmd.bat file.Each time the Diagnostic Utility is run, information about which tests have been selectedto run is saved in the HCMDiagnosticsConfig.xml file. When the Diagnostic Utility islaunched from the launchDiagnostics_cmd.bat file, previously saved selections are used.
To run the launchDiagnostics_cmd.bat file, perform the following steps:
1. Navigate to the Diagnostics Root.
The Diagnostic Utility 85
2. Double-click launchDiagnostics_cmd.bat. After beginning the diagnostic, a commandwindow opens to track the progress of the diagnostic.
When the diagnostic has completed, a report is not automatically launched. The diagnosticreport can be accessed by opening the DiagnosticsResults.html file in the Results folderat the Diagnostics Root.
Note: If you encounter errors running the Diagnostic Utility, see the SAS SolutionsServices: System Administration Guide for help resolving them.
Running the Diagnostic Utility from the Administration ApplicationThe Diagnostic Utility can be run from the Configuration tab of the Administrationapplication in SAS Human Capital Management. To run the diagnostic utility:
1. Click Run Diagnostics.
General diagnostics information appears on the Diagnostics tab. Click the Setup tabfor information on credentials settings. Click the Platform tab for a list of platform-level diagnostics tests to select. Click the HCM tab for a list of diagnostics tests forSAS Human Capital Management.
For more information about the purpose of each diagnostic test, see “Summary ofDiagnostic Tests” on page 83.
2. For each element that you want to be included in the diagnostics, select the Select toverify check box.
3. (Optional) Select Email Diagnostics Report and enter a comma-separated list of e-mail addresses in the associated box.
4. Click Diagnose. When the diagnostic has completed running, an HTML report isdisplayed.
Note:
• If you encounter errors running the Diagnostic Utility, see the SAS SolutionsServices: System Administration Guide for help resolving them.
• The Diagnostic Utility cannot be run from the SAS Human Capital ManagementAdministration application when SAS Human Capital Management and SASFinancial Management are both deployed on the same instance of version 7 ofthe WebSphere Application Server. Diagnostics can still be run (or batched, ifrequired) in stand-alone mode from the middle-tier server.
The diagnostics report lists the findings for each module and element. For more informationabout interpreting the HTML diagnostic report, see “Viewing the Diagnostic Results” onpage 86.
Note: Depending on your installation configuration, the section about users and rolesmight report that the SAS Trusted User (sastrust) does not have an HCM role and doesnot have an employee mapping. Neither is required for that identity. See “ImportingUsers” on page 60.
Viewing the Diagnostic ResultsAfter running a diagnostic, results are grouped and presented in a table format:
86 Chapter 5 • Configuring SAS Human Capital Management
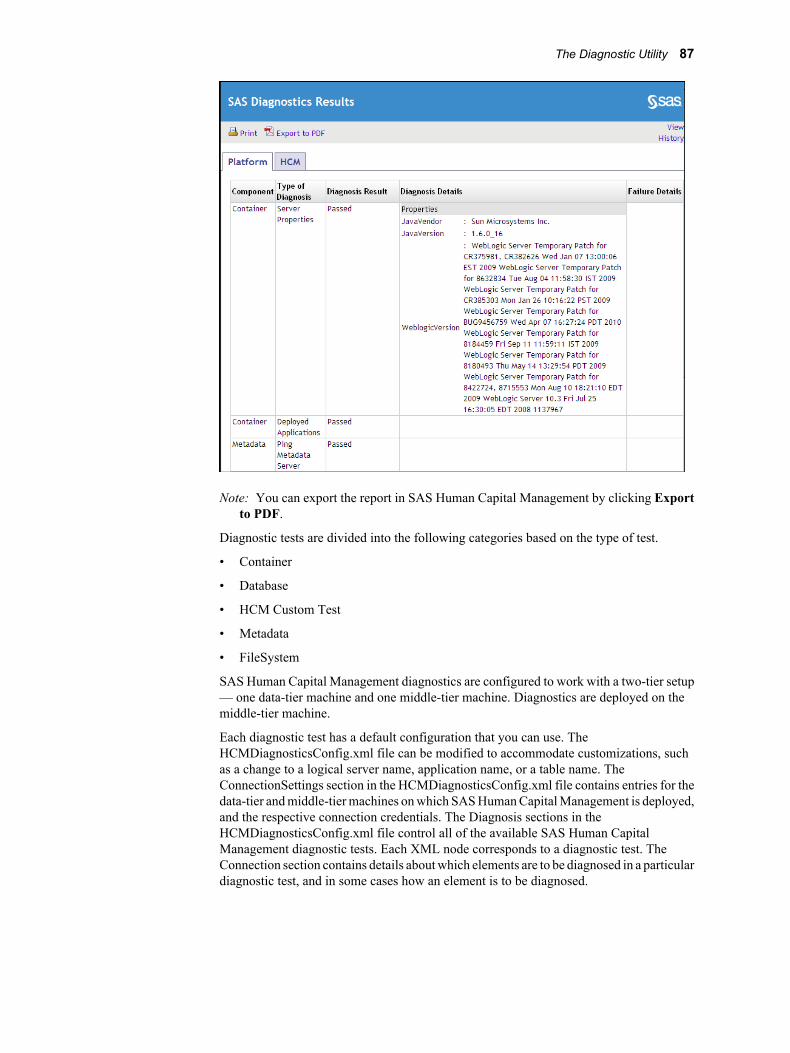
Note: You can export the report in SAS Human Capital Management by clicking Exportto PDF.
Diagnostic tests are divided into the following categories based on the type of test.
• Container
• Database
• HCM Custom Test
• Metadata
• FileSystem
SAS Human Capital Management diagnostics are configured to work with a two-tier setup— one data-tier machine and one middle-tier machine. Diagnostics are deployed on themiddle-tier machine.
Each diagnostic test has a default configuration that you can use. TheHCMDiagnosticsConfig.xml file can be modified to accommodate customizations, suchas a change to a logical server name, application name, or a table name. TheConnectionSettings section in the HCMDiagnosticsConfig.xml file contains entries for thedata-tier and middle-tier machines on which SAS Human Capital Management is deployed,and the respective connection credentials. The Diagnosis sections in theHCMDiagnosticsConfig.xml file control all of the available SAS Human CapitalManagement diagnostic tests. Each XML node corresponds to a diagnostic test. TheConnection section contains details about which elements are to be diagnosed in a particulardiagnostic test, and in some cases how an element is to be diagnosed.
The Diagnostic Utility 87
About the Configuration PropertiesThe configuration properties are grouped as follows:
• system properties that apply to SAS Human Capital Management system utilities (see“System Properties” on page 88)
• application properties that apply to SAS Human Capital Management applications(see “Application Properties” on page 90)
• custom properties that are defined at a site (see “Custom Properties” on page 92)
These properties reflect default values for SAS Human Capital Management, as well asvalues that were set when the SAS Intelligence Platform and SAS Human CapitalManagement were installed and configured. Some of the properties are informational only(for example, the current version numbers for the SAS Intelligence Platform and SASHuman Capital Management). Other properties (such as the e-mail properties for a generalsearch or for the employee profiles) can be reconfigured on this page without redeployingthe application or restarting the Web application server.
If you make changes to the metadata repository or the Web application server, you can usethe Configuration tab to update HCM properties so that they reflect those changes. Afteryou make changes to the properties for a category, click Apply Changes to update theHCMConfig.xml file. After you finish making all your changes, click Refresh Cache ifyou want SAS Human Capital Management to begin using the new values immediately.Otherwise, the new values are used the next time the Web application server is restarted.
CAUTION:Before making any changes, we suggest that you make a backup copy of theHCMConfig.xml file, which is stored in the SAS-config-dir/Lev1/AppData/SASHumanCapitalManagement5.2 directory. Your changes update this file, andyou might want access to the file's previous values.
System PropertiesThe System properties apply to SAS Human Capital Management system utilities.
If you are using a 64 bit Windows machine and have trouble importing an Excel 2007 filewith an .xlsx extension, perform the following steps:
1. Navigate to HCMConfig.xml, which is stored in the SAS-config-dir/Lev1/AppData/SASHumanCapitalManagement5.2 directory.
2. Open HCMConfig.xml, and find the OSVersion property.
3. If the value of the OSVersion property is set to false, set it to true.
Note: You can check system properties in the Administration application by selectingHCM System Properties ð Version on the Configuration tab.
88 Chapter 5 • Configuring SAS Human Capital Management

Table 5.2 HCM System Properties
Category Information
Configured Servers The names of the SAS servers that were initially configured, including the SAS OLAP server,SAS stored process server, and SAS workspace server. If you created an additional server afterinitial configuration (for example, if you created a pooled workspace server), it is not listed. Theseproperties are read-only.
Data Sources Data sources that are used by SAS Human Capital Management. All properties are read-only.
Diagnostics Properties Properties that are used by the diagnostics tool. The Diagnostics Installation Root isconfigurable. It holds the path to the diagnostics configuration file.
External ApplicationActions
Actions that are used to open SAS Human Capital Management and other applications that areexternal to SAS Human Capital Management, such as SAS Web Report Studio. These values areread-only. They can be helpful in working with Technical Support.
Folder Locations Default folder locations. You can configure the following properties:
• HCMDefaultETLJobLocation: When a user imports a table (on the Data tab), the user canchoose to create an ETL job that loads the table in the HCM database. The job is stored inthis location.
• HCMDefaultEEPDocumentLocation: Default location in which employee profiles arestored.
In order to use an employee profile, a user must have ReadMetadata permission for the profiledocument. You can use this permission to restrict access to specific profiles.
In order to update a profile, a user must also have WriteMetadata permission for the folderand its contents.
• IMPORT_CONTENT_DAV: The WebDAV location that holds documents that areimported into the workspace.
• employeeImagesPath: The path to the employee image files, within the deployed HCMapplication. The default is images/EmployeeImages.
• employeeImageExtension: The file extension for employee images (such as gif or png).Do not use a period. In the Employee Browser, an employee image is displayed if one isavailable, in the form employee_id.extension.
• noPhotoFileName: The file name of the picture to be displayed if no photo is available foran employee. Include an extension. The default is nophoto.png. The file must be locatedin employeeImagesPath.
Logger Settings Logging levels for HCM applications. The HCMLoggingLevel is configurable. From most toleast inclusive, the possible values are: DEBUG, INFO, WARN, ERROR, or FATAL. A value ofDEBUG logs everything. A value of FATAL logs only fatal errors.
Logging is configured in the SASHumanCapitalManagement-log4j.xml file in the SAS-config-dir\Lev1\Web\Common\LogConfig directory on the middle tier. If youleave the HCMLoggingLevel empty, the settings from the log4j file are applied. If you select alogging level, it affects any classes that start with com.sas.solutions.hcm.
General Properties The General Properties apply to SAS for Workforce Planning & Budgeting:
• newEmployeeIdTemplate: This value is used as the prefix when a user adds a new employeein a planning form. (A unique identifier is appended to each new employee entry.) The defaultvalue is NewEmployee. The maximum length of this string is 16 characters.
System Properties 89

Category Information
Localization Settings The Localization Settings contain two configurable properties:
• HCMFontForNonDBCSCharacter
• HCMFontForDBCSCharacter
These values are the default fonts for single- and double-byte character sets, respectively. Theyare used when a user saves data to a PDF file from the Employee Browser, a geographic analysis,an organization analysis, or the general search results.
The default value for HCMFontForDBCSCharacter is MHei-Medium. If your site supportsDBCS languages, you should set the HCMFontForDBCSCharacter property appropriately forthose languages. (Not all DBCS fonts support all DBCS languages.)
The following DBCS fonts are recommended:
• For Chinese Simplified: STSong-Light and STSongStd-Light
• For Chinese Traditional: MHei-Medium, MSung-Light and MSungStd-Light
• For Japanese: HeiseiMin-W3, HeiseiKakuGo-W5 and KozMinPro-Regular
• For Korean: HYGoThic-Medium, HYSMyeongJo-Medium and HYSMyeongJoStd-Medium
Note: If users encounter problems displaying a double-byte character set (DBCS), recommendthat they upgrade their browsers to Windows Internet Explorer 7 or later.
Security The default names of the three roles that are required in SAS Human Capital Management: HCMAdministrator, HCM Analyst, and HCM User. If the site wishes to use different names forthese roles, you can update the values in this section.
The new values must match roles that you have defined (and assigned) in the metadata repository.In addition, you must modify any properties that you have set using the old role names. Forexample, you must create new row-level security filters and modify any object security settingsthat were based on the default role names.
Software Components The names of the software components that SAS Human Capital Management interacts with.These properties are configurable. For example, you could modify a software component to pointto a different instance of an application.
Web Services Inbound The Web services that are consumed by SAS Human Capital Management. These properties areread-only.
Web ServicesOutbound
The Web services that are provided by SAS Human Capital Management. These properties areread-only.
Workspace Filters The document types that are supported in the SAS Human Capital Management workspace. Theseproperties are read-only.
Version The current versions of SAS Human Capital Management and the SAS Intelligence Platform.These properties are read-only.
Application PropertiesThe Application properties apply to SAS Human Capital Management applications.
90 Chapter 5 • Configuring SAS Human Capital Management
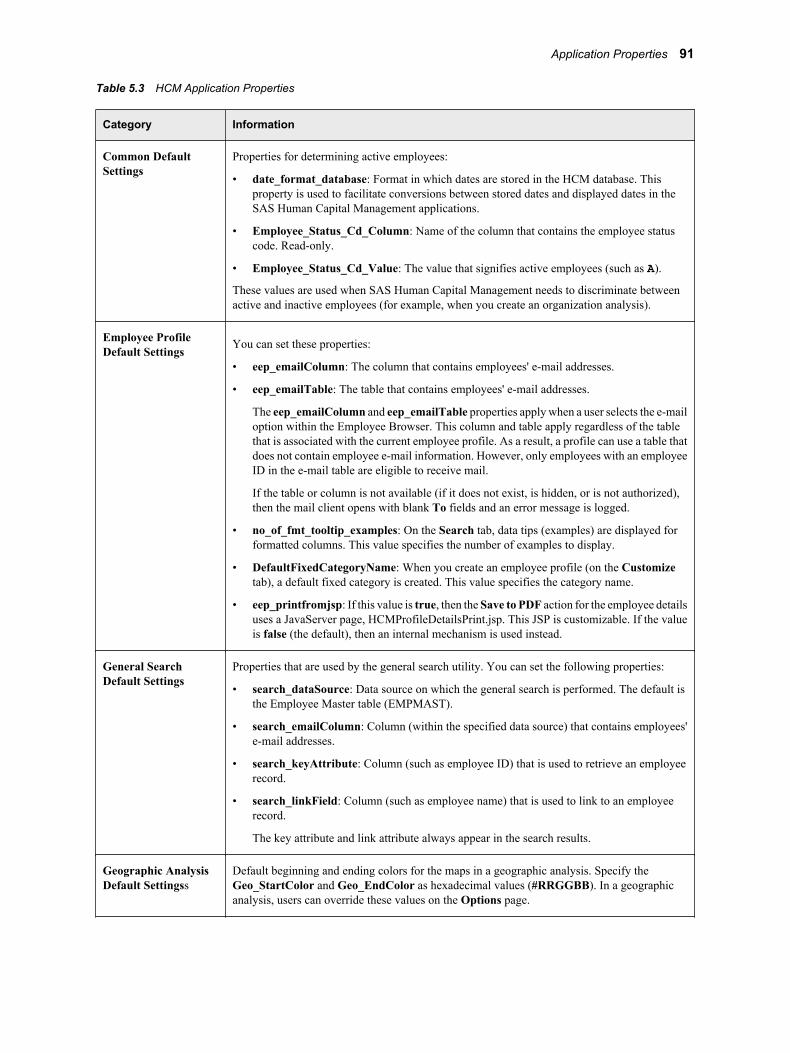
Table 5.3 HCM Application Properties
Category Information
Common DefaultSettings
Properties for determining active employees:
• date_format_database: Format in which dates are stored in the HCM database. Thisproperty is used to facilitate conversions between stored dates and displayed dates in theSAS Human Capital Management applications.
• Employee_Status_Cd_Column: Name of the column that contains the employee statuscode. Read-only.
• Employee_Status_Cd_Value: The value that signifies active employees (such as A).
These values are used when SAS Human Capital Management needs to discriminate betweenactive and inactive employees (for example, when you create an organization analysis).
Employee ProfileDefault Settings
You can set these properties:
• eep_emailColumn: The column that contains employees' e-mail addresses.
• eep_emailTable: The table that contains employees' e-mail addresses.
The eep_emailColumn and eep_emailTable properties apply when a user selects the e-mailoption within the Employee Browser. This column and table apply regardless of the tablethat is associated with the current employee profile. As a result, a profile can use a table thatdoes not contain employee e-mail information. However, only employees with an employeeID in the e-mail table are eligible to receive mail.
If the table or column is not available (if it does not exist, is hidden, or is not authorized),then the mail client opens with blank To fields and an error message is logged.
• no_of_fmt_tooltip_examples: On the Search tab, data tips (examples) are displayed forformatted columns. This value specifies the number of examples to display.
• DefaultFixedCategoryName: When you create an employee profile (on the Customizetab), a default fixed category is created. This value specifies the category name.
• eep_printfromjsp: If this value is true, then the Save to PDF action for the employee detailsuses a JavaServer page, HCMProfileDetailsPrint.jsp. This JSP is customizable. If the valueis false (the default), then an internal mechanism is used instead.
General SearchDefault Settings
Properties that are used by the general search utility. You can set the following properties:
• search_dataSource: Data source on which the general search is performed. The default isthe Employee Master table (EMPMAST).
• search_emailColumn: Column (within the specified data source) that contains employees'e-mail addresses.
• search_keyAttribute: Column (such as employee ID) that is used to retrieve an employeerecord.
• search_linkField: Column (such as employee name) that is used to link to an employeerecord.
The key attribute and link attribute always appear in the search results.
Geographic AnalysisDefault Settingss
Default beginning and ending colors for the maps in a geographic analysis. Specify theGeo_StartColor and Geo_EndColor as hexadecimal values (#RRGGBB). In a geographicanalysis, users can override these values on the Options page.
Application Properties 91
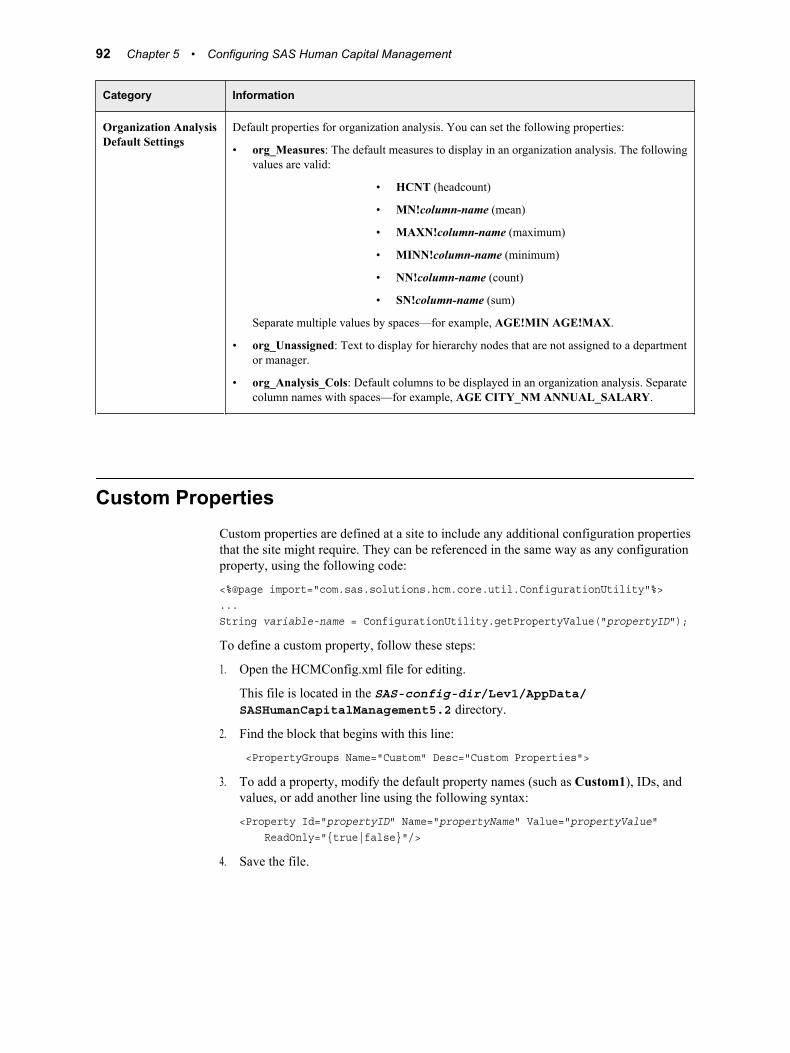
Category Information
Organization AnalysisDefault Settings
Default properties for organization analysis. You can set the following properties:
• org_Measures: The default measures to display in an organization analysis. The followingvalues are valid:
• HCNT (headcount)
• MN!column-name (mean)
• MAXN!column-name (maximum)
• MINN!column-name (minimum)
• NN!column-name (count)
• SN!column-name (sum)
Separate multiple values by spaces—for example, AGE!MIN AGE!MAX.
• org_Unassigned: Text to display for hierarchy nodes that are not assigned to a departmentor manager.
• org_Analysis_Cols: Default columns to be displayed in an organization analysis. Separatecolumn names with spaces—for example, AGE CITY_NM ANNUAL_SALARY.
Custom PropertiesCustom properties are defined at a site to include any additional configuration propertiesthat the site might require. They can be referenced in the same way as any configurationproperty, using the following code:
<%@page import="com.sas.solutions.hcm.core.util.ConfigurationUtility"%>...String variable-name = ConfigurationUtility.getPropertyValue("propertyID");
To define a custom property, follow these steps:
1. Open the HCMConfig.xml file for editing.
This file is located in the SAS-config-dir/Lev1/AppData/SASHumanCapitalManagement5.2 directory.
2. Find the block that begins with this line:
<PropertyGroups Name="Custom" Desc="Custom Properties">
3. To add a property, modify the default property names (such as Custom1), IDs, andvalues, or add another line using the following syntax:
<Property Id="propertyID" Name="propertyName" Value="propertyValue" ReadOnly="{true|false}"/>
4. Save the file.
92 Chapter 5 • Configuring SAS Human Capital Management
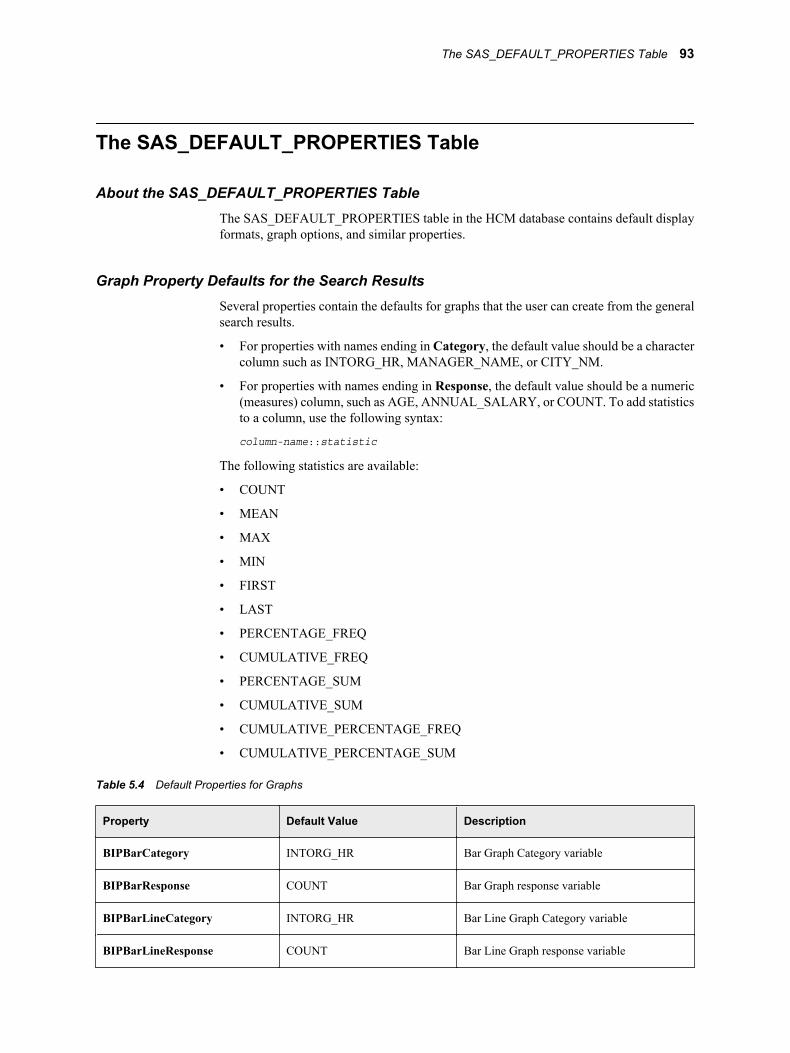
The SAS_DEFAULT_PROPERTIES Table
About the SAS_DEFAULT_PROPERTIES TableThe SAS_DEFAULT_PROPERTIES table in the HCM database contains default displayformats, graph options, and similar properties.
Graph Property Defaults for the Search ResultsSeveral properties contain the defaults for graphs that the user can create from the generalsearch results.
• For properties with names ending in Category, the default value should be a charactercolumn such as INTORG_HR, MANAGER_NAME, or CITY_NM.
• For properties with names ending in Response, the default value should be a numeric(measures) column, such as AGE, ANNUAL_SALARY, or COUNT. To add statisticsto a column, use the following syntax:
column-name::statistic
The following statistics are available:
• COUNT
• MEAN
• MAX
• MIN
• FIRST
• LAST
• PERCENTAGE_FREQ
• CUMULATIVE_FREQ
• PERCENTAGE_SUM
• CUMULATIVE_SUM
• CUMULATIVE_PERCENTAGE_FREQ
• CUMULATIVE_PERCENTAGE_SUM
Table 5.4 Default Properties for Graphs
Property Default Value Description
BIPBarCategory INTORG_HR Bar Graph Category variable
BIPBarResponse COUNT Bar Graph response variable
BIPBarLineCategory INTORG_HR Bar Line Graph Category variable
BIPBarLineResponse COUNT Bar Line Graph response variable
The SAS_DEFAULT_PROPERTIES Table 93

Property Default Value Description
BIPBarLine_YResponse AGE::MEAN Bar Line - Y response variable
BIPLineCategory INTORG_HR Line Graph Category variable
BIPLineResponse COUNT Line Graph response variable
BIPPieCategory INTORG_HR Pie Graph Category variable
BIPPieResponse COUNT Pie Graph response variable
BIPScatterplotResponse_X AGE Scatterplot Graph response-X variable
BIPScatterplotResponse_Y ANNUAL_SALARY Scatterplot Graph response-Y variable
94 Chapter 5 • Configuring SAS Human Capital Management
Chapter 6
Customizing the Employee ProfileTemplates
Overview . . . . . . . . . . . . . . . . . . . . . . . . . . . . . . . . . . . . . . . . . . . . . . . . . . . . . . . . . . . . 95
A Look at the Available Templates . . . . . . . . . . . . . . . . . . . . . . . . . . . . . . . . . . . . . . . 96The Executive Profile Template . . . . . . . . . . . . . . . . . . . . . . . . . . . . . . . . . . . . . . . . 96Additional Templates . . . . . . . . . . . . . . . . . . . . . . . . . . . . . . . . . . . . . . . . . . . . . . . . 97
Customizing a Template . . . . . . . . . . . . . . . . . . . . . . . . . . . . . . . . . . . . . . . . . . . . . . . . 98About Customizing a Template . . . . . . . . . . . . . . . . . . . . . . . . . . . . . . . . . . . . . . . . 98Required Imports . . . . . . . . . . . . . . . . . . . . . . . . . . . . . . . . . . . . . . . . . . . . . . . . . . . 98Styles and Style Sheets . . . . . . . . . . . . . . . . . . . . . . . . . . . . . . . . . . . . . . . . . . . . . . . 98Displaying Header Details . . . . . . . . . . . . . . . . . . . . . . . . . . . . . . . . . . . . . . . . . . . . 99Displaying the Category List . . . . . . . . . . . . . . . . . . . . . . . . . . . . . . . . . . . . . . . . . 101Displaying Details for the Selected Category . . . . . . . . . . . . . . . . . . . . . . . . . . . . . 102Using Methods from the PublicAPIInterface . . . . . . . . . . . . . . . . . . . . . . . . . . . . . 103Saving Employee Details in a PDF File . . . . . . . . . . . . . . . . . . . . . . . . . . . . . . . . . 106
Making a Template Available . . . . . . . . . . . . . . . . . . . . . . . . . . . . . . . . . . . . . . . . . . 106Deploy the Custom JSP . . . . . . . . . . . . . . . . . . . . . . . . . . . . . . . . . . . . . . . . . . . . . 106Make the Template Known to SAS Human Capital Management . . . . . . . . . . . . . 106
OverviewSAS Human Capital Management supports custom employee profile templates, in the formof JavaServer Pages (JSPs) that use classes and methods of the HCM Public API. Thesetemplates determine the display of the profile header and profile details that appear in theEmployee Browser, in terms of both format and content.
Note: The templates do not affect the profile summary (that a user might see upon selectinga node) or data that is displayed on the search page.
On the Customize tab of the Administration application, you associate a template with anemployee profile. In addition to selecting from the templates that are available with SASHuman Capital Management, you can create custom templates that are appropriate for yoursite. The recommended approach is as follows:
1. Make a copy of an existing template (JSP file).
2. Customize your copied JSP. For example, you might modify the font or the layout ofprofile details, or you might display additional information in the profile detail area.
3. Make the template available.
95
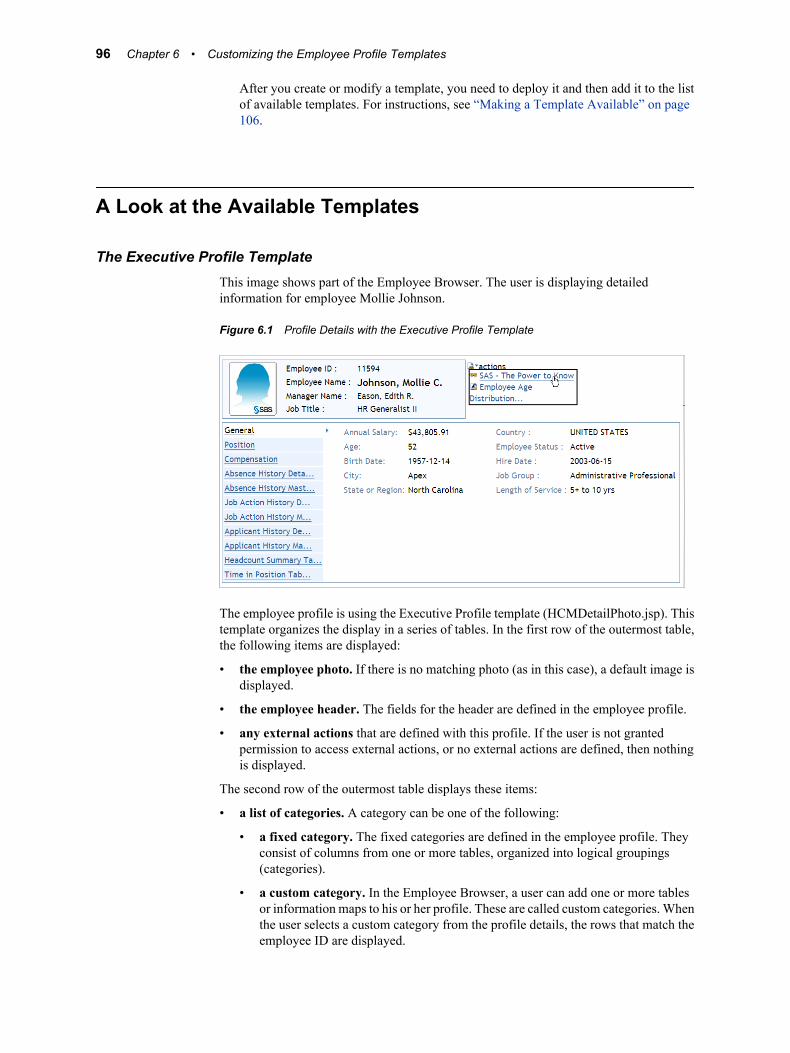
After you create or modify a template, you need to deploy it and then add it to the listof available templates. For instructions, see “Making a Template Available” on page106.
A Look at the Available Templates
The Executive Profile TemplateThis image shows part of the Employee Browser. The user is displaying detailedinformation for employee Mollie Johnson.
Figure 6.1 Profile Details with the Executive Profile Template
The employee profile is using the Executive Profile template (HCMDetailPhoto.jsp). Thistemplate organizes the display in a series of tables. In the first row of the outermost table,the following items are displayed:
• the employee photo. If there is no matching photo (as in this case), a default image isdisplayed.
• the employee header. The fields for the header are defined in the employee profile.
• any external actions that are defined with this profile. If the user is not grantedpermission to access external actions, or no external actions are defined, then nothingis displayed.
The second row of the outermost table displays these items:
• a list of categories. A category can be one of the following:
• a fixed category. The fixed categories are defined in the employee profile. Theyconsist of columns from one or more tables, organized into logical groupings(categories).
• a custom category. In the Employee Browser, a user can add one or more tablesor information maps to his or her profile. These are called custom categories. Whenthe user selects a custom category from the profile details, the rows that match theemployee ID are displayed.
96 Chapter 6 • Customizing the Employee Profile Templates

• details for the selected category. Notice that the profile details page contains links forseveral categories, including General, Position, and Compensation. When the userselects a category, the details (such as annual salary, age, and birth date) are displayed.
Additional TemplatesOther available templates are as follows:
• Section View Profile (HCMProfileTemplateSectionView.jsp) displays categories insections. The user clicks the plus sign beside a section title to display its contents.
Figure 6.2 Employee Details with the Section View Template
• Tab View template (HCMProfileTemplateTabView.jsp) displays categories as a setof tabs. A user clicks a tab to display the corresponding information.
Note: This template should be used only for a small number of categories.
Figure 6.3 Employee Details with the Tab View Template
• General Profile (HCMProfileViewerContent.jsp) uses a drop-down list for selectingthe category.
A Look at the Available Templates 97

Figure 6.4 Employee Details with the General Profile Template
Note: This template does not use the Public API and is not customizable.
These JSPs are available on the middle tier at SAS-config-dir\Lev1\Web\Staging\exploded\sas.humancapitalmanagement5.2.ear\sas.humancapitalmanagement.war.
Customizing a Template
About Customizing a TemplateThe remainder of this chapter describes how to use the Public API to customize an employeeprofile template. The examples are taken from the Executive Profile template. The otherexample templates also call HCM Public API methods to display employee detailinformation. As noted earlier, each template has a different layout, such as a drop-downlist or tabs to hold the list of categories. Like the Executive Profile template, they can becustomized to display additional information or to use a different layout.
For additional documentation, see “The Public API” on page 184.
Required ImportsThe following classes must be imported in each JSP template:
<%@ page import="com.sas.solutions.hcm.publicapi.beans.ProfileBean" %><%@ page import="com.sas.solutions.hcm.publicapi.beans.GenericBean" %><%@ page import="com.sas.solutions.hcm.publicapi.beans.CategoryBean" %><%@ page import="com.sas.solutions.hcm.publicapi.PublicAPIInterface" %><%@ page import="com.sas.solutions.hcm.publicapi.connector.PublicAPIFactory" %><%@ page import="com.sas.solutions.hcm.publicapi.models.PublicAPITableModel" %><%@ page import="java.util.List" %><%@ page import="java.util.Iterator" %>
Styles and Style SheetsThe example templates define style attributes internally, as in this example from theExecutive Profile template:
<style type="text/css"> table.tableview { border: solid 1px #7f9db9; border-collapse: collapse; font-size: small; width: 100%;
98 Chapter 6 • Customizing the Employee Profile Templates

}.style2 {color: #6F829D}</style>
In your custom template, you might decide to include a reference to a style sheet (CSS file)that would need to be deployed with the JSP.
Displaying Header Details
OverviewThe first part of the JSP displays the profile header, which might include header attributes,an employee photograph, and external actions.
Get the Selected CategoryThe category that the user selects is available on the request object. This method retrievesthe selected category:
String selectedCategory = request.getParameter("select");
Get a Reference to a PublicAPIInterface ObjectThe next step is to get a reference to an object that implements the PublicAPIInterface,using a static factory method:
PublicAPIInterface employeeProfilePublicAPI = PublicAPIFactory.getEmployeeProfilePublicAPI();
Get a ProfileBeanThe getProfileDetails method returns a ProfileBean, from which the JSP can retrieve headerattributes, the path to employee images, and category attributes:
ProfileBean profileBean = employeeProfilePublicAPI.getProfileDetails(selectedCategory, request);
The ProfileBean class has the following methods:
Table 6.1 Selected Methods of the ProfileBean Class
Method Description
java.util.List<CategoryList>getCategoriesList()
Gets the categories list, which includes the category attributes.
public java.lang.StringgetEmpPhotoSrc()
Gets the source of an image of the currently displayedemployee.
The returned value is in the form path/employee_id.extension.
The path and extension are set on the Configuration tab of theAdministration application.
public java.util.List<GenericBean>getExternalActions()
Gets the list of external actions that are attached to thisemployee profile.
public java.util.List<GenericBean>getHeaderAttributesList()
Gets the headerAttributes.
Customizing a Template 99
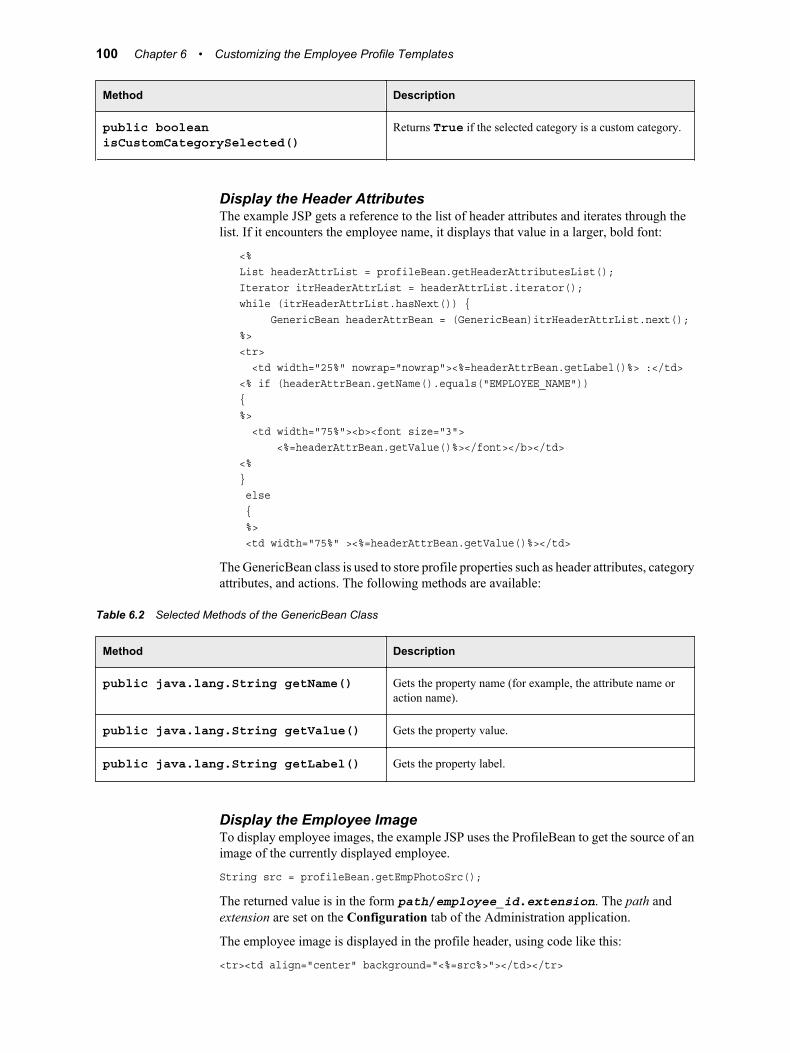
Method Description
public booleanisCustomCategorySelected()
Returns True if the selected category is a custom category.
Display the Header AttributesThe example JSP gets a reference to the list of header attributes and iterates through thelist. If it encounters the employee name, it displays that value in a larger, bold font:
<%List headerAttrList = profileBean.getHeaderAttributesList();Iterator itrHeaderAttrList = headerAttrList.iterator();while (itrHeaderAttrList.hasNext()) { GenericBean headerAttrBean = (GenericBean)itrHeaderAttrList.next();%><tr> <td width="25%" nowrap="nowrap"><%=headerAttrBean.getLabel()%> :</td><% if (headerAttrBean.getName().equals("EMPLOYEE_NAME")){%> <td width="75%"><b><font size="3"> <%=headerAttrBean.getValue()%></font></b></td><% } else { %> <td width="75%" ><%=headerAttrBean.getValue()%></td>
The GenericBean class is used to store profile properties such as header attributes, categoryattributes, and actions. The following methods are available:
Table 6.2 Selected Methods of the GenericBean Class
Method Description
public java.lang.String getName() Gets the property name (for example, the attribute name oraction name).
public java.lang.String getValue() Gets the property value.
public java.lang.String getLabel() Gets the property label.
Display the Employee ImageTo display employee images, the example JSP uses the ProfileBean to get the source of animage of the currently displayed employee.
String src = profileBean.getEmpPhotoSrc();
The returned value is in the form path/employee_id.extension. The path andextension are set on the Configuration tab of the Administration application.
The employee image is displayed in the profile header, using code like this:
<tr><td align="center" background="<%=src%>"></td></tr>
100 Chapter 6 • Customizing the Employee Profile Templates
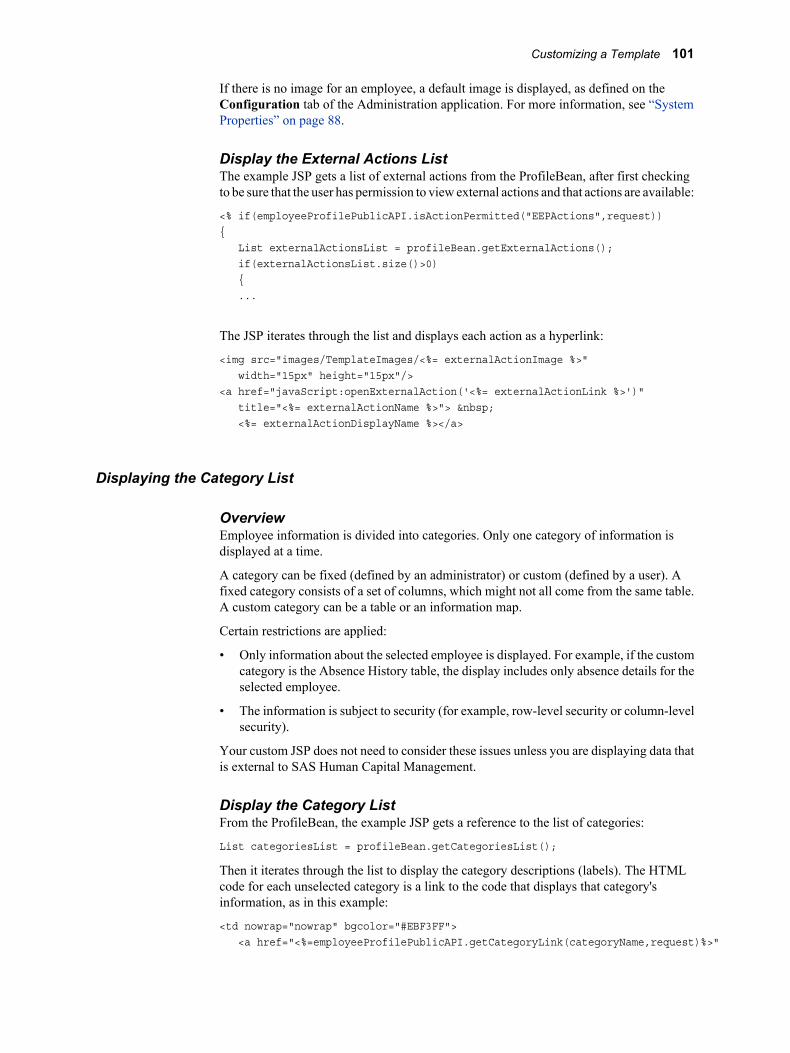
If there is no image for an employee, a default image is displayed, as defined on theConfiguration tab of the Administration application. For more information, see “SystemProperties” on page 88.
Display the External Actions ListThe example JSP gets a list of external actions from the ProfileBean, after first checkingto be sure that the user has permission to view external actions and that actions are available:
<% if(employeeProfilePublicAPI.isActionPermitted("EEPActions",request)){ List externalActionsList = profileBean.getExternalActions(); if(externalActionsList.size()>0) { ...
The JSP iterates through the list and displays each action as a hyperlink:
<img src="images/TemplateImages/<%= externalActionImage %>" width="15px" height="15px"/><a href="javaScript:openExternalAction('<%= externalActionLink %>')" title="<%= externalActionName %>"> <%= externalActionDisplayName %></a>
Displaying the Category List
OverviewEmployee information is divided into categories. Only one category of information isdisplayed at a time.
A category can be fixed (defined by an administrator) or custom (defined by a user). Afixed category consists of a set of columns, which might not all come from the same table.A custom category can be a table or an information map.
Certain restrictions are applied:
• Only information about the selected employee is displayed. For example, if the customcategory is the Absence History table, the display includes only absence details for theselected employee.
• The information is subject to security (for example, row-level security or column-levelsecurity).
Your custom JSP does not need to consider these issues unless you are displaying data thatis external to SAS Human Capital Management.
Display the Category ListFrom the ProfileBean, the example JSP gets a reference to the list of categories:
List categoriesList = profileBean.getCategoriesList();
Then it iterates through the list to display the category descriptions (labels). The HTMLcode for each unselected category is a link to the code that displays that category'sinformation, as in this example:
<td nowrap="nowrap" bgcolor="#EBF3FF"> <a href="<%=employeeProfilePublicAPI.getCategoryLink(categoryName,request)%>"
Customizing a Template 101
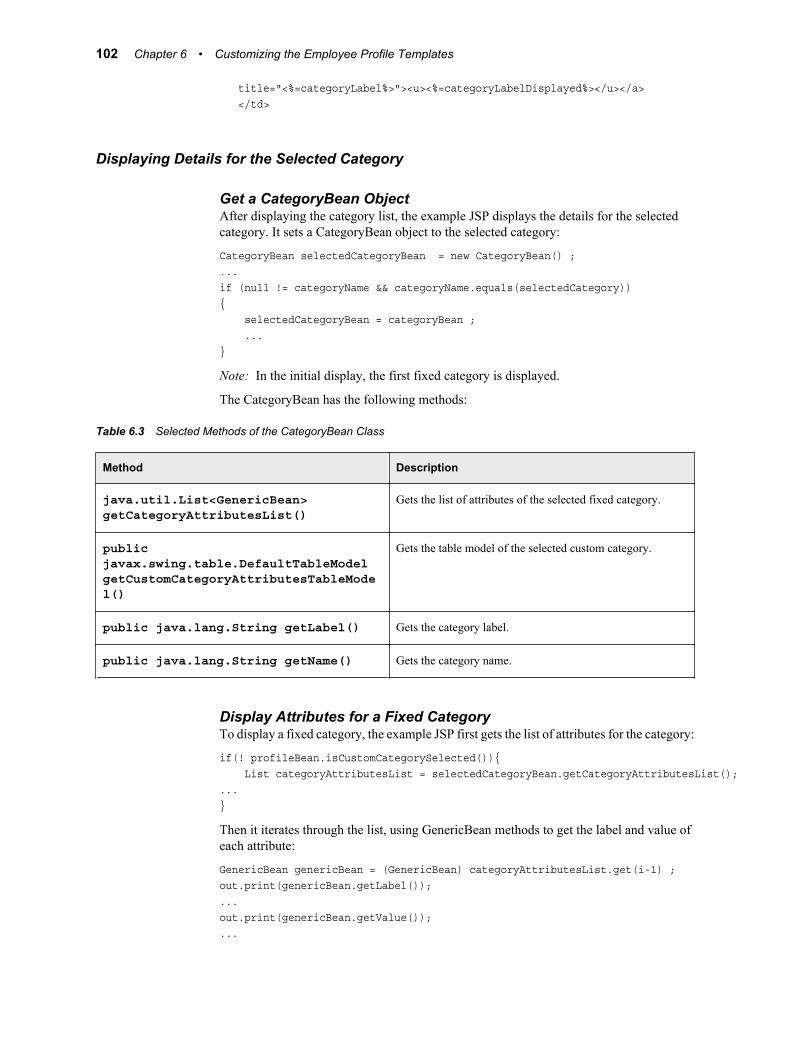
title="<%=categoryLabel%>"><u><%=categoryLabelDisplayed%></u></a> </td>
Displaying Details for the Selected Category
Get a CategoryBean ObjectAfter displaying the category list, the example JSP displays the details for the selectedcategory. It sets a CategoryBean object to the selected category:
CategoryBean selectedCategoryBean = new CategoryBean() ;...if (null != categoryName && categoryName.equals(selectedCategory)){ selectedCategoryBean = categoryBean ; ...}
Note: In the initial display, the first fixed category is displayed.
The CategoryBean has the following methods:
Table 6.3 Selected Methods of the CategoryBean Class
Method Description
java.util.List<GenericBean>getCategoryAttributesList()
Gets the list of attributes of the selected fixed category.
publicjavax.swing.table.DefaultTableModelgetCustomCategoryAttributesTableModel()
Gets the table model of the selected custom category.
public java.lang.String getLabel() Gets the category label.
public java.lang.String getName() Gets the category name.
Display Attributes for a Fixed CategoryTo display a fixed category, the example JSP first gets the list of attributes for the category:
if(! profileBean.isCustomCategorySelected()){ List categoryAttributesList = selectedCategoryBean.getCategoryAttributesList();...}
Then it iterates through the list, using GenericBean methods to get the label and value ofeach attribute:
GenericBean genericBean = (GenericBean) categoryAttributesList.get(i-1) ;out.print(genericBean.getLabel());...out.print(genericBean.getValue());...
102 Chapter 6 • Customizing the Employee Profile Templates

Display Attributes for a Custom CategoryTo display custom category attributes, the JSP uses methods of the PublicAPITableModelclass:
// If a table/infomap is selectedPublicAPITableModel tableModel = (PublicAPITableModel) selectedCategoryBean.getCustomCategoryAttributesTableModel();Object[] columnLabels = tableModel.getColumnInfoNames();if(tableModel != null) { int columnCount = tableModel.getColumnCount(); int rowCount = tableModel.getRowCount();%>
The following methods are available in the PublicAPITableModel class:
Table 6.4 Selected Methods of the PublicAPITableModel Class
Method Description
public int getColumnCount() Gets the number of columns that were returned for the table.
public Object getColumnInfo(intindex, String columnInfoName)
Gets the column label of a column based upon its name.
public Object[] getColumnInfoNames() Gets the column labels.
public int getRowCount() Gets the number of rows that were returned for the table.
public Object getValueAt(int i, intj)
Gets the value of the cell at (i, j).
Using Methods from the PublicAPIInterfaceSome of the methods that are defined in the PublicAPIInterface take the employee ID asone of their parameters and can be used to retrieve information about other employees. Forexample, a template might use these methods to get details about an employee's manager.Other methods are utility methods, used to get a list of authorized columns or to get a tablemodel.
The following methods are available:
Table 6.5 Selected Methods of the PublicAPIInterface
Method Description
java.util.List <GenericBean>getAuthorizedColumns(java.lang.String, HttpServletRequest)
Returns a list of authorized column names, given a table name.
java.lang.StringgetCategoryLink(java.lang.StringcategoryName, HttpServletRequestrequest)
Returns a link to view a category.
Customizing a Template 103

Method Description
java.lang.StringgetConfigValue(java.lang.StringconfigKey, HttpServletRequestrequest)
Returns the value corresponding to the key passed, from theHCM configuration.
GenericResultBeangetEmployeeDetails(java.lang.StringemployeeId, HttpServletRequestrequest)
Returns the specified employee's details from the defaultsearch table (set on the Configuration tab of theAdministration application).
GenericResultBeangetEmployeeDetails(java.lang.StringtableName, java.lang.StringemployeeId, HttpServletRequestrequest)
Returns the specified employee's details from the specifiedtable.
GenericResultBeangetEmployeeDetails(java.lang.StringtableName, java.lang.StringemployeeId,java.util.List<java.langString>columnList, HttpServletRequestrequest)
Returns details of an employee from the specified table andcolumns.
GenericResultBeangetEmployeeList(HttpServletRequestrequest)
Returns the details for all employees from the default searchtable (set on the Configuration tab of the Administrationapplication).
java.lang.StringgetEmployeeList(java.lang.StringtableName, HttpServletRequestrequest)
Returns details for all employees from the specified table.
java.lang.StringgetEmployeeList(java.lang.StringtableName,java.util.List<java.lang.String>columnList, HttpServletRequestrequest)
Returns details for all employees from the specified table andcolumns.
java.lang.StringgetEmployeePhotographSrc(java.lang.String employeeId, HttpServletRequestrequest)
Returns the relative path to a photograph of the specifiedemployee. This path is set on the Configuration tab of theAdministration application.
java.util.List<GenericBean>getHeaderDetails(HttpServletRequestrequest)
Returns the employee profile's header details.
FastRelationshipTreegetHierarchyTree(java.lang.StringhierarchyCode, HttpServletRequestrequest)
Returns an object of FastRelationshipTree type, given ahierarchy code and a table name.
104 Chapter 6 • Customizing the Employee Profile Templates

Method Description
ProfileBeanetProfileDetails(java.lang.StringcategoryId, HttpServletRequestrequest)
Returns employee details for the specified category of thecurrent profile, as selected by the user.
java.util.List<java.lang.String>getTableList(HttpServletRequestrequest)
Returns a list of all tables that are authorized for the currentuser.
PublicAPITableModelgetTableModel(java.lang.String[]columnNames, java.lang.StringtableName, java.lang.String where,HttpServletRequest request)
Returns a PublicAPITableModel object based upon theparameters passed. Results are filtered according to thesecurity that has been defined.
booleanisActionPermitted(java.lang.StringactionName, HttpServletRequestrequest)
Returns true if the specified action is permitted for this user.
This example shows the use of PublicAPIInterface methods (and GenericResultBeanmethods) to retrieve details for a particular employee:
PublicAPIInterface hcmPublicAPI = PublicAPIFactory.getPublicAPI();
GenericResultBean employeeDetailsBean = hcmPublicAPI.getEmployeeDetails( "empmast", "10433", request);
List columnNameList = employeeDetailsBean.getColumnNameList(); Iterator itrColumnName = columnNameList.iterator();
List rowDataList = employeeDetailsBean.getRowDataList(); Iterator itrRowDataList = rowDataList.iterator();
while (itrColumnName.hasNext()) { String columnName = (String) itrColumnName.next(); System.out.print(columnName); } while (itrRowDataList.hasNext()) { List rowList = (List) itrRowDataList.next(); Iterator itrRowList = rowList.iterator();
while (itrRowList.hasNext()) { String value = (String) itrRowList.next(); System.out.print(value); } }
Note: For descriptions of GenericResultBean methods, see Appendix A3, “The PublicAPI,” on page 183.
Customizing a Template 105
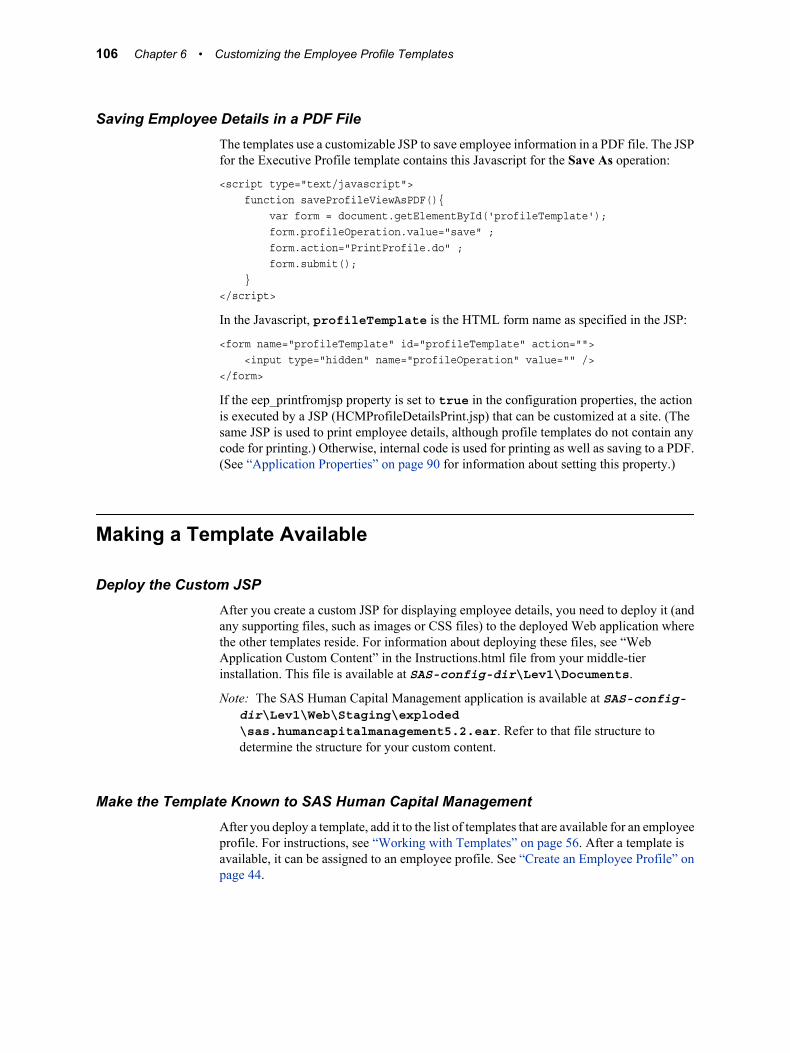
Saving Employee Details in a PDF FileThe templates use a customizable JSP to save employee information in a PDF file. The JSPfor the Executive Profile template contains this Javascript for the Save As operation:
<script type="text/javascript"> function saveProfileViewAsPDF(){ var form = document.getElementById('profileTemplate'); form.profileOperation.value="save" ; form.action="PrintProfile.do" ; form.submit(); } </script>
In the Javascript, profileTemplate is the HTML form name as specified in the JSP:
<form name="profileTemplate" id="profileTemplate" action=""> <input type="hidden" name="profileOperation" value="" /></form>
If the eep_printfromjsp property is set to true in the configuration properties, the actionis executed by a JSP (HCMProfileDetailsPrint.jsp) that can be customized at a site. (Thesame JSP is used to print employee details, although profile templates do not contain anycode for printing.) Otherwise, internal code is used for printing as well as saving to a PDF.(See “Application Properties” on page 90 for information about setting this property.)
Making a Template Available
Deploy the Custom JSPAfter you create a custom JSP for displaying employee details, you need to deploy it (andany supporting files, such as images or CSS files) to the deployed Web application wherethe other templates reside. For information about deploying these files, see “WebApplication Custom Content” in the Instructions.html file from your middle-tierinstallation. This file is available at SAS-config-dir\Lev1\Documents.
Note: The SAS Human Capital Management application is available at SAS-config-dir\Lev1\Web\Staging\exploded\sas.humancapitalmanagement5.2.ear. Refer to that file structure todetermine the structure for your custom content.
Make the Template Known to SAS Human Capital ManagementAfter you deploy a template, add it to the list of templates that are available for an employeeprofile. For instructions, see “Working with Templates” on page 56. After a template isavailable, it can be assigned to an employee profile. See “Create an Employee Profile” onpage 44.
106 Chapter 6 • Customizing the Employee Profile Templates

Chapter 7
Forecasting in SAS HumanCapital Management
About Forecasting in SAS Human Capital Management . . . . . . . . . . . . . . . . . . . . 107Overview of Forecasting . . . . . . . . . . . . . . . . . . . . . . . . . . . . . . . . . . . . . . . . . . . . . 107Overview of the Process . . . . . . . . . . . . . . . . . . . . . . . . . . . . . . . . . . . . . . . . . . . . . 108
Preparing the Data . . . . . . . . . . . . . . . . . . . . . . . . . . . . . . . . . . . . . . . . . . . . . . . . . . . 109
Create a Stored Process Definition . . . . . . . . . . . . . . . . . . . . . . . . . . . . . . . . . . . . . . 112
Customize HCM Forecasting . . . . . . . . . . . . . . . . . . . . . . . . . . . . . . . . . . . . . . . . . . . 116Add Classification Variables . . . . . . . . . . . . . . . . . . . . . . . . . . . . . . . . . . . . . . . . . 116
About Forecasting in SAS Human CapitalManagement
Overview of ForecastingThe forecasting feature in SAS Human Capital Management predicts the value of a variable,based on the variable’s historical value. The forecast variable represents a measure ofinterest to the organization, such as headcount, voluntary terminations, or involuntaryterminations. End users can generate a graph of the results, as in this example, which showspredicted headcount within a company over the coming years.
107

To generate the forecast data, an ETL job calls SAS procedures that perform high—performance forecasting. The forecasting software uses sophisticated automatic modelselection techniques to choose the best-fitting model for the data. It reconciles forecasts atdifferent levels of aggregation, so that (for example) the forecast for a division is consistentwith the forecasts for the individual departments that make up that division.
End users call a stored process that generates a graph of the forecast results. The graphdisplays the historical and predicted value of a variable. Users can filter the results byclassification variables such as job group code, hierarchy variables, EEO-1 classification,or the job's permanence (such as regular or temporary). Here are some possible uses:
• projecting fluctuations in contract hiring over the next two years
• projecting headcount changes in a particular division
• projecting voluntary terminations (retirements and resignations) for a particular jobgroup
A forecast does not make predictions for individual employees. It bases its predictionssolely on the forecast variable's historical values, not on other variables that mightcontribute to its value. The more data points available, the more accurate the predictions.
Overview of the ProcessThere are two parts to the forecasting process:
1. Generate the forecast data:
a. In SAS Data Integration Studio, set the transformation properties for the ETL jobsthat will generate the forecast data sets.
b. Run the ETL jobs.
c. In SAS Management Console, create a stored process definition for each of theforecast data sets.
108 Chapter 7 • Forecasting in SAS Human Capital Management
The prompts for the stored process must match the selections that you made in theETL job.
2. Run the stored process:
a. An end user logs on to SAS Human Capital Management and runs a forecastingstored process.
b. The stored process generates a graph, based on the forecast data set.
End users can run the stored process multiple times, making different selectionseach time. Each execution would provide a different view into the same data set.In other words, the forecasting is done when the ETL job is run. The stored processfilters the data, based on user selections, and generates the graph.
You can regenerate the forecast data sets periodically (for example, to collect additionalhistorical data or to change the forecast variables or classification variables). If you modifythe transformation properties in the ETL job, you must also modify the prompts in thecorresponding stored process definition.
Preparing the DataAn ETL job generates the forecasting data. To prepare the job for execution, follow thesesteps:
1. Log on to SAS Data Integration Studio as a user with the Data Administrator role.
2. Open the job in the process designer window.
There might be multiple forecasting jobs. By default the software includes the followingthree jobs, for monthly, quarterly, and yearly forecasting:
• hcm_126050_run_month_forecast
• hcm_126100_run_quarter_forecast
• hcm_126150_run_year_forecast
3. Right-click the transformation and select Properties.
4. On the Options tab, specify the following options:
Preparing the Data 109
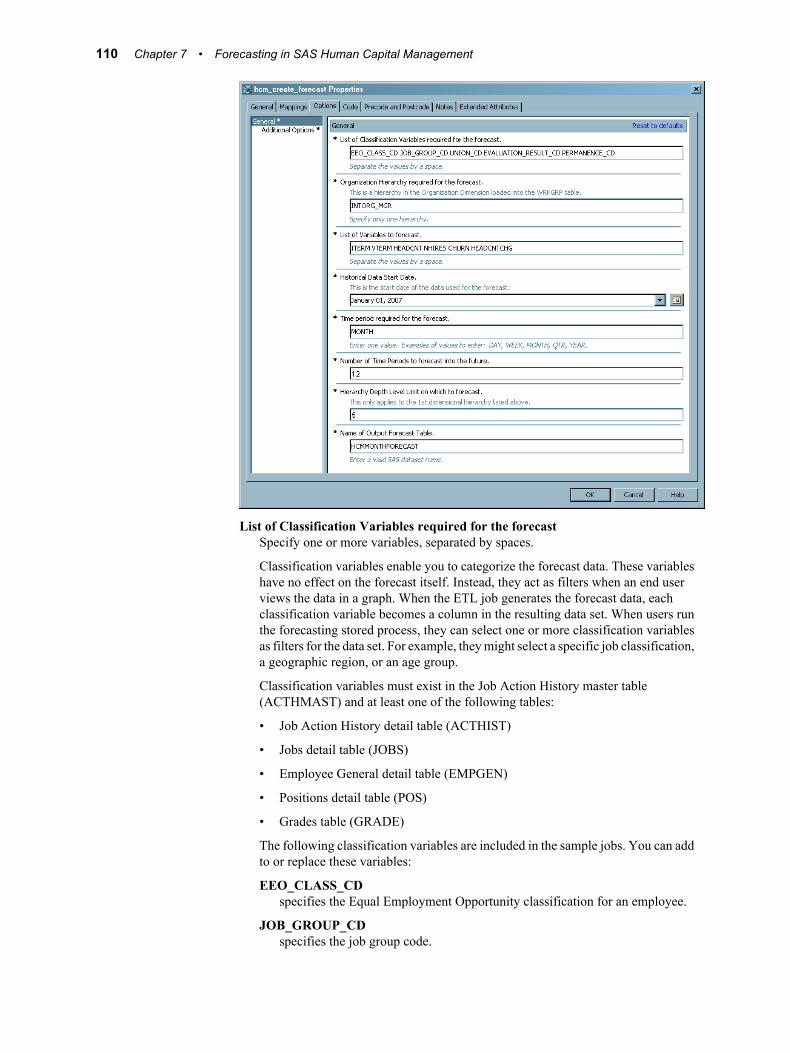
List of Classification Variables required for the forecastSpecify one or more variables, separated by spaces.
Classification variables enable you to categorize the forecast data. These variableshave no effect on the forecast itself. Instead, they act as filters when an end userviews the data in a graph. When the ETL job generates the forecast data, eachclassification variable becomes a column in the resulting data set. When users runthe forecasting stored process, they can select one or more classification variablesas filters for the data set. For example, they might select a specific job classification,a geographic region, or an age group.
Classification variables must exist in the Job Action History master table(ACTHMAST) and at least one of the following tables:
• Job Action History detail table (ACTHIST)
• Jobs detail table (JOBS)
• Employee General detail table (EMPGEN)
• Positions detail table (POS)
• Grades table (GRADE)
The following classification variables are included in the sample jobs. You can addto or replace these variables:
EEO_CLASS_CDspecifies the Equal Employment Opportunity classification for an employee.
JOB_GROUP_CDspecifies the job group code.
110 Chapter 7 • Forecasting in SAS Human Capital Management

UNION_CDspecifies the union membership code.
EVALUATION_RESULT_CDspecifies the results of evaluations. For example, in the sample data, somepossible evaluation results are Meets Expectations, ConsistentlyExceeds Expectations, and so on.
PERMANENCE_CDspecifies a job classification in terms of permanence (for example, Regularor Temporary).
Organization Hierarchy required for the forecastSpecify one hierarchy code. This hierarchy must be in the Work Group Table(WRKGRP), and it must be a populated column in the Job Action History Table(ACTHIST). This step is optional.
List of Variables to forecastSpecify the forecast variables to include in the transformation. Separate items inthe list by spaces.
In SAS Human Capital Management, a single forecast variable can be viewed orgraphed at a time. The ETL job can include multiple forecast variables, but the datafor each variable is forecasted independently of the others. When users run aforecasting stored process, they select a single forecast variable to view in a graph.
Forecasting is supported for the following variables:
VTERMspecifies voluntary terminations—the number of employees that are projectedto leave the organization voluntarily during the forecast period.
HEADCNTCHGspecifies the projected change in headcount (additions or subtractions) duringthe forecast period.
NHIRESspecifies the projected new hires during the forecast period.
HEADCNTspecifies the projected headcount during the forecast period.
ITERMspecifies involuntary terminations—the number of employees that are projectedto leave the organization involuntarily during the forecast period.
CHURNspecifies the projected internal movement (such as employees moving todifferent departments) during the forecast period.
Historical Data Start DateSpecify the starting date for the data on which the forecasting software bases itspredictions. For best results, specify a period that includes a minimum of 20 datapoints (for monthly forecasts, 20 months; for quarterly forecasts, 20 quarters; andso on). With fewer data points, the accuracy of the forecast is diminished.
Time Period required for the forecastSpecify a required time period. The example ETL jobs use these time periods:MONTH, QTR, and YEAR.
You can specify other time periods, such as weekly or 10-day intervals. For acomplete list and description, see "About Date and Time Intervals" in the SAS(R)9.2 Language Reference.
Preparing the Data 111
Number of Time Periods to forecast into the futureSpecify how far into the future you want to forecast, in terms of the selected timeperiod. For a monthly forecast, you would enter 12 to forecast a year into the future,24 to forecast 2 years into the future, and so on.
Hierarchy Depth Level Limit on which to forecastThis field applies to the Hierarchy variable that you specify. It determines thenumber of levels for which forecast data is generated. As this number gets larger,the forecast generation time gets longer and the data set gets larger. We recommendthat you start with a level of 1, which means that forecast data would be availableonly at the top level of the hierarchy.
Name of Output Forecast TableGive the output table a unique name. The table is stored in the HCM database andregistered in the metadata repository.
For more information about forecasting with SAS, see SAS High-Performance Forecastingdocumentation at http://support.sas.com/documentation/onlinedoc/hpf.
Create a Stored Process DefinitionThe default installation includes a stored process template and three example stored processdefinitions: Monthly Forecast, Quarterly Forecast, and Yearly Forecast. To create anew stored process definition, copy the template or one of the examples and modify it asnecessary.
As you modify a stored process definition, the important thing to remember is that most ofthese parameters must match the variables that were specified in the ETL job that generatedthe forecast data set. The graph type and output type parameters are the only exceptions.
In the examples, parameters are grouped. You can rearrange those groupings for a differentuser interface. You can also give some parameters default values and hide them from endusers, or make other site-specific changes.
The default parameters are as follows:
FORECAST_VARIABLE_NAMEspecifies the variable whose value you want to forecast. This variable must be one ofthe forecast variables specified in the ETL job that produced the forecast.
HCMGRAPHTYPE_VARspecifies the type of graph in which to convey the historical and projected values of theforecast variable. The historical data is displayed to the left of the red line; the forecastdata, to the right of the red line. The gray area represents the confidence interval.
By default, these selections are available:
• dlines (Floating Lines) specifies a modified line graph. Confidence intervals aredisplayed as gray bar areas above and below the forecasted line.
112 Chapter 7 • Forecasting in SAS Human Capital Management

• bbars (Vertical Bars) specifies a traditional histogram. Confidence intervals canbe displayed on the Time axis or on top of the histogram.
• sarrows (Floating Arrows) specifies a scatter plot that uses arrow symbols asmarkers.
Create a Stored Process Definition 113

• sgraph (Statistical Graph) specifies a traditional statistical graph. Confidenceintervals are displayed in areas above and below the line plot.
Data InputSpecify the name and interval of your forecast data.
FORECAST_DATA_NAMEis the name of the forecast data set, which must be registered in the metadatarepository. This prompt is hidden from end users because other prompts like classand hierarchy are dependent on its value.
FORECAST_TIME_INTERVAL_VARspecifies the time period that is associated with the forecast data. Only one timeperiod can be specified. Its value must match the time period that was selected inthe ETL job that generated the forecast data set. This prompt should be hidden fromend users.
There are three possible values for the default stored processes. MONTHLY dividesa year into 12 months and assumes that the input data is in that form. QTR dividesa year into 4 quarters and assumes that the input data is in that form. YEARLYassumes a time period of 1 year for the forecast data set.
114 Chapter 7 • Forecasting in SAS Human Capital Management
Class variablesThese variables act as filters on the forecast data. For example, if the forecast datacontains a category for job group code, the end user can select a specific job groupvalue and view a graph that contains data only for that job group.
The prompts for these parameters should be lookups into the forecast data set. Forexample, the EEO_CLASS_VALUE prompt takes its possible values from theEEO_CLASS_CD column of the forecast data set. The following parameters aresupported by default in the stored process. However, the parameters must match theclassification variables that were selected in the ETL job that generated the forecastdata.
EEO_CLASS_VALUEspecifies the EEO classification.
JOB_GROUP_VALUEspecifies the job group code.
UNION_VALUEspecifies the union membership code.
EVALUATION_RESULT_VALUEspecifies the results of evaluations.
PERMANENCE_VALUEspecifies the job position permanence (with values such as Regular orTemporary).
To add a prompt for your own class variables, see “Add Classification Variables” onpage 116.
Hierarchy variablesThese variables filter the results by hierarchy level (for example, by department or bymanager).
The hierarchy variables can go only as deep as the hierarchy depth that you specifiedfor the ETL job transformation. For example, the INTORG_HR hierarchy has thesefive levels: INTORG_HR5 (the highest level), INTORG_HR4, INTORG_HR3,INTORG_HR2, and INTORG_HR1. Assume that in the ETL job, you selectedINTORG_HR as the hierarchy code, and three as the hierarchy depth. The forecast datawould then include these columns: INTORG_HR5, INTORG_HR4, andINTORG_HR3. In the stored process definition, you would typically prompt for valuesfor each of those three hierarchy variables. There is no point in drilling deeper into theorganization, because there is no data available at lower levels.
Note: If you also specified a security hierarchy in the ETL job, then all levels of thathierarchy are available in the forecast data.
To ensure accuracy and to make things easier for your end users, we recommend usingcascading prompts for these values, so that selecting a value at one level of the hierarchyrestricts the prompts at the next lower level.
Graph output parametersThe output parameters modify how your graph is displayed.
CI_DISPLAY_TYPE_VARspecifies the confidence interval display type.
NUM_OF_HIST_LIMITspecifies the number of historical values. This prompt can be useful to produce agraph with fewer historical values and be less crowded, for example.
Create a Stored Process Definition 115
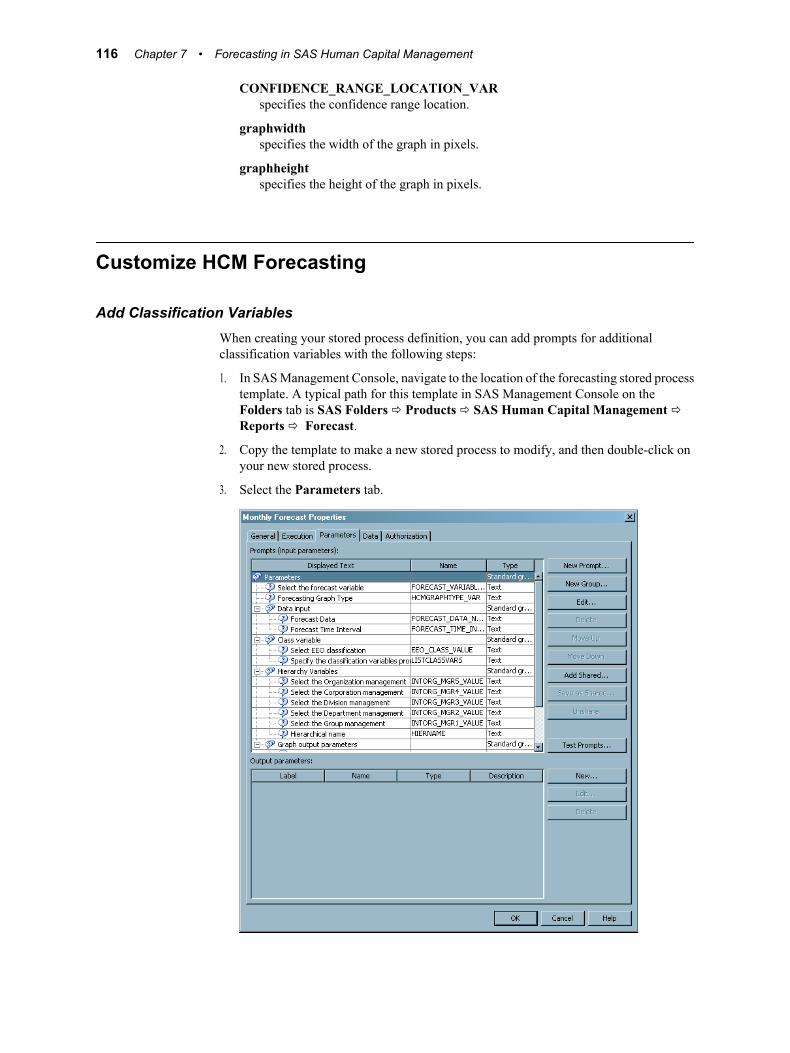
CONFIDENCE_RANGE_LOCATION_VARspecifies the confidence range location.
graphwidthspecifies the width of the graph in pixels.
graphheightspecifies the height of the graph in pixels.
Customize HCM Forecasting
Add Classification VariablesWhen creating your stored process definition, you can add prompts for additionalclassification variables with the following steps:
1. In SAS Management Console, navigate to the location of the forecasting stored processtemplate. A typical path for this template in SAS Management Console on theFolders tab is SAS Folders ð Products ð SAS Human Capital Management ðReports ð Forecast.
2. Copy the template to make a new stored process to modify, and then double-click onyour new stored process.
3. Select the Parameters tab.
116 Chapter 7 • Forecasting in SAS Human Capital Management
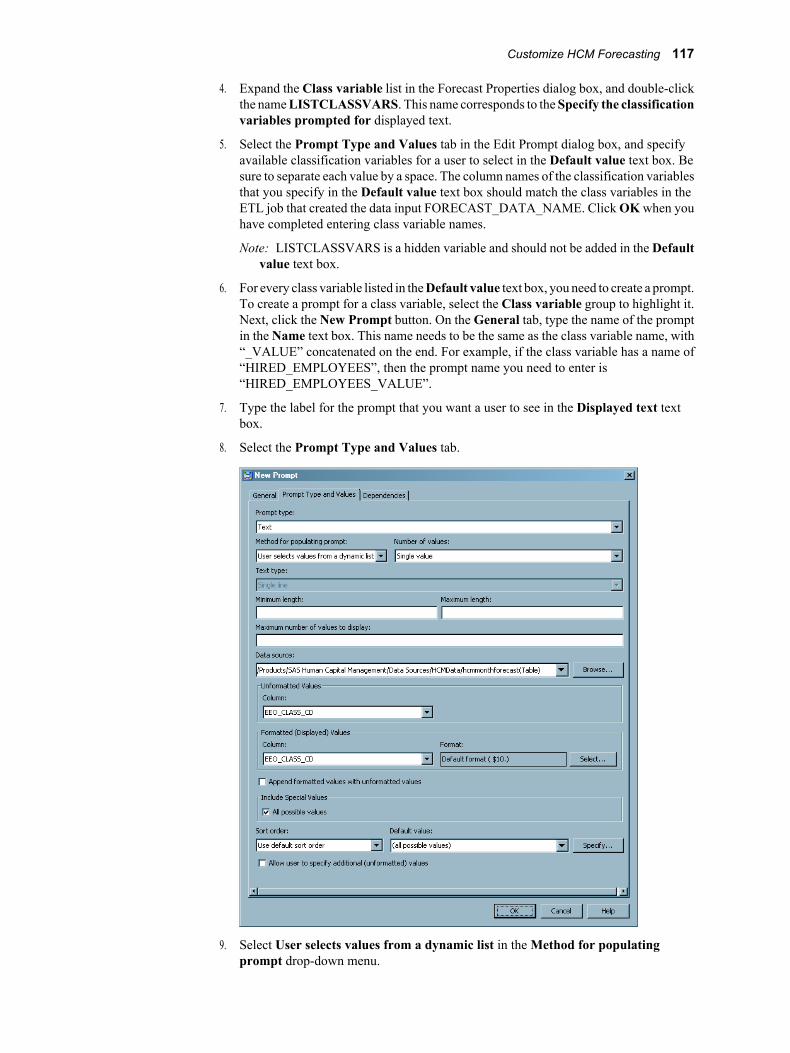
4. Expand the Class variable list in the Forecast Properties dialog box, and double-clickthe name LISTCLASSVARS. This name corresponds to the Specify the classificationvariables prompted for displayed text.
5. Select the Prompt Type and Values tab in the Edit Prompt dialog box, and specifyavailable classification variables for a user to select in the Default value text box. Besure to separate each value by a space. The column names of the classification variablesthat you specify in the Default value text box should match the class variables in theETL job that created the data input FORECAST_DATA_NAME. Click OK when youhave completed entering class variable names.
Note: LISTCLASSVARS is a hidden variable and should not be added in the Defaultvalue text box.
6. For every class variable listed in the Default value text box, you need to create a prompt.To create a prompt for a class variable, select the Class variable group to highlight it.Next, click the New Prompt button. On the General tab, type the name of the promptin the Name text box. This name needs to be the same as the class variable name, with“_VALUE” concatenated on the end. For example, if the class variable has a name of“HIRED_EMPLOYEES”, then the prompt name you need to enter is“HIRED_EMPLOYEES_VALUE”.
7. Type the label for the prompt that you want a user to see in the Displayed text textbox.
8. Select the Prompt Type and Values tab.
9. Select User selects values from a dynamic list in the Method for populatingprompt drop-down menu.
Customize HCM Forecasting 117
10. Click the Browse button next to the Data source drop-down menu, and select theforecast table that contains the forecast data set. Note that this is the same data sourceas the FORECAST_DATA_NAME.
11. In the Unformatted Values section, select the class column name for the unformattedvalues from the Column drop-down menu.
12. In the Formatted (Displayed) Values section, select the column name for theformatted values from the Column drop-down menu. In the Format box, define theformat that matches that value.
13. Select the All possible values check box to enable it.
14. Select Use default sort order from the Sort order drop-down menu.
15. Select (all possible values) from the Default value drop-down menu.
16. Click OK. Repeat this procedure to create prompts for each of the class variables youspecified in the Default value text box in the Edit Prompt dialog box for theLISTCLASSVARS class variable.
17. Next you need to set up cascading prompts for the hierarchy variables. Expand theHierarchy Variables group. Double-click HIERNAME to open the Edit Promptdialog box for that variable.
18. Select the Prompt Types and Values tab.
19. Select User selects values for a static list in the Method for populating prompt drop-down menu. In the List of Values pane make sure that there is one value, which is thename of the hierarchy without the level. Click OK.
20. Create prompts for each hierarchy level by beginning with the highest level and endingwith the lowest level. It is important to set up the hierarchy levels in order to set updependencies correctly. When creating the prompt for the highest level, select the Allpossible values check box.
21. After you have created prompts for each hierarchy variable, beginning with the highestlevel and ending with the lowest level in the organization, you need to configure theprompts. Configure the prompts beginning with the highest level and ending with thelowest level. Double-click the name for the highest level in your organization on theParameters tab to open the Edit Prompt dialog box.
22. Select the General tab, and specify the name of the prompt and the text to display.
23. Select the Prompt Type and Values tab.
24. Make sure that (all possible values) is selected from the Default value drop-downmenu for the hierarchy prompt that corresponds to the highest level in your hierarchy.For all subsequent prompts that are at levels below the highest level in your organization(none) should be selected.
25. If you are configuring the prompt for the highest level in your organization, clickOK, and skip the rest of this step. If you are configuring a prompt for a level that isbelow the highest level in your hierarchy, select the Dependencies tab.
All levels below the highest level are dependent upon higher levels. Click Add, andselect the level for each level in the hierarchy that is above the current level you areconfiguring, beginning with the top level in the hierarchy. For example, consider ahierarchy with three levels, 1, 2, and 3, with 1 being the highest level and 3 being thelowest level. It is important that you add dependencies beginning with the highest levelin the organization, and work down to the level right above the current level you areconfiguring. Otherwise, the path might not be correct to set up the cascading hierarchyprompts. When configuring the dependencies for level 3, add the prompt for level 1,
118 Chapter 7 • Forecasting in SAS Human Capital Management

and then add the prompt for level 2. When you have completed adding dependenciesfor each level above the current level in the hierarchy, click OK.
Customize HCM Forecasting 119

120 Chapter 7 • Forecasting in SAS Human Capital Management
Chapter 8
Retention Analysis
Introduction to Retention Analysis . . . . . . . . . . . . . . . . . . . . . . . . . . . . . . . . . . . . . . 121Retention Analysis in SAS Human Capital Management . . . . . . . . . . . . . . . . . . . 121The Process . . . . . . . . . . . . . . . . . . . . . . . . . . . . . . . . . . . . . . . . . . . . . . . . . . . . . . . 122
Extracting the Data . . . . . . . . . . . . . . . . . . . . . . . . . . . . . . . . . . . . . . . . . . . . . . . . . . . 123Overview of Extraction . . . . . . . . . . . . . . . . . . . . . . . . . . . . . . . . . . . . . . . . . . . . . . 123Modifying Macro Files . . . . . . . . . . . . . . . . . . . . . . . . . . . . . . . . . . . . . . . . . . . . . . 124Requirements and Assumptions for Extraction . . . . . . . . . . . . . . . . . . . . . . . . . . . 124Modify the %PREBUILD Macro . . . . . . . . . . . . . . . . . . . . . . . . . . . . . . . . . . . . . . 126Modify the %VTAPB Macro . . . . . . . . . . . . . . . . . . . . . . . . . . . . . . . . . . . . . . . . . 127The Output Table (HRVANLY2) . . . . . . . . . . . . . . . . . . . . . . . . . . . . . . . . . . . . . . 129
Generating the Scoring Table . . . . . . . . . . . . . . . . . . . . . . . . . . . . . . . . . . . . . . . . . . 129Overview of Transformation . . . . . . . . . . . . . . . . . . . . . . . . . . . . . . . . . . . . . . . . . 129Generate the Model . . . . . . . . . . . . . . . . . . . . . . . . . . . . . . . . . . . . . . . . . . . . . . . . . 130Generate the Scoring Table . . . . . . . . . . . . . . . . . . . . . . . . . . . . . . . . . . . . . . . . . . 131Contents of the Scoring Table . . . . . . . . . . . . . . . . . . . . . . . . . . . . . . . . . . . . . . . . 136
Working with the Results . . . . . . . . . . . . . . . . . . . . . . . . . . . . . . . . . . . . . . . . . . . . . . 137Merging the Tables . . . . . . . . . . . . . . . . . . . . . . . . . . . . . . . . . . . . . . . . . . . . . . . . . 137Using the EMPSCORES Table in a Report . . . . . . . . . . . . . . . . . . . . . . . . . . . . . . 139Updating the Results . . . . . . . . . . . . . . . . . . . . . . . . . . . . . . . . . . . . . . . . . . . . . . . . 139
Introduction to Retention Analysis
Retention Analysis in SAS Human Capital ManagementPredictive modeling is a way of projecting the values of one or more variables (targetvariables), based on historical data. A predictive model is a structure and process forpredicting those values, using one or more techniques such as linear regression, decisiontrees, or neural networking.
For SAS Human Capital Management, one rewarding use of predictive modeling is forretention analysis—predicting which employees in an organization are likely to leavewithin a specified time period. Retention analysis does not predict the date that an employeeis likely to terminate; rather, it predicts the likelihood that an employee will terminate withinthe specified time period.
Using SAS Human Capital Management, consultants and power users can generate reportsbased on the retention analysis data that correlate various factors with retentionprobabilities. Such reports might analyze retention probabilities by job group, geographical
121

regions, length of service, or divisions within the organization. Organizations can use thisinformation to plan for the future (for example, to plan additional recruiting efforts in areasthat are expected to be affected, or to take corrective action to help reduce the terminationrate in high-risk groups).
This document describes the steps involved in retention analysis for SAS Human CapitalManagement. The document is written for use by HCM consultants, site administrators, orother persons who need to create the utility table that is the input for retention analysis,work with the analytical consultant who creates the retention model, run the code to createthe output, or process the results.
Note: For more background information about the predictive modeling process, see "It's9:00am - Do You Know Where Your Critical Talent Is? Retention Analytics and SASHuman Capital Management," a paper from SAS Global Forum 2008 (http://support.sas.com/rnd/papers/sgf2008/Retentionmodelingpaper.pdf).
The ProcessAt a site with SAS Human Capital Management, the general process for retention analysisis as follows:
1. The extraction stage. You (and perhaps a database administrator) meet with the analyticconsultant to examine the site’s data. You refresh the data warehouse, customize somemacro variables, and extract the data for the analysis.
The input comes from several tables. The output of the extraction process is a singletable, with one row per employee. At least two years of historical data is required.
See “Extracting the Data” on page 123. For a list of input tables, see “Required Tables”on page 124.
2. The transformation stage. Using SAS Enterprise Miner, the analytic consultantgenerates the predictive model. The result is a scoring function that is given to thesite.
At the site, you use the scoring function to generate the Voluntary Termination Scoringtable. You wrap the scoring function in a SAS macro, customize a number of macrovariables (based on information from the analytic consultant), and run a program thatgenerates the scoring table.
See “Generating the Scoring Table” on page 129.
3. The merge stage. You merge the scoring table with the Employee Master table(EMPMAST) to generate a table (EMPSCORES) that combines employee data withpredicted termination scores.
You (or perhaps a power user) create cubes and reports from the merged table.
See “Working with the Results” on page 137.
The following diagram illustrates the overall retention analysis process:
122 Chapter 8 • Retention Analysis
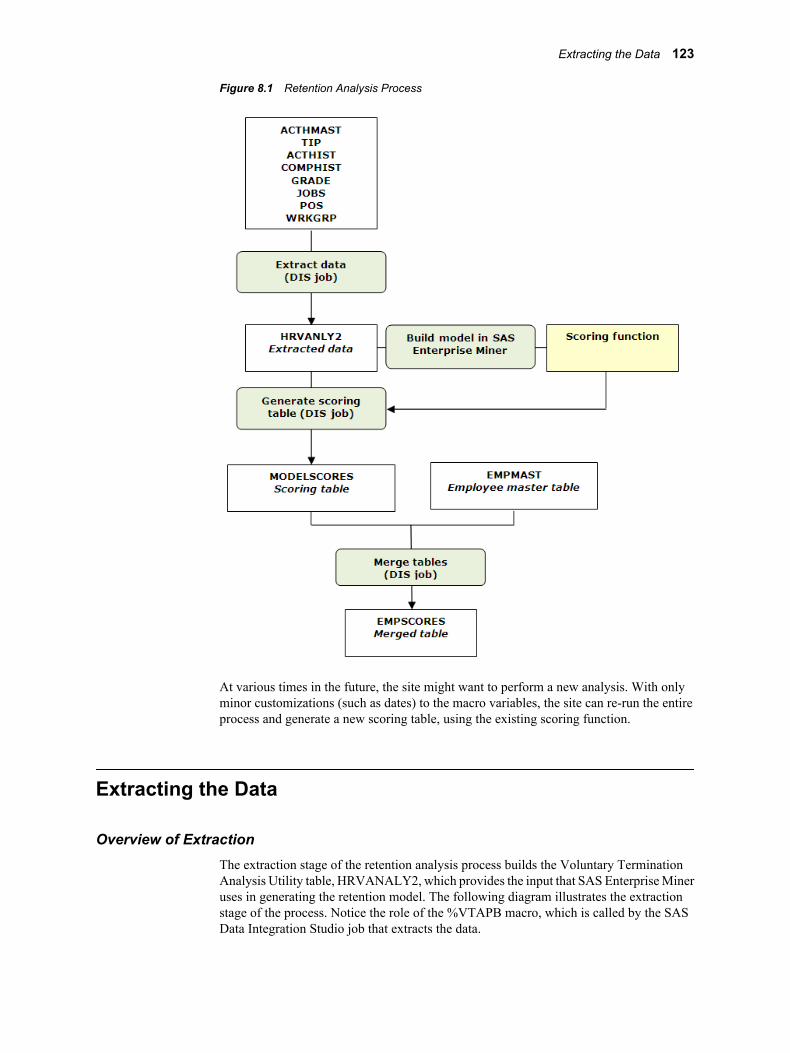
Figure 8.1 Retention Analysis Process
At various times in the future, the site might want to perform a new analysis. With onlyminor customizations (such as dates) to the macro variables, the site can re-run the entireprocess and generate a new scoring table, using the existing scoring function.
Extracting the Data
Overview of ExtractionThe extraction stage of the retention analysis process builds the Voluntary TerminationAnalysis Utility table, HRVANALY2, which provides the input that SAS Enterprise Mineruses in generating the retention model. The following diagram illustrates the extractionstage of the process. Notice the role of the %VTAPB macro, which is called by the SASData Integration Studio job that extracts the data.
Extracting the Data 123

Figure 8.2 Extraction Stage of Retention Analysis Process
By default, the HRVANALY2 utility table is an extraction and summarization from SASHuman Capital Management’s headcount summary, time in position, and detail tables. Itcontains one record per employee. To build the utility table, follow these steps:
1. Examine the requirements for the extraction process and make any necessary changes.See “Requirements and Assumptions for Extraction” on page 124.
2. Refresh the HCM data warehouse using your usual procedures.
3. Modify the %VTAPB macro to customize the process for your site.
For details, see Table 8.3 on page 127.
4. In SAS Data Integration Studio, run the hcm_140050_load_hrvanly2_table job.
Modifying Macro FilesThe macros that are listed in this chapter are stored in one of the SASAUTOS folders (asdefined in the SASV9.CFG file). When you modify one of the macro files (such as vtapb.sasor modlpb.sas), first copy it to the SASMacro directory that is located in SAS-config-dir\Lev1\SASApp\SASEnvironment\HumanCapitalManagement (on the datatier). Then make your modifications in that directory, rather than modifying the originalversion. At runtime, macros in the SASMacro folder override the original macros.
Ensure that the operating system permissions for the SASMacro directory are the same asthe permissions for the SASApp directory. Without these permissions, the macros cannotbe executed. For details, see the table of “Recommended and Default Operating SystemProtections” in the SAS Intelligence Platform: System Administration Guide.
Requirements and Assumptions for Extraction
Required TablesA minimum of two years of data is required to produce meaningful results. The extractionprocess relies on these tables from the HCMData library:
• ACTHMAST: Job Actions History Master table
• TIP: Time In Position Summary table
• ACTHIST: Job Actions History Detail table
• POS: Positions History Detail table
124 Chapter 8 • Retention Analysis
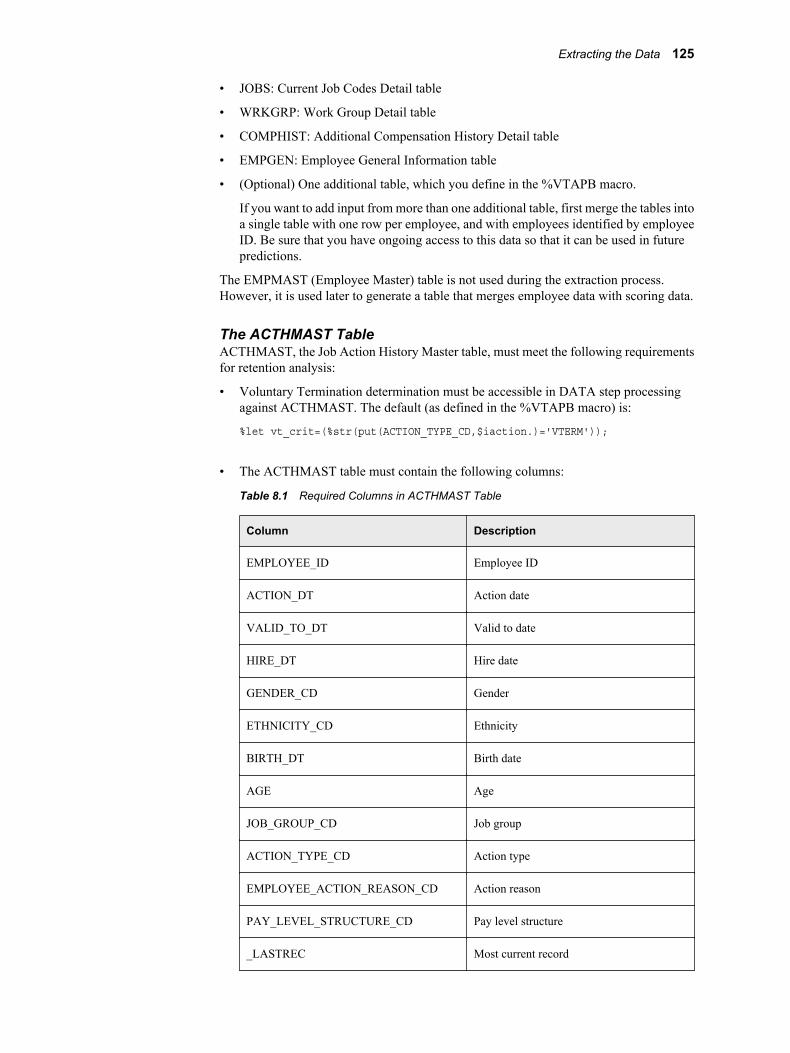
• JOBS: Current Job Codes Detail table
• WRKGRP: Work Group Detail table
• COMPHIST: Additional Compensation History Detail table
• EMPGEN: Employee General Information table
• (Optional) One additional table, which you define in the %VTAPB macro.
If you want to add input from more than one additional table, first merge the tables intoa single table with one row per employee, and with employees identified by employeeID. Be sure that you have ongoing access to this data so that it can be used in futurepredictions.
The EMPMAST (Employee Master) table is not used during the extraction process.However, it is used later to generate a table that merges employee data with scoring data.
The ACTHMAST TableACTHMAST, the Job Action History Master table, must meet the following requirementsfor retention analysis:
• Voluntary Termination determination must be accessible in DATA step processingagainst ACTHMAST. The default (as defined in the %VTAPB macro) is:
%let vt_crit=(%str(put(ACTION_TYPE_CD,$iaction.)='VTERM'));
• The ACTHMAST table must contain the following columns:
Table 8.1 Required Columns in ACTHMAST Table
Column Description
EMPLOYEE_ID Employee ID
ACTION_DT Action date
VALID_TO_DT Valid to date
HIRE_DT Hire date
GENDER_CD Gender
ETHNICITY_CD Ethnicity
BIRTH_DT Birth date
AGE Age
JOB_GROUP_CD Job group
ACTION_TYPE_CD Action type
EMPLOYEE_ACTION_REASON_CD Action reason
PAY_LEVEL_STRUCTURE_CD Pay level structure
_LASTREC Most current record
Extracting the Data 125
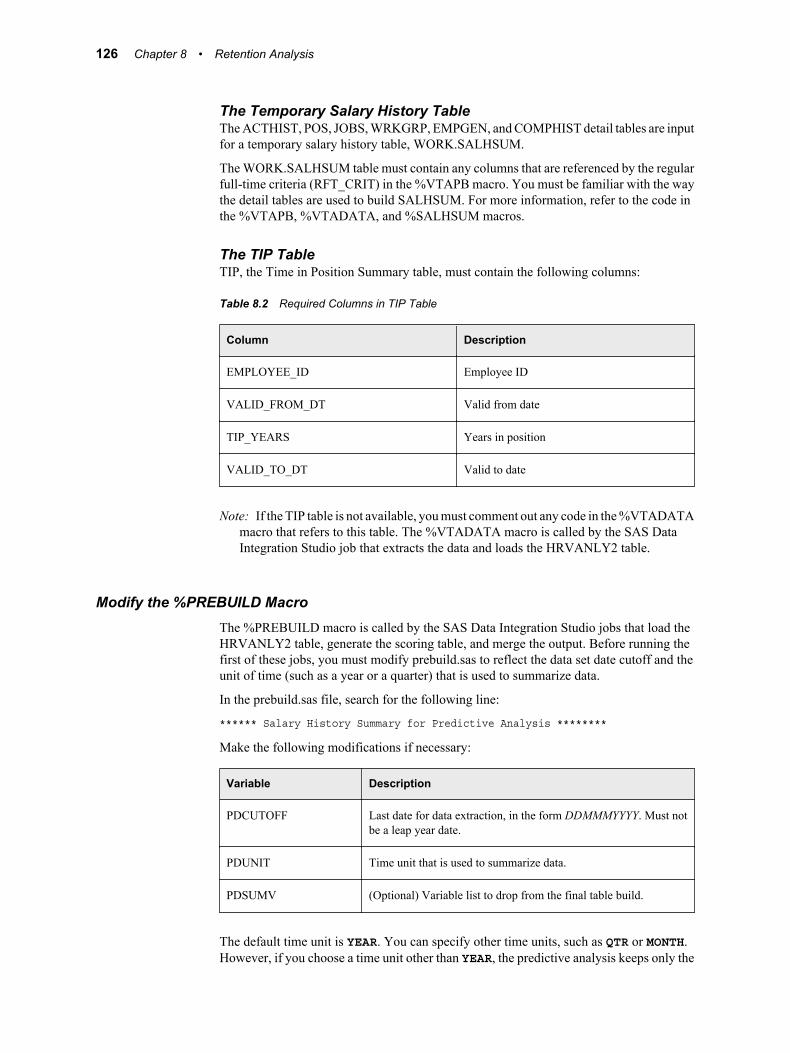
The Temporary Salary History TableThe ACTHIST, POS, JOBS, WRKGRP, EMPGEN, and COMPHIST detail tables are inputfor a temporary salary history table, WORK.SALHSUM.
The WORK.SALHSUM table must contain any columns that are referenced by the regularfull-time criteria (RFT_CRIT) in the %VTAPB macro. You must be familiar with the waythe detail tables are used to build SALHSUM. For more information, refer to the code inthe %VTAPB, %VTADATA, and %SALHSUM macros.
The TIP TableTIP, the Time in Position Summary table, must contain the following columns:
Table 8.2 Required Columns in TIP Table
Column Description
EMPLOYEE_ID Employee ID
VALID_FROM_DT Valid from date
TIP_YEARS Years in position
VALID_TO_DT Valid to date
Note: If the TIP table is not available, you must comment out any code in the %VTADATAmacro that refers to this table. The %VTADATA macro is called by the SAS DataIntegration Studio job that extracts the data and loads the HRVANLY2 table.
Modify the %PREBUILD MacroThe %PREBUILD macro is called by the SAS Data Integration Studio jobs that load theHRVANLY2 table, generate the scoring table, and merge the output. Before running thefirst of these jobs, you must modify prebuild.sas to reflect the data set date cutoff and theunit of time (such as a year or a quarter) that is used to summarize data.
In the prebuild.sas file, search for the following line:
****** Salary History Summary for Predictive Analysis ********
Make the following modifications if necessary:
Variable Description
PDCUTOFF Last date for data extraction, in the form DDMMMYYYY. Must notbe a leap year date.
PDUNIT Time unit that is used to summarize data.
PDSUMV (Optional) Variable list to drop from the final table build.
The default time unit is YEAR. You can specify other time units, such as QTR or MONTH.However, if you choose a time unit other than YEAR, the predictive analysis keeps only the
126 Chapter 8 • Retention Analysis

first summary record in a year. For a complete list and description, see "About Date andTime Intervals" in the SAS Language Reference.
The retention analysis code assumes that the time period begins on the first day of the period(for example, January 1 for yearly periods, and January 1, April 1, July 1, and October 1for quarterly periods).
Note: The remainder of this chapter describes yearly time units, to which theWORK.SALHSUM data is converted if its time period is not yearly.
Modify the %VTAPB MacroThe %VTAPB macro identifies organizational characteristics of the site, includingvoluntary termination, involuntary termination, promotional criteria, regular full-timeemployees, and time-dependent analysis columns. It is similar to the %PREBUILD macroin that it enables you to customize data derivation and report creation without modifyingthe calling program.
By modifying the parameters in the %VTAPB macro, you can customize the derivationand transformation of data, as well as select and format the variables that appear in thereports. Working with the analytical consultant will produce the best results. This macrois used to build the utility table and to build the scoring table.
The following table describes the variables that are defined in the %VTAPB macro.
Table 8.3 Variables in the %VTAPB Macro
Variable Description
VT_CRIT Defines the voluntary termination criteria as a valid DATA step statementthat can be processed against ACTHMAST. Example:
%let vt_crit=(%str(put(ACTION_TYPE_CD,$iaction.)='VTERM'));
NVT_CRIT Defines the involuntary termination criteria as a valid DATA stepstatement that can be processed against ACTHMAST. Example:
%let nvt_crit=(%str(put(ACTION_TYPE_CD,$iterm.)='TERMS') and %str(put(ACTION_TYPE_CD,$iaction.) ne 'VTERM'));
ASUBVARS (Optional) Defines any non-standard variables that are used in thetermination criteria and promotion criteria macro variables. “Non-standard” refers to columns that are not listed in Table 8.1 on page 125.
For example, assume that the site defines voluntary termination as acombination of ACTION_TYPE_CD and MYREASON (a non-standardcolumn):
%let vt_crit = %str((put(ACTION_TYPE_CD, $iaction.)=’VTERM’)) and myreason = ’T’);
In that case, you would assign asubvars as follows:
%let asubvars = myreason;
PRO_CRIT (Optional) Defines promotion criteria as a valid DATA step statement thatcan be processed against ACTHMAST. Example:
%let pro_crit=(%str(ACTION_TYPE_CD=’DPRO’));
Extracting the Data 127

Variable Description
RFT_CRIT Defines criteria for regular full-time employees as a valid DATA stepstatement that can be processed against the WORK.SALHSUM table.Example:
%let rft_crit=%str(PERMANENCE_CD="R");
SHAVARS Defines the time-dependent analysis columns from theWORK.SALHSUM table. (To determine these columns, look at thecolumns in the permanent SALHSUM table.) Example:
%let shavars=ANNUAL_SALARY TOTOTHER PAY_LEVEL_STRUCTURE_CD CHGAMT CHGPCT JOB_GROUP_CD;
AHAVARS Defines the time-dependent analysis columns from the ACTHMASTtable. Example:
%let ahavars=COMRATIO RNG_PENE;
ASPECDAT (Optional) Specifies the name of a table that contains custom parametersto be included in the analysis. This table might have been created fromsurvey data or as the result of a query. The format of this data set mustcorrespond to the format of HRVANLY2. Example:
%let aspecdat=hcmdata.mytable;
ASPECVAR Defines the names of the columns to be analyzed from the optional tablethat is identified in ASPECDAT. Required if ASPECDAT is defined.Example:
%let aspecvar=myvar02 myvar03 myvar04 myvar05;
MEDVARS (Optional) Specifies one or more analysis columns to be compared withthe median values for the group that is specified in the MEDGRP variable.Example:
%let medvars=CHGAMT RNG_PENE;
MEDGRP (Optional) Defines the grouping column to be used to create the medians.For example, grouping by job group means that values for a particularemployee are compared to the median for that employee’s job group, ratherthan across the organization. Assume this example:
%let medvars=ANNUAL_SALARY CHGPCT; %let medgrp=JOB_GROUP_CD;
In this case, ANNUAL_SALARY_CUR_MED would be derived as 0 ifits value was below the median value and 1 if its value was at or abovethe median value of ANNUAL_SALARY for that job group. Namingconventions used are _CUR_ for the current period and _PRI_ for theprevious period being analyzed.
The %ANLYVAR1 macro provides a location for valid DATA step or nested DATA stepsyntax that can be processed against WORK.SALHSUM. Example:
%macro analyvar1; if ANNUAL_SALARY <50000 and JOB_GROUP_CD in (’A’,’D’,’X’) then newvar=1; else ...; %mend analyvar1;
128 Chapter 8 • Retention Analysis
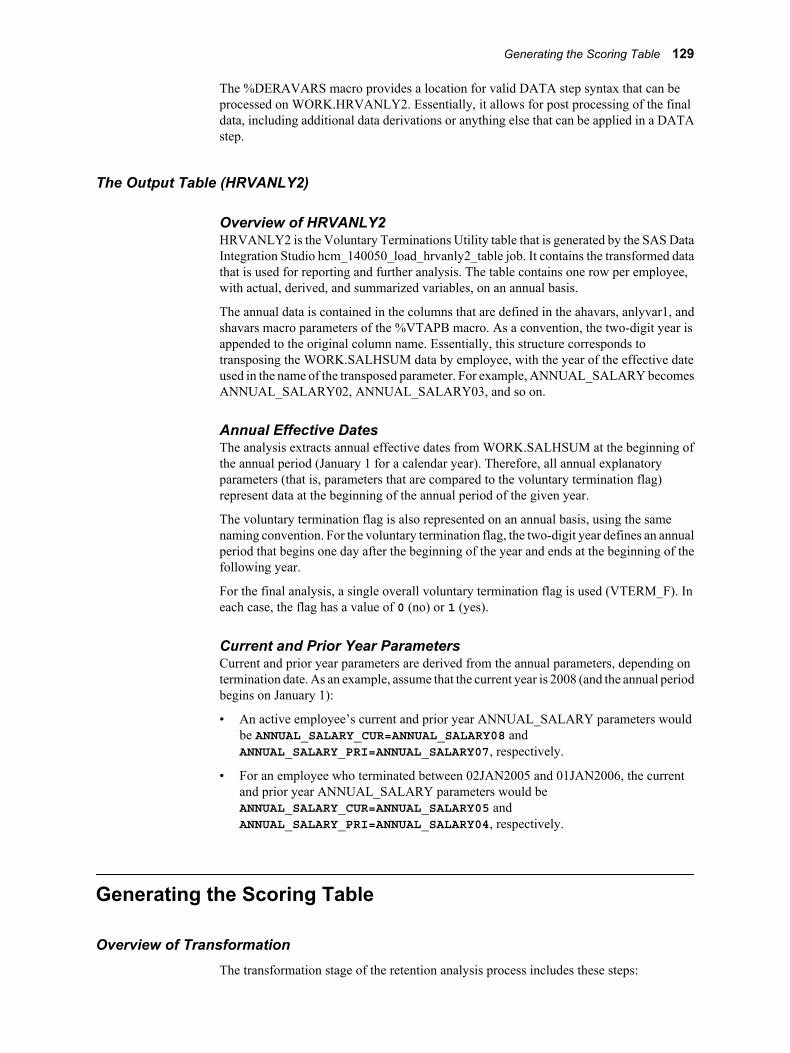
The %DERAVARS macro provides a location for valid DATA step syntax that can beprocessed on WORK.HRVANLY2. Essentially, it allows for post processing of the finaldata, including additional data derivations or anything else that can be applied in a DATAstep.
The Output Table (HRVANLY2)
Overview of HRVANLY2HRVANLY2 is the Voluntary Terminations Utility table that is generated by the SAS DataIntegration Studio hcm_140050_load_hrvanly2_table job. It contains the transformed datathat is used for reporting and further analysis. The table contains one row per employee,with actual, derived, and summarized variables, on an annual basis.
The annual data is contained in the columns that are defined in the ahavars, anlyvar1, andshavars macro parameters of the %VTAPB macro. As a convention, the two-digit year isappended to the original column name. Essentially, this structure corresponds totransposing the WORK.SALHSUM data by employee, with the year of the effective dateused in the name of the transposed parameter. For example, ANNUAL_SALARY becomesANNUAL_SALARY02, ANNUAL_SALARY03, and so on.
Annual Effective DatesThe analysis extracts annual effective dates from WORK.SALHSUM at the beginning ofthe annual period (January 1 for a calendar year). Therefore, all annual explanatoryparameters (that is, parameters that are compared to the voluntary termination flag)represent data at the beginning of the annual period of the given year.
The voluntary termination flag is also represented on an annual basis, using the samenaming convention. For the voluntary termination flag, the two-digit year defines an annualperiod that begins one day after the beginning of the year and ends at the beginning of thefollowing year.
For the final analysis, a single overall voluntary termination flag is used (VTERM_F). Ineach case, the flag has a value of 0 (no) or 1 (yes).
Current and Prior Year ParametersCurrent and prior year parameters are derived from the annual parameters, depending ontermination date. As an example, assume that the current year is 2008 (and the annual periodbegins on January 1):
• An active employee’s current and prior year ANNUAL_SALARY parameters wouldbe ANNUAL_SALARY_CUR=ANNUAL_SALARY08 andANNUAL_SALARY_PRI=ANNUAL_SALARY07, respectively.
• For an employee who terminated between 02JAN2005 and 01JAN2006, the currentand prior year ANNUAL_SALARY parameters would beANNUAL_SALARY_CUR=ANNUAL_SALARY05 andANNUAL_SALARY_PRI=ANNUAL_SALARY04, respectively.
Generating the Scoring Table
Overview of TransformationThe transformation stage of the retention analysis process includes these steps:
Generating the Scoring Table 129
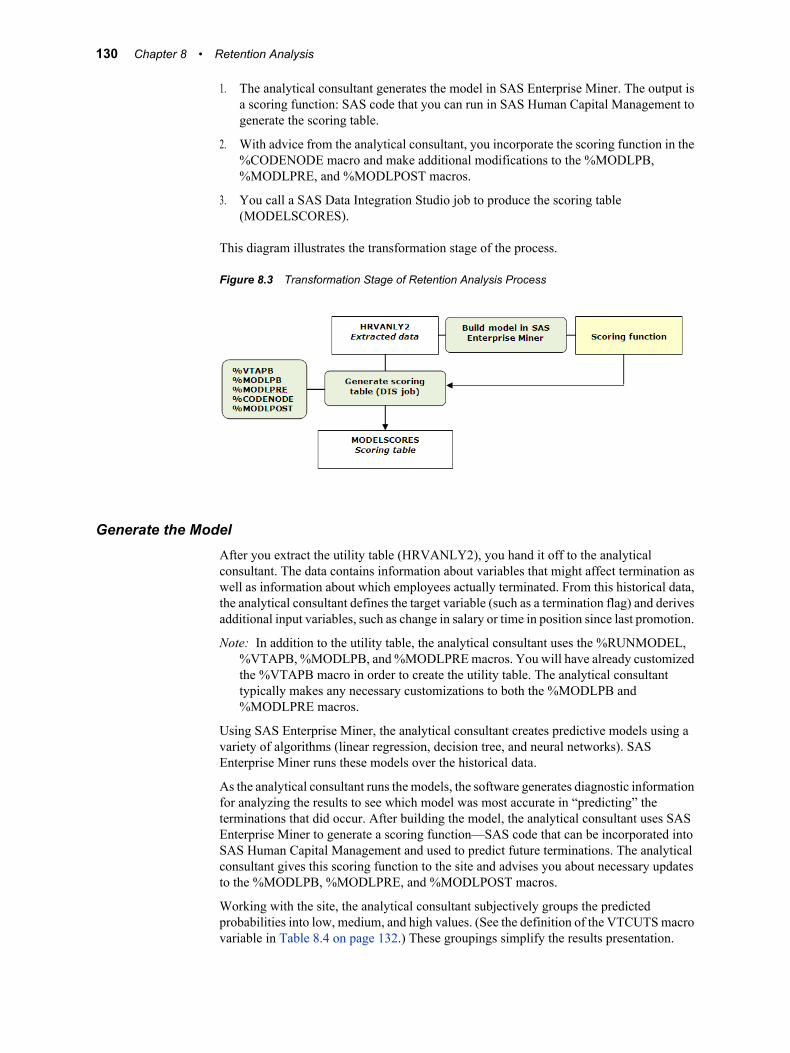
1. The analytical consultant generates the model in SAS Enterprise Miner. The output isa scoring function: SAS code that you can run in SAS Human Capital Management togenerate the scoring table.
2. With advice from the analytical consultant, you incorporate the scoring function in the%CODENODE macro and make additional modifications to the %MODLPB,%MODLPRE, and %MODLPOST macros.
3. You call a SAS Data Integration Studio job to produce the scoring table(MODELSCORES).
This diagram illustrates the transformation stage of the process.
Figure 8.3 Transformation Stage of Retention Analysis Process
Generate the ModelAfter you extract the utility table (HRVANLY2), you hand it off to the analyticalconsultant. The data contains information about variables that might affect termination aswell as information about which employees actually terminated. From this historical data,the analytical consultant defines the target variable (such as a termination flag) and derivesadditional input variables, such as change in salary or time in position since last promotion.
Note: In addition to the utility table, the analytical consultant uses the %RUNMODEL,%VTAPB, %MODLPB, and %MODLPRE macros. You will have already customizedthe %VTAPB macro in order to create the utility table. The analytical consultanttypically makes any necessary customizations to both the %MODLPB and%MODLPRE macros.
Using SAS Enterprise Miner, the analytical consultant creates predictive models using avariety of algorithms (linear regression, decision tree, and neural networks). SASEnterprise Miner runs these models over the historical data.
As the analytical consultant runs the models, the software generates diagnostic informationfor analyzing the results to see which model was most accurate in “predicting” theterminations that did occur. After building the model, the analytical consultant uses SASEnterprise Miner to generate a scoring function—SAS code that can be incorporated intoSAS Human Capital Management and used to predict future terminations. The analyticalconsultant gives this scoring function to the site and advises you about necessary updatesto the %MODLPB, %MODLPRE, and %MODLPOST macros.
Working with the site, the analytical consultant subjectively groups the predictedprobabilities into low, medium, and high values. (See the definition of the VTCUTS macrovariable in Table 8.4 on page 132.) These groupings simplify the results presentation.
130 Chapter 8 • Retention Analysis
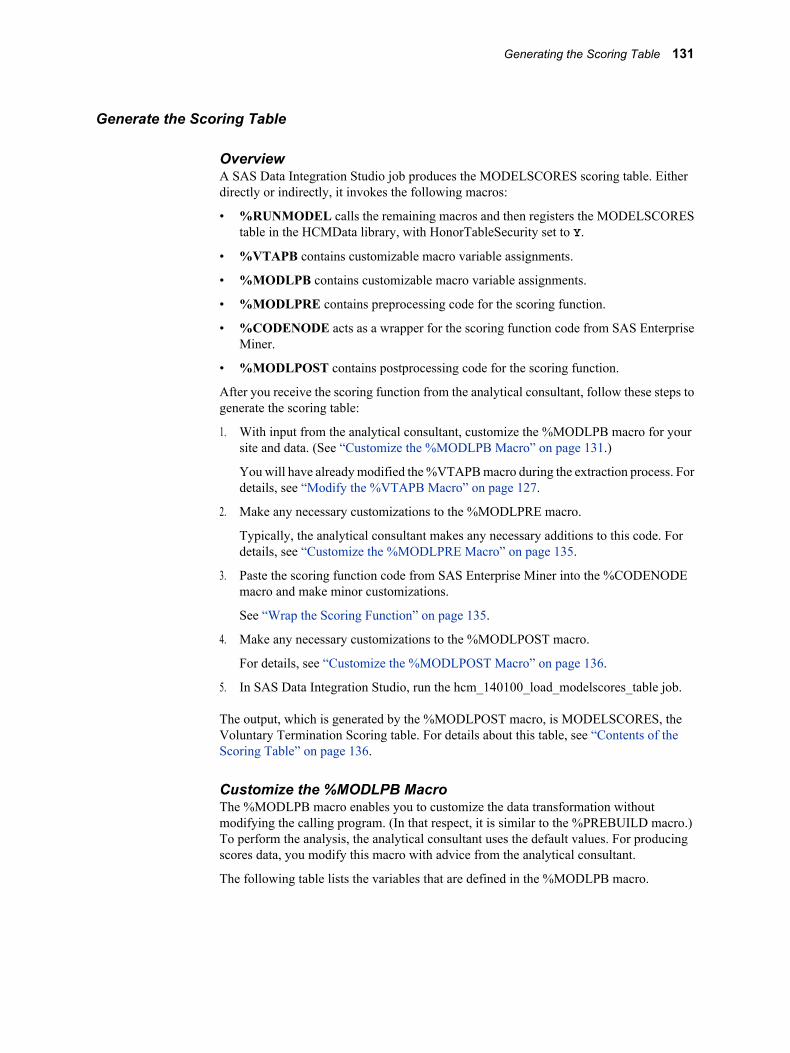
Generate the Scoring Table
OverviewA SAS Data Integration Studio job produces the MODELSCORES scoring table. Eitherdirectly or indirectly, it invokes the following macros:
• %RUNMODEL calls the remaining macros and then registers the MODELSCOREStable in the HCMData library, with HonorTableSecurity set to Y.
• %VTAPB contains customizable macro variable assignments.
• %MODLPB contains customizable macro variable assignments.
• %MODLPRE contains preprocessing code for the scoring function.
• %CODENODE acts as a wrapper for the scoring function code from SAS EnterpriseMiner.
• %MODLPOST contains postprocessing code for the scoring function.
After you receive the scoring function from the analytical consultant, follow these steps togenerate the scoring table:
1. With input from the analytical consultant, customize the %MODLPB macro for yoursite and data. (See “Customize the %MODLPB Macro” on page 131.)
You will have already modified the %VTAPB macro during the extraction process. Fordetails, see “Modify the %VTAPB Macro” on page 127.
2. Make any necessary customizations to the %MODLPRE macro.
Typically, the analytical consultant makes any necessary additions to this code. Fordetails, see “Customize the %MODLPRE Macro” on page 135.
3. Paste the scoring function code from SAS Enterprise Miner into the %CODENODEmacro and make minor customizations.
See “Wrap the Scoring Function” on page 135.
4. Make any necessary customizations to the %MODLPOST macro.
For details, see “Customize the %MODLPOST Macro” on page 136.
5. In SAS Data Integration Studio, run the hcm_140100_load_modelscores_table job.
The output, which is generated by the %MODLPOST macro, is MODELSCORES, theVoluntary Termination Scoring table. For details about this table, see “Contents of theScoring Table” on page 136.
Customize the %MODLPB MacroThe %MODLPB macro enables you to customize the data transformation withoutmodifying the calling program. (In that respect, it is similar to the %PREBUILD macro.)To perform the analysis, the analytical consultant uses the default values. For producingscores data, you modify this macro with advice from the analytical consultant.
The following table lists the variables that are defined in the %MODLPB macro.
Generating the Scoring Table 131
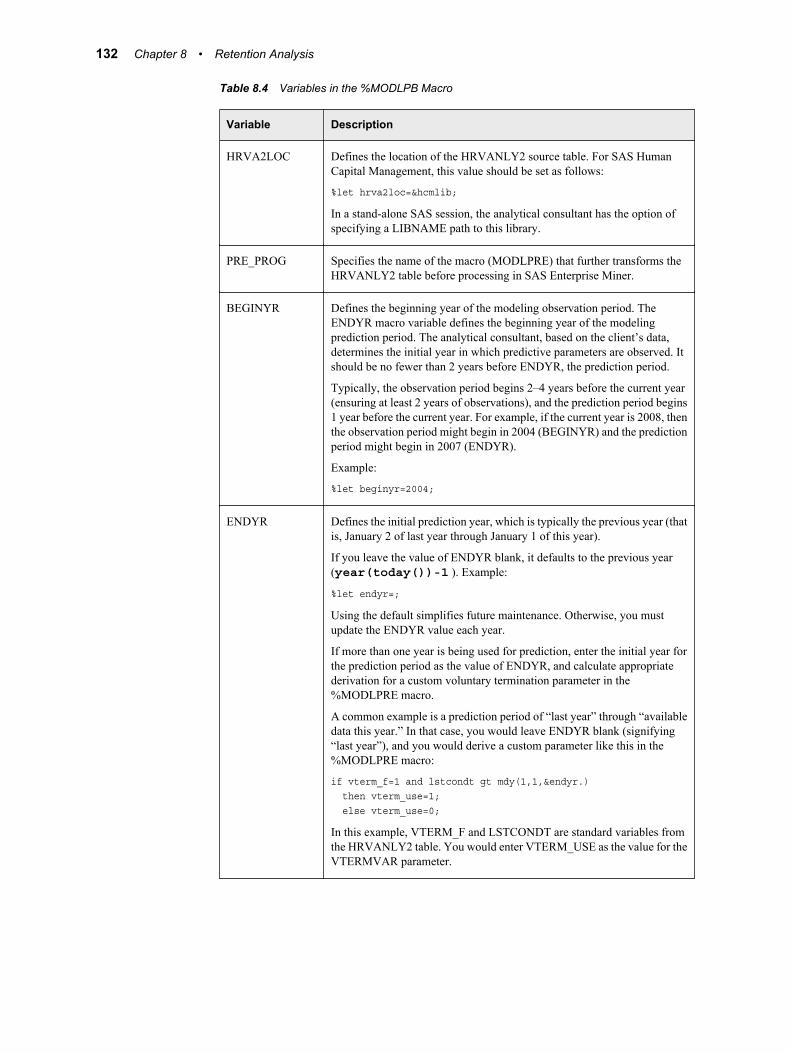
Table 8.4 Variables in the %MODLPB Macro
Variable Description
HRVA2LOC Defines the location of the HRVANLY2 source table. For SAS HumanCapital Management, this value should be set as follows:
%let hrva2loc=&hcmlib;
In a stand-alone SAS session, the analytical consultant has the option ofspecifying a LIBNAME path to this library.
PRE_PROG Specifies the name of the macro (MODLPRE) that further transforms theHRVANLY2 table before processing in SAS Enterprise Miner.
BEGINYR Defines the beginning year of the modeling observation period. TheENDYR macro variable defines the beginning year of the modelingprediction period. The analytical consultant, based on the client’s data,determines the initial year in which predictive parameters are observed. Itshould be no fewer than 2 years before ENDYR, the prediction period.
Typically, the observation period begins 2–4 years before the current year(ensuring at least 2 years of observations), and the prediction period begins1 year before the current year. For example, if the current year is 2008, thenthe observation period might begin in 2004 (BEGINYR) and the predictionperiod might begin in 2007 (ENDYR).
Example:
%let beginyr=2004;
ENDYR Defines the initial prediction year, which is typically the previous year (thatis, January 2 of last year through January 1 of this year).
If you leave the value of ENDYR blank, it defaults to the previous year(year(today())-1 ). Example:
%let endyr=;
Using the default simplifies future maintenance. Otherwise, you mustupdate the ENDYR value each year.
If more than one year is being used for prediction, enter the initial year forthe prediction period as the value of ENDYR, and calculate appropriatederivation for a custom voluntary termination parameter in the%MODLPRE macro.
A common example is a prediction period of “last year” through “availabledata this year.” In that case, you would leave ENDYR blank (signifying“last year”), and you would derive a custom parameter like this in the%MODLPRE macro:
if vterm_f=1 and lstcondt gt mdy(1,1,&endyr.) then vterm_use=1; else vterm_use=0;
In this example, VTERM_F and LSTCONDT are standard variables fromthe HRVANLY2 table. You would enter VTERM_USE as the value for theVTERMVAR parameter.
132 Chapter 8 • Retention Analysis

Variable Description
MODELSUB Defines a population subset for the analysis. For model creation, the typicalassignment is as follows:
%let modelsub=where HIRE_DT le mdy(1,1,%eval(%sysfunc(year(%sysfunc(today())))-1));
That statement subsets the data so that only employees who were activeduring the entire modeling observation period are used to develop thestatistical model.
For producing scores data, this subset should be changed in order to derivepredicted voluntary termination probabilities for as many employees aspossible. The following subset should be sufficient in most situations. Itallows voluntary termination probabilities to be derived for employees whowere active for only a portion of the observation period:
%let modelsub=where HIRE_DT le mdy(1,1, &endyr.);
(Only full-time employees who did not involuntarily terminate are includedin the HRVANLY2 data.) Because this parameter is called in a DATA stepin the %MODLPRE macro, any valid DATA step code can be used (forexample, the WHERE statement could be replaced by an IF statement).
PRE_DATA Defines the name of the output table to be created from the %MODLPREpreprocessing macro. Typically, this is a WORK file. The default isHRVANLY3. Example:
%let pre_data=HRVANLY3;
EM_PROG Defines the name of the macro that contains the scoring program that wasgenerated by SAS Enterprise Miner (codenode).
_SCORE Defines the input table for the SAS Enterprise Miner program. The defaultis as follows:
%let _score=&pre_data.;
_PREDICT Defines the output table from the SAS Enterprise Miner program. Thedefault is as follows:
%let _predict=&pre_data.;
POST_PROG Defines the name of the postprocessing macro (modlpost). After the SASEnterprise Miner code processing., the %MODLPOST macro performs thefinal data transformations (for example, it calculates the voluntarytermination probabilities).
BODDS, POINTS,and BASE
These parameters are defined by the analytical consultant. They control thederivation of a score from the voluntary termination probability.
VTERMVAR Defines the name of the variable that identifies the voluntary terminationflag for the model. The default value is vterm_f, which represents theprevious year’s voluntary terminations (for example, from January 2 lastyear until January 1 this year). The variable contains values of 0 (no) or 1(yes).
Generating the Scoring Table 133
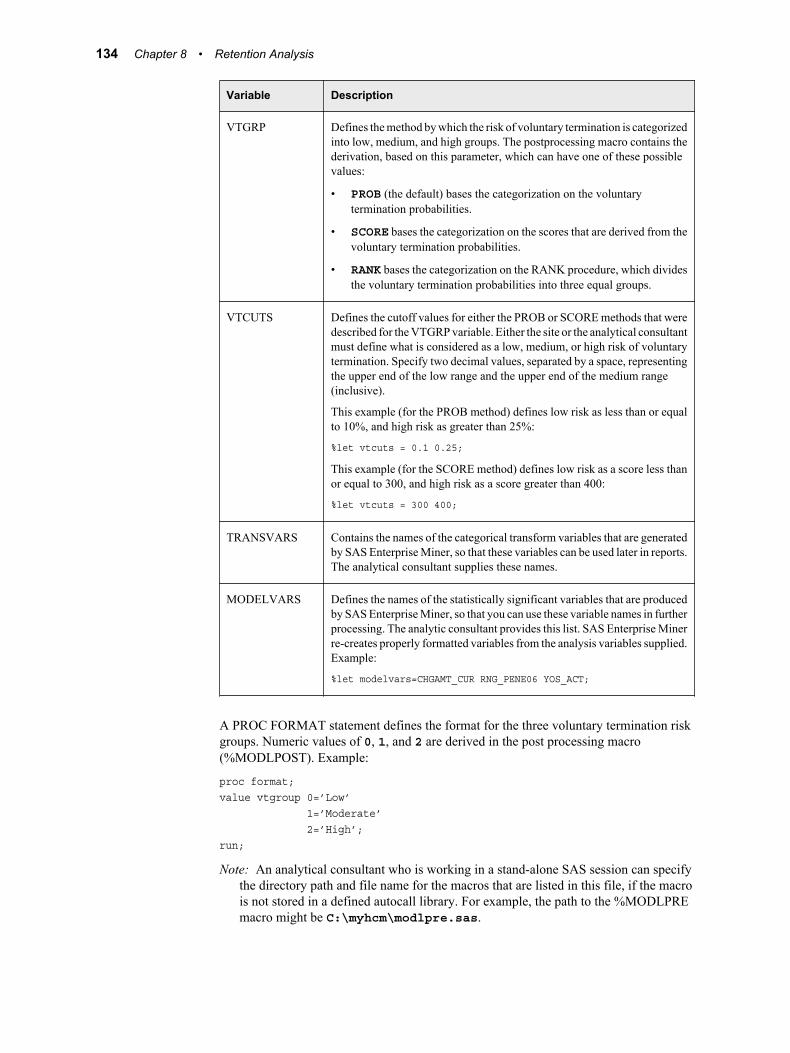
Variable Description
VTGRP Defines the method by which the risk of voluntary termination is categorizedinto low, medium, and high groups. The postprocessing macro contains thederivation, based on this parameter, which can have one of these possiblevalues:
• PROB (the default) bases the categorization on the voluntarytermination probabilities.
• SCORE bases the categorization on the scores that are derived from thevoluntary termination probabilities.
• RANK bases the categorization on the RANK procedure, which dividesthe voluntary termination probabilities into three equal groups.
VTCUTS Defines the cutoff values for either the PROB or SCORE methods that weredescribed for the VTGRP variable. Either the site or the analytical consultantmust define what is considered as a low, medium, or high risk of voluntarytermination. Specify two decimal values, separated by a space, representingthe upper end of the low range and the upper end of the medium range(inclusive).
This example (for the PROB method) defines low risk as less than or equalto 10%, and high risk as greater than 25%:
%let vtcuts = 0.1 0.25;
This example (for the SCORE method) defines low risk as a score less thanor equal to 300, and high risk as a score greater than 400:
%let vtcuts = 300 400;
TRANSVARS Contains the names of the categorical transform variables that are generatedby SAS Enterprise Miner, so that these variables can be used later in reports.The analytical consultant supplies these names.
MODELVARS Defines the names of the statistically significant variables that are producedby SAS Enterprise Miner, so that you can use these variable names in furtherprocessing. The analytic consultant provides this list. SAS Enterprise Minerre-creates properly formatted variables from the analysis variables supplied.Example:
%let modelvars=CHGAMT_CUR RNG_PENE06 YOS_ACT;
A PROC FORMAT statement defines the format for the three voluntary termination riskgroups. Numeric values of 0, 1, and 2 are derived in the post processing macro(%MODLPOST). Example:
proc format; value vtgroup 0=’Low’ 1=’Moderate’ 2=’High’; run;
Note: An analytical consultant who is working in a stand-alone SAS session can specifythe directory path and file name for the macros that are listed in this file, if the macrois not stored in a defined autocall library. For example, the path to the %MODLPREmacro might be C:\myhcm\modlpre.sas.
134 Chapter 8 • Retention Analysis
Customize the %MODLPRE MacroThe %MODLPRE macro transforms the HRVANLY2 table for use by SAS EnterpriseMiner. This macro uses values that are defined in the %VTAPB macro. The defaulttransformations include a macro to rename the annual time-dependent parameters, basedupon the year of the prediction period. For example, if the prediction period year were2007, then ANNUAL_SALARY05, ANNUAL_SALARY06, andANNUAL_SALARY07 would be renamed as ANNUAL_SALARY_0,ANNUAL_SALARY_1, and ANNUAL_SALARY_2, respectively.
The macro also calls the population subset, which is defined in the MODELSUB macrovariable in the %MODLPB macro.
Typically, you do not need to modify this code. Custom data transformations, which areusually added by the analytical consultant, should go below the commented area near thebottom of the default code.
Wrap the Scoring FunctionThe scoring function code that is produced from SAS Enterprise Miner must be includedin the %CODENODE macro, as follows:
1. Open the codenode.sas file for editing. Initially the %CODENODE macro containsthese lines:
%macro codenode; /**** PASTE ENTERPRISE MINER SCORE CODE HERE ****/ %mend codenode;
2. Immediately after the /**** PASTE ENTERPRISE MINER SCORE CODE HERE****/ line, add the following statements:
DATA &_PREDICT; SET &_SCORE;
3. Immediately after those two statements, paste the scoring function code. The analyticalconsultant will furnish this code.
4. (Optional) If the scoring function uses a logistic regression model, you can makeadditional changes to the scoring code and extract more in-depth data about the score.This data will tell you how much each input variable contributes to the score for eachindividual employee. With this data, you can create additional reports to provideinformation on which factors are increasing (or decreasing) employees likelihood ofleaving. To capture this optional data, make the following additional changes to thecode:
a. Near the end of the file, find the section entitled Compute LinearPredictor.
b. An example codenode.sas file is included with the SAS Human CapitalManagement sample data. Using this file as a model, add new code to capture eachlinear predictor. (These variables are listed in the MODELVARS macro variablein the %MODLPB macro.) We recommend that you name each new variableoriginal-variable_LP. Here is an example for the CHGAMT_CUR variable:
*** Effect: CHGAMT_cur; _TEMP = CHGAMT_cur; _LP0 = _LP0 + ( 0.01772224338353 * _TEMP);
*** CHANGED HERE: Added following line; chgamt_cur_LP = _LP0;
Generating the Scoring Table 135

c. Scale the individual linear predictor variables: Using the sample codenode.sas fileas a model, add new code to scale each linear predictor.
We recommend that you name each new scaled variable as original-variable_SC.Here is an example for the CHGAMT_CUR variable:
chgamt_cur_SC = round(chgamt_cur_LP*(X) + SHIFT, .001);
d. Add the scaled variables together to create the voluntary termination score, as inthis example:
VTSCORE = round(chgamt_cur_SC + rng_pene06_SC + yos_act_SC, 1);
5. Save your changes.
Note: The %CODENODE macro is called by the %RUNMODEL macro. Check to be surethat the %CODENODE macro does not also contain a %CODENODE macro call. Ifit does, the macro is executed twice and does not produce the correct output.
Customize the %MODLPOST MacroThe %MODLPOST macro applies final data transformations to the model that was createdin SAS Enterprise Miner and produces the MODELSCORES table, which is registered inthe HCM database. It also updates the SAS_HCMFORMATS table in the HCM databaseand the SAS formats catalog.
For customer implementations, update the %MODLPOST macro as advised by theanalytical consultant. This DATA step within modlpost.sas generates the percentagemeasures for reporting. An example of this code follows, for model variables that are namedCHGAMT_CUR, RNG_PENE06, and YOS_ACT.
*** Create Permanent Data ***;data &hcmlib..modelscores; set modelscores; /* add percentage measures for WEBEIS reporting */ attrib chgamt_cur_PERCT length=8. label = '% Due to Salary Change'; attrib rng_pene06_PERCT length=8. label = '% Due to Range Penetration'; attrib yos_act_PERCT length=8. label = '% Due to Service Length'; attrib TOT_PERCT length=8. label = '% Due to All Factors';
chgamt_cur_PERCT = (chgamt_cur_SC / VTSCORE); rng_pene06_PERCT = (rng_pene06_SC / VTSCORE); yos_act_PERCT = (yos_act_SC / VTSCORE); TOT_PERCT = sum(chgamt_cur_PERCT,rng_pene06_PERCT,yos_act_PERCT);
format vtgroup vtgroup.;
*** Call Modeling Variable Labels ***; %model_lbls;
run;
Contents of the Scoring TableA SAS Data Integration Studio job calls the %MODLPOST macro to generate theVoluntary Termination Scoring Table (MODELSCORES). This table lists the defaultcolumns in the scoring table:
136 Chapter 8 • Retention Analysis
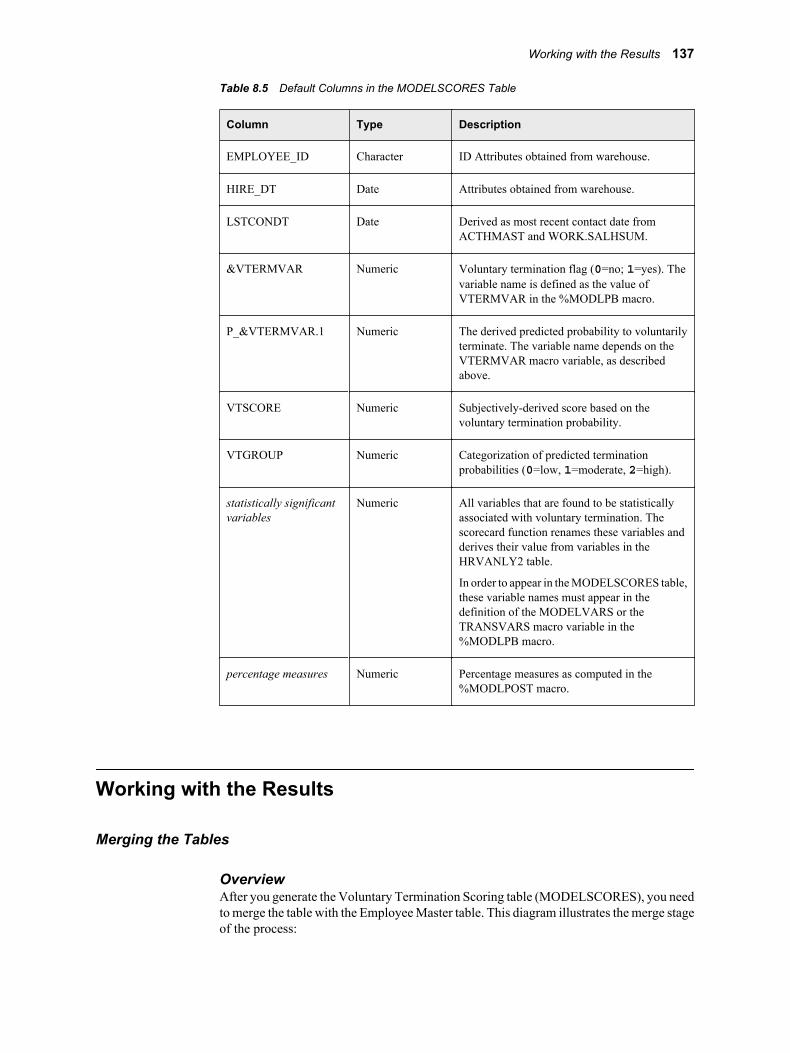
Table 8.5 Default Columns in the MODELSCORES Table
Column Type Description
EMPLOYEE_ID Character ID Attributes obtained from warehouse.
HIRE_DT Date Attributes obtained from warehouse.
LSTCONDT Date Derived as most recent contact date fromACTHMAST and WORK.SALHSUM.
&VTERMVAR Numeric Voluntary termination flag (0=no; 1=yes). Thevariable name is defined as the value ofVTERMVAR in the %MODLPB macro.
P_&VTERMVAR.1 Numeric The derived predicted probability to voluntarilyterminate. The variable name depends on theVTERMVAR macro variable, as describedabove.
VTSCORE Numeric Subjectively-derived score based on thevoluntary termination probability.
VTGROUP Numeric Categorization of predicted terminationprobabilities (0=low, 1=moderate, 2=high).
statistically significantvariables
Numeric All variables that are found to be statisticallyassociated with voluntary termination. Thescorecard function renames these variables andderives their value from variables in theHRVANLY2 table.
In order to appear in the MODELSCORES table,these variable names must appear in thedefinition of the MODELVARS or theTRANSVARS macro variable in the%MODLPB macro.
percentage measures Numeric Percentage measures as computed in the%MODLPOST macro.
Working with the Results
Merging the Tables
OverviewAfter you generate the Voluntary Termination Scoring table (MODELSCORES), you needto merge the table with the Employee Master table. This diagram illustrates the merge stageof the process:
Working with the Results 137

Figure 8.4 Merge Stage of Retention Analysis Process
The result of the merge is the Voluntary Termination and Employee Information Scoringtable (EMPSCORES), which can be used in reports, in data explorations, in the EmployeeBrowser, and in an organization analysis.
Merge the Scoring Table and the Employee Master TableA SAS Data Integration Studio job merges the MODELSCORES table with the EmployeeMaster table (EMPMAST). The output is the EMPSCORES table. By default, threecolumns from the scoring table are kept: VTSCORE, VTGROUP, and the column specifiedby the voluntary termination flag (P_&TERMVAR.1). All columns from the EmployeeMaster table are kept.
Follow these steps:
1. If necessary, modify the %VTSCORES macro, which is called by the SAS DataIntegration Studio job.
2. In SAS Data Integration Studio, run the hcm_140150_load_empscores_table job. Thisjob loads the EMPSCORES table in the HCM database, using code similar to thefollowing:
proc sql noprint; create table &hcmlib..empscores (drop=hcm_uniq_id) as select b.*, a.vtscore, a.vtgroup, a.p_&vtermvar.1 from modelscores as a, EMPMAST as b where a.EMPLOYEE_ID = b.EMPLOYEE_ID;quit;
It also registers the EMPSCORES table in the metadata repository, withHonorTableSecurity set to Y.
3. By default, the EMPSCORES table has entries in the SAS_HCMMETATABLE andSAS_HCMMETACOLUMN tables, with default formats for the standard columns.Modify the formats for the new columns in the EMPSCORES table. To make thesechanges in the Administration application:
a. Log on to SAS Human Capital Management as a user with the HCM Administratorrole.
b. Click Administration.
c. On the Data tab, select Tables ð EMPSCORES.
d. Modify the formats for the new table columns. For details, see “Modify ColumnAttributes” on page 12.
138 Chapter 8 • Retention Analysis

4. On the Security tab of the Administration application, create row-level filters for theEMPSCORES table. Create a filter for each of the roles (HCM Administrator, HCMAnalyst, HCM User) that you want to have access to the EMPSCORES table. Setsecurity appropriately for each role.
For an overview of table security and detailed instructions, see “Securing Table Rows”on page 68.
Create a Cube from the EMPSCORES Table(Optional) Create a cube from the EMPSCORES table:
1. Log on to SAS Human Capital Management as a user with the HCM Administratorrole.
2. Click Administration.
3. On the Data tab, select New Cube. For detailed instructions, see “Working withCubes” on page 23.
Using the EMPSCORES Table in a ReportAfter you make the EMPSCORES table available for use in SAS Human CapitalManagement, users can perform tasks such as the following:
Note: Security settings can restrict access to the table or the ability to perform certain tasks.
• select the table for display in the Employee Browser.
• use the table as the basis for an organization analysis or geographic analysis.
• create an information map from the table or cube.
• in SAS Web Report Studio, create a report that is based on the information map.
Updating the ResultsAt various times in the future, the site might want to regenerate the MODELSCORES andEMPSCORES tables, based on new data. After refreshing the HCM data warehouse andupdating the macros appropriately, you can rerun the jobs using the original code from SASEnterprise Miner. (Typically, this code is useful for about two years. After that time, thecode might need to be modified by the analytical consultant to reflect changes in theorganization or other factors.)
Working with the Results 139

140 Chapter 8 • Retention Analysis
Chapter 9
SAS for Workforce Planning &Budgeting
About SAS for Workforce Planning & Budgeting . . . . . . . . . . . . . . . . . . . . . . . . . 141
Administering SAS for Workforce Planning & Budgeting . . . . . . . . . . . . . . . . . . 142
Creating Planning Measures . . . . . . . . . . . . . . . . . . . . . . . . . . . . . . . . . . . . . . . . . . . 142About Planning Measures . . . . . . . . . . . . . . . . . . . . . . . . . . . . . . . . . . . . . . . . . . . . 142Measures for Creating New Positions . . . . . . . . . . . . . . . . . . . . . . . . . . . . . . . . . . 142Measures for Supplemental Schedules . . . . . . . . . . . . . . . . . . . . . . . . . . . . . . . . . . 143Measures That Depend on a Slicer . . . . . . . . . . . . . . . . . . . . . . . . . . . . . . . . . . . . . 143Define a Planning Measure . . . . . . . . . . . . . . . . . . . . . . . . . . . . . . . . . . . . . . . . . . . 144Define SAS Code for Target Measures . . . . . . . . . . . . . . . . . . . . . . . . . . . . . . . . . 146Draw Information from Additional Tables . . . . . . . . . . . . . . . . . . . . . . . . . . . . . . . 147
Creating a Form Set with Supplemental Schedules . . . . . . . . . . . . . . . . . . . . . . . . 148Designing a Form Set Template . . . . . . . . . . . . . . . . . . . . . . . . . . . . . . . . . . . . . . . 148Creating a Supplemental Schedule . . . . . . . . . . . . . . . . . . . . . . . . . . . . . . . . . . . . . 148What Happens at Runtime . . . . . . . . . . . . . . . . . . . . . . . . . . . . . . . . . . . . . . . . . . . 150
Managing Plans . . . . . . . . . . . . . . . . . . . . . . . . . . . . . . . . . . . . . . . . . . . . . . . . . . . . . . 150
About SAS for Workforce Planning & BudgetingWith SAS for Workforce Planning & Budgeting, HCM data is made available to the SASFinancial Management budgeting workflow. In a data-entry form, users have access to datafrom SAS Human Capital Management tables. This data, which is displayed in additionaltables (supplemental schedules), might include details such as salary, bonus, travelexpenses, and evaluations for each employee. In bottom-up workflows, data from thesupplemental schedules is rolled up to the data-entry table and stored in SAS FinancialManagement.
This chapter contains an overview of the administrative process and details that are specificto SAS Human Capital Management. For detailed information about creating a form setwith supplemental schedules, see the online Help for the SAS Financial Management Add-In for Microsoft Excel. For an overview of the end-user experience, see “Participating inthe Budgeting Process” in the SAS Human Capital Management: User's Guide.
141
Administering SAS for Workforce Planning &Budgeting
The basic administration process is as follows:
1. In the HCM Administration application, an HCM administrator defines one or moreplanning measures. Depending on their definition, these measures might be columnsin a supplemental schedule or prompts in a New Position dialog box.
2. In SAS Financial Management Studio, a finance process administrator creates a formset.
3. In Microsoft Excel, the finance process administrator opens the form template andinserts one or more data-entry tables and supplemental schedules.
4. The finance process administrator edits the template (for example, applying formulas,headings, and styles).
5. The finance process administrator publishes the form set.
Creating Planning Measures
About Planning MeasuresWhen finance process administrators create a form set template, they can insert two kindsof measures: FM measures and planning measures.
Planning measures are defined on the Data tab of the SAS Human Capital ManagementAdministration application. Their values can come from HCM tables, from an end user'sdata entry, from a calculation, or from executing SAS code.
There are two kinds of planning measures:
• measures that can appear in a new-position dialog box. If an end user expects to behiring new employees during the budget period, he can create one or more new positionsas placeholders. These measures (such as job group and salary) are used to define thenew position.
• measures that can appear in a supplemental schedule.
Measures for Creating New PositionsAt runtime, during data entry, a user can define one or more anticipated positions. In theNew Position dialog box, the following types of measures can appear:
• Prompts are text boxes in which the user types a value. For example, the user mightbe prompted to enter the required years of experience for a new position. Promptsappear only in a New Position dialog box.
• Lookups appear as a drop-down list from which the user can select a value (such asjob group). Lookups are populated by the source table and column (to a maximum of100 distinct values). Like prompts, lookups appear only in a New Position dialog box.
142 Chapter 9 • SAS for Workforce Planning & Budgeting
When the user clicks OK to close the dialog box, SAS code is executed. It uses the valuesfrom these two field types to populate columns (target measures) in the supplementalschedules.
Measures for Supplemental SchedulesThe following types of measures can appear only in a supplemental schedule:
• Target measures are the targets of the SAS code that is executed when an end usercreates a new position. If you want the user to be able to override the value that theSAS code provides, make the measure editable for new employees.
Target measures can also contain information for existing employees. To display datafrom an HCM table, specify a source table and column and make the measure editableonly for new employees. To enable the user to enter a value, leave the source table andcolumn blank and make the measure always editable.
• None identifies a measure that appears only in a supplemental schedule but that is nota target measure. These measures might be used for comments or for reference.
As an example of a reference measure, imagine that you want to create a planningmeasure with information that managers might use in calculating salary increases orbonuses. For example, you might want the planning form to display the number of yearsan employee has been working at the company. You create a measure called Tenure,which takes its value from the SERVICE_YEARS column of the Employee Mastertable (EMPMAST). Tenure has no meaning for new employees, and you do not wantthis measure to appear in the New Position dialog box. You set the Field Type toNone, and you set Editable to Never, because this measure is for reference only.
Measures That Depend on a SlicerMeasures can be designated as slicer-dependent or slicer-independent.
• A slicer-dependent measure changes its value when the slicer's value changes. Atypical slicer-dependent measure might contain employee expense information thatdepends on a particular account. In a budgeting form, as a user changes the accountslicer, a different value appears in the employee expense cells.
Other slicer-dependent measures might be associated with a time period or anotherdimension.
• A slicer-independent measure does not change value when the slicer changes. Atypical slicer-independent measure might contain a value such as an employee's startdate or date of birth.
For existing employees, measures that are based on the standard HCM tables are alwaysslicer-independent.
For new employees, measures that are based on the standard HCM tables can be designatedslicer-dependent. In that case, the plan tables store separate values for the measure for eachdependency.
If a measure is not based on a table (that is, if you leave both the Source Table and SourceColumn boxes empty), then the measure can be designated slicer-dependent and cancontain information for both new and existing employees.
Creating Planning Measures 143
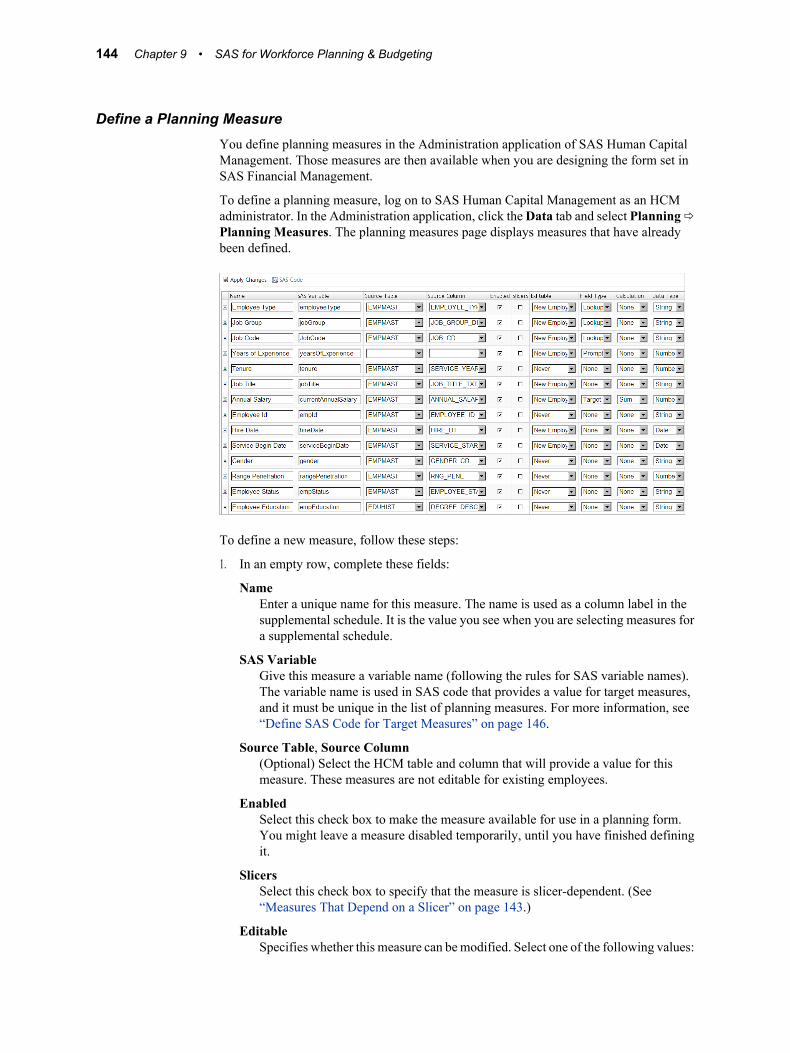
Define a Planning MeasureYou define planning measures in the Administration application of SAS Human CapitalManagement. Those measures are then available when you are designing the form set inSAS Financial Management.
To define a planning measure, log on to SAS Human Capital Management as an HCMadministrator. In the Administration application, click the Data tab and select Planning ðPlanning Measures. The planning measures page displays measures that have alreadybeen defined.
To define a new measure, follow these steps:
1. In an empty row, complete these fields:
NameEnter a unique name for this measure. The name is used as a column label in thesupplemental schedule. It is the value you see when you are selecting measures fora supplemental schedule.
SAS VariableGive this measure a variable name (following the rules for SAS variable names).The variable name is used in SAS code that provides a value for target measures,and it must be unique in the list of planning measures. For more information, see“Define SAS Code for Target Measures” on page 146.
Source Table, Source Column(Optional) Select the HCM table and column that will provide a value for thismeasure. These measures are not editable for existing employees.
EnabledSelect this check box to make the measure available for use in a planning form.You might leave a measure disabled temporarily, until you have finished definingit.
SlicersSelect this check box to specify that the measure is slicer-dependent. (See“Measures That Depend on a Slicer” on page 143.)
EditableSpecifies whether this measure can be modified. Select one of the following values:
144 Chapter 9 • SAS for Workforce Planning & Budgeting

• Never applies to historical measures (for example, last year's salary) and othermeasures that should not be changed by the user.
• Always applies to measures that need user input, such as planned bonuspercentage.
• New Employee applies to measures that require user input only for newemployees.
Note: If a measure has a source table and column, you can select Never or NewEmployee, but not Always.
Field TypeThe field type determines the user interface for this measure in the New Positiondialog box. Select one of the following values:
• None specifies a measure that does not appear in the New Position dialog boxand is not a target measure.
• Prompt creates a text-box prompt in the New Position dialog box. Prompts donot appear in the supplemental schedule.
• Lookup creates a drop-down list in the New Position dialog box, using valuesfrom the source table (for example, job group descriptions). Lookups do notappear in the supplemental schedule.
• Target specifies a measure that appears only in the supplemental schedule, notin the New Position dialog box. For new positions, the value of a target measureis based on other measures in the New Position dialog box. When the user clicksOK to close the dialog box, SAS code is executed to provide the value for thismeasure. (See “Define SAS Code for Target Measures” on page 146.)
CalculationThe Calculation drop-down list defines a calculation that takes place on thismeasure at runtime. (This option applies only to numeric measures.) Select one ofthe following values:
• None specifies no calculation.
• Sum specifies to create a sum for this measure.
• Averaged specifies to create an average for this measure.
Data TypeSelect one of the following data types:
• String specifies a character string.
• Number specifies a numeric value.
• Date specifies a date field. If the Field Type is Prompt, the New Position dialogbox contains a pop-up for date selection.
2. To add another measure, click Add Row.
3. Click Apply Changes.
Be sure to apply row-level security and column-level security appropriately to any tablesthat provide values for the planning measures.
Measures for employee IDs or employee names are handled differently than othermeasures:
• The New Position dialog box automatically has a prompt for the employee name. Itnever has a prompt for the employee ID, which is automatically generated and cannotbe edited.
Creating Planning Measures 145
• If you create measures that get their value from the EMPLOYEE_NAME orEMPLOYEE_ID column, those measures are not editable in the supplementalschedule, and they do not appear in the New Position dialog box.
• To change the employee name for a new position, right-click the employee name andselect Change Description.
Define SAS Code for Target Measures
OverviewOn the Planning Measures page, click SAS Code to open a dialog box for code that isapplied at runtime to compute target planning measures. For example, you might want tocalculate projected salary for new employees, based on typical pay for their level ofexperience and the type of job they will be doing.
There is a single instance of the SAS code for target measures that applies to allsupplemental schedules. If a form set does not use a particular target measure, that part ofthe code is ignored. The code is run when an end user clicks OK in the New Position dialogbox, to add one or more new employees to a supplemental schedule. It does not apply toexisting employees.
Here is an example of the contents of the SAS Code window:
%hcmlib;
/*New Employee Suggested Salary Calculation*/%nuempsal(nexp=&yearsOfExperience, jobgrp=&jobGroup, emptype=&employeeType);
/*New Employee Suggested Bonus Calculation*/%nuempbns(jobgrp=&jobGroup);
/*New Employee Suggested Travel Calculation*/%nuemptvl(jobgrp=&jobGroup);
The SAS code has three parts:
1. First is a call to %HCMLIB, which sets the locale macro variables and contains theLIBNAME statement for the HCM database.
2. It is followed by code that produces values for the target planning measures (also knownas target variables). For the sake of readability and maintenance, we recommend thatyou define a separate macro for each target variable. (See “Example Macro Code” onpage 147.)
If you look at the first of these macros, notice that it references three input macrovariables:
%nuempsal(nexp=&yearsOfExperience, jobgrp=&jobGroup, emptype=&employeeType);
These input variables come from the New Position dialog box, from measures that havea field type of Lookup or Prompt.
3. Optionally, you can add statements to write the variables to the log.
146 Chapter 9 • SAS for Workforce Planning & Budgeting
Note: The workspace server log from the most recent operation is stored in theSAS_HCM_PLAN_SAS_CODE table in the HCM database.
When you finish updating the SAS Code dialog box, click OK to save your changes. (Ifthe OK button is not visible, press the TAB key on your keyboard.)
Example Macro CodeThis sample macro (%NUEMPSAL) generates a suggested salary for a new employeebased on the average annual salary of other employees with the same job group andemployee type and with similar years of experience. You can treat SAS variables for theplanning measures just as you would any other macro variable. In this case, the SASvariable for the target planning measure is currentAnnualSalary.
%macro nuempsal(nexp=, jobgrp=, emptype= ); proc summary data=&hcmlib..empmast (where= (job_group_desc=&jobgrp and strip(put(employee_type_cd, $emptype.))=&emptype and service_years >=(&nexp-1) and service_years <=(&nexp+1))); var annual_salary; output out=newempsal mean=annual_salary; run;
data _null_; set newempsal; call symput("currentAnnualSalary",round(annual_salary, 100)); run;%mend;
Note: If a lookup measure is from a formatted column, the formatted value is passed tothe SAS code. The SAS code should include an appropriate INFORMAT statement.
The sample macros (%NUEMPSAL, %NUEMPBNS, and %NUEMPTVL) are stored inthe !sasroot\hrds\macros directory on the data tier. A site must modify these macros,or add other macros, to support the target measures that are defined for the site. Store anycustom macros in the following location on the data tier: SAS-config-dir\Lev1\SASApp\SASEnvironment\HumanCapitalManagement\SASMacro.
Draw Information from Additional TablesIf a site has additional tables or spreadsheets with information that would be helpful in thebudgeting process, you can include those tables as input for the planning measures, asfollows:
1. If the table will be used to populate a field in the supplemental schedule, be sure thatthe table contains an EMPLOYEE_ID column.
If the table will be used only as a lookup in the New Position dialog box, theEMPLOYEE_ID column is not necessary.
2. On the Data tab of the Administration application, import the table to SAS HumanCapital Management.
Make sure that Register table in metadata repository is selected.
3. Click Refresh Cache.
4. Define planning measures that use columns from the table.
Creating Planning Measures 147
Creating a Form Set with Supplemental Schedules
Designing a Form Set TemplateThe online Help for the SAS Financial Management Add-In for Microsoft Excel hasdetailed instructions about creating form sets with supplemental schedules. Here are somepoints to keep in mind for SAS Human Capital Management:
• Both bottom-up workflows and top-down workflows are supported in SAS forWorkforce Planning & Budgeting.
• The model for data-entry forms must reference a financial cycle, not an operationalplanning cycle. The model must include the hierarchy that you plan to use as the targethierarchy in the form set. It must be an Organization hierarchy that has the samemembers in both SAS Human Capital Management and SAS Financial Management.
• Design the data-entry table carefully, to contain only the information that is needed.When you insert a supplemental schedule, you select its fields from the set of leafmembers in the FM data-entry table and the set of HCM planning measures. Thisselection will be easier if you limit the members in the data-entry table.
• Do not copy or import a form set that contains a supplemental schedule. You mustcreate a new form set instead.
• When you create a form set, you are prompted for the default currency, which appliesonly when you are editing the form template. It should match the currency that wasconfigured for SAS Human Capital Management.
Creating a Supplemental ScheduleYou can insert one or more supplemental schedules in a form set template. A typicalimplementation is to design a data-entry form with the Time dimension in the columns, theAccount dimension in the rows, and the Organization dimension as a slicer. Then you mightinsert multiple supplemental schedules, using the Time dimension in the columns and theAccount dimension as a slicer. (In a supplemental schedule, the row headings are alwaysOrganization members.)
In this figure (which shows only part of a form template), each supplemental schedule isset to display a different slicer value (that is, a different account). With such a layout, eachsupplemental schedule could have different formulas that are appropriate for the selectedaccount.
148 Chapter 9 • SAS for Workforce Planning & Budgeting
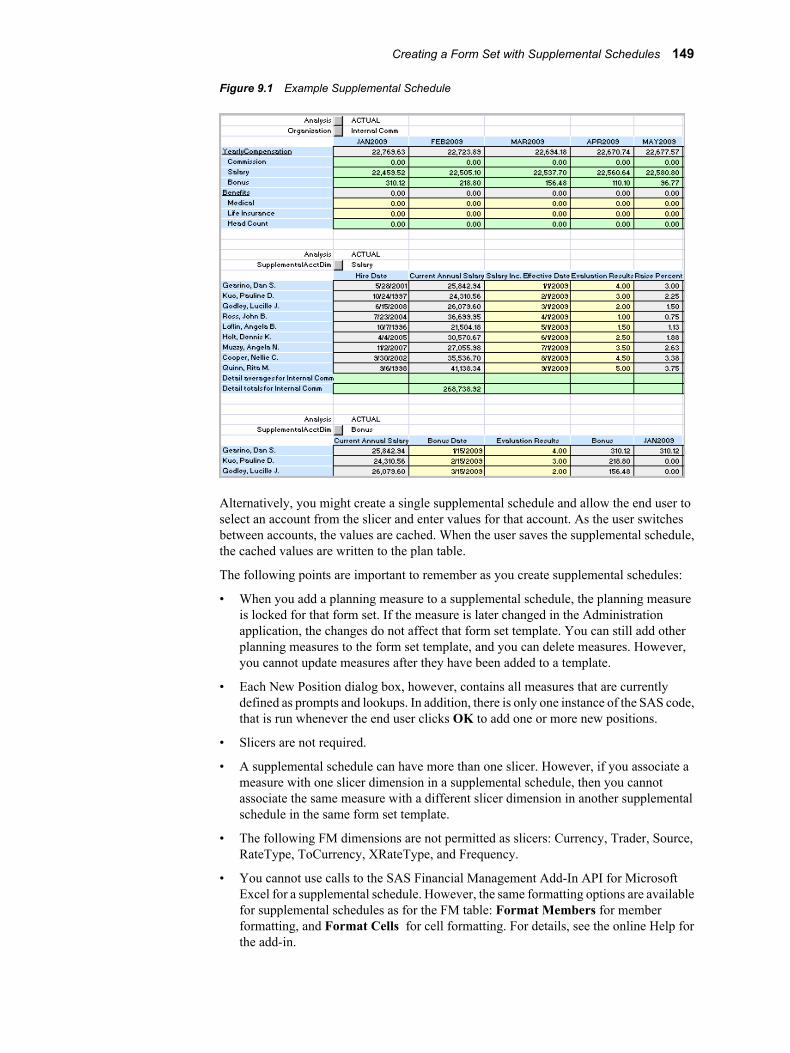
Figure 9.1 Example Supplemental Schedule
Alternatively, you might create a single supplemental schedule and allow the end user toselect an account from the slicer and enter values for that account. As the user switchesbetween accounts, the values are cached. When the user saves the supplemental schedule,the cached values are written to the plan table.
The following points are important to remember as you create supplemental schedules:
• When you add a planning measure to a supplemental schedule, the planning measureis locked for that form set. If the measure is later changed in the Administrationapplication, the changes do not affect that form set template. You can still add otherplanning measures to the form set template, and you can delete measures. However,you cannot update measures after they have been added to a template.
• Each New Position dialog box, however, contains all measures that are currentlydefined as prompts and lookups. In addition, there is only one instance of the SAS code,that is run whenever the end user clicks OK to add one or more new positions.
• Slicers are not required.
• A supplemental schedule can have more than one slicer. However, if you associate ameasure with one slicer dimension in a supplemental schedule, then you cannotassociate the same measure with a different slicer dimension in another supplementalschedule in the same form set template.
• The following FM dimensions are not permitted as slicers: Currency, Trader, Source,RateType, ToCurrency, XRateType, and Frequency.
• You cannot use calls to the SAS Financial Management Add-In API for MicrosoftExcel for a supplemental schedule. However, the same formatting options are availablefor supplemental schedules as for the FM table: Format Members for memberformatting, and Format Cells for cell formatting. For details, see the online Help forthe add-in.
Creating a Form Set with Supplemental Schedules 149
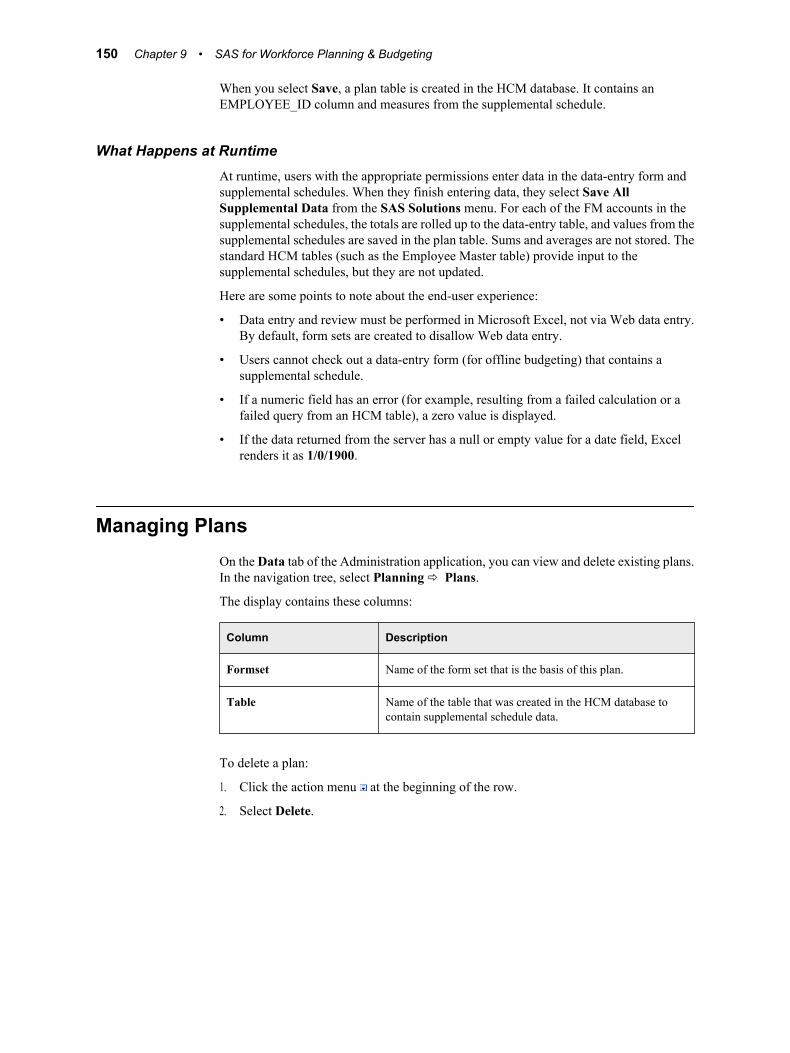
When you select Save, a plan table is created in the HCM database. It contains anEMPLOYEE_ID column and measures from the supplemental schedule.
What Happens at RuntimeAt runtime, users with the appropriate permissions enter data in the data-entry form andsupplemental schedules. When they finish entering data, they select Save AllSupplemental Data from the SAS Solutions menu. For each of the FM accounts in thesupplemental schedules, the totals are rolled up to the data-entry table, and values from thesupplemental schedules are saved in the plan table. Sums and averages are not stored. Thestandard HCM tables (such as the Employee Master table) provide input to thesupplemental schedules, but they are not updated.
Here are some points to note about the end-user experience:
• Data entry and review must be performed in Microsoft Excel, not via Web data entry.By default, form sets are created to disallow Web data entry.
• Users cannot check out a data-entry form (for offline budgeting) that contains asupplemental schedule.
• If a numeric field has an error (for example, resulting from a failed calculation or afailed query from an HCM table), a zero value is displayed.
• If the data returned from the server has a null or empty value for a date field, Excelrenders it as 1/0/1900.
Managing PlansOn the Data tab of the Administration application, you can view and delete existing plans.In the navigation tree, select Planning ð Plans.
The display contains these columns:
Column Description
Formset Name of the form set that is the basis of this plan.
Table Name of the table that was created in the HCM database tocontain supplemental schedule data.
To delete a plan:
1. Click the action menu at the beginning of the row.
2. Select Delete.
150 Chapter 9 • SAS for Workforce Planning & Budgeting

Appendix 1
Object Security: List of Objects
About Object Security . . . . . . . . . . . . . . . . . . . . . . . . . . . . . . . . . . . . . . . . . . . . . . . . 151
Employee Profile Objects . . . . . . . . . . . . . . . . . . . . . . . . . . . . . . . . . . . . . . . . . . . . . . 151
Geographical Analysis Objects . . . . . . . . . . . . . . . . . . . . . . . . . . . . . . . . . . . . . . . . . 152
Organization Analysis Objects . . . . . . . . . . . . . . . . . . . . . . . . . . . . . . . . . . . . . . . . . 153
General Search Objects . . . . . . . . . . . . . . . . . . . . . . . . . . . . . . . . . . . . . . . . . . . . . . . 153
Administrator Options: Data Tab . . . . . . . . . . . . . . . . . . . . . . . . . . . . . . . . . . . . . . . 154
Administrator Objects: Customize Tab . . . . . . . . . . . . . . . . . . . . . . . . . . . . . . . . . . 157
Administrator Objects: Security Tab . . . . . . . . . . . . . . . . . . . . . . . . . . . . . . . . . . . . 157
Administrator Objects: Configuration Tab . . . . . . . . . . . . . . . . . . . . . . . . . . . . . . . 159
Home Page Objects . . . . . . . . . . . . . . . . . . . . . . . . . . . . . . . . . . . . . . . . . . . . . . . . . . . 159
Custom Objects . . . . . . . . . . . . . . . . . . . . . . . . . . . . . . . . . . . . . . . . . . . . . . . . . . . . . . 160
About Object SecurityObject security refers to actions that the user can perform. If a user has permission for anobject (via user, group, or role permissions), the user can perform the action. On theSecurity tab of the Administration application, objects are divided into groups based onwhere they appear in the user interface.
This appendix lists the objects that are a part of object security: For more information, see“Securing Objects” on page 61.
Employee Profile Objects
Object Description
External Actions Access external actions in the Employee Browser.
Email All Send an e-mail message to listed employees.
151
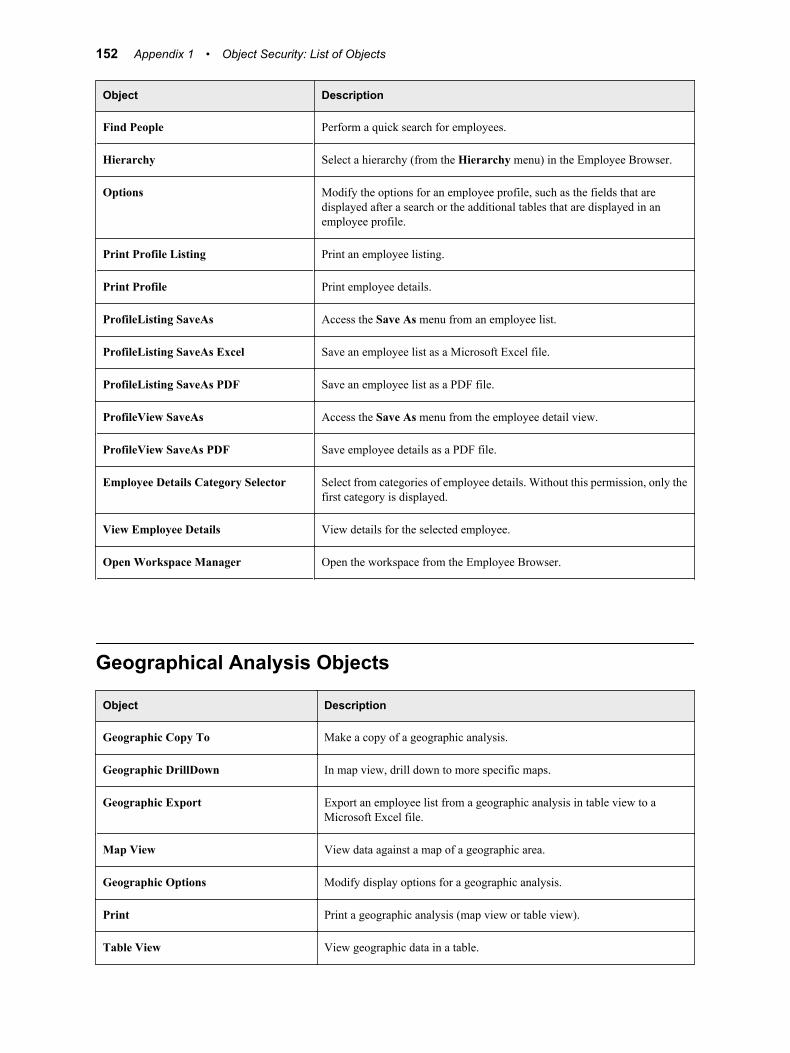
Object Description
Find People Perform a quick search for employees.
Hierarchy Select a hierarchy (from the Hierarchy menu) in the Employee Browser.
Options Modify the options for an employee profile, such as the fields that aredisplayed after a search or the additional tables that are displayed in anemployee profile.
Print Profile Listing Print an employee listing.
Print Profile Print employee details.
ProfileListing SaveAs Access the Save As menu from an employee list.
ProfileListing SaveAs Excel Save an employee list as a Microsoft Excel file.
ProfileListing SaveAs PDF Save an employee list as a PDF file.
ProfileView SaveAs Access the Save As menu from the employee detail view.
ProfileView SaveAs PDF Save employee details as a PDF file.
Employee Details Category Selector Select from categories of employee details. Without this permission, only thefirst category is displayed.
View Employee Details View details for the selected employee.
Open Workspace Manager Open the workspace from the Employee Browser.
Geographical Analysis Objects
Object Description
Geographic Copy To Make a copy of a geographic analysis.
Geographic DrillDown In map view, drill down to more specific maps.
Geographic Export Export an employee list from a geographic analysis in table view to aMicrosoft Excel file.
Map View View data against a map of a geographic area.
Geographic Options Modify display options for a geographic analysis.
Print Print a geographic analysis (map view or table view).
Table View View geographic data in a table.
152 Appendix 1 • Object Security: List of Objects
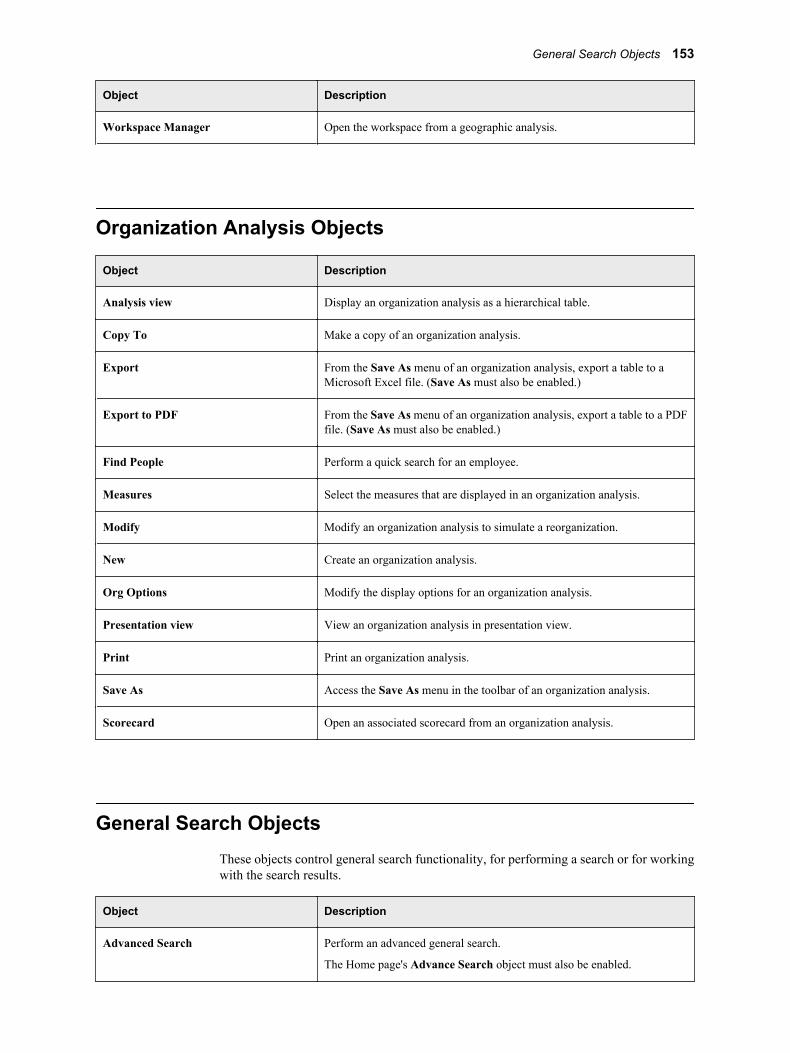
Object Description
Workspace Manager Open the workspace from a geographic analysis.
Organization Analysis Objects
Object Description
Analysis view Display an organization analysis as a hierarchical table.
Copy To Make a copy of an organization analysis.
Export From the Save As menu of an organization analysis, export a table to aMicrosoft Excel file. (Save As must also be enabled.)
Export to PDF From the Save As menu of an organization analysis, export a table to a PDFfile. (Save As must also be enabled.)
Find People Perform a quick search for an employee.
Measures Select the measures that are displayed in an organization analysis.
Modify Modify an organization analysis to simulate a reorganization.
New Create an organization analysis.
Org Options Modify the display options for an organization analysis.
Presentation view View an organization analysis in presentation view.
Print Print an organization analysis.
Save As Access the Save As menu in the toolbar of an organization analysis.
Scorecard Open an associated scorecard from an organization analysis.
General Search ObjectsThese objects control general search functionality, for performing a search or for workingwith the search results.
Object Description
Advanced Search Perform an advanced general search.
The Home page's Advance Search object must also be enabled.
General Search Objects 153
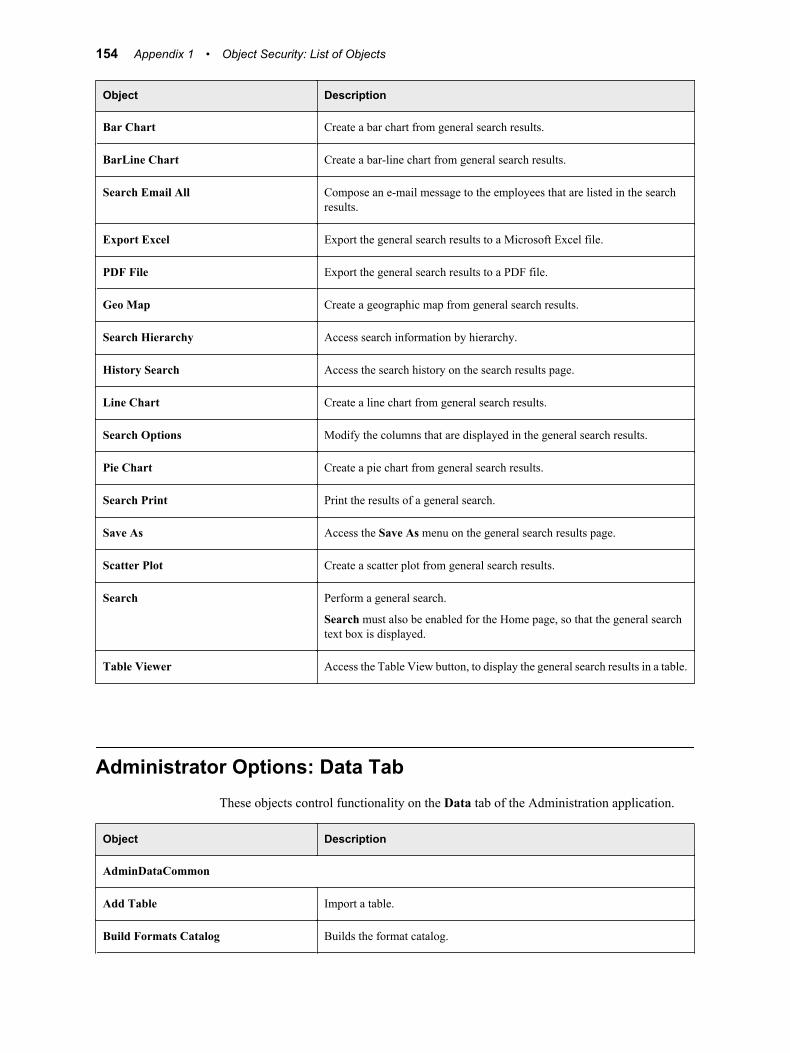
Object Description
Bar Chart Create a bar chart from general search results.
BarLine Chart Create a bar-line chart from general search results.
Search Email All Compose an e-mail message to the employees that are listed in the searchresults.
Export Excel Export the general search results to a Microsoft Excel file.
PDF File Export the general search results to a PDF file.
Geo Map Create a geographic map from general search results.
Search Hierarchy Access search information by hierarchy.
History Search Access the search history on the search results page.
Line Chart Create a line chart from general search results.
Search Options Modify the columns that are displayed in the general search results.
Pie Chart Create a pie chart from general search results.
Search Print Print the results of a general search.
Save As Access the Save As menu on the general search results page.
Scatter Plot Create a scatter plot from general search results.
Search Perform a general search.
Search must also be enabled for the Home page, so that the general searchtext box is displayed.
Table Viewer Access the Table View button, to display the general search results in a table.
Administrator Options: Data TabThese objects control functionality on the Data tab of the Administration application.
Object Description
AdminDataCommon
Add Table Import a table.
Build Formats Catalog Builds the format catalog.
154 Appendix 1 • Object Security: List of Objects

Object Description
SAS Log View the SAS log for an operation.
Map Hierarchies Create a hierarchy mapping.
New Format Create a format.
New Metric Create a measure.
Refresh Data Cache Access the Refresh Cache button from the Data tab.
Run Job Run a job to calculate values for measures.
Measures Menu — Delete Delete a measure.
Measures Menu — Edit Edit a measure.
Planning — Apply Changes Apply changes to planning attributes.
Planning — SAS Code View planning SAS code.
AdminData
Table Columns Apply Changes Apply changes to table column attributes.
Table Apply Changes Apply changes to table attributes.
Table Columns Apply and PropagateChanges
Modify column attributes and apply the changes to all tables with this columnname.
AdminDataContextMenu BuildInfoMap Create an information map from a table.
TableDetails Context Menu View the action menu for table's column attributes.
AdminDataContextMenu CopyTable Copy a table.
Delete Column Delete a column.
Delete Formats Delete a format.
Delete Hierarchy Delete a hierarchy.
AdminDataContextMenu Delete Table Delete a table.
Format Properties Modify format properties.
Admin Data Map Hierarchies Details Modify hierarchy details.
AdminDataContextMenuExportToExcel
Export a table to Excel.
Formats Context Menu Access the Formats action menu.
Administrator Options: Data Tab 155

Object Description
Generate Symbol Generate a symbol for a column.
AdminDataContextMenuGenerateSymbol
Generate a symbol for a table.
TableContextMenu View the action menu for each table in the list of tables.
AdminDataContextMenu ViewTable View table data.
AdminCubeIMAP
New Cube Create a cube.
Rebuild Information Map Rebuild information maps.
Refresh Cube Refresh all cubes on the page.
AdminDataTabCubeContextMenuBuild CubeIMAP
Build an information map from a cube (action menu selection).
Cube Context Menu Open cube context menu.
AdminDataTabCubeContextMenuDelete Cube
Delete a cube (action menu selection).
IMAP Menu - Delete Delete an information map (action menu selection).
AdminDataTabCubeContextMenuRebuild Cube
Rebuild a cube (action menu selection).
IMAP Menu - Rebuild Rebuild an information map (action menu selection).
AdminDataTabCubeContextMenuViewCube
Open a cube in SAS Web Report Studio.
IMAP Menu - View Open an information map in SAS Web Report Studio.
Add Cube Dimension ButtonBar Create a new dimension in the New Cube wizard.
Rebuild Cube ButtonBar Rebuild or refresh one or more cubes.
AdminDataTabCubeContextMenu CubeRefresh
Refresh a cube (action menu selection)
156 Appendix 1 • Object Security: List of Objects
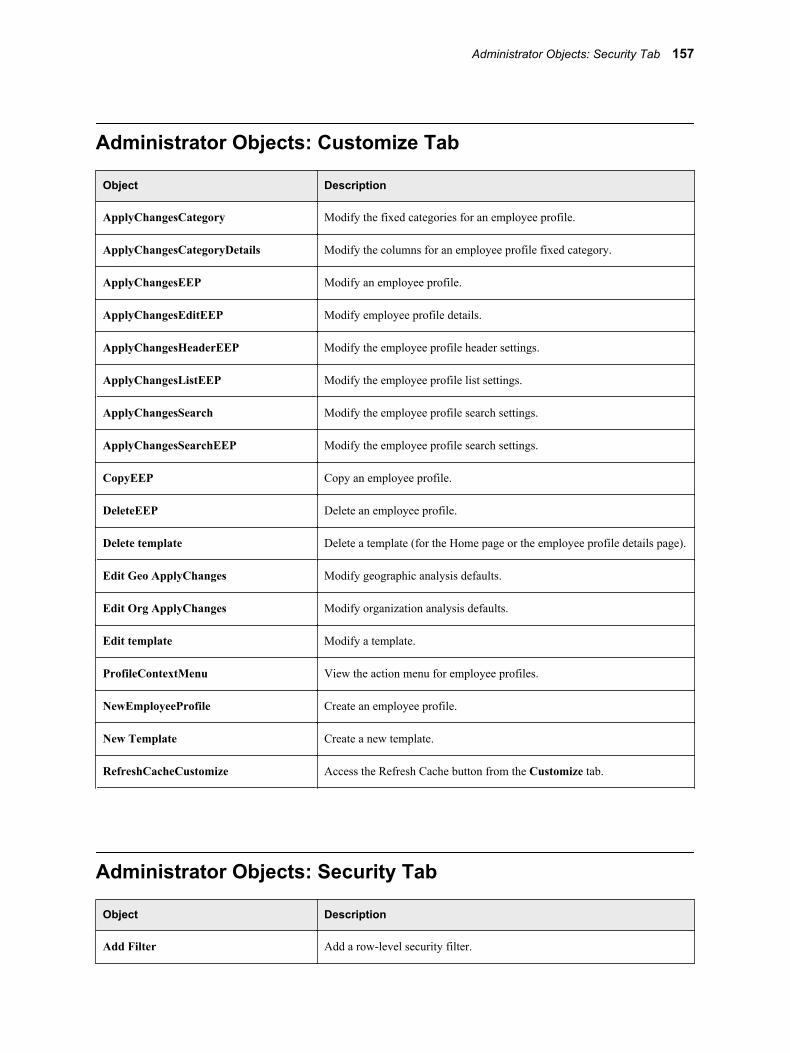
Administrator Objects: Customize Tab
Object Description
ApplyChangesCategory Modify the fixed categories for an employee profile.
ApplyChangesCategoryDetails Modify the columns for an employee profile fixed category.
ApplyChangesEEP Modify an employee profile.
ApplyChangesEditEEP Modify employee profile details.
ApplyChangesHeaderEEP Modify the employee profile header settings.
ApplyChangesListEEP Modify the employee profile list settings.
ApplyChangesSearch Modify the employee profile search settings.
ApplyChangesSearchEEP Modify the employee profile search settings.
CopyEEP Copy an employee profile.
DeleteEEP Delete an employee profile.
Delete template Delete a template (for the Home page or the employee profile details page).
Edit Geo ApplyChanges Modify geographic analysis defaults.
Edit Org ApplyChanges Modify organization analysis defaults.
Edit template Modify a template.
ProfileContextMenu View the action menu for employee profiles.
NewEmployeeProfile Create an employee profile.
New Template Create a new template.
RefreshCacheCustomize Access the Refresh Cache button from the Customize tab.
Administrator Objects: Security Tab
Object Description
Add Filter Add a row-level security filter.
Administrator Objects: Security Tab 157

Object Description
Edit Object Permissions Modify object permissions.
Apply Changes to Column Permissions Modify column permissions.
Apply Changes to Custom Objects Modify custom object permissions.
Edit Hierarchy Modify the hierarchical filter.
Apply Changes to Enable Row LevelSecurity
Enable or disable row-level security.
Column Permissions Apply andPropagate Changes
Modify column permissions and apply those changes to all columns with thatname.
Column Permissions Context Menu View the action menu for column security.
Table Filters Context Menu View the action menu for row-level security.
Object Permissions Context Menu View the action menu for object security.
Search User Filters Context Menu On the Search Users results page for row-level filters, view the action menu.
Show User Filters Context Menu On the Show Filters page for row-level filters, view the action menu.
Delete Custom Objects Delete custom objects that have been defined.
Delete Filter Delete row-level security filters.
Import Users Load the SAS_USER_EMPLOYEE table with all users who are members ofthe HCM Solution Users group.
View Filter View or edit an existing row-level security filter.
Refresh Security Cache Access the Refresh Cache button from the Security tab.
Remove Column Permissions Delete direct column permissions for an identity.
Remove Object Permissions Delete direct object permissions for an identity.
Column Permissions Search Users Search for identities for adding column permissions.
Object Permissions Search Users Search for identities for adding object permissions.
Filters Search Users Search for identities for adding row-level filters.
Show Filters Display all row-level filters for an identity.
View Object Permissions View all object permissions for an identity.
View Report In the permissions for an object, select the types of identities to view (withoutthis permission, all identities are displayed).
158 Appendix 1 • Object Security: List of Objects
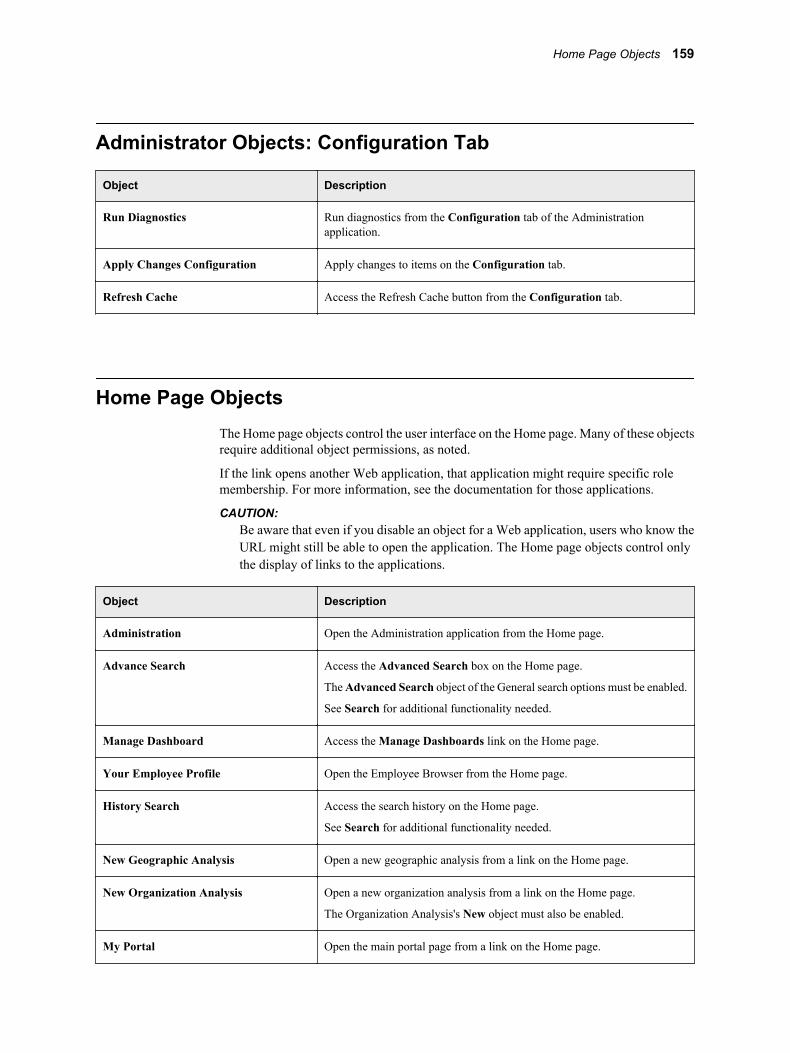
Administrator Objects: Configuration Tab
Object Description
Run Diagnostics Run diagnostics from the Configuration tab of the Administrationapplication.
Apply Changes Configuration Apply changes to items on the Configuration tab.
Refresh Cache Access the Refresh Cache button from the Configuration tab.
Home Page ObjectsThe Home page objects control the user interface on the Home page. Many of these objectsrequire additional object permissions, as noted.
If the link opens another Web application, that application might require specific rolemembership. For more information, see the documentation for those applications.
CAUTION:Be aware that even if you disable an object for a Web application, users who know theURL might still be able to open the application. The Home page objects control onlythe display of links to the applications.
Object Description
Administration Open the Administration application from the Home page.
Advance Search Access the Advanced Search box on the Home page.
The Advanced Search object of the General search options must be enabled.
See Search for additional functionality needed.
Manage Dashboard Access the Manage Dashboards link on the Home page.
Your Employee Profile Open the Employee Browser from the Home page.
History Search Access the search history on the Home page.
See Search for additional functionality needed.
New Geographic Analysis Open a new geographic analysis from a link on the Home page.
New Organization Analysis Open a new organization analysis from a link on the Home page.
The Organization Analysis's New object must also be enabled.
My Portal Open the main portal page from a link on the Home page.
Home Page Objects 159
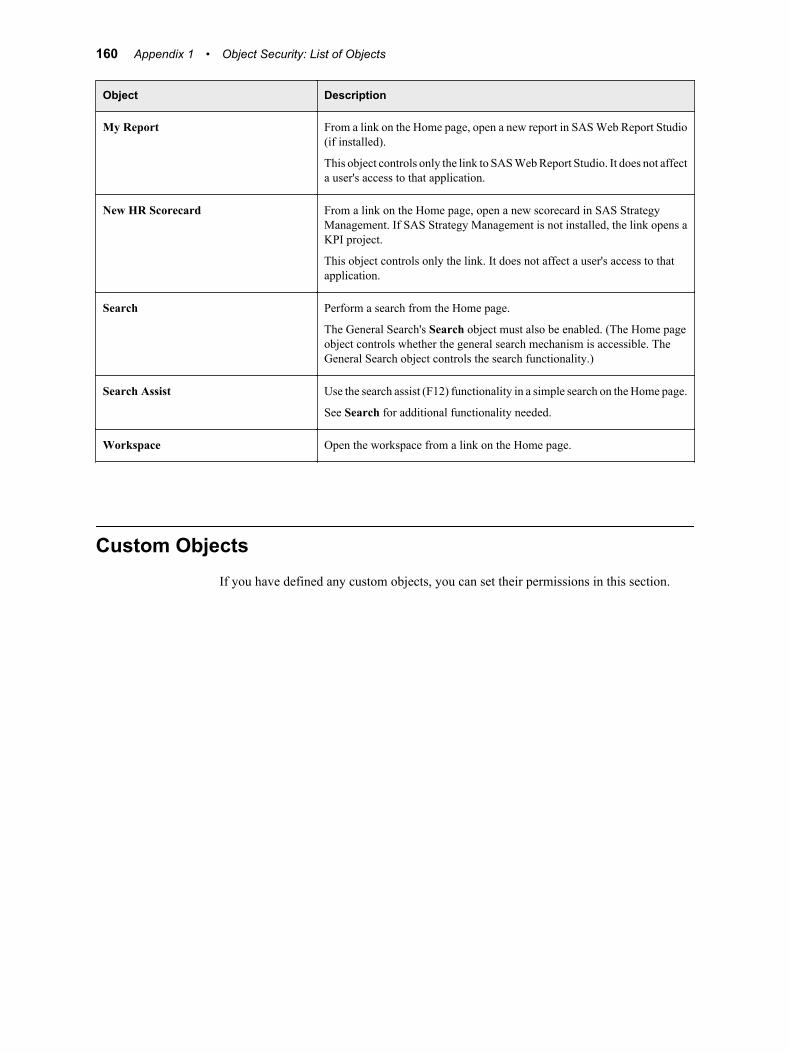
Object Description
My Report From a link on the Home page, open a new report in SAS Web Report Studio(if installed).
This object controls only the link to SAS Web Report Studio. It does not affecta user's access to that application.
New HR Scorecard From a link on the Home page, open a new scorecard in SAS StrategyManagement. If SAS Strategy Management is not installed, the link opens aKPI project.
This object controls only the link. It does not affect a user's access to thatapplication.
Search Perform a search from the Home page.
The General Search's Search object must also be enabled. (The Home pageobject controls whether the general search mechanism is accessible. TheGeneral Search object controls the search functionality.)
Search Assist Use the search assist (F12) functionality in a simple search on the Home page.
See Search for additional functionality needed.
Workspace Open the workspace from a link on the Home page.
Custom ObjectsIf you have defined any custom objects, you can set their permissions in this section.
160 Appendix 1 • Object Security: List of Objects

Appendix 2
Metrics in SAS Human CapitalManagement
Introduction . . . . . . . . . . . . . . . . . . . . . . . . . . . . . . . . . . . . . . . . . . . . . . . . . . . . . . . . . 161
Organizational Effectiveness . . . . . . . . . . . . . . . . . . . . . . . . . . . . . . . . . . . . . . . . . . . 162
Human Resources Structure . . . . . . . . . . . . . . . . . . . . . . . . . . . . . . . . . . . . . . . . . . . 164
Compensation . . . . . . . . . . . . . . . . . . . . . . . . . . . . . . . . . . . . . . . . . . . . . . . . . . . . . . . 165
Benefits . . . . . . . . . . . . . . . . . . . . . . . . . . . . . . . . . . . . . . . . . . . . . . . . . . . . . . . . . . . . . 167
Separations . . . . . . . . . . . . . . . . . . . . . . . . . . . . . . . . . . . . . . . . . . . . . . . . . . . . . . . . . 169
Staffing . . . . . . . . . . . . . . . . . . . . . . . . . . . . . . . . . . . . . . . . . . . . . . . . . . . . . . . . . . . . . 173
Training and Development . . . . . . . . . . . . . . . . . . . . . . . . . . . . . . . . . . . . . . . . . . . . 179
IntroductionSAS Human Capital Management provides an extensive collection of predefined measuresthat are designed to be used with data provided by the Saratoga Institute.
Note: An administrator must have set up the data to use with these measures by runninga job that loads the metric tables. Having the measures does not imply that you havethe data.
The measures are available in the following categories:
• Organizational Effectiveness
• Human Resources Structure
• Compensation
• Benefits
• Separations
• Staffing
• Training and Development
161

Organizational EffectivenessTable A2.1 Organizational Effectiveness Measures
Name Description Formula
Revenue Factor - Total Dollars of unit revenue generated per total FTE Revenue / Total FTE
Revenue Factor - WorkforceEmployees
Dollars of unit revenue generated per workforceon payroll FTE
Revenue / Workforce on Payroll FTE
Revenue Factor - RegularEmployees
Dollars of unit revenue generated per all regularFTE employees
Revenue / Regular FTE
Expense Factor - Total Dollars of unit operating expense incurred pertotal FTE
Operating Expense / Total FTE
Expense Factor - WorkforceEmployees
Dollars of unit operating expense incurred perworkforce on payroll FTE
Operating Expense / Workforce onPayroll FTE
Expense Factor - RegularEmployees
Dollars of unit operating expense incurred perall regular FTE employees
Operating Expense / Regular FTE
Income Factor - Total Dollars of unit profit generated per total FTE (Revenue - Operating Expense) / TotalFTE
Income Factor - WorkforceEmployees
Dollars of unit profit generated per workforceon payroll FTE
(Revenue - Operating Expense) /Workforce on Payroll FTE
Income Factor - RegularEmployees
Dollars of unit profit generated per all regularFTE employees
(Revenue - Operating Expense) /Regular FTE
Human Capital Value Added Dollars of adjusted profit added per total FTE (Revenue - (Operating Expense -(Compensation Cost (Workforce onPayroll) + Benefit Cost EPTNW))) /Total FTE
Human Capital ROI Dollars of adjusted profit per each dollar spenton employee compensation and benefits
(Revenue - (Operating Expense -(Compensation Cost (Workforce onPayroll) + Benefit Cost EPTNW))) /(Compensation Cost (Workforce onPayroll) + Benefit Cost EPTNW)
Human Economic Value Added Dollars of true profit (after expenses, taxes andcapital costs) generated per total FTE
Net Operating Profit After Tax -(Shareholder's Equity * 0.12) / TotalFTE
Outsourcing Expense Percent Outsourcing costs as a percentage of totaloperating costs
Outsourcing Expense / OperatingExpense
Management Ratio - Total Average number of employees to each manager Total Headcount / ManagementHeadcount
162 Appendix 2 • Metrics in SAS Human Capital Management
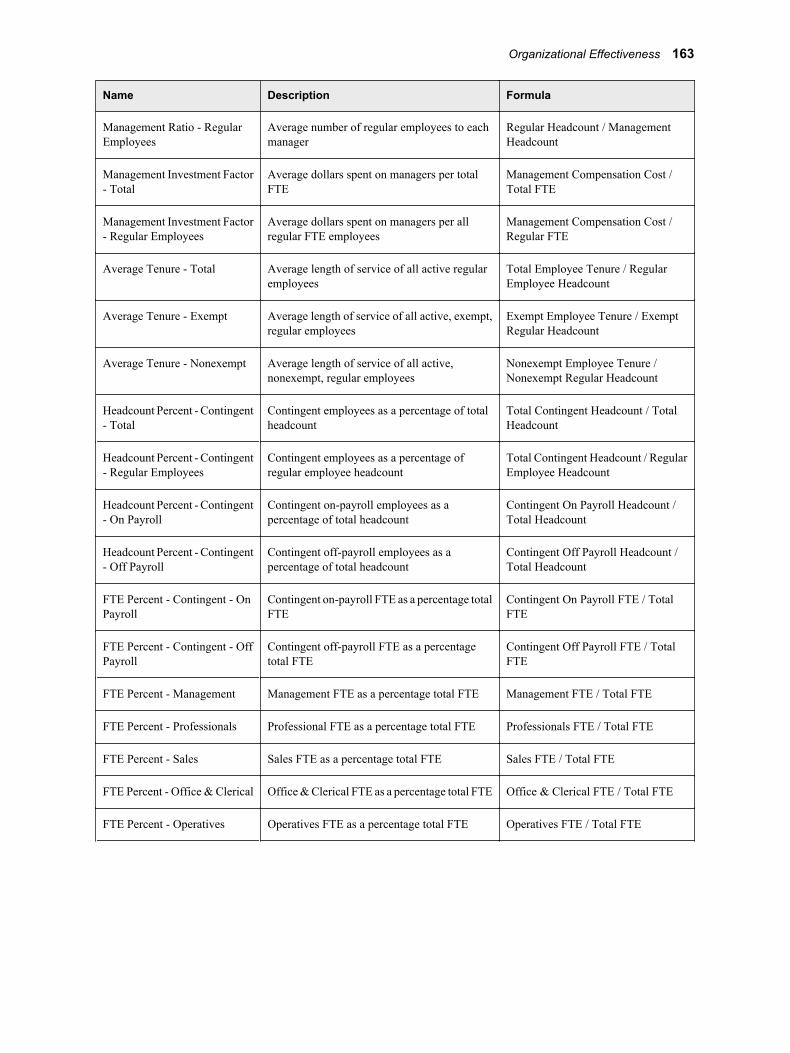
Name Description Formula
Management Ratio - RegularEmployees
Average number of regular employees to eachmanager
Regular Headcount / ManagementHeadcount
Management Investment Factor- Total
Average dollars spent on managers per totalFTE
Management Compensation Cost /Total FTE
Management Investment Factor- Regular Employees
Average dollars spent on managers per allregular FTE employees
Management Compensation Cost /Regular FTE
Average Tenure - Total Average length of service of all active regularemployees
Total Employee Tenure / RegularEmployee Headcount
Average Tenure - Exempt Average length of service of all active, exempt,regular employees
Exempt Employee Tenure / ExemptRegular Headcount
Average Tenure - Nonexempt Average length of service of all active,nonexempt, regular employees
Nonexempt Employee Tenure /Nonexempt Regular Headcount
Headcount Percent - Contingent- Total
Contingent employees as a percentage of totalheadcount
Total Contingent Headcount / TotalHeadcount
Headcount Percent - Contingent- Regular Employees
Contingent employees as a percentage ofregular employee headcount
Total Contingent Headcount / RegularEmployee Headcount
Headcount Percent - Contingent- On Payroll
Contingent on-payroll employees as apercentage of total headcount
Contingent On Payroll Headcount /Total Headcount
Headcount Percent - Contingent- Off Payroll
Contingent off-payroll employees as apercentage of total headcount
Contingent Off Payroll Headcount /Total Headcount
FTE Percent - Contingent - OnPayroll
Contingent on-payroll FTE as a percentage totalFTE
Contingent On Payroll FTE / TotalFTE
FTE Percent - Contingent - OffPayroll
Contingent off-payroll FTE as a percentagetotal FTE
Contingent Off Payroll FTE / TotalFTE
FTE Percent - Management Management FTE as a percentage total FTE Management FTE / Total FTE
FTE Percent - Professionals Professional FTE as a percentage total FTE Professionals FTE / Total FTE
FTE Percent - Sales Sales FTE as a percentage total FTE Sales FTE / Total FTE
FTE Percent - Office & Clerical Office & Clerical FTE as a percentage total FTE Office & Clerical FTE / Total FTE
FTE Percent - Operatives Operatives FTE as a percentage total FTE Operatives FTE / Total FTE
Organizational Effectiveness 163

Human Resources StructureTable A2.2 Human Resources Structure Measures
Name Description Formula
HR Expense Percent Internal and external HR expenses as apercentage of operating expense
HR Expense / Operating Expense
HR FTE Ratio - Total Total number of FTE employees that eachHuman Resource FTE supports
Total FTE / Total HR FTE
HR FTE Ratio - RegularEmployees
All regular employees that each HumanResource FTE supports
Regular FTE / Total HR FTE
HR Exempt Percent - Total Exempt HR FTE as a percentage of total HRFTE
HR Exempt FTE / Total HR FTE
HR Exempt Percent - RegularEmployees
Exempt HR FTE as a percentage of regular HRFTE
HR Exempt FTE / Regular HR FTE
HR FTE Investment Factor -Total
Dollars spent on Human Resource functions pertotal FTE
HR Expense / Total FTE
HR FTE Investment Factor -Regular Employees
Dollars spent on Human Resource functions perregular FTE
HR Expense / Regular FTE
HR Headcount InvestmentFactor - Total
Dollars spent on Human Resource functions perheadcount employee
HR Expense / Total Headcount
HR Headcount InvestmentFactor- Regular Employees
Dollars spent on Human Resource functions perregular employee headcount
HR Expense / Regular EmployeeHeadcount
HR Outsourcing Percent HR outsourcing expenses as a percentage oftotal HR expense
HR Outsourcing Cost / HR Expense
HR Consulting Percent HR consulting services expenses as apercentage of HR expense
HR Consulting Cost / HR Expense
HR Compensation ExpensePercent
HR compensation costs as a percentage of totaloperating expenses
HR Compensation Cost / OperatingExpense
HR Employee Cost Factor Average compensation paid to regular HR FTE HR Compensation Cost / Regular HRFTE
HR Total Employee Cost Factor Average compensation paid to regular HRemployees including benefit costs
HR Compensation Cost * (1 +Benefits Comp Percent /Compensation Cost (Workforce ofPayroll)) / Regular HR FTE
HR Separation Rate - Total HR employees who terminated as a percentageof total HR headcount
Total HR Separations / Total HRHeadcount
164 Appendix 2 • Metrics in SAS Human Capital Management

Name Description Formula
HR Separation Rate - Exempt HR exempt employees who terminated as apercentage of total HR headcount
Exempt HR Separations / Exempt HRHeadcount
HR Separation Rate -Nonexempt
HR nonexempt employees who terminated as apercentage of total HR headcount
Nonexempt HR Separations /Nonexempt HR Headcount
HR Structure Breakdown -Administrative
HR FTE in Administrative functions as apercentage of total HR FTE
HR Administrative FTE / Total HRFTE
HR Structure Breakdown -Benefits
HR FTE in Benefit functions as a percentage oftotal HR FTE
HR Benefits FTE / Total HR FTE
HR Structure Breakdown -Compensation
HR FTE in Compensation functions as apercentage of total HR FTE
HR Compensation FTE / Total HRFTE
HR Structure Breakdown -Employee Relations
HR FTE in Employee Relations functions as apercentage of total HR FTE
HR Employee Relations FTE / TotalHR FTE
HR Structure Breakdown -HRIS
HR FTE in HRIS functions as a percentage oftotal HR FTE
HR HRIS FTE / Total HR FTE
HR Structure Breakdown - HRManagement
HR FTE in HR Management functions as apercentage of total HR FTE
HR Management FTE / Total HR FTE
HR Structure Breakdown -Legal
HR FTE in Legal functions as a percentage oftotal HR FTE
HR Legal FTE / Total HR FTE
HR Structure Breakdown -Staffing
HR FTE in Staffing functions as a percentageof total HR FTE
HR Staffing FTE / Total HR FTE
CompensationTable A2.3 Compensation Measures
Name Description Formula
Compensation Revenue Percent- Workforce Employees
Workforce on-payroll compensation cost as apercentage of revenue
Compensation Cost (Workforce onPayroll) / Revenue
Compensation Revenue Percent- Regular Employees
Regular employee compensation cost as apercentage of revenue
Compensation Cost (RegularEmployees) / Revenue
Total Compensation RevenuePercent
Workforce on-payroll compensation andbenefit cost, excluding payments for time notworked (EPTNW), as a percentage of revenue
(Compensation Cost (Workforce onPayroll) + Benefit Cost EPTNW) /Revenue
Total Labor Cost RevenuePercent
Total compensation and benefit costs,excluding payments for time not worked(EPTNW), as a percentage of revenue
(Compensation Cost (Total) + BenefitCost EPTNW) / Revenue
Compensation 165
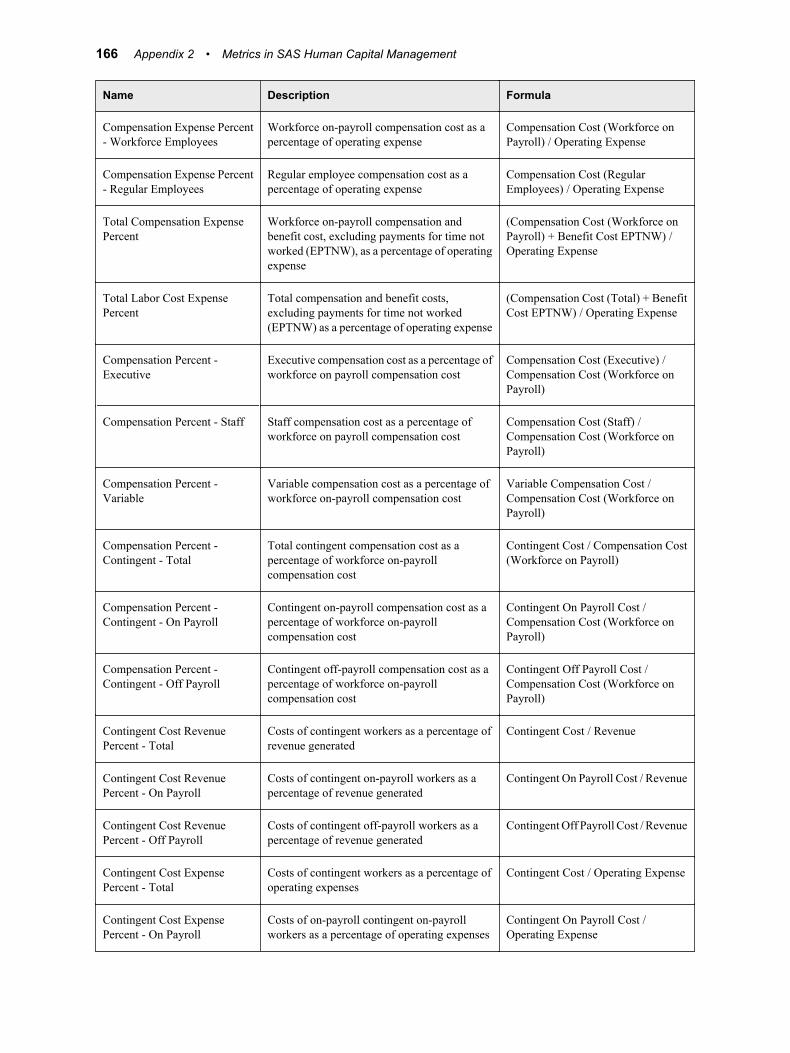
Name Description Formula
Compensation Expense Percent- Workforce Employees
Workforce on-payroll compensation cost as apercentage of operating expense
Compensation Cost (Workforce onPayroll) / Operating Expense
Compensation Expense Percent- Regular Employees
Regular employee compensation cost as apercentage of operating expense
Compensation Cost (RegularEmployees) / Operating Expense
Total Compensation ExpensePercent
Workforce on-payroll compensation andbenefit cost, excluding payments for time notworked (EPTNW), as a percentage of operatingexpense
(Compensation Cost (Workforce onPayroll) + Benefit Cost EPTNW) /Operating Expense
Total Labor Cost ExpensePercent
Total compensation and benefit costs,excluding payments for time not worked(EPTNW) as a percentage of operating expense
(Compensation Cost (Total) + BenefitCost EPTNW) / Operating Expense
Compensation Percent -Executive
Executive compensation cost as a percentage ofworkforce on payroll compensation cost
Compensation Cost (Executive) /Compensation Cost (Workforce onPayroll)
Compensation Percent - Staff Staff compensation cost as a percentage ofworkforce on payroll compensation cost
Compensation Cost (Staff) /Compensation Cost (Workforce onPayroll)
Compensation Percent -Variable
Variable compensation cost as a percentage ofworkforce on-payroll compensation cost
Variable Compensation Cost /Compensation Cost (Workforce onPayroll)
Compensation Percent -Contingent - Total
Total contingent compensation cost as apercentage of workforce on-payrollcompensation cost
Contingent Cost / Compensation Cost(Workforce on Payroll)
Compensation Percent -Contingent - On Payroll
Contingent on-payroll compensation cost as apercentage of workforce on-payrollcompensation cost
Contingent On Payroll Cost /Compensation Cost (Workforce onPayroll)
Compensation Percent -Contingent - Off Payroll
Contingent off-payroll compensation cost as apercentage of workforce on-payrollcompensation cost
Contingent Off Payroll Cost /Compensation Cost (Workforce onPayroll)
Contingent Cost RevenuePercent - Total
Costs of contingent workers as a percentage ofrevenue generated
Contingent Cost / Revenue
Contingent Cost RevenuePercent - On Payroll
Costs of contingent on-payroll workers as apercentage of revenue generated
Contingent On Payroll Cost / Revenue
Contingent Cost RevenuePercent - Off Payroll
Costs of contingent off-payroll workers as apercentage of revenue generated
Contingent Off Payroll Cost / Revenue
Contingent Cost ExpensePercent - Total
Costs of contingent workers as a percentage ofoperating expenses
Contingent Cost / Operating Expense
Contingent Cost ExpensePercent - On Payroll
Costs of on-payroll contingent on-payrollworkers as a percentage of operating expenses
Contingent On Payroll Cost /Operating Expense
166 Appendix 2 • Metrics in SAS Human Capital Management

Name Description Formula
Contingent Cost ExpensePercent - Off Payroll
Costs of contingent off-payroll workers as apercentage of operating expenses
Contingent Off Payroll Cost /Operating Expense
Employee Cost Factor - RegularEmployees
Average compensation paid to each regular FTEemployee
Compensation Cost (RegularEmployee) / Regular Employee FTE
Employee Cost Factor -Workforce
Average compensation paid to each workforceon payroll FTE employee
Compensation Cost (Workforce onPayroll) / Workforce on Payroll FTE
Employee Cost Factor -Executive
Average compensation paid to executive levelstaff (vice-president level and above)
Compensation Cost (Executive) /Executive FTE
Employee Cost Factor -Manager
Average compensation paid to managers Compensation Cost (Manager) /Manager FTE
Employee Cost Factor - Staff Average compensation paid to individualcontributor employees, not includingexecutives, managers and contingents
Compensation Cost (Staff) / Staff FTE
Total Employee Cost Factor Average compensation and benefit costs,excluding payments for time not worked(EPTNW), per regular employee FTE
(Compensation Cost (RegularEmployee) + Benefits Cost EPTNW) /Regular Employee FTE
Total Labor Cost Factor Average compensation and benefit costs,excluding payments for time not worked(EPTNW), per all FTE, including contingentoff-payroll employees
(Compensation Cost (Total) +Benefits EPTNW) / Total FTE
Contingent Cost Factor - Total Average dollars paid to each contingent worker Contingent Cost / Total ContingentFTE
Contingent Cost Factor - OnPayroll
Average dollars paid to each contingent on-payroll worker
Contingent On Payroll Cost /Contingent On Payroll FTE
Contingent Cost Factor - OffPayroll
Average dollars paid to each contingent off-payroll worker
Contingent Off Payroll Cost /Contingent Off Payroll FTE
BenefitsTable A2.4 Benefits Measures
Name Description Formula
Benefit Revenue Percent Employee benefit cost as a percentage ofrevenue
Benefit Cost / Revenue
Benefit Expense Percent Employee benefit cost as a percentage ofoperating expense
Benefit Cost / Operating Expense
Benefits 167
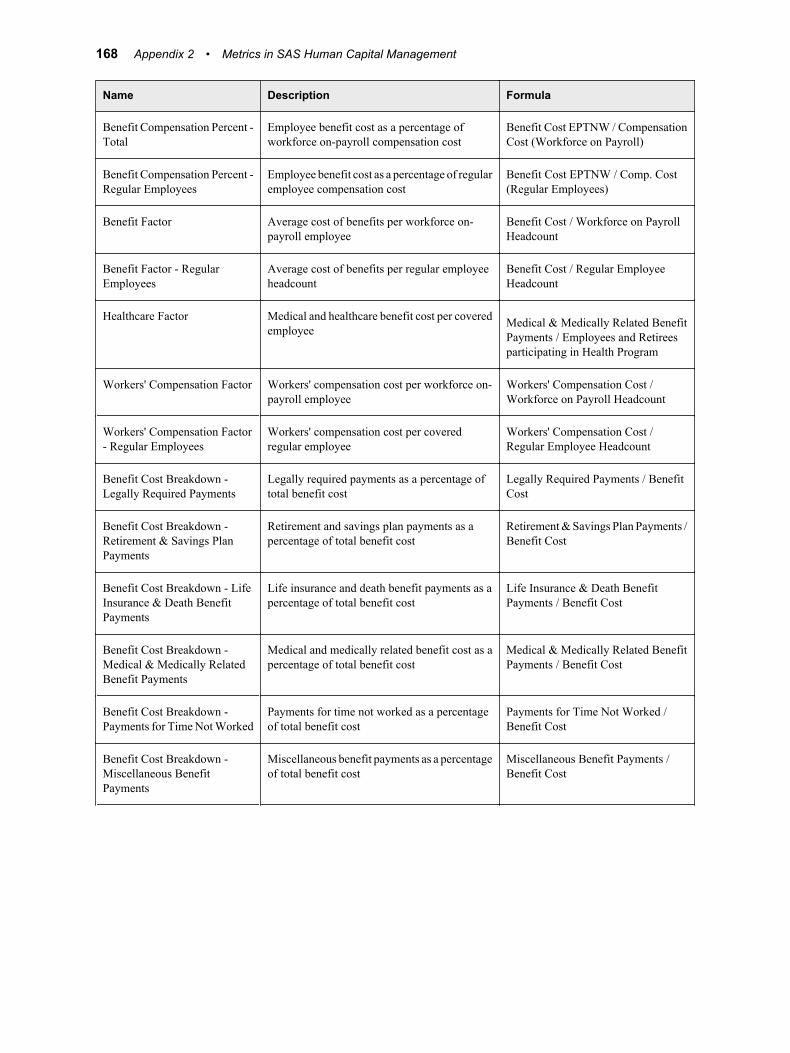
Name Description Formula
Benefit Compensation Percent -Total
Employee benefit cost as a percentage ofworkforce on-payroll compensation cost
Benefit Cost EPTNW / CompensationCost (Workforce on Payroll)
Benefit Compensation Percent -Regular Employees
Employee benefit cost as a percentage of regularemployee compensation cost
Benefit Cost EPTNW / Comp. Cost(Regular Employees)
Benefit Factor Average cost of benefits per workforce on-payroll employee
Benefit Cost / Workforce on PayrollHeadcount
Benefit Factor - RegularEmployees
Average cost of benefits per regular employeeheadcount
Benefit Cost / Regular EmployeeHeadcount
Healthcare Factor Medical and healthcare benefit cost per coveredemployee
Medical & Medically Related BenefitPayments / Employees and Retireesparticipating in Health Program
Workers' Compensation Factor Workers' compensation cost per workforce on-payroll employee
Workers' Compensation Cost /Workforce on Payroll Headcount
Workers' Compensation Factor- Regular Employees
Workers' compensation cost per coveredregular employee
Workers' Compensation Cost /Regular Employee Headcount
Benefit Cost Breakdown -Legally Required Payments
Legally required payments as a percentage oftotal benefit cost
Legally Required Payments / BenefitCost
Benefit Cost Breakdown -Retirement & Savings PlanPayments
Retirement and savings plan payments as apercentage of total benefit cost
Retirement & Savings Plan Payments /Benefit Cost
Benefit Cost Breakdown - LifeInsurance & Death BenefitPayments
Life insurance and death benefit payments as apercentage of total benefit cost
Life Insurance & Death BenefitPayments / Benefit Cost
Benefit Cost Breakdown -Medical & Medically RelatedBenefit Payments
Medical and medically related benefit cost as apercentage of total benefit cost
Medical & Medically Related BenefitPayments / Benefit Cost
Benefit Cost Breakdown -Payments for Time Not Worked
Payments for time not worked as a percentageof total benefit cost
Payments for Time Not Worked /Benefit Cost
Benefit Cost Breakdown -Miscellaneous BenefitPayments
Miscellaneous benefit payments as a percentageof total benefit cost
Miscellaneous Benefit Payments /Benefit Cost
168 Appendix 2 • Metrics in SAS Human Capital Management
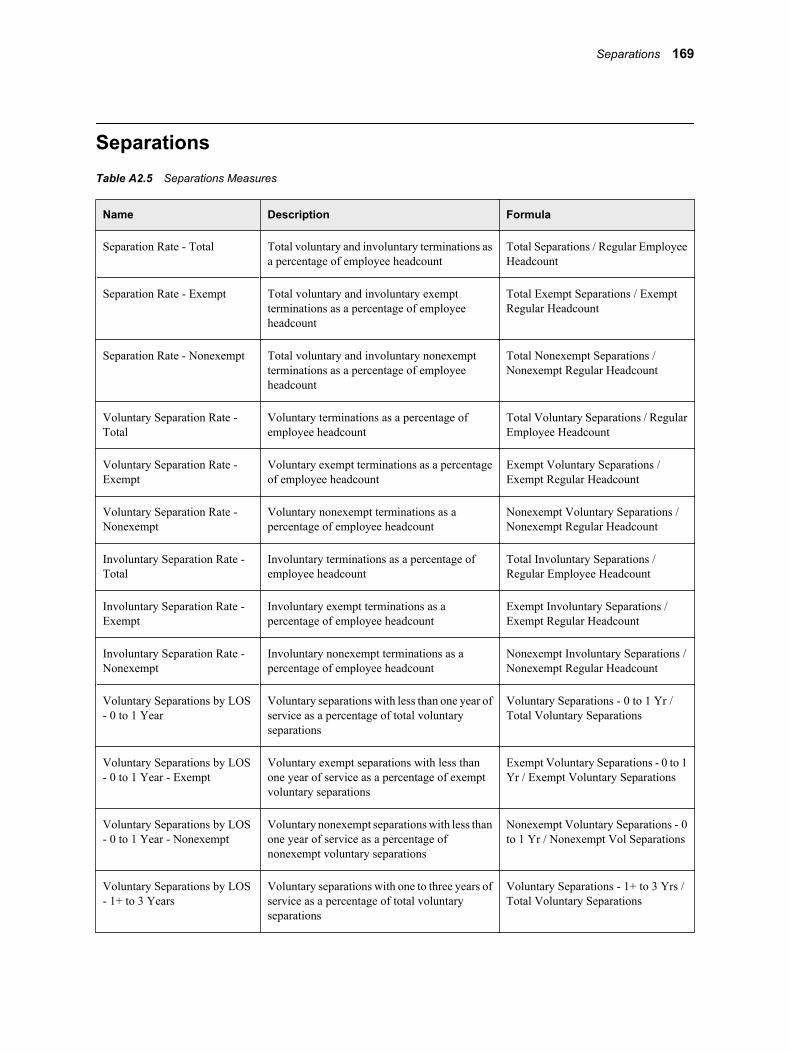
SeparationsTable A2.5 Separations Measures
Name Description Formula
Separation Rate - Total Total voluntary and involuntary terminations asa percentage of employee headcount
Total Separations / Regular EmployeeHeadcount
Separation Rate - Exempt Total voluntary and involuntary exemptterminations as a percentage of employeeheadcount
Total Exempt Separations / ExemptRegular Headcount
Separation Rate - Nonexempt Total voluntary and involuntary nonexemptterminations as a percentage of employeeheadcount
Total Nonexempt Separations /Nonexempt Regular Headcount
Voluntary Separation Rate -Total
Voluntary terminations as a percentage ofemployee headcount
Total Voluntary Separations / RegularEmployee Headcount
Voluntary Separation Rate -Exempt
Voluntary exempt terminations as a percentageof employee headcount
Exempt Voluntary Separations /Exempt Regular Headcount
Voluntary Separation Rate -Nonexempt
Voluntary nonexempt terminations as apercentage of employee headcount
Nonexempt Voluntary Separations /Nonexempt Regular Headcount
Involuntary Separation Rate -Total
Involuntary terminations as a percentage ofemployee headcount
Total Involuntary Separations /Regular Employee Headcount
Involuntary Separation Rate -Exempt
Involuntary exempt terminations as apercentage of employee headcount
Exempt Involuntary Separations /Exempt Regular Headcount
Involuntary Separation Rate -Nonexempt
Involuntary nonexempt terminations as apercentage of employee headcount
Nonexempt Involuntary Separations /Nonexempt Regular Headcount
Voluntary Separations by LOS- 0 to 1 Year
Voluntary separations with less than one year ofservice as a percentage of total voluntaryseparations
Voluntary Separations - 0 to 1 Yr /Total Voluntary Separations
Voluntary Separations by LOS- 0 to 1 Year - Exempt
Voluntary exempt separations with less thanone year of service as a percentage of exemptvoluntary separations
Exempt Voluntary Separations - 0 to 1Yr / Exempt Voluntary Separations
Voluntary Separations by LOS- 0 to 1 Year - Nonexempt
Voluntary nonexempt separations with less thanone year of service as a percentage ofnonexempt voluntary separations
Nonexempt Voluntary Separations - 0to 1 Yr / Nonexempt Vol Separations
Voluntary Separations by LOS- 1+ to 3 Years
Voluntary separations with one to three years ofservice as a percentage of total voluntaryseparations
Voluntary Separations - 1+ to 3 Yrs /Total Voluntary Separations
Separations 169
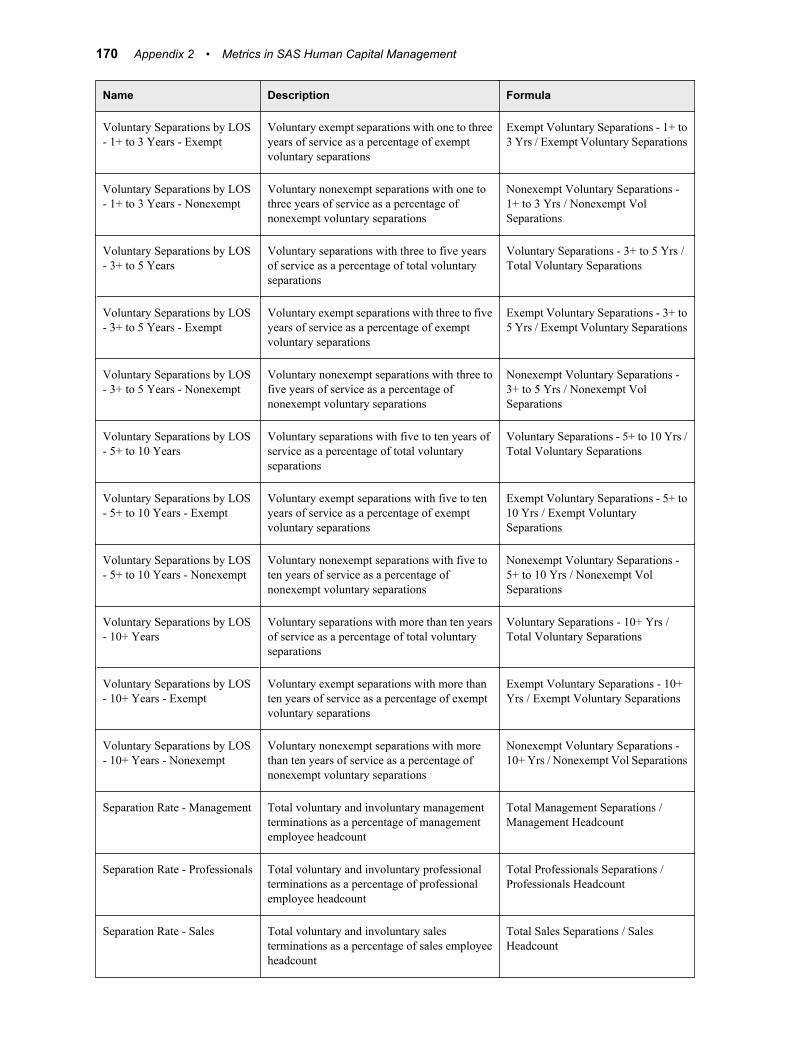
Name Description Formula
Voluntary Separations by LOS- 1+ to 3 Years - Exempt
Voluntary exempt separations with one to threeyears of service as a percentage of exemptvoluntary separations
Exempt Voluntary Separations - 1+ to3 Yrs / Exempt Voluntary Separations
Voluntary Separations by LOS- 1+ to 3 Years - Nonexempt
Voluntary nonexempt separations with one tothree years of service as a percentage ofnonexempt voluntary separations
Nonexempt Voluntary Separations -1+ to 3 Yrs / Nonexempt VolSeparations
Voluntary Separations by LOS- 3+ to 5 Years
Voluntary separations with three to five yearsof service as a percentage of total voluntaryseparations
Voluntary Separations - 3+ to 5 Yrs /Total Voluntary Separations
Voluntary Separations by LOS- 3+ to 5 Years - Exempt
Voluntary exempt separations with three to fiveyears of service as a percentage of exemptvoluntary separations
Exempt Voluntary Separations - 3+ to5 Yrs / Exempt Voluntary Separations
Voluntary Separations by LOS- 3+ to 5 Years - Nonexempt
Voluntary nonexempt separations with three tofive years of service as a percentage ofnonexempt voluntary separations
Nonexempt Voluntary Separations -3+ to 5 Yrs / Nonexempt VolSeparations
Voluntary Separations by LOS- 5+ to 10 Years
Voluntary separations with five to ten years ofservice as a percentage of total voluntaryseparations
Voluntary Separations - 5+ to 10 Yrs /Total Voluntary Separations
Voluntary Separations by LOS- 5+ to 10 Years - Exempt
Voluntary exempt separations with five to tenyears of service as a percentage of exemptvoluntary separations
Exempt Voluntary Separations - 5+ to10 Yrs / Exempt VoluntarySeparations
Voluntary Separations by LOS- 5+ to 10 Years - Nonexempt
Voluntary nonexempt separations with five toten years of service as a percentage ofnonexempt voluntary separations
Nonexempt Voluntary Separations -5+ to 10 Yrs / Nonexempt VolSeparations
Voluntary Separations by LOS- 10+ Years
Voluntary separations with more than ten yearsof service as a percentage of total voluntaryseparations
Voluntary Separations - 10+ Yrs /Total Voluntary Separations
Voluntary Separations by LOS- 10+ Years - Exempt
Voluntary exempt separations with more thanten years of service as a percentage of exemptvoluntary separations
Exempt Voluntary Separations - 10+Yrs / Exempt Voluntary Separations
Voluntary Separations by LOS- 10+ Years - Nonexempt
Voluntary nonexempt separations with morethan ten years of service as a percentage ofnonexempt voluntary separations
Nonexempt Voluntary Separations -10+ Yrs / Nonexempt Vol Separations
Separation Rate - Management Total voluntary and involuntary managementterminations as a percentage of managementemployee headcount
Total Management Separations /Management Headcount
Separation Rate - Professionals Total voluntary and involuntary professionalterminations as a percentage of professionalemployee headcount
Total Professionals Separations /Professionals Headcount
Separation Rate - Sales Total voluntary and involuntary salesterminations as a percentage of sales employeeheadcount
Total Sales Separations / SalesHeadcount
170 Appendix 2 • Metrics in SAS Human Capital Management
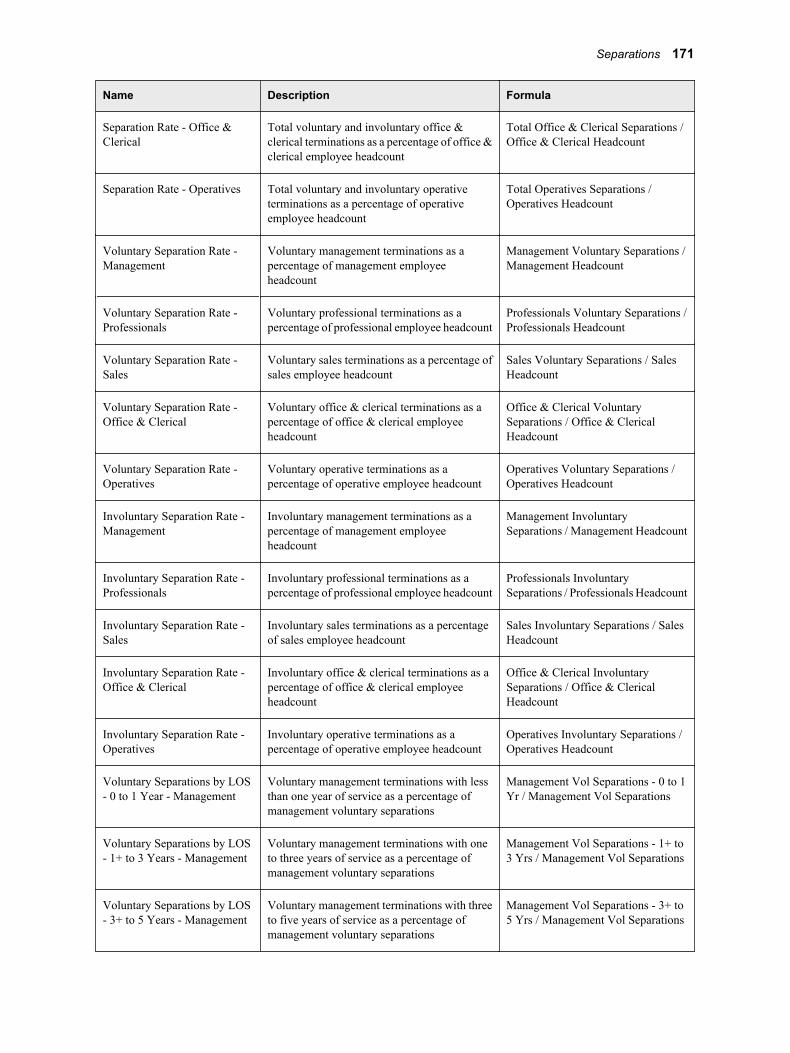
Name Description Formula
Separation Rate - Office &Clerical
Total voluntary and involuntary office &clerical terminations as a percentage of office &clerical employee headcount
Total Office & Clerical Separations /Office & Clerical Headcount
Separation Rate - Operatives Total voluntary and involuntary operativeterminations as a percentage of operativeemployee headcount
Total Operatives Separations /Operatives Headcount
Voluntary Separation Rate -Management
Voluntary management terminations as apercentage of management employeeheadcount
Management Voluntary Separations /Management Headcount
Voluntary Separation Rate -Professionals
Voluntary professional terminations as apercentage of professional employee headcount
Professionals Voluntary Separations /Professionals Headcount
Voluntary Separation Rate -Sales
Voluntary sales terminations as a percentage ofsales employee headcount
Sales Voluntary Separations / SalesHeadcount
Voluntary Separation Rate -Office & Clerical
Voluntary office & clerical terminations as apercentage of office & clerical employeeheadcount
Office & Clerical VoluntarySeparations / Office & ClericalHeadcount
Voluntary Separation Rate -Operatives
Voluntary operative terminations as apercentage of operative employee headcount
Operatives Voluntary Separations /Operatives Headcount
Involuntary Separation Rate -Management
Involuntary management terminations as apercentage of management employeeheadcount
Management InvoluntarySeparations / Management Headcount
Involuntary Separation Rate -Professionals
Involuntary professional terminations as apercentage of professional employee headcount
Professionals InvoluntarySeparations / Professionals Headcount
Involuntary Separation Rate -Sales
Involuntary sales terminations as a percentageof sales employee headcount
Sales Involuntary Separations / SalesHeadcount
Involuntary Separation Rate -Office & Clerical
Involuntary office & clerical terminations as apercentage of office & clerical employeeheadcount
Office & Clerical InvoluntarySeparations / Office & ClericalHeadcount
Involuntary Separation Rate -Operatives
Involuntary operative terminations as apercentage of operative employee headcount
Operatives Involuntary Separations /Operatives Headcount
Voluntary Separations by LOS- 0 to 1 Year - Management
Voluntary management terminations with lessthan one year of service as a percentage ofmanagement voluntary separations
Management Vol Separations - 0 to 1Yr / Management Vol Separations
Voluntary Separations by LOS- 1+ to 3 Years - Management
Voluntary management terminations with oneto three years of service as a percentage ofmanagement voluntary separations
Management Vol Separations - 1+ to3 Yrs / Management Vol Separations
Voluntary Separations by LOS- 3+ to 5 Years - Management
Voluntary management terminations with threeto five years of service as a percentage ofmanagement voluntary separations
Management Vol Separations - 3+ to5 Yrs / Management Vol Separations
Separations 171
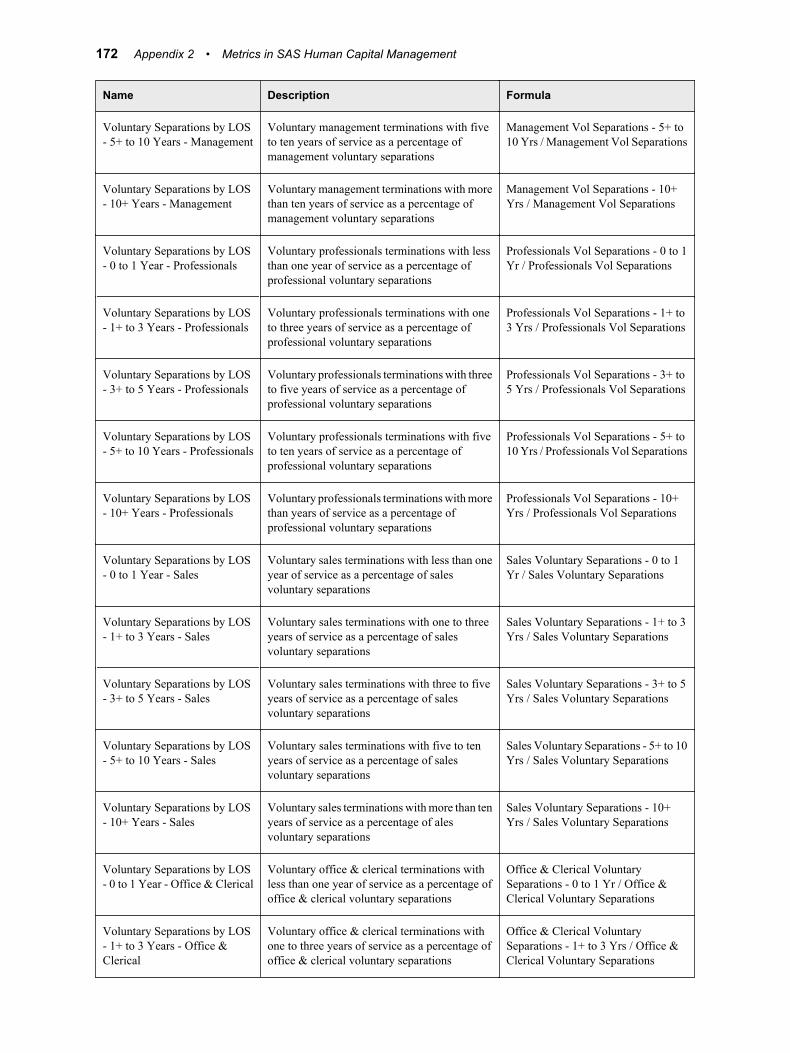
Name Description Formula
Voluntary Separations by LOS- 5+ to 10 Years - Management
Voluntary management terminations with fiveto ten years of service as a percentage ofmanagement voluntary separations
Management Vol Separations - 5+ to10 Yrs / Management Vol Separations
Voluntary Separations by LOS- 10+ Years - Management
Voluntary management terminations with morethan ten years of service as a percentage ofmanagement voluntary separations
Management Vol Separations - 10+Yrs / Management Vol Separations
Voluntary Separations by LOS- 0 to 1 Year - Professionals
Voluntary professionals terminations with lessthan one year of service as a percentage ofprofessional voluntary separations
Professionals Vol Separations - 0 to 1Yr / Professionals Vol Separations
Voluntary Separations by LOS- 1+ to 3 Years - Professionals
Voluntary professionals terminations with oneto three years of service as a percentage ofprofessional voluntary separations
Professionals Vol Separations - 1+ to3 Yrs / Professionals Vol Separations
Voluntary Separations by LOS- 3+ to 5 Years - Professionals
Voluntary professionals terminations with threeto five years of service as a percentage ofprofessional voluntary separations
Professionals Vol Separations - 3+ to5 Yrs / Professionals Vol Separations
Voluntary Separations by LOS- 5+ to 10 Years - Professionals
Voluntary professionals terminations with fiveto ten years of service as a percentage ofprofessional voluntary separations
Professionals Vol Separations - 5+ to10 Yrs / Professionals Vol Separations
Voluntary Separations by LOS- 10+ Years - Professionals
Voluntary professionals terminations with morethan years of service as a percentage ofprofessional voluntary separations
Professionals Vol Separations - 10+Yrs / Professionals Vol Separations
Voluntary Separations by LOS- 0 to 1 Year - Sales
Voluntary sales terminations with less than oneyear of service as a percentage of salesvoluntary separations
Sales Voluntary Separations - 0 to 1Yr / Sales Voluntary Separations
Voluntary Separations by LOS- 1+ to 3 Years - Sales
Voluntary sales terminations with one to threeyears of service as a percentage of salesvoluntary separations
Sales Voluntary Separations - 1+ to 3Yrs / Sales Voluntary Separations
Voluntary Separations by LOS- 3+ to 5 Years - Sales
Voluntary sales terminations with three to fiveyears of service as a percentage of salesvoluntary separations
Sales Voluntary Separations - 3+ to 5Yrs / Sales Voluntary Separations
Voluntary Separations by LOS- 5+ to 10 Years - Sales
Voluntary sales terminations with five to tenyears of service as a percentage of salesvoluntary separations
Sales Voluntary Separations - 5+ to 10Yrs / Sales Voluntary Separations
Voluntary Separations by LOS- 10+ Years - Sales
Voluntary sales terminations with more than tenyears of service as a percentage of alesvoluntary separations
Sales Voluntary Separations - 10+Yrs / Sales Voluntary Separations
Voluntary Separations by LOS- 0 to 1 Year - Office & Clerical
Voluntary office & clerical terminations withless than one year of service as a percentage ofoffice & clerical voluntary separations
Office & Clerical VoluntarySeparations - 0 to 1 Yr / Office &Clerical Voluntary Separations
Voluntary Separations by LOS- 1+ to 3 Years - Office &Clerical
Voluntary office & clerical terminations withone to three years of service as a percentage ofoffice & clerical voluntary separations
Office & Clerical VoluntarySeparations - 1+ to 3 Yrs / Office &Clerical Voluntary Separations
172 Appendix 2 • Metrics in SAS Human Capital Management

Name Description Formula
Voluntary Separations by LOS- 3+ to 5 Years - Office &Clerical
Voluntary office & clerical terminations withthree to five years of service as a percentage ofoffice & clerical voluntary separations
Office & Clerical VoluntarySeparations - 3+ to 5 Yrs / Office &Clerical Voluntary Separations
Voluntary Separations by LOS- 5+ to 10 Years - Office &Clerical
Voluntary office & clerical terminations withfive to ten years of service as a percentage ofoffice & clerical voluntary separations
Office & Clerical VoluntarySeparations - 5+ to 10 Yrs / Office &Clerical Voluntary Separations
Voluntary Separations by LOS- 10+ Years - Office & Clerical
Voluntary office & clerical terminations withmore than ten years of service as a percentageof office & clerical voluntary separations
Office & Clerical VoluntarySeparations - 10+ Yrs / Office &Clerical Voluntary Separations
Voluntary Separations by LOS- 0 to 1 Year - Operatives
Voluntary operatives' terminations with lessthan one year of service as a percentage ofoperatives voluntary separations
Operatives Vol Separations - 0 to 1Yr / Operatives Vol Separations
Voluntary Separations by LOS- 1+ to 3 Years - Operatives
Voluntary operatives' terminations with one tothree years of service as a percentage ofoperatives voluntary separations
Operatives Vol Separations - 1+ to 3Yrs / Operatives Vol Separations
Voluntary Separations by LOS- 3+ to 5 Years - Operatives
Voluntary operatives' terminations with three tofive years of service as a percentage ofoperatives voluntary separations
Operatives Vol Separations - 3+ to 5Yrs / Operatives Vol Separations
Voluntary Separations by LOS- 5+ to 10 Years - Operatives
Voluntary operatives' terminations with five toten years of service as a percentage of operativesvoluntary separations
Operatives Vol Separations - 5+ to 10Yrs / Operatives Vol Separations
Voluntary Separations by LOS- 10+ Years - Operatives
Voluntary operatives' terminations with morethan years of service as a percentage ofoperatives voluntary separations
Operatives Vol Separations - 10+ Yrs /Operatives Vol Separations
StaffingTable A2.6 Staffing Measures
Name Description Formula
Accession Rate - Total All hires as a percentage of regular employeeheadcount
Total Hires / Regular EmployeeHeadcount
Accession Rate - Exempt All exempt hires as a percentage of exemptregular employee headcount
Exempt Hires / Exempt RegularHeadcount
Accession Rate - Nonexempt All nonexempt hires as a percentage ofnonexempt regular employee headcount
Nonexempt Hires / NonexemptRegular Headcount
Accession Rate - External -Total
External new hire employees as a percentage ofregular employee headcount
External Hires / Regular EmployeeHeadcount
Staffing 173
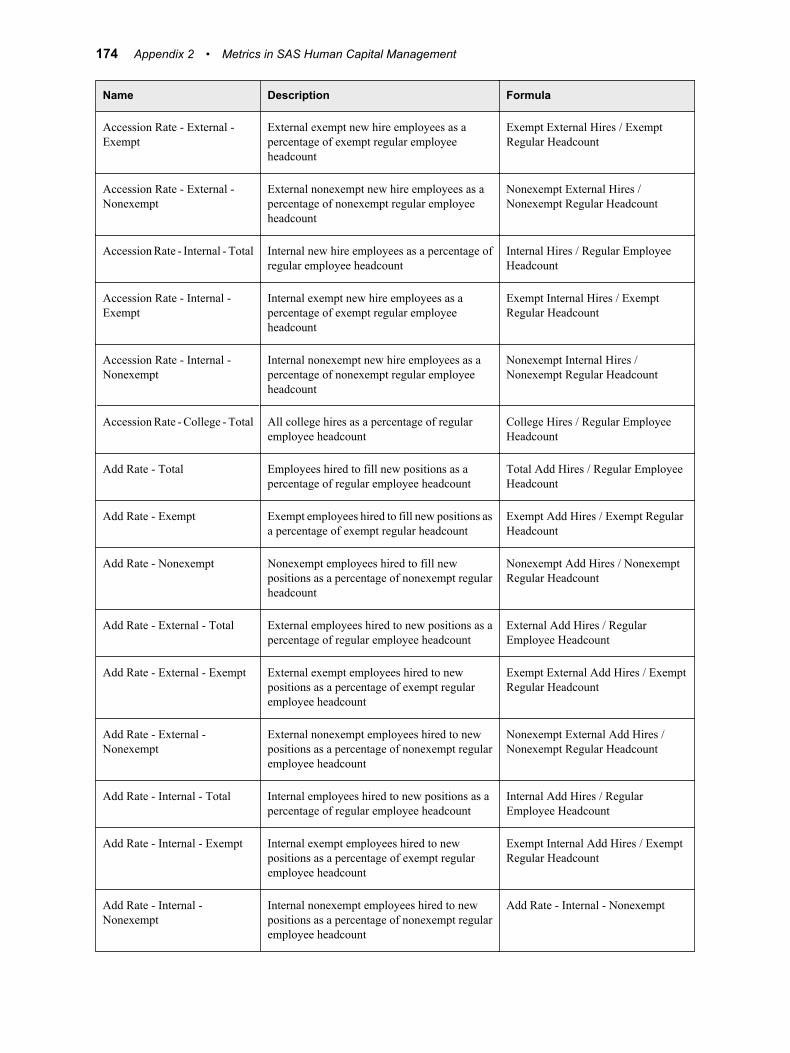
Name Description Formula
Accession Rate - External -Exempt
External exempt new hire employees as apercentage of exempt regular employeeheadcount
Exempt External Hires / ExemptRegular Headcount
Accession Rate - External -Nonexempt
External nonexempt new hire employees as apercentage of nonexempt regular employeeheadcount
Nonexempt External Hires /Nonexempt Regular Headcount
Accession Rate - Internal - Total Internal new hire employees as a percentage ofregular employee headcount
Internal Hires / Regular EmployeeHeadcount
Accession Rate - Internal -Exempt
Internal exempt new hire employees as apercentage of exempt regular employeeheadcount
Exempt Internal Hires / ExemptRegular Headcount
Accession Rate - Internal -Nonexempt
Internal nonexempt new hire employees as apercentage of nonexempt regular employeeheadcount
Nonexempt Internal Hires /Nonexempt Regular Headcount
Accession Rate - College - Total All college hires as a percentage of regularemployee headcount
College Hires / Regular EmployeeHeadcount
Add Rate - Total Employees hired to fill new positions as apercentage of regular employee headcount
Total Add Hires / Regular EmployeeHeadcount
Add Rate - Exempt Exempt employees hired to fill new positions asa percentage of exempt regular headcount
Exempt Add Hires / Exempt RegularHeadcount
Add Rate - Nonexempt Nonexempt employees hired to fill newpositions as a percentage of nonexempt regularheadcount
Nonexempt Add Hires / NonexemptRegular Headcount
Add Rate - External - Total External employees hired to new positions as apercentage of regular employee headcount
External Add Hires / RegularEmployee Headcount
Add Rate - External - Exempt External exempt employees hired to newpositions as a percentage of exempt regularemployee headcount
Exempt External Add Hires / ExemptRegular Headcount
Add Rate - External -Nonexempt
External nonexempt employees hired to newpositions as a percentage of nonexempt regularemployee headcount
Nonexempt External Add Hires /Nonexempt Regular Headcount
Add Rate - Internal - Total Internal employees hired to new positions as apercentage of regular employee headcount
Internal Add Hires / RegularEmployee Headcount
Add Rate - Internal - Exempt Internal exempt employees hired to newpositions as a percentage of exempt regularemployee headcount
Exempt Internal Add Hires / ExemptRegular Headcount
Add Rate - Internal -Nonexempt
Internal nonexempt employees hired to newpositions as a percentage of nonexempt regularemployee headcount
Add Rate - Internal - Nonexempt
174 Appendix 2 • Metrics in SAS Human Capital Management

Name Description Formula
Replacement Rate - Total Employees hired to fill existing positions as apercentage of regular employee headcount
Total Replacement Hires / RegularEmployee Headcount
Replacement Rate - Exempt Exempt employees hired to fill existingpositions as a percentage of exempt regularemployee headcount
Exempt Replacement Hires / ExemptRegular Headcount
Replacement Rate - Nonexempt Nonexempt employees hired to fill existingpositions as a percentage of nonexempt regularemployee headcount
Nonexempt Replacement Hires /Nonexempt Regular Headcount
Replacement Rate - External -Total
External employees hired to fill existingpositions as a percentage of regular employeeheadcount
External Replacement Hires / RegularEmployee Headcount
Replacement Rate - External -Exempt
External exempt employees hired to fill existingpositions as a percentage of exempt regularemployee headcount
Exempt External Replacement Hires /Exempt Regular Headcount
Replacement Rate - External -Nonexempt
External nonexempt employees hired to fillexisting positions as a percentage of nonexemptregular employee headcount
Nonexempt External ReplacementHires / Nonexempt RegularHeadcount
Replacement Rate - Internal -Total
Internal employees hired to fill existingpositions as a percentage of regular employeeheadcount
Internal Replacement Hires / RegularEmployee Headcount
Replacement Rate - Internal -Exempt
Internal exempt employees hired to fill existingpositions as a percentage of exempt regularemployee headcount
Exempt Internal Replacement Hires /Exempt Regular Headcount
Replacement Rate - Internal -Nonexempt
Internal nonexempt employees hired to fillexisting positions as a percentage of nonexemptregular employee headcount
Nonexempt Internal ReplacementHires / Nonexempt RegularHeadcount
Career Path Ratio - Total Promotions as a percentage of all movementwithin the organization
Total Promotions / (Total Promotions+ Total Transfers)
Career Path Ratio - Exempt Exempt promotions as a percentage of exemptmovement within the organization
Exempt Promotions / (ExemptPromotions + Exempt Transfers)
Career Path Ratio - Nonexempt Nonexempt promotions as a percentage ofnonexempt movement within the organization
Nonexempt Promotions / (NonexemptPromotions + Nonexempt Transfers)
Cost per Hire - Total Average dollars spent on hiring costs peremployee hired
(Total Hiring Costs * 1.1 Factor) /Total Hires
Cost Per Hire - Exempt Average dollars spent on exempt employeehiring costs per exempt employee hired
(Exempt Hiring Costs * 1.1 Factor) /Exempt Hires
Cost Per Hire - Nonexempt Average dollars spent on nonexempt employeehiring costs per nonexempt employee hired
(Nonexempt Hiring Costs * 1.1Factor) / Nonexempt Hires
Staffing 175

Name Description Formula
Cost Per Hire - External - Total Average dollars spent on external employeehiring costs per external employee hired
(External Hiring Costs * 1.1 Factor) /External Hires
Cost Per Hire - External -Exempt
Average dollars spent on exempt externalemployee hiring costs per exempt externalemployee hired
(Exempt External Hiring Costs * 1.1Factor) / Exempt External Hires
Cost Per Hire - External -Nonexempt
Average dollars spent on nonexempt externalemployee hiring costs per nonexempt externalemployee hired
(Nonexempt External Hiring Costs *1.1 Factor) / Nonexempt ExternalHires
Cost Per Hire - Internal - Total Average dollars spent on internal employeehiring costs per internal employee hired
(Internal Hiring Costs * 1.1 Factor) /Internal Hires
Cost Per Hire - Internal -Exempt
Average dollars spent on exempt internalemployee hiring costs per exempt internalemployee hired
(Exempt Internal Hiring Costs * 1.1Factor) / Exempt Internal Hires
Cost Per Hire - Internal -Nonexempt
Average dollars spent on nonexempt internalemployee hiring costs per nonexempt internalemployee hired
(Nonexempt Internal Hiring Costs *1.1 Factor) / Nonexempt Internal Hires
Cost Per Hire - College - Total Average dollars spent on college employeehiring costs per college employee hired
(College Hiring Costs * 1.1 Factor) /College Hires
Cost Per Hire - Advertising Advertising costs as a percentage of total newhire cost
Cost Per Hire - Advertising
Cost Per Hire - Agency Agency costs as a percentage of total new hirecost
Agency Hiring Costs / Total HiringCosts
Cost Per Hire - ReferralBonuses
Referral bonuses costs as a percentage of totalnew hire cost
Referral Bonuses Hiring Costs / TotalHiring Costs
Cost Per Hire - Travel Travel costs as a percentage of total new hirecost
Travel Hiring Costs / Total HiringCosts
Cost Per Hire - Relocation Relocation costs as a percentage of total newhire cost
Relocation Hiring Costs / Total HiringCosts
Cost Per Hire - Recruiter HR recruiter costs as a percentage of total newhire cost
Recruiter Hiring Costs / Total HiringCosts
Cost Per Hire - External -Advertising
External advertising costs as a percentage oftotal external new hire cost
External Advertising Hiring Costs /External Hiring Costs
Cost Per Hire - External -Agency
External agency costs as a percentage of totalexternal new hire cost
External Agency Hiring Costs /External Hiring Costs
Cost Per Hire - External -Referral Bonuses
External referral bonuses costs as a percentageof total external new hire cost
External Referral Bonuses HiringCosts / External Hiring Costs
Cost Per Hire - External - Travel External travel costs as a percentage of totalexternal new hire cost
External Travel Hiring Costs /External Hiring Costs
176 Appendix 2 • Metrics in SAS Human Capital Management
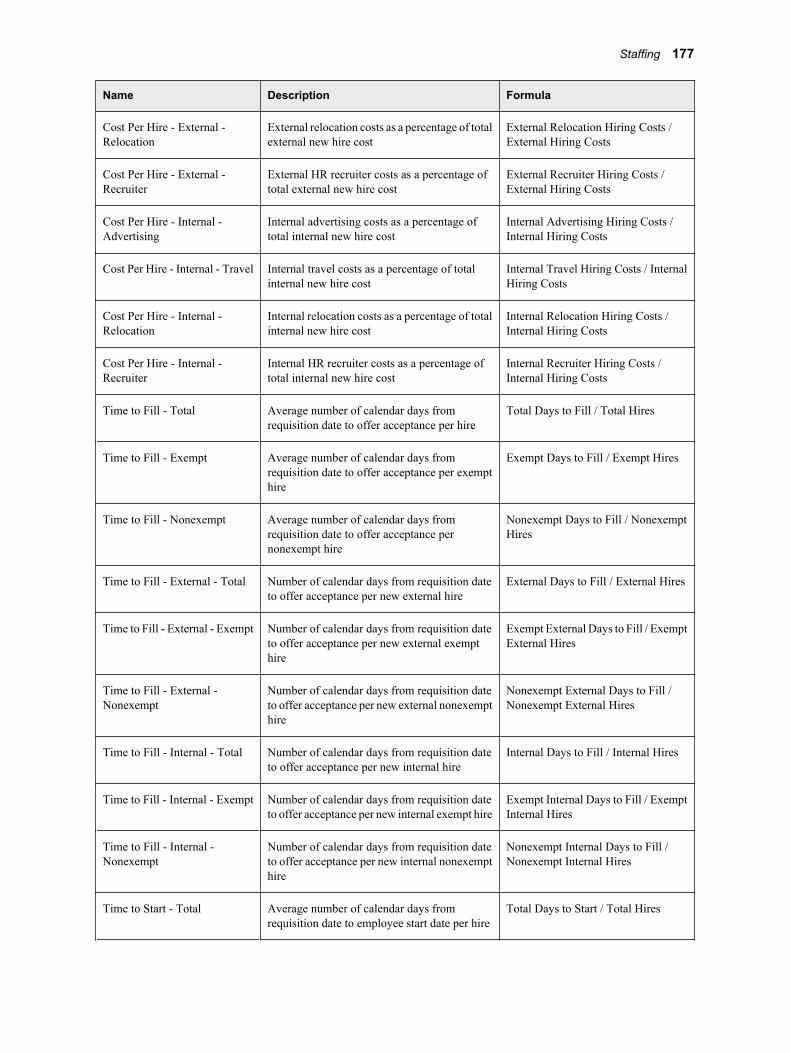
Name Description Formula
Cost Per Hire - External -Relocation
External relocation costs as a percentage of totalexternal new hire cost
External Relocation Hiring Costs /External Hiring Costs
Cost Per Hire - External -Recruiter
External HR recruiter costs as a percentage oftotal external new hire cost
External Recruiter Hiring Costs /External Hiring Costs
Cost Per Hire - Internal -Advertising
Internal advertising costs as a percentage oftotal internal new hire cost
Internal Advertising Hiring Costs /Internal Hiring Costs
Cost Per Hire - Internal - Travel Internal travel costs as a percentage of totalinternal new hire cost
Internal Travel Hiring Costs / InternalHiring Costs
Cost Per Hire - Internal -Relocation
Internal relocation costs as a percentage of totalinternal new hire cost
Internal Relocation Hiring Costs /Internal Hiring Costs
Cost Per Hire - Internal -Recruiter
Internal HR recruiter costs as a percentage oftotal internal new hire cost
Internal Recruiter Hiring Costs /Internal Hiring Costs
Time to Fill - Total Average number of calendar days fromrequisition date to offer acceptance per hire
Total Days to Fill / Total Hires
Time to Fill - Exempt Average number of calendar days fromrequisition date to offer acceptance per exempthire
Exempt Days to Fill / Exempt Hires
Time to Fill - Nonexempt Average number of calendar days fromrequisition date to offer acceptance pernonexempt hire
Nonexempt Days to Fill / NonexemptHires
Time to Fill - External - Total Number of calendar days from requisition dateto offer acceptance per new external hire
External Days to Fill / External Hires
Time to Fill - External - Exempt Number of calendar days from requisition dateto offer acceptance per new external exempthire
Exempt External Days to Fill / ExemptExternal Hires
Time to Fill - External -Nonexempt
Number of calendar days from requisition dateto offer acceptance per new external nonexempthire
Nonexempt External Days to Fill /Nonexempt External Hires
Time to Fill - Internal - Total Number of calendar days from requisition dateto offer acceptance per new internal hire
Internal Days to Fill / Internal Hires
Time to Fill - Internal - Exempt Number of calendar days from requisition dateto offer acceptance per new internal exempt hire
Exempt Internal Days to Fill / ExemptInternal Hires
Time to Fill - Internal -Nonexempt
Number of calendar days from requisition dateto offer acceptance per new internal nonexempthire
Nonexempt Internal Days to Fill /Nonexempt Internal Hires
Time to Start - Total Average number of calendar days fromrequisition date to employee start date per hire
Total Days to Start / Total Hires
Staffing 177
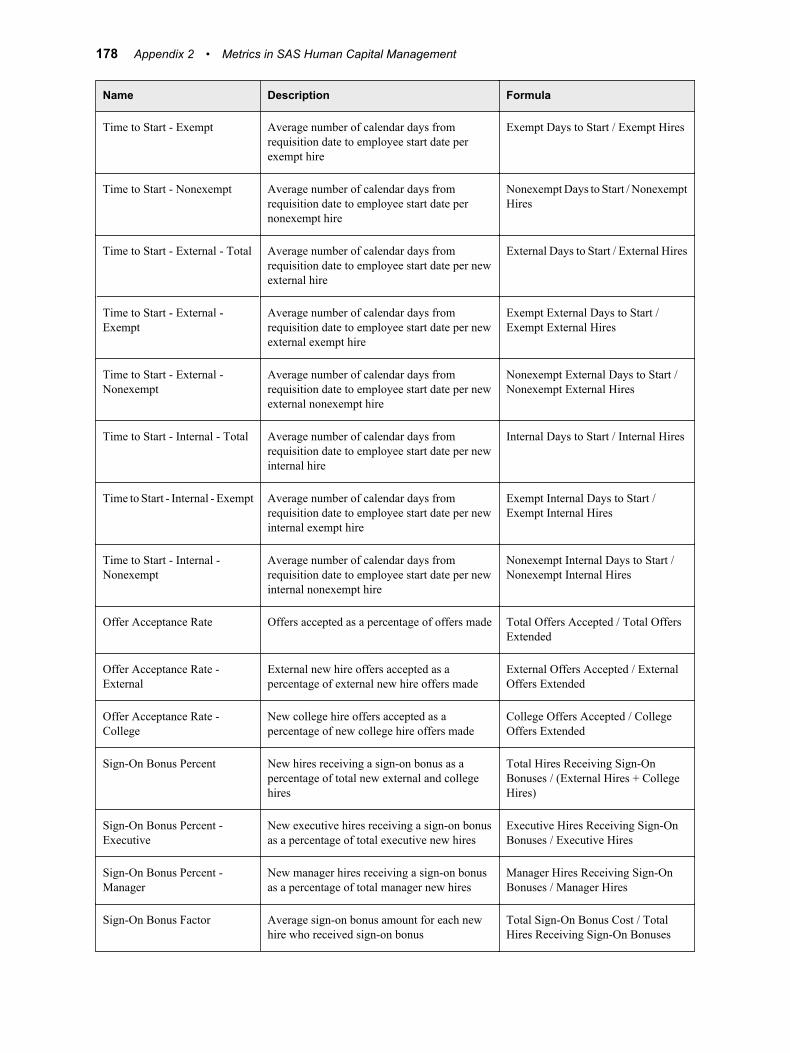
Name Description Formula
Time to Start - Exempt Average number of calendar days fromrequisition date to employee start date perexempt hire
Exempt Days to Start / Exempt Hires
Time to Start - Nonexempt Average number of calendar days fromrequisition date to employee start date pernonexempt hire
Nonexempt Days to Start / NonexemptHires
Time to Start - External - Total Average number of calendar days fromrequisition date to employee start date per newexternal hire
External Days to Start / External Hires
Time to Start - External -Exempt
Average number of calendar days fromrequisition date to employee start date per newexternal exempt hire
Exempt External Days to Start /Exempt External Hires
Time to Start - External -Nonexempt
Average number of calendar days fromrequisition date to employee start date per newexternal nonexempt hire
Nonexempt External Days to Start /Nonexempt External Hires
Time to Start - Internal - Total Average number of calendar days fromrequisition date to employee start date per newinternal hire
Internal Days to Start / Internal Hires
Time to Start - Internal - Exempt Average number of calendar days fromrequisition date to employee start date per newinternal exempt hire
Exempt Internal Days to Start /Exempt Internal Hires
Time to Start - Internal -Nonexempt
Average number of calendar days fromrequisition date to employee start date per newinternal nonexempt hire
Nonexempt Internal Days to Start /Nonexempt Internal Hires
Offer Acceptance Rate Offers accepted as a percentage of offers made Total Offers Accepted / Total OffersExtended
Offer Acceptance Rate -External
External new hire offers accepted as apercentage of external new hire offers made
External Offers Accepted / ExternalOffers Extended
Offer Acceptance Rate -College
New college hire offers accepted as apercentage of new college hire offers made
College Offers Accepted / CollegeOffers Extended
Sign-On Bonus Percent New hires receiving a sign-on bonus as apercentage of total new external and collegehires
Total Hires Receiving Sign-OnBonuses / (External Hires + CollegeHires)
Sign-On Bonus Percent -Executive
New executive hires receiving a sign-on bonusas a percentage of total executive new hires
Executive Hires Receiving Sign-OnBonuses / Executive Hires
Sign-On Bonus Percent -Manager
New manager hires receiving a sign-on bonusas a percentage of total manager new hires
Manager Hires Receiving Sign-OnBonuses / Manager Hires
Sign-On Bonus Factor Average sign-on bonus amount for each newhire who received sign-on bonus
Total Sign-On Bonus Cost / TotalHires Receiving Sign-On Bonuses
178 Appendix 2 • Metrics in SAS Human Capital Management
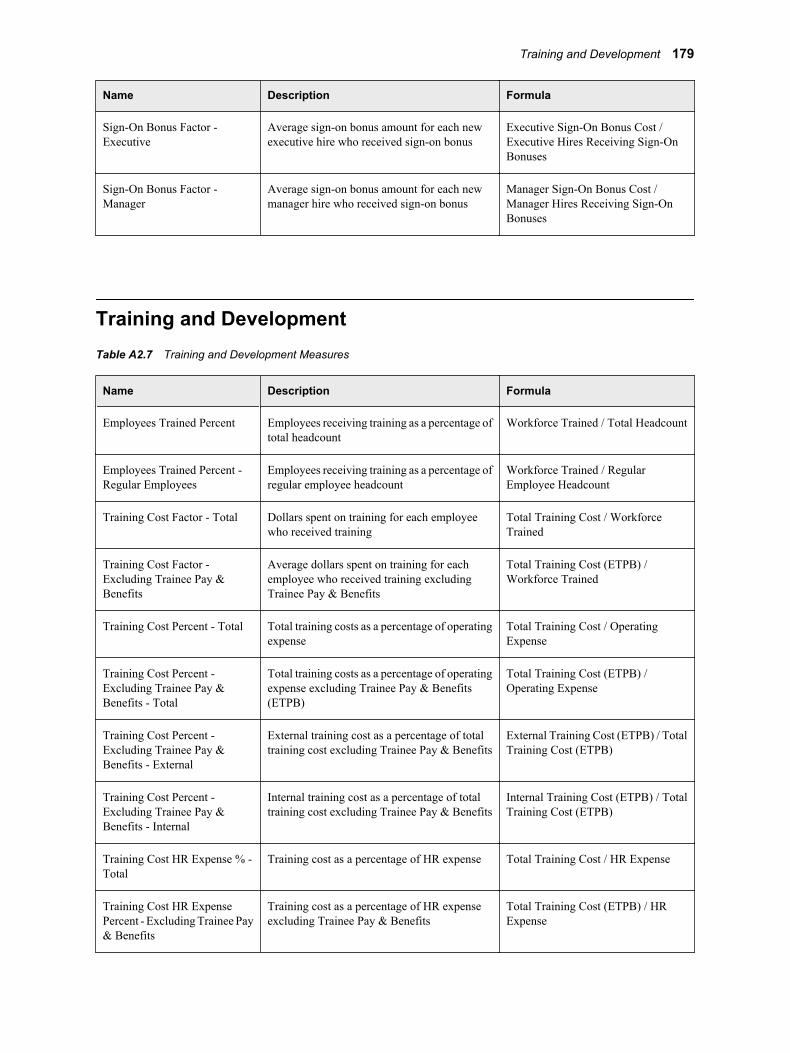
Name Description Formula
Sign-On Bonus Factor -Executive
Average sign-on bonus amount for each newexecutive hire who received sign-on bonus
Executive Sign-On Bonus Cost /Executive Hires Receiving Sign-OnBonuses
Sign-On Bonus Factor -Manager
Average sign-on bonus amount for each newmanager hire who received sign-on bonus
Manager Sign-On Bonus Cost /Manager Hires Receiving Sign-OnBonuses
Training and DevelopmentTable A2.7 Training and Development Measures
Name Description Formula
Employees Trained Percent Employees receiving training as a percentage oftotal headcount
Workforce Trained / Total Headcount
Employees Trained Percent -Regular Employees
Employees receiving training as a percentage ofregular employee headcount
Workforce Trained / RegularEmployee Headcount
Training Cost Factor - Total Dollars spent on training for each employeewho received training
Total Training Cost / WorkforceTrained
Training Cost Factor -Excluding Trainee Pay &Benefits
Average dollars spent on training for eachemployee who received training excludingTrainee Pay & Benefits
Total Training Cost (ETPB) /Workforce Trained
Training Cost Percent - Total Total training costs as a percentage of operatingexpense
Total Training Cost / OperatingExpense
Training Cost Percent -Excluding Trainee Pay &Benefits - Total
Total training costs as a percentage of operatingexpense excluding Trainee Pay & Benefits(ETPB)
Total Training Cost (ETPB) /Operating Expense
Training Cost Percent -Excluding Trainee Pay &Benefits - External
External training cost as a percentage of totaltraining cost excluding Trainee Pay & Benefits
External Training Cost (ETPB) / TotalTraining Cost (ETPB)
Training Cost Percent -Excluding Trainee Pay &Benefits - Internal
Internal training cost as a percentage of totaltraining cost excluding Trainee Pay & Benefits
Internal Training Cost (ETPB) / TotalTraining Cost (ETPB)
Training Cost HR Expense % -Total
Training cost as a percentage of HR expense Total Training Cost / HR Expense
Training Cost HR ExpensePercent - Excluding Trainee Pay& Benefits
Training cost as a percentage of HR expenseexcluding Trainee Pay & Benefits
Total Training Cost (ETPB) / HRExpense
Training and Development 179

Name Description Formula
Training Compensation % -Total
Training cost as a percentage of workforce onpayroll compensation cost
Total Training Cost / CompensationCost (Workforce on Payroll)
Training Compensation Percent- Regular Employees
Training cost as a percentage of regularemployee compensation cost
Total Training Cost / Comp. Cost(Regular Employees)
Training Compensation Percent- Excluding Trainee Pay &Benefits (ETPB)
Training cost, excluding Trainee Pay &Benefits (ETPB) as a percentage of workforceon payroll compensation cost
Total Training Cost (ETPB) /Compensation Cost (Workforce onPayroll)
Training Compensation Percent- Regular Employees (ETPB)
Training cost, excluding trainee pay andbenefits (ETPB) as a percentage of regularemployee compensation cost
Total Training Cost ETPB / Comp.Cost (Regular Employees)
Training Headcount InvestmentFactor
Average dollars spent on training per headcountemployee
Total Training Cost / Total Headcount
Training Headcount InvestmentFactor - Regular Employees
Average dollars spent on training per regularemployee headcount
Total Training Cost / RegularEmployee Headcount
Training Headcount InvestmentFactor - Excluding Trainee Pay& Benefits
Average dollars spent on training excludingtrainee pay and benefits (ETPB) per headcountemployee
Total Training Cost (ETPB) / TotalHeadcount
Training Headcount InvestmentFactor - Regular Employees(ETPB)
Average dollars spent on training excludingtrainee pay and benefits (ETPB) per regularemployee headcount
Total Training Cost (ETPB) / RegularEmployee Headcount
Headcount Training Factor -Total
Average number of hours of training perheadcount employee
Total Training Hours / TotalHeadcount
Headcount Training Factor -Regular Employees
Average number of hours of training per regularemployee headcount
Total Training Hours / RegularEmployee Headcount
FTE Training Factor - Total Average number of hours of training per FTEemployee
Total Training Hours / Total FTE
FTE Training Factor - RegularEmployees
Average number of hours of training per regularFTE
Total Training Hours / Regular FTE
Training FTE InvestmentFactor - Total
Average dollar amount spent on training perFTE employee
Total Training Cost / Total FTE
Training FTE InvestmentFactor - Regular Employees
Average dollar amount spent on training perregular FTE
Total Training Cost / Regular FTE
Training FTE InvestmentFactor - Total - Exempt
Average dollar amount spent on exempttraining per exempt FTE employee
Total Exempt Training Cost / ExemptFTE
Training FTE InvestmentFactor - Total - Nonexempt
Average dollar amount spent on nonexempttraining per nonexempt FTE employee
Total Nonexempt Training Cost /Nonexempt FTE
180 Appendix 2 • Metrics in SAS Human Capital Management
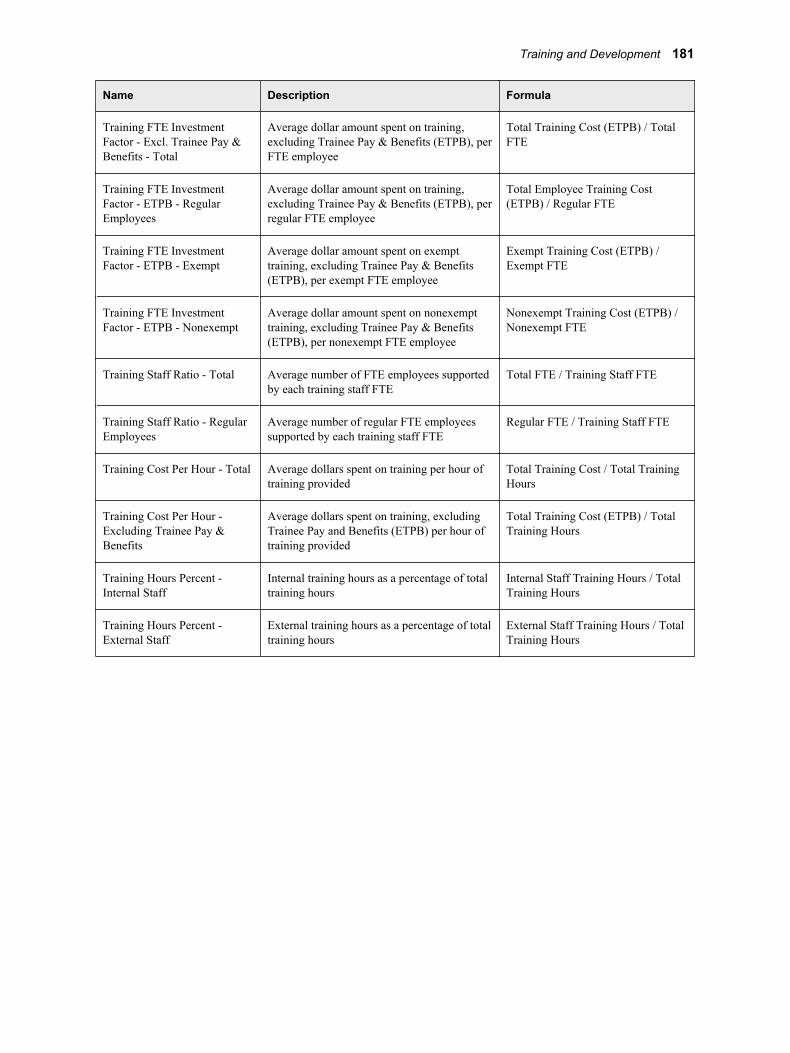
Name Description Formula
Training FTE InvestmentFactor - Excl. Trainee Pay &Benefits - Total
Average dollar amount spent on training,excluding Trainee Pay & Benefits (ETPB), perFTE employee
Total Training Cost (ETPB) / TotalFTE
Training FTE InvestmentFactor - ETPB - RegularEmployees
Average dollar amount spent on training,excluding Trainee Pay & Benefits (ETPB), perregular FTE employee
Total Employee Training Cost(ETPB) / Regular FTE
Training FTE InvestmentFactor - ETPB - Exempt
Average dollar amount spent on exempttraining, excluding Trainee Pay & Benefits(ETPB), per exempt FTE employee
Exempt Training Cost (ETPB) /Exempt FTE
Training FTE InvestmentFactor - ETPB - Nonexempt
Average dollar amount spent on nonexempttraining, excluding Trainee Pay & Benefits(ETPB), per nonexempt FTE employee
Nonexempt Training Cost (ETPB) /Nonexempt FTE
Training Staff Ratio - Total Average number of FTE employees supportedby each training staff FTE
Total FTE / Training Staff FTE
Training Staff Ratio - RegularEmployees
Average number of regular FTE employeessupported by each training staff FTE
Regular FTE / Training Staff FTE
Training Cost Per Hour - Total Average dollars spent on training per hour oftraining provided
Total Training Cost / Total TrainingHours
Training Cost Per Hour -Excluding Trainee Pay &Benefits
Average dollars spent on training, excludingTrainee Pay and Benefits (ETPB) per hour oftraining provided
Total Training Cost (ETPB) / TotalTraining Hours
Training Hours Percent -Internal Staff
Internal training hours as a percentage of totaltraining hours
Internal Staff Training Hours / TotalTraining Hours
Training Hours Percent -External Staff
External training hours as a percentage of totaltraining hours
External Staff Training Hours / TotalTraining Hours
Training and Development 181

182 Appendix 2 • Metrics in SAS Human Capital Management
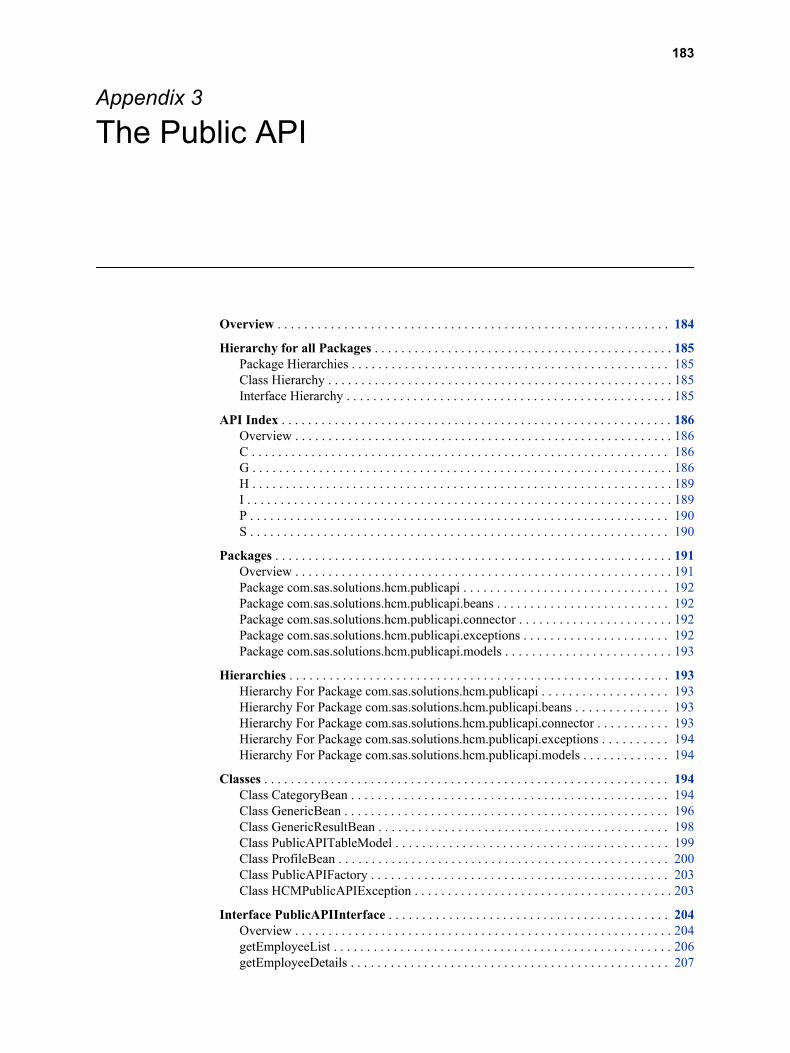
Appendix 3
The Public API
Overview . . . . . . . . . . . . . . . . . . . . . . . . . . . . . . . . . . . . . . . . . . . . . . . . . . . . . . . . . . . 184
Hierarchy for all Packages . . . . . . . . . . . . . . . . . . . . . . . . . . . . . . . . . . . . . . . . . . . . . 185Package Hierarchies . . . . . . . . . . . . . . . . . . . . . . . . . . . . . . . . . . . . . . . . . . . . . . . . 185Class Hierarchy . . . . . . . . . . . . . . . . . . . . . . . . . . . . . . . . . . . . . . . . . . . . . . . . . . . . 185Interface Hierarchy . . . . . . . . . . . . . . . . . . . . . . . . . . . . . . . . . . . . . . . . . . . . . . . . . 185
API Index . . . . . . . . . . . . . . . . . . . . . . . . . . . . . . . . . . . . . . . . . . . . . . . . . . . . . . . . . . . 186Overview . . . . . . . . . . . . . . . . . . . . . . . . . . . . . . . . . . . . . . . . . . . . . . . . . . . . . . . . . 186C . . . . . . . . . . . . . . . . . . . . . . . . . . . . . . . . . . . . . . . . . . . . . . . . . . . . . . . . . . . . . . . 186G . . . . . . . . . . . . . . . . . . . . . . . . . . . . . . . . . . . . . . . . . . . . . . . . . . . . . . . . . . . . . . . 186H . . . . . . . . . . . . . . . . . . . . . . . . . . . . . . . . . . . . . . . . . . . . . . . . . . . . . . . . . . . . . . . 189I . . . . . . . . . . . . . . . . . . . . . . . . . . . . . . . . . . . . . . . . . . . . . . . . . . . . . . . . . . . . . . . . 189P . . . . . . . . . . . . . . . . . . . . . . . . . . . . . . . . . . . . . . . . . . . . . . . . . . . . . . . . . . . . . . . 190S . . . . . . . . . . . . . . . . . . . . . . . . . . . . . . . . . . . . . . . . . . . . . . . . . . . . . . . . . . . . . . . 190
Packages . . . . . . . . . . . . . . . . . . . . . . . . . . . . . . . . . . . . . . . . . . . . . . . . . . . . . . . . . . . . 191Overview . . . . . . . . . . . . . . . . . . . . . . . . . . . . . . . . . . . . . . . . . . . . . . . . . . . . . . . . . 191Package com.sas.solutions.hcm.publicapi . . . . . . . . . . . . . . . . . . . . . . . . . . . . . . . 192Package com.sas.solutions.hcm.publicapi.beans . . . . . . . . . . . . . . . . . . . . . . . . . . 192Package com.sas.solutions.hcm.publicapi.connector . . . . . . . . . . . . . . . . . . . . . . . 192Package com.sas.solutions.hcm.publicapi.exceptions . . . . . . . . . . . . . . . . . . . . . . 192Package com.sas.solutions.hcm.publicapi.models . . . . . . . . . . . . . . . . . . . . . . . . . 193
Hierarchies . . . . . . . . . . . . . . . . . . . . . . . . . . . . . . . . . . . . . . . . . . . . . . . . . . . . . . . . . 193Hierarchy For Package com.sas.solutions.hcm.publicapi . . . . . . . . . . . . . . . . . . . 193Hierarchy For Package com.sas.solutions.hcm.publicapi.beans . . . . . . . . . . . . . . 193Hierarchy For Package com.sas.solutions.hcm.publicapi.connector . . . . . . . . . . . 193Hierarchy For Package com.sas.solutions.hcm.publicapi.exceptions . . . . . . . . . . 194Hierarchy For Package com.sas.solutions.hcm.publicapi.models . . . . . . . . . . . . . 194
Classes . . . . . . . . . . . . . . . . . . . . . . . . . . . . . . . . . . . . . . . . . . . . . . . . . . . . . . . . . . . . . 194Class CategoryBean . . . . . . . . . . . . . . . . . . . . . . . . . . . . . . . . . . . . . . . . . . . . . . . . 194Class GenericBean . . . . . . . . . . . . . . . . . . . . . . . . . . . . . . . . . . . . . . . . . . . . . . . . . 196Class GenericResultBean . . . . . . . . . . . . . . . . . . . . . . . . . . . . . . . . . . . . . . . . . . . . 198Class PublicAPITableModel . . . . . . . . . . . . . . . . . . . . . . . . . . . . . . . . . . . . . . . . . 199Class ProfileBean . . . . . . . . . . . . . . . . . . . . . . . . . . . . . . . . . . . . . . . . . . . . . . . . . . 200Class PublicAPIFactory . . . . . . . . . . . . . . . . . . . . . . . . . . . . . . . . . . . . . . . . . . . . . 203Class HCMPublicAPIException . . . . . . . . . . . . . . . . . . . . . . . . . . . . . . . . . . . . . . . 203
Interface PublicAPIInterface . . . . . . . . . . . . . . . . . . . . . . . . . . . . . . . . . . . . . . . . . . 204Overview . . . . . . . . . . . . . . . . . . . . . . . . . . . . . . . . . . . . . . . . . . . . . . . . . . . . . . . . . 204getEmployeeList . . . . . . . . . . . . . . . . . . . . . . . . . . . . . . . . . . . . . . . . . . . . . . . . . . . 206getEmployeeDetails . . . . . . . . . . . . . . . . . . . . . . . . . . . . . . . . . . . . . . . . . . . . . . . . 207
183

getTableList . . . . . . . . . . . . . . . . . . . . . . . . . . . . . . . . . . . . . . . . . . . . . . . . . . . . . . 207getEmployeeList . . . . . . . . . . . . . . . . . . . . . . . . . . . . . . . . . . . . . . . . . . . . . . . . . . . 207getEmployeeDetails . . . . . . . . . . . . . . . . . . . . . . . . . . . . . . . . . . . . . . . . . . . . . . . . 207getEmployeeList . . . . . . . . . . . . . . . . . . . . . . . . . . . . . . . . . . . . . . . . . . . . . . . . . . . 208getEmployeeDetails . . . . . . . . . . . . . . . . . . . . . . . . . . . . . . . . . . . . . . . . . . . . . . . . 208getProfileDetails . . . . . . . . . . . . . . . . . . . . . . . . . . . . . . . . . . . . . . . . . . . . . . . . . . . 209getHeaderDetails . . . . . . . . . . . . . . . . . . . . . . . . . . . . . . . . . . . . . . . . . . . . . . . . . . . 209getEmployeePhotographSrc . . . . . . . . . . . . . . . . . . . . . . . . . . . . . . . . . . . . . . . . . . 209getConfigValue . . . . . . . . . . . . . . . . . . . . . . . . . . . . . . . . . . . . . . . . . . . . . . . . . . . . 209getHierarchyTree . . . . . . . . . . . . . . . . . . . . . . . . . . . . . . . . . . . . . . . . . . . . . . . . . . 210getTableModel . . . . . . . . . . . . . . . . . . . . . . . . . . . . . . . . . . . . . . . . . . . . . . . . . . . . 210getAuthorizedColumns . . . . . . . . . . . . . . . . . . . . . . . . . . . . . . . . . . . . . . . . . . . . . . 210isActionPermitted . . . . . . . . . . . . . . . . . . . . . . . . . . . . . . . . . . . . . . . . . . . . . . . . . . 211getCategoryLink . . . . . . . . . . . . . . . . . . . . . . . . . . . . . . . . . . . . . . . . . . . . . . . . . . . 211
Serialized Form . . . . . . . . . . . . . . . . . . . . . . . . . . . . . . . . . . . . . . . . . . . . . . . . . . . . . . 211
OverviewThis appendix contains documentation for the public API that SAS Human CapitalManagement provides for customizing employee profile templates. For information aboutusing this API, see “Customizing the Employee Profile Templates” on page 95.
SAS Human Capital Management supports custom employee profile templates in the formof Java Server Pages (JSPs) that use classes and methods from the HCM Public API. PublicAPI classes are divided into various packages according to their function.
The most important interface is com.sas.solutions.hcm.publicapi.PublicAPIInterface. Thisinterface is the gateway to the employee data for the client JSPs, which use the interfaceto obtain employee data in the form of beans (such as the GenericBean and CategoryBean)or standard Java API objects (such as List or String).
Sample Usage:
PublicAPIInterface hcmPublicAPI = PublicAPIFactory.getPublicAPI();GenericResultBean employeeDetailsBean = hcmPublicAPI.getEmployeeDetails( "empmast", "10433", request);
Packages Description
com.sas.solutions.hcm.publicapi on page 192 This is the parent-level package. It contains key public APIinterfaces.
com.sas.solutions.hcm.publicapi.beans on page 192 Provides Public API classes that act as beans for holdingdata.
com.sas.solutions.hcm.publicapi.connector on page 192 Provides Public API factory classes.
com.sas.solutions.hcm.publicapi.exceptions on page 192 Provides classes for exceptions in Public API.
com.sas.solutions.hcm.publicapi.models on page 193 Provides Public API model classes.
184 Appendix 3 • The Public API
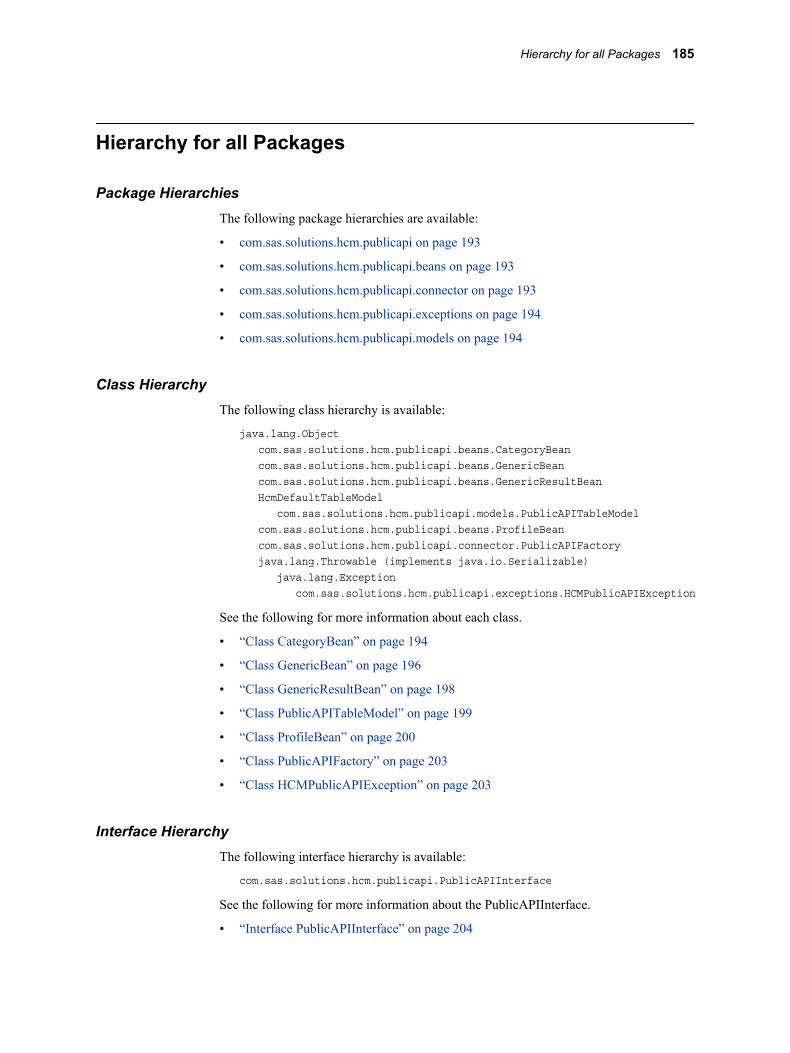
Hierarchy for all Packages
Package HierarchiesThe following package hierarchies are available:
• com.sas.solutions.hcm.publicapi on page 193
• com.sas.solutions.hcm.publicapi.beans on page 193
• com.sas.solutions.hcm.publicapi.connector on page 193
• com.sas.solutions.hcm.publicapi.exceptions on page 194
• com.sas.solutions.hcm.publicapi.models on page 194
Class HierarchyThe following class hierarchy is available:
java.lang.Object com.sas.solutions.hcm.publicapi.beans.CategoryBean com.sas.solutions.hcm.publicapi.beans.GenericBean com.sas.solutions.hcm.publicapi.beans.GenericResultBean HcmDefaultTableModel com.sas.solutions.hcm.publicapi.models.PublicAPITableModel com.sas.solutions.hcm.publicapi.beans.ProfileBean com.sas.solutions.hcm.publicapi.connector.PublicAPIFactory java.lang.Throwable (implements java.io.Serializable) java.lang.Exception com.sas.solutions.hcm.publicapi.exceptions.HCMPublicAPIException
See the following for more information about each class.
• “Class CategoryBean” on page 194
• “Class GenericBean” on page 196
• “Class GenericResultBean” on page 198
• “Class PublicAPITableModel” on page 199
• “Class ProfileBean” on page 200
• “Class PublicAPIFactory” on page 203
• “Class HCMPublicAPIException” on page 203
Interface HierarchyThe following interface hierarchy is available:
com.sas.solutions.hcm.publicapi.PublicAPIInterface
See the following for more information about the PublicAPIInterface.
• “Interface PublicAPIInterface” on page 204
Hierarchy for all Packages 185

API Index
OverviewThis index contains an alphabetical list of all classes, interfaces, constructors, methods, andfields.
CCategoryBean
Class in com.sas.solutions.hcm.publicapi.beans. This bean contains category detailssuch as category name, category label, and category attributes for fixed and customcategories. See “Class CategoryBean” on page 194 for more information.
CategoryBean()Constructor for class com.sas.solutions.hcm.publicapi.beans.CategoryBean. See TableA3.6 on page 194 for more information.
com.sas.solutions.hcm.publicapiPackage com.sas.solutions.hcm.publicapi. See “Packagecom.sas.solutions.hcm.publicapi” on page 192 for more information.
com.sas.solutions.hcm.publicapi.beansPackage com.sas.solutions.hcm.publicapi.beans. See “Packagecom.sas.solutions.hcm.publicapi.beans” on page 192 for more information.
com.sas.solutions.hcm.publicapi.connectorPackage com.sas.solutions.hcm.publicapi.connector. See “Packagecom.sas.solutions.hcm.publicapi.connector” on page 192 for more information.
com.sas.solutions.hcm.publicapi.exceptionsPackage com.sas.solutions.hcm.publicapi.exceptions. See “Packagecom.sas.solutions.hcm.publicapi.exceptions” on page 192 for more information.
com.sas.solutions.hcm.publicapi.modelsPackage com.sas.solutions.hcm.publicapi.models. See “Packagecom.sas.solutions.hcm.publicapi.models” on page 193 for more information.
GGenericBean
Class in com.sas.solutions.hcm.publicapi.beans. This is a generic bean that containsname, value, and label. See “Class GenericBean” on page 196 for more information.
GenericBean()Constructor for class com.sas.solutions.hcm.publicapi.beans.GenericBean. See TableA3.6 on page 194 for more information.
GenericResultBeanClass in com.sas.solutions.hcm.publicapi.beans. This bean contains column name listand row data. See “Class GenericResultBean” on page 198 for more information.
GenericResultBean()Constructor for class com.sas.solutions.hcm.publicapi.beans.GenericResultBean. SeeTable A3.12 on page 198 for more information.
186 Appendix 3 • The Public API
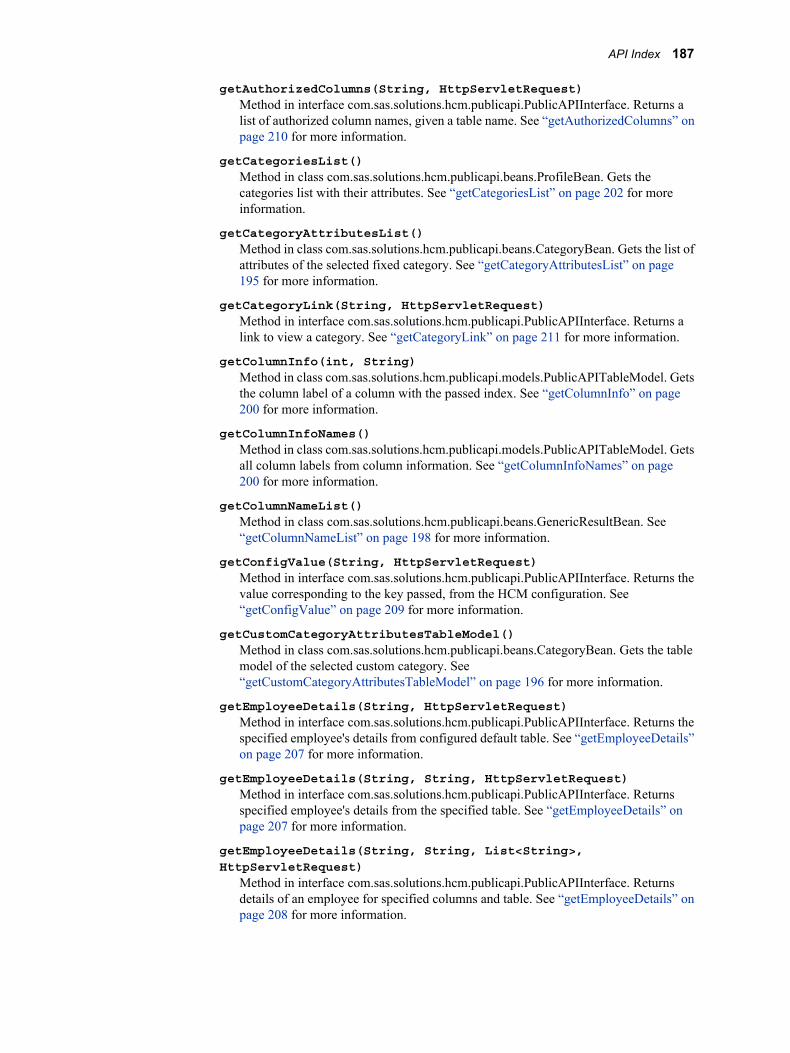
getAuthorizedColumns(String, HttpServletRequest)Method in interface com.sas.solutions.hcm.publicapi.PublicAPIInterface. Returns alist of authorized column names, given a table name. See “getAuthorizedColumns” onpage 210 for more information.
getCategoriesList()Method in class com.sas.solutions.hcm.publicapi.beans.ProfileBean. Gets thecategories list with their attributes. See “getCategoriesList” on page 202 for moreinformation.
getCategoryAttributesList()Method in class com.sas.solutions.hcm.publicapi.beans.CategoryBean. Gets the list ofattributes of the selected fixed category. See “getCategoryAttributesList” on page195 for more information.
getCategoryLink(String, HttpServletRequest)Method in interface com.sas.solutions.hcm.publicapi.PublicAPIInterface. Returns alink to view a category. See “getCategoryLink” on page 211 for more information.
getColumnInfo(int, String)Method in class com.sas.solutions.hcm.publicapi.models.PublicAPITableModel. Getsthe column label of a column with the passed index. See “getColumnInfo” on page200 for more information.
getColumnInfoNames()Method in class com.sas.solutions.hcm.publicapi.models.PublicAPITableModel. Getsall column labels from column information. See “getColumnInfoNames” on page200 for more information.
getColumnNameList()Method in class com.sas.solutions.hcm.publicapi.beans.GenericResultBean. See“getColumnNameList” on page 198 for more information.
getConfigValue(String, HttpServletRequest)Method in interface com.sas.solutions.hcm.publicapi.PublicAPIInterface. Returns thevalue corresponding to the key passed, from the HCM configuration. See“getConfigValue” on page 209 for more information.
getCustomCategoryAttributesTableModel()Method in class com.sas.solutions.hcm.publicapi.beans.CategoryBean. Gets the tablemodel of the selected custom category. See“getCustomCategoryAttributesTableModel” on page 196 for more information.
getEmployeeDetails(String, HttpServletRequest)Method in interface com.sas.solutions.hcm.publicapi.PublicAPIInterface. Returns thespecified employee's details from configured default table. See “getEmployeeDetails”on page 207 for more information.
getEmployeeDetails(String, String, HttpServletRequest)Method in interface com.sas.solutions.hcm.publicapi.PublicAPIInterface. Returnsspecified employee's details from the specified table. See “getEmployeeDetails” onpage 207 for more information.
getEmployeeDetails(String, String, List<String>,HttpServletRequest)
Method in interface com.sas.solutions.hcm.publicapi.PublicAPIInterface. Returnsdetails of an employee for specified columns and table. See “getEmployeeDetails” onpage 208 for more information.
API Index 187

getEmployeeList(HttpServletRequest)Method in interface com.sas.solutions.hcm.publicapi.PublicAPIInterface. Returns thedetails of all employees from configured default table. See “getEmployeeList” on page206 for more information.
getEmployeeList(String, HttpServletRequest)Method in interface com.sas.solutions.hcm.publicapi.PublicAPIInterface. Returnsdetails of all employees from the specified table. See “getEmployeeList” on page207 for more information.
getEmployeeList(String, List<String>, HttpServletRequest)Method in interface com.sas.solutions.hcm. publicapi.PublicAPIInterface. Returnsdetails of all employees from specified table for a list of columns. See“getEmployeeList” on page 208 for more information.
getEmployeePhotographSrc(String, HttpServletRequest)Method in interface com.sas.solutions.hcm.publicapi.PublicAPIInterface. Returns therelative path to a photograph of the specified employee according to configuration. See“getEmployeePhotographSrc” on page 209 for more information.
getEmployeeProfilePublicAPI()Static method in class com.sas.solutions.hcm.publicapi.connector.PublicAPIFactory.This method returns an instance of a class implementing PublicAPIInterface to getemployee details. See “getEmployeeProfilePublicAPI” on page 203 for moreinformation.
getEmpPhotoSrc()Method in class com.sas.solutions.hcm.publicapi.beans.ProfileBean. Gets the sourceof employee photograph. See “getEmpPhotoSrc” on page 202 for more information.
getExternalActions()Method in class com.sas.solutions.hcm.publicapi.beans.ProfileBean. Gets the list ofexternal actions. See “getExternalActions” on page 202 for more information.
getHeaderAttributesList()Method in class com.sas.solutions.hcm.publicapi.beans.ProfileBean. Gets theheaderAttributes. See “getHeaderAttributesList” on page 202 for more information.
getHeaderDetails(HttpServletRequest)Method in interface com.sas.solutions.hcm.publicapi.PublicAPIInterface. Returnsemployee profile's header details. See “getHeaderDetails” on page 209 for moreinformation.
getHierarchyTree(String, HttpServletRequest)Method in interface com.sas.solutions.hcm.publicapi.PublicAPIInterface. Returns anobject of FastRelationshipTree type, given a hierarchy code and a table name. See“getHierarchyTree” on page 210 for more information.
getLabel()Method in class com.sas.solutions.hcm.publicapi.beans.CategoryBean. Gets thecategoryLabel. See “getLabel” on page 196 for more information.
getLabel()Method in class com.sas.solutions.hcm.publicapi.beans.GenericBean. See “getLabel”on page 197 for more information.
getName()Method in class com.sas.solutions.hcm.publicapi.beans.CategoryBean. Gets thecategoryName. See “getName” on page 196 for more information.
188 Appendix 3 • The Public API
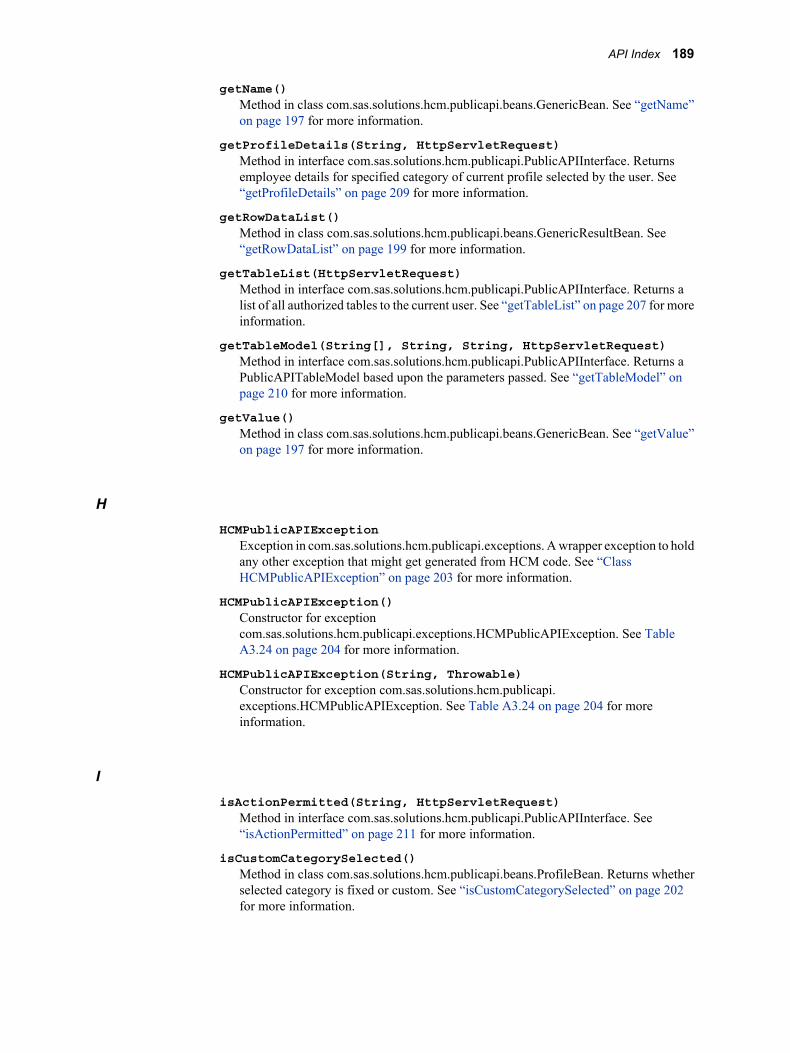
getName()Method in class com.sas.solutions.hcm.publicapi.beans.GenericBean. See “getName”on page 197 for more information.
getProfileDetails(String, HttpServletRequest)Method in interface com.sas.solutions.hcm.publicapi.PublicAPIInterface. Returnsemployee details for specified category of current profile selected by the user. See“getProfileDetails” on page 209 for more information.
getRowDataList()Method in class com.sas.solutions.hcm.publicapi.beans.GenericResultBean. See“getRowDataList” on page 199 for more information.
getTableList(HttpServletRequest)Method in interface com.sas.solutions.hcm.publicapi.PublicAPIInterface. Returns alist of all authorized tables to the current user. See “getTableList” on page 207 for moreinformation.
getTableModel(String[], String, String, HttpServletRequest)Method in interface com.sas.solutions.hcm.publicapi.PublicAPIInterface. Returns aPublicAPITableModel based upon the parameters passed. See “getTableModel” onpage 210 for more information.
getValue()Method in class com.sas.solutions.hcm.publicapi.beans.GenericBean. See “getValue”on page 197 for more information.
HHCMPublicAPIException
Exception in com.sas.solutions.hcm.publicapi.exceptions. A wrapper exception to holdany other exception that might get generated from HCM code. See “ClassHCMPublicAPIException” on page 203 for more information.
HCMPublicAPIException()Constructor for exceptioncom.sas.solutions.hcm.publicapi.exceptions.HCMPublicAPIException. See TableA3.24 on page 204 for more information.
HCMPublicAPIException(String, Throwable)Constructor for exception com.sas.solutions.hcm.publicapi.exceptions.HCMPublicAPIException. See Table A3.24 on page 204 for moreinformation.
IisActionPermitted(String, HttpServletRequest)
Method in interface com.sas.solutions.hcm.publicapi.PublicAPIInterface. See“isActionPermitted” on page 211 for more information.
isCustomCategorySelected()Method in class com.sas.solutions.hcm.publicapi.beans.ProfileBean. Returns whetherselected category is fixed or custom. See “isCustomCategorySelected” on page 202for more information.
API Index 189

PProfileBean
Class in com.sas.solutions.hcm.publicapi.beans. This bean contains the employeeprofile-related details such as header attributes, category details, and external actions.See “Class ProfileBean” on page 200 for more information.
ProfileBean()Constructor for class com.sas.solutions.hcm.publicapi.beans.ProfileBean. See TableA3.18 on page 200 for more information.
PublicAPIFactoryClass in com.sas.solutions.hcm.publicapi.connector. This is a factory class for gettinginstances of classes implementing Public API interfaces. See “ClassPublicAPIFactory” on page 203 for more information.
PublicAPIFactory()Constructor for class com.sas.solutions.hcm.publicapi.connector.PublicAPIFactory.See Table A3.21 on page 203 for more information.
PublicAPIInterfaceInterface in com.sas.solutions.hcm.publicapi. This interface contains Public APImethods that HCM exposes to external APIs. See “Interface PublicAPIInterface” onpage 204 for more information.
PublicAPITableModelClass in com.sas.solutions.hcm.publicapi.models. This class, through inheritance, is anextension of javax.swing.table.DefaultTableModel. See “ClassPublicAPITableModel” on page 199 for more information.
PublicAPITableModel(HcmDefaultTableModel)Constructor for class com.sas.solutions.hcm.publicapi.models.PublicAPITableModel.This constructor is used by internal classes to create an instance of this class. See “ClassPublicAPITableModel” on page 199 for more information.
SsetCategoriesList(List<CategoryBean>)
Method in class com.sas.solutions.hcm.publicapi.beans.ProfileBean. Sets thecategories list with their attributes. See “setCategoriesList” on page 202 for moreinformation.
setCategoryAttributesList(List<GenericBean>)Method in class com.sas.solutions.hcm.publicapi.beans.CategoryBean. Sets the list ofattributes of the selected fixed category. See “setCategoryAttributesList” on page195 for more information.
setColumnNameList(List)Method in class com.sas.solutions.hcm.publicapi.beans.GenericResultBean. See“setColumnNameList” on page 199 for more information.
setCustomCategoryAttributesTableModel(DefaultTableModel)Method in class com.sas.solutions.hcm.publicapi.beans.CategoryBean. Sets the tablemodel of the selected custom category. See“setCustomCategoryAttributesTableModel” on page 196 for more information.
190 Appendix 3 • The Public API

setCustomCategorySelected(boolean)Method in class com.sas.solutions.hcm.publicapi.beans.ProfileBean. Sets the selectedcategory's type. See “setCustomCategorySelected” on page 202 for more information.
setEmpPhotoSrc(String)Method in class com.sas.solutions.hcm.publicapi.beans.ProfileBean. Sets the source ofemployee photograph. See “setEmpPhotoSrc” on page 202 for more information.
setExternalActions(List<GenericBean>)Method in class com.sas.solutions.hcm.publicapi.beans.ProfileBean. Sets the list ofexternal actions. See “setExternalActions” on page 202 for more information.
setHeaderAttributesList(List<GenericBean>)Method in class com.sas.solutions.hcm.publicapi.beans.ProfileBean. Sets theheaderAttributes. See “setHeaderAttributesList” on page 201 for more information.
setLabel(String)Method in class com.sas.solutions.hcm.publicapi.beans.CategoryBean. Sets thecategoryLabel. See “setLabel” on page 196 for more information.
setLabel(String)Method in class com.sas.solutions.hcm.publicapi.beans.GenericBean. See “setLabel”on page 198 for more information.
setName(String)Method in class com.sas.solutions.hcm.publicapi.beans.CategoryBean. Sets thecategoryName. See “setName” on page 196 for more information.
setName(String)Method in class com.sas.solutions.hcm.publicapi.beans.GenericBean. See “setName”on page 197 for more information.
setRowDataList(List)Method in class com.sas.solutions.hcm.publicapi.beans.GenericResultBean. See“setRowDataList” on page 199 for more information.
setValue(String)Method in class com.sas.solutions.hcm.publicapi.beans.GenericBean. See “setValue”on page 197 for more information.
Packages
OverviewThis section contains the following types of information about available packages:
• Interfaces
• Classes
• Enums
• Exceptions
• Errors
• Annotation Types
Packages 191

Package com.sas.solutions.hcm.publicapiThis is the parent-level package. It contains key public API interfaces.
Table A3.1 Interface Summary
PublicAPIInterface on page 204 This interface contains Public API methods that HCMexposes to external APIs.
Package com.sas.solutions.hcm.publicapi.beansProvides Public API classes that act as beans for holding data.
Table A3.2 Class Summary
CategoryBean on page 194 This bean contains category details such as category name,category label, and category attributes for fixed and customcategories.
GenericBean on page 196 This is a generic bean that contains name, value, and label.
GenericResultBean on page 198 This bean contains column name list and row data.
ProfileBean on page 200 This bean contains the employee profile-related details suchas header attributes, category details, and external actions.
Package com.sas.solutions.hcm.publicapi.connectorProvides Public API factory classes.
Table A3.3 Class Summary
PublicAPIFactory on page 203 This is a factory class for getting instances of classesimplementing Public API interfaces
Package com.sas.solutions.hcm.publicapi.exceptionsProvides classes for exceptions in Public API.
Table A3.4 Exception Summary
HCMPublicAPIException on page 203 This is a wrapper exception to hold any other exception thatmight get generated from HCM code.
192 Appendix 3 • The Public API
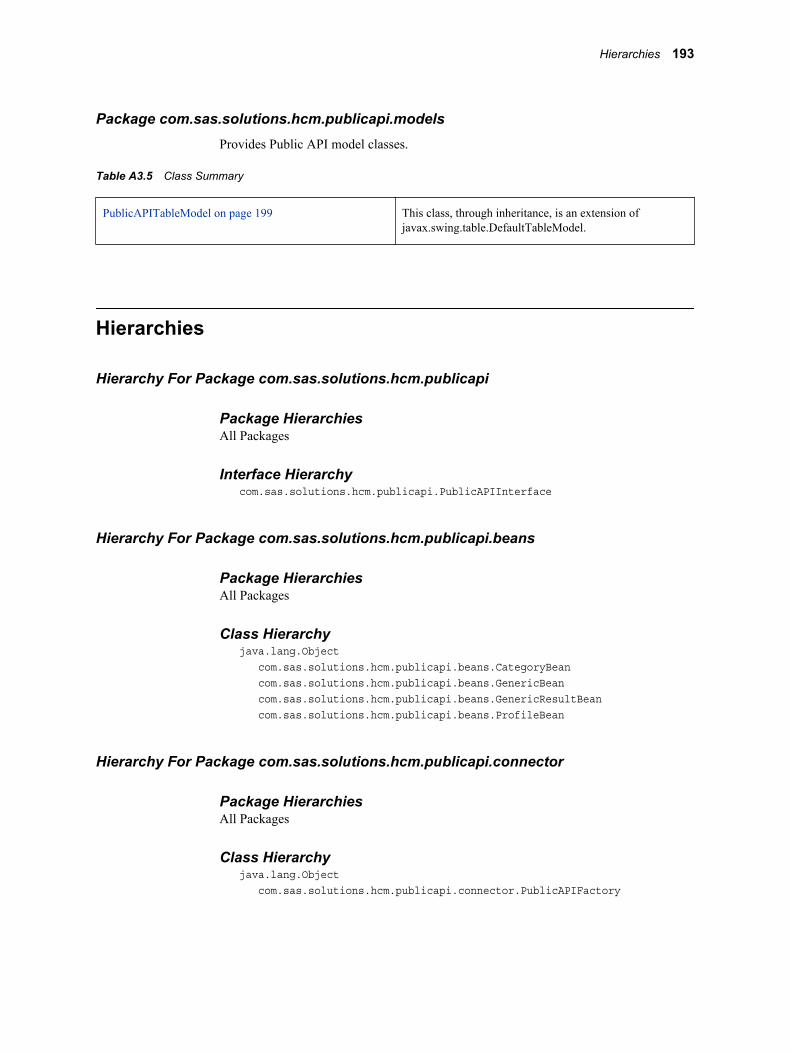
Package com.sas.solutions.hcm.publicapi.modelsProvides Public API model classes.
Table A3.5 Class Summary
PublicAPITableModel on page 199 This class, through inheritance, is an extension ofjavax.swing.table.DefaultTableModel.
Hierarchies
Hierarchy For Package com.sas.solutions.hcm.publicapi
Package HierarchiesAll Packages
Interface Hierarchycom.sas.solutions.hcm.publicapi.PublicAPIInterface
Hierarchy For Package com.sas.solutions.hcm.publicapi.beans
Package HierarchiesAll Packages
Class Hierarchyjava.lang.Object com.sas.solutions.hcm.publicapi.beans.CategoryBean com.sas.solutions.hcm.publicapi.beans.GenericBean com.sas.solutions.hcm.publicapi.beans.GenericResultBean com.sas.solutions.hcm.publicapi.beans.ProfileBean
Hierarchy For Package com.sas.solutions.hcm.publicapi.connector
Package HierarchiesAll Packages
Class Hierarchyjava.lang.Object com.sas.solutions.hcm.publicapi.connector.PublicAPIFactory
Hierarchies 193

Hierarchy For Package com.sas.solutions.hcm.publicapi.exceptions
Package HierarchiesAll Packages
Class Hierarchyjava.lang.Object java.lang.Throwable (implements java.io.Serializable) java.lang.Exception com.sas.solutions.hcm.publicapi.exceptions.HCMPublicAPIException
Hierarchy For Package com.sas.solutions.hcm.publicapi.models
Package HierarchiesAll Packages
Class Hierarchyjava.lang.Object HcmDefaultTableModel com.sas.solutions.hcm.publicapi.models.PublicAPITableModel
Classes
Class CategoryBean
Overviewjava.lang.Object com.sas.solutions.hcm.publicapi.beans.CategoryBean
public class CategoryBean
extends java.lang.Object
This bean contains category details such as category name, category label, and categoryattributes for fixed and custom categories.
Table A3.6 Constructor Summary
CategoryBean()
Table A3.7 Method Summary
java.util.List<GenericBean> getCategoryAttributesList()
Gets the list of attributes of the selected fixed category.
194 Appendix 3 • The Public API
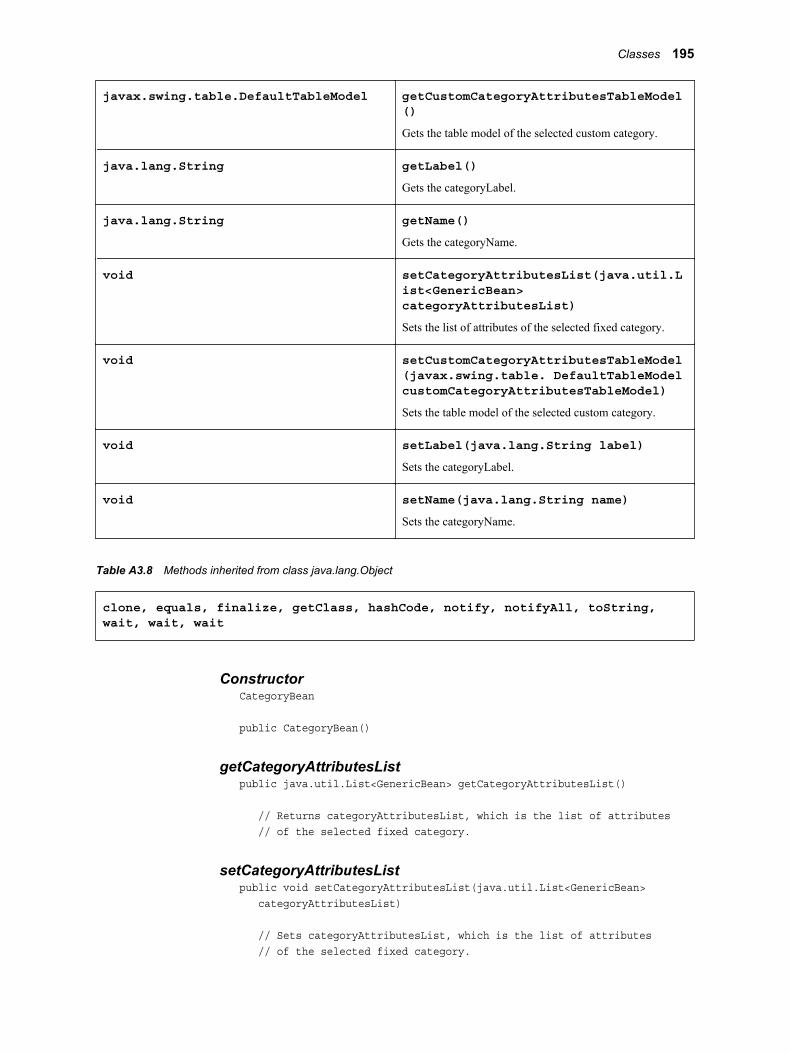
javax.swing.table.DefaultTableModel getCustomCategoryAttributesTableModel()
Gets the table model of the selected custom category.
java.lang.String getLabel()
Gets the categoryLabel.
java.lang.String getName()
Gets the categoryName.
void setCategoryAttributesList(java.util.List<GenericBean>categoryAttributesList)
Sets the list of attributes of the selected fixed category.
void setCustomCategoryAttributesTableModel(javax.swing.table. DefaultTableModelcustomCategoryAttributesTableModel)
Sets the table model of the selected custom category.
void setLabel(java.lang.String label)
Sets the categoryLabel.
void setName(java.lang.String name)
Sets the categoryName.
Table A3.8 Methods inherited from class java.lang.Object
clone, equals, finalize, getClass, hashCode, notify, notifyAll, toString,wait, wait, wait
ConstructorCategoryBean
public CategoryBean()
getCategoryAttributesListpublic java.util.List<GenericBean> getCategoryAttributesList()
// Returns categoryAttributesList, which is the list of attributes // of the selected fixed category.
setCategoryAttributesListpublic void setCategoryAttributesList(java.util.List<GenericBean> categoryAttributesList)
// Sets categoryAttributesList, which is the list of attributes // of the selected fixed category.
Classes 195
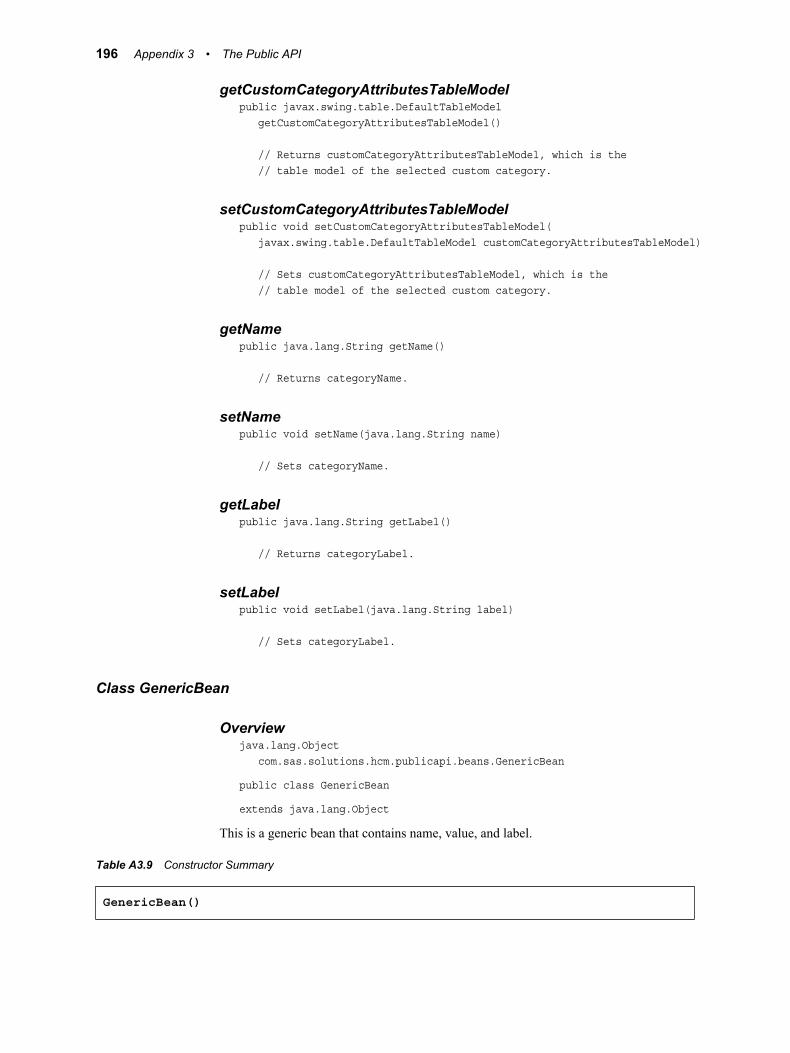
getCustomCategoryAttributesTableModelpublic javax.swing.table.DefaultTableModel getCustomCategoryAttributesTableModel()
// Returns customCategoryAttributesTableModel, which is the // table model of the selected custom category.
setCustomCategoryAttributesTableModelpublic void setCustomCategoryAttributesTableModel( javax.swing.table.DefaultTableModel customCategoryAttributesTableModel)
// Sets customCategoryAttributesTableModel, which is the // table model of the selected custom category.
getNamepublic java.lang.String getName()
// Returns categoryName.
setNamepublic void setName(java.lang.String name)
// Sets categoryName.
getLabelpublic java.lang.String getLabel()
// Returns categoryLabel.
setLabelpublic void setLabel(java.lang.String label)
// Sets categoryLabel.
Class GenericBean
Overviewjava.lang.Object com.sas.solutions.hcm.publicapi.beans.GenericBean
public class GenericBean
extends java.lang.Object
This is a generic bean that contains name, value, and label.
Table A3.9 Constructor Summary
GenericBean()
196 Appendix 3 • The Public API
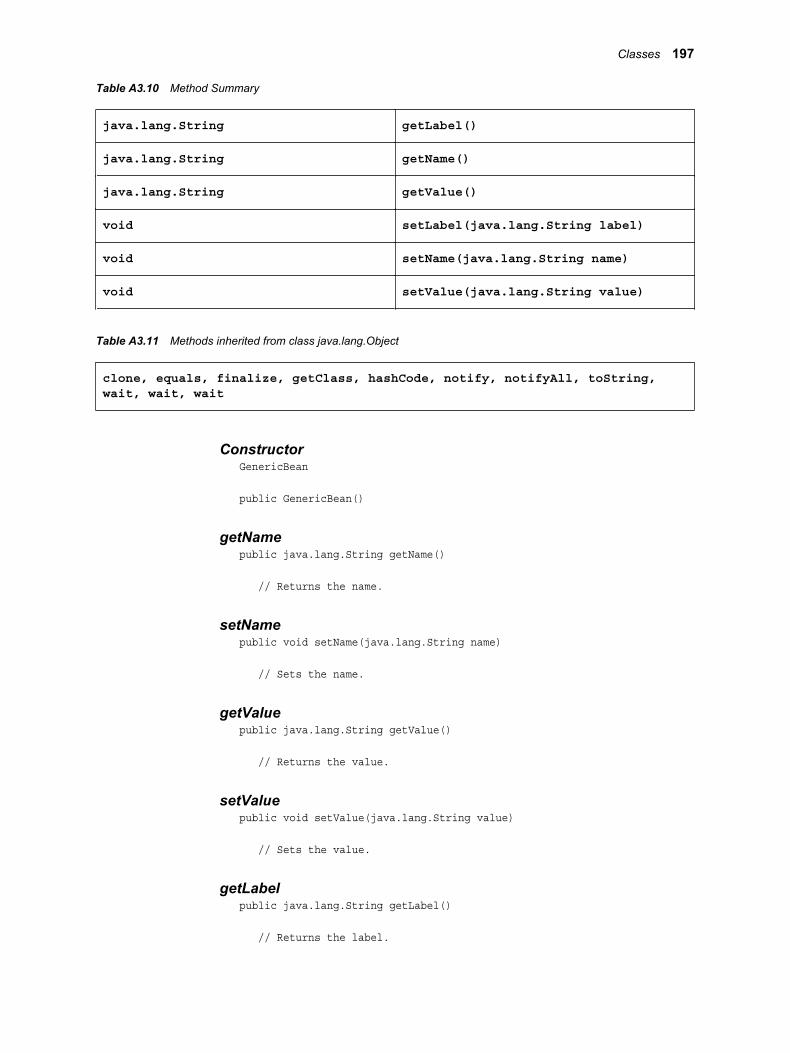
Table A3.10 Method Summary
java.lang.String getLabel()
java.lang.String getName()
java.lang.String getValue()
void setLabel(java.lang.String label)
void setName(java.lang.String name)
void setValue(java.lang.String value)
Table A3.11 Methods inherited from class java.lang.Object
clone, equals, finalize, getClass, hashCode, notify, notifyAll, toString,wait, wait, wait
ConstructorGenericBean
public GenericBean()
getNamepublic java.lang.String getName()
// Returns the name.
setNamepublic void setName(java.lang.String name)
// Sets the name.
getValuepublic java.lang.String getValue()
// Returns the value.
setValuepublic void setValue(java.lang.String value)
// Sets the value.
getLabelpublic java.lang.String getLabel()
// Returns the label.
Classes 197

setLabelpublic void setLabel(java.lang.String label)
// Sets the label.
Class GenericResultBean
Overviewjava.lang.Object com.sas.solutions.hcm.publicapi.beans.GenericResultBean
public class GenericResultBean
extends java.lang.Object
This bean contains column name list and row data.
Table A3.12 Constructor Summary
GenericResultBean()
Table A3.13 Method Summary
java.util.List getColumnNameList()
java.util.List getRowDataList()
void setColumnNameList(java.util.ListcolumnNameList)
void setRowDataList(java.util.ListrowDataList)
Table A3.14 Methods inherited from class java.lang.Object
clone, equals, finalize, getClass, hashCode, notify, notifyAll, toString,wait, wait, wait
ConstructorGenericResultBean
public GenericResultBean()
getColumnNameListpublic final java.util.List getColumnNameList()
// Returns columnNameList.
198 Appendix 3 • The Public API

setColumnNameListpublic final void setColumnNameList(java.util.List columnNameList)
// Sets columnNameList.
getRowDataListpublic final java.util.List getRowDataList()
// Returns rowDataList.
setRowDataListpublic final void setRowDataList(java.util.List rowDataList)
// Sets rowDataList.
Class PublicAPITableModel
Overviewjavax.swing.table.DefaultTableModel HcmDefaultTableModel com.sas.solutions.hcm.publicapi.models.PublicAPITableModel
public class PublicAPITableModel
extends HcmDefaultTableModel
This class, through inheritance, is an extension of javax.swing.table.DefaultTableModel.It additionally provides column information, such as column labels from the underlyingtable model.
Table A3.15 Constructor
PublicAPITableModel(HcmDefaultTableModel tableModel)
This constructor is used by internal classes to create an instance of this class.
Table A3.16 Method Summary
java.lang.Object getColumnInfo(int index,java.lang.String columnInfoName)
Gets the column label of a column with the passed index.
java.lang.Object[] getColumnInfoNames()
Gets all column labels from column information.
Table A3.17 Methods inherited from class java.lang.Object
clone, equals, finalize, getClass, hashCode, notify, notifyAll, toString,wait, wait, wait
Classes 199
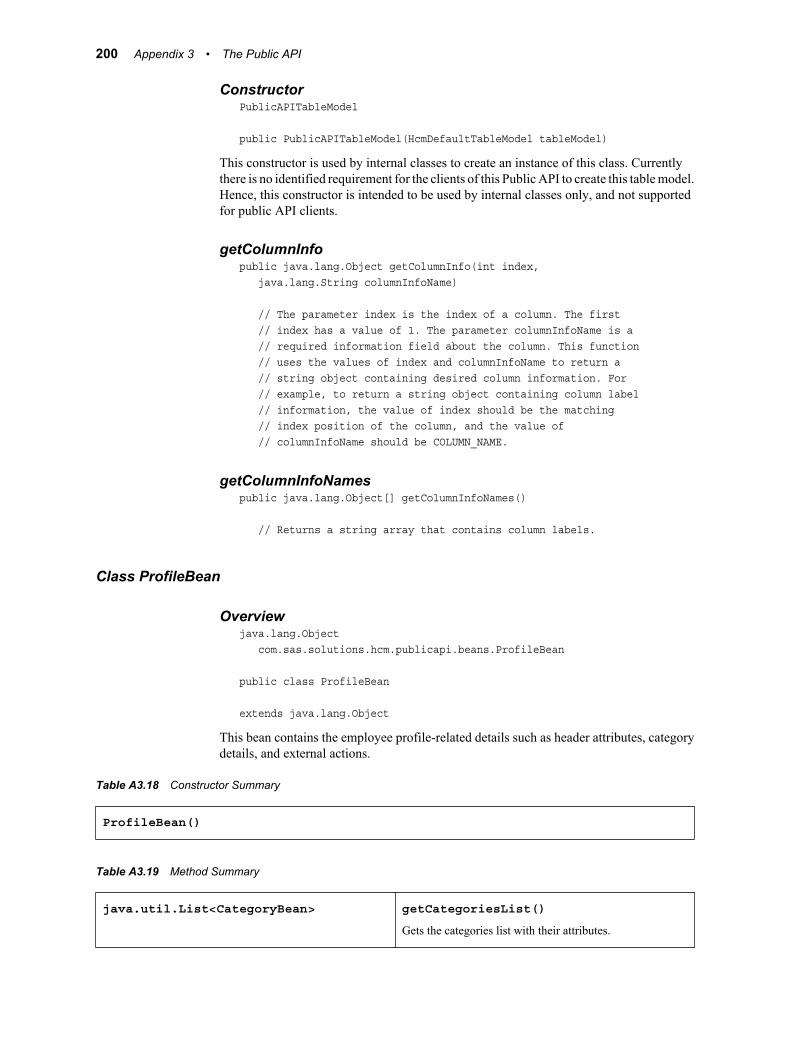
ConstructorPublicAPITableModel
public PublicAPITableModel(HcmDefaultTableModel tableModel)
This constructor is used by internal classes to create an instance of this class. Currentlythere is no identified requirement for the clients of this Public API to create this table model.Hence, this constructor is intended to be used by internal classes only, and not supportedfor public API clients.
getColumnInfopublic java.lang.Object getColumnInfo(int index, java.lang.String columnInfoName)
// The parameter index is the index of a column. The first // index has a value of 1. The parameter columnInfoName is a // required information field about the column. This function // uses the values of index and columnInfoName to return a // string object containing desired column information. For // example, to return a string object containing column label // information, the value of index should be the matching // index position of the column, and the value of // columnInfoName should be COLUMN_NAME.
getColumnInfoNamespublic java.lang.Object[] getColumnInfoNames()
// Returns a string array that contains column labels.
Class ProfileBean
Overviewjava.lang.Object com.sas.solutions.hcm.publicapi.beans.ProfileBean
public class ProfileBean
extends java.lang.Object
This bean contains the employee profile-related details such as header attributes, categorydetails, and external actions.
Table A3.18 Constructor Summary
ProfileBean()
Table A3.19 Method Summary
java.util.List<CategoryBean> getCategoriesList()
Gets the categories list with their attributes.
200 Appendix 3 • The Public API

java.lang.String getEmpPhotoSrc()
Gets the source of employee photograph.
java.util.List<GenericBean> getExternalActions()
Gets the list of external actions.
java.util.List<GenericBean> getHeaderAttributesList()
Gets the headerAttributes.
boolean isCustomCategorySelected()
Returns whether selected category is fixed or custom.
void setCategoriesList(java.util.List<CategoryBean> categoriesList)
Sets the categories list with their attributes.
void setCustomCategorySelected(booleanisCustomCategorySelected)
Sets the selected category's type.
void setEmpPhotoSrc(java.lang.StringempPhotoSrc)
Sets the source of employee photograph.
void setExternalActions(java.util.List<GenericBean> externalActions)
Sets the list of external actions.
void setHeaderAttributesList(java.util.List<GenericBean> headerAttributesList)
Sets the headerAttributes.
Table A3.20 Methods inherited from class java.lang.Object
clone, equals, finalize, getClass, hashCode, notify, notifyAll, toString,wait, wait, wait
ConstructorProfileBean
public ProfileBean()
setHeaderAttributesListpublic void setHeaderAttributesList(java.util.List<GenericBean> headerAttributesList)
// Sets headerAttributes with headerAttributesList.
Classes 201

getHeaderAttributesListpublic java.util.List<GenericBean> getHeaderAttributesList()
// Returns headerAttributesList, which contains headerAttributes.
getCategoriesListpublic java.util.List<CategoryBean> getCategoriesList()
// Returns categoriesList, which contains categories.
setCategoriesListpublic void setCategoriesList(java.util.List<CategoryBean> categoriesList)
// Sets categories with categoriesList.
isCustomCategorySelectedpublic boolean isCustomCategorySelected()
// Returns the value of isCustomCategorySelected, which indicates // whether the selected category is fixed or custom.
setCustomCategorySelectedpublic void setCustomCategorySelected(boolean isCustomCategorySelected)
// Sets the value of isCustomCategorySelected, which indicates // whether the selected category is fixed or custom.
getEmpPhotoSrcpublic java.lang.String getEmpPhotoSrc()
// Returns the value of empPhotoSrc, which indicates the source // of an employee photograph.
setEmpPhotoSrcpublic void setEmpPhotoSrc(java.lang.String empPhotoSrc)
// Sets the value of empPhotoSrc, which indicates the source // of an employee photograph.
getExternalActionspublic java.util.List<GenericBean> getExternalActions()
// Returns externalActions, which is a list of external actions.
setExternalActionspublic void setExternalActions(java.util.List<GenericBean> externalActions)
// Sets externalActions, which is a list of external actions.
202 Appendix 3 • The Public API
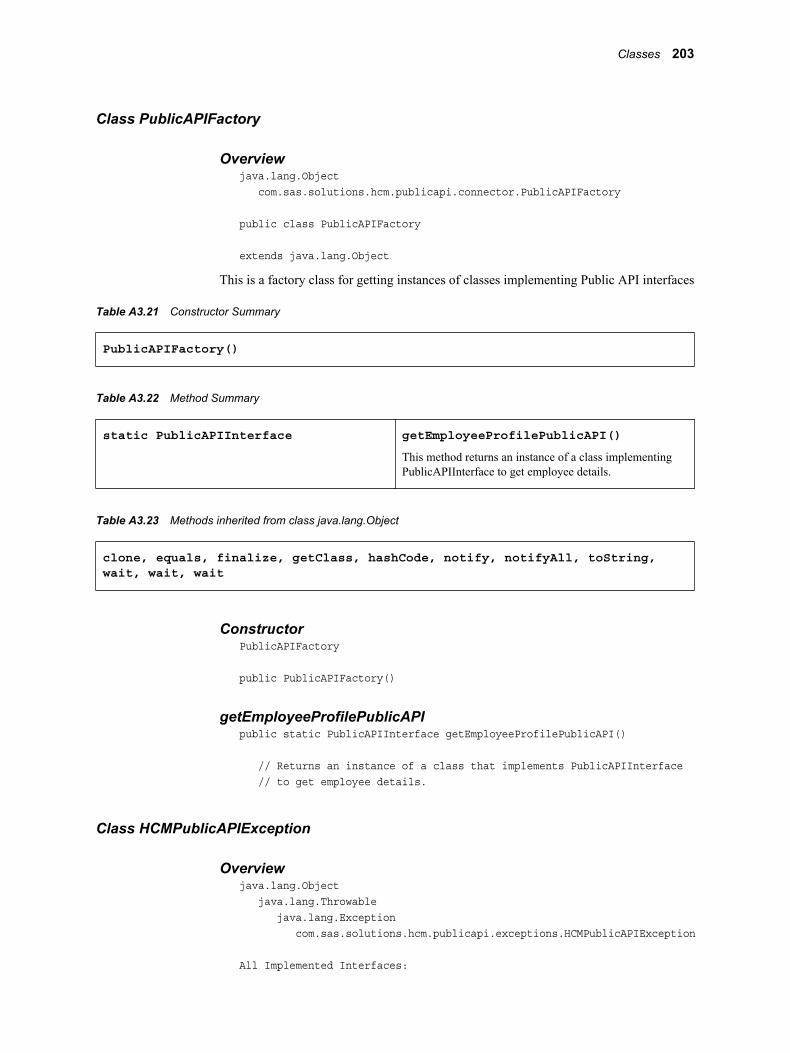
Class PublicAPIFactory
Overviewjava.lang.Object com.sas.solutions.hcm.publicapi.connector.PublicAPIFactory
public class PublicAPIFactory
extends java.lang.Object
This is a factory class for getting instances of classes implementing Public API interfaces
Table A3.21 Constructor Summary
PublicAPIFactory()
Table A3.22 Method Summary
static PublicAPIInterface getEmployeeProfilePublicAPI()
This method returns an instance of a class implementingPublicAPIInterface to get employee details.
Table A3.23 Methods inherited from class java.lang.Object
clone, equals, finalize, getClass, hashCode, notify, notifyAll, toString,wait, wait, wait
ConstructorPublicAPIFactory
public PublicAPIFactory()
getEmployeeProfilePublicAPIpublic static PublicAPIInterface getEmployeeProfilePublicAPI()
// Returns an instance of a class that implements PublicAPIInterface // to get employee details.
Class HCMPublicAPIException
Overviewjava.lang.Object java.lang.Throwable java.lang.Exception com.sas.solutions.hcm.publicapi.exceptions.HCMPublicAPIException
All Implemented Interfaces:
Classes 203
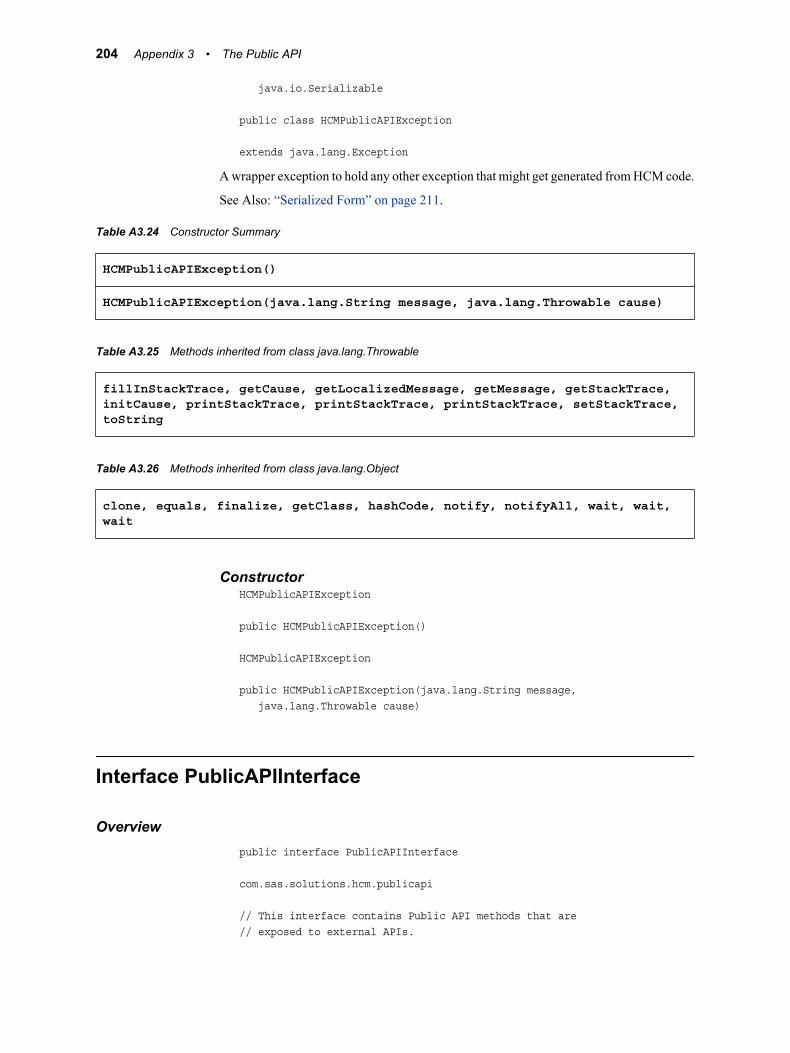
java.io.Serializable
public class HCMPublicAPIException
extends java.lang.Exception
A wrapper exception to hold any other exception that might get generated from HCM code.
See Also: “Serialized Form” on page 211.
Table A3.24 Constructor Summary
HCMPublicAPIException()
HCMPublicAPIException(java.lang.String message, java.lang.Throwable cause)
Table A3.25 Methods inherited from class java.lang.Throwable
fillInStackTrace, getCause, getLocalizedMessage, getMessage, getStackTrace,initCause, printStackTrace, printStackTrace, printStackTrace, setStackTrace,toString
Table A3.26 Methods inherited from class java.lang.Object
clone, equals, finalize, getClass, hashCode, notify, notifyAll, wait, wait,wait
ConstructorHCMPublicAPIException
public HCMPublicAPIException()
HCMPublicAPIException
public HCMPublicAPIException(java.lang.String message, java.lang.Throwable cause)
Interface PublicAPIInterface
Overviewpublic interface PublicAPIInterface
com.sas.solutions.hcm.publicapi
// This interface contains Public API methods that are // exposed to external APIs.
204 Appendix 3 • The Public API
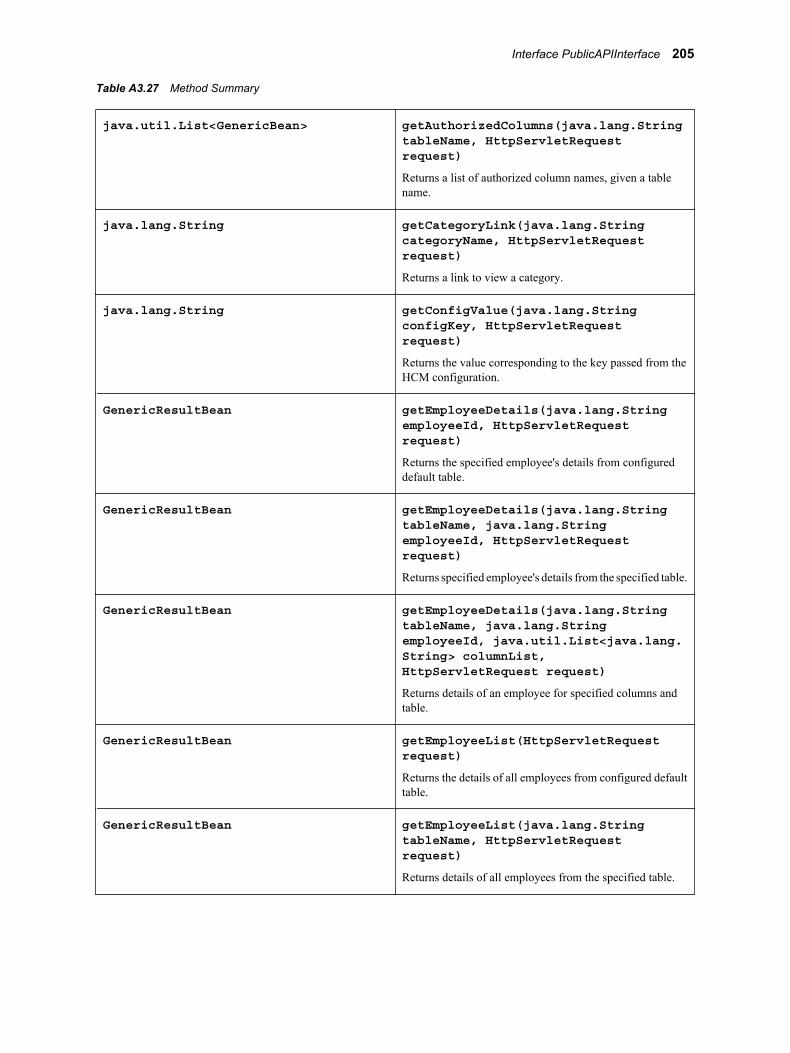
Table A3.27 Method Summary
java.util.List<GenericBean> getAuthorizedColumns(java.lang.StringtableName, HttpServletRequestrequest)
Returns a list of authorized column names, given a tablename.
java.lang.String getCategoryLink(java.lang.StringcategoryName, HttpServletRequestrequest)
Returns a link to view a category.
java.lang.String getConfigValue(java.lang.StringconfigKey, HttpServletRequestrequest)
Returns the value corresponding to the key passed from theHCM configuration.
GenericResultBean getEmployeeDetails(java.lang.StringemployeeId, HttpServletRequestrequest)
Returns the specified employee's details from configureddefault table.
GenericResultBean getEmployeeDetails(java.lang.StringtableName, java.lang.StringemployeeId, HttpServletRequestrequest)
Returns specified employee's details from the specified table.
GenericResultBean getEmployeeDetails(java.lang.StringtableName, java.lang.StringemployeeId, java.util.List<java.lang.String> columnList,HttpServletRequest request)
Returns details of an employee for specified columns andtable.
GenericResultBean getEmployeeList(HttpServletRequestrequest)
Returns the details of all employees from configured defaulttable.
GenericResultBean getEmployeeList(java.lang.StringtableName, HttpServletRequestrequest)
Returns details of all employees from the specified table.
Interface PublicAPIInterface 205
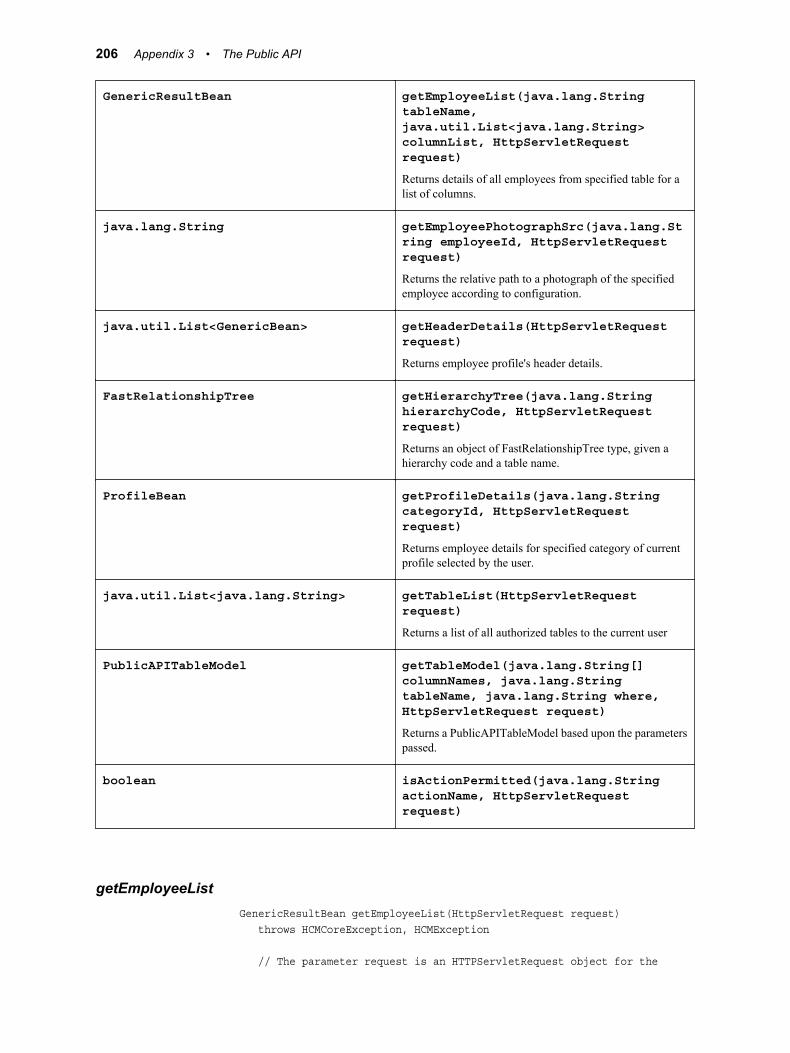
GenericResultBean getEmployeeList(java.lang.StringtableName,java.util.List<java.lang.String>columnList, HttpServletRequestrequest)
Returns details of all employees from specified table for alist of columns.
java.lang.String getEmployeePhotographSrc(java.lang.String employeeId, HttpServletRequestrequest)
Returns the relative path to a photograph of the specifiedemployee according to configuration.
java.util.List<GenericBean> getHeaderDetails(HttpServletRequestrequest)
Returns employee profile's header details.
FastRelationshipTree getHierarchyTree(java.lang.StringhierarchyCode, HttpServletRequestrequest)
Returns an object of FastRelationshipTree type, given ahierarchy code and a table name.
ProfileBean getProfileDetails(java.lang.StringcategoryId, HttpServletRequestrequest)
Returns employee details for specified category of currentprofile selected by the user.
java.util.List<java.lang.String> getTableList(HttpServletRequestrequest)
Returns a list of all authorized tables to the current user
PublicAPITableModel getTableModel(java.lang.String[]columnNames, java.lang.StringtableName, java.lang.String where,HttpServletRequest request)
Returns a PublicAPITableModel based upon the parameterspassed.
boolean isActionPermitted(java.lang.StringactionName, HttpServletRequestrequest)
getEmployeeListGenericResultBean getEmployeeList(HttpServletRequest request) throws HCMCoreException, HCMException
// The parameter request is an HTTPServletRequest object for the
206 Appendix 3 • The Public API

// current request. This function returns a GenericResultBean // instance that contains the details of all employees from a // configured default table.
getEmployeeDetailsGenericResultBean getEmployeeDetails(java.lang.String employeeId, HttpServletRequest request) throws HCMCoreException, HCMException
// The parameter employeeId is the employee ID of the employee // whose details are required. The parameter request is the // HTTPServletRequest object for the current request. This // function returns a GenericResultBean that contains the // specified employee's details from a configured default table.
getTableListjava.util.List<java.lang.String> getTableList(HttpServletRequest request) throws HCMCoreException, HCMException
// The parameter request is an HTTPServletRequest object for the // current request. This function returns a list of string type // objects that contain table names of all authorized tables for // the current user.
getEmployeeListGenericResultBean getEmployeeList(java.lang.String tableName, HttpServletRequest request) throws HCMCoreException, HCMException
// The parameter tableName is the name of a table. The parameter // request is an HTTPServletRequest object for the current request. // This function returns a GenericResultBean that contains employee // details of all employees in the specified table.
getEmployeeDetailsGenericResultBean getEmployeeDetails(java.lang.String tableName, java.lang.String employeeId, HttpServletRequest request) throws HCMCoreException, HCMException
// The parameter tableName is the name of the table from where // to get details. The parameter employeeId is the employee Id // of the employee whose details are to be returned. The // parameter request is an HTTPServletRequest object for the // current request. This function returns a GenericResultBean // that contains column names and values (employee details) of // the specified employee in the specified table.
// Sample Usage:
Interface PublicAPIInterface 207

PublicAPIInterface hcmPublicAPI = PublicAPIFactory.getPublicAPI(); GenericResultBean employeeDetailsBean = hcmPublicAPI.getEmployeeDetails( "empmast", "10433", request);
List columnNameList = employeeDetailsBean.getColumnNameList(); Iterator itrColumnName = columnNameList.iterator(); List rowDataList = employeeDetailsBean.getRowDataList(); Iterator itrRowDataList = rowDataList.iterator();
while (itrColumnName.hasNext()) { String columnName = (String) itrColumnName.next(); System.out.print(columnName); }
while (itrRowDataList.hasNext()) { List rowList = (List) itrRowDataList.next(); Iterator itrRowList = rowList.iterator();
while (itrRowList.hasNext()) { String value = (String) itrRowList.next(); System.out.print(value); } }
getEmployeeListGenericResultBean getEmployeeList(java.lang.String tableName, java.util.List<java.lang.String> columnList, HttpServletRequest request) throws HCMCoreException, HCMException
// The parameter tableName is the name of the table from which values // are to be returned. The parameter columnList is a list of column names. // The parameter request is an HTTPServletRequest object for the current // request. This function returns details of all employees from the specified // table and for the specified list of columns using a GenericResultBean that // contains column names and list of values.
getEmployeeDetailsGenericResultBean getEmployeeDetails(java.lang.String tableName, java.lang.String employeeId, java.util.List<java.lang.String> columnList, HttpServletRequest request) throws HCMCoreException, HCMException
// The parameter tableName is the name of a table from which values are // to be returned. The parameter employeeId is the employee Id of the // employee. The parameter columnList is a list of string objects that // contains column names. The parameter request is an HTTPServletRequest // object for the current request. This function returns details of an // employee for the specified columns and table using a GenericResultBean // that contains column names and lists of values.
208 Appendix 3 • The Public API

getProfileDetailsProfileBean getProfileDetails(java.lang.String categoryId, HttpServletRequest request) throws HCMCoreException, HCMConfigurationException
// The parameter categoryId is the Id of the desired category. The // parameter request is an HTTPServletRequest object for the current // request. This function returns employee details for the specified // category of the current profile selected by the user using a // ProfileBean, which is populated with category details for the // specified category.
getHeaderDetailsjava.util.List<GenericBean> getHeaderDetails(HttpServletRequest request) throws HCMCoreException, HCMConfigurationException
// The parameter request is an HTTPServletRequest object for the current // request. This function returns an employee profile's header details // using a list of GenericBean objects.
getEmployeePhotographSrcjava.lang.String getEmployeePhotographSrc(java.lang.String employeeId, HttpServletRequest request)
// The parameter employeeId is the employee Id of the employee. The // paramater request is an HTTPServletRequest object for the current // request. This function uses the value of employeeId to return the // relative path to a photograph of the specified employee, according // to configuration.
getConfigValuejava.lang.String getConfigValue(java.lang.String configKey, HttpServletRequest request)
// The parameter configKey passes a string that contains a key to get // the value of. The parameter request is an HTTPServletRequest object // for the current request. This function returns a string that contains // the value corresponding to the key specified by configKey. This value // is dependent on the HCM configuration.
// If there are multiple keys with same name, this function will return // the first entry that matches.
// Sample Usage:
PublicAPIInterface hcmPublicAPI = PublicAPIFactory.getPublicAPI(); String configValue = hcmPublicAPI.getConfigValue("ENABLESPM", request);
Interface PublicAPIInterface 209
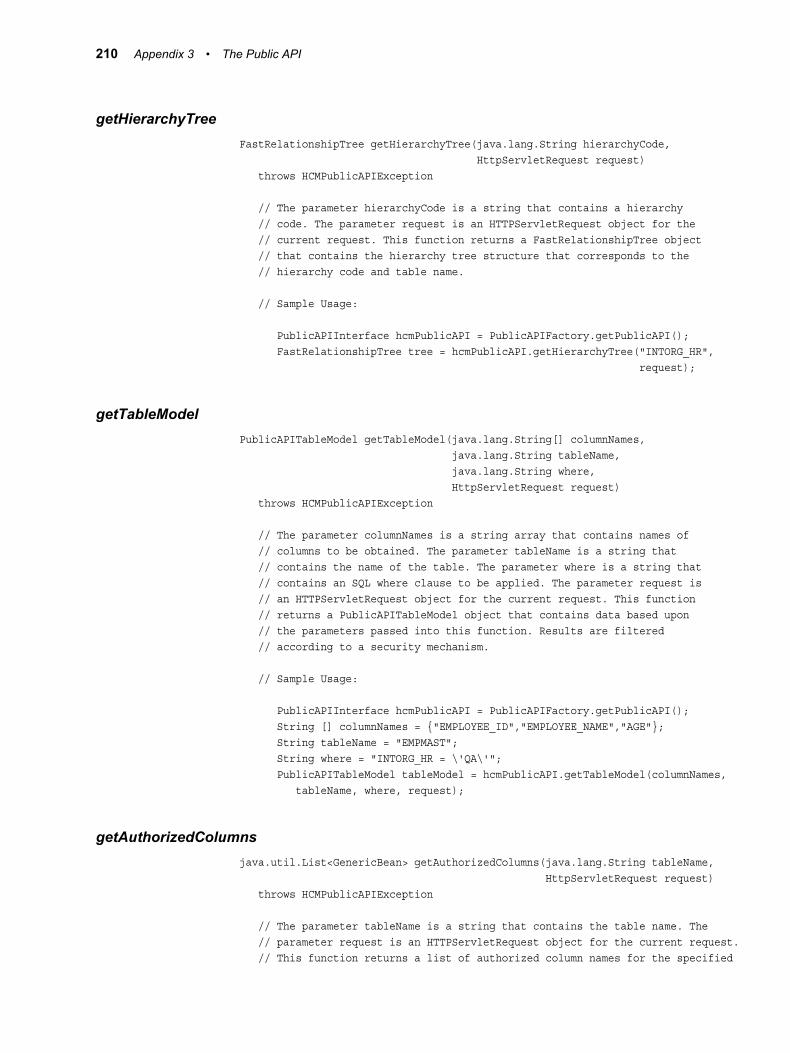
getHierarchyTreeFastRelationshipTree getHierarchyTree(java.lang.String hierarchyCode, HttpServletRequest request) throws HCMPublicAPIException
// The parameter hierarchyCode is a string that contains a hierarchy // code. The parameter request is an HTTPServletRequest object for the // current request. This function returns a FastRelationshipTree object // that contains the hierarchy tree structure that corresponds to the // hierarchy code and table name.
// Sample Usage:
PublicAPIInterface hcmPublicAPI = PublicAPIFactory.getPublicAPI(); FastRelationshipTree tree = hcmPublicAPI.getHierarchyTree("INTORG_HR", request);
getTableModelPublicAPITableModel getTableModel(java.lang.String[] columnNames, java.lang.String tableName, java.lang.String where, HttpServletRequest request) throws HCMPublicAPIException
// The parameter columnNames is a string array that contains names of // columns to be obtained. The parameter tableName is a string that // contains the name of the table. The parameter where is a string that // contains an SQL where clause to be applied. The parameter request is // an HTTPServletRequest object for the current request. This function // returns a PublicAPITableModel object that contains data based upon // the parameters passed into this function. Results are filtered // according to a security mechanism.
// Sample Usage:
PublicAPIInterface hcmPublicAPI = PublicAPIFactory.getPublicAPI(); String [] columnNames = {"EMPLOYEE_ID","EMPLOYEE_NAME","AGE"}; String tableName = "EMPMAST"; String where = "INTORG_HR = \'QA\'"; PublicAPITableModel tableModel = hcmPublicAPI.getTableModel(columnNames, tableName, where, request);
getAuthorizedColumnsjava.util.List<GenericBean> getAuthorizedColumns(java.lang.String tableName, HttpServletRequest request) throws HCMPublicAPIException
// The parameter tableName is a string that contains the table name. The // parameter request is an HTTPServletRequest object for the current request. // This function returns a list of authorized column names for the specified
210 Appendix 3 • The Public API
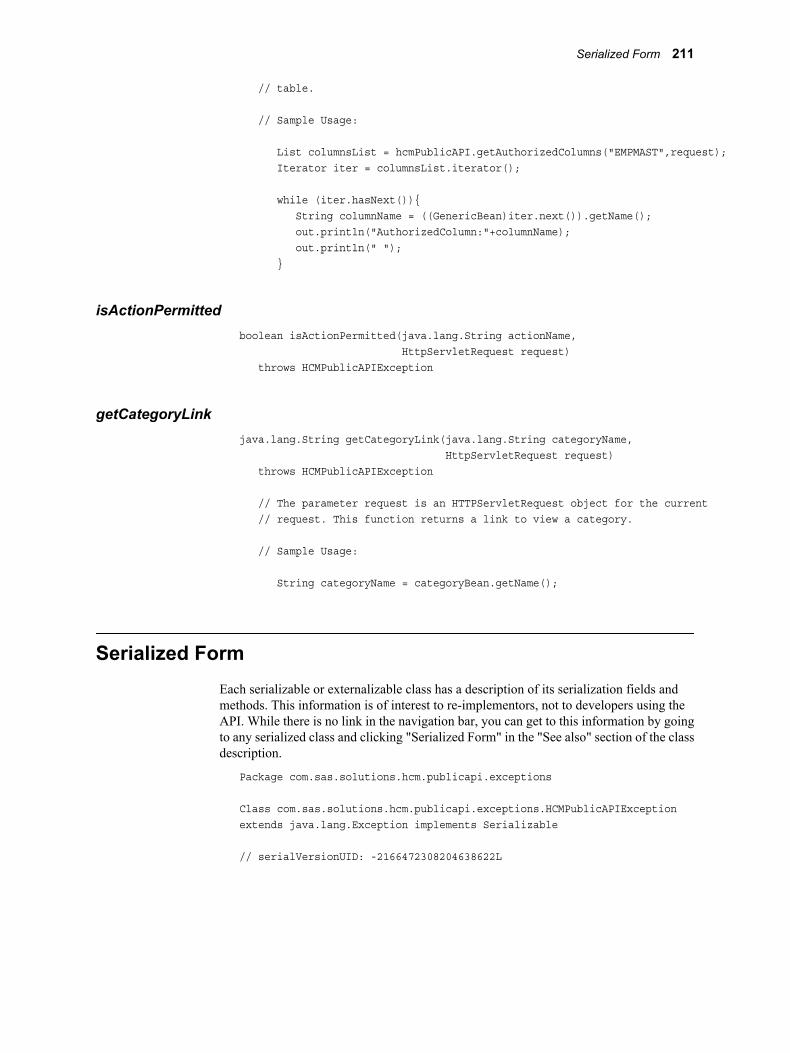
// table.
// Sample Usage:
List columnsList = hcmPublicAPI.getAuthorizedColumns("EMPMAST",request); Iterator iter = columnsList.iterator();
while (iter.hasNext()){ String columnName = ((GenericBean)iter.next()).getName(); out.println("AuthorizedColumn:"+columnName); out.println(" "); }
isActionPermittedboolean isActionPermitted(java.lang.String actionName, HttpServletRequest request) throws HCMPublicAPIException
getCategoryLinkjava.lang.String getCategoryLink(java.lang.String categoryName, HttpServletRequest request) throws HCMPublicAPIException
// The parameter request is an HTTPServletRequest object for the current // request. This function returns a link to view a category.
// Sample Usage:
String categoryName = categoryBean.getName();
Serialized FormEach serializable or externalizable class has a description of its serialization fields andmethods. This information is of interest to re-implementors, not to developers using theAPI. While there is no link in the navigation bar, you can get to this information by goingto any serialized class and clicking "Serialized Form" in the "See also" section of the classdescription.
Package com.sas.solutions.hcm.publicapi.exceptions
Class com.sas.solutions.hcm.publicapi.exceptions.HCMPublicAPIExceptionextends java.lang.Exception implements Serializable
// serialVersionUID: -2166472308204638622L
Serialized Form 211

212 Appendix 3 • The Public API

Index
Aactions 48Administration application
overview 4application configuration properties 90
Ccache
refreshing 5categories, fixed 44column filters
identities, adding 79modifying 78
column security 77applying 77
columnsSee tables
configuration properties 88application properties 90custom properties 92system properties 88
cube wizard 23cubes 5
See also dimensionscreating 23deleting 28description 23information maps, creating 28labels 14managing 28rebuilding 28refreshing 28viewing 28
custom configuration properties 92custom objects
security 66
Ddashboards
configuring 81diagnostic utility
e-mailed results 86launchDiagnostics_cmd.bat 85launchDiagnostics_UI.bat 85overview 82running from Administration application
86saving results to PDF 86stand-alone mode 85summary of tests 83viewing the results 86
dimensions 20creating 26
Eemployee list 42
for an employee profile, customizing 46employee profile
default 50default category 51
employee profile templatesSee also Public APIadding to SAS Human Capital
Management 106available templates 96category details 102category list 101custom categories 103customizing 95, 98deploying 106employee images 100external actions list 101fixed categories 102header details 99PublicAPIInterface methods 103required imports 98saving to PDF 106styles 98
employee profiles
213
actions 48assigning to users or groups 42contents 42copying 47creating 44customizing 41, 46defined 41deleting 51fixed categories 44, 47required permissions 42
employee search 43
Ffixed categories 44
adding 47forecasting
customizing 116defining a stored process 112overview 107preparing the data 109process overview 108
formats 32adding 33assigning to a column 34catalog, updating 35deleting 35editing 35predefined 35viewing 35
formats catalogupdating 35
Ggeneral search
default columns 58geographic analysis 51
actions 48creating additional maps 54drill level hierarchy 53drilling down 52link fields 52
groupssearching for 67
Hhcmlabels.properties file 14hcmtitles.properties file 14hierarchical filters 74
applying 75hierarchy, selecting 74overriding 76power user group 76
hierarchies 20
See also hierarchy mappingsviewing 20
hierarchy mappingsadding 21description 20viewing 21
HR measures 30creating 30deleting 32editing 32recalculating 32viewing 32
Iidentities
searching 67Import Users 60information maps
creating, from cubes 28creating, from tables 18opening, in SAS Web Report Studio 30rebuilding 30
Llink fields
for a geographic analysis 52
Mmap tables 7, 54master tables 6measures
See also HR measuresSee also planning measurespredefined 161Saratoga Institute 161
Oobject security 61
custom objects 66list of objects 151permissions, adding 64permissions, interpreting 62
organization analysis 55defaults 55
organization chartsSee organization analysis
Pplanning measures 144
for new positions 142for supplemental schedules 143
214 Index

managing plans 150overview 142SAS code 146, 147slicer-dependent 143
power user group 76predictive modeling 121profile header 43
customizing 46profiles
See employee profilesPublic API 95
See also employee profile templates
RRefresh Cache 5retention analysis
creating a cube 139customizing the %MODLPB macro 131EMPSCORES table 137, 139extraction stage 123generating the model 130generating the scoring table 129HRVANLY2 table 129introduction 121merge stage 137merging the tables 137MODELSCORES table 137modifying the %PREBUILD macro 126modifying the %VTAPB macro 127process overview 122reporting 139scoring table 136transformation stage 129
rolessearching for 67
row-level security 68See also hierarchical filtersdefault filters 69enabling 71filters, adding 72filters, deleting 73filters modifying 73how filters are applied 69
SSaratoga Institute
measures 161SAS for Workforce Planning & Budgeting
See also planning measuresSee also supplemental schedulesadministering, overview 142creating a form set 148data entry 150overview 141
planning measures 144SAS Human Capital Management
administration overview 1search criteria
for an employee profile, customizing 46search symbols 19security 60
See also column securitySee also object securitySee also row-level securityadditional security measures 60custom objects 66importing users 60SAS_USER_EMPLOYEE table 60searching for identities 67user criteria 60
stored processesforecasting 112
summary tables 7supplemental schedules
creating 148planning measures 143
system configuration properties 88
Ttables
adding 9attributes 11column attributes 12copying 15data types 8deleting 19detail tables 5exporting 7, 18formatted columns, exporting 8formatted columns, importing 8hcmtitles.properties file 14history tables 5importing 7, 9importing, custom 11information maps, creating 18location, for importing 7map tables 5, 7master tables 5, 6properties files 14search symbols 19summary tables 5, 7types 5viewing 16warning messages, on export 8
templatesadding 57employee profiles 56Home page 56selecting 56
Index 215

Uusers
importing 60searching for 67
216 Index

Your Turn
We welcome your feedback.
• If you have comments about this book, please send them to [email protected] the full title and page numbers (if applicable).
• If you have comments about the software, please send them to [email protected].
