sarah baartman district business plan
TRANSCRIPT

MASTER AGRI-PARK BUSINESS PLAN:
EASTERN CAPE
April 2016
SARAH BAARTMAN DISTRICT
BUSINESS PLAN
Final Report

Sarah Baartman Master Agri-Park Business Plan P a g e | ii
URBAN-ECON DEVELOPMENT ECONOMISTS
49 Parliament Street
Central
Port Elizabeth
South Africa
6001
Tel: 041 585 6640
Fax: 041 585 6151
E-mail: [email protected]
Website: www.urban-econ.com
Lead Consultant:
Sub-Consultant:
OPTIMAL AGRICULTURAL BUSINESS SYSTEMS
49 Stander Street
George
South Africa

Sarah Baartman Master Agri-Park Business Plan P a g e | iii
DOCUMENT APPROVAL
PSSC Representative
Name Designation Signature
RID Representative
Name Designation Signature
REID Representative
Name Designation Signature
District Representative
Name Designation Signature

Sarah Baartman Master Agri-Park Business Plan P a g e | iv
Executive Summary
The Sarah Baartman Agri-Park Business Plan reviewed the current agricultural activities in the Sarah Baartman
District Municipality including, but not limited to, a review of the major agricultural products produced and the
activities of the various public sector organisations supporting agriculture and farming projects in the region. This
report serves as the first phase of the Agri-Park Business Plan, providing a status quo analysis, commodity
selection, prioritisation and identification as well as a development concept and implementation guideline. The
first section deals with the status quo and major role players in the region. The second section is the commodity
prioritisation section and deals with the selection of commodities and the market environment around those
commodities. The third section is the development concept and the implementation guidelines which consists
of high level costing and recommendations for the development of the Agri-Park in Sarah Baartman District.
The Department of Rural Development and Land Reform has defined an Agri-Park as “a networked innovation
system of agro-production, processing, logistics, marketing, training and extension services, located in District
Municipalities. As a network it enables a market-driven combination and integration of various agricultural
activities and rural transformation services.” Thus the Agri-Park concept involves integrating collective farming,
farmer incubation programmes, Agri-Clusters, and Eco-Villages; while also contributing to land conservation and
preservation. A business plan for the Agri-Park in Sarah Baartman DM was developed in 2015 by the Department
of Rural Development and Agrarian Reform and this report builds on that research as well as the Agricultural
Policy Action Plana (APAP).
In this report reference is made to ‘commodities’ this being a broad range of agricultural products and not strictly
traded agricultural commodities. Commodities were identified through a review of the status quo of agricultural
activities and biophysical conditions of the region, a review of policy documents and current agricultural projects.
These commodities were then by way of a prioritisation matrix which has assessed each commodity according
to 37 scoring criteria falling into four broad classes. These are:
A) Biophysical criteria
B) Enterprise viability
C) Economic development
D) Political & social objectives
Based on a Sarah Baartman District Municipality Council decision the site of the Agri-Hub for the district is in the
town of Addo, in Sundays River Valley LM. The concept of the Agri-park and its supporting structures within the
Sarah Baartman DM will be explored within the Final Report.
In accordance with the Agricultural Policy Action Plan and directives from the Department of Rural Development
and Land Reform the three top scoring commodities have been identified for inclusion as the core focus areas
for the Sarah Baartman Agri-Park. The top three scoring commodities for Sarah Baartman were identified as Red
Meat (Including Beef, Sheep, and Chevon); Vegetable production, and Citrus production.
The identified commodities were then taken through a detailed Market Analysis, Value Chain Assessment, and
SWOT Analysis (Chapter 8 -10)
The following were the key outcomes of the commodity analysis, relating to these three candidate commodities:
Red Meat:

Sarah Baartman Master Agri-Park Business Plan P a g e | v
The Sarah Baartman environment is well suited to livestock farming (particularly beef and sheep) with
almost all areas of the District showcasing decent suitability to some form of livestock farming.
Large opportunities exist in the Sarah Baartman District in Red Meat sub-classes Beef, Sheep, and Goat.
These opportunities include farming opportunities for commercial and emerging farmers as well as
numerous opportunities for small and large concerns in the upstream and downstream portions of
the value-chain including agro-processing.
The demand for red meat grew between 2013 and 2014 and it is believed that the local and international
market for red meat will grow in the future.
Vegetables:
While the Sarah Baartman environment may not be perfectly suited in all areas to vegetable farming,
there are some pockets across the District where a variety of crops can be produced.
By supporting multiple crops the Agri-Park can ensure more faming concerns are catered for and the
most suitable crops are planted in each area. This will greatly improve the quality of production, improve
enterprise flexibility to market demands and enhance food security.
Vegetable production and consumption has been increasing and it is believed that demand for
vegetables will continue to grow. Because vegetables are a necessary part of the human diet, the
demand for them should not decline.
Citrus:
Citrus is well suited to areas around the Agri-Hub of Addo. Citrus Is also suited to the Gamtoos area of
SBDM
The crop is grown as a commercial crop in the District and has historically been an area of high
production thus the area has the necessary skills and familiarity for this product to be supported by the
Agri-Park.
There are great opportunities to increase citrus production in Sarah Baartman District
Farms and existing small holder citrus farmers have already been ear-marked for inclusion in the Agri-
Park by the District
The demand for South African citrus is expected to grow in the future both locally and nationally.
Hectares planted has increased by over 18% and it is believed this will increase in the next 10 years to
cope with growing demand.
There is a well-established commercial citrus industry in Sundays River Valley LM that can support and
would be willing to support emerging farmers. There are already 15 emerging farms that are being
supported by various programmes and commercial farmers.
It has also recently come to light that there has been existing project plans involving two sites namely
KK113 and Enon Bersheba supported by the ECRDA, Sundays River Valley LM and SRCC.
As with many rural municipalities, the agricultural development is constrained by road infrastructure, access to
water and electricity infrastructure as well as issues affecting access to arable land. For the Agri-Park concept to
succeed it is imperative that these issues be adequately addressed. These weaknesses were discussed within the
SWOT Analysis, which include; drought and poor rainfall affecting the potential of the area; infrastructural
challenges (road and water) impacting the current development of the agricultural sector and the ever-present
threat of theft and vandalism.
The third section of this report deals with the development concept and the implementation guidelines which
consists of high level costing and recommendations for the development of the Agri-Park in Sarah Baartman
District.

Sarah Baartman Master Agri-Park Business Plan P a g e | vi
The development concept covers what the completed Agri-Park should contain per commodity. The key thrusts
are listed in a table below for each commodity. These key thrusts are activities/ products that should be
developed by the Agri-Park.
Table I.I: Key thrusts for each commodity in the Agri-Park
Livestock
Genetic improvement Improving the genetic quality of emerging and small-holder farmers for immediate relatively fast improvement of prices offered for carcasses and wool/ mohair when sold.
Feedlot A feedlot using citrus pulp as the primary means of feed. Operational during the citrus season in order to improve the quality of the cattle that are being sent to abattoirs. Develop a feedlot in Cookhouse through a Public Private Partnership (i.e. Humansdorp Co-Op).
Fencing Fencing of commonage key grazing areas for small holder and emerging farmers.
Management of commonage A key aspect of improving small holder farmer’s herds is an improvement in the management of commonage. Commonage, if correctly planned and managed, can be vital for small holder farmers.
Veterinary support FPSUs could potentially provide a base for DAFF veterinarians to operate out of and are invaluable to emerging and smallholder farmers.
Training Training is a vital aspect of the Agri-Park concept. In order to give small holder and merging farmers an opportunity to produce livestock for the market then it is important to train farmers in animal handling and market information.
Abattoir facilities There is currently space in the market for an abattoir at FPSU level that has deboning facilities. This should largely be focused on B and C grade meats for the local markets in the Ndlambe and Makana areas. (Redevelopment of the IMPEC Ostrich Abattoir).
Vegetables
Organic vegetables There is a growing market in South Africa for organically grown vegetables as consumers become more aware of food production. There may be a gap in the market to exploit organically grown vegetables.
Processing of vegetables Basic processing of vegetables could take place at the Agri-Hub. Cutting, peeling and packaging could be an important processing opportunity.
Production of vegetables in key projects
Vegetable production can be kick-started in areas through investment in key projects particularly at KK113 (interim production) and Enon Bersheba (110ha).
Market Linkages Farmers must engage with Agri-Park, commercial farmers and destination markets to gain key market intelligence, form production agreements and make long term partnerships to exchange information and expertise.
Training A key aspect involved in Agri-Park concept is that of training and development of farmers. Emerging vegetable farmers need practical training in best farming practices as well as training in how to access markets.
Citrus
Emerging Farmer Support While there is a well-established commercial citrus sector, production
opportunities lie with emerging farmers namely on two sites (KK113 -
225ha and Enon Bersheba 220ha) which has already been explored in
research1
Training and Mentorship Training and mentorship are extremely important for the Agri-Park. A key initiative for training and mentorship would be the establishment of

Sarah Baartman Master Agri-Park Business Plan P a g e | vii
a Citrus Academy1, supporting both the NARYSEC youth programme and citrus industry initiatives; supported by the Nelson Mandela Metropolitan University.
Citrus nursery and pruning
enterprise1 Establishment of a citrus nursery and a pruning enterprise which shall
be institutionally and operationally supported by the Sundays River
Citrus Company.
Creating linkages to established citrus production
It is vitally important that emerging citrus farmers create linkages to established citrus farmers and established businesses. These linkages will benefit farmers. Unlike other commodities, citrus is largely exported and increasing production of citrus in the region can boost exports and satisfy demand in overseas areas thus increasing the amount that is paid to farmers. This system can be extremely beneficial to emerging farmers.
This section also contains the high level costing which was conducted. This cost is purely indicative of a green-
fields development and will vary wildly from FPSU to Agri-hub. A key recommendation from this report is that
the development must consider services and infrastructure already in place before building more infrastructure
or providing services. This ensures that projects and emerging farmers will receive necessary funding.
Finally the implementation guidelines provides guidelines on how to implement the Agri-Parks concept. It
contains alignment with government programmes, projects and campaigns that are currently ongoing. Private
programmes are included in this section. Recommendations and the rollout plan are also part of this section.
Specific recommendations are given for:
Infrastructure
Natural resources
Agri-Park commodities
Technology
Training
Agri-Park units
Logistics
Policy environment
Funding/ investment
Private/ public integration
Market and
Incentive programmes
1 SURE AGRI MARKETING, January 2015. The KK113 Citrus Industry Initiative. A development project supported by the ECRDA and SRCC.

Sarah Baartman Master Agri-Park Business Plan P a g e | viii
List of Abbreviations
ACIP Aquaculture Competitiveness Improvement Programme
AGOA African Growth and Opportunity Agreement
AH Agri-Hub
APAP Agricultural Policy Action Plan
CASP Comprehensive Agriculture Support Programmes
CDA Cacadu Development Agency
CGA Citrus Growers Association
CRDP Comprehensive Rural Development Programme
CSA Climate Smart Agriculture
CSAP Camdeboo Satellite Aquaculture Project
DAFF Department of Agriculture, Forestry and Fisheries.
DEDEAT Department of Economic Development, Environmental Affairs and Tourism
DRDLR Department of Rural Development and Land Reform
DRDAR Department of Rural Development and Agrarian Reform
ECDC Eastern Cape Development Corporation
ECRDA Eastern Cape Rural Development Agency
ECRDS Eastern Cape Rural Development Strategy
ECSECC Eastern Cape Socio-Economic Consultative Council
FPSU Farmer Production Support Unit
GDP-R Regional Gross Domestic Product
IDP Integrated Development Plan
IDZ Industrial Development Zone
IPAP Industrial Policy Action Plan
LRAD Land Redistribution for Agricultural Development Programme
MPO Milk Producers Organisation
NDP National Development Plan
NGP New Growth Path
NMBM Nelson Mandela Bay Metropolitan Municipality
NNIP Ndlambe Natural Industrial Products
REID Rural Enterprise and Industry Development
RID Rural and Infrastructure Development

Sarah Baartman Master Agri-Park Business Plan P a g e | ix
RPO Red Meat Producers Organisation
RUMC Rural Urban Market Centre
SBDM Sarah Baartman District Municipality
SEDA Small Sector Enterprise Development
SIP Strategic Integrated Project
SMME Small, Medium and Micro Enterprise
SRCC Sundays River Citrus Company
WTO World Trade Organisation

Sarah Baartman Master Agri-Park Business Plan P a g e | x
Table of Contents
1. Report Overview 1
1.1. Methodology 3
1.2. Master Business Plan 3
2. Agri-Park Model 5
2.1. Introduction 6
2.2. Objective of the Agri-Park programme 7
2.3. Agri-Park structure 7
3. Policy Review 11
3.1. National Development Plan (NDP) (2012) 12
3.2. Comprehensive Rural Development Programme (CRDP) (2009) 12
3.3. Department of Rural Development and Land Reform – Strategic Plan 2015-2020 (2015) 12
3.4. Industrial Policy Action Plan 2013/14 – 2015/16 (2013) 13
3.5. Diagnostic overview of the Eastern Cape Province (2013) 13
3.6. Eastern Cape Rural Development Strategy (ECRDS) (2010) 13
3.7. Eastern Cape Rural Development Plan (2013) 14
3.8. Agricultural Policy Action Plan (APAP) 2015 14
3.9. Eastern Cape Vision 2030 17
3.10. Sarah Baartman District Municipality IDP – 2015 - 2016 18
3.11. DRDAR Sarah Baartman Agri-Park Business Plan (2015) 19
4. Location Context 20
4.1. Description of the district 21
4.2. Location of Agri-Park 21
4.3. Economic infrastructure 22
5. Agriculture Role-Players 24
5.1. Public Sector 25
5.1.1. National Dept. Rural Development & Land Reform (DRDLR) 25
5.1.2. EC Dept. Rural Development & Agrarian Reform (DRDAR) 25
5.1.3. Sarah Baartman District Municipality 26
5.1.4. Eastern Cape Rural Development (ECRDA) 27
5.1.5. Dept. of Economic Development, Environmental Affairs & Tourism (DEDEAT) 28
5.1.6. Eastern Cape Development Corporation (ECDC) 29
5.1.7. Eastern Cape Socio-Economic Consultative Council (ECSECC) 30
5.1.8. Small Enterprise Development Agency (SEDA) 30
5.1.9. Extension and Support Services 31
5.2. Private sector 31
5.2.1. Commercial Banks 31
5.2.2. Agricultural Co-Operative Finance 31
5.2.3. Agro-Processing Businesses 32
5.3. Other key role-players 32
5.3.1. Land Bank 32
5.3.2. Associations and Organisations 33

Sarah Baartman Master Agri-Park Business Plan P a g e | xi
6. District Economic & Demographic Overview 36
6.1. Demographic analysis 37
6.1.1. Population densities 37
6.1.2. Age structure 38
6.1.3. Dependency ratio 39
6.1.4. Population growth rates 39
6.1.5. Migration trends 40
6.2. Education 41
6.2.1. Education attainment levels 42
6.3. Poverty and income levels 43
6.3.1. Average household income 43
6.3.2. Poverty line and GINI coefficient 45
6.4. Economic Profile 45
6.4.1. Eastern Cape GDP-R growth rates and projections 48
6.4.2. Employment 48
7. Agriculture Sector Analysis 50
7.1. Sarah Baartman District Agriculture Activities 51
7.1.1. Livestock 51
7.1.2. Fruit and Vegetables 54
7.1.3. Forestry 56
7.1.4. Aquaculture 56
7.1.5. Biofuels 56
7.2. Current and proposed projects in the region 57
7.2.1. Rural Enterprise and Industrial Development (REID) 57
7.2.2. Rural Infrastructure and Development (RID) 57
7.2.3. Land Redistribution for Agricultural Development (LRAD) 57
7.2.4. Comprehensive Agricultural Support Programme (CASP) 58
7.2.5. Ilima/Letsema 59
7.2.6. Integrated Development Plans (IDP) 59
7.2.7. Social Relief Projects 59
7.2.8. Special Projects 60
7.3. Environmental Profile 60
7.3.1. Temperature 60
7.3.2. Rainfall, hail risk, humidity and water availability for irrigation and animal watering 62
7.3.3. Land and soil resources 65
7.4. APAP commodity selection criteria 66
7.5. Agri-Park commodity prioritisation matrix 67
7.5.1. Biophysical criteria 67
7.5.2. Enterprise viability criteria 68
7.5.3. Forward and backward economic linkages and agro-processing opportunities 70
7.5.4. Political/ institutional, social and food security/ sustainability criteria 71
7.6. Prioritisation matrix results 72
7.6.1. Red meat 74
7.6.2. Vegetables 74
7.6.3. Citrus 75
7.7. Summary 76

Sarah Baartman Master Agri-Park Business Plan P a g e | xii
8. Red Meat 77
8.1. Market analysis 78
8.1.1. Global markets 78
8.1.2. National market 81
8.1.3. Production 81
8.1.4. Production by province 82
8.1.5. Local Consumption 85
8.1.6. Local market developments 87
8.1.7. Price 88
8.2. Value-chain assessment 90
8.2.1. Beef 90
8.2.2. Mutton & Chevon 92
8.3 Stakeholders 97
8.4 Technology 98
8.5 Demand and Needs Analysis 101
8.6 Competition 102
8.7 Job Creation 102
8.8 Contribution to Food Security 103
8.9 Regulatory Requirements 103
8.10 Substitute Products and Services 105
8.11 Barriers to Entry 105
8.12 Societal and Cultural practices 106
8.13 SWOT Analysis 107
8.13.1 Strengths 107
8.13.2 Weaknesses 108
8.13.3 Opportunities 108
8.13.4 Threats 109
9. Vegetables 110
9.1. Market analysis 111
9.1.1. Production 111
9.1.2. Distribution channels 113
9.1.3. Prices 114
9.1.4. Consumption 116
9.1.5. Vegetable Production in Sarah Baartman 116
9.2. Value-chain assessment 118
9.3. Stakeholders 121
9.4. Technology 122
9.5. Demand and Needs Analysis 124
9.6. Competition 125
9.7. Job Creation 125
9.8. Contribution to Food Security 126
9.9. Regulatory Requirements 126
9.10. Substitute Products and Services 128
9.11. Barriers to Entry 128
9.12. SWOT Analysis 129
9.12.1. Strengths 129
9.12.2. Weaknesses 130
9.12.3. Opportunities 130

Sarah Baartman Master Agri-Park Business Plan P a g e | xiii
9.12.4 Threats 131
10 Citrus 132
10.1. Market assessment 133
10.1.1. Global Citrus Market 133
10.1.2. National & Provincial Citrus Market Overview 134
10.1.3. Export Markets 135
10.1.4. Local markets 138
10.1.5. Citrus Sector in Sarah Baartman 138
10.2. Citrus Value Chain Assessment 140
10.3. Stakeholders 143
10.4. Technology 144
10.5. Demand and Needs Analysis 145
10.6. Competition 146
10.7. Job Creation 146
10.8. Contribution to Food Security 147
10.9. Regulatory Requirements 147
10.10. Substitute Products and Services 150
10.11. Barriers to Entry 150
10.12. SWOT Analysis 151
10.12.1. Strengths 151
10.12.2. Weaknesses 152
10.12.3. Opportunities 152
10.12.4 Threats 153
11 Development Concept 154
11.1 Introduction 155
11.2 DRDAR Agri-Park Concept 156
11.3 Sarah Baartman Development Concept 158
11.3.1 Location of Agri-Park Units 158
11.3.1 Key Thrusts 160
11.4 Commodity Development Concepts 161
11.4.1 Livestock 162
11.4.2 Vegetables 169
11.4.3 Citrus 175
11.5 Logistics Plan 182
11.5.1 Understanding the Logistics Chain 182
11.5.2 Recommended Logistics Strategy 182
11.6 High Level Costing 184
12 Implementation Guidelines 187
12.1 Introduction 188
12.2 Alignment with Government Programmes, Projects and Campaigns 189
12.3 Recommendations 193
12.4 Rollout Plan 196
13 Agri-Parks Organisational Structure 200
13.1 Advisory Structures 201
13.1.1 The NAAC 201

Sarah Baartman Master Agri-Park Business Plan P a g e | xiv
13.1.2 The DAMC 202
13.2 Approval Structures 202
13.2.1 DAPOTT 202
13.2.2 DLRC 203
13.2.3 PCRDP 203
13.2.4 NLARCC 203
13.2.5 NDC 204
13.3 Implementation and Monitoring Structures 204
13.3.1 NAPOTT 204
13.3.2 PAPOTT 205
14 List of References 206
Overview Chapter 1
Sarah Baartman Master Agri-Park Business Plan
P a g e | 2
1. REPORT OVERVIEW
The Department of Rural Development has defined an Agri-Park as “a networked innovation system of agro-
production, processing, logistics, marketing, training and extension services, located in District Municipalities.
As a network it enables a market-driven combination and integration of various agricultural activities and rural
transformation services.” This means that the Agri-Park concept involves integrating collective farming, farmer
incubation programmes, Agri-Clusters, and Eco-Villages; while also contributing to land conservation and
preservation.
The DRDLR has identified the need for business plans for 44 district municipalities across South Africa for the
development of these Agri-Parks. The four Agri-Parks earmarked for the Eastern Cape will be situated in
Amathole DM, Joe Gqabi DM, OR Tambo DM and Sarah Baartman DM. This business plan is specifically
developed for the Sarah Baartman DM.
This draft report includes the agriculture industry analysis and the prioritisation of commodities for inclusion
into the Agri-Park and a full analysis of the selected commodities. The final report will continue by developing
the Agri-Park business plan and implementation guidelines
The goal of the Agri-Park Master Business Plan is described as:
The objectives of the Agri-Park Business Plan is summarised from the Terms of Reference as follows:
1. To understand the Agri-Park Model developed by the DRLDR.
2. To identify the existing agro-processing facilities and farmers within each district municipality and
to establish possible linkages.
3. To identify three possible agro-processing business opportunities for each Agri-Park.
4. To develop an institutional/operational plan for each Agri-Park that indicated how existing farmers
will be linked with the Agri-Park.
5. Review all existing documentation, maps and information.
6. To work with the representative of the districts and the CSIR.
7. SWOT analysis that includes a legal, environmental, financial and technical analysis.
8. Identify current agro-processing initiatives and possible synergies, linkages and opportunities to
buy into existing businesses.
9. Do a financial analysis of the proposed agro-business opportunities.
10. To conduct a feasibility and viability assessment of the proposed agro-processing facilities.
11. Develop an operational plan for the business park.
12. Determine the costing of the Agri-Park.
“To develop a Master Agri-Park Business Plan that aligns with the Agri-Park Model that was developed by the
Department of Rural Development and Land Reform and the dominant Commodity Value Chains in the
specified District Municipalities.”

Sarah Baartman Master Agri-Park Business Plan
P a g e | 3
1.1 Methodology
Figure 1.1 below, provides for a methodology illustration of the various steps that are undertaken for the study,
these are issue described below in more detail.
Figure 1.1: Methodology
1.2 Draft Business Plan Commodity Selection Report
The purpose of the Master Business Plan is to provide Sarah Baartman DM with a strategic document that will
outline how to establish and develop a viable and successful Agri-Park in Sarah Baartman DM. The Master
Business Plan report comprises of the following chapters:
Chapter 2: Agri-Park Model: This chapter is aimed at providing a theoretical understanding of the Agri-Park
concept. This will describe what an Agri-Park is, how it will operate, why it is being established and who it will
service.
Chapter 3: Policy Review: The policy review chapter briefly outlines national, provincial and local policies and
documents related to agricultural production and processing. The chapter will also consider district specific
policies and documents such as the IDPs, SDFs and the existing Agri-Parks Business Plan for SBDM.
Chapter 4: Location Context: This chapter provides a description of the district in terms of location, major towns,
transport routes and main economic activities. It also provides the location of the Agri-Park, including maps and
depiction of economic infrastructure.
Chapter 5: Agriculture Role-Players: This chapter identifies the government, private sector and associations and
organisations involved in the agricultural sector in the district. This will include the descriptions of the
stakeholders’ mandates and related agricultural projects.
Chapter 6: District Economic and Demographic Overview: This chapter describes the economic and socio-
economic status of Sarah Baartman DM. Details around district demographics, labour trends, income and
poverty levels are also provided.
Step 1: Orientation
Step 2: Policy Review
Step 3: Status Quo
Step 4: Identify existing
initiatives
Step 5: Agri-Hub Opportunity
Analysis
Step 6: Feasibility Assessment
Step 7: Financial Analysis
Step 8: Operational Plan
Step 9: Business Plan
Sarah Baartman Master Agri-Park Business Plan
P a g e | 4
Chapter 7: Agricultural Industry Analysis: The agricultural industry analysis provides insights into the main
agricultural activities, current and proposed agricultural projects and the environmental conditions in the
district. This chapter will also determine the main commodities for the Agri-Park by means of a multi-criteria
prioritisation model.
Chapter 8 - 10: Prioritised Commodity Market Analysis: The three main commodities for the Agri-Park identified
in chapter 7 are discussed in more detail in this chapter. This includes a market assessment, value chain
assessment and SWOT analysis.
Chapter 11: Development Concept: The development concept is discussed in chapter 12 in which the key
components of the Agri-Park are discussed. This chapter also contains a high level costing of the Agri-Park
concept.
Chapter 12: Implementation Guidelines: Chapter 13 contains the implementation guidelines for the Agri-Park.
This chapter also contains specific recommendations regarding the future development of this concept.

Agri-Park Model Chapter 2

Sarah Baartman Master Agri-Park Business Plan
P a g e | 6
2. AGRI-PARK MODEL
2.1 Introduction
Agri-Parks are the culmination of existing models in both local and international spheres of development. The
concept was developed (by the DRDLR) after examining multiple private and public land usage models, ranging
over educational and experimental farm operations, collective farming initiatives, farmer-incubator projects,
Agri-clusters, eco-villages, and urban-edge allotments and market gardens. Agri-Parks seek to serve as the
transition zone between agricultural production zones in rural areas and urban processing and transportation
hubs.
Agri-Parks are doubly named, in that the park seeks to aid in open space preservation, and seeks to promote a
business park environment, with multiple organisations and initiatives based out of a centralised area. The
centralisation of developmental agricultural activities within districts encourage linkages between the parks and
the surrounding land for production. Additionally, it enables the centralisation of physical infrastructure within
the district, enabling development of rural agricultural activities.
Agri-Parks, which will be farmer controlled, seek to achieve multiple developmental objectives within the rural
environment, aimed at promoting agricultural production within the realm of subsistence and small-scale
producers. The Agri-Park approach will include the selection and training of smallholder farmers, as well as
selecting farms per province for the placement, incubation and training of unemployed graduates and other
entrepreneurs. These agri-business entrepreneurs, and emerging farmers, will be actively mobilised and
organised to support this initiative. Strategic public partnerships between the Department of Rural Development
and Land Reform with other key government institutions, such as the Department of Agriculture, Forestry and
Fisheries, the Department of Cooperative Governance and Traditional Affairs, and local institutions such as
provincial development agencies, and the Eastern Cape Rural Development Agency.
Agri-Park Guidelines
1. One Agri-Park per District (44 nationally, 6 provincially)
2. Agri-Parks must be farmer controlled.
3. Agri-Parks must be the catalyst around which rural industrialization will takes place.
4. Agri-Parks must be supported by government (for 10 years) to ensure economic sustainability.
5. Partnerships between government and private sector stakeholders should be strengthened,
ensuring increased access to water, energy, and transport services, and production and develop
existing and create new markets to strengthen and expand value-chains.
6. Maximise production of state land with high agricultural potential.
7. Increase and maximise access to markets to all farmers, especially emerging farmers and rural
communities.
8. Maximise the use of land with high agricultural potential (i.e. land with high production
capability).
9. Maximise use of existing agro-processing, bulk and logistics infrastructure.
10. Revitalise rural towns and provide support to towns with good growth potential, particularly towns
with high current or potential economic growth, and high population growth over the past ten
years.
Sarah Baartman Master Agri-Park Business Plan
P a g e | 7
The development of Agri-Parks will necessitate the review of all existing land reform policies, to ensure sufficient
policy support. State and communal land is expected to be used for both production and processing.
2.2 Objectives of the Agri-Parks Programme
The following are the strategic objectives of the Agri-Parks Programme:
Establish Agri-Parks in all of South Africa’s Districts District Municipalities that will kick start the Rural
Economic Transformation for these rural regions.
Promote the growth of the smallholder sector by creating 300 000 new small-scale producers, as well
as 145 000 new jobs in the agro-processing industry by the year 2020 (as set out in the National Growth
Path).
Promote the skills of, and support to, small-holder farmers through the provision of capacity building,
mentorship, farm infrastructure, extension services, production inputs and mechanisation inputs.
Strengthen existing and create new partnerships within all three spheres of government, the private
sector and civil society to develop critical economic infrastructure such as roads, energy, water, ICT and
transportation/logistics corridors that support the Agri-Park value chain.
Enable producer ownership of the majority of Agri-Parks equity (70%), with the state and commercial
interests holding minority shares (30%).
Allow smallholder producers to take full control of Agri-Parks by steadily decreasing state support over
a period of ten years.
Bring under-utilised land (especially in Communal Areas Land and land reform farms) into full
production over the next few years, and expand irrigated agriculture.
Contribute to the achievement of the National Development Plan’s “inclusive rural economy” and
target of 1 million jobs created in agriculture sector through creating a higher demand for raw
agricultural produce, primary and ancillary inputs, as well as generating increased downstream
economic activities in the sector.
The Agri-Parks Programme seeks to achieve a rural economic development through an all-inclusive approach to
development by developing agricultural value chains that are linked nationally. The programme will also be able
to address issues of employment, skills development and productivity of land.
The Agri-Parks programme is viewed as a programme that will address issues of rural economic development,
one of government’s key areas to address. Government has previously intervened with various anti-poverty
programmes, but with a lower impact than what was expected. The Agri-Parks model, however, is expected to
co-ordinate anti-poverty activities, providing an integrated package service that will match the local priorities.
The development of Agri-Parks will necessitate the review of all existing land reform policies, to ensure sufficient
policy support. State land is expected to be used for both production and processing.
2.3 Agri-Park Structure
An Agri-Park is a networked innovation system of agro-production, processing, logistics, and marketing, training
and extension services. The Agri-Park system is located in a district municipality, serving to enable market-driven

Sarah Baartman Master Agri-Park Business Plan
P a g e | 8
combination and integration of various agricultural activities and rural transformation services. The Agri-Park
concept comprises of three basic units:
• Agri-Hub Unit (AH).
• The Farmer Production Support Unit (FPSU).
• The Rural Urban Market Centre Unit (RUMC).
Figure 2.1 provides a visual representation of the information and produce flows within the Agri-Park system.
Figure 2.1: Visual Representation of Agri-Park System
Source: DRDLR, 2015
Agri-Hub
Agri-Hubs are located in centralised places within a District Municipality that are able to service and interact
favourable with agricultural activities within the district. The Agri-Hub, by necessity, is located in an area that
can serve as a link between district agricultural production and markets, and supply inputs from service and
product providers towards the agricultural producers. Agri-Hubs, ultimately, need to possess sufficient physical
and social infrastructure to accommodate:
Storage/warehousing facilities (cold storage, dehydrators, silos etc.)
Agri-processing facilities (mills, abattoirs, juicing, etc.)
Enterprise development areas: lease space to high intensity start-up industries that can benefit from
the inputs of outputs of the Agri-Hub, i.e. piggeries, tunnel grow crops, bio-gas production etc.
Large scale nurseries to supply agricultural production initiatives.
Packaging facilities for national and international markets.
Weighing facilities
Logistics hubs for collection of goods from the FPSUs.
Transport service workshops and spare parts for larger maintenance tasks of Agri-Hub and FPSU
equipment.
Agricultural technology demonstration parks to train farmers in the Agri-Park catchment area on new
technologies in terms of fertilizers, plants and seeds, irrigation, energy use and farm implements
Soil testing laboratories.
Sarah Baartman Master Agri-Park Business Plan
P a g e | 9
Accommodation for extension training and capacity building programs
Housing and recreational facilities for workers and Agri-Hub staff.
Business, marketing and Banking facilities, (ICT)
Rural development organization offices.
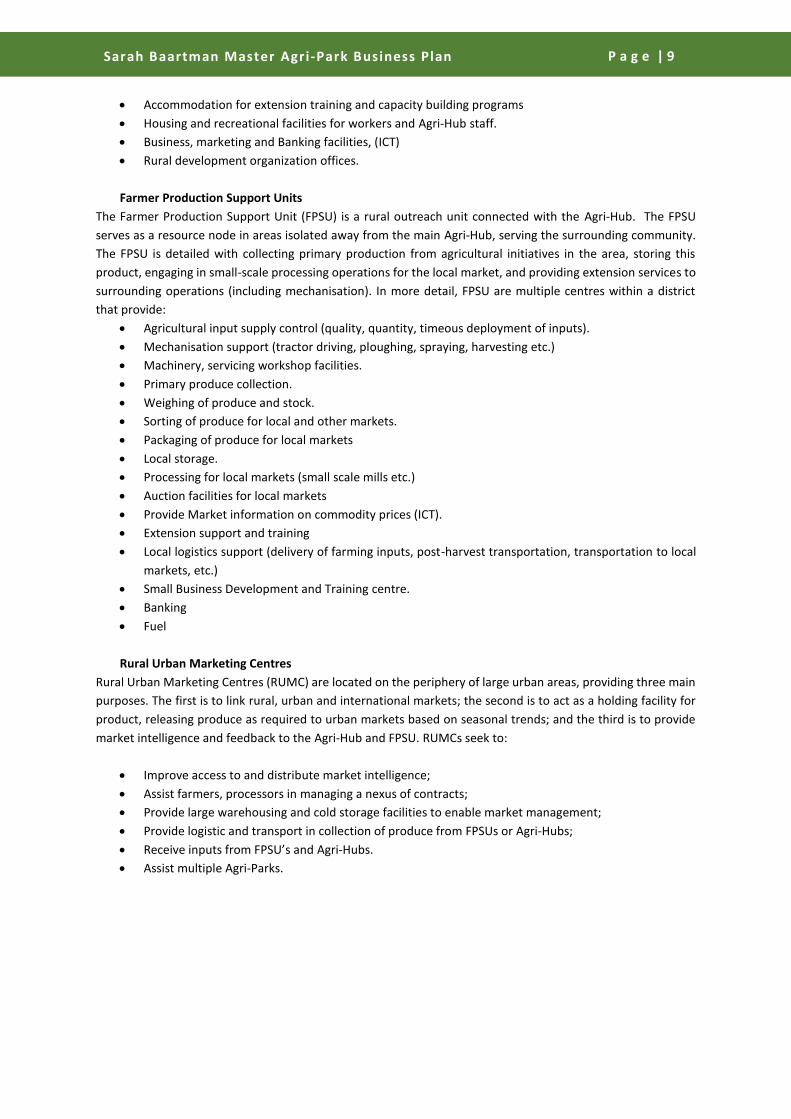
Farmer Production Support Units
The Farmer Production Support Unit (FPSU) is a rural outreach unit connected with the Agri-Hub. The FPSU
serves as a resource node in areas isolated away from the main Agri-Hub, serving the surrounding community.
The FPSU is detailed with collecting primary production from agricultural initiatives in the area, storing this
product, engaging in small-scale processing operations for the local market, and providing extension services to
surrounding operations (including mechanisation). In more detail, FPSU are multiple centres within a district
that provide:
Agricultural input supply control (quality, quantity, timeous deployment of inputs).
Mechanisation support (tractor driving, ploughing, spraying, harvesting etc.)
Machinery, servicing workshop facilities.
Primary produce collection.
Weighing of produce and stock.
Sorting of produce for local and other markets.
Packaging of produce for local markets
Local storage.
Processing for local markets (small scale mills etc.)
Auction facilities for local markets
Provide Market information on commodity prices (ICT).
Extension support and training
Local logistics support (delivery of farming inputs, post-harvest transportation, transportation to local
markets, etc.)
Small Business Development and Training centre.
Banking
Fuel
Rural Urban Marketing Centres
Rural Urban Marketing Centres (RUMC) are located on the periphery of large urban areas, providing three main
purposes. The first is to link rural, urban and international markets; the second is to act as a holding facility for
product, releasing produce as required to urban markets based on seasonal trends; and the third is to provide
market intelligence and feedback to the Agri-Hub and FPSU. RUMCs seek to:
Improve access to and distribute market intelligence;
Assist farmers, processors in managing a nexus of contracts;
Provide large warehousing and cold storage facilities to enable market management;
Provide logistic and transport in collection of produce from FPSUs or Agri-Hubs;
Receive inputs from FPSU’s and Agri-Hubs.
Assist multiple Agri-Parks.

Sarah Baartman Master Agri-Park Business Plan
P a g e | 10
Figure 2.2: Strategic Representation of the Agri-Park Model
Source: DRDLR, 2015
Figure 2.2. Depicts the catchment area of the Agri-Park in the grey circle, essentially illustrating the size and
contents of the Park that includes farmers, FPSU’s, AH’s and RUMC’s. The Agri-Hub, or AH, forms the central
point of the Agri-Park that is linked to the FPSU’s. There will be more than one FPSU per district, which is
intended to provide a supporting role between the AH and the farmers. All these components of the Agri-Hub
are interlinked, providing a streamlined and integrated approach to agricultural and rural development. Table
2.1 provides the relevant detail of the catchment of each component.
Table 2.1: Norms and Standards for Agri-Parks
Component Proposed catchment area in
areas of low density population
Proposed catchment area in
areas of high density population
FPSU 30km 10km
Agri-Hub 120km 60km
RUMC 250km 150km
Source: DRDLR, 2015
The FPSU is designed to have catchment areas of 30km in low density areas and 10km in high density areas,
indicating that there will be several per district. The AH is designed to have catchment areas of 120km in low
density areas and 60km in high density areas, indicating fewer AH’s than FPSU’s. There are likely only to be one
RUMC in the Eastern Cape for the initial phase of the Agri-Parks roll out. It will likely be located in Buffalo City.
After this initial phase a RUMC may be located in each district municipality if there is a need for it. When the
SBDM Agri-Park develops into a feasible business venture and there is a demand for a RUMC, one could be
developed specifically for SBDM in Nelson Mandela Bay.

Policy Review Chapter 3

Sarah Baartman Master Agri-Park Business Plan
P a g e | 12
3. POLICY REVIEW
The following chapter aims to discuss the relevant agricultural policy. Agriculture policy documents are provided
at three levels of government: National, provincial and municipal. Each of these levels approach agriculture and
Rural Development with their own priorities. National government seeks to address high-level inequalities
resulting from changing governmental regime and general migratory trends. National-level documents also seek
to create employment and income for South Africans. Provincial level reports are more focused in that lower-
level initiatives can be identified and developed for rural development. Municipal government, again, be more
specific still, allowing for targeted rural policies and initiatives.
It is important to examine the policy documents as it is necessary to align the business plan to planned
interventions and
3.1 National Development Plan (NDP) (2012)
The National Development Plan outlines the visions for South Africa, to be realised in 2030, which the provincial
(e.g. Eastern Cape Vision 2030) and municipality (e.g. Nelson Mandela Bay Vision 2030) development plans have
subsequently been based. The Plan emphasises the importance of inclusive rural development alongside urban
initiatives, giving due diligence to the large populace throughout SA that resides within rural areas, enabling
rural communities to have greater opportunities to participate in the economic, social and political life of the
country (NPC, 2012).
The main driving force of rural development within the National Development Plan is implemented through job
creation in the agricultural sector, through development based on effective land reform, and the growth of
production in traditional agriculture and aquaculture. Should these policies be implemented, the agricultural
initiatives will also enable development within agro-processing and fishing sub-sectors, as well as enabling
additional tourism and entrepreneurial capabilities of the regions. Finally, South Africa is committed to providing
and improving access to basic services that will develop capabilities of communities to take advantages of
opportunities around the region, assisting the communities through remittances and skills transfer (NPC, 2012)
3.2 Comprehensive Rural Development Programme (CRDP) (2009)
The CRDP condenses the policies affecting rural communities into a single organised directive. The framework
is “aimed at being an effective response against poverty and food insecurity by maximising the use and
management of natural resources to create vibrant, equitable and sustainable rural communities” (Department
of Rural Development and Land Reform, 2009:10).
The strategic objective of the CRDP is to facilitate integrated development and social cohesion through
participatory approaches in partnership with all sectors of society, and seeks to accomplish this through a three-
pronged strategy focusing on:
A coordinated and integrated broad-based agrarian transformation;
Strategically increasing rural development; and
An improved land reform programme
3.3 Department of Rural Development and Land Reform – Strategic Plan 2015-2020 (2015)
The Strategic Plan outlines five programmes that will assist in completing its mission statement: To initiate,
facilitate, coordinate, catalyse and implement an integrated rural development programme (Department of
Rural Development and Land Reform, 2015:9). Of these programmes, one specifically targets rural development,
Programme 3: Rural Development.

Sarah Baartman Master Agri-Park Business Plan
P a g e | 13
Programme 3 plans set in place actions for government entities to implement for rural development. The main
objectives of the programme are to:
Facilitate rural livelihoods development;
Develop infrastructure that will support the rural economy;
Provide support to rural enterprises and development of rural sectors and sub-sectors; and
Encourage job creation and skills development in rural areas.
These objectives have links to the Agriculture Policy Action Plan, the CRDP, and the National Development Plan.
3.4 Industrial Policy Action Plan 2013/14 – 2015/16 (2013)
The IPAP is unlike the previous rural development policy reports, in that it does not focus primarily on rural
development, but rather industrial development. National industrial development is not isolated to industrial
hubs, but spread across the whole value chain. The plan focuses on rural development via improving rural inputs
into the value chain. Examples of rural inputs range from agricultural produce from formalised farming
structures to animal hides sold informally from subsistence farmers. The IPAP seeks to inform and standardize
the latter markets, so that a uniform, high quality product is available for processing.
3.5 Diagnostic overview of the Eastern Cape Province (2013)
This report is a summary of the main challenges, attributes and accomplishments of the Eastern Cape. It serves
as a diagnostic review that highlights the main development challenges and problems in the province.
Furthermore, the review acknowledges and seeks to address the well-known provincial crisis areas, specifically
health, education, employment and the functioning of the state, with particular focus on education and health,
economic development, and governance and institutional capabilities, the core chapters of the overview.
The review does not specifically focus on rural development, but similar to the IPAP, addresses the core role that
rural communities play in correcting the above concerns. Human Development, as a good example, focuses on
the disparities between the rural and urban areas, the disparities between the former homeland areas and the
Cape Province, and the legacies of Apartheid. The chapter also acknowledges and discusses migratory trends,
such as the circular rural-rural and the rural-urban migration patterns.
3.6 Eastern Cape Rural Development Strategy (ECRDS) (2010)
The ECRDS is a response by the Eastern Cape Department of Agriculture and Rural Development to a then
growing national focus on rural development. Rural development was seen as a corrective tool to address
uneven development, as a result of increased urbanisation after 1994. The ECRDS seeks to “align and effectively
coordinate all policy interventions in order to ensure that the strategy draws from, and is aligned with all major
policy frameworks across all spheres of government”. (Eastern Cape Department of Agriculture and Rural
Development, 2010:9)
The ECRDS acknowledges that the Rural Eastern Cape is a region that required a different approach than macro-
policy objectives. Rural development, with respects to the Eastern Cape, is a process where people need to be
involved in creating a different society, and must be created around population organisation and mobilisation.
The strategy ties the need for rural development into several fundamental concerns currently existing within
the province, particularly:
Structural factors
Historical political economy
Land and agrarian relations
Settlement patterns and migration
Food security; and

Sarah Baartman Master Agri-Park Business Plan
P a g e | 14
Impacts of past initiatives.
The strategy also outlines the principles of which it uses to understand Rural Development, before outlining its
strategic vision and goals. The goals are broadly defined as the transformation of rural areas into regions that
are socially and economically developed, and creating a conducive institutional environment for rural
development. The goals will be achieved through the implementation of six pillars, focusing on land reform,
agrarian transformation and food security, non-agriculture rural economic development, infrastructure, social
and human development, and providing an enabling environment.
3.7 Eastern Cape Rural Development Plan (2013)
The Eastern Cape Rural Development Plan, builds on the Eastern Cape Rural Development Strategy by
developing actionable plans to affect the Eastern Cape Rural Development Strategy. The EC RDP defines and
identifies the rural population within the province, as well as providing an industrial review of key rural industries
within the province (Agriculture, Forestry, Tourism, Agro-Processing, Construction, and Mining). The Plan also
seeks to outline rural-focused development opportunities within the province, based upon existing initiatives
and industrial gaps identified within the various districts. The document achieves this by focusing on four
developmental pillars: Land Reform, Agrarian Transformation and Food Security, Non-Farm Rural Economy, and
Infrastructure and Social Development.
The four pillars streamline developmental objectives, identified within the document, into distinct categories,
enabling project planning and industrial development. One of the key developmental projects identified within
the Rural Development Plan is the Agri-Park, with the plan unpacking the Agri-Park concept. The positive knock-
on effects can be obtained near, and as a result of, the development of the Agri-Park and FPSU, such as improved
transport infrastructure, localised agri-processing initiatives and enabling consolidated agricultural production.
3.8 Agricultural Policy Action Plan (APAP), ( 2014)
The Agricultural Policy Action Plan (APAP) seeks to translate the high-level responses offered in the IGDP, into
tangible, concrete steps. The first iteration of APAP is not offered as a fully comprehensive plan; rather, based
on the model of the Industrial Policy Action Plan (‘IPAP’), it identifies an ambitious but manageable number of
focused actions, in anticipation of future APAP iterations that will take the process further.
The APAP aligns itself with the New Growth Path (NGP), the National Development Plan (NDP) and Industrial
Policy Action Plan (IPAP) and seeks to assist in the achievement of Outcome 4, Decent Employment through
Inclusive Growth, and that of Outcome 7, Comprehensive Rural Development and Food Security.
The APAP presents ‘sectoral interventions’ that concern selected subsectors/value chains, and ‘transversal
interventions’ which will support multiple subsectors (such as addressing common constraints or addressing
core competencies) and implementation management, monitoring and evaluation process.
The key outcomes of the APAP are listed below:
SECTORAL INTERVENTIONS
Poultry / Soybean / Maize integrated value chain
Interventions are concerned primarily with supporting the domestic soybean and yellow maize industries
with the aim of increasing production and lowering animal feed costs i.e. by relying less on imported oil-
cake, which is double of what is locally produced, and in this way render domestic poultry producers
more competitive.
Red meat value chain

Sarah Baartman Master Agri-Park Business Plan
P a g e | 15
Intervention are concerned with commercialising the communal livestock systems by means of improving
the herd health status and husbandry, continual reduction and prevention of food borne illness. There is
a need to ensure an analysis is done determining the potential of communal the communal farmers, and
the support required to prepare them (standards and meat quality and other processes) to meet market
requirements.
Wheat value chain
Interventions seek to make South African wheat farmers more competitive. This will be done through a
combination of R&D in new cultivars, adaptation of conservation agriculture technologies to wheat
production, while examining the possibility of augmenting milling capacity in the Western Cape near to
one of South Africa’s main production areas.
Fruits & vegetables
Interventions for fruits and vegetables include the supporting of fresh produce markets through
infrastructure investment, raising levels of skills and agricultural knowledge and the development of new
technologies to increase the productivity and profitability of fruit and vegetable farming.
Wine industry
Interventions for the wine value chain are focused on rendering it more adaptable, robust, globally
competitive and profitable. The sustainability of possible solutions and interventions will be directly
proportionate to the extent to which the industry is able to institutionalise with the necessary
government support.
Biofuels value chain
There are two main types of interventions regarding biofuels. The one type relates to a cluster of R&D
initiatives to ensure that farmers have access to the best possible varieties for feedstock production,
including R&D that enables them to increasingly take advantage of conservation agriculture methods.
The second is to determine how best to develop the smallholder sector to become feedstock suppliers,
especially as much of the land that could be made available for biofuels feedstock production is located
within the former homelands.
Forestry
The interventions for forestry are concerned with the following:
o Infrastructure development
o Land allocation and providing land tenure security
o Develop new management model for state owned forests
o Small growers support
Small-scale fisheries
The interventions for small-scale fisheries as described in the Small-Scale Fisheries Policy are as follows:
o Subsidy schemes for the storage of fish, skills training in the areas of processing, and basic business
skills.
o Subsidy schemes for the establishment of locally based and owned marketing companies,
o The development of a South African label/certificate for fish products caught by small-scale fishers.
o Establish small-scale fisheries development nodes.
Aquaculture competitiveness improvement programme (ACIP)
Sarah Baartman Master Agri-Park Business Plan
P a g e | 16
Interventions for aquaculture are taken from the National Aquaculture Strategic Framework and are as
follows:
1. Create an enabling, integrated regulatory and operational environment for developing an equitable
and globally competitive aquaculture sector for South Africa.
2. Increase access to available public and private land and water bodies for utilisation for aquaculture
purposes.
3. Ensure that appropriate funding instruments are put in place to attract private and public
investments into the sector.
4. Make provision for a reliable supply of good-quality and affordable seed and feed to all fish farmers.
5. Ensure adequate investment in the undertaking of aquaculture research and development to ensure
technical knowledge and transfer of technology which will make the aquaculture sector highly
competitive.
6. Implement environmental and biosecurity programmes to assure food safety and enhance quality
of aquaculture products.
7. Increase South African aquaculture products’ market share locally and internationally.
8. Ensure information management and dissemination to create awareness and promote aquaculture
as a socially, environmentally and economically viable activity.
9. Create partnerships and coordination between various government departments, industry and the
private sector.
10. Invest in capacity building and skills development in government, fish farmers and the private
sector.
TRANSVERSAL INTERVENTIONS
Fetsa Tlala
Fetsa Tlala Integrated Food Production Intervention focuses on supporting subsistence and smallholder farmers
to increase the area under production, with particular attention to bringing under-utilised arable land in the
former homelands into production, targeting 1 million hectares by March 2019.
Research and innovation
Interventions include the establishment of appropriate national bodies with the purpose of setting the national
Research and Development agenda for agriculture, forestry and fisheries, to guide and monitor agricultural
innovation.
Promoting climate-smart agriculture (CSA)
Interventions are in support of the following aspirations:
The development of CSA framework / strategy
Up-scaling of the CSA concept and practices by/among all farmers in all the nine provinces.
The provision of incentives for CSA practices with special focus on small holder farmers
CSA through measures such as, but not limited to, reduced tax on fuel.
To produce more with the same amount of water by using more efficient irrigation methods & water
demand management.
Trade, agri-business development and support
Interventions are aimed at increasing market access for agriculture, forestry and fisheries products both
domestically and internationally through targeted/ product specific interventions. The priority should be given
to smallholder farmers through research, capacity building and technical assistance.
Sarah Baartman Master Agri-Park Business Plan
P a g e | 17
Strategic Integrated Project (SIP) 11
The Interventions for the SIP 11 - Agri-logistics and rural infrastructure – are listed below:
Maximise the use of communal land and productivity of land reform projects
Expand irrigated agriculture by 500 000 Ha
Support agricultural sectors and regions with high productive potential.
Bio-security
Interventions for bio-security include:
Develop and strengthen regulatory frameworks in the biosecurity sphere
Promotion of regulatory compliance and training and advisory services in the field of biosecurity
Verification and registration of production unit codes for export markets
Control and eradication of quarantine diseases and pests
Procurement of an electronic information management system, and
Improvement of the early warning and early detection systems.
3.9 Eastern Cape Vision 2030
The Eastern Cape Vision 2030 is a comprehensive response by Eastern Cape Planning Commission to the National
Development Plan (Vision 2030) outlining the province’s critical priorities. The Provincial Development Plan
(PDP) has, at its core, ten principles. These are:
• The implementation, monitoring and review cycle of the PDP must encourage the active and critical
participation of all citizens of the Eastern Cape in their own development. Key to this will be people-
centred local action.
• The PDP and its implementation must be decisive in redressing injustices of the past effectively, while
fostering a consciousness for justice in future judgments and arrangements.
• The PDP should foster equitable economic growth and investment, as well as opportunities for
meaningful work.
• High-quality education, a healthy population and effective social protection are important to the
realisation of a flourishing future for all. The PDP should particularly guarantee an equal start for all
children, and ensure that no child suffers from malnutrition.
• The PDP should foster creative links between economic and social strategies to promote inclusive and
equitable participation in the economy by an active, hardworking and cohesive society.
• Collaboration between communities, the public and private sectors should be strengthened, with
greater attention paid to strengthening the capabilities of a community-anchored agency for
sustainable development.
• An effective and capable government, and public institutions with ethically committed leaders, are key
to the success of the PDP.
• An ethical, accountable private sector is equally important to the success of the PDP.
• Conscientious leadership is encouraged from all sectors of society and there should be a conscious,
ongoing effort to develop and strengthen such leadership.
• The PDP should foster the province’s knowledge-driven, evidence-based development.
The Eastern Cape Planning Commission responds to the challenges outlined in the NDP by illustrating that,
provincially:
1. There are too few labourers to work
2. The standard of education for most poor learners is poor
3. Infrastructure is poorly located, under-maintained and insufficient to foster higher growth and spatial
transformation
4. Spatial patterns exclude the poor from development
5. The economy is overly and unsustainably resource intensive

Sarah Baartman Master Agri-Park Business Plan
P a g e | 18
6. A widespread disease burden is compounded by a failing public health system,
7. Public services are uneven and often of poor quality
8. Corruption is widespread
9. South Africa remains a divided society.
The Commission seeks to address these issues through rural development strategies, regionally targeted, that
encourage spatially specific solutions. For example, the eastern and north-eastern parts of the province are
identified as high-density, poverty-stricken rural areas, and are acknowledged as potential agricultural hubs;
whereas the central region of the province is encouraged to make use of the East London Industrial Development
Zone (IDZ), through sectoral expansion. The western regions of the province are identified as having untapped
economic and tourism potential, as well expansion opportunities within existing agricultural and agro-processing
production, such as Mohair.
The PDP ultimately identifies three pillars through which the province can achieve its strategic vision and
objectives, specifically:
• Human Development;
• Economic Opportunity and Rights; and
• Institutional Capabilities.
3.10 Sarah Baartman District Municipality Integrated Development Plan 2012 – 2017 (2015/16 Review)
The SBDM IDP is a comprehensive document that deals with the status quo of the demographics, economy and
infrastructure. It also gives an outline as to the goals of the municipality and how it plans to achieve the goals.
For the purpose of this study it is important to determine the agricultural policy of the municipality. SBDM has
the following goals regarding agriculture and the development of rural areas:
Increase agricultural income to achieve a 1% year on year growth in the agriculture and agro-processing
sectors.
Regenerating at least four core towns as service and economic hubs
Improving connectivity infrastructure in all nine local municipalities
It aims to achieve these goals through the following strategies namely:
Support local and regional food systems that keep wealth in rural communities
Promote rural tourism (including agri-tourism) and niche services and manufacturing
Rural connectivity infrastructure particularly broadband and mobile phones access
Improve rural infrastructure, particularly roads
The SBDM notes that agro-processing in the district is very small and is in need of expansion. It is noted that an
increase of this sector needs to occur so that value can be added in the district and that raw products do not
simply leave the district. This results in lost opportunities to develop an industry in the municipality. The
municipality is currently promoting further investment into food security initiatives as well as attempting to
secure more commonage for local residents as there is a lack of commonage areas to graze animals.
The District is also supporting the Agricultural Mentorship Programme which is a measure that aims to educate
emerging farmers and to ensure that knowledge gained is applied correctly and in a flexible manner and adapting
it to local conditions. This is being done in collaboration with GIZ and is being piloted on five projects in the
District.

Sarah Baartman Master Agri-Park Business Plan
P a g e | 19
3.11 EC DRDAR Western Region Proposed (Sarah Baartman) Agri-Park Business Plan 2015
The Eastern Cape Department of Rural Development & Agrarian Reform has produced an Agri-Park Business
Plan for the Sarah Baartman District in response to the Agriculture Policy Action Plan. This document presents
a plan and proposal to the Department of Rural Development and Land Reform (DRDLR) on the establishment
of an Agri Park in the SBDM.
This document proposes establishment of an Agri-Park in the Sundays River Local Municipality on Portion 307
of the Farm Commando Kraal 113, known simply as KK113 in Addo. However, the main purpose of this document
is to map the best Agri-Park model that will best fit the local conditions, but without deviating from that of
national government and its strategic goals. This document suggests commodities that will can be focused on as
well as potential projects that align with the commodities. The market conditions are briefly examined as well
as the potential linkages with established projects in the area.
The current report will expand and build on the suggestions and proposals made in this document in order to
gain an understanding of the important projects and commodities that the District wishes to take forward.

Location Context Chapter 4

Sarah Baartman Master Agri-Park Business Plan
P a g e | 21
4. LOCATION CONTEXT
4.1 Description of the district
The Sarah Baartman District Municipality is bordered by the Chris Hani and Amathole Districts, and the Western
Cape Province. The district comprises nine local municipalities but the merger of Ikwezi, Baviaans and Camdeboo
has been confirmed. These are the current local municipalities:
Camdeboo,
Blue Crane Route,
Ikwezi,
Makana,
Ndlambe,
Sundays River Valley,
Baviaans,
Kouga, and
Kou-Kamma
It covers an area of roughly 58 245 km2. The major population centres in the district are Grahamstown,
Humansdorp, Jeffreys Bay, Graaff-Reinet, Kirkwood and Port Alfred. The municipal offices are located in Port
Elizabeth.
The Sarah Baartman District Municipality is the second smallest district by population in the province, with
452 000 people, while also being the largest in area. As a result, it has the lowest population density within the
province by a significant amount, with just 7.7 people distributed per square kilometre. The district has one of
the highest levels of education attainment, with 20.3% of the adult population having matric and 8.2% with
higher education. The District has the lowest unemployment rate in the province.
4.2 Location of the Agri-Hub
The Sarah Baartman District Municipality is one of the most agriculturally diverse districts in the province,
supplying citrus, fruit, potatoes, beef, dairy, wood, wool, mohair, lamb, and goat, amongst others, to the
provincial and national market. The district itself is also the largest, of the district municipalities in the Eastern
Cape.
The location for the Agri-Park Hub has been identified as the greater Addo area. Addo is close (32km) to
Kirkwood which is home to the commercial citrus industry. The Agri-Hub is centrally located and is only 60km
from the Port Elizabeth Harbour and 50km to the Port of Ngqura. The Agri-Hub is also only 70km to the
international airport in Nelson Mandela Bay. Existing transport infrastructure already exists in the area but is
need of maintenance. One of the possible sites for identified for the Agri-Hub is Portion 307 of the Farm
Commando Kraal 113, known simply as KK113, which is a 440 hectare property currently owned by the Sundays
River Municipality. While this may be one of the sites identified by the DRDAR it is recognised that the Agri-Hub
itself may spread its operations over available municipal and government land in the area, but the Hub location
itself will largely be located in the Addo area around the site known as KK113. Some operations may occur
throughout the Addo area. For the purpose of costing, KK113 has been used as the site. The DAPOTT and DAMC
have yet to make a final decision regarding the site for the Agri-Hub.

Sarah Baartman Master Agri-Park Business Plan
P a g e | 22
Figure 4.1: Location of the Agri-Hub
Source: Urban-Econ GIS Unit, 2015
4.3 Economic Infrastructure
The N2 National Road enters into the Sarah Baartman District in the west, passing near Kareedouw,
Humansdorp, and Jeffreys Bay before heading towards Nelson Mandela Bay. The N2 continues through the
district on the other side of the Nelson Mandela Bay Metropolitan Area, heading towards Grahamstown, before
continuing on out of the district towards Peddie. The N2 links Cape Town to Nelson Mandela Bay to Durban. The
N2 splits into the N10 just outside of Nelson Mandela Bay, heading towards Craddock (Chris Hani District) in the
north. The N9 enters the district near Willowmore, passing through Willowmore, Aberdeen, and Graaff-Reinet
on its way towards Middelburg (Chris Hani District). Regional roads in the region serve as routes to traverse the
significant district area, with multiple regional roads serving this purpose. These are the R61, R63, R67, R72, R75,
R306, R329, R335, R337, R338, R342, R343, and R400. The road infrastructure around the Agri-Hub is a challenge
to growth in the region as road quality is extremely poor. This will need to be addressed if the Agri-Hub is to be
placed in Addo and its surrounds. There are road quality concerns throughout the District which will need to be
addressed as well.
There are three major railway routes in the district, both emanating from Nelson Mandela Bay; the first heads
from Nelson Mandela Bay to Grahamstown, before continuing on to Port Alfred. The second splits from the
Grahamstown line and heads towards Middelburg. The final route heads through Uitenhage, past Kirkwood, and
splitting within in the district, to head towards Graaff-Reinet, continuing on to Middelburg with the other route
heading towards George (Western Cape). The Addo railway line is directly connected to the major industrial
regions of Coega and Port Elizabeth.
No major ports exist in the District but it is served well by the Port of Ngqura and Port Elizabeth in Nelson
Mandela Bay Metro. Port St Francis, Jeffreys Bay, and Port Alfred serve as minor fishing ports. There are no

Sarah Baartman Master Agri-Park Business Plan
P a g e | 23
major airports in the region either but once again it is served by the Port Elizabeth International Airport. There
are various small aerodromes around larger towns in the District and there is an airport initiative underway at
Somerset East.
Much of the Eastern Cape and especially Sarah Baartman District is water deficient. While there are dams in the
district, water scarcity is an issue. This led to developments around water transfers in the Eastern Cape to
support irrigation, industrial and domestic use. The areas around Kirkwood and Addo are also part of the
Sundays River Irrigation scheme which supplies water for crops to the farms in the surrounding areas. This water
is largely used for citrus farming but Water is supplied from the Orange River into the Gariep Dam which is then
fed into the Fish River via the Orange-Fish tunnel which is then sent on to the Sundays River. The primary purpose
of the water transfer scheme is to supply water for irrigation and domestic use. The issues of water rights does
appear to be of concern however. In order to draw water from the scheme, water right s needs to be obtained
from the Department of Water Affairs and Sanitation. There is uncertainty among stakeholders as to the granting
of water rights and if any more water can or will be allocated. The process of allocation is also unclear and the
requirements that the DWA use to grant water rights is not clearly known.
Much of the electrical network in the municipality is of acceptable quality with a few towns in the District in
need of upgrades to the network and maintenance. The load-shedding outages that occur throughout the
country limit the economic effectiveness of the area but this is a common theme across the country. Electricity
infrastructure is largely acceptable in the District.

Role-Players Chapter 5

Sarah Baartman Master Agri-Park Business Plan
P a g e | 25
5. ROLE-PLAYERS
The following chapter will discuss the main role-players who could provide support, finance and skills for the
Agri-Park. This section will include possible role-players from the public sector, private sector and various
associations and organisations. It will discuss the role-players mandate, budgets if available and current projects.
5.1 Public Sector
5.1.1 The National Department of Rural Development and Land Reform (DRDLR)
The mandate of the DRDLR is to promote sustainable land and agrarian transformation in the country while
promoting rural development and creating sustainable tenure systems that will enhance South Africans
livelihoods. They are also tasked with fighting poverty and promoting food security. The DRDLR functions under
three pillars namely:
The first pillar - sustainable land and agrarian transformation: The aim is to increase agricultural production
through the optimal and sustainable use of natural resources and appropriate technologies to ensure food
security, dignity and improved rural livelihoods. This will subsequently lead to vibrant local economic
development.
The second pillar - rural development: This focus is on improving both economic infrastructure (such as roads,
community gardens, food production, fencing for agriculture, etc.) and social infrastructure (e.g., communal
sanitation, and non-farming activities). To successfully achieve this, ownership of processes, projects and
programmes is vital.
The third pillar- land reform based on restitution, redistribution and land tenure reform: Deliberate and
intensified post-settlement support is available to ensure that land transferred to black South Africans
contributes to the fight against poverty, by ensuring food security and underpinning economic and social
transformation in rural areas. Land reform remains critical to the comprehensive development of South Africa’s
rural areas and the government’s recapitalisation and development of land reform projects, currently in distress,
bears testimony to this.
The main projects that DRDLR are going to be involved in in the District is the Agri-Parks Project. The DRDLR are
the main drivers of the Agri-Parks concept and are heavily involved in it implementation and conceptualisation.
5.1.2 Eastern Cape Department of Rural Development and Agrarian Reform (DRDAR)
The mandate of DRDAR is to “promote, support and coordinate rural development and agrarian reform to
reduce poverty and underdevelopment through integrated and participatory interventions.”
The three strategic goals of the Department are is to create a thriving farming sector and access to affordable
food, to develop improved rural economic livelihoods and creation of employment opportunities and an
environment conducive to the enhancement of service delivery.
The Eastern Cape Rural Development Agency (ECRDA) is a public entity that reports to the DRDAR and many of
the projects that are funded and implemented are done so through the ECDRA.
Current projects and initiatives that are promoted through the DRDAR in the district include:

Sarah Baartman Master Agri-Park Business Plan
P a g e | 26
Table 5.1: Projects previously assisted by DRDAR in SBDM
NAME OF PROJECT LOCATION ASSISTANCE PROVIDED
Belvoir Farm Addo Boundary fence, irrigation system
Willowtree Addo Citrus sprayer
Siyathemba Citrus Farm Addo Citrus inputs
Welwediend Farm Kirkwood Citrus sprayer; 20 citrus bins and production inputs
Mbuyiselo farm Kirkwood Boundary fence
Luthando Farm Kirkwood Boundary fence, citrus bins, irrigation fittings, pruning machines
Khangela Farm Addo Citrus tractors, citrus inputs, citrus bins
Source: DRDAR, 2015
5.1.3 Sarah Baartman District Municipality
The Sarah Baartman District Municipality is one of the key stakeholders in the Agri-Parks concept. The Sarah
Baartman District Municipality is one of 46 district municipalities in South Africa and one of the largest in the
Eastern Cape covering 34% of the province. The Sarah Baartman District Municipality is made up of nine local
municipalities namely Kou-Kamma, Baviaans, Kouga, Ikwezi, Camdeboo, Blue Crane Route, Sundays River Valley,
Ndlambe and Makana. It shares the responsibility of providing basic services like electricity, water and refuse
removal with the local municipalities. As a district municipality it provides support to local municipalities within
its area that are too small, poor or rural to provide all the services required by their communities.
The SBDMs role in the Agri-Parks plan will be to take ownership of the Agri-Parks concept and be the primary
driver of the Agri-Parks concept. The SBDM will be able to include key LED projects as well as other special
projects into the Agri-Parks concept that drive agriculture in the District.
Strategically it is important for the SBDM to be included in the planning for the Agri-park as they Agri-Park
concept can be used to solve challenges that the municipality is facing. These challenges include reducing
poverty, economic development, transformation and agrarian reform. The SBDM identifies various projects
through its LED strategy and IDP process which can be included in the Agri-Park concept to assist emerging
farmers.
The SBDM also has a development agency which is responsible for facilitating economic growth in the district. It
is important to also include this agency in the role-players for the Agri-Park.
Cacadu Development Agency (CDA)
The CDA was established by the Cacadu District Municipality (now Sarah Baartman) in 2012 with the goal of
facilitating economic, social and environmental policies and projects. Approximately R 4 million was set aside
predominantly for feasibility studies into various projects. Its purpose is also to fund projects that could sustain
economic growth and create a suitable investment climate in the District in order to stimulate employment and
economic development.
The primary areas that the CDA aim to achieve success is in agriculture and tourism. The CDA aims to develop
various programmes centred on agro-processing, aquaculture, renewable energy, natural fibre beneficiation,
and Agri-tourism.
The main goals of the CDA are to:

Sarah Baartman Master Agri-Park Business Plan
P a g e | 27
Initiate, identify and implement high economic impact development programmes and projects
Generate sustainable economic growth as well as social transformation to the benefit of communities
within the district
Promote productive partnerships and cooperation between the relevant stakeholders on
area/regional-based initiatives
Manage the spatial organisation of the area in a socially efficient manner, particularly through the use
of public land and targeted private project”
Acquire, own and manage buildings to be used for social and economic development purposes
Facilitate a business environment conducive to private sector investment and the leveraging of public
and private sector resources for economic development, and
Contribute towards integrating the region/district into domestic and international markets.
The CDA have identified a number of potential projects that have the potential to create employment and
economic development. These include:
Fig production in BCRM
Cactus pear production in BCRM
The Somerset East airport development
Agro-processing operations related to leather, hides, wool and other animal products.
Agro-processing opportunities related to fruit and veg processing.
Agri-tourism in the Sarah Baartman District.
5.1.4 Eastern Cape Rural Development Agency (ECRDA)
The ECRDAs mandate is to promote, support and coordinate rural development and agrarian reform to reduce
poverty and underdevelopment through integrated and participatory interventions. The ECRDA seeks to
enhance Department of Rural Development and Agricultural Reform programmes and support initiatives, with
the aim of rejuvenating rural economies, by focusing on 5 main pillars, namely:
Effective co-ordination and implementation of agrarian-driven high impact priority programmes
Promoting entrepreneurship through rural finance and support programmes
Develop, institutionalise and sustain an effective, capable and fit-for-purpose organisation including
best-in-class project management, targeted research and innovation driven Agency
Leverage strategic partnerships toward implementation and funding of rural development initiatives
Develop sustainable, localised institutionalised rural framework.
The ECRDA has 9 major Programmes in various stages of implementation which are:
Programme 1: Rural Development Programme
The establishment of nine agro-processing and marketing infrastructure projects to enhance value-addition over
a period of three years. Increasing the feedstock supply to an estimated 13 200 tons to support milling plants
over a period of three years. Facilitating the establishment, support and oversight of community-owned and
operated forestry projects covering 20 000 ha over the next 3 years.
Programme 2: Renewable Energy Programme
Undertake eight renewable energy research studies by 2017/2018. Facilitate the implementation of four
renewable energy and ancillary projects by 2017/2018. Facilitate the production/provision of 164 500 tons of
feedstock for the bio-energy industry by 2017/2018.
Both of these programmes falls under the ECRDA’s Pillar 1, with a total cost of R 35 572 000.
Programme 3: Rural Finance Programme (including micro-finance)
Sarah Baartman Master Agri-Park Business Plan
P a g e | 28
Facilitate disbursements and recovery of loans to the value of R19.3 million by 2017/2018, with the loans used
to stimulate entrepreneurship in rural areas by guiding and supporting communities through providing guidance
during the entrepreneurship stages. The ECRDA is budgeting R34.5 million over the 2014-2018 period.
Programme 4: Rural Development Support Programme
Facilitate the establishment of 90 sustainable rural development enterprises by 2017/2018, by identifying rural
development entities, mobilising these entities, providing capacity building through training of cooperative
members and to encourage linkages to other partners that are able to provide assistance. The budget for the
programme is R5.724 million.
Programme 7: Co-ordinate and facilitate external funding and investments to co-fund mega projects.
This is with reference to six rural enterprise development hubs, completed by 2017/2018.
Programme 9: Establishment of rural development clusters and nodes.
This is achieved via the establishment of nine rural development clusters across the six district municipalities in
the Eastern Cape between 2015/2016 and 2017/2018, with a budget of R400 000.
ECRDA provides finance in the form of loans is given to clients who qualify and who wish to start economically
viable business undertakings. The client must accept full responsibility for the funds borrowed. ECRDA does not
fund infrastructure and/or goods that the Comprehensive Agricultural Support Programme (CASP) programme
of the Department of Agriculture can finance by way of grant funding. ECRDA is an accredited agent of the
National Department of Agriculture and has been identified as the principal implementing agent in the Eastern
Cape for the MAFISA loan finance scheme. Details of the scheme are available from the Agricultural Extension
Officer in each district.
Financial Support is further available through the Provincial Department of Rural Development and Agrarian
Reform.
5.1.5 Department of Economic Development, Environmental Affairs and Tourism (DEDEAT)
The blueprint for economic development comes from the Provincial Growth and Development Plan (PGDP). The
main goal of DEDEAT is to lead economic development in the province through environmentally sound and
sustainable practices.
DEDEAT is predominantly involved in creating policy that will facilitate the necessary economic development
and funding the various public enterprises that are part of DEDEAT. Through various funding platforms DEDEAT
encourages the development and creation of infrastructure and special economic zones, enterprise
development, development of the trade sector, provision of regulation services, research and planning,
partnerships and linkages, tourism development and environmental management.
DEDEAT concentrates and performs on three main programmes namely:
Programme 1 – Administration
Provides the department with strategic leadership and management
Programme 2 – Economic development and tourism
This programme is primarily responsible for promoting and administering job creation and economic
development in the province.
Programme 3 – Environmental Affairs

Sarah Baartman Master Agri-Park Business Plan
P a g e | 29
Administration of environmental policy that cascades from national level and alignment of
departmental policy. This programme regulates environmental management through environmental
impact assessments compliance and enforcement, air quality, waste and biodiversity management.
DEDEAT performs functions through public entities which are listed below with their budget allocation for 2014:
Eastern Cape Development Corporation (ECDC) – R 208 million
East London Industrial Development Corporation (ELIDZ) – R 95 million
Coega Development Corporation (CDC) – R 185 million
Eastern Cape Parks and Tourism Agency (ECPTA) – R 193 million
Eastern Cape Gambling and Betting Board (ECGBB) – R 44 million
Eastern Cape Liquor Board (ECLB) – R 42 million
Each of these agencies are responsible for various activities and projects. Some are region and location specific
such as the CDC and ELIDZ which operates in the IDZs in the Eastern Cape while others operate throughout the
Eastern Cape such as ECDC, ECPTA, ECGBB and ECLB. Outside of the IDZs most of the economic development
projects are planned and funded by the ECDC and ECPTA. For this exercise the ECDC will be discussed in further
detail.
5.1.6 Eastern Cape Development Corporation (ECDC)
The ECDCs mandate is to promote sustainable economic development in the Eastern Cape through focused
provision of innovative development finance and the leveraging of resources, strategic alliances, investment and
partnerships. The ECDC seeks to act as a bridge between the socio-economic goals of the Eastern Cape and the
areas of the private sector that requires development. The primary mandate is to positively contribute to
governmental development objectives for the province, and to overcome the constraints of poverty,
unemployment, inequality, under-development and apartheid inheritance.
The ECDC has numerous priority areas for projects namely: Business Finance, Investment Promotion, Enterprise
Development, Project Development, Property Management, Export Promotion, Spatial and Rural Projects. The
table below is a list of projects under the ECDC. It should be noted that there are a broad range of projects that
are funded by the ECDC including mining operations and tourism operations (Table 5.2):
Table 5.2: ECDC Projects in and around SBDM
Project Name Location Budget
Ndlambe Natural Industrial Products East London/Bathurst R27 million
Bio-coal Manufacturers and Distributors R3.9 million
Tourism Enterprise Partnership East London, Hankey,
Mthatha, Port St Johns,
Graaff-Reinet, Somerset East
R200 000
Imvaba Co-operative Fund Eastern Cape R6.2 million
Karoo Blue Trust Fish project Graaff-Reinet R1 million
Giant Flag Project Graaff-Reinet R800 000
Clover Perseverance R100 million
Forestry Rehabilitation R113 million
Source: ECDC, 2015
The Eastern Cape Provincial Government, as part of its Provincial Growth and Development Plan (PGDP), has
identified agriculture as an economic growth sector for the province. Agrarian transformation forms a large part
of the PGDP in terms of the economic diversification within the province. As such this sector has large-scale
investment potential which will contribute significantly to economic diversification and job-creation. THE ECDC

Sarah Baartman Master Agri-Park Business Plan
P a g e | 30
provides both Financial and Non – Financial business support services to predominantly SME businesses in the
Eastern Cape.
5.1.7 Eastern Cape Socio-Economic Consultative Council (ECSECC)
The mandate of the ECSECC is to be a multi-stakeholder centre of excellence in applied policy research,
development planning and facilitation.
The principal goal of the ECSECC is to advise and assist government and other stakeholders to achieve an
integrated development strategy for the Province and its constituent regions, to address the socio-economic
development of the province, and particularly the needs of the communities and underdeveloped areas.
The Eastern Cape Socio-Economic Consultative Council provides supportive roles for planning and project
development, ensuring that there is alignment with governmental policies, such as the provincial growth plan.
ECSECC is also involved in service delivery, promoting alternative service delivery initiatives to poor and
underserviced communities.
The projects that the ECSECC are currently involved in include:
Political Economy of HIV and AIDS Conference
Development of the Rural Development Strategy
Development of the Business Case from the establishment of a rural development agency
Liberation Heritage Route
Skills Indaba
Database of Provincial Training providers
5.1.8 Small Enterprise Development Agency (SEDA)
SEDA is an agency of the Department of Small Business Development. SEDA was established in December 2004,
through the National Small Business Amendment Act, Act 29 of 2004. SEDAs mandate is to develop, support and
promote small enterprises throughout the country, ensuring their growth and sustainability in co–ordination
and partnership with various role players, including global partners, who make international best practices
available to local entrepreneurs.
SEDAs main goal is to develop small enterprise development ecosystem, and its network provides access to
much needed support services to small enterprises and co-operatives. These services include information to
start-up businesses, support through incubation, market access and expansion for established small enterprises
and co-operatives
SEDA is involved in projects that deal with entrepreneur, skills and business development. Some of the successful
projects (and SEDAs role) in the Eastern Cape include:
Anax Fleet Management & Fuel Supply Solutions – Business plan and project proposals.
Four Star Communications – Computer skills training
Maletswai Waste and Recycling cooperative - Developing a business plan, skills training
Sithembeni Woman Cooperative – Developing a business plan, learning exhibitions in Canada.
SEDA is also planning to budget between R 5 million and R 20 million with the establishment of poultry
cooperatives, servicing the live bird and indigenous poultry demand throughout the Eastern Cape in association
with other development agencies such as DRDAR and DEDEAT.

Sarah Baartman Master Agri-Park Business Plan
P a g e | 31
5.1.9 Extension and Support Services
DAFF has implemented an Extension and Advisory Revitalisation Programme worth R1.1 billion over the last five
years. By the end of 2012/13, more than 1 200 extension and advisory officers had been recruited to improve
the ratio of extension officers to farmers. To ensure that these officers are visible and accountable on the
ground, the Digital Pen technology has been rolled out nationally. This technology is used by extension personnel
to record their interaction with clients and allows the taking of pictures on site for evidence purposes. To ensure
access to appropriate information, the Extension Suite Online system has been adopted nationally. This
computerised system enables extension officers to access relevant information during their interaction with the
farmers in the field.
Veterinary services are also provided through DAFF which assists the local commercial and emerging farmers
with any issues they may have with livestock and animals.
Table 5.3 indicates the extension and support services being offered by different organisations. These services
usually include training, business and financial services.
Table 5.3: Extension and Support Services Offered by Various Organisations
Organisation Type of Support
DAFF Provides state veterinary services and various
agricultural services through the extension and
advisory offices
ECDC Financial and business support services
ECRDA Financial and business support through CASP and
uVimba services. It is the implementing agent of the
MAFISA loan finance scheme
DRDAR Provides support and training to farmers and
financial services
SBDM Provides financial and operational services mainly to
SMMEs
5.2 Private Sector
5.2.1 Commercial Banks
The four major commercial banks target market comprises of both the commercial as well as developing
agriculture. Their focus is on retaining and selective acquisitioning of their market share in commercial
agriculture. Products and services offered are, amongst others, cheque accounts, overdraft facilities, term loans,
mortgage loans, asset finance, investments, estate and asset management, insurance and assurance,
international banking services, contract growing, hedging and trading as well as electronic banking services and
advisory services. Agricultural Long-term Loans are used to buy farm property, make capital improvements such
as fencing, water provision and soil conservation or to consolidate short-term debt (where farmers have
previously financed fixed assets out of working capital or short-term finance). Agricultural Project Loan is a
medium-term loan product. It is a multipurpose agricultural loan suited for the acquisition of livestock, orchards,
farm buildings, etc., which generates an income only after a certain establishment period. Agricultural Cheque
Account fulfils the transmission of funds requirements of a farming business, as well as providing a dedicated
product for short-term (less than 12 months) production credit.
5.2.2 Agricultural Co-operative Finance
Depending on the scale of co-operatives they often have financial assistance divisions which offer assistance to
farmers. These can include production loans or seasonal facilities for period of up to one year. These facilities
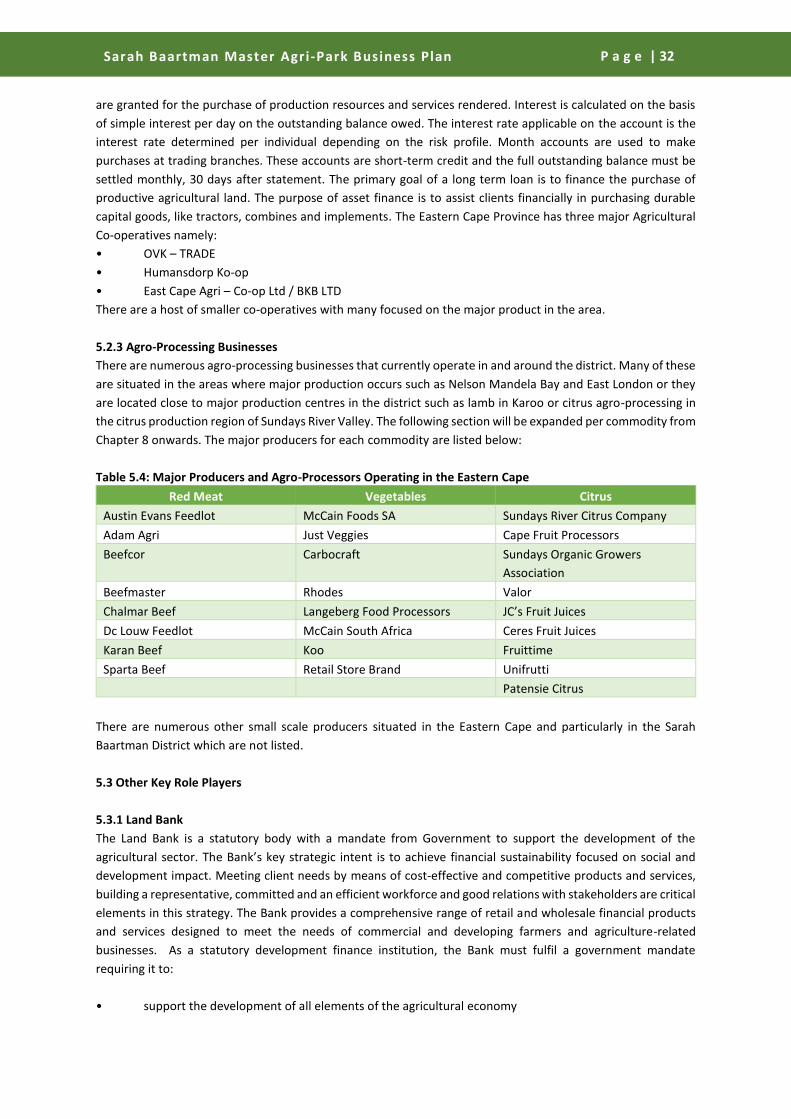
Sarah Baartman Master Agri-Park Business Plan
P a g e | 32
are granted for the purchase of production resources and services rendered. Interest is calculated on the basis
of simple interest per day on the outstanding balance owed. The interest rate applicable on the account is the
interest rate determined per individual depending on the risk profile. Month accounts are used to make
purchases at trading branches. These accounts are short-term credit and the full outstanding balance must be
settled monthly, 30 days after statement. The primary goal of a long term loan is to finance the purchase of
productive agricultural land. The purpose of asset finance is to assist clients financially in purchasing durable
capital goods, like tractors, combines and implements. The Eastern Cape Province has three major Agricultural
Co-operatives namely:
• OVK – TRADE
• Humansdorp Ko-op
• East Cape Agri – Co-op Ltd / BKB LTD
There are a host of smaller co-operatives with many focused on the major product in the area.
5.2.3 Agro-Processing Businesses
There are numerous agro-processing businesses that currently operate in and around the district. Many of these
are situated in the areas where major production occurs such as Nelson Mandela Bay and East London or they
are located close to major production centres in the district such as lamb in Karoo or citrus agro-processing in
the citrus production region of Sundays River Valley. The following section will be expanded per commodity from
Chapter 8 onwards. The major producers for each commodity are listed below:
Table 5.4: Major Producers and Agro-Processors Operating in the Eastern Cape
Red Meat Vegetables Citrus
Austin Evans Feedlot McCain Foods SA Sundays River Citrus Company
Adam Agri Just Veggies Cape Fruit Processors
Beefcor Carbocraft Sundays Organic Growers
Association
Beefmaster Rhodes Valor
Chalmar Beef Langeberg Food Processors JC’s Fruit Juices
Dc Louw Feedlot McCain South Africa Ceres Fruit Juices
Karan Beef Koo Fruittime
Sparta Beef Retail Store Brand Unifrutti
Patensie Citrus
There are numerous other small scale producers situated in the Eastern Cape and particularly in the Sarah
Baartman District which are not listed.
5.3 Other Key Role Players
5.3.1 Land Bank
The Land Bank is a statutory body with a mandate from Government to support the development of the
agricultural sector. The Bank’s key strategic intent is to achieve financial sustainability focused on social and
development impact. Meeting client needs by means of cost-effective and competitive products and services,
building a representative, committed and an efficient workforce and good relations with stakeholders are critical
elements in this strategy. The Bank provides a comprehensive range of retail and wholesale financial products
and services designed to meet the needs of commercial and developing farmers and agriculture-related
businesses. As a statutory development finance institution, the Bank must fulfil a government mandate
requiring it to:
• support the development of all elements of the agricultural economy

Sarah Baartman Master Agri-Park Business Plan
P a g e | 33
• give special attention to the needs of previously-disadvantaged people in the sector
• benchmark its operating efficiencies and service delivery against financial-sector norms
• ensure its financial sustainability.
The Land Bank gives low, medium and high-risk clients access to a full range of long, medium and short-term
loans to meet all financial needs, including land and equipment purchases, asset improvement and production
credit. During 1999 the bank added Gold Premium and Platinum risk categories to its existing Gold low-risk
category. Clients who qualify on the basis of exceptional security and high loan values pay reduced interest rates.
Specific criteria for medium and high-risk clients with limited security increases access to credit while minimising
the risk of default.
The table below provides key institutions that will be able to provide support to the Agri-Parks concept in the
District. Some of the institutions are located outside of the District but are extremely important to the area.
These institutions can mainly provide research, expertise and training.
Table 5.5: Key Institutions
Institutions Description
Tertiary Institutions Tertiary institutions such as Nelson Mandela Metropolitan University,
Rhodes University and the University of Fort Hare are important to consider
in the Agri-Parks planning as they can provide expertise, research and
provide valuable training to emerging farmers and managers of the Agri-
Park. Buy-in from these institutions can provide valuable support.
Colleges If the proper linkages can be formed, colleges and TVET institutions can
provide valuable skills training that can directly assist those emerging
farmers who need to be trained. TVET colleges also provide practical and
job ready skills that emerging farmers can make use of.
Research Institutions Research institutions such as CSIR and ARC can provide key research
regarding a wide range of subjects that may impact emerging farmers such
as weather, soil conditions, temperature variations, cultivar use among
other things. It is essential to form linkages to these research institutions.
5.3.2 Associations and Organisations
The following section outlines the associations and organisations that may be important to consider and consult
during the planning stage of the Agri-Park. Some of these organisations operate nationally while also having
provincial and local offices. Other organisations are only represented at a local level. The organisations that are
represented here are only a small set of those in the district and nationally and once FPSUs are set up then other
associations in relevant areas need to be considered. Table 5.6 is a list of the stakeholders.
Table 5.6: Associations and Organisations
Associations/ Organisations Description
Agri-SA Agri-SA is a non-profit organisation aimed at developing a
stable, profitable agricultural environment within South
Africa. Through its affiliated membership, Agri-SA
represents a diverse group of farmers. Agri SA’s policy
advocacy includes work on trade negotiations, industrial
policy, taxation, financing, land reform, labour laws,
training, farmer development, environmental affairs, water
rights and water pricing, other input-related issues, farm
safety, law and order, infrastructure, technology

Sarah Baartman Master Agri-Park Business Plan
P a g e | 34
Associations/ Organisations Description
development and transfer, statistical information and local
government. The organisation also maintains an extensive
communication network with its members and other
affected communities, organisations and individuals.
African Farmers Association (AFASA) AFASA aims to commercialise the developing agricultural
sector and ensure meaningful participation of black
individuals within the mainstream commercial agribusiness
sector, hence ensuring the long-term sustainability of the
agricultural sector in South Africa.
The Agricultural Economics Association of
South Africa (AEASA)
AEASA is the professional organisation of Agricultural
Economists in South Africa. AEASA's products and services
should support all agricultural economists active in the
industry.
South African Agricultural Machinery
Association (SAAMA)
SAAMA serves as a combined forum for the agricultural
machinery industry in South Africa in which the interests of
its members and agriculture as a whole are addressed,
promoted and developed through responsible, co-
ordinated discussion, action and provision of funded
information about the industry as a whole.
Citrus Growers Association (CGA) The CGA was established in 1997 after the citrus industry
was deregulated in order to protect the interests of citrus
farmers. Since then it has also taken on additional
responsibilities in providing the industry with access to
global markets, optimising cost effective production of
quality fruit, development and research into citrus, as well
as effectively transforming the industry.
Red Meat Producers Organisation (RPO) RPO is service organisation that acts as mouthpiece for
South African commercial red meat producers. It is an
independent producer’s organisation that strives to
dynamically promote the sustainability and the profitability
of the red meat industry in South Africa.
Agricultural Employers Association (AEA) An affiliate of Agri EC, the LWO offers specialised knowledge
and assistance with matters such as employment contracts,
disciplinary hearings, strikes, restructuring, retrenchments
and union negotiations.
Citrus Growers Association Development
Chamber (CGDC)
The CGDC is responsible for overseeing the emergence of
new and emerging farmers in the citrus industry. It also
plays an important part in the transformation in the citrus
industry.
Agri-EC Formerly known as the Eastern Province Agricultural Union,
was established in 2001 and is the voice of the farmer in the
province. Its vision is to develop and grow the agricultural
industry as a sustainable economic sector by promoting
agricultural business interests, influencing government
policy formulation and providing value-added services to its
members.
Lower Sundays River Water Users Association Formed in 1917 (as the Sundays River Irrigation Board) to
oversee the construction of Darlington, the original board’s

Sarah Baartman Master Agri-Park Business Plan
P a g e | 35
Associations/ Organisations Description
role was to ensure that continuous and scheduled delivery
of water to farmers in the valley through a water transfer
scheme from the Gariep Dam. The board was restructured
to an association of water users in 2005 in line with
legislation and today promotes the concerns of water users
in the Sundays River Valley.
Agri-Sondagsrivier A local farmers’ association that promotes the interests of
farmers in the Sundays River Valley. Associated with Agri-
EC.
Addo Farmers Association A local farmers association dedicated to promoting the
concerns of local farmers.
Farm Dwellers Association An association dedicated to promoting the concerns and
issues of local farm dwellers in the Sundays River Valley
Municipality.

District Overview Chapter 6
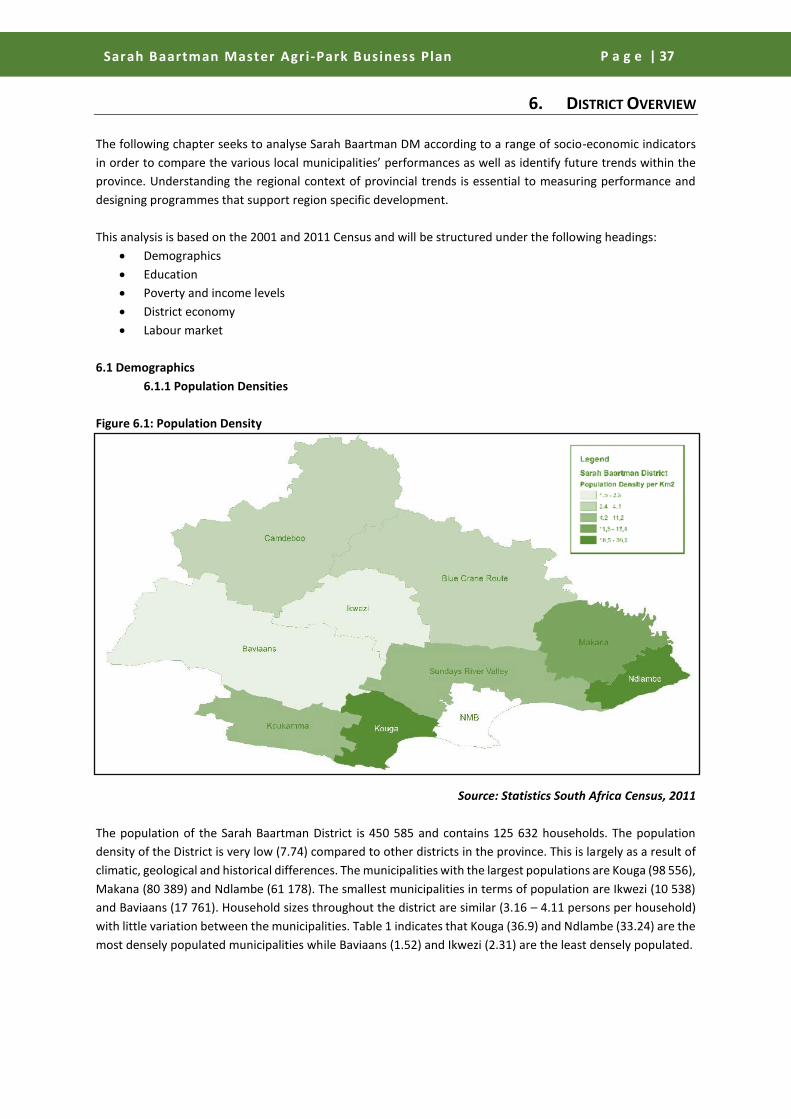
Sarah Baartman Master Agri-Park Business Plan
P a g e | 37
6. DISTRICT OVERVIEW
The following chapter seeks to analyse Sarah Baartman DM according to a range of socio-economic indicators
in order to compare the various local municipalities’ performances as well as identify future trends within the
province. Understanding the regional context of provincial trends is essential to measuring performance and
designing programmes that support region specific development.
This analysis is based on the 2001 and 2011 Census and will be structured under the following headings:
Demographics
Education
Poverty and income levels
District economy
Labour market
6.1 Demographics
6.1.1 Population Densities
Figure 6.1: Population Density
Source: Statistics South Africa Census, 2011
The population of the Sarah Baartman District is 450 585 and contains 125 632 households. The population
density of the District is very low (7.74) compared to other districts in the province. This is largely as a result of
climatic, geological and historical differences. The municipalities with the largest populations are Kouga (98 556),
Makana (80 389) and Ndlambe (61 178). The smallest municipalities in terms of population are Ikwezi (10 538)
and Baviaans (17 761). Household sizes throughout the district are similar (3.16 – 4.11 persons per household)
with little variation between the municipalities. Table 1 indicates that Kouga (36.9) and Ndlambe (33.24) are the
most densely populated municipalities while Baviaans (1.52) and Ikwezi (2.31) are the least densely populated.

Sarah Baartman Master Agri-Park Business Plan
P a g e | 38
Population densities are important to consider in agriculture as if an area has low population then finding
suitably skilled labourers would be difficult and labourers would have to be brought in from areas outside of the
district.
Table 6.1: Population Densities of Sarah Baartman
Municipality Population Number of Households Population Density Average Household Size
Sarah Baartman 450 585 125 632 7.74 3.59
Camdeboo 50 994 12 401 4.11 4.11
BCR 35 999 9 760 3.25 3.69
Ikwezi 10 538 2 915 2.31 3.62
Makana 80 389 21 385 18.37 3.76
Ndlambe 61 178 19 333 33.24 3.16
SRV 54 504 14 747 9.09 3.70
Baviaans 17 761 4 611 1.52 3.85
Kouga 98 556 29 448 36.92 3.35
Kou-Kamma 40 666 11 032 11.16 3.69
Source: Statistics South Africa Census, 2011
6.1.2 Age Structure
It is important to consider age in agricultural planning as this has a direct impact on the labour requirements of
an area. Agriculture generally requires labourers who are physically fit and many areas are experiencing
migration of the working aged group to major centres leaving the elderly and young in the rural areas.
In 2011, 65.7% of the inhabitants of the Sarah Baartman District were between the ages of 15 and 64. Table 2
indicates that 34.3% of the population are in the age range of 0-14 and 65 years and older. Generally the Sarah
Baartman District has a higher proportion of working age inhabitants than other districts in the Eastern Cape.
Table 6.2 indicates that Ndlambe has a high proportion of inhabitants that are 65 years and older (10%). This
could largely be a result of the large number of people who move to the area to retire. Kou-Kamma (4.6%) and
Sundays River valley have lower numbers of elderly (5.2%). Makana has the lowest proportion of inhabitants
between the ages of 0-14 but does have the largest proportion of 15-34 year olds (38.2%). This is largely as a
result of the numerous educational centres located in the region. Grahamstown is the location of Rhodes
University and various private and public schools which inflate the proportion of school aged inhabitants.
Sundays River Valley also has a high proportion of 15-34 year old inhabitants (36.2%). This is as a result of the
agricultural industry which employs a large number of people in the municipality.
Table 6.2: Proportional Age Distribution in the Sarah Baartman District Municipality
Municipality 0-14 15-34 35-64 65+ years
Sarah Baartman 27.2% 33.9% 31.8% 7.0%
Camdeboo 29.7% 32.9% 30.4% 7.0%
BCR 29.2% 30.8% 33.0% 7.0%
Ikwezi 30.9% 29.5% 32.7% 6.8%
Makana 24.4% 38.2% 31.2% 6.2%
Ndlambe 25.2% 31.5% 33.3% 10.0%
SRV 26.8% 36.2% 31.8% 5.2%
Baviaans 31.2% 30.0% 32.2% 6.5%
Kouga 26.8% 33.8% 31.5% 7.9%

Sarah Baartman Master Agri-Park Business Plan
P a g e | 39
Kou-Kamma 29.7% 33.6% 32.1% 4.6%
Source: Statistics South Africa Census, 2011
6.1.3 Dependency Ratio
The dependency ratio measures the ratio of the non-working age population (i.e. people between the ages of 0
and 14 years old, and those older than 65) to the working age population. The higher the ratio, the more pressure
there is upon the working age population to provide for the non-working age individuals. The measure, however,
does not take into account that age may not be an indicator of economic dependency as children and the elderly
can qualify for social security grants. The indicator also assumes that those older than 65 years do not have
other sources of income (e.g. pensions). Regardless, the indicator does provide a useful indication of age-based
dependency, both for households and for the state. Where the ratio is high, there is a greater burden placed on
the state to assist households with the provision of child and social services and welfare assistance. The
dependency ratio can also be presented as a percentage, as indicated in Figure 6.2
Figure 6.2: Dependency ratios across the Eastern Cape in 2011
Source: Urban-Econ calculations based on Census, 2011
The Eastern Capes Dependency ratio was 66% while Sarah Baartman DM’s ratio was that of 52%. In fact Sarah
Baartman has the lowest dependency ratio compared to all district municipalities in the Eastern Cape excluding
the two metropolitans. Cities, such as Nelson Mandela Bay and East London, naturally attract the working age
population who migrate from rural areas. This often results in the very young and old populations remaining in
rural and under developed areas.
6.1.4 Population Growth Rates
Table 6.3 indicates the growth rates of the Eastern Cape and the various district municipalities. As indicated in
the table, the Eastern Cape’s population grew by 0.4% between 2001 and 2011. Sarah Baartman District
Municipality grew by 1.5% which is the highest growth rate among any of the district municipalities. Population
growth is important to understand in this context as it indicates how a district is growing and what planning
needs to take place. Sarah Baartman has shown a slight growth in population which indicates that agriculture
may be viable in the area. The impact of migration may not be all that drastic in the area.
66%
52%
73% 74% 71%
80%
89%
46% 48%

Sarah Baartman Master Agri-Park Business Plan
P a g e | 40
Table 6.3: Population growth rates in the Eastern Cape
MUNICIPALITY POPULATION ANNUAL POPULATION
GROWTH RATE (2001-
2011) 2001 2011
EASTERN CAPE 6 278 650 6 562 057 0.4%
SARAH BAARTMAN 388 205 450 585 1.5%
AMATHOLE 962 203 892 634 -0.7%
CHRIS HANI 809 454 795 461 -0.2%
JOE GQABI 341 961 349 768 0.2%
O.R. TAMBO 1 295 060 1 364 946 0.5%
ALFRED NZO 773 704 801 344 0.4%
BUFFALO CITY METRO 1 005 779 1 152 115 1.4%
NELSON MANDELA BAY METRO 702 284 755 204 0.7%
Source: Urban-Econ calculations based on Census, 2001 and Census, 2011
6.1.5 Migration Trends
The Eastern Cape’s historic migration patterns, which are still evident today, are of external migration out of the
province. Historically, it was the colonial and apartheid policies which drove outward migration, as the Eastern
Cape was seen as a source of cheap migrant labour. Today migration is socio-economic in nature, as Eastern
Cape residents migrate to cities in other provinces for employment and education opportunities. Internal
migration within the province has become increasingly evident in recent years, with individuals migrating from
rural areas to peri-urban and urban areas due to these areas’ proximity to transport corridors, services and
employment opportunities. A number of Eastern Cape migration trends were identified by including:
• Rural populations are highly mobile
• Rural to rural migration is where most migration is occurring and occurs between rural areas or
between small towns and rural areas
• Rural densification the trend of ‘rural peri-urbanisation’ where ‘densification of small rural towns and
coastal towns is taking place on a very large scale
• Circular migration was an identified trend whereby individuals and households moved from one
settlement hierarchy to another onwards; from rural to peri-urban and then on to urban centres
• Pursuing development and infrastructure was an identified migration trend whereby migrants go in
search, not just of jobs, but also access to infrastructure and services in relatively advantaged urban
areas
There are a number of trends in the Eastern Cape’s internal migration:
• Movements towards coastal towns: The coastal towns of Jeffrey’s Bay, Port Alfred and Kenton-on-
Sea have seen an increase in their settlement footprint as residents move from inland to these towns.
This development has been both through investment in property developments for middle income
migrants, as well as those attracted to the area in search of economic opportunities. This migration is
associated with the growth of the Kouga and Ndlambe Local Municipalities (both in the Sarah
Baartman District Municipality).
• Movement between secondary towns: There has been movement around and between secondary
towns of the Eastern Cape. This is associated with proximity to accessing welfare grants.
• Movement from rural to peri-urban: This is especially prominent in the Eastern portion of the Eastern
Cape where residents move from rural village settlements to towns and peri-urban settlements
surrounding towns such as Mthatha (O.R. Tambo District Municipality) and Butterworth (Amathole
District Municipality). This correlates with lower change in absolute population numbers.

Sarah Baartman Master Agri-Park Business Plan
P a g e | 41
• Movement out of the Karoo: There has been a general depopulation of the arid areas of the province,
often to the Western Cape and to coastal towns and cities. This is characterised by a consolidation of
commercial farms and a shrinking commercial farming community. Farm labourers have moved into
settlements in towns.
• Movement to transport corridors: This refers to movement along the N2 and accounts for increases in
the population of King Sabata Dalindyebo, Nyandeni (both in the O.R. Tambo District Municipality)
and Mbizana (Alfred Nzo District Municipality).
• Movement to cities: The rural parts of the Eastern Cape have been impacted by migration of people
to cities. The degree to which the Eastern Cape cities have from these migration patterns has been
reduced as migrants often prefer to move to Gauteng and the Western Cape.
Net rural‐urban migration is the primary driver of urbanisation. As peri-urban areas become settled and urban
areas expand, so too does the demand for services and infrastructure. Urbanisation means that there will be
further demands for land by commercial agriculture, industry, businesses and residents. It results in
unsustainable settlement sprawl increasing the cost of infrastructure provision.
6.2 Education
Educational attainment directly impacts on how agriculture is performed and planned in the district. To perform
commercial levels of agriculture a higher level of education is needed. This includes understanding of market
forces, trade and monetary policies.
The current size of the education system within each district is provided based on the number of learners and
schools. In total, there were 1.9 million learners in the Eastern Cape spread over 5 589 public and 166
independent schools. These schools had approximately 68 499 educators, resulting in an average of 28.6 learners
per educator in 2011.
Table 6.4: Learners, Educators and Schools in the Eastern Cape, 20112
MUNICIPALITY NUMBER OF
LEARNERS
NUMBER OF
EDUCATORS
NUMBER OF
SCHOOLS
EASTERN CAPE 1 963 578 68 499 5 755
SARAH BAARTMAN 90 534 3 176 264
AMATHOLE3 459 255 18 030 1 757
CHRIS HANI 251 673 9 521 934
JOE GQABI 108 534 3 763 365
O.R. TAMBO 685 353 21 111 1 617
ALFRED NZO 146 191 5 043 480
NELSON MANDELA BAY METRO 218 682 7 564 323
Source: Department of Basic Education, 2013
The Eastern Cape has suffered from ongoing challenges with regards to supplying sufficient educators, resources
and support to schools. Table 6.4 indicates that the smallest learner population is in Sarah Baartman as well as
the smallest number of educators and number of schools.
2 SOURCE: Department Of Basic Education. 2013. Education Statistics in South Africa, 2011. Pretoria: Department of Basic Education. 3 Under Department of Education statistics Buffalo City is included within the Amathole dataset.

Sarah Baartman Master Agri-Park Business Plan
P a g e | 42
6.2.1 Education Attainment Levels
The figures in Table 6.5 indicates that 21.3% of the population in Sarah Baartman has an education while 6.4%
of the population over the age of 20 have no schooling at all. Approximately 65.9% of the population have some
form of education lower than a matric pass.
Table 6.5 indicates Ikwezi has the highest proportion of the population over the age of 20 without an education
(10%) While Blue Crane Route has 8.1% without an education. The municipalities that have the lowest
proportion of people without schooling are Kouga (4.9%) and Makana (5.3%). Sundays River has 7.4% without
schooling, 11.6% has Grade 12 and 2.7% have higher degrees.
Table 6.5: Education attainment levels for Sarah Baartman, 2011
Municipality No
Schooling
Some
Primary
Completed
Primary
Some
Secondary
Grade
12
Highe
r
Sarah
Baartman
6.4% 30.8% 7.7% 33.5% 15.3% 6.0%
Camdeboo 7.2% 30.7% 8.4% 32.6% 14.2% 6.8%
BCR 8.1% 34.9% 7.8% 30.4% 14.3% 4.3%
Ikwezi 10.0% 36.0% 7.5% 31.0% 11.7% 3.6%
Makana 5.3% 27.4% 6.5% 34.2% 17.4% 8.8%
Ndlambe 7.8% 31.0% 6.6% 31.3% 15.7% 7.2%
SRV 7.4% 34.0% 8.7% 35.5% 11.6% 2.7%
Baviaans 6.2% 33.5% 10.7% 34.8% 11.8% 2.9%
Kouga 4.9% 27.7% 7.4% 34.1% 18.4% 7.3%
Kou-Kamma 5.5% 34.5% 9.1% 34.8% 13.0% 3.0%
Source: Statistics South Africa Census, 2011
Table 6.5 and Figure 6.4 indicate that the municipalities with the highest proportion of the population who have
a matric or higher are Makana (26.2%) and Kouga (25.7%). Makana’s high proportion of the population who
have a matric or higher could be related to the fact that a large number of university students and highly qualified
lecturers reside in Grahamstown. Conversely the areas with the lowest proportion of the population with matric
or higher is Sundays River Valley (14.3%), Baviaans (14.7%) and Ikwezi (15.3%). The low proportion of the
population with matric or higher in Sundays River Valley may be as a result of the large agricultural sector which
employs a large number of semi-skilled and unskilled labourers. Thus there is a large proportion of the
population in the area who have not complete high school. The reason areas such as Baviaans and Ikwezi have
lower proportions of people who have completed matric or higher may be as a result of the lack of economic
opportunities in the two municipalities and have thus migrated to areas where there are more skills based
employment.
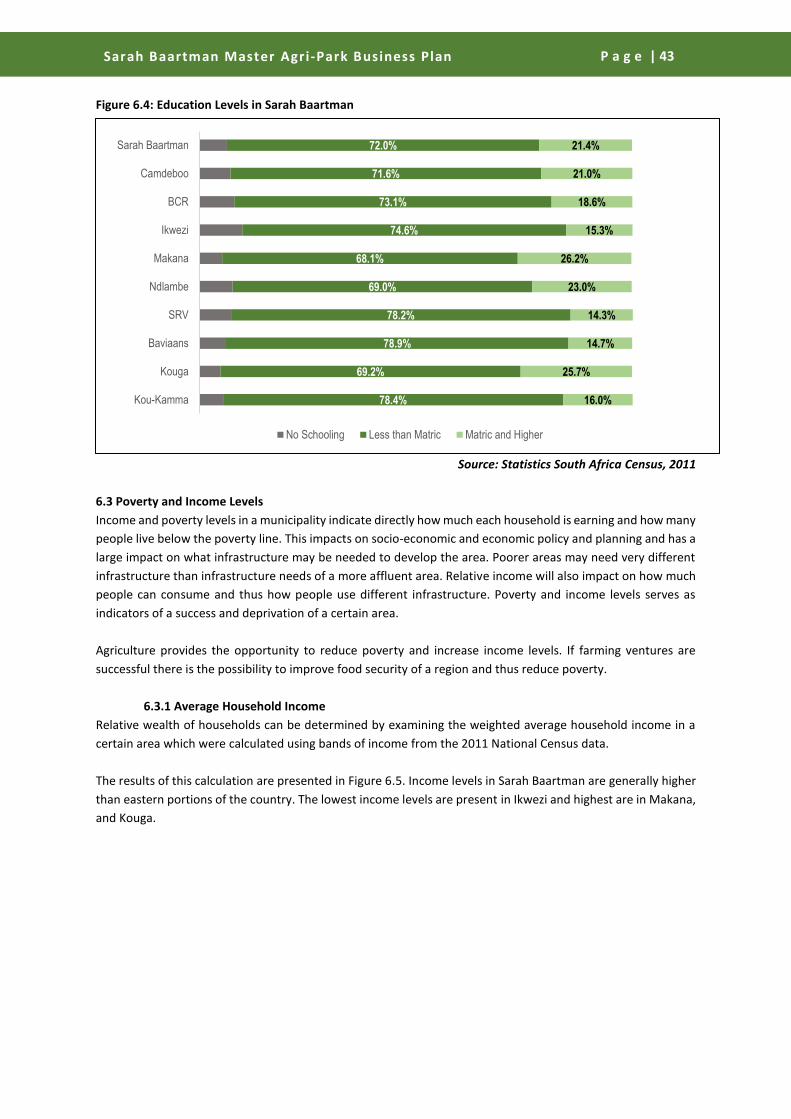
Sarah Baartman Master Agri-Park Business Plan
P a g e | 43
Figure 6.4: Education Levels in Sarah Baartman
Source: Statistics South Africa Census, 2011
6.3 Poverty and Income Levels
Income and poverty levels in a municipality indicate directly how much each household is earning and how many
people live below the poverty line. This impacts on socio-economic and economic policy and planning and has a
large impact on what infrastructure may be needed to develop the area. Poorer areas may need very different
infrastructure than infrastructure needs of a more affluent area. Relative income will also impact on how much
people can consume and thus how people use different infrastructure. Poverty and income levels serves as
indicators of a success and deprivation of a certain area.
Agriculture provides the opportunity to reduce poverty and increase income levels. If farming ventures are
successful there is the possibility to improve food security of a region and thus reduce poverty.
6.3.1 Average Household Income
Relative wealth of households can be determined by examining the weighted average household income in a
certain area which were calculated using bands of income from the 2011 National Census data.
The results of this calculation are presented in Figure 6.5. Income levels in Sarah Baartman are generally higher
than eastern portions of the country. The lowest income levels are present in Ikwezi and highest are in Makana,
and Kouga.
72.0%
71.6%
73.1%
74.6%
68.1%
69.0%
78.2%
78.9%
69.2%
78.4%
21.4%
21.0%
18.6%
15.3%
26.2%
23.0%
14.3%
14.7%
25.7%
16.0%
Sarah Baartman
Camdeboo
BCR
Ikwezi
Makana
Ndlambe
SRV
Baviaans
Kouga
Kou-Kamma
No Schooling Less than Matric Matric and Higher

Sarah Baartman Master Agri-Park Business Plan
P a g e | 44
Figure 6.5: Average monthly household across the Eastern Cape in 2011
Source: Urban-Econ calculations based on Census, 2011
Sarah Baartman has an average household income of R 6 687.23. This is generally higher than that of the Eastern
Cape and other district municipalities. The municipalities in Sarah Baartman with the highest income include
Makana (R 7 874.71), Kouga (R 7 753.09) and Camdeboo (R 7 489.84). The areas with the lowest household
income levels are Ikwezi (R 4 005.39), Sundays River Valley (R 4 965.97) and Kou-Kamma (R 5 023.54) as seen in
Figure 6.6.
Figure 6.6: Average Monthly Household Income Levels across the Eastern Cape
Source: Urban-Econ calculations based on Census (2001) and Census (2011)
R6,687.23
R7,489.84
R5,415.01
R4,005.39
R7,874.71
R6,872.51
R4,965.97 R5,311.38
R7,753.09
R5,023.54
R-
R1,500.00
R3,000.00
R4,500.00
R6,000.00
R7,500.00
R9,000.00

Sarah Baartman Master Agri-Park Business Plan
P a g e | 45
6.3.2 Poverty Line and Gini Coefficient
In 2010, approximately 49.8% of the Eastern Cape population, or 3.3 million individuals, were classified as living
below the poverty line. The districts with the highest proportion of individuals below the poverty line were Alfred
Nzo with 66.2%, or 551 135 people, and O.R. Tambo with 60.2% or 876 130 people.
The Gini Coefficient is an indicator of income equality that looks at how concentrated the income of a region is,
over the population. Higher ratios are indicative of high income inequality whilst lower ratios indicate a more
equal distribution of a region’s wealth. The highest Gini Coefficients, globally, are in the 60 to 70 range, whereas
the lowest are the 20 to 30 range. South Africa has one of the highest Gini Coefficients in the world at 64.3. The
Eastern Cape’s Gini Coefficient at 63.6 is the highest in the country. Sarah Baartman’s Gini coefficient is 61.6.
Table 6.6: Eastern Cape Households below Poverty Line and Gini Coefficient in 2010
MUNICIPALITY PEOPLE BELOW THE
POVERTY LINE
% BELOW THE
POVERTY LINE
GINI
COEFFICIENT
EASTERN CAPE 3 393 984 49.8% 63.6
SARAH BAARTMAN 158 515 35.5% 61.6
AMATHOLE 516 321 52.6% 57.8
CHRIS HANI 429 033 53.0% 60.6
JOE GQABI 226 697 60.2% 59.5
O.R. TAMBO 876 130 62.7% 59.3
ALFRED NZO 551 135 66.2% 55.7
BUFFALO CITY METRO 366 308 31.1% 61.6
NELSON MANDELA BAY METRO 269 845 33.8% 63.2
Source: ECSECC (2012)
6.4 Economic profile
The Eastern Cape economy experienced low growth in 2014, in line with the underwhelming national economic
performance. Weak sectoral performance in key industries, such as automotive manufacturing, is expected to
continue in 2015. This is to be compounded by continued slow growth in the Euro Zone economy, which in turn
will adversely affect provincial exports. Despite these vulnerabilities, it is expected that key investments planned
for the Eastern Cape in the short and medium term, will offset some of these factors, helping to promote job
creation and output growth.
This chapter considers provincial economic and sectoral performance between 2003 and 2013, as well as labour
market conditions and future economic performance. These factors are assessed at a provincial, district and
local level. In addition, the chapter provides a high level analysis of the identified priority sectors at a provincial
and district level. This will help to contextualise the more detailed sectoral analysis presented in subsequent
chapters.
The GDP-R (Gross Value Added + Taxes – Subsidies) per local municipality within the Sarah Baartman District is
illustrated in the Table 6.7 below. GDP-R is the regional Gross Domestic Product and measures output of a region.
From the table it is evident that the Kouga Local Municipality accounts for the overwhelming majority of the real
GDP-R of the District (28.1%) followed by the Makana (20.7%) and Ndlambe (11.2%) Local Municipalities. The
economic dominance of the Kouga and Makana Local Municipalities is a function of the large population residing
in these two areas and the corresponding buying power linked to this population.
Although GDP-R is an important measure of the economic position of a municipality, GDP-R per capita serves as
a better mechanism for assessing the relative strength of a given municipal economy against a benchmark
location, in this case either the Eastern Cape or South Africa.
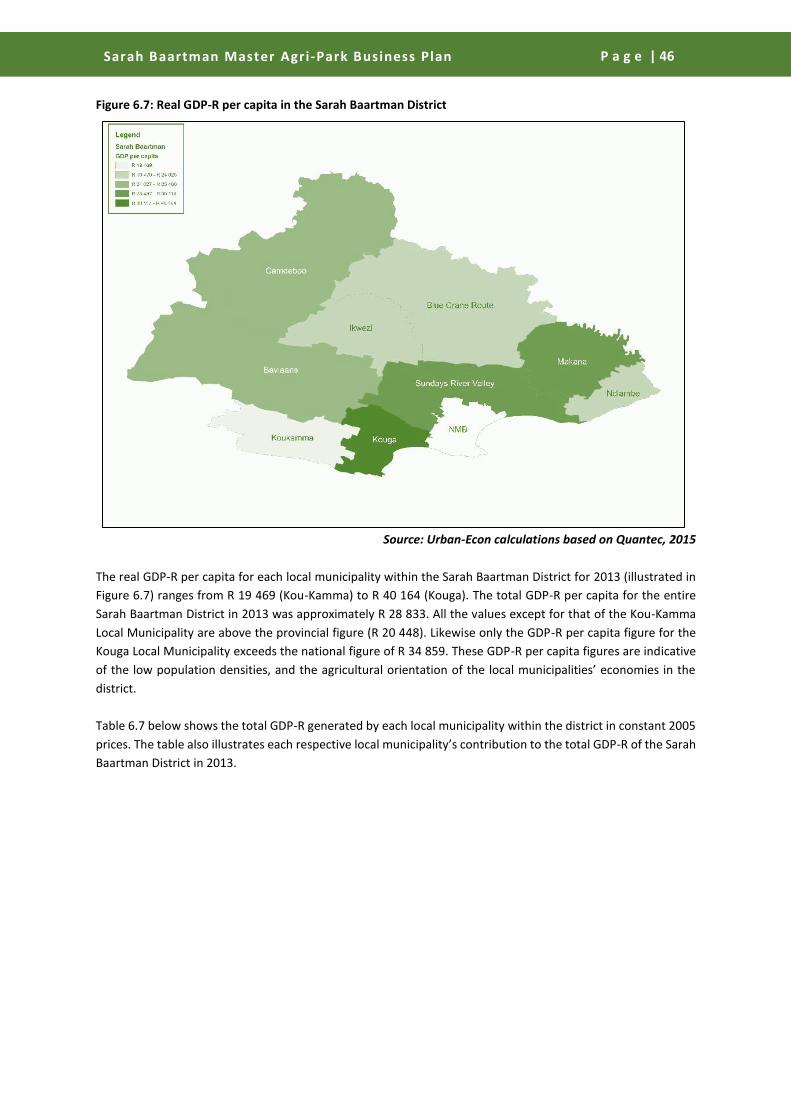
Sarah Baartman Master Agri-Park Business Plan
P a g e | 46
Figure 6.7: Real GDP-R per capita in the Sarah Baartman District
Source: Urban-Econ calculations based on Quantec, 2015
The real GDP-R per capita for each local municipality within the Sarah Baartman District for 2013 (illustrated in
Figure 6.7) ranges from R 19 469 (Kou-Kamma) to R 40 164 (Kouga). The total GDP-R per capita for the entire
Sarah Baartman District in 2013 was approximately R 28 833. All the values except for that of the Kou-Kamma
Local Municipality are above the provincial figure (R 20 448). Likewise only the GDP-R per capita figure for the
Kouga Local Municipality exceeds the national figure of R 34 859. These GDP-R per capita figures are indicative
of the low population densities, and the agricultural orientation of the local municipalities’ economies in the
district.
Table 6.7 below shows the total GDP-R generated by each local municipality within the district in constant 2005
prices. The table also illustrates each respective local municipality’s contribution to the total GDP-R of the Sarah
Baartman District in 2013.

Sarah Baartman Master Agri-Park Business Plan
P a g e | 47
Table 6.7: Real GDP-R for the Sarah Baartman District and its Local Municipalities
MUNICIPALITY GDP-R (R, MILLIONS4) SHARE OF TOTAL GDP-R
(2013) 2012 2013
SARAH BAARTMAN5 R 10 809 R 11 053 7.8%6
CAMDEBOO R 1 096 R 1 103 10.2%
BLUE CRANE ROUTE R 648 R 662 6.1%
IKWEZI R 270 R 279 2.6%
MAKANA R 2 223 R 2 252 20.7%
NDLAMBE R 1 199 R 1 216 11.2%
SUNDAYS RIVER VALLEY R 1 060 R 1 086 10.0%
BAVIAANS R 364 R 373 3.4%
KOUGA R 2 959 R 3 056 28.1%
KOU-KAMMA R 809 R 835 7.7%
Source: Urban-Econ calculations based on Quantec, 2015
Although Table 6.8 indicates that the Kouga Local Municipality contributed the greatest percentage of the
district’s total GDP-R in 2013, the local municipality’s GDP-R only grew by 3.3% in absolute terms between 2012
and 2013. The GDP-R of the Ikwezi Local Municipality in comparison, which only accounts for 2.6% of the total
real GDP-R of the Sarah Baartman District, increased by 3.4% between 2012 and 2013. This however can be
attributed to the low base from which the Ikwezi Local Municipality’s economy is growing. Sundays River Valley
contributes 10% of the GDP_R to Sarah Baartman.
Table 6.8: Real GDP-R growth rates for the Eastern Cape
AREA AVERAGE ANNUAL GROWTH IN REAL
GDP-R
FORECASTED ANNUAL GROWTH IN
REAL GDP-R
2012 2013 2003 –
2013
2014 2015 2016
EASTERN CAPE 2.5% 1.8% 3.2% 1.6% 2.2% 2.4%
SARAH BAARTMAN 3.6% 2.3% 3.6% 1.6% 2.2% 2.5%
AMATHOLE 3.9% 2.4% 5.1% 1.8% 2.5% 2.8%
CHRIS HANI 2.2% 1.6% 2.9% 1.4% 2.0% 2.2%
JOE GQABI 5.3% 2.9% 5.2% 1.9% 2.6% 2.8%
O.R. TAMBO 3.9% 2.6% 6.5% 1.7% 2.4% 2.6%
ALFRED NZO 5.8% 3.7% 8.4% 2.3% 3.2% 3.6%
BUFFALO CITY 2.0% 1.5% 2.8% 1.5% 2.1% 2.4%
NELSON MANDELA BAY
METRO
0.6% 0.9% 0.8% 1.5% 2.1% 2.3%
Source: Urban-Econ calculations based on Quantec, 2015
4 Figures are in Constant 2005 Prices 5 In 2006 the Sarah Baartman District Municipality still included District Management Areas (DMA). The figures presented in this table have
been retrospectively adjusted through the recalculation of the 2006 figures to take into the account the dissolution of the DMA. 6 Sarah Baartman District’s contribution to the total GDP-R of the Eastern Cape.

Sarah Baartman Master Agri-Park Business Plan
P a g e | 48
6.4.1 Eastern Cape GDP-R Growth rates and Projections
The most recent economic statistics for the Eastern Cape show that provincial GDP grew by 1.8% in 2013, 0.7%
lower than the 2012 growth rate. This figure was, however, lower than the national average (2.1%) as well as all
but the Northern Cape whose GDP-R only grew by 1.3% over the period. The statistics also show that the GDP-
R growth in the Eastern Cape (as well as the rest of South Africa) is lower than the pre-crisis growth rate of
approximately 5.3%, recorded between 2006 and 2007.
The Eastern Cape performed below expectations in 2014, only growing at 1.6% year-on-year compared to 1.8%
during 2013. Figure 3.2 and Table 3.3 indicate that the forecasted GDP-R growth for the Eastern Cape in 2015 is
2.2%, recovering to 2.4% in 2016, in line with national expectations. Growth in 2015 is expected to be moderate
and below the national figure. These expectations of constrained growth are based on continuing power supply
challenges which will impact business productivity, increased electricity costs, and reduced domestic demand.
Figure 6.8: Current and Projected Growth Rate
Source: Urban-Econ calculations based on Quantec, 2015
6.4.2 Employment
This section outlines the structure and performance of the Eastern Cape labour market between 2003 and 2013.
The labour market, through job retention and employment creation, is the principle means by which changes in
economic structure and performance filter through to changes in household and individual welfare.
Table 6.10 indicates that the number of employed have decreased between 2003 and 2013. This is as a result of
a large number the workforce is migrating out of the district to the major metropolitans and other provinces
such as Western Cape and Gauteng. The biggest decrease in employment figures has been in Blue Crane Route
which has decreased by 6.25% between 2003 and 2013. This is followed by Sundays River Valley which has seen
a decline by 3.45% for the same period. The smallest decrease has been in Kou-Kamma which has only seen a
decrease of 0.75% followed by Kouga which experienced a 1.03% decrease.
9.5%
2.5%
4.3%
4.1%
3.3%
0.3%
2.5%
4.3%
3.6%
2.3%
1.6%
2.2%2.5%
2.7%
0%
1%
2%
3%
4%
5%
6%
7%
8%
9%
10%
2004 2005 2006 2007 2008 2009 2010 2011 2012 2013 2014 2015 2016 2017

Sarah Baartman Master Agri-Park Business Plan
P a g e | 49
Table 6.9: Sarah Baartman District’s employment status in 2013
MUNICIPALITY EMPLOYED UNEMPLOYED
NUMBER RATE
SARAH BAARTMAN 139 628 37 050 21.0%
CAMDEBOO 14 728 3 434 18.9%
BLUE CRANE ROUTE 9 580 1 744 15.4%
IKWEZI 3 626 2 101 36.7%
MAKANA 23 746 13 654 36.5%
NDLAMBE 18 377 5 586 23.3%
SUNDAYS RIVER VALLEY 14 439 1 036 6.7%
BAVIAANS 4 605 985 17.6%
KOUGA 33 923 5 810 14.6%
KOU-KAMMA 13 748 2 173 13.6%
Source: Urban-Econ calculations based on Quantec, 2015
Table 6.10: Employment growth trends in the Sarah Baartman District
MUNICIPALITY AVERAGE ANNUAL EMPLOYMENT GROWTH
2012 2013 2003 – 2013
SARAH BAARTMAN 3.0% 5.2% -2.4%
CAMDEBOO 1.3% 3.0% -3.4%
BLUE CRANE ROUTE 2.9% 5.9% -6.3%
IKWEZI 4.9% 7.3% -3.1%
MAKANA 0.0% 2.4% -1.2%
NDLAMBE 3.1% 5.8% -2.7%
SUNDAYS RIVER VALLEY 5.1% 6.0% -3.5%
BAVIAANS 3.0% 6.1% -2.8%
KOUGA 3.8% 5.6% -1.0%
KOU-KAMMA 4.4% 7.9% -0.8%
Source: Urban-Econ calculations based on Quantec, 2015
The tables provide insight into the employment sector in the District and indicates that average annual
employment is decreasing in every local municipality in the District. Sundays River in particular is experiencing a
decrease in employment. This can largely be attributed to increasing mechanisation and rural urban migration.

Agriculture
Sector Analysis Chapter 7
Sarah Baartman Master Agri-Park Business Plan
P a g e | 51
7. AGRICULTURAL INDUSTRY ANALYSIS
7.1 Sarah Baartman District Agricultural Activities
The Sarah Baartman District has a wide variety of agricultural pursuits compared to other districts in Eastern
Cape. This is as a result of the wide variety of climatic regions and fairly well developed infrastructure in the
area. This section aims to outline the current agricultural status quo of the Sarah Baartman District. The following
sectors will be examined:
Livestock
Fruit and Vegetables
Forestry
Aquaculture
Biofuels
7.1.1 Livestock
The District is home to a wide range of livestock that are kept for a variety of agricultural reasons. Cattle, sheep
and goats are the most common livestock that are kept in the District. The most common agricultural products
gained from livestock are wool and meat products.
Red Meat (Beef, Mutton, Chevon)
The beef industry is fairly well established in the District. Beef and red meat are produced throughout the region
with main centres of production in Camdeboo, Blue Crane Route, Kouga and Makana. In 2007/2008 beef
production and consumption fell in South Africa due to the global economic downturn which saw many people
reduce their consumption of beef (RPO, 2015). In 2010/2011 beef production also fell because of an outbreak
of foot and mouth disease which impacted regions all over South Africa. Cattle production for the purpose of
beef only accounts for 6% of all cattle in the province with the majority in Sarah Baartman. While not a major
industry in Sarah Baartman District there are numerous projects planned for the area to increase support to
emerging farmers in the beef industry (RPO, 2015). Stock production has seen a decline in the past decade,
primarily as a result of game farm establishment and the expansion of the Addo National Elephant Park.
Mutton and chevon (goat) are also common in the District for wool, mohair and red meat production. Small-
stock farming predominates in the dry Karoo interior predominantly in Camdeboo, Baviaans and Blue Crane
Route. Goat production is particularly focused in Camdeboo around Aberdeen and Graaff-Reinet. Baviaans and
Blue Crane Route. These areas are renowned for Karoo mutton and mohair production. These sub-sectors are
set to expand as the government invests in more co-operatives involving sheep and goats. Most of the livestock
in the area are sent to abattoirs in the District or to Nelson Mandela Bay to be processed. Sakkies Small Farmers
(Goats and sheep), Mimosdale (Goats and sheep), Khanya Cambria (Livestock), Lamoney Trust (Livestock),
Sewefontein (Livestock) and Inyebo Trust (Livestock) are all part of the Agricultural Mentorship Programme
which aims to address the skills challenges in the district and promote food security in the area (RPO, 2015).
Dairy
There are four major dairy breeds (not used for beef) in South Africa namely, Holstein, Jersey, Guernsey and
Ayrshire. The industry comprises of number of different economic activities and significant differences exist
between farming methods and processing of dairy products. Dairy products are produced in the district and are
a large source of income for the region. The commercial dairy industry is large and is located in the Kou-Kamma,
Kouga and Ndlambe area. The dairy industry in the Eastern Cape is well organised and produces approximately
30% of South Africa’s milk. Approximately 20% of the South Africa’s milk is produced in Sarah Baartman District
alone (MPO, 2015). Major companies such as Parmalat, Woodlands and Clover purchase milk from local farmers
and produce dairy products. Most of the products produced are in the form of milk and cream and are largely
focused around the Humansdorp area of Kouga which produced 226 035 872 litres of milk in 2014. The Kouga
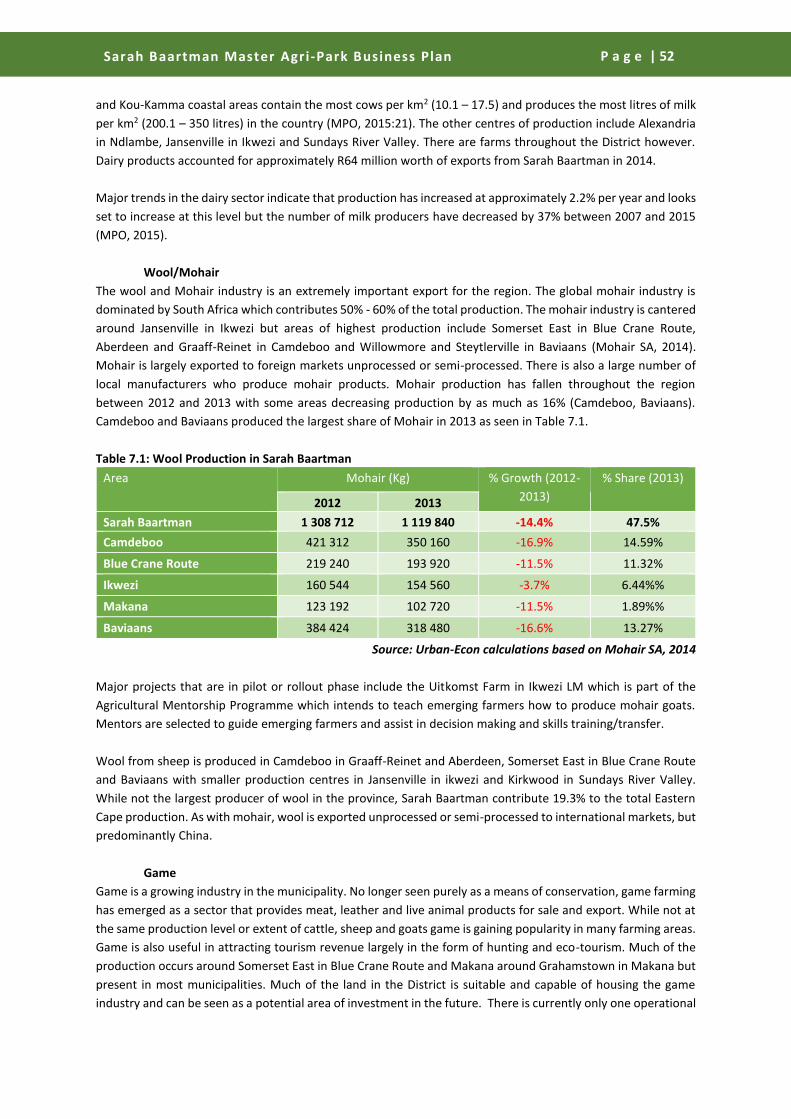
Sarah Baartman Master Agri-Park Business Plan
P a g e | 52
and Kou-Kamma coastal areas contain the most cows per km2 (10.1 – 17.5) and produces the most litres of milk
per km2 (200.1 – 350 litres) in the country (MPO, 2015:21). The other centres of production include Alexandria
in Ndlambe, Jansenville in Ikwezi and Sundays River Valley. There are farms throughout the District however.
Dairy products accounted for approximately R64 million worth of exports from Sarah Baartman in 2014.
Major trends in the dairy sector indicate that production has increased at approximately 2.2% per year and looks
set to increase at this level but the number of milk producers have decreased by 37% between 2007 and 2015
(MPO, 2015).
Wool/Mohair
The wool and Mohair industry is an extremely important export for the region. The global mohair industry is
dominated by South Africa which contributes 50% - 60% of the total production. The mohair industry is cantered
around Jansenville in Ikwezi but areas of highest production include Somerset East in Blue Crane Route,
Aberdeen and Graaff-Reinet in Camdeboo and Willowmore and Steytlerville in Baviaans (Mohair SA, 2014).
Mohair is largely exported to foreign markets unprocessed or semi-processed. There is also a large number of
local manufacturers who produce mohair products. Mohair production has fallen throughout the region
between 2012 and 2013 with some areas decreasing production by as much as 16% (Camdeboo, Baviaans).
Camdeboo and Baviaans produced the largest share of Mohair in 2013 as seen in Table 7.1.
Table 7.1: Wool Production in Sarah Baartman
Area Mohair (Kg) % Growth (2012-
2013)
% Share (2013)
2012 2013
Sarah Baartman 1 308 712 1 119 840 -14.4% 47.5%
Camdeboo 421 312 350 160 -16.9% 14.59%
Blue Crane Route 219 240 193 920 -11.5% 11.32%
Ikwezi 160 544 154 560 -3.7% 6.44%%
Makana 123 192 102 720 -11.5% 1.89%%
Baviaans 384 424 318 480 -16.6% 13.27%
Source: Urban-Econ calculations based on Mohair SA, 2014
Major projects that are in pilot or rollout phase include the Uitkomst Farm in Ikwezi LM which is part of the
Agricultural Mentorship Programme which intends to teach emerging farmers how to produce mohair goats.
Mentors are selected to guide emerging farmers and assist in decision making and skills training/transfer.
Wool from sheep is produced in Camdeboo in Graaff-Reinet and Aberdeen, Somerset East in Blue Crane Route
and Baviaans with smaller production centres in Jansenville in ikwezi and Kirkwood in Sundays River Valley.
While not the largest producer of wool in the province, Sarah Baartman contribute 19.3% to the total Eastern
Cape production. As with mohair, wool is exported unprocessed or semi-processed to international markets, but
predominantly China.
Game
Game is a growing industry in the municipality. No longer seen purely as a means of conservation, game farming
has emerged as a sector that provides meat, leather and live animal products for sale and export. While not at
the same production level or extent of cattle, sheep and goats game is gaining popularity in many farming areas.
Game is also useful in attracting tourism revenue largely in the form of hunting and eco-tourism. Much of the
production occurs around Somerset East in Blue Crane Route and Makana around Grahamstown in Makana but
present in most municipalities. Much of the land in the District is suitable and capable of housing the game
industry and can be seen as a potential area of investment in the future. There is currently only one operational

Sarah Baartman Master Agri-Park Business Plan
P a g e | 53
abattoir in the District located in Graaff-Reinet which processes game meat. The other abattoir in Grahamstown
was shut down to operating losses stemming from poor production. This is largely produced for the export
market with some limited domestic markets in mind. There is however an increasing concern that the
unregulated importation of game will have a negative impact on livestock established in the area by bringing in
disease (Farmers Weekly, 2015).
Recently a ban from the EU on the importing of South African meat exports was lifted and it is expected that the
industry is set to grow again with opportunities to export meat to this market. This can be seen as a large
opportunity for emerging farmers (Farmers Weekly, 2015).
Pork
Pork and pig farming is not as large as the red meat industry in the District but is seen as an important part of
the agricultural industry. The District Municipality believes that in the future pork can be a major export from
the region as well as used in conjunction with the meat production industry (requires pork fats and other pork
products) to produce a viable industry in the area. Pig farming is more labour intensive than other red meat
farming and is a useful tool in employment creation. Pig farming also supports small holder farmers as many
pigs can be kept in a smaller area than compared to cows. This has benefits if land availability is an issue. The
region is conducive to pig farming as waste from the citrus, vegetable and pineapple industry can be used as
feed to support the pig farming industry.
Currently the Aberdeen Piggery project in Camdeboo is a being supported as part of the Agricultural Mentorship
Programme which is providing support for local farmers. It is also receiving support from the local government
in the form of piglets and infrastructure. There are piggery projects proposed for various other towns such as
Grahamstown and Humansdorp.
Poultry Integrated Value Chain (layers, breeders, broilers)
Poultry is an extremely important industry in South Africa. Production of poultry products are a major source of
food for the majority of South Africans. The industry is believed to be expanding with many opportunities for
emerging farmers in both local and export markets. South Africa is a net importer of poultry broiler meat as
consumption of the product outstrips production but it is believed that there is an oversupply of eggs in the
market with supply outstripping demand. Eggs and meat are mainly sold to the major retailers such as Pick n
Pay, Shoprite Group, Spar, Woolworths and MassMart. The main export markets are SADC countries.
While not the main production area for South Africa, poultry is still extremely important in providing jobs and
food to the area. Major producers such as Sovereign Poultry are located outside the District in Thornhill and
Uitenhage but these areas allow for linkages to be created in the District. There are numerous projects planned
by the DRDAR, DEDEAT and SEDA to create poultry co-operatives throughout the district particularly in
Alexandria, Port Alfred, Bathurst, Somerset East, Hankey, Humansdorp, Patensie, Waggie and Zandvlakte, . Each
project areas may receive between R1.2 – R20 million support.
The poultry industry is not a particularly labour intensive industry but does ensure food security for communities
with scope to make profits from exports and local markets.
Ostrich is also produced in the area but has come under increasing pressure in District. South Africa is a net
exporter of Ostrich meat. The main export market is the EU which constitutes 98% of the exports of Ostrich
meat. The ban of Ostrich meat to the EU in 2011 had a drastic impact on the industry and saw an extremely large
decrease in Ostrich exports largely as a result of the restrictions imposed by the EU after numerous birds
throughout the country were infected with disease. Recently the ban has been lifted but the industry in the area
is still suffering. There are very few export ready Ostrich farms and only one (Graaff-Reinet) out of two abattoirs
Sarah Baartman Master Agri-Park Business Plan
P a g e | 54
are operational. There is scope to increase the production of Ostrich products in the area including leather
products.
7.1.2 Fruit and Vegetables
Fruit is one of the most exported agricultural commodities in the District with R357 million worth of exports in
2014 which is mostly grown in the Sundays River Valley, Kouga and Kou-Kamma. Small pockets of fruit farmers
in other municipalities (Makana, Blue Crane Route) (DAFF, 2014).
Citrus
The citrus industry is one of the most critical industries in the District. The citrus industry is centred on Kirkwood
and the surrounding area in Sundays River Valley but there are significant plantations in the Gamtoos Valley as
well (Hankey and Patensie). The Sundays River Valley and Gamtoos Valley produces a large proportion of South
Africa’s citrus. Packing, juicing and other processing plants are located around Kirkwood and Addo which is
where the citrus industry is centralised. The Sundays River Citrus Company (SRCC) is responsible for a large part
of the Sundays River Valley Local Municipality production, producing 2 million pockets of citrus for the local
market, with approximately 10.0% of this regional production is produced for the export market. These
production levels make the Sundays River Citrus Company the largest producer of citrus in southern Africa. Citrus
is one of the major beneficiaries of the Sundays River Valley Irrigation Scheme that was set up to transfer water
from the Gariep Dam into the Sundays River. Citrus accounts for 66% (13 442.86 ha) of the area in the irrigation
scheme alone (DAFF, 2014). The biggest challenges that face the citrus industry in the area is road infrastructure
which causes up to R 250 million in losses per season (Personal Communication CGA, 2014). The main types of
citrus grown around the Gamtoos Valley include oranges, grapefruit, lemons and soft citrus. Patensie Citrus has
two packhouses in the Gamtoos Valley and is able to pack 60 tons per hour. Approximately 1.8 million cartons
of citrus are exported annually while fruit not acceptable for export are sold locally. Patensie Citrus currently
exports to the UK, Canada, Russia, Northern & Southern Europe, China, South East Asia, Far East and the Middle
East. Paksaam Nursery (located in the Gamtoos) is one of 22 accredited nurseries in South Africa and produces
citrus trees for local farmers and is an integral part of the citrus industry in the area.
It is expected that the local demand for citrus will still increase thus creating an opportunity for emerging
farmers. While local markets are important the main focus of citrus in South Africa is the export market. South
African citrus is sent all over the world but, the largest export regions are Asia (Western and eastern Asia) and
Europe (European Union member states) (CGA, 2014). It is expected that demand for South African citrus is
largely as a result of reductions in citrus production during the northern hemispheres off season. The largest
competitors facing the industry are fellow southern hemisphere producers such as Argentina, Brazil and
Australia. It is believed that there is potential to export a large quantity of citrus to emerging markets such as
China and other eastern Asian countries (CGA, 2014).
Pineapples
Pineapples are considered one of the most important export crops in South Africa because of their foreign
exchange earnings, employment creation and linkages with support institutions. The pineapple industry is
closely associated with the agro-processing industry and most fruit is often absorbed into the process which is
then exported and sold to retailers. The biggest export competitors are the Philippines, Brazil and Thailand
(DAFF, 2014).
Pineapples are also grown in the District and accounts for 90% of the Eastern Capes production. Pineapple
exports from Sarah Baartman total almost R53 million. Pineapple production is located almost exclusively in the
Ndlambe Local Municipality surrounding Bathurst. The pineapple sub-sector is labour intensive, contributing
greatly to social and economic growth in the region. It is seen as a priority growth area that can boost
employment in the surrounding Ndlambe community (DAFF, 2014).
Sarah Baartman Master Agri-Park Business Plan
P a g e | 55
In 2007 the pineapple industry in Eastern Cape was on the brink of collapse largely owing to strong competition
from overseas producers, high Rand Dollar exchange rate and declining fruit volumes to name a few. The
Ndlambe Natural Industrial Products (NNIP) was formed to determine if pineapple waste could be used to create
useful products. Soon after feasibility studies were completed and it was determined that Bromelain (used in
medicine as an anti-inflammatory), dietary fibre, and MCC (micro-crystalline cellulose – an anti-caking agent,
stabiliser and fat replacement) could be created from the waste products usually discarded in the pineapple
production process. Despite this intervention the pineapple industry is still very volatile and faces challenges in
the future.
Deciduous and Stone Fruit
Fruit such as apples, pears and quinces are commonly referred to as deciduous. Apricots, peaches, plums and
nectarines are also deciduous but are commonly referred to as stone fruit or drupes. Deciduous fruits are
predominantly produced in the Western Cape while apples and pears are focused in the Ceres area. In the Sarah
Baartman District the major deciduous fruit producing areas are the Langkloof in Kou-Kamma and Gamtoos
Valley in Kouga. It is centred on the towns of Hankey and Patensie (DAFF, 2014).
The Langkloof alone produces apples (19% of the country’s total production area), pears (13%), apricots (4%),
peaches (2%), and plums (4%). While not widespread across the entire district the fruit industry is vitally
important to employment and skills development in the Langkloof and Gamtoos (DAFF, 2014).
Vegetable Production
Vegetables are popular in the Sarah Baartman District and are grown throughout. The major vegetable
production areas are mainly along the coastal belt in the Sundays River and Gamtoos Valley. Besides citrus these
areas produce a large number of vegetable goods such as potatoes, cabbage, spinach, carrots, cauliflower,
tomatoes and cucumber among other goods. Vegetable production is spread throughout the District with
numerous projects planned for emerging farmers (Abstract of Agricultural Statistics, 2015).
Potatoes are grown throughout South Africa but predominantly in Limpopo. Potatoes are seen as a good export
commodity as they last longer than traditional vegetables and can endure long transits to markets. This being
said Potatoes are not a major export in South Africa. Potatoes are mainly sold within South Africa or exported
to neighbouring countries such as Mozambique or Zimbabwe. The major potato growing region in Sarah
Baartman is located in Kouga Municipality around Hankey and Patensie.
Major challenges faced by the industry are largely infrastructural in nature as many farmers cannot move their
produce out of the Gamtoos or Sundays River area without damaging produce.
Field Crops (including grains, sugar cane, etc.)
Field crops such as maize, sorghum, wheat and other grains are not common in the municipality. The most
common field crops that are present include Lucerne, which is primarily grown for cattle feed and Chicory, which
is used as a coffee substitute and sold to local manufacturers. Maize is predominantly grown on a subsistence
level and with some produced for animal feed as well.
Chicory
South Africa is the second largest producer of chicory in the world. Chicory is a plant that has Chicory is also
grown and produced almost exclusively in Alexandria area where it is processed and distributed for national
consumption. There is also a small area of Chicory production in the Gamtoos area. Chicory is used for three
main uses. The first is as a coffee substitute, the second as part of the greens for salad and lastly as fodder for
Sarah Baartman Master Agri-Park Business Plan
P a g e | 56
agriculture. The production units in Alexandria largely concentrate on the production of chicory for coffee
manufacturers around the country. Fodder is sold to local milk producers in the Alexandria area.
7.1.3 Forestry
Forestry is not present throughout the municipality as the climate is not suitable for large plantations but, it
does form an important part of the economy in the Kou-Kamma and Kouga municipalities. Forestry has potential
to provide economic spin-offs in terms of manufacturing (pulp milling, paper manufacturing, sawmilling,
furniture manufacturing). The forestry industry can also play an important part in environmental services such
as conserving soil, water and biological diversity. The main purposes of forests are conservation, commercial
activities or woodlots which provide small scale production such as fire wood, non-timber forest products and
recreational uses. Natural forests cover the largest area in Sarah Baartman (48 703 ha) while commercial forests
occupy a slightly smaller area (DAFF, 2014).
Sarah Baartman has over 30 068 ha (10 634 in Kouga and 19 434 in Kou-Kamma) of state owned forestry which
is used for commercial activities. Forestry employs approximately 100 labourers in Kouga and 500 labourers in
Kou-Kamma for plantations while downstream employment in forestry related industries account for 532 jobs
in Kou-Kamma (DAFF, 2014).
Infrastructure in the forestry industry is vitally important. The most critical factor in forest production is the risk
of fire. Sufficient support systems and preventative infrastructure needs to be in place. In 2005 nearly 15 000 ha
in the Kou-Kamma and Kouga areas were destroyed by fire. Minimising risk is vitally important. Effective water,
road and fire protection service needs to be in place (DAFF, 2014).
7.1.4 Aquaculture
Fishing and aquaculture is seen as an underdeveloped sector in the District. The district does however, produce
a large amount fish and crustaceans for export these are largely produced in Kouga and Ndlambe. The District
has two separate sections of coastline and limited access to rivers and fresh water bodies that can be utilised to
improve the sector. There are currently projects set to expand the aquaculture sector by creating fish farms in
Camdeboo through the DAFF and the ECDC called the Camdeboo Satellite Aquaculture Project (CSAP).
There are also plans to expand this industry by creating fishing fleets in Kouga, Cape St Francis and Ndlambe
Port Alfred to further take advantage of the natural resources off the coast of the municipalities. Fish processing
plants are also planned for Kouga and Kou-Kamma. This will increase the contribution of fishing to the GDP_R of
the region.
Aquaculture and fishing industries are reliant on effective infrastructure. Fishing activities need access to
suitable port areas and to sea worthy boats and craft that that withstand ocean currents. Freshwater
aquaculture requires good water and electricity infrastructure (for refrigeration and processing) and needs to
be effectively maintained to avoid the destruction of the products
7.1.5 Biofuels
Biofuels in the District are still in a planning phase and it is expected that more investment will be focused on
producing crops such as sugar beet and sorghum to produce biofuels. The planned construction of a biofuel
production plant in Cradock will allow linkages to be created especially in the Blue Crane Route Local
Municipality with regards to producing sugar beet and sorghum. Opportunities exist for biofuel from waste
products in the agricultural industry especially from forestry, pineapples, citrus and vegetable farming.
Sarah Baartman Master Agri-Park Business Plan
P a g e | 57
7.2 Current and proposed projects in the region
There are multiple project categories for economic, social and socio-economic development within South Africa.
The following section brings to the fore the more common project types, namely REID, RID, CASP, LRAD, Ilima/
Letsema, and others, that are applicable to the O.R. District Municipality.
7.2.1 Rural Enterprise and Industrial Development (REID)
REID was established by the Department of Rural Development. It aims to create an enabling institutional
environment for vibrant and sustainable rural communities. REID consists of four units. Each unit is briefly
described below.
The social organisation and mobilisation unit, which is responsible for the promotion of participatory approach
to rural development.
The technical support, skills development and nurturing units, this unit provides technical support to institutions
and organisations in rural communities through skills and capacity building.
The Institutional Building and Mentoring unit is responsible for facilitating, building and mentoring institutions
in rural communities.
The rural livelihoods and food security unit, that is responsible for facilitating strategic partnerships that would
promote economic and rural enterprise development. Strategic partners are from the private sector,
government entities and international organisations. These strategic partnerships also facilitate value added
services such as agro-processing and the establishment of village industries and enterprises.
There are 12 REID projects operating in Sarah Baartman.
7.2.2 Rural Infrastructure and Development (RID)
The Rural Infrastructure and Development initiative was established and run by the DRDLR in order to facilitate
rural infrastructure development strategies for socio-economic growth. The key role of RID is to provide ICT,
economic and social infrastructure necessary to uplift rural communities. The functions of the programme
include provision of economic and ICT infrastructure and development services; facilitation of social
infrastructure, development and adaptation of innovative and appropriate technologies within rural areas.
RID also intends to facilitate access to additional funding to implement infrastructure project services, to provide
project management functional specific support to RID in provinces, to provide financial and administrative
support services and finally to provide service delivery coordination services.
An example of how RID links with other projects is that it would, for example, provide the fencing for a project
area while REID will provide the funding and invest in food gardens.
There are numerous RID projects that are currently being run in the SBDM as can be seen in Figure 7.1 the
highest concentration of which appear to be in Sundays River Valley LM and Makana LM.
7.2.3 Land Redistribution for Agriculture Development (LRAD)
The Land Redistribution for Agricultural Development (LRAD) programme was designed to help previously
disadvantaged citizens from African, Coloured and Indian communities to buy land or agricultural implements
specifically for agricultural purposes. The LRAD grant is made available as a non-refundable form of funding or
financial contribution to help prospective farmers to purchase land by government.

Sarah Baartman Master Agri-Park Business Plan
P a g e | 58
The grants are made available through the Dept. Land Affairs with assistance from the Dept. of Agriculture,
Fisheries and Forestry. Funds can be used for the acquisition of land or the financing of land improvements,
infrastructure investments, capital assets and short-term agricultural inputs.
LRAD funding is made available to beneficiaries at various levels, these are:
Safety-net projects: This is the level at which beneficiaries will acquire land to produce mainly for own
consumption.
Equity schemes: Members of a group will each contribute a certain amount towards accessing the grant. In turn,
each member will own a certain percentage of the project according to the degree of their contribution.
Production for markets: Some people will enter the programme at a much higher level than the ones mentioned
above. These people will most probably have more farming experience as well as access to additional finance
through normal bank loans as well as their own assets and cash to purchase bigger farms and therefore farm on
a much larger scale.
Agriculture in communal areas: Quite a number of people in communal areas already have secure access to
agricultural land, but may not have the money to start using that land productively. Such people will be allowed
to apply for assistance to start putting up productive investments on the land.
Figure 7.1: DRDLR Projects in SBDM
Source: Urban Dynamics, 2015
7.2.4 Comprehensive Agriculture Support Programme (CASP)
The Comprehensive Agricultural Support Programme is a Dept. of Agriculture, Fisheries and Forestry project,
supported by National Treasury, which seeks to provide agricultural support to land and agrarian reform
projects.
The strategic goals of the CASP programme are to create a favourable and supportive agricultural service
environment for the farming community, including subsistence, smallholder and commercial farmers.

Sarah Baartman Master Agri-Park Business Plan
P a g e | 59
Grants are allocated with the aim of expanding the provision of agricultural support services and the promotion
& facilitation of agricultural development by targeting smallholder and previously disadvantaged farmers.
7.2.5 Ilima/ Letsema
The Ilima Letsema initiative was established in 2008 and reformed in 2013 by the DAFF with the aim of
encouraging food gardens among to support food security in rural areas. The funding originated with the special
poverty allocations made by National Government for a specific purpose and a conditional grant enables
government to ensure that specific projects are targeted. The funding will look to support small emerging
farmers and takes the form of grants given to farmers. The grant is given to farmers who apply and uses a grant
framework to assist targeted vulnerable South African farming communities to increase agricultural production
and improve farming skills. Some of the funding goes towards strategic interventions like the rehabilitation of
irrigation schemes.
The expected outcomes from this project includes:
Increased production efficiency
Increased agricultural production for the targeted group
Improved ability of targeted group to cope with high food prices.
Improved food production at both household and national level.
In 2012 it is believed that a total of 4 021 farmers had been supported through the Ilima Letsema programme.
It is believed that through this programme, farmers will be trained in appropriate agricultural practices, the
number of hectares under production will increase and new irrigation schemes will be established.
In the SBDM, Ilima Letsema has a strong presence with a number of projects in Baviaans, Makana and Ndlambe
LM.
7.2.6 Integrated Development Plans (IDP)
District Municipality Integrated Development Plans (IDP) is a super plan for an area that gives an overall
framework for development. It aims to co-ordinate the work of local and other spheres of government in a
coherent plan to improve the quality of life for all the people living in an area. It should take into account the
existing conditions and problems and resources available for development. The plan should look at economic
and social development for the area as a whole. It must set a framework for how land should be used, what
infrastructure and services are needed and how the environment should be protected.
All municipalities have to produce an Integrated Development Plan (IDP). The municipality is responsible for the
co-ordination of the IDP and must draw in other stakeholders in the area who can impact on and/or benefit from
development in the area.
Once the IDP is drawn up all municipal planning and projects should happen in terms of the IDP. The annual
council budget should be based on the IDP. Other government departments working in the area should take the
IDP into account when making their own plans.
The IDP develops projects in conjunction with regional and provincial government departments to aid specific
development objectives. Funding for District IDP projects is accessed through these government departments,
from the District IDP budget and through other funding avenues and mechanisms.
7.2.7 Social Relief Projects
Social relief projects are generally temporary assistance projects for those in dire need of support. In the case
of the agricultural sector, social relief projects are generally directed at those who have experienced a natural

Sarah Baartman Master Agri-Park Business Plan
P a g e | 60
disaster such as drought, fire or floods. Social relief projects are funded by a number of organisations, including
the private sector. There are currently no social relief projects underway in SBDM.
7.2.8 Special Projects
Special projects are projects that are usually large and unique in nature which have specific goals that are linked
to national and regional development. Examples of these projects include IDZs and large infrastructure projects
such as dams and electricity projects.
Figure 7.2: Projects in SBDM
Source: Urban Dynamics, 2015
7.3 Environmental Profile
Sarah Baartman has a unique and interesting environment. Biodiversity in the municipality is broad and ranges
greatly from one extent of the District to the other. Just as biodiversity differs, so does the temperature, rainfall
and general climate. The following section details the environmental characteristics of the municipality.
7.3.1 Temperature
Decadel (ten day period) 1km X1km surfaces were created from temperature data (1920 to 1999) obtained from
the AgroMet databank at the ARC-ISCW (South African Weather Service and ISCW weather stations) from
stations with a recording period of 10 years or more. Regression analysis and spatial modelling were utilised
taking into account topographic indices such as altitude, aspect, slope and distance to the sea during the
development of the surface. Monthly averages were calculated (Malherbe & Tackrah, 2003). The SAWS in Nelson
Mandela Bay indicated that Sarah Baartman DM is the DM with the best distribution of meteorological data
available in the Eastern Cape.
The Tsitsikamma forest in Kou-Kamma municipality has a mean temperature of 23°C during summer and a winter
mean temperature of 17°C, while temperature in Graaff-Reinet in Camdeboo municipality rises to the mid 40°C
with a mean summer temperature of 31.5°C and mean winter temperature of 19.4°C (SBDM, 2015).
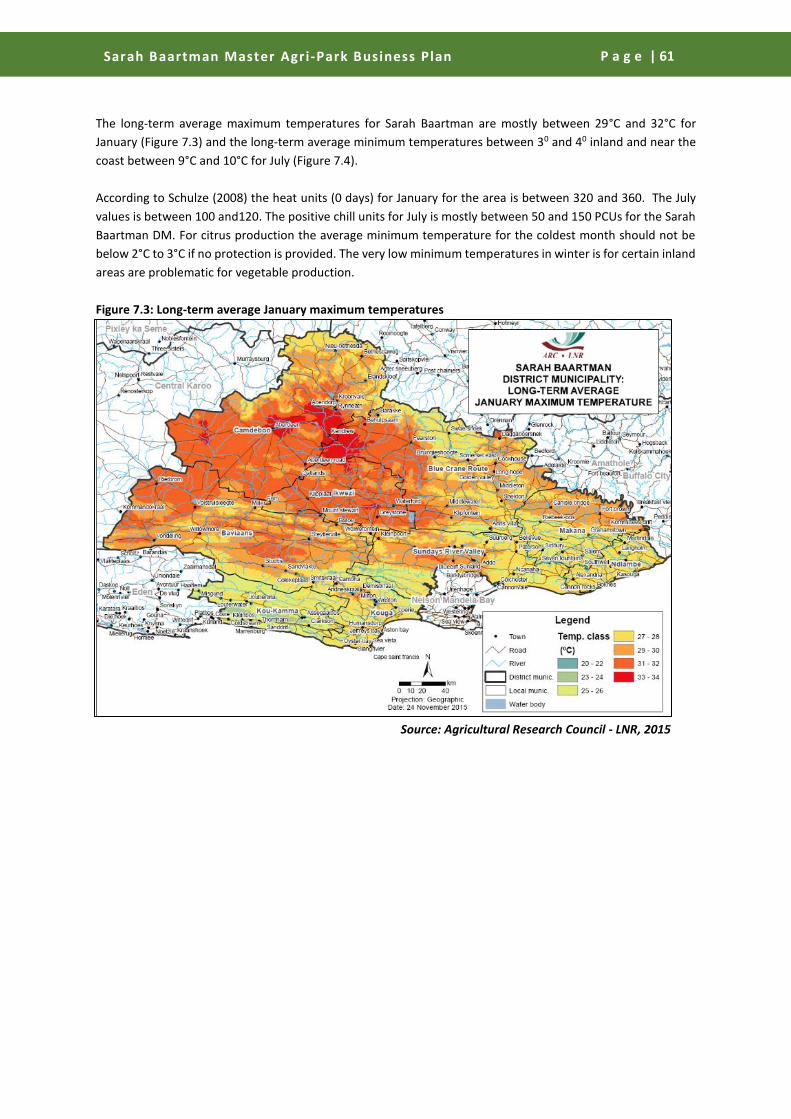
Sarah Baartman Master Agri-Park Business Plan
P a g e | 61
The long-term average maximum temperatures for Sarah Baartman are mostly between 29°C and 32°C for
January (Figure 7.3) and the long-term average minimum temperatures between 30 and 40 inland and near the
coast between 9°C and 10°C for July (Figure 7.4).
According to Schulze (2008) the heat units (0 days) for January for the area is between 320 and 360. The July
values is between 100 and120. The positive chill units for July is mostly between 50 and 150 PCUs for the Sarah
Baartman DM. For citrus production the average minimum temperature for the coldest month should not be
below 2°C to 3°C if no protection is provided. The very low minimum temperatures in winter is for certain inland
areas are problematic for vegetable production.
Figure 7.3: Long-term average January maximum temperatures
Source: Agricultural Research Council - LNR, 2015

Sarah Baartman Master Agri-Park Business Plan
P a g e | 62
Figure 7.4: Long-term average July minimum temperatures
Source: Agricultural Research Council - LNR, 2015
7.3.2 Rainfall, hail risk, humidity and water availability for irrigation or animal watering
Climate in Sarah Baartman DM vary from mild conditions and moderate rainfall along the coast to harsh and
arid conditions in the Karoo. Rainfall varies from 900 to 1 000mm in the Tsitsikamma forest in the most southern
part of the district to less than 200mm in the Karoo in the western part of the district. The eastern part of the
district receives about 600mm per annum with approximately 400mm per annum in the central part of Sarah
Baartman DM (Figure 7.5). Intensive crop production in the Sarah Baartman DM is not possible without
irrigation.
From the long-term 33rd and 67th percentile annual rainfall (Figures 7.5 and 7.6) it can be seen that the
Tsitsikamma has the highest probably of high rainfall (900 mm) even during drought conditions.
Drought is a regular phenomenon in Sarah Baartman DM. Of critical and in national interest is the shortage of
water during dry periods in the Nelson Mandela Bay Metro (NMBM). Water shortages are regularly experienced
in Willowmore, Steytlerville (Baviaans), Jansenville (Ikwezi) Graaff-Reinet (Camdeboo) and Port Alfred
(Ndlambe). The Paterson area (Sundays River Valley) has a particular water shortage problem in that
groundwater exploration yielded no returns and the town experience regular water crisis, which is exacerbated
by the influx of people (Jordaan, 2013). This however will be partially alleviated when Paterson is supplied with
pumped water from water treatment works near Kirkwood.

Sarah Baartman Master Agri-Park Business Plan
P a g e | 63
Figure 7.5: Long-Term Median Annual Rainfall
Source: Agricultural Research Council - LNR, 2015
Sarah Baartman DM depends predominantly on groundwater for human consumption as well as for agricultural
activities. The low inland rainfall toward the west of the province results in sporadic dry periods and
consequently drying up boreholes and disrupt water supply to towns and human settlements. As a result of
these, there is a competing demand for the scarce water resources between agriculture and the communities
(SBDM, 2015).
The three major dams, Churchill, Impofu and Loerie are situated in Kouga and Kou-Kamma Municipalities, and
predominantly serve the Nelson Mandela Metro, with limited supply to Humansdorp, Jeffreys Bay and St Francis
Bay. The transfer schemes were developed predominantly to serve the agriculture sector in the District. There
is one water board in Ndlambe Municipality, the Albany Coast Water Board that services Bushmans River Mouth
and Kenton-on-Sea. All nine Local Municipalities in Sarah Baartman District are Water Services Authorities
(SBDM, 2015).

Sarah Baartman Master Agri-Park Business Plan
P a g e | 64
Figure 7.6: Long-term 33rd Percentile Annual Rainfall
Source: Agricultural Research Council - LNR, 2015

Sarah Baartman Master Agri-Park Business Plan
P a g e | 65
Figure 7.7: Long-term 67 Percentile Annual Rainfall
Source: Agricultural Research Council - LNR, 2015
7.3.3 Land and Soil Resources
Digital Land type information and the spatial component were used to determine the top soil clay content and
the soil depth. Soil depth is recorded as a range for each soil entry. A weighted average was calculated for each
land type unit (Land Type Survey Staff, 1972 to 2006).
The topsoil clay is mostly between 16 and 25% (Figure 7.8) in the DM, an indication of a low infiltration rate and
high water-holding capacity.

Sarah Baartman Master Agri-Park Business Plan
P a g e | 66
Figure 7.8: Sarah Baartman Topsoil Clay Content
Source: Agricultural Research Council - LNR, 2015
The majority of the area has a relatively shallow soil depth between 300 and 600 mm (Figure 7.8), which is
problematic for the production of most crops. The deep alluvial soils in the valleys of the Sundays River, Great
Fish River and Gamtoos River have a high irrigation potential, although salinity and sodicity problems are
common.
The total area of permanent cultivation under irrigation add up to approximately 39 600 ha (high value crops
and feed and fodder for dairy cows) with temporary cultivation (mostly for animal feed and fodder) at about 60
000 ha. Carrying capacity for extensive livestock varies from 10 ha per LSU in the south near the coastal region
to 40 - 60 ha per LSU in the west. Sarah Baartman DM is also the largest producer of mohair in the country with
more than 2, 9 million kg of mohair annually; that is more than 50% of total mohair production in South Africa.
The coastal belt of the district, particularly the Kou-Kamma, Ndlambe and Kouga local municipalities are the
centre of the dairy industry in the EC and are responsible for producing more than 20% of total milk production
in SA. Citrus production is concentrated in the Sundays River valley with Kirkwood regarded as the citrus capital
in the Eastern Cape. Kirkwood is also surrounded by one of the largest citrus areas in SA with 12 000 ha of citrus
orchards (SBDM, 2015 and Jordaan, 2013). Other areas in the Sarah Baartman district are only marginally suited
to citrus production under irrigation and include areas to the east of the Sundays River Valley, the northern parts
of Camdeboo, south of Klipplaat in Ikwezi, the Aberdeen Plain west of Willowmore and in the Kou-Kamma
Municipality around Kareedouw. Other marginally suitable soils also include limited areas of the Blue Crane
Route Municipality around Somerset East and Cookhouse and scattered areas of the Makana Municipality
(Jordaan, 2013). This being said there is a significant citrus industry located in the Gamtoos Valley around
Patensie and Hankey which produces oranges, lemons, grapefruit and soft citrus. Most of what is produced in
the Gamtoos Valley is also exported as with the Sundays River Valley. Gamtoos has two packhouses which
operates under the Patensie Citrus organisation.

Sarah Baartman Master Agri-Park Business Plan
P a g e | 67
Cattle and dairy farming are dominant in the areas around Grahamstown, Cookhouse, Alexandria and
Humansdorp. Stock production has seen a decline in the past decade, primarily as a result of game farm
establishment and the expansion of the Addo National Elephant Park. Commercial forestry is established around
Tsitsikamma and Grahamstown (Jordaan, 2013).
Figure 7.9: Sarah Baartman Soil Depth
Source: Agricultural Research Council - LNR, 2015
7.4 APAP Commodity selection criteria
The Agricultural Policy Action Plan (APAP) proposed 5 criteria for the assessment of agriculture ‘sectoral
interventions’, referred to in this report as ‘commodities’. These criteria were developed to support outcomes
4, 7 and 10 and the associated objectives set out in the New Growth Path (NGP), National Development Plan
(NDP) and the Industrial Policy Action Plan (IPAP). The APAP criteria were used as a basis for the criteria in this
document.
The 2015 – 2019 APAP report stated the following:
“For APAP to effectively speak to Outcomes 4, 7 and 10, and to the objectives set out in the NGP, NDP and IPAP,
it needs to unlock the productive potential of agriculture, forestry and fisheries by considering the nature of
their binding constraints, whether these be at the level of primary production, beneficiation, or marketing, or
indeed a combination of these. However, different subsectors within agriculture, forestry and fisheries operate
according to different dynamics and face distinct challenges, thus there is a need to be selective as to which
subsectors or value chains to focus upon in the short and medium term, while also recognising that agricultural
commodities in particular are often inter-related, in which case it is more helpful to speak of ‘integrated value
chains’. Using the following general selection criteria, this first APAP focuses on a discrete number of value chains
identified as strategic in meeting the objectives of the NGP, NDP and IPAP”
The APAP criteria are listed below:
Sarah Baartman Master Agri-Park Business Plan
P a g e | 68
th potential
7.5 Agri-Park Commodity Prioritisation Matrix
The Agri-Hub will predominantly support three main commodities with services, implements, training and
various expertise. In order to choose the three main commodities a selection matrix was designed in order to
fulfil this role. These criteria were adapted from the APAP commodity selection criteria. These criteria were
weighted and prioritised based on their importance and placed into a matrix. All of the currently operational
agricultural activities in the area were included in the matrix and the top three were selected. In this case the
top four were selected as beef cattle and other red meat (lamb, mutton and chevon) have very similar value
chains and could be combined. The criteria used to select the top three commodities were as follows:
Biophysical Criteria
Enterprise Viability Criteria
Economic Development Criteria
Political/ Institutional, Social and Food Security/ Sustainability criteria
Each of these criteria, which were used to select the top three commodities, were broken down into sub groups
according to each of the parent criteria.
7.5.1 Biophysical Criteria
Some of the most important criteria to consider is the biophysical criteria. If crops or livestock cannot cope in a
certain area then the entire project will not be effective and may be too costly to continue. It is important to
select crops and livestock that can cope with biophysical environment and use strains and breeds that are
already present in the area.
Temperature
Temperature is important to consider as it directly relates to how livestock and crops may grow. Some crops and
animals cannot cope in certain temperatures e.g. certain types of grains and cereals cannot have extreme
temperatures during their early growth periods and need a temperate climate.
The prioritisation matrix examines the:
growth temperature during the months of the growing season as required by the particular crop
frost risk and frost sensitivity or tolerance of the crop
temperature ranges through the year
ability of the animal to cope with heat and chills
Water/ Moisture
Livestock and crops need to have sufficient water in order to support growth. A reliable source of water or
moisture either in the form of precipitation or irrigation needs to be adequate in order for the growth of
commodity to be successful. The matrix examined the following sections with regards to water and moisture:
sufficient rainfall during the months of the growing season;
sufficient quantity of irrigation water potentially available from surface and/or groundwater
resources that can be sustainably abstracted;
water quality for crops and animals;
sufficient irrigation infrastructure or schemes already available in the area;
sufficient quantity of water available from surface and/or groundwater resources for animal
watering purposes

Sarah Baartman Master Agri-Park Business Plan
P a g e | 69
Land Type, Capability and Soil
The soil section attempts to ascertain the quality and carrying capacity of the soil for the given commodity. It
essentially determines if there are extensive patches of land covered by suitable soil in terms of:
Texture
Drainage
Depth
It also determines land type and capability of the crop and given the land capability of the area is there enough
land capable of supporting the crop or animal. Low scoring crops and animals may require finishing or feedlots
before they are sold.
Weed, Pest, and Disease Resilience
Weeds, pests, and disease resilience is an important aspect in determining the crops and animals that are
chosen. The matrix determines the competitiveness of the crop compared to weeds, if the crop requires
extensive pest and disease control or if disease is common in the area. The matrix examines if certain livestock
can be maintained in the area based on their resilience to pests and disease and if bush encroachment and
unpalatable/poisonous plants are infesting an area that livestock occupy.
Adaptability to adverse conditions
The crops and livestock that were chosen need to be adaptable to adverse conditions. The biggest threats to the
long term sustainability of the commodity will be climate change and associated weather conditions. The
solution to this is to obtain naturalised varieties and breeds that can compete with exotic breeds and be
adaptable to the threat of changing climates.
7.5.2 Enterprise Viability Criteria
Transport, Market Access and Demand Criteria
Distance to Markets and Transport Costs
This section asks the questions: “is the enterprise compatible with the general rule that it is not economically
viable to transport bulky, large volume, heavy or low value products over large distances to markets, while high
value products can be transported over much larger distances, even tens of thousands kilometres away,
considering modes of transport, transportation infrastructure, travel friction, road conditions etc.?” and “Is the
enterprise compatible with the general rule that it is not economically viable to transport highly perishable
products over long distances unless fast, cost efficient cold chains are available?”
Current Demand
This section tries to determine the current demand for the product and if it is sufficiently strong or large. It also
asks if there is an established market for the product, including existing marketing channels and demand
amongst customers already having a strong preference for the product. Finally it determines if there is a
possibility of creating a demand as the current demand may not be fulfilled.
Future Market Growth Potential
This section attempts to determine the future growth of the commodity given global and local market trends
and further marketing potential for example the future of poultry growth in the South African market may be
extremely limited based on the recent changes to the AGOA act between South Africa and the USA as cheaper
USA imports may flood the market.
Market Openness

Sarah Baartman Master Agri-Park Business Plan
P a g e | 70
Determines the willingness of buyers of the product to purchase goods from new and emerging small-scale
farmers. An example of an open market is the wool and mohair industry where the current buyers (BKB and
Cape Wool and Mohair) purchase directly from small-scale farmers.
Human, Physical and Financial Capital Requirements
Familiarity and Local Knowledge and Skills
This section determines if the crop or livestock is already familiar amongst farmers in the area or if significant
awareness creation be needed. It also attempts to ascertain if local farmers and workers are likely to have the
required skills or could fairly easily obtain the required skills to farm with the crop and to add value to it.
Labour Cost and Productivity
This section asks whether or not the local labour cost is competitive and whether the labourers would be willing
to perform farm and agro-processing work. It also attempts to decide how productive a labourer would be in
this sector.
Implements and Infrastructure
This section ascertains the availability and difficulty the process of obtaining required implements and
infrastructure would be for example dairy farming is noted for being a practice that requires large number of
complex implements in order to be competitive and to produce enough milk in one day. Thus this activity would
score low in the matrix.
Ease to Finance
Determines the ease of obtaining financing for the commodity. It asks the question whether or not an enterprise
would be able to secure funding through various means e.g. g be fairly easy, e.g. through tight value chain
financing mechanisms, contract farming, equipment leasing rather than ownership etc.
Business strategy, payback period and profitability criteria
Business strategy and positioning
Determines where or not a business or enterprise can be aligned to a viable business strategy for small scale
farmers in order to remain competitive e.g. being a low cost vs good value vs high quality vs highly differentiated
producer, and various other competitive and business strategies.
Payback Period
This section determines if there will be a long payback period once the crops or livestock are in in place and how
long this may take to pay back any investments. This is particularly important to emerging and small-scale
farmers who may not have the funds or access to funds to last a long period without a payback to the farmer
e.g. forestry will have an extremely long payback period while vegetables may be a lot less.
Profitability
Attempts to ascertain if the enterprise can become profitable in its particular area. For example a game or flower
farm can become exceptionally profitable if managed correctly as there is a large demand abroad for their goods.
Maize and Lucerne farming can also become extremely profitable as there is a demand locally for the products
produced from them.
7.5.3 Economic development criteria
Forward and Backward Economic Linkages and Argo-Processing Opportunities
Forward and Backward Economic Linkages
Considered the economic linkages of the commodity and whether or not they were high or low. A commodity
with high economic linkages will be less vulnerable to changes in economy and can adapt to changes. A
commodity with a high number of forward and backward linkages is the forestry industry which has many uses
for the products that are produced.
Sarah Baartman Master Agri-Park Business Plan
P a g e | 71
Agro-Processing Opportunities at District Level
This section considers the ability of the district to value add to the product being produced in the area. This
includes both primary and secondary agro-processing opportunities to be exploited. These activities will most
likely take place at the Agri-Hub.
Job Creation
Direct On-Farm Job Creation
This category explains how labour intensive the activity may be. It was considered important to have activities
that are sufficiently labour intensive rather than capital intensive as this contributes directly to on farm job
creation and rural development.
Direct, Indirect and Induced Job creation through the Value Chain
This category considers whether or not jobs are created or induced through the value chain. Once again it was
important to have a commodity that was creating a sufficient number of jobs throughout the value chain e.g.
forestry has a very high degree of jobs that it creates throughout the value chain as the product that is produced
is used extensively throughout society while lucerne is does not have a large number of induced jobs as it has a
limited value chain.
Job Decency
Job decency is the category that examines the quality of the job that would be created by the farm and value
adding process. This category attempted to identify the most skilled positions and rank them higher than semi-
skilled or unskilled jobs. Generally quality jobs are created is created when labourers are integrated in the
business and management of the farm in order to create buy in and develop skills around the commodity being
farmed.
Local Development
Business Opportunities, Agglomeration Effects and Job Creation at Local or District Level
This category determines the ability of the commodity to create business opportunities and job creation down
the value chain and on the farm which could lead to local and economic development. This section asks whether
or not the commodity has the ability to create economic opportunities for local small emerging entrepreneurs
or will the opportunities be available for distant overseas companies. In this situation wool is an example where
once it is sheered and bailed it is then exported for use overseas with very little production occurring in South
Africa
Agricultural Intensification and Increased Local GDP
Determines if the enterprise is characterised by a relative high level of agricultural intensification, and high
income per surface area unit. In this situation it was preferred that low intensity agriculture be prioritised as it
is associated with higher local GDP due to higher income directly from the enterprise, as well as higher associated
incomes from indirect opportunities.
Global Competitiveness and Trade
Global Competitiveness
This section considers if the region is truly globally or at least regionally competitive to produce the crop/animal,
or if “cheap imports” likely to be or become a threat. In this category, owing to the recent changes to AGOA,
poultry would rank low in this section as it would not be very competitive globally.
Export Potential
Export potential ascertains if the crop and its value added products have strong export potential. This section
essentially considers if a crop, once successfully grown and value added, has the possibility of being exported

Sarah Baartman Master Agri-Park Business Plan
P a g e | 72
e.g. flowers produced in the Western Cape are produced almost exclusively for the export market and have a
high export potential if grown in the Eastern Cape.
Import Substitution Potential
This section determines if the crop or its value adding products present an opportunity to contribute to import
substitution, at local, regional or national level e.g. South Africa is a net importer of maize so any maize grown
in the country would substitute any maize imported into the country.
7.5.4 Political/ Institutional, Social and Food Security/ Sustainability Criteria
Political and Institutional Criteria
Government Priority Including APAP
Considers if the particular enterprise is regarded as priority by APAP and other policies, strategies, plans or
programs. These programmes are given greater scores on the matrix as they align to policy and existing
programmes which can be included in the Agri-Parks concept and can be promoted simultaneously.
Existing Successful or Planned Projects
Attempts to ascertain if there already projects in place in the area that the farms with the particular animal/
plant, or are there plans for establishment in place that are likely to be successful. Existing successful projects
may indicate that the enterprise already “proofed itself” under local circumstances, and additional production
may utilize existing marketing channels, infrastructure and may benefit from increasing scale efficiency.
State or Communal Land Suitability of the Likely Business Model
Determines if there are state or communal parcels of land that can be used or if collective models of production
can be marketed and applied to the enterprise. Obviously land tenure and availability is a large issue and needs
to be examined in detail on a per farm basis.
Social Criteria
Acceptability (Local “buy-in”)
This criteria considers if the farmers will be willing to grow the particular crop/livestock and adopt associated
best practices and new technologies, or if they would be resistant to the idea of adopting the product e.g. if an
area is already used to production of poultry then adoption of flower production may be resisted by the
community.
Income Equality
Considers the economic factors described above and if it will provide significant income associated with the
particular enterprise. Attempts to determine if the economic benefits will flow to low income as opposed to
higher income households.
Smallholder Suitability
Attempts to ascertain if the enterprise be considered suitable for small farmers. This tries to identify which
commodities would be suitable to emerging farmers.
Crime and Vandalism Resilience
This sections determines if the commodity, implements, property and all associated infrastructure is vulnerable
to theft and vandalism given the local crime levels. Theft and vandalism is an important consideration to
determine as many emerging farmers face this challenge daily. Stock theft is an important aspect in the Eastern
Cape as well as vandalism of infrastructure.
Sarah Baartman Master Agri-Park Business Plan
P a g e | 73
Food Security and Sustainability Criteria
Contribution to Food Security
This section of the prioritisation matrix examined the ability of the crop to contribute to food security nationally,
provincially and at a district level. It examined the affordability, distribution of the commodity, biomass
production, nutrient density, stability throughout the year and minimisation of food losses. Commodities chosen
should provide food security for the community.
Sustainability
Ascertains if the commodity is likely to be sustainably produced, thereby conserving the ability of the region to
produce food over the long term and contributing to other social and economic services provided by the
landscape.
7.6 Prioritisation Matrix Results
The three commodities with the highest scores were selected and are discussed below. It should be noted that
the categories of “Other Red Meat” and “Beef Cattle” are combined in the following section as the value chains
of the two are extremely similar and can be combined and supported in the Agri-Hub. They were selected as
they scored the highest on the prioritisation matrix. They will be discussed according to the prioritisation matrix
criteria as discussed in the chapter above. Table 7.2 indicates the top three chosen commodities as well as a list
of other commodities examined for consideration.

Sarah Baartman Master Agri-Park Business Plan
P a g e | 74
Table 7.2: Commodity Prioritisation Matrix
Source: Urban Econ, 2015
Possible crop/livestock for District A.
Bio
ph
ysic
al
cri
teri
a
Te
mp
era
ture
Wa
ter/
mo
istu
re
La
nd
typ
e,
ca
pa
bilit
y a
nd
so
il
We
ed
, p
est
an
d d
ise
ase
re
silie
nce
Ad
ap
tab
ilit
y t
o a
dve
rse
co
nd
itio
ns
B.
En
terp
rise
via
bil
ity c
rite
ria
B.1
Tra
nsp
ort
, m
ark
et
acce
ss a
nd
de
ma
nd
Dis
tan
ce
to
ma
rkets
an
d t
ran
sp
ort
co
st
Cu
rre
nt
de
ma
nd
Fu
ture
ma
rket
gro
wth
po
ten
tia
l
Ma
rket
op
en
ne
ss
B.2
Str
ate
gy,
pa
yb
ack
an
d p
rofi
tab
ilit
y
Bu
sin
ess s
tra
tegy a
nd
po
sit
ion
ing
Pa
yb
ack
pe
rio
d
Pro
fita
bilit
y
B.3
Hu
ma
n,
ph
ysic
al
an
d f
ina
ncia
l ca
pit
al
Fa
milia
rity
an
d lo
ca
l k
no
wle
dge
/sk
ills
La
bo
ur
co
st
an
d p
rod
ucti
vit
y
Imp
lem
en
ts a
nd
in
fra
str
uctu
re
Ea
se
to
fin
an
ce
C.
Eco
no
mic
de
ve
lop
me
nt
cri
teri
a
C.1
Lin
ka
ge
s a
nd
pro
ce
ssin
g o
pp
ort
un
itie
s
Fo
rwa
rd a
nd
ba
ck
wa
rd e
co
no
mic
lin
ka
ge
s
Pro
ce
ssin
g o
pp
ort
un
itie
s a
t d
istr
ict
leve
l
C.2
Jo
b c
rea
tio
n
Dir
ect
on
-fa
rm jo
b c
rea
tio
n
Ind
ire
ct
an
d in
du
ce
d jo
b c
rea
tio
n
Job
qu
ality
/d
ece
ncy
C.3
Lo
ca
l d
eve
lop
me
nt
Lo
ca
l o
pp
ort
un
itie
s a
nd
agglo
me
rati
on
Agro
-in
ten
sif
ica
tio
n a
nd
lo
ca
l G
DP
gro
wth
C.4
Glo
ba
l co
mp
eti
tive
ne
ss a
nd
tra
de
Glo
ba
l co
mp
eti
tive
ne
ss
Exp
ort
po
ten
tia
l
Imp
ort
su
bsti
tuti
on
po
ten
tia
l
D.
Po
liti
ca
l a
nd
so
cia
l cri
teri
a
D.1
Po
liti
ca
l a
nd
in
sti
tuti
on
al
issu
es
Go
ve
rnm
en
t p
rio
rity
in
clu
din
g A
PA
P
Sh
ort
liste
d b
y t
he
dis
tric
t
Exis
tin
g s
ucce
ssfu
l o
r p
lan
ne
d p
roje
cts
Sta
te/co
mm
un
al la
nd
su
ita
bilit
y
D.2
So
cia
l is
su
es
Acce
pta
bilit
y (
Lo
ca
l “b
uy-in
”)
Inco
me
eq
ua
lity
Bla
ck
sm
allh
old
er
su
ita
bilit
y
Cri
me
an
d v
an
da
lism
re
silie
nce
D.3
Fo
od
se
cu
rity
an
d s
usta
ina
bil
ity
Co
ntr
ibu
tio
n t
o f
oo
d s
ecu
rity
Su
sta
ina
bilit
y
Su
b-t
ota
ls
Bio
ph
ysic
al
tota
l
En
terp
rise
via
bil
ity t
ota
l
Eco
no
mic
de
ve
lop
me
nt
tota
l
Po
liti
ca
l a
nd
so
cia
l to
tal
Ove
rall
to
tal
Weight→ 3 3 2 1 1 3 3 2 1 2 1 3 2 2 1 2 1 3 1 1 1 3 1 3 2 3 2 2 1 1 2 3 3 1 3 1
Beef cattle 3 2 3 2 3 3 3 3 3 3 2 3 3 2 2 3 2 3 1 3 1 3 1 2 2 2 3 3 3 1 3 2 2 2 3 2 26 62 42 47 177Vegetables 3 3 3 2 2 2 2 2 3 3 3 2 3 2 3 3 3 2 2 2 2 3 3 1 2 3 3 3 2 3 2 2 3 2 3 3 28 53 43 50 174Citrus 3 3 3 2 2 1 2 2 2 2 1 3 3 2 1 3 2 3 3 3 2 2 3 3 3 2 3 3 3 3 3 2 2 2 2 3 28 46 49 47 170Other Red Meat (Lamb, Mutton, Chevon) 3 2 3 2 2 1 2 2 3 3 3 2 3 2 2 3 2 3 2 2 1 2 2 3 3 2 3 2 2 1 3 2 3 2 3 3 25 49 45 48 167Game, Ostrich 3 3 3 3 3 3 2 3 1 2 1 3 2 2 2 2 1 2 2 2 3 3 1 3 3 3 1 2 1 1 2 2 2 2 2 3 30 50 48 35 163Pork 2 2 2 2 2 2 2 3 3 2 2 3 2 2 1 2 2 2 2 2 2 2 3 2 2 2 3 2 2 3 3 2 3 2 3 3 20 49 39 50 158Maize 2 2 2 2 2 2 2 3 3 2 2 2 2 2 2 3 3 1 1 2 1 2 2 1 2 3 3 3 1 2 3 2 3 2 3 3 20 49 34 50 153Forestry 2 3 2 2 2 3 2 2 2 2 1 2 3 2 1 3 3 2 2 3 3 3 1 2 2 2 3 2 3 3 2 2 1 1 1 3 23 49 43 36 151Dairy 2 2 3 2 2 3 2 2 2 2 3 2 3 2 1 2 3 3 3 3 3 2 2 1 1 2 3 2 1 2 2 2 2 2 2 2 22 49 40 39 150
Honeybush 2 2 2 3 3 1 3 3 3 2 2 2 2 2 3 2 2 2 2 2 2 2 1 3 3 2 2 2 2 2 2 2 3 2 1 2 22 48 42 38 150
Chicory 3 2 3 2 2 3 2 2 2 2 3 2 3 2 2 2 2 2 3 2 1 2 1 3 1 2 2 2 2 2 2 2 2 2 1 3 25 50 38 36 149
Floriculture (Protea, Greens, Ferns) 2 3 2 2 2 2 2 3 2 2 2 3 3 2 2 3 1 2 2 2 3 3 1 1 3 1 2 2 1 3 1 2 2 2 2 3 23 53 36 37 149
Deciduous fruit and Stone fruit 2 3 2 2 2 1 2 2 2 2 1 3 3 2 1 2 2 3 3 2 2 2 2 2 3 2 1 2 2 2 3 1 2 2 2 3 23 44 44 36 147
Wool (Merino and Mohair) 2 2 3 3 2 1 2 2 3 3 3 1 3 2 2 2 2 2 2 3 2 2 2 3 3 1 3 3 3 1 2 1 3 2 1 2 23 44 41 39 147
Honey 2 3 2 2 2 3 2 2 2 3 3 2 1 1 3 3 1 2 1 1 2 2 1 1 1 3 2 3 2 3 2 2 2 2 1 3 23 49 32 39 143
Poultry 1 2 3 1 2 3 3 1 1 2 1 1 2 2 1 1 2 2 1 2 1 2 2 1 1 3 3 2 2 3 3 2 3 1 3 3 18 40 34 49 141
Lucerne 3 3 3 3 2 3 2 2 3 2 3 2 2 2 2 1 2 1 1 1 1 2 1 1 1 3 1 3 2 2 1 2 2 2 1 3 29 47 29 34 139
Aquaculture (Fresh and Saltwater) 2 3 3 2 2 2 2 3 2 2 2 2 1 2 1 1 1 1 2 2 2 1 3 2 2 2 3 3 2 3 1 2 2 1 2 2 25 41 32 40 138
Pineapples 2 2 2 2 2 3 2 1 2 2 1 1 3 2 1 1 1 1 2 2 1 2 1 1 1 1 1 2 2 1 2 2 1 2 1 1 20 40 24 28 112

Sarah Baartman Master Agri-Park Business Plan
P a g e | 75
7.6.1 Red Meat (Beef, Mutton, Lamb, Chevon)
Red meat emerged as the highest scoring commodity from the prioritisation matrix particularly with regards to
beef and other red meat (lamb, mutton and chevon). Pork is not as suitable as beef and other red meat as it is
not suited to the environment as the other meats are.
Generally the biophysical environment is well suited to the red meat industry especially around the Blue Crane
Route, Sundays River LM, Makana and certain parts of the Camdeboo LM. Red meat scored well in the
temperature, land type, capability and soil, and adaptability to adverse conditions. Certain varieties of crops and
breeds of animals that are more suitable to the arid areas of the SBDM. It must be noted that animals which are
suited to the region should be utilised to minimise pests and diseases.
Beef scored well in the enterprise viability criteria particularly in the transport, market access and demand. This
is largely as a result of the close proximity of the N10 as well as other regional roads running through the beef
areas. There is also market demand for beef and profitability of beef is generally high. Farmers in these areas
also have the knowledge and skills to be able to operate farms as red meat is a familiar commodity throughout
the region. Other red meats scored lower on distance to market as they are farmed in more remote areas that
have poor road infrastructure.
According to the economic development criteria red meat scored one of the higher scores as largely because
the livestock farming has good development potential. Red meat scored well in processing opportunities as
there are numerous value adding services that can be established around the red meat industry. On average for
every R 1 million of production of citrus 2.07 jobs are created directly on farm with a further 1.61 in the
downstream economy and 1.88 is induced. Indirect job creation for red meat is fairly high and scored well in the
matrix as the red meat value chain is large and numerous opportunities exist for employment. Export potential
also scored high as there are opportunities to export products such as chevon, mutton and lamb to Middle East
and African countries because of the well-established Karoo lamb and mutton brand.
Red meat scored well in the social and political criteria as it is well suited to the projects that are run by the
DRDLR, DAFF, etc. These projects are supported at a departmental and a district level through various
programmes to improve food security and income equality. Red meat was well placed in terms of the
Government Priority section as the government is currently supporting these projects. Red meat is an essential
part of the diet in many communities as it is a valuable source of protein. It thus scored highly in this section.
Overall red meat was the highest commodity to emerge from the prioritisation matrix as it scored well
throughout all of the subsections. The commodity is well established in region and there is support for the
commodity. There is already a well-established network of farmers that can benefit from the Agri-Park concept.
7.6.2 Vegetables
Vegetables was amongst the most popular commodities in the prioritisation matrix. Vegetables is made up of
various crops ranging from cabbages, onions, spinach beetroot, pumpkin, carrots etc. These were examined in
a general sense in the prioritisation matrix as vegetables. Vegetables in this situation refer to field grown
vegetables and not those vegetables grown in hydroponic tunnels.
Biophysically vegetables are very well suited to certain areas of the district. These areas are largely around the
towns of Hankey and Patensie in Kouga, Kirkwood and Addo in Sundays River Valley and various other locations
spread across the District. Various backyard and community vegetable gardens exist in the District and are an
important part of food security in the region. In the regions where vegetables are grown, the temperature, water
supply, and land type are very suitable and scored well on the matrix.

Sarah Baartman Master Agri-Park Business Plan
P a g e | 76
In the enterprise viability section vegetables scored well in market openness, business strategy, payback period,
familiarity implements and infrastructure, and ease of finance. The market openness for vegetables is generally
good as small holders are able to sell at fresh produce markets and to various smaller chain outlets. The payback
period for vegetables is very low and thus scored high on the matrix. Vegetables do not take an extended period
to grow and thus income can be generated after a season. On average for every R 1 million of production of
citrus 2.49 jobs are created directly on farm with a further 1.37 in the downstream economy and 1.89 is induced.
Vegetables scored well in the economic development criteria especially in the forward and backward economic
linkages. Vegetables have good forward and backward linkages and a very large value chain. Vegetables scored
high for local opportunities and agglomeration as well as agro-intensification and GDP growth as they provide
opportunities for agglomeration in the District which will increase support and thus potentially increase GDP of
the region. Production of vegetables will also substitute imports into the District which can lower costs of the
goods that consumers buy, thus vegetables scored well for this criteria.
In the political and social criteria vegetables scored extremely well as they are well supported at all levels of
government. National Government sees vegetables as the solution to food insecurity and is seen as a way of
increasing agricultural skills. There is support at a district and local municipal level as well as there are numerous
vegetable projects being funded especially cabbage in the Sundays River Valley area. Numerous backyard and
community vegetable gardens are being encouraged and funded as well. Vegetables are an important
component of the human diet and are grown world-wide at a range of scales from small backyard vegetable
gardens to commercial farms. Vegetables are an integral part of food security.
Overall vegetables performed well as they are versatile biophysically, there is an opportunity in the market for
them and they have good support from local communities and government.
7.6.3 Citrus
Citrus emerged as the second highest commodity from the prioritisation matrix as it scored well in all of the
subsections. While not as well scoring as red meat, it is an extremely well supported commodity in the district
and an important part of agricultural production for the Eastern Cape.
Citrus scored well based on the biophysical criteria. Citrus is well suited to the areas that it is grown in as the
soil, temperature and irrigation are very good for the production of citrus. While citrus cannot be extensively
grown throughout the district, large quantities are produced in the spaces available for it. It is also well placed
near the Agri-Hub and thus in a good position to receive support from the Agri-Park.
Citrus scored well in familiarity and knowledge as labourers and farmers are knowledgeable about citrus
production as this region has been the focus of the citrus industry for many years. It is believed that once the
emerging sector is established it will become a profitable venture. The citrus growing regions of SBDM are
relatively close to the markets but poor road conditions mean that citrus score low according to the matrix.
Payback period also scored lower as the trees take longer to grow than other crops and thus there is a 3-5 year
lag in income.
In the economic development criteria, citrus scored well largely as a result of the processing opportunities, on-
farm job creation, global competitiveness and export potential. There are a number of opportunities available
for processing of citrus at a local level and thus scored well. On average for every R 1 million of production of
citrus 3.49 jobs are created directly on farm with a further 1.34 in the downstream economy and 1.91 is induced.
The citrus industry is also a labour intensive industry and requires a large number of workers to pick, sort,
package, and do day to day running of the farm. Downstream employment from citrus is also high as the value
chain for citrus is fairly large. The production of citrus based products also requires more skilled labourers. Thus

Sarah Baartman Master Agri-Park Business Plan
P a g e | 77
citrus scored high in these regards. The citrus industry in the Eastern Cape is globally competitive and the export
potential from these areas are large as there is already an established export orientated market in the area.
In the political and social sections citrus scored well and it well supported by the District and the Sundays River
LM. There are numerous projects aimed at providing infrastructure, skills, and trees in order to promote farmers
to create viable enterprises. The Enon Besheba project is an example of one such project where the Sundays
River Municipality is attempting to support the creation of a citrus farm. This project is supported by various
government departments such as DRDLR, DAFF etc. Citrus is also well supported by the local community as they
are familiar with the commodity and there is buy-in from local communities. Citrus, while not being a staple
food such as rice and potatoes or red meat can contribute greatly to food security. The nutrients and vitamins
provided from citrus are valuable and are not easily available in other vegetable produced. Citrus also form an
essential part of the diet and can lead to improved health among a community. Money earned by employees in
the industry can also be used to secure food.
Overall citrus is a well-established in the District and has scored well on the prioritisation matrix largely as a
result of citrus performing well in the biophysical criteria, economic development criteria and the political and
social criteria.
7.7 Summary
The above section gives insight as to why the top three commodities were chosen. They are generally better
placed than any other products to perform well in the Agri-Park context as they are close to the hub, have an
established infrastructure, enjoy support from the locals and the government and there are recognised
opportunities that can be exploited by emerging farmers.

DRAFT – Sarah Baartman Agri-Park Business Plan P a g e | 78
Red Meat Chapter 8

Sarah Baartman Master Agri-Park Business Plan
P a g e | 79
8. Red Meat / Livestock
8.1 Market Analysis
The South African red meat market covers several commodities, most important to the local market being: beef
(cattle), lamb (sheep), and chevon (goat). This section will discuss the commodity of red meat that was selected
from the prioritisation matrix. It will discuss the market, production and value chain of red meat. In this section
red meat is used interchangeably with livestock. It is suggested that wool and mohair are supported in the Agri-
Park because the wool and mohair industry is closely related to the livestock/ red meat industry. This is done
because increasing animal wellness and farming methods can improve the quality of wool and mohair obtained
from an animal. This is also important to consider as there are numerous programmes in place which take place
in the District to assist emerging and small holder farmers in the region. Wool and mohair market related
information are presented in the section below.
8.1.1 Global Markets
Global red meat production was 191 million tons (including beef, pork, mutton and chevon) in 2013. With red
meat production per region as follows:
Asia 87 million tons (45.5%).
North America 25 million tons (13.3%).
Central America 4 million tons (2.3%).
South America 21 million tons (11.2%).
Europe 39 million tons (20.2%).
Africa 10 million tons (5.2%).
Oceania 5 million tons (2.4%).
Table 8.1 provides global livestock production figures by region and heads of stock for 2013. African livestock
producers are a significant contributor to global mutton and chevon production. The main global regional
producers of beef are South America and Asia. Whilst the main pork producer globally is Asia (Table 8.1 – 8.2).
South Africa leads Southern Africa production, producing 1.2 million tons of red meat, or 12.5% of Africa’s total.
Other notable producers of red meat across the continent are Ethiopia (5.0%), Egypt (6.0%), and Nigeria (11.3%),
with these three countries contributing 31.5% of Africa’s total population. In Table 8.3 – 8.4 the production of
red meat in South Africa is compared to neighbouring trading partners in SADC, namely Botswana, Lesotho,
Mozambique, Namibia, Swaziland, Zambia and Zimbabwe.
South Africa is a major red meat producer within SADC, dwarfing its neighbours in terms of beef, mutton, and
total production. Mozambique produces a relatively large amount of pork, almost 10% of the African total.
Southern African chevon production is relatively small compared to its production of other red meat products.
The African continent is the 2nd largest producer of chevon globally, behind Asia, and chevon produced within
South Africa is primarily for the export market.

Sarah Baartman Master Agri-Park Business Plan
P a g e | 80
Table 8.1: Global Red Meat Production (2013)
Beef Pork Mutton Chevon Total
(Tons) % (Tons) % (Tons) % (Tons) % (Tons) %
Africa 5 694 271 8,9% 1 304 128 1,2% 1 687 934 19,7% 1 301 339 24,2% 9 987 672 5,2%
Asia 14 373 105 22,5% 64 448 557 57,0% 4 254 075 49,5% 3 805 643 70,8% 86 881 380 45,5%
Europe 10 140 072 15,8% 27 121 641 24,0% 1 130 148 13,2% 112 260 2,1% 38 504 121 20,2%
North America 12 754 389 19,9% 12 486 933 11,0% 90 280 1,1% 2 0,0% 25 331 604 13,3%
Central
America
2 502 264 3,9% 1 804 085 1,6% 74 155 0,9% 52 342 1,0% 4 432 846 2,3%
South America 15 617 999 24,4% 5 371 205 4,8% 242 076 2,8% 73 491 1,4% 21 304 771 11,2%
Oceania 2 901 429 4,5% 498 264 0,4% 1 110 589 12,9% 27 329 0,5% 4 537 611 2,4%
World 63 983 529 100,0% 113 034 814 100,0% 8 589 257 100,0% 5 372 407 100,0% 190 980 007 100,0%
Source: FOASTAT, 2015
Table 8.2: Global Livestock Populations (2013)
Cattle Pigs Sheep Goat Total
Heads of
Cattle
% Heads of Pigs % Heads of Sheep % Heads of Goat % Heads of
Livestock
%
Africa 304 746 910 20,8% 35 732 880 3,7% 328 450 262 28,2% 347 957 726 35,7% 1 016 887 778 22,2%
Asia 494 982 171 33,7% 589 902 648 60,4% 511 796 697 44,0% 571 051 689 58,5% 2 167 733 205 47,3%
Europe 122 048 722 8,3% 184 006 466 18,8% 129 945 891 11,2% 16 527 388 1,7% 452 528 467 9,9%
North America 101 515 311 6,9% 77 654 800 7,9% 6 246 750 0,5% 2 841 350 0,3% 188 258 211 4,1%
Central
America
55 632 189 3,8% 24 735 788 2,5% 11 744 464 1,0% 12 367 813 1,3% 104 480 254 2,3%
South America 348 401 875 23,7% 60 060 193 6,1% 68 340 324 5,9% 21 096 760 2,2% 497 899 152 10,9%
Oceania 40 221 546 2,7% 5 181 471 0,5% 106 351 147 9,1% 3 960 537 0,4% 155 714 701 3,4%
World 1 467 548 724 100.0% 977 274 246 100.0% 1 162 875 535 100.0% 975 803 263 100.0% 4 583 501 768 100,0%
Source: FOASTAT, 2015

Sarah Baartman Master Agri-Park Business Plan
P a g e | 81
Table 8.3: African Red Meat Production (2013)
Beef Pork Mutton Chevon Total
(Tons) % of
Total
(Tons) % of
Total
(Tons) % of
Total
(Tons) % of
Total
(Tons) % of
Total
South Africa 851 000 14,9% 216 000 16,6% 143 750 8,5% 35 450 2,7% 1 246 200 12,5%
Botswana 47 000 0,8% 500 0,0% 1 876 0,1% 5 760 0,4% 55 136 0,6%
Lesotho 13 500 0,2% 3 700 0,3% 4 250 0,3% 2 240 0,2% 23 690 0,2%
Mozambique 25 500 0,4% 129 600 9,9% 1 008 0,1% 22 200 1,7% 178 308 1,8%
Namibia 35 800 0,6% 4 675 0,4% 13 200 0,8% 3 840 0,3% 57 515 0,6%
Swaziland 17 100 0,3% 1 310 0,1% 526 0,0% 1 782 0,1% 20 718 0,2%
Zambia 197 827 3,5% 35 244 2,7% 882 0,1% 9 000 0,7% 242 953 2,4%
Zimbabwe 103 750 1,8% 31 900 2,4% 448 0,0% 13 200 1,0% 149 298 1,5%
Africa 5 694 271 100,0% 1 304 128 100,0% 1 687 934 100,0% 1 301 339 100,0% 9 987 672 100,0%
Source: FOASTAT, 2015
Table 8.4: African Livestock Populations (2013)
Cattle Pigs Sheep Goat Total
Heads of
Cattle
% of
Total
Heads of Pigs % of
Total
Heads of Sheep % of
Total
Heads of Goat % of
Total
Total % of Total
South Africa 14 000 000 4,6% 1 600 000 4,5% 25 000 000 7,6% 6 200 000 1,8% 46 800 000 4,6%
Botswana 2 500 000 0,8% 13 500 0,0% 290 000 0,1% 1 700 000 0,5% 4 503 500 0,4%
Lesotho 665 000 0,2% 81 000 0,2% 1 230 000 0,4% 850 000 0,2% 2 826 000 0,3%
Mozambique 1 690 000 0,6% 1 800 000 5,0% 250 000 0,1% 4 350 000 1,3% 8 090 000 0,8%
Namibia 2 370 000 0,8% 72 500 0,2% 2 930 000 0,9% 2 235 000 0,6% 7 607 500 0,7%
Swaziland 635 000 0,2% 35 000 0,1% 36 000 0,0% 270 000 0,1% 976 000 0,1%
Zambia 4 026 658 1,3% 1 098 951 3,1% 240 000 0,1% 2 500 000 0,7% 7 865 609 0,8%
Zimbabwe 5 150 000 1,7% 650 000 1,8% 375 000 0,1% 2 750 000 0,8% 8 925 000 0,9%
Africa 304 746 910 100.0% 35 732 880 100.0% 328 450 262 100.0% 347 957 726 100.0% 1 016 887 778 100,0%
Source: FOASTAT, 2015

Sarah Baartman Master Agri-Park Business Plan
P a g e | 82
8.1.2 National Market
The South African red meat industry is well established and remains one of the most important agricultural sub-
sectors in the country. It contributed approximately 14.0% to the gross value of agricultural production in the
SA during 2013/14. It is estimated that the total number of cattle, pigs and sheep slaughtered increased by
9.5%, 3.1% and 11.2% respectively from 2012/13 to 2013/14.
The cattle and calves slaughtered market earned R 25.449 billion between April 2014 and March 2015, with the
sheep slaughtered market earning R6.008 billion over the same period. In comparison, poultry meat earned
R35.573 billion, and the animal product market as a whole earned R105.420 billion.
South African red meat production is largely in line with red meat consumption, with the short fall imported into
the country. This is presented graphically in Figure 8.1 below. In recent years, the quantity of red meat imported
for consumption has been on the decline, especially in the 2013/14. Mutton imports have declined over the 10
year period from 34 800 tons to a mere 7 100 tons, while beef imports have likewise dropped considerably from
56 000 tons to 20 000 tons. Pork import figures were unavailable, however South Africa produced 300 tons more
pork than was consumed in 2013/2014. Imports of red meat decreased from 43 120 tons in 2012/13 to 23 010
tons in 2013/14, a decrease of 46.6%.
Figure 8.1: South African Red Meat Production, Consumption and Consumption/Capita, 2013/14
Source: DAFF, 2015A
8.1.3 Production
Figure 8.2 illustrates the growth in production of beef, pork and mutton7 since the 2003/04 season. Red meat
production has increased steadily year on year over the 2003/04-2013/14 period, with mutton production
increasing by 52.5%, pork production increasing by 50.7%, and beef & veal production increasing by 55.5%.
7 Chevon, while produced within the country, is primarily for export and is not included in the statistics for consumption and production. Goat populations peaked in 1987, with 2 989 000 goats in the country, and has since been on a general decline, with average annual growth of goat herds between 2005 and 2014 as low as -0.7%. Goat herds have dropped below 2 million animals in 2014, to 1.987 million, the lowest value in the provided record (1980 to 2014).
0
5
10
15
20
25
30
35
40
45
0
500
1,000
1,500
2,000
2,500
Mutton Pork Beef and Veal Red Meat White Meat
Co
nsu
mp
tio
n p
er C
apit
a (k
gs)
Pro
du
ctio
n a
nd
Co
nsu
mp
tio
n in
To
ns
Production Consumption Consumption per Capita

Sarah Baartman Master Agri-Park Business Plan
P a g e | 83
Figure 8.2: South African Red Meat Production
Source: DAFF, 2015A
8.1.4 Production by Province
Major production of certain livestock is concentrated in certain provinces, and the provincial production
dynamics are discussed in this section.
Cattle
Cattle populations are found throughout the country, but predominantly within the Eastern Cape (24.0%),
KwaZulu-Natal (19.8%), Free State (16.7%) and North West (12.2%) provinces. Herd sizes vary according to type
of cattle. Beef cattle herds range from fairly small herds of less than 20 heads of cattle, to large farms and
feedlots environments with well over 1 head of cattle. The production of weaners for the feedlot industry is the
most frequent form of cattle farming in South Africa, such that feedlots account for approximately 75% of all
beef produced in the country.
The total number of cattle in South Africa at the end of August 2014 is estimated at 13.81 million, comprising
various international dairy and beef cattle breeds as well as indigenous breeds such as the Afrikaner and the
Nguni. Beef cattle contribute approximately 80% of the total number of cattle in the country, translating into an
estimated 11.04 million animals, while dairy cattle make up the remaining 20% (Figure 8.3).
0
200,000
400,000
600,000
800,000
1,000,000
1,200,000
Ton
s
Mutton Pork Beef & Veal
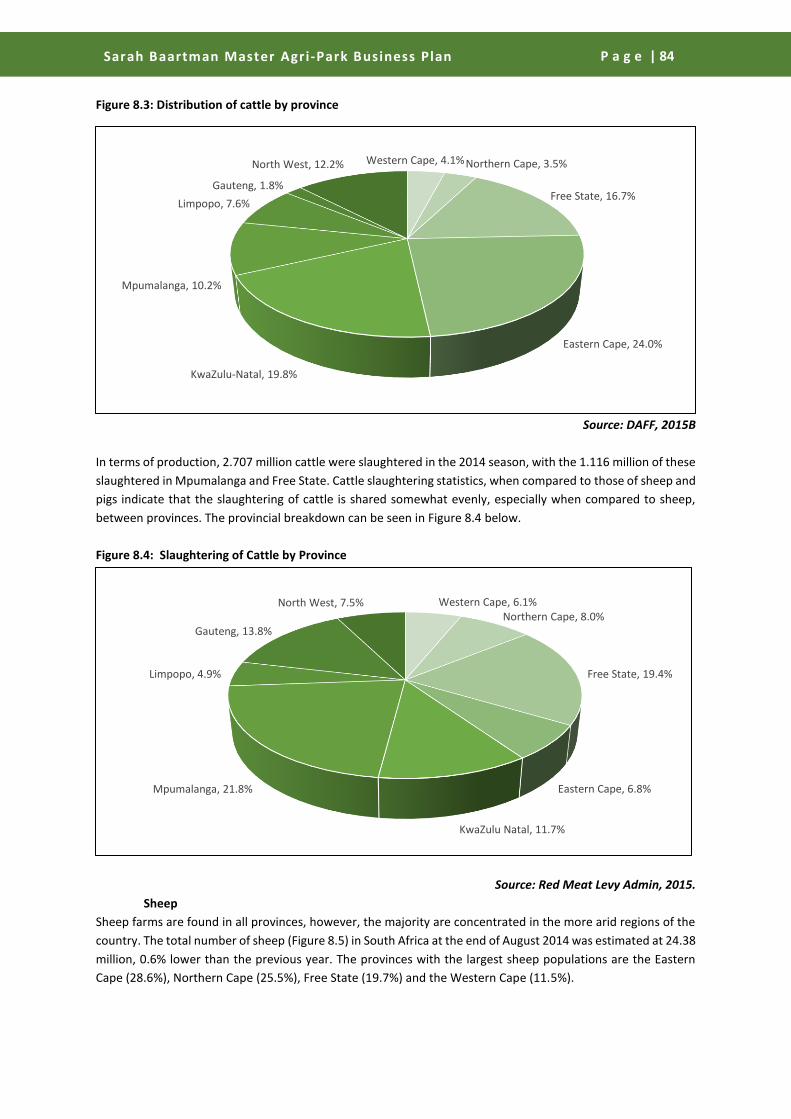
Sarah Baartman Master Agri-Park Business Plan
P a g e | 84
Figure 8.3: Distribution of cattle by province
Source: DAFF, 2015B
In terms of production, 2.707 million cattle were slaughtered in the 2014 season, with the 1.116 million of these
slaughtered in Mpumalanga and Free State. Cattle slaughtering statistics, when compared to those of sheep and
pigs indicate that the slaughtering of cattle is shared somewhat evenly, especially when compared to sheep,
between provinces. The provincial breakdown can be seen in Figure 8.4 below.
Figure 8.4: Slaughtering of Cattle by Province
Source: Red Meat Levy Admin, 2015.
Sheep
Sheep farms are found in all provinces, however, the majority are concentrated in the more arid regions of the
country. The total number of sheep (Figure 8.5) in South Africa at the end of August 2014 was estimated at 24.38
million, 0.6% lower than the previous year. The provinces with the largest sheep populations are the Eastern
Cape (28.6%), Northern Cape (25.5%), Free State (19.7%) and the Western Cape (11.5%).
Western Cape, 4.1%Northern Cape, 3.5%
Free State, 16.7%
Eastern Cape, 24.0%
KwaZulu-Natal, 19.8%
Mpumalanga, 10.2%
Limpopo, 7.6%
Gauteng, 1.8%
North West, 12.2%
Western Cape, 6.1%Northern Cape, 8.0%
Free State, 19.4%
Eastern Cape, 6.8%
KwaZulu Natal, 11.7%
Mpumalanga, 21.8%
Limpopo, 4.9%
Gauteng, 13.8%
North West, 7.5%

Sarah Baartman Master Agri-Park Business Plan
P a g e | 85
Figure 8.5: Distribution of Sheep by Province
Source: DAFF, 2015B
In terms of production, 5.492 million sheep were slaughtered in 2014, with main provinces in which this was
undertaken the Northern Cape, the Western Cape and the Free State. The provincial breakdown can be seen in
Figure 8.6.
Figure 8.6: Slaughtering of Sheep by Province
Source: Red Meat Levy Admin, 2015.
Flock sizes vary between less than 50 and 1 800 animals, with the larger herds found in the Eastern, Western
and Northern Cape provinces.
Western Cape, 11.5%
Northern Cape, 25.5%
Free State, 19.7%
Eastern Cape, 28.6%
KwaZulu-Natal, 3.2%
Mpumalanga, 7.3%
Limpopo, 1.1% Gauteng, 0.4% North West, 2.8%
Western Cape, 22.7%
Northern Cape, 33.7%
Free State, 15.4%
Eastern Cape, 10.6%
KwaZulu Natal, 2.1%
Mpumalanga, 1.9%
Limpopo, 0.3% Gauteng, 12.4%North West, 1.0%

Sarah Baartman Master Agri-Park Business Plan
P a g e | 86
Goats
Goat populations are found mainly in the Eastern Cape (37.7%) followed by Limpopo (19.1%), KwaZulu-Natal
(13.4%) and North West (11.5%) provinces. Estimates indicate that there was a decrease of 0.9% in the number
of goats between August 2013 and August 2014, to 5.976 million in August 2014 (Figure 8.7).
Figure 8.7: Distribution of goats by province
Source: DAFF, 2015B
Flocks of goats intended for meat production are usually smaller than sheep flocks, averaging approximately 300
goats per farm. Angora goats are kept primarily for mohair production, while Boer goats are for meat production,
and both are included in the above statistics. Some producers have adopted a market differentiation strategy
by producing goat’s milk and these producers are increasing in numbers. Chevon is not consumed in significant
quantities locally, however there is a large export market contained within the African continent, that South
African goat producers cater towards.
8.1.5 Local Consumption
The industry is experiencing pressure from various sources, most notably increased competition from overseas
producers and changes in consumer preferences towards poultry and other substitute goods. This has resulted
in red meat consumed per capita remaining relatively stagnant over the last few years, fluctuating between 24kg
and 26kg per capita. This can be linked to the declining per capita disposable income, which encourages the
substitution of red meat for other products, such as poultry.
Although per capita consumption is stagnant, total consumption in tons has increased over the 2003/04-
2013/14 period. In 2014 national consumption of red meat totalled 1 405 000 tons, including 188 000 tons of
mutton, 236 000 tons of pork and 981 000 tons of beef & veal. The consumption of white meat is 45% higher
than that of red meat, with 2 040 000 tons consumed in South Africa in 2014.
Figure 8.8 provides red meat consumption over a ten year period. Mutton consumption was higher than
production by some 32 700 tons in 2003/04, with consumption increasing to 188 000 tons in 2013/14, with a
deficit of only 4 600 tons. Mutton consumption grew 9.9% between 2012/13 and 2013/14, whilst production
increased by 11.6% in the same period.
Western Cape, 3.6%Northern Cape, 8.5%
Free State, 3.9%
Eastern Cape, 37.7%
KwaZulu-Natal, 13.4%
Mpumalanga, 1.5%
Limpopo, 19.1%
Gauteng, 0.7%
North West, 11.5%

Sarah Baartman Master Agri-Park Business Plan
P a g e | 87
Pork production increased by 5.4% over the 2012/13 to 2013/14 period, whilst consumption decreased by 3.7%.
Beef & veal production increased by 8.6% whilst consumption grew 7.6% in the same period. Since 2003/04
consumption has grown on all products with mutton, pork, beef & veal growing by 22.9%, 35.6% and 45.3%
respectively.
Figure 8.8: South African Red Meat Consumption
Source: DAFF, 2015A
South African per capita consumption of meat products shows consumption relative to the population size, as
indicated in Figure 8.9. The changes in the red meat per capita consumption were largely attributed to changes
in consumption of beef & veal, which increased by 45.9% since 2000. In comparison white meat consumption
per capita increased by 79.2% over the same period. Red meat consumption per capita can be seen to mirror
the beef graph line very closely, also increasing by 39.9% over the 2000/01 – 2013/14 period. Red meat
consumption per capita peaked at 26.87kg per capita in 2006/2007, higher than the current consumption per
capita in 2014 at 26.53kg per capita.
Mutton consumption per capita has remained fairly stable, with 3.6kg per capita consumed in both 2000/2001
and 2013/2014, a zero percentage change. Pork consumption per capita increased by 73.1%, from 2.6kg to 4.5kg
over the 2000/01 – 2013/14 period.
In 2014 consumption per capita grew for that year by 6.4% for beef & veal, 9.1% for mutton and -4.3% for pork.
Red meat consumption per capita in total grew by 4.7% in 2014, in contrast to white meat, which dropped by
3.0%.
White meat consumption per capita has increased sharply since 2004/05 as can be seen when compared to the
earlier years. Per capita consumption of white meat started to deviate significantly from the red meat
consumption trends during that year and this trend has continued since that point. Indicating the increased
competition Red Meat has received from substitute products.
0
200,000
400,000
600,000
800,000
1,000,000
1,200,000
Ton
s
Mutton Pork Beef & Veal

Sarah Baartman Master Agri-Park Business Plan
P a g e | 88
Figure 8.9: South African Meat Consumption per Capita
Source: DAFF, 2015A
8.1.6 Local Market Developments
The most significant development in the red meat industry has been vertical integration, occurring through
feedlots entering the red meat market; the marketing regime; and the major expansion of the abattoir industry.
Vertical integration has characterised the industry over recent years, mainly through larger feedlots establishing
their own abattoirs. Furthermore, some feedlots have included further integration down the value chain and
sell directly to the customer through their own retail outlets, for example Eskort.
The previous market regime only allowed meat wholesalers to purchase carcasses on a wholesale system. Now,
wholesalers can source live animals (excluding weaners) directly from farmers and feedlots on a willing buyer/
willing seller basis. This allows the wholesaler to take ownership of the animal prior to slaughtering. The animals
are then distributed to an abattoir of the wholesalers’ choice from which point the carcasses are distributed to
various retailers.
The deregulation of the red meat industry in the early 1990s has seen a significant expansion in the number and
capacity of abattoirs. The industry can be further divided into those abattoirs linked to feedlots, the wholesale
sector, or municipal owned, and those that are owned by farmers and small, medium and micro-sized
enterprises (SMME’s).
Approximately 449 red meat abattoirs currently operate in South Africa. According to the Department of
Agriculture, Forestry and Fisheries (DAFF) approximately 60% of all slaughtering is carried out by abattoirs that
are highly regulated with a high throughput capacity. Other large-scale abattoirs, known as low throughput
abattoirs also operate within the province, with approximately 34 spread throughout the country. Many of these
abattoirs have linkages with feedlots. Approximately 60% of the 80% of livestock that go through feedlots are
slaughtered by abattoirs that are vertically integrated. The remaining abattoirs are considerably smaller,
servicing small livestock producers and localised population centres, most commonly known as butchers and
rural throughput abattoirs (Figure 8.10).
0
5
10
15
20
25
30
35
40
45
kg p
er c
apit
a
Mutton Pork Beef & Veal Red Meat White Meat

Sarah Baartman Master Agri-Park Business Plan
P a g e | 89
Figure 8.10: Abattoir Distribution by Province
Source: RPO, 2015
8.1.7 Price
South African market price is measured through the price per kilogram of the chilled carcass post slaughter
(Figure 8.11). As can be seen within the graph below, all three commodities have seen an increase in their price
over the 2003/04 to 2013/14 period. Prices increased for all products in 2006/07 and 2011/12. Mutton prices
have been the most vulnerable to these price increases. Pork prices are the most stable of the three, with beef
and veal prices performing between the two. In terms of total growth, cattle carcasses experienced the greatest
increase in value between 2003/04 and 2013/14, increasing by 120.9%. Sheep carcasses increased by 114.8%,
while pig carcasses increased by only 100.5% over the same period. In the most recent period, of 2012/13 –
2013/14, the inverse is true, with pork prices increasing by 13.2%, mutton by 4.0%, and beef & veal by only 1.6%.
9 5
4
1
7
5
0
2
1
5
8 2
2
1
3 2
7
3
5
1
5
2
0
6
1
1
1
7
3
2
2
2
2
High throughput
Low throughput
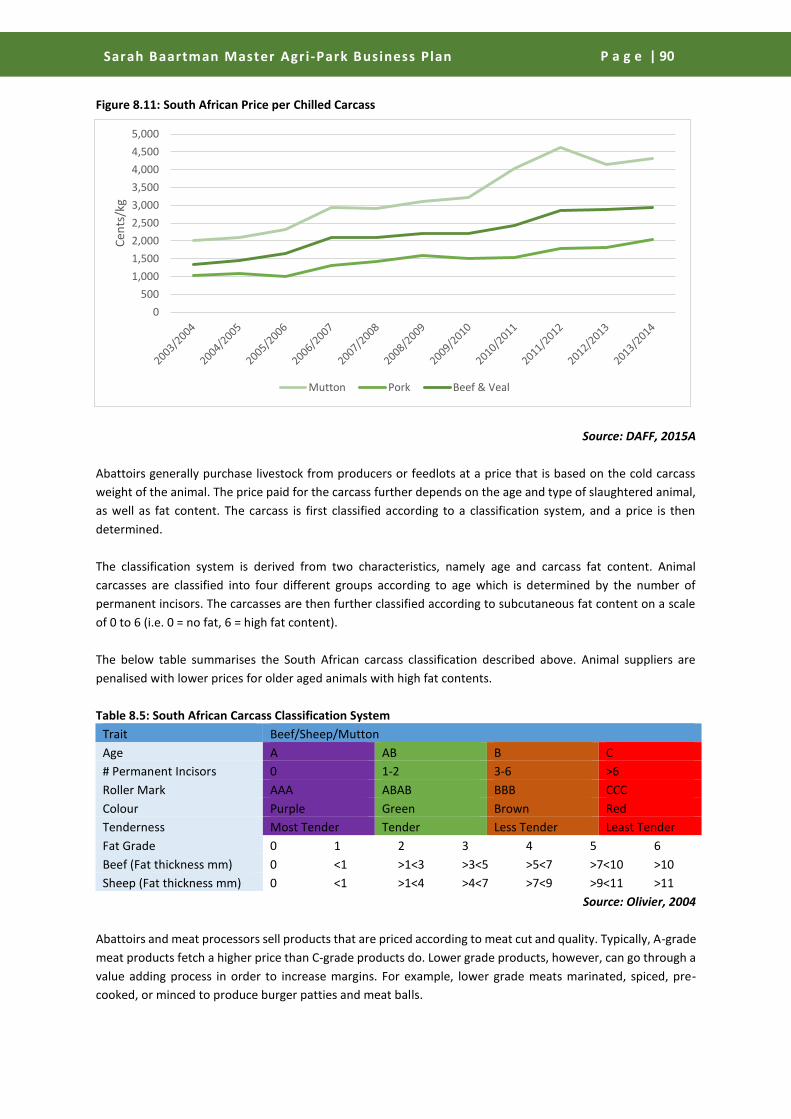
Sarah Baartman Master Agri-Park Business Plan
P a g e | 90
Figure 8.11: South African Price per Chilled Carcass
Source: DAFF, 2015A
Abattoirs generally purchase livestock from producers or feedlots at a price that is based on the cold carcass
weight of the animal. The price paid for the carcass further depends on the age and type of slaughtered animal,
as well as fat content. The carcass is first classified according to a classification system, and a price is then
determined.
The classification system is derived from two characteristics, namely age and carcass fat content. Animal
carcasses are classified into four different groups according to age which is determined by the number of
permanent incisors. The carcasses are then further classified according to subcutaneous fat content on a scale
of 0 to 6 (i.e. 0 = no fat, 6 = high fat content).
The below table summarises the South African carcass classification described above. Animal suppliers are
penalised with lower prices for older aged animals with high fat contents.
Table 8.5: South African Carcass Classification System
Trait Beef/Sheep/Mutton
Age A AB B C
# Permanent Incisors 0 1-2 3-6 >6
Roller Mark AAA ABAB BBB CCC
Colour Purple Green Brown Red
Tenderness Most Tender Tender Less Tender Least Tender
Fat Grade 0 1 2 3 4 5 6
Beef (Fat thickness mm) 0 <1 >1<3 >3<5 >5<7 >7<10 >10
Sheep (Fat thickness mm) 0 <1 >1<4 >4<7 >7<9 >9<11 >11
Source: Olivier, 2004
Abattoirs and meat processors sell products that are priced according to meat cut and quality. Typically, A-grade
meat products fetch a higher price than C-grade products do. Lower grade products, however, can go through a
value adding process in order to increase margins. For example, lower grade meats marinated, spiced, pre-
cooked, or minced to produce burger patties and meat balls.
0
500
1,000
1,500
2,000
2,500
3,000
3,500
4,000
4,500
5,000
Cen
ts/k
g
Mutton Pork Beef & Veal

Sarah Baartman Master Agri-Park Business Plan
P a g e | 91
Hides are also produced from the abattoir, predominantly cattle hides, although a few sheep, goat and pig skins
will also be produced. The prices for the hides are determined by hide quality and weight. Cattle hides currently
trade at between R14.00 and R15.00 per kilogram, while sheep pelts trade for between R70.00 and R120.00.
8.2 Value-Chain Assessment
8.2.1 Beef
The following section will discuss the Beef value chain in which upstream and downstream activities will be
analysed.
Figure 8.12: Beef Value Chain
Source: Urban Econ, 2015
Upstream activities
As beef production is classified as primary production the Up-stream activities relevant to the value chain are
primary the input supplies used in the production system. The major inputs for livestock production include
animal genetic resources, feeds and forages, veterinary drugs, vaccines, machinery equipment as well as
knowledge. Most of these inputs are supplied by Agricultural Co-operatives in the respective areas. The Eastern
Cape Province has three major Agricultural Co-operatives namely:
• OVK – TRADE
• Humansdorp Ko-op
Sarah Baartman Master Agri-Park Business Plan
P a g e | 92
• East Cape Agri – Co-op Ltd / BKB LTD
Primary production activities
Beef is produced throughout South Africa. The amount of beef produced depends on the infrastructure such as
feedlots and abattoirs, not necessarily by the number of cattle available in those areas. South Africa has highly
developed transport infrastructure that allows movement of cattle and calves from one area to another, even
from other countries such as Namibia. For these reasons, Mpumalanga commands the greatest share of beef
production in South Africa accounting for 23% of the beef produced in 2009 followed by Free State and Gauteng
taking up 20% and 13% respectively.
Despite all the challenges, cattle form an integral part of the economy within the communal farming sector. To
unlock this potential to its fullest, the first step would be to recognize that cattle-ownership for many people
remain a culturally resonant, economically rational and socially acceptable option for strategies of production
and accumulation. This being the case, the role players in this sector should be safeguarded and their
investments enhanced with targeted interventions that expressly increase both the productivity and overall rand
value of the herds. To be successful, the focus should be on increasing both the capacity and the options of
poor people to enable them to make strategic investments in their own future.
Future research should address the incomplete picture that exists of the overall distribution of cattle across
livelihoods in the province. A research void exists regarding herd productivity in situ, including reproductive
rates, weaning rates, mortality rates, growth rates and present marketing patterns. The average age and
composition of individual herds, which has a direct influence on productivity, is also largely unknown. Research
and development into the effective utilization and enhancement of the grazing resource becomes a more
pertinent issue as far as cattle is concerned as they tend to react faster to and recover slower after drastic
changes in the grazing resource.
It is a reality that by unlocking the potential of cattle within the communal areas of the Eastern Cape Province,
it is possible to become a net exporter of beef.
Downstream activities
The market players in the beef industry are vertically integrated. They have their own feedlots, abattoirs,
processors and distributors. It is estimated that there are approximately 50 000 commercial farmers currently
farming with livestock. This includes producers that keep livestock as their main enterprise and those that keep
livestock as a secondary enterprise. They own around 8.2 million cattle. There are 240 000 small-scale farmers
and 3 million subsistence farmers that own around 5.69 million cattle.
The beef supply chain has become increasingly vertically integrated. This integration is mainly fuelled by the
feedlot industry where most of the large feedlots own their own abattoirs, or at least have some business
interest in certain abattoirs. In addition, some feedlots have integrated further down the value chain and sell
directly to consumers through their own retail outlets. Some abattoirs have also started to integrate vertically
towards the wholesale level. Under the previous marketing regime, wholesalers mostly bought carcasses
through the auction system. Currently, many wholesalers source live slaughter animals (not weaners) directly
from farmers or feedlots on a bid and offer basis, i.e. they take ownership of the animal before the animal is
slaughtered. The animal is then slaughtered at an abattoir of the wholesaler’s choice, where after the carcass is
distributed to retailers. In some instances, the public can also buy carcasses directly from wholesalers. The
abattoir industry has expanded tremendously in number and in capacity.
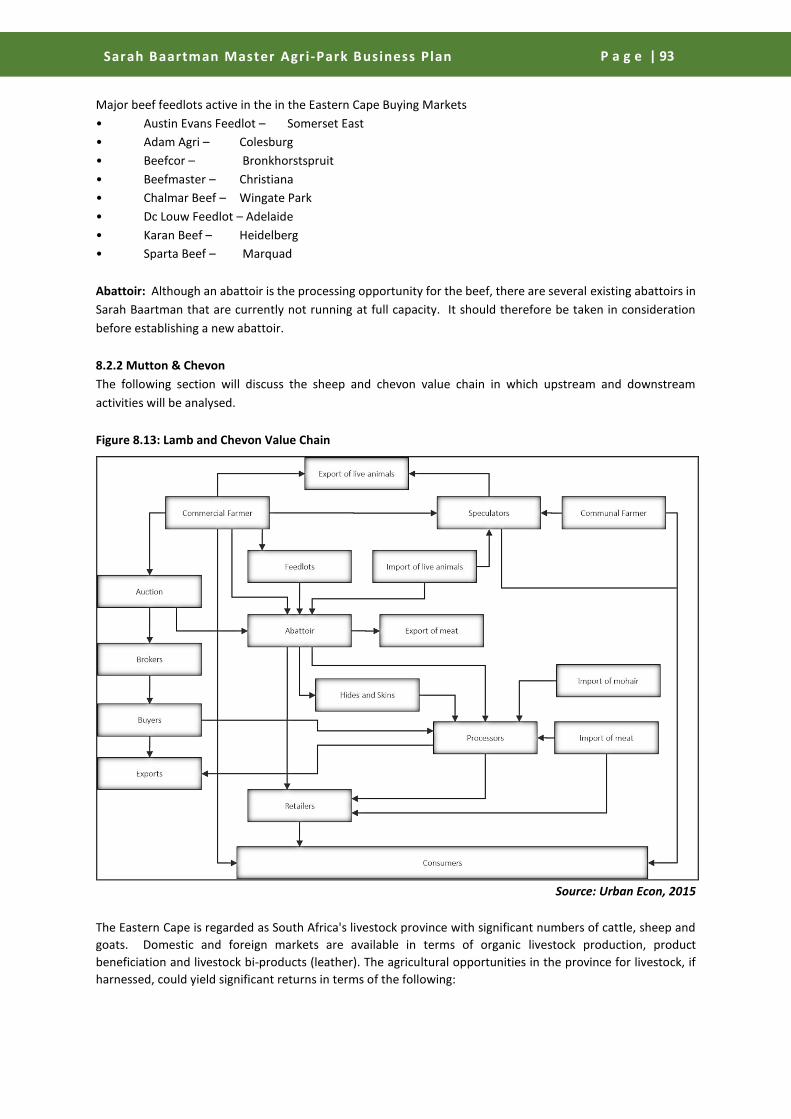
Sarah Baartman Master Agri-Park Business Plan
P a g e | 93
Major beef feedlots active in the in the Eastern Cape Buying Markets
• Austin Evans Feedlot – Somerset East
• Adam Agri – Colesburg
• Beefcor – Bronkhorstspruit
• Beefmaster – Christiana
• Chalmar Beef – Wingate Park
• Dc Louw Feedlot – Adelaide
• Karan Beef – Heidelberg
• Sparta Beef – Marquad
Abattoir: Although an abattoir is the processing opportunity for the beef, there are several existing abattoirs in
Sarah Baartman that are currently not running at full capacity. It should therefore be taken in consideration
before establishing a new abattoir.
8.2.2 Mutton & Chevon
The following section will discuss the sheep and chevon value chain in which upstream and downstream
activities will be analysed.
Figure 8.13: Lamb and Chevon Value Chain
Source: Urban Econ, 2015
The Eastern Cape is regarded as South Africa's livestock province with significant numbers of cattle, sheep and
goats. Domestic and foreign markets are available in terms of organic livestock production, product
beneficiation and livestock bi-products (leather). The agricultural opportunities in the province for livestock, if
harnessed, could yield significant returns in terms of the following:

Sarah Baartman Master Agri-Park Business Plan
P a g e | 94
Organic meat production - organic meat supply is becoming a global trend. The Eastern Cape provides
opportunities for investment in primary and secondary organic meat farming for both the domestic and
international market.
Livestock farmers - the province is looking to establish new commercial livestock enterprises. Interested
investors can partner with community-based organisations and agricultural co-operatives to utilise local skill and
knowledge around livestock farming in the Eastern Cape.
Sheep and goat breeding - sheep and goat breeding, as part of community agricultural development, has
significant opportunities in the rural areas. Opportunities exist in supply of young sheep and goats to rural
farmers, meat production, hide beneficiation and the provision of alternative breeding stock.
Upstream activities
As sheep and goat production is classified as primary production the upstream activities relevant to the value
chain are primary the input supplies used in the production system. The major inputs for livestock production
include animal genetic resources, feeds and forages, veterinary drugs, vaccines, machinery equipment as well
as knowledge. Most of these inputs are supplied by agricultural co-operatives in the respective areas. The
Eastern Cape has three major Agricultural Co-operatives namely:
• OVK – TRADE
• Humansdorp Ko-op
• East Cape Agri – Co-op Ltd / BKB LTD
Primary production activities
Goats
Goats are farmed throughout South Africa. In regions where bush encroachment is rife goats are farmed
together with cattle. The robust Boer goats and hardy African goats fare well in these combined production
systems. In the dry North West region, extensive ranching of goats is done together with Karakul, Persian and
Dorper sheep. Angora goats are an important industry in the Eastern Karoo. Farming with Angoras extends into
the temperate regions and to the Lesotho highlands. Milk goat farming is not a major industry. However, given
the high occurrence of cow milk allergy, there are considerable opportunities for this industry to expand.
Goats make a valuable contribution to the livestock industry in southern Africa. In the rural, economically
deprived regions goats are a ready source of cash-income and food and social security. The greatest need for
research into the constraints in livestock production lies in these regions. Agriculture can no longer afford
inefficiency in any form. Whilst traditional livestock production is a part of cultural life, inefficiency can no longer
be part of it and cannot be afforded.
There are various marketing channels
Auctions
Production sales
Contract Selling
Direct Sales
Goat Lambs are marketed at between six months and two years in order to obtain the best prices for quality
animals. The slaughter market generally requires an animal weighing between 30kg and 45kg on the hoof.
Sheep
The 5 most common breeds of wool sheep in South Africa are, the Merino, the Dohne – Merino, Letelle, the SA
Mutton Merino, and the Landsheep. The most common mutton breeds are Dorper, Dormer, Meatmaster,
Damara and Ille de France. Most of the sheep breeds in South Africa are not seasonal breeders. The best results
are achieved with autumn parings. The choice of breeding times is determined by the availability of feed at
mating, lambing and weaning. The gestation period of a sheep is five (5) months. It is important that the lamb
drinks colostrum within two hours of birth in order to build up immunity against disease. If this doesn’t happen
the lamb will weaken and get sick.
Sarah Baartman Master Agri-Park Business Plan
P a g e | 95
Fertility is the most important economic factor with sheep farming. A high fertility rate will ensure high lambing
and weaning percentages if management is good. The ewe should have good mothering skills and produce
enough milk to feed her lamb or lambs until old enough to wean. The percentage of lambs born does not ensure
the success of the farmer, but rather the percentage of lambs weaned.
Ewes usually have one or two lambs. The lambing percentage ranges between 80 – 130% amongst the different
breeds. This percentage is worked out by dividing the number of ewes mated by the number of lambs weaned
multiplied by 100. Loss of lambs must be limited because this affects the profit of the farm. Loss of lambs is
usually due to predators, cold, rain, poor mothering or poor nutrition. Special attention should be given to these
aspects during lambing. Ewes usually lamb every year, but with good management and nutrition, Ewes can lamb
every 8 months. At mating, 3-4% rams are placed with a flock of ewes for a period of 34 – 42 days.
Nutrition of the sheep is very important as it is the determining factor of the growth, lambing and weaning
percentages. Good nutrition is also important in the preparation of sheep for shows. It is also important to make
sure the sheep is not overweight. Not only is it frowned upon by the judges, but it also undermines the breeding
capacity of the sheep thereafter.
Drastic increase or decrease of the feed causes a fault in the wool which negatively influences the price of the
wool. Increase in the feed causes an increase in the mass of the wool, as well as a stronger wool, while poor
feeding results in a lesser mass of wool, as well as a reduction in fibre quality (finer wool). Nutrition is also the
single determining factor of a successful wool sheep business. Pregnant and lactating ewes should be kept on a
highly nutritious feeding programme to ensure healthy and fast growing lambs. In the above mentioned breeds,
castrated rams, cull rams and ewes are sold with a live weight of 25 - 45 kg’s at 100 – 150 days either to the
feedlots or the abattoir.
Downstream activities
Goat Products
The main products from goats are meat, milk, hides and fibres.
Goat Meat products
The Boer goat is regarded as the only breed of goat on earth that is bred exclusively for meat. Slaughter-
masses vary from 35 to 40 kg for rams, and from 30 to 35 kg for ewes and adult animals.
Goat Milk production
It is claimed that goat’s milk is better than cow’s milk for human consumption.
A comparison of goat’s milk and human breast milk shows the following:
The protein content of goat’s milk is higher than that of breast milk - 25% in the case of goat’s milk,
against 7% for humans.
The total fat content in both cases is virtually identical.
Goat’s milk contains more than the required amounts of calcium and phosphate for babies, but
without any detrimental effects on the child.
As in the case of cow’s milk, untreated goat’s milk can also transmit diseases such as brucellosis, but
not tuberculosis, since goats do not readily succumb to tuberculosis.
Goat’s milk tends to be more suitable for the treatment of stomach ulcers.
In poor countries where the consumption of meat is low, goat’s milk provides for an important daily
intake of protein, phosphorus and calcium which would not otherwise have been available due to the
severe shortage of cow’s milk.
Goat Fibre production/ Mohair
Boer goats produce both fine and coarse fibre. A very fine fibre known as cashmere, develops on the skin
beneath a longer type of hair. The long hair is combed. Any long-tooth comb may be used. Comb downwards
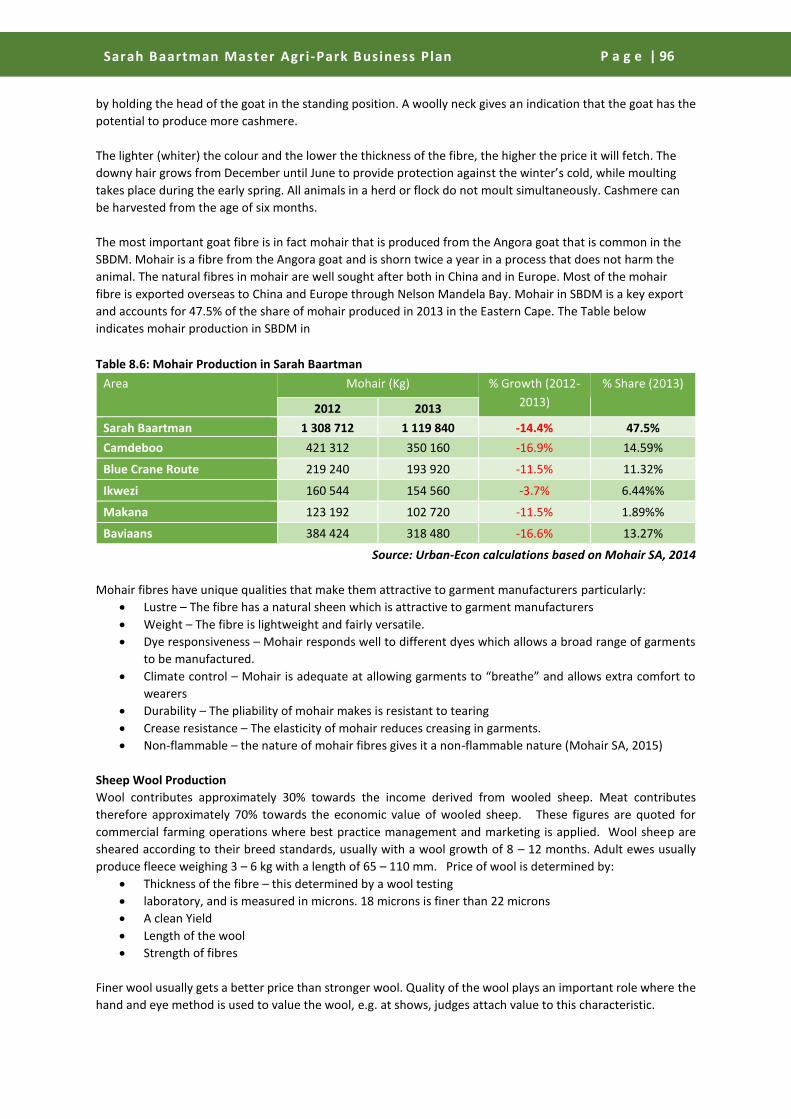
Sarah Baartman Master Agri-Park Business Plan
P a g e | 96
by holding the head of the goat in the standing position. A woolly neck gives an indication that the goat has the
potential to produce more cashmere.
The lighter (whiter) the colour and the lower the thickness of the fibre, the higher the price it will fetch. The
downy hair grows from December until June to provide protection against the winter’s cold, while moulting
takes place during the early spring. All animals in a herd or flock do not moult simultaneously. Cashmere can
be harvested from the age of six months.
The most important goat fibre is in fact mohair that is produced from the Angora goat that is common in the
SBDM. Mohair is a fibre from the Angora goat and is shorn twice a year in a process that does not harm the
animal. The natural fibres in mohair are well sought after both in China and in Europe. Most of the mohair
fibre is exported overseas to China and Europe through Nelson Mandela Bay. Mohair in SBDM is a key export
and accounts for 47.5% of the share of mohair produced in 2013 in the Eastern Cape. The Table below
indicates mohair production in SBDM in
Table 8.6: Mohair Production in Sarah Baartman
Area Mohair (Kg) % Growth (2012-
2013)
% Share (2013)
2012 2013
Sarah Baartman 1 308 712 1 119 840 -14.4% 47.5%
Camdeboo 421 312 350 160 -16.9% 14.59%
Blue Crane Route 219 240 193 920 -11.5% 11.32%
Ikwezi 160 544 154 560 -3.7% 6.44%%
Makana 123 192 102 720 -11.5% 1.89%%
Baviaans 384 424 318 480 -16.6% 13.27%
Source: Urban-Econ calculations based on Mohair SA, 2014
Mohair fibres have unique qualities that make them attractive to garment manufacturers particularly:
Lustre – The fibre has a natural sheen which is attractive to garment manufacturers
Weight – The fibre is lightweight and fairly versatile.
Dye responsiveness – Mohair responds well to different dyes which allows a broad range of garments
to be manufactured.
Climate control – Mohair is adequate at allowing garments to “breathe” and allows extra comfort to
wearers
Durability – The pliability of mohair makes is resistant to tearing
Crease resistance – The elasticity of mohair reduces creasing in garments.
Non-flammable – the nature of mohair fibres gives it a non-flammable nature (Mohair SA, 2015)
Sheep Wool Production
Wool contributes approximately 30% towards the income derived from wooled sheep. Meat contributes
therefore approximately 70% towards the economic value of wooled sheep. These figures are quoted for
commercial farming operations where best practice management and marketing is applied. Wool sheep are
sheared according to their breed standards, usually with a wool growth of 8 – 12 months. Adult ewes usually
produce fleece weighing 3 – 6 kg with a length of 65 – 110 mm. Price of wool is determined by:
Thickness of the fibre – this determined by a wool testing
laboratory, and is measured in microns. 18 microns is finer than 22 microns
A clean Yield
Length of the wool
Strength of fibres
Finer wool usually gets a better price than stronger wool. Quality of the wool plays an important role where the
hand and eye method is used to value the wool, e.g. at shows, judges attach value to this characteristic.

Sarah Baartman Master Agri-Park Business Plan
P a g e | 97
As mentioned above The Sheep are sheared in periods ranging from 8 – 12 months where after wool is classed
and baled on farm before being transported to the processing facilities in Nelson Mandela Bay where it is sold
on to buyers on an open floor auction system.
Mutton Production from Woollen Sheep and haired sheep
Mutton production contributes to approximately 70% of revenue for woollen sheep breeds like Merino, Dohne
Merino, Ille de France etc. Meat production is driven by optimal reproduction, weaning %, efficient and optimal
growth and eventually by the marketing % (number of animals sold) as to total number of animals. Mutton
sheep and lambs are sold on Auction or via buying agents to abattoirs and feedlots which slaughter and package
carcasses and cuts for the retail industry. Sheep Breeds such as Dorper and Meatmaster are farmed entirely for
their mutton production and are not sheared for commercial reasons. The price of meat is determined by:
The age of the animal
The distribution of fat on the carcass
The conformation of the animal
The size (body mass) of the sheep is decided by The length of the body, The depth of the body and The
breadth of the body
Because meat is sold per kilogram, the body mass of the sheep, as well as the rate of growth of the animal plays
an important role. Lamb is more tender than mutton, and therefore gets a better price per kilogram. The
consumer does not want a lot fat and therefore it is important to sell lambs before the meat is downgraded for
having too much fat. Meat on the rump and chops are the expensive cuts and therefore enjoy special attention
from the judge. When the length of body is being shown, the judges judge the size of the sheep. When showing
the back end of the sheep, the judges look at the grade of musculature of the sheep’s outer and inner thighs
A broad chest is an indication an indication of adequate chest capacity which can house healthy lungs. The
capacity of the animal for walking is important where they may have to graze in mountainous conditions. It’s for
this reason that the fetlock joints must be strong so that the sheep don’t walk on their heels and cause lameness.
Agro-processing opportunities
Meat
Both wooled and non wooled sheep are processed through main stream Abattoirs. There are a number of
abattoirs in the Eastern Cape (See section on Beef) The Distance from market is of extreme importance. Abattoirs
in the Eastern Cape are generally not functioning at capacity and as such no immediate agro-processing
opportunities exist at present in this sphere. A vast majority of goats are transported live to Indian markets in
Kwa Zulu Natal where they are slaughtered and processed.
Wool and fibre
Sheep and goats are sheared in periods ranging from 8 – 12 months where after wool/mohair is classed and
baled on farm before being transported to the processing facilities in Nelson Mandela Bay where it is sold on
to buyers on an open floor auction system. A number of feasibility studies have recently been completed on
Wool Washing facilities in Rural Eastern Cape but have not been proved viable and the existing facilities are
functioning well below capacity. The large wool and Mohair processers in Nelson Mandela Bay (Cape Mohair
and Wool & BKB) Dominate this sector and smaller rural processing plants cannot compete effectively due to
processing volumes.
Abattoirs
The following table is a list of important abattoirs in the district (Note: there are other abattoirs in the district
not accounted for in this table).

Sarah Baartman Master Agri-Park Business Plan
P a g e | 98
Table 8.7: Important Abattoirs in the District Abattoir Name Species
(Bovine/Ostrich/ Sheep/Pigs)
Owner/Contact Location
Witelsbos Abattoir No Pigs P S Ferreira Witselbos
Du Preez Boerdery Bovine M du Preez Patensie
Humansdorp Abattoir B/O/S Spitzbak Estate (Pty) Ltd Humansdorp
Karnoor Abattoir B/O/S Kings Beach Investments Jansenville
Grandview Abattoir B/O/S E Olivier Aberdeen
Graaff Reinet Meat Processing Abattoir
B/O/S W F Gouws Graaff-Reinet
Kareedouw Abattoir
M A Strydom Kareedouw
Karoo Wild Game Abattoir Game S Kleinhans Jansenville
Rosedale Abattoir Bovine A le Roux Grahamstown
Twee Riviere Abattoir B/O/S G Fourie Joubertina
J C Steyn Correctional Services Abattoir
Dept of Correctional Services
Kirkwood
Fonte Abattoir B/O/S J du Plessis Family Trust Humansdorp
Bosbok Abattoir Sheep J Strydom Humansdorp
Fish River Abattoir Game J Coetzee Grahamstown
Olyvenfontein Abattoir
D Taljaard Jansenville
Lofdal Slagtery Abattoir Sheep A Strydom Aberdeen
Walplaas Abattoir Sheep W R Pienaar Graaff-Reinet
Rosedale Abattoir Sheep J P Zietsman Humansdorp
Dowefontein Abattoir Sheep H T Marx Aberdeen
Lentaba Meat B/O/S NMB
Alwynhoek Slaghuis B/O/S NMB
Source: RPO, 2015
8.3 Stakeholders
There are a number of organisations involved in the red meat value chain in South Africa. One of the key
organisations is Red Meat Producers Organisation (RPO). RPO is service organisation that acts as mouthpiece
for South African commercial red meat producers. It is an independent producer’s organisation that strives to
dynamically promote the sustainability and the profitability of the red meat industry in South Africa. Table 8.8
shows other key stakeholders in the red meat sector in South Africa. It is important to consider the buy-in of the
relevant stakeholders into the Agri-Park as they can provide skills, expertise and advice to emerging farmers.
Key wool and mohair stakeholders are also included in this table.
Table 8.8: Livestock Stakeholders
Stakeholder Description
Red Meat Abattoir Association (RMAA) The RMAA is an independent membership-based
organisation. Its primary aim being training at all abattoirs in
South Africa. The Association is a representative forum for red
meat abattoir owners in South Africa and aims to establish

Sarah Baartman Master Agri-Park Business Plan
P a g e | 99
communication and co-operation between the members of the
Association.
Livestock registering federation The principal business and purpose of the Livestock Registering
Federation shall be to unite, promote and protect its members
acting as Independent Registering Authorities (animal
Improvement Act 62 of 1998), into an affiliated federation.
South African Meat Industry Company
(SAMIC)
SAMIC is a quality assurance company which was created by the
Red Meat Industry of South Africa to ensure the quality and
safety of meat in South Africa.
National Emergent Red Meat Producers'
Organisation (NERPO)
The primary aim of NERPO is to commercialise the developing
agricultural sector and ensure meaningful participation of black
individuals within the mainstream commercial agribusiness
sector, hence ensuring the long term sustainability of the
agricultural sector in South Africa.
Red Meat Industry Forum The Red Meat Industry Forum of South Africa represents all the
most nationally representative sector specific role player
organisations within the red meat value chain.
South African Feedlot Association (SAFA) The SA feedlot industry was started during the 1960s by a few
entrepreneurial cattle farmers in the grain producing areas who
were forced, due to a lack of grazing, to "over-winter" their
stock on grain and/or potato by-products and hay of inferior
quality.
International Quality Assurance Services
(IMQAS)
IMQAS services the hygiene and quality needs of the meat
industry in South Africa on an independent basis. Their services
are available to primary producers, abattoirs and processing
establishments.
South African National Halaal Authority
(SANHA)
SANHA is a non-profit organisation promoting professionalism
in the certification of Halaal products.
Red Meat Research & Development SA The specific aim of the RMRD SA and its Project Committee is to
co-ordinate and fund research projects.
Mohair SA Mohair South Africa is a non-profit organisation that is
responsible for the marketing and promotion of the mohair
fibre along with other functions.
National Woolgrowersʼ Association of SA
(NWGA)
The National Wool Growers Association is a national
commodity structure formed by commercial and communal
wool sheep farmers in South Africa with the purpose of
collectively representing the wool farmers in the country and to
integrate, in a single representative structure, the development
requirements of the sector.
Wool Brokers and Traders BKB Ltd
Cape Mohair and Wool (CMW)
Van Lill Woolbuyers Trust (CC)
Junior Steenkamp - Wool & Mohair
Lanata (Pty) Ltd Wool/Mohair Broker
Bruce, Lappersonne & Saunders
8.4 Technology
Agri-Park farmers can make use of a wide variety of technology to improve their access to markets and the
efficiency of their production. Emerging farmers in South Africa have traditionally lagged behind in the usage of

Sarah Baartman Master Agri-Park Business Plan
P a g e | 100
technology in their production and marketing activities. There is however more information and initiatives
available today to connect emerging farmers with the latest technology. The areas in which innovation is
improving efficiencies in small holder agriculture include nanotechnology, genetically modified crops, GIS and
remote sensing, cellular phones, information technology and applications etc. As with any technology, it is
important to strike a balance of mechanisation and job creation which improves skills and creates meaningful
jobs.
To farm and manage livestock various equipment and infrastructure will be needed such as management and
farming software, boreholes, water pumps and storage, animal reproduction, handling, feeding, watering &
health equipment and training, veld management techniques to prevent soil erosion, security technology, and
other innovations.
Recent developments in farming will have to be considered in order for any farming activity to be competitive
in the future. Three areas in which technology is impacting on the livestock industry is in animal health practices,
veld management and automated refilling water troughs.
Animal Health
Animal health practices are important in livestock farming to guarantee the survival of the animal and the quality
and acceptability of the product for the commercialised market structures. There are two major methods in
managing the health of animals: via vaccinations and via anti-biotics. Both of those methods are practiced within
commercial operations, however the importance of these activities have not fully penetrated the small-scale
market.
Vaccines contains inactive parts (usually the capsid) or molecules that resembles surface proteins of a
pathogenic virus or bacterium, which are introduced into the animal's blood stream so that antibodies can be
developed. This will enable the animal to develop immunity and to be protected against the pathogen when and
if exposed to it later in life. New vaccines are constantly developed therefore it is important to consult with an
animal health professional on the most appropriate vaccination program. Vaccines have a highly positive effect
on disease control and even eradication. Vaccinated animals normally exhibit high returns on investment, as
there is less likelihood of losing the animal during the raising process. Costs associated with vaccination are
normally low, and they require low levels of training to implement successfully.
Anti-biotics have two main applications in agriculture. The first is to treat infections, which is an important
application, but too specialised a feel to discuss in detail. Infection treatments are predominantly taken care of
by animal health professionals. Secondly, anti-biotics serve as a routine feed supplement to animals in intensive
farming systems (feedlots, piggeries, chicken houses, fisheries etc.) which can be considered a dangerous and
unsustainable practice. This second method occurs as anti-biotics encourage increased growth rates and
resistances against disease. However, the cost to society could be large and devastating, due to extensive
untested treatment of medication to animals not necessarily requiring prolonged exposure to the chemicals.
Prolonged exposure to the anti-biotics encourage drug resistance strains to develop that can potentially be
carried over to the human population via consumption. The drugs are cheap to acquire, however to correctly
implement, via the trained veterinary profession, does require substantial service charges.
Veld Management
Veld management practices serve two primary functions. Firstly, they prevent the encroachment of indigenous
brush onto grazing areas, and, secondly, they enable land rehabilitation to other purposes. Two ways in which
this can occur is by brush removal for input into related markets, and land rehabilitation practices.

Sarah Baartman Master Agri-Park Business Plan
P a g e | 101
A good example of brush removal is the potential contained within bush-to-feed converters. Brush removal
enables production feed pellets from shrubs and trees. It also enables minor forestry production with thick
branches and tree stems that cannot be converted into feed, can be sold as fire wood or converted to biochar.
The practice is centred on converting a liability (bushes that reduce the carrying capacity of the veld) into a
valuable asset (feed for game and cattle). And could serve as an effective method of bush encroachment control.
The process requires some skills training and is moderately expensive to obtain and operate.
Land rehabilitation covers a range of technological processes, that can differ in complexity from as simple as
brush packing to as complex as production of biodegradable or long lasting soil cloths and mesh materials. The
main purpose of the rehabilitation is to stabilise soil, control or reverse existing erosion damage and restore
degraded land so that it can again be utilised for agricultural purposes. Land rehabilitation also serves as a
preventative measure for future soil degradation, by enabling vegetation on the land, preventing future
problems. Depending on the type, extent and location of re the rehabilitation, the required expenditure skills
range from low to moderately high.
Automated-refill watering troughs
Providing water for livestock can be a drain on communal water resources and put unnecessary strain on
communities, especially in times of drought. If animals are scattered in rural areas, it may be time consuming or
difficult to access their water troughs to keep refilling them. Automated-refill water troughs seek to manage
livestock water usage, by utilising water troughs fitted with a small reservoir and low pressure floating valves to
enable automated re-filling.
These water-provision systems would be more resilient to evaporation, and when properly maintained ensure
sufficient levels of water provision of animals, by minimising water contamination and the risk of wastage.
Furthermore, the systems are consistent, preventing livestock tampering, and easy to clean. The cost of the
system is relatively low, requiring an investment of a few thousand rand, and are also relatively simple to
operate.
ICT
ICT is possibly the biggest development in the agricultural sector for emerging and commercial farmers alike.
The emergence of the internet and mobile phones has led to an exorbitant amount of data at the fingertips of
the farmers. If they require information then it can be obtained immediately and problems solved sooner than
before (e-Agriculture, 2015). ICT has allowed the emergence of training software and applications (Apps) which
people can use for the benefit of the staff who work for them and for themselves. Training can be done outside
of training centres and content directly displayed on smartphones. Smartphones have also allowed for greater
access to market prices and market related news as it happens and sooner than what used to occur (e-
Agriculture, 2015). This can allow farmers to make adjustments before they impacted negatively. This has also
allowed access to online and cell phone banking and various finance facilities (e-Agriculture, 2015). This means
that farmers have access to their finances from their phones and do not have to leave the farm to bank. Online
banking has also made farming safer as large amounts of cash is no longer used to pay staff and instead can be
paid into bank accounts or cell phone numbers. ICT has allowed for the effective design of farms around the land
that is available to farmers and has allowed for farmers to be more efficient and handle finance and information
related queries over a long distance instead of being at a physical location in person. This has also allowed for
the effective management and understanding changing markets as they occur which allow farmers to react in a
timely manner (e-Agriculture, 2015).
Numerous smartphone apps also exist for the convenience of the farmer. Pantheon Farming from App Lab allows
farmers to enter all data directly on location, which is synchronized with a main database. This reduces the
possibility of errors and eliminates duplicate data entries. eFarmer is a simple app designed for the agricultural
Sarah Baartman Master Agri-Park Business Plan
P a g e | 102
industry that allows users to construct an electronic map of fields to create a database of various crops in the
fields. The app also allows users to take notes on the fields as points of interest, keep the location of specific
objects on the farm and keep a diary of the operations for each field users own. AgriApp is an Android app that
enables farmers to access large pool of relevant information related to agriculture and specific crops and
animals.
Specifically for the livestock industry, the Merck Veterinary Manual Mobile App, is available for both Android
and Apple and contains guidelines for the diagnosis, treatment, and prevention of animal disorders and diseases.
Online resources also exist which can be accessed through a phone, tablet or PC which is connected to the
internet. Sites such as FAO:Ecocrop provides detailed crop requirement information for almost any crop that are
cultivated throughout the world, including its uses and requirements for temperature, rainfall/water, soil type,
soil depth, soil pH, salinity, altitude etc. It also include hundreds of forage crop species for extensive animal
farmers. Another site My Agriculture Information Bank provides a variety of general agricultural information
to farmers.
The Agri-Park needs to take cognisance of the technology that is available in order to assist the emerging
farmers. By integrating technology into training regimes that are provided in the Agri-Park, emerging farmers
will have access to the latest events in their respective fields.
Logistics
In order for the Agri-Park to be successful there needs to be an effective and well run logistics system. Logistics
is an extremely important part of agriculture as it relies on transport of goods to and from the farm to the
processing facilities and o to markets. Trucks and other large freight vehicles which transport goods are vitally
important in any industry and is also important in the vegetable industry. Goods need to be transported in such
a manner that they are not damaged. If goods need preservation then it is important to consider using
refrigerated trucks to transport of produce. The second aspect of logistics is the medium of transport itself.
Roads or the rail system need to be in good order and should be well connected in order to reduce the loss of
produce and damage to trucks which can add on unnecessary costs to the farmers.
8.5 Demand and Needs Analysis
The following section outlines the demand for red meat in South Africa and the district and will discuss the
opportunities that exist in the district. Opportunities exist for the following in the red meat market:
Production/supply of animal feed
Increasing existing capacity and development of new abattoirs
Development of cattle feedlots
Increasing herd size of beef cattle
Long term opportunity for SMME cattle hide processing (tanneries) for the automotive industry
It is possible to provide an estimate for demand based on historical consumption figures and populations. The
figure below provides a summary on estimated demand on a national and provincial level.
At an average per capita consumption for red meat of 25.5kg per person (beef at 17.6kg, mutton at 3.3kg and
pork at 4.6kg), there is a clear demand for red meat products in South Africa. Demand for red meat on a national
level is approximately 1.3 million tons. In Sarah Baartman the demand for red meat is approximately 11 490
tonnes annually as seen in Table 8.9.

Sarah Baartman Master Agri-Park Business Plan
P a g e | 103
Table 8.9: Annual demand for red meat (tons)
Area of Demand Estimated Demand
South Africa 1 320 149
Eastern Cape 167 332
Sarah Baartman District 11 490
Camdeboo 1 300
Blue Crane 918
Ikwezi 269
Makana 2 050
Ndlambe 1 560
Sundays River Valley 1 390
Baviaans 453
Kouga 2 513
Kou-Kamma 1 037
Nelson Mandela Bay 29 379
Source: Quantec 2013, Census 2011
8.6 Competition
While there are numerous established commercial farmers in the District competition is seen as an advantage
rather than a disadvantage in this situation. Commercial farmers have established contacts and networks that
they can take advantage of. This information can be accessed through various government various government
programmes which encourage mentorship of farmers. The benefits of farming in areas that already have a strong
presence of farmers is possibly more of a benefit than a disadvantage. The largest form of competition will come
in the form of cheaper imports of poultry from the USA as part of the AGOA act that was recently amended.
8.7 Socio-Economic (Job Creation)
The Agri-Park project vision, as discussed in Chapters 1 and 2, outlines the importance of socio-economic
development as an objective of the Business Plan. Socio-economic progress and development can be measured
in various ways, however the primary method of measurement selected for livestock commodity is Job Creation.
Job creation is measured via the use of commodity labour multipliers, measuring the number of jobs created
per R1 million produced directly into commodity production. The three relevant multipliers for the Sarah
Baartman District Municipality red meat market are the:
Direct Multiplier
Indirect Multiplier
Induced Multiplier
The three multipliers measure the total numbers of job created in an ideal economic environment for the red
meat market. However as the economic environment diverges away from the ideal environment, so do the
multipliers.
The table below displays the sectoral labour multipliers applicable to the red meat industry, i.e. the number of
the job opportunities created at different levels for every additional R1-million production. The table below
indicates that livestock creates 2.07 direct on farm jobs, 1.61 indirect jobs and 1.88 induced jobs for every R1
million produced. Livestock farming is not as labour intensive at small-scale production levels as such as
vegetable production in the district, however, the cattle commodity specifically does have an extensive value
chain with job opportunities at production, processing, retailing and service level. Numerous abattoirs exist in
the District and thus indirect job multipliers can be expected to be marginally lower, until the need for additional
abattoirs arise. Induced job creation from the income already received in the direct and indirect multiplier
phases, however, could be increased, due to the receptiveness of the area to low-income earners.

Sarah Baartman Master Agri-Park Business Plan
P a g e | 104
Table 8.10: Direct, Indirect and Induced Jobs Created in the Red Meat Industry
BFAP (2015) agrees with this outlook and states that livestock farming is not very labour intensive and can vary
from approximately 0.01 person per hectare to approximately 0.05 people per hectare. Sheep and cattle are
non-labour intensive but do have high growth potential and the large value chains can be exploited to increase
labour.
Information that is available on the District’s livestock production and the potential number of hectares,
together with the Bureau for Food and Agriculture Policy, have been used to estimate the employment
opportunities that livestock production can contribute in the 10-year period. The Agri-Park can provide
approximately 180 employment opportunities from the programme. It must be noted however that these
figures are purely indicative and will change through the development of the Agri-Park.
8.8 Contribution to Food Security
One of the core concepts that the Agri-Park seeks to address is the issue of food security of communities. It is
believed that the Agri-Park concept can assist in increasing food security and sustainability of communities’
livelihoods. DAFF launched a Zero Hunger Policy in 2012 in order to curb poverty and improve food security for
vulnerable communities who are in need of support. The Zero Hunger Policy was created to uphold Section 27,1
(b) of the bill of rights which states that every citizen has the right to food and water and Section 28,1 (b) which
states that every child has the right to basic nutrition shelter and basic care and social services. The policy suggest
that adult daily calorie should be 1792 kcal (7502kj) per day for an adult and sets a food poverty line of R260 per
individual expenditure for food every month (DAFF, 2002). Meat consumption is based largely on availability,
price and tradition. Meat production is a very complex operation depending not only on demand (which is
usually based on price and income) but on many social and economic influences such as official policy, price
support mechanisms, and interrelations such as the interaction between beef and milk production etc. (FAO,
2002). While it is clear that meat is not essential in the diet the inclusion of animal products makes it easier to
ensure a good diet. Many diets in developing countries are based on cereals or root crops and are relatively
bulky, especially where fats are in short supply, and this can limit the total energy intake (FAO, 2002). The
importance of meat in the diet is as a concentrated source of protein which is not only of high biological value
but its amino acid composition complements that of cereal and other vegetable proteins (FAO, 2002).
Meat is an adequate source of protein in the human diet and it is assumed that between 55g of meat per day
provides enough protein. The quality of the meat however plays a role as the lower the quality, the more meat
is needed to make up the 55g. Meat and meat products are important sources of all the B-complex vitamins
including thiamin, riboflavin, niacin, biotin, vitamins B6 and B12, pantothenic acid and folacin (FAO, 2002). The
last two are especially abundant in liver which, together with certain other organs is rich in vitamin A and
supplies appreciable amounts of vitamins D, E and K. Meats are excellent sources of some of the minerals, such
as iron, copper, zinc and manganese, and play an important role in the prevention of zinc deficiency, and
particularly of iron deficiency which is widespread (FAO, 2002).
There are issues associated with consumption of large quantities of meat and having an unbalanced diet. Issues
such as coronary disease and cholesterol are well known effects of eating an unbalanced diet of large quantities
of red meat (FAO, 2002).
Income earned from the red meat industry can also be used to purchase food goods in order to be more food
secure as well.
Sector Direct Indirect Direct + Indirect Induced Total
Livestock Products 2.07 1.61 3.68 1.88 5.57

Sarah Baartman Master Agri-Park Business Plan
P a g e | 105
8.9 Regulatory Requirements
There are numerous legislation documents governing the production of red meat. These range from regulations
as to the production inputs (National Water Act), to those governing production (Meat Safety Act) and to
production standards and consumption. The most pertinent of the acts are contained in Table 8.11. It is
extremely important to acknowledge the available legislature and policies as the Agri-Park must follow the rule
of law as set out by the relevant departments. It will align itself to the legislature that is published.
Table 8.11: Red Meat Governing Legislature
Act Description
The Meat Safety Act, 2000 (Act No.
40 of 2000)
The abattoir is responsible for the conversion of livestock to meat. The
process remains critical to ensure a safe and wholesome product
reaches the consumer. The Meat Safety Act addresses measures to
promote the safety of meat and animal products and to establish and
maintain essential national standards in respect of abattoirs.
Red meat regulations regulate processes and procedures under the
Meat Safety Act.
Animal Health Act, 2002 (Act No. 7
of 2002)
To provide for measure to promote animal health and to control animal
diseases; to assign executive authority with regard to certain provisions
of this Act to provinces; to regulate the importation and exportation of
animals; to establish health schemes; and to provide for matters
connected therewith.
Animals Protection Act, 1962 (Act
No. 71 of 1962)
The act encompasses the prevention of cruelty towards animals. The
act further encompasses the code of best practices for the handling and
transport of livestock.
Fertilisers, Farm Feeds, Agricultural
Remedies and Stock Remedies Act,
1947 (Act No. 36 of 1947)
The act provides for the appointment of a Registrar of Fertilizers, Farm
Feeds, Agricultural Remedies and Stock Remedies; for the registration
of fertilizers, farm feeds, agricultural remedies, stock remedies,
sterilizing plants and pest control operators; to regulate or prohibit the
importation, sale, acquisition, disposal or use of fertilizers, farm feeds,
agricultural remedies and stock remedies; to provide for the
designation of technical advisers and analysts; and to provide for
matters incidental thereto.
National Water Act, 1998 (Act
No.36 of 1998)
This act encompasses laws relating to water resources and the use
thereof.
Occupational Health and Safety
Act, 1993 (Act No.85 of 1993)
The act aims to provide for the health and safety of persons at work and
the health and safety of persons in connection with the activities of
persons at work and to establish an advisory council for occupational
health and safety.
Basic Conditions of Employment
Act, 1983 (Act No. 3 of 1983)
The act encompasses those regulations associated with fair labour
practices.
Municipal By-Laws and
Regulations, where relevant
Municipal by-laws will need to be investigated with regard to the
establishment of the abattoir in a municipal area.
Marketing Act, 1968 (Act No. 59 of
1968)
The Act has authorised an establishment and enforcement of
regulatory measures to intervene in the marketing of agricultural
products, including the introduction of levies on agricultural products.
Agricultural Products Standards
Act, 1990 (Act No. 119 of 1990)
The act controls and promotes specific product standards from mainly
a quality point of view for local as well as export purposes. A list of

Sarah Baartman Master Agri-Park Business Plan
P a g e | 106
Act Description
products for which standards have been set through regulations is
promulgated under the act by the minister of agriculture.
Stock Theft Act, 1959 (Act No. 57 of
1959)
This Act encompasses those laws associated with the theft of animal
stock and produce.
Consumer Protection Act (Act No68
of 2008)
To promote a fair, accessible and sustainable marketplace for consumer
products and services and for that purpose establish national standards
relating to consumer protection.
8.10 Substitute Products and Services
Substitutes are products that can replace the product that is grown or produced. In the red meat value chain
various products can be replaced. Red meat is often substituted by white meat products. This has increased as
a result of the growth in popularity in white meat and the perceived benefits of white meat over red meat (FAO,
2014). Chicken and pork is often also eaten more as they are a cheaper source of protein compared to red meat.
Some groups do not eat red meat at all and substitute red meat with vegetable rich diets and with soy based
alternatives such as soya-mince (FAO, 2014).
Products such as leather and hides have been increasingly replaced by cheaper plastic based textiles. Leather
has increasingly been used as a luxury item for textiles and the clothing industry (FAO, 2014).
8.11 Red Meat Barriers to Entry
Barriers to entry are obstacles that make entry into a given market difficult such as regulations, high
infrastructure costs or competition in the given area. This section will discuss the barriers to entry of the red
meat industry. The table below may provide some indications as the barriers that are faced by emerging farmers
in the Agri-Park.
Table 8.12 Barriers to entry: Red Meat
CONSTRAINT DESCRIPTION LEVEL OF INFLUENCE
CAPITAL, RAW MATERIALS AND PRODUCTION ISSUES
Poor carrying capacity In many parts of the district the natural carrying
capacity of the veld has been reduced due to unsound
grazing practices (mainly overstocking).
-
Input Costs There has been an upward trend in input costs, over
the last several years particularly feed and electricity.
This has an adverse impact on farmers bottom-line.
-
Stock Theft The theft of stock is an ongoing challenge for both
commercial and emerging/small scale farmers.
Provincial, District
Start-up costs There is a high capital cost associated with setting up
fixed structures, installing requisite technology and
also the financing of the first production and the
initial stock of weaners
-
Poor breeding stock
amongst emerging farmers
Poor quality breeding stock and a lack of quality
weaners amongst emerging and small scale farmers
means that they are not able to improve the overall
level of their herd which in turn negatively impacts
profits.
Provincial, District

Sarah Baartman Master Agri-Park Business Plan
P a g e | 107
CONSTRAINT DESCRIPTION LEVEL OF INFLUENCE
Disease and high
mortality rates
The expansion of game farming in the Eastern Cape
has resulted in the spread of diseases that affect
sheep and goats. Sheep must be dipped regularly to
avoid catching diseases. Due to a lack of technical
skills, emerging and traditional farmers especially
have problems with disease and mortality rates.
Provincial
Availability of land
for farming
There are good opportunities for sheep and goat
production, however limited land availability. Sheep
farming has to compete with ostrich, cattle, and goat
farming for production space. The costs and returns
on each should be considered sufficiently before
engaging in any of the options.
Provincial
INFRASTRUCTURE
Roads The poor road network and lack of connectivity within
the district hampers the cattle industry, particularly
given that animals have to be transported out of the
area for finishing.
Provincial, District
Fencing The lack of fencing leads to an increased incidence of
stock losses, theft and poorer quality products. The
provincial government does have a programme in
place to address the issue of fencing; however the
resources of the Department of Agriculture are
spread amongst a number of priority areas and are
limited.
Provincial, District
COMPETITION AND ACCESS TO MARKETS
Consumer preference Red meat production faces stiff competition from
poultry meat; per capita consumption in this sector is
not rising as fast as in the poultry sector. Within the
sector, pork production and consumption are
generally growing faster than beef and lamb.
National
International (SADC)
competition
Increasing competition from Southern African
Development Community (SADC) and international
producers with comparative advantage due to
subsidies.
-
Compliance with
international standards
Meeting international standards of sanitary and
quality (especially proving that South Africa does
meet the required standards). In short, the challenge
is lack of a traceability system and a national quality
assurance scheme.
Provincial
Popularity of chevon Chevon is not as popular as beef or chicken amongst
South African consumers which means that it has
difficulty in finding a large domestic consumer base.
It is a popular export, but the Eastern Cape currently
does not contribute.
National
Source: Urban Econ, 2015

Sarah Baartman Master Agri-Park Business Plan
P a g e | 108
8.12 Societal and Cultural Trends
Beef cattle production remains spatially important and is a multifunctional livelihood strategy in rural South
Africa. This is especially true in marginal and remote areas with poor agricultural lands and minimal economic
opportunities.
It has been estimated that 5.6 million cattle (40 % of the total cattle population) are owned by 240 000 small-
scale farmers and 3 million subsistence farmers. For the livelihoods of these small-scale producers, cattle farming
has multiple functions. Non-commercial motives include economic functions (e.g. wealth storage), agro-
economic functions (e.g. provision of draught power), agro-ecological functions (e.g. provision of manure),
nutritional (e.g. provision of milk for infants) and socio-cultural functions (e.g. dowry) (Ndoro et al., 2014).
The sustainability of cattle-based livelihoods, however, is threatened by the competition for natural resources
such as land and water, and decreasing grazing areas. Despite this, cattle production has increased by a million
from 1994 to 2004 (Republic of South Africa, 2011). The increase owes to recent developments in breeding,
nutrition and animal health that has contributed to potential production, efficiency and genetic gains (Ndoro et
al., 2014).
Goats have long been seen as a culturally important animal in southern Africa. They are specifically used as
ceremonial animals and have various connotations attached to them based on different cultural groups. Goats
also have a negative connotation with consumers based on various cultural backgrounds (Roets, 2014). The goat
is seen by consumers to represent cultural and traditional practices and is not eaten unless for a specific
ceremony. Today these perceptions are changing but at a slow pace (Roets, 2014). Goat meat consumption is
far more acceptable outside of South Africa. Thus goats and goat meat products may be difficult to sell to local
consumers in South Africa.
The reason for the lack of awareness of goat consumption stems from multiple sources including the lack of
research into goats during apartheid (Roets, 2014). Other livestock such as sheep and cattle were far more
researched and studied. Research that was completed was not done in conjunction with commercial farmers
which led to slow adoption of new farming practices. For the cultural aspects of goat’s weight, milk, or meat
production quality may not be as important as the goat itself, its colour, sex, or the use to which it will be put
traditionally (Roets, 2014).
8.13 SWOT
A SWOT analysis is an examination of the strengths, weaknesses, opportunities and threats of the red meat
industry in the Sarah Baartman District. The strengths and weaknesses refers to internal positive and negative
factors affecting the growth of the industry; whereas threats and opportunities refer to the external factors
affecting the commodity.
8.13.1 Strengths
Biophysical
The eastern portions of the SBDM exhibit good temperatures for rearing of livestock
The land is capable of carrying livestock used in red meat production
Local breeds of cattle goats and sheep are more resilient to many common diseases and
droughts and are suitable for small and emerging farmers
Enterprise Viability
The main beef farming area is along the N10 and has good connectivity to major markets in
Nelson Mandela Bay
Red meat has a fairly open market structure and small and emerging farmers can easily sell
their meat to local buyers of the product
Sarah Baartman Master Agri-Park Business Plan
P a g e | 109
Red meat is a fairly profitable endeavour and can be very profitable for an emerging farmer
The area is known for red meat farming and thus there is already knowledge and familiarity
Finance for this commodity would be fairly easily available
Payback period for mutton, lamb and chevon is fairly low and income can be generated in a
season
Infrastructure requirements are relatively small for new livestock farmers
Economic Development
Karoo lamb and mutton is a known brand throughout the world for its quality and thus the
brand is a strength of the red meat market
All livestock classes contribute to the reduction on the reliance of imported meats into the
District
Indirect and induced job creation for red meat is fairly high as there are many impacts on
employment in the local economy
Political and Social
Government departments and the SBDM are already active in supporting commercial and
emerging farmers in the area
State and communal land is already being used for projects run by the government
Livestock farming is highly suitable for communities and emerging farmers
Livestock farming contributes greatly to food security in the SBDM and Eastern Cape as a whole
Local breeds of animals should make the project more acceptable and more resilient thus it
will be sustainable in the long run
8.13.2 Weaknesses
Biophysical
The area is prone to drought and water shortages
Introduction of game has brought new diseases into the area
Enterprise Viability
The main goat and sheep farming areas have poor connectivity and poor internal roads
These areas under sheep and goat production are located fairly far away from the main
markets
Current demand for chevon meat is very low locally
The payback period for beef is longer than that of chevon, mutton or lamb
Economic Development
On-farm job creation for cattle and goat farming is very limited. There are not many
opportunities for employment
The jobs that are on offer are relatively low skilled and do not contribute significantly to skills
development.
Cattle and goat farming to do not contribute significantly to the local GDP
Political and Social
Suitable state land is not readily available throughout the District and may be an issue if there
is a will to expand the red meat industry in the area
8.13.3 Opportunities
Biophysical
The suitability of the land area gives opportunities to expand the red meat industry at an
emerging or commercial scale
Enterprise Viability
Current demand for red meat is fairly high and has outstripped production in the local markets

Sarah Baartman Master Agri-Park Business Plan
P a g e | 110
The future market growth potential is expected to be higher than current figures so there is
an opportunity to expand red meat production
Emerging farmers should be able to access funding for red meat relatively easily
There are opportunities to expand the fat lamb industry as there is currently a gap in the
market
National shortage of 340 000 head of cattle
Shortage of feedlots and finishing lots in the District which can be exploited by emerging
farmers
Opportunity for farmers to change from rearing traditional cattle breeds, to local indigenous
breeds such as Nguni or Bonsmara
Long term opportunity for SMME hide processing (tanneries) for the automotive industry
Economic Development
Good opportunities exist for agglomeration in the District specifically for emerging owners to
enter the SBDM red meat market
Opportunities exist for the expansion of agro-processing at a district level through initiatives
such as packaging, rendering, etc.
Political and Social
Increased potential for emerging farmers to compete in the agricultural sector
Increased opportunity for private public partnerships in the agricultural sector
8.13.4 Threats
Biophysical
The threat of new diseases brought in by the game industry is ever present. The Eastern Cape
has a history of disease among livestock
Climate change poses a significant threat to the agriculture sector particularly in terms of
rainfall and access to water
Carrying capacity of the land has been reduced due to poor farming practices (mainly
overstocking)
Poor quality breeding stock and a lack of quality weaners amongst emerging and small scale
farmers means that they are not able to improve the overall level of their herd which in turn
negatively impacts profits.
Enterprise Viability
There has been an upward trend in input costs, over the last several years particularly feed
and electricity. This has an adverse impact on farmers bottom-line.
There is a high capital cost associated with setting up fixed structures, installing requisite
technology and also the financing of the first production and the initial stock of weaners
Economic Development
The poor road network and lack of connectivity within the district hampers the red meat
industry, particularly given that animals have to be transported out of the area for finishing.
Red meat production faces stiff competition from poultry meat; per capita consumption in this
sector is not rising as fast as in the poultry sector. Within the sector, pork production and
consumption are generally growing faster than beef and lamb.
Increasing competition from Southern African Development Community (SADC) and
international producers with comparative advantage due to subsidies.
Meeting international standards of sanitary and quality (especially proving that South Africa
does meet the required standards). In short, the challenge is lack of a traceability system and
a national quality assurance scheme.
Political and Social

Sarah Baartman Master Agri-Park Business Plan
P a g e | 111
The theft of stock is an ongoing challenge for both commercial and emerging/small scale
farmers.

Vegetables Chapter 9

Sarah Baartman Master Agri-Park Business Plan
P a g e | 113 P a g e | 113
9. VEGETABLES
9.1 Market Analysis
This section deals with vegetables which was selected through the prioritisation matrix. It discusses the global
production, value chain and Sarah Baartman examples of vegetable farms. Vegetables are produced in most
parts of the country. However, in certain areas farmers tend to concentrate on specific crops; for example, green
beans are grown mainly in Kaapmuiden, Marble Hall and Tzaneen, green peas mainly in George and Vaalharts,
onions mainly in Caledon, Pretoria and Brits, and asparagus mainly in Krugersdorp and Ficksburg regions.
9.1.1 Production
The production of vegetables in South Africa for the period 2009/10 to 2013/14 compares as summarised in
Table 9.1.
Table 9.1: Production volumes of vegetable types
Year July to June 2009/10 2010/11 2011/12 2012/13 2013/14
‘000 tons
Potatoes 1 955 2 165 2 205 2 202 2 193
Tomatoes 575 523 545 527 525
Pumpkins 234 237 244 247 245
Green mealies 339 340 347 361 362
Onions 489 563 625 596 592
Sweet potatoes 60 63 55 57 69
Green peas 17 12 8 11 12
Beetroot 67 62 66 68 61
Cauliflower 25 16 16 14 12
Cabbage and red
cabbage
141 153 141 136 145
Carrots 151 152 178 183 184
Green beans 23 25 25 24 19
Other 400 406 421 420 416
Total 4 476 4 717 4 876 4 846 4 835
Source: Abstract of Agricultural Statistics, 2015
From 2012/13 to 2012/13 (July–June), the total production of vegetables decreased by 0.22%, from
approximately 4 846 000 tons to 4 835 000 tons. Concerning the major vegetable types in terms of volumes
produced, the production of green mealies rose slightly from approximately 361 000 tons to 362 000 tons and
sweet potato’s increased by approximately 12 000 tons or 21.2%. Most of the vegetable crops, however,
decreased over the period.
Relative importance of major vegetable types:
The relative importance of the major vegetable types, according to gross value of production, during the 2013/14
season, is depicted in Table 9.2:
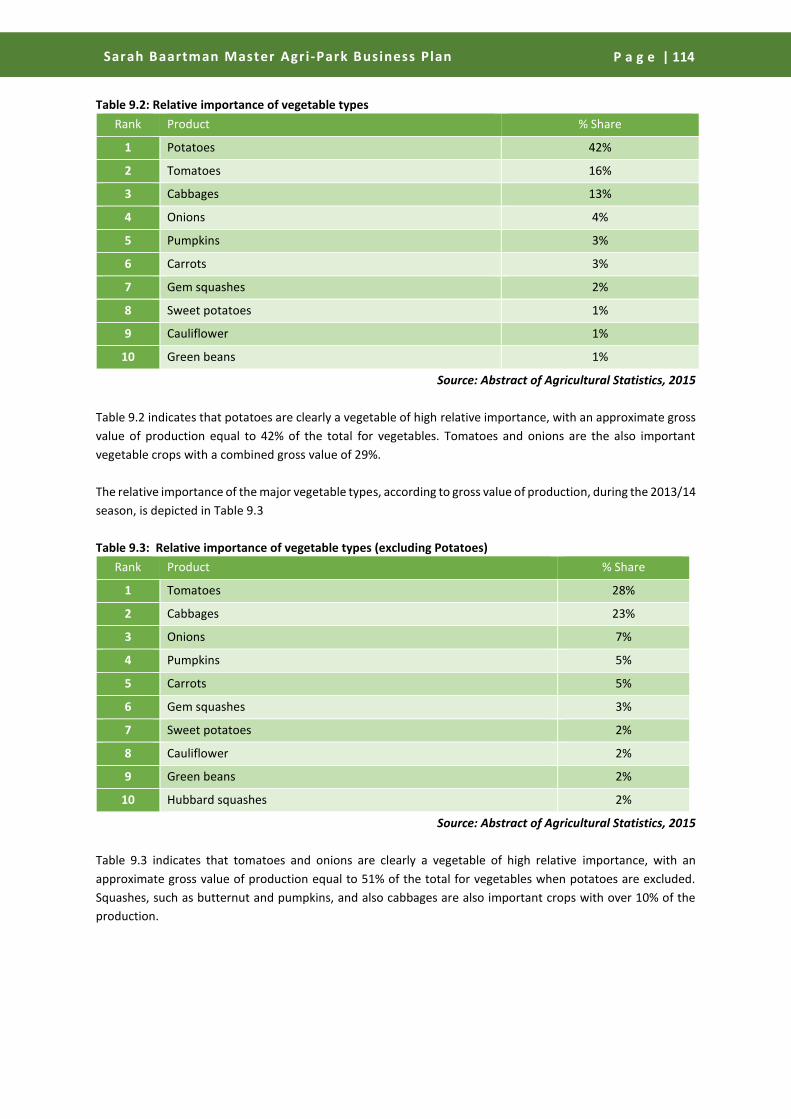
Sarah Baartman Master Agri-Park Business Plan
P a g e | 114 P a g e | 114
Table 9.2: Relative importance of vegetable types
Rank Product % Share
1 Potatoes 42%
2 Tomatoes 16%
3 Cabbages 13%
4 Onions 4%
5 Pumpkins 3%
6 Carrots 3%
7 Gem squashes 2%
8 Sweet potatoes 1%
9 Cauliflower 1%
10 Green beans 1%
Source: Abstract of Agricultural Statistics, 2015
Table 9.2 indicates that potatoes are clearly a vegetable of high relative importance, with an approximate gross
value of production equal to 42% of the total for vegetables. Tomatoes and onions are the also important
vegetable crops with a combined gross value of 29%.
The relative importance of the major vegetable types, according to gross value of production, during the 2013/14
season, is depicted in Table 9.3
Table 9.3: Relative importance of vegetable types (excluding Potatoes)
Rank Product % Share
1 Tomatoes 28%
2 Cabbages 23%
3 Onions 7%
4 Pumpkins 5%
5 Carrots 5%
6 Gem squashes 3%
7 Sweet potatoes 2%
8 Cauliflower 2%
9 Green beans 2%
10 Hubbard squashes 2%
Source: Abstract of Agricultural Statistics, 2015
Table 9.3 indicates that tomatoes and onions are clearly a vegetable of high relative importance, with an
approximate gross value of production equal to 51% of the total for vegetables when potatoes are excluded.
Squashes, such as butternut and pumpkins, and also cabbages are also important crops with over 10% of the
production.

Sarah Baartman Master Agri-Park Business Plan
P a g e | 115 P a g e | 115
9.1.2 Distribution channels
Figure 9.1 indicates the volume of vegetables that are traded through various distribution channels that are
available to farmers.
Figure 9.1: Distribution channels for vegetables
Source: Abstract of Agricultural Studies, 2015
It is clear from Figure 9.1 that approximately 46% of the volume of vegetables produced is traded on the major
fresh produce markets. The total volume of vegetables sold on these markets during 2014 amounted to 2 293.6
thousand tons, compared to the 2 107.8 thousand tons that sold during 2010, an increase of approximately 9%.
Table 9.4: Quantity of important vegetables sold on the major fresh produce markets
Year 2010 2011 2012 2013 2014
Total (‘000 tons) 2 107.8 2 222.1 2 334.4 2 290.2 2 293.6
Source: Abstract of Agricultural Statistics, 2015
The values of sales of vegetables on the major South African fresh produce markets for the period 2008/09 to
2012/13 are as follows:
Figure 9.2: Average volume and average price of vegetables (2005/06 – 2013/14)
Source: Abstract of Agricultural Statistics, 2015
Fresh Produce Markets
46%
Processing7%
Direct Sales and Own Consumption
43%
Exports4%
500
1 000
1 500
2 000
2 500
3 000
3 500
4 000
4 500
1 700.0
1 800.0
1 900.0
2 000.0
2 100.0
2 200.0
2 300.0
2 400.0
2005 2006 2007 2008 2009 2010 2011 2012 2013 2014
00
0 t
on
s

Sarah Baartman Master Agri-Park Business Plan
P a g e | 116 P a g e | 116
9.1.3 Prices
The average prices of vegetables realised on the fresh produce markets for the period 2008/09 to 2012/13 were
as follows (Tablele 9.5):
Table 9.5: Average price of vegetable types
Product 2011 2012 2013 2014 Average Price
Increase (%)
R/ton
Potatoes 2 591 2 645 3 379 3 428 10%
Tomatoes 4 339 4 407 4 847 6 082 12%
Cabbages 1 516 1 772 2 109 2 180 13%
Onions 2 221 2 587 3 433 3 334 15%
Pumpkins 1 675 1 617 2 156 2 128 10%
Carrots 2 815 2 633 3 154 3 644 10%
Gem squashes 2 615 2 702 2 666 3 248 8%
Sweet potatoes 2 995 3 636 2 798 3 724 10%
Cauliflower 4 145 4 960 5 066 8 380 29%
Green beans 6 572 6 815 7 263 8 454 9%
Hubbard squashes 1 880 1 844 1 954 2 283 7%
Beetroot 2 821 2 365 3 858 4 335 20%
Cucumbers 5 862 7 337 7 320 8 487 14%
Lettuce 4 263 4 828 4 573 5 508 9%
Green peas 21 035 27 516 23 923 37 621 25%
Green mealies 9 471 11 409 8 344 13 089 17%
Marrows 8 575 7 648 9 085 10 718 9%
Turnips 3 651 2 728 3 527 4 052 6%
Butternut squashes 2 420 2 408 2 871 3 227 10%
All vegetables 2 944 3 047 3 683 4 024 11%
Source: Abstract of Agricultural Statistics, 2015
Table 9.5 indicates that, on average, prices of vegetables have increased by 11% annually between 2011 and
2014. Of the vegetables above, cauliflower, beetroot, and green peas increased the most over the period, with
increases of 29%, 20% and 25% respectively.
Households participating in vegetable production
According to the agricultural census survey conducted in 2011, a total of 1 123 520 households are involved on
the production of vegetables. The summary of findings are summarised in Table 9.6 below.
Table 9.6: Number of agricultural households in a specific activity by province
Province Livestock
Production
Poultry
Production
Vegetable
Production
Production
of other
crops
Fodder/
grazing
production
Other
Western Cape 28,334 29,176 39,337 22,725 16,516 23,804

Sarah Baartman Master Agri-Park Business Plan
P a g e | 117 P a g e | 117
Eastern Cape 330,354 334,665 246,412 99,052 24,335 33,493
Northern Cape 28,040 25,853 9,334 11,324 4,518 5,415
Free State 45,207 51,414 106,809 63,193 11,106 13,811
KwaZulu-Natal 268,656 356,881 340,743 109,580 27,393 45,715
North West 88,633 117,453 36,620 42,923 16,013 25,301
Gauteng 62,047 82,403 147,870 89,167 50,650 78,847
Mpumalanga 72,896 127,759 91,214 59,885 11,439 20,595
Limpopo 172,683 173,681 105,181 161,888 13,995 31,067
South Africa 1,096,850 1,299,285 1,123,520 659,737 175,965 278,048
Source: Abstract of Agricultural Statistics, 2015
Table 9.6 suggests that KwaZulu-Natal has the largest number (30%) of households involved in vegetable
production, followed by Eastern Cape (22%) and Gauteng (13%). Gauteng has approximately 147 870 households
that are involved in vegetable production. Table 9.7 summarises gender of household heads of the vegetable
producers.
Table 9.7: Number of agricultural households in vegetable production by sex of household head and province
Province Male Female Total
Western Cape 11,618 27,719 39,337
Eastern Cape 132,952 113,460 246,412
Northern Cape 3,370 5,963 9,333
Free State 50,914 55,895 106,809
KwaZulu-Natal 184,361 156,381 340,742
North West 12,869 23,750 36,619
Gauteng 51,082 96,788 147,870
Mpumalanga 41,581 49,633 91,214
Limpopo 52,159 53,021 105,180
South Africa 540,906 582,610 540,906
Source: Abstract of Agricultural Statistics, 2015
Table 9.7 indicates that, overall, 70% of the households involved in vegetable production are headed by female
members. Limpopo has an even split of male and female household heads, while Western Cape has the highest
number of households lead by women in vegetable production. Within Gauteng 65% of the households are
female headed households.
9.1.4 Consumption
The importance of vegetables in a healthy diet is being strongly promoted by all the stakeholders in the fresh
produce marketing chain. The per capita consumption of fresh vegetables was 43.01kg during 2014,
approximately 2.8% lower than the previous year. Table 9.8 summarises consumption of vegetables (excluding
potatoes) between 2010 and 2014.
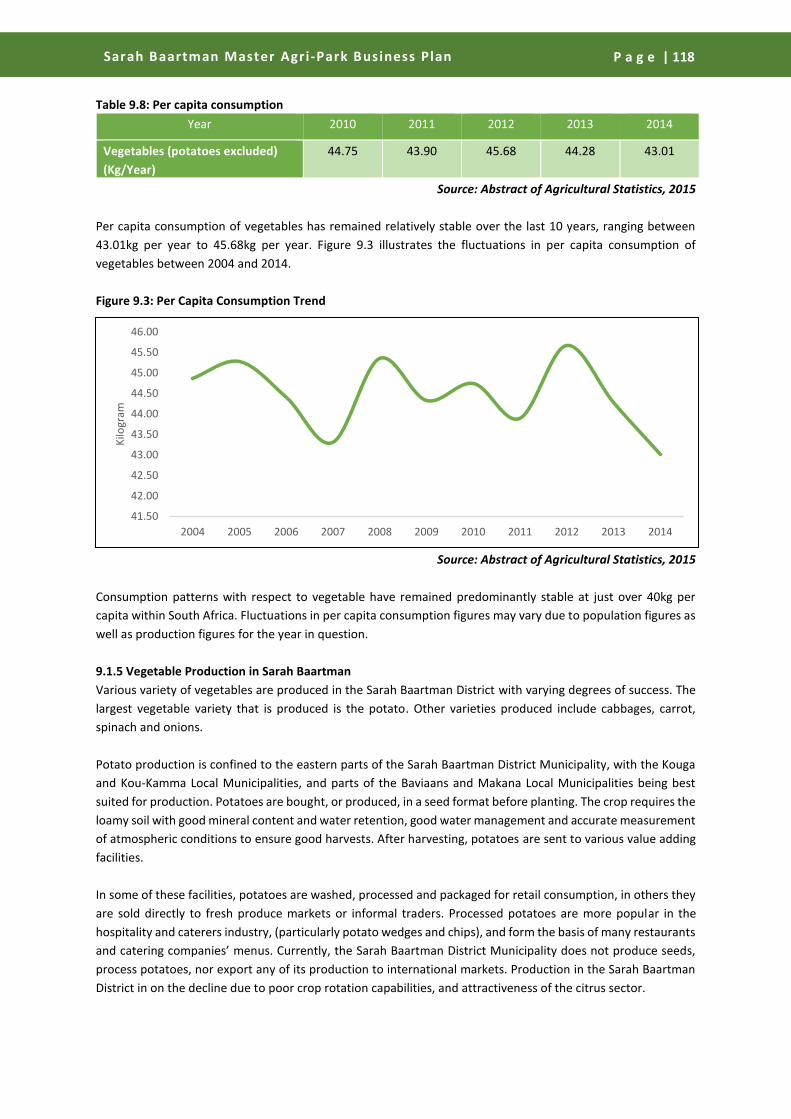
Sarah Baartman Master Agri-Park Business Plan
P a g e | 118 P a g e | 118
Table 9.8: Per capita consumption
Year 2010 2011 2012 2013 2014
Vegetables (potatoes excluded)
(Kg/Year)
44.75 43.90 45.68 44.28 43.01
Source: Abstract of Agricultural Statistics, 2015
Per capita consumption of vegetables has remained relatively stable over the last 10 years, ranging between
43.01kg per year to 45.68kg per year. Figure 9.3 illustrates the fluctuations in per capita consumption of
vegetables between 2004 and 2014.
Figure 9.3: Per Capita Consumption Trend
Source: Abstract of Agricultural Statistics, 2015
Consumption patterns with respect to vegetable have remained predominantly stable at just over 40kg per
capita within South Africa. Fluctuations in per capita consumption figures may vary due to population figures as
well as production figures for the year in question.
9.1.5 Vegetable Production in Sarah Baartman
Various variety of vegetables are produced in the Sarah Baartman District with varying degrees of success. The
largest vegetable variety that is produced is the potato. Other varieties produced include cabbages, carrot,
spinach and onions.
Potato production is confined to the eastern parts of the Sarah Baartman District Municipality, with the Kouga
and Kou-Kamma Local Municipalities, and parts of the Baviaans and Makana Local Municipalities being best
suited for production. Potatoes are bought, or produced, in a seed format before planting. The crop requires the
loamy soil with good mineral content and water retention, good water management and accurate measurement
of atmospheric conditions to ensure good harvests. After harvesting, potatoes are sent to various value adding
facilities.
In some of these facilities, potatoes are washed, processed and packaged for retail consumption, in others they
are sold directly to fresh produce markets or informal traders. Processed potatoes are more popular in the
hospitality and caterers industry, (particularly potato wedges and chips), and form the basis of many restaurants
and catering companies’ menus. Currently, the Sarah Baartman District Municipality does not produce seeds,
process potatoes, nor export any of its production to international markets. Production in the Sarah Baartman
District in on the decline due to poor crop rotation capabilities, and attractiveness of the citrus sector.
41.50
42.00
42.50
43.00
43.50
44.00
44.50
45.00
45.50
46.00
2004 2005 2006 2007 2008 2009 2010 2011 2012 2013 2014
Kilo
gram

Sarah Baartman Master Agri-Park Business Plan
P a g e | 119 P a g e | 119
The municipality has shortlisted farms for future development of the vegetable industry. The Table 9.9 indicates
the farms, the total extent of production and the area to be developed in the future. These farms are planned
to be integrated into the Agri-Hub located in Addo.
Table 9.9: Vegetable Projects
Farm Name Total Extent
(Ha)
Ha Under
Production
Tunnel s Ha To Be
Developed
Land tenure
Vukaphile Farm 6 0 3 Municipal
Cleveland Farm 8 0 6(30mX14m) 3 Private
KK113 Municipal
Santa Clara
Enon Besheba 10200 0 120
Total 10213 0 6 126 -
Source: DRDAR, 2015

Sarah Baartman Master Agri-Park Business Plan
P a g e | 120 P a g e | 120
9.2 Vegetable Value Chain Assessment
The following section will discuss the vegetable value chain in which upstream and downstream activities will
be analysed.
Figure 9.4: Vegetable Value Chain
Source: Urban Econ, 2015
Upstream activities
As vegetable production is classified as primary production the upstream activities relevant to the value chain
are primarily the input supplies used in the production system. The major inputs for vegetable production
include seedlings, fertilizing, weed, pest and disease control, irrigation equipment, machinery equipment as well
as knowledge. Most of these inputs are supplied by Agricultural Co-operatives in the respective areas. The
Eastern Cape Province has three major Agricultural Co-operatives namely:
OVK – TRADE
Humansdorp Ko-op
East Cape Agri – Co-op Ltd / BKB LTD
Primary production activities
The vegetable industry of South Africa accounts for nearly one-third of total gross farm income in the country.
There are 17 major fresh produce markets throughout South Africa, the largest being the Johannesburg Fresh
Produce Market (JFPM) which comprises a 34% market share with a total turnover of nearly 900,000 tons valued
at over R2.0 billion in 2006 (NAMC Section 7 Report, 2006). In 2007, tomato volumes sold at the JFPM were 107
000 tonnes (JFPM Statistics, 2008) at a value of over R300 million. Potatoes, onions, and cabbages are the other
major vegetables sold nationwide. Between 2005 and 2006, gross income from vegetable products increased by
1.3%, from R20 388million to R20 648 million. Income from vegetable production rose by 13.9% to R7 229

Sarah Baartman Master Agri-Park Business Plan
P a g e | 121 P a g e | 121
million. In general, the South African vegetable industry is growing in both quantities produced and prices
received.
In 2005-2007, total production of vegetables produced were 2 157 579 tons. Production of major vegetables
such as tomatoes, potatoes, onion and carrots increased annually for vegetables and approximately 56% of
potatoes produced in South Africa are traded on the fresh produce markets. The total volume of vegetables and
potatoes sold on these markets during 2006/07 amounted to 1 119 646 tons and 950 000 tons respectively. The
per capita consumption of fresh vegetables was 38, 74 kg during 2006/07, approximately 4.7% lower than the
40, 64 kg of 2006/06. The promotion of a healthy diet by various stakeholders in fresh produce could be
attributed to high consumption of fresh products. The total gross human consumption of potatoes during 2006
is 1.58 million tons and the per capita consumption estimated at 33 kg per annum.
Using the gross farm income for vegetable production as a ranking yardstick, the most important district
municipalities in Eastern Cape are Amathole, Sarah Baartman, and Chris Hani, generating R6.5 million, R4.8
million, R3.5 million and R1.3 million respectively to the gross farm income of the province (Table 1-a; 1-b). In
this province, the gross farm income from vegetables runs into millions in all district municipalities except for
Alfred Nzo and OR Tambo. Vegetables mainly produced are potatoes and tomatoes each contributing to a
provincial gross farm income of R9.5 million and R4.3 million respectively.
Downstream activities
Agro-processing opportunities
Harvesting, handling, washing, trimming, grading, packing, packaging, labelling and transporting are all
important practices aimed at preserving the quality of the produce, and presenting it to the best advantage.
Prices achieved, and thus differences in income obtained, can be greatly affected by the emphasis placed on
these practices. They must, therefore, be considered as important elements in the marketing strategy.
Most commercial producers consider only one or two of the major national markets as marketing outlets, to the
exclusion of all other possibilities. The larger producers will supply even some of the far-distant national
markets, provided better prices prevail there. Nationally linked information networks can supply daily prices to
producers. These national markets, in all the big centres, must remain the major outlets for many of the large
vegetable growers, because of the scale of their operations, but even these growers should investigate other
possibilities. Smaller producers may possibly be able to dispose of the bulk of their produce more profitably
through outlets other than the national markets. Outlets to consider are:
Direct sales to hawkers or consumers on the farm. Savings may be made on packaging, agents’ fees,
market commission and transport and so on.
Farm stalls. Savings as above, but require suitable reliable staff.
Direct sales to wholesalers, retailers, consumer groups or individual consumers. Delivery costs may be
disproportionately high for small consignments.
Small municipal markets or farmers’ markets. Usually not very different to the national markets, more
easily glutted, and lower throughput.
Export.
Critical points are the generally high quality specifications, chemical residue tolerances, possible pre-chilling or
cooling requirements, specific packaging requirements, high transport costs (particularly air transport), the
prevailing demand for the product and expected prices, specific market needs, sales agents, and so on.
Processing companies cannot compete with the premium prices paid for out-of-season produce, but are usually
highly competitive with prices in peak season. However, some processing, or value-added practices, such as
Sarah Baartman Master Agri-Park Business Plan
P a g e | 122 P a g e | 122
pre-packing of certain crops, could be done on the farm. Special markets might need to be developed for such
products
Significant Points of Sale for Vegetables produced are listed below:
Fresh Produce Markets
Prisons and school feeding schemes
Retailers
Significant informal trade
Significant Marketing Considerations of Vegetables produced are:
Size of outlet, and cost of servicing it.
Transport availability and cost. Distances, which affects cost, as well as deterioration of the product.
Condition of the roads.
Packaging required, e.g. pre-packs, cartons, boxes, pockets and their relative costs in relation to prices
attained.
Market or consumer preferences.
Product quality or specifications.
Contact person or agents.
Seasonal price trends.
Market commission and agents’ fees.
Possible delays in payment for consignments.
Various other possible requirements for the specified outlet.
Approximately 46% of the volume of vegetables in South Africa is traded on the major fresh produce markets
and 43% are direct sales and for own consumption. Roughly 7% are destined for processing.
The Global Fruit and Vegetables Processing industry includes all businesses that alter fresh fruit or vegetables to
create a higher, valued-added food product for human consumption.
Even though Fresh Vegetables poses stiff competition for Frozen Vegetables the latter experiences major growth
due to the increase of the global urban population, which has less access to fresh fruits and vegetables than
rural populations .
According to IBISWorld (2015), “Sales of frozen fruit and vegetables represent the Global Fruit and Vegetables
industry's second most important source of revenue, accounting for an estimated 36.0% of revenue. Within this
segment, frozen potatoes, the popularity of which is growing across the world, account for the most important
specific product type. Other popular frozen vegetables are peas, carrots, beans and vegetable mixes for stir-
fries. In the developed nations of the Organisation for Economic Co-operation and Development (OECD),
consumers have become more health consciousness and increasingly time-poor, which has driven demand in
these countries for frozen fruit and vegetable products. In the developing world, the expansion of middle-classes
has led to increased durable good ownership rates. This includes expanded freezer ownership, which are
necessary for storing frozen fruits and vegetables. As a result, economic growth and rising incomes have led to
expanding demand for products within this segment from the developing world. As a result of this widespread
increase in global demand for products within this segment, this product segment has expanded as a share of
overall industry revenue over the past five years”.
This phenomenon is underlined by the growth of frozen vegetables exports that worldwide grew with 37% from
2005 to 2014 and with 23% for dried vegetables over the same period.

Sarah Baartman Master Agri-Park Business Plan
P a g e | 123 P a g e | 123
The development of sustainable supply and value chains in the vegetable sector from production through
processing to markets, where there are unequal power relationships between large retailers/wholesalers and
agro processors, and primary vegetable producers is a constraint. Producers are vulnerable to demand volatility
and price fluctuations and are "price takers" because of the buyers' market power. The major vegetable
processing players in South Africa are:
1. Fresh
2. Canning and Pickling
Rhodes
Langeberg Food Processors Ltd
Giants Canning - Everyday
Koo
All Gold
SA Fruit & Vegetable Canners’ Association (SAFVCA)
3. Frozen
McCain Foods SA
Just Veggies
Nature’s Choice Products
Lamberts Bay Foods
Tender Harvest
Findus Foods
4. Slice and Dice
Retailers own products
Drying & Dehydration
Just Veggies
Carbocraft (Pty)Ltd
9.3 Stakeholders
Vegetable associations are largely based off of what commodity is grown by the farmers such as potatoes
(Potatoes South Africa) and onions (Onion Producers’ Organisation). Industry specific organisations assist
farmers growing those crops in providing information on the markets and recent developments in the industry.
They provide valuable support networks which farmers can take advantage of in order to solve problems or
further expand their business. Other general stakeholders are provided in the table below. It is important to
consider the buy-in of the relevant stakeholders into the Agri-Park as they can provide skills, expertise and advice
to emerging farmers.
Table 9.10: Vegetable Stakeholders
Stakeholder Description
The South African Society of Crop
Production
The SASCP is a science-based organisation which provides
leadership in crop science to promote training, research and
technology transfer involving all crops.
South African Fruit and Vegetable
Canners Association
SAFVCA was founded in January 1954 with 20 members
representing the 3 main industry sectors with regards to
Deciduous Fruit, Pineapple, Vegetables and Tomatoes.
The Association is a voluntary grouping of fruit and vegetable
canning industry members and its mission is to protect and
promote their interests and provide its members with
synergistic services of value.
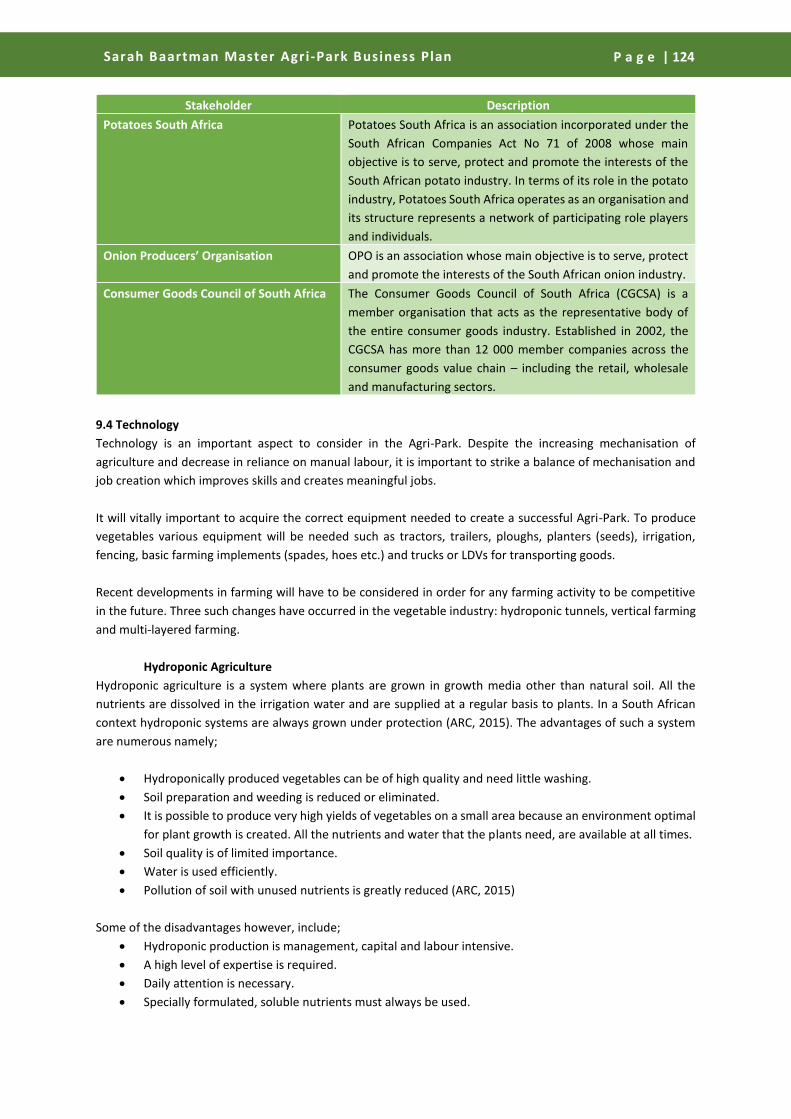
Sarah Baartman Master Agri-Park Business Plan
P a g e | 124 P a g e | 124
Stakeholder Description
Potatoes South Africa Potatoes South Africa is an association incorporated under the
South African Companies Act No 71 of 2008 whose main
objective is to serve, protect and promote the interests of the
South African potato industry. In terms of its role in the potato
industry, Potatoes South Africa operates as an organisation and
its structure represents a network of participating role players
and individuals.
Onion Producers’ Organisation OPO is an association whose main objective is to serve, protect
and promote the interests of the South African onion industry.
Consumer Goods Council of South Africa The Consumer Goods Council of South Africa (CGCSA) is a
member organisation that acts as the representative body of
the entire consumer goods industry. Established in 2002, the
CGCSA has more than 12 000 member companies across the
consumer goods value chain – including the retail, wholesale
and manufacturing sectors.
9.4 Technology
Technology is an important aspect to consider in the Agri-Park. Despite the increasing mechanisation of
agriculture and decrease in reliance on manual labour, it is important to strike a balance of mechanisation and
job creation which improves skills and creates meaningful jobs.
It will vitally important to acquire the correct equipment needed to create a successful Agri-Park. To produce
vegetables various equipment will be needed such as tractors, trailers, ploughs, planters (seeds), irrigation,
fencing, basic farming implements (spades, hoes etc.) and trucks or LDVs for transporting goods.
Recent developments in farming will have to be considered in order for any farming activity to be competitive
in the future. Three such changes have occurred in the vegetable industry: hydroponic tunnels, vertical farming
and multi-layered farming.
Hydroponic Agriculture
Hydroponic agriculture is a system where plants are grown in growth media other than natural soil. All the
nutrients are dissolved in the irrigation water and are supplied at a regular basis to plants. In a South African
context hydroponic systems are always grown under protection (ARC, 2015). The advantages of such a system
are numerous namely;
Hydroponically produced vegetables can be of high quality and need little washing.
Soil preparation and weeding is reduced or eliminated.
It is possible to produce very high yields of vegetables on a small area because an environment optimal
for plant growth is created. All the nutrients and water that the plants need, are available at all times.
Soil quality is of limited importance.
Water is used efficiently.
Pollution of soil with unused nutrients is greatly reduced (ARC, 2015)
Some of the disadvantages however, include;
Hydroponic production is management, capital and labour intensive.
A high level of expertise is required.
Daily attention is necessary.
Specially formulated, soluble nutrients must always be used.

Sarah Baartman Master Agri-Park Business Plan
P a g e | 125 P a g e | 125
Pests and diseases remain a big risk.
Finding a market can be a problem (ARC, 2015).
Vertical Farming
Similarly to hydroponic agriculture is the idea of vertical farming. Vertical farming is the act of growing plants
using hydroponics but stacked vertically on top of each other (AVF, 2015). It utilises LED lights to simulate
sunlight and thus can be placed in doors in old buildings and underutilised spaces. Crops can grow 40% faster
than in a field and often do not require poisonous substances as pest are kept at bay (AVF, 2015). The exact
nutrients and minerals are provided through the irrigation system with little to no use of soil. The overall impact
is that more plants can be grown in a limited space with little concern for the outdoor temperature or soil
conditions. The pioneers of this industry are the USA, Japan and Singapore. The biggest negatives of this system
is that it utilises a large amount of electrical power (AVF, 2015). Additionally, depending on the method used to
produce electricity then it could be possible that vertical farming is more dangerous to the environment than
field farming.
Multi-layered farming
Although not a novel concept multi-layered farming has emerged as important part of the global livelihoods
strategy and a possible way forward for emerging farmers. While commercial farmers have the opportunity to
grow extensive amounts of a single crop, emerging farmers may not have the luxury of large tracts of land and
need to utilise the land as much as possible while maintaining the soils integrity (Agricultures Network, 2015).
Multi-layer farming is using the different layers of soil to grow different crops. Tubers can be grown deep in the
bottom layer of soil, carrots or other bulbs in the mid layer and lettuce or cabbage in the top layer of soil. It
should be noted that it is important to choose crops that are complimentary and not choose crops and that use
the same minerals (Agricultures Network, 2015).
This method of farming was used extensively in the Himalayas and is seen as a solution to not having extensive
tracts of land to grow crops. It provides emerging and small farmers with many marketable options and
sustainability as well as livelihood resilience. If one crop is undesirable or is not successful then other crops can
cover any losses experienced. The biggest pitfalls of this system is that it requires extensive knowledge of the
area and of the crops that can be grown together (Agricultures Network, 2015).
The Agri-Park needs to take cognisance of the technology that is available in order to assist the emerging
farmers. By integrating technology into training regimes that are provided in the Agri-Park, emerging farmers
will have access to the latest events and changes in their respective fields.
ICT
ICT is possibly the biggest development in the agricultural sector for emerging and commercial farmers alike.
The emergence of the internet and mobile phones has led to an exorbitant amount of data at the fingertips of
the farmers. If they require information then it can be obtained immediately and problems solved sooner than
before (e-Agriculture, 2015). ICT has allowed the emergence of training software and applications (Apps) which
people can use for the benefit of the staff who work for them and for themselves. Training can be done outside
of training centres and content directly displayed on smartphones. Smartphones have also allowed for greater
access to market prices and market related news as it happens and sooner than what used to occur (e-
Agriculture, 2015). This can allow farmers to make adjustments before they impacted negatively. This has also
allowed access to online and cell phone banking and various finance facilities (e-Agriculture, 2015). This means
that farmers have access to their finances from their phones and do not have to leave the farm to bank. Online
banking has also made farming safer as large amounts of cash is no longer used to pay staff and instead can be
paid into bank accounts or cell phone numbers. ICT has allowed for the effective design of farms around the land
that is available to farmers and has allowed for farmers to be more efficient and handle finance and information
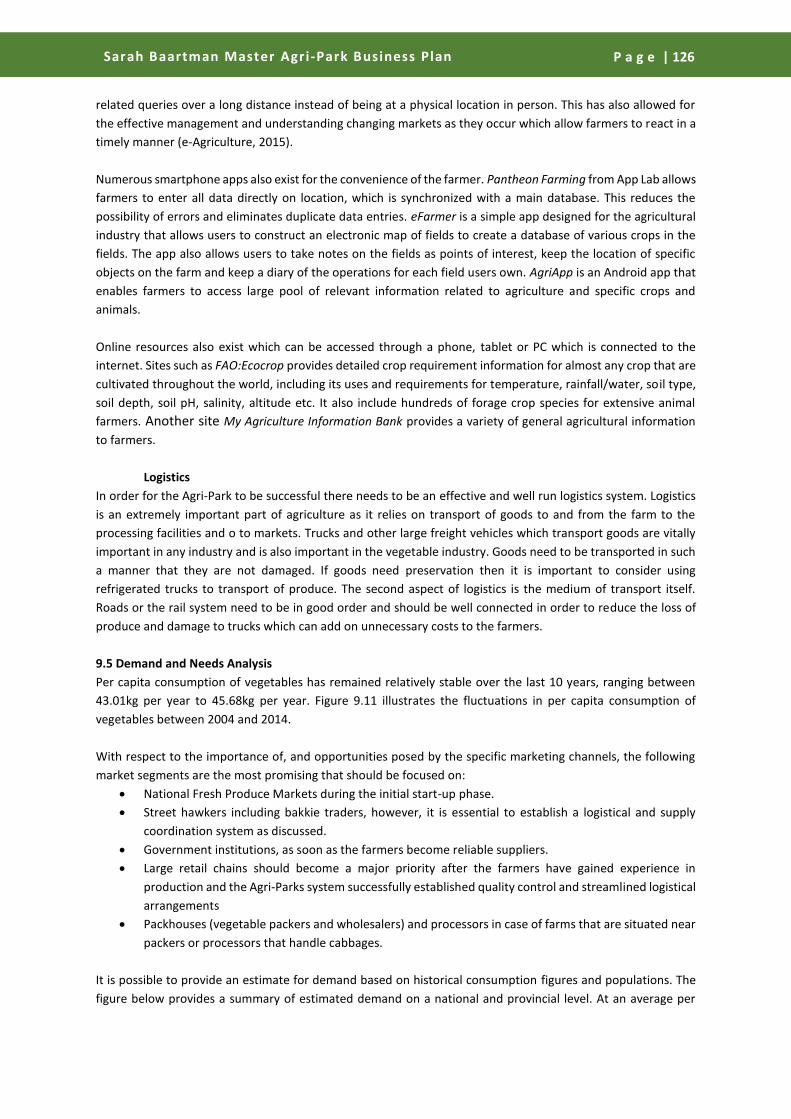
Sarah Baartman Master Agri-Park Business Plan
P a g e | 126 P a g e | 126
related queries over a long distance instead of being at a physical location in person. This has also allowed for
the effective management and understanding changing markets as they occur which allow farmers to react in a
timely manner (e-Agriculture, 2015).
Numerous smartphone apps also exist for the convenience of the farmer. Pantheon Farming from App Lab allows
farmers to enter all data directly on location, which is synchronized with a main database. This reduces the
possibility of errors and eliminates duplicate data entries. eFarmer is a simple app designed for the agricultural
industry that allows users to construct an electronic map of fields to create a database of various crops in the
fields. The app also allows users to take notes on the fields as points of interest, keep the location of specific
objects on the farm and keep a diary of the operations for each field users own. AgriApp is an Android app that
enables farmers to access large pool of relevant information related to agriculture and specific crops and
animals.
Online resources also exist which can be accessed through a phone, tablet or PC which is connected to the
internet. Sites such as FAO:Ecocrop provides detailed crop requirement information for almost any crop that are
cultivated throughout the world, including its uses and requirements for temperature, rainfall/water, soil type,
soil depth, soil pH, salinity, altitude etc. It also include hundreds of forage crop species for extensive animal
farmers. Another site My Agriculture Information Bank provides a variety of general agricultural information
to farmers.
Logistics
In order for the Agri-Park to be successful there needs to be an effective and well run logistics system. Logistics
is an extremely important part of agriculture as it relies on transport of goods to and from the farm to the
processing facilities and o to markets. Trucks and other large freight vehicles which transport goods are vitally
important in any industry and is also important in the vegetable industry. Goods need to be transported in such
a manner that they are not damaged. If goods need preservation then it is important to consider using
refrigerated trucks to transport of produce. The second aspect of logistics is the medium of transport itself.
Roads or the rail system need to be in good order and should be well connected in order to reduce the loss of
produce and damage to trucks which can add on unnecessary costs to the farmers.
9.5 Demand and Needs Analysis
Per capita consumption of vegetables has remained relatively stable over the last 10 years, ranging between
43.01kg per year to 45.68kg per year. Figure 9.11 illustrates the fluctuations in per capita consumption of
vegetables between 2004 and 2014.
With respect to the importance of, and opportunities posed by the specific marketing channels, the following
market segments are the most promising that should be focused on:
National Fresh Produce Markets during the initial start-up phase.
Street hawkers including bakkie traders, however, it is essential to establish a logistical and supply
coordination system as discussed.
Government institutions, as soon as the farmers become reliable suppliers.
Large retail chains should become a major priority after the farmers have gained experience in
production and the Agri-Parks system successfully established quality control and streamlined logistical
arrangements
Packhouses (vegetable packers and wholesalers) and processors in case of farms that are situated near
packers or processors that handle cabbages.
It is possible to provide an estimate for demand based on historical consumption figures and populations. The
figure below provides a summary of estimated demand on a national and provincial level. At an average per

Sarah Baartman Master Agri-Park Business Plan
P a g e | 127 P a g e | 127
capita consumption of vegetables at 43kg, there is clear demand for vegetables in South Africa. Demand for
vegetables is approximately 2.2 million tons per year. In Sarah Baartman the demand for vegetables is
approximately 19 375,12 tonnes as seen in Table 9.11. The areas of highest demand are Kouga and Makana.
Table 9.11: Annual demand for vegetables (tons)
Area of Demand Estimated Demand
South Africa 2 226 134,09
Eastern Cape 282 168,28
Sarah Baartman District 19 375,12
Camdeboo 2 192,72
Blue Crane 1 548,08
Ikwezi 453,11
Makana 3 456,75
Ndlambe 2 630,57
Sundays River Valley 2 343,67
Baviaans 763,73
Kouga 4 237,99
Kou-Kamma 1 748,52
Nelson Mandela Bay 49 540,96
Source: Quantec 2013, Census 2011
9.6 Competitors
While the area has a few competing commercial farmers in the immediate area of Addo, there are a few
commercial vegetable farmers located in the Hankey and Patensie area. Any competitors in the area however,
will provide significant input in terms of skills and expertise in the municipality. The benefits of farming in areas
that already have a strong presence of commercial farmers is possibly more of a benefit than a disadvantage.
This in turn can lead to agglomeration and greater focus from the public sector in providing services that are
needed.
9.7 Socio-Economic (Job Creation)
The Agri-Park project vision, as discussed in Chapters 1 and 2, outlines the importance of socio-economic
development as an objective of the Business Plan. Socio-economic progress and development can be measured
in various ways, however the primary method of measurement selected for livestock commodity is Job Creation.
Job creation is measured via the use of commodity labour multipliers, measuring the number of jobs created
per R1 million produced directly into commodity production. The three relevant multipliers for the Sarah
Baartman District Municipality vegetable market are the:
Direct Multiplier
Indirect Multiplier
Induced Multiplier
The three multipliers measure the total numbers of job created in an ideal economic environment for the
vegetable market however, as the economic environment diverges away from the ideal environment, so do the
multipliers.
The table below displays the sectoral labour multipliers applicable to the vegetable industry, i.e. the number of
the job opportunities created at different levels for every additional R1-million production. From the table below

Sarah Baartman Master Agri-Park Business Plan
P a g e | 128 P a g e | 128
it can be determined that 2.49 jobs are directly created while 1.37 are indirectly created for every R 1million
produced. Overall 5.75 jobs are created throughout the value-chain for every R 1 million produced.
Table 9.12: Direct, Indirect and Induced Jobs Created in the Vegetable Industry
Vegetables are considered labour intensive and have a high growth potential according to the BFAP (2015).
Vegetables can provide work for upwards of 1.3 people per hectare. This is a vastly superior to many other
industries in the district. This can be considered suitable to small and emerging farmers as the high growth
potential allows for stable employment and growth of income.
Information that is available on the District’s vegetable production and the potential number of hectares,
together with the Bureau for Food and Agriculture Policy, have been used to estimate the employment
opportunities that vegetables production can contribute in the 10-year period. The Agri-Park can provide
between 1 200 and 3800 employment opportunities from the programme. It must be noted however that these
figures are purely indicative and will change through the development of the Agri-Park.
9.8 Contribution to Food Security
One of the core concepts that the Agri-Park seeks to address is the issue of food security of communities. It is
believed that the Agri-Park concept can assist in increasing food security and sustainability of communities’
livelihoods. DAFF launched a Zero Hunger Policy in 2012 in order to curb poverty and improve food security for
vulnerable communities who are in need of support. The Zero Hunger Policy was created to uphold Section 27,1
(b) of the bill of rights which states that every citizen has the right to food and water and Section 28,1 (b) which
states that every child has the right to basic nutrition shelter and basic care and social services. The policy suggest
that adult daily calorie should be 1792 kcal (7502kj) per day for an adult and sets a food poverty line of R260 per
individual expenditure for food every month (DAFF, 2002). Vegetables are an extremely important part of food
security as they provide valuable nutrients and minerals required in the day to day diet of all community
members. Vegetables provide an abundant, cheap source of fibre and several vitamins and minerals. In general,
they have the highest nutritional value when eaten fresh, although an exception may be fermented foods, in
which the process of fermentation can increase the content of B-vitamins (FAO, 2001). Vegetables can often be
used as staples such as potatoes and various others. Processes which can improve the quality and taste of
vegetables are also important and can be performed such as drying, fermenting and pickling (FAO, 2001). These
can prolong the life of the goods so that they are used at a later stage when food is scarce or sold on as a value
added good. Bottling, canning and packing are important to preserve food for later consumption.
Income earned from the vegetable industry can also be used to purchase food goods in order to be more food
secure as well.
9.9 Regulatory Requirements
There are numerous legislation documents governing the production of vegetables. These range from
regulations as to the production inputs (National Water Act), to those governing production (Draft Plant Health
(Phytosanitary) Bill) and to production standards and consumption. The most pertinent of the acts are contained
in Table 9.13. It is extremely important to acknowledge the available legislature and policies as the Agri-Park
must follow the rule of law as set out by the relevant departments. It will align itself to the legislature that is
published. Various other acts and policies are also apply to the citrus industry which are included in Table 9.13
below.
Sector Direct Indirect Direct + Indirect Induced Total
Vegetables 2.49 1.37 3.86 1.89 5.75
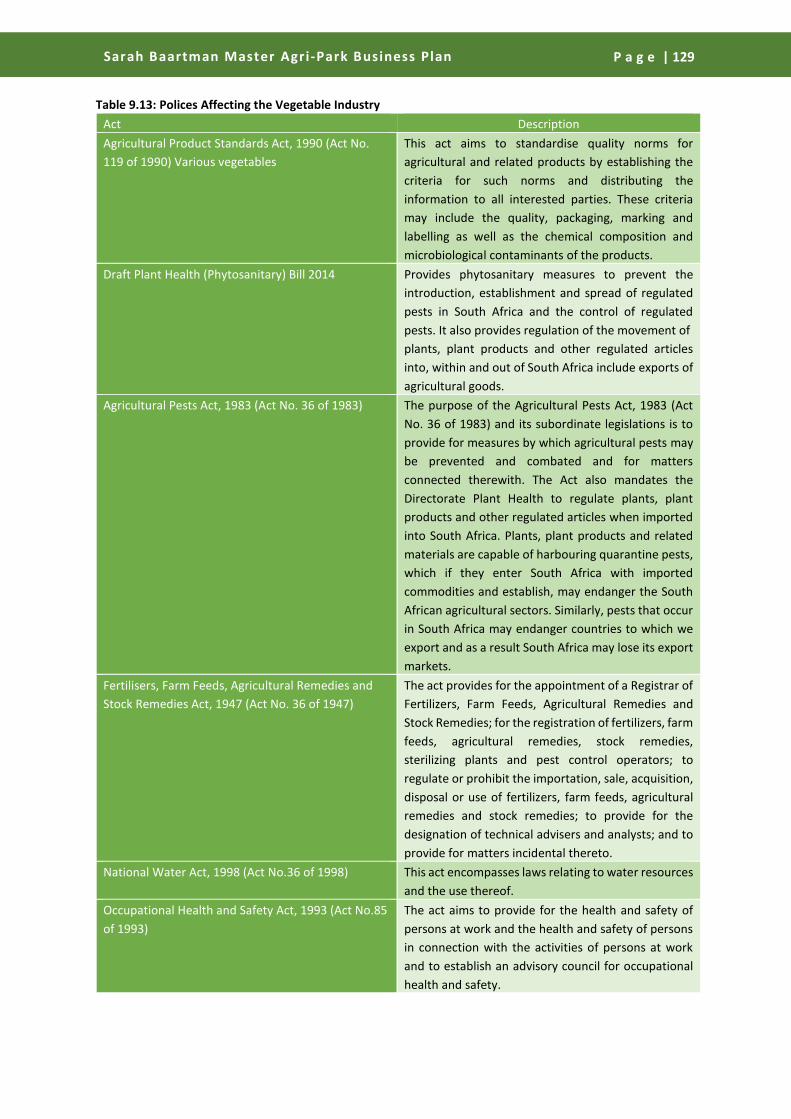
Sarah Baartman Master Agri-Park Business Plan
P a g e | 129 P a g e | 129
Table 9.13: Polices Affecting the Vegetable Industry
Act Description
Agricultural Product Standards Act, 1990 (Act No.
119 of 1990) Various vegetables
This act aims to standardise quality norms for
agricultural and related products by establishing the
criteria for such norms and distributing the
information to all interested parties. These criteria
may include the quality, packaging, marking and
labelling as well as the chemical composition and
microbiological contaminants of the products.
Draft Plant Health (Phytosanitary) Bill 2014 Provides phytosanitary measures to prevent the
introduction, establishment and spread of regulated
pests in South Africa and the control of regulated
pests. It also provides regulation of the movement of
plants, plant products and other regulated articles
into, within and out of South Africa include exports of
agricultural goods.
Agricultural Pests Act, 1983 (Act No. 36 of 1983) The purpose of the Agricultural Pests Act, 1983 (Act
No. 36 of 1983) and its subordinate legislations is to
provide for measures by which agricultural pests may
be prevented and combated and for matters
connected therewith. The Act also mandates the
Directorate Plant Health to regulate plants, plant
products and other regulated articles when imported
into South Africa. Plants, plant products and related
materials are capable of harbouring quarantine pests,
which if they enter South Africa with imported
commodities and establish, may endanger the South
African agricultural sectors. Similarly, pests that occur
in South Africa may endanger countries to which we
export and as a result South Africa may lose its export
markets.
Fertilisers, Farm Feeds, Agricultural Remedies and
Stock Remedies Act, 1947 (Act No. 36 of 1947)
The act provides for the appointment of a Registrar of
Fertilizers, Farm Feeds, Agricultural Remedies and
Stock Remedies; for the registration of fertilizers, farm
feeds, agricultural remedies, stock remedies,
sterilizing plants and pest control operators; to
regulate or prohibit the importation, sale, acquisition,
disposal or use of fertilizers, farm feeds, agricultural
remedies and stock remedies; to provide for the
designation of technical advisers and analysts; and to
provide for matters incidental thereto.
National Water Act, 1998 (Act No.36 of 1998) This act encompasses laws relating to water resources
and the use thereof.
Occupational Health and Safety Act, 1993 (Act No.85
of 1993)
The act aims to provide for the health and safety of
persons at work and the health and safety of persons
in connection with the activities of persons at work
and to establish an advisory council for occupational
health and safety.

Sarah Baartman Master Agri-Park Business Plan
P a g e | 130 P a g e | 130
Act Description
Basic Conditions of Employment Act, 1983 (Act No. 3
of 1983)
The act encompasses those regulations associated
with fair labour practices.
Marketing Act, 1968 (Act No. 59 of 1968) The Act has authorised an establishment and
enforcement of regulatory measures to intervene in
the marketing of agricultural products, including the
introduction of levies on agricultural products.
Stock Theft Act, 1959 (Act No. 57 of 1959) This Act encompasses those laws associated with the
theft of animal stock and produce.
Consumer Protection Act To promote a fair, accessible and sustainable
marketplace for consumer products and services and
for that purpose establish national standards relating
to consumer protection.
9.10 Substitute Products and Services
Vegetables are generally not substituted by any other products and play a pivotal role in the diet of the
population and are very important part of society. Value added products from vegetables are also generally not
substituted by many other products.
9.11 Vegetable Barriers to Entry
Barriers to entry are obstacles that make entry into a given market difficult such as regulations, high
infrastructure costs or competition in the given area. This section will discuss the barriers to entry of the
vegetable industry. The table below may provide some indications as the barriers that are faced by emerging
farmers in the Agri-Park.
Table 9.14: Barriers to entry: Vegetables
CONSTRAINT DESCRIPTION LEVEL OF INFLUENCE
POTATO BARRIERS TO ENTRY
Climatic conditions Soil must be suitable for growth of potatoes, with large
parts of the Sarah Baartman District Municipality
possessing sandy soil, as opposed the required loam.
Local
Irrigation intensive Irrigated potato crops have substantially higher yields
than non-irrigated (or dry) crops. The irrigation system
needs to be installed and correctly monitored.
Additionally, the opportunity cost of water in the
Kouga and Kou-Kamma regions is high, with many
additional uses in the district.
-
CAPITAL, RAW MATERIALS AND PRODUCTION ISSUES
Climatic conditions The prevailing climatic conditions determine where
horticultural products can be grown. This limits
production certain parts the district.
-
Capital intensive The establishment of new high volume producing
vegetable farms is capital intensive. This could prevent
small scale and emerging farmers from entering the
industry. Farming in hydroponic tunnels is also
extremely capital intensive and could prevent entry
into the market.
-
COMPETITION AND ACCESS TO MARKETS
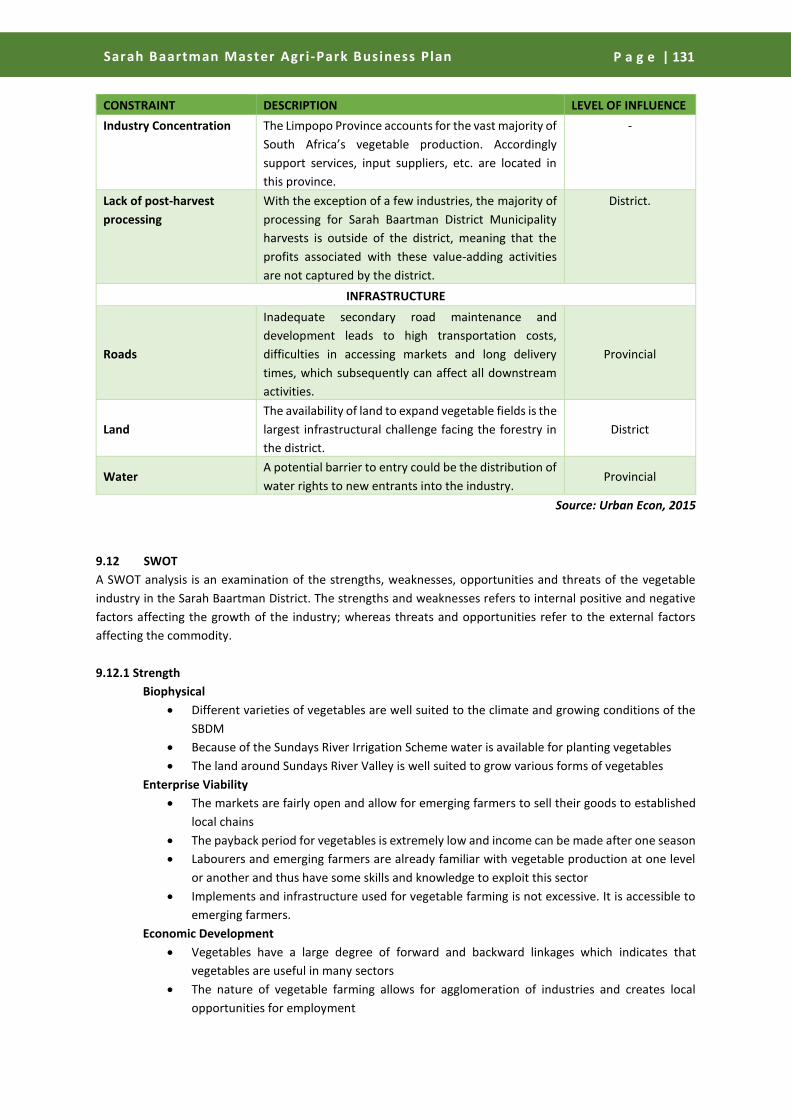
Sarah Baartman Master Agri-Park Business Plan
P a g e | 131 P a g e | 131
CONSTRAINT DESCRIPTION LEVEL OF INFLUENCE
Industry Concentration The Limpopo Province accounts for the vast majority of
South Africa’s vegetable production. Accordingly
support services, input suppliers, etc. are located in
this province.
-
Lack of post-harvest
processing
With the exception of a few industries, the majority of
processing for Sarah Baartman District Municipality
harvests is outside of the district, meaning that the
profits associated with these value-adding activities
are not captured by the district.
District.
INFRASTRUCTURE
Roads
Inadequate secondary road maintenance and
development leads to high transportation costs,
difficulties in accessing markets and long delivery
times, which subsequently can affect all downstream
activities.
Provincial
Land
The availability of land to expand vegetable fields is the
largest infrastructural challenge facing the forestry in
the district.
District
Water A potential barrier to entry could be the distribution of
water rights to new entrants into the industry. Provincial
Source: Urban Econ, 2015
9.12 SWOT
A SWOT analysis is an examination of the strengths, weaknesses, opportunities and threats of the vegetable
industry in the Sarah Baartman District. The strengths and weaknesses refers to internal positive and negative
factors affecting the growth of the industry; whereas threats and opportunities refer to the external factors
affecting the commodity.
9.12.1 Strength
Biophysical
Different varieties of vegetables are well suited to the climate and growing conditions of the
SBDM
Because of the Sundays River Irrigation Scheme water is available for planting vegetables
The land around Sundays River Valley is well suited to grow various forms of vegetables
Enterprise Viability
The markets are fairly open and allow for emerging farmers to sell their goods to established
local chains
The payback period for vegetables is extremely low and income can be made after one season
Labourers and emerging farmers are already familiar with vegetable production at one level
or another and thus have some skills and knowledge to exploit this sector
Implements and infrastructure used for vegetable farming is not excessive. It is accessible to
emerging farmers.
Economic Development
Vegetables have a large degree of forward and backward linkages which indicates that
vegetables are useful in many sectors
The nature of vegetable farming allows for agglomeration of industries and creates local
opportunities for employment

Sarah Baartman Master Agri-Park Business Plan
P a g e | 132 P a g e | 132
Vegetables can uplift a local economy with both food and income into the local GDP
It is likely that any vegetables grown locally will substitute any imports of vegetables from
other regions and countries
Political and Social
Vegetables are useful for food security and can provide communities with food
Vegetables are well supported by the government projects that are currently running and
planned and there is buy in from the district municipality to increase vegetable production
There are existing projects that are successful in the district that can be used as pilot projects
for other farmers
9.12.2 Weaknesses
Biophysical
Rainfall in the area is very poor and thus all vegetable projects will need adequate irrigation
infrastructure
Not all areas are suitable for the production of vegetables. It limits production to only certain
parts of the district
Not all varieties of vegetables are capable of being grown in the district
Enterprise Viability
Vegetables are unlikely to increase local GDP by a large degree as the venture is not as
profitable as other agricultural pursuits
The nature of certain vegetables makes them unlikely to be transported far distances and thus
limits their range. This makes them unlikely to be exported
Significant skills development will need to be undertaken before projects introduce more
people to vegetable farming
Economic Development
Export potential of vegetables is low and thus will limit the markets that vegetables will be
available to
The region may produce a large number of crops but it is not globally competitive
There is a need to secure water rights for the region for emerging farmers
9.12.3 Opportunities
Biophysical
The suitability of the land area gives opportunities to expand the vegetable industry at an
emerging or commercial scale
Enterprise Viability
The local market for horticultural produce is increasing as many of these products are
household commodities and used in local government institutions (schools, hospital) to ensure
food security
Horticultural farmers have the opportunity to increase the value of their produce through semi
processing which includes washing, packaging, peeling and cutting.
The growing market for convenience food can be exploited by horticultural farmers through
the creation of local brands linked to small-scale processing activities which supply local
markets.
There is an opportunity to exploit the open market for vegetables
Economic Development
There is an opportunity to create an agro-processing industry around the District based on the
vegetable industry

Sarah Baartman Master Agri-Park Business Plan
P a g e | 133 P a g e | 133
There are opportunities to create more forward and backward linkages in the vegetable
industry such as nurseries which provide farmers with seedlings and processing facilities to
value add products
The benefit of buying locally processed horticultural produce will reduce travelling costs and
will help to create job opportunities in local communities.
Political and Social
There is an opportunity for government to create
Food security in the district can be achieved by developing emerging farmers and communities
There is an opportunity for commercial farmers to pass their skills and expertise down to
emerging farmers through mentorship programmes
9.12.4 Threats
Biophysical
Climate change poses a significant threat to the agriculture sector particularly in terms of
rainfall and access to water
Poor farming practices has led to a drastically reduced number of farms that can produce
vegetables
New diseases and pests introduced from other countries are an ever present threat to the
agricultural sector
Enterprise Viability
The establishment of new high volume producing vegetable farms is capital intensive. This
could prevent small scale and emerging farmers from entering the industry.
With the exception of a few industries, the majority of processing for Sarah Baartman District
Municipality harvests is outside of the district, meaning that the profits associated with these
value-adding activities are not captured by the district.
Economic Development
Theft and vandalism of infrastructure and the produce can severely inhibit the industry
Political and Social
The Limpopo Province accounts for the vast majority of South Africa’s vegetable production.
Accordingly support services, input suppliers, etc. are located in this province.

Citrus Chapter 10

Sarah Baartman Master Agri-Park Business Plan
P a g e | 135
10. CITRUS
10.1 Market Assessment
Citrus is one of South Africa’s largest horticultural industries after deciduous fruits and vegetables. Citrus
represents one of South Africa’s most important fruit groups by value and volume. Limpopo, Western Cape,
Mpumalanga, Eastern Cape, KwaZulu-Natal and Northern Cape provinces where sub-tropical conditions prevail
(warm to hot summers, mild winters). The South African Citrus sector is well organised and well represented
through the farmers’ association known as the Citrus Growers Association (CGA). The CGA represents over 1400
citrus growers predominantly in South Africa but also in Zimbabwe and Swaziland. It was believed that in 2014
approximately 64 202 ha was under citrus production and was expected to increase.
10.1.1 Global Citrus Market
The global citrus market is extremely competitive with many countries producing citrus fruit. Many countries
produced various forms of citrus (Table 10.1). China and Brazil are the largest producers of citrus in the world
and produce 33 million and 19 million tonnes of fruit respectively. China dominates world production of
grapefruit, tangerines (soft citrus. Satsumas etc.) and other forms of citrus. Brazil is the largest producer of
oranges while India is the largest producer of lemons and limes. South Africa is an extremely important producer
of grapefruit, lemons and oranges. While South Africa does not produce as much citrus as Mexico or Spain, it is
constantly among the top 3 citrus exporting countries in the world. The top 15 primary producers of citrus
globally are:
Table 10.1: World Citrus Production Grapefruit Lemons and Limes Oranges Tangerines, etc. Total % Total
Tons
World 8 453 446 15 191 482 71 445 353 28 678 214 135 761 181 100.00%
China 3 802 324 1 937 880 7 469 840 15 356 700 33 104 744 24.38%
Brazil 78 000 1 169 370 17 549 536 937 819 19 734 725 14.54%
United States
of America
1 074 108 827 353 7 574 094 620 515 10 133 246 7.46%
India 285 300 2 523 500 6 426 200
10 090 000 7.43%
Mexico 425 433 2 138 737 4 409 968 493 643 7 613 105 5.61%
Spain 58 800 715 300 3 394 100 2 198 900 6 379 100 4.70%
Egypt 2 789 280 641 2 886 015 917 404 4 092 339 3.01%
Turkey 228 799 726 283 1 781 258 942 226 3 681 158 2.71%
Argentina 203 943 1 301 902 900 126 408 726 2 814 697 2.07%
Italy 7 789 336 195 1 708 337 650 465 2 744 779 2.02%
South Africa 325 746 248 926 1 671 508 150 000 2 407 180 1.77%
Pakistan
86 000 1 505 000 559 000 2 150 000 1.58%
Morocco 520 28 141 759 289 664 127 1 467 925 1.08%
Indonesia
1 411 215
1 411 215 1.04%
Source: FAOSTA, 2015
Citrus products are routinely exported in the form of juices and other products. Table 10.2 indicates the
production figures of single strength citrus juice, single strength orange juice and grapefruit juice. China is the
world’s leading producer of single strength citrus juice while Brazil is the largest producer of single strength
orange juice. South Africa is the largest producer grapefruit juice while being the fifth biggest producer of
grapefruit in the world.
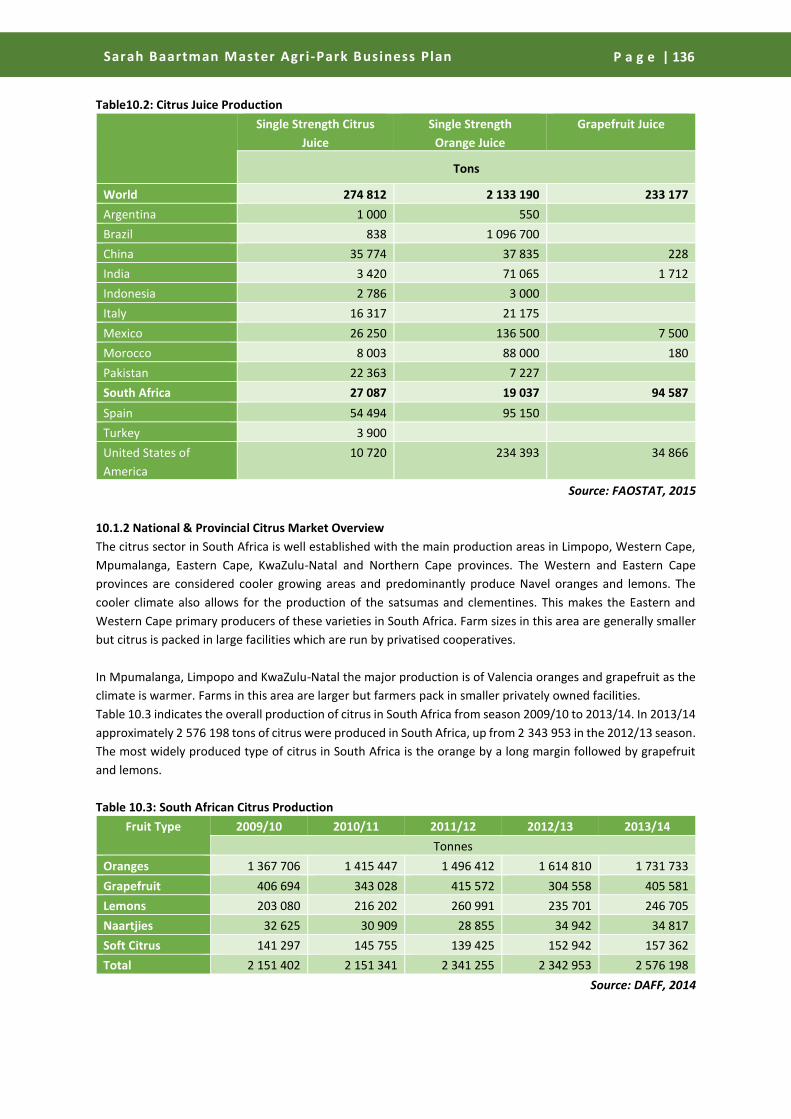
Sarah Baartman Master Agri-Park Business Plan
P a g e | 136
Table10.2: Citrus Juice Production Single Strength Citrus
Juice
Single Strength
Orange Juice
Grapefruit Juice
Tons
World 274 812 2 133 190 233 177
Argentina 1 000 550
Brazil 838 1 096 700
China 35 774 37 835 228
India 3 420 71 065 1 712
Indonesia 2 786 3 000
Italy 16 317 21 175
Mexico 26 250 136 500 7 500
Morocco 8 003 88 000 180
Pakistan 22 363 7 227
South Africa 27 087 19 037 94 587
Spain 54 494 95 150
Turkey 3 900
United States of
America
10 720 234 393 34 866
Source: FAOSTAT, 2015
10.1.2 National & Provincial Citrus Market Overview
The citrus sector in South Africa is well established with the main production areas in Limpopo, Western Cape,
Mpumalanga, Eastern Cape, KwaZulu-Natal and Northern Cape provinces. The Western and Eastern Cape
provinces are considered cooler growing areas and predominantly produce Navel oranges and lemons. The
cooler climate also allows for the production of the satsumas and clementines. This makes the Eastern and
Western Cape primary producers of these varieties in South Africa. Farm sizes in this area are generally smaller
but citrus is packed in large facilities which are run by privatised cooperatives.
In Mpumalanga, Limpopo and KwaZulu-Natal the major production is of Valencia oranges and grapefruit as the
climate is warmer. Farms in this area are larger but farmers pack in smaller privately owned facilities.
Table 10.3 indicates the overall production of citrus in South Africa from season 2009/10 to 2013/14. In 2013/14
approximately 2 576 198 tons of citrus were produced in South Africa, up from 2 343 953 in the 2012/13 season.
The most widely produced type of citrus in South Africa is the orange by a long margin followed by grapefruit
and lemons.
Table 10.3: South African Citrus Production
Fruit Type 2009/10 2010/11 2011/12 2012/13 2013/14
Tonnes
Oranges 1 367 706 1 415 447 1 496 412 1 614 810 1 731 733
Grapefruit 406 694 343 028 415 572 304 558 405 581
Lemons 203 080 216 202 260 991 235 701 246 705
Naartjies 32 625 30 909 28 855 34 942 34 817
Soft Citrus 141 297 145 755 139 425 152 942 157 362
Total 2 151 402 2 151 341 2 341 255 2 342 953 2 576 198
Source: DAFF, 2014

Sarah Baartman Master Agri-Park Business Plan
P a g e | 137
On a national level, about 11.2% of citrus production is sold as fruit to the local market, 28.0% is sent for further
processing, and 70.1% is exported. The Eastern Cape is the most significant contributor to citrus production in
South Africa; this trend has remained steady since 2004. The Sarah Baartman District Municipality is the largest
citrus producing municipality within the province. The citrus that is grown in the Sundays River Valley Local
Municipality equates to about 12% of national production, where growers in the area constantly explore new
varieties in order to satisfy the changing market demand. There are also a few citrus farms located in the Kouga
Local Municipality, with major production occurring near the Gamtoos River and Patensie. Citrus production also
takes place at a smaller scale in the Fort Beaufort area.
10.1.3 Export Markets
The main markets for exports of citrus are largely northern hemisphere countries as South Africa can export
citrus during the offseason of the northern hemisphere producers. Export of citrus is governed by multinational
agreements between countries. Exports can be divided into tariff and non-tariff barriers. It is recognised that
non-tariff barriers such as sanitary and phyto-sanitary measures, labels, etc. can be justified through health and
standards, tariff measures are increasingly seen by the World Trade Organisation (WTO) as a barrier and are
gradually being phased out. Export of agricultural products are generally well regulated through non-tariff
means as they are seen as primary carriers of pests that may harm the importing country’s own agricultural
sector. This applies to many European countries, North America and some parts of the Far East such as Japan.
Despite strict controls and tariffs in place against South African citrus, Europe has always been one of the most
important importers of citrus from South Africa. The most important factor in exports of citrus to Europe is the
prevalence of diseases such as Citrus Black Spot. The fastest growing citrus markets are the eastern European
markets of Russia and Ukraine.
Citrus exports to the USA currently fall under the African Growth and Opportunity Agreement (AGOA) which is
currently under review by both the South African and the USA governments. The AGOA act was set up by the
USA government in 2000 and provides trade preferences and duty free entry of certain goods into the USA. This
includes citrus among other products. Thus a certain quota of citrus products are allowed into the USA without
any tariffs. While it is important that the exports to the Americas is maintained, it is unlikely that exports to this
destination will show the same growth as Asia or Europe.
The second largest destination for South African citrus is the Asian markets. This market has grown exponentially
and there is supporting evidence to suggest that export volumes can be increased. Smaller amounts of citrus are
exported to Africa and the market for citrus in these areas is limited.
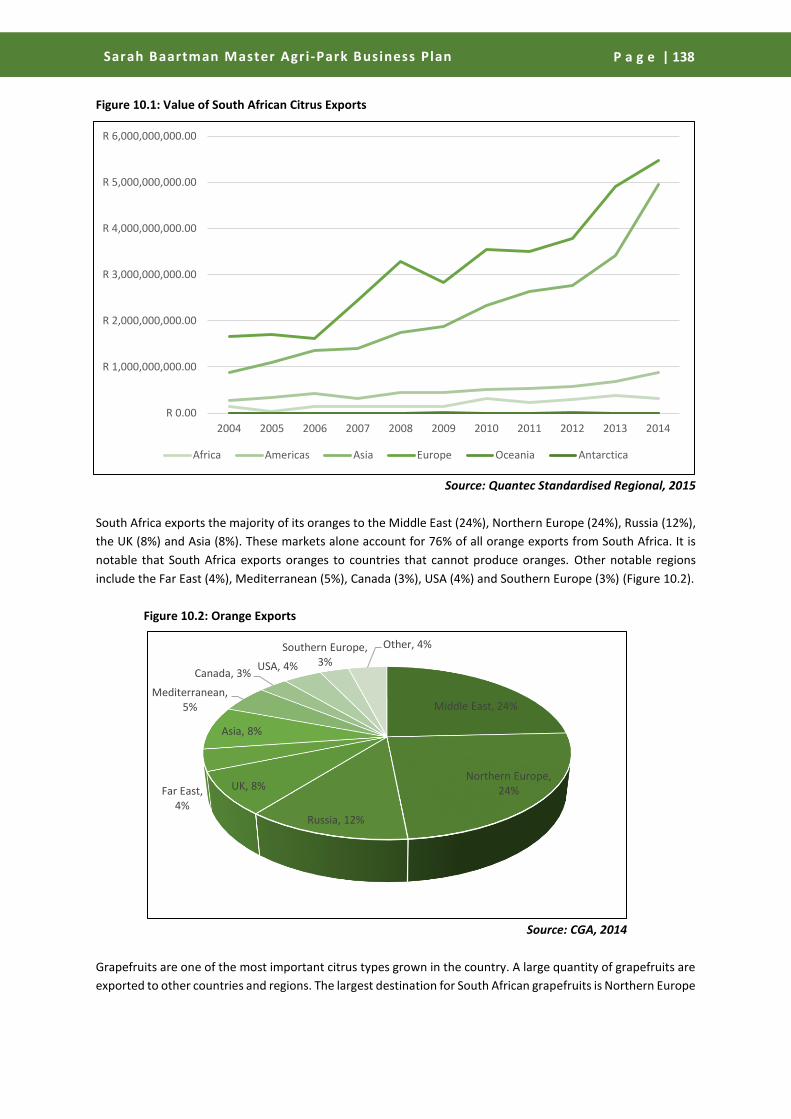
Sarah Baartman Master Agri-Park Business Plan
P a g e | 138
Figure 10.1: Value of South African Citrus Exports
Source: Quantec Standardised Regional, 2015
South Africa exports the majority of its oranges to the Middle East (24%), Northern Europe (24%), Russia (12%),
the UK (8%) and Asia (8%). These markets alone account for 76% of all orange exports from South Africa. It is
notable that South Africa exports oranges to countries that cannot produce oranges. Other notable regions
include the Far East (4%), Mediterranean (5%), Canada (3%), USA (4%) and Southern Europe (3%) (Figure 10.2).
Figure 10.2: Orange Exports
Source: CGA, 2014
Grapefruits are one of the most important citrus types grown in the country. A large quantity of grapefruits are
exported to other countries and regions. The largest destination for South African grapefruits is Northern Europe
R 0.00
R 1,000,000,000.00
R 2,000,000,000.00
R 3,000,000,000.00
R 4,000,000,000.00
R 5,000,000,000.00
R 6,000,000,000.00
2004 2005 2006 2007 2008 2009 2010 2011 2012 2013 2014
Africa Americas Asia Europe Oceania Antarctica
Middle East, 24%
Northern Europe, 24%
Russia, 12%
UK, 8%Far East, 4%
Asia, 8%
Mediterranean, 5%
Canada, 3%USA, 4%
Southern Europe, 3%
Other, 4%
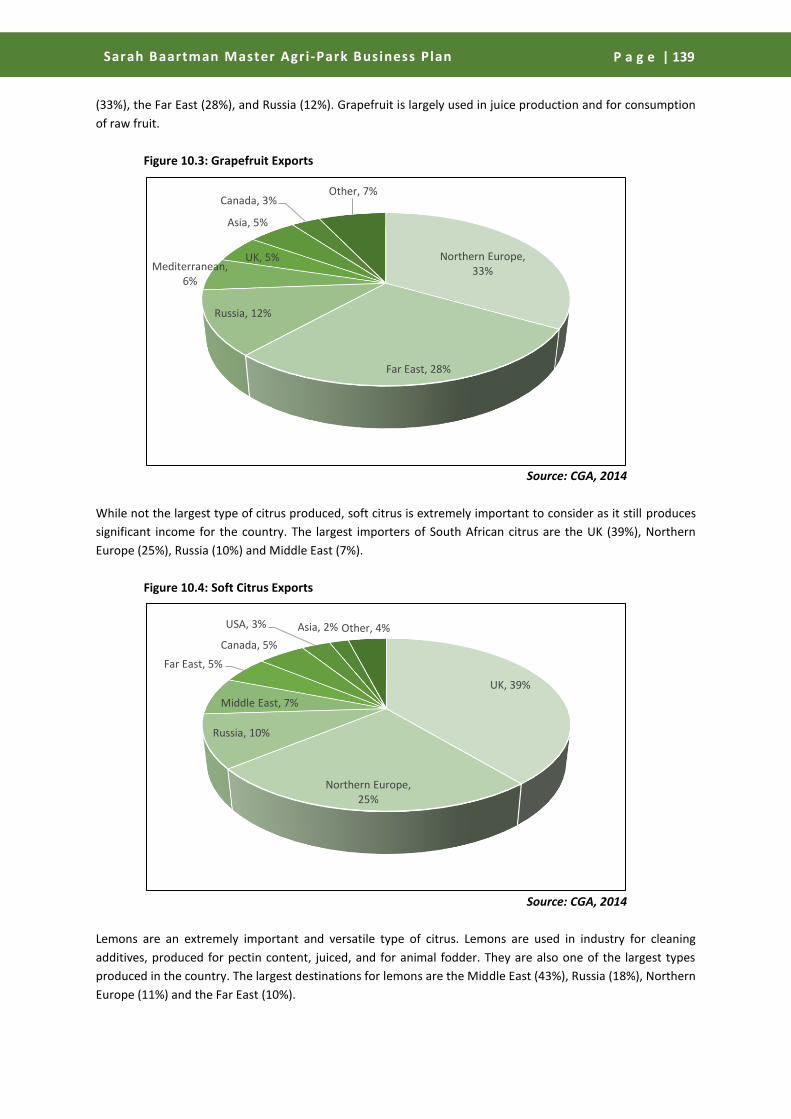
Sarah Baartman Master Agri-Park Business Plan
P a g e | 139
(33%), the Far East (28%), and Russia (12%). Grapefruit is largely used in juice production and for consumption
of raw fruit.
Figure 10.3: Grapefruit Exports
Source: CGA, 2014
While not the largest type of citrus produced, soft citrus is extremely important to consider as it still produces
significant income for the country. The largest importers of South African citrus are the UK (39%), Northern
Europe (25%), Russia (10%) and Middle East (7%).
Figure 10.4: Soft Citrus Exports
Source: CGA, 2014
Lemons are an extremely important and versatile type of citrus. Lemons are used in industry for cleaning
additives, produced for pectin content, juiced, and for animal fodder. They are also one of the largest types
produced in the country. The largest destinations for lemons are the Middle East (43%), Russia (18%), Northern
Europe (11%) and the Far East (10%).
Northern Europe, 33%
Far East, 28%
Russia, 12%
Mediterranean, 6%
UK, 5%
Asia, 5%
Canada, 3%Other, 7%
UK, 39%
Northern Europe, 25%
Russia, 10%
Middle East, 7%
Far East, 5%
Canada, 5%
USA, 3% Asia, 2% Other, 4%
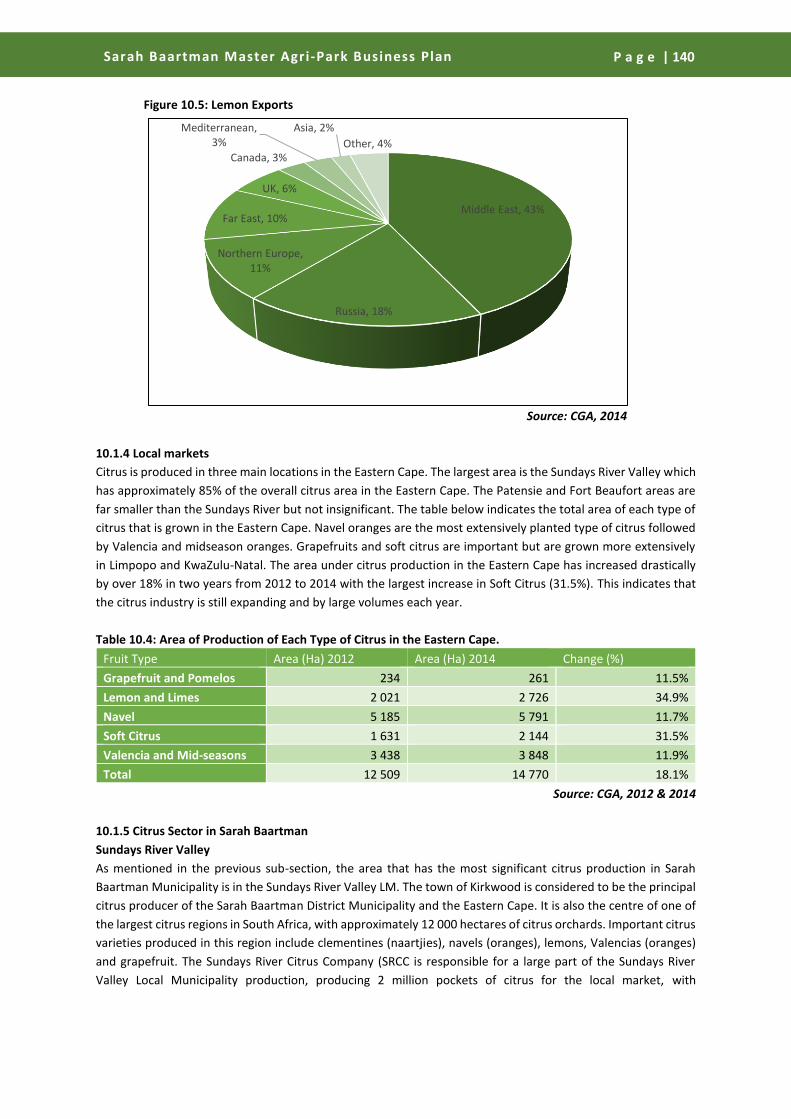
Sarah Baartman Master Agri-Park Business Plan
P a g e | 140
Figure 10.5: Lemon Exports
Source: CGA, 2014
10.1.4 Local markets
Citrus is produced in three main locations in the Eastern Cape. The largest area is the Sundays River Valley which
has approximately 85% of the overall citrus area in the Eastern Cape. The Patensie and Fort Beaufort areas are
far smaller than the Sundays River but not insignificant. The table below indicates the total area of each type of
citrus that is grown in the Eastern Cape. Navel oranges are the most extensively planted type of citrus followed
by Valencia and midseason oranges. Grapefruits and soft citrus are important but are grown more extensively
in Limpopo and KwaZulu-Natal. The area under citrus production in the Eastern Cape has increased drastically
by over 18% in two years from 2012 to 2014 with the largest increase in Soft Citrus (31.5%). This indicates that
the citrus industry is still expanding and by large volumes each year.
Table 10.4: Area of Production of Each Type of Citrus in the Eastern Cape.
Fruit Type Area (Ha) 2012 Area (Ha) 2014 Change (%)
Grapefruit and Pomelos 234 261 11.5%
Lemon and Limes 2 021 2 726 34.9%
Navel 5 185 5 791 11.7%
Soft Citrus 1 631 2 144 31.5%
Valencia and Mid-seasons 3 438 3 848 11.9%
Total 12 509 14 770 18.1%
Source: CGA, 2012 & 2014
10.1.5 Citrus Sector in Sarah Baartman
Sundays River Valley
As mentioned in the previous sub-section, the area that has the most significant citrus production in Sarah
Baartman Municipality is in the Sundays River Valley LM. The town of Kirkwood is considered to be the principal
citrus producer of the Sarah Baartman District Municipality and the Eastern Cape. It is also the centre of one of
the largest citrus regions in South Africa, with approximately 12 000 hectares of citrus orchards. Important citrus
varieties produced in this region include clementines (naartjies), navels (oranges), lemons, Valencias (oranges)
and grapefruit. The Sundays River Citrus Company (SRCC is responsible for a large part of the Sundays River
Valley Local Municipality production, producing 2 million pockets of citrus for the local market, with
Middle East, 43%
Russia, 18%
Northern Europe, 11%
Far East, 10%
UK, 6%
Canada, 3%
Mediterranean, 3%
Asia, 2%
Other, 4%

Sarah Baartman Master Agri-Park Business Plan
P a g e | 141
approximately 10.0% of this regional production produced for the export market. These production levels make
the Sundays River Citrus Company the largest producer of citrus in southern Africa.
Cape Fruit Processors is one of the few major juice processing facilities, located within the vicinity of Kirkwood
(Sundays River Valley), and is a relatively recent addition to the area, constructed in 2008. In addition to the
large scale operations, there are also smaller juice producers, such as the Sundays Organic Growers Association
(SOGA) who combine organic production with juice processing. Otherwise, juicing factories for citrus product
are located primarily in the Nelson Mandela Bay, with Valor and JC’s Fruit Juices having processing facilities in
Nelson Mandela Bay and Uitenhage respectively. Ceres Fruit Juices (including the 7 Up and Liqui-Fruit brands)
and Fruittime are other major produces with offices in Nelson Mandela Bay, showing that there is a lack of large-
scale processing for citrus fruit in the Sarah Baartman District Municipality.
There are emerging farmers and farms that are already producing citrus in the region and wish to expand under
the Agri-Parks development. These farms are included in the Table below.
Table 10.6: Citrus projects to be developed
FARM NAME Total extent (ha) Ha under
production
Ha to be
developed
Land tenure
Siyaphambili
117 23 70 PRIVATE
Willowtree 159 120 15 PLAS
Siyathemba 56 54 0 PLAS
Glengrove 60.46 56 0 PLAS
Eendracht 110 97.67 0 PLAS
Belvoir 26 16 0 PRIVATE
Sunlands 246 195.18 0 PLAS
Nebraska and
Greengables
38.27 17.83 0 PLAS
Welvediend 8 6.76 1.7* LRAD
Mbuyiselo 63 60 1.4* LRAD
Luthando 135 109 4.38* LRAD
Nomzamo 700 7.5 81.5 SLAG
KK113 440 0 225 Municipal
Ennon Besheba 10200 0 220 DRDLR
Santa Clara 0 PLAS
Khangela 452 134 50
Total 12 810.73 896.94 661.5
Source: DRDAR, 2015
* - uprooting from existing orchards
Gamtoos Valley
While the main citrus producing area may be the Sundays River Valley (85%), Gamtoos Valley is not an
insignificant producer in the Eastern Cape. The main types of citrus grown around the Gamtoos Valley include
oranges, grapefruit, lemons and soft citrus. Patensie Citrus owns two packhouses in the Gamtoos Valley and is
able to pack 60 tons of citrus per hour. Approximately 1.8 million cartons of citrus are exported annually while
fruit not acceptable for export is sold locally. Patensie Citrus currently exports to the UK, Canada, Russia,
northern & southern Europe, China, South East Asia, Far East and the Middle East. Paksaam Nursery (located in
the Gamtoos) is one of 22 accredited nurseries in South Africa and produces citrus trees for local farmers and is
an integral part of the citrus industry in the area.

Sarah Baartman Master Agri-Park Business Plan
P a g e | 142
10.2 Citrus Value Chain Assessment
Figure 10.6: Citrus Value Chain
Source: Urban Econ, 2015
Sarah Baartman Master Agri-Park Business Plan
P a g e | 143
Upstream Activities
As Citrus production is classified as primary production the upstream activities relevant to the value chain are
primary the input supplies used in the production system. The major inputs for Citrus production include
seedlings, fertilizing, weed and pest control, irrigation equipment, machinery equipment as well as knowledge.
Most of these inputs are supplied by Agricultural Co-operatives in the respective areas. The Eastern Cape
Province has three major Agricultural Co-operatives namely:
OVK – TRADE
Humansdorp Ko-op
East Cape Agri – Co-op Ltd / BKB LTD
Primary Production Activities
The four predominant citrus types are segmented into oranges, grapefruit, lemons and soft citrus. They are
produced in the Addo, Eastern Cape Midlands, Gamtoos River, Langkloof, Patensie and Sundays River Valley
regions. Addo is not only the largest lemon producer in the Eastern Cape, but also in the country. Citrus trees
vary in height from five to 15 metres and produce fruit in well-drained soil. Irrigation is essential for citrus
production but the trees should not be drenched, as this can stunt their growth. Citrus farming has a long lag
time between planting trees and harvesting fruit. It takes tree three to five years to start bearing fruit and lives
for approximately 25 to 30 years. These trees can grow in a wide range of climatic conditions, but do not tolerate
winter frost. The Citrus Growers Association (CGA) provides the citrus industry with access to global markets,
keeps production as cost effective as possible and cares for the community and environment in which the
farmers operate. The association represents the interests of export citrus producers and has roughly 1 400
members throughout South Africa.
Downstream Activities
Over 160 thousand tons of lemons and limes were exported in 2011. This represented 63% of the total
production of lemons and limes in 2011. The second most important market for South African lemons and limes
is the processing industry. Over 31% (79 204 tons) of the total annual crop was sent to the processing industry
in 2011 while the remaining 6% was sold in the local markets. The quantities of lemons and limes sent to the
export markets have been increasing throughout the last decade while volumes sent to the processing and local
markets have been stagnant. South Africa exported a total combined volume of 1 493 017 tons of citrus products
in 2011.
The volumes of citrus available for processing in South Africa fluctuate yearly, depending on the crop size and
the percentages of exportable fruit. In 2009/10, the processing industries absorbed approximately 25% (555 189
tons) of all citrus production (2 230 187 tons). That represents direct purchases from growers and quantities of
citrus purchased from the NFPMs. Most citrus products processed are converted into juice and can be presented
in different forms such as frozen, concentrate and freshly-squeezed juice.
Oranges are commonly peeled and eaten fresh, or squeezed for juice. It has a thick bitter rind that is usually
discarded, but can be processed into animal feed by removing water, using pressure and heat. It is also used in
certain recipes as flavouring or a garnish. The outer most layer of the rind is grated or thinly veneered with a
tool called a zester, to produce orange zest, popular in cooking because it has a flavour similar to the fleshy inner
part of the orange. The white part of the rind called the pericarp with the pith, is a source of pectin and has
nearly the same amount of vitamin C as the flesh.
Slices of lemon are served as a garnish on fish or meat or with iced or hot tea, to be squeezed for the flavourful
juice. Lemon soup is made by adding slices of lemon to dry bread roll that has been sautéed in shortening until
soft and then sieved. Sugar and a cup of wine are added and the mixture brought to a boil, and then served.

Sarah Baartman Master Agri-Park Business Plan
P a g e | 144
Lemon juice, fresh, canned, concentrated and frozen, or dehydrated and powdered, is primarily used for
lemonade, in carbonated beverages, or other drinks. It is also used for making pies and tarts, as a flavouring for
cakes, cookies, cake icings, puddings, sherbet, confectionery, preserves and pharmaceutical products. A few
drops of lemon juice, added to cream before whipping, gives stability to the whipped cream.
Lemon peel can be candied at home and is preserved in brine and supplied to manufacturers of confectionery
and baked goods. It is the source of lemon oil, pectin and citric acid. Lemon oil, often with terpenes and
sesquiterpenes (bio-chemical components) removed, is added to frozen or otherwise processed lemon juice to
enrich the flavour. It is much employed as flavouring for hard candies.
Lime fruit particularly their juices are used in beverages, such as limeade (akin to lemonade). Alcoholic beverages
prepared with lime include cocktails such as gin and tonic, margarita and Cuba libre, as well as many drinks that
may be garnished with thins slice of the fruit or corkscrew strip of the peel (twist).
Grapefruit is customarily a breakfast fruit, chilled, cut in half, the sections loosened from the peel and each other
by a special curved knife, and the pulp spooned from the “half-shell”. Some consumers sweeten it with white or
brown sugar, or a bit of honey. Some add cinnamon, nutmeg or cloves. As an appetizer before dinner, grapefruit
halves may be similarly sweetened, lightly broiled, and served hot, often topped with a maraschino cherry. The
sections are commonly used in fruit cups or fruit salads, in gelatines or puddings and tarts. They are commercially
canned in syrup. In countries like Australia, grapefruit is commercially processed as marmalade. It may also be
made into jelly. The juice is marketed as a beverage fresh, canned, or dehydrated as powder, or concentrated
and frozen. It can be made into excellent vinegar or carefully fermented as wine.
Grapefruit peel is candied and is an important source of pectin for the preservation of other fruits. The peel oil,
expressed or distilled, is commonly employed in soft-drink flavouring, after the removal of 50% of the
monoterpenes. The main ingredient in the outer peel oil is nookatone. Extracted nookatone, added to grapefruit
juice powder, enhances the flavour of the reconstituted juice. Naringin, extracted from the inner peel (albedo),
is used as a bitter in “tonic” beverages, bitter chocolate, ice cream and ices. It is chemically converted into a
sweetener about 1,500 times sweeter than sugar. After the extraction of naringin, the albedo can be reprocessed
to recover pectin.
Agro-Processing Opportunities
Various processing opportunities are possible e.g.:
Grapefruit
Canned grapefruit
Grapefruit juice
Lemon Products
Cold pressed lemon oil: Cold pressed lemon oil for flavouring in the food, beverage, cosmetics, and
pharmaceuticals.
Dried lemon peel
Lemon juice
Lemon juice concentrate
Lemon puree
Orange Products
Cold pressed orange oil
Dried orange peel
Frozen orange pulp
Orange juice
Orange juice concentrate

Sarah Baartman Master Agri-Park Business Plan
P a g e | 145
Orange puree
Orange wine
10.3 Stakeholders
The following section outlines the relevant stakeholders in the citrus industry around the Sundays River Valley
Municipality. It is important to consider the buy-in of the relevant stakeholders into the Agri-Park as they can
provide skills, expertise and advice to emerging farmers.
Table 10.7 Citrus Stakeholders
Stakeholder Description
Citrus Growers Association (CGA) The CGA was established in 1997 after the citrus industry was
deregulated in order to protect the interests of citrus farmers.
Since then it has also taken on additional responsibilities in
providing the industry with access to global markets, optimising
cost effective production of quality fruit, development and
research into citrus, as well as effectively transforming the
industry.
Citrus Growers Association Development
Chamber (CGDC)
The CGDC is responsible for overseeing the emergence of new
and emerging farmers in the citrus industry. It also plays an
important part in the transformation in the citrus industry.
Citrus Academy The Citrus Academy is a non-profit company that was
established by the Citrus Growers' Association of Southern
Africa to enable human resource development in the Southern
African citrus industry. The Academy is tasked with addressing
specific challenges faced by the industry, being low production
skills levels, employment equity, scarce and critical skills, black
economic empowerment, and the quality of skills delivery.
Citrus Research International (CRI)
The main goal of the CRI is to maximise the long-term global
competitiveness of the southern African citrus growers through
the development, support, co-ordination and provision of
Research and Technical services.
Sundays River Citrus Company (SRCC)
Established in 1924, the SRCC was established as a co-operative
in Kirkwood and today is the largest packer and marketer of
citrus in southern Africa. In 2006 alone the company exported
8.5 million cartons which accounted for 12% of the total citrus
crop. The SRCC is moving towards adding value to the citrus
crop as well as through development of niche products such as
organic citrus.
Patensie Citrus Founded in 1928, Patensie Citrus has become one of the largest
exporters of citrus in South Africa (approximately 1.8 million
cartons of citrus). Operating predominantly in the Gamtoos
Valley Patensie Citrus packs, grades and exports citrus to a wide
variety of countries.
Sundays Organic Growers Association
(SOGA)
SOGA was formed in 2005 when four farmers wished to grow
and export organically grown citrus fruit. The organisation
focuses on co-operation, research, marketing, packing and
logistics. SOGA has a close relationship with SRCC who packs
and markets their fruit.

Sarah Baartman Master Agri-Park Business Plan
P a g e | 146
South African Fruit Juice Association
(SAFJA)
The South African Fruit Juice Association, launched in March
2011, is a voluntary body representing the processing and
packaging companies that produce fruit juice concentrates,
pulps and purees and ready-to-drink fruit juices, nectars and
drinks for local consumption and the export market.
10.4 Technology
Technology is an important aspect to consider in the Agri-Park. Despite the increasing mechanisation of
agriculture and decrease in reliance on manual labour, it is important to strike a balance of mechanisation and
job creation which improves skills and creates meaningful jobs.
It will vitally important to acquire the correct equipment needed to create a successful Agri-Park. To produce
vegetables various equipment will be needed such as tractors, trailers, ploughs, sprayers, pruners, irrigation,
fencing, basic farming implements (spades, hoes etc.) and trucks or LDVs for transporting goods.
Technology used in citrus farming is fairly complex and vast. Depending on the size of the operation, various
forms of mechanised technology will need to be used. In South Africa a large workforce is used to plant, take
care of and harvest the plants but in other citrus producing areas such as the USA, production of citrus is
mechanised particularly the harvesting of the citrus plants.
Nutrient Sprays and Tree Management Techniques
Recent developments in citrus farming will have to be considered in order for any farming activity to be
competitive in the future. While citrus farming in South Africa has remained fairly constant in terms of
equipment and implements but the largest changes have been in the care-taking strategies. Many of these
strategies are in line with new export protocols that have been put into place by the EU and other export
partners. Many new care-taking strategies have also increased production of citrus and have reduced the
number of citrus lost to splitting and to certain diseases and pests (NSW DPI, 2008). This includes spraying with
certain nutrient compounds during very specific growth periods. The most common of these sprays include
gibberellic acid which improves the fruit immensely and reduces issues such as creasing and splitting (NSW DPI,
2008). Various techniques which promote fruit growth are also used such as girdling. Girdling is the striping a
small ring of bark away from the tree to stop it from sending carbohydrates to the roots (Rivas et al., 2006). This
technique is extremely useful in increasing yield among the final fruit set (Rivas et al., 2006). This is a result of
delaying the carbohydrates (that is created in the leaves through photosynthesis) from moving to the roots
(Rivas et al., 2006). This increases the amount of soluble sugars in the fruit and produces better fruit on the tree
(Rivas et al., 2006). Many of these techniques and nutrient sprays would need to be adopted by emerging
farmers in order to be effective.
ICT
ICT is possibly the biggest development in the agricultural sector for emerging and commercial farmers alike.
The emergence of the internet and mobile phones has led to an exorbitant amount of data at the fingertips of
the farmers. If they require information then it can be obtained immediately and problems solved sooner than
before (e-Agriculture, 2015). ICT has allowed the emergence of training software and applications (Apps) which
people can use for the benefit of the staff who work for them and for themselves. Training can be done outside
of training centres and content directly displayed on smartphones. Smartphones have also allowed for greater
access to market prices and market related news as it happens and sooner than what used to occur (e-
Agriculture, 2015). This can allow farmers to make adjustments before they impacted negatively. This has also
allowed access to online and cell phone banking and various finance facilities (e-Agriculture, 2015). This means
that farmers have access to their finances from their phones and do not have to leave the farm to bank. Online
banking has also made farming safer as large amounts of cash is no longer used to pay staff and instead can be
Sarah Baartman Master Agri-Park Business Plan
P a g e | 147
paid into bank accounts or cell phone numbers. ICT has allowed for the effective design of farms around the land
that is available to farmers and has allowed for farmers to be more efficient and handle finance and information
related queries over a long distance instead of being at a physical location in person. This has also allowed for
the effective management and understanding changing markets as they occur which allow farmers to react in a
timely manner (e-Agriculture, 2015).
Numerous smartphone apps also exist for the convenience of the farmer. Pantheon Farming from App Lab allows
farmers to enter all data directly on location, which is synchronized with a main database. This reduces the
possibility of errors and eliminates duplicate data entries. eFarmer is a simple app designed for the agricultural
industry that allows users to construct an electronic map of fields to create a database of various crops in the
fields. The app also allows users to take notes on the fields as points of interest, keep the location of specific
objects on the farm and keep a diary of the operations for each field users own. AgriApp is an Android app that
enables farmers to access large pool of relevant information related to agriculture and specific crops and
animals.
Online resources also exist which can be accessed through a phone, tablet or PC which is connected to the
internet. Sites such as FAO:Ecocrop provides detailed crop requirement information for almost any crop that are
cultivated throughout the world, including its uses and requirements for temperature, rainfall/water, soil type,
soil depth, soil pH, salinity, altitude etc. It also include hundreds of forage crop species for extensive animal
farmers. Another site My Agriculture Information Bank provides a variety of general agricultural information
to farmers.
The Agri-Park needs to take cognisance of the technology that is available in order to assist the emerging
farmers. By integrating technology into training regimes that are provided in the Agri-Park, emerging farmers
will have access to the latest events in their respective fields.
Logistics
In order for the Agri-Park to be successful there needs to be an effective and well run logistics system. Logistics
is an extremely important part of agriculture as it relies on transport of goods to and from the farm to the
processing facilities and o to markets. Trucks and other large freight vehicles which transport goods are vitally
important in any industry and is also important in the vegetable industry. Goods need to be transported in such
a manner that they are not damaged. If goods need preservation then it is important to consider using
refrigerated trucks to transport of produce. The second aspect of logistics is the medium of transport itself.
Roads or the rail system need to be in good order and should be well connected in order to reduce the loss of
produce and damage to trucks which can add on unnecessary costs to the farmers.
10.5 Demand and Needs Analysis
Unlike other commodities in this report domestic consumption of citrus is far more difficult to determine.
Estimations are made by the Global Agricultural Information Network (GAIN) at a national level. The main reason
for this is that citrus is seen as an export crop and much of the produce is exported to overseas markets such as
Europe and Asia. In this section the estimations of the GAIN (2014) report are examined and the export markets
will be used as proxies for demand.
It is believed consumption of oranges will remain flat at 130 000 tonnes based on a static consumer demand as
a result of the slow economic growth in South Africa and the financial pressure faced by consumers (GAIN, 2014).
Fresh oranges are the most popular citrus consumed in South Africa. Grapefruit domestic consumption will
remain flat at 5 000 tonnes (GAIN, 2014). Domestic consumption of grapefruit is low as most South African
consumers especially the younger generation have not acquired the taste for grapefruit. Domestic consumption
of tangerines/mandarins will remain flat at 10 000 because of the slow economic growth and increasing financial

Sarah Baartman Master Agri-Park Business Plan
P a g e | 148
pressure faced by domestic consumers. It is expected that lemons and limes will either remain flat or decrease
because of the return of normal weather (GAIN, 2014). In 2014 the weather produced exceptional growing
conditions for lemons in the country. If economic conditions return to a more favourable state then citrus
consumption and demand will increase. Consumption and demand for products made from citrus are expected
to either remain flat or increase (such as orange juice) (GAIN, 2014).
Table 10.8: Domestic Consumption and Expected Growth
Citrus Type Domestic Consumption 2014
(tonnes)
Expected Growth in Consumption
(2015)
Oranges 130 000
Tangerines and Mandarins 10 000
Lemons 13 000
Grapefruit 5 000
Orange Juice 7 200 9%
Source: GAIN, 2015
Citrus has largely been grown as an export crop in South Africa and has shown a great increase in demand from
overseas sources (GAIN, 2014). It is believed that in 2015/2016 that demand in Europe may fall because of the
perceived threat of Citrus Black Spot. Growth in other regions is expected to occur especially in Russia and China.
Exports to the USA are dependent on the outcomes on the AGOA act that has yet to be finalised (GAIN, 2014).
If no agreement is reached then it is expected that South African citrus will be tariffed and demand may
decrease. If an agreement is reached then demand will depend on the quota (set by the USA) of citrus that is
exported whether demand increases or decreases (GAIN, 2014). For demand to increase South Africa needs to
solve the issue of Citrus Black Spot, open and export to new markets in Asia and solve the lingering doubts over
AGOA.
10.6 Competition
While there are numerous established commercial farmers in the District competition is seen as an advantage
rather than a disadvantage in this situation. Commercial farmers have established contacts and networks that
they can take advantage of. This information can be accessed through various government various government
programmes which encourage mentorship of farmers. The benefits of farming in areas that already have a strong
presence of farmers is possibly more of a benefit than a disadvantage.
10.7 Socio-Economic (Job Creation)
The Agri-Park project vision, as discussed in Chapters 1 and 2, outlines the importance of socio-economic
development as an objective of the Business Plan. Socio-economic progress and development can be measured
in various ways, however the primary method of measurement selected for livestock commodity is job creation.
Job creation is measured via the use of commodity labour multipliers, measuring the number of jobs created
per R1 million produced directly into commodity production. The three relevant multipliers for the Sarah
Baartman District Municipality citrus market are the:
Direct Multiplier
Indirect Multiplier
Induced Multiplier
The three multipliers measure the total numbers of job created in an ideal economic environment for the citrus
market however, as the economic environment diverges away from the ideal environment, so do the multipliers.
The table below displays the sectoral labour multipliers applicable to the vegetable industry, i.e. the number of
the job opportunities created at different levels for every additional R1 million production. From the table below

Sarah Baartman Master Agri-Park Business Plan
P a g e | 149
it is thus estimated that for every R1 million of production there will be 3.49 jobs directly created while 1.34 will
be indirectly created. A total of 6.74 jobs can be created. Citrus is thus fairly labour intensive and already creates
numerous employment opportunities for labourers in the District. The value chain for citrus is also large and
thus employs a large number of labourers.
Table 10.9: Direct, Indirect and Induced Jobs Created in the Citrus Industry
The CGA (2011) states that each hectare of citrus produces one on farm job. It is thus thought that between
13 500 and 15 000 people are employed directly in on farm jobs in the Sundays River Valley while a further 500
– 700 are employed further down the value chain.
Information that is available on the District’s citrus production and the potential number of hectares, together
with the Bureau for Food and Agriculture Policy, have been used to estimate the employment opportunities that
citrus production can contribute in the 10-year period. The Agri-Park can provide between 2 600 and 4 000
employment opportunities from the programme. It must be noted however that these figures are purely
indicative and will change through the development of the Agri-Park.
10.8 Contribution to Food Security
One of the core concepts that the Agri-Park seeks to address is the issue of food security of communities. It is
believed that the Agri-Park concept can assist in increasing food security and sustainability of communities’
livelihoods. DAFF launched a Zero Hunger Policy in 2012 in order to curb poverty and improve food security for
vulnerable communities who are in need of support. The Zero Hunger Policy was created to uphold Section 27,1
(b) of the bill of rights which states that every citizen has the right to food and water and Section 28,1 (b) which
states that every child has the right to basic nutrition shelter and basic care and social services. The policy suggest
that adult daily calorie should be 1792 kcal (7502kj) per day for an adult and sets a food poverty line of R260 per
individual expenditure for food every month (DAFF, 2002). Citrus while not as important in food security as red
meat or vegetables is still an important aspect in daily diets of communities. Citrus contains valuable nutrients
and minerals that are needed in the daily diet of humans such as carbohydrates, vitamin C, folate, potassium,
and phytochemicals (FAO, 2000). There is considerable evidence that citrus foods may help reduce the risk, or
retard the progression, of several serious diseases and disorders such as cardiovascular disease, heart disease,
hypertension, stroke, cancer, neural tube defects and anaemia (FAO, 2000).
Income earned from the citrus industry can also be used to purchase food goods in order to be more food secure
as well.
10.9 Regulatory Requirements
Local markets are governed by a series of policies in place for various reasons. Table 10.10 indicates the relevant
policies that affect local market with regards to citrus. The most important of these Acts is the Agricultural
Product Standards Act, 1990 which sets out to establish a set of norms and standards related to the sale,
labelling, storage and packaging of citrus throughout South Africa. This indicates that all citrus sold in South
Africa has to comply with the regulations set out in the norms. The citrus containers have to be labelled correctly
with the name of the cultivar, pack house code, grade, weight and number of units must be displayed on the
packaging. The act also details the juice content in drinks and how they should be labelled. Finally the Act also
outlines offences and penalties. Various other acts and policies are also apply to the citrus industry which are
included in Table 10.10 below. It is extremely important to acknowledge the available legislature and policies as
the Agri-Park must follow the rule of law as set out by the relevant departments. It will align itself to the
legislature that is published

Sarah Baartman Master Agri-Park Business Plan
P a g e | 150
Table 10.10: Polices Affecting the Citrus Industry
Act Description
Agricultural Product Standards Act, 1990 (Act No.
119 of 1990) Citrus
This act aims to standardise quality norms for
agricultural and related products by establishing the
criteria for such norms and distributing the
information to all interested parties. These criteria
may include the quality, packaging, marking and
labelling as well as the chemical composition and
microbiological contaminants of the products.
This relates to all goods made from citrus e.g. labelling
of pure orange juice (min. 90% juice) vs. orange nectar
(min. 50% juice), orange drink (min. 6% juice) or
flavoured orange drink (less than 6% juice) etc.
Draft Plant Health (Phytosanitary) Bill 2014 Provides phytosanitary measures to prevent the
introduction, establishment and spread of regulated
pests in South Africa and the control of regulated
pests. It also provides regulation of the movement of
plants, plant products and other regulated articles
into, within and out of South Africa include exports of
agricultural goods.
Agricultural Pests Act, 1983 (Act No. 36 of 1983) The purpose of the Agricultural Pests Act, 1983 (Act
No. 36 of 1983) and its subordinate legislations is to
provide for measures by which agricultural pests may
be prevented and combated and for matters
connected therewith. The Act also mandates the
Directorate Plant Health to regulate plants, plant
products and other regulated articles when imported
into South Africa. Plants, plant products and related
materials are capable of harbouring quarantine pests,
which if they enter South Africa with imported
commodities and establish, may endanger the South
African agricultural sectors. Similarly, pests that occur
in South Africa may endanger countries to which we
export and as a result South Africa may lose its export
markets.
Fertilisers, Farm Feeds, Agricultural Remedies and
Stock Remedies Act, 1947 (Act No. 36 of 1947)
The act provides for the appointment of a Registrar of
Fertilizers, Farm Feeds, Agricultural Remedies and
Stock Remedies; for the registration of fertilizers, farm
feeds, agricultural remedies, stock remedies,
sterilizing plants and pest control operators; to
regulate or prohibit the importation, sale, acquisition,
disposal or use of fertilizers, farm feeds, agricultural
remedies and stock remedies; to provide for the
designation of technical advisers and analysts; and to
provide for matters incidental thereto.
National Water Act, 1998 (Act No.36 of 1998) This act encompasses laws relating to water resources
and the use thereof.
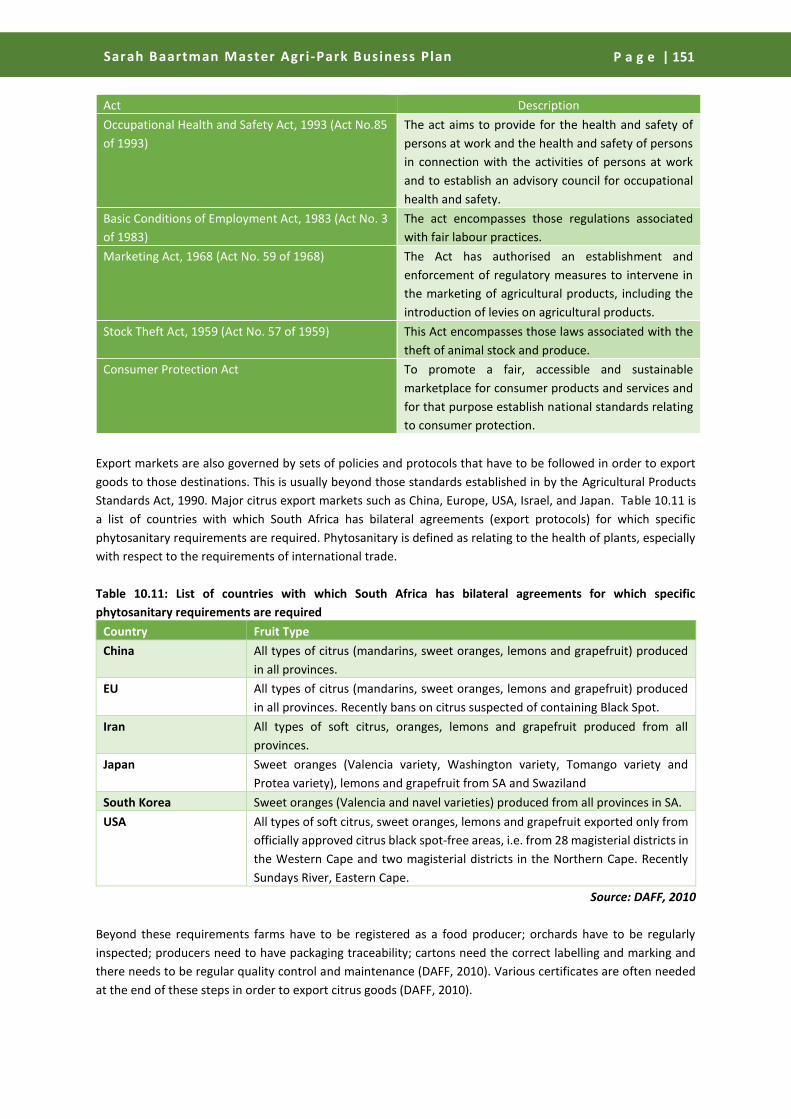
Sarah Baartman Master Agri-Park Business Plan
P a g e | 151
Act Description
Occupational Health and Safety Act, 1993 (Act No.85
of 1993)
The act aims to provide for the health and safety of
persons at work and the health and safety of persons
in connection with the activities of persons at work
and to establish an advisory council for occupational
health and safety.
Basic Conditions of Employment Act, 1983 (Act No. 3
of 1983)
The act encompasses those regulations associated
with fair labour practices.
Marketing Act, 1968 (Act No. 59 of 1968) The Act has authorised an establishment and
enforcement of regulatory measures to intervene in
the marketing of agricultural products, including the
introduction of levies on agricultural products.
Stock Theft Act, 1959 (Act No. 57 of 1959) This Act encompasses those laws associated with the
theft of animal stock and produce.
Consumer Protection Act To promote a fair, accessible and sustainable
marketplace for consumer products and services and
for that purpose establish national standards relating
to consumer protection.
Export markets are also governed by sets of policies and protocols that have to be followed in order to export
goods to those destinations. This is usually beyond those standards established in by the Agricultural Products
Standards Act, 1990. Major citrus export markets such as China, Europe, USA, Israel, and Japan. Table 10.11 is
a list of countries with which South Africa has bilateral agreements (export protocols) for which specific
phytosanitary requirements are required. Phytosanitary is defined as relating to the health of plants, especially
with respect to the requirements of international trade.
Table 10.11: List of countries with which South Africa has bilateral agreements for which specific
phytosanitary requirements are required
Country Fruit Type
China All types of citrus (mandarins, sweet oranges, lemons and grapefruit) produced
in all provinces.
EU All types of citrus (mandarins, sweet oranges, lemons and grapefruit) produced
in all provinces. Recently bans on citrus suspected of containing Black Spot.
Iran All types of soft citrus, oranges, lemons and grapefruit produced from all
provinces.
Japan Sweet oranges (Valencia variety, Washington variety, Tomango variety and
Protea variety), lemons and grapefruit from SA and Swaziland
South Korea Sweet oranges (Valencia and navel varieties) produced from all provinces in SA.
USA All types of soft citrus, sweet oranges, lemons and grapefruit exported only from
officially approved citrus black spot-free areas, i.e. from 28 magisterial districts in
the Western Cape and two magisterial districts in the Northern Cape. Recently
Sundays River, Eastern Cape.
Source: DAFF, 2010
Beyond these requirements farms have to be registered as a food producer; orchards have to be regularly
inspected; producers need to have packaging traceability; cartons need the correct labelling and marking and
there needs to be regular quality control and maintenance (DAFF, 2010). Various certificates are often needed
at the end of these steps in order to export citrus goods (DAFF, 2010).

Sarah Baartman Master Agri-Park Business Plan
P a g e | 152
Tariffs also play an important aspect in the export of goods. Many countries that import South African citrus
impose certain degrees of tax on to the good that is entering the country. Often there are specific cases where
bilateral agreements have been signed to waive the tariff imposed by the country importing the good. It is
important to establish which tariffs will impact on the product.
10.10 Substitute Products and Services
Citrus and citrus products do not have many substitutes. In everyday consumption citrus products are often
substituted from one type of citrus to another for example, an orange may be a substitute for a soft citrus or
mandarin. Generally the products from citrus are not very well substituted either. This however, is not the case
with juice which can be substituted by various soft drink products on the market.
10.11 Citrus Barriers to Entry
Barriers to entry are obstacles that make entry into a given market difficult such as regulations, high
infrastructure costs or competition in the given area. This section will discuss the barriers to entry of the Citrus
industry. The table below may provide some indications as the barriers that are faced by emerging farmers in
the Agri-Park.
Table 10.12: Barriers to entry: Citrus
CONSTRAINT DESCRIPTION LEVEL OF INFLUENCE
CAPITAL, RAW MATERIALS AND PRODUCTION ISSUES
High start-up costs. Capital costs are significant, however the profit gained
is substantial once production is started.
-
Climatic conditions Climate change is of recent concern with fluctuations
adversely affecting fruit sizes
District
Irrigation required Citrus is a water intensive crop that requires access to
consistent water supply. A good irrigation system is
required to optimise citrus production, especially as
tree age increases, and a readily available supply must
be available. The climate must also be within
acceptable temperature ranges to ensure production
National
Orchard and
infrastructure availability
The citrus infrastructure and support industries are
well developed in the Sundays River Valley and Kouga
Local Municipalities; furthermore the area is closely
situated to a major port which is important for the
exporting of citrus products. Production in other areas
would not have access to these facilities as readily as
operations within them.
District
Long Lead times Citrus trees need to grow for three to five years before
they can start producing, and profits can be obtained.
-
Diseases Citrus diseases can affect the harvest and/or the
success of the fruit accessing foreign markets.
COMPETITION AND ACCESS TO MARKETS
Import Controls Citrus developed for export must be competitive after
import tariffs (and any export duties if applicable in the
future) are applied.
District, National
Health and Sanitation Citrus produced within South Africa can be rejected
from international markets based on concerns during

Sarah Baartman Master Agri-Park Business Plan
P a g e | 153
CONSTRAINT DESCRIPTION LEVEL OF INFLUENCE
the production process and/or concerns over the
quality of the delivered product.
Intense Competition Producers in the Sarah Baartman District Municipality
are already established, and any new producers would
also have to compete with larger producers outside
the province as well (e.g. Limpopo Province).
International Production South Africa is currently the second largest exporter of
citrus, but only the 12th largest producer. Expanding
production from Brazil, Chile and Argentina is a threat
to South African market share, as well as international
market access.
National
INFRASTRUCTURE
Roads
Inadequate secondary road maintenance and
development leads to high transportation costs,
difficulties in accessing markets and long delivery
times, which subsequently can affect all downstream
activities. Losses from poor road networks are
estimated to be in the hundreds of millions.
Provincial
Land
The availability of land to expand orchards is the
largest infrastructural challenge facing the forestry in
the district.
District
Water A potential barrier to entry could be the distribution of
water rights to new entrants into the industry. Provincial
Source: Urban Econ, 2015
10.12 SWOT
10.12.1 Strength
Biophysical
The area that is under production is well suited to citrus growth in terms of temperature and
receives water through the Sundays River Water Transfer Scheme
The land capability of the area is good for citrus production and has supported the industry for
the past 102 years.
The biophysical nature of the citrus industry allows for complementary industries to form such
as beekeeping.
Enterprise Viability
The area is closely situated to a major port which is important for the exporting of citrus
products
The citrus industry can be very profitable if the correct procedures are followed and if the
farmers become export orientated
Farmers and labourers in the area are familiar with the industry as it has been ever-present in
the district for over 100 years. The skills and knowledge are present in the District.
Complementary industries can form surrounding the citrus industries such as beekeeping
Economic Development
The citrus infrastructure and support industries are well developed in the Sundays River Valley
and Kouga Local Municipalities
On-farm employment in the citrus industry is extremely high and much more labour intensive
than other industries in the area.

Sarah Baartman Master Agri-Park Business Plan
P a g e | 154
Indirect and induced job creation is high as there are many forward and backward linkages in
the citrus industry.
The Sundays River Valley is globally renowned for its citrus exports and has a high degree of
global competitiveness
Political and Social
There is a large degree of government support for the citrus industry and there are numerous
projects that are being developed by the District.
State land is currently being used for the expansion of the citrus industry in the Sundays River
Valley
Locals are willing to buy into projects where citrus is the dominant agricultural product as they
have familiarity with it
10.12.2 Weaknesses
Biophysical
The District does not receive sufficient rainfall to make citrus production viable through only
rain fed means
There are very limited areas that citrus can be grown in the entire district
Citrus is prone to certain disease that can eliminate the export potential of the crop
Enterprise Viability
Capital costs are significant, however the profit gained is substantial once production is
started.
Citrus trees need to grow for three to five years before they can start producing, and profits
can be obtained.
Implements and infrastructure needed for the industry is capital intensive and can be an
inhibitor to emerging farmers
There is currently uncertainty with regards to water rights given to emerging farmers. These
need to be secured in order to ensure the long term viability of the enterprises.
Political and Social
The citrus industry might not be the most suitable industry to emerging farmers because of
the inhibitive cost of the infrastructure required and the long lag time between planting and
harvesting
The citrus industry does not contribute directly to food security as red meat or vegetables do
but there are benefits of citrus on the health of people who consume it
10.12.3 Opportunities
Biophysical
The areas where citrus is grown are extremely well suited to production and thus expansion
of the industry will not inhibit emerging farmers
New varieties of citrus are constantly being produced to be drought resistant and cope with
different climates, there is an opportunity to expand the industry into areas that were
previously considered unsuitable
Enterprise Viability
Small-scale value adding (zest, honey, ice-creams, yoghurts, jams, jellies, etc.) for local and
tourist distribution
Farm stalls and informal traders with roadside stalls
Citrus waste-product used for biomass
Economic Development
Expansion of the Fish-Sundays transfer scheme enabling more and/or better irrigation

Sarah Baartman Master Agri-Park Business Plan
P a g e | 155
Increasing demand for healthier products like fruit juices and whole fruits (both internationally
and nationally).
Organic production opportunities for domestic and international juice markets
Political and Social
There are opportunities to expand government projects into the citrus industry with the help
of emerging farmers providing key skills, insight and knowledge of the export markets
10.12.4 Threats
Biophysical
Citrus is a water intensive crop that requires access to consistent water supply. A good
irrigation system is required to optimise citrus production, especially as tree age increases,
and a readily available supply must be available. The climate must also be within acceptable
temperature ranges to ensure production
Climate change is of recent concern with fluctuations adversely affecting fruit sizes
Citrus diseases can affect the harvest and/or the success of the fruit accessing foreign markets
Enterprise Viability
Poor road conditions negate the close proximity of the ports and threaten the export focused
industry through heavy losses during transport
Producers in the Sarah Baartman District Municipality are already established, and any new
producers would also have to compete with larger producers outside the province as well (e.g.
Limpopo Province).
Economic Development
Citrus developed for export must be competitive after import tariffs (and any export duties if
applicable in the future) are applied.
Citrus produced within South Africa can be rejected from international markets based on
concerns during the production process and/or concerns over the quality of the delivered
product.
Political and Social South Africa is currently the second largest exporter of citrus, but only the
12th largest producer. Expanding production from Brazil, Chile and Argentina is a threat to
South African market share, as well as international market access.

156
Sarah Baartman Master Agri-Park Business Plan
P a g e | 156 Sarah Baartman Master Agri-Park Business Plan
P a g e | 156
Development
Concept Chapter 11
157
Sarah Baartman Master Agri-Park Business Plan
P a g e | 157
11. DEVELOPMENT CONCEPT
11.1 Introduction
This Sarah Baartman Master Agri-Park Business Plan reviewed the current agricultural activities in the Sarah
Baartman District Municipality including, but not limited to, a review of the major agricultural products produced
and the activities of the various public sector organisations supporting agriculture and farming projects in the
region.
Commodities were identified through a review of the status quo of agricultural activities and biophysical
conditions of the region (chapter 7), a review of policy documents and current agricultural projects. These
commodities were then analysed by way of a prioritisation matrix which has assessed each commodity according
to 37 scoring criteria falling into four broad classes. These are:
A) Biophysical criteria
B) Enterprise viability
C) Economic development
D) Political & social objectives
In accordance with the APAP and directives from the DRDLR the three top scoring commodities have been
identified for inclusion as the core focus areas for the Sarah Baartman Agri-Park. The top three scoring
commodities for Sarah Baartman were identified as: red meat (Including beef, sheep, and chevon/goat);
vegetable production and citrus production. The identified commodities were then taken through a detailed
analysis, including a Market Analysis; Value-Chain Assessment and SWOT Analysis (Chapter 8). These commodity
reports (Chapters 8, 9, 10) were workshopped with the DAPPOTS and consensus was reached regarding
commodities that will be represented at the Agri-Hub. The following were the key outcomes of the commodity
analysis, relating to these three candidate commodities:
Livestock:
The SBDM environment is well suited to certain types of livestock farming with almost all areas of the
District showcasing good suitability to livestock farming (Namely sheep and goats in the drier areas and
cattle along the coast and in the eastern areas).
Large opportunities exist in the SBDM in red meat sub-class beef, sheep and goats. These opportunities
include production prospects for commercial and emerging farmers as well as numerous opportunities
for small and large concerns in the upstream and downstream portions of the value-chain including
agro-processing.
The demand for red meat has shown strong growth in recent years and conditions seem optimal for
new entrants into the red meat market.
Vegetables:
There are numerous areas across the District where a variety of crops can be produced.
By supporting multiple crops the Agri-Park can ensure more farming concerns are catered for and the
most suitable crops are planted in each area. This will greatly improve the quality of production,
improve enterprise flexibility to market demands and enhance food security.
Markets for vegetables are strong and new supply will easily find a market, especially in the Nelson
Mandela Bay market which has a large retail sector.

158
Sarah Baartman Master Agri-Park Business Plan
P a g e | 158
Citrus
The Eastern Cape (particularly Sundays River Valley and Gamtoos Valley) is one of the largest producers
of citrus in the country with production increasing by over 10% in the Eastern Cape alone over
2012/2013 to 2013/ 2014 period.
Citrus is one of the largest contributors to employment and GDP in the District.
It is believed that demand of citrus will increase or maintain its current trajectory. If markets in Asia and
the USA can be penetrated then it is possible for the citrus market to grow exponentially.
There is a well-established commercial citrus industry in Sundays River Valley LM that can support and
would be willing to support emerging farmers. There are already 15 emerging farms that are being
supported by various programmes and commercial farmers.
It has also recently emerged that there has already been significant planning related to various citrus
development projects in the region, particularly related to the support and growth of the emerging
farms, with a particular emphasis on unlocking the potential of citrus production and training on
unutilised state land in the area.
General:
Large investments in road, water and electricity infrastructure is required to facilitate the growth of
agriculture in the rural areas of the Sarah Baartman DM.
Significant investment in skills development and training in all identified commodities is required before
significant levels of production can be achieved
A large portion of the SBDM comprises arid areas. As a result, much of this land is unable to support
commercial farming.
Theft and vandalism of farm infrastructure / crops poses a moderate threat to vegetable farming in the
SBDM.
State land needs to be prioritised as a quick-win that can have an immediate benefit to the agricultural
economy.
12.2 DRDAR Agri-Park Concept
Agri-Park
An Agri-Park is a networked innovation system of agro-production, processing, logistics, and marketing, training
and extension services. The Agri-Park system is located in a district municipality, serving to enable market-driven
combination and integration of various agricultural activities and rural transformation services. The Agri-Park
concept comprises of three basic units:
A. Agri-Hub Unit (AH).
B. The Farmer Production Support Unit (FPSU).
C. The Rural Urban Market Centre Unit (RUMC).
The objectives of which is primarily to:
• Kick start rural economic transformation,
• Promote the growth smallholder and emerging farmer agriculture,
• Promote the development of skills for, and assistance to, small-holder and emerging farmers,
• Strengthen existing and create new partnerships between government, the private sector and civil
society,
• Bring under-utilised land into full production.
Figure 11.1 below shows the structure of the Agri-Park, displaying the various elements of the model such as
the Agri-Hub, FSPU and RUMC. These three elements of the Agri-Park model are described briefly below.

159
Sarah Baartman Master Agri-Park Business Plan
P a g e | 159
Figure 11.1: Agri-Park Structure
Source: DRDLR 2015
Agri-Hub
Agri-Hubs are located in centralised places within a District Municipality that are able to service and interact
favourable with agricultural activities within the district. The Agri-Hub, by necessity, is located in an area that
can serve as a link between district agricultural production and markets, and supply inputs from service and
product providers towards the agricultural producers.
Farmer Production Support Units
The Farmer Production Support Unit (FPSU) is a rural outreach unit connected with the Agri-Hub. The FPSU
serves as a resource node in areas isolated away from the main Agri-Hub, serving the surrounding community.
The FPSU is detailed with collecting primary production from agricultural initiatives in the area, storing this
product, engaging in small-scale processing operations for the local market, and providing extension services to
surrounding operations (including mechanisation).
Rural Urban Market Centres
Rural Urban Market Centres (RUMC) are located on the periphery of large urban areas, providing three main
purposes. The first is to link rural, urban and international markets; the second is to act as a holding facility for
product, releasing produce as required to urban markets based on seasonal trends; and the third is to provide
market intelligence and feedback to the Agri-Hub and FPSU. There will likely only be one RUMC per province in
the early stages of the Agri-Parks development.
11.3 Sarah Baartman Development Agri-Park Concept

160
Sarah Baartman Master Agri-Park Business Plan
P a g e | 160
The three commodities that were selected for prioritisation and integration into the SBDM Agri-Park include
livestock, vegetables and citrus. These have been deemed to have the greatest potential for growth and
development in the district especially when considering criteria such as local agro-processing opportunities,
suitability for smallholder and emerging farmers, and potential contribution to employment within the district.
The following sections outline the roles within the district for the Agri-Hub, RUMC and FPSUs, the physical and
organisational requirements of each, discussions on the operational dynamics between the various role-players
in the Agri-Park model (Agri-Hub, FSPUs, RUMC, the commercial, smallholder and emerging farmers, public
sector entities, and the markets for the goods produced), as well as considerations affecting the implementation
of the Agri-Park concept in the Sarah Baartman District Municipality.
The Agri-Parks main elements, the central Agri-Hub, the Farmer Production Support Units and the Rural-Urban
Market Centre are three complimentary elements that will contribute to a competitive, successful and inclusive
national agriculture sector.
Small and emerging farmers will be able to access key agricultural inputs, equipment, skills training and business
administration and production assistance through the FPSU’s as well as assistance with the productive elements
of farming such as harvesting and moving produce from the farm onwards. The Agri-Hub will feature the
centralised planning and oversight necessary to manage the multitude of agricultural projects in the district as
well as key infrastructure and agricultural services necessary process base agricultural production such as meat,
fresh vegetables and un-milled maize into finished and semi-finished products. Farmers, in addition to being
able to access the services provided by the Agri-Hub, will also be able to sell directly to commercial farming
cooperatives and/or form production agreements with commercial farming concerns. Choosing not to restrict
smallholder and emerging farmers to the usage of the Agri-Hub facilities will ensure that local farmers receive
the best price for their produce and allow them to form business relationships that may see them accessing
financial and management support at a level which the Agri-Hub may not be in a position to offer.
The RUMC then provides an avenue for local farmers and the Agri-Hub to sell goods either to large retail
concerns, smaller local retailers or directly to the person on the street. Here again, the Agri-Parks model should
be flexible in how it accommodates farmers and Agri-Hubs, allowing both groups to sell produce forward to the
client / market where production will fetch the highest price and allow commercial entities and other agricultural
entities to make use of the RUMC.
11.3.1 Location of Agri-Park Units
The Agri-Hub is located in the Addo in Sundays River Valley Local Municipality The Agri-Hub is located:
60km from Port Elizabeth on the R335
30km from Kirkwood on the R336
50km from Port of Ngqura
70km from Port of Port Elizabeth
65km from Port Elizabeth Airport
There will likely only be two RUMCs in the Eastern Cape for the initial phase of the Agri-Parks roll out. They will
likely be located in Buffalo City and Nelson Mandela Bay. After this initial phase a RUMC may be located in the
Mthatha SEZ.
The FPSUs are located in:
Grahamstown - Makana
Alexandria - Ndlambe
Somerset East - BCR

161
Sarah Baartman Master Agri-Park Business Plan
P a g e | 161
Graaff-Reinet - Camdeboo
Joubertina - Kou Kamma
Steytlerville - Baviaans
Jansenville - Ikwezi
Humansdorp - Kouga
Figure 11.2: Location of the Agri-Hub and FPSUs, in SBDM.
Source: Urban-Econ GIS Unit, 2015.
The figure below indicates the Agri-Hubs, RUMC and FPSUs throughout the entire province. It is important to
consider the cross border linkages with other Districts particularly if those districts have the same commodities
such as vegetables and livestock that is shared with Amathole District. It would be beneficial for those FPSUs
that are on the border of each district to share information and expertise.

162
Sarah Baartman Master Agri-Park Business Plan
P a g e | 162
Figure 11.3: Location of Agri-Hubs, RUMC and FPSUs throughout the Province8
Source: Urban-Econ GIS Unit, 2015.
It is important to consider the commodities of each district municipality and create linkages to those areas where
the same commodity is supported e.g. livestock is supported in SBDM and in neighbouring ADM. The following
table outlines the commodities in each district municipality.
Table 11.1: Commodities Prioritised in other Districts in the Eastern Cape8
District Municipality Prioritised Commodities
Amathole Livestock Maize Vegetables
Joe Gqabi Livestock Wool Maize
OR Tambo Livestock Maize Vegetables and Fruit
Sarah Baartman Livestock Vegetables Citrus
11.3.2 Key thrusts
The three commodities identified are unique and require different levels of support and different development
initiatives to enable them to grow and achieve the stated goals of the Agri-Park development concept. As
discussed through chapters 7 through 10, the key thrusts (focus areas) for each commodity are outlined below
in Table 11.2.
8 The FPSUs and prioritised commodities of Chris Hani and Alfred Nzo are not known at the time of publication.
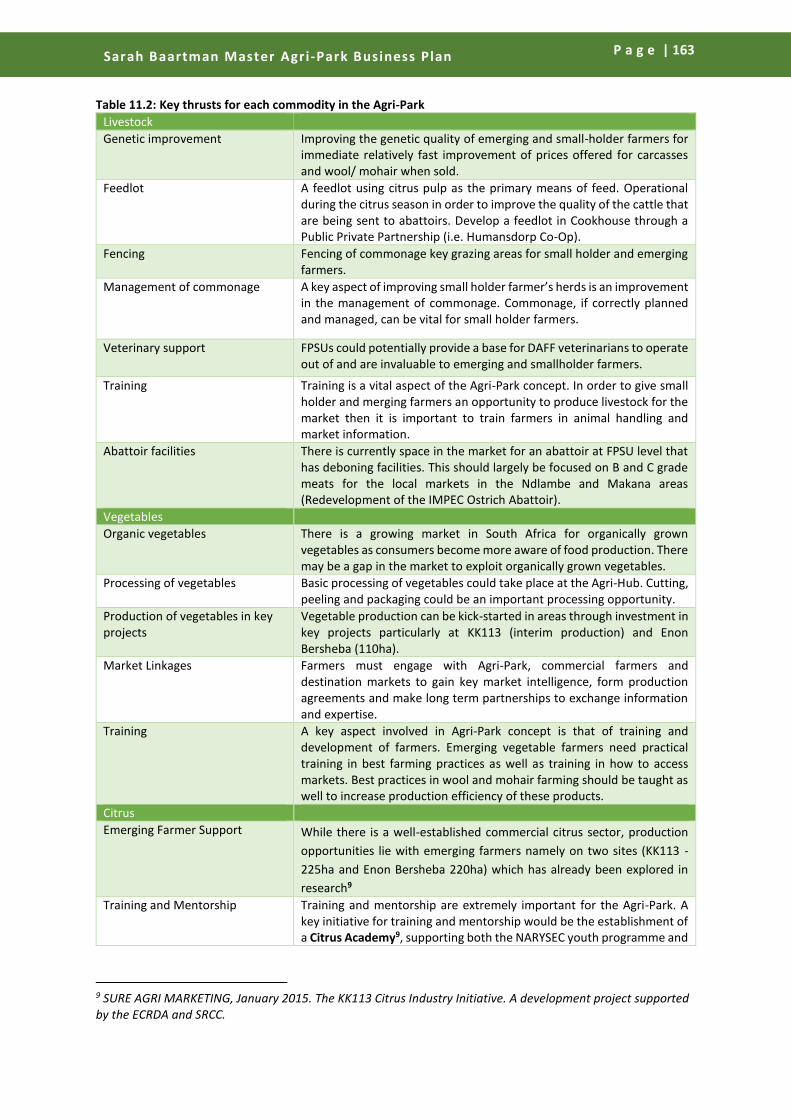
163
Sarah Baartman Master Agri-Park Business Plan
P a g e | 163
Table 11.2: Key thrusts for each commodity in the Agri-Park
Livestock
Genetic improvement Improving the genetic quality of emerging and small-holder farmers for immediate relatively fast improvement of prices offered for carcasses and wool/ mohair when sold.
Feedlot A feedlot using citrus pulp as the primary means of feed. Operational during the citrus season in order to improve the quality of the cattle that are being sent to abattoirs. Develop a feedlot in Cookhouse through a Public Private Partnership (i.e. Humansdorp Co-Op).
Fencing Fencing of commonage key grazing areas for small holder and emerging farmers.
Management of commonage A key aspect of improving small holder farmer’s herds is an improvement in the management of commonage. Commonage, if correctly planned and managed, can be vital for small holder farmers.
Veterinary support FPSUs could potentially provide a base for DAFF veterinarians to operate out of and are invaluable to emerging and smallholder farmers.
Training Training is a vital aspect of the Agri-Park concept. In order to give small holder and merging farmers an opportunity to produce livestock for the market then it is important to train farmers in animal handling and market information.
Abattoir facilities There is currently space in the market for an abattoir at FPSU level that has deboning facilities. This should largely be focused on B and C grade meats for the local markets in the Ndlambe and Makana areas (Redevelopment of the IMPEC Ostrich Abattoir).
Vegetables
Organic vegetables There is a growing market in South Africa for organically grown vegetables as consumers become more aware of food production. There may be a gap in the market to exploit organically grown vegetables.
Processing of vegetables Basic processing of vegetables could take place at the Agri-Hub. Cutting, peeling and packaging could be an important processing opportunity.
Production of vegetables in key projects
Vegetable production can be kick-started in areas through investment in key projects particularly at KK113 (interim production) and Enon Bersheba (110ha).
Market Linkages Farmers must engage with Agri-Park, commercial farmers and destination markets to gain key market intelligence, form production agreements and make long term partnerships to exchange information and expertise.
Training A key aspect involved in Agri-Park concept is that of training and development of farmers. Emerging vegetable farmers need practical training in best farming practices as well as training in how to access markets. Best practices in wool and mohair farming should be taught as well to increase production efficiency of these products.
Citrus
Emerging Farmer Support While there is a well-established commercial citrus sector, production
opportunities lie with emerging farmers namely on two sites (KK113 -
225ha and Enon Bersheba 220ha) which has already been explored in
research9
Training and Mentorship Training and mentorship are extremely important for the Agri-Park. A key initiative for training and mentorship would be the establishment of a Citrus Academy9, supporting both the NARYSEC youth programme and
9 SURE AGRI MARKETING, January 2015. The KK113 Citrus Industry Initiative. A development project supported by the ECRDA and SRCC.

164
Sarah Baartman Master Agri-Park Business Plan
P a g e | 164
citrus industry initiatives; supported by the Nelson Mandela Metropolitan University.
Citrus nursery and pruning
enterprise9 Establishment of a citrus nursery and a pruning enterprise which shall
be institutionally and operationally supported by the Sundays River
Citrus Company.
Creating linkages to established citrus production
It is vitally important that emerging citrus farmers create linkages to established citrus farmers and established businesses. These linkages will benefit farmers. Unlike other commodities, citrus is largely exported and increasing production of citrus in the region can boost exports and satisfy demand in overseas areas thus increasing the amount that is paid to farmers. This system can be extremely beneficial to emerging farmers.
11.4 Commodity Development Concepts
The following section unpacks the proposed SBDM Agri-Park development concept, including the function of
each element of the project. While they are presented separately the development concepts should not be seen
as separate and should be viewed in synergy between all three commodities. They should share resources
between them and not duplicate functions or infrastructure.
The commodity development concepts, unpacked below, consider the requirements of the location and
coverage of the FPSU, AH, and the RUMC.
The concept is developed by the defining the following aspects:
• Roles and functions
• Location
• Key products/services
• Infrastructure and equipment
• Logistics
• Human Resources (HR)
• Training
The development concepts take into consideration the current agricultural situation of each commodity and
translates this into how the Agri-Park should support and develop the commodity and agricultural sector in the
district.
11.4.1 Livestock
The development concept for the production of livestock has been developed according to the Agri-Parks Model,
as stated in the introduction. The process begins with the production of livestock by the farmer and is supported
by the FPSU by providing services such as supplying feed, veterinary assistance, and auctions and sales. Livestock
that is not intended for processing is sold at the FPSU to the local market, while livestock for further processing
is transported to the AH. From the AH or abattoir, the red meat products can be sold, transported to various
retail and distribution markets or the RUMC. The RUMC can further transport products to local and international
market, while providing information on demand and market trends to the other components. Wool and mohair
will be organised at an FPSU level through which key implements and farming inputs will be provided to the
farmer. Wool and mohair best farming practices as well as management and business skills will be taught to
emerging farmers in the region. Table 11.3 explores the development for red meat production.

165
Sarah Baartman Master Agri-Park Business Plan
P a g e | 165 Sarah Baartman Master Agri-Park Business Plan
P a g e | 165
Production Flow Farmers FPSU AGRI-HUB RUMC
Location All smallholder farmers and some commercial
farmers (those willing to participate) involved
in livestock production in the SBDM. Beef
cattle is concentrated in the eastern portion of
the municipality and sheep and goats in the
western and central portions of the district.
Livestock farmers will be supported by all the
FPSU(s) that would be situated in the SBDM
since it is a major primary agricultural activity
in the SBDM. Sheep and goats will be largely
supported in the west, north and central
areas of SBDM while the eastern and
southern areas will be predominantly focused
on cattle. All FPSUs should support livestock
namely:
Grahamstown - Makana
Alexandria - Ndlambe
Somerset East - BCR
Graaff-Reinet - Camdeboo
Joubertina - Kou Kamma
Steytlerville - Baviaans
Jansenville - Ikwezi
Humansdorp - Kouga
The Agri-Hub is located in Addo.
Addo is close (32km) to Kirkwood
which is home to the commercial
citrus industry. The Agri-Hub is
centrally located and is only
60km from the Port Elizabeth
Harbour and 50km to the Port of
Ngqura. The Agri-Hub is also only
70km to the international airport
in Nelson Mandela Bay. Existing
transport infrastructure is
already present in the area but is
need of maintenance. The site
itself is located on Portion 307 of
the Farm Commando Kraal 113,
known simply as KK113, which is
a 440 hectare property currently
owned by the Sundays River
Municipality. The hub itself will
more likely expand over different
farms in the Addo area. The
location can be seen in figure
11.2.
There are likely only to be one
RUMC in the Eastern Cape for
the initial phase of the Agri-
Parks roll out. It will likely be
located in Buffalo City. After this
initial phase a RUMC may be
located in each district
municipality if there is a need for
it. When the SBDM Agri-Park
develops into a feasible business
venture and there is a demand
for a RUMC, one could be
developed specifically for SBDM
in Nelson Mandela Bay.
Key Role & Function Farmers are responsible for the primary
production of livestock, but have slightly
different roles according to size and
complexity of operations.
The primary role of the FPSUs should be the
improvement of the genetic material of the
livestock. Currently the genetic quality of the
livestock is poor and thus emerging farmers
do not receive a large amount of money per
The Agri-Hub is not the optimum
location for livestock production.
There are not many livestock
farmers in the area.
Links the livestock producers to
local and international markets.
Provision of market
intelligence in the beef and
related industries.
Table 11.3: Livestock Development Concept

166
Sarah Baartman Master Agri-Park Business Plan
P a g e | 166
Smallholder
Smallholder farmers and subsistence farmers
are primarily concerned with production to
aid food security supplying primarily to their
own households and communities and also to
local markets or selling directly to public in
village market centres.
Emerging farmer
Emerging farmers form a link between
smallholder farmers and commercial farmers,
being more sophisticated that smallholders
and having higher levels of production. These
farmers exhibit features of both smallholder
and commercial farmers and may sell produce
in small markets and/or through commercial
marketing channels.
Commercial
Commercial farmers farm large portions of
land with a high degree of mechanisation and
technical sophistication. These farmers make
use of well-established commercial marketing
channels to sell livestock and move to
destination markets.
carcass. Both wool and mohair quality will
increase allowing for higher prices to be
offered to farmers. As well as better quality
wool, genetic improvement will offer the
opportunity to get more fibre from livestock.
If the herds are improved then this will
automatically improve the prices that can be
asked by emerging farmers. The FPSUs can be
the centres of regional programmes that offer
genetic improvement of livestock. The FPSUs
will be the bases through which these
programmes can take place.
Of great importance is the training of
emerging farmers while this genetic
improvement programme continues as there
would need to be a good understanding to
maintain the good quality of the genes in the
livestock herds. Genetic improvement will
also improve the quality of wool that is
produced in the region.
The key role and function of FPSUs will be to
provide input supplies (such as feed,
pesticides, medicine, etc.), training and
extension support, mechanisation support,
local logistics support, storage of some
animals that can improve genetic material of
the emerging farmers livestock.
There is an opportunity to locate an abattoir
in Grahamstown or Alexandria to service
smallholder and commercial farmers in the
The main role of the Agri-Hub will
be the training of emerging
farmers in the region on how to
farm livestock sustainably to a
market acceptable quality and
how to improve animal well-
being and training in the
marketing aspects of farming.
The most important immediate
factor will be training on how to
improve and maintain the
genetic diversity of the livestock
that they will be rearing. Along
with this training, it is important
to consider training in business
practices and marketing. These
actions alone should improve the
prices that are being offered to
emerging farmers. Training
sessions involving practical and
experiential learning will be
crucial to the success of emerging
farmers. Critical to the services
offered by the Agri-Hub is the
facilitation of training and skills
development especially in the
area of agricultural economics to
ensure farmers understand the
fundamentals running a
sustainable farming enterprise.
This will be beneficial to livestock
Identification of livestock
markets.
Interact and negotiate with
buyers in the various
market channels.
Undertakes contractual
agreements

167
Sarah Baartman Master Agri-Park Business Plan
P a g e | 167
area. This area is currently not well serviced
by abattoirs. This can either be done by
repurposing the old Grahamstown Ostrich
Abattoir but focusing on a smaller scale or by
building a new abattoir in Alexandria (a large
project has been proposed by the Ndlambe
Municipality and a smaller scale version of
this project could be more viable). This
abattoir should focus on producing B and C
grade carcasses that can service local markets
and obtain contracts to supply meat to
government institutions such as hospitals,
prisons or feeding schemes. Reducing the
distance that carcasses and livestock have to
travel will improve the prices that can be
asked for by emerging farmers. Processing in
the form of deboning may be a suitable
option to pursue at this FPSU.
FPSUs need to effectively manage the
commonage areas in each local municipality.
Commonage can provide farmers with grazing
but this needs to be managed effectively in
order to maintain a high quality of grazing for
the animals.
farmers at all levels including
wool and mohair farmers.
It is also recommended that a
feedlot be established so that
livestock, especially cattle, can be
finished and improved before
being sold to abattoirs. This
feedlot can be supported by the
waste products of the citrus
industry. This should not be
considered a large development
as the pulp that is produced is
seasonal and is not sustainable
throughout the year. Citrus pulp
is produced just before the
increase in beef sales (over the
holiday period) and forms a good
linkage between the two
industries. Cattle can be finished
in a feedlot and then be sent to
the abattoir in time for an
increase in red meat demand.
The Agri-Hub will be the centre of
training and support for livestock
industry. While processing
should occur at an FPSU level,
there are small opportunities for
feedlots in the Agri-Hub.
Human Resources The core HR personnel that the SHF would
require from the FPSU are:
The following positions or services are
required to assist smallholder or emerging
The following positions or
services are required to assist
The following positions or
services are required to assist

168
Sarah Baartman Master Agri-Park Business Plan
P a g e | 168
Extension officers
State veterinarians
Agronomist
Researchers
Some permanent staff to manage day to
day farm operations.
Commercial farmers should have all the HR
personnel they need to operate a farm but can
use extension officers from the FPSUs and the
Agri-Hub.
farmers in each FPSU area. These may
available at present through existing public or
private agriculture industry structures. If
access to these services or personnel are not
available in a FPSU area they need to be
provided by the Agri-Park.
If there are existing staff – integrate into AP
Local private and public entities much be
approached to identify what services are
available for inclusion into the Agri-Park
model so duplication of services is avoided
The FPSU will provide the following HR/HR
facilities;
Agricultural extension officer / support
office;
Machine operators / Local mechanisation
centre and workshops;
Researchers
Voluntary/Established commercial
farmers to mentor the small scale farmers
(as many as possible).
State veterinarian linked to DAFF
smallholder or emerging farmers
in each FPSU area. These may
available at present through
existing public or private
agriculture industry structures. If
access to these services or
personnel are not available in a
FPSU area they need to be
provided by the Agri-Park.
Local private and public entities
much be approached to identify
what services are available for
inclusion into the Agri-Park
model so duplication of services
is avoided
The AH will provide the following
HR;
Administrative manager
Quality control personnel
Feedlot personnel
Research and Demonstration
personnel
Training personnel
It must be noted that the main
production areas of livestock will
not be in the Agri-Park.
smallholder or emerging farmers
in each FPSU area. These may
available at present through
existing public or private
agriculture industry structures.
If access to these services or
personnel are not available in a
FPSU area they need to be
provided by the Agri-Park.
Local private and public entities
much be approached to identify
what services are available for
inclusion into the Agri-Park
model so duplication of services
is avoided
The RUMC will provide the
following HR;
IT expert/personnel
Administrative manager
Training personnel
Marketing agents (to
faceplate market linkages,
facilitate contracts with
wholesalers and major
retail outlets and also to
gather information on
prices at fresh produce
market that would be
communicated to the AH
and FPSU).

169
Sarah Baartman Master Agri-Park Business Plan
P a g e | 169
Training Small holder and emerging farmers would
require training on: best farm practices
(animal growth and nutrition), use of tools and
equipment, training on how to interpret
market information (Access to markets and
prices) and ICT. The extension officers that are
involved with livestock production are well
positioned to render this type of training. Also,
training can be provided by the well-
established commercial farmers through a
mentorship programme. Extension officers
through the DAFF can also organise Agri-
shows, where farmers can express their
concerns, and where training can be provided.
One of the key function of the FPSU would be
to provide training and extension support on
various farm practices, to the SHF and
emerging farmers.
They can also provide some support to the
commercial farmers particularly with
veterinary services.
Some training would also be
required at the hub e.g.
Training on best practices,
based on changing demand
and supply.
Training on new innovations
as they surface.
Training on how to operate
feedlots with citrus pulp
waste products.
Training of training personnel on
how to disseminate information
to the SHF, AH and the FPSU.
Key product/
activities
The core activities of the small holder farmers
are:
Ensuring animal health
Disease control
Rearing of young livestock to replace
herds taken to abattoir
Live animals that are taken to abattoirs
Wool and mohair fibre
Improving the genetic quality of the herds
Commercial farmers will focus on these
aspects as well.
The core activities of the FPSU are:
Collection of livestock from the farmers
Transportation of livestock to abattoirs/
feedlots or holding areas for sale
Some quality control (most to be
performed by abattoirs and feedlots)
Transportation of processed carcasses
from abattoirs to markets
Collection of wool and mohair from
farmers.
The core activities of the AH are:
Training of farmers on how
to effective raise livestock.
Training farmers in business
management
Logistics support
The core activities of the RUMC
are:
Collection of final products
from the AH/ FPSU
(abattoir)
Marketing and distribution
of final products to
different wholesalers and
major retail outlets
Exporting of final products
Bulk storage of final
products
Infrastructure/
Equipment
The smallholder farmer would require the
following equipment, which can be hired from
the FPSU:
Tractor
Trailer
Feeding troughs
The FPSU would require to put in place the
following equipment/infrastructure:
Transport ( e.g. Bakkie or pick-up vehicles)
Weighing facilities
Auction facility
Storage facility
The AH would require to put in
place the following
equipment/infrastructure:
Administrative facilities
Rental facilities
Quality control facilities
The RUMC would require to put
in place the following
equipment/infrastructure:
Large warehouses/ holding
facilities
Cold storage facilities

170
Sarah Baartman Master Agri-Park Business Plan
P a g e | 170
Water troughs
Tagging equipment
Animal handling areas
Storage facilities for feed, poisons, and
medicines.
Sheering sheds and equipment
Commercial farmers should have access to all
of this equipment and infrastructure.
All equipment listed to be required by the
small holder farmers.
Agricultural input
distribution and sales centre
Training centre
Student and staff housing
Logistics and transport
facility
Administrative facilities/
information centre
Logistics Smallholder farmers should be organised into
groups. Each group should have a group head
that would communicate information from
the farmers to the FPSU and also arrange for
delivery of inputs with the FPSU.
Selling of animals: Certain days of the week
should be assigned for collection of animals
from the farmers. Farmers will unlikely have
the necessary logistics available to take the
animals to abattoir so this will have to be
organised with the FPSU. Farmers intending
to sell on certain days would notify the FPSU
for necessary arrangements. For farmers with
large numbers of livestock, special
arrangements should be made to transport
these animals as this can greatly increase
capacity at an abattoir. They should be
allowed to rent a truck and driver to fill a truck
and deliver it to the abattoir for processing.
Commercial farmers will have access to their
own vehicles or hire vehicles from the FPSU.
The FPSU should organise Primary logistics in
the form of collection vehicles either to hire
or operated by the FPSU to collect livestock to
transport to the abattoirs and feedlots.
Cold storage transport should also be
arranged for distribution to the various
marketing channels and the RUMC.
*It should be noted that some of these
transport facilities will be used to deliver
farm inputs to the collection centres, after
which it can be distributed to individual
farmers.
Rental of transport could occur
from the AH but will primarily be
the role of the FPSU.
Transportation to the different
markets from the AH, especially
international markets can also
be arranged through the RUMC.
The products that are stored at
the RUMC holding facilities will
also be transported to the
identified markets.

171
Sarah Baartman Master Agri-Park Business Plan
P a g e | 171
Collection of wool and mohair: The key to
developing logistics for wool and mohair
collection would be to include key role players
and stakeholders in the process. Cape Wool
and BKB are the largest organisations who
collect animal fibres. These organisations
already have the infrastructure in place for
collecting these products and can prove
invaluable to farmers if they are integrated
into the Agri-Parks concept.
Technology/ ICT In order to boost their production efficiency
and health of the animals, the SHF would
require:
Modern tools,
Mobile devices for subscription to Apps. ,
to enable them receive information from
the RUMC on weather forecast, disease
control etc.
Tracking devices on all vehicles to prevent
theft and also to monitor the movements and
locations of the drivers.
The FPSU would also require a subscription to
certain Apps from the RUMC to remain aware
of current prices fetched on the global,
national and local market, so as to be able to
strategically supply vegetable/ products to
the markets.
*It should be noted the same transport
facilitates would be used to service all the
basic units of the Agri-Park, therefore, all the
Transportation facilities would have these
tracking devices.
In order to remain aware of the
current prices fetched on the
global, national and local market,
so as to be able to strategically
supply red meat to the markets,
the RUMC would also require
subscription to certain Digital
Applications. This will enable the
AH to remain informed.
The RMUC will provide an
information database that all
the various basic units of the
Agri-Park can subscribe to.
Economic and marketing
computer applications and
programmes can be used by the
RUMC.
11.4.2 Vegetables
The concept for the production of vegetables in the district also looks at the production flow from the farm to the market (through to the RUMC). Vegetables is one of the
district’s key commodities and it is therefore essential to provide training and support to smallholder and emerging farmers that want to enter the market. The production
of vegetables will entail mechanisation and storage support from the various FPSUs among other services. The FPSUs will support farmers with the supply of inputs, such as
seeds and fertilisers and will provide collective transport means for fresh produce. Distribution to markets can also be facilitated by the AH where possible, otherwise the
RUMC will act as a distribution centre and assist with market related information. Further details on the development concept for vegetables are found in Table 11.4

172
Sarah Baartman Master Agri-Park Business Plan
P a g e | 172
Table 11.4: Vegetable Development Concept
Production Flow Farmers FPSU AH RUMC
Location Vegetables can be grown in most areas of the
SBDM to varying degrees either in tunnels or
in fields. The varying climatic and soil
conditions across the district will determine
what crops farming projects are suitable in
each LM and to what degree.
All FPSUs should to some degree support
vegetable farming as there are a large number
of projects which support community
vegetable gardening initiatives.
Sarah Baartman
Baviaans - Steytlerville
Camdeboo – Graaff-Reinet
Ikwezi - Jansenville
Kouga - Humansdorp
Kou-Kamma - Joubertina
Makana - Grahamstown
Ndlambe - Alexandria
Sundays River Valley – Addo
The site of the Agri-Hub will be in
the town of Addo on the farm
portion of KK113 and other
municipally owned land in the
Addo area as seen in Figure 11.2.
There are likely only to be one
RUMC in the Eastern Cape for
the initial phase of the Agri-
Parks roll out. It will likely be
located in Buffalo City. After this
initial phase a RUMC may be
located in each district
municipality if there is a need
for it. When the SBDM Agri-Park
develops into a feasible
business venture and there is a
demand for a RUMC, one could
be developed specifically for
SBDM in Nelson Mandela Bay.
Key Role & Function Farmers are responsible for the primary
production of fresh vegetables, but have
slightly different roles according to size and
complexity of operations.
Smallholder
Smallholder farmers and subsistence farmers
are primarily concerned with crop production
to aid food security supplying primarily to
their own households and communities and
also to local fresh produce markets or selling
directly to public in village market centres.
The FPSU plays a critical role in ensuring
availability and facilitating access to Input
supplies such as vegetable seed, seedlings,
fertilizer, pesticides, herbicides, training and
extension support, mechanisation support,
local logistics support, limited sorting of fresh
produce, some packaging, some storage, and
processing for local markets, through-put of
excess products to Agri-hubs.
The main role of the Agri-Hub will
be the training of emerging
farmers in the region on how to
farm vegetables sustainably to a
market acceptable quality.
Critical to the services offered by
the Agri-Hub is the facilitation of
training and skills development
especially in the area of
agricultural economics to ensure
farmers understand the
Links the vegetables producers
to local and international
markets.
Provision of market
intelligence in vegetable
and related industries.
Identification of vegetable
markets.
Interact and negotiate with
buyers in the various
market channels.
Undertakes contractual
agreements

173
Sarah Baartman Master Agri-Park Business Plan
P a g e | 173
Emerging farmer
Emerging farmers form a link between
smallholder farmers and commercial farmers,
being more sophisticated than smallholders
and having higher levels of production. These
farmers exhibit features of both smallholder
and commercial farmers and may sell produce
in small fresh produce markets and/or
through commercial marketing channels.
Commercial
Commercial farmers farm large portions of
land with a high degree of mechanisation and
technical sophistication. These farmers make
use of well-established commercial fresh
produce marketing channels to sell produce
and move to destination markets.
fundamentals of running a
sustainable farming enterprise.
The Agri-Hub should also facilitate
access to key agricultural
processes including pack-houses,
grading and sorting facilities,
logistics services and agro-
processing services. Agro-
Processing can include cutting and
peeling of vegetables that can be
packaged and sold to local
markets and retail outlets.
Reintroducing the Port
Elizabeth Fresh produce
market where emerging
farmers produce can be
sent to be sold on the local
market.
Human Resources The core HR personnel that farmers may
require from the FPSU are:
Extension officers
Agronomist
Researchers
Seasonal staff (harvest labour)
Some permanent staff to manage
day to day farm operations.
Commercial farmers should have all the HR
personnel they need to operate a farm but
can use extension officers from the FPSUs and
the Agri-Hub.
The following positions / services are required
to assist smallholder / emerging farmers in
each FPSU area. These may be available at
present through existing public/private
agriculture industry structures. If access to
these services or personnel are not available
in a FSPU area they need to be provided by
the Agri-Park.
Local public and private entities must be
approached to identify what services are
available for inclusion into the FSPU service
model to ensure duplication of positions /
functions is avoided.
The following positions / services
are required to assist smallholder
/ emerging farmers in the Agri-
Hub area. These may be available
at present through existing
public/private agriculture
industry structures. If access to
these services or personnel are
not available in an Agri-Hub area
they need to be provided by the
Agri-Park.
Local public and private entities
must be approached to identify
what services are available for
The following positions /
services are required to assist
smallholder / emerging farmers
in the RUMC area. These may be
available at present through
existing public/private
agriculture industry structures.
If access to these services or
personnel are not available in
the RUMC area they need to be
provided by the Agri-Park.
Local public and private entities
must be approached to identify
what services are available for

174
Sarah Baartman Master Agri-Park Business Plan
P a g e | 174
The FPSU will provide the following HR/HR
facilities;
Agricultural extension officer / support
office;
Machine operators / Local mechanisation
centre and workshops;
Agronomist (for soil testing etc.)
Researchers
Voluntary/Established commercial farmers
to mentor the small scale farmers (as many
as possible).
inclusion into the FSPU service
model to ensure duplication of
positions / functions is avoided.
The AH will provide the following
HR;
Administrative manager
Quality control personnel
Staffs to manage the Agro-
Processing facilities
Research and Demonstration
personnel
Training personnel
inclusion into the FSPU service
model to ensure duplication of
positions / functions is avoided.
The RUMC will provide the
following HR;
IT expert/personnel
Administrative manager
Training personnel
Marketing agents (to
Facilitate market linkages,
facilitate contracts with
wholesalers and major
retail outlets and also to
gather information on
prices at fresh produce
market that would be
communicated to the AH
and FPSU).
Training Small holder farmers would require training
on: best farm practices, use of tools and
equipment, training on how to interpret
market information (Access to markets and
prices) and ICT. The extension officers that are
involved with livestock production are well
positioned to render this type of training.
Also, training can be provided by the well-
established commercial farmers through a
mentorship programme. Extension officers
through the DAFF can also organise Agri-
shows, where farmers can express their
One of the key function of the FPSU would be
to provide training and extension support on
various farm practices, to the farmers.
Some training would also be
required at the hub e.g.
Training of processing staffs
on how to handle and
operate various processing
equipment.
Training on best practices,
based on changing demand
and supply.
Training on new innovations
as they surface.
Training of training personnel’s
on how to disseminate
information to the farmers, AH
and the FPSU.
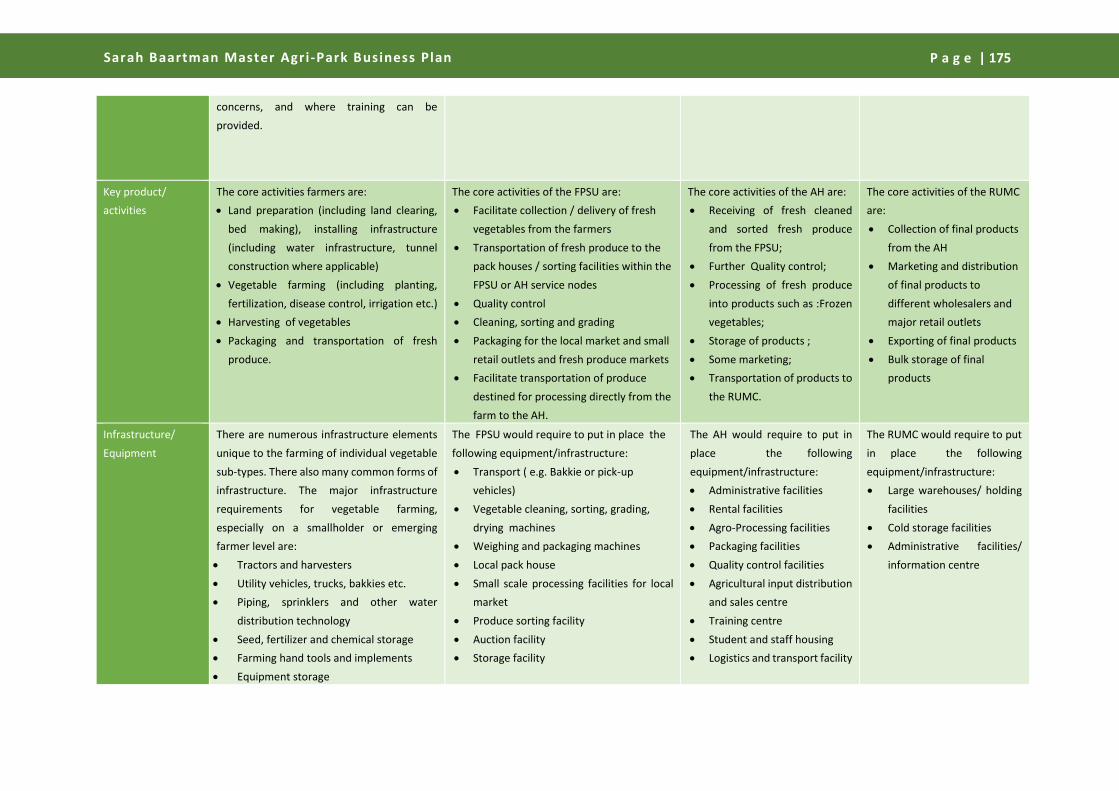
175
Sarah Baartman Master Agri-Park Business Plan
P a g e | 175
concerns, and where training can be
provided.
Key product/
activities
The core activities farmers are:
Land preparation (including land clearing,
bed making), installing infrastructure
(including water infrastructure, tunnel
construction where applicable)
Vegetable farming (including planting,
fertilization, disease control, irrigation etc.)
Harvesting of vegetables
Packaging and transportation of fresh
produce.
The core activities of the FPSU are:
Facilitate collection / delivery of fresh
vegetables from the farmers
Transportation of fresh produce to the
pack houses / sorting facilities within the
FPSU or AH service nodes
Quality control
Cleaning, sorting and grading
Packaging for the local market and small
retail outlets and fresh produce markets
Facilitate transportation of produce
destined for processing directly from the
farm to the AH.
The core activities of the AH are:
Receiving of fresh cleaned
and sorted fresh produce
from the FPSU;
Further Quality control;
Processing of fresh produce
into products such as :Frozen
vegetables;
Storage of products ;
Some marketing;
Transportation of products to
the RUMC.
The core activities of the RUMC
are:
Collection of final products
from the AH
Marketing and distribution
of final products to
different wholesalers and
major retail outlets
Exporting of final products
Bulk storage of final
products
Infrastructure/
Equipment
There are numerous infrastructure elements
unique to the farming of individual vegetable
sub-types. There also many common forms of
infrastructure. The major infrastructure
requirements for vegetable farming,
especially on a smallholder or emerging
farmer level are:
Tractors and harvesters
Utility vehicles, trucks, bakkies etc.
Piping, sprinklers and other water
distribution technology
Seed, fertilizer and chemical storage
Farming hand tools and implements
Equipment storage
The FPSU would require to put in place the
following equipment/infrastructure:
Transport ( e.g. Bakkie or pick-up
vehicles)
Vegetable cleaning, sorting, grading,
drying machines
Weighing and packaging machines
Local pack house
Small scale processing facilities for local
market
Produce sorting facility
Auction facility
Storage facility
The AH would require to put in
place the following
equipment/infrastructure:
Administrative facilities
Rental facilities
Agro-Processing facilities
Packaging facilities
Quality control facilities
Agricultural input distribution
and sales centre
Training centre
Student and staff housing
Logistics and transport facility
The RUMC would require to put
in place the following
equipment/infrastructure:
Large warehouses/ holding
facilities
Cold storage facilities
Administrative facilities/
information centre

176
Sarah Baartman Master Agri-Park Business Plan
P a g e | 176
Fencing
Packaging infrastructure and materials
Sprayers
Greenhouses / farming tunnels
(depending on crop)
All equipment listed to be required by the
small holder farmers.
Logistics Smallholder farmers should be organised into
groups. Each group should have a group head
that would communicate information from
the farmers to the FPSU and also arrange for
delivery of inputs with the FPSU. It is
suggested that there should be input
collection centres which would serve as small
offices for the group heads. This group heads
would work closely with the pack houses and
the FPSU.
Harvesting: Farmers intending to harvest on
certain days would notify the FPSU for
necessary arrangements. For smallholders
with less than 2ha of land, harvesting would
be done semi-manually, harvested potatoes
will be transported as each trailer gets filled
up. For farmers with more than two hectares,
harvesting would be done mechanically and
vegetables will be transported to the FPSU as
each trailer gets filled up.
The FPSU should organise Primary logistics
collection centre in the form of pack houses
where trucks (bakkie/pick up vehicles) would
pick up potatoes from various farms and
convey it to these pack houses. Cold storage
transport should also be arranged for
distribution to the various marketing channels
and the RUMC.
*It should be noted that some of these
transport facilities will be used to deliver
farm inputs to the collection centres, after
which it can be distributed to individual
farmers.
Rental of transport could occur
from the AH.
The same cold storage transport
will be used for distribution of
final products to wholesales and
major retail outlets.
Technology/ICT In order to boost their production efficiency,
the SHF would require:
Modern tools,
Mobile devices for subscription to Apps. , to
enable them receive information from the
RUMC on weather forecast, disease control
etc.
Tracking devices on all vehicles to prevent
hijack and also to monitor the movements
and locations of the drivers.
Also, the FPSU would require subscription to
certain Apps from the RMUC to remain
conversant with the current prices fetched on
the global, national and local market, so as to
In order to remain aware of the
current prices fetched on the
global, national and local market,
so as to be able to strategically
supply red meat to the markets,
the RUMC would also require
subscription to certain Apps. This
The RUMC will provide
Information Data base that all
the various basic units of the
Agri-Park can subscribe to.
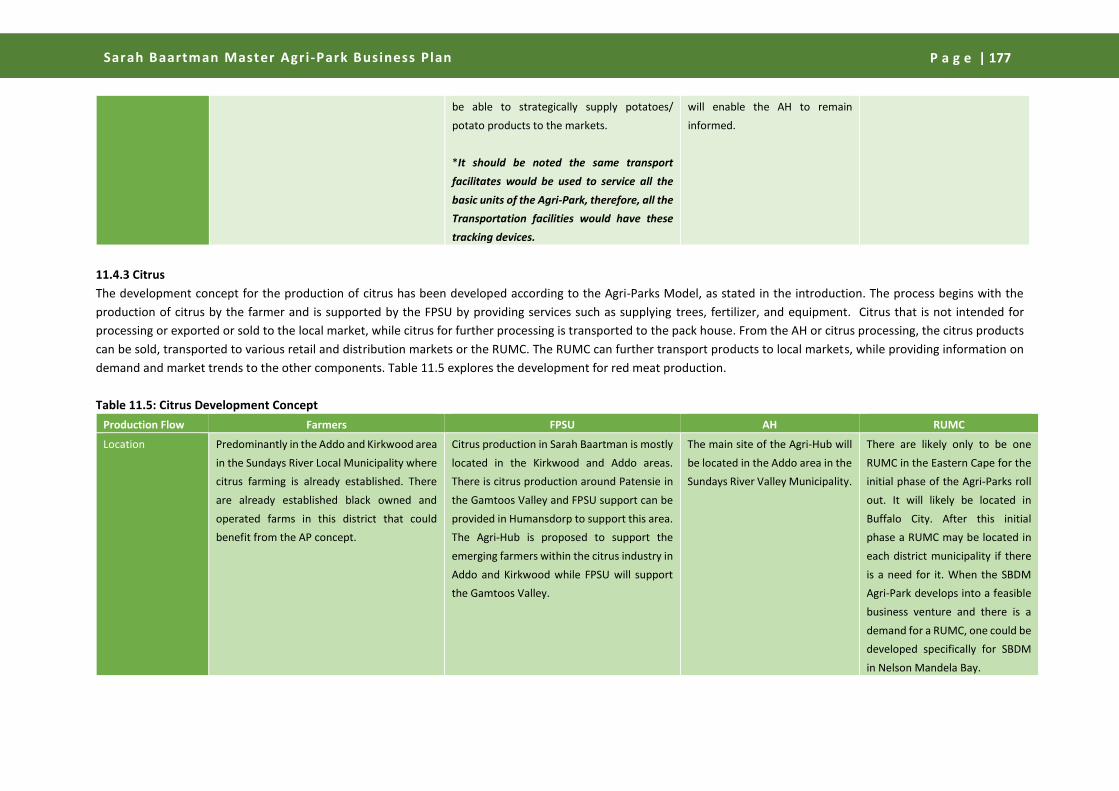
177
Sarah Baartman Master Agri-Park Business Plan
P a g e | 177
be able to strategically supply potatoes/
potato products to the markets.
*It should be noted the same transport
facilitates would be used to service all the
basic units of the Agri-Park, therefore, all the
Transportation facilities would have these
tracking devices.
will enable the AH to remain
informed.
11.4.3 Citrus
The development concept for the production of citrus has been developed according to the Agri-Parks Model, as stated in the introduction. The process begins with the
production of citrus by the farmer and is supported by the FPSU by providing services such as supplying trees, fertilizer, and equipment. Citrus that is not intended for
processing or exported or sold to the local market, while citrus for further processing is transported to the pack house. From the AH or citrus processing, the citrus products
can be sold, transported to various retail and distribution markets or the RUMC. The RUMC can further transport products to local markets, while providing information on
demand and market trends to the other components. Table 11.5 explores the development for red meat production.
Table 11.5: Citrus Development Concept
Production Flow Farmers FPSU AH RUMC
Location Predominantly in the Addo and Kirkwood area
in the Sundays River Local Municipality where
citrus farming is already established. There
are already established black owned and
operated farms in this district that could
benefit from the AP concept.
Citrus production in Sarah Baartman is mostly
located in the Kirkwood and Addo areas.
There is citrus production around Patensie in
the Gamtoos Valley and FPSU support can be
provided in Humansdorp to support this area.
The Agri-Hub is proposed to support the
emerging farmers within the citrus industry in
Addo and Kirkwood while FPSU will support
the Gamtoos Valley.
The main site of the Agri-Hub will
be located in the Addo area in the
Sundays River Valley Municipality.
There are likely only to be one
RUMC in the Eastern Cape for the
initial phase of the Agri-Parks roll
out. It will likely be located in
Buffalo City. After this initial
phase a RUMC may be located in
each district municipality if there
is a need for it. When the SBDM
Agri-Park develops into a feasible
business venture and there is a
demand for a RUMC, one could be
developed specifically for SBDM
in Nelson Mandela Bay.
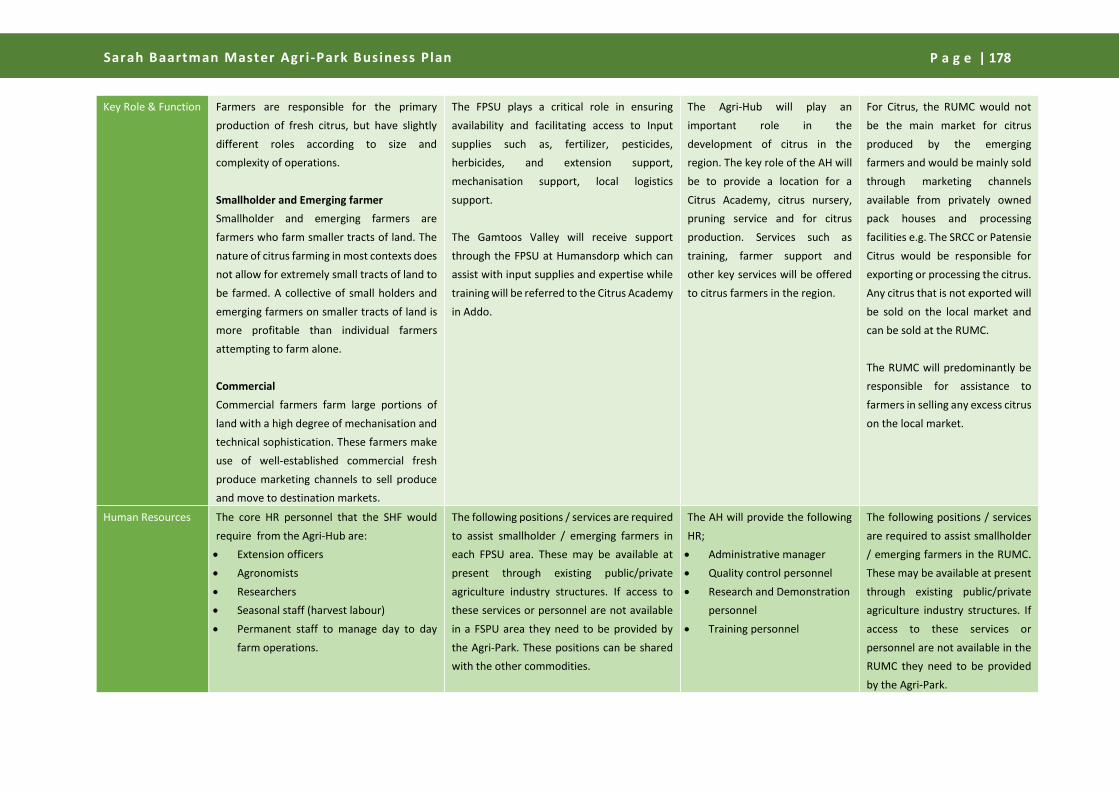
178
Sarah Baartman Master Agri-Park Business Plan
P a g e | 178
Key Role & Function Farmers are responsible for the primary
production of fresh citrus, but have slightly
different roles according to size and
complexity of operations.
Smallholder and Emerging farmer
Smallholder and emerging farmers are
farmers who farm smaller tracts of land. The
nature of citrus farming in most contexts does
not allow for extremely small tracts of land to
be farmed. A collective of small holders and
emerging farmers on smaller tracts of land is
more profitable than individual farmers
attempting to farm alone.
Commercial
Commercial farmers farm large portions of
land with a high degree of mechanisation and
technical sophistication. These farmers make
use of well-established commercial fresh
produce marketing channels to sell produce
and move to destination markets.
The FPSU plays a critical role in ensuring
availability and facilitating access to Input
supplies such as, fertilizer, pesticides,
herbicides, and extension support,
mechanisation support, local logistics
support.
The Gamtoos Valley will receive support
through the FPSU at Humansdorp which can
assist with input supplies and expertise while
training will be referred to the Citrus Academy
in Addo.
The Agri-Hub will play an
important role in the
development of citrus in the
region. The key role of the AH will
be to provide a location for a
Citrus Academy, citrus nursery,
pruning service and for citrus
production. Services such as
training, farmer support and
other key services will be offered
to citrus farmers in the region.
For Citrus, the RUMC would not
be the main market for citrus
produced by the emerging
farmers and would be mainly sold
through marketing channels
available from privately owned
pack houses and processing
facilities e.g. The SRCC or Patensie
Citrus would be responsible for
exporting or processing the citrus.
Any citrus that is not exported will
be sold on the local market and
can be sold at the RUMC.
The RUMC will predominantly be
responsible for assistance to
farmers in selling any excess citrus
on the local market.
Human Resources The core HR personnel that the SHF would
require from the Agri-Hub are:
Extension officers
Agronomists
Researchers
Seasonal staff (harvest labour)
Permanent staff to manage day to day
farm operations.
The following positions / services are required
to assist smallholder / emerging farmers in
each FPSU area. These may be available at
present through existing public/private
agriculture industry structures. If access to
these services or personnel are not available
in a FSPU area they need to be provided by
the Agri-Park. These positions can be shared
with the other commodities.
The AH will provide the following
HR;
Administrative manager
Quality control personnel
Research and Demonstration
personnel
Training personnel
The following positions / services
are required to assist smallholder
/ emerging farmers in the RUMC.
These may be available at present
through existing public/private
agriculture industry structures. If
access to these services or
personnel are not available in the
RUMC they need to be provided
by the Agri-Park.

179
Sarah Baartman Master Agri-Park Business Plan
P a g e | 179
Local public and private entities must be
approached to identify what services are
available for inclusion into the FSPU service
model to ensure duplication of positions /
functions is avoided.
The FPSU will provide the following HR/HR
facilities;
Agricultural extension officer / support
office;
Machine operators / Local mechanisation
centre and workshops;
Agronomist (for soil testing etc.)
Researchers
Voluntary/Established commercial farmers
to mentor the small scale farmers.
Local public and private entities
must be approached to identify
what services are available for
inclusion into the FSPU service
model to ensure duplication of
positions / functions is avoided.
The RUMC will provide the
following HR;
IT expert/personnel
Administrative manager
Training personnel
Marketing agents (to
Facilitate market linkages,
facilitate contracts with
wholesalers and major retail
outlets and also to gather
information on prices at fresh
produce market that would
be communicated to the AH
and FPSU).
Training Small holder farmers would require training
on:
Best farm practices, use of tools and
equipment (Sprayers, pruners etc.), training
on how to interpret market information and
ICT. Training can also be provided by the well-
established commercial citrus farmers
through a mentorship programme and skills
sharing programme through the SRCC.
Extension officers through the DAFF can also
Training should not be done at the FPSU For
citrus as the citrus academy would negate the
need for training to be performed at the FPSU.
Thus all citrus training for the Gamtoos area
should be performed at the Agri-Hub in Addo.
Citrus Academy – The citrus
academy is a vital component of
the Agri-Hub. It will assist in
training young farmers in
technical, administration and
management skills needed in the
citrus industry. The citrus
academy allows an opportunity to
expand on skillsets and provide
certificate and diploma type
Training of personnel on how to
disseminate information to the
farmers, AH and the FPSU.

180
Sarah Baartman Master Agri-Park Business Plan
P a g e | 180
organise Agri-shows, where farmers can
express their concerns, and where training
can be provided.
courses if it is affiliated with an
established tertiary institution
such as Nelson Mandela
Metropolitan University. The
citrus academy can source
workers who are working on
commercial farms and those who
operate their own farms and
provide a source of skilled labour
to the commercial industry. The
DRDLR has suggested (in previous
proposals presented to the SRV
LM) that this facility capacitate a
number of selected NARYSEC
youth and after qualification and
on-site experience, place these
persons on farms that have been
acquired by DRLDR for hand-over
to these emerging farmers.
Key product/
activities
The core activities of the small holder farmers
are:
Land preparation (land clearing, orchard
preparation)
Management of citrus nursery and
pruning equipment
Citrus farming (planting, fertilization,
disease control, irrigation etc.)
Harvesting of citrus
Loading of citrus into field
trucks/tractors and transporting to pack
houses
The core activities of the FPSU are:
Facilitate collection / delivery of fresh
citrus from the farmers in Gamtoos
Valley
Transportation of fresh produce to the
pack houses / sorting facilities within the
FPSU service nodes in Gamtoos Valley
Quality control
Facilitate transportation of produce
destined for processing directly from the
farm to the pack houses.
The core activities of the AH are:
Facilitate collection / delivery of fresh citrus from the farmers in the area
Further Quality control
Transportation of products to
the RUMC.
Citrus Pruning Services – Citrus
pruning is a vital service that can
be offered by the Agri-Hub.
Pruning is important process that
is necessary for the growth of the
The core activities of the RUMC
are:
Collection of final products
from the AH
Marketing and distribution of
final products to different
wholesalers and major retail
outlets
Exporting of final products
Bulk storage of final products

181
Sarah Baartman Master Agri-Park Business Plan
P a g e | 181
citrus plants. In order to produce
top quality export ready citrus
there needs to be an effective
pruning system. While a pruning
service is already established in
the area, a report10 presented to
SRV LM indicated that the
established pruner would want to
work with the new service
provider.
Citrus Nursery – A citrus nursery
is a vital component of the citrus
industry. Replanting of old citrus
trees every year has placed a
large demand on existing
nursery’s supply. Farmers have to
order saplings two years in
advance in order to replace older
trees in orchards. It was thus
recognised by the SRCC to
develop a citrus nursery that can
provide saplings for SRCC
members and eventually expand
to include provision to other
commercial farmers. It is
estimate that 26 jobs can be
created from this activity alone.
10 SURE AGRI MARKETING, March 2014. Mayibuye Compost Company Pruning Project.
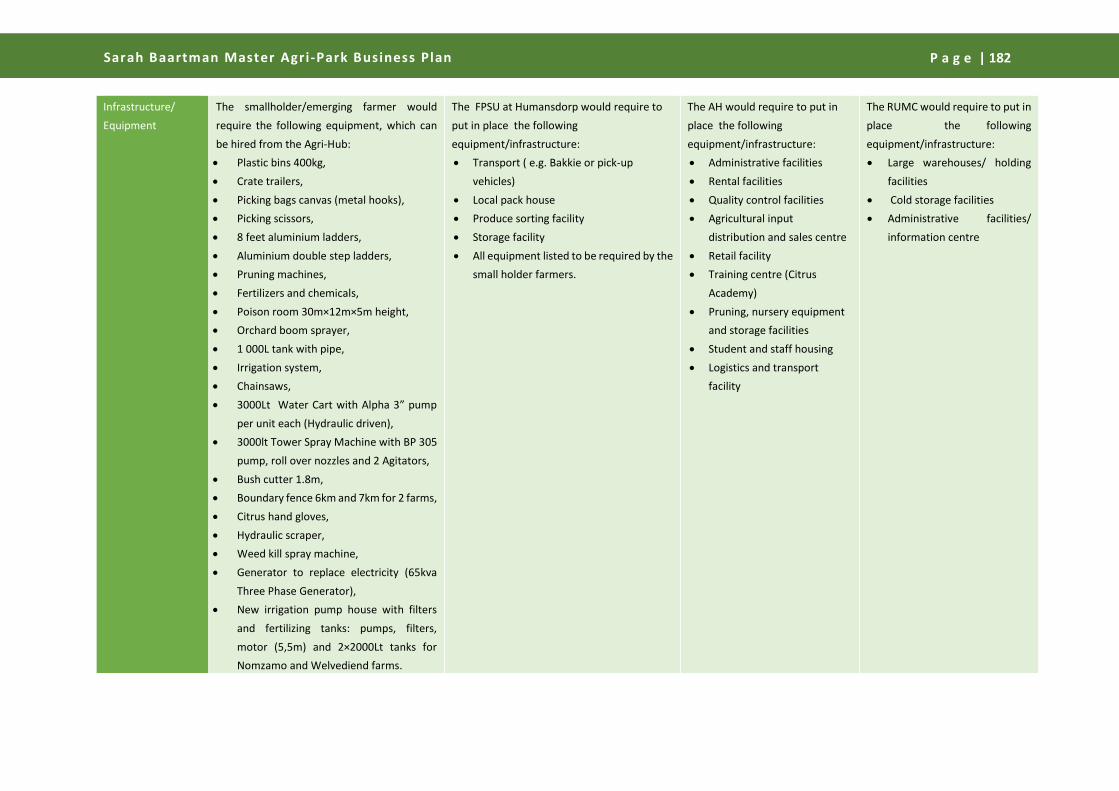
182
Sarah Baartman Master Agri-Park Business Plan
P a g e | 182
Infrastructure/
Equipment
The smallholder/emerging farmer would
require the following equipment, which can
be hired from the Agri-Hub:
Plastic bins 400kg,
Crate trailers,
Picking bags canvas (metal hooks),
Picking scissors,
8 feet aluminium ladders,
Aluminium double step ladders,
Pruning machines,
Fertilizers and chemicals,
Poison room 30m×12m×5m height,
Orchard boom sprayer,
1 000L tank with pipe,
Irrigation system,
Chainsaws,
3000Lt Water Cart with Alpha 3” pump
per unit each (Hydraulic driven),
3000lt Tower Spray Machine with BP 305
pump, roll over nozzles and 2 Agitators,
Bush cutter 1.8m,
Boundary fence 6km and 7km for 2 farms,
Citrus hand gloves,
Hydraulic scraper,
Weed kill spray machine,
Generator to replace electricity (65kva
Three Phase Generator),
New irrigation pump house with filters
and fertilizing tanks: pumps, filters,
motor (5,5m) and 2×2000Lt tanks for
Nomzamo and Welvediend farms.
The FPSU at Humansdorp would require to
put in place the following
equipment/infrastructure:
Transport ( e.g. Bakkie or pick-up
vehicles)
Local pack house
Produce sorting facility
Storage facility
All equipment listed to be required by the
small holder farmers.
The AH would require to put in
place the following
equipment/infrastructure:
Administrative facilities
Rental facilities
Quality control facilities
Agricultural input
distribution and sales centre
Retail facility
Training centre (Citrus
Academy)
Pruning, nursery equipment
and storage facilities
Student and staff housing
Logistics and transport
facility
The RUMC would require to put in
place the following
equipment/infrastructure:
Large warehouses/ holding
facilities
Cold storage facilities
Administrative facilities/
information centre

183
Sarah Baartman Master Agri-Park Business Plan
P a g e | 183
Logistics Smallholder farmers, as near as possible,
should be organised into groups or
collectives. Each group should have a group
head that would communicate information
from the farmers to the Agri-Hub and also
arrange for delivery of inputs with the Agri-
Hub. It is suggested that there should be input
collection centres which would serve as small
offices for the group heads. This group heads
would work closely with the pack houses and
the Agri-Hub.
Harvesting: Harvesting should be organised in
conjunction with the SRCC and Patensie Citrus
who already processes much of the citrus that
is produced by the black owned farms. These
logistics that are already in place should be
taken advantage of as establishing new links
would not be beneficial to emerging farmers
and can be quite costly to farmers.
The FPSU should organise Primary logistics
collection centre in the form of pack houses
where trucks (bakkie/pick up vehicles) would
pick up citrus from various farms and convey
it to these pack houses. Cold storage
transport should also be arranged for
distribution to the various marketing channels
and the RUMC.
*It should be noted that some of these
transport facilities will be used to deliver
farm inputs to the collection centres, after
which it can be distributed to individual
farmers.
The same transport (especially
the cold storage transport) will be
used to collect fresh potatoes
from the FPSU to the AH for
processing. Indicating that the
transport facilities would serve
multiple purposes.
The same cold storage transport
will be used for distribution of
final products to wholesales and
major retail outlets.
Technology/ICT In order to boost their production efficiency,
the SHF would require:
Modern tools,
Mobile devices for subscription to Apps. ,
to enable them receive information from
the RUMC on weather forecast, pest and
disease control etc.
Tracking devices on all vehicles to prevent
theft and also to monitor the movements and
locations of the drivers.
The FPSU would also, require subscription to
certain Digital Applications from the RUMC to
remain conversant with the current prices
fetched on the global, national and local
market, so as to be able to strategically supply
potatoes/ potato products to the markets.
*It should be noted the same transport
facilitates would be used to service all the
In order to remain aware of
current prices fetched on the
global, national and local market,
so as to be able to strategically
supply potatoes/ potato products
to the markets, the RUMC would
also require subscription to
certain Apps from the RMUC. This
will enable the AH to remain
informed.
The RUMC will provide
Information Data base that all the
various basic units of the Agri-
Park can subscribe to.

184
Sarah Baartman Master Agri-Park Business Plan
P a g e | 184
basic units of the Agri-Park, therefore, all the
Transportation facilities would have these
tracking devices.

185
Sarah Baartman Master Agri-Park Business Plan
P a g e | 185 P a g e | 185
11.5 Logistics Plan
The focus of the logistics plan is to develop a strategy to move farm produce to market as smallholder and
emerging farmers seek to become important players in the emerging food supply chain in South Africa. The
logistics plan draws on challenges and opportunities faced by the farmers that are likely to participate within the
Agri-Parks programme, while the focus remains on recognising the importance that transport plays in the
emerging farmer value chains.
11.5.1 Understanding the Logistics Chain
It is important that the transport segments in the emerging agricultural sector are understood. The segments
include the primary, intermediate and final transport route segments, described in further detail below:
1. The primary transport segment, also known figuratively as the first mile, is the segment in which
product moves from farm to a consolidation/collection point that are found on primary roads where
collection is typically easier. The key role-players in this segment are the farmers who move the produce
from their farm to the consolidation/collection point.
2. The intermediate transport segment realises the movement of produce from the primary consolidation,
or collection point to an intermediate point, or in this case an Agri-Hub. The key role-players at this
point are larger, commercial farmers, or transporters.
3. The final transport segment will move product from the intermediate point to the final market, or
destination.
These segments are exemplified in the following figure:
The above figure is a generic emerging, or small-scale farmer’s logistics chain that contains the farm,
consolidation/collection points, intermediate processing points and the final markets for the product. The first
mile, in general, is the most important segment since it can be the most expensive segment of the logistics chain.
It is often the case that product quality is compromised through bruising and ageing in this segment.
11.5.2 Recommended Logistics Strategy:
Unlike commercial, large-scale farming, small-scale and emerging farmers produce smaller quantities and farms
are spread over a wide spatial territory. As such, it is of high importance that consolidation points are developed
in order to collect produce in viable volumes, while coordination with intermediaries and transporters is crucial
so that the farmers jointly are able to create economies of scale. Consolidation points should therefore be
developed at strategic locations on easy access roads and a well-structured approach is required in order to
assist the farmers in produce consolidation. This is exemplified in the following logistics plan:

186
Sarah Baartman Master Agri-Park Business Plan
P a g e | 186 P a g e | 186
In order to do this, appropriate infrastructure is required at the consolidation points along with organised
transport coordination (exploiting ICT) that will reduce value deterioration at the farm gate and
consolidation/collection points. The following recommendations can be used in order to develop the logistics
plan for the Agri-Park:
1. Locate and demarcate specific areas of production that will participate in the Agri-Parks programme.
2. Develop an inventory of what will be produced in the given demarcated areas.
3. Determine quantities to be produced in the demarcated areas.
4. Determine the total value of production that will be produced my small-scale farmers.
5. Determine and map the spatial location and spread of farms that will be producing within the
programme.
6. Determine the location of the consolidation/collection points and what facilities should be made
available.
7. Assess the potential perishability of the produce/value of the post-harvest losses.
8. Plan for the availability and reliability of transport services to collect produce.
9. Assess the quality of transport infrastructure in the location.
10. Determine the key market locations/destinations in the given area.
11. Develop, or enhance farmers’ organisations and support groups.
The above process will assist in providing a better understanding of how to move produce from farm to market,
while a comprehensive and integrated logistics management system can be employed to improve the efficiency
in which produce can be moved to market taking into account rural infrastructure, consolidation management
and collection services. The ability to understand the product movement will provide a foundation from which
a logistics plan can be developed.
The following steps provide a broad outline toward the logistics plan, in which all elements of the Agri-Park
including the farmers, FPSU, Agri-Hub and RUMC are integrated:
1. Demarcate farmer groups within a given production area.
2. Determine a central location of the consolidation/collection point for the produce in each of the
demarcated areas.
3. Implement a logistics management system and programme through the FPSU and RUMC that will assist
in moving farmers produce to the consolidation points.
4. Implement a logistics management system and programme through the FPSU and RUMC that will move
product from the consolidation points to the Agri-Hub.
5. Implement a logistics management system and programme through the RUMC that will move product
from the Agri-Hub to the market/final product destination.
The FPSU will be responsible for the movement/transportation of the product.
The RUMC will provide the market intelligence and therefore the timing of the movement of the
product.

187
Sarah Baartman Master Agri-Park Business Plan
P a g e | 187 P a g e | 187
11.6 High Level Costing
The following tables present a high level analysis of the costs to establish the Agri-Park by looking at the costing
examples of one FPSU and the Agri-Hub in Addo. These costing examples are for complete new builds and do
not take into consideration all of the existing infrastructure / services which may already be available for
integration into the FPSU, AH and RUMCs.
The following costing presents an estimation of the costs to establish an FPSU with all the commodities
supported such as the FPSU at Humansdorp. These costs are representative of the costs for FPSUs in other parts
of the SBDM. The total new-build cost for a complete FPSU is calculated at ± R 27 165 000 over an extended
period of time. It must be noted that not all FPSUs will support citrus and only Humansdorp will have all three
commodities supported. These costs can and should be mitigated with the sharing of equipment, vehicles, and
certain processing equipment. This cost is purely indicative of a green-fields development and will vary wildly
from FPSU to Agri-hub. A key recommendation from this section is that the development must consider services
and infrastructure already in place before building more infrastructure or providing services. This ensures that
projects and emerging farmers will receive necessary funding.
Table 11.6: Example FPSU Costing
Element Cost (Rand)
Buildings
Office Space R 1 600 000
Mechanisation Centre and Workshop R 1 750 000
Warehousing Facility (Sorting, Processing, Packaging & Storage Facility)
R 1 500 000
Cold Storage R 500 000
Retail R 1 100 000
Auction Facility R 700 000
Training Facility R 400 000
Infrastructure
Water Bulk Connection R 65 000
Electricity Connection R 1 100 000
Roads/Paving R 900 000
Security Fencing & Installation R 600 000
Parking R 300 000
Red Meat Equipment
Farm Vehicles R 750 000
Transport Vehicles R 3 500 000
Implements R 150 000
Processing Equipment R 900 000
Vegetable Equipment
Farm Vehicles R 750 000
Transport Vehicles R 3 500 000
Implements R 750 000
Processing Equipment R 900 000
Orchard Equipment
Farm Vehicles R 750 000
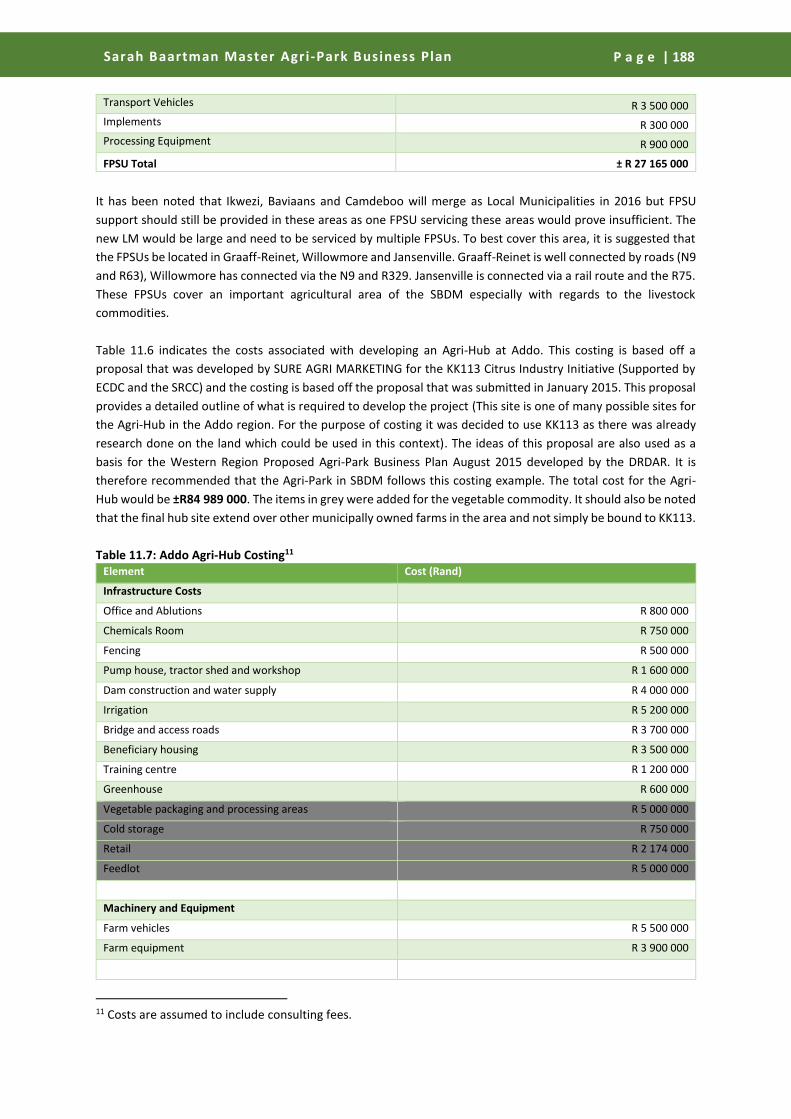
188
Sarah Baartman Master Agri-Park Business Plan
P a g e | 188 P a g e | 188
Transport Vehicles R 3 500 000
Implements R 300 000
Processing Equipment R 900 000
FPSU Total ± R 27 165 000
It has been noted that Ikwezi, Baviaans and Camdeboo will merge as Local Municipalities in 2016 but FPSU
support should still be provided in these areas as one FPSU servicing these areas would prove insufficient. The
new LM would be large and need to be serviced by multiple FPSUs. To best cover this area, it is suggested that
the FPSUs be located in Graaff-Reinet, Willowmore and Jansenville. Graaff-Reinet is well connected by roads (N9
and R63), Willowmore has connected via the N9 and R329. Jansenville is connected via a rail route and the R75.
These FPSUs cover an important agricultural area of the SBDM especially with regards to the livestock
commodities.
Table 11.6 indicates the costs associated with developing an Agri-Hub at Addo. This costing is based off a
proposal that was developed by SURE AGRI MARKETING for the KK113 Citrus Industry Initiative (Supported by
ECDC and the SRCC) and the costing is based off the proposal that was submitted in January 2015. This proposal
provides a detailed outline of what is required to develop the project (This site is one of many possible sites for
the Agri-Hub in the Addo region. For the purpose of costing it was decided to use KK113 as there was already
research done on the land which could be used in this context). The ideas of this proposal are also used as a
basis for the Western Region Proposed Agri-Park Business Plan August 2015 developed by the DRDAR. It is
therefore recommended that the Agri-Park in SBDM follows this costing example. The total cost for the Agri-
Hub would be ±R84 989 000. The items in grey were added for the vegetable commodity. It should also be noted
that the final hub site extend over other municipally owned farms in the area and not simply be bound to KK113.
Table 11.7: Addo Agri-Hub Costing11 Element Cost (Rand)
Infrastructure Costs
Office and Ablutions R 800 000
Chemicals Room R 750 000
Fencing R 500 000
Pump house, tractor shed and workshop R 1 600 000
Dam construction and water supply R 4 000 000
Irrigation R 5 200 000
Bridge and access roads R 3 700 000
Beneficiary housing R 3 500 000
Training centre R 1 200 000
Greenhouse R 600 000
Vegetable packaging and processing areas R 5 000 000
Cold storage R 750 000
Retail R 2 174 000
Feedlot R 5 000 000
Machinery and Equipment
Farm vehicles R 5 500 000
Farm equipment R 3 900 000
11 Costs are assumed to include consulting fees.

189
Sarah Baartman Master Agri-Park Business Plan
P a g e | 189 P a g e | 189
Development Costs
EIA R 250 000
Soil preparation, removal of bushes, citrus tree planting, irrigation installation
R 7 700 000
Eskom point and water bulk connection R 465 000
Project management & support services: Sundays River Citrus Company
R 2 400 000
Capacity Building R 2 700 000
Nursery order trees R 5 700 000
Windbreaks R 1 000 000
Contingency R 2 600 000
Sub-Total R 66 989 000
Working Capital Costs R 18 000 000
Total R 84 989 000
Source: Adapted from SURE AGRI MARKETING, 2015.
Costing for the RUMC has not been included as there will likely only be one RUMC in the Eastern Cape for the
initial phase of the Agri-Parks roll out. It will likely be located in Buffalo City. After this initial phase a RUMC
may be located in NMB.

190
DRAFT – Sarah Baartman Agri-Park Business Plan P a g e | 190 P a g e | 190
Implementation
Guidelines Chapter 12

191
Sarah Baartman Master Agri-Park Business Plan
P a g e | 191 P a g e | 191
12. IMPLEMENTATION GUIDELINES
12.1 Introduction
The following implementation guidelines provide an overview of what should be achieved in order to
successfully implement the Agri-Parks programme within the SBDM. The implementation guidelines provide
valuable information about:
Understanding the implementation process and what is required for the process.
How to align the implementation of the Agri-Parks programme with various government initiatives in
developing agriculture.
Recommendations that will streamline and assist the development of the Agri-Parks programme.
Steps to be taken in developing Implementation Process
The Agri-Park in the form of a roll-out plan.
This final chapter lays out the implementation guidelines and planning required to implement the Sarah
Baartman District Municipality’s Agri-Parks programme, starting with the implementation process.
The above guidelines are used to develop the following implementation process for the rollout of the SBDM
Agri-Park. The process follow the following 14 steps:
1. Agri-park model: The Agri-Parks model has been developed by the DRDLR and has been adopted as the
model of preference nationally.
2. Selection of the 44 Districts Municipalities: The Agri-Parks model is to be implemented across 44
districts nationally over a 10 year period.
3. Agri-Hub location selection: The DRDLR along with technical partners have identified locations for the
Agri-Hubs in each of the given districts. The Agri-Hub forms the heart of the Agri-Parks programmes,
where significant agro-processing takes place.
1. Agri-Parks Model
developed
2. Selection of 44 districts
3. Agri-Hub locations identified
4. Agri-Parks business plans
5. Establish governance
6. Define funding model
7. Technical planning
8. Agri-Park unit business
plans
9. Financing 10.
Construction 11. Training
rollout12. Production
13. Agro-Processing
14. Product marketing
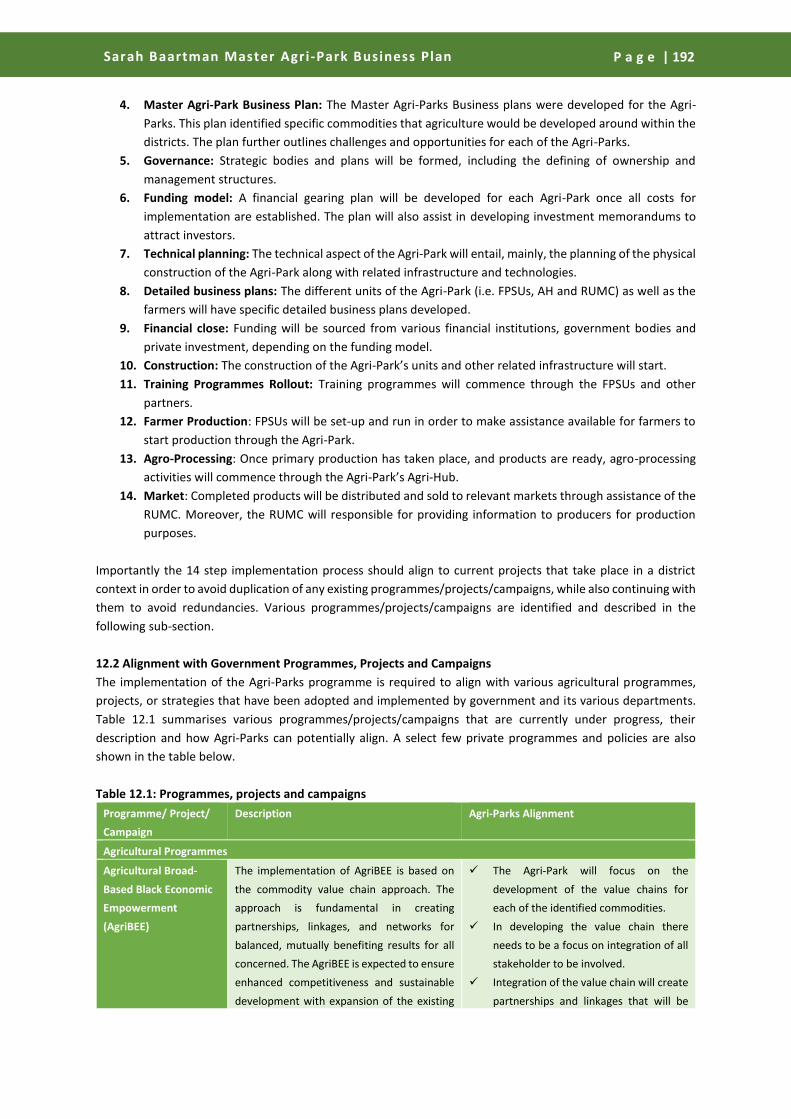
192
Sarah Baartman Master Agri-Park Business Plan
P a g e | 192 P a g e | 192
4. Master Agri-Park Business Plan: The Master Agri-Parks Business plans were developed for the Agri-
Parks. This plan identified specific commodities that agriculture would be developed around within the
districts. The plan further outlines challenges and opportunities for each of the Agri-Parks.
5. Governance: Strategic bodies and plans will be formed, including the defining of ownership and
management structures.
6. Funding model: A financial gearing plan will be developed for each Agri-Park once all costs for
implementation are established. The plan will also assist in developing investment memorandums to
attract investors.
7. Technical planning: The technical aspect of the Agri-Park will entail, mainly, the planning of the physical
construction of the Agri-Park along with related infrastructure and technologies.
8. Detailed business plans: The different units of the Agri-Park (i.e. FPSUs, AH and RUMC) as well as the
farmers will have specific detailed business plans developed.
9. Financial close: Funding will be sourced from various financial institutions, government bodies and
private investment, depending on the funding model.
10. Construction: The construction of the Agri-Park’s units and other related infrastructure will start.
11. Training Programmes Rollout: Training programmes will commence through the FPSUs and other
partners.
12. Farmer Production: FPSUs will be set-up and run in order to make assistance available for farmers to
start production through the Agri-Park.
13. Agro-Processing: Once primary production has taken place, and products are ready, agro-processing
activities will commence through the Agri-Park’s Agri-Hub.
14. Market: Completed products will be distributed and sold to relevant markets through assistance of the
RUMC. Moreover, the RUMC will responsible for providing information to producers for production
purposes.
Importantly the 14 step implementation process should align to current projects that take place in a district
context in order to avoid duplication of any existing programmes/projects/campaigns, while also continuing with
them to avoid redundancies. Various programmes/projects/campaigns are identified and described in the
following sub-section.
12.2 Alignment with Government Programmes, Projects and Campaigns
The implementation of the Agri-Parks programme is required to align with various agricultural programmes,
projects, or strategies that have been adopted and implemented by government and its various departments.
Table 12.1 summarises various programmes/projects/campaigns that are currently under progress, their
description and how Agri-Parks can potentially align. A select few private programmes and policies are also
shown in the table below.
Table 12.1: Programmes, projects and campaigns
Programme/ Project/
Campaign
Description Agri-Parks Alignment
Agricultural Programmes
Agricultural Broad-
Based Black Economic
Empowerment
(AgriBEE)
The implementation of AgriBEE is based on
the commodity value chain approach. The
approach is fundamental in creating
partnerships, linkages, and networks for
balanced, mutually benefiting results for all
concerned. The AgriBEE is expected to ensure
enhanced competitiveness and sustainable
development with expansion of the existing
The Agri-Park will focus on the
development of the value chains for
each of the identified commodities.
In developing the value chain there
needs to be a focus on integration of all
stakeholder to be involved.
Integration of the value chain will create
partnerships and linkages that will be
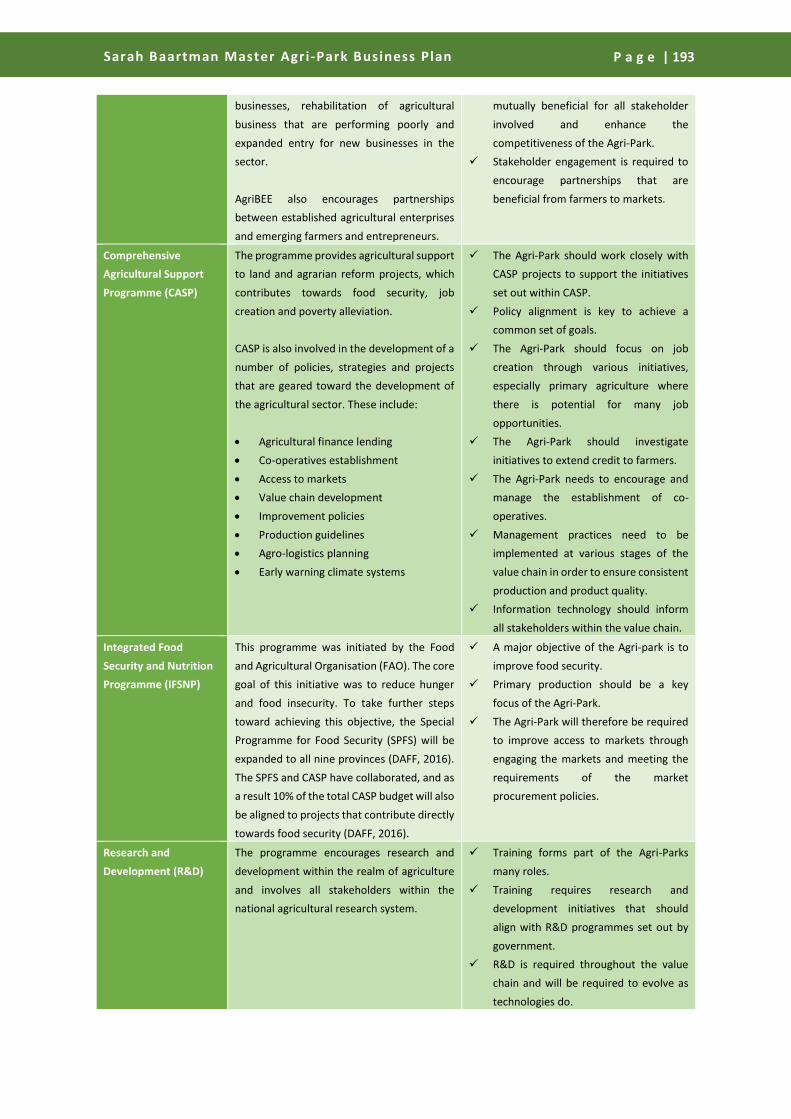
193
Sarah Baartman Master Agri-Park Business Plan
P a g e | 193 P a g e | 193
businesses, rehabilitation of agricultural
business that are performing poorly and
expanded entry for new businesses in the
sector.
AgriBEE also encourages partnerships
between established agricultural enterprises
and emerging farmers and entrepreneurs.
mutually beneficial for all stakeholder
involved and enhance the
competitiveness of the Agri-Park.
Stakeholder engagement is required to
encourage partnerships that are
beneficial from farmers to markets.
Comprehensive
Agricultural Support
Programme (CASP)
The programme provides agricultural support
to land and agrarian reform projects, which
contributes towards food security, job
creation and poverty alleviation.
CASP is also involved in the development of a
number of policies, strategies and projects
that are geared toward the development of
the agricultural sector. These include:
Agricultural finance lending
Co-operatives establishment
Access to markets
Value chain development
Improvement policies
Production guidelines
Agro-logistics planning
Early warning climate systems
The Agri-Park should work closely with
CASP projects to support the initiatives
set out within CASP.
Policy alignment is key to achieve a
common set of goals.
The Agri-Park should focus on job
creation through various initiatives,
especially primary agriculture where
there is potential for many job
opportunities.
The Agri-Park should investigate
initiatives to extend credit to farmers.
The Agri-Park needs to encourage and
manage the establishment of co-
operatives.
Management practices need to be
implemented at various stages of the
value chain in order to ensure consistent
production and product quality.
Information technology should inform
all stakeholders within the value chain.
Integrated Food
Security and Nutrition
Programme (IFSNP)
This programme was initiated by the Food
and Agricultural Organisation (FAO). The core
goal of this initiative was to reduce hunger
and food insecurity. To take further steps
toward achieving this objective, the Special
Programme for Food Security (SPFS) will be
expanded to all nine provinces (DAFF, 2016).
The SPFS and CASP have collaborated, and as
a result 10% of the total CASP budget will also
be aligned to projects that contribute directly
towards food security (DAFF, 2016).
A major objective of the Agri-park is to
improve food security.
Primary production should be a key
focus of the Agri-Park.
The Agri-Park will therefore be required
to improve access to markets through
engaging the markets and meeting the
requirements of the market
procurement policies.
Research and
Development (R&D)
The programme encourages research and
development within the realm of agriculture
and involves all stakeholders within the
national agricultural research system.
Training forms part of the Agri-Parks
many roles.
Training requires research and
development initiatives that should
align with R&D programmes set out by
government.
R&D is required throughout the value
chain and will be required to evolve as
technologies do.

194
Sarah Baartman Master Agri-Park Business Plan
P a g e | 194 P a g e | 194
National Regulatory
Services (NRS)
The increased trade in regulated agricultural
products has required the development of
the NRS that regulates and promotes
international trade. This includes inspections
of agricultural produce and bilateral
negotiations. In addition, the NRS promotes
awareness with respect to agricultural
produce health matters.
The Agri-park should implement policies
that enforce international standards on
production and processing that will
allow the programme access to
international markets.
LAND and AGRARIAN
REFORM PROJECT
(LARP)
The objectives of LARP are the redistribution
of land, increased black entrepreneurship,
promoting access to agricultural support
services, increased agricultural production,
and increased agricultural trade.
The programme builds on lessons that have
been learnt from previous land reform
projects, reviews, the Land Summit and
implementation reforms.
The Agri-Park forms part of the market
for farmers and will therefore encourage
production.
Models are to be developed to distribute
state own land and ensure land tenure is
in place for producers.
Access to the market through the Agri-
Park will further encourage land that
was previously not in production to
produce.
LandCare The LandCare programme was established to
promote productivity through the
sustainable use of natural resources, to
improve food security and create
employment, therefore encouraging South
Africans to use sustainable methods of
cultivation, livestock grazing and harvesting
of natural resources in order to limit land
degradation.
Access to the market through the Agri-
Park will further encourage land that
was previously not in production to
produce.
The Agri-Park is to encourage the
sustainable use of land and resources.
Small Holder Farmer
Evaluation
The programme focuses on the integration of
smallholder farmers into the greater
agricultural value chain. The programme
works in conjunction with other programmes
and provides strategic agricultural support.
The Agri-Park will manage and
encourage smallholder production, a
primary objective of the Agri-park.
Logistics and management plans are key
to the success of integration of
smallholder farmers.
Rural Development Programmes
Comprehensive Rural
Development
Programme (CRDP)
The CRDP is in place to create decent work
and sustainable livelihoods. The programme
ensures sustainability, communal ownership
and effective contribution toward the
objectives of developing rural areas.
The overarching objective of the CRDP is
social cohesion and integrated development
through participatory approaches and
partnerships with all sectors of society.
The Agri-park encourage primary
production.
Will have support mechanisms in place
to ensure best production methods.
Create jobs in primary agriculture.
Ownership models encourage social
cohesion, integration and participation
from all stakeholders.
National Rural Youth
Service Corps
programme (Narysec)
Narysec is a youth skills development and
employment programme that also forms part
of the CRDP.
The Agri-Parks programme will
encourage youth to participate in
agriculture by creating viable and
attractive agricultural enterprises.

195
Sarah Baartman Master Agri-Park Business Plan
P a g e | 195 P a g e | 195
The programme also provides character
building programmes, soft and hard skills
training and dispatches youth to rural areas
for rural development projects. The
programme further transforms the youth of
rural areas, from being job seekers to being
job creators.
Rural Enterprise and
Industrial
Development (REID)
REID is in place to facilitate poverty reduction,
social organisation, youth development and
the development of cooperatives, rural
enterprises and industries.
The Agri-park encourage primary
production.
Will have support mechanisms in place
to ensure best production methods.
Create jobs in primary agriculture.
Ownership models encourage social
cohesion.
DRDAR Projects The DRDAR seeks to develop Agri-Hubs that
will result in the growth of the local
agricultural sector through integrated
agricultural value chains.
Similarities in the programmes are
complementary and will align
accordingly.
Eastern Cape Rural Development Agency
The ECRDAs mandate is to promote, support
and coordinate rural development and
agrarian reform to reduce poverty and
underdevelopment through integrated and
participatory interventions.
Rural development programme Renewable energy programme Rural finance programme Rural development support programme Coordinate and facilitate external
funding and investments to co-fund mega projects
Establishment of rural development clusters and nodes.
Private Programmes
SRCC Development
Trust
Development of operational enterprises
supporting SRCC member farming operations
and greater Sundays River Valley citrus
farming operations. This enterprise will
initially include a citrus nursery and a pruning
enterprise and shall be institutionally and
operationally supported by the Sundays River
Citrus Company.
Alignment to the Agri-Park concept
through the assistance to emerging
farmers by commercial farmers.
Citrus Growers
Association
Development Chamber
(CGDC)
The CGDC is responsible for overseeing the
emergence of new and emerging farmers in
the citrus industry. It also plays an important
part in the transformation in the citrus
industry.
The Agri-park encourages primary
production in citrus by black farmers.
Support of black farmers aligns to the
Agri-Park goals.
African Farmers
Association (AFASA)
AFASA aims to commercialise the developing
agricultural sector and ensure meaningful
participation of black individuals within the
mainstream commercial agribusiness sector,
hence ensuring the long-term sustainability
of the agricultural sector in South Africa.
Support of black farmers aligns to the
Agri-Park goals.

196
Sarah Baartman Master Agri-Park Business Plan
P a g e | 196 P a g e | 196
12.3 Recommendations
The business plan has highlighted what needs to be done in the way of developing the agricultural sector within
the district. Challenges have been highlighted and recommendations have been made in order to streamline the
implementation process.
The below table provides a list of recommendations that should be considered for the development of the Agri-
Park in the SBDM:
Table 12.2: Table Showing the Specific Recommendations for the SBDM Agri-Park.
Key Areas Recommendations
Infrastructure It is recommended that roads in poor condition (R75, R335, and R336) and unsurfaced (gravel)
roads around the proposed location of the Agri-Hub should be upgraded and developed, to
facilitate easy access to and fro the Agri-Hub. This will likely result in faster transport times, less
bruising to produce, and have a lesser impact on vehicles.
The road network that will link to the various market centres (e.g. the RUMC) must be carefully
considered and upgraded where necessary.
The district should look into the potentials of tapping into rail roads for the transportation of large
and heavy agricultural produce to long distances.
It is further recommended that the district should capitalise on all already existing initiatives and
infrastructure for the establishment of the Agri-Park. There should be upgrading and
revitalisation of any existing infrastructure that can be used to support the Agri-Park process.
This is particularly relevant in establishing a new abattoir to support Ndlambe and Makana
farmers. In this case, the Grahamstown Ostrich Abattoir could be repurposed for livestock in the
area.
Also, it is recommended that the district should look into establishing infrastructure that will aid
the recycling of water.
Natural
Resources
Considering that the entire district is water scarce, more work should be done in determining
water availability for agricultural production around the proposed location of the Agri-Hub,
FPSU(s) and around all the major areas where primary production potential is significant as well
as areas where the available water sources can be used to support primary production.
The district should also look into water allocations and the existing irrigation schemes in the major
production areas and maximise the use of these existing infrastructures. This is particularly
important in Addo and Kirkwood where there is an extensive irrigation system already in place.
A further recommendation is that small scale farmers should have rain harvesters (e.g. Plastic
Water Tanks) on their farms. This would serve as water reservoirs in the absence of rain fall.
Agri-Park
commodities
Efforts should be made in ensuring that Products processing and packaging (value –addition)
comply with international standards, to enhance products’ suitability for the export markets.
It is important that the citrus commodities are in line with export standards. This can be achieved
by aligning the citrus production with established initiatives such as the SRCC development trust.
Although, the initial phase of the project will support the development of the value-chain of the
three (3) pre-dominant commodities in the SBDM, it is recommended that processing facilities
should be expanded in subsequent phases to accommodate the production of crops that will be
produced during the period of crop rotation.

197
Sarah Baartman Master Agri-Park Business Plan
P a g e | 197 P a g e | 197
Citrus Nursery - A citrus nursery is a vital component of the citrus industry. Replanting of old citrus
trees every year has placed a large demand on existing nursery’s supply. Farmers have to order
saplings two years in advance in order to replace older trees in orchards. It was thus recognised
by the SRCC to develop a citrus nursery that can provide saplings for SRCC members and
eventually expand to include provision to other commercial farmers. It is estimate that 26 jobs
can be created from this activity alone.
Citrus Pruning - Citrus pruning is a vital service that can be offered by the Agri-Hub. Pruning is
important process that is necessary for the growth of the citrus plants. In order to produce top
quality export ready citrus there needs to be an effective pruning system. While a pruning service
is already established in the area, a report presented to SRV LM indicated that the established
pruner would want to work with the new service provider.
Vegetable peeling and cutting - Basic processing of vegetables could take place at the Agri-Hub. Cutting, peeling and packaging could be an important processing opportunity.
Livestock citrus feedlot - A feedlot using citrus pulp as the primary means of feed. Operational during the citrus season in order to improve the quality of the cattle that are being sent to abattoirs.
Abattoir in Grahamstown or Alexandria - There is currently space in the market for an abattoir at FPSU level that has deboning facilities. This should largely be focused on B and C grade meats for the local markets in the Ndlambe and Makana areas.
Technology Although, statistics show that the majority (78%) of households in the SBDM already have access
to cell phones, it is recommended that the telecommunication services should be upgraded (e.g.
erection of cell towers) in areas that are currently underserviced, particularly in the rural areas,
since most of the farmers that would be targeted are located in these Areas (StatsSA, Census,
2011).
It is also recommended that Government should subsidize telecommunication services (e.g.
provision of free Wi-Fi) in some of these rural areas to enable them overcome the cost barrier
associated with their low levels of connectedness.
A further recommendation is that all the technologies that are to be adopted (particularly in the
area of farm mechanisation) throughout the Agri-Park process should be those that will not lead
to a decline in the number of job opportunities. There needs to be a balance between
mechanisation and job creation.
The ICT to be adopted or introduced to the farmers should be user friendly and not be too
complex, since some of the users may have little or no form of education.
Training Develop a citrus academy which teaches valuable skills around the citrus industry. This can be
incentivised through the development of degrees and diplomas being offered on completion of a
certain number of years/ courses.
It is recommended that the citrus academy should establish partnerships with certain research
institutions for research and development, and also to facilitate training programmes. Partnership
should also be established with commercial farmers in this regard.
It is also recommended that practical manuals and information packages should be developed for
the small scale and emerging farmers to assist them in their production processes. These manuals
and information packages should cover aspects relating to: regulatory requirements, information
on support programmes, production guidelines, etc. Where possible, manuals should be
developed in language of choice to enhance easy understanding e.g. Two manuals produced for
the main languages spoken in the area (Afrikaans and isiXhosa)

198
Sarah Baartman Master Agri-Park Business Plan
P a g e | 198 P a g e | 198
A further recommendation is that farmers should be provided with training that are specifically
targeted at helping them change their perception about farming or agricultural production as a
whole. E.g. Training on educating farmers on how to see the business opportunities rather than
as a sign of wealth.
Agri-Park Units It is recommended that the RUMC should be strategically situated in Buffalo City to further
position the district for export opportunities.
Because the district has a low population density, it is recommended that there should only be
one FPSU per local municipality for example:
• Grahamstown - Makana
• Alexandria - Ndlambe
• Somerset East - BCR
• Graaff-Reinet - Camdeboo
• Joubertina - Kou Kamma
• Steytlerville - Baviaans
• Jansenville - Ikwezi
• Humansdorp - Kouga
Develop an inventory a map farmers that are earmarked for production within the Agri-Park.
Production areas should be zoned and mapped and FPSUs should be centrally located to these
production zones. Zoning in this manner will allow for streamlining of logistic activities that take
place within the Agri-Park. Farmers are to be engaged and informed of the process and
development of the Agri-park – they will also be required to have a representative body for
engagement with various stakeholders.
Business Plans should be developed for each of the entities within the Agri-Park, including the
farmers, FPSUs, the Agri-Hub and the RUMC. The business plans are required to detail the
operations of each of the entities, further detailing their role and responsibility within the Agri-
Park.
Develop a rental unit at FPSU level to rent out farming equipment that can be outsourced to a
private company which maintains equipment.
Logistics A comprehensive logistics plan should be developed to guide the implementation of the Agri-Park. The plan should investigate various methods of moving produce from farm to fork. This should be done to allow smallholder and emerging farmers ease of access to markets, a crucial area for the success of these farmers.
Smallholder farmers with small production capacities should be encouraged to work in joint ventures in order to participate in supplying the Agri-Park. Consolidating produce in order to create economies of scale is critical in gaining access to the market – this should be considered in depth within the logistics plan – consolidation points are of critical importance within the Agri-Parks model.
A further recommendation is that internal transport facilities (e.g. long buses) should be
arranged for the purpose of transporting tourist visiting the Agri-Parks. This transport facilities
can also be used as staff buses. This will serve as a source of revenue for the Agri-Park.
The District Agri-Parks Council should engage with other departments and be responsible for the implementation of the Agri-Parks. A representative body must take ownership of the Agri-Park and implement the project. This body should represent all stakeholders, public and private, within the Agri-Park.
Policy
Environment
Also, cross-border relationships and partnerships should be encouraged or formed with
neighbouring districts, where infrastructure and resources can be shared, should the district be
short of or have excess of certain resources.
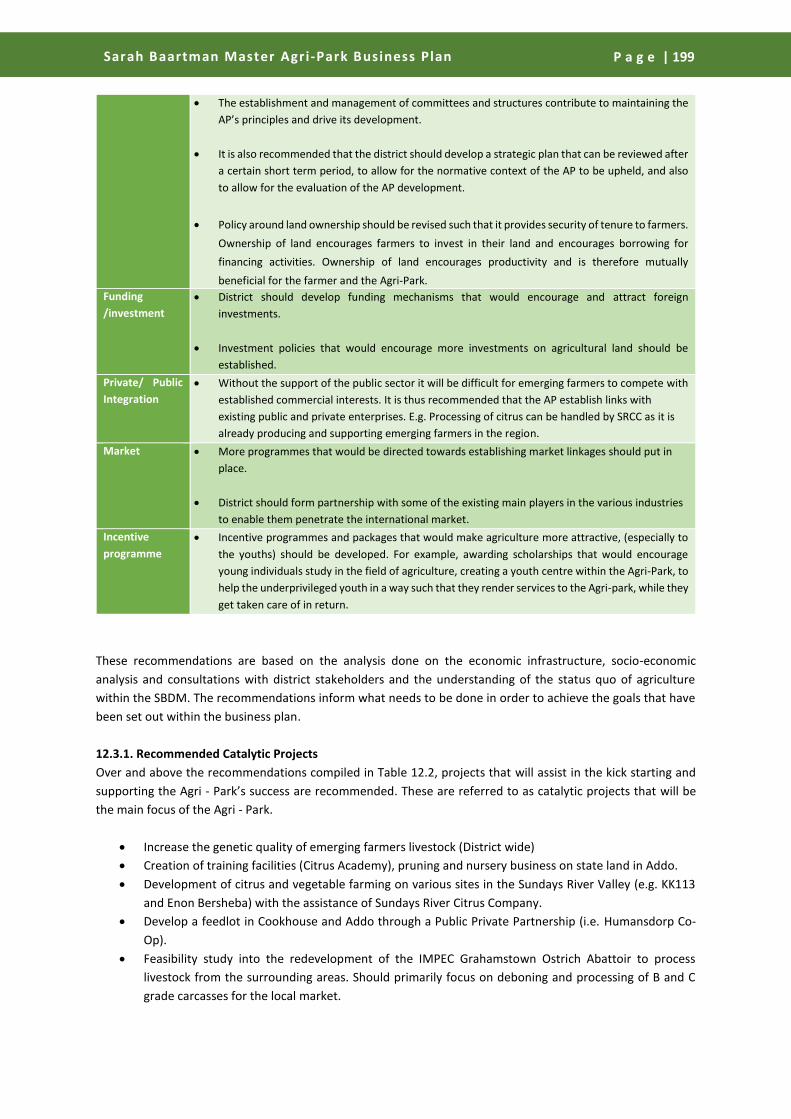
199
Sarah Baartman Master Agri-Park Business Plan
P a g e | 199 P a g e | 199
The establishment and management of committees and structures contribute to maintaining the
AP’s principles and drive its development.
It is also recommended that the district should develop a strategic plan that can be reviewed after
a certain short term period, to allow for the normative context of the AP to be upheld, and also
to allow for the evaluation of the AP development.
Policy around land ownership should be revised such that it provides security of tenure to farmers.
Ownership of land encourages farmers to invest in their land and encourages borrowing for
financing activities. Ownership of land encourages productivity and is therefore mutually
beneficial for the farmer and the Agri-Park.
Funding
/investment
District should develop funding mechanisms that would encourage and attract foreign
investments.
Investment policies that would encourage more investments on agricultural land should be
established.
Private/ Public
Integration
Without the support of the public sector it will be difficult for emerging farmers to compete with
established commercial interests. It is thus recommended that the AP establish links with
existing public and private enterprises. E.g. Processing of citrus can be handled by SRCC as it is
already producing and supporting emerging farmers in the region.
Market More programmes that would be directed towards establishing market linkages should put in
place.
District should form partnership with some of the existing main players in the various industries
to enable them penetrate the international market.
Incentive
programme
Incentive programmes and packages that would make agriculture more attractive, (especially to
the youths) should be developed. For example, awarding scholarships that would encourage
young individuals study in the field of agriculture, creating a youth centre within the Agri-Park, to
help the underprivileged youth in a way such that they render services to the Agri-park, while they
get taken care of in return.
These recommendations are based on the analysis done on the economic infrastructure, socio-economic
analysis and consultations with district stakeholders and the understanding of the status quo of agriculture
within the SBDM. The recommendations inform what needs to be done in order to achieve the goals that have
been set out within the business plan.
12.3.1. Recommended Catalytic Projects
Over and above the recommendations compiled in Table 12.2, projects that will assist in the kick starting and
supporting the Agri - Park’s success are recommended. These are referred to as catalytic projects that will be
the main focus of the Agri - Park.
Increase the genetic quality of emerging farmers livestock (District wide)
Creation of training facilities (Citrus Academy), pruning and nursery business on state land in Addo.
Development of citrus and vegetable farming on various sites in the Sundays River Valley (e.g. KK113
and Enon Bersheba) with the assistance of Sundays River Citrus Company.
Develop a feedlot in Cookhouse and Addo through a Public Private Partnership (i.e. Humansdorp Co-
Op).
Feasibility study into the redevelopment of the IMPEC Grahamstown Ostrich Abattoir to process
livestock from the surrounding areas. Should primarily focus on deboning and processing of B and C
grade carcasses for the local market.

200
Sarah Baartman Master Agri-Park Business Plan
P a g e | 200 P a g e | 200
12.4 Roll-out Plan
The roll out plan is illustrated below – indicates a step-by-step plan that should be followed.
Action Description Start month Timeframe
Infrastructure
investment plan
The infrastructure investment plan will determine what
infrastructure is required at each FPSU, Agri-Hub and
RUMC and prioritise infrastructure projects to ensure
efficient allocation of resources and the greatest impact
on local agriculture.
Month 5 3 – 6 months
Construction of
FPSU
infrastructure
Construction of all necessary FPSU infrastructure as listed
in the report.
Month 6 3 – 6 months
Construction of
Agri-Hub
infrastructure
Construction of core Agri-Hub infrastructure aimed at
developing local small-holder and emerging farmer groups.
Month 6 6 – 12 months
Construction of processing and agro-processing
infrastructure (where necessary) to advance the local
agriculture sector.
Varying Varying
investment
timelines for agro-
processing
infrastructure
according to
infrastructure
investment plan
Construction of
RUMC
infrastructure (If
complete new
build required)
Construction of RUMC infrastructure as listed in the
report. *NOTE: It is likely that no new RUMC infrastructure
is required and that the existing fresh-produce market in
Nelson Mandela Bay/ Buffalo City can be used / upgraded
to suit the needs of the RUMC.
Month 10 3 – 6 months
Agriculture land
audit
An agricultural land audit is necessary to determine
specific areas of agricultural suitability within the district
for agricultural production of the three prioritised
commodities, including an assessment of the land
currently under cultivation by small-holder and emerging
farmers to guide the development of these farming
concerns.
Month 1 3 – 6 months
Farmer
identification
Interested small-holder and emerging farmers must be
assessed to determine current levels of production,
infrastructure and equipment gaps and organisational
requirements. A prioritisation model must be applied to
candidate farmers to determine the farms/farmers where
Agri-Park projects can have the greatest impact.
Month 1 3 – 6 months
Project
development &
prioritisation
The Agri-Park, in addition to supplying key services to local
farmers also has a role to play as an implementing agent
developing projects to develop local farmers or invest in
key processes and technologies to advance local small-
holder and emerging farmer agriculture.
Month 3 Ongoing
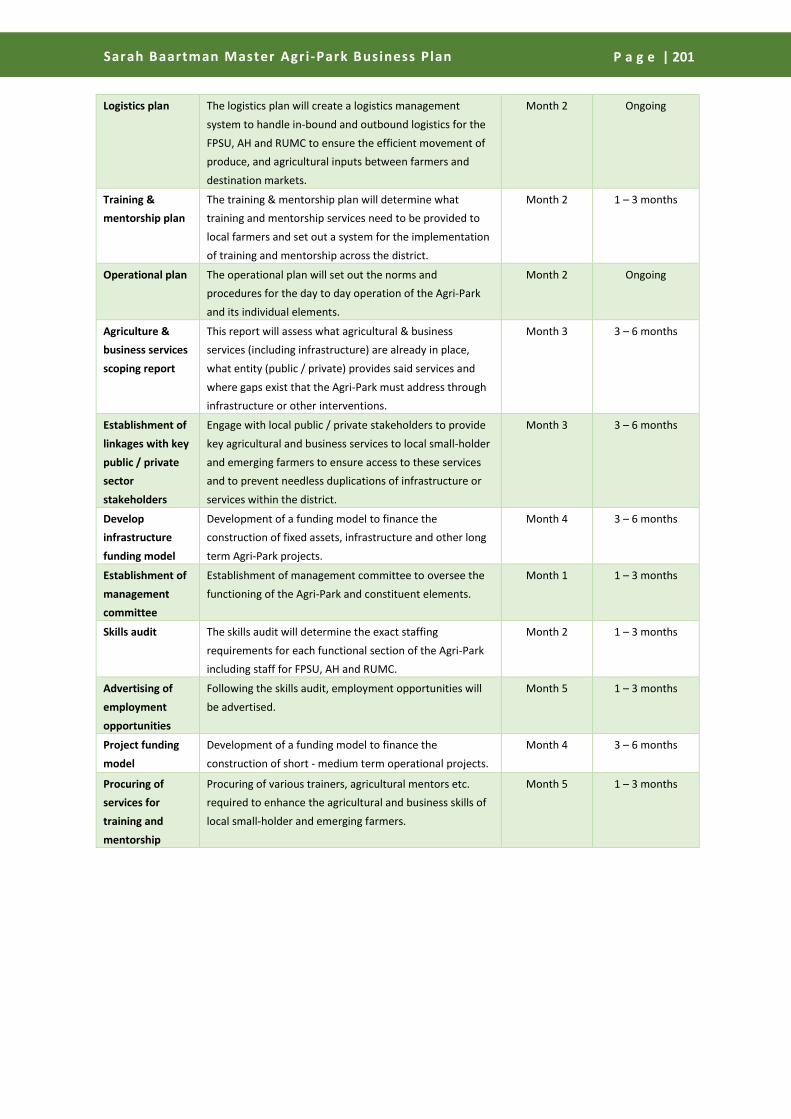
201
Sarah Baartman Master Agri-Park Business Plan
P a g e | 201 P a g e | 201
Logistics plan The logistics plan will create a logistics management
system to handle in-bound and outbound logistics for the
FPSU, AH and RUMC to ensure the efficient movement of
produce, and agricultural inputs between farmers and
destination markets.
Month 2 Ongoing
Training &
mentorship plan
The training & mentorship plan will determine what
training and mentorship services need to be provided to
local farmers and set out a system for the implementation
of training and mentorship across the district.
Month 2 1 – 3 months
Operational plan The operational plan will set out the norms and
procedures for the day to day operation of the Agri-Park
and its individual elements.
Month 2 Ongoing
Agriculture &
business services
scoping report
This report will assess what agricultural & business
services (including infrastructure) are already in place,
what entity (public / private) provides said services and
where gaps exist that the Agri-Park must address through
infrastructure or other interventions.
Month 3 3 – 6 months
Establishment of
linkages with key
public / private
sector
stakeholders
Engage with local public / private stakeholders to provide
key agricultural and business services to local small-holder
and emerging farmers to ensure access to these services
and to prevent needless duplications of infrastructure or
services within the district.
Month 3 3 – 6 months
Develop
infrastructure
funding model
Development of a funding model to finance the
construction of fixed assets, infrastructure and other long
term Agri-Park projects.
Month 4 3 – 6 months
Establishment of
management
committee
Establishment of management committee to oversee the
functioning of the Agri-Park and constituent elements.
Month 1 1 – 3 months
Skills audit The skills audit will determine the exact staffing
requirements for each functional section of the Agri-Park
including staff for FPSU, AH and RUMC.
Month 2 1 – 3 months
Advertising of
employment
opportunities
Following the skills audit, employment opportunities will
be advertised.
Month 5 1 – 3 months
Project funding
model
Development of a funding model to finance the
construction of short - medium term operational projects.
Month 4 3 – 6 months
Procuring of
services for
training and
mentorship
Procuring of various trainers, agricultural mentors etc.
required to enhance the agricultural and business skills of
local small-holder and emerging farmers.
Month 5 1 – 3 months

202
Sarah Baartman Master Agri-Park Business Plan
P a g e | 202 P a g e | 202
Organisational
Structure Chapter 13

203
Sarah Baartman Master Agri-Park Business Plan
P a g e | 203 P a g e | 203
13. AGRI-PARKS ORGANISATIONAL STRUCTURE
To explain the organisational structure of the Agri-Parks the following schematic is used:
Figure 13.1: Agri-Parks Organisational Structures
In explaining the organisational structure, there are three sub structures that form part of the Agri-Parks: 1.
Advisory Structures, 2. Approval Structures and 3. Implementation Monitoring structures.
13. 1 Advisory Structures:
The main functions of the advisory structures within the Agri-Parks organisational structure are to give advice
to the approval structures. The advisory structures that are currently identified are the National Agri-Parks
Advisory Council (NAAC) and District Agri-Parks Management Council (DAMC). It is important to note that the
advisory structures’ member primarily comprise of stakeholders and interested party.
13.1.1 NAAC
This council reports directly to the minister and consists of elected representatives of various organisations.
Functions of the NAAC may include (as stipulated in Circular 9 of 2016):
To solicit, co-ordinate and advise the Executive, on issues and concerns of the implementation of the
Agri-parks Programme;
To encourage public awareness and education of the Agri-parks Programme;
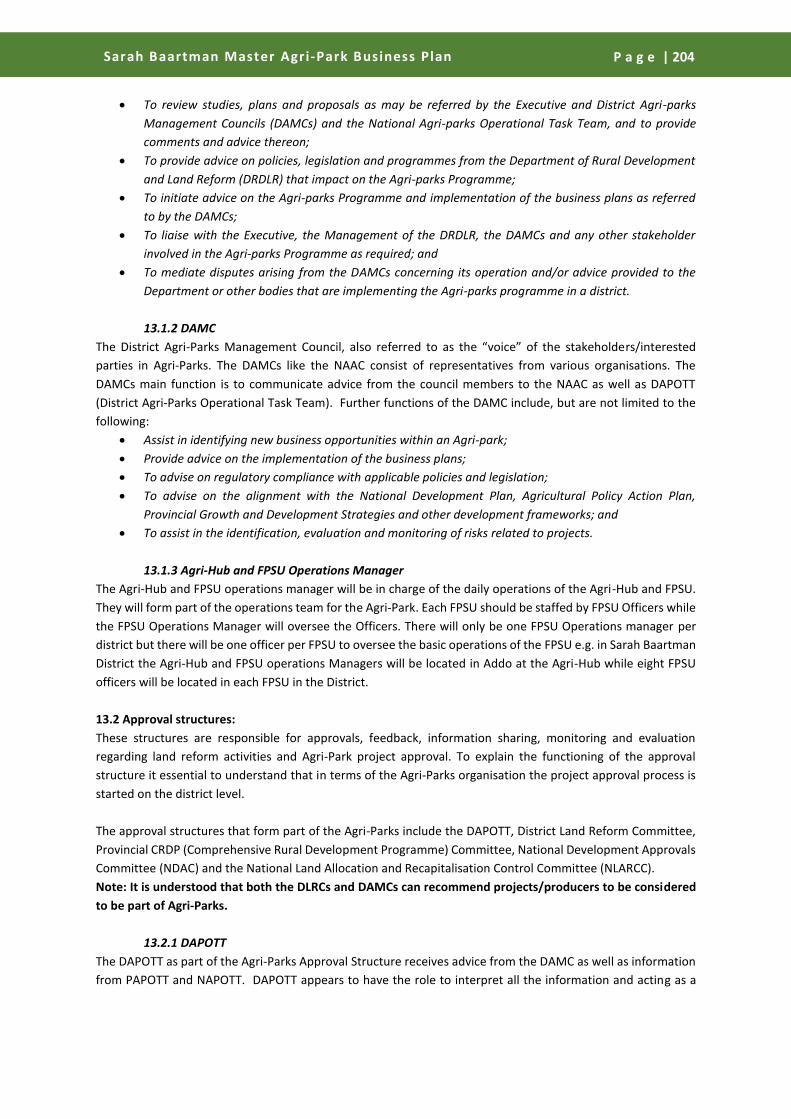
204
Sarah Baartman Master Agri-Park Business Plan
P a g e | 204 P a g e | 204
To review studies, plans and proposals as may be referred by the Executive and District Agri-parks
Management Councils (DAMCs) and the National Agri-parks Operational Task Team, and to provide
comments and advice thereon;
To provide advice on policies, legislation and programmes from the Department of Rural Development
and Land Reform (DRDLR) that impact on the Agri-parks Programme;
To initiate advice on the Agri-parks Programme and implementation of the business plans as referred
to by the DAMCs;
To liaise with the Executive, the Management of the DRDLR, the DAMCs and any other stakeholder
involved in the Agri-parks Programme as required; and
To mediate disputes arising from the DAMCs concerning its operation and/or advice provided to the
Department or other bodies that are implementing the Agri-parks programme in a district.
13.1.2 DAMC
The District Agri-Parks Management Council, also referred to as the “voice” of the stakeholders/interested
parties in Agri-Parks. The DAMCs like the NAAC consist of representatives from various organisations. The
DAMCs main function is to communicate advice from the council members to the NAAC as well as DAPOTT
(District Agri-Parks Operational Task Team). Further functions of the DAMC include, but are not limited to the
following:
Assist in identifying new business opportunities within an Agri-park;
Provide advice on the implementation of the business plans;
To advise on regulatory compliance with applicable policies and legislation;
To advise on the alignment with the National Development Plan, Agricultural Policy Action Plan,
Provincial Growth and Development Strategies and other development frameworks; and
To assist in the identification, evaluation and monitoring of risks related to projects.
13.1.3 Agri-Hub and FPSU Operations Manager
The Agri-Hub and FPSU operations manager will be in charge of the daily operations of the Agri-Hub and FPSU.
They will form part of the operations team for the Agri-Park. Each FPSU should be staffed by FPSU Officers while
the FPSU Operations Manager will oversee the Officers. There will only be one FPSU Operations manager per
district but there will be one officer per FPSU to oversee the basic operations of the FPSU e.g. in Sarah Baartman
District the Agri-Hub and FPSU operations Managers will be located in Addo at the Agri-Hub while eight FPSU
officers will be located in each FPSU in the District.
13.2 Approval structures:
These structures are responsible for approvals, feedback, information sharing, monitoring and evaluation
regarding land reform activities and Agri-Park project approval. To explain the functioning of the approval
structure it essential to understand that in terms of the Agri-Parks organisation the project approval process is
started on the district level.
The approval structures that form part of the Agri-Parks include the DAPOTT, District Land Reform Committee,
Provincial CRDP (Comprehensive Rural Development Programme) Committee, National Development Approvals
Committee (NDAC) and the National Land Allocation and Recapitalisation Control Committee (NLARCC).
Note: It is understood that both the DLRCs and DAMCs can recommend projects/producers to be considered
to be part of Agri-Parks.
13.2.1 DAPOTT
The DAPOTT as part of the Agri-Parks Approval Structure receives advice from the DAMC as well as information
from PAPOTT and NAPOTT. DAPOTT appears to have the role to interpret all the information and acting as a
205
Sarah Baartman Master Agri-Park Business Plan
P a g e | 205 P a g e | 205
monitoring agent to advise on projects and land reform beneficiaries to be included in the Agri-Parks. Some of
the functions of the DAPOTT include but are not limited to:
To provide technical support and guidance for implementation;
To provide oversight of the implementation of the district Agri-parks business plan;
To monitor expenditure against the district Agri-parks business plan;
To identify all district projects that contribute to the district Agri-parks business plan and to compile a
district project register (all DRDLR branches);
To monitor project implementation against the approved project plan and district Agri-parks business
plan;
To participate in the identification and packaging of local development projects in support of the
mandate of the Department of Rural Development and Land Reform;
To advise on proposals that should be submitted to the Provincial CRDP Committee; and
To provide an oversight function and monitor the implementation of the Government’s Rural
Development Programmes.
13.2.2 DLRC
The District Land Reform Committees (DLRCs), are primarily concerned with land reform in general. However,
the DLRCs have additional functions linked to Agri-Parks:
To identify the district projects contributing to Agri-Parks business plans; and
To align projects and beneficiaries with the identified sites for Agri-Parks.
The abovementioned functions are however secondary to the following main functions:
• Identify farms suitable for acquisition by Government (the target is 20% of agricultural land per
district);
• Identify and interview potential candidates for farm allocation;
• Advise the Minister on the strategic support needs of identified farms and support needs of
recommended candidates; and
• Advise the Minister on resolving land rights conflicts, as might be referred to a DLRC by him/her.
Note: Projects and or beneficiaries identified by the DLRCs and DAPOTT, are subjected to technical compliance
checks before being passed onto the PCRDP
13.2.3 PCRDP
The PCRDP functions as the provincial approval structure that passes projects/beneficiaries identified by the
DLRCs and DAPOTTs onto the National Government structures. Regarding this specific structure within the Agri-
Parks organisational structure the name of this structure may have changed to the PJSC (unknown) as suggested
in a different schematic (see below). The projects/beneficiaries identified are then catalogued into a Provincial
Project Register that contributes to the formulation of a provincial spatial target plan. The functions of the PCRDP
include:
To provide inputs to assist in the compilation of the provincial spatial targeting plan, as provided by the
districts;
To recommend all development, land acquisition and tenure projects in line with a Delegation of
Authority Framework to the NLARCC and NDAC through its technical committees; and
To provide an oversight function in relation to the work of the Provincial Technical Committees and
District CRDP Committees, to eliminate disjuncture and to ensure alignment of projects and funding at
a provincial level.
The PCRDP can also include specialists if specialist skills are required to inform decisions to be made regarding
project selection.
Projects and or beneficiaries chosen by the PCRDP are subjected to technical compliance checks before being
passed onto the NLARCC and the NDAC

206
Sarah Baartman Master Agri-Park Business Plan
P a g e | 206 P a g e | 206
13.2.4 NLARCC
The function of the NLARCC is to recommend land acquisition and recapitalisation projects to the MCM
(Ministerial Coordinating Management committee). The full list of functions of the NLARCC is as follows:
To provide inputs to assist in the compilation of the national spatial targeting plan as provided by the
provinces;
To identify all national projects as per operational plans and compile a national project register
To approve land acquisition, tenure and recapitalisation and development projects in line with a
delegation of authority framework; and
To provide an oversight function in relation to the work of the National Technical Committee and
Provincial Committees, to eliminate disjuncture and to ensure alignment of projects and funding at a
national level.
Looking at the above function, the NLARCC and PCRDP have the same functions but only on different levels
within the government.
13.2.5 NDAC
The main function of the NDAC is to approve all the national development projects and to give oversight to the
PCRDP committees and the National Technical Committees (NTCs part of the land reform approval process). The
functions of the NDAC are almost the same as the functions of the NLARCC, but the NDAC does not play a role
in the identification of projects or the approval land acquisition, tenure recapitalisation and development
projects.
13.3 Implementation and Monitoring Structures
Currently there are only two structures within the Agri-Parks organisational structure that are solely dedicated
to implementation and monitoring, the PAPOTT (provincial Agri-Parks Operation Task Team). PAPOTT and
NAPOTT are however not exclusively dedicated to Agri-Parks, these two structures also play a role in the
monitoring and implementation of other programmes that can influence the Agri-Parks programme.
Figure 13.2: Implementation and Monitoring Structures

207
Sarah Baartman Master Agri-Park Business Plan
P a g e | 207 P a g e | 207
13.3.1 NAPOTT
The NAPOTT has various functions that are focussed towards on the operation of Agri-Parks both in terms of
implementation and on-going operation. These functions include but are not limited to:
Developing the National Agri-Parks Plan;
Contributing to the development guidelines of Agri-Parks;
Monitoring provincial business plans against the abovementioned guidelines;
Monitoring budget alignment as set out in the business plans;
Giving inputs to assist in the compilations of provincial Agri-Park business plans; and
Managing project roll out of Agri-Parks in line with approved project plans nationwide.
13.3.2 PAPOTT
The main functions of the PAPOTT is to coordinate and facilitate integrated implementation of Agri-Parks by
providing technical support regarding planning and implementation, giving inputs to the compilations of Agri-
Parks Business plans etc. Note: PAPOTT will only remain operational until the Agri-Parks programme has
reached a sustainable level, then PAPOTT will be integrated with the PCRDP.

208
Sarah Baartman Master Agri-Park Business Plan
P a g e | 208 P a g e | 208
List of References
ABSA, 2015. Agricultural Outlook 2015, [Online] Available: http://agriconnect.co.za/agricultural-outlook/absa-
agricultural-outlook/agricultural-outlook-digital-edition/book/91-absa-agricultural-outlook-2015/7-
agricultural-outlook.html?tmpl=component
BUREAU FOR FOOD AND AGRICULTURAL POLICY (BFAP). 2015a. Labour and Employment. Available [Online]:
http://www.bfap.co.za/index.php/focus/socio-economic-analysis/labour-and-employment
BUREAU FOR FOOD AND AGRICULTURAL POLICY (BFAP). 2015b. Agricultural Outlook 2015-2024. [Online]
Available: www.bfap.co.za/documents/baselines/BFAP_Baseline_2015.pdf
BRITZ, P.J., LEE, B. and BOTES, L. 2009. Aquaculture Benchmarking Survey: Primary Production and Markets. A
report for the Aquaculture Institute of South Africa.
CAPE WOOL SA. 2013. Production statistics: Production per province 2011/12. [Online] Available:
ttp://www.capewools.co.za/
CAPE WOOLS SA. 2014. 2012/2013 Provincial Production Statistics. [Online] Available:
ttp://www.capewools.co.za/
CAPE WOOL SA, 2015. Production Statistics. [Online] Available: ttp://www.capewools.co.za/
CITRUS GROWERS ASSOCIATION (CGA), 2014, Annual Report 2014. [Online] Available:
http://cdn.webhouse.co.za/site/files/5438/CGA%20Annual%20Report%202014%20e12.pdf [29/11/2015].
CITRUS GROWERS ASSOCIATION (CGA), 2014, Annual Report 2012. [Online] Available:
http://cdn.webhouse.co.za/site/files/5438/CGA%20Annual%20Report%202012e.pdf
CITRUS GROWERS’ ASSOCIATION (CGA). 2011. Citrus Growers’ Association Submission to Agricultural Job Creation
Imbizo. Available [Online]: http://bizconnect.standardbank.co.za/media/123273/citrus.pdf
CROSS, C., 2000. Spatial implications of population migration for South Africa’s development and infrastructure
programmes. University of KwaZulu-Natal, January 2000.
DEPARTMENT OF AGRICULTURE, FORESTRY AND FISHERIES (DAFF), 2015a. Abstract of Agricultural Statistics,
Pretoria: Directorate Statistics and Economic Analysis.
DEPARTMENT OF AGRICULTURE, FORESTRY AND FISHERIES (DAFF), 2015b. Newsletter: National Livestock
Statistics, Pretoria: Department of Agriculture, Forestry and Fisheries.
DEPARTMENT OF AGRICULTURE, FORESTRY AND FISHERIES (DAFF), 2015c. Crops and Markets, first quarter 2015.
Vol 96, no. 963. Issued by the Directorate Statistics and Economic Analysis. Department of Agriculture,
Forestry and Fisheries, Pretoria.
DEPARTMENT OF AGRICULTURE, FORESTRY AND FISHERIES (DAFF). 2014a. Agricultural Policy Action Plan (APAP).
Pretoria: Department of Agriculture, Forestry and Fisheries.
DEPARTMENT OF AGRICULTURE, FORESTRY AND FISHERIES (DAFF). 2014b. Apple and Pear Value Chain
Assessment. Pretoria: Department of Agriculture, Forestry and Fisheries.
DEPARTMENT OF AGRICULTURE, FORESTRY AND FISHERIES (DAFF). 2014c. Citrus Value Chain Assessment.
Pretoria: Department of Agriculture, Forestry and Fisheries.

209
Sarah Baartman Master Agri-Park Business Plan
P a g e | 209 P a g e | 209
DEPARTMENT OF AGRICULTURE, FORESTRY AND FISHERIES (DAFF). 2014d. Profile of the South African Forestry
and Wood Products Market Value Chain. Pretoria: Department of Agriculture, Forestry and Fisheries.
DEPARTMENT OF AGRICULTURE, FORESTRY AND FISHERIES (DAFF). 2014e. Pineapple Value Chain Assessment.
Pretoria: Department of Agriculture, Forestry and Fisheries.
DEPARTMENT OF AGRICULTURE, FORESTRY AND FISHERIES (DAFF). 2012. South Africa’s Aquaculture Yearbook
2012. Pretoria: Department of Agriculture, Forestry and Fisheries.
DEPARTMENT OF AGRICULTURE, FORESTRY AND FISHERIES (DAFF). 2011. A profile of the South African Broiler
Market Value Chain. Pretoria: Department of Agriculture, Forestry and Fisheries.
DEPARTMENT OF BASIC EDUCATION. 2013. Education Statistics in South Africa, 2011. Pretoria: Department of
Basic Education.
DEPARTMENT OF AGRICULTURE, FORESTRY AND FISHERIES (DAFF). 2010. Step by Step Export Manual for the
South African Fruit Industry. Pretoria: Department of Agriculture, Forestry and Fisheries.
DEPARTMENT OF AGRICULTURE, FORESTRY AND FISHERIES (DAFF). 2002. The Integrated Food Security Strategy
for South Africa. Pretoria: Department of Agriculture, Forestry and Fisheries.
DEPARTMENT OF ENVIRONMENTAL AFFAIRS. 2011. National Strategy for Sustainable Development. Pretoria:
Department of Environmental Affairs.
DEPARTMENT OF RURAL DEVELOPMENT AND AGRARIAN REFORM. 2015. Sarah Baartman Agri-Park Proposal Draft
2015. Bhisho: Department of Rural Development and Agrarian Reform.
DEPARTMENT OF RURAL DEVELOPMENT AND AGRARIAN REFORM. 2015. One Pager Executive Summaries – 27
Priority Districts Agri-Hubs as on 15 July 2015. Bhisho: Department of Rural Development and Agrarian
Reform.
DEPARTMENT OF RURAL DEVELOPMENT AND LAND REFORM. 2015. The Rural Economy Transformation Model:
One District, One Agri-Park/Every Municipality – A CRDP Site. Pretoria: Department of Rural
Development and Land Reform.
DEPARTMENT OF RURAL DEVELOPMENT AND LAND REFORM. 2009. Strategic Plan, 2009-2012. Pretoria:
Department of Rural Development and Land Reform.
DEPARTMENT OF RURAL DEVELOPMENT AND LAND REFORM. 2015. Draft Eastern Cape Rural Development Plan
Pretoria: Department of Rural Development and Land Reform.
EASTERN CAPE DEVELOPMENT CORPORATION. 2015. Regional Economic Profile – Sarah Baartman District. ECDC.
EASTERN CAPE PROVINCIAL GOVERNMENT. 2010. Eastern Cape Provincial Spatial Development Plan. Bhisho:
Eastern Cape Provincial Government.
EASTERN CAPE SOCIO ECONOMIC CONSULTATIVE COUNCIL (ECSECC). 2012. Eastern Cape Socio-Economic Atlas. .
[Online] Available: http://www.ecsecc.org/home.
FARMERS WEEKLY, 2015. Game exports after FMD. [Online] Available:
http://www.farmersweekly.co.za/article.aspx?id=72026&h=Game-exports-after-FMD
FOASTAT, 2015. Food and Agriculture Organization of the United Nations: Statistics. [Online] Available:
http://faostat.fao.org/
FOOD AND AGRICULTURE ORGANISATION (FAO). 2014. Meat Consumption. Available [Online]:
http://www.fao.org/ag/againfo/themes/en/meat/background.html

210
Sarah Baartman Master Agri-Park Business Plan
P a g e | 210 P a g e | 210
FOOD AND AGRICULTURE ORGANISATION (FAO). 2002. Meat and Health. Available [Online]:
http://www.fao.org/docrep/t0562e/t0562e05.htm
FOOD AND AGRICULTURE ORGANISATION (FAO). 2001. Food Security, Nutrition and health. Available [Online]:
http://www.fao.org/docrep/w6864e/w6864e06.htm
FOOD AND AGRICULTURE ORGANISATION (FAO). 2000. Nutritional and Health Benefits of Citrus Fruits. Available
[Online]: http://www.fao.org/docrep/x2650t/x2650t03.htm
FRASER, G. 2006. Value Chain Report on Vegetable Processing Project. Thina Sinako.
FROST AND SULLIVAN. 2008. In Managed Shared Services Centre (2008): SA BPO Industry Analysis and
International Participation Analysis.
GLOBAL AGRICULTURAL INFORMATION NETWORK (GAIN). 2014. South African Citrus Annual Report. Available
[Online]:http://gain.fas.usda.gov/Recent%20GAIN%20Publications/Citrus%20Annual_Pretoria_South%20A
frica%20-%20Republic%20of_12-15-2014.pdf
HINRICHSEN, E. 2008. Introduction to Aquaculture in the Eastern Cape: Edition 1. Division of Aquaculture,
Stellenbosch University Report.
INTERNATIONAL TRADE CENTRE. 2015. ITC Trade Maps, 2015. [Online] Available at: http://www.trademap.org
[Accessed 18 February 2015].
JORDAAN, A.J., 2013. Vulnerability, adaptation to and coping with drought: The case of commercial and
subsistence rainfed farming in the Eastern Cape. WRC/KSA4 /1002947/2280 (Project in Progress):
JUMA, C., 2011. "Advances in Science, Technology, and Engineering." Chap. 2 in The New Harvest: Agricultural
Innovation in Africa. New York: Oxford University Press, January 2011.
KOTZE, W. A. G., 1987. Fifty years of fruit research: A bibliography review. Fruit and Fruit Technology Research
Institute. Pretoria: Government Printer.
LAND TYPE SURVEY STAFF. 1972 – 2006. Land Types of South Africa: Digital map (1:250 000 scale) and soil
inventory databases. ARC-Institute for Soil, Climate and Water, Pretoria, South Africa.
LOBELL, D.B., BURKE, M.B., TEBALDI, C., MASTRANDREA, M.D., FALCON, W.P. AND NAYLOR, R.L 2008. Prioritizing
climate change adaptation needs for food security in 2030. Science, Vol. 319 (5863).
MALHERBE, J., and TACKRAH, A, 2003. Long term average ten daily 1km X 1km temperature, rainfall and
evaporation grid surfaces modelled from weather station data with a long term recording period.
Unpublished. ARC-Institute for Soil, Climate and Water, Pretoria.
MENNONITE ECONOMIC DEVELOPMENT ASSOCIATES (MEDA), 2009. Agricultural market research for microfinance
and SME interventions.
MILK PRODUCERS ORGANISATION (MPO). 2014. Lacota Data Statistics. [Online] Available:
http://www.mpo.co.za/en/information/lactodata
NEW SOUTH WALES DEPARTMENT OF PRIMARY INDUSTRIES (NSW DPI). 2008. Using gibberellic acid sprays on
navel oranges. Available [Online]:
http://www.dpi.nsw.gov.au/__data/assets/pdf_file/0006/232197/Using-gibberellic-acid-sprays-on-navel-
oranges.pdf
NDORO, J.T., MUDHARA, M., CHIMONYAO, M. 2014. Livestock extension programmes participation and impact on
smallholder cattle productivity in KwaZulu-Natal: A propensity score matching approach. South African
Journal of Agricultural Extension, Vol 42: No. 2 December 2014. Pretoria.
211
Sarah Baartman Master Agri-Park Business Plan
P a g e | 211 P a g e | 211
OLIVIER, G. C. (2004). An Analysis of the Beef Supply Chain: From Farm to Fork. Johannesburg: Rand Afrikaans
University.
OOSTHUIZEN, H.J. 2014. Modelling the financial vulnerability of farming systems to climate change in selected
case study areas in South Africa. PhD thesis, Stellenbosch University, South Africa.
QUANTEC. 2015. Regional, Standardised Data Set. Available: http://www.quantec.co.za.
RED MEAT LEVY ADMIN, 2015. Total Slaughters – Nov. 2013 to Oct. 2014. Red Meat Levy Admin, Pretoria
RED MEAT PRODUCERS ORGANISATION (RPO), 2015. Agricultural Trends. [Online] Available:
http://www.rpo.co.za/InformationCentre/ABSA/AgriTrends.aspx
RIVAS, F., ERNER, Y., ALOS, E., JUAN, M., ALMELA, V., AGUSTI, M., 2006. Girdling increases carbohydrate
availability and fruit-set in citrus cultivars irrespective of parthenocarpic ability. The Journal of
Horticultural Science and Biotechnology, 81(2):289-295.
ROETS, M, 2004. From Folklore to Feasibility: Commercialisation of South Africa's Indigenous Goats. Pretoria:
University of Pretoria.
SBDM, 2015. Sarah Baartman District Municipality Integrated Management Plan 2012-2017 (2015/16 Review)
[Online] Available: http://www.sarahbaartman.co.za/
SCHULZE, R.E. (ED). 2008. South African Atlas of Climatology and Agrohydrology. Water Research Commission,
Pretoria, RSA, WRC Report 1489/1/08, Section 18.3.
SCHULZE, R.E. 2011. Atlas of Climate Change and the South African Agricultural Sector: A 2010 Perspective.
Department of Agriculture, Forestry and Fisheries, Pretoria, RSA.
STATISTICS SOUTH AFRICA (STATS SA). 2002. Census 2001. Statistics South Africa: Pretoria.
STATISTICS SOUTH AFRICA (STATS SA). 2007. Census of Commercial Agriculture 2007 (Eastern Cape). Stats South
Africa: Pretoria.
STATISTICS SOUTH AFRICA (STATS SA). 2012. Census 2011. Statistics South Africa: Pretoria.
STATISTICS SOUTH AFRICA (STATS SA). 2014. Quarterly Labour Force Survey, 4th Quarter 2013. Statistics South
Africa: Pretoria.
STATISTICS SOUTH AFRICA (STATS SA).2014. Survey of Employers and the Self-Employed 2013. Statistics South
Africa: Pretoria.
WORLD HEALTH ORGANISATION (WHO), 2015. Codex Alimentarius. [Online] Available:
http://www.codexalimentarius.org/