safety evaluation of centerline rumble strips: crash and driver behavior analysis
TRANSCRIPT

Safety Evaluation of Centerline Rumble Strips: A Crash And Driver Behavior Analysis
By
David A. Noyce Assistant Professor
Department of Civil and Environmental Engineering University of Wisconsin-Madison
1210 Engineering Hall 1415 Engineering Drive
Madison, WI 53706 Telephone: (608) 265-1882
Fax: (608) 262-5199 Email: [email protected]
and
Vetri Venthan Elango
Graduate Research Assistant School of Civil and Environmental Engineering
Georgia Institute of Technology Atlanta, GA 30332
Telephone: (404) 441 0586 Fax: (404) 894 2278
Email: [email protected]
Paper Number: 04-3932 Review Committee: Traffic Control Devices Prepared for the 83rd Annual meeting of the
Transportation Research Board, Washington, D.C. January, 2004
Length of Paper:
4,932 words, 6 figures + 4 tables @ 250 words each 7,432 equivalent words
TRB 2004 Annual Meeting CD-ROM Paper revised from original submittal.

ABSTRACT
The objective of this research was to evaluate the effectiveness of centerline rumble strips in reducing cross-over-the-centerline crashes and improving the safety of undivided roadways. Twenty U.S. states, along with several Canadian provinces, are currently using centerline rumble strips. A detailed analysis of crashes on State Routes 2, 20, and 88 in Massachusetts, before and after the installation of centerline rumble strips, showed no significant change in crash frequencies after the installation of centerline rumble strips; however, no fatal crashes have occurred on State Routes 2 and 88 since the installation of centerline rumble strips. Three cross-over-the-centerline fatal crashes did occur on State Route 20 after the centerline rumble strips were installed; centerline rumble strips where not a countermeasure to these specific crash types. Driver behavior at shoulder and centerline rumble strips was evaluated using a full-scale driving simulator. Drivers were found to react and correct the vehicle trajectory more quickly with centerline rumble strip encounters than with shoulder rumbles strip encounters. Approximately 27 percent of the drivers made an initial leftward correction of the vehicle when encountering centerline rumble strips. Although this percentage may be inflated due to laboratory conditions, there is some probability of a driver confusing centerline rumble strips with shoulder rumble strips and reacting improperly. No improper (rightward) corrections were experienced with shoulder rumble strip scenarios. Centerline rumble strips were found to be effective at gaining drivers attention and therefore an effective traffic control device and safety countermeasure in areas were a history of cross-over-the-centerline fatal and injury crashes occur. Keywords: Centerline Rumble Strips, Shoulder Rumble Strips, Safety, Driver Behavior, Driving Simulation
TRB 2004 Annual Meeting CD-ROM Paper revised from original submittal.

Noyce and Elango 1
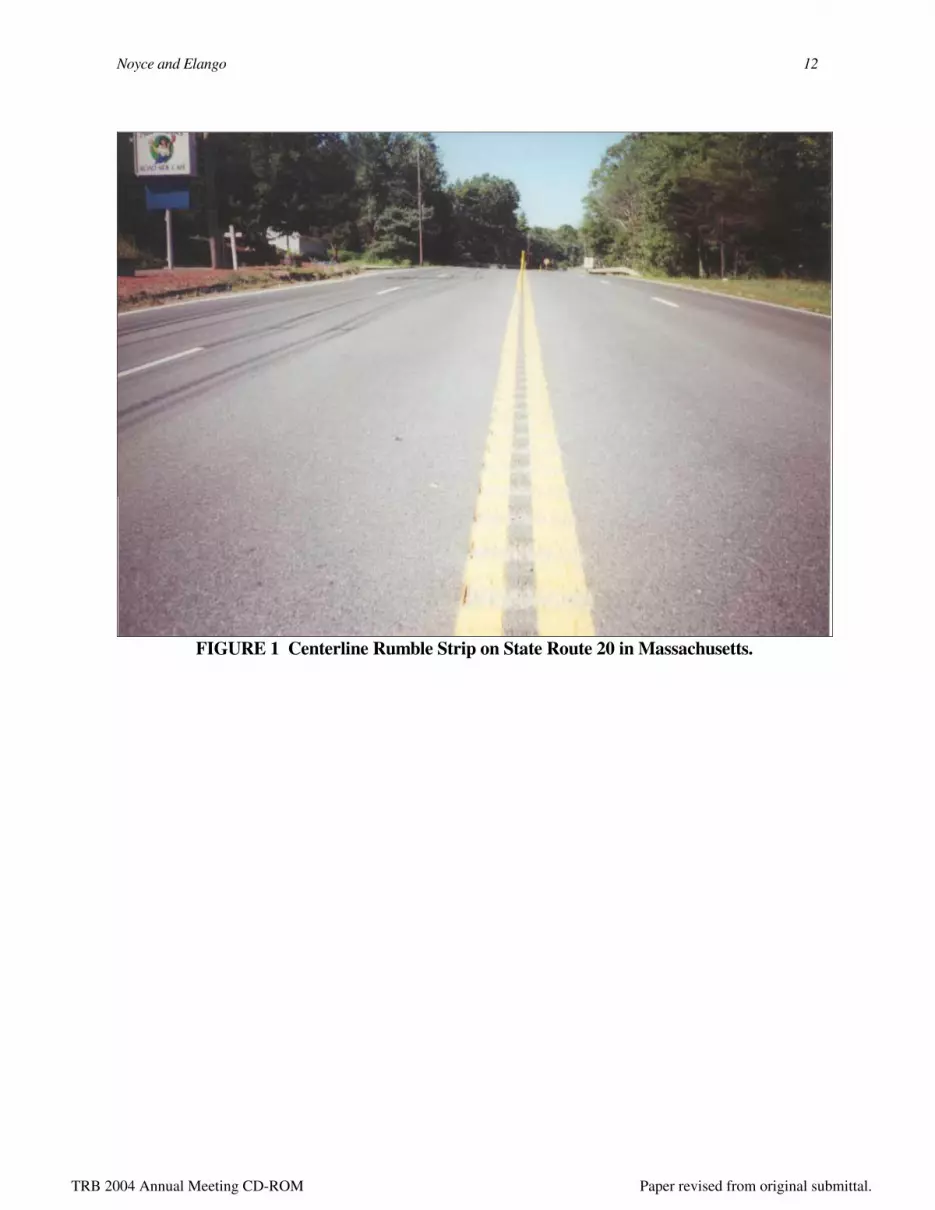
INTRODUCTION Roadway departures or run-off-the-road crashes, in which a vehicle leaves the roadway and either turns over or hits a fixed object, continues to be one of the most significant crash types in the Unites States. In 2002, failure to keep in lane or running off road accounted for one-third of all traffic fatalities, and two-thirds of traffic fatalities on rural roadways (1, 2). In an effort to reduce run-off-the-road crashes and other crash types caused from vehicles deviating from their designated lane, many state transportation agencies have installed continuous shoulder rumble strips along the travel lanes of primary roadways (functional classification of freeway or principal arterial) as a traffic control device countermeasure. Rumble strips are a series of raised or grooved patterns most commonly constructed in roadway shoulders. When a vehicle passes over the rumble strips, a rumbling sound is generated due to the vibration of the vehicle and the tire-pavement interaction. The intent of rumble strips is to alert drivers to a potential conflict or crash situation due to lane departure. Moreover, rumble strips can act as a roadway guide for drivers in areas where rain, fog, snow, and dust obscure pavement edges. Research has shown that shoulder rumble strips have been effective at reducing the frequency of run-off-the-road crashes (3 - 7). The safety benefits documented with shoulder rumble strips have prompted transportation engineers to use rumble strips along the centerline of undivided roadways. In 2002, there were 3,841 fatal head-on collisions in the United States (1). The National Highway Traffic Safety Administration (NHTSA) also reports that a substantial number of fatalities each year are due to drivers crossing the centerline/driving in the wrong direction and drowsiness, fatigue, illness, and blackout. Traffic engineers believe that centerline rumble strip may be effective in reducing the number of cross-over-the-centerline crash types and associated fatalities and injuries. As presented in Figure 1, centerline rumble strips are typically constructed in a similar manner as shoulder rumble strips, with a linear series of transverse grooves milled into the pavement longitudinally along the centerline. A 1999 survey of transportation agencies found only eight states and Alberta, Canada using centerline rumble strips (8). Nevertheless, a growing interest in the potential safety benefits of centerline rumble strips exists. One of the concerns with the use of centerline rumble strips (and inside shoulder rumble strips on divided highways) is driver’s ad hoc and a priori expectancies derived from previous experiences with shoulder rumble strips. Shoulder rumble strips were first installed on the New Jersey Garden State Parkway in 1955 and many states started using them in the 1960’s. Therefore, most drivers are familiar with shoulder rumble strips and aware of their presence on the outside shoulder of freeways and many principal arterials. Because of this awareness (i.e., expectancy), driver’s subconscious reaction to an unexpected encounter with shoulder rumble strips is to correct the trajectory of the vehicle by turning left, away from the outside edge of roadway. A priori expectancy and driver reaction can be problematic with the use of centerline rumble strips. Drivers who encounter a centerline rumble strip, and are unaware of their lane position, may assume that they are encountering a shoulder rumble strip. Reaction to the rumble strip encounter may be to turn the steering wheel to the left, which can be detrimental to the potential safety benefits of centerline rumble strips. A question remains as to driver’s ability to properly distinguish and correctly react to centerline and shoulder rumble strips when they are encountered.
TRB 2004 Annual Meeting CD-ROM Paper revised from original submittal.
Noyce and Elango 2
RESEARCH OBJECTIVES The overall objective of this research was to evaluate the effectiveness of centerline rumble strips in reducing cross-over-the-centerline crashes and improving the safety of undivided roadways. Specific objectives included: • Identify the state-of-the-knowledge and current use of centerline rumble strips in the United
States; • Evaluate the safety effects of centerline rumble strips installed on State Routes 2, 20, and 88 in
Massachusetts; and • Evaluate driver’s reaction to centerline rumble strip encounters.
BACKGROUND
Several studies on the safety effects of centerline rumble strips have been completed. The Colorado Department of Transportation evaluated the safety benefits of 17 miles of centerline rumble strips installation on State Highway 119 (9). An analysis of 44 months of before and after crash data found a statistically significant reduction in the number of cross-over-the-centerline type crashes, including a 34 percent reduction in head-on collisions and a 37 percent reduction in cross-over sideswipe crashes.
The Delaware Department of Transportation conducted a crash analysis on the centerline rumble strips installation on Route US 301 (10). Considering three years of before data and six years of after data, the results showed that head-on collisions decreased by 90 percent after the installation of centerline rumble strips. Crashes caused by drivers crossing over the centerline rumble strips decreased by 60 percent. The benefit/cost ratio for centerline rumble strip installations was estimated to be 110. California tested the effects of centerline rumble strips in no-passing zones (11). A review of three years of before and after crash data found that crashes were reduced by 11 percent and fatalities reduced by 77 percent. Minnesota installed centerline rumble strips at two sites on rural roads with 55 mph speed limits (11). A review of three years of before and after crash data found no reduction in head-on crashes.
Kansas conducted a study of centerline rumble strips focusing on how states were constructing and placing milled centerline rumble strips, and the associated noise and vibration produced by different rumble strip patterns (8, 12, 13). The results indicated that continuously 12-inch on center spaced rumble strips produced the highest decibel levels, ranging between 80 and 94 dB at 60 mph, depending on vehicle type.
No literature was found pertaining to driver behavior or driver comprehension of centerline rumble strips. Furthermore, no research evaluating driver’s reaction to both centerline and shoulder rumble strips was identified. RESEARCH PROCEDURE
Three research phases were designed to meet the project objectives. Phase I included a survey of transportation agencies with the objective of determining their use of centerline rumble strips. Phase II was designed to collect and analyze crash data for the segments of Massachusetts State
TRB 2004 Annual Meeting CD-ROM Paper revised from original submittal.

Noyce and Elango 3
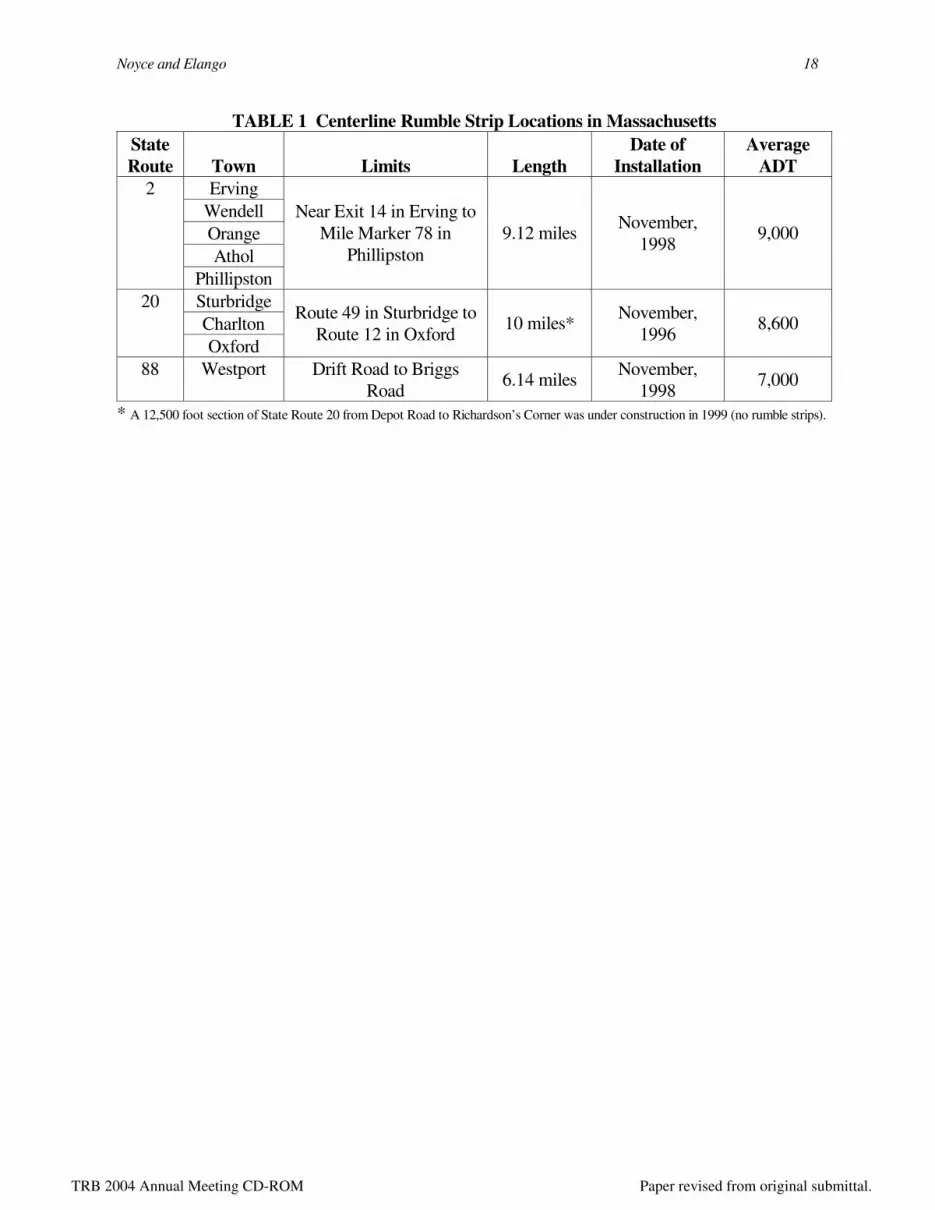
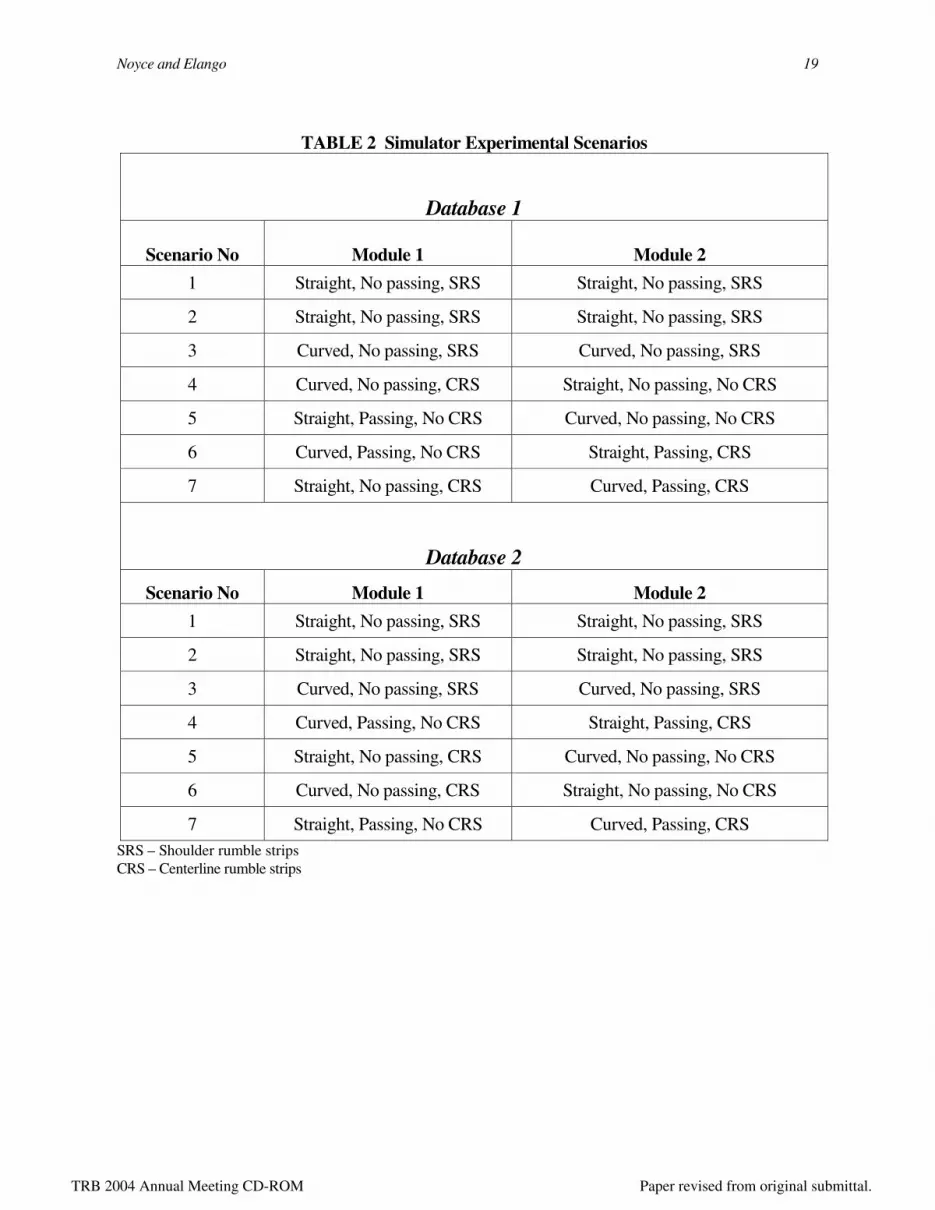
Routes 2, 20, and 88, all 2-lane rural highways containing centerline rumble strips. Crash data were obtained from MassHighway’s Accident Record System for two years before and two years after the installation of centerline rumble strips, through the year 2000. Target crashes were those reported that involved head-on collisions, angle collisions (nearly head-on); sideswipe in opposite directions, and run-off-the-road crashes with centerline encounters. A before and after (BAA) statistical analysis with comparison sites procedure was used (14). The BAA procedure considers crash frequencies before and after the installation of centerline rumble strips, and computes a predicted estimate of safety (i.e., crash frequency) in the after period, assuming that the centerline rumble strips had not been installed. This predicted value accounts for the influence of causal factors that change with time by considering crash trends at the study site before the centerline rumble strip installation as well as at one or more comparison sites. Predicted crash values were compared to actual crash values in the after period to determine the safety effects of the centerline rumble strips; therefore, if the number of crashes predicted is greater than the actual number of crashes after the installation of centerline rumble strips, and outside of the variability range measured by the standard deviation, a positive safety benefit is found. Crash frequencies were defined at the total number of targeted crashes per unit of time. Comparison sites used were roadways similar in geometric (12-foot lanes; shoulders; similar length) and operational features (2-lane rural highway) except that no centerline rumble strips existed. At least two comparison sites were identified for each study site. Traffic volume counts were obtained from all study and comparison sites to allow for the comparison of both crash frequencies and rates. Table 1 provides a summary of the relevant centerline rumble strip data. Figures 2 shows the approximate location of the centerline rumble strip installations. The third phase of the research was designed to evaluate driver behavior and reaction to encounters with rumble strips. Because of the limitations and potential safety issues associated with conducting a field evaluation of centerline rumble strips, a fixed-base full-scale driving simulator was used to conduct this evaluation. The driving simulator allowed issues pertaining to roadway geometry, passing zones, driver behavior, and driver expectancy to be considered. A photo of the driving simulator is shown in Figure 3. Participating drivers sat in the driving simulator vehicle and maneuvered through a virtual world, displayed on a screen in front, just as if operating their own vehicle. Two visual worlds (databases) were created, each containing a roadway with both curved and straight alignments. Passing and no passing zones were also included. Databases were further broken down into two modules. The only difference in these modules was the order in which the scenarios were presented. Each module consisted of a two-lane roadway segment using a rural cross-section, approximately eight miles in length. To assure that each driver encountered rumble strips, several visual distracters were placed in each module that required drivers to temporarily take their eyes off the road. During this time, small shifts in the travel lane (lane shifts) were programmed into the visual database. These lane shifts forced drivers into a centerline or shoulder incursion and an unexpected encounter with continuous rumble strips. Lane shifts occurred at various locations within each module, some on tangent sections of roadway and some on curves. Lane curvature and lane shifts were independent; drivers were in the curve before a lane shift occurred. The desire to create these unexpected encounters necessitated that drivers did not see the lane shifts programmed into each module; therefore, a nighttime environment in the visual database was made with haze conditions, creating a visibility range of approximately six meters.
TRB 2004 Annual Meeting CD-ROM Paper revised from original submittal.

Noyce and Elango 4
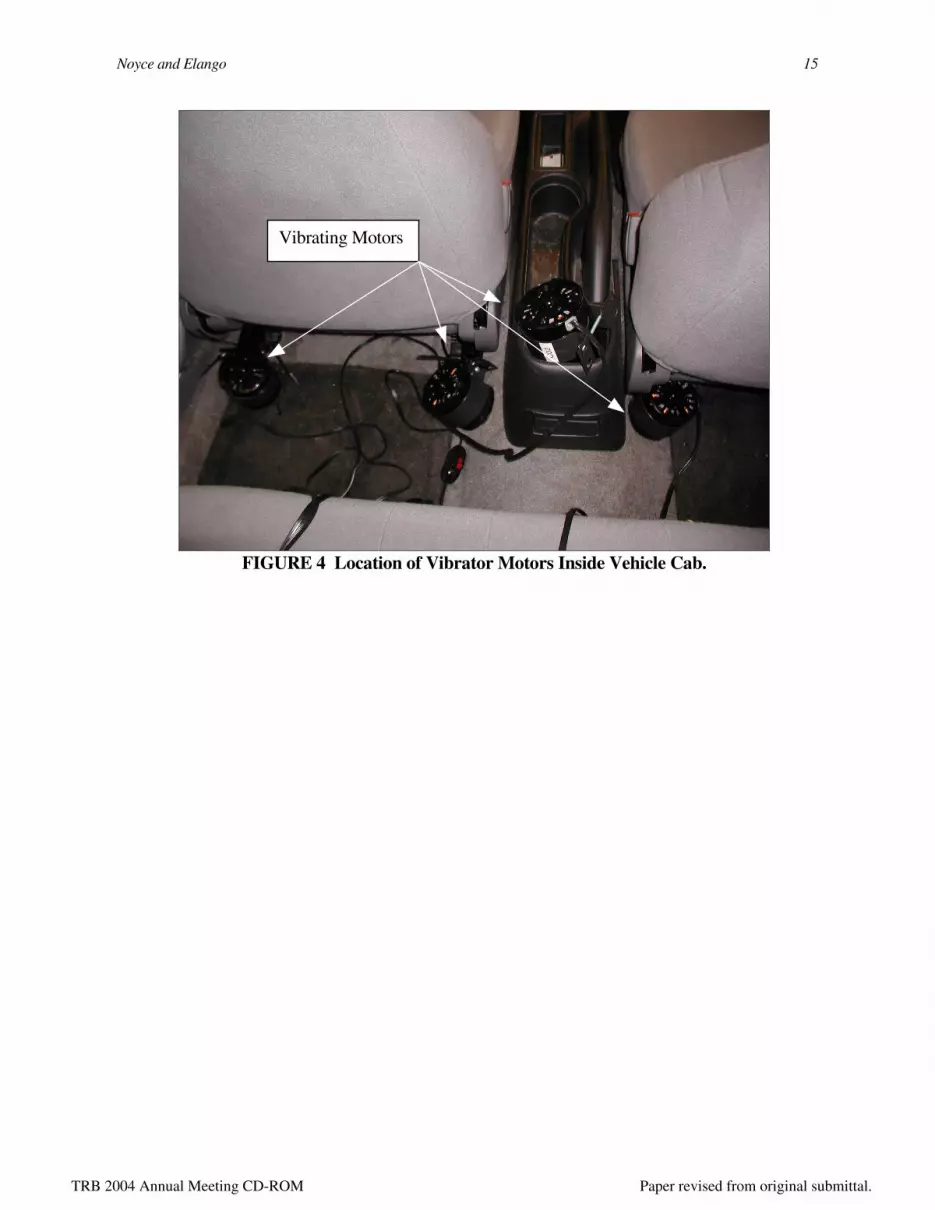
At the beginning of each experiment, participants were told that the research team was interested in the effect of different billboard formats on the time that it takes a driver to find certain key information when driving in hazy conditions such as fog or rain. Billboards were randomly placed on both sides of the roadway so that drivers needed to be consistently searching for a billboard and the associated target word or symbol. The billboards contained three rows of three letters. Drivers were asked to indicate how many times the letter “V” appeared in each row of the billboard. While searching for billboards, drivers were required to maintain a speed of approximately 30 mph. No opposing traffic was provided at each lane shift although random opposing vehicles were included in the simulation. The rumble of the rumble strip was completed using a series of five vibratory motors placed in the driving simulator vehicle cab. Motors provided a ‘physical’ shaking of the simulator vehicle and passenger compartment at a frequency similar to an actual rumble strip encounter. Placement of the motors within the vehicle cab is shown in Figure 4. The motors were manually operated using an electronic control device when the driver encountered a rumble strip. Motors under the driver’s seat, along with the center console, were activated when centerline rumble strips were encountered. Motors under the passenger’s seat, along with the center console, were activated when shoulder rumble strips were encountered. This methodology provided noise and vibration location realism consistent with rumble strips encounters in actual driving conditions. To further replicate a real rumble strip encounter, a comprehensive stereo system, including two subwoofers placed under the hood of the vehicle and tied to the frame, provide noise replication of a rumble strip. The volume of the simulated rumble strip noise was measured and compared to observations obtained from actual rumble strip encounters. A total of 60 drivers were tested in the full experiment using two visual databases. Drivers were demographically divided by age. Twenty-five young (18-30), 23 middle aged (40-60) and 12 older (60+) drivers, all from the Amherst, MA area, participated. Drivers were also randomly divided between the two visual databases. This methodology counterbalanced the data collection to assure validity of results. The random scenario presentation is shown in Table 2. Driver’s position in the visual database (‘x’, ‘y’, ‘z’ coordinates) and velocity were recorded during the critical roadway sections. These data provided last position and trajectory information on driver’s first reaction to the rumble strip encounter. By plotting the vehicle trajectory data in relation to the centerline rumble strip location, corrective maneuvers could be visually observed. Coordinate data accounted for roadway curves to either the left or right, and the associated lane incursions, allowing differentiation between vehicle trajectories related to simple lane curvature and changes in trajectories due to lane shifts. RESEARCH RESULTS Use of Centerline Rumble Strips All 50 U.S. states responded to the survey. Twenty states indicated that they have installed centerline rumble strips, including Alaska, Arizona, California, Colorado, Connecticut, Delaware, Hawaii, Kentucky, Maryland, Massachusetts, Minnesota, Nevada, New Hampshire, New Mexico, Ohio, Oregon, Pennsylvania, Virginia, Washington, and Wyoming. Kansas had near-term plans to install centerline rumble strips. Each of the 20 states indicated that they use continuous centerline
TRB 2004 Annual Meeting CD-ROM Paper revised from original submittal.

Noyce and Elango 5
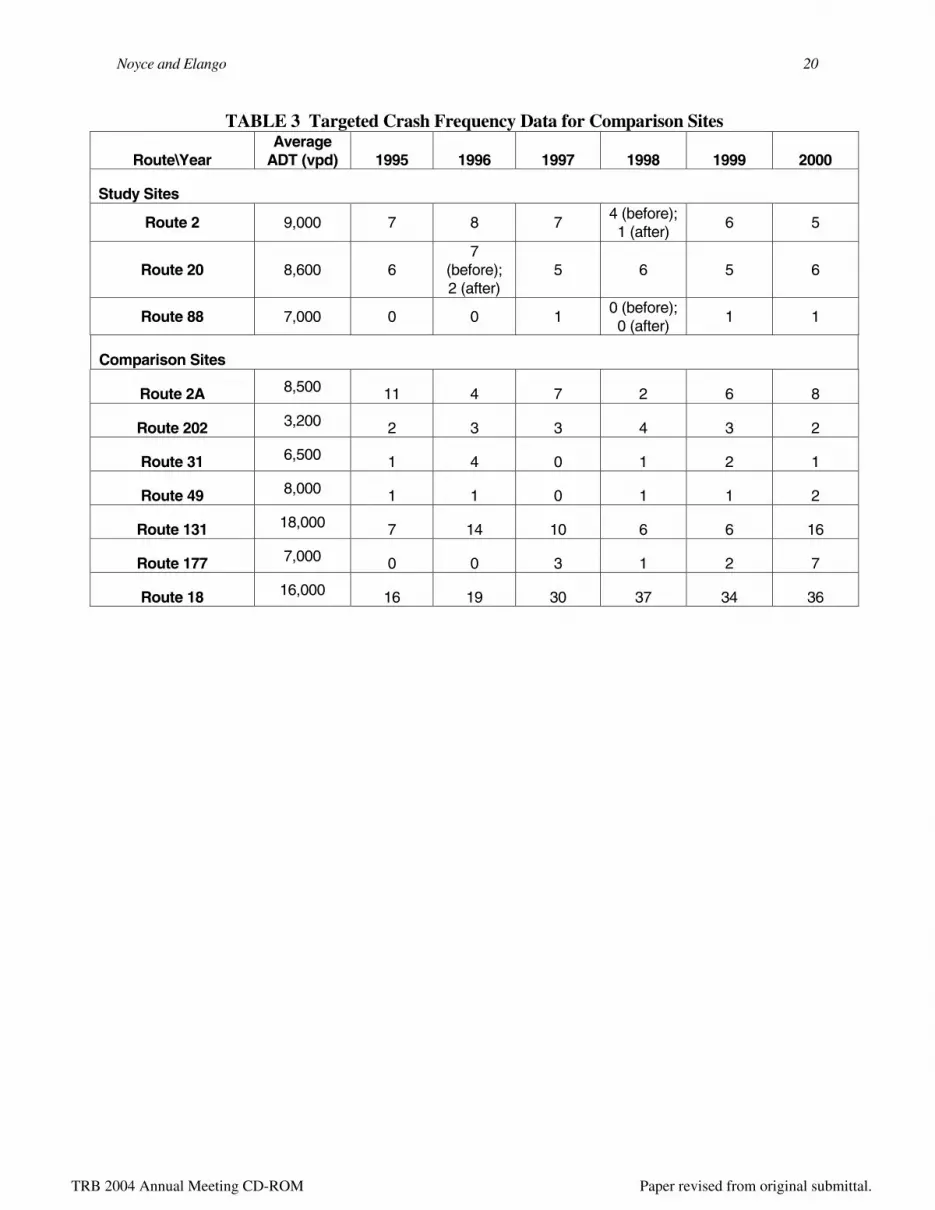
rumble strips except New Mexico, who used intermittent centerline rumble of approximately two meters length with two meters spacing. The most common reason cited for installing centerline rumble strips was a countermeasure to high crash locations or a general enhancement to improve road safety. No state was using centerline rumble strips exclusively as delineation in low visibility areas. States identified noise problems and pavement deterioration as the main issues/problems with centerline rumble strips. Concern about motorcycle and bicycle riders was also mentioned. Some reported that emergency vehicle operators were critical of centerline rumble strips, specifically during high-speed chases by police and while using cardiac monitoring devices by emergency medical staff. Several states noted visibility and retroreflectivity problems with the centerline pavement markings on centerline rumble strips under nighttime conditions because snow, salt, sand, or debris collecting in the ‘grooves’ of the rumble strips. Some states have developed carriage adjustments to pavement marking paint trucks and place centerline markings on either side of the rumble strips. Crash Data Analysis Table 3 presents the number of targeted/selected crashes reported on each of the study and comparison sites. Targeted crashes were those crashes involving head-on crashes or other cross-over-the-centerline events. Recall that the centerline rumble strips on State Route 20 were installed in November of 1996, while the centerline rumble strips on State Routes 2 and 88 were installed in November of 1998. The frequency of cross-over-the-centerline-related crashes per year at the study locations did not experience a dramatic decrease after the installation of centerline rumble strips. State Route 2 experienced a slight decrease in the annual frequency of targeted crashes while State Route 20 and State Route 88 remained relatively consistent. Several of the comparison sites, specifically State Route 18 and State Route 131, witnessed significant increases in these crash types. An analysis of fatal crashes at the study locations found no fatal crashes on State Routes 2 or State Route 88 in the analysis area since the installation of centerline rumble strips. Six fatal crashes had occurred on Route 2 and one fatal crash on Route 88 in the two years prior. State Route 20 experienced one fatal crash prior and three fatal crashes after the installation of the centerline rumble strips. All three fatal crashes after rumble strip installation occurred during wet/ice weather conditions at approximately the same location near an 819-foot radius horizontal curve. Each crash involved loss of vehicle control; crash types in which centerline rumble strips are not a countermeasure. Study site crash data were combined with various combinations of comparison site data to statistically compute changes in crash patterns after the installation of centerline rumble strips. Comparison sites were:
• State Route 2A and 202 for State Route 2; • State Route 31, 131 and 49 for State Route 20; and • State Route 18 and 177 for State Route 88.
The results show that the overall number of predicted crashes increased by approximately seven percent with a "41 percent standard deviation. Note that with the large standard deviations,
TRB 2004 Annual Meeting CD-ROM Paper revised from original submittal.
Noyce and Elango 6
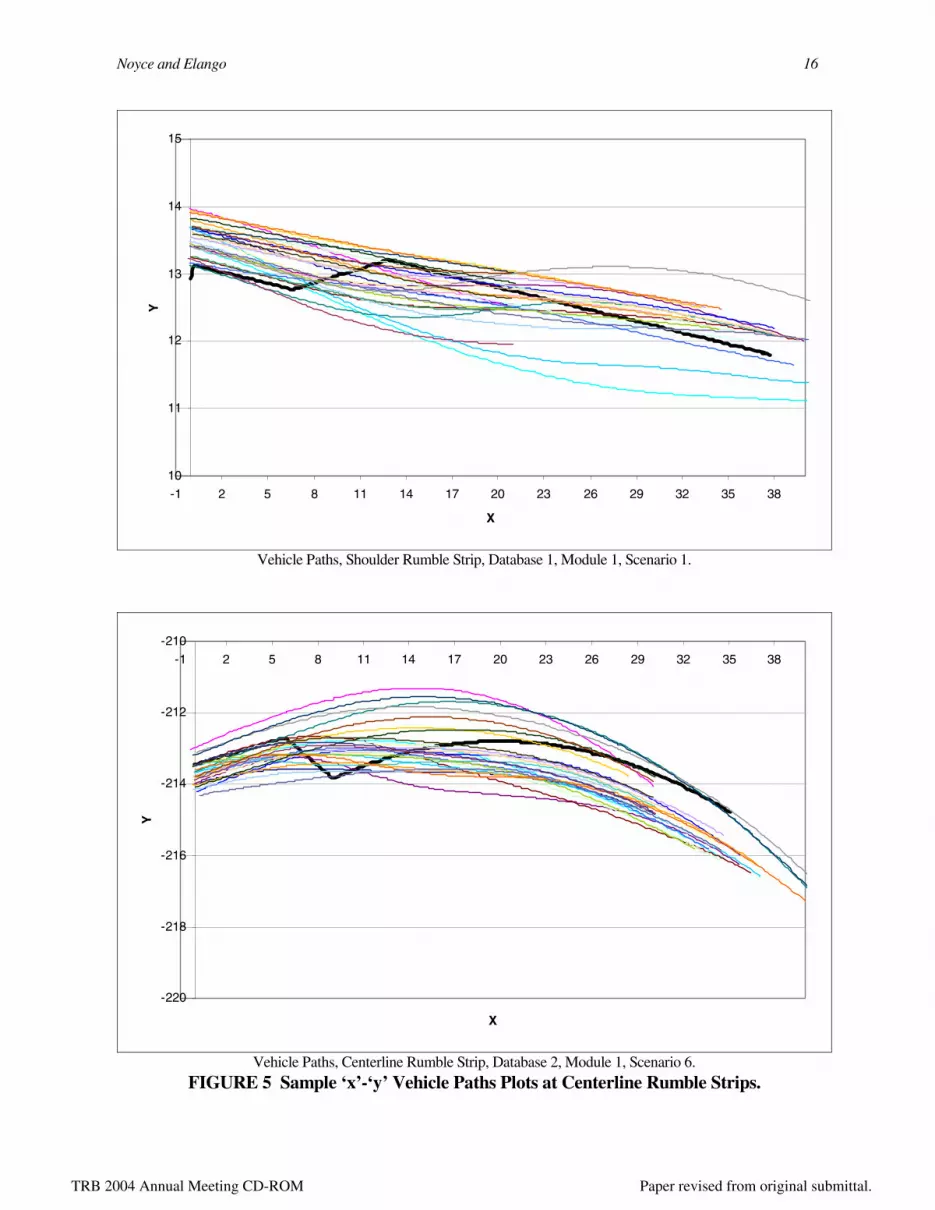
the change in crash frequency before and after the installation of centerline rumble strips is not statistically significant. Considering only State Route 2, the number of actual crashes was approximately one crash/year lower than predicted, with a "3.8 crash standard deviation. This finding results in a small percent improvement; however, the large standard deviation indicates that the results are not statistically significant. State Route 20 data shows that actual crashes were approximately 2.2 crashes/year greater than predicted, with a standard deviation of "2.9. This results in an estimated crash increase of 15 percent, with a standard deviation of "28 percent. Again, the results are not statistically significant. State Route 88 data shows that actual crashes were approximately 1 crash/year higher than predicted, not statistically significant. An expanded evaluation was made considering targeted crashes at the study sites with trends in all crash types at the comparison sites. Additionally, a more global evaluation was made, considering targeted crashes with trends in surrounding areas/towns to each study site. This evaluation compared trends in targeted crashes to the trend in all crashes in one or more nearby areas. The results from both analyses were consistent and again show no significant change in crash frequencies before and after the installation of centerline rumble strips. There were no significant trends in the comparison sites to conclude that the stability of the crash frequencies at the study location were a function of the environment. Considering all crash data, there was no statistical evidence to suggest that the installation of the centerline rumble strips significantly reduced crash rates; however, no fatal crashes occurred on State Route 2 and State Route 88 after the installation of centerline rumble strips. Three cross-over-the-centerline fatal crashes did occur on State Route 20 in the two-year period after the centerline rumble strips were installed, all involving loss of vehicle control near the same geometric feature. Centerline rumble strips are not an effective countermeasure for these crash types. No fatal crashes occurred on Route 20 after the installation of centerline rumble strips involving vehicles under control. These findings suggest the centerline rumble strips were effective in reducing the severity of crashes. Driving Simulator Analysis A total of 60 drivers completed the driving simulator experiment. Each database had 30 drivers, 15 male and 15 female. Twenty-six drivers were less than 40 years of age, 22 drivers were between 40 to 60 years of age, and 12 drivers were over 60 years old. The demographic distribution of the drivers who completed the experiment is presented in Table 4. To determine how drivers reacted to each centerline and shoulder rumble strip encounter (i.e., direction of vehicle trajectory), each vehicle path was traced in ‘x’ and ‘y’ coordinates (each coordinate value is 1 meter (3.28 feet)) and compared to a linear map of the rumble strip location. These plots provided a simple visual representation of vehicle trajectories to observe how drivers responded in each of the scenarios presented. Example ‘x-y’ plots for two of the driver-scenario combinations are presented in Figure 5. Note that on each plot, the solid black line shows the pavement edge or centerline location, with the sharp change in location representing the shift in edge/center line at the beginning of the rumble strip location. Recall that the roadway was experimentally shifted in the driving simulator, while the driver was distracted, to assure that the rumble strip was encountered. The curvature of the roadway (either left or right), reflected by the solid black line, allowed differentiation between vehicle trajectories and driver corrections due to roadway curvature and rumble strip incursions. Each of the thin gray-shaded lines in the figure
TRB 2004 Annual Meeting CD-ROM Paper revised from original submittal.
Noyce and Elango 7
represents a vehicle wheel path and its relation to the edge/center line. Lines that move in the positive ‘y’ direction and cross over the black centerline in scenarios that considered centerline rumble strips represent drivers who to some degree improperly correct (i.e., corrected left) when encountering the centerline rumble strip. These figures were used to visually evaluate the opposing lane incursions at each of the study scenarios locations. Recall that Table 2 provided a summary of the database, module, and scenario for each figure shown. A review of the trajectory data shows that several drivers corrected improperly when encountering centerline rumble strips. Increased variability in trajectory was observed as drivers reacted to the rumble strip encounter and determined the appropriate correction. The random lines on the centerline example in Figure 5, above the black line representing the centerline, indicates drivers whose initial reaction was more of a left-hand than a right-hand correction (a right-hand correction is appropriate for the centerline rumble strip encounter). An analysis was completed to compare the time to return to the lane with and without centerline rumble strips present. The results show that the mean time to return the lane, when there are no centerline rumble strips, was about 20 milliseconds less than that of the time to return when there are centerline rumble strips. These results were not statistically significant (p = 0.723).
Another analysis considered time for drivers to return to their lane in scenarios when drivers first encountered centerline rumble strips. Drivers took approximately 125 milliseconds longer to return to their travel lane when centerline rumble strips were encountered as compared to cross-over-the-centerline scenarios when no centerline rumble strips were present. The difference in mean times was not statistically significant (p = 0.112). The results imply that drivers took more time to return to the travel lane when they encountered centerline rumble strips. This difference became smaller as the number of encounters with centerline rumble strips increased. It appeared that, with experience, drivers were quicker to return to the appropriate travel lane.
The next evaluation considered the effects of passing/no passing zones and curved/straight alignments on the time to return back to the travel lane. Differences between the times to return to the travel lane, when centerline rumble strips were or were not present, were compared in this analysis. Findings show that there was a statistically significant difference in mean time on curved sections (p = 0.001). This result implies that geometry of the road has an effect on the time to return to the travel lane when centerline rumble strips are present. There was no statistically significant difference when passing/no passing zones were considered (p = 0.255). Passing or no passing zones did not have a direct effect on the time to return to the travel lane.
A follow-up analysis compared the performance of drivers on shoulder rumble strips and centerline rumble strips. The results showed that on average, drivers took approximately 250 milliseconds more time to return to the travel lane after encountering shoulder rumble strips when compared to the average time it took to return to the travel lane after encountering centerline rumble strips. These results were statistically significant (p = 0.0001). The last analysis determined the percentage of drivers who turn incorrectly when they encountered centerline rumble strips. The results are presented in Figure 6. Considering all scenarios, approximately 27 percent of drivers initially corrected left (versus right) after encountering centerline rumble strips. Nearly 37 percent of the drivers corrected left when they encountered centerline rumble strips in curve and no passing segments of the roads, and 27 percent of the drivers in curve and passing segments of the roads. Twenty-eight percent of the drivers corrected left initially when they encountered centerline rumble strips for the first time. Between 20 and 23 percent of drivers corrected left on the straight roadway segments. There were no significant sex or
TRB 2004 Annual Meeting CD-ROM Paper revised from original submittal.
Noyce and Elango 8
age effects in the results. Note that no opposing traffic was present in any of the scenarios although the nighttime and haze conditions limited visibility. As a comparison, an evaluation was completed on the shoulder rumble strip encounters to determine how many drivers corrected right instead of the desired left correction. From a review of the observations and simulator data, the results showed that no drivers initially corrected right when encountering a shoulder rumble strip. Furthermore, drivers appeared more comfortable when they encountered shoulder rumble strips whereas they appeared to be more alarmed when they encountered centerline rumble strips. The hypothesis that drivers may correct left instead of right with centerline rumble strips because of previous a priori expectancies appears to be valid. CONCLUSIONS Twenty of the 50 state Departments of Transportation, along with several provinces in Canada, are using centerline rumble strips. States who do not plan to use centerline rumble strips had concerns with noise, pavement deterioration, pooling of water in the rumble strips and freezing in winter, and the safety of motorcyclists and bicyclists. A detailed analysis of crashes on Massachusetts State Routes 2, 20, and 88, before and after the installation of centerline rumble strips, found that State Route 2 experienced a slight decrease in the annual frequency of targeted crash types while State Route 20 and State Route 88 remained relatively consistent. Several of the comparison sites, specifically State Route 18 and State Route 131, witnessed significant increases in targeted crash types. An analysis of fatal crashes at the study locations, during the analysis period, provides more insight into the effectiveness of centerline rumble strips. No fatal crashes were experienced on State Routes 2 and 88 in the analysis area since the installation of the centerline rumble strips. Three cross-over-the-centerline fatal crashes did occur on State Route 20 after the centerline rumble strips were installed; centerline rumble strips where not a countermeasure to these crash types. No fatal crashes were experienced in 1999 and 2000. The results of the crash data analysis showed no significant change in crash frequencies before and after the installation of centerline rumble strips. There were no significant trends in the comparison sites to conclude that the stability of the crash frequencies at the study location were a function of the environment. There was no evidence to suggest the installation of centerline rumble strips significantly reduced crash rates. No fatal crashes have occurred on State Routes 2 and 88 since the installation of centerline rumble strips, which may be attributed to the benefits of centerline rumble strips. Three cross-over-the-centerline fatal crashes did occur on State Route 20 after the centerline rumble strips were installed, all near the same geometric feature. The results of the driving simulator analysis found that drivers took more time to return to the travel lane when centerline rumble strips were present as compared to when centerline rumble strips were not present. This result was probably due to a violation of driver’s expectancy with the centerline rumble strip encounter. Considering all scenarios, the difference in the mean time to return to the travel lane was significantly higher during the first encounter, but improved with experience and exposure. Drivers reacted to and correct the vehicle trajectory more quickly with centerline rumble strip encounters than with shoulder rumbles strip encounters. Familiarity with shoulder rumble strips is likely the reason for this result. An initial concern expressed by at least one state who has not installed centerline rumble strips, and hypothesized by the research team, was validated. That is, some drivers did correct left
TRB 2004 Annual Meeting CD-ROM Paper revised from original submittal.

Noyce and Elango 9
instead of right when encountering centerline rumble strips. Approximately 27 percent of the drivers made an initial leftward correction of the vehicle when encountering centerline rumble strips. Results varied from approximately 20 percent of drivers on straight roadway segments to 37 percent of drivers on curved roadway segments of sufficient radius to require no passing zones. It can be hypothesized that the unexpectedly high percentage of drivers correcting left is due to the laboratory conditions, lack of opposing vehicles in the simulation, the experimental nature of this research, less than normal driving conditions, or limited exposure to actual centerline rumble strip installations. Additionally, the increase in the percentage of left corrections on horizontal curves may be due simply to the uniqueness of the simulated driving environment. Nevertheless, it is difficult to deny the fact that there is some probability of a driver becoming confused and reacting improperly. Considering a drowsy or inattentive driver who is unaware of their roadway position, this result is potentially concerning. Yet centerline rumble strips were effective at gaining driver’s attention, and although a slight correction into the opposing lane is not ideal, the attentiveness gained by the centerline rumble strips may still prevent a crash or result in a far less severe incident than a complete head-on collision with a drowsy driver. The majority of drivers made proper corrections when encountering centerline rumble strips demonstrating their value at improving safety on the national roadway system. Furthermore, no improper (rightward) corrections were experienced with shoulder rumble strip scenarios. Considering all results from the three research phases presented, centerline rumble strips are an effective traffic control device and safety countermeasure in areas with a history of cross-over-the-centerline fatal and severe injury crashes. The results show positive trends in fatal and injury crash reductions; however, a statistically significant decrease in all crashes was not observed. The fatal crashes on State Route 20 after the installation of centerline rumble strips demonstrate the fact that centerline rumble strips can only warn but not prevent drivers from crossing over the roadway centerline. RECOMMENDATIONS The authors recommend that further research be completed pertaining to the human factors elements of centerline rumble strips. Some consideration should be given to an alternate configuration or intermittent layout of centerline rumble strips to produce a different tone and message to the driver (as used in New Mexico) than that which is experienced with continuous shoulder rumble strips. Placing narrow rumble strips on both sides of the centerline, not affecting the center joint of the pavement or pavement marking, and creating an earlier warning of lane departure, should also be considered. ACKNOWLEDGMENTS The research presented in this paper was funded as part of the Massachusetts Highway Department (MassHighway) Research Program. The author’s thank Stephen Pepin, Director of Research, Charles Sterling, State Traffic Engineer, and Andreina Luckett, Traffic Operations Engineer, for their support and review of this research. A full research report can be obtained from MassHighway.
TRB 2004 Annual Meeting CD-ROM Paper revised from original submittal.

Noyce and Elango 10
REFERENCES 1. National Highway Traffic Safety Administration (NHTSA), Crash Information Web Site.
Traffic Safety Facts 2002. Early Edition. http://www-nrd.nhtsa.dot.gov/pdf/nrd-30/NCSA/TSFAnn/TSF2002EE.pdf, Accessed November 11, 2003.
2. AASHTO Strategic Highway Safety Plan, A Comprehensive Plan to Substantially Reduce Vehicle-Related Fatalities and Injuries on the Nation’s Highways, American Association of State Highway and Transportation Officials (AASHTO), Washington, D.C., 1998.
3. Federal Highway Administration (FHWA) – Wyoming Divisions Office, Shoulder Rumble Strips - Effectiveness and Current Practice. http://safety.fhwa.dot.gov/fourthlevel/rumble/state_wyom.htm. Accessed November 20, 2000.
4. Federal Highway Administration (FHWA), Safety - Run-off-the-Road Rumble Strips. http://safety.fhwa.dot.gov/programs/ rumble.htm. Accessed November 15, 2000.
5. Garder, P., and J. Alexander. Fatigue Related Accidents and Continuous Shoulder Rumble Strips. http://www.umeciv.maine.edu/ce/research/rumbles.htm. Accessed on November 20, 2000.
6. Griffith, Michael S. Safety Evaluation of Rolled-In Continuous Shoulder Rumble Strips Installed on Freeways. In Transportation Research Record 1665, TRB, National Research Council, Washington, D.C., 1999, pp. 28–34.
7. Harwood, D.W. NCHRP Synthesis 191: Use of Rumble Strips to Enhance Safety. TRB, National Research Council, Washington, D.C., 1993.
8. Brin, T.S., M.J. Rys, and E.R. Russell. Centerline Rumble Strips on Two-Lane Roads in the U.S. Kansas State University, K-TRAN Project Number KSU (00)-1, Manhattan, KS, 2000.
9. Outcalt, William. Centerline Rumble Strips. Report No. CDOT-DTD-R-2001-8 Interim Report, Colorado Department of Transportation, Denver, CO, August 2001.
10. Delaware Department of Transportation. Centerline Rumble Strips – The Delaware Experience. http://www.deldot.net/static/projects/rumblestrip/handout.pdf. Accessed December 4, 2002.
11. Bahar, G., J. Wales, and L. Longtin-Nobel. Synthesis of Best Practices for the Implementation of Shoulder and Centerline Rumble Strips. Transportation Association of Canada, Ottawa, ON, 2001.
12. Russell, E.R., R. Stokes, and M.J. Rys. Guidelines for Centerline Rumble Strips on Two-Lane Rural Highways – Draft Report. Kansas State University, K-TRAN Project Number KSU (00)-1, Manhattan, KS, 2000.
13. Russell, E.R., M.J. Rys, and T. Brin. Reducing Crossover Collisions on Kansas Highways Using Milled Centerline Rumble Strips – Preliminary Report. Kansas State University, K-TRAN Project Number KSU (00)-1, Manhattan, KS, 2000.
14. Hauer, E. Observational Before-After Studies in Road Safety. Elsevier Sciences, Tarrytown, NY, 1997.
TRB 2004 Annual Meeting CD-ROM Paper revised from original submittal.

Noyce and Elango 11
LIST OF FIGURES AND TABLES Figures FIGURE 1 Centerline Rumble Strip on State Route 20 in Massachusetts. FIGURE 2 Centerline Rumble Strip Locations on Two-Lane Undivided Roadways in Massachusetts. FIGURE 3 Driving Simulator at the University of Massachusetts. FIGURE 4 Location of Vibrator Motors Inside Vehicle Cab. FIGURE 5 Sample ‘x’-‘y’ Vehicle Paths Plots at Centerline Rumble Strips. FIGURE 6 Percentage of Drivers Who Corrected Left or Right at First Centerline Rumble Strip Encounter. Tables TABLE 1 Centerline Rumble Strip Locations in Massachusetts TABLE 2 Simulator Experimental Scenarios TABLE 3 Targeted Crash Frequency Data for Comparison Sites TABLE 4 Demographic Distribution of Simulator Drivers
TRB 2004 Annual Meeting CD-ROM Paper revised from original submittal.
Noyce and Elango 12
FIGURE 1 Centerline Rumble Strip on State Route 20 in Massachusetts.
TRB 2004 Annual Meeting CD-ROM Paper revised from original submittal.

Noyce and Elango 13
FIGURE 2 Centerline Rumble Strips Locations on Two-Lane Undivided Roadways in
Massachusetts.
State Route 2
State Route 20
State Route 88
TRB 2004 Annual Meeting CD-ROM Paper revised from original submittal.

Noyce and Elango 14
FIGURE 3 Driving Simulator at the University of Massachusetts.
TRB 2004 Annual Meeting CD-ROM Paper revised from original submittal.
Noyce and Elango 15
FIGURE 4 Location of Vibrator Motors Inside Vehicle Cab.
Vibrating Motors
TRB 2004 Annual Meeting CD-ROM Paper revised from original submittal.
Noyce and Elango 16
10
11
12
13
14
15
-1 2 5 8 11 14 17 20 23 26 29 32 35 38
X
Y
Vehicle Paths, Shoulder Rumble Strip, Database 1, Module 1, Scenario 1.
-220
-218
-216
-214
-212
-210
-1 2 5 8 11 14 17 20 23 26 29 32 35 38
X
Y
Vehicle Paths, Centerline Rumble Strip, Database 2, Module 1, Scenario 6.
FIGURE 5 Sample ‘x’-‘y’ Vehicle Paths Plots at Centerline Rumble Strips.
TRB 2004 Annual Meeting CD-ROM Paper revised from original submittal.

Noyce and Elango 17
0
10
20
30
40
50
60
70
80
90
Curve, NoPassing
Curve, Passing Straight, NoPassing
Straight, Passing First Encounterwith CRS
Overall
Scenario
Per
cen
tag
e
Percent Correcting Left
Percent Correcting Right
FIGURE 6 Percentage of Drivers Who Corrected Left or Right at First Centerline Rumble Strip Encounter.
TRB 2004 Annual Meeting CD-ROM Paper revised from original submittal.
Noyce and Elango 18
TABLE 1 Centerline Rumble Strip Locations in Massachusetts State Route Town Limits Length
Date of Installation
Average ADT
Erving Wendell Orange Athol
2
Phillipston
Near Exit 14 in Erving to Mile Marker 78 in
Phillipston 9.12 miles
November, 1998
9,000
Sturbridge Charlton
20
Oxford
Route 49 in Sturbridge to Route 12 in Oxford
10 miles* November,
1996 8,600
88 Westport Drift Road to Briggs Road
6.14 miles November,
1998 7,000
* A 12,500 foot section of State Route 20 from Depot Road to Richardson’s Corner was under construction in 1999 (no rumble strips).
TRB 2004 Annual Meeting CD-ROM Paper revised from original submittal.
Noyce and Elango 19
TABLE 2 Simulator Experimental Scenarios
Database 1
Scenario No Module 1 Module 2
1 Straight, No passing, SRS Straight, No passing, SRS
2 Straight, No passing, SRS Straight, No passing, SRS
3 Curved, No passing, SRS Curved, No passing, SRS
4 Curved, No passing, CRS Straight, No passing, No CRS
5 Straight, Passing, No CRS Curved, No passing, No CRS
6 Curved, Passing, No CRS Straight, Passing, CRS
7 Straight, No passing, CRS Curved, Passing, CRS
Database 2
Scenario No Module 1 Module 2
1 Straight, No passing, SRS Straight, No passing, SRS
2 Straight, No passing, SRS Straight, No passing, SRS
3 Curved, No passing, SRS Curved, No passing, SRS
4 Curved, Passing, No CRS Straight, Passing, CRS
5 Straight, No passing, CRS Curved, No passing, No CRS
6 Curved, No passing, CRS Straight, No passing, No CRS
7 Straight, Passing, No CRS Curved, Passing, CRS SRS – Shoulder rumble strips CRS – Centerline rumble strips
TRB 2004 Annual Meeting CD-ROM Paper revised from original submittal.
Noyce and Elango 20
TABLE 3 Targeted Crash Frequency Data for Comparison Sites
Route\Year Average
ADT (vpd) 1995 1996 1997 1998 1999 2000
Study Sites
Route 2 9,000 7 8 7 4 (before); 1 (after)
6 5
Route 20 8,600 6 7
(before); 2 (after)
5 6 5 6
Route 88 7,000 0 0 1 0 (before); 0 (after)
1 1
Comparison Sites
Route 2A 8,500 11 4 7 2 6 8
Route 202 3,200 2 3 3 4 3 2
Route 31 6,500 1 4 0 1 2 1
Route 49 8,000 1 1 0 1 1 2
Route 131 18,000 7 14 10 6 6 16
Route 177 7,000 0 0 3 1 2 7
Route 18 16,000 16 19 30 37 34 36
TRB 2004 Annual Meeting CD-ROM Paper revised from original submittal.

Noyce and Elango 21
TABLE 4 Demographic Distribution of Simulator Drivers
Database 1 Module 1, Module 2 Module 2, Module 1
Age Male Female Age Male Female
<20 0 1 <20 2 0
20 – 30 2 2 20 - 30 0 2
30 – 40 1 1 30 - 40 1 1
40 – 50 3 1 40 - 50 1 3
50 – 60 1 0 50 - 60 1 0
60+ 1 2 60+ 2 2
Total 8 7 Total 7 8
Database 2 Module 1, Module 2 Module 2, Module 1
Age Male Female Age Male Female
<20 0 1 <20 1 1
20 - 30 4 2 20 - 30 1 1
30 - 40 0 1 30 - 40 1 0
40 - 50 2 1 40 - 50 1 3
50 - 60 0 2 50 - 60 2 1
60+ 1 1 60+ 2 1
Total 7 8 Total 8 7
TRB 2004 Annual Meeting CD-ROM Paper revised from original submittal.