root architecture of six tropical seagrass species, growing in three contrasting habitats in...
TRANSCRIPT
Aquatic Botany 90 (2009) 235–245
Root architecture of six tropical seagrass species, growing in three contrastinghabitats in Indonesian waters
W. Kiswara a,b, N. Behnke b, P. van Avesaath b, A.H.L. Huiskes b, P.L.A. Erftemeijer c, T.J. Bouma b,*a Research Centre for Oceanography, Indonesian Institute of Sciences, Jl. Pasir Putih No. 1, Ancol Timur Jakarta Utara, Indonesiab Netherlands Institute of Ecology (NIOO-KNAW), Koringaweg 7, 4401 AC Yerseke, The Netherlandsc Deltares (formerly Delft Hydraulics), Rotterdamseweg 185, 2600 MH Delft, The Netherlands
A R T I C L E I N F O
Article history:
Received 14 November 2007
Received in revised form 20 October 2008
Accepted 24 October 2008
Available online 5 November 2008
Keywords:
Root architecture
Oligotrophic
Tropical seagrass
Toplogical index
Root branching
A B S T R A C T
Although several recent studies point at the importance of seagrass roots for nutrient acquisition in
oligotrophic tropical ecosystems, remarkably little is known about the root architecture of tropical
seagrasses. The present study provides a detailed description of the root architecture of six seagrass
species that were extracted from three sites differing in sediment type and nutrient availability (i.e.,
except for one species that was not present at one of the sites). Number of roots per node, order of root
branching, length and diameter per root order, root hair density and length were determined and used to
calculate a topological index for the different species and habitats. Root architecture differed strongly
between species. The relatively long-lived and slowly-growing species Thalassia hemprichii and Enhalus
acoroides were characterised by short internodes with relatively few unbranched roots per node and a
high root hair density. More fast growing species such as Cymodocea rotundata, Cymodocea serrulata and
Syringodium isoetifolium had many roots per node, the majority of which were branched. Surprisingly,
differences in sediment type and nutrient availability, as present between locations, had little effect on
root architecture. We expect this to be due to a relatively homogeneous nutrient distribution at the small
scale within water saturated sediments. Overall, all seagrass species had relatively simple branching
(topological index> 0.7), comparable to angiosperms of the low temperate salt marsh. We speculate that
relatively simple root architecture of plants in flooded systems reflects the need for a minimal path length
for oxygen transport from shoots to roots.
� 2009 Published by Elsevier B.V.
Contents lists available at ScienceDirect
Aquatic Botany
journal homepage: www.e lsev ier .com/ locate /aquabot
1. Introduction
Seagrasses are ecologically well studied and economicallyimportant vegetations, that often occur in oligotrophic coastalecosystems (Duarte and Chiscano, 1999; Costanza et al., 1997; Orthet al., 2006). In such oligotrophic ecosystems, seagrasses have acontinuous need for nutrients due to their relatively low efficiencyin reusing internal nutrient pools (Stapel and Hemminga, 1997;Hemminga et al., 1999; Romero et al., 2006). Calculations onnutrient balance constraints (Erftemeijer and Middelburg, 1995)and recent observations on nutrient uptake from (particulate)organic matter that is trapped within the sediment (Evrard et al.,2005; Barron et al., 2006; Vonk et al., 2008a; but see Kilminster
* Corresponding author at: Netherlands Institute of Ecology, Centre for Estuarine
and Marine Ecology, P.O. Box 140, 4400 AC Yerseke, The Netherlands.
E-mail address: [email protected] (T.J. Bouma).
0304-3770/$ – see front matter � 2009 Published by Elsevier B.V.
doi:10.1016/j.aquabot.2008.10.005
et al., 2006), underline the importance of seagrass roots foracquiring nutrients in addition to foliar uptake. Moreover, nutrientlimitations have been shown to enhance root development (Perezet al., 1994). However, until now, little work has focused on theform and functioning of seagrass roots (Duarte, 1999).
Architecture (Fitter, 1987, 1991; Fitter et al., 1991, 2002; Boumaet al., 2001a), plasticity (Campbell et al., 1991; De Kroon andMommer, 2006; but see Kembel and Cahill, 2005) and longevity(Eissenstat and Yanai, 1997; Bouma et al., 2001b) have beenidentified as important factors in determining the overall nutrientcapture and efficiency (nutrient gain per carbon expenditure) ofroot systems. Root architecture and root plasticity may offerseagrass species advantages in acquiring nutrients in contrastingsediment types that differ in nutrient availability, such as e.g.carbonaceous nutrient-poor sediments as well as in more muddyand nutrient-rich sediments (Erftemeijer and Middelburg, 1993;Kamp-Nielsen et al., 2002). However, roots are also important foranchoring seagrasses and below-ground biomass distributions are
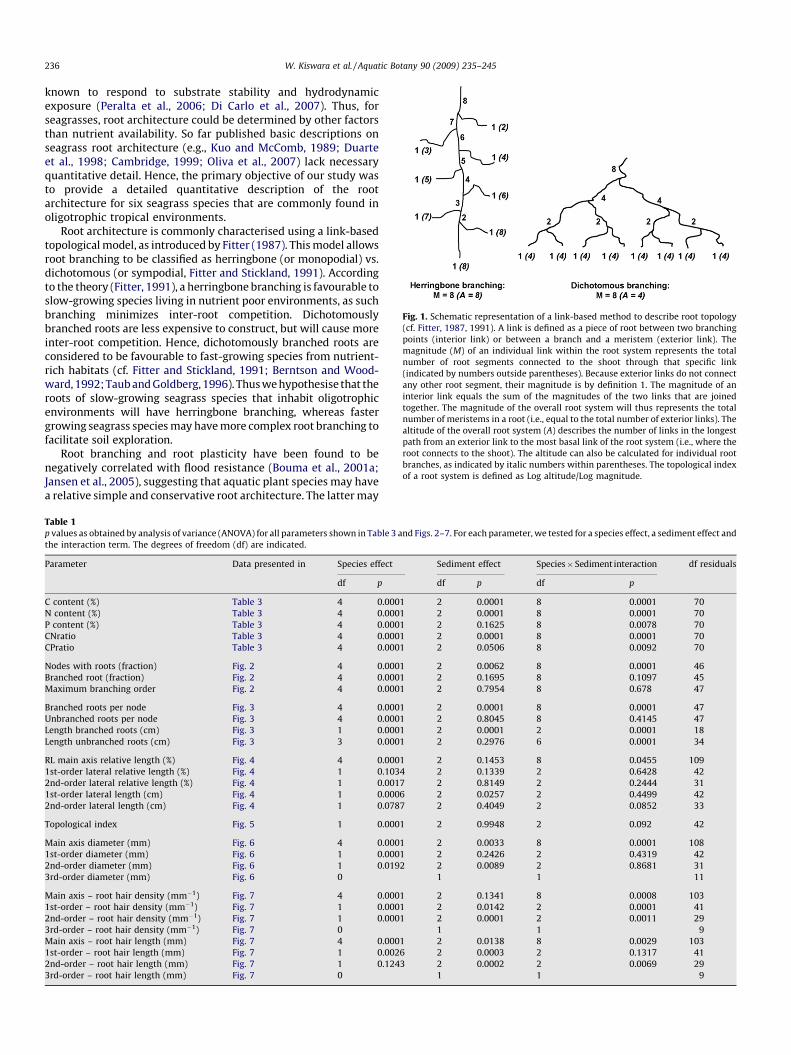
Fig. 1. Schematic representation of a link-based method to describe root topology
(cf. Fitter, 1987, 1991). A link is defined as a piece of root between two branching
points (interior link) or between a branch and a meristem (exterior link). The
magnitude (M) of an individual link within the root system represents the total
number of root segments connected to the shoot through that specific link
(indicated by numbers outside parentheses). Because exterior links do not connect
any other root segment, their magnitude is by definition 1. The magnitude of an
interior link equals the sum of the magnitudes of the two links that are joined
together. The magnitude of the overall root system will thus represents the total
number of meristems in a root (i.e., equal to the total number of exterior links). The
altitude of the overall root system (A) describes the number of links in the longest
path from an exterior link to the most basal link of the root system (i.e., where the
root connects to the shoot). The altitude can also be calculated for individual root
branches, as indicated by italic numbers within parentheses. The topological index
of a root system is defined as Log altitude/Log magnitude.
W. Kiswara et al. / Aquatic Botany 90 (2009) 235–245236
known to respond to substrate stability and hydrodynamicexposure (Peralta et al., 2006; Di Carlo et al., 2007). Thus, forseagrasses, root architecture could be determined by other factorsthan nutrient availability. So far published basic descriptions onseagrass root architecture (e.g., Kuo and McComb, 1989; Duarteet al., 1998; Cambridge, 1999; Oliva et al., 2007) lack necessaryquantitative detail. Hence, the primary objective of our study wasto provide a detailed quantitative description of the rootarchitecture for six seagrass species that are commonly found inoligotrophic tropical environments.
Root architecture is commonly characterised using a link-basedtopological model, as introduced by Fitter (1987). This model allowsroot branching to be classified as herringbone (or monopodial) vs.dichotomous (or sympodial, Fitter and Stickland, 1991). Accordingto the theory (Fitter, 1991), a herringbone branching is favourable toslow-growing species living in nutrient poor environments, as suchbranching minimizes inter-root competition. Dichotomouslybranched roots are less expensive to construct, but will cause moreinter-root competition. Hence, dichotomously branched roots areconsidered to be favourable to fast-growing species from nutrient-rich habitats (cf. Fitter and Stickland, 1991; Berntson and Wood-ward, 1992; Taub and Goldberg, 1996). Thus we hypothesise that theroots of slow-growing seagrass species that inhabit oligotrophicenvironments will have herringbone branching, whereas fastergrowing seagrass species may have more complex root branching tofacilitate soil exploration.
Root branching and root plasticity have been found to benegatively correlated with flood resistance (Bouma et al., 2001a;Jansen et al., 2005), suggesting that aquatic plant species may havea relative simple and conservative root architecture. The latter may
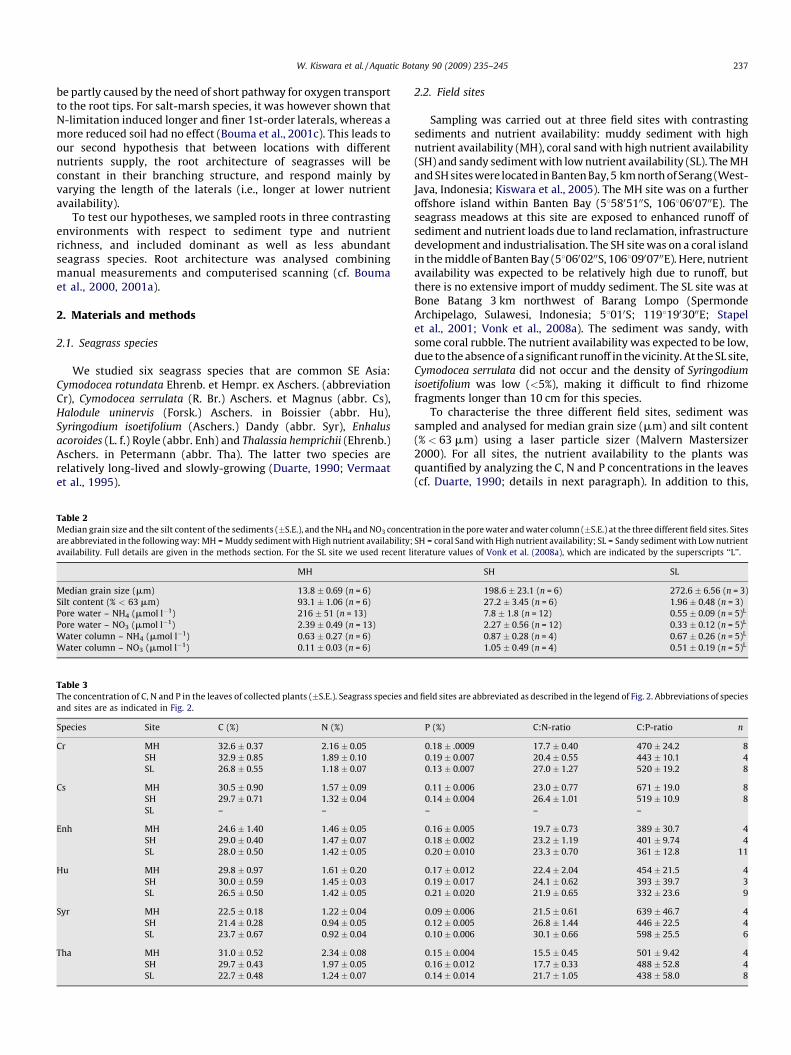
Table 1p values as obtained by analysis of variance (ANOVA) for all parameters shown in Table 3 and Figs. 2–7. For each parameter, we tested for a species effect, a sediment effect and
the interaction term. The degrees of freedom (df) are indicated.
Parameter Data presented in Species effect Sediment effect Species�Sediment interaction df residuals
df p df p df p
C content (%) Table 3 4 0.0001 2 0.0001 8 0.0001 70
N content (%) Table 3 4 0.0001 2 0.0001 8 0.0001 70
P content (%) Table 3 4 0.0001 2 0.1625 8 0.0078 70
CNratio Table 3 4 0.0001 2 0.0001 8 0.0001 70
CPratio Table 3 4 0.0001 2 0.0506 8 0.0092 70
Nodes with roots (fraction) Fig. 2 4 0.0001 2 0.0062 8 0.0001 46
Branched root (fraction) Fig. 2 4 0.0001 2 0.1695 8 0.1097 45
Maximum branching order Fig. 2 4 0.0001 2 0.7954 8 0.678 47
Branched roots per node Fig. 3 4 0.0001 2 0.0001 8 0.0001 47
Unbranched roots per node Fig. 3 4 0.0001 2 0.8045 8 0.4145 47
Length branched roots (cm) Fig. 3 1 0.0001 2 0.0001 2 0.0001 18
Length unbranched roots (cm) Fig. 3 3 0.0001 2 0.2976 6 0.0001 34
RL main axis relative length (%) Fig. 4 4 0.0001 2 0.1453 8 0.0455 109
1st-order lateral relative length (%) Fig. 4 1 0.1034 2 0.1339 2 0.6428 42
2nd-order lateral relative length (%) Fig. 4 1 0.0017 2 0.8149 2 0.2444 31
1st-order lateral length (cm) Fig. 4 1 0.0006 2 0.0257 2 0.4499 42
2nd-order lateral length (cm) Fig. 4 1 0.0787 2 0.4049 2 0.0852 33
Topological index Fig. 5 1 0.0001 2 0.9948 2 0.092 42
Main axis diameter (mm) Fig. 6 4 0.0001 2 0.0033 8 0.0001 108
1st-order diameter (mm) Fig. 6 1 0.0001 2 0.2426 2 0.4319 42
2nd-order diameter (mm) Fig. 6 1 0.0192 2 0.0089 2 0.8681 31
3rd-order diameter (mm) Fig. 6 0 1 1 11
Main axis – root hair density (mm�1) Fig. 7 4 0.0001 2 0.1341 8 0.0008 103
1st-order – root hair density (mm�1) Fig. 7 1 0.0001 2 0.0142 2 0.0001 41
2nd-order – root hair density (mm�1) Fig. 7 1 0.0001 2 0.0001 2 0.0011 29
3rd-order – root hair density (mm�1) Fig. 7 0 1 1 9
Main axis – root hair length (mm) Fig. 7 4 0.0001 2 0.0138 8 0.0029 103
1st-order – root hair length (mm) Fig. 7 1 0.0026 2 0.0003 2 0.1317 41
2nd-order – root hair length (mm) Fig. 7 1 0.1243 2 0.0002 2 0.0069 29
3rd-order – root hair length (mm) Fig. 7 0 1 1 9
W. Kiswara et al. / Aquatic Botany 90 (2009) 235–245 237
be partly caused by the need of short pathway for oxygen transportto the root tips. For salt-marsh species, it was however shown thatN-limitation induced longer and finer 1st-order laterals, whereas amore reduced soil had no effect (Bouma et al., 2001c). This leads toour second hypothesis that between locations with differentnutrients supply, the root architecture of seagrasses will beconstant in their branching structure, and respond mainly byvarying the length of the laterals (i.e., longer at lower nutrientavailability).
To test our hypotheses, we sampled roots in three contrastingenvironments with respect to sediment type and nutrientrichness, and included dominant as well as less abundantseagrass species. Root architecture was analysed combiningmanual measurements and computerised scanning (cf. Boumaet al., 2000, 2001a).
2. Materials and methods
2.1. Seagrass species
We studied six seagrass species that are common SE Asia:Cymodocea rotundata Ehrenb. et Hempr. ex Aschers. (abbreviationCr), Cymodocea serrulata (R. Br.) Aschers. et Magnus (abbr. Cs),Halodule uninervis (Forsk.) Aschers. in Boissier (abbr. Hu),Syringodium isoetifolium (Aschers.) Dandy (abbr. Syr), Enhalus
acoroides (L. f.) Royle (abbr. Enh) and Thalassia hemprichii (Ehrenb.)Aschers. in Petermann (abbr. Tha). The latter two species arerelatively long-lived and slowly-growing (Duarte, 1990; Vermaatet al., 1995).
Table 3The concentration of C, N and P in the leaves of collected plants (�S.E.). Seagrass species an
and sites are as indicated in Fig. 2.
Species Site C (%) N (%)
Cr MH 32.6 � 0.37 2.16 � 0.05
SH 32.9 � 0.85 1.89 � 0.10
SL 26.8 � 0.55 1.18 � 0.07
Cs MH 30.5 � 0.90 1.57 � 0.09
SH 29.7 � 0.71 1.32 � 0.04
SL – –
Enh MH 24.6 � 1.40 1.46 � 0.05
SH 29.0 � 0.40 1.47 � 0.07
SL 28.0 � 0.50 1.42 � 0.05
Hu MH 29.8 � 0.97 1.61 � 0.20
SH 30.0 � 0.59 1.45 � 0.03
SL 26.5 � 0.50 1.42 � 0.05
Syr MH 22.5 � 0.18 1.22 � 0.04
SH 21.4 � 0.28 0.94 � 0.05
SL 23.7 � 0.67 0.92 � 0.04
Tha MH 31.0 � 0.52 2.34 � 0.08
SH 29.7 � 0.43 1.97 � 0.05
SL 22.7 � 0.48 1.24 � 0.07
Table 2Median grain size and the silt content of the sediments (�S.E.), and the NH4 and NO3 concen
are abbreviated in the following way: MH = Muddy sediment with High nutrient availability;
availability. Full details are given in the methods section. For the SL site we used recent l
MH
Median grain size (mm) 13.8 � 0.69 (n = 6)
Silt content (% < 63 mm) 93.1 � 1.06 (n = 6)
Pore water – NH4 (mmol l�1) 216 � 51 (n = 13)
Pore water – NO3 (mmol l�1) 2.39 � 0.49 (n = 13)
Water column – NH4 (mmol l�1) 0.63 � 0.27 (n = 6)
Water column – NO3 (mmol l�1) 0.11 � 0.03 (n = 6)
2.2. Field sites
Sampling was carried out at three field sites with contrastingsediments and nutrient availability: muddy sediment with highnutrient availability (MH), coral sand with high nutrient availability(SH) and sandy sediment with low nutrient availability (SL). The MHand SH sites were located in Banten Bay, 5 km north of Serang (West-Java, Indonesia; Kiswara et al., 2005). The MH site was on a furtheroffshore island within Banten Bay (585805100S, 10680600700E). Theseagrass meadows at this site are exposed to enhanced runoff ofsediment and nutrient loads due to land reclamation, infrastructuredevelopment and industrialisation. The SH site was on a coral islandin the middle of Banten Bay (580600200S, 10680900700E). Here, nutrientavailability was expected to be relatively high due to runoff, butthere is no extensive import of muddy sediment. The SL site was atBone Batang 3 km northwest of Barang Lompo (SpermondeArchipelago, Sulawesi, Indonesia; 58010S; 11981903000E; Stapelet al., 2001; Vonk et al., 2008a). The sediment was sandy, withsome coral rubble. The nutrient availability was expected to be low,due to the absence of a significant runoff in the vicinity. At the SL site,Cymodocea serrulata did not occur and the density of Syringodium
isoetifolium was low (<5%), making it difficult to find rhizomefragments longer than 10 cm for this species.
To characterise the three different field sites, sediment wassampled and analysed for median grain size (mm) and silt content(% < 63 mm) using a laser particle sizer (Malvern Mastersizer2000). For all sites, the nutrient availability to the plants wasquantified by analyzing the C, N and P concentrations in the leaves(cf. Duarte, 1990; details in next paragraph). In addition to this,
d field sites are abbreviated as described in the legend of Fig. 2. Abbreviations of species
P (%) C:N-ratio C:P-ratio n
0.18 � .0009 17.7 � 0.40 470 � 24.2 8
0.19 � 0.007 20.4 � 0.55 443 � 10.1 4
0.13 � 0.007 27.0 � 1.27 520 � 19.2 8
0.11 � 0.006 23.0 � 0.77 671 � 19.0 8
0.14 � 0.004 26.4 � 1.01 519 � 10.9 8
– – –
0.16 � 0.005 19.7 � 0.73 389 � 30.7 4
0.18 � 0.002 23.2 � 1.19 401 � 9.74 4
0.20 � 0.010 23.3 � 0.70 361 � 12.8 11
0.17 � 0.012 22.4 � 2.04 454 � 21.5 4
0.19 � 0.017 24.1 � 0.62 393 � 39.7 3
0.21 � 0.020 21.9 � 0.65 332 � 23.6 9
0.09 � 0.006 21.5 � 0.61 639 � 46.7 4
0.12 � 0.005 26.8 � 1.44 446 � 22.5 4
0.10 � 0.006 30.1 � 0.66 598 � 25.5 6
0.15 � 0.004 15.5 � 0.45 501 � 9.42 4
0.16 � 0.012 17.7 � 0.33 488 � 52.8 4
0.14 � 0.014 21.7 � 1.05 438 � 58.0 8
tration in the pore water and water column (�S.E.) at the three different field sites. Sites
SH = coral Sand with High nutrient availability; SL = Sandy sediment with Low nutrient
iterature values of Vonk et al. (2008a), which are indicated by the superscripts ‘‘L’’.
SH SL
198.6 � 23.1 (n = 6) 272.6 � 6.56 (n = 3)
27.2 � 3.45 (n = 6) 1.96 � 0.48 (n = 3)
7.8 � 1.8 (n = 12) 0.55 � 0.09 (n = 5)L
2.27 � 0.56 (n = 12) 0.33 � 0.12 (n = 5)L
0.87 � 0.28 (n = 4) 0.67 � 0.26 (n = 5)L
1.05 � 0.49 (n = 4) 0.51 � 0.19 (n = 5)L
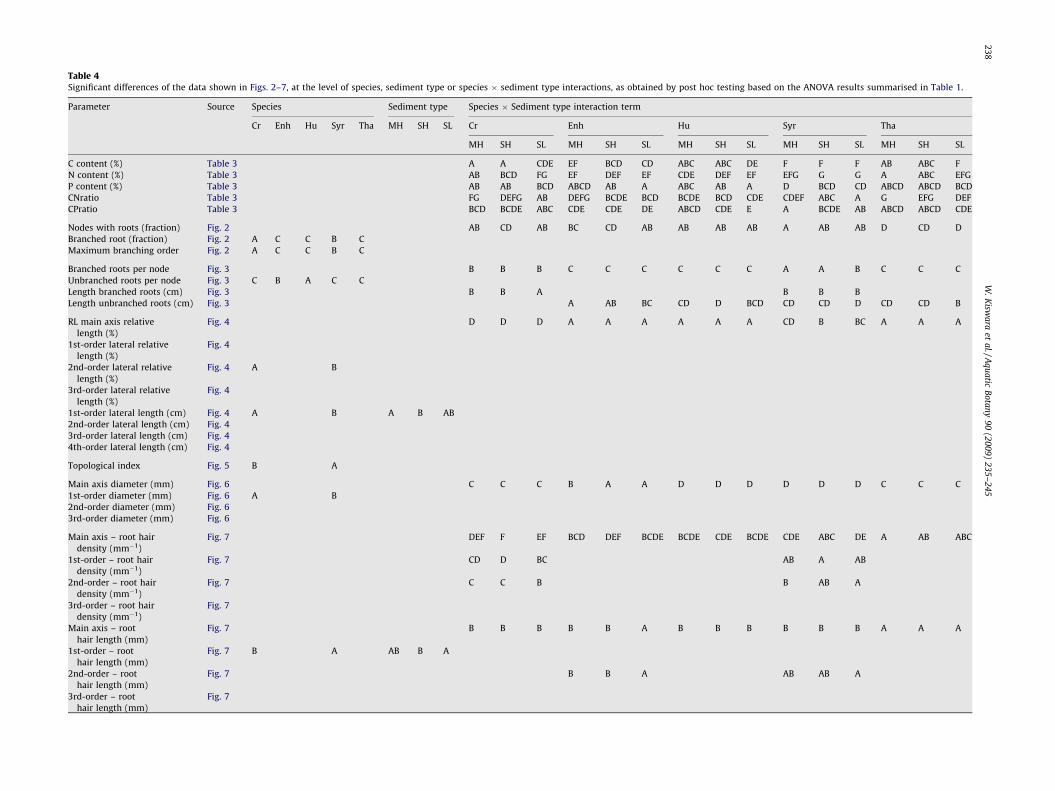
Table 4Significant differences of the data shown in Figs. 2–7, at the level of species, sediment type or species � sediment type interactions, as obtained by post hoc testing based on the ANOVA results summarised in Table 1.
Parameter Source Species Sediment type Species � Sediment type interaction term
Cr Enh Hu Syr Tha MH SH SL Cr Enh Hu Syr Tha
MH SH SL MH SH SL MH SH SL MH SH SL MH SH SL
C content (%) Table 3 A A CDE EF BCD CD ABC ABC DE F F F AB ABC F
N content (%) Table 3 AB BCD FG EF DEF EF CDE DEF EF EFG G G A ABC EFG
P content (%) Table 3 AB AB BCD ABCD AB A ABC AB A D BCD CD ABCD ABCD BCD
CNratio Table 3 FG DEFG AB DEFG BCDE BCD BCDE BCD CDE CDEF ABC A G EFG DEF
CPratio Table 3 BCD BCDE ABC CDE CDE DE ABCD CDE E A BCDE AB ABCD ABCD CDE
Nodes with roots (fraction) Fig. 2 AB CD AB BC CD AB AB AB AB A AB AB D CD D
Branched root (fraction) Fig. 2 A C C B C
Maximum branching order Fig. 2 A C C B C
Branched roots per node Fig. 3 B B B C C C C C C A A B C C C
Unbranched roots per node Fig. 3 C B A C C
Length branched roots (cm) Fig. 3 B B A B B B
Length unbranched roots (cm) Fig. 3 A AB BC CD D BCD CD CD D CD CD B
RL main axis relative
length (%)
Fig. 4 D D D A A A A A A CD B BC A A A
1st-order lateral relative
length (%)
Fig. 4
2nd-order lateral relative
length (%)
Fig. 4 A B
3rd-order lateral relative
length (%)
Fig. 4
1st-order lateral length (cm) Fig. 4 A B A B AB
2nd-order lateral length (cm) Fig. 4
3rd-order lateral length (cm) Fig. 4
4th-order lateral length (cm) Fig. 4
Topological index Fig. 5 B A
Main axis diameter (mm) Fig. 6 C C C B A A D D D D D D C C C
1st-order diameter (mm) Fig. 6 A B
2nd-order diameter (mm) Fig. 6
3rd-order diameter (mm) Fig. 6
Main axis – root hair
density (mm�1)
Fig. 7 DEF F EF BCD DEF BCDE BCDE CDE BCDE CDE ABC DE A AB ABC
1st-order – root hair
density (mm�1)
Fig. 7 CD D BC AB A AB
2nd-order – root hair
density (mm�1)
Fig. 7 C C B B AB A
3rd-order – root hair
density (mm�1)
Fig. 7
Main axis – root
hair length (mm)
Fig. 7 B B B B B A B B B B B B A A A
1st-order – root
hair length (mm)
Fig. 7 B A AB B A
2nd-order – root
hair length (mm)
Fig. 7 B B A AB AB A
3rd-order – root
hair length (mm)
Fig. 7
W.
Kisw
ara
eta
l./Aq
ua
ticB
ota
ny
90
(20
09
)2
35
–2
45
23
8
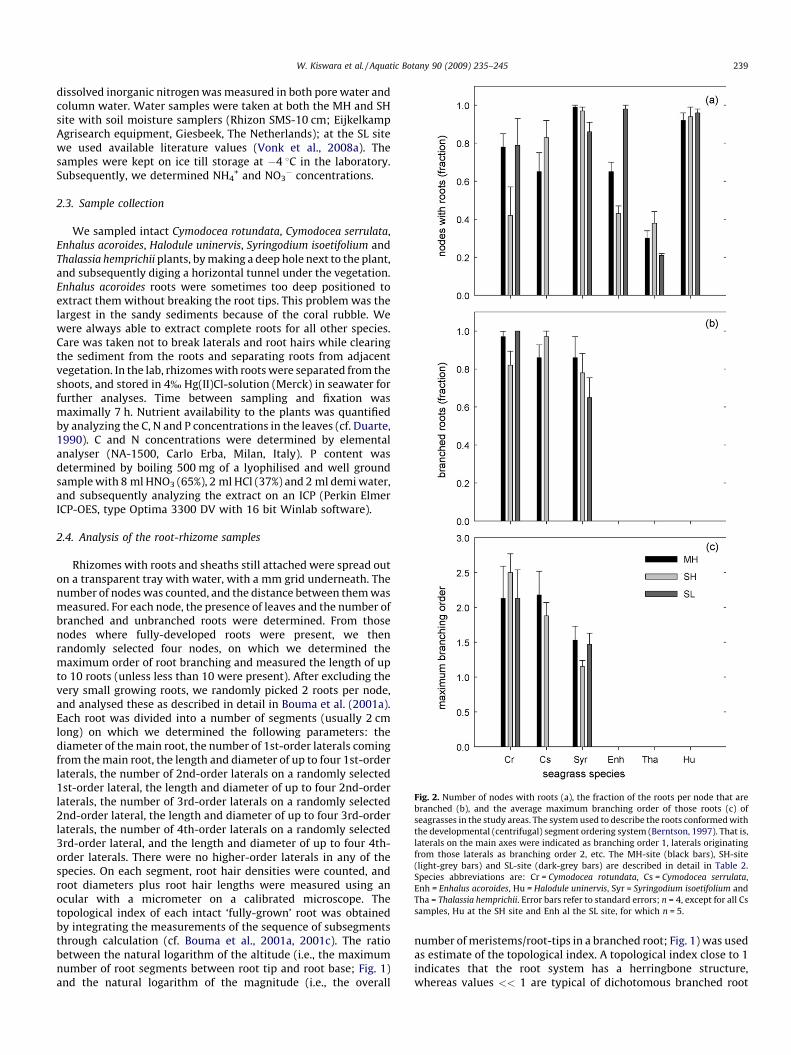
Fig. 2. Number of nodes with roots (a), the fraction of the roots per node that are
branched (b), and the average maximum branching order of those roots (c) of
seagrasses in the study areas. The system used to describe the roots conformed with
the developmental (centrifugal) segment ordering system (Berntson, 1997). That is,
laterals on the main axes were indicated as branching order 1, laterals originating
from those laterals as branching order 2, etc. The MH-site (black bars), SH-site
(light-grey bars) and SL-site (dark-grey bars) are described in detail in Table 2.
Species abbreviations are: Cr = Cymodocea rotundata, Cs = Cymodocea serrulata,
Enh = Enhalus acoroides, Hu = Halodule uninervis, Syr = Syringodium isoetifolium and
Tha = Thalassia hemprichii. Error bars refer to standard errors; n = 4, except for all Cs
samples, Hu at the SH site and Enh al the SL site, for which n = 5.
W. Kiswara et al. / Aquatic Botany 90 (2009) 235–245 239
dissolved inorganic nitrogen was measured in both pore water andcolumn water. Water samples were taken at both the MH and SHsite with soil moisture samplers (Rhizon SMS-10 cm; EijkelkampAgrisearch equipment, Giesbeek, The Netherlands); at the SL sitewe used available literature values (Vonk et al., 2008a). Thesamples were kept on ice till storage at �4 8C in the laboratory.Subsequently, we determined NH4
+ and NO3� concentrations.
2.3. Sample collection
We sampled intact Cymodocea rotundata, Cymodocea serrulata,Enhalus acoroides, Halodule uninervis, Syringodium isoetifolium andThalassia hemprichii plants, by making a deep hole next to the plant,and subsequently diging a horizontal tunnel under the vegetation.Enhalus acoroides roots were sometimes too deep positioned toextract them without breaking the root tips. This problem was thelargest in the sandy sediments because of the coral rubble. Wewere always able to extract complete roots for all other species.Care was taken not to break laterals and root hairs while clearingthe sediment from the roots and separating roots from adjacentvegetation. In the lab, rhizomes with roots were separated from theshoots, and stored in 4% Hg(II)Cl-solution (Merck) in seawater forfurther analyses. Time between sampling and fixation wasmaximally 7 h. Nutrient availability to the plants was quantifiedby analyzing the C, N and P concentrations in the leaves (cf. Duarte,1990). C and N concentrations were determined by elementalanalyser (NA-1500, Carlo Erba, Milan, Italy). P content wasdetermined by boiling 500 mg of a lyophilised and well groundsample with 8 ml HNO3 (65%), 2 ml HCl (37%) and 2 ml demi water,and subsequently analyzing the extract on an ICP (Perkin ElmerICP-OES, type Optima 3300 DV with 16 bit Winlab software).
2.4. Analysis of the root-rhizome samples
Rhizomes with roots and sheaths still attached were spread outon a transparent tray with water, with a mm grid underneath. Thenumber of nodes was counted, and the distance between them wasmeasured. For each node, the presence of leaves and the number ofbranched and unbranched roots were determined. From thosenodes where fully-developed roots were present, we thenrandomly selected four nodes, on which we determined themaximum order of root branching and measured the length of upto 10 roots (unless less than 10 were present). After excluding thevery small growing roots, we randomly picked 2 roots per node,and analysed these as described in detail in Bouma et al. (2001a).Each root was divided into a number of segments (usually 2 cmlong) on which we determined the following parameters: thediameter of the main root, the number of 1st-order laterals comingfrom the main root, the length and diameter of up to four 1st-orderlaterals, the number of 2nd-order laterals on a randomly selected1st-order lateral, the length and diameter of up to four 2nd-orderlaterals, the number of 3rd-order laterals on a randomly selected2nd-order lateral, the length and diameter of up to four 3rd-orderlaterals, the number of 4th-order laterals on a randomly selected3rd-order lateral, and the length and diameter of up to four 4th-order laterals. There were no higher-order laterals in any of thespecies. On each segment, root hair densities were counted, androot diameters plus root hair lengths were measured using anocular with a micrometer on a calibrated microscope. Thetopological index of each intact ‘fully-grown’ root was obtainedby integrating the measurements of the sequence of subsegmentsthrough calculation (cf. Bouma et al., 2001a, 2001c). The ratiobetween the natural logarithm of the altitude (i.e., the maximumnumber of root segments between root tip and root base; Fig. 1)and the natural logarithm of the magnitude (i.e., the overall
number of meristems/root-tips in a branched root; Fig. 1) was usedas estimate of the topological index. A topological index close to 1indicates that the root system has a herringbone structure,whereas values << 1 are typical of dichotomous branched root
W. Kiswara et al. / Aquatic Botany 90 (2009) 235–245240
systems (Fitter, 1987, 1991; Fitter and Stickland, 1991; Fitter et al.,1991).
2.5. Statistics
Analysis of variance (ANOVA) was used to test for effects ofspecies, sediment type and possible species � sediment typeinteractions. Cymodocea serrulata was excluded from all statisticaltests, as there were no samples available for the SL sites. When theANOVA revealed significant differences, we did a post hoc analysisusing Tukey’s honestly significant difference test including acorrection for multiple tests to control type I error rates or aStudent’s t-test in case only 2 species or 2 sites were compared. Allindependent variables, interactions, and F and p values aresummarised in Table 1 of the results.
3. Results
Studying the bulk of the root characteristics revealed largedifferences in root architecture among seagrass species, regardlessof the sites (Figs. 2–7). Although there were statistically significanteffects of site on the root architecture of individual species(Tables 1 and 4), these effects were relatively small compared tothe differences among species, and did not provide a clear generalpattern across species. Field sites did however clearly affect bothenvironmental variables and the nutrient content in the plant(Tables 2 and 3). The most obvious difference between sites was ingrain size distribution. In addition to the higher silt content andsmaller median grain size for the MH site, our data also showedthat the SH site contained more silt and had a smaller grain size
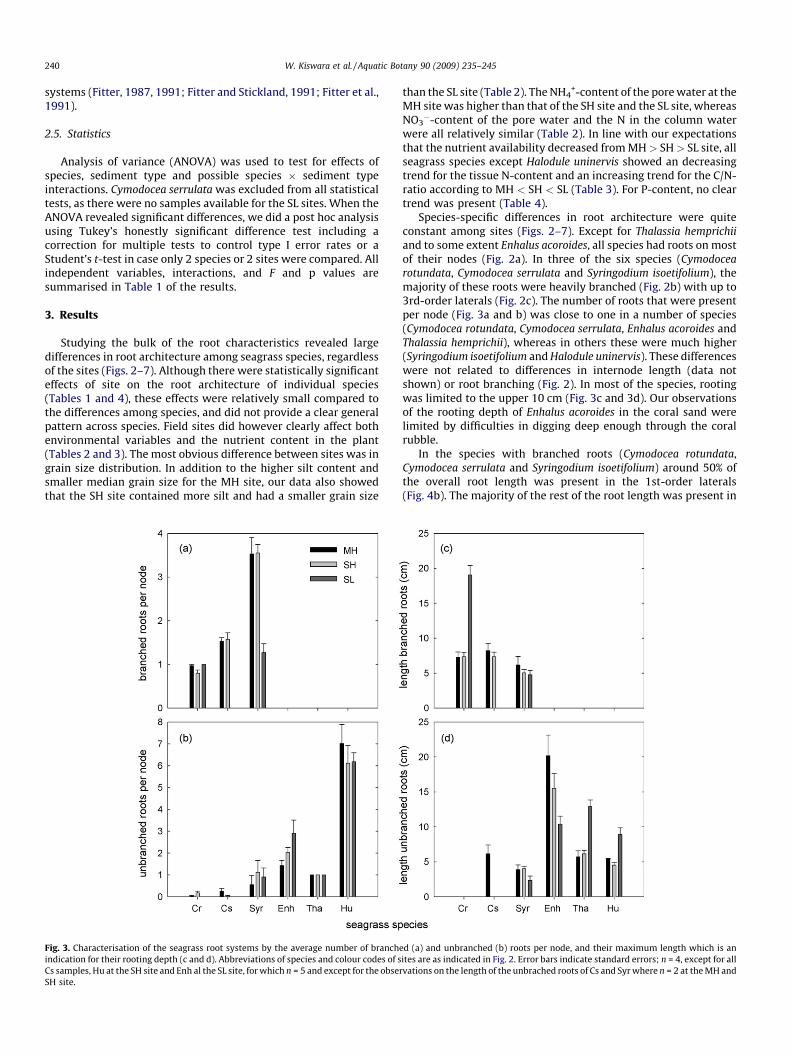
Fig. 3. Characterisation of the seagrass root systems by the average number of branch
indication for their rooting depth (c and d). Abbreviations of species and colour codes of s
Cs samples, Hu at the SH site and Enh al the SL site, for which n = 5 and except for the obse
SH site.
than the SL site (Table 2). The NH4+-content of the pore water at the
MH site was higher than that of the SH site and the SL site, whereasNO3
�-content of the pore water and the N in the column waterwere all relatively similar (Table 2). In line with our expectationsthat the nutrient availability decreased from MH > SH> SL site, allseagrass species except Halodule uninervis showed an decreasingtrend for the tissue N-content and an increasing trend for the C/N-ratio according to MH < SH < SL (Table 3). For P-content, no cleartrend was present (Table 4).
Species-specific differences in root architecture were quiteconstant among sites (Figs. 2–7). Except for Thalassia hemprichii
and to some extent Enhalus acoroides, all species had roots on mostof their nodes (Fig. 2a). In three of the six species (Cymodocea
rotundata, Cymodocea serrulata and Syringodium isoetifolium), themajority of these roots were heavily branched (Fig. 2b) with up to3rd-order laterals (Fig. 2c). The number of roots that were presentper node (Fig. 3a and b) was close to one in a number of species(Cymodocea rotundata, Cymodocea serrulata, Enhalus acoroides andThalassia hemprichii), whereas in others these were much higher(Syringodium isoetifolium and Halodule uninervis). These differenceswere not related to differences in internode length (data notshown) or root branching (Fig. 2). In most of the species, rootingwas limited to the upper 10 cm (Fig. 3c and 3d). Our observationsof the rooting depth of Enhalus acoroides in the coral sand werelimited by difficulties in digging deep enough through the coralrubble.
In the species with branched roots (Cymodocea rotundata,Cymodocea serrulata and Syringodium isoetifolium) around 50% ofthe overall root length was present in the 1st-order laterals(Fig. 4b). The majority of the rest of the root length was present in
ed (a) and unbranched (b) roots per node, and their maximum length which is an
ites are as indicated in Fig. 2. Error bars indicate standard errors; n = 4, except for all
rvations on the length of the unbrached roots of Cs and Syr where n = 2 at the MH and
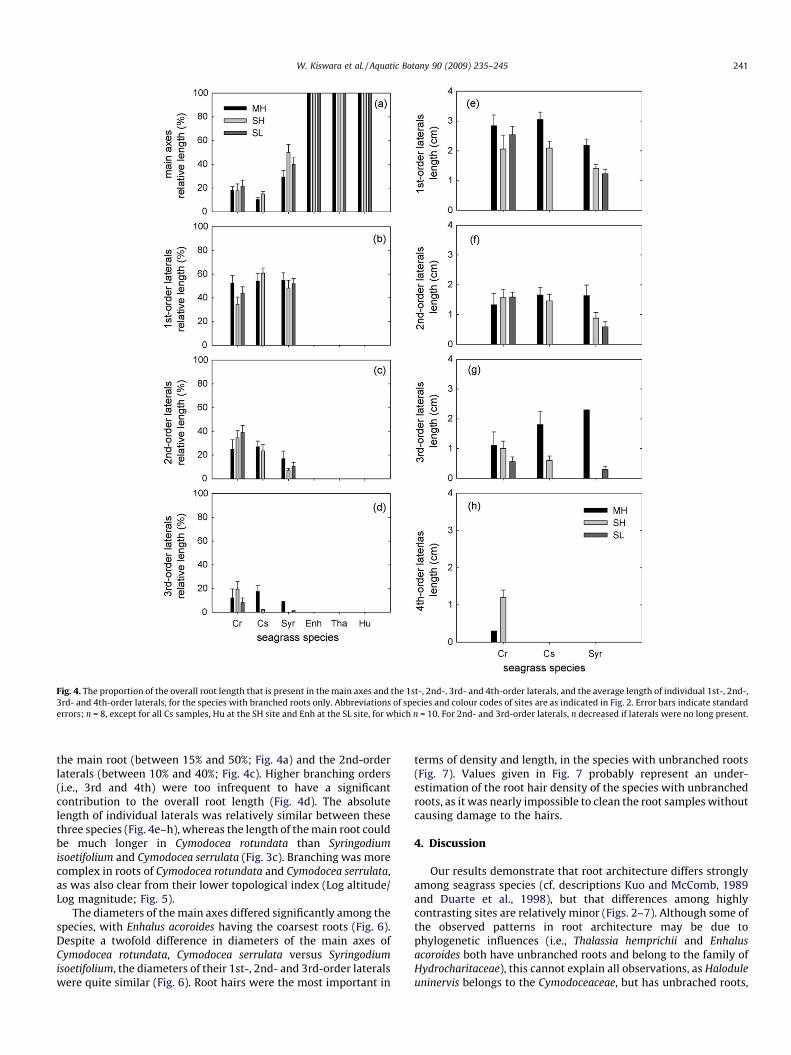
Fig. 4. The proportion of the overall root length that is present in the main axes and the 1st-, 2nd-, 3rd- and 4th-order laterals, and the average length of individual 1st-, 2nd-,
3rd- and 4th-order laterals, for the species with branched roots only. Abbreviations of species and colour codes of sites are as indicated in Fig. 2. Error bars indicate standard
errors; n = 8, except for all Cs samples, Hu at the SH site and Enh at the SL site, for which n = 10. For 2nd- and 3rd-order laterals, n decreased if laterals were no long present.
W. Kiswara et al. / Aquatic Botany 90 (2009) 235–245 241
the main root (between 15% and 50%; Fig. 4a) and the 2nd-orderlaterals (between 10% and 40%; Fig. 4c). Higher branching orders(i.e., 3rd and 4th) were too infrequent to have a significantcontribution to the overall root length (Fig. 4d). The absolutelength of individual laterals was relatively similar between thesethree species (Fig. 4e–h), whereas the length of the main root couldbe much longer in Cymodocea rotundata than Syringodium
isoetifolium and Cymodocea serrulata (Fig. 3c). Branching was morecomplex in roots of Cymodocea rotundata and Cymodocea serrulata,as was also clear from their lower topological index (Log altitude/Log magnitude; Fig. 5).
The diameters of the main axes differed significantly among thespecies, with Enhalus acoroides having the coarsest roots (Fig. 6).Despite a twofold difference in diameters of the main axes ofCymodocea rotundata, Cymodocea serrulata versus Syringodium
isoetifolium, the diameters of their 1st-, 2nd- and 3rd-order lateralswere quite similar (Fig. 6). Root hairs were the most important in
terms of density and length, in the species with unbranched roots(Fig. 7). Values given in Fig. 7 probably represent an under-estimation of the root hair density of the species with unbranchedroots, as it was nearly impossible to clean the root samples withoutcausing damage to the hairs.
4. Discussion
Our results demonstrate that root architecture differs stronglyamong seagrass species (cf. descriptions Kuo and McComb, 1989and Duarte et al., 1998), but that differences among highlycontrasting sites are relatively minor (Figs. 2–7). Although some ofthe observed patterns in root architecture may be due tophylogenetic influences (i.e., Thalassia hemprichii and Enhalus
acoroides both have unbranched roots and belong to the family ofHydrocharitaceae), this cannot explain all observations, as Halodule
uninervis belongs to the Cymodoceaceae, but has unbrached roots,
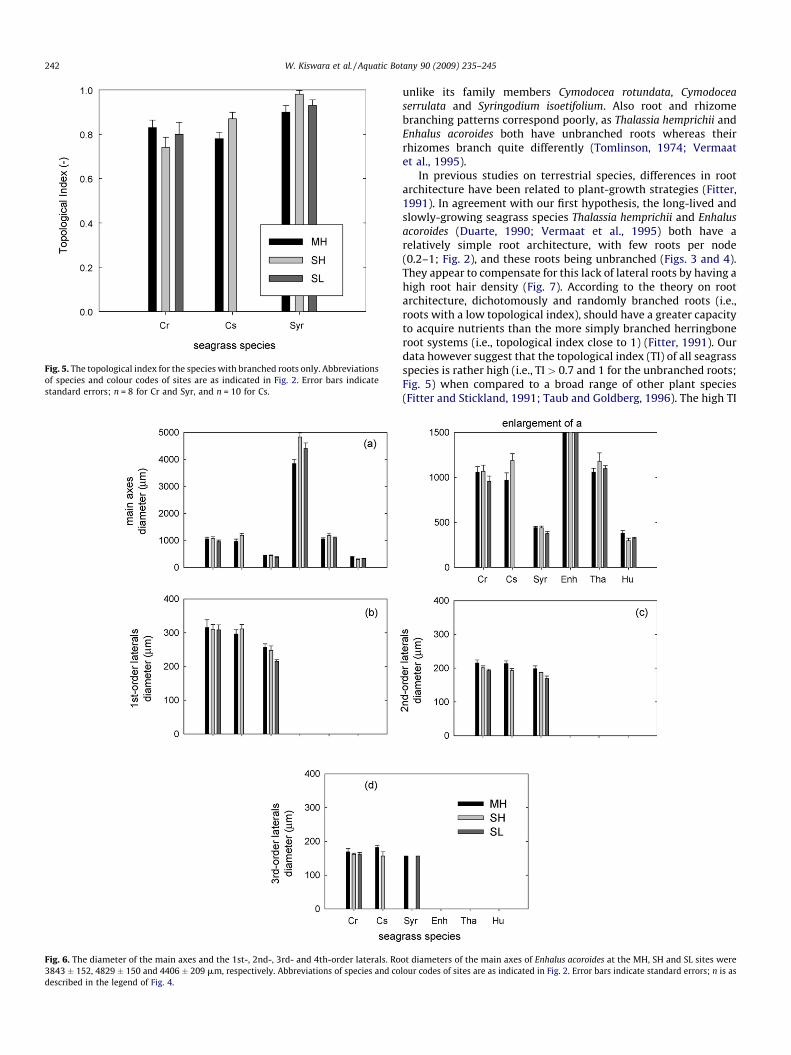
Fig. 5. The topological index for the species with branched roots only. Abbreviations
of species and colour codes of sites are as indicated in Fig. 2. Error bars indicate
standard errors; n = 8 for Cr and Syr, and n = 10 for Cs.
Fig. 6. The diameter of the main axes and the 1st-, 2nd-, 3rd- and 4th-order laterals. Ro
3843 � 152, 4829 � 150 and 4406 � 209 mm, respectively. Abbreviations of species and co
described in the legend of Fig. 4.
W. Kiswara et al. / Aquatic Botany 90 (2009) 235–245242
unlike its family members Cymodocea rotundata, Cymodocea
serrulata and Syringodium isoetifolium. Also root and rhizomebranching patterns correspond poorly, as Thalassia hemprichii andEnhalus acoroides both have unbranched roots whereas theirrhizomes branch quite differently (Tomlinson, 1974; Vermaatet al., 1995).
In previous studies on terrestrial species, differences in rootarchitecture have been related to plant-growth strategies (Fitter,1991). In agreement with our first hypothesis, the long-lived andslowly-growing seagrass species Thalassia hemprichii and Enhalus
acoroides (Duarte, 1990; Vermaat et al., 1995) both have arelatively simple root architecture, with few roots per node(0.2–1; Fig. 2), and these roots being unbranched (Figs. 3 and 4).They appear to compensate for this lack of lateral roots by having ahigh root hair density (Fig. 7). According to the theory on rootarchitecture, dichotomously and randomly branched roots (i.e.,roots with a low topological index), should have a greater capacityto acquire nutrients than the more simply branched herringboneroot systems (i.e., topological index close to 1) (Fitter, 1991). Ourdata however suggest that the topological index (TI) of all seagrassspecies is rather high (i.e., TI > 0.7 and 1 for the unbranched roots;Fig. 5) when compared to a broad range of other plant species(Fitter and Stickland, 1991; Taub and Goldberg, 1996). The high TI
ot diameters of the main axes of Enhalus acoroides at the MH, SH and SL sites were
lour codes of sites are as indicated in Fig. 2. Error bars indicate standard errors; n is as
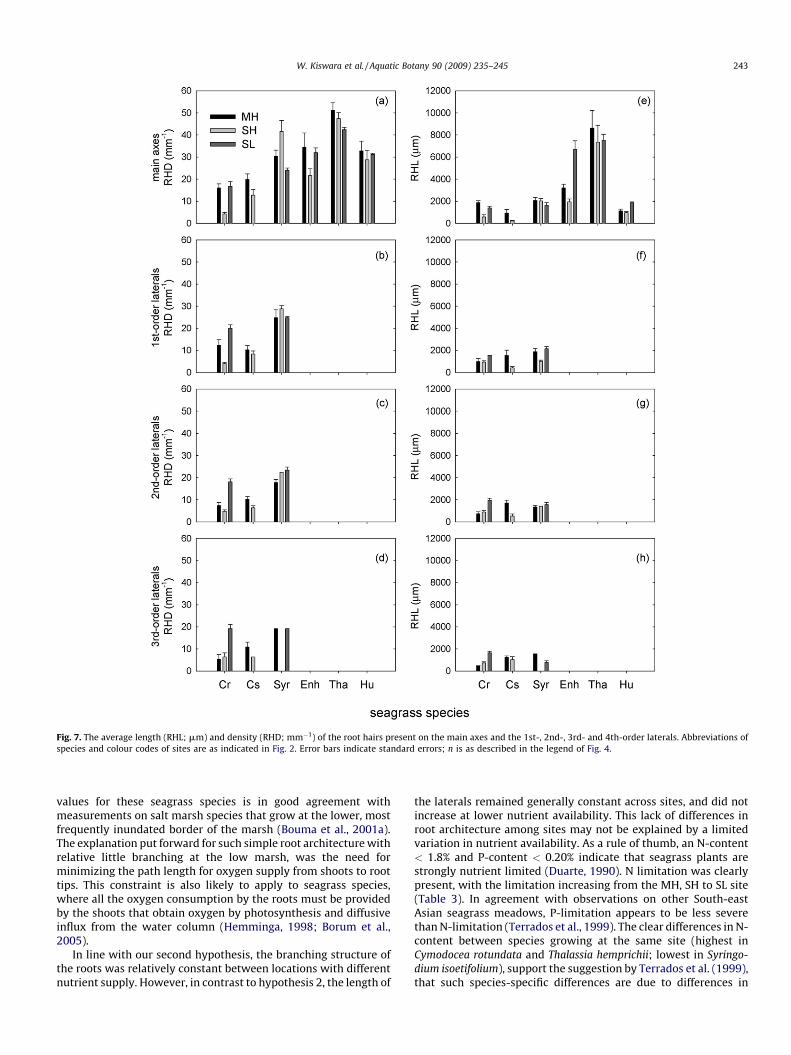
Fig. 7. The average length (RHL; mm) and density (RHD; mm�1) of the root hairs present on the main axes and the 1st-, 2nd-, 3rd- and 4th-order laterals. Abbreviations of
species and colour codes of sites are as indicated in Fig. 2. Error bars indicate standard errors; n is as described in the legend of Fig. 4.
W. Kiswara et al. / Aquatic Botany 90 (2009) 235–245 243
values for these seagrass species is in good agreement withmeasurements on salt marsh species that grow at the lower, mostfrequently inundated border of the marsh (Bouma et al., 2001a).The explanation put forward for such simple root architecture withrelative little branching at the low marsh, was the need forminimizing the path length for oxygen supply from shoots to roottips. This constraint is also likely to apply to seagrass species,where all the oxygen consumption by the roots must be providedby the shoots that obtain oxygen by photosynthesis and diffusiveinflux from the water column (Hemminga, 1998; Borum et al.,2005).
In line with our second hypothesis, the branching structure ofthe roots was relatively constant between locations with differentnutrient supply. However, in contrast to hypothesis 2, the length of
the laterals remained generally constant across sites, and did notincrease at lower nutrient availability. This lack of differences inroot architecture among sites may not be explained by a limitedvariation in nutrient availability. As a rule of thumb, an N-content< 1.8% and P-content < 0.20% indicate that seagrass plants arestrongly nutrient limited (Duarte, 1990). N limitation was clearlypresent, with the limitation increasing from the MH, SH to SL site(Table 3). In agreement with observations on other South-eastAsian seagrass meadows, P-limitation appears to be less severethan N-limitation (Terrados et al., 1999). The clear differences in N-content between species growing at the same site (highest inCymodocea rotundata and Thalassia hemprichii; lowest in Syringo-
dium isoetifolium), support the suggestion by Terrados et al. (1999),that such species-specific differences are due to differences in
W. Kiswara et al. / Aquatic Botany 90 (2009) 235–245244
nutrient acquisition or requirements. These species-specificdifferences in N-content do not correspond with variation in rootarchitecture, as the species with the highest N-contents have verydifferent roots: branched for Cymodocea rotundata and unbranchedfor Thalassia hemprichii).
A few possible explanations for the observed similarity in rootarchitecture between sites might be postulated. Firstly, as rootbranching is known to strongly respond to heterogeneousenvironments (for terrestrial species see, e.g., Campbell et al.,1991; Wijesinghe et al., 2005; Hodge, 2006; Grime, 2007; forwetland species, see Jansen et al., 2005), and less to contrastingnutrient levels that were homogeneously supplied throughout thesediment (Bouma et al., 2001a, 2001c), a homogeneous nutrientavailability in the rooting zone could explain the similarity in rootarchitecture between sites. In some tropical areas, relativehomogeneous low nutrient gradients have been observed till adepth of 0.3 m depth (Vonk et al., 2008b), which is the depth inwhich we sampled roots. Factors that may contribute to suchrelative homogeneous nutrient distribution, could be the watersaturation of the sediment and perhaps rapid water exchangebetween pore water and column water as can occur in poroussediments (Huettel and Gust, 1992a, 1992b; Huettel and Rusch,2000; Rusch and Huettel, 2000). However, other studies indicatethat nutrient gradients can exist in seagrass meadows (e.g., seeErftemeijer and Middelburg, 1993; Hebert et al., 2007) and thatroot morphology can differ in response to an eutrophicationgradient (Oliva et al., 2007). Secondly, the large difference betweenspecies and little differences between sites with contrastingnutrient availability may indicate that root growth may be drivenby allometric relationships, as these have been shown to be highlyimportant for understanding seagrass growth and productivity(Duarte, 1991; Marba et al., 2006). Thirdly, as below-groundbiomass distribution can also respond to substrate stability andhydrodynamic exposure (Peralta et al., 2006; Di Carlo et al., 2007),the root architecture could be determined by hydrodynamicexposure. Regarding the different locations and contrastingsediment types, it is however not likely that hydrodynamics playsa role in present study.
Assessing the role of spatial nutrient gradients, anchoringstrength and allometric relations on the root architecture ofseagrass species requires data beyond those available in thepresent study, but offers interesting perspectives for futurestudies. The relative small differences in root architecture betweenlocations also poses the question to which extent seagrass rootscan respond to local nutrient supply.
Acknowledgements
This research was supported by WOTRO (The NetherlandsFoundation for the Advancement of Tropical Research), grantnumber WT84-422. A. Arifin, and Asep Rasyidin are thanked fortheir valuable help during the field work. Sara Puijalon is thankedfor her help in running the statistical analyses. Two anonymousreviewers are thanked for there valuable comments on a previousversion of this manuscript. We like to especially thank the editorJan Vermaat for his detailed comments that enabled us tosignificantly improve this MS. This is NIOO-KNAW publicationnumber 4427.
References
Barron, C., Middelburg, J.J., Duarte, C.M., 2006. Phytoplankton trapped withinseagrass (Posidonia oceanica) sediments are a nitrogen source: an in situ isotopelabeling experiment. Limnol. Oceanogr. 51, 1648–1653.
Berntson, G.M., 1997. Topological scaling and plant root system architecture:developmental and functional hierarchies. New Phytol. 135, 621–634.
Berntson, G.M., Woodward, F.I., 1992. The root system architecture and develop-ment of Senecio vulgaris in elevated CO2 and drought. Funct. Ecol. 6, 324–333.
Borum, J., Pedersen, O., Greve, T.M., Frankovich, T.A., Zieman, J.C., Fourqurean, J.W.,Madden, C.J., 2005. The potential role of plant oxygen and sulphide dynamics indie-off events of the tropical seagrass, Thalassia testudinum. J. Ecol. 93, 148–158.
Bouma, T.J., Nielsen, K.L., Koutstaal, B., 2000. Sample preparation and scanningprotocol for computerised analysis of root length and diameter. Plant Soil 218,185–196.
Bouma, T.J., Nielsen, K.L., van Hal, J., Koutstaal, B., 2001a. Root system topology anddiameter distribution of species from habitats differing in inundation fre-quency. Funct. Ecol. 15, 360–369.
Bouma, T.J., Eissenstat, D.M., Yanai, R.D., Elkin, A., Hartmond, U., Flores, D., 2001b.Estimating age-dependent costs and benefits of roots with contrasting lifespan:comparing apples and oranges. New Phytol. 150, 685–695.
Bouma, T.J., Koutstaal, B.P., van Dongen, M., Nielsen, K.L., 2001c. Coping with lownutrient availability and inundation: root growth responses of three halophyticgrass species from different elevations along a flooding gradient. Oecologia 126,472–481.
Cambridge, M.L., 1999. Growth strategies of Rottnest island seagrass. In: Waker,D.I., Wells, F.E. (Eds.), The Seagrass Flora and Fauna of Rottnest Island,Western Australia. Perth, Western Australia Museum, pp. 1–24.
Campbell, B.D., Grime, J.P., Mackey, J.M.L., 1991. A trade-off between scale andprecision in resource foraging. Oecologia 87, 532–538.
Costanza, R., dArge, R., de Groot, R., Farber, S., Grasso, M., Hannon, B., Limburg, K.,Naeem, S., ONeill, R.V., Paruelo, J., Raskin, R.G., Sutton, P., van den Belt, M., 1997.The value of the world’s ecosystem services and natural capital. Nature 387,253–260.
De Kroon, H., Mommer, L., 2006. Root foraging theory put to the test. Trends Ecol.Evol. 21, 113–116.
Di Carlo, G., Badalamenti, F., Terlizzi, A., 2007. Recruitment of Posidonia oceanica onrubble mounds: Substratum effects on biomass partitioning and leaf morphol-ogy. Aquat. Bot. 87, 97–103.
Duarte, C.M., 1990. Seagrass nutrient content. Mar. Ecol. Prog. Ser. 67, 201–207.Duarte, C.M., 1991. Allometric scaling of seagrass form and productivity. Mar. Ecol.
Prog. Ser. 77, 289–300.Duarte, C.M., 1999. Seagrass ecology at the turn of the millennium: challenges for
the new century. Aquat. Bot. 65, 7–20.Duarte, C.M., Chiscano, C.L., 1999. Seagrass biomass and production: a reassesment.
Aquat. Bot. 65, 1–4.Duarte, C.M., Merino, M., Agawin, N.S.R., Uri, J., Fortes, M.D., Gallegos, M.E., Marba,
N., Hemminga, M.A., 1998. Root production and belowground seagrass biomass.Mar. Ecol. Prog. Ser. 171, 97–108.
Eissenstat, D.M., Yanai, R.D., 1997. The ecology of root lifespan. Adv. Ecol. Res. 27,1–60.
Erftemeijer, P.L.A., Middelburg, J.J., 1993. Sediment–nutrient interactions in tropicalseagrass beds – a comparison between a terrigenous and a carbonate sedi-mentary environment in South Sulawesi (Indonesia). Mar. Ecol. Prog. Ser. 102,187–198.
Erftemeijer, P.L.A., Middelburg, J.J., 1995. Mass balance constraints on nutrientcycling in tropical seagrass beds. Aquat. Bot. 50, 21–36.
Evrard, V., Kiswara, W., Bouma, T.J., Middelburg, J.J., 2005. Nutrient dynamics ofseagrass systems: 15N evidence for the importance of particulate organic matterand root systems. Mar. Ecol. Prog. Ser. 295, 49–55.
Fitter, A.H., 1987. An architectural approach to comparative ecology of plant rootsystems. New Phytol. 106 (Suppl.), 61–77.
Fitter, A.H., 1991. The ecological significance of root system architecture: aneconomic approach. In: Atkinson, D. (Ed.), Plant Root Growth: An EcologicalPerspective. Blackwell Scientific Publishers, London, pp. 229–243.
Fitter, A.H., Stickland, T.R., 1991. Architectural analysis of plant root systems. 2.Influence of nutrient supply on architectural contrasting plant species. NewPhytol. 118, 383–389.
Fitter, A.H., Stickland, T.R., Harvey, M.L., Wilson, G.W., 1991. Architectural analysisof plant-roots systems. 1. Architectural correlates of exploitation efficiency.New Phytol. 118, 375–382.
Fitter, A., Williamson, L., Linkohr, B., Leyser, O., 2002. Root system architecturedetermines fitness in an Arabidopsis mutant in competition for immobilephosphate ions but not for nitrate ions. Proc. Roy. Soc. London Ser. B-Biol.Sci. 269, 2017–2022.
Grime, J.P., 2007. The scale-precision trade-off in spacial resource foraging byplants: restoring perspective. Ann. Bot. 99, 1017–1021.
Hebert, A.B., Morse, J.W., Eldridge, P.M., 2007. Small-scale heterogeneity in thegeochemistry of seagrass vegetated and non-vegetated estuarine sediments:causes and consequences. Aquat. Geochem. 13, 19–39.
Hemminga, M.A., 1998. The root/rhizome system of seagrasses: an asset and aburden. J. Sea Res. 39, 183–196.
Hemminga, M.A., Marba, N., Stapel, J., 1999. Leaf nutrient resorption, leaf lifespanand the retention of nutrients in seagrass systems. Aquat. Bot. 65, 141–158.
Hodge, A., 2006. Plastic plants and patchy soils. J. Exp. Bot. 57, 401–411.Huettel, M., Gust, G., 1992a. Impact of bioroughness on interfacial solute exchange
in permeable sediments. Mar. Ecol. Prog. Ser. 89, 253–267.Huettel, M., Gust, G., 1992b. Solute release mechanisms from confined sediment
cores in stirred benthic chambers and flume flows. Mar. Ecol. Prog. Ser. 82,187–197.
Huettel, M., Rusch, A., 2000. Transport and degradation of phytoplankton in perme-able sediment. Limnol. Oceanogr. 45, 534–549.
W. Kiswara et al. / Aquatic Botany 90 (2009) 235–245 245
Jansen, C., Van de Steeg, H.M., De Kroon, H., 2005. Investigating a trade-off in rootmorphological responses to a heterogeneous nutrient supply and to flooding.Funct. Ecol. 19, 952–960.
Kamp-Nielsen, L., Vermaat, J.E., Wesseling, I., Borum, J., Geertz-Hansen, O., 2002.Sediment properties along gradients of siltation in South-east Asia. Est. Coast.Shelf Sci. 54, 127–138.
Kembel, S.W., Cahill, J.F., 2005. Plant phenotypic plasticity belowground: a phylo-genetic perspective on root foraging trade-offs. Am. Nat. 166, 216–230.
Kilminster, K.L., Walker, D.I., Thompson, P.A., Raven, J.A., 2006. Limited nutritionalbenefit to the seagrass Halophila ovalis, in culture, following sediment organicmatter enrichment. Est. Coast. Shelf Sci. 68, 675–685.
Kiswara, W., Huiskes, A.H.L., Herman, P.M.J., 2005. Uptake and allocation of 13C byEnhalus acoroides at sites differing in light availability. Aquat. Bot. 81, 353–366.
Kuo, J., McComb, A.J., 1989. Seagrass taxonomy, structure and development. In:Larkum, A.W.D., McComb, A.J., Shepherd, S.A. (Eds.), Biology of Seagrasses.Elsevier, Amsterdam, pp. 6–73.
Marba, N., Hemminga, M.A., Duarte, C.M., 2006. Resource translocation withinseagrass clones: allometric scaling to plant size and productivity. Oecologia150, 362–372.
Oliva, S., Mascaro O., Romero J., Perez M., 2007. Root morphology of Cymodoceanodosa reflects eutrophication gradients. In: Pergent-Martini, C., El Asmi, S., LeRavallec C. (Eds.), Proceedings of the Third Mediterranean Symposium onMarine Vegetation, Marseilles, 27–29 March 2007. RAC/SPA Publ., Tunis, pp.288–290.
Orth, R.J., Carruthers, T.J.B., Dennison, W.C., Duarte, C.M., Fourqurean, J.W., Heck,K.L., Hughes, A.R., Kendrick, G.A., Kenworthy, W.J., Olyarnik, S., Short, F.T.,Waycott, M., Williams, S.L., 2006. A global crisis for seagrass ecosystems.Bioscience 56, 987–996.
Peralta, G., Brun, F.G., Perez-Llorens, J.L., Bouma, T.J., 2006. Direct effects of currentvelocity on the growth, morphometry and architecture of seagrasses: a casestudy on Zostera noltii. Mar. Ecol. Prog. Ser. 327, 135–142.
Perez, M., Duarte, C.M., Romero, J., SandJensen, K., Alcoverro, T., 1994. Growthplasticity in Cymodocea-nodosa stands – the importance of nutrient supply.Aquat. Bot. 47, 249–264.
Romero, J., Lee, K.S., Perez, M., Mateo, M.A., Alcoverro, T., 2006. Nutrient dynamics inseagrass ecosystems. In: Larkum, A.W.D., Orth, R.J., Duarte, C.M. (Eds.), Sea-grasses: Biology, Ecology and Conservation. Springer, pp. 227–254.
Rusch, A., Huettel, M., 2000. Advective particle transport into permeable sediments– evidence from experiments in an intertidal sandflat. Limnol. Oceanogr. 45,525–533.
Stapel, J., Hemminga, M.A., 1997. Nutrient resorption from seagrass leaves. Mar.Biol. 128, 197–206.
Stapel, J., Hemminga, M.A., Bogert, C.G., Maas, Y.E.M., 2001. Nitrogen (15N) retentionin small Thalassia hemprichii seagrass plots in an offshore meadow in SouthSulawesi, Indonesia. Limnol. Oceanogr. 46, 24–37.
Taub, D.R., Goldberg, D., 1996. Root system topology of plants from habitatsdiffering in soil resource availability. Funct. Ecol. 10, 258–264.
Terrados, J., Agawin, N.S.R., Duarte, C.M., Fortes, M.D., Kamp-Nielsen, L., Borum, J.,1999. Nutrient limitation of the tropical seagrass Enhalus acoroides (L.) Royle inCape Bolinao, NW Philippines. Aquat. Bot. 65, 123–139.
Tomlinson, P.B., 1974. Vegetative morphology and meristem dependence – founda-tion of productivity in seagrasses. Aquaculture 4, 107–130.
Vermaat, J.E., Agawin, N.S.R., Duarte, C.M., Fortes, M.D., Marba, N., Uri, J.S., 1995.Meadow maintenance, growth and productivity of a mixed Philippine seagrassbed. Mar. Ecol. Prog. Ser. 124, 215–225.
Vonk, J.A., Middelburg, J.J., Stapel, J., Bouma, T.J., 2008a. Dissolved organic nitrogenuptake by seagrasses. Limnol. Oceanogr. 53, 542–548.
Vonk, J.A., Kneer, D., Stapel, J., Asmus, H., 2008b. Shrimp burrow in tropical seagrassmeadows: an important sink for litter. Est. Coast. Shelf Sci. 79, 79–85.
Wijesinghe, D.K., John, E.A., Hutchings, M.J., 2005. Does pattern of soil resourceheterogeneity determine plant community structure? An experimentalinvestigation. J. Ecol. 93, 99–112.