role of strategic leadership on execution
TRANSCRIPT

ROLE OF STRATEGIC LEADERSHIP ON EXECUTION
OF COUNTY INTEGRATED DEVELOPMENT PLANS BY
COUNTY GOVERNMENTS IN KENYA
JAMES KAMAU WARIBU
DOCTOR OF PHILOSOPHY
(Business Administration)
JOMO KENYATTA UNIVERSITY OF
AGRICULTURE AND TECHNOLOGY
2019

Role of Strategic Leadership on Execution of County Integrated
Development Plans by County Governments in Kenya
James Kamau Waribu
A thesis submitted in partial fulfillment for the Degree of Doctor of
Philosophy in Business Administration (Strategic Management Option)
in the Jomo Kenyatta University of Agriculture and Technology
2019
ii
DECLARATION
This thesis is my original work and has not been presented for a degree in any other
university.
Signature ……..…………………………………Date……………………………
James Kamau Waribu
This thesis has been submitted for examination with our approval as University
Supervisors.
Signature ……..………………………………… Date……………………………
Dr. Kabare Karanja, PhD
JKUAT, Kenya
Signature ……..………………………………… Date……………………………
Prof. Maurice M. Sakwa, PhD.
JKUAT, Kenya

iii
DEDICATION
This research thesis is dedicated to my dear wife Teresia, our children: Michael Waribu,
David Njuguna and Mark Wainaina for their support and understanding and to my dear
mother Anne Waruguru and siblings for their encouragement too.

iv
ACKNOWLEDGEMENT
I wish to acknowledge the Almighty God for his amazing grace so far. I am greatly
indebted to my able supervisors Dr. Kabare Karanja and Prof. Maurice Sakwa for
providing invaluable advice and guidance in course of developing this thesis.
I salute all lecturers from School of Business and Economics, Jomo Kenyatta University
of Agriculture and Technology who imparted me with knowledge and skills during the
entire course. The research covered five counties and I must thank the leadership of
these counties for granting authority to carry the research in their counties. I also take
this opportunity to thank sincerely all those respondents who filled the questionnaires
despite the time constraints. I wish also to salute the data analyst Mr .Abiud Saya and
research assistants, Mr. John Wahome and Ms. Nthiga. Lastly, I wish to convey my
sincere appreciation to all people who in one way or the other contributed to the
successful completion of this thesis. I salute you and May God Bless you abundantly.
v
TABLE OF CONTENT
DECLARATION ............................................................................................................. ii
DEDICATION ................................................................................................................ iii
ACKNOWLEDGEMENT ............................................................................................. iv
TABLE OF CONTENT .................................................................................................. v
LIST OF TABLES ....................................................................................................... xiii
LIST OF FIGURES .................................................................................................... xvii
LIST OF APPENDICES ........................................................................................... xviii
LIST OF ACRONYMS AND ABBREVIATIONS ................................................... xix
DEFINITION OF TERMS ........................................................................................... xx
ABSTRACT ................................................................................................................ xxiii
CHAPTER ONE ............................................................................................................. 1
INTRODUCTION ........................................................................................................... 1
1.1 Background of the Study ......................................................................................... 1
1.1.1 Strategic Leadership .......................................................................................... 5
1.1.2 Strategic Planning .............................................................................................. 8
vi
1.1.3 Execution of Strategic Plans .............................................................................. 9
1.1.4 Service Delivery-Global Trends ...................................................................... 11
1.1.5 The Philippines Service Delivery .................................................................... 12
1.1.6 Decentralization as an enabling Policy environment for Local Service Delivery
………………………………………………………………………………...13
1.1.7 Local Governance and Service Delivery in Nigeria ........................................ 14
1.1.8 Lessons learnt from both Nigeria and Philippines on Service Delivery ......... 17
1.1.9 Execution of County Integrated Development Plans (CIDPs)-Kenyan Context
………………………………………………………………………………...19
1.2 Statement of the Problem ....................................................................................... 22
1.3 Objectives of the Study .......................................................................................... 26
1.3.1 General objective ............................................................................................. 26
1.3.2 Specific Objectives .......................................................................................... 26
1.4 Research Hypotheses ............................................................................................. 27
1.5 Justification of the Study ....................................................................................... 28
1.6 Scope of the Study ................................................................................................. 29
1.7 Limitations of the Study ........................................................................................ 29
vii
CHAPTER TWO .......................................................................................................... 31
LITERATURE REVIEW ............................................................................................. 31
2.1 Introduction ............................................................................................................ 31
2.2 Theoretical Framework .......................................................................................... 31
2.2.1 Strategic Leadership Theory ........................................................................... 31
2.2.2 The Contingency Theory ................................................................................. 36
2.2.3 Theory of Constraints ...................................................................................... 37
2.2.4 Theory of Change ............................................................................................ 38
2.3 Conceptual Framework .......................................................................................... 39
2.4 Empirical Review .................................................................................................. 41
2.4.1 Envisioning ...................................................................................................... 42
2.4.2 Institutionalization Process on Execution of County Development Plans ..... 46
2.4.3 Innovation ........................................................................................................ 51
2.4.4 Monitoring and Evaluation .............................................................................. 52
2.4.5 Policy Framework ........................................................................................... 55
2.4.6 Execution of County Integrated Development Plans ...................................... 59
2.5 Critique of the Related Literature .......................................................................... 61
2.6 Research Gaps........................................................................................................ 62
viii
2.7 Summary ................................................................................................................ 65
CHAPTER THREE ...................................................................................................... 67
RESEARCH METHODOLOGY ................................................................................ 67
3.1 Introduction ............................................................................................................ 67
3.2 Research Philosophy .............................................................................................. 67
3.3 Research Design .................................................................................................... 68
3.4 Target Population ................................................................................................... 68
3.5 Sampling Frame ..................................................................................................... 69
3.6 Sample and Sampling Techniques ......................................................................... 69
3.6.1 Sample Size ..................................................................................................... 70
3.7 Data Collection Instruments .................................................................................. 72
3.8 Data Collection Procedure ..................................................................................... 73
3.8.1 Questionnaires ................................................ Error! Bookmark not defined.
3.8.2 Secondary Data ............................................................................................... 74
3.9 Pilot Testing ........................................................................................................... 74
3.9.1 Validity of Research Instrument ...................................................................... 75
3.9.2 Reliability of the Research Instrument ........................................................... 75
3.10 Data Analysis and Presentation ........................................................................... 76
ix
CHAPTER FOUR ......................................................................................................... 80
RESEARCH FINDINGS AND DISCUSSION ........................................................... 80
4.1 Introduction ............................................................................................................ 80
4.2 Response Rate ........................................................................................................ 80
4.3 Reliability Tests ..................................................................................................... 82
4.3.1 Factor Analysis ................................................................................................ 84
4.4 Sample Demographics ........................................................................................... 84
4.4.1 Distribution of Respondents by Gender .......................................................... 84
4.4.2 Distribution of Respondents by Age ............................................................... 85
4.4.3 Distribution of Respondents according to highest academic qualifications .... 86
4.4.4 Departments Served by the Respondents ........................................................ 87
4.4.5 Positions of the respondents ............................................................................ 88
4.4.6 Number of years serving in the county............................................................ 88
4.5 Normality Test ....................................................................................................... 89
4.5.1 Quantile-Quantile Plot of Execution of CIDPs ............................................... 92
4.6 Autocorrelation Test .............................................................................................. 93
4.6.1 Descriptive Results ............................................................................................. 94
x
4.6.1 Descriptive results on the role of Envisioning (Strategic direction and
Communication) on Execution of County Integrated Development Plans .............. 94
4.6.2 Qualitative Analysis ...................................................................................... 103
4.6.3 Envisioning (Strategic direction and Communication) versus Execution of
County Integrated Development Plans. .................................................................. 108
4.6.4 The effect of institutionalization on execution of county integrated
development plans by county governments in Kenya ............................................ 113
4.6.5 Qualitative results of respondents who indicated that span of control affect
operational effectiveness ........................................................................................ 119
4.7 Role of Innovation in the Execution of County Integrated Development Plans by
County Governments in Kenya.................................................................................. 127
4.7.1 Inferential analysis ........................................................................................ 134
4.7.1.1 To explore the role of innovation in execution of County Integrated
Development Plans by County Governments in Kenya ......................................... 134
4.7.2 Role of Monitoring and Evaluation in the Execution of County Integrated
Development Plans by County Governments in Kenya ......................................... 137
4.7.2 Descriptive results............................................................................................. 137
4.7.3 To determine the role of monitoring and evaluation in execution of County
Integrated Development Plans by County Governments in Kenya ........................ 144
4.7.4 Moderating Influence of Policy framework on the role of strategic leadership
in Execution of County Integrated Development Plans by County Governments in
Kenya. ..................................................................................................................... 148
xi
4.7.5 To establish the Moderating Influence of Policy framework on the role of
strategic leadership in Execution of County Integrated Development Plans by
County Governments in Kenya .............................................................................. 155
4.7.5. Inferential Analysis ...................................................................................... 155
4.7.6. Descriptive results ........................................................................................ 159
CHAPTER FIVE ......................................................................................................... 166
SUMMARY, CONCLUSION AND RECOMMENDATIONS ............................... 166
5.1 Introduction .......................................................................................................... 166
5.2 Summary .............................................................................................................. 166
5.2.1 Specific Oobjective 1:. .................................................................................. 166
5.2.2 Specific Objective 2: ..................................................................................... 167
5.2.3 Specific Objective 3: .................................................................................... 169
5.2.4 Specific Objective 4: ................................................................................... 170
5.2.5 Specific Objective 5: . .................................................................................. 172
5.3 Conclusions .......................................................................................................... 172
5.4 Study’s Contribution to Theory ........................................................................... 175
5.5 Recommendations ................................................................................................ 176
5.5.1 Macro Level-Government of Kenya ............................................................. 176
xii
5.5.2 County Governments ..................................................................................... 178
5.5.3 Areas of Further Research ............................................................................. 179
REFERENCES ............................................................................................................ 181
APPENDICES ............................................................................................................. 203
Appendix I: Introduction Letter to Respondents ....................................................... 203
Appendix II: The Research Questionnaire ................................................................. 204
Appendix III: NACOSTI permit ................................................................................ 218
Appendix IV: Factor analysis .................................................................................... 219
Appendix V: Study Objectives, Hypotheses and Analytical Models ........................ 222
xiii
LIST OF TABLES
Table 3.1: Distribution of sample per each group ........................................................... 71
Table 3.2: Operationalization of Variables ..................................................................... 78
Table 4.1: Response Rate ................................................................................................ 81
Table 4.2: Cronbach Alpha Decision Matrix .................................................................. 82
Table 4.3: Reliability statistics for each variable ............................................................ 83
Table 4.4: Distribution of Respondents by Gender ......................................................... 84
Table 4.5: Distribution of Respondents by Age .............................................................. 85
Table 4.6: Distribution of Respondents by Academic Qualifications ............................. 86
Table 4.7: Departments respondents work in .................................................................. 87
Table 4.8: Positions of the respondents ........................................................................... 88
Table 4.9: Number of Years serving the County ............................................................ 89
Table 4.10: Kolmogorov-Smirnov and Shapiro-Wilk Tests ........................................... 91
Table 4.11: Test for Autocorrelation ............................................................................... 93
Table 4.12: Role of envisioning on execution of county integrated development plans 94
Table 4.13: Extent of Difficulty compromised in attainment of performance goals..... 100
xiv
Table 4.14: Preferred mode of communication between management and staffs ........ 102
Table 4.15: Other envisioning influence on the execution of CIDPS ........................... 103
Table 4.16: Correlation Analysis Results ...................................................................... 105
Table 4.17: Model Summary for Envisioning (Strategic direction & Communication)
Versus Execution of CIDPs ...................................................................... 110
Table 4.18: ANOVA Results for Envisioning (Strategic direction &Communication) 111
Table 4.19: Relationship between Envisioning and Execution of CIDPs ..................... 112
Table 4.20: The Effect of Institutionalization on Execution of CIDPs ......................... 113
Table 4.21: Number of employees who report directly to one senior officer ............... 117
Table 4.22: Span of control affects operational effectiveness ...................................... 119
Table 4.23: Other opinion on organizational structure and culture influence the
execution of CIDPS .................................................................................. 120
Table 4.24: Model Summary for institutionalization of programmes Versus Execution
of CIDPs ................................................................................................... 123
Table 4.25: ANOVA Results for Institutionalization of programmes .......................... 124
Table 4.26: Relationship between Institutionalization of programmes and Execution of
CIDPs ........................................................................................................ 126
xv
Table 4.27: Role of Innovation in the Execution of CIDPS by County Government in
Kenya ........................................................................................................ 127
Table 4.28: How else has the County Eembraced Innovation in Its CIDPs Execution 131
Table 4.29: Results on how Innovation can be adopted in the County ......................... 132
Table 4.30: Model Summary for Innovation versus Execution of CIDPs .................... 135
Table 4.31: ANOVA Results for Innovation ................................................................ 136
Table 4.32: Relationship between Innovation and Execution of CIDPs ....................... 137
Table 4.33: Role of Monitoring and Evaluation in the Execution of County Integrated
Development Plans by County Governments in Kenya ........................... 138
Table 4.34: M&E Team’s non-independence ............................................................... 143
Table 4.35: Model Summary for Monitoring and evaluation Versus Execution of CIDPs
.................................................................................................................. 146
Table 4.36: ANOVA Results for Monitoring and Evaluation ...................................... 147
Table 4.37: Relationship between Monitoring and Evaluation and Execution of CIDPs
.................................................................................................................. 147
Table 4.38: Extent of Influence of policy framework on the role of strategic leadership
in Execution of CIDPs .............................................................................. 148
xvi
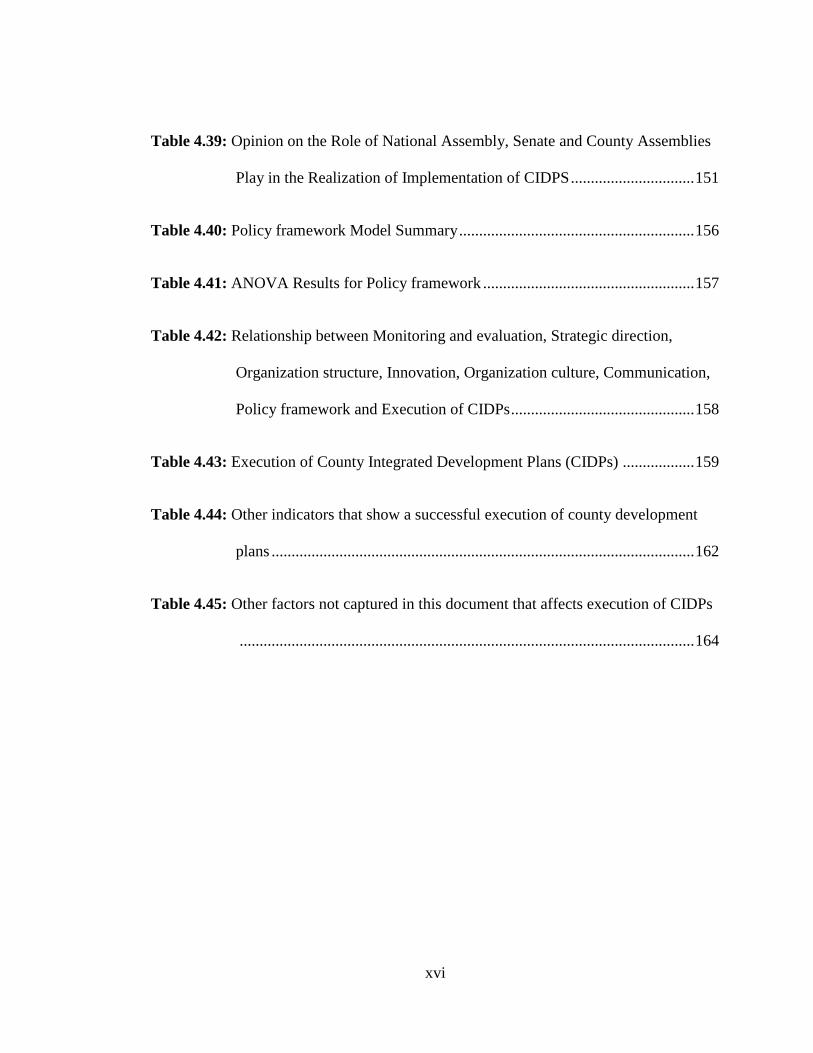
Table 4.39: Opinion on the Role of National Assembly, Senate and County Assemblies
Play in the Realization of Implementation of CIDPS ............................... 151
Table 4.40: Policy framework Model Summary ........................................................... 156
Table 4.41: ANOVA Results for Policy framework ..................................................... 157
Table 4.42: Relationship between Monitoring and evaluation, Strategic direction,
Organization structure, Innovation, Organization culture, Communication,
Policy framework and Execution of CIDPs .............................................. 158
Table 4.43: Execution of County Integrated Development Plans (CIDPs) .................. 159
Table 4.44: Other indicators that show a successful execution of county development
plans .......................................................................................................... 162
Table 4.45: Other factors not captured in this document that affects execution of CIDPs
.................................................................................................................. 164
xvii
LIST OF FIGURES
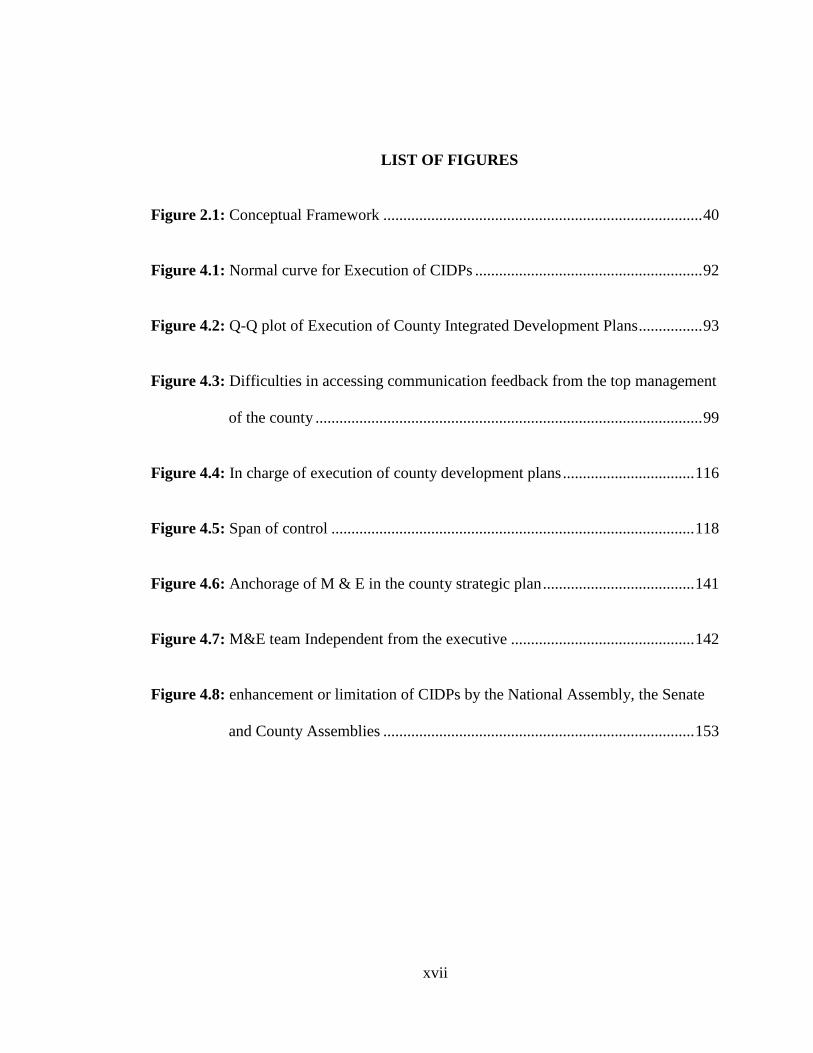
Figure 2.1: Conceptual Framework ................................................................................ 40
Figure 4.1: Normal curve for Execution of CIDPs ......................................................... 92
Figure 4.2: Q-Q plot of Execution of County Integrated Development Plans ................ 93
Figure 4.3: Difficulties in accessing communication feedback from the top management
of the county ................................................................................................. 99
Figure 4.4: In charge of execution of county development plans ................................. 116
Figure 4.5: Span of control ........................................................................................... 118
Figure 4.6: Anchorage of M & E in the county strategic plan ...................................... 141
Figure 4.7: M&E team Independent from the executive .............................................. 142
Figure 4.8: enhancement or limitation of CIDPs by the National Assembly, the Senate
and County Assemblies .............................................................................. 153

xviii
LIST OF APPENDICES
Appendix I: Introduction Letter to Respondents ...................................................... 203
Appendix II: The Research Questionnaire ............................................................... 204
Appendix III: NACOSTI permit .............................................................................. 218
Appendix IV: Factor analysis ................................................................................... 219
xix
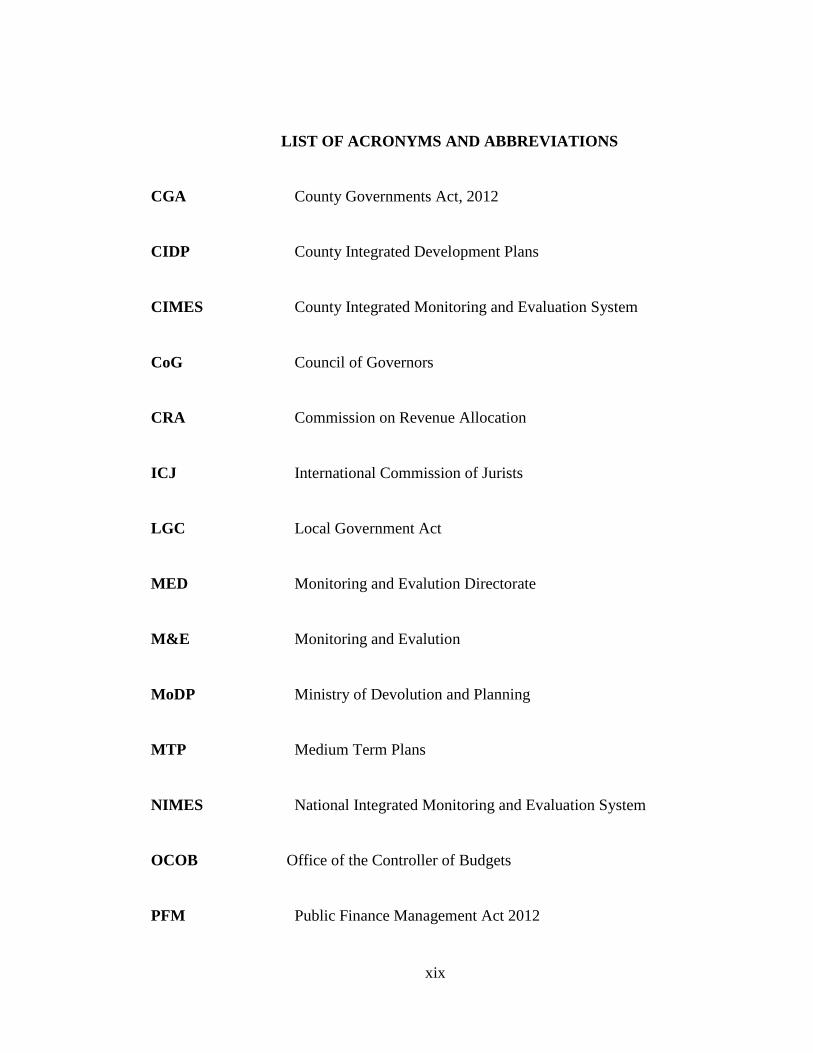
LIST OF ACRONYMS AND ABBREVIATIONS
CGA County Governments Act, 2012
CIDP County Integrated Development Plans
CIMES County Integrated Monitoring and Evaluation System
CoG Council of Governors
CRA Commission on Revenue Allocation
ICJ International Commission of Jurists
LGC Local Government Act
MED Monitoring and Evalution Directorate
M&E Monitoring and Evalution
MoDP Ministry of Devolution and Planning
MTP Medium Term Plans
NIMES National Integrated Monitoring and Evaluation System
OCOB Office of the Controller of Budgets
PFM Public Finance Management Act 2012
xx
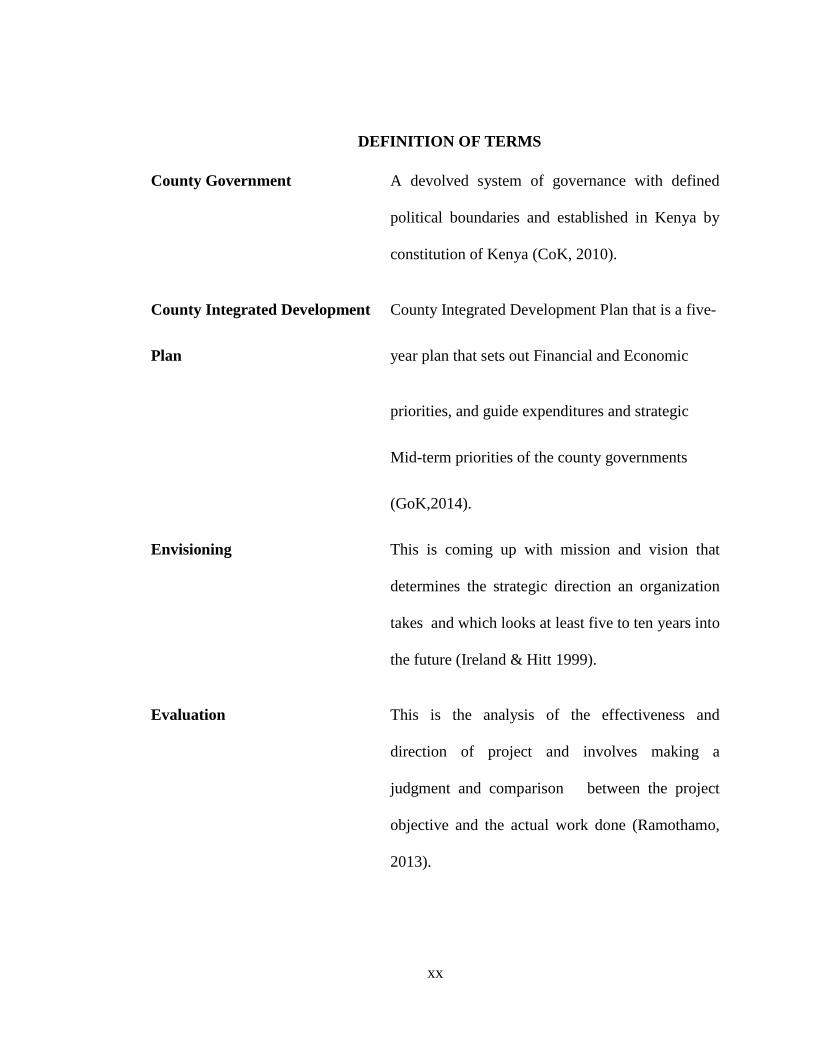
DEFINITION OF TERMS
County Government A devolved system of governance with defined
political boundaries and established in Kenya by
constitution of Kenya (CoK, 2010).
County Integrated Development County Integrated Development Plan that is a five-
Plan year plan that sets out Financial and Economic
priorities, and guide expenditures and strategic
Mid-term priorities of the county governments
(GoK,2014).
Envisioning This is coming up with mission and vision that
determines the strategic direction an organization
takes and which looks at least five to ten years into
the future (Ireland & Hitt 1999).
Evaluation This is the analysis of the effectiveness and
direction of project and involves making a
judgment and comparison between the project
objective and the actual work done (Ramothamo,
2013).
xxi
Execution The strategy execution is the process of making
the Organization ready for implementation. It is
where the strategy gets communicated to the
organization so that everyone involved knows
what, why and how of the strategy (Bob de Wit &
Ron Meyer, 2004).
Innovation This is the execution of a new or significantly
improved product (good or service), or process, a
new marketing method, or a new organizational
method in business practices, workplace or
external relations (OECD, 2005).
Institutionalization It is how an organization configuration takes effect
that entails of the structures, processes,
relationships and boundaries through which the
organization operates (Johnson & Scholes, 2003).
Monitoring This is the day-to-day systematic collection and
occasional analysis of data during the course of
project execution (Failing & Gregory, 2003).
Organizational Culture: It is a pattern of basic assumptions that a group has
discovered, invented or developed, in its quest to
cope with challenges of external adaptation and or/
internal integration (Schein, 2010).
xxii
Organizational Structure: Defines how activities such as task allocation,
coordination and supervision are directed toward
the achievement of organizational objectives. It can
also be considered as perspective through which
individuals see their organization and its
environment (Robbins & Judge, 2007).
Strategy This is an integrated and coordinated set of
commitments and actions designed to exploit core
competencies and gain a competitive advantage (
Hitt,Ireland & Hiskisson,2003)
Strategic Leadership: Ireland and Hitt (2005) define strategic leadership
as a person’s ability to anticipate, envision,
maintain flexibility, think strategically and work
with others to initiate changes that will create a
viable future for the organization.
Strategic Management This is the process whereby managers establish a
firm’s long term direction, set specific performance
objectives, develop strategies to achieve these
objectives in line with the relevant internal and
external circumstances (Thompson & Strickland,
2003).
xxiii
ABSTRACT
This study sought to identify the role of strategic leadership on execution of
development plans by county governments in Kenya. The objectives of the study were:
To analyse the role of envisioning in execution of development plans by county
governments in Kenya, to analyse the effect of institutionalization of programmes in
execution of development plans by county governments in Kenya, to explore the role of
innovation in execution of development plans by county governments in Kenya, to
analyse the role of monitoring and evaluation in execution of development plans by
county governments in Kenya and to establish the moderating effect of policy
framework in execution of development plans by county governments in Kenya. The
target population of the study was government officers from five counties which was
10% of forty-seven counties who comprised of 5 County Secretaries, 5 Heads of
Monitoring and Evaluation, 5 Chairs of Public Accounts Committees and 5 Clerks of the
County Assemblies. Others are 48 Chief Officers and 55 Directors. The target
population was 123 participants and sample size was 92. The study adopted a descriptive
research design. The questionnaire was used as the data collection instrument. Data
analysis and interpretation was based on descriptive statistics and inferential statistics
namely, Pearson correlation and Analysis of Variance. In addition a multiple regression
model was used to explore the relationship between the variables. The study adopted the
multiple regression to assess the effects of the moderating variable (Policy framework)
whose findings indicates that a 6.2 % change in variation after introduction of the
moderator variable was realized. The effect of the moderator on the relationship between
the independent variables (Monitoring and evaluation, Strategic direction, Organization
structure, Innovation, Organization culture, Communication) and dependent variable
(Execution) is statistically significant (F (7, 55) = 9.544, p-value = 0.000).Envisioning role
was found to positively influence the execution of CIDPs. Institutionalization had a
positive influence on execution of CIDPs. Innovation role in the execution of CIDPs was
significant. Monitoring and evaluation role in the execution of CIDPs had a significant
relationship with execution.The study recommends that county governments should
embrace innovation for better service delivery through county integrated development
plans. Monitoring and evaluation should be embraced and qualified and competent staff
should be hired and the function should be adequately funded and be independent of the
execution for it to function properly. Also National government to allocate funds to
counties that utilize their funds transparently and starve funds to counties that do not
account for the allocated funds. Senate to take its oversight role seriously by ensuring
that counties deliver without deviating from the crafted county integrated development
plans. The study concludes that County governments should exercise strategic kind of
leadership in the execution of CIDPs as its role has proved to have impact on the
execution of CIDPs.
1
CHAPTER ONE
INTRODUCTION
1.1 Background of the Study
The people of Kenya had been agitating for change of the constitution to reflect on the
changing aspects of their country on matters service delivery by their government. The
dawn of the new constitution that was promulgated in 2010 brought a paradigm shift in
governance. However, the 2010 constitution was operationalized in March 2013 after
general election in Kenya. The new paradigm shift of governance established 47 county
governments with one national government (Wagana, Iravo & Nzulwa, 2015). Kenya’s
devolution was a unique form of decentralization that included three elements of
political, fiscal and administrative decentralization (ICJ Kenya, 2013).
Challenges that citizens encountered were such issues as conflicts, inequalities,
economic stagnation, corruption and inefficient use of public resources that were
earmarked to be addressed by devolution. However, for devolution to be seen to be
effective the local level must make a decision which should be agreed through consensus
(Dent, 2004; Kimenyi & Meagher, 2004). Devolved governments are the first contact
form of government that citizens meet and which is able to look into the local needs. It
ensures that public services are provided efficiently.
The centralized systems of governments have been shown to be a stumbling block for
efficient delivery of public services (Wagana et. al., 2015).
2
Improved service delivery has been noted due to decentralization of social services for
example education, health, water and sanitation (Ekpo & Ekpo, 2008). There is a wide
acknowledgement of decentralization as a tool for improving service delivery to the
people. Wagana, Iravo et. al., (2015) citing a study by World Bank (2003) posits that
decentralization has both an direct and implied motivation of improving service delivery
and cites two major elements. Basic services which are under the purview of the state
are not being realized. Improving service delivery through decentralization is important
as services are locally consumed. Devolution has been by some countries to ensure that
governments use power and resources for the good of all like enhancing social services
provision efficiency. Countries like are Britain, Germany, United States of America,
Canada and Australia adopted devolution.
In Africa, examples of countries where devolution has been successfully adopted entails
such countries as South Africa, Nigeria and Ethiopia ( Keraro & Isoe, 2015). Kenya’s
devolution has been touted as unique and ambitious. It devolved the administrative
systems, political structures and resources simultaneously. The new constitution of
Kenya 2010 reversed the centralized non-participatory governance paradigm by
institutionalizing a devolved governance system.
County governments have been mandated to manage and develop their own affairs by
enhancing social, economic and political development. The sectors are Agriculture,
health, transport, trade development and regulation, pre-primary education and planning
3
and development. There are forty-seven county governments and one national
government and each county government has a county assembly and county executive.
Services that were devolved entails: county health services, solid waste disposal, county
transport, including county roads, street lighting, traffic and parking, water conservation,
and social welfare (Constitution of Kenya, 2010).
Service delivery has been defined as a set of institutional arrangement adopted by the
government to provide public goods and services to its citizens UNDP (1999). Some of
these services include collection of refuse and disposing it or lighting the streets by
municipal research and services center MRSC (Makanyeza, Kwandayi, & Ikobe, 2013).
According to Onyango (2015) service delivery can be said to be a complex collaboration
between government, society and citizens. According to Djordje (2013) local
government is the most visible form of government to the grassroot level citizens.
Consumers have a right to demand services from their suppliers that meet their needs:
These needs are like fast services, accessible roads of good quality and at modest cost.
This is holds true to the government as a supplier of key public services (Onyango,
2015).
Counties are expected to formulate and execute strategies that are in line with the
national government’s vision 2030 and Medium Term Plans by incorporating their
counties strategic plans. Counties are endowed with diverse human and natural resources
which calls for strategic leadership in order to manage these resources well. County
4
Governments Act, 2012 (CGA), 104 is the service delivery avenue that expects a county
to develop an integrated plan and designate planning units at county administrative
levels. It also calls for the promotion of public participation and also non-state actors
involvement in the planning process. The Act also envisions a closer working
relationship between leaders in the counties and the national government for better
service delivery. Counties are required to develop their plans as the basis of their
budgeting and expenditure and have made significant efforts to develop CIDPs aligned
to vision 2030. County plans entails the County Integrated Development Plans
(CIDPs).CIDPs is a 5 year plan that informs county’s annual budget. It also entails a
County Sectoral Plan that is a ten (10) year plan. Also a County Spatial Plan that is a ten
(10) year plan using the Geographic Information System (GIS) based system that is
reviewed every five (5) years and also City Municipal Plans.
The CIDPs that were developed in the first year of devolution were guided by the county
development profiles and the Second Medium Term Goals of Vision 2030.According to
the Council of Governors (CoG) report of 2014, CIDPs experienced the various
challenges among them credible statistics to align county planning, budgeting and
eventually development to the Vision 2030.It was noted that data present was divided
into districts, divisions and locations and not by county, sub-county or wards.
The planning and service delivery units of the devolved system are counties, sub-
counties and the wards. It was also noted that some counties had not created the County
Budget and Economic Forum to facilitate public consultation on public finance and
5
economic planning. Also noted was the cost of public participation and generally low
turnouts in consultative forums.
Absence of effective engagement frameworks with non-state actors and private sectors
was observed. Creation of urban areas had not been met and also lack of adequate public
communication mechanisms to engage the public on county planning and feedback on
areas of priorities. A report by the Controller of budgets also identified problems faced
by counties on matters absorption capacities. Identified issues included: inconsistencies
and delays in procurement and execution others were clarification of roles between
governments levels more so on execution of special fund.
1.1.1 Strategic Leadership
Strategic leadership has been defined as the ability to anticipate, envision and maintain
flexibility, empower others to create a strategic chance and a bright future of the
organisation (Kjelin, 2009).Further, strategic leadership has equally been defined as the
ability to envision the future of the organisation (Abudho-Riwo, Njanja & Ochieng,
2012).It entails the capacity to communicate the vision of the organisation and to
motivate the followers toward the execution of the strategic goals.
The role of strategic leadership is fundamental in the creation of an enabling
organizational values and cultures which makes an organisation succeed (Mauri &
Romero, 2013). Some researchers hold that strategic leadership concept may become the
most apt concept to embracing better value driven culture in public sector in the era of
21st century (Daft &Pirola-Merlo 2009; Jing& Avery 2008; Ireland and Hitt 2005).
6
Shuria (2015) posits that strategic leadership has been one of the most critical issues
confronting organizations in the twenty first century. Strategic leadership is the ability or
capacity to influence followers to follow on their own accord and make decisions that
enhance both the long-term and short-term viability and stability of the organization
(Daft, 2010). Strategic leadership is viewed as having a many functional capability that
enhances management of organisation processes which require leaders to ensure that
organisation changes are always evaluated in order to fit the current business
environment (Jamal & Saif, 2011).
According to Kirmi and Minja (2010), strategic leaders are shapers of the formation of
strategic intent and strategic mission and hence influence successful strategic actions in
their respective organisations. Strategic leadership is fundamental in all types of
organizations of the 21st century according to a research by Hitt,Haynes and Serpa
(2010).Research by Ruderman et. al., (2010) has confirmed that strategic leadership is
all about transformation of an organisation via vision and values, culture and climate,
structure & systems as well as its strategy.
A study by Kelly and Mark (2013) found that strategic leaders practice different styles
of administration to craft vision that enable them maintain competition in a dynamic
world. Further, a study carried out by Dinwoodie, Quinn & McGuire (2014) revealed
that through strategic leadership both individuals as well as groups potentials are
aroused which helps an organisation achieve its goals. Strategic leaders integrate the
7
vision, creativity and innovation which are fundamental for the long term success. A
study by Brent and Barbara (2012) further revealed that current organizations have
embraced strategic leadership as part of their management styles. Leadership is critical
to formulate and execute strategy. Formulated strategies are counted as nothing if they
are not executed efficiently. Leaders should focus at continuous improvements of
strategic management processes (James and Green, 2005).
Seven capabilities and characteristics have been put forward as to what constitutes
strategic leadership: planning, forecasting and envisioning, maintaining core
competencies, building highly effective and motivated teams, organizational culture,
goal priorities and effective communication ( Budiarso, 2014). Strategic leader first role
is determination of organization’s vision and strategic direction (Budiarso, 2014). Clear
commitment and direction from the leaders in terms of vision and mission gives a goal
that can later measure their own and organisation’s performance. Absence of clear vision
renders managers ineffective (Thompson & Strickland, 2003).The purpose and vision of
a firm aligns the activities of all people in the firm (Haris, 2008). Organization vision
that is clearly determined makes an organization anticipate and envision the future
opportunities and challenges, maintain flexibility due to environmental changes.
Strategic leaders are responsible for understanding the environment and setting strategic
directions that followers believe in (Shuria, 2015).An organization’s culture is a
collection of core beliefs and behaviours that are shared within the organisation and
drives the way operations are carried out. Organizations have cultures from which their
employees tap from in their day today conduct (Raisch & Birkinshaw, 2008). Distefano
8
and Maznevski (2003) posit that it is fundamental to enhance human capital if strategic
leadership is expected to achieve its purpose. Strategic leaders get things done
personally and in collaboration with other people (Ongonge, 2013).Carter & Greer
(2013) view strategic leadership on the basis of thinking and visionary capabilities of
whose purpose is to establish an organisation that is transformative. On the other hand,
Shoemaker & Krupp (2015) argue that strategic leadership not only is it concerned with
possession of rare abilities but it has adaptive capacity to respond to the dynamic and
complex external environment. Most recent studies on the influence of strategic
leadership on performance are fundamental (Quigley & Graffin, 2017).
Execution of strategic plans by the counties calls for a strategic leadership that will be
able to enlist the followers to its long term goals and one that will be able to nurture and
guide the followers to reach the ultimate goals for both followers and citizens of
respective counties. A leadership that will inspire followers to embrace the new
paradigm shift in governance and make the old mindset rejuvenated to embrace the 2010
Constitution requirements of service delivery to the people.
1.1.2 Strategic Planning
Steiner (2010) states that strategic planning started and was adopted as a modern design
in business in the 1950s. During that era only big entities had strategic plans which were
then called strategic planning systems. Since then, formal strategic planning had gone
through maturity and then many companies have embraced strategic planning
irrespective of the size.
9
Strategic planning cannot be ignored by Business management since they are compatible
as organizations need to consider their environment before making any decisions
(Steiner, 2010). Simerson (2011) is of the argument that most people consider strategic
planning as a very hard process. He posits that it can be divided into five simple phases
that any organization can follow. The first phase is whereby the organization carries out
a SWOT analysis, whose purpose is to get a vivid picture of the business in relation to
the market place, its competitive environment and the actual competencies.
The phase two is appreciating what is significant for an organization and the future
direction it needs to take for example the long term objectives required to be taken by
defining the mission and vision. Thirdly, the need to have a clear and practical
organization needs to achieve as it checks on the priority areas (Smith, 2004). The
fourth phase is the need to state that is accountable and this brings in the element of
performance rating in relation to the objectives of the organization. The strategies that
have been set, the action plans and budgets are just steps in the process of strategic
planning thus communication is required on how all these processes will interact
bringing about an achievement of the defined objectives (Kenny, 2012). Lastly, after the
launch of the strategy, a review is needed periodically to ensure that things are moving
in the right direction.
1.1.3 Execution of Strategic Plans
Strategy execution is defined as the means in which an organization develops, uses and
binds organizational structure, control systems and culture to follow strategies that lead
10
to competitive advantage and enhanced performance ( Pryor,et. al., 2007).Execution of
strategies successfully is important for all organizations irrespective of whether they are
private or public. The major task of managers is to assure service delivery in their firms
(Chimhanzi, 2011).Executing a strategy according to Pearce and Robinson (2007) is the
means through which a set of agreed work is transformed into functional and operational
targets. This is supported by Kotter and Best (2006) who said that execution indicates
who, where, when and how.
According to Dess and Priem (2011) great strategies matters not if they cannot be
executed. Execution has therefore come out as fundamental to attaining organizational
outcomes. Strategy execution is key but difficult since execution activities take a longer
time period than formulation. According to Hussey (2000), execution follows a six step
cycle namely: envision, activate, install, ensure and recognize. Execution success is
contingent to the selection of the right strategy and translating that strategy into action.
Strategy implementation is dependent to a fit of several factors. These factors are
structure and process elements.
Structure defines the relationships that exist between the various parts of a firm. On the
other hand, process elements entail leadership, resources, culture and other
administrative factors. While structure follows strategy, there is evidence also that
structure influences strategy in certain conditions (Chandler, 2002). For effective
execution of strategy to be realized, it calls for adequate leadership in the firm. Culture
of an organisation should be compatible with the strategy being executed. Roy (1994)
argues that organizational culture is one of the fundamental factors defining the
11
management of organizations. Myrna (2009) identified several challenges experienced
during execution such as lack of stakeholder involvement, insufficient resources
allocation to the execution plans that are not realistic, lack of passion, competence &
commitment.
1.1.4 Service Delivery-Global Trends
Decentralized service delivery has been observed by both developing and developed
countries that it results in quicker benefits unlike centralized systems of governance.
Devolution is the most acceptable form of decentralization. In devolution, elected local
governments are empowered in two folds: Via the authority of general competence in
certain spheres and by transfer of specific delivery function through a constitutional
framework. On the global scale, the trend has been toward the development of elected
forms of local government .There exists a vertical accountability, a strong public service
delivery function and finally accountability that is direct to its people. Local
governments are well suited and need to be more empowered to ensure effective service
delivery.
Enactment of the Public service delivery has been carried out by many countries. In the
developed world we have the United States of America the government had The USA’s
Government Performance and Results Act (GPRA).In the United Kingdom they had
UK’s Citizens’ Charter and Australia’s Public Service Act. Japan had Japan’s Public
Service Reform Act. It was noted however that the former active, direct and leading role
of public governance has observed a paradigm shift to a more passive, indirect and
12
facilitating role. This was observed in high-income as well as middle and low income
countries. Countries such as Australia, Belgium, Canada, France, New Zealand, The
UK, The USA, Singapore and South Korea representing high income while in countries
such as Malaysia, Thailand, Argentina and India catered for middle and low income
countries (Frost & Sullivan, 2012) as cited by Maina (2016). Despite the strategies and
resources deployed to reforms, much has not been realized towards goals of developing
and transforming the standards of their people as envisaged. Services such as quality
health services, education and housing still remain a mirage for many people with a few
exceptions of successful cases for example the Philippines. Transformation of public
administration drives these reforms by ever changing dynamics of demand and supply of
public services. The new public administration prioritizes the needs of the people.
Recent trends concerns finding alternative approaches to organizing and managing the
public services, Maina (2016). This study drew examples from two countries namely the
Philippines and Nigeria on public service delivery.
1.1.5 The Philippines Service Delivery
The key instrument of decentralization for The Philippines government was enacted as
Local Government Code (LGC) 1760.It was considered to be one of the outstanding
reforms in the developing world (World Bank, 2003:117).The Local Government Code
transferred provinces,cities,municipalities and barangays the former mandate of national
government to them. Before its enactment, the mandated roles and responsibilities of
local governments units before 1991 LGC were: Regulation of business activities,
garbage collection administration, public cemeteries and public markets. Other mandates
13
were slaughter houses and levying and finally tax collection for the central government
within their respective areas and administration of garbage collection, public cemeteries,
public markets and slaughter houses and levying and collecting of local taxes for the
national government.
The enactment of The 1991 Local Government Code, four major functions and
responsibilities were decentralized. They were meant to inject efficient service delivery,
management of the environment, economic development and poverty alleviation.
Section 17 of the 1991 LGC was earmarked to provide for Basic-Services and Facilities.
The four devolved functions and responsibilities are in the areas of agricultural
extension and research, social forestry and environmental management. Others were
pollution control, primary health and hospital care. Further sectors such as social welfare
services, repair and maintenance of infrastructure, water supply and communal irrigation
and finally land use planning.
1.1.6 Decentralization as an enabling Policy environment for Local Service Delivery
In the Philippines, the tool that was promised to better the local service delivery and
improve quality of life was decentralization (de Leon, 2005:319-20; Manasan,
2007:275). A certain threshold was however required for decentralization to meet the
expectations. These were policy, institutions and finance were first to be availed. The
design of decentralization-its 3Ds that is deconcentration, delegation and devolution or
its political, administrative, financial and market-based characteristics needed to be
based on rightsizing. Proper designing of intergovernmental transfer of powers,

14
functions and responsibilities too. However, there was a challenge between local
government’s powers and their responsibilities and their constitutional and financial
capacities were noted due to abrupt power transfer, functions and responsibilities more
so on decentralization of such sectors as social services, health and agriculture. In health
the cost of devolution had made the LGUs particularly the Provinces incapable of
delivering public goods and services and hence the clamor to return health service
responsibilities to the national government.
The institutional factors both local and national should be capacitated with a sense of
urgency to own up the local service delivery agenda as a way to make decentralization
work for the people through their innovative ideas, capabilities and political will.
Finally, the 3Fs-functions, functionaries and funds-demand no less than commensurate
transfer and burden-sharing of the required capacity-building, institutional development
and financial sustainability. LGUs greatly impacted on the quality and quantity of
services delivered due to resources constraints and institutional deficits.
1.1.7 Local Governance and Service Delivery in Nigeria
In Nigeria, every government in power had tried to deal with the problem of making
local governments’ effective, efficient, development-oriented, people -focused, and
result-oriented. This was actualized through local government reforms of 1976 backed
up with other administrative reforms. Under the reforms, local governments were
constitutionally recognized as third level of government in Nigeria as well as official
beneficiaries from the Federation Accounts. The impact of the reforms was that it led to
15
increase in local government powers, enhanced status, financial resources, and potential
for self-sustenance at grassroots level. Also a new strategy to local government activity
involving local participation in decision making and effective service delivery (Ibok,
2014). In order for the local governments to effectively provide essential services at the
lowest possible level, there had to be an enabling environment more so availability of
funds in order to carry out its mandates. In Nigeria, aside from other challenges, non-
provision of enough funds to local government has hindered effective performance by
the local council. It was expected that the expansion, development and improvement of
existing services and introduction of new services are necessary for the continued
existence of local government. Insufficient funds to finance existing and new projects
and to buy new equipment and maintain old ones, local governance was incapacitated in
its efforts to provide a better and more extensive and effective services to the citizens.
Populations of more than 70% of Nigerians live in the rural areas where local
governments are constitutionally mandated to provide most social and public services.
Efficient service delivery has been derailed by inadequate finance- observed low
revenue collection capability of the councils. Most state governments fail to meet
monthly statutory obligations to local governments and refusal to remit 10% of revenue
generated internally accrued to the state monthly. This has led many times to delays by
councils to remunerate their staff and meet basic needs provisions.
Absence or under developed revenue sources was another factor. Sources of revenue to
local council were not only unviable but there was poor attitude to work by revenue
16
collectors hence affecting revenue collection. Some of these revenue collectors withheld
the revenue, while others got paid through fraudulent means such as forwarding of fake
claims. The consequence of these ills weakened the councils financially (Duru, 2004).
Corruption was another vice which came in form of embezzlement and misappropriation
of the council’s funds by the officials. Political interference was also present which
resulted into negative effects on local governance since public policies were politicized
and served the elite at the expense of the public. Councils appointments were politically
and party aligned that led to both mediocre and non-performance (Duru, 2004).
Lack of accountability was a key hindrance to efficient service delivery. Accountability
is a powerful instrument for effective and efficient administration. Council leadership
frequent changes led to a fragile political leadership whereby local government
executives are relieved of their duties. Elected officials were not spared either and they
were sacked and care-taker committees and sole administrators engaged.
These appointees served the appointing authorities and local people’s interest was at risk
( Duru, 2004).
Lack of accountability was found to be a big threat to efficient service delivery.
Accountability prevents abuse of power on the part of the top management and it
ensures that the public is satisfied with how the government is being run. Frequent
changes in council leadership created crisis in political leadership which led to sacking
of local government executives. Elected officials were replaced with appointed care-
taker committees and sole administrators.
17
1.1.8 Lessons learnt from both Nigeria and Philippines on Service Delivery
Despite the good intentions by both governments, through their respective constitutions
to devolve their governments in order to serve their citizens, challenges experienced are
numerous which hampered the well intentioned policies. In Nigeria, local governments
are constitutionally recognized as a third tier of government as well as the official
beneficiaries from the Federal Accounts. It has led to an increase in local government
powers, enhanced status, financial resources, potential for self-sustenance, local
participation in decision making and effective delivery. Challenges still face the same
governments for example lack of enough funds from the national government, hence
hindering effective service delivery.
Corruption has been noted in cases of embezzlement and misappropriation of funds by
council officials. Political interference whereby those in the possession of authority
appoint their own who serve their interests instead of the citizens which leads to poor
service delivery. In Philippines, the Local Government Code (LGC) of 1991 was the key
instrument of decentralization. Four major functions were devolved namely: Efficient
service delivery, Management of the environment, Economic development and Poverty
alleviation .Functions assigned required inter-jurisdictional provision of services such as
district and provincial hospital by provincial governments. Cities and Municipalities
directly manage, implement, monitor and evaluate service provision such as primary
18
health care, construction, repair and maintenance of public schools building and
facilities ( PID & UNICEF, 2009).
Abrupt transfer of powers, functions and responsibilities especially on health, social
services and agriculture has created a mismatch between council’s powers and their
responsibilities and their institutional and financial capacities, which has impacted on
the delivery of services and public goods. Due to incapability of provinces to deliver
health services clamor to return health services responsibilities to national government
has been noted. There are also resources constraints and institutional deficits
experienced by provinces which greatly impacts on the quality and quantity of services
delivered.
The Nigerian case clearly fits well with what is currently happening in Kenya. Despite
the devolution having been embraced by Kenya through the Constitution of 2010,
government agencies like the office of the Controller of Budgets and the Auditor
General are awash with reports of huge embezzlements and misappropriations of funds
running into billions of shillings by county governments. Others are low absorption rates
by counties despite having been allocated funds are unable to utilize within the required
times. Cases of revenue collection by county staffs and non-remittance to the appropriate
county accounts have been cited in many counties in Kenya. Lack of public participation
which is constitutional requirement before any project is undertaken has also been
observed. This clearly indicates lack of leadership that is able to enlist its followers to
buy its mission and vision for the constitutional mandate of service delivery to its
citizens who are actually the tax payers.
19
The Philippines case demonstrates that devolution of governance to ensure quick and
efficient service delivery has been met with many challenges. The devolved system must
work in collaboration with the national government to ensure smooth running of the
devolved system. Strategic leadership is required in municipalities and cities whose
mandate is to manage, implement, monitor and evaluate services provisions. Clamor for
health services being returned to the national government in the Philippines is the same
in Kenya whereby strikes by different cadres of health providers are requesting for
different packages in their terms of employment which has greatly affected the health
service delivery in the counties.
1.1.9 Execution of County Integrated Development Plans (CIDPs)-Kenyan Context
The Constitution of Kenya 2010, the vision 2030 and the Medium Term Plans constitute
the preparation of the first County Integrated Development Plans (CIDPs) foundation.
Preparation of county integrated development plans is to assist in scarce resources
allocation to the projects that the public have prioritized through the principle of public
participation. The preparation of CIDPs must be aligned with the County Governments
Act (2012) and also CIDP Guidelines .There must be participation by all elements of
governance. National values are to be integrated in all planning of projects and
execution issues. County Integrated Development Plans (CIDPs) are five-year plans.
They provide the critical foundation in order to have speedy, inclusive and sustainable
development of the counties. County Integrated Development Plans (CIDPs) are the blue
prints or strategic plans for the execution of the devolved functions.
20
Development of CIDPs has been institutionalized in Kenya, with each of the 47 counties
actively undertaking the process of executing their first CIDPs which came to an end in
June 2017.The on-going CIDPs are the first for counties and covers the period 2013-
2017.They replaced the District Development Plans, which were used to guide
development with the focus at the district under the former constitutional dispensation.
The two levels of governments are distinct but interdependent. The Governor is elected
by the citizens of the county and is the chief executive officer of the county. There is
also the County Executive Committee (CEC) and the County Assembly. The role of the
County Executive Committee entails supervision of the administration and delivery of
services as well as coming up with and execution of policies and county legislation. The
County Assembly plays a legislative role and oversight role on all County public
institutions including the urban areas.
Some observations were registered by The Second Devolution Conference of 2015 on
execution of county integrated development plans. That there was different planning at
county level. Weak long-term planning and also weak content. The plans were just made
for compliance while there was absence of capital investment plans and weak spatial
alignment. Further, multi-disciplinary teams were absent,, inter-governmental as well as
inter-county teams were equally lacking. Lastly intra-county teams were missing. Lack
of maintenance strategies for both capital and development investments were lacking
and weak resource mobilization plans. The conference also noted lack of annual
integration of procurement plans. The constitution of Kenya 2010 envisages the
21
development of monitoring and evaluation (M&E) systems for county governments in
Kenya.
Principles of good governance and transparency are expected in the conduct and
management of public projects. Both levels of governments appreciate that performance
monitoring and evaluation are pivotal developmental and service delivery tools. Hence
the goal of both governments is on development outcomes and on how best they can be
measured. Kenya as a country has been having development planning from the time it
got independence. It has been noted however that due to absence of an integrated
monitoring and evaluation system, the execution of development plans in the first forty
years of independence was weak. There were issues such non-completion or non-
execution of projects. Information collection and its analysis were not done well. Due to
lack of comprehensive monitoring and evaluation system in place, decision making and
feedback was anchored on verifiable evidence. The government came up with individual
project-and programme-based monitoring and evaluation in the 1980s and
1990s.Development plans started then had a part on monitoring and evaluation.
Monitoring and evaluation plans were prepared for donor standards to be met and led to
particular project and programme evaluation. It resulted to the expected beneficiaries
failing to get the required reports.
Monitoring and Evaluation of the execution of service delivery by counties is done at the
national level by the National Integrated Monitoring and Evaluation System. This is
envisaged to improve the effectiveness and quality of monitoring of implementation of
development policies,programmes and strategies. National government development
22
planning and policy as well as private sector and civil society organizations and
development partners are informed by NIMES output processes On the other hand a
county Integrated Monitoring and Evaluation System (CIMES)-is an observation tool. It
is used to check on activities of each county’s priority projects whether they are as per
schedules aligned in the county integrated development plans. It also checks if resources
are used correctly and efficiently.
Dissemination of M&E results can raise awareness of a county’s programmes and
projects and hence have a positive image on the county’s leadership and this may lead to
increase in resource allocation towards well performing counties. The system supplies
leadership with a regular flow of information throughout the course of CIDP programme
execution. It makes it possible to detect changes in status and utilization of resources
allocated to CIDP priority projects or programmes. Government of Kenya established
reform strategies since the year 2003 so as to enhance service delivery in public service.
These reform strategies were as follows: Rapid Results Initiative (RRI), Citizen,
Contracting, Transformative Leadership, Values & Ethics and Institutional capacity
building (GoK, 2007) as quoted by Korir, Rotich and Bengat, (2014). Since 1990s the
Kenyan government carried out Civil Service Reform Programs. These reforms were
meant to reduce government wage bill, streamline and rationalize government ministries
and departs as well as enhancing personnel and payrolls controls and capacity building
(Korir et al., 2014).
Poor service delivery had made Kenyans to complain to the government and in response
to this, the government came up with the introduction of Huduma Centers in November
23
2013.Services that Kenyans access from Huduma Centers are passports, land title
deeds,KRA personal identification numbers, identity cards and driving licenses without
having to travel to Nairobi.
1.2 Statement of the Problem
The basis for the preparation of the first County Integrated Development Plans were the
Constitution of Kenya 2010, the Vision 2030 and the Medium Term Plans. County
Integrated Development Plans purpose is to enable the allocation of scare resources to
priority project that have been identified by the people through the principle of public
participation.CIDPs are the strategic plans for the county governments in Kenya. Once
the strategic plans have been projected, the top management’s priorities swing into
converting the chosen strategic plans into actions and desirable results (Thompson et. al.,
2008). Strategy execution is defined as a process by which policies and strategies are
actionable through provision of budgets, development procedures and programmes.
The ultimate aim of CIDPs is to ensure that citizen’s service delivery is being felt by
those who are supposed to get it at the grass roots level. County governments being a
new paradigm shift in governance in Kenya has experienced a myriad of challenges in
24
the execution of county integrated development plans. This could be attributed to lack of
a tested leadership in the execution of CIDPs.
According to Pearce and Robison (2007) strategic leadership is about coping with
change; and more changes always demand more leadership.Hitt,Ireland,and Hoskisson
(2007) define strategic leadership as the ability to envision, anticipate and maintain
flexibility by the leaders in ensuring empowerment to others so as to create the
necessary strategic changes; it entails managing through others. Capon (2008) states that
good strategic leadership is one with strategic vision and is persuasive at executing
strategies. Lynch (2009) is of the view that strategic leadership involves communicating
with and listening to stakeholders in the organisation with the objective of spreading
knowledge and at the same time creating and innovating new spheres and solutions to
challenges.
Reports from various government agencies mandated to audit and assess the execution
of CIDPs and general service delivery have raised queries on the manner the execution
of CIDPs are being carried out at the counties levels. For instance, a report by
Monitoring and Evaluation department (2016) indicated that county governments were
facing challenges pertaining to the development use of monitoring and evaluation
systems. M&E systems units are not yet operational in some counties and where present
there were capacity and skills deficiency. The Commission on Revenue Allocation for
2015/16 indicated that 42 counties had low absorption of development funds, unrealistic
projections of own revenues collection, excessive expenditure on non-priority areas and
weak monitoring and evaluation frameworks. For the year 2015/2016 the office of

25
Controller of Budgets cited delays in approval of key budget documents, inadequate
audit function and audit committee, late submission of financial reports, delays in
disbursement of funds by the national government, high levels of pending bills and high
wage bills as factors derailing the service delivery. Council of Governors report of 2014
noted existence of lack of connection between CIDPs and county budgeting. In some
counties, it was noted that county assemblies used blackmail and intimidation upon the
executive through threats of impeachment while others mutilated and altered the county
executives’ proposed budgets and re-allocated funds outside the county integrated
development plans in total violation of the Public Finance Management Act 2012.
A number of studies have been carried out on the role of strategic leadership in strategy
implementation as follows: Ndunge (2014) studied the influence of strategic leadership
on implementation change management practices at the Kenya Wildlife Service. The
study revealed that leaders were key element in implementation of change management
practices more so in guidance and provision of direction. Organisation culture,
Management styles, stakeholders and organisation resources had a great significance in
the execution of strategic plans in Kenya (Abok,Waititu,Ogutu, &Ragui,2013).This
study did not focus on strategic leadership role and hence the difference with this study.
Wagana (2017) did a study on effect of Governance Decentralization on service delivery
in county governments in Kenya while Maina (2016) had a study on effects of
transformational leadership on service delivery by county governments in Kenya. On the
other hand a study by Mwongela (2013) revealed that one of the key factors affecting
strategy implementation at Kenya National Audit Office was poor strategic leadership.

26
Mokaya (2016) did a research on board functions, accountability practices, governance
structures and performance of county governments in Kenya. The research did not look
into the aspect of strategic leadership role in the counties which the current study
explored on the execution of the county integrated development plans. All of identified
studies were on strategic leadership and implementation of strategic plans. None of the
studies had been on the role of strategic leadership on execution of county integrated
development plans by county governments in Kenya. It is therefore against this
backdrop that this research was undertaken to fill the gap.
1.3 Objectives of the Study
The objectives of this study were both general and specific as follows:
1.3.1 General objective
The general objective of the study was to establish the role of Strategic Leadership on
execution of County Integrated Development Plans by County Governments in Kenya.
1.3.2 Specific Objectives
1. To determine the role of envisioning in execution of County Integrated
Development Plans by County Governments in Kenya.
2. To analyse the effect of institutionalization of programmes in execution of
County Integrated Development Plans by County Governments in Kenya.
3. To explore the role of innovation in execution of County Integrated Development
Plans by County Governments in Kenya.
27
4. To analyse the role of monitoring and evaluation in execution of County
Integrated Development Plans by County Governments in Kenya.
5. To establish the moderating influence of policy framework on the role of
strategic leadership in execution of County Integrated Development Plans by
County Governments in Kenya.
1.4 Research Hypotheses
The study tested the following null hypotheses:-
HO1: Envisioning has no significant role in execution of County Integrated
Development Plans by County Governments in Kenya.
HO2: Institutionalization of programmes has no significant effect in execution of
County Integrated Development Plans by County Governments in Kenya.
HO3: Innovation has no significant role in execution of County Integrated
Development Plans by County Governments in Kenya.
HO4: Monitoring and Evaluation has no significant role in execution of County
Integrated Development Plans by County Governments in Kenya.
HO5: Policy framework has no moderating influence on the role of strategic
leadership in execution of County Integrated Development Plans by County
Governments in Kenya.
28
1.5 Justification of the Study
This section explained the significance of the study with respect to the role of strategic
leadership on execution of county integrated development plans by county governments
in Kenya. The following listed are some of the main beneficiaries.
a) Government of Kenya
The findings would influence the enhancement of execution of CIDPs by analyzing the
findings of the study. This would assist the national government when drafting its
policies on issues pertaining to budget disbursements, collaborations and other matters
that might be brought forward by the implementers of CIDPs.
b) County Governments
The study would inform the county executive and the county assemblies on areas that
need more collaboration for the efficient and effective execution of the county integrated
development plans. Strategies for better service delivery through CIDPs may also be
articulated for the two arms to work as partners and not as competitors.
c) Researchers
The research would add value to the existing body of knowledge. The study would
benefit the researchers and scholars who wish to undertake further research aimed at
other forms of other than strategic leadership on execution of CIDPs in Kenya and
beyond.
29
1.6 Scope of the Study
The selection was based on the report by the Office of Controller of Budgets, OCOB
(2016) for the financial year 2015/16 on the Development Absorption rate in which the
targeted counties had over 60 % absorption and 80% of the same counties had met the
30% of PFM Act 2012 threshold on the County governments’ Development Budget
allocation as a percentage of the total budget. Also another reason the researcher had
selected the said counties was informed by an Infotrak County Index in which they
ranked these counties in top five in addition of being densely populated which exhibited
a unique balance between rural and urban populations ( Infotrak, 2015).
1.7 Limitations of the Study
The researcher encountered challenges during the data collection exercise. Some
respondents had perception that the information they provided could leak to their seniors
and some cited confirmed cases of their colleagues who had been disciplined for
disclosing some vital information to researchers. The researcher had to assure them that
the information volunteered was purely for academic purpose and confidentiality was
guaranteed. The researcher had to attach introductory letter from Jomo Kenyatta
University of Agriculture and Technology and a research permit from the National
Commission for Science, Technology and Innovation, which assured the respondents
that it was purely for academic purposes.
30
Another challenge was that most of the respondents were very busy and the researcher
had to leave the questionnaires with the secretaries to give to respondents and researcher
also booked for appointments as per the schedule of the respondents.
The questionnaire was long and some of the respondents felt it was consuming their
precious time. The researcher was sometimes made to go through the questionnaire with
the respondents and this would take a shorter time. Other respondents could misplace the
questionnaires and the researcher made replacements immediately.
31
CHAPTER TWO
LITERATURE REVIEW
2.1 Introduction
This chapter explains theoretical and empirical literature on the role of strategic
leadership on execution of county integrated development plans. It outlines a theoretical
framework and theories that relate to the stated objectives. It also gives the conceptual
framework that shows the relationship among the dependent, independent and
moderating variables. Finally the chapter discusses empirical review, critique, research
gaps and summary.
2.2 Theoretical Framework
Various theories have been engaged to enlighten on the role of strategic leadership on
execution of county integrated development plans by county governments in Kenya. The
theories are: Strategic Leadership Theory, The Contingency Theory, Theory of
Constraints and Theory of Change.
2.2.1 Strategic Leadership Theory
Strategic leadership theory explains that strategic leaders should be capable of exploring
different tasks and roles. It must be able to perform these roles and tasks using
complementary leadership styles, personal characteristics and strategies that influence
lower managers and teams ( Oppong, 2014).
32
Strategic leaders are expected to take roles such as making strategic direction, creation
and communicating visions of the future, develop key competencies and capabilities,
come up with organizational structures, processes and controls.Also they are expected to
manage diverse constituencies, selection and developing of the next generation of
leaders, creation and sustenance of an effective organizational culture and
institutionalization of ethical value systems into the organizational culture (Boal
&Hooijberg,2000).
An examination of strategic leadership has revealed the importance of the top
management and the Upper Echelons Theory (Hambrick & Mason, 1984; Finkelstein &
Hambrick, 1996). According to Hambrick (1989) a complex, uncertain and a pressured
environment fits the strategic leadership. It is a leadership has the ability to anticipate,
envision, mobilize resources, maintain flexibility, strategic thinking and working with
others (Pazireh, Akhlagh, & Akbari, 2014). The importance of strategy creation with
others without only communicating the strategy maybe the critical skill which strategic
leaders apply in determining the strategic direction of the organisation (Kakabadse et al.,
1998; Boal & Hooijberg, 2001).
The theory of Strategic leadership was originally developed and expanded from
Hambrick & Mason (1984) Upper Echelons theory that was based on the leadership
impact on organizational results and performance (Vera & Crossan, 2004) .Boal and
Hooijbergy (2001) as cited by Nthini ( 2013) argued that while supervisory theories of
leadership have concentrated on task and personal oriented behaviours of leaders to
expound on the relationship between the leader and the followers, strategic leadership
33
focuses on the established meaning and purpose for the organization. Publications over
the past 30 years have analysed and compared different leadership styles (Vera &
Crossan, 2004). Most of it dwelt on transactional, transformational and charismatic
leadership while current work has began considering styles and approaches e.g.
authentic, servant and responsible leadership. These works have therefore brought forth
a better view of how the leadership style influence is imposed on the individual, the
team and group performance outcomes.
The assumption of strategic leadership theory is that organizations performance and
values are reflections and the efforts of their leaders (Finkelstein & Hambrick, 1996).
For example, top managers adopted strategic choices will ultimately affect the
performance of the organization (Oppong, 2014). Empirical studies indicated that top
management influence organizational performance and effectiveness and there is
existence of significant relationship between the characteristics of the top management
and organizational performance (Hambrick, & Mason, 1984; Carpenter, et. al., 2004;
Oppong, 2014).
The choices of leaders, the values and beliefs will affect the organizational performance
and equally how issues are interpreted and acted upon by the organizational teams and
followers (Nthini, 2013). Another argument that makes strategic leadership theory the
underpinning theory for this study is that it describes the process through which top
executives or leaders of an organization guide the organizational processes and
structures that define the organization’s performance, long-term goals and survival. This
relates to how strategic leaders influence and drive the effectiveness of county integrated
34
development plans for effective service delivery to the citizens of their respective
counties. The focus of strategic leadership theory is the overall impact of the top-level
leaders on organizational performance through their influence, strategy formulation and
implementation in the context in which the organization operates. According to Phipps
and Burbach (2010) as cited by Shuria ( 2016) the leader’s vision, influence, personality
and communication abilities are the most crucial elements of strategic leadership theory.
According to Yukl (2008), strategic leadership theory also explains how managers
influence competitive strategies, management models, organizational structure, entire
organizational culture and team effectiveness via shared values and motivation. Studies
based on strategic leadership theory addressed the relationship between and the
influence of the top-level leaders on organizational performance.
The theory of strategic leadership also takes into consideration the important aspects of
the environment on which the top managers operate and how this environmental context
affects and influences their actions and decisions (Yukl, 2008). It also considers how
groups of leaders within an organization interact, share power and influence each other
to perform effectively (Pearce & Conger, 2003). Many situational leadership models
may explain the dynamics of effective interpersonal or direct leadership, while strategic
leadership models deals with how leaders craft effective organization-wide leadership
(Zaccaro & Horn, 2003). However, Boal and Hooijberg (2001) indicated that
researchers have paid less attention to the environmental context of the organization that
sets the settings, timing, and actions of the strategic leaders.
35
Therefore, strategic leaders perform and act differently depending on the context of their
environment so as to create effective organizations.
Strategic leadership is normally linked directly to the organizational performance and
effectiveness. Furthermore the relationship between effectiveness , successes of the
organization and performance is linked to how executive shape the teams, organization
culture and various departments ( Dechurch et. al., 2010). Strategic leadership theory
focuses on the organization's structure, human and social capital and capabilities to meet
real-time opportunities and threats faced by the organization. The theory seeks the top
leader to conceptualize and play a more active role in developing ideas and vision of the
overall organization, while middle and low level management execute the strategies,
structures and processes of the organization as it had been envisioned by managers (Boal
& Schultz, 2007).
Strategic leaders communicate through passion, positivity and sensations their vision
and goals to their followers. This motivates them at meeting the goals and ensuring the
vision succeeds (Eberly et. al., 2013). Strategic leaders are expected to take roles such as
making strategic decisions, crafting and communicating visions of the future. Others are
developing key competencies and capabilities, developing organizational structures,
processes and controls. They are expected also to manage multiple constituencies by
selecting and developing the next generation of leaders and sustaining an effective
organizational culture and the institutionalization of ethical value systems into the
organization's culture (Boal & Schultz, 2007).
36
2.2.2 The Contingency Theory
Fielder Contingency model was created by Fred Fielder in the mid-1960s.The model
explains that leader’s effectiveness is determined by the situation. This theory suggests
effective leadership is determined by the situation and an effective leader is able to
adapt to a variety of situations. There are many models under the contingency theory of
leadership. The Situational Leadership Model (Hersey and Blanchard, 1977) was the
most accepted model under the contingency theory (Graeff, 1983) as cited by Awolusi
Olawumi Dele et. al., (2015). The contingency theory of leadership suggests the leader's
ability to lead is contingent to various situational factors, including the leader’s
preferred style, the capabilities and behaviors of followers and various other
situational factors (Graeff, 1983; Bryan, 2002; Timothy et. al., 2011). The theory
assumes leadership behaviors affect results such as group performance and achieving
goals by influencing the staff behaviour (Butler & Reese, 1991).
According to Obiruwu et. al., (2011) a transformational leadership kind of a style entrust
a feeling of trust, admiration, loyalty and respect towards the leader in the mind of
followers, this is envisaged to motivate them to do more (Bass, 1985).Fiedler believed
that the leader’s task should balance with the leader’s control over situations and a
leader could predict with some certainty the results of a situation if he had a high degree
of control over the situation. Critical thinking is encouraged among the followers whose
outcome is intellectual stimulation that leads to improved satisfaction and performance
(Bass & Avolio, 1990; Obiruwu et. al., 2011; Onikoyi & Awolusi, 2014; Sanda &
Awolusi, 2014; Podsakoff et al., 1996).This theory therefore resonates well with the
37
innovation variable. Innovation being an act of starting something for the first time,
introducing something new (Meldrum, 2012).
2.2.3 Theory of Constraints
The Theory of Constraints (TOC) framework was developed by Eliyahu Goldratt in the
mid 1980’s for managing organizations (Motwani & Klein, 1996, Ellis, 2011). Umble
and Spoede (1991) defines TOC as an overall management philosophy which
emphasizes constraints identification and management as the keys to focusing limited
time and resources on areas where potential returns are greatest. According to Gupta and
Boyd (2008), TOC emphasizes the cross-functional and interdependent nature of
organizational processes by viewing organization as a chain of interdependent
functions, processes, departments or resources where a variety of inputs are transformed
into a variety of products and services which when sold become throughput.
According to this theory, a constraint is anything that limits an organization’s higher
performance in terms of its goal. The framework desire is to improve performance of
organizations throughout, through a process of continuous improvement (Motwani &
Klein, 1996). TOC emphasizes the importance of defining and understanding the
universal goal of the organization as a condition for success. This concept is based on
the assumption that resources are limited, and should therefore be directed towards a
well defined and focused goal.
The relevance of this theory in this study supports the moderating variable-Policy
framework-The Intergovernmental relations and Public Finance Management which are
38
cross-functional between the two levels of governments. The two governments are
interdependent in nature but distinct. For effective execution of strategic plans by
counties, there should be healthy intergovernmental relations between the two levels of
governments.
2.2.4 Theory of Change
Theory of Change (TOC) was brought up by Fredrick Perls (2005). It defines pieces and
steps necessary to bring about a long term goal. It also describes the types of
interventions that bring about results envisaged. A theory of change includes
assumptions that stakeholders use to explain in the process of change (Rogers, 2008).
The theory of change describes how changes might occur; the point being not to predict
change, but to comprehend how change may happen through community participation in
monitoring and evaluation and how it could be influenced through intervention
strategies. Theory of change therefore serves as a basis for future planning M&E
activities, as well as communication about such activities with partners and funders. This
theory supports the monitoring and evaluation variable. Monitoring is a continuous
function that uses systematic collection of data on specified indicators to provide
management and other stakeholders of the extent of progress and achievement of
objectives and progress in the use of allocated funds. Evaluation on the other hand is a
time bound and periodic exercise that performance seeks to provide credible and useful
information in order to guide decision making-checks on relevance, efficiency,
effectiveness, impact and sustainability. Impact is a positive & negative, primary &
secondary, long-term effects produced by a development intervention, directly or
39
indirectly, intended or unintended. It is often only detectable after several years and
usually not attained during the life cycle of one project (UNODC, 2005).
2.3 Conceptual Framework
A concept is a word or phrase that symbolizes several interrelated ideas. Unlike a theory,
a concept does not need to be discussed to be understood (Smyth, 2004). According to
Kothari (2003), a variable is a concept, which can take on qualities of quantitative
values. A dependent variable is the outcome variable, the one that is being predicted and
whose variation is what the study tries to explain. The independent variables, also
known as the predictor or explanatory variables, are factors that explain variation in the
dependent variable (Alison, 1996).
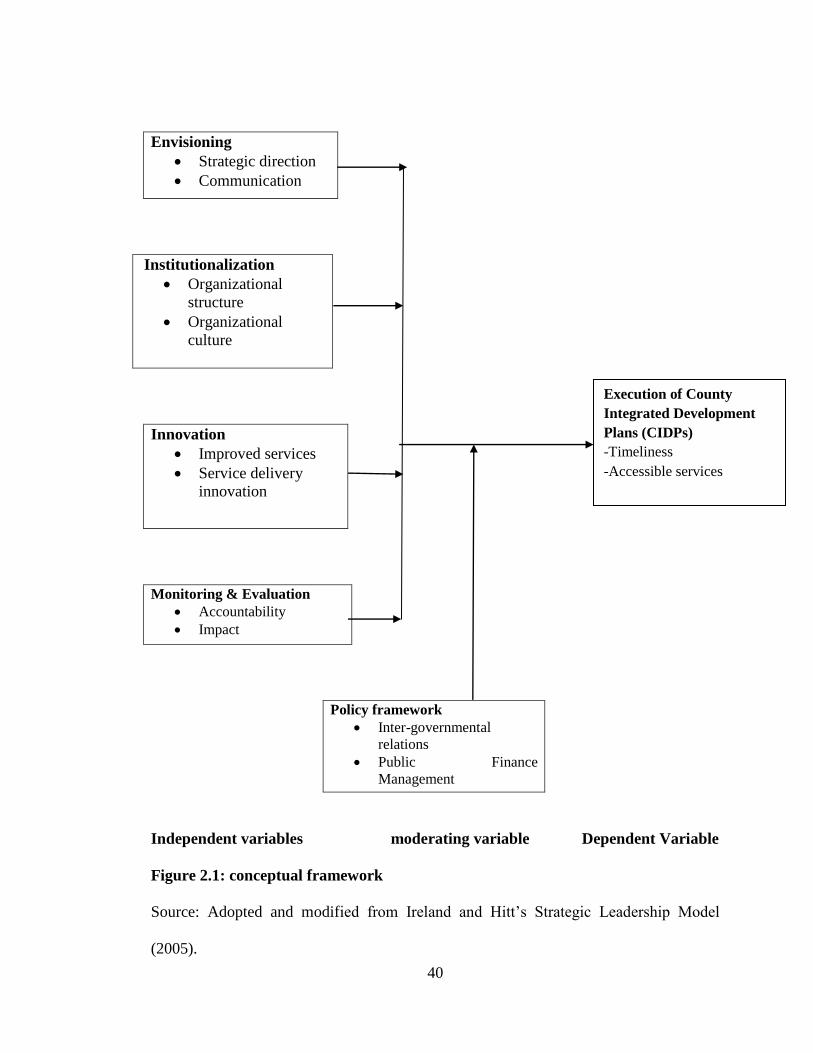
40
Envisioning
Strategic direction
Communication
Institutionalization
Organizational
structure
Organizational
culture
Innovation
Improved services
Service delivery
innovation
Monitoring & Evaluation
Accountability
Impact
Policy framework
Inter-governmental
relations
Public Finance
Management
Independent variables moderating variable Dependent Variable
Figure 2.1: conceptual framework
Source: Adopted and modified from Ireland and Hitt’s Strategic Leadership Model
(2005).
Execution of County
Integrated Development
Plans (CIDPs)
-Timeliness
-Accessible services
41
The four independent variables namely: Envisioning, Institutionalization, Innovation and
Monitoring and Evaluation and their relationship with dependent variable, the
executions of County development plans are influenced by the Policy framework. Under
the policy framework the institutions created by the constitution are the Parliament
which constitutes the National Assembly and the Senate. For Counties to effectively
execute their plans, these two institutions and counties are expected to work in harmony
through consultation and cooperation despite being distinct and inter-dependent.
The National Assembly mandate is the allocation of national revenue between the two
levels of governments namely the county governments and the national government. The
senate has an important representative, legislative and oversight role in the operations of
the devolved system. It considers debates and approves bills concerning counties and
oversights national revenue allocated to the county governments. The Public Finance
Management Act 2012 calls for openness and accountability, public participation, the
promotion of an equitable society, sharing of the burden of taxation fairly, promotion of
equitable development, responsible financial management and fiscal reporting.
2.4 Empirical Review
This section explores the previous empirical studies relating to the influence of the
independent variables for this study (envision, institutionalization, innovation and
monitoring and evaluation) on the dependent variable (execution of CIDPs).
42
2.4.1 Envisioning
County governments inherited staff from the defunct local governments and
municipalities whose orientation is alien to the new county governments. Also new
employees were recruited by the counties and these two groups must be brought to
middle ground whereby they must read from the same script if the counties strategic
plans are to be implemented. Strategic leadership in the counties therefore has a key role
to ensure that the staffs buy their vision in order for the counties to have an efficient
service delivery to its citizenry.
Strategic direction involves developing long-term vision of the organization’s intent. A
long-term vision typically looks at least five to ten years in future. According to
Prokesch (1997) as quoted by Nthini (2013), the mission and vision of an organization
aligns the people actions across the whole organization. A real vision is very active and
each and every one in the organization understands it and live it. The strategic direction
of the firm is often embedded in its strategic vision and mission statements. The strategic
vision and mission of the organization is the first step in formulating and executing
strategies. The firm’s strategic vision gives it the reason for future plans and directions
of the organization. It directs the organization in a particular direction while providing a
long term strategic direction to follow in line with the shareholders dreams (Madu,
2013).
According to Hamel and Prahalad (1989), to realize strategic direction calls for some
level of activities and behavior in an organisation.In respect to this, the organization
43
need to redirect all her energies to discover ways that confers success, allocate required
resources, mobilize, marshal, communicate effectively, motivate employees and clarify
issues on a timely basis when there is change or need to change. An internal
organizational tension should be brought about by the strategic intent that inspires and
compels all to be dedicated to the future direction given (Hamel & Prahalad, 1989).
According to Robbins, Judge and Campbell (2010) as cited by Sila and Gichinga (
2016) strategic direction determination is one of the major tasks that should be carried
out by a strategic leaders in strategy success realization. According to them, the top
management must come up with a clear vision for the organization. The critical tasks of
the strategic leadership are the development, articulation and communication of a
compelling vision. Strategic leaders “paint a picture” of where the organization will be
in 5-10 years and get staff to “buy” into and commit to this future. The visions make
employees to think beyond their current expectations. The vision role is to serves as a
destination for the organization and therefore a guide for strategy formulation and
execution. More so the vision proposed by the management should clearly show the core
values and ideology that the organization intends to “live by”. For the vision to have any
significance, it must be communicated and reinforced throughout the organization and
over time. For example, Mullane (2002) cited by Dauber, Fin and Yolles (2012),
discusses the need to translate the generalities of the vision into measurable targets with
commitment from all managers and business areas.
Kihara (2016) studied the role of determining strategic direction on not-for- profit
organizational performance in Kenya and found out that strategic direction has a
44
significant positive influence on performance in these organizations. Strategic direction
is the cornerstone upon which strategies are crafted, developed and eventually
implemented. Therefore, it is paramount that strategic direction needs to be very clear
and understandable to all stakeholders in an organization. According to Bateman and
Snell (2009), strategic leadership gives purpose and meaning to organizations. Strategic
leadership involves anticipating and envisioning a viable future for the organization and
working with others to create such a future. County leadership is expected to exercise
strategic leadership to come up with realistic visions and missions for their counties.
Jooste and Fourie (2009) in their study on the role of strategic leadership in effective
strategy implementation: perceptions of South African strategic leaders used a likert
scale questionnaire designed to measure the respondents’ perceptions of the role of
specified strategic leadership actions in strategy implementation in their organizations.
Findings from the study indicated that the respondents were of the opinion that all the
given strategic leadership actions had a positive effect on strategy implementation in
their organizations. The perception of the respondents on the determination of a strategic
direction for the organization was that strategic leadership action plays the most
important role in effective strategy implementation (Jooste & Fourie, 2009).
Communication was a sub-variable of envisioning and it should be a common rather
than a one-off exercise and should be pursued through various channels that
management deem fit to access the employees of an organization. People need to be
involved in the strategic plan implementation and hence a continuous message
effectively communicated will energize people into fully participating in the firm
45
activities (Aosa, 1992) cited by (Abok, 2013). Managers are expected to select those to
be involved in communication of organizational needs to avoid skeptics or spoilers who
would otherwise bend the intended aim as stipulated in the strategic plan. This will
involve drawing discussions and debates about the right timing plus the freedom to have
open talk on how efficient a plan is being implemented.
Aatonen and Ikavalko (2002) pinpointed three major factors that bring forth strategy
execution success. These issues or factors are proper and significant communication
among the implementers as well as the top management. Others are strategic acting
supporting, identifying and helping the major player of strategy execution. Establishing
the relationship between the system and structure of the organization with the content
and context of the strategy was also cited. Focusing on the role of communication is
(Nyakeriga, 2015).
In her research entitled, ‘factors influencing strategic plan implementation in the newly
established public universities in Kenya’, she argues that many researchers have
emphasized the importance of adequate communication channels for the process of
strategy implementation as provided by the strategic leader.
Alexander (1985) as cited by Nyakeriga (2015) notes that communication is mentioned
more frequently than any other single item that promotes successful strategy
implementation in any organization or institution in the world since ancient times.
Communication entails explaining issues like what new responsibilities, tasks, and
duties need to be performed by the employees in order to implement the strategy. It
46
answers the why behind the changed job activities, and explains the reasons why the
new strategic decision was made. She also quotes Rapert and Wren (1998) who found
that organizations where employees have easy access to management through open and
supportive communication channels outperform those with more restrictive
communication environments. Robinson and Pearce (2004) have observed that
miscommunication occurs between the point where communication starts and the point
where it is received. Interpretation of that communication plays a significant role that
requires managers to be practising a strong culture that embrace clear understanding of
communications from the entire organization. This indicates that managers must be
aware of people’s behavior, beliefs, attitudes, demands and arguments in order to
communicate effectively the message of strategic plan execution to the employees
(Burnes, 2004).
According to a study by the Hay Group, a global management consultancy, effective
communication by leadership in three significant areas was the key to winning
organizational trust and confidence (Lamb & McKee, 2004): it helps staff to appreciate
overall business strategy as well as how they contribute towards achievement of
business goals. It equally enables in information sharing with employees on how the
organisation, the employees are doing towards the business goals.
2.4.2 Institutionalization Process on Execution of County Development Plans
Johnson and Scholes (2003) said that institutionalization depends highly on the
organization configuration. This configuration entails the structures, processes,
47
relationships and boundaries by which the organization functions .Devolution is
captured in the Kenya Constitution 2010 in chapter eleven. It envisages the creation of
forty-seven counties, each constituting its own government as per the County
Governments Act, 2012. This County Governments Act, 2012 also established elaborate
structures to ensure the full execution and success of devolution.
Organizational structure is a model that managers apply for the division and
coordination of the activities of employees of an organization (Stoner, Freeman &
Gilbert, 2001). The relationship between structure and strategy an organization adopts
was first suggested by Chandler (1962). He said that the strategy of an organization
determines the long term goals and objectives. In order to do this better, there is the
need, in the organization, to determine the course of actions, allocation of adequate
resources and determine the right structure which supports a given strategy. According
to Chandler (1961) an organization structure must follow her strategy for better
performance.
In studying the challenges facing the implementation of differentiation strategy at the
Mumias Sugar Company Limited in Kenya, Bolo, Wandera, Imaita and K’Obonyo
(2010) just like in Johnson and Scholes (2003) found that the structure of an
organization plays an important role in the implementation of strategy and the successful
acceptance of the strategy. The organizational structure, processes, relationships and
boundaries present internal sources of challenges. Wrong systems utilized during the
process of operationalization, institutionalization and control of the strategy are often
sources of challenges during strategy execution.
48
A research by Donselaar (2012) on drivers and barriers of strategy implementation at the
Netherlands Red Cross (NRC) revealed that the implementation of the NRCs strategy
had several organizational barriers in place. The main barriers for the organizational
structure were lack of coordination activities related towards the strategy
implementation, existence of differences in the processes of decision making, and the
negative effect of the organizational structure on the results of the implementation
process.
The choice of a particular structure was found to be a great challenge by Shattock (2003)
in a study on managing successful universities where for example, the strategic
challenge in the functional structure is effective coordination of the separate functional
units. Some form of divisional structure is therefore essential to meet the coordination
and decision-making requirements resulting from increased diversity and size.
Moreover, increased diversity, size and number of units necessitate grouping various
divisions in terms of common strategic elements. The relationships consist of
interactions, influence, communication and power dynamics, among other elements that
occur in a systematic or a structured manner. Whilst the strategy should be chosen in a
way that it fits the organization structure, the process of matching structure to strategy is
complex.
Organizational culture has been defined as the basic beliefs that are commonly held and
learned by a group, that govern their perceptions, thoughts, feelings and actions, and that
are typical for the group as a whole (Sackmann, 2003). It represents a complex pattern of
beliefs, expectations, ideas, values, attitudes, and behaviors shared by the members of an
49
organization that evolve over time (Trice & Beyer, 1984). Pearce and Robinson (2006)
refer to Organizational culture as the set of important assumptions (often unstated) that
members of an organization share in common. The link between organizational culture
and achieving sustained high performance has been proven. Culture-strategy fit
evaluations and culture alignment strategies are important works that leaders have an
obligation to undertake for strategic priorities to work.
A study by Ahmadi, Salamzadeh, Daraei, and Akbari (2012) on the impact of
organizational culture when executing strategies in Iranian banks found a meaningful
relationship existence between organizational culture and strategy execution. The
research revealed that all types of organizational cultures have significant relationships
with the execution process and that culture’s influence differs from the most effective
clan culture to the least effective or hierarchy culture. In 2006, Ke and Wei investigated
the relationship between enterprise resource planning (ERP) implementation and
organizational culture. It was found out that the success of ERP implementation is
positively related to organizational culture along the following dimensions: learning and
development, participative decision making, power sharing, support and collaboration,
and tolerance for risk and conflicts, which all form part of an organization’s cultural
environment.
A tight culture strategy that is developed by strategic leaders fit furthers an
organization’s execution of strategy, provides clear guidance on ‘how we do things
around here’, produces significant peer pressure to conform to the acceptable norms and
promotes strong employee identification with and commitment to a company’s vision,
50
performance targets and strategy (Comerford, 1985). According to Muthoni (2014),
strategies are normally formed within the existing organization culture which calls for
the adjustment to fit into the new strategies.
Muthoni (2012) focused on the reasons as to why leadership should strengthen mission
culture. According to her, Mission describes an organizations’ reason for existence. This
has been supported by (Hughes 2005) who argued that, minus strategic leadership in
developing the mission of a firm or institution, the organization losses direction. Nazir
and Mushtaq (2008) found that mission is the most critical cultural trait that today’s
organizations need to focus on. In organizations embracing mission culture, strategic
leaders concentrate on establishing and communicating a clear mission and purpose for
the organization and allowing employees to design their own work activities with this
mission. Leaders play the role of coaches in giving general direction, but encourage
individual decision-making to determine the operating details to execute the plan.
Strong cultures encourage successful strategy implementation. On the contrary, weak
cultures are a stumbling block to successful strategy implementation (Buul, 2010).
Mehta and Krishnan (2004) argue that strong culture support shared belief in norms,
practices and other virtues within the organization that help strengthen everyone to
partake their jobs to promote successful strategy implementation. In weak cultures,
employees have little or no pride in ownership of work. Such cultures provide little or no
assistance to implement strategy. County leaders must instill a culture to their employees
that will be responsive to the promise of the devolution on efficient and effective service
delivery through implementation of the county integrated development plans. A culture
51
that is so internalized that despite turnover among the individuals it can still be retained
in counties for many years to come.
2.4.3 Innovation
Innovation has been defined as the implementation of a new or significantly improved
product (good or service), or process, a new marketing method, or a new organizational
method in business practices, workplace organization or external relations (OECD,
2005). According to IDeA (2005), Innovation could also involve new ways of solving
tasks, delivering services and interacting with service users in supplying services which
is termed as delivery innovation, new or altered ways of organizing activities within
supplier organization also known as organizational innovation, introduction of new
objectives or strategies also called conceptual innovation and social innovation which
involves innovating through ideas, concepts and processes to meet social needs
effectively.
Rapid changes in the business environment calls for more creativity and innovation for
business sustenance, competition, growth and market lead (Gumusluoglu & Iisev, 2009).
Innovation is also increasingly recognized as an important source of sustainable
competitive advantage for organizations (Kirui, 2016) citing (Tseng, Liu & West, 2009).
Leaders can positively influence team members’ innovation according to a study
conducted on research on team leaders’ influence on innovation conducted by Denti
(2013) as cited by (Maina, 2016). It also revealed that leaders can exert such influence
by stimulating discussion and reflection in teams, by discouraging narrow and
52
conformist thinking, and by facilitating innovative ideas (Somech, 2006). Moreover,
leaders can stimulate their team members’ beliefs in their own creativity and these
results in innovation outcomes (Gong et al., 2009; Redmond et al., 1993). According to
Ross and Horenkamp (2007), service delivery innovation is an ongoing process and
must be embedded into the way an organization develops new products and services. It
is also important that everyone in the organization is involved in seeking better ways to
deliver services to their clients whether internal or external.
2.4.4 Monitoring and Evaluation
Governments are constantly pressured to show results, as a performance obligation for
good governance, transparency and accountability. There has been a paradigm shift in
public service management, forcing governments to be more accountable to the
stakeholders and the public in particular. The accountability growing need is seen as the
main purpose of evaluation (Lehtonen, 2005:169). Monitoring and evaluation (M&E) is
a powerful public management tool that can be used to enhance the way governments
and organizations get outcomes. Just as governments need financial, human resource,
and accountability systems, governments also need good performance feedback systems.
Monitoring as defined by The Organization for Economic Cooperation and
Development (OECD) (2004:16) is ‘a continuous function that uses systematic
collection of data on specified indicators to provide management and other stakeholders
of an on-going development intervention with indications of the extent of progress and
the achievement of objectives and progress in the use of allocated funds.
53
Evaluation is a time-bound and periodic exercise that seeks to provide credible and
useful information to answer specific questions to guide decision making by staff,
managers and policy makers GWM&ES policy framework (2007:6). Evaluations assess
relevance, efficiency, effectiveness, impact and sustainability. The Constitution of
Kenya (2010) is the basis for the process of devolution in Kenya. To ensure greater
transparency and accountability, the Constitution of Kenya requires that government
uses the M&E mechanism as an integral part of developing and executing government
policies, programmes and projects, and in resource allocation and management at the
two levels of government. This requirement is reflected in several sections of the
Constitution of Kenya that relate to good governance and planning.
Monitoring and evaluation are tools to measure the performance of the organization in
the timely implementation of its strategic plans. Monitoring and evaluation equally
contribute to the identification of good practices and lessons learnt with respect to
execution, as well as policy, strategy and programmatic design that will inform the next
phase of the strategic planning.
The evaluation outcomes are important inputs to the strategic planning process and are
used to adjust strategic direction and priorities (Young, 2001).The County Governments
Act No. 17 (2012 ) outlines the responsibilities of the devolved levels, and the processes
and procedures governing the relationship between the national and county levels. This
includes the responsibility to prepare a County Integrated Development Plan that must
include a monitoring and evaluation section. Section 108 (1) states that there shall be a
five year CIDP for each county which shall have: (a) clear goals and objectives; (b) an

54
implementation plan with clear outcomes; (c) provisions for monitoring and evaluation;
and (d) clear reporting mechanisms.
According to Crawford and Bryce (2003), monitoring provides the background for
reducing schedule and cost overruns at the same time it ensures that required quality
standards are achieved in project execution. Evaluation is an instrument that helps to
assess to what extent the projects have achieved the set objectives (Field & Keller,
1997). Projects completion within the budget is a measure of project success. Project
costs can be calculated in various forms for example of unit cost, percentage of net
variation over final cost and so on (Chan, 2001).
Baker et. al., (2008) identified performance as one of the project success factors among
others such as schedule performance and cost performance. Quality achievement by
projects has a bearing on project success. The quality of projects and project information
has a significant role in project success (Raymond & Bergeron, 2008).
County governments are expected to have monitoring and evaluation units in place in
order to ensure that the county integrated development plans are carried out as planned.
Counties receive billions of shillings every financial year for development and these
funds must be accounted for by ensuring a systematic monitoring and evaluation
activities are carried out by competent staffs. This is a key unit since counties must be
accountable for the funds allocated by the national treasury and transparency must be
observed.
55
2.4.5 Policy Framework
The people of Kenya hold all sovereign power under Article 2 of the constitution of
Kenya 2010 where in effect all state organs derive their powers from. These powers are
expressed in distinct functions responsibilities. They are applied by state organs at the
national and county governments’ levels. The two organs of governments are distinct
and inter-dependent and calls for mutual relations on the basis of consultation and
cooperation under Article 6(2). The Constitution provides for separation of powers, that
institutes a system of checks and balances among the three arms of government. It also
creates strong and independent national institutions such as the Judiciary, independent
tribunals and commissions. These institutions and offices are however not devolved,
they are meant to be shared between the national and county governments. Nationally,
we have the Parliament, which is made up of two houses comprising of the Senate and
the National Assembly. They are constitutionally mandated to represent, legislate and
oversight in the operation of the devolved system. The National Assembly determines
the allocation of national revenue between the two levels of government.
The Senate on the other hand is mandated to protect the interests of the counties and the
county governments at the national level. Besides the protection of counties interests,
other roles of the Senate include considering, debating and approving Bills concerning
counties, determining the allocation of national revenue among counties, and exercising
oversight over national revenue allocated to the county governments. The National
Assembly and the Senate are expected to work in harmony in the discharge of their
mandate. The Constitution establishes forty-seven county governments, each consisting
56
of a county assembly and a county executive with different functions and powers. The
Constitution has vested county legislative authority, oversight, and appropriation powers
in the County Assembly. On the other hand, the County Executive is expected to
implement county legislation, manage and coordinate county administration. It is further
tasked with the performance of other constitutional functions among others. Each and
every county government is required to decentralize its functions and services to the
extent that is efficient and practicable.
The Constitution of Kenya, 2010 stipulates the relationship between the two levels of
government. In Article 6(2), of the constitution two levels of governments are the
national government and county governments which are distinct and inter-dependent and
its envisaged that they conduct their mutual relations on the basis of consultation and
cooperation. Each level of government performs and exercises its powers in a manner
that respects the functional and institutional integrity as well as the constitutional status
of institutions of government at the other level.
The Inter-Governmental Relations Act, 2012stipulates the framework for consultation
among the two levels of governments and cooperation and dispute resolution
mechanisms too. Structures have also been established on how the mutual relations and
dispute resolutions should be conducted. These bodies include the Intergovernmental
Relations Technical Committee, the National and County Government Coordinating
Summit, the Council of County Governors and Intergovernmental Sectoral Consultative
Forums on specific functions. The PFM Act 2012 also establishes the IBEC to provide a

57
forum for consultation and cooperation between the national government and county
governments on all fiscal matters.
Both governments are expected to relate in a harmonious, collaborative and coordinated
way. Under the ambit of the mentioned bodies, there have been fruitful collaborative
engagements between the national and county governments that have facilitated the
successful implementation of many aspects of devolution. The Summit has provided a
platform for the Executives of the national and county governments to share
information. The Council of Governors has also stepped in to resolve disputes at the
county level.
Public finance management is anchored in the Constitution of Kenya 2010, that brought
forth the fiscal decentralization and public financial management became central to
policy reforms. Chapter Twelve of the Constitution outlines the principles of public
finance.
The principles of public finance, based on Article 201, include the following: there
should be openness, accountability also public participation and the promotion of an
equitable society. It further stipulates of the sharing of the burden of taxation fairly as
well as the promotion of equitable development that makes special provision for
marginalized groups and areas. Also expected are responsible financial management and
fiscal reporting. It calls also to the requirement that the burdens and benefits of the use
of resources and public borrowing be shared equitably between the present and
generations to come.
58
County budgeting and development planning should be informed by the priorities set out
in the County Integrated Development Plans (CIDP). The CIDPs should be aligned to
Medium Term Plans, the Kenya Vision 2030 and other national development plans.
However, at the moment, it is evident that members of the county assemblies in some
counties are in conflict with the county executives over the expenditure of county funds.
This arises from demands to allocate funds to, and implement projects outside the CIDP.
According to (MoDP, 2015) there have been challenges with the ability of county
governments to raise adequate revenues. In addition, the capacity of counties to absorb
allocated funds threatens the delivery of services. It has also been noted that few
counties have been able to adhere to the requirement that 30% of their budget be
reserved for development activities due to the fact that over 70% of their budget is
consumed by recurrent expenditure and a burgeoning workforce among other factors.
59
2.4.6 Execution of County Integrated Development Plans
Execution of County Integrated Development Plans (CIDPs) formed the dependent
variable of the study and was measured by timeliness and accessible services. Strategy
implementation involves development and execution of a series of plans, programmes
and portfolios over a period of time (Pearce & Robinson, 2011). Ochanda (2010) in a
study on determination of strategy implementation challenges at Kenya Industrial
Estates Limited applied in-depth interviews with the board members, top-level
managers, the middle level managers and the shop floor employees with the assistance
of an interview guide. In the execution of the period between the years’ 2003-2008
strategic plan, out of the strategy critical elements of the organisation, the organisation
was only capable to align its structure, culture and leadership to its strategy. Policies,
procedures and support systems, the reward and motivational structures, resource
allocation and budgetary allocation persisted posing a challenge to the successful
execution of the strategy. The significance of communication of responsibilities and
accountability with regard to the strategic plans was overlooked. The organization poor
performance persisted.
According to Hamm (2011) as cited by Katana (2017), execution is all about outcomes.
Hamm (2011) describes execution as the point where the rubber meets the road, as a
game in which scoring is done and winners and losers are declared, where there is no
place to hide during the game and where every day is a game day. It is a belief that at the
end of the day leaders are paid and held accountable to produce results.
60
Execution is marked by measurement and feedback and by continually keeping score,
learning and making improvements or corrections.
Muell and Cronje (2008) cited by Katana (2017) identifies execution of strategy the
number one obstacle facing managers in the 21st century. They perceive execution as the
least researched management area and that unsuccessful strategy execution is persisting
to have a key financial impact on organization’s profits and competitive advantage. A
government is expected to deliver better services through implementation of strategic
plans to its citizens and the parameters of measuring this service delivery entails low
inflation, better education, provision of improved health care at affordable rates,
provision of clean water, provision of good roads and good road networks to the rural
areas for the transport of agricultural products and raw materials (Abe & Monisola,2014)
as cited by Wagana (2017).Service delivery entails services and their supporting systems
that are regarded as a state responsibility. These include social services that are primary
education and basic health services, infrastructure-water, sanitation, roads and bridges
and services that promote personal security (Carlson et. al., 2005).
The process of implementing strategies entails the periodic review of strategy on the
basis of the changes within and outside the organization and adopting changes from the
lessons learnt. As a continuous and repetitive process, organization’s selected plan needs
to be continuously reviewed during implementation. This element of implementing
strategy makes it possible for the strategy of the organization to continue being flexible
and that ensures the organization compete favourably in the current market environment.
61
2.5 Critique of the Related Literature
The fact that leader-behaviour and leader-trait research centered almost exclusively on
the observation of individuals at lower organizational levels, whose primary role
concerned supervision or observation of university students in laboratories, to the
exclusion of studies on higher-level leaders responsible for the functioning of entire
organizations (House, 1997). Recent studies have caused confusion by using the term
strategic leadership extensively. This has led to some researchers observing that
empirical literature does not always distinguish between the study of strategic leaders,
and that of strategic leadership (B.Boal, 2001).In addition, Rowe (2001) as quoted by
(Serfontein & Hough, 2010) argued that the terms strategic leadership and executive
leadership have been used interchangeably, and that they both involve the management
of the organization as a whole, as well as efforts to attain short and long-term objectives
for the organization (Rowe 2001).
According to Kihara (2016) there is a mixed perception from contemporary scholars that
deviates from the original thinking advanced by Chandler (1962) that “structure always
follows organization’s strategy”. There are counter arguments in the literature that tend
to point out that the opposite also holds some truth. Some scholars have argued that
organization “strategy follows the structures that are already laid down in organizations
(Hall & Saias, 1980; Bielawska, 2016). The scholars observed that while most of the
studies are in agreement with Chandler’s (1962) works, the nature of the relationship
62
between structure and strategy requires re-examination. The scholars suggested an
alternative view by stating that the strategy, structure, and environment are closely
intertwined. The literature has it that strategic direction variable (Hamel, & Prahalad,
1989, Madu, 2013) is often embedded in various organizations’ practices and
configurations implying that it does not influence organization’s performance directly.
The direct treatment of this variable in previous studies also raises a fundamental
question if it needs to be treated directly or have to be mediated by other variables.
Majority of the past studies have treated it directly.
It was also observed that similar studies in strategic direction gave mixed outcomes
(Lumpkin & Dess, 1996; Odita &Bello, 2015; Kitonga, Bichanga & Muema;
2016).Some of them found a direct relationship between strategic direction and
organisation performance (Lumpkin & Dess, 1996; Odita &Bello,2015;
Kitonga,Bichanga & Muema; 2016) while others have found that strategic direction
works well when it is embedded in other strategy variables.
2.6 Research Gaps.
The research that has been carried out on the strategic leader has comprised studies
trying to establish a link between CEO charisma and performance (Tosi, Misangyi,
Fanelli, Waldman & Yammarino, 2004). Simba et. al., (2015) evaluated the strategic
management determinants of value addition of industrial fish processors in the sea food
processing sub chain in Kenya and used the variables: strategic planning practice,
technological competitiveness, market competition and corporate policies. In Kenya the
63
government commenced many strategies on public service reform all expected to
improve efficiency in service delivery to the public by ensuring that holders of public
office are held accountable for results (Hope, 2013).Other studies carried out includes
one on factors influencing the implementation of county governments mandates in
Kenya. Taylor (2007) did a study on the role of strategic leaders in strategy
implementation. He used an explorative research design for a period of ten years. The
findings revealed that good leaders will always ensure that major changes take place
such that they can obtain the highest level of improvement in activities related to the
organization. To succeed, such leaders communicate to both external and internal
members through the use of an open style of management, whose main objective is the
development of new corporate cultures which employees can fit in to. Awino (2007)
examined selected variables on corporate performance: A survey of supply chain
management in large private manufacturing firms in Kenya.
The study used a descriptive survey research design to investigate the relationship
between variables. The study used both primary and secondary source of data. It found
out that it is only good leadership which can ensure effective implementation of
strategies. Awino (2007) further argues that the top management, led by the CEO, must
commit everything for strategy implementation to be a success, and that includes
involving all members of staff.
Lufthans (2012) did a survey of the influence of transformational leadership on strategy

64
Implementation at Kellogg a multinational food manufacturing company. The study
used a descriptive survey and interviewed a hundred top management executives. The
findings showed that it was imperative for organizational leaders to provide resources,
share the vision, show commitment, and ensure employee involvement in strategy
implementation as well as welcoming new ideas. Aosa (2008) studied the nature of
strategic management; the findings revealed that the kind of leadership exhibited by the
top management influenced how strategic plans implementation would vary from one
organization to the other, with some organizations having low participation while others
exhibited high participation. Ndunge (2014) studied the role of strategic leadership and
change management practices at the Kenya Wildlife Service. Muhoro (2011)
investigated the effect of leadership in strategic change implementation in Telkom
Kenya. The study used a descriptive survey to explain the existing relationship between
strategic leadership and implementation of strategic change management. The study
used primary data which was collected using a questionnaire.
The results showed that leadership was an essential tool in effective change
management; leaders provided support, direction, facilities and resources that enhanced
successful implementation of strategy. Wagana (2017) did a study on effect of
Governance Decentralization on service delivery in county governments in Kenya while
Maina (2016) had a study on effects of transformational leadership on service delivery
by county governments in Kenya. Mokaya (2016) did a research on board functions,
accountability practices, governance structures and performance of county governments
in Kenya. The research did not look into the aspect of strategic leadership in the counties

65
which the current study intended to explore on the execution of the county integrated
development plans. Omoro (2016) study on the role of strategic leadership in strategy
implementation in the Geothermal Development Company in Kenya, the findings
revealed that strategic leadership plays a crucial role in effective strategy
implementation at GDC.This research was done in the energy sector and hence could not
be generalized to other areas like county governments in Kenya which therefore creates
a gap to be filled by the current study. From the above review, the findings depict that
strategic leadership play an important role in contributing towards execution of
strategies. The kind of leadership style, communication approach and organizational
resources highly influence strategy Implementation in the organization. Even though
extensive research has been done on the influence of strategic leadership on strategy
implementation, no current study that is known has been carried on counties pertaining
the role of strategic leadership on county governments execution of county integrated
development plans.
This study attempts therefore, to bridge this gap by determining the role of strategic
leadership on execution of county integrated development plans by county governments
in Kenya.
2.7 Summary
This chapter discusses the strategic leadership theory as the main theory and other
theories that captures the variables. This is followed by a review of literature on each of
the five variables under study namely: envisioning, institutionalization, innovation,
66
monitoring and evaluation and policy framework as a moderating variable. Strategic
leadership has been found to be the preferred style of leadership in an environment that
is as complex as county governments where cultural and organizational structure are
needed in order to implement the county integrated development plans.
Organizations that embrace strategic planning record better performances. Every aspect
of county budgeting and development planning should be informed by the priorities set
out in the County Integrated Development Plans (CIDP). The CIDPs should be aligned
to Medium Term Plans, the Kenya Vision 2030 and other national development plans.
Visionary leadership combined with managerial leadership is found in strategic
leadership. Counties are allocated billions of Kenyan shillings which needs
accountability to different government agencies.
67
CHAPTER THREE
RESEARCH METHODOLOGY
3.1 Introduction
This chapter presents the methods and study approaches involved in carrying out the
research. The aim of this chapter is meant to indicate the sample that was chosen, the
techniques that were employed in arriving at the samples and the instruments that were
employed during the collection of the data. It also includes methods that were employed
in data analysis, type of research design and kind of data collected.
3.2 Research Philosophy
Research philosophy relates to the development of knowledge and nature of that
knowledge and contains important assumptions about the way in which researchers view
the world (Saunders, et. al., 2007).There are two main epistemological research
philosophies that are applied in social sciences. These are positivism and
Phenomenology. This study was anchored in the positivism because it sought to
objectively establish facts by empirically establishing relationships between variables.
Positivism is based on the assumption that the observer is independent of what is being
observed and measurement should be through objective based rather than being inferred
subjectively ( Mugenda and Mugenda, 2003).
68
3.3 Research Design
According to Creswell (2014) a research design is plans and procedures for research that
span the decisions from broad assumptions to detailed methods of data collection and
analysis. This study employed a descriptive survey research design. Descriptive survey
design was appropriate for this study since it facilitated proper description of the
variables under review (Okumbe, 2001). The design was appropriate for the study since
it allowed collection of information for independent and dependent variables using
questionnaire. Orodho (2003) and Namusonge (2010) observed that this method was
best suited for gathering descriptive information where the researcher wanted to know
about people attitudes pertaining one or more variables through direct questions.
3.4 Target Population
Sekaran (2010) posits that a target population is classified as all members of a given
group to which investigation is related, whereas the accessible population was looked at
in terms of those elements in the target population within the reach of the study. Kothari
(2012) defined a population as a group of events, people or items of interest with a
common observable attributes. Ewing (2011), described a population as the set of
sampling units or cases that the researcher is interested in.
The target population was five counties which was 10% of the total number of 47
Counties in Kenya. The key staffs that carried out the task of implementation of CIDPs
had been identified as the County Chief Officers, County Boards Secretaries, Directors,
69
Clerks of County Assemblies, Chairs of Public Accounts Committees in County
Assembles and Heads of M&E in the counties. Target population was 123 respondents.
3.5 Sampling Frame
The County Governments of Kenya formed the sampling frame. The Constitution of
Kenya 2010 provided for devolution of political and administrative authority to forty-
seven counties which are semi-autonomous (CoK, 2010).The researcher targeted five
counties namely: Kiambu County, Murang’a County, Nyeri County, Kirinyaga County
and Nyandarua County. Selection was based on Infotrak County Index that ranked them
in top five in addition of being densely populated which exhibited a unique balance
between rural and urban populations ( Infotrak,2015).
3.6 Sample and Sampling Techniques
Sampling has been described as a procedure a researcher uses to gather people, places or
things to study. It’s a process of selecting a number of individuals or objects from a
population such that the selected group contains elements representative of the
characteristics found in the entire group (Orodho & Kombo, 2002). The study applied
two steps sampling approaches. These were Purposive Sampling and Simple random
sampling. Purposive sampling is a non-probability technique that entails the conscious
selection by the researcher of opinion leaders to include in the study. The participants
were selected on the basis of having particular characteristics that were of interest to the
researcher.
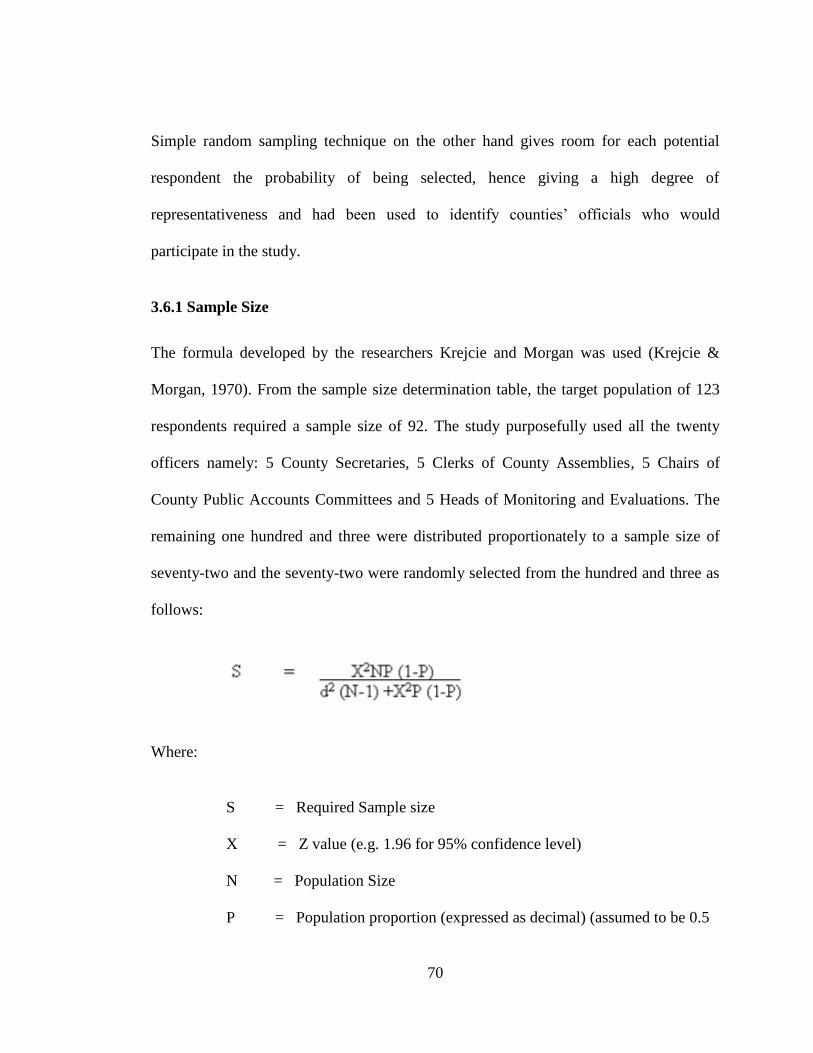
70
Simple random sampling technique on the other hand gives room for each potential
respondent the probability of being selected, hence giving a high degree of
representativeness and had been used to identify counties’ officials who would
participate in the study.
3.6.1 Sample Size
The formula developed by the researchers Krejcie and Morgan was used (Krejcie &
Morgan, 1970). From the sample size determination table, the target population of 123
respondents required a sample size of 92. The study purposefully used all the twenty
officers namely: 5 County Secretaries, 5 Clerks of County Assemblies, 5 Chairs of
County Public Accounts Committees and 5 Heads of Monitoring and Evaluations. The
remaining one hundred and three were distributed proportionately to a sample size of
seventy-two and the seventy-two were randomly selected from the hundred and three as
follows:
Where:
S = Required Sample size
X = Z value (e.g. 1.96 for 95% confidence level)
N = Population Size
P = Population proportion (expressed as decimal) (assumed to be 0.5
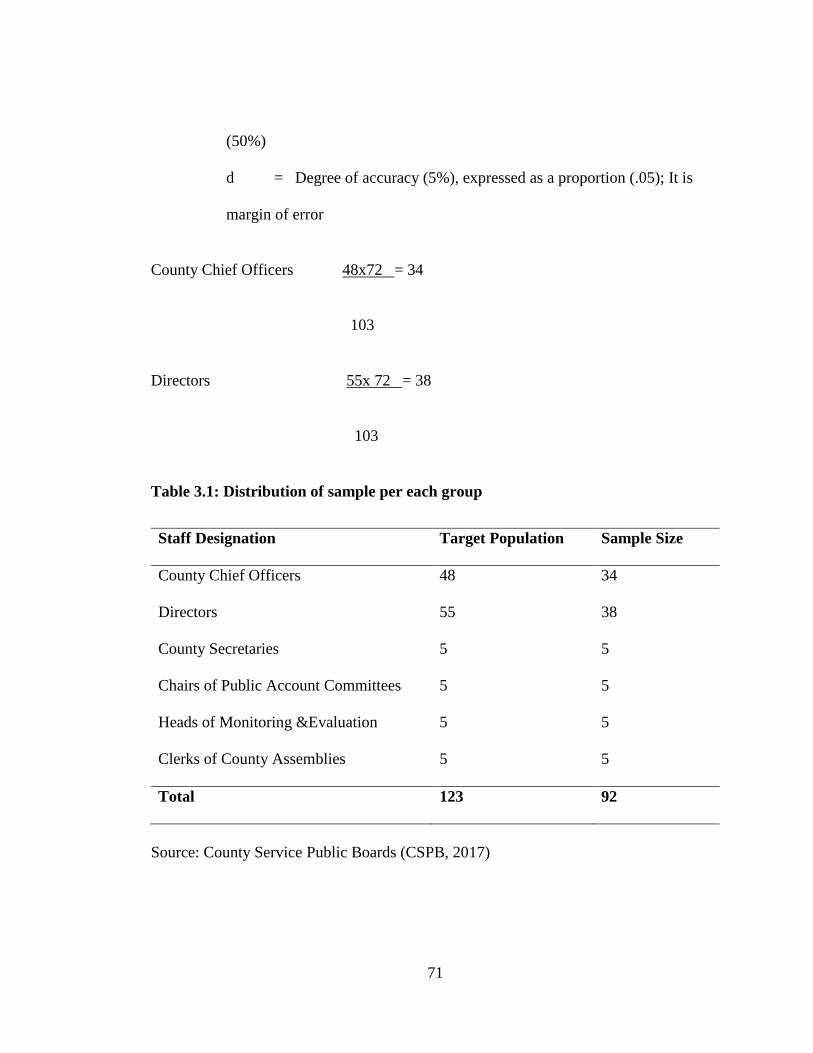
71
(50%)
d = Degree of accuracy (5%), expressed as a proportion (.05); It is
margin of error
County Chief Officers 48x72 = 34
103
Directors 55x 72 = 38
103
Table 3.1: Distribution of sample per each group
Staff Designation Target Population Sample Size
County Chief Officers 48 34
Directors 55 38
County Secretaries 5 5
Chairs of Public Account Committees 5 5
Heads of Monitoring &Evaluation 5 5
Clerks of County Assemblies 5 5
Total 123 92
Source: County Service Public Boards (CSPB, 2017)
72
3.7 Data Collection Instruments
Instruments for data collection choice are key to the success of a research. It is therefore
important for the researcher to take into consideration the type of the topic, response
rate, time and the targeted population. Kothari (2004) defines a questionnaire as a
document that consists of a number of questions printed or typed in a definite order on a
form or set of forms. Wilson (1994) states that the questionnaire is a widely used and
useful instrument for collecting survey information, providing structured, often
numerical data, being able to be administered without the presence of the researcher and
often being comparatively straight forward to analyze. Cohen (1989) defines a
questionnaire as a self-report instrument used for gathering information about variables
of interest to an investigation.
The choice of a questionnaire was because it had merits of allowing respondents a
greater depth of response, time to verify answers and anonymity. Another advantage is
that it was economical since it saves time and also cost. The questionnaire was divided
into different sections. The questionnaire had close - ended and open-ended questions.
An open ended question gives respondents the freedom to express their views or
opinions and also make suggestions (Aleck, 2004). A 5-point Likert scale ranging from
‘Strongly Agree’ to ‘Strongly Disagree was adopted for rating purpose.
73
3.8 Data Collection Procedure
3.8.1 Questionnaires
This was the main or primary data collection instrument for this research. A
questionnaire is a data collecting tool that is designed by the researcher and its major
reason being to communicate to the participants what is intended to elicit desired
responses in terms of empirical data from the participants in order to achieve research
objectives (Mugenda & Mugenda, 2008). A questionnaire containing both open-ended
and closed questions, as well as 5-point likert scales was used for collecting primary
data.
Questionnaires were distributed to the respondents with instructions on how to fill them.
A respondent was selected purposely (purposive sampling) there after he/she directed
the researcher to a colleague (snowball sampling) and so on till the researcher achieved
his target per county per category. Yang (2008) states that the questions in a study are
directly related to the research questions. The procedure for issuing the questionnaires to
the respondents was through self introduction. The Questionnaires were administered
using a drop and pick method. The questionnaires were accompanied with an
introduction letter and a data collection authority letter from the National Council for
Science, Technology and Innovation (NACOSTI). Research assistants were trained and
engaged to administer and follow up on the questionnaires.
74
3.8.2 Secondary Data
Secondary data was collected from Office of Controller of Budgets reports, Commission
on Revenue Allocation, Peer. Reviewed journals, County integrated Development Plans
reports and research articles.
3.9 Pilot Testing
The questionnaire was pilot tested to determine its validity and reliability. Pilot test was
conducted in order to determine approximate length of the survey in terms of time, as
well as to further refine the instrument. The pilot test checked if the length of
questionnaire was acceptable and uncovered any difficulties arising from the procedure
and feedback given was used to make necessary adjustments. According to Mugenda
and Mugenda (1999), a successful pilot study uses a 1% to 10 % of the actual sample
size. The research instrument was pretested using a sample of 10% of the actual sample
size. A total number of 10 respondents were targeted. The respondents who took take
part in the pilot test were not included in the final data collection process. Kericho
County was selected county for pilot-testing. It was a County that had been ranked
among the top counties by the office of the Controller of budgets on absorption of
development funds and allocated its budget beyond the 30% threshold on development
agenda as per the PFM Act 2012.
75
3.9.1 Validity of Research Instrument
Validity is the ability of the research instrument to measure what is supposed to measure
(Copper & Schindler, 2006). There are various types of validity including construct,
content, face and criteria related validity. The research study used both content and
constructs validities. Content validity was observed by questionnaire being examined by
experts in the strategic management discipline. Construct validity was observed by
dividing the questionnaire into several parts which had information for a specific
objective and ensured that it was in tandem with the conceptual framework. This
enabled the researcher to assess validity of instrument including clarity, relevance,
interpretation of questions and time spent and improve where necessary.
3.9.2 Reliability of the Research Instrument
Reliability is a measure of the degree to which instruments yields consistent results or
data after repeated trials (Mugenda & Mugenda, 2003). Reliability of pilot study was
carried out using officers from county which were not included in the study. Cronbach
alpha coefficient which is used to assess the internal consistency among research
instruments items was used. Cronbach Alpha coefficient equals zero when the true score
is not measured at all and there is only an error component. Alpha equals 1.0 when all
items measure only the true score and there is no error component. If the values are too
low, either too few items were used or the items had little in common (Kothari, 2004).
76
His suggestion is that of a value of not less than 0.7 to be acceptable while Sekaran
(2003) posits that any values between 0.5 and 0.8 are adequate to accept internal
consistency. A threshold of a Cronbach Alpha of 0.7 and above is acceptable. Cronbach
Alpha was used to test the reliability of the proposed constructs.
3.10 Data Analysis and Presentation
According to Bryan and Cramer (2011), data analysis is aimed at meeting the research
objectives and provides answers to research questions. Kothari (2008) defines data
analysis as the use of logic to understand and interpret data collected. Filled
questionnaires were edited for completeness and consistency. Qualitative data was
analysed by coding, categorizing into themes and analysed using the required statistical
tests for descriptive statistics and frequency distributions such as standard deviation,
mean and percentage. Statistical software for data analysis known as statistical package
for social sciences (SPSS version 22) was used. Pearson Correlation and regression
analysis was used to establish the association among the study variables and to test the
formulated hypotheses. The ANOVA tests were carried out to test if the regression
analysis model used was fit or not. Namusonge (2016) argues that the significance of F
ration is used to determine if the model used was fit or not. ANOVA tests by application
of p-values. Testing hypothesis was done using p value, where if p value was less than
or equal to 0.05 the null hypothesis was rejected.
77
The Multiple regression model (details Appendix V: Study Objectives, Hypotheses
and Analytical Models) equation is:
Y= βo + β1X1 + β2X2+ β3X3+ β4X4+ βiXiZ+ e
Where: Y is the dependent variable
βo is the constant term
𝛽𝑖 is the coefficient of the independent variable X𝑖 where 𝑖= [1, 2…n]
𝑋𝑖 is independent variable where 𝑖 = [1,2…n], 𝑒 is the error term.
Y = Execution of CIDPs by County Governments in Kenya, X1 = Envisioning,
X2 =Institutionalization, X3 = Innovation, X4 = Monitoring &Evaluation, XiZ =
is the interaction between the moderating variable (policy framework) and each
independent variable.
Moderating Effect Analysis – A moderator is variable that affects the direction and the
strength of the relationship between an independent variable and a dependent variable.
The moderating variable may reduce or enhance the direction of the relationship
between independent variable (predictor) and dependent variable, or it may change the
direction of the relationship between the two variables from positive to negative
(Ng’ethe, 2013). A moderator is supported if the interaction of predictor and moderator
on the outcome of the dependent variable is significant (Berry, 2010).
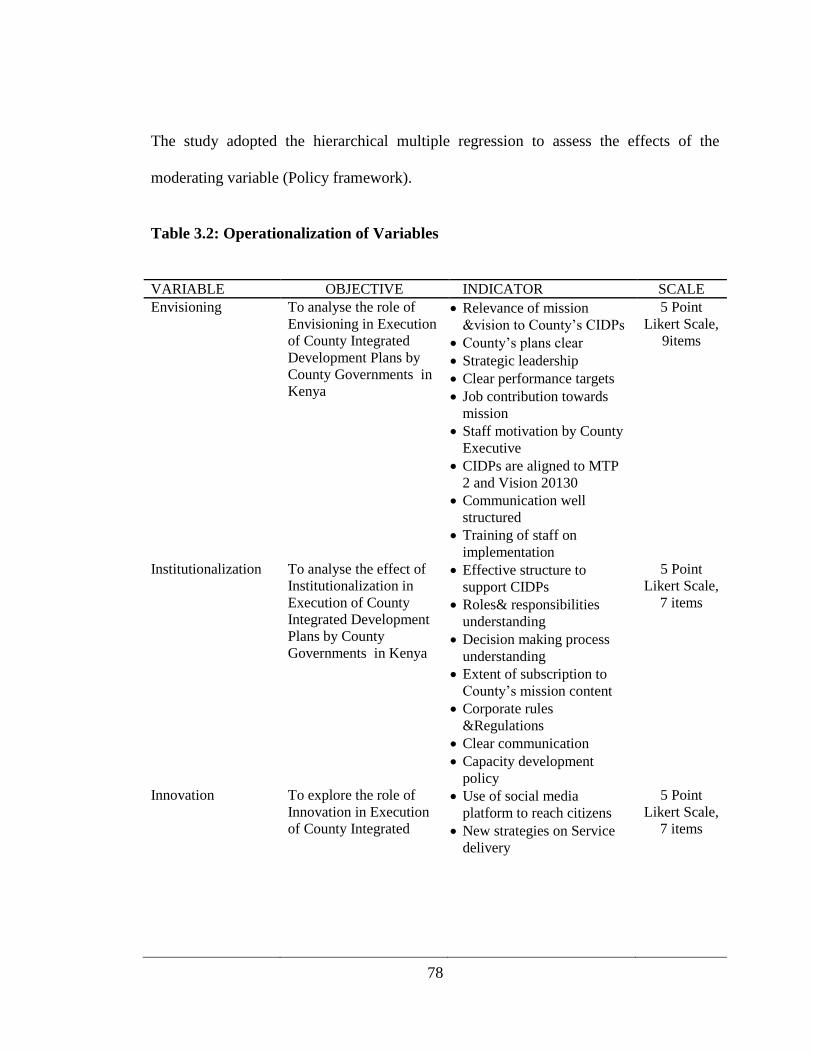
78
The study adopted the hierarchical multiple regression to assess the effects of the
moderating variable (Policy framework).
Table 3.2: Operationalization of Variables
VARIABLE OBJECTIVE INDICATOR SCALE
Envisioning To analyse the role of
Envisioning in Execution
of County Integrated
Development Plans by
County Governments in
Kenya
Relevance of mission
&vision to County’s CIDPs
County’s plans clear
Strategic leadership
Clear performance targets
Job contribution towards
mission
Staff motivation by County
Executive
CIDPs are aligned to MTP
2 and Vision 20130
Communication well
structured
Training of staff on
implementation
5 Point
Likert Scale,
9items
Institutionalization To analyse the effect of
Institutionalization in
Execution of County
Integrated Development
Plans by County
Governments in Kenya
Effective structure to
support CIDPs
Roles& responsibilities
understanding
Decision making process
understanding
Extent of subscription to
County’s mission content
Corporate rules
&Regulations
Clear communication
Capacity development
policy
5 Point
Likert Scale,
7 items
Innovation To explore the role of
Innovation in Execution
of County Integrated
Use of social media
platform to reach citizens
New strategies on Service
delivery
5 Point
Likert Scale,
7 items
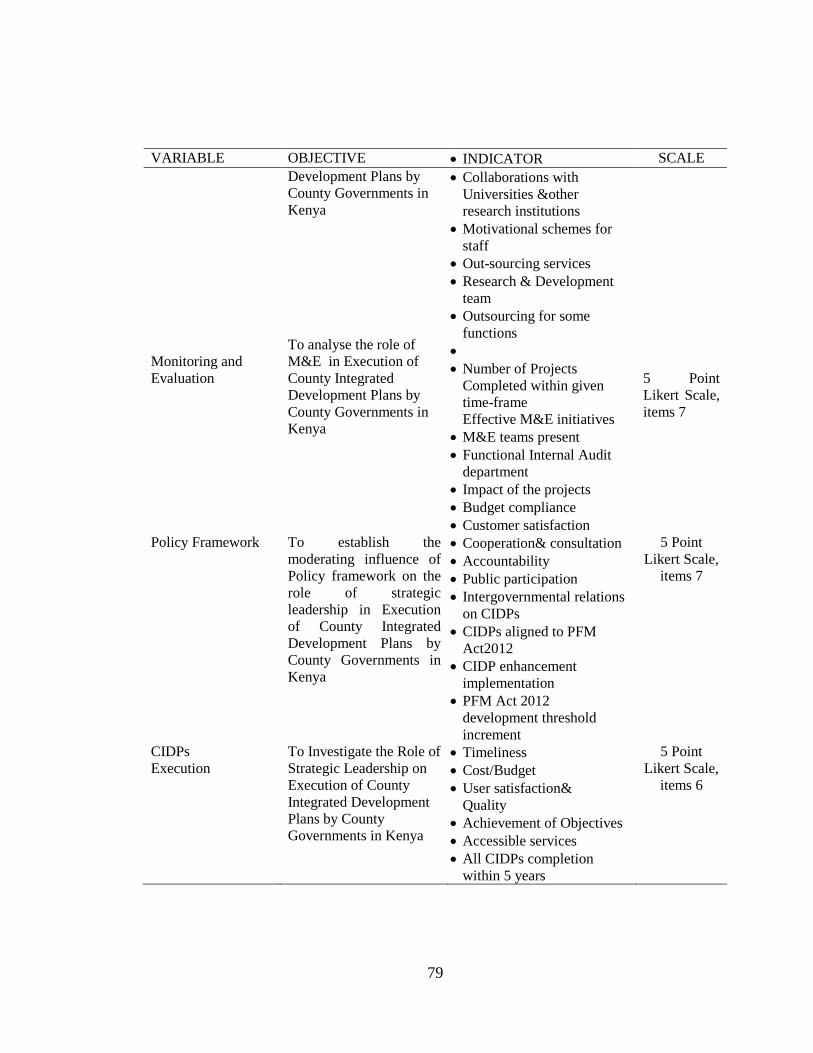
79
VARIABLE OBJECTIVE INDICATOR SCALE
Monitoring and
Evaluation
Development Plans by
County Governments in
Kenya
To analyse the role of
M&E in Execution of
County Integrated
Development Plans by
County Governments in
Kenya
Collaborations with
Universities &other
research institutions
Motivational schemes for
staff
Out-sourcing services
Research & Development
team
Outsourcing for some
functions
Number of Projects
Completed within given
time-frame
Effective M&E initiatives
M&E teams present
Functional Internal Audit
department
Impact of the projects
Budget compliance
Customer satisfaction
5 Point
Likert Scale,
items 7
Policy Framework To establish the
moderating influence of
Policy framework on the
role of strategic
leadership in Execution
of County Integrated
Development Plans by
County Governments in
Kenya
Cooperation& consultation
Accountability
Public participation
Intergovernmental relations
on CIDPs
CIDPs aligned to PFM
Act2012
CIDP enhancement
implementation
PFM Act 2012
development threshold
increment
5 Point
Likert Scale,
items 7
CIDPs
Execution
To Investigate the Role of
Strategic Leadership on
Execution of County
Integrated Development
Plans by County
Governments in Kenya
Timeliness
Cost/Budget
User satisfaction&
Quality
Achievement of Objectives
Accessible services
All CIDPs completion
within 5 years
5 Point
Likert Scale,
items 6
80
CHAPTER FOUR
RESEARCH FINDINGS AND DISCUSSION
4.1 Introduction
This chapter presents the key findings of the study that sought to establish the role of
strategic leadership on the execution of county integrated development plans by county
governments in Kenya. Response rate and study sample characteristics are the first to be
presented. The chapter further presents research results using descriptive and inferential
statistics. It starts with the response rate, personal characteristics of the sample and
provides findings according to the following study objectives: To analyse the role of
envisioning in execution of County Integrated Development Plans by County
Governments in Kenya. To analyse the effect of institutionalization of programmes in
execution of County Integrated Development Plans by County Governments in Kenya.
To explore the role of innovation in execution of County Integrated Development Plans
by County Governments in Kenya. To analyse the role of monitoring and evaluation in
execution of County Integrated Development Plans by County Governments in Kenya.
To establish the moderating influence of policy framework on the role of strategic
leadership in execution of County Integrated Development plans.
4.2 Response Rate
High response rate assures that the findings are representative of the target population.
In the study sixty six (66) out of ninety two (92) questionnaires administered to the
participants were filled and returned.
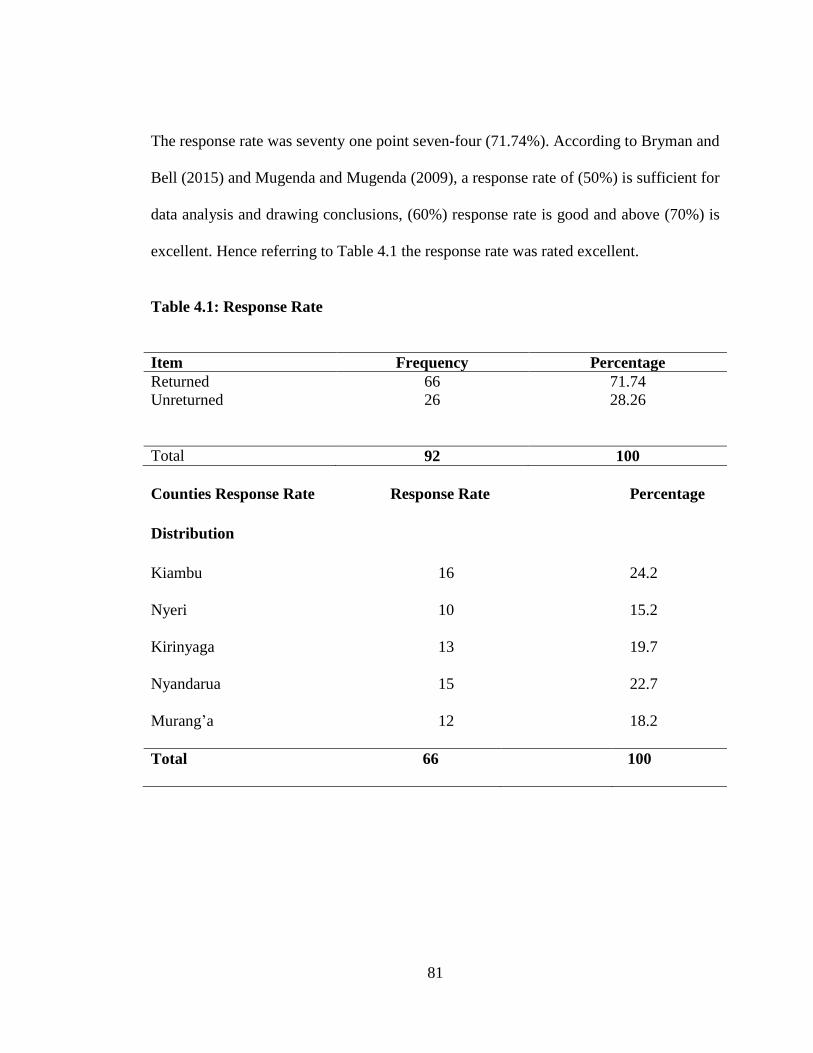
81
The response rate was seventy one point seven-four (71.74%). According to Bryman and
Bell (2015) and Mugenda and Mugenda (2009), a response rate of (50%) is sufficient for
data analysis and drawing conclusions, (60%) response rate is good and above (70%) is
excellent. Hence referring to Table 4.1 the response rate was rated excellent.
Table 4.1: Response Rate
Item Frequency Percentage
Returned 66 71.74
Unreturned 26 28.26
Total 92 100
Counties Response Rate Response Rate Percentage
Distribution
Kiambu 16 24.2
Nyeri 10 15.2
Kirinyaga 13 19.7
Nyandarua 15 22.7
Murang’a 12 18.2
Total 66
100
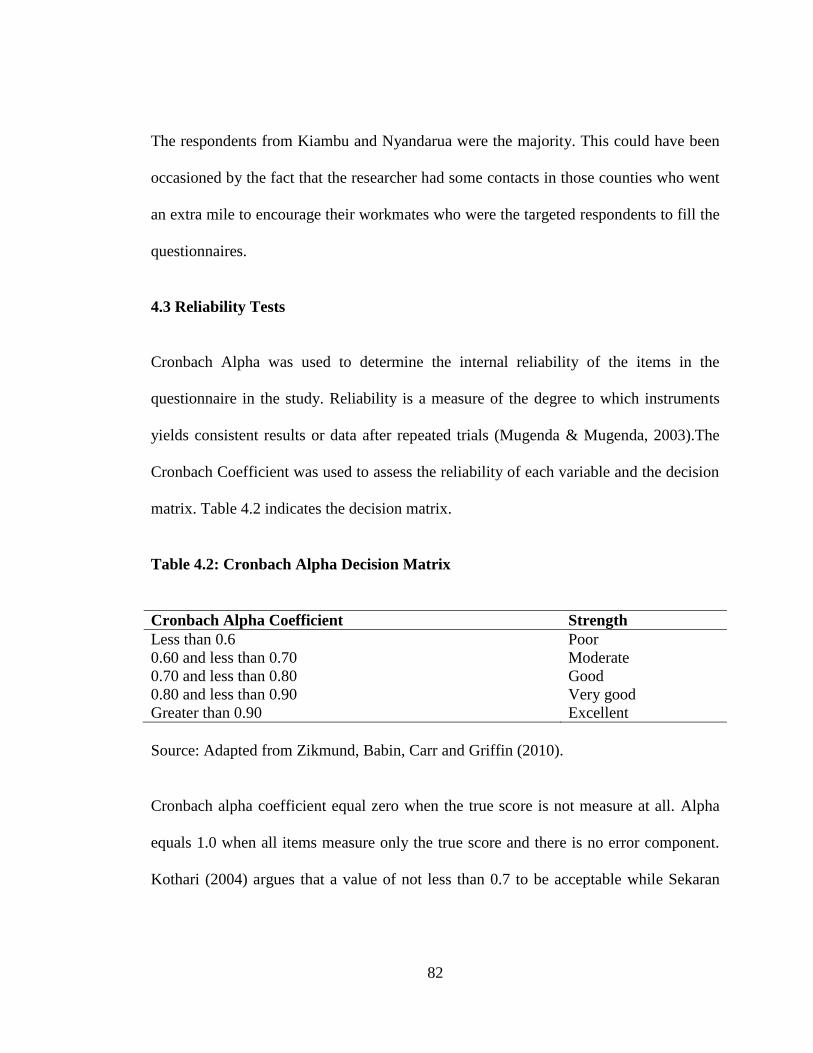
82
The respondents from Kiambu and Nyandarua were the majority. This could have been
occasioned by the fact that the researcher had some contacts in those counties who went
an extra mile to encourage their workmates who were the targeted respondents to fill the
questionnaires.
4.3 Reliability Tests
Cronbach Alpha was used to determine the internal reliability of the items in the
questionnaire in the study. Reliability is a measure of the degree to which instruments
yields consistent results or data after repeated trials (Mugenda & Mugenda, 2003).The
Cronbach Coefficient was used to assess the reliability of each variable and the decision
matrix. Table 4.2 indicates the decision matrix.
Table 4.2: Cronbach Alpha Decision Matrix
Cronbach Alpha Coefficient Strength
Less than 0.6 Poor
0.60 and less than 0.70 Moderate
0.70 and less than 0.80 Good
0.80 and less than 0.90 Very good
Greater than 0.90 Excellent
Source: Adapted from Zikmund, Babin, Carr and Griffin (2010).
Cronbach alpha coefficient equal zero when the true score is not measure at all. Alpha
equals 1.0 when all items measure only the true score and there is no error component.
Kothari (2004) argues that a value of not less than 0.7 to be acceptable while Sekaran
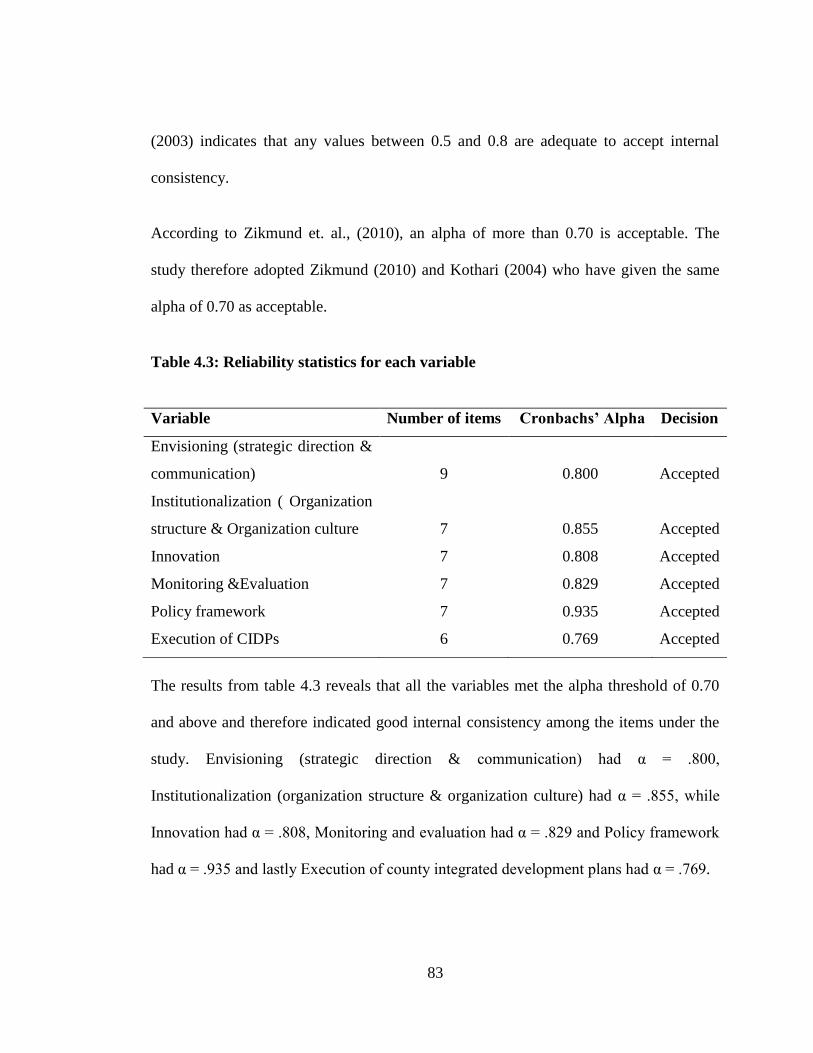
83
(2003) indicates that any values between 0.5 and 0.8 are adequate to accept internal
consistency.
According to Zikmund et. al., (2010), an alpha of more than 0.70 is acceptable. The
study therefore adopted Zikmund (2010) and Kothari (2004) who have given the same
alpha of 0.70 as acceptable.
Table 4.3: Reliability statistics for each variable
Variable Number of items Cronbachs’ Alpha Decision
Envisioning (strategic direction &
communication) 9 0.800 Accepted
Institutionalization ( Organization
structure & Organization culture 7 0.855 Accepted
Innovation 7 0.808 Accepted
Monitoring &Evaluation 7 0.829 Accepted
Policy framework 7 0.935 Accepted
Execution of CIDPs 6 0.769 Accepted
The results from table 4.3 reveals that all the variables met the alpha threshold of 0.70
and above and therefore indicated good internal consistency among the items under the
study. Envisioning (strategic direction & communication) had α = .800,
Institutionalization (organization structure & organization culture) had α = .855, while
Innovation had α = .808, Monitoring and evaluation had α = .829 and Policy framework
had α = .935 and lastly Execution of county integrated development plans had α = .769.
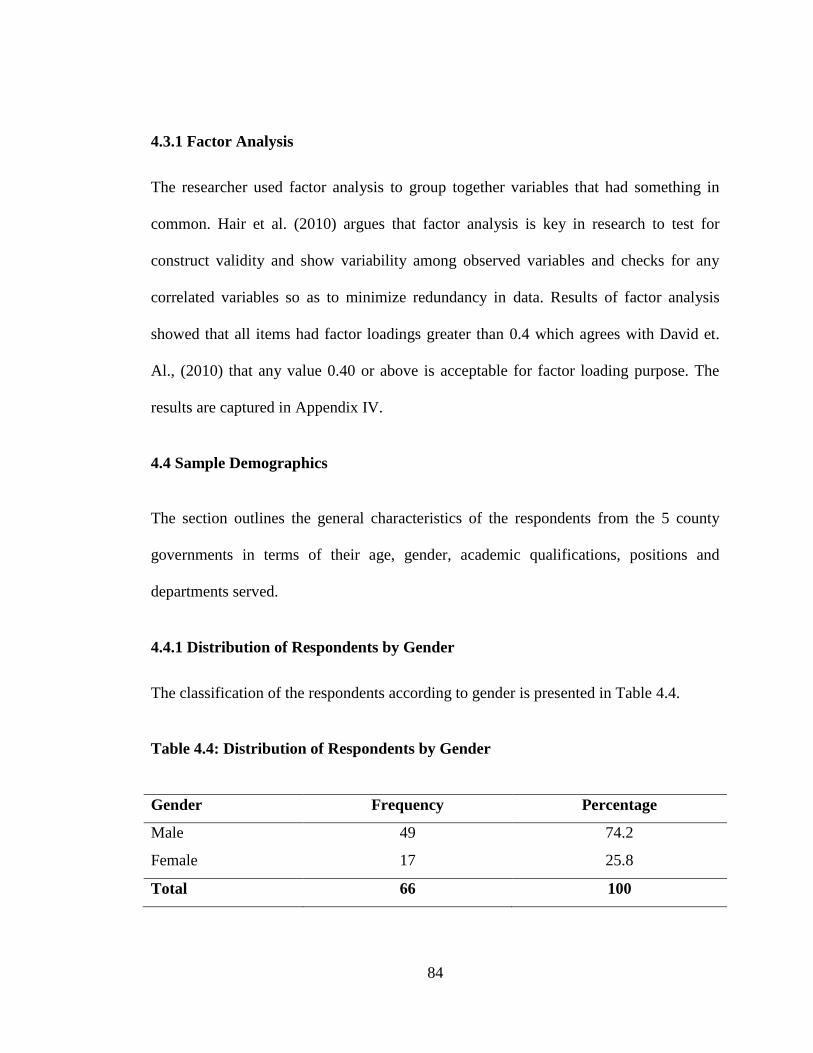
84
4.3.1 Factor Analysis
The researcher used factor analysis to group together variables that had something in
common. Hair et al. (2010) argues that factor analysis is key in research to test for
construct validity and show variability among observed variables and checks for any
correlated variables so as to minimize redundancy in data. Results of factor analysis
showed that all items had factor loadings greater than 0.4 which agrees with David et.
Al., (2010) that any value 0.40 or above is acceptable for factor loading purpose. The
results are captured in Appendix IV.
4.4 Sample Demographics
The section outlines the general characteristics of the respondents from the 5 county
governments in terms of their age, gender, academic qualifications, positions and
departments served.
4.4.1 Distribution of Respondents by Gender
The classification of the respondents according to gender is presented in Table 4.4.
Table 4.4: Distribution of Respondents by Gender
Gender Frequency Percentage
Male 49 74.2
Female 17 25.8
Total 66 100
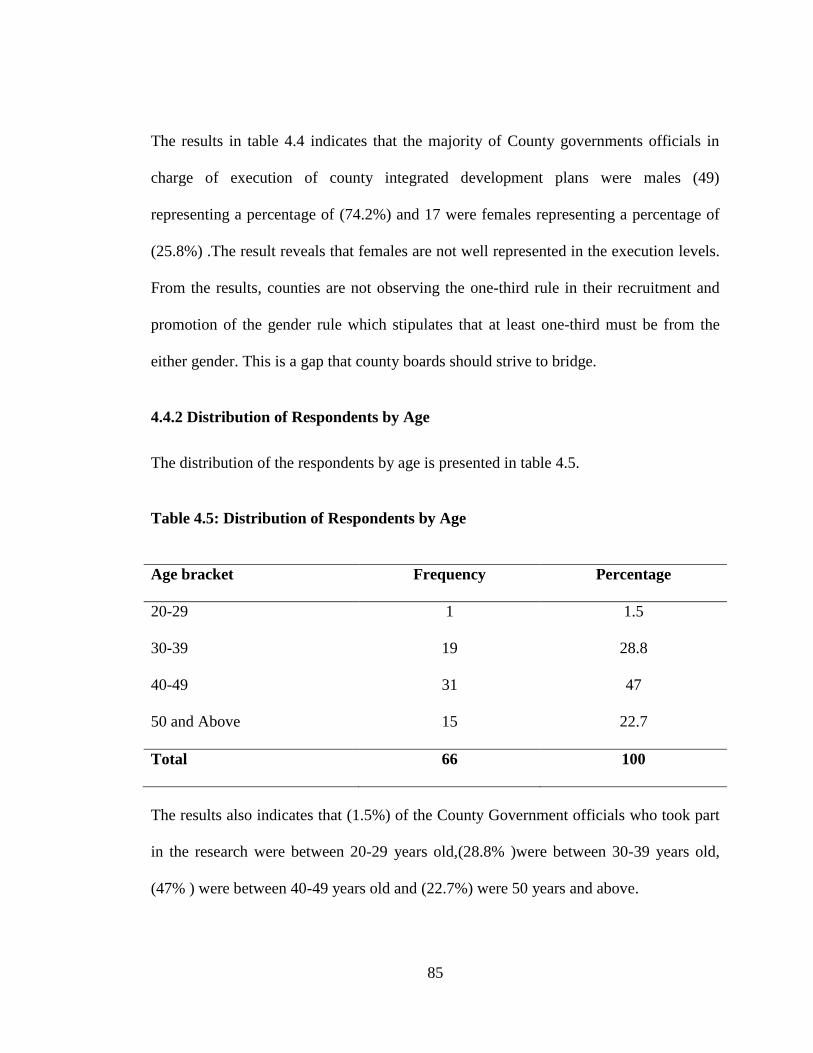
85
The results in table 4.4 indicates that the majority of County governments officials in
charge of execution of county integrated development plans were males (49)
representing a percentage of (74.2%) and 17 were females representing a percentage of
(25.8%) .The result reveals that females are not well represented in the execution levels.
From the results, counties are not observing the one-third rule in their recruitment and
promotion of the gender rule which stipulates that at least one-third must be from the
either gender. This is a gap that county boards should strive to bridge.
4.4.2 Distribution of Respondents by Age
The distribution of the respondents by age is presented in table 4.5.
Table 4.5: Distribution of Respondents by Age
Age bracket Frequency Percentage
20-29 1 1.5
30-39 19 28.8
40-49 31 47
50 and Above 15 22.7
Total 66 100
The results also indicates that (1.5%) of the County Government officials who took part
in the research were between 20-29 years old,(28.8% )were between 30-39 years old,
(47% ) were between 40-49 years old and (22.7%) were 50 years and above.
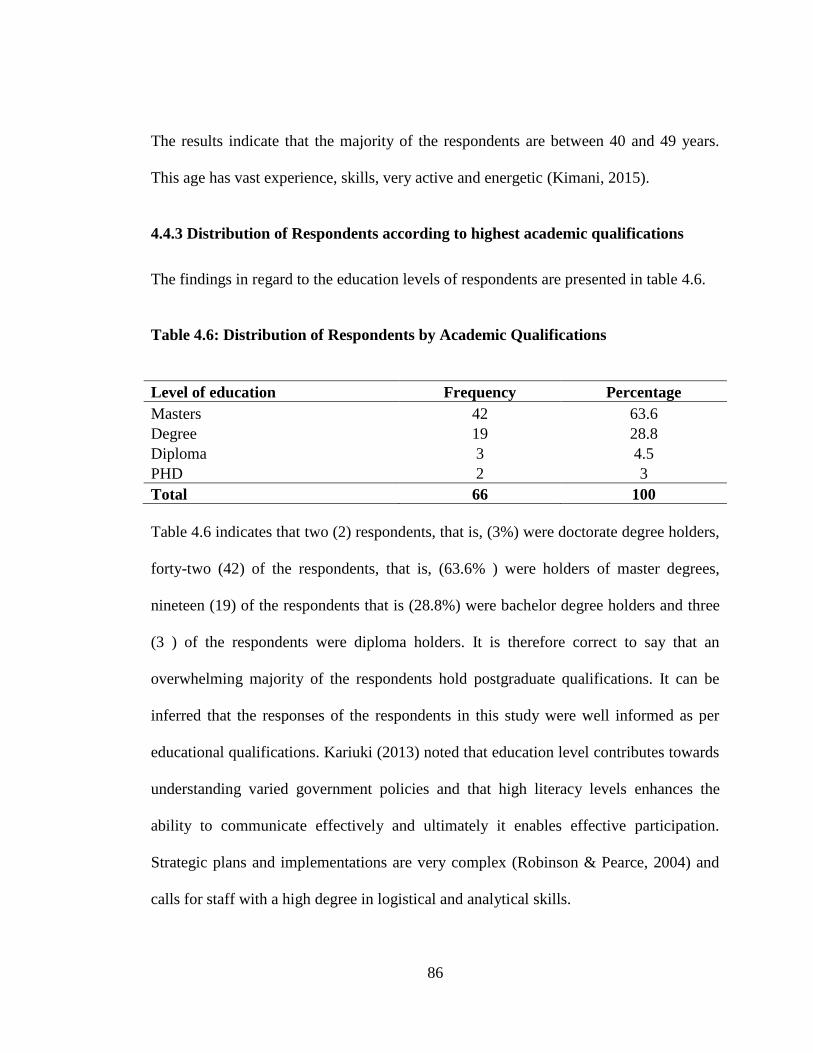
86
The results indicate that the majority of the respondents are between 40 and 49 years.
This age has vast experience, skills, very active and energetic (Kimani, 2015).
4.4.3 Distribution of Respondents according to highest academic qualifications
The findings in regard to the education levels of respondents are presented in table 4.6.
Table 4.6: Distribution of Respondents by Academic Qualifications
Level of education Frequency Percentage
Masters 42 63.6
Degree 19 28.8
Diploma 3 4.5
PHD 2 3
Total 66 100
Table 4.6 indicates that two (2) respondents, that is, (3%) were doctorate degree holders,
forty-two (42) of the respondents, that is, (63.6% ) were holders of master degrees,
nineteen (19) of the respondents that is (28.8%) were bachelor degree holders and three
(3 ) of the respondents were diploma holders. It is therefore correct to say that an
overwhelming majority of the respondents hold postgraduate qualifications. It can be
inferred that the responses of the respondents in this study were well informed as per
educational qualifications. Kariuki (2013) noted that education level contributes towards
understanding varied government policies and that high literacy levels enhances the
ability to communicate effectively and ultimately it enables effective participation.
Strategic plans and implementations are very complex (Robinson & Pearce, 2004) and
calls for staff with a high degree in logistical and analytical skills.
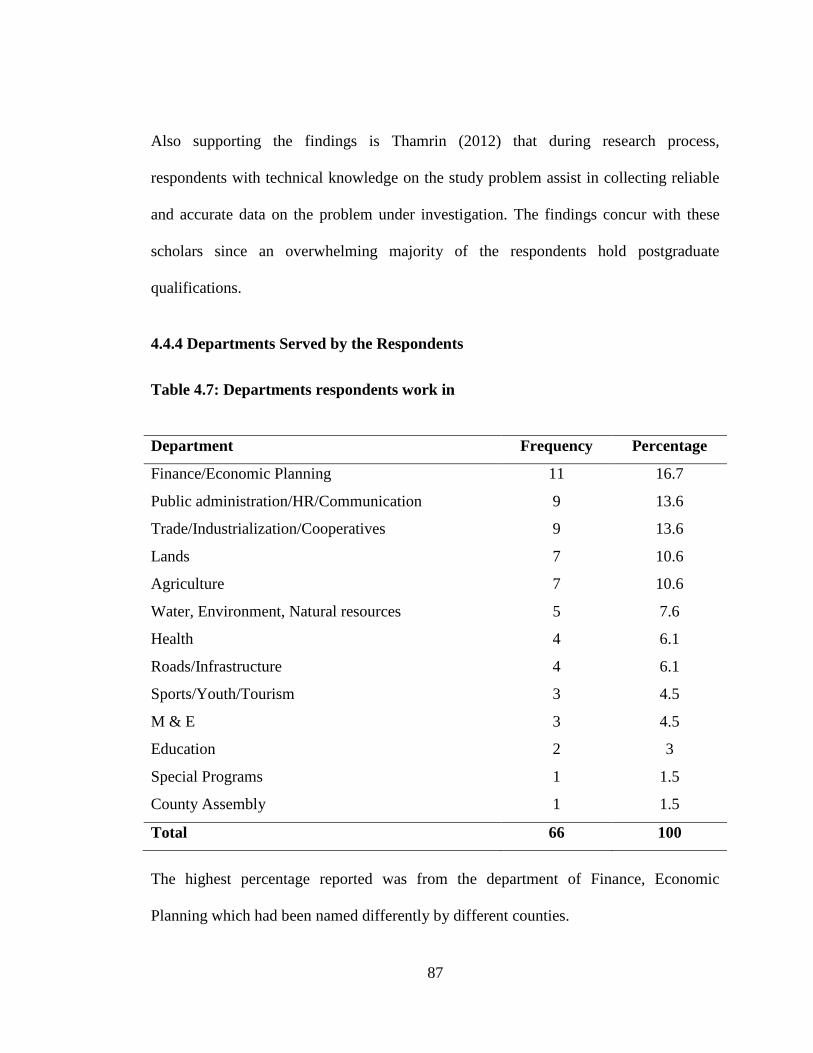
87
Also supporting the findings is Thamrin (2012) that during research process,
respondents with technical knowledge on the study problem assist in collecting reliable
and accurate data on the problem under investigation. The findings concur with these
scholars since an overwhelming majority of the respondents hold postgraduate
qualifications.
4.4.4 Departments Served by the Respondents
Table 4.7: Departments respondents work in
Department Frequency Percentage
Finance/Economic Planning 11 16.7
Public administration/HR/Communication 9 13.6
Trade/Industrialization/Cooperatives 9 13.6
Lands 7 10.6
Agriculture 7 10.6
Water, Environment, Natural resources 5 7.6
Health 4 6.1
Roads/Infrastructure 4 6.1
Sports/Youth/Tourism 3 4.5
M & E 3 4.5
Education 2 3
Special Programs 1 1.5
County Assembly 1 1.5
Total 66 100
The highest percentage reported was from the department of Finance, Economic
Planning which had been named differently by different counties.
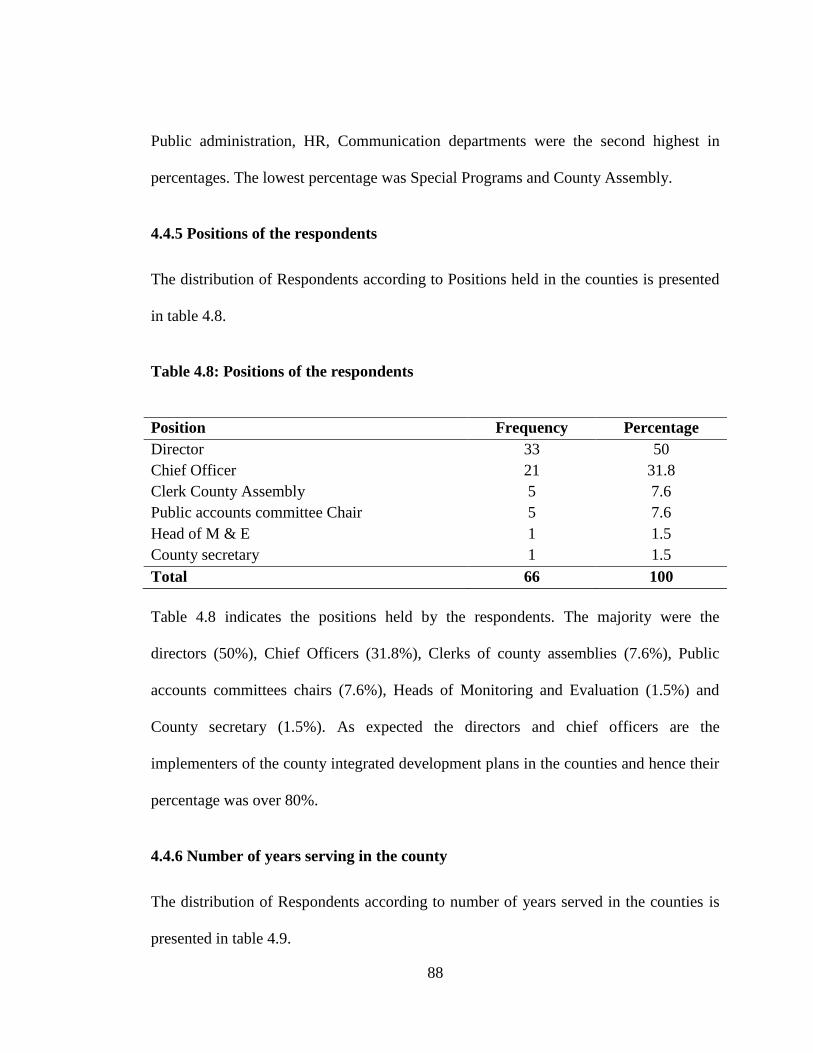
88
Public administration, HR, Communication departments were the second highest in
percentages. The lowest percentage was Special Programs and County Assembly.
4.4.5 Positions of the respondents
The distribution of Respondents according to Positions held in the counties is presented
in table 4.8.
Table 4.8: Positions of the respondents
Position Frequency Percentage
Director 33 50
Chief Officer 21 31.8
Clerk County Assembly 5 7.6
Public accounts committee Chair 5 7.6
Head of M & E 1 1.5
County secretary 1 1.5
Total 66 100
Table 4.8 indicates the positions held by the respondents. The majority were the
directors (50%), Chief Officers (31.8%), Clerks of county assemblies (7.6%), Public
accounts committees chairs (7.6%), Heads of Monitoring and Evaluation (1.5%) and
County secretary (1.5%). As expected the directors and chief officers are the
implementers of the county integrated development plans in the counties and hence their
percentage was over 80%.
4.4.6 Number of years serving in the county
The distribution of Respondents according to number of years served in the counties is
presented in table 4.9.
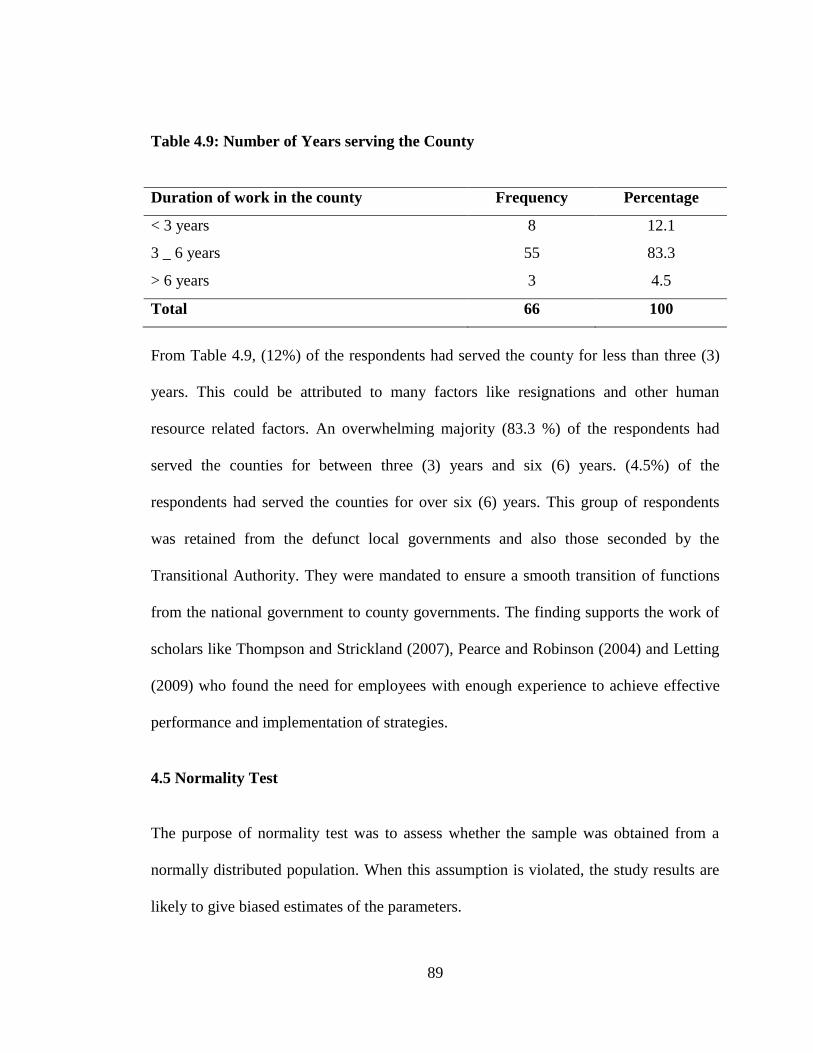
89
Table 4.9: Number of Years serving the County
Duration of work in the county Frequency Percentage
< 3 years 8 12.1
3 _ 6 years 55 83.3
> 6 years 3 4.5
Total 66 100
From Table 4.9, (12%) of the respondents had served the county for less than three (3)
years. This could be attributed to many factors like resignations and other human
resource related factors. An overwhelming majority (83.3 %) of the respondents had
served the counties for between three (3) years and six (6) years. (4.5%) of the
respondents had served the counties for over six (6) years. This group of respondents
was retained from the defunct local governments and also those seconded by the
Transitional Authority. They were mandated to ensure a smooth transition of functions
from the national government to county governments. The finding supports the work of
scholars like Thompson and Strickland (2007), Pearce and Robinson (2004) and Letting
(2009) who found the need for employees with enough experience to achieve effective
performance and implementation of strategies.
4.5 Normality Test
The purpose of normality test was to assess whether the sample was obtained from a
normally distributed population. When this assumption is violated, the study results are
likely to give biased estimates of the parameters.

90
Kolmogorov-Smirnov and Shapiro-Wilk test were used to test the normality of
dependent variable (Execution of CIDPs).The null hypothesis in the Kolmogorov-
Smirnov and Shapiro Wilk test of normality is that the data for the variable is normally
distributed. The desirable outcome for this test is to fail to reject the null hypothesis. The
tests fail to reject the hypothesis of normality when the p-value is greater than or equal
to 0.05 (Shapiro &Wilk, 1965). The decision rule is such that fail to reject H0 if P- value
greater than the 0.05 alpha level otherwise reject H0 if P- value is less than 0.05 alpha
level. The hypotheses were stated as follows:
H0: The data is normal
H1: The data is not normal.
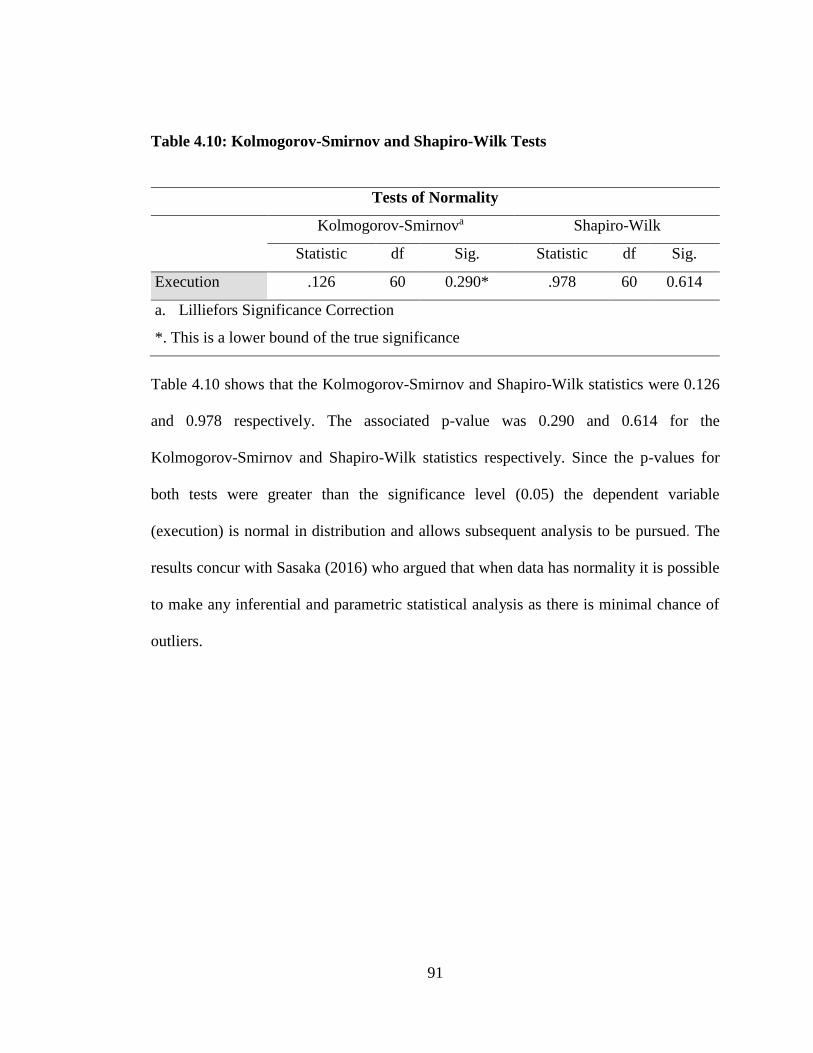
91
Table 4.10: Kolmogorov-Smirnov and Shapiro-Wilk Tests
Tests of Normality
Kolmogorov-Smirnova Shapiro-Wilk
Statistic df Sig. Statistic df Sig.
Execution .126 60 0.290* .978 60 0.614
a. Lilliefors Significance Correction
*. This is a lower bound of the true significance
Table 4.10 shows that the Kolmogorov-Smirnov and Shapiro-Wilk statistics were 0.126
and 0.978 respectively. The associated p-value was 0.290 and 0.614 for the
Kolmogorov-Smirnov and Shapiro-Wilk statistics respectively. Since the p-values for
both tests were greater than the significance level (0.05) the dependent variable
(execution) is normal in distribution and allows subsequent analysis to be pursued. The
results concur with Sasaka (2016) who argued that when data has normality it is possible
to make any inferential and parametric statistical analysis as there is minimal chance of
outliers.
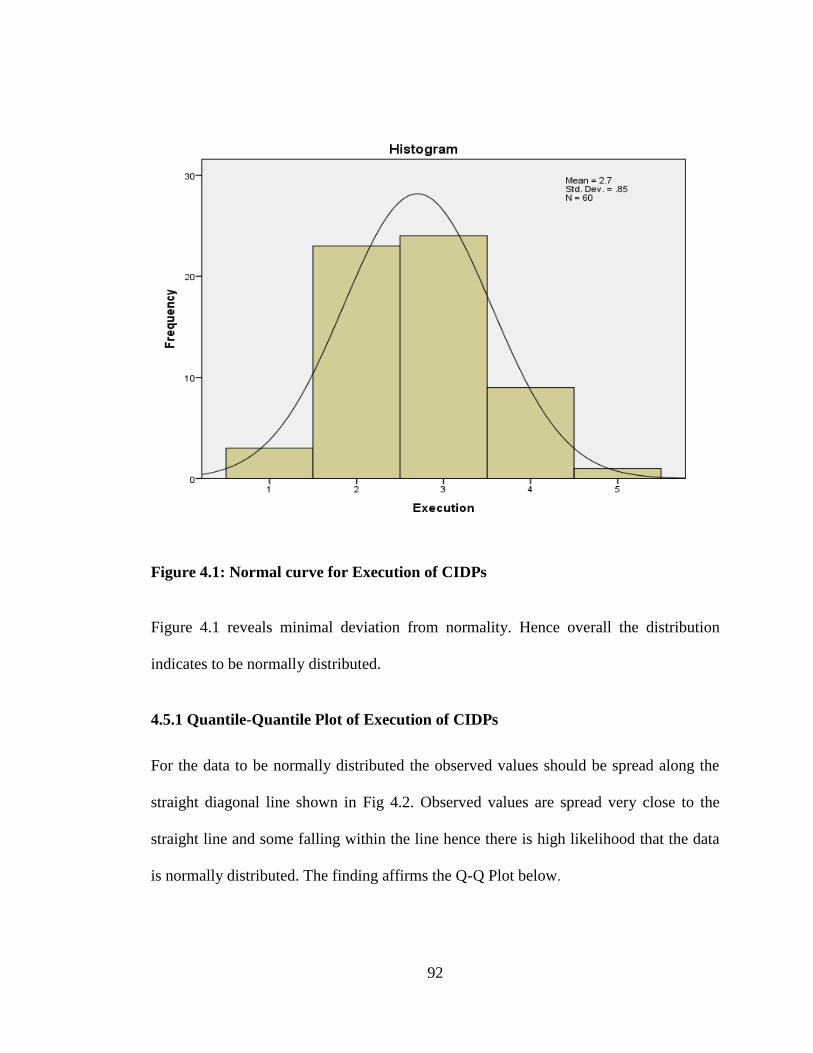
92
Figure 4.1: Normal curve for Execution of CIDPs
Figure 4.1 reveals minimal deviation from normality. Hence overall the distribution
indicates to be normally distributed.
4.5.1 Quantile-Quantile Plot of Execution of CIDPs
For the data to be normally distributed the observed values should be spread along the
straight diagonal line shown in Fig 4.2. Observed values are spread very close to the
straight line and some falling within the line hence there is high likelihood that the data
is normally distributed. The finding affirms the Q-Q Plot below.
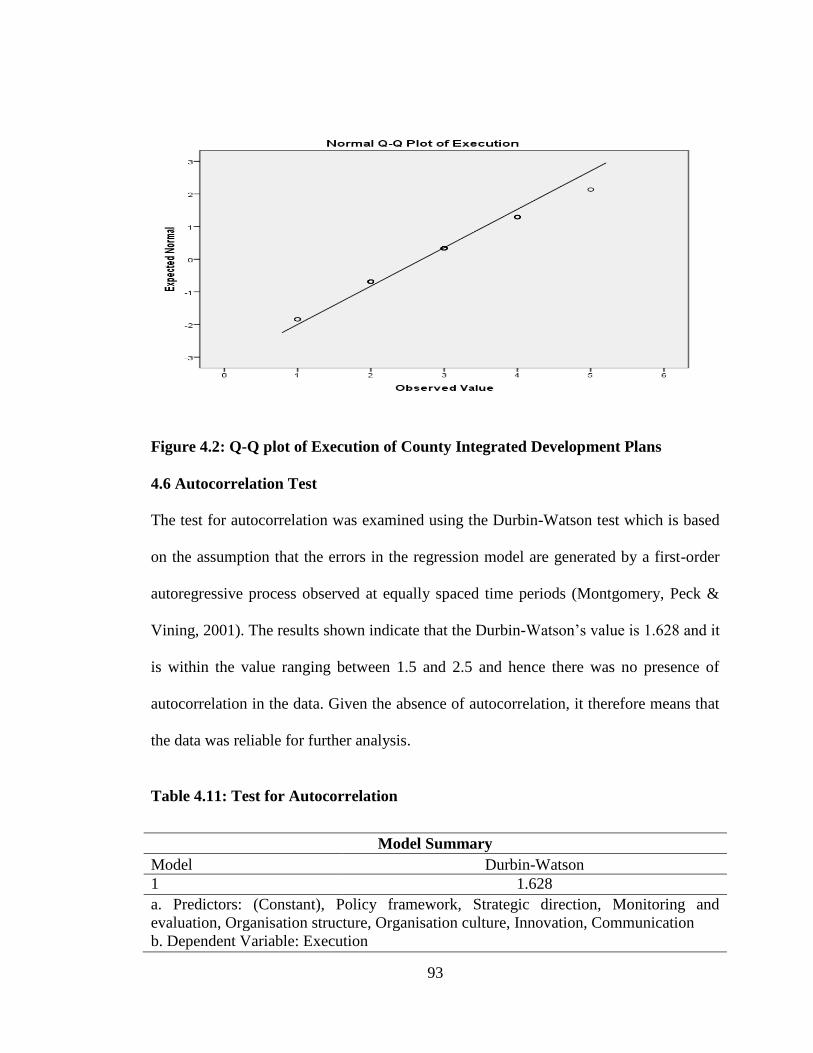
93
Figure 4.2: Q-Q plot of Execution of County Integrated Development Plans
4.6 Autocorrelation Test
The test for autocorrelation was examined using the Durbin-Watson test which is based
on the assumption that the errors in the regression model are generated by a first-order
autoregressive process observed at equally spaced time periods (Montgomery, Peck &
Vining, 2001). The results shown indicate that the Durbin-Watson’s value is 1.628 and it
is within the value ranging between 1.5 and 2.5 and hence there was no presence of
autocorrelation in the data. Given the absence of autocorrelation, it therefore means that
the data was reliable for further analysis.
Table 4.11: Test for Autocorrelation
Model Summary
Model Durbin-Watson
1 1.628
a. Predictors: (Constant), Policy framework, Strategic direction, Monitoring and
evaluation, Organisation structure, Organisation culture, Innovation, Communication
b. Dependent Variable: Execution
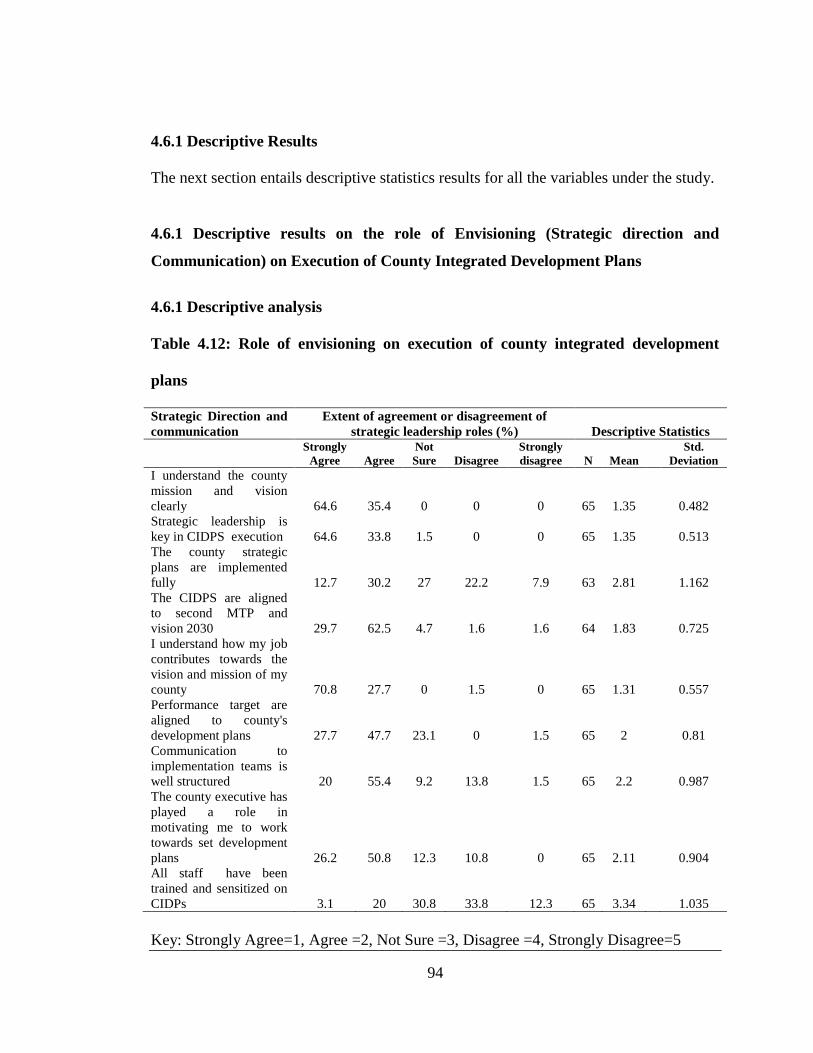
94
4.6.1 Descriptive Results
The next section entails descriptive statistics results for all the variables under the study.
4.6.1 Descriptive results on the role of Envisioning (Strategic direction and
Communication) on Execution of County Integrated Development Plans
4.6.1 Descriptive analysis
Table 4.12: Role of envisioning on execution of county integrated development
plans
Strategic Direction and
communication
Extent of agreement or disagreement of
strategic leadership roles (%) Descriptive Statistics
Strongly
Agree Agree
Not
Sure Disagree
Strongly
disagree N Mean
Std.
Deviation
I understand the county
mission and vision
clearly 64.6 35.4 0 0 0 65 1.35
0.482
Strategic leadership is
key in CIDPS execution 64.6 33.8 1.5 0 0 65 1.35
0.513
The county strategic
plans are implemented
fully 12.7 30.2 27 22.2 7.9 63 2.81
1.162
The CIDPS are aligned
to second MTP and
vision 2030 29.7 62.5 4.7 1.6 1.6 64 1.83
0.725
I understand how my job
contributes towards the
vision and mission of my
county 70.8 27.7 0 1.5 0 65 1.31
0.557
Performance target are
aligned to county's
development plans 27.7 47.7 23.1 0 1.5 65 2
0.81
Communication to
implementation teams is
well structured 20 55.4 9.2 13.8 1.5 65 2.2
0.987
The county executive has
played a role in
motivating me to work
towards set development
plans 26.2 50.8 12.3 10.8 0 65 2.11
0.904
All staff have been
trained and sensitized on
CIDPs 3.1 20 30.8 33.8 12.3 65 3.34
1.035
Key: Strongly Agree=1, Agree =2, Not Sure =3, Disagree =4, Strongly Disagree=5
95
The response in Table 4.12 reveals that two items had a standard deviation of more than
1.0 which therefore indicates that there were extremes in scoring. Standard deviation is
the most widely used and stable measure of dispersion and takes into account each score
in the distribution (Kothari & Gary, 2014). The highest standard deviation was 1.162
which shows there were extremes in the scoring. In the item ‘The county strategic plans
are implemented fully,’ (12.7%) of the respondents strongly agree, (30.2%) agree.
However, (27.0%) of the respondents are not sure, (22.2%) disagree and (7.9%) of the
respondents strongly disagree. This shows that the respondents were spread to the
positive and to the negative hence the high standard deviation of 1.162 and a mean of
2.81 respectively.
The results indicated that (64.6%) of the respondents strongly agreed and (35.4%)
agreed that they understand their county mission and vision clearly. This statement was
a 100% agreed upon by all respondents. This item had the lowest standard deviation of
0.482 and a mean of 1.35. The findings hence reflects that majority of the respondents
viewed the item from same angle. The findings are in agreement with Odita and Bello
(2015) whose study revealed that strategic direction positively and significantly relates
to organization performance and it is found in the mission and vision and
objectives.Makori (2014) further collaborates that mission and vision provides direction,
discovery and destiny for the organization. The current study concur with Ozdem (2014)
who states that a vision explains what the organization wants to be and the level it wants
to attain and communicates the organization’s dream. Seven items had a standard
deviation of less than 1.0 which indicates there were no extremes in the scoring.
96
As to whether Strategic leadership is key in CIDPs execution, a majority (64.6%)
strongly agreed and (33.8%) agreed. A majority of the respondents affirmed that
strategic leadership is key in execution of strategies. A paltry (1.5%) of the respondents
were not sure. An overwhelming majority of the respondents were in agreement that
strategic leadership is key in county integrated development plans execution with a
mean of 1.35 and a standard deviation of 0.513. The findings are in agreement with
Katana (2017) on the influence of strategic leadership on strategy execution in shipping
companies in Kenya. The findings are in tandem with studies by Lear, (2012),
Serfontein (2010) and Nthini (2013) who found strategic leadership and organizational
performance to be positively correlated.
In response as to whether the CIDPs are aligned to second MTP and vision 2030,results
indicated that majority (62.5%) of the respondents agreed with this opinion with another
(29.7%) strongly agreed. While (4.7%) remained unsure or neutral, and equal (1.6%)
divided in opinion for those who disagreed and strongly disagreed. From the results, an
overwhelming majority (92.2%) agreed with the opinion that county integrated
development plans are aligned to second Medium Term Plans and Vision 2030 with a
mean of 1.83 and standard deviation of 0.725. Respondents were asked if they
understood how their jobs contribute towards the vision and mission of their counties,
majority (70.8%) strongly agreed and (27.7%) agreed and a paltry (1.5%) of the
respondents disagreed. From the results an overwhelming (98.5%) of the respondents
agreed with the statement whose mean was 1.31 and a standard deviation of 0.557.
97
In response to the statement as to whether Performance target are aligned to county's
development plans, a majority of the respondents (47.7%) agreed with the
statement,(27.7%) strongly agreed with the statement. However, (23.1%) of the
respondents were not sure of the statement and (1.5%) strongly disagreed with a mean of
2.00 and a standard deviation of 0.810. As to whether Communication to
implementation teams is well structured, a majority of respondents (55.4%) agreed with
the statement, (20%) agreed. The findings indicate that communication has a significant
and positive influence on execution of strategic plans. This finding is supported by
Mulube (2009) and Amukobole (2010) who indicated poor knowledge of goals as an
element in execution. Those respondents that were not sure were (9.2%) and (13.8%) of
the respondents disagreed and a paltry (1.5%) strongly disagreed with the statement
which had a mean of 2.20 and a standard deviation of 0.987. As to whether the county
executive had played a role in motivating them to work towards set development plans,
(50.8%) agreed with the statement while (26.2%) of them strongly agreed. (12.3%) of
the respondents were however not sure and (10.8%) disagreed with the statement. It had
a mean of 2.11 and a standard of 0.904.
An overwhelming majority 77.0% of the respondents agreed with the statement which
indicates the key role the executive plays in motivating their staff for effective execution
of development plans. Finally, respondents were asked if all staff had been trained and
sensitized on CIDPs. The results indicated that (23.1%) of the respondents agreed with
the statement while (30.8%) of the respondents were not sure. Those respondents who
disagreed were (33.8%) and (12.3%) of the respondents strongly disagreed.
98
The results indicated that (46.1%) of the respondents were in disagreement with the
statement, while 30.8% were unsure, indicating a wide variation in the responses with a
mean of 3.34 and a standard deviation of 1.035 respectively. This percentage that is
contrary to the statement is almost half .The results indicates that there is urgent need in
counties to train and sensitize their staff on county integrated development plans so that
the staff can have a clear direction. According to Armstrong (2001),employees training
helps them to identify organizational goals and mission, helps not only to manage
change but also developing positive culture in organization, which in turn may lead to
providing higher level of service to stakeholders.
In summary, the findings indicate that staffs understand the counties missions and
visions clearly and that Strategic leadership is key in CIDPs execution. Counties
strategic plans were reported to be implemented fully and that the CIDPs are aligned to
second MTP and vision 2030. Furthermore, they indicated understanding how their jobs
contribute towards the visions and missions of their counties. Performance target were
said to be aligned to counties development plans and that Communication to
implementation teams is well structured. The counties executives have played a role in
motivating them to work towards set development plans and all staff have been trained
and sensitized on CIDPs.
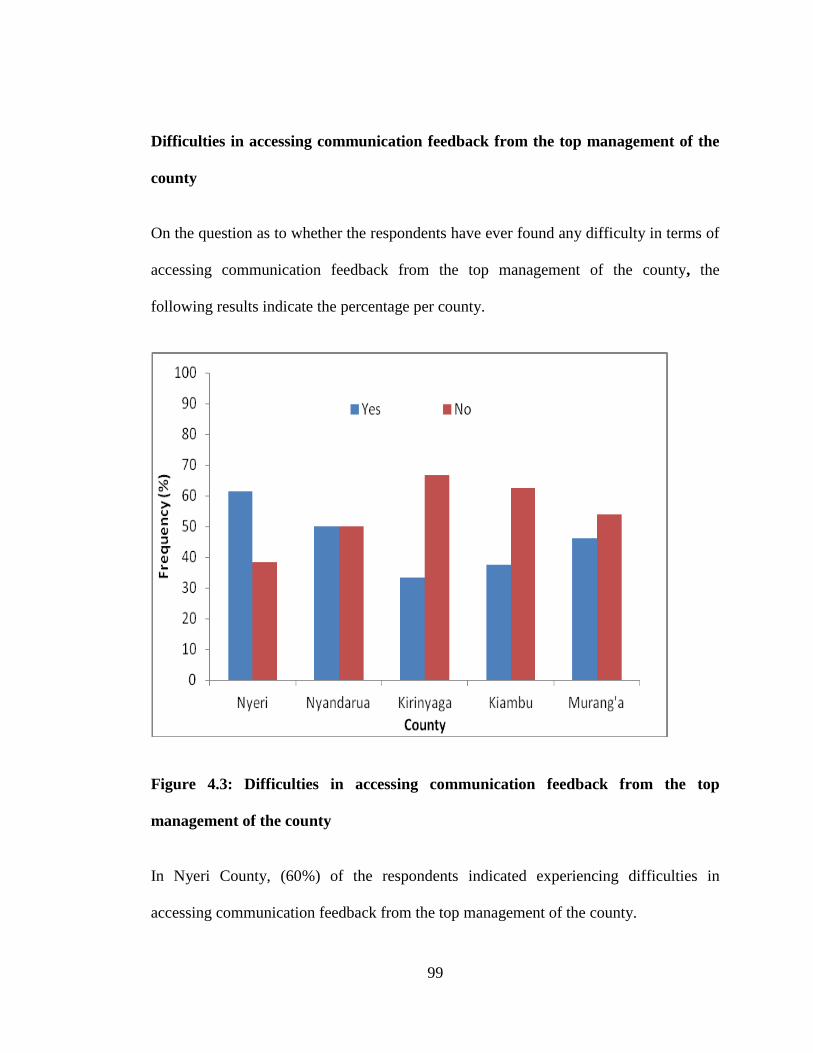
99
Difficulties in accessing communication feedback from the top management of the
county
On the question as to whether the respondents have ever found any difficulty in terms of
accessing communication feedback from the top management of the county, the
following results indicate the percentage per county.
Figure 4.3: Difficulties in accessing communication feedback from the top
management of the county
In Nyeri County, (60%) of the respondents indicated experiencing difficulties in
accessing communication feedback from the top management of the county.
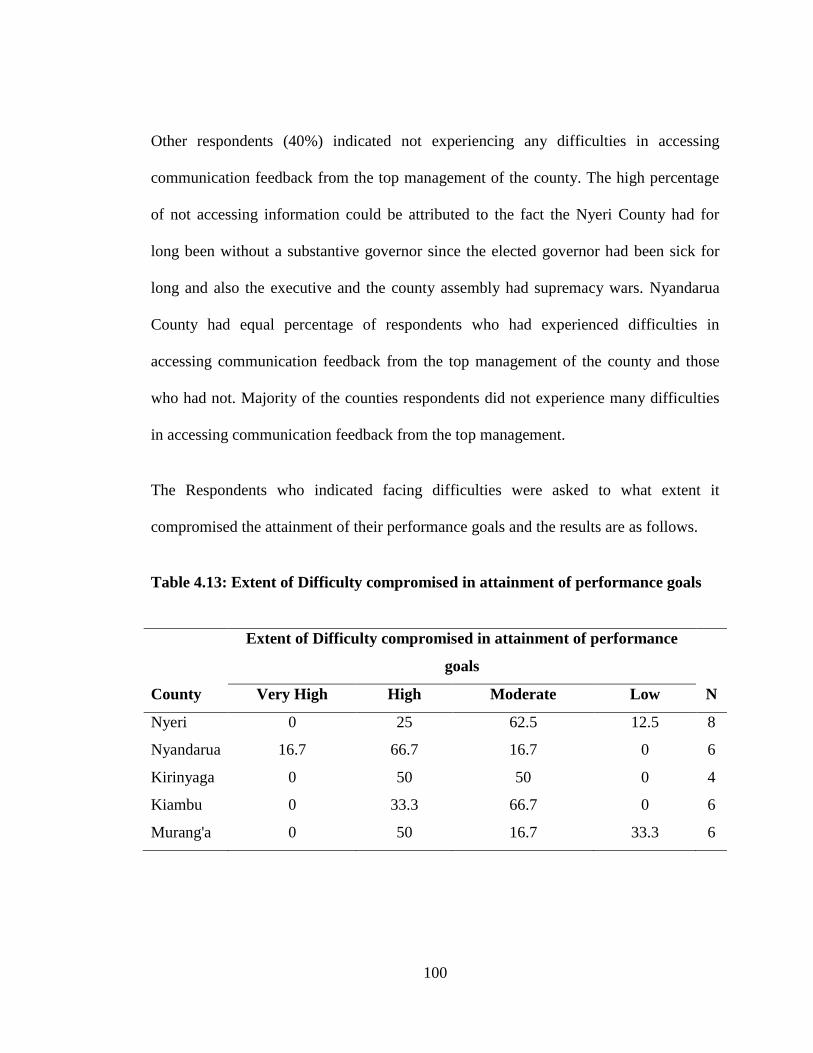
100
Other respondents (40%) indicated not experiencing any difficulties in accessing
communication feedback from the top management of the county. The high percentage
of not accessing information could be attributed to the fact the Nyeri County had for
long been without a substantive governor since the elected governor had been sick for
long and also the executive and the county assembly had supremacy wars. Nyandarua
County had equal percentage of respondents who had experienced difficulties in
accessing communication feedback from the top management of the county and those
who had not. Majority of the counties respondents did not experience many difficulties
in accessing communication feedback from the top management.
The Respondents who indicated facing difficulties were asked to what extent it
compromised the attainment of their performance goals and the results are as follows.
Table 4.13: Extent of Difficulty compromised in attainment of performance goals
County
Extent of Difficulty compromised in attainment of performance
goals
N Very High High Moderate Low
Nyeri 0 25 62.5 12.5 8
Nyandarua 16.7 66.7 16.7 0 6
Kirinyaga 0 50 50 0 4
Kiambu 0 33.3 66.7 0 6
Murang'a 0 50 16.7 33.3 6
101
Response from Nyeri County respondents indicated that (25.0%) experienced a high
extent of difficulty in terms of accessing communication feedback which compromised
to the attainment of their performance. The results also indicate that a majority (62.5%)
experienced a moderate extent difficulty in terms of accessing communication feedback
which compromised to the attainment of their performance. Only (12.5%) of the
respondents cited low extent.
In Nyandarua County, a majority of the respondents indicated a high extent (66.7%) of
difficulty that compromised attainment of performance goals. An equal percentage
indicated a very high extent and moderate extent at (16.7%).
A high extent of (50%) response was reported from Kirinyaga County and moderate
extent of (50%).In Kiambu County, a majority (66.7%) indicated a moderate extent
difficulty in terms of accessing communication feedback which compromised to the
attainment of their performance. A response rate of (33.3%) indicates a high extent of
difficulty in terms of accessing communication feedback which compromised to the
attainment of their performance. In Murang’a County the majority cited a high extent
(50%) of difficulty in terms of accessing communication feedback which compromised
to the attainment of their performance, while (16.7%) indicated moderate extent and
(33.3%) indicated low extent difficulty in terms of accessing communication feedback
which compromised to the attainment of their performance.
The respondents were asked the most preferred mode of communication between the
management and staff. The responses are as indicated shown.
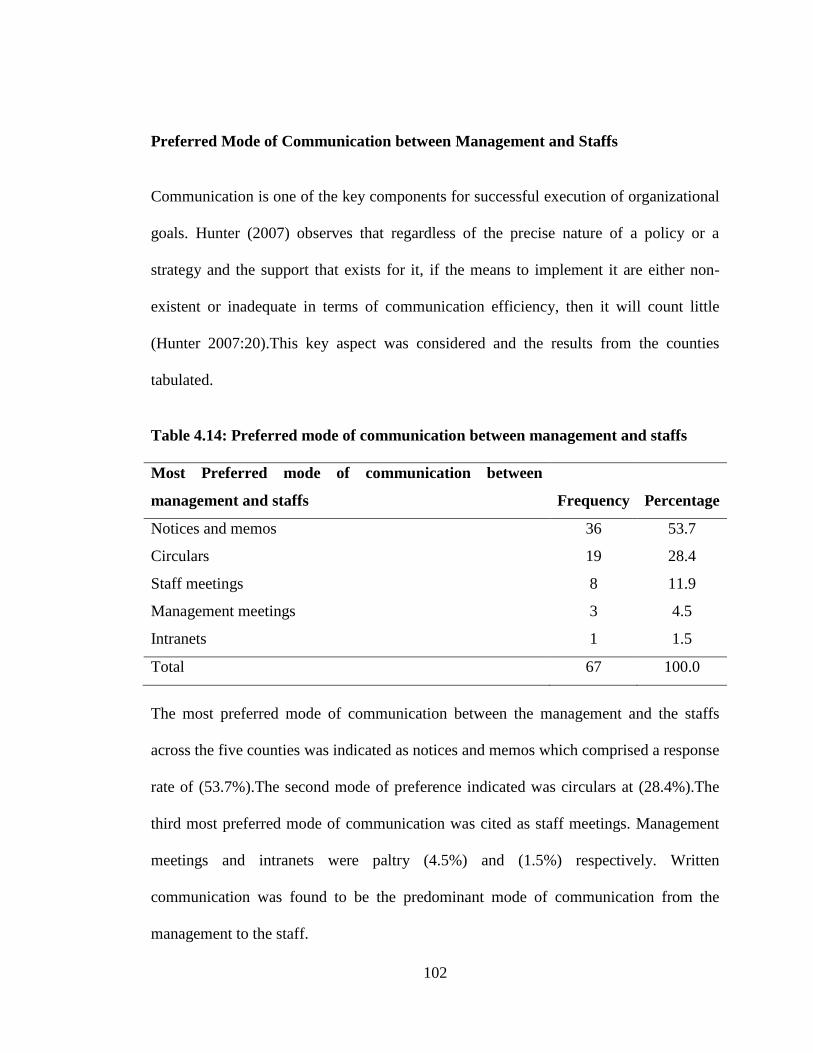
102
Preferred Mode of Communication between Management and Staffs
Communication is one of the key components for successful execution of organizational
goals. Hunter (2007) observes that regardless of the precise nature of a policy or a
strategy and the support that exists for it, if the means to implement it are either non-
existent or inadequate in terms of communication efficiency, then it will count little
(Hunter 2007:20).This key aspect was considered and the results from the counties
tabulated.
Table 4.14: Preferred mode of communication between management and staffs
Most Preferred mode of communication between
management and staffs Frequency Percentage
Notices and memos 36 53.7
Circulars 19 28.4
Staff meetings 8 11.9
Management meetings 3 4.5
Intranets 1 1.5
Total 67 100.0
The most preferred mode of communication between the management and the staffs
across the five counties was indicated as notices and memos which comprised a response
rate of (53.7%).The second mode of preference indicated was circulars at (28.4%).The
third most preferred mode of communication was cited as staff meetings. Management
meetings and intranets were paltry (4.5%) and (1.5%) respectively. Written
communication was found to be the predominant mode of communication from the
management to the staff.
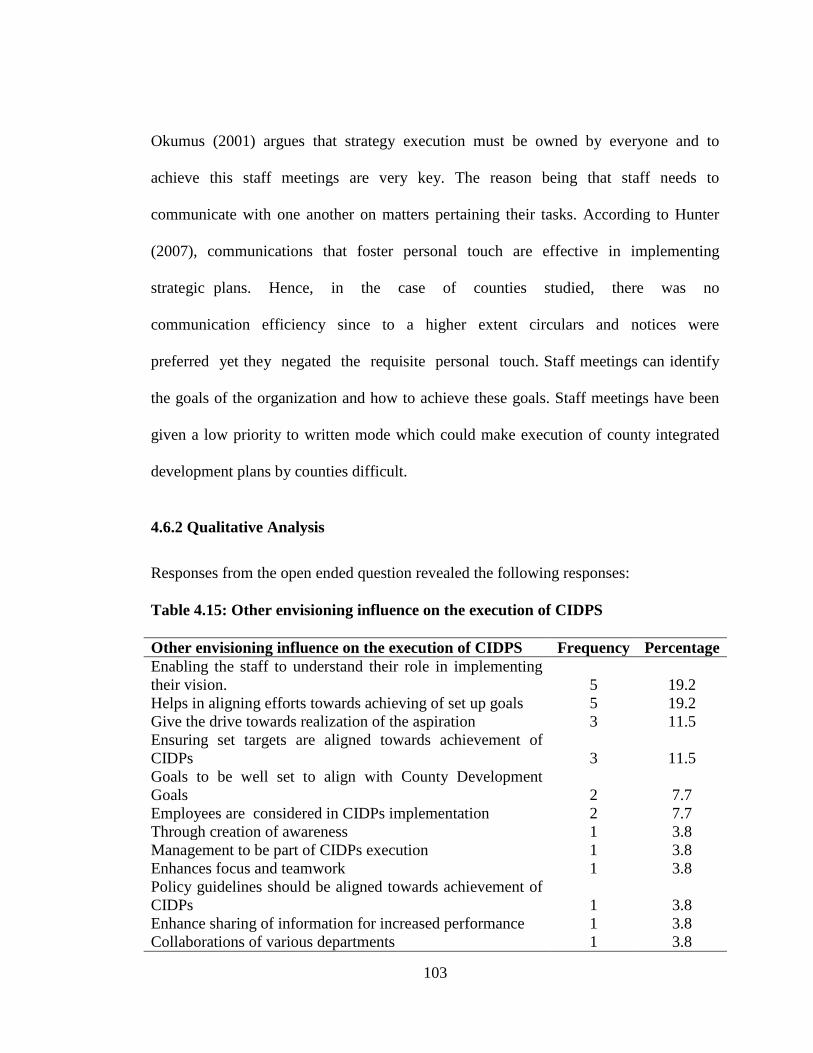
103
Okumus (2001) argues that strategy execution must be owned by everyone and to
achieve this staff meetings are very key. The reason being that staff needs to
communicate with one another on matters pertaining their tasks. According to Hunter
(2007), communications that foster personal touch are effective in implementing
strategic plans. Hence, in the case of counties studied, there was no
communication efficiency since to a higher extent circulars and notices were
preferred yet they negated the requisite personal touch. Staff meetings can identify
the goals of the organization and how to achieve these goals. Staff meetings have been
given a low priority to written mode which could make execution of county integrated
development plans by counties difficult.
4.6.2 Qualitative Analysis
Responses from the open ended question revealed the following responses:
Table 4.15: Other envisioning influence on the execution of CIDPS
Other envisioning influence on the execution of CIDPS Frequency Percentage
Enabling the staff to understand their role in implementing
their vision. 5 19.2
Helps in aligning efforts towards achieving of set up goals 5 19.2
Give the drive towards realization of the aspiration 3 11.5
Ensuring set targets are aligned towards achievement of
CIDPs 3 11.5
Goals to be well set to align with County Development
Goals 2 7.7
Employees are considered in CIDPs implementation 2 7.7
Through creation of awareness 1 3.8
Management to be part of CIDPs execution 1 3.8
Enhances focus and teamwork 1 3.8
Policy guidelines should be aligned towards achievement of
CIDPs 1 3.8
Enhance sharing of information for increased performance 1 3.8
Collaborations of various departments 1 3.8
104
Most respondents (19.2%) indicated that envisioning help staff to understand their role
in implementation of their vision. A similar percentage responded that it helps in
aligning efforts towards achieving of set-up goals. (11.5%) of the respondents said that it
gives the drive towards realization of the aspiration. Another (11.5%) indicated that it
ensures that set targets are aligned towards achievement of CIDPs. (7.7%) responded
that goals should be well set to align with county development goals. An equal
percentage also indicated that employees should be considered in CIDPs
implementation. Creation of awareness was cited by (3.8%), while management to be
part of CIDPs execution was indicated by (3.8%) of the respondents. Enhancement focus
and team (3.8%), policy guideline alignment towards achievement of CIDPs was cited
by (3.8%) of the respondents. Another (3.8%) of the respondents indicated enhancement
of sharing information for increased performance and finally collaborations of various
departments was indicated by (3.8%) of the respondents.
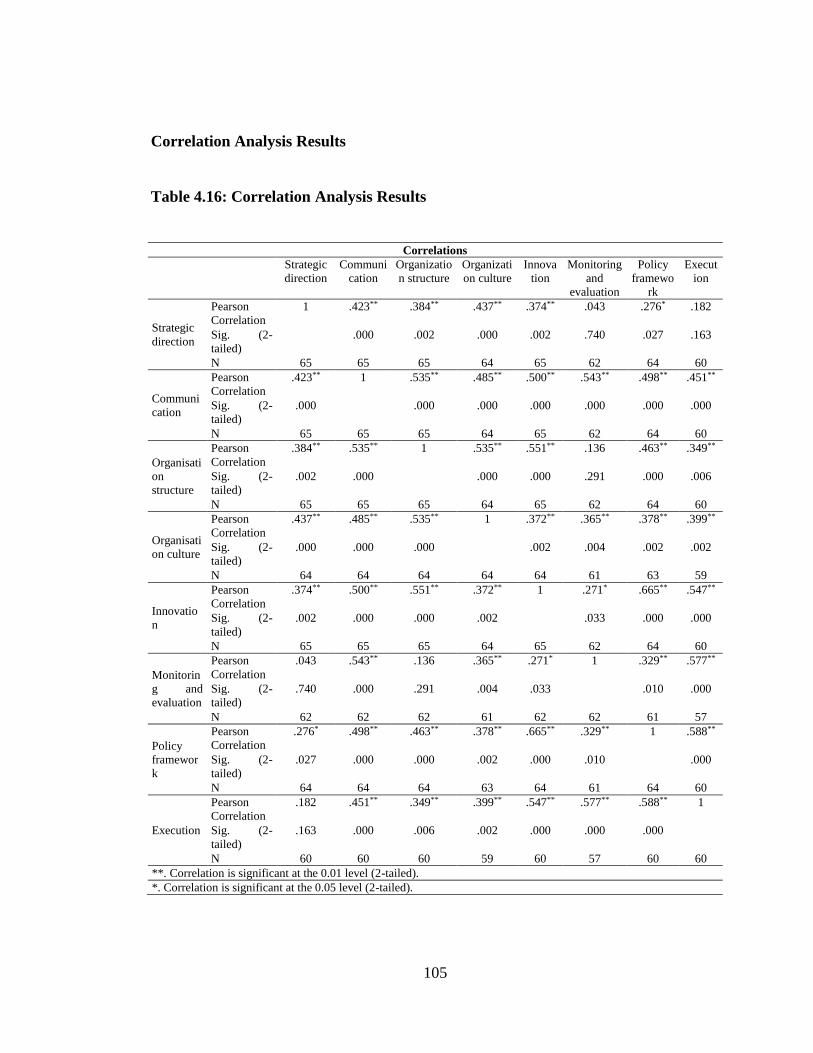
105
Correlation Analysis Results
Table 4.16: Correlation Analysis Results
Correlations
Strategic
direction
Communi
cation
Organizatio
n structure
Organizati
on culture
Innova
tion
Monitoring
and
evaluation
Policy
framewo
rk
Execut
ion
Strategic
direction
Pearson
Correlation
1 .423** .384** .437** .374** .043 .276* .182
Sig. (2-
tailed)
.000 .002 .000 .002 .740 .027 .163
N 65 65 65 64 65 62 64 60
Communi
cation
Pearson
Correlation
.423** 1 .535** .485** .500** .543** .498** .451**
Sig. (2-
tailed)
.000 .000 .000 .000 .000 .000 .000
N 65 65 65 64 65 62 64 60
Organisati
on
structure
Pearson
Correlation
.384** .535** 1 .535** .551** .136 .463** .349**
Sig. (2-
tailed)
.002 .000 .000 .000 .291 .000 .006
N 65 65 65 64 65 62 64 60
Organisati
on culture
Pearson
Correlation
.437** .485** .535** 1 .372** .365** .378** .399**
Sig. (2-
tailed)
.000 .000 .000 .002 .004 .002 .002
N 64 64 64 64 64 61 63 59
Innovatio
n
Pearson
Correlation
.374** .500** .551** .372** 1 .271* .665** .547**
Sig. (2-
tailed)
.002 .000 .000 .002 .033 .000 .000
N 65 65 65 64 65 62 64 60
Monitorin
g and
evaluation
Pearson
Correlation
.043 .543** .136 .365** .271* 1 .329** .577**
Sig. (2-
tailed)
.740 .000 .291 .004 .033 .010 .000
N 62 62 62 61 62 62 61 57
Policy
framewor
k
Pearson
Correlation
.276* .498** .463** .378** .665** .329** 1 .588**
Sig. (2-
tailed)
.027 .000 .000 .002 .000 .010 .000
N 64 64 64 63 64 61 64 60
Execution
Pearson
Correlation
.182 .451** .349** .399** .547** .577** .588** 1
Sig. (2-
tailed)
.163 .000 .006 .002 .000 .000 .000
N 60 60 60 59 60 57 60 60
**. Correlation is significant at the 0.01 level (2-tailed).
*. Correlation is significant at the 0.05 level (2-tailed).
106
A Pearson product-moment correlation was run to determine the relationship between
the eight (8) study variables (Strategic direction, communication, organization structure,
organization culture, innovation, monitoring and evaluation, policy framework and
execution).
There is a moderate significant and positive linear relationship between the strategic
direction and communication (r=0.423, n=65, p=0.010). There is a positive correlation
between the strategic direction and the organizational structure (r=0.384, n=65,
p=0.002). There is a positive and significant correlation between the strategic direction
and the organizational culture (r=0.437, n=64, p=0.000). There is a positive correlation
between the strategic direction and innovation (r=0.374, n=65, p=0.002). There is a
weak and insignificant correlation between the strategic direction and monitoring and
evaluation (r=0.043, n=62, p=0.740). There is a weak and significant relationship
between the strategic direction and the policy framework (r=0.276, n=64, p=0.027).
There is insignificant correlation between the strategic direction and execution (r=0.182,
n=60, p=0.163).
There is moderate and significant correlation between communication and
organizational structure (r=0.535, n=65, p=0.000). There is moderate and significant
correlation between communication and culture (r=0.485, n=64, p=0.000). There is
moderate significant correlation between communication and innovation (r=0.500, n=65,
p=0.000). There is moderate positive correlation between communication and
monitoring and evaluation, (r=0.543, n=62, p= p=0.000).
107
There is moderate and significant relationship between communication and the policy
framework (r=0.498, n=64, p=0.000). There is a moderate and significant correlation
between communication and execution (r=0.451, n=60, p=0.000).
There is a moderate and positive relationship between the organizational structure and
the organizational culture (r=0.535, n=64, p=0.000), there is a significant and positive
linear relationship between the organizational structure and innovation (r=0.551, n=65,
p=0.000). There is a weak and insignificant correlation between the organizational
structure and monitoring and evaluation (r=0.136, n=62, p=0.291). There is a moderate
and positive relationship between the organizational structure and the policy framework
(r=0.463, n=64, p=0.000), and there is a weak and significant relationship between the
organizational structure and execution (r=0.349, n=60, p=0.006).
There is a significant and positive correlation between the organizational culture and
innovation (r=0.372, n=65, p=0.002), there is a positive relationship between the
organizational culture and monitoring and evaluation (r=0.365, n=61, p=0.004), there is
a positive and significant correlation between the organizational culture and the policy
framework (r=0.378, n=63, p=0.002), there is a positive and significant correlation
between the organizational culture and execution (r=0.399, n=59, p=0.002).
There is a weak and significant correlation between innovation and monitoring and
evaluation (r=0.271, n=62, p=0.033), there is a strong and significant correlation
between innovation and the policy framework (r=0.665, n=64, p=0.000), there is a
108
moderate and significant relationship between innovation and execution (r=0.547, n=60,
p=0.000).
There is a positive and significant relationship between monitoring and evaluation and
the policy framework (r=0.329, n=61, p=0.010), there is a moderate and significant
correlation between monitoring and evaluation and execution (r=0.577, n=57, p=0.000).
There is a significant correlation between the policy framework and execution (r=588,
n=60, p=0.000).
Pearson’s coefficient was used to verify the existence or non-existence of linear
correlation between and among the study variables as indicated above.
4.6.3 Envisioning (Strategic direction and Communication) versus Execution of
County Integrated Development Plans.
The Pearson Correlation coefficient of Strategic direction and Communication versus
Execution of County Integrated Development Plans (CIDPs) is 0.182 and 0.451
respectively. O.182 for the strategic direction indicates a weak positive relationship that
is insignificant. This disputes Kihara (2016) who studied the role of determining
strategic direction on not-for-profit organizational performance in Kenya found that
strategic direction has a significant positive influence on performance of these
organizations. Correlation coefficient of 0.451 for communication indicates a moderate
significant and positive linear relationship between the two variables, that is envisioning
and execution.
109
This is in agreement with Nyakeriga (2015) who indicated that communication is the
most single item that promotes successful strategy implementation in any organization.
Inferential Statistics
Regression Analysis:
Objective One: To determine the role of envisioning in execution of County
Integrated Development Plans by County Governments in Kenya, a multiple
regression was performed based on the model below.
Y= β0 + β1X1 + β2X2 + ɛ …………………………………………….. (i)
Where:-
Y = Execution of County Integrated Development Plans
β0= Constant, showing execution of County Integrated Development Plans in the
absence of the factors
Β1-β2= Regression Coefficients
X1= Strategic direction
X2= Communication
ɛ =Error Term
Coefficient of Determination
Table 4.17 shows that the coefficient of determination R square is 0.203 and R is 0.451
at 0.05 level of significance. A value of 0.451 indicates a moderately good level of
prediction .
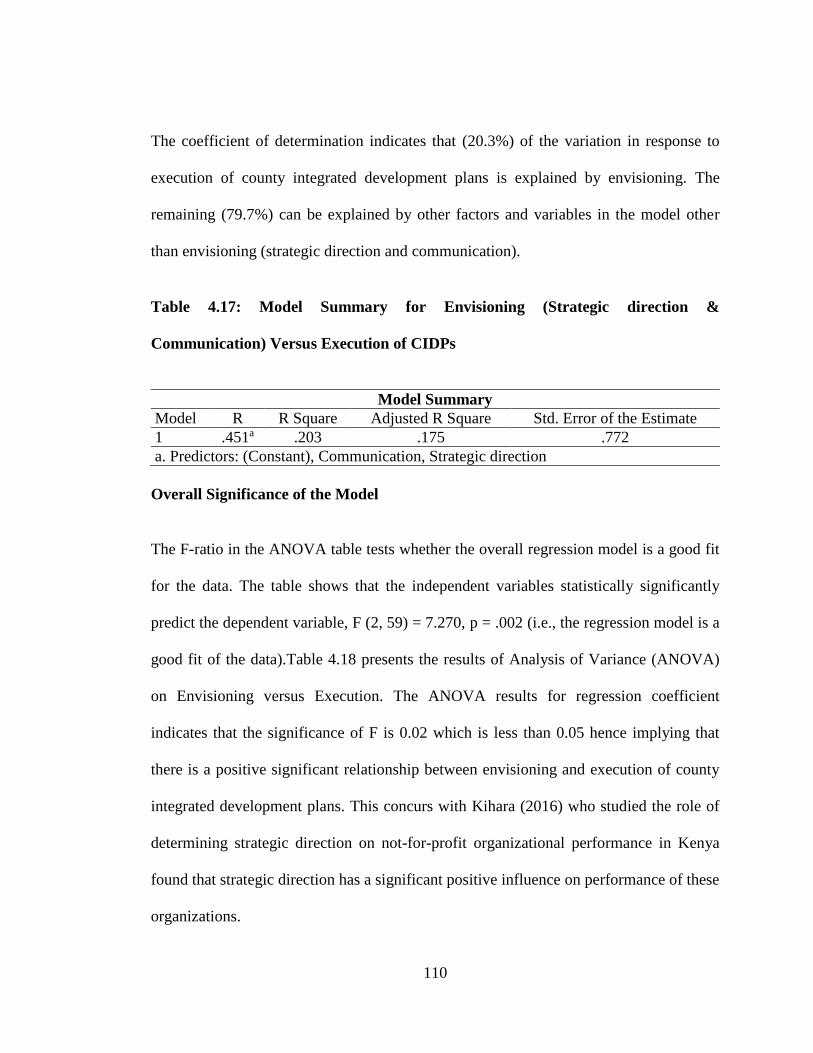
110
The coefficient of determination indicates that (20.3%) of the variation in response to
execution of county integrated development plans is explained by envisioning. The
remaining (79.7%) can be explained by other factors and variables in the model other
than envisioning (strategic direction and communication).
Table 4.17: Model Summary for Envisioning (Strategic direction &
Communication) Versus Execution of CIDPs
Model Summary
Model R R Square Adjusted R Square Std. Error of the Estimate
1 .451a .203 .175 .772
a. Predictors: (Constant), Communication, Strategic direction
Overall Significance of the Model
The F-ratio in the ANOVA table tests whether the overall regression model is a good fit
for the data. The table shows that the independent variables statistically significantly
predict the dependent variable, F (2, 59) = 7.270, p = .002 (i.e., the regression model is a
good fit of the data).Table 4.18 presents the results of Analysis of Variance (ANOVA)
on Envisioning versus Execution. The ANOVA results for regression coefficient
indicates that the significance of F is 0.02 which is less than 0.05 hence implying that
there is a positive significant relationship between envisioning and execution of county
integrated development plans. This concurs with Kihara (2016) who studied the role of
determining strategic direction on not-for-profit organizational performance in Kenya
found that strategic direction has a significant positive influence on performance of these
organizations.
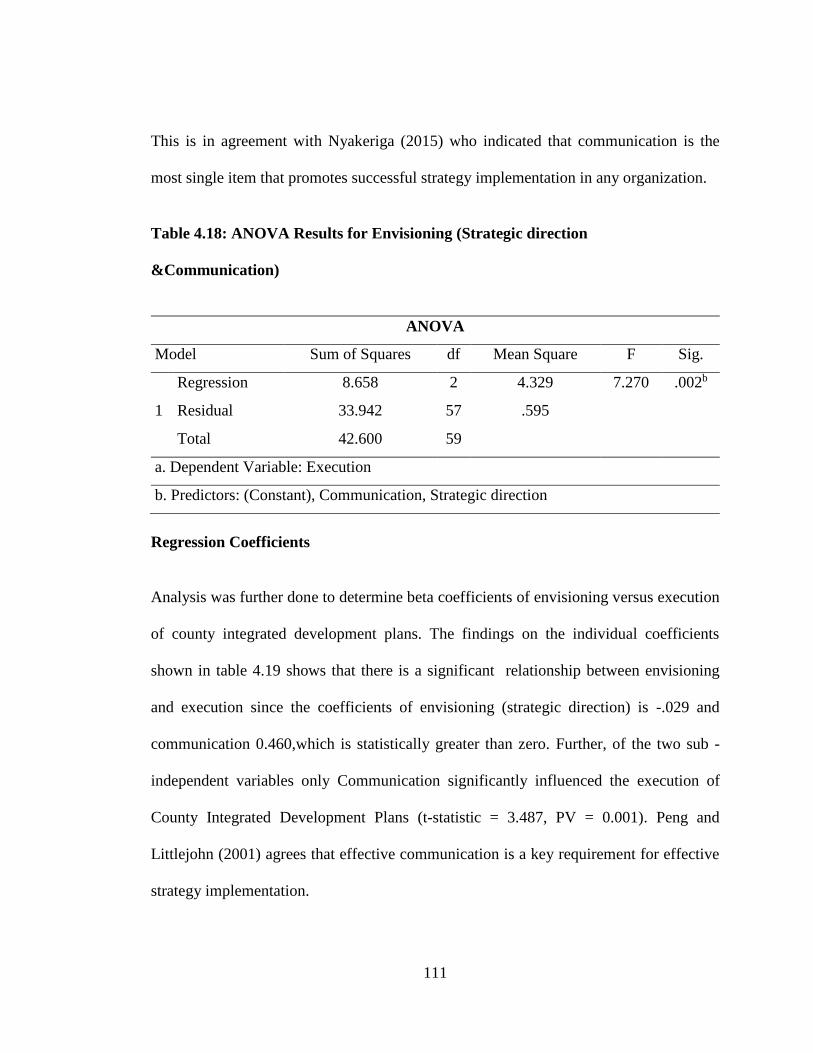
111
This is in agreement with Nyakeriga (2015) who indicated that communication is the
most single item that promotes successful strategy implementation in any organization.
Table 4.18: ANOVA Results for Envisioning (Strategic direction
&Communication)
ANOVA
Model Sum of Squares df Mean Square F Sig.
1
Regression 8.658 2 4.329 7.270 .002b
Residual 33.942 57 .595
Total 42.600 59
a. Dependent Variable: Execution
b. Predictors: (Constant), Communication, Strategic direction
Regression Coefficients
Analysis was further done to determine beta coefficients of envisioning versus execution
of county integrated development plans. The findings on the individual coefficients
shown in table 4.19 shows that there is a significant relationship between envisioning
and execution since the coefficients of envisioning (strategic direction) is -.029 and
communication 0.460,which is statistically greater than zero. Further, of the two sub -
independent variables only Communication significantly influenced the execution of
County Integrated Development Plans (t-statistic = 3.487, PV = 0.001). Peng and
Littlejohn (2001) agrees that effective communication is a key requirement for effective
strategy implementation.
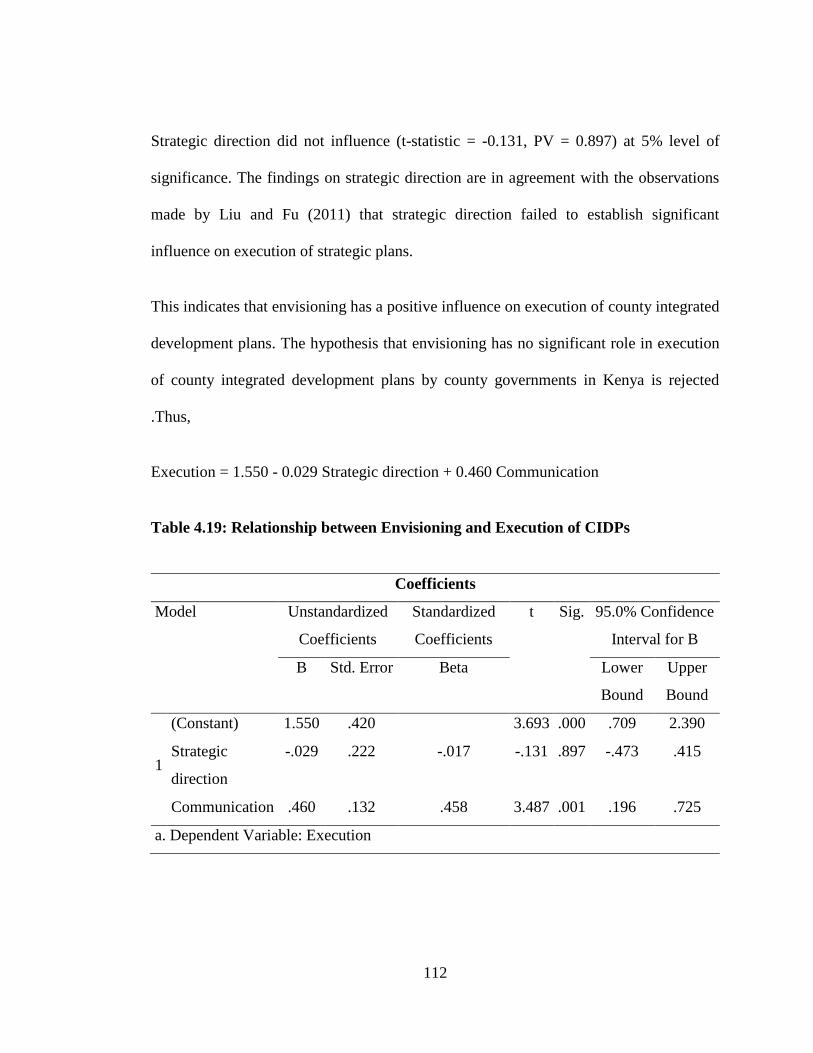
112
Strategic direction did not influence (t-statistic = -0.131, PV = 0.897) at 5% level of
significance. The findings on strategic direction are in agreement with the observations
made by Liu and Fu (2011) that strategic direction failed to establish significant
influence on execution of strategic plans.
This indicates that envisioning has a positive influence on execution of county integrated
development plans. The hypothesis that envisioning has no significant role in execution
of county integrated development plans by county governments in Kenya is rejected
.Thus,
Execution = 1.550 - 0.029 Strategic direction + 0.460 Communication
Table 4.19: Relationship between Envisioning and Execution of CIDPs
Coefficients
Model Unstandardized
Coefficients
Standardized
Coefficients
t Sig. 95.0% Confidence
Interval for B
B Std. Error Beta Lower
Bound
Upper
Bound
1
(Constant) 1.550 .420 3.693 .000 .709 2.390
Strategic
direction
-.029 .222 -.017 -.131 .897 -.473 .415
Communication .460 .132 .458 3.487 .001 .196 .725
a. Dependent Variable: Execution
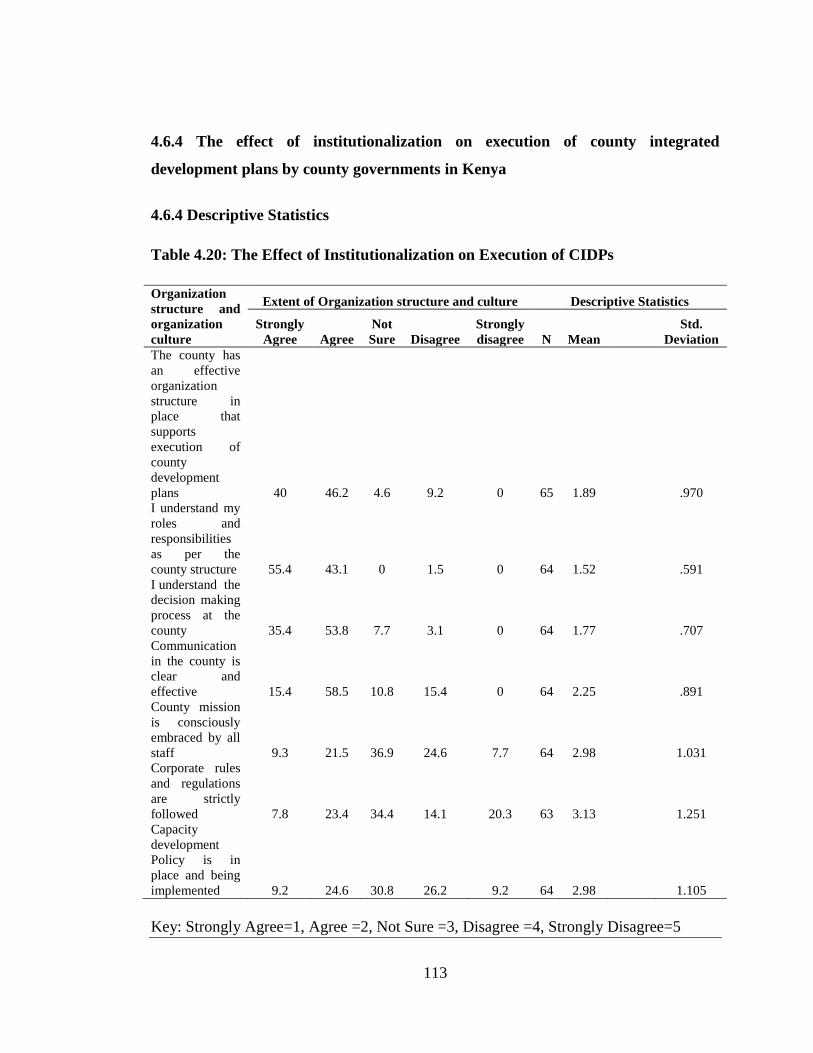
113
4.6.4 The effect of institutionalization on execution of county integrated
development plans by county governments in Kenya
4.6.4 Descriptive Statistics
Table 4.20: The Effect of Institutionalization on Execution of CIDPs
Organization
structure and
organization
culture
Extent of Organization structure and culture Descriptive Statistics
Strongly
Agree Agree
Not
Sure Disagree
Strongly
disagree N Mean
Std.
Deviation
The county has
an effective
organization
structure in
place that
supports
execution of
county
development
plans 40 46.2 4.6 9.2 0 65 1.89
.970
I understand my
roles and
responsibilities
as per the
county structure 55.4 43.1 0 1.5 0 64 1.52
.591
I understand the
decision making
process at the
county 35.4 53.8 7.7 3.1 0 64 1.77
.707
Communication
in the county is
clear and
effective 15.4 58.5 10.8 15.4 0 64 2.25
.891
County mission
is consciously
embraced by all
staff 9.3 21.5 36.9 24.6 7.7 64 2.98
1.031
Corporate rules
and regulations
are strictly
followed 7.8 23.4 34.4 14.1 20.3 63 3.13
1.251
Capacity
development
Policy is in
place and being
implemented 9.2 24.6 30.8 26.2 9.2 64 2.98
1.105
Key: Strongly Agree=1, Agree =2, Not Sure =3, Disagree =4, Strongly Disagree=5
114
The responses in table 4.20 depicts that three items had a standard deviation of more
than 1.0 which shows there were extremes in the scoring. The highest standard deviation
for the items was 1.251 and a mean of 3.13 which shows there were extremes in the
scoring. In the item ‘Corporate rules and regulations are strictly followed.’ (7.8%) and
(23.4%) strongly agree and agree respectively, while (14.1%) and (20.3%) disagree and
strongly disagree respectively. This shows that the respondents were spread to the
positive and to the negative hence the high standard deviation witnessed. However the
results depicts that four items had a standard deviation of less than 1.0 which shows that
there were no extreme scoring hence the items were good measure. The item, ‘I
understand my roles and responsibilities as per the county structure,’ had the lowest
standard deviation of 0.591 and a mean of 1.52. The responses indicates that (55.4%)
and (43.1%) strongly agree and agree respectively with the statement. Only a paltry
(1.5%) disagreed with the statement.
The findings further reveals that an overwhelming majority (86.2%) of the respondents
agreed that their counties have an effective organizational structure in place that
supports execution of county development plans which had a mean of 1.89 and standard
deviation of 0.970. This is in agreement with studies done by Bolo, Wandera,Imaita and
K’Obonyo (2010) found that the structure of the organization plays an integral role in
the execution of strategy. Further, an overwhelming majority (89.2 %) of the
respondents indicated that they understood the decision making process at the county
whose mean was 1.77 and a standard deviation of 0.707.
115
Moreover the majority of the respondents, (73.9%) agreed that communication in the
county is clear and effective attracting a mean of 2.25 and a standard deviation of 0.891.
This concurs with the recommendations of scholars including Abok (2013) Amukobole
(2010), Letting (2009) and Kidombo (2007) that clear communication is vital to
execution of strategic plans. On the statement whether County mission is consciously
embraced by all staff, (30.8%) of the respondents agreed with the statement, (32.3%) of
the respondents were in disagreement and the simple majority (36.9%) were unsure,
indicating a wide variation of responses with a mean of 2.98 and standard deviation of
1.031. The results contradict the response that an overwhelming majority indicated that
they understood the county mission and vision clearly where a 100% of the respondents
were in agreement. On whether Corporate rules and regulations are strictly followed,
(31.2%) of the respondents agreed with the statement, (34.4%) of the respondents
disagreed and a similar percentage (34.4%) were not sure if the corporate rules and
regulations were being strictly followed which indicated a wide variation in the
responses with a mean of 3.13 and a standard variation of 1.251. Finally, on the
statement if Capacity development Policy is in place and being implemented, (33.8%) of
the respondents agreed that it is being implemented, (35.4%) disagreed and (30.8%) of
the respondents were not sure if it is being effected. The result indicates a wide range of
responses which had a mean of 2.98 and a standard deviation of 1.105. It can be
inferred that counties have not put much emphasis on developing the capacity of their
staffs towards higher level achievements of their CIDPs. Organizations are dynamic and
requires skilled, knowledgeable workforce which is adaptive, flexible and focused on the
future (Pettigrew, 2005).
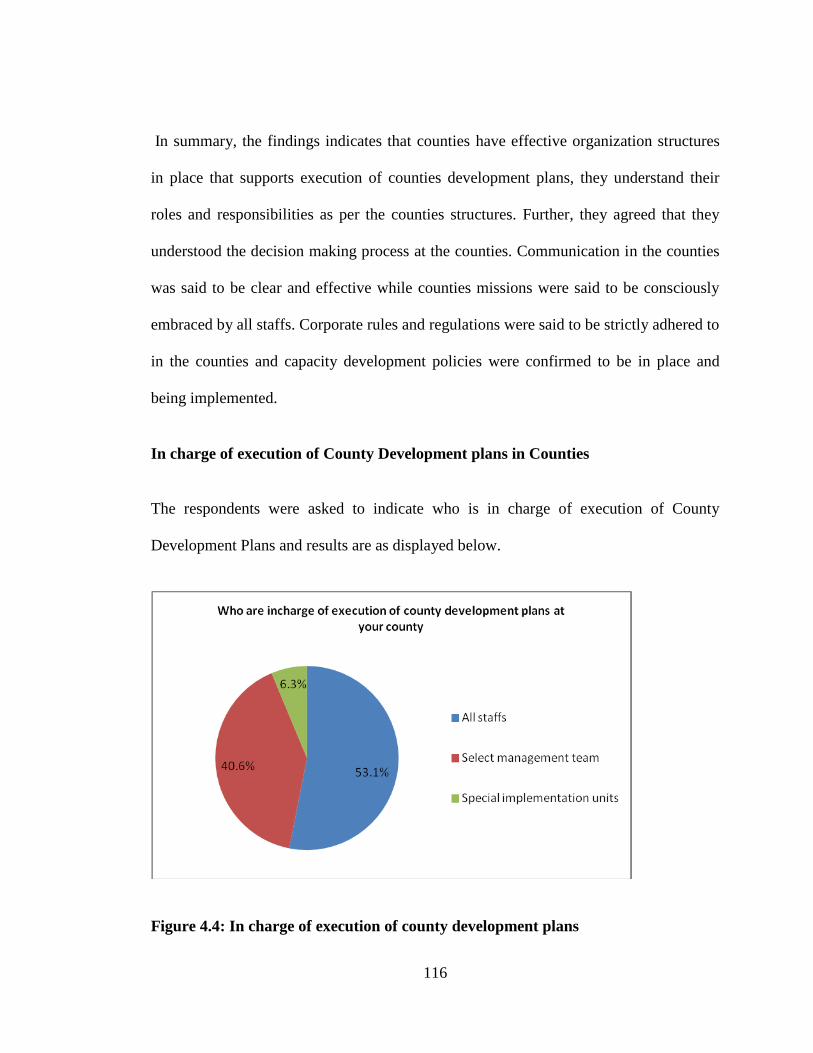
116
In summary, the findings indicates that counties have effective organization structures
in place that supports execution of counties development plans, they understand their
roles and responsibilities as per the counties structures. Further, they agreed that they
understood the decision making process at the counties. Communication in the counties
was said to be clear and effective while counties missions were said to be consciously
embraced by all staffs. Corporate rules and regulations were said to be strictly adhered to
in the counties and capacity development policies were confirmed to be in place and
being implemented.
In charge of execution of County Development plans in Counties
The respondents were asked to indicate who is in charge of execution of County
Development Plans and results are as displayed below.
Figure 4.4: In charge of execution of county development plans
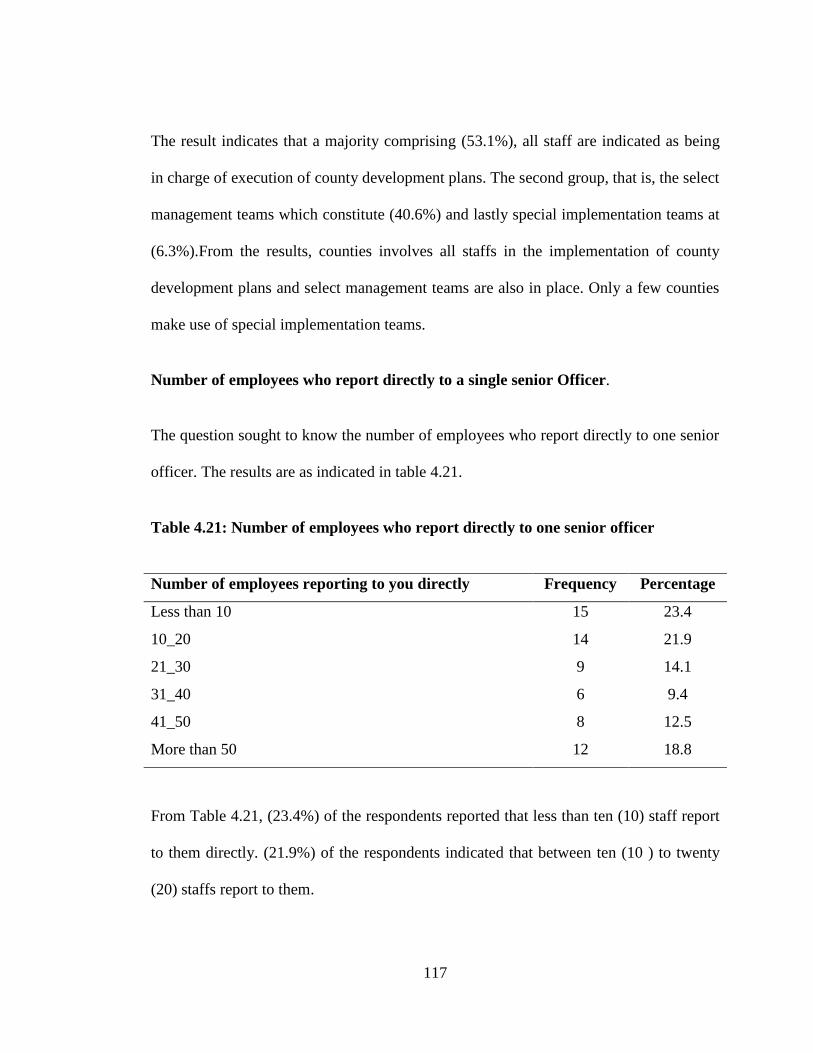
117
The result indicates that a majority comprising (53.1%), all staff are indicated as being
in charge of execution of county development plans. The second group, that is, the select
management teams which constitute (40.6%) and lastly special implementation teams at
(6.3%).From the results, counties involves all staffs in the implementation of county
development plans and select management teams are also in place. Only a few counties
make use of special implementation teams.
Number of employees who report directly to a single senior Officer.
The question sought to know the number of employees who report directly to one senior
officer. The results are as indicated in table 4.21.
Table 4.21: Number of employees who report directly to one senior officer
Number of employees reporting to you directly Frequency Percentage
Less than 10 15 23.4
10_20 14 21.9
21_30 9 14.1
31_40 6 9.4
41_50 8 12.5
More than 50 12 18.8
From Table 4.21, (23.4%) of the respondents reported that less than ten (10) staff report
to them directly. (21.9%) of the respondents indicated that between ten (10 ) to twenty
(20) staffs report to them.
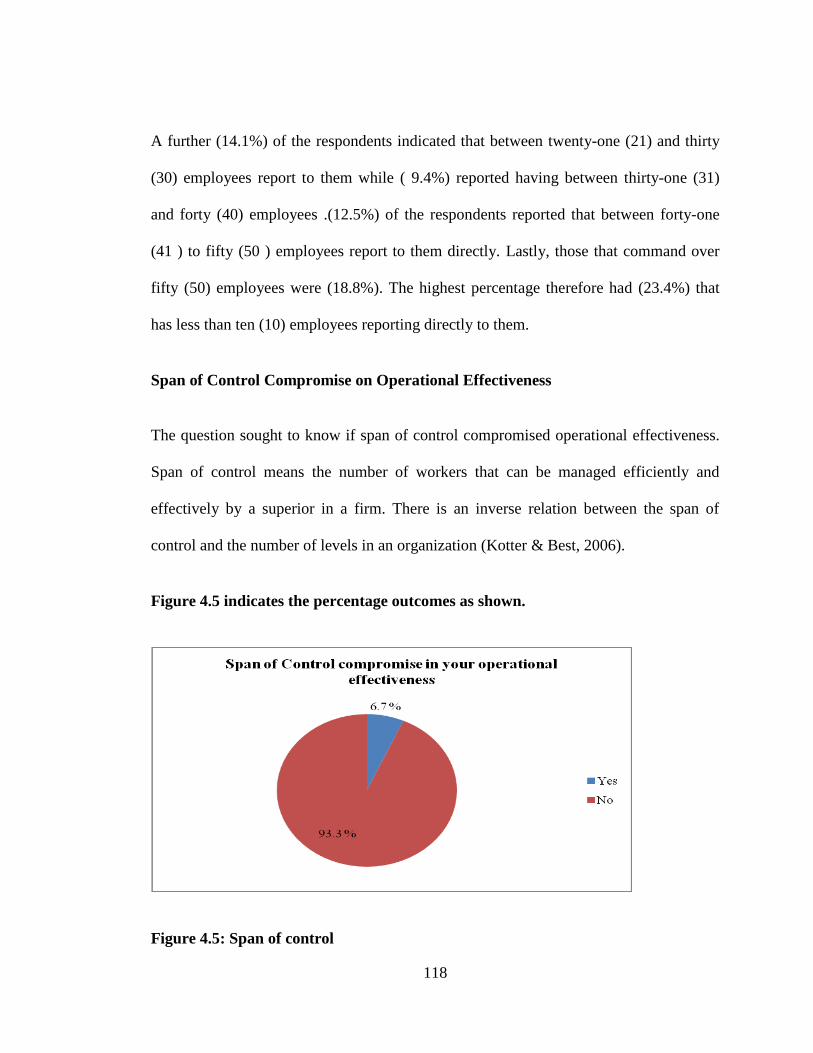
118
A further (14.1%) of the respondents indicated that between twenty-one (21) and thirty
(30) employees report to them while ( 9.4%) reported having between thirty-one (31)
and forty (40) employees .(12.5%) of the respondents reported that between forty-one
(41 ) to fifty (50 ) employees report to them directly. Lastly, those that command over
fifty (50) employees were (18.8%). The highest percentage therefore had (23.4%) that
has less than ten (10) employees reporting directly to them.
Span of Control Compromise on Operational Effectiveness
The question sought to know if span of control compromised operational effectiveness.
Span of control means the number of workers that can be managed efficiently and
effectively by a superior in a firm. There is an inverse relation between the span of
control and the number of levels in an organization (Kotter & Best, 2006).
Figure 4.5 indicates the percentage outcomes as shown.
Figure 4.5: Span of control
119
An overwhelming majority (93.3%) of the respondents indicated that span of control
does not compromise their operational effectiveness. However, only (6.7%) of the
respondents indicated that indeed span of control compromises their operational
effectiveness.
4.6.5 Qualitative results of respondents who indicated that span of control affect
operational effectiveness
Table 4.22: Span of control affects operational effectiveness
If Yes, state How Frequency Percentage
Difficult to monitor employees 2 50.0
Officers are scattered in all counties 1 25.0
Department has deployed GIS systems in land management 1 25.0
From the results shown, (50%) of the respondents indicated experiencing difficulties in
the monitoring aspect of the employees. Another (25%) indicated that employees are
scattered in the counties which makes management a problem. Finally another (25%) of
the respondents cited deployment of GIS systems in land management.
120
Qualitative results on how else organizational structure and culture influence the
execution of CIDPs. Table 4.23 indicates the responses
Table 4.23: Other opinion on organizational structure and culture influence the
execution of CIDPS
Other opinion on organizational structure and culture
influence the execution of CIDPS Frequency Percentage
Lack of establishing work and ethics culture 6 16.2
Helps staff to understand the mission and vision of the
leadership 6 16.2
Lack of qualified personnel making it difficult to implement
rules 4 10.8
Many employees who do less 3 8.1
Positive cultural aspects helps pulling in same direction 3 8.1
Every staff knows their role 3 8.1
Execution is not uniform 2 5.4
Gives direction and accountability 2 5.4
Avoids duplication of functions 2 5.4
Developing goals with clear performance indicators 2 5.4
Change of plans hence slowing down execution of CIDPs 1 2.7
Decisions which are politically influenced 1 2.7
bureaucracy slows down implementation 1 2.7
Participation in both formulation and implementation 1 2.7
As shown in table 4.23, lack of established work and ethics in culture were cited by
(16.2%) and a similar percentage indicated that it helps staff to understand the mission
and vision of their leaders. Lack of qualified staff which makes implementation difficult
was mentioned by (10.8%) of the respondents.(8.1%) of the respondents cited that the
counties have many employees who however do little to implement the CIDPs. A
similar percentage indicated that positive cultural aspects that help the staff to pull in the
same direction. Another (8.1%) indicated that the culture and structure ensures that each
staff is well versed with their roles in the execution.
121
Execution was mentioned as not being uniform by (5.4%) of the respondents while
another (5.4%) indicated that structure and culture gives direction and accountability.
Another (5.4%) said that structure and culture avoids duplication of functions in the
counties. Organizational structure and culture were also said to influence the execution
of CIDPs by developing goals with clear performance indicators which was answered by
(2.7%) of the respondents. Change of plans which slow down execution of CIDPs was
mentioned by (2.7%) of the respondents. Politics was also mentioned as factor which has
some influence in the execution of CIDPs by (2.7%) of the respondents who said that
decisions are politically influenced.(2.7%) indicated that structure and culture brings in
the aspect of bureaucracy which slows down the implementation of the county
integrated development plans in the counties. Finally, participation in both formulation
and implementation of the CIDPs were also cited by (2.7%) of the respondents as factors
that influence the execution of CIDPs.
4.6.6 Inferential Results
Correlation Analysis: The effect of institutionalization (Organization Structure &
Organization Culture) on execution of county integrated development plans by
county governments
The Pearson Correlation coefficient of Organization Structure and Organization Culture
versus Execution of County Integrated Development Plans (CIDPs) is 0.349 and 0.399
respectively in table 4.16. O.349 for the organization structure indicates a positive
relationship that is significant.
122
This is supported by Khayota (2014) who opines that organizational structures influence
implementation of strategic plans through task allocation, decentralization of authority,
span of control, employee coordination, integration and structural flexibility. The finds
are also in tandem with Drazin and Howard (2009) who indicated that strategy-structure
alignment is a factor to successful strategy execution. Pearson correlation coefficient of
0.399 for organization culture indicates moderate and positive linear relationship
between the two variables. This findings is supported by Abuya (2011) in his study on
implementation of strategic plans challenges in Action Aid Kenya found that there was
an overwhelming agreement that culture has a strong influence to implementation of
strategic plans. The results equally resonated well with findings on organizational
culture influence in implementation of strategic plans in Lake Victoria Water Services
Board by Khatoya (2014).
Regression Analysis
Objective two: To analyse the effect of institutionalization of programmes in
execution of County Integrated Development Plans by County Governments in
Kenya. A multiple regression was performed based on the model below.
Y= β0 + β3X3 + β4X4 + ɛ …………………………………………….. (ii)
Where:-
Y = Execution of County Integrated Development Plans
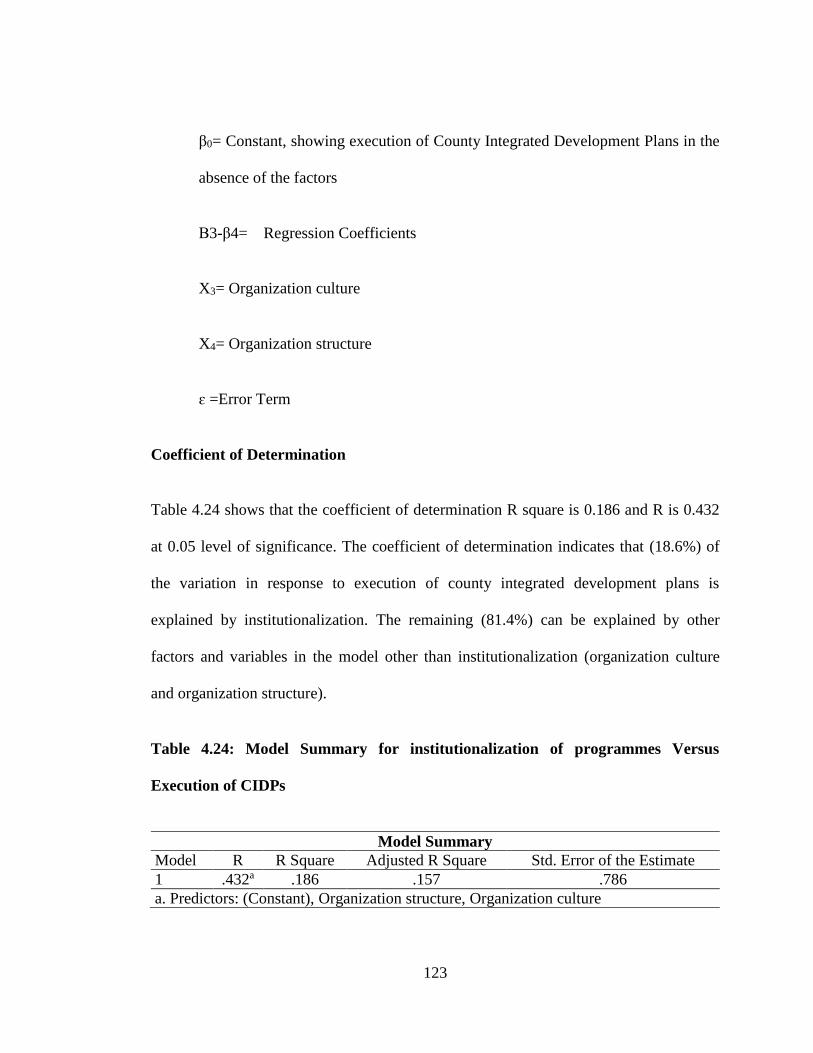
123
β0= Constant, showing execution of County Integrated Development Plans in the
absence of the factors
Β3-β4= Regression Coefficients
X3= Organization culture
X4= Organization structure
ɛ =Error Term
Coefficient of Determination
Table 4.24 shows that the coefficient of determination R square is 0.186 and R is 0.432
at 0.05 level of significance. The coefficient of determination indicates that (18.6%) of
the variation in response to execution of county integrated development plans is
explained by institutionalization. The remaining (81.4%) can be explained by other
factors and variables in the model other than institutionalization (organization culture
and organization structure).
Table 4.24: Model Summary for institutionalization of programmes Versus
Execution of CIDPs
Model Summary
Model R R Square Adjusted R Square Std. Error of the Estimate
1 .432a .186 .157 .786
a. Predictors: (Constant), Organization structure, Organization culture
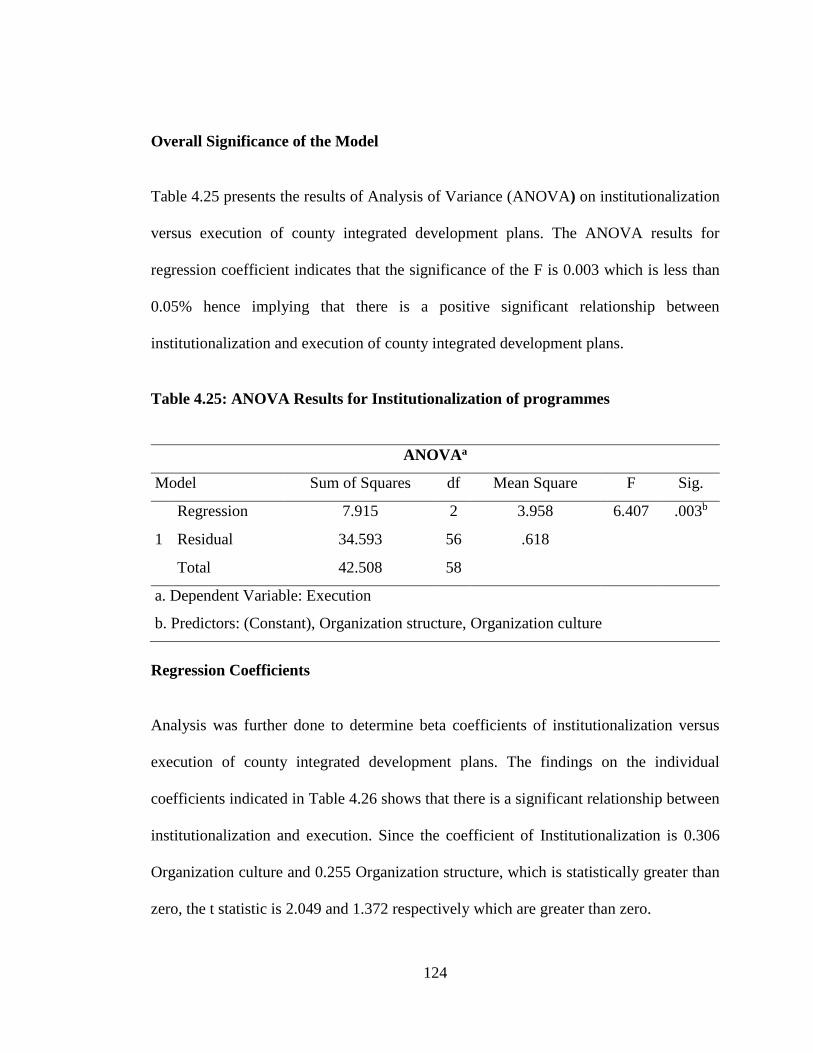
124
Overall Significance of the Model
Table 4.25 presents the results of Analysis of Variance (ANOVA) on institutionalization
versus execution of county integrated development plans. The ANOVA results for
regression coefficient indicates that the significance of the F is 0.003 which is less than
0.05% hence implying that there is a positive significant relationship between
institutionalization and execution of county integrated development plans.
Table 4.25: ANOVA Results for Institutionalization of programmes
ANOVAa
Model Sum of Squares df Mean Square F Sig.
1
Regression 7.915 2 3.958 6.407 .003b
Residual 34.593 56 .618
Total 42.508 58
a. Dependent Variable: Execution
b. Predictors: (Constant), Organization structure, Organization culture
Regression Coefficients
Analysis was further done to determine beta coefficients of institutionalization versus
execution of county integrated development plans. The findings on the individual
coefficients indicated in Table 4.26 shows that there is a significant relationship between
institutionalization and execution. Since the coefficient of Institutionalization is 0.306
Organization culture and 0.255 Organization structure, which is statistically greater than
zero, the t statistic is 2.049 and 1.372 respectively which are greater than zero.
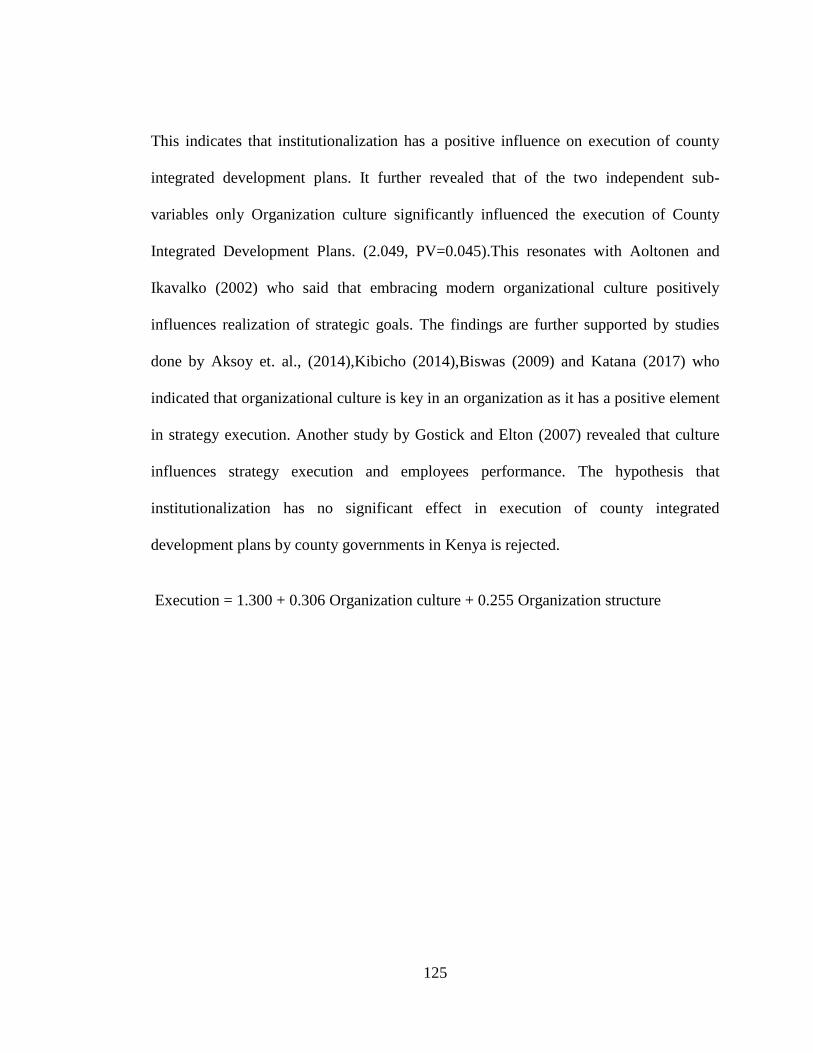
125
This indicates that institutionalization has a positive influence on execution of county
integrated development plans. It further revealed that of the two independent sub-
variables only Organization culture significantly influenced the execution of County
Integrated Development Plans. (2.049, PV=0.045).This resonates with Aoltonen and
Ikavalko (2002) who said that embracing modern organizational culture positively
influences realization of strategic goals. The findings are further supported by studies
done by Aksoy et. al., (2014),Kibicho (2014),Biswas (2009) and Katana (2017) who
indicated that organizational culture is key in an organization as it has a positive element
in strategy execution. Another study by Gostick and Elton (2007) revealed that culture
influences strategy execution and employees performance. The hypothesis that
institutionalization has no significant effect in execution of county integrated
development plans by county governments in Kenya is rejected.
Execution = 1.300 + 0.306 Organization culture + 0.255 Organization structure
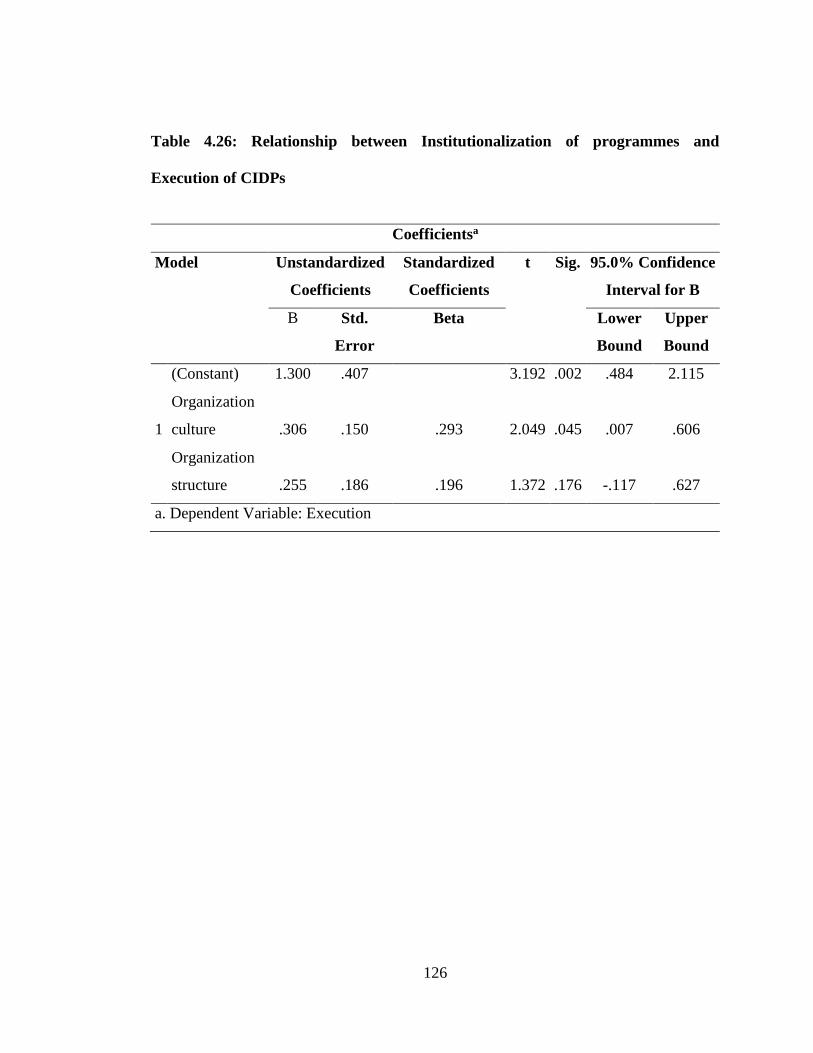
126
Table 4.26: Relationship between Institutionalization of programmes and
Execution of CIDPs
Coefficientsa
Model Unstandardized
Coefficients
Standardized
Coefficients
t Sig. 95.0% Confidence
Interval for B
B Std.
Error
Beta Lower
Bound
Upper
Bound
1
(Constant) 1.300 .407 3.192 .002 .484 2.115
Organization
culture .306 .150 .293 2.049 .045 .007 .606
Organization
structure .255 .186 .196 1.372 .176 -.117 .627
a. Dependent Variable: Execution
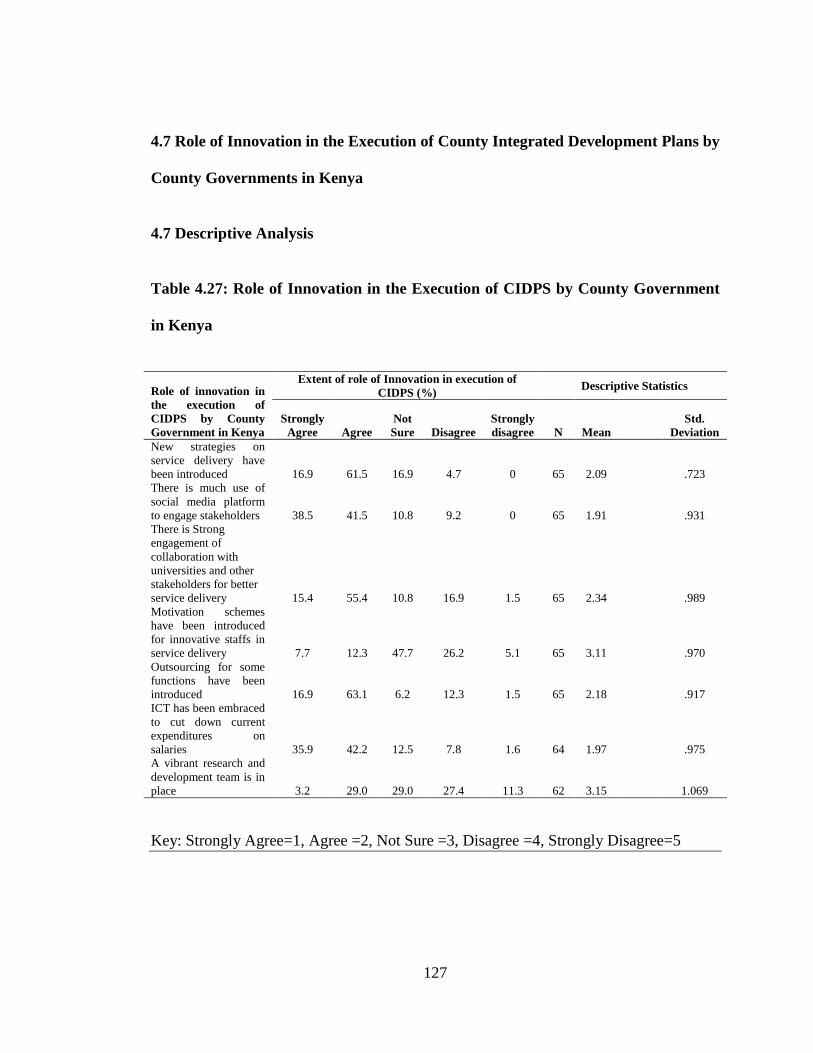
127
4.7 Role of Innovation in the Execution of County Integrated Development Plans by
County Governments in Kenya
4.7 Descriptive Analysis
Table 4.27: Role of Innovation in the Execution of CIDPS by County Government
in Kenya
Role of innovation in
the execution of
CIDPS by County
Government in Kenya
Extent of role of Innovation in execution of
CIDPS (%) Descriptive Statistics
Strongly
Agree Agree
Not
Sure Disagree
Strongly
disagree N Mean
Std.
Deviation
New strategies on
service delivery have
been introduced 16.9 61.5 16.9 4.7 0 65 2.09
.723
There is much use of
social media platform
to engage stakeholders 38.5 41.5 10.8 9.2 0 65 1.91
.931
There is Strong
engagement of
collaboration with
universities and other
stakeholders for better
service delivery 15.4 55.4 10.8 16.9 1.5 65 2.34
.989
Motivation schemes
have been introduced
for innovative staffs in
service delivery 7.7 12.3 47.7 26.2 5.1 65 3.11
.970
Outsourcing for some
functions have been
introduced 16.9 63.1 6.2 12.3 1.5 65 2.18
.917
ICT has been embraced
to cut down current
expenditures on
salaries 35.9 42.2 12.5 7.8 1.6 64 1.97
.975
A vibrant research and
development team is in
place 3.2 29.0 29.0 27.4 11.3 62 3.15
1.069
Key: Strongly Agree=1, Agree =2, Not Sure =3, Disagree =4, Strongly Disagree=5
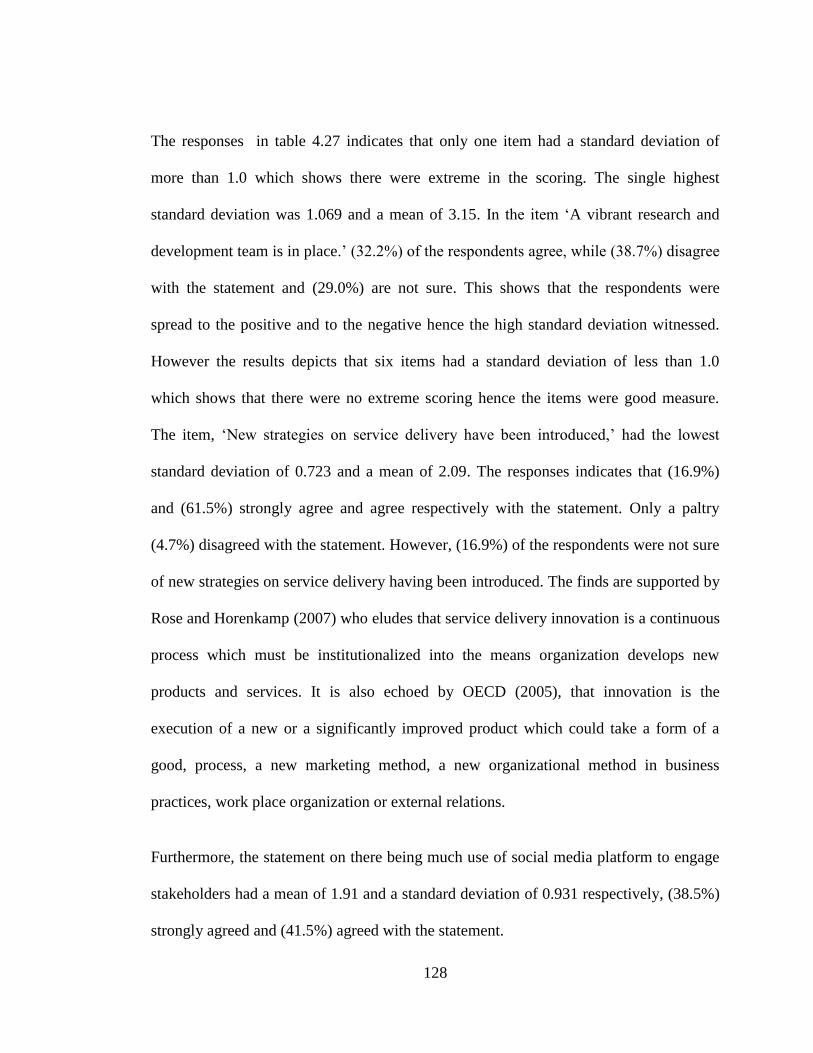
128
The responses in table 4.27 indicates that only one item had a standard deviation of
more than 1.0 which shows there were extreme in the scoring. The single highest
standard deviation was 1.069 and a mean of 3.15. In the item ‘A vibrant research and
development team is in place.’ (32.2%) of the respondents agree, while (38.7%) disagree
with the statement and (29.0%) are not sure. This shows that the respondents were
spread to the positive and to the negative hence the high standard deviation witnessed.
However the results depicts that six items had a standard deviation of less than 1.0
which shows that there were no extreme scoring hence the items were good measure.
The item, ‘New strategies on service delivery have been introduced,’ had the lowest
standard deviation of 0.723 and a mean of 2.09. The responses indicates that (16.9%)
and (61.5%) strongly agree and agree respectively with the statement. Only a paltry
(4.7%) disagreed with the statement. However, (16.9%) of the respondents were not sure
of new strategies on service delivery having been introduced. The finds are supported by
Rose and Horenkamp (2007) who eludes that service delivery innovation is a continuous
process which must be institutionalized into the means organization develops new
products and services. It is also echoed by OECD (2005), that innovation is the
execution of a new or a significantly improved product which could take a form of a
good, process, a new marketing method, a new organizational method in business
practices, work place organization or external relations.
Furthermore, the statement on there being much use of social media platform to engage
stakeholders had a mean of 1.91 and a standard deviation of 0.931 respectively, (38.5%)
strongly agreed and (41.5%) agreed with the statement.
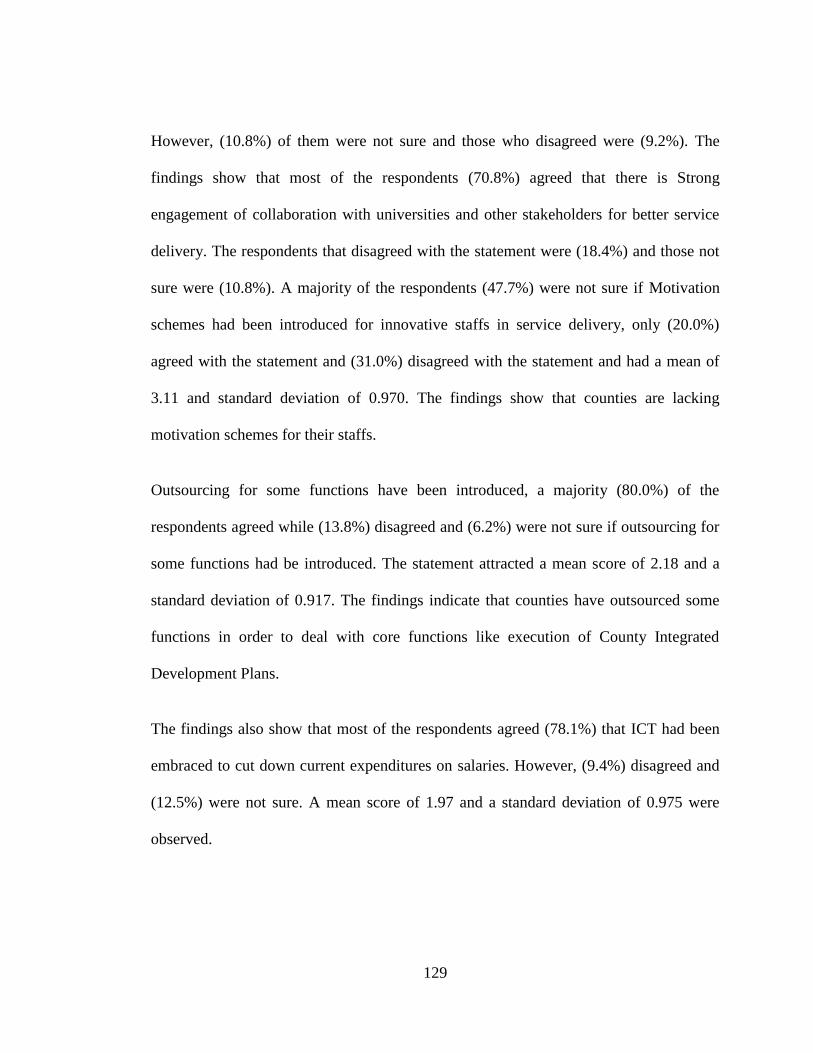
129
However, (10.8%) of them were not sure and those who disagreed were (9.2%). The
findings show that most of the respondents (70.8%) agreed that there is Strong
engagement of collaboration with universities and other stakeholders for better service
delivery. The respondents that disagreed with the statement were (18.4%) and those not
sure were (10.8%). A majority of the respondents (47.7%) were not sure if Motivation
schemes had been introduced for innovative staffs in service delivery, only (20.0%)
agreed with the statement and (31.0%) disagreed with the statement and had a mean of
3.11 and standard deviation of 0.970. The findings show that counties are lacking
motivation schemes for their staffs.
Outsourcing for some functions have been introduced, a majority (80.0%) of the
respondents agreed while (13.8%) disagreed and (6.2%) were not sure if outsourcing for
some functions had be introduced. The statement attracted a mean score of 2.18 and a
standard deviation of 0.917. The findings indicate that counties have outsourced some
functions in order to deal with core functions like execution of County Integrated
Development Plans.
The findings also show that most of the respondents agreed (78.1%) that ICT had been
embraced to cut down current expenditures on salaries. However, (9.4%) disagreed and
(12.5%) were not sure. A mean score of 1.97 and a standard deviation of 0.975 were
observed.
130
In summary, the findings indicate that counties have embraced innovation that supports
execution of counties development plans by introducing new strategies on service
delivery. Further, much use of social media platform to engage stakeholder has been
employed. Strong engagement of collaboration with universities and other stakeholders
for better service delivery has been acknowledged. However on the motivation schemes
having been introduced for innovative staffs in service delivery a majority of the
respondents were not sure and others disagreed of its existence. Outsourcing for some
functions have been introduced was confirmed by a majority of the respondents.
Further, on the issue on ICT having been embraced to cut down current expenditures on
salaries, majority of the respondents agreed that their counties have embraced ICT in
their operations. Counties have bloated staff and ICT embracement should lead to leaner
staff and hence save resources for developmental issues other than using more than half
of the budgets for paying salaries only which goes contrary to the cardinal premise of
devolution. Finally a vibrant research and development teams were said not to be active
in the counties by the majority of the respondents.
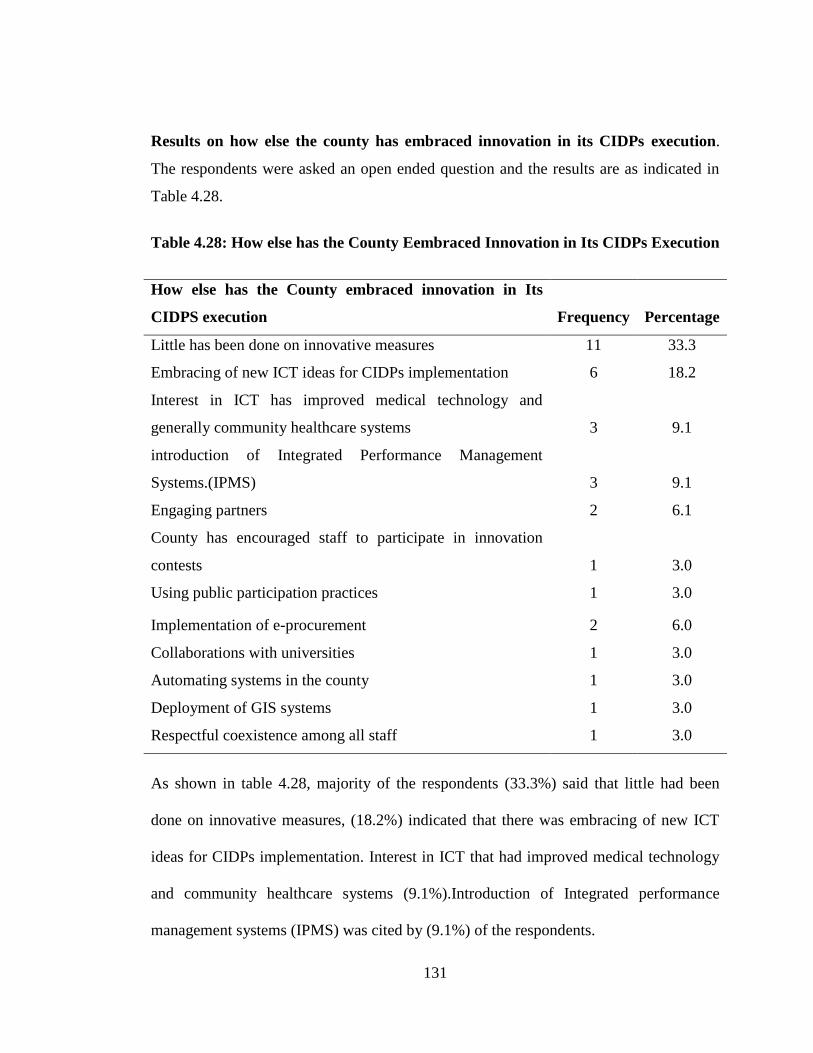
131
Results on how else the county has embraced innovation in its CIDPs execution.
The respondents were asked an open ended question and the results are as indicated in
Table 4.28.
Table 4.28: How else has the County Eembraced Innovation in Its CIDPs Execution
How else has the County embraced innovation in Its
CIDPS execution Frequency Percentage
Little has been done on innovative measures 11 33.3
Embracing of new ICT ideas for CIDPs implementation 6 18.2
Interest in ICT has improved medical technology and
generally community healthcare systems 3 9.1
introduction of Integrated Performance Management
Systems.(IPMS) 3 9.1
Engaging partners 2 6.1
County has encouraged staff to participate in innovation
contests 1 3.0
Using public participation practices 1 3.0
Implementation of e-procurement 2 6.0
Collaborations with universities 1 3.0
Automating systems in the county 1 3.0
Deployment of GIS systems 1 3.0
Respectful coexistence among all staff 1 3.0
As shown in table 4.28, majority of the respondents (33.3%) said that little had been
done on innovative measures, (18.2%) indicated that there was embracing of new ICT
ideas for CIDPs implementation. Interest in ICT that had improved medical technology
and community healthcare systems (9.1%).Introduction of Integrated performance
management systems (IPMS) was cited by (9.1%) of the respondents.
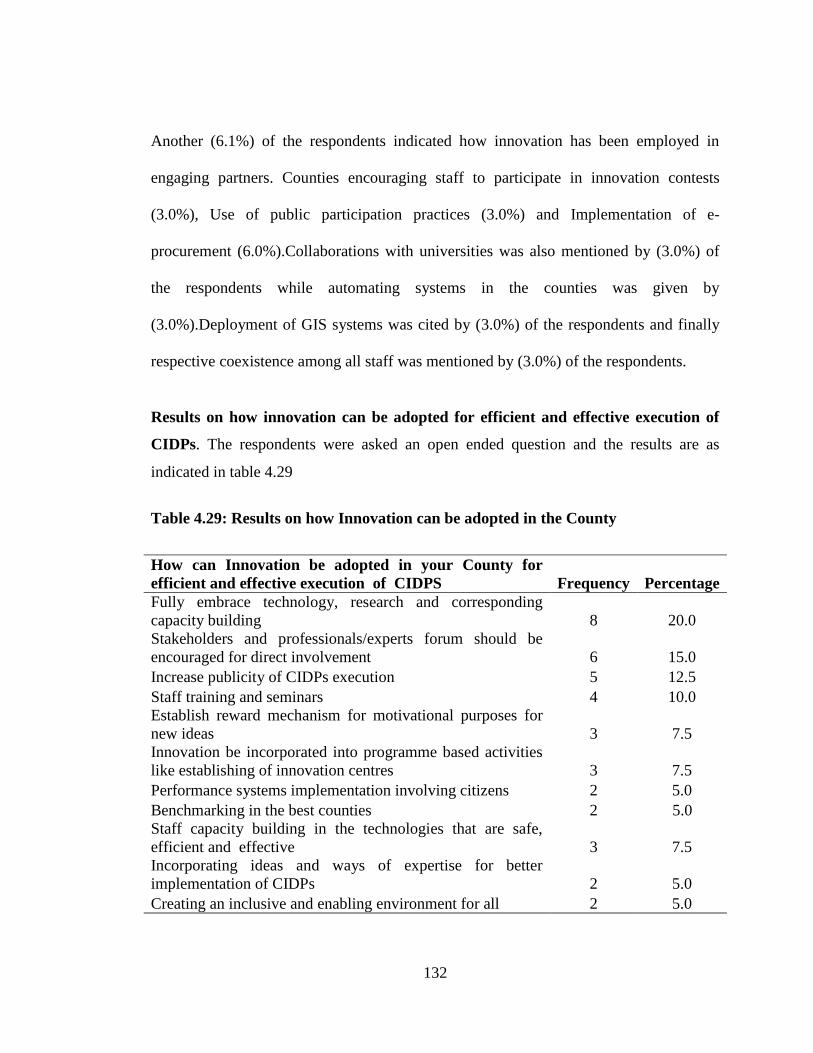
132
Another (6.1%) of the respondents indicated how innovation has been employed in
engaging partners. Counties encouraging staff to participate in innovation contests
(3.0%), Use of public participation practices (3.0%) and Implementation of e-
procurement (6.0%).Collaborations with universities was also mentioned by (3.0%) of
the respondents while automating systems in the counties was given by
(3.0%).Deployment of GIS systems was cited by (3.0%) of the respondents and finally
respective coexistence among all staff was mentioned by (3.0%) of the respondents.
Results on how innovation can be adopted for efficient and effective execution of
CIDPs. The respondents were asked an open ended question and the results are as
indicated in table 4.29
Table 4.29: Results on how Innovation can be adopted in the County
How can Innovation be adopted in your County for
efficient and effective execution of CIDPS Frequency Percentage
Fully embrace technology, research and corresponding
capacity building 8 20.0
Stakeholders and professionals/experts forum should be
encouraged for direct involvement 6 15.0
Increase publicity of CIDPs execution 5 12.5
Staff training and seminars 4 10.0
Establish reward mechanism for motivational purposes for
new ideas 3 7.5
Innovation be incorporated into programme based activities
like establishing of innovation centres 3 7.5
Performance systems implementation involving citizens 2 5.0
Benchmarking in the best counties 2 5.0
Staff capacity building in the technologies that are safe,
efficient and effective 3 7.5
Incorporating ideas and ways of expertise for better
implementation of CIDPs 2 5.0
Creating an inclusive and enabling environment for all 2 5.0
133
From the responses in table 4.29, (20.0%) of the respondents were of the opinion that by
fully embracing technology, research and corresponding capacity building as innovation
would lead to efficient and effective execution of CIDPs. Stakeholders and professionals
or experts forum should be encouraged for direct involvement (15.0%).Increased
publicity of CIDPs execution and staff training and seminars were put forward by
(12.5%) and(10.0) of the respondents respectively. Establishment of reward mechanisms
for motivational purposes for new ideas was cited by (7.5%) and a similar percentage for
innovation being incorporated into programme based activities like establishing of
innovation centres.
Furthermore, establishment of performance systems implementations involving citizens
was indicated by (5.0%) of the respondents and another (5.0%) put forward the need for
benchmarking in the best performing counties. Staff capacity building in the
technologies that are safe, efficient and effective had a (7.5%) response while
incorporation of ideas and ways of expertise for better implementation of CIDPs had
been cited by (5.0%) of the respondents and a similar percentage indicated the need to
create an inclusive and enabling environment for all for efficient and effective execution
of CIDPs.
134
4.7.1 Inferential analysis
4.7.1.1 To explore the role of innovation in execution of County Integrated
Development Plans by County Governments in Kenya
Correlation Analysis:
The Pearson Correlation of Innovation versus Execution of County Integrated
Development Plans (CIDPs) is 0.547 (p value = 0.000).This shows a significant and
positive relationship between Innovation and Execution of county integrated
development plans. It can therefore be affirmed of the existence of a moderate positive
linear relationship between the two variables, namely innovation and execution.
Objective Three: To explore the role of innovation in execution of County
Integrated Development Plans by County Governments in Kenya. A multiple
regression was performed based on the model below.
Y= β0 + β5X5 + ɛ …………………………………………….. (iii)
Where:-
Y = Execution of County Integrated Development Plans
β0= Constant, showing execution of County Integrated Development Plans in the
absence of the factors
Β1-β5= Regression Coefficients
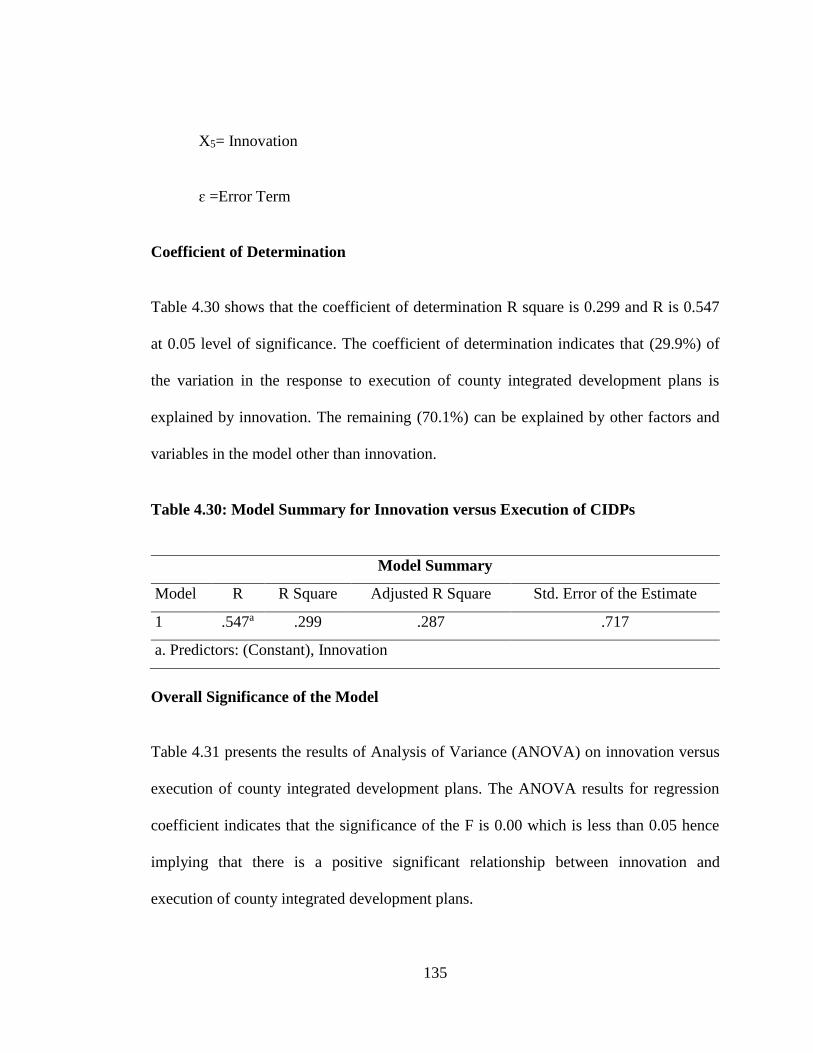
135
X5= Innovation
ɛ =Error Term
Coefficient of Determination
Table 4.30 shows that the coefficient of determination R square is 0.299 and R is 0.547
at 0.05 level of significance. The coefficient of determination indicates that (29.9%) of
the variation in the response to execution of county integrated development plans is
explained by innovation. The remaining (70.1%) can be explained by other factors and
variables in the model other than innovation.
Table 4.30: Model Summary for Innovation versus Execution of CIDPs
Model Summary
Model R R Square Adjusted R Square Std. Error of the Estimate
1 .547a .299 .287 .717
a. Predictors: (Constant), Innovation
Overall Significance of the Model
Table 4.31 presents the results of Analysis of Variance (ANOVA) on innovation versus
execution of county integrated development plans. The ANOVA results for regression
coefficient indicates that the significance of the F is 0.00 which is less than 0.05 hence
implying that there is a positive significant relationship between innovation and
execution of county integrated development plans.
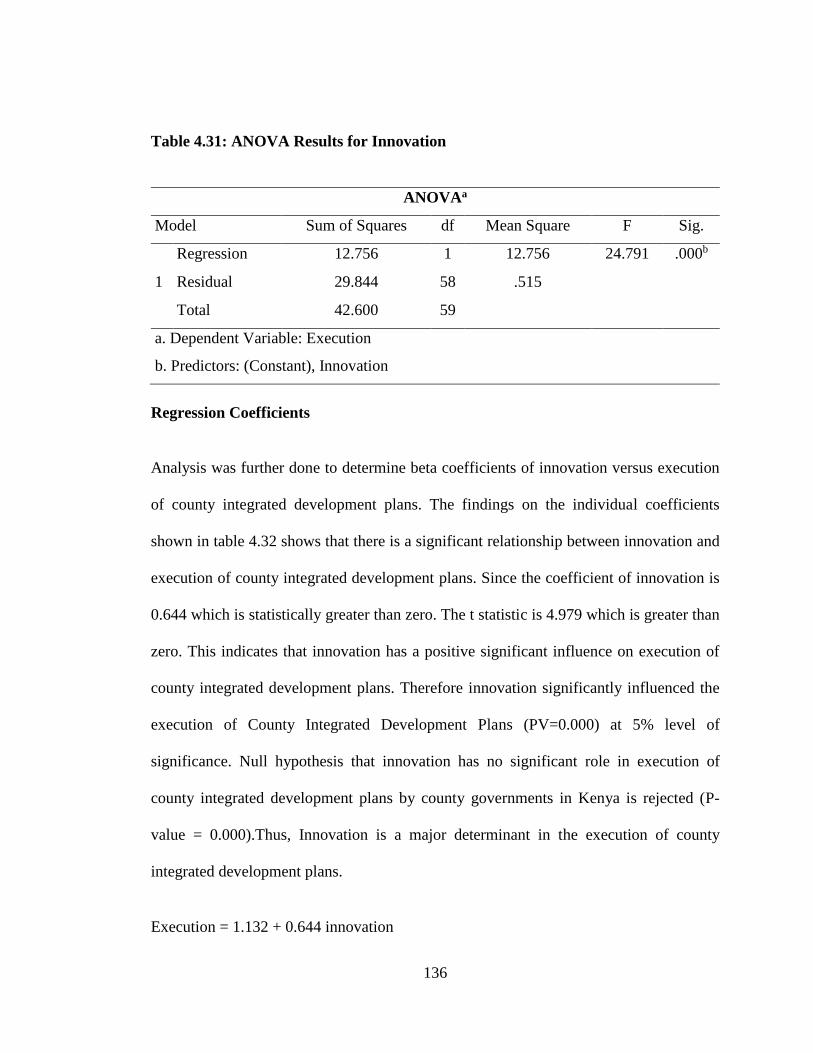
136
Table 4.31: ANOVA Results for Innovation
ANOVAa
Model Sum of Squares df Mean Square F Sig.
1
Regression 12.756 1 12.756 24.791 .000b
Residual 29.844 58 .515
Total 42.600 59
a. Dependent Variable: Execution
b. Predictors: (Constant), Innovation
Regression Coefficients
Analysis was further done to determine beta coefficients of innovation versus execution
of county integrated development plans. The findings on the individual coefficients
shown in table 4.32 shows that there is a significant relationship between innovation and
execution of county integrated development plans. Since the coefficient of innovation is
0.644 which is statistically greater than zero. The t statistic is 4.979 which is greater than
zero. This indicates that innovation has a positive significant influence on execution of
county integrated development plans. Therefore innovation significantly influenced the
execution of County Integrated Development Plans (PV=0.000) at 5% level of
significance. Null hypothesis that innovation has no significant role in execution of
county integrated development plans by county governments in Kenya is rejected (P-
value = 0.000).Thus, Innovation is a major determinant in the execution of county
integrated development plans.
Execution = 1.132 + 0.644 innovation
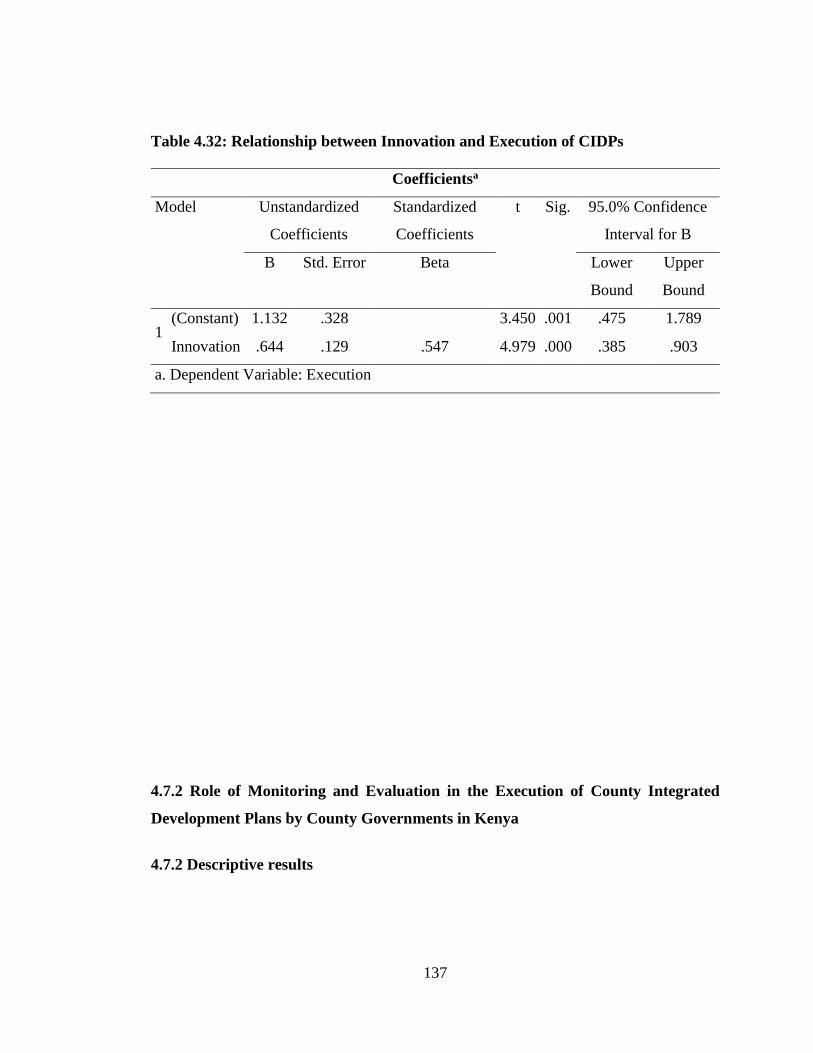
137
Table 4.32: Relationship between Innovation and Execution of CIDPs
Coefficientsa
Model Unstandardized
Coefficients
Standardized
Coefficients
t Sig. 95.0% Confidence
Interval for B
B Std. Error Beta Lower
Bound
Upper
Bound
1 (Constant) 1.132 .328 3.450 .001 .475 1.789
Innovation .644 .129 .547 4.979 .000 .385 .903
a. Dependent Variable: Execution
4.7.2 Role of Monitoring and Evaluation in the Execution of County Integrated
Development Plans by County Governments in Kenya
4.7.2 Descriptive results
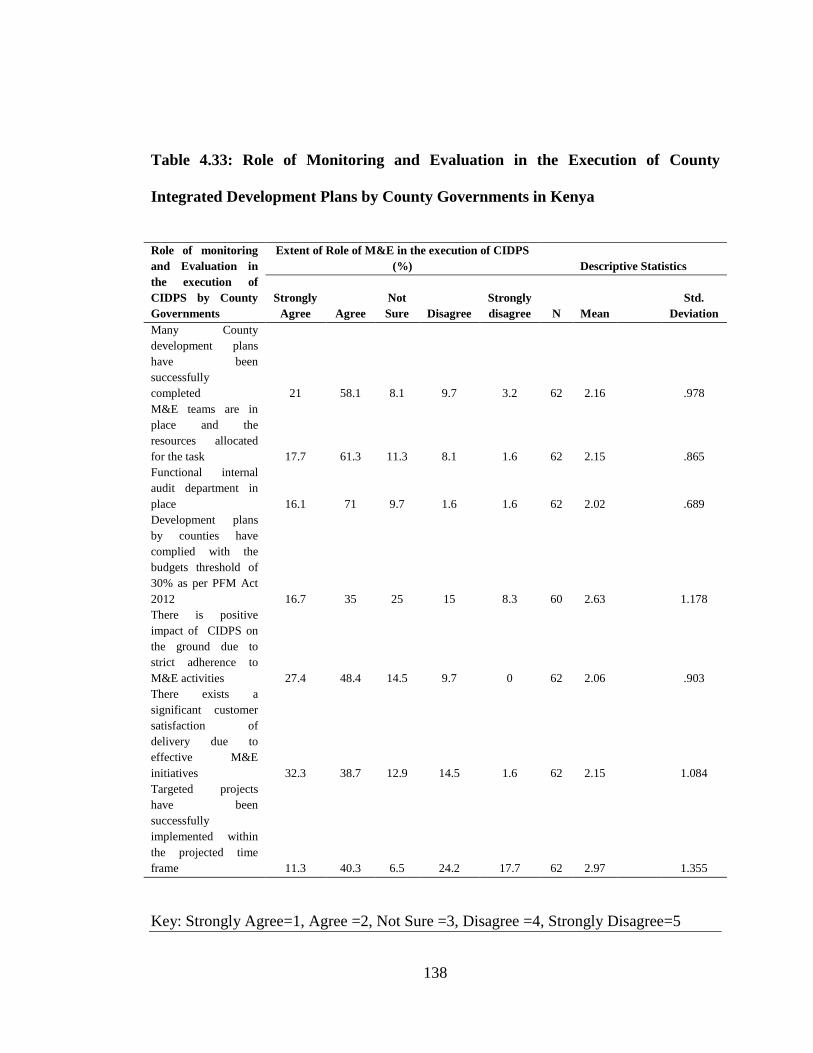
138
Table 4.33: Role of Monitoring and Evaluation in the Execution of County
Integrated Development Plans by County Governments in Kenya
Role of monitoring
and Evaluation in
the execution of
CIDPS by County
Governments
Extent of Role of M&E in the execution of CIDPS
(%) Descriptive Statistics
Strongly
Agree Agree
Not
Sure Disagree
Strongly
disagree N Mean
Std.
Deviation
Many County
development plans
have been
successfully
completed 21 58.1 8.1 9.7 3.2 62 2.16
.978
M&E teams are in
place and the
resources allocated
for the task 17.7 61.3 11.3 8.1 1.6 62 2.15
.865
Functional internal
audit department in
place 16.1 71 9.7 1.6 1.6 62 2.02
.689
Development plans
by counties have
complied with the
budgets threshold of
30% as per PFM Act
2012 16.7 35 25 15 8.3 60 2.63
1.178
There is positive
impact of CIDPS on
the ground due to
strict adherence to
M&E activities 27.4 48.4 14.5 9.7 0 62 2.06
.903
There exists a
significant customer
satisfaction of
delivery due to
effective M&E
initiatives 32.3 38.7 12.9 14.5 1.6 62 2.15
1.084
Targeted projects
have been
successfully
implemented within
the projected time
frame 11.3 40.3 6.5 24.2 17.7 62 2.97
1.355
Key: Strongly Agree=1, Agree =2, Not Sure =3, Disagree =4, Strongly Disagree=5
139
The responses in table 4.33 indicates that three items had a standard deviation of more
than 1.0 which shows there were extreme in the scoring. The highest standard deviation
was 1.355 a mean score of 2.97. In the item ‘Targeted projects have been successfully
implemented within the projected time frame,’ (51.6%) of the respondents agree, while
(41.9%) disagree with the statement and (6.5%) are not sure. This shows that the
respondents were spread to the positive and to the negative hence the high standard
deviation witnessed. However the results depicts that four items had a standard deviation
of less than 1.0 which shows that there were no extreme scoring hence the items were
good measure. The item, ‘Functional internal audit department in place,’ had the lowest
standard deviation of 0.689 and a mean score of 2.02. The responses indicates that
(16.1%) and (71.0%) strongly agree and agree respectively with the statement. Only a
paltry (3.2%) disagreed with the statement and (9.7%) of the respondents were not sure.
The next statement sought to find out if monitoring and evaluation teams are in place
and resources allocated for the tasks had a mean score of 2.15 and a standard deviation
of 0.865. Majority of the respondents (61.3%) agreed with the statement while (17.7%)
strongly agreed. However (9.7%) of the respondents disagreed and (11.3%) were not
sure. The results are echoed by Stem et al., (2005) who argued that budget allocations
develops human resources and enhances management capabilities in planning and
implementation of the project. As to whether development plans by counties have
complied with the budgets threshold of 30% as per PFM Act 2012 had a mean of 2.63
and a standard deviation of 1.178 which indicated a wide variety of responses, majority
(51.7%) of the respondents answered in the affirmative, (23.3%) disagreed and (25.0%)
140
were not sure. As to whether there is Positive impact of CIDPs on the ground due to
strict adherence to M&E activities a mean score of 2.06 and a standard deviation of
0.903 were observed and an overwhelming majority (75.8%) agreed. and (9.7%)
disagreed, those not sure were (14.5%).Effective monitoring and evaluation enhances
the project management decision making process at the execution hence positive impact
on implementation of project (Gyorkos, 2003, Crawford and Bryce, 2003). On the
statement that there exists a significant customer satisfaction of delivery due to effective
M&E initiatives a mean score of 2.15 and a standard deviation of 1.084 were observed
with (71.0%) of the respondents agreed and (16.1%) disagreed and (12.9%) were not
sure. This is in agreement with McCoy (2005) who said that evaluation provides an
assessment of the effectiveness of the project in realization of the goal and the relevance
& sustainability of the projects in progress.
In summary, the findings indicate that Many County development plans have been
successfully completed, and that M&E teams are in place and the resources allocated for
the task and that functional internal audit department in place. Further, slightly over half
of the respondents indicated that development plans by counties had complied with the
budgets threshold of 30% as per PFM Act 2012. There is positive impact of CIDPs on
the ground due to strict adherence to M&E activities. There exists a significant customer
satisfaction of delivery due to effective M&E initiatives had an overwhelming
acknowledgement from the respondents and finally targeted projects have been
successfully implemented within the projected time frame was agreed by slightly over
half of the respondents.
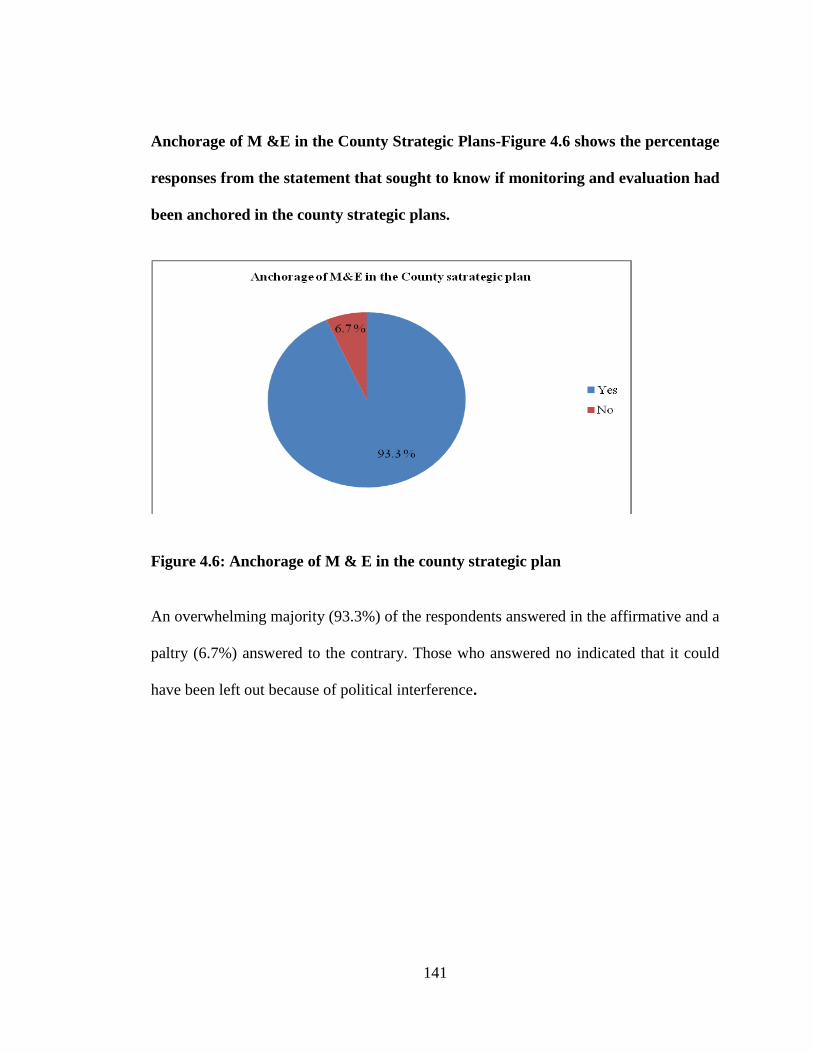
141
Anchorage of M &E in the County Strategic Plans-Figure 4.6 shows the percentage
responses from the statement that sought to know if monitoring and evaluation had
been anchored in the county strategic plans.
Figure 4.6: Anchorage of M & E in the county strategic plan
An overwhelming majority (93.3%) of the respondents answered in the affirmative and a
paltry (6.7%) answered to the contrary. Those who answered no indicated that it could
have been left out because of political interference.
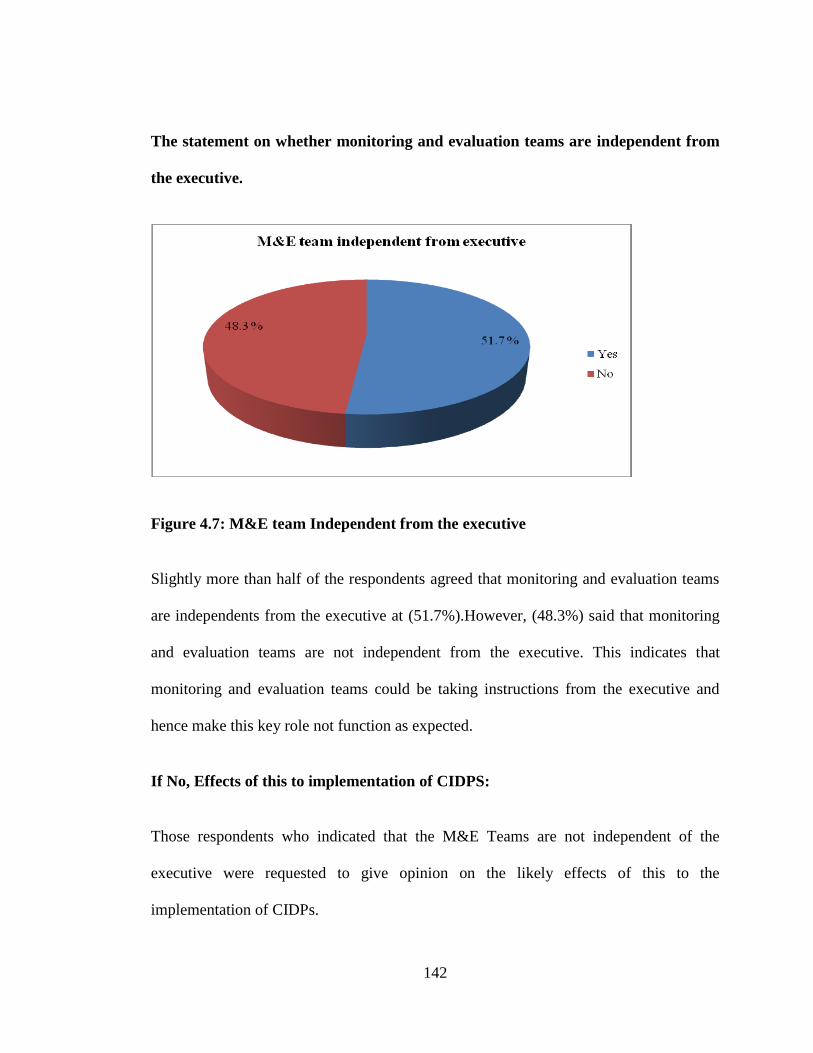
142
The statement on whether monitoring and evaluation teams are independent from
the executive.
Figure 4.7: M&E team Independent from the executive
Slightly more than half of the respondents agreed that monitoring and evaluation teams
are independents from the executive at (51.7%).However, (48.3%) said that monitoring
and evaluation teams are not independent from the executive. This indicates that
monitoring and evaluation teams could be taking instructions from the executive and
hence make this key role not function as expected.
If No, Effects of this to implementation of CIDPS:
Those respondents who indicated that the M&E Teams are not independent of the
executive were requested to give opinion on the likely effects of this to the
implementation of CIDPs.
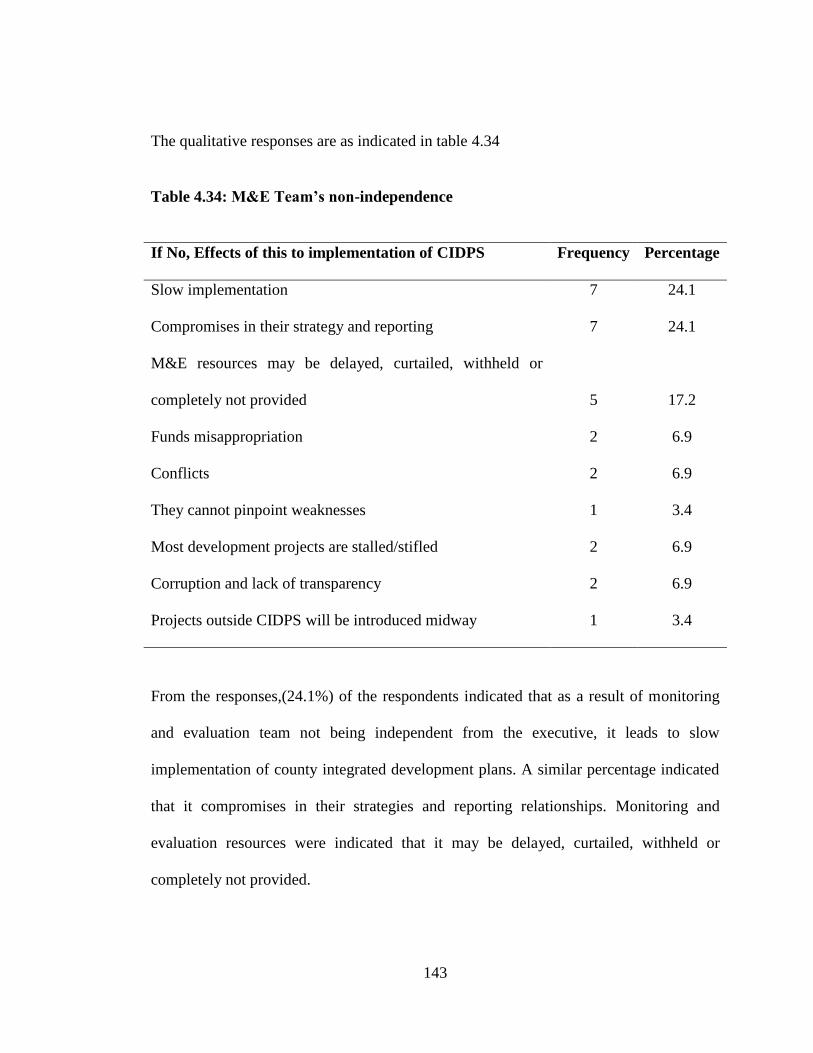
143
The qualitative responses are as indicated in table 4.34
Table 4.34: M&E Team’s non-independence
If No, Effects of this to implementation of CIDPS Frequency Percentage
Slow implementation 7 24.1
Compromises in their strategy and reporting 7 24.1
M&E resources may be delayed, curtailed, withheld or
completely not provided 5 17.2
Funds misappropriation 2 6.9
Conflicts 2 6.9
They cannot pinpoint weaknesses 1 3.4
Most development projects are stalled/stifled 2 6.9
Corruption and lack of transparency 2 6.9
Projects outside CIDPS will be introduced midway 1 3.4
From the responses,(24.1%) of the respondents indicated that as a result of monitoring
and evaluation team not being independent from the executive, it leads to slow
implementation of county integrated development plans. A similar percentage indicated
that it compromises in their strategies and reporting relationships. Monitoring and
evaluation resources were indicated that it may be delayed, curtailed, withheld or
completely not provided.
144
Further, (6.9%) of the respondents said that it leads to funds being misappropriated and a
similar percentage cited that conflicts are experienced. It was also noted by (3.4%) of the
respondents that the team cannot pinpoint weaknesses in the system. Most development
projects being stifled was also mentioned by (6.9%) of the respondents. Another (6.9%)
of the respondents indicated that corruption and lack of transparency is experienced.
Lastly (3.4%) of the respondents indicated that projects that had not been captured in the
CIDPs are introduced midway.
4.7.3 To determine the role of monitoring and evaluation in execution of County
Integrated Development Plans by County Governments in Kenya
4.7.3. Inferential analysis
Correlation Analysis
Correlation analysis is a method of statistical evaluation used to study the strength of a
relationship between two, numerically measured, continuous variables. The Pearson
Correlation of Monitoring and Evaluation versus Execution of County Integrated
Development Plans (CIDPs) is 0.577(p value = 0.000) in table 4.16.This shows a
moderate significant and positive relationship between Monitoring and Evaluation and
Execution of county integrated development plans. It can therefore be affirmed of the
existence of a moderate and positive linear relationship between the two variables,
namely Monitoring and Evaluation and execution.
145
Objective four: Regression Analysis: To determine the role of monitoring and
evaluation in execution of County Integrated Development Plans by County
Governments in Kenya. A multiple regression was performed based on the model
below.
Y= β0 + β6X6 + ɛ …………………………………………….. (iv)
Where:-
Y = Execution of County Integrated Development Plans
β0= Constant, showing execution of County Integrated Development Plans in the
absence of the factors
Β1-β6= Regression Coefficients
X6= Monitoring and evaluation
ɛ =Error Term
Coefficient of Determination
Coefficient of determination square -measures explained variation. Table 4.35 shows
that the coefficient of determination R square is 0.333 and R is 0.577 at 0.05 level of
significance.
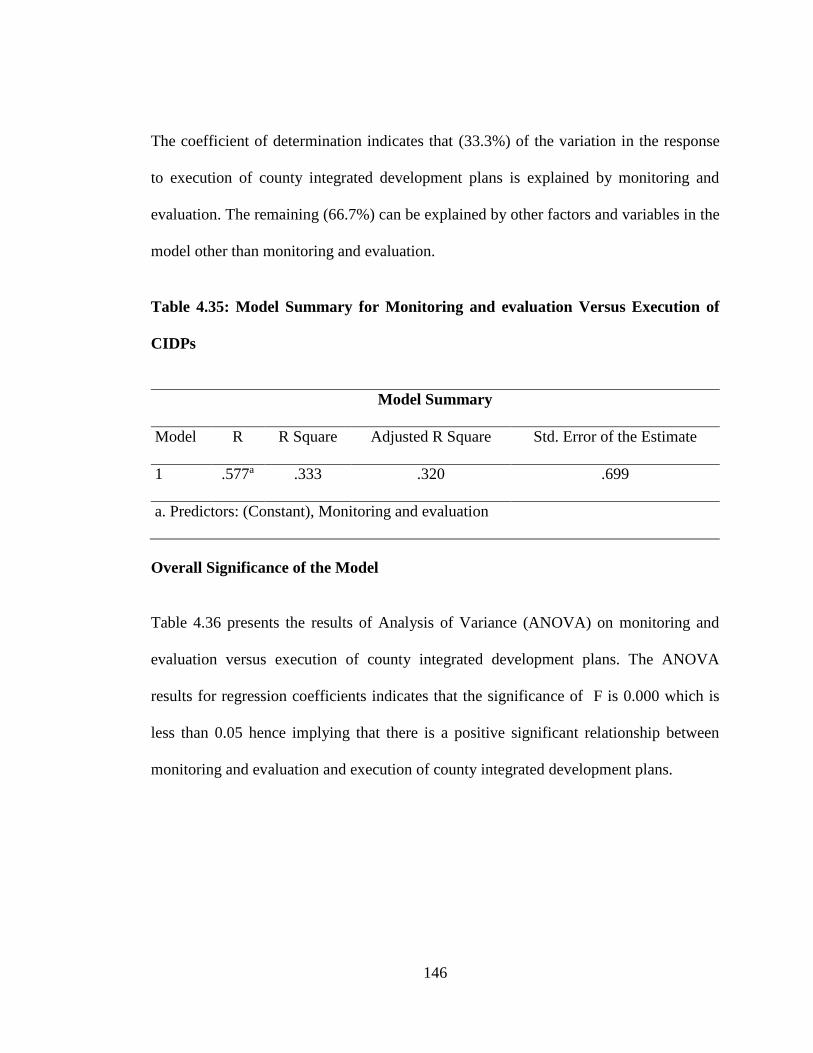
146
The coefficient of determination indicates that (33.3%) of the variation in the response
to execution of county integrated development plans is explained by monitoring and
evaluation. The remaining (66.7%) can be explained by other factors and variables in the
model other than monitoring and evaluation.
Table 4.35: Model Summary for Monitoring and evaluation Versus Execution of
CIDPs
Model Summary
Model R R Square Adjusted R Square Std. Error of the Estimate
1 .577a .333 .320 .699
a. Predictors: (Constant), Monitoring and evaluation
Overall Significance of the Model
Table 4.36 presents the results of Analysis of Variance (ANOVA) on monitoring and
evaluation versus execution of county integrated development plans. The ANOVA
results for regression coefficients indicates that the significance of F is 0.000 which is
less than 0.05 hence implying that there is a positive significant relationship between
monitoring and evaluation and execution of county integrated development plans.
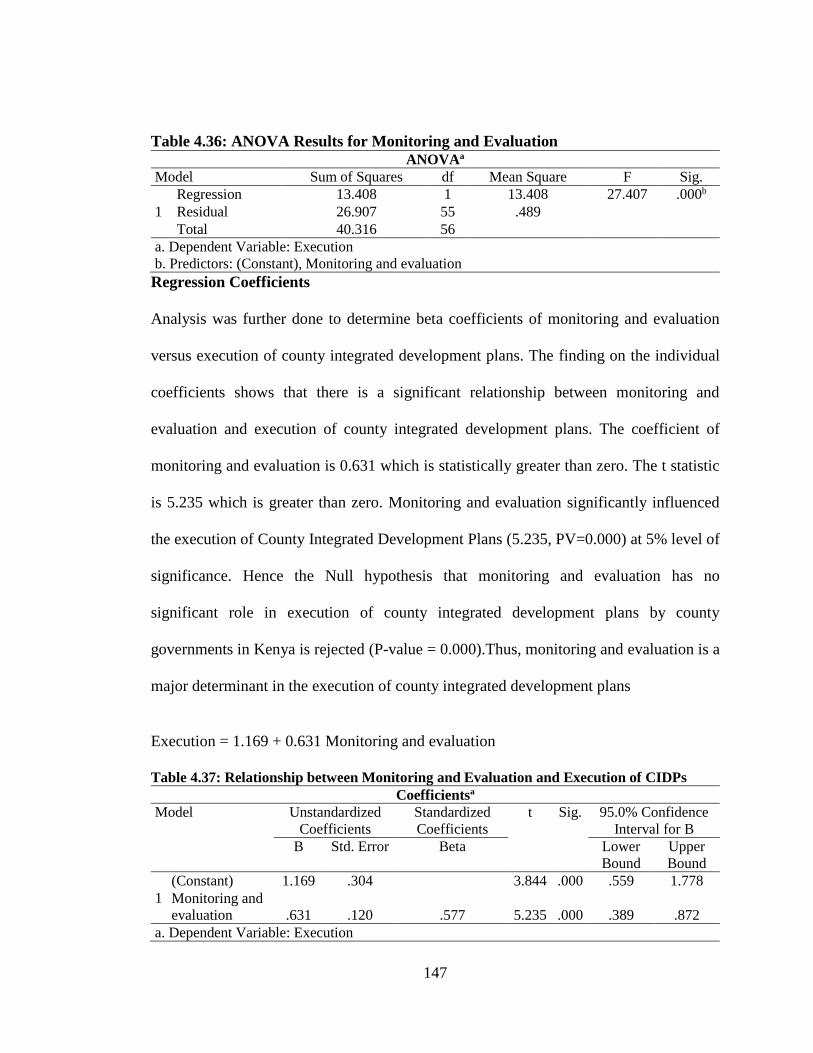
147
Table 4.36: ANOVA Results for Monitoring and Evaluation
ANOVAa
Model Sum of Squares df Mean Square F Sig.
1
Regression 13.408 1 13.408 27.407 .000b
Residual 26.907 55 .489
Total 40.316 56
a. Dependent Variable: Execution
b. Predictors: (Constant), Monitoring and evaluation
Regression Coefficients
Analysis was further done to determine beta coefficients of monitoring and evaluation
versus execution of county integrated development plans. The finding on the individual
coefficients shows that there is a significant relationship between monitoring and
evaluation and execution of county integrated development plans. The coefficient of
monitoring and evaluation is 0.631 which is statistically greater than zero. The t statistic
is 5.235 which is greater than zero. Monitoring and evaluation significantly influenced
the execution of County Integrated Development Plans (5.235, PV=0.000) at 5% level of
significance. Hence the Null hypothesis that monitoring and evaluation has no
significant role in execution of county integrated development plans by county
governments in Kenya is rejected (P-value = 0.000).Thus, monitoring and evaluation is a
major determinant in the execution of county integrated development plans
Execution = 1.169 + 0.631 Monitoring and evaluation
Table 4.37: Relationship between Monitoring and Evaluation and Execution of CIDPs
Coefficientsa
Model Unstandardized
Coefficients
Standardized
Coefficients
t Sig. 95.0% Confidence
Interval for B
B Std. Error Beta Lower
Bound
Upper
Bound
1
(Constant) 1.169 .304 3.844 .000 .559 1.778
Monitoring and
evaluation .631 .120 .577 5.235 .000 .389 .872
a. Dependent Variable: Execution
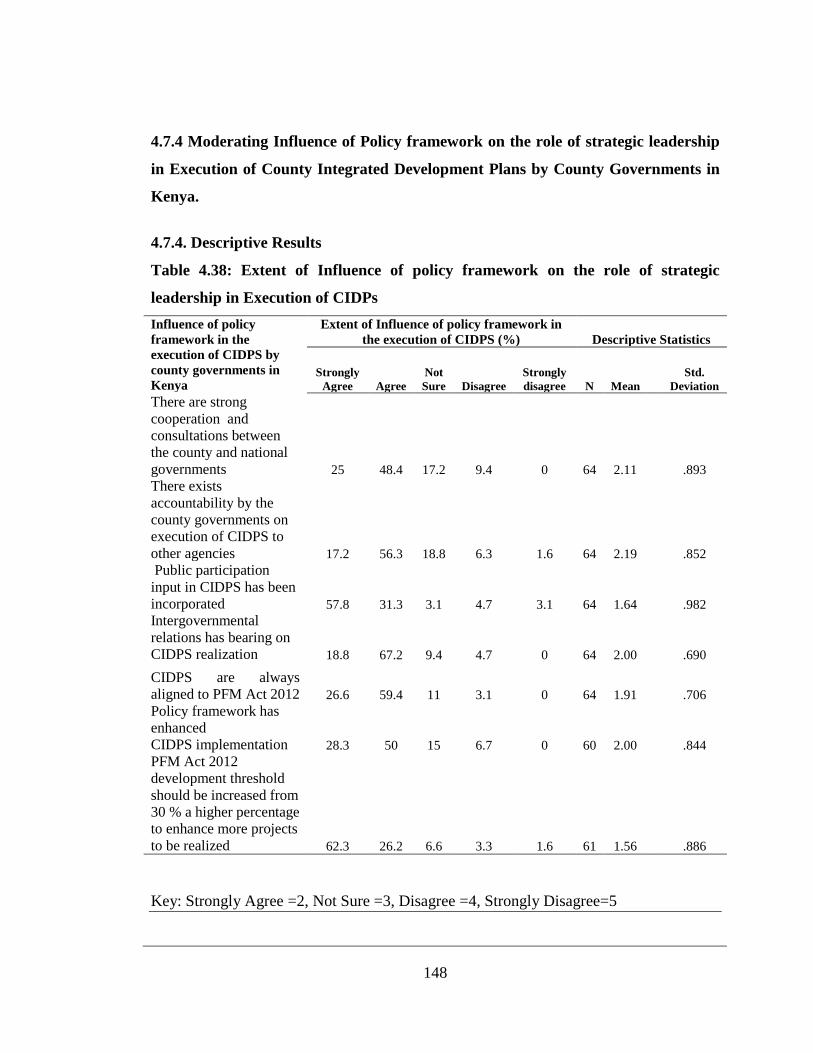
148
4.7.4 Moderating Influence of Policy framework on the role of strategic leadership
in Execution of County Integrated Development Plans by County Governments in
Kenya.
4.7.4. Descriptive Results
Table 4.38: Extent of Influence of policy framework on the role of strategic
leadership in Execution of CIDPs
Influence of policy
framework in the
execution of CIDPS by
county governments in
Kenya
Extent of Influence of policy framework in
the execution of CIDPS (%) Descriptive Statistics
Strongly
Agree Agree
Not
Sure Disagree
Strongly
disagree N Mean
Std.
Deviation
There are strong
cooperation and
consultations between
the county and national
governments 25 48.4 17.2 9.4 0 64 2.11
.893
There exists
accountability by the
county governments on
execution of CIDPS to
other agencies 17.2 56.3 18.8 6.3 1.6 64 2.19
.852
Public participation
input in CIDPS has been
incorporated 57.8 31.3 3.1 4.7 3.1 64 1.64
.982
Intergovernmental
relations has bearing on
CIDPS realization 18.8 67.2 9.4 4.7 0 64 2.00
.690
CIDPS are always
aligned to PFM Act 2012 26.6 59.4 11 3.1 0 64 1.91
.706
Policy framework has
enhanced
CIDPS implementation 28.3 50 15 6.7 0 60 2.00
.844
PFM Act 2012
development threshold
should be increased from
30 % a higher percentage
to enhance more projects
to be realized 62.3 26.2 6.6 3.3 1.6 61 1.56
.886
Key: Strongly Agree =2, Not Sure =3, Disagree =4, Strongly Disagree=5
149
The responses in table 4.38 indicates that the results depicts that all seven items had a
standard deviation of less than 1.0 which shows that there were no extreme scoring
hence the items were good measure. The first statement had a mean score of 2.11 and a
standard deviation of 0.893, (25.0%) of the respondents who strongly agreed that there
are strong cooperation and consultations between the county and national government,
(48.4%) agreed, and (9.4%) disagreed. However, (17.2%) of the respondents were not
sure of the statement. The second statement on accountability existence by the county
governments on execution of CIDPs to other agencies attracted a mean score of 2.19 and
a standard deviation of 0.852 where a majority (73.5%) of the respondents agreed while
(18.8%) were not sure and (7.9%) disagreed. Third statement on Public participation
input in CIDPs has been incorporated had a mean score of 1.64 and a standard deviation
of 0.982 received an overwhelming agreement by (89.1%) of all the respondents while a
paltry (3.1%) were not sure and (7.8%) disagreed with the observation.
Majority (86.0%) of the respondents indicated that Intergovernmental relations have
bearing on CIDPs realization with a mean score of 2.00 and a standard deviation of
0.690 while only (4.7%) disagreed with the observation. However, (9.4%) of the
respondents were not sure. CIDPs are always aligned to PFM Act 2012 was
acknowledged by (86.0%) of the respondents and only (3.1%) had a divergent views.
(11.0%) of the respondents were however not sure and had a mean score of 1.91 and a
standard deviation of 0.706. A majority of the respondents agreed (78.3%) that Policy
framework has enhanced CIDPs implementation while (15.0%) were not sure and those
in disagreement were (6.7%) with a mean of 2.00 and a standard deviation of 0.844.
150
Lastly, PFM Act 2012 development threshold should be increased from 30 % a higher
percentage to enhance more projects to be realized had a mean of score of 1.56 and a
standard deviation of 0.886, received the highest percentage of agreement by (88.5%) of
the respondents. Further, (6.6%) of the respondents were not sure and (4.9%) disagreed
with the statement.
In summary, the findings indicate that there are strong cooperation and consultations
between the county and national governments and that there exists accountability by the
county governments on execution of CIDPs to other agencies. Further the result
indicates that Public participation input in CIDPs has been incorporated and that Inter-
governmental relations have bearing on CIDPs realization. CIDPs are always aligned to
PFM Act 2012 and that Policy framework has enhanced CIDPs implementation. Finally,
most of the respondents indicated that PFM Act 2012 development threshold should be
increased from 30% to a higher percentage to enhance more projects to be realized.
Qualitative results-The respondent’s opinion on the role of the National Assembly, The
Senate and County Assemblies play in the realization of implementation of CIDPs. The
responses are shown in Table 4.39.
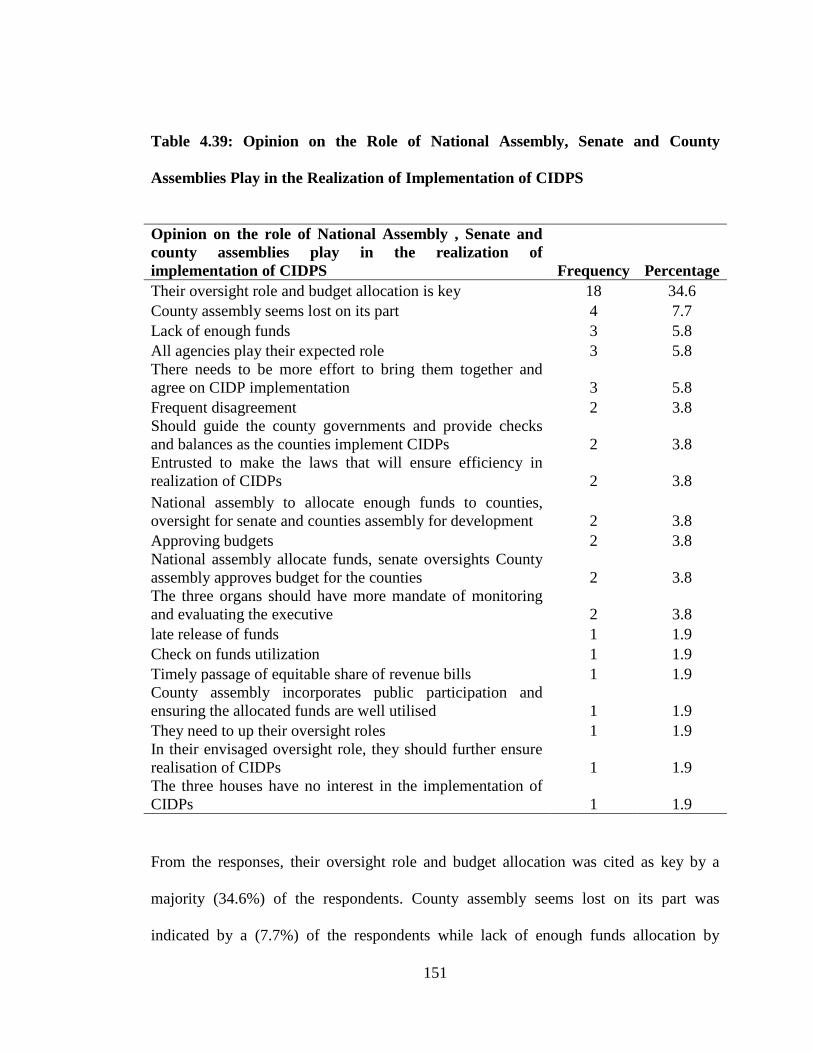
151
Table 4.39: Opinion on the Role of National Assembly, Senate and County
Assemblies Play in the Realization of Implementation of CIDPS
Opinion on the role of National Assembly , Senate and
county assemblies play in the realization of
implementation of CIDPS Frequency Percentage
Their oversight role and budget allocation is key 18 34.6
County assembly seems lost on its part 4 7.7
Lack of enough funds 3 5.8
All agencies play their expected role 3 5.8
There needs to be more effort to bring them together and
agree on CIDP implementation 3 5.8
Frequent disagreement 2 3.8
Should guide the county governments and provide checks
and balances as the counties implement CIDPs 2 3.8
Entrusted to make the laws that will ensure efficiency in
realization of CIDPs 2 3.8
National assembly to allocate enough funds to counties,
oversight for senate and counties assembly for development 2 3.8
Approving budgets 2 3.8
National assembly allocate funds, senate oversights County
assembly approves budget for the counties 2 3.8
The three organs should have more mandate of monitoring
and evaluating the executive 2 3.8
late release of funds 1 1.9
Check on funds utilization 1 1.9
Timely passage of equitable share of revenue bills 1 1.9
County assembly incorporates public participation and
ensuring the allocated funds are well utilised 1 1.9
They need to up their oversight roles 1 1.9
In their envisaged oversight role, they should further ensure
realisation of CIDPs 1 1.9
The three houses have no interest in the implementation of
CIDPs 1 1.9
From the responses, their oversight role and budget allocation was cited as key by a
majority (34.6%) of the respondents. County assembly seems lost on its part was
indicated by a (7.7%) of the respondents while lack of enough funds allocation by
152
national assembly was mentioned (5.8%) of the respondents.(5.8%) indicated that all
agencies play their expected role and that there needs to be more effort to bring them
together and agree on CIDPs implementation (5.8%).
Frequent disagreements and need for them to guide and provide checks and balances as
the counties implement CIDPs (7.6%). These bodies are entrusted with laws making that
would ensure efficiency in realization of CIDPs (3.8%) and (3.8%) of the respondents
mentioned that National assembly should allocate enough funds to counties, oversight
for senate and counties assembly for development. The three organs should have more
mandate of monitoring and evaluation of the executive and late release of funds was
mentioned by 3.8% and 1.9% of the respondents respectively. Checking on funds
utilization and timely passage of equitable share of revenue bills was mentioned by 3.8%
of the respondents.
County Assembly Incorporation of public participation and ensuring of the allocated
funds are well utilized while the need for the three organs to up their oversight roles was
indicated by (3.8%) of the respondents. (1.9%) of the respondents said that in their
envisaged oversight role the three organs should further ensure realization of CIDPs.
However, the three organs lack of interest in the implementation of CIDPs was cited by
(1.9%) of the respondents.
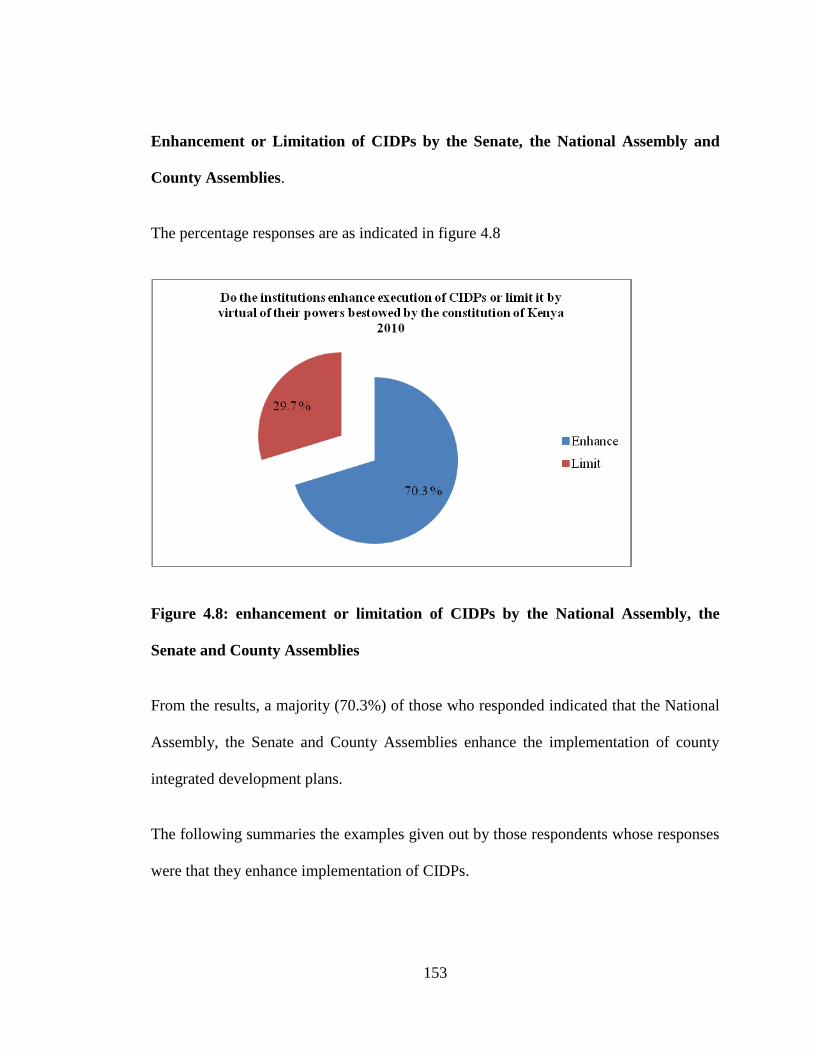
153
Enhancement or Limitation of CIDPs by the Senate, the National Assembly and
County Assemblies.
The percentage responses are as indicated in figure 4.8
Figure 4.8: enhancement or limitation of CIDPs by the National Assembly, the
Senate and County Assemblies
From the results, a majority (70.3%) of those who responded indicated that the National
Assembly, the Senate and County Assemblies enhance the implementation of county
integrated development plans.
The following summaries the examples given out by those respondents whose responses
were that they enhance implementation of CIDPs.
154
Reasons given by those who thought the institutions enhance CIDPs
The national assembly and the senate enhance, not so with the county assembly.
Through budgetary allocation leads to the implementation of CIDPs. Providing oversight
and make the county's executive work towards achieving CIDPs. The national assembly
and the senate were said to enhance the implementation of CIDPs and timely approvals
were cited as enhancing implementation of CIDPs.
Reasons given by those who thought the institutions limit CIDPs
Responses from those who thought that the three organs limit the CIDPs
implementation, County assemblies were cited as the biggest stumbling blocks of the
CIDPs implementation. Failure to approve county budget hence no development worth
reporting while low funding to counties was also mentioned. County assemblies’ refusal
to approve county budgets was also indicated as limitation of CIDPs implementation.
Competition among the three organs that leads to derailing of the implementation of
county integrated development plans. The non-effective policy/internal controls and
inadequate facilitation on revenue allocation were equally cited as a limitation factor and
powers vested to each organ do not take cognizance that they are devoted towards the
same agenda-development. Unnecessary delays in passing budgets were also a factor
hindering implementation.
155
4.7.5 To establish the Moderating Influence of Policy framework on the role of
strategic leadership in Execution of County Integrated Development Plans by
County Governments in Kenya
4.7.5. Inferential Analysis
Correlation Analysis
The Pearson Correlation of policy framework versus Execution of County Integrated
Development Plans (CIDPs) is 0.588 (p value = 0.000) as indicated in table 4.16. This
shows a significant and positive relationship between policy framework and Execution
of county integrated development plans. There is therefore a moderate positive linear
relationship between the two variables, policy framework and execution.
Objective Five: to establish the moderating influence of policy framework on the
role of strategic leadership in execution of County Integrated Development Plans
by County governments in Kenya
Y= β0 + β1X1+ β2X2+ β3X3+ β4X4+ β5X5+ β6X6+ β7X7+ ɛ ……………………….. (v)
Where:-
Y = Execution of County Integrated Development Plans
β0= Constant, showing execution of County Integrated Development Plans in the
absence of the factors
Β1-β7= Regression Coefficients
X7= policy framework
ɛ =Error Term
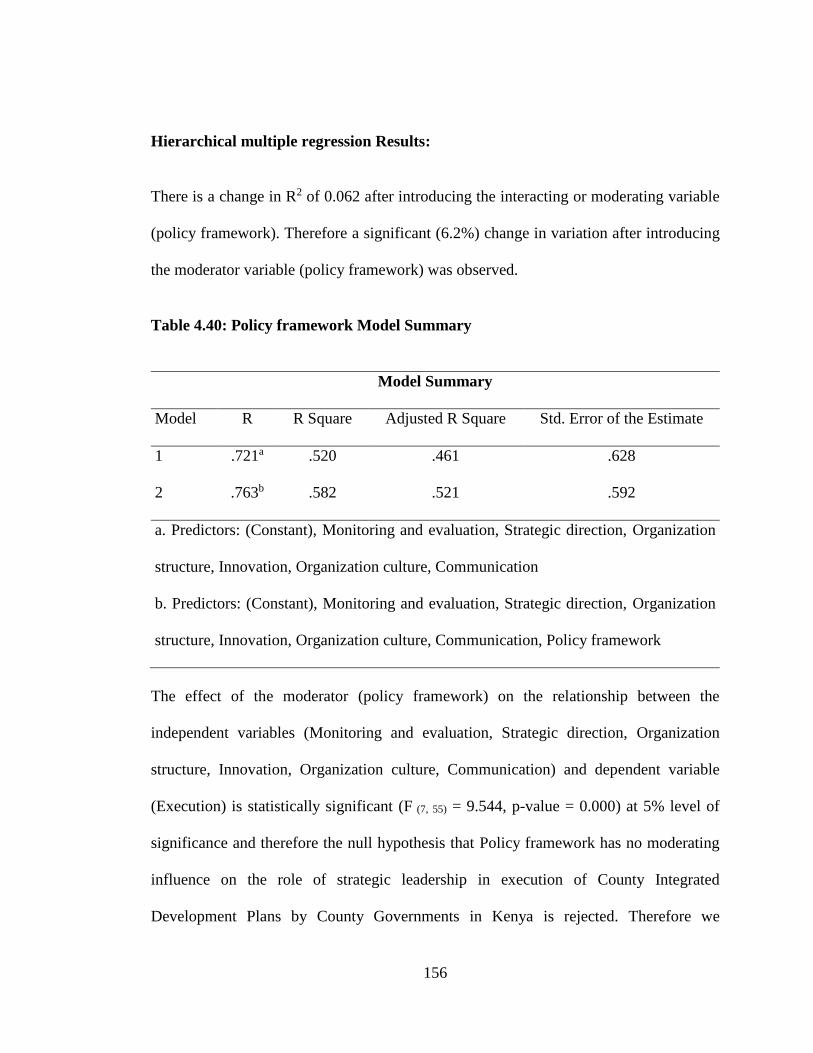
156
Hierarchical multiple regression Results:
There is a change in R2 of 0.062 after introducing the interacting or moderating variable
(policy framework). Therefore a significant (6.2%) change in variation after introducing
the moderator variable (policy framework) was observed.
Table 4.40: Policy framework Model Summary
Model Summary
Model R R Square Adjusted R Square Std. Error of the Estimate
1 .721a .520 .461 .628
2 .763b .582 .521 .592
a. Predictors: (Constant), Monitoring and evaluation, Strategic direction, Organization
structure, Innovation, Organization culture, Communication
b. Predictors: (Constant), Monitoring and evaluation, Strategic direction, Organization
structure, Innovation, Organization culture, Communication, Policy framework
The effect of the moderator (policy framework) on the relationship between the
independent variables (Monitoring and evaluation, Strategic direction, Organization
structure, Innovation, Organization culture, Communication) and dependent variable
(Execution) is statistically significant (F (7, 55) = 9.544, p-value = 0.000) at 5% level of
significance and therefore the null hypothesis that Policy framework has no moderating
influence on the role of strategic leadership in execution of County Integrated
Development Plans by County Governments in Kenya is rejected. Therefore we
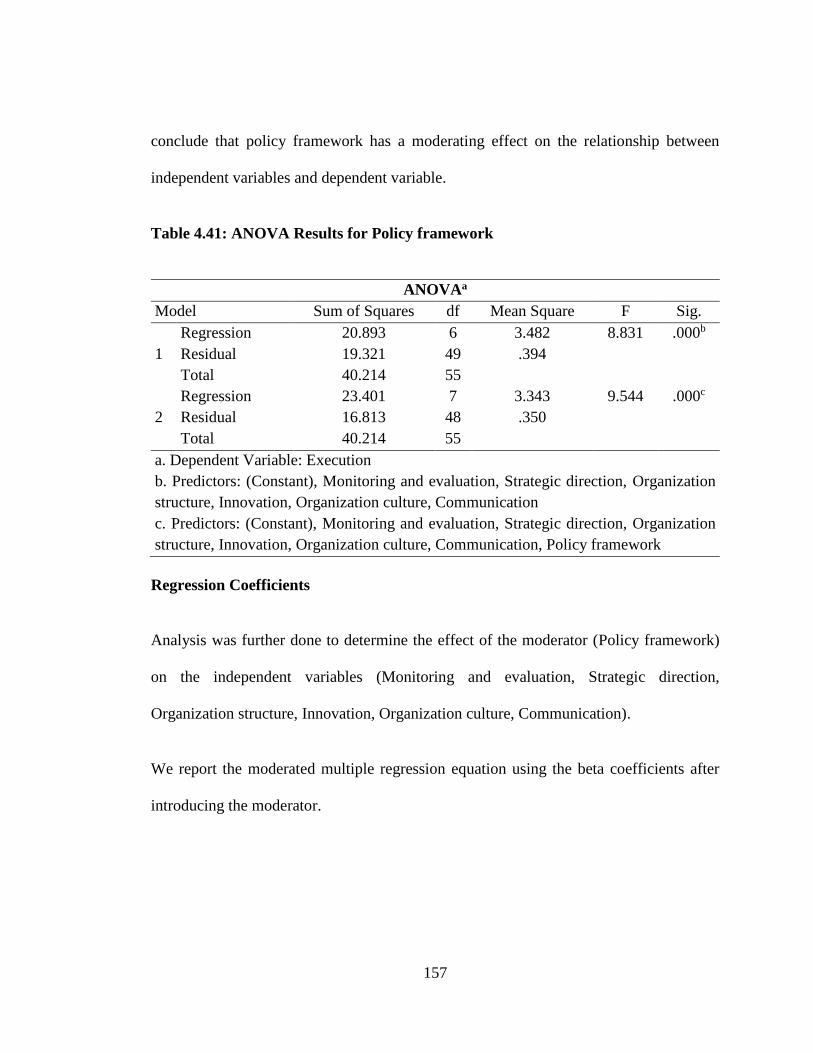
157
conclude that policy framework has a moderating effect on the relationship between
independent variables and dependent variable.
Table 4.41: ANOVA Results for Policy framework
ANOVAa
Model Sum of Squares df Mean Square F Sig.
1
Regression 20.893 6 3.482 8.831 .000b
Residual 19.321 49 .394
Total 40.214 55
2
Regression 23.401 7 3.343 9.544 .000c
Residual 16.813 48 .350
Total 40.214 55
a. Dependent Variable: Execution
b. Predictors: (Constant), Monitoring and evaluation, Strategic direction, Organization
structure, Innovation, Organization culture, Communication
c. Predictors: (Constant), Monitoring and evaluation, Strategic direction, Organization
structure, Innovation, Organization culture, Communication, Policy framework
Regression Coefficients
Analysis was further done to determine the effect of the moderator (Policy framework)
on the independent variables (Monitoring and evaluation, Strategic direction,
Organization structure, Innovation, Organization culture, Communication).
We report the moderated multiple regression equation using the beta coefficients after
introducing the moderator.
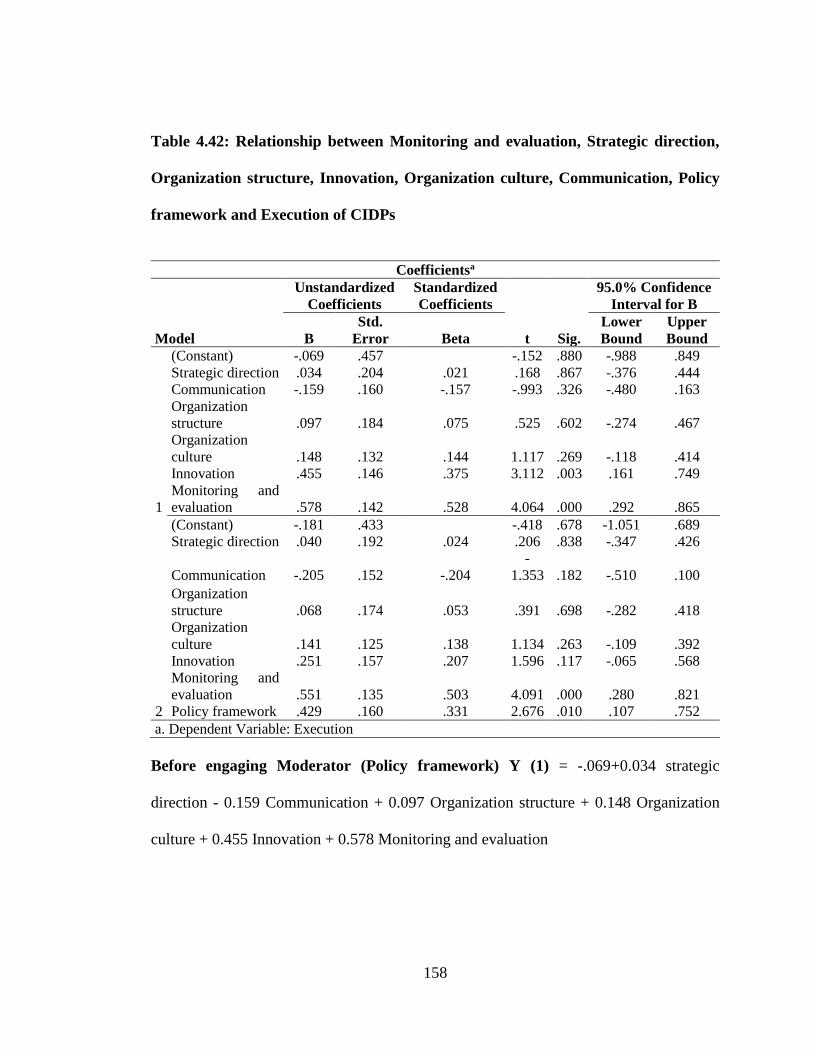
158
Table 4.42: Relationship between Monitoring and evaluation, Strategic direction,
Organization structure, Innovation, Organization culture, Communication, Policy
framework and Execution of CIDPs
Coefficientsa
Model
Unstandardized
Coefficients
Standardized
Coefficients
t Sig.
95.0% Confidence
Interval for B
B
Std.
Error Beta
Lower
Bound
Upper
Bound
1
(Constant) -.069 .457 -.152 .880 -.988 .849
Strategic direction .034 .204 .021 .168 .867 -.376 .444
Communication -.159 .160 -.157 -.993 .326 -.480 .163
Organization
structure .097 .184 .075 .525 .602 -.274 .467
Organization
culture .148 .132 .144 1.117 .269 -.118 .414
Innovation .455 .146 .375 3.112 .003 .161 .749
Monitoring and
evaluation .578 .142 .528 4.064 .000 .292 .865
2
(Constant) -.181 .433 -.418 .678 -1.051 .689
Strategic direction .040 .192 .024 .206 .838 -.347 .426
Communication -.205 .152 -.204
-
1.353 .182 -.510 .100
Organization
structure .068 .174 .053 .391 .698 -.282 .418
Organization
culture .141 .125 .138 1.134 .263 -.109 .392
Innovation .251 .157 .207 1.596 .117 -.065 .568
Monitoring and
evaluation .551 .135 .503 4.091 .000 .280 .821
Policy framework .429 .160 .331 2.676 .010 .107 .752
a. Dependent Variable: Execution
Before engaging Moderator (Policy framework) Y (1) = -.069+0.034 strategic
direction - 0.159 Communication + 0.097 Organization structure + 0.148 Organization
culture + 0.455 Innovation + 0.578 Monitoring and evaluation
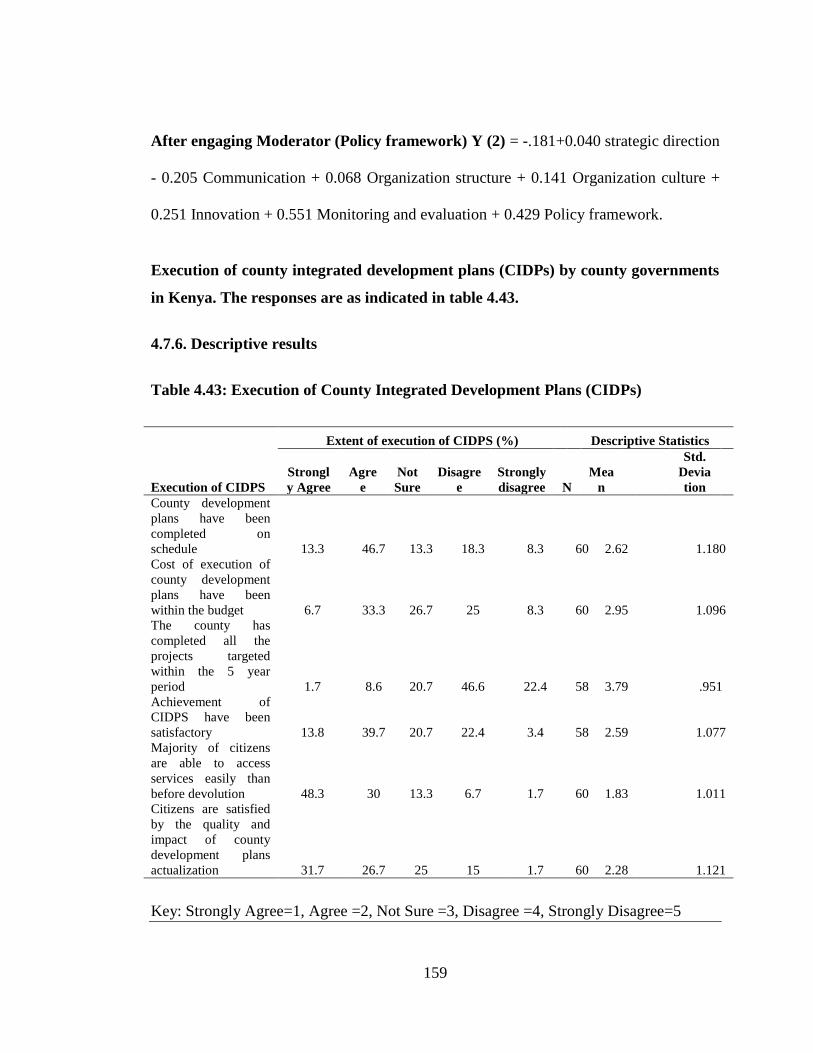
159
After engaging Moderator (Policy framework) Y (2) = -.181+0.040 strategic direction
- 0.205 Communication + 0.068 Organization structure + 0.141 Organization culture +
0.251 Innovation + 0.551 Monitoring and evaluation + 0.429 Policy framework.
Execution of county integrated development plans (CIDPs) by county governments
in Kenya. The responses are as indicated in table 4.43.
4.7.6. Descriptive results
Table 4.43: Execution of County Integrated Development Plans (CIDPs)
Execution of CIDPS
Extent of execution of CIDPS (%) Descriptive Statistics
Strongl
y Agree
Agre
e
Not
Sure
Disagre
e
Strongly
disagree N
Mea
n
Std.
Devia
tion
County development
plans have been
completed on
schedule 13.3 46.7 13.3 18.3 8.3 60 2.62
1.180
Cost of execution of
county development
plans have been
within the budget 6.7 33.3 26.7 25 8.3 60 2.95
1.096
The county has
completed all the
projects targeted
within the 5 year
period 1.7 8.6 20.7 46.6 22.4 58 3.79
.951
Achievement of
CIDPS have been
satisfactory 13.8 39.7 20.7 22.4 3.4 58 2.59
1.077
Majority of citizens
are able to access
services easily than
before devolution 48.3 30 13.3 6.7 1.7 60 1.83
1.011
Citizens are satisfied
by the quality and
impact of county
development plans
actualization 31.7 26.7 25 15 1.7 60 2.28
1.121
Key: Strongly Agree=1, Agree =2, Not Sure =3, Disagree =4, Strongly Disagree=5
160
The responses in table 4.43 indicates that five items had a standard deviation of more
than 1.0 which shows there were extreme in the scoring. The highest standard deviation
was 1.180 and a mean score of 2.62. In the item ‘County development plans have been
completed on schedule.’ (46.7%) of the respondents agree, while (13.3%) strongly agree
with the statement and (13.3%) are not sure. Further, (18.3%) disagree and (8.3%)
strongly disagree. This shows that the respondents were spread to the positive and to the
negative hence the high standard deviation witnessed. However the results depicts that
one item had a standard deviation of less than 1.0 which shows that there were no
extreme scoring hence the items were good measure. The item, ‘The County has
completed all the projects targeted within the 5 year period,’ had the lowest standard
deviation of 0.951 and a mean of 3.79. The responses indicate that (1.7%) and (8.6%)
strongly agree and agree respectively with the statement. Majority of the respondents
(46.6%) disagree and (22.4%) strongly disagree with the statement while (20.7%) were
not sure if the counties had completed all the projects targeted within the 5 year period.
On the statement as to whether cost of execution of county integrated development plans
have been within the budget a mean of 2.95 and a standard deviation of 1.096 were
recorded where a (40.0%) responded in the affirmative, (26.7%) were not sure and a
third (33.3%) disagreed. Achievement of CIDPs have been satisfactory had a standard
deviation of 1.077 and a mean of 2.59 where majority of the respondents (53.5%) agreed
while (25.8%) of the respondents disagreed and (20.7%) said that they were not sure.
161
Further on second last statement that majority of citizens are able to access services
easily than before devolution a mean of 1.83 and a standard deviation of 1.011 were
observe and a majority (78.3%) of the respondents agreed with the statement while only
(8.4%) who disagreed. However, (13.3%) of the respondents were not sure if majority of
citizens are able to access services easily than before devolution. Lastly, on the
statement that citizen are satisfied by the quality and impact of county development
plans actualization a mean of 2.28 and a standard deviation of 1.121 were observed
where a majority of those who responded agreed with the statement at (58.4%) while
(16.7%) disagreed and (25.0%) indicated that they were not sure as to whether citizen
are satisfied by the quality and impact of county development plans actualization.
In summary, the findings indicate that half of the respondents agreed with all the six
statements that County development plans have been completed on schedule and that
cost of execution of county development plans have been within the budget. That the
counties have completed all the projects targeted within the 5 year period and
Achievement of CIDPs has been satisfactory. Majority of citizens are able to access
services easily than before devolution and finally Citizens are satisfied by the quality
and impact of county development plans actualization.
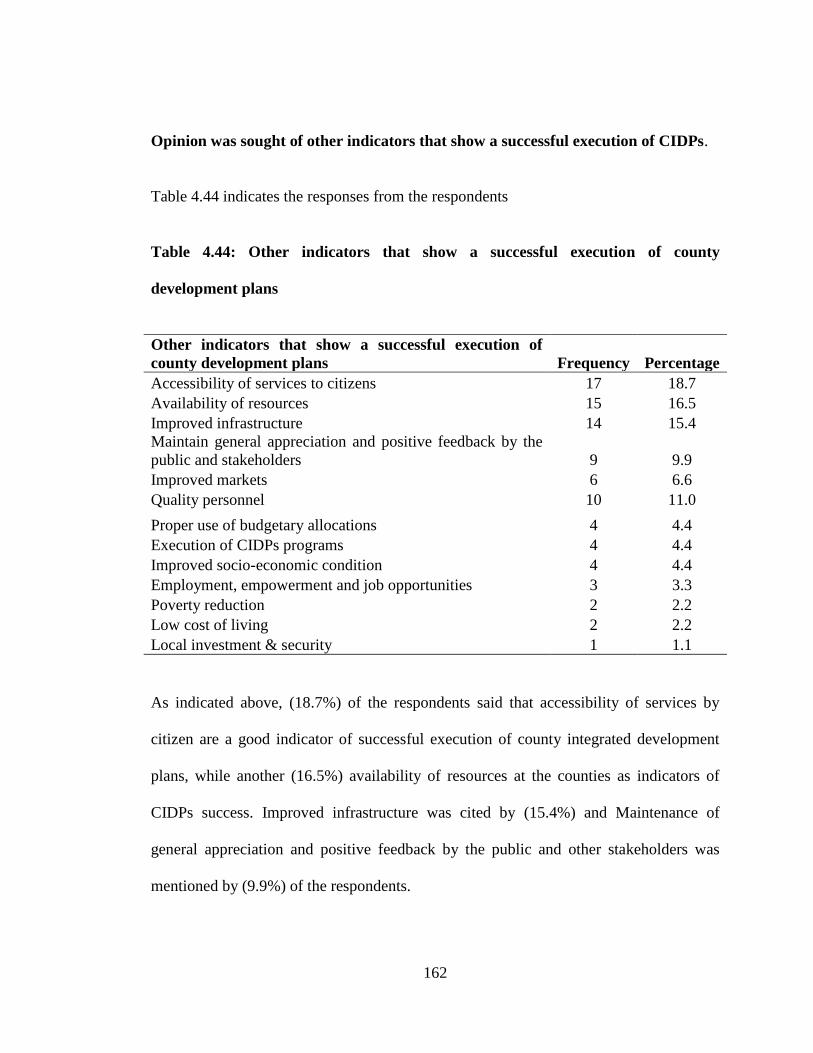
162
Opinion was sought of other indicators that show a successful execution of CIDPs.
Table 4.44 indicates the responses from the respondents
Table 4.44: Other indicators that show a successful execution of county
development plans
Other indicators that show a successful execution of
county development plans Frequency Percentage
Accessibility of services to citizens 17 18.7
Availability of resources 15 16.5
Improved infrastructure 14 15.4
Maintain general appreciation and positive feedback by the
public and stakeholders 9 9.9
Improved markets 6 6.6
Quality personnel 10 11.0
Proper use of budgetary allocations 4 4.4
Execution of CIDPs programs 4 4.4
Improved socio-economic condition 4 4.4
Employment, empowerment and job opportunities 3 3.3
Poverty reduction 2 2.2
Low cost of living 2 2.2
Local investment & security 1 1.1
As indicated above, (18.7%) of the respondents said that accessibility of services by
citizen are a good indicator of successful execution of county integrated development
plans, while another (16.5%) availability of resources at the counties as indicators of
CIDPs success. Improved infrastructure was cited by (15.4%) and Maintenance of
general appreciation and positive feedback by the public and other stakeholders was
mentioned by (9.9%) of the respondents.
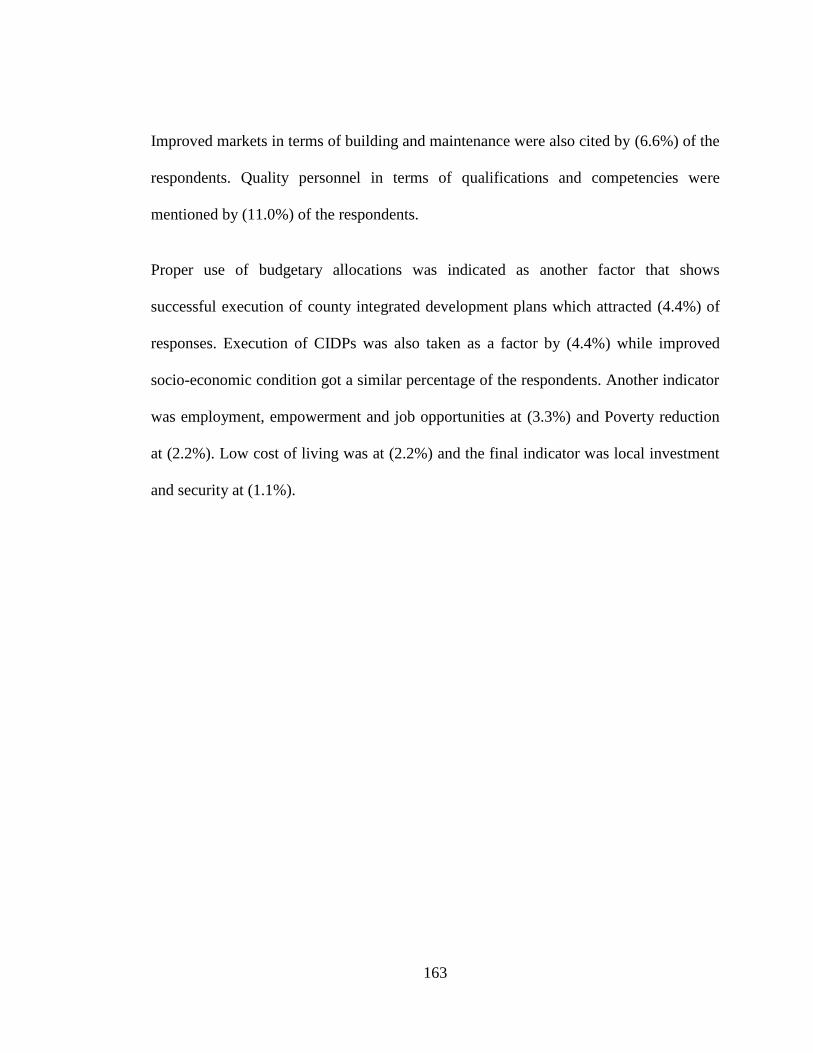
163
Improved markets in terms of building and maintenance were also cited by (6.6%) of the
respondents. Quality personnel in terms of qualifications and competencies were
mentioned by (11.0%) of the respondents.
Proper use of budgetary allocations was indicated as another factor that shows
successful execution of county integrated development plans which attracted (4.4%) of
responses. Execution of CIDPs was also taken as a factor by (4.4%) while improved
socio-economic condition got a similar percentage of the respondents. Another indicator
was employment, empowerment and job opportunities at (3.3%) and Poverty reduction
at (2.2%). Low cost of living was at (2.2%) and the final indicator was local investment
and security at (1.1%).
164
Opinion was sought of other factors not captured in the document that affects
execution of CIDPs
Table 4.45 indicates the responses from the respondents.
Table 4.45: Other factors not captured in this document that affects execution of
CIDPs
Other factors not captured in this document that affects
execution of CIDPS Frequency Percentage
Budget constraints 11 17.2
Non-Cooperating county assemblies 7 10.9
Delay in release of funds 6 9.4
Unforeseen circumstances 6 9.4
Proper training 5 7.8
Wrong priority projects captured in the CIDP 5 7.8
Good leadership 4 6.3
Set goals and objectives 6 4.7
Clear communication 3 4.7
Community participation in county development agenda not
productive 3 4.7
Motivation of employees 3 4.7
Cultural practices 2 3.1
Human resource policies 2 3.1
Lack of proper ownership 1 1.6
Media awareness 1 1.6
Limited time frame 1 1.6
Performance of staff 1 1.6
Table 4.45 shows that (17.2%) of the respondents indicated that budget constraints as a
factor has not been captured and it affects the execution of county integrated
development plans. Non-cooperation of county assemblies at (10.9%) was mentioned by
the respondents as a factor that affects the execution of CIDPs.
165
Funds release delays was also a factor at (9.4%) and unforeseen circumstances were
cited at (9.4%) too. Factors like proper training was indicated by (7.8%) of the
respondents while wrong priority projects are captured in the CIDPs at (7.8%).
Motivation of employees and cultural practices were cited by (4.7%) and (3.1%)
respectively. Human resource policies were mentioned by (3.1%) and lack of proper
ownership at (1.6%).Media awareness was a factor cited by (1.6%) of the respondents as
a factor not captures that affect the execution of county integrated development plans.
Limited time was also a factor cited by (1.6%) of the respondents and performance of
staff was cited by (1.6%) of the respondents.

166
CHAPTER FIVE
SUMMARY, CONCLUSION AND RECOMMENDATIONS
5.1 Introduction
This chapter presents summary of the findings of the research and conclusion as per the
study objectives. The chapter further puts across the recommendations and areas for
further research as per the findings. The study sought to establish the role of strategic
leadership on execution of county integrated development plans by county governments
in Kenya.
5.2 Summary
5.2.1 Specific Objective 1: To determine the role of envisioning in execution of
County Integrated Development Plans by County Governments in Kenya.
It was hypothesized that envisioning had no significant role in execution of county
integrated development plans by county governments in Kenya. The findings showed
that there was indeed a significant relationship between envisioning and execution since
the coefficients of envisioning (strategic direction) and communications were
statistically greater than zero. The results are consistent with Anyieni and Areri (2016)
that communication style influences success in execution of strategic plans. The results
further agree with Mugoi (2015) that challenges in communication affect strategy
execution. This indicated that envisioning had a positive influence on execution of
county integrated development plans and hence the hypothesis that envisioning had

167
significantly no role in execution of county integrated development plans by county
governments in Kenya was rejected.
The findings are in agreement with Odita and Bello (2015) whose study revealed that
strategic direction positively and significantly relates to organization performance and it
is found in the mission and vision and objectives.Makori (2014) further collaborates that
mission and vision provides direction, discovery and destiny for the organization.The
findings revealed that envisioning positively influences the execution of county
integrated development plans by county governments in Kenya. The results of the
Pearson product moment correlation coefficient indicated a moderate and significant
linear correlation between envisioning and execution of county integrated development
plans by county governments in Kenya. The results of Analysis of Variance (ANOVA)
on Envisioning versus Execution indicated that there was a positive and significant
relationship between envisioning and execution of county integrated development plans.
5.2.2 Specific Objective 2: To analyse the effect of institutionalization of programmes
in execution of county integrated development plans by county governments in Kenya.
It was hypothesized that institutionalization of programmes had no significant effect in
execution of county integrated development plans by county governments in Kenya. The
results of Analysis of Variance (ANOVA) on institutionalization versus execution
indicated that there was a positive and significant relationship between
institutionalization and execution of county integrated development plans. The results
showed that strategic leaders use of institutionalization (organization culture and
organization structure) as a factor of strategic leadership had a significant role in the

168
execution of county integrated development plans by county governments in Kenya.
This is in agreement with studies done by Bolo, Wandera, Imaita and K’Obonyo (2010)
found that the structure of the organization plays an integral role in the execution of
strategy. The findings also are in agreement with Waiganjo et. al., (2017) who carried
out a study on the impact of organizational structure on strategy implementation by
county governments in Kenya which revealed that organization structure has a
recognizable effect on their strategy execution.Further,the results agree with Abass et.
al.,(2017) that organization structure influences execution of the strategic plans of
county governments in Kenya. On organization culture, the results are supported by
study by Abass et. al., (2017) that organization culture influences execution of strategic
plans of county governments in Kenya. The results are also echoed by Mwachibibo
(2017) who argued that organizational culture-strategy alignment is a priority during
strategy formulation as well as during strategy execution phase.
The results equally resonated well with findings on organizational culture influence in
implementation of strategic plans in Lake Victoria Water Services Board by Khatoya
(2014).The hypothesis that institutionalization significantly had no effect in execution of
county integrated development plans by county governments in Kenya was rejected.
The findings revealed that institutionalization of programmes positively influenced the
execution of county integrated development plans by county governments in Kenya. The
results of the Pearson product moment correlation coefficient indicated a positive and
significant correlation between institutionalization of programmes and execution of
county integrated development plans by county governments in Kenya. The results

169
indicated that institutionalization of programmes explains nineteen per cent of the
variation in execution of county integrated development plans by county governments in
Kenya. County governments should put more emphasis on the type of culture that is in
tandem with the strategic plans in place for smooth execution of these plans.
5.2.3 Specific Objective 3: To explore the role of innovation in execution of county
integrated development plans by county governments in Kenya.
It was hypothesized that innovation had no significant role in execution of county
integrated development plans by county governments in Kenya. Results indicated that
Innovation significantly influenced the execution of County Integrated Development
Plans. Null hypothesis that innovation does not significantly have a role in execution of
county integrated development plans by county governments in Kenya was therefore
rejected .Thus Innovation was major determinant in the execution of county integrated
development plans.
The Pearson Correlation of Innovation versus Execution of County Integrated
Development Plans showed a moderate significant and positive relationship between
Innovation and Execution of county integrated development plans. It can therefore be
affirmed of the existence of a moderate and positive linear relationship between the two
variables, namely innovation and execution.
The descriptive findings indicated that counties had embraced innovation that supports
execution of counties development plans by introducing new strategies on service
delivery. Further, much use of social media platform to engage stakeholder had been
170
employed. Strong engagement of collaboration with universities and other stakeholders
for better service delivery had been acknowledged.
The results of coefficient of determination R square indicated that thirty per cent of the
variation in the response to execution of county integrated development plans was
explained by innovation. It was an indication that counties should embrace innovation
for execution of service delivery through the county integrated development plans
(CIDPs) to be efficient and effective. The findings concurred with those of Maina (2016)
who found a variation of (49.2%) in service delivery by county governments in Kenya to
be made up of factors of innovativeness, awareness and organization capability. Ross
and Horenkamp (2007) as cited by Maina (2016) agreed with the findings that service
delivery innovation was a continuous process which must be adopted by organizations in
developing new products and services.
5.2.4 Specific Objective 4: To analyse the role of monitoring and evaluation in
execution of county integrated development plans by county governments in Kenya.
It was hypothesized that monitoring and evaluation had no significant role in execution
of county integrated development plans by county governments in Kenya. The findings
on the individual coefficients showed that there was a significant relationship between
monitoring and evaluation and execution of county integrated development plans as
coefficient of monitoring and evaluation was statistically greater than zero. Monitoring
and evaluation significantly influenced the execution of County Integrated Development
Plans. Null hypothesis that monitoring and evaluation does not significantly have a role

171
in execution of county integrated development plans by county governments in Kenya
was rejected.
The results of the Pearson Correlation of Monitoring & Evaluation versus Execution of
County Integrated Development Plans (CIDPs) revealed a moderate, significant and
positive relationship between Monitoring & Evaluation and Execution of county
integrated development plans. There was therefore existence of a moderate and positive
linear relationship between the two variables, namely Monitoring and Evaluation and
execution. This is in agreement with McCoy (2005) who said that evaluation provides an
assessment of the effectiveness of the project in realization of the goal and the relevance
& sustainability of the projects in progress.
The results of coefficient of determination showed a third of the variation in the
response to execution of county integrated development plans was explained by
monitoring and evaluation. Effective monitoring and evaluation enhances the project
management decision making process at the execution hence positive impact on
implementation of project (Gyorkos, 2003, Crawford and Bryce, 2003). Counties are
expected to have robust teams of monitoring and evaluation in place and which are
independent from the executive in order to ensure that funds allocated from the national
government are used for the intended purposes-service delivery to the grassroots.
172
5.2.5 Specific Objective 5: To establish the moderating influence of policy
framework on the role of strategic leadership in execution of County Integrated
Development Plans by County governments in Kenya.
It was hypothesized that there was no moderating influence of policy framework in
execution of county integrated development plans by county governments in Kenya.
A moderated multiple regression (MMR) was carried out and results showed that there
was a change in R2 of 0.062 after introducing the interacting variable (policy
framework). Therefore there was a remarked (6.2%) change in variation after
introducing the moderator variable.
The effect of the moderator on the relationship between the independent variables
(Monitoring and evaluation, Strategic direction, Organization structure, Innovation,
Organization culture, Communication) and dependent variable (Execution) was
statistically significant and therefore the null hypothesis that Policy framework had no
moderating influence in execution of County Integrated Development Plans by County
Governments in Kenya was rejected. Therefore we conclude that policy framework had
a moderating effect on the relationship between independent variable and dependent
variable.
5.3 Conclusions
The research findings informed on the role of strategic leadership on execution of county
integrated development plans in county governments in Kenya as explained below:

173
Envisioning which had strategic direction and communication as sub-variables was
found to have a significant relationship with execution of county integrated development
plans. Communication significantly influenced the execution of County Integrated
Development Plans while strategic direction did not have a significant influence. The
most preferred mode of communication between the management and the staff across
the five counties were notices and memos. Communication should be one factor to be
enhanced for better execution of County Integrated Development Plans.
Results further revealed that institutionalization had a positive influence on execution of
county integrated development plans. Organization culture significantly influenced the
execution of County Integrated Development Plans and Organization structure did not.
We can therefore say Culture is a strategic factor in the execution of county strategic
plans and hence counties should give more attention to the type of culture that would
ensure performance other than giving too much time and resources to organization
structures like building expensive structures and also having complicated reporting
structures which slows down the execution of strategic plans.
Results indicated that innovation had a coefficient of determination of thirty per cent of
the variation in the response to execution of county integrated development plans.
Innovation should therefore be embraced by counties in order to drive the execution of
the county integrated development plans through creating an environment conducive for
innovation.

174
Monitoring and evaluation was found to be a key component for successful execution of
county integrated development plans. The coefficient of determination indicated that a
third of the variation in the response to execution of county integrated development
plans was explained by monitoring and evaluation. Counties should take monitoring and
evaluation as one of the key drivers in the execution of county integrated development
plans. County will be able to monitor and evaluate the impact their projects are
impacting on the ground and they will be able to account to different government
agencies and the public at large.
Policy framework was found to be significant in the relationship between the strategic
leadership variables and the execution of county integrated development plans by county
governments in Kenya. Results revealed that a majority of respondents agreed that
policy framework had enhanced execution of county integrated development plans. A
need to increase PMF Act 2012 development threshold from thirty percent to a higher
percentage was indicated by the majority of the respondents. County assemblies were
cited as the major stumbling block of execution of county integrated development plans
by counties. The different agencies which are entrusted with the smooth running of the
devolved governments should work in harmony in order for the final beneficiary (the
citizens) benefit from the county integrated development plans. National Assembly
should allocate and Treasury to release funds on time and the Senate whose mandate is
oversight should ensure it does its work professionally and effectively. County
assemblies should pass county bills for the smooth running of the counties without
threats to the executive about impeachments.

175
5.4 Study’s Contribution to Theory
The study added knowledge on the role of strategic leadership from the context of
devolved system of governance. This relationship between the role of strategic
leadership and execution of county integrated development plans in Kenya provides a
significant contribution to the strategic leadership literature. The knowledge achieved
from the findings confirms the role of strategic leadership in execution of county
integrated development plans, hence counties service delivery studies. The findings have
also contributed on the role of strategic leader in relation to strategic leadership practices
namely strategic direction determination, communication, determining organisation
structure and culture, innovation and monitoring and evaluation. The study established
specifically the extent to which these variables influenced the execution of county
integrated development plans by county governments in Kenya. Therefore, the findings
have bridged the knowledge gap on the lack of this kind of undertaking in county
governments in Kenya.
176
5.5 Recommendations
Recommendations to Researchers
The results of this study provide valuable insights on the role of strategic leadership on
the execution of county integrated development plans by county governments in Kenya.
Strategic leadership identified components were strategic direction determination,
communication, determining organisation structure and organisation culture, innovation
and monitoring &evaluation. Innovation and monitoring evaluation were found to have a
significant influence to the execution of county integrated development plans.
Organisation structure was however not found to significantly influence the
implementation of county integrated development plans. Communication had a
significant influence. Policy framework which was the moderating variable had a
significant effect between the role of strategic leadership and execution of county
integrated development plans. The research recommends more studies on the role of
strategic leadership in other public institutions mandated to offer services to citizens and
engaging organisation structure as one of the variables.
5.5.1 Macro Level-Government of Kenya
The findings of this study informs the researcher that county governments in Kenya
should adopt strategic leadership style of management in the execution of county
integrated development plans. Envisioning was found to have a significant influence on
the execution of county integrated development plans. Communication significantly
influenced the execution of county integrated development plans while strategic
177
direction did not significantly influence the implementation of county integrated
development plans. National government and county governments should therefore have
strategies meant to make communication between and among different agencies easy
with less government red tapes. This would ensure that decision are made and
communicated easily and efficiently.
Institutionalization as a component whose sub-variables were organisation culture and
organisation structure, only organisation culture significantly influenced the execution of
county integrated development plans. Culture that promotes the execution of county
integrated development plans should be encouraged in order to enhance cohesion,
improve morale, integrity among and between the implementers of strategic plans.
Organisation structure should therefore not be given more prominence than the culture.
Further, the study results indicated that innovation had a significant positive impact in
the implementation of county integrated development plans and hence the national
government parent ministry for devolution should budget for more resources for
innovations that are meant to enhance the execution of county integrated development
plans.
The study also found out that monitoring and evaluation had an equally significant
impact in the execution of county integrated development plans. This call for more
resources in terms of funding and engagement of staff with requisite qualifications for
better accountability of resources devolved in counties which are billions of shillings.
Monitoring and evaluation is a key exercise that need to be given more attention during
the execution of projects both for the national and county governments in Kenya. Lastly,
178
Policy framework which was a moderating variable between the role of strategic
leadership and execution of county integrated development plans had a significant
impact in the execution of county integrated development plans by county governments
in Kenya. Therefore, Policy framework which entailed inter-governmental relations and
Public finance management should be enhanced for better execution of county integrated
development plans through consultation and collaboration.
5.5.2 County Governments
Execution of county integrated development plans by county governments calls for
leadership that is strategic in nature. It is a leadership that will be able to share its
mission and vision with its followers and also it is an innovative and results-oriented
leadership. Devolution cardinal aim is to ensure that services are availed as close as
possible to the citizens and strategic leadership is made up of most of the ingredients
needed for the mission and vision of service delivery through county integrated
development plans be actualized .County governments need to nurture a culture that is
all inclusive in order for all implementers of strategic plans are reading from the same
script-vision.
Communication was found to be a key component in the execution of the strategic plans.
Counties should therefore invest in ways and means of ensuring the existence of an
efficient and effective system of communication in the counties- having clear hierarchy
of communication and prompt feedback for quick decision making.
179
Innovation was found to be a very key factor in the execution of county integrated
development plans. County governments should come up with innovative strategies
unique to their environment by or through collaborations with universities and research
agencies. They could also explore the collaborating with different counties for what they
could provide at a cheaper price and vice versa-use of comparative advantage.
Innovative staff should be encouraged through providing them with funds-hence need
for counties to set aside research and development funds.
Monitoring and evaluation should be taken as a key activity for the counties by having
qualified staff and resources allocated to the department. This would ensure that all
projects being executed are monitored and evaluated and therefore money being misused
will be a thing of the past since there will be staff assigned and they are held accountable
should funds be deviated from the intended projects. Also monitoring and evaluation
staff should be independent of the executive for them to work without fear of
intimidation from the executive.
5.5.3 Areas of Further Research
The study investigated the role of strategic leadership on the execution of county
integrated development plans by county governments in Kenya. Service delivery was
found to experience a myriad of constraints for example budget constraints and hence
derailing the execution of county integrated development plans. A research on how
counties could explore other revenue generating activities could be carried out to bridge
the budget deficit challenges being experienced. A research on the relationship between

180
the County executive and County Assemblies on execution of county integrated
development plans could also be viable since county assemblies were cited as being a
stumbling block to the execution and hence service delivery.
181
REFERENCES
Abass, M.K.Munga, J., &Were, E. (2017).The relationship between Strategy
Implementation and Performance in County Governments of Kenya: A case
study of Wajir County Government. International Academic Journal of
Human Resource and Business Administration,2(3),381-401.
Abok, A.M. (2013). Factors Affecting Effective Implementation of Strategic Plans in
Non- Governmnetal Organizations in Kenya. Unpublished PhD Thesis, Juja:
Jomo Kenyatta University of Agriculture and Technology.
Abudho-Riwo,M.,Njanja,L. & Ochieng,T.(2012).The role of strategic leadership during
change:KCA University Journal of Business Management,4,48-61.
Abuya,B.A.(2011).Implementation of Strategic Plans Challenges at the Action Aid
Kenya,Unpublished MBA Thesis,University of Nairobi.
Ahmadi,S.A.,Salamzadeh,Y., Daraei,M., & Akbari,J.(2012).Relationship between
organisation culture and Implementation of strategic plans:Typologies and
Dimensions:Global Business and Management Research:An International
Journal,4(3-4),286-299.
Aksoy,M.,Apak,S., Eren,E., & Korkmaz,M.(2014).Analysis of the effects of
organisational learning-based organisational culture on performance,job
182
satisfaction and efficiency.A field study in the banking sector.International
Journal of Academic Research,6(1)301-313.
Anyieni,A.G., &Areri,D.K.(2016).Assessement of the Factors Influencing the
Implementation of Strategic Plans in Secondary Schools in Kenya.Journal of
Education and Practice,7(16),1-8.
Armstrong, M. (2001). A Hand book of Human Resource Management Practice,
London: Kogen Page.
Arsovski, S., & Arsovski, Z. (2012). Management’s challenge for quality improvement.
Challenges of quality management, 11-30.
Baker, B.N., Murphy, D.C. & Fisher, D. (1988). Factors affecting project success In:
Cleland DI, King WR, editors. Project management handbook. (2nd ed.).
New York: John Wiley.
Bass, B.M. (1990). From Transactional to Iransformational Leadership : Learning to
Share the Vision. Organizational Dynamics, 18(3), 19–32.
Berry, L.M. (2010). Examining Turnover Intent: Examining the Effect of Employee
Engagement, Compensation Fairness, Job Satisfaction and Age:
Unpublished PhD Thesis. Tennessee: Tennessee University.
Boal, K.B., & Hooijberg, R. (2001). Strategic Leadership: Moving on. Leadership
Quarterly, 11(4), 515-550.
183
Boal, K.B., & Schultz, P.L. (2007). Storytelling, Time, and Evolution: The Role of
Strategic Leadership in Complex Adaptive Systems. Leadership Quarterly,
18(4), 411–428. https://doi.org/10.1016/j.leaqua.2007.04.008
Bogopane,L.(2014).A qualitative exploratory analysis of the impact of perceived erosion
of the politics administration dichotomy on good governance and service
delivery in a democratic developmental state:South African
perspective.European Scientific Journal,211-222.
Bossody,L. & Charan,R.,(2011).Execution the Discipline of getting Things done.(2nd
ed.).London:Random house business books.
Burnes,B.(2007).Managing change a Strategic approach to organizational dynamics ( 4th
Ed.).Cambridge:Prentice Hall.
Boyd, B. K. (1991). Strategic planning and financial performance: a meta‐analytic
review. Journal of management studies, 28(4), 353-374.
Brenes,E.R., Mena,M., & Molina,G.E.(2008).Key Success Factors for Strategy
Implementation in Latin Ameriva.Journal of Business Research,61(6),590-
598.
Brent, D., & Barbara J.D.(2012).'The Nature and Dimensions of Strategic leadership’.
International Studies in Educational Administration,38,(1),5-21.
Bryman, A. & Cramer, D. (2011). Quantitative data analysis with IBM SPSS Statistics
184
17, 18 and 19: A guide for social scientists. New York: Routledge.
Budiarso, A. (2014). Improving Government Performance In Indonesia: The Experience
of the Balanced Scorecard in the Ministry of Finance. Unpublished PhD
Dissertation, Canberra: University of Canberra.
Capon, C. (2008).Understanding Strategic management.England: Prentice Hall.
Carter, S.M., & Greer, C.R. (2013).Strategic Leadership: Values, Styles, and
Organisation Performance. Journal of Leadership & Organizational Studies,
20(4), 375-393.
Chandler, A, D, (2002).Strategy and Structure, Cambridge, MA: MIT Press.
Chan, A. (2001). Framework for Measuring Success of Construction Projects Retrieved
from: eprints.qut.edu.au
Chimhanzi, J. (2011).The impact of marketing/HR interactions on Marketing Strategy
Implementation. European Journal of Marketing.38,73-98.
Constitution of Kenya, (2010). Chapter eleven (Cap II). Nairobi: GoK.
Creswell, J.W. (2014). Research Design: Qualitative. Quantitative and Mixed Methods
Approaches, (4th ed.). London: SAGE Publications.
Creswell, J.W. (2015). Basic features of Mixed Methods Research. A concise
Introduction to Mixed Methods Research. Thousand Oaks, CA: SAGE
185
Publications.
Daft, R.L. (2010). The leadership experience. (5th ed.). Cincinnati, Ohio: Cengage
Learning South-Western
Daft, R., Pirola-Merlo, A. (2009).The Leadership experience. Smith Meibourne, Vic.
Cengage Learning.
Damanpour, F., & Evan, W.M. (1984).Organizational innovation and performance: the
problem of 'organizational lag’. Administrative science quarterly,392-409.
Datche, E.A. (2015). Iinfluence of Transformational Leadership on Organizational
Performance of State Corporations in Kenya. Unpublished PhD Thesis. Juja:
Jomo Kenyatta University of Agriculture and Technology.
Dess,G.G., & Priem,R.L.(2011).Consensus-Performance Research:Theoritical and
Empirical Extension:Journal of Management Studies,32,401-417.
Distefano,J.J., & Maznevski,L.M. (2003).Developing global managers integrating
theory,behaviour,data and performance.Advances in Global
Leadership.Oxford UK:Elsevier Science,Ltd.
Donselaar,R. (2012).The organisational drivers and barriers of strategy implementation
within non-profit organisations: A case study at the Netherlands Red
Cross.Graduate Research.The Netherlands:University of Twente.
186
Dubrin, A.J. (2007). Leadership: Research Findings, Practice and Skills, (5th ed.). New
York: Houghton Mifflin Company.
Duru, E.J. (2004). Nigeria Local Government and Rural Development Administration.
Nigeria: Cymarx Ventures.
Eberly, M.B., Johnson, M.D., Hernandez, M., & Avolio, B.J. (2013). An Integrative
Process Model of Leadership: examining loci, mechanisms, and event
cycles. The American Psychologist, 68(6), 427–43.
https://doi.org/10.1037/a0032244
Ekpo, A.H., & Ekpo, A.H. (2008). Decentralization And Service Delivery : Department
of Economics University of Uyo Uyo, Nigeria Prepared for the African
Economic Research Consortium ( AERC ), Nairobi , Kenya October , 2007
Revised April , 2008 The comments by an anonymous referee.
Elenkov,D.,Judge,W., Wright,P.(2005).Strategic leadership and executive innovation
influence:An international multi-cluster Comparative study.Strategic
management Journal,26,665-682.
Emeka, N. H. (2015). The International Journal of Business & Management Effect of
Strategic Planning on Organizational Performance : A Study of Selected
Brewing Firms in Nigeria. Abstract, 3(2), 162–186.
Failing, L., & Gregory, R. (2003). Ten common mistakes in designing biodiversity
187
indicators for 75 forest policy. Journal of Environmental Management, 68,
121 - 132
George, W.N. (2008). The Lived Experience of the Strategic Leader: What Effective
CEOs Do, How they do it and an Exploration into how they think about it.
Gitau, G. (2017, June 29). Nyeri Ranked Last in Uptake of Budget on
Development.Daily [email protected]
Gostick,A.R., & Elton,C., (2007).The Carrot principle:How best managers use
recognition to engage their people,retain talent and accelerate
performance.New York: Free Press.
Hailey, J. (2006). NGO Leadership Development. Praxis Paper, (July). Retrieved from
http://incidenciapolitica.info/biblioteca/DC_068.
Hamel,G. & Prahalad,C.(1989).Strategic intent,Harvard Business Review,67(3),63-76.
Hambrick, D. C. (1989). Guest editor's introduction: Putting top managers back in the
strategy picture. Strat. Mgmt. J., 10, 5–15. doi:10.1002/smj.4250100703.
Hambrick, D.C., & Mason, P.A. (1984). Echelons : of Reflection The Its Organization as
Top a. Management, 9(2), 193–206. https://doi.org/10.2307/258434
Hamm,J.,(2011).Unsually Excellent-The necessary nine skills required for the practice
of great leadership,New York:Jossey-Bass,Wiley.
188
Hair,F., Joseph,K.W., Babin,B.& Anderson,R.(2010).Multivariate Data Analysis: A
Global Perspective.
Harris,A.(2008).Distributed leadership: Developing Leaders for
Tomorrow,London:Routledge Press.
Heide,M., Gronhaug,K., & Johannessed,S.(2002).Exploring barriers to the successful
Implementation of formulated strategy.18(2)217-231.
Hiller,N.A.,DeCHURCH,L.A., Murase,T., & Doty,D.(2011).Searching for outcomes of
leadership: A 25-year review,Journal of Management,37,1137-1177.
Hill,C.W.L., & Jones,G.R.(2008).Strategic Management: An Integrated Approach ( 8th
Ed.).Boston,USA:Houghton Mifflin.
Hitts,M.A.,Ireland,R.D.,&Hoskisson,R.E.(2007).Strategic Management:Competitiveness
and globalization,7th edition,Ohio:Thomson/South Western.
Hitt, M., Ireland, R., & Hiskisson, R. (2003). Strategic Management:Competitiveness
and Globalization ( 5th ed.). Mason:Thomson.
House, R.J. (1997). The Social Scientific Study of Leadership: Quo Vadis? Journal of
Management, 23(June), 409–473.
Hunter, D. (2007). Making Strategy Work New Jersey: Wharton School Publishing
189
Hussey, D. (2008).Strategic management from theory to implementation,4th
edition,Oxford:Butterworth Heinemann.
Ibok, E. (2012). Alternative Sources of Revenue generation for the Development of
Rural Areas in Africa: The Nigerian Experience. Cirds: International
Journals of Social Science, 6(5), 1-11.
Ibok, E. E. (2014). Local governance and service delivery in Nigeria. Caribbean Journal
of Science and Technology, 2, 536-541.
ICJ Kenya, (2013). Handbook on devolution. The Kenyan Section of the International
Commission of Jurists. Nairobi: ICJ.
Ireland, R. D. and M. A. Hitt (1999). "Achieving and maintaining strategic
competitiveness in the 21st century: The role of strategic leadership. The
Academy of Management Executive, 13(1), 43-57.
Ireland, R.D. & Hitt, M.A. (2005).Achieving and Maintaining Strategic Competitiveness
in the 21st Century: The Role of Strategic Leadership. Academy of
Management Executive, 19(4), 63-77.
Ireland, R.D., & Hitt, M.A. (1999). Achieving and Maintaining Strategic
Competitiveness in the 21st Century: The Role of Strategic Leadership.
Academy of Management Executive, 13, 43–57.
Ireland, R.D., & Hitt, M.A. (2005). Achieving and maintaining strategic competitiveness

190
in the 21st century: The role of strategic leadership. Academy of
Management Perspectives, 13(1), 43–57.
ttps://doi.org/10.5465/AME.1999.1567311
James & Green 2005:The leader's role in strategy GRAZIADIO business view.
Jensen,D., Lonergan,S.( Eds.). (2013).Assessing and restoring natural resources in post-
conflict peace building.Routledge.
Jing,F.F., & Avery,G.C.(2008).Where have the mediating variables in leadership
performance research gone?Journal of Business and Economics
Research,6(10),73-84.
Johnson,G., & Scholes, K.(2002).Explaining Corporate Strategy:texts and
cases.Harlow:Prentice Hall.
Joshua,K.W.(2013).Challenges of Strategy Implementation at Kimisitu Sacco
Ltd.Kenya.Unpublished MBA Project.University of Nairobi.
Kagumu,J.G.(2018).Determinants of Implementation of Strategic Plans by County
Governments in Kenya.Jomo Kenyatta University of Agriculture and
Technology.Unpublished PhD Thesis.
Kaplan,R.S.,& Norton,D.P.(2008).The Execution Premium-Linking strategy to
operations for competitive advantage,Harvard Business School Publishing
Corporation.
191
Kariuki, D., Kinyanjui, N. & Misaro, J. (2013). International journal of humanities and
social science socio economic status and participatory development in
Kenya. Retrieved from:www.kenya/law.org/downloads
Ke, W., & Wei, K.K. (2006). Organizational learning process: its antecedents and
consequences in enterprise system implementation. Journal of Global
Information Management, 14(1), 1-22.
Kelly, A.P. & Mark E.B.(2013).Strategic Leadership in the Nonprofit Sector:
Opportunities for Research, Institute of Behavioral and Applied
Management.
Kenya School of Government, (2015). Building Public Participation in Kenya’s
Devolved Government. Working Paper 1 - Overview Note.
Keraro, V. N., & Isoe, H. O. (2015). Good Governance and the Enhancement of
Effective Service Delivery for Accelerated. Economics, 3(3), 18–32.
Khan, N., & Kundi, G. M. (2011). Devolution and political accountability: Some
insights from Pakistan. Journal of Public Administration and Policy
Research, 3(9), 242.
Khayota,O.M. (2014).Critical Analysis of Strategy Implementation on Organization
Performance in Service Delivery: Case of Lake Victoria South Water
Services Board in Kisumu.Vol. 6,No.30,2014.192-208
192
Kibicho,P.M.,(2014).Influence of managerial competence and resource mobilization in
the insurance companies in Kenya.International Journal of Social Sciences
and Entrepreneurship,1 (10), 42-58.
Kirui, J. K. (2017). Role of Transformational Leadership in Organizational
Performance of State-Owned Banks in Kenya, Unpublished PhD
dissertation, Juja: JKUAT).
Kjelin, E. (2009).A Concept Analysis for Strategic Leadership.EBS Review No.26, 37-
57.
Koech, A.K & Were, S. (2016).Factors Influencing Strategy Implementation at the
National Treasury-Kenya: The Strategic Journal of Business & Change
Management,4(15),269-288.
Kotter, B. & Best, H. (2006). Management by Policy: How Companies Focus Their
Total Quality Efforts to Achieve Competitive Advantage, Milwaukee: ASQC
Quality Press.
Korir, S.C.R., Rotich, J., & Bengat, J. (2014). Performance management and public
service delivery in Kenya. European Journal of Research and Reflection in
Management Sciences, 3(4), 42–54.
Korir, V. C. (2013). service delivery challenges affecting devolution of public sector
services in local authorities in Kenya:A case study of Kericho.
193
Kothari, C. (2012). Research Methodology: Methods and Techniques. ( 3rd ed.).New
Delhi: New Age International Publishers Ltd.
Kyriacou, A.P., & Roca-Sagale's, O. (2011).Fiscal and Political decentralization and
government quality. Environment and Planning: Government and Policy,
29,204-223.
Lear, L.W. (2012). The Relationship between Strategic Leadership and Strategic
Alignment in High-Performing Companies in South Africa.
Letting, S. L. (2009). Leadership in Strategic Management: A Theory of Corporate
Governance Emergence. Unpublished PhD Thesis. Nairobi: University of
Nairobi.
Lumpkin,G., & Dess,G.(1996).Clarifying the Entrepreneurial Orientation Construct and
Linking it to performance. Academy of Management Review,21(1) 135-172.
Lynch, R. (2009).Strategic Management (5th Edition).London: Prentice Halls.
Maina, R.A. (2016). Effect of Transformational Stewardship on Service Delivery by
County Governments in Kenya. Unpublished PhD Thesis. Juja: Jomo
Kenyatta University of Agriculture and Technology.
Makanyeza, C., Kwandayi, H.P., & Ikobe, B.N. (2013). Strategies To Improve Service
Delivery In Local Authorities. Retrieved from: researchgate.net
194
Mathews, O. (2015). Operations Strategy And Service Delivery. New York: Pearson
education.
Mauri,M., & Romero,I.(2013).Strategic action for a sustained leadership of the Cuban
biotechnology industry.Biotechnologia Applicada,30,305-310.
Menon,S.,Karl,J., &Wagnaraja,K.(2009).Handbook on Planning,Monitoring And
Evaluating for Development Results.New York:UNDP Evaluation
office,NY.
Mobarak,A., Rajkumar, A., & Cropper,M.(2006).The political economy of health
service provision in Brazil WP S3508.Boulder:University of Colorado.
Muell,R.P.&Cronje,S.,(2008).Strategy Implementation: Overcoming the challenge,
Management Today,12-15.
Mugenda, A. & Mugenda, O. (2008). Research methods: Qualitative and quantitative
approaches. Nairobi: Acts Press.
Mugenda, M. & Mugenda, G. (1999). Research Methods: Quantitative and Qualitative
Approaches. Nairobi: Acts press.
Muhindi, E.W.(2012).Organizational factors affecting adoption of strategic planning
Mission Hospitals in Kiambu County.Unpublished MBA Project.Kenyatta
University.

195
Muriu, A.R. (2013). Decentralization, Citizen Participation and Local Public Service
Delivery, 1–83. https://doi.org/2190-4561
Musyoka,L.W.(2011).Challenges of strategy implementation in Jomo Kenyatta
Foundation.International Journal of Current Research,3(11),301-308.
Mokaya,O.N.(2016).Board Functions.Accountability Practices,Governance Structures
and Performance of County Governments in Kenya.University of Nairobi
PhD Thesi (Unpublished).
Mwongela,E.(2013).Factors affecting strategy implementation at Kenya National Audit
Office,Unpublished MBA Project,Kenyatta University.
Ndunge,W.E.(2014).Strategic leadership and change management practices at the Kenya
Wildlife Services.Unpublished MBA Project.University of Nairobi.
Neilson, G., Martin, K.L., & Powers. (2008).The Secrets to Successful Strategy
Execution. Harvard Business Review 86 (6), 60-70.
Nel, C. (2008).High performing organisations.Unpublished document.Stellenbosch:
University of Stellenbosch.
Nge'the, M.J. (2013). Determinants of Academic Staff Retention in Public Universities in
Kenya. Unpublished PhD Thesis, Jomo Kenyatta University of Agriculture
& Technology.
196
Nthini, E.K. (2013). Effect of Strategic Leadership on the Performance of Commercial
and Financial State Corporations in Kenya. Unpublished MBA Project,
Nairobi: University of Nairobi.
Nyakeriga, C.K. (2015). Factors Influencing Strategic Plan Implementation in the
Newly Established Public Universities in Kenya. Unpublished PhD thesis,
Kitui: SEKU.
Nzyioki J.&Laari M.(2015).Factors Influencing Implementation of Strategic Plans in the
Municipal Council of Machakos,Kenya.International Journal of Art &
Humanity Science,11-21.
Ochanda,R.A.(2010).Challenges of Strategy Implemented at the Kenya Industrial
Estates Limited.Graduate Research Proposal Nairobi:UoN.
Odita, A. & Bello, A. (2015).Strategic Intent and Organisational performance: A Study
of Banks in Asaba Delta State in Nigeria. Information and Knowledge
Management.5(4):60-71.
Okumus, F. (2001). Towards a strategy implementation framework. International
Journal of Contemporary Hospitality Management, 13, 327-338.
Olotana, J.B., & Olomola,P.A.(2015).Analysis of Fiscal Decentralization and Public
Delivery in Nigeria.Journal of Economics and Sustainable Development
6(9).
197
Omboi, B.M., & Mucai, P.G. (2012).Factors affecting the implementation of strategic
plans in government tertiary institutions: A survey of selected technical
training institutes.European Journal of Business and Management.3(3),85-
105.
Oppong, S. (2014). Upper Echelons Theory Revisited: The Need for a Change from
Causal Description to Causal Explanation. Journal of Management, 19(2),
169–183.
Organisation for Economic Cooperation and Development (2005).Oslo
manual:Guidelines for Collecting and Interpreting Innovation Data (
3rd.ed.).Paris OECD.
Oriakhi,D.E.(2006).Public Expenditure and Efficient Service Delivery:An Assessement
of the performance of Sub-National Levels of Government in Nigeria.United
Nations Economic Commission for Africa,9-11.
Ozdem, G. (2011).An Analysis of the Mission and Vision Statements on the Strategic
Plans of Higher Education Institutions. Educational Sciences: Theory and
Practice,11(4),1887-1894.
Paddy, P.O.O. (2014). Monitoring Transition To Devolved Government.
Pearce,J.A. &Robinson,B.R.(2007).Strategic Management:Strategy Formulation and
Implementation.Richard D.IRWIN,INC.Homewood,Illinois 60430.
198
Pettigrew, A.M. (2005). The Character and Significance of Strategy Process Research.
Strategic Management Journal, 13, 5-16.
Polit, D.F. & Beck, C.T. (2008). Nursing Research: Generating and Assessing Evidence
for Nursing Practice. Philadelphia: Lippincott Williams & Wilkins.
Pradeep, H. (2011). Challenges of Local Government Service Delivery: A Case Study of
Matara Municipal Council. Unpublished PhD Dissertation, NSU: NOMA
MPPG Program, NSU.
Prenestini, A., & Lega, F. (2013).Do senior management cultures affect performance?
Evidence from Italian Public healthcare organisations.Journal of Healthcare
Management,58(5),336-351.
Qi, D. (2005).Employee Buy-In.New York:Mclntire-Mills Press
Quigley, T.J., & Garffin, S.D. (2017).Reaffirming the CEO effect is significant and
much larger than chance: A comment on Fitza (2014).Strategic Management
Journal, 38 (3), 793-801.
Raisch,S.& Birkinshaw,J.(2008).Organisational ambidexterity:antecedents,outcomes,and
moderators. Journal of Management,34(3)375-409.
Raymond, L., & Bergeron, F. (2008). Project Management Information Systems: An
Empirical Study of Their Impact on Project Managers and Project Success.
International Journal of Project Management, 26(2), 213-220.
199
Redding. (2002).The capitalistic business system of China and its rational. Asia Pacific
Journal of Management, 19,221-249.
Robbins, S.F. & Judge, T.A. (2007). Organizational Behavior (12th Ed.). New York:
Pearson Education Inc.
Ross, D. & Horenkamp, and M. (2007) .Service Delivery Innovation-Creating client
value and enhancing profitability: The best run business SAP.
Roy, M.P. (1994).Organizations: Rational, Natural, and Open systems, Englewood
Cliffs, N.J: Prentice Hall International.
Ruderman, M.N., Ohlott, P.J., Panzer, K., &Kings’. (2010).Benefits of multiple roles for
managerial women. Academy of Management Journal, 4(5), 369-386.
Saavedra, P.A. (2010).A Study of the Impact of Decentralization on Access to Service
Delivery. Unpublished Doctoral Thesis,Georgia: Georgia State University.
Safarzadeh,T.,Dahghan,E., Pazireh,M., & Pouraskari,F.(2015).Checking the relationship
between strategic leadership, competitive advantage and organizational
performance with meditating role of innovation. International Journal of
Business and Behavioural Science.5 (1), 11-18.
Salum, V.S. (2018).Factors Influencing Implementation of Strategic Plans in Tanzania's
Executive Agencies. Unpublished PhD Thesis, Jomo Kenyatta University of
Agriculture and Technology.
Schein, E.H. (2010). Organizational Culture and Leadership (4th Ed.). New York:
Jossey-Bass Publishers
200
Schreurs, K., (2010).The Strategy Execution Research Report 2009/2010,
Belgium:Performanc Factors.
Sekaran, U. (2010). Research Methods for Business: A skill building approach (5th.
ed.).USA: John Willey & Son's publisher.
Serfontein, J.J., & Hough, J. (2010). The Impact of Strategic Leadership on the
Operational Strategy and Performance of Business Organisations in South
Africa, (December), 1–282.
Shoemaker,P.J.H.,Krupp,S., & Howland,S.(2003).Strategic leadership:The Essential
Skills.Harvard Business Review,91,131-134.
Shuria, H.A. (2015). The influence of strategic leadership on humanitarian aid delivery
effectiveness in Somalia. Nairobi: USIU.
Shuria, H.A. (2016). The Influence of Strategic Planning and Forecasting on
Humanitarian Aid Delivery in Somalia, The International Journal of
Business and Management 4(6), 137–148.
Sila, H.M., & Gichinga, L. (2016). Role of Strategic Leadership on Strategy
Implementation in Public Universities in Kenya-A Case Study of JKUAT
Main Campus. International Journal of innovative research and
development, 5(6).
Simba, F.T., Mugambi, F. & Namusonge, G.S. (2015). Strategic management
201
determinants of value addition of industrial fish processors in the Sea food
processing Sub chain in Kenya. Unpublished PhD thesis, Juja: Jomo
Kenyatta University of Agriculture and Technology.
Simon, T. (2007). Research Methods Resources for Researcher Lecturer and Students,
Social Sciences Collection guides: Topical Bibliographies, Retrieved from
www.bl.uk./socialsciences.
Stanleigh, M. (2015).7 Key Trends in Innovation. Retrieved
from:www.bia.ca/articles/7keyTrendsinInnovation.htm.August,2015.
Stoner, J.A.F., Freeman. & Gilbert, D.R. (2001).Management. New Delhi: Prentice Hall.
Sull, B, (2009).Leadership in administration: A sociological interpretation.NewYork:
Harper & Row.Simon, H.A. 1945.Administrative behaviour:New
York:Macmillan.
Storey, J. (2005). What Next for Strategic-level Leadership Research? Leadership, 1(1),
89–104. https://doi.org/10.1177/1742715005049353
Thabethe, L. M. (2011). The impact of leadership in the acceleration of service delivery
in the Department of Health and Social Development, Capricorn district
Unpublishe PhD thesis, South Africa: University of Limpopo.
Thompson, A.A. & Strickland, A.J. (2003). Strategic Management Concepts and Case
(12th ed.). New York: McGraw-Hill.
202
Thompson, A. A. & Strickland, A.J. (2007).Crafting and Executing Strategy Texts and
Readings. (15th ed.). New York: McGraw-Hill Irwin.
Timothy, O., Okwu, A.T., & Akpa, V.O. (2011). Effects of Leadership Style on
Organizational Performance: a Survey of Selected Small Scale Enterprises in
Ikosi-Ketu Council Development Area of Lagos State, Nigeria. Australian
Journal of Business and Management Research, 1(7), 100–111.
Vera, D., & Crossan, M. (2004). Strategic leadership and organizational learning.
Academy of management review, 29(2), 222-240.
Wagana, D.M., Iravo, M.A., & Nzulwa, J.D. (2015). Analysis of the Relationship
Between Devolved Governance, Political Decentralization, and Service
Delivery:a Critical Review of Literature. European Scientific Journal,
11(31), 1857–78.
Waititu,J.W.(2016).Relationship between Strategy Implementation and Performance in
Commercial Banks in Nairobi County Kenya.International Journal of
Business and Management:11(9),2016-2040.
Zaccaro, S. J., & Horn, Z. N. (2003). Leadership theory and practice: Fostering an
effective symbiosis. The Leadership Quarterly, 14(6), 769-806.
Zaribaf, M., & Bayrami, H.(2010). An effective Factor Pattern Affecting
Implementation of Strategic Plans. Academic and Business Research
Institute.

203
APPENDICES
Appendix I: Introduction Letter to Respondents
James K. Waribu
P.O. Box 12243-00100
Nairobi-Kenya
Dear Sir/Madam,
RE: INTRODUCTION AND REQUEST TO PARTICIPATE IN STUDY
I am a post graduate student at College of Human Resource and Development
(COHRED), of Jomo Kenyatta University of Agriculture and Technology. I am pursuing
a PhD Degree in Business Administration (Strategic Management Option).As a
requirement for the fulfillment of this degree course, I am expected to conduct a
research. My research title is ‘The Role of Strategic Leadership on Execution of
County Integrated Development Plans (CIDPs) by County Governments in Kenya’.
You have been selected to participate in this study by filling in the questionnaire to
enable the collection of the needed data for analysis.
Participation in this survey is voluntary and will be treated with utmost confidence.
Your cooperation will be highly appreciated.
Thank you.
Yours faithfully,
James Waribu
Student/Researcher
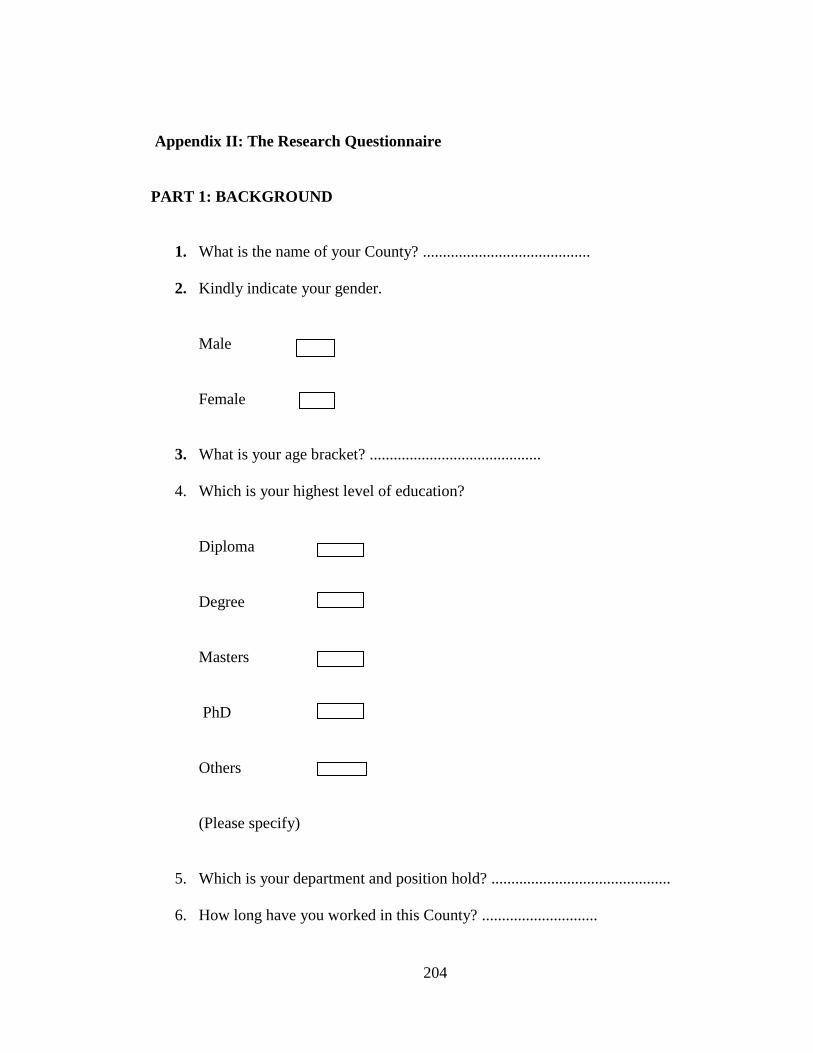
204
Appendix II: The Research Questionnaire
PART 1: BACKGROUND
1. What is the name of your County? ..........................................
2. Kindly indicate your gender.
Male
Female
3. What is your age bracket? ...........................................
4. Which is your highest level of education?
Diploma
Degree
Masters
PhD
Others
(Please specify)
5. Which is your department and position hold? .............................................
6. How long have you worked in this County? .............................
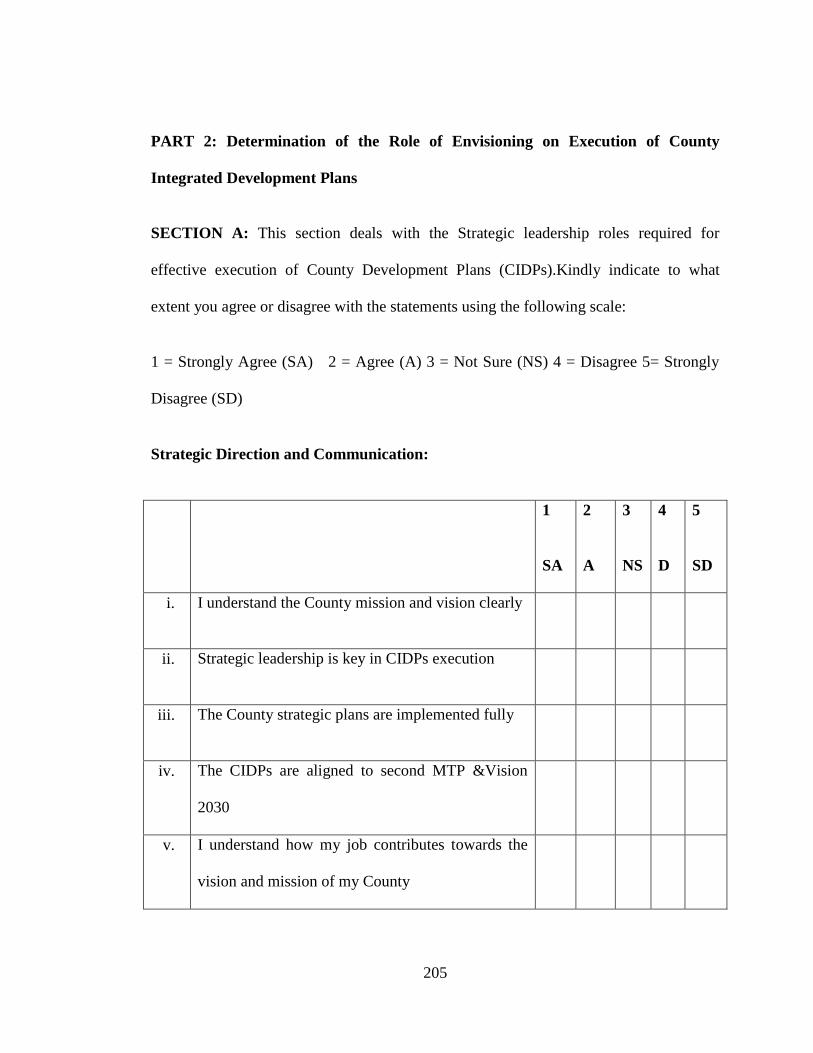
205
PART 2: Determination of the Role of Envisioning on Execution of County
Integrated Development Plans
SECTION A: This section deals with the Strategic leadership roles required for
effective execution of County Development Plans (CIDPs).Kindly indicate to what
extent you agree or disagree with the statements using the following scale:
1 = Strongly Agree (SA) 2 = Agree (A) 3 = Not Sure (NS) 4 = Disagree 5= Strongly
Disagree (SD)
Strategic Direction and Communication:
1
SA
2
A
3
NS
4
D
5
SD
i. I understand the County mission and vision clearly
ii. Strategic leadership is key in CIDPs execution
iii. The County strategic plans are implemented fully
iv. The CIDPs are aligned to second MTP &Vision
2030
v. I understand how my job contributes towards the
vision and mission of my County
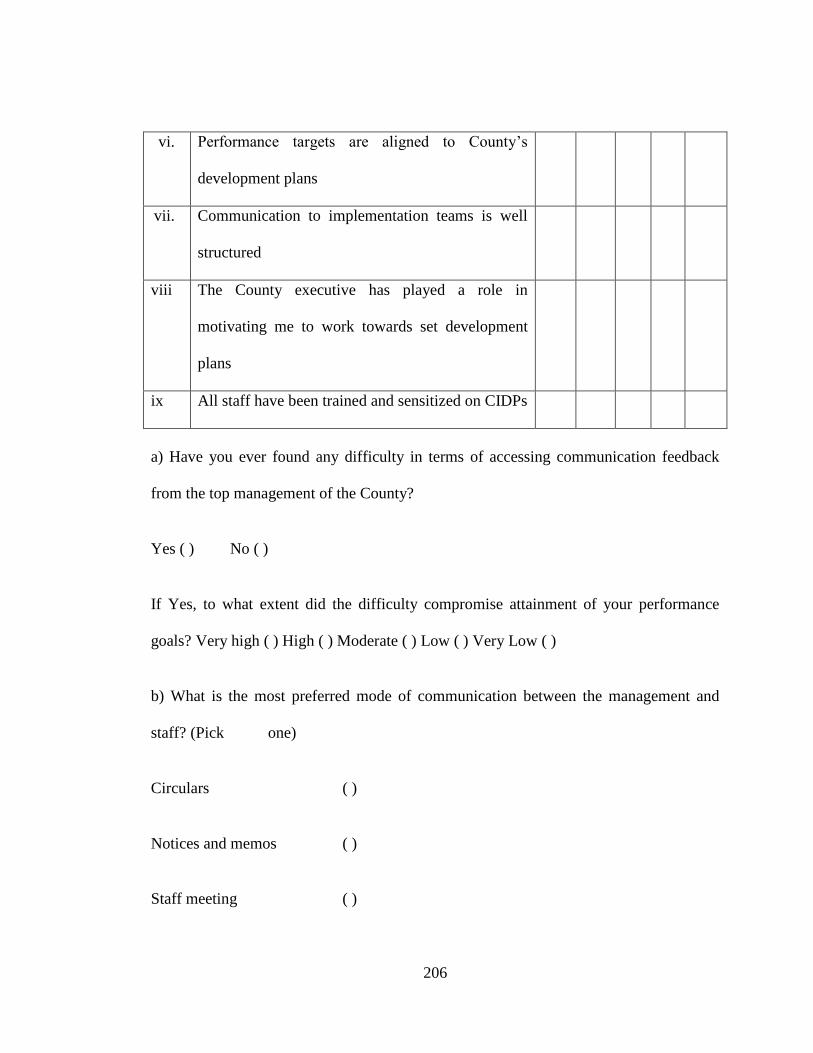
206
vi. Performance targets are aligned to County’s
development plans
vii. Communication to implementation teams is well
structured
viii The County executive has played a role in
motivating me to work towards set development
plans
ix All staff have been trained and sensitized on CIDPs
a) Have you ever found any difficulty in terms of accessing communication feedback
from the top management of the County?
Yes ( ) No ( )
If Yes, to what extent did the difficulty compromise attainment of your performance
goals? Very high ( ) High ( ) Moderate ( ) Low ( ) Very Low ( )
b) What is the most preferred mode of communication between the management and
staff? (Pick one)
Circulars ( )
Notices and memos ( )
Staff meeting ( )
207
Management meetings ( )
Intranets ( )
Any other (Specify): ……………………………………………………………………
c) In your opinion, how else does envisioning influence the execution of CIDPs?
………………………………………………………………………………………..
………………………………………………………………………………………..
………………………………………………………………………………………….
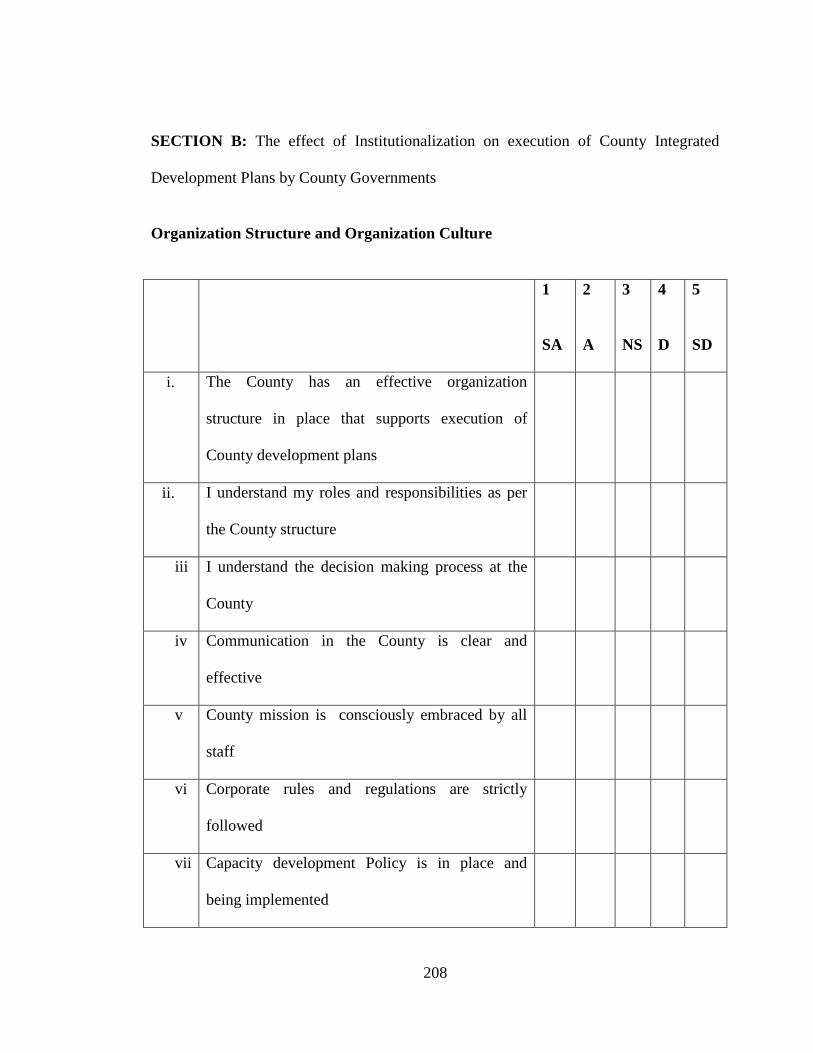
208
SECTION B: The effect of Institutionalization on execution of County Integrated
Development Plans by County Governments
Organization Structure and Organization Culture
1
SA
2
A
3
NS
4
D
5
SD
i. The County has an effective organization
structure in place that supports execution of
County development plans
ii. I understand my roles and responsibilities as per
the County structure
iii I understand the decision making process at the
County
iv Communication in the County is clear and
effective
v County mission is consciously embraced by all
staff
vi Corporate rules and regulations are strictly
followed
vii Capacity development Policy is in place and
being implemented
209
a) Who are in charge of execution of County development plans at your County?
All staff ( )
Special Implementation Unit ( )
External experts ( )
Select management team ( )
Any other (Specify): ……………………………………………………………………
b) How many employees report to you directly?
Less than 10 ( )
10 – 20 ( )
21 – 30 ( )
31 – 40 ( )
41 – 50 ( )
More than 50 ( )
c) Does your span of control compromise your operational effectiveness?
Yes ( )
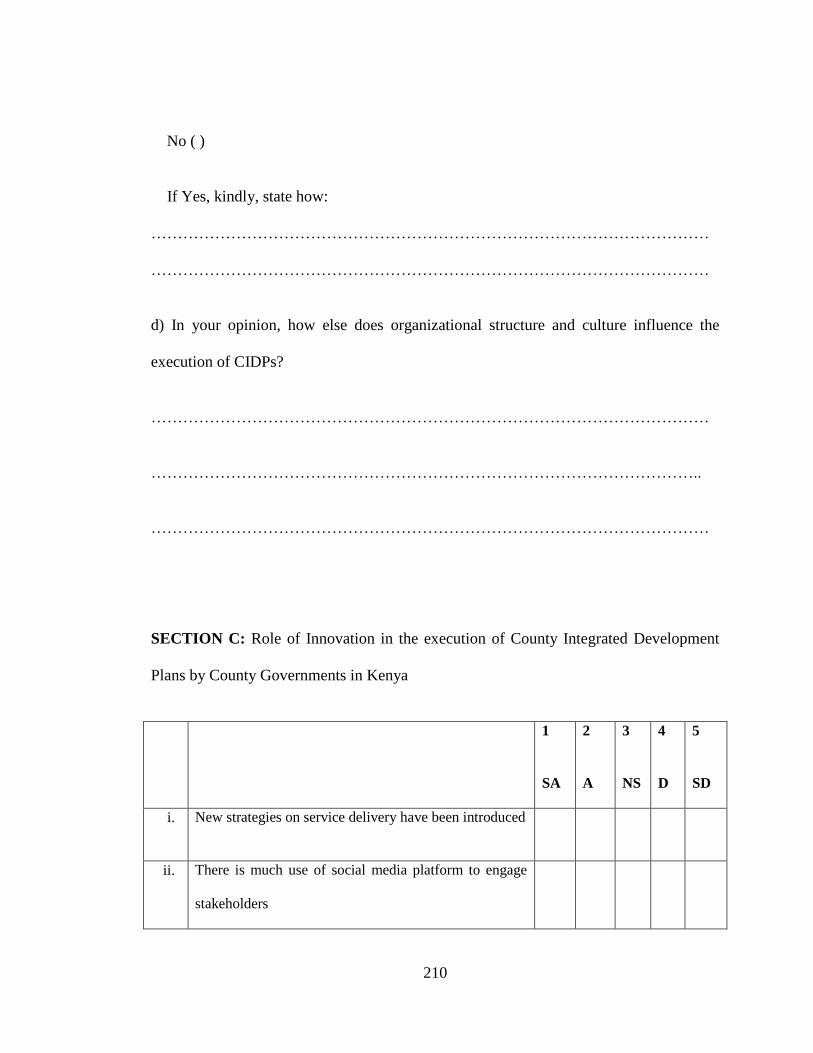
210
No ( )
If Yes, kindly, state how:
……………………………………………………………………………………………
……………………………………………………………………………………………
d) In your opinion, how else does organizational structure and culture influence the
execution of CIDPs?
……………………………………………………………………………………………
…………………………………………………………………………………………..
……………………………………………………………………………………………
SECTION C: Role of Innovation in the execution of County Integrated Development
Plans by County Governments in Kenya
1
SA
2
A
3
NS
4
D
5
SD
i. New strategies on service delivery have been introduced
ii. There is much use of social media platform to engage
stakeholders
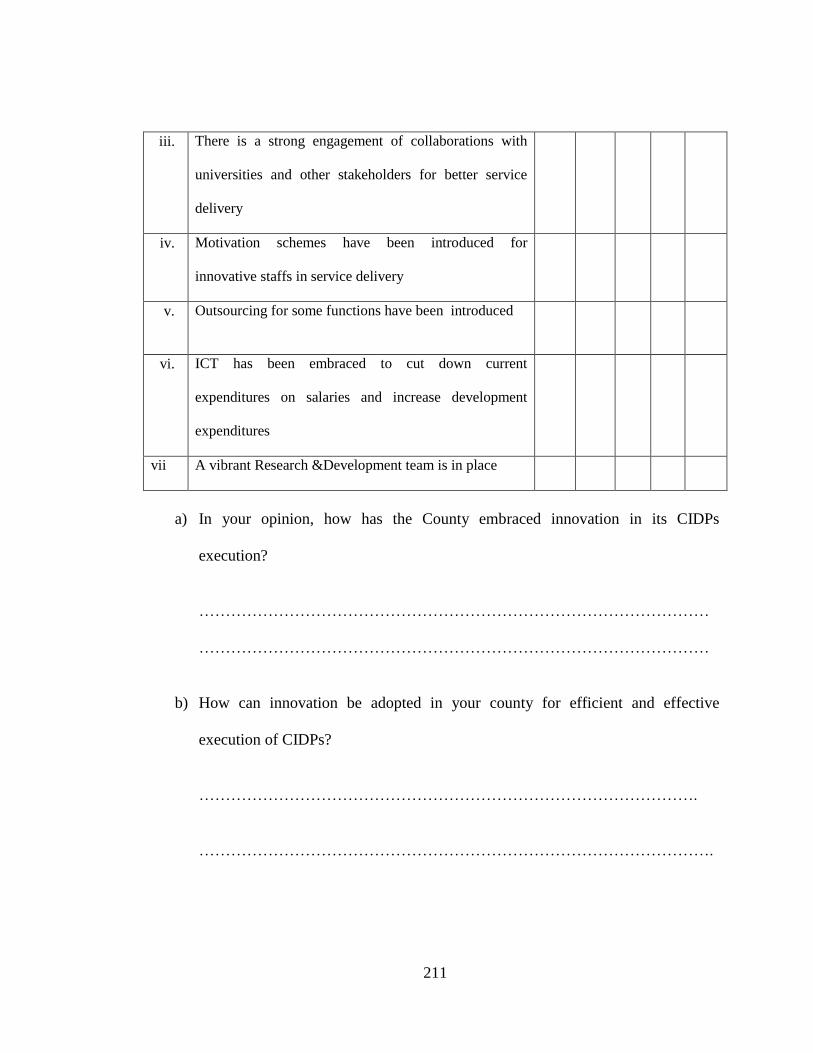
211
iii. There is a strong engagement of collaborations with
universities and other stakeholders for better service
delivery
iv. Motivation schemes have been introduced for
innovative staffs in service delivery
v. Outsourcing for some functions have been introduced
vi. ICT has been embraced to cut down current
expenditures on salaries and increase development
expenditures
vii A vibrant Research &Development team is in place
a) In your opinion, how has the County embraced innovation in its CIDPs
execution?
……………………………………………………………………………………
……………………………………………………………………………………
b) How can innovation be adopted in your county for efficient and effective
execution of CIDPs?
………………………………………………………………………………….
…………………………………………………………………………………….
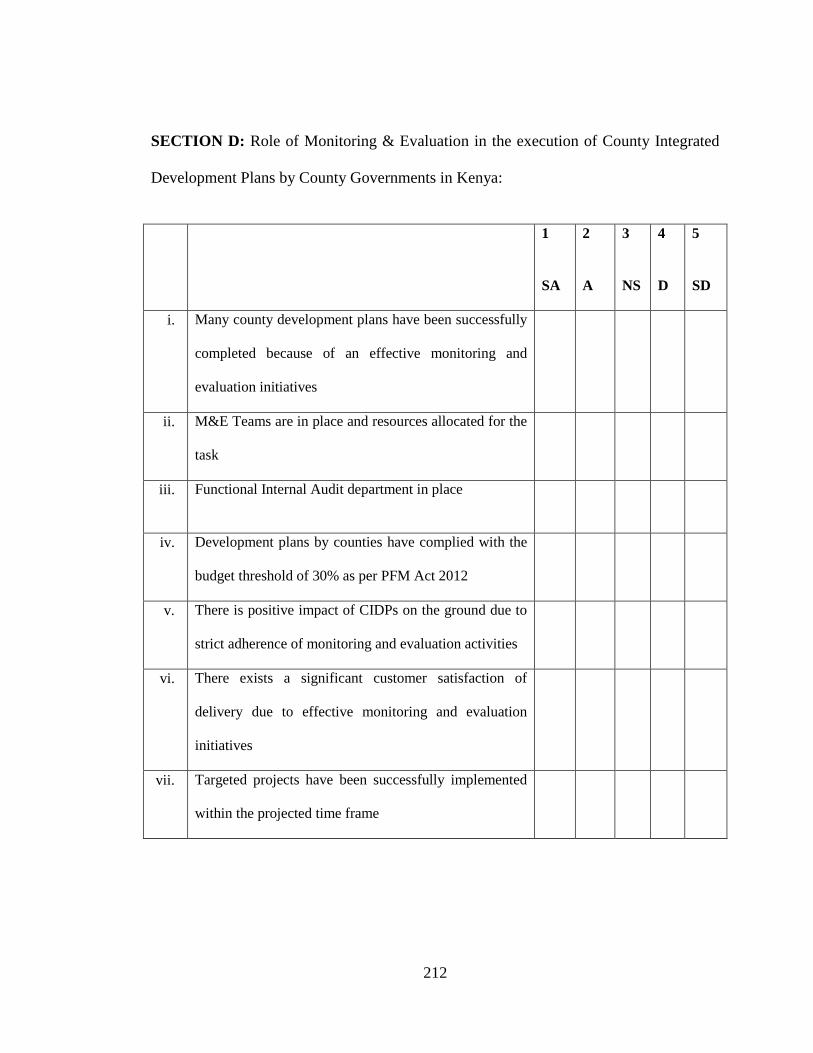
212
SECTION D: Role of Monitoring & Evaluation in the execution of County Integrated
Development Plans by County Governments in Kenya:
1
SA
2
A
3
NS
4
D
5
SD
i. Many county development plans have been successfully
completed because of an effective monitoring and
evaluation initiatives
ii. M&E Teams are in place and resources allocated for the
task
iii. Functional Internal Audit department in place
iv. Development plans by counties have complied with the
budget threshold of 30% as per PFM Act 2012
v. There is positive impact of CIDPs on the ground due to
strict adherence of monitoring and evaluation activities
vi. There exists a significant customer satisfaction of
delivery due to effective monitoring and evaluation
initiatives
vii. Targeted projects have been successfully implemented
within the projected time frame
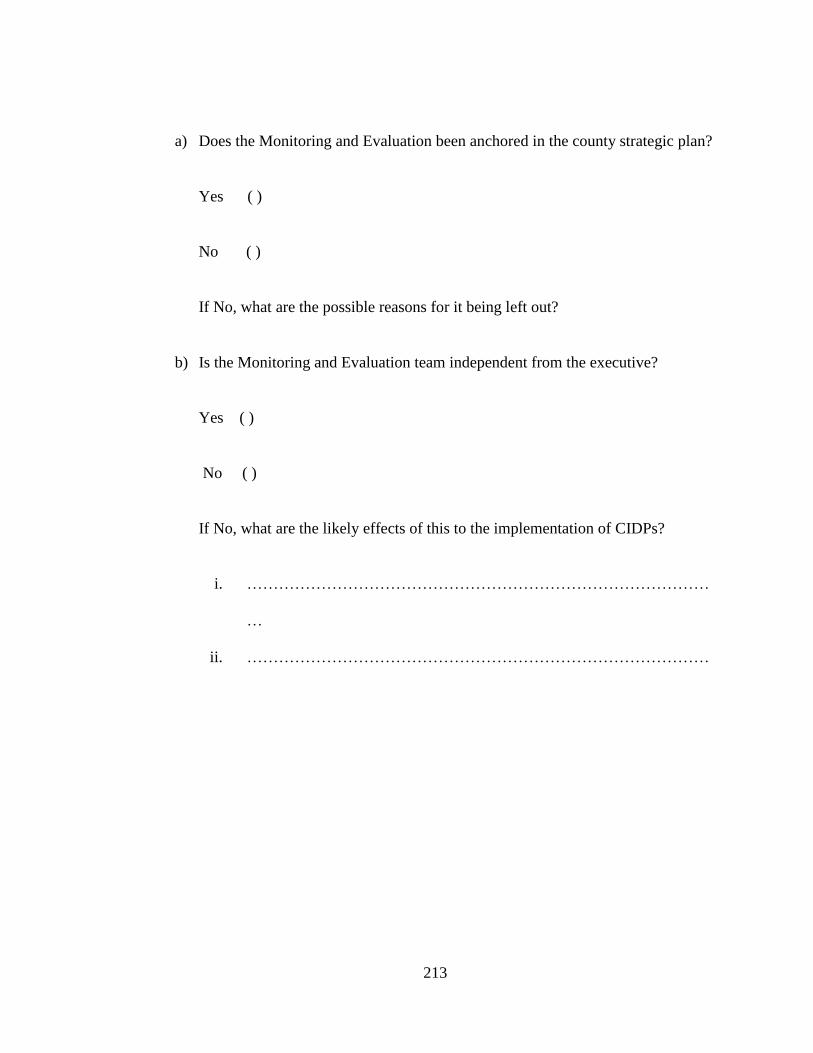
213
a) Does the Monitoring and Evaluation been anchored in the county strategic plan?
Yes ( )
No ( )
If No, what are the possible reasons for it being left out?
b) Is the Monitoring and Evaluation team independent from the executive?
Yes ( )
No ( )
If No, what are the likely effects of this to the implementation of CIDPs?
i. ……………………………………………………………………………
…
ii. ……………………………………………………………………………
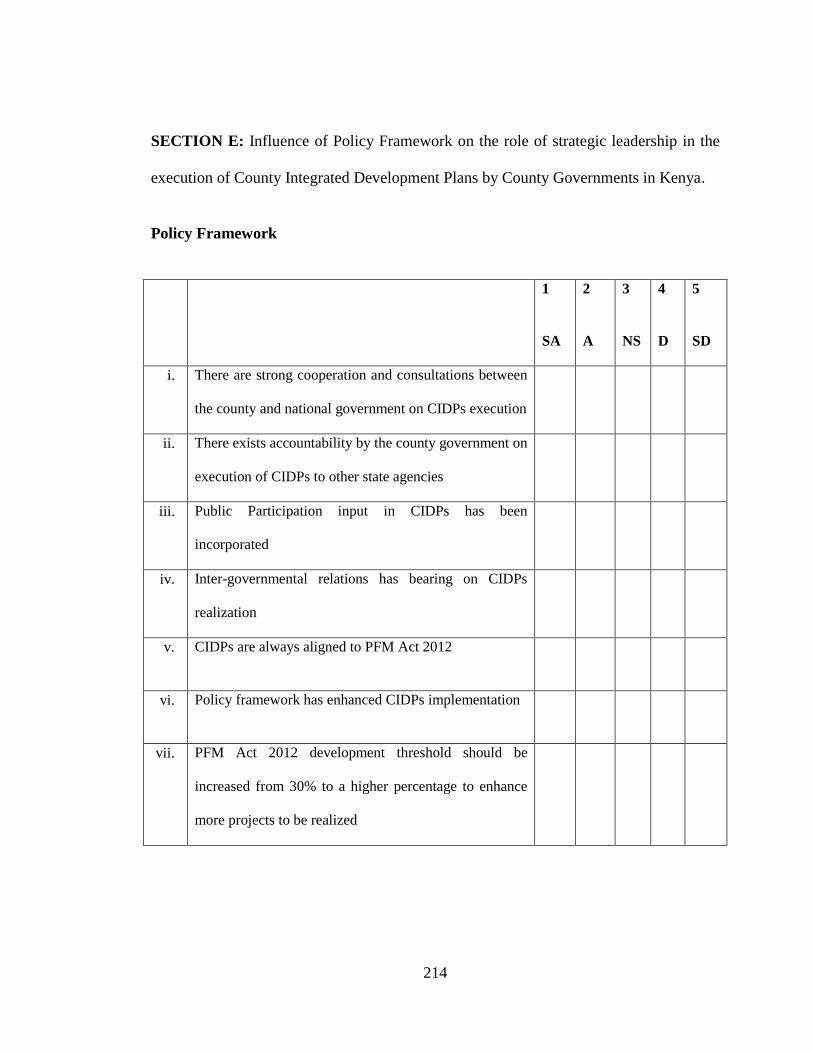
214
SECTION E: Influence of Policy Framework on the role of strategic leadership in the
execution of County Integrated Development Plans by County Governments in Kenya.
Policy Framework
1
SA
2
A
3
NS
4
D
5
SD
i. There are strong cooperation and consultations between
the county and national government on CIDPs execution
ii. There exists accountability by the county government on
execution of CIDPs to other state agencies
iii. Public Participation input in CIDPs has been
incorporated
iv. Inter-governmental relations has bearing on CIDPs
realization
v. CIDPs are always aligned to PFM Act 2012
vi. Policy framework has enhanced CIDPs implementation
vii. PFM Act 2012 development threshold should be
increased from 30% to a higher percentage to enhance
more projects to be realized

215
a) What is your opinion on the role that the National Assembly, The Senate and the
County Assemblies play in the realization of implementation of county
integrated development plans.
Kindly express your opinion briefly …………………………………………………….
……………………………………………………………………………………………
……………………………………………………………………………………………
…………………………………………………………………………………………….
a) Do the above institutions enhance the implementation of county integrated
development plans or do they limit it by virtual of their powers bestowed by the
Constitution of Kenya 2010? Explain giving examples where possible.
……………………………………………………………………………………
……………………………………………………………………………………
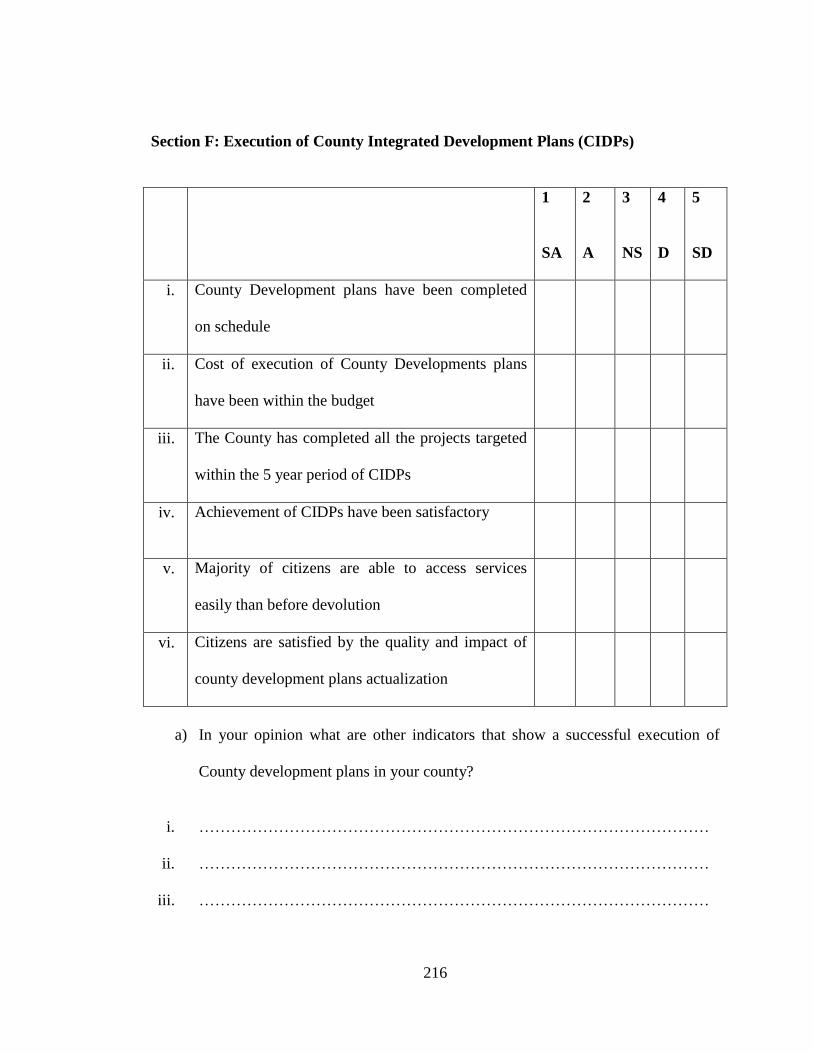
216
Section F: Execution of County Integrated Development Plans (CIDPs)
1
SA
2
A
3
NS
4
D
5
SD
i. County Development plans have been completed
on schedule
ii. Cost of execution of County Developments plans
have been within the budget
iii. The County has completed all the projects targeted
within the 5 year period of CIDPs
iv. Achievement of CIDPs have been satisfactory
v. Majority of citizens are able to access services
easily than before devolution
vi. Citizens are satisfied by the quality and impact of
county development plans actualization
a) In your opinion what are other indicators that show a successful execution of
County development plans in your county?
i. ……………………………………………………………………………………
ii. ……………………………………………………………………………………
iii. ……………………………………………………………………………………

217
b) Kindly mention other factors not captured in this document that in your opinion
affect the execution of CIDPs.
i. ……………………………………………………………………………..
ii. ……………………………………………………………………………..
iii. ……………………………………………………………………………
…
THANK YOU FOR YOUR COOPERATION

218
Appendix III: NACOSTI permit
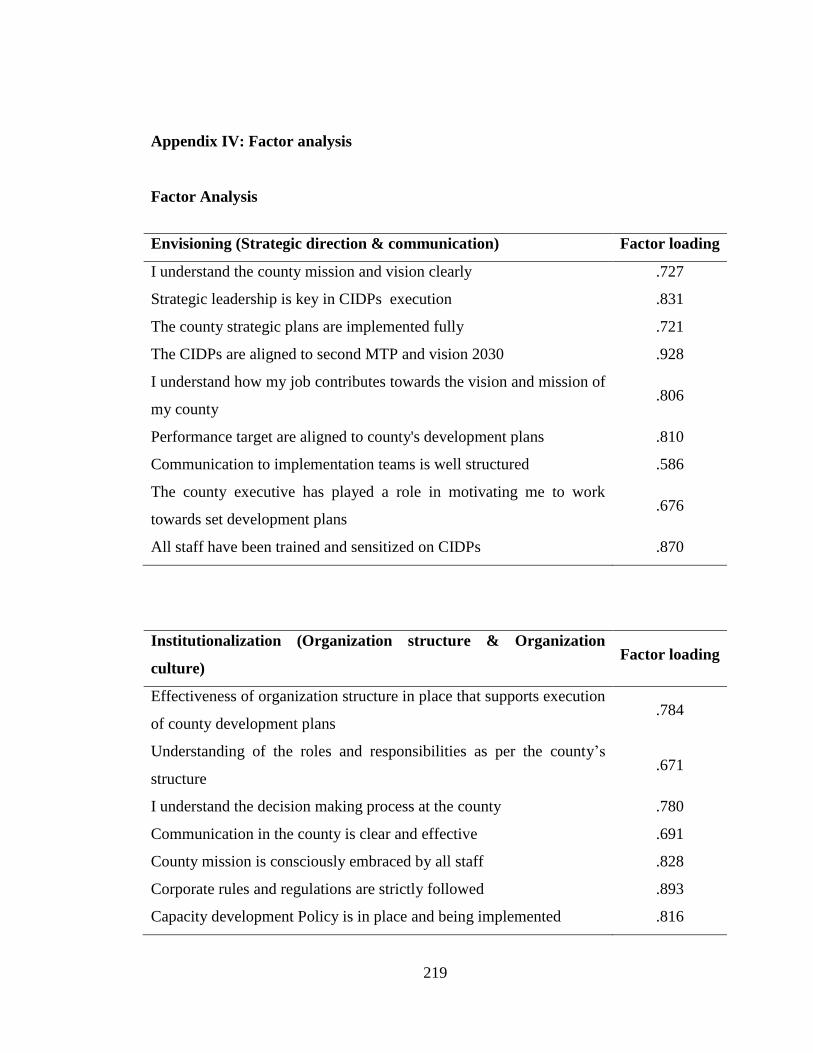
219
Appendix IV: Factor analysis
Factor Analysis
Envisioning (Strategic direction & communication) Factor loading
I understand the county mission and vision clearly .727
Strategic leadership is key in CIDPs execution .831
The county strategic plans are implemented fully .721
The CIDPs are aligned to second MTP and vision 2030 .928
I understand how my job contributes towards the vision and mission of
my county .806
Performance target are aligned to county's development plans .810
Communication to implementation teams is well structured .586
The county executive has played a role in motivating me to work
towards set development plans .676
All staff have been trained and sensitized on CIDPs .870
Institutionalization (Organization structure & Organization
culture) Factor loading
Effectiveness of organization structure in place that supports execution
of county development plans .784
Understanding of the roles and responsibilities as per the county’s
structure .671
I understand the decision making process at the county .780
Communication in the county is clear and effective .691
County mission is consciously embraced by all staff .828
Corporate rules and regulations are strictly followed .893
Capacity development Policy is in place and being implemented .816
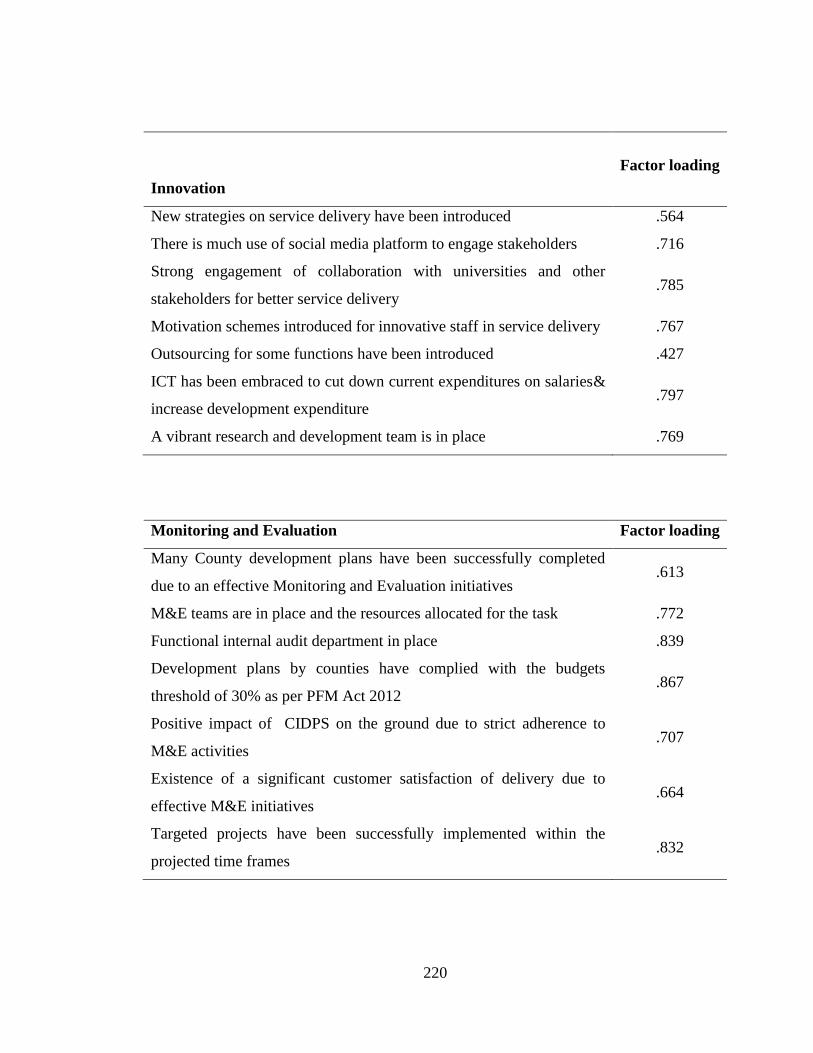
220
Innovation
Factor loading
New strategies on service delivery have been introduced .564
There is much use of social media platform to engage stakeholders .716
Strong engagement of collaboration with universities and other
stakeholders for better service delivery .785
Motivation schemes introduced for innovative staff in service delivery .767
Outsourcing for some functions have been introduced .427
ICT has been embraced to cut down current expenditures on salaries&
increase development expenditure .797
A vibrant research and development team is in place .769
Monitoring and Evaluation Factor loading
Many County development plans have been successfully completed
due to an effective Monitoring and Evaluation initiatives .613
M&E teams are in place and the resources allocated for the task .772
Functional internal audit department in place .839
Development plans by counties have complied with the budgets
threshold of 30% as per PFM Act 2012 .867
Positive impact of CIDPS on the ground due to strict adherence to
M&E activities .707
Existence of a significant customer satisfaction of delivery due to
effective M&E initiatives .664
Targeted projects have been successfully implemented within the
projected time frames .832
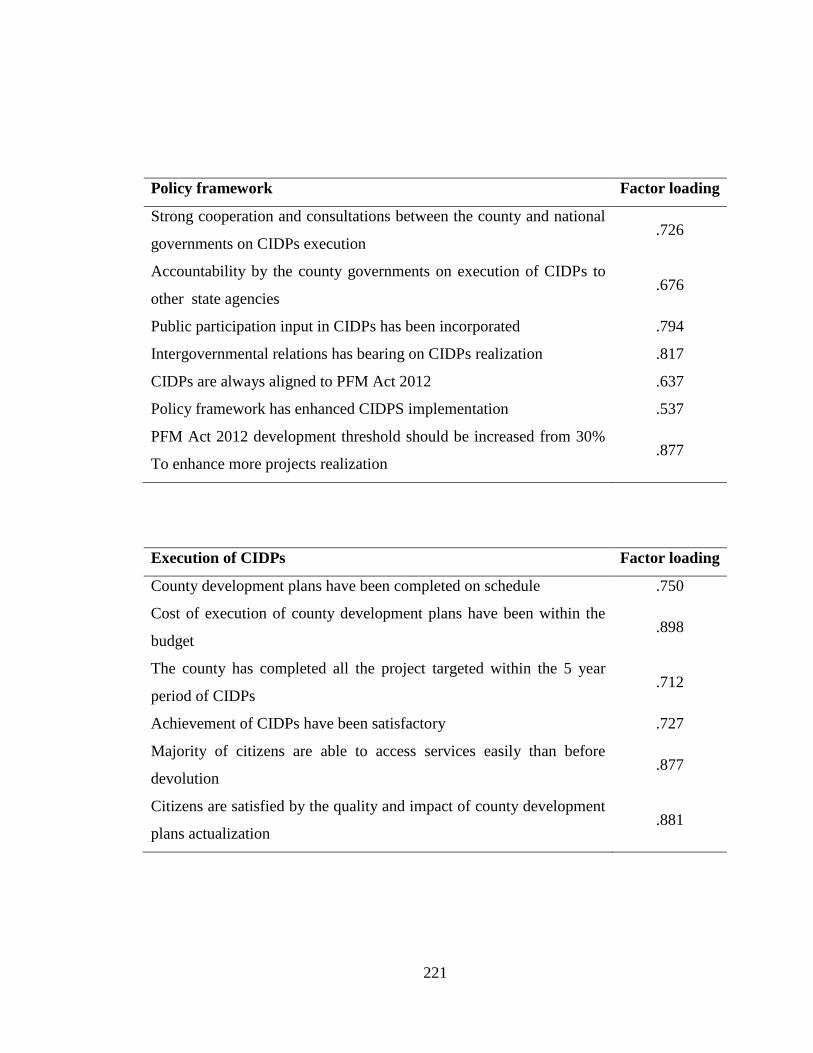
221
Policy framework Factor loading
Strong cooperation and consultations between the county and national
governments on CIDPs execution .726
Accountability by the county governments on execution of CIDPs to
other state agencies .676
Public participation input in CIDPs has been incorporated .794
Intergovernmental relations has bearing on CIDPs realization .817
CIDPs are always aligned to PFM Act 2012 .637
Policy framework has enhanced CIDPS implementation .537
PFM Act 2012 development threshold should be increased from 30%
To enhance more projects realization .877
Execution of CIDPs Factor loading
County development plans have been completed on schedule .750
Cost of execution of county development plans have been within the
budget .898
The county has completed all the project targeted within the 5 year
period of CIDPs .712
Achievement of CIDPs have been satisfactory .727
Majority of citizens are able to access services easily than before
devolution .877
Citizens are satisfied by the quality and impact of county development
plans actualization .881
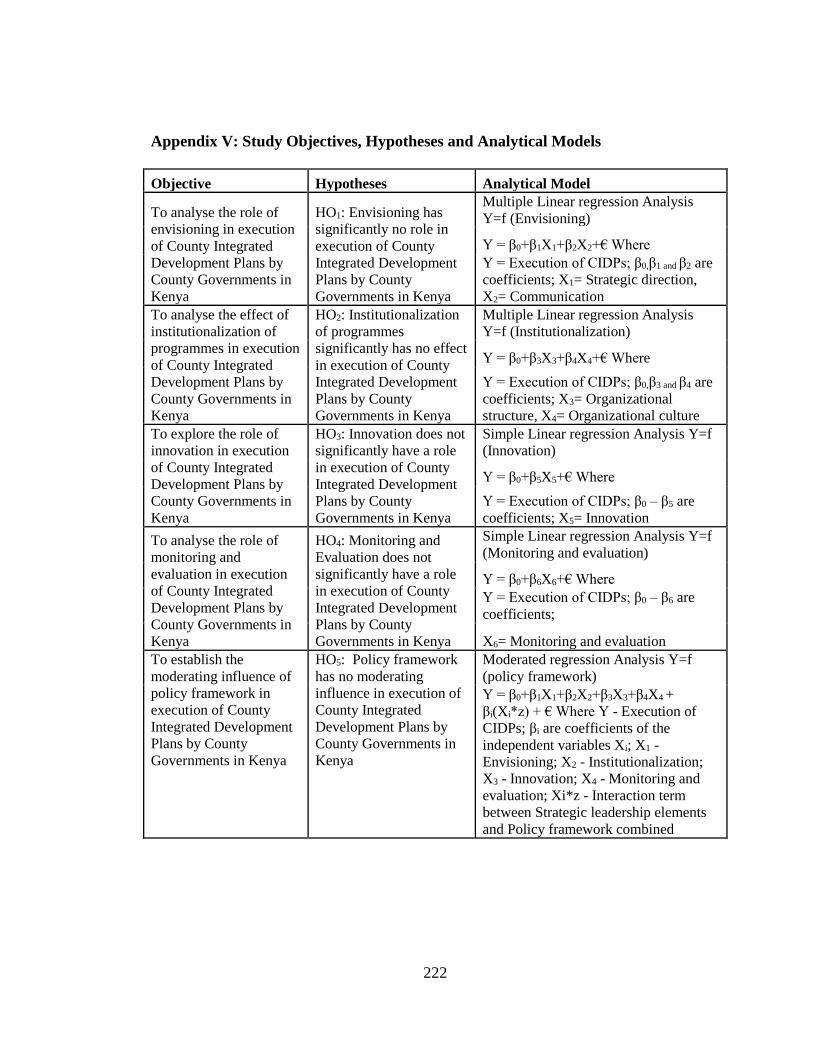
222
Appendix V: Study Objectives, Hypotheses and Analytical Models
Objective Hypotheses Analytical Model
To analyse the role of
envisioning in execution
of County Integrated
Development Plans by
County Governments in
Kenya
HO1: Envisioning has
significantly no role in
execution of County
Integrated Development
Plans by County
Governments in Kenya
Multiple Linear regression Analysis
Y=f (Envisioning)
Y = β0+β1X1+β2X2+€ Where
Y = Execution of CIDPs; β0,β1 and β2 are
coefficients; X1= Strategic direction,
X2= Communication
To analyse the effect of
institutionalization of
programmes in execution
of County Integrated
Development Plans by
County Governments in
Kenya
HO2: Institutionalization
of programmes
significantly has no effect
in execution of County
Integrated Development
Plans by County
Governments in Kenya
Multiple Linear regression Analysis
Y=f (Institutionalization)
Y = β0+β3X3+β4X4+€ Where
Y = Execution of CIDPs; β0,β3 and β4 are
coefficients; X3= Organizational
structure, X4= Organizational culture
To explore the role of
innovation in execution
of County Integrated
Development Plans by
County Governments in
Kenya
HO3: Innovation does not
significantly have a role
in execution of County
Integrated Development
Plans by County
Governments in Kenya
Simple Linear regression Analysis Y=f
(Innovation)
Y = β0+β5X5+€ Where
Y = Execution of CIDPs; β0 – β5 are
coefficients; X5= Innovation
To analyse the role of
monitoring and
evaluation in execution
of County Integrated
Development Plans by
County Governments in
Kenya
HO4: Monitoring and
Evaluation does not
significantly have a role
in execution of County
Integrated Development
Plans by County
Governments in Kenya
Simple Linear regression Analysis Y=f
(Monitoring and evaluation)
Y = β0+β6X6+€ Where
Y = Execution of CIDPs; β0 – β6 are
coefficients;
X6= Monitoring and evaluation
To establish the
moderating influence of
policy framework in
execution of County
Integrated Development
Plans by County
Governments in Kenya
HO5: Policy framework
has no moderating
influence in execution of
County Integrated
Development Plans by
County Governments in
Kenya
Moderated regression Analysis Y=f
(policy framework)
Y = β0+β1X1+β2X2+β3X3+β4X4 +
βi(Xi*z) + € Where Y - Execution of
CIDPs; βi are coefficients of the
independent variables Xi; X1 -
Envisioning; X2 - Institutionalization;
X3 - Innovation; X4 - Monitoring and
evaluation; Xi*z - Interaction term
between Strategic leadership elements
and Policy framework combined