role du silicium sur la tolerance au cuivre et la croissance des
TRANSCRIPT
AIXMARSEILLEUNIVERSITE
N°bibliothèque:XXX
ROLE DU SILICIUM SUR LA TOLERANCE AU CUIVRE
ET LA CROISSANCE DES BAMBOUS
THESE
pourobtenirlegradede
DOCTEURDEL’UNIVERSITEPAULCEZANNE
FacultédesSciencesetTechniques
Discipline:Géosciencesdel’Environnement
Présentéeetsoutenuepubliquementpar
Blanche COLLIN
Le29novembre2011
JURY
M.Jean‐ClaudeDAVIDIAN Professeur,MontpellierSupAgro RapporteurMmeGéraldineSARRET ChargéedeRecherche,CNRS RapporteurMmeCamilleDUMAT Professeur,INP‐ENSAT ExaminateurMmeCatherineKELLER Professeur,UniversitéAix‐Marseille ExaminateurM.Jean‐DominiqueMEUNIER DirecteurdeRecherche,CNRS DirecteurdethèseM.EmmanuelDOELSCH ChargédeRecherche,CIRAD Co‐directeurdethèseMmeVeroniqueARFI DirectriceGénérale,Phytorem InvitéeM.FrédéricPANFILI ResponsableR&D,Phytorem Invité
ANNEE 2011


i

ii
iii
TABLE DES MATIERES
TABLEDESMATIERES...................................................................................................................................................iii
LISTEDESTABLES.........................................................................................................................................................vii
LISTEDESFIGURES ........................................................................................................................................................ ix
INTRODUCTION ............................................................................................................................... 1
CHAPITRE1SYNTHESEBIBLIOGRAPHIQUE......................................................................... 9
1. LECUIVREDANSLESPLANTES.........................................................................................................................111.1. Lecuivre,oligoélément ........................................................................................................................................................ 111.2. Mécanismesdeprélèvement................................................................................................................................................ 131.2.1 Adsorptionducuivredansl’apoplasmeracinaire .......................................................................................141.2.2 Absorptionracinaire.................................................................................................................................................15
1.3. Homéostasieauseindelacellule ...................................................................................................................................... 151.4. Transportetcomplexation .................................................................................................................................................. 161.5. Distribution................................................................................................................................................................................. 191.6. Toxicité.......................................................................................................................................................................................... 191.6.1 Rhizotoxicité.................................................................................................................................................................201.6.2 Stressoxydatifetgénotoxicité..............................................................................................................................201.6.3 Phytotoxicitéauniveaudespartiesaériennes..............................................................................................21
1.7. MécanismedetoléranceàlatoxicitédeCu.................................................................................................................. 221.8. Utilisationdelaspectroscopied’absorptiondesrayonsXpourétudierlaspéciationdeCudanslesplantes ........................................................................................................................................................................................................ 24
2. LESILICIUM.............................................................................................................................................................322.1. TeneurenSidanslesplantesetdanslebambou ....................................................................................................... 322.2. Absorptionracinaire............................................................................................................................................................... 332.3. Transportetstockage ............................................................................................................................................................ 342.4. Fonctiondusiliciumdanslebambou .............................................................................................................................. 382.5. Métauxetsilicium .................................................................................................................................................................... 402.5.1 Modificationdesconditionsenvironnementales .........................................................................................402.5.2 Augmentationdelabiomasse...............................................................................................................................412.5.3 Diminutiondel’absorptiondesmétaux ...........................................................................................................412.5.4 Modificationdelarépartitiondesmétaux ......................................................................................................42
iv
2.5.5 Modificationdel’expressiondegènes ..............................................................................................................43
3. BILANDUCHAPITREI .........................................................................................................................................44
4. REFERENCESBIBLIOGRAPHIQUES..................................................................................................................45
CHAPITREIIDISTRIBUTIONANDVARIABILITYOFSILICON,COPPERANDZINCINDIFFERENTBAMBOOSPECIES ..................................................................................................57
1. INTRODUCTION.....................................................................................................................................................65
2. MATERIALSANDMETHODS ..............................................................................................................................672.1. Geographicalareaofthestudy,soildescriptionandsamplingprocedure..................................................... 672.2. Soilmaterialandanalysis .................................................................................................................................................... 682.3. Plantmaterialandanalysis................................................................................................................................................. 692.4. Statisticalanalyses .................................................................................................................................................................. 69
3. RESULTS...................................................................................................................................................................703.1. Soil .................................................................................................................................................................................................. 703.2. Betweenplantparts ................................................................................................................................................................ 703.3. Betweenplantspecies ............................................................................................................................................................ 71
4. DISCUSSION.............................................................................................................................................................754.1. PhytoavailabilityofSi,CuandZn ..................................................................................................................................... 754.2. OriginofSivariationinbamboos ..................................................................................................................................... 754.3. OriginofCuandZnvariabilityinbamboo.................................................................................................................... 784.4. InteractionsbetweenmetalsandSi ................................................................................................................................. 80
5. BILANDUCHAPITREII........................................................................................................................................81
6. REFERENCESBIBLIOGRAPHIQUES..................................................................................................................82
CHAPITREIIIEFFECTSOFSILICONANDCOPPERONBAMBOOGROWNHYDROPONICALLY........................................................................................................................87
1 INTRODUCTION ......................................................................................................................................................95
2 MATERIALANDMETHODS .................................................................................................................................962.1 Plantmaterial,experimentaldesignandpreculture............................................................................................... 962.2 Experimentinnutrientsolution.......................................................................................................................................... 972.2.1 PhaseI:Sitreatment .................................................................................................................................................972.2.2 PhaseII:Cu+Sitreatment .....................................................................................................................................98
2.3 Plantanalysis .............................................................................................................................................................................. 992.3.1 Growthparameters ...................................................................................................................................................992.3.2 Analysisoftissues ...................................................................................................................................................100
v
2.4 Statisticalanalyses ................................................................................................................................................................ 100
3 RESULTS................................................................................................................................................................. 1013.1 Evolutionoftheelementconcentrationsinthenutrientsolution.................................................................... 1013.2 Bamboogrowthparametersandelementaldistribution .................................................................................... 105
4 DISCUSSION........................................................................................................................................................... 1094.1 Siliconinbamboo................................................................................................................................................................... 1094.1.1 Mechanismsofsiliconaccumulation ..............................................................................................................1094.1.2 EffectofSiuptakeonthenutrientconcentrationandgrowthparameters ...................................111
4.2 Effectsofcopperonbamboogrowth............................................................................................................................. 1124.3 EffectsofbambooSionCusensitivity ........................................................................................................................... 115
5 BILANDUCHAPITREIII .................................................................................................................................... 117
6 REFERENCESBIBLIOGRAPHIQUES................................................................................................................ 118
CHAPITREIVCOPPERDISTRIBUTIONANDSPECIATIONINBAMBOOS“Phyllostachysfastuosa”EXPOSEDTODIFFERENTCOPPERANDSILICONCONCENTRATIONS..................................................................................................................... 125
1. INTRODUCTION.................................................................................................................................................. 133
2. MATERIALANDMETHODS ............................................................................................................................. 1342.1. Plantmaterial,experimentaldesignandpreculture........................................................................................... 1342.2. Siliconandcoppertreatment .......................................................................................................................................... 1352.3. Plantanalysis .......................................................................................................................................................................... 1362.3.1 Growthparameters ................................................................................................................................................1362.3.2 Analysisofmacroandmicronutrients...........................................................................................................136
2.4. Desorptionprocedure.......................................................................................................................................................... 1362.5. Anionassays ............................................................................................................................................................................ 1372.6. Totalsolubleaminoacid.................................................................................................................................................... 1382.7. SEMEDX ................................................................................................................................................................................... 1382.8. LaboratoryBasedµXRF ..................................................................................................................................................... 1382.9. EXAFSandXANES:dataacquisitionandanalysis.................................................................................................. 1392.10. Statisticalanalyses............................................................................................................................................................. 140
3. RESULTS................................................................................................................................................................ 1403.1. Siliconandcopperinnutrientsolution ....................................................................................................................... 1403.2. Growthparameters .............................................................................................................................................................. 1413.3. CuandSidistributionbetweenplantparts ............................................................................................................... 1423.4. CuandSilocalizationintheroot ................................................................................................................................... 1443.5. Theeffectsofcopperandsilicononsomeplantcomponents ............................................................................ 1453.6. XANESfeatures....................................................................................................................................................................... 149

vi
3.7. EXAFSfeatures ....................................................................................................................................................................... 151
4. DISCUSSION.......................................................................................................................................................... 156
5. SUPPORTINGINFORMATIONS....................................................................................................................... 162
6. BILANDUCHAPITREIV.................................................................................................................................... 170
7. REFERENCESBIBLIOGRAPHIQUES............................................................................................................... 171
CONCLUSIONSETPERSPECTIVES ......................................................................................... 178
RESUME.......................................................................................................................................................................... 185
ABSTRACT..................................................................................................................................................................... 185

vii
L ISTE DES TABLES
Table I.1 Synthèse des concentrations en Si publiées dans le bambou..............................33
Table I.2 Relation entre la teneur de SiO2 des feuilles de bambou et la productivité de la bambousaie (Ma et Takahashi, 2002)..........................................................39
Table II.1 Characteristics of the total soil population (N=18)............................................70
Table II.2 SiO2, Cu and Zn concentrations in the different plant parts (N=47). Data are expressed as mg kg-1 of dry matter for Cu and Zn concentrations and mg g-1 of dry matter for SiO2 concentrations. ............................................................71
Table II.3 Mean SiO2, Cu and Zn concentrations in different plant parts in each species. For each species, the sample number is 3. The type of bamboo is indicated: S: Sympodial bamboo species, M: Monopodial bamboo species. .........................74
Table II.4 Inventory of Si data found in the literature......................................................77
Table III.1 Ca, Mg, P, Fe and Zn concentrations in the nutrient solution with Si0 and Si1.5 treatments in the input and output solutions at three different time periods during the experiment.....................................................................102
Table III.2 Concentration of macro and micronutrients in the leaves, stems, and roots of the bamboo plants that were grown with different Si concentr ation in the nutrient solution. .......................................................................................107
Table III.3 Effect of different levels of Si nutrition on the following growth parameters: number of stems and leaves that developed during the experiment in phase I and phase II. ..........................................................................................107
Table IV.1 Cu and Si concentrations in plant parts of bamboos grown in the five treatments (n=4, mean ± standard deviation)...............................................144
Table IV.2 N, P, K, Ca, Mg, Fe, Mn and Zn concentrations in leaves and roots of bamboos from control, Cu100 and Cu100+Si treatments (n=4, mean ± standard deviation)....................................................................................147
Table IV.3 Composition of inorganic acids, carboxylic acids and amino acid in leaves, stems and roots of plant grown in treatments control, Cu100 and Cu100Si (mmoles kg dry weight-1, n=4 for inorganic acids and carboxylic acids, n=3 for amino acids). The standard deviation was not indicated for the lisiblity of the table. .................................................................................................148
Table IV.4 Proportion of Cu species determined by LCF of the Cu K-edge EXAFS spectra. The proportions were adjusted to reach 100 %..............................................155
Table IV.5 Reference compounds database...................................................................162
Table IV.6 Component output parameters determined by principal component analysis of the whole set of XANES spectra ...............................................................164

viii
Table IV.7 Results of target transform of XANES spectra (Chi square, R value and Spoil values) of the main Cu references................................................................165
Table IV.8 Proportion of Cu species determined by LCF of the Cu K-edge XANES spectra ....166
Table IV.9 Results of target transform of EXAFS spectra (Chi square, R value and Spoil values) of the main Cu references................................................................168
Table IV.10 Proportion of Cu species determined by LCF of the Cu K-edge EXAFS spectra.....168
ix
L ISTE DES F IGURES
Figure I.1 Courbe de croissance en réponse au statut nutritionnel de la plante, d’après Reuter and Robinson (1997) .........................................................................13
Figure I.2 Transfert radial des minéraux dans une racine, de la solution de sol au xylème (image issue du site internet biologie-forums.com) ...............................14
Figure I.3 Schéma récapitulant les différents transports de Cu identifiés dans une cellule générique (essentiellement dans Arabidopsis). Les protéines membranaires transporteurs de Cu sont représentées en orange, les Cu chaperonnes en violet. Abréviations : CCH, copper chaperone; ATX : antioxydant1 ; COPT, copper transporter; FRO, ferric reductase oxidase; HMA, heavy metal P-type ATPase; MT, metallothioneins; ZIP, IRT-like protein. Schéma modifié d’après (Yruela 2009)..............................................................................................16
Figure I.4 Structure chimique d’acides aminés, d’acides carboxyliques et de la phytochélatine et du glutathion .....................................................................18
Figure I.5 Distribution du cuivre sur une racine de niébé (cowpea) observée par µ-fluorescence X (Kopittke et al. 2011)..............................................................19
Figure I.6 Schéma présentant les caractéristiques du XANES et de l’EXAFS ........................25
Figure I.7 Spectre XANES au seuil K du Cu des feuilles, tiges, racines de créosotier et du sol d’origine des plantes (Polette et al. 2000)..............................................26
Figure I.8 Spectres EXAFS normalisés et transformées de Fourier des échantillons de feuilles de Thalspi caerulescens de l’étude de Mijovilovich et al (2009). Les données sont représentées en traits pleins et les fits en pointillés.......................29
Figure I.9 Spectres EXAFS (A et C) et XANES (B et D) au seuil K du Cu des racines de niébé (cowpea) soumises à 1,5 µM Cu pendant 3h (en haut) ou 24h (en bas). Les spectres des composés de référence les plus importants (i.e. acide polygalacturonique ou cystéine) et les résultats des combinaisons linéaires sont également représentés. .........................................................................31
Figure I.10 Processus de formation de particules de silice par différentes réactions de polymérisation (dimères, oligomères et agrégats) de monomères de silicium (Currie and Perry 2007). ..............................................................................34
Figure I.11 Absorption et localisation de Si dans le bambou. Le mécanisme d’absorption est celui qui est décrit pour le blé et le maïs (Mitani et al. 2009a; Mitani et al. 2009b). La localisation de Si a été schématisée sur les photographies MEB de feuilles (B) et de racines (C) de bambou selon les analyses EDX des études de Motomura et al (2006) (B) et de Lux et al (2003) (C)...................................36
Figure I.12 Teneurs en SiO2 dans des feuilles de bambous pendant trois ans : 1998 (carrés), 1999 (cercles), 2000 (triangles) (Motomura, 2002) .............................38
Figure I.13 Résumé des fonctions du silicium (schéma provenant de Ma and Yamaji 2006) ........................................................................................................40
x
Figure II.0 Types de rhizomes, figure modifiée d’après (Soderstrom and Young 1983) ..........62
Figure II.1 Comparison of SiO2, Cu, Zn concentrations in stem bases, stem tips and leaves of monopodial bamboos (n= 18) and sympodial bamboos (n = 29). DM: dry matter; Boxes represent the median (vertical solid line) and 25–75 % percentile. Whiskers represent the 90th and 10th percentile. Significant differences were determined by a post hoc comparison of means (Tukey test after ANOVA; P < 0.05) and are indicated by different letters. ...........................73
Figure III.1 Concentrations of macronutrients (Ca, Mg and P) and micronutrients (Fe and Zn) in the Si0.4 treatment during phase II from days 196 to 201. ....................102
Figure III.2 Bamboo Si uptake throughout the experiment, which was calculated as the difference between the Si concentrations that were measured in the input and output solutions. “Theo. max” is the theoretical maximum uptake that could be obtained if the entire Si in solution is taken up by the plants...............103
Figure III.3 Bamboo Cu uptake throughout the experiment, which was calculated from the difference in the Cu concentrations in the input and output solutions. “Theo. max” is the theoretical maximum uptake that would be obtained if all of the Cu in the solution was taken up by the plants.......................................104
Figure III.4 Si and Cu concentrations in the nutrient solution during the Si0.4 treatment in phase II from days 196 to 201.................................................................105
Figure III.5 Si concentrations in different bamboo organs as a function of the Si concentration in the nutrient solution at 1.5 µM Cu. The error bars represent the standard deviation of the SiO2 concentrations in the 5 different bamboo plants. .....................................................................................................106
Figure III.6 Repartitioning of the Cu concentration in bamboo plants. ................................108
Figure IV.1 Si and Cu amount (µmol) in the nutrient solution in treatment Cu1.5Si and Cu100Si from day 27 to 34 .........................................................................140
Figure IV.2 Mean number of bamboo leaves in the 5 treatments, throughout the experiment from day 0 to day 70. Values followed by same letter for the same days are statistically not different according to Tukey test at the 95 % confidence level.........................................................................................141
Figure IV.3 Photographs of whole plants harvested after 70 days in treatments: (A) control; (B) Cu100; (C) Cu100 Si.................................................................142
Figure IV.4 Cu and Si concentration in leaves, stems, roots in the different treatments. Values followed by same letter between treatments are statistically not different according to Tukey test at the 95 % confidence level. ........................143
Figure IV.5 cryo-SEM image with two EDX spectra taken in the root epidermis cells (A) and in the endodermis cells (B) ...................................................................145
Figure IV.6 µXRF image of a root cross-section from treatment Cu100Si, tricolour image combining Si (red), K (blue) and Cu (green)..................................................145
Figure IV.7 (a) Normalized Cu K-edge XANES spectra of plant samples and (b) the corresponding first derivatives of Cu K-edge XANES spectra. ...........................150
Figure IV.8 The derivative of XANES spectra showing the evolution of the feature B in different part of the plant and the splitting of the 4p orbitals resulting from the Jahn-Teller distortion, in leaf Cu100, desorbed root Cu100 and root Cu100......................................................................................................150
xi
Figure IV.9 Proportions of Cu(I) and Cu(II) determined by LCF on XANES spectra. The proportions were adjusted to reach 100 %....................................................151
Figure IV.10 (a) Cu K-edge extended X-ray absorption fine structure spectra; (b) radial distribution function (RDF) for plant samples. k = photoelectron wave number (Å−1), R = distance to the neighboring atom (Å). ..............................152
Figure IV.11 Cu K-edge k3-weighted EXAFS (solid line) and linear combination fits (dotted line) for plant samples................................................................................153
Figure IV.12 Cu K-edge k3-weighted EXAFS spectra of leaf in treatment Cu100Si (solid line) and fits (dotted line) with and without the contribution of Cu2S compound (Cu(I)S-inorganic)......................................................................154
Figure IV.13 Proportions of Cu compounds determined by LCF on EXAFS spectra. The proportions were adjusted to reach 100 %....................................................155
Figure IV.14 XANES spectra and their first derivative of reference compounds .....................166
Figure IV.15 a) Component spectra of the principal component analysis, b) first to eight component output parameters determined by principal component analysis of a whole set of EXAFS spectra ......................................................................167
Figure IV.16 EXAFS spectra of reference compounds ........................................................169

xii
Introductiongénérale
1
INTRODUCTION
Face à la croissance démographique, la gestion des déchets et des eaux usées représente un
enjeutechnologique,économiqueetscientifiquemajeurdesannéesàvenir,aussibiendansles
paysduNordquedansceuxduSud.Ilestindispensabledetravailleràl’élaborationdesolutions
detraitementquipermettentuneépurationoptimaledeseauxuséesavantleurréutilisationou
leurrejetdans lemilieunaturel.Afindepallier les limitesenvironnementales,économiqueset
sociétalesdesméthodesconventionnellesqui sontactuellementemployéespour le traitement
des sols pollués, telles que l’incinération et le confinement, les recherches s’orientent, depuis
unequinzained’années,versdenouvellesméthodesbiologiquesdetraitementdessolsbasées
surl’utilisationdesplantes.Cesméthodes,quiseregroupentsousletermedephytoremédiation,
apparaissent comme des voies alternatives, moins coûteuses, plus extensives et plus
respectueuses des sols et de l’environnement (Jabeen et al. 2009; Keller 2005; Pilon‐Smits
2005).
La société PHYTOREM® a développé une technologie d’épuration utilisant le procédé de
phytoremédiation sur sol en place : le BAMBOU ASSAINISSEMENT®. Cette technologie est
optimiséeparlechoixdubambou,planteligneusedelafamilledespoaceae,quipossèdel’undes
plus forts tauxde croissancedu règnevégétal.Une forteproductiondebiomasse, combinéeà
unefortecapacitéàabsorberdel’eauetdesélémentsminéraux,permetaubamboud’êtreune
plante adaptée aux techniques de phytoépuration (Arfi et al. 2009). Le BAMBOU
ASSAINISSEMENT® est une technologie rustique et simple dans sa mise en œuvre et son
exploitation.PHYTOREM®conçoitetgèredesstationsquiexploitentaumaximumcesprocessus
pourépurerplusieurs typesd'effluents :eauxusées,effluents industrielsetvinicoles, lixiviats,
eauxpluviales,etc.
LesactivitéshumainesliéesauxévolutionsindustriellesdesXIXeetXXesièclesontdéversédes
quantités importantes d'éléments traces métalliques (ETM) dans les compartiments liquides,
solides et gazeux de la terre, augmentant ainsi leur concentration dans lemilieu naturel. Ces
métauxsontnonbiodégradablesetontdonctendanceàs’accumulerdanslesdéchetsetleseaux
Introductiongénérale
2
usées que nous produisons. Mais, jusqu’à présent, le comportement des bambous face à la
présencedemétauxn’apasétéévalué.Commel’undessymptômesdelatoxicitémétalliqueest
la réductionde la croissancedesplantes, il convientdedéterminer si l’efficienceduBAMBOU
ASSAINNISSEMENT®estaffectéeparlaprésencedesETMdansleseffluentsàtraiter.Ainsi,ilest
nécessaire de comprendre le comportement conjoint des ETM et du bambou: comme leur
capacité d’absorption, la localisation des éléments dans la plante et leur toxicité. Nous avons
choisi le cuivre (Cu) comme ETM car c’est l’un des contaminants les plus abondants dans
certains polluants qui peuvent être traités par le BAMBOU ASSAINNISSEMENT®, comme par
exemplele lisierdeporc(Legrosetal.2010).Lecuivreestégalementintéressantpuisqu’il fait
partiedesoligoéléments:ilestnécessairepourledéveloppementdelaplanteàfaibledosemais
induitunefortetoxicitéquandsaconcentrationcellulaireesttropélevée.
Lebamboupossèdelaparticularitéd’absorberdefortesquantitésdesilicium,jusqu’à40%de
matièresèchedeSiO2dans les feuilles.Orderécentesétudesmontrentque lesiliciumpermet
d’améliorer la croissanceet la résistancedesplantes soumisesàdes stress,notammentàune
toxicité métallique (da Cunha and do Nascimento 2009; Gu et al. 2011). Ainsi il est donc
intéressant,danslebutd’améliorerlatechnologiedephytoremédiationdubambou,d’étudierle
rôle que peut avoir sur lui le silicium, en particulier lorsque celui‐ci fait face à une toxicité
métallique.
Lesobjectifsdecetravaildethèsesontlessuivants:
1‐ Déterminerlerôledusiliciumdanslebambou.
– L’apportdesiliciumpermet‐ild’augmenterlabiomassedubambou?
– Les nombreuses espèces de bambous présentent‐elles des différences
d’accumulationsdeSi?
– L’amendement en silicium peut‐il être envisagé pour le BAMBOU
ASSAINNISSEMENT®?
2‐ DéterminerlecomportementdeCudanslebambou
– QuelleestlarépartitiondeCudanslesdifférentespartiesdubambou?
– A quelle concentration Cu devient toxique pour le bambou, quels sont les
symptômes?
– Est‐cequeCuauncomportementdifférentenfonctiondel’espècedebambou?
3‐ DéterminersilaprésencedeSiminimiselatoxicitédeCu.
Introductiongénérale
3
CetteétudeapprofondiedesdifférentsprocessusimpliquésdanslatoxicitédeCuetlerôledeSi
dans le bambou a été réalisée à différentes échelles et en couplant plusieurs techniques
analytiques.
Toutd’abordlarépartitionetlavariabilitédeCuetSiontétéétudiéesdansplusieursespècesde
bambous sedéveloppantdansun contextepédoclimatiquenaturel. Commeaucunedonnéede
concentrationdeCuetZnn’existedanslalittérature,cetteapprocheadoncpermisd’établirdes
concentrationsderéférencesdeCuetZndanslesbambous.
Ensuite,desexpériencesen culturehydroponiqueontété réaliséesafinde contrôler finement
l’apport de Si et Cu aux bambous. Ces expériences ont permis de caractériser de manière
«macroscopique»laréponsedesbambousenfonctiondesapportsdeSietàCu.Parallèlement,
nousavonsétudiélaspéciationdeCuauseindesdifférentsorganesdubambou.Laspéciation
(spectroscopie d’absorption des rayons X) associée à la localisation des éléments
(microfluorescence X et microscopie électronique) sont deux caractérisations indispensables
pourmieuxappréhenderlecomportementdeCudanslebambou.
Cedocuments’articuleenquatrepartiesprincipales:
Danslechapitre1,seraprésentéunétatdel’artsurlecomportementdeCuetdeSidans
lesplantesetlebambouenparticulier.
Le chapitre 2 décrit et discute la variabilité et la localisation de Si, Cu et Zn dans
plusieursespècesdebambousdéveloppéesenconditionspédoclimatiquesnaturelles.
Lechapitre3présentel’effetdeSietCusurdesbambouscultivésenhydroponie.
Le chapitre 4 traite de l’effet d’une toxicité au Cu chez le bambou et le rôle de Si, en
culturehydroponique.Nousprésenteronsdanscechapitrel’étudedelaspéciationdeCu.
Ce projet de recherche a été mené dans le cadre d’une bourse CIFRE entre le CEREGE (Centre
Européen de Recherche et d’Enseignement des Géosciences de l’Environnement) et la société
PHYTOREMetd’uncontratdecollaborationderechercheentreleCEREGEetPHYTOREMsoutenu
parlaDirectionGénéraledesEntreprises.
Introductiongénérale
4
REFERENCESBIBLIOGRAPHIQUES
ArfiV,BagoudouD,KorboulewskyNandBoisG2009Initialefficiencyofabamboogrove‐basedtreatmentsystemforwinerywastewater.Desalination246,69‐77.
daCunhaKPVanddoNascimentoCWA2009SiliconEffectsonMetalToleranceandStructural
ChangesinMaize(ZeamaysL.)GrownonaCadmiumandZincEnrichedSoil.WaterAirandSoilPollution197,323‐330.
GuHH,QiuH,TianT,ZhanSS,DengTHB,ChaneyRL,WangSZ,TangYT,MorelJLandQiuRL
2011Mitigationeffectsofsiliconrichamendmentsonheavymetalaccumulationinrice(Oryza sativa L.) planted on multi‐metal contaminated acidic soil. Chemosphere 83,1234‐1240.
Jabeen R, Ahmad A and Iqbal M 2009 Phytoremediation of Heavy Metals: Physiological and
MolecularMechanisms.TheBotanicalReview75,339‐364.Keller C 2005 Efficiency and Limitations of Phytoextraction byHigh Biomass Plants. In Trace
ElementsintheEnvironment.pp611‐630.CRCPress.LegrosS,ChaurandP,Rose J,MasionA,BrioisV,Ferrasse JH,SaintMacaryH,Bottero JYand
Doelsch E 2010 Investigation of Copper Speciation in Pig Slurry by a MultitechniqueApproach.EnvironmentalScience&Technology44,6926‐6932.
Pilon‐SmitsE2005Phytoremediation.AnnualReviewofPlantBiology56,15‐39.

Introductiongénérale
5

Introductiongénérale
6
C H A P I T R E 1
SYNTHESE B IBL IOGRAPHIQUE

ChapitreI:Synthèsebibliographique
9
TABLE DES MATIERES
CHAPITRE1SYNTHESEBIBLIOGRAPHIQUE.......................................................................11
1. LECUIVREDANSLESPLANTES.........................................................................................................................111.1. Lecuivre,oligoélément ........................................................................................................................................................ 111.2. Mécanismesdeprélèvement................................................................................................................................................ 131.2.1 Adsorptionducuivredansl’apoplasmeracinaire .......................................................................................141.2.2 Absorptionracinaire.................................................................................................................................................15
1.3. Homéostasieauseindelacellule ...................................................................................................................................... 151.4. Transportetcomplexation .................................................................................................................................................. 161.5. Distribution................................................................................................................................................................................. 191.6. Toxicité.......................................................................................................................................................................................... 191.6.1 Rhizotoxicité.................................................................................................................................................................201.6.2 Stressoxydatifetgénotoxicité..............................................................................................................................201.6.3 Phytotoxicitéauniveaudespartiesaériennes..............................................................................................21
1.7. MécanismedetoléranceàlatoxicitédeCu.................................................................................................................. 221.8. Utilisationdelaspectroscopied’absorptiondesrayonsXpourétudierlaspéciationdeCudanslesplantes ........................................................................................................................................................................................................ 24
2. LESILICIUM.............................................................................................................................................................322.1. TeneurenSidanslesplantesetdanslebambou ....................................................................................................... 322.2. Absorptionracinaire............................................................................................................................................................... 332.3. Transportetstockage ............................................................................................................................................................ 342.4. Fonctiondusiliciumdanslebambou .............................................................................................................................. 382.5. Métauxetsilicium .................................................................................................................................................................... 402.5.1 Modificationdesconditionsenvironnementales .........................................................................................402.5.2 Augmentationdelabiomasse...............................................................................................................................412.5.3 Diminutiondel’absorptiondesmétaux ...........................................................................................................412.5.4 Modificationdelarépartitiondesmétaux ......................................................................................................422.5.5 Modificationdel’expressiondegènes ..............................................................................................................43
3. BILANDUCHAPITREI .........................................................................................................................................44
4. REFERENCESBIBLIOGRAPHIQUES..................................................................................................................45

ChapitreI:Synthèsebibliographique
10
ChapitreI:Synthèsebibliographique
11
CHAPITRE 1
SYNTHESE B IBL IOGRAPHIQUE
Cette synthèse bibliographique est organisée en deux axes principaux dédiésau cuivre et au
siliciumdanslesplantes.
Commeaucunedonnéen’estencorepubliéesurCudanslebambou,lapremièrepartieprésente
les connaissances actuelles sur la présence de Cu dans les plantes: ses caractéristiques, ses
mécanismesdeprélèvement,detransportetsatoxicité.Lesapprochesetlesoutilsutiliséspour
caractériser le comportement de Cu dans les plantes sont nombreux et couvrent différentes
échelles:de l’observationmacroscopiquedeseffetsdeCuàdesétudesdegénomique.Comme
nousavonsutilisélaspectroscopied’absorptiondesrayonsXpourcaractériserlaspéciationdu
Cudanslesbambous,uneprésentationdesprincipauxrésultatsdespéciationdeCuacquisgrâce
àcetteméthodedanslesplantescomplètecettepremièrepartie.
Lasecondepartiedétaillelecomportementdusiliciumdanslesplantesetdanslebambou:ses
mécanismesdeprélèvement,detransport,sarépartitiondans lesdifférentstissusdubambou,
sesfonctionsdanslesplantesetsonrôlefaceàunetoxicitémétallique.
1. LE CUIVRE DANS LES PLANTES
1.1. Le cuivre, oligo-élément
Lecuivrefaitpartiedesmétauxdetransition,c’estunoligo‐élémentprésentenproportiontrès
faibledans lestissusbiologiquesmais indispensableà lavie.En1930,Cuestreconnuélément
trace essentiel pour les plantes (Alloway 1995). Certains éléments traces cationiques
plurivalentscommeCupeuventseprésentersousdifférentsétatsd'oxydation(Cu2++e‐↔Cu+)
etjouentainsiunrôled'accepteuroudedonneurd'électrons,cequiesttrèsimportantdansles
multiplessystèmesenzymatiquesmettanten jeudesréactionsd'oxydoréduction.Lecuivreest
également nécessaire à de nombreuses enzymes, comme activateur ou comme constituant
spécifique des protéines (Marschner 1995). Dans le cas d'une croissance optimale, les
concentrationsenCudanslesplantesatteignentdesvaleurscomprisesentre5et20mg.kg‐1de
ChapitreI:Synthèsebibliographique
12
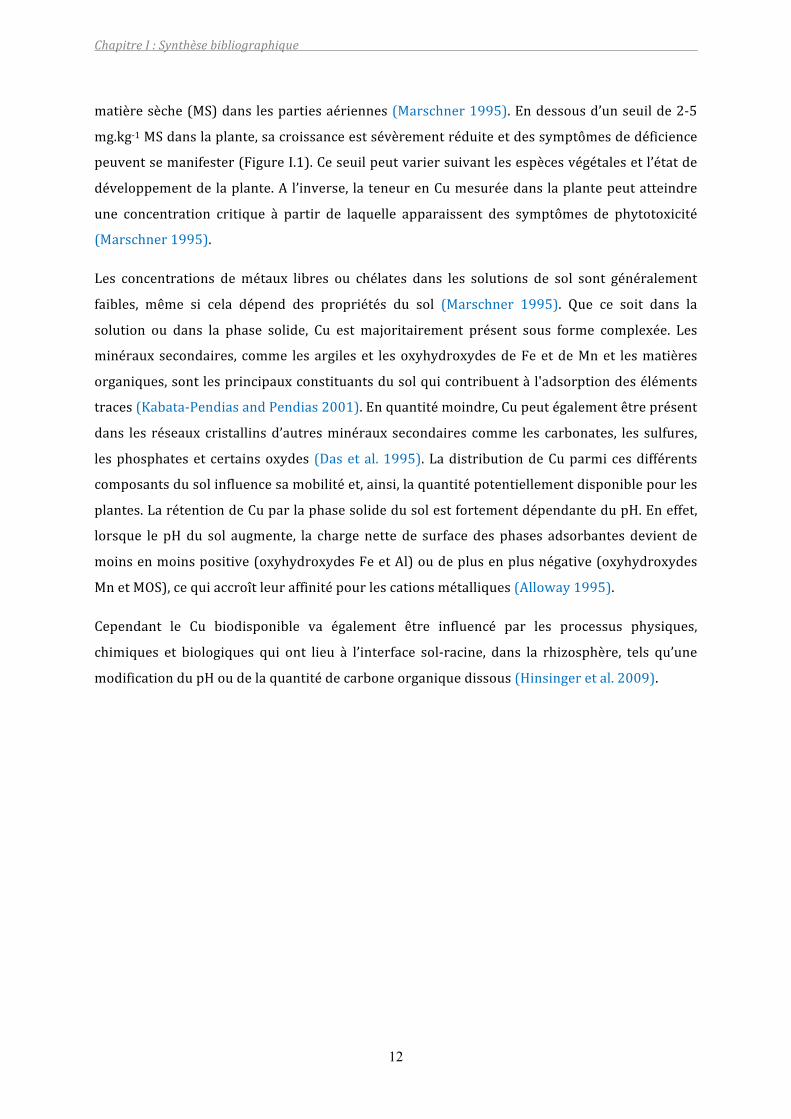
matièresèche(MS)danslespartiesaériennes(Marschner1995).Endessousd’unseuilde2‐5
mg.kg‐1MSdanslaplante,sacroissanceestsévèrementréduiteetdessymptômesdedéficience
peuventsemanifester(FigureI.1).Ceseuilpeutvariersuivantlesespècesvégétalesetl’étatde
développementdelaplante.Al’inverse, lateneurenCumesuréedanslaplantepeutatteindre
une concentration critique à partir de laquelle apparaissent des symptômes de phytotoxicité
(Marschner1995).
Les concentrations demétaux libres ou chélates dans les solutions de sol sont généralement
faibles, même si cela dépend des propriétés du sol (Marschner 1995). Que ce soit dans la
solution ou dans la phase solide, Cu est majoritairement présent sous forme complexée. Les
minéraux secondaires, comme lesargileset lesoxyhydroxydesdeFeetdeMnet lesmatières
organiques,sontlesprincipauxconstituantsdusolquicontribuentàl'adsorptiondeséléments
traces(Kabata‐PendiasandPendias2001).Enquantitémoindre,Cupeutégalementêtreprésent
dans les réseaux cristallinsd’autresminéraux secondaires comme les carbonates, les sulfures,
lesphosphateset certainsoxydes (Dasetal.1995).LadistributiondeCuparmicesdifférents
composantsdusolinfluencesamobilitéet,ainsi,laquantitépotentiellementdisponiblepourles
plantes.LarétentiondeCuparlaphasesolidedusolestfortementdépendantedupH.Eneffet,
lorsque le pHdu sol augmente, la charge nette de surface des phases adsorbantes devient de
moinsenmoinspositive(oxyhydroxydesFeetAl)oudeplusenplusnégative(oxyhydroxydes
MnetMOS),cequiaccroîtleuraffinitépourlescationsmétalliques(Alloway1995).
Cependant le Cu biodisponible va également être influencé par les processus physiques,
chimiques et biologiques qui ont lieu à l’interface sol‐racine, dans la rhizosphère, tels qu’une
modificationdupHoudelaquantitédecarboneorganiquedissous(Hinsingeretal.2009).
ChapitreI:Synthèsebibliographique
13
Figure I.1 Courbe de croissance en réponse au statut nutritionnel de la plante, d’après Reuter and Robinson (1997)
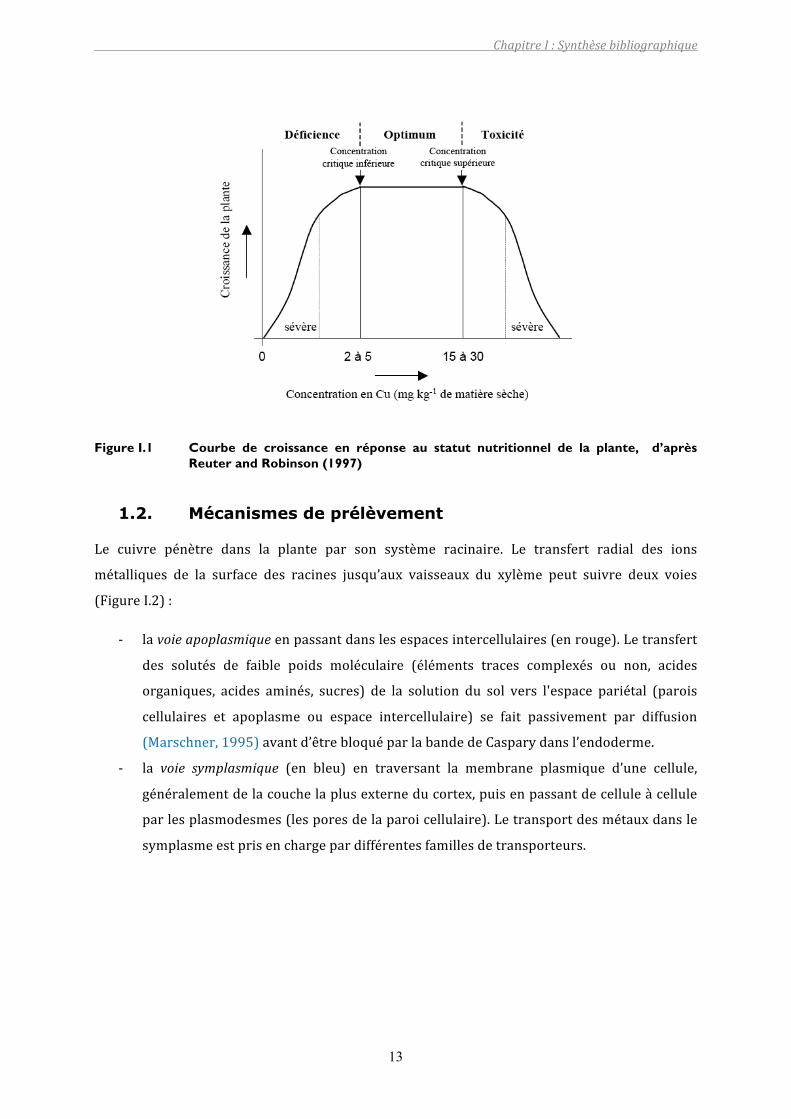
1.2. Mécanismes de prélèvement
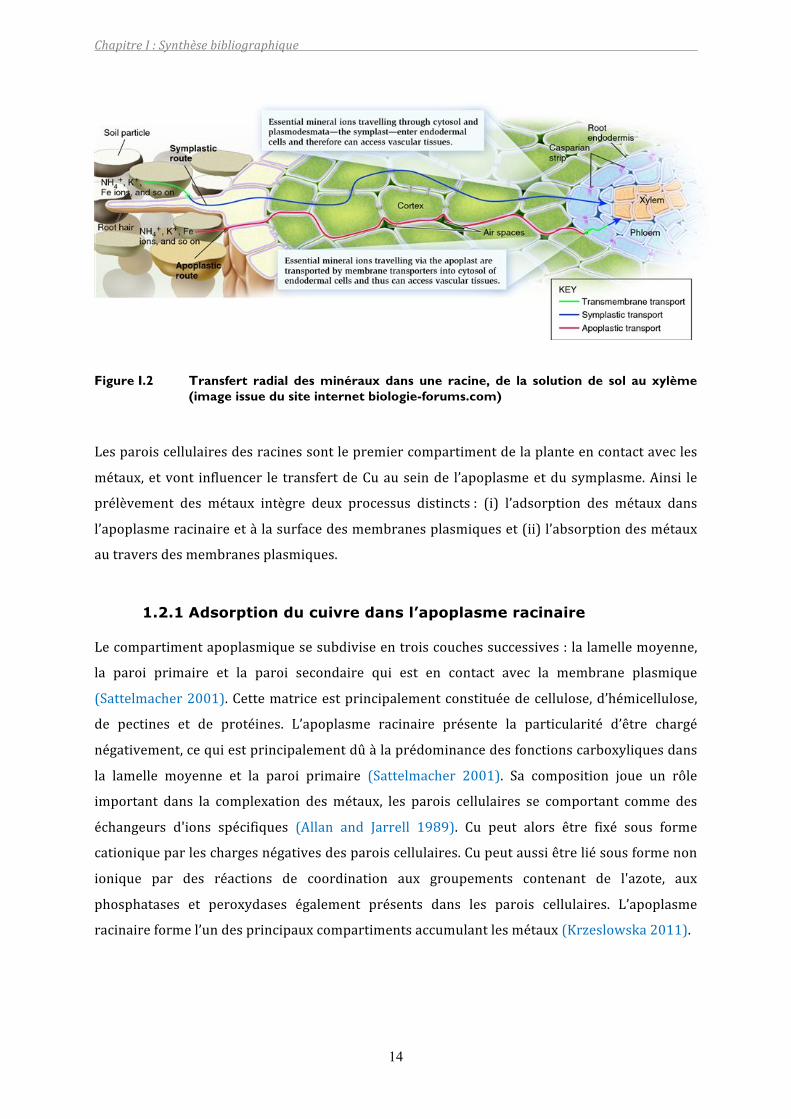
Le cuivre pénètre dans la plante par son système racinaire. Le transfert radial des ions
métalliques de la surface des racines jusqu’aux vaisseaux du xylème peut suivre deux voies
(FigureI.2):
‐ lavoieapoplasmiqueenpassantdanslesespacesintercellulaires(enrouge).Letransfert
des solutés de faible poids moléculaire (éléments traces complexés ou non, acides
organiques, acides aminés, sucres) de la solution du sol vers l'espace pariétal (parois
cellulaires et apoplasme ou espace intercellulaire) se fait passivement par diffusion
(Marschner,1995)avantd’êtrebloquéparlabandedeCasparydansl’endoderme.
‐ la voie symplasmique (en bleu) en traversant la membrane plasmique d’une cellule,
généralementdelacouchelaplusexterneducortex,puisenpassantdecelluleàcellule
parlesplasmodesmes(lesporesdelaparoicellulaire).Letransportdesmétauxdansle
symplasmeestprisenchargepardifférentesfamillesdetransporteurs.
ChapitreI:Synthèsebibliographique
14
Figure I.2 Transfert radial des minéraux dans une racine, de la solution de sol au xylème (image issue du site internet biologie-forums.com)
Lesparoiscellulairesdesracinessontlepremiercompartimentdelaplanteencontactavecles
métaux,etvont influencer le transfertdeCuauseinde l’apoplasmeetdusymplasme.Ainsi le
prélèvement des métaux intègre deux processus distincts: (i) l’adsorption des métaux dans
l’apoplasmeracinaireetàlasurfacedesmembranesplasmiqueset(ii)l’absorptiondesmétaux
autraversdesmembranesplasmiques.
1.2.1 Adsorption du cuivre dans l’apoplasme racinaire
Lecompartimentapoplasmiquesesubdiviseentroiscouchessuccessives:lalamellemoyenne,
la paroi primaire et la paroi secondaire qui est en contact avec la membrane plasmique
(Sattelmacher2001).Cettematriceestprincipalementconstituéedecellulose,d’hémicellulose,
de pectines et de protéines. L’apoplasme racinaire présente la particularité d’être chargé
négativement,cequiestprincipalementdûàlaprédominancedesfonctionscarboxyliquesdans
la lamelle moyenne et la paroi primaire (Sattelmacher 2001). Sa composition joue un rôle
important dans la complexation desmétaux, les parois cellulaires se comportant comme des
échangeurs d'ions spécifiques (Allan and Jarrell 1989). Cu peut alors être fixé sous forme
cationiqueparleschargesnégativesdesparoiscellulaires.Cupeutaussiêtreliésousformenon
ionique par des réactions de coordination aux groupements contenant de l'azote, aux
phosphatases et peroxydases également présents dans les parois cellulaires. L’apoplasme
racinaireformel’undesprincipauxcompartimentsaccumulantlesmétaux(Krzeslowska2011).
ChapitreI:Synthèsebibliographique
15
1.2.2 Absorption racinaire
Lesmécanismes d’absorption de Cu restent à l’heure actuelle encoremal identifiés et ont été
essentiellement caractérisés chez Arabidopsis thaliana L. (Burkhead et al. 2009; Puig et al.
2007b;Sancenonetal.2004;Sancenonetal.2003;Yruela2009).L’absorptionracinairedeCu
semble principalement dépendre de transporteurs à haute affinité spécifique de Cu(I)
appartenantàlafamilleCTR(CopperTRansporter)etenparticulierCOPT1(COPper Transporter
protein), fortement exprimé dans les racines (Sancenon et al. 2004). L'expression de ce
transporteur est contrôlée négativement par le cuivre (Sancenon et al. 2004). Ces protéines
COPT transportent le cuivre sous une forme réduite Cu(I), mais celui‐ci est majoritairement
présentsous formeoxydéeCu(II)dans lasolutiondesol.Laréductionducuivrepourraitêtre
assuréepardesprotéinesréductasesferreuses(FRO2etFRO3)présentesdans lamembrane
plasmique,quisontimpliquéesdanslaréductionduFe3+chezlesdicotylédones(Mukherjeeet
al.2006;Welchetal.1993).Cependantlaprésencedecesréductaseschezlesmonocotylédones
n’estpasconfirmée.Enplusdel'importdeCu(I)parCOPT1,Cu(II)pourraitêtreimportépardes
membresde la familleZIP(GrotzandGuerinot2006;Wintzetal.2003).Cependant, lerôlede
cesprotéinesdansletransportdecuivreinplantaresteàvérifier.
1.3. Homéostasie au sein de la cellule
Il est primordial pour les cellules de contrôler finement l’homéostasie des métaux afin de
pouvoirfairefaceàunexcèsdecesions,etéviterdesdommagestelsquedesstressoxydatifs.
Unefoistransportésdanslesdifférentstissus,lesmétauxdoiventêtrecorrectementdistribués
dansl'ensembledescompartimentssubcellulairesetàdesconcentrationsnontoxiquespourla
cellule. Ceci peut se faire grâce à la présencede transporteurs spécifiques et demolécules ou
protéinesquivontprendreenchargecesmétaux.Danslacellulevégétale,lecuivreestessentiel
pour de nombreux processus comme la photosynthèse, la respiration, la perception de
l'éthylène,lemétabolismedesdérivésréactifsdel’oxygène....Lecuivredoitdoncêtreacheminé
dans de nombreux compartiments subcellulaires comme le réticulum endoplasmique, la
mitochondrie, lechloroplasteet l’apoplaste(Marschner1995).Dans lecytosol,Cu(I)peutêtre
chélatépardesphytochélatinesetdesmétallothionines(CobbettandGoldsbrough2002)oupris
en charge par des métallochaperonnes. Les métallochaperonnes permettent d'acheminer le
métal à une protéine cible spécifique via des interactions protéine‐protéine. Ces
métallochaperonnespermettraientaussid'augmenter la capacitéde la celluleà chélaterCu(I).
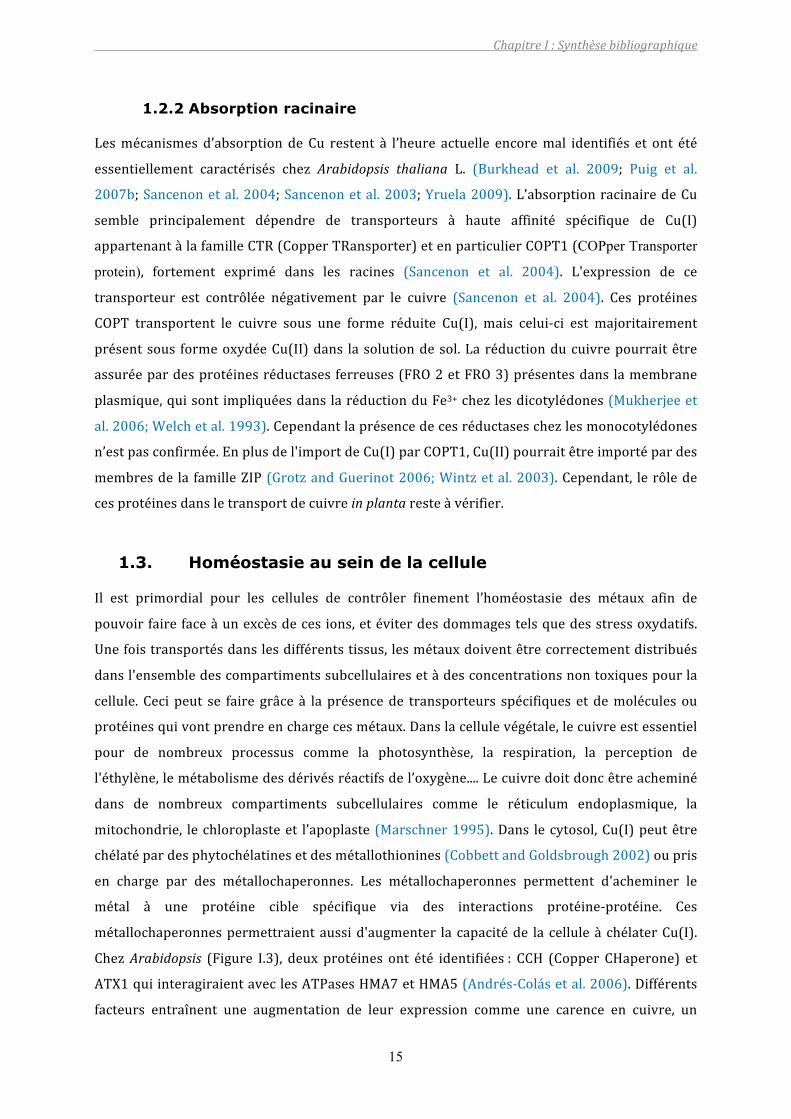
ChezArabidopsis (Figure I.3), deux protéines ont été identifiées: CCH (Copper CHaperone) et
ATX1quiinteragiraientaveclesATPasesHMA7etHMA5(Andrés‐Colásetal.2006).Différents
facteurs entraînent une augmentation de leur expression comme une carence en cuivre, un
ChapitreI:Synthèsebibliographique
16
stress oxydatif, la sénescence ou encore des stress mécaniques (Burkhead et al. 2009).
Récemment,deuxnouvellesmétallochaperonnesquicomplexentCu(II),CUTAetPCaP1,ontété
identifiéesetcaractérisées(Burkeadetal.,2003).CUTAestlocaliséedanslechloroplaste,PCaP1
seraitassociéeàlamembraneplasmiqueavecuneforteaffinitépourCu(II).Ellenepossèdepas
de résidus cystéine ou histidine mais de nombreux résidus glutamate qui pourraient être
impliquésdanslaliaisonducuivre(Nagasaki‐Takeuchietal.2008).
Figure I.3 Schéma récapitulant les différents transports de Cu identifiés dans une cellule générique (essentiellement dans Arabidopsis). Les protéines membranaires transporteurs de Cu sont représentées en orange, les Cu chaperonnes en violet. Abréviations : CCH, copper chaperone; ATX : antioxydant1 ; COPT, copper transporter; FRO, ferric reductase oxidase; HMA, heavy metal P-type ATPase; MT, metallothioneins; ZIP, IRT-like protein. Schéma modifié d’après (Yruela 2009).
1.4. Transport et complexation
Une fois incorporé dans les cellules racinaires, le cuivre est libéré dans les vaisseaux
conducteursdelasèvebrute, lexylème,pourêtretransportéjusqu’auxpartiesaériennesdela
plante. L'efflux de Cu(I) de la racine vers le xylème, s’effectue en partie par le transporteur
HMA5(ATPasedetypeP)(Andrés‐Colásetal.2006).Celaaétéenpartiemontréparlaprésence
ChapitreI:Synthèsebibliographique
17
deHMA5danslesracinesetunblocagedelatranslocationdeCu,quis’accumulealorsdansles
racines,dansunmutantdéficientenHMA5.
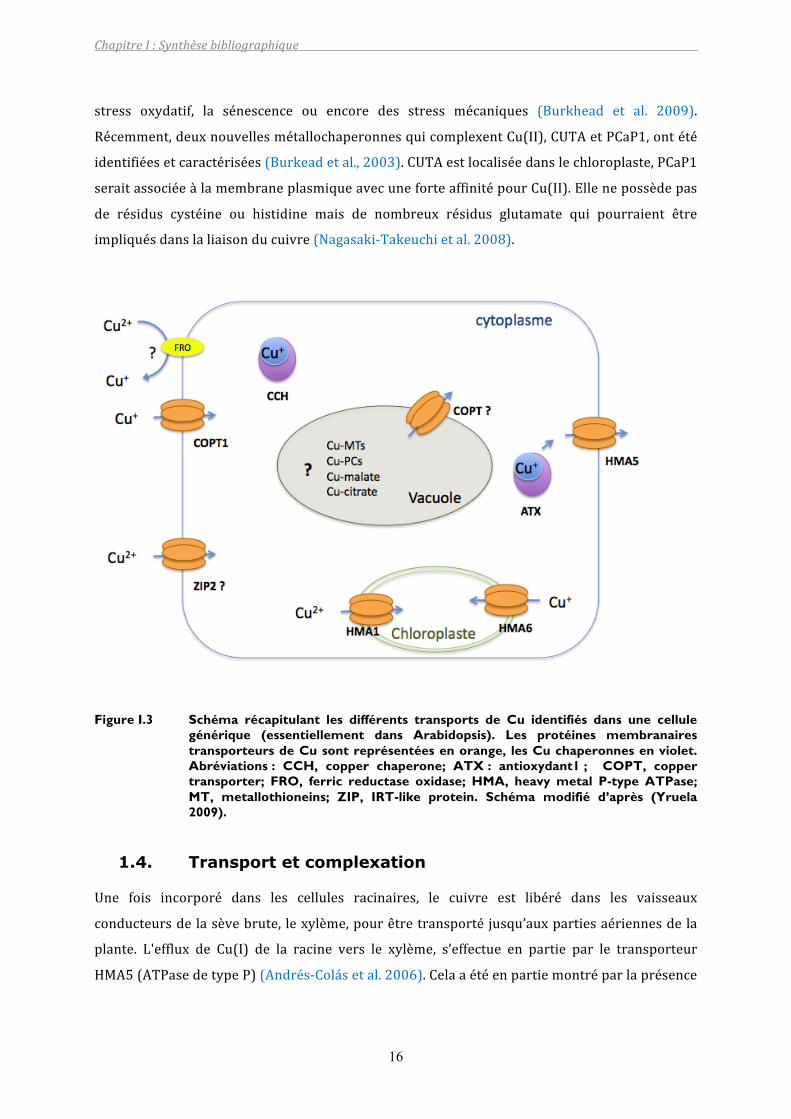
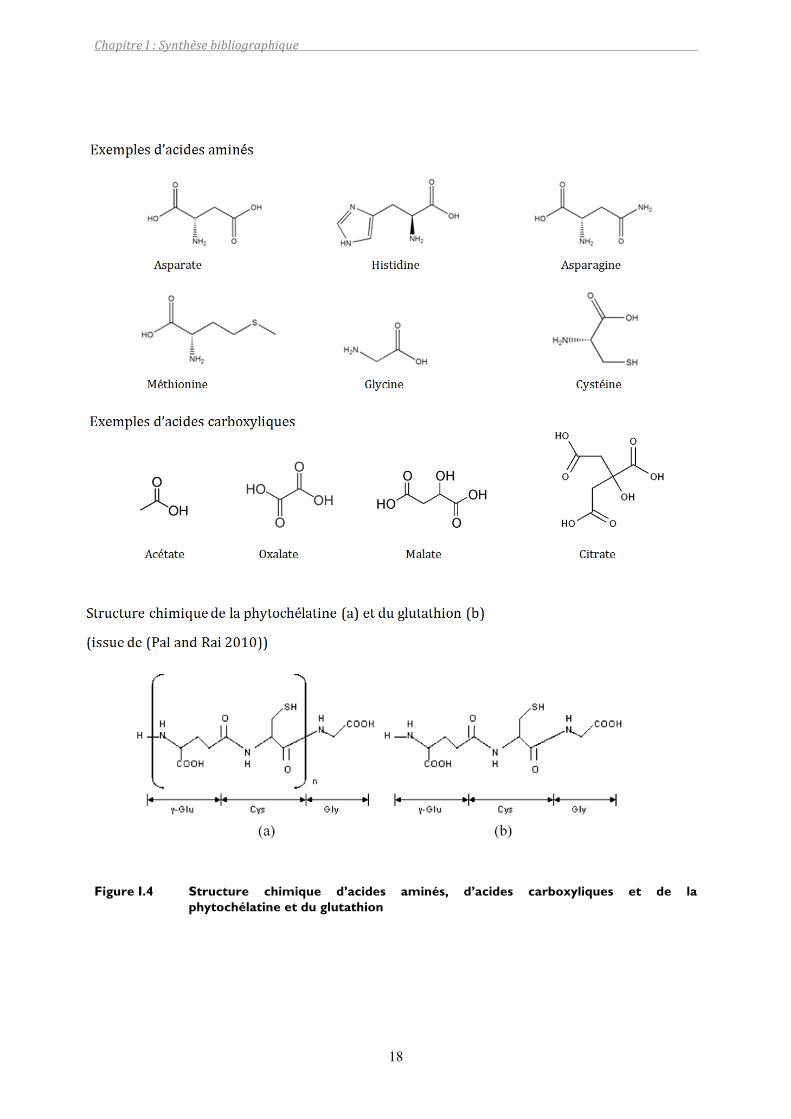
Dans la sève, Cu peut modifier sa spéciation et former des complexes avec les substances
organiquesprésentes(Pohlmeier1999).Lesligandspotentielssontlessuivants:
- carboxylates(citrate,oxalate,malate,succinate,tartrate,phtalate,salicylate,acétate),
- acides aminés et acides mercaptiques, ils possèdent au moins un groupement
carboxylique et un groupement amine (glycine, acide glutamique, histidine, cystéine,
asparagine,nicotianamine)(FigureI.4)(Whiteetal.1981a;Whiteetal.1981b),
- polymères (protéines, pectines, ADN, ARN, lignine et polysaccharides). Ils sont formés
d’unechaînedemonomèresquipossèdentdesgroupementsfonctionnelscarboxyliques
ouaminés.
Lecuivreestdistribuédanslesdifférentsorganes,puispeutêtreremobilisé,c’estàdirechanger
d’organeenpassantparlesvaisseauxconducteursdesèveélaborée,lephloème.
ChapitreI:Synthèsebibliographique
18
Figure I.4 Structure chimique d’acides aminés, d’acides carboxyliques et de la phytochélatine et du glutathion
ChapitreI:Synthèsebibliographique
19
1.5. Distribution
Dans laplupartdesplantesétudiées, lesconcentrationsracinairesdeCusontsupérieuresaux
concentrationsdespartiesaériennes,quecesoitpourdesplantescapablesdetolérerdefortes
quantités de Cu comme Haumaniastrum katangense, Nicotiana plumbaginifolia, Elsholtzia
haichowensis,Silenevulgaris(Chipengetal.2009;XiaandShen2007),oupourdesplantesnon
tolérantes,commeleblé, lemaïs, lesroseaux, leniébéetc…(Alietal.2002;Bravinetal.2010;
KopittkeandMenzies2006).Ainsi,lerapportdesconcentrationstotalesdeCuentrelesracines
et les parties aériennes peut considérablement varier et être compris entre 2.5 et 166 en
fonctionduniveaud’expositiondesplantes(Brunetal.2001;Santibanezetal.2008).Cetteforte
accumulation racinaire s’explique en partie par la quantité importante de Cu liée aux parois
cellulaireset/ouàunmécanismedeséquestrationducuivre.Enséparantlesparoiscellulaires
ducytoplasmedecellulesderacinesdeAthyriumyokoscense,Nishizonoetal.(1987)montrent
que 70 à 90 % de Cu de la racine est localisé dans les parois cellulaires. Par une méthode
similaire, Lou et al. (2004)mesurent 60% du cuivre racinaire lié aux parois cellulaires dans
Elsholtziahaichowensis.Ceciestégalementobservéparobservationsinsitu,commeparexemple
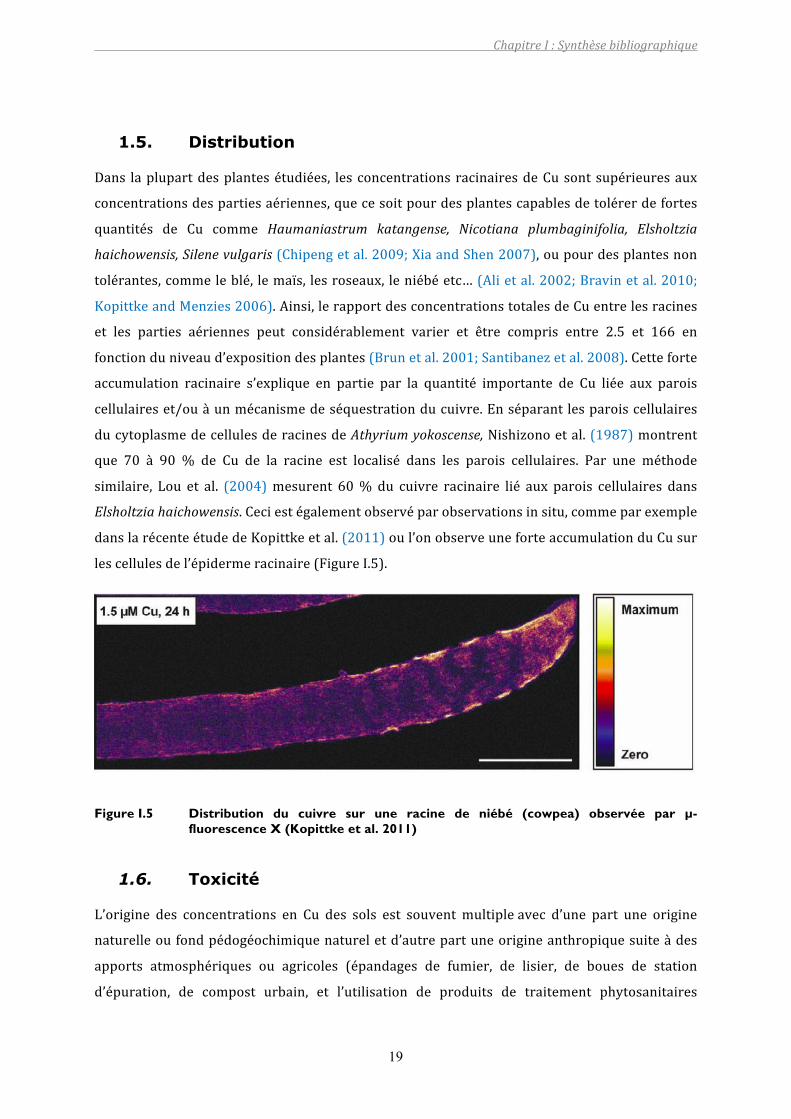
danslarécenteétudedeKopittkeetal.(2011)oul’onobserveuneforteaccumulationduCusur
lescellulesdel’épidermeracinaire(FigureI.5).
Figure I.5 Distribution du cuivre sur une racine de niébé (cowpea) observée par µ-fluorescence X (Kopittke et al. 2011)
1.6. Toxicité
L’origine des concentrations en Cu des sols est souvent multipleavec d’une part une origine
naturelleoufondpédogéochimiquenatureletd’autrepartuneorigineanthropiquesuiteàdes
apports atmosphériques ou agricoles (épandages de fumier, de lisier, de boues de station
d’épuration, de compost urbain, et l’utilisation de produits de traitement phytosanitaires
ChapitreI:Synthèsebibliographique
20
(Kabata‐Pendias and Pendias 2001; Pilon‐Smits 2005)). Au‐delà de la concentration en Cu
requise pour une croissance optimale, Cu devient toxique, excepté pour quelques plantes
tolérantesàde fortesconcentrationdeCu(i.e.ArabidopsishalleriL.Silenevulgaris (Moench).,
Elshotziasplendens)(Lietal.2009;Qianetal.2005;Shietal.2008;Shietal.2004;Songetal.
2004;Yangetal.2002).
1.6.1 Rhizotoxicité
Un excès de Cu inhibe la croissance racinaire avant d’inhiber la croissance des tiges. Comme
nous l’avons vu auparavant, Cu a une très forte affinité pour les parois cellulaires, et a donc
tendance à s’accumuler dans ce compartiment (Iwasaki et al. 1990). Une inhibition de
l’élongation racinaire et les dégâts causés à la membrane plasmique sont des symptômes
immédiatsd’unetoxicitéauCu(DeVosetal.1991).L’excèsdeCuentraîneégalementcertaines
modificationsmorphologiques tel qu’un épaississement de la racine, une coloration brunâtre,
unediminutionde l’élongationracinaireetuneaugmentationde la ramification(Kopittkeand
Menzies 2006; Kopittke et al. 2009; Panou‐Filotheou and Bosabalidis 2004). Ces symptômes
sontprincipalementattribuésà la rigidificationdesparoiscellulairespar l’adsorptionmassive
des métaux en remplacement du Ca dans l’apoplasme, en particulier au niveau de la zone
d’élongation. Cette rigidité de l’apoplasme freine l’élongation racinaire et peut provoquer des
ruptures au niveau des cellules du rhizoderme et du cortex externe qui seraient dues à des
vitessesdecroissancedifférentesentrelescellulesdescortexinternesetexternes(Kopittkeet
al.2008).
LaconcentrationenCuracinairepeutêtreuneindicationdelatoléranceauCudesplantesplus
fiable que celle qui est donnée par les parties aériennes (Marschner 1995). En effet, la
translocationdeCuauxpartiesaériennesest limitéepar la forteaccumulationdeCudans les
racines, donc les phénomènes de toxicité et les atteintes physiologiques (i.e. réduction de la
croissance racinaire et de l’absorption des nutriments) se produisent avant que les parties
aériennes n’atteignent des teneurs en Cu anormalement hautes (Michaud et al. 2008). Ainsi,
Michaudetal.(2008)ontdéterminéunseuilde100‐150mgCukg‐1danslesracines,enincluant
lecompartimentapoplasmique,pourunerhizotoxicitémodérée(EC10)etunseuilde250‐300
mgCukg‐1pourunerhizotoxicitéimportante(EC50).
1.6.2 Stress oxydatif et génotoxicité
UneconcentrationtropélevéedeCuinduitlaformationd’espècesréactivesdel’oxygène(ROS)
par la réaction d’Haber‐Weiss et de Fenton. Cette formation d’ions superoxydes (oxygène
ChapitreI:Synthèsebibliographique
21
moléculaire ionisé par addition d’un électron supplémentaire) entraîne des dommages
oxydatifs. Les plantes ont développé des systèmes de défense antioxydants qui, dans des
conditionsnonoupeustressantes,sontsuffisantspourassurerl’homéostasieetainsiempêcher
desdégâtsdusauxstressoxydatifs(Foyeretal.1994).Lesenzymesantioxydantesprésentesen
majorité sontdes enzymesdétoxifiantes : superoxidesdismutases (SOD),Cu/ZnSOD, catalase
(CAT),etdesenzymesperoxydasesquidécomposentlescomposéspéroxydes(H202),commeles
glutathions peroxydases. De nombreux antioxydants non‐enzymatiques sont également
impliqués: le glutathion, l’acide ascorbique, les caroténoïdes, l’acide urique, plusieurs acides
aminésetdesthiols.
Quandlesystèmenesuffitplusàempêcherlestressoxydatif, lesROSparleurnatureinstable,
sont particulièrement réactives et sont capables de provoquer des dégâts cellulaires
importants(BriatandLebrun1999;DietzandBaier1999):
• la peroxydation des membranes lipidiques; les acides gras polyinsaturés des
membranescellulairesoudeslipoprotéinessontlacibleprincipaledesROS(Lunaetal.
1994),
• cassuresetmutationsdel’ADN(Lloydetal.1997),
• inactivationdesprotéinesetdesenzymes,
• oxydationdespigments,dessucres…,
• dégradation de la chlorophylle et inhibition de la photosynthèse (Luna et al. 1994;
Patsikkaetal.2002).
Le cuivre peut également être génotoxique, c’est à dire capable de générer des mutations
génétiques (génique, chromosomiques ou génomiques). Les effets génotoxiques sont
vraisemblablement causés par les radicaux libres et agents oxydants libérés par l’action du
métal(Souguiretal.2008;Yildizetal.2009).
1.6.3 Phytotoxicité au niveau des parties aériennes
Laphytotoxicitéauniveaudespartiesaérienness’observeparuneréductiondebiomasse,des
symptômeschlorotiques,desnécrosesetune inhibitionde lacroissance.Unediminutionde la
quantitédechlorophylle,desaltérationsdelastructuredeschloroplastesetde lacomposition
delamembranedesthylakoïdesontétéobservéesdansleriz,leblé,leharicotetl’origandans
des conditions toxiques (Panou‐Filotheou and Bosabalidis 2004; Patsikka et al. 2002; Yruela
2009). Il a été proposé que Cu interfère avec la biosynthèse de l’appareil photosynthétique,
modifiantlacompositiondespigmentsetdelamembraneinternedeschloroplastes(Maksymiec
ChapitreI:Synthèsebibliographique
22
etal.1994).Patsikkaetal.(2002)attribuentcetteréductiondechlorophylleàunedéficienceen
Fe induitepar la toxicitédeCu.Commeon l’a signalédans leparagrapheprécédent, celapeut
égalementêtredûaustressoxydatifquientraîneladégradationdesmembranesdesthylakoides
(Lunaetal.1994).
La phytotoxicité de Cu semble également se traduire par l’apparition de déficiences en
nutriments.DesdiminutionssignificativesdesconcentrationsenCa,Fe,K,Mg,MnetZndansles
partiesaériennesdeRhodesGrass,duniébé(cowpea),etdumaïsontétéobservées(AitAlietal.
2002; Kopittke and Menzies 2006; Sheldon and Menzies 2005). Des décolorations
internervaires,synonymesdechloroseferrique,ontégalementétédécrites.L’origineexactede
cesphénomènesdedéficiencen’estpasconnueprécisément.Cependant,l’apparitionsimultanée
de déficiences multiples laisse penser qu’il s’agit d’une conséquence de l’altération de la
structuredusystèmeracinaire,commeladégradationde lamembraneplasmique(Kopittkeet
al.2009;Panou‐FilotheouandBosabalidis2004).Danslecasparticulierdesmonocotylédones,
l’induction d’une déficience en Fe lors d’une forte exposition à Cu pourrait être due à un
mécanisme plus spécifique, impliquant la perturbation par Cu2+ du rôle complexant des
phytosidérophoresvis‐à‐visdeFe3+,ouàunantagonismeFe‐Cuauniveaudestransporteursdes
complexesformésparlesphytosidérophoresaveccesdeuxmétaux(Michaudetal.2008).
1.7. Mécanisme de tolérance à la toxicité de Cu
Les mécanismes cellulaires impliqués dans la tolérance au cuivre peuvent avoir les effets
suivants(Clemens2006;Hall2002;Yruela2009):
• réduire l’absorption métallique via l’action des mycorhizes ou des exsudats extra
cellulaires,
• immobiliserl’excèsdeCudanslesracinesetainsiexclurelemétaldespartiesaériennes,
• stimulerlapompeàeffluxdumétaldanslamembraneplasmique,
• chélaterCupardesphytochélatines,desmétallothionines,desacidesorganiquesoudes
protéinesdechocthermique(HSP),
• séquestrerCudanslesvacuoles.
Des acides organiques (citrate, malate, oxalate), carbohydrates, protéines ou peptides sont
excrétésparlesplantesetpeuventfaciliterl’absorptiondesmétaux,maiscesmoléculespeuvent
également inhiber leur acquisition en formant des complexes extérieurs à la racine.
L’importancedecesmécanismessemblevarierselonlaconcentrationdemétaux,lesespèceset
variétés impliquées et le temps d’exposition. Des dépôts foncés extracellulaires riches en Cu,
couplésàuneforteconcentrationdecitrateetdemalateontétéobservéssurdescellulesisolées
ChapitreI:Synthèsebibliographique
23
desoja,enprésencede10µMdeCu(Bernaletal.2006).Desconcentrationssimilairesdecitrate
etdemalateontétéobservéesdansdescellulestolérantesauCudeNicotianaplumbaginifoliaL.
(KishinamiandWidholm1987).Lerôledesacidesorganiquesdanslarhizosphèreestimportant
pourtolérerunecontaminationaluminique(Jones1998),mêmesilesmécanismesquiactivent
etrégulentlasynthèsedesacidesorganiquesnesonttoujourspasbienidentifiés(Walkeretal.
2003).
Une fois internalisés, lesmétauxenexcèsvontêtre stockésdansunendroitmétaboliquement
peuactif.Uneséquestrationdesmétauxpeutavoirlieudanslavacuole,l’apoplasme,oudansdes
cellulesspécialiséescommelescellulesépidermalesoudestrichômes.
Malgrélaprésencedemétallothioneines(MTs)etlaforteexpressiondecertainsgènesdesMTs,
leurs fonctionsdans lesplantesrestentpeuconnues.L’expressiondeplusieursgènesdesMTs
estinduiteparlaprésencedeCu(Guoetal.2003),leniveaud’expressiondugènedutype2de
MTsestassociéàlatoléranceauCuchezlesAthaliana(MurphyandTaiz1995)etlatolérance
desplantesmétallophytesSilenevulgarisetSileneparadoxaestassociéeàuneaugmentationde
l’expression des gènes MTs (van Hoof et al. 2001). Cependant, l’implication des MTs dans la
détoxificationdeCudanslesplantesn’apasétédémontréedemanièreconcluante(Hassinenet
al.2011).LadivergencedesséquencesdesprotéinesMTsetleprofild’expressioncomplexedes
gènesMTslaissesuggérerquelesfonctionsdeMTsnesontpaslimitéesàladétoxificationdeCu.
Récemment,despreuvesontétéapportéesquelesMTscontribuentàl’homéostasiedesmétaux
danslesplantes(Guoetal.2008;Roosensetal.2004).
Lerôledesphytochélatines(PCs)dansladétoxificationdeCun’apasétémisenévidence.Cuest
unactivateurde labiosynthèsedePCs,mais lesplantesmutantesdéficientesenPCsmontrent
peu de sensibilité au cuivre (Lee and Kang 2005; Schat et al. 2002). Comme les PCs peuvent
formerdescomplexesavecCu,ilestpossiblequelescomplexesPC‐Cunesoientpasséquestrés
danslavacuole(CobbettandGoldsbrough2002).RécemmentSinghetal.(2010)montrentaussi
quelaproductiondePCsn’estpasliéeàlatolérancedeCudanslepoischiche(Cicerarietinum).
Lemétabolismedel’azoteaunrôlecentraldanslaréponsedesplantesaustressmétallique(Lea
andAzevedo2007).L’accumulationdecertainsacidesaminés,commelaprolineoul’histidinea
étémesuréedansdesplantesayantétésoumisesàdefortesteneursdeCulaissantsuggérerun
rôleentantquechélateurouantioxydant(SharmaandDietz2006).
LesATPasesdetypesP1BquitransportentCusontimportantes,pasuniquementpourimporter
les quantités de Cu nécessaires au fonctionnement de la cellule, mais aussi pour limiter leur
accumulation.Lecuivreestchélatéàdeschaperonnesqui letransportent jusqu’auxorganelles
ChapitreI:Synthèsebibliographique
24
oudirectementàdesprotéinescytosoliquesdépendantesdeCu.Ilsemblequelachélationetle
transport de Cu ne soit pas seulement requis pour l’absorption de Cu mais aussi pour des
processus de détoxification (Puig et al. 2007). Par exemple, l’inactivation du gène ActP, qui
encodeuneATPasedetypePentraîneunehypersensibilitéduRhizobiumlegominosarumetdu
Sinorhizobiummeliloti (Reeveetal.2002). IlaétémontréquechezA. thaliana le transporteur
ATPaseHMA5amélioreladétoxificationdeCu(Andrés‐Colásetal.2006).
1.8. Utilisation de la spectroscopie d’absorption des rayons X
pour étudier la spéciation de Cu dans les plantes
La spectroscopie d’absorption des rayons X est utilisée pour caractériser la spéciation des
éléments tracesmétalliquesdans lesplantes (Krameretal.2000;Saltetal.2002;Sarretetal.
2009). L’utilisation de la XAS présente de nombreux avantages comme l’absence de
prétraitementdel’échantillon,quiestsusceptibledemodifier laspéciationdel’élémentétudié
(Gardea‐Torresdey et al. 2005). Lesméthodesbasées surdes extractions séquentielles ou sur
une homogénéisation des tissus frais (par exemple la chromatographie) entraînent une
dégradation desmembranes intracellulaires. Lesmétaux faiblement liés initialement localisés
dans les vacuoles, peuvent se retrouver en contact avec divers ligands forts du cytoplasme,
entraînantalorsdeschangementsartificielsdelaspéciation.Parmilesautresavantagesdecette
technique spectroscopique, nous pouvons citer la sélectivité chimique ainsi que les seuils de
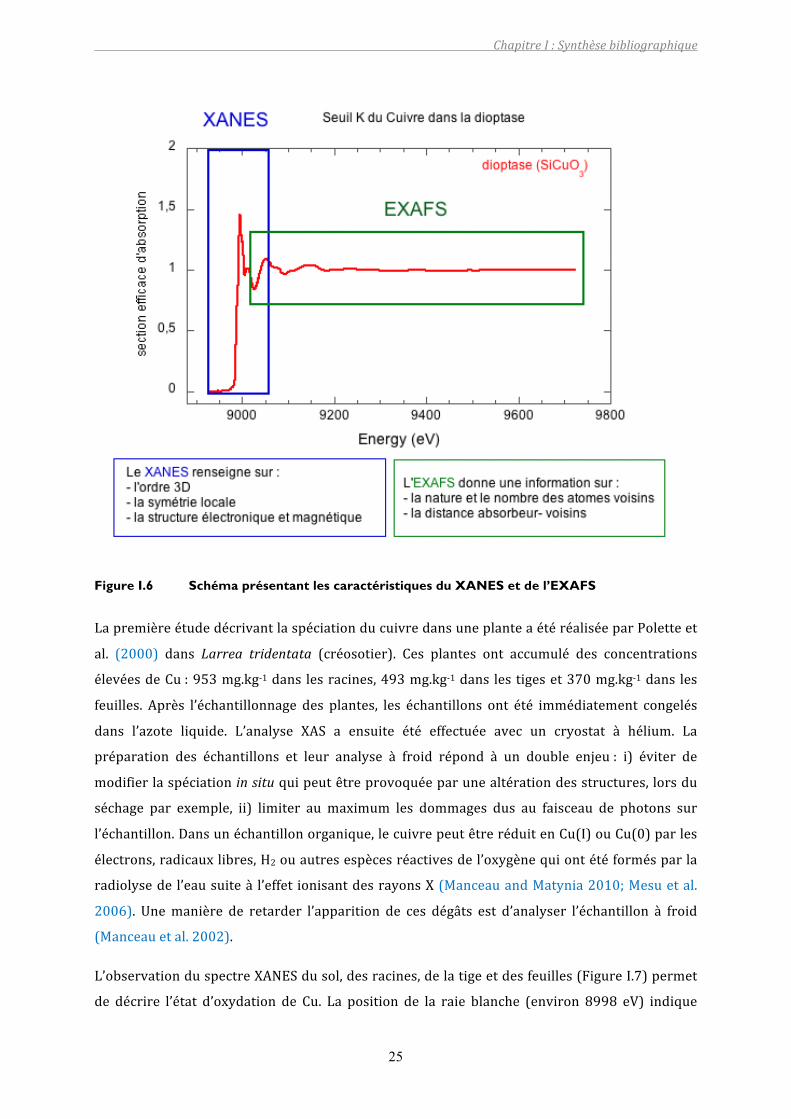
détectionbasquipermettentdetravailleravecdesconcentrationsphysiologiques.LaFigureI.6
résume les principales informations que l’on peut obtenir grâce à l’analyse d’un spectre
d’absorptiondesrayonsX.
La spéciation du cuivre (état d’oxydation, nombre et nature des voisins) dans les tissus des
plantes est peu étudiée malgré une bonne connaissance de la structure et des fonctions de
nombreusesenzymesquidépendentducuivreetdesCuchaperonnes(voir lareviewdePilon
parexemple(2006)).
ChapitreI:Synthèsebibliographique
25
Figure I.6 Schéma présentant les caractéristiques du XANES et de l’EXAFS
LapremièreétudedécrivantlaspéciationducuivredansuneplanteaétéréaliséeparPoletteet
al. (2000) dans Larrea tridentata (créosotier). Ces plantes ont accumulé des concentrations
élevéesdeCu:953mg.kg‐1dans lesracines,493mg.kg‐1dans lestigeset370mg.kg‐1dans les
feuilles. Après l’échantillonnage des plantes, les échantillons ont été immédiatement congelés
dans l’azote liquide. L’analyse XAS a ensuite été effectuée avec un cryostat à hélium. La
préparation des échantillons et leur analyse à froid répond à un double enjeu: i) éviter de
modifierlaspéciationinsituquipeutêtreprovoquéeparunealtérationdesstructures,lorsdu
séchage par exemple, ii) limiter au maximum les dommages dus au faisceau de photons sur
l’échantillon.Dansunéchantillonorganique,lecuivrepeutêtreréduitenCu(I)ouCu(0)parles
électrons,radicauxlibres,H2ouautresespècesréactivesdel’oxygènequiontétéformésparla
radiolysede l’eausuiteà l’effet ionisantdesrayonsX(ManceauandMatynia2010;Mesuetal.
2006). Unemanière de retarder l’apparition de ces dégâts est d’analyser l’échantillon à froid
(Manceauetal.2002).
L’observationduspectreXANESdusol,desracines,delatigeetdesfeuilles(FigureI.7)permet
de décrire l’état d’oxydation de Cu. La position de la raie blanche (environ 8998 eV) indique
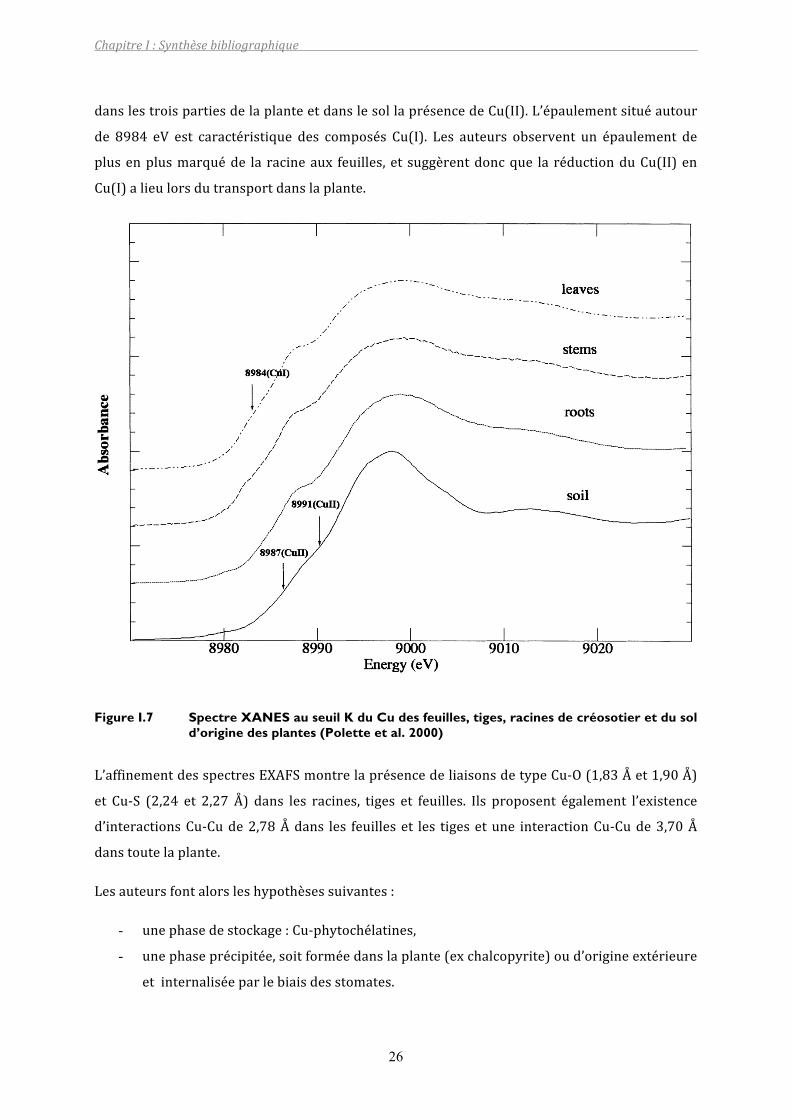
ChapitreI:Synthèsebibliographique
26
danslestroispartiesdelaplanteetdanslesollaprésencedeCu(II).L’épaulementsituéautour
de 8984 eV est caractéristique des composés Cu(I). Les auteurs observent un épaulement de
plusenplusmarquéde la racineaux feuilles, et suggèrentdoncque la réductionduCu(II)en
Cu(I)alieulorsdutransportdanslaplante.
Figure I.7 Spectre XANES au seuil K du Cu des feuilles, tiges, racines de créosotier et du sol d’origine des plantes (Polette et al. 2000)
L’affinementdesspectresEXAFSmontrelaprésencedeliaisonsdetypeCu‐O(1,83Ået1,90Å)
et Cu‐S (2,24 et 2,27 Å) dans les racines, tiges et feuilles. Ils proposent également l’existence
d’interactionsCu‐Cude2,78Ådans les feuilleset les tigesetune interactionCu‐Cude3,70Å
danstoutelaplante.
Lesauteursfontalorsleshypothèsessuivantes:
- unephasedestockage:Cu‐phytochélatines,
- unephaseprécipitée,soitforméedanslaplante(exchalcopyrite)oud’origineextérieure
etinternaliséeparlebiaisdesstomates.
ChapitreI:Synthèsebibliographique
27
Une autre étudedeGardea‐Torresdey et al. (2001) a également porté sur la spéciation de Cu
danslecréosotier,maisenutilisantdesplantesdéveloppéesenculturehydroponique,exposées
àuneconcentrationde635mg.L‐1deCuSO4.Lesplantesontétémisesaucontactd’unesolution
deCuSO4pendant48h.Lapréparationdesplantesprécédantl’analyseXASn’estpasdétaillée,il
semble que les différentes parties de la plante ont été séchées à 59°C. Contrairement à la
précédente étude, Cu est présent uniquement sous forme oxydée dans les tiges, racines et
feuilles et est complexéàun ligandde typeacideorganique.Un résultat similaireestobservé
chez la plante Sesbania drummondii (Sahi et al. 2007) qui a été cultivée en hydroponie et
exposée à des concentrations de 25 mg.L‐1 et 100 mg.L‐1 de CuSO4 pendant 10 jours.
Préalablementàl’analyseXAS,leséchantillonsontétélyophilisés.Lesauteursneprécisentpas
quellepartiedelaplanteestanalysée,noussupposonsqu’ils’agitdelaplanteentière.Lecuivre
présente un seul degré d’oxydation Cu(II) dans la plante. Des analyses par combinaisons
linéairesmontrent que Cu est complexé à des ligands semblables à des sucres ou des acides
organiques (référence utilisée: Cu(II)‐gluconate) et une forme précipitée (Cu(II)oxide et
Cu(II)nitrate).LamodélisationdesspectresEXAFSindiquelaprésencede4voisinsOà1.95Å,2
voisinsOà2,32Å,et4voisinsCà2,80Å.
Cependantdanscesdeuxétudes,laspéciationdeCupeutavoirétéinfluencéeparleséchagede
l’échantillon. Le séchage peut entraîner une oxydation de Cu présent dans les tissus et
éventuellementlaprécipitationdelaphasedécriteparSahietal(2007)dansleurséchantillons.
Shietal(2008)ontétudiélaspéciationdeCuprésentd’uneplantetoléranteElshotziasplendens
quiaétécultivéeenhydroponieetmiseaucontactd’unesolutionde300µMdeCupendant10
ou 60 jours. Les concentrations en Cu des tissus varient entre 165 et 248 mg.kg‐1 dans les
feuilles, 202 à 263 mg.kg‐1 dans les tiges et 11 755 et 13 796 mg.kg‐1 dans les racines. Les
échantillons frais ont été congelés à l’azote liquide. La spéciation de Cu est similaire dans les
feuilles, tiges et racines et est caractérisée par une forte proportion de Cu(II), même si la
présencedeCu(I)estdétectée.L’analyseparcombinaisonlinéairedesspectresXANESindique
quelesespècesdetype:Cu‐histidine(33‐52%)etCu‐paroiscellulairessontmajoritaires,alors
que les espèces de type Cu‐oxalate (9‐18 %) et Cu‐glutathione (7‐16 %) sont minoritaires.
D’après lamodélisationdes spectresEXAFS, l’interactiondominanteestCu‐N/Oà1,94‐1,97Å
danslesracines,lestigesetlesfeuilles.
Ainsi,lesmécanismesdetolérancedeCudansE.Splendensimpliqueraient:
‐ LacomplexationdeCusurlesparoiscellulaires,notammentsurlesgroupesoxygénés‐
OHou–COOHprésentssurlacellulose,lalignineoulapectine,
‐ Lacomplexationàdesacidesaminés(detypehistidine)ouorganiques,éventuellement
séquestrésdanslavacuole,
ChapitreI:Synthèsebibliographique
28
‐ Uneabsencedecomplexationàdescomposésdetypephytochélatines.
Deuxétudesrécentesontétudiélacomplexationetlatoxicitéducuivredansdeuxplantes:une
plante accumulatrice de Cu Crassula helmsii et une plante non tolérante Thlaspi caerulescens
(Kupperetal.2009;Mijovilovichetal.2009).
DesgrainesdeT.caerulescensontétéplacéesenculturehydroponiqueetsoumisesà10µMde
Cupendant8semaines.Certainesplantesdites«résistantes»sesontmieuxadaptéesàl’apport
deCuetontétécultivéespendant4mois.LesconcentrationsenCudesfeuillesdesplantesdites
«sensibles» sont de 31,4mg.kg‐1MS et celles des plantes «résistantes» de 42,7mg.kg‐1MS.
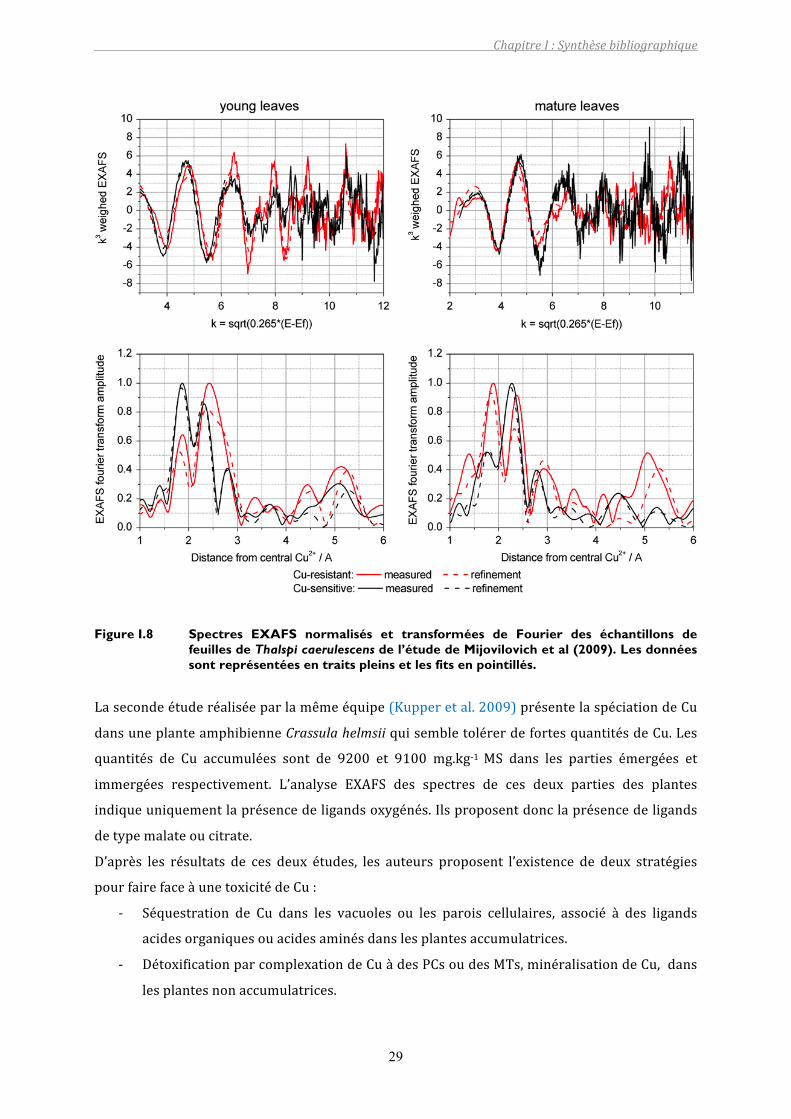
L’affinement des spectres EXAFS (Figure I.8) indique la présence de ligands O et S dans la
premièresphèredecoordinationetdesinteractionsCu‐Cuàplusgrandedistance.Unepartiede
ligandOayantunecontributionà2,8Åproviendraitdelanicotianamide.LaprésencedeCuaété
proposéecarl’interactionCu‐CuexpliqueraitlepicobservésurlatransforméedeFourierà4,4Å
et à 5,2 Å. L’analyse par combinaison linéaire indique la présence de ligands de type: soufré
(Cu(I/II)‐glutathione), acide organique (CuSO4, Cu(II)‐malate, Cu(II)‐citrate, Cu(II)‐Pro),
nicotianamine,histidine,dontlesproportionsvarientselonlarésistanceàCuetl’âgedesfeuilles
(juvénilesoumatures).
Ainsi,lesauteurssuggèrent:
‐ la présence de Cu lié à des métallothioneines, en quantité plus importante dans les
individusrésistants,
‐ de labiominéralisationdeCu.Celapourrait êtreexpliquéenpartiepar laprésencede
moolooite, une forme hydratée cristalline de Cu oxalate, détectée auparavant dans du
lichen,etuneautreforme,commeunoxydedeCu,ouunehydrocalcite(CaCO3.H2O),
‐ LaprésencedeCuliéàdelanicotianamide.
ChapitreI:Synthèsebibliographique
29
Figure I.8 Spectres EXAFS normalisés et transformées de Fourier des échantillons de feuilles de Thalspi caerulescens de l’étude de Mijovilovich et al (2009). Les données sont représentées en traits pleins et les fits en pointillés.
Lasecondeétuderéaliséeparlamêmeéquipe(Kupperetal.2009)présentelaspéciationdeCu
dansuneplanteamphibienneCrassulahelmsiiquisembletolérerdefortesquantitésdeCu.Les
quantités de Cu accumulées sont de 9200 et 9100 mg.kg‐1 MS dans les parties émergées et
immergées respectivement. L’analyse EXAFS des spectres de ces deux parties des plantes
indiqueuniquementlaprésencedeligandsoxygénés.Ilsproposentdonclaprésencedeligands
detypemalateoucitrate.
D’après les résultats de ces deux études, les auteurs proposent l’existence de deux stratégies
pourfairefaceàunetoxicitédeCu:
‐ Séquestration de Cu dans les vacuoles ou les parois cellulaires, associé à des ligands
acidesorganiquesouacidesaminésdanslesplantesaccumulatrices.
‐ DétoxificationparcomplexationdeCuàdesPCsoudesMTs,minéralisationdeCu,dans
lesplantesnonaccumulatrices.
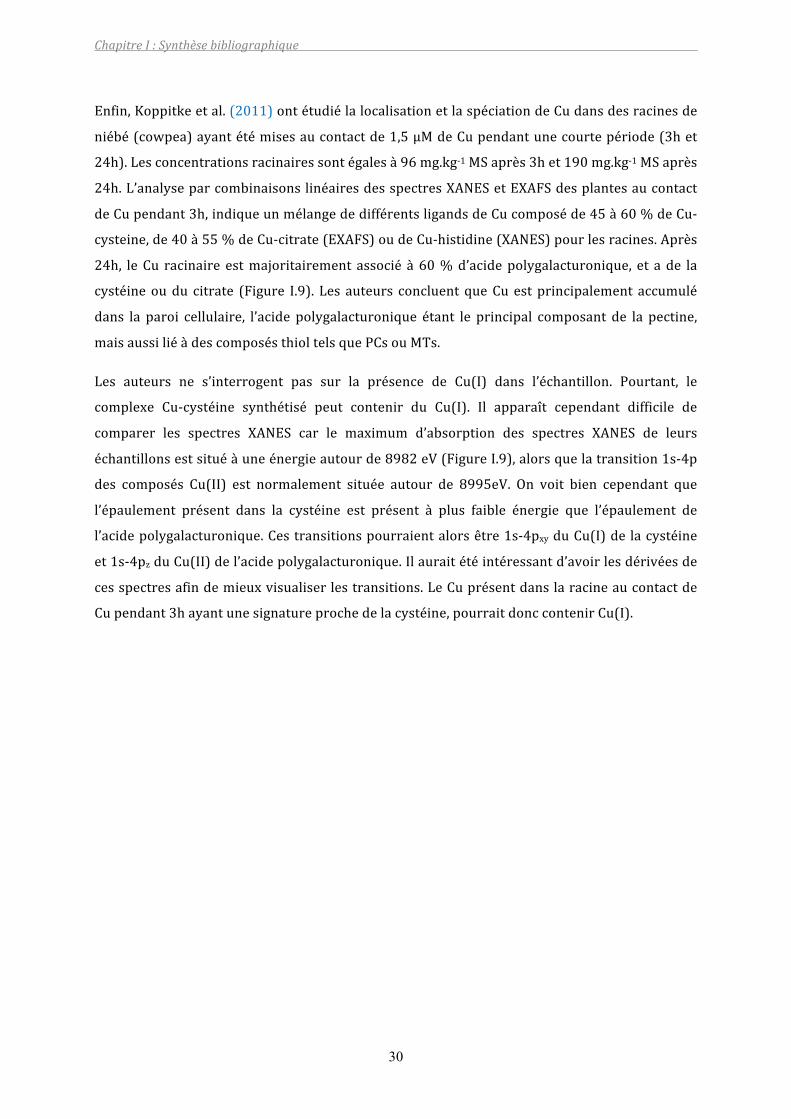
ChapitreI:Synthèsebibliographique
30
Enfin,Koppitkeetal.(2011)ontétudiélalocalisationetlaspéciationdeCudansdesracinesde
niébé(cowpea)ayantétémisesaucontactde1,5µMdeCupendantunecourtepériode(3het
24h).Lesconcentrationsracinairessontégalesà96mg.kg‐1MSaprès3het190mg.kg‐1MSaprès
24h.L’analyseparcombinaisonslinéairesdesspectresXANESetEXAFSdesplantesaucontact
deCupendant3h,indiqueunmélangededifférentsligandsdeCucomposéde45à60%deCu‐
cysteine,de40à55%deCu‐citrate(EXAFS)oudeCu‐histidine(XANES)pourlesracines.Après
24h, leCu racinaire estmajoritairement associé à60%d’acidepolygalacturonique, et ade la
cystéineoudu citrate (Figure I.9). Les auteurs concluentqueCuestprincipalement accumulé
dans la paroi cellulaire, l’acide polygalacturonique étant le principal composant de la pectine,
maisaussiliéàdescomposésthioltelsquePCsouMTs.
Les auteurs ne s’interrogent pas sur la présence de Cu(I) dans l’échantillon. Pourtant, le
complexe Cu‐cystéine synthétisé peut contenir du Cu(I). Il apparaît cependant difficile de
comparer les spectres XANES car le maximum d’absorption des spectres XANES de leurs
échantillonsestsituéàuneénergieautourde8982eV(FigureI.9),alorsquelatransition1s‐4p
des composés Cu(II) est normalement située autour de 8995eV. On voit bien cependant que
l’épaulement présent dans la cystéine est présent à plus faible énergie que l’épaulement de
l’acidepolygalacturonique.Cestransitionspourraientalorsêtre1s‐4pxyduCu(I)de lacystéine
et1s‐4pzduCu(II)del’acidepolygalacturonique.Ilauraitétéintéressantd’avoirlesdérivéesde
cesspectresafindemieuxvisualiserlestransitions.LeCuprésentdanslaracineaucontactde
Cupendant3hayantunesignatureprochedelacystéine,pourraitdonccontenirCu(I).
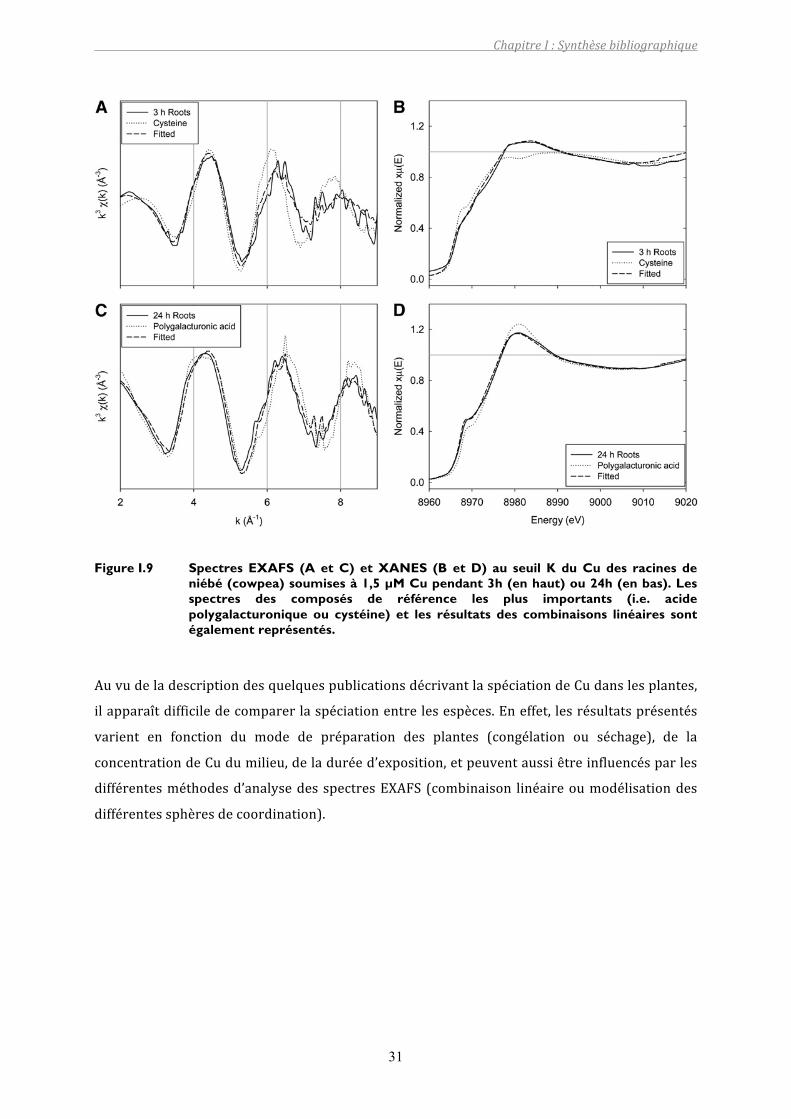
ChapitreI:Synthèsebibliographique
31
Figure I.9 Spectres EXAFS (A et C) et XANES (B et D) au seuil K du Cu des racines de niébé (cowpea) soumises à 1,5 µM Cu pendant 3h (en haut) ou 24h (en bas). Les spectres des composés de référence les plus importants (i.e. acide polygalacturonique ou cystéine) et les résultats des combinaisons linéaires sont également représentés.
AuvudeladescriptiondesquelquespublicationsdécrivantlaspéciationdeCudanslesplantes,
ilapparaîtdifficiledecomparerlaspéciationentrelesespèces.Eneffet, lesrésultatsprésentés
varient en fonction du mode de préparation des plantes (congélation ou séchage), de la
concentrationdeCudumilieu,deladuréed’exposition,etpeuventaussiêtreinfluencésparles
différentesméthodesd’analysedesspectresEXAFS(combinaison linéaireoumodélisationdes
différentessphèresdecoordination).
ChapitreI:Synthèsebibliographique
32
2. LE SILICIUM
Lesilicium(Si)représentelesecondélémentleplusabondantdanslesol,aprèsl’oxygène.Ainsi,
la plupart des plantes se développant sur du sol contiennent de la silice dans leurs tissus
(Epstein 1994). La question du rôle de Si dans le développement des plantes a été soulevée
depuisplusd’unsiècle(Epstein1994;JonesandHandreck1965;Sachs1862).LesteneursenSi
danslesplantessontcomparablesauxteneursdesmacronutriments,maislesiliciumn’estpas
considérécommeunélément«essentiel»pourlacroissancedesplantes(Epstein1994;Epstein
1999).Laprincipaleraisonestl’absencedepreuvedel’implicationdeSidanslemétabolismede
la plante, qui est l’un des trois critères requis pour l’essentialité établis par Arnon et Stout
(1939).Cependant,denombreusesétudesmettentenévidencelerôlebénéfiquedecetélément
pour les plantes: amélioration de la croissance, meilleure résistance aux stress biotiques et
abiotiques(MaandTakahashi2002).
2.1. Teneur en Si dans les plantes et dans le bambou
Lesteneursd’acidesiliciquemesuréesdanslesplantesvariententre1et100mg.g‐1dematière
sèche (MS) en fonction de l’espèce (Epstein 1999; Hodson et al. 2005). Hodson et al. (2005)
montrent que la concentration en Si des plantes dépend majoritairement de la position
phylogénétiquedel’espèceplutôtquedesonenvironnement(i.econcentrationenSidanslesol
et la solution de sol, pH, climat…). Les espèces les plus riches font partie de la famille des
Poacées (Poaceae) dans la classe des monocotylédones. La capacité d’accumuler Si dans les
parties aériennes dépend de l’absorption racinaire, qui n’a pas la même efficacité selon les
espèces. Les plantes sont considérées comme «accumulatrices» quand la teneur en Si est
supérieure à 10 mg.g‐1 (Ma and Takahashi 2002). Avec une concentration en Si pouvant
atteindre jusqu'à410mg.g‐1 (Table I.1), lesbambous fontpartiedesplantesquiaccumulent le
plus de silicium (Motomura et al. 2002). Comme le montre la Table I.1, le nombre de
publications présentant des teneurs dans les bambous reste faible et quelques questions
importantesrestentsujettesàcontroverse.Parexemple,Dingetal.,(2008b)mesurentdansles
racines une concentration de 7,9 mg.g‐1, concentration qui se situe entre celle des tiges
(3,9mg.g‐1) et des branches (17,8 mg.g‐1). Alors que Li et al.,(2006) et Lux et al., (2003)
reportent des teneurs dans les racines supérieuresaux feuilles : 73,2 mg.g‐1 et 24 mg.g‐1
respectivement.
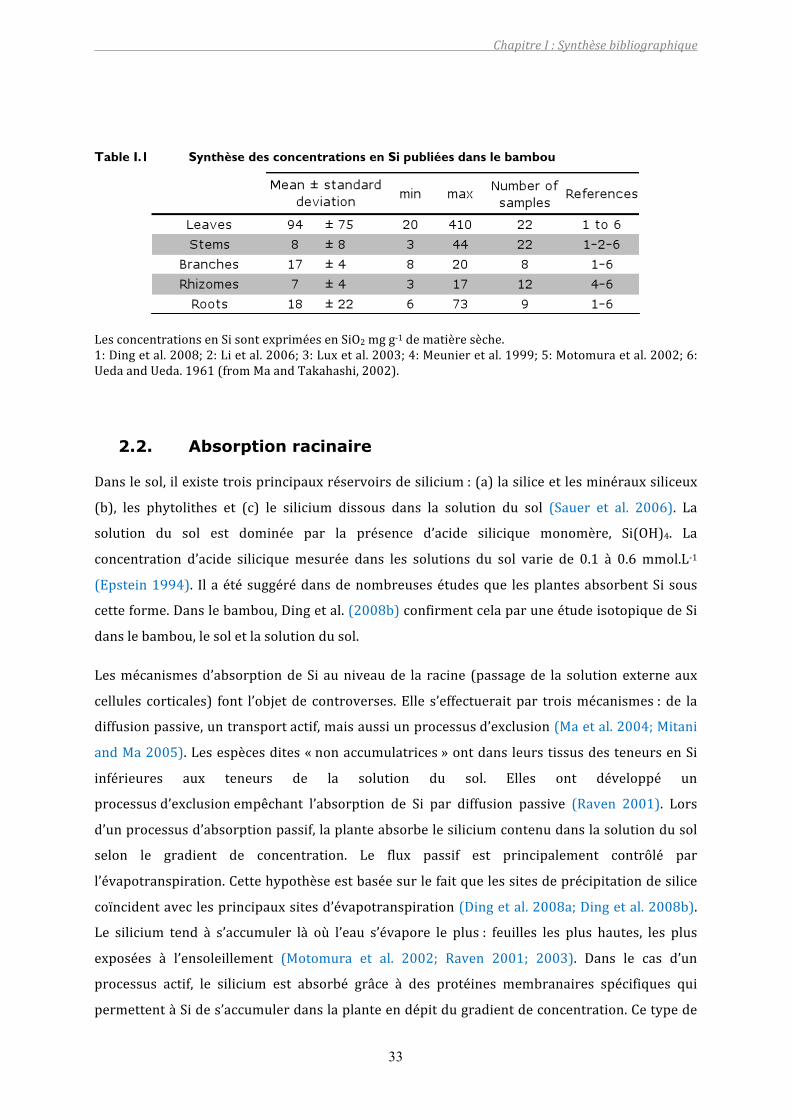
ChapitreI:Synthèsebibliographique
33
Table I.1 Synthèse des concentrations en Si publiées dans le bambou
LesconcentrationsenSisontexpriméesenSiO2mgg‐1dematièresèche.1:Dingetal.2008;2:Lietal.2006;3:Luxetal.2003;4:Meunieretal.1999;5:Motomuraetal.2002;6:UedaandUeda.1961(fromMaandTakahashi,2002).
2.2. Absorption racinaire
Danslesol,ilexistetroisprincipauxréservoirsdesilicium:(a)lasiliceetlesminérauxsiliceux
(b), les phytolithes et (c) le silicium dissous dans la solution du sol (Sauer et al. 2006). La
solution du sol est dominée par la présence d’acide silicique monomère, Si(OH)4. La
concentration d’acide siliciquemesurée dans les solutions du sol varie de 0.1 à 0.6mmol.L‐1
(Epstein1994). Il aétésuggérédansdenombreusesétudesque lesplantesabsorbentSi sous
cetteforme.Danslebambou,Dingetal.(2008b)confirmentcelaparuneétudeisotopiquedeSi
danslebambou,lesoletlasolutiondusol.
Lesmécanismesd’absorptiondeSi auniveaude la racine (passagede la solutionexterneaux
cellules corticales) font l’objet de controverses. Elle s’effectuerait par troismécanismes: de la
diffusionpassive,untransportactif,maisaussiunprocessusd’exclusion(Maetal.2004;Mitani
andMa2005).Lesespècesdites«nonaccumulatrices»ontdansleurstissusdesteneursenSi
inférieures aux teneurs de la solution du sol. Elles ont développé un
processusd’exclusionempêchant l’absorption de Si par diffusion passive (Raven 2001). Lors
d’unprocessusd’absorptionpassif,laplanteabsorbelesiliciumcontenudanslasolutiondusol
selon le gradient de concentration. Le flux passif est principalement contrôlé par
l’évapotranspiration.Cettehypothèseestbaséesurlefaitquelessitesdeprécipitationdesilice
coïncidentaveclesprincipauxsitesd’évapotranspiration(Dingetal.2008a;Dingetal.2008b).
Le silicium tend à s’accumuler là où l’eau s’évapore le plus: feuilles les plus hautes, les plus
exposées à l’ensoleillement (Motomura et al. 2002; Raven 2001; 2003). Dans le cas d’un
processus actif, le silicium est absorbé grâce à des protéines membranaires spécifiques qui
permettentàSides’accumulerdanslaplanteendépitdugradientdeconcentration.Cetypede
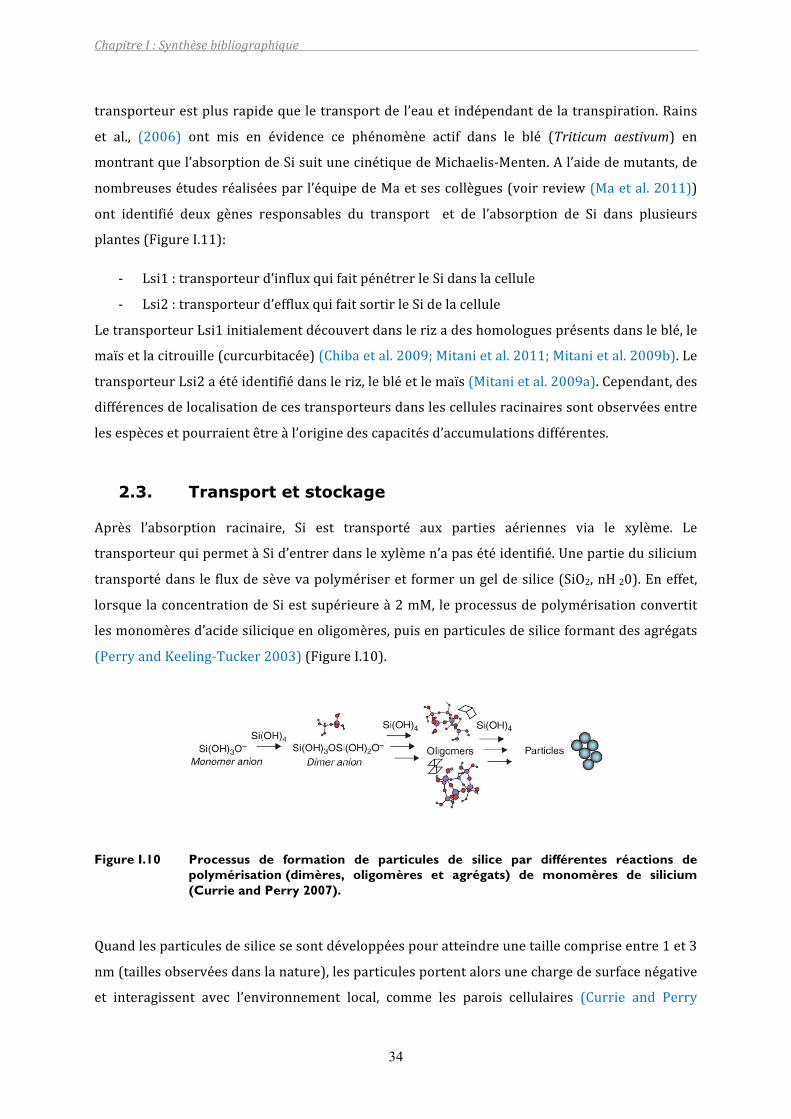
ChapitreI:Synthèsebibliographique
34
transporteurestplusrapidequeletransportdel’eauetindépendantdelatranspiration.Rains
et al., (2006) ont mis en évidence ce phénomène actif dans le blé (Triticum aestivum) en
montrantquel’absorptiondeSisuitunecinétiquedeMichaelis‐Menten.Al’aidedemutants,de
nombreusesétudesréaliséesparl’équipedeMaetsescollègues(voirreview(Maetal.2011))
ont identifié deux gènes responsables du transport et de l’absorption de Si dans plusieurs
plantes(FigureI.11):
‐ Lsi1:transporteurd’influxquifaitpénétrerleSidanslacellule
‐ Lsi2:transporteurd’effluxquifaitsortirleSidelacellule
LetransporteurLsi1initialementdécouvertdanslerizadeshomologuesprésentsdansleblé,le
maïsetlacitrouille(curcurbitacée)(Chibaetal.2009;Mitanietal.2011;Mitanietal.2009b).Le
transporteurLsi2aétéidentifiédansleriz,lebléetlemaïs(Mitanietal.2009a).Cependant,des
différencesdelocalisationdecestransporteursdanslescellulesracinairessontobservéesentre
lesespècesetpourraientêtreàl’originedescapacitésd’accumulationsdifférentes.
2.3. Transport et stockage
Après l’absorption racinaire, Si est transporté aux parties aériennes via le xylème. Le
transporteurquipermetàSid’entrerdanslexylèmen’apasétéidentifié.Unepartiedusilicium
transportédanslefluxdesèvevapolymériseretformerungeldesilice(SiO2,nH20).Eneffet,
lorsquelaconcentrationdeSiestsupérieureà2mM,leprocessusdepolymérisationconvertit
lesmonomèresd’acidesiliciqueenoligomères,puisenparticulesdesiliceformantdesagrégats
(PerryandKeeling‐Tucker2003)(FigureI.10).
Figure I.10 Processus de formation de particules de silice par différentes réactions de polymérisation (dimères, oligomères et agrégats) de monomères de silicium (Currie and Perry 2007).
Quandlesparticulesdesilicesesontdéveloppéespouratteindreunetaillecompriseentre1et3
nm(taillesobservéesdanslanature),lesparticulesportentalorsunechargedesurfacenégative
et interagissent avec l’environnement local, comme les parois cellulaires (Currie and Perry

ChapitreI:Synthèsebibliographique
35
2007).MalgrécesobservationsetlaforteconcentrationdeSidanslasèveduxylème,quipeut
atteindre18mM,Siestmajoritairementdétectésousuneformemonomérique:H4SiO4(Caseyet
al.2004;Dingetal.2005;Mitanietal.2005).Mais lemécanismeempêchantlapolymérisation
n’estpasconnu.
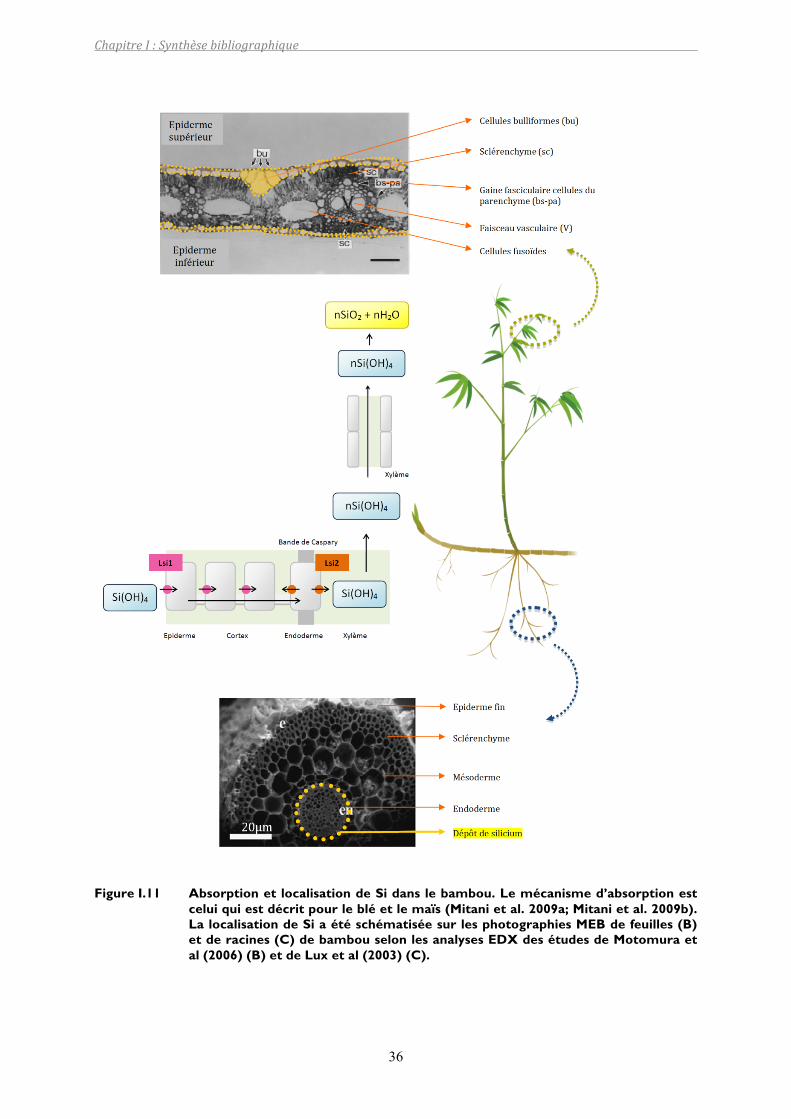
ChapitreI:Synthèsebibliographique
36
Figure I.11 Absorption et localisation de Si dans le bambou. Le mécanisme d’absorption est celui qui est décrit pour le blé et le maïs (Mitani et al. 2009a; Mitani et al. 2009b). La localisation de Si a été schématisée sur les photographies MEB de feuilles (B) et de racines (C) de bambou selon les analyses EDX des études de Motomura et al (2006) (B) et de Lux et al (2003) (C).
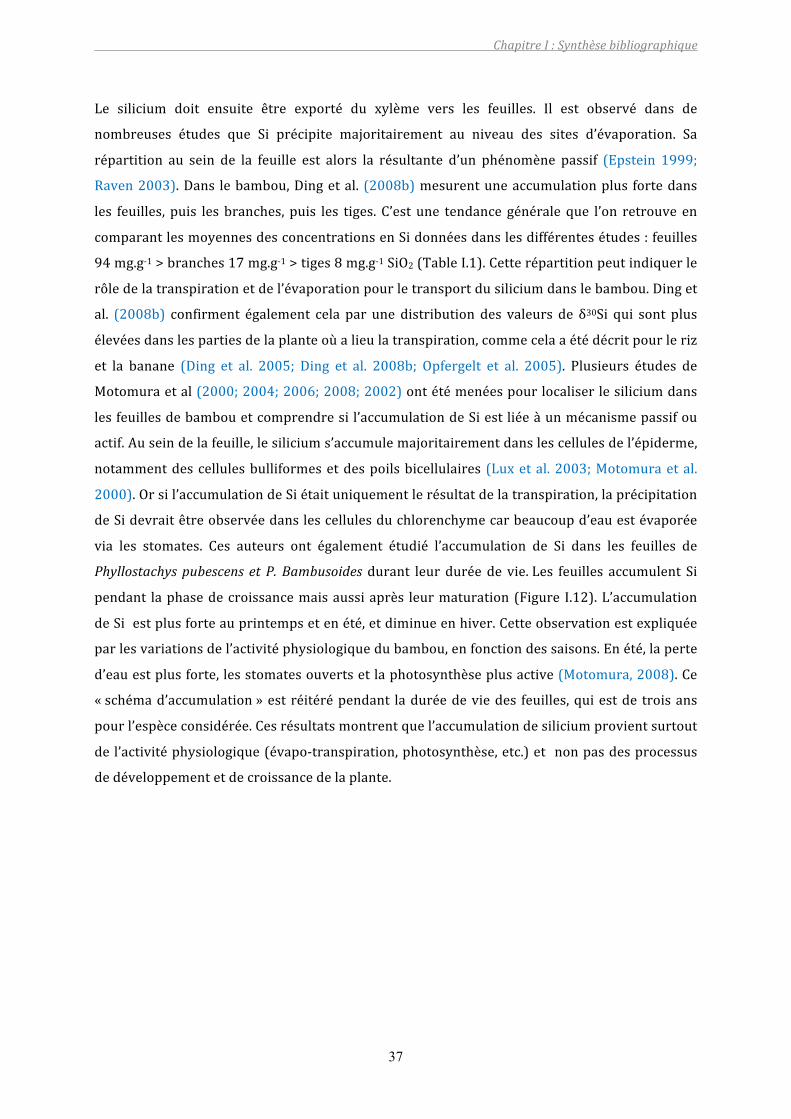
ChapitreI:Synthèsebibliographique
37
Le silicium doit ensuite être exporté du xylème vers les feuilles. Il est observé dans de
nombreuses études que Si précipite majoritairement au niveau des sites d’évaporation. Sa
répartition au sein de la feuille est alors la résultante d’un phénomène passif (Epstein 1999;
Raven2003).Dans lebambou,Dingetal. (2008b)mesurentuneaccumulationplus fortedans
les feuilles, puis les branches, puis les tiges. C’est une tendance générale que l’on retrouve en
comparantlesmoyennesdesconcentrationsenSidonnéesdanslesdifférentesétudes:feuilles
94mg.g‐1>branches17mg.g‐1>tiges8mg.g‐1SiO2(TableI.1).Cetterépartitionpeutindiquerle
rôledelatranspirationetdel’évaporationpourletransportdusiliciumdanslebambou.Dinget
al. (2008b) confirment également cela par une distribution des valeurs de δ30Si qui sont plus
élevéesdanslespartiesdelaplanteoùalieulatranspiration,commecelaaétédécritpourleriz
et la banane (Ding et al. 2005; Ding et al. 2008b; Opfergelt et al. 2005). Plusieurs études de
Motomuraetal(2000;2004;2006;2008;2002)ontétémenéespourlocaliserlesiliciumdans
lesfeuillesdebambouetcomprendresil’accumulationdeSiestliéeàunmécanismepassifou
actif.Auseindelafeuille,lesiliciums’accumulemajoritairementdanslescellulesdel’épiderme,
notammentdescellulesbulliformesetdespoilsbicellulaires (Luxetal.2003;Motomuraetal.
2000).Orsil’accumulationdeSiétaituniquementlerésultatdelatranspiration,laprécipitation
deSidevraitêtreobservéedanslescellulesduchlorenchymecarbeaucoupd’eauestévaporée
via les stomates. Ces auteurs ont également étudié l’accumulation de Si dans les feuilles de
Phyllostachys pubescens et P. Bambusoidesdurant leurduréede vie.Les feuilles accumulent Si
pendant laphasedecroissancemaisaussiaprès leurmaturation(Figure I.12).L’accumulation
deSiestplusforteauprintempsetenété,etdiminueenhiver.Cetteobservationestexpliquée
parlesvariationsdel’activitéphysiologiquedubambou,enfonctiondessaisons.Enété,laperte
d’eauestplusforte,lesstomatesouvertsetlaphotosynthèseplusactive(Motomura,2008).Ce
«schémad’accumulation»est réitérépendant laduréedeviedes feuilles,quiestde troisans
pourl’espèceconsidérée.Cesrésultatsmontrentquel’accumulationdesiliciumprovientsurtout
del’activitéphysiologique(évapo‐transpiration,photosynthèse,etc.)et nonpasdesprocessus
dedéveloppementetdecroissancedelaplante.
ChapitreI:Synthèsebibliographique
38
Figure I.12 Teneurs en SiO2 dans des feuilles de bambous pendant trois ans : 1998 (carrés), 1999 (cercles), 2000 (triangles) (Motomura, 2002)
Ainsi,ilsemblequedanslebambou,onnepuisseexpliquerletransportetl’accumulationdeSi
danslespartiesaériennesuniquementparuntransportpassif.Deplusuntransporteur(Lsi6),
permettantd’exporterSiduxylèmeverscertainescellulesaccumulatricesdeSidelafeuille(ex
cellulebulliforme),aétémisenévidencedansleriz(Yamajietal.2008).Ainsilaprésencedece
transporteur indique que le dépôt de Si dans les cellules spécialisées est dépendant d’un
transportsymplasmiqueplutôtqued’untransportapoplasmique(Yamajietal.2008).
2.4. Fonction du silicium dans le bambou
MaetTakahashi(2002)montrentquelaquantitédesilicedessolsinfluesurlaquantitédesilice
concentrée dans les feuilles et le développement des bambousaies. Ils observent que les
bambousaies ayant une forte productivité se développent sur des sols riches en silice
biodisponibleetsecaractérisentpardesteneursélevéesensiliciumdanslesfeuilles(voirTable
I.2).Al’inverse,lesfeuillesdesbambousaiesatteintesdemaladieoucellesquisontcaractérisées
paruneproductivitéfaible,ontdesteneursplusfaiblesenSi.
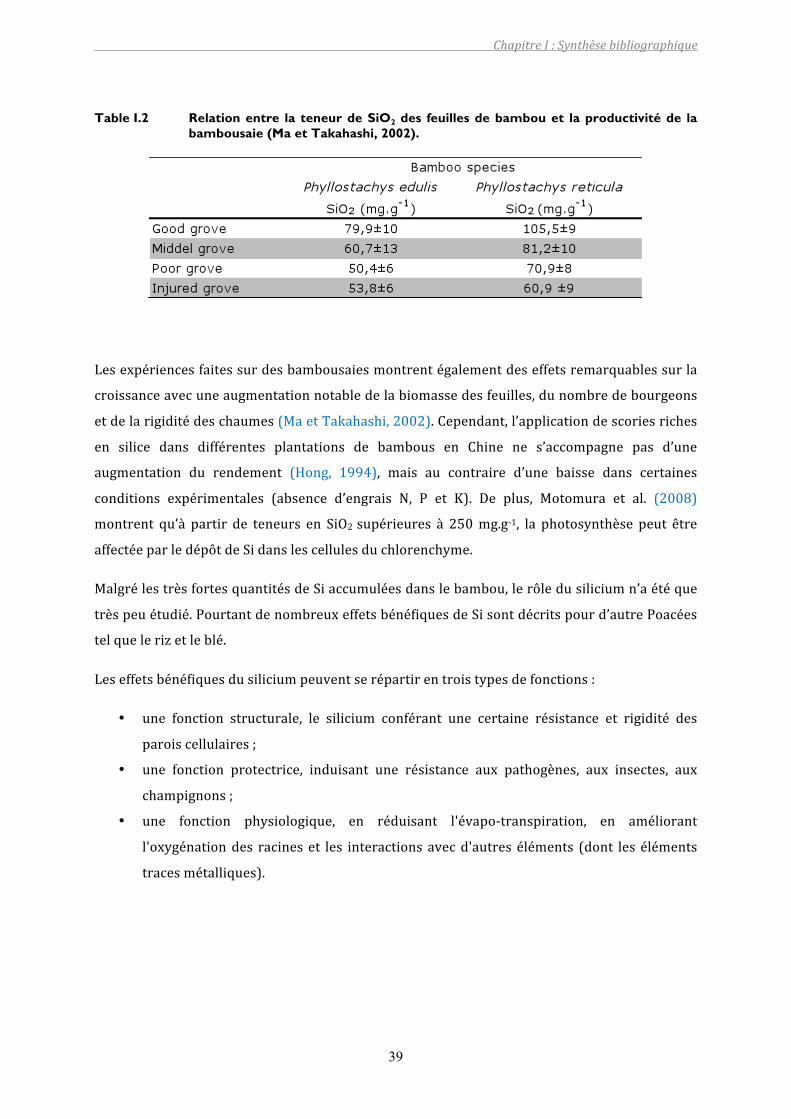
ChapitreI:Synthèsebibliographique
39
Table I.2 Relation entre la teneur de SiO2 des feuilles de bambou et la productivité de la bambousaie (Ma et Takahashi, 2002).
Lesexpériencesfaitessurdesbambousaiesmontrentégalementdeseffetsremarquablessurla
croissanceavecuneaugmentationnotabledelabiomassedesfeuilles,dunombredebourgeons
etdelarigiditédeschaumes(MaetTakahashi,2002).Cependant,l’applicationdescoriesriches
en silice dans différentes plantations de bambous en Chine ne s’accompagne pas d’une
augmentation du rendement (Hong, 1994), mais au contraire d’une baisse dans certaines
conditions expérimentales (absence d’engrais N, P et K). De plus, Motomura et al. (2008)
montrent qu’à partir de teneurs en SiO2 supérieures à 250mg.g‐1, la photosynthèse peut être
affectéeparledépôtdeSidanslescellulesduchlorenchyme.
MalgrélestrèsfortesquantitésdeSiaccumuléesdanslebambou,lerôledusiliciumn’aétéque
trèspeuétudié.PourtantdenombreuxeffetsbénéfiquesdeSisontdécritspourd’autrePoacées
telquelerizetleblé.
Leseffetsbénéfiquesdusiliciumpeuventserépartirentroistypesdefonctions:
• une fonction structurale, le silicium conférant une certaine résistance et rigidité des
paroiscellulaires;
• une fonction protectrice, induisant une résistance aux pathogènes, aux insectes, aux
champignons;
• une fonction physiologique, en réduisant l'évapo‐transpiration, en améliorant
l'oxygénationdes racineset les interactionsavecd'autreséléments (dont les éléments
tracesmétalliques).
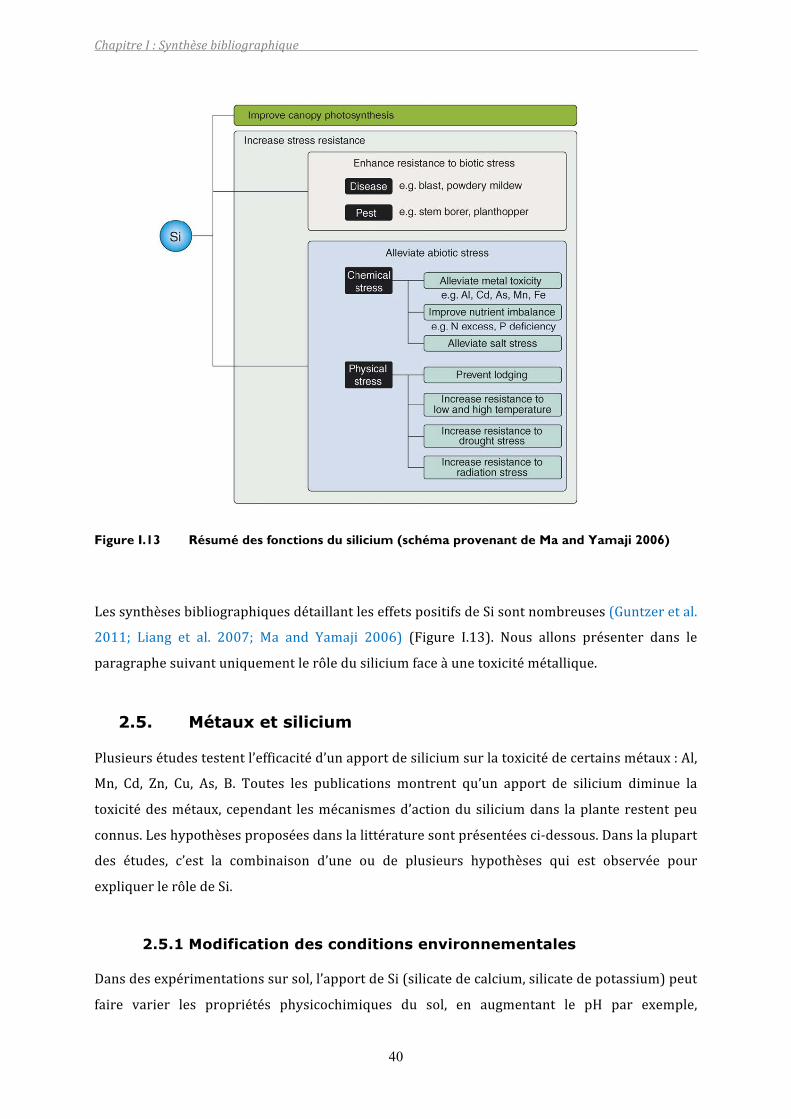
ChapitreI:Synthèsebibliographique
40
Figure I.13 Résumé des fonctions du silicium (schéma provenant de Ma and Yamaji 2006)
LessynthèsesbibliographiquesdétaillantleseffetspositifsdeSisontnombreuses(Guntzeretal.
2011; Liang et al. 2007; Ma and Yamaji 2006) (Figure I.13). Nous allons présenter dans le
paragraphesuivantuniquementlerôledusiliciumfaceàunetoxicitémétallique.
2.5. Métaux et silicium
Plusieursétudestestentl’efficacitéd’unapportdesiliciumsurlatoxicitédecertainsmétaux:Al,
Mn, Cd, Zn, Cu, As, B. Toutes les publications montrent qu’un apport de silicium diminue la
toxicitédesmétaux, cependant lesmécanismesd’actiondusiliciumdans laplanterestentpeu
connus.Leshypothèsesproposéesdanslalittératuresontprésentéesci‐dessous.Danslaplupart
des études, c’est la combinaison d’une ou de plusieurs hypothèses qui est observée pour
expliquerlerôledeSi.
2.5.1 Modification des conditions environnementales
Dansdesexpérimentationssursol,l’apportdeSi(silicatedecalcium,silicatedepotassium)peut
faire varier les propriétés physicochimiques du sol, en augmentant le pH par exemple,
ChapitreI:Synthèsebibliographique
41
entraînantainsiunediminutiondelaphytodisponibilitédesmétaux(Chenetal.2000;Guetal.
2011;Liangetal.2005;TrederandCieslinski2005;ZhaoandMasaihiko2007).L’apportdeSi
danslasolutiondesolpeutégalementmodifierlaspéciationdesmétauxetnotammentformer
uncomplexesilicaté:Si‐Al(Liangetal.2001;Maetal.1997).Cependantceteffetindirectn’est
passuffisantpourexpliquerlameilleuretoléranceauxmétaux,etestassociéàuneffetduSiin
planta.
2.5.2 Augmentation de la biomasse
L’apport de silicium peut entraîner une augmentation la biomasse, diluant ainsi l’effet du
polluant.Lorsd’uneexpérienceenpot,desajoutsdesilicatedecalcium(de50à200mg.kg‐1)
dansdusolenrichienZn(100mg.kg‐1)etenCd(10mg.kg‐1)ontprovoquéuneaugmentationde
biomassechezlemaïs(daCunhaanddoNascimento2009).Zhangetal(2008)ontobservéune
augmentationsignificativedelabiomassederacinesetdefeuillesderizcultivéenhydroponieà
lasuited’unapportde2mMSiensolution,quecesoitsansajoutdeCdouavecajoutdeCden
solution. De même Si améliore la croissance de plants de maïs (augmentation de la surface
foliaire, du poids frais) (Vaculik et al. 2009), et de pak‐choï, une brassicacée (variété de chou
chinois)sanstoxicitémétallique(Songetal.2009).Cependant,enconditionenvironnementale
non stressante, l’augmentation de la biomasse n’est pas systématique (Hammond et al. 1995;
Olivaetal.2011;RichmondandSussman2003).
2.5.3 Diminution de l’absorption des métaux
Un des principaux effets du Si vis‐à‐vis de la diminution d’une toxicité métallique est une
réduction de la concentration des métaux dans les parties aériennes des plantes. Cela a été
observépourCd,Zn,Mn,Cudansdesmonocotylédonescommeleriz(Shietal.2005b;Zhanget
al.2008), lemaïs(Liangetal.2005),maisaussidesespècesdicotylédonescomme lepak‐choï
(Song et al. 2009), le concombre (Feng et al. 2009), l’arachide (Shi et al. 2010), Erica
Andevalensis (Olivaetal.2011).Cettediminutionpeutêtreexpliquéepar labarrièrephysique
que forment les dépôts de Si sur les parois de l’endoderme entraînant une diminution de la
porosité des parois cellulaires, et réduisant ainsi le passage des métaux dans le xylème (da
CunhaanddoNascimento2009).Shietal.(2005b)ontégalementmontré laréductionduflux
apoplastiqueinduitparSilorsd’unetoxicitéauCddansleriz,enmesurantlafluorescenced’un
traceur apoplastique (PTS) qui renseigne sur l’efficacité du transport apoplastique. Il est
cependant peu probable que le mécanisme réduisant la concentration des métaux dans les
parties aériennes soit communpour toutes les espèces étudiéeset s’expliqueuniquementpar
une réduction du flux de métaux entrant. De plus, dans certaines études, Si entraine une
ChapitreI:Synthèsebibliographique
42
augmentationdes teneurs enmétauxdans la plante tout en réduisant leur toxicité (daCunha
anddoNascimento2009;Vaculiketal.2009).
2.5.4 Modification de la répartition des métaux
Plusieurs études ont observé la localisation desmétaux et du silicium dans les tissus afin de
comprendre leurs interactions. Da Cunha and doNascimento (2009) ont localisé, par analyse
optiquehisto‐chimique,Cd,ZnetSidanslesmêmescellules,auniveaudel’épidermefoliaireet
auniveaude l’endodermed’uneracinedemaïs.Zhangetal. (2008)ontobservéparMEB‐EDX
une répartition similaire de Cd et Si dans une cellule bulliforme de feuille de riz. Ces auteurs
proposent alors une co‐précipitation de Si avec Cd ou Zn. Grâce à une observation par
spectrométrie de perte d'énergie des électrons (EELS) Neumann and zur Nieden (2001) ont
déterminélacompositiondesdépôtsdesilicedansCardaminopsis.Cesauteurssuggèrentquele
silicium intracellulaire forme des complexes Zn‐silicate dans le cytoplasme des feuilles de
Cardaminopsis.Ces silicates seraientensuite transformésenSi02dans le cytoplasmealorsque
lesmétauxseraientséquestrésdanslavacuole.
De nombreuses études analysent Si présent dans les différents compartiments en faisant des
extractions chimiques: fluide apoplastique, fluide symplastique, parois cellulaires. Les
premières études de ce type ont porté sur l’effet de Si face à une toxicité auMn. Si réduit le
développementdetâchesbrunessur les feuilles,quiestunsymptômetypiqued’unetoxicitéà
Mn.Pourtantlesteneursmesuréesdanslesplantesnesontpastoujoursdiminuéesaprèsapport
deSi,maisc’est ladistributionduMndansune feuillequiestmodifiée.AprèsunapportdeSi
dans le haricot et la vigne, Mn est réparti de manière homogène dans la feuille, ce qui
expliquerait la réduction de sa toxicité (Horst and Marschner 1978; Iwasaki and Matsumura
1999). Les mécanismes d’action de Si entraînent donc une meilleure tolérance à Mn dans la
celluleplutôtqu’unmécanismed’exclusion(RogallaandRomheld2002b).Dans leconcombre,
l’apport de Si augmente la quantité de Mn lié aux parois cellulaires (90 %) et diminue la
proportionsymplasmique(10%).IlestdoncproposéparlesauteursqueSifavoriselaliaisonde
Mn aux parois cellulaires ce qui permet de diminuer la quantité deMn du cytosol et donc sa
toxicité(RogallaandRomheld2002a;b;Wangetal.2000).Danslepotiron(Cucurbitamoschata
Duch.),1,44mMSidiminuelatoxicitédeMnparuneaccumulationdeMnetSisousuneforme
métabolique inactive autour de la base des trichomes sur la surface des feuilles (Iwasaki and
Matsumura,1999).DansdesfeuillesdeCowpea,Iwasakietal.(2002)observentunediminution
delaquantitédeMndanslefluideapoplastiquecombinéàunplusforttauxdeMnadsorbésur
lesparoiscellulairesaprèsunapportdeSide50µM.
ChapitreI:Synthèsebibliographique
43
Cette modification de distribution a été observée pour d’autres métaux. Lors d’une étude en
hydroponie, la concentration totale en Al des racines de maïs n’est pas influencée par Si, en
revanchelapartieéchangeabledeAlprésentsurlesparoiscellulairesestmodifiée(Wangetal.
2004). La partie facilement échangeable est réduite avec l’apport de Si et la répartition deAl
dans les tissus des racines est modifiée. Ces auteurs proposent la formation de complexes
biologiquement inactifs d’hydroxyaluminosilicate (HAS) dans l’apex des racines. Dans
Arabidopsis Thaliana, Li et al. (2008) expliquent la meilleure tolérance à Cu par une
séquestration de Cu dans les parois cellulaires. Leur étude montre également que la
concentration enCudesplantesn’est pasmodifiéemais que la plantemodifie sa stratégiede
toléranceàCu.
Cependant,cesrésultatssontendésaccordavecceuxdeShietal.(2010)dansArachishypogaea
(arachide). Ces auteurs montrent que Si affecte la distribution de Cd dans les feuilles en
diminuantlafractionduCdliéeauxparoiscellulaires.Cettedifférencepeutêtreexpliquéeparle
comportement de Si qui diffère entre des espèces accumulatrices de Si comme le riz, et une
espècenonaccumulatrice:l’arachide.
2.5.5 Modification de l’expression de gènes
Un mécanisme qui semble être responsable d’une meilleure tolérance aux métaux est la
stimulationdusystèmeanti‐oxydant.Ceteffetaétémisenévidenceparlamesuredel’activité
d’enzymes anti‐oxydantes (par exemple SOD, POD, CAT, APX) dans Arabidopsis lors d’une
toxicité à Cu (Khandekar and Leisner 2011), dans Brassica chinensis (pak‐choï) et Arachis
hypogaea (Arachide) lorsd’une toxicitéàCd(Shietal.2010;Songetal.2009), dansDucumis
sativusenréponseàunetoxicitéàMn(Shietal.2005a),etdansleblé,latomateetlesépinards
enréponseàunetoxicitéàB(Gunesetal.2007a;Gunesetal.2007b).
Récemment,KhandekarandLeisner(2011)ontmontréqu’unapportde1,5mMdeSi,lorsd’une
toxicité au Cu chez Arabidopsis Thaliana, maintient ou augmente l’expression des gènes
responsables de la production de métallothioneines (MTs) qui peuvent être des molécules
chélatantesdeCu(CobbettandGoldsbrough2002).
IlsembleraitégalementqueSiaitunrôlesurl’activitédesgènesPAL(PhenylalanineAmmonia
Lyase),diminuantleurexpressionlorsd’unstressàCu(Lietal.2008).Cependantleurrôledans
ladiminutiondelatoxicitén’estpasbiencompris(KhandekarandLeisner2011).
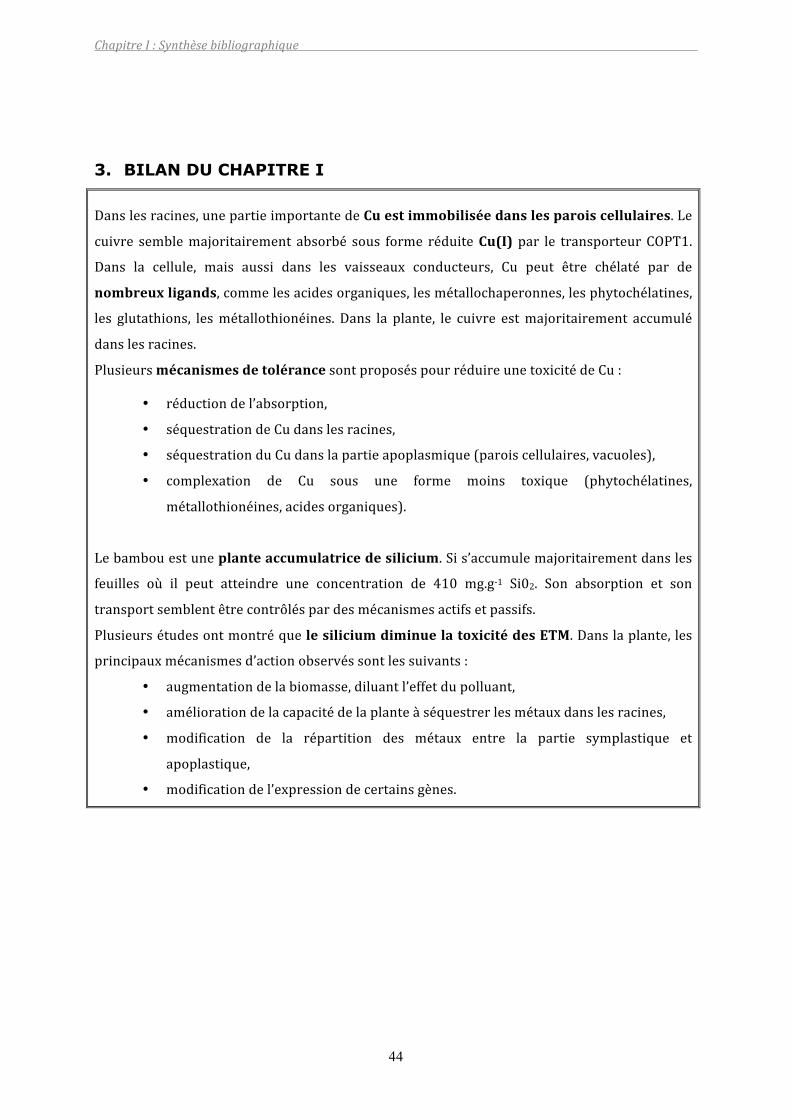
ChapitreI:Synthèsebibliographique
44
3. BILAN DU CHAPITRE I
Danslesracines,unepartieimportantedeCuestimmobiliséedanslesparoiscellulaires.Le
cuivre semblemajoritairement absorbé sous forme réduiteCu(I) par le transporteurCOPT1.
Dans la cellule, mais aussi dans les vaisseaux conducteurs, Cu peut être chélaté par de
nombreuxligands,commelesacidesorganiques,lesmétallochaperonnes,lesphytochélatines,
les glutathions, lesmétallothionéines. Dans la plante, le cuivre estmajoritairement accumulé
danslesracines.
PlusieursmécanismesdetolérancesontproposéspourréduireunetoxicitédeCu:
• réductiondel’absorption,
• séquestrationdeCudanslesracines,
• séquestrationduCudanslapartieapoplasmique(paroiscellulaires,vacuoles),
• complexation de Cu sous une forme moins toxique (phytochélatines,
métallothionéines,acidesorganiques).
Lebambouestuneplanteaccumulatricedesilicium.Sis’accumulemajoritairementdansles
feuilles où il peut atteindre une concentration de 410 mg.g‐1 Si02. Son absorption et son
transportsemblentêtrecontrôléspardesmécanismesactifsetpassifs.
PlusieursétudesontmontréquelesiliciumdiminuelatoxicitédesETM.Danslaplante,les
principauxmécanismesd’actionobservéssontlessuivants:
• augmentationdelabiomasse,diluantl’effetdupolluant,
• améliorationdelacapacitédelaplanteàséquestrerlesmétauxdanslesracines,
• modification de la répartition des métaux entre la partie symplastique et
apoplastique,
• modificationdel’expressiondecertainsgènes.
ChapitreI:Synthèsebibliographique
45
4. REFERENCES BIBLIOGRAPHIQUES
AitAliN,BernalMPandAterM2002ToleranceandbioaccumulationofcopperinPhragmitesaustralisandZeamays.PlantandSoil239,103‐111.
AllanDLandJarrellWM1989Protonandcopperadsorptiontomaizeandsoybeanrootcell‐
walls.PlantPhysiology89,823‐832.AllowayBJ1995Heavymetalinsoils.Chapman&Hill,London.Andrés‐Colás N, Sancenón V, Rodríguez‐Navarro S, Mayo S, Thiele D J, Ecker J R, Puig S and
Peñarrubia L 2006 The Arabidopsis heavy metal P‐type ATPase HMA5 interacts withmetallochaperonesandfunctionsincopperdetoxificationofroots.ThePlantJournal45,225‐236.
ArnonDIandStoutPR1939Theessentialityofcertainelementsinminutequantityforplants
withspecialreferencetocopper.PlantPhysiology14,371‐375.Bernal,Maria,SanchezT,Pilar,Risueno,MariaDelC,YruelaandInmaculada2006Excesscopper
induces structural changes in cultured photosynthetic soybean cells. CommonwealthScientificandIndustrialResearchOrganization,Collingwood,AUSTRALIE.pp.12.
BriatJFandLebrunM1999Plantresponsestometaltoxicity.ComptesRendusDeLAcademie
DesSciencesSerieIii‐SciencesDeLaVie‐LifeSciences322,43‐54.Burkhead J L, Gogolin Reynolds K A, Abdel‐Ghany S E, Cohu C M and Pilon M 2009 Copper
homeostasis.NewPhytologist182,799‐816.CaseyWH,KinradeSD,KnightCTG,RainsDWandEpsteinE2004Aqueoussilicatecomplexes
inwheat,TriticumaestivumL.PlantCellandEnvironment27,51‐54.ChenHM,ZhengCR,TuCandShenZG2000Chemicalmethodsandphytoremediationofsoil
contaminatedwithheavymetals.Chemosphere41,229‐234.ChibaY,MitaniN,YamajiNandMaJF2009HvLsi1isasiliconinfluxtransporterinbarley.Plant
Journal57,810‐818.Chipeng F, Hermans C, Colinet G, Faucon M‐P, Ngongo M, Meerts P and Verbruggen N 2009
CoppertoleranceinthecuprophyteHaumaniastrumkatangense(S.Moore)P.A.Duvign.&Plancke.PlantandSoil.
ClemensS2006Toxicmetalaccumulation,responsestoexposureandmechanismsoftolerance
inplants.Biochimie88,1707‐1719.CobbettCandGoldsbroughP2002Phytochelatinsandmetallothioneins:Roles inheavymetal
detoxificationandhomeostasis.AnnualReviewofPlantBiology53,159‐182.CurrieHA and Perry C C 2007 Silica in Plants: Biological, Biochemical and Chemical Studies.
100,1383‐1389.
ChapitreI:Synthèsebibliographique
46
daCunhaKPVanddoNascimentoCWA2009SiliconEffectsonMetalToleranceandStructuralChangesinMaize(ZeamaysL.)GrownonaCadmiumandZincEnrichedSoil.WaterAirandSoilPollution197,323‐330.
Das A K, Chakraborty R, Cervera M L and de la Guardia M 1995 Metal speciation in solid
matrices.Talanta42,1007‐1030.DeVosCHR,SchatH,DeWaalMAM,VooijsRandErnstWHO1991Increasedresistanceto
copper‐induced damage of the root cell plasmalemma in copper tolerant Silenecucubalus.PhysiologiaPlantarum82,523‐528.
Dietz K J and BaierM 1999 Free radicals and reactive oxygen species asmediators of heavy
metaltoxicityinplants.DingTP,MaGR,ShuiMX,WanDFandLiRH2005Siliconisotopestudyonriceplantsfromthe
Zhejiangprovince,China.ChemicalGeology218,41‐50.DingTP,TianSH, SunL,WuLH, Zhou JX andChenZY2008aSilicon isotope fractionation
betweenriceplantsandnutrientsolutionanditssignificancetothestudyofthesiliconcycle.GeochimicaetCosmochimicaActa72,5600‐5615.
DingTP,ZhouJX,WanDF,ChenZY,WangCYandZhangF2008bSiliconisotopefractionation
in bamboo and its significance to the biogeochemical cycle of silicon. Geochimica etCosmochimicaActa72,1381‐1395.
EpsteinE1994TheAnomalyofSiliconinPlantBiology.ProceedingsoftheNationalAcademyof
SciencesoftheUnitedStatesofAmerica91,11‐17.EpsteinE1999SILICON.pp641‐664.FengJ‐p,ShiQ‐handWangX‐f2009EffectsofExogenousSilicononPhotosyntheticCapacityand
Antioxidant Enzyme Activities in Chloroplast of Cucumber Seedlings Under ExcessManganese.AgriculturalSciencesinChina8,40‐50.
Foyer C H, Lelandais M and Kunert K J 1994 Photooxidative stress in plants. Physiologia
Plantarum92,696‐717.Gardea‐Torresdey J L, Arteaga S, Tiemann K J, Chianelli R, Pingitore N and Mackay W 2001
Absorptionofcopper(II)bycreosotebush(Larreatridentata):Useofatomicandx‐rayabsorptionspectroscopy.EnvironmentalToxicologyandChemistry20,2572‐2579.
Gardea‐TorresdeyJL,Peralta‐VideaJR,delaRosaGandParsonsJG2005Phytoremediationof
heavy metals and study of the metal coordination by X‐ray absorption spectroscopy.CoordinationChemistryReviews249,1797‐1810.
Grotz N and Guerinot M L 2006 Molecular aspects of Cu, Fe and Zn homeostasis in plants.
BiochimicaetBiophysicaActa(BBA)‐MolecularCellResearch1763,595‐608.GuHH,QiuH,TianT,ZhanSS,DengTHB,ChaneyRL,WangSZ,TangYT,MorelJLandQiuRL
2011Mitigationeffectsofsiliconrichamendmentsonheavymetalaccumulationinrice(Oryza sativa L.) planted on multi‐metal contaminated acidic soil. Chemosphere 83,1234‐1240.
ChapitreI:Synthèsebibliographique
47
GunesA, InalA,BagciEGandCobanS2007aSilicon‐mediatedchangesonsomephysiologicaland enzymatic parameters symptomatic of oxidative stress in barley grown in sodic‐Btoxicsoil.JournalofPlantPhysiology164,807‐811.
GunesA,InalA,BagciEGandPilbeamDJ2007bSilicon‐mediatedchangesofsomephysiological
and enzymatic parameters symptomatic for oxidative stress in spinach and tomatogrowninsodic‐Btoxicsoil.PlantandSoil290,103‐114.
GuntzerF,KellerCandMeunierJ‐D2011Benefitsofplantsiliconforcrops:areview.Agronomy
forSustainableDevelopment,1‐13.Guo W J, Bundithya W and Goldsbrough P B 2003 Characterization of the Arabidopsis
metallothioneingenefamily:tissue‐specificexpressionandinductionduringsenescenceandinresponsetocopper.NewPhytologist159,369‐381.
Guo W J, Meetam M and Goldsbrough P B 2008 Examining the specific contributions of
individualArabidopsismetallothioneinstocopperdistributionandmetaltolerance.PlantPhysiology146,1697‐1706.
Hall J L 2002 Cellular mechanisms for heavy metal detoxification and tolerance. Journal of
ExperimentalBotany53,1‐11.Hammond K E, Evans D E and Hodson M J 1995 Aluminium/silicon interactions in barley
(HordeumvulgareL.)seedlings.PlantandSoil173,89‐95.HassinenVH,TervahautaAI,SchatHandKarenlampiSO2011Plantmetallothioneins‐metal
chelatorswithROSscavengingactivity?PlantBiology13,225‐232.Hinsinger P, Bengough A, Vetterlein D and Young I 2009 Rhizosphere: biophysics,
biogeochemistryandecologicalrelevance.PlantandSoil321,117‐152.HodsonM J,White P J, Mead A and BroadleyM R 2005 Phylogenetic variation in the silicon
compositionofplants.AnnalsofBotany96,1027‐1046.Horst W and Marschner H 1978 Effect of silicon on manganese tolerance of bean plants
(PhaseolusvulgarisL.).PlantandSoil50,287‐303.Iwasaki K,Maier P, FechtM andHorstW J 2002 Leaf apoplastic silicon enhancesmanganese
toleranceofcowpea(Vignaunguiculata).JournalofPlantPhysiology159,167‐173.Iwasaki K and Matsumura A 1999 Effect of silicon on alleviation of manganese toxicity in
pumpkin (Cucurbita moschata Duch cv. Shintosa). Soil Science and Plant Nutrition 45,909‐920.
Iwasaki K, Sakurai K and Takahashi E 1990 Copper‐Binding by the root cell‐walls of Italian
Ryegrassandred‐clover.SoilScienceandPlantNutrition36,431‐439.JonesDL1998Organicacidsintherhizosphere–acriticalreview.PlantandSoil205,25‐44.JonesLHPandHandreckKA1965Studiesofsilicaintheoatplant.PlantandSoil23,79‐96.Kabata‐PendiasAandPendiasH2001Traceelementsinsoilsandplants.CRCPress,BocaRaton,
Fla,413p.
ChapitreI:Synthèsebibliographique
48
Khandekar S andLeisner S 2011 Soluble siliconmodulates expressionofArabidopsis thaliana
genesinvolvedincopperstress.JournalofPlantPhysiology168,699‐705.Kishinami I and Widholm J M 1987 Characterization of Cu and Zn Resistant Nicotiana
plumbaginifoliaSuspensionCultures.PlantandCellPhysiology28,203‐210.KopittkeP,BlameyFandMenziesN2008ToxicitiesofsolubleAl,Cu,andLaincluderupturesto
rhizodermalandrootcorticalcellsofcowpea.PlantandSoil303,217‐227.KopittkePandMenziesN2006EffectofCuToxicityonGrowthofCowpea(Vignaunguiculata).
PlantandSoil279,287‐296.KopittkePM,AsherCJ,BlameyFPCandMenziesNW2009ToxiceffectsofCu2+ongrowth,
nutrition,rootmorphology,anddistributionofCu inrootsofSabigrass.Scienceof theTotalEnvironment407,4616‐4621.
Kopittke PM,Menzies NW, de JongeM D,McKenna B A, Donner E,Webb R I, Paterson D J,
HowardDL,RyanCG,GloverCJ,ScheckelKGandLombiE2011InSituDistributionandSpeciation of Toxic Copper, Nickel, and Zinc in Hydrated Roots of Cowpea. PlantPhysiology156,663‐673.
Kramer U, Pickering I J, Prince R C, Raskin I and Salt D E 2000 Subcellular localization and
speciation of nickel in hyperaccumulator and non‐accumulator Thlaspi species. PlantPhysiology122,1343‐1353.
Krzeslowska M 2011 The cell wall in plant cell response to trace metals: polysaccharide
remodelinganditsroleindefensestrategy.ActaPhysiologiaePlantarum33,35‐51.Kupper H, Gotz B, Mijovilovich A, Kupper F C andMeyer‐KlauckeW 2009 Complexation and
Toxicity of Copper in Higher Plants. I. Characterization of Copper Accumulation,Speciation, and Toxicity in Crassula helmsii as a New Copper Accumulator. PlantPhysiology151,702‐714.
Lea P J and Azevedo R A 2007 Nitrogen use efficiency. 2. Amino acid metabolism. Annals of
AppliedBiology151,269‐275.LiF, Shi J, ShenC,ChenG,HuSandChenY2009Proteomiccharacterizationof copper stress
responseinElsholtziasplendensrootsandleaves.PlantMolecularBiology71,251‐263.LiJ,LeisnerMandFrantzJ2008AlleviationofcoppertoxicityinArabidopsisthalianabysilicon
addition to hydroponic solutions. Journal of the American Society for HorticulturalScience133,670‐677.
Li Z‐j, Lin P,He J‐y, Yang Z‐w and Lin Y‐m2006 Silicon’s organic pool and biological cycle in
moso bamboo community of Wuyishan Biosphere Reserve. Journal of ZhejiangUniversity‐ScienceB7,849‐857.
LiangY,Wong JWCandWeiL2005Silicon‐mediatedenhancementof cadmium tolerance in
maize(ZeamaysL.)grownincadmiumcontaminatedsoil.Chemosphere58,475‐483.LiangYC,SunWC,ZhuYGandChristieP2007Mechanismsofsilicon‐mediatedalleviationof
abioticstressesinhigherplants:Areview.EnvironmentalPollution147,422‐428.
ChapitreI:Synthèsebibliographique
49
LiangYC,YangCGandShiHH2001Effectsofsiliconongrowthandmineralcompositionof
barleygrownundertoxiclevelsofaluminum.JournalofPlantNutrition24,229‐243.LloydDR,PhillipsDHandCarmichaelPL1997Generationofputativeintrastrandcross‐links
and strand breaks in DNA by transition metal ion‐mediated oxygen radical attack.ChemicalResearchinToxicology10,393‐400.
LouLQ,ShenZGandLiXD2004ThecoppertolerancemechanismsofElsholtziahaichowensis,
a plant from copper‐enriched soils. Environmental and Experimental Botany 51, 111‐120.
LunaCM,GonzalezCAandTrippiVS1994Oxidativedamagecaudesbyanexcessofcopperin
oatleaves.PlantandCellPhysiology35,11‐15.Lux A, Luxova M, Abe J, Morita S and Inanaga S 2003 Silicification of bamboo (Phyllostachys
heterocyclaMitf.)rootandleaf.PlantandSoil255,85‐91.MaJF,MitaniN,NagaoS,KonishiS,TamaiK,IwashitaTandYanoM2004Characterizationof
thesiliconuptakesystemandmolecularmappingofthesilicontransportergeneinrice.PlantPhysiology136,3284‐3289.
Ma J F, SasakiMandMatsumotoH1997Al‐induced inhibitionof root elongation in corn,Zea
maysLisovercomebySiaddition.PlantandSoil188,171‐176.MaJFandTakahashiE2002Soil,fertilizerandPlantSiliconResearchinJapan.ElsevierScience.Ma J F and Yamaji N 2006 Silicon uptake and accumulation in higher plants. Trends in Plant
Science11,392‐397.MaJF,YamajiNandMitani‐UenoN2011Transportofsiliconfromrootstopaniclesinplants.
ProceedingsoftheJapanAcademySeriesB‐PhysicalandBiologicalSciences87,377‐385.MaksymiecW,RussaR,Urbanik‐SypniewskaTandBaszyńskiT1994EffectofexcessCuonthe
photosyntheticapparatusofrunnerbeanleavestreatedattwodifferentgrowthstages.PhysiologiaPlantarum91,715‐721.
ManceauA,MarcusMAandTamuraN2002Quantitativespeciationofheavymetalsinsoilsand
sedimentsbysynchrotronX‐raytechniques.InApplicationsofSynchrotronRadiationinLow‐Temperature Geochemistry and Environmental Science. Ed. E P. Fenter and N.C.Sturchio.pp341‐428.ReviewsinMineralogyandGeochemistry,MineralogicalSocietyofAmerica,WashingtonDC.
MarschnerH1995MineralNutritionofHigherPlants,London.pp.889.MichaudA,ChappellazCandHinsingerP2008Copperphytotoxicityaffectsrootelongationand
ironnutrition indurumwheat (TriticumturgidumdurumL.).PlantandSoil310,151‐165.
Mijovilovich A, Leitenmaier B,Meyer‐KlauckeW, Kroneck PMH, Gotz B and KupperH 2009
Complexation and Toxicity of Copper in Higher Plants. II. Different Mechanisms forCopper versus Cadmium Detoxification in the Copper‐Sensitive Cadmium/Zinc
ChapitreI:Synthèsebibliographique
50
Hyperaccumulator Thlaspi caerulescens (Ganges Ecotype). Plant Physiology 151, 715‐731.
MitaniN,ChibaY,YamajiNandMaJF2009aIdentificationandCharacterizationofMaizeand
Barley Lsi2‐Like Silicon Efflux Transporters Reveals a Distinct Silicon Uptake SystemfromThatinRice.PlantCell21,2133‐2142.
Mitani N and Ma J F 2005 Uptake system of silicon in different plant species. Journal of
ExperimentalBotany56,1255‐1261.MitaniN,MaJFandIwashitaT2005Identificationofthesiliconforminxylemsapofrice(Oryza
sativaL.).PlantandCellPhysiology46,279‐283.MitaniN,YamajiN,AgoY,IwasakiKandMaJF2011Isolationandfunctionalcharacterizationof
an influx silicon transporter in two pumpkin cultivars contrasting in siliconaccumulation.PlantJournal66,231‐240.
MitaniN,YamajiNandMa JF2009b IdentificationofMaizeSilicon InfluxTransporters.Plant
andCellPhysiology50,5‐12.Motomura H, Fujii T and Suzuki M 2000 Distribution of silicified cells in the leaf blades of
Pleioblastuschino (FranchetetSavatier)Makino(Bambusoideae).AnnalsofBotany85,751‐757.
MotomuraH,FujiiTandSuzukiM2004Silicadepositioninrelationtoageingofleaftissuesin
Sasaveitchii(Carriere)rehder(Poaceae:Bambusoideae).AnnalsofBotany93,235‐248.Motomura H, Fujii T and Suzuki M 2006 Silica deposition in abaxial epidermis before the
openingof leafbladesofPleioblastuschino (Poaceae,Bambusoideae).AnnalsofBotany97,513‐519.
MotomuraH,HikosakaKandSuzukiM2008Relationshipsbetweenphotosyntheticactivityand
silicaaccumulationwithagesofleafinSasaveitchii(Poaceae,Bambusoideae).AnnalsofBotany101,463‐468.
MotomuraH,MitaNandSuzukiM2002Silicaaccumulationinlong‐livedleavesofSasaveitchii
(Carriere)Rehder(Poaceae‐Bambusoideae).AnnalsofBotany90,149‐152.Mukherjee I, Campbell N, Ash J and Connolly E 2006 Expression profiling of the Arabidopsis
ferric chelate reductase (FRO) gene family reveals differential regulation by iron andcopper.Planta223,1178‐1190.
Murphy A and Taiz L 1995 Comparison of Metallothionein Gene Expression and Nonprotein
Thiols in Ten Arabidopsis Ecotypes (Correlation with Copper Tolerance). PlantPhysiology109,945‐954.
Nagasaki‐TakeuchiN,MiyanoMandMaeshimaM2008APlasmaMembrane‐associatedProtein
of Arabidopsis thaliana AtPCaP1 Binds Copper Ions and Changes Its Higher OrderStructure.JournalofBiochemistry144,487‐497.
Neumann D and zur Nieden U 2001 Silicon and heavy metal tolerance of higher plants.
Phytochemistry56,685‐692.
ChapitreI:Synthèsebibliographique
51
NishizonoH, IchikawaH, Suziki Sand IshiiF1987The roleof the toot cell‐wall in theheavy‐metaltoleranceofAthyriumyokoscence.PlantandSoil101,15‐20.
Oliva S R, Mingorance M D and Leidi E O 2011 Effects of silicon on copper toxicity in Erica
andevalensisCabezudoandRivera:apotentialspeciestoremediatecontaminatedsoils.JournalofEnvironmentalMonitoring13,591‐596.
Opfergelt S, Cardinal D, Henriet C, Andre L and Delvaux B 2005 Silicon isotope fractionation
between plant parts in banana: In situ vs. in vitro. In 7th Symposium on theGeochemistry of the Earths Surface (GES‐7). pp 224‐227. Elsevier Science Bv, Aix enProvence,FRANCE.
Pal R and Rai J P N 2010 Phytochelatins: Peptides Involved in Heavy Metal Detoxification.
AppliedBiochemistryandBiotechnology160,945‐963.Panou‐FilotheouH and Bosabalidis AM 2004 Root structural aspects associatedwith copper
toxicityinoregano(Origanumvulgaresubsphirtum).PlantScience166,1497‐1504.Patsikka E, KairavuoM, Sersen F, Aro E‐M and Tyystjarvi E 2002 Excess Copper Predisposes
PhotosystemIItoPhotoinhibitioninVivobyOutcompetingIronandCausingDecreaseinLeafChlorophyll.PlantPhysiology129,1359‐1367.
Perry C C and Keeling‐Tucker T 2003 Model studies of colloidal silica precipitation using
biosilicaextractsfromEquisetumtelmateia.ColloidandPolymerScience281,652‐664.PilonM, Abdel‐Ghany S E, Cohu CM, GogolinKA andYeH 2006Copper cofactor delivery in
plantcells.CurrentOpinioninPlantBiology9,256‐263.Pilon‐SmitsE2005Phytoremediation.AnnualReviewofPlantBiology56,15‐39.Pohlmeier1999MetalSpeciation,ChelationandComplexingLigands inPlants. InHeavyMetal
Stress inPlants:FromMolecules toEcosystems.Ed.MNVPrasad.pp34‐43.Springer,NewDelhi.
PoletteLA,Gardea‐TorresdeyJL,ChianelliRR,GeorgeGN,PickeringIJandArenasJ2000XAS
and microscopy studies of the uptake and bio‐transformation of copper in Larreatridentata(creosotebush).MicrochemicalJournal65,227‐236.
PuigS,AndrÉS‐ColÁSN,GarcÍA‐MolinaAandPeÑArrubiaL2007Copperandironhomeostasis
in Arabidopsis: responses to metal deficiencies, interactions and biotechnologicalapplications.Plant,Cell&Environment30,271‐290.
QianM, Li X and Shen Z 2005Adaptive Copper Tolerance inElsholtzia haichowensis Involves
ProductionofCu‐inducedThiolPeptides.PlantGrowthRegulation47,65‐73.Raven JA2001Silicon transportat the cell and tissues level. In silicon inagriculture.Ed.TN
Elsevier.pp41‐55.Raven J A 2003 Cycling silicon ‐ the role of accumulation in plants ‐ Commentary. New
Phytologist158,419‐421.
ChapitreI:Synthèsebibliographique
52
Reeve W G, Tiwari R P, Kale N B, Dilworth M J and Glenn A R 2002 ActP controls copperhomeostasis in Rhizobium leguminosarum bv. viciae and Sinorhizobium melilotipreventinglowpH‐inducedcoppertoxicity.MolecularMicrobiology43,981‐991.
ReuterD JandRobinsonJB1997Plantanalysis :an interpretationmanual.CSIROpublishing,
Australia.Richmond K E and SussmanM 2003 Got silicon? The non‐essential beneficial plant nutrient.
CurrentOpinioninPlantBiology6,268‐272.RogallaHandRomheldV2002aEffectsofsiliconontheavailabilityofboron:Possibleeffectson
thephenolpathwayandontheredoxstatusinCucumissativusL.InBoroninPlantandAnimalNutrition.Eds.HEGoldbach,BRerkasem,MAWimmer,PHBrown,MThellierandRWBell.pp205‐211.KluwerAcademic/PlenumPubl,NewYork.
RogallaHandRomheldV2002bRoleofleafapoplastinsilicon‐mediatedmanganesetolerance
ofCucumissativusL.PlantCellandEnvironment25,549‐555.Roosens N H, Bernard C, Leplae R and Verbruggen N 2004 Evidence for copper homeostasis
function metallothionein of metallothionein (MT3) in the hyperaccumulator Thlaspicaerulescens.FEBSLetters577,9‐16.
SachsJ1862FloraS53.Sahi S V, Israr M, Srivastava A K, Gardea‐Torresdey J L and Parsons J G 2007 Accumulation,
speciationandcellularlocalizationofcopperinSesbaniadrummondii.Chemosphere67,2257‐2266.
SaltDE,PrinceRCandPickeringIJ2002Chemicalspeciationofaccumulatedmetalsinplants:
evidencefromX‐rayabsorptionspectroscopy.MicrochemicalJournal71,255‐259.SancenonV,PuigS,Mateu‐AndresI,DorceyE,ThieleDJandPearrubiaL2004TheArabidopsis
Copper Transporter COPT1 Functions in Root Elongation and Pollen Development.JournalofBiologicalChemistry279,15348‐15355.
SarretG,WillemsG,IsaureM‐P,MarcusMA,FakraSC,FrerotH,PairisS,GeoffroyN,ManceauA
andSaumitou‐LapradeP2009Zincdistribution and speciation inArabidopsis halleri xArabidopsis lyrata progenies presenting various zinc accumulation capacities. NewPhytologist184,581‐595.
SattelmacherB2001Tansleyreviewno.22‐Theapoplastanditssignificanceforplantmineral
nutrition.NewPhytologist149,167‐192.SauerD,SacconeL,ConleyDJ,HerrmannLandSommerM2006Reviewofmethodologiesfor
extracting plant‐available and amorphous Si from soils and aquatic sediments.Biogeochemistry80,89‐108.
SharmaSSandDietzKJ2006Thesignificanceofaminoacidsandaminoacid‐derivedmolecules
inplantresponsesandadaptationtoheavymetalstress.JournalofExperimentalBotany57,711‐726.
ChapitreI:Synthèsebibliographique
53
Sheldon A and Menzies N 2005 The Effect of Copper Toxicity on the Growth and RootMorphologyofRhodesGrass(ChlorisgayanaKnuth.)inResinBufferedSolutionCulture.PlantandSoil278,341‐349.
ShiG,CaiQ,LiuCandWuL2010Siliconalleviatescadmiumtoxicityinpeanutplantsinrelation
to cadmium distribution and stimulation of antioxidative enzymes. Plant GrowthRegulation61,45‐52.
Shi J,Wu B, Yuan X, Yy C, Chen X, Chen Y and Hu T 2008 An X‐ray absorption spectroscopy
investigationofspeciationandbiotransformationofcopperinElsholtziasplendens.PlantandSoil302,163‐174.
Shi J Y, Chen Y X, Huang Y Y andHeW 2004 SRXRFmicroprobe as a technique for studying
elementsdistributioninElsholtziasplendens.Micron35,557‐564.ShiQ,BaoZ,ZhuZ,HeY,QianQandYu J2005aSilicon‐mediatedalleviationofMntoxicity in
Cucumis sativus in relation to activities of superoxide dismutase and ascorbateperoxidase.Phytochemistry66,1551‐1559.
ShiX,ZhangC,WangHandZhangF2005bEffectofSionthedistributionofCdinriceseedlings.
PlantandSoil272,53‐60.SinghV,BhattI,AggarwalA,TripathiB,MunjalAandSharmaV2010Prolineimprovescopper
toleranceinchickpea(Cicerarietinum).Protoplasma245,173‐181.SongA, Li Z, Zhang J, XueG, FanF andLiangY2009Silicon‐enhanced resistance to cadmium
toxicity in Brassica chinensis L. is attributed to Si‐suppressed cadmium uptake andtransportandSi‐enhancedantioxidantdefensecapacity.JournalofHazardousMaterials172,74‐83.
SongJ,ZhaoF‐J,LuoY‐M,McGrathSPandZhangH2004CopperuptakebyElsholtziasplendens
and Silene vulgaris and assessment of copper phytoavailability in contaminated soils.EnvironmentalPollution128,307‐315.
SouguirD,FerjaniE,LedoigtGandGoupilP2008ExposureofViciafabaltandPisumsativumto
copper‐inducedgenotoxicity.Protoplasma233,203‐207.TrederWandCieslinskiG2005Effectofsiliconapplicationoncadmiumuptakeanddistribution
in strawberry plants grown on contaminated soils. Journal of PlantNutrition 28, 917‐929.
Vaculik M, Lux A, Luxova M, Tanimoto E and Lichtscheidl I 2009 Silicon mitigates cadmium
inhibitoryeffectsinyoungmaizeplants.EnvironmentalandExperimentalBotany67,52‐58.
vanHoofN,HassinenVH,HakvoortHWJ,BallintijnKF,SchatH,Verkleij JAC,ErnstWHO,
KarenlampiSOandTervahautaA I2001Enhancedcopper tolerance inSilenevulgaris(Moench)Garckepopulationsfromcopperminesisassociatedwithincreasedtranscriptlevelsofa2b‐typemetallothioneingene.PlantPhysiology126,1519‐1526.
Walker T S, Bais H P, Grotewold E and Vivanco J M 2003 Root Exudation and Rhizosphere
Biology.PlantPhysiology132,44‐51.
ChapitreI:Synthèsebibliographique
54
Wang L J, Wang Y H, Chen Q, CaoW D, Li M and Zhang F S 2000 Silicon induced cadmiumtoleranceofriceseedlings.JournalofPlantNutrition23,1397‐1406.
WangYX, StassA andHorstW J 2004Apoplastic bindingof aluminum is involved in silicon‐
inducedameliorationofaluminumtoxicityinmaize.PlantPhysiology136,3762‐3770.Welch,RM,Norvell,WA,Schaefer,SC,Schaff,JE,KochianandLV1993Inductionofiron(III)
andcopper(II)reductioninpea(PisumsativumL.)rootsbyFeandCustatus:doestheroot‐cell plasmalemma Fe(III)‐chelate reductase perform a general role in regulatingcationuptake?190.
WhiteMC,BakerFD,ChaneyRLandDeckerAM1981aMetalcomplexationinxylemfluid.2.
Theoreticalequilibrium‐modelandcomputationalcomputer‐program.PlantPhysiology67,301‐310.
WhiteMC,DeckerAMandChaneyRL1981bMetalcompexation inxylemfluid .1.Chemical‐
compositionoftomatoandsoybeanstemexudate.PlantPhysiology67,292‐300.WintzH,FoxT,WuY‐Y,FengV,ChenW,ChangH‐S,ZhuTandVulpeC2003ExpressionProfiles
ofArabidopsis thaliana in Mineral Deficiencies Reveal Novel Transporters Involved inMetalHomeostasis.JournalofBiologicalChemistry278,47644‐47653.
Xia Y and Shen Z G 2007 Comparative studies of copper tolerance and uptake by three plant
speciesofthegenusElsholtzia.BulletinofEnvironmentalContaminationandToxicology79,53‐57.
YamajiN,MitatniNandMaJF2008Atransporterregulatingsilicondistributioninriceshoots.
PlantCell20,1381‐1389.YangMJ,YangXEandRomheldV2002GrowthandnutrientcompositionofElsholtziasplendens
Nakaiundercoppertoxicity.JournalofPlantNutrition25,1359‐1375.YildizM,CigerciIH,KonukM,FatihFidanAandTerziH2009Determinationofgenotoxiceffects
of copper sulphate and cobalt chloride in Allium cepa root cells by chromosomeaberrationandcometassays.Chemosphere75,934‐938.
YruelaI2009Copperinplants:acquisition,transportandinteractions.Functionalplantbiology:
FPB36,409‐430.Zhang C C,Wang L J, Nie Q, ZhangW X and Zhang F S 2008 Long‐term effects of exogenous
silicon on cadmium translocation and toxicity in rice (Oryza sativa L.). EnvironmentalandExperimentalBotany62,300‐307.
Zhao X‐L and Masaihiko S 2007 Amelioration of Cadmium Polluted Paddy Soils by Porous
HydratedCalciumSilicate.Water,Air,&SoilPollution183,309‐315.

ChapitreI:Synthèsebibliographique
55

ChapitreI:Synthèsebibliographique
56
C H A P I T R E I I
DISTRIBUTION AND VARIABIL ITY OF
S IL ICON, COPPER AND ZINC IN
DIFFERENT BAMBOO SPECIES

ChapitreII:Distributionandvariabilityofsilicon,copperandzincindifferentbamboosspecies
58
ChapitreII:Distributionandvariabilityofsilicon,copperandzincindifferentbamboosspecies
59
TABLE DES MATIERES
CHAPITREIIDISTRIBUTIONANDVARIABILITYOFSILICON,COPPERANDZINCINDIFFERENTBAMBOOSPECIES ..................................................................................................61
1. INTRODUCTION.....................................................................................................................................................65
2. MATERIALSANDMETHODS ..............................................................................................................................672.1. Geographicalareaofthestudy,soildescriptionandsamplingprocedure..................................................... 672.2. Soilmaterialandanalysis .................................................................................................................................................... 682.3. Plantmaterialandanalysis................................................................................................................................................. 692.4. Statisticalanalyses .................................................................................................................................................................. 69
3. RESULTS...................................................................................................................................................................703.1. Soil .................................................................................................................................................................................................. 703.2. Betweenplantparts ................................................................................................................................................................ 703.3. Betweenplantspecies ............................................................................................................................................................ 71
4. DISCUSSION.............................................................................................................................................................754.1. PhytoavailabilityofSi,CuandZn ..................................................................................................................................... 754.2. OriginofSivariationinbamboos ..................................................................................................................................... 754.3. OriginofCuandZnvariabilityinbamboo.................................................................................................................... 784.4. InteractionsbetweenmetalsandSi ................................................................................................................................. 80
5. BILANDUCHAPITREII........................................................................................................................................81
6. REFERENCESBIBLIOGRAPHIQUES..................................................................................................................82

ChapitreII:Distributionandvariabilityofsilicon,copperandzincindifferentbamboosspecies
60
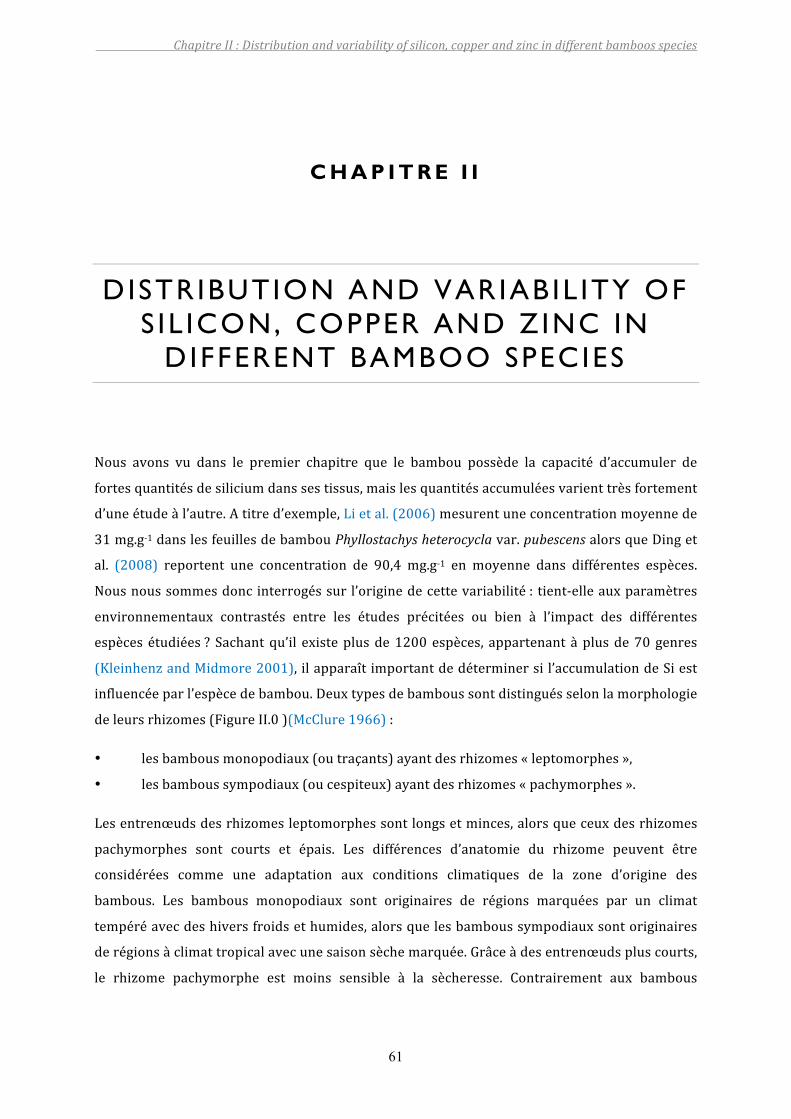
ChapitreII:Distributionandvariabilityofsilicon,copperandzincindifferentbamboosspecies
61
C H A P I T R E I I
DISTRIBUTION AND VARIABIL ITY OF S IL ICON, COPPER AND ZINC IN
DIFFERENT BAMBOO SPECIES
Nous avons vu dans le premier chapitre que le bambou possède la capacité d’accumuler de
fortesquantitésdesiliciumdanssestissus,maislesquantitésaccumuléesvarienttrèsfortement
d’uneétudeàl’autre.Atitred’exemple,Lietal.(2006)mesurentuneconcentrationmoyennede
31mg.g‐1danslesfeuillesdebambouPhyllostachysheterocyclavar.pubescensalorsqueDinget
al. (2008) reportent une concentration de 90,4 mg.g‐1 en moyenne dans différentes espèces.
Nousnoussommesdoncinterrogéssurl’originedecettevariabilité: tient‐elleauxparamètres
environnementaux contrastés entre les études précitées ou bien à l’impact des différentes
espècesétudiées? Sachantqu’il existeplusde1200espèces, appartenant àplusde70genres
(KleinhenzandMidmore2001),ilapparaîtimportantdedéterminersil’accumulationdeSiest
influencéeparl’espècedebambou.Deuxtypesdebamboussontdistinguésselonlamorphologie
deleursrhizomes(FigureII.0)(McClure1966):
• lesbambousmonopodiaux(outraçants)ayantdesrhizomes«leptomorphes»,
• lesbamboussympodiaux(oucespiteux)ayantdesrhizomes«pachymorphes».
Lesentrenœudsdesrhizomesleptomorphessontlongsetminces,alorsqueceuxdesrhizomes
pachymorphes sont courts et épais. Les différences d’anatomie du rhizome peuvent être
considérées comme une adaptation aux conditions climatiques de la zone d’origine des
bambous. Les bambous monopodiaux sont originaires de régions marquées par un climat
tempéréavecdeshiversfroidsethumides,alorsquelesbamboussympodiauxsontoriginaires
derégionsàclimattropicalavecunesaisonsèchemarquée.Grâceàdesentrenœudspluscourts,
le rhizome pachymorphe est moins sensible à la sècheresse. Contrairement aux bambous
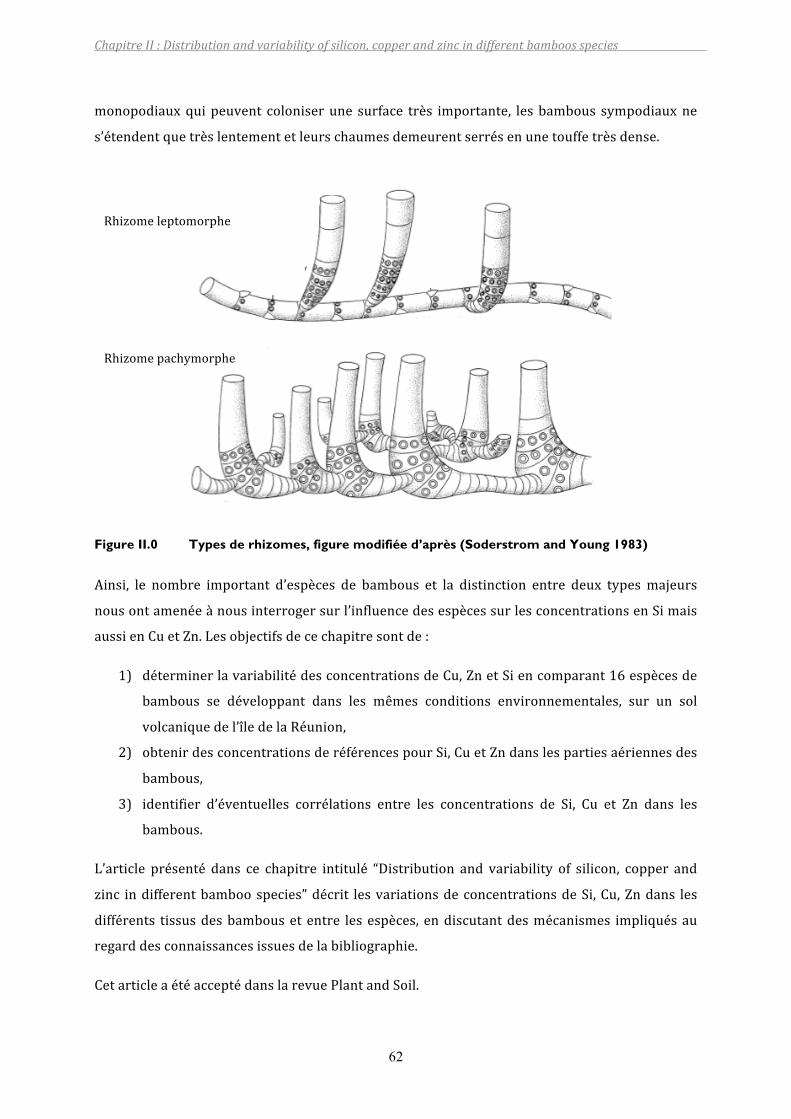
ChapitreII:Distributionandvariabilityofsilicon,copperandzincindifferentbamboosspecies
62
monopodiauxquipeuvent coloniserune surface très importante, lesbambous sympodiauxne
s’étendentquetrèslentementetleurschaumesdemeurentserrésenunetouffetrèsdense.
Figure II.0 Types de rhizomes, figure modifiée d’après (Soderstrom and Young 1983)
Ainsi, le nombre important d’espèces de bambous et la distinction entre deux typesmajeurs
nousontamenéeànousinterrogersurl’influencedesespècessurlesconcentrationsenSimais
aussienCuetZn.Lesobjectifsdecechapitresontde:
1) déterminerlavariabilitédesconcentrationsdeCu,ZnetSiencomparant16espècesde
bambous se développant dans les mêmes conditions environnementales, sur un sol
volcaniquedel’îledelaRéunion,
2) obtenirdesconcentrationsderéférencespourSi,CuetZndanslespartiesaériennesdes
bambous,
3) identifier d’éventuelles corrélations entre les concentrations de Si, Cu et Zn dans les
bambous.
L’article présenté dans ce chapitre intitulé “Distribution and variability of silicon, copper and
zinc indifferentbamboospecies”décrit lesvariationsdeconcentrationsdeSi,Cu,Zndans les
différents tissusdesbambouset entre lesespèces, endiscutantdesmécanismes impliquésau
regarddesconnaissancesissuesdelabibliographie.
CetarticleaétéacceptédanslarevuePlantandSoil.
Rhizomeleptomorphe
Rhizomepachymorphe
ChapitreII:Distributionandvariabilityofsilicon,copperandzincindifferentbamboosspecies
63
Distribution and variability of silicon, copper and zinc in
different bamboo species
BlancheCollin*a,b,EmmanuelDoelschc,CatherineKellerb,FredericPanfilia,Jean‐Dominique
Meunierb
a Département de recherche développement de la société PHYTOREM S.A., 13140 Miramas,
France
bCEREGE,CNRS,Aix‐MarseilleUniversité,Europôleméditerranéendel'ArboisBP80,13545Aix
enProvence,France
cCIRAD,UPRRecyclageetrisque,34398Montpellier,France
*Correspondingauthor.
DOI:10.1007/s11104‐011‐0974‐9
ABSTRACT
With a high growth rate and biomass production, bamboos are frequently used for industrial
applications and recently have proven to be useful for wastewater treatment. Bamboos are
consideredasSiaccumulatorsandthereisincreasingevidencethatsiliconmayalleviateabiotic
stresses such as metal toxicity. The aim of this study was to investigate the extent of metal
concentrationsandpossiblecorrelationswithSi concentrations inplants.Thisstudypresents,
for the first time,referencevalues forsilicon(Si), copper(Cu)andzinc(Zn)concentrations in
stemsandleavesofvariousbamboospeciesgrownunderthenaturalpedo‐climaticconditions
oftheislandofRéunion(IndianOcean).Abroadrangeofsiliconconcentrations,from0(inferior
todetectionlimit)to183mgg‐1drymatter(DM),werefoundinstemsandleaves.MeanleafCu
andZnconcentrationswerelow,i.e.5.1mgkg‐1DMand15.7mgkg‐1DM,respectively.Silicon,
CuandZnconcentrationsincreasedoverthefollowinggradient:stembase<stemtip<leaves.
Significant differences in Si, Cu and Zn contents (except Zn in the stem)were noted between
bamboospecies,particularlybetweenmonopodialandsympodialbamboospecies,whichdiffer

ChapitreII:Distributionandvariabilityofsilicon,copperandzincindifferentbamboosspecies
64
intheirrhizomemorphology.SympodialbamboosaccumulatedmoreSiandCuthanmonopodial
bamboos,inbothstemsandleaves,whereassympodialbamboosaccumulatedlessZninleaves
thanmonopodialbamboos.Thefindingsofthisstudysuggestthatagenotypiccharactermaybe
responsibleforSi,CuandZnaccumulationinbamboo.
Keywords:traceelement,silica,Poaceae,genotypicvariability,islandofRéunion
ChapitreII:Distributionandvariabilityofsilicon,copperandzincindifferentbamboosspecies
65
1. INTRODUCTION
Bamboos arewidespread plants belonging to the grass family (Poaceae). They are commonly
foundintemperate,tropicalandsubtropicalregionsandwidelyusedforindustrialpurposes,as
freshedibleshoots,makingpaper,buildingmaterialandeveninmedicines.Bamboosareknown
for their resistance to awide range of stress factors and their high growth rate and biomass
production, with potential uses in phytoremediation. The PHYTOREM company (France) has
developedBAMBOO‐ASSAINISSEMENT®technologyforwastewatertreatment(Arfietal.2009).
Thecompanyiscurrentlyoptimizingthephytoremediationcapacityofbamboosundertropical
climaticconditions.
TheuptakeandaccumulationofessentialnutrientssuchasN,PandKarewelldocumentedin
bamboos (Embaye et al. 2005; Shanmughavel and Francis 2001), butmetal accumulation has
been poorly documented so far. Metals are naturally present in the pedo‐geochemical
backgroundofsoilsatvarious levelsandmanymetalsareessential toplants,buttheymaybe
toxic at higher concentrations.Metals accumulate in soil due to anthropogenic contamination
throughfertilizerandorganicmanureapplications, industrialandmunicipalwastes, irrigation,
and wet and/or dry deposits (Doelsch et al. 2010; Novak J et al. 2004). Phytoremediation
techniques have been put forward as alternatives to remediate metal contaminated soils,
especially agricultural soils (McCutcheon and Schnoor 2003). One of the limitations of such
technologiesistheavailabilityofplantspeciesadaptedtospecificenvironmentalconditionsand,
accumulatingand/ortolerantto largemetalormetalloidconcentrationsinsoils(Keller2005).
Bamboos are potentially good candidates for phytoremediation because of their widespread
distribution,theireasyandwell‐knownpropagationmode,thebroadrangeofspeciesandtheir
possibleadditionaluseasrawmaterial.Toourknowledge, there isnodataavailableonmetal
concentrationsinbamboos,especiallyundernaturalconditions.Inthisstudy,wefocusedonthe
case of copper (Cu) and zinc (Zn), twometalswhichmaybepresent at high concentration in
wastewater.
Like many Poaceae species (sugarcane, rice, wheat, etc.), bamboos are considered as Si
accumulators,withSiconcentrationsrangingfrom3to410mgg‐1SiO2(DM)(Dingetal.2008;Li
etal.2006).ThevariabilityinSicontentinbamboomaybeexplainedby:(i)theavailablepoolof
Si insoil (Henrietetal.2008; Jonesetal.1967); (ii) the increase inSicontentduringbamboo
ageing (Motomura et al. 2002) and (iii) genetic variability among species. This last point has
ChapitreII:Distributionandvariabilityofsilicon,copperandzincindifferentbamboosspecies
66
never been studied in bamboos,whereas itmay be important because of the high number of
bamboo species: a total of about 1030 bamboo species (77 genera) are grouped in the sub‐
familyBambusoideae,withinthefamilyPoaceae.Inordertoclarifytheroleofthespeciesinthe
Siuptakecapacity,dataarethusneededonSiconcentrations inbamboosof thesameageand
growninsimilarsoils.
Inriceorwheat,thereisincreasingevidencethatsiliconmayalleviatemetaltoxicity(Liangetal.
2007).SeveralmechanismshavebeenproposedtoexplaintheroleofSiinmetaltolerance,such
as limitation of metal uptake, reduction of root‐to‐shoot translocation or changes in metal
allocation within the plant. In bamboos, the role of Si on metal tolerance has not been
investigated. The first step before any attempt to test bamboos in contaminated soils for
phytoremediation technologies is to investigate, under natural conditions, the extent ofmetal
concentrationsandpossiblecorrelationswithSiconcentrationsinplants.
Theobjectivesofthepresentstudywereto:(1)determinethevariabilityinCuandZn(forthe
firsttime)andSiconcentrationsbetweenspeciesbycomparing16bamboospeciesgrownunder
similar environmental conditions, i.e. a volcanic soil on the island of Réunion (Indian Ocean,
France),(2)obtainreferencevaluesforSi,Cu,Znconcentrationsinthedifferentabove‐ground
partsofbamboosand,(3)highlightthepossiblerelationshipbetweenSi,ZnandCuinbamboos
growinginanaturalsoilundertropicalclimaticconditions.
ChapitreII:Distributionandvariabilityofsilicon,copperandzincindifferentbamboosspecies
67
2. MATERIALS AND METHODS
2.1. Geographical area of the study, soil description and
sampling procedure
Bamboo samples were collected from a 3.5‐ha bamboo nursery in Réunion (Indian Ocean
island), France (Mr Perrussot, Le Guillaume, Saint Paul). 130 different species have been
maintained in thisnursery since1987.The climate is both tropical andoceanic,with easterly
prevailingwinds.Thestudiedsite(21°03’51S,55°19’28E)isonthewestsideofthePitondes
Neigesshieldvolcano,1035mabovesealevel.Themeanannualprecipitationis1700mm,and
the temperature ranges from 10 to 28°C, with hot and humid summers and warm and wet
winters. Soil in this area is classified as a chromic Andosol developed from Piton des Neiges
volcanicmaterial(Raunet1991).
SixteenbamboospeciesbelongingtosixgeneraweresampledinthesamefieldinOctober2008.
Thesebambooswereselectedbecausetheymaybegoodcandidatesforphytoremediationunder
tropical conditions, due to their high biomass production and good adaptations to tropical
climates.Bamboospeciesdiffer the rhizome form, i.e. theundergroundpart fromwhich roots
andshootsgrowfromnodes.Accordingtotherhizomemorphology,bamboosaredividedinto
monopodial bamboos with leptomorph rhizome systems, and sympodial bamboos with
pachymorph rhizome systems (McClure 1966). These differences in rhizome systems can be
regarded as adaptations to the climatic conditions from which the bamboos originated:
monopodial bamboos are native to temperate climates and sympodial bamboos are native to
tropical climates (Kleinhenz andMidmore 2001). Ten out of the 16 speciesweremonopodial
bamboos, i.e. Dendrocalamus giganteus, Dendrocalamus strictus, Bambusa bambos, Bambusa
oldhamii, Bambusa vulgaris 'Vittata', Bambusa multiplex ‘Golden Goddess’, Bambusa multiplex
'AlphonseKarr',Bambusatuldoides,Gigantochloasp.'MalayDwarf'andThyrsostachyssiamensis;
andsixweresympodialbamboos,i.e.Phyllostachysaurea,Phyllostachysbambusoïdes‘Castillon’,
Phyllostachysbissetii,Phyllostachysflexuosa,PhyllostachyshumilisandPseudosasajaponica.
Foreachspecies, threedifferent1‐year‐oldbamboospecimenswereselected tosamplestems
andleaves.Twosamplesweretakenfromeachstem:oneatthethirdinternodeabovethesoil
surface, further referred to as the “stem base”, and the second at the tip of the stem, further
referredtoasthe“stemtip”.Foreachstem,onebulkleafsamplewastaken.Atotalof94stem
samplesand47leafsampleswerecollected.
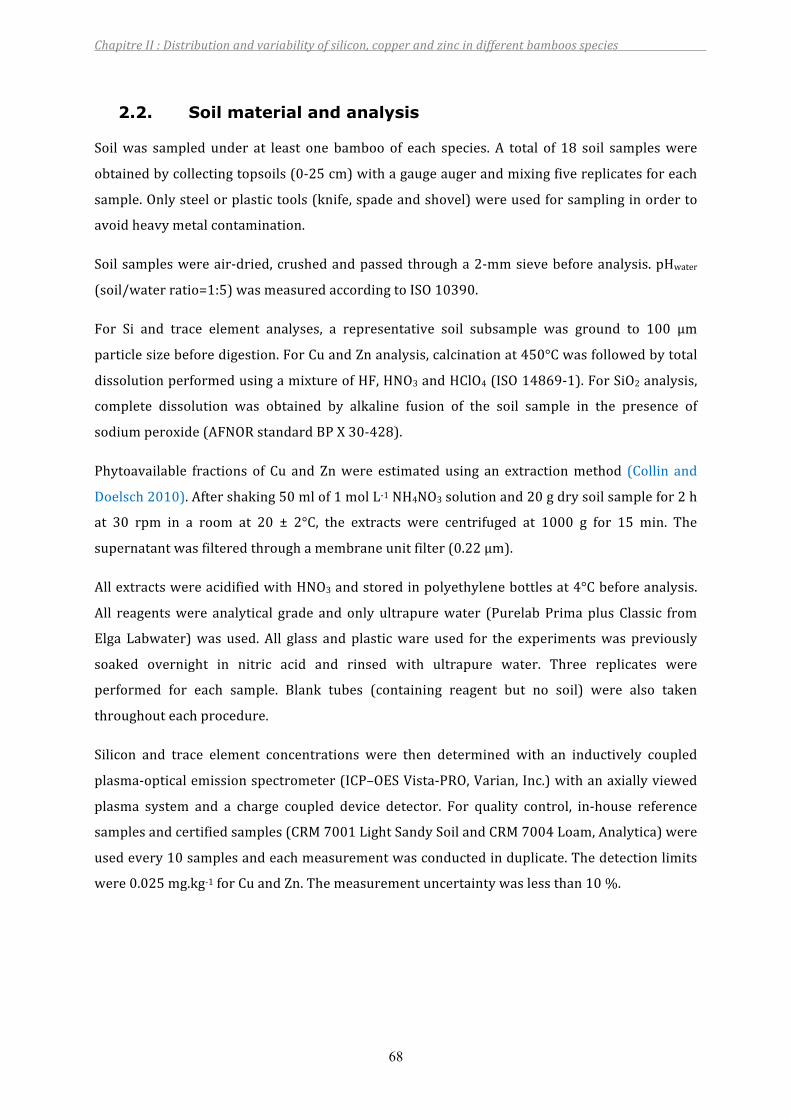
ChapitreII:Distributionandvariabilityofsilicon,copperandzincindifferentbamboosspecies
68
2.2. Soil material and analysis
Soilwas sampled under at least one bamboo of each species. A total of 18 soil sampleswere
obtainedbycollectingtopsoils(0‐25cm)withagaugeaugerandmixingfivereplicatesforeach
sample.Onlysteelorplastictools(knife,spadeandshovel)wereusedforsamplinginorderto
avoidheavymetalcontamination.
Soilsampleswereair‐dried,crushedandpassedthrougha2‐mmsievebeforeanalysis.pHwater
(soil/waterratio=1:5)wasmeasuredaccordingtoISO10390.
For Si and trace element analyses, a representative soil subsample was ground to 100 µm
particlesizebeforedigestion.ForCuandZnanalysis,calcinationat450°Cwasfollowedbytotal
dissolutionperformedusingamixtureofHF,HNO3andHClO4(ISO14869‐1).ForSiO2analysis,
complete dissolution was obtained by alkaline fusion of the soil sample in the presence of
sodiumperoxide(AFNORstandardBPX30‐428).
Phytoavailable fractions of Cu and Znwere estimated using an extractionmethod (Collin and
Doelsch2010).Aftershaking50mlof1molL‐1NH4NO3solutionand20gdrysoilsamplefor2h
at 30 rpm in a room at 20 ± 2°C, the extracts were centrifuged at 1000 g for 15 min. The
supernatantwasfilteredthroughamembraneunitfilter(0.22µm).
AllextractswereacidifiedwithHNO3andstoredinpolyethylenebottlesat4°Cbeforeanalysis.
All reagentswere analytical grade andonlyultrapurewater (PurelabPrimaplusClassic from
Elga Labwater)was used. All glass and plasticware used for the experimentswas previously
soaked overnight in nitric acid and rinsed with ultrapure water. Three replicates were
performed for each sample. Blank tubes (containing reagent but no soil) were also taken
throughouteachprocedure.
Silicon and trace element concentrations were then determined with an inductively coupled
plasma‐opticalemissionspectrometer(ICP–OESVista‐PRO,Varian,Inc.)withanaxiallyviewed
plasma system and a charge coupled device detector. For quality control, in‐house reference
samplesandcertifiedsamples(CRM7001LightSandySoilandCRM7004Loam,Analytica)were
usedevery10samplesandeachmeasurementwasconductedinduplicate.Thedetectionlimits
were0.025mg.kg‐1forCuandZn.Themeasurementuncertaintywaslessthan10%.
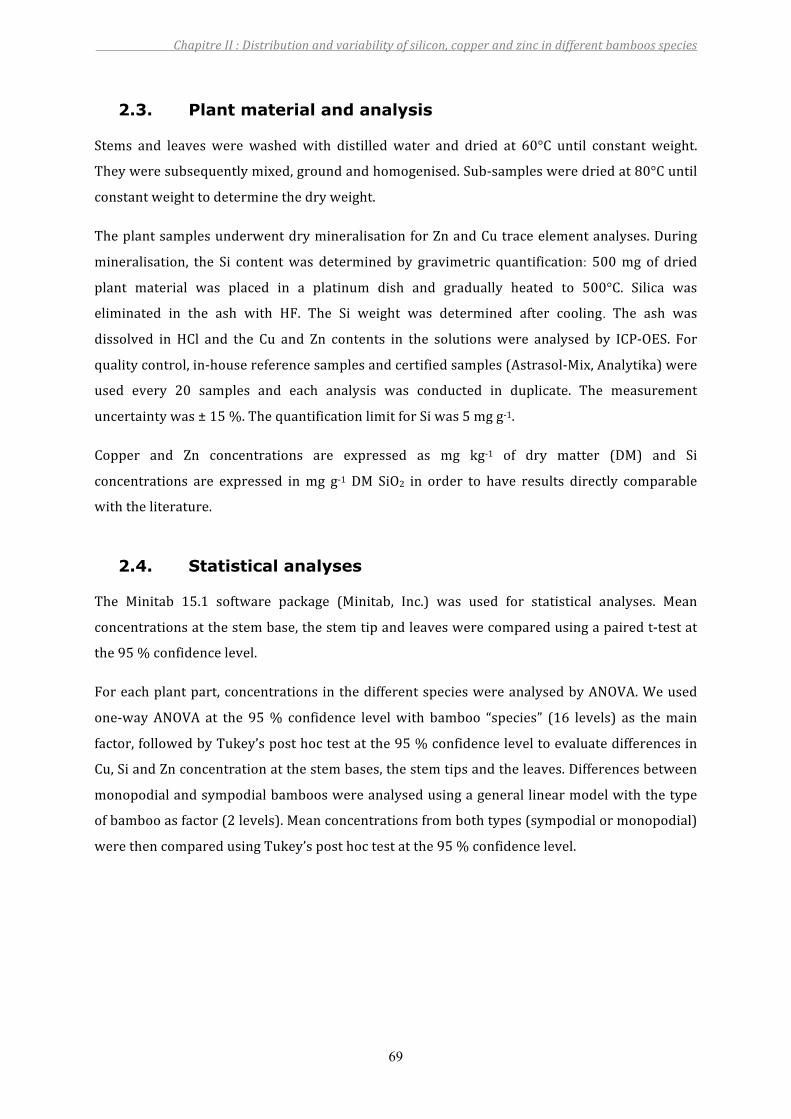
ChapitreII:Distributionandvariabilityofsilicon,copperandzincindifferentbamboosspecies
69
2.3. Plant material and analysis
Stems and leaves were washed with distilled water and dried at 60°C until constant weight.
Theyweresubsequentlymixed,groundandhomogenised.Sub‐samplesweredriedat80°Cuntil
constantweighttodeterminethedryweight.
TheplantsamplesunderwentdrymineralisationforZnandCutraceelementanalyses.During
mineralisation, the Si contentwas determined by gravimetric quantification: 500mg of dried
plant material was placed in a platinum dish and gradually heated to 500°C. Silica was
eliminated in the ash with HF. The Si weight was determined after cooling. The ash was
dissolved in HCl and the Cu and Zn contents in the solutionswere analysed by ICP‐OES. For
qualitycontrol,in‐housereferencesamplesandcertifiedsamples(Astrasol‐Mix,Analytika)were
used every 20 samples and each analysis was conducted in duplicate. The measurement
uncertaintywas±15%.ThequantificationlimitforSiwas5mgg‐1.
Copper and Zn concentrations are expressed as mg kg‐1 of dry matter (DM) and Si
concentrations are expressed inmg g‐1 DM SiO2 in order to have results directly comparable
withtheliterature.
2.4. Statistical analyses
The Minitab 15.1 software package (Minitab, Inc.) was used for statistical analyses. Mean
concentrationsatthestembase,thestemtipandleaveswerecomparedusingapairedt‐testat
the95%confidencelevel.
Foreachplantpart,concentrationsinthedifferentspecieswereanalysedbyANOVA.Weused
one‐wayANOVA at the 95% confidence levelwith bamboo “species” (16 levels) as themain
factor,followedbyTukey’sposthoctestatthe95%confidenceleveltoevaluatedifferencesin
Cu,SiandZnconcentrationatthestembases,thestemtipsandtheleaves.Differencesbetween
monopodialandsympodialbambooswereanalysedusingagenerallinearmodelwiththetype
ofbambooasfactor(2levels).Meanconcentrationsfrombothtypes(sympodialormonopodial)
werethencomparedusingTukey’sposthoctestatthe95%confidencelevel.
ChapitreII:Distributionandvariabilityofsilicon,copperandzincindifferentbamboosspecies
70
3. RESULTS
3.1. Soil
TotalSi,CuandZnsoilconcentrationsarepresentedinTableII.1.Themeantotalconcentrations
in the soil samples were 213 ± 23.3 mg g‐1 for SiO2, 26.5 ± 5.8 mg kg‐1 for Cu and
113±18.2mgkg‐1forZn,andtheaveragesoilpHwas6.1±0.3.Withinthestudyframework,soil
variations in Si, Cu, Zn concentration were reduced, while the coefficient of variation of
concentrationswithinthesampledareawasof11%forSiand21.8%forCuand16.2%(Table
II.1).TheCuNH4NO3‐extractable fractions (CuNH4NO3)werebelow thedetection limit inall soil
samplesandthemeanZnNH4NO3‐extractablefractions(ZnNH4NO3)were0.3±0.23mgkg‐1(Table
II.1).
Table II.1 Characteristics of the total soil population (N=18)
aDatafromDoelschetal.(2006)andCollinandDoelsch(2010)bDatafromKabata‐PendiasandMukherjee,(2007)
3.2. Between plant parts
TableII.2showstheaverageSi,Cu,Znconcentrationsatthestembase,atthestemtipandinthe
leaves.Withinthestem,Si,CuandZnconcentrationssignificantlyincreasedfromthestembase
tothetip.ThemeanconcentrationsatthestembasewereunderquantificationlimitforSi,3.5
mgCukg‐1and7.0mgZnkg‐1,whereasatthestemtip,themeanconcentrationswere21mgSig‐
1,4.5mgCukg‐1and14.8mgZnkg‐1.TheSicontentatthestemtipwasthusmorethan4.1‐fold
higherthanatthestembase,andthisdifferencewasgreaterthanthatnotedforCuandZn:1.3‐
and 2.1‐fold, respectively. The leaf Si and Cu concentrations, i.e. 109 mg g‐1 and 5.1 mg kg‐1
respectively,weresignificantlyhigherthaninthestem.
ChapitreII:Distributionandvariabilityofsilicon,copperandzincindifferentbamboosspecies
71
NocorrelationsbetweenCu,ZnandSicontentswerefoundinstemsandleaves(R2<0.18).There
wasnolongeranycorrelationbetweenthetotalSi,CuandZnsoilconcentrationandtheSi,Cu
and Zn plant concentration (R2<0.2), or between the ZnNH4NO3 fraction and the Zn plant
concentration(R2<0.3)(forCu,CuNH4NO3fractionsarebelowthedetectionlimit).
Table II.2 SiO2, Cu and Zn concentrations in the different plant parts (N=47). Data are expressed as mg kg-1 of dry matter for Cu and Zn concentrations and mg g-1 of dry matter for SiO2 concentrations.
Stembases Stemtips Leaves
Numberofsamples 47 45 47
Mean±standarddeviation <QLτ 21aττ±16 109b±30
Coefficientofvariation <QL 785 279
Range 5‐12 5‐102 23‐183
SiO2
ANOVAFSPECIES ‐ 2.12* 2.23*
Mean±standarddeviation 3.5a±1.0 4.5b±2.0 5.1c±1.0
Coefficientofvariation 28.1 43.9 18.8
Range 1.8‐6.4 1.7‐10.9 3.4‐7
Cu
ANOVAFSPECIES 4.99*** 5.53*** 6.8***
Mean±standarddeviation 7.0a±6.3 14.8b±16 15.7b±5.6
Coefficientofvariation 89.5 110 35.9
Range 1.5‐36.7 1.7‐87.6 9.8‐37.8
Zn
ANOVAFSPECIES 4.73*** 1.56NS 2.54*
τ<QL:underthequantificationlimitof5mgg‐1ττValues followedbysame letterwithin thesame lineare statisticallynotdifferentaccording toTukeytestatthe95%confidencelevel.
0ne‐wayanalysisofvarianceandF‐testforSiO2,Cu,Zn,concentrationsinstembases,stemtipsandleavesrelativetothespeciesfactor.NS:notsignificantp>0.05Sig.:*=P<0.05,***P<0.001
3.3. Between plant species
MeanSi concentrationswere significantlydifferentbetween species in leaves and in the stem
tips(TableII.2).Inourstudy,therewassubstantialvariationintheSicontentrangebetweenthe
16 species: from 5.7mg g‐1 inPhyllostachys aurea to 56mg g‐1 inBambusamultiplex ‘Golden
Goddess’ at the stem tip, and from 82 mg g‐1 in Phyllostachys bissetii to 159 mg g‐1 in
Dendrocalamus strictus in the leaves (Table II.3).We assumed that thiswide Si content range
could mainly be explained by the genotypic variation since both soil and climatic conditions
weresimilarforallthesampledspecies.
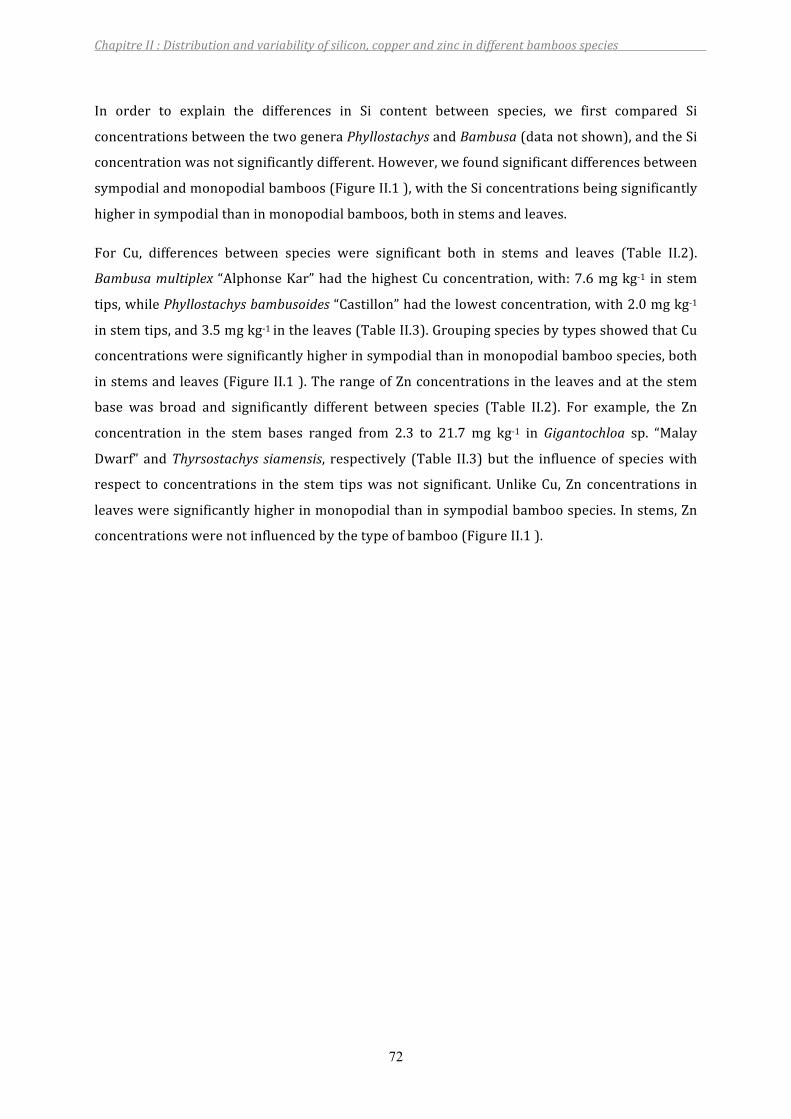
ChapitreII:Distributionandvariabilityofsilicon,copperandzincindifferentbamboosspecies
72
In order to explain the differences in Si content between species, we first compared Si
concentrationsbetweenthetwogeneraPhyllostachysandBambusa(datanotshown),andtheSi
concentrationwasnotsignificantlydifferent.However,wefoundsignificantdifferencesbetween
sympodialandmonopodialbamboos(FigureII.1),withtheSiconcentrationsbeingsignificantly
higherinsympodialthaninmonopodialbamboos,bothinstemsandleaves.
For Cu, differences between species were significant both in stems and leaves (Table II.2).
Bambusamultiplex“AlphonseKar”hadthehighestCuconcentration,with:7.6mgkg‐1 instem
tips,whilePhyllostachysbambusoides“Castillon”hadthelowestconcentration,with2.0mgkg‐1
instemtips,and3.5mgkg‐1intheleaves(TableII.3).GroupingspeciesbytypesshowedthatCu
concentrationsweresignificantlyhigherinsympodialthaninmonopodialbamboospecies,both
instemsandleaves(FigureII.1).TherangeofZnconcentrationsintheleavesandatthestem
base was broad and significantly different between species (Table II.2). For example, the Zn
concentration in the stem bases ranged from 2.3 to 21.7 mg kg‐1 in Gigantochloa sp. “Malay
Dwarf” andThyrsostachys siamensis, respectively (Table II.3)but the influenceof specieswith
respect to concentrations in the stem tipswasnot significant.UnlikeCu,Zn concentrations in
leavesweresignificantlyhigherinmonopodialthaninsympodialbamboospecies.Instems,Zn
concentrationswerenotinfluencedbythetypeofbamboo(FigureII.1).
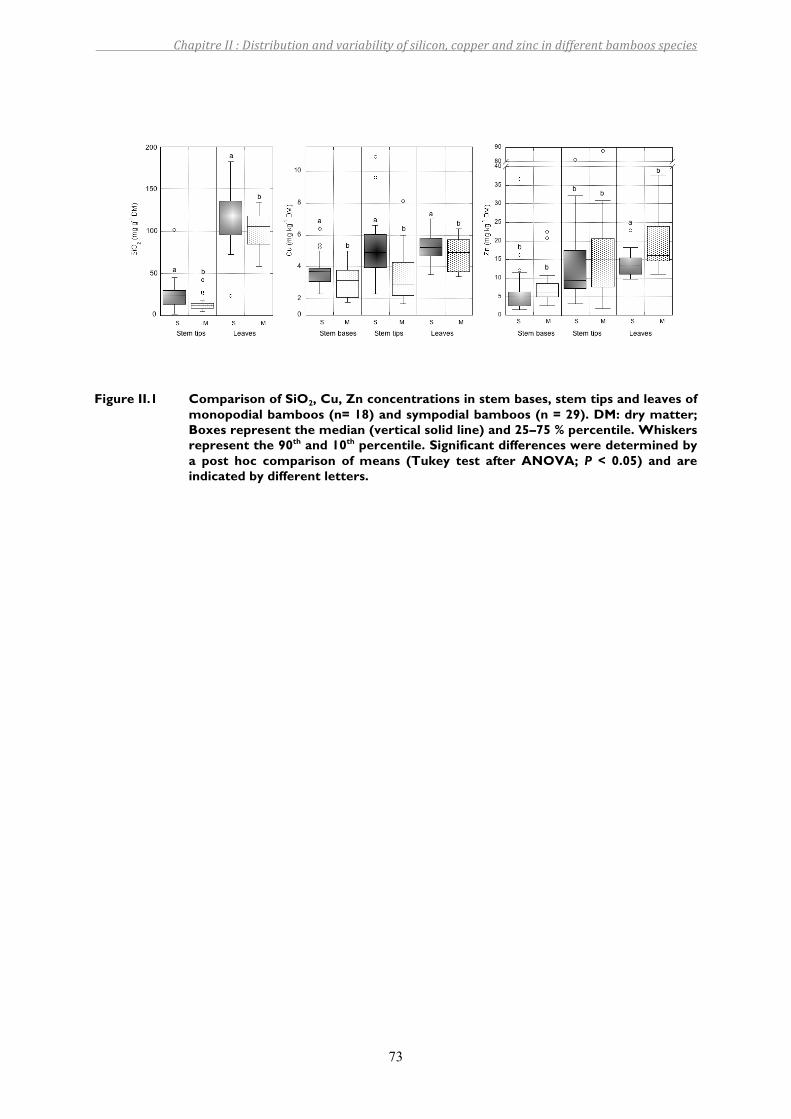
ChapitreII:Distributionandvariabilityofsilicon,copperandzincindifferentbamboosspecies
73
Figure II.1 Comparison of SiO2, Cu, Zn concentrations in stem bases, stem tips and leaves of
monopodial bamboos (n= 18) and sympodial bamboos (n = 29). DM: dry matter; Boxes represent the median (vertical solid line) and 25–75 % percentile. Whiskers represent the 90th and 10th percentile. Significant differences were determined by a post hoc comparison of means (Tukey test after ANOVA; P < 0.05) and are indicated by different letters.
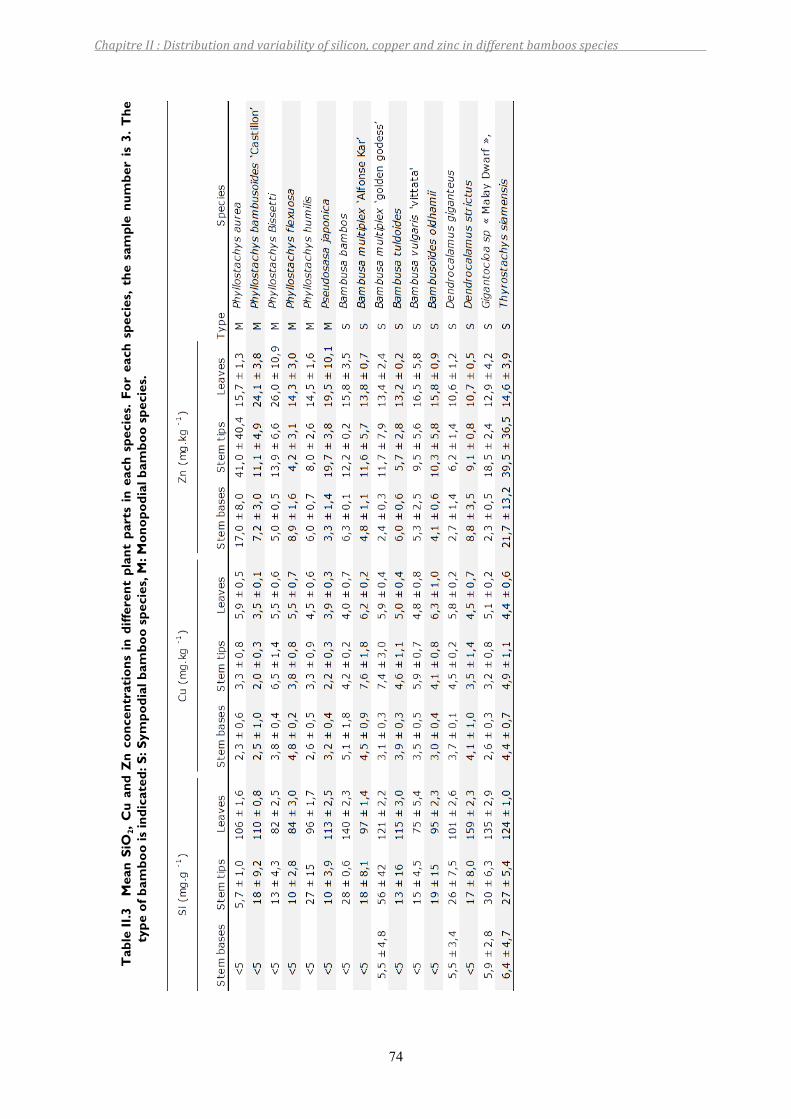
ChapitreII:Distributionandvariabilityofsilicon,copperandzincindifferentbamboosspecies
74
Tab
le II
.3
Mea
n Si
O2,
Cu
and
Zn
conc
entr
atio
ns i
n di
ffere
nt p
lant
par
ts i
n ea
ch s
peci
es.
For
each
spe
cies
, th
e sa
mpl
e nu
mbe
r is
3.
The
ty
pe o
f bam
boo
is in
dica
ted:
S: S
ympo
dial
bam
boo
spec
ies,
M: M
onop
odia
l bam
boo
spec
ies.
ChapitreII:Distributionandvariabilityofsilicon,copperandzincindifferentbamboosspecies
75
4. DISCUSSION
4.1. Phytoavailability of Si, Cu and Zn
Themean total SiO2 concentration of the soil samples (213 ± 23.3mg g‐1)was similar to the
meanSiconcentrationpreviouslymeasuredinRéunionsoils,i.e.216mgg‐1(TableII.1)(Doelsch
etal.2006).Thisvolcanicsoilcontainseasilyweatherablesilicatemineralsduetothepresence
ofpoorlycrystallinemineralsandparticularlyverylowpolymerizedaluminosilicatesthatmay
contributethephytoavailableSipool(Basile‐Doelschetal.2005).
ThemeantotalCuconcentration(TableII.1)wasclosetothemeanconcentrationinworldsoil
(20mgkg‐1),butlowerthanthemeanconcentrationmeasuredinasetofRéunionsoils(Doelsch
etal.2006).ThemeanZnconcentrationwasalsomuchhigherthanthemeansoilconcentration
givenbyKabata‐PendiasandMukherjee(2007),andslightlylowerthanthemeanconcentration
calculated for Réunion soils (Doelsch et al. 2006). These larger Cu and Zn concentrations as
comparedtoworldsoilconcentrationscouldbeexplainedbytheoriginoftheparentmaterial:
soilsformedfromthePitondesNeigesvolcanicmaterialarecharacterisedbylowCr,CuandNi
concentrationsandrelativelyhighZnconcentrations(Doelschetal.2006). Indeed,theselatter
authorsdemonstratedthatthenaturalpedogeochemicalbackgroundcouldaccountforthehigh
Cr, Cu, Ni and Zn concentrations in Réunion soils. In spite of these higher average total
concentrations,theCuandZnNH4NO3‐extractablefractionswerelow,whichisconsistentwith
thefindingsofCollinandDoelsch(2010),whodemonstratedthelowphytoavailabilityofCu,Cr,
NiandZninRéunionsoils.TheabsenceofcorrelationsbetweenCuandZntotalconcentrationin
soilandCu,Znconcentrationinplants(R2<0.2)wasthusnotsurprisingandconfirmedthelow
phytoavailabilityoftheseelements.
4.2. Origin of Si variation in bamboos
Silica concentrations in leaveswerewithin the 20 to 410mg g‐1 Si range reported in several
previous studies (Table II.4). Silicon concentrations in stems ranged from <5 to 102 mg g‐1,
whichisabroaderrangethanreportedintheliteraturepresentedinTableII.4(3–44mgg‐1).
The mean Si concentration measured at the stem tip in the 16 species (21 mg g‐1) was
significantlyhigherthantheconcentrationatthestembase(underthedetectionlimit),whichis
out of linewith the findings of Li et al. (2006). Indeed, at the stembase in theMosobamboo
stand(Phyllostachysheterocyclavar.pubescens),theseauthorsmeasuredaconcentrationof44
mgg‐1Si,whereastheymeasured1.5mgg‐1Siinthestem.However,theexactlocationsofthe
analysedsamplescorrespondingto“baseofthestem”andthe“stem”werenotgivenbyLietal.
ChapitreII:Distributionandvariabilityofsilicon,copperandzincindifferentbamboosspecies
76
(2006),thuslimitingthepossibilityofcomparisonwithourresults.Siliconconcentrationsthus
variedbetweenplantparts,withtheaccumulationofSi in leavesandaconcentrationgradient
along thestem.Toexplain thedistributionwith theplant, transpirationhasbeenproposedas
the main mechanism for Si transportation and precipitation in Chinese bamboos (Ding et al.
2008).Theevidenceisbasedonthetotalsiliconcontentandδ30Sivalues,whichbothincrease
fromthestem,throughthebranchestotheleaves.Theresultsofthisstudyareconsistentwith
the hypothesis of silica being carried passively through the transpiration stream and being
depositedwherewaterislostinlargestquantities,asproposedbyDingetal.(2008).However,
inanSiaccumulator,itislikelythatactivesilicondistributionmechanismsinbambooshootsare
alsorequired(MaandYamaji2008).
In leaves and at the stem tips, therewasmarked variation in the Si content between the 16
sampledspecies(TableII.2).ThisresultisingoodagreementwiththefindingsofHodsonetal.,
(2005)whoshowedthatvariabilityinSicontentover735plantspeciesismainlyexplainedby
genotypic variation rather than environment. However, although differences in Si content
between plant families are well known (Hodson et al. 2005), genotypic variation in Si
concentration within species is less documented. The effect of genotypic variation has been
studiedinafewotherplants,particularlyinotherPoaceaespecies.Forexample,in52sugarcane
genotypesgrowninthesamesoil,theshootSiconcentrationrangedfrom6to8mgg‐1(Derenet
al. 1993). In rice, the sameauthors compared theSi concentration inplants from18cultivars
growningreenhouseexperimentsandinfieldsamendedwithvariousamountsofSi.Thesilica
concentrationinplanttissuesrangedfrom3to60mgg‐1dependingontheSisupply,butwithin
eachSitreatmentthecoefficientofvariationduetogenotypicdifferenceswas9to17%(Deren
etal.2001;Derenetal.1993).Infieldtrials,Winslowetal.(1997)observeddifferencesbetween
japonica and indica rice cultivars, with mean Si concentrations in husks of 2 and 1.2 mg g‐1,
respectively.Inasurveyofabout400barleyspecies,theSiconcentrationingrainrangedfrom0
(under the detection limit) to 3.8 mg g‐1 in hulled barley cultivars (Feng Ma et al. 2003).
However, no significant differences in Si absorptionwere observed in three different banana
genotypes grown in hydroponic culture conditions (Henriet et al. 2006). Although genotypic
differencesinSicontenthavebeenfoundinotherPoaceaespeciessuchasrice,sugarcaneand
wheat,thisisnotsystematicinallspeciesandmayquestionthegeneticmechanismsthatcontrol
Siaccumulationindifferentspecies.
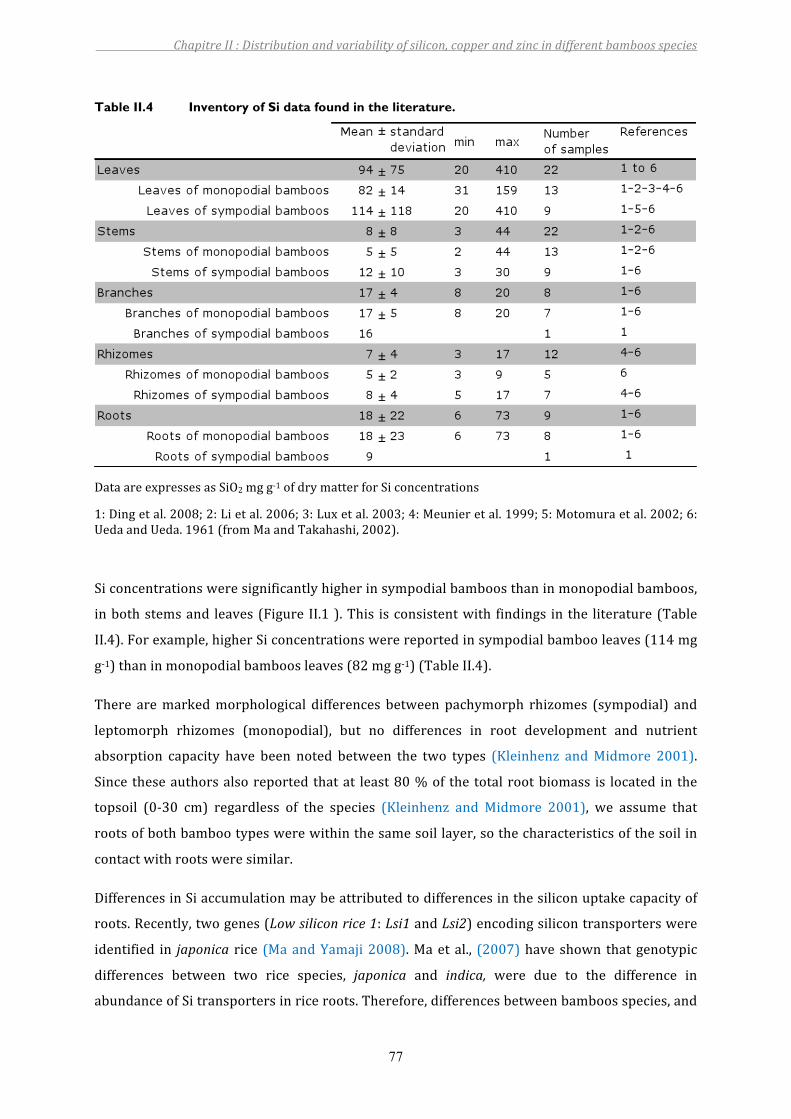
ChapitreII:Distributionandvariabilityofsilicon,copperandzincindifferentbamboosspecies
77
Table II.4 Inventory of Si data found in the literature.
DataareexpressesasSiO2mgg‐1ofdrymatterforSiconcentrations
1:Dingetal.2008;2:Lietal.2006;3:Luxetal.2003;4:Meunieretal.1999;5:Motomuraetal.2002;6:UedaandUeda.1961(fromMaandTakahashi,2002).
Siconcentrationsweresignificantlyhigherinsympodialbamboosthaninmonopodialbamboos,
inbothstemsand leaves(Figure II.1 ).This isconsistentwith findings in the literature(Table
II.4).Forexample,higherSiconcentrationswerereportedinsympodialbambooleaves(114mg
g‐1)thaninmonopodialbamboosleaves(82mgg‐1)(TableII.4).
There aremarkedmorphological differences betweenpachymorph rhizomes (sympodial) and
leptomorph rhizomes (monopodial), but no differences in root development and nutrient
absorption capacity have been noted between the two types (Kleinhenz andMidmore 2001).
Since theseauthorsalsoreportedthatat least80%of the totalrootbiomass is located in the
topsoil (0‐30 cm) regardless of the species (Kleinhenz and Midmore 2001), we assume that
rootsofbothbambootypeswerewithinthesamesoillayer,sothecharacteristicsofthesoilin
contactwithrootsweresimilar.
DifferencesinSiaccumulationmaybeattributedtodifferencesinthesiliconuptakecapacityof
roots.Recently,twogenes(Lowsiliconrice1:Lsi1andLsi2)encodingsilicontransporterswere
identified in japonica rice (MaandYamaji2008).Maetal., (2007)have shown thatgenotypic
differences between two rice species, japonica and indica, were due to the difference in
abundanceofSitransportersinriceroots.Therefore,differencesbetweenbamboosspecies,and
ChapitreII:Distributionandvariabilityofsilicon,copperandzincindifferentbamboosspecies
78
toafurtherextentbetweenthetwotypesofbamboocouldreflectadifferenceinexpressionof
genesresponsibleforsiliconuptake.
Afterrootuptake,Siistranslocatedtotheshootviathexylem.Itislikelythattransportersare
also required for xylem Si loading and unloading and for distributing Si to the above‐ground
plant parts (Ma and Yamaji 2008). Genetic differencesmay also be expressed in the relative
distribution of Si in stems and leaves. For example, Keeping et al., (2009) found that cultivar
differences in sugarcane stalks could be explained by differing propensities of cultivars to
deposit Si within the stalk epidermis. Active processes could partly explain differences in Si
concentrationsbetweenspecies,buttheunderstandingofthesilicadepositionprocessandthe
identificationoftransportersinplantshootsstillneedtobestudied.
In the above‐ground parts of bamboos, Kleinhenz and Midmore (2001) highlighted that the
lifespanofleaveswassubstantiallydifferentbetweenmonopodialandsympodialbamboos.The
canopyofmonopodialspeciesisrejuvenatedeveryyearwhen2‐year‐oldleavesarereplacedby
newones.Thoseofsympodialspeciesremainonculmslonger,i.e.uptoabout6years.Therefore
culms of sympodial bamboos of over 2‐years‐old contain relatively older and less productive
leavesthanmonopodialbamboos.Motomuraetal.(2002)reportedthatinbambooleavessilica
iscontinuouslyaccumulated inthetissuesthroughouttheir life.Leavesofsympodialbamboos
may thereforehave a higher Si content than leaves ofmonopodial bamboos.However, in this
study,weonly sampled1‐year‐old stems, so the leaf ages shouldall havebeen the same.The
differencesobservedinourstudybetweenmonopodialandsympodialbambooswerethusnot
relatedtothischaracter.
4.3. Origin of Cu and Zn variability in bamboo
DuetothelackofpublishedZnandCuconcentrationsinbamboos,wefirstcomparedourresults
withanotherPoaceaespecies,i.e.sugarcane(stems),growinginRéuniononsimilarsoils(Collin
andDoelsch2010).Copper concentrations inbamboo sampleswerehigher than in sugarcane
samples,withanaverageof3.5±1.0and4.5±2.0mgkg‐1atthestembaseandtip,respectively
(Table II.2), whereas in sugarcane the average was 2.1 ± 0.6 mg kg‐1. Zinc concentrations in
bamboostemsweresimilartoconcentrationsinsugarcanestems,withanaverageof7.0±6.3
and14.8±16mgkg‐1atthebamboostembaseandthetip,respectively(TableII.2),and10±5.2
mgk‐1 insugarcane.Wethencomparedleafconcentrationswithdatacompiledformatureleaf
tissue from various plant species (Kabata‐Pendias and Mukherjee 2007). The concentration
rangesthattheseauthorsconsiderednormalwere5‐30mgkg−1forCuand27‐150mgkg−1for
Zn. The concentration measured in bamboo leaves were within this range for Cu, with an
ChapitreII:Distributionandvariabilityofsilicon,copperandzincindifferentbamboosspecies
79
averageof5.1±1.0mgCukg‐1,andlowerforZn,withanaverageof15.7±5.6mgZnkg‐1(Table
II.2).CuandZnconcentrationsinabove‐groundpartsofRéunionbambooswerethusrelatively
low, which may confirm the low phytoavailability of these elements measured by NH4NO3‐
extraction,aswellasthenonspecificabilityofbamboostoaccumulateCuandZn.
Within thestem,CuandZnconcentrations,similar toSi, significantly increased fromthestem
base to the tip (Table II.2), suggesting that part of this element translocation was driven by
transpiration. However, metals do not move freely in the plant. Interactions of cations with
negativelychargedsites(mainlywithpectins)inxylemorphloemcellwallsleadtodecoupling
ofiontransportandwaterflow(Francoetal.2002).Inaddition,mostmetalsarecomplexedby
organic acids, amino acids, peptides, metallothionine or phytochelatin (Broadley et al. 2007;
CobbettandGoldsbrough2002;Liaoetal.2000).ThegreaterZnaccumulationatthestemtipas
comparedtothatofCumaythusbeexplainedbydifferencesinthemobilityofmetalcomplexes
formedwithintheplant.
SignificantdifferencesbetweenspeciesweremeasuredforCuinstemsandleavesandforZnin
leaves (Table II.2). This finding is in good agreementwith the studyofBroadley et al. (2007)
who reported that, in a dataset of 365 species, therewere substantial differences in shoot Zn
contentbetweenandwithingeneraand species.Metal absorption inplants isbothactiveand
passive,andmetabolicmechanisms,suchastheexpressionofspecifictransportersinrootcells,
is genetically controlledandmay thusvarybetweenspecies. Forexample, theexpressionand
gene organization of proton pumping ATPase genes in the plant plasmamembrane seems to
differbetweenspecies(MorsommeandBoutry2000).Moreover,theavailabilityofelementsin
thesoilandrootuptakecanbeaffectedbyplantfactorssuchasrootexudates,rootsurfacearea,
rootabsorptionabilityandmycorrhization(Kelleretal.2003;Langeretal.2010;Whitingetal.
2000). For example in rice, Zn uptake efficiency is correlated with exudation rates of low
molecularweightorganicanionsandasubstantialproportionofthephenotypicvariationinZn
uptakeefficiencyisundergeneticcontrol(Wissuwaetal.2006).Inwheat,genotypicvariations
inZnuptakemaybe related to the releaseofphytosiderophores (mugineic andavenic acids),
whichwereshowntosignificantlyenhanceZnbioavailability(Cakmaketal.1996;Rengeletal.
1998; Tolay et al. 2001). Thus, these mechanisms and inherent differences in uptake,
translocationandaccumulationmaypartlyexplainthesignificantdifferencesnotedinCuandZn
concentrationsamongthe16bamboospecies.
DifferencesbetweenmonopodialandsympodialbamboosweresignificantforCuandZn,butno
information is available in the literature on any possible specific behaviour regardingmetals
ChapitreII:Distributionandvariabilityofsilicon,copperandzincindifferentbamboosspecies
80
between the two typesofbamboo.Analysesof thedifferenceswithSi contentwerediscussed
above,andmayalsoapplyforCuandZn.
4.4. Interactions between metals and Si
NocorrelationsbetweenCu,ZnandSicontentswerefoundinstemsandleaves.Inthenatural
pedo‐climaticenvironmentofRéunion,withasoilhavinglowNH4NO3‐extractableCuandZn,the
Si and trace metal behaviours in bamboos seem to be independent. This could be easily
explained since thebeneficial effects of Si areusually expressedwhenplants are subjected to
stressconditions(Liangetal.2007).Ithasbeenshown,forexample,thatSialleviatesZntoxicity
inheavymetal‐tolerantCardaminopsishalleri(NeumannandzurNieden2001).Theseauthors
suggestedthattheformationofZn‐silicatecompoundsinthecytoplasmmayberesponsiblefor
the alleviation of the Zn toxicity. InArabidopsis thaliana, Li et al. (2008) have shown that Si
improvestheresistancetoCustress.ArecentstudyhasshownthatSimodulatestheexpression
of various genes involved in Cu tolerance in A. thaliana (Khandekar and Leisner 2011). Our
studywasnotdesignedtoassesstheinteractionbetweenSiandmetalsatthecellularlevel,but
wecanassumethat,withsuchahighSiabsorptioncapacityinitstissues,bamboomaybeableto
toleratehighermetalconcentrationsthanthosepresent inRéunionsoils.However, thiswould
needfurthertestingwithincreasingmetalconcentrations.
In conclusion, we report the first data on Cu and Zn concentrations in stems and leaves of
variousbamboospeciesandnewdataonSiinbamboos.Ourresultshighlighttheimportanceof
thevariabilitybetweenspecies,particularlybetweenmonopodialandsympodialspeciesforZn,
Cu, andSi contents inbamboos, suggesting that a genotypic charactermaybe responsible for
theiraccumulation.
ChapitreII:Distributionandvariabilityofsilicon,copperandzincindifferentbamboosspecies
81
ACKNOWLEDGMENTS
This work was financially supported by the Direction Générale des Entreprises, Direction
GénéraledelaCompétitivité,del’IndustrieetdesServices,régionRéunion,régionPACAinthe
frame of the research program RUN INNOVATION II and by the Association Nationale de la
RechercheetdelaTechnologie(CIFREgrant).
TheauthorsthankMrAlexandrePerrussot,MrGregoryBoisandMmeVeroniqueArfifortheir
assistanceandfruitfuldiscussions.
5. BILAN DU CHAPITRE II
Le silicium est majoritairement accumulé dans les feuilles, au sein desquelles sa
concentration varie entre 82±2,5 et 159±2,3 mg.g‐1 de MS. Les concentrations en Cu et Zn
mesurées dans les bambous sont relativement faibles, elles sont comprises entre 2,0±0,3 et
7,6±1,8mgCukg‐1deMSetentre2,3±0,5et41±40mgZnkg‐1dansleschaumesetlesfeuilles.
Unepartiede la variabilitéobservéeest expliquéepardesdifférencesd’accumulation entre
les16espècesdebambous.Nousavonsmontréquelesbamboussympodiaux,présentsdans
lesrégionsàclimattropical,accumulentplusdeSietCudansleschaumesetlesfeuilles,que
les bambous monopodiaux. A l’inverse, les bambous sympodiaux accumulent moins de Zn
danslesfeuillesquelesbambousmonopodiaux.
Danscesconditionspédoclimatiquesnaturelles,lescomportementsdeSietCudanslebambou
semblentindépendants.
ChapitreII:Distributionandvariabilityofsilicon,copperandzincindifferentbamboosspecies
82
6. REFERENCES BIBLIOGRAPHIQUES
ArfiV,BagoudouD,KorboulewskyNandBoisG2009Initialefficiencyofabamboogrove‐basedtreatmentsystemforwinerywastewater.Desalination246,69‐77.
Basile‐Doelsch I, Amundson R, Stone W E E, Masiello C A, Bottero J Y, Colin F, Masin F,
BorschneckDandMeunierJD2005MineralogicalcontroloforganiccarbondynamicsinavolcanicashsoilonLaReunion.EuropeanJournalofSoilScience56,689‐703.
BroadleyMR,WhitePJ,HammondJP,ZelkoIandLuxA2007Zincinplants.NewPhytologist
173,677‐702.Cakmak I, Sari N, Marschner H, Ekiz H, Kalayci M, Yilmaz A and Braun H J 1996
Phytosiderophore release in bread and durum wheat genotypes differing in zincefficiency.PlantandSoil180,183‐189.
CobbettCandGoldsbroughP2002Phytochelatinsandmetallothioneins:Roles inheavymetal
detoxificationandhomeostasis.AnnualReviewofPlantBiology53,159‐182.CollinBandDoelschE2010Impactofhighnaturalsoilborneheavymetalconcentrationsonthe
mobilityandphytoavailabilityoftheseelementsforsugarcane.Geoderma159,452‐458.Deren C W, Datnoff L E, Snyder G H and Korndorfer G H 2001 Plant genotype, silicon
concentration, and silicon‐related responses. In Studies in Plant Science. pp 149‐158.Elsevier.
Deren C W, Glaz B and Snyder G H 1993 Leaf‐tissue silicon content of sugarcane genotypes
grownonevergladeshistosols.JournalofPlantNutrition16,2273‐2280.DingTP,ZhouJX,WanDF,ChenZY,WangCYandZhangF2008Siliconisotopefractionation
in bamboo and its significance to the biogeochemical cycle of silicon. Geochimica etCosmochimicaActa72,1381‐1395.
DoelschE,MasionA,MoussardG,Chevassus‐RossetCandWojciechowiczO2010Impactofpig
slurry and greenwaste compost application on heavymetal exchangeable fractions intropicalsoils.Geoderma155,390‐400.
DoelschE,VandeKerchoveVandSaintMacaryH2006HeavymetalcontentinsoilsofReunion
(IndianOcean).Geoderma134,119‐134.Embaye K,Weih M, Ledin S and Christersson L 2005 Biomass and nutrient distribution in a
highland bamboo forest in southwest Ethiopia: implications for management. ForestEcologyandManagement204,159‐169.
FengMaJ,HigashitaniA,SatoKandTakedaK2003Genotypicvariationinsiliconconcentration
ofbarleygrain.PlantandSoil249,383‐387.FrancoCR,ChagasAPandJorgeRA2002Ion‐exchangeequilibriawithaluminumpectinates.
ColloidsandSurfacesa‐PhysicochemicalandEngineeringAspects204,183‐192.
ChapitreII:Distributionandvariabilityofsilicon,copperandzincindifferentbamboosspecies
83
Henriet C, Bodarwe L, Dorel M, Draye X and Delvaux B 2008 Leaf silicon content in banana
(Musaspp.)revealstheweatheringstageofvolcanicashsoilsinGuadeloupe.PlantandSoil313,71‐82.
HenrietC,DrayeX,OppitzI,SwennenRandDelvauxB2006Effects,distributionanduptakeof
siliconinbanana(Musaspp.)undercontrolledconditions.PlantandSoil287,359‐374.HodsonM J,White P J, Mead A and BroadleyM R 2005 Phylogenetic variation in the silicon
compositionofplants.AnnalsofBotany96,1027‐1046.JonesLHP,HandreckKAandNormanAG1967SilicaInSoils,Plants,andAnimals.InAdvances
inAgronomy.pp107‐149.AcademicPress.Kabata‐Pendias A andMukherjeeAB 2007Trace Elements from Soil toHuman Springer. pp.
578.Keeping M G, Kvedaras O L and Bruton A G 2009 Epidermal silicon in sugarcane: Cultivar
differencesandroleinresistancetosugarcaneborerEldanasaccharina.EnvironmentalandExperimentalBotany66,54‐60.
Keller C 2005 Efficiency and Limitations of Phytoextraction byHigh Biomass Plants. In Trace
ElementsintheEnvironment.pp611‐630.CRCPress.Keller C, Hammer D, Kayser A, Richner W, Brodbeck M and Sennhauser M 2003 Root
developmentandheavymetalphytoextractionefficiency:comparisonofdifferentplantspeciesinthefield.PlantandSoil249,67‐81.
Khandekar S andLeisner S 2011 Soluble siliconmodulates expressionofArabidopsis thaliana
genesinvolvedincopperstress.JournalofPlantPhysiology168,699‐705.KleinhenzVandMidmoreDJ2001Aspectsofbambooagronomy.InAdvancesinAgronomy.Ed.
DLSparks.pp99‐153.AcademicPress,Newyork,USA.LangerI,SyafruddinS,SteinkellnerS,PuschenreiterMandWenzelWW2010Plantgrowthand
root morphology of Phaseolus vulgaris L. grown in a split‐root system is affected byheterogeneity of crude oil pollution andmycorrhizal colonization. Plant and Soil 332,339‐355.
LiJ,LeisnerMandFrantzJ2008AlleviationofcoppertoxicityinArabidopsisthalianabysilicon
addition to hydroponic solutions. Journal of the American Society for HorticulturalScience133,670‐677.
Li Z‐j, Lin P,He J‐y, Yang Z‐w and Lin Y‐m2006 Silicon’s organic pool and biological cycle in
moso bamboo community of Wuyishan Biosphere Reserve. Journal of ZhejiangUniversity‐ScienceB7,849‐857.
LiangYC,SunWC,ZhuYGandChristieP2007Mechanismsofsilicon‐mediatedalleviationof
abioticstressesinhigherplants:Areview.EnvironmentalPollution147,422‐428.LiaoM,HedleyM,WoolleyD,BrooksRandNicholsM2000Copperuptakeandtranslocationin
chicory(CichoriumintybusL.cv.GrasslandsPuna)andtomato(Lycopersiconesculentum
ChapitreII:Distributionandvariabilityofsilicon,copperandzincindifferentbamboosspecies
84
Mill.cv.Rondy)plantsgrowninNFTsystem.II.Theroleofnicotianamineandhistidineinxylemsapcoppertransport.PlantandSoil223,245‐254.
Ma JFandYamajiN2008Functionsand transportof silicon inplants.CellularandMolecular
LifeSciences65,3049‐3057.Ma J F, Yamaji N, Tamai K and Mitani N 2007 Genotypic Difference in Silicon Uptake and
ExpressionofSiliconTransporterGenesinRice.PlantPhysiology145,919‐924.McClureFA1966Thebamboos.Afreshperspective.Mass.,HarvardUniversityPress.pp.362.McCutcheon S C and Schnoor J L 2003 Phytoremediation– Transformation and Control of
Contaminants.WileyInter‐science,USA.pp.987.MorsommePandBoutryM2000TheplantplasmamembraneH+‐ATPase:structure, function
andregulation.BiochimicaEtBiophysicaActa‐Biomembranes1465,1‐16.MotomuraH,MitaNandSuzukiM2002Silicaaccumulationinlong‐livedleavesofSasaveitchii
(Carriere)Rehder(Poaceae‐Bambusoideae).AnnalsofBotany90,149‐152.Neumann D and zur Nieden U 2001 Silicon and heavy metal tolerance of higher plants.
Phytochemistry56,685‐692.Novak JM,WattsDWandStoneKC2004Copperandzincaccumulation,profiledistribution,
and crop removal in coastal plain soils receiving long‐term, intensive applications ofswinemanure.TransactionsoftheAmericanSocietyofAgriculturalEngineers47,1513‐1522.
RaunetM1991Lemilieuphysiqueetlessolsdel'îledelaRéunion.Conséquencespourlamise
envaleuragricole.CIRADIRAT,Montpellier.pp.438Rengel Z, Romheld V and Marschner H 1998 Uptake of zinc and iron by wheat genotypes
differingintolerancetozincdeficiency.JournalofPlantPhysiology152,433‐438.ShanmughavelPandFrancisK2001Bioproductivityandnutrientcyclinginbambooandacacia
plantationforests.BioresourceTechnology80,45‐48.Soderstrom T R and Young SM 1983 A guide to Collecting Bamboos. Annals of theMissouri
BotanicalGarden70,128‐136.Tolay I, Erenoglu B, Romheld V, Braun H J and Cakmak I 2001 Phytosiderophore release in
Aegilops tauschii and Triticum species under zinc and iron deficiencies. Journal ofExperimentalBotany52,1093‐1099.
WhitingSN,LeakeJR,McGrathSPandBakerAJM2000PositiveresponsestoZnandCdby
roots of the Zn and Cd hyperaccumulator Thlaspi caerulescens. New Phytologist 145,199‐210.
Winslow M D, Okada K and CorreaVictoria F 1997 Silicon deficiency and the adaptation of
tropicalriceecotypes.PlantandSoil188,239‐248.WissuwaM, Ismail AM and Yanagihara S 2006 Effects of zinc deficiency on rice growth and
geneticfactorscontributingtotolerance.PlantPhysiology142,731‐741.

ChapitreII:Distributionandvariabilityofsilicon,copperandzincindifferentbamboosspecies
85

ChapitreII:Distributionandvariabilityofsilicon,copperandzincindifferentbamboosspecies
86
C H A P I T R E I I I
EFFECTS OF S IL ICON AND COPPER
ON BAMBOO GROWN
HYDROPONICALLY

ChapitreIII:Effectsofsiliconandcopperonbamboogrownhydroponically
88
ChapitreIII:Effectsofsiliconandcopperonbamboogrownhydroponically
89
TABLE DES MATIERES
CHAPITREIIIEFFECTSOFSILICONANDCOPPERONBAMBOOGROWNHYDROPONICALLY........................................................................................................................91
1 INTRODUCTION ......................................................................................................................................................95
2 MATERIALANDMETHODS .................................................................................................................................962.1 Plantmaterial,experimentaldesignandpreculture............................................................................................... 962.2 Experimentinnutrientsolution.......................................................................................................................................... 972.2.1 PhaseI:Sitreatment .................................................................................................................................................972.2.2 PhaseII:Cu+Sitreatment .....................................................................................................................................98
2.3 Plantanalysis .............................................................................................................................................................................. 992.3.1 Growthparameters ...................................................................................................................................................992.3.2 Analysisoftissues ...................................................................................................................................................100
2.4 Statisticalanalyses ................................................................................................................................................................ 100
3 RESULTS................................................................................................................................................................. 1013.1 Evolutionoftheelementconcentrationsinthenutrientsolution.................................................................... 1013.2 Bamboogrowthparametersandelementaldistribution .................................................................................... 105
4 DISCUSSION........................................................................................................................................................... 1094.1 Siliconinbamboo ................................................................................................................................................................... 1094.1.1 Mechanismsofsiliconaccumulation ..............................................................................................................1094.1.2 EffectofSiuptakeonthenutrientconcentrationandgrowthparameters ...................................111
4.2 Effectsofcopperonbamboogrowth............................................................................................................................. 1124.3 EffectsofbambooSionCusensitivity ........................................................................................................................... 115
5 BILANDUCHAPITREIII .................................................................................................................................... 117
6 REFERENCES ......................................................................................................................................................... 118

ChapitreIII:Effectsofsiliconandcopperonbamboogrownhydroponically
90
ChapitreIII:Effectsofsiliconandcopperonbamboogrownhydroponically
91
C H A P I T R E I I I
EFFECTS OF S IL ICON AND COPPER ON BAMBOO GROWN
HYDROPONICALLY
L’un des objectifs principaux de ce travail de thèse est d’évaluer le rôle du silicium sur les
bambous, en vue d’améliorer, si possible, leur croissance et donc leur productivité dans un
systèmedephytoremédiation.Nousavonsvudanslechapitreprécédentquelesconcentrations
deSiaccumuléesdanslesbamboussonttrèsfortes,109mg.g‐1enmoyennedanslesfeuilles.On
peut donc se demander si la quantité de Si biodisponible dans le milieu va influencer leur
croissance.UndéficitdeSiaffecte‐t‐illeurdéveloppement?Lacroissancevat’elleêtrecorrélée
àlaquantitédeSidisponible?
Surunsolprésentantdesconcentrationsdecuivrephytodisponiblesfaibles,nousavonsmontré,
danslechapitreprécédent,quelesbambousaccumulentdesconcentrationsrelativementbasses
deCudansleurstissus:de3,5à6,3mg.g‐1danslesfeuilles.Danscecontexte,lescomportements
deSietdeCudans lebambousemblent indépendants.Maisonpeutsedemandersi les fortes
concentrationsdeSiaccumuléesdans lesbambousvontpermettred’améliorer latolérancedu
bambouàdeplusfortesconcentrationsdeCu.Jusqu’àprésentlesétudesmontrantuneffetdeSi
surlesmétaux,ontétéeffectuéesdansdesconditionsdefortetoxicitémétallique.Parexemple,
Olivaetal. (2011)ontmis leursplantesaucontactd’unesolutionde300µMdeCuenculture
hydroponique. Des concentrations de Cu libre si élevées ne sont pasmesurées en conditions
environnementales,enraisondelaforteaffinitédeCupourlamatièreorganiqueprésentedans
le sol (Sauvé et al. 1997). Pour cette étude, nous avons choisi d’étudier le rôle de Si sur des
bambousquisontexposésàuneconcentrationdeCuélevéemaiscohérenteavecdesconditions
environnementales.
Afindecontrôler les concentrationsdeCuetSiapportéesauxbambous,nousavonscultivé le
bambouenhydroponie.Cette techniquenousapermisde fairevarieruniquementSietCu,de
ChapitreIII:Effectsofsiliconandcopperonbamboogrownhydroponically
92
suivreleursconcentrationsdanslessolutionsnutritivesetd’observerleseffetsdeceséléments
surlesbambous.
Lesobjectifsdecetteexpériencesontlessuivants:
• Localiser et quantifier Si dans les tissus du bambou exposés à une large gamme de
concentrationdeSidanslasolutionnutritive;
• Evaluerl’effetdeSisurlacroissanceetledéveloppementdubambou;
• Evaluerl’effetdeSisurlaconcentrationetlasensibilitéaucuivredubambou;
L’article ci‐après décrit l’expérience d’hydroponie qui a été réalisée pendant 11 mois. Nous
avons choisi une espèce de bambou sympodial: Gigantochloa sp «Malay Dwarf» pour cette
expérience.LesbambousontétéexposésàunelargegammedeSiensolution(de0à1,5mM)
pendant6mois,puisàuneconcentrationpotentiellementtoxiquedeCu(1.5µMCu2+)pendant2
mois.
CetarticleestsoumisàlarevuePlantandSoil.
ChapitreIII:Effectsofsiliconandcopperonbamboogrownhydroponically
93
Effects of silicon and copper on bamboo grown
hydroponically
BlancheCollin*a,b,EmmanuelDoelschc,CatherineKellerb,FredericPanfilia,Jean‐Dominique
Meunierb
a Département de recherche développement de la société PHYTOREM S.A., 13140 Miramas,
France
bCEREGE,CNRS,Aix‐MarseilleUniv.,Europôleméditerranéende l'ArboisBP80,13545Aixen
Provence,France
cCIRAD,UPRRecyclageetrisque,34398Montpellier,France
*Correspondingauthor.
ABSTRACT
Due to its high growth rate and biomass production, bamboo is frequently used in industrial
applicationsandhasrecentlyproventobeusefulinwastewatertreatment.Bambooaccumulates
highsilicon(Si)levelsinitstissues,whichmayimproveitsdevelopmentandtolerancetoabiotic
stresses, such as metal toxicity. This study investigates the beneficial effect of Si on bamboo
growth and copper (Cu) sensitivity. A hydroponic culture of bamboo Gigantocloa sp. “Malay
Dwarf”wasperformedfor8months.Thebambooplantswere firstsubmittedtoarangeofSi
supplementation(0to1.5mM)thatwasaddedtoapotentiallytoxicCuconcentrationforplants
(1.5µMCu2+)after6months.
Silicon affected neither the development (number of stems and leaves, height and total dry
mass) nor the nutrient content of the bamboo plants. The Si concentration in the plants
increasedmarkedlywithanincreasingSiconcentrationinthenutrientsolution.Thedistribution
ChapitreIII:Effectsofsiliconandcopperonbamboogrownhydroponically
94
ofSiamongthedifferentplantpartsinalloftheSitreatmentswasasfollows:root<stem<leaf.
In the leaves, the Si concentration ranged from below the detection limit to 218 ± 19mg g‐1,
whichisoneofthehighestSivaluesofSifoundthathavebeenobservedinbambooplantsthat
weregrowninnature.Aftereachrenewalofthenutrientsolution,theSicontentinthesolution
decreased progressively, whereas the Cu concentration decreased abruptly during the first
hours and then remained constant in the solution.Thesedifferences inCuandSi uptakemay
indicatethatbambootakesupandallocatesthesetwoelementsdifferently.TheCuadditiondid
not induce any toxicity symptoms in the bambooplants. The absorption of Cu in the bamboo
plantswasnotalteredbytheSisupplementation;Cuaccumulatedmainly inroots(131±39.3
mgkg‐1),whichwasfollowedbyitsaccumulationinleaves(16.6±3.6mgkg‐1)andstems(9.8±
3.8mgkg‐1).
Hydroponic culture has proven to be an efficient technique to grow the sympodial bamboo
Gigantocloa sp. “MalayDwarf”. Bamboo growthdoes not dependon Si levels even though the
bambooGigantocloasp.“MalayDwarf”didabsorbSiinlargeamounts.Thedifferentabsorption
mechanismsforCuandSimaypartiallyexplainwhySididnotinfluencetheCurepartitionand
concentration in bamboo. Given the high biomass and its adsorption capacity, the bamboo
tolerateshighCuconcentrationsinnutrientsolutions.
Keywords:hydroponics,metal,siliconaccumulator,Poaceae
ChapitreIII:Effectsofsiliconandcopperonbamboogrownhydroponically
95
1 INTRODUCTION
Extensive agronomic evidence supports the beneficial effects of silicon (Si) on the growth,
developmentandyieldofplantsandtheprotectionofplantsagainstbioticandabioticstresses
(Cooke and Leishman 2011; Epstein 1994; Epstein 1999). Bamboo species that contain large
deposits of silica in the leaves (Motomura et al. 2004) are classified among the silicon‐
accumulating plants (Ma and Takahashi 2002). Although Si distribution in bamboo has been
describedinseveralstudies(Collinetal.2011;Dingetal.2008b;Lietal.2006;Luxetal.2003),
the effects of Si on bamboo growth are poorly described (Ma and Takahashi 2002). Bamboo
speciesarecommonlyfoundintemperate,tropicalandsubtropicalregions,andtheyarewidely
usedforindustrialpurposes,asfreshedibleshoots,formakingpaper,asbuildingmaterialand
even inmedicine. They are known for their resistance to awide range of stress factors, their
high growth rate and their high biomass production, and they have potential uses in
phytoremediation. The PHYTOREM company (France) has developed BAMBOO‐
ASSAINISSEMENT® technology for wastewater treatment (Arfi et al. 2009). Therefore, the
potential beneficial effects of Si on bamboo may be used to optimise the phytoremediation
capacityofbamboo.
For various reasons, there is increasing concern regarding copper (Cu) toxicity in agriculture.
TheseconcernsinvolvethehighsoilCucontentsthatarecausedbythelong‐termuseofcopper–
containing fungicides (e.g., in vineyards) (Michaudet al. 2007), industrial andurbanactivities
(airpollution,citywasteandsewagesludge),andtheapplicationofpigandpoultryslurriesthat
arerichincopper(Legrosetal.2010;Marschner1995).
Silicon is known to play a significant role in minimising the toxic effects of metals. Several
mechanisms that are responsible formetal‐stress alleviationhavebeenproposed, such as the
modificationofthemetaldistributioninsidetheplant,anincreaseofmetalbindingtocellwalls,
andtheco‐precipitationofSi‐metal(RogallaandRomheld2002).Thesestudieshaveprimarily
focussed on Cd, Zn, Mn and Al, but Cu has been poorly studied to date. Two recent studies
regardingtheCu‐tolerantspeciesEricaandevalensisandArabidopsisthalianahavedescribedthe
beneficial effects of Si onCu toxicity (Khandekar andLeisner2011; Li et al. 2008;Oliva et al.
2011).Olivaetal.(2011)reportedthatadditionofSireducedtheleafmetalconcentration,while
Li et al. (2008) suggested that Si affects metal distribution or bioavailability. The Cu
concentration in bamboo and its interaction with Si has been recently assessed (Collin et al.
ChapitreIII:Effectsofsiliconandcopperonbamboogrownhydroponically
96
2011). Collin et al. (2011) provided the first data regarding Cu concentrations in various
bamboospecies thatweregrownundersimilarnaturalpedo‐climaticconditions; theyshowed
that theCuconcentrationswererelatively low,whereasSiwasaccumulated in the leavesata
levelof82to159mgg‐1dryweightdependingonthespecies.Withsuchahighvariability,itwill
be interesting to assess the extent of Si accumulation under increasing available Si
concentrations and the effects that this supplementationmayhaveonCuuptake and toxicity.
We chose to grow bamboo using hydroponics. Themain advantage of this procedure is that
plantscanbegrownunderoptimalnutrientconditions,andthenutrientsupplycanbeadapted
over time as necessary. To our knowledge, this is the first example of the application of this
techniquetobamboo.Thequestionsthatareaddressedinthisstudyareasfollows.1)Howare
bamboogrowthanddevelopmentaffectedbyvariousSisupplementations?2)HowdoestheSi
quantityandlocalisationindifferentbambooorganschangewithSisupplementation?3)DoesSi
supplementationmodifythecoppersensitivityofbamboo?
2 MATERIAL AND METHODS
2.1 Plant material, experimental design and pre-culture
Fiftyone‐year‐oldsympodialbambooplantsGigantocloasp.“MalayDwarf”thatweregrownon
the same substratewere provided by a bamboo nursery (A. PERRUSSOT, Le Guillaume, Saint
Paul,Réunion Island). Inmost of thehydroponic experiments that havebeenperformedwith
other species, seeds were directly used; however bamboo seeds are not typically used to
propagate bamboo plants. Indeed, bamboo seeds are difficult to obtain and have a low
germination rate. Most of the time, the propagation of bamboo is performed by vegetative
reproduction, which involves culm cutting for sympodial bamboo and rhizome cutting for
monopodialspecies.However,thegrowthfromcuttingisslowandproducesnon‐homogeneous
plants; therefore, we decided to use soil‐grown bamboo andmade a posteriori selections for
theirsimilarsizeanddevelopmentsothatwecouldworkwithahomogeneouspopulation.The
adaptation of the bamboo plants to hydroponic conditions was delicate because the bamboo
rootswerefirstadaptedtosoil.Afteracarefulwashingoftherootsincludingremovalofallof
thesoilparticles,thebambooplantsweretransferredintoaeratednutrientsolutiontanks.
Theexperimentwasperformedfor11months.Athree‐monthpre‐culturephasewasconducted;
during this period, the bamboo plants lost their leaves and began to develop new ones. The
bamboogrowthwasconducted for6months (phase I).During thisperiod, thebambooplants
ChapitreIII:Effectsofsiliconandcopperonbamboogrownhydroponically
97
weresupplementedwitha largerangeofSiconcentrationstoobservetheSieffectonbamboo
growth. After the bamboo was well‐developed with several news stems and leaves, Cu was
addedtotheSitreatmentsfor2months(phaseII).Thissecondphasewasperformedtoobserve
theeffectofSionCuconcentrationsinbamboo.
The composition of the pre‐culture nutrient solution consisted of a 25 %‐strength complete
Hoaglandsolution.Thecompositionofthemacroelements(mM)wasasfollows:1Ca(NO3)2,1.5
KNO3, 0.24MgSO4, and 0.22 (NH4)2HPO4; the composition of themicroelements (µM)was as
follows:11.6H3BO3,0.08CuSO4,0.2ZnSO4,0.03MoO3,2.3MnCl2,and100FeNaEDTA.ThepHof
thissolutionwasadjustedtoapHof6withNaOHorHNO3.Thenutrientsolutionwasrenewed
every7days.Analytical‐gradechemicalreagentsandultrapurewaterwereusedtopreparethe
nutrient solutions. No glassware was used, which minimised Si contamination. All of the
plasticwarethatwasusedintheexperimentswaspreviouslysoakedovernightinnitricacidand
rinsed with ultrapure water. The growth chamber parameters were set to the following
(day/night):28/24°C,90/70%relativehumidityand450μmolphotonsm−2s−1lightintensity.
2.2 Experiment in nutrient solution
2.2.1 Phase I: Si treatment
At the end of the pre‐culture stage, 25 bamboo plants of similar sizes were selected and
transferred to individual pots. The plants were then grown in cylindrical PVC pots that
contained 2.5 L of nutrient solution. For 6months, fromday 0 to day 191, five Si treatments
wereappliedasfollows:0.0(control),0.38,0.75,1.13and1.5mM,whicharereferredtoasSi0,
Si04, Si08, Si1.1, and Si1.5, respectively. These concentrations were chosen to cover a large
range of environmentally relevant Si concentrations. Indeed, in natural soil solutions,
orthosilicicacid(H4SiO4)concentrationsrange from0.1 to1.7mM(Knightetal.2001).Siwas
provided as amonosilicic acid from potassiummetasilicate Si(KOH)2,which has amolar K:Si
ratio of 2 (Metso 400 ‐ YARA) (Voogt et al. 2001). The potassium and hydroxide levelswere
adjusted to compensate for the additional input of K and OH from the addition of Si. The
compositionof themacroelements(mM) in thismodifiednutrientsolutionwas therefore0.35
Ca(NO3)2, 0.3 CaCl2, 0.24MgSO4, and 0.22 (NH4)2HPO4, and the composition ofmicroelements
(µM)was11.6H3BO3,0.08CuSO4,0.2ZnSO4,0.03MoO3,and6.5MnCl2.Fewasprovidedas15
µM Fe‐N, N9‐di (2‐hydroxybenzyl) ethylenediamine‐N, N9‐diacetic acid monohydrochloride
hydrate (HBED; Strem chemical, USA). Fe(III)‐HBEDwas prepared according to Chaney et al.
(1998) in a manner such that all of the HBED was saturated with Fe. The KNO3 and HNO3
ChapitreIII:Effectsofsiliconandcopperonbamboogrownhydroponically
98
concentrations were adjusted in each treatment such that the concentrations of K and NO3
reached 3 mM. The solution was set to a pH of 6.0 (±0.2) and was buffered with 1 mM 2‐
morpholinoethanesulphonicacid(MES).
Five replicates per treatment were conducted. The solution was continuously supplied by a
peristalticpumpfromthe15‐L“reservetank”tothebaseofthefive2.5‐Lpots,andthesolution
thatexceeded2.5Lwasrecoveredviaanoverflowpipeandreturnedtothereservetank.The
nutrientsolutionswerecontinuouslyaeratedwithanairpumpineachpot.Allofthesolutions
fromeachpotandthereservetankwerecompletelyrenewedevery7days.
The nutrient solution was sampled throughout the experiment at the beginning of the week
(beforecontactwithbamboos),referredtoas“inputsolution”.Thesolutionwasalsosampledat
theendoftheweek(justbeforetherenewal),whenitwasreferredtoasthe“outputsolution”.
ThepHwasmeasuredinallofthesolutionswithacombinedglasselectrode.Thesolutionswere
thenfiltered(0.2µm,Sartorius)andacidifiedtopH<2usingconcentratedHNO3,andtheywere
refrigerated(4°C)before theanalysis.Thesolutionswereanalysed for thepresenceofcations
(Si,Ca,Fe,Mg,Mn,P,andZn)byinductivelycoupledplasma‐atomicemissionspectrometer(ICP‐
AESJobinYvonJ38).
2.2.2 Phase II: Cu + Si treatment
Fromday191untilday226(2months),1.5µMCuwasaddedtoeachSitreatmentusingCuSO4.
TheSiandnutrientconcentrationsweremaintainedatlevelsthatwereidenticaltophaseI.The
CuconcentrationwaschosenbecauseithadbeenpreviouslyshowntoinducetoxicityinPoaceae
plants(Bravinetal.2010),anditwasconsistentwithCuconcentrationsthatweremeasuredin
contaminated soil (Sauvé et al. 1997). Due to the high bamboo biomass at this stage, which
consequentlyrequiredhigherwateruptake,thenutrientsolutionswererenewedevery5days.
GeochemicalcalculationswereperformedusingPHREEQC(version2‐17)(Parkhurst1995)and
theMINTEQdatabaseofthermodynamicconstantstodeterminetheCuspeciationintheinput
solution.Thecalculationsindicatedthatfreecoppershouldaccountfor97.6%ofthetotalCuin
thesolutionatpH6.ThequalityofthespeciationmodellingwasconfirmedbymeasuringCu2+
withacupricionselectiveelectrode(Cu‐ISE)(Orion9629BNWP).TheISEmeasurementswere
calibratedbetweenpCu2+9.0and5.2ina10‐4MCusolutionthatwasbufferedwithiminodiacetic
acidandpotassiumphthalateaccordingtotheprocedurepreviouslydescribedbyRachouetal.
(2007).
In phase II, 40‐mL nutrient solution samples were taken from each of the input and output
nutrient solutions. In addition, to more precisely evaluate the changes in the nutrient
ChapitreIII:Effectsofsiliconandcopperonbamboogrownhydroponically
99
concentrationsduringthe5days(betweentheinputandoutputsolutions),thenutrientsolution
wasalsosampledfromday196today201at1,2,3,4,5,20,23,27,43,72and96hafterthe
solutionwas renewed. Additional sampleswere taken at day 216 1 h, 3 h and 44 h after the
renewalofthesolution.
Allofthesolutionswerefiltered(0.2µm,Sartorius)andkeptata4°Ctemperature.Asubsample
wasacidified,andthesolutionswereanalysedforthepresenceofcations(Si,Ca,Fe,Mg,Mn,P
and Zn) by ICP‐AES; the total Cu concentrationwasmeasured by inductively coupled plasma
mass spectrometer (ICP‐MS, Agilent 7500 CE). Free Cu2+ was analysed by Cu‐ISE in another
subsample immediately following the solution sampling. The Cu‐ISE measurement was
conducted on the following selected samples: in the input solution on day 196 and in the
solutionsthatweresampledafter1,2,4,27,43,and96h;intheinputsolutiononday216and
at1hand3h;andintheoutputsolutionthatwascollectedonday221.
The Si and Cu uptake levels from the nutrient solution were calculated throughout the
experiment.TheuptakeofSiorCucorrespondstothequantityofSiorCuthatwasmeasuredin
the input solution (mmol) minus the quantity of Si or Cu that was measured in the output
solution(mmol).Theelementalquantity(SiorCu)inthesolutionistheelementconcentration
thatwasmeasuredbyICP‐AESorICP‐MSmultipliedbythevolumeofthesolution.Thevolume
oftheinputsolutionwas15L,andthevolumeoftheoutputsolutionswasmeasuredthroughout
theexperimentandvariedbetween13and8L. Inthe figures thatrepresentCuandSiuptake
(Figure III.2 and Figure III.3 ), the errors are estimated to be 20%, and these errors were
calculatedbasedontheerrorsintheoutputvolumeofthesolutionsandtheanalyticalerrors.In
theother figures (Figure III.1andFigure III.4 ), errorbars represent theuncertainty thatwas
estimatedfromtheanalyticalerrors(ICPAESorICP‐MS).
2.3 Plant analysis
2.3.1 Growth parameters
Thenumberandheightofthestemsandthenumberofleaveswereassayedatthebeginningof
theexperiment(day0),attheendofphaseI(day191)andattheendofthephaseII(day226).
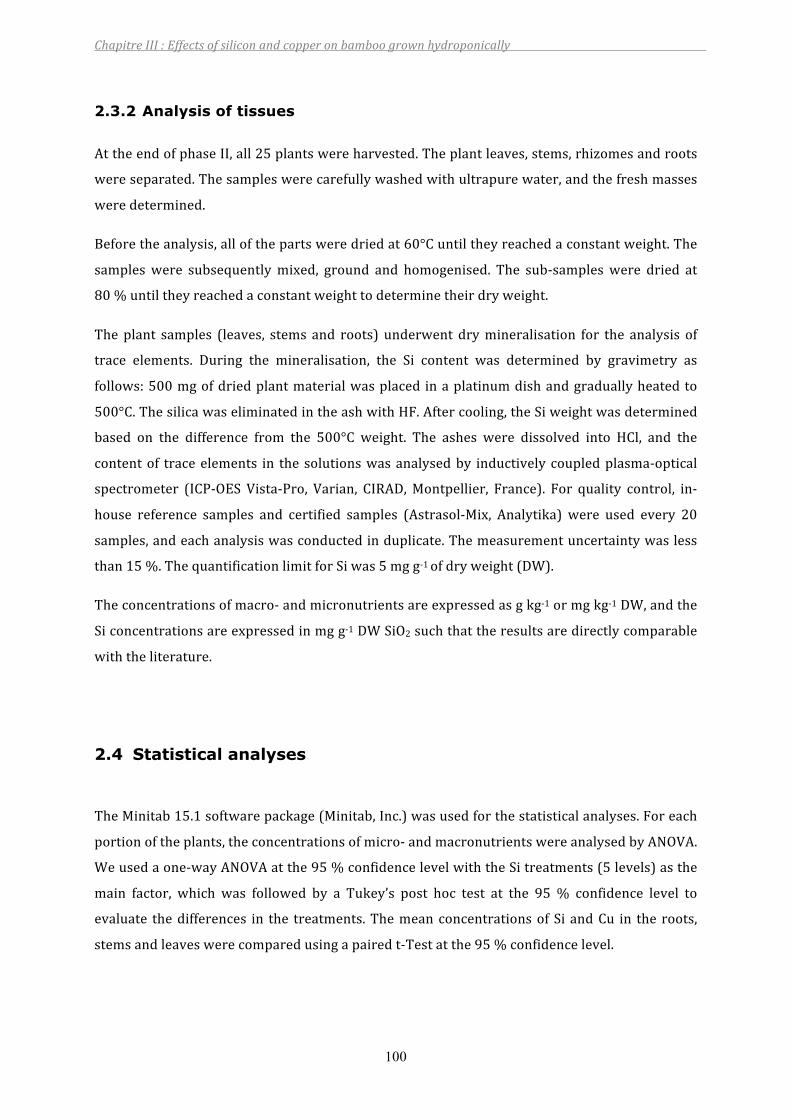
ChapitreIII:Effectsofsiliconandcopperonbamboogrownhydroponically
100
2.3.2 Analysis of tissues
AttheendofphaseII,all25plantswereharvested.Theplantleaves,stems,rhizomesandroots
wereseparated.Thesampleswerecarefullywashedwithultrapurewater,andthefreshmasses
weredetermined.
Beforetheanalysis,allofthepartsweredriedat60°Cuntiltheyreachedaconstantweight.The
sampleswere subsequentlymixed, ground and homogenised. The sub‐sampleswere dried at
80%untiltheyreachedaconstantweighttodeterminetheirdryweight.
Theplant samples (leaves, stems and roots) underwent drymineralisation for the analysis of
trace elements. During the mineralisation, the Si content was determined by gravimetry as
follows:500mgofdriedplantmaterialwasplaced inaplatinumdishandgraduallyheatedto
500°C.ThesilicawaseliminatedintheashwithHF.Aftercooling,theSiweightwasdetermined
based on the difference from the 500°C weight. The ashes were dissolved into HCl, and the
contentof traceelements in thesolutionswasanalysedby inductivelycoupledplasma‐optical
spectrometer (ICP‐OES Vista‐Pro, Varian, CIRAD,Montpellier, France). For quality control, in‐
house reference samples and certified samples (Astrasol‐Mix, Analytika) were used every 20
samples,andeachanalysiswasconductedinduplicate.Themeasurementuncertaintywasless
than15%.ThequantificationlimitforSiwas5mgg‐1ofdryweight(DW).
Theconcentrationsofmacro‐andmicronutrientsareexpressedasgkg‐1ormgkg‐1DW,andthe
Siconcentrationsareexpressedinmgg‐1DWSiO2suchthattheresultsaredirectlycomparable
withtheliterature.
2.4 Statistical analyses
TheMinitab15.1softwarepackage(Minitab,Inc.)wasusedforthestatisticalanalyses.Foreach
portionoftheplants,theconcentrationsofmicro‐andmacronutrientswereanalysedbyANOVA.
Weusedaone‐wayANOVAatthe95%confidencelevelwiththeSitreatments(5levels)asthe
main factor, which was followed by a Tukey’s post hoc test at the 95% confidence level to
evaluate thedifferences in the treatments.ThemeanconcentrationsofSi andCu in the roots,
stemsandleaveswerecomparedusingapairedt‐Testatthe95%confidencelevel.
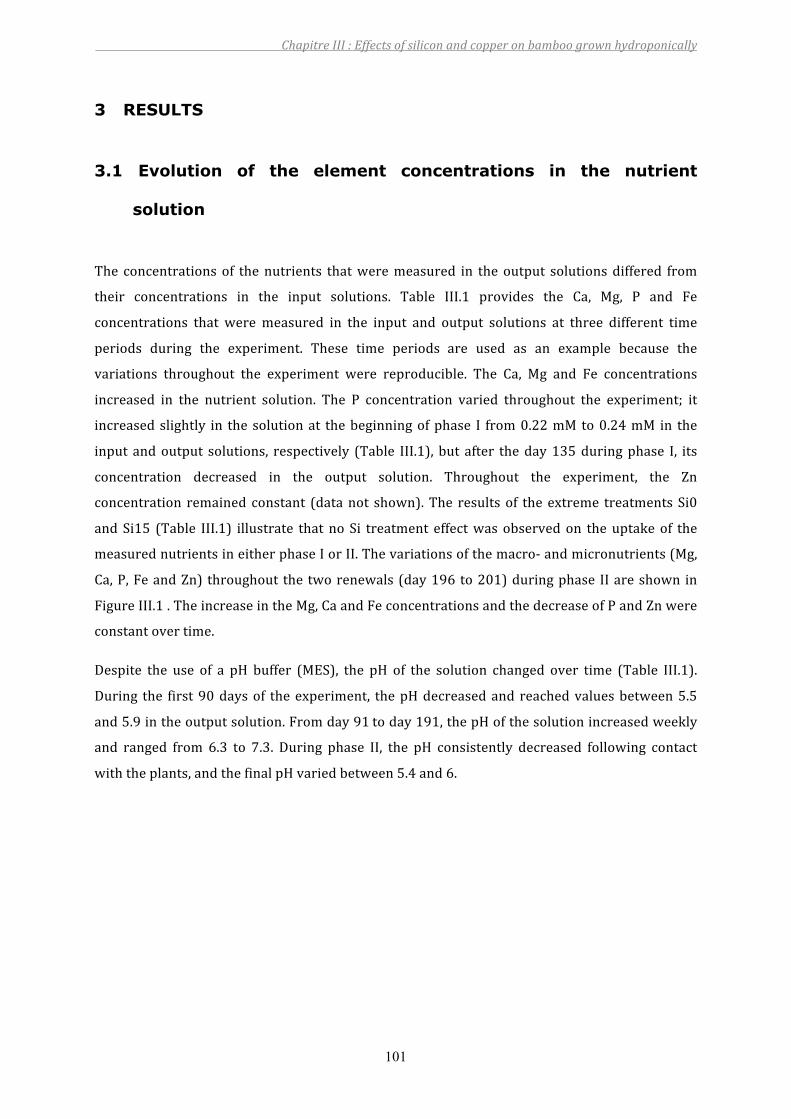
ChapitreIII:Effectsofsiliconandcopperonbamboogrownhydroponically
101
3 RESULTS
3.1 Evolution of the element concentrations in the nutrient
solution
The concentrationsof thenutrients thatweremeasured in theoutput solutionsdiffered from
their concentrations in the input solutions. Table III.1 provides the Ca, Mg, P and Fe
concentrations that weremeasured in the input and output solutions at three different time
periods during the experiment. These time periods are used as an example because the
variations throughout the experiment were reproducible. The Ca, Mg and Fe concentrations
increased in the nutrient solution. The P concentration varied throughout the experiment; it
increasedslightly in thesolutionat thebeginningofphase I from0.22mMto0.24mM in the
input andoutput solutions, respectively (Table III.1), but after theday135duringphase I, its
concentration decreased in the output solution. Throughout the experiment, the Zn
concentration remainedconstant (datanot shown).The resultsof theextreme treatmentsSi0
andSi15 (Table III.1) illustrate thatnoSi treatment effectwasobservedon theuptakeof the
measurednutrientsineitherphaseIorII.Thevariationsofthemacro‐andmicronutrients(Mg,
Ca,P,FeandZn) throughout the tworenewals(day196to201)duringphase IIareshown in
FigureIII.1.TheincreaseintheMg,CaandFeconcentrationsandthedecreaseofPandZnwere
constantovertime.
Despite the use of a pH buffer (MES), the pH of the solution changed over time (Table III.1).
During the first90daysof theexperiment, thepHdecreasedandreachedvaluesbetween5.5
and5.9intheoutputsolution.Fromday91today191,thepHofthesolutionincreasedweekly
and ranged from 6.3 to 7.3. During phase II, the pH consistently decreased following contact
withtheplants,andthefinalpHvariedbetween5.4and6.
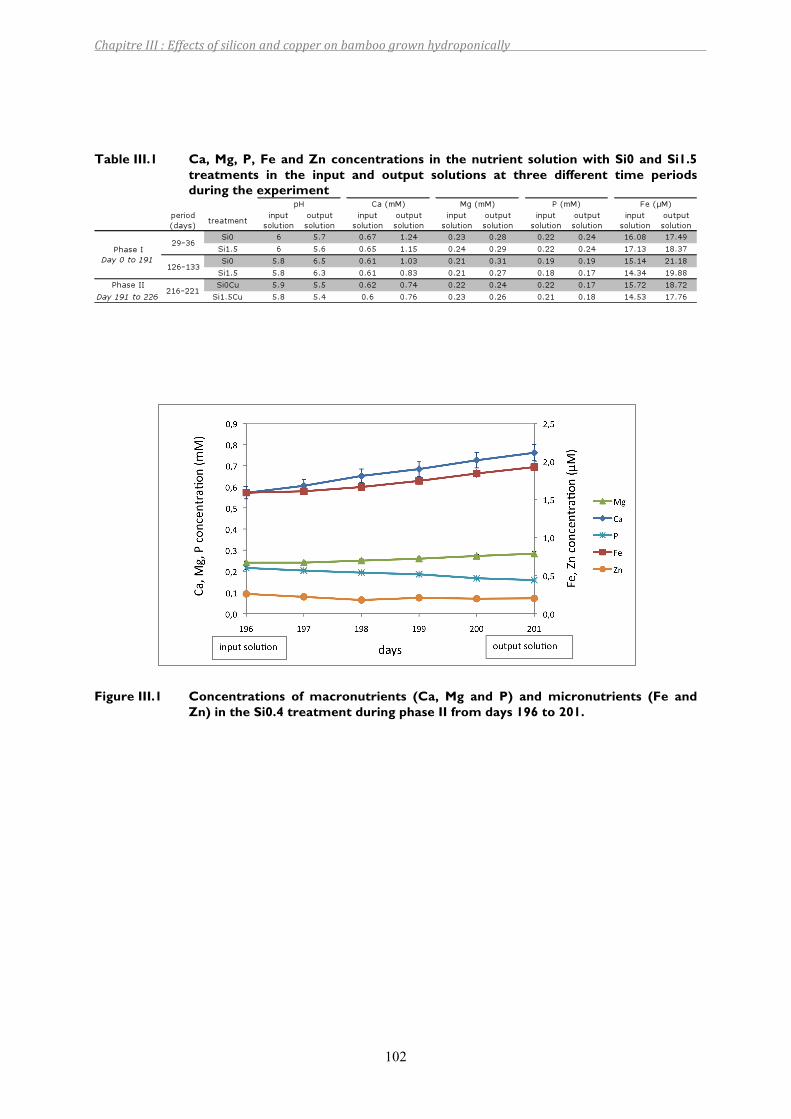
ChapitreIII:Effectsofsiliconandcopperonbamboogrownhydroponically
102
Table III.1 Ca, Mg, P, Fe and Zn concentrations in the nutrient solution with Si0 and Si1.5 treatments in the input and output solutions at three different time periods during the experiment
Figure III.1 Concentrations of macronutrients (Ca, Mg and P) and micronutrients (Fe and Zn) in the Si0.4 treatment during phase II from days 196 to 201.
ChapitreIII:Effectsofsiliconandcopperonbamboogrownhydroponically
103
Figure III.2 Bamboo Si uptake throughout the experiment, which was calculated as the difference between the Si concentrations that were measured in the input and output solutions. “Theo. max” is the theoretical maximum uptake that could be obtained if the entire Si in solution is taken up by the plants.
Thesiliconconcentrationsinthesolutiondecreasedduringthecontactwithbamboo.Siuptake
from theSi concentrations in the input andoutput solutionswas calculated for each renewal,
andtheevolutionthroughouttheexperimentisshowninFigureIII.2.Forallofthetreatments,
atthebeginningoftheexperiment,theuptakeincreaseduntilitreachedaplateau.Thisplateau
indicates that the solution was entirely depleted during its contact with the bamboo. The Si
content in the solutionwas initially depleted in the less‐concentrated solutions, starting from
day 65, 73 and 106 for the Si0.4, Si0.8 and Si1.1 treatments, respectively. The uptake then
decreased starting on days 176, 157 and 164 for the Si0.4, Si0.8 and Si1.1 treatments,
respectively.TheSiuptakeinthehighertreatment(1.5mM)increaseduntilday114,anditthen
decreaseduntilday176.TheSiuptakewassimilar in theSi1.1andSi1.5 treatments,with the
exception of the period between days 114 and 126. This uptake decrease was observed,
althoughnothingwaschangedintheexperiment.Cuwasaddedtothesolutionbeginningonday
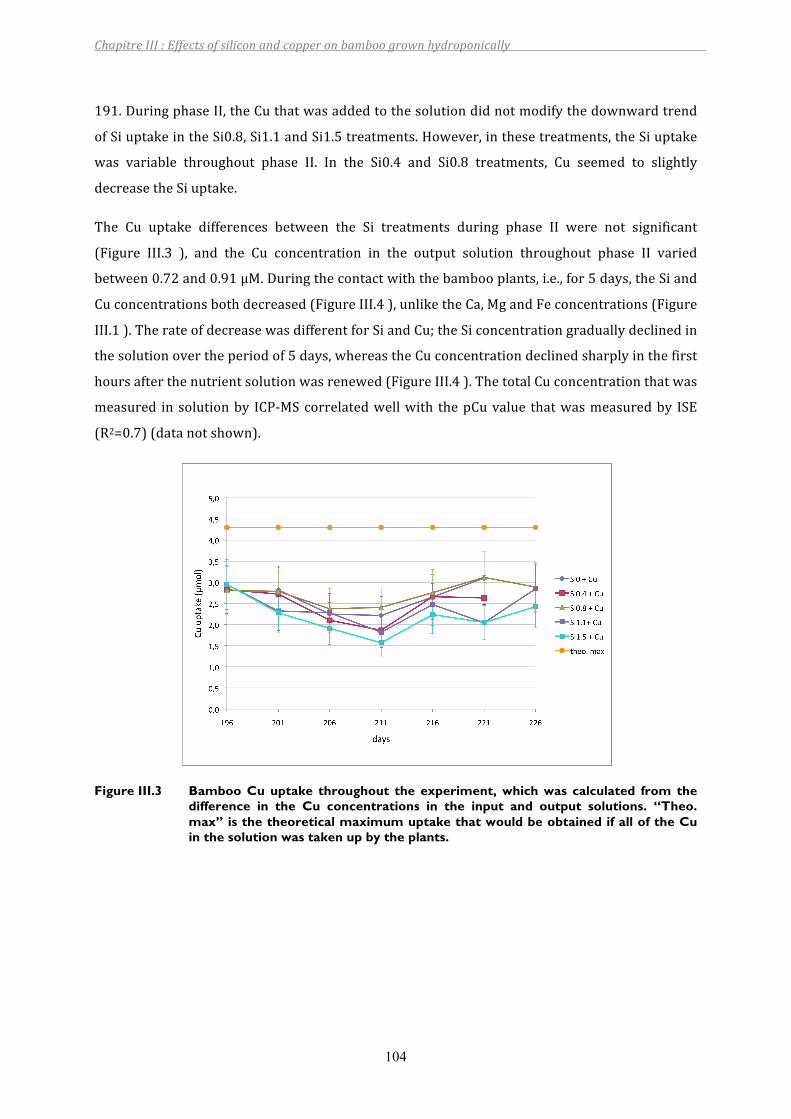
ChapitreIII:Effectsofsiliconandcopperonbamboogrownhydroponically
104
191.DuringphaseII,theCuthatwasaddedtothesolutiondidnotmodifythedownwardtrend
ofSiuptakeintheSi0.8,Si1.1andSi1.5treatments.However,inthesetreatments,theSiuptake
was variable throughout phase II. In the Si0.4 and Si0.8 treatments, Cu seemed to slightly
decreasetheSiuptake.
The Cu uptake differences between the Si treatments during phase II were not significant
(Figure III.3 ), and the Cu concentration in the output solution throughout phase II varied
between0.72and0.91µM.Duringthecontactwiththebambooplants,i.e.,for5days,theSiand
Cuconcentrationsbothdecreased(FigureIII.4),unliketheCa,MgandFeconcentrations(Figure
III.1).TherateofdecreasewasdifferentforSiandCu;theSiconcentrationgraduallydeclinedin
thesolutionovertheperiodof5days,whereastheCuconcentrationdeclinedsharplyinthefirst
hoursafterthenutrientsolutionwasrenewed(FigureIII.4).ThetotalCuconcentrationthatwas
measured insolutionby ICP‐MScorrelatedwellwith thepCuvalue thatwasmeasuredby ISE
(R2=0.7)(datanotshown).
Figure III.3 Bamboo Cu uptake throughout the experiment, which was calculated from the difference in the Cu concentrations in the input and output solutions. “Theo. max” is the theoretical maximum uptake that would be obtained if all of the Cu in the solution was taken up by the plants.
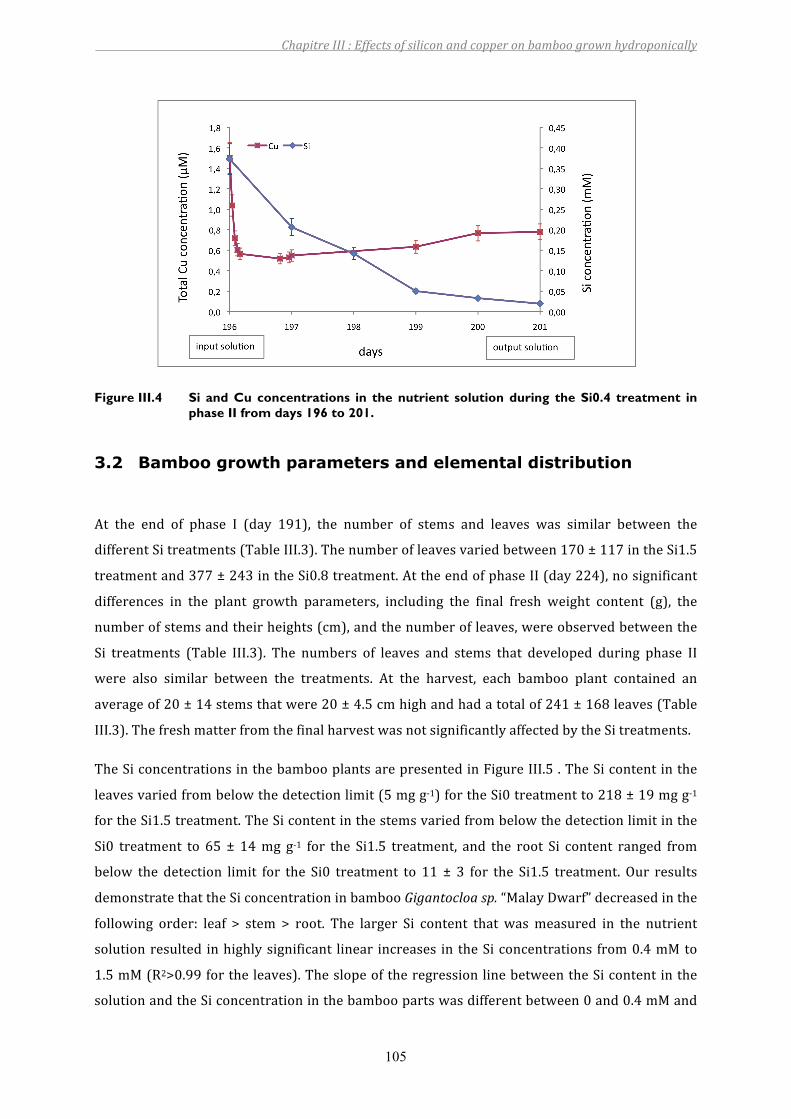
ChapitreIII:Effectsofsiliconandcopperonbamboogrownhydroponically
105
Figure III.4 Si and Cu concentrations in the nutrient solution during the Si0.4 treatment in phase II from days 196 to 201.
3.2 Bamboo growth parameters and elemental distribution
At the end of phase I (day 191), the number of stems and leaves was similar between the
differentSitreatments(TableIII.3).Thenumberofleavesvariedbetween170±117intheSi1.5
treatmentand377±243intheSi0.8treatment.AttheendofphaseII(day224),nosignificant
differences in the plant growth parameters, including the final fresh weight content (g), the
numberofstemsandtheirheights(cm),andthenumberofleaves,wereobservedbetweenthe
Si treatments (Table III.3). The numbers of leaves and stems that developed during phase II
were also similar between the treatments. At the harvest, each bamboo plant contained an
averageof20±14stemsthatwere20±4.5cmhighandhadatotalof241±168leaves(Table
III.3).ThefreshmatterfromthefinalharvestwasnotsignificantlyaffectedbytheSitreatments.
TheSiconcentrationsinthebambooplantsarepresentedinFigureIII.5 .TheSicontentinthe
leavesvariedfrombelowthedetectionlimit(5mgg‐1)fortheSi0treatmentto218±19mgg‐1
fortheSi1.5treatment.TheSicontentinthestemsvariedfrombelowthedetectionlimitinthe
Si0 treatment to 65 ± 14mg g‐1 for the Si1.5 treatment, and the root Si content ranged from
below the detection limit for the Si0 treatment to 11 ± 3 for the Si1.5 treatment. Our results
demonstratethattheSiconcentrationinbambooGigantocloasp.“MalayDwarf”decreasedinthe
following order: leaf > stem > root. The larger Si content that wasmeasured in the nutrient
solutionresulted inhighlysignificant linear increases in theSiconcentrations from0.4mMto
1.5mM(R2>0.99fortheleaves).TheslopeoftheregressionlinebetweentheSicontentinthe
solutionandtheSiconcentrationinthebamboopartswasdifferentbetween0and0.4mMand
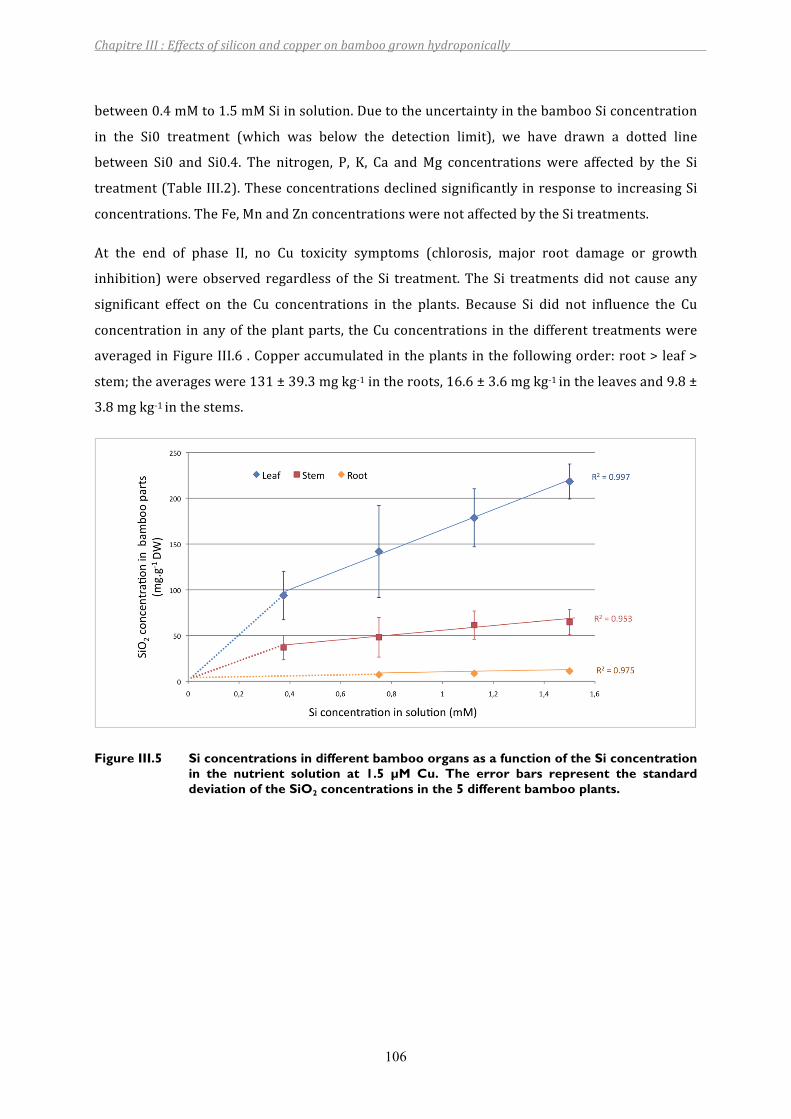
ChapitreIII:Effectsofsiliconandcopperonbamboogrownhydroponically
106
between0.4mMto1.5mMSiinsolution.DuetotheuncertaintyinthebambooSiconcentration
in the Si0 treatment (which was below the detection limit), we have drawn a dotted line
between Si0 and Si0.4. The nitrogen, P, K, Ca andMg concentrationswere affected by the Si
treatment(TableIII.2).TheseconcentrationsdeclinedsignificantlyinresponsetoincreasingSi
concentrations.TheFe,MnandZnconcentrationswerenotaffectedbytheSitreatments.
At the end of phase II, no Cu toxicity symptoms (chlorosis, major root damage or growth
inhibition)wereobserved regardlessof theSi treatment.TheSi treatmentsdidnot causeany
significant effect on the Cu concentrations in the plants. Because Si did not influence the Cu
concentrationinanyoftheplantparts, theCuconcentrations inthedifferenttreatmentswere
averagedinFigureIII.6 .Copperaccumulatedintheplantsinthefollowingorder:root>leaf>
stem;theaverageswere131±39.3mgkg‐1intheroots,16.6±3.6mgkg‐1intheleavesand9.8±
3.8mgkg‐1inthestems.
Figure III.5 Si concentrations in different bamboo organs as a function of the Si concentration in the nutrient solution at 1.5 µM Cu. The error bars represent the standard deviation of the SiO2 concentrations in the 5 different bamboo plants.
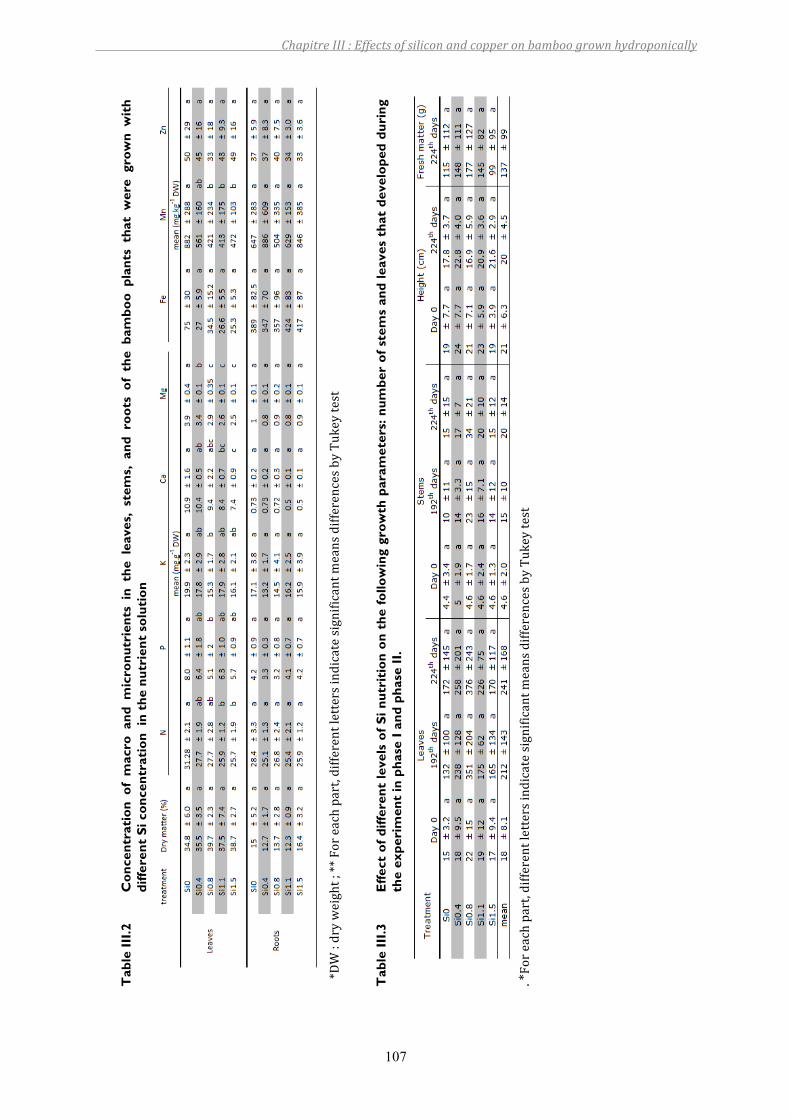
ChapitreIII:Effectsofsiliconandcopperonbamboogrownhydroponically
107
Tab
le II
I.2
Con
cent
rati
on o
f m
acro
and
mic
ronu
trie
nts
in t
he l
eave
s, s
tem
s, a
nd r
oots
of
the
bam
boo
plan
ts t
hat
wer
e gr
own
wit
h di
ffere
nt S
i con
cent
rati
on i
n th
e nu
trie
nt s
olut
ion
*DW:dryweight;**Foreachpart,differentlettersindicatesignificantmeansdifferencesbyTukeytest
Tab
le II
I.3
Effe
ct o
f diff
eren
t le
vels
of S
i nut
riti
on o
n th
e fo
llow
ing
grow
th p
aram
eter
s: n
umbe
r of
ste
ms
and
leav
es t
hat
deve
lope
d du
ring
th
e ex
peri
men
t in
pha
se I
and
phas
e II
. .*Foreachpart,differentlettersindicatesignificantmeansdifferencesbyTukeytest
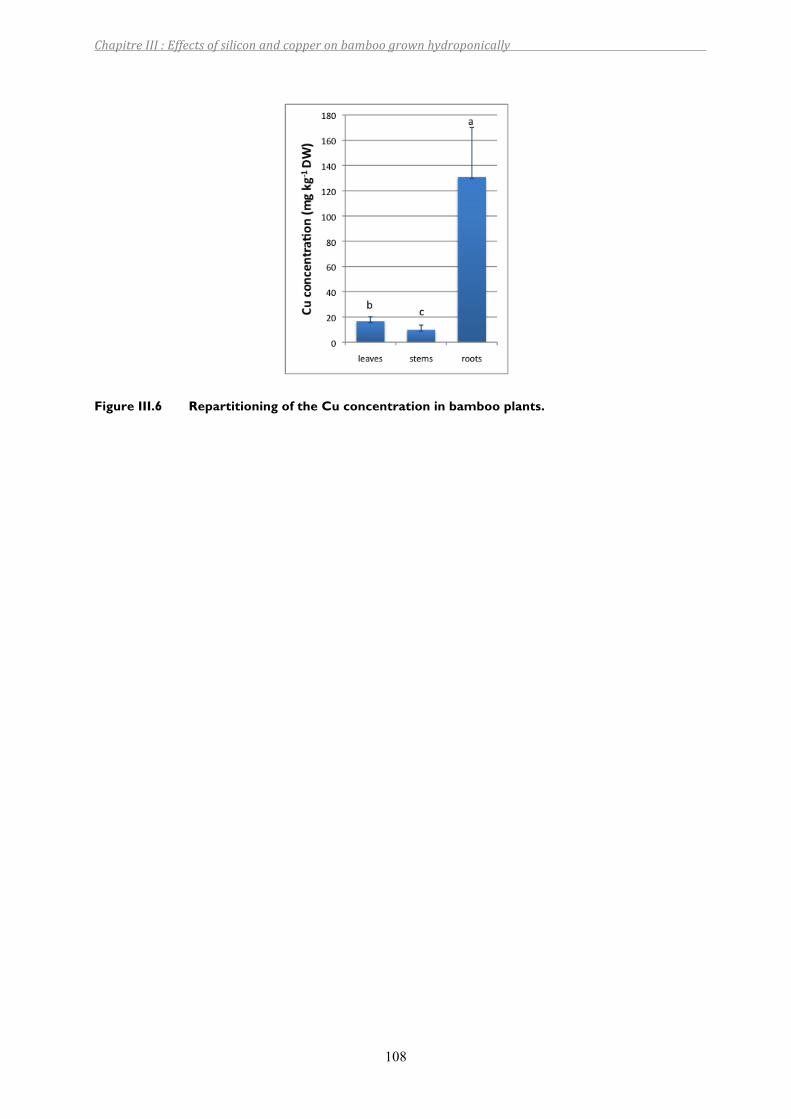
ChapitreIII:Effectsofsiliconandcopperonbamboogrownhydroponically
108
Figure III.6 Repartitioning of the Cu concentration in bamboo plants.
ChapitreIII:Effectsofsiliconandcopperonbamboogrownhydroponically
109
4 DISCUSSION
4.1 Silicon in bamboo
4.1.1 Mechanisms of silicon accumulation
TheSiuptakevariedgreatlythroughouttheexperiment.The increaseduptakeduringthe first
106 days that is shown in Figure III.2 is likely associated with biomass production. At the
beginning of the experiment (day 0), the bamboo plants contained an average of 18 leaves
(Table III.3), and they developed until they each contained between 124 and 324 leaves at
harvest. Si uptake decreased beginning on day 114 in the Si1.5 treatment and day 164 in the
Si0.4, Si0.8 and Si1.1 treatments. One hypothesis thatwould explain this decrease is that the
plants developed at a slower rate. Indeed, the development of the bamboo plants and,
particularly,therootsmayhavebeeninhibitedbythepotsize.
During phase I, the pH of the output solution ranged from 5.5 to 7.3 (Table III.1). The pH
decreasedat thebeginningof theexperimentduringplantcontact,whereasafter90days, the
pHincreased.ThepHinthesolutionseemstocorrelatewiththebamboodevelopment.ThepH
is an important property in the regulation of solubility and the speciation of elements in the
nutrientsolution.However,atpH8,Sispeciationisnotaffected,andSiisprimarilypresentasan
orthosilicicacidinthenutrientsolution,whichshouldnotmodifySiuptake.
Silica concentrations in the leaves and stemsofbambooGigantocloa sp. “MalayDwarf” that is
grown in hydroponics can be comparedwith data that have been obtained from field‐grown
plants (Collin et al. 2011). The same species that were grown under natural conditions
contained a leaf Si content of 135mg g‐1 and a stem Si content thatwas between 5.9mg g‐1
(base) and 30 mg g‐1 (tip of the stem). These concentrations are similar to those that were
measured in the Si0.4 and Si0.8 treatments; the leaves contained 94 and 142 mg g‐1 Si,
respectively, and the stemscontained37and49mgg‐1, respectively.TheSi concentrations in
the leaves and stems of the Si1.1 and Si1.5 treatments were higher than those that were
measuredinallofthestudiedbamboospeciesasreportedbyCollinetal.(2011),whoreporteda
Sirangeof55to159mgg‐1Si02intheleavesof16temperateandtropicalbamboospecies.The
Si concentrations in the leaves reached an average of 218mg g‐1 in the highest Si treatment,
whichwashigherthananySicontentthathasbeenpreviouslyreportedintheliterature(Dinget
ChapitreIII:Effectsofsiliconandcopperonbamboogrownhydroponically
110
al. 2008b; Li et al. 2006; Lux et al. 2003)with the exception ofMotomura et al. (2002). The
authorsreportedaSicontentof410mgg‐1inthe3‐year‐oldleavesofthebambooSasaveitchii,
whileinourstudy,theSicontentwasmeasuredinbulkfromamaximumof8month‐oldleaves.
Inall of the treatments, the root silica contentwasalways lower than the stemand leaf silica
contents (Figure III.5 ). This pattern is different from the pattern thatwas found in previous
studiesconcerningSiinbamboo,whichshowedthattherootSicontentwashigherthanthatof
thestemsbutlowerthanthoseofthebranchesandleaves(Dingetal.2008b;Luxetal.2003).
Thesepreviousstudieswereperformedonbamboothatwasgrowninsoil,andtheroot‐cleaning
proceduremayhavebeeninefficientatremovingalloftheSi‐containingsoilparticles.However,
thispossibilitycanberuledoutforthestudyofDingetal.(2008b),whoattemptedtoreducethe
potential bias throughout the cleaning procedure. However, this concentration pattern is
consistentwithpreviousstudies thatwereperformed inhydroponicswith twootherPoaceae,
rice(Dingetal.2008a)andbanana(Henrietetal.2006;Opfergeltetal.2006).Inthesespecies,
theconcentrationsalsoincreasedfromtherootstothestemsandtheleaves.
AfterSiwassuppliedinsolution,asignificantlinearrelationshipbetweenthetissue(leaf,stem
and root) Si content and the nutritive Si concentration was observed (Figure III.5 ). This Si
distribution in thedifferentpartsof theplant suggestspassiveuptake. Si translocationwithin
theplantislargelydependentonthetranspirationstream,whichcarriessilicicacidanddeposits
itintheformofamorphoussilica(Jonesetal.1967);thisprimarilyoccursintheleaves.Inthe
leavesandroots, theSicontentdidnotreachaplateau,which indicatesthattheSiuptakecan
increase even more; this is contrary to rice, which reached maximum Si uptake at a Si
concentrationgreaterthan1.28mM(MaandTakahashi2002).However,asSimaypolymerise
insolutionatconcentrationsabove2mM,itisnotpossibletotestlargerSiconcentrationsand
thuspossiblyobservealargeruptakebybamboo.Theonlypossibilitywouldbetoincreasethe
lengthoftheexperimentunderthehypothesisthatbamboocantakeupSimorequicklythanit
cangrow.
Recent studies have demonstrated the existence of active Si transporters in roots (Lsi1 and
Lsi2),which are responsible for the high Si uptake capacities of rice andmaize (Mitani et al.
2009; Yamaji and Ma 2011). Therefore, Si uptake in Si accumulators is explained by the
coexistenceofactiveandpassiveuptakemechanisms(Dingetal.2008b;Maetal.2007;Mitani
et al. 2009). In our study, the depletion of Si in the nutrient solution of the Si0.4 and Si0.8
treatments indicates that silicon, which is transported together with water, is not the only
absorption mechanism; this further suggests that an active process is involved in Si uptake
(Henriet et al. 2006; Rafi and Epstein 1999). Therefore, the coexistence of passive and active
ChapitreIII:Effectsofsiliconandcopperonbamboogrownhydroponically
111
uptakeandtransportationmechanismswouldbeconsistentwithpreviousstudiesonbamboo,
riceandwheat(Dingetal.2008b;MaandYamaji2008;Motomuraetal.2004).
4.1.2 Effect of Si uptake on the nutrient concentration and growth
parameters
Thevariationsinthemacro‐andmicronutrient(Mg,Ca,P,FeandZn)concentrationsthroughout
the two renewals (Figure III.1 )were attributed to bothplant uptake and thedecrease in the
solutionvolumeduetoevaporationandwateruptake(waterdecreaseof13%atthebeginning
and 47% at the end of the experiment). The variation of the P concentration in the output
solutionthroughouttheexperiment(i.e.,anincreasethatwasfollowedbyadecreasefromday
135 in theoutputsolution) indicates that thenutritionalneedof thebambooplants increased
afterday135.TheSisupplydidnotaffect theuptakeofanyof themeasurednutrients(Table
III.1).However,theadditionofSisignificantlyreducedtheleafconcentrationsofmacronutrients
(N, P, K, Ca and Mg) (Table III.2). The decrease in these concentrations is correlated to the
increaseinSi intheleaves.Infact,thehighamountofsilicathatprecipitatedintheleavescan
explain thedecrease in thenutrientconcentrations. Indeed, ifwesubtract thequantityofSiO2
from the dry matter, the nutrient concentrations were identical between the treatments.
Therefore,thequantityofthenutrientsinthebamboopartsisthesamebetweentreatments,but
theconcentrationdecreasedbecauseofthecontributionoftheprecipitatedSitothedrymatter.
Thisresult isconsistentwiththesimilaruptakeofnutrientsthatwasobservedbetweentheSi
treatments.
IncreasingtheSiconcentrationinthenutrientsolutiondidnotsignificantlymodifythegrowth
parameters:ourresultsdidnotrevealanypositiveeffectonthenumbersof leavesandstems,
the height of the stems or the total biomass. Si has often been described in the literature to
promoteplantgrowth.Indeed,Hattorietal.(2003)showedthatsupplementationwith1.67mM
Siinhydroponiccultureenhancedsorghumrootelongation,andHossainetal.(2002)reported
thatSipromotedtheseedlinggrowthofseveralPoaceaespecies,namelyrice,oatandwheat,by
increasing cell‐wall extensibility. Dakora et al. (2003) reported that cowpea root growth
increased significantly in hydroponic culture when Si was added. In our study, neither stem
growthnor total rootweightwasaffectedbySi,androotgrowthwasnotmeasured; this is in
contrasttosomehorticulturalcrops,suchascucumber,courgetteandrose,forwhichthetotal
weightincreasedfollowingtheapplicationofpotassiumsilicate(Hwangetal.2005;Voogtetal.
2001).Inmostcases,however,itisuncertainwhetherthegrowthstimulationwasattributable
to a nutritional effect or to the alleviation of biotic and abiotic stresses. Indeed, the
misinterpretationof theresultsof someexperimentshavebeendescribedbyMarschneretal.
ChapitreIII:Effectsofsiliconandcopperonbamboogrownhydroponically
112
(1990). For example, Miyake and Takahashi (1978) (tomato), Miyake and Takahashi (1983)
(cucumber), Miyake and Takahashi (1985) (soybean) and Miyake and Takahashi (1986)
(strawberry)arguedthatSiwasessentialforplantgrowthbecausetheyobservedthatthelack
of Si in the nutrient solution caused severe leaf chlorosis, depressions in flower and fruit
formation,malformation andwilting. However,Marschner et al. (1990) demonstrated that in
these experiments, the toxicity symptoms were caused by a nutrient imbalance, which is
characterisedbyahighPconcentrationandalowZnconcentration;theyalsodemonstratedthat
theSieffectwasindirectbecauseitincreasedthephysiologicalavailabilityofZn,whichthereby
reduceditsdeficiency.
SeveralstudieshavealsoreportedthatSifertilisationinfieldtrialsmayincreaseandsustainthe
productivity of rice, sugarcane and non‐accumulator species, such as tomato and strawberry
(Korndorferetal.2001).Tavakkolietal.(2011)foundasignificantincreaseinriceyieldinared
Ferrosolfollowingcalciumsilicatefertilisation.However,infieldstudies,itislikelythatSimay
increaseyieldbyalleviatingbioticandabioticstresses,suchasinsectdamageandlodging(Ma
andYamaji2006). Inhydroponicculture,Fauteuxetal. (2006)demonstratedthatSialonedid
notaffectArabidopsis thalianametabolism. In someother Poaceae plants,high levelsofSidid
notaffectwheatgrowth(RafiandEpstein1999),bananagrowth,therateofwaterandnutrient
uptake(Henrietetal.2006)orBrachiariabrizanthaforageproduction(deMeloetal.2010).One
couldthereforespeculatethatSiindirectlybenefitsplantgrowthbyalleviatingstress.
Inthisstudy,itisnoteworthythatthebamboointheSi0treatmentdevelopednormallyanddid
notdisplayanydeficiencysymptoms.BecausetheSicontentintheplantsthatweretreatedwith
Si0werebelowthedetectionlimit(<5mgg‐1),itseemsthattherequirementofbambooforSiis
low. This should be investigated in further studies that can assess the requirement of Si as a
mineralelementforbamboo;forexample,thecontentofSi inthesolutioncouldbedecreased,
andtheSicontentinbamboocouldbequantifiedwithamoresensitivetechnique(Guntzeretal.
2010). Indeed, despite the results of several studies that have described the effect of Si, its
requirementforplantgrowthisstilldebated(Fauteuxetal.2006).
4.2 Effects of copper on bamboo growth
On average, the leaves and stems contained 16.6 ± 3.6mg kg‐1 and 9.8 ± 3.8mg Cu kg‐1 DW.
Theseconcentrationswerehigherthanthoseofseveralbamboospeciesthatweregrowninnon‐
contaminatedsoil; theseplantscontained3.5and4.5mgCukg‐1DWinthestembaseandtip,
respectively,and5.1mgCukg‐1DWintheleaf(Collinetal.2011),whichindicatesthatbamboo
ChapitreIII:Effectsofsiliconandcopperonbamboogrownhydroponically
113
respondedtoCuinsolution.However,theleafconcentrationswerestillwithintherangethatis
considered to be normal for mature leaf tissues (5‐30 mg kg‐1 Cu) (Kabata‐Pendias and
Mukherjee 2007). With an average of 131 ± 39.3 mg kg‐1, more than 80 % of the Cu was
concentrated in the roots of the bamboo plants. This pattern is consistent with a number of
studiesthatindicatethatCuaccumulatesmoreinplantrootsthanintheshootsorleaves(Aliet
al. 2002; Ouzounidou et al. 1995). Because we did not desorb Cu from the roots, we cannot
distinguishbetweenadsorptionandabsorptionbytheroots.However,ahighproportionofCu
intherootsmaybeboundtothecellwall(Nishizonoetal.1987).Indeed,cellwallsarerichin
compounds that can bind Cu, such as pectin polysaccharide and glycoprotein constituents
(Krzeslowska2011).It is likelythattherapiddecreaseinthenutrientsolutionduringthefirst
hoursmaybeexplainedbyCuadsorptionontotherootsurface.Weobservedthisrapiddecline
throughout phase II; it occurred following each contact with the bamboo plants, which may
indicate that the Cu‐binding capacity of the roots was not saturated even at the end of the
experiment.Bravinetal.(2010)suggestedthattheCu‐bindingcapacityoftherootapoplasmcan
reach approximately 1 g Cu kg‐1 root DW. In the present study, the quantity of Cu that was
delivered to theplantmayrepresentapproximately0.4gCukg‐1 rootDWperplant (datanot
shown). Thus, the binding capacity of the bamboo roots was certainly not entirely saturated
withCu.DuetoitsabilitytobindCu2+ontoitsroots,theuseofbamboohasbeenproposedfor
theadsorbentremovalofCuinwastewater(Babatundeetal.2009).
RegardlessoftheSitreatments,notoxicitysymptoms(i.e.,leafchlorosis,visiblerootchangesor
biomassdecrease)weredetectedwithasupplyof1.5µMCu2+duringphaseII,althoughsimilar
concentrationshavebeenfoundtobetoxicinPoaceae.Severalauthorshaveobservedchlorosis
indurumwheatseedlingsatCu2+solution levels thatwereaboveeither0.55µM(Bravinetal.
2010)or1µM(Michaudetal.,2008);a50%reductionoftheSabigrassfreshshootbiomassat
1.2µMCu2+andthefreshrootweightat1.0µMCu2+(Kopittkeetal.2009);anda50%reduction
inrootelongationindurumwheatataCu2+solutionconcentrationofeither0.06µM(Bravinet
al. 2010) or 0.6 µM (Michaud et al. 2008).Root damagewas observed in the roots ofRhodes
grassthatwasgrownwithasolutionconcentrationof0.22µMCu(SheldonandMenzies2005).
Moreover,arecentreviewoftheliteratureoverthepast34years(Kopittkeetal.2010)reported
thatthemediantoxicCuconcentrationwas2µMinhydroponicstudies.
Severalhypothesesmayexplaintheabsenceoftoxicitysymptomsinourexperiments.First,this
resultmaybeduetoamodificationoftheCuconcentrationandspeciationinthesolution.The
initialconcentrationwaseffectively1.5µMCu2+;thiswasconfirmedbybothchemicalmodelling
and Cu‐ISE. Once it was in contact with the plant, the Cu content in the solution decreased
abruptlyinthefirsthoursandstabilisedtoavaluebetween0.72and0.91µM.After24h,theCu
ChapitreIII:Effectsofsiliconandcopperonbamboogrownhydroponically
114
concentration increased slightly and homogeneously until the next renewal, but this increase
maybe explainedby thedecrease in volumeof thenutrient solutiondue toplantuptake and
evaporation.TheISEresultsthatwerecombinedwiththecalculationswithPHREEQCusingthe
compositionandpHoftheoutputsolutionindicatethattheremainingCuisprimarilypresentas
freecopper.Therefore, theCu2+content inthesolutionwassmallerthaninthe inputsolution;
however,whencomparedtotheworkofBravinetal.(2010)andSheldonandMenzies(2005),
theCu2+inthesolutionshouldhavebeensufficienttoinducetoxicitysymptomsindurumwheat.
Second,theabsenceofanyobservedtoxicitymaybeaconsequenceofthehighbiomassthatwas
produced during phase I. Typically, and in the previous cited studies, toxicity measurements
wereperformedon2‐or3‐week‐oldplants;theseyoungplantshavealowerbiomassthanthe
plantsthatwereusedinthecurrentstudy(Kopittkeetal.2010). Inourcase,oncetheCuwas
absorbedand translocated, itmayhavebeendiluted in the largenumberof stemsand leaves,
whichmayhaveinducedanimprovedCutolerancethroughalowerinternalCuconcentration.
This hypothesis can be ruled out because in our experiment, the Cu concentrations in the
bambooleaveswere16.6mgCukg‐1,whiletheyreached21mgCukg‐1intheexperimentsthat
were performed by Michaud et al. (2008) and Kopittke et al. (2009) when the plants were
exposedtoasimilarCucontent(1.1‐1.2µMCu2+).
Finally, the main differences between the previous studies and our study are the exposure
length (2months vs. 8 to 10 days) and the plantmaturity (mature plants vs. seedlings). The
largerootbiomassmightmayhavecontributedtotolerancethroughaCudilution in/ontothe
roots.Incontrasttotheshoots,theCucontentinthebambooroots(anaverageof131±39.3mg
Cu kg‐1 DW) was lower than the concentrations that were measured in the roots of the
aforementioned studies (approximately 350 mg Cu kg‐1 DW in durum wheat (Michaud et al.
2008)and890mgCukg‐1DWinSabiGrass(Kopittkeetal.2009)).ThebindingofCuontothe
cellwallreducestheamountofCuthatisinternalised;ifthebindingsitesarenotsaturated,the
roots may be better able to prevent translocation to the stems and leaves, which therefore
protectsthemostsensitivesitesfromCutoxicity.Ithasbeensuggestedthatthesequestrationof
tracemetalsincellwallsisoneofthemainstrategiesthatplantsusetocopewithmetalstress
(Krzeslowska2011).Indurumwheat,Michaudetal.(2008)suggestedthatarootCucontentof
approximately100‐150mgkg‐1 is thecritical level thatcorrespondstoearlyandmoderateCu
phytotoxicity. Incomparison, theCucontent in thebambooroots iswithin the lowerrangeof
theCuconcentrationthatmayinducetoxicity.
Based on its high biomass and its adsorption capacity, the bamboo Gigantocloa sp. “Malay
Dwarf”tolerateshighCuconcentrationsinnutrientsolution.
ChapitreIII:Effectsofsiliconandcopperonbamboogrownhydroponically
115
4.3 Effects of bamboo Si on Cu sensitivity
Despite the addition of Cu into the nutrient solution, no differences regarding the biomass
measurements or the Cu content in plants were observed between the Si treatments. These
resultscontrastwiththoseofthestudyofNowakowskiandNowakowska(1997),whichshowed
that the additionof 0.4mmolL‐1 Si significantlydecreased theCu content in the roots and in
shootsof7‐day‐oldwheatseedlings.TwootherstudiesalsodemonstratedtheSialleviationof
CutoxicityinArabidopsisthaliana(Brassicaceaea)(KhandekarandLeisner2011;Lietal.2008)
andEricaandevalensis(Ericaceaea)(Olivaetal.2011). Inbothstudies, theSisupplementation
inducedanincreaseintheshootbiomassandareductionofchlorosissymptoms.However,the
mechanisms by which Si alleviates Cu toxicity are still poorly understood. Li et al. (2008)
demonstratedthatsupplementalSididnotchangethetotalCuconcentrationsintheleaftissue,
suggestingthatSiinfluencedthedistributionorbioavailabilityofCuwithintheleaves(Rogalla
and Romheld 2002). Conversely, Oliva et al. (2011) observed that Si induced a significant
reduction of the Cu concentration in the leaves, which likely occurred by inhibiting the
translocation of Cu from the roots to the shoots. Interestingly, Li (2008) and Khandekar and
Leisner(2011)observedthatSialteredgeneexpression.InresponsetohighCu,Sisignificantly
decreased the expression of two Arabidopsis copper transport genes, copper transporter 1
(COPT1)andheavymetalATPasesubunit5(HMA5).Sihelps toreducestress throughamore
efficient response toCu toxicitybymaintainingorup‐regulatingCu‐bindingmoleculesandby
increasingtheexpressionoffree‐radical‐metabolisingenzymes(KhandekarandLeisner2011).
ThequantitiesofCu thatwereused in thesestudieswerehigher than theconcentrations that
werechoseninthepresentstudy;Olivaetal.used500µM(2011),andKhandekarandLeisner
(2011) and Li et al. (2008) used 30 µM. However, in Erica plants, even at the lowest Cu
treatment(1µM),SisignificantlydecreasedtheCucontent,whereasinthepresentstudy,theCu
contentwasnotaffectedbySisupplementation.
Inourstudy,weidentifiedtwodifferentmechanismsthatregulatetheuptakeofSiandCu.Siis
absorbedhomogeneouslybetweentworenewals,whereasCuisprimarilyadsorbedinthefirst
hoursaftereachsolutionrenewal.Asaresult,Cuismainlyaccumulatedintheroots,andithasa
low concentration in aerial parts,whereas Siwas accumulated in high amounts in the leaves.
Thesedifferences in theuptakeandrepartitionofCuandSi in theplantmay indicate that the
bamboo plant utilises two different strategies to govern the allocation of these elements.
Therefore,differencesintheresponseofbambooplantswhencomparedtoArabidopsisorErica
maybeduetothedifferencesinCuandSiacquisition,transportorinteractioninplants.
ChapitreIII:Effectsofsiliconandcopperonbamboogrownhydroponically
116
Copper uptake mechanisms in monocotyledonous species are poorly understood when
compared to those in dicotyledonous species; the mechanisms in monocotyledons have
primarily been studied in Arabidopsis (Yruela 2009). However, it is known that Si uptake
mechanisms and their ability to accumulate Si differ between phylogenetic groups and plant
species(Hodsonetal.2005;MaandYamaji2006).CuandSiinEricaarebothaccumulatedinthe
roots (Olivaetal.2011),whereas inbamboo,Si isprimarilyaccumulated in the leaves.TheSi
concentration variedwidely between different plant families; for example, the leaf Si content
rangedfrom0.565to1.2mgg‐1inErica,rangedfrom0.084to0.566mgg‐1inArabidopsis,and
rangedfrombelowthedetectionlimitto218mgg‐1inbamboo(ourstudy).Therefore,theplant
responsetotheSisupply iscertainlydifferentbetweenSi‐accumulatingandnon‐accumulating
plants.
Our data lead us to conclude that Si displayed no significant effects when it was supplied to
plants that were growing under controlled conditions, although the bamboo Gigantocloa sp.
“MalayDwarf”didabsorbSiinlargeamounts.ThedifferentabsorptionmechanismsforCuand
Si may partially explain why Si did not influence the Cu repartition and concentration in
bamboo. No toxicity symptoms were observed for the applied Cu concentration, which were
relevanttoCuconcentrationsthathavebeenmeasuredincontaminatedsoil;thisindicatesthat
bambooplantsaretoleranttoCu.Therefore, itseemsthatbamboocancopewith largeCusoil
concentrations and could thus be used in phytoremediation schemes. However, this result
shouldbefurther investigatedbytestinghigherCuconcentrations,anditshouldbeconfirmed
withfieldexperiments.
Acknowledgments
This work was financially supported by the Direction Générale des Entreprises, Direction
GénéraledelaCompétitivité,del’IndustrieetdesServices,régionRéunion,régionPACAinthe
frame of the research program RUN INNOVATION II and by the Association Nationale de la
RechercheetdelaTechnologie(CIFREgrant).
Theauthors thankDr.WimVoogt forproviding thepotassiummetasilicateand forhishelpful
advice,BernardAngeletti forperforming the ICP‐MSmeasurements andDr.GregoryBois and
VéroniqueArfifromPHYTOREMfortheirassistanceandfruitfuldiscussions.
ChapitreIII:Effectsofsiliconandcopperonbamboogrownhydroponically
117
5 BILAN DU CHAPITRE III
Malgré des temps de culture longs, la culture hydroponique s’est révélée adaptée à la
croissancedesbamboussympodiaux,etnousapermisdesuivreavecprécisionl’évolutiondes
nutrimentsdanslasolutionnutritive.
L’accumulationdeSidanslebambouGigantochloasp«MalayDwarf»estproportionnelleàla
concentrationdeSiensolution.DansletraitementdeSileplusélevé,laconcentrationenSides
feuilles est de 218 ± 19mg g‐1 enmoyenne. En revanche, Si n’a pas eu d’influence sur le
développementetlacroissancedesbambous.
LesuividesconcentrationsdeSietCudanslasolutionnutritivenousapermisd’identifierdeux
mécanismesd’absorptiondifférentspourcesdeuxélémentsdanslaplante:uneabsorption
progressivedeSi,etuneadsorptionrapideetimportantedeCusurlesracines.
L’accumulationdeSidanslesdifférentespartiesdelaplantesuitlatendancesuivante:feuilles
>tiges>racines,alorsqueladistributiondeCuest lasuivante :racines>tiges≥feuilles.Les
concentrationsdeCunesontpasmodifiéesparlesdifférentstraitementsdeSi.
Grâceàsafortebiomasseracinaire,etàsacapacitéàséquestrerCudanslesracines,lebambou
atolérélaforteconcentrationdeCuàlaquelleilaétéexposé.
ChapitreIII:Effectsofsiliconandcopperonbamboogrownhydroponically
118
6 REFERENCES BIBLIOGRAPHIQUES
AliNA,BernalMPandAterM2002Toleranceandbioaccumulationof copper inPhragmitesaustralisandZeamays.PlantandSoil239,103‐111.
ArfiV,BagoudouD,KorboulewskyNandBoisG2009Initialefficiencyofabamboogrove‐based
treatmentsystemforwinerywastewater.Desalination246,69‐77.BabatundeAI,AbiolaOK,OsidekoOAandOyelolaOT2009Kineticandequilibriumstudieson
theadsorptionofCu2+andZn2+ionsfromaqueoussolutionsbybamboorootbiomass.AfricanJournalofBiotechnology8,3364‐3368.
BravinM,LeMerrerB,DenaixL,SchneiderAandHinsingerP2010Copperuptakekinetics in
hydroponically‐grown durumwheat (Triticum turgidum durum L.) as compared withsoil’sabilitytosupplycopper.PlantandSoil331,91‐104.
Chaney R, Brown S and Angle J 1998 Soil–root interface: ecosystem health and human food‐
chainprotection.InHuangP.Ed.Scaehealth.pp279–311.Madison,Winsconsin:SoilScienceSocietyofAmerica.
Collin B, Doelsch E, Keller C, Panfili F and Meunier J‐D 2011 Distribution and variability of
silicon,copperandzincindifferentbamboospecies.PlantandSoil,1‐11.CookeJandLeishmanMR2011Isplantecologymoresiliceousthanwerealise?TrendsinPlant
Science16,61‐68.Dakora,FelixD,NelwamondoandAziwe2003Siliconnutritionpromotesrootgrowthandtissue
mechanical strength in symbiotic cowpea. Commonwealth Scientific and IndustrialResearchOrganization,Collingwood,AUSTRALIE.pp.7.
deMeloS,MonteiroFandDeBonaF2010Silicondistributionandaccumulationinshoottissue
ofthetropicalforagegrassBrachiariabrizantha.PlantandSoil336,241‐249.DingTP,TianSH, SunL,WuLH, Zhou JX andChenZY2008aSilicon isotope fractionation
betweenriceplantsandnutrientsolutionanditssignificancetothestudyofthesiliconcycle.GeochimicaetCosmochimicaActa72,5600‐5615.
DingTP,ZhouJX,WanDF,ChenZY,WangCYandZhangF2008bSiliconisotopefractionation
in bamboo and its significance to the biogeochemical cycle of silicon. Geochimica etCosmochimicaActa72,1381‐1395.
EpsteinE1994TheAnomalyofSiliconinPlantBiology.ProceedingsoftheNationalAcademyof
SciencesoftheUnitedStatesofAmerica91,11‐17.EpsteinE1999SILICON.pp641‐664.
ChapitreIII:Effectsofsiliconandcopperonbamboogrownhydroponically
119
FauteuxF,ChainF,BelzileF,MenziesJGandBelangerRR2006TheprotectiveroleofsiliconintheArabidopsis‐powderymildewpathosystem.ProceedingsoftheNationalAcademyofSciencesoftheUnitedStatesofAmerica103,17554‐17559.
Guntzer F, Keller C andMeunier JD 2010Determination of the silicon concentration in plant
materialusingTironextraction.NewPhytologist188,902‐906.Hattori T, Inanaga S, Tanimoto E, Lux A, Luxov√° M and Sugimoto Y 2003 Silicon‐Induced
ChangesinViscoelasticPropertiesofSorghumRootCellWalls.PlantandCellPhysiology44,743‐749.
HenrietC,DrayeX,OppitzI,SwennenRandDelvauxB2006Effects,distributionanduptakeof
siliconinbanana(Musaspp.)undercontrolledconditions.PlantandSoil287,359‐374.HodsonM J,White P J, Mead A and BroadleyM R 2005 Phylogenetic variation in the silicon
compositionofplants.AnnalsofBotany96,1027‐1046.HossainMT,MoriR,SogaK,WakabayashiK,KamisakaS,FujiiS,YamamotoRandHosonT2002
Growthpromotionandan increase incellwallextensibilitybysilicon inriceandsomeotherPoaceaeseedlings.JournalofPlantResearch115,23‐27.
HwangSJ,ParkHMandJeongBR2005Effectsofpotassiumsilicateonthegrowthofminiature
rose 'Pinocchio' grownon rockwool and its cut flowerquality. Journal of the JapaneseSocietyforHorticulturalScience74,242‐247.
JonesLHP,HandreckKAandNormanAG1967SilicaInSoils,Plants,andAnimals.InAdvances
inAgronomy.pp107‐149.AcademicPress.Kabata‐Pendias A andMukherjeeAB 2007Trace Elements from Soil toHuman Springer. pp.
578.KhandekarSandLeisnerS2011Soluble siliconmodulatesexpressionofArabidopsis thaliana
genesinvolvedincopperstress.JournalofPlantPhysiology168,699‐705.KnightCTG,KinradeSD,L.E.DatnoffGHSandKorndˆrferGH2001Chapter4Aprimeronthe
aqueouschemistryofsilicon.InStudiesinPlantScience.pp57‐84.Elsevier.KopittkePM,AsherCJ,BlameyFPCandMenziesNW2009ToxiceffectsofCu2+ongrowth,
nutrition,rootmorphology,anddistributionofCu inrootsofSabigrass.Scienceof theTotalEnvironment407,4616‐4621.
Kopittke P M, Blamey F P C, Asher C J and Menzies NW 2010 Trace metal phytotoxicity in
solutionculture:areview.JournalofExperimentalBotany61,945‐954.KorndorferGH,LepschI,L.E.DatnoffGHSandKorndˆrferGH2001Chapter7Effectofsilicon
onplantgrowthandcropyield.InStudiesinPlantScience.pp133‐147.Elsevier.Krzeslowska M 2011 The cell wall in plant cell response to trace metals: polysaccharide
remodelinganditsroleindefensestrategy.ActaPhysiologiaePlantarum33,35‐51.LegrosS,ChaurandP,Rose J,MasionA,BrioisV,Ferrasse JH,SaintMacaryH,Bottero JYand
Doelsch E 2010 Investigation of Copper Speciation in Pig Slurry by a MultitechniqueApproach.EnvironmentalScience&Technology44,6926‐6932.
ChapitreIII:Effectsofsiliconandcopperonbamboogrownhydroponically
120
LiJ,LeisnerMandFrantzJ2008AlleviationofcoppertoxicityinArabidopsisthalianabysilicon
addition to hydroponic solutions. Journal of the American Society for HorticulturalScience133,670‐677.
Li Z‐j, Lin P,He J‐y, Yang Z‐w and Lin Y‐m2006 Silicon’s organic pool and biological cycle in
moso bamboo community of Wuyishan Biosphere Reserve. Journal of ZhejiangUniversity‐ScienceB7,849‐857.
Lux A, LuxovaM, Abe J, Morita S and Inanaga S 2003 Silicification of bamboo (Phyllostachys
heterocyclaMitf.)rootandleaf.PlantandSoil255,85‐91.MaJFandTakahashiE2002Soil,fertilizerandPlantSiliconResearchinJapan.ElsevierScience.Ma J F and Yamaji N 2006 Silicon uptake and accumulation in higher plants. Trends in Plant
Science11,392‐397.Ma JFandYamajiN2008Functionsand transportof silicon inplants.CellularandMolecular
LifeSciences65,3049‐3057.Ma JF,YamajiN,MitaniN,TamaiK,KonishiS,FujiwaraT,KatsuharaMandYanoM2007An
effluxtransporterofsiliconinrice.Nature448,209‐U212.MarschnerH1995MineralNutritionofHigherPlants,London.pp.889.Marschner H, Oberle H, Cakmak I and Römheld V 1990 Growth enhancement by silicon in
cucumber (Cucumis sativus) plants depends on imbalance in phosphorus and zincsupply.PlantandSoil124,211‐219.
MichaudA,ChappellazCandHinsingerP2008Copperphytotoxicityaffectsrootelongationand
ironnutritionindurumwheat(TriticumturgidumdurumL.).PlantandSoil310,151‐165.
MichaudAM,BravinMN,GalleguillosMandHinsingerP2007Copperuptakeandphytotoxicity
as assessed in situ for durum wheat (Triticum turgidum durum L.) cultivated in Cu‐contaminated,formervineyardsoils.PlantandSoil298,99‐111.
MitaniN,YamajiNandMaJF2009IdentificationofMaizeSiliconInfluxTransporters.Plantand
CellPhysiology50,5‐12.Miyake Y and Takahashi E 1978 Silicon Deficiency of Tomato Plant. Soil Science and Plant
Nutrition24,175‐189.MiyakeYandTakahashiE1983EffectofSiliconontheGrowthofSolution‐CulturedCucumber
Plant.SoilScienceandPlantNutrition29,71‐83.MiyakeYandTakahashiE1985EffectofSiliconontheGrowthofSoybeanPlantsinaSolution
Culture.SoilScienceandPlantNutrition31,625‐636.Miyake Y and Takahashi E 1986 Effect of Silicon on the Growth and Fruit Production of
StrawberryPlantsinaSolutionCulture.SoilScienceandPlantNutrition32,321‐326.
ChapitreIII:Effectsofsiliconandcopperonbamboogrownhydroponically
121
MotomuraH,FujiiTandSuzukiM2004SilicadepositioninrelationtoageingofleaftissuesinSasaveitchii(Carriere)rehder(Poaceae:Bambusoideae).AnnalsofBotany93,235‐248.
MotomuraH,MitaNandSuzukiM2002Silicaaccumulationinlong‐livedleavesofSasaveitchii
(Carriere)Rehder(Poaceae‐Bambusoideae).AnnalsofBotany90,149‐152.NishizonoH, IchikawaH, Suziki S and Ishii F 1987The role of the root cell‐wall in theheavy
metaltoleranceofAthyrium‐yokoscense.PlantandSoil101,15‐20.NowakowskiWandNowakowskaJ1997Siliconandcopperinteractioninthegrowthofspring
wheatseedlings.BiologiaPlantarum39,463‐466.Oliva S R, Mingorance M D and Leidi E O 2011 Effects of silicon on copper toxicity in Erica
andevalensisCabezudoandRivera:apotentialspeciestoremediatecontaminatedsoils.JournalofEnvironmentalMonitoring13,591‐596.
Opfergelt S, Cardinal D, Henriet C, Draye X, Andre L and Delvaux B 2006 Silicon isotopic
fractionationbybanana (Musaspp.)grown ina continuousnutrient flowdevice.PlantandSoil285,333‐345.
Ouzounidou G, Ciamporova M, Moustakas M and Karataglis S 1995 Responses of maize (Zea
maysL.)plantstocopperstress.1.Growth,mineral‐contentandultrastructureofroots.EnvironmentalandExperimentalBotany35,167‐176.
Parkhurst D L 1995 A Computer Program for Speciation, Reaction Path, Advective‐Transport,
andInverseGeochemicalCalculations.Ed.USDotILakewood,Colorado.Rachou J, Gagnon C and Sauve S 2007 Use of an ion‐selective electrode for free copper
measurementsinlowsalinityandlowionicstrengthmatrices.EnvironmentalChemistry4,90‐97.
RafiMMandEpsteinE1999Siliconabsorptionbywheat(TriticumaestivumL.).PlantandSoil
211,223‐230.RogallaHandRomheldV2002Roleofleafapoplastinsilicon‐mediatedmanganesetoleranceof
CucumissativusL.PlantCellandEnvironment25,549‐555.SauvéS,McBrideMB,NorvellWAandHendershotWH1997CopperSolubilityandSpeciation
ofInSituContaminatedSoils:EffectsofCopperLevel,pHandOrganicMatter.Water,Air,&SoilPollution100,133‐149.
Sheldon A and Menzies N 2005 The Effect of Copper Toxicity on the Growth and Root
MorphologyofRhodesGrass(ChlorisgayanaKnuth.)inResinBufferedSolutionCulture.PlantandSoil278,341‐349.
TavakkoliE,LyonsG,EnglishPandGuppyCN2011Siliconnutritionofriceisaffectedbysoil
pH,weatheringandsiliconfertilisation. JournalofPlantNutritionandSoilScience174,437‐446.
Voogt W, Sonneveld C, L.E. Datnoff G H S and Korndˆrfer G H 2001 Chapter 6 Silicon in
horticultural crops grown in soilless culture. In Studies in Plant Science. pp 115‐131.Elsevier.
ChapitreIII:Effectsofsiliconandcopperonbamboogrownhydroponically
122
YamajiNandMaJF2011Furthercharacterizationofaricesiliconeffluxtransporter,Lsi2.SoilScienceandPlantNutrition57,259‐264.
YruelaI2009Copperinplants:acquisition,transportandinteractions.Functionalplantbiology:
FPB36,409‐430.

ChapitreIII:Effectsofsiliconandcopperonbamboogrownhydroponically
123

ChapitreIII:Effectsofsiliconandcopperonbamboogrownhydroponically
124
C H A P I T R E I V
COPPER DISTRIBUTION AND
SPECIATION IN BAMBOOS
“Phy l l o s ta chy s f a s tuo sa” EXPOSED TO
DIFFERENT COPPER AND S IL ICON
CONCENTRATIONS

ChapitreIV:Copperdistributionandspeciationinbamboos“Phyllostachysfastuosa”
126
ChapitreIV:Copperdistributionandspeciationinbamboos“Phyllostachysfastuosa”
127
TABLE DES MATIERES
CHAPITREIVCOPPERDISTRIBUTIONANDSPECIATIONINBAMBOOS“Phyllostachysfastuosa”EXPOSEDTODIFFERENTCOPPERANDSILICONCONCENTRATIONS..................................................................................................................... 128
1. INTRODUCTION.................................................................................................................................................. 133
2. MATERIALANDMETHODS ............................................................................................................................. 1342.1. Plantmaterial,experimentaldesignandpreculture........................................................................................... 1342.2. Siliconandcoppertreatment .......................................................................................................................................... 1352.3. Plantanalysis .......................................................................................................................................................................... 1362.3.1 Growthparameters ................................................................................................................................................1362.3.2 Analysisofmacroandmicronutrients...........................................................................................................136
2.4. Desorptionprocedure.......................................................................................................................................................... 1362.5. Anionassays ............................................................................................................................................................................ 1372.6. Totalsolubleaminoacid.................................................................................................................................................... 1382.7. SEMEDX ................................................................................................................................................................................... 1382.8. LaboratoryBasedµXRF ..................................................................................................................................................... 1382.9. EXAFSandXANES:dataacquisitionandanalysis.................................................................................................. 1392.10. Statisticalanalyses............................................................................................................................................................. 140
3. RESULTS................................................................................................................................................................ 1403.1. Siliconandcopperinnutrientsolution ....................................................................................................................... 1403.2. Growthparameters .............................................................................................................................................................. 1413.3. CuandSidistributionbetweenplantparts ............................................................................................................... 1423.4. CuandSilocalizationintheroot ................................................................................................................................... 1443.5. Theeffectsofcopperandsilicononsomeplantcomponents ............................................................................ 1453.6. XANESfeatures....................................................................................................................................................................... 1493.7. EXAFSfeatures ....................................................................................................................................................................... 151
4. DISCUSSION.......................................................................................................................................................... 156
5. SUPPORTINGINFORMATIONS....................................................................................................................... 162
6. BILANDUCHAPITREIV.................................................................................................................................... 170
7. REFERENCESBIBLIOGRAPHIQUES............................................................................................................... 171

ChapitreIV:Copperdistributionandspeciationinbamboos“Phyllostachysfastuosa”
128
ChapitreIV:Copperdistributionandspeciationinbamboos“Phyllostachysfastuosa”
129
CHAPITRE IV
COPPER DISTRIBUTION AND SPECIATION IN BAMBOO
“Phy l l o s ta chy s f a s tuo sa” EXPOSED TO DIFFERENT COPPER AND S IL ICON
CONCENTRATIONS
Dansdesconditionsnonoupeustressantes,lesiliciumn’apaseud’effetssurlacroissanceetle
développement du bambou sympodial Gigantocloa sp. «Malay Dwarf» malgré la forte
accumulation de Si dans ses tissus. Cela est cohérent avec des observations effectuées pour
d’autresplantes,commelebananier(Henrietetal.2006)oudesplantulesdeconifères(Cornelis
et al. 2010): le silicium jouerait un rôle lorsque laplante est soumise àun stressbiotiqueou
abiotique (Liang et al. 2007). Or, il s’avère que la concentration de Cu choisie dans l’étude
précédenten’apasinduitdetoxicitéchezlebambou,contrairementàcequiaétéobservépour
d’autres Poaceae telles que le blé et la Sabi grass (Bravin et al. 2010; Kopittke et al. 2009;
Michaudetal.2008).Nousn’avonsdoncpaspu,danscetteétude,statuersurl’effetdeSifaceà
une toxicité de Cu. En revanche, nous avons identifié deux comportements différents de
l’absorptionausenslarge,deCuetSi:alorsqueSiestprélevédemanièrecontinueaucoursdu
temps,Cuestprélevédemanièrerapidelespremièresheuresaprèschaquerenouvellementde
lasolutionnutritive.CelasembleindiqueruneadsorptionrapidedeCusurlesparoisracinaires
qu’ilseraitintéressantdevérifierparuneobservationprécisedelalocalisationducuivredansla
racineententantd’estimerlaproportiondeCuadsorbée.
La toxicité du cuivre dépend non seulement de sa localisation dans les différents tissusmais
aussidesaspéciation.Laplanteadoptedifférentesstratégiespourgérerunexcèsdecuivredans
sestissus,commeuneséquestrationdanslesparoiscellulaires(Krzeslowska2011),oubienune
complexationpardifférents ligands(CfchapitreI).Undesmécanismespermettantd’expliquer
laréductiond’unetoxicitégrâceàSiestlaformationdecomplexesmétaux‐Si,commecelaaété
proposé pour Zn dans Cardaminopsis halleri (Neumann and zur Nieden 2001). L’étude de la
spéciationdeCuparspectroscopied’absorptiondesrayonsXdoitnouspermettred’identifierla
ChapitreIV:Copperdistributionandspeciationinbamboos“Phyllostachysfastuosa”
130
nature des complexes formés avec Cu, d’éventuelles interactions entre Cu et Si et/ou une
modificationdelaspéciationdeCuinduiteparSitellequ’unemodificationdesligands.
NousavonsvudanslechapitreIIque,danslesconditionspédoclimatiquesdel’îledelaRéunion,
les bambous sympodiaux accumulent significativement plus de Si et de Cu que les bambous
monopodiaux.Lesbambousmonopodiaux,qui sont lesplus répandusdans lespays tempérés,
présentent‐ilségalement lacapacitéde toléreruneconcentration fortedeCu(1.5µMCu2+)en
solution?C’est cequenousavons testédanscetteexpérienceconduiteenhydroponieavec le
bambouPhyllostachys fastuosa et deux niveaux de concentrations en Cu: 1.5 et 100 µMCu2+.
Cettedernièreconcentrationaétéchoisieafind’induireunefortetoxicitéetd’observerl’effetde
Sisurcettetoxicité.
Lesobjectifsdecechapitresontlessuivants:
• Evaluer la distribution et la localisation de Cu et Si dans les différentes parties du
bambou,
• Evaluerl’effetdeSisurlaconcentrationetlatoxicitédeCu,
• Evaluer l’effet de Si et Cu sur la nutrition (acides organiques et inorganiques) du
bambou,
• CaractériserlaspéciationdeCudanslebambou.
Pour répondre à ces objectifs, plusieurs techniques ont été utilisées: en premier lieu des
analyses chimiques desmacro etmicronutriments, puis l’identification et la quantification de
composésorganiquesetinorganiquesparchromatographieionique,ensuitelalocalisationdeSi
etCudanslesracinesparmicroscopeélectroniqueetmicro‐fluorescenceX,etenfinlaspéciation
de Cu par spectroscopie d’absorption X en couplant le XANES (X‐ray Absorption Near Edge
Structure)et l’EXAFS(ExtendedX‐rayAbsorptionFineStructure).Lesrésultatssontprésentés
dansl’articleci‐après,quiaétérédigéafind’êtresoumisàlarevueNewPhytologist.
ChapitreIV:Copperdistributionandspeciationinbamboos“Phyllostachysfastuosa”
131
Copper distribution and speciation in bamboo
“Phyllostachys fastuosa” exposed to different copper
and silicon concentrations. First evidence of the
presence of reduced copper bound to sulfur compound
in a Poaceae species.
BlancheCollin*a,b,EmmanuelDoelschc,CatherineKellerb,PatrickCazevieillec,FredericPanfilia,
DenisTestemaled,Jean‐LouisHazemannd,Jean‐DominiqueMeunierb
a Département de recherche développement de la société PHYTOREM S.A., 13140 Miramas,
France
bCEREGE,CNRS,Aix‐MarseilleUniv.,Europôleméditerranéende l'ArboisBP80,13545Aixen
Provence,France
cCIRAD,UPRRecyclageetrisque,F‐34398Montpellier,France
dInstitutNéel,CNRSetUniversitéJosephFourier,BP166,F‐38042GrenobleCedex9,France.
*Correspondingauthor.
SUMMARY
• The purpose of this study was to examine copper (Cu) absorption, repartition and
toxicityanddeterminetheroleofaSisupplementationinapoaceaespecies:thebamboo
Phyllostachysfastuosa.
• Anhydroponicculturewascarriedoutfor3months,bamboosweresubmittedtothree
contrastedcopperconcentrations,andtwosilicon(Si)concentrations.Copperspeciation
and Cu and Si distributionwere investigated by chemical analyses, spectroscopic and
microscopictechniques.
ChapitreIV:Copperdistributionandspeciationinbamboos“Phyllostachysfastuosa”
132
• Copper ismainlyaccumulated inbambooroots,wherea largepartofCu isretained in
epidermis.Inroots,siliconismainlyaccumulatedinendodermalcells.Inroots,stemand
leaves, Cu was present under two oxidation states Cu(I) and Cu(II) with different
proportions.
• Silicon supplementation modified the Cu speciation but did not induced significant
improve of bamboo Cu tolerance. Themain strategy of bamboo to copewith high Cu
concentrationinitstissuesis(i)animportantsequestrationintherootsapoplast,mainly
in epidermis, and (ii) a Cu(I) complexation with sulfur ligands both organic and
inorganic.
Keywords:toxicity,alleviation,ExtendedX‐rayabsorptionfinestructurespectroscopy(EXAFS),
X‐rayAbsorptionNear‐EdgeSpectroscopy(XANES),microfluorescenceX(µ‐XRF)
ChapitreIV:Copperdistributionandspeciationinbamboos“Phyllostachysfastuosa”
133
1. INTRODUCTION
Copperplaysacentralroleinplantmetabolismbutisdetrimentalwhencriticalthresholdsare
exceeded. Excess copper is cytotoxic, induces stress and causes injury to plants. Cu
contamination is widespread as a result of its use in fungicides, application of pig slurries,
atmospheric deposition from industrial and urban activities and metalliferous mining.
Phytoremediation of tracemetals has been proposed forwastewater treatment. Bamboos are
knownfortheirresistancetoawiderangeofstressfactorsaswellastheirhighgrowthrateand
biomassproduction.Bamboosarealsousedinphytoremediationtechnologies(Arfietal.2009).
ThereforeinordertooptimizethistechnologyitisessentialtotesttheextentofCutolerancein
bamboos and thereafter to identifymechanisms used by bamboos to copewith an excess Cu
content.SpeciationofCuassociatedtoitsdistributionwithintheplantultimatelydeterminesthe
various mechanisms of availability, detoxification and toxicity (Lombi et al. 2011). X‐ray
absorptionspectroscopy(XAS)isapowerfultooltoassessthechemicalspeciationinplants(Salt
etal.2002)andcanbeusedtodeterminetheoxidationsateandthephysicalstructureofsites
surroundingCuinplanttissues.Cuspeciationhadbeenreportedinthefollowingplants;Larrea
tridentate(Gardea‐Torresdeyetal.2001;Poletteetal.2000),Vignaunguiculata(Kopittkeetal.
2011), Sesbania drummondii (Sahi et al. 2007), Elsholtzia splendens (Shi et al. 2008), Thlaspi
caerulescens (Mijovilovich et al. 2009), Crassula helmsii (Kupper et al. 2009). However, no
studies have been performed on monocotyledonous species, and particularly poaceae family.
Poaceaeplants,andbamboosinparticular,areabletoaccumulatehighamountsofsilicon(Si)in
theirtissues(Collinetal.2011).Recently,ithasbeenshownthatsiliconalleviatesCutoxicityin
Arabidopsis thaliana (Khandekar and Leisner 2011; Li et al. 2008) and in Erica andevalensis
(Olivaetal.2011).However,weshowedinapreviousstudy,thatawiderangeofSiinsolution
didnotinfluencethegrowthanddevelopmentofbamboosGigantocloasp“Malaydwarf”which
weresubmittedtoaCuconcentrationof1.5µMCu2+inhydroponics(Collinetal,chapIII).This
Cuconcentrationdidnotinducetoxicitysymptomsinbambooscontrarytoeffectsdescribedin
otherPoaceae plants such aswheat (Bravin et al. 2010) and Sabi grass (Kopittke et al. 2009)
exposedat similarCu content. Silicon isknown tobebeneficialmostlyunderabioticorbiotic
stress(Liangetal.2007).ThefactthatCollinetal.(chapIII)didnotobservetheeffectofSion
bamboomayberelated to theabsenceof stressconditions.Toconfirm that, it isnecessary to
testSiwithahigherCuconcentration,thatmayinducetoxicityinbamboos.
ChapitreIV:Copperdistributionandspeciationinbamboos“Phyllostachysfastuosa”
134
Theprevioushydroponiccultureofbamboos(Collinetal,chapIII)weredoneonamonopodial
type of bamboo, which has been shown to accumulate significantly more Cu and Si than
sympodialbamboosinnaturalpedo‐climaticenvironment(Collinetal.2011).Wethereforecan
wonderiftheabilitytotoleratehighCucontentdependsonthebamboospecies.Thuswealso
chosetotestCutoleranceonasympodialbamboo:Phyllostachysfastuosa.Bamboosweregrown
in a 4‐month hydroponic experiment and submitted to the same Cu content (1.5 µM) as in
(Collinetal,chapIII)whichis largebutenvironmentallyrelevant(Sauvéetal.1997),andtoa
higherCuconcentrationinordertoreachacutetoxicityandtestthepossibleCualleviatingeffect
ofSi.InordertoidentifythepossibleCutolerancemechanismsinbamboossupplementedornot
with Si, we investigated the in situ distribution and speciation of Cu using several combined
approaches:mineralandorganicanalyses,CuandSilocalizationintherootsinvestigatedbyX‐
ray fluorescence micro‐spectroscopy (µXRF) and scanning electron microscopy coupled to
energydispersiveX‐rayanalysis(SEM‐EDX),CuspeciationdeterminedbyCuK‐edgeExtended
X‐ray absorption fine structure spectroscopy (EXAFS) and X‐ray Absorption Near‐Edge
Spectroscopy(XANES).
2. MATERIAL AND METHODS
2.1. Plant material, experimental design and pre-culture
Thirty‐five one‐year old monopodial bamboos Phyllostachys Fastuosa grown on the same
substrate were provided by PHYTOREM (Miramas, France). Bamboos were transferred in
hydroponiccultureafteracarefulwashingoftherootsinordertoremoveallthesoilparticles.A
preliminaryexperimentwas carriedout toadapthydroponic culture tobamboos (Collinet al,
chapIII).Theexperimentwasperformedduring4months.Apre‐culturephasewasconducted
over2months.Plantsweregrown in cylindricalPVCpots containing3Lofnutrient solution.
The compositionof thepre‐culturenutrient solutionwasa25%strength completeHoagland
solution.Thecompositioninmacroelements(mM)was:1Ca(NO3)2,1.5KNO3,0.24MgSO4,0.22
(NH4)2HPO4, and in microelements (µM): 11.6 H3BO3, 0.08 CuSO4, 0.2 ZnSO4, 0.03 MoO3, 2.3
MnCl2, 100 FeNaEDTA. The pH of this solution was adjusted to 6 with NaOH or HNO3. The
nutrient solutions were continuously aerated with an air pump in each pot. The nutrient
solutionwas renewed every 7 days. Analytical‐grade chemical reagents and ultra purewater
were used in the preparation of nutrients solutions. No glassware was used to minimize Si
contamination.Allplasticwareused for theexperimentswerepreviously soakedovernight in
nitric acid and rinsed with ultrapure water. The growth chamber parameters were set at
(day/night):28/25°C,90/75%ofrelativehumidityand450μmolphotonsm−2s−1lightintensity.
ChapitreIV:Copperdistributionandspeciationinbamboos“Phyllostachysfastuosa”
135
2.2. Silicon and copper treatment
At the end of the pre‐culture phase, 25 bamboo plants of uniform size were selected. Five
treatmentswereappliedduring70days,2concentrationsofSiand3concentrationsofCuwith
thefollowingcombinations:0mMSi+0.1µMCu,0mMSi+1,5µMCu,1.1mMSi+1,5µMCu,0
mMSi+100µMCu,1.1µMSi+100µMCuthereafterreferredtorespectivelyascontrol,Cu1.5,
Cu1.5Si, Cu100, Cu100Si. Si was provided as monosilic acid from potassium‐metasilicate
Si(KOH)2,whichhasaK:Simoleratioof2(Metso400‐YARA)(Voogtetal.2001).Cuwasadded
using CuSO4. Potassium and hydroxide levels were adjusted in the nutrient solution to
compensate for the additional input of K and OH from the silicon addition. KNO3 and HNO3
concentrationswereadjustedineachtreatmenttoreachK=NO3=2.25mM.Thecompositionof
macroelements(mM)inthisnutrientsolutionwas1CaCl2,0.24MgSO4,0.22(NH4)2HPO4andthe
compositionofmicroelements (µM)was:11.6H3BO3,0.2ZnSO4,0.03MoO3,6.5MnCl2.Fewas
provided as 20 µM Fe‐N, N9‐di (2‐hydroxybenzyl) ethylenediamine‐N, N9‐diacetic acid
monohydrochloride hydrate (HBED; Strem chemical, USA). Fe(III)‐HBED was prepared
followingthedescriptionofChaneyetal.(1998)insuchawaythatallHBEDwassaturatedwith
Fe. SolutionpHwas set at6.0 (±0.2)bufferedwith1mMMES (2‐morpholinoethanesulphonic
acid).Five replicatesper treatmentwereconducted.Foreach treatment, thenutrient solution
circulated continuously between the five pots and the 15L “reserve tank”. The solution was
continuouslysuppliedbyaperistalticpumpfromthereservetanktothebaseofthepotandthe
solution inexcessof2.5 lwasreleasedandcollectedviaanoverflowpipetocomeback inthe
reservetank.Thenutrientsolutionswerecontinuouslyaeratedwithanairpumpineachpot.All
solutionscontainedineachpotandinthereservetankweretotallyrenewedevery7days.
GeochemicalcalculationswereperformedwithPHREEQC(version2‐17)(Parkhurst1995)and
the MINTEQ database of thermodynamic constant. The quality of speciation modelling was
checked by measuring Cu2+ with a Cupric Ion Selective Electrode (Orion 9629BNWP). To
measure Cu in treatment Cu1.5 and Cu1.5Si, Cu‐ISE measurements were calibrated between
pCu2+ 12.0‐4.2 in 10‐4M Cu solution buffered with iminodiacetic acid and potassium phtalate
accordingtotheproceduredescribedbyRachouetal.(2007).DuetothehighCuconcentration
oftreatmentCu100andCu100Si,ISEmeasurementswerecalibratedbetween30‐500µMusing
adirectmeasurementinCustandards.
Throughouttheexperiment,nutritivesolutionwassampledatthebeginningoftheweek(before
contact with bamboos) further referred to as “input solution” and just before the renewal,
further referred as “output solution”. All the solutions were filtered (0.2 µm membrane,
Sartorius)andkeptatatemperatureof4°Ctemperature.ThepHineachsolutionwasmeasured
ChapitreIV:Copperdistributionandspeciationinbamboos“Phyllostachysfastuosa”
136
withacombinedglass‐electrode.AsubsamplewasacidifiedandsolutionswereanalysedforSi
byICP‐AES(JobinYvonJ38),andtotalCuconcentrationwasmeasuredbyICP‐MS(Agilent7500
CE, Montpellier). Free Cu2+ was analysed by Cu‐ISE in another subsample, immediately after
solutionsampling.TheCu‐ISEmeasurementwasconductedonthefollowingselectedsamples:
fortreatmentCu100andCu100Si,inalltheinputandoutputsolutionsandfortreatmentCu1.5,
Cu1.5Si:intheinputsolutiononday196andinthesolutionsthatweresampledafter1,2,4,27,
43,and96h; in the input solutiononday27andatday28and29 (afteroneand twodayof
solutioncontactwithplant);andintheoutputsolutionthatwascollectedonday34.
The total volumesof each inputandoutput solutionweremeasured.Thevolumeof the input
solutionwas14,5Lonaverage,andoutputvolumevariedbetween9,2and5L.Theamountof
element(SiorCu)inthesolutionistheelementconcentrationmeasuredbyICP‐AESorICP‐MS
multipliedbythevolumeofthesolution.Errorscalculatedfromtheerrorsonoutputvolumeof
solutionsandanalyticalerrorsareestimatedtobe15%.
2.3. Plant analysis
2.3.1 Growth parameters
Thenumberandheightofthestems,thenumberofleavesandthefreshweightwereassayedat
thebeginningoftheexperiment(day0),duringtheexperiment(day21andday49),andatthe
endoftheexperiment(day226).
2.3.2 Analysis of macro and micronutrients
At theendof theexperiment, the25plantswereharvested.Plant leaves,stems,rhizomesand
rootswere separated.The sampleswere carefullywashedwithultrapurewaterand the fresh
massesweredetermined.
Beforetheanalysis,allofthepartsweredriedat60°Cuntiltheyreachedaconstantweight.The
sampleswere subsequentlymixed, ground and homogenised. The sub‐sampleswere dried at
80% until they reached a constantweight to determine their dryweight. The plant samples
(leaves, stems and roots) underwent dry mineralisation for the analysis of trace elements.
Duringthemineralisation, theSicontentwasdeterminedbygravimetryas follows:500mgof
driedplantmaterialwasplacedinaplatinumdishandgraduallyheatedto500°C.Thesilicawas
eliminated in the ash with HF. After cooling, the Si weight was determined based on the
difference fromthe500°Cweight.Theashesweredissolved intoHCl,and thecontentof trace
ChapitreIV:Copperdistributionandspeciationinbamboos“Phyllostachysfastuosa”
137
elements in the solutions was analysed by inductively coupled plasma‐optical spectrometer
(ICP‐OESVista‐Pro,Varian,CIRAD,Montpellier,France).Forqualitycontrol,in‐housereference
samplesandcertifiedsamples(Astrasol‐Mix,Analytika)wereusedevery20samples,andeach
analysis was conducted in duplicate. Themeasurement uncertainty was less than 15%. The
quantificationlimitforSiwas5mgg‐1ofdryweight(DW).
Theconcentrationsofmacro‐andmicronutrientsareexpressedasgkg‐1ormgkg‐1DW,andthe
Siconcentrationsareexpressedinmgg‐1DWSiO2suchthattheresultsaredirectlycomparable
withtheliterature.
2.4. Desorption procedure
Asetof frozenrootsub‐sampleswasused tomeasure theadsorbedCuafter theextractionof
apoplasmicCuwithHClonthawnroots.Theextractionprocedurewaspreviouslydetailedand
testedbyChaignonetal.(2002).Briefly,asubsampleof0.4goffresh(thawed)rootswasshaken
end‐over‐endwith20mlof1mMHClfor3min,then180μlof1MHClwereaddedtoyieldafinal
concentration of 10mMHCl. After shaking for a further 5min, the suspensionswere filtered
throughanashlessfilterpaper(Whatman40).CopperinthesuspensionswereanalysedbyICP‐
MS(MSE,Montpellier).Rootsampleswerethenrinsed3timeswithultrapurewater,apartof
thesampleweredryat80°Cinordertomeasurethedryweightandtheotherpartwasfrozenin
liquidnitrogen tostudycopperspeciation: these roots sampleswere further referredas “root
desorbed”.Copperadsorbedontherootswerecalculatedandexpressedinµg.kg‐1DWfromthe
quantityofCuinthesuspensions.TherootdesorbedconcentrationswerecalculatedastotalCu
concentrationinrootsminusCuadsorbedconcentration.
2.5. Anion assays
Plantmaterialwerefreeze‐driedandgroundinablender(Retsh,MM301).Approximately10mg
of resulting powder were immersed in 1 ml of 50 % (v/v) methanol at 4°C, then 300 µL
chloroformwasadded.Thesampleswereshakenfor20min,40rpmat4°Candcentrifugedat
13200 rpm, 4°C, for 10min. 800 µL of upper phasewas collected and evaporated to dryness
usingacentrifugalvacuumdryeratambienttemperaturefor4handredissolvedin1600µLof
ultra‐pure water. Anions concentrations were determined by High Performance Ionic
Chromatography(DionexDX600)usingtheIonPaqAS11HCanionexchangecolumnandaNaOH
gradient.NaOHconcentrationwasraised linearlyfrom1.25to25.0mMover8min, thenfrom
25.0to65.0mMover45min.Identificationandquantificationofeachanionwereperformedby
ChapitreIV:Copperdistributionandspeciationinbamboos“Phyllostachysfastuosa”
138
comparison of the retention times and peak areas –integrated using Chromeleon software
(Dionex)–withthestandards.
2.6. Total soluble amino acid
Frozenplantmaterialswerehomogenisedwithapestleandmortarinliquidnitrogen.Analiquot
of1mgofthehomogenatewasmixedin10mlof0.1Mandcentrifugedat12500rpm,4°Cfor10
min.Theupperphasewerecollected, filteredat0.22µmand immediatelyanalyzed foramino
acid determination. Amino acids were detected by High Performance Ionic Chromatography
(DionexICS3000)usingatrapcolumn(CRC)andanaminoacidcolumn(AminoPacPA10)witha
NaOHgradient.Weusedavolumeinjectionof20µMandaflowrateof0.25mL/min.Detection
wasperformedwithAuworkingelectrodes(060082Dionex). Identificationandquantification
of asparagine, threonine, glycine, histidine, cysteine were performed by comparison to
standardsAAADirectmethod(Dionex).
2.7. SEM-EDX
TwosamplesofrootsoftreatmentCu100Siwerefreeze‐fracturedinacryospecimenchamber,
sputter‐coatedwithamixtureofgoldandpalladiuminargonatmosphere,andexaminedusinga
PhilipsXL30SFEGscanningelectronmicroscope (SEM)atnitrogen liquid temperature (North
Billerica, MA) coupled to an Oxford Instruments (Oxfordshire, UK) energy dispersive X‐ray
spectrometer(EDX).TheSEMwasoperatedat15kVwithacountingtimeof60sperpoint.With
SEM‐EDS,chemicalmicroanalysisresultscanbeobtainedwithaspatialresolutionofabout2to
5μmandapenetrationdepthofaboutthesamerange.
2.8. Laboratory-Based µXRF
Root samples were dried at 40°C, embedded in an epoxy resin and cut transversely with
diamondwire saw.The thicknessof theobtainedsectionswasof200µm.Themeasurements
werecarriedoutonaHORIBAXGT7000microscopeequippedwithanX‐rayguidetubeproducing
a finely focused and high‐intensity beamwith a 10‐μm spot size (Rh X‐ray tube, accelerating
voltageof30kVandacurrentof1mA).X‐raysemittedfromtheirradiatedsampleweredetected
with an energy‐dispersive X‐ray (EDX) spectrometer equipped with a liquid nitrogen cooled
high‐puritySidetector.Elementalmaps(256px2,pixelsizeof8mm),showinginparticularCu,
Si and K distribution in root cross sections, were recorded with a total counting time of
20*1000sundertotalvacuummode(toenhanceSidetection).Thebackgroundcontributionwas
ChapitreIV:Copperdistributionandspeciationinbamboos“Phyllostachysfastuosa”
139
removedforSiandCu.ImageswereobtainedfromtheintensityoftheSi(Kα),K(Kα)andCu(Kα)
emissionlines.
2.9. EXAFS and XANES: data acquisition and analysis
Copper K‐edge bulk X ray absorption spectra for the plant leaves, stems, roots and reference
compoundswererecordedonaFAMEBeamlineattheEuropeanSynchrotronRadiationFacility
(ESRF,Grenoble,France).Inordertoavoidartifactualchangesofspeciationduetothedryingof
samples, thesampleswereplunged in liquidnitrogen immediatelyafter theharvestandplant
washing, and stored frozen. Frozen leaves, stems and rootswere ground and compacted into
pressedpellets in liquidnitrogen (77K),with special care tokeep thepellets frozen in liquid
nitrogen until the XAS analysis. Pellets of frozen‐hydrated plant samples and referencecompounds were transferred to a He cryostat and cooled to 15 K. Spectra were recorded in
fluorescencemodeusingaSi(220)doublecrystalmonochromatoranda30‐elementsolid‐state
Gedetector(Canberra,France).Foreachsample,1to14scansof45mineachwereaveraged.To
reduce the riskofbeamdamageand toobtain representative spectra, each scanwasdoneon
differentpositionineachspecimen.TheenergywascalibratedusingaCufoil(thresholdenergy
takenatthezero‐crossingpointofthesecondderivativespectrum).Thedatawerenormalized
usingtheAthenasoftware(RavelandNewville2005).EXAFSspectrawereFouriertransformed
from the k to R space using Kaiser–Bessel apodization Windows. This procedure results in
pseudo‐radialdistributionfunctions(RDF)uncorrectedfromphaseshiftfunctions.
In this study, we used a combination of principal component analysis (PCA), target
transformation(TT),andlinearcombinationfitting(LCF)tofitCuKedgeXANESspectra(‐30‐
50keV) andk3‐weightedEXAFS (2.6‐10.5Å‐1) recordedon theplants.Thegoodnessof fitwas
assessed with the normalized sum‐square (NSS) equation
€
NSS =100 × k 3χ(ki)measured − k3[
i=1
N
∑ χ(ki) fitted ]2
/ k 3χ(ki)measured[ ]
2
i=1
N
∑
, N is the number of
points, k3χ(ki)measured is theEXAFS spectrumof the sample in thek‐space andk3χ(ki)fitted is the
EXAFSfit inthek‐space).PCAandTTweredonewiththeSixPacksoftwareandLCFwasdone
withAthenasoftware.Thisprocedurehasalreadybeenusedto fitXANESspectrathatcontain
multiple chemical species (Beaucheminet al. 2002;Legroset al. 2010).Reference compounds
arechosenfromalargepanelofpotentialchemicalspeciesthatcouldcontributetoexplaining
thecoordination,oxidationstate,andatomicenvironmentofCuwithinplantsamples.CuK‐edge
XANESspectraandk3‐weightedEXAFSspectraforCumodelcompounds,contained10inorganic
and 9 organic compounds with various Cu oxidation states (Cu(0), Cu(I), and Cu(II)) were
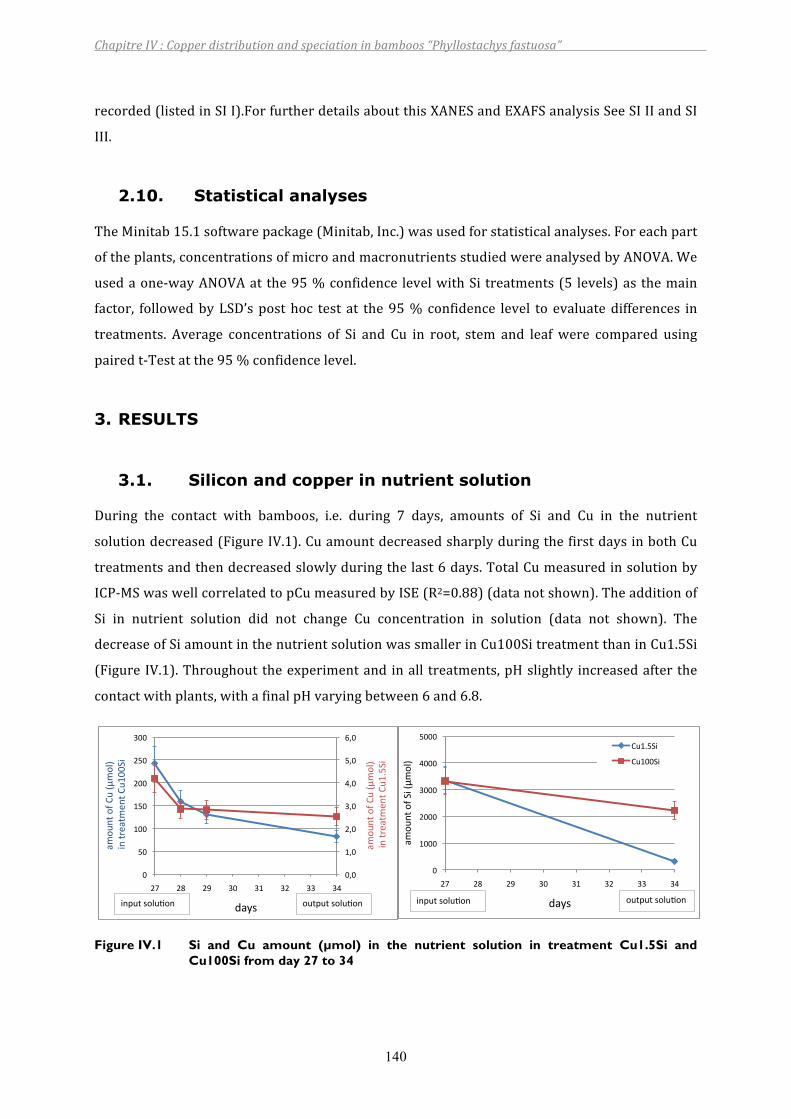
ChapitreIV:Copperdistributionandspeciationinbamboos“Phyllostachysfastuosa”
140
recorded(listedinSII).ForfurtherdetailsaboutthisXANESandEXAFSanalysisSeeSIIIandSI
III.
2.10. Statistical analyses
TheMinitab15.1softwarepackage(Minitab,Inc.)wasusedforstatisticalanalyses.Foreachpart
oftheplants,concentrationsofmicroandmacronutrientsstudiedwereanalysedbyANOVA.We
usedaone‐wayANOVAat the95%confidence levelwithSi treatments(5 levels)as themain
factor, followedbyLSD’sposthoc test at the95%confidence level to evaluatedifferences in
treatments. Average concentrations of Si and Cu in root, stem and leafwere compared using
pairedt‐Testatthe95%confidencelevel.
3. RESULTS
3.1. Silicon and copper in nutrient solution
During the contact with bamboos, i.e. during 7 days, amounts of Si and Cu in the nutrient
solutiondecreased(FigureIV.1).CuamountdecreasedsharplyduringthefirstdaysinbothCu
treatmentsandthendecreasedslowlyduringthelast6days.TotalCumeasuredinsolutionby
ICP‐MSwaswellcorrelatedtopCumeasuredbyISE(R2=0.88)(datanotshown).Theadditionof
Si in nutrient solution did not change Cu concentration in solution (data not shown). The
decreaseofSiamountinthenutrientsolutionwassmallerinCu100SitreatmentthaninCu1.5Si
(FigureIV.1).Throughouttheexperimentand inall treatments,pHslightly increasedafter the
contactwithplants,withafinalpHvaryingbetween6and6.8.
Figure IV.1 Si and Cu amount (µmol) in the nutrient solution in treatment Cu1.5Si and Cu100Si from day 27 to 34
!"!#
$"!#
%"!#
&"!#
'"!#
("!#
)"!#
!#
(!#
$!!#
$(!#
%!!#
%(!#
&!!#
%*# %+# %,# &!# &$# &%# &&# &'#
-./012#/3#40#56./78##
#91#2:;-2.
;12#40$<(=9#
-./012#/3#40#56./78##
#91#2:;-2.
;12#40$!!=9#
>-?@#91A02#@/70B/1# /02A02#@/70B/1#
!#
$!!!#
%!!!#
&!!!#
'!!!#
(!!!#
%*# %+# %,# &!# &$# &%# &&# &'#
-./012#/3#=9#56./78#
>-?@#
40$<(=9#
40$!!=9#
/02A02#@/70B/1#91A02#@/70B/1#
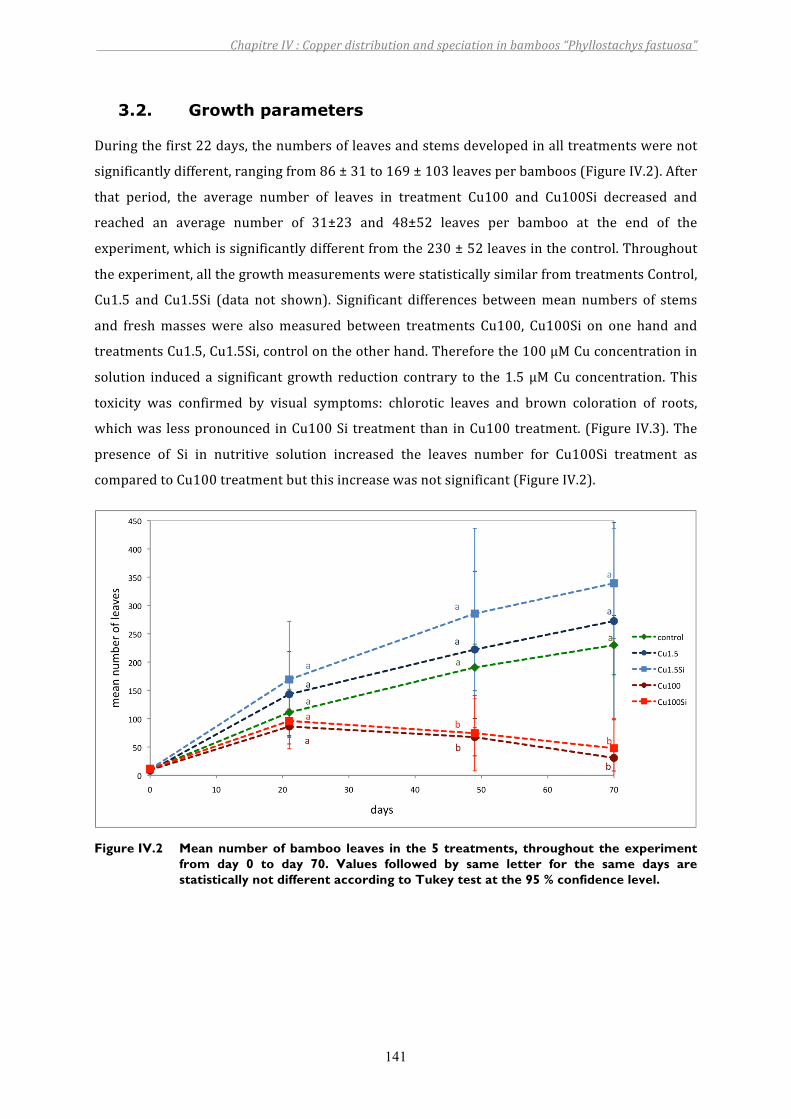
ChapitreIV:Copperdistributionandspeciationinbamboos“Phyllostachysfastuosa”
141
3.2. Growth parameters
Duringthefirst22days,thenumbersofleavesandstemsdevelopedinalltreatmentswerenot
significantlydifferent,rangingfrom86±31to169±103leavesperbamboos(FigureIV.2).After
that period, the average number of leaves in treatment Cu100 and Cu100Si decreased and
reached an average number of 31±23 and 48±52 leaves per bamboo at the end of the
experiment,whichissignificantlydifferentfromthe230±52leavesinthecontrol.Throughout
theexperiment,allthegrowthmeasurementswerestatisticallysimilarfromtreatmentsControl,
Cu1.5 and Cu1.5Si (data not shown). Significant differences betweenmean numbers of stems
and freshmasseswere alsomeasured between treatments Cu100, Cu100Si on one hand and
treatmentsCu1.5,Cu1.5Si,controlontheotherhand.Thereforethe100µMCuconcentrationin
solution induceda significant growth reduction contrary to the1.5µMCu concentration.This
toxicity was confirmed by visual symptoms: chlorotic leaves and brown coloration of roots,
whichwas lesspronouncedinCu100Si treatmentthan inCu100treatment.(FigureIV.3).The
presence of Si in nutritive solution increased the leaves number for Cu100Si treatment as
comparedtoCu100treatmentbutthisincreasewasnotsignificant(FigureIV.2).
Figure IV.2 Mean number of bamboo leaves in the 5 treatments, throughout the experiment from day 0 to day 70. Values followed by same letter for the same days are statistically not different according to Tukey test at the 95 % confidence level.
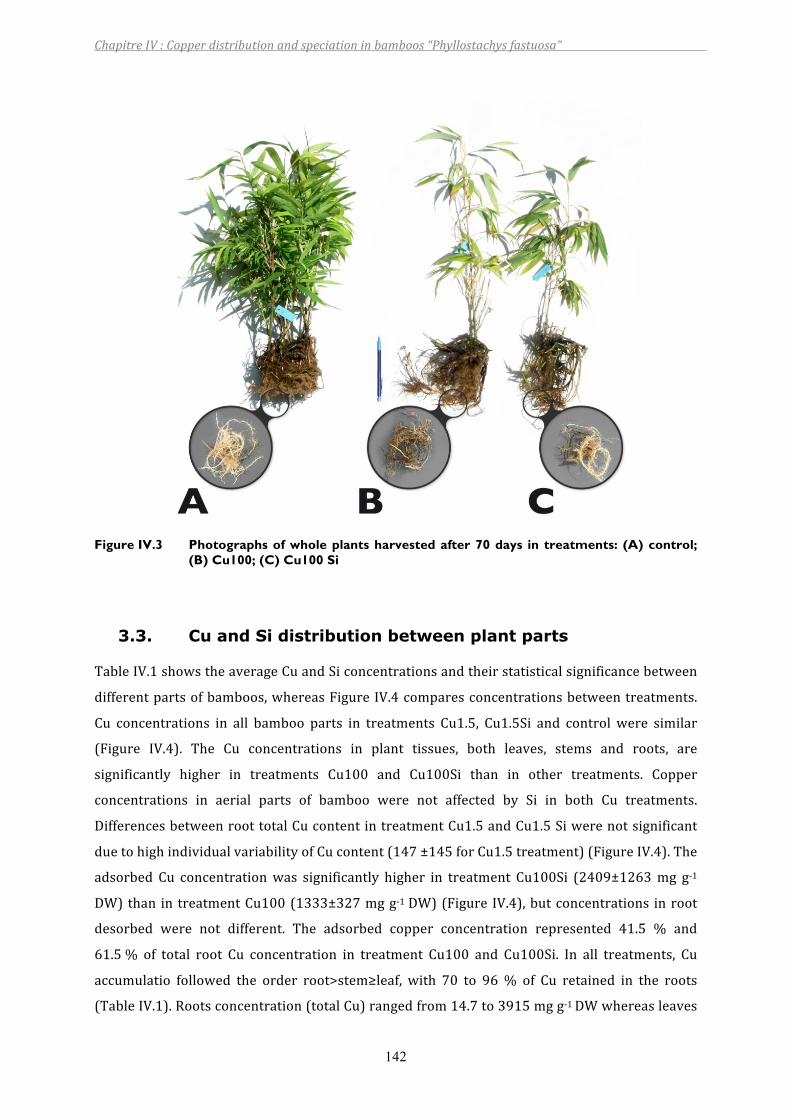
ChapitreIV:Copperdistributionandspeciationinbamboos“Phyllostachysfastuosa”
142
Figure IV.3 Photographs of whole plants harvested after 70 days in treatments: (A) control;
(B) Cu100; (C) Cu100 Si
3.3. Cu and Si distribution between plant parts
TableIV.1showstheaverageCuandSiconcentrationsandtheirstatisticalsignificancebetween
differentpartsofbamboos,whereasFigureIV.4comparesconcentrationsbetweentreatments.
Cu concentrations in all bamboo parts in treatments Cu1.5, Cu1.5Si and control were similar
(Figure IV.4). The Cu concentrations in plant tissues, both leaves, stems and roots, are
significantly higher in treatments Cu100 and Cu100Si than in other treatments. Copper
concentrations in aerial parts of bamboo were not affected by Si in both Cu treatments.
DifferencesbetweenroottotalCucontentintreatmentCu1.5andCu1.5Siwerenotsignificant
duetohighindividualvariabilityofCucontent(147±145forCu1.5treatment)(FigureIV.4).The
adsorbed Cu concentrationwas significantly higher in treatment Cu100Si (2409±1263mg g‐1
DW)than in treatmentCu100(1333±327mgg‐1DW)(Figure IV.4),butconcentrations inroot
desorbed were not different. The adsorbed copper concentration represented 41.5 % and
61.5% of total root Cu concentration in treatment Cu100 and Cu100Si. In all treatments, Cu
accumulatio followed the order root>stem≥leaf, with 70 to 96% of Cu retained in the roots
(TableIV.1).Rootsconcentration(totalCu)rangedfrom14.7to3915mgg‐1DWwhereasleaves
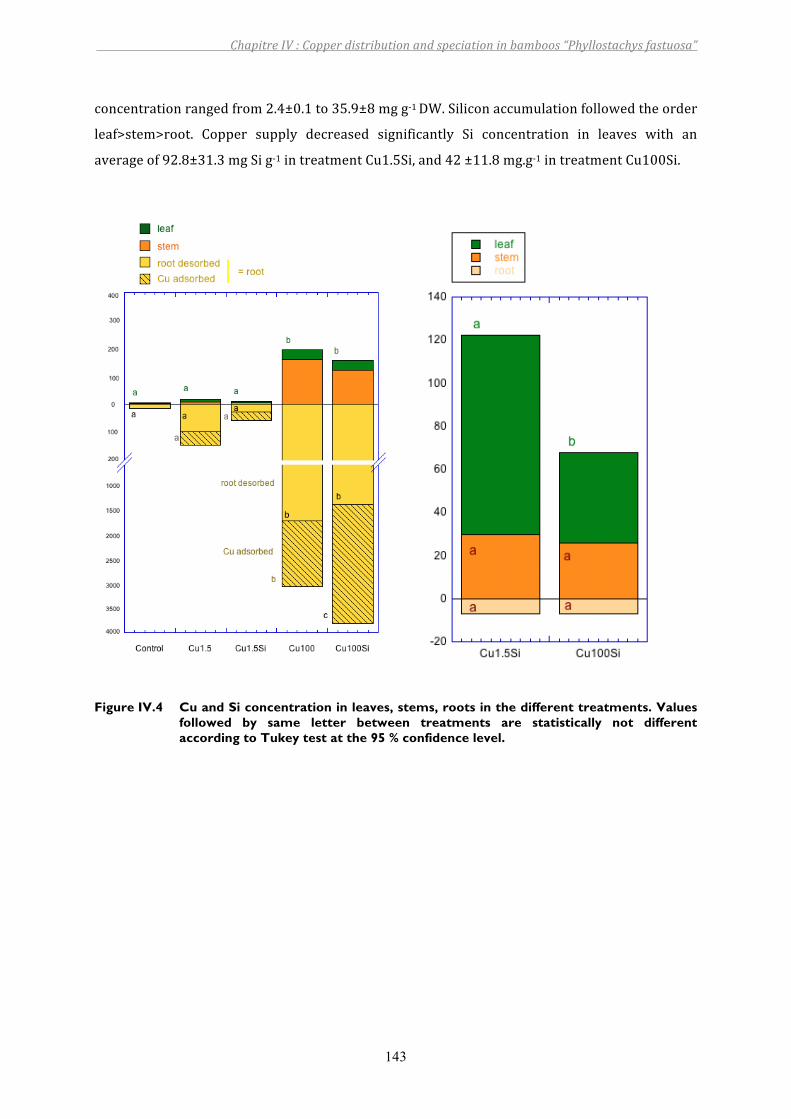
ChapitreIV:Copperdistributionandspeciationinbamboos“Phyllostachysfastuosa”
143
concentrationrangedfrom2.4±0.1to35.9±8mgg‐1DW.Siliconaccumulationfollowedtheorder
leaf>stem>root. Copper supply decreased significantly Si concentration in leaves with an
averageof92.8±31.3mgSig‐1intreatmentCu1.5Si,and42±11.8mg.g‐1intreatmentCu100Si.
Figure IV.4 Cu and Si concentration in leaves, stems, roots in the different treatments. Values
followed by same letter between treatments are statistically not different according to Tukey test at the 95 % confidence level.
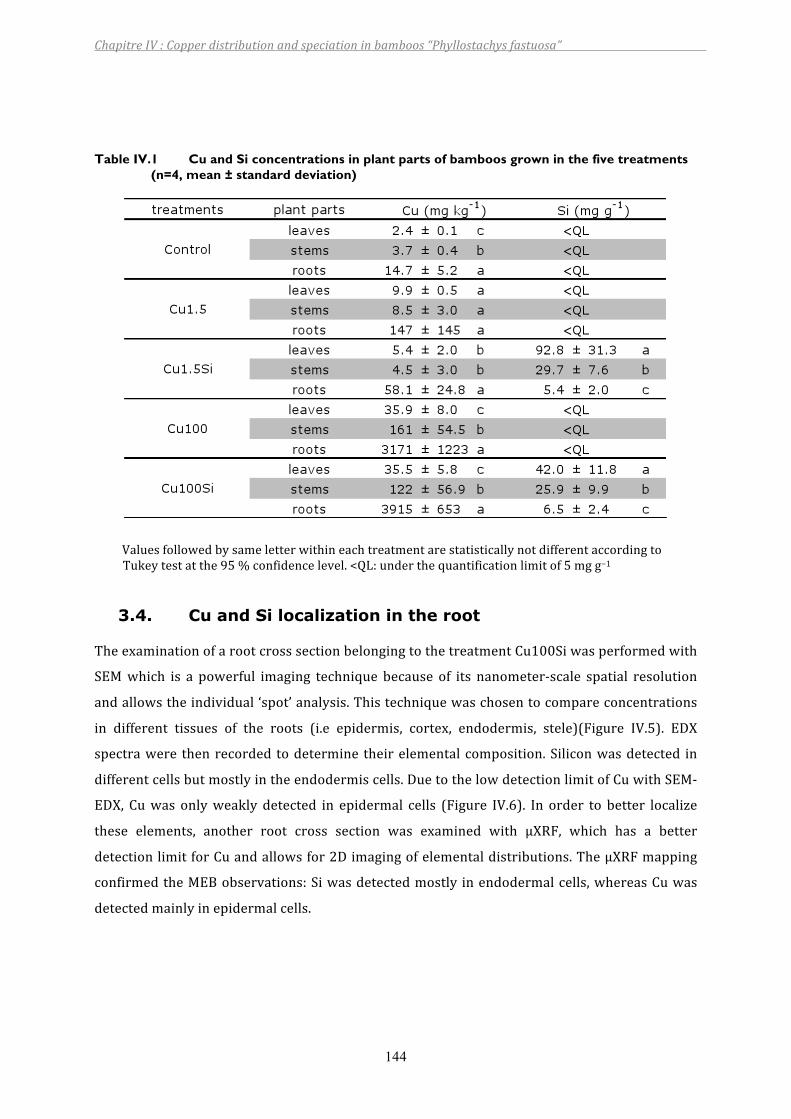
ChapitreIV:Copperdistributionandspeciationinbamboos“Phyllostachysfastuosa”
144
Table IV.1 Cu and Si concentrations in plant parts of bamboos grown in the five treatments (n=4, mean ± standard deviation)
ValuesfollowedbysameletterwithineachtreatmentarestatisticallynotdifferentaccordingtoTukeytestatthe95%confidencelevel.<QL:underthequantificationlimitof5mgg−1
3.4. Cu and Si localization in the root
TheexaminationofarootcrosssectionbelongingtothetreatmentCu100Siwasperformedwith
SEMwhich is a powerful imaging technique because of its nanometer‐scale spatial resolution
andallowstheindividual‘spot’analysis.Thistechniquewaschosentocompareconcentrations
in different tissues of the roots (i.e epidermis, cortex, endodermis, stele)(Figure IV.5). EDX
spectrawere thenrecorded todetermine theirelementalcomposition.Siliconwasdetected in
differentcellsbutmostlyintheendodermiscells.DuetothelowdetectionlimitofCuwithSEM‐
EDX, Cuwas onlyweakly detected in epidermal cells (Figure IV.6). In order to better localize
these elements, another root cross section was examined with μXRF, which has a better
detectionlimitforCuandallowsfor2Dimagingofelementaldistributions.TheµXRFmapping
confirmedtheMEBobservations:Siwasdetectedmostly inendodermalcells,whereasCuwas
detectedmainlyinepidermalcells.
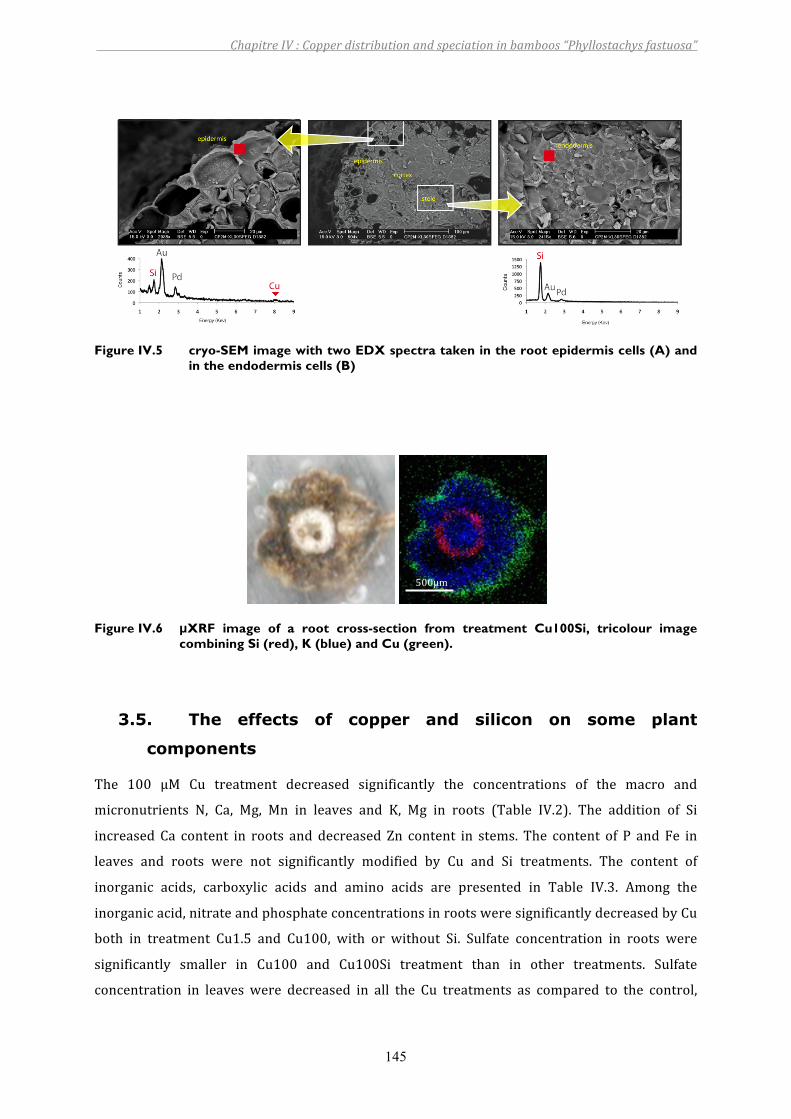
ChapitreIV:Copperdistributionandspeciationinbamboos“Phyllostachysfastuosa”
145
Figure IV.5 cryo-SEM image with two EDX spectra taken in the root epidermis cells (A) and
in the endodermis cells (B)
Figure IV.6 µXRF image of a root cross-section from treatment Cu100Si, tricolour image combining Si (red), K (blue) and Cu (green).
3.5. The effects of copper and silicon on some plant
components
The 100 µM Cu treatment decreased significantly the concentrations of the macro and
micronutrients N, Ca, Mg, Mn in leaves and K, Mg in roots (Table IV.2). The addition of Si
increased Ca content in roots and decreased Zn content in stems. The content of P and Fe in
leaves and roots were not significantly modified by Cu and Si treatments. The content of
inorganic acids, carboxylic acids and amino acids are presented in Table IV.3. Among the
inorganicacid,nitrateandphosphateconcentrationsinrootsweresignificantlydecreasedbyCu
both in treatment Cu1.5 and Cu100, with or without Si. Sulfate concentration in roots were
significantly smaller in Cu100 and Cu100Si treatment than in other treatments. Sulfate
concentration in leaves were decreased in all the Cu treatments as compared to the control,
500µm
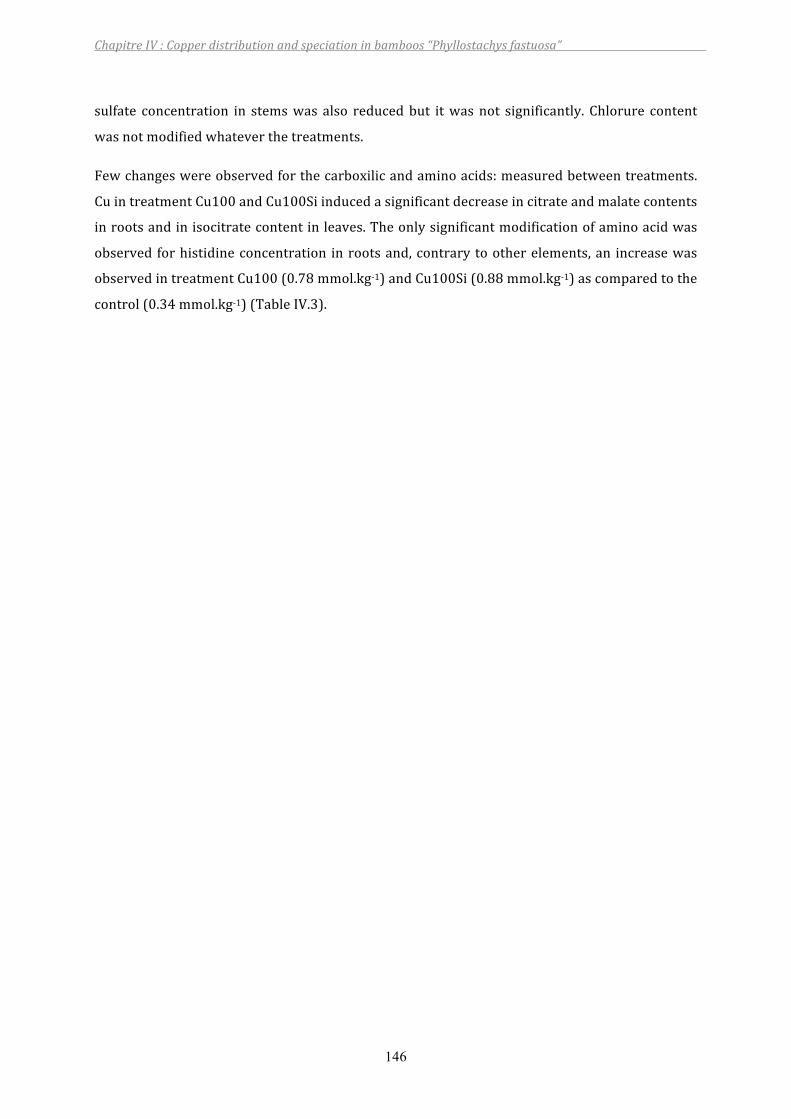
ChapitreIV:Copperdistributionandspeciationinbamboos“Phyllostachysfastuosa”
146
sulfate concentration in stemswas also reducedbut itwasnot significantly. Chlorure content
wasnotmodifiedwhateverthetreatments.
Fewchangeswereobservedforthecarboxilicandaminoacids:measuredbetweentreatments.
CuintreatmentCu100andCu100Siinducedasignificantdecreaseincitrateandmalatecontents
inrootsandinisocitratecontentinleaves.Theonlysignificantmodificationofaminoacidwas
observed forhistidineconcentration inrootsand,contrarytootherelements,an increasewas
observedintreatmentCu100(0.78mmol.kg‐1)andCu100Si(0.88mmol.kg‐1)ascomparedtothe
control(0.34mmol.kg‐1)(TableIV.3).
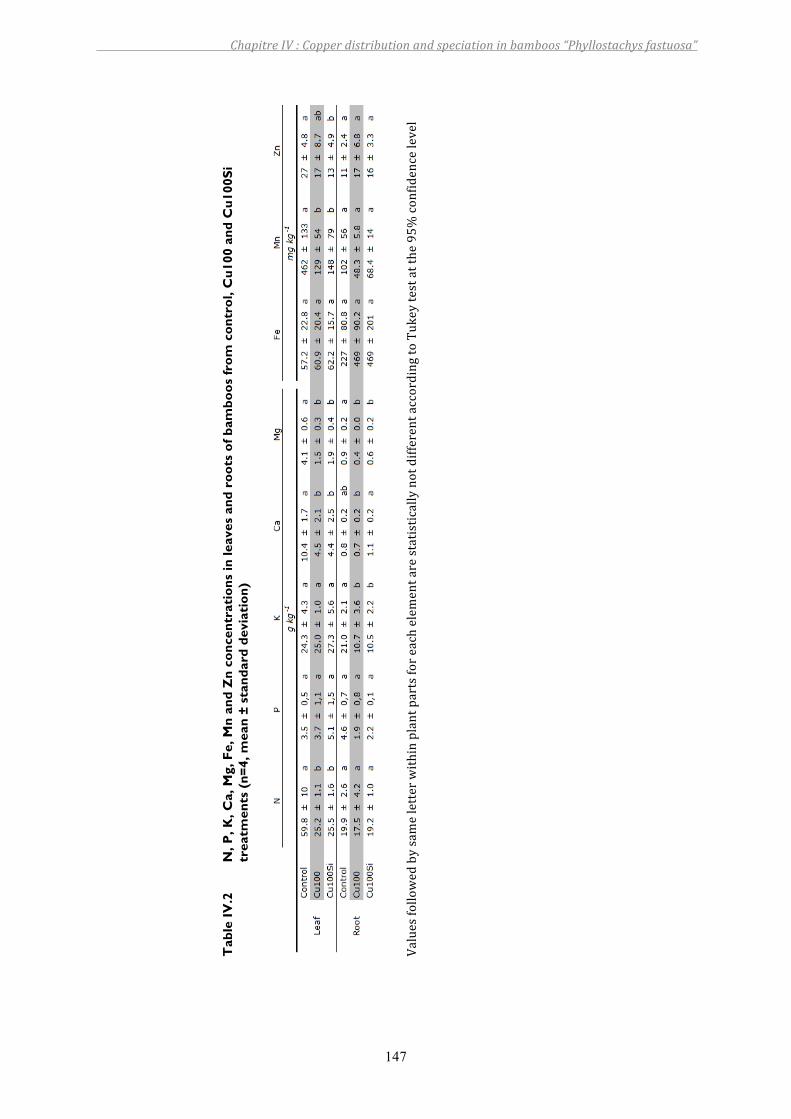
ChapitreIV:Copperdistributionandspeciationinbamboos“Phyllostachysfastuosa”
147
Tab
le IV
.2
N, P
, K, C
a, M
g, F
e, M
n an
d Z
n co
ncen
trat
ions
in le
aves
and
roo
ts o
f bam
boos
from
con
trol
, Cu1
00 a
nd C
u100
Si
trea
tmen
ts (
n=4,
mea
n ±
stan
dard
dev
iati
on)
Valuesfollowedbysameletterwithinplantpartsforeachelem
entarestatisticallynotdifferentaccordingtoTukeytestatthe95%
confidencelevel
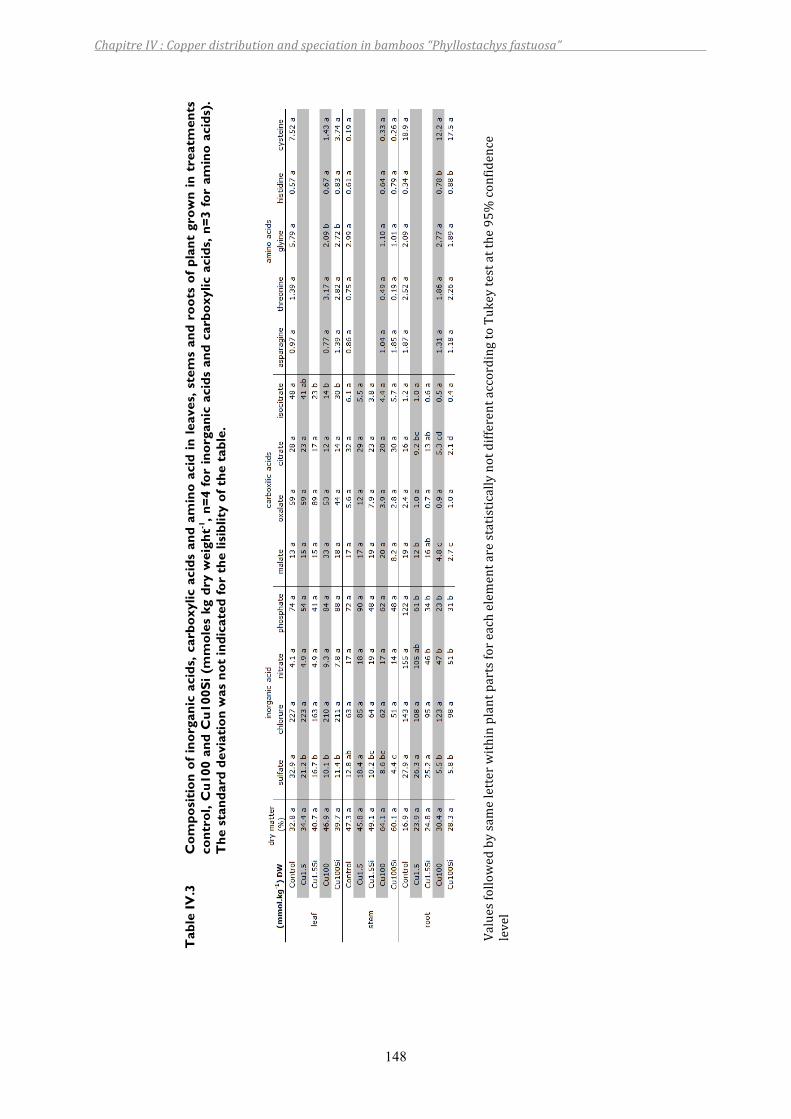
ChapitreIV:Copperdistributionandspeciationinbamboos“Phyllostachysfastuosa”
148
Tab
le IV
.3
Com
posi
tion
of
inor
gani
c ac
ids,
car
boxy
lic a
cids
and
am
ino
acid
in le
aves
, ste
ms
and
root
s of
pla
nt g
row
n in
tre
atm
ents
co
ntro
l, C
u100
and
Cu1
00Si
(m
mol
es k
g dr
y w
eigh
t-1, n
=4 f
or in
orga
nic
acid
s an
d ca
rbox
ylic
aci
ds, n
=3 f
or a
min
o ac
ids)
. T
he s
tand
ard
devi
atio
n w
as n
ot in
dica
ted
for
the
lisib
lity
of t
he t
able
.
Valuesfollowedbysameletterwithinplantpartsforeachelem
entarestatisticallynotdifferentaccordingtoTukeytestatthe95%
confidence
level
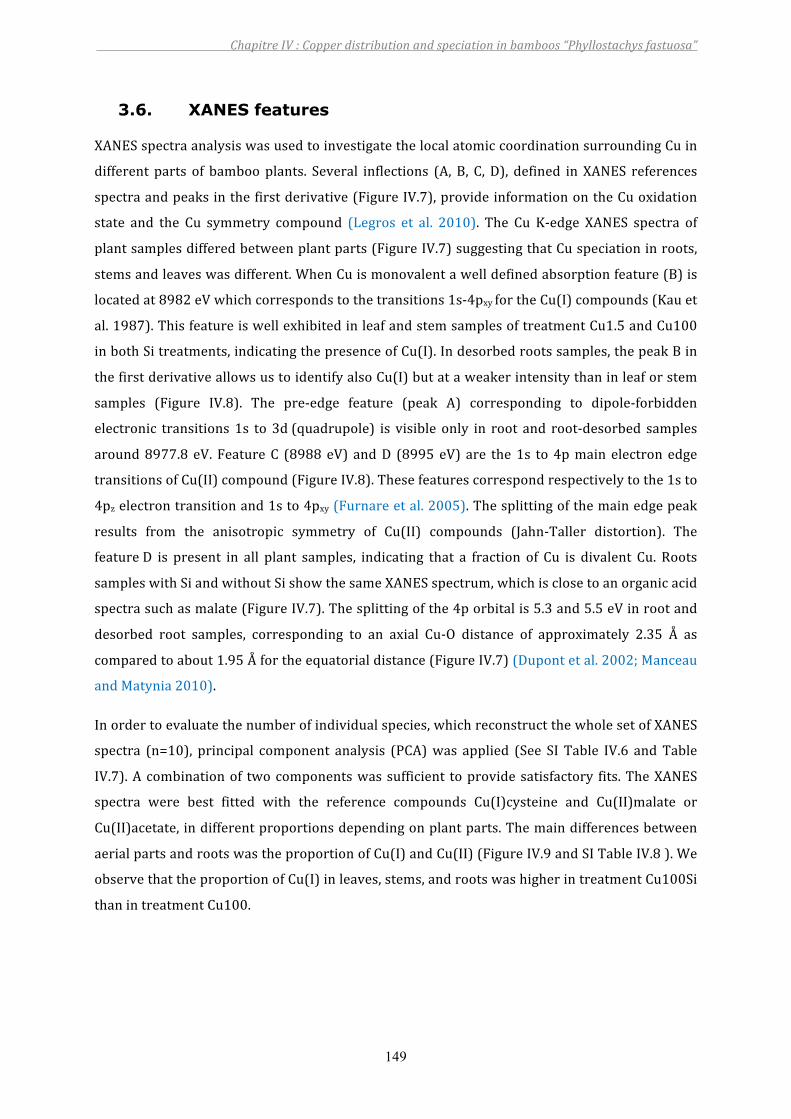
ChapitreIV:Copperdistributionandspeciationinbamboos“Phyllostachysfastuosa”
149
3.6. XANES features
XANESspectraanalysiswasusedtoinvestigatethelocalatomiccoordinationsurroundingCuin
different parts of bambooplants. Several inflections (A, B, C,D), defined in XANES references
spectraandpeaksinthefirstderivative(FigureIV.7),provideinformationontheCuoxidation
state and the Cu symmetry compound (Legros et al. 2010). The Cu K‐edge XANES spectra of
plantsamplesdifferedbetweenplantparts(FigureIV.7)suggestingthatCuspeciationinroots,
stemsandleaveswasdifferent.WhenCuismonovalentawelldefinedabsorptionfeature(B)is
locatedat8982eVwhichcorrespondstothetransitions1s‐4pxyfortheCu(I)compounds(Kauet
al.1987).ThisfeatureiswellexhibitedinleafandstemsamplesoftreatmentCu1.5andCu100
inbothSitreatments,indicatingthepresenceofCu(I).Indesorbedrootssamples,thepeakBin
thefirstderivativeallowsustoidentifyalsoCu(I)butataweakerintensitythaninleaforstem
samples (Figure IV.8). The pre‐edge feature (peak A) corresponding to dipole‐forbidden
electronic transitions1s to 3d(quadrupole) is visible only in root and root‐desorbed samples
around8977.8 eV. FeatureC (8988eV) andD (8995eV) are the1s to4pmain electronedge
transitionsofCu(II)compound(FigureIV.8).Thesefeaturescorrespondrespectivelytothe1sto
4pzelectrontransitionand1sto4pxy(Furnareetal.2005).Thesplittingofthemainedgepeak
results from the anisotropic symmetry of Cu(II) compounds (Jahn‐Taller distortion). The
featureD is present in all plant samples, indicating that a fraction of Cu is divalent Cu. Roots
sampleswithSiandwithoutSishowthesameXANESspectrum,whichisclosetoanorganicacid
spectrasuchasmalate(FigureIV.7).Thesplittingofthe4porbitalis5.3and5.5eVinrootand
desorbed root samples, corresponding to an axial Cu‐O distance of approximately 2.35 Å as
comparedtoabout1.95Åfortheequatorialdistance(FigureIV.7)(Dupontetal.2002;Manceau
andMatynia2010).
Inordertoevaluatethenumberofindividualspecies,whichreconstructthewholesetofXANES
spectra (n=10), principal component analysis (PCA)was applied (See SI Table IV.6 andTable
IV.7).Acombinationof twocomponentswassufficient toprovidesatisfactory fits.TheXANES
spectra were best fitted with the reference compounds Cu(I)cysteine and Cu(II)malate or
Cu(II)acetate,indifferentproportionsdependingonplantparts.Themaindifferencesbetween
aerialpartsandrootswastheproportionofCu(I)andCu(II)(FigureIV.9andSITableIV.8).We
observethattheproportionofCu(I)inleaves,stems,androotswashigherintreatmentCu100Si
thanintreatmentCu100.
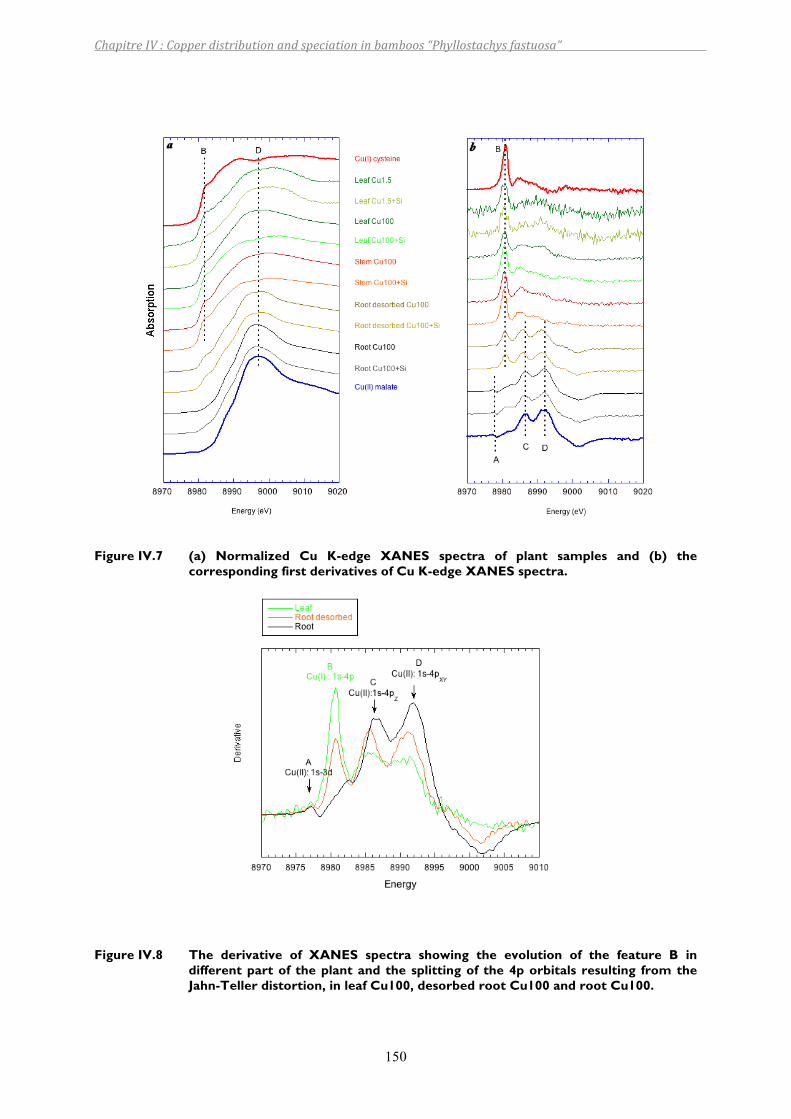
ChapitreIV:Copperdistributionandspeciationinbamboos“Phyllostachysfastuosa”
150
Figure IV.7 (a) Normalized Cu K-edge XANES spectra of plant samples and (b) the
corresponding first derivatives of Cu K-edge XANES spectra.
Figure IV.8 The derivative of XANES spectra showing the evolution of the feature B in
different part of the plant and the splitting of the 4p orbitals resulting from the Jahn-Teller distortion, in leaf Cu100, desorbed root Cu100 and root Cu100.
ChapitreIV:Copperdistributionandspeciationinbamboos“Phyllostachysfastuosa”
151
Figure IV.9 Proportions of Cu(I) and Cu(II) determined by LCF on XANES spectra. The
proportions were adjusted to reach 100 %.
3.7. EXAFS features
To gain more insight into the molecular structure of Cu in plant, the EXAFS Spectra were
compared (Figure IV.10)with two reference compounds that have coordination shells: Cu(I)‐
cysteine and Cu(II)‐malate. For Cu(I)‐cysteine, Cuwas surrounded by S atoms located 2.34 Å
fromthecentralatom(Cu‐Sbinding),whereasforCu(II)‐malate,CuwasboundtofourOatoms
at a distance ranging from 1.95 to 1.97 Å (Cu‐O binding). This was reflected on the EXAFS
spectra of these reference compounds by out‐of‐phase oscillations and by RDF peaks, for the
firstcoordinationshell,whichwasshiftedto1.9ÅforCu(I)‐cysteine(featureD)andto1.4Åfor
Cu(II)‐malate (feature C) (distances uncorrected for phase shifts). The leaf and stem EXAFS
spectra(FigureIV.10)showedoscillationssimilartoCu(I)‐cysteineat6.2and7.7Å‐1(featureA),
whereasrootsspectrashowedoscillationssimilartoCu(II)‐malateat6.5and8.5Å‐1(featureB).
ComparingtheEXAFSspectra,wedetectedashiftfromadominantCu‐Obindingpattern(root)
to a dominant Cu‐S binding pattern (leaves). This pattern was clearly expressed by the RDF
pattern. The peak at 1.4 Å (uncorrected for phase shifts) was dominant in roots and its
amplitudegraduallydecreasedintheaerialpartofbamboos,whereastheintensityofthepeak
at1.9Å(uncorrectedforphaseshifts)increased.ThereforeEXAFSspectraconfirmthatdifferent
typesofligandsareinvolvedinmetalcomplexationinvariouspartsoftheplant.
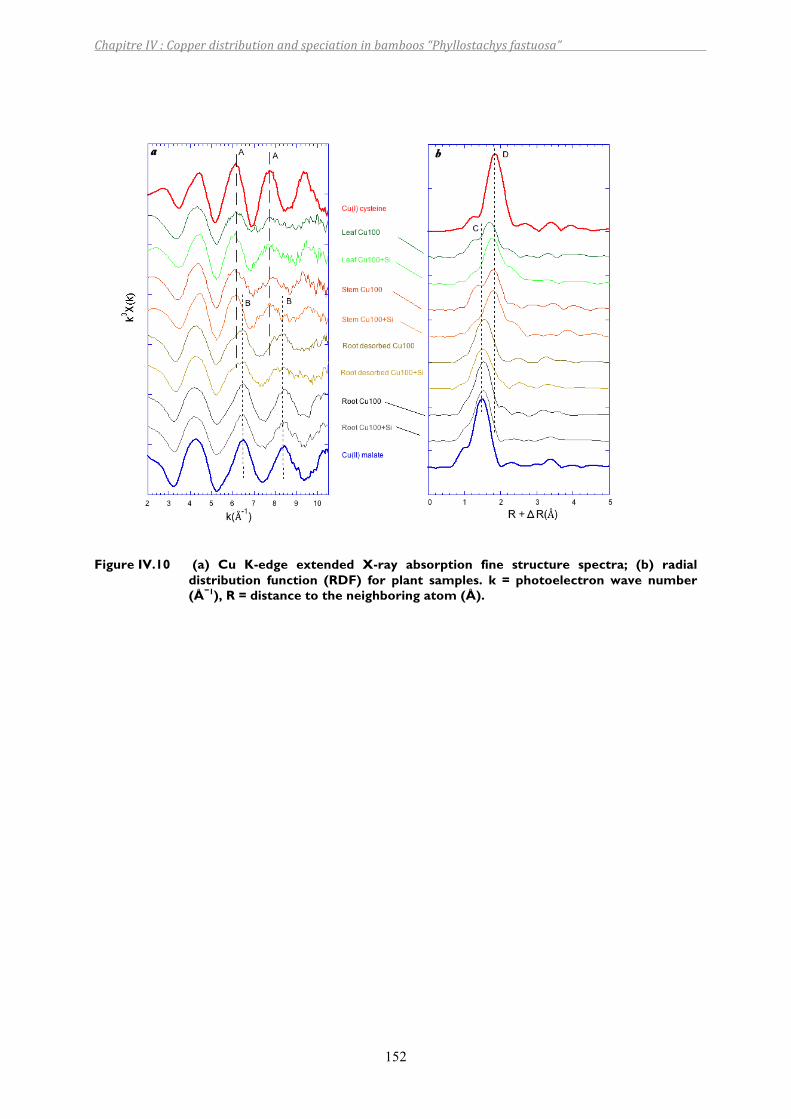
ChapitreIV:Copperdistributionandspeciationinbamboos“Phyllostachysfastuosa”
152
Figure IV.10 (a) Cu K-edge extended X-ray absorption fine structure spectra; (b) radial
distribution function (RDF) for plant samples. k = photoelectron wave number (Å−1), R = distance to the neighboring atom (Å).
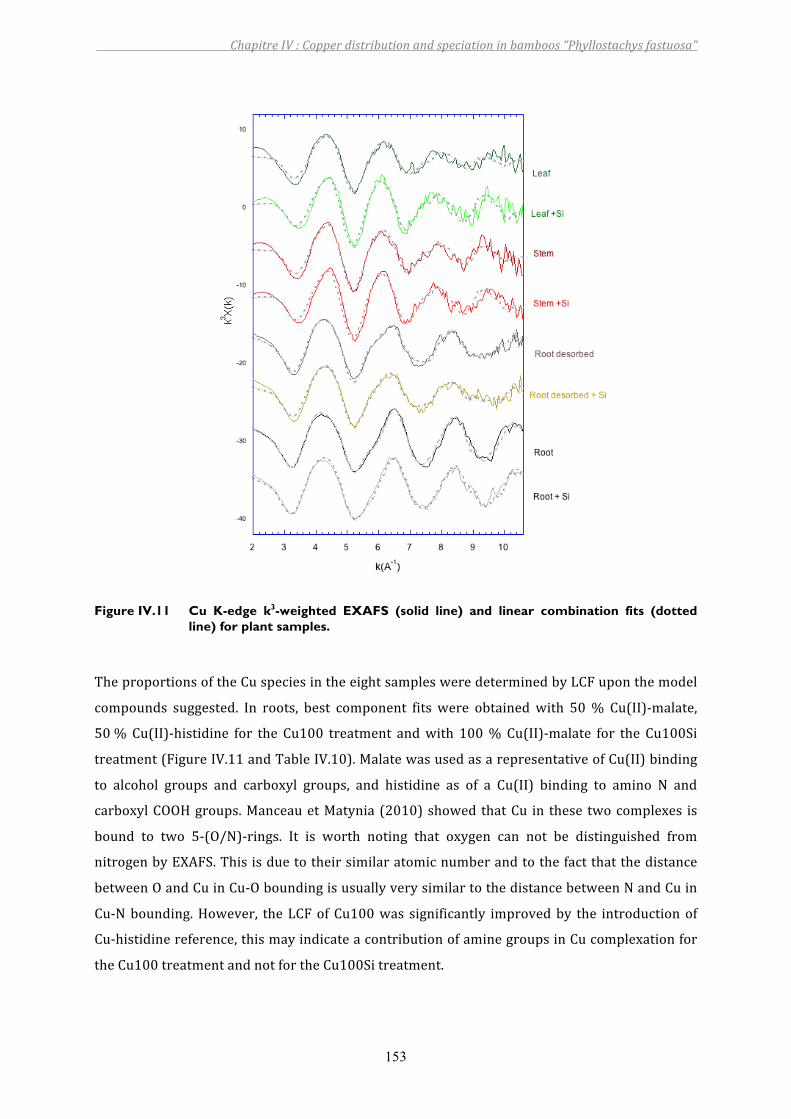
ChapitreIV:Copperdistributionandspeciationinbamboos“Phyllostachysfastuosa”
153
Figure IV.11 Cu K-edge k3-weighted EXAFS (solid line) and linear combination fits (dotted
line) for plant samples.
TheproportionsoftheCuspeciesintheeightsamplesweredeterminedbyLCFuponthemodel
compounds suggested. In roots, best component fits were obtainedwith 50% Cu(II)‐malate,
50%Cu(II)‐histidine for the Cu100 treatment andwith 100%Cu(II)‐malate for the Cu100Si
treatment(FigureIV.11andTableIV.10).MalatewasusedasarepresentativeofCu(II)binding
to alcohol groups and carboxyl groups, and histidine as of a Cu(II) binding to amino N and
carboxylCOOHgroups.ManceauetMatynia (2010)showedthatCu in these twocomplexes is
bound to two 5‐(O/N)‐rings. It is worth noting that oxygen can not be distinguished from
nitrogenbyEXAFS.Thisisduetotheirsimilaratomicnumberandtothefactthatthedistance
betweenOandCuinCu‐OboundingisusuallyverysimilartothedistancebetweenNandCuin
Cu‐Nbounding.However, theLCFofCu100was significantly improvedby the introductionof
Cu‐histidinereference,thismayindicateacontributionofaminegroupsinCucomplexationfor
theCu100treatmentandnotfortheCu100Sitreatment.
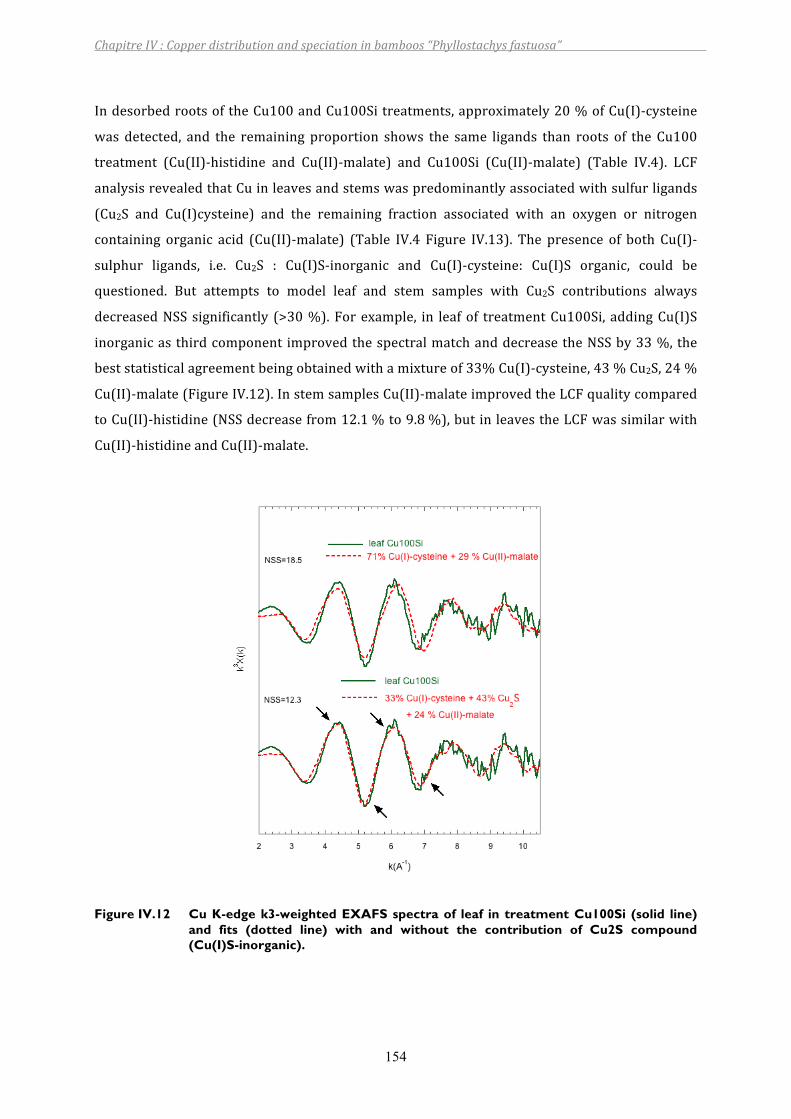
ChapitreIV:Copperdistributionandspeciationinbamboos“Phyllostachysfastuosa”
154
IndesorbedrootsoftheCu100andCu100Sitreatments,approximately20%ofCu(I)‐cysteine
was detected, and the remaining proportion shows the same ligands than roots of the Cu100
treatment (Cu(II)‐histidine and Cu(II)‐malate) and Cu100Si (Cu(II)‐malate) (Table IV.4). LCF
analysisrevealedthatCuinleavesandstemswaspredominantlyassociatedwithsulfurligands
(Cu2S and Cu(I)cysteine) and the remaining fraction associated with an oxygen or nitrogen
containing organic acid (Cu(II)‐malate) (Table IV.4 Figure IV.13). The presence of both Cu(I)‐
sulphur ligands, i.e. Cu2S : Cu(I)S‐inorganic and Cu(I)‐cysteine: Cu(I)S organic, could be
questioned. But attempts to model leaf and stem samples with Cu2S contributions always
decreasedNSSsignificantly (>30%).Forexample, in leafof treatmentCu100Si, addingCu(I)S
inorganicasthirdcomponent improvedthespectralmatchanddecreasetheNSSby33%,the
beststatisticalagreementbeingobtainedwithamixtureof33%Cu(I)‐cysteine,43%Cu2S,24%
Cu(II)‐malate(FigureIV.12).InstemsamplesCu(II)‐malateimprovedtheLCFqualitycompared
toCu(II)‐histidine(NSSdecreasefrom12.1%to9.8%),butinleavestheLCFwassimilarwith
Cu(II)‐histidineandCu(II)‐malate.
Figure IV.12 Cu K-edge k3-weighted EXAFS spectra of leaf in treatment Cu100Si (solid line)
and fits (dotted line) with and without the contribution of Cu2S compound (Cu(I)S-inorganic).
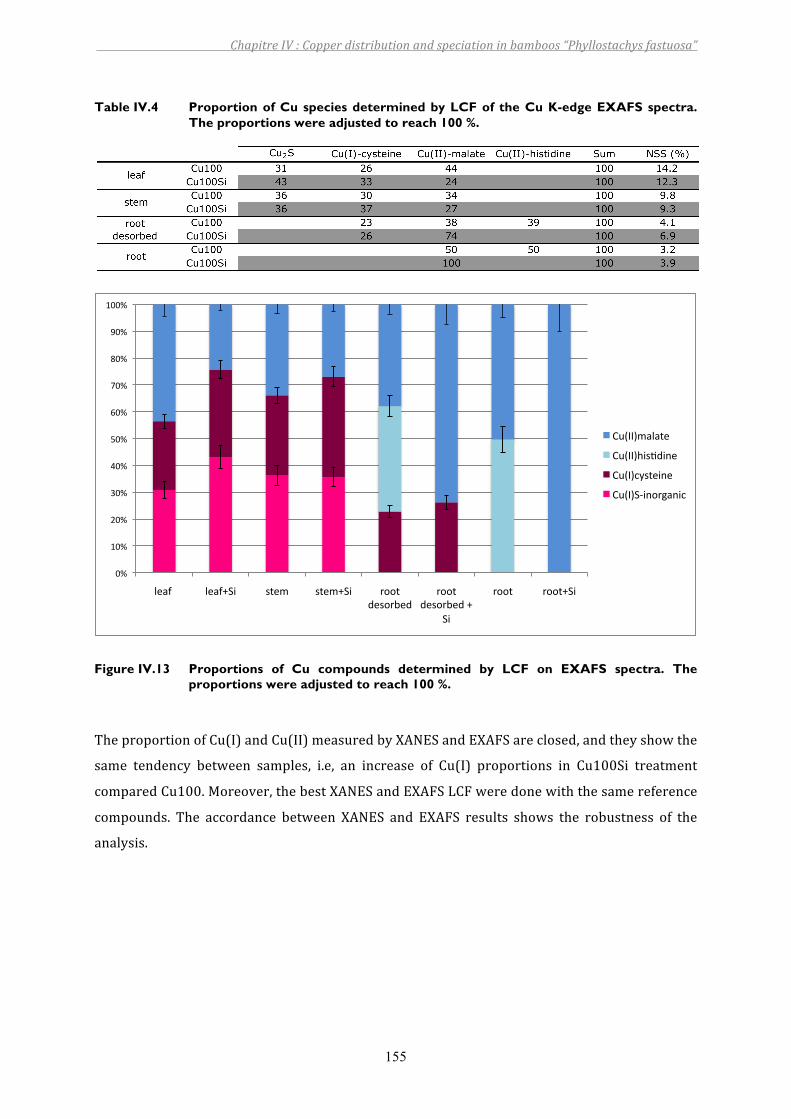
ChapitreIV:Copperdistributionandspeciationinbamboos“Phyllostachysfastuosa”
155
Table IV.4 Proportion of Cu species determined by LCF of the Cu K-edge EXAFS spectra. The proportions were adjusted to reach 100 %.
Figure IV.13 Proportions of Cu compounds determined by LCF on EXAFS spectra. The
proportions were adjusted to reach 100 %.
TheproportionofCu(I)andCu(II)measuredbyXANESandEXAFSareclosed,andtheyshowthe
same tendency between samples, i.e, an increase of Cu(I) proportions in Cu100Si treatment
comparedCu100.Moreover,thebestXANESandEXAFSLCFweredonewiththesamereference
compounds. The accordance between XANES and EXAFS results shows the robustness of the
analysis.
!"#
$!"#
%!"#
&!"#
'!"#
(!"#
)!"#
*!"#
+!"#
,!"#
$!!"#
-./0## -./0123# 45.6# 45.6123# 7885#
9.487:.9#
7885#
9.487:.9#1#
23#
7885# 7885123#
;<=>>?6/-/5.#
;<=>>?@34A93B.#
;<=>?CD45.3B.#
;<=>?2E3B87F/B3C#
ChapitreIV:Copperdistributionandspeciationinbamboos“Phyllostachysfastuosa”
156
4. DISCUSSION
ThebambooPhyllostachysfastuosaexposedtoaCuconcentrationof1.5µMCu2+inhydroponics
did not express any toxicity symptoms. This result is in accordancewith the tolerance of the
bambooGigantocloasp.“Malaydwarf”exposedtothesameCucontentinaprevioushydroponic
study (Collin et al., Chap III). Therefore, monopodial bamboos Phyllostachys fastuosa and
sympodial bamboos Gigantocloa sp. “Malay dwarf” seem to have the same ability to tolerate
copper.Thisnon‐toxicitydiffers fromobservedtoxicity inhydroponiccultureofdurumwheat
(Bravin et al. 2010) and Sabi Grass (Kopittke et al. 2009) for similar Cu contents. Cu
concentrationinleaves,stemsandrootsincontrolandtreatmentCu1.5andCu1.5Siwerenot
significantlydifferentandthemeansrangedfrom2.4mgkg‐1 in leavesto147mgkg‐1 inroots
(TableIV.1),whichisclosertotheCuconcentrationmeasuredinGigantocloasp.“Malaydwarf”
exposed to1.5µM: 16.6mgkg‐1 in leavesand131mgkg‐1 in roots (Collinet al.Chap III).Cu
contentinleavesandstemsareclosedtothoseofseveralbamboospeciesinanon‐contaminated
soil:3.5and4.5instembaseandtipand5.1mgkg‐1inleaf(Collinetal.2011).Withtheaddition
of100µMCu2+ insolution,Cucontent in leaveshadanaverageof35.9and35.5mgkg‐1anda
rootaverageof3171and3915mgkg‐1inthetreatmentCu100andCu100Sirespectively(Table
IV.1),whichisthehighestCucontentreportedsofarinbambooplants(Collinetal.2011,Collin
et al, chap III). These concentrations are above the toxic thresholds of 20‐30 mg kg‐1 DW
proposed by Marschner (1995) and above the critical root concentration of 250‐300mg.kg‐1
measuredindurumwheat(Michaudetal.2008).WhatevertheSisupplementation,weobserved
strongphytotoxicitysymptomsasevidencedbythebiomassdecrease(FigureIV.2).InbothCu
treatments, Si supplementation did not significantly modify the absorption of Cu whereas Si
concentrations in bamboos parts were increased. However, visual symptoms (chlorosis and
brown coloration of roots) were reduced by the Si supplementation. The measured Si
concentrationinleavesofPhyllostachysfastuosa(averageof92.8mg.g‐1,TableIV.1)wassmaller
than Si concentration measured in a previous hydroponic study with the same Si content in
solution for the bamboo Gigantocloa sp “Malay Dwarf” (179mg.g‐1, Collin et al, chap III).
Bamboos are known to accumulate Si throughout their live (Motomura et al. 2004), thus this
differencemaybeexplainedbythesmallerdurationofthisstudy(3months)ascomparedtothe
previous8monthsstudyofCollinetal.(ChapIII).
Toxic metal may interfere with essential nutrient uptake and transport, thereby disturbing
mineralnutritioncomposition. Inourstudy,CureducedtheuptakeofN,Ca,Mg,K,MnandZn
(Table IV.2) in treatment Cu100 and Cu100Si. It is generally accepted that damage to the
ChapitreIV:Copperdistributionandspeciationinbamboos“Phyllostachysfastuosa”
157
plasmalemmaofrootcellsconstitutesthefirsteffectofCutoxicitybycausingalossofions,such
asKorothersolutes(DeVosetal.1991).ThestrongdecreaseofNconcentrationinleavesand
NO3‐inroots(TableIV.2andTableIV.3)showsthatexcessiveCuaffectednitrogenandprotein
metabolisminplants.TheseobservationsareconsistentwiththedecreaseofNO32‐,aminoacids
andproteincontentinducedbyexcessCuinE.haichowensis(Lietal.2007)andinSilenevulgaris
(Weberetal.1991).
ThemajorityofCuwasstoredor immobilized inbambooroots,andonlya little fraction(4 to
30%)of total Cuwas translocated from the root to aerial parts (Figure IV.4). Thedesorption
procedurehas shown that the fractionadsorbed, i.e. stored in theapoplast, represented42%
and 61.5 % of total root Cu concentration in respectively treatments Cu100 and Cu100Si.
Moreover, the examination of a root cross‐section by SEM‐EDX and µXRF, revealed that
substantialdepositionofCuoccurredintheepidermalregion.Thisresultis inagreementwith
severalstudiesusingdifferentapproaches:Cuanalysesafterisolatingthecellwalls(Konnoetal.
2010;Louetal.2004;Nishizonoetal.1987),observationandanalysesbySEM‐EDX(Brunneret
al. 2008; MacFarlane and Burchett 2000), localization using synchrotron‐based X‐ray
fluorescencemicroscopy(Kopittkeetal.2011).Inaprevioushydroponicstudywiththebamboo
Gigantocloasp“MalayDwarf”,weobservedahighandrapiddecreaseofCucontentinsolution
duringthefirsthoursafternutrientsolutionrenewal.Inthisstudyweconfirmthebehaviourof
Cu insolution,whichdecreasedsharplyduring the firstday inbothCu treatments.Therefore,
the desorption procedure, the localization, and the evolution of Cu in the nutrient solution
indicate the important role of Cu adsorption in bamboo roots. The ability of bamboo roots to
bind Cu2+ has been suggested for a use as an adsorbent for the removal of Cu inwastewater
(Babatundeet al. 2009).The cellwallsofplantshave theability tobind copperonnegatively
charged sites, mainly on polysaccharide compounds rich in carboxyl groups (Krzeslowska
2011). The binding to plant cell walls may be a mechanism of heavy metal tolerance and a
defensivestrategyofplantstometalstress(Krzeslowska2011;Nishizonoetal.1987).
The localisation of Si within root tissue, mainly in the region of endodermal cells, is in
accordancewithSEMobservationsinthebambooPhyllostachysheterocycla(Luxetal.2003)and
Sidepositioninotherpoaceaespecies(Hattorietal.2003;Sparksetal.2011).Endodermalcells
are directly connectedwith the Casparian stripswhich provide selectivity againstmetalwith
reduced concentration entering the stele of root (MacFarlane and Burchett 2000). It is
hypothesized that silica deposits in the endodermis cellwall alongwith the thickening of the
Casparianstripsisoneofthemechanismsthatreducethemetalsapoplastictransport(daCunha
anddoNascimento2009).Thiswouldbeexplainedbyaco‐precipitationofSiandmetalinthe
endodermandbyareductioninthetranspirationby‐passflowinducedbytheSideposition(Shi
ChapitreIV:Copperdistributionandspeciationinbamboos“Phyllostachysfastuosa”
158
etal.2005).Inthepresentstudy,CuwasnotdetectedintheendodermisandCuconcentration
in aerial partwas not affected by Si supplementation. Despite the important Si deposition in
endodermis,thereductionofapoplasticby‐passofCuandaco‐precipitationdoesnotseemtobe
arelevantmechanismhere.
ThequantityofadsorbedCuissignificantlyhigherintreatmentCu100SithantreatmentCu100.
Another hypothesis to explain the alleviation of excess metal is the mediation of the metal
binding to the cell wall, thereby lowering the symplasmic concentration while the total
concentrationwas the same. Thismechanism has been proposed for the Si alleviation ofMn
toxicityinCucumissativus(RogallaandRomheld2002).MorerecentlyLietal.(2008)suggested
thatSidecreasesCutoxicitybyitssequestrationincellwalls inArabidopsisthaliana.Asimilar
mechanism may occur in bamboo roots since Cu speciation in roots is influenced by the
presenceofSiinnutrientsolution:Cuisboundto50%Cu(II)malate‐likecompoundsand50%
Cu(II)histidine‐like compounds in the treatment Cu100, whereas Cu is entirely bound to
Cu(II)malate‐like compounds in treatment Cu100Si (Table IV.3). In rice, Wang et al. (2004)
suggested the formationofAl‐Si complexes as amechanism for the sequestrationofAl into a
non‐phytotoxic form. But if Si seems to affect Cu speciation, Si was not detected in the local
environmentofCu,contrarytowhatwassuggestedforAl‐Siinriceroots(Wangetal.2004).
XAS results on desorbed roots confirmed that a significant part of Cu in roots (≈40%Figure
IV.9)ispresentasCu(I).WeexplainedthefactthatCu(I)washigherindesorbedrootcompared
toroot,becauseitssignaturewasdilutedbythehighamountofCu(II)presentintheadsorbed
pool.AsCu is known tobe a redox activemetal in plants, thepresenceof the twooxidations
stateinplanttissueisinlinewithphysiologicalstudies(Yruela2009).Coppermaybereduced
before its acquisition by root cells, or Cumay be reduced in the cytoplasm after acquisition,
eitherchemically,metabolisedenzymaticallyorbycellmacro‐molecules(Meharg2005).Ithas
beenshown,inArabidospisthaliana,thatCuismostlikelytoenterthecytosolofrootcellsviaa
cellsurfaceCOPT‐familytransporter(Sancenonetal.2003).TheCOPTproteinstransportCuin
a reduced form, so a reduction step may be necessary at the cell surface. The prevaling
hypothesis is that the Cu(II) would be reduced before by root cell surface ferric reductase
(Mukherjeeetal.2006;Welchetal.1993).Besides,noevidenceofaCureductionbyaplasma
membranereductaseinpoaceaehasbeenshownyet.TheresultofthisstudyshowsthatCu(I)is
foundinrootsbutasCuspeciationwasanalyzedonabulkofroots,wecannotassesswhether
reduction occured at the root surface, in the apoplast or in the symplast. Cu(I) is also
translocatedtostemsandleaveswhereitrepresentsfrom63to85%basedonXANESresults.
InpreviousXASstudy,Cu(I)wasdetectedinCreosotebush(Zygophyllaceae)(Poletteetal.2000)
andThalspi caerulescens (Brassicaceae) (Mijovilovich et al. 2009), and in small proportions in
ChapitreIV:Copperdistributionandspeciationinbamboos“Phyllostachysfastuosa”
159
Elsholtziasplendens(Laminaceae)(Shietal.2008)butourresultsarethefirstevidenceforthe
presenceofCu(I)inthetissuesofamonocotyledonspecies.
In treatments Cu100 and Cu100Si, the EXAFS LCF results indicate that Cu was bound to S‐
containing ligands, in two different types of complexes: Cu(I)S‐organic and Cu(I)S‐inorganic
(FigureIV.13).CopperfromCu(I)S‐organiccomplexcanoriginatedfromthiolgroupspresenton
cysteineormethionineligand.TheconsiderablecontentofS‐containgligandstobindCumaybe
correlated to the decrease of sulfate content in bamboo leaves, stems and roots (Table IV.3),
indeed inorganic S is converted to nutritionally and functionally important S‐containing
compounds and their synthesis might be a major factor in plant stress‐defense (Sirko et al.
2007). Several cysteine‐rich binding ligands are involved in the homeostasie, transport and
tolerance mechanisms of Cu, namely opper chaperones, Glutathione (GSH), Phytochelatines
(PCs) and Metallothioneins (MTs). Copper chaperones are involved in the intracellular
trafficking ofmetal ions and insert the Cu into the active sites of specific proteins (Gonzalez‐
GuerreroandArguello2008).GSHandPCsmaybeinvolvedinhomeostasisandinCutransport
both in the phloem (Mendoza‐Cozatl et al. 2008) and xylem (Wei et al. 2007). PCs play an
important role in Cu toxicity by forming stable Cu complexes (Clemens 2006; Cobbett and
Goldsbrough2002;Qianetal.2005).MetallothioneinsarealsoinvolvedinCuhomeostasisand
Cu tolerance of Arabidopsis thaliana (Guo et al. 2008; Roosens et al. 2004). Therefore the
strategy of bamboo to cope with Cu is the internal Cu sequestration by S‐rich ligands and
probablymanyof them.ThehigherproportionofCu(I)S‐compoundinaerialpart isconsistent
withthefindingofQianetal.(2005)whichshowsthatPCshaveamoreactiveroleintheleaves
thanintheroots.
ThepresenceofaCu(I)Sinorganicligandismoresurprising,andrevealthepresenceofanother
Cu S‐rich complex. To our knowledge, this is the first time that a Cu(I)S inorganic phase is
described.Mineralizationcouldbeadefenseagainsttoxiccopper,butreportsofCubiominerals
arerare:coppersulfidemineralizationinyeast(Yuetal.1996),copperoxalateinlichens(Purvis
etal.2008),infungus(Fominaetal.2005)andinThalspicaerulescens(Mijovilovichetal.2009).
It has been shown that in plants cadmium may be stored in a stable high‐molecular weight
complex that contains Cd, PCs and sulfides (Pickering et al. 1999; Reese et al. 1992). Some
complexeswithhighCdratiosconsistofaggregatedparticleswhichthemselvesconsistofCdS
crystallite core coatedwith PCs (Bae andMehra 1998; Dameron andWinge 1990).We could
makethehypothesisthatasimilarprocessoccurswithCuandPCsandinorganicsulfides,and
participatetothestorageofCuinordertoreduceavailableCu.
ChapitreIV:Copperdistributionandspeciationinbamboos“Phyllostachysfastuosa”
160
PartofCu instemsand leavesofbamboo ispresentasaCu(II)‐malatecomplex. In leaves,we
cannotdiscriminatetheCu(II)asCu(II)‐malatecomplexfromCu(II)‐histidinecomplex.Inplants,
S‐free ligands include free aminoacids (histidine, asparagine, andalanine), organic carboxylic
acids(citric,malicetc.)andphytosiderophores(nicotinamine(NA),mugineicacid,avenicacid.
Simulation models (Mullins et al. 1986; White et al. 1981a; White et al. 1981b) and in vivo
studiesof xylemsap (Irtelli et al.2009;Liaoetal.2000;PichandScholz1996) show that the
most important long‐distance Cu‐chelating compounds are amino acids mostly histidine,
asparagineandnicotianamine.Inbamboos,thehistidineconcentrationincreasedsignificantlyin
treatment Cu100 and Cu100Si in roots, but not in stems (Table IV.3). Therefore, the role of
aminoacidscouldbeinvolvedintheCucomplexes,althoughtheconcentrationofsolubleamino
acidscontentissmallerthanthoseofcarboxylicacids.ForexampleinstemsintreatmentCu100,
the average histidine concentration was 0.64 mmol kg‐1, whereas malate concentration was
20mmol kg‐1 (Table IV.3). Carboxilic acidsmay also bind to Cu and thus contribute to in its
sequestration or transport (Callahan et al. 2006). EXAFS data demonstrated that malonate,
citrateappearedunlikelytocoordinateCu(II),whilemalatewasfoundtobethemostlikelytodo
so. Although data resulting from malate or histidine complexes were difficult to separate
becauseoftheirchemicalsimilarity,theirevaluationinLCFandtheirdifferentconcentrationin
bamboos,somewhatfavourmalateoverhistidineasthemorelikelymainligand.
ThespeciationofCuinleavesofCu1.5treatmentandCu100treatmentissimilar(FigureIV.9),
thereforeitseemsthatthebambooappliesthesamestrategytocopewithCuconcentrationsin
itstissuesthatareeithertoxicornon‐toxic.
Inleavesandstems,thesupplementationofSiinnutrientsolutionintreatmentCu100Siinduced
an increase of the Cu(I) proportion compared to treatment Cu100. Recently, Khandekar and
Leisner(2011)examinedtheexpressionofthreeMTgenesinArabidopsis,subsequenttoaCu
toxicity and Si supplementationwhich alleviatesmetal toxicity. Cu induced the expression of
these genes, as previously reported (Guo et al. 2003), but the levels of expression either
remainedelevatedorwereboostedtoevenhigherlevelsinplantsprovidedwithextraSi.Inthis
study,wecanassessthatanincreaseofMTsproductioninpresenceofSimayinduceanincrease
in complexes Cu(I)‐MT concentration. Therefore, the formation of these complexes will be a
strategytocopewiththehighCutoxicitylevelincells.However,silicon‐mediatedalleviationof
CutoxicityhasnotbeenconfirmedbythisstudywithbambooPhyllostachysfastuosa.
ChapitreIV:Copperdistributionandspeciationinbamboos“Phyllostachysfastuosa”
161
Insummary,thisstudyprovidesimportantevidencesforthepresenceofCu(I)boundtosulfur
compound in a Poaceae species. The main strategy of bamboo to cope with high Cu
concentration in its tissues is (i) an important sequestration in the roots apoplast, mainly in
epidermis,and(ii)acomplexationwithCu(I)Scompoundorganic,thatcanbephytochelatines,
metallothioneins,metalochaperonnes, etc (iii) formationof aCu(I) sulfur compound inorganic
thatmay be involved in Cu storage. Si supplementation has induced low beneficial effects on
bambooCutolerance,butmodifiedtheCuspeciation.
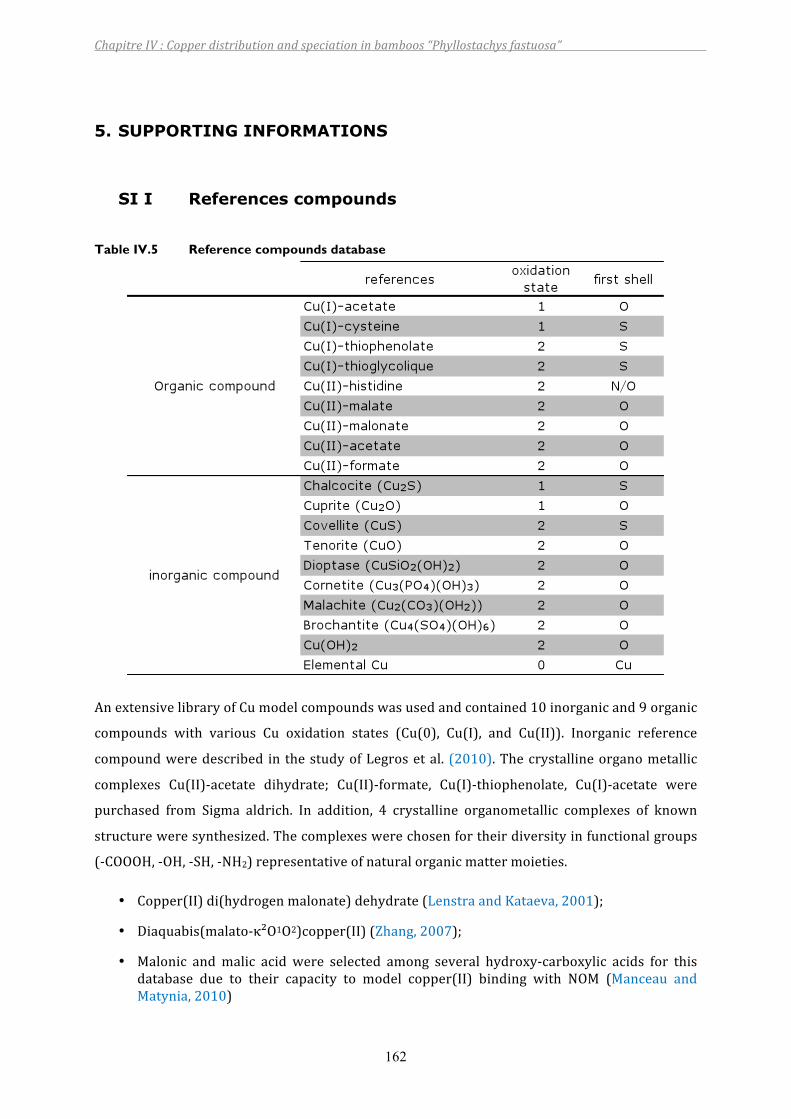
ChapitreIV:Copperdistributionandspeciationinbamboos“Phyllostachysfastuosa”
162
5. SUPPORTING INFORMATIONS
SI I References compounds
Table IV.5 Reference compounds database
AnextensivelibraryofCumodelcompoundswasusedandcontained10inorganicand9organic
compounds with various Cu oxidation states (Cu(0), Cu(I), and Cu(II)). Inorganic reference
compoundweredescribed in thestudyofLegrosetal. (2010).Thecrystallineorganometallic
complexes Cu(II)‐acetate dihydrate; Cu(II)‐formate, Cu(I)‐thiophenolate, Cu(I)‐acetate were
purchased from Sigma aldrich. In addition, 4 crystalline organometallic complexes of known
structureweresynthesized.Thecomplexeswerechosenfortheirdiversityinfunctionalgroups
(‐COOOH,‐OH,‐SH,‐NH2)representativeofnaturalorganicmattermoieties.
• Copper(II)di(hydrogenmalonate)dehydrate(LenstraandKataeva,2001);
• Diaquabis(malato‐κ²O1O2)copper(II)(Zhang,2007);
• Malonic andmalic acid were selected among several hydroxy‐carboxylic acids for thisdatabase due to their capacity to model copper(II) binding with NOM (Manceau andMatynia,2010)
ChapitreIV:Copperdistributionandspeciationinbamboos“Phyllostachysfastuosa”
163
• Bis‐L‐Histidinecopper(II)DinitrateDihydrate(Evertsson,1969).
• Copper(I)cysteine(Rigoetal,2004).
Synthesisof copper(II) complexeswith thio‐organicacidswereattempted:Cu(II)with cystein
(Dokken et al., 2001) and Cu(II) with thioglycolic acid (synthesis adapted from Ogawa et al.,
1981).Unfortunately,copperreductionwasobservedresultinginpresenceofCu(I).Itwasthus
conductedthatCu(II)isunlikelytobestableinthepresenceofligandcontainingreducedsulfur;
thesedatawerenotconsideredinfurtheranalysis.
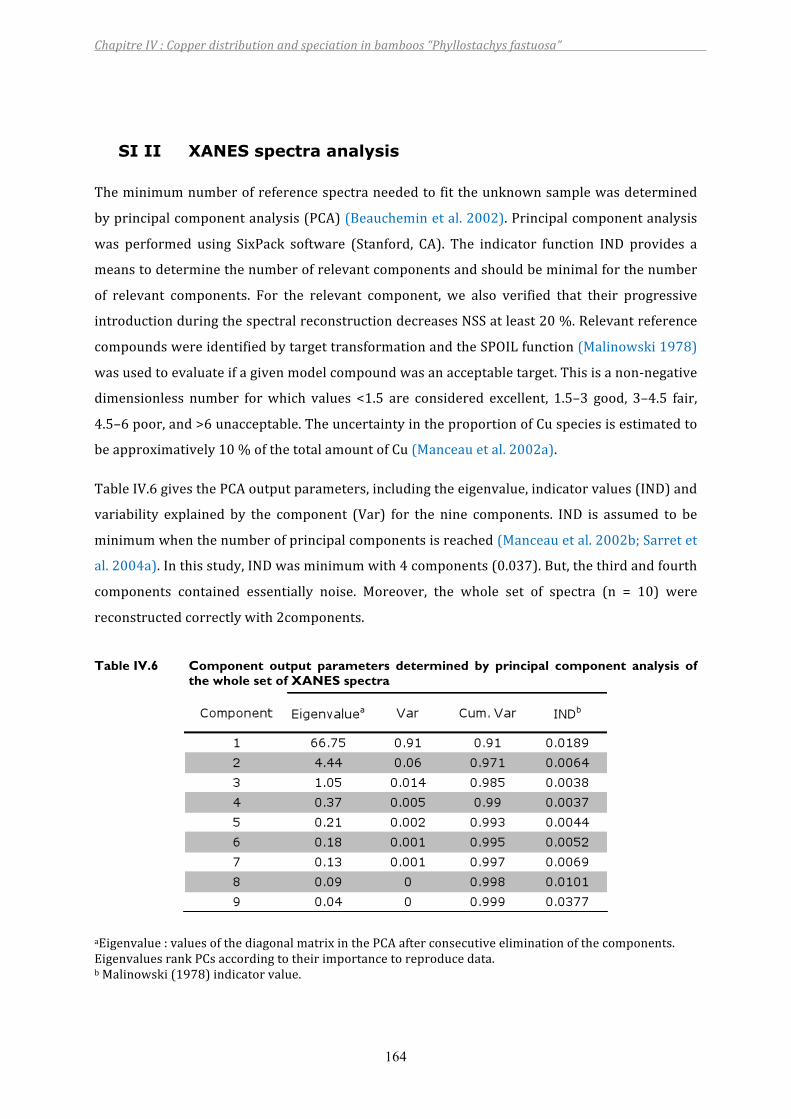
ChapitreIV:Copperdistributionandspeciationinbamboos“Phyllostachysfastuosa”
164
SI II XANES spectra analysis
Theminimumnumberofreferencespectraneededtofittheunknownsamplewasdetermined
byprincipalcomponentanalysis(PCA)(Beaucheminetal.2002).Principalcomponentanalysis
was performed using SixPack software (Stanford, CA). The indicator function IND provides a
meanstodeterminethenumberofrelevantcomponentsandshouldbeminimalforthenumber
of relevant components. For the relevant component, we also verified that their progressive
introductionduringthespectralreconstructiondecreasesNSSatleast20%.Relevantreference
compoundswereidentifiedbytargettransformationandtheSPOILfunction(Malinowski1978)
wasusedtoevaluateifagivenmodelcompoundwasanacceptabletarget.Thisisanon‐negative
dimensionless number forwhich values <1.5 are considered excellent, 1.5–3 good, 3–4.5 fair,
4.5–6poor,and>6unacceptable.TheuncertaintyintheproportionofCuspeciesisestimatedto
beapproximatively10%ofthetotalamountofCu(Manceauetal.2002a).
TableIV.6givesthePCAoutputparameters,includingtheeigenvalue,indicatorvalues(IND)and
variability explained by the component (Var) for the nine components. IND is assumed to be
minimumwhenthenumberofprincipalcomponentsisreached(Manceauetal.2002b;Sarretet
al.2004a).Inthisstudy,INDwasminimumwith4components(0.037).But,thethirdandfourth
components contained essentially noise. Moreover, the whole set of spectra (n = 10) were
reconstructedcorrectlywith2components.
Table IV.6 Component output parameters determined by principal component analysis of the whole set of XANES spectra
aEigenvalue:valuesofthediagonalmatrixinthePCAafterconsecutiveeliminationofthecomponents.EigenvaluesrankPCsaccordingtotheirimportancetoreproducedata.bMalinowski(1978)indicatorvalue.
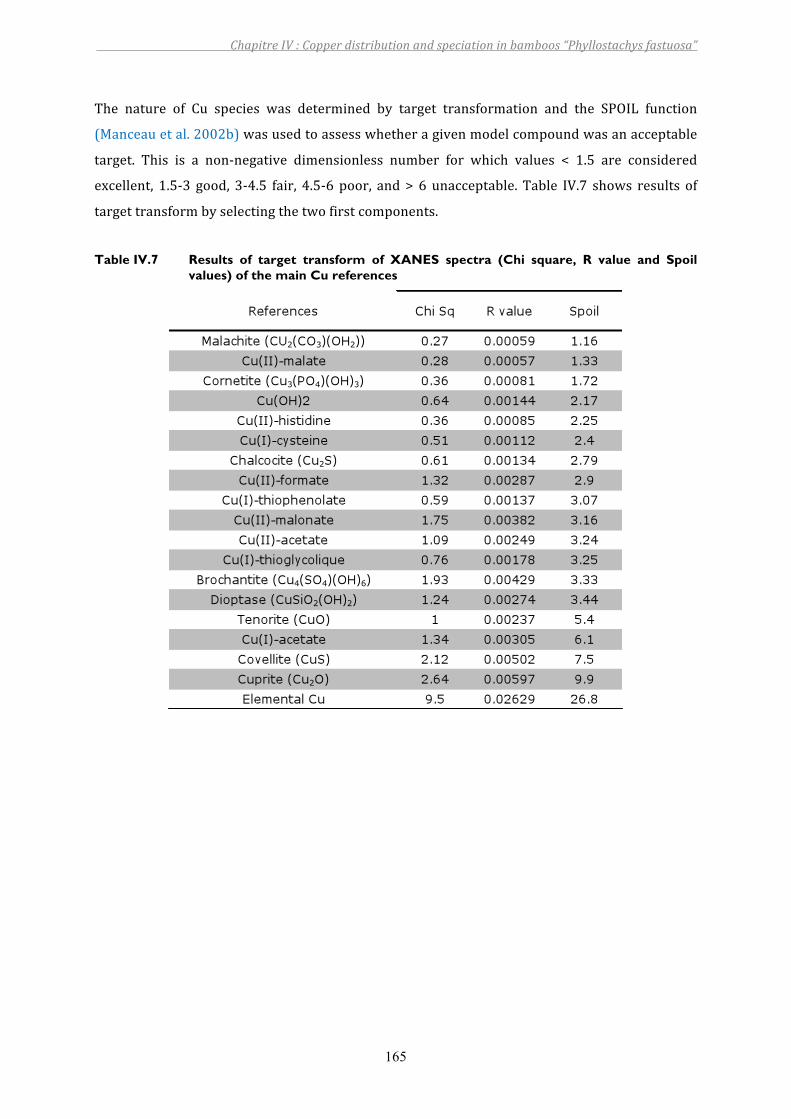
ChapitreIV:Copperdistributionandspeciationinbamboos“Phyllostachysfastuosa”
165
The nature of Cu species was determined by target transformation and the SPOIL function
(Manceauetal.2002b)wasusedtoassesswhetheragivenmodelcompoundwasanacceptable
target. This is a non‐negative dimensionless number for which values < 1.5 are considered
excellent, 1.5‐3 good, 3‐4.5 fair, 4.5‐6 poor, and> 6 unacceptable. Table IV.7 shows results of
targettransformbyselectingthetwofirstcomponents.
Table IV.7 Results of target transform of XANES spectra (Chi square, R value and Spoil values) of the main Cu references
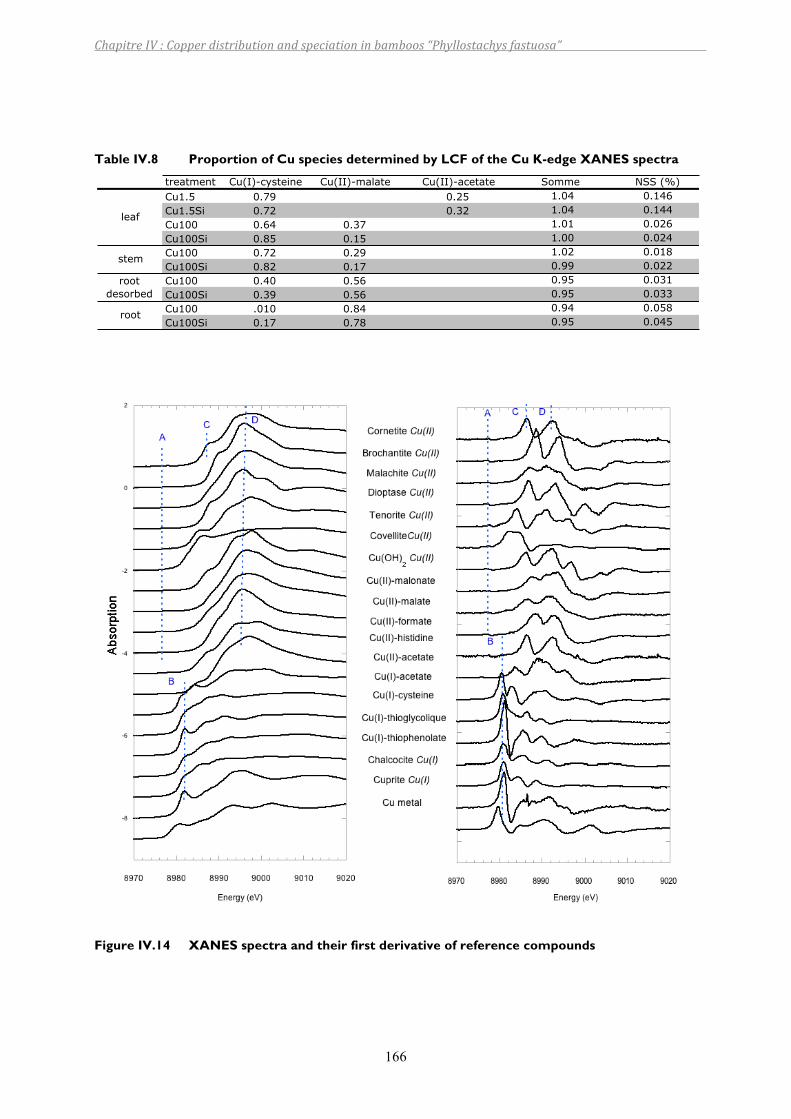
ChapitreIV:Copperdistributionandspeciationinbamboos“Phyllostachysfastuosa”
166
Table IV.8 Proportion of Cu species determined by LCF of the Cu K-edge XANES spectra
Figure IV.14 XANES spectra and their first derivative of reference compounds
treatment Cu(I)-cysteine Cu(II)-malate Cu(II)-acetate Somme NSS (%)
Cu1.5 0.79 0.25 1.04 0.146
Cu1.5Si 0.72 0.32 1.04 0.144
Cu100 0.64 0.37 1.01 0.026
Cu100Si 0.85 0.15 1.00 0.024
Cu100 0.72 0.29 1.02 0.018
Cu100Si 0.82 0.17 0.99 0.022
Cu100 0.40 0.56 0.95 0.031
Cu100Si 0.39 0.56 0.95 0.033
Cu100 .010 0.84 0.94 0.058
Cu100Si 0.17 0.78 0.95 0.045
leaf
stem
root
desorbed
root
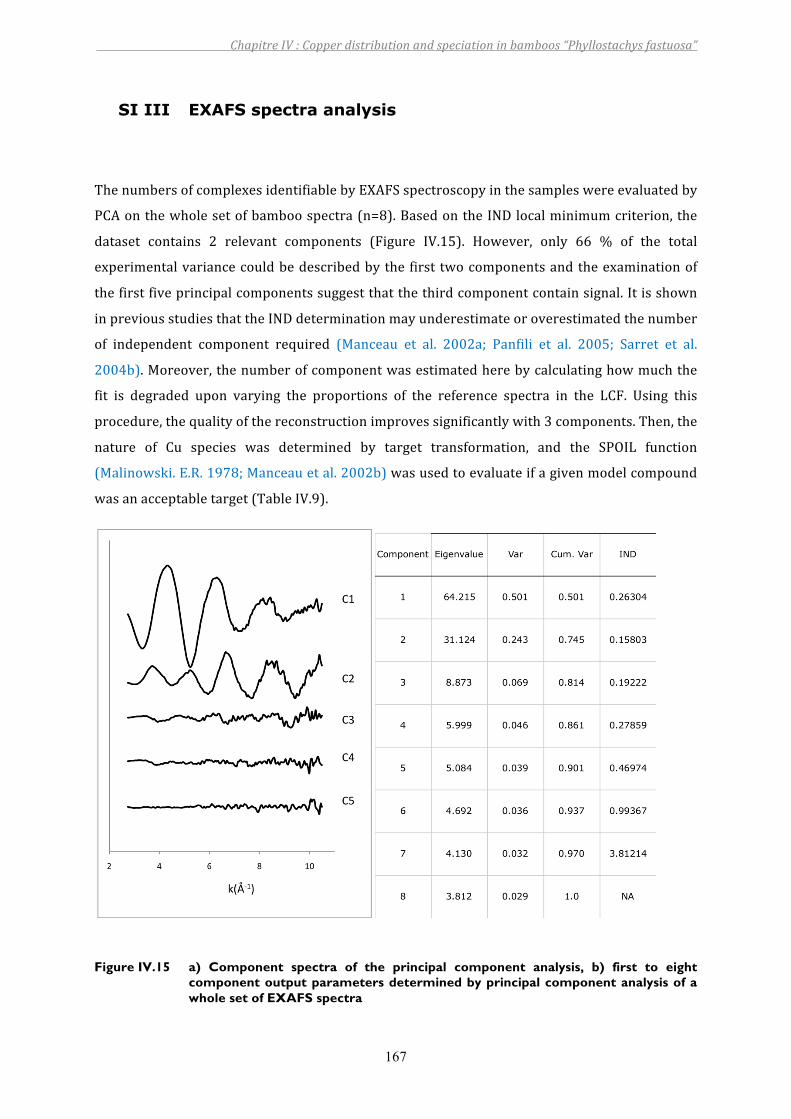
ChapitreIV:Copperdistributionandspeciationinbamboos“Phyllostachysfastuosa”
167
SI III EXAFS spectra analysis
ThenumbersofcomplexesidentifiablebyEXAFSspectroscopyinthesampleswereevaluatedby
PCAonthewholesetofbamboospectra(n=8).BasedontheINDlocalminimumcriterion,the
dataset contains 2 relevant components (Figure IV.15). However, only 66 % of the total
experimentalvariancecouldbedescribedbythe first twocomponentsandtheexaminationof
thefirstfiveprincipalcomponentssuggestthatthethirdcomponentcontainsignal.Itisshown
inpreviousstudiesthattheINDdeterminationmayunderestimateoroverestimatedthenumber
of independent component required (Manceau et al. 2002a; Panfili et al. 2005; Sarret et al.
2004b).Moreover,thenumberofcomponentwasestimatedherebycalculatinghowmuchthe
fit is degraded upon varying the proportions of the reference spectra in the LCF. Using this
procedure,thequalityofthereconstructionimprovessignificantlywith3components.Then,the
nature of Cu species was determined by target transformation, and the SPOIL function
(Malinowski.E.R.1978;Manceauetal.2002b)wasusedtoevaluateifagivenmodelcompound
wasanacceptabletarget(TableIV.9).
Figure IV.15 a) Component spectra of the principal component analysis, b) first to eight component output parameters determined by principal component analysis of a whole set of EXAFS spectra
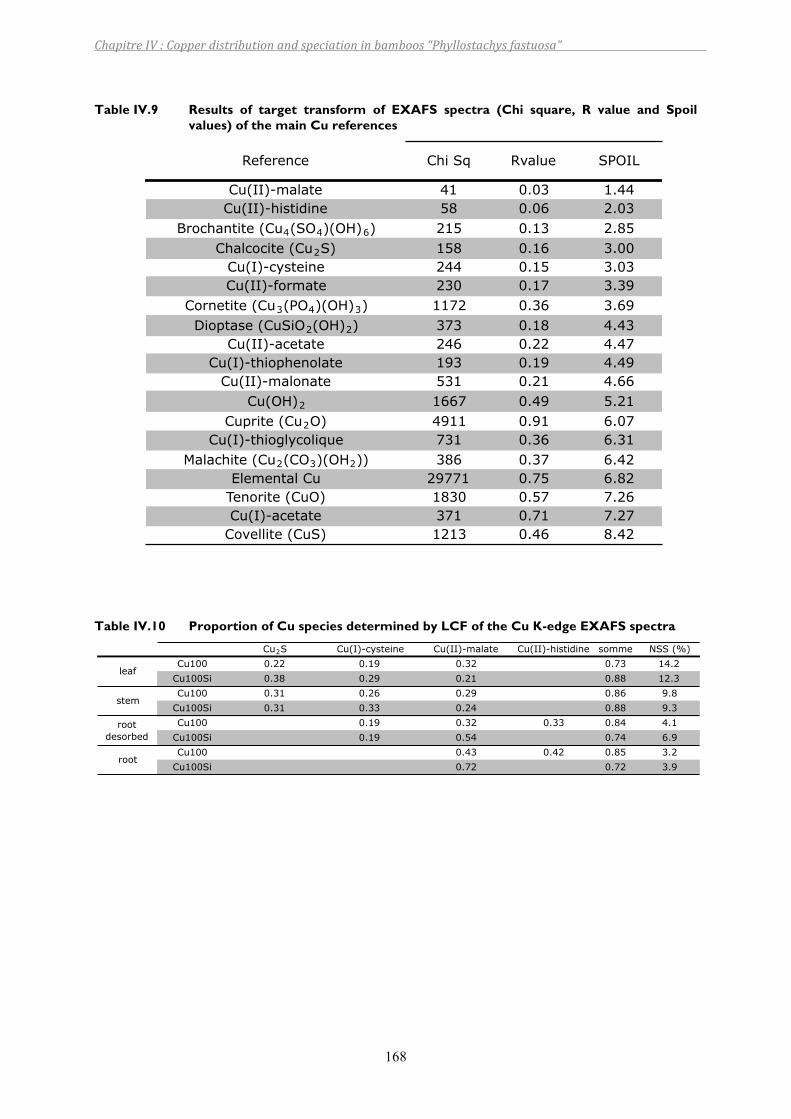
ChapitreIV:Copperdistributionandspeciationinbamboos“Phyllostachysfastuosa”
168
Table IV.9 Results of target transform of EXAFS spectra (Chi square, R value and Spoil values) of the main Cu references
Table IV.10 Proportion of Cu species determined by LCF of the Cu K-edge EXAFS spectra
Reference Chi Sq Rvalue SPOIL
Cu(II)-malate 41 0.03 1.44
Cu(II)-histidine 58 0.06 2.03
Brochantite (Cu4(SO4)(OH)6) 215 0.13 2.85
Chalcocite (Cu2S) 158 0.16 3.00
Cu(I)-cysteine 244 0.15 3.03
Cu(II)-formate 230 0.17 3.39
Cornetite (Cu3(PO4)(OH)3) 1172 0.36 3.69
Dioptase (CuSiO2(OH)2) 373 0.18 4.43
Cu(II)-acetate 246 0.22 4.47
Cu(I)-thiophenolate 193 0.19 4.49
Cu(II)-malonate 531 0.21 4.66
Cu(OH)2 1667 0.49 5.21
Cuprite (Cu2O) 4911 0.91 6.07
Cu(I)-thioglycolique 731 0.36 6.31
Malachite (Cu2(CO3)(OH2)) 386 0.37 6.42
Elemental Cu 29771 0.75 6.82
Tenorite (CuO) 1830 0.57 7.26
Cu(I)-acetate 371 0.71 7.27
Covellite (CuS) 1213 0.46 8.42
Cu2S Cu(I)-cysteine Cu(II)-malate Cu(II)-histidine somme NSS (%)
Cu100 0.22 0.19 0.32 0.73 14.2
Cu100Si 0.38 0.29 0.21 0.88 12.3
Cu100 0.31 0.26 0.29 0.86 9.8
Cu100Si 0.31 0.33 0.24 0.88 9.3
Cu100 0.19 0.32 0.33 0.84 4.1
Cu100Si 0.19 0.54 0.74 6.9
Cu100 0.43 0.42 0.85 3.2
Cu100Si 0.72 0.72 3.9
stem
root
desorbed
root
leaf
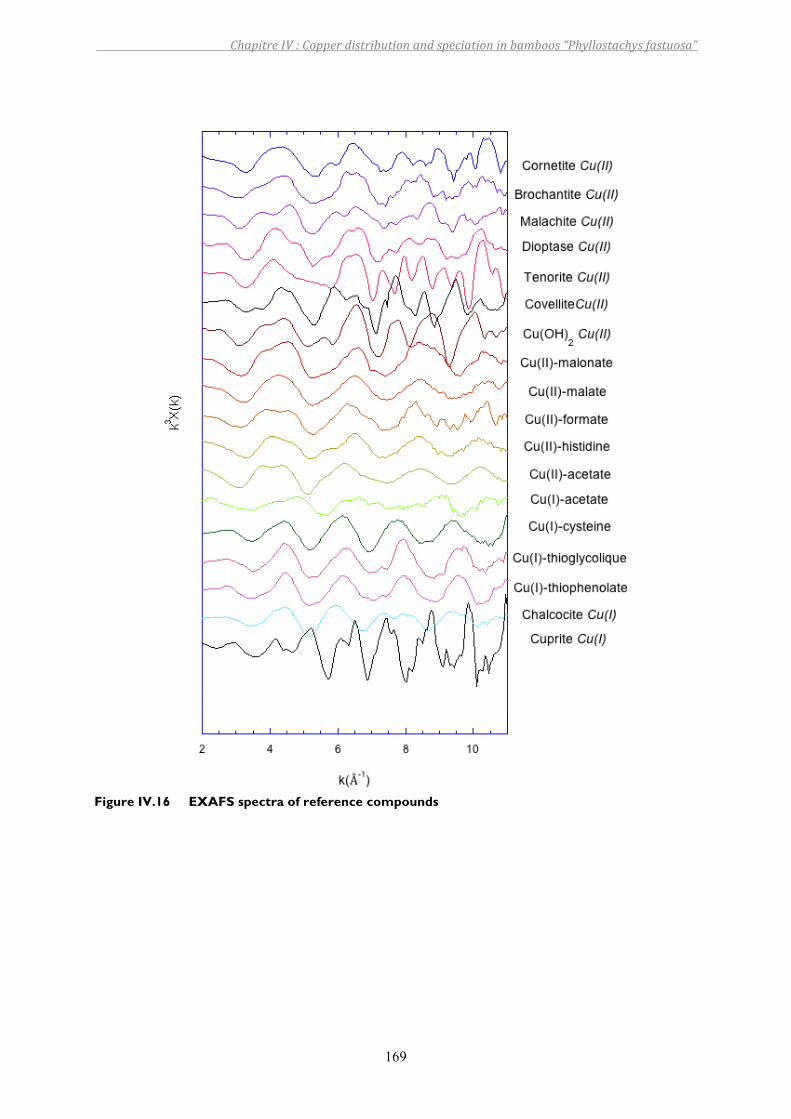
ChapitreIV:Copperdistributionandspeciationinbamboos“Phyllostachysfastuosa”
169
Figure IV.16 EXAFS spectra of reference compounds
ChapitreIV:Copperdistributionandspeciationinbamboos“Phyllostachysfastuosa”
170
6. BILAN DU CHAPITRE IV
LesbambousmonopodiauxPhyllostachysfastuosaonttoléréuneconcentrationde1.5µMCu2+
en solution, en accumulant des concentrations de Cu similaires à celle de l’expérience
d’hydroponie précédente effectuée avec des bambous sympodiaux Gigantocloa sp. «Malay
Dwarf».Enrevanche,uneconcentrationde100µMCu2+ensolutionainduitunefortetoxicité
chezlesbambous:diminutiondelabiomasse,apparitiondechlorose,concentrationenCudans
les tissus élevée, diminution de certains nutriments. L’ajout de silicium n’a pas eu d’effets
significatifs sur ledéveloppementdesbambousquelquesoit le traitement,maisa induitune
diminutiondessymptômesvisuelsdelatoxicitédeCu.
Lecuivreestessentiellementaccumulédanslesracines,cecompartimentretenant70à96%
deCudubambou.Enraisondesaforteaffinitépourlesparoisracinaires,unepartimportante
deCuestretenuedanslecompartimentapoplasmiqueetenparticulierauniveaudescellules
de l’épiderme. Cela a été observé par microscopie et est confirmé par la spéciation de Cu
racinaire: il est complexé majoritairement sous forme Cu(II) par des composés
carboxyliques,detypemalate,oudescomposésaminésdetypehistidine.Laproportionde
cescomposésdiminuelorsquel’ondésorbeleCuracinaireauprofitdecomposésCu(I).L’ajout
de silicium à entraîné une augmentation de la proportion de Cu apoplasmique etmodifié la
spéciation de Cu (forme Cu(II)‐malate uniquement), sans toutefois entraîner la formation de
liaisonSi‐Cu.
Lecuivreprésentedeuxétatsd’oxydationdanslestissusdubambou:Cu(I)etCu(II),etcedès
laracine.Lesplantesexposéesà1.5µMet100µMCu2+semblentavoirdesstratégiessimilaires
pour faire face à la toxicité du Cu dans la plante. Dans les parties aériennes, Cu(I) est
majoritairement lié à des composés organosulfurés de type cystéine, mais aussi à des
composés inorganiques soufrés. Une proportion mineure de Cu est présente sous forme
oxydée Cu(II) liée à des composés organiques non soufrés: des acides carboxyliques ou
aminésdetypemalateouhistidine.L’ajoutdesiliciumaugmentesensiblementlaproportionde
composés Cu(I) soufrés dans les bambous exposés à 100 µM Cu2+. Le silicium, en induisant
l’augmentationdelaproportiondeCucomplexéeàdesligandsorgano‐sulfurés,pourraitalors
diminuerlatoxicitédeCu.
ChapitreIV:Copperdistributionandspeciationinbamboos“Phyllostachysfastuosa”
171
7. REFERENCES BIBLIOGRAPHIQUES
ArfiV,BagoudouD,KorboulewskyNandBoisG2009Initialefficiencyofabamboogrove‐basedtreatmentsystemforwinerywastewater.Desalination246,69‐77.
BabatundeAI,AbiolaOK,OsidekoOAandOyelolaOT2009Kineticandequilibriumstudieson
theadsorptionofCu2+andZn2+ionsfromaqueoussolutionsbybamboorootbiomass.AfricanJournalofBiotechnology8,3364‐3368.
Bae W and Mehra R K 1998 Properties of glutathione‐ and phytochelatin‐capped CdS
bionanocrystallites.JournalofInorganicBiochemistry69,33‐43.Beauchemin,Suzanne,Hesterberg,DeanandMario2002Principalcomponentanalysisapproach
for modeling sulfur K‐XANES spectra of humic acids. Soil Science Society of America,Madison,WI,ETATS‐UNIS.
BravinM,LeMerrerB,DenaixL,SchneiderAandHinsingerP2010Copperuptakekinetics in
hydroponically‐grown durum wheat (Triticum turgidum durum L.) as compared withsoil’sabilitytosupplycopper.PlantandSoil331,91‐104.
Brunner I, Luster J, Gunthardt‐Goerg M S and Frey B 2008 Heavy metal accumulation and
phytostabilisation potential of tree fine roots in a contaminated soil. EnvironmentalPollution152,559‐568.
CallahanD,BakerA,KolevSandWeddA2006Metal ion ligands inhyperaccumulatingplants.
JournalofBiologicalInorganicChemistry11,2‐12.ChaignonV,DiMaltaDandHinsingerP2002Fe‐deficiency increasesCuacquisitionbywheat
croppedinaCu‐contaminatedvineyardsoil.NewPhytologist154,121‐130.Chaney R, Brown S and Angle J 1998 Soil–root interface: ecosystem health and human food‐
chainprotection.InHuangP.Ed.Scaehealth.pp279–311.Madison,Winsconsin:SoilScienceSocietyofAmerica.
ClemensS2006Toxicmetalaccumulation,responsestoexposureandmechanismsoftolerance
inplants.Biochimie88,1707‐1719.CobbettCandGoldsbroughP2002Phytochelatinsandmetallothioneins:Roles inheavymetal
detoxificationandhomeostasis.AnnualReviewofPlantBiology53,159‐182.Collin B, Doelsch E, Keller C, Panfili F and Meunier J‐D 2011 Distribution and variability of
silicon,copperandzincindifferentbamboospecies.PlantandSoil,1‐11.Cornelis J T, Delvaux B and Titeux H 2010 Contrasting silicon uptakes by coniferous trees: a
hydroponicexperimentonyoungseedlings.PlantandSoil336,99‐106.
ChapitreIV:Copperdistributionandspeciationinbamboos“Phyllostachysfastuosa”
172
daCunhaKPVanddoNascimentoCWA2009SiliconEffectsonMetalToleranceandStructuralChangesinMaize(ZeamaysL.)GrownonaCadmiumandZincEnrichedSoil.WaterAirandSoilPollution197,323‐330.
Dameron C T and Winge D R 1990 Characterization of peptide‐coated cadmium‐sulfide
crystallites.InorganicChemistry29,1343‐1348.DeVosCHR,SchatH,DeWaalMAM,VooijsRandErnstWHO1991Increasedresistanceto
copper‐induced damage of the root cell plasmalemma in copper tolerant Silenecucubalus.PhysiologiaPlantarum82,523‐528.
DupontL,GuillonE,BouandaJ,DumonceauJandAplincourtM2002EXAFSandXANESStudies
ofRetentionofCopperandLeadbyaLignocellulosicBiomaterial.EnvironmentalScience&Technology36,5062‐5066.
FominaM,HillierS,Charnock JM,MelvilleK,Alexander I JandGaddGM2005RoleofOxalic
AcidOverexcretioninTransformationsofToxicMetalMineralsbyBeauveriacaledonica.Appl.Environ.Microbiol.71,371‐381.
Furnare L J, Vailionis A and Strawn D G 2005 Polarized XANES and EXAFS spectroscopic
investigation into copper(II) complexes on vermiculite. Geochimica et CosmochimicaActa69,5219‐5231.
Gardea‐Torresdey J L, Arteaga S, Tiemann K J, Chianelli R, Pingitore N and Mackay W 2001
Absorptionofcopper(II)bycreosotebush(Larreatridentata):Useofatomicandx‐rayabsorptionspectroscopy.EnvironmentalToxicologyandChemistry20,2572‐2579.
Gonzalez‐GuerreroMandArguello JM2008MechanismofCu+‐transportingATPases:Soluble
Cu+chaperonesdirectlytransferCu+totransmembranetransportsites.ProceedingsoftheNationalAcademyofSciences105,5992‐5997.
Guo W J, Bundithya W and Goldsbrough P B 2003 Characterization of the Arabidopsis
metallothioneingenefamily:tissue‐specificexpressionandinductionduringsenescenceandinresponsetocopper.NewPhytologist159,369‐381.
Guo W J, Meetam M and Goldsbrough P B 2008 Examining the specific contributions of
individualArabidopsismetallothioneinstocopperdistributionandmetaltolerance.PlantPhysiology146,1697‐1706.
HattoriT,InanagaS,TanimotoE,LuxA,LuxovMandSugimotoY2003Silicon‐InducedChanges
inViscoelasticPropertiesofSorghumRootCellWalls.PlantandCellPhysiology44,743‐749.
HenrietC,DrayeX,OppitzI,SwennenRandDelvauxB2006Effects,distributionanduptakeof
siliconinbanana(Musaspp.)undercontrolledconditions.PlantandSoil287,359‐374.Irtelli B, Petrucci W A and Navari‐Izzo F 2009 Nicotianamine and histidine/proline are,
respectively, the most important copper chelators in xylem sap of Brassica carinataunder conditions of copper deficiency and excess. Journal of Experimental Botany 60,269‐277.
Kau L S, Spira‐Solomon D J, Penner‐Hahn J E, Hodgson K O and Solomon E I 1987 X‐ray
absorption edge determination of the oxidation state and coordination number of
ChapitreIV:Copperdistributionandspeciationinbamboos“Phyllostachysfastuosa”
173
copper. Application to the type 3 site inRhus vernicifera laccase and its reactionwithoxygen.JournaloftheAmericanChemicalSociety109,6433‐6442.
Khandekar S andLeisner S 2011 Soluble siliconmodulates expressionofArabidopsis thaliana
genesinvolvedincopperstress.JournalofPlantPhysiology168,699‐705.Konno H, Nakashima S and Katoh K 2010 Metal‐tolerant moss Scopelophila cataractae
accumulatescopperinthecellwallpectinoftheprotonema.JournalofPlantPhysiology167,358‐364.
KopittkePM,AsherCJ,BlameyFPCandMenziesNW2009ToxiceffectsofCu2+ongrowth,
nutrition,rootmorphology,anddistributionofCu inrootsofSabigrass.Scienceof theTotalEnvironment407,4616‐4621.
Kopittke PM,Menzies NW, de JongeM D,McKenna B A, Donner E,Webb R I, Paterson D J,
HowardDL,RyanCG,GloverCJ,ScheckelKGandLombiE2011InSituDistributionandSpeciation of Toxic Copper, Nickel, and Zinc in Hydrated Roots of Cowpea. PlantPhysiology156,663‐673.
Krzeslowska M 2011 The cell wall in plant cell response to trace metals: polysaccharide
remodelinganditsroleindefensestrategy.ActaPhysiologiaePlantarum33,35‐51.Kupper H, Gotz B, Mijovilovich A, Kupper F C andMeyer‐KlauckeW 2009 Complexation and
Toxicity of Copper in Higher Plants. I. Characterization of Copper Accumulation,Speciation, and Toxicity in Crassula helmsii as a New Copper Accumulator. PlantPhysiology151,702‐714.
LegrosS,ChaurandP,Rose J,MasionA,BrioisV,Ferrasse JH,SaintMacaryH,Bottero JYand
Doelsch E 2010 Investigation of Copper Speciation in Pig Slurry by a MultitechniqueApproach.EnvironmentalScience&Technology44,6926‐6932.
LiJ,LeisnerMandFrantzJ2008AlleviationofcoppertoxicityinArabidopsisthalianabysilicon
addition to hydroponic solutions. Journal of the American Society for HorticulturalScience133,670‐677.
LiM,XiongZ,Dai L andHuangY2007EffectsofCopperonNitrogenAssimilation inCopper‐
tolerant and Non‐tolerant Populations of Elsholtzia haichowensis S. Water, Air, & SoilPollution184,323‐333.
LiangYC,SunWC,ZhuYGandChristieP2007Mechanismsofsilicon‐mediatedalleviationof
abioticstressesinhigherplants:Areview.EnvironmentalPollution147,422‐428.LiaoM,HedleyM,WoolleyD,BrooksRandNicholsM2000Copperuptakeandtranslocationin
chicory(CichoriumintybusL.cv.GrasslandsPuna)andtomato(LycopersiconesculentumMill.cv.Rondy)plantsgrowninNFTsystem.II.Theroleofnicotianamineandhistidineinxylemsapcoppertransport.PlantandSoil223,245‐254.
LombiE,ScheckelKGandKempsonIM2011Insituanalysisofmetal(loid)sinplants:Stateof
theartandartefacts.EnvironmentalandExperimentalBotany72,3‐17.LouLQ,ShenZGandLiXD2004ThecoppertolerancemechanismsofElsholtziahaichowensis,
a plant from copper‐enriched soils. Environmental and Experimental Botany 51, 111‐120.
ChapitreIV:Copperdistributionandspeciationinbamboos“Phyllostachysfastuosa”
174
Lux A, Luxova M, Abe J, Morita S and Inanaga S 2003 Silicification of bamboo (Phyllostachys
heterocyclaMitf.)rootandleaf.PlantandSoil255,85‐91.MacFarlaneGRandBurchettMD2000Cellulardistributionofcopper,leadandzincinthegrey
mangrove,Avicenniamarina(Forsk.)Vierh.AquaticBotany68,45‐59.Malinowski E R 1978 Theory of error for target factor analysis with applications to mass
spectrometry and nuclear magnetic resonance spectrometry. Analytica Chimica Acta103,339‐354.
Malinowski. E.R. 1978 Theory of error for target factor analysis with applications to mass
spectrometry and nuclear magnetic resonance spectrometry. Analytica Chemica Acta103,354‐359.
ManceauA,MarcusMAandTamuraN2002aQuantitative speciationofheavymetals in soils
and sediments by synchrotron X‐ray techniques. In Applications of SynchrotronRadiationinLow‐TemperatureGeochemistryandEnvironmentalScience.Ed.EP.FenterandN.C.Sturchio.pp341‐428.ReviewsinMineralogyandGeochemistry,MineralogicalSocietyofAmerica,WashingtonDC.
ManceauA,MarcusMAandTamuraN2002bQuantitativeSpeciationofHeavyMetals inSoils
andSedimentsbySynchrotronX‐rayTechniques.Reviews inMineralogyGeochemistry49,341‐428.
ManceauAandMatyniaA2010ThenatureofCubondingtonaturalorganicmatter.Geochimica
etCosmochimicaActa74,2556‐2580.MarschnerH1995MineralNutritionofHigherPlants,London.pp.889.Meharg A A 2005 Mechanisms of plant resistance to metal and metalloid ions and potential
biotechnologicalapplications.PlantandSoil274,163‐174.Mendoza‐CozatlDG,ButkoE,SpringerF,TorpeyJW,KomivesEA,KehrJandSchroederJI2008
Identificationofhigh levels ofphytochelatins, glutathione and cadmium in thephloemsapofBrassicanapus.Aroleforthiol‐peptidesinthelong‐distancetransportofcadmiumandtheeffectofcadmiumonirontranslocation.PlantJournal54,249‐259.
MichaudA,ChappellazCandHinsingerP2008Copperphytotoxicityaffectsrootelongationand
iron nutrition in durumwheat (Triticum turgidumdurumL.). Plant and Soil 310, 151‐165.
Mijovilovich A, Leitenmaier B,Meyer‐KlauckeW, Kroneck PMH, Gotz B and KupperH 2009
Complexation and Toxicity of Copper in Higher Plants. II. Different Mechanisms forCopper versus Cadmium Detoxification in the Copper‐Sensitive Cadmium/ZincHyperaccumulator Thlaspi caerulescens (Ganges Ecotype). Plant Physiology 151, 715‐731.
MotomuraH,FujiiTandSuzukiM2004Silicadepositioninrelationtoageingofleaftissuesin
Sasaveitchii(Carriere)rehder(Poaceae:Bambusoideae).AnnalsofBotany93,235‐248.
ChapitreIV:Copperdistributionandspeciationinbamboos“Phyllostachysfastuosa”
175
Mukherjee I, Campbell N, Ash J and Connolly E 2006 Expression profiling of the Arabidopsisferric chelate reductase (FRO) gene family reveals differential regulation by iron andcopper.Planta223,1178‐1190.
MullinsG,SommersLandHousleyT1986Metalspeciationinxylemandphloemexudates.Plant
andSoil96,377‐391.Neumann D and zur Nieden U 2001 Silicon and heavy metal tolerance of higher plants.
Phytochemistry56,685‐692.NishizonoH, IchikawaH, Suziki S and Ishii F 1987The role of the root cell‐wall in theheavy
metaltoleranceofAthyriumyokoscense.PlantandSoil101,15‐20.Oliva S R, Mingorance M D and Leidi E O 2011 Effects of silicon on copper toxicity in Erica
andevalensisCabezudoandRivera:apotentialspeciestoremediatecontaminatedsoils.JournalofEnvironmentalMonitoring13,591‐596.
PanfiliFR,ManceauA,SarretG,SpadiniL,KirpichtchikovaT,BertV,LaboudigueA,MarcusMA,
AhamdachNandLibertMF2005TheeffectofphytostabilizationonZnspeciationinadredgedcontaminatedsedimentusingscanningelectronmicroscopy,X‐rayfluorescence,EXAFS spectroscopy, and principal components analysis. Geochimica et CosmochimicaActa69,2265‐2284.
Parkhurst D L 1995 A Computer Program for Speciation, Reaction Path, Advective‐Transport,
andInverseGeochemicalCalculations.Ed.USDotILakewood,Colorado.PichAandScholzGn1996Translocationofcopperandothermicronutrientsintomatoplants
(LycopersiconesculentumMill.):nicotianamine‐stimulatedcoppertransportinthexylem.JournalofExperimentalBotany47,41‐47.
PickeringIJ,PrinceRC,GeorgeGN,RauserWE,WickramasingheWA,WatsonAA,DameronC
T,Dance IG,FairlieDPandSaltDE1999X‐rayabsorptionspectroscopyof cadmiumphytochelatinandmodelsystems.BiochimicaEtBiophysicaActa‐ProteinStructureandMolecularEnzymology1429,351‐364.
PoletteLA,Gardea‐TorresdeyJL,ChianelliRR,GeorgeGN,PickeringIJandArenasJ2000XAS
and microscopy studies of the uptake and bio‐transformation of copper in Larreatridentata(creosotebush).MicrochemicalJournal65,227‐236.
PurvisOW,Pawlik‐SkowronskaB,CresseyG, JonesGC,KearsleyAandSpratt J2008Mineral
phases and element composition of the copper hyperaccumulator lichen Lecanorapolytropa.MineralMag72,607‐616.
QianM, Li X and Shen Z 2005Adaptive Copper Tolerance inElsholtzia haichowensis Involves
ProductionofCu‐inducedThiolPeptides.PlantGrowthRegulation47,65‐73.Rachou J, Gagnon C and Sauve S 2007 Use of an ion‐selective electrode for free copper
measurementsinlowsalinityandlowionicstrengthmatrices.EnvironmentalChemistry4,90‐97.
Ravel B and Newville M 2005 ATHENA, ARTEMIS, HEPHAESTUS: data analysis for X‐ray
absorptionspectroscopyusingIFEFFIT.JournalofSynchrotronRadiation12,537‐541.
ChapitreIV:Copperdistributionandspeciationinbamboos“Phyllostachysfastuosa”
176
ReeseRN,WhiteCAandWingeDR1992Cadmium‐SulfidecrystallitesinCD‐(GAMMA‐EC)NGpeptidecomplexesfromtomato.PlantPhysiology98,225‐229.
RogallaHandRomheldV2002Roleofleafapoplastinsilicon‐mediatedmanganesetoleranceof
CucumissativusL.PlantCellandEnvironment25,549‐555.Roosens N H, Bernard C, Leplae R and Verbruggen N 2004 Evidence for copper homeostasis
function metallothionein of metallothionein (MT3) in the hyperaccumulator Thlaspicaerulescens.FEBSLetters577,9‐16.
Sahi S V, Israr M, Srivastava A K, Gardea‐Torresdey J L and Parsons J G 2007 Accumulation,
speciationandcellularlocalizationofcopperinSesbaniadrummondii.Chemosphere67,2257‐2266.
SaltDE,PrinceRCandPickeringIJ2002Chemicalspeciationofaccumulatedmetalsinplants:
evidencefromX‐rayabsorptionspectroscopy.MicrochemicalJournal71,255‐259.Sancenon V, Puig S, Mira H, Thiele D J and Penarrubia L 2003 Identification of a copper
transporterfamilyinArabidopsisthaliana.PlantMolecularBiology51,577‐587.SarretG,Balesdent J,BouziriL,Garnier JM,MarcusMA,GeoffroyN,PanfiliFandManceauA
2004a Zn Speciation in the Organic Horizon of a Contaminated Soil by Micro‐X‐rayFluorescence, Micro‐ and Powder‐EXAFS Spectroscopy, and Isotopic Dilution.EnvironmentalScienceandTechnology38,2792‐2801.
SarretG,Balesdent J,BouziriL,Garnier JM,MarcusMA,GeoffroyN,PanfiliFandManceauA
2004b Zn speciation in the organic horizon of a contaminated soil by micro‐x‐rayfluorescence, micro‐ and powder‐EXAFS spectroscopy, and isotopic dilution.EnvironmentalScience&Technology38,2792‐2801.
SauvéS,McBrideMB,NorvellWAandHendershotWH1997CopperSolubilityandSpeciation
ofInSituContaminatedSoils:EffectsofCopperLevel,pHandOrganicMatter.Water,Air,&SoilPollution100,133‐149.
Shi J,Wu B, Yuan X, Yy C, Chen X, Chen Y and Hu T 2008 An X‐ray absorption spectroscopy
investigationofspeciationandbiotransformationofcopperinElsholtziasplendens.PlantandSoil302,163‐174.
ShiX,ZhangC,WangHandZhangF2005EffectofSionthedistributionofCdinriceseedlings.
PlantandSoil272,53‐60.Sirko A, Gotor C, Hawkesford M J and Kok L J 2007 Molecular links between metals in the
environmentandplantsulfurmetabolism.SulfurinPlantsAnEcologicalPerspective.pp169‐195.SpringerNetherlands.
Sparks J P, Chandra S, Derry L A, Parthasarathy M V, Daugherty C S and Griffin R 2011
SubcellularlocalizationofsiliconandgermaniumingrassrootandleaftissuesbySIMS:evidencefordifferentialandactivetransport.Biogeochemistry104,237‐249.
Voogt W, Sonneveld C, L.E. Datnoff G H S and Korndˆrfer G H 2001 Chapter 6 Silicon in
horticultural crops grown in soilless culture. In Studies in Plant Science. pp 115‐131.Elsevier.
ChapitreIV:Copperdistributionandspeciationinbamboos“Phyllostachysfastuosa”
177
WangYX, StassA andHorstW J 2004Apoplastic bindingof aluminum is involved in silicon‐inducedameliorationofaluminumtoxicityinmaize.PlantPhysiology136,3762‐3770.
WeberMB,SchatHandTenBookum‐VanDerMaarelWM1991Theeffectofcoppertoxicityon
thecontentsofnitrogencompounds inSilenevulgaris; (Moench)Garcke.PlantandSoil133,101‐109.
Wei Z,Wong J, ZhaoH, ZhangH, LiH andHuF2007Separation andDeterminationofHeavy
MetalsAssociatedwithLowMolecularWeightChelatorsinXylemSapsofIndianMustard(Brassica juncea) by Size Exclusion Chromatography and Atomic AbsorptionSpectrometry.BiologicalTraceElementResearch118,146‐158.
Welch,RM,Norvell,WA,Schaefer,SC,Schaff,JE,KochianandLV1993Inductionofiron(III)
andcopper(II)reductioninpea(PisumsativumL.)rootsbyFeandCustatus:doestheroot‐cell plasmalemma Fe(III)‐chelate reductase perform a general role in regulatingcationuptake?190.
WhiteMC,BakerFD,ChaneyRLandDeckerAM1981aMetalcomplexationinxylemfluid.2.
Theoreticalequilibrium‐Modelandcomputationalcomputer‐program,PlantPhysiology67,301‐310.
WhiteMC,DeckerAMandChaneyRL1981bMetalcomplexation inxylemfluid.1.Chemical‐
compositionoftomatoandsoybeanstemexudate.PlantPhysiology67,292‐300.YruelaI2009Copperinplants:acquisition,transportandinteractions.Functionalplantbiology:
FPB36,409‐430.YuW, Farrell R A, Stillman D J andWinge D R 1996 Identification of SLF1 as a new copper
homeostasisgeneinvolvedincoppersulfidemineralizationinSaccharomycescerevisiae.Mol.Cell.Biol.16,2464‐2472.
Conclusionetperspectives
178
CONCLUSIONS ET PERSPECTIVES
Rôlebénéfiquedusiliciumchezlebambou
Cestravauxderecherchetrouventleuroriginedanslepostulatsuivant:l’apportdeSiaméliore
la croissance et la tolérance des bambous aux métaux, permettant une amélioration de la
technologiedephytoremédiation.Onassiste,depuisunevingtained’années,àuneaugmentation
du nombre d’études concernant le Si dans les plantes. Certaines abordent la question de
l’essentialité,d’autresdel’identificationdestransporteurs,d’autresencoredesonrôlefaceàde
nombreuxstressbiotiquesouabiotiques.SicompréhensiondutransportdeSidanslesplantesa
progressé,onremarque toutefoisque lesmécanismesd’actionduSipermettantà laplantede
réduirel’impactd’unstresssonttrèsdiversetqu’ilconvientdelesétudier.L’actiondusilicium
semble être différente selon les types de stress, les espèces étudiées, les conditions
environnementales,etc.
Lesbambouspossèdentune fortecapacitéàaccumulerSi,principalementdans les feuilles.Ce
travail a permis de montrer que cette capacité varie significativement entre les espèces, et
particulièrement entre les deux principaux types de bambous: les bambous monopodiaux, à
rhizomes traçants et les bambous sympodiaux, à rhizomes cespiteux. Grâce aux
expérimentationsenhydroponie,nousavonsmesuréuneplusfaibleconcentrationdeSidansles
racinesquedanslestigesetlesfeuilles.Cerésultat,quiestendésaccordaveclesconcentrations
deSimesuréesdans lesracinesdebambous lorsd’étudespubliéesprécédemment(Dingetal.
2008;Luxetal.2003),estnéanmoinsimportantpourcomprendrelemécanismed’accumulation
deSidanslebambou.LarépartitiondeSidanslesbambous,etlesuividesaconcentrationdans
les solutions nutritives (notamment un appauvrissement total de Si en solution) confirme la
présencedemécanismesd’absorptionàlafoisactifsetpassifs.
Aucoursdesexpériencesd’hydroponie,Sin’apaseud’effetbénéfiquesurledéveloppementdes
bambouslorsqu’ilsnesontpassoumisàunstressetce,malgréleurfortecapacitéàaccumuler
Si, que ce soit dans le cas d’un bambou sympodial Gigantocloa sp «Malay Dwarf» ou d’un
bamboumonopodial:Phyllostachys fastuosa. FaceauxdeuxconcentrationsdeCu testéesdans
lescultureshydroponiques(1.5µMet100µM),l’apportdeSinemodifienilesmacronutriments
Conclusionetperspectives
179
absorbés,nilesteneursenacidesinorganiques,acidesorganiquesouacidesaminés.Cependant,
face à une forte toxicité de Cu (100 µM), la présence de Si dans le milieu induit une légère
diminutiondessymptômesvisuelsdelatoxicitédeCuainsiqu’unemodificationdelaspéciation
deCuauniveaudesracinesetdespartiesaériennes.L’apportdeSipourraitdoncdiminuer la
toxicité de Cu par une plus forte immobilisation de Cu dans l’apoplasme racinaire, et une
augmentationdanslespartiesaériennesdeligandscomplexantstelsquelesmétallotionéinesou
lesphytochélatines.
Variabilitéducuivredanslesdifférentesespècesdebambou
Ce travail est le premier à étudier le cuivre dans le bambou : à savoir les concentrations
absorbées en conditions naturelles d’une part et sa toxicité d’autre part. Dans les conditions
naturelles pédoclimatiques de l’île de la Réunion, les concentrations en Cu du bambou sont
faiblesmaissimilairesàcellesdelacanneàsucre,uneautrePoacée(Poaceae)développéesur
dessolssemblables(CollinandDoelsch2010).Malgrécela, lesconcentrationsmesuréesentre
les différentes espèces sont significativement différentes, et il apparaît que les bambous
sympodiauxaccumulentplusdeCuque lesbambousmonopodiaux.Nousavonsalors testé,au
cours de nos expériences en hydroponie, la réponse à un apport de Cu dans deux espèces de
bambous appartenant aux deux différents types. Les bambous sympodiaux Gigantocloa sp
«MalayDwarf»commelesbambousmonopodiauxPhyllostachysfastuosaontprésentélamême
réponsefaceàlaconcentrationdeCuappliquéeensolution(1,5µMCu2+):concentrationdeCu
similairedans lesdifférents tissus, absencede symptômesde toxicité.Ainsi, nousn’avonspas
mis en évidence de différence de réaction entre les deux types de bambous lorsqu’ils sont
exposés à une forte concentration de Cu contrairement à ce qui avait été observé dans les
conditionsenvironnementalesdessolsdelaRéunion.
Stratégiedetoléranceaucuivrechezlebambou
LapremièreetprincipalestratégiedubamboupourtolérerCuest laséquestrationdeCudans
ses racines, diminuant ainsi la quantité de Cu internalisée et potentiellement toxique. Cela
s’expliqueaisémentparsaforteaffinitéauxparoiscellulaires.UnegrandepartiedeCuracinaire
est en effetprésentedans le compartiment apoplastique et localisée, enparticulier, auniveau
des cellules épidermiques des racines. Ce mécanisme semble être suffisant pour tolérer une
concentrationde1,5µMCu2+ensolution.Eneffet,aucunsignedetoxicitén’aétédétectéchezles
bambousexposésàcetteconcentration,quecesoitsurlesracinesousurlespartiesaériennes.
LasecondestratégiepourgérerCuestunecomplexation inplantaquipermetdediminuersa
toxicité.Malgré les nombreux travaux dédiés à Cu dans les plantes, sa spéciation au sein des
Conclusionetperspectives
180
tissusestpeuconnue.Unrésultatimportantapportéparcetteétudeestlamiseenévidencede
Cu réduit dans les racines. Cela avait été observé chez deux dicotylédones (Mijovilovich et al.
2009;Poletteetal.2000),maiscetteétudeapportelapremièreévidencedelaprésencedeCu(I)
dansunePoaceae.CommeCuestuncofacteurdenombreusesenzymes,laprésencedeCu(I)et
deCu(II)dans laplanteestenaccordavec les fonctionsphysiologiquesqui luisontconférées.
UneformeminoritairedeCuestprésentedanslespartiesaériennessousformedeCu(II)O/N‐
organique, forme qui peut être impliquée dans le transport, en formant des complexes à des
acidescarboxyliquesouacidesaminés.Nousmontronsdanscetteétudequelaphasemajoritaire
deCudanslespartiesaériennesdubambouestsousformedeCu(I)complexéàdescomposés
soufrésdedeuxtypes: uncomposéCu(I)S‐organiqueetCu(I)S‐inorganique.Cetteétudeest la
premièreàdétecter laprésenced’uncomposésoufré inorganiquedans laplante.Uncomplexe
de type Cu(I)S‐organique indique une complexation à des acides aminés soufrés tels que la
cystéineet laméthionine,quisontdesconstituantsdenombreusesmoléculesimpliquéesdans
l’homéostasie,letransportetlestockage.
PERSPECTIVES
SpéciationdeCudanslaplante
Danslestigesetlesfeuilles,nousavonsidentifiéuncomplexeCu(I)inorganiquesoufré.Ilserait
intéressant de confirmer la présence de cette phase. Plusieurs techniques sont utilisées pour
identifier la localisation des éléments traces dans les plantes, comme par exemple la
spectroscopie par perte d'énergie d'électrons (EELS) (Liu and Kottke 2004), l’analyse par
faisceaux d’ions (proton‐induced X‐ray émission: PIXE)(Kramer et al. 1997), la micro‐
fluorescence X induite par rayonnement synchrotron (Sarret et al. 2009; Shi et al. 2011). Ces
techniquessontleplussouventutiliséespouruneétudeàl’échelledutissuoudescellules,avec
une résolution spatiale de l’ordre de 1 µm. Le développement récent de l’utilisation du
NanoSIMS(Nano‐scaleSecondaryIonMassspectrometry)enbiologiesembleparticulièrement
intéressant. En effet, cette technique permet d’analyser des échantillons avec une très bonne
résolutionspatiale(<50nm),unetrèsbonnesensibilité,toutendiscriminantclairementtousles
élémentsetisotopesprésents(Smartetal.2010).Desétudesrécentesontutilisécettetechnique
pourétudierladistributiondunickeldanslescellulesd’uneplanteaccumulatrice(Smartetal.
2010), localiser l’arsenicet leséléniumdansdesgrainesdecéréales(Mooreetal.2010),ou la
distribution subcellulaire du silicium et de l’arsenic (As) dans les racines de riz (Moore et al.
2011).Danscettedernièreétude,lesauteurssontcapablesdelocaliserlesiliciumsurlesparois
Conclusionetperspectives
181
cellulairesdel’endodermeetdeco‐localiserl’arsenicetlesoufredanslesvacuolesdecertaines
cellules, confirmant une forme de stockage de type As‐phytochelatin (Moore et al. 2011). Les
analysesnanoSIMSs’effectuant surdeséchantillons secs, la contraintemajeurede l’utilisation
du nanoSIMS est la préparation des échantillons qui doit préserver les structures
morphologiquesetconserverladistributionchimique(Grovenoretal.2006).
Ce travail de thèse a apporté des résultats importants concernant la spéciation de Cu et la
localisation de Cu et Si dans la racine.Mais l’utilisation d’une technique d’imagerie ayant une
meilleurerésolutionspatialeetunemeilleuresensibilitépourraitêtreutiliséepourlocaliserles
élémentsdanslescellulesdestigesetdesfeuilles.Celapourraitpermettredemieuxcomprendre
lecomportementdeCudans laplante,commeparexemple la localisationdescomplexesCu‐S
danslescellules:sont‐ilsséquestrédanslavacuole,danslecytoplasme?LescomplexesCu‐O/N
organiques sont‐ils des formes de transport, ou bien des formes de stockage? Au niveau
racinaire,celapermettraitégalementdemieuxcomprendrelerôledusiliciumobservélorsdela
secondeexpérienced’hydroponie.NousavonsvuquelaprésencedeSiaugmentelaproportion
deCuapoplasmiqueetmodifiesaspéciation.Ilestpossiblequedesobservationscommecelles
qui sont décrites dans l’étude de Moore et al (2011) pourraient révéler des distributions
différentesdes éléments enprésencedeSi, etdoncunemeilleure compréhensionde son rôle
danslaracine.
La famille des Poacées, dont fait partie le bambou, représente plus de 20%de la couverture
végétaleterrestreetrassembledenombreusesespècesessentiellespourl’alimentationhumaine
(Arber 2010). Il est probable que le comportement de Cu présente des similarités entre les
espèces de Poacées. Ainsi, unemeilleure connaissance de la spéciation de Cu représente une
avancéeimportantepourestimersatoxicitéaucoursdelachaînealimentaire,sondevenirdans
lessols,etc.
Ilseraitdoncintéressant,pourpoursuivrecetravail,d’étudierlaspéciationetlalocalisationde
Cu dans d’autres Poacées. De plus, même si le bambou à un fort taux de croissance, son
développementenhydroponieest longetsaréponse faceàune forte toxicitén’estobservable
qu’aprèsunmoisdeculture.Afind’avoirdesrésultatsquantifiables,nousavonsdûmenernos
deux expériences de 11mois et 6 mois respectivement, en incluant le temps de pré‐culture.
Ainsi, l’utilisation d’une Poacée plus facile à cultiver (croissance à partir de graines,
développementplusrapide)tellequeleblé,seraitintéressantepourcompléterlesrésultatsde
spéciation et de localisation de Cu. En outre, nos résultats nous renseignent sur l’effet d’une
toxicitéàlongtermedeCuchezlebambou,cequiestadaptéaucontextedephytoremédiation.
Cependantcommelesmétauxinduisentunetoxicitédèslespremièresheuresd’expositiondela
Conclusionetperspectives
182
plante (ex,Blameyetal.2011;Kopittkeetal.2011) il seraitégalement intéressantd’effectuer
desétudesàcourttermeafindecomprendrelaréponsedesplantesàunetoxicitédeCu.
Améliorationdelatechnologiedephytoremédiation
Le cuivre est un contaminant abondant des effluents qui peuvent être traités par le BAMBOU
ASSAINNISSEMENT®;lacompréhensiondesoncomportement,desmécanismesdeprélèvement
etdetoxicité,estunenjeufortpouraméliorerlatechnologie.
Ilestdélicatd’extrapolerlesrésultatsobtenusenculturehydroponiqueàceuxquel’onpourrait
obtenirsurunsolenconditionsnaturelles.Toutefois, ilsembleque lebambousoitcapablede
tolérerdefortesconcentrationsdeCu.NousavonsvuquelafortecapacitéàtolérerCuestliéeà
saséquestrationdanslesracines,etnotammentàsaforteadsorptionsurlesparoiscellulaires.
Ainsi,uneaugmentationdebiomasseaugmentelaquantitédesitesd’adsorptiondisponibles.Il
semble donc que, grâce à son fort taux de croissance, le bambou présente des capacités de
toléranceàCusupérieuresàd’autresespèces, lebléparexemple(Bravinetal.2010).Dansun
sol, la forteproductiondebiomasse racinairedubamboupourraitpermettredesmécanismes
similairesd’adsorptiondeCusurlesparoiscellulairesdesracines,etainsiunebonnetolérance
àCu.
CettetoléranceàCupermetaubamboudeconserversonefficacitépourl’épurationdesautres
polluants. Lamajeure partie de Cu prélevée par le bambou est difficilement exportable de la
parcellepuisqueelleest localiséedans lesracines.Enrevanche,cettecapacitéàséquestrerCu
dans ses tissus racinaires semble être intéressante pour une utilisation du bambou dans un
objectif de phytostabilisation. Cela permettrait de réduire la mobilité de Cu dans le sol en
l’immobilisantinsitu,etderéduireainsilesrisquesdedispersiondanslemilieuenvironnant.
Nous avons montré que le silicium n’influence pas directement la croissance et le
développement du bambou en conditions contrôlées. Cependant, en conditions
environnementales,lesbamboussontexposésàdenombreuxstressnonétudiésici(desstress
salins, stress hydriques, stress biotiques…), par conséquent Si pourrait avoir un rôle indirect
maisbénéfiquesurlebambou.Enfin,iln’estpasexclunonplusqueSipuisseavoirunrôleplus
importantdans lebamboufaceàunetoxicité induitepard’autresmétaux,commelecadmium
parexemple,oufaceàunepollutionmultimétalliquecommecelaaétédécritrécemmentpour
leriz(Guetal.2011).
Conclusionetperspectives
183
REFERENCESBIBLIOGRAPHIQUES
ArberA2010TheGramineae:AStudyofCereal,BambooandGrass.CambridgeUniversityPress.Blamey F, Kopittke P, Wehr J and Menzies N 2011 Recovery of cowpea seedling roots from
exposuretotoxicconcentrationsoftracemetals.PlantandSoil341,423‐436.BravinM,LeMerrerB,DenaixL,SchneiderAandHinsingerP2010Copperuptakekinetics in
hydroponically‐grown durum wheat (Triticum turgidum durum L.) as compared withsoil’sabilitytosupplycopper.PlantandSoil331,91‐104.
CollinBandDoelschE2010Impactofhighnaturalsoilborneheavymetalconcentrationsonthe
mobilityandphytoavailabilityoftheseelementsforsugarcane.Geoderma159,452‐458.DingTP,ZhouJX,WanDF,ChenZY,WangCYandZhangF2008Siliconisotopefractionation
in bamboo and its significance to the biogeochemical cycle of silicon. Geochimica etCosmochimicaActa72,1381‐1395.
GrovenorCRM,SmartKE,KilburnMR,ShoreB,DilworthJR,MartinB,HawesCandRickabyR
EM2006Specimenpreparation forNanoSIMSanalysisofbiologicalmaterials.AppliedSurfaceScience252,6917‐6924.
GuHH,QiuH,TianT,ZhanSS,DengTHB,ChaneyRL,WangSZ,TangYT,MorelJLandQiuRL
2011Mitigationeffectsofsiliconrichamendmentsonheavymetalaccumulationinrice(Oryza sativa L.) planted on multi‐metal contaminated acidic soil. Chemosphere 83,1234‐1240.
Kopittke PM,Menzies NW, de JongeM D,McKenna B A, Donner E,Webb R I, Paterson D J,
HowardDL,RyanCG,GloverCJ,ScheckelKGandLombiE2011InSituDistributionandSpeciation of Toxic Copper, Nickel, and Zinc in Hydrated Roots of Cowpea. PlantPhysiology156,663‐673.
KramerU,GrimeGW,SmithJAC,HawesCRandBakerAJM1997Micro‐PIXEasatechnique
for studying nickel localization in leaves of the hyperaccumulator plant Alyssumlesbiacum. Nuclear Instruments and Methods in Physics Research Section B: BeamInteractionswithMaterialsandAtoms130,346‐350.
LiuDandKottkeI2004SubcellularlocalizationofcopperintherootcellsofAlliumsativumby
electronenergylossspectroscopy(EELS).BioresourceTechnology94,153‐158.Lux A, Luxova M, Abe J, Morita S and Inanaga S 2003 Silicification of bamboo (Phyllostachys
heterocyclaMitf.)rootandleaf.PlantandSoil255,85‐91.Mijovilovich A, Leitenmaier B,Meyer‐KlauckeW, Kroneck PMH, Gotz B and KupperH 2009
Complexation and Toxicity of Copper in Higher Plants. II. Different Mechanisms forCopper versus Cadmium Detoxification in the Copper‐Sensitive Cadmium/ZincHyperaccumulator Thlaspi caerulescens (Ganges Ecotype). Plant Physiology 151, 715‐731.
MooreKL,Schr√∂derM,WuZ‐C,MartinBGH,HawesCR,McGrathSP,HawkesfordMJ,MaJF,
ZhaoF J andGrovenorCRM2011HighResolutionSecondary IonMassSpectrometry
Conclusionetperspectives
184
Reveals the Contrasting Subcellular Distribution of Arsenic and Silicon in Rice Roots.PlantPhysiology.
Moore K L, Schroder M, Lombi E, Zhao F J, McGrath S P, Hawkesford M J, Shewry P R and
GrovenorCRM2010NanoSIMSanalysisofarsenicandselenium incerealgrain.NewPhytologist185,434‐445.
PoletteLA,Gardea‐TorresdeyJL,ChianelliRR,GeorgeGN,PickeringIJandArenasJ2000XAS
and microscopy studies of the uptake and bio‐transformation of copper in Larreatridentata(creosotebush).MicrochemicalJournal65,227‐236.
SarretG,WillemsG,IsaureM‐P,MarcusMA,FakraSC,FrerotH,PairisS,GeoffroyN,ManceauA
and Saumitou‐LapradeP2009Zincdistribution and speciation inArabidopsis halleri xArabidopsis lyrata progenies presenting various zinc accumulation capacities. NewPhytologist184,581‐595.
ShiJY,YuanXF,ChenXC,WuB,HuangYYandChenYX2011CopperUptakeandItsEffecton
MetalDistribution inRootGrowthZonesofCommelinacommunisRevealedbySRXRF.BiologicalTraceElementResearch141,294‐304.
SmartKE, Smith JAC,KilburnMR,MartinBGH,HawesC andGrovenorCRM2010High‐
resolution elemental localization in vacuolate plant cells by nanoscale secondary ionmassspectrometry.PlantJournal63,870‐879.
RESUME
Cette étude vise à évaluer le rôle du silicium (Si) sur l’amélioration de la croissance et de latoléranceaucuivre(Cu)dubambou,planteutiliséeenphytoremédiation.Plusieursapprochesont été choisies. Dans un premier temps, la répartition et la variabilité de Cu et Si ont étéétudiéesdansplusieursespècesdebamboussedéveloppantdansuncontextepédoclimatiquenaturel afin d’établir des concentrations de référence pour ces éléments. Des cultureshydroponiques ont ensuite permis de caractériser demanièremacroscopique la réponse desbambous à des apports de Si et Cu, et, parallèlement, d’étudier la spéciation de Cu et lalocalisationdeSietCuauseindesdifférentsorganesdubambou(racines,tiges,feuilles).Les concentrations en Si et Cu présentent des différences significatives entre les principauxtypes de bambous, suggérant l’importance d’un caractère génotypique responsable del’absorptiondeceséléments.Faceàunetoxicitéaucuivre,unapportdeSimodifielaspéciationde Cu dans les tissus du bambou, sans toutefois améliorer significativement sa tolérance. Ilapparaît que la stratégie principale dubamboupour gérer de fortes concentrationsdeCu esttoutd’abordune importanteséquestrationdans lesracines,puisunecomplexationdeCuavecdes composés soufrés organiques et inorganiques. Les résultats de cette étude permettrontd’optimiser les technologies liées aux capacités épuratives des bambous face à une pollutionmétallique.Mots clefs: silicium, cuivre, bambou, phytoremédiation, culture hydroponique, spectroscopied’absorptionX(EXAFS,XANES)
ABSTRACT
Thisstudyaimsatassessingtheroleofsilicon(Si)ontheplantgrowthandalleviationofcopper(Cu)toxicityinbamboos.Severalapproacheshavebeenperformed.Firstly,thedistributionandvariabilityofSiandCuwereinvestigatedinseveralbamboospeciesgrownundernaturalpedo‐climatic conditions in order to obtain reference values for Cu and Si in bamboos. Secondly,hydroponicexperimentswerecarriedouttocharacterizethemacroscopicresponseofbambooplants exposed to Si and Cu and, investigated in parallel the Cu speciation and Si and Culocalisationindifferentpartofbamboos(roots,stems,leaves).Significant differences were measured between bamboo species, suggesting that a genotypiccharactermayberesponsibleforSiandCuaccumulation.SiliconsupplementationmodifiedtheCuspeciationbutdidnotinducesignificantimprovementofCutolerance.ThemainstrategyofbambootocopewithhighCuconcentrationsinitstissuesisinitiallyanimportantsequestrationin the roots apoplast, mainly in epidermis, and then a Cu complexation with organic andinorganic sulphur compounds. These results will allow the optimisation of phytoremediationprocessesusingbambooplants.
Keywords: silicon, copper, bamboo, phytoremediation, hydroponic, X‐ray absorptionspectroscopy(EXAFS,XANES)