robotic assessment of sensorimotor deficits after traumatic brain injury
TRANSCRIPT
RESEARCH ARTICLES
Robotic Assessment of Sensorimotor Deficits AfterTraumatic Brain Injury
Chantel T. Debert, MD, MSc, Troy M. Herter, PhD, Stephen H. Scott, PhD, and Sean Dukelow, MD, PhD
Background and Purpose: Robotic technology is commonly usedto quantify aspects of typical sensorimotor function. We evaluatedthe feasibility of using robotic technology to assess visuomotor andposition sense impairments following traumatic brain injury (TBI).We present results of robotic sensorimotor function testing in 12subjects with TBI, who had a range of initial severities (9 severe, 2moderate, 1 mild), and contrast these results with those of clinicaltests. We also compared these with robotic test outcomes in personswithout disability.Methods: For each subject with TBI, a review of the initial in-jury and neuroradiologic findings was conducted. Following this,each subject completed a number of standardized clinical measures(Fugl-Meyer Assessment, Purdue Peg Board, Montreal CognitiveAssessment, Rancho Los Amigos Scale), followed by two robotictasks. A visually guided reaching task was performed to assess vi-suomotor control of the upper limb. An arm position-matching taskwas used to assess position sense. Robotic task performance in thesubjects with TBI was compared with findings in a cohort of 170person without disabilities.Results: Subjects with TBI demonstrated a broad range of sensoryand motor deficits on robotic testing. Notably, several subjects withTBI displayed significant deficits in one or both of the robotic tasks,despite normal scores on traditional clinical motor and cognitiveassessment measures.Discussion and Conclusions: The findings demonstrate the potentialof robotic assessments for identifying deficits in visuomotor control
The Hotchkiss Brain Institute, Division of Physical Medicine and Reha-bilitation, Department of Clinical Neurosciences, University of Calgary,Calgary, Alberta, Canada (C.T.D., T.M.H., S.D.); and Department ofAnatomy and Cell Biology, Queen’s University, Kingston, Ontario, Canada(T.M.H., S.H.S.)
Parts of this work were presented in poster format at the 2010 Annual Meetingfor the Society of Neuroscience in San Diego, California.
Dr Scott is the cofounder and scientific officer of BKIN technologies, thecompany that manufactures the KINARM robotic device. Funding for thisproject was made possible through CIHR operating grants (MOP 81366and NSP 104015); a grant-in-aid from the Heart and Stroke Foundationof Alberta, Nunavut, and Northwest Territories; and a research excellencegrant from the Ontario Research Foundation.
Supplemental digital content is available for this article. Direct URL citationappears in the printed text and is provided in the HTML and PDF versionsof this article on the journal’s Web site (www.jnpt.org).
The authors declare no conflict of interest.Correspondence: Sean Dukelow, E-mail: sean.dukelow@albertahealth
services.caCopyright C© 2012 Neurology Section, APTA.ISSN: 1557-0576/12/3602-0058DOI: 10.1097/NPT.0b013e318254bd4f
and position sense following TBI. Improved identification of neuro-logic impairments following TBI may ultimately enhance rehabilita-tion.
Key words: proprioception, reaching, rehabilitation, robotics, trau-matic brain injury
(JNPT 2012;36: 58–67)
INTRODUCTION
T raumatic Brain Injury (TBI) is a health problem that tran-scends gender, age, and race. Incidence of TBI ranges
from 250 to 300 per 100,000 people in developed Westerncountries1,2 and is approximately 1.7 million annually in theUnited States.3-5 Traumatic brain injury can produce com-plex and heterogeneous neurologic deficits. In clinical studies,tasks such as the Purdue Pegboard test, Fugl-Meyer Assess-ment tool, finger-tapping test, go/no-go test, alertness test, andphysical performance measures (eg, strength testing and gaitanalysis) have demonstrated that motor impairments in indi-viduals with mild to severe TBI often persist long after theinitial injury.6-13 Some of these assessments rely on observer-based ordinal scales, which may miss subtle but potentiallyclinically important changes. Others provide little insight intowhy an individual has difficulty with a task.14 Furthermore, toour knowledge, no study has rigorously assessed propriocep-tive impairment following TBI.
Deficits in sensory, motor, or cognitive function mayplay a role, individually or in combination, in the inability toperform daily activities. Identifying deficits, and the magni-tude of these deficits, should represent one of the first steps indeveloping a rehabilitation treatment plan. In clinical practice,the detection and quantification of abnormalities, even if small,may be useful when advocating for rehabilitation resources forindividuals with TBI. Furthermore, the development of betterassessment tools has been identified as a key step in improv-ing clinical trials in rehabilitation.15 Finally, better assessmenttools should help provide insight into the neurophysiologicbasis of deficits and thereby help guide development of noveltherapeutic approaches.
For many years, basic scientific research on human mo-tor performance has used robotic technology to assess sen-sorimotor function.16-18 Robotic technology combined withvirtual reality offers obvious value for quantifying sensorimo-tor impairments, because of the ability to measure a subject’sperformance during a variety of behaviors in a highly con-trolled sensory and motor environment.14 Robotic assessments
Copyright © 2012 Neurology Section, APTA. Unauthorized reproduction of this article is prohibited.
58 JNPT � Volume 36, June 2012
JNPT � Volume 36, June 2012 Robotic Assessment of Sensorimotor Deficits After TBI
are inherently objective and may allow for detection of smallchanges in function not visible to the human examiner. Thepurpose of this study was to explore the feasibility of usingrobot-based assessments to detect and quantify arm sensoryand motor deficits in a series of individuals with TBI. Here,we present the results of the robotic assessments, accompaniedby a number of traditional clinical assessments.
METHODS
SubjectsSubjects with TBI were recruited as inpatients and out-
patients at the Foothills Medical Centre in Calgary, Alberta,Canada. Subjects with TBI were included in the study if theywere 18 years of age or older and were able to understand the in-structions required to complete the assessments. They were ex-cluded from the study if they had ongoing acute medical issues(eg, active cardiac disease), history of a prior TBI, other neu-rologic disorders, or ongoing musculoskeletal problems of theupper extremity. For comparison, persons without disabilities(comparison subjects) were recruited from the communities ofCalgary and Kingston (Ontario, Canada). Contact was madethrough posted flyers, advertisements in local newspapers,and direct communication with families of inpatients at theFoothills Medical Centre and St Mary’s of the Lake Hospital(Kingston). Recruitment was tailored to obtain a roughly uni-form distribution of subjects aged between 20 and 85 years andequal representation of both sexes. Comparison subjects wereexcluded from the study if they had any history of neurologicdisorders or ongoing musculoskeletal problems of the upperextremity. All subjects provided informed consent before par-ticipating in the study. This study was approved by the researchethics boards at the University of Calgary, Queen’s University,and Providence Care.
Clinical HistorySubject demographics and histories were obtained from
charts. We report Glasgow Coma Scale (GCS) scores deter-mined on arrival at the emergency department. TBI was definedon the basis of GCS scores, as follows: a score >12, mild;9 to 12, moderate; and ≤8, severe.19 Durations of posttrau-matic amnesia (PTA) and loss of consciousness (LOC) wereobtained from patients’ clinical charts but were self-reportedwhen such information was otherwise unavailable. Radiologiccharacteristics of each TBI were documented from computedtomography scans reviewed by a neuroradiologist.
Clinical AssessmentThe clinical assessment took 60 to 90 minutes to com-
plete and was done prior to the robotic assessment.
TBI SubjectsA brief medical history was taken. Neurologic exam-
ination of the upper extremities included muscle power andreflexes.20 A Modified Ashworth Scale was used to assessspasticity.21 Range of motion was evaluated to ensure that itwas adequate for subjects to complete both robotic tasks. Vi-sual acuity was tested with a Snellen eye chart to ensure ade-quate vision to complete the tasks. Visual fields were tested by
the confrontation technique.20 Clinical assessments includedthe Edinburgh Handedness Inventory,22 upper-extremity por-tion of the Fugl-Meyer Assessment (FMA),23 Purdue Peg-board (PPB),24 Ranchos Los Amigos Scale,25 Montreal Cogni-tive Assessment (MoCA),26 and Behavioral Inattention Test.27
These were performed because they represent a mix of assess-ments used in standard clinical care of patients with TBI andthose historically used to assess sensorimotor function afterTBI. All assessments were performed by either a trained studyphysician or a physical therapist.
Comparison SubjectsBefore performing the robotic assessment, comparison
subjects completed a simplified clinical assessment, includ-ing the Edinburgh Handedness Inventory and tests for musclepower, dexterity (PPB), visual acuity, and visual fields.
Robotic AssessmentApparatus
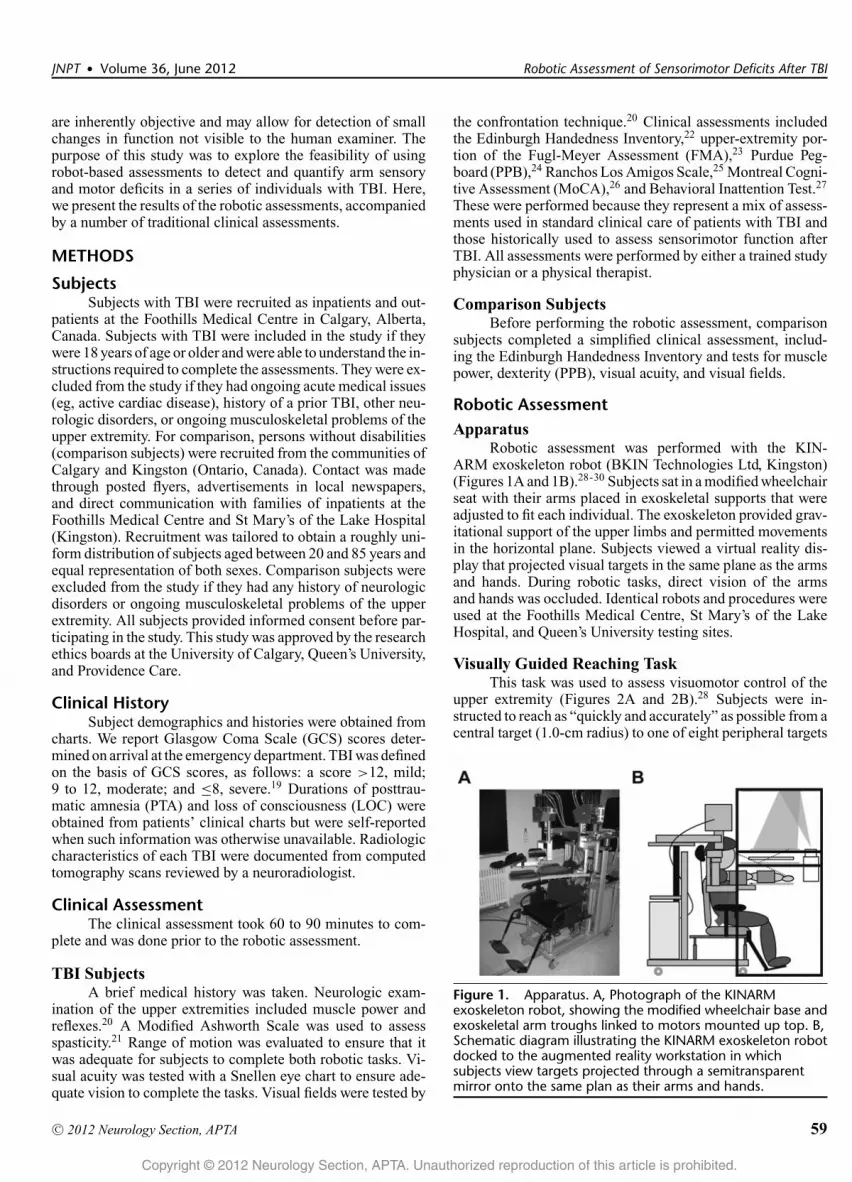
Robotic assessment was performed with the KIN-ARM exoskeleton robot (BKIN Technologies Ltd, Kingston)(Figures 1A and 1B).28-30 Subjects sat in a modified wheelchairseat with their arms placed in exoskeletal supports that wereadjusted to fit each individual. The exoskeleton provided grav-itational support of the upper limbs and permitted movementsin the horizontal plane. Subjects viewed a virtual reality dis-play that projected visual targets in the same plane as the armsand hands. During robotic tasks, direct vision of the armsand hands was occluded. Identical robots and procedures wereused at the Foothills Medical Centre, St Mary’s of the LakeHospital, and Queen’s University testing sites.
Visually Guided Reaching TaskThis task was used to assess visuomotor control of the
upper extremity (Figures 2A and 2B).28 Subjects were in-structed to reach as “quickly and accurately” as possible from acentral target (1.0-cm radius) to one of eight peripheral targets
Figure 1. Apparatus. A, Photograph of the KINARMexoskeleton robot, showing the modified wheelchair base andexoskeletal arm troughs linked to motors mounted up top. B,Schematic diagram illustrating the KINARM exoskeleton robotdocked to the augmented reality workstation in whichsubjects view targets projected through a semitransparentmirror onto the same plan as their arms and hands.
Copyright © 2012 Neurology Section, APTA. Unauthorized reproduction of this article is prohibited.
C© 2012 Neurology Section, APTA 59

Debert et al JNPT � Volume 36, June 2012
Figure 2. Robotic assessment tasks. A, Hand paths (reachingtrajectories) of a subject without disability performing thevisually guided reaching task with the right arm. B,Hand-speed profiles of reaching movements to the target onright in A (shown in black). C, Workspace view of the samesubject without disability performing the armposition-matching task, using the right hand to actively matchthe passively moved left hand. Mean hand positions of thepassive (closed symbols) and active (open symbols) hands areshown for each of the nine target locations. Mean positions ofthe eight peripheral targets are joined by solid (passive hand)and dashed (active hand) gray lines. Variability of the activehand is illustrated with the ellipses (1 SD) centered on eachopen symbol. D, Illustration of the matching performance inC, with the passive left hand superimposed on the active righthand. Symbols are the same as in C.
(1.0-cm radius) distributed uniformly 10 cm from the center.The central target was located near the center of the workspacefor each arm. The position of the index finger was presentedas a white dot (0.5-cm radius) by means of the virtual realitysystem. Subjects started each trial by holding their index fingerat the center target for 1250 to 1750 ms before the peripheraltarget was illuminated. Each peripheral target was presentedonce in a randomized block, which also included two “catch”trials in which a peripheral target was not presented. Eightblocks were obtained, for a total of 80 trials. All subjects com-pleted the task twice, once with each arm, in random order(total time ≈ 12 minutes).
Arm Position-Matching TaskThis task was used to assess accuracy of upper extremity
position sense (Figures 2C and 2D).30 The robot moved onearm (passive arm) to one of nine different target locations.After the robot completed the movement, subjects activelymoved the opposite arm (active arm) to the mirror location inspace. Each of the nine target locations was presented once ina randomized block. Six different blocks were obtained, for a
total of 54 trials. Subjects completed the task twice, once witheach arm, in random order (total time ≈ 7 minutes).
Data AnalysisFor the reaching task, data are reported for nine
parameters.28 Descriptions/definitions of these parameters aregiven in Table 1. Most measures were characterized by com-puting median values across all trials and targets (posturespeed, reaction time, initial direction error, initial distance ra-tio, movement time, and maximum speed), whereas highlynonlinear parameters (initial speed ratio, number of speedpeaks, and minimum–maximum speed difference) were de-fined on the basis of a mean (see Coderre et al28). For thearm position-matching task, data are reported for three mea-sures of underlying position sense30: (1) variability, (2) spatialcontraction/expansion, and (3) systematic shifts (Table 1).
Statistical analyses were performed in MATLAB (Math-works, Inc, Natick, Massachusetts, USA). Performance by thecomparison group (subjects without disability) was used toidentify normative ranges for each parameter that spanned95% of the group. In most cases, the 95% range was one-sided,reflecting the fact that abnormal values would be expected tobe larger or smaller than the comparison sample (ie, movementtime would be expected to be longer in individuals with TBI;see Table 1 for ranges). These normative ranges reflected theinfluence of age, sex, and handedness (see Supplemental Dig-ital Content 1, http://links.lww.com/JNPT/A25, which givesdetailed methods describing the regression analysis and nor-malized scores). For visualization purposes, values for eachparameter were transformed into a normalized score, akin toa z score, by using the median, 5th, and 95th percentiles (p50,p5, and p95, respectively).
RESULTS
Participant PoolDemographic data, initial clinical history, time between
injury and assessment (delay), and clinical assessment scoresfor individual subjects with TBI are shown in Table 2. Subjectsare organized on the basis of initial GCS scores. Nine subjectshad severe TBI, whereas relatively few had moderate (n = 2)or mild (n = 1) TBI. Neuroradiologic assessment of initialCT scans indicated eight subjects had focal lesions and diffuseaxonal injury, whereas four subjects had focal lesions only.
The subjects without disabilities included 81 men and 89women, ranging from 20 to 83 years of age (median age = 49).Although most comparison subjects were right-hand domi-nant, nine were left-hand dominant and five were ambidex-trous.
Comparison Subject PerformanceExample hand paths (A) and speed profiles (B) during
reaching for a comparison subject (a 23-year-old female) areillustrated in Figure 2. Hand position remained fairly constantduring the postural hold period preceding onset of the periph-eral target (vertical line at 0 s). Movements were initiated withsimilar reaction times and were fairly straight, with bell-shapedvelocity profiles and only minor corrective movements to attainto the peripheral target. The performance of this same subject
Copyright © 2012 Neurology Section, APTA. Unauthorized reproduction of this article is prohibited.
60 C© 2012 Neurology Section, APTA
JNPT � Volume 36, June 2012 Robotic Assessment of Sensorimotor Deficits After TBI
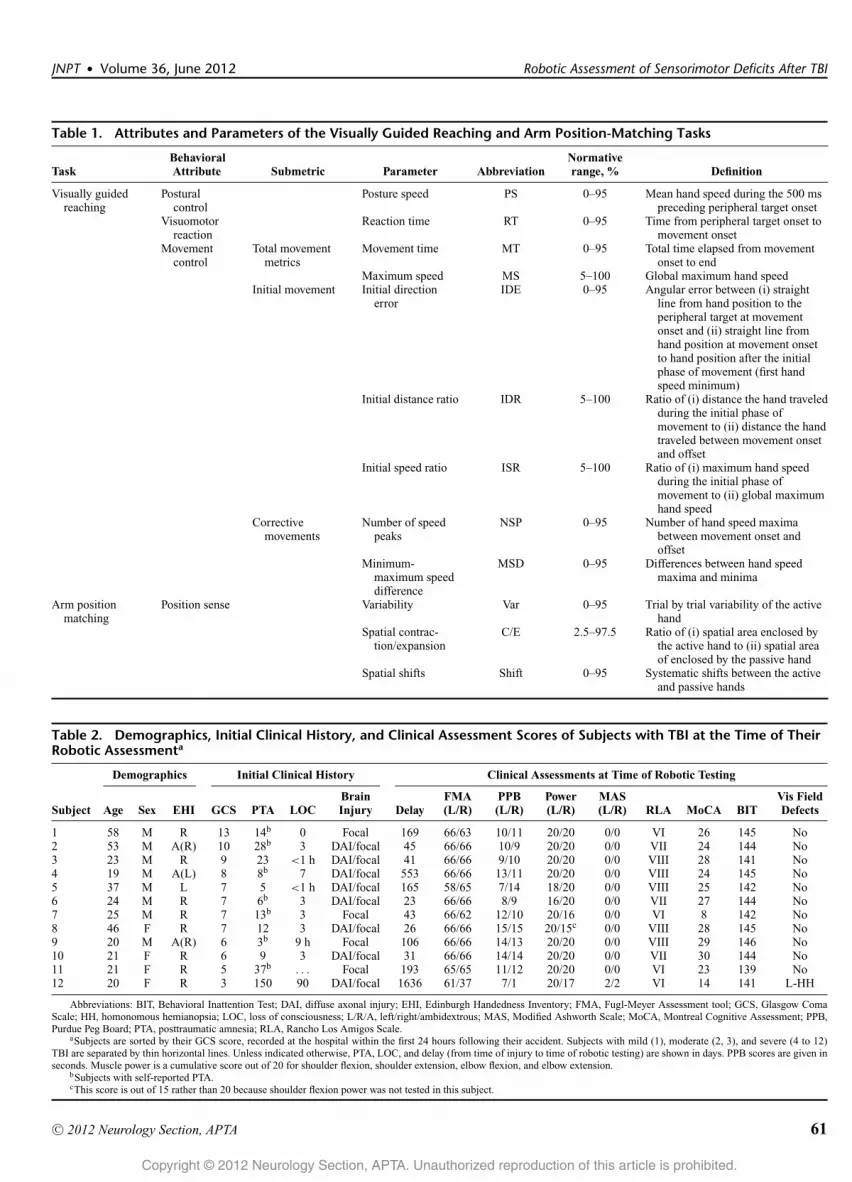
Table 1. Attributes and Parameters of the Visually Guided Reaching and Arm Position-Matching Tasks
TaskBehavioralAttribute Submetric Parameter Abbreviation
Normativerange, % Definition
Visually guidedreaching
Posturalcontrol
Posture speed PS 0–95 Mean hand speed during the 500 mspreceding peripheral target onset
Visuomotorreaction
Reaction time RT 0–95 Time from peripheral target onset tomovement onset
Movementcontrol
Total movementmetrics
Movement time MT 0–95 Total time elapsed from movementonset to end
Maximum speed MS 5–100 Global maximum hand speedInitial movement Initial direction
errorIDE 0–95 Angular error between (i) straight
line from hand position to theperipheral target at movementonset and (ii) straight line fromhand position at movement onsetto hand position after the initialphase of movement (first handspeed minimum)
Initial distance ratio IDR 5–100 Ratio of (i) distance the hand traveledduring the initial phase ofmovement to (ii) distance the handtraveled between movement onsetand offset
Initial speed ratio ISR 5–100 Ratio of (i) maximum hand speedduring the initial phase ofmovement to (ii) global maximumhand speed
Correctivemovements
Number of speedpeaks
NSP 0–95 Number of hand speed maximabetween movement onset andoffset
Minimum-maximum speeddifference
MSD 0–95 Differences between hand speedmaxima and minima
Arm positionmatching
Position sense Variability Var 0–95 Trial by trial variability of the activehand
Spatial contrac-tion/expansion
C/E 2.5–97.5 Ratio of (i) spatial area enclosed bythe active hand to (ii) spatial areaof enclosed by the passive hand
Spatial shifts Shift 0–95 Systematic shifts between the activeand passive hands
Table 2. Demographics, Initial Clinical History, and Clinical Assessment Scores of Subjects with TBI at the Time of TheirRobotic Assessmenta
Demographics Initial Clinical History Clinical Assessments at Time of Robotic Testing
Subject Age Sex EHI GCS PTA LOCBrainInjury Delay
FMA(L/R)
PPB(L/R)
Power(L/R)
MAS(L/R) RLA MoCA BIT
Vis FieldDefects
1 58 M R 13 14b 0 Focal 169 66/63 10/11 20/20 0/0 VI 26 145 No2 53 M A(R) 10 28b 3 DAI/focal 45 66/66 10/9 20/20 0/0 VII 24 144 No3 23 M R 9 23 <1 h DAI/focal 41 66/66 9/10 20/20 0/0 VIII 28 141 No4 19 M A(L) 8 8b 7 DAI/focal 553 66/66 13/11 20/20 0/0 VIII 24 145 No5 37 M L 7 5 <1 h DAI/focal 165 58/65 7/14 18/20 0/0 VIII 25 142 No6 24 M R 7 6b 3 DAI/focal 23 66/66 8/9 16/20 0/0 VII 27 144 No7 25 M R 7 13b 3 Focal 43 66/62 12/10 20/16 0/0 VI 8 142 No8 46 F R 7 12 3 DAI/focal 26 66/66 15/15 20/15c 0/0 VIII 28 145 No9 20 M A(R) 6 3b 9 h Focal 106 66/66 14/13 20/20 0/0 VIII 29 146 No10 21 F R 6 9 3 DAI/focal 31 66/66 14/14 20/20 0/0 VII 30 144 No11 21 F R 5 37b . . . Focal 193 65/65 11/12 20/20 0/0 VI 23 139 No12 20 F R 3 150 90 DAI/focal 1636 61/37 7/1 20/17 2/2 VI 14 141 L-HH
Abbreviations: BIT, Behavioral Inattention Test; DAI, diffuse axonal injury; EHI, Edinburgh Handedness Inventory; FMA, Fugl-Meyer Assessment tool; GCS, Glasgow ComaScale; HH, homonomous hemianopsia; LOC, loss of consciousness; L/R/A, left/right/ambidextrous; MAS, Modified Ashworth Scale; MoCA, Montreal Cognitive Assessment; PPB,Purdue Peg Board; PTA, posttraumatic amnesia; RLA, Rancho Los Amigos Scale.
aSubjects are sorted by their GCS score, recorded at the hospital within the first 24 hours following their accident. Subjects with mild (1), moderate (2, 3), and severe (4 to 12)TBI are separated by thin horizontal lines. Unless indicated otherwise, PTA, LOC, and delay (from time of injury to time of robotic testing) are shown in days. PPB scores are given inseconds. Muscle power is a cumulative score out of 20 for shoulder flexion, shoulder extension, elbow flexion, and elbow extension.
bSubjects with self-reported PTA.cThis score is out of 15 rather than 20 because shoulder flexion power was not tested in this subject.
Copyright © 2012 Neurology Section, APTA. Unauthorized reproduction of this article is prohibited.
C© 2012 Neurology Section, APTA 61
Debert et al JNPT � Volume 36, June 2012
in the position-matching task is illustrated in Figures 2C and2D. In this example, the robot passively moved the left armand the subject actively moved the right arm to mirror-matchthe position of the left arm at each target (Figure 2C). Whenthe active and passive arms are superimposed (Figure 2D), itis evident that the end positions of the active arm are generallylocated near the corresponding end positions of the passivearm. Across all targets, the area subtended by the active armis similar to that of the passive arm, and there is no obvi-ous systematic shift between the end positions of the activeand passive arms. The variability ellipses demonstrate that thetrial-to-trial position of the active arm about each end positionwas small (<6 cm).
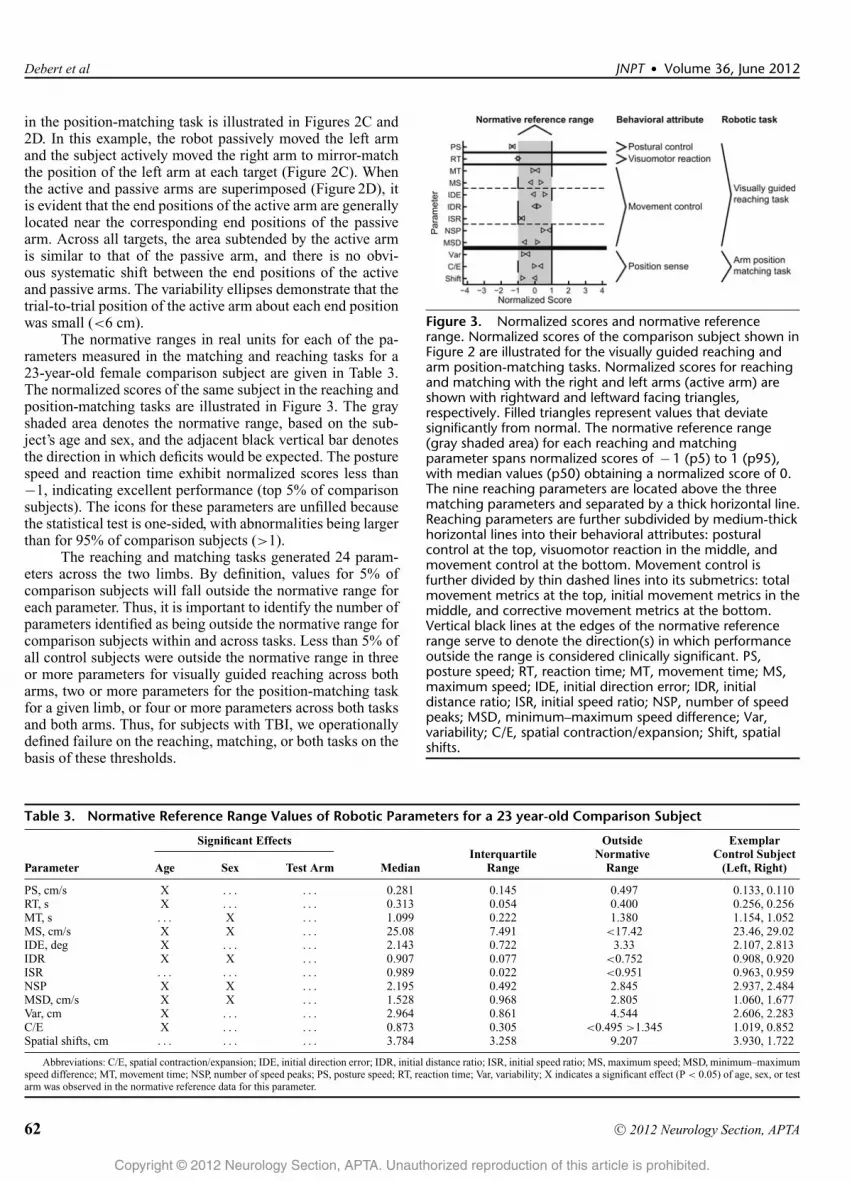
The normative ranges in real units for each of the pa-rameters measured in the matching and reaching tasks for a23-year-old female comparison subject are given in Table 3.The normalized scores of the same subject in the reaching andposition-matching tasks are illustrated in Figure 3. The grayshaded area denotes the normative range, based on the sub-ject’s age and sex, and the adjacent black vertical bar denotesthe direction in which deficits would be expected. The posturespeed and reaction time exhibit normalized scores less than−1, indicating excellent performance (top 5% of comparisonsubjects). The icons for these parameters are unfilled becausethe statistical test is one-sided, with abnormalities being largerthan for 95% of comparison subjects (>1).
The reaching and matching tasks generated 24 param-eters across the two limbs. By definition, values for 5% ofcomparison subjects will fall outside the normative range foreach parameter. Thus, it is important to identify the number ofparameters identified as being outside the normative range forcomparison subjects within and across tasks. Less than 5% ofall control subjects were outside the normative range in threeor more parameters for visually guided reaching across botharms, two or more parameters for the position-matching taskfor a given limb, or four or more parameters across both tasksand both arms. Thus, for subjects with TBI, we operationallydefined failure on the reaching, matching, or both tasks on thebasis of these thresholds.
Figure 3. Normalized scores and normative referencerange. Normalized scores of the comparison subject shown inFigure 2 are illustrated for the visually guided reaching andarm position-matching tasks. Normalized scores for reachingand matching with the right and left arms (active arm) areshown with rightward and leftward facing triangles,respectively. Filled triangles represent values that deviatesignificantly from normal. The normative reference range(gray shaded area) for each reaching and matchingparameter spans normalized scores of − 1 (p5) to 1 (p95),with median values (p50) obtaining a normalized score of 0.The nine reaching parameters are located above the threematching parameters and separated by a thick horizontal line.Reaching parameters are further subdivided by medium-thickhorizontal lines into their behavioral attributes: posturalcontrol at the top, visuomotor reaction in the middle, andmovement control at the bottom. Movement control isfurther divided by thin dashed lines into its submetrics: totalmovement metrics at the top, initial movement metrics in themiddle, and corrective movement metrics at the bottom.Vertical black lines at the edges of the normative referencerange serve to denote the direction(s) in which performanceoutside the range is considered clinically significant. PS,posture speed; RT, reaction time; MT, movement time; MS,maximum speed; IDE, initial direction error; IDR, initialdistance ratio; ISR, initial speed ratio; NSP, number of speedpeaks; MSD, minimum–maximum speed difference; Var,variability; C/E, spatial contraction/expansion; Shift, spatialshifts.
Table 3. Normative Reference Range Values of Robotic Parameters for a 23 year-old Comparison Subject
Significant Effects
Parameter Age Sex Test Arm MedianInterquartile
Range
OutsideNormative
Range
ExemplarControl Subject
(Left, Right)
PS, cm/s X . . . . . . 0.281 0.145 0.497 0.133, 0.110RT, s X . . . . . . 0.313 0.054 0.400 0.256, 0.256MT, s . . . X . . . 1.099 0.222 1.380 1.154, 1.052MS, cm/s X X . . . 25.08 7.491 <17.42 23.46, 29.02IDE, deg X . . . . . . 2.143 0.722 3.33 2.107, 2.813IDR X X . . . 0.907 0.077 <0.752 0.908, 0.920ISR . . . . . . . . . 0.989 0.022 <0.951 0.963, 0.959NSP X X . . . 2.195 0.492 2.845 2.937, 2.484MSD, cm/s X X . . . 1.528 0.968 2.805 1.060, 1.677Var, cm X . . . . . . 2.964 0.861 4.544 2.606, 2.283C/E X . . . . . . 0.873 0.305 <0.495 >1.345 1.019, 0.852Spatial shifts, cm . . . . . . . . . 3.784 3.258 9.207 3.930, 1.722
Abbreviations: C/E, spatial contraction/expansion; IDE, initial direction error; IDR, initial distance ratio; ISR, initial speed ratio; MS, maximum speed; MSD, minimum–maximumspeed difference; MT, movement time; NSP, number of speed peaks; PS, posture speed; RT, reaction time; Var, variability; X indicates a significant effect (P < 0.05) of age, sex, or testarm was observed in the normative reference data for this parameter.
Copyright © 2012 Neurology Section, APTA. Unauthorized reproduction of this article is prohibited.
62 C© 2012 Neurology Section, APTA
JNPT � Volume 36, June 2012 Robotic Assessment of Sensorimotor Deficits After TBI
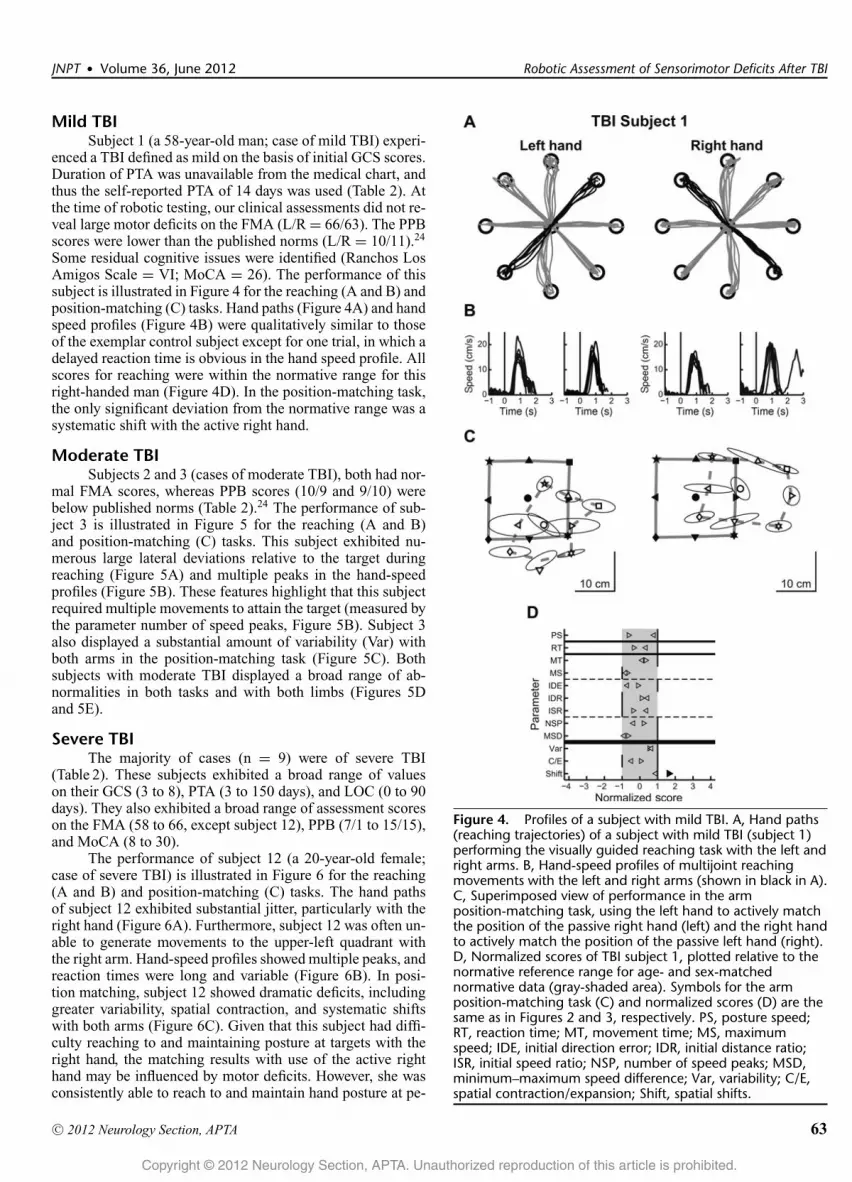
Mild TBISubject 1 (a 58-year-old man; case of mild TBI) experi-
enced a TBI defined as mild on the basis of initial GCS scores.Duration of PTA was unavailable from the medical chart, andthus the self-reported PTA of 14 days was used (Table 2). Atthe time of robotic testing, our clinical assessments did not re-veal large motor deficits on the FMA (L/R = 66/63). The PPBscores were lower than the published norms (L/R = 10/11).24
Some residual cognitive issues were identified (Ranchos LosAmigos Scale = VI; MoCA = 26). The performance of thissubject is illustrated in Figure 4 for the reaching (A and B) andposition-matching (C) tasks. Hand paths (Figure 4A) and handspeed profiles (Figure 4B) were qualitatively similar to thoseof the exemplar control subject except for one trial, in which adelayed reaction time is obvious in the hand speed profile. Allscores for reaching were within the normative range for thisright-handed man (Figure 4D). In the position-matching task,the only significant deviation from the normative range was asystematic shift with the active right hand.
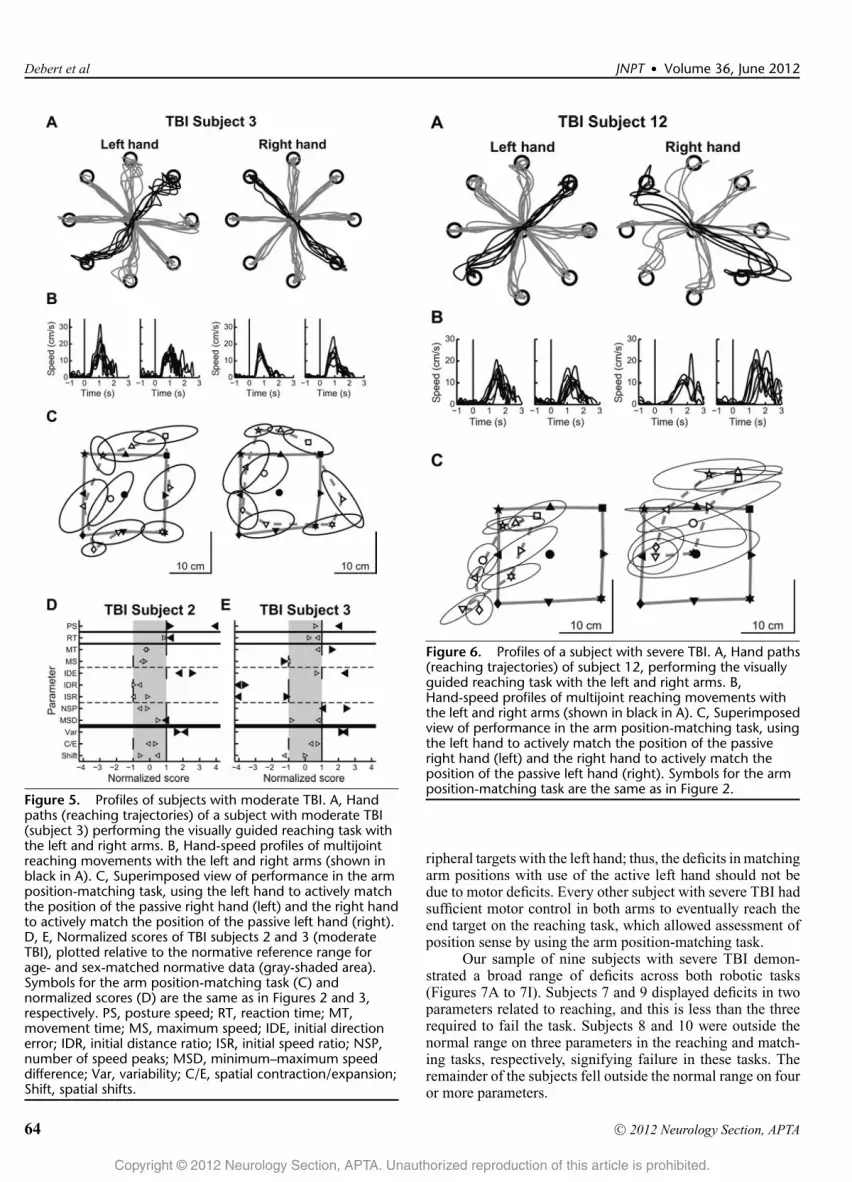
Moderate TBISubjects 2 and 3 (cases of moderate TBI), both had nor-
mal FMA scores, whereas PPB scores (10/9 and 9/10) werebelow published norms (Table 2).24 The performance of sub-ject 3 is illustrated in Figure 5 for the reaching (A and B)and position-matching (C) tasks. This subject exhibited nu-merous large lateral deviations relative to the target duringreaching (Figure 5A) and multiple peaks in the hand-speedprofiles (Figure 5B). These features highlight that this subjectrequired multiple movements to attain the target (measured bythe parameter number of speed peaks, Figure 5B). Subject 3also displayed a substantial amount of variability (Var) withboth arms in the position-matching task (Figure 5C). Bothsubjects with moderate TBI displayed a broad range of ab-normalities in both tasks and with both limbs (Figures 5Dand 5E).
Severe TBIThe majority of cases (n = 9) were of severe TBI
(Table 2). These subjects exhibited a broad range of valueson their GCS (3 to 8), PTA (3 to 150 days), and LOC (0 to 90days). They also exhibited a broad range of assessment scoreson the FMA (58 to 66, except subject 12), PPB (7/1 to 15/15),and MoCA (8 to 30).
The performance of subject 12 (a 20-year-old female;case of severe TBI) is illustrated in Figure 6 for the reaching(A and B) and position-matching (C) tasks. The hand pathsof subject 12 exhibited substantial jitter, particularly with theright hand (Figure 6A). Furthermore, subject 12 was often un-able to generate movements to the upper-left quadrant withthe right arm. Hand-speed profiles showed multiple peaks, andreaction times were long and variable (Figure 6B). In posi-tion matching, subject 12 showed dramatic deficits, includinggreater variability, spatial contraction, and systematic shiftswith both arms (Figure 6C). Given that this subject had diffi-culty reaching to and maintaining posture at targets with theright hand, the matching results with use of the active righthand may be influenced by motor deficits. However, she wasconsistently able to reach to and maintain hand posture at pe-
Figure 4. Profiles of a subject with mild TBI. A, Hand paths(reaching trajectories) of a subject with mild TBI (subject 1)performing the visually guided reaching task with the left andright arms. B, Hand-speed profiles of multijoint reachingmovements with the left and right arms (shown in black in A).C, Superimposed view of performance in the armposition-matching task, using the left hand to actively matchthe position of the passive right hand (left) and the right handto actively match the position of the passive left hand (right).D, Normalized scores of TBI subject 1, plotted relative to thenormative reference range for age- and sex-matchednormative data (gray-shaded area). Symbols for the armposition-matching task (C) and normalized scores (D) are thesame as in Figures 2 and 3, respectively. PS, posture speed;RT, reaction time; MT, movement time; MS, maximumspeed; IDE, initial direction error; IDR, initial distance ratio;ISR, initial speed ratio; NSP, number of speed peaks; MSD,minimum–maximum speed difference; Var, variability; C/E,spatial contraction/expansion; Shift, spatial shifts.
Copyright © 2012 Neurology Section, APTA. Unauthorized reproduction of this article is prohibited.
C© 2012 Neurology Section, APTA 63
Debert et al JNPT � Volume 36, June 2012
Figure 5. Profiles of subjects with moderate TBI. A, Handpaths (reaching trajectories) of a subject with moderate TBI(subject 3) performing the visually guided reaching task withthe left and right arms. B, Hand-speed profiles of multijointreaching movements with the left and right arms (shown inblack in A). C, Superimposed view of performance in the armposition-matching task, using the left hand to actively matchthe position of the passive right hand (left) and the right handto actively match the position of the passive left hand (right).D, E, Normalized scores of TBI subjects 2 and 3 (moderateTBI), plotted relative to the normative reference range forage- and sex-matched normative data (gray-shaded area).Symbols for the arm position-matching task (C) andnormalized scores (D) are the same as in Figures 2 and 3,respectively. PS, posture speed; RT, reaction time; MT,movement time; MS, maximum speed; IDE, initial directionerror; IDR, initial distance ratio; ISR, initial speed ratio; NSP,number of speed peaks; MSD, minimum–maximum speeddifference; Var, variability; C/E, spatial contraction/expansion;Shift, spatial shifts.
Figure 6. Profiles of a subject with severe TBI. A, Hand paths(reaching trajectories) of subject 12, performing the visuallyguided reaching task with the left and right arms. B,Hand-speed profiles of multijoint reaching movements withthe left and right arms (shown in black in A). C, Superimposedview of performance in the arm position-matching task, usingthe left hand to actively match the position of the passiveright hand (left) and the right hand to actively match theposition of the passive left hand (right). Symbols for the armposition-matching task are the same as in Figure 2.
ripheral targets with the left hand; thus, the deficits in matchingarm positions with use of the active left hand should not bedue to motor deficits. Every other subject with severe TBI hadsufficient motor control in both arms to eventually reach theend target on the reaching task, which allowed assessment ofposition sense by using the arm position-matching task.
Our sample of nine subjects with severe TBI demon-strated a broad range of deficits across both robotic tasks(Figures 7A to 7I). Subjects 7 and 9 displayed deficits in twoparameters related to reaching, and this is less than the threerequired to fail the task. Subjects 8 and 10 were outside thenormal range on three parameters in the reaching and match-ing tasks, respectively, signifying failure in these tasks. Theremainder of the subjects fell outside the normal range on fouror more parameters.
Copyright © 2012 Neurology Section, APTA. Unauthorized reproduction of this article is prohibited.
64 C© 2012 Neurology Section, APTA

JNPT � Volume 36, June 2012 Robotic Assessment of Sensorimotor Deficits After TBI
Figure 7. Normalized scores of all subjects with severe TBI. A–I, Normalized scores sorted by TBI severity (highest to lowestGlasgow Coma Scale scores). For each subject, normalized scores are plotted relative to the normative reference range for age-and sex-matched normative data (gray-shaded area). Symbols are the same as in Figure 3. PS, posture speed; RT, reaction time;MT, movement time; MS, maximum speed; IDE, initial direction error; IDR, initial distance ratio; ISR, initial speed ratio; NSP,number of speed peaks; MSD, minimum–maximum speed difference; Var, variability; C/E, spatial contraction/expansion; Shift,spatial shifts.
DISCUSSIONThis study highlights some of the potential strengths of
using robotic technology to perform assessments of sensori-motor function for individuals with TBI. Robotic technologyoffers the promise of objectivity and the ability to quantifymany different aspects of subject performance related to agiven behavior. Given that this was a feasibility study focusedon assessment rather than treatment, it was fundamentally im-portant to include a wide variety of cases from inpatient andoutpatient clinics, some acute and some more chronic in nature.The subjects with TBI demonstrated a broad range of deficitson the robotic assessment. The number of deficits detectedin each individual did not always match well with traditional
measures of severity (ie, GCS, PTA, LOC). This is not sur-prising, given the considerable variability in the time sinceinjury and the heterogeneous nature of TBI. To truly under-stand the relationship between the more traditional measuresof TBI severity and the current robotic assessment tools, alarger study will be necessary. Despite this, the current studyraises some interesting issues.
There was considerable mismatch between the find-ings from FMA23 and visually guided reaching. Many of thesubjects with TBI scored a maximal (or near maximal) score onthe FMA, yet numerous deficits were identified with the roboticreaching task. This is not surprising, given the known prob-lems with ceiling effects on the FMA.31 Another assessment
Copyright © 2012 Neurology Section, APTA. Unauthorized reproduction of this article is prohibited.
C© 2012 Neurology Section, APTA 65
Debert et al JNPT � Volume 36, June 2012
of manual dexterity, the PPB, seemed to better match therobotic reaching results. The clinical test, however, gives lit-tle insight into the underlying reason an individual performspoorly. Did they have a problem with coordination, slowedmovements, and/or proprioception? Robotic assessment canhelp answer these questions.
Many subjects with TBI in this study exhibited deficitson the robotic position-matching task. Our clinical experi-ence has been that position sense deficits can go unrecog-nized with current clinical assessment tools. Other authorshave commented that the standard clinical assessments of po-sition sense are insensitive and unreliable.32 In stroke, wehave shown that approximately 50% of inpatients have po-sition sense difficulties30 and that these correlate with poorperformance on the Functional Independence Measure.33 Theassessment of proprioception represents a potential area wherethe robotic assessment tools may be able to provide clinicianswith more information than a traditional clinical examination.
Cognitive issues represent a potential challenge for at-tempting to measure sensorimotor deficits in TBI. We screenedcognition in this study with the MoCA. Previous studies haveproposed a cutoff score of 26 for mild cognitive impairment.26
However, individuals with scores less than 26 can still be ca-pable of basic sensorimotor skills and motor learning. Weroutinely see patients with MoCA scores in the mid-teenswho actively participate and improve in daily rehabilitation.A somewhat extreme example in this study is subject 7, whohad a MoCA score of 8 and performance that was nearly withinthe normative range on sensory and motor testing. Potentially,the reason that subjects with low MoCA scores could per-form well on the robotic testing is that the tasks used in thisstudy were relatively simple and that the staff operating therobot took the time to ensure the subjects could understandthe task instructions. It is likely that if we had examined ele-ments of higher cognitive function such as divided attention orvisuospatial memory, the influence of this subject’s cognitivedeficits would have been more obvious on the robotic testing.Much like neuropsychometric testing, robotic measures canbe designed to probe different areas of cognition. This is apotential area for future research.
After TBI, many individuals have bilateral deficits. Thispresents challenges in determining loss of position sense byusing the arm position-matching task in individuals with se-vere motor deficits in both arms, as was the case with subject12. However, she was able to reach all targets and hold at theend position with her left hand (data not shown), and thusher position-matching deficits likely represent a true proprio-ceptive problem. This issue, however, does serve to highlighta limitation of the arm position-matching task for individu-als with severe bilateral deficits. Other variants of the armposition-matching task will need to be designed to overcomethis limitation.
Another potential limitation in this study is that theKINARM robot (BKIN Technologies Ltd., Kingston, ON,Canada) allows movement only in the horizontal plane. Be-cause real-world movements are multiplanar, practicing move-ments that are restricted to the horizontal plane may havelimited generalizability to performance functional activities.However, some authors have recommended this position34 be-
cause it provides support for individuals with weakness andallows testing in a “gravity-eliminated” environment. Thismay be an important consideration when studying motorfunction in individuals with disabilities. With regard to theposition-matching task, essentially the same muscles cross-ing the shoulder or elbow would undergo stretch for verti-cally oriented movements. As position sense is derived pre-dominantly from muscle spindles,35-38 theoretically, similarresults should be obtained whether working in two or threedimensions.
In this study, we chose not to include a standardizedclinical measure for proprioception, which could be viewed asa limitation. We have used the clinical thumb localizer task inprevious studies in stroke.30,33 Unfortunately, this test and asimpler test in which an examiner moves the distal segment ata joint and asks the subject which direction it was moved inhave both been shown to be unreliable.32 Most researchers whoattempt to quantify position sense with any sort of accuracyhave used some form of mechanized approach.39-42 Limita-tions in the sample size preclude us from making meaningfulconclusions about the relationship between failure in the po-sition sense task by subjects with TBI and performance ofactivities of daily living. In stroke patients, however, we haveshown that the robotic measure of position sense is correlatedwith performance of activities of daily living as measuredby the Functional Independence Measure, independent of thesubjects’ performance on the reaching task.33
Another important aspect of using robotic assessmenttools for measuring sensorimotor function lies in the definitionof “normal.” Using normative reference data to identify ab-normalities is standard practice in many areas of medicine (eg,blood tests such as hemoglobin, glucose, or electrolyte levelsin laboratory medicine). This methodology is extremely usefulin evaluating the severity of deficits and can also be used todetermine when performance returns to normal. Many currentclinical assessments used in rehabilitation simply assume thatthe top (or bottom) end of their observer-based ordinal scalerepresents normal functioning. Inherently, this can lead to flooror ceiling effects (eg, the FMA). The method of using “nor-mal” reference ranges, however, does have some challenges.In this study, each task had a number of different parameters.However, a question arises about how a clinician interprets theresults when a single parameter is abnormal, as was the caseTBI subject 1, depicted in Figure 4. In other fields of clinicaltesting (eg, a multiparameter blood screening panel collectedto work up a differential diagnosis), a single abnormal mea-surement is not uncommon. One must interpret the results ofany single parameter or test within a context that considers thewhole patient. Furthermore, the magnitude by which a singleparameter deviates from normative values is also an importantfactor to consider. In this case, subject 1 is well outside thenormal range and had continued to have clinical complaintsthat may have been related to impaired sensory function. In thepresent study we operationally defined failure at a task basedon a set number of parameters for which a subject with TBIfell outside the normative range. We fully acknowledge theneed to develop methodology that also accounts for very poorperformance on a single parameter, and this represents an areafor future study.
Copyright © 2012 Neurology Section, APTA. Unauthorized reproduction of this article is prohibited.
66 C© 2012 Neurology Section, APTA
JNPT � Volume 36, June 2012 Robotic Assessment of Sensorimotor Deficits After TBI
CONCLUSIONSThis study was our first attempt to use robotics to mea-
sure deficits in individuals with TBI. The study focused onusing robotic tasks that had been previously validated in in-dividuals with stroke.28,30,33 On the basis of the outcomes ofthe present study, a more thorough “tool kit” including auto-mated assessments of different aspects of cognition (eg, visualspatial abilities, sustained and divided attention, memory) isunder development. Ultimately, the use of robotic monitoringof neurologic function may represent a significant advance-ment for monitoring and predicting recovery following TBI,but more research is clearly necessary.14
ACKNOWLEDGMENTSThe authors thank Drs Christine McGovern and
Stephanie Plamondon, for their assistance with recruitment ofsubjects with TBI, and Mrs Janice Yajure, Ms Kim Moore, MrJustin Peterson, and Ms Helen Bretzke for technical assistance.
REFERENCES1. Campbell M. Understanding Traumatic Brain Injury. Toronto, Ontario,
Canada: Churchill Livingstone; 2000.2. Liss M, Willer B. Traumatic brain injury and marital relationships: a
literature review. Int J Rehabil Res. 1990;13(4):309-320.3. Thurman DJ, Alverson C, Dunn KA, Guerrero J, Sniezek JE. Traumatic
brain injury in the United States: a public health perspective. J HeadTrauma Rehabil. 1999;14(6):602-615.
4. Zaloshnja E, Miller T, Langlois JA, Selassie AW. Prevalence of long-termdisability from traumatic brain injury in the civilian population of theUnited States, 2005. J Head Trauma Rehabil. 2008;23(6):394-400.
5. Faul M, Xu L, Wald MM, Coronado VG. Traumatic Brain Injury in theUnited States: Emergency Department Visits, Hospitalizations and Deaths2002–2006. Atlanta, GA: Centers for Disease Control and Prevention,National Center for Injury Prevention and Control; 2010.
6. Chaplin D, Deitz J, Jaffe KM. Motor performance in children after trau-matic brain injury. Arch Phys Med Rehabil. 1993;74(2):161-164.
7. Haaland KY, Temkin N, Randahl G, Dikmen S. Recovery of simple motorskills after head injury. J Clin Exp Neuropsychol. 1994;16(3):448-456.
8. Gray C, Cantagallo A, Della Sala S, Basaglia N. Bradykinesia andbradyphrenia revisited: patterns of subclinical deficit in motor speed andcognitive functioning in head-injured patients with good recovery. BrainInj. 1998;12(5):429-441.
9. Incoccia C, Formisano R, Muscato P, Reali G, Zoccolotti P. Reaction andmovement times in individuals with chronic traumatic brain injury withgood motor recovery. Cortex. 2004;40(1):111-115.
10. Kuhtz-Buschbeck JP, Hoppe B, Golge M, Dreesmann M, Damm-StunitzU, Ritz A. Sensorimotor recovery in children after traumatic brain injury:analyses of gait, gross motor, and fine motor skills. Dev Med Child Neurol.2003;45(12):821-828.
11. Kuhtz-Buschbeck JP, Stolze H, Golge M, Ritz A. Analyses of gait, reach-ing, and grasping in children after traumatic brain injury. Arch Phys MedRehabil. 2003;84(3):424-430.
12. Gagnon I, Forget R, Sullivan SJ, Friedman D. Motor performance follow-ing a mild traumatic brain injury in children: an exploratory study. BrainInj. 1998;12(10):843-853.
13. Walker WC, Pickett TC. Motor impairment after severe traumatic brain in-jury: a longitudinal multicenter study. J Rehabil Res Dev. 2007;44(7):975-982.
14. Scott SH, Dukelow SP. Potential of robots as next-generation technologyfor clinical assessment of neurological disorders and upper-limb therapy.J Rehabil Res Dev. 2011;48(4):335-354.
15. Dobkin BH, Dorsch A. The promise of mHealth: daily activity monitor-ing and outcome assessments by wearable sensors. Neurorehabil NeuralRepair. 2011;25(9):788-798.
16. Shadmehr R, Mussa-Ivaldi FA. Adaptive representation of dynamics dur-ing learning of a motor task. J Neurosci. 1994;14(5 Pt 2):3208-3224.
17. Singh K, Scott SH. A motor learning strategy reflects neural circuitry forlimb control. Nat Neurosci. 2003;6(4):399-403.
18. Wolpert DM, Flanagan JR. Q&A: Robotics as a tool to understand thebrain. BMC Biol. 2010;8:92.
19. Teasdale G, Jennett B. Assessment of coma and impaired consciousness.A practical scale. Lancet. 1974;2(7872):81-84.
20. Bickley LS, Szilagyi PG. Bates’ Guide to Physical Examination and His-tory Taking. 9th ed. Hagerstown, MD: Lippincott Williams & Wilkins;2007.
21. Bohannon RW, Smith MB. Interrater reliability of a modified Ashworthscale of muscle spasticity. Phys Ther. 1987;67(2):206-207.
22. Oldfield RC. The assessment and analysis of handedness: the Edinburghinventory. Neuropsychologia. 1971;9(1):97-113.
23. Fugl-Meyer AR, Jaasko L, Leyman I, Olsson S, Steglind S. The post-strokehemiplegic patient. 1. A method for evaluation of physical performance.Scand J Rehabil Med. 1975;7(1):13-31.
24. Tiffin J, Asher EJ. The Purdue pegboard; norms and studies of reliabilityand validity. J Appl Psychol. 1948;32(3):234-247.
25. Hagen C, Malkmus D, Durham P. Levels of Cognitive Functioning.Downey, CA: Rancho Los Amigos Hospital; 1972.
26. Nasreddine ZS, Phillips NA, Bedirian V, et al. The Montreal CognitiveAssessment, MoCA: a brief screening tool for mild cognitive impairment.J Am Geriatr Soc. 2005;53(4):695-699.
27. Wilson B, Cockburn J, Halligan P. Development of a behavioraltest of visuospatial neglect. Arch Phys Med Rehabil. 1987;68(2):98-102.
28. Coderre AM, Zeid AA, Dukelow SP, et al. Assessment of upper-limbsensorimotor function of subacute stroke patients using visually guidedreaching. Neurorehabil Neural Repair. 2010;24(6):528-541.
29. Scott SH. Apparatus for measuring and perturbing shoulder and el-bow joint positions and torques during reaching. J Neurosci Methods.1999;89(2):119-127.
30. Dukelow SP, Herter TM, Moore KD, et al. Quantitative assessmentof limb position sense following stroke. Neurorehabil Neural Repair.2010;24(2):178-187.
31. Gladstone DJ, Danells CJ, Black SE. The Fugl-Meyer assessment of motorrecovery after stroke: a critical review of its measurement properties.Neurorehabil Neural Repair. 2002;16(3):232-240.
32. Lincoln NB, Crow JL, Jackson JM, Waters GR, Adams SA, Hodg-son P. The unreliability of sensory assessments. Clin Rehabil. 1991;5:273-282.
33. Dukelow SP, Herter TM, Coderre AM, Scott SH. Position sense im-pairments are largely independent of visumotor deficits following stroke.Paper presented at: Society for Neuroscience, 2009; Chicago, IL.
34. Ellis MD, Sukal T, DeMott T, Dewald JP. Augmenting clinical evalua-tion of hemiparetic arm movement with a laboratory-based quantitativemeasurement of kinematics as a function of limb loading. NeurorehabilNeural Repair. 2008;22(4):321-329.
35. Gandevia SC, McCloskey DI. Joint sense, muscle sense, and their com-bination as position sense, measured at the distal interphalangeal joint ofthe middle finger. J Physiol. 1976;260(2):387-407.
36. Goodwin GM, McCloskey DI, Matthews PB. Proprioceptive illusions in-duced by muscle vibration: contribution by muscle spindles to perception?Science. 1972;175(28):1382-1384.
37. Goodwin GM, McCloskey DI, Matthews PB. The persistence of appre-ciable kinesthesia after paralysing joint afferents but preserving muscleafferents. Brain Res. 1972;37(2):326-329.
38. Matthews PB. Where does Sherrington’s “muscular sense” originate?Muscles, joints, corollary discharges? Annu Rev Neurosci. 1982;5:189-218.
39. Carey LM, Oke LE, Matyas TA. Impaired limb position sense afterstroke: a quantitative test for clinical use. Arch Phys Med Rehabil.1996;77(12):1271-1278.
40. Goble DJ, Lewis CA, Hurvitz EA, Brown SH. Development of upperlimb proprioceptive accuracy in children and adolescents. Hum Mov Sci.2005;24(2):155-170.
41. Collins DF, Refshauge KM, Todd G, Gandevia SC. Cutaneous receptorscontribute to kinesthesia at the index finger, elbow, and knee. J Neuro-physiol. 2005;94(3):1699-1706.
42. Adamo DE, Alexander NB, Brown SH. The influence of age and phys-ical activity on upper limb proprioceptive ability. J Aging Phys Act.2009;17(3):272-293.
Copyright © 2012 Neurology Section, APTA. Unauthorized reproduction of this article is prohibited.
C© 2012 Neurology Section, APTA 67