roadmap to sustainable plastic waste management
TRANSCRIPT
https://doi.org/10.1007/s11356-022-20854-2
REVIEW ARTICLE
Roadmap to sustainable plastic waste management: a focused study on recycling PET for triboelectric nanogenerator production in Singapore and India
Wei Liang Lai1,2 · Shreya Sharma1,3 · Sunanda Roy4,5 · Pradip Kumar Maji4 · Bhasha Sharma6 · Seeram Ramakrishna7 · Kheng Lim Goh1,2
Received: 21 January 2022 / Accepted: 12 May 2022 © The Author(s) 2022
AbstractThis study explores the implications of plastic waste and recycling management on recyclates for manufacturing clean-energy harvesting devices. The focus is on a comparative analysis of using recycled polyethylene terephthalate (PET) for triboelectric nanogenerator (TENG) production, in two densely populated Asian countries of large economies, namely Singapore and India. Of the total 930,000 tonnes of plastic waste generated in Singapore in 2019, only 4% were recycled and the rest were incinerated. In comparison, India yielded 8.6 million tonnes of plastic waste and 70% were recycled. Both countries have strict recycling goals and have instituted different waste and recycling management regulations. The findings show that the waste policies and legislations, responsibilities and heterogeneity in collection systems and infrastructure of the respective country are the pivotal attributes to successful recycling. Challenges to recycle plastic include segregation, adulterants and macromolecular structure degradation which could influence the recyclate properties and pose challenges for manufacturing products. A model was developed to evaluate the economic value and mechanical potential of PET recyclate. The model predicted a 30% loss of material performance and a 65% loss of economic value after the first recycling cycle. The economic value depreciates to zero with decreasing mechanical performance of plastic after multiple recycling cycles. For understand-ing how TENG technology could be incorporated into the circular economy, a model has estimated about 20 million and 7300 billion pieces of aerogel mats can be manufactured from the PET bottles disposed in Singapore and India, respectively which were sufficient to produce small-scale TENG devices for all peoples in both countries.
Keywords Plastic recycling · Policy · Recyclate value model · Sustainability · Triboelectric nanogenerator · Waste management
Responsible Editor: Angeles Blanco
* Wei Liang Lai [email protected]; [email protected]
* Sunanda Roy [email protected]
1 Newcastle Research & Innovation Institute Singapore (NewRIIS), 80 Jurong East Street 21, #05-04, Singapore 609607, Singapore
2 Faculty of Science, Agriculture and Engineering, Newcastle University, Newcastle Upon Tyne NE1 7RU, UK
3 Department of Biological Sciences and Engineering, Netaji Subhas University of Technology, Delhi 110078, India
4 Department of Polymer and Process Engineering, Indian Institute of Technology Roorkee, Saharanpur Campus, Saharanpur, Uttar Pradesh 247001, India
5 Department of Mechanical Engineering, GLA University, Mathura, Uttar Pradesh 281406, India
6 Department of Chemistry, University of Delhi, Delhi 110007, India
7 Department of Mechanical Engineering, National University of Singapore, Singapore 117576, Singapore
/ Published online: 23 May 2022
Environmental Science and Pollution Research (2022) 29:51234–51268
1 3
Introduction
The vast amount of plastics entering the environment annually is contributing to an ever-increasing problem of pollution from plastic waste both on land and in the ocean (Garcia and Robert-son 2017). This escalating problem is spurred by the global popu-lation growth and demand for plastic products, resulting in the rapid growth in plastic production coupled with the linear ‘take-make-waste’ economy. In addition, on the peak of the COVID-19 pandemic, a substantial increase in single-use plastics, such as personal protective equipment (namely masks and gloves), has further aggravated the plastic waste problem (Lau et al. 2020) .
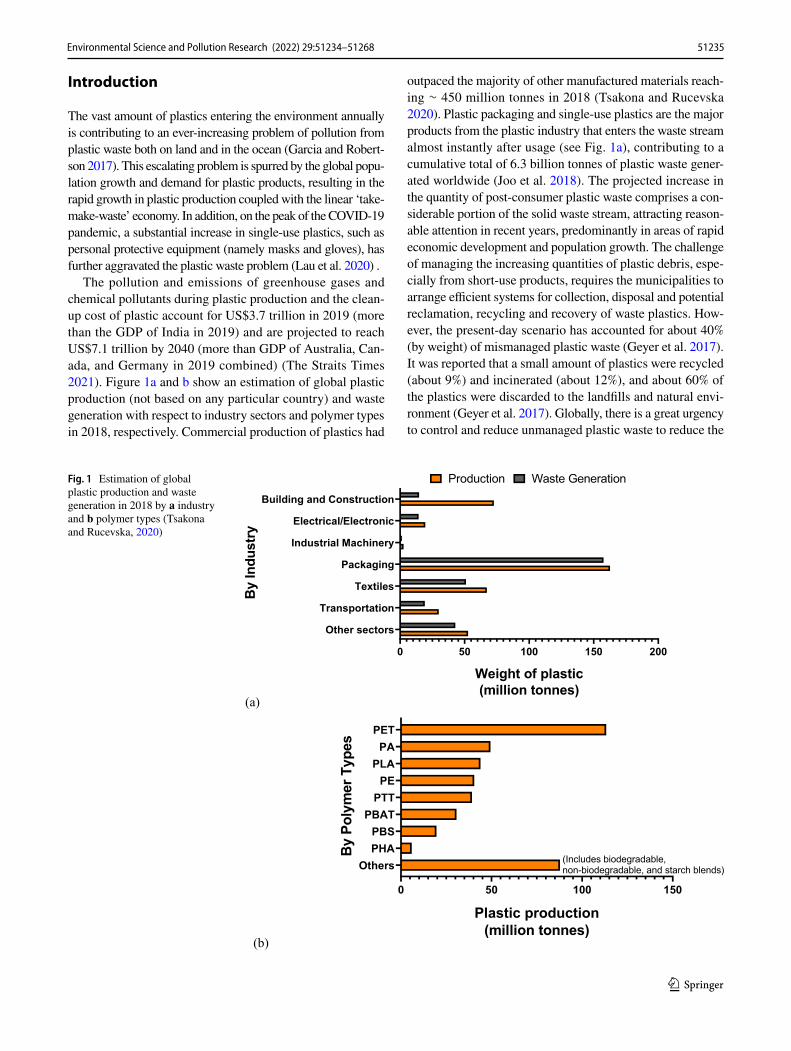
The pollution and emissions of greenhouse gases and chemical pollutants during plastic production and the clean-up cost of plastic account for US$3.7 trillion in 2019 (more than the GDP of India in 2019) and are projected to reach US$7.1 trillion by 2040 (more than GDP of Australia, Can-ada, and Germany in 2019 combined) (The Straits Times 2021). Figure 1a and b show an estimation of global plastic production (not based on any particular country) and waste generation with respect to industry sectors and polymer types in 2018, respectively. Commercial production of plastics had
outpaced the majority of other manufactured materials reach-ing ∼ 450 million tonnes in 2018 (Tsakona and Rucevska 2020). Plastic packaging and single-use plastics are the major products from the plastic industry that enters the waste stream almost instantly after usage (see Fig. 1a), contributing to a cumulative total of 6.3 billion tonnes of plastic waste gener-ated worldwide (Joo et al. 2018). The projected increase in the quantity of post-consumer plastic waste comprises a con-siderable portion of the solid waste stream, attracting reason-able attention in recent years, predominantly in areas of rapid economic development and population growth. The challenge of managing the increasing quantities of plastic debris, espe-cially from short-use products, requires the municipalities to arrange efficient systems for collection, disposal and potential reclamation, recycling and recovery of waste plastics. How-ever, the present-day scenario has accounted for about 40% (by weight) of mismanaged plastic waste (Geyer et al. 2017). It was reported that a small amount of plastics were recycled (about 9%) and incinerated (about 12%), and about 60% of the plastics were discarded to the landfills and natural envi-ronment (Geyer et al. 2017). Globally, there is a great urgency to control and reduce unmanaged plastic waste to reduce the
Fig. 1 Estimation of global plastic production and waste generation in 2018 by a industry and b polymer types (Tsakona and Rucevska, 2020)
51235Environmental Science and Pollution Research (2022) 29:51234–51268
1 3
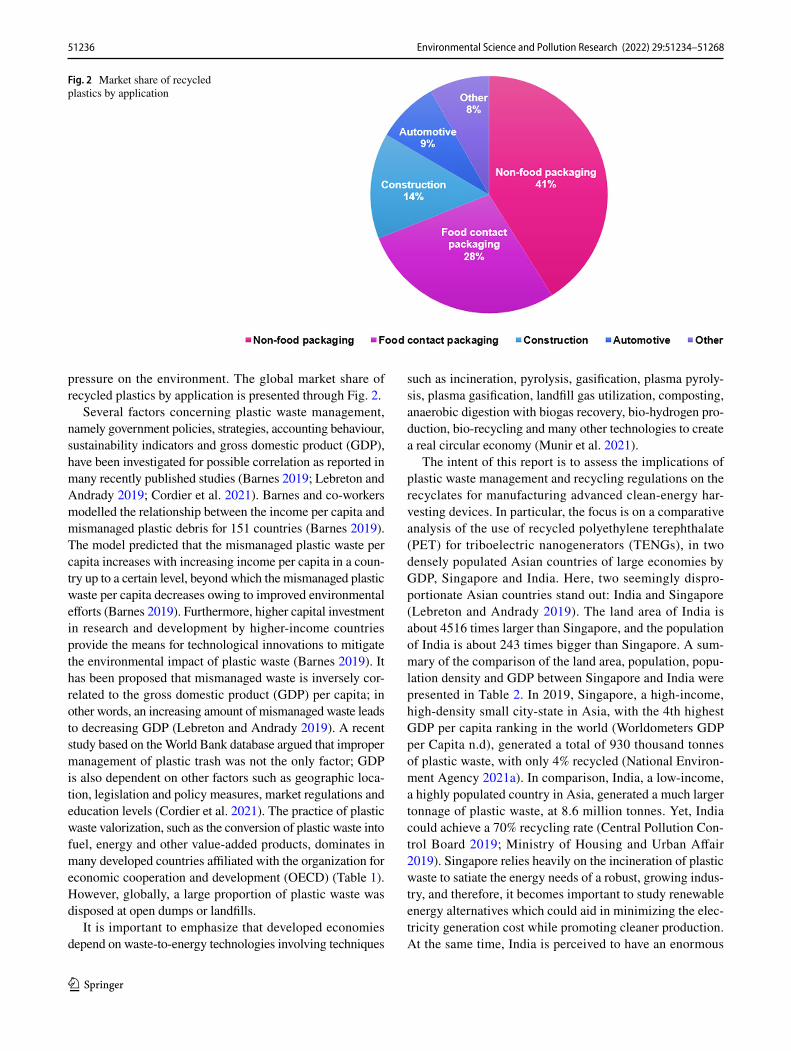
pressure on the environment. The global market share of recycled plastics by application is presented through Fig. 2.
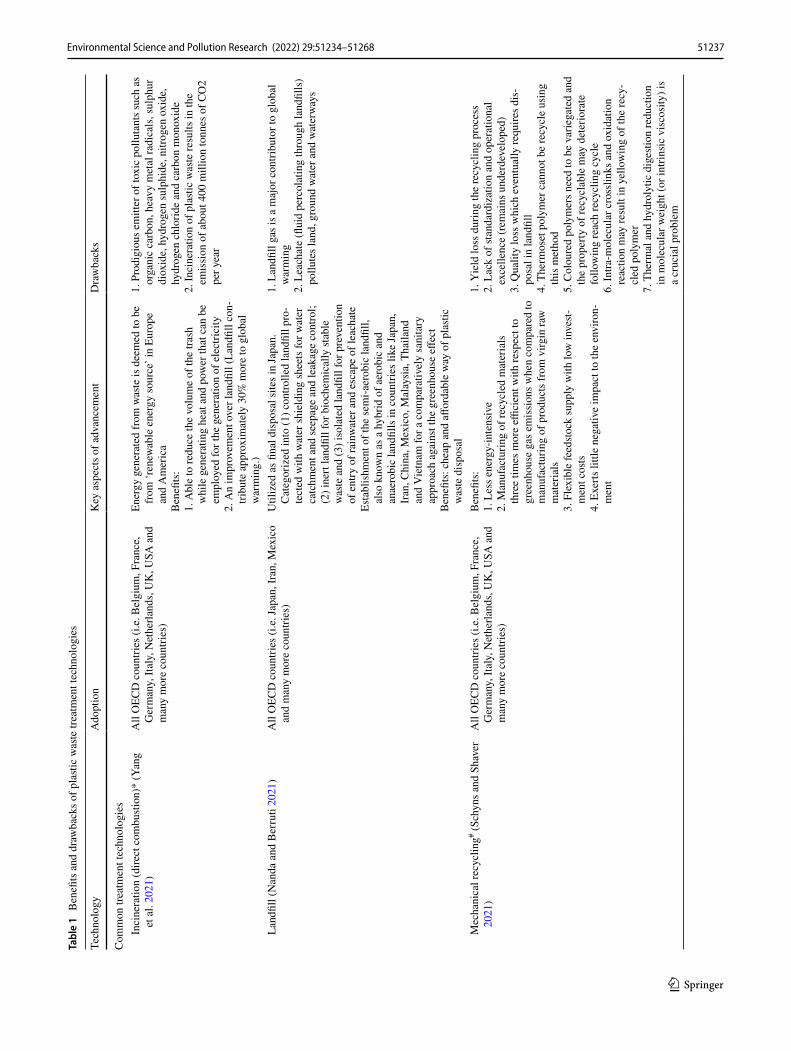
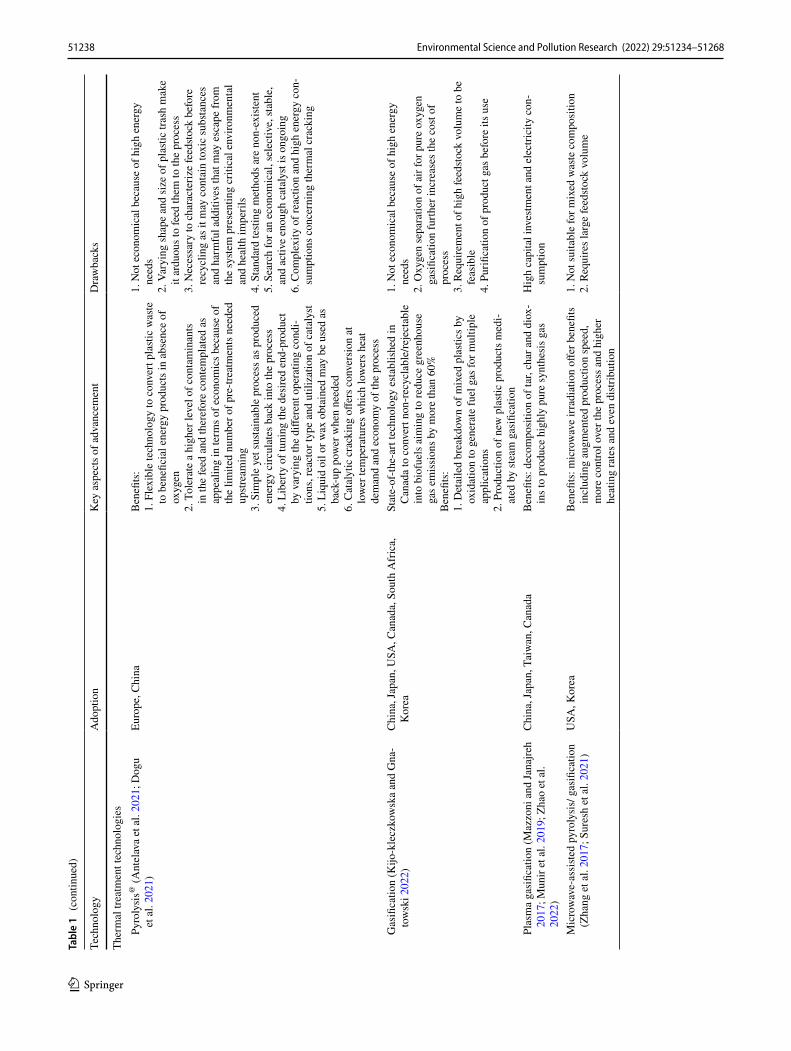
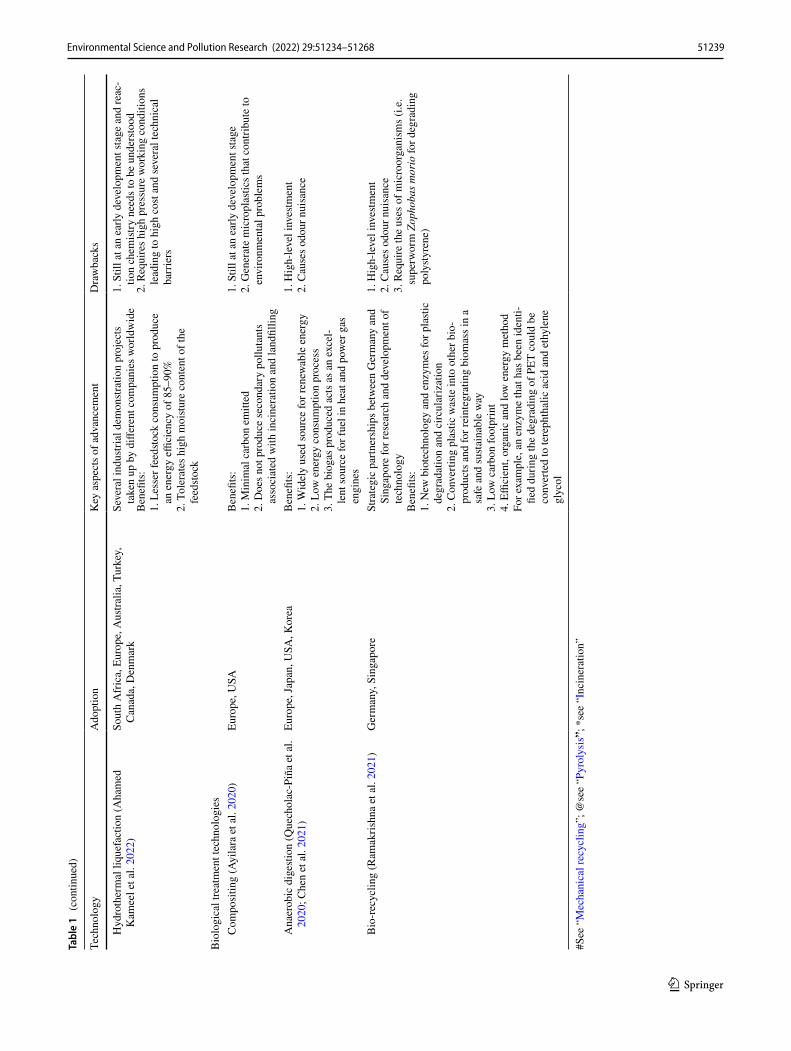
Several factors concerning plastic waste management, namely government policies, strategies, accounting behaviour, sustainability indicators and gross domestic product (GDP), have been investigated for possible correlation as reported in many recently published studies (Barnes 2019; Lebreton and Andrady 2019; Cordier et al. 2021). Barnes and co-workers modelled the relationship between the income per capita and mismanaged plastic debris for 151 countries (Barnes 2019). The model predicted that the mismanaged plastic waste per capita increases with increasing income per capita in a coun-try up to a certain level, beyond which the mismanaged plastic waste per capita decreases owing to improved environmental efforts (Barnes 2019). Furthermore, higher capital investment in research and development by higher-income countries provide the means for technological innovations to mitigate the environmental impact of plastic waste (Barnes 2019). It has been proposed that mismanaged waste is inversely cor-related to the gross domestic product (GDP) per capita; in other words, an increasing amount of mismanaged waste leads to decreasing GDP (Lebreton and Andrady 2019). A recent study based on the World Bank database argued that improper management of plastic trash was not the only factor; GDP is also dependent on other factors such as geographic loca-tion, legislation and policy measures, market regulations and education levels (Cordier et al. 2021). The practice of plastic waste valorization, such as the conversion of plastic waste into fuel, energy and other value-added products, dominates in many developed countries affiliated with the organization for economic cooperation and development (OECD) (Table 1). However, globally, a large proportion of plastic waste was disposed at open dumps or landfills.
It is important to emphasize that developed economies depend on waste-to-energy technologies involving techniques
such as incineration, pyrolysis, gasification, plasma pyroly-sis, plasma gasification, landfill gas utilization, composting, anaerobic digestion with biogas recovery, bio-hydrogen pro-duction, bio-recycling and many other technologies to create a real circular economy (Munir et al. 2021).
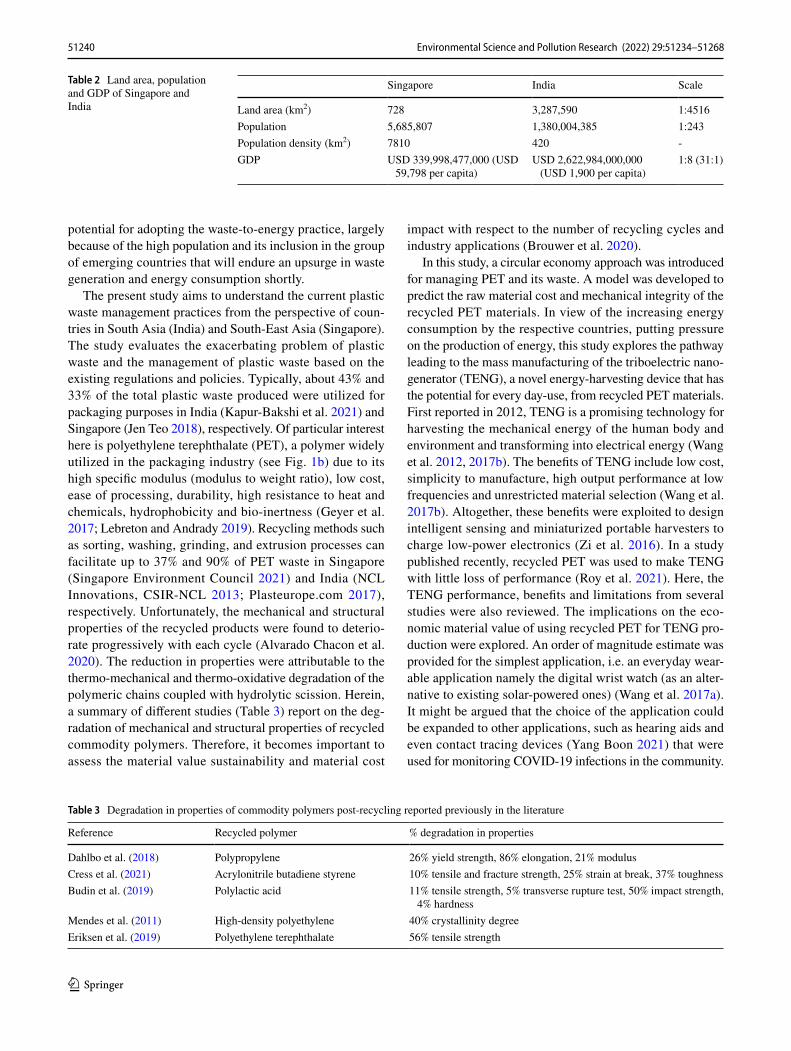
The intent of this report is to assess the implications of plastic waste management and recycling regulations on the recyclates for manufacturing advanced clean-energy har-vesting devices. In particular, the focus is on a comparative analysis of the use of recycled polyethylene terephthalate (PET) for triboelectric nanogenerators (TENGs), in two densely populated Asian countries of large economies by GDP, Singapore and India. Here, two seemingly dispro-portionate Asian countries stand out: India and Singapore (Lebreton and Andrady 2019). The land area of India is about 4516 times larger than Singapore, and the population of India is about 243 times bigger than Singapore. A sum-mary of the comparison of the land area, population, popu-lation density and GDP between Singapore and India were presented in Table 2. In 2019, Singapore, a high-income, high-density small city-state in Asia, with the 4th highest GDP per capita ranking in the world (Worldometers GDP per Capita n.d), generated a total of 930 thousand tonnes of plastic waste, with only 4% recycled (National Environ-ment Agency 2021a). In comparison, India, a low-income, a highly populated country in Asia, generated a much larger tonnage of plastic waste, at 8.6 million tonnes. Yet, India could achieve a 70% recycling rate (Central Pollution Con-trol Board 2019; Ministry of Housing and Urban Affair 2019). Singapore relies heavily on the incineration of plastic waste to satiate the energy needs of a robust, growing indus-try, and therefore, it becomes important to study renewable energy alternatives which could aid in minimizing the elec-tricity generation cost while promoting cleaner production. At the same time, India is perceived to have an enormous
Fig. 2 Market share of recycled plastics by application
51236 Environmental Science and Pollution Research (2022) 29:51234–51268
1 3
Tabl
e 1
Ben
efits
and
dra
wba
cks o
f pla
stic
was
te tr
eatm
ent t
echn
olog
ies
Tech
nolo
gyA
dopt
ion
Key
asp
ects
of a
dvan
cem
ent
Dra
wba
cks
Com
mon
trea
tmen
t tec
hnol
ogie
s I
ncin
erat
ion
(dire
ct c
ombu
stion
)* (Y
ang
et a
l. 20
21)
All
OEC
D c
ount
ries (
i.e. B
elgi
um, F
ranc
e,
Ger
man
y, It
aly,
Net
herla
nds,
UK
, USA
and
m
any
mor
e co
untri
es)
Ener
gy g
ener
ated
from
was
te is
dee
med
to b
e fro
m ‘r
enew
able
ene
rgy
sour
ce’ i
n Eu
rope
an
d A
mer
ica
Ben
efits
:1.
Abl
e to
redu
ce th
e vo
lum
e of
the
trash
w
hile
gen
erat
ing
heat
and
pow
er th
at c
an b
e em
ploy
ed fo
r the
gen
erat
ion
of e
lect
ricity
2. A
n im
prov
emen
t ove
r lan
dfill
(Lan
dfill
con-
tribu
te a
ppro
xim
atel
y 30
% m
ore
to g
loba
l w
arm
ing.
)
1. P
rodi
giou
s em
itter
of t
oxic
pol
luta
nts s
uch
as
orga
nic
carb
on, h
eavy
met
al ra
dica
ls, s
ulph
ur
diox
ide,
hyd
roge
n su
lphi
de, n
itrog
en o
xide
, hy
drog
en c
hlor
ide
and
carb
on m
onox
ide
2. In
cine
ratio
n of
pla
stic
was
te re
sults
in th
e em
issi
on o
f abo
ut 4
00 m
illio
n to
nnes
of C
O2
per y
ear
Lan
dfill
(Nan
da a
nd B
erru
ti 20
21)
All
OEC
D c
ount
ries (
i.e. J
apan
, Ira
n, M
exic
o an
d m
any
mor
e co
untri
es)
Util
ized
as fi
nal d
ispo
sal s
ites i
n Ja
pan.
C
ateg
oriz
ed in
to (1
) con
trolle
d la
ndfil
l pro
-te
cted
with
wat
er sh
ield
ing
shee
ts fo
r wat
er
catc
hmen
t and
seep
age
and
leak
age
cont
rol;
(2) i
nert
land
fill f
or b
ioch
emic
ally
stab
le
was
te a
nd (3
) iso
late
d la
ndfil
l for
pre
vent
ion
of e
ntry
of r
ainw
ater
and
esc
ape
of le
acha
teEs
tabl
ishm
ent o
f the
sem
i-aer
obic
land
fill,
also
kno
wn
as a
hyb
rid o
f aer
obic
and
an
aero
bic
land
fills
in c
ount
ries l
ike
Japa
n,
Iran
, Chi
na, M
exic
o, M
alay
sia,
Tha
iland
an
d V
ietn
am fo
r a c
ompa
rativ
ely
sani
tary
ap
proa
ch a
gain
st th
e gr
eenh
ouse
effe
ctB
enefi
ts: c
heap
and
affo
rdab
le w
ay o
f pla
stic
was
te d
ispo
sal
1. L
andfi
ll ga
s is a
maj
or c
ontri
buto
r to
glob
al
war
min
g2.
Lea
chat
e (fl
uid
perc
olat
ing
thro
ugh
land
fills
) po
llute
s lan
d, g
roun
d w
ater
and
wat
erw
ays
Mec
hani
cal r
ecyc
ling# (S
chyn
s and
Sha
ver
2021
)A
ll O
ECD
cou
ntrie
s (i.e
. Bel
gium
, Fra
nce,
G
erm
any,
Ital
y, N
ethe
rland
s, U
K, U
SA a
nd
man
y m
ore
coun
tries
)
Ben
efits
:1.
Les
s ene
rgy-
inte
nsiv
e2.
Man
ufac
turin
g of
recy
cled
mat
eria
ls
thre
e tim
es m
ore
effici
ent w
ith re
spec
t to
gree
nhou
se g
as e
mis
sion
s whe
n co
mpa
red
to
man
ufac
turin
g of
pro
duct
s fro
m v
irgin
raw
m
ater
ials
3. F
lexi
ble
feed
stock
supp
ly w
ith lo
w in
vest-
men
t cos
ts4.
Exe
rts li
ttle
nega
tive
impa
ct to
the
envi
ron-
men
t
1. Y
ield
loss
dur
ing
the
recy
clin
g pr
oces
s2.
Lac
k of
stan
dard
izat
ion
and
oper
atio
nal
exce
llenc
e (r
emai
ns u
nder
deve
lope
d)3.
Qua
lity
loss
whi
ch e
vent
ually
requ
ires d
is-
posa
l in
land
fill
4. T
herm
oset
pol
ymer
can
not b
e re
cycl
e us
ing
this
met
hod
5. C
olou
red
poly
mer
s nee
d to
be
varie
gate
d an
d th
e pr
oper
ty o
f rec
ycla
ble
may
det
erio
rate
fo
llow
ing
reac
h re
cycl
ing
cycl
e6.
Intra
-mol
ecul
ar c
ross
links
and
oxi
datio
n re
actio
n m
ay re
sult
in y
ello
win
g of
the
recy
-cl
ed p
olym
er7.
The
rmal
and
hyd
roly
tic d
iges
tion
redu
ctio
n in
mol
ecul
ar w
eigh
t (or
intri
nsic
vis
cosi
ty) i
s a
cruc
ial p
robl
em
51237Environmental Science and Pollution Research (2022) 29:51234–51268
1 3
Tabl
e 1
(con
tinue
d)
Tech
nolo
gyA
dopt
ion
Key
asp
ects
of a
dvan
cem
ent
Dra
wba
cks
Ther
mal
trea
tmen
t tec
hnol
ogie
s P
yrol
ysis
@ (A
ntel
ava
et a
l. 20
21; D
ogu
et a
l. 20
21)
Euro
pe, C
hina
Ben
efits
:1.
Fle
xibl
e te
chno
logy
to c
onve
rt pl
astic
was
te
to b
enefi
cial
ene
rgy
prod
ucts
in a
bsen
ce o
f ox
ygen
2. T
oler
ate
a hi
gher
leve
l of c
onta
min
ants
in
the
feed
and
ther
efor
e co
ntem
plat
ed a
s ap
peal
ing
in te
rms o
f eco
nom
ics b
ecau
se o
f th
e lim
ited
num
ber o
f pre
-trea
tmen
ts n
eede
d up
strea
min
g3.
Sim
ple
yet s
usta
inab
le p
roce
ss a
s pro
duce
d en
ergy
circ
ulat
es b
ack
into
the
proc
ess
4. L
iber
ty o
f tun
ing
the
desi
red
end-
prod
uct
by v
aryi
ng th
e di
ffere
nt o
pera
ting
cond
i-tio
ns, r
eact
or ty
pe a
nd u
tiliz
atio
n of
cat
alys
t5.
Liq
uid
oil o
r wax
obt
aine
d m
ay b
e us
ed a
s ba
ck-u
p po
wer
whe
n ne
eded
6. C
atal
ytic
cra
ckin
g off
ers c
onve
rsio
n at
lo
wer
tem
pera
ture
s whi
ch lo
wer
s hea
t de
man
d an
d ec
onom
y of
the
proc
ess
1. N
ot e
cono
mic
al b
ecau
se o
f hig
h en
ergy
ne
eds
2. V
aryi
ng sh
ape
and
size
of p
lasti
c tra
sh m
ake
it ar
duou
s to
feed
them
to th
e pr
oces
s3.
Nec
essa
ry to
cha
ract
eriz
e fe
edsto
ck b
efor
e re
cycl
ing
as it
may
con
tain
toxi
c su
bsta
nces
an
d ha
rmfu
l add
itive
s tha
t may
esc
ape
from
th
e sy
stem
pre
sent
ing
criti
cal e
nviro
nmen
tal
and
heal
th im
peril
s4.
Sta
ndar
d te
sting
met
hods
are
non
-exi
stent
5. S
earc
h fo
r an
econ
omic
al, s
elec
tive,
stab
le,
and
activ
e en
ough
cat
alys
t is o
ngoi
ng6.
Com
plex
ity o
f rea
ctio
n an
d hi
gh e
nerg
y co
n-su
mpt
ions
con
cern
ing
ther
mal
cra
ckin
g
Gas
ifica
tion
(Kijo
-kle
czko
wsk
a an
d G
na-
tow
ski 2
022)
Chi
na, J
apan
, USA
, Can
ada,
Sou
th A
fric
a,
Kor
eaSt
ate-
of-th
e-ar
t tec
hnol
ogy
esta
blis
hed
in
Can
ada
to c
onve
rt no
n-re
cycl
able
/reje
ctab
le
into
bio
fuel
s aim
ing
to re
duce
gre
enho
use
gas e
mis
sion
s by
mor
e th
an 6
0%B
enefi
ts:
1. D
etai
led
brea
kdow
n of
mix
ed p
lasti
cs b
y ox
idat
ion
to g
ener
ate
fuel
gas
for m
ultip
le
appl
icat
ions
2. P
rodu
ctio
n of
new
pla
stic
prod
ucts
med
i-at
ed b
y ste
am g
asifi
catio
n
1. N
ot e
cono
mic
al b
ecau
se o
f hig
h en
ergy
ne
eds
2. O
xyge
n se
para
tion
of a
ir fo
r pur
e ox
ygen
ga
sific
atio
n fu
rther
incr
ease
s the
cos
t of
proc
ess
3. R
equi
rem
ent o
f hig
h fe
edsto
ck v
olum
e to
be
feas
ible
4. P
urifi
catio
n of
pro
duct
gas
bef
ore
its u
se
Pla
sma
gasi
ficat
ion
(Maz
zoni
and
Jana
jreh
2017
; Mun
ir et
al.
2019
; Zha
o et
al.
2022
)
Chi
na, J
apan
, Tai
wan
, Can
ada
Ben
efits
: dec
ompo
sitio
n of
tar,
char
and
dio
x-in
s to
prod
uce
high
ly p
ure
synt
hesi
s gas
Hig
h ca
pita
l inv
estm
ent a
nd e
lect
ricity
con
-su
mpt
ion
Mic
row
ave-
assi
sted
pyro
lysi
s/ g
asifi
catio
n (Z
hang
et a
l. 20
17; S
ures
h et
al.
2021
)U
SA, K
orea
Ben
efits
: mic
row
ave
irrad
iatio
n off
er b
enefi
ts
incl
udin
g au
gmen
ted
prod
uctio
n sp
eed,
m
ore
cont
rol o
ver t
he p
roce
ss a
nd h
ighe
r he
atin
g ra
tes a
nd e
ven
distr
ibut
ion
1. N
ot su
itabl
e fo
r mix
ed w
aste
com
posi
tion
2. R
equi
res l
arge
feed
stock
vol
ume
51238 Environmental Science and Pollution Research (2022) 29:51234–51268
1 3
Tabl
e 1
(con
tinue
d)
Tech
nolo
gyA
dopt
ion
Key
asp
ects
of a
dvan
cem
ent
Dra
wba
cks
Hyd
roth
erm
al li
quef
actio
n (A
ham
ed
Kam
eel e
t al.
2022
)So
uth
Afr
ica,
Eur
ope,
Aus
tralia
, Tur
key,
C
anad
a, D
enm
ark
Seve
ral i
ndus
trial
dem
onstr
atio
n pr
ojec
ts
take
n up
by
diffe
rent
com
pani
es w
orld
wid
eB
enefi
ts:
1. L
esse
r fee
dsto
ck c
onsu
mpt
ion
to p
rodu
ce
an e
nerg
y effi
cien
cy o
f 85–
90%
2. T
oler
ates
hig
h m
oistu
re c
onte
nt o
f the
fe
edsto
ck
1. S
till a
t an
early
dev
elop
men
t sta
ge a
nd re
ac-
tion
chem
istry
nee
ds to
be
unde
rsto
od2.
Req
uire
s hig
h pr
essu
re w
orki
ng c
ondi
tions
le
adin
g to
hig
h co
st an
d se
vera
l tec
hnic
al
barr
iers
Bio
logi
cal t
reat
men
t tec
hnol
ogie
s C
ompo
sitin
g (A
yila
ra e
t al.
2020
)Eu
rope
, USA
Ben
efits
:1.
Min
imal
car
bon
emitt
ed2.
Doe
s not
pro
duce
seco
ndar
y po
lluta
nts
asso
ciat
ed w
ith in
cine
ratio
n an
d la
ndfil
ling
1. S
till a
t an
early
dev
elop
men
t sta
ge2.
Gen
erat
e m
icro
plas
tics t
hat c
ontri
bute
to
envi
ronm
enta
l pro
blem
s
Ana
erob
ic d
iges
tion
(Que
chol
ac-P
iña
et a
l. 20
20; C
hen
et a
l. 20
21)
Euro
pe, J
apan
, USA
, Kor
eaB
enefi
ts:
1. W
idel
y us
ed so
urce
for r
enew
able
ene
rgy
2. L
ow e
nerg
y co
nsum
ptio
n pr
oces
s3.
The
bio
gas p
rodu
ced
acts
as a
n ex
cel-
lent
sour
ce fo
r fue
l in
heat
and
pow
er g
as
engi
nes
1. H
igh-
leve
l inv
estm
ent
2. C
ause
s odo
ur n
uisa
nce
Bio
-rec
yclin
g (R
amak
rishn
a et
al.
2021
)G
erm
any,
Sin
gapo
reSt
rate
gic
partn
ersh
ips b
etw
een
Ger
man
y an
d Si
ngap
ore
for r
esea
rch
and
deve
lopm
ent o
f te
chno
logy
Ben
efits
:1.
New
bio
tech
nolo
gy a
nd e
nzym
es fo
r pla
stic
degr
adat
ion
and
circ
ular
izat
ion
2. C
onve
rting
pla
stic
was
te in
to o
ther
bio
-pr
oduc
ts a
nd fo
r rei
nteg
ratin
g bi
omas
s in
a sa
fe a
nd su
stai
nabl
e w
ay3.
Low
car
bon
foot
prin
t4.
Effi
cien
t, or
gani
c an
d lo
w e
nerg
y m
etho
dFo
r exa
mpl
e, a
n en
zym
e th
at h
as b
een
iden
ti-fie
d du
ring
the
degr
adin
g of
PET
cou
ld b
e co
nver
ted
to te
reph
thal
ic a
cid
and
ethy
lene
gl
ycol
1. H
igh-
leve
l inv
estm
ent
2. C
ause
s odo
ur n
uisa
nce
3. R
equi
re th
e us
es o
f mic
roor
gani
sms (
i.e.
supe
rwor
m Z
opho
bas m
orio
for d
egra
ding
po
lysty
rene
)
#See
“M
echa
nica
l rec
yclin
g”; @
see
“Pyr
olys
is”;
*se
e “I
ncin
erat
ion”
51239Environmental Science and Pollution Research (2022) 29:51234–51268
1 3
potential for adopting the waste-to-energy practice, largely because of the high population and its inclusion in the group of emerging countries that will endure an upsurge in waste generation and energy consumption shortly.
The present study aims to understand the current plastic waste management practices from the perspective of coun-tries in South Asia (India) and South-East Asia (Singapore). The study evaluates the exacerbating problem of plastic waste and the management of plastic waste based on the existing regulations and policies. Typically, about 43% and 33% of the total plastic waste produced were utilized for packaging purposes in India (Kapur-Bakshi et al. 2021) and Singapore (Jen Teo 2018), respectively. Of particular interest here is polyethylene terephthalate (PET), a polymer widely utilized in the packaging industry (see Fig. 1b) due to its high specific modulus (modulus to weight ratio), low cost, ease of processing, durability, high resistance to heat and chemicals, hydrophobicity and bio-inertness (Geyer et al. 2017; Lebreton and Andrady 2019). Recycling methods such as sorting, washing, grinding, and extrusion processes can facilitate up to 37% and 90% of PET waste in Singapore (Singapore Environment Council 2021) and India (NCL Innovations, CSIR-NCL 2013; Plasteurope.com 2017), respectively. Unfortunately, the mechanical and structural properties of the recycled products were found to deterio-rate progressively with each cycle (Alvarado Chacon et al. 2020). The reduction in properties were attributable to the thermo-mechanical and thermo-oxidative degradation of the polymeric chains coupled with hydrolytic scission. Herein, a summary of different studies (Table 3) report on the deg-radation of mechanical and structural properties of recycled commodity polymers. Therefore, it becomes important to assess the material value sustainability and material cost
impact with respect to the number of recycling cycles and industry applications (Brouwer et al. 2020).
In this study, a circular economy approach was introduced for managing PET and its waste. A model was developed to predict the raw material cost and mechanical integrity of the recycled PET materials. In view of the increasing energy consumption by the respective countries, putting pressure on the production of energy, this study explores the pathway leading to the mass manufacturing of the triboelectric nano-generator (TENG), a novel energy-harvesting device that has the potential for every day-use, from recycled PET materials. First reported in 2012, TENG is a promising technology for harvesting the mechanical energy of the human body and environment and transforming into electrical energy (Wang et al. 2012, 2017b). The benefits of TENG include low cost, simplicity to manufacture, high output performance at low frequencies and unrestricted material selection (Wang et al. 2017b). Altogether, these benefits were exploited to design intelligent sensing and miniaturized portable harvesters to charge low-power electronics (Zi et al. 2016). In a study published recently, recycled PET was used to make TENG with little loss of performance (Roy et al. 2021). Here, the TENG performance, benefits and limitations from several studies were also reviewed. The implications on the eco-nomic material value of using recycled PET for TENG pro-duction were explored. An order of magnitude estimate was provided for the simplest application, i.e. an everyday wear-able application namely the digital wrist watch (as an alter-native to existing solar-powered ones) (Wang et al. 2017a). It might be argued that the choice of the application could be expanded to other applications, such as hearing aids and even contact tracing devices (Yang Boon 2021) that were used for monitoring COVID-19 infections in the community.
Table 2 Land area, population and GDP of Singapore and India
Singapore India Scale
Land area (km2) 728 3,287,590 1:4516Population 5,685,807 1,380,004,385 1:243Population density (km2) 7810 420 -GDP USD 339,998,477,000 (USD
59,798 per capita)USD 2,622,984,000,000
(USD 1,900 per capita)1:8 (31:1)
Table 3 Degradation in properties of commodity polymers post-recycling reported previously in the literature
Reference Recycled polymer % degradation in properties
Dahlbo et al. (2018) Polypropylene 26% yield strength, 86% elongation, 21% modulusCress et al. (2021) Acrylonitrile butadiene styrene 10% tensile and fracture strength, 25% strain at break, 37% toughnessBudin et al. (2019) Polylactic acid 11% tensile strength, 5% transverse rupture test, 50% impact strength,
4% hardnessMendes et al. (2011) High-density polyethylene 40% crystallinity degreeEriksen et al. (2019) Polyethylene terephthalate 56% tensile strength
51240 Environmental Science and Pollution Research (2022) 29:51234–51268
1 3
The waste-to-energy (WTE) treatment were argued to be not suitable for recovering the resources when the ‘reduce, reuse and recycle’ (3R’s) methods could be implemented.
This article presents the findings of the plastic waste management policies, legislation and infrastructure of both Asian countries (India and Singapore) that highlights the proper management and mismanagement of plastic waste and their environmental pollution and energy consump-tion. Further to address the gaps and add to the body of knowledge, this article focuses on the progress of TENGs for renewable energy generation by recycling PET plastic (for increasing recycling rate) for the manufacturing of tri-boelectric material. The article aims to provide a perspec-tive to understand plastic waste as an evolving resource that could be proposed and implemented in the waste-to-energy technology for improving plastic waste management in both countries.
Landscape of plastic waste management and recycling
This section discussed the current legislation and policies for plastic waste management and recycling, related infra-structure and recycling statistics in Singapore and India. The legislation in waste and recycling management has been con-stantly amended by the governing body in the respective countries (Singapore and India) to provide an opportunity to implement new regime. The related infrastructure and processes facilitate the flow of plastic waste and recyclables, and the statistics of the total plastic waste generated and the recycling rate of the respective countries were presented.
Legislation and policies
Table 4 shows the comparison of the plastic waste manage-ment regulations and goals of Singapore and India. In Singa-pore, the National Environment Agency (NEA) administers licencing and regulatory functions of waste collection, treat-ment and disposal (National Environment Agency 2021b). The Environment Public Health Act (EPHA) regulates the waste management system aided by (1) general waste collection regulations, (2) general waste disposal facili-ties regulations and (3) toxic industrial waste regulations (National Environment Agency 2021b). In 2014, a manda-tory waste reporting (MWR) framework was introduced under the EPHA, requiring the owners, occupiers or les-see of a workplace to furnish data on the specific types of waste generated and recycled, and corresponding reduce, reuse and recycle (3Rs) plan annually to the NEA Waste and Resource Management System (WRMS) (National Environ-ment Agency 2021c). NEA states that the purpose of the MWR framework is to bring awareness to the producers on
the amount of waste being generated at their premises and also to encourage them to improve their waste management system (National Environment Agency 2021c). Since the enactment of MWR frameworks, NEA has found that more commercial premises have step up their effort in the recy-cling activities which had led to an increased in the recycling rate in 2019, e.g. 7.4% and 11.4% for the respective hotels and malls (National Environment Agency 2021c).
In Singapore, typically, one-third of the total generated waste comprises packaging waste (including plastics). Pack-aging waste has been identified as the key priority waste stream in the Zero Waste Master plan that requires atten-tion and efforts to close the resource loop for Singapore to achieve its goal as a Zero Waste Nation (National Envi-ronment Agency 2022a). The enactment of the Resource Sustainability Act (2019) requires the brand owners, manu-facturers, importers and retailers (i.e. supermarkets) of pack-aged products to comply with the Mandatory Packaging Reporting (MPR) framework entailing the reporting of the packaging data (namely material types, form and weight) and 3R strategies (including initiatives, plans, goals and key performance indicators for tracking the progress of plastic reduction in subsequent years) to the WRMS. The Act was fully enforced on the 1st of January 2021 (Republic of Sin-gapore Government 2022). The MPR framework aims to curb the utilization of single-use plastics and improve the plastic recycling rate (Jen Teo 2018; National Environment Agency 2022a).
In India, the Ministry of Environment, Forest, and Cli-mate change (MoEF) in conjunction with the pollution con-trol boards (Central Pollution Control Board (CPCB) and State Pollution Control Board (SPCB)) regulates the waste management system. In 2011, the MoEF enacted the Plastic Waste (management and handling) Rules to enforce coercive laws to mandate the responsibilities of the respective SPCBs, urban local bodies and gram panchayats for the imposition of provisions for plastic waste collection, treatment and disposal (Ministry of Housing and Urban Affair 2019). In response to the global concerns on sanitation and waste man-agement through the Swachh Bharat Mission (SBM) dated October 2014, new plastic waste management rules, namely the ‘Plastic Waste Management (PWM) Rules, 2016’, super-seded the ‘Plastic Waste (management and handling) Rules, 2011’ (Ministry of Housing and Urban Affair 2019). The new PWM legislation integrates with the concept of the EPR framework to dictate brand owners, importers and producers to establish systems for the assemblage of waste generated from their products within a period of 6 months and subse-quent implementation within 2 years. Mandatory registra-tion of manufacturers to sell plastics to user (or members of the public) and transporting plastic waste recyclables to register recyclers are required. Also, individuals involved in recycling waste processes are required to submit a grant
51241Environmental Science and Pollution Research (2022) 29:51234–51268
1 3
Tabl
e 4
Com
paris
on o
f w
aste
man
agem
ent r
egul
atio
ns a
nd g
oals
bet
wee
n Si
ngap
ore
(Nat
iona
l Env
ironm
ent A
genc
y 20
21b,
c)
and
Indi
a (M
inist
ry o
f En
viro
nmen
t 201
6a; P
ani a
nd P
atha
k 20
21)
Sing
apor
eIn
dia
Gov
erni
ng b
ody
Min
istry
of S
usta
inab
ility
and
the
Envi
ronm
ent (
MSE
). Re
spon
sibl
e fo
r im
prov
ing
and
sus-
tain
ing
a cl
ean
envi
ronm
ent,
prom
otin
g su
stai
nabi
lity
and
reso
urce
effi
cien
cy a
nd m
aint
ain-
ing
high
pub
lic h
ealth
stan
dard
s
Min
istry
of E
nviro
nmen
t, Fo
rest,
and
Clim
ate
(MoE
F). R
espo
nsib
le fo
r pla
nnin
g, p
rom
otin
g,
coor
dina
ting
and
over
seei
ng th
e im
plem
en-
tatio
n of
env
ironm
enta
l and
fore
stry
pro-
gram
mes
in In
dia
Regu
lato
ry le
vel
Nat
iona
l and
mun
icip
al•
Nat
iona
l: N
EA is
a st
atut
ory
boar
d un
der M
SE. N
EA fo
rmul
ates
pol
icy
and
adm
inist
ers
licen
cing
and
regu
lato
ry fu
nctio
ns o
f was
te c
olle
ctio
n, tr
eatm
ent a
nd d
ispo
sal
• M
unic
ipal
: tow
n co
unci
l man
age
and
mai
ntai
n th
e co
mm
on p
rope
rty o
f the
pub
lic h
ousi
ng
esta
te (w
hich
incl
udes
man
agin
g of
was
te a
nd re
cycl
able
s loc
ated
at t
he c
omm
on p
rope
rty
such
as v
oid
deck
s, co
mm
on c
orrid
ors a
nd li
ft ar
eas.)
Nat
iona
l, st
ate
and
mun
icip
al•
Nat
iona
l: C
PCB
is a
stat
utor
y or
gani
zatio
n un
der M
oEF.
CPC
B p
rom
otes
cle
anlin
ess i
n di
ffere
nt a
reas
of t
he S
tate
s by
prev
entio
n, a
nd
cont
rol t
o im
prov
e th
e en
viro
nmen
tal c
ondi
-tio
ns in
the
coun
try•
Stat
e: S
PCB
impl
emen
ts e
nviro
nmen
tal l
aws
and
rule
s with
in th
e st
ate’
s jur
isdi
ctio
n an
d to
rais
e aw
aren
ess t
o its
resi
dent
s reg
ardi
ng
sust
aina
ble
deve
lopm
ent t
o im
prov
e en
viro
n-m
enta
l qua
lity
• M
unic
ipal
: mun
icip
al a
utho
rity
plan
, im
ple-
men
t and
mon
itor a
ll sy
stem
s of u
rban
serv
ice
deliv
ery
of m
unic
ipal
solid
was
teLe
gisl
atio
nEn
viro
nmen
t Pub
lic H
ealth
Act
(EPH
A),
Cha
pter
95,
Rev
ised
200
2•
Enfo
rcin
g en
viro
nmen
tal h
ealth
resp
onsi
bilit
ies b
y cr
eatin
g a
stan
dard
cod
e fo
r hea
lth-
rela
ted
issu
es (s
uch
as p
ublic
cle
anin
g, m
arke
ts, f
ood
esta
blis
hmen
ts, g
ener
al h
ealth
, san
ita-
tion
and
hygi
ene)
• To
striv
e fo
r hig
her c
lean
ing
and
hygi
ene
stan
dard
s to
addr
ess w
aste
dis
posa
l int
o str
eam
s, riv
ers,
cana
ls, d
rain
s, re
serv
oirs
, lak
es a
nd c
atch
men
t are
asRe
sour
ce S
usta
inab
ility
Act
201
9:•
To re
gula
te th
e M
anda
tory
Pac
kagi
ng R
epor
ting
(MPR
) fra
mew
ork
• To
stra
tegi
ze fo
r pac
kagi
ng re
duct
ion
Plas
tic w
aste
man
agem
ent (
PWM
) rul
es u
nder
th
e En
viro
nmen
t pro
tect
ion
act,
1986
• En
forc
ing
rule
s to
prot
ect a
nd im
prov
e en
viro
nmen
tal q
ualit
y, c
ontro
l and
redu
ce p
ol-
lutio
n fro
m a
ll so
urce
s, an
d pr
ohib
it or
restr
ict
the
setti
ng a
nd/o
r ope
ratio
n of
any
indu
stria
l fa
cilit
y on
env
ironm
enta
l gro
unds
• To
rais
e th
e pr
oduc
er’s
awar
enes
s of t
he
amou
nt o
f was
te p
rodu
ced
and
to im
prov
e w
aste
man
agem
ent
Fram
ewor
kM
WR
fram
ewor
k: to
rais
e aw
aren
ess o
n th
e am
ount
of w
aste
pro
duce
d by
man
ufac
ture
rs, a
nd
to im
prov
e w
aste
man
agem
ent
PWM
Rul
es E
xten
ded
Prod
ucer
Res
pons
ibil-
ity (E
PR) f
ram
ewor
k: to
mon
itor p
acka
ging
da
ta a
nd to
val
idat
e th
e eff
ectiv
enes
s of P
WM
ru
les b
y C
PCB
Plas
tic w
aste
col
lect
ion
Lice
nced
pub
lic w
aste
col
lect
ors c
olle
ct th
e ge
nera
l was
te a
nd re
cycl
able
s usi
ng d
edic
ated
tru
ck a
nd d
eliv
er it
to th
e W
aste
-to-e
nerg
y (W
TE in
cine
ratio
n fa
cilit
ies a
nd th
e M
ater
ials
Re
cove
ry F
acili
ties (
MR
Fs))
, res
pect
ivel
y
Gra
m p
anch
ayat
s and
Mun
icip
aliti
es o
vers
ee
the
colle
ctio
ns a
nd se
greg
atio
ns o
f gen
eral
w
aste
and
recy
clab
les.
Hea
vily
dep
ends
on
info
rmal
was
te c
olle
ctor
s inc
ludi
ng, t
rash
/rag
pick
ers a
nd ro
ad sw
eepe
rs, D
hala
os (d
umpi
ng
spot
), in
term
edia
te d
eale
rs/ju
nkya
rd o
wne
rs,
and
recy
cler
s
51242 Environmental Science and Pollution Research (2022) 29:51234–51268
1 3
application or renewal of registration for recycling. In con-formity with the PMW rules, the Solid Waste Management Rules mandated the responsibility of waste producers such as event organizers and institutions to implement waste gen-eration and minimization, prevent illegal disposal of waste and facilitate waste storage following segregation and hand-ing over of the segregated waste to local bodies or agencies authorized by the local bodies. The latest amendment of the rules, referred to as the PWM (Amendment) Rules, 2018, includes a central registration system for brand owners, importers and producers under the purview of CPCB (Min-istry of Environment 2016a). Similarly to the MPR frame-work in Singapore, the advent of the Uniform Framework for EPR in India in June 2020 requires packaging brand owners, importers and producers to submit quarterly reports, while the producer responsibility organizations (PROs), SPCBs and CPCBs submit their annual reports on waste collection and disposal to the National registration and database reposi-tory web portal. These reports are intended to inform CPCB for monitoring the effectiveness of the PWM rules (Pani and Pathak 2021).
Plastic waste management infrastructure
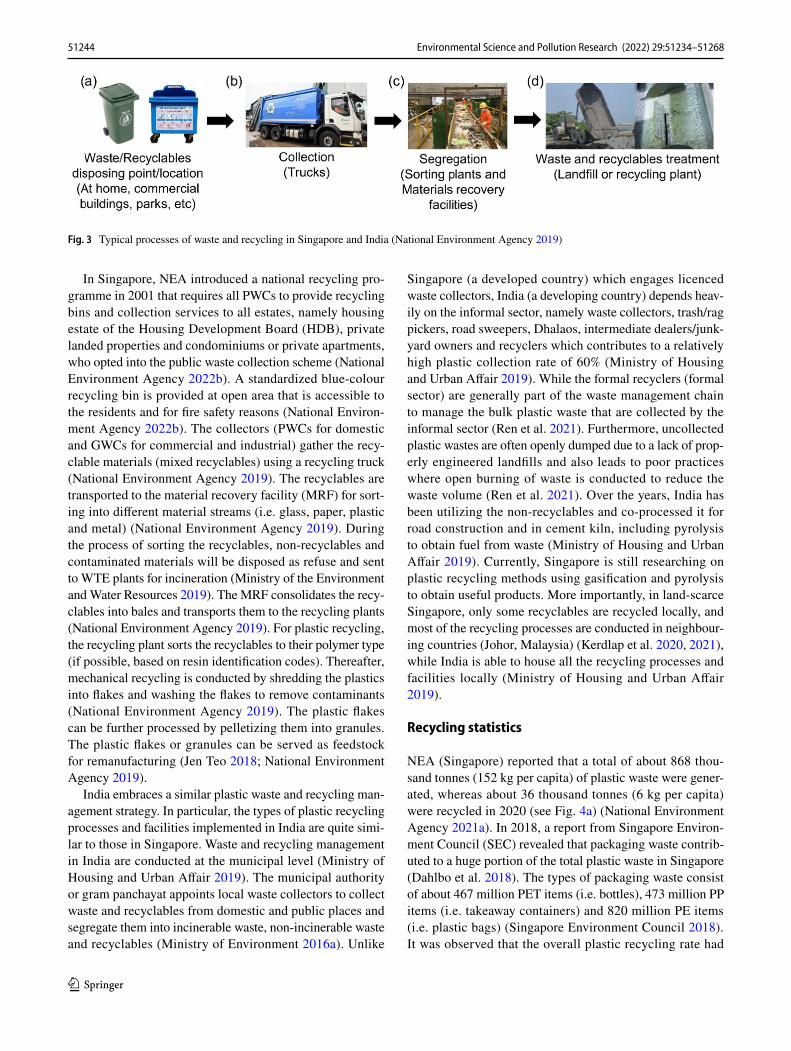
The process flow for managing plastic waste and recyclables (Fig. 3) in both Singapore and India includes (a) identify-ing the disposal point/locations; (b) collections by waste collectors; (c) segregation and (d) treatments to waste and recyclables.
Table 5 presents the comparison of waste and recycling infrastructure between Singapore and India. In Singa-pore, the NEA award licences to the public waste collector (PWCs) for providing waste collection and recycling ser-vices for domestic and trade premises and to the general waste collectors (GWCs) to provide services to commer-cial and industrial premises. Residents dispose the waste in the general waste bin or the collection point (i.e. rub-bish chute and green bins around estates). The incinerable waste is collected by the waste collector and transported to the WTE incineration plants using a refuse collection vehicle (National Environment Agency 2020a). The WTE plant crushes the bulky waste with a high-capacity rotary crusher, followed by feeding the waste into the incinera-tor and burning it at temperatures of about 850 to 1000 °C (National Environment Agency 2020a). The heat produced during combustion generates steam in the boilers to drive the turbogenerators, which produced about 3% of the electric-ity needs in Singapore. The ash from the burnt waste has a volume of about 10% before incineration (National Environ-ment Agency 2020a). The ashes are transported to the Tuas marine transfer station for disposal at the offshore Semakau landfill (National Environment Agency 2020a).Ta
ble
4 (c
ontin
ued)
Sing
apor
eIn
dia
Goa
ls•
To st
reng
then
clim
ate
resi
lienc
e, re
sour
ce re
silie
nce
and
econ
omic
resi
lienc
e by
ado
ptin
g th
e ci
rcul
ar e
cono
my
appr
oach
• To
pro
long
the
lifes
pan
of th
e Se
mak
au la
ndfil
l bey
ond
2035
by
redu
cing
the
amou
nt o
f w
aste
sent
to la
ndfil
ls b
y 30
% (p
er c
apita
per
day
) by
2030
• To
min
imiz
e th
e am
ount
of w
aste
by
inve
ntin
g, in
nova
ting,
and
enc
oura
ging
the
uses
of
was
te (e
.g. N
EWs a
nd fo
r con
struc
tion,
and
Mag
oriu
m fo
r roa
ds)
• To
ach
ievi
ng b
eyon
d 70
% o
f the
tota
l rec
yclin
g ra
te b
y lo
opin
g th
e pl
astic
s in
the
circ
ular
ec
onom
y
• To
add
ress
soci
al a
nd e
nviro
nmen
tal c
halle
nges
and
aim
to d
ecou
ple
virg
in fe
edsto
ck b
y ad
optin
g th
e ci
rcul
ar e
cono
my
appr
oach
• To
redu
ce la
ndfil
l/dum
ping
site
s due
to h
igh
popu
latio
n de
nsity
nea
r the
site
s whi
ch c
ause
s ste
nch
and
affec
ts th
e liv
ing
cond
ition
• To
min
imiz
e th
e am
ount
of w
aste
by
inve
ntin
g, in
nova
ting
and
enco
urag
ing
the
uses
of
was
te (e
.g. r
oads
, bric
ks a
nd o
ther
bio
-bas
ed m
ater
ials
)•
To e
ncou
rage
to re
use
and
recy
cle
of p
lasti
cs a
s fee
dsto
ck in
the
circ
ular
eco
nom
y w
ithou
t le
akag
es
51243Environmental Science and Pollution Research (2022) 29:51234–51268
1 3
In Singapore, NEA introduced a national recycling pro-gramme in 2001 that requires all PWCs to provide recycling bins and collection services to all estates, namely housing estate of the Housing Development Board (HDB), private landed properties and condominiums or private apartments, who opted into the public waste collection scheme (National Environment Agency 2022b). A standardized blue-colour recycling bin is provided at open area that is accessible to the residents and for fire safety reasons (National Environ-ment Agency 2022b). The collectors (PWCs for domestic and GWCs for commercial and industrial) gather the recy-clable materials (mixed recyclables) using a recycling truck (National Environment Agency 2019). The recyclables are transported to the material recovery facility (MRF) for sort-ing into different material streams (i.e. glass, paper, plastic and metal) (National Environment Agency 2019). During the process of sorting the recyclables, non-recyclables and contaminated materials will be disposed as refuse and sent to WTE plants for incineration (Ministry of the Environment and Water Resources 2019). The MRF consolidates the recy-clables into bales and transports them to the recycling plants (National Environment Agency 2019). For plastic recycling, the recycling plant sorts the recyclables to their polymer type (if possible, based on resin identification codes). Thereafter, mechanical recycling is conducted by shredding the plastics into flakes and washing the flakes to remove contaminants (National Environment Agency 2019). The plastic flakes can be further processed by pelletizing them into granules. The plastic flakes or granules can be served as feedstock for remanufacturing (Jen Teo 2018; National Environment Agency 2019).
India embraces a similar plastic waste and recycling man-agement strategy. In particular, the types of plastic recycling processes and facilities implemented in India are quite simi-lar to those in Singapore. Waste and recycling management in India are conducted at the municipal level (Ministry of Housing and Urban Affair 2019). The municipal authority or gram panchayat appoints local waste collectors to collect waste and recyclables from domestic and public places and segregate them into incinerable waste, non-incinerable waste and recyclables (Ministry of Environment 2016a). Unlike
Singapore (a developed country) which engages licenced waste collectors, India (a developing country) depends heav-ily on the informal sector, namely waste collectors, trash/rag pickers, road sweepers, Dhalaos, intermediate dealers/junk-yard owners and recyclers which contributes to a relatively high plastic collection rate of 60% (Ministry of Housing and Urban Affair 2019). While the formal recyclers (formal sector) are generally part of the waste management chain to manage the bulk plastic waste that are collected by the informal sector (Ren et al. 2021). Furthermore, uncollected plastic wastes are often openly dumped due to a lack of prop-erly engineered landfills and also leads to poor practices where open burning of waste is conducted to reduce the waste volume (Ren et al. 2021). Over the years, India has been utilizing the non-recyclables and co-processed it for road construction and in cement kiln, including pyrolysis to obtain fuel from waste (Ministry of Housing and Urban Affair 2019). Currently, Singapore is still researching on plastic recycling methods using gasification and pyrolysis to obtain useful products. More importantly, in land-scarce Singapore, only some recyclables are recycled locally, and most of the recycling processes are conducted in neighbour-ing countries (Johor, Malaysia) (Kerdlap et al. 2020, 2021), while India is able to house all the recycling processes and facilities locally (Ministry of Housing and Urban Affair 2019).
Recycling statistics
NEA (Singapore) reported that a total of about 868 thou-sand tonnes (152 kg per capita) of plastic waste were gener-ated, whereas about 36 thousand tonnes (6 kg per capita) were recycled in 2020 (see Fig. 4a) (National Environment Agency 2021a). In 2018, a report from Singapore Environ-ment Council (SEC) revealed that packaging waste contrib-uted to a huge portion of the total plastic waste in Singapore (Dahlbo et al. 2018). The types of packaging waste consist of about 467 million PET items (i.e. bottles), 473 million PP items (i.e. takeaway containers) and 820 million PE items (i.e. plastic bags) (Singapore Environment Council 2018). It was observed that the overall plastic recycling rate had
Fig. 3 Typical processes of waste and recycling in Singapore and India (National Environment Agency 2019)
51244 Environmental Science and Pollution Research (2022) 29:51234–51268
1 3
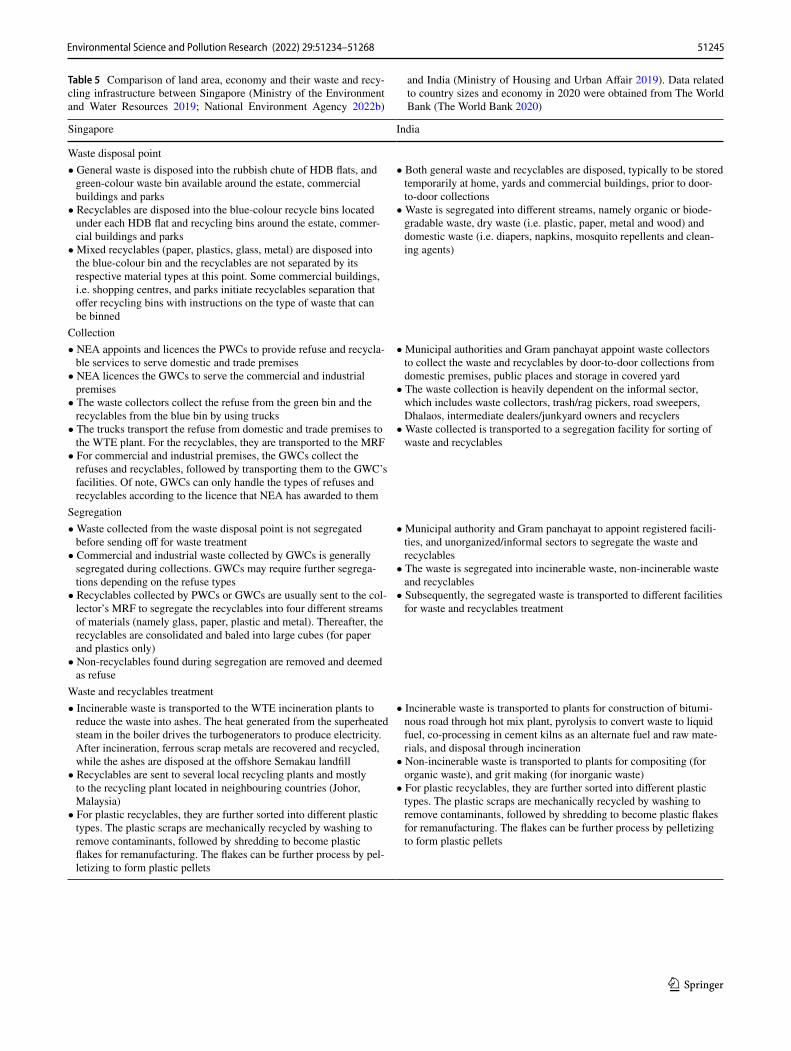
Table 5 Comparison of land area, economy and their waste and recy-cling infrastructure between Singapore (Ministry of the Environment and Water Resources 2019; National Environment Agency 2022b)
and India (Ministry of Housing and Urban Affair 2019). Data related to country sizes and economy in 2020 were obtained from The World Bank (The World Bank 2020)
Singapore India
Waste disposal point• General waste is disposed into the rubbish chute of HDB flats, and
green-colour waste bin available around the estate, commercial buildings and parks
• Recyclables are disposed into the blue-colour recycle bins located under each HDB flat and recycling bins around the estate, commer-cial buildings and parks
• Mixed recyclables (paper, plastics, glass, metal) are disposed into the blue-colour bin and the recyclables are not separated by its respective material types at this point. Some commercial buildings, i.e. shopping centres, and parks initiate recyclables separation that offer recycling bins with instructions on the type of waste that can be binned
• Both general waste and recyclables are disposed, typically to be stored temporarily at home, yards and commercial buildings, prior to door-to-door collections
• Waste is segregated into different streams, namely organic or biode-gradable waste, dry waste (i.e. plastic, paper, metal and wood) and domestic waste (i.e. diapers, napkins, mosquito repellents and clean-ing agents)
Collection• NEA appoints and licences the PWCs to provide refuse and recycla-
ble services to serve domestic and trade premises• NEA licences the GWCs to serve the commercial and industrial
premises• The waste collectors collect the refuse from the green bin and the
recyclables from the blue bin by using trucks• The trucks transport the refuse from domestic and trade premises to
the WTE plant. For the recyclables, they are transported to the MRF• For commercial and industrial premises, the GWCs collect the
refuses and recyclables, followed by transporting them to the GWC’s facilities. Of note, GWCs can only handle the types of refuses and recyclables according to the licence that NEA has awarded to them
• Municipal authorities and Gram panchayat appoint waste collectors to collect the waste and recyclables by door-to-door collections from domestic premises, public places and storage in covered yard
• The waste collection is heavily dependent on the informal sector, which includes waste collectors, trash/rag pickers, road sweepers, Dhalaos, intermediate dealers/junkyard owners and recyclers
• Waste collected is transported to a segregation facility for sorting of waste and recyclables
Segregation• Waste collected from the waste disposal point is not segregated
before sending off for waste treatment• Commercial and industrial waste collected by GWCs is generally
segregated during collections. GWCs may require further segrega-tions depending on the refuse types
• Recyclables collected by PWCs or GWCs are usually sent to the col-lector’s MRF to segregate the recyclables into four different streams of materials (namely glass, paper, plastic and metal). Thereafter, the recyclables are consolidated and baled into large cubes (for paper and plastics only)
• Non-recyclables found during segregation are removed and deemed as refuse
• Municipal authority and Gram panchayat to appoint registered facili-ties, and unorganized/informal sectors to segregate the waste and recyclables
• The waste is segregated into incinerable waste, non-incinerable waste and recyclables
• Subsequently, the segregated waste is transported to different facilities for waste and recyclables treatment
Waste and recyclables treatment• Incinerable waste is transported to the WTE incineration plants to
reduce the waste into ashes. The heat generated from the superheated steam in the boiler drives the turbogenerators to produce electricity. After incineration, ferrous scrap metals are recovered and recycled, while the ashes are disposed at the offshore Semakau landfill
• Recyclables are sent to several local recycling plants and mostly to the recycling plant located in neighbouring countries (Johor, Malaysia)
• For plastic recyclables, they are further sorted into different plastic types. The plastic scraps are mechanically recycled by washing to remove contaminants, followed by shredding to become plastic flakes for remanufacturing. The flakes can be further process by pel-letizing to form plastic pellets
• Incinerable waste is transported to plants for construction of bitumi-nous road through hot mix plant, pyrolysis to convert waste to liquid fuel, co-processing in cement kilns as an alternate fuel and raw mate-rials, and disposal through incineration
• Non-incinerable waste is transported to plants for compositing (for organic waste), and grit making (for inorganic waste)
• For plastic recyclables, they are further sorted into different plastic types. The plastic scraps are mechanically recycled by washing to remove contaminants, followed by shredding to become plastic flakes for remanufacturing. The flakes can be further process by pelletizing to form plastic pellets
51245Environmental Science and Pollution Research (2022) 29:51234–51268
1 3
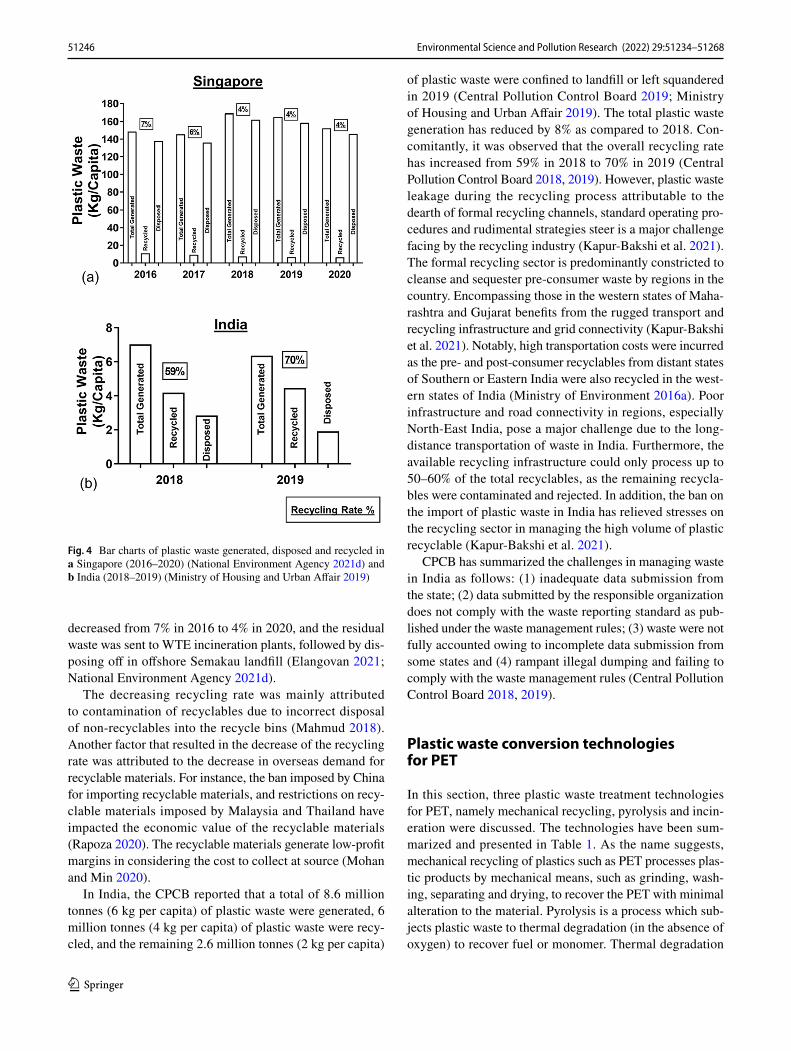
decreased from 7% in 2016 to 4% in 2020, and the residual waste was sent to WTE incineration plants, followed by dis-posing off in offshore Semakau landfill (Elangovan 2021; National Environment Agency 2021d).
The decreasing recycling rate was mainly attributed to contamination of recyclables due to incorrect disposal of non-recyclables into the recycle bins (Mahmud 2018). Another factor that resulted in the decrease of the recycling rate was attributed to the decrease in overseas demand for recyclable materials. For instance, the ban imposed by China for importing recyclable materials, and restrictions on recy-clable materials imposed by Malaysia and Thailand have impacted the economic value of the recyclable materials (Rapoza 2020). The recyclable materials generate low-profit margins in considering the cost to collect at source (Mohan and Min 2020).
In India, the CPCB reported that a total of 8.6 million tonnes (6 kg per capita) of plastic waste were generated, 6 million tonnes (4 kg per capita) of plastic waste were recy-cled, and the remaining 2.6 million tonnes (2 kg per capita)
of plastic waste were confined to landfill or left squandered in 2019 (Central Pollution Control Board 2019; Ministry of Housing and Urban Affair 2019). The total plastic waste generation has reduced by 8% as compared to 2018. Con-comitantly, it was observed that the overall recycling rate has increased from 59% in 2018 to 70% in 2019 (Central Pollution Control Board 2018, 2019). However, plastic waste leakage during the recycling process attributable to the dearth of formal recycling channels, standard operating pro-cedures and rudimental strategies steer is a major challenge facing by the recycling industry (Kapur-Bakshi et al. 2021). The formal recycling sector is predominantly constricted to cleanse and sequester pre-consumer waste by regions in the country. Encompassing those in the western states of Maha-rashtra and Gujarat benefits from the rugged transport and recycling infrastructure and grid connectivity (Kapur-Bakshi et al. 2021). Notably, high transportation costs were incurred as the pre- and post-consumer recyclables from distant states of Southern or Eastern India were also recycled in the west-ern states of India (Ministry of Environment 2016a). Poor infrastructure and road connectivity in regions, especially North-East India, pose a major challenge due to the long-distance transportation of waste in India. Furthermore, the available recycling infrastructure could only process up to 50–60% of the total recyclables, as the remaining recycla-bles were contaminated and rejected. In addition, the ban on the import of plastic waste in India has relieved stresses on the recycling sector in managing the high volume of plastic recyclable (Kapur-Bakshi et al. 2021).
CPCB has summarized the challenges in managing waste in India as follows: (1) inadequate data submission from the state; (2) data submitted by the responsible organization does not comply with the waste reporting standard as pub-lished under the waste management rules; (3) waste were not fully accounted owing to incomplete data submission from some states and (4) rampant illegal dumping and failing to comply with the waste management rules (Central Pollution Control Board 2018, 2019).
Plastic waste conversion technologies for PET
In this section, three plastic waste treatment technologies for PET, namely mechanical recycling, pyrolysis and incin-eration were discussed. The technologies have been sum-marized and presented in Table 1. As the name suggests, mechanical recycling of plastics such as PET processes plas-tic products by mechanical means, such as grinding, wash-ing, separating and drying, to recover the PET with minimal alteration to the material. Pyrolysis is a process which sub-jects plastic waste to thermal degradation (in the absence of oxygen) to recover fuel or monomer. Thermal degradation
Fig. 4 Bar charts of plastic waste generated, disposed and recycled in a Singapore (2016–2020) (National Environment Agency 2021d) and b India (2018–2019) (Ministry of Housing and Urban Affair 2019)
51246 Environmental Science and Pollution Research (2022) 29:51234–51268
1 3
reduces long-chain polymer molecules to smaller, less com-plex molecules under the effect of pressure and heat in the absence of oxygen (Damayanti and Wu 2021). Incineration is a terminator process of eliminating plastic waste by the combustion of plastic waste to ashes (thus reducing the original physical volume of the waste by 85–90%) before disposal takes place; the process in turn produces heat for powering devices.
Moreover, with the help of mechanical recycling, the recovered PET could be used for manufacturing products such as clean energy devices (TENG) (A potential energy harvesting device made from recycled PET). After going through several cycles of recycling, degradation in the physi-cal and chemical properties of PET could reduce the eco-nomic value (Retrofitting PET waste treatment towards a sustainable circular economy). Eventually, the PET waste could be treated through the pyrolysis or incineration pro-cess. The key strength and weaknesses of the respective technologies have been highlighted. A major concern with mechanical recycling is the presence of different contami-nants including heat stabilizers, additives, plasticizers, pig-ments, flame retardants and concoction of different polymer types affect the quality of secondary plastics inferring low economic and technical values. The pyrolysis technology currently requires high carbon and energy inputs which lim-its its implementation on industrial scales. The incineration technology is limited by large greenhouse gas emission and landfills are needed to accommodate the ashes (National Environment Agency 2020b).
Mechanical recycling
To date, the mechanical processing of plastics is the most traditional and economical technique employed for recycling post-consumer plastic waste (Geyer et al. 2017). A large proportion of the recovered post-consumer PET bottles are recycled through mechanical recycling in India and Singa-pore (Central Institute of Plastics Engineering & Technology 2008; Khoo 2019). However, the recycled materials could only be employed for applications that are not intended for exigent performance.
Mechanical recycling could be operated in two modes, namely primary and secondary. The primary recycling mode, otherwise known as ‘closed loop recycling’, refers to reprocessing of plastics to manufacture products utilized for the same purpose as the pristine materials. The secondary recycling mode refers to the utilization of reclaimed materi-als as a source of new production (National Environment Agency 2019). These modes of recycling involve sorting, shredding, washing and pelletizing (or extrusion to form pellets) of the material as described in the “Plastic waste management infrastructure” section.
The polymer materials are limited by the number of reprocessing cycles, due to the shortened polymeric chains after chain scission amortize polymer viscosity and elas-ticity and embrittles the polymer (Hopewell et al. 2009). The presence of contaminants and additives complicates the processes and affects the amount of recovered mate-rials (Hopewell et al. 2009). Residues of PVC, PLA and PVA in PET can leach acids and stimulate hydrolysis or acidolysis of PET during extrusion. Contaminated plastic trash demands rigorous cleaning prior to recycling, which, even with state-of-art technology, involves the utilization of about 2 to 3 m3 of water per tonnes of materials (Dama-yanti and Wu 2021). Furthermore, cross-linking during chain extension (due to an increase of molecular weight) adversely affects the recyclate quality and risk damaging the equipment used for the recycling processes. The degrada-tion of PET chains is prompted by carbon to hydrogen trans-fers or attacks by free radicals. As a result of the heat and the stress from the extruder, the reaction of macroradicals with oxygen occurs, resulting in the formation of peroxy-based radicals. Emanating macroradical chains as a result of radical hydrogen abstraction exacerbates the concentration of carboxylic acid end groups and causes thermo-oxidation. Henceforth, the recyclables are more prone to degradation after each recycling cycle due to the degradation of the polymer chain (Hopewell et al. 2009).
The microstructure of the PET could take on the follow-ing forms: rigid amorphous, mobile amorphous and crystal-line. The mobile amorphous fraction is more prone to attack, releasing short chains to fold into intercrystalline domains nucleate crystallization (Vollmer et al. 2020). Thickening and rearrangement of the crystalline domains can occur, resulting in new crystalline domains with smaller average sizes formed with increased recycling, causing increased embrittlement and stiffness. Irrevocable impairment of poly-meric chains as a result from mechanical recycling leads to the final disposal in landfills (Vollmer et al. 2020).
Pyrolysis
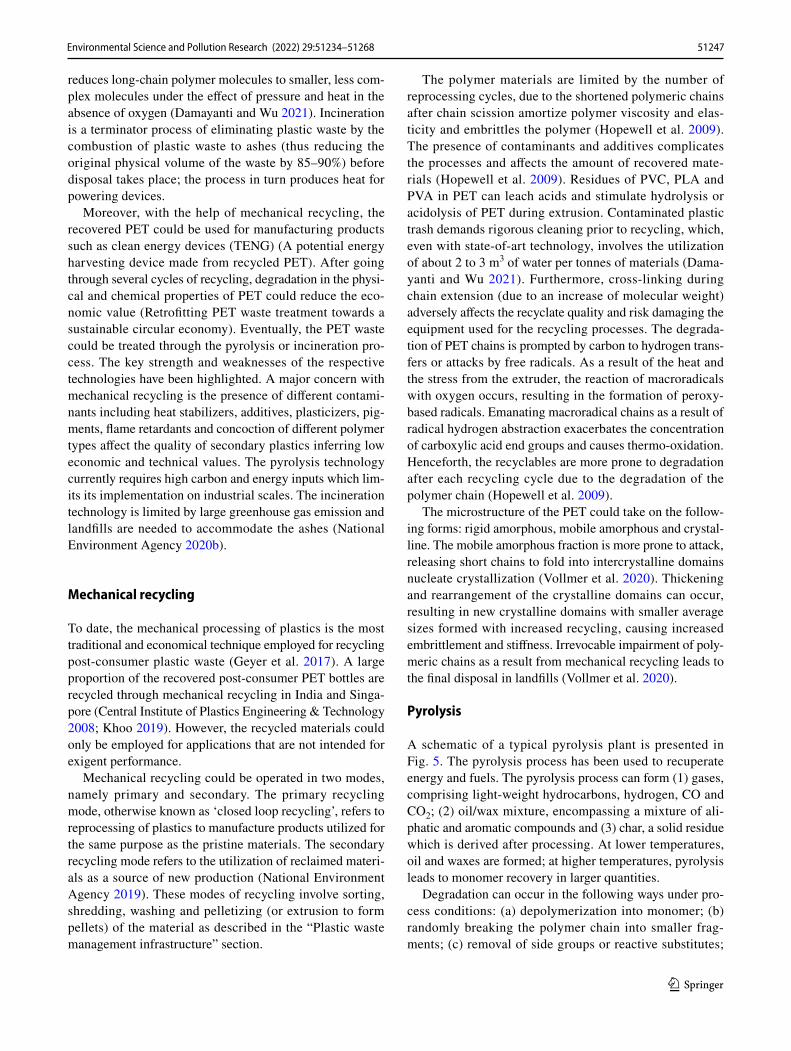
A schematic of a typical pyrolysis plant is presented in Fig. 5. The pyrolysis process has been used to recuperate energy and fuels. The pyrolysis process can form (1) gases, comprising light-weight hydrocarbons, hydrogen, CO and CO2; (2) oil/wax mixture, encompassing a mixture of ali-phatic and aromatic compounds and (3) char, a solid residue which is derived after processing. At lower temperatures, oil and waxes are formed; at higher temperatures, pyrolysis leads to monomer recovery in larger quantities.
Degradation can occur in the following ways under pro-cess conditions: (a) depolymerization into monomer; (b) randomly breaking the polymer chain into smaller frag-ments; (c) removal of side groups or reactive substitutes;
51247Environmental Science and Pollution Research (2022) 29:51234–51268
1 3
(d) cross-linking in case of thermosetting polymers during heating. Desired products could be obtained by varying the process parameters (i.e. temperature, catalysts, residence time, pressure, type of fluidizing gas and its rate, type of reactors) (Dogu et al. 2021).
Pyrolysis has been investigated as an appealing substi-tute for incineration for waste disposal. In contrast to the conventional incineration plant operated in the capacity of kilotonnes per day, the scale of the pyrolysis plant is more versatile, and the output of pyrolysis can be consolidated with other downstream technologies for product upgrada-tion (Peng et al. 2022; Yansaneh and Zein 2022). The liquid oil yielded can be utilized in several applications, including boilers, furnaces, diesel engines, and turbines, without fur-ther treatment (Rajendran et al. 2019).
Compared to mechanical recycling, the pyrolysis technol-ogy is in the early stage of development and a majority of the technologies were in pilot scale in both countries (Khoo and Tan 2010; Kapur-Bakshi et al. 2021). High production cost, energy inputs and release of harmful chemicals, for instance, biphenyls and polycyclic compounds could further limit its application (Roosen et al. 2020). Several small-scale pyrolysis systems have been implemented in India (Dutta and Bhaskar 2017) and Singapore (National Environment
Agency 2020c), but more research are needed namely on the design, environmental impact of the incineration before full-scale commercialization in both countries could be realized.
Incineration
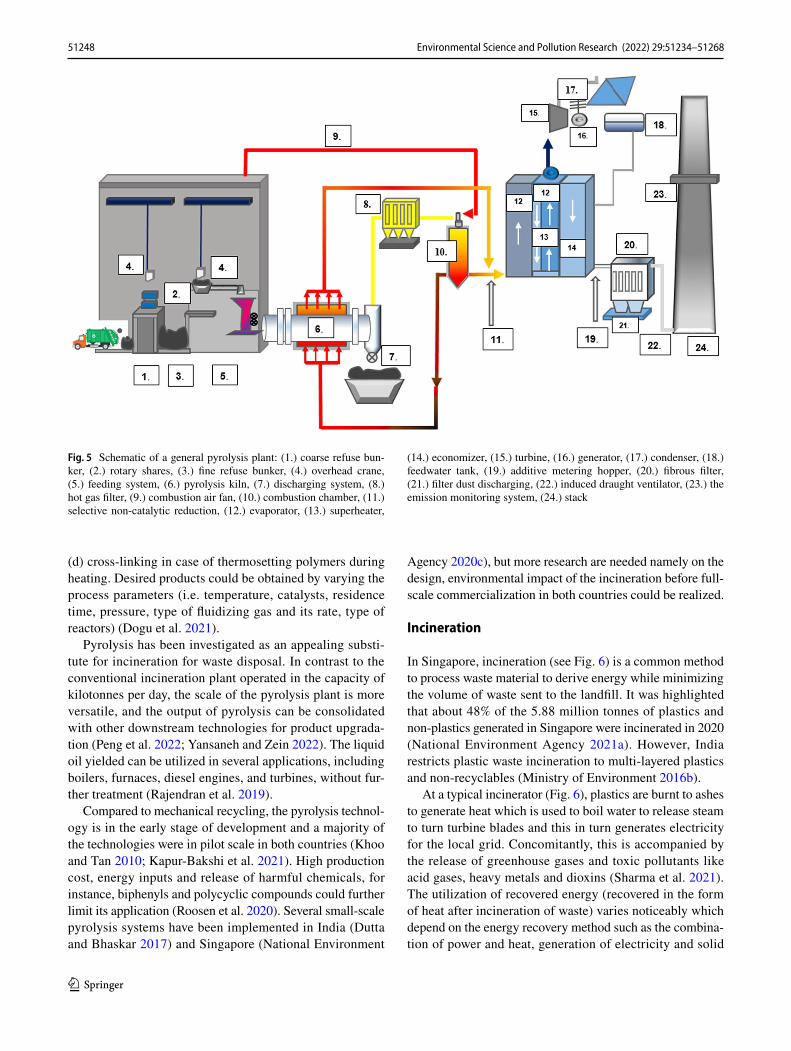
In Singapore, incineration (see Fig. 6) is a common method to process waste material to derive energy while minimizing the volume of waste sent to the landfill. It was highlighted that about 48% of the 5.88 million tonnes of plastics and non-plastics generated in Singapore were incinerated in 2020 (National Environment Agency 2021a). However, India restricts plastic waste incineration to multi-layered plastics and non-recyclables (Ministry of Environment 2016b).
At a typical incinerator (Fig. 6), plastics are burnt to ashes to generate heat which is used to boil water to release steam to turn turbine blades and this in turn generates electricity for the local grid. Concomitantly, this is accompanied by the release of greenhouse gases and toxic pollutants like acid gases, heavy metals and dioxins (Sharma et al. 2021). The utilization of recovered energy (recovered in the form of heat after incineration of waste) varies noticeably which depend on the energy recovery method such as the combina-tion of power and heat, generation of electricity and solid
Fig. 5 Schematic of a general pyrolysis plant: (1.) coarse refuse bun-ker, (2.) rotary shares, (3.) fine refuse bunker, (4.) overhead crane, (5.) feeding system, (6.) pyrolysis kiln, (7.) discharging system, (8.) hot gas filter, (9.) combustion air fan, (10.) combustion chamber, (11.) selective non-catalytic reduction, (12.) evaporator, (13.) superheater,
(14.) economizer, (15.) turbine, (16.) generator, (17.) condenser, (18.) feedwater tank, (19.) additive metering hopper, (20.) fibrous filter, (21.) filter dust discharging, (22.) induced draught ventilator, (23.) the emission monitoring system, (24.) stack
51248 Environmental Science and Pollution Research (2022) 29:51234–51268
1 3
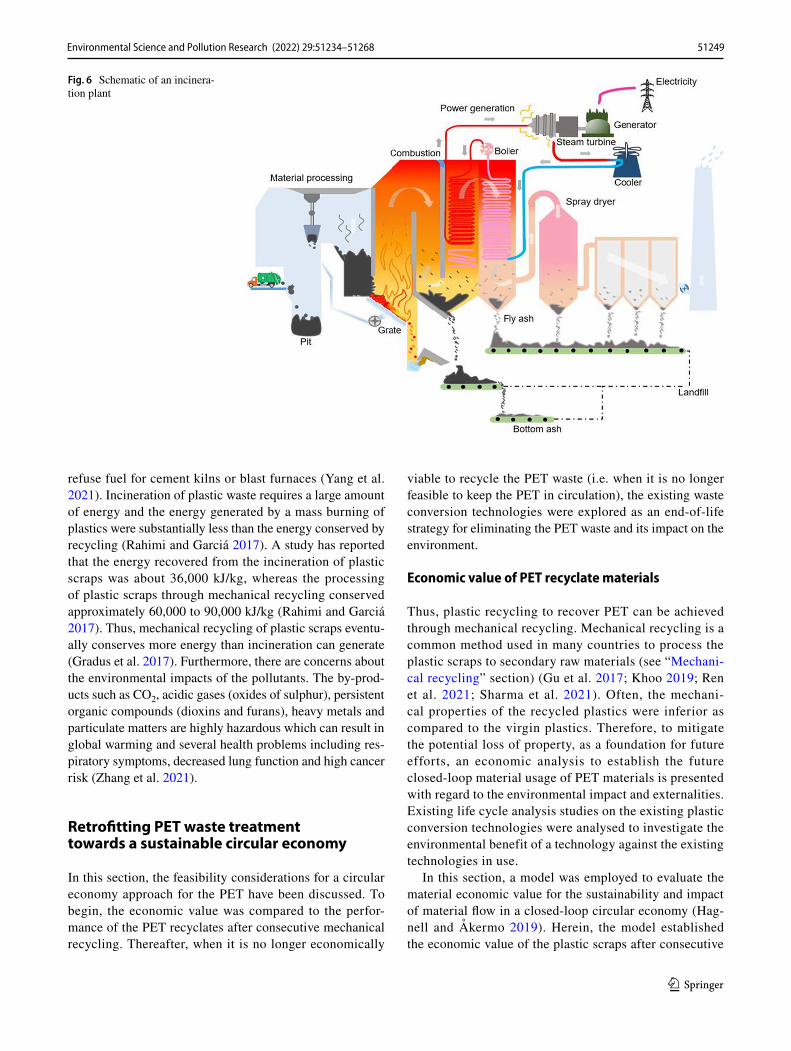
refuse fuel for cement kilns or blast furnaces (Yang et al. 2021). Incineration of plastic waste requires a large amount of energy and the energy generated by a mass burning of plastics were substantially less than the energy conserved by recycling (Rahimi and Garciá 2017). A study has reported that the energy recovered from the incineration of plastic scraps was about 36,000 kJ/kg, whereas the processing of plastic scraps through mechanical recycling conserved approximately 60,000 to 90,000 kJ/kg (Rahimi and Garciá 2017). Thus, mechanical recycling of plastic scraps eventu-ally conserves more energy than incineration can generate (Gradus et al. 2017). Furthermore, there are concerns about the environmental impacts of the pollutants. The by-prod-ucts such as CO2, acidic gases (oxides of sulphur), persistent organic compounds (dioxins and furans), heavy metals and particulate matters are highly hazardous which can result in global warming and several health problems including res-piratory symptoms, decreased lung function and high cancer risk (Zhang et al. 2021).
Retrofitting PET waste treatment towards a sustainable circular economy
In this section, the feasibility considerations for a circular economy approach for the PET have been discussed. To begin, the economic value was compared to the perfor-mance of the PET recyclates after consecutive mechanical recycling. Thereafter, when it is no longer economically
viable to recycle the PET waste (i.e. when it is no longer feasible to keep the PET in circulation), the existing waste conversion technologies were explored as an end-of-life strategy for eliminating the PET waste and its impact on the environment.
Economic value of PET recyclate materials
Thus, plastic recycling to recover PET can be achieved through mechanical recycling. Mechanical recycling is a common method used in many countries to process the plastic scraps to secondary raw materials (see “Mechani-cal recycling” section) (Gu et al. 2017; Khoo 2019; Ren et al. 2021; Sharma et al. 2021). Often, the mechani-cal properties of the recycled plastics were inferior as compared to the virgin plastics. Therefore, to mitigate the potential loss of property, as a foundation for future efforts, an economic analysis to establish the future closed-loop material usage of PET materials is presented with regard to the environmental impact and externalities. Existing life cycle analysis studies on the existing plastic conversion technologies were analysed to investigate the environmental benefit of a technology against the existing technologies in use.
In this section, a model was employed to evaluate the material economic value for the sustainability and impact of material flow in a closed-loop circular economy (Hag-nell and Åkermo 2019). Herein, the model established the economic value of the plastic scraps after consecutive
Fig. 6 Schematic of an incinera-tion plant
51249Environmental Science and Pollution Research (2022) 29:51234–51268
1 3
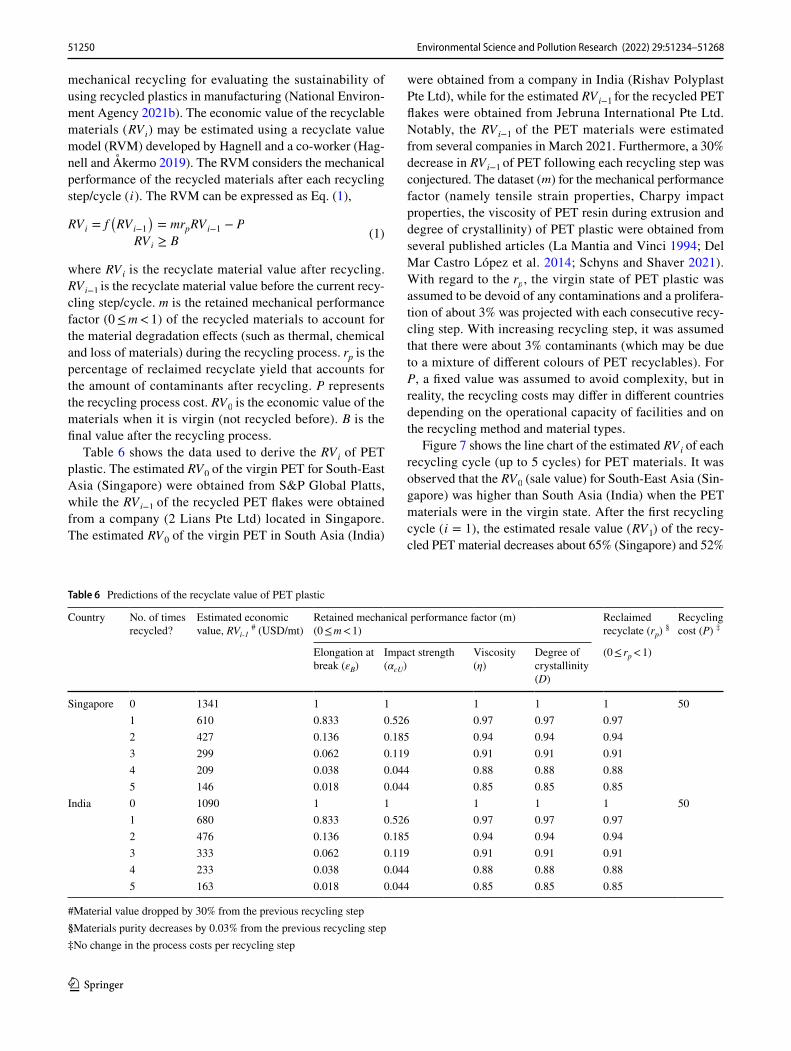
mechanical recycling for evaluating the sustainability of using recycled plastics in manufacturing (National Environ-ment Agency 2021b). The economic value of the recyclable materials ( RVi ) may be estimated using a recyclate value model (RVM) developed by Hagnell and a co-worker (Hag-nell and Åkermo 2019). The RVM considers the mechanical performance of the recycled materials after each recycling step/cycle ( i ). The RVM can be expressed as Eq. (1),
where RVi is the recyclate material value after recycling. RVi−1 is the recyclate material value before the current recy-cling step/cycle. m is the retained mechanical performance factor (0 ≤ m < 1) of the recycled materials to account for the material degradation effects (such as thermal, chemical and loss of materials) during the recycling process. rp is the percentage of reclaimed recyclate yield that accounts for the amount of contaminants after recycling. P represents the recycling process cost. RV
0 is the economic value of the
materials when it is virgin (not recycled before). B is the final value after the recycling process.
Table 6 shows the data used to derive the RVi of PET plastic. The estimated RV
0 of the virgin PET for South-East
Asia (Singapore) were obtained from S&P Global Platts, while the RVi−1 of the recycled PET flakes were obtained from a company (2 Lians Pte Ltd) located in Singapore. The estimated RV
0 of the virgin PET in South Asia (India)
(1)RVi = f
(
RVi−1
)
= mrpRVi−1 − P
RVi ≥ B
were obtained from a company in India (Rishav Polyplast Pte Ltd), while for the estimated RVi−1 for the recycled PET flakes were obtained from Jebruna International Pte Ltd. Notably, the RVi−1 of the PET materials were estimated from several companies in March 2021. Furthermore, a 30% decrease in RVi−1 of PET following each recycling step was conjectured. The dataset ( m ) for the mechanical performance factor (namely tensile strain properties, Charpy impact properties, the viscosity of PET resin during extrusion and degree of crystallinity) of PET plastic were obtained from several published articles (La Mantia and Vinci 1994; Del Mar Castro López et al. 2014; Schyns and Shaver 2021). With regard to the rp , the virgin state of PET plastic was assumed to be devoid of any contaminations and a prolifera-tion of about 3% was projected with each consecutive recy-cling step. With increasing recycling step, it was assumed that there were about 3% contaminants (which may be due to a mixture of different colours of PET recyclables). For P, a fixed value was assumed to avoid complexity, but in reality, the recycling costs may differ in different countries depending on the operational capacity of facilities and on the recycling method and material types.
Figure 7 shows the line chart of the estimated RVi of each recycling cycle (up to 5 cycles) for PET materials. It was observed that the RV
0 (sale value) for South-East Asia (Sin-
gapore) was higher than South Asia (India) when the PET materials were in the virgin state. After the first recycling cycle ( i = 1), the estimated resale value ( RV
1 ) of the recy-
cled PET material decreases about 65% (Singapore) and 52%
Table 6 Predictions of the recyclate value of PET plastic
#Material value dropped by 30% from the previous recycling step§Materials purity decreases by 0.03% from the previous recycling step‡No change in the process costs per recycling step
Country No. of times recycled?
Estimated economic value, RVi-1 # (USD/mt)
Retained mechanical performance factor (m)(0 ≤ m < 1)
Reclaimed recyclate (rp) §
Recycling cost (P) ‡
Elongation at break (εB)
Impact strength(αcU)
Viscosity(η)
Degree of crystallinity(D)
(0 ≤ rp < 1)
Singapore 0 1341 1 1 1 1 1 501 610 0.833 0.526 0.97 0.97 0.972 427 0.136 0.185 0.94 0.94 0.943 299 0.062 0.119 0.91 0.91 0.914 209 0.038 0.044 0.88 0.88 0.885 146 0.018 0.044 0.85 0.85 0.85
India 0 1090 1 1 1 1 1 501 680 0.833 0.526 0.97 0.97 0.972 476 0.136 0.185 0.94 0.94 0.943 333 0.062 0.119 0.91 0.91 0.914 233 0.038 0.044 0.88 0.88 0.885 163 0.018 0.044 0.85 0.85 0.85
51250 Environmental Science and Pollution Research (2022) 29:51234–51268
1 3
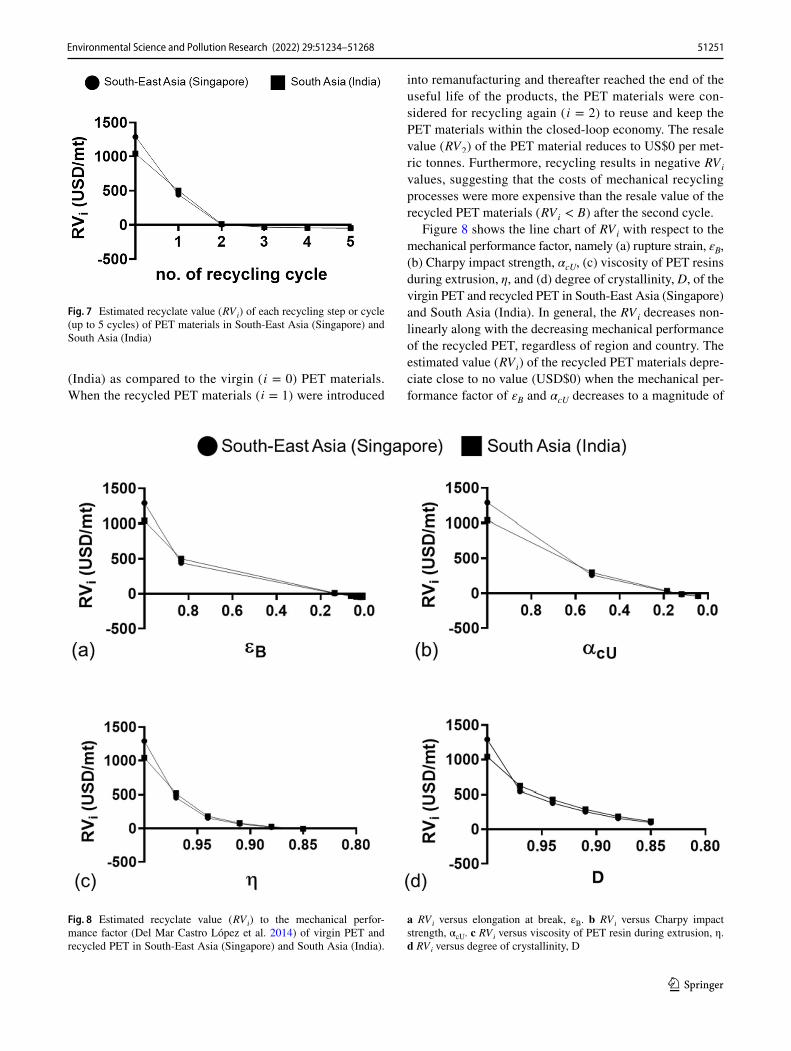
(India) as compared to the virgin ( i = 0) PET materials. When the recycled PET materials ( i = 1) were introduced
into remanufacturing and thereafter reached the end of the useful life of the products, the PET materials were con-sidered for recycling again ( i = 2) to reuse and keep the PET materials within the closed-loop economy. The resale value ( RV
2 ) of the PET material reduces to US$0 per met-
ric tonnes. Furthermore, recycling results in negative RVi values, suggesting that the costs of mechanical recycling processes were more expensive than the resale value of the recycled PET materials ( RVi < B ) after the second cycle.
Figure 8 shows the line chart of RVi with respect to the mechanical performance factor, namely (a) rupture strain, εB, (b) Charpy impact strength, αcU, (c) viscosity of PET resins during extrusion, η, and (d) degree of crystallinity, D, of the virgin PET and recycled PET in South-East Asia (Singapore) and South Asia (India). In general, the RVi decreases non-linearly along with the decreasing mechanical performance of the recycled PET, regardless of region and country. The estimated value ( RVi ) of the recycled PET materials depre-ciate close to no value (USD$0) when the mechanical per-formance factor of εB and αcU decreases to a magnitude of
Fig. 7 Estimated recyclate value ( RVi ) of each recycling step or cycle
(up to 5 cycles) of PET materials in South-East Asia (Singapore) and South Asia (India)
Fig. 8 Estimated recyclate value ( RVi ) to the mechanical perfor-
mance factor (Del Mar Castro López et al. 2014) of virgin PET and recycled PET in South-East Asia (Singapore) and South Asia (India).
a RVi versus elongation at break, εB. b RV
i versus Charpy impact
strength, αcU. c RVi versus viscosity of PET resin during extrusion, η.
d RVi versus degree of crystallinity, D
51251Environmental Science and Pollution Research (2022) 29:51234–51268
1 3
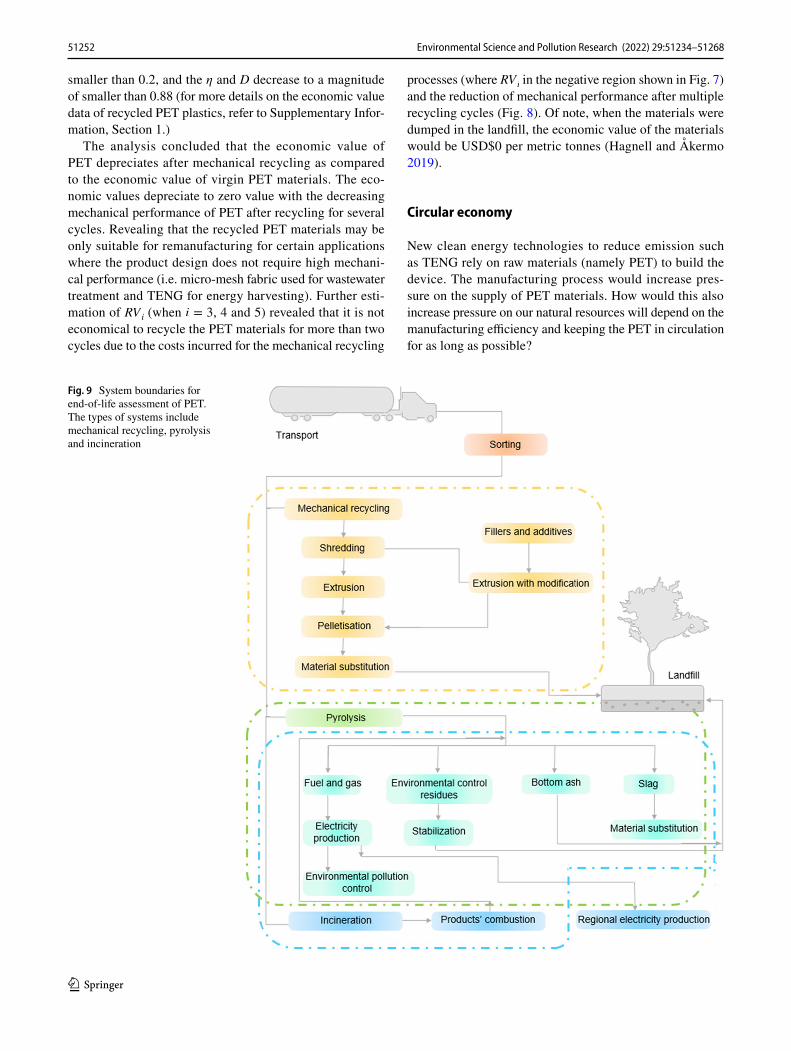
smaller than 0.2, and the η and D decrease to a magnitude of smaller than 0.88 (for more details on the economic value data of recycled PET plastics, refer to Supplementary Infor-mation, Section 1.)
The analysis concluded that the economic value of PET depreciates after mechanical recycling as compared to the economic value of virgin PET materials. The eco-nomic values depreciate to zero value with the decreasing mechanical performance of PET after recycling for several cycles. Revealing that the recycled PET materials may be only suitable for remanufacturing for certain applications where the product design does not require high mechani-cal performance (i.e. micro-mesh fabric used for wastewater treatment and TENG for energy harvesting). Further esti-mation of RVi (when i = 3, 4 and 5) revealed that it is not economical to recycle the PET materials for more than two cycles due to the costs incurred for the mechanical recycling
processes (where RVi in the negative region shown in Fig. 7) and the reduction of mechanical performance after multiple recycling cycles (Fig. 8). Of note, when the materials were dumped in the landfill, the economic value of the materials would be USD$0 per metric tonnes (Hagnell and Åkermo 2019).
Circular economy
New clean energy technologies to reduce emission such as TENG rely on raw materials (namely PET) to build the device. The manufacturing process would increase pres-sure on the supply of PET materials. How would this also increase pressure on our natural resources will depend on the manufacturing efficiency and keeping the PET in circulation for as long as possible?
Fig. 9 System boundaries for end-of-life assessment of PET. The types of systems include mechanical recycling, pyrolysis and incineration
51252 Environmental Science and Pollution Research (2022) 29:51234–51268
1 3
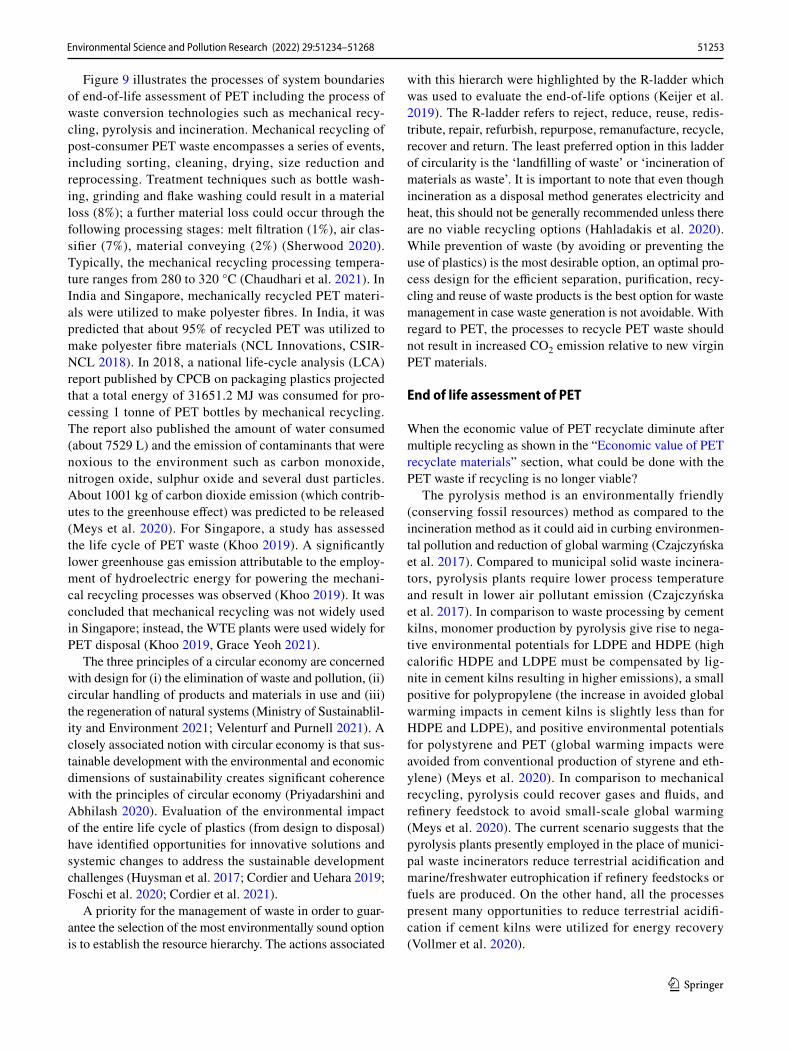
Figure 9 illustrates the processes of system boundaries of end-of-life assessment of PET including the process of waste conversion technologies such as mechanical recy-cling, pyrolysis and incineration. Mechanical recycling of post-consumer PET waste encompasses a series of events, including sorting, cleaning, drying, size reduction and reprocessing. Treatment techniques such as bottle wash-ing, grinding and flake washing could result in a material loss (8%); a further material loss could occur through the following processing stages: melt filtration (1%), air clas-sifier (7%), material conveying (2%) (Sherwood 2020). Typically, the mechanical recycling processing tempera-ture ranges from 280 to 320 °C (Chaudhari et al. 2021). In India and Singapore, mechanically recycled PET materi-als were utilized to make polyester fibres. In India, it was predicted that about 95% of recycled PET was utilized to make polyester fibre materials (NCL Innovations, CSIR-NCL 2018). In 2018, a national life-cycle analysis (LCA) report published by CPCB on packaging plastics projected that a total energy of 31651.2 MJ was consumed for pro-cessing 1 tonne of PET bottles by mechanical recycling. The report also published the amount of water consumed (about 7529 L) and the emission of contaminants that were noxious to the environment such as carbon monoxide, nitrogen oxide, sulphur oxide and several dust particles. About 1001 kg of carbon dioxide emission (which contrib-utes to the greenhouse effect) was predicted to be released (Meys et al. 2020). For Singapore, a study has assessed the life cycle of PET waste (Khoo 2019). A significantly lower greenhouse gas emission attributable to the employ-ment of hydroelectric energy for powering the mechani-cal recycling processes was observed (Khoo 2019). It was concluded that mechanical recycling was not widely used in Singapore; instead, the WTE plants were used widely for PET disposal (Khoo 2019, Grace Yeoh 2021).
The three principles of a circular economy are concerned with design for (i) the elimination of waste and pollution, (ii) circular handling of products and materials in use and (iii) the regeneration of natural systems (Ministry of Sustainablil-ity and Environment 2021; Velenturf and Purnell 2021). A closely associated notion with circular economy is that sus-tainable development with the environmental and economic dimensions of sustainability creates significant coherence with the principles of circular economy (Priyadarshini and Abhilash 2020). Evaluation of the environmental impact of the entire life cycle of plastics (from design to disposal) have identified opportunities for innovative solutions and systemic changes to address the sustainable development challenges (Huysman et al. 2017; Cordier and Uehara 2019; Foschi et al. 2020; Cordier et al. 2021).
A priority for the management of waste in order to guar-antee the selection of the most environmentally sound option is to establish the resource hierarchy. The actions associated
with this hierarch were highlighted by the R-ladder which was used to evaluate the end-of-life options (Keijer et al. 2019). The R-ladder refers to reject, reduce, reuse, redis-tribute, repair, refurbish, repurpose, remanufacture, recycle, recover and return. The least preferred option in this ladder of circularity is the ‘landfilling of waste’ or ‘incineration of materials as waste’. It is important to note that even though incineration as a disposal method generates electricity and heat, this should not be generally recommended unless there are no viable recycling options (Hahladakis et al. 2020). While prevention of waste (by avoiding or preventing the use of plastics) is the most desirable option, an optimal pro-cess design for the efficient separation, purification, recy-cling and reuse of waste products is the best option for waste management in case waste generation is not avoidable. With regard to PET, the processes to recycle PET waste should not result in increased CO2 emission relative to new virgin PET materials.
End of life assessment of PET
When the economic value of PET recyclate diminute after multiple recycling as shown in the “Economic value of PET recyclate materials” section, what could be done with the PET waste if recycling is no longer viable?
The pyrolysis method is an environmentally friendly (conserving fossil resources) method as compared to the incineration method as it could aid in curbing environmen-tal pollution and reduction of global warming (Czajczyńska et al. 2017). Compared to municipal solid waste incinera-tors, pyrolysis plants require lower process temperature and result in lower air pollutant emission (Czajczyńska et al. 2017). In comparison to waste processing by cement kilns, monomer production by pyrolysis give rise to nega-tive environmental potentials for LDPE and HDPE (high calorific HDPE and LDPE must be compensated by lig-nite in cement kilns resulting in higher emissions), a small positive for polypropylene (the increase in avoided global warming impacts in cement kilns is slightly less than for HDPE and LDPE), and positive environmental potentials for polystyrene and PET (global warming impacts were avoided from conventional production of styrene and eth-ylene) (Meys et al. 2020). In comparison to mechanical recycling, pyrolysis could recover gases and fluids, and refinery feedstock to avoid small-scale global warming (Meys et al. 2020). The current scenario suggests that the pyrolysis plants presently employed in the place of munici-pal waste incinerators reduce terrestrial acidification and marine/freshwater eutrophication if refinery feedstocks or fuels are produced. On the other hand, all the processes present many opportunities to reduce terrestrial acidifi-cation if cement kilns were utilized for energy recovery (Vollmer et al. 2020).
51253Environmental Science and Pollution Research (2022) 29:51234–51268
1 3
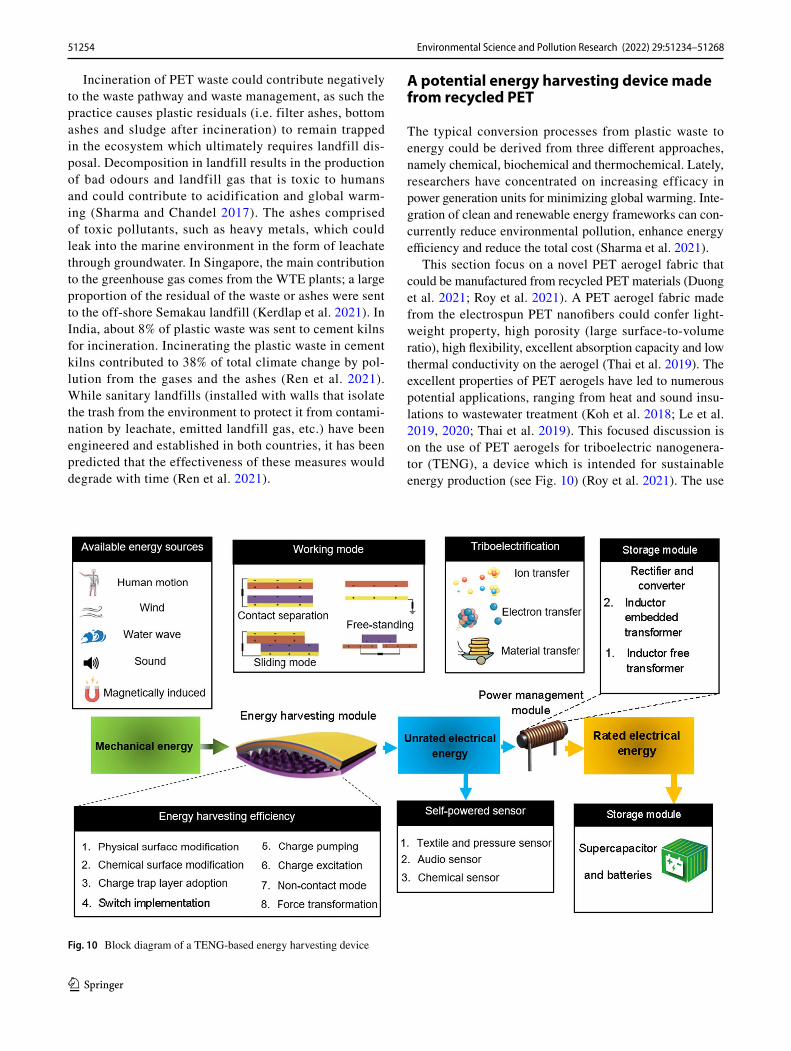
Incineration of PET waste could contribute negatively to the waste pathway and waste management, as such the practice causes plastic residuals (i.e. filter ashes, bottom ashes and sludge after incineration) to remain trapped in the ecosystem which ultimately requires landfill dis-posal. Decomposition in landfill results in the production of bad odours and landfill gas that is toxic to humans and could contribute to acidification and global warm-ing (Sharma and Chandel 2017). The ashes comprised of toxic pollutants, such as heavy metals, which could leak into the marine environment in the form of leachate through groundwater. In Singapore, the main contribution to the greenhouse gas comes from the WTE plants; a large proportion of the residual of the waste or ashes were sent to the off-shore Semakau landfill (Kerdlap et al. 2021). In India, about 8% of plastic waste was sent to cement kilns for incineration. Incinerating the plastic waste in cement kilns contributed to 38% of total climate change by pol-lution from the gases and the ashes (Ren et al. 2021). While sanitary landfills (installed with walls that isolate the trash from the environment to protect it from contami-nation by leachate, emitted landfill gas, etc.) have been engineered and established in both countries, it has been predicted that the effectiveness of these measures would degrade with time (Ren et al. 2021).
A potential energy harvesting device made from recycled PET
The typical conversion processes from plastic waste to energy could be derived from three different approaches, namely chemical, biochemical and thermochemical. Lately, researchers have concentrated on increasing efficacy in power generation units for minimizing global warming. Inte-gration of clean and renewable energy frameworks can con-currently reduce environmental pollution, enhance energy efficiency and reduce the total cost (Sharma et al. 2021).
This section focus on a novel PET aerogel fabric that could be manufactured from recycled PET materials (Duong et al. 2021; Roy et al. 2021). A PET aerogel fabric made from the electrospun PET nanofibers could confer light-weight property, high porosity (large surface-to-volume ratio), high flexibility, excellent absorption capacity and low thermal conductivity on the aerogel (Thai et al. 2019). The excellent properties of PET aerogels have led to numerous potential applications, ranging from heat and sound insu-lations to wastewater treatment (Koh et al. 2018; Le et al. 2019, 2020; Thai et al. 2019). This focused discussion is on the use of PET aerogels for triboelectric nanogenera-tor (TENG), a device which is intended for sustainable energy production (see Fig. 10) (Roy et al. 2021). The use
Fig. 10 Block diagram of a TENG-based energy harvesting device
51254 Environmental Science and Pollution Research (2022) 29:51234–51268
1 3
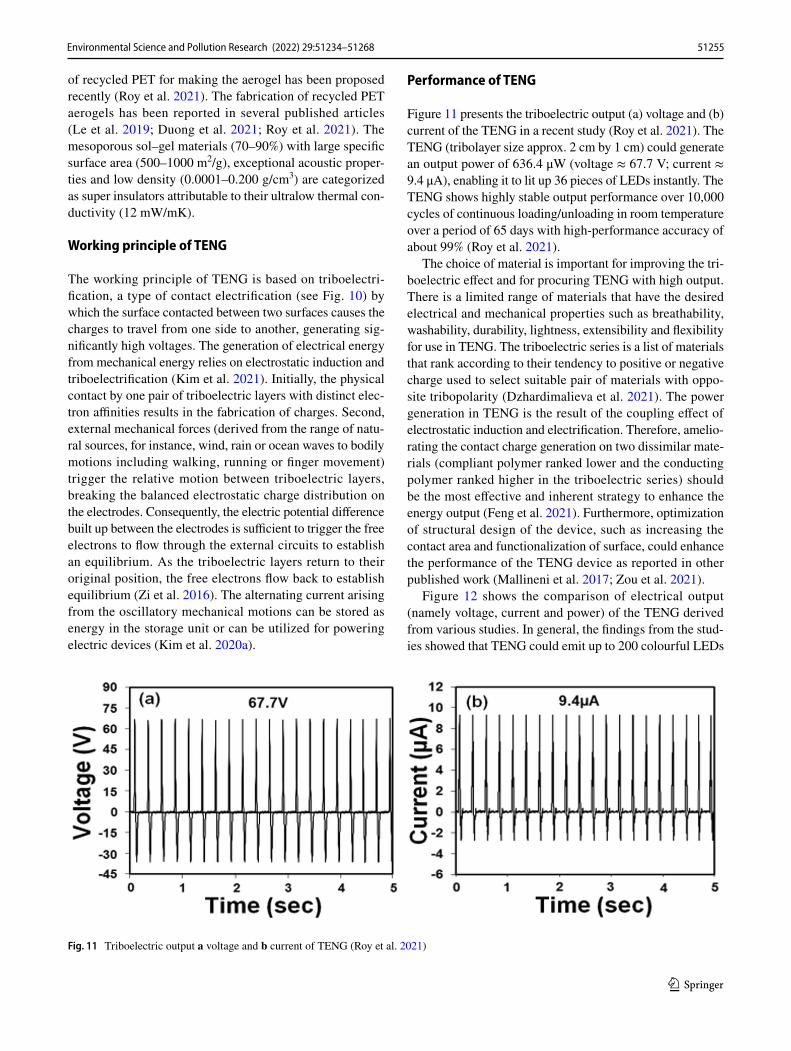
of recycled PET for making the aerogel has been proposed recently (Roy et al. 2021). The fabrication of recycled PET aerogels has been reported in several published articles (Le et al. 2019; Duong et al. 2021; Roy et al. 2021). The mesoporous sol–gel materials (70–90%) with large specific surface area (500–1000 m2/g), exceptional acoustic proper-ties and low density (0.0001–0.200 g/cm3) are categorized as super insulators attributable to their ultralow thermal con-ductivity (12 mW/mK).
Working principle of TENG
The working principle of TENG is based on triboelectri-fication, a type of contact electrification (see Fig. 10) by which the surface contacted between two surfaces causes the charges to travel from one side to another, generating sig-nificantly high voltages. The generation of electrical energy from mechanical energy relies on electrostatic induction and triboelectrification (Kim et al. 2021). Initially, the physical contact by one pair of triboelectric layers with distinct elec-tron affinities results in the fabrication of charges. Second, external mechanical forces (derived from the range of natu-ral sources, for instance, wind, rain or ocean waves to bodily motions including walking, running or finger movement) trigger the relative motion between triboelectric layers, breaking the balanced electrostatic charge distribution on the electrodes. Consequently, the electric potential difference built up between the electrodes is sufficient to trigger the free electrons to flow through the external circuits to establish an equilibrium. As the triboelectric layers return to their original position, the free electrons flow back to establish equilibrium (Zi et al. 2016). The alternating current arising from the oscillatory mechanical motions can be stored as energy in the storage unit or can be utilized for powering electric devices (Kim et al. 2020a).
Performance of TENG
Figure 11 presents the triboelectric output (a) voltage and (b) current of the TENG in a recent study (Roy et al. 2021). The TENG (tribolayer size approx. 2 cm by 1 cm) could generate an output power of 636.4 μW (voltage ≈ 67.7 V; current ≈ 9.4 μA), enabling it to lit up 36 pieces of LEDs instantly. The TENG shows highly stable output performance over 10,000 cycles of continuous loading/unloading in room temperature over a period of 65 days with high-performance accuracy of about 99% (Roy et al. 2021).
The choice of material is important for improving the tri-boelectric effect and for procuring TENG with high output. There is a limited range of materials that have the desired electrical and mechanical properties such as breathability, washability, durability, lightness, extensibility and flexibility for use in TENG. The triboelectric series is a list of materials that rank according to their tendency to positive or negative charge used to select suitable pair of materials with oppo-site tribopolarity (Dzhardimalieva et al. 2021). The power generation in TENG is the result of the coupling effect of electrostatic induction and electrification. Therefore, amelio-rating the contact charge generation on two dissimilar mate-rials (compliant polymer ranked lower and the conducting polymer ranked higher in the triboelectric series) should be the most effective and inherent strategy to enhance the energy output (Feng et al. 2021). Furthermore, optimization of structural design of the device, such as increasing the contact area and functionalization of surface, could enhance the performance of the TENG device as reported in other published work (Mallineni et al. 2017; Zou et al. 2021).
Figure 12 shows the comparison of electrical output (namely voltage, current and power) of the TENG derived from various studies. In general, the findings from the stud-ies showed that TENG could emit up to 200 colourful LEDs
Fig. 11 Triboelectric output a voltage and b current of TENG (Roy et al. 2021)
51255Environmental Science and Pollution Research (2022) 29:51234–51268
1 3
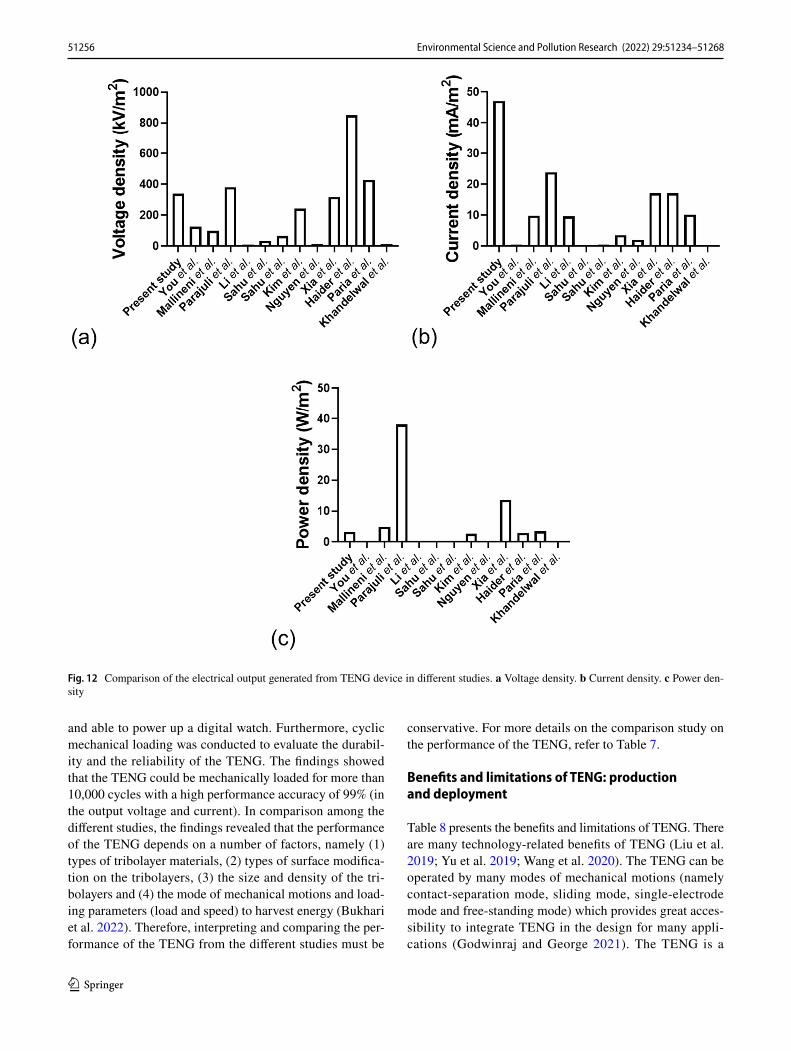
and able to power up a digital watch. Furthermore, cyclic mechanical loading was conducted to evaluate the durabil-ity and the reliability of the TENG. The findings showed that the TENG could be mechanically loaded for more than 10,000 cycles with a high performance accuracy of 99% (in the output voltage and current). In comparison among the different studies, the findings revealed that the performance of the TENG depends on a number of factors, namely (1) types of tribolayer materials, (2) types of surface modifica-tion on the tribolayers, (3) the size and density of the tri-bolayers and (4) the mode of mechanical motions and load-ing parameters (load and speed) to harvest energy (Bukhari et al. 2022). Therefore, interpreting and comparing the per-formance of the TENG from the different studies must be
conservative. For more details on the comparison study on the performance of the TENG, refer to Table 7.
Benefits and limitations of TENG: production and deployment
Table 8 presents the benefits and limitations of TENG. There are many technology-related benefits of TENG (Liu et al. 2019; Yu et al. 2019; Wang et al. 2020). The TENG can be operated by many modes of mechanical motions (namely contact-separation mode, sliding mode, single-electrode mode and free-standing mode) which provides great acces-sibility to integrate TENG in the design for many appli-cations (Godwinraj and George 2021). The TENG is a
Fig. 12 Comparison of the electrical output generated from TENG device in different studies. a Voltage density. b Current density. c Power den-sity
51256 Environmental Science and Pollution Research (2022) 29:51234–51268
1 3
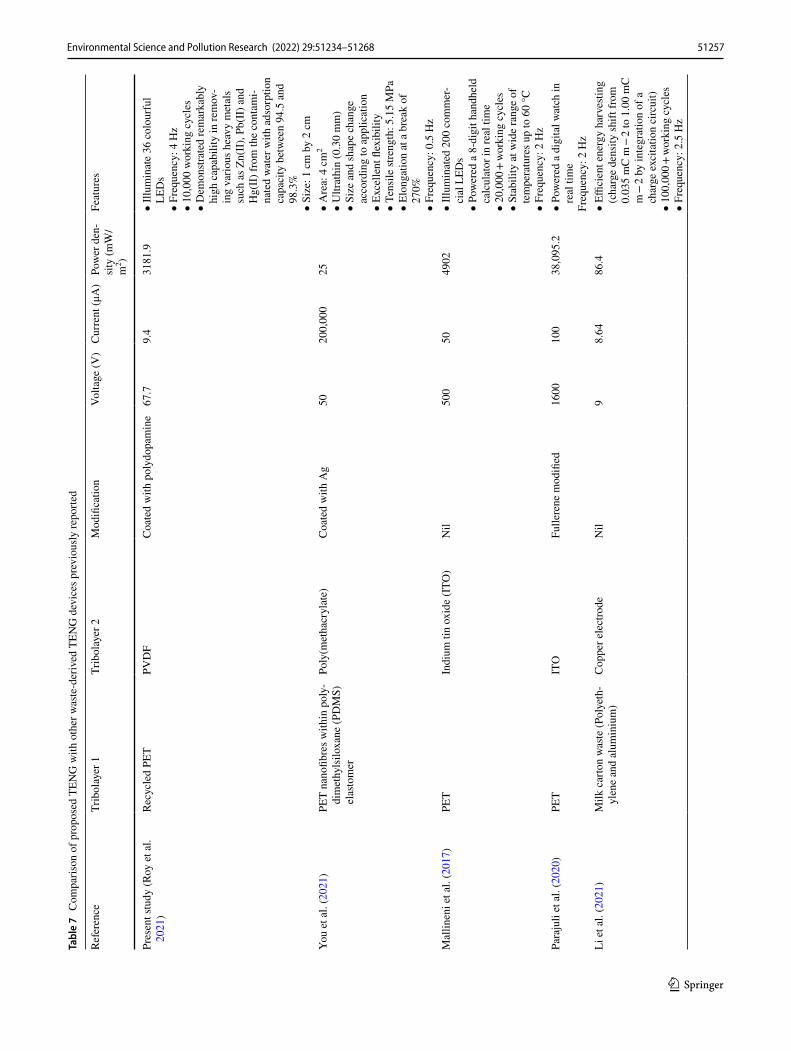
Tabl
e 7
Com
paris
on o
f pro
pose
d TE
NG
with
oth
er w
aste
-der
ived
TEN
G d
evic
es p
revi
ously
repo
rted
Refe
renc
eTr
ibol
ayer
1Tr
ibol
ayer
2M
odifi
catio
nVo
ltage
(V)
Cur
rent
(μA
)Po
wer
den
-si
ty (m
W/
m2 )
Feat
ures
Pres
ent s
tudy
(Roy
et a
l. 20
21)
Recy
cled
PET
PVD
FC
oate
d w
ith p
olyd
opam
ine
67.7
9.4
3181
.9•
Illum
inat
e 36
col
ourf
ul
LED
s•
Freq
uenc
y: 4
Hz
• 10
,000
wor
king
cyc
les
• D
emon
strat
ed re
mar
kabl
y hi
gh c
apab
ility
in re
mov
-in
g va
rious
hea
vy m
etal
s su
ch a
s Zn(
II),
Pb(I
I) a
nd
Hg(
II) f
rom
the
cont
ami-
nate
d w
ater
with
ads
orpt
ion
capa
city
bet
wee
n 94
.5 a
nd
98.3
%•
Size
: 1 c
m b
y 2
cmYo
u et
al.
(202
1)PE
T na
nofib
res w
ithin
pol
y-di
met
hyls
iloxa
ne (P
DM
S)
elas
tom
er
Poly
(met
hacr
ylat
e)C
oate
d w
ith A
g50
200,
000
25•
Are
a: 4
cm
2
• U
ltrat
hin
(0.3
0 m
m)
• Si
ze a
nd sh
ape
chan
ge
acco
rdin
g to
app
licat
ion
• Ex
celle
nt fl
exib
ility
• Te
nsile
stre
ngth
: 5.1
5 M
Pa•
Elon
gatio
n at
a b
reak
of
270%
• Fr
eque
ncy:
0.5
Hz
Mal
linen
i et a
l. (2
017)
PET
Indi
um ti
n ox
ide
(ITO
)N
il50
050
4902
• Ill
umin
ated
200
com
mer
-ci
al L
EDs
• Po
wer
ed a
8-d
igit
hand
held
ca
lcul
ator
in re
al ti
me
• 20
,000
+ w
orki
ng c
ycle
s•
Stab
ility
at w
ide
rang
e of
te
mpe
ratu
res u
p to
60
°C•
Freq
uenc
y: 2
Hz
Para
juli
et a
l. (2
020)
PET
ITO
Fulle
rene
mod
ified
1600
100
38,0
95.2
• Po
wer
ed a
dig
ital w
atch
in
real
tim
eFr
eque
ncy:
2 H
zLi
et a
l. (2
021)
Milk
car
ton
was
te (P
olye
th-
ylen
e an
d al
umin
ium
)C
oppe
r ele
ctro
deN
il9
8.64
86.4
• Effi
cien
t ene
rgy
harv
estin
g (c
harg
e de
nsity
shift
from
0.
035
mC
m −
2 to
1.0
0 m
C
m −
2 by
inte
grat
ion
of a
ch
arge
exc
itatio
n ci
rcui
t)•
100,
000 +
wor
king
cyc
les
• Fr
eque
ncy:
2.5
Hz
51257Environmental Science and Pollution Research (2022) 29:51234–51268
1 3
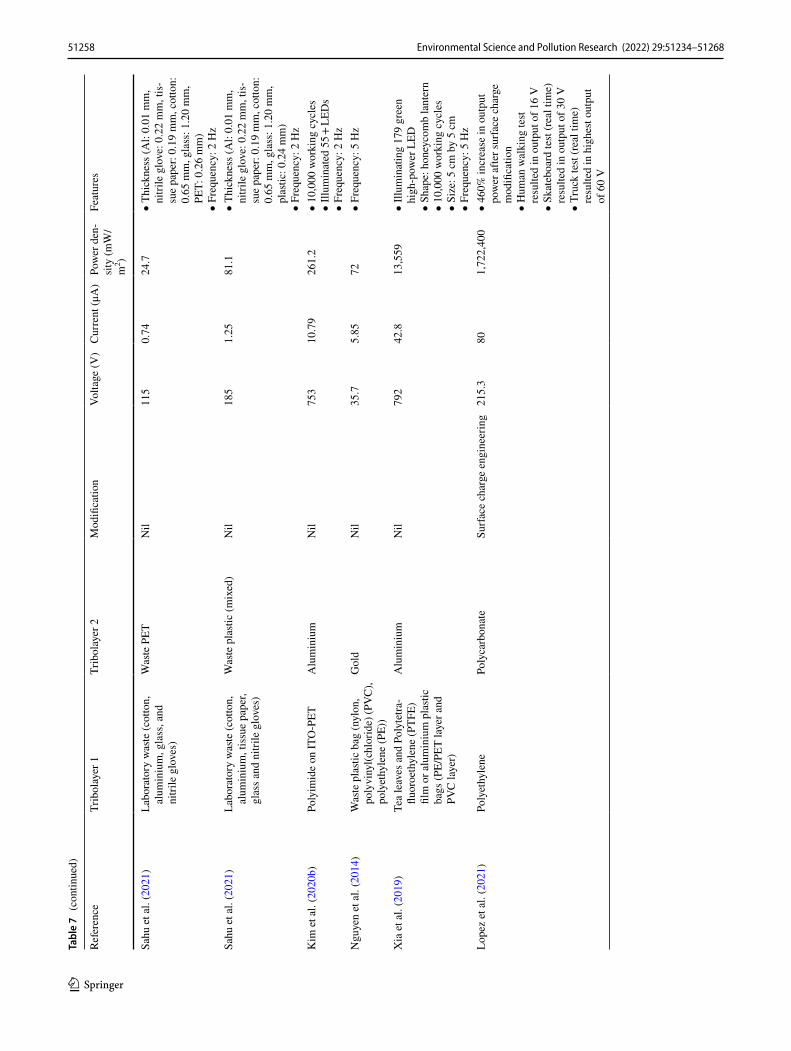
Tabl
e 7
(con
tinue
d)
Refe
renc
eTr
ibol
ayer
1Tr
ibol
ayer
2M
odifi
catio
nVo
ltage
(V)
Cur
rent
(μA
)Po
wer
den
-si
ty (m
W/
m2 )
Feat
ures
Sahu
et a
l. (2
021)
Labo
rato
ry w
aste
(cot
ton,
al
umin
ium
, gla
ss, a
nd
nitri
le g
love
s)
Was
te P
ETN
il11
50.
7424
.7•
Thic
knes
s (A
l: 0.
01 m
m,
nitri
le g
love
: 0.2
2 m
m, t
is-
sue
pape
r: 0.
19 m
m, c
otto
n:
0.65
mm
, gla
ss: 1
.20
mm
, PE
T: 0
.26
mm
)•
Freq
uenc
y: 2
Hz
Sahu
et a
l. (2
021)
Labo
rato
ry w
aste
(cot
ton,
al
umin
ium
, tis
sue
pape
r, gl
ass a
nd n
itrile
glo
ves)
Was
te p
lasti
c (m
ixed
)N
il18
51.
2581
.1•
Thic
knes
s (A
l: 0.
01 m
m,
nitri
le g
love
: 0.2
2 m
m, t
is-
sue
pape
r: 0.
19 m
m, c
otto
n:
0.65
mm
, gla
ss: 1
.20
mm
, pl
astic
: 0.2
4 m
m)
• Fr
eque
ncy:
2 H
zK
im e
t al.
(202
0b)
Poly
imid
e on
ITO
-PET
Alu
min
ium
Nil
753
10.7
926
1.2
• 10
,000
wor
king
cyc
les
• Ill
umin
ated
55 +
LED
s•
Freq
uenc
y: 2
Hz
Ngu
yen
et a
l. (2
014)
Was
te p
lasti
c ba
g (n
ylon
, po
lyvi
nyl(c
hlor
ide)
(PV
C),
poly
ethy
lene
(PE)
)
Gol
dN
il35
.75.
8572
• Fr
eque
ncy:
5 H
z
Xia
et a
l. (2
019)
Tea
leav
es a
nd P
olyt
etra
-flu
oroe
thyl
ene
(PTF
E)
film
or a
lum
iniu
m p
lasti
c ba
gs (P
E/PE
T la
yer a
nd
PVC
laye
r)
Alu
min
ium
Nil
792
42.8
13,5
59•
Illum
inat
ing
179
gree
n hi
gh-p
ower
LED
• Sh
ape:
hon
eyco
mb
lant
ern
• 10
,000
wor
king
cyc
les
• Si
ze: 5
cm
by
5 cm
• Fr
eque
ncy:
5 H
zLo
pez
et a
l. (2
021)
Poly
ethy
lene
Poly
carb
onat
eSu
rface
cha
rge
engi
neer
ing
215.
380
1,72
2,40
0•
460%
incr
ease
in o
utpu
t po
wer
afte
r sur
face
cha
rge
mod
ifica
tion
• H
uman
wal
king
test
resu
lted
in o
utpu
t of 1
6 V
• Sk
ateb
oard
test
(rea
l tim
e)
resu
lted
in o
utpu
t of 3
0 V
• Tr
uck
test
(rea
l tim
e)
resu
lted
in h
ighe
st ou
tput
of
60
V
51258 Environmental Science and Pollution Research (2022) 29:51234–51268
1 3
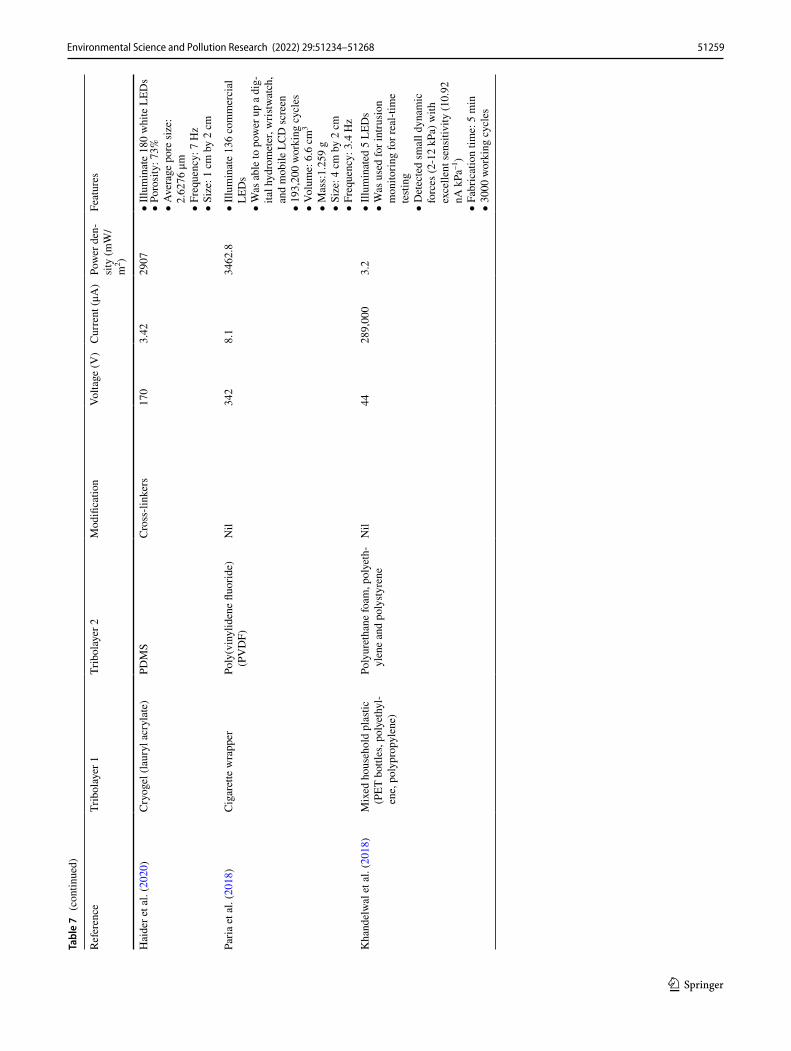
Tabl
e 7
(con
tinue
d)
Refe
renc
eTr
ibol
ayer
1Tr
ibol
ayer
2M
odifi
catio
nVo
ltage
(V)
Cur
rent
(μA
)Po
wer
den
-si
ty (m
W/
m2 )
Feat
ures
Hai
der e
t al.
(202
0)C
ryog
el (l
aury
l acr
ylat
e)PD
MS
Cro
ss-li
nker
s17
03.
4229
07•
Illum
inat
e 18
0 w
hite
LED
s•
Poro
sity
: 73%
• A
vera
ge p
ore
size
: 2.
6276
μm
• Fr
eque
ncy:
7 H
z•
Size
: 1 c
m b
y 2
cm
Paria
et a
l. (2
018)
Cig
aret
te w
rapp
erPo
ly(v
inyl
iden
e flu
orid
e)
(PV
DF)
Nil
342
8.1
3462
.8•
Illum
inat
e 13
6 co
mm
erci
al
LED
s•
Was
abl
e to
pow
er u
p a
dig-
ital h
ydro
met
er, w
ristw
atch
, an
d m
obile
LC
D sc
reen
• 19
3,20
0 w
orki
ng c
ycle
s•
Volu
me:
6.6
cm
3
• M
ass:
1.25
9 g
• Si
ze: 4
cm
by
2 cm
• Fr
eque
ncy:
3.4
Hz
Kha
ndel
wal
et a
l. (2
018)
Mix
ed h
ouse
hold
pla
stic
(PET
bot
tles,
poly
ethy
l-en
e, p
olyp
ropy
lene
)
Poly
uret
hane
foam
, pol
yeth
-yl
ene
and
poly
styre
neN
il44
289,
000
3.2
• Ill
umin
ated
5 L
EDs
• W
as u
sed
for i
ntru
sion
m
onito
ring
for r
eal-t
ime
testi
ng•
Det
ecte
d sm
all d
ynam
ic
forc
es (2
-12
kPa)
with
ex
celle
nt se
nsiti
vity
(10.
92
nA k
Pa–1
)•
Fabr
icat
ion
time:
5 m
in•
3000
wor
king
cyc
les
51259Environmental Science and Pollution Research (2022) 29:51234–51268
1 3
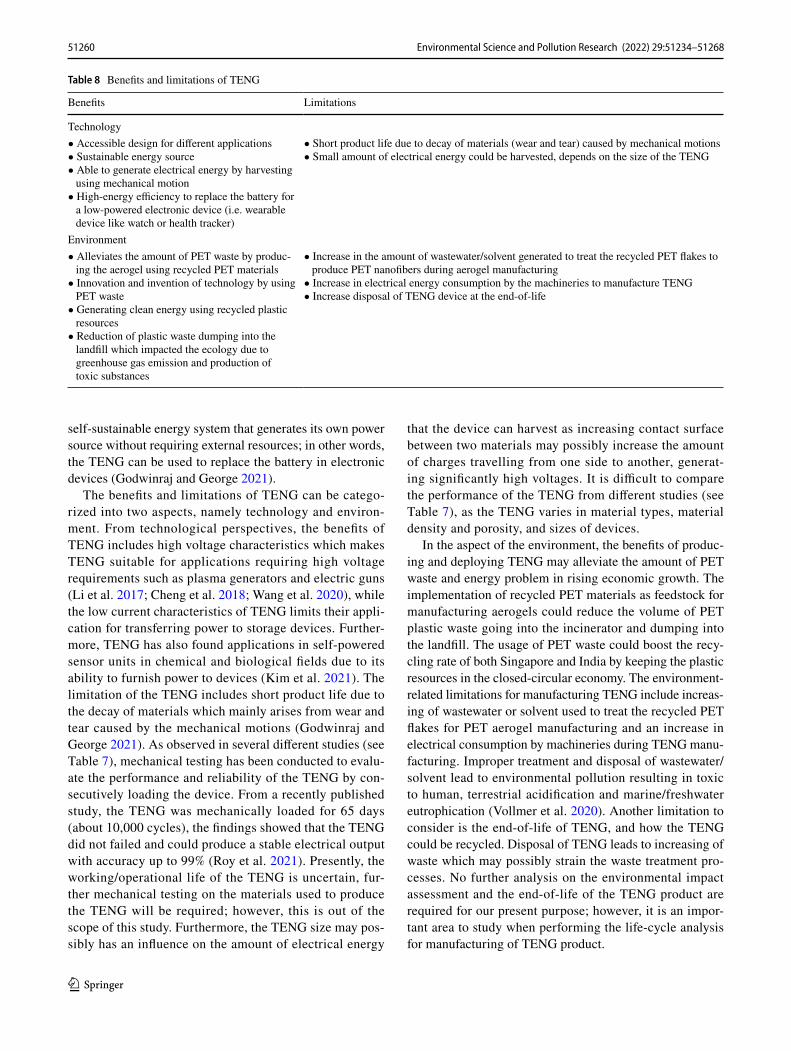
self-sustainable energy system that generates its own power source without requiring external resources; in other words, the TENG can be used to replace the battery in electronic devices (Godwinraj and George 2021).
The benefits and limitations of TENG can be catego-rized into two aspects, namely technology and environ-ment. From technological perspectives, the benefits of TENG includes high voltage characteristics which makes TENG suitable for applications requiring high voltage requirements such as plasma generators and electric guns (Li et al. 2017; Cheng et al. 2018; Wang et al. 2020), while the low current characteristics of TENG limits their appli-cation for transferring power to storage devices. Further-more, TENG has also found applications in self-powered sensor units in chemical and biological fields due to its ability to furnish power to devices (Kim et al. 2021). The limitation of the TENG includes short product life due to the decay of materials which mainly arises from wear and tear caused by the mechanical motions (Godwinraj and George 2021). As observed in several different studies (see Table 7), mechanical testing has been conducted to evalu-ate the performance and reliability of the TENG by con-secutively loading the device. From a recently published study, the TENG was mechanically loaded for 65 days (about 10,000 cycles), the findings showed that the TENG did not failed and could produce a stable electrical output with accuracy up to 99% (Roy et al. 2021). Presently, the working/operational life of the TENG is uncertain, fur-ther mechanical testing on the materials used to produce the TENG will be required; however, this is out of the scope of this study. Furthermore, the TENG size may pos-sibly has an influence on the amount of electrical energy
that the device can harvest as increasing contact surface between two materials may possibly increase the amount of charges travelling from one side to another, generat-ing significantly high voltages. It is difficult to compare the performance of the TENG from different studies (see Table 7), as the TENG varies in material types, material density and porosity, and sizes of devices.
In the aspect of the environment, the benefits of produc-ing and deploying TENG may alleviate the amount of PET waste and energy problem in rising economic growth. The implementation of recycled PET materials as feedstock for manufacturing aerogels could reduce the volume of PET plastic waste going into the incinerator and dumping into the landfill. The usage of PET waste could boost the recy-cling rate of both Singapore and India by keeping the plastic resources in the closed-circular economy. The environment-related limitations for manufacturing TENG include increas-ing of wastewater or solvent used to treat the recycled PET flakes for PET aerogel manufacturing and an increase in electrical consumption by machineries during TENG manu-facturing. Improper treatment and disposal of wastewater/solvent lead to environmental pollution resulting in toxic to human, terrestrial acidification and marine/freshwater eutrophication (Vollmer et al. 2020). Another limitation to consider is the end-of-life of TENG, and how the TENG could be recycled. Disposal of TENG leads to increasing of waste which may possibly strain the waste treatment pro-cesses. No further analysis on the environmental impact assessment and the end-of-life of the TENG product are required for our present purpose; however, it is an impor-tant area to study when performing the life-cycle analysis for manufacturing of TENG product.
Table 8 Benefits and limitations of TENG
Benefits Limitations
Technology• Accessible design for different applications• Sustainable energy source• Able to generate electrical energy by harvesting
using mechanical motion• High-energy efficiency to replace the battery for
a low-powered electronic device (i.e. wearable device like watch or health tracker)
• Short product life due to decay of materials (wear and tear) caused by mechanical motions• Small amount of electrical energy could be harvested, depends on the size of the TENG
Environment• Alleviates the amount of PET waste by produc-
ing the aerogel using recycled PET materials• Innovation and invention of technology by using
PET waste• Generating clean energy using recycled plastic
resources• Reduction of plastic waste dumping into the
landfill which impacted the ecology due to greenhouse gas emission and production of toxic substances
• Increase in the amount of wastewater/solvent generated to treat the recycled PET flakes to produce PET nanofibers during aerogel manufacturing
• Increase in electrical energy consumption by the machineries to manufacture TENG• Increase disposal of TENG device at the end-of-life
51260 Environmental Science and Pollution Research (2022) 29:51234–51268
1 3
Challenges of using plastic scraps for manufacturing
TENG has many remarkable merits (as shown in Table 8); however, in-country supply chains must be established in order to commercialize and market the TENG devices. Infra-structures for a sustainable supply chain need to be put in place and their activities include recycling of plastic scraps, manufacturing, storage, packaging, transportation and to end-users/consumers (Mc Loughlin et al. 2021). Evidently, the current price of producing recycled plastics was high (due to the effort required for managing and costs of recy-cling processes) which makes wider adoption as feedstock for manufacturing to be difficult (Arwa Mahdawi 2020). In-country supply challenges and integrated opportunities for futuristic sustainable development in converting plastic waste to TENG are embellished through Fig. 13.
In Singapore, the supply of recycled plastic scraps for manufacturing of TENG devices poses a challenge as most of the plastic scraps were exported to neighbouring countries for recycling (Kerdlap et al. 2020, 2021). In a recent report, the plastic recycling association of Singapore envisioned to build its first operational plastic recycling plant in the country by the year 2023 and aims to increase the plastic recycling rate from 4 (in 2020) to 30% in the next 5 years to support the Singapore Green Plan 2030, a national move-ment to advance Singapore’s national agenda on sustainable development (Justin Ong 2021). The report showed that an estimate of 500 million PET bottles was disposed yearly and only 4% were recycled (about only 20 million PET bot-tles) to check if the recycled materials would be sufficient to achieve a sustainable manufacturing of TENG devices in Singapore. For the purpose of illustration, an order of mag-nitude estimates are considered for an everyday wearable application, namely the digital wristwatch (as an alternative to existing solar-powered ones) as highlighted in a previ-ously published report by Wang et al. (2017a). One 500-ml PET bottle results in aerogel of size 210 mm in length by 297 mm in width (Crystal Ho 2018). Considering 20 mil-lion PET bottles (of 500-ml PET bottles) were recycled in 2020, an estimation of about 610 million pieces of aerogel mats (size: 20 mm in length by 10 mm in width) could be produced. When the recycling rate increased to 30% (about 150 million PET bottles) in the next 5 years, an estimated of about 46.5 billion pieces of aerogel mats could be produced. However, India is able to house all the recycling processes and facilities in the country (Ministry of Housing and Urban Affair 2019). An approximately 900,000 tonnes of PET bot-tles were disposed, and 23 to 25 billion pieces of PET bottles (~ 800,000 tonnes) were recycled (recycling rate = 90% for PET waste) yearly since 2017. Here, an estimation of about 7300 to 7800 billion pieces of aerogel mats (size: 20 mm in length by 10 mm in width) could be produced. Based on the findings, i.e. the amount of recycled PET plastics that
were disposed yearly, if a proportion of this were to be used to make PET aerogels for the TENG devices, it would be sufficient to produce small-scale TENG wearable devices to cater for all the residents/peoples in Singapore (popula-tion ≈ 5.68 million in 2020) and India (population ≈ 1.38 billion in 2020).
Herein, the estimates of the recycled PET plastics used for manufacturing one tribolayer of aerogel of the TENG device were evaluated. The usage of PET plastic scraps could only recover a small percentage (about 4% for Sin-gapore and 1.5% for India) of the PET scraps from the total amount of plastic waste generated in the respective coun-tries. However, recovery of different plastic types from the generated waste is required in order to have a significant change in the plastic waste recovery system. Likewise, apart from PET, other types of plastic scraps (i.e. polyethylene, polycarbonate, polystyrene, polyvinyl chloride) could also be used to make different components of the TENG device such as an alternative tribolayers, device casing and packag-ing. However, employing different recycled plastic materi-als to produce TENG device is a challenge as the different material characteristics may affect the performance of the TENG (see Table 7). Furthermore, the recycling processes for different plastic scraps may differ due to the different in the resin characteristics (Rick Leblanc 2020). Additional recycling processes for different types of plastic scraps may increase the costs of the recycled plastics which increases the difficulty for the manufacturer to accept recycled plastics materials in production (Rick Leblanc 2020). Further studies are important to study the recycling processes for different plastic scraps and to evaluate the performance of the TENG using different recycled plastic materials to explore their benefits for different applications. However, the studies were beyond the scope of this paper.
Moreover, another big challenge is the low recycling rates due to the lack of improved technologies in plas-tic waste collection, sorting and segregation and the lack of authentic data about recyclable and recycled plastics (Woidasky et al. 2020). Large-scale production and com-mercialization of TENG would demand a secured platform for tagging, testing and tracking the plastic products to measure the real value of plastic products in terms of its recyclability. Advanced technology with unique molecular tags (molecular barcodes) applied in the manufacturing process may help in solving the issue of ambiguous plas-tic labelling (Sandhiya and Ramakrishna 2021). Block-chain technology, a digital innovation, offers the potential to trace the journey of plastic products across their life cycle from production, manufacturing, usage and disposal. These records can be further utilized by different economic agents, serving as a trust-based platform between plastic waste segregators, recyclers and recycled feedstock buyers (Chidepatil et al. 2020; Liu et al. 2021). As per the strategy
51261Environmental Science and Pollution Research (2022) 29:51234–51268
1 3
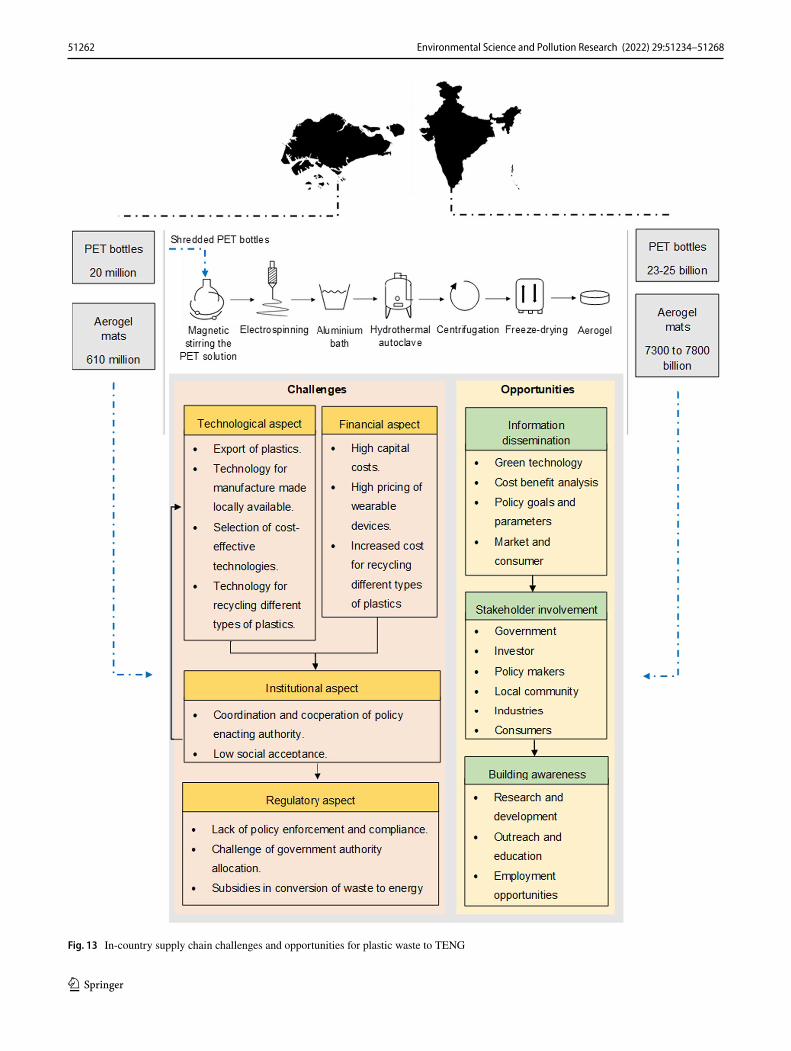
Fig. 13 In-country supply chain challenges and opportunities for plastic waste to TENG
51262 Environmental Science and Pollution Research (2022) 29:51234–51268
1 3
of blockchain technology, stakeholders are benefitted for their involvement in the validation process using digital cash (Sandhiya and Ramakrishna 2021). The shortcomings of the present sorting and segregation technologies may be overcome with the application of a multi-sensor driven artificial intelligence approach, i.e. using high-definition optical sensors to identify the shape, colour and texture of plastics to separate selected recyclables or incompatible materials in the recycling process (Chidepatil et al. 2020; Gussen et al. 2020).
Conclusions
Efficacious plastic waste management demands the highest priority from the environmental and economic perspectives. Comparing the two large economies (Singapore and India) based on governance, social, market regulatory and financial data, the study evaluated how both countries managed their waste system. The findings were summarized as follows,
(1) The legislation and policy measures have been imple-mented in both Singapore and India to administer regulatory functions of waste collection, treatment and disposal for identifying the key waste stream and strengthen the resource resilience.
(2) Recycling infrastructure (i.e. MRF, WTE plant and landfill) and technologies (i.e. mechanical recycling, pyrolysis and incineration) have been developed in both countries to convert the waste to useful resources. The recycling statistics showed that the plastic recycling rate in Singapore were much lower (most were being incinerated) as compared to India.
(3) The economic value of recycled PET materials was estimated for considering as resources for remanufac-turing. It was predicted that the economic value of PET depreciates after each consecutive recycling cycle as compared to virgin PET materials. Also, the economic value of the PET depreciates when the mechanical performance of the PET materials reduces after each recycling cycle.
(4) An emerging technology known as TENG, which is an energy harvesting device, was proposed. The produc-tion of TENG using recycled plastics could appreciably aid in reducing plastic waste and keeping the plastic resources in the closed-loop economy, thus promoting sustainable cities and communities. Rerouting waste streams and utilizing them as chemical feedstocks should become pervasive for the manufacturing of merchantable products to accomplish the complete and continuous circulation of resources within the circular economy.
In addition, this work had benefitted from produc-tive collaboration at the academic level and cooperation between industry and academic researchers, non-govern-ment entities and legislative bodies.
Abbreviations 3Rs: Reduce, reuse, recycle; CPCB: Central pollution control board; EPHA: Environment public health act; EPR: Extended producer responsibility; GDP: Gross domestic product; GWC : Gen-eral waste collector; HDB: Housing development board; HDPE: High-density polyethylene; LCA: Life cycle analysis; LDPE: Low-density polyethylene; MoEF: Ministry of environment, forest, and climate change; MPR: Mandatory packaging reporting; MRF: Materials recov-ery facilities; NEA: National Environment Agency; PA: Polyamide; PBAT: Polybutylene adipate terephthalate; PBS: Polybutylene succi-nate; PE: Polyethylene; PET: Polyethylene terephthalate; PHA: Polyhy-droxyalkanoates; PLA: Polylactic acid; PP: Polypropylene; PPP: Sur-face-modified PET aerogel; PRO: Producer responsibility organization; PS: Polystyrene; PTT: Polytrimethylene terephthalate; PVA: Polyvi-nyl alcohol; PVC: Polyvinyl chloride; PVDF: Polyvinylidene fluo-ride; PWC: Public waste collector; PWM: Plastic waste management rules; RVM: Recyclate value model; SBM: Swachh Bharat mission; SEC: Singapore Environment Council; SPCB: State Pollution Con-trol Board; TENG: Triboelectric nanogenerator; WRMS: Waste and Resource Management System; WTE: Waste to energy
Supplementary Information The online version contains supplemen-tary material available at https:// doi. org/ 10. 1007/ s11356- 022- 20854-2.
Acknowledgements We thank Dr Eugene Wong, Dr Michael Lau, Dr Zi Jie Choong, and Dr Jun Jie Chong for the useful discussion on the impact of plastic waste and recycling in Singapore. We thank Mr Lincoln Ang, Ms Chia Hong Ling, and Ms Tan Jia Ling (Waste Management Division, National Environment Agency, Singapore), and Ms Regina Cheah and Ms Cassandra Foo (Sembwaste Pte Ltd., Singa-pore) for the useful discussions and for providing us non-confidential information on the landscape of waste and recycling management, pro-cesses, and challenges in Singapore.
Author contribution All authors contributed to the literature search, conceptualization, and methodology; investigation and data analysis: Wei Liang Lai, Shreya Sharma, Sunanda Roy, Pradip Kumar Maji, and Kheng-Lim Goh; writing—original draft preparation: Wei Liang Lai and Shreya Sharma; writing—reviewing and editing: Sunanda Roy, Pradip Kumar Maji, Bhasha Sharma, Seeram Ramakrishna, and Kheng-Lim Goh; supervision: Sunanda Roy and Kheng-Lim Goh; funding acquisition: Wei Liang Lai and Kheng-Lim Goh. All authors read and approved the final manuscript.
Funding This work was supported by the UK Research and Innovation (UKRI): Research England – Quality-related Research Strategic Priori-ties Fund (Category: NU-CORE—Energy), and Newcastle University: International Partnership Seed Fund.
Data availability The data are available in the Supplementary Informa-tion document.
Declarations
Ethical approval Not applicable.
Consent to participate All authors certify that they consent to partici-pate in this research study.
51263Environmental Science and Pollution Research (2022) 29:51234–51268
1 3
Consent to publish All authors certify that they give consent to publish this research study.
Competing interests The authors declare no competing interests.
Open Access This article is licensed under a Creative Commons Attri-bution 4.0 International License, which permits use, sharing, adapta-tion, distribution and reproduction in any medium or format, as long as you give appropriate credit to the original author(s) and the source, provide a link to the Creative Commons licence, and indicate if changes were made. The images or other third party material in this article are included in the article's Creative Commons licence, unless indicated otherwise in a credit line to the material. If material is not included in the article's Creative Commons licence and your intended use is not permitted by statutory regulation or exceeds the permitted use, you will need to obtain permission directly from the copyright holder. To view a copy of this licence, visit http:// creat iveco mmons. org/ licen ses/ by/4. 0/.
References
Ahamed Kameel NI, Wan Daud WMA, Abdul Patah MF, Mohd Zulkifli NW (2022) Influence of reaction parameters on ther-mal liquefaction of plastic wastes into oil: a review. Energy Convers Manag X 14:100196. https:// doi. org/ 10. 1016/j. ecmx. 2022. 100196
Alvarado Chacon F, Brouwer MT, Thoden van Velzen EU (2020) Effect of recycled content and rPET quality on the properties of PET bottles, part I: optical and mechanical properties. Packag Technol Sci 33:347–357. https:// doi. org/ 10. 1002/ pts. 2490
Antelava A, Jablonska N, Constantinou A et al (2021) Energy poten-tial of plastic waste valorization: a short comparative assessment of pyrolysis versus gasification. Energy Fuels 35:3558–3571. https:// doi. org/ 10. 1021/ acs. energ yfuels. 0c040 17
Arwa Mahdawi (2020) More plastic will never be recycled - and the manufacturers couldn’t care less. In: Guard. News Media Ltd. https:// www. thegu ardian. com/ comme ntisf ree/ 2020/ sep/ 15/ most- plast ic- will- never- be- recyc led- and- the- manuf actur ers- could nt- care- less
Ayilara MS, Olanrewaju OS, Babalola OO, Odeyemi O (2020) Waste management through composting: challenges and potentials. Sus-tain 12:1–23. https:// doi. org/ 10. 3390/ su121 14456
Barnes SJ (2019) Understanding plastics pollution: the role of eco-nomic development and technological research. Environ Pollut 249:812–821. https:// doi. org/ 10. 1016/j. envpol. 2019. 03. 108
Brouwer MT, Alvarado Chacon F, Thoden van Velzen EU (2020) Effect of recycled content and rPET quality on the properties of PET bottles, part III: modelling of repetitive recycling. Packag Technol Sci 33:373–383. https:// doi. org/ 10. 1002/ pts. 2489
Budin S, Maideen NC, Koay MH, et al (2019) A comparison study on mechanical properties of virgin and recycled polylactic acid (PLA). J Phys Conf Ser 1349:. https:// doi. org/ 10. 1088/ 1742- 6596/ 1349/1/ 012002
Bukhari MU, Khan A, Maqbool KQ et al (2022) Waste to energy: fac-ile, low-cost and environment-friendly triboelectric nanogenera-tors using recycled plastic and electronic wastes for self-powered portable electronics. Energy Rep 8:1687–1695. https:// doi. org/ 10. 1016/j. egyr. 2021. 12. 072
Central Institute of Plastics Engineering & Technology (CIPET) (2008) Promotion of recycling technology for post consumer Plastics waste. 0:1–17
Central Pollution Control Board (2018) Annual report for the year 2017-18 on implementation of solid waste management rules. India
Central Pollution Control Board (2019) Annual report for the year 2018-19 on implementation of solid waste management rules. India
Chaudhari US, Lin Y, Thompson VS et al (2021) Systems analysis approach to polyethylene terephthalate and olefin plastics sup-ply chains in the circular economy: a review of data sets and models. ACS Sustain Chem Eng. https:// doi. org/ 10. 1021/ acssu schem eng. 0c086 22
Chen Y, Zhang Y, Zhang Z (2021) Occurrence, effects, and biodegrada-tion of plastic additives in sludge anaerobic digestion: a review. Environ Pollut 287:117568. https:// doi. org/ 10. 1016/j. envpol. 2021. 117568
Cheng J, Ding W, Zi Y et al (2018) Triboelectric microplasma powered by mechanical stimuli. Nat Commun 9:1–11. https:// doi. org/ 10. 1038/ s41467- 018- 06198-x
Chidepatil A, Bindra P, Kulkarni D et al (2020) From trash to cash: how blockchain and multi-sensor-driven artificial intelligence can transform circular economy of plastic waste? Adm Sci 10:23. https:// doi. org/ 10. 3390/ admsc i1002 0023
Cordier M, Uehara T (2019) How much innovation is needed to pro-tect the ocean from plastic contamination? Sci Total Environ 670:789–799. https:// doi. org/ 10. 1016/j. scito tenv. 2019. 03. 258
Cordier M, Uehara T, Baztan J et al (2021) Plastic pollution and eco-nomic growth: the influence of corruption and lack of education. Ecol Econ 182:106930. https:// doi. org/ 10. 1016/j. ecole con. 2020. 106930
Cress AK, Huynh J, Anderson EH, et al (2021) Effect of recycling on the mechanical behavior and structure of additively manufactured acrylonitrile butadiene styrene (ABS). J Clean Prod 279:. https:// doi. org/ 10. 1016/j. jclep ro. 2020. 123689
Crystal Ho (2018) World’s first PET aerogel is made from recycled bottles. In: Eco-business. https:// www. eco- busin ess. com/ news/ worlds- first- aerog els- made- from- pet- bottl es- to- tackle- plast ic- waste/
Czajczyńska D, Anguilano L, Ghazal H et al (2017) Potential of pyroly-sis processes in the waste management sector. Therm Sci Eng Prog 3:171–197. https:// doi. org/ 10. 1016/j. tsep. 2017. 06. 003
Dahlbo H, Poliakova V, Mylläri V et al (2018) Recycling potential of post-consumer plastic packaging waste in Finland. Waste Manag 71:52–61. https:// doi. org/ 10. 1016/j. wasman. 2017. 10. 033
Damayanti WuHS (2021) Strategic possibility routes of recycled pet. Polymers (Basel) 13:1–37. https:// doi. org/ 10. 3390/ polym 13091 475
Del Mar Castro López M, Ares Pernas AI, Abad López MJ et al (2014) Assessing changes on poly(ethylene terephthalate) properties after recycling: mechanical recycling in laboratory versus post-consumer recycled material. Mater Chem Phys 147(884):894. https:// doi. org/ 10. 1016/j. match emphys. 2014. 06. 034
Dogu O, Pelucchi M, Van de Vijver R et al (2021) The chemistry of chemical recycling of solid plastic waste via pyrolysis and gasi-fication: state-of-the-art, challenges, and future directions. Prog Energy Combust Sci 84:100901. https:// doi. org/ 10. 1016/j. pecs. 2020. 100901
Duong HM, Tien NP, Nguyen TX, et al (2021) Polyethylene tereph-thalate (PET). 2021
Dutta S, Sonia Bhaskar (2017) Recycling plastic in India: converting plastic waste to fuel, the unrealised potential. https:// swach hin-dia. ndtv. com/ recyc ling- plast ic- in- india- conve rting- plast ic- waste- to- fuel- the- unrea lised- poten tial- 9436/
Dzhardimalieva GI, Yadav BC, Lifintseva T V., Uflyand IE (2021) Polymer chemistry underpinning materials for triboelectric nano-generators (TENGs): recent trends. Eur Polym J 142:. https:// doi. org/ 10. 1016/j. eurpo lymj. 2020. 110163
51264 Environmental Science and Pollution Research (2022) 29:51234–51268
1 3
Elangovan N (2021) Singaporeans generated less waste in 2019, but also recycled less : NEA. In: Today. https:// www. today online. com/ singa pore/ singa porea ns- gener ated- less- waste- 2019- also- recyc led- less- nea
Eriksen MK, Christiansen JD, Daugaard AE, Astrup TF (2019) Closing the loop for PET, PE and PP waste from households: influence of material properties and product design for plastic recycling. Waste Manag 96:75–85. https:// doi. org/ 10. 1016/j. wasman. 2019. 07. 005
Feng PY, Xia Z, Sun B et al (2021) Enhancing the performance of fabric-based triboelectric nanogenerators by structural and chem-ical modification. ACS Appl Mater Interfaces 13:16916–16927. https:// doi. org/ 10. 1021/ acsami. 1c028 15
Foschi E, Zanni S, Bonoli A (2020) Combining eco-design and LCA as decision-making process to prevent plastics in packaging applica-tion. Sustain 12:1–13. https:// doi. org/ 10. 3390/ su122 29738
Garcia JM, Robertson ML (2017) The future of plastics recycling. Sci-ence (80- ) 358:870–872. https:// doi. org/ 10. 1126/ scien ce. aaq03 24
Geyer R, Jambeck JR, Law KL (2017) Production, use, and fate of all plastics ever made. Sci Adv 3:25–29. https:// doi. org/ 10. 1126/ sciadv. 17007 82
Godwinraj D, George SC (2021) Recent advancement in TENG poly-mer structures and energy efficient charge control circuits. Adv Ind Eng Polym Res 4:1–8. https:// doi. org/ 10. 1016/j. aiepr. 2020. 12. 003
Grace Yeoh (2021) New association launched to help enhance rate of recycling plastic waste in Singapore. In: Channel News Asia. https:// www. chann elnew sasia. com/ susta inabi lity/ pras- assoc iation- plast ic- recyc ling- waste- 21181 21
Gradus RHJM, Nillesen PHL, Dijkgraaf E, van Koppen RJ (2017) A cost-effectiveness analysis for incineration or recycling of Dutch household plastic waste. Ecol Econ 135:22–28. https:// doi. org/ 10. 1016/j. ecole con. 2016. 12. 021
Gu F, Guo J, Zhang W et al (2017) From waste plastics to industrial raw materials: a life cycle assessment of mechanical plastic recycling practice based on a real-world case study. Sci Total Environ 601–602:1192–1207. https:// doi. org/ 10. 1016/j. scito tenv. 2017. 05. 278
Gussen LC, Ellerich M, Schmitt RH (2020) Equivalence analysis of plastic surface materials and comparable sustainable surfaces by a multisensory measurement system. Procedia Manuf 43:627–634. https:// doi. org/ 10. 1016/j. promfg. 2020. 02. 143
Hagnell MK, Åkermo M (2019) The economic and mechanical poten-tial of closed loop material usage and recycling of fibre-rein-forced composite materials. J Clean Prod 223:957–968. https:// doi. org/ 10. 1016/j. jclep ro. 2019. 03. 156
Hahladakis JN, Iacovidou E, Gerassimidou S (2020) Plastic waste in a circular economy. Plast Waste Recycl 481–512. https:// doi. org/ 10. 1016/ b978-0- 12- 817880- 5. 00019-0
Haider Z, Haleem A, Ahmad R et al (2020) Highly porous polymer cryogel based tribopositive material for high performance tri-boelectric nanogenerators. Nano Energy 68:104294. https:// doi. org/ 10. 1016/j. nanoen. 2019. 104294
Hopewell J, Dvorak R, Kosior E (2009) Plastics recycling: challenges and opportunities. Philos Trans R Soc B Biol Sci 364:2115–2126. https:// doi. org/ 10. 1098/ rstb. 2008. 0311
Huysman S, De Schaepmeester J, Ragaert K et al (2017) Performance indicators for a circular economy: a case study on post-industrial plastic waste. Resour Conserv Recycl 120:46–54. https:// doi. org/ 10. 1016/j. resco nrec. 2017. 01. 013
Teo J (2018) Consumer plastic and plastic resource ecosystem in sin-gapore: a position paper by Singapore Environment Council. Singapore Environment Council, Singapore
Joo S, Cho IJ, Seo H, et al (2018) Structural insight into molecular mechanism of poly(ethylene terephthalate) degradation. Nat Commun 9:. https:// doi. org/ 10. 1038/ s41467- 018- 02881-1
Ong J (2021) Study underway for Singapore’s first plastic bottle recy-cling plant, which could recycle 150 million bottles a year. In: Mediacorp Pte Ltd. https:// www. today online. com/ singa pore/ study- under way- singa pore- first- plast ic- bottle- recyc ling- plant- which- could- recyc le- 150- milli on
Kapur-Bakshi S, Kaur M, Gautam S (2021a) Circular economy for plastics in India: a roadmap. 85
Keijer T, Bakker V, Slootweg JC (2019) Circular chemistry to enable a circular economy. Nat Chem 11:190–195. https:// doi. org/ 10. 1038/ s41557- 019- 0226-9
Kerdlap P, Purnama AR, Low JSC et al (2020) Environmental evalu-ation of distributed versus centralized plastic waste recycling: integrating life cycle assessment and agent-based modeling. Pro-cedia CIRP 90:689–694. https:// doi. org/ 10. 1016/j. procir. 2020. 01. 083
Kerdlap P, Purnama AR, Low JSC, et al (2021) Comparing the envi-ronmental performance of distributed versus centralized plastic recycling systems: applying hybrid simulation modeling to life cycle assessment. J Ind Ecol 1–20. https:// doi. org/ 10. 1111/ jiec. 13151
Khandelwal G, Chandrasekhar A, Alluri NR et al (2018) Trash to energy: a facile, robust and cheap approach for mitigating envi-ronment pollutant using household triboelectric nanogenerator. Appl Energy 219:338–349. https:// doi. org/ 10. 1016/j. apene rgy. 2018. 03. 031
Khoo HH, Tan RBH (2010) Environmental impacts of conventional plastic and bio-based carrier bags: Part 2: end-of-life options. Int J Life Cycle Assess 15:338–345. https:// doi. org/ 10. 1007/ s11367- 010- 0163-8
Khoo HH (2019) LCA of plastic waste recovery into recycled mate-rials, energy and fuels in Singapore. Resour Conserv Recycl 145:67–77. https:// doi. org/ 10. 1016/j. resco nrec. 2019. 02. 010
Kijo-kleczkowska A, Gnatowski A (2022) Recycling of plastic waste , with particular emphasis on thermal methods — Review
Kim DW, Lee JH, Kim JK, Jeong U (2020a) Material aspects of tri-boelectric energy generation and sensors. NPG Asia Mater 12:. https:// doi. org/ 10. 1038/ s41427- 019- 0176-0
Kim WG, Kim DW, Tcho IW et al (2021) Triboelectric nanogenerator: structure, mechanism, and applications. ACS Nano 15:258–287. https:// doi. org/ 10. 1021/ acsna no. 0c098 03
Kim Y, Wu X, Oh JH (2020b) Fabrication of triboelectric nanogenera-tors based on electrospun polyimide nanofibers membrane. Sci Rep 10:1–9. https:// doi. org/ 10. 1038/ s41598- 020- 59546-7
Koh H, Le D, Ng G et al (2018) Advanced recycled polyethylene tere-phthalate aerogels from plastic waste for acoustic and thermal insulation applications. Gels 4:43. https:// doi. org/ 10. 3390/ gels4 020043
La Mantia FP, Vinci M (1994) Recycling poly(ethyleneterephthalate). Polym Degrad Stab 45:121–125. https:// doi. org/ 10. 1016/ 0141- 3910(94) 90187-2
Lau WWY, Shiran Y, Bailey RM et al (2020) Evaluating scenarios toward zero plastic pollution. Science (80- ) 369:1–9. https:// doi. org/ 10. 1126/ SCIEN CE. ABA94 75
Le DK, Leung RIH, Er ASR et al (2019) Applications of functionalized polyethylene terephthalate aerogels from plastic bottle waste. Waste Manag 100:296–305. https:// doi. org/ 10. 1016/j. wasman. 2019. 09. 031
Le DK, Ng GN, Koh HW et al (2020) Methyltrimethoxysilane-coated recycled polyethylene terephthalate aerogels for oil spill cleaning applications. Mater Chem Phys 239:122064. https:// doi. org/ 10. 1016/j. match emphys. 2019. 122064
51265Environmental Science and Pollution Research (2022) 29:51234–51268
1 3
Lebreton L, Andrady A (2019) Future scenarios of global plastic waste generation and disposal. Palgrave Commun 5:1–11. https:// doi. org/ 10. 1057/ s41599- 018- 0212-7
Li A, Zi Y, Guo H et al (2017) Triboelectric nanogenerators for sensi-tive nano-coulomb molecular mass spectrometry. Nat Nanotech-nol 12:481–487. https:// doi. org/ 10. 1038/ nnano. 2017. 17
Li Y, Zhao Z, Gao Y et al (2021) Low-cost, environmentally friendly, and high-performance triboelectric nanogenerator based on a common waste material. ACS Appl Mater Interfaces. https:// doi. org/ 10. 1021/ acsami. 1c091 92
Liu D, Yin X, Guo H et al (2019) A constant current triboelectric nanogenerator arising from electrostatic breakdown. Sci Adv 5:eaav6437. https:// doi. org/ 10. 1126/ sciadv. aav64 37
Liu C, Zhang X, Medda F (2021) Plastic credit: a consortium block-chain-based plastic recyclability system. Waste Manag 121:42–51. https:// doi. org/ 10. 1016/j. wasman. 2020. 11. 045
Lopez D, Chowdhury AR, Abdullah AM et al (2021) Polymer based triboelectric nanogenerator for cost-effective green energy generation and implementation of surface-charge engineer-ing. Energy Technol 2001088:1–9. https:// doi. org/ 10. 1002/ ente. 20200 1088
Mahmud AH (2018) ‘Cannot sell ... so they burn’: What’s next in the uncertain future for plastic waste in Singapore? In: Channel News Asia. https:// www. chann elnew sasia. com/ news/ singa pore/ china- bans- plast ic- waste- whats- next- for- recyc ling- in- singa pore- 10281 026
Mallineni SSK, Behlow H, Dong Y et al (2017) Facile and robust triboelectric nanogenerators assembled using off-the-shelf materials. Nano Energy 35:263–270. https:// doi. org/ 10. 1016/j. nanoen. 2017. 03. 043
Mazzoni L, Janajreh I (2017) Plasma gasification of municipal solid waste with variable content of plastic solid waste for enhanced energy recovery. Int J Hydrogen Energy 42:19446–19457. https:// doi. org/ 10. 1016/j. ijhyd ene. 2017. 06. 069
Mc Loughlin K, Lewis K, Lascelles D, Nudurupati S (2021) Sustain-ability in supply chains: reappraising business process manage-ment. Prod Plan Control 1–34. https:// doi. org/ 10. 1080/ 09537 287. 2021. 18847 64
Mendes AA, Cunha AM, Bernardo CA (2011) Study of the degrada-tion mechanisms of polyethylene during reprocessing. Polym Degrad Stab 96:1125–1133. https:// doi. org/ 10. 1016/j. polym degra dstab. 2011. 02. 015
Meys R, Frick F, Westhues S et al (2020) Towards a circular econ-omy for plastic packaging wastes – the environmental potential of chemical recycling. Resour Conserv Recycl 162:105010. https:// doi. org/ 10. 1016/j. resco nrec. 2020. 105010
Ministry of Environment F and CC (2016a) Solid waste management rules, 2016a_S.O. 1357(E) [08–04–2016a]
Ministry of Environment F and CC (2016b) Gazette of India, Part-II, Section-3, Sub-section (ii)
Ministry of Housing and Urban Affair (2019) Plastic waste manage-ment. India
Ministry of Sustainablility and Environment (2021) Reducing waste and adopting a circular economy approach will benefit the environment and create economic opportunites. https:// www. towar dszer owaste. gov. sg/ circu lar- econo my/
Ministry of the Environment and Water Resources (2019) Zero Waste Masterplan
Mohan M, Min AH (2020) Contamination of recyclables, incorrect recycling among possible factors for Singapore’s low domestic recycling rate: Experts. CNA
Munir MT, Mardon I, Al-Zuhair S et al (2019) Plasma gasification of municipal solid waste for waste-to-value processing. Renew Sustain Energy Rev 116:109461. https:// doi. org/ 10. 1016/j. rser. 2019. 109461
Munir MT, Mohaddespour A, Nasr AT, Carter S (2021) Municipal solid waste-to-energy processing for a circular economy in New Zealand. Renew Sustain Energy Rev 145:111080. https:// doi. org/ 10. 1016/j. rser. 2021. 111080
Nanda S, Berruti F (2021) Municipal solid waste management and landfilling technologies: a review. Environ Chem Lett 19:1433–1456
National Environment Agency (2019) Types of recyclables and recy-cling processes. https:// www. nea. gov. sg/ our- servi ces/ waste- manag ement/ 3r- progr ammes- and- resou rces/ types- of- recyc lables- and- recyc ling- proce sses
National Environment Agency (2020a) Waste management infra-structure. In: Natl. Environ. Agency. https:// www. nea. gov. sg/ our- servi ces/ waste- manag ement/ 3r- progr ammes- and- resou rces/ waste- manag ement- infra struc ture/ solid- waste- manag ement- infra struc ture
National Environment Agency (2020b) Waste-to-energy plants. In: NEA Off. Website
National Environment Agency (2020c) NEA and Shell to jointly explore new chemical recycling value chain to turn plastic waste into chemicals. https:// www. nea. gov. sg/ media/ news/ news/ index/ nea- and- shell- to- joint ly- explo re- new- chemi cal- recyc ling- value- chain- to- turn- plast ic- waste- into- chemi cals
National Environment Agency (2021a) Waste management statistics and overall recycling measures. In: Nea. https:// www. nea. gov. sg/ our- servi ces/ waste- manag ement/ waste- stati stics- and- overa ll- recyc ling
National Environment Agency (2021b) Waste management. https:// www. nea. gov. sg/ our- servi ces/ waste- manag ement/ overv iew
National Environment Agency (2021c) Mandatory waste reporting. https:// www. nea. gov. sg/ our- servi ces/ waste- manag ement/ manda tory- waste- repor ting
National Environment Agency (2022a) Mandatory packaging report-ing. https:// www. nea. gov. sg/ our- servi ces/ waste- manag ement/ manda tory- packa ging- repor ting
National Environment Agency (2022b) National recycling programme. https:// www. nea. gov. sg/ our- servi ces/ waste- manag ement/ 3r- progr ammes- and- resou rces/ natio nal- recyc ling- progr amme
National Environment Agency (2021d) Waste statistics and overall recycling. In: Nea. https:// www. nea. gov. sg/ our- servi ces/ waste- manag ement/ waste- stati stics- and- overa ll- recyc ling
NCL Innovations, CSIR-NCL P (2013) PET Recycling in India: map-ping the recycling landscape. India
NCL Innovations, CSIR-NCL P (2018) Uses of recycled PET – PET recycling in India. http:// www. petre cycli ng. in/ in- the- news/
Nguyen ST, Feng J, Ng SK et al (2014) Advanced thermal insulation and absorption properties of recycled cellulose aerogels. Colloids Surfaces A Physicochem Eng Asp 445:128–134. https:// doi. org/ 10. 1016/j. colsu rfa. 2014. 01. 015
Pani SK, Pathak AA (2021) Managing plastic packaging waste in emerging economies: the case of EPR in India. J Environ Man-age 288:112405. https:// doi. org/ 10. 1016/j. jenvm an. 2021. 112405
Parajuli P, Sharma B, Behlow H, Rao AM (2020) Fullerene-enhanced triboelectric nanogenerators. Adv. Mater Technol 5:1–8. https:// doi. org/ 10. 1002/ admt. 20200 0295
Paria S, Bera R, Karan SK et al (2018) Insight into cigarette wrapper and electroactive polymer based efficient TENG as biomechani-cal energy harvester for smart electronic applications. ACS Appl Energy Mater 1:4963–4975. https:// doi. org/ 10. 1021/ acsaem. 8b009 51
Peng Y, Wang Y, Ke L et al (2022) A review on catalytic pyrolysis of plastic wastes to high-value products. Energy Convers Manag 254:115243. https:// doi. org/ 10. 1016/j. encon man. 2022. 115243
Plasteurope.com (2017) PET recycling. In: Plasteurope. https:// www. plast europe. com/ news/ PET_ RECYC LING_ t2364 41/
51266 Environmental Science and Pollution Research (2022) 29:51234–51268
1 3
Priyadarshini P, Abhilash PC (2020) Circular economy practices within energy and waste management sectors of India: a meta-analysis. Bioresour Technol 304:123018. https:// doi. org/ 10. 1016/j. biort ech. 2020. 123018
Quecholac-Piña X, del Consuelo Hernández-Berriel M, del Consuelo Mañó-Salas M et al (2020) Degradation of plastics under anaero-bic conditions: a short review. Polyme 109(12):109. https:// doi. org/ 10. 3390/ POLYM 12010 109
Rahimi AR, Garciá JM (2017) Chemical recycling of waste plastics for new materials production. Nat Rev Chem 1:1–11. https:// doi. org/ 10. 1038/ s41570- 017- 0046
Rajendran K, Lin R, Wall DM, Murphy JD (2019) Influential aspects in waste management practices. Elsevier B.V.
Ramakrishna S, Pervaiz M, Tjong J et al (2021) Low-carbon materi-als: genesis, thoughts, case study, and perspectives. Circ Econ Sustain. https:// doi. org/ 10. 1007/ s43615- 021- 00135-9
Rapoza K (2020) China doesn’t want the world’s trash anymore. Including ‘recyclable’ goods. In: Forbes. https:// www. forbes. com/ sites/ kenra poza/ 2020/ 11/ 29/ china- doesnt- want- the- worlds- trash- anymo re- inclu ding- recyc lable- goods/? sh= 74f85 4f572 90
Ren E, Neo K, Chin G et al (2021) Life cycle assessment of plastic waste end-of-life for India and Indonesia. Resour Conserv Recycl 174:105774. https:// doi. org/ 10. 1016/j. resco nrec. 2021. 105774
Republic of Singapore Government (2022) Resource sustainability act 2019. Singapore
Rick Leblanc (2020) An overview of plastic recycling. In: Balanc. https:// www. theba lance smb. com/ an- overv iew- of- plast ic- recyc ling- 40187 61# citat ion-2
Roosen M, Mys N, Kusenberg M et al (2020) Detailed analysis of the composition of selected plastic packaging waste products and its implications for mechanical and thermochemical recycling. Environ Sci Technol 54:13282–13293. https:// doi. org/ 10. 1021/ acs. est. 0c033 71
Roy S, Maji PK, Goh KL (2021) Sustainable design of flexible 3D aerogel from waste PET bottle for wastewater treatment to energy harvesting device. Chem Eng J 413:127409. https:// doi. org/ 10. 1016/j. cej. 2020. 127409
Sahu M, Hajra S, Kim H-G et al (2021) Additive manufacturing-based recycling of laboratory waste into energy harvesting device for self-powered applications. Nano Energy 88:106255. https:// doi. org/ 10. 1016/j. nanoen. 2021. 106255
Sandhiya R, Ramakrishna S (2021) Investigating the applicability of blockchain technology and ontology in plastics recycling by the adoption of ZERO plastic model. Mater Circ Econ 3:. https:// doi. org/ 10. 1007/ s42824- 021- 00021-7
Schyns ZOG, Shaver MP (2021) Mechanical recycling of packaging plastics: a review. Macromol Rapid Commun 42:1–27. https:// doi. org/ 10. 1002/ marc. 20200 0415
Sharma BK, Chandel MK (2017) Life cycle assessment of potential municipal solid waste management strategies for Mumbai, India. Waste Manag Res 35:79–91. https:// doi. org/ 10. 1177/ 07342 42X16 675683
Sharma B, Goswami Y, Sharma S, Shekhar S (2021) Inherent road-map of conversion of plastic waste into energy and its life cycle assessment: a frontrunner compendium. Renew Sustain Energy Rev 146:111070. https:// doi. org/ 10. 1016/j. rser. 2021. 111070
Sherwood J (2020) Closed-loop recycling of polymers using solvents: remaking plastics for a circular economy. Johnson Matthey Tech-nol Rev 64:4–15. https:// doi. org/ 10. 1595/ 20565 1319X 15574 75673 6831
Singapore Environment Council (2018) Consumer Plastic and Plastic Resource Ecosystem in Singapore
Singapore Environment Council (2021) One less plastic - overview. https:// sec. org. sg/ one- less- plast ic/ one- less- plast ic- overv iew/
Suresh A, Alagusundaram A, Kumar PS et al (2021) Microwave pyrol-ysis of coal, biomass and plastic waste: a review. Environ Chem Lett. https:// doi. org/ 10. 1007/ s10311- 021- 01245-4
Thai QB, Le DK, Luu TP et al (2019) Aerogels from wastes and their applications aerogels from wastes and their applications. 5:1–5. https:// doi. org/ 10. 19080/ JOJMS. 2019. 05. 555663
The Straits Times (2021) Social cost of plastic from 2019 more than GDP of India. https:// www. strai tstim es. com/ world/ europe/ social- cost- of- plast ic- from- 2019- more- than- gdp- of- india
The World Bank (2020) Data for Singapore, India. https:// data. world bank. org/? locat ions= SG- IN
Tsakona M, Ieva Rucevska (2020) Baseline report on plastic wasteVelenturf APM, Purnell P (2021) Principles for a sustainable circular
economy. Sustain Prod Consum 27:1437–1457. https:// doi. org/ 10. 1016/j. spc. 2021. 02. 018
Vollmer I, Jenks MJF, Roelands MCP et al (2020) Beyond mechanical recycling: giving new life to plastic waste. Angew Chemie - Int Ed 59:15402–15423. https:// doi. org/ 10. 1002/ anie. 20191 5651
Wang S, Lin L, Wang ZL (2012) Nanoscale triboelectric-effect-enabled energy conversion for sustainably powering portable electron-ics. Nano Lett 12:6339–6346. https:// doi. org/ 10. 1021/ nl303 573d
Wang J, Wu C, Dai Y et al (2017a) Achieving ultrahigh triboelec-tric charge density for efficient energy harvesting. Nat Commun 8:1–7. https:// doi. org/ 10. 1038/ s41467- 017- 00131-4
Wang Y, Yang Y, Wang ZL (2017) Triboelectric nanogenerators as flexible power sources. NPJ Flex Electron 1:1–9. https:// doi. org/ 10. 1038/ s41528- 017- 0007-8
Wang X, Chen X, Iwamoto M (2020) Recent progress in the devel-opment of portable high voltage source based on triboelectric nanogenerator. Smart Mater Med 1:66–76. https:// doi. org/ 10. 1016/j. smaim. 2020. 07. 002
Woidasky J, Sander I, Schau A, et al (2020) Inorganic fluorescent marker materials for identification of post-consumer plastic pack-aging. Resour Conserv Recycl 161:. https:// doi. org/ 10. 1016/j. resco nrec. 2020. 104976
Worldometers GDP per Capita. In: Worldometer. https:// www. world omete rs. info/ gdp/ gdp- per- capita/
Xia K, Zhu Z, Fu J et al (2019) A triboelectric nanogenerator based on waste tea leaves and packaging bags for powering electronic office supplies and behavior monitoring. Nano Energy 60:61–71. https:// doi. org/ 10. 1016/j. nanoen. 2019. 03. 050
Yang Boon Q (2021) Tracetogether token. SingaporeYang Z, Lü F, Zhang H et al (2021) Is incineration the terminator of
plastics and microplastics? J Hazard Mater 401:123429. https:// doi. org/ 10. 1016/j. jhazm at. 2020. 123429
Yansaneh OY, Zein SH (2022) Recent advances on waste plastic ther-mal pyrolysis: a critical overview. Processes 10:. https:// doi. org/ 10. 3390/ pr100 20332
You A, Zhang X, Peng X et al (2021) A skin-inspired triboelectric nanogenerator with an interpenetrating structure for motion sens-ing and energy harvesting. Macromol Mater Eng 2100147:1–9. https:// doi. org/ 10. 1002/ mame. 20210 0147
Yu A, Zhu Y, Wang W, Zhai J (2019) Progress in triboelectric materi-als: toward high performance and widespread applications. Adv Funct Mater 29:1–27. https:// doi. org/ 10. 1002/ adfm. 20190 0098
Zhang Y, Chen P, Liu S et al (2017) Effects of feedstock characteristics on microwave-assisted pyrolysis – a review. Bioresour Technol 230:143–151. https:// doi. org/ 10. 1016/j. biort ech. 2017. 01. 046
Zhang F, Zhao Y, Wang D et al (2021) Current technologies for plastic waste treatment: a review. J Clean Prod 282:124523. https:// doi. org/ 10. 1016/j. jclep ro. 2020. 124523
51267Environmental Science and Pollution Research (2022) 29:51234–51268
1 3
Zhao X, Korey M, Li K et al (2022) Plastic waste upcycling toward a circular economy. Chem Eng J 428:131928. https:// doi. org/ 10. 1016/j. cej. 2021. 131928
Zi Y, Wang J, Wang S et al (2016) Effective energy storage from a triboelectric nanogenerator. Nat Commun 7:1–8. https:// doi. org/ 10. 1038/ ncomm s10987
Zou Y, Xu J, Chen K, Chen J (2021) Advances in nanostructures for high-performance triboelectric nanogenerators. Adv Mater Tech-nol 6:1–16. https:// doi. org/ 10. 1002/ admt. 20200 0916
Publisher's note Springer Nature remains neutral with regard to jurisdictional claims in published maps and institutional affiliations.
51268 Environmental Science and Pollution Research (2022) 29:51234–51268
1 3