rnai screening reveals proteasome- and cullin3-dependent stages in vaccinia virus infection
TRANSCRIPT

Please cite this article in press as: Mercer et al., RNAi Screening Reveals Proteasome- and Cullin3-Dependent Stages in Vaccinia Virus Infection, CellReports (2012), http://dx.doi.org/10.1016/j.celrep.2012.09.003
Cell Reports
Resource
RNAi Screening Reveals Proteasome- andCullin3-Dependent Stages in Vaccinia Virus InfectionJason Mercer,1,5 Berend Snijder,3,5 Raphael Sacher,2 Christine Burkard,1 Christopher Karl Ernst Bleck,4
Henning Stahlberg,4 Lucas Pelkmans,3,* and Ari Helenius1,*1Institute of Biochemistry2Institute of Molecular Systems Biology
ETH Zurich, 8093 Zurich, Switzerland3Institute of Molecular Life Sciences, University of Zurich, 8057 Zurich, Switzerland4Center for Cellular Imaging and NanoAnalytics (C-CINA), Structural Biology and Biophysics, University Basel, Biozentrum, 4058 Basel,
Switzerland5These authors contributed equally to this work*Correspondence: [email protected] (L.P.), [email protected] (A.H.)
http://dx.doi.org/10.1016/j.celrep.2012.09.003
SUMMARY
A two-step, automated, high-throughput RNAisilencing screen was used to identify host cellfactors required during vaccinia virus infection.Validation and analysis of clustered hits revealedpreviously unknown processes during virus entry,including a mechanism for genome uncoating. Viralcore proteins were found to be already ubiquiti-nated during virus assembly. After entering thecytosol of an uninfected cell, the viral DNA wasreleased from the core through the activity of thecell’s proteasomes. Next, a Cullin3-based ubiquitinligase mediated a further round of ubiquitinationand proteasome action. This was needed in orderto initiate viral DNA replication. The results accen-tuate the value of large-scale RNAi screens inproviding directions for detailed cell biological in-vestigation of complex pathways. The list of cellfunctions required during poxvirus infection will,moreover, provide a resource for future virus-hostcell interaction studies and for the discovery ofantivirals.
INTRODUCTION
Poxviruses are enveloped DNA viruses characterized by their
large size, intricate structure, and a complex cytoplasmic repli-
cation cycle (Moss et al., 2007). Vaccinia virus (VACV), the
prototypic poxvirus used in this study, served as a vaccine
during the eradication of smallpox, one of the most devas-
tating diseases of the 20th century (Moss et al., 2007). The
potential deployment of the smallpox virus as a biological
weapon, risks associated with resumed vaccination, and recent
monkeypox outbreaks warrant continued research toward new
antipoxvirus agents (Di Giulio and Eckburg, 2004; Harrison
et al., 2004).
The VACV lifecycle begins with macropinocytic internalization
of the virus into host cells (Huang et al., 2008; Mercer and Helen-
ius, 2008). This is followed by low pH-dependent membrane
fusion to release the viral core into the cytosol (Townsley et al.,
2006). Postpenetration steps include loss of core-associated
lateral bodies, core expansion, and transcription of early viral
genes within the expanded core (Dales, 1963; Kates and Bee-
son, 1970; Moss, 1990; Pedersen et al., 2000). Early messenger
RNAs (mRNAs) generate about 100 different viral proteins,
including unidentified factors required for DNA uncoating (Joklik,
1964b; Magee and Miller, 1968). During the subsequent
uncoating process, cores disappear as visible structures, the
viral DNA is released and replicated, intermediate and late genes
are expressed, and cytosolic virus factories are formed. While
many of the cellular factors and functions required for initial entry
have been described (Huang et al., 2008; Laliberte et al., 2011;
Mercer and Helenius, 2008; Schmidt et al., 2012; Townsley
et al., 2006), the cellular factors that participate in viral genome
uncoating remain largely undefined.
In the last few years, large-scale RNAi screening has become
a powerful tool for the analysis of pathogen-host interactions.
This approach has been previously applied to a variety of
pathogens (reviewed in Cherry, 2009). For VACV, a Drosophila
kinome screen was used to identify and describe a role for
AMP-activated protein kinase (AMPK) during infection (Moser
et al., 2010).
Our goal was to elucidate the host factors in human tissue
culture cells needed in the VACV life cycle. Using a large-
scale RNAi screen, we identified critical cellular processes that
the virus exploits during infection. By focusing our validation
studies on protein clusters involved in ubiquitin-mediated
proteasome degradation, which has been previously implicated
in poxvirus DNA replication (Satheshkumar et al., 2009;
Teale et al., 2009), we uncovered additional roles for protea-
somes and ubiquitination in virus assembly and genome
uncoating. In addition, we identified a Cullin3-based ubiquitin
ligase, as required for VACV genome replication. Ultimately,
this information could facilitate the development of novel
antiviral agents that would target the host rather than the virus
directly.
Cell Reports 2, 1–12, October 25, 2012 ª2012 The Authors 1

A
B
CYTOPLASM
EXTRACELLULAR SPACE
NUCLEUS
NUP98
NUP62
KPNB1 KPNA2
NUP153
LBR TXN2
TCF7L2
GTPBP4 WTAP
LAMA1
IL26
LAMC2
SELPLG
DDX48
SNRPD3
SNRPA1
PRPF31
NARG1
HTATIP TCF1
PA2G4
NEK11 CAD RPA1
FHL2
ETS2
NFATC3
ESRRA
POLE
POLL
POLR2C
POLA
SNRP70
XAB2
KIF17
VN1R1
PFN1
TNFRSF13C
IL1RAPL1
IL17RE
IL17RA
PAK1
MS4A7
SLC35B2
LCK
RAC1
ATP6V1B2
RACGAP1
EGFR
HCK
FES
GP1BARXFP4
CXCL13
XCL1
FPR1
CCL21
SUCNR1
P2RY1
KCNF1
GPR20HTR4HTR3A
TRAR3
PEAK1
OR2H2
GPR132
OR4D1
RAB34
LYST COPB2
NACA
RPL7A RPL27
RPL36 RPL38
TAOK3
WNK4
WNK1
PLIN3
RIPK3 MAST4
SGK2
TRPC3
PPP2R1A
LATS2 MAP3K7IP1
HES5
HK1
PIK4CB
MAOB
TESSP1
TMPRSS9
PSMA6
FRAP1
PRKAR1B
PRKAR1A
PSMC4
CUL3
RBX1
USP11
HCRTR2 TUBB3OGFR
GPR73 GPR83
NEU1
SLC40A1
CCT4
PTPN23
PSMB4
PSMD7
PSMA3PSMB3
PSMD2
PSMA1
PSMC3
BUB1B
MAFK
PSMC5
TSG101
HRKFASTK
NGFRAP1 DPF1
MYLIP
STR
ING
inte
ract
ion
scor
e
0.35
0.68
1
SPLICEOSOME
NUCLEAR LUMENDNA REPLICATION
POSITIVEREGULATION OFTRANSCRIPTION
RNASPLICING
REGULATION OF ACTIN CYTOSKELETON
INTEGRAL TO MEMBRANE
TYROSINEPROTEIN
KINASE
CHEMOTAXISION CHANNELACTIVITY GPCR
PROTEIN TRANSPORT
RIBOSOME
SERINE/THREONINE-PROTEIN KINASE
PROTEIN KINASE, C-TERMINAL
INDUCTION OF APOPTOSIS
REGULATION OF KINASE ACTIVITY
MITOCHONDRION OUTER MEMBRANE
PEPTIDASEACTIVITY
PROTEASOMEUBIQUITIN-DEPENDENT PROTEIN CATABOLIC PROCESS
PEPTIDE RECEPTOR ACTIVITY
VESICLE
(REGULATION OF)CELL MIGRATION
NUCLEAR PORE
PROTEIN MODIFICATIONBY SMALL PROTEIN
CONJUGATION
CHEMOKINE ACTIVITY
Seco
ndar
y sc
reen
& an
alys
is 276 genes (Ambion)
Analysis as before
3 siRNAs / gene, screened 3x
DAPI~200
GFP Features
Anal
ysis Automated fluorescence imaging
9 images per well, 550•106 cellsAutomated image analysisSupervised machine learning
Data
inte
grat
ion
Interactionnetwork
Functionalannotations
210 xPrim
ary
scre
en 7,000 genes (Qiagen)3 siRNAs / gene, screened 3xReverse transfection of siRNAs (72h)Infection with VACV-EGFP-MV (8h)
ABC
J
LMNO
ED
IHGF
K
P
1 232221201918171615141312111098765432 24
grei
ner
ABC
J
LMNO
ED
IHGF
K
P
1 232221201918171615141312111098765432 24
grei
ner
ABC
J
LMNO
ED
IHGF
K
P
1 232221201918171615141312111098765432 24
grei
ner 12 x
ABC
J
LMNO
ED
IHGF
K
P
1 232221201918171615141312111098765432 24
grei
ner
ABC
J
LMNO
ED
IHGF
K
P
1 232221201918171615141312111098765432 24
grei
ner
ABC
J
LMNO
ED
IHGF
K
P
1 232221201918171615141312111098765432 24
grei
ner
FUNCTIONAL MODULES188 CONFIRMED ‘HITS’276 PRELIMINARY ‘HITS’
2 Cell Reports 2, 1–12, October 25, 2012 ª2012 The Authors
Please cite this article in press as: Mercer et al., RNAi Screening Reveals Proteasome- and Cullin3-Dependent Stages in Vaccinia Virus Infection, CellReports (2012), http://dx.doi.org/10.1016/j.celrep.2012.09.003
Please cite this article in press as: Mercer et al., RNAi Screening Reveals Proteasome- and Cullin3-Dependent Stages in Vaccinia Virus Infection, CellReports (2012), http://dx.doi.org/10.1016/j.celrep.2012.09.003
RESULTS
RNAi Screening Identifies 188 Cellular Factors Requiredfor VACV InfectionWe used an automated, high-content, high-throughput RNAi
screen in human tissue culture cells (HeLa) to identify host cell
factors and processes required during the VACV life cycle. Using
the mature virion (MV) form of a recombinant VACV that
expresses enhanced green fluorescent protein (EGFP) under
a synthetic early/late viral promoter (VACV-EGFP) (Mercer and
Helenius, 2008), we could readily distinguish infected from
noninfected cells based on EGFP expression 8 hr postinfection
(hpi). Automated fluorescence microscopy and image analysis
was employed to score for cell factors required during the repli-
cation cycle, up to and including translation of late viral genes,
without distinguishing between early and late defects.
To avoid some of the pitfalls encountered in previous virus
infection screens (Cherry, 2009; Mohr et al., 2010), we chose
to screen a set of 7,000 genes selected for their potential to be
inhibited by small compounds (the 7,000 druggable genome
library; QIAGEN). Although covering only one-third of human
genes, these represent a well-studied and well-annotated
cross-section of the full genome, and for these factors, inhibitors
and other reagents are more readily available for follow-up
studies. In addition, we improved image analysis, hit visualiza-
tion, and hit validation (Extended Experimental Procedures;
Figure S1; Bray et al., 2012; Snijder et al., 2012).
To increase reliability, we introduced a fully automated
computational pipeline for high-content image analysis
(Carpenter et al., 2006; Snijder et al., 2009). Over 200 quantitative
features were extracted from each of 624 million individual cells
from 1.45 million images (Carpenter et al., 2006). Using these
features as a basis, several iterations of supervised machine
learning were applied to identify virus infection, mitosis,
apoptosis, and technical phenotypes (Ramo et al., 2009; Snijder
et al., 2009) (see Extended Experimental Procedures for details).
Cell number and density (population-context) effects were
normalized to improve both reproducibility of screening results
in different cell lines and consistency of phenotypes obtained
by different small interfering RNAs (siRNAs) targeting the same
gene (Snijder et al., 2012).
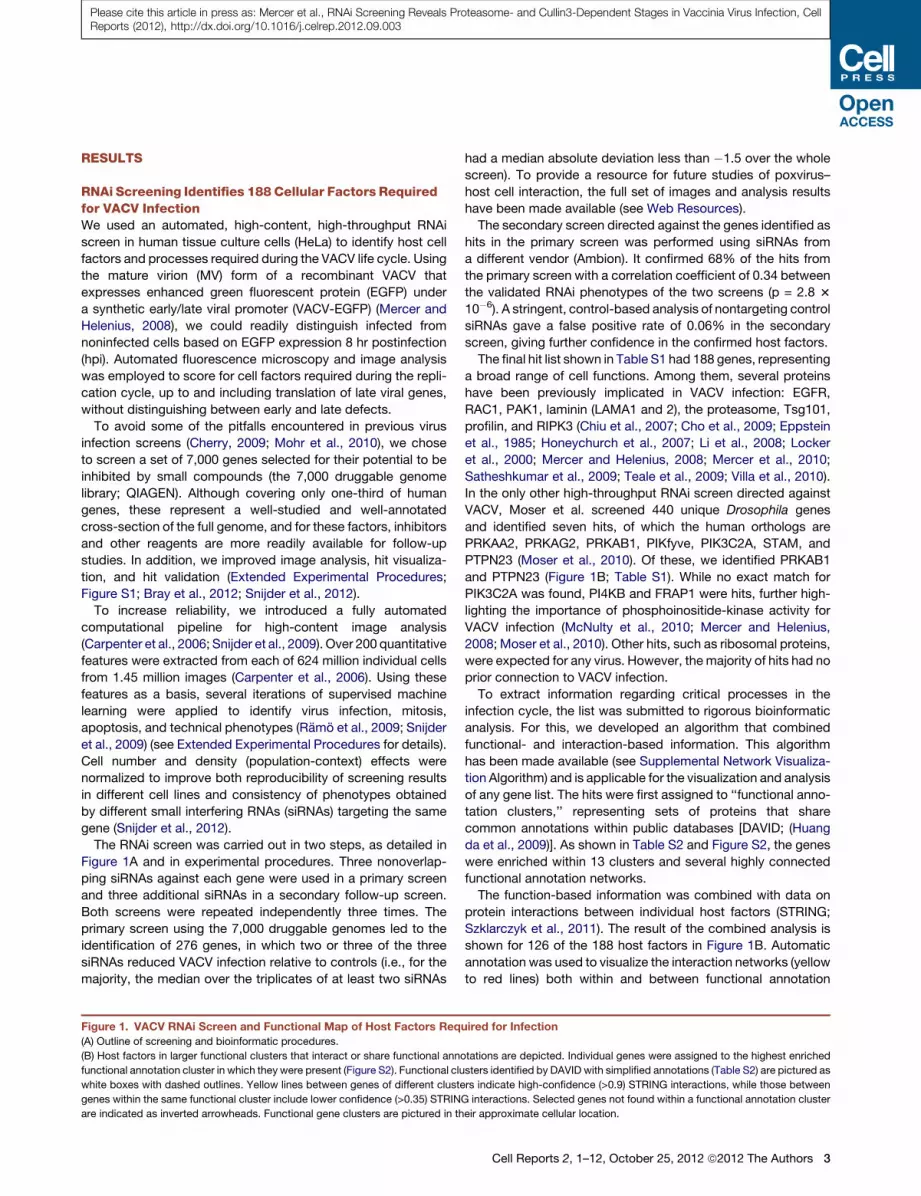
The RNAi screen was carried out in two steps, as detailed in
Figure 1A and in experimental procedures. Three nonoverlap-
ping siRNAs against each gene were used in a primary screen
and three additional siRNAs in a secondary follow-up screen.
Both screens were repeated independently three times. The
primary screen using the 7,000 druggable genomes led to the
identification of 276 genes, in which two or three of the three
siRNAs reduced VACV infection relative to controls (i.e., for the
majority, the median over the triplicates of at least two siRNAs
Figure 1. VACV RNAi Screen and Functional Map of Host Factors Req
(A) Outline of screening and bioinformatic procedures.
(B) Host factors in larger functional clusters that interact or share functional ann
functional annotation cluster in which they were present (Figure S2). Functional clu
white boxes with dashed outlines. Yellow lines between genes of different cluste
genes within the same functional cluster include lower confidence (>0.35) STRIN
are indicated as inverted arrowheads. Functional gene clusters are pictured in th
had a median absolute deviation less than �1.5 over the whole
screen). To provide a resource for future studies of poxvirus–
host cell interaction, the full set of images and analysis results
have been made available (see Web Resources).
The secondary screen directed against the genes identified as
hits in the primary screen was performed using siRNAs from
a different vendor (Ambion). It confirmed 68% of the hits from
the primary screen with a correlation coefficient of 0.34 between
the validated RNAi phenotypes of the two screens (p = 2.8 3
10�6). A stringent, control-based analysis of nontargeting control
siRNAs gave a false positive rate of 0.06% in the secondary
screen, giving further confidence in the confirmed host factors.
The final hit list shown in Table S1 had 188 genes, representing
a broad range of cell functions. Among them, several proteins
have been previously implicated in VACV infection: EGFR,
RAC1, PAK1, laminin (LAMA1 and 2), the proteasome, Tsg101,
profilin, and RIPK3 (Chiu et al., 2007; Cho et al., 2009; Eppstein
et al., 1985; Honeychurch et al., 2007; Li et al., 2008; Locker
et al., 2000; Mercer and Helenius, 2008; Mercer et al., 2010;
Satheshkumar et al., 2009; Teale et al., 2009; Villa et al., 2010).
In the only other high-throughput RNAi screen directed against
VACV, Moser et al. screened 440 unique Drosophila genes
and identified seven hits, of which the human orthologs are
PRKAA2, PRKAG2, PRKAB1, PIKfyve, PIK3C2A, STAM, and
PTPN23 (Moser et al., 2010). Of these, we identified PRKAB1
and PTPN23 (Figure 1B; Table S1). While no exact match for
PIK3C2A was found, PI4KB and FRAP1 were hits, further high-
lighting the importance of phosphoinositide-kinase activity for
VACV infection (McNulty et al., 2010; Mercer and Helenius,
2008; Moser et al., 2010). Other hits, such as ribosomal proteins,
were expected for any virus. However, themajority of hits had no
prior connection to VACV infection.
To extract information regarding critical processes in the
infection cycle, the list was submitted to rigorous bioinformatic
analysis. For this, we developed an algorithm that combined
functional- and interaction-based information. This algorithm
has been made available (see Supplemental Network Visualiza-
tion Algorithm) and is applicable for the visualization and analysis
of any gene list. The hits were first assigned to ‘‘functional anno-
tation clusters,’’ representing sets of proteins that share
common annotations within public databases [DAVID; (Huang
da et al., 2009)]. As shown in Table S2 and Figure S2, the genes
were enriched within 13 clusters and several highly connected
functional annotation networks.
The function-based information was combined with data on
protein interactions between individual host factors (STRING;
Szklarczyk et al., 2011). The result of the combined analysis is
shown for 126 of the 188 host factors in Figure 1B. Automatic
annotation was used to visualize the interaction networks (yellow
to red lines) both within and between functional annotation
uired for Infection
otations are depicted. Individual genes were assigned to the highest enriched
sters identified by DAVID with simplified annotations (Table S2) are pictured as
rs indicate high-confidence (>0.9) STRING interactions, while those between
G interactions. Selected genes not found within a functional annotation cluster
eir approximate cellular location.
Cell Reports 2, 1–12, October 25, 2012 ª2012 The Authors 3

Figure 2. Proteasome but not E1-Activating Enzyme Function Is Required for VACV Genome Uncoating
(A) RNAi-mediated silencing of proteasome subunits PSMA1 and PSMB3 impair VACV infection. Representative images from the screen are displayed with nuclei
in red and infected cells in green.
(B) Proteasome (MG132) and E1-activating enzyme (UBEI-41) inhibitors block VACV production (MOI 1; 24 hpi; 10 mM AraC, 10 mg/ml CHX, 25 mMMG132, and
50 mM UBEI-41 used throughout).
(C) MG132 and UBEI-41 allow for early but not late VACV gene expression. Cells were infected with VACV (MOI 1), expressing EGFP from either an early (Early) or
a late (Late) promoter. Infectionswere performed in the presence of the indicated inhibitors. Cells were harvested 6 hpi and analyzed for the number of early or late
EGFP-expressing cells, respectively. Cells infected in the presence of CHX or AraC were used as controls.
(D) MG132 and UBEI-41 inhibit VACV infection after internalization. VACV-EGFP MVs (MOI 1) were bound to cells for 1 hr in the presence of inhibitors. Cells were
then washed, treated with pH 7.4 or pH 5.0 media for 5 min, washed, and media containing the inhibitors added back. Cells were analyzed by flow cytometry for
EGFP at 6 hpi.
4 Cell Reports 2, 1–12, October 25, 2012 ª2012 The Authors
Please cite this article in press as: Mercer et al., RNAi Screening Reveals Proteasome- and Cullin3-Dependent Stages in Vaccinia Virus Infection, CellReports (2012), http://dx.doi.org/10.1016/j.celrep.2012.09.003

Please cite this article in press as: Mercer et al., RNAi Screening Reveals Proteasome- and Cullin3-Dependent Stages in Vaccinia Virus Infection, CellReports (2012), http://dx.doi.org/10.1016/j.celrep.2012.09.003
clusters (gray dashed boxes). Without going into detail, it was
evident that, although replication and assembly of progeny virus
occurs in the cytoplasm of host cells, VACV depends on cyto-
plasmic as well as nuclear factors. Since the nucleus and its
many functions, such as splicing and nuclear pore complex
function, have been largely ignored with regard to the infectious
lifecycle of poxviruses, these findings are likely to open new
avenues in VACV research. The cytoplasmic functions included
membrane trafficking, signaling, proteolysis, and ion transport.
Factors in the tyrosine kinase and actin clusters have already
been shown to be necessary for phosphatidylserine-mediated
macropinocytosis of the virus during entry (Mercer and Helenius,
2008; Mercer et al., 2010).
VACV Core Breakdown Requires Proteasome Activity,but Is Independent of New UbiquitinationIn the follow-up, we focused on two prominent clusters: the pro-
teasome and ubiquitination (Figure 1B). Both have been previ-
ously implicated in VACV genome replication (Satheshkumar
et al., 2009; Teale et al., 2009). SiRNA-mediated depletion of
proteasome subunits caused a nearly complete block in late viral
gene expression (Figure 2A). For confirmation, we determined
the virus yield in the presence of MG132, a proteasome inhibitor,
and UBEI-41, an inhibitor of the cellular E1 ubiquitin-conjugating
enzyme UBA1. Both decreased viral yield by �3 logs, similar to
cycloheximide (CHX), a protein synthesis inhibitor (Figure 2B).
When infection with VACV strains that express EGFP specifically
from an early (E-EGFP-VACV) or a late (L-EGFP-VACV) promoter
was analyzed by flow cytometry, we found that the inhibitors
blocked late but not early viral gene expression (Figure 2C).
This suggested that early steps in the virus lifecycle, such as
virus binding and endocytosis, were not impacted by these
inhibitors. To confirm this, we tested whether the effects of
MG132 and UBEI-41 could be circumvented by forcing fusion
of virions at the plasma membrane with low pH. This treatment
results in deposition of viral cores into the cytoplasm, effectively
bypassing the need for endocytosis (Mercer and Helenius,
2008). Consistent with a postpenetration block, the inhibitors
could not be bypassed upon low pH treatment (Figure 2D). Viral
yield, late gene expression, and inhibition after bypass were also
affected when using the more specific proteasome inhibitor,
Velcade (Figure S3). Thus, as reported by Teale et al. and
Satheshkumar et al. (Satheshkumar et al., 2009; Teale et al.,
2009), we found that proteasomes and UBA1 had no role in virus
endocytosis and penetration.
Next, we addressed genome uncoating. The efficient release
of viral DNA from internalized cores is of interest because
poxvirus particles and cores are extremely stable when exposed
to desiccation, denaturants, proteases, extremes of tempera-
(E) VACV core degradation is proteasome-, but not E1-activating enzyme-depen
MG132, or UBEI-41. At 4 hpi, cells were fixed and intact virions identified by immu
intact virions aremarked by closed arrowheads and free green cytoplasmic cores
number of cores per cell under each condition displayed as mean ± SEM (right)
(F) Electron microscopy (EM) shows that MG132 and UBEI-41 inhibit distinct stag
EM. Intact viral cores are indicated by arrowheads. Blowup of virion (MG132) ind
500 nm. All experiments have been performed in triplicate and displayed as the
See also Figures S3, S4, S5, and S6.
ture, etc. (Essbauer et al., 2007; MacCallum and McDonald,
1957; Malkin et al., 2003).
Using a microscopy-based core stabilization assay that relied
on immunofluorescence staining of released cores, Satheshku-
mar and coworkers reported that inhibition of proteasome
activity had only a minor impact on genome uncoating (Sathesh-
kumar et al., 2009). Although over a 2-fold increase in core stabi-
lization was observed in the presence of MG132, they concluded
that inhibition of proteasome activity may delay or reduce
uncoating, but the effect was not sufficient to account for the
reduction in infectivity.
In light of these previous findings and the observation that
VACV cores are rapidly and efficiently disassembled during
entry into a new host cell (Joklik, 1964b; Magee and Miller,
1968), we found it conceivable that proteasome-directed core
degradation was directly connected to DNA release. To further
investigate this possibility, we followed the fate of individual
viruses and cores by fluorescence microscopy using a virus in
which the core protein A5 was tagged with EGFP (Mercer and
Helenius, 2008) and by immunofluorescence staining of the
viral membrane protein L1 (Schmidt et al., 2011). HeLa cells
were incubated at a multiplicity of infection (MOI) of 10 for 4 hr,
a time sufficient for virions to enter and undergo genome
uncoating. Intact virions that still contained the viral membrane
were yellow (closed arrowheads), and internalized, released
viral cores devoid of membrane were green (open arrowheads).
When the cores in control cells were quantified (Figure S4),
few were observed (25–50/cell; green) (Figure 2E; untreated
[UNTR]). However, in the presence of CHX, which prevents
core breakdown and genome uncoating (Joklik, 1964b), intact
cytoplasmic cores numbered 275–320 per cell (Figure 2E;
CHX). The same was observed when the proteasome was
inhibited with MG132 (250–300/cell) (Figure 2E; MG132). UBEI-
41 had virtually no impact on core breakdown (50–60 cores/
cell) (Figure 2E; UBEI-41). This suggested that protein synthesis
and the proteasome were needed for uncoating, but UBA1
was not.
When the state of cytoplasmic cores after entry in the pres-
ence of MG132 was investigated using electron microscopy,
we could confirm that viral cores remained intact (Figure 2F,
MG132; Figure S5). While core expansion occurred (Figure S6),
it was evident that the genome (i.e., the electron dense material
within the cores) was not released (Figure 2F; blow-up). Electron
microscopy also showed that, while UBEI-41 did not inhibit core
breakdown, it prevented formation of viral DNA replication
factories (Figure 2F; UBEI-41). This was consistent with previous
reports that ubiquitination is needed for DNA replication (Sa-
theshkumar et al., 2009; Teale et al., 2009). Taken together, the
results suggested, somewhat paradoxically, that proteasomes
dent. Cells were infected with WR-EGFP-A5 (MOI 10) in the presence of CHX,
nofluorescence against the viral membrane protein L1R. Representative yellow
by open arrowheads. Experimentswere performed in triplicate, and the average
(Figure S4). Scale bars, 10 mm.
es of the VACV lifecycle. Cells treated as in (F) (MOI 10; 4 hpi) were analyzed by
icates that the electron dense viral genome is still within the core. Scale bars,
mean ± SD (B)–(D) or representative images displayed (A), (E), and (F).
Cell Reports 2, 1–12, October 25, 2012 ª2012 The Authors 5

Figure 3. Polyubiquitination of VACV Cores
Facilitates Their Degradation and Subse-
quent Genome Uncoating
(A) MG132 prevents VACV genome release, and
UBEI-41 blocks viral DNA replication. Cells were
infected (MOI 10) in the absence of inhibitors
(UNTR) or in the presence of MG132 or UBEI-41.
Cells were fixed at 4 hpi and immunofluorescence
against the viral DNA binding protein, I3, per-
formed, followed by staining of nuclei with Draq5.
In all images, nuclei are colored red and I3 staining
is in green. Cells treated with CHX, which prevents
genome release, or AraC, which allows for release
of parental genomes, but not their replication,
served as controls for the assay. Scale bars,
10 mm. The number of cells positive for parental
DNA staining (I3 spot formation) under each
condition is displayed as the mean ± SD (right).
(B) VACV core proteins are packaged in a poly-
ubiquitinated state. Immunoblots directed against
total (mono and poly) ubiquitin were performed on
1.0, 2.5, and 5.0 mg of purified VACV MVs (left), on
2.5 mg of whole (W) VACV MVs, or MVs separated
into core (C) andmembrane (M) fractions (right). As
a control for the detection of ubiquitin, 100 mg of
cell lysate (Cells) was used. Experiments were
performed in triplicate and representative blots
shown.
(C) Viral core proteins are positive for K48-, but
not K63-linked ubiquitin chains. Immunoblots
directed against K48- or K63-specific ubiquitin
chains were performed on whole (W), core (C), and
membrane (M) fractions of VACV MVs. One
hundred micrograms of cell lysate was used as
a control for each antibody (Cells).
(D) Late addition of MG132 or UBEI-41 does not
impede late viral gene expression. Cells were
infected (MOI 1) with VACV-EGFP-LATE. Either
10 mM AraC or 50 mM UBEI-41 were added at the
indicated times. Infection was allowed to proceed
for a total of 12 hr before cells were harvested and
analyzed by flow cytometry for EGFP expression.
Values are displayed as the percentage of cells
expressing late genes relative to untreated in-
fected control cells at 12 hpi.
(E) Inhibition of E1-ligase function at 6 hpi impedes
production of infectious virus. Cells were infected
with VACV MVs (MOI 1) and AraC or UBEI-41
added at either the time of infection (0) or after
6 hr (6). Cells were harvested 24 hpi, and the
progeny virus was purified by banding (Figure S8), followed by titration for plaque-forming units/ml. (A)–(C) Experiments were performed in triplicate and
representative images shown. (D) and (E) Experiments were performed in triplicate and displayed as the mean ± SD.
See also Figures S7 and S8.
Please cite this article in press as: Mercer et al., RNAi Screening Reveals Proteasome- and Cullin3-Dependent Stages in Vaccinia Virus Infection, CellReports (2012), http://dx.doi.org/10.1016/j.celrep.2012.09.003
were needed for breakdown of the core, whereas ubiquitination,
which normally serves to prepare substrates for degradation,
was required for a subsequent step, one preceding DNA
replication.
The microscopy-based uncoating assays used by Satheshku-
mar and coworkers and here by us rely on core destabilization as
an indicator of genome uncoating. However, the release of
parental genomes from incoming viral cores is not analyzed.
Thus, it was possible that the viral DNA was released from viral
cores in the presence of MG132, but the cores themselves
were not degraded in the absence of proteasome activity. To
6 Cell Reports 2, 1–12, October 25, 2012 ª2012 The Authors
directly monitor release of incoming viral DNA as a consequence
of core breakdown, we used immunofluorescence staining for
the viral protein I3L that is bound to the viral DNA (Welsch
et al., 2003). That antibodies directed against this protein can
be used to detect uncoated parental VACV DNA in the absence
of viral replication has been demonstrated (Domi and Beaud,
2000; Welsch et al., 2003). While unable to access the antigen
in intact cores (Figure S7), antibodies to I3L stained cytoplasmic
viral DNA after release from incoming cores (Figure 3A). Later in
infection, it also stained the I3L complexed with viral DNA in
the large perinuclear virus factories. When control cells were

Please cite this article in press as: Mercer et al., RNAi Screening Reveals Proteasome- and Cullin3-Dependent Stages in Vaccinia Virus Infection, CellReports (2012), http://dx.doi.org/10.1016/j.celrep.2012.09.003
infected for 4 hr at a MOI of 10 and the viral DNA visualized by
anti-I3L, replication factories and cytoplasmic I3 staining were
seen (green) (Figure 3A; UNTR). With CHX present to prevent
early gene expression and genome release, only 5% of cells
had I3L-positive spots in the cytoplasm. In the presence of
cytosine arabinoside (AraC), an inhibitor of viral DNA replication,
78% of cells contained cytoplasmic I3L spots, indicating that
incoming viral DNA had been released, but not replicated. Cells
infected in the presence of MG132 were positive for diffuse cyto-
plasmic I3L staining, but did not contain I3L-positive viral DNA
spots. This showed that, even though expression of I3L (an early
protein) had occurred, viral genomes had not been released
(Figure 3A; MG132). In contrast, UBEI-41-treated cells displayed
diffuse cytoplasmic I3L staining and I3L-positive spots, as seen
in AraC-treated cells, confirming that viral genomes were
released but not replicated. Collectively, these results showed
that the proteasome and UBA1 acted in distinct steps in the early
infection cycle: proteasomes in core breakdown and DNA
release and UBA1 (and thus ubiquitination) in replication of
released viral DNA.
VACV Core Proteins Are Packaged in a K48-Ubiquitinated State to Mediate Proteasome-DependentGenome UncoatingThat core degradation was not dependent on UBA1 suggested
that ubiquitin must have been added to core proteins prior to
virus entry. Proteomic analysis of isolated VACV virions has indi-
cated that ubiquitin accounts for 1–3 mole percent of total
protein (Chung et al., 2006). However, the location of this ubiqui-
tin within the viral particle and the potential role of this host
protein in the virus lifecycle have not been investigated.
Immunoblot analysis on highly purified VACV virions
confirmed that they contained a striking amount of ubiquitin (Fig-
ure 3B, left). The molecular weight of the detected bands indi-
cated that these were ubiquitin-conjugated proteins and not
free ubiquitin. To assess the location of the ubiquitin-conjugated
proteins, virions were separated into membrane and core frac-
tions (Mercer and Traktman, 2003). Immunoblot analysis on
these fractions indicated that the vast majority of the ubiquiti-
nated factors were components of the viral core (Figure 3B,
right). Using lysine-48- and lysine-63-linked polyubiquitin
specific antibodies, we showed that only lysine-48-linked ubiqui-
tinated proteins were present (Figure 3C). Since lysine-48-linked
ubiquitin chains mark proteins for proteasomal degradation
(Clague and Urbe, 2010; Komander, 2009), it was evident that
this was the mechanism that triggered proteasome-mediated
genome uncoating.
Since ubiquitination of core proteins must occur during virion
production in infected cells, we asked whether infectious virus
could be produced if ubiquitination was inhibited late in infection.
Addition of AraC at 6 hr had little effect on late viral gene expres-
sion (Figure 3D, white) and only marginally reduced the 24 hr
virus yield (Figure 3E, white). As late genes are expressed from
newly replicated genomes, this indicated that, by 6 hpi, viral
DNA replication and late gene expression was sufficient for
significant virus production. When UBEI-41 was added at
6 hpi, again there was no impact on late viral gene expression
(Figure 3D, gray). However, unlike AraC, which had little effect
on virus yield, addition of UBEI-41 after 6 hr prevented the
production of infectious virus (Figure 3E, gray). We were, in
fact, unable to isolate virus particles from infected cells treated
with UBEI-41 from 6 hpi (Figure S8). This indicated that there
are at least two steps in the VACV infectious cycle that require
ubiquitination: not only viral DNA replication after genome
uncoating, but also assembly of progeny virus.
A Cullin-3 Ubiquitin Ligase Complex Is Requiredfor VACV Genome ReplicationIt has been reported that poxvirus DNA replication is inhibited in
MG132- and Velcade-treated cells (Satheshkumar et al., 2009;
Teale et al., 2009). Could this observation be explained by the
upstream inhibition of uncoating, or was there a second step in
the early infection program that required ubiquitination and the
proteasome? After confirming that both MG132 and UBEI-41
prevented VACV replication site formation (Figure 4A), we used
an AraC wash-out assay to test for direct effects on replication.
AraC has no impact on the uncoating of viral genomes, but
prevents their replication. Cells were infected in the presence
of AraC for 6 hr to allow uncoating, but to stop replication of
incoming genomes. AraC was then washed out or replaced
with either UBEI-41 or MG132. Infection was allowed to proceed
for an additional 6 hr, after which cells were analyzed for viral
replication sites (Figure 4B). In control cells without a second
inhibitor (No Inh.), replication site formation was normal.
However, in the presence of UBEI-41 or MG132, the formation
of viral replication sites did not occur. These results confirmed
that the initiation of DNA replication requires both a ubiquitination
step and proteasome-mediated degradation.
Reasoning that a cellular ubiquitin ligase was likely to be
involved, we turned to the hits in the RNAi screen. The ubiquitin
functional annotation cluster (Figure 1B) contained two compo-
nents of the BCR E3 ubiquitin-ligase complex: Cullin3 (Cul3)
and RING-box protein 1 (Rbx1). Images from the screen indi-
cated that depletion of these factors resulted in the absence of
late gene expression (Figure 4C). A requirement for Cul3 and
Rbx1 was validated with three independent siRNAs each. Deple-
tion of either factor decreased the 24 hr viral yield by two logs
(Figure 4D; left). Silencing of Cullin-1 (Cul1), a component of
the SCF E3 ubiquitin-ligase complex that was not a hit in the
screen, had no impact (Figure 4C and 4D; left). The knockdown
efficiency of these siRNAs was confirmed by Western blot (Fig-
ure 4D; right).
Additional experiments were performed using the siRNA with
the strongest knockdown efficiency (Cul3-1, Rbx1-3, and Cul1-
2). Depletion of Cul3 or Rbx1 was found to significantly decrease
late but not early gene expression (Figure 4E), mirroring the effect
of AraC and confirming a defect in DNA replication. In line with
this, Cul3 and Rbx1 knockdown inhibited the formation of cyto-
plasmic DNA replication factories (Figure 4F). We concluded that
UBA1, a Cul3 ubiquitin ligase, and the proteasomewere required
to initiate the replication of uncoated VACV DNA.
DISCUSSION
Our results demonstrated that large-scale RNAi screening
can, despite inherent problems and pitfalls (off-target effects,
Cell Reports 2, 1–12, October 25, 2012 ª2012 The Authors 7

Figure 4. A Cullin3 E3-Ligase Complex Is Required for VACV DNA Replication
(A) MG132 and UBEI-41 block VACV DNA replication site formation. Cells were infected with VACV MVs (MOI 1) in the presence of AraC, MG132, or UBEI-41.
Cells were fixed and stained for DNA at 4 hpi. Representative images (left) scale bars, 2 mm; mean ± SD of triplicate experiments (right).
(B) MG132 and UBEI-41 block VACV DNA replication after uncoating. Cells were infected with VACV MVs (MOI 1) in the presence of AraC. At 6 hpi, cells were
washed and released from AraC (No Inh.) or shifted into MG132 or UBEI-41. Cells were fixed at 12 hpi and assessed for the presence of cytoplasmic DNA
replication sites.
(C) RNAi against Cul3 or Rbx1, but not Cul1, impairs VACV infection. Representative images from the screen are displayed with nuclei in red and infected cells in
green.
(D) Silencing of Cul3 or Rbx1, but not Cul1, reduces virus production. Cells were reverse transfected with 20 nM (final concentration) of three independent siRNAs
directed against either Cul3, Rbx1, or Cul1. After 72 hr, cells were infected with VACV MVs (MOI 1). Twenty-four hours later, cells were harvested and lysates
titered for plaque-forming units/ml (left). Immunoblot analysis of Cul3, Rbx1, and Cul1 after siRNA mediated silencing for 72 hr. Immunoblot analysis directed
against actin was used as a loading control (right; representative blots shown).
8 Cell Reports 2, 1–12, October 25, 2012 ª2012 The Authors
Please cite this article in press as: Mercer et al., RNAi Screening Reveals Proteasome- and Cullin3-Dependent Stages in Vaccinia Virus Infection, CellReports (2012), http://dx.doi.org/10.1016/j.celrep.2012.09.003

Please cite this article in press as: Mercer et al., RNAi Screening Reveals Proteasome- and Cullin3-Dependent Stages in Vaccinia Virus Infection, CellReports (2012), http://dx.doi.org/10.1016/j.celrep.2012.09.003
insufficient knockdown, cell population context effects, incom-
plete genome annotation, etc. [Cherry, 2009; Mohr et al.,
2010]) serve as a valuable tool in the study of pathogen/host
interactions. The positive outcome relied in this case on a robust
image-based assay, on supervised classification of cellular
phenotypes, a separation of indirect and direct effects of
siRNAs, and on improved bioinformatics analysis to identify
gene clusters (Snijder et al., 2012). That the screening data, anal-
ysis, and bioinformatic tools used for the purpose of this study
are publically available will be of general usefulness in the anal-
ysis of future screening data.
Among the 188 hits, we identified numerous clusters in which
multiple hits occurred in the same pathway or complex.
Regarding the validity of the final hit list, we are encouraged by
how many of the hits corresponded to factors identified earlier
as essential genes in VACV infection. Validation studies with
two of the clusters as a starting point allowed us to extend
previous findings regarding a role for ubiquitination in DNA repli-
cation (Satheshkumar et al., 2009; Teale et al., 2009) and
discover a new role for ubiquitination and the proteasome in virus
assembly and uncoating (Figure 4G). We could thus confirm the
value of the hit list as a resource for functional studies of poxvirus
host cell interactions.
Our results showed that ubiquitination comes into play as an
essential process already during the assembly of VACV particles
in virus factories located in the cytoplasm of producer cells. Core
proteins undergo extensive K48-linked polyubiquitination. This is
consistent with the accumulation of ubiquitin observed in
poxvirus replication sites and the detection of ubiquitin within
purified VACV particles (Chung et al., 2006; Nerenberg et al.,
2005). Polyubiquitination is probably an essential step in virus
assembly, because inhibition of the E1 ubiquitin-activating
enzyme prevented the generation of viral particles. VACV
encodes one ubiquitin ligase, p28, which localizes to VACV repli-
cation sites (Nerenberg et al., 2005). However, as this protein is
not required for virus production in tissue culture, it is unlikely to
be the ligase responsible for the ubiquitination of viral core
proteins. Future work is needed to identify the core components
that are ubiquitinated as well as the ubiquitin ligase(s) respon-
sible. During egress from the viral factory, the viral membrane
may protect the ubiquitinated core proteins from the degradation
machinery.
After macropinocytic internalization of VACV into a new host
cell and low pH-dependent membrane fusion, polyubiquitinated
cores are released into the cytosol. They immediately undergo
activation marked by major expansion in size, a step that does
not require early gene expression (Dales, 1963; Ichihashi et al.,
(E) Silencing of Cul3 and Rbx1, but not Cul1, reduces late but not early viral gene e
by infection with VACV (MOI 1), expressing EGFP specifically from an early or a l
expressing early and late EGFP, respectively. Cells infected in the presence of C
(F) Cul3 and Rbx1 are required for VACV DNA replication site formation. Cells in w
with VACVMVs (MOI 1). At 4 hpi, cells were fixed, stained with Draq5, and analyze
triplicate and displayed as mean ± SD (A, B, and D–F).
(G) Model of VACV core ubiquitination, core degradation/genome uncoating, an
ubiquitinated in a K48-linked fashion. Upon infection of naive cells, fusion of viral a
A first round of cellular proteasome action directs the degradation of the ubiquitin
second round of proteasome action serves to initiate replication of the releas
accessible (green); proteasomes (gray bullets); cullin-based ubiquitin ligase com
1984; Pedersen et al., 2000). The expanded cores serve as the
site for early gene transcription (Joklik, 1964a; Magee andMiller,
1968). That they are not yet substrates for proteasome-mediated
uncoating suggests that the ubiquitin chains are not accessible.
For degradation of the core and uncoating of the DNA, early
genes have to be expressed. One or more of the early proteins
are likely responsible for making the ubiquitinated core proteins
accessible as substrates for the proteasome. The core particle is
destroyed and some of the core components, such as the A5
protein, degraded.
As a result of the proteolysis, the viral DNA genome is released
and the core itself is no longer recognizable as a structure in
the cytosol. That UBA1 activity is not required indicates that
the ubiquitin present in the core is sufficient to mediate genome
uncoating. Although proteasome function has been implicated in
the regulation of viral trafficking, replication, egress, and immune
evasion (reviewed in Banks et al., 2003), a direct role for protea-
somes in the uncoating of viruses or viral capsids has not, to our
knowledge, been observed before.
It was previously reported that viral DNA replication requires
ubiquitination and proteasome activity (Satheshkumar et al.,
2009; Teale et al., 2009). Our results extended these findings
to show that replication of the viral DNA depends on Cul3 and
Rbx1, two components of an important, multifunctional E3-
ligase family (Petroski and Deshaies, 2005). As recently reviewed
(Barry et al., 2010), VACV encodes at least four Cul3 substrate
adapters: A55R, C2L, C5L, and F3L (Beard et al., 2006; Froggatt
et al., 2007; Pires de Miranda et al., 2003). Although each of
these is required for VACV virulence, they are not essential for
replication in tissue culture. This implies that they are not the
adaptor proteins used by Cul3 to facilitate VACV DNA replica-
tion. While the substrates are yet to be identified, one possibility
is that they represent remaining DNA-associated proteins to be
removed before replication.
The proteasome thus plays a central role in at least two steps
in the replication cycle of VACV. Collectively, the RNAi screen
and follow-up studies, like those described here, are likely to
provide a starting point for detailed cell and molecular biology
analysis of poxvirus-host cell interactions, and theymay facilitate
the development of novel antipoxvirus agents that target the host
cell rather than viral factors.
EXPERIMENTAL PROCEDURES
RNAi Screen
HeLa MZ cells from Marino Zerial (MPI-CBG, Dresden) were maintained at
37�C and 5% CO2 in Dulbecco’s modified Eagle’s medium (DMEM; GIBCO
xpression. Cells were subjected to siRNA-mediated silencing as in (D) followed
ate promoter. Cells were harvested 6 hpi and analyzed for the number of cells
HX or AraC were used as controls.
hich Cul3, Rbx1, or Cul1 had been silenced (20 nM siRNA; 72 hr) were infected
d for the presence of viral DNA replication sites. Experiments were performed in
d genome replication. During assembly of VACV MVs, viral core proteins are
nd cellular membranes releases the ubiquitinated viral core into the cytoplasm.
ated core and concomitant genome release. A Cul3-based ubiquitin ligase and
ed viral genomes. Ubiquitination events: new (red); nonaccessible (yellow);
plex (gray crescents).
Cell Reports 2, 1–12, October 25, 2012 ª2012 The Authors 9
Please cite this article in press as: Mercer et al., RNAi Screening Reveals Proteasome- and Cullin3-Dependent Stages in Vaccinia Virus Infection, CellReports (2012), http://dx.doi.org/10.1016/j.celrep.2012.09.003
BRL) supplemented with 10% fetal calf serum (FCS) and glutamax. All liquid-
handling steps, including preparing cell plates, virus infection, and cell fixation,
were performed on a Freedom Evo200 liquid-handling robot (Tecan) set up
specifically for this purpose. Seeding, fixing, and DAPI staining of the cells
was performed using a Matrix Wellmate Microplate Dispenser (Thermo
Scientific).
RNA interference against the 6,979 gene targets was achieved with
three independent siRNAs targeting each (siRNAs #1 and #2 from QIAGEN
druggable genome version 2 and siRNA #3 from QIAGEN druggable
genome version 3) or three independent siRNAs from Ambion for sec-
ondary screening (custom ordered). Each siRNA was tested in triplicate.
Experiments were conducted in a 384 well plate format, amounting to 210
plates for the primary screen (see Extended Experimental Procedures for plate
layout).
All images were acquired on automated wide field cellWoRx microscopes
(Applied Precision) with a 10X objective, and 23 2 binning per pixel. Multiwell
plates were loaded onto the cellWoRx microscopes using Freedom Evo
robotics from Tecan. Three by three directly adjacent images were taken per
well, covering over �90% of each well surface. An image-based autofocus
was performed on the DAPI signal for each imaged site. The images were
recorded with 12-bit charge-coupled device (CCD) cameras and stored as
individual 16-bit uncompressed tagged image file format (TIFF) files per
imaged site and per channel.
Computational Image Analysis, Supervised Classification of Cellular
Phenotypes, Hit Scoring, DAVID Annotation Clustering Network, and
Combined DAVID/STRING Functional Gene View
Please refer to the Extended Experimental Procedures for details on bio-
informatics methodology.
Cells, Viruses, and Reagents
HeLa ATCC and HeLa MZ cells were maintained at 37�C and 5% CO2 in
DMEM (GIBCO BRL) supplemented with 10% FCS and glutamax. Wild-type
vaccinia virus (strain WR), (EGFP-VACV) containing the EGFP gene driven by
a synthetic VACV early-late promoter inserted into the thymidine kinase (tk)
locus, and vaccinia virus containing EGFP-tagged versions of the core protein
A5 (WR-EGFP-CORE) were generated as previously described (Mercer and
Helenius, 2008). AraC, CHX, and MG132 were purchased from Sigma.
UBEI-41 (PYR-41) was purchased from Calbiochem.
Flow Cytometry Analysis and Perturbant Analysis
To analyze temporal viral gene expression, cells were infected with recombi-
nant VACV viruses that express EGFP from the J2R early viral promoter
(E-EGFP-VACV) or the F18R late viral promoter (L-EGFP-VACV). Cells were
infected at an MOI of 1. For all experiments, cells were harvested at 6 hpi
and prepared as previously described (Mercer and Helenius, 2008). Cells ex-
pressing early or late EGFP were gated based on uninfected controls. CHX
and AraC served as specific controls for inhibition of early and late gene
expression, respectively. Flow cytometry was performed on a BD Bioscience
Calibur System. For each sample, 10,000 cells were analyzed. For all experi-
ments, cells were infected with E- or L-EGFP-VACV in the presence of drug
at an MOI of 1, unless otherwise indicated.
Viral DNA Uncoating
HeLa cells were infected in the presence of CHX (25 mg/ml), AraC (10 mM),
MG132 (25 mM), or UBEI-41 (50 mM). Cells were then infected at an MOI of
10. Four hpi cells were fixed and stainedwith antisera directed against vaccinia
I3L protein (1:500) (a generous gift of Jacomine Krijnse-Locker; University of
Heidelberg, Germany) followed by Alexa594 secondary antibody (1:1000)
and draq5 (1:5000). Images were acquired on a Zeiss LSM510 confocal micro-
scope at 100X oil immersion objective.
Virion Ubiquitin Immunoblot Analysis
One to five micrograms of band-purified wild-type (WT) MVs were left
untreated or were fractionated into membrane and core components as previ-
ously described (Mercer and Traktman, 2003). Samples were separated on
SDS-PAGE, transferred to nitrocellulose, and immunoblot analysis was per-
10 Cell Reports 2, 1–12, October 25, 2012 ª2012 The Authors
formed for total mono- and polyubiquitination (clone FK2, Enzo Life sciences),
k48-linked ubiquitin chains (clone Apu2; Millipore), or K63-linked ubiquitin
chains (clone Apu3; Millipore).
siRNA Transfection
For siRNA transfection, 25,000 HeLa ATCC cells were seeded in a 24 well dish
1 day prior to transfection. A 20 nM final concentration of siRNA was used to
transfect cells 72 hr prior to infection. siRNAs were purchased from QIAGEN:
Cullin1: (1) Hs_CUL1_6; (2) Hs_CUL1_5; (3) Hs_CUL1_3, Cullin3: (1)
Hs_CUL3_5; (2) Hs_CUL3_8; (3) Hs_CUL3_10, and Rbx1: (1) Hs_RBX1_6; (2)
Hs_RBX1_5; (3) Hs_RBX1_10.
siRNA Depletion Confirmation
Immunoblot analyses to confirm the depletion of target proteins by siRNAwere
performed on siRNA-treated cells. Antibodies were directed against Cullin1
(1:250; Zymed Laboratories), Skp1 (1:1000; Cell Signaling Technology), or
Rbx1 (1:250; Sigma-Aldrich). Cul3 antibody (1:1000) was a generous gift of
Prof. M. Peter (Institute of Biochemistry, ETH Zurich).
SUPPLEMENTAL INFORMATION
Supplemental Information includes Extended Experimental Procedures, eight
figures, two tables, and a supplemental network visualization algorithm and
can be found with this article online at http://dx.doi.org/10.1016/j.celrep.
2012.09.003.
LICENSING INFORMATION
This is an open-access article distributed under the terms of the Creative
Commons Attribution-Noncommercial-No Derivative Works 3.0 Unported
License (CC-BY-NC-ND; http://creativecommons.org/licenses/by-nc-nd/3.0/
legalcode).
ACKNOWLEDGMENTS
We thank T. Steiger and O. Byrde for data storage and cluster computing,
Pauli Ramo for statistical and image analysis, Karin Mench for technical assis-
tance, and Jacomine Krijnse-Locker for anti-I3L. J.M. is supported by an SNF
Ambizione (PZ00P3_131988), L.P. by the University of Zurich, SNSF, Sys-
temsX.ch (http://SystemsX.ch) RTD project InfectX, and the European Union,
C.K.E.B by the SNF Sinergia CRSII3_125110 and the SystemsX.ch RTD
project C-CINA, and A.H. by ETH Zurich, InfectX, and an ERC advanced inves-
tigator grant.
Received: July 26, 2012
Revised: August 30, 2012
Accepted: September 7, 2012
Published online: October 18, 2012
WEB RESOURCES
The URLs for data presented herein are as follows:
CellClassifier, http://www.cellclassifier.ethz.ch
CellProfiler, http://www.cellprofiler.org/
Full set of images and analysis results, http://www.infectome.org
STRING databse, http://www.string-db.org
REFERENCES
Banks, L., Pim, D., and Thomas, M. (2003). Viruses and the 26S proteasome:
hacking into destruction. Trends Biochem. Sci. 28, 452–459.
Barry, M., van Buuren, N., Burles, K., Mottet, K., Wang, Q., and Teale, A.
(2010). Poxvirus exploitation of the ubiquitin-proteasome system. Viruses 2,
2356–2380.
Please cite this article in press as: Mercer et al., RNAi Screening Reveals Proteasome- and Cullin3-Dependent Stages in Vaccinia Virus Infection, CellReports (2012), http://dx.doi.org/10.1016/j.celrep.2012.09.003
Beard, P.M., Froggatt, G.C., and Smith, G.L. (2006). Vaccinia virus kelch
protein A55 is a 64 kDa intracellular factor that affects virus-induced cytopathic
effect and the outcome of infection in amurine intradermal model. J. Gen. Virol.
87, 1521–1529.
Bray, M.A., Fraser, A.N., Hasaka, T.P., and Carpenter, A.E. (2012). Workflow
and metrics for image quality control in large-scale high-content screens. J.
Biomol. Screen. 17, 266–274.
Carpenter, A.E., Jones, T.R., Lamprecht, M.R., Clarke, C., Kang, I.H., Friman,
O., Guertin, D.A., Chang, J.H., Lindquist, R.A., Moffat, J., et al. (2006).
CellProfiler: image analysis software for identifying and quantifying cell pheno-
types. Genome Biol. 7, R100.
Cherry, S. (2009). What have RNAi screens taught us about viral-host interac-
tions? Curr. Opin. Microbiol. 12, 446–452.
Chiu, W.L., Lin, C.L., Yang, M.H., Tzou, D.L., and Chang, W. (2007). Vaccinia
virus 4c (A26L) protein on intracellular mature virus binds to the extracellular
cellular matrix laminin. J. Virol. 81, 2149–2157.
Cho, Y.S., Challa, S., Moquin, D., Genga, R., Ray, T.D., Guildford, M., and
Chan, F.K. (2009). Phosphorylation-driven assembly of the RIP1-RIP3
complex regulates programmed necrosis and virus-induced inflammation.
Cell 137, 1112–1123.
Chung, C.S., Chen, C.H., Ho, M.Y., Huang, C.Y., Liao, C.L., and Chang, W.
(2006). Vaccinia virus proteome: identification of proteins in vaccinia virus
intracellular mature virion particles. J. Virol. 80, 2127–2140.
Clague, M.J., and Urbe, S. (2010). Ubiquitin: same molecule, different degra-
dation pathways. Cell 143, 682–685.
Dales, S. (1963). The uptake and development of vaccinia virus in strain L cells
followed with labeled viral deoxyribonucleic acid. J. Cell Biol. 18, 51–72.
Di Giulio, D.B., and Eckburg, P.B. (2004). Human monkeypox: an emerging
zoonosis. Lancet Infect. Dis. 4, 15–25.
Domi, A., and Beaud, G. (2000). The punctate sites of accumulation of vaccinia
virus early proteins are precursors of sites of viral DNA synthesis. J. Gen. Virol.
81, 1231–1235.
Eppstein, D.A., Marsh, Y.V., Schreiber, A.B., Newman, S.R., Todaro, G.J., and
Nestor, J.J., Jr. (1985). Epidermal growth factor receptor occupancy inhibits
vaccinia virus infection. Nature 318, 663–665.
Essbauer, S., Meyer, H., Porsch-Ozcurumez, M., and Pfeffer, M. (2007). Long-
lasting stability of vaccinia virus (orthopoxvirus) in food and environmental
samples. Zoonoses Public Health 54, 118–124.
Froggatt, G.C., Smith, G.L., and Beard, P.M. (2007). Vaccinia virus gene F3L
encodes an intracellular protein that affects the innate immune response. J.
Gen. Virol. 88, 1917–1921.
Harrison, S.C., Alberts, B., Ehrenfeld, E., Enquist, L., Fineberg, H., McKnight,
S.L., Moss, B., O’Donnell, M., Ploegh, H., Schmid, S.L., et al. (2004). Discovery
of antivirals against smallpox. Proc. Natl. Acad. Sci. USA 101, 11178–11192.
Honeychurch, K.M., Yang, G., Jordan, R., and Hruby, D.E. (2007). The vaccinia
virus F13L YPPL motif is required for efficient release of extracellular envel-
oped virus. J. Virol. 81, 7310–7315.
Huang, C.Y., Lu, T.Y., Bair, C.H., Chang, Y.S., Jwo, J.K., andChang,W. (2008).
A novel cellular protein, VPEF, facilitates vaccinia virus penetration into HeLa
cells through fluid phase endocytosis. J. Virol. 82, 7988–7999.
Huang da, W., Sherman, B.T., and Lempicki, R.A. (2009). Systematic and
integrative analysis of large gene lists using DAVID bioinformatics resources.
Nat. Protoc. 4, 44–57.
Ichihashi, Y., Oie, M., and Tsuruhara, T. (1984). Location of DNA-binding
proteins and disulfide-linked proteins in vaccinia virus structural elements. J.
Virol. 50, 929–938.
Joklik, W.K. (1964a). The Intracellular Uncoating of Poxvirus DNA. I. The Fate
of Radioactively-Labeled Rabbitpox Virus. J. Mol. Biol. 8, 263–276.
Joklik, W.K. (1964b). The Intracellular Uncoating of Poxvirus DNA. Ii. The
Molecular Basis of the Uncoating Process. J. Mol. Biol. 8, 277–288.
Kates, J., and Beeson, J. (1970). Ribonucleic acid synthesis in vaccinia virus. I.
Themechanism of synthesis and release of RNA in vaccinia cores. J. Mol. Biol.
50, 1–18.
Komander, D. (2009). The emerging complexity of protein ubiquitination.
Biochem. Soc. Trans. 37, 937–953.
Laliberte, J.P., Weisberg, A.S., and Moss, B. (2011). The membrane fusion
step of vaccinia virus entry is cooperatively mediated by multiple viral proteins
and host cell components. PLoS Pathog. 7, e1002446.
Li, Y., Grenklo, S., Higgins, T., and Karlsson, R. (2008). The profilin:actin
complex localizes to sites of dynamic actin polymerization at the leading
edge of migrating cells and pathogen-induced actin tails. Eur. J. Cell Biol.
87, 893–904.
Locker, J.K., Kuehn, A., Schleich, S., Rutter, G., Hohenberg, H., Wepf, R., and
Griffiths, G. (2000). Entry of the two infectious forms of vaccinia virus at the
plasma membane is signaling-dependent for the IMV but not the EEV. Mol.
Biol. Cell 11, 2497–2511.
MacCallum, F.O., and McDonald, J.R. (1957). Effect of temperatures of up to
45 degrees C on survival of variola virus in human material in relation to
laboratory diagnosis. Bull. World Health Organ. 16, 441–443.
Magee,W.E., andMiller, O.V. (1968). Initiation of vaccinia virus infection in acti-
nomycin D-pretreated cells. J. Virol. 2, 678–685.
Malkin, A.J., McPherson, A., and Gershon, P.D. (2003). Structure of intracel-
lular mature vaccinia virus visualized by in situ atomic force microscopy.
J. Virol. 77, 6332–6340.
McNulty, S., Bornmann, W., Schriewer, J., Werner, C., Smith, S.K., Olson,
V.A., Damon, I.K., Buller, R.M., Heuser, J., and Kalman, D. (2010). Multiple
phosphatidylinositol 3-kinases regulate vaccinia virus morphogenesis. PLoS
ONE 5, e10884.
Mercer, J., and Traktman, P. (2003). Investigation of structural and functional
motifs within the vaccinia virus A14 phosphoprotein, an essential component
of the virion membrane. J. Virol. 77, 8857–8871.
Mercer, J., and Helenius, A. (2008). Vaccinia virus uses macropinocytosis and
apoptotic mimicry to enter host cells. Science 320, 531–535.
Mercer, J., Knebel, S., Schmidt, F.I., Crouse, J., Burkard, C., and Helenius, A.
(2010). Vaccinia virus strains use distinct forms of macropinocytosis for host-
cell entry. Proc. Natl. Acad. Sci. USA 107, 9346–9351.
Mohr, S., Bakal, C., and Perrimon, N. (2010). Genomic screening with RNAi:
results and challenges. Annu. Rev. Biochem. 79, 37–64.
Moser, T.S., Jones, R.G., Thompson, C.B., Coyne, C.B., and Cherry, S. (2010).
A kinome RNAi screen identified AMPK as promoting poxvirus entry through
the control of actin dynamics. PLoS Pathog. 6, e1000954.
Moss, B. (1990). Regulation of vaccinia virus transcription. Annu. Rev. Bio-
chem. 59, 661–688.
Moss, B., Knipe, D.M., and Howley, P.M. (2007). Poxviridae: The viruses and
their replication. In Fields Virology (Philadelphia: Lippincott-Raven).
Nerenberg, B.T., Taylor, J., Bartee, E., Gouveia, K., Barry, M., and Fruh, K.
(2005). The poxviral RING protein p28 is a ubiquitin ligase that targets ubiquitin
to viral replication factories. J. Virol. 79, 597–601.
Pedersen, K., Snijder, E.J., Schleich, S., Roos, N., Griffiths, G., and Locker,
J.K. (2000). Characterization of vaccinia virus intracellular cores: implications
for viral uncoating and core structure. J. Virol. 74, 3525–3536.
Petroski, M.D., and Deshaies, R.J. (2005). Function and regulation of cullin-
RING ubiquitin ligases. Nat. Rev. Mol. Cell Biol. 6, 9–20.
Pires de Miranda, M., Reading, P.C., Tscharke, D.C., Murphy, B.J., and Smith,
G.L. (2003). The vaccinia virus kelch-like protein C2L affects calcium-indepen-
dent adhesion to the extracellular matrix and inflammation in a murine intra-
dermal model. J. Gen. Virol. 84, 2459–2471.
Ramo, P., Sacher, R., Snijder, B., Begemann, B., and Pelkmans, L. (2009).
CellClassifier: supervised learning of cellular phenotypes. Bioinformatics 25,
3028–3030.
Cell Reports 2, 1–12, October 25, 2012 ª2012 The Authors 11

Please cite this article in press as: Mercer et al., RNAi Screening Reveals Proteasome- and Cullin3-Dependent Stages in Vaccinia Virus Infection, CellReports (2012), http://dx.doi.org/10.1016/j.celrep.2012.09.003
Satheshkumar, P.S., Anton, L.C., Sanz, P., and Moss, B. (2009). Inhibition of
the ubiquitin-proteasome system prevents vaccinia virus DNA replication
and expression of intermediate and late genes. J. Virol. 83, 2469–2479.
Schmidt, F.I., Bleck, C.K., Helenius, A., and Mercer, J. (2011). Vaccinia extra-
cellular virions enter cells by macropinocytosis and acid-activated membrane
rupture. EMBO J. 30, 3647–3661.
Schmidt, F.I., Bleck, C.K., and Mercer, J. (2012). Poxvirus host cell entry. Curr.
Opin. Virol. 2, 20–27.
Snijder, B., Sacher, R., Ramo, P., Damm, E.M., Liberali, P., and Pelkmans, L.
(2009). Population context determines cell-to-cell variability in endocytosis
and virus infection. Nature 461, 520–523.
Snijder, B., Sacher, R., Ramo, P., Liberali, P., Mench, K.,Wolfrum, N., Burleigh,
L., Scott, C.C., Verheije, M.H., Mercer, J., et al. (2012). Single-cell analysis of
population context advances RNAi screening at multiple levels. Mol. Syst.
Biol. 8, 579.
Szklarczyk, D., Franceschini, A., Kuhn, M., Simonovic, M., Roth, A., Minguez,
P., Doerks, T., Stark, M., Muller, J., Bork, P., et al. (2011). The STRING data-
12 Cell Reports 2, 1–12, October 25, 2012 ª2012 The Authors
base in 2011: functional interaction networks of proteins, globally integrated
and scored. Nucleic Acids Res. 39(Database issue), D561–D568.
Teale, A., Campbell, S., Van Buuren, N., Magee, W.C., Watmough, K.,
Couturier, B., Shipclark, R., and Barry, M. (2009). Orthopoxviruses require
a functional ubiquitin-proteasome system for productive replication. J. Virol.
83, 2099–2108.
Townsley, A.C., Weisberg, A.S., Wagenaar, T.R., and Moss, B. (2006).
Vaccinia virus entry into cells via a low-pH-dependent endosomal pathway.
J. Virol. 80, 8899–8908.
Villa, N.Y., Bartee, E., Mohamed, M.R., Rahman, M.M., Barrett, J.W., and
McFadden, G. (2010). Myxoma and vaccinia viruses exploit different mecha-
nisms to enter and infect human cancer cells. Virology 401, 266–279.
Welsch, S., Doglio, L., Schleich, S., and Krijnse Locker, J. (2003). The vaccinia
virus I3L gene product is localized to a complex endoplasmic reticulum-asso-
ciated structure that contains the viral parental DNA. J. Virol. 77, 6014–6028.

Supplemental Information
EXTENDED EXPERIMENTAL PROCEDURES
siRNA Screen Reverse TransfectionReverse transfection of siRNAwas performed by seeding the cells into a well containing 20ml of transfectionmix. The transfectionmix
for onewell contained 0.1ml LP2000 (QIAGEN), 14.9ml Optimemand 5ml of 1mMsiRNA (diluted in RNase free ddH2O). In eachwell, 900
cells were seeded in 50 ml/well of complete medium (10% FCS and glutamax). Cells were then left at 37�C for 72h prior to infection.
InfectionA single sucrose purified VACV stock (see Experimental Procedures) was utilized for the entire screening procedure. Amean infection
index of �10% was chosen to allow for a dynamic range of possible upregulating and downregulating hits. Infection index is
a combined function of the amount of virus added and the properties of the host cells (Snijder et al., 2009). Therefore, the necessary
amount of virus needed to achieve 10% infection was determined using ‘‘checkerboard’’ assays (see Figure S1).
Fixation and Staining
All assays were fixed by adding formaldehyde to a final concentration of 4% at 8hpi. Cells were incubated for 30min, followed by two
PBS washes. To assure a homogeneous DAPI stain, cells were permeabilized for 3 min with PBS containing 0.1% Triton X-100. After
one PBS wash, the cells were incubated with PBS containing 1mg/ml DAPI for 10 min. Before scanning, a final wash with ddH2O was
performed to minimize contaminants when imaging with automated microscopes.
ImagingAll imageswere acquired on 2 automated wide field cellWoRxmicroscopes (Applied Precision) with a 103 objective, and 2x2 binning
per pixel. Multiwell plates were loaded onto the cellWoRx microscopes using Freedom Evo robotics from Tecan. 33 3 directly adja-
cent images were taken per well, covering over�90% of each well surface. An image-based auto-focus was performed on the DAPI
signal for each imaged site. The images were recorded with 12-bit CCD cameras, and stored as individual 16-bit uncompressed TIFF
files per imaged site and per channel.
Computational Image AnalysisFor the primary screen 1,451,520 images (combining both DAPI andGFP channel) were analyzed, amounting to 1.2TB of image data.
The images were analyzed with open-source image analysis software (CellProfiler; Carpenter et al., 2006), combined with previously
published software for supervised classification of cellular phenotypes (Ramo et al., 2009), and image analysis methods described
previously (Snijder et al., 2009, 2012). All computational image analysis was run on the high-performance computing cluster Brutus,
and data storage on the central IT services, both from the ETH Zurich. The analysis resulted in 540GB of MATLAB analysis result files,
describing �200 measurements for each of 6.24x10⁸ cells.
CellProfiler Image Analysis
The CellProfiler (Carpenter et al., 2006) image analysis pipeline was as follows: first, nuclei were identified based on the DAPI stain.
Next, cell boundaries were estimated using nuclear expansion. Standard CellProfiler texture, intensity, size, and shape features were
extracted from nucleus and cell regions, as well as from complete images, for all available channels. In total, around 200 features
were measured per individual cell.
Supervised Classification of Cellular Phenotypes
We applied supervised machine learning using the open source support vector machine (SVM) learning tool CellClassifier (Ramo
et al., 2009), to identify biologically and technically relevant cellular phenotypes. Using relevant subsets of the �200 raw single-
cell features we classified all cells in each screen into 5 distinct binary phenotype classes (infected/non-infected, interphase/non-
interphase, mitotic/non-mitotic, apoptotic/non-apoptotic, blob/non-blob). Classification was performed as described (Snijder
et al., 2009, 2012). In total, 6.24x10⁸ cells were analyzed, of which 15% were discarded by the SVM based selection (cell segmen-
tation errors, out-of-focus image regions, and experimental contaminants), leaving 5.44x10⁸ high-quality cells in the final analysis.
After SVM cleanup, the median correlation coefficient for infection over replicate plates was 0.45, and for the total number of cells
per well it was 0.89, indicating a high reproducibility of the applied screening pipeline.
Hit Scoring
Genes were scored according their changed level of infection after several steps of data normalization. Cytotoxic RNAi knockdown
phenotypes were filtered from the hit scoring by excluding wells in which fewer than 300 cells passed the SVM-based quality control.
Fold-change of infection was calculated for the remaining wells as the log2 transform of the measured infection divided over the pre-
dicted level of infection for that well. Well infection predictions were calculated given the population-context (See Figure S1). This
model-predicted value represents the expected infection level in the absence of any direct effect of the RNAi perturbation. The
fold change of infection over this prediction therefore represents the RNAi perturbation effect that is independent of changes in
the population context. We show this normalization to improve screening results in general and for VACV infection specifically in
(Snijder et al., 2012). These fold-changes of infection were next corrected for column and row-wise plate effects, and plate-wise
z-score normalized (subtract plate mean, then divide by plate stdev). The median of the triplicate z-scores was determined for
each individual siRNA. As three siRNAs per gene were used, we next calculated the median of the three siRNAs scores correspond-
ing to each gene. The genes were then ranked from lowest to highest based on these median-of-median scores. Selection of the 276
Cell Reports 2, 1–12, October 25, 2012 ª2012 The Authors S1

genes that were followed up was done by manually selecting the genes with lowest ranking scores taken from two analyses that
differed only in their use of the population-context normalization step.
The gene phenotypes for the secondary screen, performed in experimental triplicates with three independent siRNAs from
a different vendor (Ambion) compared to the primary screen, were calculated in the same way as described above, except that
the population-context dependent model was built per plate from cells derived from negative control wells (containing either non-
targeting siRNA or only the RNAi transfection reagent). These infection scores were compared against a set of negative control wells
with a two tailed t test. Those genes with a probability p < 0.01 for belonging to the control wells distribution were scored as validated
hits, resulting in 188 genes of the original 276 being validated (68%) (see below).
DAVID Annotation Clustering Network
We performed functional annotation clustering and enrichment scoring of the 188 validated hits for VACV infection using DAVID
(http://david.abcc.ncifcrf.gov) (Huang da et al., 2009) version 6.7, with ‘‘high’’ classification stringency settings. We included all stan-
dard annotation categories except UP_SEQ_FEATURE. This yielded 76 functional annotation clusters, of which 15 highly enriched
(EASE score above 1) against the background list of all genes tested in the druggable genome. However, the clusters showed signif-
icant overlap regarding the genes they described, with many genes being associated in multiple clusters (see below).
We therefore next visualized the overlap between these functional annotation clusters by drawing clusters as nodes in a network,
with edges representing the fraction of genes shared between two nodes as a function of the cluster with fewest genes, displayed in
Figure S2. All edges above 75% gene-identity (of the smaller cluster) were depicted. We further added edges of 33% or higher for
otherwise unconnected annotation cluster nodes. The code used to generate the visualization was implemented in Matlab, and
requires Cytoscape for visualization. This code has been tested for use on both PC and Mac and can be found with a short manual
in the Supplementary Materials (draw_david_network.m).
Combined DAVID and STRING Functional Gene View
The functional annotation clustering was combined with the functional interactions described in the STRING database for the 188
validated host factors (version 9) (Szklarczyk et al., 2011). To create the combined network viewwe assigned each gene to the cluster
with the highest enrichment, in which the genewas present in the highest fraction of individual annotations. For visualization purposes
the ATP/GTP-binding cluster was removed from analysis. Genes not clustered in any of the DAVID clusters were left unconnected,
and selected unclustered genes were placed back in the visualization as inverted arrowheads. We next added all STRING interac-
tions (yellow solid lines) with a confidence score of 0.9 or higher, and all interactions of 0.35 or higher between genes within the same
functional annotation cluster. The functional annotation clusters were manually placed in their approximate cellular locations in the
final image (see Figure 1B). Some smaller annotation clusters and unconnected genes (52 genes in total) were left out of the visual-
ization due to space limitation. As above, the code used to generate the visualization was implemented in Matlab, and requires Cyto-
scape for visualization. This code has been tested for use on both PC and Mac and can be found in the Supplementary Materials
(draw_string_david_combination_network.m).
24 Hr Viral Yield
HeLa cells were infected with WT WR (MOI = 1) in the presence of inhibitors and harvested 24 hr post infection (hpi). Cells were
washed with PBS, resuspended in 1 mM Tris-HCl pH 9.0 and disrupted by three consecutive freeze/thaw cycles and the virus
concentration determined by serial titration on BSC-40 cells.
Analysis of DNA Replication Site Formation
HeLa cells were infected with EGFP-VACV (MOI 1) in the presence of the indicated inhibitors and fixed 5 hpi with 4% formaldehyde.
Draq5 (Biostatus, UK) was used to visualize cellular and viral DNA. One hundred cells per condition were scored for the presence of
cytoplasmic replication sites.
Quantification of Core Breakdown
Preliminary studies indicated that 4 hr post infection in the absence of virion pre-binding was the optimal condition to assess core
breakdown in untreated cells and stabilized cores in cyclohexamide control cells. Using this experimental setup cells were infected
with WR-EGFP-CORE virions with 400 virions per cell in the presence of the indicated inhibitors. Four hpi cells were fixed and
membrane-containing virions distinguished using an antibody against L1R (1:10,000; a gift of A. L. Schmaljohn, University of Mary-
land School of Medicine, Baltimore, MD) followed by Alexa594 secondary antibody. Imaging was performed on a Zeiss LSM 510
Meta confocal microscope. Images were taken using the appropriate excitation and emission settings with a 100x objective. Ten
confocal Z-sections were collected for each cell and displayed as a maximum projection. To quantify the intracellular cores L1R/
EGFP positive spots representing external virions were subtracted from the EGFP images. Images representing intracellular cores
were then inverted, subjected to auto-thresholding and cores quantified with the ImageJ particle analysis plugin (Size pixel>.05-5;
Circularity 0.0-1.0). 20 cells per condition from 3 independent experiments were analyzed.
Electron Microscopy
For conventional electron microscopy, WT VACV infected cells were fixed in 2.5% glutaraldehyde (0.05 M sodium cacodylate
adjusted to pH 7.2, 50 mM KCl, 2.5 mM CaCl2) for 60 min at RT. After several washes with 50 mM sodium cacodylate buffer,
post-fixed in reduced OsO4 (2% OsO4, 1.5% potassium ferrocyanide in water) for 1 hr on ice, followed by block staining in 0.5%
aqueous uranyl acetate over night. The specimens were then serially dehydrated in ethanol and propylene oxide, followed by embed-
ding in Epon. Ultrathin sections (50-60 nm) were obtained using a FC7/UC7-ultramicrotome (Leica, Vienna, Austria). Sections were
S2 Cell Reports 2, 1–12, October 25, 2012 ª2012 The Authors

acquired with a CM10 Philips transmission electron microscope with an Olympus ‘‘Veleta’’ 2k x 2k side-mounted TEM CCD camera.
Raw images were adjusted for brightness and contrast. Images are representative of 3 independent experiments.
SUPPLEMENTAL REFERENCES
Carpenter, A.E., Jones, T.R., Lamprecht, M.R., Clarke, C., Kang, I.H., Friman, O., Guertin, D.A., Chang, J.H., Lindquist, R.A., Moffat, J., et al. (2006). CellProfiler:
image analysis software for identifying and quantifying cell phenotypes. Genome Biol. 7, R100.
Griffiths, G., and Hoppeler, H. (1986). Quantitation in immunocytochemistry: correlation of immunogold labeling to absolute number of membrane antigens. J.
Histochem. Cytochem. 34, 1389–1398.
Huang da, W., Sherman, B.T., and Lempicki, R.A. (2009). Systematic and integrative analysis of large gene lists using DAVID bioinformatics resources. Nat. Pro-
toc. 4, 44–57.
Ramo, P., Sacher, R., Snijder, B., Begemann, B., and Pelkmans, L. (2009). CellClassifier: supervised learning of cellular phenotypes. Bioinformatics 25, 3028–
3030.
Snijder, B., Sacher, R., Ramo, P., Damm, E.M., Liberali, P., and Pelkmans, L. (2009). Population context determines cell-to-cell variability in endocytosis and virus
infection. Nature 461, 520–523.
Snijder, B., Sacher, R., Ramo, P., Liberali, P., Mench, K., Wolfrum, N., Burleigh, L., Scott, C.C., Verheije, M.H., Mercer, J., et al. (2012). Single-cell analysis of
population context advances RNAi screening at multiple levels. Mol. Syst. Biol. 8, 579.
Szklarczyk, D., Franceschini, A., Kuhn, M., Simonovic, M., Roth, A., Minguez, P., Doerks, T., Stark, M., Muller, J., Bork, P., et al. (2011). The STRING database in
2011: functional interaction networks of proteins, globally integrated and scored. Nucleic Acids Res. 39(Database issue), D561–D568.
Cell Reports 2, 1–12, October 25, 2012 ª2012 The Authors S3

Figure S1. Extended Experimental Screening Procedures, Related to Figures 1, 2, 3, and 4
(A) siRNA screen plate layout. Each plate of the primary screen had 37 mock (no RNAi), three transfection controls (RNAi against PLK1, see total cell number;
right), four AllStars scrambled siRNA controls, and 16 no-virus controls.
(B) Checkerboard assay for determination of optimal virus amount. The optimal virus amount needed for �10% infection, at 8 hr postinfection (hpi), over a wide
range of cell numbers was determined by seeding a gradient of HeLa MZ cells in the columns of a 384-well plate and infecting with a gradient of virus in the rows.
Results for the selected final virus dilution are shown on the right; the local mean (black line) and local standard deviation (outer gray area) of 144 wells are shown.
Note that the primary screen is performed with an average total cell number of �7,000 cells per well.
(C) Typical population context dependent VACV infection observed for amultiwell plate in the primary screen. Well infection predictions were calculated given the
population context (population size, local cell density, cell-islet edge, cell size) dependency of VACV infection measured over the entire 384-well plate (a typical
example from the primary screen and the measured population-context of individual cells for that well are displayed.
(D) Number of times a gene appears in different functional annotation clusters. Shown are genes present in 4 or more clusters based on functional annotation
clustering and enrichment scoring of the 188 validated hits for VACV infection using DAVID with ‘‘high’’ classification stringency settings.
S4 Cell Reports 2, 1–12, October 25, 2012 ª2012 The Authors

Figure S2. Network View of 73 Functional Annotation Clusters Identified by DAVID 6.7 Within the 188 Host Factors Required for VACV
Infection, Related to Figure 1 and Table S2
Network nodes represent individual functional annotation clusters. Node sizes reflect the number of factors in each cluster (see legend). Node color represents
the enrichment relative to the total genes screened (see legend and supplementary information). Lines between the functional clusters indicate shared genes. The
line thickness defines the percentage (33%–100%) of genes in the smaller cluster that are shared with the larger cluster. Solid lines represent all edges of at least
75% similarity, while dashed lines represent the single strongest edge of 33% or higher for otherwise unconnected clusters. Individual networks are outlined in
dashed gray lines. The largest network (1) consists of 98 genes, occurring 233 times in 25 functional annotation clusters, and is centered around both ATP/GTP
binding genes and proteasomal genes. The second largest network (2) consists of 93 genes occurring 191 times in 18 functional annotation clusters and contains
transcriptional regulators and nuclear lumen annotated genes involved in mRNA and protein transport. Smaller networks include: (3) Membrane intrinsic genes
including cation channels and G protein coupled receptors; (4) Ion binding genes with (Ring-type) zinc-finger domains, EGF binding domains, and DNA poly-
merases; (5) positive and negative regulators of kinase activity; and (6) apoptosis. Highly enriched clusters not in larger networks included the spliceosome,
nuclear mRNA splicing, and the ribosome. Less enriched functional clusters included chemotaxis, cell-migration, mitosis, axon-guidance, laminin G, lipid
degradation, heparin binding, and vesicle (membrane) annotated genes.
Cell Reports 2, 1–12, October 25, 2012 ª2012 The Authors S5

Figure S3. Proteasome Inhibition by Velcade Blocks VACV Infection Akin to MG132, Related to Figures 2 and 4
(A) Proteasome inhibitor (Velcade) blocks VACV production (MOI 1; 24 hpi; 10-100 nM Velcade).
(B) Velcade has no impact on early, but inhibits late VACV gene expression (MOI 1; 6 hpi). Cells infected in the presence of CHX or ARAC served as controls for
gating early and late gene expressing cells.
(C) Velcade inhibits VACV infection after internalization. VACV-EGFP (MOI 1) was bound to cells for 1 hr in the presence of 100 nMVelcade. Cells werewashed and
treated with pH 7.4 or pH 5.0 media for 5 min, after which media containing 100 nM Velcade was added back. Cells were analyzed by flow cytometry for EGFP at
6 hpi.
(D) Velcade blocks VACV DNA replication site formation. Cells were infected with VACVMVs (MOI 1) in the presence of 10 mMAraC or 100 nMVelcade. Cells were
fixed and stained for DNA at 4 hpi. Representative images (left); Mean ± SD of triplicate experiments (right).
(E) Velcade stabilizes cytoplasmic VACV cores (assay performed in parallel to Figure 2E).
S6 Cell Reports 2, 1–12, October 25, 2012 ª2012 The Authors
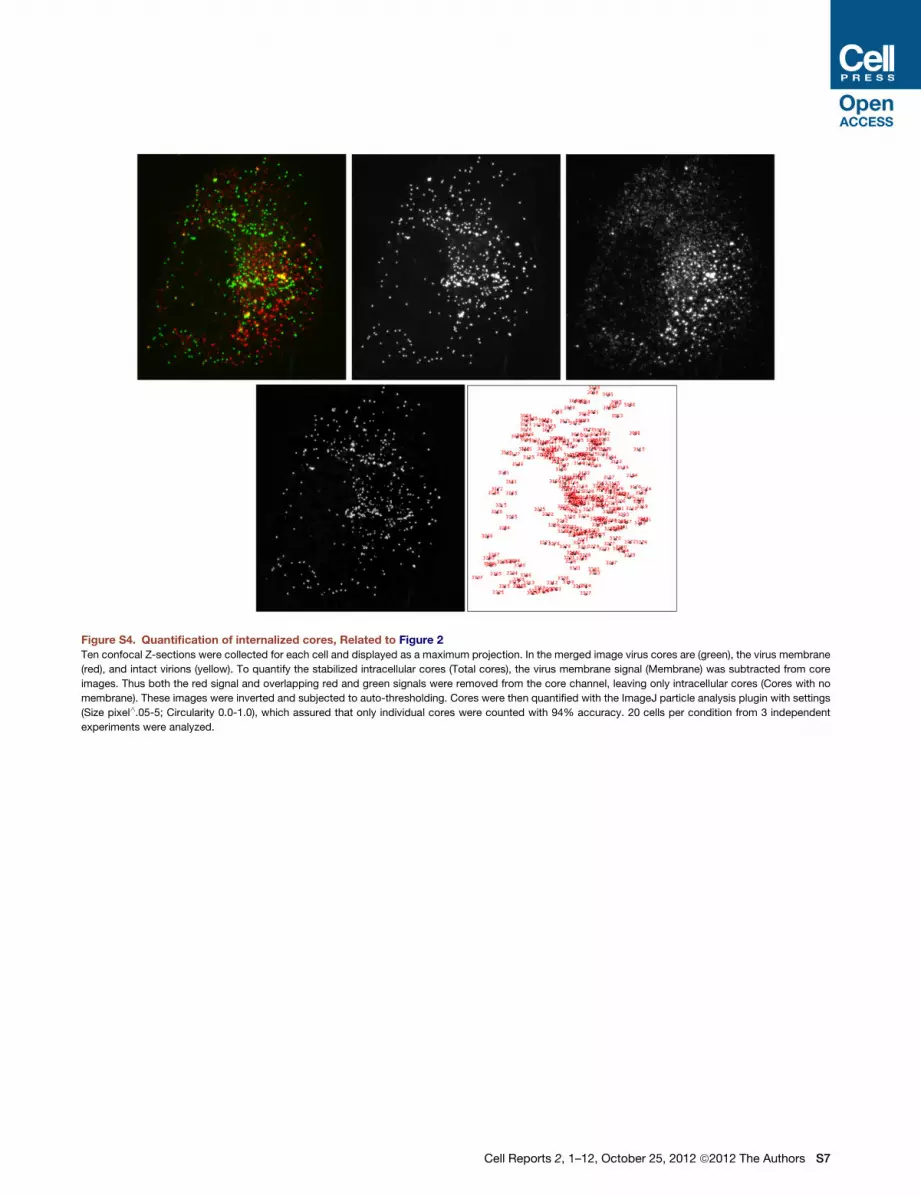
Figure S4. Quantification of internalized cores, Related to Figure 2
Ten confocal Z-sections were collected for each cell and displayed as a maximum projection. In the merged image virus cores are (green), the virus membrane
(red), and intact virions (yellow). To quantify the stabilized intracellular cores (Total cores), the virus membrane signal (Membrane) was subtracted from core
images. Thus both the red signal and overlapping red and green signals were removed from the core channel, leaving only intracellular cores (Cores with no
membrane). These images were inverted and subjected to auto-thresholding. Cores were then quantified with the ImageJ particle analysis plugin with settings
(Size pixel^.05-5; Circularity 0.0-1.0), which assured that only individual cores were counted with 94% accuracy. 20 cells per condition from 3 independent
experiments were analyzed.
Cell Reports 2, 1–12, October 25, 2012 ª2012 The Authors S7

Figure S5. Quantification of internalized cores visualized by EM, Related to Figure 2
(A) The number of stabilized cores in control cells and cells infected in the presence of CHX,MG132, or UBEI-41 inmicrographs of 0.1 mm thin epoxy sections were
quantified by point counting. For each sample condition, 25 micrographs were acquired at a magnification of 5800x on a 2k x 2k camera (pixel size = 8.36 nm). A
square lattice grid (2 cm grid spacing) was placed on printed micrographs to cover eachmicrograph completely. The number of cores per grid point in the cytosol
were counted and analyzed as published by Griffiths and Hoppeler, 1986.
(B) Cores are stabilized in the absence of proteasome, but not UBEI-41 function. The average number of cores observed per cell and per unit volume in untreated,
CHX, MG132, and UBEI-41 EM samples.
S8 Cell Reports 2, 1–12, October 25, 2012 ª2012 The Authors
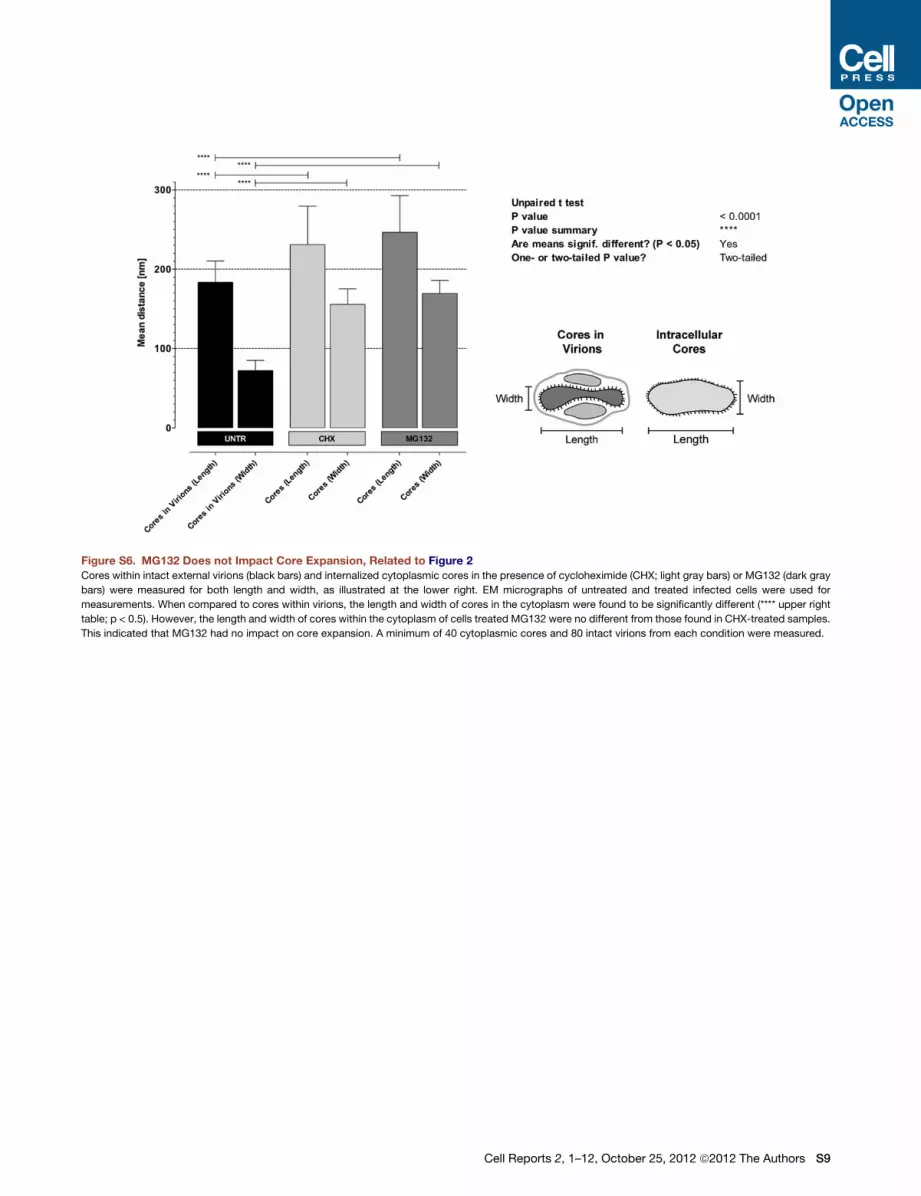
Figure S6. MG132 Does not Impact Core Expansion, Related to Figure 2
Cores within intact external virions (black bars) and internalized cytoplasmic cores in the presence of cycloheximide (CHX; light gray bars) or MG132 (dark gray
bars) were measured for both length and width, as illustrated at the lower right. EM micrographs of untreated and treated infected cells were used for
measurements. When compared to cores within virions, the length and width of cores in the cytoplasm were found to be significantly different (**** upper right
table; p < 0.5). However, the length and width of cores within the cytoplasm of cells treated MG132 were no different from those found in CHX-treated samples.
This indicated that MG132 had no impact on core expansion. A minimum of 40 cytoplasmic cores and 80 intact virions from each condition were measured.
Cell Reports 2, 1–12, October 25, 2012 ª2012 The Authors S9

Figure S7. The I3 Protein Is not Accessible in Intact VACV MVs, Related to Figure 3
VACV MVs, which package the A5 core protein as a mCherry fusion, were left untreated (UNTR) or were treated with 1% NP40/50 mM DTT to remove the viral
membrane. These virions were bound to a coverslip and stained with anti-I3L antibody, followed by secondary staining with a 488-coupled secondary antibody.
The I3 protein could only be detected in samples that had been treated with NP40/DTT.
S10 Cell Reports 2, 1–12, October 25, 2012 ª2012 The Authors

Figure S8. VACV Virions Cannot Be Isolated in the Presence of UBEI-41, Related to Figure 3
HeLa cells were infected at an MOI of 1 with VACV-EGFP-A5. At 6 hpi, UBEI-41 (50 mM) was added to one set of cells, a time when late gene expression was
determined to be unaffected (Figure 3D). Infections were allowed to proceed for a total of 24 hr before cells were harvested and progeny virions were collected
and purified over a 25%–40% sucrose gradient. Virions can be visualized as a white light-scattering band. Virions could not be obtained from samples treated
with UBEI-41. Virions from untreated (UNTR) cells were purified in parallel for comparison (white band). One ml was collected from the same region of both
gradients and titered to determine the number of infectious particles produced. For the untreated sample�13 109 infectious particles were recovered. When the
same region of the UBEI-41 treated gradient was measured by plaque titration �1 3 106 infectious particles were recovered.
Cell Reports 2, 1–12, October 25, 2012 ª2012 The Authors S11