rna sequencing of arabidopsis thaliana seedlings after non
TRANSCRIPT
�����������������
Citation: Waskow, A.; Guihur, A.;
Howling, A.; Furno, I. RNA
Sequencing of Arabidopsis thaliana
Seedlings after Non-Thermal
Plasma-Seed Treatment Reveals
Upregulation in Plant Stress and
Defense Pathways. Int. J. Mol. Sci.
2022, 23, 3070. https://doi.org/
10.3390/ijms23063070
Academic Editor: Laurence Lins
Received: 7 February 2022
Accepted: 10 March 2022
Published: 12 March 2022
Publisher’s Note: MDPI stays neutral
with regard to jurisdictional claims in
published maps and institutional affil-
iations.
Copyright: © 2022 by the authors.
Licensee MDPI, Basel, Switzerland.
This article is an open access article
distributed under the terms and
conditions of the Creative Commons
Attribution (CC BY) license (https://
creativecommons.org/licenses/by/
4.0/).
International Journal of
Molecular Sciences
Article
RNA Sequencing of Arabidopsis thaliana Seedlings afterNon-Thermal Plasma-Seed Treatment Reveals Upregulation inPlant Stress and Defense PathwaysAlexandra Waskow 1,*,†, Anthony Guihur 2,† , Alan Howling 1 and Ivo Furno 1
1 Swiss Plasma Center (SPC), École Polytechnique Fédérale de Lausanne (EPFL),CH-1015 Lausanne, Switzerland; [email protected] (A.H.); [email protected] (I.F.)
2 Department of Plant Molecular Biology, Faculty of Biology and Medicine, University of Lausanne (UNIL),CH-1015 Lausanne, Switzerland; [email protected]
* Correspondence: [email protected]† These authors contributed equally to this work.
Abstract: Not all agricultural practices are sustainable; however, non-thermal plasma treatment ofseeds may be an eco-friendly alternative to improve macroscopic plant growth parameters. Despitethe numerous successful results of plasma-seed treatments reported in the literature, there is a largegap in our understanding of how non-thermal plasma treatments affect seeds, especially due tothe plethora of physical, chemical, and biological variables. This study uses RNA sequencing tocharacterize the changes in gene transcription in Arabidopsis thaliana (L.) Heynh. seeds 6 days afterexposure to surface dielectric barrier discharge plasma treatment. Here, we provide an overviewof all pathways that are differentially expressed where few genes are upregulated and many genesare downregulated. Our results reveal that plasma treatment time is a parameter that can activatedifferent pathways in plant defense. An 80 s treatment upregulates the glucosinolate pathway, adefense response to insects and herbivores to deter feeding, whereas a shorter treatment of 60 supregulates the phenylpropanoid pathway, which reinforces the cell wall with lignin and producesantimicrobial compounds, a defense response to bacterial or fungal plant pathogens. It seems thatplasma elicits a wounding response from the seed in addition to redox changes. This suggests thatplasma treatment can be potentially applied in agriculture to protect plants against abiotic and bioticstresses without discharging residues into the environment.
Keywords: non-thermal plasma; RNA sequencing; Arabidopsis thaliana; oxidation-reduction; plant defense;secondary metabolism; glucosinolates; phenylpropanoids; wounding
1. Introduction
Currently, not every agricultural practice used to date is sustainable; however, non-thermal plasma treatment for seed treatment may be an alternative that produces no toxicresidues, consumes little energy, has low penetration depth to avoid injuring cells whilesupporting seed development such as germination, and crop yield, as well as resistance toabiotic and biotic stresses when dosed adequately [1–3].
Cold, non-thermal plasma is an ionized gas, a complex mixture of energetic electrons,ions, UV, thermal radiation, electric field, and reactive oxygen and nitrogen species. Non-thermal plasma is unique; although the electrons are high energy at several thousandKelvin, the overall gas temperature remains low. This is due to the efficient inelasticelectron-molecule collisions, which create an exotic, high-temperature chemistry, andthe inefficient elastic electron-molecule collisions, which avoid gas heating. Because ofthese properties, interesting biological applications of plasmas can be achieved. Dielectricbarrier discharges (DBDs) at atmospheric pressure are often used, convenient for practicalapplication in agriculture, and have an insulating dielectric layer that can be made of but
Int. J. Mol. Sci. 2022, 23, 3070. https://doi.org/10.3390/ijms23063070 https://www.mdpi.com/journal/ijms
Int. J. Mol. Sci. 2022, 23, 3070 2 of 24
not limited to glass, ceramic, plastic, or quartz. This layer is necessary to insulate theelectrodes and avoid possible arcing due to the use of high voltages in the several kVsranges. The plasma treatment time and duty cycle can be chosen to maintain a sufficientlylow gas temperature, which is advantageous when working with heat-sensitive biologicalsubstrates such as seeds.
It has been shown that seed germination can be accelerated, or the plant properties canbe altered where root length, shoot length, harvest mass or stress and disease resistance haveincreased after plasma treatment [4,5]. Despite the numerous successful results obtainedin other studies, it remains elusive which plasma treatment parameters are required toaffect plant growth parameters mainly because of the plethora of physical, chemical, andbiological variables [6]. Therefore, the focus has recently shifted toward analyzing thegene transcription in seedlings and plants developing from plasma-treated seeds or evenanalyzing the methylation on genes or proteins using quantitative PCR (qPCR) or otherhigh throughput methods, respectively [7–10].
Currently, the most common method for analyzing gene transcription in the plasmaagriculture literature is qPCR, where specific genes of interest are targeted, but very fewstudies analyze genes in an unbiased manner using micro-arrays or RNA sequencing(RNA-seq) [11–24]. Furthermore, these findings are often only relevant to that plant andmay not be applicable elsewhere to understand the molecular mechanisms of plasma-seed treatments. Therefore, it remains poorly understood which molecular mechanismsare involved in plasma-induced growth enhancement or disease and stress resistance.Although the plant choice is well justified based on local or global economic importance,there is often only one or a few studies of each plant type, which makes it difficult tocompare the results and find commonalities. However, there are a few studies publishedrecently using transcriptomics that provide a global overview of changes in gene expressionafter plasma treatment [25–28].
In this study, we use a surface DBD (SDBD) with two electrodes separated by thedielectric, and the plasma is formed in the gas at the edges of high-voltage patternedelectrode to treat Arabidopsis thaliana (L.) Heynh. as a seed substrate. A. thaliana has its entiregenome sequenced, and thus, unraveling the molecular mechanisms of the interactionswith plasmas is more feasible. Since it is a plant model organism for the Brassica family,these findings could be potentially applied to agriculturally relevant crop plants. Thisstudy is among the first ones using RNA-seq in A. thaliana to characterize the changes ingene transcription in these seeds 6 days after SDBD plasma treatment using dry syntheticair. Here, we provide an overview of all pathways that are differentially expressed where afew genes are upregulated and many genes are downregulated. A hypothesis is proposedin the Discussion and Conclusions as to how plants could react to non-thermal plasma.
2. Results2.1. Germination Rate of Plasma-Treated A. thaliana Seeds
As shown in a previous study [29], germination rates were measured for parametricscans of treatment time, voltage, flow rate, gap distance between the plasma and seed, andfrequency. Here, the operating parameters were either 60 or 80 s treatment time, 8 kV peak-to-peak; 2 L/min flow rate of dry synthetic air; seed substrate distance 3.7 mm; and 10 kHzfrequency with a power on/off modulation at 500 Hz and 10% duty cycle, corresponding toa burst of 2 cycles per modulation period. The 10% duty cycle was used to avoid heat shockof the seeds. Figure 1 shows the germination rate of seeds measured after 48 h, comparedto the control untreated seeds with no plasma exposure (indicated as 0 s in the figure).
As marked by the asterisks in Figure 1, scans of treatment time yielded statisticallysignificant increases in the germination rate for 20, 60, and 80 s times. The longest plasmatreatment time of 80 s had the highest statistical significance for the germination rate;therefore, this parameter set is the focus of this paper. However, data from 60 s are addedand mentioned where appropriate.
Int. J. Mol. Sci. 2022, 23, 3070 3 of 24Int. J. Mol. Sci. 2022, 23, 3070 3 of 24
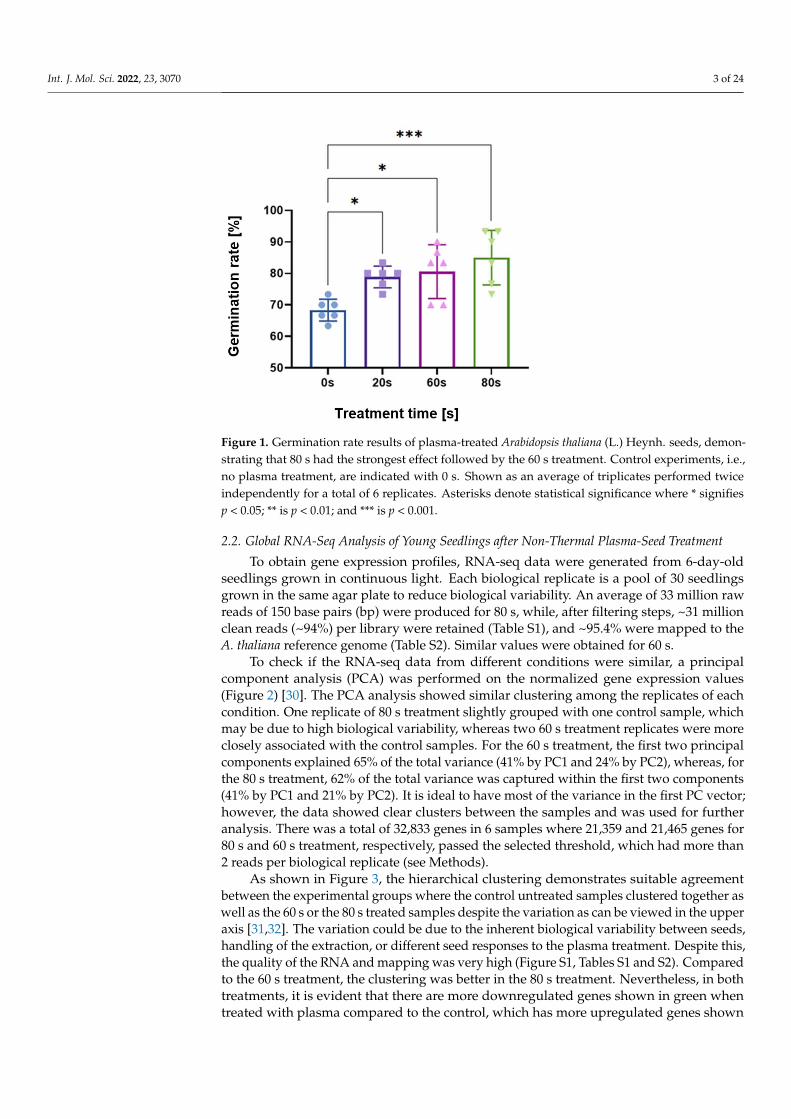
Figure 1. Germination rate results of plasma-treated Arabidopsis thaliana (L.) Heynh. seeds, demon-strating that 80 s had the strongest effect followed by the 60 s treatment. Control experiments, i.e., no plasma treatment, are indicated with 0 s. Shown as an average of triplicates performed twice independently for a total of 6 replicates. Asterisks denote statistical significance where * signifies p < 0.05; ** is p < 0.01; and *** is p < 0.001.
As marked by the asterisks in Figure 1, scans of treatment time yielded statistically significant increases in the germination rate for 20, 60, and 80 s times. The longest plasma treatment time of 80 s had the highest statistical significance for the germination rate; therefore, this parameter set is the focus of this paper. However, data from 60 s are added and mentioned where appropriate.
2.2. Global RNA-Seq Analysis of Young Seedlings after Non-Thermal Plasma-Seed Treatment To obtain gene expression profiles, RNA-seq data were generated from 6-day-old
seedlings grown in continuous light. Each biological replicate is a pool of 30 seedlings grown in the same agar plate to reduce biological variability. An average of 33 million raw reads of 150 base pairs (bp) were produced for 80 s, while, after filtering steps, ~31 million clean reads (~94%) per library were retained (Table S1), and ~95.4% were mapped to the A. thaliana reference genome (Table S2). Similar values were obtained for 60 s.
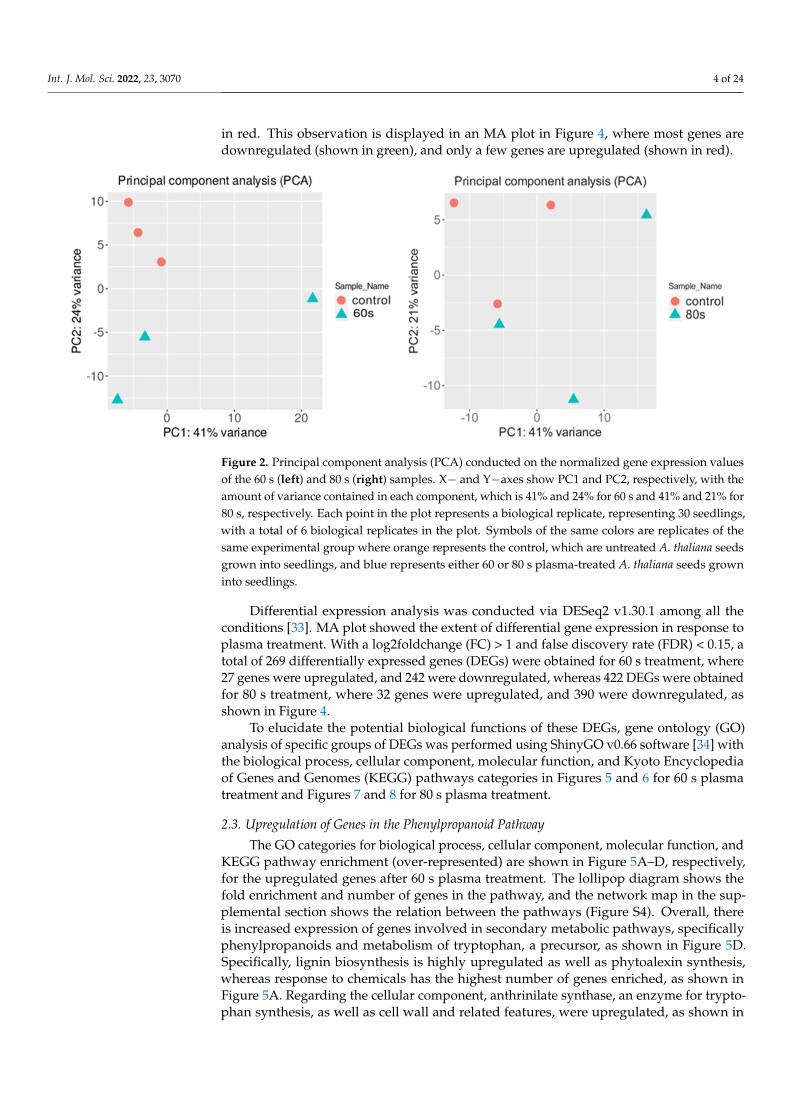
To check if the RNA-seq data from different conditions were similar, a principal com-ponent analysis (PCA) was performed on the normalized gene expression values (Figure 2) [30]. The PCA analysis showed similar clustering among the replicates of each condi-tion. One replicate of 80 s treatment slightly grouped with one control sample, which may be due to high biological variability, whereas two 60 s treatment replicates were more closely associated with the control samples. For the 60 s treatment, the first two principal components explained 65% of the total variance (41% by PC1 and 24% by PC2), whereas, for the 80 s treatment, 62% of the total variance was captured within the first two compo-nents (41% by PC1 and 21% by PC2). It is ideal to have most of the variance in the first PC vector; however, the data showed clear clusters between the samples and was used for further analysis. There was a total of 32,833 genes in 6 samples where 21,359 and 21,465 genes for 80 s and 60 s treatment, respectively, passed the selected threshold, which had more than 2 reads per biological replicate (see Methods).
Figure 1. Germination rate results of plasma-treated Arabidopsis thaliana (L.) Heynh. seeds, demon-strating that 80 s had the strongest effect followed by the 60 s treatment. Control experiments, i.e.,no plasma treatment, are indicated with 0 s. Shown as an average of triplicates performed twiceindependently for a total of 6 replicates. Asterisks denote statistical significance where * signifiesp < 0.05; ** is p < 0.01; and *** is p < 0.001.
2.2. Global RNA-Seq Analysis of Young Seedlings after Non-Thermal Plasma-Seed Treatment
To obtain gene expression profiles, RNA-seq data were generated from 6-day-oldseedlings grown in continuous light. Each biological replicate is a pool of 30 seedlingsgrown in the same agar plate to reduce biological variability. An average of 33 million rawreads of 150 base pairs (bp) were produced for 80 s, while, after filtering steps, ~31 millionclean reads (~94%) per library were retained (Table S1), and ~95.4% were mapped to theA. thaliana reference genome (Table S2). Similar values were obtained for 60 s.
To check if the RNA-seq data from different conditions were similar, a principalcomponent analysis (PCA) was performed on the normalized gene expression values(Figure 2) [30]. The PCA analysis showed similar clustering among the replicates of eachcondition. One replicate of 80 s treatment slightly grouped with one control sample, whichmay be due to high biological variability, whereas two 60 s treatment replicates were moreclosely associated with the control samples. For the 60 s treatment, the first two principalcomponents explained 65% of the total variance (41% by PC1 and 24% by PC2), whereas, forthe 80 s treatment, 62% of the total variance was captured within the first two components(41% by PC1 and 21% by PC2). It is ideal to have most of the variance in the first PC vector;however, the data showed clear clusters between the samples and was used for furtheranalysis. There was a total of 32,833 genes in 6 samples where 21,359 and 21,465 genes for80 s and 60 s treatment, respectively, passed the selected threshold, which had more than2 reads per biological replicate (see Methods).
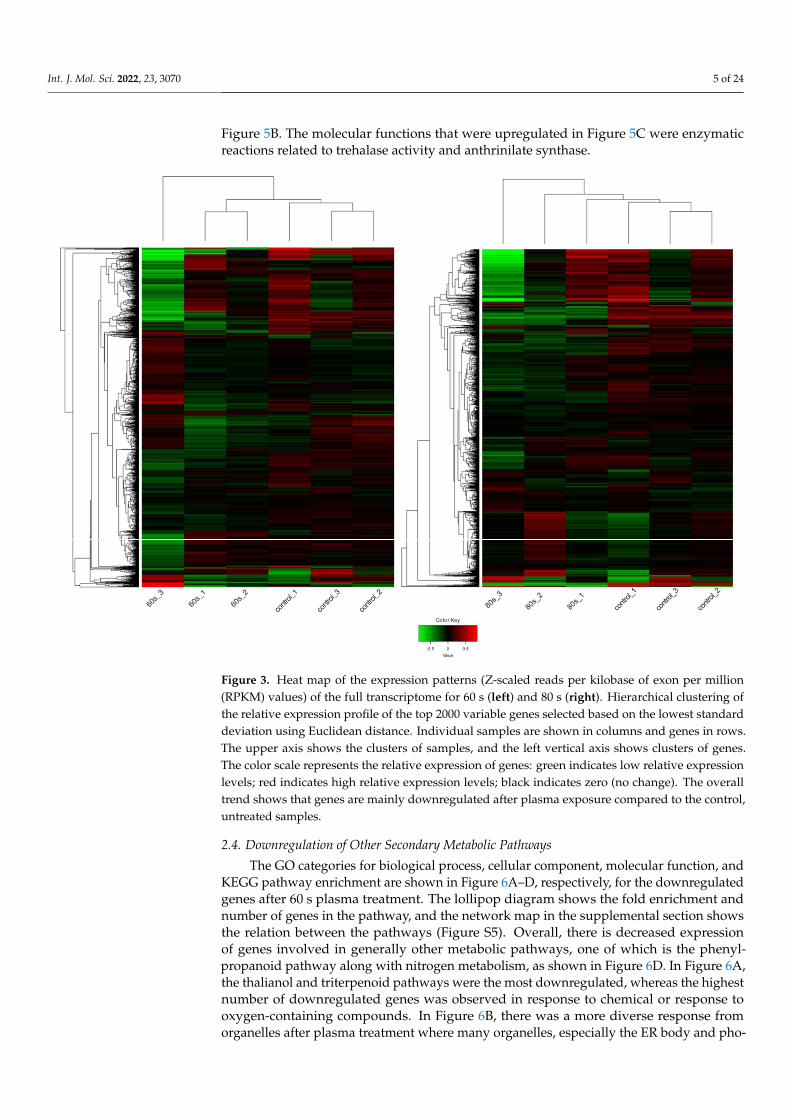
As shown in Figure 3, the hierarchical clustering demonstrates suitable agreementbetween the experimental groups where the control untreated samples clustered together aswell as the 60 s or the 80 s treated samples despite the variation as can be viewed in the upperaxis [31,32]. The variation could be due to the inherent biological variability between seeds,handling of the extraction, or different seed responses to the plasma treatment. Despite this,the quality of the RNA and mapping was very high (Figure S1, Tables S1 and S2). Comparedto the 60 s treatment, the clustering was better in the 80 s treatment. Nevertheless, in bothtreatments, it is evident that there are more downregulated genes shown in green whentreated with plasma compared to the control, which has more upregulated genes shown
Int. J. Mol. Sci. 2022, 23, 3070 4 of 24
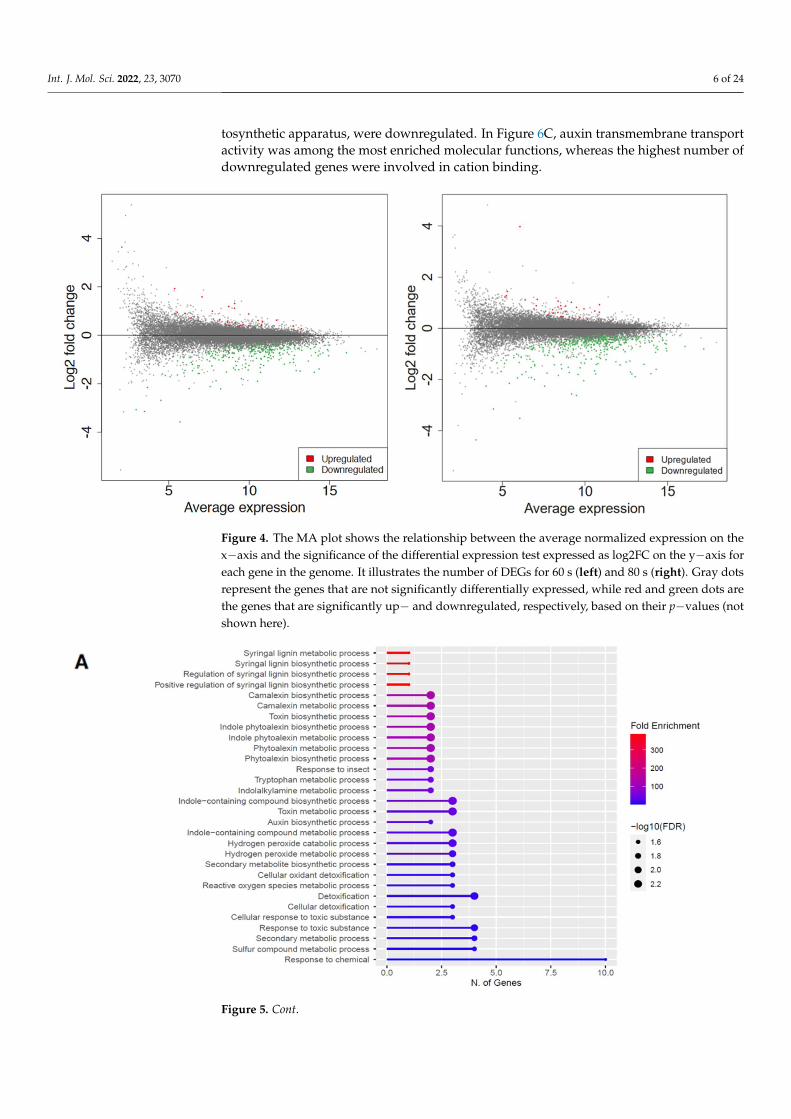
in red. This observation is displayed in an MA plot in Figure 4, where most genes aredownregulated (shown in green), and only a few genes are upregulated (shown in red).
Int. J. Mol. Sci. 2022, 23, 3070 4 of 24
Figure 2. Principal component analysis (PCA) conducted on the normalized gene expression values of the 60 s (left) and 80 s (right) samples. X− and Y−axes show PC1 and PC2, respectively, with the amount of variance contained in each component, which is 41% and 24% for 60 s and 41% and 21% for 80 s, respectively. Each point in the plot represents a biological replicate, representing 30 seed-lings, with a total of 6 biological replicates in the plot. Symbols of the same colors are replicates of the same experimental group where orange represents the control, which are untreated A. thaliana seeds grown into seedlings, and blue represents either 60 or 80 s plasma-treated A. thaliana seeds grown into seedlings.
As shown in Figure 3, the hierarchical clustering demonstrates suitable agreement between the experimental groups where the control untreated samples clustered together as well as the 60 s or the 80 s treated samples despite the variation as can be viewed in the upper axis [31,32]. The variation could be due to the inherent biological variability be-tween seeds, handling of the extraction, or different seed responses to the plasma treat-ment. Despite this, the quality of the RNA and mapping was very high (Figure S1, Table S1 and S2). Compared to the 60 s treatment, the clustering was better in the 80 s treatment. Nevertheless, in both treatments, it is evident that there are more downregulated genes shown in green when treated with plasma compared to the control, which has more up-regulated genes shown in red. This observation is displayed in an MA plot in Figure 4, where most genes are downregulated (shown in green), and only a few genes are upreg-ulated (shown in red).
Differential expression analysis was conducted via DESeq2 v1.30.1 among all the con-ditions [33]. MA plot showed the extent of differential gene expression in response to plasma treatment. With a log2foldchange (FC) > 1 and false discovery rate (FDR) < 0.15, a total of 269 differentially expressed genes (DEGs) were obtained for 60 s treatment, where 27 genes were upregulated, and 242 were downregulated, whereas 422 DEGs were ob-tained for 80 s treatment, where 32 genes were upregulated, and 390 were downregulated, as shown in Figure 4.
To elucidate the potential biological functions of these DEGs, gene ontology (GO) analysis of specific groups of DEGs was performed using ShinyGO v0.66 software [34] with the biological process, cellular component, molecular function, and Kyoto Encyclo-pedia of Genes and Genomes (KEGG) pathways categories in Figures 5 and 6 for 60 s plasma treatment and Figures 7 and 8 for 80 s plasma treatment.
Figure 2. Principal component analysis (PCA) conducted on the normalized gene expression valuesof the 60 s (left) and 80 s (right) samples. X− and Y−axes show PC1 and PC2, respectively, with theamount of variance contained in each component, which is 41% and 24% for 60 s and 41% and 21% for80 s, respectively. Each point in the plot represents a biological replicate, representing 30 seedlings,with a total of 6 biological replicates in the plot. Symbols of the same colors are replicates of thesame experimental group where orange represents the control, which are untreated A. thaliana seedsgrown into seedlings, and blue represents either 60 or 80 s plasma-treated A. thaliana seeds growninto seedlings.
Differential expression analysis was conducted via DESeq2 v1.30.1 among all theconditions [33]. MA plot showed the extent of differential gene expression in response toplasma treatment. With a log2foldchange (FC) > 1 and false discovery rate (FDR) < 0.15, atotal of 269 differentially expressed genes (DEGs) were obtained for 60 s treatment, where27 genes were upregulated, and 242 were downregulated, whereas 422 DEGs were obtainedfor 80 s treatment, where 32 genes were upregulated, and 390 were downregulated, asshown in Figure 4.
To elucidate the potential biological functions of these DEGs, gene ontology (GO)analysis of specific groups of DEGs was performed using ShinyGO v0.66 software [34] withthe biological process, cellular component, molecular function, and Kyoto Encyclopediaof Genes and Genomes (KEGG) pathways categories in Figures 5 and 6 for 60 s plasmatreatment and Figures 7 and 8 for 80 s plasma treatment.
2.3. Upregulation of Genes in the Phenylpropanoid Pathway
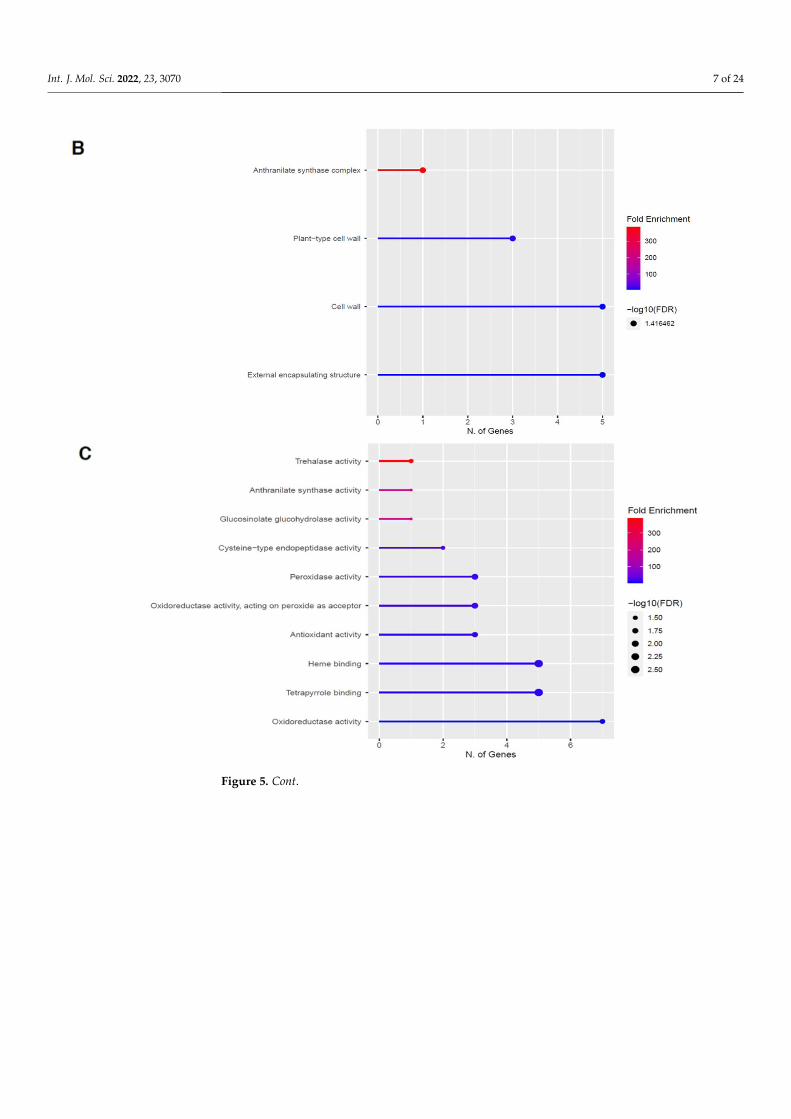
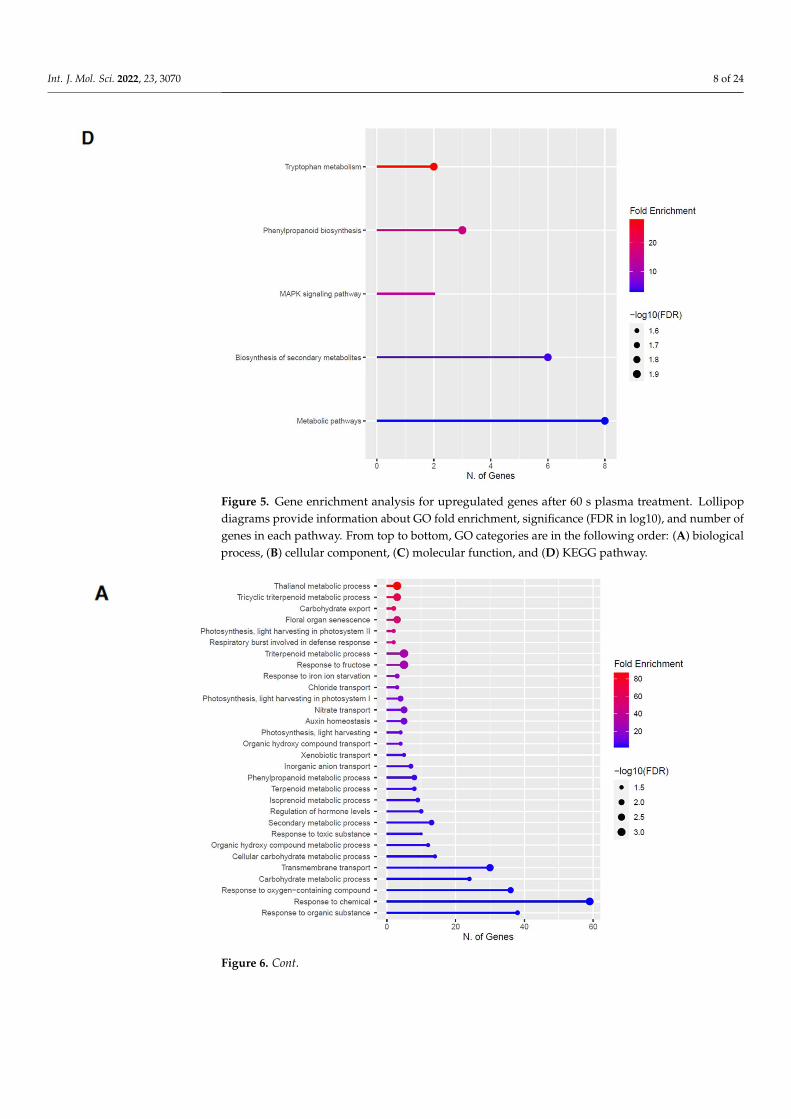
The GO categories for biological process, cellular component, molecular function, andKEGG pathway enrichment (over-represented) are shown in Figure 5A–D, respectively,for the upregulated genes after 60 s plasma treatment. The lollipop diagram shows thefold enrichment and number of genes in the pathway, and the network map in the sup-plemental section shows the relation between the pathways (Figure S4). Overall, thereis increased expression of genes involved in secondary metabolic pathways, specificallyphenylpropanoids and metabolism of tryptophan, a precursor, as shown in Figure 5D.Specifically, lignin biosynthesis is highly upregulated as well as phytoalexin synthesis,whereas response to chemicals has the highest number of genes enriched, as shown inFigure 5A. Regarding the cellular component, anthrinilate synthase, an enzyme for trypto-phan synthesis, as well as cell wall and related features, were upregulated, as shown in
Int. J. Mol. Sci. 2022, 23, 3070 5 of 24
Figure 5B. The molecular functions that were upregulated in Figure 5C were enzymaticreactions related to trehalase activity and anthrinilate synthase.
Int. J. Mol. Sci. 2022, 23, 3070 5 of 24
Figure 3. Heat map of the expression patterns (Z-scaled reads per kilobase of exon per million (RPKM) values) of the full transcriptome for 60 s (left) and 80 s (right). Hierarchical clustering of the relative expression profile of the top 2000 variable genes selected based on the lowest standard deviation using Euclidean distance. Individual samples are shown in columns and genes in rows. The upper axis shows the clusters of samples, and the left vertical axis shows clusters of genes. The color scale represents the relative expression of genes: green indicates low relative expression levels; red indicates high relative expression levels; black indicates zero (no change). The overall trend shows that genes are mainly downregulated after plasma exposure compared to the control, un-treated samples.
2.3. Upregulation of Genes in the Phenylpropanoid Pathway The GO categories for biological process, cellular component, molecular function,
and KEGG pathway enrichment (over-represented) are shown in Figure 5A–D, respec-tively, for the upregulated genes after 60 s plasma treatment. The lollipop diagram shows the fold enrichment and number of genes in the pathway, and the network map in the supplemental section shows the relation between the pathways (Figure S4). Overall, there is increased expression of genes involved in secondary metabolic pathways, specifically phenylpropanoids and metabolism of tryptophan, a precursor, as shown in Figure 5D. Specifically, lignin biosynthesis is highly upregulated as well as phytoalexin synthesis, whereas response to chemicals has the highest number of genes enriched, as shown in Figure 5A. Regarding the cellular component, anthrinilate synthase, an enzyme for tryp-tophan synthesis, as well as cell wall and related features, were upregulated, as shown in Figure 5B. The molecular functions that were upregulated in Figure 5C were enzymatic reactions related to trehalase activity and anthrinilate synthase.
Figure 3. Heat map of the expression patterns (Z-scaled reads per kilobase of exon per million(RPKM) values) of the full transcriptome for 60 s (left) and 80 s (right). Hierarchical clustering ofthe relative expression profile of the top 2000 variable genes selected based on the lowest standarddeviation using Euclidean distance. Individual samples are shown in columns and genes in rows.The upper axis shows the clusters of samples, and the left vertical axis shows clusters of genes.The color scale represents the relative expression of genes: green indicates low relative expressionlevels; red indicates high relative expression levels; black indicates zero (no change). The overalltrend shows that genes are mainly downregulated after plasma exposure compared to the control,untreated samples.
2.4. Downregulation of Other Secondary Metabolic Pathways
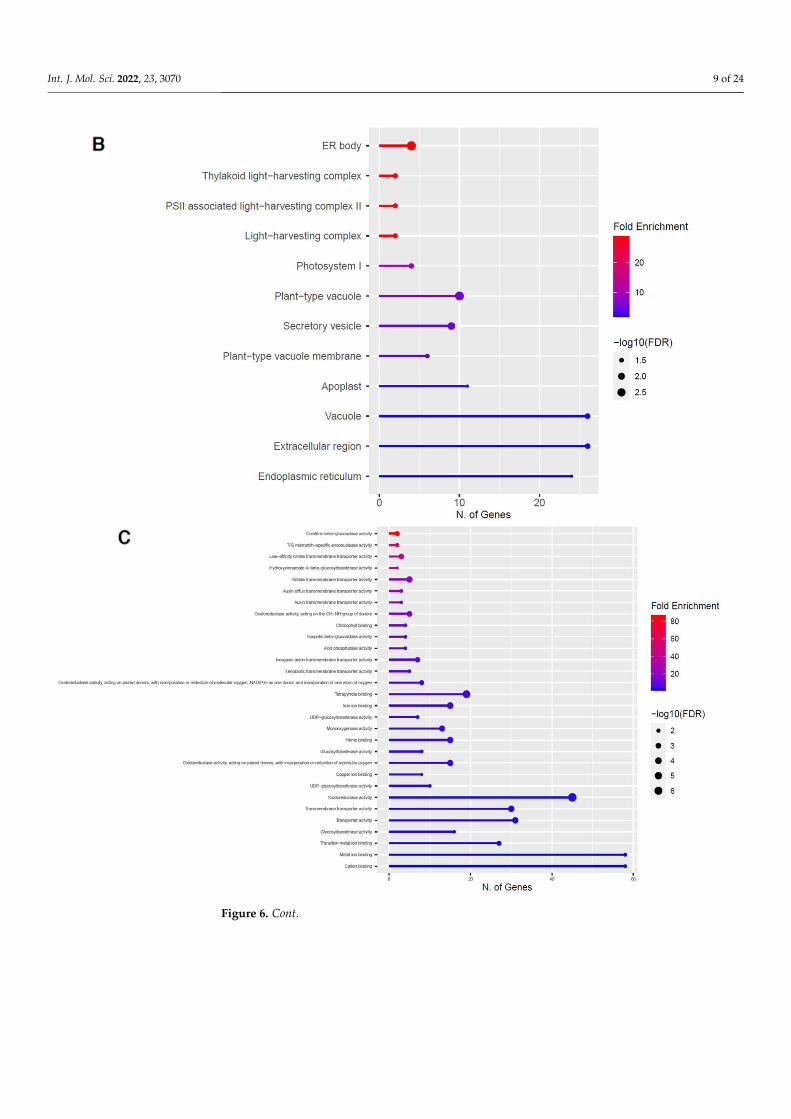
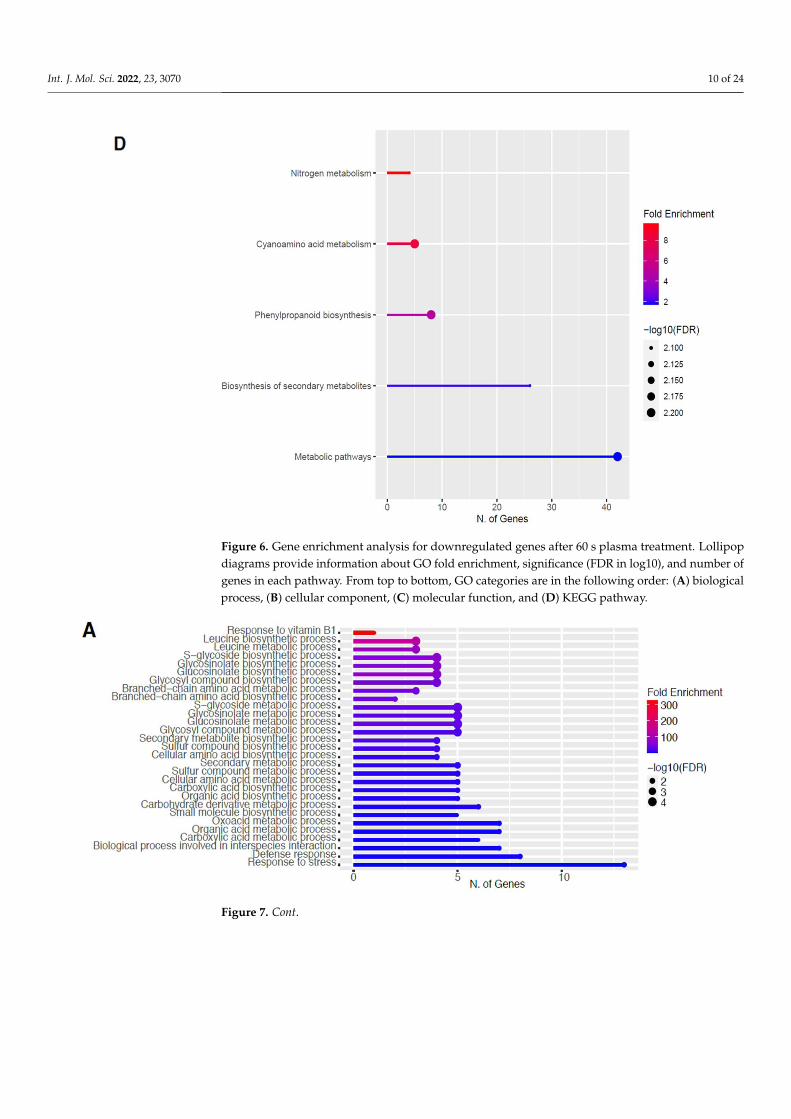
The GO categories for biological process, cellular component, molecular function, andKEGG pathway enrichment are shown in Figure 6A–D, respectively, for the downregulatedgenes after 60 s plasma treatment. The lollipop diagram shows the fold enrichment andnumber of genes in the pathway, and the network map in the supplemental section showsthe relation between the pathways (Figure S5). Overall, there is decreased expressionof genes involved in generally other metabolic pathways, one of which is the phenyl-propanoid pathway along with nitrogen metabolism, as shown in Figure 6D. In Figure 6A,the thalianol and triterpenoid pathways were the most downregulated, whereas the highestnumber of downregulated genes was observed in response to chemical or response tooxygen-containing compounds. In Figure 6B, there was a more diverse response fromorganelles after plasma treatment where many organelles, especially the ER body and pho-
Int. J. Mol. Sci. 2022, 23, 3070 6 of 24
tosynthetic apparatus, were downregulated. In Figure 6C, auxin transmembrane transportactivity was among the most enriched molecular functions, whereas the highest number ofdownregulated genes were involved in cation binding.
Int. J. Mol. Sci. 2022, 23, 3070 6 of 24
Figure 4. The MA plot shows the relationship between the average normalized expression on the x−axis and the significance of the differential expression test expressed as log2FC on the y−axis for each gene in the genome. It illustrates the number of DEGs for 60 s (left) and 80 s (right). Gray dots represent the genes that are not significantly differentially expressed, while red and green dots are the genes that are significantly up− and downregulated, respectively, based on their p−values (not shown here).
2.4. Downregulation of Other Secondary Metabolic Pathways The GO categories for biological process, cellular component, molecular function,
and KEGG pathway enrichment are shown in Figure 6A–D, respectively, for the down-regulated genes after 60 s plasma treatment. The lollipop diagram shows the fold enrich-ment and number of genes in the pathway, and the network map in the supplemental section shows the relation between the pathways (Figure S5). Overall, there is decreased expression of genes involved in generally other metabolic pathways, one of which is the phenylpropanoid pathway along with nitrogen metabolism, as shown in Figure 6D. In Figure 6A, the thalianol and triterpenoid pathways were the most downregulated, whereas the highest number of downregulated genes was observed in response to chem-ical or response to oxygen-containing compounds. In Figure 6B, there was a more diverse response from organelles after plasma treatment where many organelles, especially the ER body and photosynthetic apparatus, were downregulated. In Figure 6C, auxin trans-membrane transport activity was among the most enriched molecular functions, whereas the highest number of downregulated genes were involved in cation binding.
2.5. Upregulation of Genes in the Glucosinolate Pathway The GO categories for biological process, cellular component, molecular function,
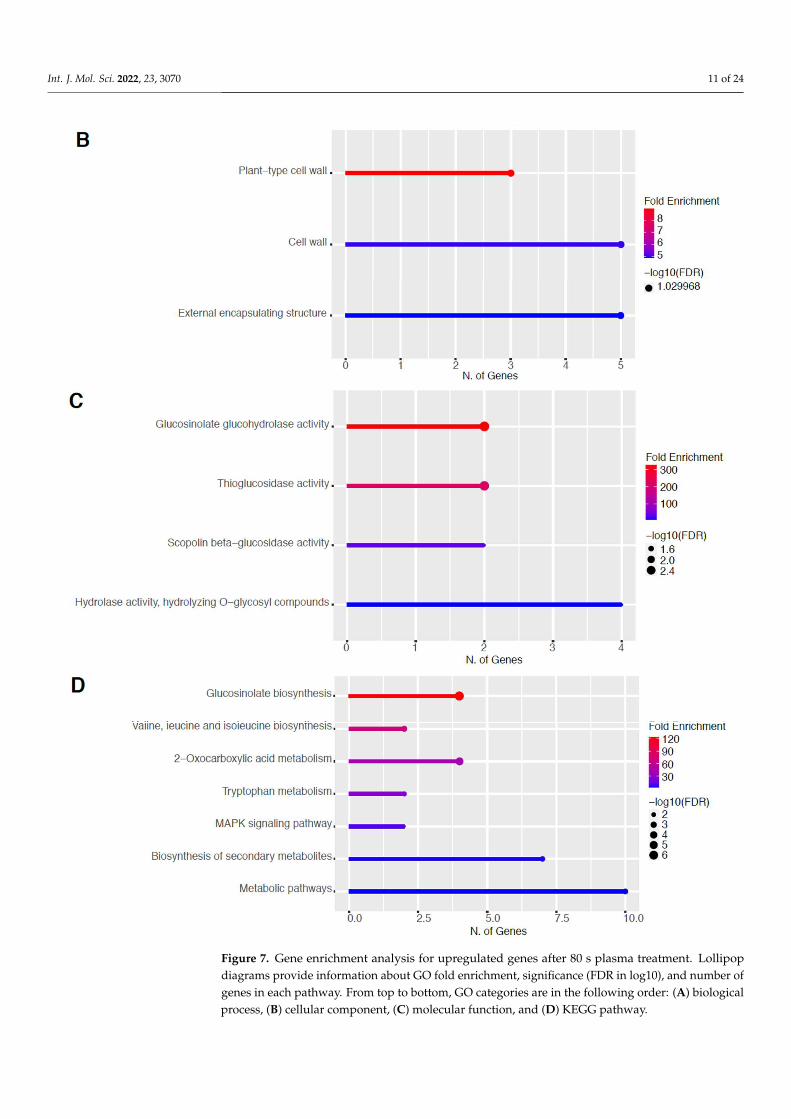
and KEGG pathway enrichment (over-represented) are shown in Figure 7A–D, respec-tively, for the upregulated genes after 80 s plasma treatment. The lollipop diagram shows the fold enrichment and number of genes in the pathway, and the network map in the supplemental section shows the relation between the pathways (Figure S8). Overall, there is increased expression of genes involved in secondary metabolic pathways, specifically glucosinolates and the precursors for their synthesis, such as valine, leucine, and trypto-phan, as shown in Figure 7D. Specifically, the response of vitamin B1 is highly upregu-lated, whereas the defense and stress responses have the highest number of genes en-riched, as shown in Figure 7A, all of which are interconnected. Regarding the cellular
Figure 4. The MA plot shows the relationship between the average normalized expression on thex−axis and the significance of the differential expression test expressed as log2FC on the y−axis foreach gene in the genome. It illustrates the number of DEGs for 60 s (left) and 80 s (right). Gray dotsrepresent the genes that are not significantly differentially expressed, while red and green dots arethe genes that are significantly up− and downregulated, respectively, based on their p−values (notshown here).
Int. J. Mol. Sci. 2022, 23, 3070 7 of 24
component, only the cell wall and related features were upregulated, which included sev-eral genes, as shown in Figure 7B. The molecular functions that were upregulated in Fig-ure 7C were enzymatic reactions related to glucosinolates. All of these upregulated ele-ments point to stress and defense responses being upregulated after 80 s plasma treat-ment.
Figure 5. Cont.
Int. J. Mol. Sci. 2022, 23, 3070 7 of 24
Int. J. Mol. Sci. 2022, 23, 3070 7 of 24
component, only the cell wall and related features were upregulated, which included sev-eral genes, as shown in Figure 7B. The molecular functions that were upregulated in Fig-ure 7C were enzymatic reactions related to glucosinolates. All of these upregulated ele-ments point to stress and defense responses being upregulated after 80 s plasma treat-ment.
Int. J. Mol. Sci. 2022, 23, 3070 8 of 24
Figure 5. Gene enrichment analysis for upregulated genes after 60 s plasma treatment. Lollipop diagrams provide information about GO fold enrichment, significance (FDR in log10), and number of genes in each pathway. From top to bottom, GO categories are in the following order: (A) biolog-ical process, (B) cellular component, (C) molecular function, and (D) KEGG pathway.
2.6. Downregulation of Other Secondary Metabolic Pathways The GO categories for biological process, cellular component, molecular function,
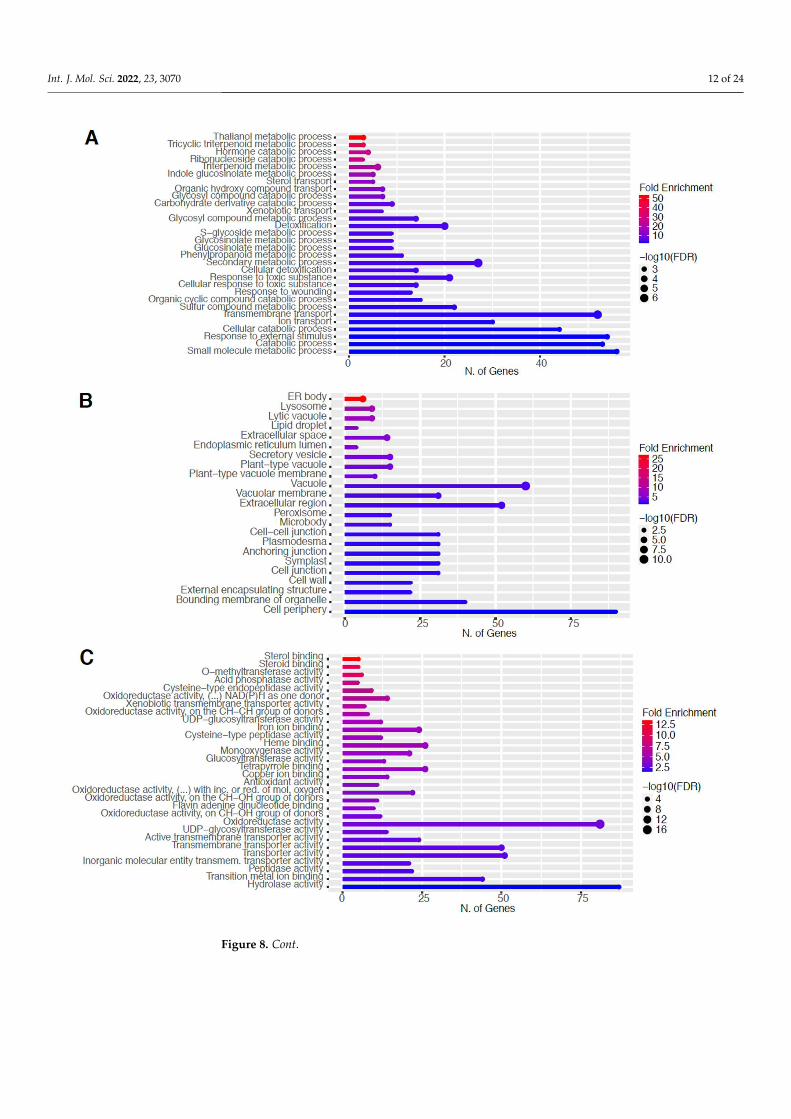
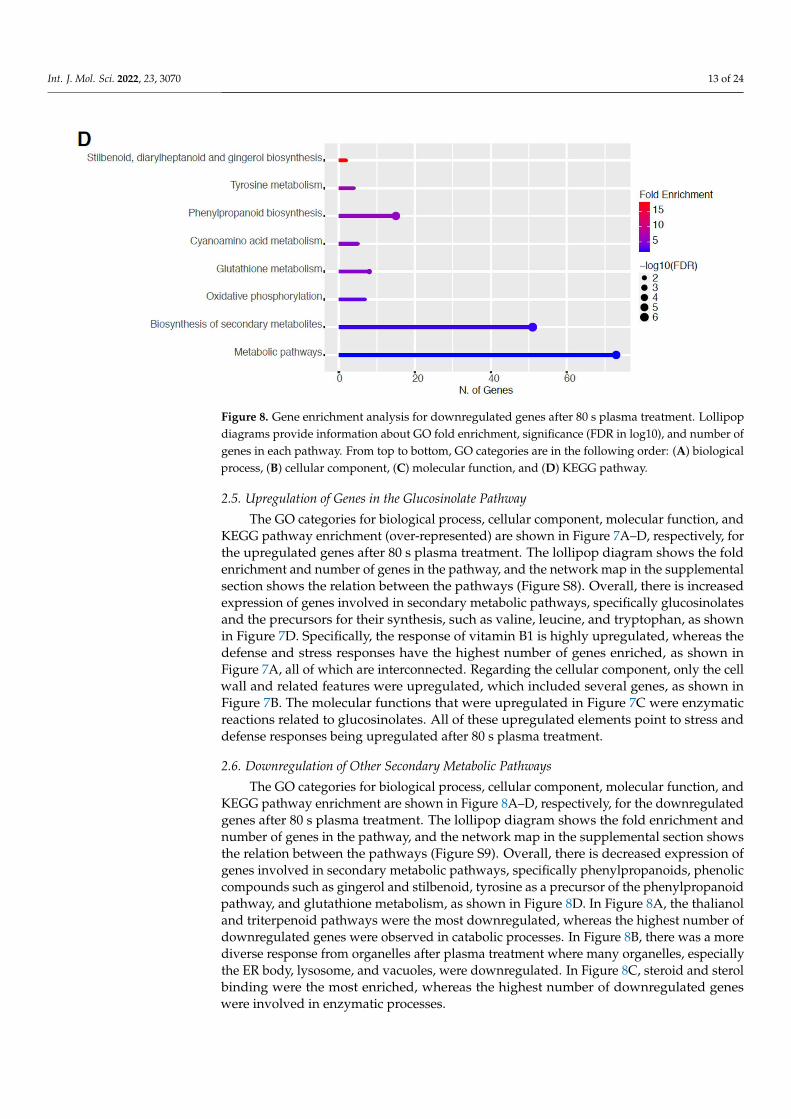
and KEGG pathway enrichment are shown in Figure 8A–D, respectively, for the down-regulated genes after 80 s plasma treatment. The lollipop diagram shows the fold enrich-ment and number of genes in the pathway, and the network map in the supplemental section shows the relation between the pathways (Figure S9). Overall, there is decreased expression of genes involved in secondary metabolic pathways, specifically phenylpro-panoids, phenolic compounds such as gingerol and stilbenoid, tyrosine as a precursor of the phenylpropanoid pathway, and glutathione metabolism, as shown in Figure 8D. In Figure 8A, the thalianol and triterpenoid pathways were the most downregulated, whereas the highest number of downregulated genes were observed in catabolic pro-cesses. In Figure 8B, there was a more diverse response from organelles after plasma treat-ment where many organelles, especially the ER body, lysosome, and vacuoles, were
Figure 5. Cont.
Int. J. Mol. Sci. 2022, 23, 3070 8 of 24
Int. J. Mol. Sci. 2022, 23, 3070 8 of 24
Figure 5. Gene enrichment analysis for upregulated genes after 60 s plasma treatment. Lollipop diagrams provide information about GO fold enrichment, significance (FDR in log10), and number of genes in each pathway. From top to bottom, GO categories are in the following order: (A) biolog-ical process, (B) cellular component, (C) molecular function, and (D) KEGG pathway.
2.6. Downregulation of Other Secondary Metabolic Pathways The GO categories for biological process, cellular component, molecular function,
and KEGG pathway enrichment are shown in Figure 8A–D, respectively, for the down-regulated genes after 80 s plasma treatment. The lollipop diagram shows the fold enrich-ment and number of genes in the pathway, and the network map in the supplemental section shows the relation between the pathways (Figure S9). Overall, there is decreased expression of genes involved in secondary metabolic pathways, specifically phenylpro-panoids, phenolic compounds such as gingerol and stilbenoid, tyrosine as a precursor of the phenylpropanoid pathway, and glutathione metabolism, as shown in Figure 8D. In Figure 8A, the thalianol and triterpenoid pathways were the most downregulated, whereas the highest number of downregulated genes were observed in catabolic pro-cesses. In Figure 8B, there was a more diverse response from organelles after plasma treat-ment where many organelles, especially the ER body, lysosome, and vacuoles, were
Figure 5. Gene enrichment analysis for upregulated genes after 60 s plasma treatment. Lollipopdiagrams provide information about GO fold enrichment, significance (FDR in log10), and number ofgenes in each pathway. From top to bottom, GO categories are in the following order: (A) biologicalprocess, (B) cellular component, (C) molecular function, and (D) KEGG pathway.
Int. J. Mol. Sci. 2022, 23, 3070 9 of 24
downregulated. In Figure 8C, steroid and sterol binding were the most enriched, whereas the highest number of downregulated genes were involved in enzymatic processes.
Figure 6. Cont.
Int. J. Mol. Sci. 2022, 23, 3070 9 of 24
Int. J. Mol. Sci. 2022, 23, 3070 9 of 24
downregulated. In Figure 8C, steroid and sterol binding were the most enriched, whereas the highest number of downregulated genes were involved in enzymatic processes.
Int. J. Mol. Sci. 2022, 23, 3070 10 of 24
Figure 6. Gene enrichment analysis for downregulated genes after 60 s plasma treatment. Lollipop diagrams provide information about GO fold enrichment, significance (FDR in log10), and number of genes in each pathway. From top to bottom, GO categories are in the following order: (A) biolog-ical process, (B) cellular component, (C) molecular function, and (D) KEGG pathway.
Figure 6. Cont.
Int. J. Mol. Sci. 2022, 23, 3070 10 of 24
Int. J. Mol. Sci. 2022, 23, 3070 10 of 24
Figure 6. Gene enrichment analysis for downregulated genes after 60 s plasma treatment. Lollipop diagrams provide information about GO fold enrichment, significance (FDR in log10), and number of genes in each pathway. From top to bottom, GO categories are in the following order: (A) biolog-ical process, (B) cellular component, (C) molecular function, and (D) KEGG pathway.
Figure 6. Gene enrichment analysis for downregulated genes after 60 s plasma treatment. Lollipopdiagrams provide information about GO fold enrichment, significance (FDR in log10), and number ofgenes in each pathway. From top to bottom, GO categories are in the following order: (A) biologicalprocess, (B) cellular component, (C) molecular function, and (D) KEGG pathway.
Int. J. Mol. Sci. 2022, 23, 3070 11 of 24
Figure 7. Cont.
Int. J. Mol. Sci. 2022, 23, 3070 11 of 24
Int. J. Mol. Sci. 2022, 23, 3070 11 of 24
Figure 7. Gene enrichment analysis for upregulated genes after 80 s plasma treatment. Lollipopdiagrams provide information about GO fold enrichment, significance (FDR in log10), and number ofgenes in each pathway. From top to bottom, GO categories are in the following order: (A) biologicalprocess, (B) cellular component, (C) molecular function, and (D) KEGG pathway.
Int. J. Mol. Sci. 2022, 23, 3070 12 of 24
Int. J. Mol. Sci. 2022, 23, 3070 12 of 24
Figure 7. Gene enrichment analysis for upregulated genes after 80 s plasma treatment. Lollipop diagrams provide information about GO fold enrichment, significance (FDR in log10), and number of genes in each pathway. From top to bottom, GO categories are in the following order: (A) biolog-ical process, (B) cellular component, (C) molecular function, and (D) KEGG pathway.
Figure 8. Cont.
Int. J. Mol. Sci. 2022, 23, 3070 13 of 24Int. J. Mol. Sci. 2022, 23, 3070 13 of 24
Figure 8. Gene enrichment analysis for downregulated genes after 80 s plasma treatment. Lollipop diagrams provide information about GO fold enrichment, significance (FDR in log10), and number of genes in each pathway. From top to bottom, GO categories are in the following order: (A) biolog-ical process, (B) cellular component, (C) molecular function, and (D) KEGG pathway.
3. Discussion and Conclusions As stated previously, it is difficult to compare results across plasma-seed treatment
studies due to the high number of variables, and if molecular analysis is performed, often specific genes are selected based on economic or health-related importance. In previous plasma agriculture studies, the genes that were targeted are related to germination, pri-mary or secondary metabolisms, such as starch-degrading enzyme [11], drought-related resistance genes [12], antioxidant genes [13], pathogen resistance (PR) genes, and epige-netic regulation related genes [14,15], and plant-specific secondary metabolites with phar-macological uses [17,19].
The aim of our study was to look at the long-term memory effect of the plasma treat-ment by using 6-day-old seedlings rather than 1–2-day-old seeds because both the root and stem would have emerged from the seed, and this would ensure that there would be transcriptional changes that could be absent if the extraction is performed too soon; this was the case in the Andrographis study [25]. Moreover, it is common practice to use young seedlings because they are more sensitive to stress, and therefore, it would be possible to observe acute stress. A limitedtreatment time was chosen to avoid additional stresses such as heat stress, which induces a plethora of cellular effects [35–38]. Early germination was the macroscopic parameter used as an indicator of changes in the molecular biology, as shown in Figure 1, which is an effect observed in other studies [39].
For this first exploratory study, RNA-seq was used since it is an unbiased method that provides a global overview of all genes. DESeq2 was used for this paper since it is common practice and to balance stringency and flexibility [40]. We analyzed approxi-mately 21,000 A. thaliana genes out of approximately 33,000 genes using RNA-seq (NCBI project number PRJNA800224) on plasma-treated seeds grown until and including the sixth day. We found 422 DEGs, with 32 upregulated and 390 downregulated (Figure 4), and suitable agreement between the biological replicates within the control and 80 s plasma-treated samples (Figure 3). For the 60 s plasma-treated samples, we found 269 DEGs, with 27 upregulated and 242 downregulated (Figures 3 and 4).
3.1. Gene Enrichment as a Result of Short Non-Thermal Air Plasma Treatment As shown in Figure 1, accelerated germination was observed, which is in line with
the growth enhancement effects observed in other studies [4,41]. Growth enhancement is not the only type of plant response to plasma and also includes seed surface functionali-zation, seed decontamination, as well as stress anddefense response [1]. Our findings in Figures 5 and 6 for 60 s and Figures 7 and 8 for 80 s suggest that on a molecular level, this
Figure 8. Gene enrichment analysis for downregulated genes after 80 s plasma treatment. Lollipopdiagrams provide information about GO fold enrichment, significance (FDR in log10), and number ofgenes in each pathway. From top to bottom, GO categories are in the following order: (A) biologicalprocess, (B) cellular component, (C) molecular function, and (D) KEGG pathway.
2.5. Upregulation of Genes in the Glucosinolate Pathway
The GO categories for biological process, cellular component, molecular function, andKEGG pathway enrichment (over-represented) are shown in Figure 7A–D, respectively, forthe upregulated genes after 80 s plasma treatment. The lollipop diagram shows the foldenrichment and number of genes in the pathway, and the network map in the supplementalsection shows the relation between the pathways (Figure S8). Overall, there is increasedexpression of genes involved in secondary metabolic pathways, specifically glucosinolatesand the precursors for their synthesis, such as valine, leucine, and tryptophan, as shownin Figure 7D. Specifically, the response of vitamin B1 is highly upregulated, whereas thedefense and stress responses have the highest number of genes enriched, as shown inFigure 7A, all of which are interconnected. Regarding the cellular component, only the cellwall and related features were upregulated, which included several genes, as shown inFigure 7B. The molecular functions that were upregulated in Figure 7C were enzymaticreactions related to glucosinolates. All of these upregulated elements point to stress anddefense responses being upregulated after 80 s plasma treatment.
2.6. Downregulation of Other Secondary Metabolic Pathways
The GO categories for biological process, cellular component, molecular function, andKEGG pathway enrichment are shown in Figure 8A–D, respectively, for the downregulatedgenes after 80 s plasma treatment. The lollipop diagram shows the fold enrichment andnumber of genes in the pathway, and the network map in the supplemental section showsthe relation between the pathways (Figure S9). Overall, there is decreased expression ofgenes involved in secondary metabolic pathways, specifically phenylpropanoids, phenoliccompounds such as gingerol and stilbenoid, tyrosine as a precursor of the phenylpropanoidpathway, and glutathione metabolism, as shown in Figure 8D. In Figure 8A, the thalianoland triterpenoid pathways were the most downregulated, whereas the highest number ofdownregulated genes were observed in catabolic processes. In Figure 8B, there was a morediverse response from organelles after plasma treatment where many organelles, especiallythe ER body, lysosome, and vacuoles, were downregulated. In Figure 8C, steroid and sterolbinding were the most enriched, whereas the highest number of downregulated geneswere involved in enzymatic processes.
Int. J. Mol. Sci. 2022, 23, 3070 14 of 24
3. Discussion and Conclusions
As stated previously, it is difficult to compare results across plasma-seed treatmentstudies due to the high number of variables, and if molecular analysis is performed, oftenspecific genes are selected based on economic or health-related importance. In previousplasma agriculture studies, the genes that were targeted are related to germination, pri-mary or secondary metabolisms, such as starch-degrading enzyme [11], drought-relatedresistance genes [12], antioxidant genes [13], pathogen resistance (PR) genes, and epi-genetic regulation related genes [14,15], and plant-specific secondary metabolites withpharmacological uses [17,19].
The aim of our study was to look at the long-term memory effect of the plasmatreatment by using 6-day-old seedlings rather than 1–2-day-old seeds because both the rootand stem would have emerged from the seed, and this would ensure that there would betranscriptional changes that could be absent if the extraction is performed too soon; thiswas the case in the Andrographis study [25]. Moreover, it is common practice to use youngseedlings because they are more sensitive to stress, and therefore, it would be possible toobserve acute stress. A limitedtreatment time was chosen to avoid additional stresses suchas heat stress, which induces a plethora of cellular effects [35–38]. Early germination wasthe macroscopic parameter used as an indicator of changes in the molecular biology, asshown in Figure 1, which is an effect observed in other studies [39].
For this first exploratory study, RNA-seq was used since it is an unbiased methodthat provides a global overview of all genes. DESeq2 was used for this paper since itis common practice and to balance stringency and flexibility [40]. We analyzed approxi-mately 21,000 A. thaliana genes out of approximately 33,000 genes using RNA-seq (NCBIproject number PRJNA800224) on plasma-treated seeds grown until and including the sixthday. We found 422 DEGs, with 32 upregulated and 390 downregulated (Figure 4), andsuitable agreement between the biological replicates within the control and 80 s plasma-treated samples (Figure 3). For the 60 s plasma-treated samples, we found 269 DEGs, with27 upregulated and 242 downregulated (Figures 3 and 4).
3.1. Gene Enrichment as a Result of Short Non-Thermal Air Plasma Treatment
As shown in Figure 1, accelerated germination was observed, which is in line withthe growth enhancement effects observed in other studies [4,41]. Growth enhancementis not the only type of plant response to plasma and also includes seed surface function-alization, seed decontamination, as well as stress anddefense response [1]. Our findingsin Figures 5 and 6 for 60 s and Figures 7 and 8 for 80 s suggest that on a molecular level,this increased germination rate is mainly an outward expression of stimulated stress anddefense response. However, this does not exclude other effects such as cell wall modifica-tions, ion homeostasis, and modified plant microbiome interactions as a result of plasmatreatment. Therefore, these will be briefly mentioned, followed by the main focus of ourfindings about the plant defense response.
Plasma is known to modify the seed surface directly, and therefore, this could explainthe upregulation in cell wall cellular components seen in Figures 5B and 7B. Bafoil andco-authors showed that the total activity of peroxidases increased in plasma-treated seeds,which were also enriched here, and peroxidases can trigger internal changes that subse-quently externally modify the cell wall [42]. It is more likely that this change has a chemicalbasis since the plasma treatment here was indirect with a 3.7 mm plasma-seed gap distance,and thus, it is unlikely, although not impossible, that there was much interaction betweenthe seeds and electrons, ions, or electric fields confined close to the electrodes.
Through seed surface modifications, it is also possible to alter ion homeostasis, whichwas indicated by downregulation in ion transport activity in Figure 8A. Previous studieshave shown ion redistribution after plasma treatment in cations such as calcium, mag-nesium, or potassium, migrating into the interior of the seed or being enriched on thesurface [43,44]. This, however, could also be interpreted by the seed as damage and,therefore, could be a symptom of a plant stress response.
Int. J. Mol. Sci. 2022, 23, 3070 15 of 24
It could be that through this stress response, plants modulate their own root activity,thereby altering their microbiome interactions. Plasma is very commonly known forits decontamination application in order to remove bacteria [45,46], but recent studieshave demonstrated that plants treated with plasma modulate their relationship with themicrobiome; root activity is modified, and nodulation is increased [8,9,47]. As shownin Figure 6A, our data revealed changes in the thalianol pathway, which could explainchanges in plasma-treated plant root performance observed in other studies. This pathwayis involved in root-specific metabolites to encourage plant-bacteria interactions and wasshown to be important for shaping the A. thaliana root microbial community (Huanget al., 2019). Additionally, triterpenes were also downregulated (Figure 8A), and thesecompounds can influence metabolite exudation and therefore indirectly modulate therhizobiome and root bacteria to have either growth-promoting or inhibitory effects [48].
Based on our gene enrichment analysis in Figure 7A,C,D, our main findings were anincreased defense response, specifically of the glucosinolate pathway with an 80 s plasmatreatment time several days after observing accelerated germination. The production ofsecondary metabolites involved in plant defense has been reported previously as well aschanges in glutathione, an antioxidant involved in detoxification, particularly of reactiveoxygen and nitrogen species during stress in living organisms [25,26,28]. Our data inFigures 5–8 suggest that the plant may still be responding to the stress even 6 days after theinitial treatment where a continuous cascade of programs has been triggered, which affectsboth primary and secondary metabolisms.
Primary metabolism is used for growth; however, it has the precursors or buildingblocks for secondary metabolites. These precursor compounds are mainly from the pentosephosphate (PP) pathway for the synthesis of phenolic compounds within the phenyl-propanoid pathway or glucosinolates, whereas other intermediates from glycolysis can beused toward the mevalonic or methylerythritol 4-phosphate (MEP) pathway to produceterpenes and sterols [49]. Therefore, increased primary metabolism such as the productionof precursors PEP, acetyl CoA, and 3-phosphoglycerate for secondary metabolites mightresult in the upregulation of organic acid pathways. Alternatively, branched-chain aminoacids such as leucine or aromatic amino acids such as tryptophan or tyrosine, as shownin Figures 7A,D, 8D, and S4D, can be shuttled to produce these phenolic compoundsor glucosinolates.
Glucosinolates are categorized into tryptophan-derived indole, tyrosine or phenylalanine-derived aromatic, or aliphatic glucosinolates. Biosynthesis of aliphatic glucosinolatesstarts out from alanine, valine, and leucine, with the most abundant group of aliphaticglucosinolates synthesized from methionine [50]. This would explain the upregulationof branched-chain amino acids as well as the increase in B1 (Figure 7A), a vitamin thatis involved in amino acid synthesis, pentose phosphate, and TCA cycle and is beingincreasingly recognized and linked with plant defense [51,52]. Moreover, this complementsthe observed enrichment of oxoacid Figures 7A and S6A), which is linked with generalistherbivory, possibly through glucosinolates [53,54].
How this stress signal is transduced based on the DEGs is largely due to mitogen-activated protein kinases (MAPK), as seen in Figures 5D and 7D. There are multiple MAPKpathways that are involved in hormone signaling and trigger various stress responsesdue to other abiotic and biotic factors [55,56]. After the signal is perceived, the organellesthat are the most affected by the plasma treatment are related to the cell wall, which wasupregulated, and ER body, which was downregulated (Figures 5B, 6B, 7B, and 8B).
It was unsurprising to find changes to the cell wall since it is the first point of contactbetween the seed and plasma. The effect on the cell wall could include reorganizationto strengthen its defense against stress. However, it was anticipated that the lysosomesand peroxisomes would also be upregulated due to oxidized, damaged macromoleculedegradation from exposure to plasma-derived RONS. In Figure 8B, the opposite wasdetermined where lysosomes were downregulated. This might be because a perceivedmild or moderate stress results in a transient upregulation, ranging from seconds to days.
Int. J. Mol. Sci. 2022, 23, 3070 16 of 24
Since the mRNA was extracted at a later development stage, this could have been missed,and the cells could have adapted by then to the stress.
Many of the organelles were downregulated, especially the ER body, which wasobserved with both plasma treatment times (Figures 6B and 8B). On the one hand, withthe increase in glucosinolates, it could be expected that the ER body, which houses thesecompounds, would also be upregulated [57]. On the other hand, it could be that thereare more than enough defense resources already available and stored in anticipation ofthe next attack, and therefore, the ER body downregulated its activity as a means to notcompromise resources still required for growth.
3.2. Comparison with Other Transcriptomic Studies
To verify whether our interpretations are valid, the most relevant comparison can bemade with the results available in another study using A. thaliana and, where appropriate,other transcriptomic studies [25–28]. A detailed comparison between our experimentalsetup and that of Cui and co-authors is shown in Table S3.
One of the main differences was in the materials of the plasma device as well as in theplasma setup, which used a continuous sinewave power supply with varying frequency,whereas ours used a 10% duty cycle. Their plasma chemistry may have differed wherethey measured atomic oxygen and NO with OES, whereas we used Fourier transforminfrared spectroscopy (FTIR) and found that we operated mainly in ozone mode with alower concentration of NOx, although NO was present within a few mm from the SDBDfrom preliminary laser-induced fluorescence (LIF) measurements [29]. There were greaterdifferences in the seed handling. Cui and co-authors worked with sterilized seeds, whereasour conscious choice was to keep the native microbiome even though we were awarethat plasma can interact with microorganisms and change the plant growth upon theirremoval. However, avoiding the rehydration of the seed with a sterilization protocol was ahigher priority for this study than sterilizing the seed since this can change the metabolicactivity, add additional stress to the plant, and thereby possibly change the final results. Itis understandable that Cui et al. placed the seedlings in water to avoid dehydrating andthus stressing the seedlings, although it should be borne in mind that the presence of watercan change the chemistry of the plasma considerably. Therefore, not only is the substratedifferent, seedling instead of seed, but the chemistry could also be different. Nevertheless,it is encouraging to see significant overlap between these studies because this promisessome robustness in the experimental results, and this might be explained by using the sameseed type, similar operating parameters for the plasma-seed treatment, and extraction timepoint [6]. The RNA extraction was performed 48 h after plasma treatment on 4-day-oldseedlings, so, both studies extracted from 6-day-old seedlings, and the main difference wasthat plasma treatment was performed on either the seed or seedling. Both studies achievedchanges in germination using a similar treatment time interval of around 1 min; however,stronger effects were observed in our study using 80 s. Heat was monitored and controlledin our study to better delineate the mechanisms by limiting additional stresses other thanplasma. It has also been demonstrated that shorter treatment times, such as 1 min, are moreeffective than longer treatment times such as 3, 5, or 10 min.
Three studies, including ours, show a similar general pattern of predominantly down-regulated genes [26,28]. However, this is not the case for other studies [25,27]. Thesedifferences may be due to physiological differences between different organisms but alsoto the plasma conditions or the selected RNA-seq approach. Cui and co-authors foundenrichment in glutathione metabolism, MAPK signaling pathway, indole alkaloid biosyn-thesis, and plant-pathogen interaction pathway, which confirms the trends observed in ourstudy. A study using sunflowers showed a shift toward the phenylpropanoid pathwayrather than the glucosinolate, and judging by the short treatment time, it could be moresimilar to our results after 60 s treatment. Since we include two plasma treatment times,it is possible to propose a model based on the findings in this study where increasing thetreatment time shifts the response of the plant from the phenylpropanoid pathway, which
Int. J. Mol. Sci. 2022, 23, 3070 17 of 24
reinforces the cell wall with lignin and rapid response with phytoalexins or camalexin at60 s (Figures 5 and 6), toward glucosinolate production at 80 s (Figures 7 and 8) as if theplant is protecting itself from an insect or herbivore attack. Therefore, depending on theintensity of the plasma, varying biological responses can be elicited from the plant.
Regarding secondary metabolism, Cui and co-authors found mostly a decrease inamino acids except for an increase in tyrosine and tryptophan after plasma treatment. Inour study, it is clear that leucine, valine, and tyrosine were the key amino acid precursors forsubsequent secondary metabolite production such as glucosinolates and phenylpropanoids,and therefore, it is in agreement with their findings. Although they had a high enrichment ofglutathione-related processes, in our data set, it was not as pronounced as glucosinolates orphenylpropanoids. Glutathione is involved in the biosynthesis of glucosinolates, specificallyspecialized glutathione-S-transferases (and for phytoalexins) [54]. One explanation couldbe that glucosinolate production is supported, and since the treatment was performed onthe seed surface, the RONS, whether plasma- or plant-derived, may have dissipated shortlyafter germination and at the point of extraction, detoxification was no longer necessary andtherefore was downregulated; perhaps even reset at a new threshold with the activatedstress response.
Triterponoids are also defense compounds; however, they were downregulated. Toattempt to explain this, it may be a question of how to best use resources where theplant decides it is preferable to use glycolysis products toward the synthesis of specificphenylpropanoid compounds or glucosinolates, especially with a common precursor suchas tryptophan (Figures 7D and 8D). For example, stilbenoids were downregulated and areclassified as phytoalexins and phenolic compounds [58]. Therefore, resources might havebeen shuttled toward glucosinolates instead sinceit has been shown that the glucosinolatepathway can limit phenylpropanoid production [59]. Alternatively, perhaps it is alsofaster to produce phenylpropanoids than glucosinolates, or it is launched as an earlier lineof defense.
Although all other transcriptomic studies reference plant hormones as an impor-tant reason for the macroscopic changes, the only plant hormone detected here wasauxin [25,28]. It showed downregulation of auxin homeostasis and catabolic process inFigures 6A,C and S7 which would make sense owing to its role in the growth and the accel-erated emergence of the root during germination. Interestingly, glucosinolate metabolismis a modulator of auxin homeostasis, so this could be another explanation for changes, par-ticularly with auxin (Figures 7A,D, S2A, S3A and S7A) [60], which could still be indirectlyin line with the hypothesis of hormone modulation as a possible mechanism of action.
3.3. Transcriptomic Plant Response to Plasma Treatment and Its Limitations
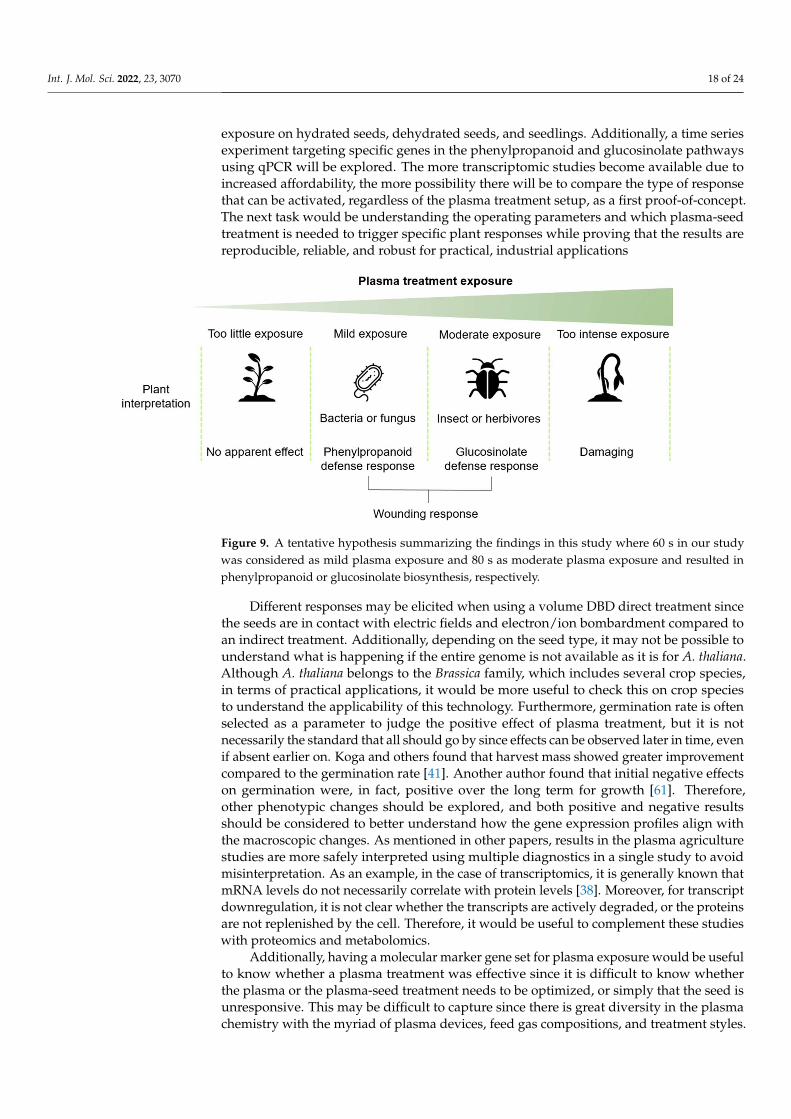
In this study, we demonstrated that stress and defense pathways are upregulatedafter plasma treatment. This seems to depend on the plasma treatment time exposure, andtherefore, this interpretation is schematically proposed in Figure 9. The plasma treatmentcould be perceived as a wounding, perhaps from ion bombardment, even though this isnot likely during indirect plasma treatment.
Plasma is a type of stress that the plant has not been previously exposed to, let alonedeveloped a specific stress or defense response, and could thus be considered xenobiotic.Moreover, plants and pathogens continuously co-evolve where the plant will recognizepathogen-associated molecular patterns (PAMPs) or damage-associated molecular patterns(DAMPs). Plasma might not exactly mimic a bacterial or fungal infection or insect wound-ing; however, there might be sufficient overlap to elicit these responses, partly due to theindividual plasma components that are already familiar to the plant.
More transcriptomic studies are required to validate this hypothesis; however, resultsare highly dependent on the conditions, for example, on the day of extraction and the tissuetype. As an example, a study plasma treating Andrographis included three time pointswith the highest number of DEGs at 28 h, followed by 48 and 0 h. Future studies willinclude multiple time points closer to the plasma treatment as well as weeks after plasma
Int. J. Mol. Sci. 2022, 23, 3070 18 of 24
exposure on hydrated seeds, dehydrated seeds, and seedlings. Additionally, a time seriesexperiment targeting specific genes in the phenylpropanoid and glucosinolate pathwaysusing qPCR will be explored. The more transcriptomic studies become available due toincreased affordability, the more possibility there will be to compare the type of responsethat can be activated, regardless of the plasma treatment setup, as a first proof-of-concept.The next task would be understanding the operating parameters and which plasma-seedtreatment is needed to trigger specific plant responses while proving that the results arereproducible, reliable, and robust for practical, industrial applications
Int. J. Mol. Sci. 2022, 23, 3070 17 of 24
emergence of the root during germination. Interestingly, glucosinolate metabolism is a modulator of auxin homeostasis, so this could be another explanation for changes, partic-ularly with auxin (Figures 7A,D, S2A, S3A, and S7A) [60], which could still be indirectly in line with the hypothesis of hormone modulation as a possible mechanism of action.
3.3. Transcriptomic Plant Response to Plasma Treatment and Its Limitations In this study, we demonstrated that stress and defense pathways are upregulated
after plasma treatment. This seems to depend on the plasma treatment time exposure, and therefore, this interpretation is schematically proposed in Figure 9. The plasma treatment could be perceived as a wounding, perhaps from ion bombardment, even though this is not likely during indirect plasma treatment.
Figure 9. A tentative hypothesis summarizing the findings in this study where 60 s in our study was considered as mild plasma exposure and 80 s as moderate plasma exposure and resulted in phe-nylpropanoid or glucosinolate biosynthesis, respectively.
Plasma is a type of stress that the plant has not been previously exposed to, let alone developed a specific stress or defense response, and could thus be considered xenobiotic. Moreover, plants and pathogens continuously co-evolve where the plant will recognize pathogen-associated molecular patterns (PAMPs) or damage-associated molecular pat-terns (DAMPs). Plasma might not exactly mimic a bacterial or fungal infection or insect wounding; however, there might be sufficient overlap to elicit these responses, partly due to the individual plasma components that are already familiar to the plant.
More transcriptomic studies are required to validate this hypothesis; however, re-sults are highly dependent on the conditions, for example, on the day of extraction and the tissue type. As an example, a study plasma treating Andrographis included three time points with the highest number of DEGs at 28 h, followed by 48 and 0 h. Future studies will include multiple time points closer to the plasma treatment as well as weeks after plasma exposure on hydrated seeds, dehydrated seeds, and seedlings. Additionally, a time series experiment targeting specific genes in the phenylpropanoid and glucosinolate pathways using qPCR will be explored. The more transcriptomic studies become available due to increased affordability, the more possibility there will be to compare the type of response that can be activated, regardless of the plasma treatment setup, as a first proof-of-concept. The next task would be understanding the operating parameters and which plasma-seed treatment is needed to trigger specific plant responses while proving that the results are reproducible, reliable, and robust for practical, industrial applications
Different responses may be elicited when using a volume DBD direct treatment since the seeds are in contact with electric fields and electron/ion bombardment compared to an indirect treatment. Additionally, depending on the seed type, it may not be possible to
Figure 9. A tentative hypothesis summarizing the findings in this study where 60 s in our studywas considered as mild plasma exposure and 80 s as moderate plasma exposure and resulted inphenylpropanoid or glucosinolate biosynthesis, respectively.
Different responses may be elicited when using a volume DBD direct treatment sincethe seeds are in contact with electric fields and electron/ion bombardment compared toan indirect treatment. Additionally, depending on the seed type, it may not be possible tounderstand what is happening if the entire genome is not available as it is for A. thaliana.Although A. thaliana belongs to the Brassica family, which includes several crop species,in terms of practical applications, it would be more useful to check this on crop speciesto understand the applicability of this technology. Furthermore, germination rate is oftenselected as a parameter to judge the positive effect of plasma treatment, but it is notnecessarily the standard that all should go by since effects can be observed later in time, evenif absent earlier on. Koga and others found that harvest mass showed greater improvementcompared to the germination rate [41]. Another author found that initial negative effectson germination were, in fact, positive over the long term for growth [61]. Therefore,other phenotypic changes should be explored, and both positive and negative resultsshould be considered to better understand how the gene expression profiles align withthe macroscopic changes. As mentioned in other papers, results in the plasma agriculturestudies are more safely interpreted using multiple diagnostics in a single study to avoidmisinterpretation. As an example, in the case of transcriptomics, it is generally known thatmRNA levels do not necessarily correlate with protein levels [38]. Moreover, for transcriptdownregulation, it is not clear whether the transcripts are actively degraded, or the proteinsare not replenished by the cell. Therefore, it would be useful to complement these studieswith proteomics and metabolomics.
Additionally, having a molecular marker gene set for plasma exposure would be usefulto know whether a plasma treatment was effective since it is difficult to know whetherthe plasma or the plasma-seed treatment needs to be optimized, or simply that the seed isunresponsive. This may be difficult to capture since there is great diversity in the plasmachemistry with the myriad of plasma devices, feed gas compositions, and treatment styles.
Int. J. Mol. Sci. 2022, 23, 3070 19 of 24
Using GENEVESTIGATOR, both upregulated and downregulated gene signature profilesfor 80 s were compared against other transcriptomic studies using A. thaliana; however,there were no clear matches between plasma and other perturbation studies (data notshown). Therefore, it remains difficult to assign a plasma response to an already knownstress with our findings in this study as it seems multiple stresses can be activated. Thisconcept of a plasma treatment gene signature would be interesting to follow up on by othersas an alternative to monitoring macroscopic changes, where an effect could be presentwithout it necessarily being expressed phenotypically.
Finally, it is always a question for living organisms of how to best use their resourcessince there is a trade-off between growth and defense. It needs to be stated that the applica-tion of plasma will largely depend on the context. In well-controlled environments, onemight want to use plasma to harvest secondary metabolites for pharmaceutical applica-tions, and therefore, there is little risk of abiotic and biotic stresses. Care should be takento not jump ahead with applications since most results are in the context of a lab and areperformed on a short time scale. It is unknown whether this would be advantageous ordisadvantageous for the plant over the long term and in a more complex environment. Thebest way to evaluate this would be in a field study with stresses related to weather change,microbes, various soil conditions, and pests. Therefore, work still needs to be performed totest the feasibility of upscaling these results, although others have shown that these effectscan persist for several years within the same generation on non-thermal plasma-responsiveseeds [62,63].
3.4. Conclusions
Our findings are among the first that have performed RNA-seq on plasma-treatedA. thaliana seeds. Here, we demonstrate that a brief (60 or 80 s) plasma treatment of dryseeds causes modifications in primary and secondary metabolisms measured after 6 days,which is evidence of a long-term memory effect. Specifically, a 60 s plasma treatment timeupregulates the phenylpropanoid pathway where the seedling reinforces its cell wall withlignin and launches antimicrobial compounds such as phytoalexins, a defense responseto bacteria or fungal plant pathogens. A longer plasma treatment of 80 s upregulatesthe glucosinolate pathway, a defense response to insects and herbivores to deter feeding.In both cases, it appears that plasma clearly acts on the plant to change the redox stateand also seems to elicit a wound response. It should not be mistaken that plasma isrecognized exactly as these stressors since seeds have never previously been exposed toplasma in their natural environment and therefore, plasma is still likely recognized as aforeign and abnormal stress. Indeed, accelerated germination and increased stress anddefense response were all observed, although it should be underlined that this needs to beconsidered carefully for future applications since there is often a trade-off between growthand stress/disease resistance. Future studies should perform a time series of RNA-seqanalyses after the plasma, explore the possibility of a gene signature profile specific toplasma, and include field studies where abiotic and biotic stresses are tested to check thesurvival of these plants under realistic conditions.
4. Materials and Methods4.1. Seed Material
A. thaliana Col-0 seeds were cultivated in a plant chamber room and harvested in May2019 using seeds from the Department of Plant Molecular Biology at the University ofLausanne. Dry seeds were 18–20 months old at the time of experiments. Seeds were storedin Eppendorf or Falcon tubes and kept at room temperature in the dark until used.
4.2. Germination Rate Measurements
Seeds were not sterilized nor subjected to seed preselection before plasma treatment.After plasma treatment, 30 seeds were sown immediately, or a few hours after (within thesame day at the latest), on water agar plates (20 g/L, using distilled water, pH of approxi-
Int. J. Mol. Sci. 2022, 23, 3070 20 of 24
mately 6.7) and kept in a phytotron (AR-36L2 PlantClimatics GmbH) under continuouslight using Osram L 18W 77 G13 Fluora with a 24 h light cycle at 23 ◦C and 65% humidity.Germination was recorded at 48 h, and seeds with roots were counted by eye. Germinationrate was calculated as the number of seeds with roots divided by the total number of seedsand converted into a percentage.
4.3. Surface Dielectric Barrier Discharge Description
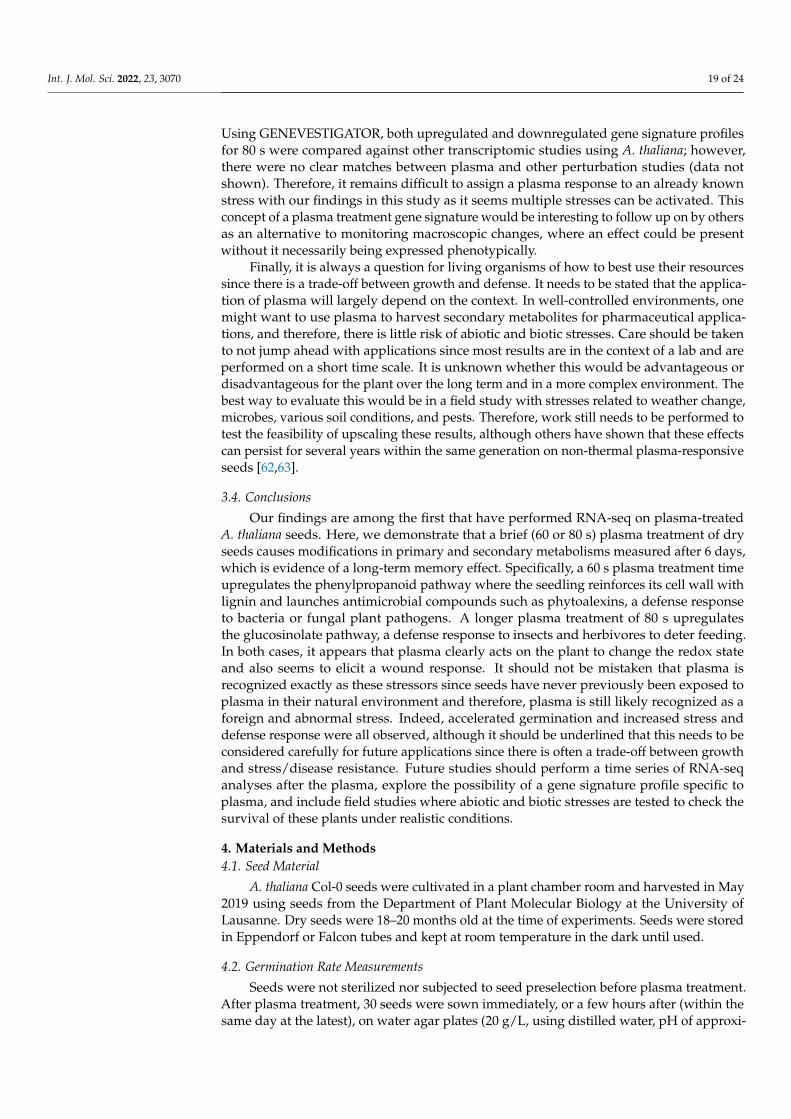
Figure 10a shows the stainless steel reactor chamber, 18 cm diameter and 11 cm high,used to confine the SDBD air plasma and its gaseous products. The A. thaliana seeds wereplaced on Teflon cylinders, 3.7 mm below the SDBD plasma, as shown in Figure 10b. TheSDBD device (Sihon Electronics) comprises an alumina dielectric and high-voltage printedelectrode in a stripe pattern, as shown in Figure 10c. Additional details can be found in aprevious study [29].
Int. J. Mol. Sci. 2022, 23, 3070 20 of 24
at the center of the SDBD with a FLIR E85 infrared camera, and the measurements for 60 and 80 s were 31.2 and 31.8 °C, respectively, using a 10% duty cycle [29].
Figure 10. Surface dielectric barrier discharge (SDBD) plasma source enclosed in the plasma-seed treatment reactor. (a) Stainless steel reactor with high-voltage coaxial cable connection; (b) sche-matic of the interior with the inverted SDBD positioned above the seed substrate; (c) photograph of the high-voltage stripe SDBD electrode printed on an alumina dielectric plate. The ground electrode is an aluminum plate behind the dielectric.
4.5. Germination Statistics Differences in germination rate between the control and plasma-treated samples
were assessed using ordinary one-way ANOVA. Each treatment group was compared to their respective control, and the bar graph in Figure 1 represents two independent exper-iments with 3 replicates each for a total of 6 replicates. GraphPad Prism 9 (GraphPad Soft-ware, Inc., San Diego, CA, USA) was used for statistical analyses. All p-values < 0.05 were considered to be significant and given directly in Figure 1.
4.6. RNA Isolation, Library Construction, and RNA Sequencing The seeds were treated with plasma and planted on agar shortly after within hours.
The germination rate was measured 48 h after sowing and was grown for another 4 days until RNA was extracted (6 days after sowing). Total RNA was extracted from three bio-logical replicates obtained from 6-day-old seedlings (up to 100 mg) using Precellys (Bertin, Montingy-le-Bretonneux, France) and lysing kit with 1.4 mm zirconium beads in 0.5 mL tubes. The settings used were 6000 rpm for 30 s, followed by a 10 s break, and finished with 6000 rpm for 30 s, all performed at 4 °C. InnuPREP Plant RNA kit (Analytic Jena, Jena, Germany) was used for RNA isolation and quantified with nanodrop (DS-11 Micro-volume Spectrophotometer).
RNA quality was assessed on a Fragment Analyzer (Agilent Technologies, Santa Clara, CA, USA), and all RNAs had an RNA quality number (RQN) above 7.9. Library preparation and RNA-seq were performed at the Lausanne Genomic Technologies Facil-ity, University of Lausanne, Switzerland (https://www.unil.ch/gtf (accessed on 15 March 2021)). RNA-seq libraries were prepared from 400 ng of total RNA with the Illumina TruSeq Stranded mRNA reagents (Illumina, San Diego, CA, USA) using a unique dual indexing strategy and following the official protocol automated on a Sciclone liquid han-dling robot (PerkinElmer, Waltham, MA, USA). Libraries were quantified by a fluorimet-ric method (QubIT, Life Technologies, Carlsbad, CA, USA), and their quality was assessed on a Fragment Analyzer (Agilent Technologies).
Figure 10. Surface dielectric barrier discharge (SDBD) plasma source enclosed in the plasma-seedtreatment reactor. (a) Stainless steel reactor with high-voltage coaxial cable connection; (b) schematicof the interior with the inverted SDBD positioned above the seed substrate; (c) photograph of thehigh-voltage stripe SDBD electrode printed on an alumina dielectric plate. The ground electrode isan aluminum plate behind the dielectric.
4.4. Plasma Parameters for the Seed Treatment
The operating parameters were 1 min flow flushing before treatment; 10 kHz; 8 kVpp;60 s or 80 s plasma treatment time; 3.7 mm distance between seeds and plasma; and2 L/min of dry synthetic air (80:20 N2:O2) controlled by mass flow controllers (Bronkhorst,Ruurlo, The Netherlands). The reactor total volume was 2.8 L with an internal gas volumeof about 1.0 L. For the flow rate of 2 L/min, the gas residence time was therefore 30 s.
The source voltage waveform for all excitation frequencies was a burst of 2 sinewavecycles with a 500 Hz on/off power modulation, provided by a Rigol DG4102 signal genera-tor amplified by a Matsusada AMPS-20B20-LC(5m) power supply. At 10 kHz sinewavefrequency, 2 cycles modulated at 500 Hz corresponds to a 10% duty cycle. Seeds were placedon Teflon spacers during treatment or on ceramic plates to reduce the seed-plasma gap.
Humidity was measured using a Vaisala model HM42 probe and ranged between1.5% and 3% RH. This low humidity is consistent with the use of dry synthetic air and onlysmall out-gassing of humidity from the reactor walls. The temperature was measured atthe center of the SDBD with a FLIR E85 infrared camera, and the measurements for 60 and80 s were 31.2 and 31.8 ◦C, respectively, using a 10% duty cycle [29].
Int. J. Mol. Sci. 2022, 23, 3070 21 of 24
4.5. Germination Statistics
Differences in germination rate between the control and plasma-treated samples wereassessed using ordinary one-way ANOVA. Each treatment group was compared to theirrespective control, and the bar graph in Figure 1 represents two independent experimentswith 3 replicates each for a total of 6 replicates. GraphPad Prism 9 (GraphPad Software, Inc.,San Diego, CA, USA) was used for statistical analyses. All p-values < 0.05 were consideredto be significant and given directly in Figure 1.
4.6. RNA Isolation, Library Construction, and RNA Sequencing
The seeds were treated with plasma and planted on agar shortly after within hours.The germination rate was measured 48 h after sowing and was grown for another 4 daysuntil RNA was extracted (6 days after sowing). Total RNA was extracted from threebiological replicates obtained from 6-day-old seedlings (up to 100 mg) using Precellys(Bertin, Montingy-le-Bretonneux, France) and lysing kit with 1.4 mm zirconium beads in0.5 mL tubes. The settings used were 6000 rpm for 30 s, followed by a 10 s break, andfinished with 6000 rpm for 30 s, all performed at 4 ◦C. InnuPREP Plant RNA kit (AnalyticJena, Jena, Germany) was used for RNA isolation and quantified with nanodrop (DS-11Microvolume Spectrophotometer).
RNA quality was assessed on a Fragment Analyzer (Agilent Technologies, Santa Clara,CA, USA), and all RNAs had an RNA quality number (RQN) above 7.9. Library preparationand RNA-seq were performed at the Lausanne Genomic Technologies Facility, Universityof Lausanne, Switzerland (https://www.unil.ch/gtf (accessed on 15 March 2021)). RNA-seq libraries were prepared from 400 ng of total RNA with the Illumina TruSeq StrandedmRNA reagents (Illumina, San Diego, CA, USA) using a unique dual indexing strategy andfollowing the official protocol automated on a Sciclone liquid handling robot (PerkinElmer,Waltham, MA, USA). Libraries were quantified by a fluorimetric method (QubIT, LifeTechnologies, Carlsbad, CA, USA), and their quality was assessed on a Fragment Analyzer(Agilent Technologies).
Cluster generation was performed with 2 nM of an equimolar pool from the resultinglibraries using the Illumina HiSeq 3000/4000 SR Cluster Kit reagents, then sequenced onthe Illumina HiSeq 4000 SR platform (single end) using HiSeq 3000/4000 SBS Kit reagentsfor 150 cycles (single end). Sequencing data were demultiplexed using the bcl2fastq2Conversion Software (version 2.20, Illumina). The analysis resulted in approximately31–37 million of 150 bp long single-end reads for each library independently (Table S1).
After sequencing, raw reads were subjected to quality control (phred score > 20)and adapter trimming using FastQC (0.11.976) and BBDuk. Reads matching ribosomalRNA sequences were removed with fastq_screen (v. 0.9.3). Reads were aligned againstthe Arabidopsis reference genome sequence (Araport11) using STAR v2.7.5 using defaultparameters (Dobin et al., 2013). FeatureCounts v1.6.2 was used to generate the count matrixand to calculate gene expression values as raw read counts. RPKM was obtained fromFeatureCounts (in house script) to make heatmaps. Count read values were analyzedusing the DESeq2 package from R software v1.30.1 [33] after rlog transformation to identifythe differentially expressed genes (DEGs). A t-test was performed to identify differentialenrichment between control and treated samples. To identify GO categories of differentiallyexpressed genes, ShinyGO v.0.66 software was used [34]. The results were based oncustomized background genes from our RNA-seq, which yield more accurate results forenrichment analysis [40]. The transcriptome data are available in NCBI Bioproject Code:PRJNA800224.
Supplementary Materials: The following supporting information can be downloaded at: https://www.mdpi.com/article/10.3390/ijms23063070/s1.
Int. J. Mol. Sci. 2022, 23, 3070 22 of 24
Author Contributions: Conceptualization, A.W.; methodology, A.W. and A.G.; software, A.G.; formalanalysis, A.W. and A.G.; investigation, A.W. and A.G.; data curation, A.W. and A.G.; writing—originaldraft preparation, A.W. and A.G.; writing—review and editing, A.W., A.G., A.H., I.F.; visualization,A.W. and A.G.; funding acquisition, I.F. All authors have read and agreed to the published version ofthe manuscript.
Funding: This work was supported by an ad-hoc grant of the Swiss Federal budgetary framework2017–2020 for the ETH Domain and by the University of Lausanne and the Swiss National Fundgrant n◦CRSK-3_196689 to AG.
Institutional Review Board Statement: Not applicable.
Informed Consent Statement: Not applicable.
Data Availability Statement: The data presented in this study are available in this article, supple-mentary material and the transcriptome data are available in NCBI Bioproject Code: PRJNA800224.
Acknowledgments: The authors would like to thank the Lausanne Genomic Technologies Facilityfor performing the RNA sequencing and Pierre Goloubinoff for useful comments.
Conflicts of Interest: The authors declare no conflict of interest. The funders had no role in the designof the study, in the collection, analyses, or interpretation of data, in the writing of the manuscript, orin the decision to publish the results.
References1. Waskow, A.; Howling, A.A.; Furno, I. Mechanisms of plasma-seed treatments as a potential seed processing technology. Front.
Phys. 2021, 9, 174. [CrossRef]2. FAO. News Article: Pollutants from Agriculture a Serious Threat to World’s Water. Available online: https://www.fao.org/news
/story/en/item/1141534/icode/ (accessed on 10 January 2022).3. IPCC. Land Is a Critical Resource, IPCC Report Says. Available online: https://www.ipcc.ch/2019/08/08/land-is-a-critical-reso
urce_srccl/ (accessed on 10 January 2022).4. Guragain, R.P.; Baniya, H.B.; Dhungana, S.; Chhetri, G.K.; Sedhai, B.; Basnet, N.; Shakya, A.; Pandey, B.P.; Pradhan, S.P.; Joshi,
U.M.; et al. Effect of plasma treatment on the seed germination and seedling growth of radish (Raphanus sativus). Plasma Sci.Technol. 2021, 24, 015502. [CrossRef]
5. Li, K.; Zhong, C.; Shi, Q.; Bi, H.; Gong, B. Cold plasma seed treatment improves chilling resistance of tomato plants throughhydrogen peroxide and abscisic acid signaling pathway. Free Radic. Biol. Med. 2021, 172, 286–297. [CrossRef] [PubMed]
6. Waskow, A.; Avino, F.; Howling, A.; Furno, I. Entering the plasma agriculture field: An attempt to standardize protocols forplasma treatment of seeds. Plasma Processes Polym. 2021, 19, e2100152. [CrossRef]
7. Suriyasak, C.; Hatanaka, K.; Tanaka, H.; Okumura, T.; Yamashita, D.; Attri, P.; Koga, K.; Shiratani, M.; Hamaoka, N.; Ishibashi, Y.Alterations of DNA Methylation Caused by Cold Plasma Treatment Restore Delayed Germination of Heat-Stressed Rice (Oryzasativa L.) Seeds. ACS Agric. Sci. Technol. 2021, 1, 5–10. [CrossRef]
8. Tamošiune, I.; Gelvonauskiene, D.; Haimi, P.; Mildažiene, V.; Koga, K.; Shiratani, M.; Baniulis, D. Cold plasma treatment ofsunflower seeds modulates plant-associated microbiome and stimulates root and lateral organ growth. Front. Plant Sci. 2020,11, 1347. [CrossRef] [PubMed]
9. Tamošiune, I.; Gelvonauskiene, D.; Ragauskaite, L.; Koga, K.; Shiratani, M.; Baniulis, D. Cold plasma treatment of Arabidopsisthaliana (L.) seeds modulates plant-associated microbiome composition. Appl. Phys. Express 2020, 13, 076001. [CrossRef]
10. Mildaziene, V.; Aleknaviciute, V.; Žukiene, R.; Paužaite, G.; Nauciene, Z.; Filatova, I.; Lyushkevich, V.; Haimi, P.; Tamošiune, I.;Baniulis, D. Treatment of Common Sunflower (Helianthus annus L.) Seeds with Radio-frequency Electromagnetic Field and ColdPlasma Induces Changes in Seed Phytohormone Balance, Seedling Development and Leaf Protein Expression. Sci. Rep. 2019,9, 6437. [CrossRef]
11. Ji, S.H.; Ki, S.H.; Kang, M.H.; Choi, J.S.; Park, Y.; Oh, J.; Kim, S.B.; Yoo, S.J.; Choi, E.H.; Park, G. Characterization of physical andbio-chemical changes in plasma treated spinach seed during germination. J. Phys. D Appl. Phys. 2018, 51, 145205. [CrossRef]
12. Guo, Q.; Wang, Y.; Zhang, H.; Qu, G.; Wang, T.; Sun, Q.; Liang, D. Alleviation of adverse effects of drought stress on wheat seedgermination using atmospheric dielectric barrier discharge plasma treatment. Sci. Rep. 2017, 7, 16680. [CrossRef]
13. Rahman, M.M.; Sajib, S.A.; Rahi, M.S.; Tahura, S.; Roy, N.C.; Parvez, S.; Reza, A.; Talukder, M.R.; Kabir, A.H. Mechanisms andsignaling associated with LPDBD plasma mediated growth improvement in wheat. Sci. Rep. 2018, 8, 10498. [CrossRef]
14. Adhikari, B.; Adhikari, M.; Ghimire, B.; Park, G.; Choi, E.H. Cold atmospheric plasma-activated water irrigation induces defensehormone and gene expression in tomato seedlings. Sci. Rep. 2019, 9, 16080. [CrossRef] [PubMed]
15. Adhikari, B.; Adhikari, M.; Ghimire, B.; Adhikari, B.C.; Park, G.; Choi, E.H. Cold plasma seed priming modulates growth, redoxhomeostasis and stress response by inducing reactive species in tomato (Solanum lycopersicum). Free Radic. Biol. Med. 2020, 156,57–69. [CrossRef]
Int. J. Mol. Sci. 2022, 23, 3070 23 of 24
16. Li, K.; Zhang, L.; Shao, C.; Zhong, C.; Cao, B.; Shi, Q.; Gong, B. Utilising cold plasma seed treatment technologies to delaycotyledon senescence in tomato seedlings. Sci. Hortic. 2021, 281, 109911. [CrossRef]
17. Ghasempour, M.; Iranbakhsh, A.; Ebadi, M.; Oraghi Ardebili, Z. Seed priming with cold plasma improved seedling performance,secondary metabolism, and expression of deacetylvindoline O-acetyltransferase gene in Catharanthus roseus. Contrib. PlasmaPhys. 2020, 60, e201900159. [CrossRef]
18. Islam, S.; Omar, F.B.; Sajib, S.A.; Roy, N.C.; Reza, A.; Hasan, M.; Talukder, M.R.; Kabir, A.H. Effects of LPDBD Plasma and PlasmaActivated Water on Germination and Growth in Rapeseed (Brassica napus). Gesunde Pflanz 2019, 71, 175–185. [CrossRef]
19. Iranbakhsh, A.; Ardebili, Z.O.; Molaei, H.; Ardebili, N.O.; Amini, M. Cold plasma up-regulated expressions of WRKY1 transcrip-tion factor and genes involved in biosynthesis of cannabinoids in Hemp (Cannabis sativa L.). Plasma Chem. Plasma Process. 2020,40, 527–537. [CrossRef]
20. Ghaemi, M.; Majd, A.; Iranbakhsh, A. Transcriptional responses following seed priming with cold plasma and electromagneticfield in Salvia nemorosa L. J. Theor. Appl. Phys. 2020, 14, 323–328. [CrossRef]
21. Ebrahimibasabi, E.; Ebrahimi, A.; Momeni, M.; Reza Amerian, M. Elevated expression of diosgenin-related genes and stimulationof the defense system in Trigonella foenum-graecum (Fenugreek) by cold plasma treatment. Sci. Hortic. 2020, 271, 109494. [CrossRef]
22. Sajib, S.A.; Billah, M.; Mahmud, S.; Miah, M.; Hossain, F.; Omar, F.B.; Roy, N.C.; Hoque, K.M.F.; Talukder, M.R.; Kabir, A.H.; et al.Plasma activated water: The next generation eco-friendly stimulant for enhancing plant seed germination, vigor and increasedenzyme activity, a study on black gram (Vigna mungo L.). Plasma Chem. Plasma Process. 2020, 40, 119–143. [CrossRef]
23. Perez, S.M.; Biondi, E.; Laurita, R.; Proto, M.; Sarti, F.; Gherardi, M.; Bertaccini, A.; Colombo, V. Plasma activated water asresistance inducer against bacterial leaf spot of tomato. PLoS ONE 2019, 14, e0217788. [CrossRef] [PubMed]
24. Ka, D.H.; Priatama, R.A.; Park, J.Y.; Park, S.J.; Kim, S.B.; Lee, I.A.; Lee, Y.K. Plasma-Activated Water Modulates Root Hair CellDensity via Root Developmental Genes in Arabidopsis thaliana L. Appl. Sci. 2021, 11, 2240. [CrossRef]
25. Tong, J.; He, R.; Tang, X.; Li, M.; Wan, J. Transcriptomic analysis of seed germination improvement of Andrographis paniculataresponding to air plasma treatment. PLoS ONE 2020, 15, e0240939. [CrossRef] [PubMed]
26. Cui, D.; Yin, Y.; Li, H.; Hu, X.; Zhuang, J.; Ma, R.; Jiao, Z. Comparative transcriptome analysis of atmospheric pressure coldplasma enhanced early seedling growth in Arabidopsis thaliana. Plasma Sci. Technol. 2021, 23, 085502. [CrossRef]
27. Han, B.; Yu, N.-N.; Zheng, W.; Zhang, L.-N.; Liu, Y.; Yu, J.-B.; Zhang, Y.-Q.; Park, G.; Sun, H.-N.; Kwon, T. Effect of non-thermalplasma (NTP) on common sunflower (Helianthus annus L.) seed growth via upregulation of antioxidant activity and energymetabolism-related gene expression. Plant Growth Regul. 2021, 95, 271–281. [CrossRef]
28. Wang, P.; Chen, F.; Huang, Y.; Sun, H.; Fan, M.; Ning, D.; Wang, T.; Wang, H.; Liu, M. New insights of low-temperature plasmaeffects on seeds germination of Platycodon grandiflorum. Isr. J. Plant Sci. 2021, 68, 306–318. [CrossRef]
29. Waskow, A.; Ibba, L.; Leftley, M.; Howling, A.; Ambrico, P.F.; Furno, I. An In Situ FTIR Study of DBD Plasma Parameters forAccelerated Germination of Arabidopsis thaliana Seeds. Int. J. Mol. Sci. 2021, 22, 11540. [CrossRef]
30. Jolliffe, I. Principal Component Analysis. In International Encyclopedia of Statistical Science; Lovric, M., Ed.; Springer:Berlin/Heidelberg, Germany, 2011. [CrossRef]
31. Jin, X.; Han, J. K-Means Clustering. In Encyclopedia of Machine Learning; Sammut, C., Webb, G.I., Eds.; Springer: Boston, MA,USA, 2011. [CrossRef]
32. Hinneburg, A. Visualizing Clustering Results. In Encyclopedia of Database Systems; Liu, L., Özsu, M.T., Eds.; Springer: Boston, MA,USA, 2009. [CrossRef]
33. Love, M.I.; Huber, W.; Anders, S. Moderated estimation of fold change and dispersion for RNA-seq data with DESeq2. GenomeBiol. 2014, 15, 550. [CrossRef]
34. Ge, S.X.; Jung, D.; Yao, R. ShinyGO: A graphical gene-set enrichment tool for animals and plants. Bioinformatics 2020, 36, 2628–2629.[CrossRef] [PubMed]
35. Zhao, J.; Lu, Z.; Wang, L.; Jin, B. Plant Responses to Heat Stress: Physiology, Transcription, Noncoding RNAs, and Epigenetics.Int. J. Mol. Sci. 2021, 22, 117. [CrossRef] [PubMed]
36. Amen, T.; Guihur, A.; Zelent, C.; Ursache, R.; Wilting, J.; Kaganovich, D. Resveratrol and related stilbene derivatives induce stressgranules with distinct clearance kinetics. Mol. Biol. Cell 2021, 32, ar18. [CrossRef] [PubMed]
37. Bourgine, B.; Guihur, A. Heat shock signaling in land plants: From plasma membrane sensing to the transcription of small heatshock proteins. Front. Plant Sci. 2021, 12, 710801. [CrossRef]
38. Guihur, A.; Fauvet, B.; Finka, A.; Quadroni, M.; Goloubinoff, P. Quantitative proteomic analysis to capture the role of heat-accumulated proteins in moss plant acquired thermotolerance. Plant Cell Environ. 2021, 44, 2117–2133. [CrossRef] [PubMed]
39. Waskow, A.; Butscher, D.; Oberbossel, G.; Klöti, D.; Rudolf von Rohr, P.; Büttner-Mainik, A.; Schuppler, M. Low-energy electronbeam has severe impact on seedling development compared to cold atmospheric pressure plasma. Sci. Rep. 2021, 11, 16373.[CrossRef]
40. Wijesooriya, K.; Jadaan, S.A.; Perera, K.L.; Kaur, T.; Ziemann, M. Guidelines for reliable and reproducible functional enrichmentanalysis. bioRxiv 2021. [CrossRef]
41. Koga, K.; Thapanut, S.; Amano, T.; Seo, H.; Itagaki, N.; Hayashi, N.; Shiratani, M. Simple method of improving harvest bynonthermal air plasma irradiation of seeds of Arabidopsis thaliana (L.). Appl. Phys. Express 2015, 9, 16201. [CrossRef]
Int. J. Mol. Sci. 2022, 23, 3070 24 of 24
42. Bafoil, M.; Le Ru, A.; Merbahi, N.; Eichwald, O.; Dunand, C.; Yousfi, M. New insights of low-temperature plasma effects ongermination of three genotypes of Arabidopsis thaliana seeds under osmotic and saline stresses. Sci. Rep. 2019, 9, 8649. [CrossRef][PubMed]
43. Ambrico, P.F.; Simek, M.; Ambrico, M.; Morano, M.; Prukner, V.; Minafra, A.; Allegretta, I.; Porfido, C.; Senesi, G.S.; Terzano, R.On the air atmospheric pressure plasma treatment effect on the physiology, germination and seedlings of basil seeds. J. Phys. DAppl. Phys. 2020, 53, 104001. [CrossRef]
44. Waskow, A.; Howling, A.; Furno, I. Advantages and limitations of surface analysis techniques on plasma-treated Arabidopsisthaliana seeds. Front. Mater. 2021, 8, 642099. [CrossRef]
45. Butscher, D.; Zimmermann, D.; Schuppler, M.; von Rohr, P.R. Plasma inactivation of bacterial endospores on wheat grains andpolymeric model substrates in a dielectric barrier discharge. Food Control 2016, 60, 636–645. [CrossRef]
46. Butscher, D.; van Loon, H.; Waskow, A.; von Rohr, P.R.; Schuppler, M. Plasma inactivation of microorganisms on sprout seeds in adielectric barrier discharge. Int. J. Food Microbiol. 2016, 238, 222–232. [CrossRef] [PubMed]
47. Mildaziene, V.; Ivankov, A.; Pauzaite, G.; Nauciene, Z.; Zukiene, R.; Degutyte-Fomins, L.; Lyushkevich, V. Seed treatment withcold plasma and electromagnetic field induces changes in red clover root growth dynamics, flavonoid exudation, and activatesnodulation. Plasma Processes Polym. 2021, 18, 2000160. [CrossRef]
48. Huang, A.C.; Jiang, T.; Liu, Y.-X.; Bai, Y.-C.; Reed, J.; Qu, B.; Goossens, A.; Nützmann, H.-W.; Bai, Y.; Osbourn, A. A specializedmetabolic network selectively modulates Arabidopsis root microbiota. Science 2019, 364, eaau6389. [CrossRef] [PubMed]
49. Sinha, S.; Sandhu, K.; Bisht, N.; Nailwal, T.; Saini, I.; Kaushik, P. Ascertaining the Paradigm of Secondary Metabolism Enhancementthrough Gene Level Modification in Therapeutic Plants. J. Young Pharm. 2019, 11, 337–343. [CrossRef]
50. Binder, S. Branched-Chain Amino Acid Metabolism in Arabidopsis thaliana. Arab. Book 2010, 8, e0137. [CrossRef] [PubMed]51. Subki, A.; Abidin, A.A.Z.; Yusof, Z.N.B. The role of thiamine in plants and current perspectives in crop improvement. B Group
Vitam.-Curr. Uses Perspect. 2018, 5, 33–44. [CrossRef]52. Ahn, I.P.; Kim, S.; Lee, Y.H. Vitamin B1 functions as an activator of plant disease resistance. Plant Physiol. 2005, 138, 1505–1515.
[CrossRef]53. Hansen, B.G.; Kerwin, R.E.; Ober, J.A.; Lambrix, V.M.; Mitchell-Olds, T.; Gershenzon, J.; Kliebenstein, D.J. A novel 2-oxoacid-
dependent dioxygenase involved in the formation of the goiterogenic 2-hydroxybut-3-enyl glucosinolate and generalist insectresistance in Arabidopsis. Plant Physiol. 2008, 148, 2096–2108. [CrossRef] [PubMed]
54. Kittipol, V.; He, Z.; Wang, L.; Doheny-Adams, T.; Langer, S.; Bancroft, I. Genetic architecture of glucosinolate variation in Brassicanapus. J. Plant Physiol. 2019, 240, 152988. [CrossRef] [PubMed]
55. Jagodzik, P.; Tajdel-Zielinska, M.; Ciesla, A.; Marczak, M.; Ludwikow, A. Mitogen-Activated Protein Kinase Cascades in PlantHormone Signaling. Front. Plant Sci. 2018, 9, 1387. [CrossRef]
56. Jalmi, S.K.; Sinha, A.K. ROS mediated MAPK signaling in abiotic and biotic stress- striking similarities and differences. Front.Plant Sci. 2015, 6, 769. [CrossRef]
57. Yamada, K.; Goto-Yamada, S.; Nakazaki, A.; Kunieda, T.; Kuwata, K.; Nagano, A.J.; Nishimura, M.; Hara-Nishimura, I.Endoplasmic reticulum-derived bodies enable a single-cell chemical defense in Brassicaceae plants. Commun. Biol. 2020, 3, 21.[CrossRef] [PubMed]
58. Akinwumi, B.C.; Bordun, K.M.; Anderson, H.D. Biological Activities of Stilbenoids. Int. J. Mol. Sci. 2018, 19, 792. [CrossRef][PubMed]
59. Kim, J.I.; Zhang, X.; Pascuzzi, P.E.; Liu, C.J.; Chapple, C. Glucosinolate and phenylpropanoid biosynthesis are linked byproteasome-dependent degradation of PAL. New Phytol. 2020, 225, 154–168. [CrossRef] [PubMed]
60. Malka, S.K.; Cheng, Y. Possible Interactions between the Biosynthetic Pathways of Indole Glucosinolate and Auxin. Front. PlantSci. 2017, 8, 2131. [CrossRef]
61. Pauzaite, G.; Malakauskiene, A.; Nauciene, Z.; Zukiene, R.; Filatova, I.; Lyushkevich, V.; Mildaziene, V. Changes in Norwayspruce germination and growth induced by pre-sowing seed treatment with cold plasma and electromagnetic field: Short-termversus long-term effects. Plasma Processes Polym. 2018, 15, 1700068. [CrossRef]
62. Hayashi, N. Growth Enhancement Effect of Gene Expression of Plants Induced by Active Oxygen Species in Oxygen Plasma. InAgritech: Innovative Agriculture Using Microwaves and Plasmas; Horikoshi, S., Brodie, G., Takaki, K., Serpone, N., Eds.; Springer:Singapore, 2022. [CrossRef]
63. Sirgedaite-Šežiene, V.; Mildažiene, V.; Žemaitis, P.; Ivankov, A.; Koga, K.; Shiratani, M.; Baliuckas, V. Long-term response ofNorway spruce to seed treatment with cold plasma: Dependence of the effects on the genotype. Plasma Processes Polym. 2021,18, 2000159. [CrossRef]