rna editome in rhesus macaque shaped by purifying selection
TRANSCRIPT

RNA Editome in Rhesus Macaque Shaped by PurifyingSelectionJia-Yu Chen1., Zhiyu Peng2,3., Rongli Zhang1., Xin-Zhuang Yang1, Bertrand Chin-Ming Tan4,
Huaying Fang5, Chu-Jun Liu1, Mingming Shi3, Zhi-Qiang Ye6, Yong E. Zhang7, Minghua Deng5,
Xiuqin Zhang1*, Chuan-Yun Li1*
1 Beijing Key Laboratory of Cardiometabolic Molecular Medicine, Institute of Molecular Medicine, Peking University, Beijing, China, 2 BGI-Guangzhou, Guangzhou, China,
3 BGI-Shenzhen, Shenzhen, China, 4 Department of Biomedical Sciences and Graduate Institute of Biomedical Sciences, College of Medicine, Chang Gung University, Tao-
Yuan, Taiwan, 5 School of Mathematical Sciences and Center for Quantitative Biology, Peking University, Beijing, China, 6 Lab of Computational Chemistry and Drug
Design, Key Laboratory of Chemical Genomics, Peking University Shenzhen Graduate School, Shenzhen, China, 7 Key Laboratory of Zoological Systematics and Evolution,
Institute of Zoology, Chinese Academy of Sciences, Beijing, China
Abstract
Understanding of the RNA editing process has been broadened considerably by the next generation sequencingtechnology; however, several issues regarding this regulatory step remain unresolved – the strategies to accuratelydelineate the editome, the mechanism by which its profile is maintained, and its evolutionary and functional relevance. Herewe report an accurate and quantitative profile of the RNA editome for rhesus macaque, a close relative of human. Bycombining genome and transcriptome sequencing of multiple tissues from the same animal, we identified 31,250 editingsites, of which 99.8% are A-to-G transitions. We verified 96.6% of editing sites in coding regions and 97.5% of randomlyselected sites in non-coding regions, as well as the corresponding levels of editing by multiple independent means,demonstrating the feasibility of our experimental paradigm. Several lines of evidence supported the notion that theadenosine deamination is associated with the macaque editome – A-to-G editing sites were flanked by sequences with theattributes of ADAR substrates, and both the sequence context and the expression profile of ADARs are relevant factors indetermining the quantitative variance of RNA editing across different sites and tissue types. In support of the functionalrelevance of some of these editing sites, substitution valley of decreased divergence was detected around the editing site,suggesting the evolutionary constraint in maintaining some of these editing substrates with their double-strandedstructure. These findings thus complement the ‘‘continuous probing’’ model that postulates tinkering-based origination of asmall proportion of functional editing sites. In conclusion, the macaque editome reported here highlights RNA editing as awidespread functional regulation in primate evolution, and provides an informative framework for further understandingRNA editing in human.
Citation: Chen J-Y, Peng Z, Zhang R, Yang X-Z, Tan BC-M, et al. (2014) RNA Editome in Rhesus Macaque Shaped by Purifying Selection. PLoS Genet 10(4):e1004274. doi:10.1371/journal.pgen.1004274
Editor: Jin Billy Li, Stanford University, United States of America
Received June 2, 2013; Accepted February 15, 2014; Published April 10, 2014
Copyright: � 2014 Chen et al. This is an open-access article distributed under the terms of the Creative Commons Attribution License, which permitsunrestricted use, distribution, and reproduction in any medium, provided the original author and source are credited.
Funding: This work was supported by grants from the National Key Basic Research Program of China (http://www.973.gov.cn/English/Index.aspx)[2013CB531202, 2012CB518004], Beijing Joint Research Program of Scientific Research and Graduate Student Training (http://www.bjedu.gov.cn) and the NationalNatural Science Foundation of China (http://www.nsfc.gov.cn/) [31171269, 31221002]. BC-MT is supported by National Science Council (http://web1.nsc.gov.tw/) [NSC102-2321-B-182-007] and National Health Research Institute (http://www.nhri.org.tw/) [NHRI-EX103-10321SI]. ZP is supported by the GuangzhouKey Laboratory of Cancer, Trans-Omics Research in BGI-Guangzhou. The funders had no role in study design, data collection and analysis, decision to publish, or preparation of the manuscript.
Competing Interests: The authors have declared that no competing interests exist.
* E-mail: [email protected] (XZ); [email protected] (CYL)
. These authors contributed equally to this work.
Introduction
Since its discovery in 1986 [1], an increasing number of genes
have been found to be subject to RNA editing, a co-transcriptional
process that alters hereditary information by introducing differ-
ences between RNA and its corresponding DNA sequence [2].
The investigation of such regulation accelerated dramatically after
the development of next generation sequencing (NGS) technology,
which facilitates the genome-wide determination of DNA and
RNA sequences at relatively low cost [3–5]. Several early NGS-
based editome studies in human [4–7] have challenged the
traditional view of human genetics, since RNA editing might be a
source of variations inaccessible to previous genetic studies.
Although the identification of RNA-editing sites by discerning
sequence discrepancies between RNA and DNA derived from the
same specimen seems to be a straightforward approach, it is error-
prone when the RNA/DNA sequences are compiled by short reads
generated from NGS technology [5]. As is being extensively discussed
[5,8–12], widespread RNA-editing sites detected in a recent study
might be largely a result of technical errors. It thus remains
technically challenging to accurately identify human editing sites
using NGS data [5,8–12]. In addition, given the difficulties of
obtaining specimens of different tissues from the same human
individual as well as accurately quantifying the levels of editing using
merely NGS data, the mechanisms by which the editome is
maintained and regulated remain unclear. Recent studies with
PLOS Genetics | www.plosgenetics.org 1 April 2014 | Volume 10 | Issue 4 | e1004274

contrasting findings are thus in line with the notion that RNA
editome may be governed by complex regulation, despite the fact that
a large proportion of non-canonical editing types were identified due
to technical errors [5]. First, large cross-tissue variations of the RNA
editome were detected [4], while the tissue-biased RNA editome
could not be directly explained by the expression and activity of
known enzymes catalyzing adenosine deamination [13,14]. Second,
genome-wide editome analysis in human also suggested large intra-
population variations [3,7], whereas one study on candidate genes
demonstrated otherwise [15]. Third, as only sporadic functional
RNA-editing sites have been reported, it remains controversial
whether the editing events detected by NGS represent functional
regulation rather than neutral signals [16]. The ‘‘continuous probing’’
model postulated that most of the editing sites are neutral with low
editing levels, acting as a selection pool for a few functional editing
sites [17], further challenged the functional significance of those
widespread RNA-editing sites detected by NGS.
Overall, NGS technology has helped open the Pandora’s box of
the editome and so has raised more questions than it answers. Key
issues, including experimental and computational strategies to
accurately identify the editome, the mechanism by which its profile
is maintained, and its functional significance, are presently not well
addressed [18]. Cross-species comparisons with our close evolu-
tionary relatives would provide a framework to clarify these issues.
Therefore, we set out to study the editome in rhesus macaque,
with the aim of complementing several recent reports on human
editome [4–7]. The macaque editome we report here provides an
important evolutionary context to understand RNA-editing
regulation in human, emphasizing RNA editing as a form of
widespread functional regulation shaped by purifying selection.
Results
Genome-wide identification of RNA-editing sites inrhesus macaque
We performed a genome-wide study to identify RNA-editing
sites in rhesus macaque (Figure 1A). Considering the error-prone
gene structures in this species, strand-specific poly(A)-positive
RNA-Seq was performed (Materials and Methods). A total of
824.8 million 90-bp paired-end reads were obtained for seven
macaque tissues (prefrontal cortex, cerebellum, muscle, kidney,
heart, testis and lung) derived from the same animal, and mapped
to the macaque genome with high quality (Table 1, Figure S1).
As a reference, genomic DNA derived from prefrontal cortex of
the same animal was sequenced; a total of 1,763.3 million 90-bp
paired-end reads were uniquely mapped to the macaque genome,
with 92.2% of the genomic regions successfully sequenced and
91.6% covered by at least ten DNA reads (Table 1, Figure S2).
Such deep coverage of the genome and transcriptome in multiple
tissues of the same animal provided an ideal dataset to profile the
RNA editome in rhesus macaque (Table 1, Figures 1A, S1 &S2).
Stringent computational pipelines were then developed to place
the DNA reads and cDNA reads to the macaque genome,
especially for the definition of uniquely-mapped cDNA reads
(Materials and Methods). Briefly, one cDNA read was
considered to be uniquely mapped only if it had no second-best
hit or the second-best hit included at least three additional
sequence alignment mismatches, when considering both the
genome and the transcriptome mapping models. The technical
issues raised recently [8–10], such as systematic sequencing errors
as well as pseudogene- or paralog-related misalignments in short-
read processing, were thus adequately addressed. Based on
uniquely-mapped reads, candidate RNA-editing sites were iden-
tified by distinguishing sequence discrepancies between DNA and
cDNA. This initial list was further subjected to stringent inclusion
criteria to control for false-positives (Figure 1A). Briefly, following
previous large-scale studies in human [3,6,7,12], a standard
computational pipeline with multiple filters was introduced to
eliminate false-positives due to amplification bias, sequencing
errors and mapping errors. To account for the error-prone gene
structures in rhesus macaque, we introduced one additional filter
to remove editing sites located in previously mis-annotated
transcripts, on the basis of in-house revised transcript structures
[19,20] (Figures 1A & 2B; Materials and Methods).
Particularly, considering the less stringent requirement for
accurately calling the widespread editing sites in Alu regions
compared with those in non-Alu regions [21], we introduced more
relaxed criteria for identifying editing sites in Alu regions
(Materials and Methods). Overall, 31,250 macaque editing
sites were identified, with 29 in coding regions, 1,198 in
untranslated regions, 15,177 in intronic regions and 14,846 in
intergenic regions (Figure 1A and Table S1; Materials andMethods). Similar to the reports in human [21], the vast majority
(30,699 of 31,250) of these sites are located in Alu repeat elements.
An accurate, quantitative and representative catalog ofRNA-editing sites across rhesus macaque transcriptome
We next set out to confirm that these sites represent bona fide
RNA-editing events rather than technical artifacts. Twenty-eight
of all 29 editing sites (96.6%) in coding regions (Figure S3,Tables 2 & S2), as well as 77 of the 79 randomly selected sites
(97.5%) in untranslated, intronic and intergenic regions (FigureS4, Table S2) were experimentally verified by PCR amplification
and Sanger sequencing of both DNA (median length of the PCR
products, 449 bp) and the corresponding cDNA (median, 449 bp).
The validation rates for both coding and non-coding regions
suggested that most of the sites identified in this genome-wide
study should be verifiable.
In addition to the traditional approach of PCR amplification
and Sanger sequencing, we also performed a medium-throughput
Author Summary
RNA editing is a co-transcriptional process that introducesdifferences between RNA and its corresponding DNAsequence. Currently, the next generation sequencing haveallowed study of the editome in a comprehensive andefficient manner. However, fundamental issues involvingaccurate mapping of the editome as well as its regulationand functional outcome remain unresolved. To furtherunveil the underlying mechanisms from the evolutionaryperspective, we report here the editome profile in rhesusmacaque, one of our closest evolutionary relatives. Weidentified a list of 31,250 RNA-editing sites and decipheredan accurate and informative editome across multiple tissuesand animals. We found that the adenosine deamination isassociated with the macaque editome, in that both thesequence context and the expression profile of ADARs arerelevant factors in determining the quantitative variance ofRNA editing across different sites and tissue types.Importantly, some of these RNA-editing events representfunctional regulation, rather than neutral signals, assuggested by substitution valley of decreased divergencedetected around the editing sites, an indication of selectiveconstraint in maintaining some of these editing substrateswith their double-stranded structure. The macaque editomethus provides an informative evolutionary context for an in-depth understanding of RNA editing regulation.
RNA Editome in Rhesus Macaque
PLOS Genetics | www.plosgenetics.org 2 April 2014 | Volume 10 | Issue 4 | e1004274

Figure 1. Genome-wide identification and verification of RNA editome in one rhesus macaque. (A) Overview of the experimental design– genome-wide identification, and medium- or low-throughput verification of RNA-editing sites. (B) An example showing the genotyping results forthe genomic DNA (gDNA) and cDNA (cDNA) of one verified RNA-editing site (chr11:5028364, KCNA1). The levels of RNA editing were estimated fromhigh-throughput, medium-throughput and low-scale data on the basis of read number, signal intensity contrast and peak height ratio between theedited and wild-type alleles, respectively. The primer peak and the genotype peak on mass spectrum are indicated by dotted lines in red. (C)Comparison of the levels of RNA editing estimated by high-throughput (H), medium-throughput (M) and low-scale (L) platforms. The example in (B) ishighlighted in red. Pearson correlation coefficients between different platforms are shown on the right.doi:10.1371/journal.pgen.1004274.g001
RNA Editome in Rhesus Macaque
PLOS Genetics | www.plosgenetics.org 3 April 2014 | Volume 10 | Issue 4 | e1004274

study to quantify the levels of coding region-associated RNA
editing in the seven tissues using a mass array-based genotyping
platform (Materials and Methods). The levels of RNA editing
were then estimated and compared between the high-throughput,
medium-throughput and low-scale assays (Figure 1B). Strikingly,
the levels of RNA editing estimated by high-throughput technol-
ogy were in close agreement with those by the other two
independent platforms, particularly for sites with $10 supporting
reads (the Pearson correlation coefficients were 0.89, 0.96 and
0.89; Figure 1C). This adequacy of the NGS data in estimation of
RNA-editing levels thus indicated that quantitative characteriza-
tion of the RNA editomes, particularly among tissues, individuals,
and species, may be based on integrating in-house RNA-Seq data
with public transcriptome data (Figure S5).
As stringent cutoffs for the sequencing depth of genome were
instituted to distinguish RNA editing from systematic sequencing
errors, allele-specific expression and duplication-related polymor-
phisms, we evaluated whether such a rigorous approach may have
hampered the site-calling sensitivity in this study. Focusing on
coding regions, we increased the coverage of genomic DNA
sequences to 115-fold through an established whole-exome
capturing and sequencing strategy [3] (Table 1). A total of 83.9
million DNA reads were then obtained and mapped to the
macaque genome, with 96.9% of the coding regions being
sequenced with high coverage (Figure S2). However, only six
additional RNA-editing sites were identified using this targeted
genomic reference, but were subsequently discarded by Sanger
validation. These false-positives might have arisen largely due to
biased capture efficiency in the exome sequencing assay favoring
the wild-type allele (Figure 2C). Actually, even considering cross-
species differences, the majority (13 out of 14) of those well-
characterized human RNA editing sites as summarized by Li et al
[4] were included in the initial list (Table S3), suggesting the high
calling sensitivity of editing sites in coding region.
However, considering the coding regions are less repetitive and
well-annotated than other genomic regions, it is not straightfor-
ward to generalize the high calling sensitivity in coding region to
other genomic regions. Notably, the overall number of macaque
editing sites we identified is lower than that in human, in which
84,750 editing sites were identified from poly(A)-positive RNA-Seq
data (Supplementary Table 1 in Reference [7,21]). Although
multiple factors, such as the differences in experimental design and
the inherent difference in genetic makeup, may contribute to the
human-macaque difference [7,21] (Discussion), it is likely that
false-negatives in RNA-editing detection could still result from our
stringent criteria (Materials and Methods, Discussion).
Nonetheless, such rigorous approach is necessary for controlling
false-positives, especially considering the poor genome annotations
and error-prone gene structures in rhesus macaque [19,20,22].
Importantly, despite the notion that certain degrees of false-
negatives exist, this dataset may still represent a representative list
of macaque editing sites for further interrogation of some global
attributes of the RNA editome.
Association of ADARs-mediated reactions with themacaque editome
Having established the feasibility of our experimental design
and the authenticity of the macaque editing dataset, we next
aimed to characterize the relevant molecular factors underlying
the macaque RNA editome. To this end, several global attributes
of the editome were first identified as follows.
First, contrary to the previous study reporting all twelve possible
forms for RNA-editing sites in human with a large proportion of
transversions (43%) [5], we found that nucleotide transitions
Ta
ble
1.
Stat
isti
cso
fd
ee
pse
qu
en
cin
gfo
ro
ne
rhe
sus
mac
aqu
e.
Tis
sue
Ty
pe
To
tal
Re
ad
sL
en
gth
Q2
0G
CC
on
ten
tU
niq
ue
ly-A
lig
ne
dR
ea
ds
Ge
no
me
Ma
pp
ing
Tra
nsc
rip
tom
eM
ap
pin
g
Str
an
d-s
pe
cifi
cm
RN
A-S
eq
Te
stis
10
0.7
M9
0b
p62
97
.1%
48
.8%
67
.6M
67
.1%
38
.7M
38
.4%
Fro
nta
lC
ort
ex
14
2.1
M9
0b
p62
97
.0%
47
.7%
95
.2M
67
.0%
60
.8M
42
.8%
Mu
scle
12
0.0
M9
0b
p62
96
.9%
49
.8%
75
.7M
63
.1%
53
.0M
44
.2%
Ce
reb
ell
um
12
9.0
M9
0b
p62
96
.4%
47
.5%
92
.5M
71
.7%
42
.6M
33
.0%
Lu
ng
11
3.6
M9
0b
p62
96
.8%
48
.9%
84
.1M
74
.0%
35
.0M
30
.8%
He
art
12
3.7
M9
0b
p62
97
.1%
46
.6%
72
.9M
58
.9%
72
.2M
58
.4%
Kid
ne
y9
5.7
M9
0b
p62
97
.3%
48
.0%
60
.0M
62
.7%
45
.1M
47
.1%
Wh
ole
Ge
no
me
Se
qu
en
cin
g
Fro
nta
lC
ort
ex
21
73
.2M
90
bp6
29
4.3
%4
1.7
%1
76
3.3
M8
1.1
%-
-
Wh
ole
Ex
om
eS
eq
ue
nci
ng
Blo
od
83
.9M
90
bp6
29
5.9
%4
9.1
%7
5.2
M8
9.6
%-
-
do
i:10
.13
71
/jo
urn
al.p
ge
n.1
00
42
74
.t0
01
RNA Editome in Rhesus Macaque
PLOS Genetics | www.plosgenetics.org 4 April 2014 | Volume 10 | Issue 4 | e1004274

accounted for 99.9% of the editing sites in the macaque editome.
Furthermore, 99.8% of the identified changes converted A to G,
which is presumably a consequence of ADAR-mediated enzymatic
reactions (Figure S6). We noted that the fraction of A-to-G
transitions increased when more stringent filters were incorporat-
ed, from 65.6% in the initial list to 99.8% in the final list (Figure
Figure 2. Experimental and computational strategies for accurate editome identification in rhesus macaque. Potential false-positivesin the RNA editing calling workflow were minimized by a more thorough design in our pipeline strategy. (A) Two discrepancies between RNA andgenomic-DNA sequences (highlighted by blue boxes) were located in a cis-natural antisense region where both DNA strands could be transcribed.Strand-specific RNA-Seq clearly distinguished the sequence reads transcribed from the two strands and correctly assigned this site as A-to-G editing,as no discrepancy was detected in the plus-strand transcribed gene. (B) Based on the macaque gene structures defined in-house (RhesusBaseStructure), one of the exon-intron boundaries of ENSMMUT00000021567 was incorrectly defined by a previous annotation (Ensembl Structure).Two T-to-A DNA-RNA discrepancies highlighted by blue boxes would be incorrectly identified as T-to-A RNA editing with the RNA-Seq reads beingaligned to the mis-annotated transcript structure. (C) The genotype of the site highlighted in the blue boxes was incorrectly recognized ashomozygous in DNA and heterozygous in RNA, since only 1 out of 28 sequence reads supported the mutant allele T in DNA, leading to incorrectassignment of a C-to-T editing event. Both Sequenom mass array and Sanger sequencing validations excluded such false-positives, which may arisedue to low sequencing coverage and biased allele capture efficiency in the exome-Seq assay.doi:10.1371/journal.pgen.1004274.g002
RNA Editome in Rhesus Macaque
PLOS Genetics | www.plosgenetics.org 5 April 2014 | Volume 10 | Issue 4 | e1004274

S6), suggesting that most of the nucleotide changes of the
transversion type may have been due to technical artifacts [5,8–
10], rather than unknown mechanisms as proposed previously [5].
Second, the identified sites exhibited considerable variance in
editing levels, with the median level ranging from 2.9% in muscle
to 30.4% in cerebellum (Figure 3A), indicating a differential
regulation profile similar to that reported in human [4]. Third,
tissue profiling also revealed higher levels of RNA editing in the
brain than in other tissues (Figure 3A), affirming a layer of
regulation underlying the complex brain development in primates
[23–25].
In addition, when comparing editing levels across tissues and
individuals by integrating the in-house RNA-Seq data with public
macaque transcriptome data, we further found smaller intra-
population variations of the editing levels in comparison with
cross-tissue variations as revealed by hierarchical clustering
Table 2. 28 verified editing sites in the macaque coding regions.
Position Form Host Gene Recoding Type Function of the Host Gene
1:138950859 ARG COPA IRV non-synonymous change nucleoside-triphosphatase regulator, ion binding,protein binding
6:129544096 ARG ARIH2 KRK synonymous change ion binding, nucleic acid binding, protein binding
6:38781096 ARG RICTOR RRG non-synonymous change protein binding
7:89331048 ARG NOVA1 SRG non-synonymous change,protein stability [51]
nucleic acid binding, protein binding
X:150275345 ARG GABRA3 IRM non-synonymous change,trafficking [52]
ion binding, protein binding, substrate-specific &transmembrane transporter, neurotransmitter binding,signal transducer
10:26945910 ARG BLCAP YRC non-synonymous change, cancerbiomarker [53]
-
10:26945919 ARG BLCAP QRR non-synonymous change, cancerbiomarker [53]
-
10:26945949 ARG BLCAP KRR non-synonymous change, cancerbiomarker [53]
-
11:5028364 ARG KCNA1 affinity for blocking particle, kineticsof channel inactivation [34]
ion binding, protein binding, substrate-specific &transmembrane transporter
12:73754116 ARG UNC80 SRG non-synonymous change -
17:24407704 ARG COG3 IRV non-synonymous change protein binding, substrate-specific transporter
5:72269698 ARG IGFBP7 KRR non-synonymous change, proteolyticcleavage [54], physiological properties [23]
protein binding
6:153684514 ARG CYFIP2 KRE non-synonymous change, biomarkerfor ALS [55]
protein binding
X:152404069 ARG FLNA QRR non-synonymous change, physiologicalproperties [23]
protein binding, signal transducer
11:47207718 ARG ASIC1 TRA non-synonymous change -
7:54257914 ARG NEIL1 KRR non-synonymous change, nucleotideremoval efficiency [36]
ion binding, nucleic acid binding, protein binding,hydrolase
7:54257915 ARG NEIL1 KRK synonymous change, nucleotideremoval efficiency [36]
ion binding, nucleic acid binding, protein binding,hydrolase
5:149561914 ARG GRIA2 QRR non-synonymous change,Ca-permeability [56], channel trafficking[57], receptor assembly [58]
protein binding, substrate-specific & transmembranetransporter, signal transducer
5:149561918 ARG GRIA2 QRQ synonymous change protein binding, substrate-specific & transmembranetransporter, signal transducer
1:134852231 ARG SMG5 RRG non-synonymous change protein binding
3:13010093 ARG SON LRL synonymous change nucleic acid binding, protein binding
7:43601461 ARG PDCD7 QRR non-synonymous change -
2:78236903 ARG FLNB MRV non-synonymous change protein binding
4:33833717 ARG GRM4 QRR non-synonymous change metabotropic glutamate, GABA-B-like receptor, signaltransducer
4: 44072645 ARG TMEM63B QRR non-synonymous change -
8:9841193 ARG XKR6 RRG non-synonymous change -
5:149585132 ARG GRIA2 RRG non-synonymous change protein binding, substrate-specific & transmembranetransporter, signal transducer
X:148223918 CRT NOL11 TRI non-synonymous change -
doi:10.1371/journal.pgen.1004274.t002
RNA Editome in Rhesus Macaque
PLOS Genetics | www.plosgenetics.org 6 April 2014 | Volume 10 | Issue 4 | e1004274

analyses (Materials and Methods; Figure 3B, Table S4). As
the editing levels were estimated according to RNA-Seq data
where the estimation might be less accurate for sites with lower
sequencing coverage, we further used a mass array-based
genotyping platform to quantify the levels of editing in coding
regions of RNA from the seven original macaque tissues and nine
additional samples (Materials and Methods). The mass array
data further verified the intra-population conservation of the
macaque editome (Figure 3C). Besides these qualitative clustering
analyses, we further measured the coefficients of variation (CV) of
editing levels across different animals, as well as across different
tissues from the same animal (Materials and Methods). As
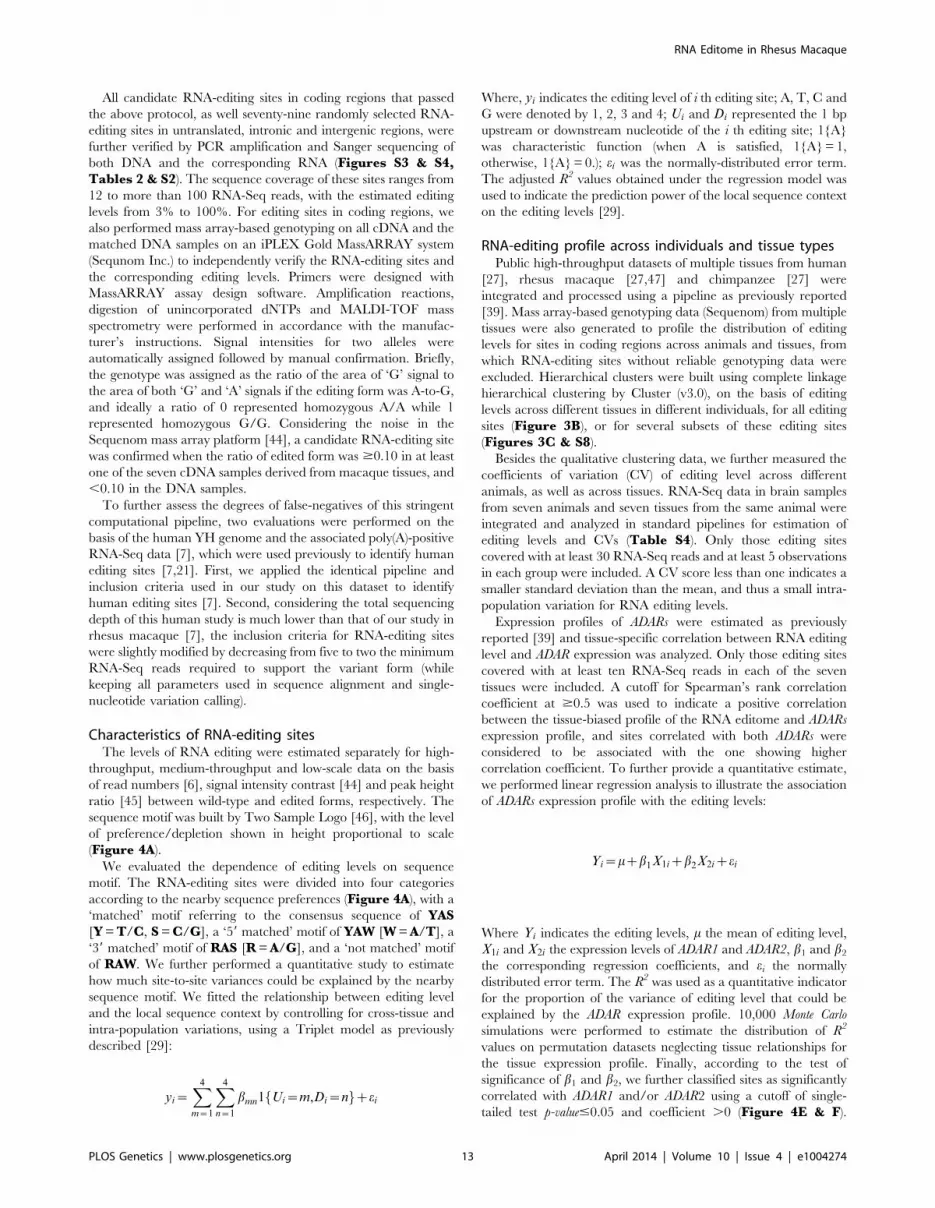
Figure 3. Characteristics of the rhesus macaque editome. (A) For editing sites in each type of tissue, the distribution of the levels of RNAediting was shown in boxplot. (B) Hierarchical clustering of editing levels of all editing sites across multiple macaque tissues and animals. Editinglevels were estimated on the basis of RNA-Seq data in this study (Testis, Lung, Kidney, Heart, Muscle, Prefrontal cortex) and other public RNA-Seq data[Brain (1–6), Cerebellum (1–2), Muscle (1–8), Heart (1–5), Kidney (1–3), Lung (1–3), Testis (1–3)], with missing data shown in dark cyan. (C) Hierarchicalclustering of editing levels is shown for selected RNA editing sites located in coding regions. Editing levels were estimated on the basis of mass array-based genotyping in seven macaque tissues derived from the same macaque (Testis, Lung, Kidney, Heart, Muscle, Cerebellum, Prefrontal Cortex), aswell as five muscle and four brain samples obtained from different macaque animals [Muscles (A–E), Whole Brains (A–D)], with missing data shown indark cyan. (D) The distribution of pair-wise comparison of intra-population and cross-tissue coefficient of variance (CV) values is shown in boxplot.doi:10.1371/journal.pgen.1004274.g003
RNA Editome in Rhesus Macaque
PLOS Genetics | www.plosgenetics.org 7 April 2014 | Volume 10 | Issue 4 | e1004274

expected, for most editing sites (93.4%), the intra-population
standard deviation of editing levels was smaller compared to the
average editing level (Figure S7A). In addition, the variability
across macaque animals is significantly lower than that across
tissues, as indicated by the pair-wise CV comparisons (Wilcoxon one-
tail test, p-value = 4.2e-6; Figure 3D). Our findings therefore
demonstrated that, similar to other fundamental gene regulation
mechanisms [26,27], there may be a regulatory commonality of
RNA editing within populations, in accordance with a previous
study on candidate genes [15].
We next investigated the relevant molecular factors underlying
the macaque editome, and subsequently made the following
observations. First, the sequence context of the overwhelmingly-
represented A-to-G editing sites verified the known attributes of
ADAR substrates, in that the nucleotide 59 to the editing site
significantly disfavored G, while the 39 nucleotide favored G [28]
(Figure 4A). In any given tissue, it seems that the local sequence
context flanking the editing sites is a relevant factor for the global
editing levels – sites with a matched ADAR recognition motif
usually showed significantly higher editing levels than those with a
partially-matched or non-matched recognition motif (Wilcoxon rank
test, p-values shown in Table S5, Figure 4B). Particularly, 59
nucleotide seemed to be more determinative as sites with 59
matched motif usually showed significantly higher editing levels
than those with 39 matched motif only, a finding consistent with
previous reports [29,30] (Figure 4B, Table S5). However,
quantitative analyses with a Triplet model as previously described
[29] revealed that only a small proportion of the site-to-site
variance could be explained by the nearby sequence motif
(Materials and Methods). We suspect that some confounding
factors, such as substrate-specific variations and quantitative
accuracy of editing level by RNA-Seq, might partially contribute
to the low prediction power: when investigating one RNA
substrate harboring 15 editing sites with the editing levels
estimated according to the Sanger sequencing data, where these
confounding issues were controlled, 52.4% site-to-site variances
could be explained by sequence motif (Figure S4), a proportion
comparable to a previous study using fixed RNA substrate and
peak-based editing level estimation [29].
Especially, we noted a quantitative correspondence of the tissue-
biased profile of the RNA editome to the tissue expression profile
of ADARs, although previous studies in rodents did not detect a
significant correlation [13,14]. First, on the basis of a test for
Spearman’s rank correlation, 70.8% of the A-to-G macaque
editing sites showed a tissue distribution of editing levels positively
correlated with the expression of ADARs (Spearman’s rank
correlation coefficient $0.5), such an observation represents a
statistically significant excess of editing sites with positive
correlations (Monte Carlo p-value,0.0001; Figure 4C; Materialsand Methods). Second, to further provide a quantitative
estimate, we performed linear regression analysis to illustrate the
association of ADAR expression profiles with the editing levels
(Table S6; Materials and Methods). To this end, the R2 was
used as a quantitative indicator for the proportion of the variance
of editing level that may be explained by ADAR expression profile
(Materials and Methods). Compared with the distribution of
R2 values on randomly shuffled profiles neglecting tissue relation-
ships for the tissue expression profile, the detected distribution of
the correlations between the cross-tissue variance of editing levels
and ADARs expression could hardly be explained by random
permutations (Monte Carlo p-value,0.0001; Figure 4D), indicating
that ADAR expression levels are indeed a relevant factor in
determining global editing levels (Figure 4D). In addition,
according to the regression analyses, we further found that 209
of these sites (10.7%) were significantly correlated with ADAR1
only, 567 sites (29.0%) with ADAR2, and 31 sites (1.6%) with
both ADARs (Table S6; Materials and Methods). For these
sites, the distributions of editing levels across seven tissues were
shown, which were closely commensurate with the tissue
expression profiles of ADARs (Figure 4E & F). After multiple
testing corrections, 381 sites (19.5%) still showed significant
positive correlation in tissue distribution between RNA editing
level and the expression of ADARs (Table S6; Materials andMethods).
Overall, our qualitative and quantitative data demonstrated that
the intra-population variability of editing levels is significantly
lower than that across tissues, and that both the ADAR expression
profile and the local sequence context are relevant factors in
determining global editing levels. Furthermore, these findings are
consistent for sites located in different genomic regions, such as Alu
vs non-Alu regions (Figures S8 & S9).
Evidence of purifying selection on the editomelandscape
With the spectrum of macaque editing sites, we next performed a
comparative analysis to examine whether the editing sites we
identified in rhesus macaque could also be detected in human and
chimpanzee orthologous regions. To this end, we integrated public
available RNA-Seq data in human or chimpanzee to trace the
orthologous regions of macaque editing sites (Table S4). For the
1,111 macaque editing sites with homology in both of these
transcriptomes with adequate cDNA coverage (Materials andMethods), 599 (or 53.9%) and 590 sites (or 53.1%) could also be
detected in human or chimpanzee, respectively, with 476 sites (or
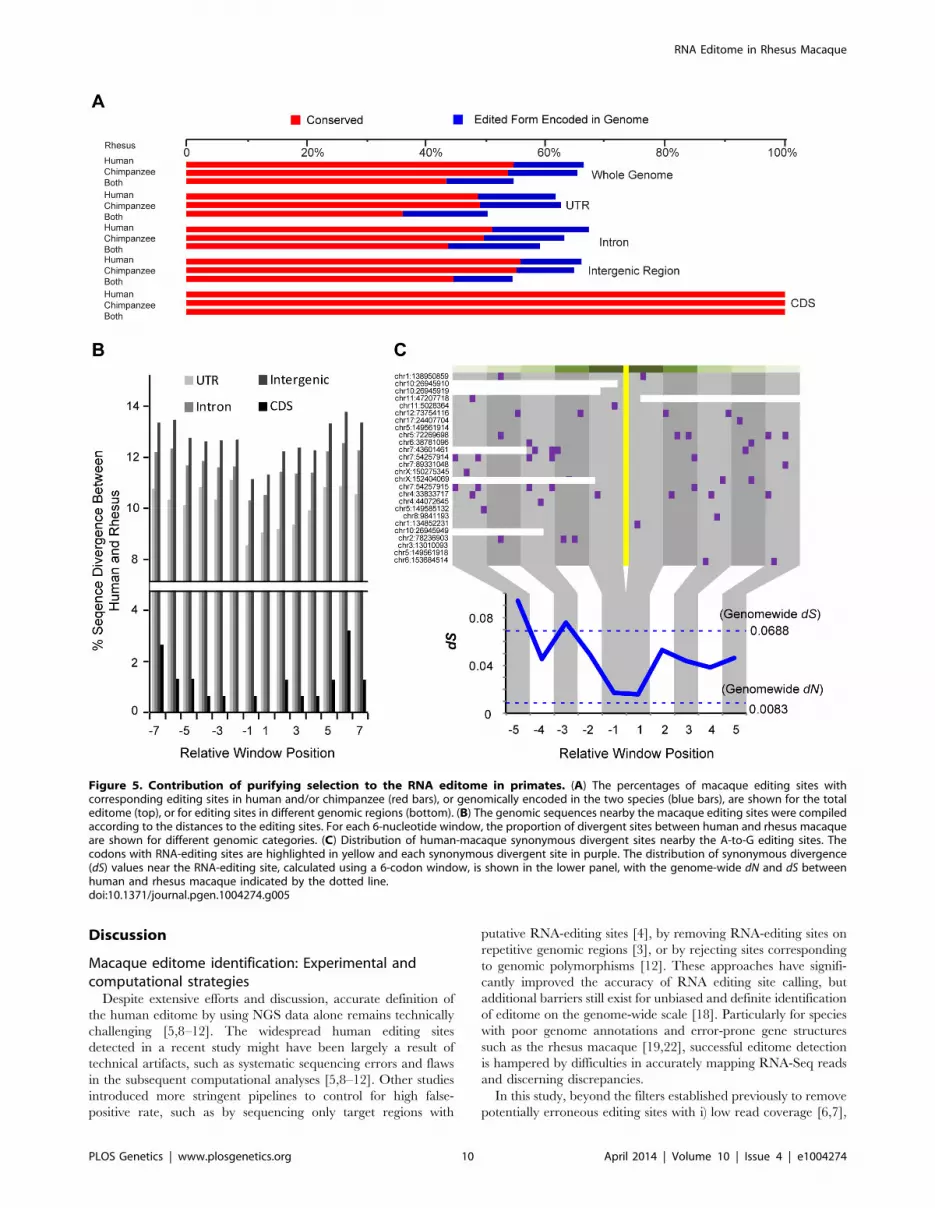
42.8%) detectable in all three species (Figure 5A). Such extent of
overlap was significantly higher than the background, which was
calculated using the adjacent non-edited sites to indicate the degree
of RNA-Seq sequencing errors (Chi-square test, p-value,2.2e-16,
Figures 5A & S9). Some macaque editing sites (138 sites, 12.4%)
were found with the edited forms encoded in human or chimpanzee
genome (Figure 5A), an observation in line with previous studies on
several human candidate genes [31,32]. Compared with other
genomic regions, RNA-editing events in coding regions showed a
particularly higher degree of parallels across the three species, in
that, all of these macaque editing sites could also be detected in
human and chimpanzee homologous regions (Figure 5A).
On the basis of these clues, we further tested whether the cross-
species similarities in RNA editome were maintained by purifying
selection due to the functional implications of these regulations, or
simply due to the relatively lower sequence divergences among these
closely related primate species. As shown above, the local sequence
context of the editing site was important in RNA-editing regulation,
as it may be implicated in the formation of a suitable ADAR
substrate structure [28]. Therefore, primate-specific purifying
selection nearby the editing site would presumably be an evidence
for the functional relevance of the RNA-editing events. When
examining the distribution of diverged sites between human and
rhesus macaque, we discovered substitution valley of decreased
divergence flanking the editing sites, as compared with the more
distal regions as background (Figures 5B & S11; Materials andMethods). As a control, for macaque editing sites encoded in both
human and chimpanzee with other types of nucleotides, no
decreased divergence was observed nearby the focal editing sites
in sequence comparison between human and chimpanzee (FigureS11C). Further analysis revealed little effect of expression levels of
the host genes on the signatures of substitution valley of decreased
divergence (Figure S11E, F & G; Materials and Methods).
Overall, the divergence rates dropped by 15.2%, 12.3% and 13.0%
RNA Editome in Rhesus Macaque
PLOS Genetics | www.plosgenetics.org 8 April 2014 | Volume 10 | Issue 4 | e1004274

for RNA-editing sites located in untranslated, intronic and
intergenic regions, respectively, in contrast to 74.0% in the coding
regions. The stronger selective constraint detected on coding
regions recapitulates the particularly higher degree of parallels of
editome in coding regions, as compared with other genomic regions
(Figure 5). Due to limited number of editing sites in coding regions,
we performed Monte Carlo simulation with random sampling of
coding regions across the macaque genome to test whether the
detected divergence rate drop was an effect of sampling bias on
limited observations. The result revealed that such a possibility is
rare (Monte Carlo p-value = 0.005).
For RNA-editing sites in coding regions, we also examined the
distribution of synonymous divergent sites between human and
rhesus macaque surrounding the editing sites. Although synony-
mous sites have been considered to be largely neutral [33], we
noted that their presence near the editing sites was actually more
selectively constrained than distant synonymous sites [23,34]
(Figure 5C). The synonymous substitution rate nearby the editing
site was nearly equivalent to the genome-wide substitution rate of
nonsynonymous sites that is under strong purifying selection
(Figure 5C; Materials and Methods). We further noted that
the genes regulated by these recoding RNA-editing events were
significantly enriched in the functional category of biological
binding [35] (Hypergeometric test, p-value = 1.7e-3). Among these sites,
three were located in orthologous proteins in human with solved
crystal structures – the nucleotide/codon re-assignment by RNA
editing reportedly regulate the activity of the voltage-gated
potassium channel [34] or the efficiency of DNA glycosylases in
the removal of damaged nucleotides [36]. These RNA-editing
events shaped by purifying selection may thus represent a form of
functional regulation that underlies processes associated with
protein, ion and nucleic acid binding.
Taken together, the dampened divergence rate or synonymous
substitution rate around the editing sites reflects the evolutionary
necessity of retaining some of these editing substrates with their
double-stranded structure (Figure 5). However, in contrast to the
sites in coding regions, it is possible that a smaller proportion of
functional RNA editing sites exist in these non-coding genomic
regions, considering the weaker selective constraints detected
(Figure 5A & B). These findings thus complement the
‘‘continuous probing’’ model postulating a tinkering-based origi-
nation of functional editing sites [17,37] (Discussion).
Figure 4. ADARs-mediated enzymatic reactions is associated with the macaque editome. (A) The enriched (above the top line) anddepleted (below the bottom line) nucleotides nearby the focal editing sites are displayed in Two-Sample Logo, with the level of preference/depletionshown in height proportional to the scale. (B) The editing sites were divided into four categories on the basis of the local sequence context nearbythe editing site, as described in Materials and Methods. For each category, levels of RNA editing are shown in boxplots according to the tissuetypes. (C) Distribution of the percentages of editing sites showing tissue distribution of editing levels positively correlated with the expression ofADARs (Spearman’s rank correlation coefficient at $0.5), for 10,000 permutation datasets neglecting tissue relationships for the tissue expressionprofile. The percentage for the real data was indicated by the arrow with Monte Carlo p-value. (D) Distributions of R2 values in models assumingassociation of editing level with ADARs expression are shown as the Real Data, as well as the Background, which correspond to randomly shuffledprofiles. (E, F) The tissue expression profiles of ADAR1 or ADAR2 were ordered based on RNA expression levels, and normalized editing levels of A-to-G sites were aligned accordingly. These A-to-G editing sites showed similar trends in the distribution of editing levels along the ordered tissueexpression profile of ADAR1 (E) or ADAR2 (F).doi:10.1371/journal.pgen.1004274.g004
RNA Editome in Rhesus Macaque
PLOS Genetics | www.plosgenetics.org 9 April 2014 | Volume 10 | Issue 4 | e1004274
Discussion
Macaque editome identification: Experimental andcomputational strategies
Despite extensive efforts and discussion, accurate definition of
the human editome by using NGS data alone remains technically
challenging [5,8–12]. The widespread human editing sites
detected in a recent study might have been largely a result of
technical artifacts, such as systematic sequencing errors and flaws
in the subsequent computational analyses [5,8–12]. Other studies
introduced more stringent pipelines to control for high false-
positive rate, such as by sequencing only target regions with
putative RNA-editing sites [4], by removing RNA-editing sites on
repetitive genomic regions [3], or by rejecting sites corresponding
to genomic polymorphisms [12]. These approaches have signifi-
cantly improved the accuracy of RNA editing site calling, but
additional barriers still exist for unbiased and definite identification
of editome on the genome-wide scale [18]. Particularly for species
with poor genome annotations and error-prone gene structures
such as the rhesus macaque [19,22], successful editome detection
is hampered by difficulties in accurately mapping RNA-Seq reads
and discerning discrepancies.
In this study, beyond the filters established previously to remove
potentially erroneous editing sites with i) low read coverage [6,7],
Figure 5. Contribution of purifying selection to the RNA editome in primates. (A) The percentages of macaque editing sites withcorresponding editing sites in human and/or chimpanzee (red bars), or genomically encoded in the two species (blue bars), are shown for the totaleditome (top), or for editing sites in different genomic regions (bottom). (B) The genomic sequences nearby the macaque editing sites were compiledaccording to the distances to the editing sites. For each 6-nucleotide window, the proportion of divergent sites between human and rhesus macaqueare shown for different genomic categories. (C) Distribution of human-macaque synonymous divergent sites nearby the A-to-G editing sites. Thecodons with RNA-editing sites are highlighted in yellow and each synonymous divergent site in purple. The distribution of synonymous divergence(dS) values near the RNA-editing site, calculated using a 6-codon window, is shown in the lower panel, with the genome-wide dN and dS betweenhuman and rhesus macaque indicated by the dotted line.doi:10.1371/journal.pgen.1004274.g005
RNA Editome in Rhesus Macaque
PLOS Genetics | www.plosgenetics.org 10 April 2014 | Volume 10 | Issue 4 | e1004274

ii) poor base-calling quality or multiple types of variation [6,7], iii)
strand-biased cDNA read distributions [7], and iv) location in
repeat genomic regions [3,7,12], we installed additional experi-
mental designs and analytical measures with advantage in
eliminating false-positives in our pipeline. First, all NGS assays
were performed in macaque tissues derived from the same animal,
which effectively excluded individual differences in the genome
and transcriptome (Materials and Methods). Second, strand-
specific RNA-Seq technique significantly controlled for potentially
ambiguous calls due to the widespread cis-natural anti-sense
expression [18,38] (Figure 2A). Third, long paired-end reads
were generated in our deep sequencing analysis, ensuring accurate
mapping with sufficient sequencing depth on .18,000 mRNAs
[39] and 96.9% of macaque genomic regions. Fourth, a more
stringent read mapping strategy was applied to facilitate the
definition of uniquely-mapped reads (Materials and Methods),
which efficiently diminished false mapping due to processed
pseudogenes [3]. In addition, considering the error-prone gene
structure annotations for rhesus macaque [19,20], we further
introduced inclusion criteria to remove editing sites located in
previously mis-annotated macaque transcripts. Taken together, as
we demonstrated above, these efforts ensured the identification of
an accurate and quantitative catalog of RNA-editing sites.
However, the stringent criteria we used to control for the false-
positives would cause some false-negatives in RNA-editing
detection, although the calling sensitivity in coding region was
proved to be good (Figures 1 & 2). To evaluate the degrees of
false-negatives of our stringent computational pipelines, we
applied the identical pipeline and inclusion criteria on human
poly(A)-positive RNA-Seq data reported previously to identify
human editing sites [7,21]. Compared with the original poly(A)-
positive RNA-Seq study reporting 84,750 human editing sites (see
Supplementary Table 1 in Reference [7,21]), 20,065 editing
sites were identified by our pipeline, with A-to-G transitions
accounted for 94.3% of the identified editing sites. Considering the
total sequencing depth of this human study is much lower than
that of our study in rhesus macaque, we slightly modified our
inclusion criteria for RNA-editing sites by decreasing from five to
two the minimum RNA-Seq reads required to support the variant
form (while keeping all other parameters used in sequence
alignment and single-nucleotide variation calling), and conse-
quently identified 80,375 editing sites, a number comparable with
the original report in human (84,750 sites; Materials andMethods) [21]. It is obvious that more macaque editing sites
would be expected, especially when increasing the sequencing
depth of the transcriptome. However, with the experimental
efforts in minimizing the effects of computational detection
sensitivity in our study, such as the significantly elevated
transcriptome sequencing depth in rhesus macaque to increase
the detection power of variants, and the strand-specific, long
paired-end reads designed to increase the proportions of uniquely-
mapped reads (Materials and Methods), it is likely that some
non-technical factors, e.g., the inherent difference in genetic
makeup for the inverted Alu pairs, may also contribute to this
human-macaque difference [4,7,40,41].
Viewed together, although our rigorous experimental and
computational paradigm would cause some false-negatives, it
would be a necessary compensation for an accurate and
quantitative catalog of RNA-editing sites in rhesus macaque,
considering the poor genome annotations and error-prone gene
structures in rhesus macaque [19,20,22]. Importantly, the catalog
represents a representative account of RNA-editing sites across
rhesus macaque genome for further interrogation of the global
attributes of the RNA editome.
Characteristics and implications of the macaque editomeAside from the technical issues, the present work on the
macaque RNA editome provided novel insights into several
aspects of the RNA editing process. First, large-scale sequencing
on a broad range of tissue samples from the same or different
animals allowed for a comparative editome analysis. We subse-
quently deduced from such a study that, while there is large degree
of variance between sites and tissues (Figure 3A), the intra-
population variability of editing levels is significantly lower than
that across tissues, suggesting a regulatory commonality of RNA
editing within populations similar to other fundamental gene
regulation mechanisms [26,27] (Figures 3B, C, D, S7 & S8).
Second, the global attributes of editing were further verified and
quantified to show that the occurrence of RNA editing is
correlated with the flanking sequence signatures, as well as the
levels of ADARs expression (Figure 4). The macaque editome is
thus partially associated with ADARs-mediated enzymatic reac-
tions, and the cis- and trans-directed mechanisms associate with
ADARs, such as the chemical affinity of ADAR binding sites and
ADARs concentration, are thus likely to be relevant with the
regulation of the macaque editome.
RNA-editing regulation: Functional outcome andsignificance
While hereditary information is modified by RNA editing,
evidence for functional significance of this process is largely lacking
thus far [17]. Although functional RNA-editing sites have been
sporadically reported, they may represent only isolated cases
rather than a general mode of regulation. In this study, with an
accurate and informative editome defined across multiple tissues
and animals, we found some intra-population conservation of the
macaque editome, as well as some parallels of the editome across
multiple primate species (Figures 3, 4 & 5). However, our
findings also suggest that the editome is partially associated with
ADARs-mediated enzymatic reactions. It is thus possible that sites
showing high affinity to ADARs in one macaque animal would also
have high affinity to ADARs in other macaque animals, or in
humans and chimpanzees, considering the relatively lower
sequence divergences among these closely related primate species.
To this end, we tested whether the cross-species similarities in
RNA editome were maintained by purifying selection due to the
functional implications of these regulations, or simply due to such
a passive mechanism. Interestingly, in support of the functional
relevance of some of these editing sites, substitution valley of
decreased divergence was detected around the editing site
(Figure 5), suggesting the evolutionary necessity of retaining
some of these editing substrates with their double-stranded
structure. Taken together, the findings on the population-wide
and evolutionary conservation of the macaque editome, as well as
the contribution of purifying selection to editome shaping, lend
support to the functional significance of this co-transcriptional
regulation as a whole.
Interestingly, when investigating the dampened divergence rate
for editing sites across different genomic regions, stronger selective
constraint was detected on coding regions, while sites in other
regions also showed some degrees of weaker evolutionary
constraints (Figure 5A & B). This analysis implies that, in
contrast to the sites in coding regions, a smaller proportion of
functional RNA editing sites exist in non-coding genomic regions
(Figure 5A & B). The varied proportions of functional editing
sites across different genomic regions thus support the ‘‘continuous
probing’’ model postulating that most of the editing sites are
neutral with low editing levels, acting as a selection pool for a few
functional editing sites [17]. However, our findings also suggest
RNA Editome in Rhesus Macaque
PLOS Genetics | www.plosgenetics.org 11 April 2014 | Volume 10 | Issue 4 | e1004274

that the RNA editing levels are partially associated with the
chemical affinity of ADAR binding sites, as well as ADAR
concentration. Thus, the editing levels are not necessarily low
even for those potentially neutral editing sites (Figure S12), a
notion that complements the ‘‘continuous probing’’ model by
illustrating a clearer process for the tinkering-based origination of
functional RNA editing sites [17,37].
Materials and Methods
Ethics statementRhesus macaque tissue samples were obtained from the
AAALAC-accredited (Association for Assessment and Accredita-
tion of Laboratory Animal Care) animal facility at the Institute of
Molecular Medicine in Peking University. Experiments with
animals were done in accordance with protocols approved by
the Institutional Animal Care and Use Committee of Peking
University and followed good practice.
Library preparation, sequencing, and quality control forRNA-Seq, genome resequencing and Exome-Seq
Strand-specific RNA-Seq libraries were prepared from seven
rhesus macaque tissues derived from the same animal as previously
reported [38,39,42]. Genomic DNA was obtained from prefrontal
cortex and blood of the same animal for the library preparation of
genome resequencing and parallel exome capture and sequencing,
respectively. Exome fragments were captured and enriched using
SureSelect Human All Exon 50 Mb kits (Agilent Technologies)
following the manufacture’s protocol. NGS was performed on a
HiSeq 2000 Sequencing System, with a 9062 paired-end read
mode. Comprehensive evaluation of sequencing data was carried
out using FastQC (v0.10.0), bedtools (v2.16.2), the Tophat (v1.2.0)
package, and in-house Perl and R scripts. Overall, high-quality
RNA-Seq data were obtained on the basis of high base quality
(Figure S1A), unbiased read distribution on transcripts (FigureS1B), correct strand information (Figure S1C), little DNA
contamination (Figure S1D), and a low and evenly-distributed
mismatch rate across the reads (Figure S1E). The quality of
genome resequencing and exome-Seq were also evaluated
following the strategy reported in a previous study [3] (FigureS2). Deep sequencing data in this study are available at NCBI
Gene Expression Omnibus and SRA under accession numbers
GSE34426, GSE42857 and SRP039366.
Sequence alignment and strategy for single-nucleotidevariation calling and filtering
Exome-Seq or genome resequencing reads were aligned to the
rhesus macaque genome (rheMac2) with BWA (v0.5.9-r16), from
which only uniquely-mapped reads were retained. RNA-Seq reads
were firstly mapped to the macaque genome (rheMac2) by BWA
(v0.5.9-r16). Meanwhile, the RNA-Seq reads were also mapped to
the transcriptome (Ensembl v65) by BWA (v0.5.9-r16) to address
the technical issue of gapped alignment, as well as to control for
false-positives derived from pseudogene- or paralog-related
misalignments in short-read processing. Unique mapping of a
RNA-Seq read was then defined as i) no more than four
mismatches detected in the alignment to the genome or
transcriptome reference; and ii) with no second-best hit or the
second-best mapping model including no less than three additional
alignment mismatches than the best model. For reads aligned to
both the genome and the transcriptome, unique mapping of RNA-
Seq reads was defined when combining the genomic mapping with
the transcriptome mapping results, while other reads uniquely
aligned only to the genome or the transcriptome were kept.
Unique alignments were further examined to remove cases with
incorrect read-pairing information [39]. This stringent mapping
strategy effectively eliminated potential mis-alignment due to
processed pseudogenes or un-annotated transcripts [3]. With this
stringent mapping strategy, it is possible that the hyper-edited
regions are under-represented, as their detection requires align-
ment procedures tolerating more mismatches and thus is different
from most of the current editing detection schemes including ours
[43].
Uniquely-mapped reads were first divided into two groups:
reads transcribed from the plus-strand and those from the minus-
strand. After removing redundant reads with identical start and
end positions, single-nucleotide variation (SNV) calling was
separately performed for the two groups of reads using Samtools
(v0.1.16), with the parameter ‘‘samtools mpileup -C 50 -E –Q 25 –
ug’’. The special parameter ‘‘bcftools view -p 1’’ was set to keep
SNVs significantly deviating from heterozygous allele distribution.
Reads harboring SNVs within 5 bp of both ends were discarded in
SNV calling due to read end-biased sequencing errors [8–10].
Inclusion criteria for RNA-editing sitesWhole genome sequencing data were used to determine the
genotype by adopting criteria similar to those of Li et al [4]. At least
ten genomic reads were required to estimate the genotype of one
site, and the corresponding genotype of a candidate RNA-editing
site was required to be homozygous with .95% of the covered
reads supporting the major allele type (DNA Filter, Figure 1A).
RNA SNVs with a homozygous genotype were included in an
initial list of RNA-editing sites, and were further subjected to a
stringent filtering protocol: i) The RNA SNP Filter, in which at
least five RNA-Seq reads, with $3 nucleotides sequenced with
high PHRED base quality ($25), were required to support the
variant form, thus eliminating false-positives due to amplification
bias or sequencing error (Figure 1A). SNVs displaying more than
one mismatch type were discarded. For candidate RNA-editing
sites in non-Alu regions, we performed BLAT alignment filtering to
eliminate SNVs potentially caused by mis-alignment to paralogs or
pseudogenes [3,7,12,21]; ii) A Strand Bias Filter was also
introduced as previously proposed [7]. Briefly, RNA-editing sites
exhibiting strand bias in read distribution (Fisher’s exact test, p-value,
0.05), or supported by ,2 reads on either of the two strands, were
excluded (Figure 1A), while the minimal supporting reads
required on each strand was decreased from two to one for
candidate editing sites located in Alu regions. To evaluate the
performance of this filter, we performed mass array-based
genotyping to evaluate the removed sites in coding regions. This
filter efficiently removed false positives at a low cost of
identification sensitivity, in that 84.6% of the sites were indeed
erroneous identification and six verified editing sites were included
in the final list; iii) The RhesusBase Filter, in which we further
checked the RNA-editing sites by mapping the raw reads
containing these sites to refined transcript structures in the
RhesusBase [19,20], since some exon-intron boundaries have
been mis-annotated previously [19,20]. SNVs located within 5 bp
of the splicing junctions were further manually curated, as
alignment errors are more frequent around these junctions
[8,10]. The locations of editing sites were then defined on the
basis of both Ensembl and RhesusBase gene annotations [19,20].
Especially, considering the error-prone macaque gene models
[19,20], editing sites located in coding regions were defined only
when the exon-intron structures were supported by at least one
RNA-Seq junction reads or RefSeq gene models mapped from
other species.
RNA Editome in Rhesus Macaque
PLOS Genetics | www.plosgenetics.org 12 April 2014 | Volume 10 | Issue 4 | e1004274
All candidate RNA-editing sites in coding regions that passed
the above protocol, as well seventy-nine randomly selected RNA-
editing sites in untranslated, intronic and intergenic regions, were
further verified by PCR amplification and Sanger sequencing of
both DNA and the corresponding RNA (Figures S3 & S4,Tables 2 & S2). The sequence coverage of these sites ranges from
12 to more than 100 RNA-Seq reads, with the estimated editing
levels from 3% to 100%. For editing sites in coding regions, we
also performed mass array-based genotyping on all cDNA and the
matched DNA samples on an iPLEX Gold MassARRAY system
(Sequnom Inc.) to independently verify the RNA-editing sites and
the corresponding editing levels. Primers were designed with
MassARRAY assay design software. Amplification reactions,
digestion of unincorporated dNTPs and MALDI-TOF mass
spectrometry were performed in accordance with the manufac-
turer’s instructions. Signal intensities for two alleles were
automatically assigned followed by manual confirmation. Briefly,
the genotype was assigned as the ratio of the area of ‘G’ signal to
the area of both ‘G’ and ‘A’ signals if the editing form was A-to-G,
and ideally a ratio of 0 represented homozygous A/A while 1
represented homozygous G/G. Considering the noise in the
Sequenom mass array platform [44], a candidate RNA-editing site
was confirmed when the ratio of edited form was $0.10 in at least
one of the seven cDNA samples derived from macaque tissues, and
,0.10 in the DNA samples.
To further assess the degrees of false-negatives of this stringent
computational pipeline, two evaluations were performed on the
basis of the human YH genome and the associated poly(A)-positive
RNA-Seq data [7], which were used previously to identify human
editing sites [7,21]. First, we applied the identical pipeline and
inclusion criteria used in our study on this dataset to identify
human editing sites [7]. Second, considering the total sequencing
depth of this human study is much lower than that of our study in
rhesus macaque [7], the inclusion criteria for RNA-editing sites
were slightly modified by decreasing from five to two the minimum
RNA-Seq reads required to support the variant form (while
keeping all parameters used in sequence alignment and single-
nucleotide variation calling).
Characteristics of RNA-editing sitesThe levels of RNA editing were estimated separately for high-
throughput, medium-throughput and low-scale data on the basis
of read numbers [6], signal intensity contrast [44] and peak height
ratio [45] between wild-type and edited forms, respectively. The
sequence motif was built by Two Sample Logo [46], with the level
of preference/depletion shown in height proportional to scale
(Figure 4A).
We evaluated the dependence of editing levels on sequence
motif. The RNA-editing sites were divided into four categories
according to the nearby sequence preferences (Figure 4A), with a
‘matched’ motif referring to the consensus sequence of YAS[Y = T/C, S = C/G], a ‘59 matched’ motif of YAW [W = A/T], a
‘39 matched’ motif of RAS [R = A/G], and a ‘not matched’ motif
of RAW. We further performed a quantitative study to estimate
how much site-to-site variances could be explained by the nearby
sequence motif. We fitted the relationship between editing level
and the local sequence context by controlling for cross-tissue and
intra-population variations, using a Triplet model as previously
described [29]:
yi~X4
m~1
X4
n~1
bmn1fUi~m,Di~ngzei
Where, yi indicates the editing level of i th editing site; A, T, C and
G were denoted by 1, 2, 3 and 4; Ui and Di represented the 1 bp
upstream or downstream nucleotide of the i th editing site; 1{A}
was characteristic function (when A is satisfied, 1{A} = 1,
otherwise, 1{A} = 0.); ei was the normally-distributed error term.
The adjusted R2 values obtained under the regression model was
used to indicate the prediction power of the local sequence context
on the editing levels [29].
RNA-editing profile across individuals and tissue typesPublic high-throughput datasets of multiple tissues from human
[27], rhesus macaque [27,47] and chimpanzee [27] were
integrated and processed using a pipeline as previously reported
[39]. Mass array-based genotyping data (Sequenom) from multiple
tissues were also generated to profile the distribution of editing
levels for sites in coding regions across animals and tissues, from
which RNA-editing sites without reliable genotyping data were
excluded. Hierarchical clusters were built using complete linkage
hierarchical clustering by Cluster (v3.0), on the basis of editing
levels across different tissues in different individuals, for all editing
sites (Figure 3B), or for several subsets of these editing sites
(Figures 3C & S8).
Besides the qualitative clustering data, we further measured the
coefficients of variation (CV) of editing level across different
animals, as well as across tissues. RNA-Seq data in brain samples
from seven animals and seven tissues from the same animal were
integrated and analyzed in standard pipelines for estimation of
editing levels and CVs (Table S4). Only those editing sites
covered with at least 30 RNA-Seq reads and at least 5 observations
in each group were included. A CV score less than one indicates a
smaller standard deviation than the mean, and thus a small intra-
population variation for RNA editing levels.
Expression profiles of ADARs were estimated as previously
reported [39] and tissue-specific correlation between RNA editing
level and ADAR expression was analyzed. Only those editing sites
covered with at least ten RNA-Seq reads in each of the seven
tissues were included. A cutoff for Spearman’s rank correlation
coefficient at $0.5 was used to indicate a positive correlation
between the tissue-biased profile of the RNA editome and ADARs
expression profile, and sites correlated with both ADARs were
considered to be associated with the one showing higher
correlation coefficient. To further provide a quantitative estimate,
we performed linear regression analysis to illustrate the association
of ADARs expression profile with the editing levels:
Yi~mzb1X1izb2X2izei
Where Yi indicates the editing levels, m the mean of editing level,
X1i and X2i the expression levels of ADAR1 and ADAR2, b1 and b2
the corresponding regression coefficients, and ei the normally
distributed error term. The R2 was used as a quantitative indicator
for the proportion of the variance of editing level that could be
explained by the ADAR expression profile. 10,000 Monte Carlo
simulations were performed to estimate the distribution of R2
values on permutation datasets neglecting tissue relationships for
the tissue expression profile. Finally, according to the test of
significance of b1 and b2, we further classified sites as significantly
correlated with ADAR1 and/or ADAR2 using a cutoff of single-
tailed test p-value#0.05 and coefficient .0 (Figure 4E & F).
RNA Editome in Rhesus Macaque
PLOS Genetics | www.plosgenetics.org 13 April 2014 | Volume 10 | Issue 4 | e1004274

Multiple testing corrections were performed as previously
described (coefficient .0 and FDR,0.1) [48].
Comparative genomics analyses and the detection ofselective constraints
To examine whether the editing sites we identified in rhesus
macaque could also be detected in human and chimpanzee
orthologous regions, we re-analyzed public available RNA-Seq
data in human or chimpanzee to trace the orthologous regions of
macaque editing sites. Cross-species comparisons of RNA-editing
regulation was analyzed in five tissues (cerebellum, prefrontal
cortex, testis, kidney and heart) in the genomic context of sequence
multiple alignments among human, chimpanzee and rhesus
macaque [49]. Only macaque editing sites covered by at least 10
reads in both human and chimpanzee were included, a cutoff of
sequence coverage required for accurate examination of the editing
status: for the remaining sites with lower coverage, the assignment of
the editing status is compromised by confounding factors such as the
lower detection power of an editing site. To further confirm the
authenticity of ‘‘editing signals’’ in other species, the adjacent non-
edited sites were used as the background to indicate the degrees of
sequence errors (Figures 5A & S10).
We then tested whether the cross-species similarities in RNA
editome were maintained by purifying selection due to the
functional implications of these regulations. The genomic sequences
nearby all of these macaque editing sites were compiled and the
percentage of sequence divergence between human and macaque
was calculated for each 6-nucleotide window. To investigate
whether higher expression may be linked with higher conservation,
we performed the analysis again using three subsets of these editing
sites, divided according to their abundance of expression tags,
estimated on the basis of the sum of normalized abundance of
expression tags in seven tissues and (Figure S11E, F & G).
For editing sites in coding regions, the dS and dN scores for each
window nearby the editing sites were estimated using DnaSP (v5).
The average dS and dN scores between human and rhesus
macaque were estimated using 2,929 coding sequences with high-
quality pairwise alignment [50]. Due to limited number of editing
sites in coding regions, 10,000 Monte Carlo simulations with
random sampling of coding regions across the macaque genome
were performed to assess whether the detected divergence rate
drop was a consequence of sampling bias on limited observations.
A series of Perl and R scripts (v2.13.1) were implemented to
perform these statistical analyses.
Supporting Information
Figure S1 High-quality strand-specific RNA-Seq was performed
for seven rhesus macaque tissues. (A) PHRED quality scores across
all bases of reads. (B) Distribution of RNA-Seq reads across
transcripts. Transcripts were binned into even intervals from 59 to
39, with the percentage of all short reads aligned to each interval
shown as mean 6 SD. (C) Efficiency of strand-specific sequencing
strategy. PFC: prefrontal cortex. (D) Average read distribution in
exonic, intronic and intergenic regions as measured by RPKM. (E)
Mismatch frequency at each position of reads summarized as
mean 6 SD.
(TIF)
Figure S2 Statistics for whole-genome sequencing (WGS) and
parallel exome capture and sequencing (Exome-Seq) in rhesus
macaque. The reads coverage in WGS (upper panel) and Exome-
Seq (lower panel) is summarized and shown in cumulative
frequency plots.
(TIF)
Figure S3 Results of Sanger sequencing validation for all 29
candidate macaque editing sites in coding regions. For each
candidate editing site (indicated by genome coordinates and red
arrows), raw chromatograms of sequences derived from seven
cDNA and the matched DNA (gDNA) samples are shown (S3-1 to
S3-27).
(PDF)
Figure S4 Results of Sanger sequencing validation for 79
candidate macaque editing sites in non-coding regions. For each
candidate editing site (indicated by genome coordinates and red
underlines) in intronic regions (S4-1), untranslated regions (S4-2),
or intergenic regions (S4-3), raw chromatograms of sequences
derived from one cDNA and the matched DNA (gDNA) samples
are shown. *Sites used in regression analysis.
(PDF)
Figure S5 The levels of RNA editing could be accurately
estimated using RNA-Seq data. For each editing site with
adequate read coverage, the levels of editing were estimated using
different RNA-Seq datasets of macaque brain. Pair-wise Pearson
correlation coefficients are shown in (A). The basic information on
these public datasets is summarized in (B).
(TIF)
Figure S6 Enrichment of the A-to-G editing sites by the multi-
filter strategy. Initial: initial list of macaque editing sites identified
by high-throughput sequencing. Relative representation of ma-
caque editing types for sites that progressively passed the DNA
filter, the RNA SNP filter, the strand-bias and RhesusBase filter, as
described in Materials and Methods.
(TIF)
Figure S7 Quantitative analysis of intra-population and cross-
tissue variations of editing levels. The distributions of coefficient of
variance (CV) values within macaque animals (A), as well as across
different tissues (B) are shown.
(TIF)
Figure S8 Hierarchical clustering of editing levels for subsets of
editing sites. Editing levels were estimated on the basis of RNA-
Seq data in this study (Testis, Lung, Kidney, Heart, Muscle,
Prefrontal cortex) and other public RNA-Seq data [Brain (1–6),
Cerebellum (1–2), Muscle (1–8), Heart (1–5), Kidney (1–3), Lung
(1–3), Testis (1–3)], with missing data in dark cyan. Six subsets of
editing sites, including sites in Alu (A), non-Alu repeat (B), non-
repetitive (C), un-translated (D), intronic (E) and intergenic (F)
regions were analyzed separately.
(TIF)
Figure S9 Distributions of R2 values. Distributions of R2 values
in models assuming association of editing level of Alu (A) or non-
Alu sites (B) with ADARs expression are shown.
(TIF)
Figure S10 Cross-species comparisons of different subsets of
editing sites. The percentages of macaque editing sites that had
corresponding editing sites in human and/or chimpanzee are
denoted by red bars. Comparisons were done for the background
using the adjacent non-edited sites to indicate the degrees of RNA-
Seq sequence errors (A), as well as for the subsets of editing sites in
different genomic context (B).
(TIF)
Figure S11 Signatures of purifying selection for editing sites in
different subsets. The genomic sequences nearby the macaque
editing sites were compiled according to the distances to the
editing sites. For each 6-nucleotide window, the proportion of
RNA Editome in Rhesus Macaque
PLOS Genetics | www.plosgenetics.org 14 April 2014 | Volume 10 | Issue 4 | e1004274

human-macaque (A, B, D, E, F & G) or human-chimpanzee (C)
divergent sites is shown for different subsets of macaque editing
sites. A: all macaque editing sites, B: conserved sites between
human and macaque, C: non-edited sites in both human and
chimpanzee, D: editing sites in Alu regions, E–G: editing sites with
low, medium and high expression levels, respectively. The nearby
regions are highlighted in red and the average divergence rate of
the distal regions is indicated by blue dashed lines.
(TIF)
Figure S12 Distribution of levels of RNA editing in different
genomic regions. For editing sites in untranslated, CDS, intronic
and intergenic regions, the distribution of the levels of RNA
editing is summarized in boxplot.
(TIF)
Table S1 Basic information of RNA-editing sites identified in
this study.
(XLSX)
Table S2 Primers used in Sanger sequencing.
(PDF)
Table S3 Known human RNA-editing sites in coding regions.
The percentage of ‘‘G’’ reads, together with the number of total
reads (‘‘A’’ and ‘‘G’’) in each tissue sample is shown. *Yes:
included in final list; DNA Depth: failed to pass inclusion criteria
for read coverage; Filter: failed to pass the filter; #Ce: cerebellum,
Te: testis, Pr: prefrontal cortex, Ki: kidney, Lu: lung, Mu: muscle,
He: heart.
(PDF)
Table S4 Statistics of public RNA-Seq data integrated in this
study. $PFC: prefrontal cortex; &C: chimpanzee, H: human, R:
rhesus macaque; #M: million reads; *Samples for cross-species
comparison in Figure 5A; @Samples for intra-species editing level
comparison in Figure 3B; %Samples for calculating intra-
population CV values in Figures 3D & S7.
(PDF)
Table S5 P-values of one-tail Wilcoxon tests for four classes of
motif. *M: matched motif; 59 M: 59 matched; 39 M: 39 Matched;
N: Not matched.
(PDF)
Table S6 Quantitative correspondence of the tissue-biased
profile of the RNA editome to the tissue expression profile of
ADARs.
(XLSX)
Acknowledgments
We thank Drs. Heping Cheng, Liping Wei and Yangming Wang at Peking
University, and Dr. Qing-Rong Liu at the National Institutes of Health
(USA) for insightful suggestions. We appreciate insightful suggestions on
statistics analyses by Xianchong Zhou of John Hopkins University. We
acknowledge the editors and the four anonymous reviewers for valuable
suggestions on this work. We acknowledge Dr. IC Bruce for critical reading
of the manuscript.
Author Contributions
Conceived and designed the experiments: CYL XZ. Performed the
experiments: JYC XZY ZP RZ CJL MS BCMT. Analyzed the data: JYC
XZY HF ZQY YEZ MD CJL MS ZP. Contributed reagents/materials/
analysis tools: RZ HF MD. Wrote the paper: CYL JYC BCMT. Conceived
the idea: CYL.
References
1. Benne R, Van den Burg J, Brakenhoff JP, Sloof P, Van Boom JH, et al. (1986)
Major transcript of the frameshifted coxII gene from trypanosome mitochondriacontains four nucleotides that are not encoded in the DNA. Cell 46: 819–826.
2. Maas S (2012) Posttranscriptional recoding by RNA editing. Adv Protein ChemStruct Biol 86: 193–224.
3. Ju YS, Kim JI, Kim S, Hong D, Park H, et al. (2011) Extensive genomic and
transcriptional diversity identified through massively parallel DNA and RNA
sequencing of eighteen Korean individuals. Nat Genet 43: 745–752.
4. Li JB, Levanon EY, Yoon JK, Aach J, Xie B, et al. (2009) Genome-wideidentification of human RNA editing sites by parallel DNA capturing and
sequencing. Science 324: 1210–1213.
5. Li M, Wang IX, Li Y, Bruzel A, Richards AL, et al. (2011) Widespread RNA
and DNA sequence differences in the human transcriptome. Science 333: 53–58.
6. Bahn JH, Lee JH, Li G, Greer C, Peng G, et al. (2012) Accurate identification ofA-to-I RNA editing in human by transcriptome sequencing. Genome Res 22:
142–150.
7. Peng Z, Cheng Y, Tan BC, Kang L, Tian Z, et al. (2012) Comprehensive
analysis of RNA-Seq data reveals extensive RNA editing in a humantranscriptome. Nat Biotechnol 30: 253–260.
8. Kleinman CL, Majewski J (2012) Comment on ‘‘Widespread RNA and DNAsequence differences in the human transcriptome’’. Science 335: 1302; author
reply 1302.
9. Lin W, Piskol R, Tan MH, Li JB (2012) Comment on ‘‘Widespread RNA and
DNA sequence differences in the human transcriptome’’. Science 335: 1302;author reply 1302.
10. Pickrell JK, Gilad Y, Pritchard JK (2012) Comment on ‘‘Widespread RNA and
DNA sequence differences in the human transcriptome’’. Science 335: 1302;author reply 1302.
11. Hayden EC (2011) Evidence of altered RNA stirs debate. Nature 473: 432.
12. Schrider DR, Gout JF, Hahn MW (2011) Very few RNA and DNA sequencedifferences in the human transcriptome. PLoS One 6: e25842.
13. Jacobs MM, Fogg RL, Emeson RB, Stanwood GD (2009) ADAR1 and ADAR2expression and editing activity during forebrain development. Dev Neurosci 31:
223–237.
14. Sergeeva OA, Amberger BT, Haas HL (2007) Editing of AMPA and serotonin
2C receptors in individual central neurons, controlling wakefulness. Cell MolNeurobiol 27: 669–680.
15. Greenberger S, Levanon EY, Paz-Yaacov N, Barzilai A, Safran M, et al. (2010)
Consistent levels of A-to-I RNA editing across individuals in coding sequences
and non-conserved Alu repeats. BMC Genomics 11: 608.
16. Birney E, Stamatoyannopoulos JA, Dutta A, Guigo R, Gingeras TR, et al.
(2007) Identification and analysis of functional elements in 1% of the human
genome by the ENCODE pilot project. Nature 447: 799–816.
17. Gommans WM, Mullen SP, Maas S (2009) RNA editing: a driving force for
adaptive evolution? Bioessays 31: 1137–1145.
18. Bass B, Hundley H, Li JB, Peng Z, Pickrell J, et al. (2012) The Difficult Calls in
RNA Editing. Nat Biotechnol 30: 1207–1209.
19. Zhang SJ, Liu CJ, Shi M, Kong L, Chen JY, et al. (2012) RhesusBase: a
knowledgebase for the monkey research community. Nucleic Acids Res 41:
D892–905.
20. Zhang SJ, Liu CJ, Yu P, Zhong X, Chen JY, et al. (2014) Evolutionary
Interrogation of Human Biology in Well-annotated Genomic Framework of
Rhesus Macaque. Mol Biol Evol. In press. doi: 10.1093/molbev/msu084
21. Ramaswami G, Lin W, Piskol R, Tan MH, Davis C, et al. (2012) Accurate
identification of human Alu and non-Alu RNA editing sites. Nat Methods 9:
579–581.
22. Zhang X, Goodsell J, Norgren RB, Jr. (2012) Limitations of the rhesus macaque
draft genome assembly and annotation. BMC Genomics 13: 206.
23. Levanon EY, Hallegger M, Kinar Y, Shemesh R, Djinovic-Carugo K, et al.
(2005) Evolutionarily conserved human targets of adenosine to inosine RNA
editing. Nucleic Acids Res 33: 1162–1168.
24. Ohlson J, Pedersen JS, Haussler D, Ohman M (2007) Editing modifies the
GABA(A) receptor subunit alpha3. RNA 13: 698–703.
25. Paschen W, Hedreen JC, Ross CA (1994) RNA editing of the glutamate receptor
subunits GluR2 and GluR6 in human brain tissue. J Neurochem 63: 1596–1602.
26. Chiang HR, Schoenfeld LW, Ruby JG, Auyeung VC, Spies N, et al. (2010)
Mammalian microRNAs: experimental evaluation of novel and previously
annotated genes. Genes Dev 24: 992–1009.
27. Brawand D, Soumillon M, Necsulea A, Julien P, Csardi G, et al. (2011) The
evolution of gene expression levels in mammalian organs. Nature 478: 343–3
48.
28. Lehmann KA, Bass BL (2000) Double-stranded RNA adenosine deaminases
ADAR1 and ADAR2 have overlapping specificities. Biochemistry 39: 12875–
12884.
29. Eggington JM, Greene T, Bass BL (2011) Predicting sites of ADAR editing in
double-stranded RNA. Nat Commun 2: 319.
30. Kleinberger Y, Eisenberg E (2010) Large-scale analysis of structural, sequence
and thermodynamic characteristics of A-to-I RNA editing sites in human Alu
repeats. BMC Genomics 11: 453.
RNA Editome in Rhesus Macaque
PLOS Genetics | www.plosgenetics.org 15 April 2014 | Volume 10 | Issue 4 | e1004274

31. Yang Y, Lv J, Gui B, Yin H, Wu X, et al. (2008) A-to-I RNA editing alters less-
conserved residues of highly conserved coding regions: implications for dual
functions in evolution. RNA 14: 1516–1525.
32. Tian N, Wu X, Zhang Y, Jin Y (2008) A-to-I editing sites are a genomically
encoded G: implications for the evolutionary significance and identification of
novel editing sites. RNA 14: 211–216.
33. Li Y, Vinckenbosch N, Tian G, Huerta-Sanchez E, Jiang T, et al. (2010)
Resequencing of 200 human exomes identifies an excess of low-frequency non-
synonymous coding variants. Nat Genet 42: 969–972.
34. Hoopengardner B, Bhalla T, Staber C, Reenan R (2003) Nervous system targets
of RNA editing identified by comparative genomics. Science 301: 832–836.
35. Blake JA, Dolan M, Drabkin H, Hill DP, Ni L, et al. (2012) The Gene Ontology:
enhancements for 2011. Nucleic Acids Res 40: D559–564.
36. Yeo J, Goodman RA, Schirle NT, David SS, Beal PA (2010) RNA editing
changes the lesion specificity for the DNA repair enzyme NEIL1. Proc Natl
Acad Sci U S A 107: 20715–20719.
37. Jacob F (1977) Evolution and tinkering. Science 196: 1161–1166.
38. Zhang Y, Liu XS, Liu QR, Wei L (2006) Genome-wide in silico identification
and analysis of cis natural antisense transcripts (cis-NATs) in ten species. Nucleic
Acids Res 34: 3465–3475.
39. Xie C, Zhang YE, Chen JY, Liu CJ, Zhou WZ, et al. (2012) Hominoid-Specific
De Novo Protein-Coding Genes Originating from Long Non-Coding RNAs.
PLoS Genet 8: e1002942.
40. Levanon EY, Eisenberg E, Yelin R, Nemzer S, Hallegger M, et al. (2004)
Systematic identification of abundant A-to-I editing sites in the human
transcriptome. Nat Biotechnol 22: 1001–1005.
41. Paz-Yaacov N, Levanon EY, Nevo E, Kinar Y, Harmelin A, et al. (2010)
Adenosine-to-inosine RNA editing shapes transcriptome diversity in primates.
Proc Natl Acad Sci U S A 107: 12174–12179.
42. Parkhomchuk D, Borodina T, Amstislavskiy V, Banaru M, Hallen L, et al.
(2009) Transcriptome analysis by strand-specific sequencing of complementary
DNA. Nucleic Acids Res 37: e123.
43. Carmi S, Borukhov I, Levanon EY (2011) Identification of widespread ultra-
edited human RNAs. PLoS Genet 7: e1002317.
44. Fumagalli D, Gavin PG, Taniyama Y, Kim SI, Choi HJ, et al. (2010) A rapid,
sensitive, reproducible and cost-effective method for mutation profiling of colon
cancer and metastatic lymph nodes. BMC Cancer 10: 101.
45. Rinkevich FD, Schweitzer PA, Scott JG (2012) Antisense sequencing improves
the accuracy and precision of A-to-I editing measurements using the peak heightratio method. BMC Res Notes 5: 63.
46. Vacic V, Iakoucheva LM, Radivojac P (2006) Two Sample Logo: a graphical
representation of the differences between two sets of sequence alignments.Bioinformatics 22: 1536–1537.
47. Merkin J, Russell C, Chen P, Burge CB (2012) Evolutionary dynamics of geneand isoform regulation in Mammalian tissues. Science 338: 1593–1599.
48. Benjamini Y, Hochberg Y (1995) Controlling the false discovery rate: a practical
and powerful approach to multiple testing. Journal of the Royal StatisticalSociety Series B 57: 289–300.
49. Dreszer TR, Karolchik D, Zweig AS, Hinrichs AS, Raney BJ, et al. (2012) TheUCSC Genome Browser database: extensions and updates 2011. Nucleic Acids
Res 40: D918–923.50. Toll-Riera M, Laurie S, Alba MM (2011) Lineage-specific variation in intensity
of natural selection in mammals. Mol Biol Evol 28: 383–398.
51. Irimia M, Denuc A, Ferran JL, Pernaute B, Puelles L, et al. (2012) Evolutionarilyconserved A-to-I editing increases protein stability of the alternative splicing
factor Nova1. RNA Biol 9: 12–21.52. Daniel C, Wahlstedt H, Ohlson J, Bjork P, Ohman M (2011) Adenosine-to-
inosine RNA editing affects trafficking of the gamma-aminobutyric acid type A
(GABA(A)) receptor. J Biol Chem 286: 2031–2040.53. Galeano F, Leroy A, Rossetti C, Gromova I, Gautier P, et al. (2010) Human
BLCAP transcript: new editing events in normal and cancerous tissues.Int J Cancer 127: 127–137.
54. Godfried Sie C, Hesler S, Maas S, Kuchka M (2012) IGFBP7’s susceptibility toproteolysis is altered by A-to-I RNA editing of its transcript. FEBS Lett 586:
2313–2317.
55. Nachmany H, Wald S, Abekasis M, Bulvik S, Weil M (2012) Two potentialbiomarkers identified in mesenchymal stem cells and leukocytes of patients with
sporadic amyotrophic lateral sclerosis. Dis Markers 32: 211–220.56. Sommer B, Kohler M, Sprengel R, Seeburg PH (1991) RNA editing in brain
controls a determinant of ion flow in glutamate-gated channels. Cell 67: 11–19.
57. Greger IH, Khatri L, Ziff EB (2002) RNA editing at arg607 controls AMPAreceptor exit from the endoplasmic reticulum. Neuron 34: 759–772.
58. Brusa R, Zimmermann F, Koh DS, Feldmeyer D, Gass P, et al. (1995) Early-onset epilepsy and postnatal lethality associated with an editing-deficient GluR-B
allele in mice. Science 270: 1677–1680.
RNA Editome in Rhesus Macaque
PLOS Genetics | www.plosgenetics.org 16 April 2014 | Volume 10 | Issue 4 | e1004274