river inflow and salinity changes in the caspian sea during the last 5500 years
TRANSCRIPT
This article was published in an Elsevier journal. The attached copyis furnished to the author for non-commercial research and
education use, including for instruction at the author’s institution,sharing with colleagues and providing to institution administration.
Other uses, including reproduction and distribution, or selling orlicensing copies, or posting to personal, institutional or third party
websites are prohibited.
In most cases authors are permitted to post their version of thearticle (e.g. in Word or Tex form) to their personal website orinstitutional repository. Authors requiring further information
regarding Elsevier’s archiving and manuscript policies areencouraged to visit:
http://www.elsevier.com/copyright

Author's personal copy
Quaternary Science Reviews 26 (2007) 3359–3383
River inflow and salinity changes in the Caspian Sea duringthe last 5500 years
S.A.G. Leroya,�, F. Marretb, E. Gibertc, F. Chalied, J.-L. Reysse, K. Arpef
aInstitute for the Environment, Brunel University, Uxbridge UB8 3PH, West London, UKbDepartment of Geography, University of Liverpool, Liverpool L69 7ZT, UK
cUMR8148-IDES, CNRS-UPS, Universite Paris-Sud, Batiment 504, F-91405 Orsay Cedex, FrancedCEREGE, UMR-6635 CNRS-UPCAM, IRD, Europole de l’Arbois, BP80, F-13545 Aix-en-Provence Cedex 04, France
eLaboratoire des Sciences du Climat et de l’Environnement, CEA-CNRS, Avenue de la Terrasse, F-91198 Gif-sur-Yvette Cedex, FrancefMax Planck Institute for Meteorology, Hamburg, Germany
Received 23 February 2007; received in revised form 24 August 2007; accepted 17 September 2007
Abstract
Pollen, spores and dinoflagellate cysts have been analysed on three sediment cores (1.8–1.4m-long) taken from the south and middle
basins of the Caspian Sea. A chronology available for one of the cores is based on calibrated radiocarbon dates (ca 5.5–0.8 cal. kaBP).
The pollen and spores assemblages indicate fluctuations between steppe and desert. In addition there are some outstanding zones with a
bias introduced by strong river inflow. The dinocyst assemblages change between slightly brackish (abundance of Pyxidinopsis psilata
and Spiniferites cruciformis) and more brackish (dominance of Impagidinium caspienense) conditions. During the second part of the
Holocene, important flow modifications of the Uzboy River and the Volga River as well as salinity changes of the Caspian Sea, causing
sea-level fluctuations, have been reconstructed. A major change is suggested at ca 4 cal. kaBP with the end of a high level phase in the
south basin. Amongst other hypotheses, this could be caused by the end of a late and abundant flow of the Uzboy River (now defunct),
carrying to the Caspian Sea either meltwater from higher latitudes or water from the Amu-Daria. A similar, later clear phase of water
inflow has also been observed from 2.1 to 1.7 cal. kaBP in the south basin and probably also in the north of the middle basin.
r 2007 Elsevier Ltd. All rights reserved.
1. Introduction
The Caspian sea (CS) levels have changed dramaticallyover various timescales both erratically and cyclically(Kazancı et al., 2004), causing vast modifications in boththe volume and the area of the water body. During the 20thCentury, CS water levels have fluctuated rapidly andsuddenly, causing serious environmental and economicdamages and adversely affecting oil and gas exploration,agriculture and fishing as well as areas contaminatedby nuclear wastes. The instrumental record (since 1837)indicates a 3m change with a sharp drop between 1930
(26m below sea level or bsl) and 1977 (29mbsl), followedby a sharp increase until 1995 (26.5mbsl), and followed bya present-day possible stabilization at 27mbsl (Cazenaveet al., 1997; Giralt et al., 2003; Leroy et al., 2006; USDA,2006). The precise causes of these changes are not welldeciphered yet. Climate, human impact and tectonic events(in sequence of decreasing likelihood) are believed to haveinteracted to influence CS levels (e.g. Shiklomanov et al.,1995; Froehlich et al., 1999). The sea-level fluctuationsduring the Holocene have been reconstructed in differentinvestigations, but no consensus has arisen: amplitude andtiming of the events vary dramatically between authors(e.g. Mamedov, 1997; Rychagov, 1997; Hoogendoornet al., 2005).The vegetation history of the area around the CS is
equally poorly known. Moreover the few works that existare published mainly in Russian. This vast region remains agap in the Global Pollen Database and makes past climate
ARTICLE IN PRESS
0277-3791/$ - see front matter r 2007 Elsevier Ltd. All rights reserved.
doi:10.1016/j.quascirev.2007.09.012
�Corresponding author. Tel.: +441895 266087; fax: +44 1895 269761.
E-mail addresses: [email protected] (S.A.G. Leroy),
[email protected] (F. Marret), [email protected] (E. Gibert),
[email protected] (F. Chalie), [email protected]
(J.-L. Reyss), [email protected] (K. Arpe).
Author's personal copy
modelling less robust. Palaeovegetation reconstructions inthis region are therefore ground breaking.
Organic-walled dinoflagellate cysts (dinocysts) found inthe CS have been described in Marret et al. (2004). Thesemicrofossils are nowadays increasingly used to reconstructsalinity changes, as the tolerance range of many species isrelatively well known (e.g. Wall et al., 1977; Dodge andHarland, 1991; de Vernal et al., 1994; Marret andZonneveld, 2003). Furthermore, quantitative reconstruc-tions of salinity have been obtained for a number of marinerecords from the Northern Hemisphere (de Vernal et al.,2005). The dinocyst record of the CS has remained poorlyknown until recently and is mostly used for the strati-graphy of oil wells. No Holocene diagrams of the dinocystassemblages have been published yet. Many forms, speciesand even genera had not been described before the recentworks of Marret et al. (2004). Since the taxonomy has beenestablished, it has become possible to investigate sedimen-tary sequences to derive palaeoenvironmental changes.Dinocyst assemblages, cyst morphology and endemismmay provide information about the impact of variousenvironmental parameters and a basis for palaeoenviron-mental reconstructions.
Based on sediment cores from the second half of theHolocene in the south and the middle basins of the CS, theaims of this investigation are to use (1) new data frompollen, spores and other microfossils to reconstructpalaeovegetation and taphonomy and (2) new dinocystassemblages to reconstruct changes in lake levels, mostlyvia salinity changes.
2. Study area
The Black, Caspian and Aral Seas constitute relics of theParatethys basin. Their relative isolation from each otherafter the closing of the Tethys led to different physical andbiological conditions in each basin.
2.1. Geographical setting, climate and vegetation
The relief around the CS is roughly of two types: lowlands in the northern half and the whole of the east side ofthe CS and high mountains in the south-west corner (theLesser and Greater Caucasus Mountains) and the south(the Elburz Mountains).
Because of its great meridional extension, the CSstraddles several climatic zones (Kosarev, 2005). Thenorthern part of the drainage basin lies in a zone oftemperate continental climate with the Volga catchmentwell into the humid mid-latitudes. The western coastfeatures a moderately warm climate, while the south-western and the southern regions fall into a subtropicalhumid climatic zone. The eastern coast has a desert climate.
Vegetation around the CS consists in the east of anorthward gradient from desert (Chenopodiaceae andArtemisia) to steppe (Artemisia and several species ofGramineae): Irano-Touranian in the south-east (summer
rainfall and cold winters) and Kazakho-Dsungarian in thewest, north and north-east (winter rainfall) (Fig. 5.1 ofWalter and Breckle, 1989). These authors mention fresh-water holes in the desert between the Aral Sea and the CSwith Populus, Elaeagnus, Salix and Alnus, as well asCalligonum and Tamarix. A very diverse vegetationincluding vast mesic and altitudinal forests has developedin the two mountain ranges (Fig. 10.17 of Walter andBreckle, 1989), even with refugial areas for some Europeanspecies such as Parrotia persica (Leroy and Roiron, 1996).Today the biogeographical distribution of P. persica isreduced to the coastal area south of the CS and to theCaucasus up to 1500m altitude, where the tree lives in aclimate mild and humid all the year round (Leroy andRoiron, 1996; Binka et al., 2003).According to Walter and Breckle (1989), the vegetation
of the Volga lowland belongs to the Kazakho–Dsungariandesert belt up to 481N, and a semi-desert up to 501N. TheVolga delta is dominated by freshwater wetlands with aPhragmites and Typha cover. Few tree species only arepresent in the delta itself: Salix, Tamarix, Ulmus andPopulus (Labutina et al., 1995). Other tree species are onlyencountered further north (Walter, 1974).
2.2. Hydrological setting
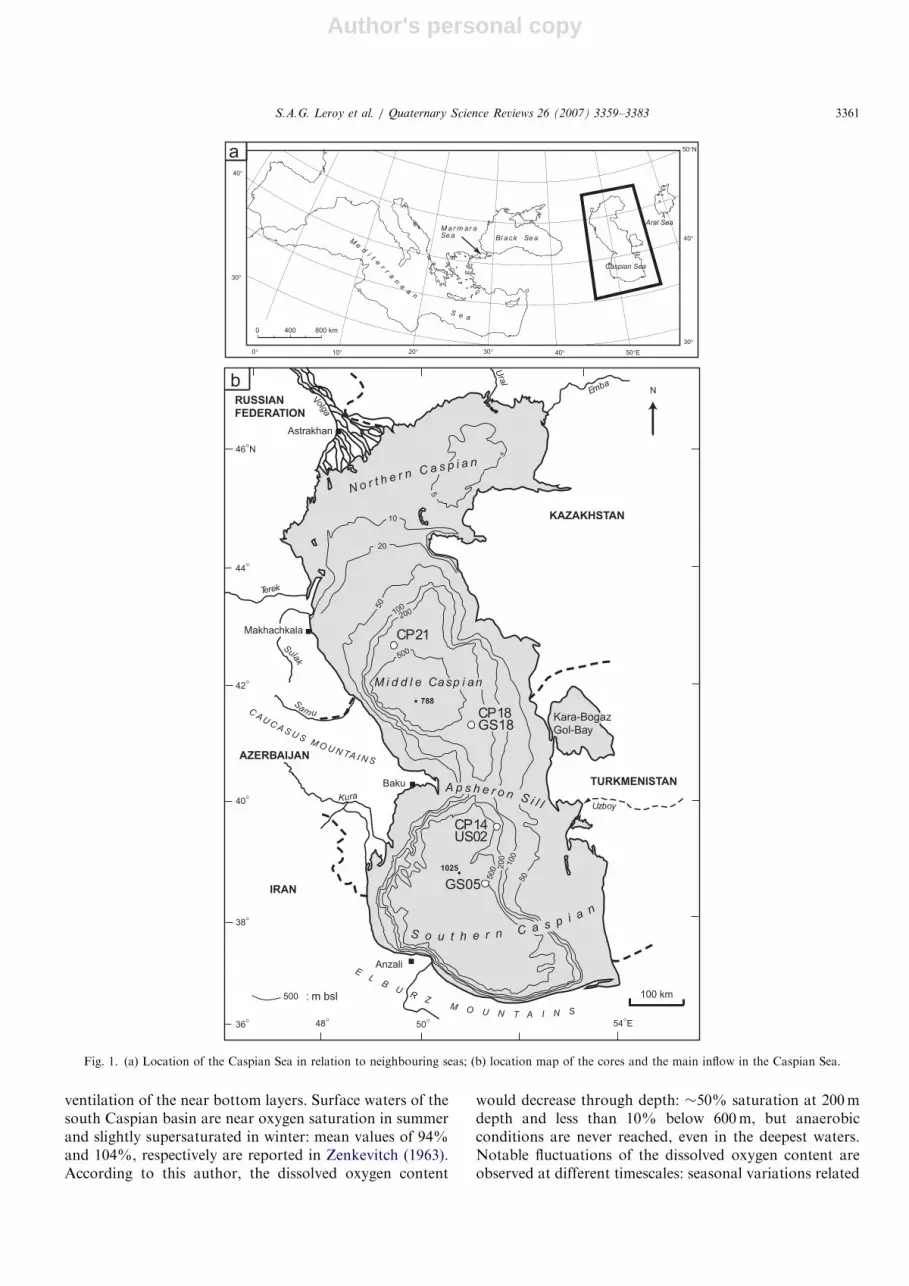
The CS is the world’s largest lake in terms of both areaand volume, extending 35–481N (41000 km) and 47–551E.The altitude of the surface was at 27mbsl in 1994 (date ofthe coring campaign). Three basins divide the sea,becoming deeper southwards: the northern basin(80,000 km2) with an average depth of 5–6m and amaximum depth of 15–20m; the middle basin(138,000 km2) with an average depth of 175m and amaximum depth of 788m; and the southern basin(168,000 km2) with an average depth of 325m and amaximum depth of 1025m (Fig. 1). The southern basinholds more than 65% of the Caspian water.The CS drainage basin covers about 3.1 million km2.
Water inputs comprise river discharges of the Volga(contributing up to 80–85% of the total), Kura, Ural andTerek Rivers (Rodionov, 1994). A series of smaller riversbring water from the western and southern sides of the CS,whilst the river drainage from the eastern side of the CS istoday inactive. This asymmetric pattern of river inflow andthe gradient in evaporation induce a North–South positivegradient of water salinity, from freshwater salinity in thenorth basin to an almost homogeneous 12.5–13.5 surfacewater salinity (salinities are given in psu) in the middle andsouth basins. In the south basin, seasonal salinity changesare less than �0.2–0.4. Mean annual salinity increases fromthe surface to the bottom waters by 0.1–0.3 (Zenkevitch,1963; Kosarev and Yablonskaya, 1994).A complex current pattern in the middle and south
basins results in a surface cyclonic gyre (Zenkevitch, 1963).There is always a very good vertical mixing of the watermasses, especially in winter sometimes enabling the
ARTICLE IN PRESSS.A.G. Leroy et al. / Quaternary Science Reviews 26 (2007) 3359–33833360
Author's personal copy
ventilation of the near bottom layers. Surface waters of thesouth Caspian basin are near oxygen saturation in summerand slightly supersaturated in winter: mean values of 94%and 104%, respectively are reported in Zenkevitch (1963).According to this author, the dissolved oxygen content
would decrease through depth: �50% saturation at 200mdepth and less than 10% below 600m, but anaerobicconditions are never reached, even in the deepest waters.Notable fluctuations of the dissolved oxygen content areobserved at different timescales: seasonal variations related
ARTICLE IN PRESS
800 km4000
20°10°0° 30° 40° 50°E
30°
50°N
30°
40°
40°
Bl ack Se a
M ar m ar aSe a
Caspian Sea
Aral Sea
Me
dit
er
ra
n
ea
n
S e a
CP14US02
500 2
00
100
50
500
20010050
20
10
5
5
500 : m bsl 100 km
Astrakhan
Volga
Ura
l
Kura
Sam u
788
1025
Baku
Sula
k
AZERBAIJAN
TURKMENISTAN
KAZAKHSTAN
RUSSIAN
FEDERATION
IRAN
36° 48° 50° 54°E
38°
40°
42°
44°
46°N
NEmba
Terek
Makhachkala
Anzali
GS05
CP21
Uzboy
S o u t h e r n C a s p i a n
A p s h e r o n S i l l
M i d d l e Casp i an
N o r t h e r n C a s p i a n
Kara-Bogaz
Gol-Bay
CP18GS18
CA U C A S U S
M O U N TA I N S
EL
BU
RZ
M O U N T A I N S
Fig. 1. (a) Location of the Caspian Sea in relation to neighbouring seas; (b) location map of the cores and the main inflow in the Caspian Sea.
S.A.G. Leroy et al. / Quaternary Science Reviews 26 (2007) 3359–3383 3361
Author's personal copy
to photosynthetic processes and water temperature, andannual to decadal variations in the convective water mixingintensity (Bordovsky, 1986; Kosarev and Yablonskaya,1994).
Most nutrients enter the CS in the northern basin via theVolga River. Today, the relatively low nutrient levels in theupper 100m are further depleted by phytoplanktonactivity, but the nutrient concentrations increase withdepth. Concentration of nutrients in the northern basin ispresently lower than befire the regulation of the VolgaRiver in the 1950s, except for the silicate group (Kosarevand Yablonskaya, 1994).
The CS waters flow out into the basin of the KarabogazGol (KBG) (Bortnik, 1991; Leroy et al., 2006), an easternextension of the middle basin. The KBG basin (which hasno outflow) thus serves as an evaporator.
Connections with adjacent seas have repeatedly takenplace through fluctuating lake levels, tectonics, or humanactivities during the last millennia. The melting of the icecap and the re-routing of north flowing rivers to the southaccelerated a water transfer from the north (River Volgaand Aral Sea/Uzboy pass) to the CS and then to the BlackSea.
In the Holocene, the Volga has built a delta in the northbasin, extending as far as the north of the middle basin attimes.
Past connections between the Azov Sea (Black Sea) andthe CS have taken place via the Kuma–Manych depression(now up to 26masl) and the lower Don River. Evidencefrom deposits in the lower Volga River suggests thatthe last overflow from the CS lasted from 16 to11 14C kaBP (19–13 cal. ka BP) with a brief interruptionat 14–13 14CkaBP (Leonov et al., 2002). The deposition ofred clays from the CS in the Black Sea shows that themost recent connection with the Black Sea is dated back toca 13 14C kaBP (ca 15.5 cal. ka BP) (Bahr et al., 2005).Some later connections are however possible becausewidespread invasion from the Black Sea to the CS by themollusc, Cerastoderma, occurred in the Middle Holocene(Grigorovich et al., 2003), although earlier dates are alsoquoted (8–6 14C kaBP; Tarasov et al., 1994). Transport byhumans cannot however be totally excluded.
The Uzboy River reached the CS 100 km south of theKBG in the Krasnovodsk Bay in the Late Pleistocene andepisodically in the Holocene, the last time being in the 16thcentury AD (Letolle, 2000). Human intervention is likelyover the last millennia. The Uzboy brought a considerablesupply of freshwater to the south basin. The lower sectionof the Uzboy River received water from the Amu-Dariaand the Sarykamysh River directly from the Tien-Shan,hence from a drainage basin under a climate totallydifferent from that of the Volga River basin (Ferronskyet al., 1999). The palaeo-Amu-Daria has left traces of apowerful Pliocene delta in the bathymetry.
Cerastoderma glaucum most likely penetrated the AralSea from the CS during a period of highstand andconnection via the Uzboy valley (Tarasov et al., 1994). This
mollusc is reported in the Aral Sea at 5800–5250 14CyrBP.Subsequent high lake levels are also described at 4475–3825,1500–1175 and 250–0 14CyrBP.The Apsheron sill separates the south basin from the
middle basin with water depths of ca 80m. Traces of anancient river are noted by Ferronsky et al. (1999). Whenthe CS level is low this threshold creates a pronounced splitbetween the two water bodies. Kuprin et al. (2003) proposethat the two basins were separated until as recently as theLate Holocene. Following this recent tectonic submer-gence, an overflow from the middle to the south CS basinoccurred (Kuprin, 2002).
2.3. Hydrobiological setting
Owing to its isolation, the CS shows a high endemismlevel (e.g. Dumont, 1998; Grigorovich et al., 2003; Marretet al., 2004).The CS biota ranges from freshwater to brackish and to
euryhaline types, with species of freshwater origin tolerat-ing salinities up to 13 and species of marine origin tolerantof salinities down to 13 (Dumont, 1998). In general, marinespecies comprise 72% of the zooplankton. Surveys of thesurface water of the CS have recorded about 440phytoplanktonic species, the northern basin containingthe greatest diversity (Kasymov and Rogers, 1996).Surveys in the 1960s and 1970s showed that dinoflagel-
lates composed 9% of the phytoplankton population,whereas a recent survey (2001) indicates that almost half ofthe population consist of dinoflagellates (Kideys et al.,2005). However, this survey, before springtime, does notindicate any occurrence of Gonyaulax species. Bulatov(pers. comm. and Leroy et al., 2006) counts 25 species,including four cyst-forming species, Gonyaulax digitalis,Gonyaulax spinifera, Lingulodinium polyedra and Preper-
idinium meunieri. Only about 20% of dinoflagellate speciesproduce an organic-walled cyst that is well preserved insediment, under anoxic conditions (Head, 1996). Evidencefrom the cyst population in recent sediments (e.g. Marretet al., 2004), shows the origin of the species is mixed, withLingulodinium machaerophorum (cyst of L. polyedra) fromthe Atlantic–Mediterranean realms, cysts of Pentapharso-
dinium dalei from the sub-Arctic region, and Spiniferites
cruciformis and Pyxidinopsis psilata from the Black Sea.
2.4. Holocene fluctuations and their possible causes
Fluvial influx to the CS, hydrometeorological conditionsover the sea and bottom morphology changes are the mainfactors that control the seawater characteristics. Transgres-sions are usually accompanied by freshening of watermasses and cold climate while regressions primarilycorrespond to increased salinities and warm climate (Chalieet al., 1997; Ferronsky et al., 1999; Ryan et al., 2003).Sequence stratigraphy in the productive layers of thePliocene and Pleistocene has shown that river deltas
ARTICLE IN PRESSS.A.G. Leroy et al. / Quaternary Science Reviews 26 (2007) 3359–33833362
Author's personal copy
(Volga, Kura and Amu Daria) have prograded during sea-level highstands (Abreu and Nummedal, 2006).
At the end of the Pleistocene, large ice-dammed fresh-water lakes formed along the southern edge of the Eurasianice sheet (Grosswald, 1993; Mangerud et al., 2004). Thetiming of these palaeolakes’ development is poorly known.Their drainage into the CS caused the Late PleistoceneKhvalynian highstand (50m asl) (Kroonenberg et al., 1997;Rychagov, 1997). Some authors consider the last part ofthe Late Khvalynian highstand (between 0 and 20mbsl) asalready Holocene (Svitoch, pers. comm.).
The following regression (the Mangyshlak; see discus-sion in Kroonenberg et al., 1997) is however considered tohave taken place at ca 11–8.6 14C kaBP with a decrease ofthe level to possibly 80mbsl. This regression is caused bythe decrease of meltwater availability and by a dry climate.It is during this dry period that the Amu-Daria would haveswitched its flow from the south CS basin to the Aral Sea(Boomer et al., 2000).
In the most recent analyses, the beginning of theNeocaspian phase (the Holocene after the Mangyshlaklowstand) becomes increasingly younger and starts well intothe Holocene (Kroonenberg et al., 1997). Svitoch (pers.comm., 2006), after reviewing radiocarbon dates of coastaldeposits, even suggests that the Neocaspian phase (char-acterised by Cerastoderma glaucum) starts after 3.9 14CkaBPwith an earlier high level, the Gousan at 6.4–5.4 14CkaBP.The preceding high phase (8.6–7.3 14CkaBP) is attributed tothe Late Khvalynian on the base of its mollusc assemblages.During the Neocaspian phase period, the sea levels aregenerally moderately high with some fluctuations, whosenumber and timing deeply diverge between authors (e.g.Mamedov, 1997; Rychagov, 1997). A more consensualreconstruction exists around the last regression, the Derbentregression (1.2–1ka 14CBP) which was quite pronounced,down to 34mbsl at least and corresponds to the Middle Ages(Hoogendoorn et al., 2005).
From the meteorological point of view, CS levels aredirectly influenced by precipitation over the Volga drainagebasin (Arpe et al., 2000; Arpe and Leroy, 2007). Over the20th century, a connection between CS levels and the ElNino Southern Oscillation has been highlighted, but notwith the North Atlantic Oscillation (Arpe et al., 2000; Arpeand Leroy, 2007). During glacial periods, this simplerelationship is complicated by a large influx of meltwater(including via rivers now dry) originating from the Northof the CS catchment area (Grosswald, 1993) and climaticfeedbacks.
3. Previous studies in the area
3.1. Pollen
Pollen analyses on Holocene CS sediment have remainedvery scarce until now. As part of an INCO-Copernicusproject, some pollen analyses have been performed on longcores (ca 10m) from the south and the middle basins
covering from ca 24 to ca 5.5 kaBP. The very low timeresolution reached for the Holocene, the very low pollencounts and the probable lack of core overlap with thesequences presented here do not enable comparisons(Kuprin and Rybakova, 2003; Seret G., pers. comm.). Anearlier extended abstract (Leroy et al., 2000) brieflypresented pollen and dinocyst data for a short core(CP14), but with a chronology now revised. A fewdisparate pollen spectra by Rybakova from the northbasin are discussed in Bezrodnykh et al. (2004).A more detailed diagram exists for the Holocene of the
lower Volga (46.221N, 42.621E) with five radiocarbon dates(Bolikhovskaya, 1990). A diagram covering the last 200years is available for the KBG (Leroy et al., 2006). Duringperiods of higher water levels, the KBG is surrounded by asteppe-like vegetation, whereas during periods of low waterlevels, it is more like desert with the emerged land areascolonised by Chenopodiaceae. In addition to the surfacesamples of Tarasov et al. (1998), some surface pollensamples are now available for the Anzali lagoon, on thecoast of Iran (Kazancı et al., 2004) and for the Aral Sea(Leroy et al., 2006).
3.2. Dinocysts in the Caspian Sea and neighbouring seas
The dinoflagellate cyst diversity found in central Asianseas has many species in common and shows a decreaseeastwards. An increase in morphological diversity (corre-lated to a wider range of salinities encountered) was alsodetected (Marret et al., 2004).For the whole of the CS, only surface samples have been
published (Marret et al., 2004), including some from theAnzali lagoon (Kazancı et al., 2004). A record of the last200 years has been published for the nearby KBG (Leroyet al., 2006) and, although the species list of the KBG issimilar to that of the CS, the assemblages are dominated bya form of L. machaerophorum (form A) and by Spiniferites
belerius. This differentiates completely the KBG sequencefrom the sequences presented here. A sequence covering thelast 2000 years (Sorrel et al., 2006) from the Aral Sea ischaracterised overall with low diversity, high levels ofI. caspienense, accompanied by Protoperidinium species andL. machaerophorum. The fluctuations in L. machaerophor-
um abundance were linked with those of the sea level:lower sea level resulted in more saline conditions, henceproviding an environment favourable for the growth ofL. machaerophorum.The pioneering work of Wall et al. (1973) and Wall and
Dale (1973) in the southern Black Sea basin enabled the useof dinocysts for semi-quantitative reconstructions of pastsalinity changes. Since then, a number of studies havedocumented the Holocene dinocyst record (e.g. Bozilovaet al., 1997; Mudie et al., 2002, 2004, 2007; Atanassova,2005). Furthermore, in order to characterise the exchangesbetween the Mediterranean–Marmara–Black Seas duringthe last 30 ka, in particular during the early Holocene, amultiproxy approach has documented outflow phases of
ARTICLE IN PRESSS.A.G. Leroy et al. / Quaternary Science Reviews 26 (2007) 3359–3383 3363
Author's personal copy
the Black Sea (e.g. Aksu et al., 2002; Hiscott et al., 2002,2006, 2007).
4. Materials and methods
4.1. Coring
Cores (140–182 cm long) have been taken in the southbasin, the middle basin and the northern part of the middlebasin during a French–Russian oceanographic cruise(August 1994), on board a Russian military ship, rentedfor the sea cruise (Fig. 1). Core locations were in deepwater, and were chosen to avoid direct river influence(CP14, 330m; CP18, 480m; and CP21, 460m depth, Fig. 1and Appendix A). Three coring techniques were combinedto recover complete sections for the Late Pleistocene andthe Holocene. Long cores (ca 10m) were obtained using aKullenberg corer (not presented in this paper). Theuppermost part is usually lost during the coring process.The Pilot cores, ca 90–200 cm, have also lost the moresurficial sediment during the coring process (Fig. 2). TheUsnel box cores (50 cm thick) contain the water–sedimentinterface. The cores (more details in Appendix A) are keptin a repository with a cool room (Laboratoire de Geologie,Museum d’Histoire Naturelle de Paris, France).
4.2. Lithological and mineralogical analyses
Carbonate contents (cores CP14, CP18 and CP21) havebeen obtained by the Bernard volumetric method.
Special attention was paid to the carbonate mineralogy,since radiocarbon dates were performed on bulk carbo-nates. The authigenic carbonates being impossible tophysically separate from the detrital ones (when present),detailed X-ray diffractometry (XRD) analyses were carriedout, as a helpful tool to determine the origin of thecarbonates, and the relative proportions of authigenicversus detrital carbonate phases. The calcite crystallinityindex can be derived from the XRD (1 0 4) peak width athalf-height; the Mg-content can be inferred from thedeviation of the (1 1 6) XRD peak. A high crystallinityindex and a low magnesium content are two indicators of adetrital character, while low crystallinity index associatedwith high Mg-content reveals authigenic origin. For eachsample, this enables the correction of the 14C activity ofbulk carbonates, and the calculation of the 14C activity ofthe authigenic fraction, assuming that detrital carbonatescontain ‘‘dead’’ carbon only. Such a procedure was appliedto Holocene Tibetan lakes, where corrections led to both avalid radiocarbon chronology and valid stable isotopesrecords (Fontes et al., 1993).
4.3. Dating methods: radionuclides and radiocarbon
210Pb, 226Ra and 137Cs records were obtained from theUsnel box-core US02 (south basin) subsampled on boardwith PVC tubes. Samples were analysed every cm for both
210Pb and 137Cs in the top 10 cm, then every 2 cm down to16 cm. A sample at 22 cm reaches background values. Drysamples were measured with a very low-background, highefficiency well-type detector settled in the undergroundlaboratory of Modane in the French Alps (Reyss et al.,1995) where 1700m of rock overburden reduces the cosmicradiation by 6 orders of magnitude.Samples for radiocarbon dating were taken in the three
cores directly after core opening and subjected to thestandard chemical protocol for AMS 14C activities andassociated 13C contents. Graphite sources were prepared inOrsay, and counted with the accelerator mass spectrometerof Gif-sur-Yvette (TANDETRON). Analytical uncertain-ties, including laboratory errors, are 70.1% for q13C andbetween 0.5 and 0.8 pMC for 14C activity. Two types ofcorrections had to be applied to the apparent ages inherentto the CS.The first correction of the measured AMS 14C activities
to be considered is linked to the apparent 14C activity (A0)of the TDIC of the modern sea surface water. For the threesamples from each part of the Caspian basin (i.e. North,
ARTICLE IN PRESS
South basin Middle basin
CP14 CP18
Pl/Ho
Pl/Ho
770
5450
2m
CP21
North of
middle basin
2.1 - 1.7
? - 3.9 ?
US
02
GS
18
GS
05
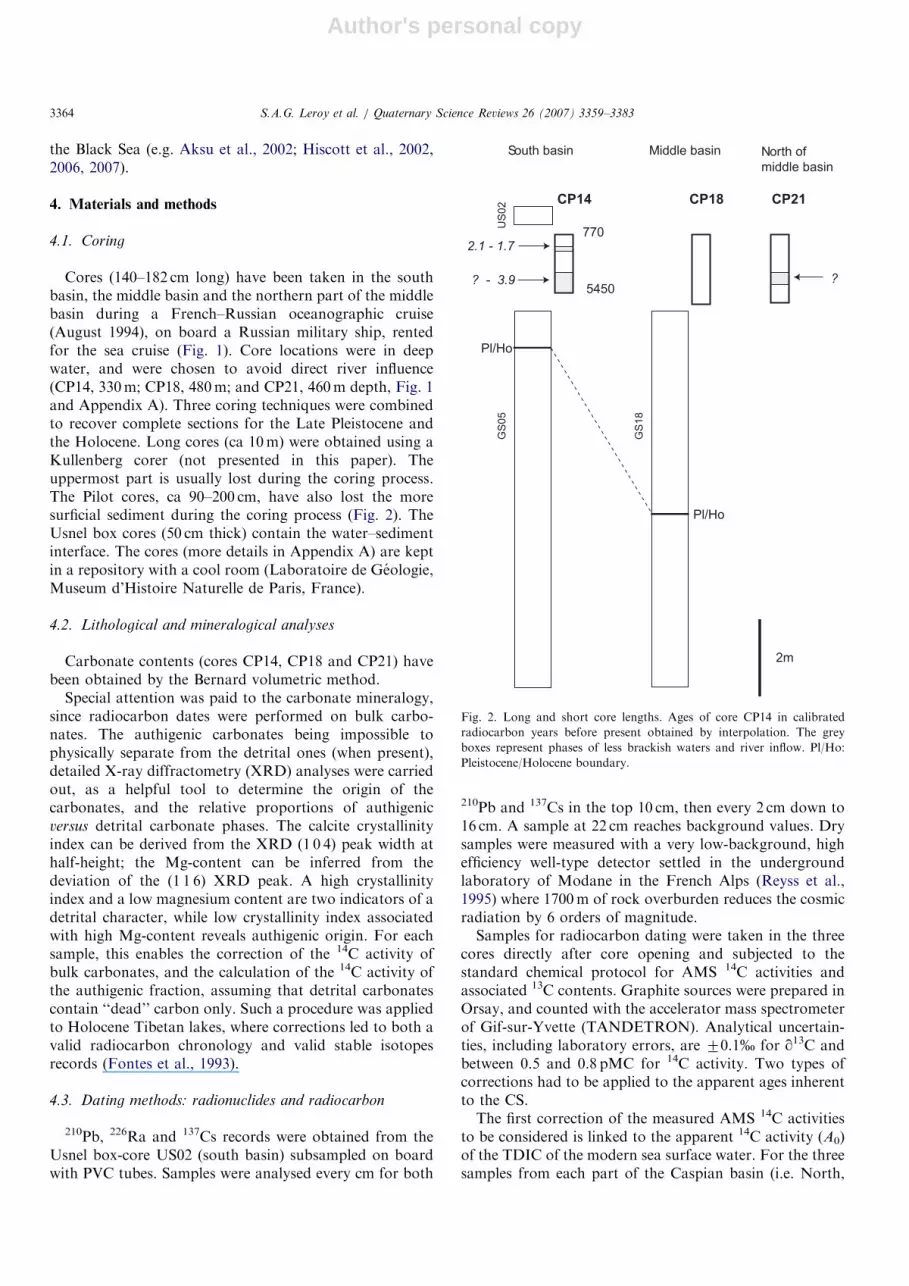
Fig. 2. Long and short core lengths. Ages of core CP14 in calibrated
radiocarbon years before present obtained by interpolation. The grey
boxes represent phases of less brackish waters and river inflow. Pl/Ho:
Pleistocene/Holocene boundary.
S.A.G. Leroy et al. / Quaternary Science Reviews 26 (2007) 3359–33833364
Author's personal copy
Central and South), results have highlighted discrepanciesbetween the existing 14C activity of the surface water andthat of atmospheric CO2 (�117 pMC at sampling time) upto D ¼ 8%. The 14C activity of surface water of thenorthern basin is 109, the middle basin 109/109.5 and thesouthern basin 108.
A second correction is based on the semi-quantitativeanalyses of the sample mineralogical compositions with themeasurement of the height (H) of the 001 main peaks,multiplied by the width at half-height (1/2b). Each referencepeak is then given a specific coefficient (F) taking intoaccount the crystallinity of the mineral (Holtzapffel, 1985):
A ¼ ðH�1=2bÞ=F
and
Að%Þ ¼ A=½Aþ Bþ C þ � � ��
with F, equal to 0.1 for clays, 1.45 for quartz, and 1.0 forfeldspars, calcite, Mg-calcite and dolomite. The measuredAMS 14C ages and associated 13C contents have beencorrected as follows:
�13C contents : dm ¼ X �ddd þ ð1� X Þ�ada, (1)
�14C activities : Am ¼ X �dAd þ ð1� X Þ�aAa (2)
with da and dd, stable isotope contents of the authigenicand detrital fractions, respectively; Xa and Xd, % ofauthigenic and detrital fractions, respectively, versus totalcarbonate fraction (Xa+Xd ¼ 1); Aa and Ad,
14C activitiesof the authigenic and detrital fractions, respectively.Assuming that the radiocarbon activity of the detritalfraction Ad equals 0 pMC, Eq. (2) becomes
AaðpMCÞ�Am=X a
and then
14C ages ðin yr BPÞ ¼ T=Lnð2Þ � LnðA0=AaÞ
with T, 14C half-life period (5730730 yr).After the above-mentioned corrections, all the dates were
converted to calendar ages according to the revisedcalibration program CALIB 4.4 (Stuiver et al., 1998;Stuiver and Reimer, 1998/2000; Table 1), and meansedimentary rates were calculated on calibrated ages.
4.4. Palynology
The same samples, taken every 5 cm in cores CP14, CP18and CP21, were used for all the pollen, spores and dinocystanalyses. Initial processing of samples (on average 1ml)involved the addition of sodium pyrophosphate todeflocculate the sediment. Samples were then treated withcold hydrochloric acid (10%) and cold hydrofluoric acid(32%), followed by a repeat HCl. The residual organicfraction was then screened through 120 and 10 mm meshsieves and mounted on slides in glycerol. Lycopodium
tablets were added at the beginning of the process forconcentration estimates. Pollen and spores percentageswere calculated on the terrestrial sum (excluding aquatic,spores and unknown or unidentifiable pollen), which isusually 300 grains. Statistical analyses are made availableby Psimpoll (Bennett, 2003). Zonation by cluster analysis(CONISS) after square root transformation was applied.The zonation, based only on terrestrial taxa, was calculatedfor the percentage diagrams. The dinocysts were counted atthe same time as pollen and other microfossils. Thesequence of taxa used in the diagrams represents anattempt to classify them by increasing salinities. The sumfor percentages (between 52 and 2400, although an effortwas made to reach a minimum of 100) is made of alldinocysts except Brigantedinium spp. (including all round-brown specimens), because of its ubiquitous character andfrequent dominance of the spectra. Brigantedinium isexpressed as a percentage of the same sum as the otherdinocysts. Brigantedinium is included only in the concen-tration diagram (in number of cysts per ml of wetsediment). The taxonomy of many dinocyst species hasbeen established by Marret et al. (2004). A ratio pollenconcentration on dinocyst concentration (P:D) has beencalculated according to McCarthy and Mudie (1998).
4.5. Taxonomy and ecological preferences
The pollen and spores diagram also includes smallmacrophytic remains such as Ceratophyllum spines andSalvinia massulae. The Salviniaceae are free-floatingaquatic ferns. They grow in quiet waters and on mud near
ARTICLE IN PRESS
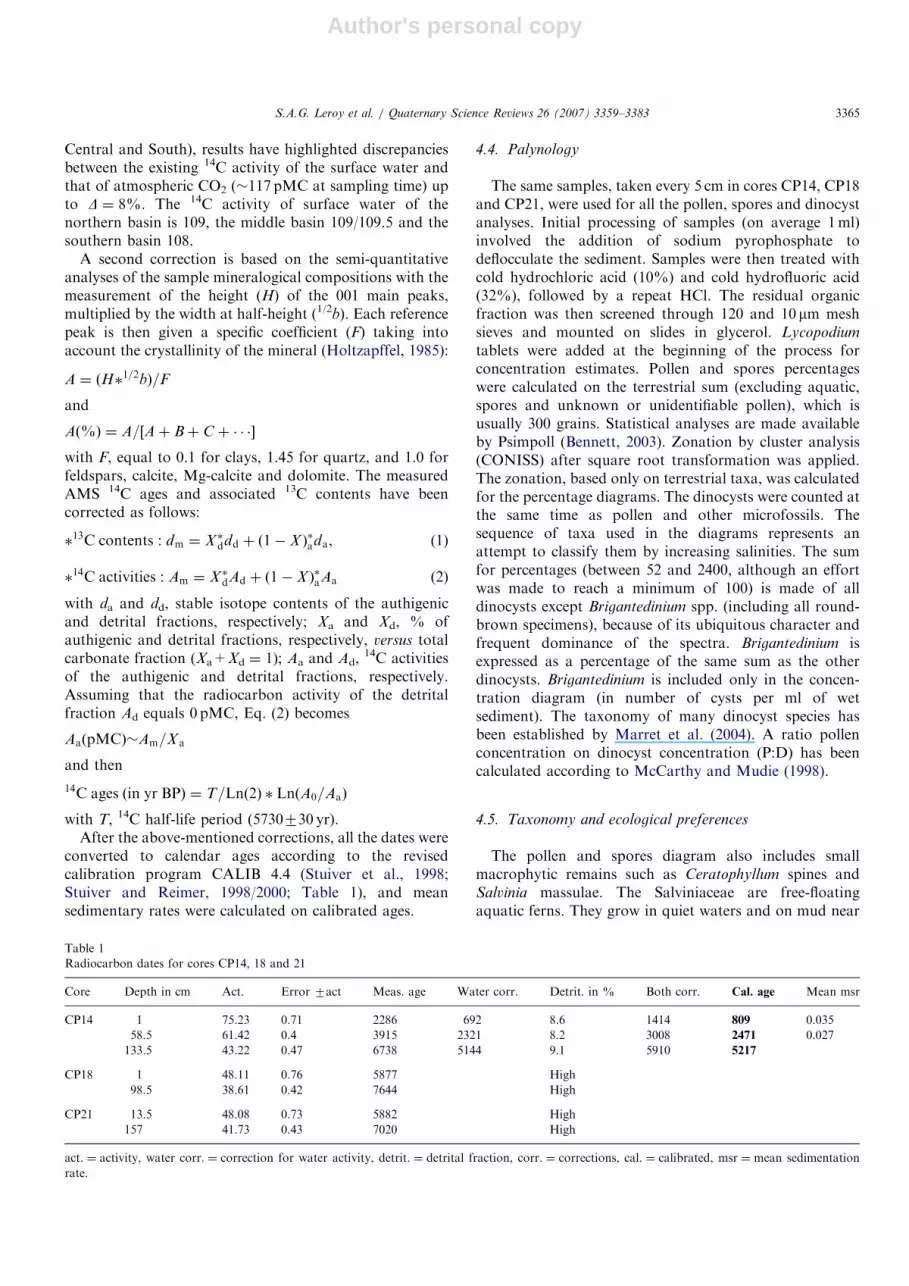
Table 1
Radiocarbon dates for cores CP14, 18 and 21
Core Depth in cm Act. Error 7act Meas. age Water corr. Detrit. in % Both corr. Cal. age Mean msr
CP14 1 75.23 0.71 2286 692 8.6 1414 809 0.035
58.5 61.42 0.4 3915 2321 8.2 3008 2471 0.027
133.5 43.22 0.47 6738 5144 9.1 5910 5217
CP18 1 48.11 0.76 5877 High
98.5 38.61 0.42 7644 High
CP21 13.5 48.08 0.73 5882 High
157 41.73 0.43 7020 High
act. ¼ activity, water corr. ¼ correction for water activity, detrit. ¼ detrital fraction, corr. ¼ corrections, cal. ¼ calibrated, msr ¼ mean sedimentation
rate.
S.A.G. Leroy et al. / Quaternary Science Reviews 26 (2007) 3359–3383 3365
Author's personal copy
sluggish river edges, occasionally forming a dense carpet onthe water surface. Salvinia natans is a frequent macrophytein the wetlands around the CS. Hence its presence, asbroken massulae sometimes with spores, is considered as asign of river transport to the coring site (as was done forAzolla in Leroy, 1992).
Some other microfossils, identified with the help of VanGeel’s plates (van Geel, 2001), such as Cyanobacteriaand Chlorophyceae, are given in the dinocyst concentra-tion diagram, as they may offer clues regarding palaeoen-vironments, especially palaeosalinities. The Prasinophyticphycoma of Pterosperma (usually around 14 mm) iswhat has been recorded as the acritarch Cymatiosphaera
globulosa in the Black Sea (Colbath and Grenfell,1995; Mudie et al., 2001). Incertae sedis 5b and 5d areprobably also prasinophytic phycomas. They are nearly thesame size as Pterosperma. Incertae sedis 5d (15 mm) issmooth with a slightly thicker wall than the two others,while incertae sedis 5b (11 mm) has a more or less densecover of short hair, sometimes with bald patches.Concentricystes circulus is a palynomorph that is probablyrelated to the Zygnemataceae. It is often considered as anindicator of river run-off into marine or lacustrine systemslinked to periods of heightened soil erosion (e.g. Leroy,1992).
Little information is available on taxonomy andecological requirements of the dinocysts of the CS. Theorganic-walled cyst species encountered in recent sedimentsof the CS and adjacent water bodies (Marret et al., 2004)show a poor diversity (seven taxa with, for some, variousforms). Recently described taxa, for which the ecology ishardly known, often dominate the assemblages.
The dinocyst taxa and their ecology found in thesediment cores of this project are the following from likelyless saline to more saline, as far as presently known:
� Pyxidinopsis psilata ( ¼ Tectatodinium psilatum) andSpiniferites cruciformis are dominant in early Holocenesediments from the Black Sea and have been related toslightly brackish conditions (o7) and usually coolwaters (Wall et al., 1973; Mudie et al., 2001, 2002).The scarcity of modern analogues does not permit thederivation of adequate constraints on the limits of theirecological affinities (Marret et al., 2004), nor thedifferentiation of separate ecological requirement forthe two taxa. P. psilata has also been found in highabundance in recent sediments from the Baltic Sea, inthe middle Baltic where salinity is around 7, but not inthe environment where salinity is below 3 (Dale, 1996).Here three forms of S. cruciformis (A, B and C)have been recorded separately (Marret et al., 2004).Mudie et al. (2001) attempted to relate differentmorphotypes of S. cruciformis with salinity conditions,based on the length of processes and shape of the body.S. cruciformis has also been observed in lakes. Forexample, it has been identified in the Lateglacialsediment of Lake Kastoria, Northern Greece (Kouli
et al., 2001) where, however, Mudie’s Forms 4 and 5were never seen. In addition, this taxon has been seen inthe top cm of Lake Sapanca sediment cores (NWTurkey) (Leroy, personal observation).� Caspidinium rugosum var. rugosum and C. rugosum: This
is a new genus about which not much is known yet. Ithas been observed in the CS, the KBG and the Aral Sea(Marret et al., 2004; Leroy et al., 2006).� Impagidinium caspienense: this is a new species whose
ecology is unknown. The known species of Impagidinium
are typically present in oceanic environments and do nottolerate salinities lower than 30, usually ca 35. The usualworking hypothesis is to assume that the new Impagi-
dinium species may have the same requirements. How-ever, because high percentages and concentrations havebeen obtained in the cores, with even a slightly higherrepresentation in the two northern ones, I. caspienense
must be a species of much lower salinities. It has alsobeen observed in the surface sediment of the Anzalilagoon, Iran (Kazancı et al., 2004).� Pentapharsodinium dalei is usually a sub-Arctic cyst, also
found in the tropics in low abundance. It occurs in theMediterranean and Black Seas, with an affinity forenvironments of strong seasonal thermal contrast. Ittolerates a wide range of salinity, from 15 to 35 (Marretand Zonneveld, 2003). It is found in the ocean and oncontinental platforms.� Lingulodinium machaerophorum, a common species in
sediment from oceans and continental seas, has arelatively well-documented distribution. Its greatestabundance is often found in neritic environments, withwinter sea-surface temperatures above 12 1C. It isconsidered as an indicator of eutrophic conditions (Daleet al., 1999). This species is known for its euryhalinenature (8–40), often characterised with a strong mor-phological variability of the cyst shape and processes(Lewis and Hallett, 1997). Two forms of L. machaer-
ophorum (var. B and ss) have been recorded separately(Leroy et al., 2006). Its thecate form, L. polyedra, isnever found where salinity is below 7 (Dale, 1996); andin culture, it does not grow in an environment wheresalinity is below 10 (Lewis and Hallett, 1997).� Brigantedinium species, produced by Protoperidinium
species, are ubiquitous in marine and continental seasediments, from low to high latitudes, and from neriticenvironments to open ocean regions. Their abundanceand preservation may be affected by oxic conditions(Zonneveld et al., 2001). They are often related to highnutrient richness or have an opportunistic behaviour.
In US02 box core (Fig. 1), I. caspienense reaches therelatively high value of 49.4% (sum without Brigantedinium
spp., see above) for a salinity of ca 13. P. psilata has 0.6%,S. cruciformis 8.0%, I. rugosum rugosum 2.8%, P. dalei
cysts 26.7%, L. machaerophorum 12.5% and finallyBrigantedinium sp. (on the sum of the other dinocysts)15.4%.
ARTICLE IN PRESSS.A.G. Leroy et al. / Quaternary Science Reviews 26 (2007) 3359–33833366
Author's personal copy
5. Results
5.1. Lithology, mineralogy and age-depth model
A brief lithological description of relatively homogenoussediment of each core is provided along with the carbonatecontent.
The core sediment CP14 (140 cm) consists of fine-grainedcarbonate mudstone, with alternation of black and greylayers, often scarcely visible all along the sequence.Between 122 and 100 cm, the sediment is sometimeslaminated. The high carbonate values fluctuate mildlybetween 42% and 53%.
Core CP18 (182 cm-long) consists of a mud, texturallyvery homogeneous, with faint laminations. The carbonatecontent is low, between 6% and 13%. The sediment islaminated at 180–150 cm, mottled at 150–110, with adarker lamination at 110–70 cm, with 3 lighter zones at97–89, 87–82 and 74–70 cm, laminated at 70–43 cm, slightlydarker at 42–38 cm and again at 30–20 cm. The top 20 cmare laminated.
The sediment of core CP21 (179 cm-long) is mud. Thecarbonate content is between 9% and 16%. The sediment ismottled, with darker–lighter alternation on a cm scalebetween ca 179 and ca 153 cm. From ca 140 to ca 92 cm,there is an alternation of 5–15 cm thick zones that aredistinctly darker or lighter. It is laminated at 39–29 and22–18 cm.
At the time of core opening, many sections showedlamination, which disappeared rapidly after exposure toair. Jelinowska et al. (1998), working on magneticcharacteristics and mineralogy of sediments in the longcores, suggested that the lamination results from diagen-esis. Such lamination tends to form when the conditionsare anoxic and when the water is less saline. Boomer et al.(2005) suggest that the bottom of the CS never becametruly anoxic over the last 15 ka and that the laminationsmay be formed by post-depositional processes.
Both the lithology and the carbonate content confirmthat there is no overlap between the short pilot cores (thisstudy) and the long Kullenberg cores (Chalie et al., 1997;Kuprin et al., 2003).
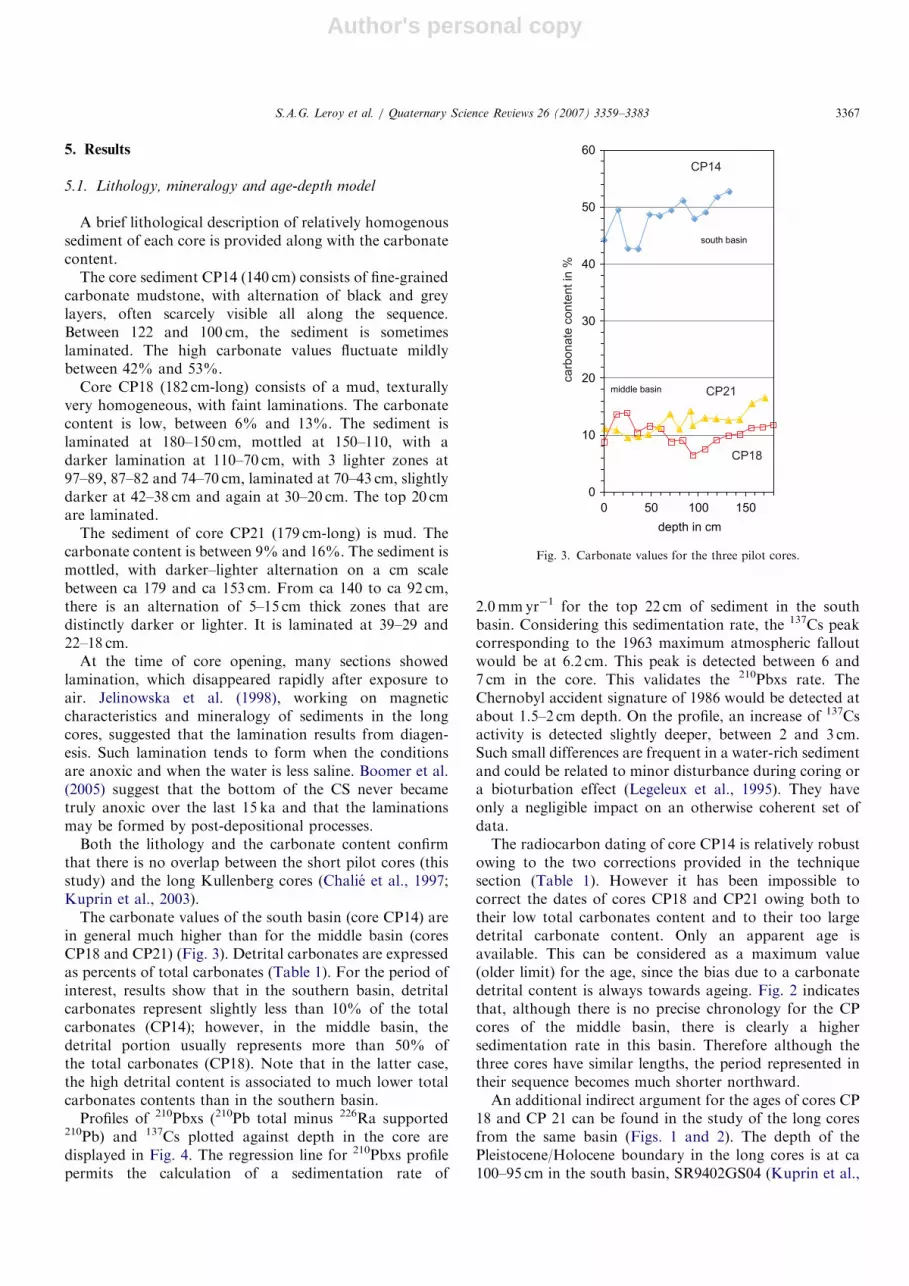
The carbonate values of the south basin (core CP14) arein general much higher than for the middle basin (coresCP18 and CP21) (Fig. 3). Detrital carbonates are expressedas percents of total carbonates (Table 1). For the period ofinterest, results show that in the southern basin, detritalcarbonates represent slightly less than 10% of the totalcarbonates (CP14); however, in the middle basin, thedetrital portion usually represents more than 50% ofthe total carbonates (CP18). Note that in the latter case,the high detrital content is associated to much lower totalcarbonates contents than in the southern basin.
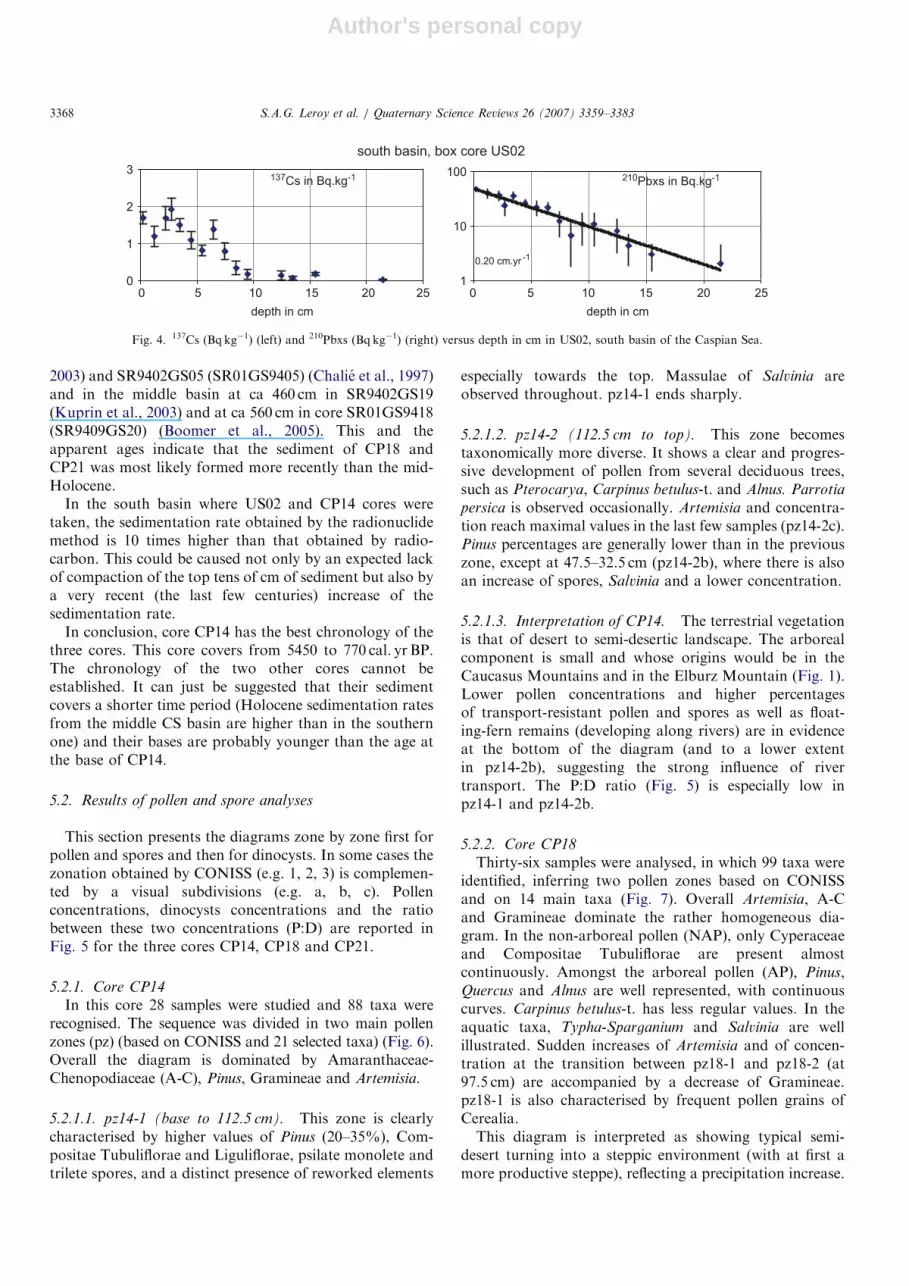
Profiles of 210Pbxs (210Pb total minus 226Ra supported210Pb) and 137Cs plotted against depth in the core aredisplayed in Fig. 4. The regression line for 210Pbxs profilepermits the calculation of a sedimentation rate of
2.0mmyr�1 for the top 22 cm of sediment in the southbasin. Considering this sedimentation rate, the 137Cs peakcorresponding to the 1963 maximum atmospheric falloutwould be at 6.2 cm. This peak is detected between 6 and7 cm in the core. This validates the 210Pbxs rate. TheChernobyl accident signature of 1986 would be detected atabout 1.5–2 cm depth. On the profile, an increase of 137Csactivity is detected slightly deeper, between 2 and 3 cm.Such small differences are frequent in a water-rich sedimentand could be related to minor disturbance during coring ora bioturbation effect (Legeleux et al., 1995). They haveonly a negligible impact on an otherwise coherent set ofdata.The radiocarbon dating of core CP14 is relatively robust
owing to the two corrections provided in the techniquesection (Table 1). However it has been impossible tocorrect the dates of cores CP18 and CP21 owing both totheir low total carbonates content and to their too largedetrital carbonate content. Only an apparent age isavailable. This can be considered as a maximum value(older limit) for the age, since the bias due to a carbonatedetrital content is always towards ageing. Fig. 2 indicatesthat, although there is no precise chronology for the CPcores of the middle basin, there is clearly a highersedimentation rate in this basin. Therefore although thethree cores have similar lengths, the period represented intheir sequence becomes much shorter northward.An additional indirect argument for the ages of cores CP
18 and CP 21 can be found in the study of the long coresfrom the same basin (Figs. 1 and 2). The depth of thePleistocene/Holocene boundary in the long cores is at ca100–95 cm in the south basin, SR9402GS04 (Kuprin et al.,
ARTICLE IN PRESS
0
10
20
30
40
50
60
0 50 100 150
depth in cm
south basin
middle basin
carb
onate
conte
nt in
%
CP14
CP21
CP18
Fig. 3. Carbonate values for the three pilot cores.
S.A.G. Leroy et al. / Quaternary Science Reviews 26 (2007) 3359–3383 3367
Author's personal copy
2003) and SR9402GS05 (SR01GS9405) (Chalie et al., 1997)and in the middle basin at ca 460 cm in SR9402GS19(Kuprin et al., 2003) and at ca 560 cm in core SR01GS9418(SR9409GS20) (Boomer et al., 2005). This and theapparent ages indicate that the sediment of CP18 andCP21 was most likely formed more recently than the mid-Holocene.
In the south basin where US02 and CP14 cores weretaken, the sedimentation rate obtained by the radionuclidemethod is 10 times higher than that obtained by radio-carbon. This could be caused not only by an expected lackof compaction of the top tens of cm of sediment but also bya very recent (the last few centuries) increase of thesedimentation rate.
In conclusion, core CP14 has the best chronology of thethree cores. This core covers from 5450 to 770 cal. yr BP.The chronology of the two other cores cannot beestablished. It can just be suggested that their sedimentcovers a shorter time period (Holocene sedimentation ratesfrom the middle CS basin are higher than in the southernone) and their bases are probably younger than the age atthe base of CP14.
5.2. Results of pollen and spore analyses
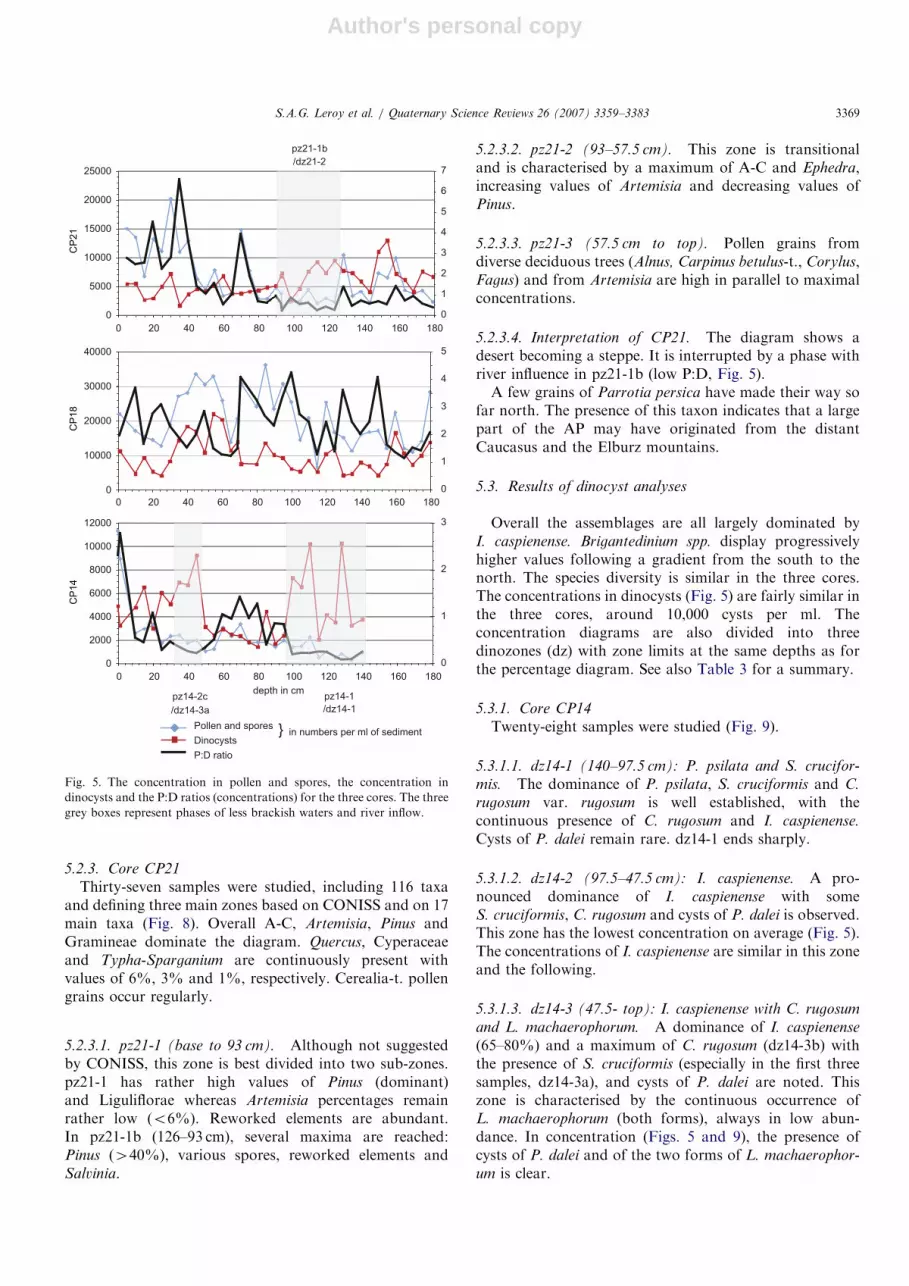
This section presents the diagrams zone by zone first forpollen and spores and then for dinocysts. In some cases thezonation obtained by CONISS (e.g. 1, 2, 3) is complemen-ted by a visual subdivisions (e.g. a, b, c). Pollenconcentrations, dinocysts concentrations and the ratiobetween these two concentrations (P:D) are reported inFig. 5 for the three cores CP14, CP18 and CP21.
5.2.1. Core CP14
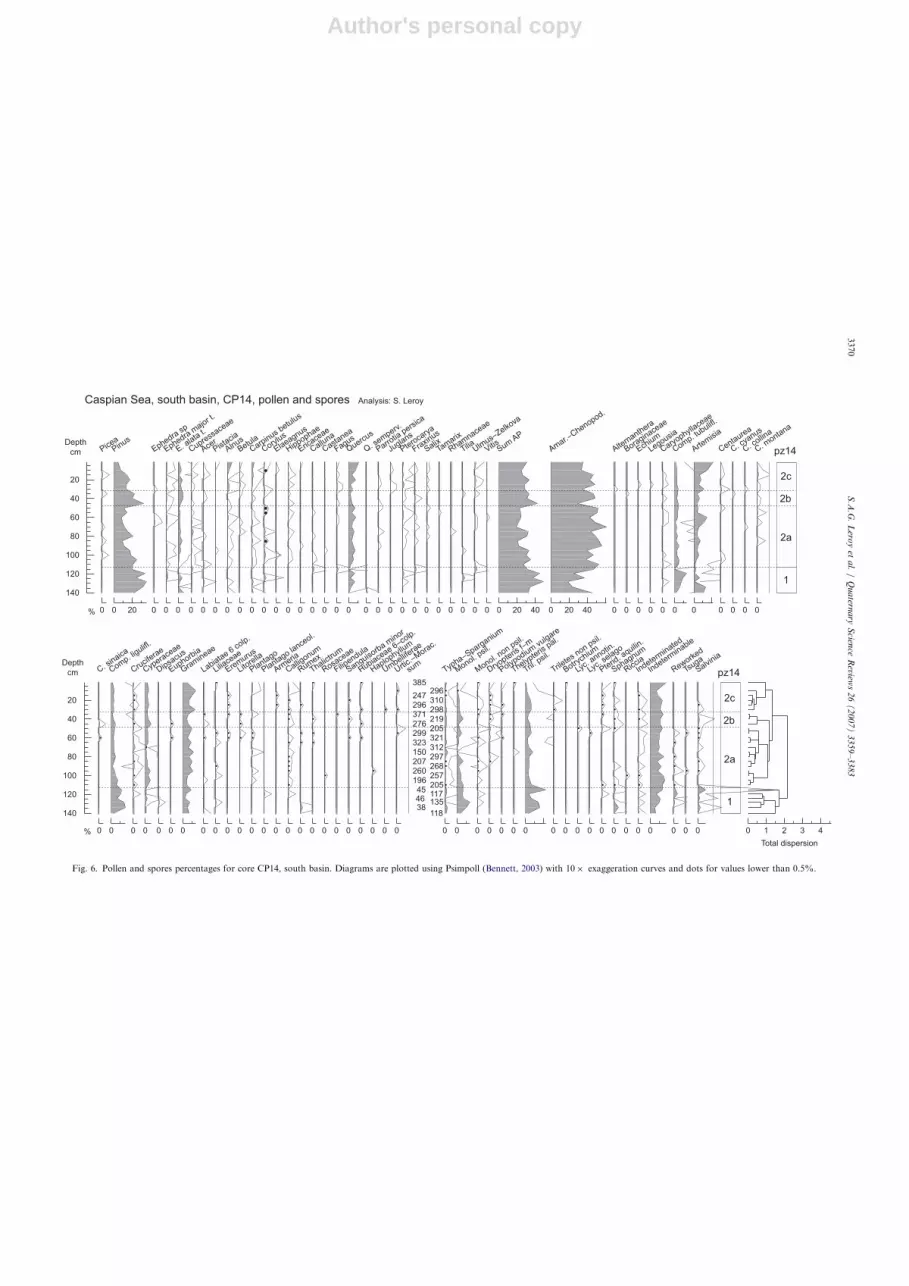
In this core 28 samples were studied and 88 taxa wererecognised. The sequence was divided in two main pollenzones (pz) (based on CONISS and 21 selected taxa) (Fig. 6).Overall the diagram is dominated by Amaranthaceae-Chenopodiaceae (A-C), Pinus, Gramineae and Artemisia.
5.2.1.1. pz14-1 (base to 112.5 cm). This zone is clearlycharacterised by higher values of Pinus (20–35%), Com-positae Tubuliflorae and Liguliflorae, psilate monolete andtrilete spores, and a distinct presence of reworked elements
especially towards the top. Massulae of Salvinia areobserved throughout. pz14-1 ends sharply.
5.2.1.2. pz14-2 (112.5 cm to top). This zone becomestaxonomically more diverse. It shows a clear and progres-sive development of pollen from several deciduous trees,such as Pterocarya, Carpinus betulus-t. and Alnus. Parrotia
persica is observed occasionally. Artemisia and concentra-tion reach maximal values in the last few samples (pz14-2c).Pinus percentages are generally lower than in the previouszone, except at 47.5–32.5 cm (pz14-2b), where there is alsoan increase of spores, Salvinia and a lower concentration.
5.2.1.3. Interpretation of CP14. The terrestrial vegetationis that of desert to semi-desertic landscape. The arborealcomponent is small and whose origins would be in theCaucasus Mountains and in the Elburz Mountain (Fig. 1).Lower pollen concentrations and higher percentagesof transport-resistant pollen and spores as well as float-ing-fern remains (developing along rivers) are in evidenceat the bottom of the diagram (and to a lower extentin pz14-2b), suggesting the strong influence of rivertransport. The P:D ratio (Fig. 5) is especially low inpz14-1 and pz14-2b.
5.2.2. Core CP18
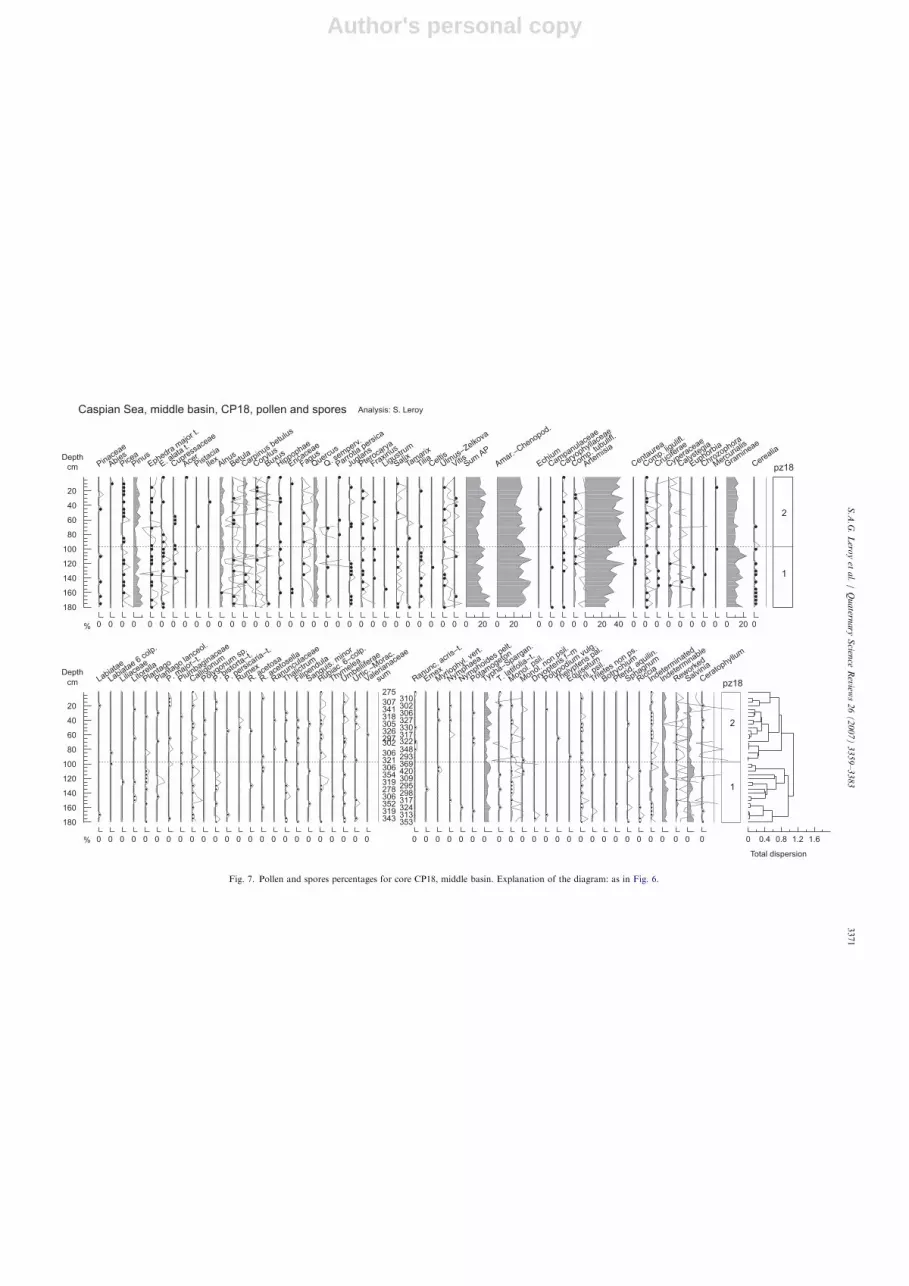
Thirty-six samples were analysed, in which 99 taxa wereidentified, inferring two pollen zones based on CONISSand on 14 main taxa (Fig. 7). Overall Artemisia, A-Cand Gramineae dominate the rather homogeneous dia-gram. In the non-arboreal pollen (NAP), only Cyperaceaeand Compositae Tubuliflorae are present almostcontinuously. Amongst the arboreal pollen (AP), Pinus,Quercus and Alnus are well represented, with continuouscurves. Carpinus betulus-t. has less regular values. In theaquatic taxa, Typha-Sparganium and Salvinia are wellillustrated. Sudden increases of Artemisia and of concen-tration at the transition between pz18-1 and pz18-2 (at97.5 cm) are accompanied by a decrease of Gramineae.pz18-1 is also characterised by frequent pollen grains ofCerealia.This diagram is interpreted as showing typical semi-
desert turning into a steppic environment (with at first amore productive steppe), reflecting a precipitation increase.
ARTICLE IN PRESS
0
1
2
3
0 5 10 15 20 25
south basin, box core US02
137Cs in Bq.kg-1
depth in cm
0.20 cm.yr -1
1
10
100
0 5 10 15 20 25
210Pbxs in Bq.kg-1
depth in cm
Fig. 4. 137Cs (Bqkg�1) (left) and 210Pbxs (Bqkg�1) (right) versus depth in cm in US02, south basin of the Caspian Sea.
S.A.G. Leroy et al. / Quaternary Science Reviews 26 (2007) 3359–33833368
Author's personal copy
5.2.3. Core CP21
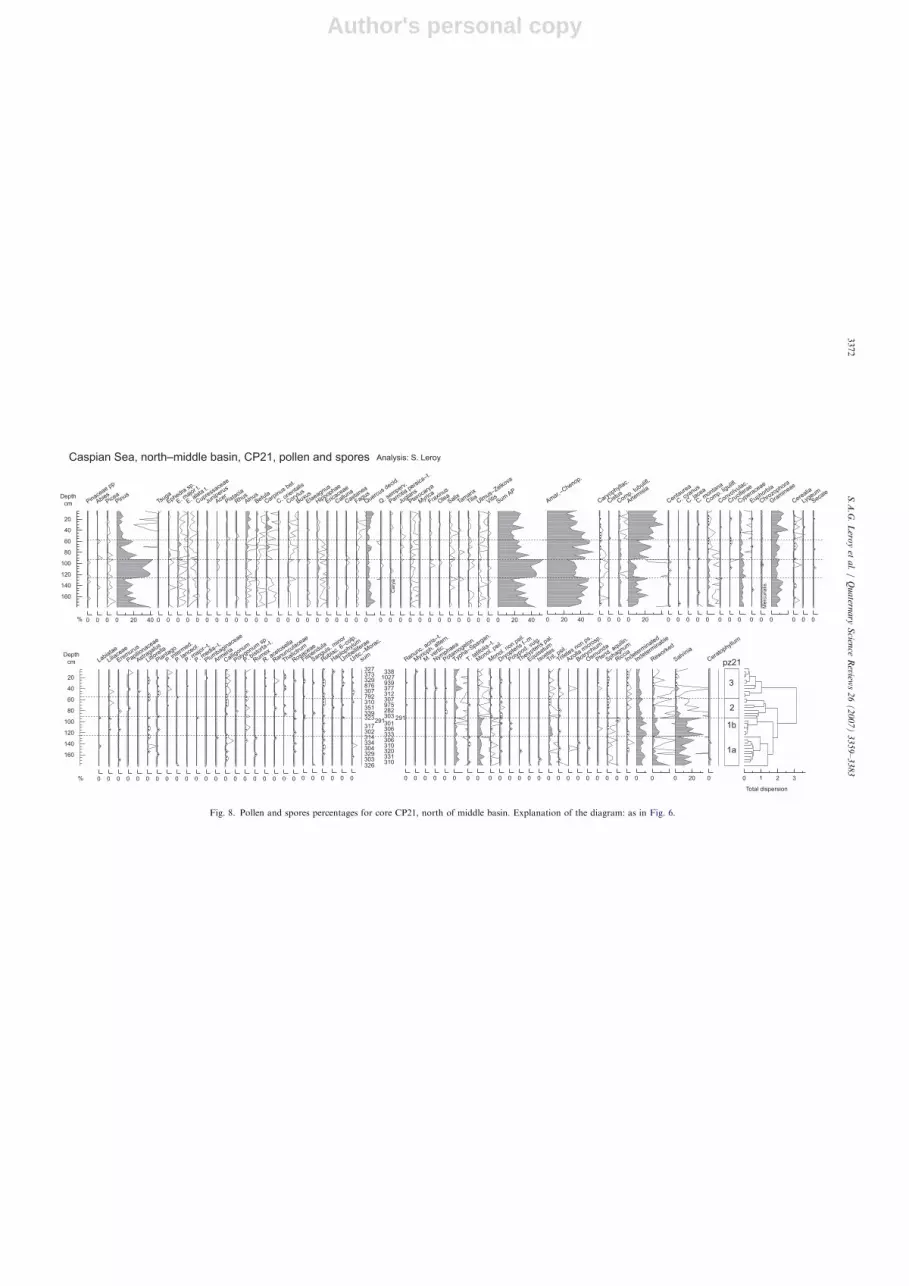
Thirty-seven samples were studied, including 116 taxaand defining three main zones based on CONISS and on 17main taxa (Fig. 8). Overall A-C, Artemisia, Pinus andGramineae dominate the diagram. Quercus, Cyperaceaeand Typha-Sparganium are continuously present withvalues of 6%, 3% and 1%, respectively. Cerealia-t. pollengrains occur regularly.
5.2.3.1. pz21-1 (base to 93 cm). Although not suggestedby CONISS, this zone is best divided into two sub-zones.pz21-1 has rather high values of Pinus (dominant)and Liguliflorae whereas Artemisia percentages remainrather low (o6%). Reworked elements are abundant.In pz21-1b (126–93 cm), several maxima are reached:Pinus (440%), various spores, reworked elements andSalvinia.
5.2.3.2. pz21-2 (93–57.5 cm). This zone is transitionaland is characterised by a maximum of A-C and Ephedra,increasing values of Artemisia and decreasing values ofPinus.
5.2.3.3. pz21-3 (57.5 cm to top). Pollen grains fromdiverse deciduous trees (Alnus, Carpinus betulus-t., Corylus,Fagus) and from Artemisia are high in parallel to maximalconcentrations.
5.2.3.4. Interpretation of CP21. The diagram shows adesert becoming a steppe. It is interrupted by a phase withriver influence in pz21-1b (low P:D, Fig. 5).A few grains of Parrotia persica have made their way so
far north. The presence of this taxon indicates that a largepart of the AP may have originated from the distantCaucasus and the Elburz mountains.
5.3. Results of dinocyst analyses
Overall the assemblages are all largely dominated byI. caspienense. Brigantedinium spp. display progressivelyhigher values following a gradient from the south to thenorth. The species diversity is similar in the three cores.The concentrations in dinocysts (Fig. 5) are fairly similar inthe three cores, around 10,000 cysts per ml. Theconcentration diagrams are also divided into threedinozones (dz) with zone limits at the same depths as forthe percentage diagram. See also Table 3 for a summary.
5.3.1. Core CP14
Twenty-eight samples were studied (Fig. 9).
5.3.1.1. dz14-1 (140–97.5 cm): P. psilata and S. crucifor-
mis. The dominance of P. psilata, S. cruciformis and C.
rugosum var. rugosum is well established, with thecontinuous presence of C. rugosum and I. caspienense.
Cysts of P. dalei remain rare. dz14-1 ends sharply.
5.3.1.2. dz14-2 (97.5–47.5 cm): I. caspienense. A pro-nounced dominance of I. caspienense with someS. cruciformis, C. rugosum and cysts of P. dalei is observed.This zone has the lowest concentration on average (Fig. 5).The concentrations of I. caspienense are similar in this zoneand the following.
5.3.1.3. dz14-3 (47.5- top): I. caspienense with C. rugosum
and L. machaerophorum. A dominance of I. caspienense
(65–80%) and a maximum of C. rugosum (dz14-3b) withthe presence of S. cruciformis (especially in the first threesamples, dz14-3a), and cysts of P. dalei are noted. Thiszone is characterised by the continuous occurrence ofL. machaerophorum (both forms), always in low abun-dance. In concentration (Figs. 5 and 9), the presence ofcysts of P. dalei and of the two forms of L. machaerophor-
um is clear.
ARTICLE IN PRESS
pz21-1b
/dz21-2
0
5000
10000
15000
20000
25000
0 20 40 60 80 100 120 140 160 180
0
1
2
3
4
5
6
7
CP
21
Pollen and spores
Dinocysts
P:D ratio
} in numbers per ml of sediment
pz14-1
/dz14-1
pz14-2c
/dz14-3a
0
2000
4000
6000
8000
10000
12000
0 20 40 60 80 100 120 140 160 180
0
1
2
3
depth in cm
CP
14
0
10000
20000
30000
40000
0 20 40 60 80 100 120 140 160 180
0
1
2
3
4
5
CP
18
Fig. 5. The concentration in pollen and spores, the concentration in
dinocysts and the P:D ratios (concentrations) for the three cores. The three
grey boxes represent phases of less brackish waters and river inflow.
S.A.G. Leroy et al. / Quaternary Science Reviews 26 (2007) 3359–3383 3369
Author's personal copyARTIC
LEIN
PRES
S
Caspian Sea, south basin, CP14, pollen and spores Analysis: S. Leroy
20
40
60
80
100
120
140
Depth
cm
0
•
•
Picea
0 20
Pinus
0
•
Ephedra sp
0
•
•
•
Ephedra m
ajor t.
0
•
E. alata
t.
0
••
••
•••
Cupress
aceae
0
•
••
•
Acer
0
•
Pistacia
0
••
•••
•
Alnus
0
••
••
•
Betula
0
••
••
•
•••
Carpinus b
etulus
0
Corylus
0
•
•
Elaeagnus
0
•
•
•
•
••
Hippophae
0
•
•
Ericace
ae
0
•
•
•
Calluna
0
•
Castanea
0
••
•
••
Fagus
0
Quercus
0
Q. sem
perv.
0
••
••
•
Parrotia
pers
ica
0
•
Juglans
0
•••••
•
•••
Ptero
cary
a
0
•
•
•
Fraxin
us
0
••••
•
••
Salix
0
•
Tam
arix
0
Rhamnace
ae
0
•
•
Tilia
0
•••
•
0
•
Vitis
0 20 40
Sum A
P
0 20 40 0
•
Altern
anthera
0
•
Boraginace
ae
0
•
Echium
0
•
Legousia
0
••
•
•
Caryophyll
aceae
0
Comp. t
ubulifl.
0
Artem
isia
0
••
•
•
Centaure
a
0
•
C. cya
nus
0
•
•
C. collin
a
0
••••
C. monta
na
pz14
2a
1
2b
2c
20
40
60
80
100
120
140
Depth
cm
% 0
•
C. sinaica
0
Comp. li
gulifl.
0
•••
•
•
••
Crucif
erae
0
•
Cypera
ceae
0
Dipsacu
s
0
•
•
Euphorbia
0
Gram
ineae
0
•
•
Labiatae 6
colp.
0
•
•
•
Liliace
ae
0
•••
••
Erem
urus
0
••
•
Litore
lla
0
••
Plantago
0
Plantago la
nceol.
0
••
Armeria
0
••••
•
••••
•
Calligonum
0
•
••
Rumex
0
•
•
••
Thalictru
m
0
•
Rosace
ae
0
•
Filipendula
0
•
•
•
Sanguisorb
a minor
0
•
•
•
•
0
•
Haplophyllum
0
•
Umbellif
erae
0
•
•
•
385296
247310
296298
371219
276205
299321
323312
150297
207268
260257
196205
45117
46 13538
118
sum
0
••
••
•
0
•
Monol. p
sil.
0
•
••
•
••
Monol. n
on psil
.
0
•••••
•
0
••
•
Polypodium
vulgare
0
•
Thelypte
ris p
al.
0
Tril. p
sil.
0
•
Trilete
s non p
sil.
0
•
Botrych
ium
0
•
Lyc. a
nnotin.
0
•
Lyc. s
elago
0
•••
•
Pterid
. aquilin
.
0
•
•••
•
Sphagnum
0
•
Riccia
0
•
••
••
Indete
rminate
d
0
Indete
rminable
0
•
••
•
Reworked
0
Tsuga
0
Salvinia
Total dispersion
0 1 2 3 4
pz14
2a
1
2b
2c
%
Fig. 6. Pollen and spores percentages for core CP14, south basin. Diagrams are plotted using Psimpoll (Bennett, 2003) with 10� exaggeration curves and dots for values lower than 0.5%.
S.A
.G.
Lero
yet
al.
/Q
ua
ternary
Scien
ceR
eviews
26
(2
00
7)
33
59
–3
38
33370
Author's personal copyARTIC
LEIN
PRES
S
Caspian Sea, middle basin, CP18, pollen and spores Analysis: S. Leroy
20
40
60
80
100
120
140
160
180
Depth
cm
% 0
Pinaceae
0
Abies
0
Picea
0
Pinus
0
Ephedra m
ajor t.
0
E. alata
t.
0
Cupress
aceae
0
Acer
0
Pistacia
0
Ilex
0
Alnus
0
Betula
0
Carpinus b
etulus
0
Corylus
0
Buxus
0
Hippophae
0
Ericace
ae
0
Fagus
0
Quercus
0
Q. sem
perv.
0
Parrotia
pers
ica
0
Juglans
0
Ptero
cary
a
0
Fraxin
us
0
Ligustrum
0
Salix
0
Tam
arix
0
Tilia
0
Celtis
0 0
Vitis
0 20
Sum A
P
0 20 0
Echium
0
Campanulace
ae
0
Caryophyll
aceae
0
Comp. t
ubulifl.
0 20 40
Artem
isia
0
Centaure
a
0
Comp. li
gulifl.
0
Crucif
erae
0
Cypera
ceae
0
Calyste
gia
0
Euphorbia
0
Chrozo
phora
0
Merc
urialis
0 20
Gram
ineae
0
Cerealia
pz18
2
1
20
40
60
80
100
120
140
160
180
Depth
cm
% 0
•
•
Labiatae
0
••
Labiatae 6
colp.
0
•
Liliace
ae
0
•
•
•
••
Litore
lla
0
•
•••••
•
•
Plantago
0
•
•
•
Plantago la
nceol.
0
•••
•
•
0
•
••
•
Plumbaginace
ae
0
•
•
••
•
••
•••
Calligonum
0
•
•
•
Polygonum
sp.
0
••
••
•
•
0
•
•
0
•
Rumex
0
•
•
R. ace
tosa
0
•
•••
•
R. ace
tose
lla
0
•
•
Ranunculace
ae
0
••
•
•
••
••
Thalictru
m
0
••••
•
•
•
Filipendula
0
•
•
•
Sanguis. m
inor
0
•
••••
•
••
•
0
•
Thymelea
0
•
•
•••
•
•
••
••
Umbellif
erae
0
•••
•
•
•
0
•
Valerianace
ae
275310307 302341 306318 327305 330326 317297 322302348306 293321 369306 420354 309319 295278 298306 317352 324319 313343 353
sum
0
•
•
•••
0
•
Emex
0
••
••
Myr
iophyl. ve
rt.
0
•
•
•
Nymphaea
0
•
Nymphoides p
elt.
0
•
••
•
Potam
ogeton
0 0
•
•
•
•
•
0
•
•••
•
••••••
Monol. p
sil.
0
••
Monol. n
on psil
.
0
•
0
•
•
Polypodium
vulg.
0
•
Thelypte
ris p
al.
0
•
Equisetu
m
0
•
••••
•••••••••
•
Tril. p
sil.
0
•
Trilete
s non p
s.
0
•
Botrych
ium
0
•
Pterid
. aquilin
.
0
•
•
•
Sphagnum
0
•
•••
Riccia
0
•••••••••
••
•
••••
Indete
rminate
d
0
Indete
rminable
0
•
••
••
Reworked
0
Salvinia
0
•
••
•
••
Cerato
phyllum
Total dispersion
0 0.4 0.8 1.2 1.6
pz18
2
1
Fig. 7. Pollen and spores percentages for core CP18, middle basin. Explanation of the diagram: as in Fig. 6.
S.A
.G.
Lero
yet
al.
/Q
ua
ternary
Scien
ceR
eviews
26
(2
00
7)
33
59
–3
38
33371
Author's personal copyARTIC
LEIN
PRES
S
Analysis: S. Leroy
20
40
60
80
100
120
140
160
Depth
cm
%
20
40
60
80
100
120
140
160
Depth
cm
% 0
•
••
•
Pinaceae p
p
0
•
•
Abies
0
•••••••
•••
•••••
Picea
0 20 40
Pinus
0
•Ts
uga
0
••
•
•
Ephedra sp
.
0
••••
•
E. major t
.
0
••••
•••
•
•
•
E. alata
t.
0
•
•
•
Cupress
aceae
0
•
•
•
•
Juniperu
s
0
••
•••
Acer
0
•
••
Pistacia
0
•
•
Rhus
0
•
•
•
•
•
Alnus
0
•••••••••
••••
Betula
0
••
••
Carpinus b
et.
0
••
•
C. orie
ntalis
0
•••
••
•••••••
Corylus
0
•
Buxus
0
•
••
•••
Elaeagnus
0
••••••
•••
••
•••
Hippophae
0
•
•
Ericace
ae
0
•
Calluna
0
••
•
Castanea
0
••••
••••
••••
Fagus
0
Quercus d
ecid.
0
•
•
Q. sem
perv.
0
•
••
•
Ca
rya
0
•
••
•••••
Juglans
0
•
•••
••••••••
•
Ptero
cary
a
0
•
Myr
ica
0
•
•••
•
Fraxin
us
0
•
•
Olea
0
•••••••••
•
•
Salix
0
•
•
Tam
arix
0
•••
••••••
•••
Tilia
0
•••
••••
•••
0
•
••
•
•
•
•
Vitis
0 20 40
Sum A
P
0 20 40 0
•••••••••
••
•
•
Caryophyll
ac.
0
•
Cistus
0
•
Comp. t
ubulifl.
0 20
Artem
isia
0
•
•
•
•
•
Centaure
a
0
•
C. cya
nus
0
•
•
C. jace
a
0
•
•
•
C. monta
na
0
••••
••••
Comp. li
gulifl.
0
•
•
Convolvu
lac.
0
•
•••
•
Crucif
erae
0
•
Cypera
ceae
0
•
•
•
Euphorbia
0
•
Chrozo
phora
•
Me
rcu
ria
lis
0
Gram
ineae
0
•••
••••
•
••
•
Cerealia
0
•
Lygeum
0
•
•
•
Secale
0
••
•
••
Filipendula
0
•
•
•
Sanguis. m
inor
0
•
•••
•••••
••
•
••••
0
•
•
•
Haplophylum
0
••••
•
•
Umbellif
erae
0
••
••
•
•
327 338373 1027329 939876 377307 312792 307310 975351 282339 303323 291291301317 306302 333314 306334 310304 320329 331303 310326
sum
0
•
•
0
•
Myr
ioph. alte
rn.
0
•
M. v
ertic.
0
•
Nymphaea
0
•
•
••
Potam
ogeton
0
•
0
•
•••
•
0
•
••
•
•
Monol. p
sil.
0
•
•
•
•
••
•
•
Monol. n
on psil
.
0
••
••
•••••
•
•
0
•
••
Polypod. v
ulg.
0
•
Thelypte
ris p
al.
0
•
Equisetu
m
0
•
Isoete
s
0
•
•
••••
Tril. p
sil.
0
•
•
•
••
•
•
•
Trilete
s non p
s.
0
Azolla
micr
osp.
0
•
•
Botrych
ium
0
•
Osmunda
0
•
•
Pterid
. aquilin
.
0
•••••
••••••
••
•
Sphagnum
0
••
Riccia
0
•••••
•
•
•••
••
Indete
rminate
d
0
Indete
rminable
0
•••
•
Reworked
0 20
••••
•
Salvinia
0
•
•
Cerato
phyllum
Total dispersion
0 1 2 3
pz21
1a
1b
2
3
0
•
•
Labiatae
0
•
•
•
Liliace
ae
0
•
•
•
Erem
urus
0
•
•
Papilionace
ae
0
•
Astragalus
0
•••
•••
•
••••
•
Littore
lla
0
•
•••
•
•
•
Plantago
0
•
•
•
P. inte
rmed.
0
•
•
P. lance
ol.
0
•
0
•
0
•
Plumbaginace
ae
0
•
Armeria
0
•
•••
•••••
•
•••
•••
Calligonum
0
•
Polygonum
sp.
0
•
••••
•
•
0
•
•
Rumex
0
•
•
R. ace
tose
lla
0
•
•
•
Ranunculace
ae
0
••
••
•
•
Thalictru
m
0
•
••
•
•
•
Rosace
ae
Caspian Sea, north–middle basin, CP21, pollen and spores
Fig. 8. Pollen and spores percentages for core CP21, north of middle basin. Explanation of the diagram: as in Fig. 6.
S.A
.G.
Lero
yet
al.
/Q
ua
ternary
Scien
ceR
eviews
26
(2
00
7)
33
59
–3
38
33372
Author's personal copy
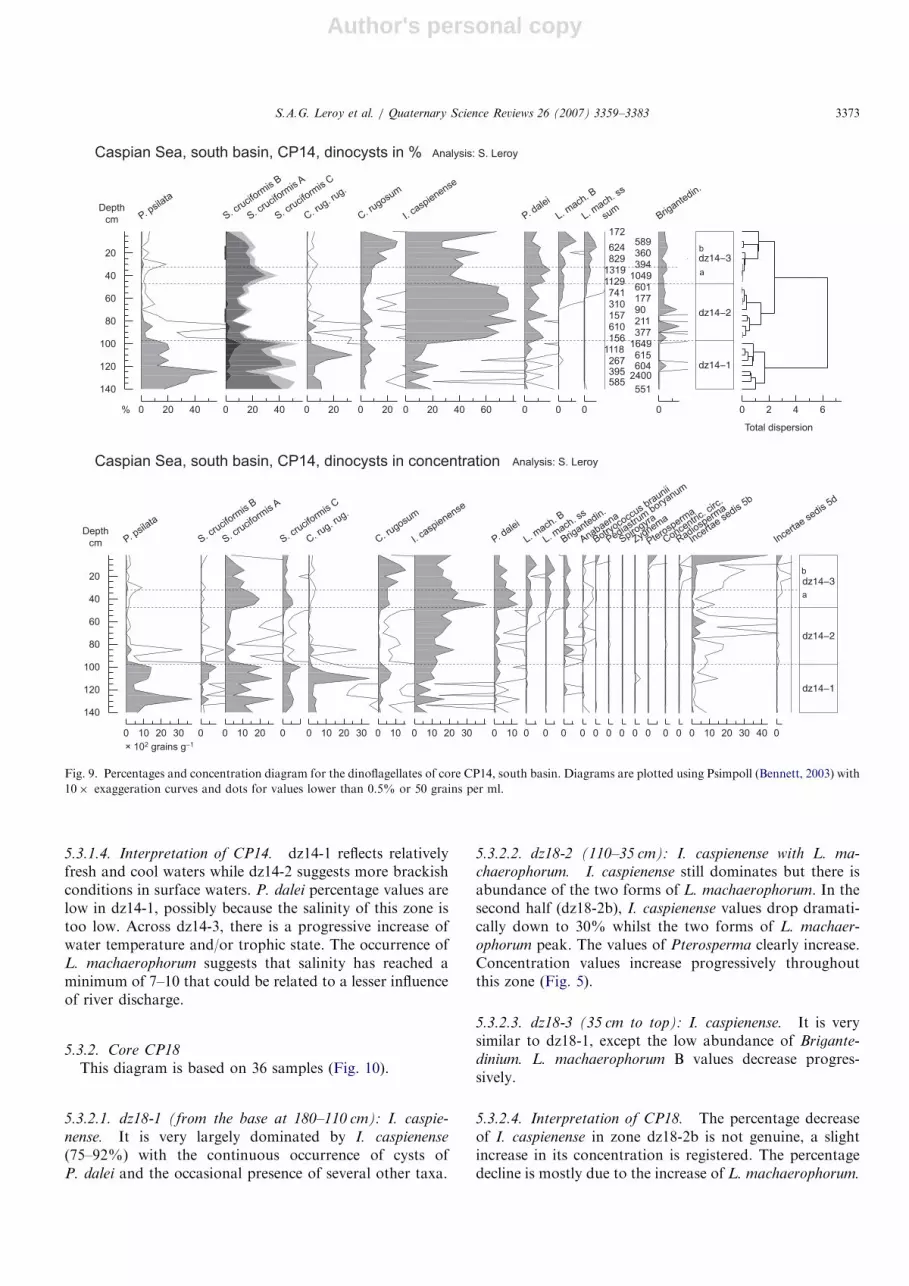
5.3.1.4. Interpretation of CP14. dz14-1 reflects relativelyfresh and cool waters while dz14-2 suggests more brackishconditions in surface waters. P. dalei percentage values arelow in dz14-1, possibly because the salinity of this zone istoo low. Across dz14-3, there is a progressive increase ofwater temperature and/or trophic state. The occurrence ofL. machaerophorum suggests that salinity has reached aminimum of 7–10 that could be related to a lesser influenceof river discharge.
5.3.2. Core CP18
This diagram is based on 36 samples (Fig. 10).
5.3.2.1. dz18-1 (from the base at 180–110 cm): I. caspie-
nense. It is very largely dominated by I. caspienense
(75–92%) with the continuous occurrence of cysts ofP. dalei and the occasional presence of several other taxa.
5.3.2.2. dz18-2 (110–35 cm): I. caspienense with L. ma-
chaerophorum. I. caspienense still dominates but there isabundance of the two forms of L. machaerophorum. In thesecond half (dz18-2b), I. caspienense values drop dramati-cally down to 30% whilst the two forms of L. machaer-
ophorum peak. The values of Pterosperma clearly increase.Concentration values increase progressively throughoutthis zone (Fig. 5).
5.3.2.3. dz18-3 (35 cm to top): I. caspienense. It is verysimilar to dz18-1, except the low abundance of Brigante-
dinium. L. machaerophorum B values decrease progres-sively.
5.3.2.4. Interpretation of CP18. The percentage decreaseof I. caspienense in zone dz18-2b is not genuine, a slightincrease in its concentration is registered. The percentagedecline is mostly due to the increase of L. machaerophorum.
ARTICLE IN PRESS
Caspian Sea, south basin, CP14, dinocysts in %
20
40
60
80
100
120
140
Depth
cm
% 0 20 40
•
••••
P. psil
ata
0 20 40
S. cru
ciform
is B
S. cru
ciform
is A
S. cru
ciform
is C
0 20
•
•••••••
•
C. rug. r
ug.
0 20
C. rugosu
m
0 20 40 60
I. ca
spienense
0
P. dalei
0
••
L. mach
. B
0
•
L. mach
. ss
172589
624360
829394
13191049
1129601
741177
31090
157211
610377
1561649
1118615
267604
395 2400585
551
sum
0
Brigante
din.
Total dispersion
0 2 4 6
Caspian Sea, south basin, CP14, dinocysts in concentration Analysis: S. Leroy
20
40
60
80
100
120
140
Depth
cm
× 102 grains g
0 10 20 30
••••••••••••••
P. psil
ata
0
••
•••••
••
••••
S. cru
ciform
is B
0 10 20
•S. c
rucif
ormis
A
0
•••
•
S. cru
ciform
is C
0 10 20 30
••••••••••••••
C. rug. r
ug.
0 10
••
C. rugosu
m
0 10 20 30
I. ca
spienense
0 10
•
P. dalei
0
•
•
••
L. mach
. B
0
••
•
L. mach
. ss
0
Brigante
din.
0
•••
•••
••••
•••
Anabaena
0
••
•
•
Botryoco
ccus b
raunii
0
•
•
Pediastrum
bory
anum
0
•
Spirogyr
a
0
•
Zygnem
a
0
••
•
Ptero
sperm
a
0
•
Concentri
c. cir
c.
0
•••
Radiosperm
a
0 10 20 30 40
••
•
••••••
Ince
rtae se
dis 5b
0
••••
•
••••
•
Ince
rtae se
dis 5d
a
b
a
b
Analysis: S. Leroy
Fig. 9. Percentages and concentration diagram for the dinoflagellates of core CP14, south basin. Diagrams are plotted using Psimpoll (Bennett, 2003) with
10� exaggeration curves and dots for values lower than 0.5% or 50 grains per ml.
S.A.G. Leroy et al. / Quaternary Science Reviews 26 (2007) 3359–3383 3373
Author's personal copy
Some other microfossils also become more abundant atthese depths.
The diagram indicates brackish waters with a slightincrease of salinity above 110 cm and colder temperaturebelow that depth. The maximum of dinoconcentration(dz18-2) and indicates a temporary higher productivity.
5.3.3. Core CP21
The diagram of CP21 (37 samples) is relatively homo-geneous with the same species as the two other Holocenediagrams. It is dominated by I. caspienense (70–85%)(Fig. 11).
5.3.3.1. dz21-1 (base to 150.5 cm): I. caspienense. This dzdisplays a maximum of I. caspienense, both in percentagesand concentration (Figs. 5 and 11). All the other taxa arepresent but in much smaller amounts.
5.3.3.2. dz21-2 (150.5–91.5 cm): I. caspienense with
S. cruciformis. Slightly higher values of S. cruciformis
(410%) occur in dz21-2. L. machaerophorum s.s. forms asmall peak in the second part of dz21-2. Rare fossils ofConcentricystes circulus are observed in dz21-2 and justabove the transition to dz21-3.
5.3.3.3. dz21-3 (91.5 cm to top): I. caspienense with
L. machaerophorum and cysts of P. dalei. dz21-3 ischaracterised by higher values of cysts of P. dalei. In thelower part of dz21-3, C. rugosum values make two peaks,while L. machaerophorum B are higher in the upper part.Anabaena, Pediastrum, Pterosperma and Incertae sedis 5bare abundant in dz21-3.
5.3.3.4. Interpretation of CP21. The diagram suggests agradual increase in salinity conditions. The fluctuationsobserved in L. machaerophorum frequencies may reflectperiods when salinity fluctuates in relation to riverdischarge.
6. Discussion
6.1. Comparison of the three cores
Based on the pollen assemblages of the Lower VolgaRiver (Bolikhovskaya, 1990), it is likely that the Volgadelta and other river deltas have had little direct impact onthe composition of the pollen diagrams presented here,even on the northernmost core (CP21). Most of the pollengrains are wind-transported from a large area around theCS (Hooghiemstra et al., 2006; Mudie and McCarthy,2006). To identify more clearly where from the wind-transported pollen originated, present-day meteorologicaldata have been used (Fig. 12, Appendix B). From the endof the winter to the beginning of the summer, the windsprogressively shift from the west (February) to the SW(April). Then after May, which is a transition month (fromSW to SE), the winds of June and July are mainly from the
east and north-east. The wind pattern provides a goodopportunity for the pollen grains of the forest of the southand south-west of the CS to be transported to the corelocations in spring and it explains the non-concealment ofthe AP by the NAP pollen grains of the desert and thesteppe that makes up most of the perimeter of the CS.The steppe vegetation (Artemisia) is more productive
than that of the desert (A-C). This is reflected by highArtemisia percentages and concentrations. The influence oftrees growing on the slopes of the Caucasus and the Elburzcan be recognised in the three cores. It is however in CP18that the AP (Ulmus-Zelkova, Vitis, Fagus and Alnus),aquatics, Artemisia and total concentration are maxima.CP18 spectra are interpreted as emerging from the mosthumid vegetation type of the three cores. The core locationis directly influenced by the forest vegetation, the localexpansion of agriculture and the rainfall in the Caucasus.Throughout the diagrams (second part of the Holocene),only trivial N–S fluctuations of the boundary betweendesert and steppe have been observed as well as only slightvertical movements of vegetation belts on the mountains.The smallness of these changes is perhaps due to thebuffering of the marine sediment and the very large sourcearea for the pollen.However three similarly outstanding zones (pz14-1,
pz14-2b and pz21-1b), indicate a strong bias of the spectrawith over-representation of the most resistant pollen andspores, higher massulae of Salvinia (river sides) and lowtotal concentration owing to fast sedimentation rates ordilution by minerals (summary in Table 2). A shift from airtransport to water transport (strong river inflow) bestexplains these spectra. Pollen and spores with resistantexines are preferentially preserved in soils, and duringperiods of soil erosion they can become incorporated intolake sediments via rivers (Wilmshurst and McGlone, 2005).Compared to the diagram of the KBG covering the last 200years (Leroy et al., 2006), pollen zone 3, displaying intensereworking linked to water run-off, palynologically is verysimilar to that of pilot cores presented here. The sametaphonomical process is the most likely cause. Precisepalaeovegetation could not be reconstructed during thesephases of strong river flow as the signal is biased by adifferent taphonomy.The successive zones of the three Holocene dinocyst
diagrams are summarised in Table 3. The presence ofrecently discovered forms of dinocysts hinders a detailedpalaeoecological reconstruction, as there is not as yet anyinformation on their ecology. However the interactionbetween the diverse taxa and the comparison to otherproxies allows some suggestions.
� The most common situation is that the assemblages aredominated by I. caspienense, a new species. This, bycomparison to modern analogues, is believed torepresent a situation similar to the modern brackishsalinities. In addition, I. caspienense largely dominatesmost of the diagrams except when P. psilata is
ARTICLE IN PRESSS.A.G. Leroy et al. / Quaternary Science Reviews 26 (2007) 3359–33833374
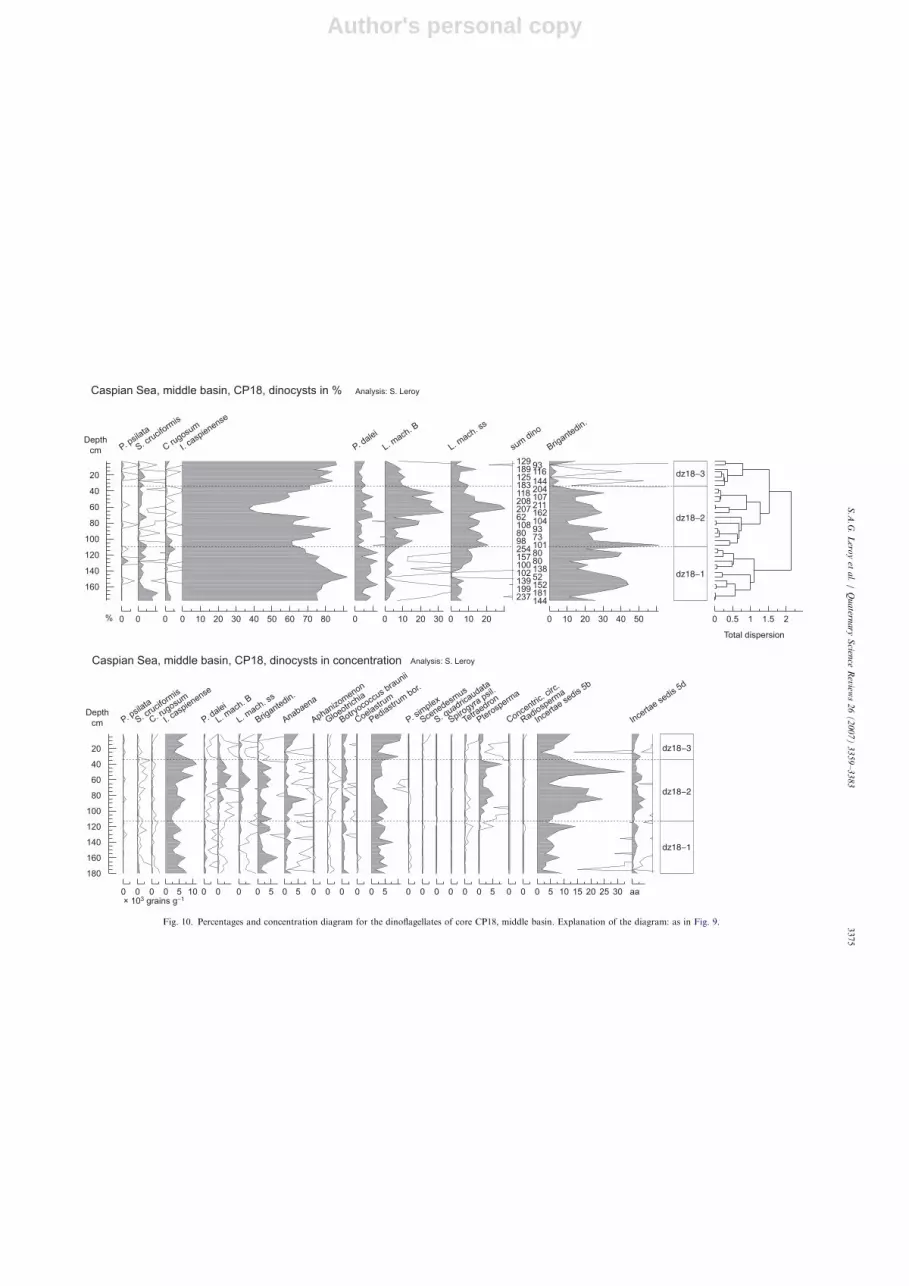
Author's personal copyARTIC
LEIN
PRES
S
Caspian Sea, middle basin, CP18, dinocysts in % Analysis: S. Leroy
20
40
60
80
100
120
140
160
Depth
cm
% 0
•
•
P. psil
ata
0
•
•
S. cru
ciform
is
0
•
C rugosu
m
0 10 20 30 40 50 60 70 80
I. ca
spienense
0
P. dalei
0 10 20 30
L. mach
. B
0 10 20
L. mach
. ss
129 93189 116125 144183 204118 107208 211207 16262 104108 9380 7398 101254 80157 80100 138102 52139 152199 181237 144
sum
dino
0 10 20 30 40 50
Brigante
din.
Total dispersion
0 0.5 1 1.5 2
Caspian Sea, middle basin, CP18, dinocysts in concentration Analysis: S. Leroy
20
40
60
80
100
120
140
160
180
Depth
cm
× 103 grains g0
•
•
P. psil
ata
0
•
•
S. cru
ciform
is
0
•
•
C. rugosu
m
0 5 10
I. ca
spienense
0
•
P. dalei
0
•
•
L. mach
. B
0
L. mach
. ss
0 5
Brigante
din.
0 5
Anabaena
0
Aphanizom
enon
0
•
••
Gloeotrich
ia
0
Botryoco
ccus b
raunii
0
••
Coelastrum
0 5
Pediastrum
bor.
0
•
••
P. sim
plex
0
•
••
•
Scenedesm
us
0
•
••
S. quadric
audata
0
Spirogyr
a psil
.
0
•
•
•
Tetra
edron
0 5
Ptero
sperm
a
0
Concentri
c. cir
c.
0
•
Radiosperm
a
0 5 10 15 20 25 30
Ince
rtae se
dis 5b
aa
•
Ince
rtae se
dis 5d
Fig. 10. Percentages and concentration diagram for the dinoflagellates of core CP18, middle basin. Explanation of the diagram: as in Fig. 9.
S.A
.G.
Lero
yet
al.
/Q
ua
ternary
Scien
ceR
eviews
26
(2
00
7)
33
59
–3
38
33375
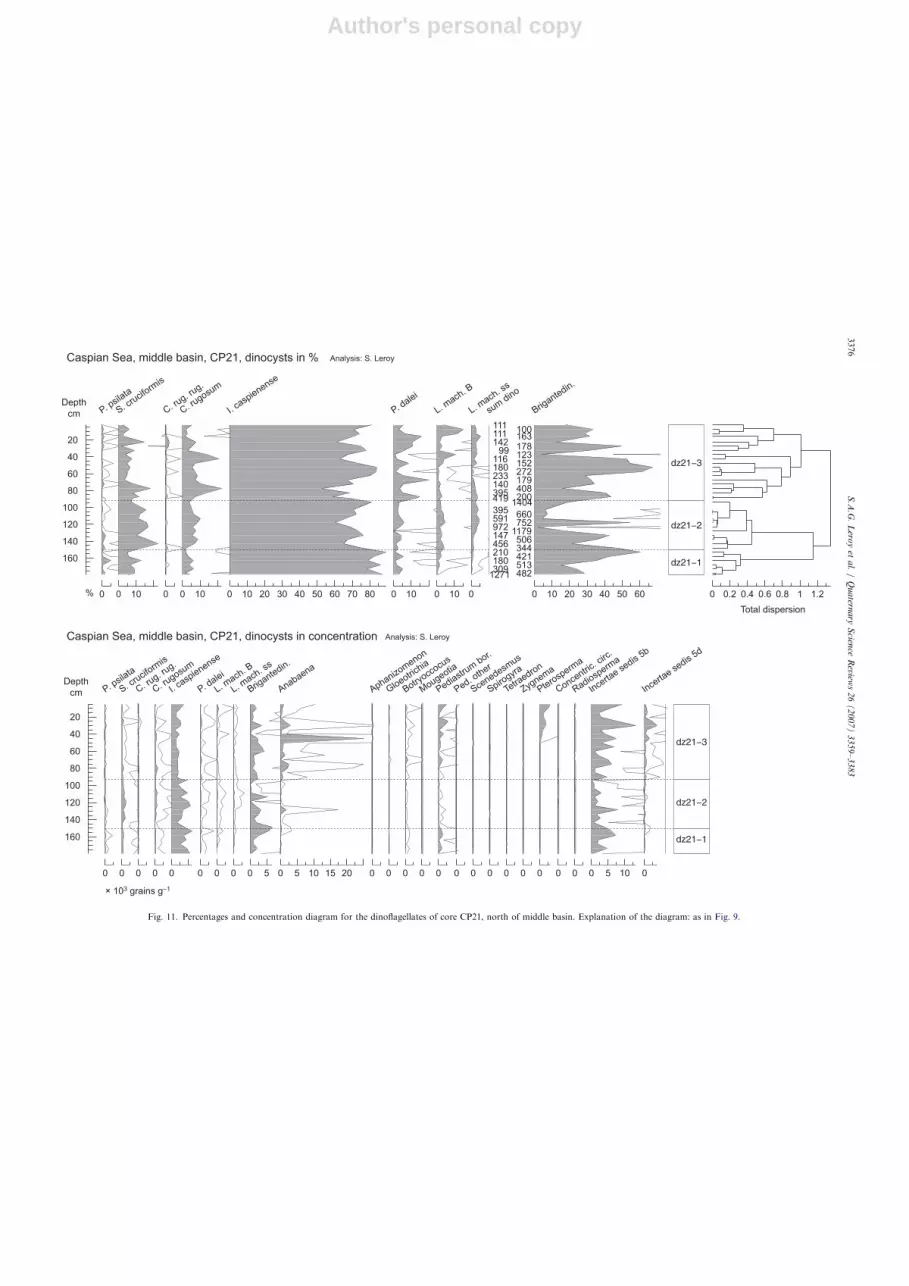
Author's personal copyARTIC
LEIN
PRES
S
20
40
60
80
100
120
140
160
Depth
cm
% 0
••
•••••••••
P. psil
ata
0 10
S. cru
ciform
is
0
••
•
•
C. rug. r
ug.
0 10
C. rugosu
m
0 10 20 30 40 50 60 70 80
I. ca
spienense
0 10
P. dalei
0 10
•
L. mach
. B
0
••
L. mach
. ss
111 100111 163142 17899 123116 152180 272233 179140 408395 200419 1404395 660591 752972 1179147 506456 344210 421180 513309 4821271
sum
dino
0 10 20 30 40 50 60
Brigante
din.
Total dispersion
0 0.2 0.4 0.6 0.8 1 1.2
20
40
60
80
100
120
140
160
Depth
cm
× 103 grains g
0
•••
••••
•••••••••••••
P. psil
ata
0
•
S. cru
ciform
is
0
•
••
•••
•
•
•
C. rug. r
ug.
0
••
•
C. rugosu
m
0
I. ca
spienense
0
•••
•
P. dalei
0
•
•••••
•••
L. mach
. B
0
••••
•••••••
L. mach
. ss
0 5
Brigante
din.
0 5 10 15 20
••••
•••
Anabaena
0
•
Aphanizom
enon
0
••••
•••
•
•
Gloeotrich
ia
0
•
•
•••••
•
•
••
Botryocc
ocus
0
•
Mougeotia
0
•••
•
•
Pediastrum
bor.
0
•
Ped. oth
er
0
•
•
Scenedesm
us
0
•
•
•
Spirogyr
a
0
•
•
•
Tetra
edron
0
•
•
•
Zygnem
a
0
•
Ptero
sperm
a
0
•••
•
Concentri
c. cir
c.
0
•
•
•
Radiosperm
a
0 5 10
Ince
rtae se
dis 5b
0
••••••
•••
Ince
rtae se
dis 5d
Analysis: S. LeroyCaspian Sea, middle basin, CP21, dinocysts in %
Analysis: S. LeroyCaspian Sea, middle basin, CP21, dinocysts in concentration
Fig. 11. Percentages and concentration diagram for the dinoflagellates of core CP21, north of middle basin. Explanation of the diagram: as in Fig. 9.
S.A
.G.
Lero
yet
al.
/Q
ua
ternary
Scien
ceR
eviews
26
(2
00
7)
33
59
–3
38
33376
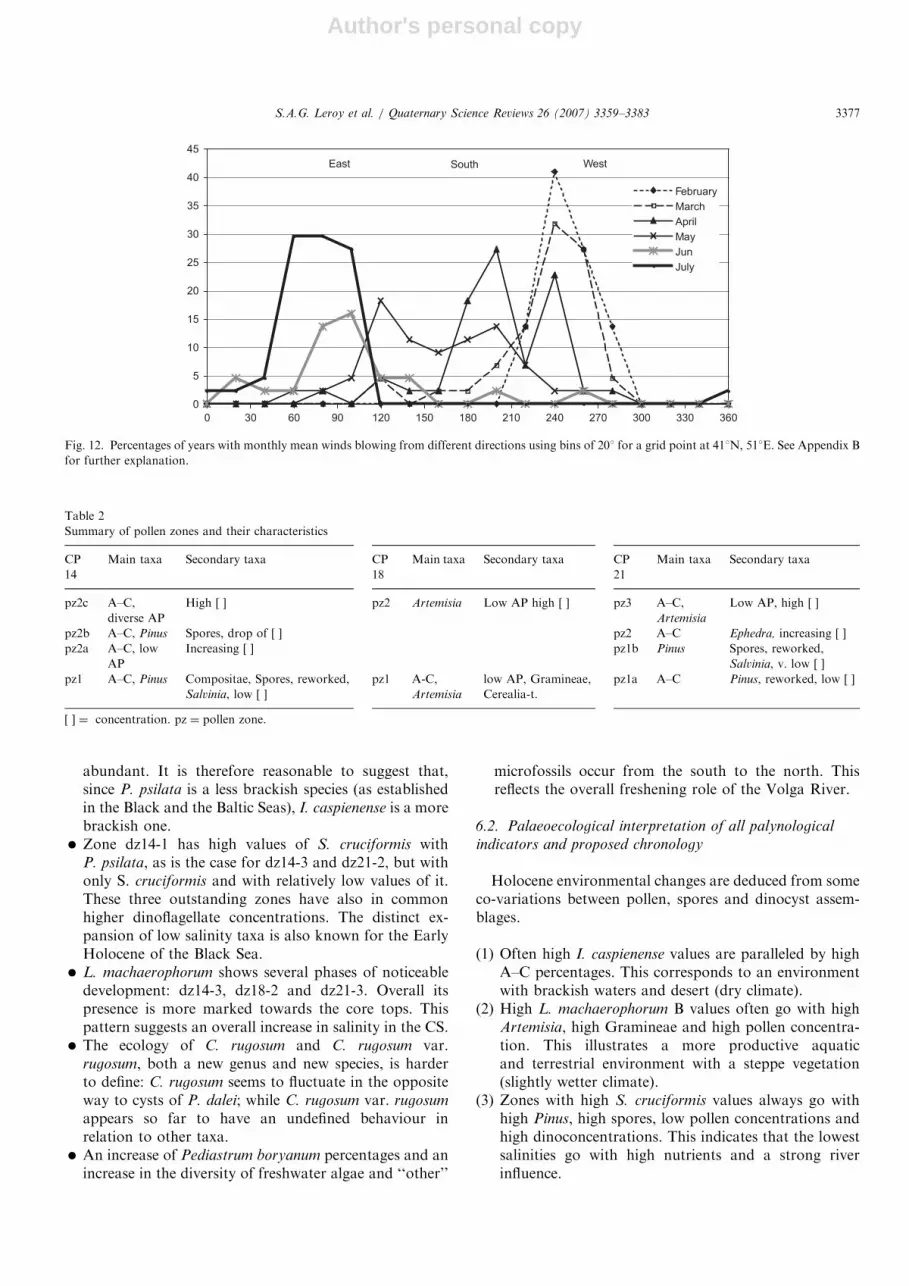
Author's personal copy
abundant. It is therefore reasonable to suggest that,since P. psilata is a less brackish species (as establishedin the Black and the Baltic Seas), I. caspienense is a morebrackish one.� Zone dz14-1 has high values of S. cruciformis with
P. psilata, as is the case for dz14-3 and dz21-2, but withonly S. cruciformis and with relatively low values of it.These three outstanding zones have also in commonhigher dinoflagellate concentrations. The distinct ex-pansion of low salinity taxa is also known for the EarlyHolocene of the Black Sea.� L. machaerophorum shows several phases of noticeable
development: dz14-3, dz18-2 and dz21-3. Overall itspresence is more marked towards the core tops. Thispattern suggests an overall increase in salinity in the CS.� The ecology of C. rugosum and C. rugosum var.
rugosum, both a new genus and new species, is harderto define: C. rugosum seems to fluctuate in the oppositeway to cysts of P. dalei; while C. rugosum var. rugosum
appears so far to have an undefined behaviour inrelation to other taxa.� An increase of Pediastrum boryanum percentages and an
increase in the diversity of freshwater algae and ‘‘other’’
microfossils occur from the south to the north. Thisreflects the overall freshening role of the Volga River.
6.2. Palaeoecological interpretation of all palynological
indicators and proposed chronology
Holocene environmental changes are deduced from someco-variations between pollen, spores and dinocyst assem-blages.
(1) Often high I. caspienense values are paralleled by highA–C percentages. This corresponds to an environmentwith brackish waters and desert (dry climate).
(2) High L. machaerophorum B values often go with highArtemisia, high Gramineae and high pollen concentra-tion. This illustrates a more productive aquaticand terrestrial environment with a steppe vegetation(slightly wetter climate).
(3) Zones with high S. cruciformis values always go withhigh Pinus, high spores, low pollen concentrations andhigh dinoconcentrations. This indicates that the lowestsalinities go with high nutrients and a strong riverinfluence.
ARTICLE IN PRESS
0
5
10
15
20
25
30
35
40
45
0 30 60 90 120 150 180 210 240 270 300 330 360
February
March
April
May
Jun
July
East WestSouth
Fig. 12. Percentages of years with monthly mean winds blowing from different directions using bins of 201 for a grid point at 411N, 511E. See Appendix B
for further explanation.
Table 2
Summary of pollen zones and their characteristics
CP
14
Main taxa Secondary taxa CP
18
Main taxa Secondary taxa CP
21
Main taxa Secondary taxa
pz2c A–C,
diverse AP
High [ ] pz2 Artemisia Low AP high [ ] pz3 A–C,
Artemisia
Low AP, high [ ]
pz2b A–C, Pinus Spores, drop of [ ] pz2 A–C Ephedra, increasing [ ]
pz2a A–C, low
AP
Increasing [ ] pz1b Pinus Spores, reworked,
Salvinia, v. low [ ]
pz1 A–C, Pinus Compositae, Spores, reworked,
Salvinia, low [ ]
pz1 A-C,
Artemisia
low AP, Gramineae,
Cerealia-t.
pz1a A–C Pinus, reworked, low [ ]
[ ] ¼ concentration. pz ¼ pollen zone.
S.A.G. Leroy et al. / Quaternary Science Reviews 26 (2007) 3359–3383 3377
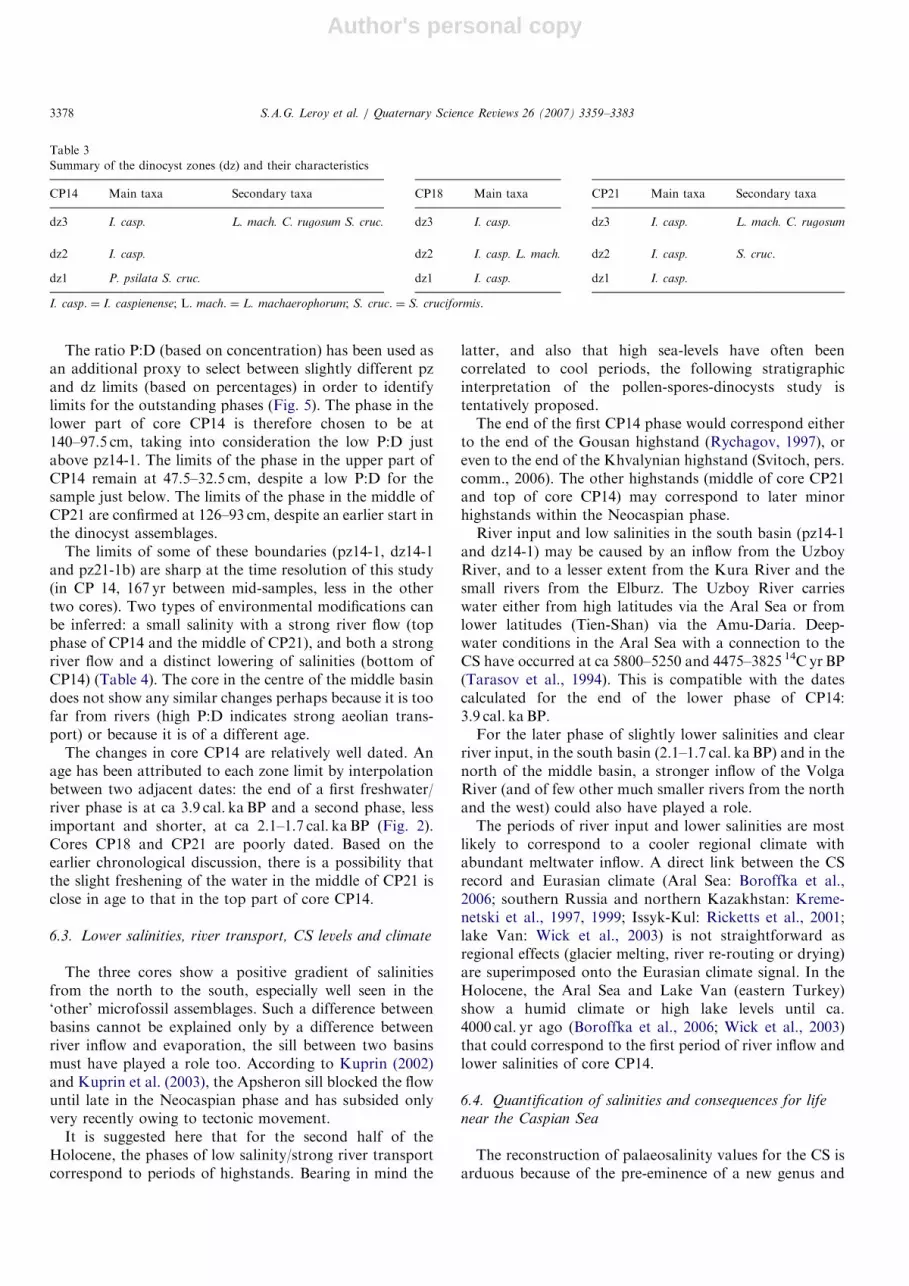
Author's personal copy
The ratio P:D (based on concentration) has been used asan additional proxy to select between slightly different pzand dz limits (based on percentages) in order to identifylimits for the outstanding phases (Fig. 5). The phase in thelower part of core CP14 is therefore chosen to be at140–97.5 cm, taking into consideration the low P:D justabove pz14-1. The limits of the phase in the upper part ofCP14 remain at 47.5–32.5 cm, despite a low P:D for thesample just below. The limits of the phase in the middle ofCP21 are confirmed at 126–93 cm, despite an earlier start inthe dinocyst assemblages.
The limits of some of these boundaries (pz14-1, dz14-1and pz21-1b) are sharp at the time resolution of this study(in CP 14, 167 yr between mid-samples, less in the othertwo cores). Two types of environmental modifications canbe inferred: a small salinity with a strong river flow (topphase of CP14 and the middle of CP21), and both a strongriver flow and a distinct lowering of salinities (bottom ofCP14) (Table 4). The core in the centre of the middle basindoes not show any similar changes perhaps because it is toofar from rivers (high P:D indicates strong aeolian trans-port) or because it is of a different age.
The changes in core CP14 are relatively well dated. Anage has been attributed to each zone limit by interpolationbetween two adjacent dates: the end of a first freshwater/river phase is at ca 3.9 cal. ka BP and a second phase, lessimportant and shorter, at ca 2.1–1.7 cal. kaBP (Fig. 2).Cores CP18 and CP21 are poorly dated. Based on theearlier chronological discussion, there is a possibility thatthe slight freshening of the water in the middle of CP21 isclose in age to that in the top part of core CP14.
6.3. Lower salinities, river transport, CS levels and climate
The three cores show a positive gradient of salinitiesfrom the north to the south, especially well seen in the‘other’ microfossil assemblages. Such a difference betweenbasins cannot be explained only by a difference betweenriver inflow and evaporation, the sill between two basinsmust have played a role too. According to Kuprin (2002)and Kuprin et al. (2003), the Apsheron sill blocked the flowuntil late in the Neocaspian phase and has subsided onlyvery recently owing to tectonic movement.
It is suggested here that for the second half of theHolocene, the phases of low salinity/strong river transportcorrespond to periods of highstands. Bearing in mind the
latter, and also that high sea-levels have often beencorrelated to cool periods, the following stratigraphicinterpretation of the pollen-spores-dinocysts study istentatively proposed.The end of the first CP14 phase would correspond either
to the end of the Gousan highstand (Rychagov, 1997), oreven to the end of the Khvalynian highstand (Svitoch, pers.comm., 2006). The other highstands (middle of core CP21and top of core CP14) may correspond to later minorhighstands within the Neocaspian phase.River input and low salinities in the south basin (pz14-1
and dz14-1) may be caused by an inflow from the UzboyRiver, and to a lesser extent from the Kura River and thesmall rivers from the Elburz. The Uzboy River carrieswater either from high latitudes via the Aral Sea or fromlower latitudes (Tien-Shan) via the Amu-Daria. Deep-water conditions in the Aral Sea with a connection to theCS have occurred at ca 5800–5250 and 4475–3825 14C yr BP(Tarasov et al., 1994). This is compatible with the datescalculated for the end of the lower phase of CP14:3.9 cal. ka BP.For the later phase of slightly lower salinities and clear
river input, in the south basin (2.1–1.7 cal. kaBP) and in thenorth of the middle basin, a stronger inflow of the VolgaRiver (and of few other much smaller rivers from the northand the west) could also have played a role.The periods of river input and lower salinities are most
likely to correspond to a cooler regional climate withabundant meltwater inflow. A direct link between the CSrecord and Eurasian climate (Aral Sea: Boroffka et al.,2006; southern Russia and northern Kazakhstan: Kreme-netski et al., 1997, 1999; Issyk-Kul: Ricketts et al., 2001;lake Van: Wick et al., 2003) is not straightforward asregional effects (glacier melting, river re-routing or drying)are superimposed onto the Eurasian climate signal. In theHolocene, the Aral Sea and Lake Van (eastern Turkey)show a humid climate or high lake levels until ca.4000 cal. yr ago (Boroffka et al., 2006; Wick et al., 2003)that could correspond to the first period of river inflow andlower salinities of core CP14.
6.4. Quantification of salinities and consequences for life
near the Caspian Sea
The reconstruction of palaeosalinity values for the CS isarduous because of the pre-eminence of a new genus and
ARTICLE IN PRESS
Table 3
Summary of the dinocyst zones (dz) and their characteristics
CP14 Main taxa Secondary taxa CP18 Main taxa CP21 Main taxa Secondary taxa
dz3 I. casp. L. mach. C. rugosum S. cruc. dz3 I. casp. dz3 I. casp. L. mach. C. rugosum
dz2 I. casp. dz2 I. casp. L. mach. dz2 I. casp. S. cruc.
dz1 P. psilata S. cruc. dz1 I. casp. dz1 I. casp.
I. casp. ¼ I. caspienense; L. mach. ¼ L. machaerophorum; S. cruc. ¼ S. cruciformis.
S.A.G. Leroy et al. / Quaternary Science Reviews 26 (2007) 3359–33833378
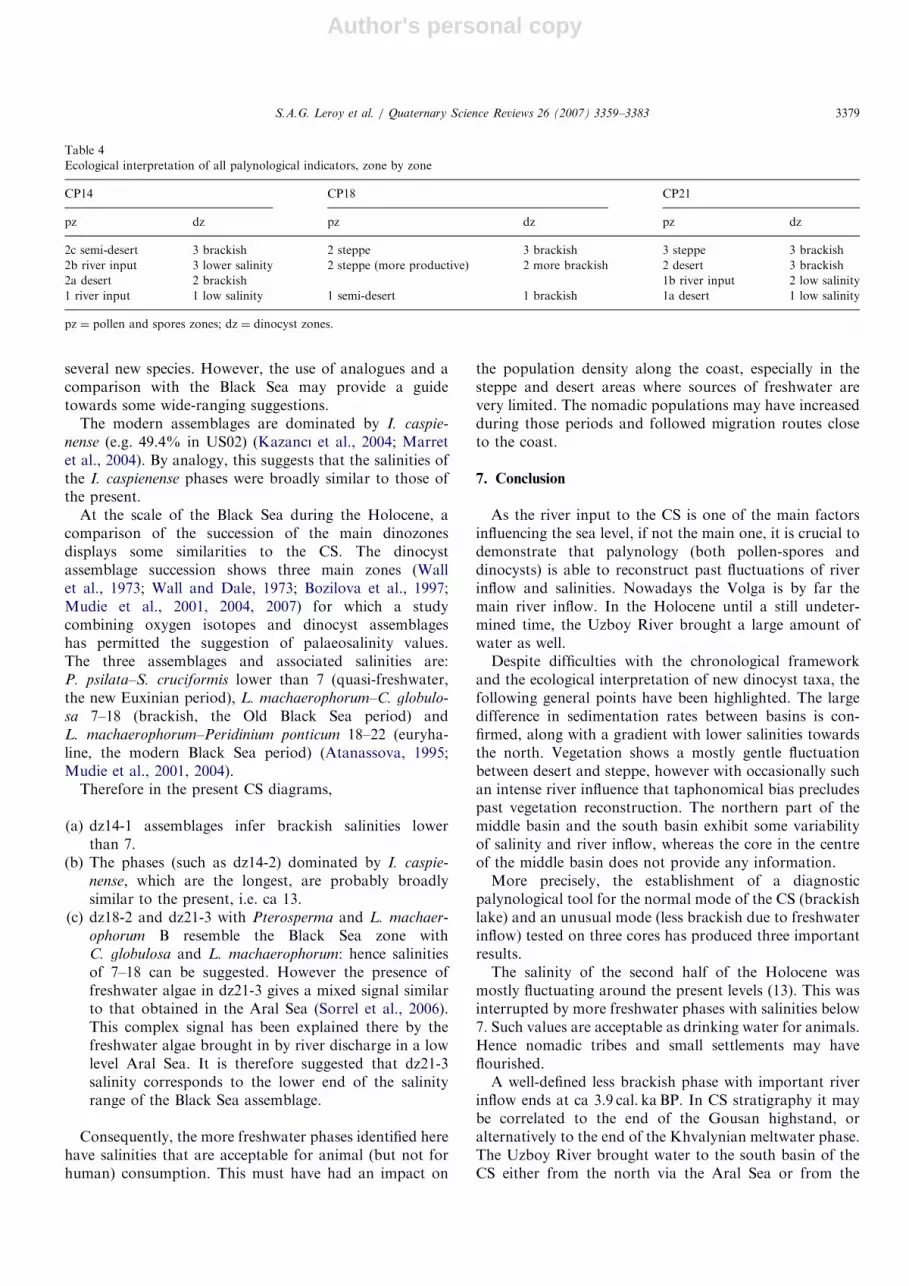
Author's personal copy
several new species. However, the use of analogues and acomparison with the Black Sea may provide a guidetowards some wide-ranging suggestions.
The modern assemblages are dominated by I. caspie-
nense (e.g. 49.4% in US02) (Kazancı et al., 2004; Marretet al., 2004). By analogy, this suggests that the salinities ofthe I. caspienense phases were broadly similar to those ofthe present.
At the scale of the Black Sea during the Holocene, acomparison of the succession of the main dinozonesdisplays some similarities to the CS. The dinocystassemblage succession shows three main zones (Wallet al., 1973; Wall and Dale, 1973; Bozilova et al., 1997;Mudie et al., 2001, 2004, 2007) for which a studycombining oxygen isotopes and dinocyst assemblageshas permitted the suggestion of palaeosalinity values.The three assemblages and associated salinities are:P. psilata–S. cruciformis lower than 7 (quasi-freshwater,the new Euxinian period), L. machaerophorum–C. globulo-
sa 7–18 (brackish, the Old Black Sea period) andL. machaerophorum–Peridinium ponticum 18–22 (euryha-line, the modern Black Sea period) (Atanassova, 1995;Mudie et al., 2001, 2004).
Therefore in the present CS diagrams,
(a) dz14-1 assemblages infer brackish salinities lowerthan 7.
(b) The phases (such as dz14-2) dominated by I. caspie-
nense, which are the longest, are probably broadlysimilar to the present, i.e. ca 13.
(c) dz18-2 and dz21-3 with Pterosperma and L. machaer-
ophorum B resemble the Black Sea zone withC. globulosa and L. machaerophorum: hence salinitiesof 7–18 can be suggested. However the presence offreshwater algae in dz21-3 gives a mixed signal similarto that obtained in the Aral Sea (Sorrel et al., 2006).This complex signal has been explained there by thefreshwater algae brought in by river discharge in a lowlevel Aral Sea. It is therefore suggested that dz21-3salinity corresponds to the lower end of the salinityrange of the Black Sea assemblage.
Consequently, the more freshwater phases identified herehave salinities that are acceptable for animal (but not forhuman) consumption. This must have had an impact on
the population density along the coast, especially in thesteppe and desert areas where sources of freshwater arevery limited. The nomadic populations may have increasedduring those periods and followed migration routes closeto the coast.
7. Conclusion
As the river input to the CS is one of the main factorsinfluencing the sea level, if not the main one, it is crucial todemonstrate that palynology (both pollen-spores anddinocysts) is able to reconstruct past fluctuations of riverinflow and salinities. Nowadays the Volga is by far themain river inflow. In the Holocene until a still undeter-mined time, the Uzboy River brought a large amount ofwater as well.Despite difficulties with the chronological framework
and the ecological interpretation of new dinocyst taxa, thefollowing general points have been highlighted. The largedifference in sedimentation rates between basins is con-firmed, along with a gradient with lower salinities towardsthe north. Vegetation shows a mostly gentle fluctuationbetween desert and steppe, however with occasionally suchan intense river influence that taphonomical bias precludespast vegetation reconstruction. The northern part of themiddle basin and the south basin exhibit some variabilityof salinity and river inflow, whereas the core in the centreof the middle basin does not provide any information.More precisely, the establishment of a diagnostic
palynological tool for the normal mode of the CS (brackishlake) and an unusual mode (less brackish due to freshwaterinflow) tested on three cores has produced three importantresults.The salinity of the second half of the Holocene was
mostly fluctuating around the present levels (13). This wasinterrupted by more freshwater phases with salinities below7. Such values are acceptable as drinking water for animals.Hence nomadic tribes and small settlements may haveflourished.A well-defined less brackish phase with important river
inflow ends at ca 3.9 cal. ka BP. In CS stratigraphy it maybe correlated to the end of the Gousan highstand, oralternatively to the end of the Khvalynian meltwater phase.The Uzboy River brought water to the south basin of theCS either from the north via the Aral Sea or from the
ARTICLE IN PRESS
Table 4
Ecological interpretation of all palynological indicators, zone by zone
CP14 CP18 CP21
pz dz pz dz pz dz
2c semi-desert 3 brackish 2 steppe 3 brackish 3 steppe 3 brackish
2b river input 3 lower salinity 2 steppe (more productive) 2 more brackish 2 desert 3 brackish
2a desert 2 brackish 1b river input 2 low salinity
1 river input 1 low salinity 1 semi-desert 1 brackish 1a desert 1 low salinity
pz ¼ pollen and spores zones; dz ¼ dinocyst zones.
S.A.G. Leroy et al. / Quaternary Science Reviews 26 (2007) 3359–3383 3379
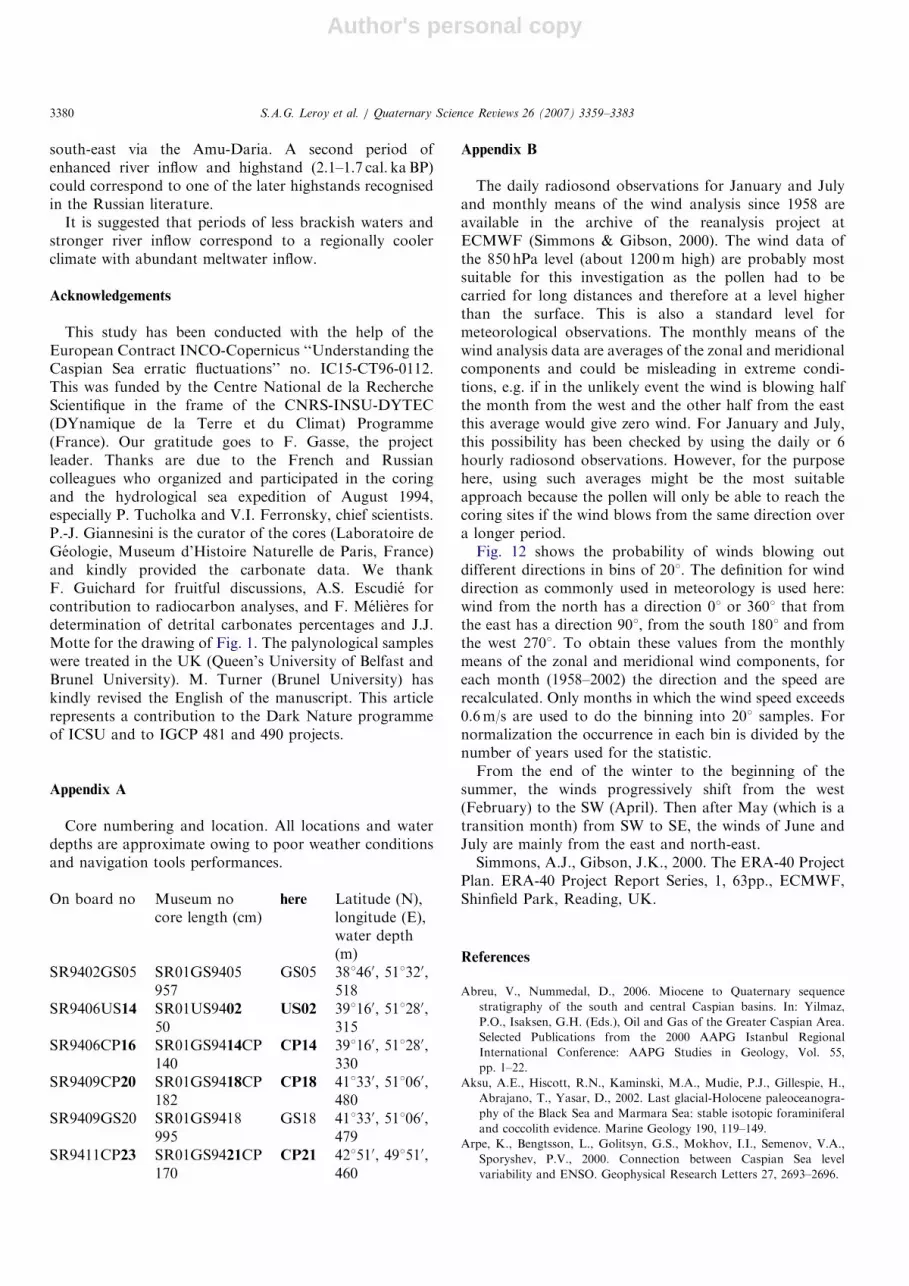
Author's personal copy
south-east via the Amu-Daria. A second period ofenhanced river inflow and highstand (2.1–1.7 cal. ka BP)could correspond to one of the later highstands recognisedin the Russian literature.
It is suggested that periods of less brackish waters andstronger river inflow correspond to a regionally coolerclimate with abundant meltwater inflow.
Acknowledgements
This study has been conducted with the help of theEuropean Contract INCO-Copernicus ‘‘Understanding theCaspian Sea erratic fluctuations’’ no. IC15-CT96-0112.This was funded by the Centre National de la RechercheScientifique in the frame of the CNRS-INSU-DYTEC(DYnamique de la Terre et du Climat) Programme(France). Our gratitude goes to F. Gasse, the projectleader. Thanks are due to the French and Russiancolleagues who organized and participated in the coringand the hydrological sea expedition of August 1994,especially P. Tucholka and V.I. Ferronsky, chief scientists.P.-J. Giannesini is the curator of the cores (Laboratoire deGeologie, Museum d’Histoire Naturelle de Paris, France)and kindly provided the carbonate data. We thankF. Guichard for fruitful discussions, A.S. Escudie forcontribution to radiocarbon analyses, and F. Melieres fordetermination of detrital carbonates percentages and J.J.Motte for the drawing of Fig. 1. The palynological sampleswere treated in the UK (Queen’s University of Belfast andBrunel University). M. Turner (Brunel University) haskindly revised the English of the manuscript. This articlerepresents a contribution to the Dark Nature programmeof ICSU and to IGCP 481 and 490 projects.
Appendix A
Core numbering and location. All locations and waterdepths are approximate owing to poor weather conditionsand navigation tools performances.
On board no Museum nocore length (cm)
here Latitude (N),longitude (E),water depth(m)
SR9402GS05 SR01GS9405 GS05 381460, 511320,518957
SR9406US14 SR01US9402 US02 391160, 511280,31550
SR9406CP16 SR01GS9414CP CP14 391160, 511280,330140
SR9409CP20 SR01GS9418CP CP18 411330, 511060,480182
SR9409GS20 SR01GS9418 GS18 411330, 511060,479995
SR9411CP23 SR01GS9421CP CP21 421510, 491510,460170
Appendix B
The daily radiosond observations for January and Julyand monthly means of the wind analysis since 1958 areavailable in the archive of the reanalysis project atECMWF (Simmons & Gibson, 2000). The wind data ofthe 850 hPa level (about 1200m high) are probably mostsuitable for this investigation as the pollen had to becarried for long distances and therefore at a level higherthan the surface. This is also a standard level formeteorological observations. The monthly means of thewind analysis data are averages of the zonal and meridionalcomponents and could be misleading in extreme condi-tions, e.g. if in the unlikely event the wind is blowing halfthe month from the west and the other half from the eastthis average would give zero wind. For January and July,this possibility has been checked by using the daily or 6hourly radiosond observations. However, for the purposehere, using such averages might be the most suitableapproach because the pollen will only be able to reach thecoring sites if the wind blows from the same direction overa longer period.Fig. 12 shows the probability of winds blowing out
different directions in bins of 201. The definition for winddirection as commonly used in meteorology is used here:wind from the north has a direction 01 or 3601 that fromthe east has a direction 901, from the south 1801 and fromthe west 2701. To obtain these values from the monthlymeans of the zonal and meridional wind components, foreach month (1958–2002) the direction and the speed arerecalculated. Only months in which the wind speed exceeds0.6m/s are used to do the binning into 201 samples. Fornormalization the occurrence in each bin is divided by thenumber of years used for the statistic.From the end of the winter to the beginning of the
summer, the winds progressively shift from the west(February) to the SW (April). Then after May (which is atransition month) from SW to SE, the winds of June andJuly are mainly from the east and north-east.Simmons, A.J., Gibson, J.K., 2000. The ERA-40 Project
Plan. ERA-40 Project Report Series, 1, 63pp., ECMWF,Shinfield Park, Reading, UK.
References
Abreu, V., Nummedal, D., 2006. Miocene to Quaternary sequence
stratigraphy of the south and central Caspian basins. In: Yilmaz,
P.O., Isaksen, G.H. (Eds.), Oil and Gas of the Greater Caspian Area.
Selected Publications from the 2000 AAPG Istanbul Regional
International Conference: AAPG Studies in Geology, Vol. 55,
pp. 1–22.
Aksu, A.E., Hiscott, R.N., Kaminski, M.A., Mudie, P.J., Gillespie, H.,
Abrajano, T., Yasar, D., 2002. Last glacial-Holocene paleoceanogra-
phy of the Black Sea and Marmara Sea: stable isotopic foraminiferal
and coccolith evidence. Marine Geology 190, 119–149.
Arpe, K., Bengtsson, L., Golitsyn, G.S., Mokhov, I.I., Semenov, V.A.,
Sporyshev, P.V., 2000. Connection between Caspian Sea level
variability and ENSO. Geophysical Research Letters 27, 2693–2696.
ARTICLE IN PRESSS.A.G. Leroy et al. / Quaternary Science Reviews 26 (2007) 3359–33833380
Author's personal copy
Arpe, K., Leroy, S.A.G., 2007. The Caspian Sea Level forced by the
atmospheric circulation, as observed and modelled. Quaternary
International 173–174, 141–152.
Atanassova, J., 1995. Dinoflagellate cysts of late Quaternary and recent
sediments from the western Black Sea. Annual of the University of
Sofia ‘‘St Kliment Ohridski,’’ book 2, Botany 87, 17–28.
Atanassova, J., 2005. Palaeoecological setting of the western Black Sea
area during the last 15 000 years. The Holocene 15, 576–584.
Bahr, A., Lamy, F., Arz, H.W., Kuhlmann, H., Wefer, G., 2005. Late
glacial to Holocene climate and sedimentation history in the NW Black
Sea. Marine Geology 214 (4), 309–322.
Bennett, K., 2003. psimpoll and pscomb programs for plotting and
analysis. Version psimpoll 4.10, /www.kv.geo.uu.se/psimpoll.htmlS.
Bezrodnykh, Yu., Romanyuk, B., Deliya, S., Magomedov, R., Sorokin,
V., Parunin, O., Babak, E., 2004. Biostratigraphy and structure of the
Upper Quaternary deposits and some paleogeographic features of the
north Caspian region. Stratigraphy and Geological Correlation 12 (1),
102–111.
Binka, K., Nitychoruk, J., Dzierzek, J., 2003. Parrotia persica C. A. M.
(Persian witch hazel, Persian ironwood) in the Mazovian (Holsteinian)
Interglacial of Poland. Grana 42, 227–233.
Bolikhovskaya, N.S., 1990. Palynological changes in the landscape of the
lower Volga in the last 10 000 years. In: Lebedev, L.I., Maev, E.G.
(Eds.), Caspian Sea, Problems of Geology and Geomorphology.
Moscow, Nauka, pp. 52–68 (in Russian).
Boomer, I., Aladin, N., Plotnikov, I., Whatley, R., 2000. The palaeo-
limnology of the Aral Sea: a review. Quaternary Science Reviews 19,
1259–1278.
Boomer, I., von Grafenstein, U., Guichard, F., Bieda, S., 2005. Modern
and Holocene sublittoral ostracod assemblages (Crustacea) from the
Caspian Sea: a unique brackish, deep-water environment. Palaeogeo-
graphy, Palaeoclimatology, Palaeoecology 225, 173–186.
Bordovsky, O.K., 1986. Changes in the Hydrochemical regime of the
Caspian Sea. Priroda 4, 16–19 (in Russian).
Boroffka, N., Oberhansli, H., Sorrel, P., Demory, C., Wunnemann, B.,
Alimov, K., Baratov, S., Rakhimov, K., Saparov, N., Shirinov, T.,
Krivonogov, S.K., Rohl, U., 2006. Archaeology and climate: settlement
and lake-level changes at the Aral Sea. Geoarchaeology 21 (7), 721–734.
Bortnik, V.N., 1991. The water balance of the Bay of Kara-Bogaz-Gol
under natural and controlled conditions. Trudy GOIN 183, 3–18 (in
Russian).
Bozilova, E., Atanassova, J., Filipova-Marinova, M., 1997. Marinopaly-
nological and archaeological evidence for the Lateglacial and
Holocene vegetation in eastern Bulgaria. In: Annual of University
of Sofia ‘‘St Kliment Ohridski,’’ Faculty of Biology, Botany Vol. 2,
pp. 69–81.
Cazenave, A., Bonnefond, P., Dominh, K., Schaeffer, P., 1997. Caspian
sea level from TOPEX/POSEIDON altimetry: level now falling.
Geophysical Research Letters 24, 881–884.
Chalie, F., Escudie, A.-S., Badaut-Trauth, D., Blanc, G., Blanc-Valleron,
M.-M., Brigault, S., Desprairies, A., Ferronsky, V.I., Giannesini, P.-J.,
Gibert, E., Guichard, F., Jelinowska, A., Massault, M., Melieres, F.,
Tribovillard, N., Tucholka, P., Gasse, F., 1997. The glacial-postglacial
transition in the southern Caspian Sea. Comptes Rendus de
l’Academie des Sciences de Paris 324 (IIa), 309–316.
Colbath, G.K., Grenfell, H.R., 1995. Review of biological affinities of
Paleozoic acid-resistant, organic-walled eukaryotic algal microfossils
(including ‘‘acritarchs’’). Review of Palaeobotany and Palynology 86,
287–314.
Dale, B., 1996. Dinoflagellate cyst ecology: modelling and geological
applications. In: Jansonius, J., McGregor, D.C. (Eds.), Palynology:
Principles and Applications. American Association of Stratigraphic
Palynologists Foundation 3, USA, pp. 1249–1275.
Dale, B., Thorsen, T.A., Fjellsa, A., 1999. Dinoflagellate cysts as
indicators of cultural eutrophication in the Oslofjord, Norway.
Estuarine, Coastal and Shelf Science 48, 371–382.
de Vernal, A., Turon, J.-L., Guiot, J., 1994. Dinoflagellate cyst
distribution in high-latitude marine environments and quantitative
reconstruction of sea-surface salinity, temperature, and seasonality.
Canadian Journal of Earth Science 31, 48–62.
de Vernal, A., Eynaud, F., Henry, M., Hillaire-Marcel, C., Londeix, L.,
Mangin, S., Matthiessen, J., Marret, F., Radi, T., Rochon, A.,
Solignac, S., Turon, J.-L., 2005. Reconstruction of sea-surface
conditions at middle to high latitudes of the Northern Hemisphere
during the Last Glacial Maximum (LGM) based on dinoflagellate cyst
assemblages. Quaternary Science Reviews 24, 897–924.
Dodge, J.D., Harland, R., 1991. The distribution of planktonic
dinoflagellates and their cysts in the eastern and northeastern Atlantic
Ocean. New Phytologist 118, 593–603.
Dumont, H.J., 1998. The Caspian Lake: history, biota, structure, and
function. Limnology and Oceanography 43 (1), 44–52.
Ferronsky, V.I., Polyakov, V.A., Kuprin, P.N., Lobov, A.L., 1999. The
nature of variations in the level of the Caspian Sea (based on bottom-
sediment data). Water Resources 26 (6), 583–596.
Fontes, J-C., Melieres, F., Gibert, E., Qing, L., Gasse, F., 1993. Stable-
isotope and radiocarbon balances of 2 Tibetan lakes (Sumxi Co,
Longmu Co) from 13,000BP. Quaternary Science Reviews 12,
875–887.
Froehlich, K., Rozanski, K., Povinec, P., Oregioni, B., Gastaud, J., 1999.
Isotope studies in the Caspian Sea. The Science of the Total
Environment 237/238, 419–427.
Giralt, S., Julia, R., Leroy, S.A.G., Gasse, F., 2003. Cyclic water level
oscillations of the KaraBogaz Gol–Caspian Sea system. Earth and
Planetary Science Letters 212 (1–2), 225–239.
Grigorovich, I.A., Therriault, T.W., MacIsaac, H.J., 2003. History of
aquatic invertebrate invasions in the Caspian Sea. Biological Invasion
5, 103–115.
Grosswald, M., 1993. Extent and melting history of the late Weichselian
ice sheet, the Barents-Kara continental margin. In: Peltier, W.R. (Ed.),
Ice in the Climate System. Nato ASI series, vol. I 12. Springer, Berlin,
pp. 1–20.
Head, M.J., 1996. Modern dinoflagellate cysts and their biological
affinities. In: Jansonius, J., McGregor, D.C. (Eds.), Palynology:
Principles and Applications, vol. 3. American Association of Strati-
graphic Palynologists Foundation, Salt Lake City, pp. 1197–1248.
Hiscott, R.N., Aksu, A.E., Yasar, D., Kaminski, M.A., Mudie, P.J.,
Kostylev, V.E., MacDonald, J.C., Isler, F.I., Lord, A.R., 2002. Deltas
south of the Bosphorus Strait record persistent Black Sea outflow to
the Marmara Sea since 10 ka. Marine Geology 190, 95–118.
Hiscott, R.N., Aksu, A.E., Mudie, P.J., Kaminski, M.A., Abrajano, T.,
Yas-ar, D., Rochon, A., 2006. The Marmara Sea Gateway since
�16 ka: non-catastrophic causes of paleoceanographic events in the
Black Sea at 8.4 and 7.15 ka. In: Yanko-Hombach, V., Gilbert, A.S.,
Panin, N., Dolukhanov, P. (Eds.), The Black Sea Flood Question:
changes in Coastline, Climate and Human Settlement. Springer,
Dordrecht, pp. 89–117.
Hiscott, R.N., Aksu, A.E., Mudie, P.J., Marret, F., Abrajano, T.,
Kaminski, M.A., Evans, J., Cakiroglu, A., Yasar, D., 2007. A gradual
drowning of the southwestern Black Sea shelf: evidence for a
progressive rather than abrupt Holocene reconnection with the eastern
Mediterranean Sea through the Marmara Sea Gateway. Quaternary
International 168, 19–34.
Hoogendoorn, R.M., Boels, J.F., Kroonenberg, S.B., Simmons, M.D.,
Aliyeva, E., Babazadeh, A.D., Huseynov, D., 2005. Development of
the Kura delta, Azerbaijan; a record of Holocene Caspian sea-level
changes. Marine Geology 222–223, 359–380.
Hooghiemstra, H., Lezine, A.-M., Leroy, S.A.G., Dupont, L., Marret, F.,
2006. Late Quaternary palynology in marine sediments: a synthesis of
the understanding of pollen distribution patterns in the NW African
setting. Quaternary International 148, 29–44.
Holtzapffel, L.T., 1985. Les mineraux argileux. Preparation, analyse
diffractometrique et determination. Publications de la Societe Geolo-
gique du Nord 12, 1–136.
Jelinowska, A., Tucholka, P., Guichard, F., Lefevre, I., Badaut-Trauth,
D., Chalie, F., Gasse, F., Tribovillard, N., Desprairies, A., 1998.
Mineral magnetic study of Late Quaternary South Caspian Sea
ARTICLE IN PRESSS.A.G. Leroy et al. / Quaternary Science Reviews 26 (2007) 3359–3383 3381
Author's personal copy
sediments: Paleoenvironmental implications. Geophysical Journal
International 133, 499–509.
Kasymov, A., Rogers, L., 1996. Ecological description of the southern
Caspian Sea in the oil-field region of ‘‘Guneshly’’. Polish Ecological
Studies 22 (3–4), 83–93.
Kazancı, N., Gulbabazadeh, T., Leroy, S.A.G., Ileri, O., 2004. Sedimen-
tary and environmental characteristics of the Gilan-Mazenderan plain,
northern Iran: influence of long- and short-term Caspian water level
fluctuations on geomorphology. Journal of Marine Systems 46 (1-4),
145–168.
Kideys, A.E., Soydemir, N., Eker, E., Vladymyrov, V., Soloviev, D.,
Melin, F., 2005. Phytoplankton distribution in the Caspian Sea during
March 2001. Hydrobiologia 543, 159–168.
Kosarev, A.N., Yablonskaya, E.A., 1994. The Caspian Sea. SPB
Academic Publishing, The Hague.
Kosarev, A.N., 2005. Physico-geographical conditions of the Caspian
Sea. In: Hutzinger, O. (Ed.), The Handbook of Environmental
Chemistry, Vol. 5, Water pollution, Part P. Springer, Berlin,
pp. 5–31.
Kouli, K., Brinkhuis, H., Dale, B., 2001. Spiniferites cruciformis: a
freshwater dinoflagellate cyst. Review of Palaeobotany and Palynology
133, 273–286.
Kremenetski, C., Tarasov, P., Cherkinsky, E., 1997. Postglacial develop-
ment of Kazakhstan pine forests. Geographie Physique et Quaternaire
51 (3), 391–404.
Kremenetski, C., Chichagova, O., Shishlina, N., 1999. Palaeoecological
evidence for Holocene vegetation, climate and land-use in the low Don
basin and Kalmuk area, southern Russia. Vegetation History and
Archaeobotany 8, 233–246.
Kroonenberg, S.B., Rusakov, G.V., Svitoch, A.A., 1997. The wandering
of the Volga delta: a response to rapid Caspian sea-level change.
Sedimentary Geology 107, 189–209.
Kuprin, P.N., 2002. Apsheron threshold and its role in the processes of
sedimentation and formation of hydrological regimes in the southern
and middle Caspian basins. Water Resources 29 (5), 473–484.
Kuprin, P.N., Ferronsky, V.I., Popovchak, V.P., Shlykov, V.G., Zolotaya,
L.A., Kalisheva, M.V., 2003. Bottom sediments of the Caspian Sea as
an indicator of changes in its water regime. Water Resources 30 (2),
136–153.
Kuprin, P.N., Rybakova, N.O., 2003. Analysis of palynological complexes
of deep-sea sediments in the Middle and Southern Caspian. Water
Resources 31 (1), 1–9.
Labutina, I., Zhivogkiad, A., Gorbunov, A., Rusanov, G., Baldina, E., de
Leeuw, J., 1995. The Astrakhanskiy Biosphere Reserve GIS. Part 3:
Vegetation map. ITC Journal 3, 197–201.
Legeleux, F., Reyss, J.L., Schmidt, S., 1995. Particles mixing rates in
sediments of the North-East Tropical Atlantic: evidence from 210Pbxs,137Cs, 228Thxs and 234Thxs downcore distributions. Earth and
Planetary Science Letters 128, 545–562.
Leonov, Yu.G., Lavrushin, Yu.A., Antipov, M.P., Spiridonova, E.A.,
Kuzmin, Ya.V., Jull, E.J.T., Burr, G.S., Jelinowska, A., Chalie, F.,
2002. New age data on sediments of the transgressive phase of the
Early Khvalyn transgression of the Caspian Sea. Doklady of RAS,
Earth Science Section 386 (7), 748–751.
Leroy, S.A.G., 1992. Palynological evidence of Azolla nilotica Dec. in
recent holocene of eastern Nile Delta, and its environment. Vegetation
History and Archaeobotany 1, 43–52.
Leroy, S.A.G., Marret, F., Gasse, F., Chalie, F., 2000. Understanding the
Caspian Sea erratic fluctuations: palynological results from the south
basin. ELDP-ESF Meeting, Pallanza, Italy, 7–12 Oct. 2000. Terra
Nostra 7, 45–49.
Leroy, S.A.G., Marret, F., Giralt, S., Bulatov, S.A., 2006. Natural and
anthropogenic rapid changes in the Kara-Bogaz Gol over the last two
centuries by palynological analyses. Quaternary International 150,
52–70.
Leroy, S.A.G., Roiron, P., 1996. Final Pliocene macro and micro floras of
the paleovalley of Bernasso (Escandorgue, France). Review of
Palaebotany and Palynology 94, 295–328.
Letolle, R., 2000. Histoire de l’Ouzboı, cours fossile de l’Amou Darya
synthese et elements nouveaux. Studia Iranica 29 (2), 195–240.
Lewis, J., Hallett, R., 1997. Lingulodinium polyedrum (Gonyaulax
polyedra) a blooming dinoflagellate. Oceanography and Marine
Biology Annual Review 2135, 97–161.
Mamedov, A.V., 1997. The Late Pleistocene–Holocene history of the
Caspian Sea. Quaternary International 41/42, 161–166.
Mangerud, J., Jakobsson, M., Alexanderson, H., Astakhov, V., Clarke,
G.K.C., Henriksen, M., Hjort, C., Krinner, G., Lunkka, J.-P.,
Moller, P., Murray, A., Nikolskaya, O., Saarnisto, M., Svendsen,
J.I., 2004. Ice-dammed lakes and rerouting of the drainage of northern
Eurasia during the last glaciation. Quaternary Science Reviews 23,
1313–1332.
Marret, F., Leroy, S.A.G., Chalie, F., Gasse, F., 2004. New organic-
walled dinoflagellate cysts from recent sediments of central Asian seas.
Review of Palaeobotany and Palynology 129, 1–20.
Marret, F., Zonneveld, K.A.F., 2003. Atlas of modern organic-walled
dinoflagellate cyst distribution. Review of Palaeobotany and Palyno-
logy 125, 1–200.
McCarthy, F.M.G., Mudie, P.J., 1998. Oceanic pollen transport and
pollen:dinocyst ratios as markers of late Cenozoic sea level change and
sediment transport. Palaeogeography, Palaeoclimatology, Palaeoecol-
ogy 138, 187–206.
Mudie, P.J., Aksu, A.E., Yasar, D., 2001. Late Quaternary dinocysts from
the Black, Marmara and Aegean Seas: variations in assemblages,
morphology and paleosalinity. Marine Micropaleontology 43,
155–178.
Mudie, P.J., McCarthy, F.M.G., 2006. Marine palynology: potentials for
onshore–offshore correlation of Pleistocene–Holocene records. Invited
paper. Transactions of the Royal Society of South Africa 61 (2),
139–157.
Mudie, P.J., Rochon, A., Aksu, A.E., Gillespie, H., 2002. Dinoflagellate
cysts, freshwater algae and fungal spores as salinity indicators in Late
Quaternary cores fromMarmara and Black seas. Marine Geology 190,
203–231.
Mudie, P.J., Rochon, A., Aksu, A.E., Gillespie, H., 2004. Late glacial,
Holocene and modern dinoflagellate cyst assemblages in the Aegean–
Marmara–Black Sea corridor: statistical analysis and re-interpretation
of the early Holocene Noah’s Flood hypothesis. Review of Palaeobo-
tany and Palynology 128 (1–2), 143–167.
Mudie, P.J., Marret, F., Aksu, A.E., Hiscott, R.N., Gillespie, H., 2007.
Palynological evidence for climatic change, anthropogenic activity and
outflow of Black Sea Water during the late Pleistocene and Holocene:
centennial- to decadal-scale records from the Black and Marmara
Seas. Quaternary International 168, 73–90.
Reyss, J.-L., Schmidt, S., Legeleux, F., Bonte, P., 1995. Large, low
background well-type detectors for measurements of environmental
radioactivity. Nuclear Instruments and Methods A 357, 391–397.
Ricketts, R.D., Johnson, T.C., Brown, E.T., Rasmussen, K.A., Roma-
novsky, V.V., 2001. The Holocene paleolimnology of Lake Issyk-Kul,
Kyrgyzstan: trace elements and stable isotope composition of
ostracods. Palaeogeography, Palaeoclimatology, Palaeoecology 176,
207–227.
Rodionov, S.N., 1994. Global and Regional Climatic Interaction: The
Caspian Sea Experience. Kluwer Academic Press, Dordrecht.
Ryan, B.F., Major, C.O., Lericolais, G., Goldstein, S.L., 2003.
Catastrophic flooding of the Black Sea. Annual Review of Earth
Planetary Science 31, 525–554.
Rychagov, G.I., 1997. Holocene oscillations of the Caspian Sea and
forecasts based on palaeogeographical reconstructions. Quaternary
International 41/42, 167–172.
Shiklomanov, I.A., Georgievsky, V.Y., Kopaliani, Z.D., 1995. Water
balance of the Caspian Sea and reasons of water level rise
in the Caspian Sea. In: UNESCO (Ed.), UNESCO-IHP-IOC-IAEA
Workshop on Sea Level Rise and the Multidisciplinary Studies of
Environmental Processes in the Caspian Sea Region. Intergovern-
mental Oceanographic Commission, Workshop Report No. 108-
Supplement, Paris (France), pp. 1–27.
ARTICLE IN PRESSS.A.G. Leroy et al. / Quaternary Science Reviews 26 (2007) 3359–33833382
Author's personal copy
Sorrel, P., Popescu, S.-M., Head, M.J., Suc, J.-P., Klotz, S., Oberhansli,
H., 2006. Hydrographic development of the Aral Sea during the
last 2000 years based on a quantitative analysis of dinoflagellate
cysts. Palaeogeography, Palaeoclimatology, Palaeoecology 234 (2–4),
304–327.
Stuiver, M., Reimer, P.J., 1998/2000. CALIB 4.3 radiocarbon calibration
program. The UW Quaternary Isotope Laboratory, /http://depts.
washington.edu/qil/S.
Stuiver, M., Reimer, P.J., Bard, E., Beck, J.W., Burr, G.S., Hughen, K.A.,
Kromer, B., McCormac, G., van der Plicht, J., Spurk, M., 1998.
INTCAL98 radiocarbon age calibration, 24,000–0 cal BP. Radio-
carbon 40 (3), 1041–1083.
Tarasov, P.E., Harrison, S.P., Saarse, L., Pushenko, M.Ya., Andreev,
A.A., Aleshinskaya, Z.V., Davydova, N.N., Dorofeyuk, N.I., Efre-
mov, Yu.V., Khomutova, V.I., Sevastyanov, D.V., Tamosaitis, J.,
Uspenskaya, O.N., Yakushko, O.F., Tarasova, I.V., 1994. Lake status
records from the former Soviet Union and Mongolia: data base
documentation. NOAA Paleoclimatology Publications Series Report
2, 274pp.
Tarasov, P.E., Webb III, T., Andreev, A.A., Afanas’eva, N.B., Berezina,
N.A., Bezusko, L.G., Blyakharchuk, T.A., Bolikhovskaya, N.S.,
Cheddadi, R., Chernavskaya, M.M., Chernova, G.M., Dorofeyuk,
N.I., Dirksen, V.G., Elina, G.A., Filimonova, L.V., Glebov, F.Z.,
Guiot, J., Gunova, V.S., Harrison, S.P., Jolly, D., Khomutova, V.I.,
Kvavadze, E.V., Osipova, I.M., Panova, N.K., Prentice, I.C., Saarse,
L., Sevastyanov, D.V., Volkova, V.S., Zernitskaya, V.P., 1998.
Present-day and mid-Holocene biomes reconstructed from pollen
and plant macrofossil data from the former Soviet Union and
Mongolia. Journal of Biogeography 25, 1029–1053.
USDA, 2006. Caspian Sea heights variations. /www.pecad.fas.usda.gov/
cropexplorer/global_reservoir/gr_regional_chart.cfm?regionid=metu&
region=&reservoir_name=CaspianS. Visited 29 Decembre 2006.
van Geel, B., 2001. Non-pollen palynomorphs. In: Smol, J.P., Birks,
H.J.B., Last, W.M. (Eds.), Tracking Environmental Change Using
Lake Sediments, vol. 3: Terrestrial, Algal and Silicaceous Indicators.
Kluwer, Dordrecht, pp. 99–119.
Wall, D., Dale, B., 1973. Paleosalinity relationships of dinoflagellates in
the Late Quaternary of the Black Sea—a summary. Geoscience and
Man 7, 95–102.
Wall, D., Dale, B., Harada, K., 1973. Descriptions of new fossil
dinoflagellates from the Late Quaternary of the Black Sea. Micro-
paleontology 19 (1), 18–31.
Wall, D., Dale, B., Lohmann, G.P., Smith, W.K., 1977. The environ-
mental and climatic distribution of dinoflagellate cysts in the North
and South Atlantic Oceans and adjacent seas. Marine Micropaleon-
tology 2, 121–200.
Walter, H., 1974. Die Vegetation Osteuropas, Nord- und Zentralasiens.
G. Fischer Verlag, Stuttgart.
Walter, H., Breckle, S.-W., 1989. Temperate and Polar Zonobiomes of
Northern Eurasia. Springer, Berlin.
Wick, L., Lemcke, G., Sturm, M., 2003. Evidence of Lateglacial and
Holocene climatic change and human impact in eastern Anatolia: high-
resolution pollen, charcoal, isotopic and geochemical records from the
laminated sediments of Lake Van, Turkey. The Holocene 13 (5),
665–675.
Wilmshurst, J.M., McGlone, S.S., 2005. Corroded pollen and spores as
indicators of changing lake sediment sources and catchment dis-
turbance. Journal of Paleolimnology 34, 503–517.
Zenkevitch, L.A., 1963. Biology of the Seas of the USSR. George Allen
and Unwin Ltd, London.
Zonneveld, K.A.F., Versteegh, G.J.M., de Lange, G.J., 2001. Palaeopro-
ductivity and post-depositional aerobic organic matter decay reflected
by dinoflagellate cyst assemblages of the Eastern Mediterranean S1
sapropel. Marine Geology 172, 181–195.
ARTICLE IN PRESSS.A.G. Leroy et al. / Quaternary Science Reviews 26 (2007) 3359–3383 3383