risk and inequality aversion in social dilemmas
TRANSCRIPT
Risk and Inequality Aversion in Social Dilemmas
Brice Magdalou ∗, Dimitri Dubois †, Phu Nguyen-Van ‡
Third version, February 2009
Abstract
We experimentally investigate cooperative behaviour in a social dilemma situa-tion, where the socially efficient outcome may be encouraged by risk aversion and/orinequality aversion. After an elicitation step, subjects are grouped according to theiraversion profiles and interact in a repeated social dilemma game. In this game, asubject is characterised by a social status so that the higher her status, the higherher earnings. Cooperation is costly for a majority of subjects at each period, butstatuses can be reversed in future periods. We show that inequality and risk aversionhave a significant impact on cooperation: groups averse in both dimensions are themore cooperative. It also appears that risk aversion is crucial in the dynamics ofcooperation, and that inequality aversion can influence the cooperative behaviour inopposite directions. Whereas cooperation may constitute a socially desirable objec-tive for inequality averse subjects, these subjects seem to be more incline to sanctionthe violation of reciprocity principle: if they are inequality averse but not risk averse,we observe that the – socially efficient – cooperation falls automatically to zero atthe end of the game.
Classification Journal of Economic Literature: C92, D31,D63, D81.Keywords: Risk aversion, inequality aversion, social preferences, social dilemmas,experimental economics, dynamic probit model.
We are indebted to Monique Flasaquier, Marie-Claire Villeval, Michael Visser, Marc Willinger andparticipants to the 4th International Meeting on Experimental and Behavioral Economics for veryuseful conversations and suggestions. Needless to say, the authors bear the entire responsibility forremaining deficiencies.
∗ CEREGMIA, Universite des Antilles et de la Guyane, campus de Schoelcher, B.P. 7209, F-97275Schoelcher Cedex, France. E-mail : [email protected]. Corresponding author.
† LAMETA, CNRS, Universite Montpellier 1, CNRS, avenue de la mer, site Richter, C.S. 79606, F-34960Montpellier Cedex 2, France. E-mail : [email protected].
‡ BETA, CNRS, Universite de Strasbourg, 61 avenue de la Foret Noire, F-67085 Strasbourg Cedex,France. E-mail : [email protected].
1

Magdalou, Dubois, Nguyen-Van / Risk and Inequality Aversion in Social Dilemmas
1. Introduction
In many economic situations, cooperative interactions come from the willingness of someindividuals to undertake costly actions, in order to achieve social objectives. For examplemost of the non-profit organizations would not exist without private donations, and somepublic goods would not be created in the absence of voluntary contributions. Althoughcooperation is generally efficient for society, it is effective only if individuals who enjoy anadvantageous position act in this way. Social cooperation is sometimes a legal measure,imposed by a social choice. The main illustration concerns redistributive taxation schemeswhich finance, among others, health insurance and unemployment insurance systems. Thescheme structure is usually progressive so that high incomes are taxed proportionallymore. Surprisingly, a large majority of citizens recognise the beneficial effects of suchredistributive policies, even if advantages are given to a minority.
Thus the question of the motivations for social cooperation often arises. Why do someindividuals in an advantageous position collaborate for social objectives by a voluntaryand apparently unselfish behaviour, and why do they accept or even encourage redistribu-tive policies? Obviously there is no immediate answer because many factors, sometimesconflicting, can influence decision-making and the weight of each factor depends on thecontext. In some cases, social cooperation is a purely altruistic attitude. Donations tocharities or research associations for example might be placed in this category. By defi-nition altruism consists in helping someone else without receiving benefits. But in mostcases, individuals do get something out of unselfish acts, which makes motivations moreambiguous (Andreoni, 1989, 1990). For example when an individual encourages measuresto promote equality, she can be motivated by altruism but also by a kind of risk aver-sion. A simple explanation is that a reduction of inequalities in society today ensures adiminution of potential risks in the future. First, small inequalities contribute to socialcohesion, which is a necessary condition to preserve an advantageous position. Examplesof countries where social conflicts, political instabilities and civil wars are correlated withinequalities are extremely large. Second, social positions are not fixed over time, and ev-eryone can fall into poverty or disease. If wealth is equitably distributed in society and ifhealth and unemployment insurance systems are generous, we are sure that the fall willbe relatively cushioned. That is, a purely egoistic but risk averse individual may take partin social programs.
This paper aims at providing a better understanding of the individual’s motivationin situations where risk aversion and inequality aversion can stimulate a cooperative be-haviour. This issue is of importance for public policies, when cooperative interactionsresult from explicit, enforceable contracts (for example, to find ways to reduce tax eva-sion), but also when cooperative interactions are based on a free participation (for exam-ple, to coordinate State-approved charities). A large literature, initiated by Rabin (1993),Fehr and Schmidt (1999) and Bolton and Ockenfels (2000), highlights the importance ofother-regarding preferences to motivate prosocial behaviours. Among all these intrinsicmotivations, altruism is recognized as a consistent component (Andreoni, 2002). Neverthe-less, concepts of altruism and prosocial behaviour can not be confused. Batson and Powell(2003) specify that: “there is no one-to-one correspondence between prosocial behaviourand altruism. Prosocial behaviour need not be motived by altruism; altruistic motivationneed not produce prosocial behaviour”. This observation is especially true in interaction
2

Magdalou, Dubois, Nguyen-Van / Risk and Inequality Aversion in Social Dilemmas
situations where a collective decision to reduce inequality implies for each member of thesociety a diminution of potential future risk (Fafchamps, 2004). For example, redistribu-tion policies are not only justified by altruism considerations, but also by the necessity tooffer a mutual coverage system of social risks. As mentioned by Cowell and Schokkaert(2001) and Brennan et al. (2008), most of the normative theories explicitly use the insur-ance analogy to justify their principles of justice. In many other economic situations, it isalso difficult to identify which motivation is the driving force behind the decision-makingprocess. For example in the public good game, inequality aversion or altruism constitutesone hypothesis to justify voluntary contributions (see e.g. Palfrey and Prisbey (1996) andMasclet and Villeval (2008)). But Shogren (1987, 1990) showed that these contributionscould be positively influenced by an increase of the risk, associated with the level at whichthe good is provided. Consequently, the author argued that voluntary contributions canbe explained by the traditional hypothesis on selfish rational behaviour in risky situations,without incorporating such notions as altruism.
The investigation of the influence of risk aversion and inequality aversion on socialcooperation raises some difficulties. First, what does inequality aversion and risk aversionmean? In the standard literature, an individual is risk-averse if she is unwilling to accepta risky gamble: she will prefer the expected payment of the gamble for sure to the gambleitself. Symmetrically, an individual exhibits inequality aversion when she is unsatisfied,other things equal, by an unequal income distribution: in her opinion, the social welfarewill be maximised if the total income is shared equally among individuals. But in ourcontext, we need to refine these definitions. First we specify that we are interested inpreferences over social risks, in the sense that risks are commonly borne by society: anindividual risk loving behaviour can endanger the situation of other persons. 1 Then anindividual is considered as inequality averse when, her personal situation remaining fixed,she is unsatisfied by an increase of the gap between her income and the income of the others.Thus, this – relatively large – concept of inequality aversion may incorporate dimensionssuch as aversion to advantageous inequality, aversion to disadvantageous inequality (Fehrand Schmidt, 1999), or altruism.
Second, can we distinguish risk aversion and inequality aversion? Clearly these twodimensions can be interpreted, depending on the context, as an aversion to variabilitywithin the distributions (respectively lotteries or income distributions). This question hasreceived substantial treatments, including Amiel et al. (2001), Amiel and Cowell (2002),Bosmans and Schokkaert (2004) or Carlsson et al. (2005). In these studies systematicdifferences between aversions are observed. Closer to our concern is the experimental studyof Brennan et al. (2008) which analyses connections between other-regarding preferencesand aversion to social risks (see also Guth et al., 2008). Nevertheless, whereas one mayreasonably consider that risk aversion and inequality aversion are different, the questionof the influence on social cooperation remains open. In that sense several empirical resultstend to corroborate the influence of risk aversion on individual motivations to reduceinequality (see e.g. Ravallion and Lokshin, 2000; Schokkaert et al., 2002).
In this paper we propose and test by an experiment a simple game where social coop-eration may result from risk aversion and/or inequality aversion. In this game each agent
1 Correlation between preferences over social risks and preferences over individual risks is evaluated byHarrison et al. (2005). Their results suggest no significative differences.
3

Magdalou, Dubois, Nguyen-Van / Risk and Inequality Aversion in Social Dilemmas
is characterised by a social status which includes all the factors justifying differences inwealth such as, for example health, intelligence, family inheritance or country of birth.The agent’s social status in the game represents her capacities to obtain high earnings:the higher the agent’s status, the higher her earnings. With status as private information,each agent has to vote for one out of two possible earnings distributions, and the majorityvote applies. In the first distribution, called cooperative, earnings are more equally dis-tributed and total earnings are greater. But in the second one, called defective, a majorityof agents have greater personal earnings. Distributions are of common knowledge so thateach agent knows her own potential earnings, depending on her status. That is, choosingcooperative distribution is socially efficient but costly for a majority of people, a situationwhich constitutes a social dilemma. The game is repeated a finite number of periods. Atthe end of each period, statuses are completely revised so that someone advantaged byher initial status can loose her privileges, and conversely. An experiment is run to ob-serve the cooperation in this game. In the first part of the experiment, we elicit subject’srisk and inequality aversion profile – in the sense described above – taking care not toconfuse the two dimensions, so that inequality is controlled when risk is elicited, and viceversa. We follow here the elicitation procedure proposed by Kroll and Davidovitz (2003)for inequality aversion, 2 which is transposed for risk aversion. Subjects are then groupedby three according to their profile, under a partner matching protocol, and they partici-pate in a twenty periods game. Our main objective is to observe levels and evolutions ofcooperation, controlling aversion profile of each group.
Intuitively, one may suppose that groups averse in both dimensions are more coopera-tive, with a reinforcement of the social cooperation across the periods. But the outcome isa priori ambiguous for groups averse in only one dimension, or non-averse in both of them.An interesting feature of this experiment is that the real impact of inequality aversion oncooperation can be observed, with a clear separation from risk aversion. As describedabove, inequality aversion can incorporate motivations such as altruism, but also motiva-tions such as reciprocity: whereas cooperation may constitute a desirable social norm foran inequality averse subject, she may be incline to sanction a cooperation failure, observedin previous periods where she was underprivileged (recalling that we adopted a partnermatching protocol). In this game, the only possibility to sanction other subjects is to notcooperate herself. Thus the intrinsic motivations to cooperate can be rapidly corruptedin the dynamics of interactions. In this objective particular attention is paid to the firstperiod of the game, because all periods but the first are influenced by the cooperation inprevious periods. In the first period, a cooperative behaviour only depends on intrinsiccharacteristics of the subjects. To summarize, our experiment allows us to observe themotivations of social cooperation – and the connections between these motivations –, witha distinction between the effect of the subjects’ intrinsic characteristics and the effect ofthe dynamics of social interactions.
This paper is organised as follows. We present in Section 2 our social dilemma game,which simplifies real economic situations described above. The experimental design isthen exposed in Section 3. The strategy used for eliciting subjects’ aversion profiles andthe parametrization of the game are detailed. Results are proposed in Section 4. First,we present the aversion profiles and we check if aversion in one dimension is correlated
2 See also Davidovitz and Kroll (2004).
4

Magdalou, Dubois, Nguyen-Van / Risk and Inequality Aversion in Social Dilemmas
with aversion in the other. Then we analyse levels and evolutions of cooperation for eachtype of group, using simple descriptive statistics and a dynamic probit model. Finally, weconclude by a discussion in Section 5.
2. A risk/inequality social dilemma game
We first propose a simple game to capture a social dilemma situation as described above.An agent i ∈ N = {1, 2, . . . , n} is characterised by a social status si ∈ S = {1, 2, . . . , s}.We assume that there exists less social statuses than agents (s ≤ n) in society, so thattwo agents can have the same status. The vector of social statuses is denoted by s =(s1, s2, . . . , sn) ∈ Sn. Social status si represents agent i’s rank in the earnings ordinal scale:the higher the agent’s status, the greater her earnings. So earnings are a correspondencex : S −→ D, where D is a non-empty subset of R, strictly increasing in social statusessuch that x(si) < x(sj) for all si < sj. Then an earnings distribution is a vector x =(x(s1), x(s2), . . . , x(sn)
) ∈ Dn. The mean earnings of distribution x ∈ Dn is defined byµ(x) =
∑ni=1 x(si)/n.
2.1. One-shot game
Consider that society is faced with two exogenous earnings distributions and has to chooseone of them. For example society has the possibility to establish a redistributive schemeor to keep the status quo. Intuitively, two main dimensions will influence the choice, themean earnings and the degree of inequality in each distribution. We need the followingdefinition:
Definition 2.1 (Social Dominance) Given two distributions x, y ∈ Dn, we will saythat x socially dominates y, denoted by x ºS y, if and only if µ(x) ≥ µ(y) and x is moreequally distributed than y. 3
Nevertheless, a redistributive scheme is generally costly for a majority of people. In thecase of a poverty reduction policy, for example, a large majority of individuals contributeto helping a small number of people. In the model, the proportion of agents having higherearnings in x than in y is defined by:
ϕ(x,y) = #{i ∈ N | x(si) ≥ y(si)
}/n , (1)
where # denoted the cardinality of the set. If the social choice between the two distribu-tions is democratic, one may argue that the value of ϕ(x,y) will play a crucial role. Weintroduce the following criterion:
Definition 2.2 (Majority Dominance) Given two distributions x,y ∈ Dn, we will saythat x majority dominates y, denoted by x ºM y, if and only if ϕ(x,y) ≥ 1/2.
3 We do not define what “more equally” means, since it requires debatable normative value judgments.For example the Gini index might be used. In our experiment there is no ambiguity because in themore equal distribution, all individuals have the same earnings.
5

Magdalou, Dubois, Nguyen-Van / Risk and Inequality Aversion in Social Dilemmas
Using Definitions 2.1 and 2.2, we immediately observe that a social dilemma situationemerges if criteria lead to a contradiction:
Definition 2.3 (Social Dilemma) Given two distributions x,y ∈ Dn, we will say thatsociety faces a social dilemma with socially efficient distribution x, denoted by x B y, ifand only if x ºS y and y ºM x.
In the following, we denote by xc ∈ Dn the cooperative distribution and by xd ∈ Dn
the defective distribution, such that xc B xd. Each agent has to vote for one of them,with her own social status – and consequently her potential earnings in each distribution– as private information. The vote of agent i is indicated by vi ∈ V = {0, 1}, wherevi = 0 represents defecting and vi = 1 cooperating. Then the voting profile is defined byv = (v1, v2, . . . , vn) ∈ Vn. The winning distribution is obtained by the majority rule, suchthat xc defeats xd if µ(v) =
∑ni=1 vi/n ≥ 1/2. We denote by I : Vn → {0, 1} the indicator
function defined by:
I(v) =
{1 , if µ(v) ≥ 1/2 ,0 , if µ(v) < 1/2 .
We are now in position to define the earnings of agent i in a one-shot-game:
πi(v, si) = I(v)xc(si) +[1− I(v)
]xd(si) . (2)
In the one-shot-game, a Nash agent simply votes for the distribution in which her ownpotential earnings are greater. If xc B xd, a majority of agents have greater earnings inthe defective distribution xd. Thus the pure-strategy Nash equilibrium is xd, the sociallyinefficient distribution.
A graphic representation can clarify this social dilemma context (see Figure 1). Tosimplify consider that s = n with n an even number, and that si = i for all i ∈ N . Thus,agent 1 with social status s1 = 1 is the poorest in this society, agent 2 with social statuss2 = 2 the second poorest, and so on until the richest agent n with social status sn = n.In the graph points
(si, x(si)
)are represented, such that all the adjacent points are joined
by a straight line. By definition the curves are increasing, since earnings are increasingwith social status. First, the mean earnings are represented by the area below the curve(deflated by n). One observes that this area is greater for xc, so that µ(xc) > µ(xd).Inequality is then captured by the slope of the curve. The slope is everywhere greater forxd, which implies that:
xc(si)− xc(si−1) ≤ xd(si)− xd(si−1) , ∀ i = 2, 3, . . . , n . (3)
This result implies that there is less inequality in xc than in xd, according to the absolutedifferential quasi-ordering. 4 This extremely demanding inequality criterion is consistentwith all standard measures used in the literature, such as the Lorenz criterion. Thusxc ºS xd. Finally, the intersection point of the curves is before n/2, which implies thatϕ(xd,xc) > 1/2, or equivalently xd ºM xc. We conclude that xc B xd.
4 See Moyes (1994,1999) for a formal presentation of this inequality criterion.
6

Magdalou, Dubois, Nguyen-Van / Risk and Inequality Aversion in Social Dilemmas
Figure 1: Social Dilemma Illustration
2.2. Repeated game
This social dilemma, limited to one-shot, is not really interesting. A cooperative behaviour(the choice of xc) by agents in an advantageous position corresponds to a purely altruisticattitude. There exists in the literature most simple games to observe such a behaviour.Interesting features appear in a repetition of the game, distributions xc and xd remainingfixed, but with a possible revision of social statuses. In that sense, a favorable positionin the social hierarchy – approximated by a hight social status – is not guarantee overtime. For example any worker can loose her job, and fall into poverty. Suppose that thereexists a finite number of periods T ∈ N, indexed by t. The distribution of social statusesat period t is indicated by st = (st
1, st2, . . . , s
tn) ∈ Sn. We suppose that social statuses are
completely revised at each period, such that st+1 = Πtst where Πt is a random (n × n)-permutation matrix. The voting profile at period t is denoted by vt = (vt
1, vt2, . . . , v
tn) ∈ Vn.
At the end of the game, agent i is characterised by her social status profile over the Tperiods, that is by the vector si = (s1
i , s2i , . . . , s
Ti ) ∈ ST . Finally, the overall voting profile
is defined by Φ = (v1, v2, . . . , vT ) ∈ Vn×T . The overall earnings of agent i, over the Tperiods, becomes: 5
Πi(Φ, si) =T∑
t=1
πi(vt, st
i) . (4)
If xc and xd remain fixed and xc Bxd, then there exists a unique – and socially inefficient– subgame perfect equilibrium, easily identifiable by backward induction: for each of theT periods, xd defeats xc.
The strategic component in this model is the overall voting profile Φ, the other variablesbeing exogenous. Contrary to the one-shot-game, a cooperative behaviour by an agentfavorably treated through her status, is more difficult to interpret. On the one hand,cooperation in one period may be encouraged by inequality aversion or altruism. On theother hand, such a behaviour may be considered as a self-insurance to cover potentialfuture difficulties, by expecting a reciprocal behaviour. The aim of this paper is to observe
5 We implicitly assume that the discount rate is equal to unity.
7

Magdalou, Dubois, Nguyen-Van / Risk and Inequality Aversion in Social Dilemmas
experimentally levels and evolutions of cooperation, controlling explicitly for risk aversionand inequality aversion.
3. Experimental design
The experiment was run on a computer network in autumn 2007 at LAMETA-LEEM,University of Montpellier, France. 108 subjects randomly drawn from a pool of 1400 vol-unteers were recruited and divided into 6 sessions, with 18 subjects each. Participantswere students and had never participated in an experiment dealing with inequality or riskaversion. The experiment was divided into three sub-experiments: the first two for elic-iting respectively inequality aversion and risk aversion, and the third to implement thesocial dilemma game. At the beginning of each sub-experiment, a paper version of the in-structions was distributed. After a silent reading of the instructions by the participants, 6
an experimenter read them aloud. Participants then had to answer a short questionnairein order to check their understanding. Subjects’ answers were centralised in real time onthe server computer, and in case of mistake(s) an experimenter proposed an individualand discreet explanation. An important feature of our design was that subjects were notinformed about the outcomes of the first two sub-experiments – and consequently their ef-fective earnings – before playing the social dilemma game. Our objective was to not affectthe subjects’ initial intentions to cooperate in this game, avoiding to provide informationon behaviour of the others. On average, a session lasted 90 minutes including instructions,questionnaires and payment. Subjects were paid according to the total number of Exper-imental Currency Units (ECUs) earned during the experiment. The conversion rate ofeach sub-experiment was given in the instructions. The average payment by subject wasabout 25 euros.
3.1. Aversion profile elicitation
The first sub-experiment was devoted to the elicitation of inequality aversion. As rightlymentioned by Kroll and Davidovitz (2003), most empirical studies which investigate in-equality aversion do not control the risk dimension. Nevertheless, an inequality reductiondiminishes the risk for future periods, particularly to new entrants in the society. Forexample if an individual has to compare two income distributions with the same meanbut one with a lower variance, the choice of the last distribution may capture aversion toinequality and/or aversion to risk. With the objective to keep the risk constant in theelicitation of inequality aversion, we followed the procedure proposed by these authors.Subjects were individually faced with a distribution, 7 composed by three possible earn-ings with equal probability: x = (20, 40, 60). Each subject had to vote for one of thefollowing alternatives:
Game 1 (Common Game CG) All subjects sample the same earnings from one mutualgamble.
6 Instructions are available in appendix.7 The conversion rate was 1 ECU = 0.1 euros.
8
Magdalou, Dubois, Nguyen-Van / Risk and Inequality Aversion in Social Dilemmas
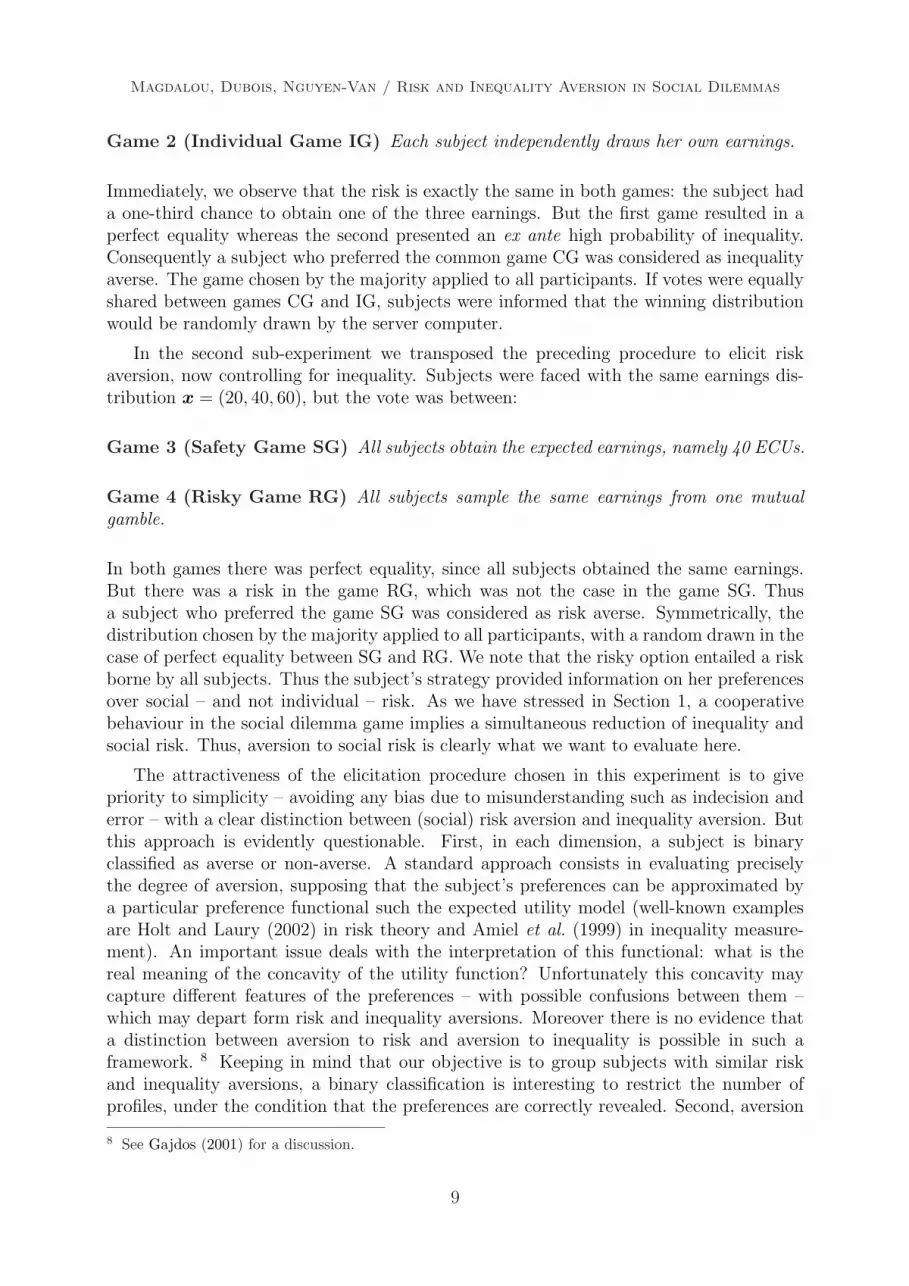
Game 2 (Individual Game IG) Each subject independently draws her own earnings.
Immediately, we observe that the risk is exactly the same in both games: the subject hada one-third chance to obtain one of the three earnings. But the first game resulted in aperfect equality whereas the second presented an ex ante high probability of inequality.Consequently a subject who preferred the common game CG was considered as inequalityaverse. The game chosen by the majority applied to all participants. If votes were equallyshared between games CG and IG, subjects were informed that the winning distributionwould be randomly drawn by the server computer.
In the second sub-experiment we transposed the preceding procedure to elicit riskaversion, now controlling for inequality. Subjects were faced with the same earnings dis-tribution x = (20, 40, 60), but the vote was between:
Game 3 (Safety Game SG) All subjects obtain the expected earnings, namely 40 ECUs.
Game 4 (Risky Game RG) All subjects sample the same earnings from one mutualgamble.
In both games there was perfect equality, since all subjects obtained the same earnings.But there was a risk in the game RG, which was not the case in the game SG. Thusa subject who preferred the game SG was considered as risk averse. Symmetrically, thedistribution chosen by the majority applied to all participants, with a random drawn in thecase of perfect equality between SG and RG. We note that the risky option entailed a riskborne by all subjects. Thus the subject’s strategy provided information on her preferencesover social – and not individual – risk. As we have stressed in Section 1, a cooperativebehaviour in the social dilemma game implies a simultaneous reduction of inequality andsocial risk. Thus, aversion to social risk is clearly what we want to evaluate here.
The attractiveness of the elicitation procedure chosen in this experiment is to givepriority to simplicity – avoiding any bias due to misunderstanding such as indecision anderror – with a clear distinction between (social) risk aversion and inequality aversion. Butthis approach is evidently questionable. First, in each dimension, a subject is binaryclassified as averse or non-averse. A standard approach consists in evaluating preciselythe degree of aversion, supposing that the subject’s preferences can be approximated bya particular preference functional such the expected utility model (well-known examplesare Holt and Laury (2002) in risk theory and Amiel et al. (1999) in inequality measure-ment). An important issue deals with the interpretation of this functional: what is thereal meaning of the concavity of the utility function? Unfortunately this concavity maycapture different features of the preferences – with possible confusions between them –which may depart form risk and inequality aversions. Moreover there is no evidence thata distinction between aversion to risk and aversion to inequality is possible in such aframework. 8 Keeping in mind that our objective is to group subjects with similar riskand inequality aversions, a binary classification is interesting to restrict the number ofprofiles, under the condition that the preferences are correctly revealed. Second, aversion
8 See Gajdos (2001) for a discussion.
9

Magdalou, Dubois, Nguyen-Van / Risk and Inequality Aversion in Social Dilemmas
is captured from only one question. We specify that particular attention in the protocolwas paid to ensuring and controlling the comprehension of the subjects. For each of thethree sub-experiments, a comprehension questionnaire was proposed before the decisions.At the end of each of them, subjects had to justify by a written comment their choicesand strategies. Inspection of these data revealed no comprehension difficulties.
3.2. Social dilemma implementation
The two first sub-experiments enabled us to separate subjects according two their aversionprofiles. Four types were observed: subjects inequality and risk-averse, subjects averse inonly one dimension and finally subjects prone in both dimensions. Subjects with thesame profile were then randomly grouped by three, following a partner matching protocol:groups were fixed for the whole game. The last subjects not affected to a group – becausein number less than three with the same profile – were randomly grouped by three ingroups called mixed. The subject was not informed that the members of her group hadthe same profile: instructions stated that groups were randomly constituted. Since eachsession consisted of 18 subjects, 6 groups were formed per session. In the following, wedenote the different types of group – apart from mixed groups – as (A,A), (A,P), (P,A) and(P,P) with A for Averse and P for Prone, the first letter of the pair devoted to inequality. 9
We parameterised the game in the simplest fashion. The game was repeated 20 periodsand, at each period, the subject had to vote for one of the following distributions:
xc = (60, 60, 60) or xd = (10, 70, 70) .
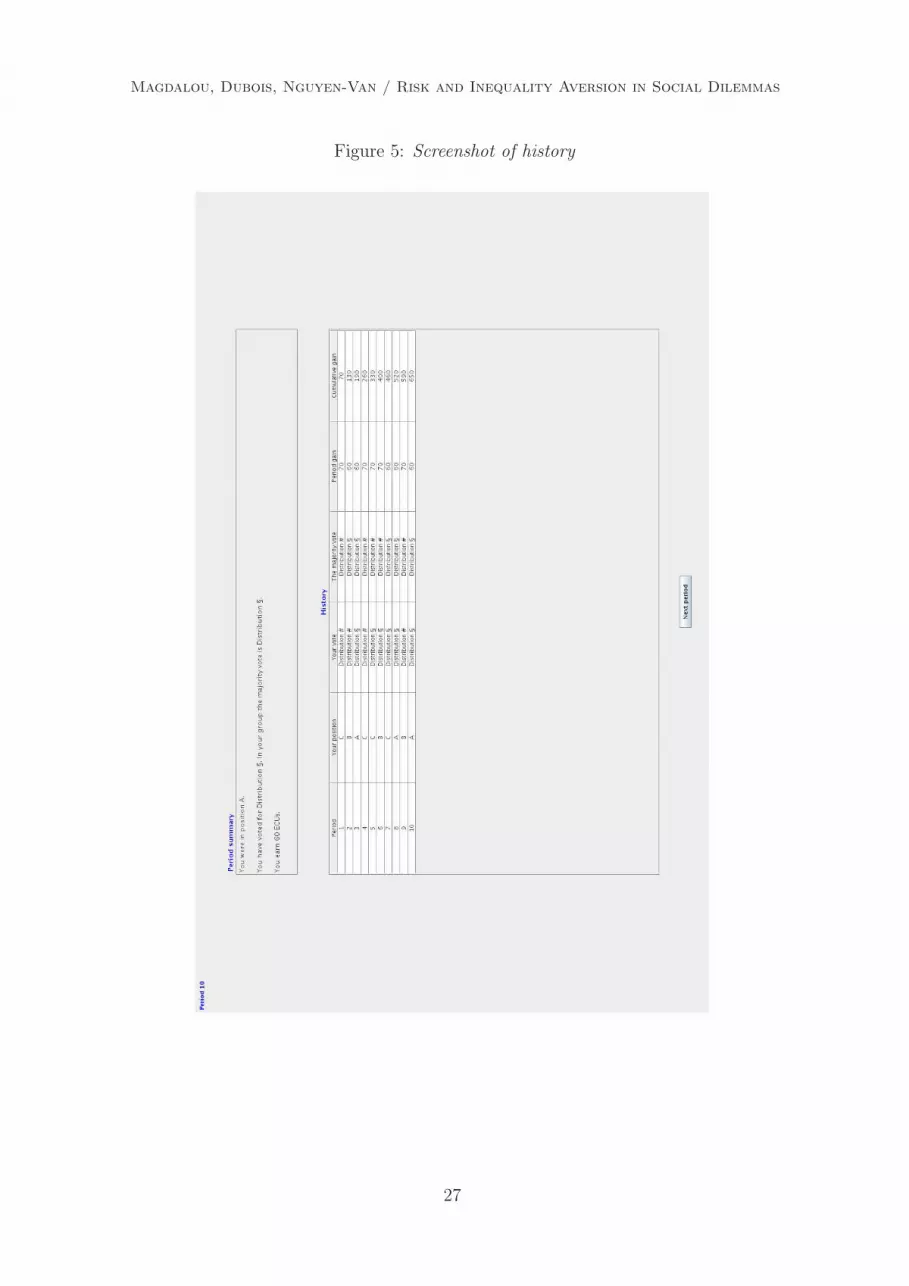
The winning distribution was chosen by majority vote. Before the vote, each member ofthe group was randomly affected to one of the three possible ranks, namely A, B or C.Subjects were informed that their potential payoff was correlated to their own rank: 60or 10 ECUs for rank A, 60 or 70 for rank B and 60 or 70 for rank C. 10 A screenshotis presented in Figure 4 (Appendix B). We note that (i) earnings were more equallydistributed in the cooperative distribution xc and (ii) the mean earnings were higher:µ(xc) = 60 ≥ 50 = µ(xd). Nevertheless two subjects out of three have a personal interestto vote for the defective distribution xd. Thus we implemented a social dilemma situation,with xc Bxd. At the beginning of each period, a redeployment of the ranks was randomlydrawn. Consequently a subject in position B or C in one period may cooperate, expectinga kind of reciprocity if in a future period she falls to rank A. At the end of each period,subjects were informed about the majority vote in their group, their payoff for the periodand their cumulative payoff since the first period. Moreover a history of the past periodswas displayed (Figure 5 in Appendix B). History was available for consultation at everymoment of the game.
9 We specify that mixed groups can not be interpreted as a benchmark, because we do not control thecomposition process of these groups. Moreover in this experiment, it appears that players with profile(A,A) are predominantly represented in mixed groups.
10 The conversion rate was in this last sub-experiment 1 ECU = 0.01 euros. We specify that each periodof the game implied effective earnings.
10

Magdalou, Dubois, Nguyen-Van / Risk and Inequality Aversion in Social Dilemmas
4. Results
In this section, experimental results are described. In a first sub-section we expose thesubjects’ aversion profiles, and we compare the risk and inequality dimensions. The fol-lowing sub-section is devoted to a description of the cooperation in the first period of thegame, and the last sub-section focuses on the dynamics of cooperation over the 20 periods.
4.1. Risk aversion vs. inequality aversion
The first question asked in this experiment deals with the connections between risk aversionand inequality aversion. We report in Table 1 the results of the first two sub-experiments,in which individual aversion profiles are elicited. When we observe the marginal column
Table 1: Individual aversion profiles
Risk
Inequality Prone Averse∑
Prone 25.00% 30.55% 55.55%(27 subjects) (33 subjects) (60 subjects)
Averse 16.67% 27.78% 44.45%(18 subjects) (30 subjects) (48 subjects)
∑ 41.67% 58.33% 100%(45 subjects) (63 subjects) (108 subjects)
and row frequencies, we note that a majority of subjects exhibit risk aversion (58.33%)whereas the tendency is inverted for inequality aversion (44.45%). This last result does notcorroborate the one obtained by Kroll and Davidovitz (2003) in a comparable treatment,where 54.12% of the subjects – 8 years old children – were inequality-averse. Then, theTable shows that aversion in one dimension does not seem to influence aversion in the otherdimension. Distribution in each row (resp. column) is consistent with the distribution ofthe marginal row (resp. column). A Spearman correlation test confirms this hypothesis(ρ = 0.076, p-value = 0.437):
Result 1 Inequality aversion and risk aversion are not correlated.
We also notice that no dominant profile emerges, but that only few subjects are simul-taneously inequality-averse and risk-prone (16.67%). Independence between the two kindof aversion appears to be unsurprising, with regard to related works in the literature.Empirical results reported by Cowell and Schokkaert (2001) suggested systematic differ-ences between inequality and risk perceptions. Brennan et al. (2008), who investigatedother-regarding concerns and aversion over social risk, led to similar observations.
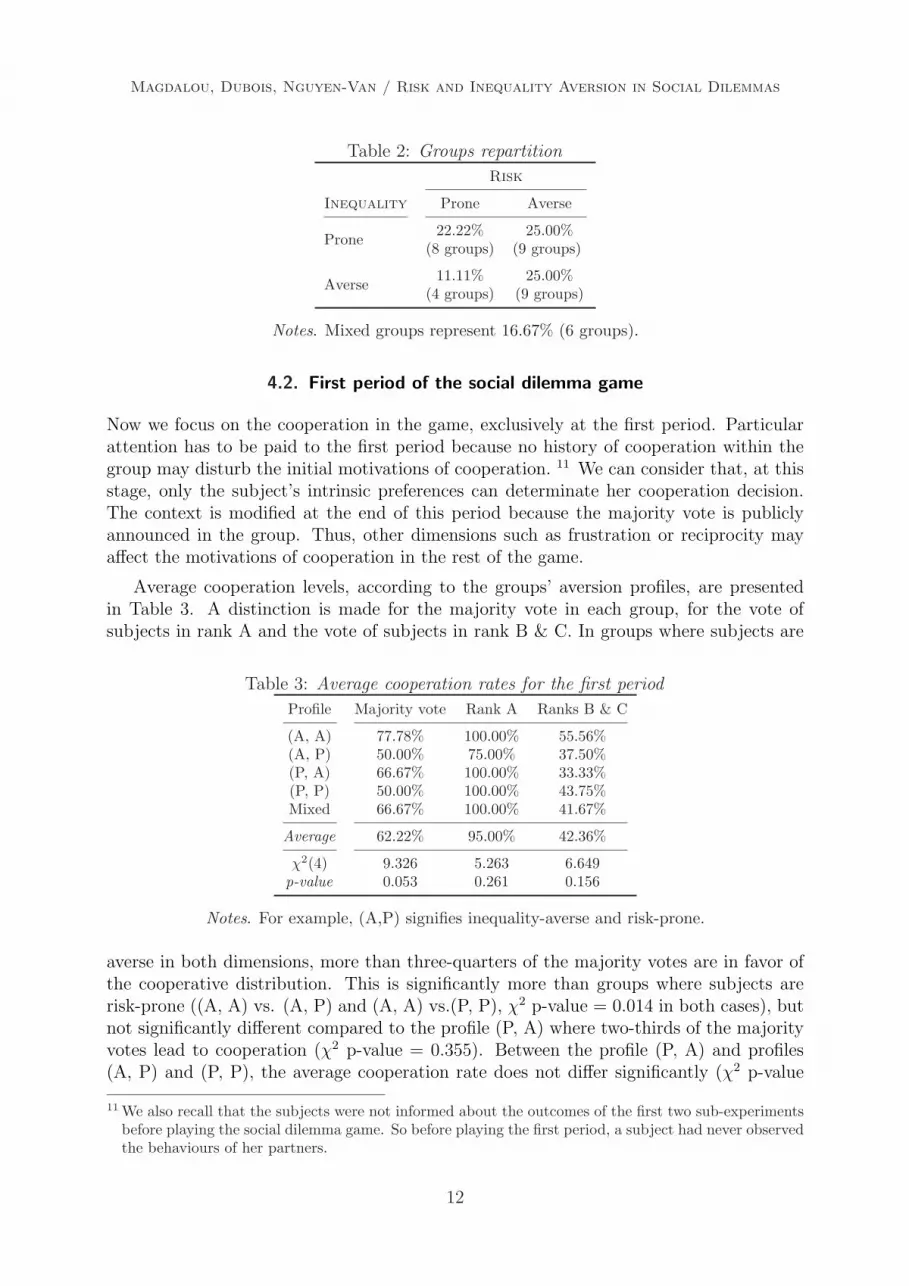
In the third part of the experiment, subjects were grouped by three according to theiraversion profiles. Table 2 displays the distribution of the 36 groups. Note that in eachsession, mixed groups were composed only if there was not a sufficient number of subjectswith the same aversion profile. Profile (A,P) – inequality-averse and risk-prone – was theleast frequently observed, only represented by 4 groups.
11
Magdalou, Dubois, Nguyen-Van / Risk and Inequality Aversion in Social Dilemmas
Table 2: Groups repartition
Risk
Inequality Prone Averse
Prone 22.22% 25.00%(8 groups) (9 groups)
Averse 11.11% 25.00%(4 groups) (9 groups)
Notes. Mixed groups represent 16.67% (6 groups).
4.2. First period of the social dilemma game
Now we focus on the cooperation in the game, exclusively at the first period. Particularattention has to be paid to the first period because no history of cooperation within thegroup may disturb the initial motivations of cooperation. 11 We can consider that, at thisstage, only the subject’s intrinsic preferences can determinate her cooperation decision.The context is modified at the end of this period because the majority vote is publiclyannounced in the group. Thus, other dimensions such as frustration or reciprocity mayaffect the motivations of cooperation in the rest of the game.
Average cooperation levels, according to the groups’ aversion profiles, are presentedin Table 3. A distinction is made for the majority vote in each group, for the vote ofsubjects in rank A and the vote of subjects in rank B & C. In groups where subjects are
Table 3: Average cooperation rates for the first period
Profile Majority vote Rank A Ranks B & C
(A, A) 77.78% 100.00% 55.56%(A, P) 50.00% 75.00% 37.50%(P, A) 66.67% 100.00% 33.33%(P, P) 50.00% 100.00% 43.75%Mixed 66.67% 100.00% 41.67%
Average 62.22% 95.00% 42.36%
χ2(4) 9.326 5.263 6.649p-value 0.053 0.261 0.156
Notes. For example, (A,P) signifies inequality-averse and risk-prone.
averse in both dimensions, more than three-quarters of the majority votes are in favor ofthe cooperative distribution. This is significantly more than groups where subjects arerisk-prone ((A, A) vs. (A, P) and (A, A) vs.(P, P), χ2 p-value = 0.014 in both cases), butnot significantly different compared to the profile (P, A) where two-thirds of the majorityvotes lead to cooperation (χ2 p-value = 0.355). Between the profile (P, A) and profiles(A, P) and (P, P), the average cooperation rate does not differ significantly (χ2 p-value
11 We also recall that the subjects were not informed about the outcomes of the first two sub-experimentsbefore playing the social dilemma game. So before playing the first period, a subject had never observedthe behaviours of her partners.
12

Magdalou, Dubois, Nguyen-Van / Risk and Inequality Aversion in Social Dilemmas
= 0.123), even if the cooperative distribution is chosen only by half of the groups (A,P) and (P, P). Now a distinction by the subject’s rank is informative. Whereas there isno objective reason to defect for subjects in rank A, 12 cooperation is costly for subjectsranked B or C. Unsurprisingly the highest cooperation rate is observed for groups aversein both dimensions, up to 55%. This is significantly more than for groups (A, P) and(P, A) (χ2 p-value = 0.061 and 0.018 respectively), but not significantly higher than thecooperation observed in profile (P, P) (χ2 p-value = 0.236). As for the majority vote,the average cooperation rate does not differ significantly between the profile (P, P) andprofiles (A, P) and (P, A) (χ2 p-value = 0.488 and 0.235 respectively). A brief overviewof these preliminary results shows that aversion in both dimensions leads to the highestcooperation.
In order to corroborate the impact of risk and inequality aversions on cooperation atthe first period, we estimate the following binary probit specification (i = 1, ..., N):
P (qi = 1|wi) = Φ(w′iθ) , (5)
where Φ is the cumulative standard normal distribution and qi denotes the observed choiceof player i (qi = 0 if i chooses xd, qi = 1 if i chooses xc). Variables included in the vectorwi are the position of player i in the game (=0 if her rank is A, =1 if B or C) and dummiesfor her inequality aversion and risk aversion (=0 if prone, =1 if averse). The model doesnot contain the intercept as we assume that individual behaviour is well balanced, i.e.probabilities of choosing xc and xd are equal to 0.5 when individual characteristics areabsent.13
Estimation results of the probit specification are reported in Table 4.14 We observethat all explanatory variables are significant at the 5% level. It is useful to interpret theresults in terms of marginal effects on the probability of cooperation P (qi = 1|wi).
15 Allcomputed marginal effects are also statistically significant, with the expected sign. Change
Table 4: Probit estimation for the first period
Coefficient Marginal effect
Variable Estimate Std. Err. Estimate Std. Err.
Position -0.768∗∗ 0.223 -0.293∗∗ 0.082Inequality aversion 0.579∗∗ 0.235 0.226∗∗ 0.088Risk aversion 0.577∗∗ 0.208 0.227∗∗ 0.079
Log-likelihood -65.585Number of observations 108
Notes. ∗∗ indicates significant values at the 5% level.
in position of player i, from position A to B or C, has a negative effect on the probability
12 Cooperation rates in rank A are closed to 100%. We note that 4 groups (A,P) are observed, thus onlyone subject over the 36 ranked A did not cooperate.
13 When θ = 0, we get P (qi = 1|wi) = P (qi = 0|wi) = Φ(0) = 0.5.14 Results remain similar for the logit specification, in particular the signs of coefficients.15 The marginal effect of a dummy variable is calculated as the discrete change of the probability of
cooperation when the dummy variable changes from 0 to 1.
13

Magdalou, Dubois, Nguyen-Van / Risk and Inequality Aversion in Social Dilemmas
of cooperation (up to 30%). This observation seems natural since cooperation is costly forthe subject when she is ranked B or C. But surprisingly, we observe that marginal effectsof aversion variables are comparable (23%). This result clearly highlights the impact ofboth inequality and risk aversions on the probability of cooperation. Finally, the effectsof inequality and risk aversions are very close (about 0.58). The equality between thesecoefficients is not rejected by a Wald test (χ2(1) statistic = 0.00 and p-value = 0.99).
Result 2 Inequality aversion and risk aversion have a significant impact on cooperation.
The above analysis underlines the role of inequality and risk aversions in the coop-eration decision of subjects, in the first period of the social dilemma game. Moreover,inequality-prone and risk-averse (P,A) groups seem to be more cooperative than inequality-averse and risk-prone (A,P) groups – even if differences of cooperation appear not to besignificant. This observation will be corroborated by the study of the whole game.
4.3. Dynamics of the social dilemma game
We start by a description of the evolution of choice for the cooperative distribution xc, asdepicted in Figure 2. Again we distinguish the majority vote, the vote of subjects in rankA and the vote of subjects in ranks B & C. Unsurprisingly subjects in rank A select almostall the time the cooperative distribution. For the majority vote the average cooperation
Figure 2: Evolution of the average cooperation rate
5 10 15 20
020
4060
8010
0
Periods
Coo
pera
tion
rate
Majority Rank A Ranks B & C
is around 50%, with a decrease over time. This decrease is significant if we compare theaverage in the first ten periods to the average in the last ten periods (Wilcoxon one-sidedp-value = < 0.001). For ranks B & C the average cooperation is around 40% with also asignificant decrease between periods 1-10 and periods 11-20 (Wilcoxon one-sided p-value= 0.015).
Result 3 Average cooperation rate is decreasing over the time.
14
Magdalou, Dubois, Nguyen-Van / Risk and Inequality Aversion in Social Dilemmas
Such cooperation evolution is a classical result for repeated social dilemma games (seeLedyard, 1995). We also graphically observe a low variability of the cooperation aroundthe decreasing linear trend.
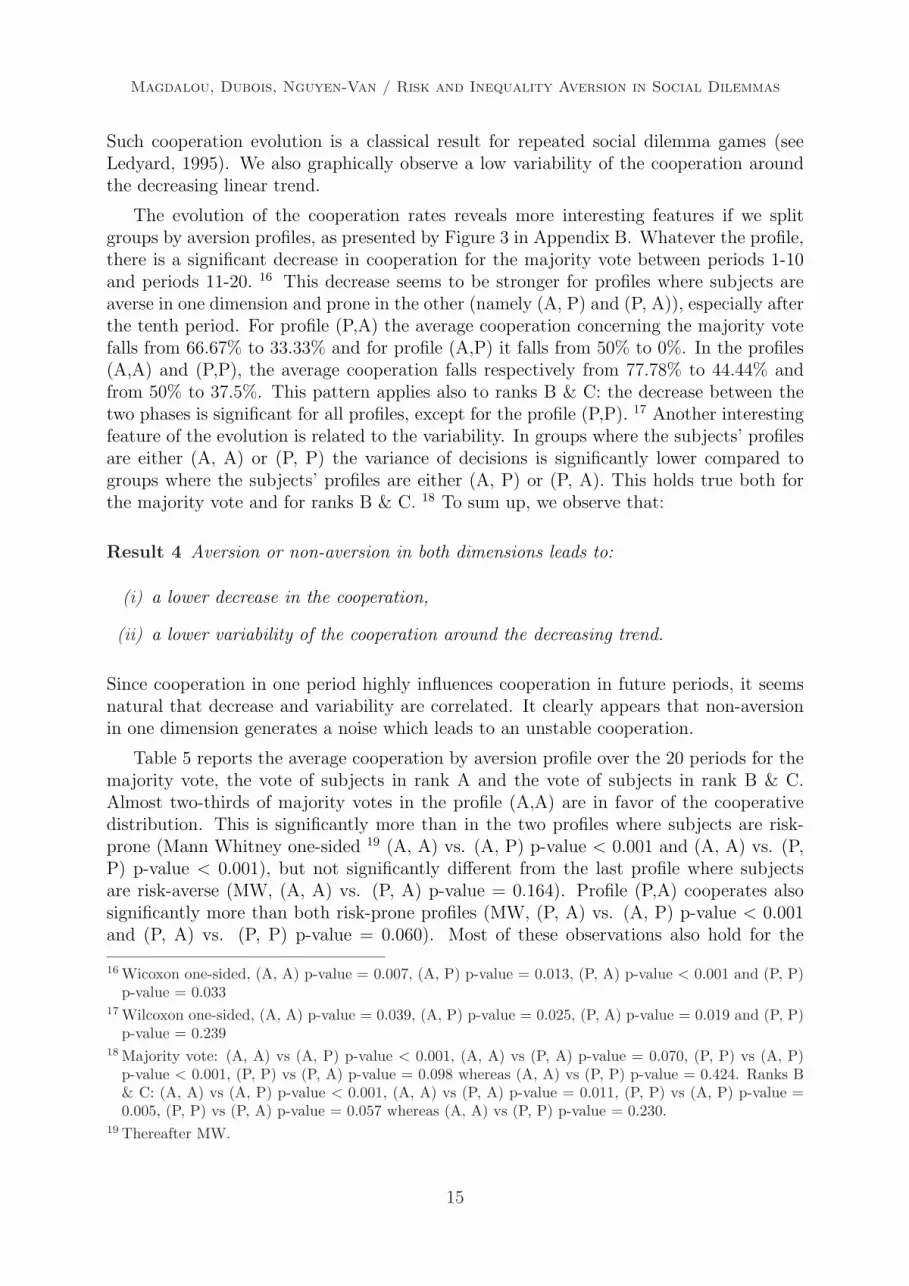
The evolution of the cooperation rates reveals more interesting features if we splitgroups by aversion profiles, as presented by Figure 3 in Appendix B. Whatever the profile,there is a significant decrease in cooperation for the majority vote between periods 1-10and periods 11-20. 16 This decrease seems to be stronger for profiles where subjects areaverse in one dimension and prone in the other (namely (A, P) and (P, A)), especially afterthe tenth period. For profile (P,A) the average cooperation concerning the majority votefalls from 66.67% to 33.33% and for profile (A,P) it falls from 50% to 0%. In the profiles(A,A) and (P,P), the average cooperation falls respectively from 77.78% to 44.44% andfrom 50% to 37.5%. This pattern applies also to ranks B & C: the decrease between thetwo phases is significant for all profiles, except for the profile (P,P). 17 Another interestingfeature of the evolution is related to the variability. In groups where the subjects’ profilesare either (A, A) or (P, P) the variance of decisions is significantly lower compared togroups where the subjects’ profiles are either (A, P) or (P, A). This holds true both forthe majority vote and for ranks B & C. 18 To sum up, we observe that:
Result 4 Aversion or non-aversion in both dimensions leads to:
(i) a lower decrease in the cooperation,
(ii) a lower variability of the cooperation around the decreasing trend.
Since cooperation in one period highly influences cooperation in future periods, it seemsnatural that decrease and variability are correlated. It clearly appears that non-aversionin one dimension generates a noise which leads to an unstable cooperation.
Table 5 reports the average cooperation by aversion profile over the 20 periods for themajority vote, the vote of subjects in rank A and the vote of subjects in rank B & C.Almost two-thirds of majority votes in the profile (A,A) are in favor of the cooperativedistribution. This is significantly more than in the two profiles where subjects are risk-prone (Mann Whitney one-sided 19 (A, A) vs. (A, P) p-value < 0.001 and (A, A) vs. (P,P) p-value < 0.001), but not significantly different from the last profile where subjectsare risk-averse (MW, (A, A) vs. (P, A) p-value = 0.164). Profile (P,A) cooperates alsosignificantly more than both risk-prone profiles (MW, (P, A) vs. (A, P) p-value < 0.001and (P, A) vs. (P, P) p-value = 0.060). Most of these observations also hold for the
16 Wicoxon one-sided, (A, A) p-value = 0.007, (A, P) p-value = 0.013, (P, A) p-value < 0.001 and (P, P)p-value = 0.033
17 Wilcoxon one-sided, (A, A) p-value = 0.039, (A, P) p-value = 0.025, (P, A) p-value = 0.019 and (P, P)p-value = 0.239
18 Majority vote: (A, A) vs (A, P) p-value < 0.001, (A, A) vs (P, A) p-value = 0.070, (P, P) vs (A, P)p-value < 0.001, (P, P) vs (P, A) p-value = 0.098 whereas (A, A) vs (P, P) p-value = 0.424. Ranks B& C: (A, A) vs (A, P) p-value < 0.001, (A, A) vs (P, A) p-value = 0.011, (P, P) vs (A, P) p-value =0.005, (P, P) vs (P, A) p-value = 0.057 whereas (A, A) vs (P, P) p-value = 0.230.
19 Thereafter MW.
15

Magdalou, Dubois, Nguyen-Van / Risk and Inequality Aversion in Social Dilemmas
Table 5: Average cooperation rates over the 20 periods
Profile Majority vote Rank A Ranks B & C
(A, A) 61.11% 97.22% 48.33%(A, P) 28.75% 97.50% 17.50%(P, A) 55.56% 100.00% 34.72%(P, P) 50.63% 95.00% 38.75%Mixed 55.00% 100.00% 38.33%
Average 50.21% 97.94% 35.53%
χ2(4) 12.569 0.182 14.296p-value 0.014 0.996 0.006
Notes. For example, (A,P) signifies inequality-averse and risk-prone.
average cooperation rates in ranks B & C, except that the rate in profile (A, A) is nowsignificantly higher than in profile (P, A) (MW p-value < 0.001).
Before interpreting these results we complete the analysis by the estimation of a probitmodel, which seems appropriate to our panel data framework. For i = 1, ..., N and t =2, ..., T , we have:
P (qit = 1|qi1, . . . , qi,t−1,wit, ci) = Φ(ρqi,t−1 + w′itθ + ci) , (6)
where ci, i = 1, ..., N , represent individual random effects.20 As in the analysis for thefirst period, we think that the current position of player i may affect her current choice.Moreover, as player i observes past decisions of the group to which she belongs, we alsothink that the majority decision at the previous period of her group may have an impact onher current choice. We can also analyse the persistent behaviour in the decision process byincluding past value of individual choice qi,t−1. The set of explanatory variables containsthen the first lag of the dependent variable qi,t−1 and time-variant covariates wit (includingposition of player i at period t, majority choice of the player i’s group at period t− 1, anda time trend).
Model (6) constitutes a dynamic probit model with random effects of which Wooldridge(2005) proposed a simple estimation method, by specifying an additional assumption onthe distribution of individual effects. The latter can be written in terms of our variablesas follows (i = 1, ..., N):
ci = α1qi1 + z′iα2 + ζi, ζi ∼ N(0, σ2ζ ) . (7)
The distribution of individual effects is then related to the initial observation qi1 and the setof time-invariant covariates zi (which includes player i’s inequality and risk aversions).21
Following Wooldridge (2005), by substituting (7) in (6), we obtain the following equation(i = 1, ..., N, t = 2, ..., T ):
P (qit = 1|qi1, . . . , qi,t−1, wit, ci) = Φ(ρqi,t−1 + w′itθ + α1qi1 + z′iα2 + ζi) , (8)
20 As it is recognised in econometric textbooks, it is cumbersome to consider probit model with fixedeffects.
21 We do not use any time-invariant covariate in wit in equation (6) as their coefficients cannot be identifiedwith those of zi in (7). It should be noted that dummies of sessions, periods, and groups are not includedin our model because they create a multicolinearity problem.
16
Magdalou, Dubois, Nguyen-Van / Risk and Inequality Aversion in Social Dilemmas
which corresponds to the usual random effect probit model where ζi now represents thestandard individual random effect and the new set of explanatory variables correspondsto qi,t−1, wit, qi1, zi.
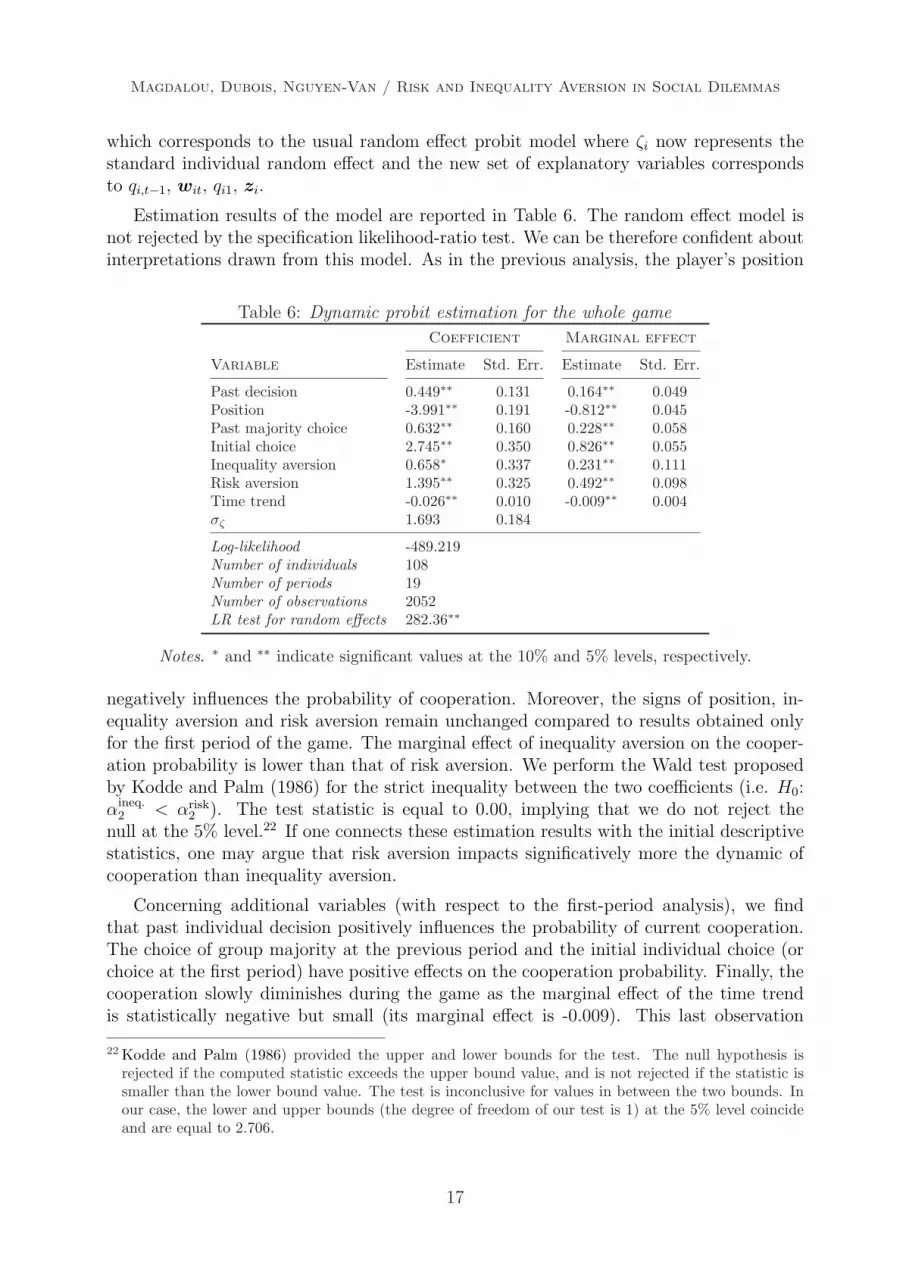
Estimation results of the model are reported in Table 6. The random effect model isnot rejected by the specification likelihood-ratio test. We can be therefore confident aboutinterpretations drawn from this model. As in the previous analysis, the player’s position
Table 6: Dynamic probit estimation for the whole game
Coefficient Marginal effect
Variable Estimate Std. Err. Estimate Std. Err.
Past decision 0.449∗∗ 0.131 0.164∗∗ 0.049Position -3.991∗∗ 0.191 -0.812∗∗ 0.045Past majority choice 0.632∗∗ 0.160 0.228∗∗ 0.058Initial choice 2.745∗∗ 0.350 0.826∗∗ 0.055Inequality aversion 0.658∗ 0.337 0.231∗∗ 0.111Risk aversion 1.395∗∗ 0.325 0.492∗∗ 0.098Time trend -0.026∗∗ 0.010 -0.009∗∗ 0.004σζ 1.693 0.184
Log-likelihood -489.219Number of individuals 108Number of periods 19Number of observations 2052LR test for random effects 282.36∗∗
Notes. ∗ and ∗∗ indicate significant values at the 10% and 5% levels, respectively.
negatively influences the probability of cooperation. Moreover, the signs of position, in-equality aversion and risk aversion remain unchanged compared to results obtained onlyfor the first period of the game. The marginal effect of inequality aversion on the cooper-ation probability is lower than that of risk aversion. We perform the Wald test proposedby Kodde and Palm (1986) for the strict inequality between the two coefficients (i.e. H0:αineq.
2 < αrisk2 ). The test statistic is equal to 0.00, implying that we do not reject the
null at the 5% level.22 If one connects these estimation results with the initial descriptivestatistics, one may argue that risk aversion impacts significatively more the dynamic ofcooperation than inequality aversion.
Concerning additional variables (with respect to the first-period analysis), we findthat past individual decision positively influences the probability of current cooperation.The choice of group majority at the previous period and the initial individual choice (orchoice at the first period) have positive effects on the cooperation probability. Finally, thecooperation slowly diminishes during the game as the marginal effect of the time trendis statistically negative but small (its marginal effect is -0.009). This last observation
22 Kodde and Palm (1986) provided the upper and lower bounds for the test. The null hypothesis isrejected if the computed statistic exceeds the upper bound value, and is not rejected if the statistic issmaller than the lower bound value. The test is inconclusive for values in between the two bounds. Inour case, the lower and upper bounds (the degree of freedom of our test is 1) at the 5% level coincideand are equal to 2.706.
17
Magdalou, Dubois, Nguyen-Van / Risk and Inequality Aversion in Social Dilemmas
confirms previous results dealing with the decreasing trend of the cooperation. Thus, themain results of our experimental study are summarised by:
Result 5 Aversion profile has an impact on cooperation:
(i) Aversion in both dimensions leads to the highest average cooperation rate.
(ii) Aversion in only one dimension is not sufficient to ensure cooperation.
(iii) Risk aversion has a greater impact than inequality aversion on the dynamics of co-operation.
The first point (i) is in line with initial intuition. The game is orientated in such a waythat aversion might encourage cooperation, which is corroborated by the experiment. Butother information emerges. First we observe that non-aversion in one-dimension leads toa decrease in cooperation. But surprisingly, inequality aversion does not seem to maintaincooperation. Whereas the decrease is not significant from (A,A) to (P,A), the cooperationfalls dramatically from (A,A) to (A,P). Second, cooperation for groups (P,P) is relativelyhigher. On average, this aversion profile cooperates more than profile (A,P). It is importantto recall that the expected payment of the cooperative distribution is higher than thedefective one. Then a perfect maximizer subject might be inclined to choose cooperation,without social motivations or risk considerations. So there is nothing irrational in obtaininga relatively high level of cooperation for groups (P,P). The cooperation level for groups(A,P) is however really surprising. Many factors can cause such an evolution. Particularly,one does not confuse inequality aversion and altruism. Whereas an altruistic individualis not satisfied if poor people exists, an individual averse to inequality will suffer if somepeople are better treated than him, without objective reasons. 23 Thus, if in one periodan individual in position A remarks that other members of her group do not cooperate,a frustration felling will probably corrupt her cooperative intentions in the future. Evenmore, she will want to punish them. Such a behaviour is in line with theories of impure orconditional altruism, for example the one developed by Rabin (1993). Since non aversionin one dimension leads to higher variability in cooperation (Result 4), combination of suchfeelings may rapidly damage the social harmony and, as a consequence, cooperation.
5. Overview and discussion
In this paper, we have proposed and tested experimentally a game where social coopera-tion may be encouraged, simultaneously by inequality and risk aversion. Such situationsare widely observed in any human society, as soon as social cooperation for a reductionof inequality today leads to a diminution of potential social risk in the future. A reallyevocative example is captured by mutual benefit societies, where the aim of cooperationis to provide a mutual insurance coverage following a solidarity rule. Our social dilemmagame describes a situation where individuals are ex ante unequal in social statuses. In-dividuals can then cooperate to establish a redistributive scheme. This scheme is costly
23 See Fehr and Schmidt (1999) for a distinction between advantageous and disadvantageous inequality.
18

Magdalou, Dubois, Nguyen-Van / Risk and Inequality Aversion in Social Dilemmas
for a majority of people, but socially efficient in the sense that earnings would be moreequally distributed and total earnings greater. The final decision is obtained by a vote, sothat redistribution becomes effective if a majority acts in this way. But statuses are notfixed over time, or in other words advantageous positions are not guarantee in the future.Consequently, inequality averse and/or risk averse individuals may be inclined to cooper-ate. A finite number of periods is repeated to duplicate the social dilemma situation, withat each period a random redeployment of social statuses and the perspective to becomericher or poorer.
Before participating in the 20 periods repeated game, the aversion profile of each sub-ject is elicited. Inequality aversion is obtained using the procedure proposed by Kroll andDavidovitz (2003), which we have transposed for risk aversion. Our objective is to clearlydistinguish the two dimensions, taking care to avoid possible confusions. For inequal-ity elicitation risk is kept constant, and vice versa. Related works in the literature tendto demonstrate that perceptions on inequality and perceptions on risk display significantdifferences. The experiment proposed here corroborates these views: we observe that aver-sions are not correlated. Whereas a majority of subjects exhibit aversion to risk, slightlymore than 50% are not inequality averse. Moreover, no dominant profile emerges. Sub-jects combining inequality aversion with non aversion in social risks are less represented,in comparison with other profiles represented in relatively comparable proportions.
Cooperation in the game is then analysed. We recall that subjects are grouped by threeaccording to their aversion profiles. The average cooperation rate, over the 20 periods andfor all the groups, is around 50%. The dynamics of cooperation is in line with standardresults in the experimental literature on repeated social dilemma games, with a slightlydecreasing trend. But evolution and level of cooperation are significatively influencedby the group’s aversion profile. First, aversion or non-aversion in both dimensions leadsto a lower decrease and a weaker variability over time. Thus non-aversion in only onedimension seems to create a noise which makes cooperation unstable. Then, in line withour initial intuition, aversion in both dimensions leads to the highest average cooperationrate. Groups averse in only one dimension are less cooperative. Nevertheless consequencesare not symmetrically related. Whereas cooperation of non-inequality-averse but risk-averse groups is not significatively different from averse/averse groups, cooperation ofnon-risk-averse but inequality-averse groups falls dramatically to zero at the last periods.Cooperation for non-averse/non-averse groups is significatively lower than the first twogroups, but not to the third.
In a situation where an inequality reduction implies a decrease in social risks, our ex-perimental results suggest that aversion profile has a significant effect on the outcome andthe robustness of cooperation. Moreover, it appears that the main driving-force whichsupports cooperation seems to be risk aversion. Individuals are aware that advantageouspositions may be reversed in the future, so they act today to improve the situation ofindividuals treated less favorably than them. This observation must however be exploitedcautiously. An over-interpretation might be to consider that inequality aversion plays amarginal role, so that any cooperative act in order to reduce inequality constitutes a kindof self-insurance. Inequality aversion is in fact a really complex cognitive process whichdepends on the environment. Initially such an aversion may encourage fairness attitudes,such as cooperation in our game. But if inequality averse individuals are not satisfied with
19
Magdalou, Dubois, Nguyen-Van / Risk and Inequality Aversion in Social Dilemmas
the existence of underprivileged persons, they will also not be pleased if persons bettertreated than them do not act to improve their own situation. That is, if they notice a co-operation failure when they are underprivileged themselves, a desire for punishment mightrule their behaviour in the future. In our opinion, the main conclusion of this paper istwofold. First, it seems imperative to take into account the risk dimension to clearly un-derstand the social motivations to reduce inequality. Second, whereas inequality aversionmay favor social cooperation, the existence of “free riders” may damage dramatically theinitial cooperative motivations, leading to a punishment behaviour costly for the wholesociety.
References
Amiel, Y. and Cowell, F. (2002). Attitudes towards risk and inequality: aquestionnaire-experimental approach. In F. Andersson and H. Holm (eds.), Experimentaleconomics: financial markets, auctions and decision-making, Deventer: Kluwer.
—, — and Polovin, A. (2001). Risk perceptions, income transformations and inequality.European Economic Review, 45, 964–976.
—, Creedy, J. and Hurn, S. (1999). Measuring attitudes towards inequality. Scandi-navian Journal of Economics, 101, 83–96.
Andreoni, J. (1989). Giving with impure altruism: Applications to charity and ricardianequivalence. Journal of Political Economy, 97, 1447–1458.
— (1990). Impure altruism and donations to public goods: A theory of warm-glow giving.The Economic Journal, 100, 464–477.
— (2002). Giving according to garp: An experimental test of the consistency of preferencesfor altruism. Econometrica, 70, 737–753.
Batson, D. and Powell, A. (2003). Altruism and prosocial behavior. In M. L. T. Millonand I. Weiner (eds.), Hanbook of Psychology, vol. 5, Personality and Social Psychology,New York: John Wiley and Sons, Inc.
Bolton, G. and Ockenfels, A. (2000). Erc: a theory of equity, reciprocity and com-petition. American Economic Review, 90, 166–193.
Bosmans, K. and Schokkaert, E. (2004). Social welfare, the veil of ignorance andpurely individual risk: an empirical examination. Research on Economic Inequality, 11,85–114.
Brennan, G., Gonzalez, L., Guth, W. and Levati, M. (2008). Attitudes towardprivate and collective risks in individual and choice situations. Journal of EconomicBehavior and Organization, 67, 253–262.
Carlsson, F., Daruvala, D. and Johansson-Stenman, O. (2005). Are peopleinequality-averse, or just risk-averse? Economica, 72, 375–396.
Cowell, F. and Schokkaert, E. (2001). Risk perceptions and distributional judge-ments. European Economic Review, 45, 941–952.
Davidovitz, L. and Kroll, Y. (2004). On the attitudes towards inequality. Researchon Economic Inequality, 11, 137–148.
20

Magdalou, Dubois, Nguyen-Van / Risk and Inequality Aversion in Social Dilemmas
Fafchamps, M. (2004). Inequality and risk. In S. Dercon (ed.), Insurance against poverty,Oxford: Oxford University Press.
Fehr, E. and Schmidt, K. (1999). A theory of fairness, competition and cooperation.Quarterly Journal of Economics, 114, 817–868.
Gajdos, T. (2001). Les fondements axiomatiques de la mesure des inegalites. Revued’Economie Politique, 111, 683–719.
Guth, W., Levati, M. and Ploner, M. (2008). On the social dimension of time andrisk preferences: An experimental study. Economic Inquiry, 46, 261–272.
Harrison, G., Lau, M., Rustrom, E. and Tarazona-Gomez, M. (2005). Preferencesover social risk. Discussion paper 2005-07, CEBR, Copenhagen Business School.
Holt, C. and Laury, S. (2002). Risk aversion and incentive effects. American EconomicReview, 92, 1644–1655.
Kodde, D. and Palm, F. (1986). Wald criteria for jointly testing equality and inequalityrestrictions. Econometrica, 54, 1243–1248.
Kroll, Y. and Davidovitz, L. (2003). Inequality aversion versus risk aversion. Eco-nomica, 70, 19–29.
Ledyard, J. (1995). Public goods: A survey of experimental research. In J. Kagel andA. Roth (eds.), Hanbook of Experimental Economics, Princeton: Princeton UniversityPress.
Masclet, D. and Villeval, M. (2008). Punishment, welfare and inequality. SocialChoice and Welfare, 31, 475–502.
Palfrey, T. and Prisbey, J. (1996). Altruism, reputation and noise in linear publicgoods experiments. Journal of Public Economics, 61, 409–427.
Rabin, M. (1993). Incorporating fairness into game theory and economics. AmericanEconomic Review, 83, 1281–1302.
Ravallion, M. and Lokshin, M. (2000). Who want to redistribute? the tunnel effectin 1900s russia. Journal of Public Economics, 76, 87–104.
Schokkaert, E., Verhue, M. and Omey, E. (2002). Unemployment compensationpreferences: Insurance and solidarity. In H. S. C. D’Aspremont, V. Ginsburgh andF. Spinnewyn (eds.), Institutional and financial incentives for social insurance, Mas-sachusetts: Kluwer Academic Publishers Norwell.
Shogren, J. (1987). Negative conjectures and increased public good provision. EconomicsLetters, 23, 181–184.
— (1990). On increased risk and the volontary provision of public goods. Social Choiceand Welfare, 7, 221–229.
Wooldridge, J. (2005). Simple solutions to the initial conditions problem in dynamic,nonlinear panel data models with unobserved heterogeneity. Journal of Applied Econo-metrics, 20, 39–54.
21

Magdalou, Dubois, Nguyen-Van / Risk and Inequality Aversion in Social Dilemmas
A. Instructions
A.1. General instructions
(translated from the french) You are going to participate in an experiment designed forstudying decision process. We ask you to read carefully the whole instructions. Theseinstructions are simple and should help you to understand the experiment. When allparticipants have read these instructions an experimenter will read it again.
Decisions you will take are anonymously collected by the computer-network.
Your earnings will depend on your own decisions as well as on the decisions taken by theother participants. The monetary unit used in the experiment is the ecu. The conversionrate of the ecus into euros will be specified at the end of these instructions. The totalamount of ecus earned during the experiment will be given to you in cash at the end ofthe experiment.
The experiment does not contain “good” or “bad” decisions. Every decision may have itsown justification.
We ask you not to communicate with the other participants during the experiment. It isa necessary condition for the success of the experiment.
A.2. Instructions dealing with the elicitation of inequality aversion
(translated from the french) We are going to describe two games you may participate in.You will have to vote for one of them. Every participant in this room will face the samevote. Only the game having obtained the majority of votes will apply. If there is a perfectequality between the votes for both games, a random draw made by the central computerwill determine the game that will apply.
The two games :
Game #In this game every participant can receive one of the three following earnings: 20 ecus, 40ecus or 60 ecus. The central computer makes one random draw for each participantin this room. Thus each participant receives her own earnings with respect to the randomdrawn applying to her.
Game §In this game each participant can receive one of the three following earnings: 20 ecus,40 ecus or 60 ecus. The central computer makes only one random draw applyingfor every participant. Thus each participant receives the same earnings with respectto the unique random draw applying to everyone.
The conversion rate is as follow: 10 ecus = 1 euro.
22

Magdalou, Dubois, Nguyen-Van / Risk and Inequality Aversion in Social Dilemmas
Before the start of the experiment you will have to complete a short questionnaire, in orderto check your understanding of the instructions. When every participant has completedthe questionnaire, you will have to vote.
A.3. Instructions dealing with the elicitation of risk aversion
(translated from the french) We are going to describe two games you may participate in.You will have to vote for one of them. Every participant in this room will face the samevote. Only the game having obtained the majority of votes will apply. If there is a perfectequality between the votes for both games, a random draw made by the central computerwill determine the game that will apply.
The two games :
Game #In this game every participant receive 40 ecus.
Game §In this game each participant can receive one of the three following earnings: 20 ecus,40 ecus or 60 ecus. The central computer makes only one random draw applyingfor every participant. Thus each participant receives the same earnings.
The conversion rate is as follow: 10 ecus = 1 euro.
Before the start of the experiment you will have to complete a short questionnaire in orderto check your understanding of the instructions. When every participant has completedthe questionnaire, you will have to vote.
A.4. Instructions dealing with the social dilemma game
(translated from the french) In this experiment all the participants in the room are dividedinto groups of three. Groups are formed randomly, and will stay fixed for the wholeexperiment. You can not identify the other members of your group, and the other membersof your group can not identify you.
This experiment consists into a repetition of 20 periods. At each period, you will have tovote for one of two earnings distributions. These distributions will remain the same for allthe periods. In each period the distribution having the majority vote in your group willapply for the period, and for your group.
At the start of each period a random draw will place each of the three group members inone of the three following position: A, B or C. You will be informed of your position forthe period before your vote. Figure 4 is an example of the decision screen.
After the vote of each member of your group, a summary of the period will be displayed,with the following information: your position for the period, your vote, the majority votein your group and your earnings for the period. Also, you will have information about
23

Magdalou, Dubois, Nguyen-Van / Risk and Inequality Aversion in Social Dilemmas
the past periods. You can consult this history at any moment by clicking on the button“history”. Figure 5 is an example of the history screen.
The two earnings distributions:
Distribution #In this distribution, earnings with respect to the position in the group are the following:
Position A B CGain (ecus) 10 70 70
Distribution §In this distribution, earnings with respect to the position in the group are the following:
Position A B CGain (ecus) 60 60 60
The conversion rate is the following: 100 ecus = 1 euro.
Before the start of the experiment you will have to complete a short questionnaire, in orderto check your understanding of the instructions. When every participant has completedthe questionnaire, the first period will begin.
B. Figures
24

Magdalou, Dubois, Nguyen-Van / Risk and Inequality Aversion in Social Dilemmas
Figure 3: Evolution of the average cooperation rate by aversion profile
5 10 15 20
020
4060
8010
0
(A, A)
Periods
Coo
pera
tion
rate
Majority Rank A Ranks B & C
5 10 15 20
020
4060
8010
0
(A, P)
Periods
Coo
pera
tion
rate
Majority Rank A Ranks B & C
5 10 15 20
020
4060
8010
0
(P, A)
Periods
Coo
pera
tion
rate
Majority Rank A Ranks B & C
5 10 15 20
020
4060
8010
0
(P, P)
Periods
Coo
pera
tion
rate
Majority Rank A Ranks B & C
5 10 15 20
020
4060
8010
0
Mixed
Periods
Coo
pera
tion
rate
Majority Rank A Ranks B & C
Notes. For example, (A,P) signifies inequality-averse and risk-prone.
25

Magdalou, Dubois, Nguyen-Van / Risk and Inequality Aversion in Social Dilemmas
Figure 4: Screenshot of decision in the game
26
Magdalou, Dubois, Nguyen-Van / Risk and Inequality Aversion in Social Dilemmas
Figure 5: Screenshot of history
27