returned unwanted medicines survey victorian
TRANSCRIPT
RETURNED UNWANTED
MEDICINES SURVEY
VICTORIAN REPORT (MELBOURNE METROPOLITAN AREA)
Bella Brushin
Melbourne 2005

iii
CONTENTS
List of figures v List of abbreviations vii Acknowledgements viii Background ix Abstract xi CHAPTER I: RESEARCH DESIGN AND METHODS 1 Introduction 1
Part A: Background 2
1.1 The aim, key research questions and specific objectives 2
1.1.1 Overall aim 2
1.1.2 The key research questions 2
1.2 The overall methodological approach and design 3
1.2.1 Research stages 3
1.2.2 Project materials 4
Part B: Overview of research methods and procedures 4
1.3 Sampling and the sample 4
1.4 Recruitment and training 6
1.4.1 Recruitment rounds 7
1.4.2 Challenges associated with recruitment 8
1.4.3 Training 9
1.5 Data collection 10
1.5.1 Methods of data collection 10
1.5.2 Strategies to improve data collection 11
1.6 Data management and analysis 12
1.6.1 Data coding 12
1.6.2 Quality assurance 13
1.6.3 Data analysis 13 1.7 Ethical and privacy issues 14
CHAPTER II: RESEARCH FINDINGS – CONSUMER CHARACTERISTICS & PRACTICES ASSOCIATED WITH RETURN OF UNWANTED MEDICINES 16
Introduction 16
Part A: Socio-demographic characteristics of consumers 17
2.1 Age, gender and levels of education reached 17
2.2 Country of birth and language spoken at home 18
iv
2.3 Place of residence and living arrangements 20
Part B: Consumer practices associated with the return of unwanted medicines 22
2.4 Locations, prior experience and occurrences of returns 22
2.4.1 Locations 22
2.4.2 Prior experiences and occurrences 24
2.5 Return of own medicines and those prescribed to or used by others 26
2.6 Sources of consumer information 28
CHAPTER III: RESEARCH FINDINGS – THE KINDS OF MEDICINES RETURNED AND THE REASONS FOR RETURN 34
Introduction 34
Part A: The kinds of medicines returned 35
3.1 Definitions 35
3.1.1 Medicines 35
3.1.2 Generic and proprietary name medicines 36
3.1.3 Prescription and non-prescription medicines 36
3.1.4 Subsidy category 37
3.2 Characteristics of returned medicines 37
3.2.1 Generic and proprietary (brand) name medicines 37
3.2.2 Prescription and non-prescription medicines 38
3.2.3 Form and presentation 39
3.2.4 Subsidy category 39
3.2.5 Medicines’ use-by date 39
3.3 Classification of returned medicines 40
3.4 The most commonly returned medicines 41
Part B: The reasons for return 47
3.5 Classification of reasons 47
3.5.1 Individual reasons and explanations 47
3.5.2 Reason categories 48
3.6 Stated reasons for return 49
3.6.1 Single and multiple reasons 49
3.6.2 Multiple responses by reason category 51
3.6.3 Medicines returned due to unwanted effects 56
3.6.4 Medicines stopped without consulting a medical practitioner 57
3.6.5 Unused medicines 58
v
CHAPTER IV: SUMMARY OF KEY RESEARCH FINDINGS AND RECOMMENDATIONS 64
Part A: Key research findings – consumer practices 64
Part B: Key research findings – the kinds of medicines returned and the reasons for return 68
Part C: Recommendations 70
4.12 Areas for further research 70
4.13 Target populations 72
REFERENCES 77
APPENDICES 79 Appendix 1: Plain language statement for data collectors 80
Appendix 2: Plain language statement for consumers 81
Appendix 3: Consent form for data collectors 82
Appendix 4: Survey Completion Instruction Manual 83
Appendix 5: Covering letter to data collectors 84
Appendix 6: Pharmacy Guild districts and pharmacy locations in Melbourne 85
Appendix 7: A joint letter of the Pharmacy Guild and the RUM Project 86
Appendix 8: Pharmacy Data Logbook 87
Appendix 9: Returned Medicines Survey 88
Appendix 10: RUMS Data Coding Manual 92
Appendix 11: Medicines returned in RUMS by medicine name 94
Appendix 12: Medicines returned in RUMS by generic name 111
LIST OF FIGURES
Chapter I 1.1 Numbers of pharmacies by geographical district 5 1.2 Stage One sample details 6 1.3 Data sources and methods of data collection and recording 10
Chapter II 2.1 Age group 17 2.2 Highest level of education reached 18 2.3 Country of birth 19 2.4 Languages spoken at home 20 2.5 Places of residence 20 2.6 Highest level of education reached – by pharmacy district 21 2.7 Country code – by pharmacy district 22 2.8 ‘Do you usually return unwanted medicines to … ?’ – by pharmacy district 23
vi
2.9 ‘Do you usually return unwanted medicines?’ – by age group 23 2.10 ‘Have you returned unwanted medicines before?’ – by age group 24 2.11 Time interval between current and prior return of unwanted medicines 25 2.12 ‘When was last time you returned medicines?’ – by age group 25 2.13 ‘Whose medicines did you dispose of today?’ – by age group 26 2.14 Returning medicines for others (passed away) – by age group 27 2.15 Returning medicines for others (others moved out) – by age group 27 2.16 Returning medicines for others (others moved out) – by gender 28 2.17 Poster display at participating pharmacies 29 2.18 Other advertising by participating pharmacies 30 2.19 Sources of information utilised by consumers – by gender 31 2.20 Sources of information utilised by consumers – by age group 32 2.21 Sources of information utilised by consumers – by language spoken at home 33
Chapter III 3.1 Expiry date range 40 3.2 Medicines returned – by therapeutic class (in descending order) 42 3.3 The top 25 most commonly returned medicines (all reasons) 43 3.4 The top 25 most commonly returned medicines (all reasons) – by generic name 44 3.5 AMS results: the top 10 most commonly used medicines in the Australian
community 45 3.6 Reason category and stated reasons for return 49 3.7 Reason 1 return by reason category 50 3.8 Reason 2 return by reason category 51 3.9 Multiple responses – reasons for return – excluding selected reasons 52 3.10 Multiple responses – therapeutic class – by reason category 53 3.11 Percent within category of return – by therapeutic class 55 3.12 Medicines returned due to unwanted effects – by selected therapeutic class 57 3.13 Medicines returned due to ‘unwanted effects’ – by therapeutic class 57 3.14 The top 10 generic medicines returned due to experiencing ‘unwanted effects’ 57 3.15 Medicines stopped by consumers without consulting a medical practitioner –
by therapeutic class 58 3.16 The top 10 medicines stopped by consumers without consulting a medical
practitioner 58 3.17 Percentage usage category (frequencies in descending order) 59 3.18 Frequency table for unused medicines – by therapeutic class (all medicines) 60 3.19 Frequencies for zero percent used medicines – by generic name (all reasons) 60 3.20 Expiry date range – unused medicines – selected reasons – multiple responses 62 3.21 Expiry date range – unused medicines – by all reason categories 62 3.22 Expiry date range – unused medicines – by reason category (excluding
reason category III) 62
Chapter IV 4.1 The top generic medicines returned – by therapeutic class 69
vii
LIST OF ABBREVIATIONS
AMH Australian Medicines Handbook
AMRO [the Association of Market Research Organisations
ASM Australian Statistics on Medicines
Board Board of the Return Unwanted Medicines Project
DUSC Drug Utilisation Sub-Committee Guild Pharmacy Guild of Australia
HIC Health Insurance Commission
LOTE language/s other than English
Manual Survey Completion Instruction Manual
NES non-English speaking NHS the National Health Survey
OTC over-the-counter medicines
PBPA the Pharmaceutical Benefits Pricing Authority
PBS Pharmaceutical Benefits Schedule
QCPP Quality Care Pharmacy Program
QUM Quality Use of Medicines
RPBS Repatriation Pharmaceutical Benefit Scheme
RUM Project the Return Unwanted Medicines Project
RUMS Returned Unwanted Medicines Survey
SPSS Statistical Package for Social Sciences
SUSDP Standard for the Uniform Scheduling of Drugs and Poisons
the survey Returned Medicines Survey: a structured research instrument utilised in
RUMS for data collection
TC therapeutic class
TGA Therapeutic Goods Administration
TI Therapeutic Index
viii
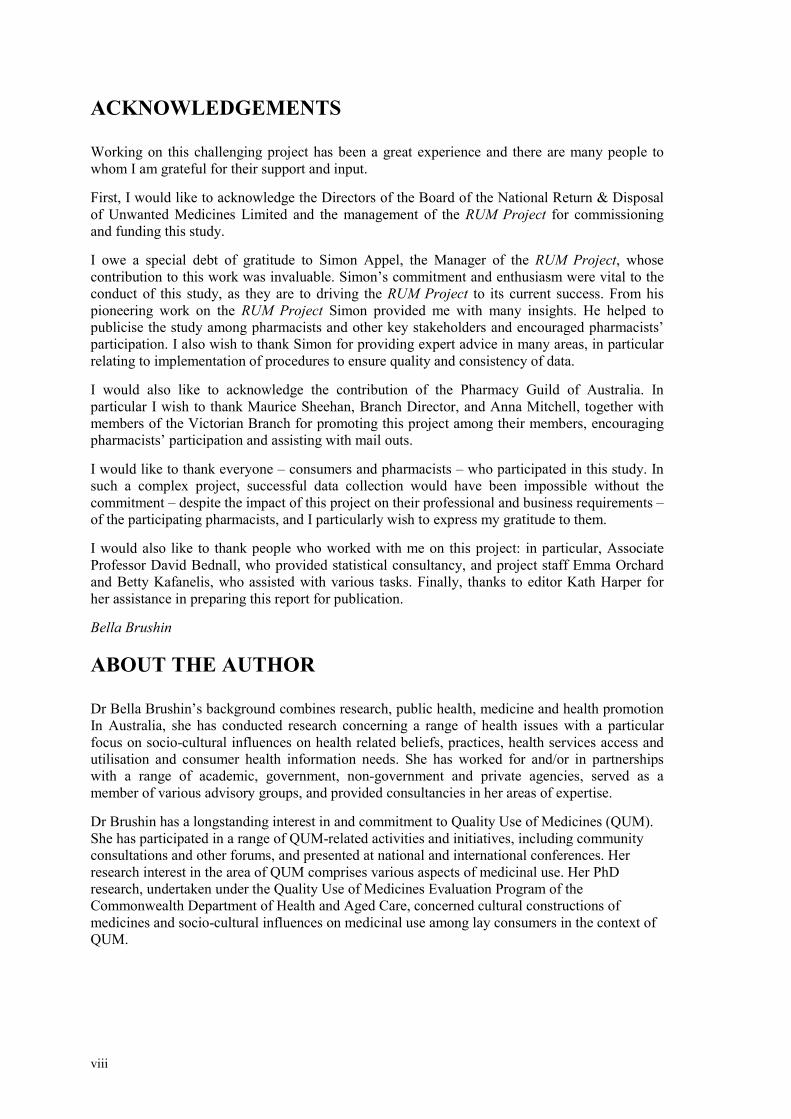
ACKNOWLEDGEMENTS
Working on this challenging project has been a great experience and there are many people to whom I am grateful for their support and input.
First, I would like to acknowledge the Directors of the Board of the National Return & Disposal of Unwanted Medicines Limited and the management of the RUM Project for commissioning and funding this study.
I owe a special debt of gratitude to Simon Appel, the Manager of the RUM Project, whose contribution to this work was invaluable. Simon’s commitment and enthusiasm were vital to the conduct of this study, as they are to driving the RUM Project to its current success. From his pioneering work on the RUM Project Simon provided me with many insights. He helped to publicise the study among pharmacists and other key stakeholders and encouraged pharmacists’ participation. I also wish to thank Simon for providing expert advice in many areas, in particular relating to implementation of procedures to ensure quality and consistency of data.
I would also like to acknowledge the contribution of the Pharmacy Guild of Australia. In particular I wish to thank Maurice Sheehan, Branch Director, and Anna Mitchell, together with members of the Victorian Branch for promoting this project among their members, encouraging pharmacists’ participation and assisting with mail outs.
I would like to thank everyone – consumers and pharmacists – who participated in this study. In such a complex project, successful data collection would have been impossible without the commitment – despite the impact of this project on their professional and business requirements – of the participating pharmacists, and I particularly wish to express my gratitude to them.
I would also like to thank people who worked with me on this project: in particular, Associate Professor David Bednall, who provided statistical consultancy, and project staff Emma Orchard and Betty Kafanelis, who assisted with various tasks. Finally, thanks to editor Kath Harper for her assistance in preparing this report for publication.
Bella Brushin
ABOUT THE AUTHOR
Dr Bella Brushin’s background combines research, public health, medicine and health promotion In Australia, she has conducted research concerning a range of health issues with a particular focus on socio-cultural influences on health related beliefs, practices, health services access and utilisation and consumer health information needs. She has worked for and/or in partnerships with a range of academic, government, non-government and private agencies, served as a member of various advisory groups, and provided consultancies in her areas of expertise.
Dr Brushin has a longstanding interest in and commitment to Quality Use of Medicines (QUM). She has participated in a range of QUM-related activities and initiatives, including community consultations and other forums, and presented at national and international conferences. Her research interest in the area of QUM comprises various aspects of medicinal use. Her PhD research, undertaken under the Quality Use of Medicines Evaluation Program of the Commonwealth Department of Health and Aged Care, concerned cultural constructions of medicines and socio-cultural influences on medicinal use among lay consumers in the context of QUM.
ix
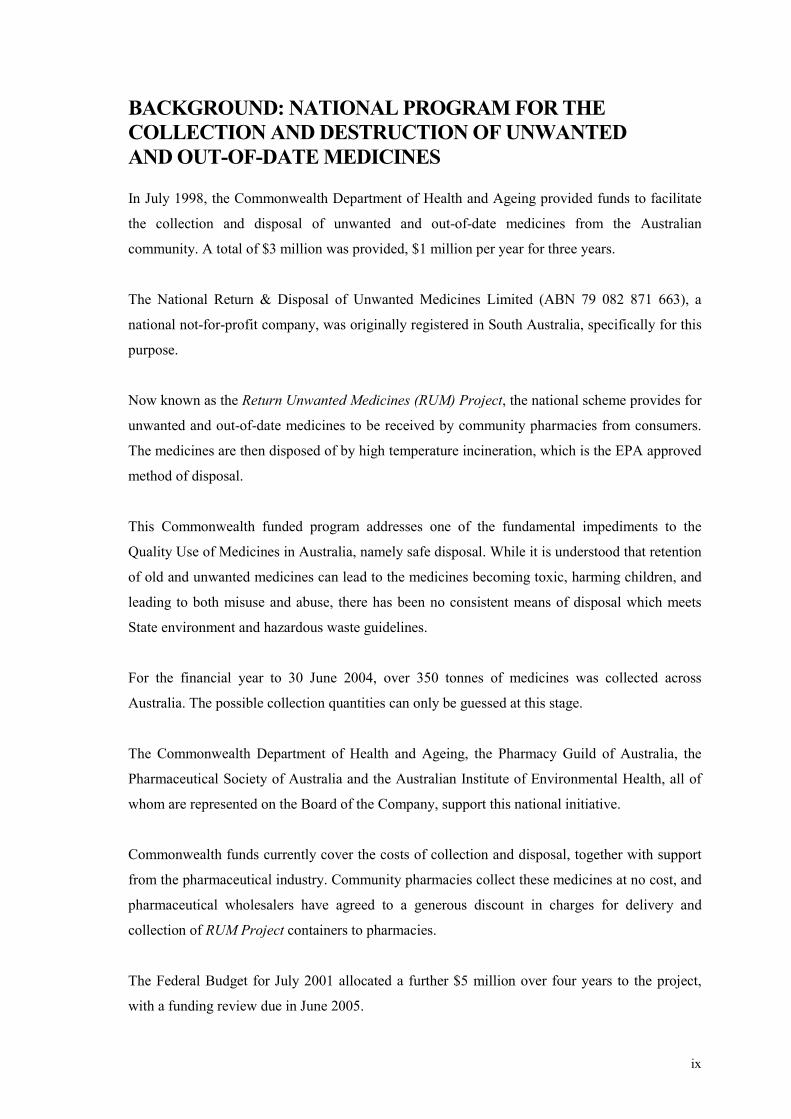
BACKGROUND: NATIONAL PROGRAM FOR THE COLLECTION AND DESTRUCTION OF UNWANTED AND OUT-OF-DATE MEDICINES
In July 1998, the Commonwealth Department of Health and Ageing provided funds to facilitate
the collection and disposal of unwanted and out-of-date medicines from the Australian
community. A total of $3 million was provided, $1 million per year for three years.
The National Return & Disposal of Unwanted Medicines Limited (ABN 79 082 871 663), a
national not-for-profit company, was originally registered in South Australia, specifically for this
purpose.
Now known as the Return Unwanted Medicines (RUM) Project, the national scheme provides for
unwanted and out-of-date medicines to be received by community pharmacies from consumers.
The medicines are then disposed of by high temperature incineration, which is the EPA approved
method of disposal.
This Commonwealth funded program addresses one of the fundamental impediments to the
Quality Use of Medicines in Australia, namely safe disposal. While it is understood that retention
of old and unwanted medicines can lead to the medicines becoming toxic, harming children, and
leading to both misuse and abuse, there has been no consistent means of disposal which meets
State environment and hazardous waste guidelines.
For the financial year to 30 June 2004, over 350 tonnes of medicines was collected across
Australia. The possible collection quantities can only be guessed at this stage.
The Commonwealth Department of Health and Ageing, the Pharmacy Guild of Australia, the
Pharmaceutical Society of Australia and the Australian Institute of Environmental Health, all of
whom are represented on the Board of the Company, support this national initiative.
Commonwealth funds currently cover the costs of collection and disposal, together with support
from the pharmaceutical industry. Community pharmacies collect these medicines at no cost, and
pharmaceutical wholesalers have agreed to a generous discount in charges for delivery and
collection of RUM Project containers to pharmacies.
The Federal Budget for July 2001 allocated a further $5 million over four years to the project,
with a funding review due in June 2005.
x
The current Commonwealth agreement does not provide for funding of ‘consumer awareness
campaigns’. While the pharmaceutical industry supports the RUM Project, consumers are
relatively unaware of the facility. A ‘consumer awareness campaign’ was conducted in New
South Wales for two years, 1991–1993. This campaign was funded by the New South Wales
Department for the Environment, which contributed $670,000 over two years. This campaign
was successful, with increases in collections greater than 20 percent over this period. Such
‘consumer awareness campaigns’ should be a serious consideration in future funding.
The RUM Project has consistently attempted State and Territory participation in the funding of
consumer awareness campaigns, with success limited to New South Wales.
The RUM Project is an important ingredient of the Quality Use of Medicines protocols. The
Quality Care Pharmacy Program (QCPP) will incorporate the protocols of the RUM Project into
professional standards in 2005, and Pharmacy Boards across Australia endorse the project.
The current agreement with the Commonwealth obliges the RUM Project to conduct a survey of
returned medicines from consumers.
The Returned Unwanted Medicines Survey, conducted by Dr Bella Brushin, provides for the
collection of returned medicines details by pharmacists, in the community pharmacy environment
in metropolitan Melbourne. Commencing in Victoria, the Survey will be extended to all states
and territories over future years.
Simon Appel Project Manager Return Unwanted Medicines (RUM) Project
xi
ABSTRACT
The Returned Unwanted Medicines Survey (RUMS) has been commissioned and funded by the
National Return & Disposal of Unwanted Medicines Limited and the RUM Project. RUMS aims
at an accurate description of the unwanted and out-of-date medicines returned by consumers to
community pharmacies and an understanding of the behaviour of both consumers and
pharmacists under the scheme. The study in this Report thus provides insights into the success of
the RUM Project and suggests areas where a change in approach may be desirable. In the context
of QUM principles, findings from this study may enhance understanding of consumer practices
relating to disposal of medicines and inform the development of programs and activities that
promote safe practices in the disposal of unwanted medicines among Australian consumers.
Conducted by Dr Bella Brushin in Melbourne, Australia, RUMS was designed as a survey of
those occasions when consumers returned unwanted and out-of-date medicines to pharmacies for
safe disposal, with research carried out in two overlapping stages. RUMS has been a complex
project requiring intricate data collection instruments, a multi-stage sampling scheme, multiple
data collection methods, extensive fieldwork arrangements and a hierarchical data set. Given the
complexity of the study, considerable effort was taken to test and refine the RUMS approach
prior to implementing the survey. Several quality assurance processes were introduced to ensure
the accuracy and consistency of data.
The material in this Report is divided into several chapters. Chapter I sets out the study’s aim, the
specific objectives and the key research questions, the overall design of this study and the data
sources; and describes specific research methods and techniques used for sampling, data
collection management and analysis and research procedures, including those to ensure ethical
conduct of research. Chapter II and Chapter III describe a range of research findings. Chapter II
focuses on socio-demographic characteristics of consumers and various aspects of consumer
practices relating to the return of unwanted and out-of-date medicines to community pharmacies,
while Chapter III describes RUMS findings relating to the kinds of medicines returned and the
reasons for their return.
Chapter IV summarises RUMS key research findings and provides recommendations within the
context of QUM. Based on findings in this report, several recommendations are made for future
research in this area and for the development of activities promoting the RUM Project and safe
disposal of unwanted medicines among diverse population groups.

CHAPTER I: RESEARCH DESIGN AND METHODS
1
CHAPTER I: RESEARCH DESIGN AND METHODS
Introduction The Returned Unwanted Medicines Survey (RUMS) has been a complex project requiring
intricate data collection instruments, a multi-stage sampling scheme, extensive fieldwork
arrangements and a hierarchical data set. Given the complexity of the study, considerable effort
was taken to test and refine the RUMS approach prior to implementing the survey. Chapter I
details the research design, methods and procedures utilised in RUMS.
The material in this chapter is divided into two parts. Part A sets out the study’s aim, the specific
objectives and the key research questions; the overall design of this study and the data sources.
Part B describes specific research methods and techniques used for sampling, data collection
management and analysis; and research procedures, including those to ensure ethical conduct of
research. The material in this chapter is divided into several sections and the material is structured
under the following subheadings:
Part A: Background
1.1 The aim, key research questions and specific objectives
1.1.1 Overall aim
1.1.2 The key research questions
1.2 The overall methodological approach and design
1.2.1 Research stages
1.2.2 Project materials
Part B: Overview of research methods and procedures
1.3 Sampling and the sample
1.4 Recruitment and training
1.4.1 Recruitment rounds
1.4.2 Challenges associated with recruitment
1.4.3 Training
1.5 Data collection
1.5.1 Methods of data collection
1.5.2 Strategies to improve data collection
1.6 Data management and analysis
1.6.1 Data coding
RUMS REPORT
2
1.6.2 Quality assurance
1.6.3 Data analysis 1.7 Ethical and privacy issues
Part A: Background 1.1 The aim, key research questions and specific objectives 1.1.1 Overall aim The RUM Project, a national scheme, provides for unwanted and out-of-date medicines to be
received by community pharmacies from consumers. The RUM Project encourages the return
and safe disposal of unwanted medicines which could otherwise poison consumers, lead to
misuse of medicines and run the risk of environmental toxicity through poor disposal practices.
The focus of the study is on prescription medicines. The study aims at an accurate description of
actual returns and an understanding of the behaviour of both consumers and pharmacists under
the scheme. In this way, the study will give insights into the success of the RUM Project and
suggest areas where a change in approach may be desirable.
1.1.2 The key research questions are:
� What are consumer practices related to return of unwanted and out-of date medicines to
community pharmacies?
� What are the social and demographic influences underpinning consumer practices related
to return of unwanted and out-of date medicines to community pharmacies?
� What medicines are being returned by consumers to community pharmacies and why are
these medicines not wanted or not needed by consumers?
More specifically, this study aims to examine consumer practices related to the disposal of
unwanted and out-of date medicines among consumers in metropolitan Melbourne, Australia.
Investigation is directed towards identifying and describing:
� demographic, social and cultural influences on consumer practices related to return of
medicines to community pharmacies;
� sources of consumer information about the disposal of unwanted medicines;
� consumer practices related to return of medicines that may jeopardise the principles of
QUM; and
� community pharmacies’ activities relating to disposal of unwanted medicines.
CHAPTER I: RESEARCH DESIGN AND METHODS
3
It is anticipated that findings from this study will enhance understanding of consumer practices
related to the disposal of medicines and inform the development of programs and activities that
promote safe practices in the disposal of unwanted medicines in the context of the QUM
principles. Ultimately the outcomes of the study will augment QUM among Australian
consumers.
1.2. The overall methodological approach and design
The overall methodological approach to RUMS is quantitative. In general, quantitative
approaches are most appropriate where an accurate description of the scope and extent of
community behaviour is required. This approach allows us to produce important information on
consumer practices relating to the return of unwanted and out-of-date medicines to community
pharmacies, the kinds of medicines that are being returned and the reasons for return.
RUMS has been designed as a survey of those occasions when consumers in Melbourne,
Australia returned unwanted and out-of-date medicines to pharmacies for safe disposal. It
collected data both on the consumers themselves and on the actual medicines returned to
community pharmacies. The study was carried out in the Melbourne metropolitan area, with
collection of data over approximately five months ending in July 2004.
1.2.1 Research stages
RUMS was conducted in two overlapping stages. The objectives of Stage I were threefold.
Firstly, it aimed to develop and refine appropriate research design, methods and instruments.
Secondly, it aimed to develop research procedures and various research materials. Thirdly, it
aimed to recruit and train community pharmacists for data collection. The objective of Stage II
was to collect and analyse data in order to meet the overall aim and the specific objectives of
RUMS and to address the key research questions.
Stage I major activities aimed to:
� establish project processes, procedures and protocols;
� implement procedures to ensure ethical conduct of research and the privacy of
participating consumers;
� publicise the study to aid the recruitment of data collectors (pharmacists and/or pharmacy
students);
� select a sampling frame and apply sampling techniques;
� recruit data collectors and provide appropriate training;
� validate and refine research instruments;
� develop and refine various study materials, including training materials; and
RUMS REPORT
4
� arrange for printing and postage of various study materials.
Stage II major activities aimed to:
� collect, store and manage data;
� provide support to participating pharmacies;
� develop relevant databases for data entry;
� develop and implement quality assurance processes for data verification and cleaning;
� identify existing sources suitable for data verification; and
� analyse data and report findings.
1.2.2 Project materials
The materials1 specifically designed for this study incorporated:
� Plain language statement for data collectors (Appendix 1);
� Plain language statement for participating consumers (Appendix 2);
� Consent form for data collectors (Appendix 3);
� Survey Completion Instruction Manual ( the Manual) (Appendix 4); and
� Covering letter to data collectors (Appendix 5).
The materials mentioned above were used in various ways. First, the materials were used to
provide general information about the study’s aims, methodology, procedures and anticipated use
of data. Then, they were utilised for training of data collectors. Some materials were also useful
to publicise RUMS. The materials also addressed issues of privacy to enhance ethical conduct of
research. Thus, plain language statements provided participants with explicit assurances of
privacy and safety.
Part B: Overview of research methods and procedures
1.3. Sampling and the sample
The primary population of interest to this project consisted of the all the medicines returned to
community pharmacies in Melbourne. Secondary populations of interest were the people who
returned these medicines and the pharmacies which accepted them. A three-stage sampling
approach was used.
1 All project materials included the RUM Project logo.
CHAPTER I: RESEARCH DESIGN AND METHODS
5
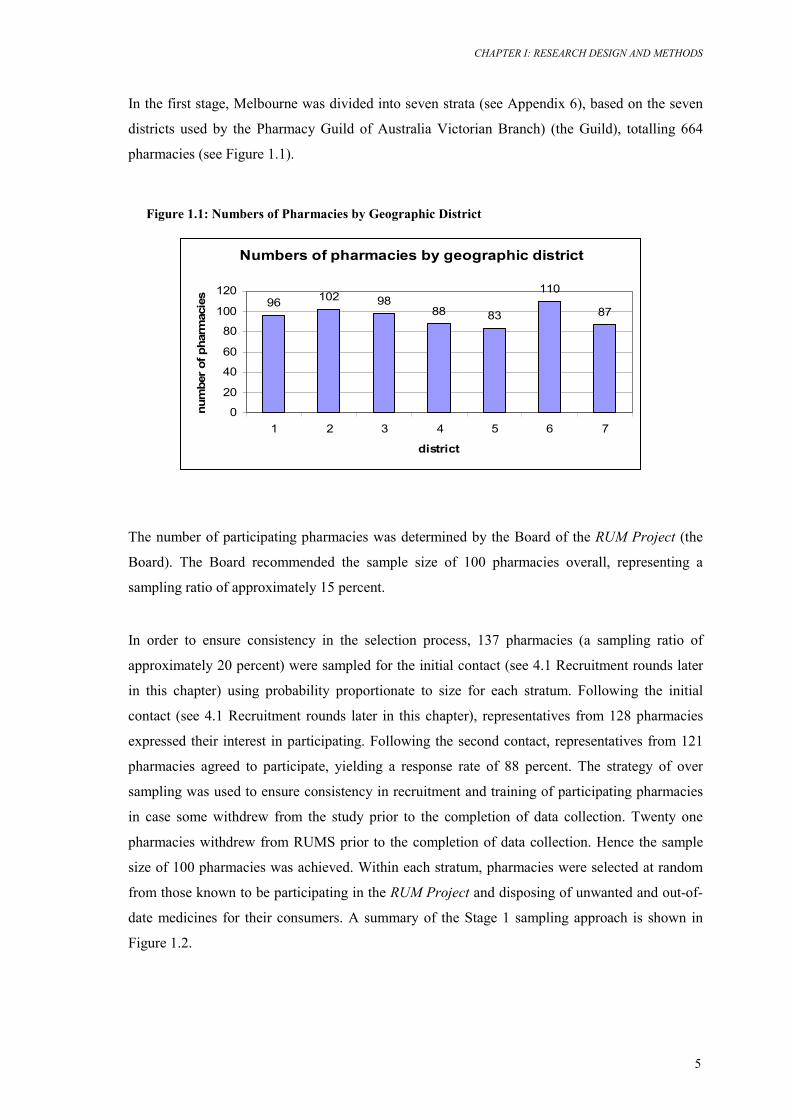
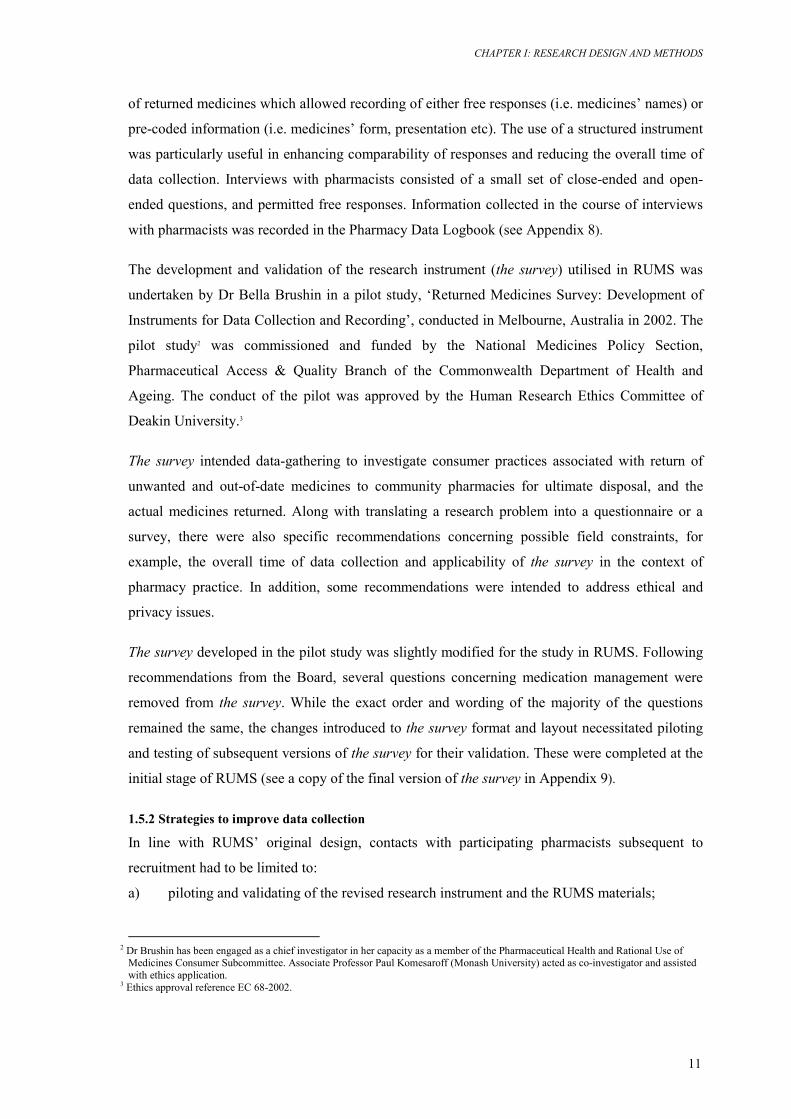
In the first stage, Melbourne was divided into seven strata (see Appendix 6), based on the seven
districts used by the Pharmacy Guild of Australia Victorian Branch) (the Guild), totalling 664
pharmacies (see Figure 1.1).
Figure 1.1: Numbers of Pharmacies by Geographic District
The number of participating pharmacies was determined by the Board of the RUM Project (the
Board). The Board recommended the sample size of 100 pharmacies overall, representing a
sampling ratio of approximately 15 percent.
In order to ensure consistency in the selection process, 137 pharmacies (a sampling ratio of
approximately 20 percent) were sampled for the initial contact (see 4.1 Recruitment rounds later
in this chapter) using probability proportionate to size for each stratum. Following the initial
contact (see 4.1 Recruitment rounds later in this chapter), representatives from 128 pharmacies
expressed their interest in participating. Following the second contact, representatives from 121
pharmacies agreed to participate, yielding a response rate of 88 percent. The strategy of over
sampling was used to ensure consistency in recruitment and training of participating pharmacies
in case some withdrew from the study prior to the completion of data collection. Twenty one
pharmacies withdrew from RUMS prior to the completion of data collection. Hence the sample
size of 100 pharmacies was achieved. Within each stratum, pharmacies were selected at random
from those known to be participating in the RUM Project and disposing of unwanted and out-of-
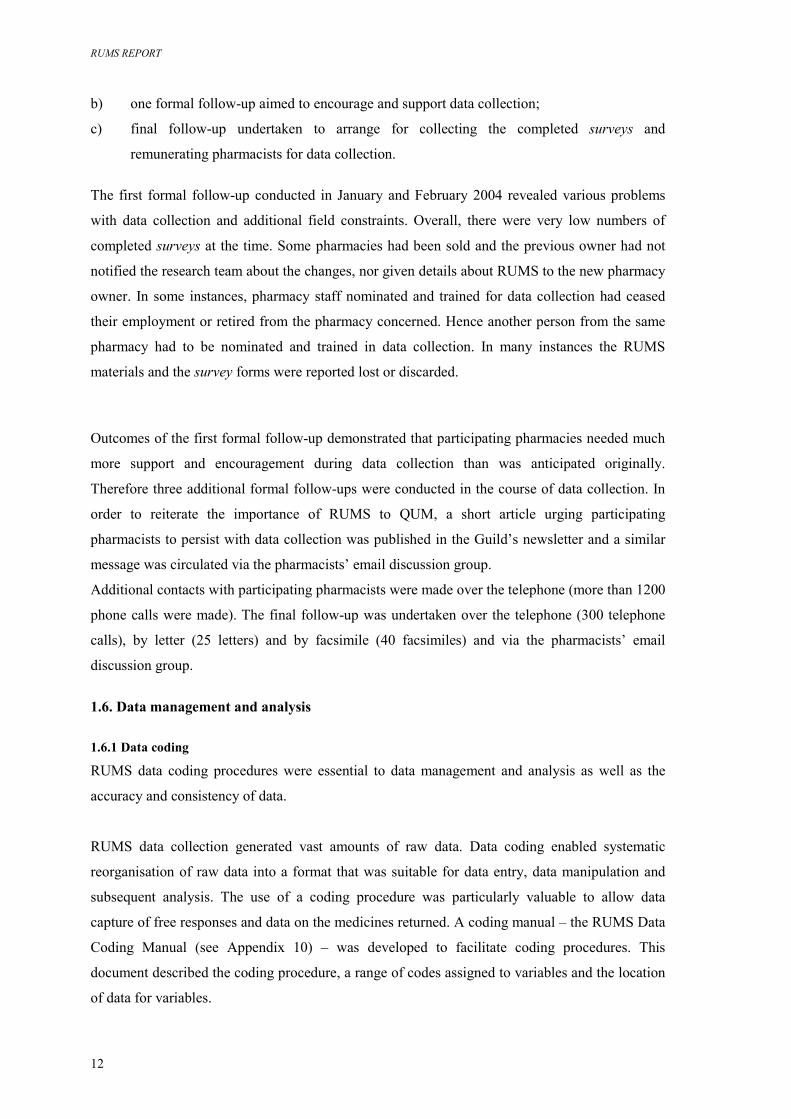
date medicines for their consumers. A summary of the Stage 1 sampling approach is shown in
Figure 1.2.
Numbers of pharmacies by geographic district
96 102 9888 83
110
87
0
20
40
60
80
100
120
1 2 3 4 5 6 7
district
num
ber
of p
harm
acie
s
RUMS REPORT
6
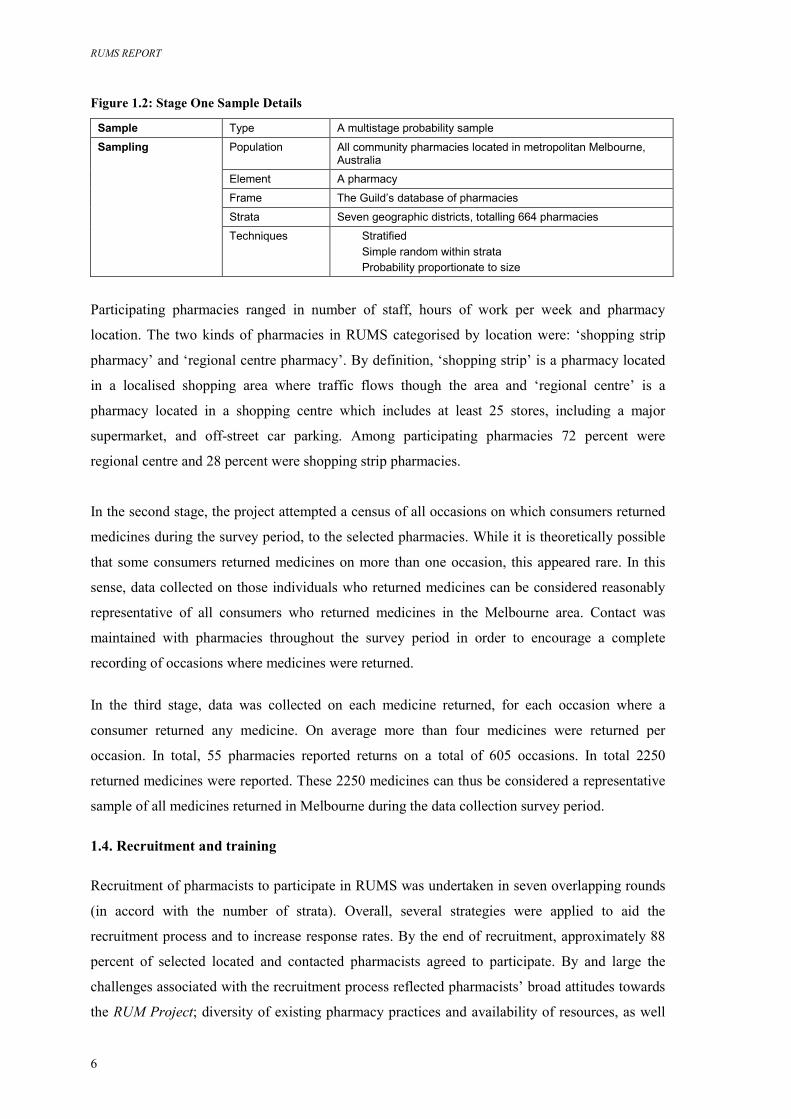
Figure 1.2: Stage One Sample Details
Sample Type A multistage probability sample
Sampling Population All community pharmacies located in metropolitan Melbourne, Australia
Element A pharmacy
Frame The Guild’s database of pharmacies
Strata Seven geographic districts, totalling 664 pharmacies
Techniques Stratified Simple random within strata Probability proportionate to size
Participating pharmacies ranged in number of staff, hours of work per week and pharmacy
location. The two kinds of pharmacies in RUMS categorised by location were: ‘shopping strip
pharmacy’ and ‘regional centre pharmacy’. By definition, ‘shopping strip’ is a pharmacy located
in a localised shopping area where traffic flows though the area and ‘regional centre’ is a
pharmacy located in a shopping centre which includes at least 25 stores, including a major
supermarket, and off-street car parking. Among participating pharmacies 72 percent were
regional centre and 28 percent were shopping strip pharmacies.
In the second stage, the project attempted a census of all occasions on which consumers returned
medicines during the survey period, to the selected pharmacies. While it is theoretically possible
that some consumers returned medicines on more than one occasion, this appeared rare. In this
sense, data collected on those individuals who returned medicines can be considered reasonably
representative of all consumers who returned medicines in the Melbourne area. Contact was
maintained with pharmacies throughout the survey period in order to encourage a complete
recording of occasions where medicines were returned.
In the third stage, data was collected on each medicine returned, for each occasion where a
consumer returned any medicine. On average more than four medicines were returned per
occasion. In total, 55 pharmacies reported returns on a total of 605 occasions. In total 2250
returned medicines were reported. These 2250 medicines can thus be considered a representative
sample of all medicines returned in Melbourne during the data collection survey period.
1.4. Recruitment and training
Recruitment of pharmacists to participate in RUMS was undertaken in seven overlapping rounds
(in accord with the number of strata). Overall, several strategies were applied to aid the
recruitment process and to increase response rates. By the end of recruitment, approximately 88
percent of selected located and contacted pharmacists agreed to participate. By and large the
challenges associated with the recruitment process reflected pharmacists’ broad attitudes towards
the RUM Project; diversity of existing pharmacy practices and availability of resources, as well
CHAPTER I: RESEARCH DESIGN AND METHODS
7
as pharmacists’ attitudes towards and experiences with conducting research in a pharmacy
setting.
Preceding recruitment, several strategies were applied to enhance response rates. These consisted
of various activities aimed at publicising and promoting RUMS among pharmacists eligible for
participation. First, an article about RUMS was published in the Pharmacy Guild’s monthly
newsletter, which is distributed to all Victorian pharmacies. Then, information about the study
was distributed via a pharmacists’ email discussion group – Auspharmlist. Also, a joint letter
from the Guild and the RUM Project (see Appendix 7) was sent to all pharmacies in metropolitan
Melbourne. This letter emphasised the importance of this study to QUM and aimed to encourage
pharmacists’ interest in participating in RUMS. The letters were distributed in seven mail outs
with each mail out being approximately a week ahead of the respective recruitment round.
1.4.1 Recruitment rounds
Each recruitment round (N=7), started with distribution of promotional letters to all pharmacies in
the given strata, and then was followed by the first contact of randomly selected pharmacies
within strata. The first contact was made by a representative of the research team over the
telephone. The aim of the first contact was threefold. First of all, it aimed to identify the
proprietor or a person nominated by the proprietor to discuss possible participation. Secondly, it
aimed to provide information about RUMS and gain a general expression of interest in
participating. Thirdly, it aimed to establish rapport with a person nominated and create a feeling
of trust as a means to future cooperation.
Due to the vast diversity of business and staffing arrangements within individual practices, as
well as various commitments of pharmacists, making the first contact presented the research team
with a considerable challenge. At this stage, it took more than 600 telephone calls to achieve the
first contact with all pharmacists concerned.
During the first contact, a representative of the research team:
� referred to the letter mentioned above and the article published in the Guild’s newsletter;
� provided information about what RUMS was about and who was able to participate as a
data collector;
� discussed the voluntary nature of participation and issues of privacy for both pharmacists
and their clients;
� explained what participation entailed and remuneration for pharmacists;
� gained pharmacists’ interest in participation and offered to send an information pack with
the RUMS materials; and
RUMS REPORT
8
� established pharmacists’ preferred times for callbacks.
Approximately 128 pharmacies expressed their interest, in principle, and requested the RUMS
materials, with several requesting more than one information pack. Altogether, 142 information
packs were distributed following the first contact.
The second contact was made within a couple of weeks and over the telephone. The aim of the
second contact was to recruit pharmacists and to arrange for training. During the second contact,
a representative of the research team:
� responded to a range of queries regarding the study;
� established preferred ways of communicating with pharmacists concerned;
� explained relevant processes and procedures in a greater detail; and
� arranged for a training session.
All recruited pharmacies were assigned a Pharmacy Identification number. This number was
quoted in all relevant communication and correspondence and was also used for data collection,
management and analysis purposes.
During the second contact, the representative of the research team also collected information
about participating pharmacies, facilitated signing of the consent form and arranged for training at
a time convenient for the participating pharmacists. Following the second contact, approximately
32 additional information packs were sent to replace those lost or discarded.
1.4.2 Challenges associated with recruitment
Strategies used in RUMS to achieve high response rates were also imperative to meeting
numerous challenges associated with recruitment. Those reflected the diversity of existing
pharmacy practices; various constraints associated with the everyday pharmacy operation;
pharmacists’ general attitudes towards the RUM Project; pharmacists’ attitudes towards research
conducted in a pharmacy setting; and their experience with conducting research.
The majority of pharmacists endorsed RUMS as an important initiative of the RUM Project and
the Guild and expressed their interest in the important issue under investigation as well as the
research outcomes. These pharmacists made many encouraging comments with regard to RUMS
design, processes and procedures and, more specifically, the RUMS materials. Notwithstanding
their interest and support, some pharmacists were not able to participate in RUMS due to existing
barriers. Thus, pharmacists who reported ‘being short on…’ or ‘having recent change of…’ staff
thought that participation in RUMS may impact on their business and provision of services to
CHAPTER I: RESEARCH DESIGN AND METHODS
9
their clients. Among pharmacists who expressed positive attitudes towards the RUM Project and
RUMS, some also declined participation due to the very limited number of medicines returned by
their consumers.
There was, however, a small group of pharmacists who declined participation because they either
doubted the value of the RUM Project or RUMS; objected to any research in a pharmacy setting;
felt that pharmacies were ‘over researched’; reported having limited skills or no interest in
conducting research; or felt that the level of remuneration for RUMS data collection was
insufficient.
1.4.3 Training
The objectives of training incorporated provision of step-by-step instructions with regard to data
collection, recording and short term storage. Issues of privacy and confidentiality were
emphasised, in particular anonymity of participants and access to data. Finally, pragmatic matters
such as means to return completed surveys, remuneration for data collection and reimbursement
of pharmacists for associated expenses were clarified.
The vast majority of pharmacists requested that training be provided over the telephone. There
were also some pharmacists (N=14) who requested a face-to-face training session. Those often
reported having limited experience with research.
Various RUMS materials were utilised in training. Thus the plain language statement for data
collectors (Appendix 1) was used to provide pharmacists with background information about the
study’s aims, methodology and procedures; the anticipated use of data; eligibility for
participation; and issues of privacy and possible risks for either pharmacists and/or consumers.
Whilst the plain language statement provided more general information about the study, the
Manual (Appendix 4) provided pharmacists with step-by-step instructions about how to collect,
record and store the data.
In order to facilitate training over the telephone, relevant project materials were colour coded:
� Plain language statement for data collectors (cream);
� Plain language statement for participating consumers (lilac); and
� Manual (yellow).
Also, text of particular importance in the Manual was highlighted and printed in red.
RUMS REPORT
10
1.5. Data collection
1.5.1 Methods of data collection
The methods of data collection for this study comprised a combination of interviews and
observation. Both data collection methods utilised in RUMS collected quantitative information
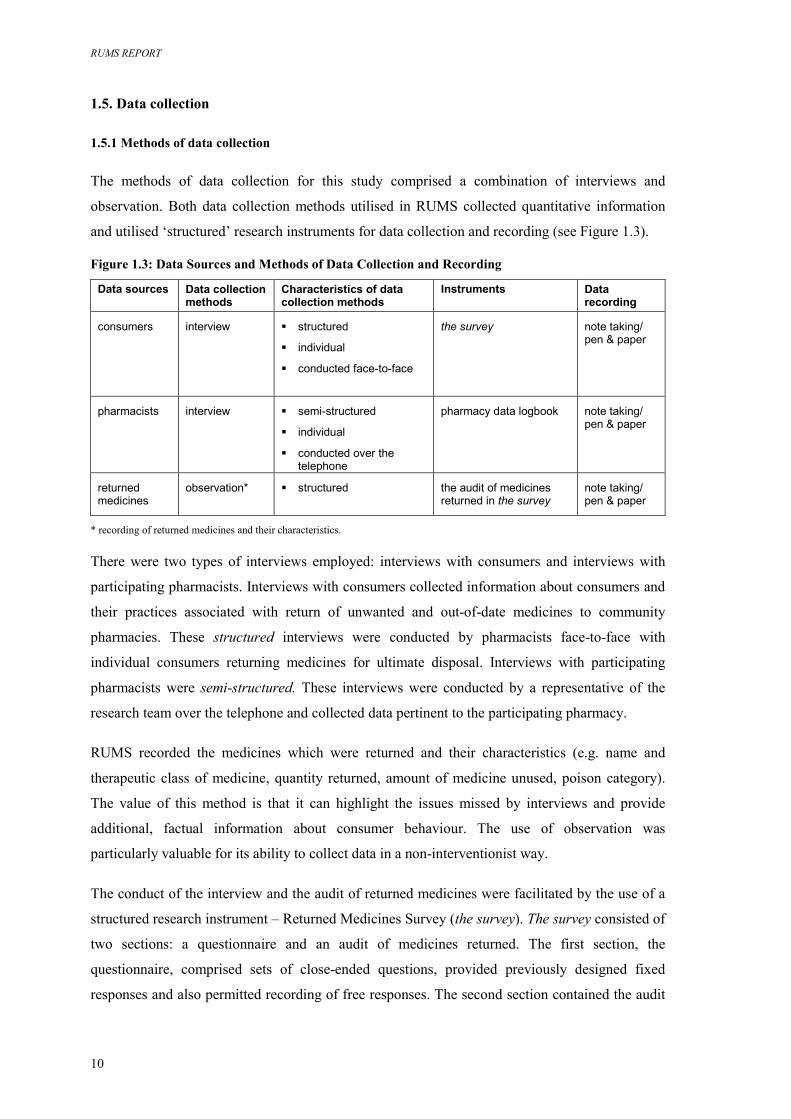
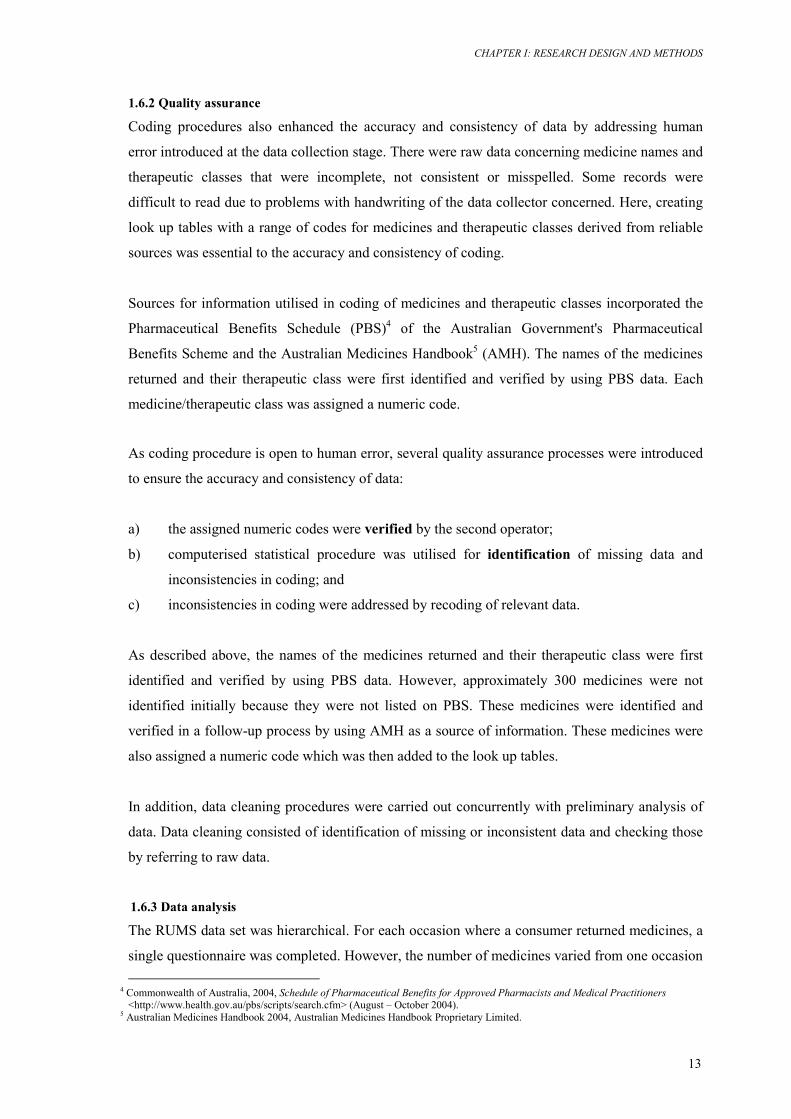
and utilised ‘structured’ research instruments for data collection and recording (see Figure 1.3).
Figure 1.3: Data Sources and Methods of Data Collection and Recording
Data sources Data collection methods
Characteristics of data collection methods
Instruments Data recording
consumers
interview
� structured
� individual
� conducted face-to-face
the survey note taking/ pen & paper
pharmacists
interview
� semi-structured
� individual
� conducted over the telephone
pharmacy data logbook note taking/ pen & paper
returned medicines
observation* � structured
the audit of medicines returned in the survey
note taking/ pen & paper
* recording of returned medicines and their characteristics. There were two types of interviews employed: interviews with consumers and interviews with
participating pharmacists. Interviews with consumers collected information about consumers and
their practices associated with return of unwanted and out-of-date medicines to community
pharmacies. These structured interviews were conducted by pharmacists face-to-face with
individual consumers returning medicines for ultimate disposal. Interviews with participating
pharmacists were semi-structured. These interviews were conducted by a representative of the
research team over the telephone and collected data pertinent to the participating pharmacy.
RUMS recorded the medicines which were returned and their characteristics (e.g. name and
therapeutic class of medicine, quantity returned, amount of medicine unused, poison category).
The value of this method is that it can highlight the issues missed by interviews and provide
additional, factual information about consumer behaviour. The use of observation was
particularly valuable for its ability to collect data in a non-interventionist way.
The conduct of the interview and the audit of returned medicines were facilitated by the use of a
structured research instrument – Returned Medicines Survey (the survey). The survey consisted of
two sections: a questionnaire and an audit of medicines returned. The first section, the
questionnaire, comprised sets of close-ended questions, provided previously designed fixed
responses and also permitted recording of free responses. The second section contained the audit
CHAPTER I: RESEARCH DESIGN AND METHODS
11
of returned medicines which allowed recording of either free responses (i.e. medicines’ names) or
pre-coded information (i.e. medicines’ form, presentation etc). The use of a structured instrument
was particularly useful in enhancing comparability of responses and reducing the overall time of
data collection. Interviews with pharmacists consisted of a small set of close-ended and open-
ended questions, and permitted free responses. Information collected in the course of interviews
with pharmacists was recorded in the Pharmacy Data Logbook (see Appendix 8).
The development and validation of the research instrument (the survey) utilised in RUMS was
undertaken by Dr Bella Brushin in a pilot study, ‘Returned Medicines Survey: Development of
Instruments for Data Collection and Recording’, conducted in Melbourne, Australia in 2002. The
pilot study2 was commissioned and funded by the National Medicines Policy Section,
Pharmaceutical Access & Quality Branch of the Commonwealth Department of Health and
Ageing. The conduct of the pilot was approved by the Human Research Ethics Committee of
Deakin University.3
The survey intended data-gathering to investigate consumer practices associated with return of
unwanted and out-of-date medicines to community pharmacies for ultimate disposal, and the
actual medicines returned. Along with translating a research problem into a questionnaire or a
survey, there were also specific recommendations concerning possible field constraints, for
example, the overall time of data collection and applicability of the survey in the context of
pharmacy practice. In addition, some recommendations were intended to address ethical and
privacy issues.
The survey developed in the pilot study was slightly modified for the study in RUMS. Following
recommendations from the Board, several questions concerning medication management were
removed from the survey. While the exact order and wording of the majority of the questions
remained the same, the changes introduced to the survey format and layout necessitated piloting
and testing of subsequent versions of the survey for their validation. These were completed at the
initial stage of RUMS (see a copy of the final version of the survey in Appendix 9).
1.5.2 Strategies to improve data collection
In line with RUMS’ original design, contacts with participating pharmacists subsequent to
recruitment had to be limited to:
a) piloting and validating of the revised research instrument and the RUMS materials;
2 Dr Brushin has been engaged as a chief investigator in her capacity as a member of the Pharmaceutical Health and Rational Use of
Medicines Consumer Subcommittee. Associate Professor Paul Komesaroff (Monash University) acted as co-investigator and assisted with ethics application.
3 Ethics approval reference EC 68-2002.
RUMS REPORT
12
b) one formal follow-up aimed to encourage and support data collection;
c) final follow-up undertaken to arrange for collecting the completed surveys and
remunerating pharmacists for data collection.
The first formal follow-up conducted in January and February 2004 revealed various problems
with data collection and additional field constraints. Overall, there were very low numbers of
completed surveys at the time. Some pharmacies had been sold and the previous owner had not
notified the research team about the changes, nor given details about RUMS to the new pharmacy
owner. In some instances, pharmacy staff nominated and trained for data collection had ceased
their employment or retired from the pharmacy concerned. Hence another person from the same
pharmacy had to be nominated and trained in data collection. In many instances the RUMS
materials and the survey forms were reported lost or discarded.
Outcomes of the first formal follow-up demonstrated that participating pharmacies needed much
more support and encouragement during data collection than was anticipated originally.
Therefore three additional formal follow-ups were conducted in the course of data collection. In
order to reiterate the importance of RUMS to QUM, a short article urging participating
pharmacists to persist with data collection was published in the Guild’s newsletter and a similar
message was circulated via the pharmacists’ email discussion group.
Additional contacts with participating pharmacists were made over the telephone (more than 1200
phone calls were made). The final follow-up was undertaken over the telephone (300 telephone
calls), by letter (25 letters) and by facsimile (40 facsimiles) and via the pharmacists’ email
discussion group.
1.6. Data management and analysis
1.6.1 Data coding
RUMS data coding procedures were essential to data management and analysis as well as the
accuracy and consistency of data.
RUMS data collection generated vast amounts of raw data. Data coding enabled systematic
reorganisation of raw data into a format that was suitable for data entry, data manipulation and
subsequent analysis. The use of a coding procedure was particularly valuable to allow data
capture of free responses and data on the medicines returned. A coding manual – the RUMS Data
Coding Manual (see Appendix 10) – was developed to facilitate coding procedures. This
document described the coding procedure, a range of codes assigned to variables and the location
of data for variables.
CHAPTER I: RESEARCH DESIGN AND METHODS
13
1.6.2 Quality assurance
Coding procedures also enhanced the accuracy and consistency of data by addressing human
error introduced at the data collection stage. There were raw data concerning medicine names and
therapeutic classes that were incomplete, not consistent or misspelled. Some records were
difficult to read due to problems with handwriting of the data collector concerned. Here, creating
look up tables with a range of codes for medicines and therapeutic classes derived from reliable
sources was essential to the accuracy and consistency of coding.
Sources for information utilised in coding of medicines and therapeutic classes incorporated the
Pharmaceutical Benefits Schedule (PBS)4 of the Australian Government's Pharmaceutical
Benefits Scheme and the Australian Medicines Handbook5 (AMH). The names of the medicines
returned and their therapeutic class were first identified and verified by using PBS data. Each
medicine/therapeutic class was assigned a numeric code.
As coding procedure is open to human error, several quality assurance processes were introduced
to ensure the accuracy and consistency of data:
a) the assigned numeric codes were verified by the second operator;
b) computerised statistical procedure was utilised for identification of missing data and
inconsistencies in coding; and
c) inconsistencies in coding were addressed by recoding of relevant data.
As described above, the names of the medicines returned and their therapeutic class were first
identified and verified by using PBS data. However, approximately 300 medicines were not
identified initially because they were not listed on PBS. These medicines were identified and
verified in a follow-up process by using AMH as a source of information. These medicines were
also assigned a numeric code which was then added to the look up tables.
In addition, data cleaning procedures were carried out concurrently with preliminary analysis of
data. Data cleaning consisted of identification of missing or inconsistent data and checking those
by referring to raw data.
1.6.3 Data analysis
The RUMS data set was hierarchical. For each occasion where a consumer returned medicines, a
single questionnaire was completed. However, the number of medicines varied from one occasion
4 Commonwealth of Australia, 2004, Schedule of Pharmaceutical Benefits for Approved Pharmacists and Medical Practitioners <http://www.health.gov.au/pbs/scripts/search.cfm> (August – October 2004).
5 Australian Medicines Handbook 2004, Australian Medicines Handbook Proprietary Limited.
RUMS REPORT
14
to the next. This meant that varying sets of returned medicines had to be linked to each
questionnaire – technically known as a hierarchical (or relational) data set.
Separate analyses were conducted of the questionnaire data and of the returned medicines data.
These analyses aimed at describing the characteristics of consumers and the returned medicines.
In addition, the two data files were restructured into a single data file, allowing an analysis to be
made relating consumer characteristics to returned medicine characteristics.
Where relationships in the data were discovered, they were tested for statistical significance,
using the usual 5 percent criterion. All results quoted were significant at this level, unless
otherwise stated. Appropriate parametric and non-parametric tests were used.
1.7. Ethical and privacy issues
The ethical dilemmas of fieldwork in research that involves human subjects are largely associated
with issues of privacy or confidentiality; and possible exposure of subjects to harm.6 Several
procedures ensured the ethical conduct of RUMS. The aims of these procedures were twofold.
First, the aim was to ensure that the research processes and procedures did not jeopardise
participants’ privacy in any way and that participants were not exposed to any physical or
emotional harm. The second aim was to provide participants with explicit assurances about their
privacy and safety.
Ethical and privacy issues in research conduct were to the requirements of the Code of
Professional Behaviour of the Australian Market & Social Research Society and the Market &
Social Research Privacy Principles.7 RUMS design and procedures were to the requirements of
the Statistical Clearing House of the Australian Bureau of Statistics.8The development and
validation of the survey were approved and overseen by the Human Research Ethics Committee
of Deakin University.9
In RUMS, the privacy of participants was ensured by protecting the identity of participants and
the confidentiality of data. For example, no identifiable information was collected from
participating consumers and all empirical materials were coded. Access to identifiable data
(pharmacist’s consent to participation forms) was limited to the members of the research team.
Provisions were made to preserve confidentiality of records.
6 National Health and Medical Research Council 1995, Canberra. 7 This code was approved by the Privacy Commissioner on 27 August 2003. This code is administered by the AMRO Secretariat, and is
subject to independent review by the Independent Code Review Panel. 8 An agency of the Australian Government. 9 Ethics approval reference EC 68-2002.
CHAPTER I: RESEARCH DESIGN AND METHODS
15
All participants were provided with detailed explanations of the study’s aims, research methods
and procedures, the possible use of data, and the processes concerning protection of participants’
identity and confidentiality of data. This information was provided in various forms: verbally and
by provision of written information. All information emphasised the voluntary nature of
participation and the responsibilities of the researchers.
RUMS REPORT
16
CHAPTER II: RESEARCH FINDINGS – CONSUMER CHARACTERISTICS & PRACTICES ASSOCIATED WITH RETURN OF UNWANTED MEDICINES Introduction Chapter II describes RUMS findings with regards to the key research questions (see Chapter I).
This chapter focuses on socio-demographic characteristics of consumers and various aspects of
consumer practices relating to the return of unwanted and out-of-date medicines to community
pharmacies.
Findings in this chapter are derived from the analysis of data collected in interviews for each
occasion where a consumer returned a medicine to a participating pharmacy, and from
observations of the medicines returned. Data related to community pharmacies was collected
from interviews with participating pharmacists.
The material in this chapter is divided into several sections. Part A describes socio-demographic
characteristics of consumers. Part B focuses on various aspects of consumer practices relating to
the return of unwanted medicines. The material is structured under the following subheadings:
Part A: Socio-demographic characteristics of consumers
2.1 Age, gender and levels of education reached
2.2 Country of birth and language spoken at home
2.3 Place of residence and living arrangements
Part B: Consumer practices associated with the return of unwanted medicines
2.4 Locations, prior experience and occurrences of returns
2.4.1 Locations
2.4.2 Prior experiences and occurrences
2.5 Return of own medicines and those prescribed to or used by others
2.6 Sources of consumer information
It is important to stress that, in the context of RUMS and this report, the definition of
‘consumer(s)’ is operational and refers to the people who returned medicines to participating
pharmacies and responded to the survey questions. The terms ‘consumer(s)’ and ‘respondent(s)’
are used interchangeably here.
CHAPTER II: RESEARCH FINDINGS – CONSUMER CHARACTERISTICS AND PRACTICES
17
Part A: Socio-demographic characteristics of consumers In total, 605 consumers participated in the study. In terms of socio-demographic characteristics,
consumers varied in age; gender; levels of formal education reached; country of birth; language
spoken at home; place of residence and living arrangements.
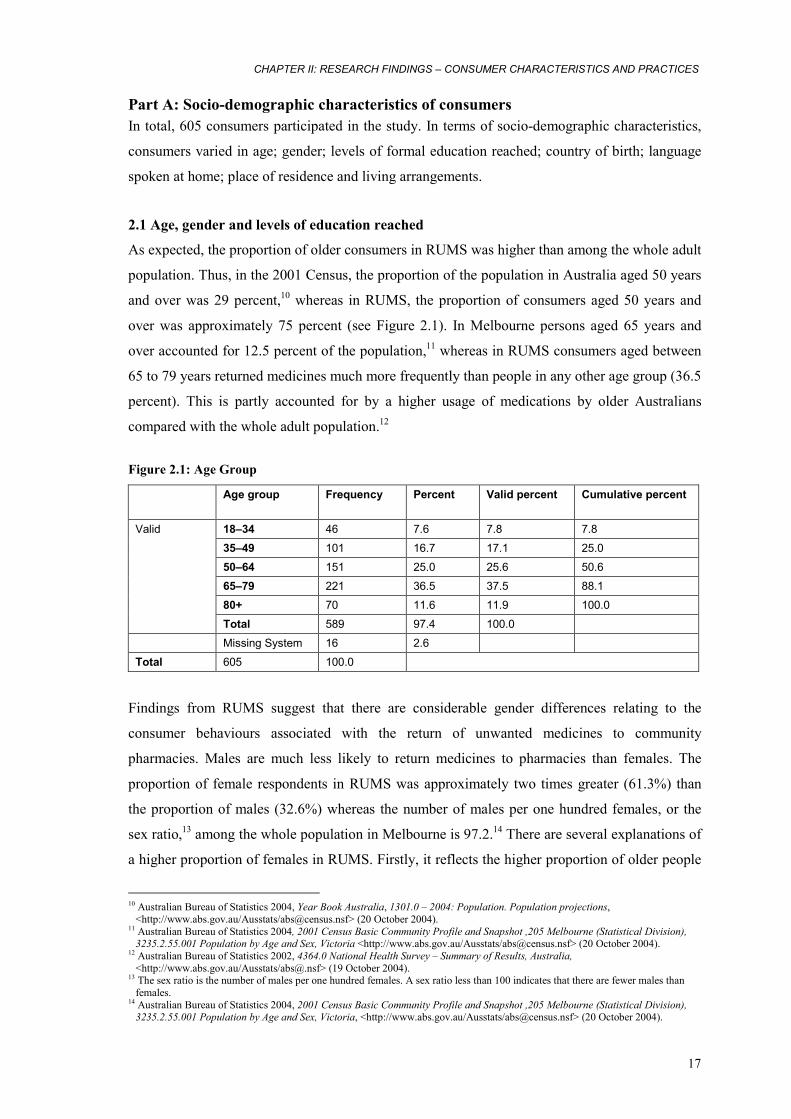
2.1 Age, gender and levels of education reached
As expected, the proportion of older consumers in RUMS was higher than among the whole adult
population. Thus, in the 2001 Census, the proportion of the population in Australia aged 50 years
and over was 29 percent,10 whereas in RUMS, the proportion of consumers aged 50 years and
over was approximately 75 percent (see Figure 2.1). In Melbourne persons aged 65 years and
over accounted for 12.5 percent of the population,11 whereas in RUMS consumers aged between
65 to 79 years returned medicines much more frequently than people in any other age group (36.5
percent). This is partly accounted for by a higher usage of medications by older Australians
compared with the whole adult population.12
Figure 2.1: Age Group
Age group
Frequency Percent Valid percent Cumulative percent
18–34 46 7.6 7.8 7.8
35–49 101 16.7 17.1 25.0
50–64 151 25.0 25.6 50.6
65–79 221 36.5 37.5 88.1
80+ 70 11.6 11.9 100.0
Valid
Total 589 97.4 100.0
Missing System 16 2.6
Total 605 100.0
Findings from RUMS suggest that there are considerable gender differences relating to the
consumer behaviours associated with the return of unwanted medicines to community
pharmacies. Males are much less likely to return medicines to pharmacies than females. The
proportion of female respondents in RUMS was approximately two times greater (61.3%) than
the proportion of males (32.6%) whereas the number of males per one hundred females, or the
sex ratio,13 among the whole population in Melbourne is 97.2.14 There are several explanations of
a higher proportion of females in RUMS. Firstly, it reflects the higher proportion of older people
10 Australian Bureau of Statistics 2004, Year Book Australia, 1301.0 – 2004: Population. Population projections,
<http://www.abs.gov.au/Ausstats/[email protected]> (20 October 2004). 11 Australian Bureau of Statistics 2004, 2001 Census Basic Community Profile and Snapshot ,205 Melbourne (Statistical Division),
3235.2.55.001 Population by Age and Sex, Victoria <http://www.abs.gov.au/Ausstats/[email protected]> (20 October 2004). 12 Australian Bureau of Statistics 2002, 4364.0 National Health Survey – Summary of Results, Australia,
<http://www.abs.gov.au/Ausstats/[email protected]> (19 October 2004). 13 The sex ratio is the number of males per one hundred females. A sex ratio less than 100 indicates that there are fewer males than
females. 14 Australian Bureau of Statistics 2004, 2001 Census Basic Community Profile and Snapshot ,205 Melbourne (Statistical Division),
3235.2.55.001 Population by Age and Sex, Victoria, <http://www.abs.gov.au/Ausstats/[email protected]> (20 October 2004).
RUMS REPORT
18
returning medicines to community pharmacies. The sex ratio in people aged 60 years and over is
lower than among the whole population due to the longer life expectancy of females. Secondly,
as revealed by the Australian National Health Surveys, a higher proportion of females than males
use medications for all medication types and across most age groups.15,16 The higher proportion
of females in RUMS may also be associated with women’s social and gender roles relating to the
use of medicines, in particular the roles they play as carers for children and the elderly.
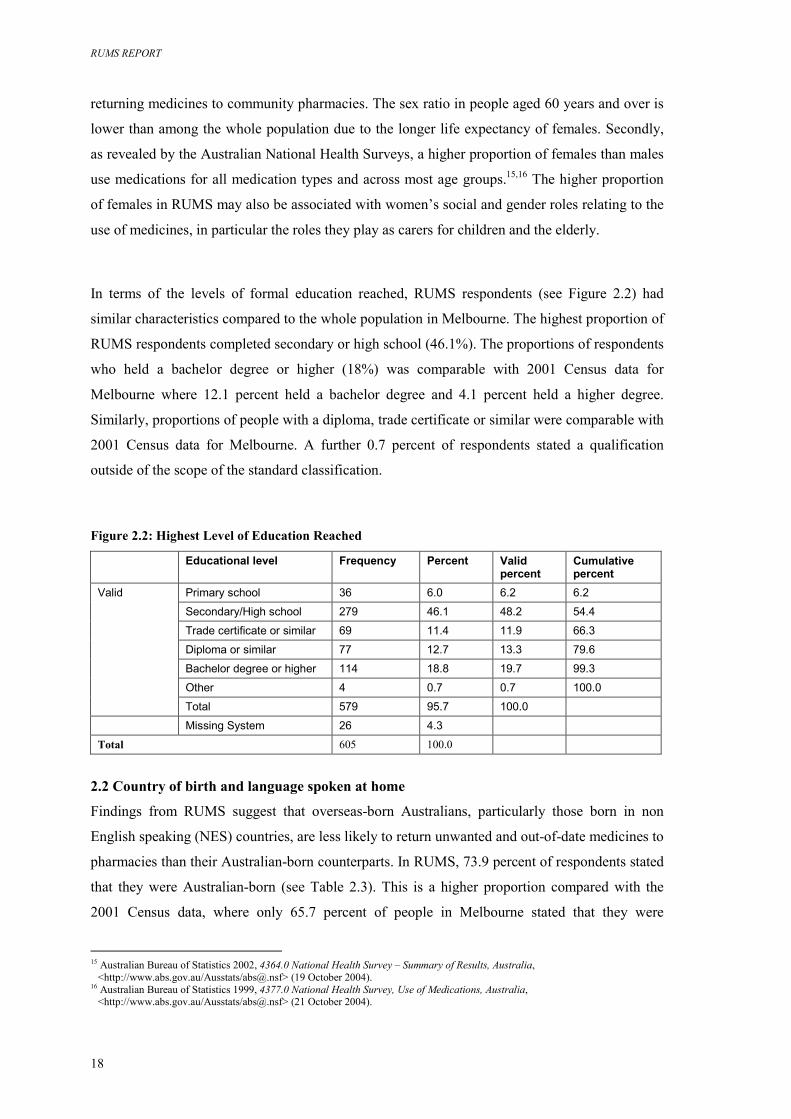
In terms of the levels of formal education reached, RUMS respondents (see Figure 2.2) had
similar characteristics compared to the whole population in Melbourne. The highest proportion of
RUMS respondents completed secondary or high school (46.1%). The proportions of respondents
who held a bachelor degree or higher (18%) was comparable with 2001 Census data for
Melbourne where 12.1 percent held a bachelor degree and 4.1 percent held a higher degree.
Similarly, proportions of people with a diploma, trade certificate or similar were comparable with
2001 Census data for Melbourne. A further 0.7 percent of respondents stated a qualification
outside of the scope of the standard classification.
Figure 2.2: Highest Level of Education Reached
Educational level Frequency Percent Valid percent
Cumulative percent
Primary school 36 6.0 6.2 6.2
Secondary/High school 279 46.1 48.2 54.4
Trade certificate or similar 69 11.4 11.9 66.3
Diploma or similar 77 12.7 13.3 79.6
Bachelor degree or higher 114 18.8 19.7 99.3
Other 4 0.7 0.7 100.0
Valid
Total 579 95.7 100.0
Missing System 26 4.3
Total 605 100.0
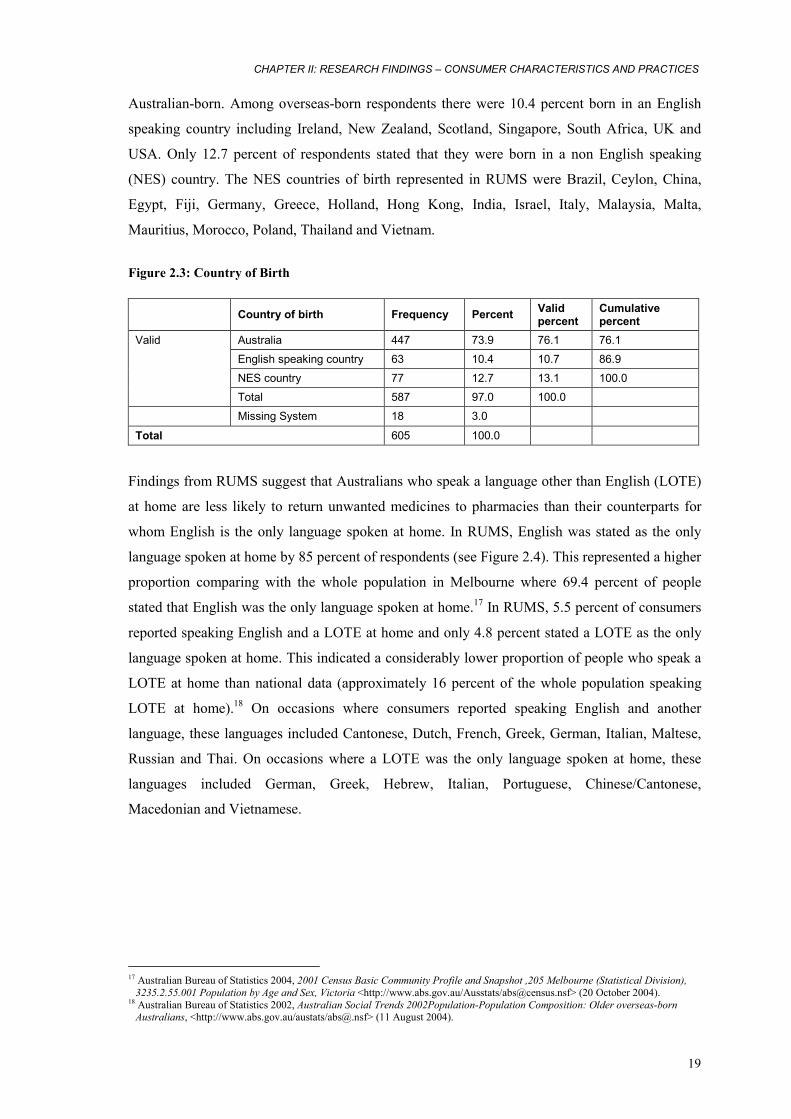
2.2 Country of birth and language spoken at home
Findings from RUMS suggest that overseas-born Australians, particularly those born in non
English speaking (NES) countries, are less likely to return unwanted and out-of-date medicines to
pharmacies than their Australian-born counterparts. In RUMS, 73.9 percent of respondents stated
that they were Australian-born (see Table 2.3). This is a higher proportion compared with the
2001 Census data, where only 65.7 percent of people in Melbourne stated that they were
15 Australian Bureau of Statistics 2002, 4364.0 National Health Survey – Summary of Results, Australia,
<http://www.abs.gov.au/Ausstats/[email protected]> (19 October 2004). 16 Australian Bureau of Statistics 1999, 4377.0 National Health Survey, Use of Medications, Australia,
<http://www.abs.gov.au/Ausstats/[email protected]> (21 October 2004).
CHAPTER II: RESEARCH FINDINGS – CONSUMER CHARACTERISTICS AND PRACTICES
19
Australian-born. Among overseas-born respondents there were 10.4 percent born in an English
speaking country including Ireland, New Zealand, Scotland, Singapore, South Africa, UK and
USA. Only 12.7 percent of respondents stated that they were born in a non English speaking
(NES) country. The NES countries of birth represented in RUMS were Brazil, Ceylon, China,
Egypt, Fiji, Germany, Greece, Holland, Hong Kong, India, Israel, Italy, Malaysia, Malta,
Mauritius, Morocco, Poland, Thailand and Vietnam.
Figure 2.3: Country of Birth
Country of birth Frequency Percent Valid percent
Cumulative percent
Australia 447 73.9 76.1 76.1
English speaking country 63 10.4 10.7 86.9
NES country 77 12.7 13.1 100.0
Valid
Total 587 97.0 100.0
Missing System 18 3.0
Total 605 100.0
Findings from RUMS suggest that Australians who speak a language other than English (LOTE)
at home are less likely to return unwanted medicines to pharmacies than their counterparts for
whom English is the only language spoken at home. In RUMS, English was stated as the only
language spoken at home by 85 percent of respondents (see Figure 2.4). This represented a higher
proportion comparing with the whole population in Melbourne where 69.4 percent of people
stated that English was the only language spoken at home.17 In RUMS, 5.5 percent of consumers
reported speaking English and a LOTE at home and only 4.8 percent stated a LOTE as the only
language spoken at home. This indicated a considerably lower proportion of people who speak a
LOTE at home than national data (approximately 16 percent of the whole population speaking
LOTE at home).18 On occasions where consumers reported speaking English and another
language, these languages included Cantonese, Dutch, French, Greek, German, Italian, Maltese,
Russian and Thai. On occasions where a LOTE was the only language spoken at home, these
languages included German, Greek, Hebrew, Italian, Portuguese, Chinese/Cantonese,
Macedonian and Vietnamese.
17 Australian Bureau of Statistics 2004, 2001 Census Basic Community Profile and Snapshot ,205 Melbourne (Statistical Division),
3235.2.55.001 Population by Age and Sex, Victoria <http://www.abs.gov.au/Ausstats/[email protected]> (20 October 2004). 18 Australian Bureau of Statistics 2002, Australian Social Trends 2002Population-Population Composition: Older overseas-born
Australians, <http://www.abs.gov.au/austats/[email protected]> (11 August 2004).
RUMS REPORT
20
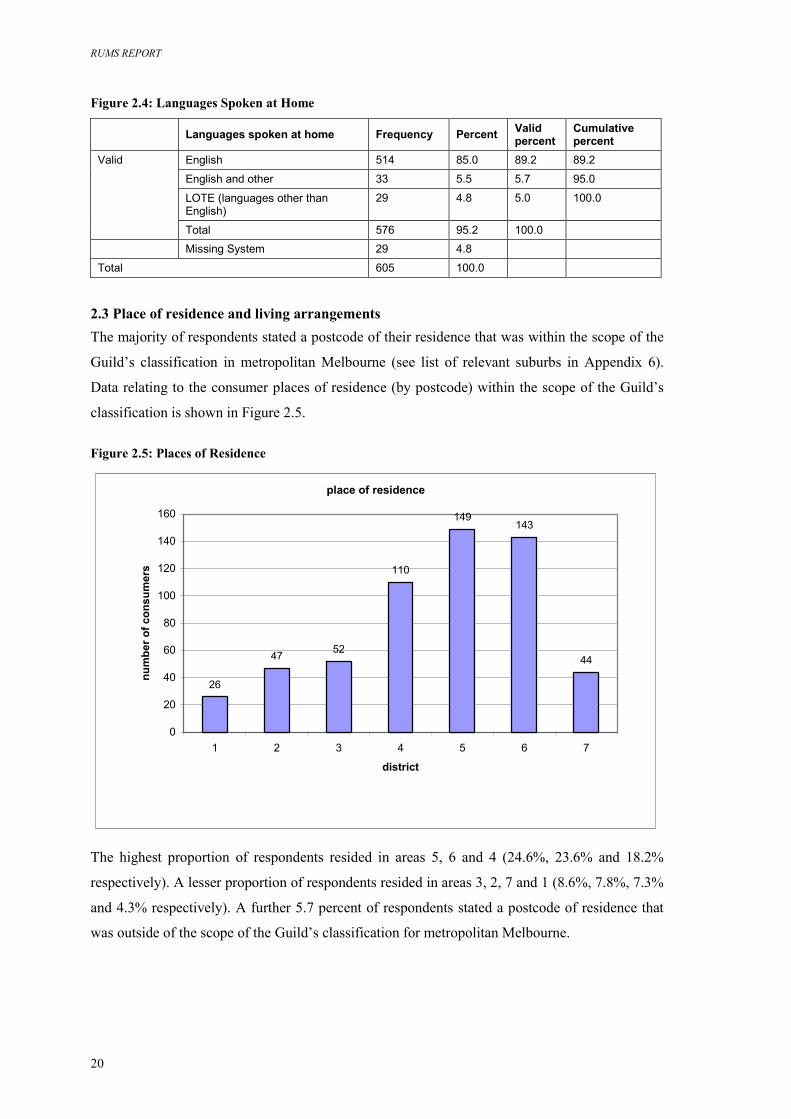
Figure 2.4: Languages Spoken at Home
Languages spoken at home Frequency Percent Valid percent
Cumulative percent
English 514 85.0 89.2 89.2
English and other 33 5.5 5.7 95.0
LOTE (languages other than English)
29 4.8 5.0 100.0
Valid
Total 576 95.2 100.0 Missing System 29 4.8
Total 605 100.0
2.3 Place of residence and living arrangements The majority of respondents stated a postcode of their residence that was within the scope of the
Guild’s classification in metropolitan Melbourne (see list of relevant suburbs in Appendix 6).
Data relating to the consumer places of residence (by postcode) within the scope of the Guild’s
classification is shown in Figure 2.5.
Figure 2.5: Places of Residence
place of residence
26
47 52
110
149143
44
0
20
40
60
80
100
120
140
160
1 2 3 4 5 6 7
district
num
ber o
f con
sum
ers
The highest proportion of respondents resided in areas 5, 6 and 4 (24.6%, 23.6% and 18.2%
respectively). A lesser proportion of respondents resided in areas 3, 2, 7 and 1 (8.6%, 7.8%, 7.3%
and 4.3% respectively). A further 5.7 percent of respondents stated a postcode of residence that
was outside of the scope of the Guild’s classification for metropolitan Melbourne.
CHAPTER II: RESEARCH FINDINGS – CONSUMER CHARACTERISTICS AND PRACTICES
21
Findings from RUMS suggest that Australians who reside in districts 5, 6 and 4 are more likely to
return unwanted medicines to pharmacies than their counterparts who live in other areas (see
Figure 2.5).
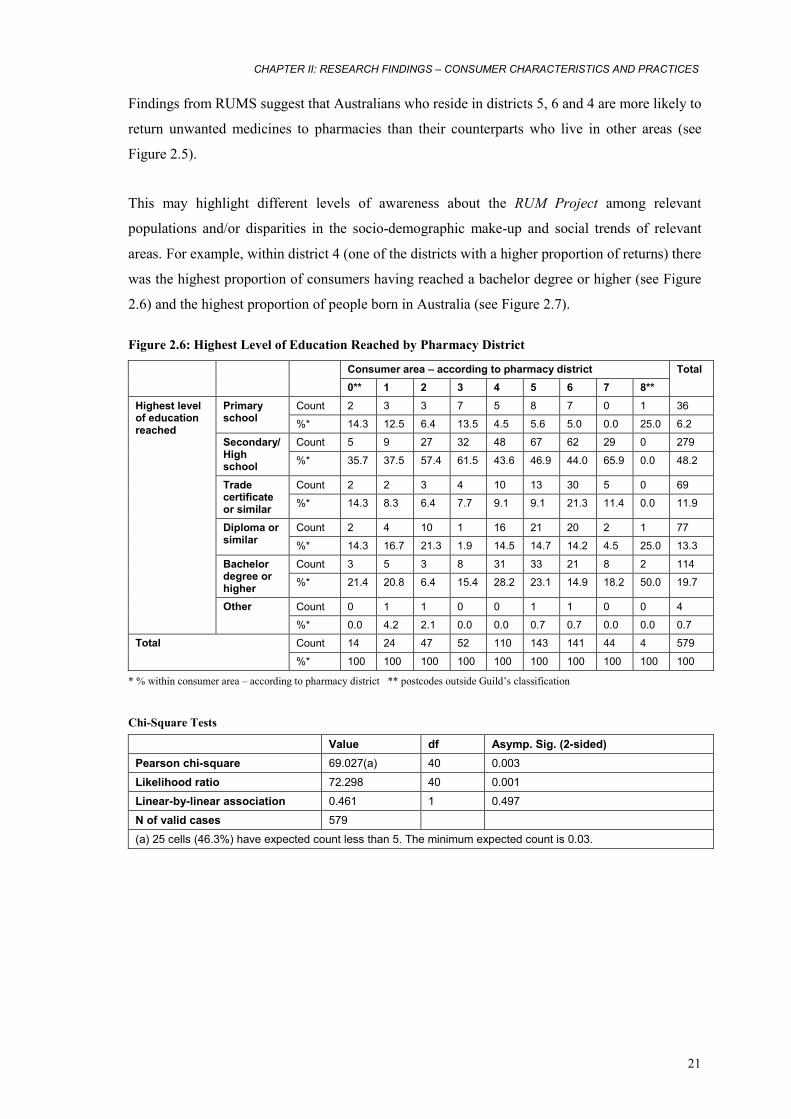
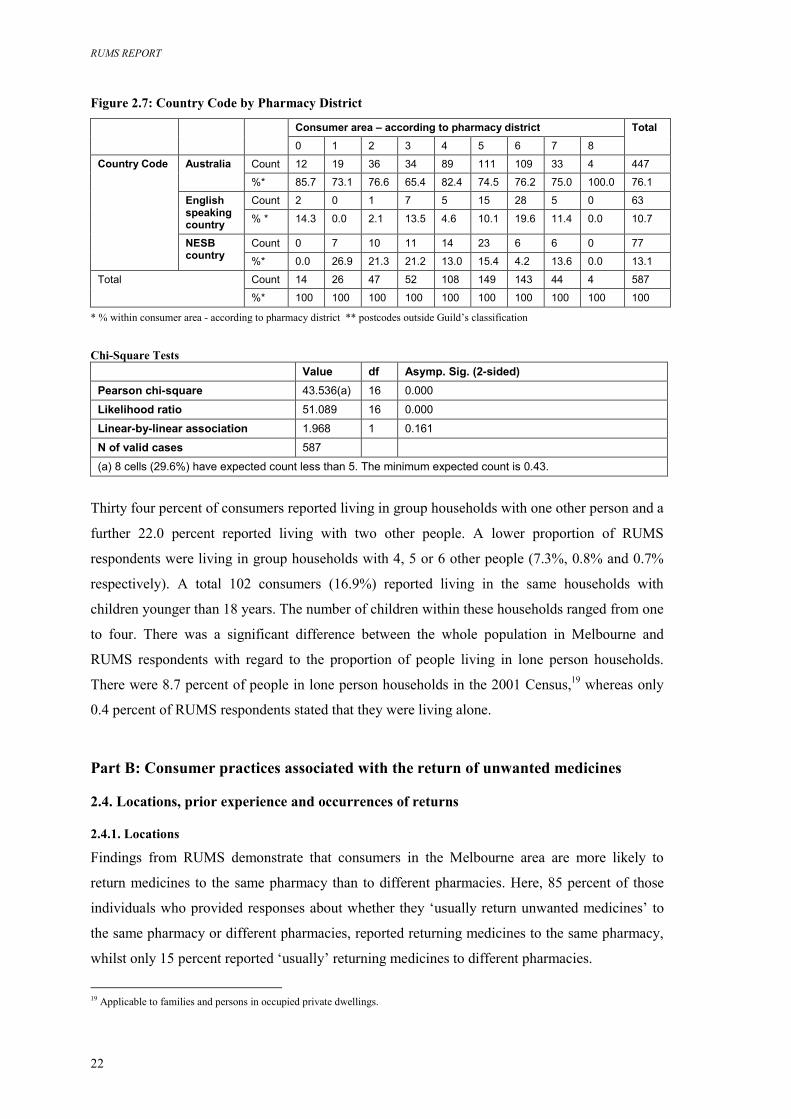
This may highlight different levels of awareness about the RUM Project among relevant
populations and/or disparities in the socio-demographic make-up and social trends of relevant
areas. For example, within district 4 (one of the districts with a higher proportion of returns) there
was the highest proportion of consumers having reached a bachelor degree or higher (see Figure
2.6) and the highest proportion of people born in Australia (see Figure 2.7).
Figure 2.6: Highest Level of Education Reached by Pharmacy District
Consumer area – according to pharmacy district
0** 1 2 3 4 5 6 7 8**
Total
Count 2 3 3 7 5 8 7 0 1 36 Primary school %* 14.3 12.5 6.4 13.5 4.5 5.6 5.0 0.0 25.0 6.2
Count 5 9 27 32 48 67 62 29 0 279 Secondary/High school %* 35.7 37.5 57.4 61.5 43.6 46.9 44.0 65.9 0.0 48.2
Count 2 2 3 4 10 13 30 5 0 69 Trade certificate or similar %* 14.3 8.3 6.4 7.7 9.1 9.1 21.3 11.4 0.0 11.9
Count 2 4 10 1 16 21 20 2 1 77 Diploma or similar %* 14.3 16.7 21.3 1.9 14.5 14.7 14.2 4.5 25.0 13.3
Count 3 5 3 8 31 33 21 8 2 114 Bachelor degree or higher %* 21.4 20.8 6.4 15.4 28.2 23.1 14.9 18.2 50.0 19.7
Count 0 1 1 0 0 1 1 0 0 4
Highest level of education reached
Other %* 0.0 4.2 2.1 0.0 0.0 0.7 0.7 0.0 0.0 0.7
Count 14 24 47 52 110 143 141 44 4 579 Total %* 100 100 100 100 100 100 100 100 100 100
* % within consumer area – according to pharmacy district ** postcodes outside Guild’s classification
Chi-Square Tests
Value df Asymp. Sig. (2-sided) Pearson chi-square 69.027(a) 40 0.003
Likelihood ratio 72.298 40 0.001
Linear-by-linear association 0.461 1 0.497
N of valid cases 579
(a) 25 cells (46.3%) have expected count less than 5. The minimum expected count is 0.03.
RUMS REPORT
22
Figure 2.7: Country Code by Pharmacy District
Consumer area – according to pharmacy district
0 1 2 3 4 5 6 7 8
Total
Count 12 19 36 34 89 111 109 33 4 447 Australia %* 85.7 73.1 76.6 65.4 82.4 74.5 76.2 75.0 100.0 76.1
Count 2 0 1 7 5 15 28 5 0 63 English speaking country % * 14.3 0.0 2.1 13.5 4.6 10.1 19.6 11.4 0.0 10.7
Count 0 7 10 11 14 23 6 6 0 77
Country Code
NESB country %* 0.0 26.9 21.3 21.2 13.0 15.4 4.2 13.6 0.0 13.1
Count 14 26 47 52 108 149 143 44 4 587 Total
%* 100 100 100 100 100 100 100 100 100 100
* % within consumer area - according to pharmacy district ** postcodes outside Guild’s classification Chi-Square Tests
Value df Asymp. Sig. (2-sided) Pearson chi-square 43.536(a) 16 0.000
Likelihood ratio 51.089 16 0.000
Linear-by-linear association 1.968 1 0.161
N of valid cases 587
(a) 8 cells (29.6%) have expected count less than 5. The minimum expected count is 0.43.
Thirty four percent of consumers reported living in group households with one other person and a
further 22.0 percent reported living with two other people. A lower proportion of RUMS
respondents were living in group households with 4, 5 or 6 other people (7.3%, 0.8% and 0.7%
respectively). A total 102 consumers (16.9%) reported living in the same households with
children younger than 18 years. The number of children within these households ranged from one
to four. There was a significant difference between the whole population in Melbourne and
RUMS respondents with regard to the proportion of people living in lone person households.
There were 8.7 percent of people in lone person households in the 2001 Census,19 whereas only
0.4 percent of RUMS respondents stated that they were living alone.
Part B: Consumer practices associated with the return of unwanted medicines
2.4. Locations, prior experience and occurrences of returns
2.4.1. Locations
Findings from RUMS demonstrate that consumers in the Melbourne area are more likely to
return medicines to the same pharmacy than to different pharmacies. Here, 85 percent of those
individuals who provided responses about whether they ‘usually return unwanted medicines’ to
the same pharmacy or different pharmacies, reported returning medicines to the same pharmacy,
whilst only 15 percent reported ‘usually’ returning medicines to different pharmacies.
19 Applicable to families and persons in occupied private dwellings.
CHAPTER II: RESEARCH FINDINGS – CONSUMER CHARACTERISTICS AND PRACTICES
23
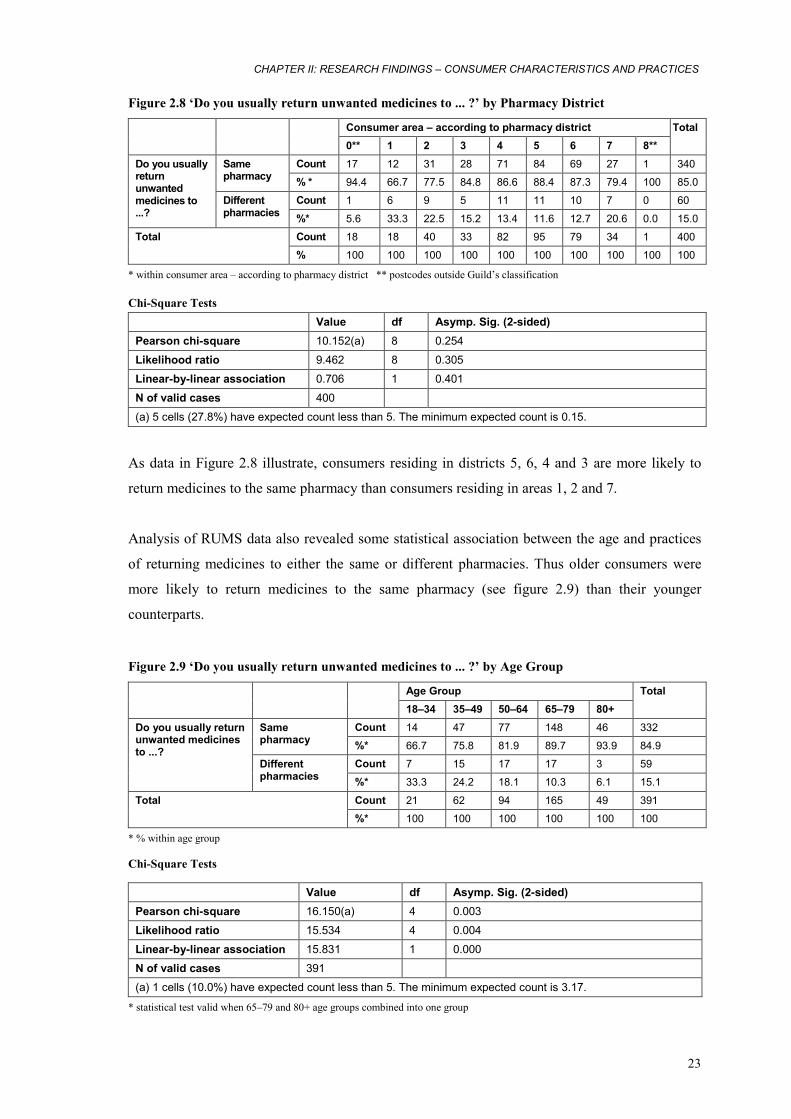
Figure 2.8 ‘Do you usually return unwanted medicines to ... ?’ by Pharmacy District
Consumer area – according to pharmacy district
0** 1 2 3 4 5 6 7 8**
Total
Count 17 12 31 28 71 84 69 27 1 340 Same pharmacy % * 94.4 66.7 77.5 84.8 86.6 88.4 87.3 79.4 100 85.0
Count 1 6 9 5 11 11 10 7 0 60
Do you usually return unwanted medicines to ...?
Different pharmacies %* 5.6 33.3 22.5 15.2 13.4 11.6 12.7 20.6 0.0 15.0
Count 18 18 40 33 82 95 79 34 1 400 Total % 100 100 100 100 100 100 100 100 100 100
* within consumer area – according to pharmacy district ** postcodes outside Guild’s classification Chi-Square Tests
Value df Asymp. Sig. (2-sided) Pearson chi-square 10.152(a) 8 0.254
Likelihood ratio 9.462 8 0.305
Linear-by-linear association 0.706 1 0.401
N of valid cases 400
(a) 5 cells (27.8%) have expected count less than 5. The minimum expected count is 0.15.
As data in Figure 2.8 illustrate, consumers residing in districts 5, 6, 4 and 3 are more likely to
return medicines to the same pharmacy than consumers residing in areas 1, 2 and 7.
Analysis of RUMS data also revealed some statistical association between the age and practices
of returning medicines to either the same or different pharmacies. Thus older consumers were
more likely to return medicines to the same pharmacy (see figure 2.9) than their younger
counterparts.
Figure 2.9 ‘Do you usually return unwanted medicines to ... ?’ by Age Group
Age Group
18–34 35–49 50–64 65–79 80+
Total
Count 14 47 77 148 46 332 Same pharmacy %* 66.7 75.8 81.9 89.7 93.9 84.9
Count 7 15 17 17 3 59
Do you usually return unwanted medicines to ...?
Different pharmacies %* 33.3 24.2 18.1 10.3 6.1 15.1
Count 21 62 94 165 49 391 Total %* 100 100 100 100 100 100
* % within age group Chi-Square Tests
Value df Asymp. Sig. (2-sided) Pearson chi-square 16.150(a) 4 0.003
Likelihood ratio 15.534 4 0.004
Linear-by-linear association 15.831 1 0.000
N of valid cases 391
(a) 1 cells (10.0%) have expected count less than 5. The minimum expected count is 3.17.
* statistical test valid when 65–79 and 80+ age groups combined into one group
RUMS REPORT
24
Several characteristics of participating pharmacies, for example number of staff, hours of work
per week and pharmacy location, were analysed with respect to consumer practices of medicinal
return. Findings reveal that number of staff and hours of work per week have no significant
influence on consumer practices while pharmacy location has. The two kinds of pharmacies in
RUMS categorised by location were: ‘shopping strip pharmacy’ and ‘regional centre pharmacy’.
By definition, ‘shopping strip’ is a pharmacy located in a localised shopping area where traffic
flows though the area, and ‘regional centre’ is a pharmacy located in a shopping centre which
includes at least 25 stores, including a major supermarket, and off-street car parking. Analysis of
RUMS data revealed that consumers are more likely to return medicines to a regional centre
pharmacy. Thus, among pharmacies that reported returns 81.8 percent were regional centre and
18.2 percent were shopping strip pharmacies, while among pharmacies that reported no returns
60 percent were regional centre and 40 percent shopping strip pharmacies.
RUMS findings identify that overall, pharmacy characteristics appear to have limited influence
on consumer behaviour associated with medicinal return. This indicates that pharmacists’ own
attitudes towards the RUM Project and their practices largely influence relevant consumer
behaviours.
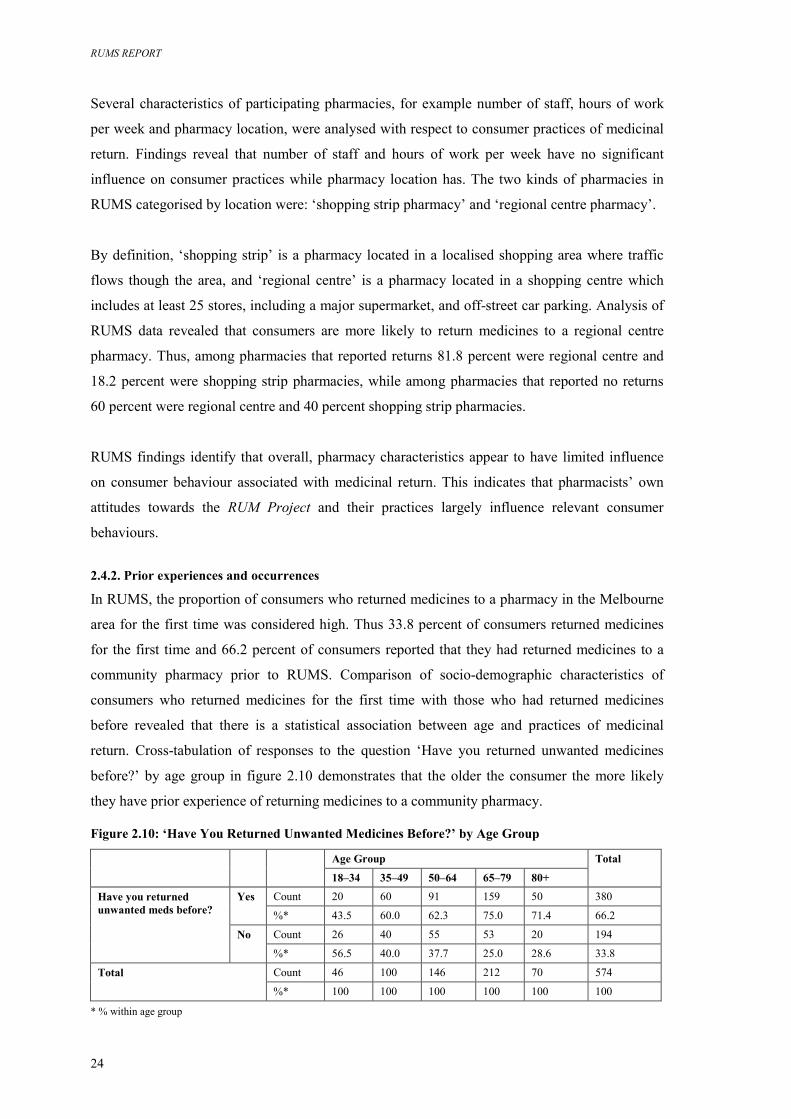
2.4.2. Prior experiences and occurrences
In RUMS, the proportion of consumers who returned medicines to a pharmacy in the Melbourne
area for the first time was considered high. Thus 33.8 percent of consumers returned medicines
for the first time and 66.2 percent of consumers reported that they had returned medicines to a
community pharmacy prior to RUMS. Comparison of socio-demographic characteristics of
consumers who returned medicines for the first time with those who had returned medicines
before revealed that there is a statistical association between age and practices of medicinal
return. Cross-tabulation of responses to the question ‘Have you returned unwanted medicines
before?’ by age group in figure 2.10 demonstrates that the older the consumer the more likely
they have prior experience of returning medicines to a community pharmacy.
Figure 2.10: ‘Have You Returned Unwanted Medicines Before?’ by Age Group
Age Group
18–34 35–49 50–64 65–79 80+
Total
Count 20 60 91 159 50 380 Yes %* 43.5 60.0 62.3 75.0 71.4 66.2
Count 26 40 55 53 20 194
Have you returned unwanted meds before?
No %* 56.5 40.0 37.7 25.0 28.6 33.8
Count 46 100 146 212 70 574 Total %* 100 100 100 100 100 100
* % within age group
CHAPTER II: RESEARCH FINDINGS – CONSUMER CHARACTERISTICS AND PRACTICES
25
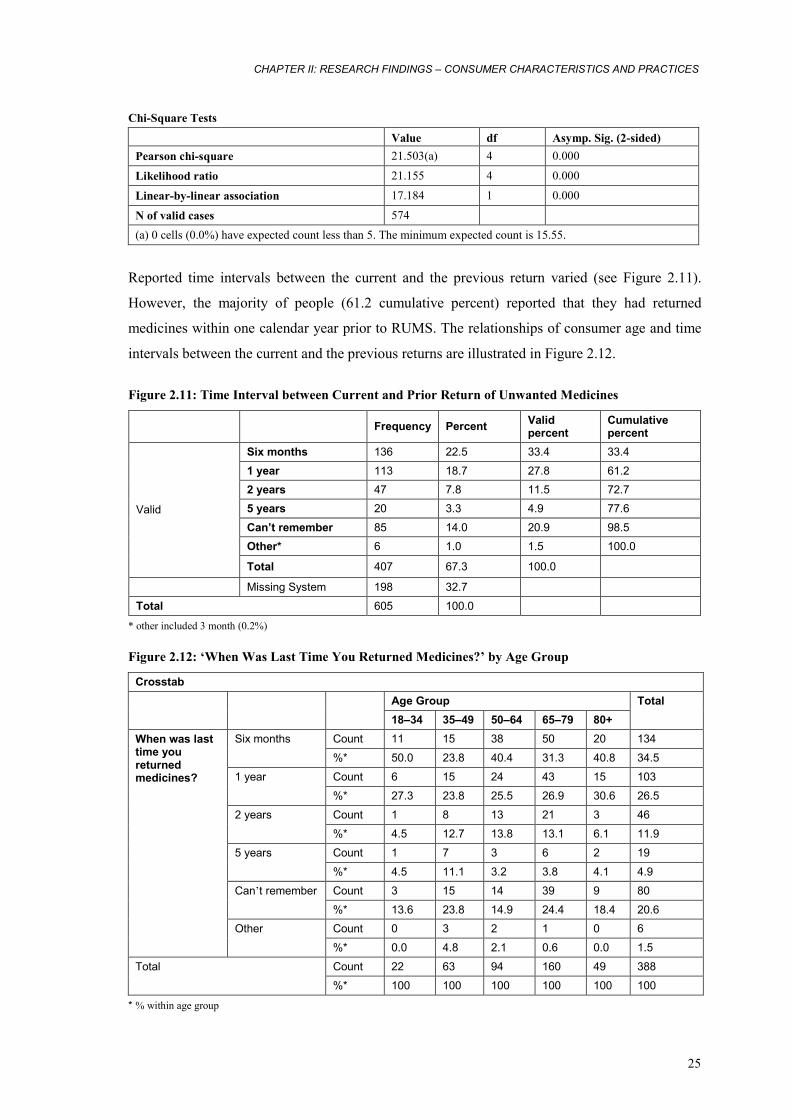
Chi-Square Tests
Value df Asymp. Sig. (2-sided) Pearson chi-square 21.503(a) 4 0.000
Likelihood ratio 21.155 4 0.000
Linear-by-linear association 17.184 1 0.000
N of valid cases 574 (a) 0 cells (0.0%) have expected count less than 5. The minimum expected count is 15.55.
Reported time intervals between the current and the previous return varied (see Figure 2.11).
However, the majority of people (61.2 cumulative percent) reported that they had returned
medicines within one calendar year prior to RUMS. The relationships of consumer age and time
intervals between the current and the previous returns are illustrated in Figure 2.12.
Figure 2.11: Time Interval between Current and Prior Return of Unwanted Medicines
Frequency Percent Valid
percent Cumulative percent
Six months 136 22.5 33.4 33.4
1 year 113 18.7 27.8 61.2 2 years 47 7.8 11.5 72.7 5 years 20 3.3 4.9 77.6
Can’t remember 85 14.0 20.9 98.5 Other* 6 1.0 1.5 100.0
Valid
Total 407 67.3 100.0
Missing System 198 32.7
Total 605 100.0
* other included 3 month (0.2%) Figure 2.12: ‘When Was Last Time You Returned Medicines?’ by Age Group
Crosstab
Age Group
18–34 35–49 50–64 65–79 80+
Total
Count 11 15 38 50 20 134 Six months
%* 50.0 23.8 40.4 31.3 40.8 34.5
Count 6 15 24 43 15 103 1 year
%* 27.3 23.8 25.5 26.9 30.6 26.5
Count 1 8 13 21 3 46 2 years
%* 4.5 12.7 13.8 13.1 6.1 11.9
Count 1 7 3 6 2 19 5 years
%* 4.5 11.1 3.2 3.8 4.1 4.9
Count 3 15 14 39 9 80 Can’t remember
%* 13.6 23.8 14.9 24.4 18.4 20.6 Count 0 3 2 1 0 6
When was last time you returned medicines?
Other
%* 0.0 4.8 2.1 0.6 0.0 1.5
Count 22 63 94 160 49 388 Total
%* 100 100 100 100 100 100
* % within age group
RUMS REPORT
26
Chi-Square Tests Value df Asymp. Sig. (2-sided)
Pearson chi-square 25.034(a) 20 0.200
Likelihood ratio 24.387 20 0.226
Linear-by-linear association 0.270 1 0.603
N of valid cases 388 (a) 11 cells (36.7%) have expected count less than 5. The minimum expected count is 0.34.
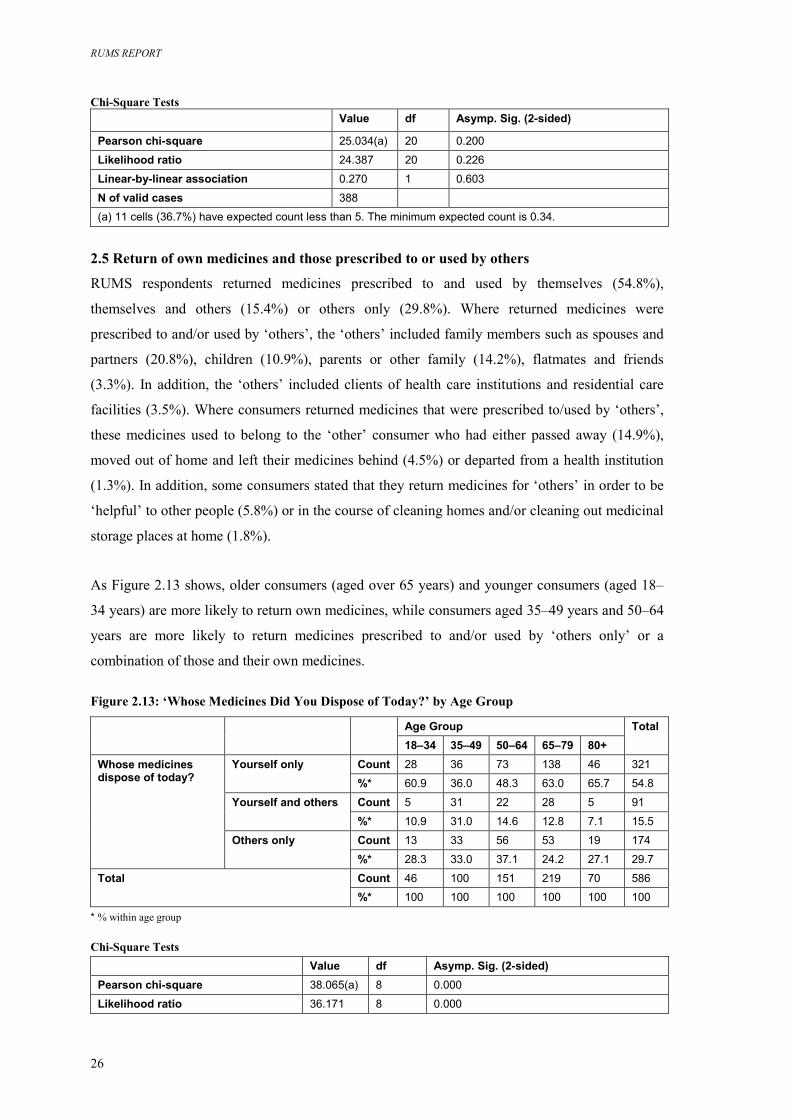
2.5 Return of own medicines and those prescribed to or used by others
RUMS respondents returned medicines prescribed to and used by themselves (54.8%),
themselves and others (15.4%) or others only (29.8%). Where returned medicines were
prescribed to and/or used by ‘others’, the ‘others’ included family members such as spouses and
partners (20.8%), children (10.9%), parents or other family (14.2%), flatmates and friends
(3.3%). In addition, the ‘others’ included clients of health care institutions and residential care
facilities (3.5%). Where consumers returned medicines that were prescribed to/used by ‘others’,
these medicines used to belong to the ‘other’ consumer who had either passed away (14.9%),
moved out of home and left their medicines behind (4.5%) or departed from a health institution
(1.3%). In addition, some consumers stated that they return medicines for ‘others’ in order to be
‘helpful’ to other people (5.8%) or in the course of cleaning homes and/or cleaning out medicinal
storage places at home (1.8%).
As Figure 2.13 shows, older consumers (aged over 65 years) and younger consumers (aged 18–
34 years) are more likely to return own medicines, while consumers aged 35–49 years and 50–64
years are more likely to return medicines prescribed to and/or used by ‘others only’ or a
combination of those and their own medicines.
Figure 2.13: ‘Whose Medicines Did You Dispose of Today?’ by Age Group
Age Group
18–34 35–49 50–64 65–79 80+
Total
Count 28 36 73 138 46 321 Yourself only %* 60.9 36.0 48.3 63.0 65.7 54.8
Count 5 31 22 28 5 91 Yourself and others %* 10.9 31.0 14.6 12.8 7.1 15.5
Count 13 33 56 53 19 174
Whose medicines dispose of today?
Others only %* 28.3 33.0 37.1 24.2 27.1 29.7
Count 46 100 151 219 70 586 Total %* 100 100 100 100 100 100
* % within age group Chi-Square Tests
Value df Asymp. Sig. (2-sided) Pearson chi-square 38.065(a) 8 0.000
Likelihood ratio 36.171 8 0.000
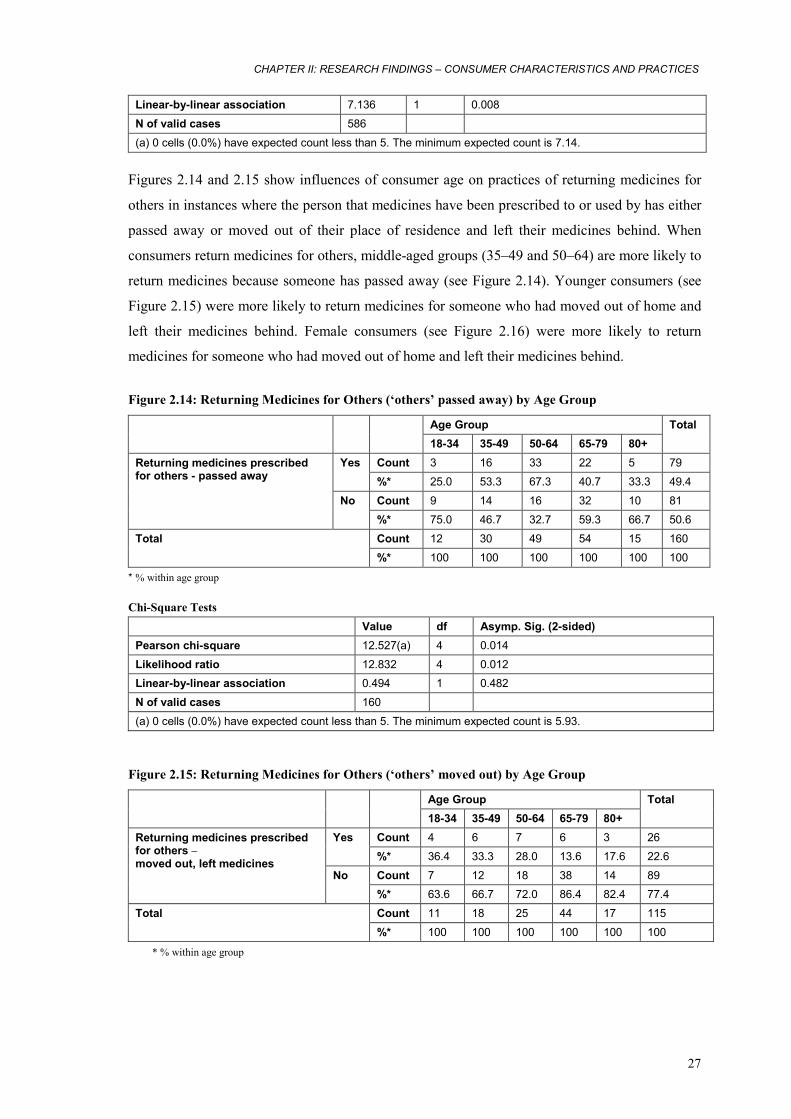
CHAPTER II: RESEARCH FINDINGS – CONSUMER CHARACTERISTICS AND PRACTICES
27
Linear-by-linear association 7.136 1 0.008
N of valid cases 586
(a) 0 cells (0.0%) have expected count less than 5. The minimum expected count is 7.14.
Figures 2.14 and 2.15 show influences of consumer age on practices of returning medicines for
others in instances where the person that medicines have been prescribed to or used by has either
passed away or moved out of their place of residence and left their medicines behind. When
consumers return medicines for others, middle-aged groups (35–49 and 50–64) are more likely to
return medicines because someone has passed away (see Figure 2.14). Younger consumers (see
Figure 2.15) were more likely to return medicines for someone who had moved out of home and
left their medicines behind. Female consumers (see Figure 2.16) were more likely to return
medicines for someone who had moved out of home and left their medicines behind.
Figure 2.14: Returning Medicines for Others (‘others’ passed away) by Age Group
Age Group 18-34 35-49 50-64 65-79 80+
Total
Count 3 16 33 22 5 79 Yes %* 25.0 53.3 67.3 40.7 33.3 49.4
Count 9 14 16 32 10 81
Returning medicines prescribed for others - passed away
No %* 75.0 46.7 32.7 59.3 66.7 50.6
Count 12 30 49 54 15 160 Total %* 100 100 100 100 100 100
* % within age group Chi-Square Tests
Value df Asymp. Sig. (2-sided) Pearson chi-square 12.527(a) 4 0.014
Likelihood ratio 12.832 4 0.012 Linear-by-linear association 0.494 1 0.482
N of valid cases 160
(a) 0 cells (0.0%) have expected count less than 5. The minimum expected count is 5.93.
Figure 2.15: Returning Medicines for Others (‘others’ moved out) by Age Group
Age Group
18-34 35-49 50-64 65-79 80+
Total
Count 4 6 7 6 3 26 Yes %* 36.4 33.3 28.0 13.6 17.6 22.6
Count 7 12 18 38 14 89
Returning medicines prescribed for others – moved out, left medicines
No %* 63.6 66.7 72.0 86.4 82.4 77.4
Count 11 18 25 44 17 115 Total %* 100 100 100 100 100 100
* % within age group
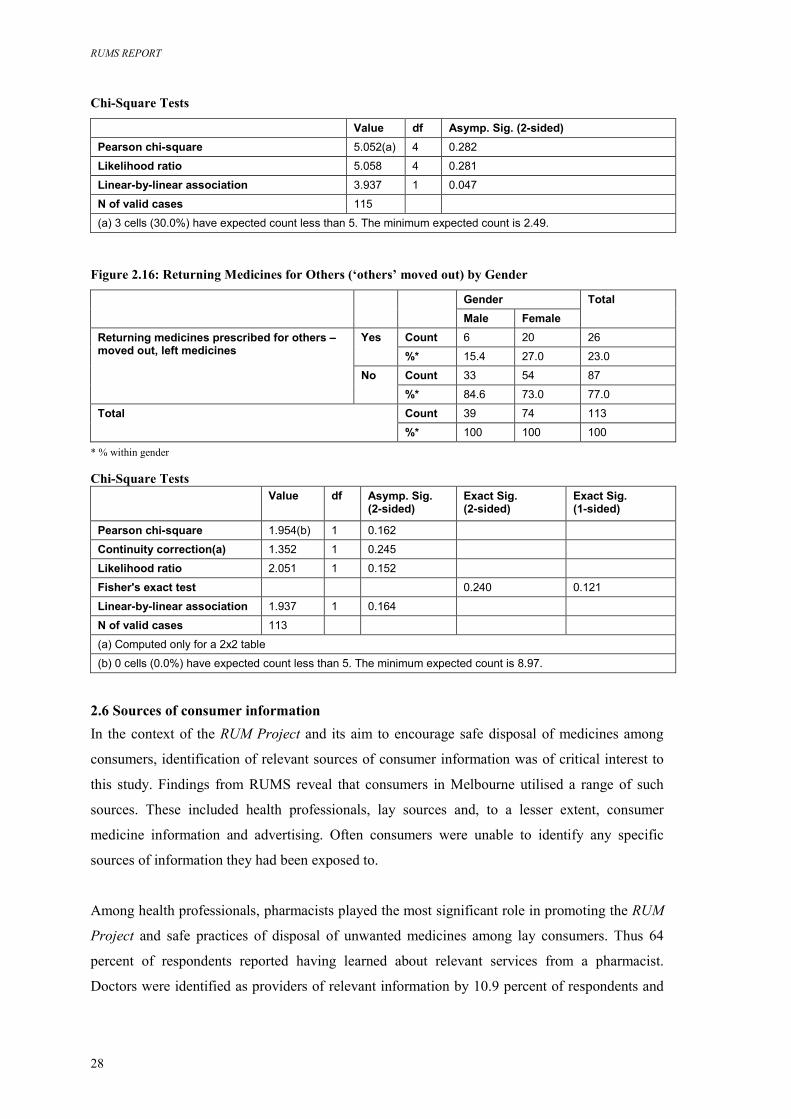
RUMS REPORT
28
Chi-Square Tests
Value df Asymp. Sig. (2-sided) Pearson chi-square 5.052(a) 4 0.282
Likelihood ratio 5.058 4 0.281
Linear-by-linear association 3.937 1 0.047
N of valid cases 115
(a) 3 cells (30.0%) have expected count less than 5. The minimum expected count is 2.49. Figure 2.16: Returning Medicines for Others (‘others’ moved out) by Gender
Gender
Male Female
Total
Count 6 20 26 Yes %* 15.4 27.0 23.0
Count 33 54 87
Returning medicines prescribed for others – moved out, left medicines
No %* 84.6 73.0 77.0
Count 39 74 113 Total %* 100 100 100
* % within gender Chi-Square Tests
Value df Asymp. Sig. (2-sided)
Exact Sig. (2-sided)
Exact Sig. (1-sided)
Pearson chi-square 1.954(b) 1 0.162
Continuity correction(a) 1.352 1 0.245
Likelihood ratio 2.051 1 0.152
Fisher's exact test 0.240 0.121
Linear-by-linear association 1.937 1 0.164
N of valid cases 113
(a) Computed only for a 2x2 table
(b) 0 cells (0.0%) have expected count less than 5. The minimum expected count is 8.97.
2.6 Sources of consumer information In the context of the RUM Project and its aim to encourage safe disposal of medicines among
consumers, identification of relevant sources of consumer information was of critical interest to
this study. Findings from RUMS reveal that consumers in Melbourne utilised a range of such
sources. These included health professionals, lay sources and, to a lesser extent, consumer
medicine information and advertising. Often consumers were unable to identify any specific
sources of information they had been exposed to.
Among health professionals, pharmacists played the most significant role in promoting the RUM
Project and safe practices of disposal of unwanted medicines among lay consumers. Thus 64
percent of respondents reported having learned about relevant services from a pharmacist.
Doctors were identified as providers of relevant information by 10.9 percent of respondents and
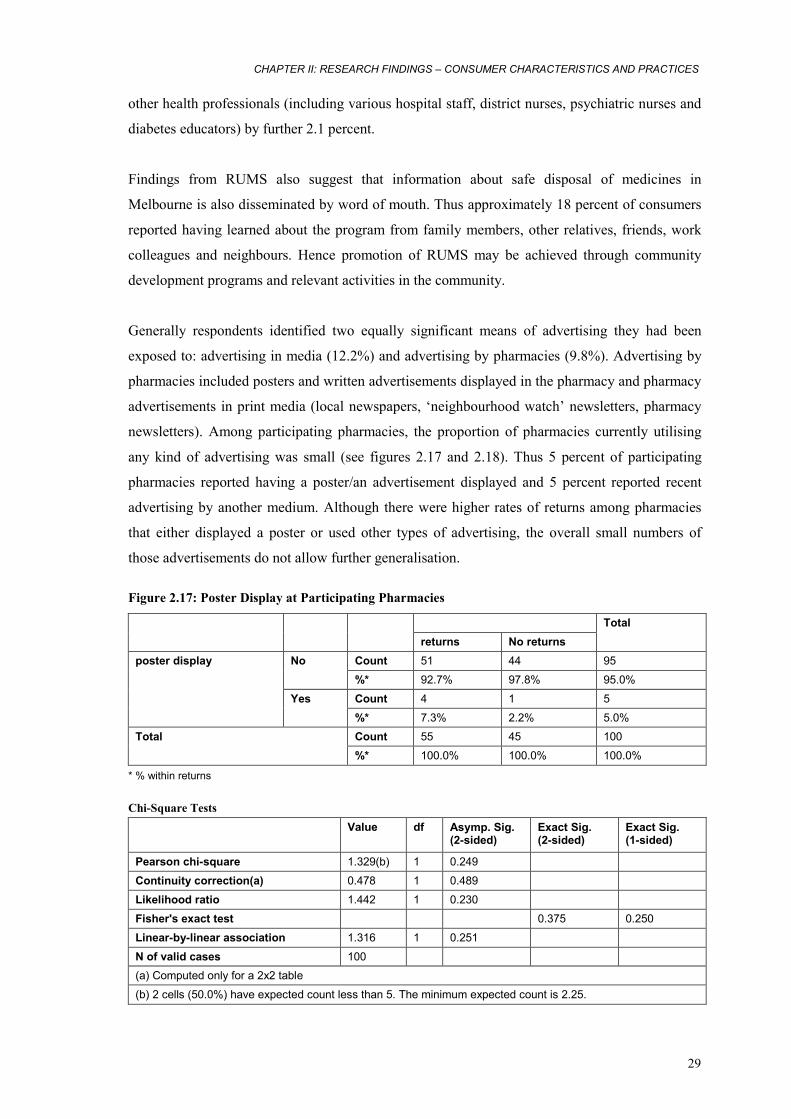
CHAPTER II: RESEARCH FINDINGS – CONSUMER CHARACTERISTICS AND PRACTICES
29
other health professionals (including various hospital staff, district nurses, psychiatric nurses and
diabetes educators) by further 2.1 percent.
Findings from RUMS also suggest that information about safe disposal of medicines in
Melbourne is also disseminated by word of mouth. Thus approximately 18 percent of consumers
reported having learned about the program from family members, other relatives, friends, work
colleagues and neighbours. Hence promotion of RUMS may be achieved through community
development programs and relevant activities in the community.
Generally respondents identified two equally significant means of advertising they had been
exposed to: advertising in media (12.2%) and advertising by pharmacies (9.8%). Advertising by
pharmacies included posters and written advertisements displayed in the pharmacy and pharmacy
advertisements in print media (local newspapers, ‘neighbourhood watch’ newsletters, pharmacy
newsletters). Among participating pharmacies, the proportion of pharmacies currently utilising
any kind of advertising was small (see figures 2.17 and 2.18). Thus 5 percent of participating
pharmacies reported having a poster/an advertisement displayed and 5 percent reported recent
advertising by another medium. Although there were higher rates of returns among pharmacies
that either displayed a poster or used other types of advertising, the overall small numbers of
those advertisements do not allow further generalisation.
Figure 2.17: Poster Display at Participating Pharmacies
returns No returns
Total
Count 51 44 95 No %* 92.7% 97.8% 95.0%
Count 4 1 5
poster display
Yes %* 7.3% 2.2% 5.0% Count 55 45 100 Total %* 100.0% 100.0% 100.0%
* % within returns Chi-Square Tests
Value df Asymp. Sig. (2-sided)
Exact Sig. (2-sided)
Exact Sig. (1-sided)
Pearson chi-square 1.329(b) 1 0.249
Continuity correction(a) 0.478 1 0.489
Likelihood ratio 1.442 1 0.230
Fisher's exact test 0.375 0.250
Linear-by-linear association 1.316 1 0.251
N of valid cases 100 (a) Computed only for a 2x2 table
(b) 2 cells (50.0%) have expected count less than 5. The minimum expected count is 2.25.
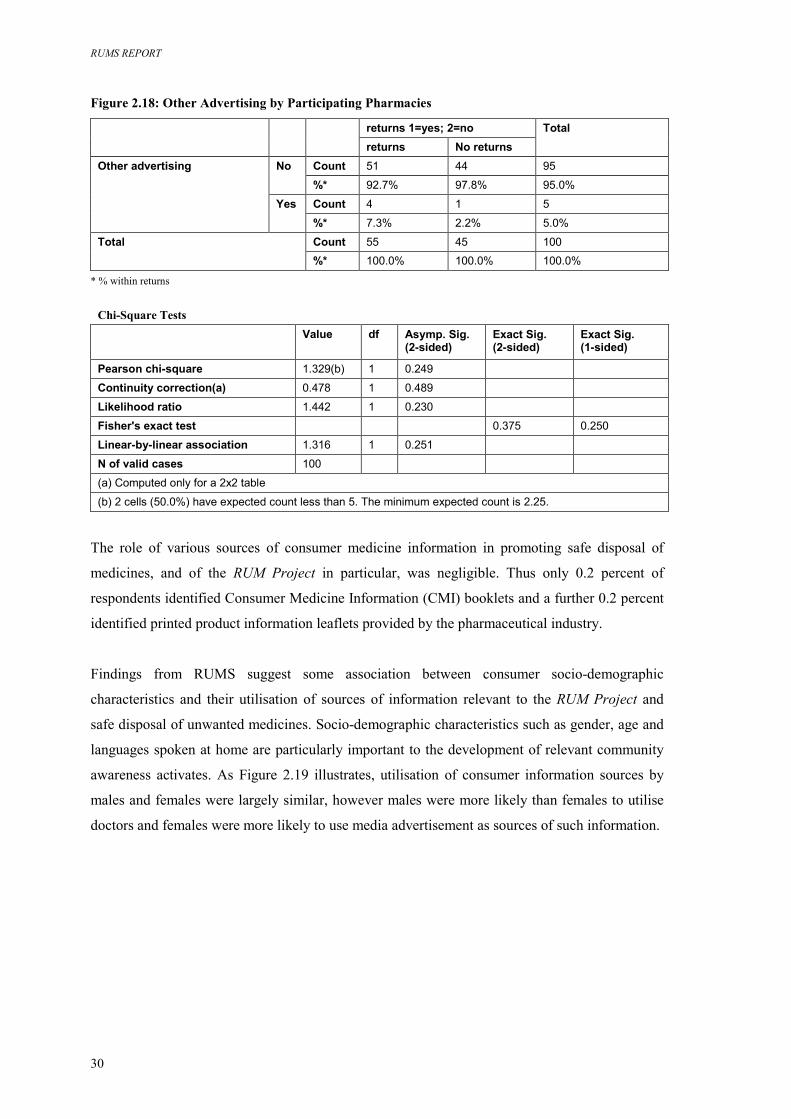
RUMS REPORT
30
Figure 2.18: Other Advertising by Participating Pharmacies
returns 1=yes; 2=no
returns No returns
Total
Count 51 44 95 No %* 92.7% 97.8% 95.0%
Count 4 1 5
Other advertising
Yes %* 7.3% 2.2% 5.0%
Count 55 45 100 Total %* 100.0% 100.0% 100.0%
* % within returns
Chi-Square Tests
Value df Asymp. Sig. (2-sided)
Exact Sig. (2-sided)
Exact Sig. (1-sided)
Pearson chi-square 1.329(b) 1 0.249
Continuity correction(a) 0.478 1 0.489
Likelihood ratio 1.442 1 0.230
Fisher's exact test 0.375 0.250
Linear-by-linear association 1.316 1 0.251
N of valid cases 100
(a) Computed only for a 2x2 table
(b) 2 cells (50.0%) have expected count less than 5. The minimum expected count is 2.25.
The role of various sources of consumer medicine information in promoting safe disposal of
medicines, and of the RUM Project in particular, was negligible. Thus only 0.2 percent of
respondents identified Consumer Medicine Information (CMI) booklets and a further 0.2 percent
identified printed product information leaflets provided by the pharmaceutical industry.
Findings from RUMS suggest some association between consumer socio-demographic
characteristics and their utilisation of sources of information relevant to the RUM Project and
safe disposal of unwanted medicines. Socio-demographic characteristics such as gender, age and
languages spoken at home are particularly important to the development of relevant community
awareness activates. As Figure 2.19 illustrates, utilisation of consumer information sources by
males and females were largely similar, however males were more likely than females to utilise
doctors and females were more likely to use media advertisement as sources of such information.
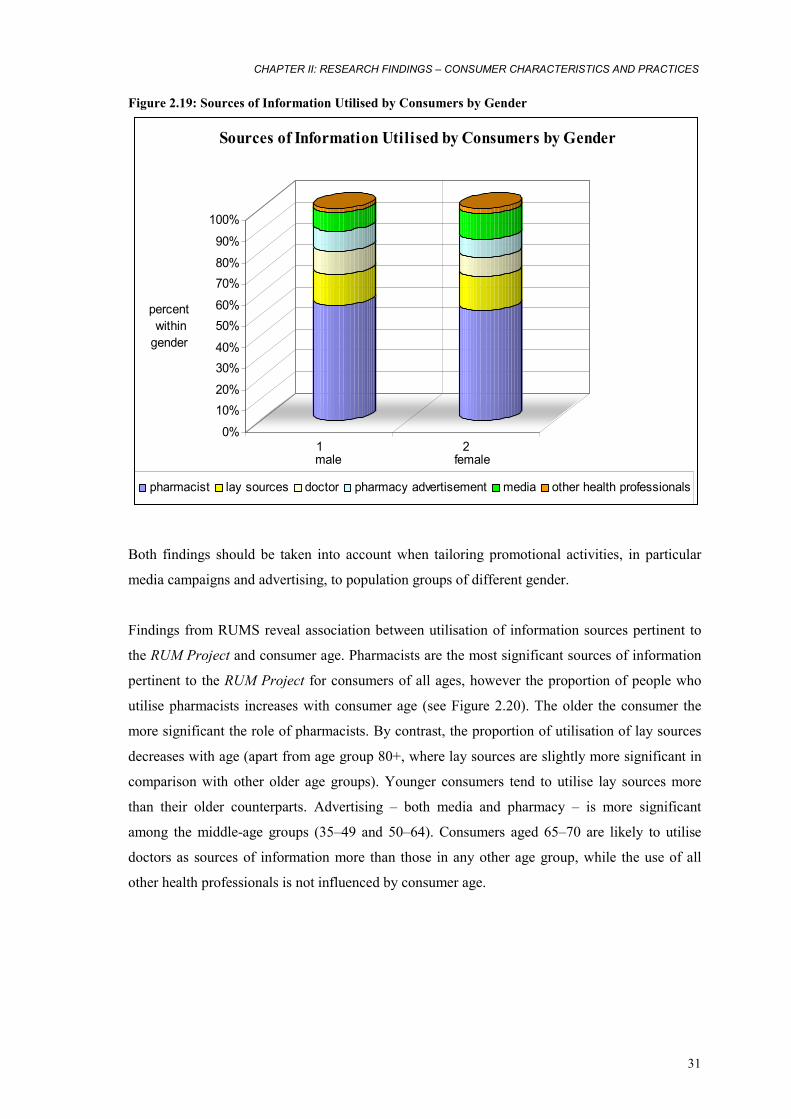
CHAPTER II: RESEARCH FINDINGS – CONSUMER CHARACTERISTICS AND PRACTICES
31
Figure 2.19: Sources of Information Utilised by Consumers by Gender
0%
10%20%
30%40%
50%60%
70%80%
90%
100%
percent within gender
1 2male female
Sources of Information Utilised by Consumers by Gender
pharmacist lay sources doctor pharmacy advertisement media other health professionals
Both findings should be taken into account when tailoring promotional activities, in particular
media campaigns and advertising, to population groups of different gender.
Findings from RUMS reveal association between utilisation of information sources pertinent to
the RUM Project and consumer age. Pharmacists are the most significant sources of information
pertinent to the RUM Project for consumers of all ages, however the proportion of people who
utilise pharmacists increases with consumer age (see Figure 2.20). The older the consumer the
more significant the role of pharmacists. By contrast, the proportion of utilisation of lay sources
decreases with age (apart from age group 80+, where lay sources are slightly more significant in
comparison with other older age groups). Younger consumers tend to utilise lay sources more
than their older counterparts. Advertising – both media and pharmacy – is more significant
among the middle-age groups (35–49 and 50–64). Consumers aged 65–70 are likely to utilise
doctors as sources of information more than those in any other age group, while the use of all
other health professionals is not influenced by consumer age.
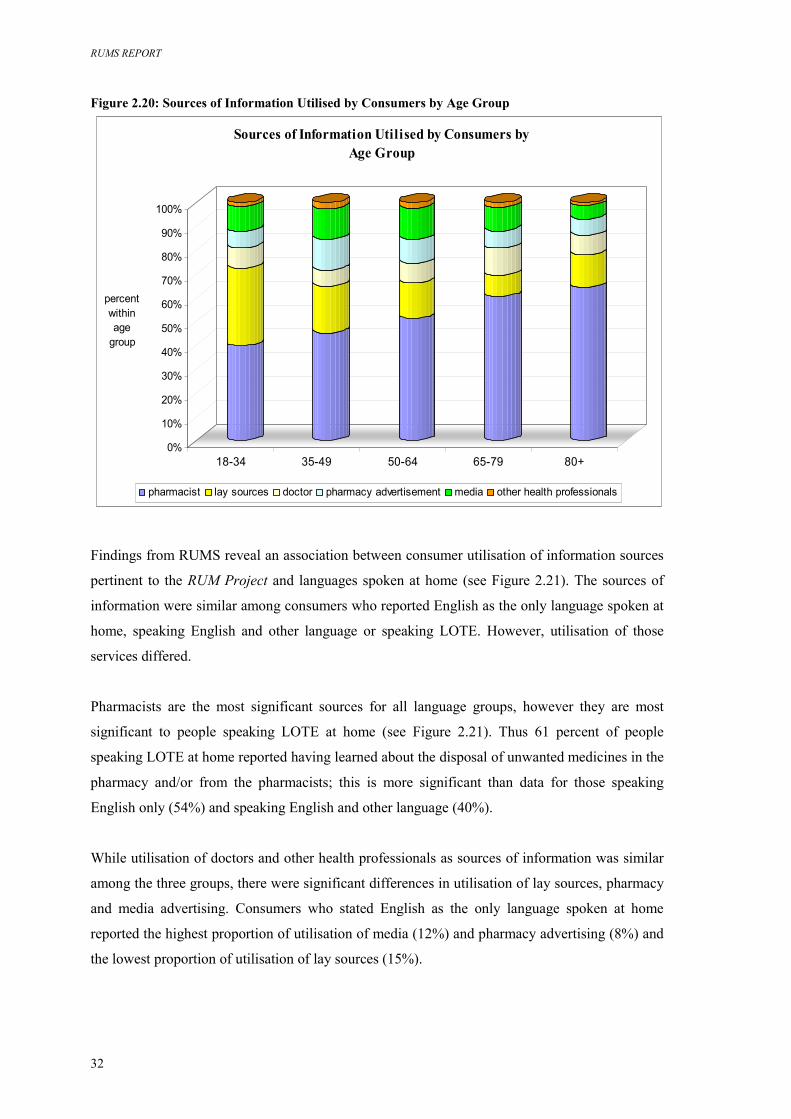
RUMS REPORT
32
Figure 2.20: Sources of Information Utilised by Consumers by Age Group
0%
10%
20%
30%
40%
50%
60%
70%
80%
90%
100%
18-34 35-49 50-64 65-79 80+
Sources of Information Utilised by Consumers by Age Group
pharmacist lay sources doctor pharmacy advertisement media other health professionals
percent within age
group
Findings from RUMS reveal an association between consumer utilisation of information sources
pertinent to the RUM Project and languages spoken at home (see Figure 2.21). The sources of
information were similar among consumers who reported English as the only language spoken at
home, speaking English and other language or speaking LOTE. However, utilisation of those
services differed.
Pharmacists are the most significant sources for all language groups, however they are most
significant to people speaking LOTE at home (see Figure 2.21). Thus 61 percent of people
speaking LOTE at home reported having learned about the disposal of unwanted medicines in the
pharmacy and/or from the pharmacists; this is more significant than data for those speaking
English only (54%) and speaking English and other language (40%).
While utilisation of doctors and other health professionals as sources of information was similar
among the three groups, there were significant differences in utilisation of lay sources, pharmacy
and media advertising. Consumers who stated English as the only language spoken at home
reported the highest proportion of utilisation of media (12%) and pharmacy advertising (8%) and
the lowest proportion of utilisation of lay sources (15%).
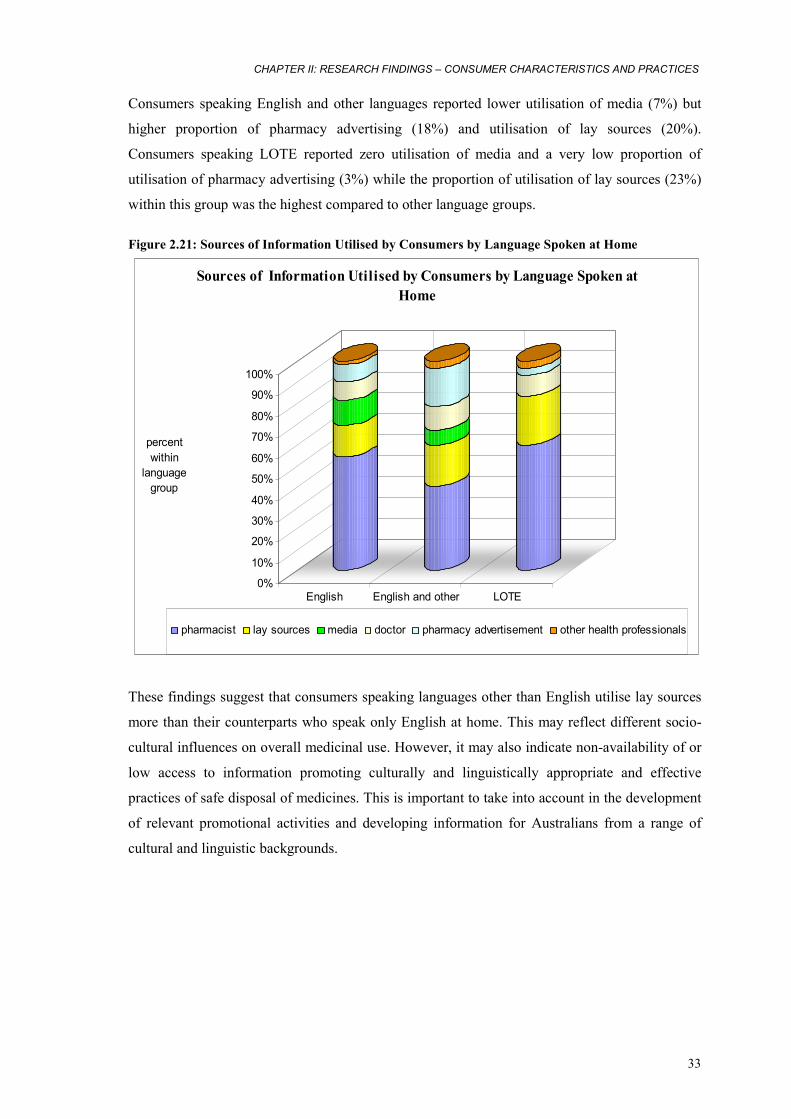
CHAPTER II: RESEARCH FINDINGS – CONSUMER CHARACTERISTICS AND PRACTICES
33
Consumers speaking English and other languages reported lower utilisation of media (7%) but
higher proportion of pharmacy advertising (18%) and utilisation of lay sources (20%).
Consumers speaking LOTE reported zero utilisation of media and a very low proportion of
utilisation of pharmacy advertising (3%) while the proportion of utilisation of lay sources (23%)
within this group was the highest compared to other language groups.
Figure 2.21: Sources of Information Utilised by Consumers by Language Spoken at Home
0%
10%
20%
30%
40%
50%
60%
70%
80%
90%
100%
English English and other LOTE
Sources of Information Utilised by Consumers by Language Spoken at Home
pharmacist lay sources media doctor pharmacy advertisement other health professionals
percent within
language group
These findings suggest that consumers speaking languages other than English utilise lay sources
more than their counterparts who speak only English at home. This may reflect different socio-
cultural influences on overall medicinal use. However, it may also indicate non-availability of or
low access to information promoting culturally and linguistically appropriate and effective
practices of safe disposal of medicines. This is important to take into account in the development
of relevant promotional activities and developing information for Australians from a range of
cultural and linguistic backgrounds.
RUMS REPORT
34
CHAPTER III: RESEARCH FINDINGS – THE KINDS OF MEDICINES RETURNED AND THE REASONS FOR RETURN Introduction Chapter III describes RUMS findings with regard to the key research questions (see Chapter I)
relating to the kinds of unwanted, and out-of-date, medicines that are being returned to
community pharmacies, and the reasons for their return. Findings in this chapter are derived from
the statistical analysis of data collected in interviews for each occasion where a consumer
returned any medicine to participating pharmacy, and from observations of the actual medicines
returned. Research findings in this chapter are often presented in figures and tables. Statistics for
each table are based on all the cases with valid data in the specified range (s) for all variables in
each table.
The material in this chapter is divided into several sections. Part A describes the kinds of
medicines that are being returned. Part B focuses on the reasons for return. The material is
structured under the following subheadings:
Part A: The kinds of medicines returned
3.1 Definitions
3.1.1 Medicines
3.1.2 Generic and proprietary name medicines
3.1.3 Prescription and non-prescription medicines
3.1.4 Subsidy category
3.2 Characteristics of returned medicines
3.2.1 Generic and proprietary (brand) name medicines
3.2.2 Prescription and non-prescription medicines
3.2.3 Form and presentation
3.2.4 Subsidy category
3.2.5 Medicines’ use-by date
3.3 Classification of returned medicines
3.4 The most commonly returned medicines
Part B: The reasons for return
3.5 Classification of reasons
3.5.3 Individual reasons and explanations
3.5.4 Reason categories
CHAPTER III: RESEACH FINDINGS – KINDS OF MEDICINES RETURNED AND REASONS FOR RETURN
35
3.6 Stated reasons for return
3.6.1 Single and multiple reasons
3.6.2 Multiple responses by reason category
3.6.3 Medicines returned due to unwanted effects
3.6.4 Medicines stopped without consulting a medical practitioner
3.6.5 Unused medicines
Part A: The kinds of medicines returned In RUMS, consumers returned a total of 2,250 medicines on 605 occasions with the number of
items returned on each occasion ranging from 1 to 22. Returned items represented 787 different
kinds of medicines with a range of different characteristics.
3.1 Definitions
3.1.1 Medicines
Definition of ‘medicines’ used in RUMS and this Report is consistent with the definition of
‘pharmaceuticals and other medical non-durables’ used by the Australian Statistics on Medicines
(ASM), which includes prescription and non-prescription medical preparations (both generic and
proprietary); serums and vaccines; oral contraceptives; vitamins, minerals and other
complementary medicines; and medical non-durables (i.e. bandages).20 In RUMS the names of
medicines were recorded using those appearing on a label. This may have included either
‘proprietary name’ (the registered trademark of the therapeutic goods or unique name assigned to
the goods by the sponsor) or, if there was no proprietary name, the non-proprietary name. For the
purposes of research and data analysis the name appearing on the label was defined as ‘medicine
name’. For each medicine name, the generic name was then identified/verified using the PBS.21
Both ‘medicine name’ and ‘generic name’ were used as variables for data analysis; however,
generic name was used as one of the major categories for data analysis and presentation.
3.1.2 Generic and proprietary name medicines
Generic and proprietary (brand) name medicines here are defined in accordance with the PBS
Generic Name Index and Proprietary Name Index.22 Generic name here is defined as a substance
or ‘a product marketed under the drug's non-proprietary approved name’,23 or chemical name,
20 Commonwealth Department of Health and Ageing 2003, Australian Statistics on Medicines. 1999–2000,
www.health.gov.au/pbs/healthpro/pubs/pdf/asm00.pdf (12 August 2004). 21 Commonwealth of Australia, 2004, Schedule of Pharmaceutical Benefits for Approved Pharmacists and Medical Practitioners,
<www.health.gov.au/pbs> (August – October 2004). 22 Commonwealth of Australia2004, Schedule of Pharmaceutical Benefits for Approved Pharmacists and Medical Practitioners,
<www.health.gov.au/pbs> (August – October 2004). 23 Birkett D.J. 2003, ‘Generics – equal or not?’, Aust Prescr, 26:85-7.
RUMS REPORT
36
while proprietary name is the registered trademark of therapeutic goods or the unique name
assigned by sponsor. Currently, there are 2838 items listed on the PBS. Out of those 794 are
listed as generic medicines and 2044 as proprietary medicines. This Report uses upper case in
medicinal names to distinguish generic medicines and sentence case for proprietary (brand) name
medicines.24
3.1.3 Prescription and non-prescription medicines
Definitions of prescription and non-prescription medicines here are those recommended by the
Therapeutic Goods Administration (TGA), which are based on the Standard for the Uniform
Scheduling of Drugs and Poisons (SUSDP).25 By TGA classification medicines are defined as
‘registered’, ‘listed’ and ‘complementary’. Registered medicines include both prescription
medicines and non-prescription medicines. TGA defines ‘prescription medicines’ as those
‘incorporating ingredients which are described in Schedule 4 or Schedule 8 of the Standard for
the SUSDP and some specified products such as sterile injectable’. Non-prescription medicines,
also known as ‘over-the-counter’ or OTC, are defined as those ‘usually containing ingredients
which are described in Schedule 2, Schedule 3, and sometimes Schedule 5 or 6 of the SUSDP’.
Listed medicines are all unscheduled medicines (i.e. not described in the SUSDP).
Complementary medicines (also known as 'traditional' or 'alternative' medicines) were either
registered or listed.26 In addition, RUMS defines prescription medicines as those dispensed for
consumers exclusively with a prescription from a medical practitioner.27
3.1.4 Subsidy category
In RUMS, ‘subsidy category’ of returned medicines is defined in accordance with the ‘patient
category’ as utilised by the Health Insurance Commission (HIC),28 the PBS29 and the
Pharmaceutical Benefits Pricing Authority (PBPA)30. The patient category refers to the patient's
eligibility status at the time of supply of the benefit under the PBS and Repatriation
Pharmaceutical Benefit Scheme (RPBS, i.e. items supplied to war veterans). The major patient
categories are: ‘general’ (all Medicare card holders) and ‘concessional’ (concession card
holders).31
24 Commonwealth of Australia2004, Schedule of Pharmaceutical Benefits for Approved Pharmacists and Medical Practitioners,
<www.health.gov.au/pbs> (July 2004). 25 Therapeutic Goods Administration 2004, Medicines definitions, <http://www.tga.gov.au/docs/html/meddef.htm> (20 July 2004). 26 Therapeutic Goods Administration 2004, Medicines definitions, <http://www.tga.gov.au/docs/html/meddef.htm> (30 August 2004). 27 Commonwealth Department of Health and Ageing 2003, Australian Statistics on Medicines. 1999–2000
<www.health.gov.au/pbs/healthpro/pubs/pdf/asm00.pdf> (12 August 2004). 28 Health Insurance Commission 2004, HIC Statistical Reporting, <http://www.hic.gov.au/cgi-bin> (1 September 2004). 29 Commonwealth Department of Health and Ageing 2003, About the PBS
<http://www.health.gov.au/internet/wcms/publishing.nsf/Content/health-pbs-general-aboutus.htm> (1 August 2004). 30 Pharmaceutical Benefits Pricing Authority 2004, Annual Report for the year ended 30 June 2003, Commonwealth Department of
Health and Ageing, Canberra. 31 Health Insurance Commission 2004, HIC Statistical Reporting, <http://www.hic.gov.au/cgi-bin> (1 September 2004).
CHAPTER III: RESEACH FINDINGS – KINDS OF MEDICINES RETURNED AND REASONS FOR RETURN
37
3.2 Characteristics of returned medicines 3.2.1 Generic and proprietary (brand) name medicines
As discussed earlier in Chapter I of this Report, the vast majority of the returned medicines were
identified and verified using the PBS Generic Name Index and Proprietary Name Index32 as the
main data source. There were approximately 190 medicines returned which were not listed by the
PBS, those were identified/verified using the AMH.33 Analysis of RUMS data revealed that the
vast majority of medicines returned were proprietary labelled medicines (N=2143, 96 percent)
and the proportion of generically labelled medicines (N=87, 4 percent) was significantly lower.
RUMS findings suggest that the proportion of generically labelled medicines returned in RUMS
is lower that the proportion of generically labelled medicines dispensed in the Australian
community. However, there are certain difficulties associated with obtaining data about the use
of generics in Australia34 that have to be taken into account when interpreting these findings.
The recent proliferation of the use of generic medicines in Australia has been well documented.
The use of generics has been steadily increasing as a result of economic pressure,35,36 and the
support for the practice of generic substitution by Australian Government and other major
stakeholders.37 In 1999, about 12 percent of all PBS scripts dispensed were generics.38 By 2001,
the share of generics in the prescription medicines market only was 18.9 percent (by number of
scripts) and 9.6 percent (by value).39
It is possible that the disproportion of generic medicines returned in RUMS compared to those
reported elsewhere reflects differences in definitions of generics utilised in this study and
elsewhere. It is important to take into consideration difficulties with the PBS hierarchy of listing40
and existing definitions. As Birkett (2003) pointed out, the use of the term ‘generic’ may vary,
which can be potentially confusing. The term can be used to define ‘a product marketed under the
drug's non-proprietary approved name’, as it is used in RUMS, or ‘it can … mean a product
marketed under a different brand (proprietary) name’.41 Confusion may reflect the fact, that the
32 Commonwealth of Australia 2004, Schedule of Pharmaceutical Benefits for Approved Pharmacists and Medical Practitioners,
<www.health.gov.au/pbs> (August – October 2004). 33 Australian Medicines Handbook, 2004. 34 Centre for Strategic Economic Studies 1999, Pharmaceuticals in Australia: Equity, cost, containment and industry development,
Victoria University, Melbourne. 35 Hassali A, Stewart K. 2004, ‘Quality use of generic medicine’, Aust Prescr, 27: 80–1. 36 Smeaton J. 2000, ‘The generics market’, Aust J Pharm, 81: 540–2. 37 Commonwealth Department of Health and Aged Care 2000, National Medicines Policy 2000, Canberra: Commonwealth
Department of Health and Aged Care. 38 Centre for Strategic Economic Studies 1999, Pharmaceuticals in Australia: Equity, cost, containment and industry development,
Victoria University, Melbourne. 39 D'Alwis E. 19 October 2004, Presentation to the Generic Drug Industry Conference, ABN AMRO Generic Drug Industry
Conference, <http://www.sigmaco.com.au> (18 October 2004). 40 Parliament of Australia 2003, The Pharmaceutical Benefits Scheme – an Overview,
<http://www.aph.gov.au/library/intguide/SP/pbs.htm> (12 October 2004). 41 Birkett, D.J. 2003, ‘Generics – equal or not?’, Aust Prescr, 26:85–7.
RUMS REPORT
38
'generic’ brands available through the PBS are named according to the pharmacy chain, while
comprising the same active ingredients and produced by the same manufacturer.42
3.2.2 Prescription and non-prescription medicines
In RUMS the vast majority of returned medicines identified with regard to the SUSDP
classification were prescription medicines. Out of those, the highest proportion comprised
medicines incorporating ingredients which are described in Schedule 4 of the SUSDP ( N=1652,
valid percent 86.0). There was a less significant proportion of prescription medicines
incorporating ingredients which are described in Schedule 8 (N=53, valid percent 2.8) of the
SUSDP. Non-prescription (over-the-counter or OTC) medicines returned in RUMS included
those containing ingredients which are described in Schedule 2 (N=131, valid percent 6.8),
Schedule 3 (N=82, valid percent 4.3) and Schedule 6 (N=1, valid percent 0.1). There were also
medicines not identified according to the SUSDP classification (14.7 percent), some of which
were listed or unscheduled medicines (i.e. complementary medicines).
The proportion of prescription medicines reported in RUMS appears high, even when taking into
account the share of those not identified with regard to the SUSDP classification. Comparing
RUMS data on prescription and non-prescription medicines with other Australian data is
challenging. Firstly, national data on returned medicines is not available and RUMS data can
only be related to national data on dispensing and/or use of medicines. Secondly, definitions of
prescription and non-prescription medicines and the data collection methods utilised in existing
sources may vary. For example, the proportion of prescription medicines returned in RUMS
appears to be higher compared with self-reported consumer use of medicines reported by the
National Health Survey (NHS). 43,44
Nevertheless, RUMS findings suggest that consumer practices pertinent to the disposal, storage
and, in fact, use of prescription and non-prescription medicines may differ. Understanding of
consumer perceptions and socio-cultural influences underlying those practices is outside the
scope of this study. It is possible that consumers perceive non-prescription medicines as being
less poisonous, and presenting less risk of environmental toxicity. While consumers’ rationale for
different practices of medicinal return and disposal of non-prescription medicines deserves
further investigation, RUMS identified poor disposal practices in relation to non-prescription
medicines as well as possible misuse of those medicines. This result is significant for its practical
42 Birkett, D.J. 2003, ‘Generics – equal or not?’, Aust Prescr, 26:85–7. 43 Australian Bureau of Statistics 2002, 4364.0 National Health Survey – Summary of Results, Australia,
<http://www.abs.gov.au/Ausstats/[email protected]> (19 October 2004). 44 Australian Bureau of Statistics 1999, 4377.0 National Health Survey, Use of Medications, Australia,
<http://www.abs.gov.au/Ausstats/[email protected]> (21 October 2004).
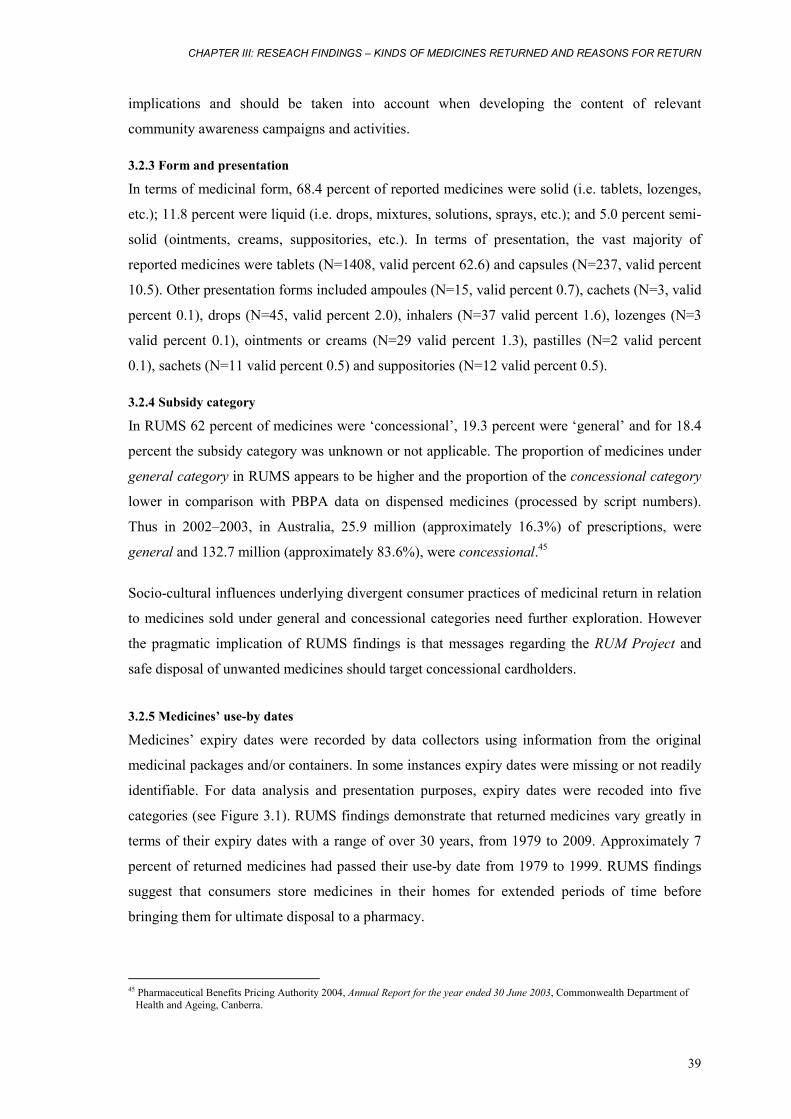
CHAPTER III: RESEACH FINDINGS – KINDS OF MEDICINES RETURNED AND REASONS FOR RETURN
39
implications and should be taken into account when developing the content of relevant
community awareness campaigns and activities.
3.2.3 Form and presentation
In terms of medicinal form, 68.4 percent of reported medicines were solid (i.e. tablets, lozenges,
etc.); 11.8 percent were liquid (i.e. drops, mixtures, solutions, sprays, etc.); and 5.0 percent semi-
solid (ointments, creams, suppositories, etc.). In terms of presentation, the vast majority of
reported medicines were tablets (N=1408, valid percent 62.6) and capsules (N=237, valid percent
10.5). Other presentation forms included ampoules (N=15, valid percent 0.7), cachets (N=3, valid
percent 0.1), drops (N=45, valid percent 2.0), inhalers (N=37 valid percent 1.6), lozenges (N=3
valid percent 0.1), ointments or creams (N=29 valid percent 1.3), pastilles (N=2 valid percent
0.1), sachets (N=11 valid percent 0.5) and suppositories (N=12 valid percent 0.5).
3.2.4 Subsidy category
In RUMS 62 percent of medicines were ‘concessional’, 19.3 percent were ‘general’ and for 18.4
percent the subsidy category was unknown or not applicable. The proportion of medicines under
general category in RUMS appears to be higher and the proportion of the concessional category
lower in comparison with PBPA data on dispensed medicines (processed by script numbers).
Thus in 2002–2003, in Australia, 25.9 million (approximately 16.3%) of prescriptions, were
general and 132.7 million (approximately 83.6%), were concessional.45
Socio-cultural influences underlying divergent consumer practices of medicinal return in relation
to medicines sold under general and concessional categories need further exploration. However
the pragmatic implication of RUMS findings is that messages regarding the RUM Project and
safe disposal of unwanted medicines should target concessional cardholders.
3.2.5 Medicines’ use-by dates Medicines’ expiry dates were recorded by data collectors using information from the original
medicinal packages and/or containers. In some instances expiry dates were missing or not readily
identifiable. For data analysis and presentation purposes, expiry dates were recoded into five
categories (see Figure 3.1). RUMS findings demonstrate that returned medicines vary greatly in
terms of their expiry dates with a range of over 30 years, from 1979 to 2009. Approximately 7
percent of returned medicines had passed their use-by date from 1979 to 1999. RUMS findings
suggest that consumers store medicines in their homes for extended periods of time before
bringing them for ultimate disposal to a pharmacy.
45 Pharmaceutical Benefits Pricing Authority 2004, Annual Report for the year ended 30 June 2003, Commonwealth Department of
Health and Ageing, Canberra.
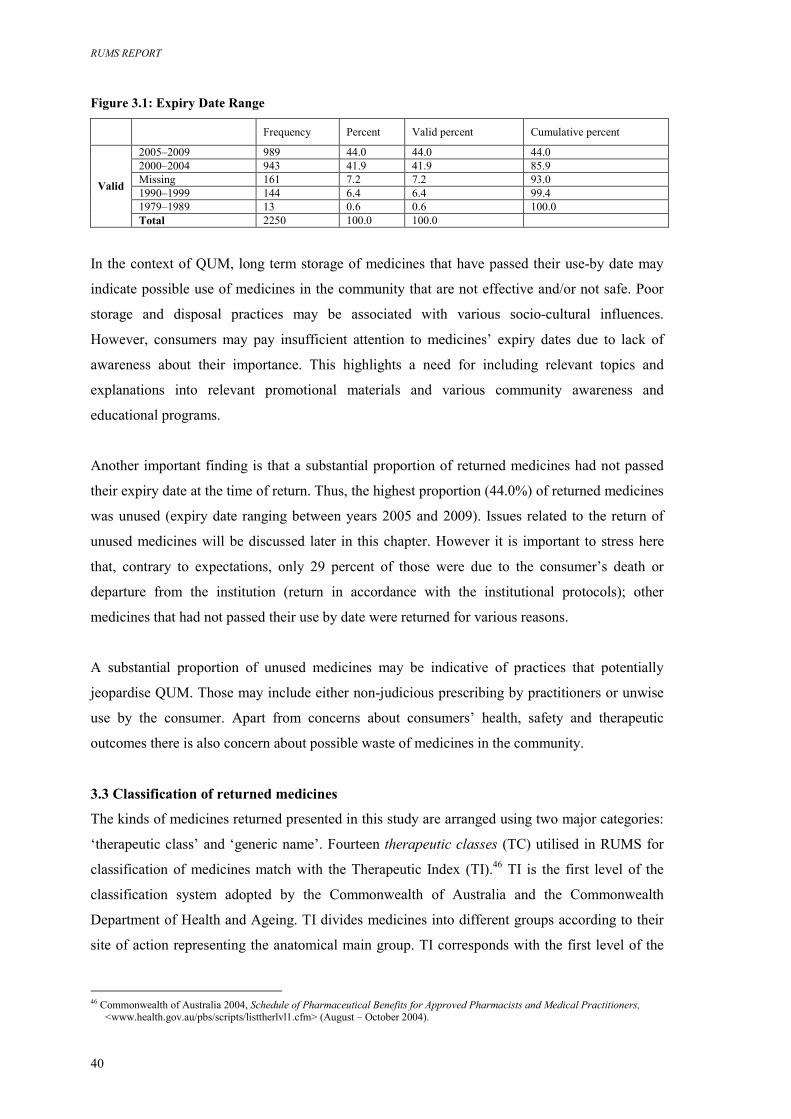
RUMS REPORT
40
Figure 3.1: Expiry Date Range
Frequency Percent Valid percent Cumulative percent
2005–2009 989 44.0 44.0 44.0 2000–2004 943 41.9 41.9 85.9 Missing 161 7.2 7.2 93.0 1990–1999 144 6.4 6.4 99.4 1979–1989 13 0.6 0.6 100.0
Valid
Total 2250 100.0 100.0
In the context of QUM, long term storage of medicines that have passed their use-by date may
indicate possible use of medicines in the community that are not effective and/or not safe. Poor
storage and disposal practices may be associated with various socio-cultural influences.
However, consumers may pay insufficient attention to medicines’ expiry dates due to lack of
awareness about their importance. This highlights a need for including relevant topics and
explanations into relevant promotional materials and various community awareness and
educational programs.
Another important finding is that a substantial proportion of returned medicines had not passed
their expiry date at the time of return. Thus, the highest proportion (44.0%) of returned medicines
was unused (expiry date ranging between years 2005 and 2009). Issues related to the return of
unused medicines will be discussed later in this chapter. However it is important to stress here
that, contrary to expectations, only 29 percent of those were due to the consumer’s death or
departure from the institution (return in accordance with the institutional protocols); other
medicines that had not passed their use by date were returned for various reasons.
A substantial proportion of unused medicines may be indicative of practices that potentially
jeopardise QUM. Those may include either non-judicious prescribing by practitioners or unwise
use by the consumer. Apart from concerns about consumers’ health, safety and therapeutic
outcomes there is also concern about possible waste of medicines in the community.
3.3 Classification of returned medicines
The kinds of medicines returned presented in this study are arranged using two major categories:
‘therapeutic class’ and ‘generic name’. Fourteen therapeutic classes (TC) utilised in RUMS for
classification of medicines match with the Therapeutic Index (TI).46 TI is the first level of the
classification system adopted by the Commonwealth of Australia and the Commonwealth
Department of Health and Ageing. TI divides medicines into different groups according to their
site of action representing the anatomical main group. TI corresponds with the first level of the
46 Commonwealth of Australia 2004, Schedule of Pharmaceutical Benefits for Approved Pharmacists and Medical Practitioners,
<www.health.gov.au/pbs/scripts/listtherlvl1.cfm> (August – October 2004).
CHAPTER III: RESEACH FINDINGS – KINDS OF MEDICINES RETURNED AND REASONS FOR RETURN
41
Anatomical Therapeutic Chemical classification system recommended by the World Health
Organization and adopted by the Australian Drug Evaluation Committee.47
In RUMS, there are 14 TC classes corresponding with the 14 anatomical main groups of the
Australian classification system48 as follows:
1. Alimentary tract and metabolism (ALIM)
2. Blood and blood forming organs (BLOOD)
3. Cardiovascular system (CARD)
4. Dermatologicals (DERM)
5. Genito-urinary system and sex hormones (GEN/U)
6. Systemic hormonal preparations, excl. sex hormones and insulins (HORM)
7. Anti-infectives for systemic use (A/Inf)
8. Antineoplastic and immunomodulating agents (A/Neo)
9. Musculo-skeletal system (MUSC)
10. Nervous system (NERV)
11. Antiparasitic products, insecticides and repellents (A/Par)
12. Respiratory system (RESP)
13. Sensory organs (SENS)
14. Various (VAR)
RUMS classification utilised two additional categories: ‘section 100’ (S100) and
‘complementary’ (COMP). The ‘section 100’ category here includes medicines that are available
under special arrangements but their site of action and/or the anatomical main group may vary or
has not been identified.49 The ‘complementary’ category here includes complementary
medicines50 with possible various or multiple sites of action.
3.4 The most commonly returned medicines
In RUMS, the most commonly returned medicines were those prescribed and/or used for
cardiovascular system (19.8%), nervous system (19.5%) and alimentary tract and metabolism
(14.6%) (see Figure 3.2).
47 Commonwealth Department of Health and Ageing 2003, Australian Statistics on Medicines 1999–2000,
<www.health.gov.au/pbs/healthpro/pubs/pdf/asm00.pdf> (25 October 2004). 48 Commonwealth of Australia 2004, Schedule of Pharmaceutical Benefits for Approved Pharmacists and Medical Practitioners,
<www.health.gov.au/pbs/scripts/listtherlvl1.cfm> (August – October 2004). 49 Commonwealth of Australia 2004, Schedule of Pharmaceutical Benefits for Approved Pharmacists and Medical Practitioners,
<www.health.gov.au/pbs> (1 August 2004). 50 Therapeutic Goods Administration 2004, Medicines definitions, <http://www.tga.gov.au/docs/html/meddef.htm > (3 September
2004).
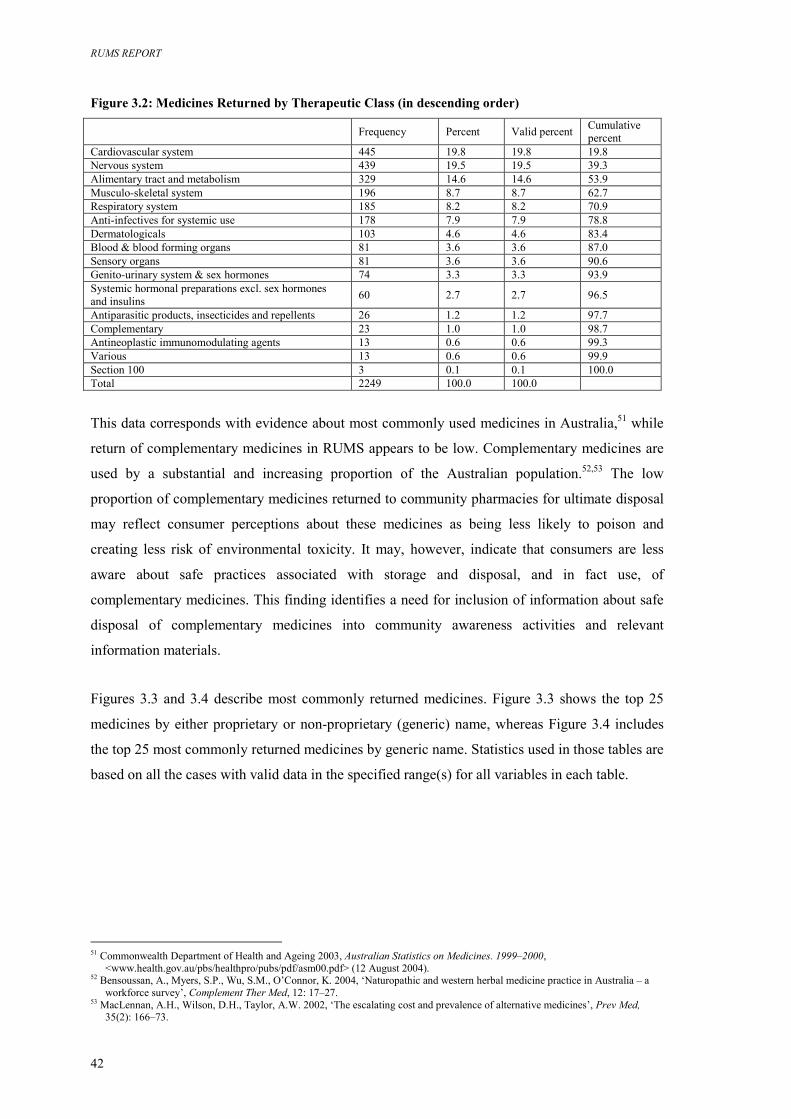
RUMS REPORT
42
Figure 3.2: Medicines Returned by Therapeutic Class (in descending order) Frequency Percent Valid percent Cumulative
percent Cardiovascular system 445 19.8 19.8 19.8 Nervous system 439 19.5 19.5 39.3 Alimentary tract and metabolism 329 14.6 14.6 53.9 Musculo-skeletal system 196 8.7 8.7 62.7 Respiratory system 185 8.2 8.2 70.9 Anti-infectives for systemic use 178 7.9 7.9 78.8 Dermatologicals 103 4.6 4.6 83.4 Blood & blood forming organs 81 3.6 3.6 87.0 Sensory organs 81 3.6 3.6 90.6 Genito-urinary system & sex hormones 74 3.3 3.3 93.9 Systemic hormonal preparations excl. sex hormones and insulins 60 2.7 2.7 96.5
Antiparasitic products, insecticides and repellents 26 1.2 1.2 97.7 Complementary 23 1.0 1.0 98.7 Antineoplastic immunomodulating agents 13 0.6 0.6 99.3 Various 13 0.6 0.6 99.9 Section 100 3 0.1 0.1 100.0 Total 2249 100.0 100.0
This data corresponds with evidence about most commonly used medicines in Australia,51 while
return of complementary medicines in RUMS appears to be low. Complementary medicines are
used by a substantial and increasing proportion of the Australian population.52,53 The low
proportion of complementary medicines returned to community pharmacies for ultimate disposal
may reflect consumer perceptions about these medicines as being less likely to poison and
creating less risk of environmental toxicity. It may, however, indicate that consumers are less
aware about safe practices associated with storage and disposal, and in fact use, of
complementary medicines. This finding identifies a need for inclusion of information about safe
disposal of complementary medicines into community awareness activities and relevant
information materials.
Figures 3.3 and 3.4 describe most commonly returned medicines. Figure 3.3 shows the top 25
medicines by either proprietary or non-proprietary (generic) name, whereas Figure 3.4 includes
the top 25 most commonly returned medicines by generic name. Statistics used in those tables are
based on all the cases with valid data in the specified range(s) for all variables in each table.
51 Commonwealth Department of Health and Ageing 2003, Australian Statistics on Medicines. 1999–2000,
<www.health.gov.au/pbs/healthpro/pubs/pdf/asm00.pdf> (12 August 2004). 52 Bensoussan, A., Myers, S.P., Wu, S.M., O’Connor, K. 2004, ‘Naturopathic and western herbal medicine practice in Australia – a
workforce survey’, Complement Ther Med, 12: 17–27. 53 MacLennan, A.H., Wilson, D.H., Taylor, A.W. 2002, ‘The escalating cost and prevalence of alternative medicines’, Prev Med,
35(2): 166–73.
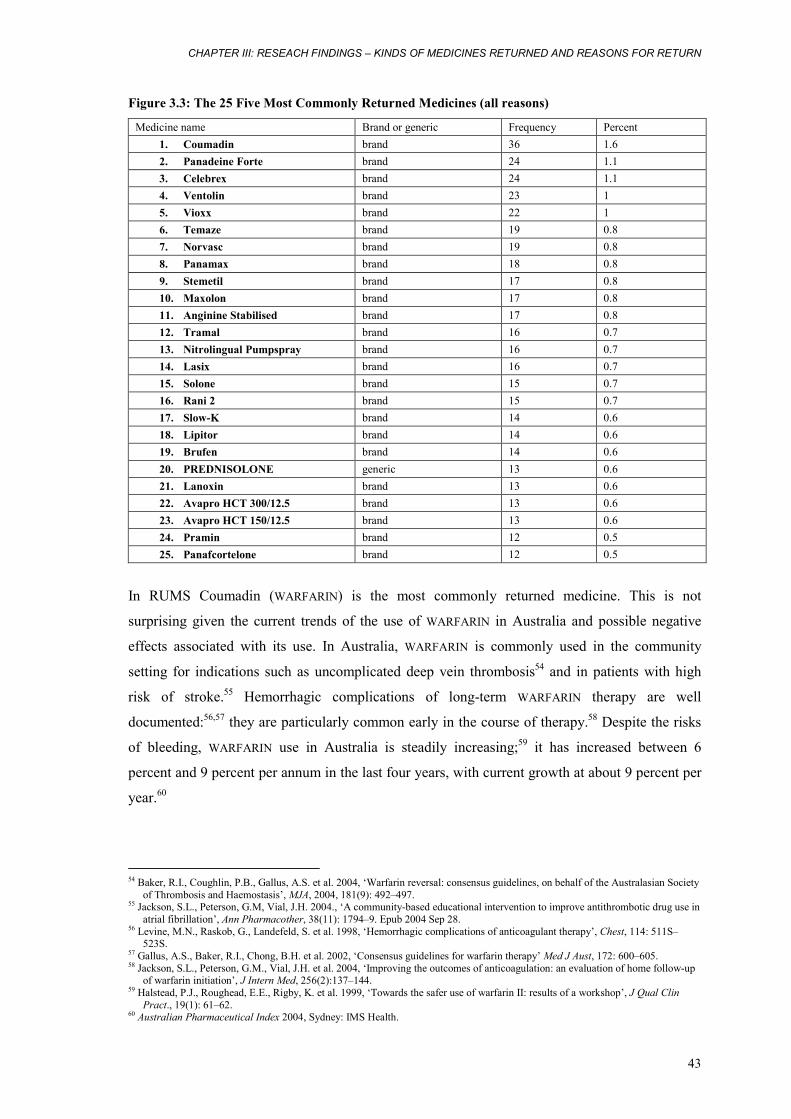
CHAPTER III: RESEACH FINDINGS – KINDS OF MEDICINES RETURNED AND REASONS FOR RETURN
43
Figure 3.3: The 25 Five Most Commonly Returned Medicines (all reasons)
Medicine name Brand or generic Frequency Percent 1. Coumadin brand 36 1.6 2. Panadeine Forte brand 24 1.1 3. Celebrex brand 24 1.1 4. Ventolin brand 23 1 5. Vioxx brand 22 1 6. Temaze brand 19 0.8 7. Norvasc brand 19 0.8 8. Panamax brand 18 0.8 9. Stemetil brand 17 0.8 10. Maxolon brand 17 0.8 11. Anginine Stabilised brand 17 0.8 12. Tramal brand 16 0.7 13. Nitrolingual Pumpspray brand 16 0.7 14. Lasix brand 16 0.7 15. Solone brand 15 0.7 16. Rani 2 brand 15 0.7 17. Slow-K brand 14 0.6 18. Lipitor brand 14 0.6 19. Brufen brand 14 0.6 20. PREDNISOLONE generic 13 0.6 21. Lanoxin brand 13 0.6 22. Avapro HCT 300/12.5 brand 13 0.6 23. Avapro HCT 150/12.5 brand 13 0.6 24. Pramin brand 12 0.5 25. Panafcortelone brand 12 0.5
In RUMS Coumadin (WARFARIN) is the most commonly returned medicine. This is not
surprising given the current trends of the use of WARFARIN in Australia and possible negative
effects associated with its use. In Australia, WARFARIN is commonly used in the community
setting for indications such as uncomplicated deep vein thrombosis54 and in patients with high
risk of stroke.55 Hemorrhagic complications of long-term WARFARIN therapy are well
documented:56,57 they are particularly common early in the course of therapy.58 Despite the risks
of bleeding, WARFARIN use in Australia is steadily increasing;59 it has increased between 6
percent and 9 percent per annum in the last four years, with current growth at about 9 percent per
year.60
54 Baker, R.I., Coughlin, P.B., Gallus, A.S. et al. 2004, ‘Warfarin reversal: consensus guidelines, on behalf of the Australasian Society
of Thrombosis and Haemostasis’, MJA, 2004, 181(9): 492–497. 55 Jackson, S.L., Peterson, G.M, Vial, J.H. 2004., ‘A community-based educational intervention to improve antithrombotic drug use in
atrial fibrillation’, Ann Pharmacother, 38(11): 1794–9. Epub 2004 Sep 28. 56 Levine, M.N., Raskob, G., Landefeld, S. et al. 1998, ‘Hemorrhagic complications of anticoagulant therapy’, Chest, 114: 511S–
523S. 57 Gallus, A.S., Baker, R.I., Chong, B.H. et al. 2002, ‘Consensus guidelines for warfarin therapy’ Med J Aust, 172: 600–605. 58 Jackson, S.L., Peterson, G.M., Vial, J.H. et al. 2004, ‘Improving the outcomes of anticoagulation: an evaluation of home follow-up
of warfarin initiation’, J Intern Med, 256(2):137–144. 59 Halstead, P.J., Roughead, E.E., Rigby, K. et al. 1999, ‘Towards the safer use of warfarin II: results of a workshop’, J Qual Clin
Pract., 19(1): 61–62. 60 Australian Pharmaceutical Index 2004, Sydney: IMS Health.
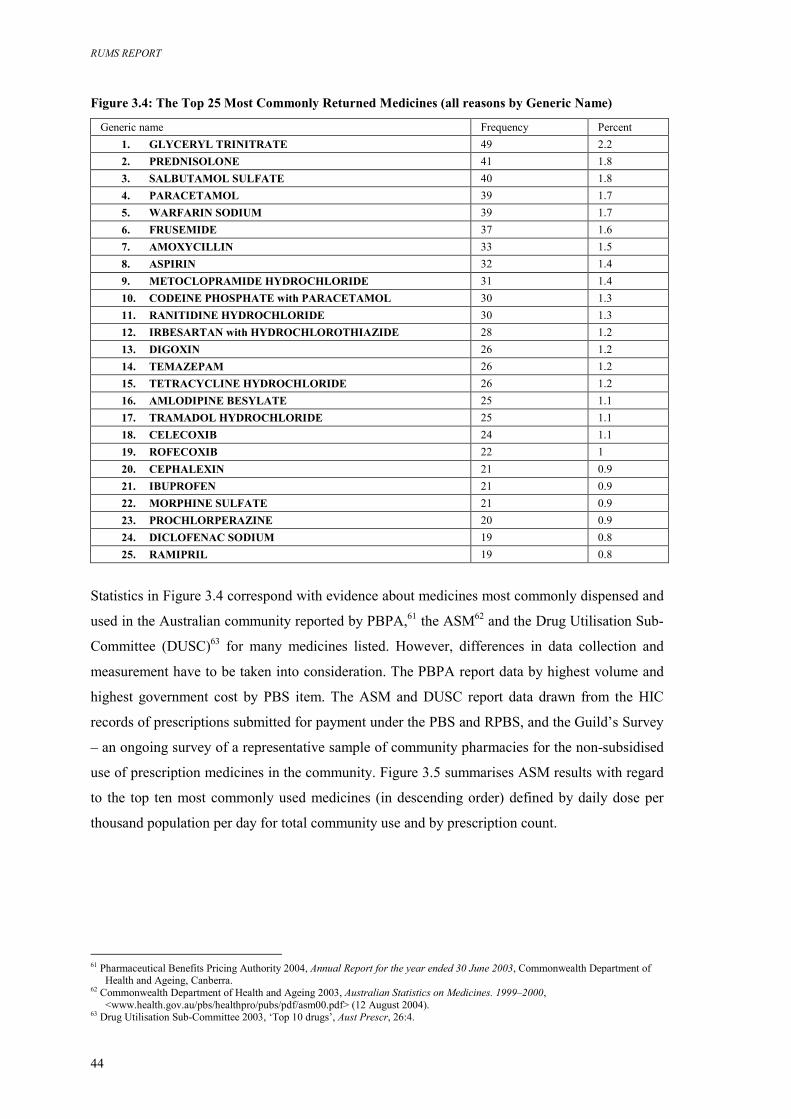
RUMS REPORT
44
Figure 3.4: The Top 25 Most Commonly Returned Medicines (all reasons by Generic Name)
Generic name Frequency Percent 1. GLYCERYL TRINITRATE 49 2.2 2. PREDNISOLONE 41 1.8 3. SALBUTAMOL SULFATE 40 1.8 4. PARACETAMOL 39 1.7 5. WARFARIN SODIUM 39 1.7 6. FRUSEMIDE 37 1.6 7. AMOXYCILLIN 33 1.5 8. ASPIRIN 32 1.4 9. METOCLOPRAMIDE HYDROCHLORIDE 31 1.4 10. CODEINE PHOSPHATE with PARACETAMOL 30 1.3 11. RANITIDINE HYDROCHLORIDE 30 1.3 12. IRBESARTAN with HYDROCHLOROTHIAZIDE 28 1.2 13. DIGOXIN 26 1.2 14. TEMAZEPAM 26 1.2 15. TETRACYCLINE HYDROCHLORIDE 26 1.2 16. AMLODIPINE BESYLATE 25 1.1 17. TRAMADOL HYDROCHLORIDE 25 1.1 18. CELECOXIB 24 1.1 19. ROFECOXIB 22 1 20. CEPHALEXIN 21 0.9 21. IBUPROFEN 21 0.9 22. MORPHINE SULFATE 21 0.9 23. PROCHLORPERAZINE 20 0.9 24. DICLOFENAC SODIUM 19 0.8 25. RAMIPRIL 19 0.8
Statistics in Figure 3.4 correspond with evidence about medicines most commonly dispensed and
used in the Australian community reported by PBPA,61 the ASM62 and the Drug Utilisation Sub-
Committee (DUSC)63 for many medicines listed. However, differences in data collection and
measurement have to be taken into consideration. The PBPA report data by highest volume and
highest government cost by PBS item. The ASM and DUSC report data drawn from the HIC
records of prescriptions submitted for payment under the PBS and RPBS, and the Guild’s Survey
– an ongoing survey of a representative sample of community pharmacies for the non-subsidised
use of prescription medicines in the community. Figure 3.5 summarises ASM results with regard
to the top ten most commonly used medicines (in descending order) defined by daily dose per
thousand population per day for total community use and by prescription count.
61 Pharmaceutical Benefits Pricing Authority 2004, Annual Report for the year ended 30 June 2003, Commonwealth Department of
Health and Ageing, Canberra. 62 Commonwealth Department of Health and Ageing 2003, Australian Statistics on Medicines. 1999–2000,
<www.health.gov.au/pbs/healthpro/pubs/pdf/asm00.pdf> (12 August 2004). 63 Drug Utilisation Sub-Committee 2003, ‘Top 10 drugs’, Aust Prescr, 26:4.
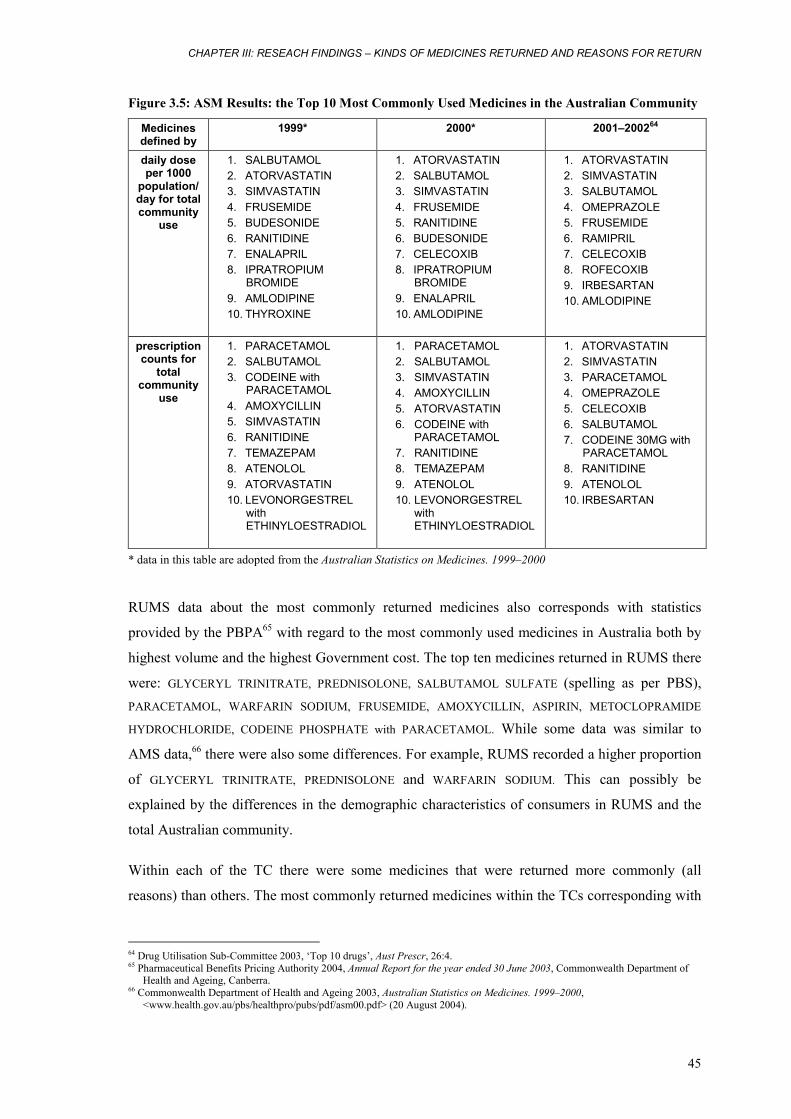
CHAPTER III: RESEACH FINDINGS – KINDS OF MEDICINES RETURNED AND REASONS FOR RETURN
45
Figure 3.5: ASM Results: the Top 10 Most Commonly Used Medicines in the Australian Community
Medicines defined by
1999* 2000* 2001–200264
daily dose per 1000
population/ day for total community
use
1. SALBUTAMOL 2. ATORVASTATIN 3. SIMVASTATIN 4. FRUSEMIDE 5. BUDESONIDE 6. RANITIDINE 7. ENALAPRIL 8. IPRATROPIUM
BROMIDE 9. AMLODIPINE 10. THYROXINE
1. ATORVASTATIN 2. SALBUTAMOL 3. SIMVASTATIN 4. FRUSEMIDE 5. RANITIDINE 6. BUDESONIDE 7. CELECOXIB 8. IPRATROPIUM
BROMIDE 9. ENALAPRIL 10. AMLODIPINE
1. ATORVASTATIN 2. SIMVASTATIN 3. SALBUTAMOL 4. OMEPRAZOLE 5. FRUSEMIDE 6. RAMIPRIL 7. CELECOXIB 8. ROFECOXIB 9. IRBESARTAN 10. AMLODIPINE
prescription counts for
total community
use
1. PARACETAMOL 2. SALBUTAMOL 3. CODEINE with
PARACETAMOL 4. AMOXYCILLIN 5. SIMVASTATIN 6. RANITIDINE 7. TEMAZEPAM 8. ATENOLOL 9. ATORVASTATIN 10. LEVONORGESTREL
with ETHINYLOESTRADIOL
1. PARACETAMOL 2. SALBUTAMOL 3. SIMVASTATIN 4. AMOXYCILLIN 5. ATORVASTATIN 6. CODEINE with
PARACETAMOL 7. RANITIDINE 8. TEMAZEPAM 9. ATENOLOL 10. LEVONORGESTREL
with ETHINYLOESTRADIOL
1. ATORVASTATIN 2. SIMVASTATIN 3. PARACETAMOL 4. OMEPRAZOLE 5. CELECOXIB 6. SALBUTAMOL 7. CODEINE 30MG with
PARACETAMOL 8. RANITIDINE 9. ATENOLOL 10. IRBESARTAN
* data in this table are adopted from the Australian Statistics on Medicines. 1999–2000
RUMS data about the most commonly returned medicines also corresponds with statistics
provided by the PBPA65 with regard to the most commonly used medicines in Australia both by
highest volume and the highest Government cost. The top ten medicines returned in RUMS there
were: GLYCERYL TRINITRATE, PREDNISOLONE, SALBUTAMOL SULFATE (spelling as per PBS), PARACETAMOL, WARFARIN SODIUM, FRUSEMIDE, AMOXYCILLIN, ASPIRIN, METOCLOPRAMIDE
HYDROCHLORIDE, CODEINE PHOSPHATE with PARACETAMOL. While some data was similar to
AMS data,66 there were also some differences. For example, RUMS recorded a higher proportion
of GLYCERYL TRINITRATE, PREDNISOLONE and WARFARIN SODIUM. This can possibly be
explained by the differences in the demographic characteristics of consumers in RUMS and the
total Australian community.
Within each of the TC there were some medicines that were returned more commonly (all
reasons) than others. The most commonly returned medicines within the TCs corresponding with
64 Drug Utilisation Sub-Committee 2003, ‘Top 10 drugs’, Aust Prescr, 26:4. 65 Pharmaceutical Benefits Pricing Authority 2004, Annual Report for the year ended 30 June 2003, Commonwealth Department of
Health and Ageing, Canberra. 66 Commonwealth Department of Health and Ageing 2003, Australian Statistics on Medicines. 1999–2000,
<www.health.gov.au/pbs/healthpro/pubs/pdf/asm00.pdf> (20 August 2004).
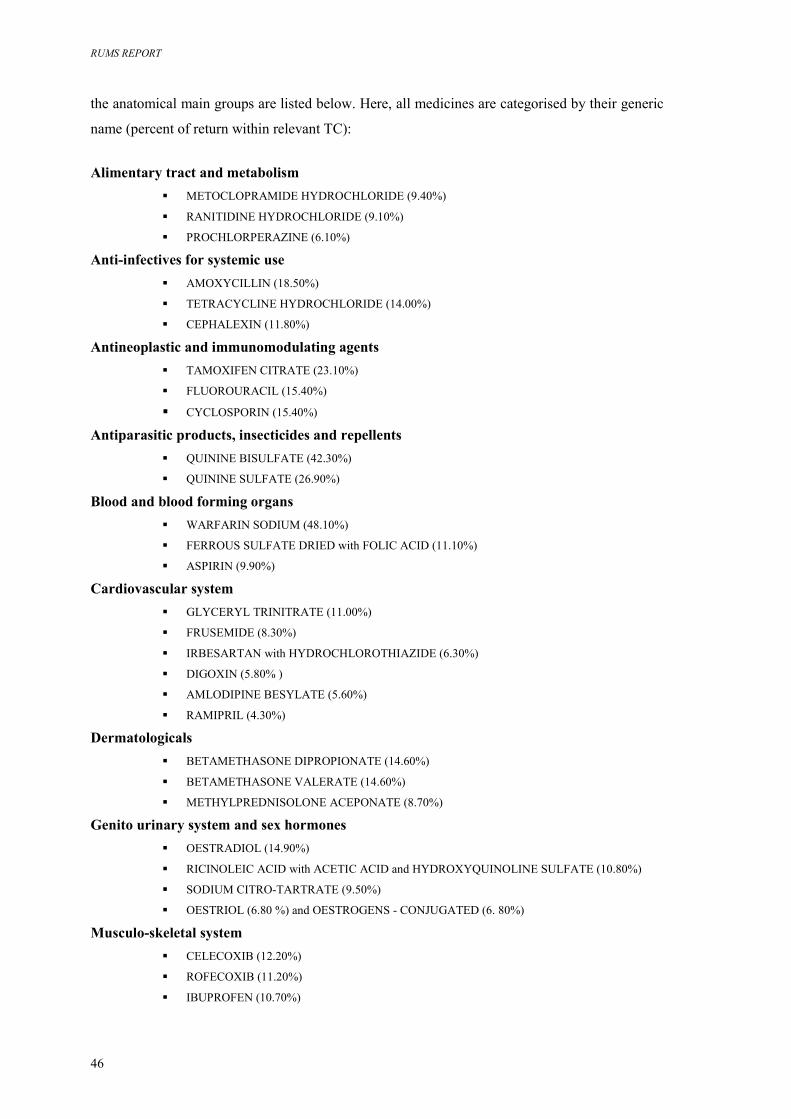
RUMS REPORT
46
the anatomical main groups are listed below. Here, all medicines are categorised by their generic
name (percent of return within relevant TC):
Alimentary tract and metabolism
� METOCLOPRAMIDE HYDROCHLORIDE (9.40%)
� RANITIDINE HYDROCHLORIDE (9.10%)
� PROCHLORPERAZINE (6.10%)
Anti-infectives for systemic use � AMOXYCILLIN (18.50%)
� TETRACYCLINE HYDROCHLORIDE (14.00%)
� CEPHALEXIN (11.80%)
Antineoplastic and immunomodulating agents � TAMOXIFEN CITRATE (23.10%)
� FLUOROURACIL (15.40%)
� CYCLOSPORIN (15.40%)
Antiparasitic products, insecticides and repellents � QUININE BISULFATE (42.30%)
� QUININE SULFATE (26.90%)
Blood and blood forming organs � WARFARIN SODIUM (48.10%)
� FERROUS SULFATE DRIED with FOLIC ACID (11.10%)
� ASPIRIN (9.90%)
Cardiovascular system � GLYCERYL TRINITRATE (11.00%)
� FRUSEMIDE (8.30%)
� IRBESARTAN with HYDROCHLOROTHIAZIDE (6.30%)
� DIGOXIN (5.80% )
� AMLODIPINE BESYLATE (5.60%)
� RAMIPRIL (4.30%)
Dermatologicals � BETAMETHASONE DIPROPIONATE (14.60%)
� BETAMETHASONE VALERATE (14.60%)
� METHYLPREDNISOLONE ACEPONATE (8.70%)
Genito urinary system and sex hormones � OESTRADIOL (14.90%)
� RICINOLEIC ACID with ACETIC ACID and HYDROXYQUINOLINE SULFATE (10.80%)
� SODIUM CITRO-TARTRATE (9.50%)
� OESTRIOL (6.80 %) and OESTROGENS - CONJUGATED (6. 80%)
Musculo-skeletal system � CELECOXIB (12.20%)
� ROFECOXIB (11.20%)
� IBUPROFEN (10.70%)
CHAPTER III: RESEACH FINDINGS – KINDS OF MEDICINES RETURNED AND REASONS FOR RETURN
47
� DICLOFENAC SODIUM (9.20%)
� NAPROXEN (9.20%)
Nervous system � PARACETAMOL (8.40%)
� CODEINE PHOSPHATE with PARACETAMOL (6.60%)
� TEMAZEPAM (5.90%)
� TRAMADOL HYDROCHLORIDE (5.70%)
� ASPIRIN (5.50%)
� DIAZEPAM (3.60%)
� MORPHINE HYDROCHLORIDE (3.40%)
Respiratory system � SALBUTAMOL SULFATE (21.60% )
� FLUTICASONE PROPIONATE with SALMETEROL XINAFOATE (8.60%)
� TERBUTALINE SULFATE (7.60%)
� BECLOMETHASONE DIPROPIONATE (5.40%)
� BUDESONIDE (4.90%)
Sensory organs � CHLORAMPHENICOL (21.00%)
� BIMATOPROST (8.60%)
� TRIAMCINOLONE ACETONIDE with NEOMYCIN SULFATE, GRAMICIDIN and
NYSTATIN (8.60%)
Systemic hormonal preparations, excl. sex hormones and insulins � PREDNISOLONE (66.70%)
� THYROXINE SODIUM (11.70%).
Part B: The reasons for return
3.5 Classification of reasons
3.5.1 Individual reasons and explanations RUMS respondents offered a wide range of individual reasons and explanations of why they
returned medicine/s and why those were either not needed or not wanted.
Listed are individual reasons and explanations offered by consumers:
� medicine passed use-by date
� consumer got better/stopped taking medicine without completing the recommended course
� consumer passed away
� consumer experienced unwanted effects of a medicine
� medicine was recalled by the manufacturer
� doctor changed/replaced medicine (with either different medicine/brand/type)
RUMS REPORT
48
� doctor recommended to stop/cease medicine (without replacing)
� doctor changed prescription to different dosage/administration mode/same medicine
� consumer completed recommended course of medication
� consumer stopped medicine without consulting a medical practitioner
� consumer unable to take oral medication
� consumer did not experience benefits (i.e. medicine ‘does not work’, ‘is useless’, ‘not
effective’)
� consumer moved into a nursing home and left medicines behind
� consumer stated that ‘medicine is no longer needed’
� medicine expired since opening (i.e. eye drops expired in 30 days after opening)
� consumer is not able/not willing to use medicine in prescribed administration mode
� consumer was taken off this medicine while in hospital
� consumer moved out of home and left medicines behind
� consumer ‘refused’ to take medicine for unknown reasons
� consumer stopped medicines due to information from ‘the media’
� consumer departed the institution (return in accord with the institutional protocols)
� consumer thought that medicine/prescription was inappropriate
� consumer cannot use medicine due to pregnancy
� consumer's ‘health/health status’ changed
� consumer stopped medication because medicine is ‘too expensive’
� unable ‘to use medicine properly’ (no further explanation)
� medication stopped as per recommendation from the home medication review team
� purchase of medicine over needs
3.5.2 Reason categories For the purpose of data analysis and presentation, individual reasons and explanations relevant to
medicinal returns were categorised into several broader categories – ‘reason categories’ – and
subsequently recoded. Reason categories, associated codes and individual reasons and
explanations under relevant reason category are described in Figure 3.6.
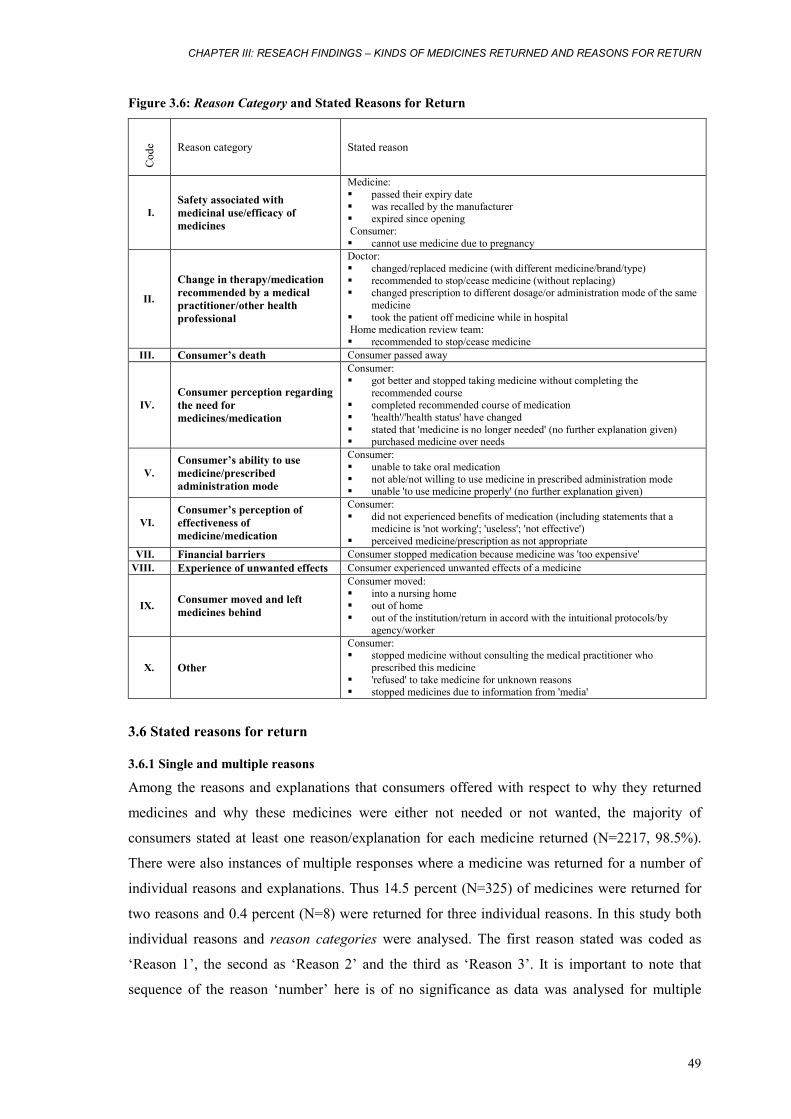
CHAPTER III: RESEACH FINDINGS – KINDS OF MEDICINES RETURNED AND REASONS FOR RETURN
49
Figure 3.6: Reason Category and Stated Reasons for Return
Cod
e Reason category Stated reason
I. Safety associated with medicinal use/efficacy of medicines
Medicine: � passed their expiry date � was recalled by the manufacturer � expired since opening Consumer: � cannot use medicine due to pregnancy
II.
Change in therapy/medication recommended by a medical practitioner/other health professional
Doctor: � changed/replaced medicine (with different medicine/brand/type) � recommended to stop/cease medicine (without replacing) � changed prescription to different dosage/or administration mode of the same
medicine � took the patient off medicine while in hospital Home medication review team: � recommended to stop/cease medicine
III. Consumer’s death Consumer passed away
IV. Consumer perception regarding the need for medicines/medication
Consumer: � got better and stopped taking medicine without completing the
recommended course � completed recommended course of medication � 'health'/'health status' have changed � stated that 'medicine is no longer needed' (no further explanation given) � purchased medicine over needs
V. Consumer’s ability to use medicine/prescribed administration mode
Consumer: � unable to take oral medication � not able/not willing to use medicine in prescribed administration mode � unable 'to use medicine properly' (no further explanation given)
VI. Consumer’s perception of effectiveness of medicine/medication
Consumer: � did not experienced benefits of medication (including statements that a
medicine is 'not working'; 'useless'; 'not effective') � perceived medicine/prescription as not appropriate
VII. Financial barriers Consumer stopped medication because medicine was 'too expensive' VIII. Experience of unwanted effects Consumer experienced unwanted effects of a medicine
IX. Consumer moved and left medicines behind
Consumer moved: � into a nursing home � out of home � out of the institution/return in accord with the intuitional protocols/by
agency/worker
X. Other
Consumer: � stopped medicine without consulting the medical practitioner who
prescribed this medicine � 'refused' to take medicine for unknown reasons � stopped medicines due to information from 'media'
3.6 Stated reasons for return
3.6.1 Single and multiple reasons
Among the reasons and explanations that consumers offered with respect to why they returned
medicines and why these medicines were either not needed or not wanted, the majority of
consumers stated at least one reason/explanation for each medicine returned (N=2217, 98.5%).
There were also instances of multiple responses where a medicine was returned for a number of
individual reasons and explanations. Thus 14.5 percent (N=325) of medicines were returned for
two reasons and 0.4 percent (N=8) were returned for three individual reasons. In this study both
individual reasons and reason categories were analysed. The first reason stated was coded as
‘Reason 1’, the second as ‘Reason 2’ and the third as ‘Reason 3’. It is important to note that
sequence of the reason ‘number’ here is of no significance as data was analysed for multiple
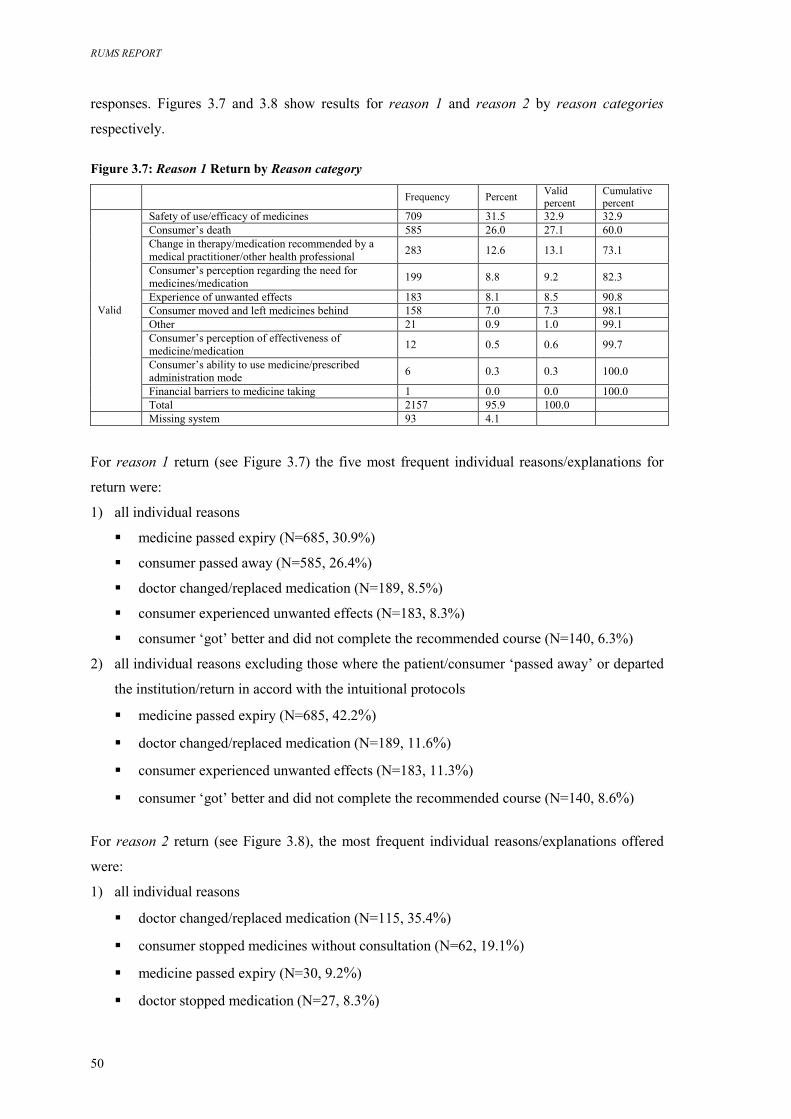
RUMS REPORT
50
responses. Figures 3.7 and 3.8 show results for reason 1 and reason 2 by reason categories
respectively.
Figure 3.7: Reason 1 Return by Reason category
Frequency Percent Valid
percent Cumulative percent
Safety of use/efficacy of medicines 709 31.5 32.9 32.9 Consumer’s death 585 26.0 27.1 60.0 Change in therapy/medication recommended by a medical practitioner/other health professional 283 12.6 13.1 73.1
Consumer’s perception regarding the need for medicines/medication 199 8.8 9.2 82.3
Experience of unwanted effects 183 8.1 8.5 90.8 Consumer moved and left medicines behind 158 7.0 7.3 98.1 Other 21 0.9 1.0 99.1 Consumer’s perception of effectiveness of medicine/medication 12 0.5 0.6 99.7
Consumer’s ability to use medicine/prescribed administration mode 6 0.3 0.3 100.0
Financial barriers to medicine taking 1 0.0 0.0 100.0
Valid
Total 2157 95.9 100.0 Missing system 93 4.1
For reason 1 return (see Figure 3.7) the five most frequent individual reasons/explanations for
return were:
1) all individual reasons
� medicine passed expiry (N=685, 30.9%)
� consumer passed away (N=585, 26.4%)
� doctor changed/replaced medication (N=189, 8.5%)
� consumer experienced unwanted effects (N=183, 8.3%)
� consumer ‘got’ better and did not complete the recommended course (N=140, 6.3%)
2) all individual reasons excluding those where the patient/consumer ‘passed away’ or departed
the institution/return in accord with the intuitional protocols
� medicine passed expiry (N=685, 42.2%)
� doctor changed/replaced medication (N=189, 11.6%)
� consumer experienced unwanted effects (N=183, 11.3%)
� consumer ‘got’ better and did not complete the recommended course (N=140, 8.6%)
For reason 2 return (see Figure 3.8), the most frequent individual reasons/explanations offered
were:
1) all individual reasons
� doctor changed/replaced medication (N=115, 35.4%)
� consumer stopped medicines without consultation (N=62, 19.1%)
� medicine passed expiry (N=30, 9.2%)
� doctor stopped medication (N=27, 8.3%)
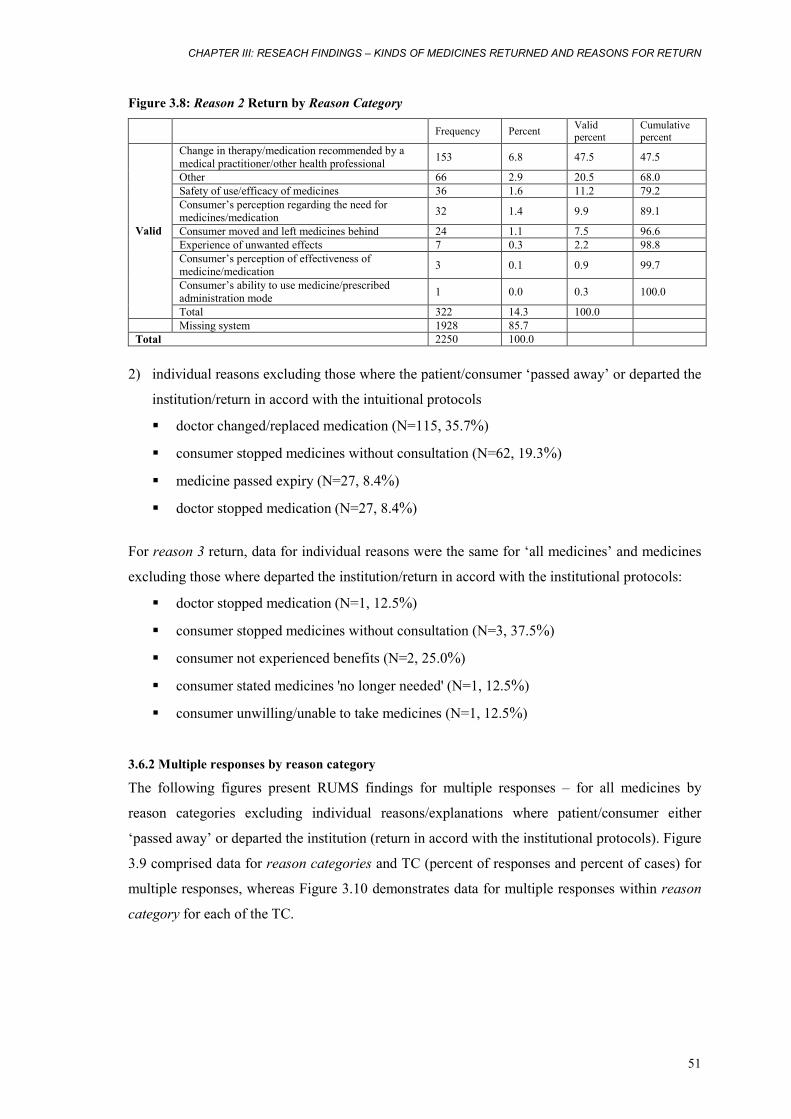
CHAPTER III: RESEACH FINDINGS – KINDS OF MEDICINES RETURNED AND REASONS FOR RETURN
51
Figure 3.8: Reason 2 Return by Reason Category
Frequency Percent Valid
percent Cumulative percent
Change in therapy/medication recommended by a medical practitioner/other health professional 153 6.8 47.5 47.5
Other 66 2.9 20.5 68.0 Safety of use/efficacy of medicines 36 1.6 11.2 79.2 Consumer’s perception regarding the need for medicines/medication 32 1.4 9.9 89.1
Consumer moved and left medicines behind 24 1.1 7.5 96.6 Experience of unwanted effects 7 0.3 2.2 98.8 Consumer’s perception of effectiveness of medicine/medication 3 0.1 0.9 99.7
Consumer’s ability to use medicine/prescribed administration mode 1 0.0 0.3 100.0
Valid
Total 322 14.3 100.0 Missing system 1928 85.7 Total 2250 100.0
2) individual reasons excluding those where the patient/consumer ‘passed away’ or departed the
institution/return in accord with the intuitional protocols
� doctor changed/replaced medication (N=115, 35.7%)
� consumer stopped medicines without consultation (N=62, 19.3%)
� medicine passed expiry (N=27, 8.4%)
� doctor stopped medication (N=27, 8.4%)
For reason 3 return, data for individual reasons were the same for ‘all medicines’ and medicines
excluding those where departed the institution/return in accord with the institutional protocols:
� doctor stopped medication (N=1, 12.5%)
� consumer stopped medicines without consultation (N=3, 37.5%)
� consumer not experienced benefits (N=2, 25.0%)
� consumer stated medicines 'no longer needed' (N=1, 12.5%)
� consumer unwilling/unable to take medicines (N=1, 12.5%)
3.6.2 Multiple responses by reason category
The following figures present RUMS findings for multiple responses – for all medicines by
reason categories excluding individual reasons/explanations where patient/consumer either
‘passed away’ or departed the institution (return in accord with the institutional protocols). Figure
3.9 comprised data for reason categories and TC (percent of responses and percent of cases) for
multiple responses, whereas Figure 3.10 demonstrates data for multiple responses within reason
category for each of the TC.
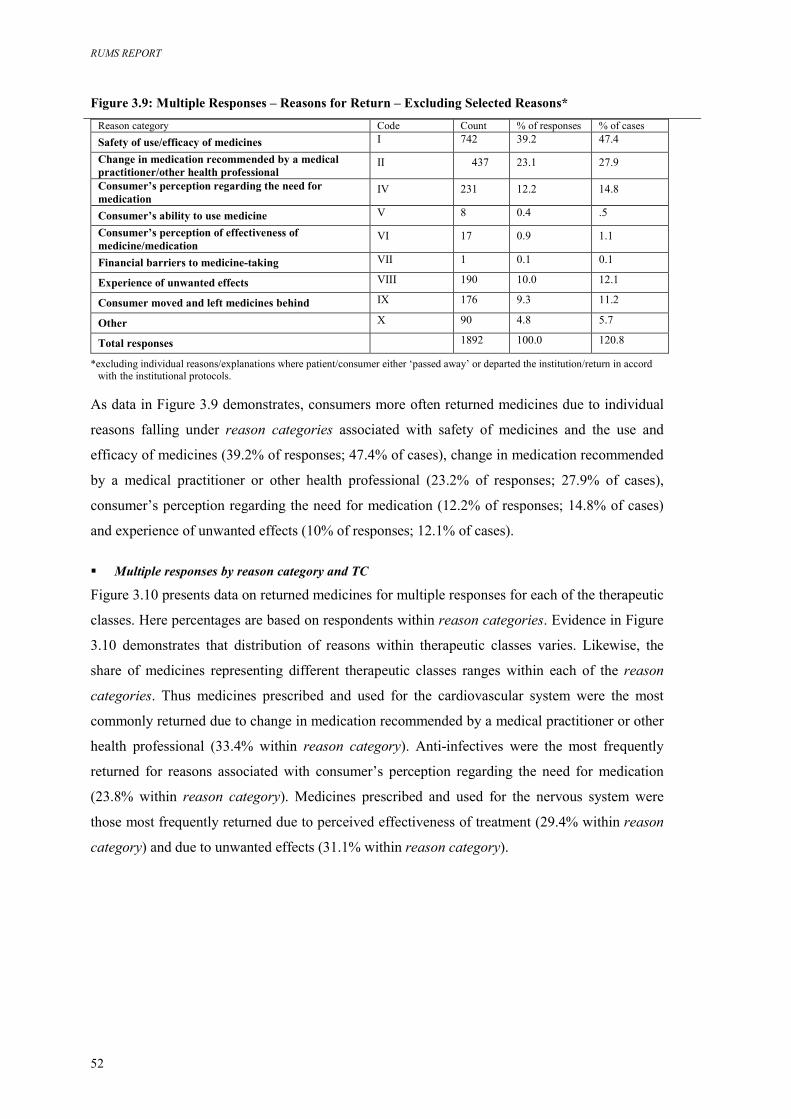
RUMS REPORT
52
Figure 3.9: Multiple Responses – Reasons for Return – Excluding Selected Reasons* Reason category Code Count % of responses % of cases Safety of use/efficacy of medicines I 742 39.2 47.4
Change in medication recommended by a medical practitioner/other health professional
II 437 23.1 27.9
Consumer’s perception regarding the need for medication
IV 231 12.2 14.8
Consumer’s ability to use medicine V 8 0.4 .5
Consumer’s perception of effectiveness of medicine/medication
VI 17 0.9 1.1
Financial barriers to medicine-taking VII 1 0.1 0.1
Experience of unwanted effects VIII 190 10.0 12.1
Consumer moved and left medicines behind IX 176 9.3 11.2
Other X 90 4.8 5.7
Total responses 1892 100.0 120.8 *excluding individual reasons/explanations where patient/consumer either ‘passed away’ or departed the institution/return in accord
with the institutional protocols.
As data in Figure 3.9 demonstrates, consumers more often returned medicines due to individual
reasons falling under reason categories associated with safety of medicines and the use and
efficacy of medicines (39.2% of responses; 47.4% of cases), change in medication recommended
by a medical practitioner or other health professional (23.2% of responses; 27.9% of cases),
consumer’s perception regarding the need for medication (12.2% of responses; 14.8% of cases)
and experience of unwanted effects (10% of responses; 12.1% of cases).
� Multiple responses by reason category and TC
Figure 3.10 presents data on returned medicines for multiple responses for each of the therapeutic
classes. Here percentages are based on respondents within reason categories. Evidence in Figure
3.10 demonstrates that distribution of reasons within therapeutic classes varies. Likewise, the
share of medicines representing different therapeutic classes ranges within each of the reason
categories. Thus medicines prescribed and used for the cardiovascular system were the most
commonly returned due to change in medication recommended by a medical practitioner or other
health professional (33.4% within reason category). Anti-infectives were the most frequently
returned for reasons associated with consumer’s perception regarding the need for medication
(23.8% within reason category). Medicines prescribed and used for the nervous system were
those most frequently returned due to perceived effectiveness of treatment (29.4% within reason
category) and due to unwanted effects (31.1% within reason category).
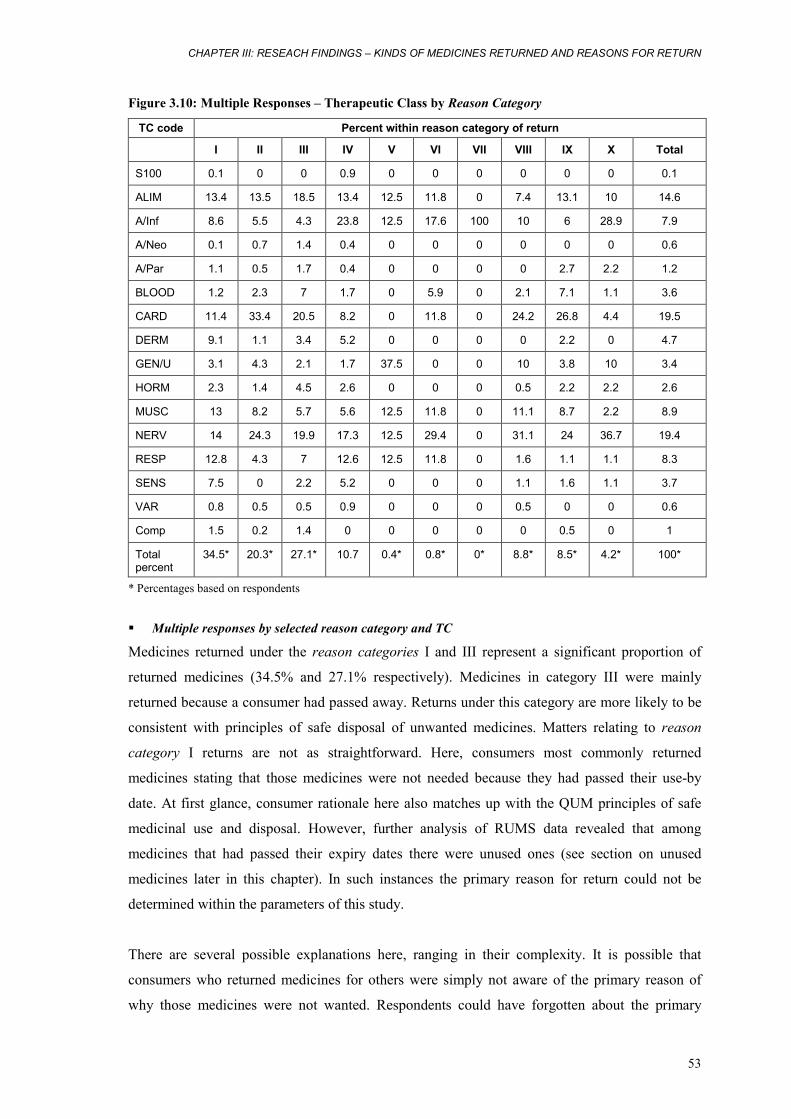
CHAPTER III: RESEACH FINDINGS – KINDS OF MEDICINES RETURNED AND REASONS FOR RETURN
53
Figure 3.10: Multiple Responses – Therapeutic Class by Reason Category
TC code Percent within reason category of return
I II III IV V VI VII VIII IX X Total
S100 0.1 0 0 0.9 0 0 0 0 0 0 0.1
ALIM 13.4 13.5 18.5 13.4 12.5 11.8 0 7.4 13.1 10 14.6
A/Inf 8.6 5.5 4.3 23.8 12.5 17.6 100 10 6 28.9 7.9
A/Neo 0.1 0.7 1.4 0.4 0 0 0 0 0 0 0.6
A/Par 1.1 0.5 1.7 0.4 0 0 0 0 2.7 2.2 1.2
BLOOD 1.2 2.3 7 1.7 0 5.9 0 2.1 7.1 1.1 3.6
CARD 11.4 33.4 20.5 8.2 0 11.8 0 24.2 26.8 4.4 19.5
DERM 9.1 1.1 3.4 5.2 0 0 0 0 2.2 0 4.7
GEN/U 3.1 4.3 2.1 1.7 37.5 0 0 10 3.8 10 3.4
HORM 2.3 1.4 4.5 2.6 0 0 0 0.5 2.2 2.2 2.6
MUSC 13 8.2 5.7 5.6 12.5 11.8 0 11.1 8.7 2.2 8.9
NERV 14 24.3 19.9 17.3 12.5 29.4 0 31.1 24 36.7 19.4
RESP 12.8 4.3 7 12.6 12.5 11.8 0 1.6 1.1 1.1 8.3
SENS 7.5 0 2.2 5.2 0 0 0 1.1 1.6 1.1 3.7
VAR 0.8 0.5 0.5 0.9 0 0 0 0.5 0 0 0.6
Comp 1.5 0.2 1.4 0 0 0 0 0 0.5 0 1
Total percent
34.5* 20.3* 27.1* 10.7 0.4* 0.8* 0* 8.8* 8.5* 4.2* 100*
* Percentages based on respondents
� Multiple responses by selected reason category and TC
Medicines returned under the reason categories I and III represent a significant proportion of
returned medicines (34.5% and 27.1% respectively). Medicines in category III were mainly
returned because a consumer had passed away. Returns under this category are more likely to be
consistent with principles of safe disposal of unwanted medicines. Matters relating to reason
category I returns are not as straightforward. Here, consumers most commonly returned
medicines stating that those medicines were not needed because they had passed their use-by
date. At first glance, consumer rationale here also matches up with the QUM principles of safe
medicinal use and disposal. However, further analysis of RUMS data revealed that among
medicines that had passed their expiry dates there were unused ones (see section on unused
medicines later in this chapter). In such instances the primary reason for return could not be
determined within the parameters of this study.
There are several possible explanations here, ranging in their complexity. It is possible that
consumers who returned medicines for others were simply not aware of the primary reason of
why those medicines were not wanted. Respondents could have forgotten about the primary
RUMS REPORT
54
reason for not using their medicines or have offered a response that in their view was socially
expected. It is also possible that there are more complex socio-cultural influences on consumer
practices that can be uncovered in further research by utilisation of methods that are equipped for
in-depth exploration of the issue.
Several reason categories were of greater interest to RUMS because of their relevance to
medication management in the community (see Figure 3.11). Those ‘selected’ categories
included:
� change in medication recommended by a medical practitioner/other health professional
(category II);
� consumer’s perception regarding the need for (category IV) and effectiveness of
(category VI) medicine/medication; and
� experience of unwanted effects (category VIII).
Figure 3.11 illustrates the share of TCs representing the main anatomical groups within each of
the ‘selected’ reason categories. For example, it shows that medicines most commonly returned
due to change in medication recommended by a medical practitioner or other health professional
were those prescribed and used for cardiovascular and nervous systems.
Among medicines returned due to consumer’s perception regarding the need for medication, anti-
infectives (23.8 percent) were returned most. High representation of anti-infectives is of concern,
because individual reasons and explanations here included consumers ceasing medication without
completing the recommended course of treatment.
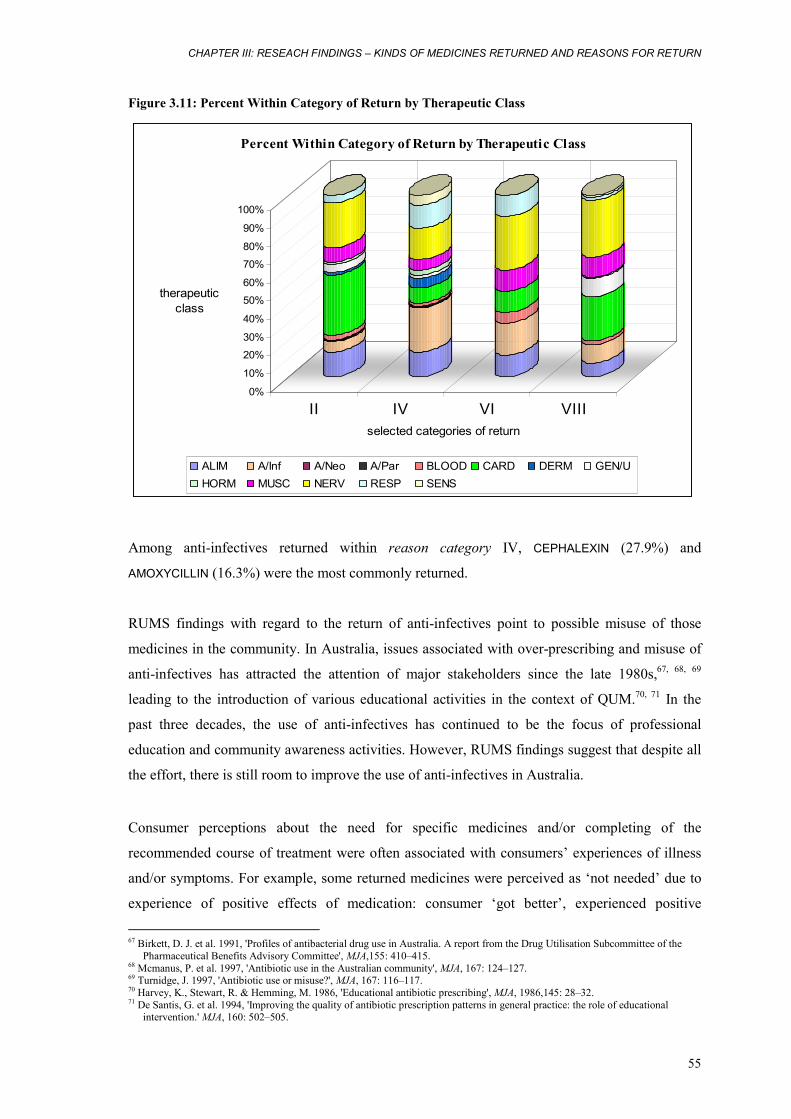
CHAPTER III: RESEACH FINDINGS – KINDS OF MEDICINES RETURNED AND REASONS FOR RETURN
55
Figure 3.11: Percent Within Category of Return by Therapeutic Class
0%
10%
20%
30%
40%
50%
60%
70%
80%
90%
100%
therapeuticclass
II IV VI VIIIselected categories of return
Percent Within Category of Return by Therapeutic Class
ALIM A/Inf A/Neo A/Par BLOOD CARD DERM GEN/UHORM MUSC NERV RESP SENS
Among anti-infectives returned within reason category IV, CEPHALEXIN (27.9%) and
AMOXYCILLIN (16.3%) were the most commonly returned.
RUMS findings with regard to the return of anti-infectives point to possible misuse of those
medicines in the community. In Australia, issues associated with over-prescribing and misuse of
anti-infectives has attracted the attention of major stakeholders since the late 1980s,67, 68, 69
leading to the introduction of various educational activities in the context of QUM.70, 71 In the
past three decades, the use of anti-infectives has continued to be the focus of professional
education and community awareness activities. However, RUMS findings suggest that despite all
the effort, there is still room to improve the use of anti-infectives in Australia.
Consumer perceptions about the need for specific medicines and/or completing of the
recommended course of treatment were often associated with consumers’ experiences of illness
and/or symptoms. For example, some returned medicines were perceived as ‘not needed’ due to
experience of positive effects of medication: consumer ‘got better’, experienced positive
67 Birkett, D. J. et al. 1991, 'Profiles of antibacterial drug use in Australia. A report from the Drug Utilisation Subcommittee of the
Pharmaceutical Benefits Advisory Committee', MJA,155: 410–415. 68 Mcmanus, P. et al. 1997, 'Antibiotic use in the Australian community', MJA, 167: 124–127. 69 Turnidge, J. 1997, 'Antibiotic use or misuse?', MJA, 167: 116–117. 70 Harvey, K., Stewart, R. & Hemming, M. 1986, 'Educational antibiotic prescribing', MJA, 1986,145: 28–32. 71 De Santis, G. et al. 1994, 'Improving the quality of antibiotic prescription patterns in general practice: the role of educational
intervention.' MJA, 160: 502–505.
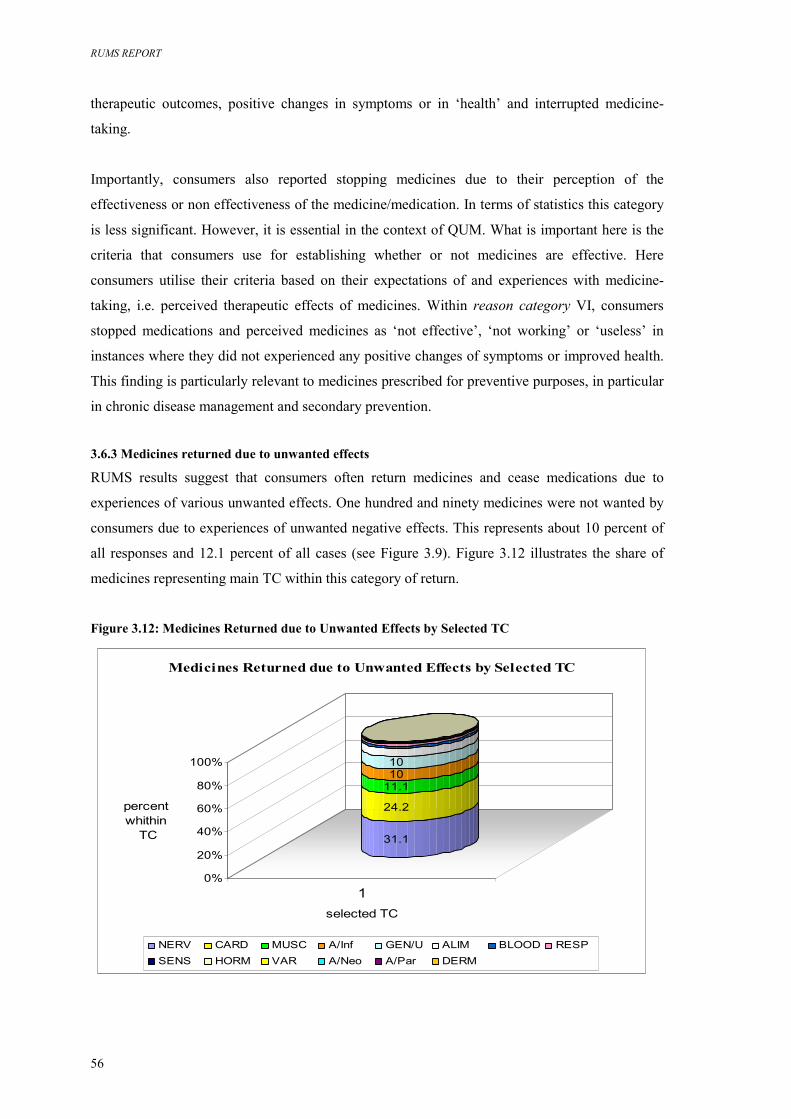
RUMS REPORT
56
therapeutic outcomes, positive changes in symptoms or in ‘health’ and interrupted medicine-
taking.
Importantly, consumers also reported stopping medicines due to their perception of the
effectiveness or non effectiveness of the medicine/medication. In terms of statistics this category
is less significant. However, it is essential in the context of QUM. What is important here is the
criteria that consumers use for establishing whether or not medicines are effective. Here
consumers utilise their criteria based on their expectations of and experiences with medicine-
taking, i.e. perceived therapeutic effects of medicines. Within reason category VI, consumers
stopped medications and perceived medicines as ‘not effective’, ‘not working’ or ‘useless’ in
instances where they did not experienced any positive changes of symptoms or improved health.
This finding is particularly relevant to medicines prescribed for preventive purposes, in particular
in chronic disease management and secondary prevention.
3.6.3 Medicines returned due to unwanted effects
RUMS results suggest that consumers often return medicines and cease medications due to
experiences of various unwanted effects. One hundred and ninety medicines were not wanted by
consumers due to experiences of unwanted negative effects. This represents about 10 percent of
all responses and 12.1 percent of all cases (see Figure 3.9). Figure 3.12 illustrates the share of
medicines representing main TC within this category of return.
Figure 3.12: Medicines Returned due to Unwanted Effects by Selected TC
31.1
24.2
11.11010
0%
20%
40%
60%
80%
100%
percent whithin
TC
1selected TC
Medicines Returned due to Unwanted Effects by Selected TC
NERV CARD MUSC A/Inf GEN/U ALIM BLOOD RESPSENS HORM VAR A/Neo A/Par DERM
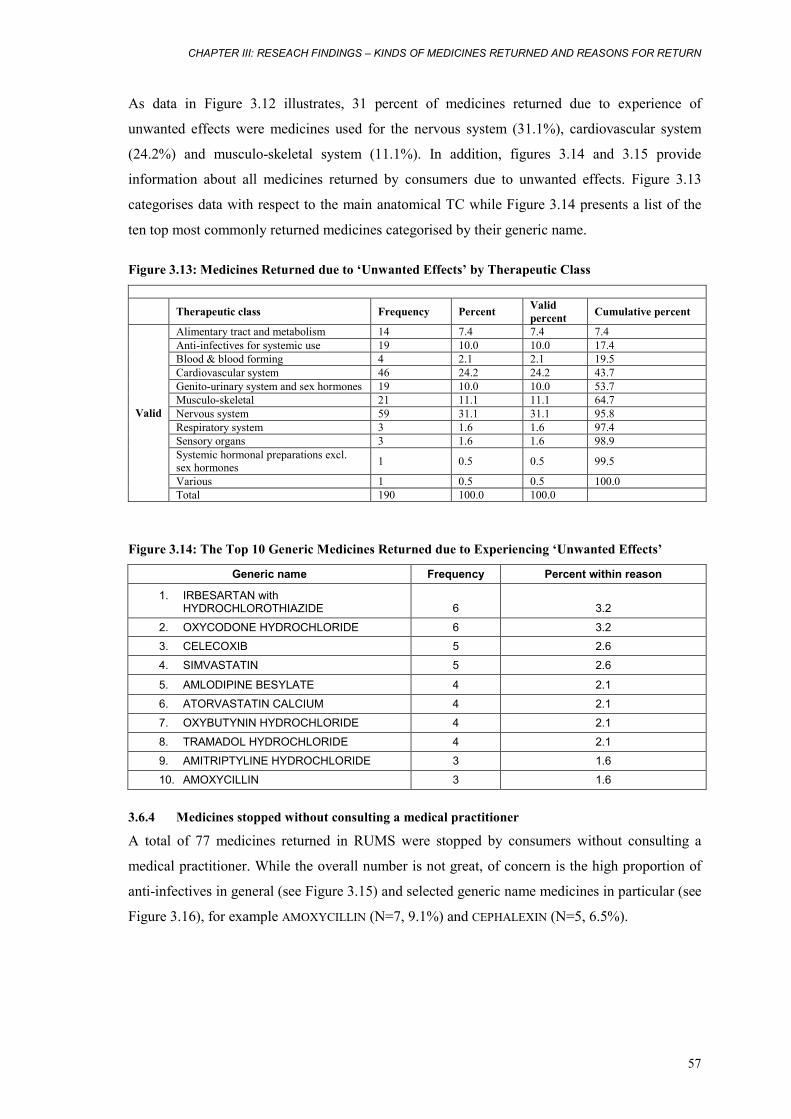
CHAPTER III: RESEACH FINDINGS – KINDS OF MEDICINES RETURNED AND REASONS FOR RETURN
57
As data in Figure 3.12 illustrates, 31 percent of medicines returned due to experience of
unwanted effects were medicines used for the nervous system (31.1%), cardiovascular system
(24.2%) and musculo-skeletal system (11.1%). In addition, figures 3.14 and 3.15 provide
information about all medicines returned by consumers due to unwanted effects. Figure 3.13
categorises data with respect to the main anatomical TC while Figure 3.14 presents a list of the
ten top most commonly returned medicines categorised by their generic name.
Figure 3.13: Medicines Returned due to ‘Unwanted Effects’ by Therapeutic Class
Therapeutic class Frequency Percent Valid
percent Cumulative percent
Alimentary tract and metabolism 14 7.4 7.4 7.4 Anti-infectives for systemic use 19 10.0 10.0 17.4 Blood & blood forming 4 2.1 2.1 19.5 Cardiovascular system 46 24.2 24.2 43.7 Genito-urinary system and sex hormones 19 10.0 10.0 53.7 Musculo-skeletal 21 11.1 11.1 64.7 Nervous system 59 31.1 31.1 95.8 Respiratory system 3 1.6 1.6 97.4 Sensory organs 3 1.6 1.6 98.9 Systemic hormonal preparations excl. sex hormones 1 0.5 0.5 99.5
Various 1 0.5 0.5 100.0
Valid
Total 190 100.0 100.0
Figure 3.14: The Top 10 Generic Medicines Returned due to Experiencing ‘Unwanted Effects’
Generic name Frequency Percent within reason
1. IRBESARTAN with HYDROCHLOROTHIAZIDE 6 3.2
2. OXYCODONE HYDROCHLORIDE 6 3.2 3. CELECOXIB 5 2.6
4. SIMVASTATIN 5 2.6
5. AMLODIPINE BESYLATE 4 2.1
6. ATORVASTATIN CALCIUM 4 2.1
7. OXYBUTYNIN HYDROCHLORIDE 4 2.1
8. TRAMADOL HYDROCHLORIDE 4 2.1
9. AMITRIPTYLINE HYDROCHLORIDE 3 1.6
10. AMOXYCILLIN 3 1.6
3.6.4 Medicines stopped without consulting a medical practitioner
A total of 77 medicines returned in RUMS were stopped by consumers without consulting a
medical practitioner. While the overall number is not great, of concern is the high proportion of
anti-infectives in general (see Figure 3.15) and selected generic name medicines in particular (see
Figure 3.16), for example AMOXYCILLIN (N=7, 9.1%) and CEPHALEXIN (N=5, 6.5%).
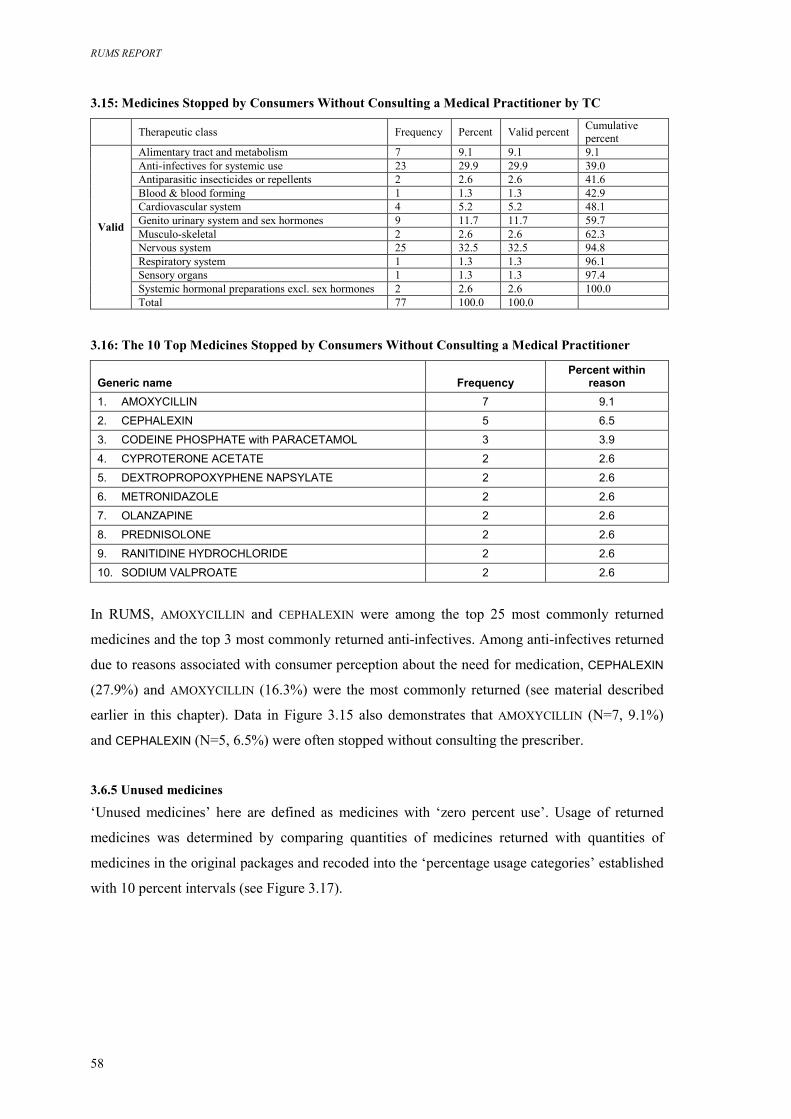
RUMS REPORT
58
3.15: Medicines Stopped by Consumers Without Consulting a Medical Practitioner by TC Therapeutic class Frequency Percent Valid percent Cumulative
percent Alimentary tract and metabolism 7 9.1 9.1 9.1 Anti-infectives for systemic use 23 29.9 29.9 39.0 Antiparasitic insecticides or repellents 2 2.6 2.6 41.6 Blood & blood forming 1 1.3 1.3 42.9 Cardiovascular system 4 5.2 5.2 48.1 Genito urinary system and sex hormones 9 11.7 11.7 59.7 Musculo-skeletal 2 2.6 2.6 62.3 Nervous system 25 32.5 32.5 94.8 Respiratory system 1 1.3 1.3 96.1 Sensory organs 1 1.3 1.3 97.4 Systemic hormonal preparations excl. sex hormones 2 2.6 2.6 100.0
Valid
Total 77 100.0 100.0 3.16: The 10 Top Medicines Stopped by Consumers Without Consulting a Medical Practitioner
Generic name Frequency Percent within
reason 1. AMOXYCILLIN 7 9.1
2. CEPHALEXIN 5 6.5
3. CODEINE PHOSPHATE with PARACETAMOL 3 3.9
4. CYPROTERONE ACETATE 2 2.6
5. DEXTROPROPOXYPHENE NAPSYLATE 2 2.6
6. METRONIDAZOLE 2 2.6
7. OLANZAPINE 2 2.6
8. PREDNISOLONE 2 2.6
9. RANITIDINE HYDROCHLORIDE 2 2.6
10. SODIUM VALPROATE 2 2.6
In RUMS, AMOXYCILLIN and CEPHALEXIN were among the top 25 most commonly returned
medicines and the top 3 most commonly returned anti-infectives. Among anti-infectives returned
due to reasons associated with consumer perception about the need for medication, CEPHALEXIN
(27.9%) and AMOXYCILLIN (16.3%) were the most commonly returned (see material described
earlier in this chapter). Data in Figure 3.15 also demonstrates that AMOXYCILLIN (N=7, 9.1%)
and CEPHALEXIN (N=5, 6.5%) were often stopped without consulting the prescriber.
3.6.5 Unused medicines
‘Unused medicines’ here are defined as medicines with ‘zero percent use’. Usage of returned
medicines was determined by comparing quantities of medicines returned with quantities of
medicines in the original packages and recoded into the ‘percentage usage categories’ established
with 10 percent intervals (see Figure 3.17).
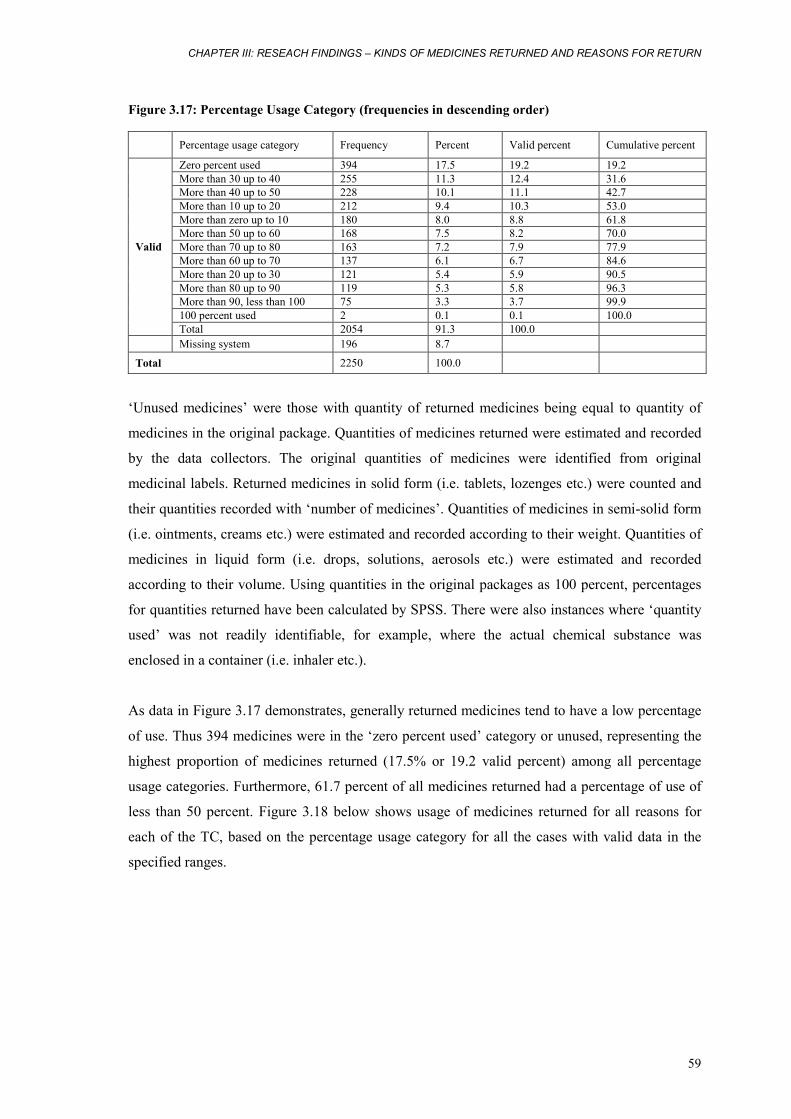
CHAPTER III: RESEACH FINDINGS – KINDS OF MEDICINES RETURNED AND REASONS FOR RETURN
59
Figure 3.17: Percentage Usage Category (frequencies in descending order)
Percentage usage category Frequency Percent Valid percent Cumulative percent
Zero percent used 394 17.5 19.2 19.2 More than 30 up to 40 255 11.3 12.4 31.6 More than 40 up to 50 228 10.1 11.1 42.7 More than 10 up to 20 212 9.4 10.3 53.0 More than zero up to 10 180 8.0 8.8 61.8 More than 50 up to 60 168 7.5 8.2 70.0 More than 70 up to 80 163 7.2 7.9 77.9 More than 60 up to 70 137 6.1 6.7 84.6 More than 20 up to 30 121 5.4 5.9 90.5 More than 80 up to 90 119 5.3 5.8 96.3 More than 90, less than 100 75 3.3 3.7 99.9 100 percent used 2 0.1 0.1 100.0
Valid
Total 2054 91.3 100.0 Missing system 196 8.7
Total 2250 100.0
‘Unused medicines’ were those with quantity of returned medicines being equal to quantity of
medicines in the original package. Quantities of medicines returned were estimated and recorded
by the data collectors. The original quantities of medicines were identified from original
medicinal labels. Returned medicines in solid form (i.e. tablets, lozenges etc.) were counted and
their quantities recorded with ‘number of medicines’. Quantities of medicines in semi-solid form
(i.e. ointments, creams etc.) were estimated and recorded according to their weight. Quantities of
medicines in liquid form (i.e. drops, solutions, aerosols etc.) were estimated and recorded
according to their volume. Using quantities in the original packages as 100 percent, percentages
for quantities returned have been calculated by SPSS. There were also instances where ‘quantity
used’ was not readily identifiable, for example, where the actual chemical substance was
enclosed in a container (i.e. inhaler etc.).
As data in Figure 3.17 demonstrates, generally returned medicines tend to have a low percentage
of use. Thus 394 medicines were in the ‘zero percent used’ category or unused, representing the
highest proportion of medicines returned (17.5% or 19.2 valid percent) among all percentage
usage categories. Furthermore, 61.7 percent of all medicines returned had a percentage of use of
less than 50 percent. Figure 3.18 below shows usage of medicines returned for all reasons for
each of the TC, based on the percentage usage category for all the cases with valid data in the
specified ranges.
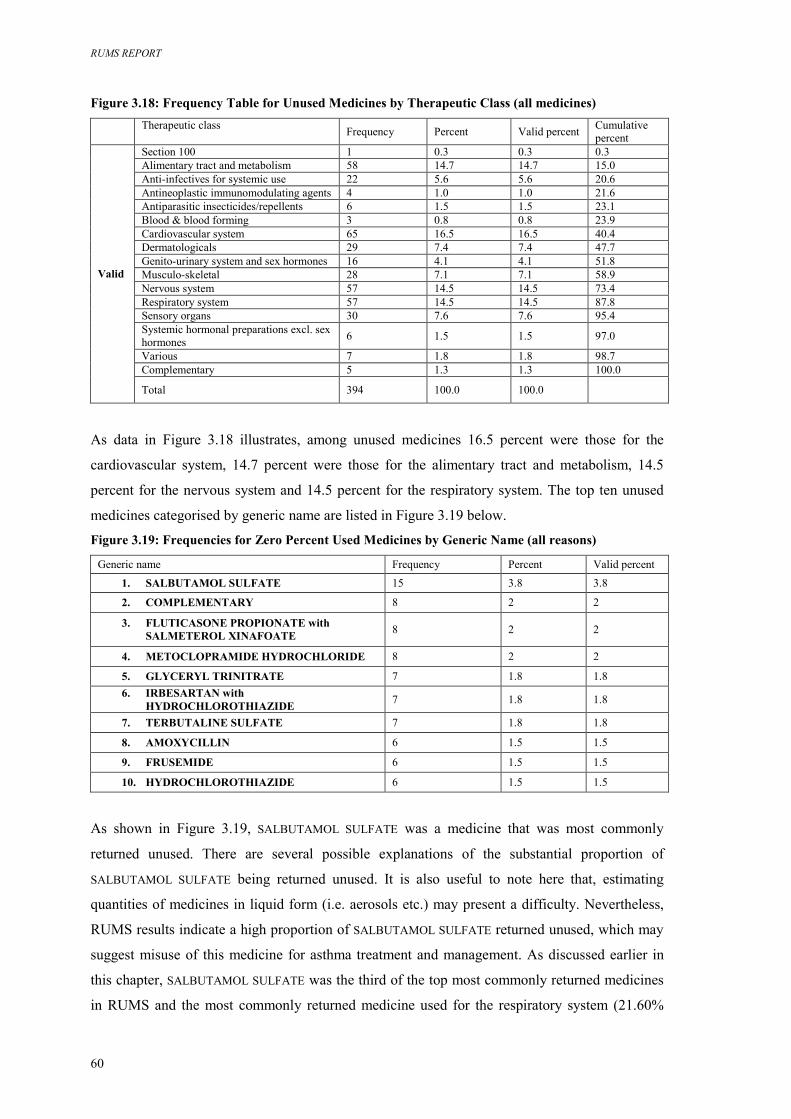
RUMS REPORT
60
Figure 3.18: Frequency Table for Unused Medicines by Therapeutic Class (all medicines)
Therapeutic class Frequency Percent Valid percent Cumulative
percent Section 100 1 0.3 0.3 0.3 Alimentary tract and metabolism 58 14.7 14.7 15.0 Anti-infectives for systemic use 22 5.6 5.6 20.6 Antineoplastic immunomodulating agents 4 1.0 1.0 21.6 Antiparasitic insecticides/repellents 6 1.5 1.5 23.1 Blood & blood forming 3 0.8 0.8 23.9 Cardiovascular system 65 16.5 16.5 40.4 Dermatologicals 29 7.4 7.4 47.7 Genito-urinary system and sex hormones 16 4.1 4.1 51.8 Musculo-skeletal 28 7.1 7.1 58.9 Nervous system 57 14.5 14.5 73.4 Respiratory system 57 14.5 14.5 87.8 Sensory organs 30 7.6 7.6 95.4 Systemic hormonal preparations excl. sex hormones 6 1.5 1.5 97.0
Various 7 1.8 1.8 98.7 Complementary 5 1.3 1.3 100.0
Valid
Total 394 100.0 100.0
As data in Figure 3.18 illustrates, among unused medicines 16.5 percent were those for the
cardiovascular system, 14.7 percent were those for the alimentary tract and metabolism, 14.5
percent for the nervous system and 14.5 percent for the respiratory system. The top ten unused
medicines categorised by generic name are listed in Figure 3.19 below.
Figure 3.19: Frequencies for Zero Percent Used Medicines by Generic Name (all reasons)
Generic name Frequency Percent Valid percent
1. SALBUTAMOL SULFATE 15 3.8 3.8
2. COMPLEMENTARY 8 2 2
3. FLUTICASONE PROPIONATE with SALMETEROL XINAFOATE 8 2 2
4. METOCLOPRAMIDE HYDROCHLORIDE 8 2 2
5. GLYCERYL TRINITRATE 7 1.8 1.8 6. IRBESARTAN with
HYDROCHLOROTHIAZIDE 7 1.8 1.8
7. TERBUTALINE SULFATE 7 1.8 1.8
8. AMOXYCILLIN 6 1.5 1.5
9. FRUSEMIDE 6 1.5 1.5
10. HYDROCHLOROTHIAZIDE 6 1.5 1.5
As shown in Figure 3.19, SALBUTAMOL SULFATE was a medicine that was most commonly
returned unused. There are several possible explanations of the substantial proportion of
SALBUTAMOL SULFATE being returned unused. It is also useful to note here that, estimating
quantities of medicines in liquid form (i.e. aerosols etc.) may present a difficulty. Nevertheless,
RUMS results indicate a high proportion of SALBUTAMOL SULFATE returned unused, which may
suggest misuse of this medicine for asthma treatment and management. As discussed earlier in
this chapter, SALBUTAMOL SULFATE was the third of the top most commonly returned medicines
in RUMS and the most commonly returned medicine used for the respiratory system (21.60%
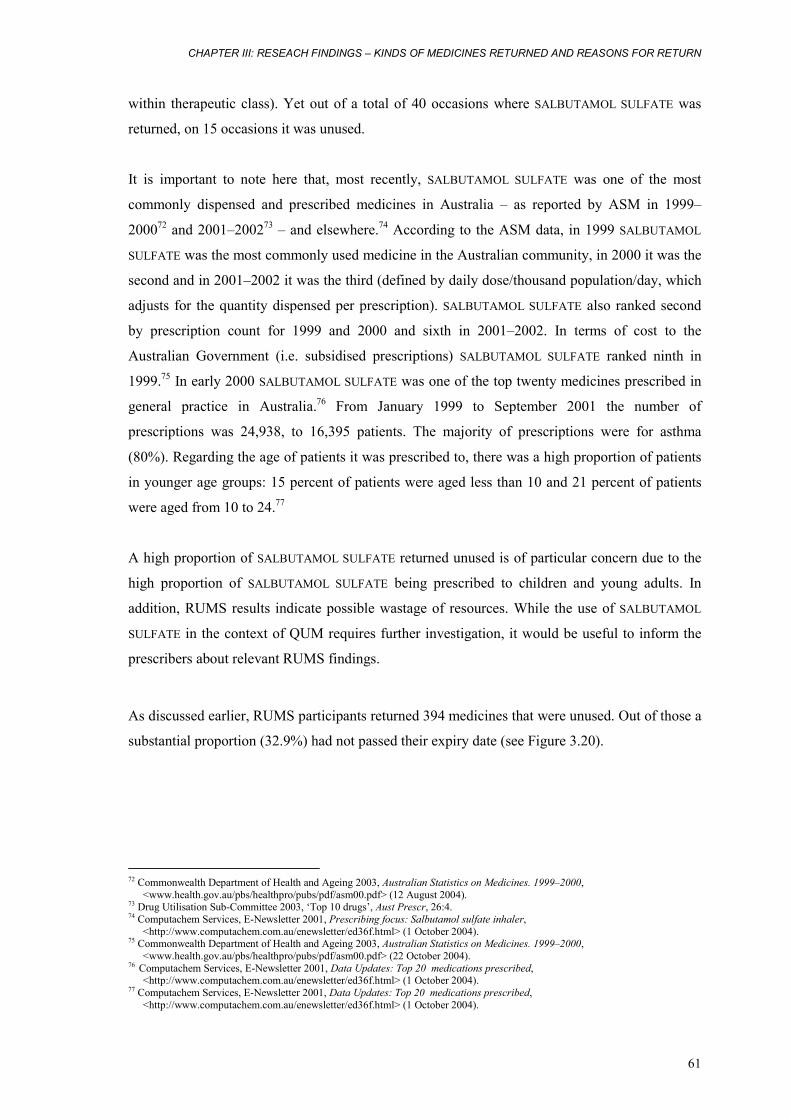
CHAPTER III: RESEACH FINDINGS – KINDS OF MEDICINES RETURNED AND REASONS FOR RETURN
61
within therapeutic class). Yet out of a total of 40 occasions where SALBUTAMOL SULFATE was
returned, on 15 occasions it was unused.
It is important to note here that, most recently, SALBUTAMOL SULFATE was one of the most
commonly dispensed and prescribed medicines in Australia – as reported by ASM in 1999–
200072 and 2001–200273 – and elsewhere.74 According to the ASM data, in 1999 SALBUTAMOL
SULFATE was the most commonly used medicine in the Australian community, in 2000 it was the
second and in 2001–2002 it was the third (defined by daily dose/thousand population/day, which
adjusts for the quantity dispensed per prescription). SALBUTAMOL SULFATE also ranked second
by prescription count for 1999 and 2000 and sixth in 2001–2002. In terms of cost to the
Australian Government (i.e. subsidised prescriptions) SALBUTAMOL SULFATE ranked ninth in
1999.75 In early 2000 SALBUTAMOL SULFATE was one of the top twenty medicines prescribed in
general practice in Australia.76 From January 1999 to September 2001 the number of
prescriptions was 24,938, to 16,395 patients. The majority of prescriptions were for asthma
(80%). Regarding the age of patients it was prescribed to, there was a high proportion of patients
in younger age groups: 15 percent of patients were aged less than 10 and 21 percent of patients
were aged from 10 to 24.77
A high proportion of SALBUTAMOL SULFATE returned unused is of particular concern due to the
high proportion of SALBUTAMOL SULFATE being prescribed to children and young adults. In
addition, RUMS results indicate possible wastage of resources. While the use of SALBUTAMOL
SULFATE in the context of QUM requires further investigation, it would be useful to inform the
prescribers about relevant RUMS findings.
As discussed earlier, RUMS participants returned 394 medicines that were unused. Out of those a
substantial proportion (32.9%) had not passed their expiry date (see Figure 3.20).
72 Commonwealth Department of Health and Ageing 2003, Australian Statistics on Medicines. 1999–2000,
<www.health.gov.au/pbs/healthpro/pubs/pdf/asm00.pdf> (12 August 2004). 73 Drug Utilisation Sub-Committee 2003, ‘Top 10 drugs’, Aust Prescr, 26:4. 74 Computachem Services, E-Newsletter 2001, Prescribing focus: Salbutamol sulfate inhaler,
<http://www.computachem.com.au/enewsletter/ed36f.html> (1 October 2004). 75 Commonwealth Department of Health and Ageing 2003, Australian Statistics on Medicines. 1999–2000,
<www.health.gov.au/pbs/healthpro/pubs/pdf/asm00.pdf> (22 October 2004). 76 Computachem Services, E-Newsletter 2001, Data Updates: Top 20 medications prescribed,
<http://www.computachem.com.au/enewsletter/ed36f.html> (1 October 2004). 77 Computachem Services, E-Newsletter 2001, Data Updates: Top 20 medications prescribed,
<http://www.computachem.com.au/enewsletter/ed36f.html> (1 October 2004).
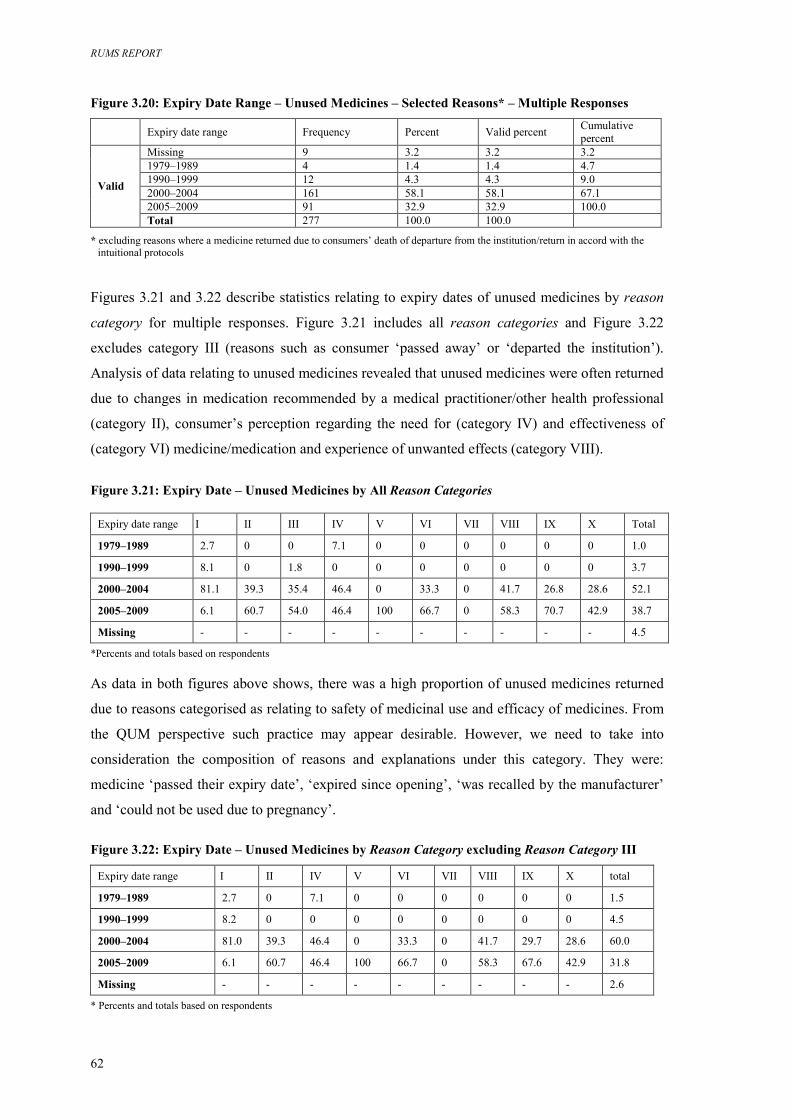
RUMS REPORT
62
Figure 3.20: Expiry Date Range – Unused Medicines – Selected Reasons* – Multiple Responses Expiry date range Frequency Percent Valid percent Cumulative
percent Missing 9 3.2 3.2 3.2 1979–1989 4 1.4 1.4 4.7 1990–1999 12 4.3 4.3 9.0 2000–2004 161 58.1 58.1 67.1 2005–2009 91 32.9 32.9 100.0
Valid
Total 277 100.0 100.0
* excluding reasons where a medicine returned due to consumers’ death of departure from the institution/return in accord with the intuitional protocols
Figures 3.21 and 3.22 describe statistics relating to expiry dates of unused medicines by reason
category for multiple responses. Figure 3.21 includes all reason categories and Figure 3.22
excludes category III (reasons such as consumer ‘passed away’ or ‘departed the institution’).
Analysis of data relating to unused medicines revealed that unused medicines were often returned
due to changes in medication recommended by a medical practitioner/other health professional
(category II), consumer’s perception regarding the need for (category IV) and effectiveness of
(category VI) medicine/medication and experience of unwanted effects (category VIII).
Figure 3.21: Expiry Date – Unused Medicines by All Reason Categories
Expiry date range I II III IV V VI VII VIII IX X Total
1979–1989 2.7 0 0 7.1 0 0 0 0 0 0 1.0
1990–1999 8.1 0 1.8 0 0 0 0 0 0 0 3.7
2000–2004 81.1 39.3 35.4 46.4 0 33.3 0 41.7 26.8 28.6 52.1
2005–2009 6.1 60.7 54.0 46.4 100 66.7 0 58.3 70.7 42.9 38.7
Missing - - - - - - - - - - 4.5
*Percents and totals based on respondents
As data in both figures above shows, there was a high proportion of unused medicines returned
due to reasons categorised as relating to safety of medicinal use and efficacy of medicines. From
the QUM perspective such practice may appear desirable. However, we need to take into
consideration the composition of reasons and explanations under this category. They were:
medicine ‘passed their expiry date’, ‘expired since opening’, ‘was recalled by the manufacturer’
and ‘could not be used due to pregnancy’.
Figure 3.22: Expiry Date – Unused Medicines by Reason Category excluding Reason Category III
Expiry date range I II IV V VI VII VIII IX X total
1979–1989 2.7 0 7.1 0 0 0 0 0 0 1.5
1990–1999 8.2 0 0 0 0 0 0 0 0 4.5
2000–2004 81.0 39.3 46.4 0 33.3 0 41.7 29.7 28.6 60.0
2005–2009 6.1 60.7 46.4 100 66.7 0 58.3 67.6 42.9 31.8
Missing - - - - - - - - - 2.6
* Percents and totals based on respondents
CHAPTER III: RESEACH FINDINGS – KINDS OF MEDICINES RETURNED AND REASONS FOR RETURN
63
The latter two reasons only accounted for a negligible number of responses here, whereas
‘expired since opening’ is not applicable since unused medicines were unopened. It then appears
that the main reason/explanation stated by consumers under this category includes medicines that
had passed their expiry date. While disposal of medicines that past their expiry date is a practice
harmonious with the QUM principles, the question remains as to why those medicines were not
used in the first instance.
With regard to the reasons and explanations of why consumers did not need or want the
medicines, consumers sometimes stated reasons relating to their perceptions of the effectiveness
of the medicine/medication and their experiences with medications. This is contradictory to the
fact that those medicines were unused. For example, there were some unused medicines reported
unwanted due to experiencing negative or ‘unwanted’ effects. It is theoretically possible that
more than one package of the same medicine was purchased. The consumer then used, or
partially used, one package and experienced some unwanted effects, or did not experience
expected positive effects, and returned the remaining medicine unused. However, there are other
possible explanations of contradictions in responses. Consumers may purchase more medicines
than they need, confuse the reasons where they return medicines for others, forget the reasons for
not wanting medicines purchased a long time ago, or offer responses which, in their view, are
more socially acceptable.
RUMS REPORT
64
CHAPTER IV: SUMMARY OF KEY RESEARCH FINDINGS AND RECOMMENDATIONS This chapter summarises RUMS key research findings pertinent to consumer practices of
disposal of unwanted and out-of-date medicines and provides recommendations within the
context of QUM. Based on findings in this report, several recommendations relate to future
research and others relate to the development of activities promoting the RUM Project and safe
disposal of unwanted medicines among diverse population groups. Recommendations are
provided in terms of strategies aiming to expand community awareness about the RUM Project
among health care providers and all consumers, as well as consumers with specific needs. The
challenge is to tailor consumer awareness programs to specific population groups using a
systematic approach and ensuring consistency of messages.
The material in this chapter is outlined under the following subheadings:
Part A: Key research findings – consumer practices
Part B: Key research findings – the kinds of medicines returned and the reasons for return
Part C: Recommendations
Part A: Key research findings – consumer practices In total, a representative sample of 605 consumers participated in RUMS in Melbourne. In terms
of socio-demographic characteristics, consumers varied in age; gender; levels of formal education
reached; country of birth; language spoken at home; place of residence; and living arrangements.
4.1 Findings from RUMS suggest some association between consumer socio-demographic
determinants and their practices of return of unwanted medicines to community pharmacies
for ultimate disposal. In Melbourne:
4.1.1 older consumers are much more likely to return unwanted and out-of-date medicines
to pharmacies than their younger counterparts;
4.1.2 consumers aged between 65 and 79 years return medicines much more frequently
than people in any other age group;
4.1.3 males are much less likely to return medicines to pharmacies than females;
4.1.4 overseas-born Australians, particularly those born in non English speaking (NES)
countries, are less likely to return medicines to pharmacies than their Australian-
born counterparts;
CHAPTER IV: KEY RESEARCH FINDINGS AND RECOMMENDATIONS
65
4.1.5 Australians who speak a language other than English (LOTE) at home are less likely
to return unwanted medicines to pharmacies than those for whom English is the only
language spoken at home;
4.1.6 consumers who reside in districts 5, 6 and 4 (the Guild’s classification in
metropolitan Melbourne) are more likely to return unwanted medicines to
pharmacies than their counterparts who live in other geographic areas; and
4.1.7 consumers living in group households are more likely to return medicines than
people living in lone person households (people living alone).
4.2 RUMS results provide information on consumer practices of and experiences with return of
unwanted medicines to community pharmacies, in particular on location and occurrences of
return. In Melbourne consumers are more likely to:
4.2.1 return medicines to the same pharmacy rather than to different pharmacies; this is
particularly true for older consumers;
4.2.2 return medicines to a regional centre pharmacy than to a shopping strip pharmacy;
4.2.3 have previously returned medicine (i.e. before participating in RUMS); the older
the consumer the more likely they are to have had prior experience with medicinal
return; and
4.2.4 return medicines within one calendar year.
4.3 RUMS findings reveal that consumers return their own unwanted medicines as well as
medicines prescribed to and/or used by other consumers. Here, ‘other’ include spouses,
partners, children, parents, other family, flatmates and friends. Various socio-demographic
influences on consumer practices relating to whose medicines they return for ultimate
disposal:
4.3.1 consumers aged 65 years and over and younger consumers are more likely to return
their own medicines;
4.3.2 middle-aged consumers (35–64) are more likely to return medicines prescribed to
and/or used by ‘others only’ or a combination of those and their own medicines;
4.3.3 middle-aged consumers are more likely to return medicines for others because
someone has passed away; and
4.3.4 younger consumers (18–34) and females are more likely to return medicines for
someone who has moved out of home.
4.4 In RUMS consumer practices and behaviours relating to medicinal return are likely to be
linked with pharmacy practice and pharmacists’ attitudes relating to the RUM Project and
RUMS REPORT
66
relevant activities. While the pharmacists’ role is undoubtedly more significant than the role
of other professionals, their own awareness about, attitudes towards, perceptions of and the
ways they participate in the RUM Project vary greatly. For example, some pharmacists
actively promote to their clients their services with regard to disposal of unwanted
medicines while others, although offering the services, do not actively promote them. The
majority of pharmacists communicate verbally with their clients about the disposal of
unwanted medicines, others advertise in print media or display posters. Sources of
information that pharmacists access may also be inconsistent. RUMS findings suggest that:
4.4.1 pharmacy location appears to be the only characteristic associated with consumer
behaviours relating to medicinal return; and
4.4.2 other measured characteristics such as working hours or numbers of staff in the
pharmacy seem to have limited influence.
Most likely differences in rates of returns between participating pharmacies reflect:
� pharmacists’ attitudes towards the RUM Project;
� diversity of existing pharmacy practices, possibly including pharmacy ownership,
management and staffing arrangements;
� availability of resources within a pharmacy;
� the kinds of relationships pharmacists developed with their customers; and
� the ways pharmacists communicate with consumers.
4.5 Findings from RUMS reveal that consumers in Melbourne utilise a range of information
sources relating to safe disposal of medicines including health professionals, lay sources
and, to a lesser extent, consumer medicine information and advertising. Some consumers in
RUMS find it difficult to identify specific sources of information they have been exposed to.
Findings from RUMS suggest that:
4.5.1 among health professionals, pharmacists play a most significant role in promoting
the RUM Project and safe practices of disposal of unwanted medicines; doctors and
other health professionals – including various hospital staff, district nurses,
psychiatric nurses and diabetes educators – also play some role, and could be more
involved;
4.5.2 consumers often learn about safe practices of disposal of unwanted medicines from
lay sources, including family members, other relatives, friends, work colleagues
and neighbours;
CHAPTER IV: KEY RESEARCH FINDINGS AND RECOMMENDATIONS
67
4.5.3 consumers are exposed to information relating to the RUM Project and safe
practices of medicinal disposal through advertising in media and advertising by
pharmacies; and
4.5.4 the role of written consumer information in promoting safe disposal of medicines,
and the RUM Project in particular, is negligible.
4.6 RUMS findings demonstrate a link between consumer utilisation of various information
sources promoting the RUM Project and safe practices of disposal of unwanted medicines
and consumer gender and age. For example:
4.6.1 males are more likely than females to utilise doctors;
4.6.2 females are more likely than males to utilise media advertising;
4.6.3 pharmacists are the most significant source of information for consumers of all
ages, however utilisation of pharmacists increases with age: the older the consumer
the more significant the role of the pharmacist;
4.6.4 younger consumers tend to utilise lay sources more than their older counterparts;
4.6.5 utilisation of lay sources decreases with age (apart from age group 80+, where lay
sources are slightly more significant in comparison with other older age groups);
4.6.6 advertising is more significant among the middle-age groups (35–49 and 50–64);
and
4.6.7 consumers aged 65–70 are more likely to utilise doctors as sources of information
than are people in any other age group.
4.7 RUMS results indicate that language spoken at home is also associated with consumer
utilisation of various information sources. Thus:
4.7.1 pharmacists are the most significant sources for all language groups, however they
are most significant to people speaking LOTE at home;
4.7.2 consumers who stated English as the only language spoken at home reported the
highest proportion of utilisation of media and pharmacy advertising and the lowest
proportion of utilisation of lay sources;
4.7.3 consumers speaking English and other languages at home reported lower utilisation
of media but higher proportion of pharmacy advertising and of lay sources; and
4.7.4 consumers speaking only LOTE at home reported zero utilisation of media and a
very low proportion of utilisation of pharmacy advertising, while the proportion of
utilisation of lay sources within this group was higher than among other language
groups.
RUMS REPORT
68
Part B: Key research findings – the kinds of medicines returned and the reasons for return
In RUMS consumers in Melbourne returned a total of 2,250 medicines on 605 occasions, with
the number of items returned on each occasion ranging from 1 to 22. Returned items represented
787 different kinds of medicines, with a range of different characteristics and reasons for return.
4.8 RUMS findings reveal differences between consumer practices in relation to the kinds of
medicines returned. Thus consumers:
4.8.1 are more likely to return prescription medicines and less likely to return non-
prescription and complementary medicines;
4.8.2 are more likely to return medicines in solid form rather than semi-solid and liquid;
and
4.8.3 are more likely to return medicines sold under the concessional rather than the
general category.
4.9 RUMS findings suggest that consumers store medicines in their homes for extended periods
of time before bringing them for ultimate disposal to a pharmacy, and often dispose of
medicines that have not passed their expiry dates. In RUMS:
4.9.1 expiry dates of returned medicines ranged over a 30 year period, from 1979 to
2009;
4.9.2 a substantial proportion of returned medicines have not passed their expiry date at
the time of return;
4.9.3 returned medicines generally tend to have a low percentage of use; and
4.9.4 a substantial proportion of returned medicines are unused.
4.10 RUMS data about the top most commonly returned medicines largely correspond with
various Australian reports relating to the use of medicines in the community. In RUMS:
4.10.1 the most commonly returned medicines were those prescribed and/or used for the
cardiovascular system, the nervous system and the alimentary tract and metabolism;
4.10.2 among proprietary name medicines Coumadin (WARFARIN SODIUM)is the most
commonly returned; and
4.10.3 the top ten generic medicines returned include: GLYCERYL TRINITRATE,
PREDNISOLONE, SALBUTAMOL SULFATE, PARACETAMOL, WARFARIN SODIUM,
FRUSEMIDE, AMOXYCILLIN, ASPIRIN, METOCLOPRAMIDE HYDROCHLORIDE,
CODEINE PHOSPHATE with PARACETAMOL.
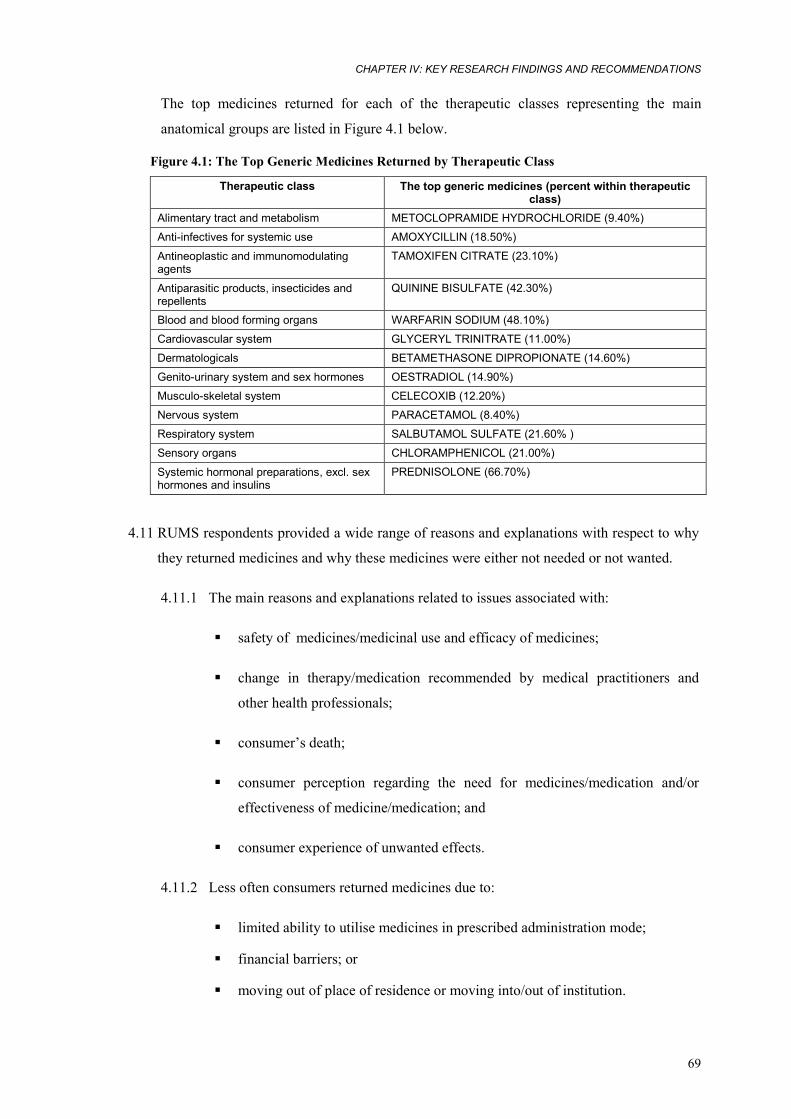
CHAPTER IV: KEY RESEARCH FINDINGS AND RECOMMENDATIONS
69
The top medicines returned for each of the therapeutic classes representing the main
anatomical groups are listed in Figure 4.1 below.
Figure 4.1: The Top Generic Medicines Returned by Therapeutic Class
Therapeutic class The top generic medicines (percent within therapeutic class)
Alimentary tract and metabolism METOCLOPRAMIDE HYDROCHLORIDE (9.40%)
Anti-infectives for systemic use AMOXYCILLIN (18.50%)
Antineoplastic and immunomodulating agents
TAMOXIFEN CITRATE (23.10%)
Antiparasitic products, insecticides and repellents
QUININE BISULFATE (42.30%)
Blood and blood forming organs WARFARIN SODIUM (48.10%)
Cardiovascular system GLYCERYL TRINITRATE (11.00%)
Dermatologicals BETAMETHASONE DIPROPIONATE (14.60%)
Genito-urinary system and sex hormones OESTRADIOL (14.90%)
Musculo-skeletal system CELECOXIB (12.20%)
Nervous system PARACETAMOL (8.40%)
Respiratory system SALBUTAMOL SULFATE (21.60% )
Sensory organs CHLORAMPHENICOL (21.00%)
Systemic hormonal preparations, excl. sex hormones and insulins
PREDNISOLONE (66.70%)
4.11 RUMS respondents provided a wide range of reasons and explanations with respect to why
they returned medicines and why these medicines were either not needed or not wanted.
4.11.1 The main reasons and explanations related to issues associated with:
� safety of medicines/medicinal use and efficacy of medicines;
� change in therapy/medication recommended by medical practitioners and
other health professionals;
� consumer’s death;
� consumer perception regarding the need for medicines/medication and/or
effectiveness of medicine/medication; and
� consumer experience of unwanted effects.
4.11.2 Less often consumers returned medicines due to:
� limited ability to utilise medicines in prescribed administration mode;
� financial barriers; or
� moving out of place of residence or moving into/out of institution.
RUMS REPORT
70
4.11.3 A significant proportion of medicines are returned because a consumer has passed
away or because medicines have passed their use by date.
4.11.4 There is a high proportion of unused medicines among those returned because they
have passed their expiry dates.
4.11.5 The share of medicines representing different therapeutic classes range within each
of the reason categories. For example:
� medicines prescribed and used for the cardiovascular system are the most
commonly returned due to change in medication recommended by a medical
practitioner or other health professional;
� anti-infectives are the most frequently returned for reasons associated with
the consumer’s perception regarding the need for medication;
� medicines prescribed and used for the nervous system are most frequently
returned due to perceived effectiveness of treatment or to unwanted effects;
� among medicines returned due to experience of unwanted effects, most are
medicines used for the nervous system, cardiovascular system and musculo-
skeletal system;
� among medicines stopped without consulting a medical practitioner anti-
infectives have the highest proportion;
� among unused medicines there is a high proportion of medicines used for
the cardiovascular system, alimentary tract and metabolism and nervous
system; and
� SALBUTAMOL SULFATE is the top medicine among those returned unused.
Part C: Recommendations
4.12 Recommendations for further research
4.12.1 RUMS describes consumer practices, the kinds of medicines returned and the
reason for return in metropolitan Melbourne. Understanding of consumer practices
relating to disposal of unwanted medicines and the kinds of medicines returned
may be further enhanced by investigating similar issues in rural and remote areas
and in different states. It is therefore recommended to conduct similar
study/studies among rural consumers, and also nationwide.
CHAPTER IV: KEY RESEARCH FINDINGS AND RECOMMENDATIONS
71
4.12.2 RUMS findings reveal several influences on consumer practices of medicinal
return and a range of reasons for return. Thus RUMS findings suggest that
consumer practices are associated with various socio-demographic characteristics,
specific pharmacy characteristics and practices. RUMS findings also suggest
existing socio-cultural influences underlying consumer perceptions that shape
practices of medicinal return. There are many possible socio-cultural influences
underlying consumer perceptions that shape practices of medicinal return that
could not be determined within the parameters of this study. In depth exploration
of complex socio-cultural influences will be best served by the utilisation of
research methods equipped for such exploration (i.e. qualitative methods or mixed
methodologies). A better understanding of complex socio-cultural influences
shaping lay perceptions and practices will potentially add an extra dimension and
further inform the development of programs and activities for consumers in the
ways that are both appropriate and effective.
4.12.3 The need for further exploration of complex socio-cultural influences is also
warranted by contradictions revealed in RUMS in relation to ‘stated’ reasons for
return vs. level of usage of returned medicines. For example, medicines returned
because they were ‘not effective’ or caused unwanted effects included some that
were unused. Similarly, among medicines returned because they had passed their
use-by date were some that were unused or unopened.
4.12.4 Issues recommended for in depth explorations may include those investigating
divergent practices of medicinal return in relation to generics vs. proprietary
medicines, prescription vs. non-prescription medicines and medicines sold under
general vs. concessional categories. It is possible, for instance, that consumers
perceive non-prescription medicines as less poisonous to people and presenting
less risk of environmental toxicity. Similarly, the low proportion of
complementary medicines returned to community pharmacies for ultimate
disposal may reflect consumer perceptions about these medicines as being less
dangerous. Issues recommended for in depth explorations may also include those
investigating socio-cultural influences on long term home storage of medicines
that have passed their use-by date.
4.12.5 In the context of broader QUM issues, the relationships between socio-cultural
influences and lay perceptions of and experiences with positive therapeutic
outcomes are of primary interest. In particular with regard to medication used for
RUMS REPORT
72
chronic disease management and for secondary prevention. Other broader issues
include the use of antiinfectives and the use of medicines in chronic disease
management.
4.13 Target populations
RUMS findings suggest that two broad population groups should be the focus of development of
various activities promoting the RUM Project and safe disposal of unwanted and out-of-date
medicines. These are health professionals and lay consumers.
4.13.1 RUMS findings suggest that community pharmacists play the most essential role in
relation to the RUM Project. Here, they are the key service providers and also play
the major role in promoting those services and practices of safe disposal of
medicines to their customers. Other health professionals, in particular doctors and
nurses, both in the community and health care institutions, also play some role.
However, their role is limited to delivery of information to lay consumers.
4.13.2 While the pharmacists’ role is undoubtedly more significant than the role of other
professionals, their own awareness about, attitudes towards, perceptions of and
ways they participate in the RUM Project vary greatly. This suggests that
pharmacists may benefit from educational activities and access to consistent
information promoting the RUM Project. It should also be taken into consideration
that pharmacists’ participation in the RUM Project reflects the diversity of existing
business and staffing arrangements within individual pharmacies and availability of
resources. For some individual pharmacies participation in the RUM Project – in
particular activities associated with its promotion to clients and consumers – can
present a considerable challenge within the context of the everyday pharmacy
operation. Therefore, it is recommended that:
� pharmacists be provided with access to consistent information about the
RUM Project and safe disposal of unwanted and out-of-date medicines in
the context of QUM. This can be achieved through the development of
relevant information and their incorporation in the relevant curricula
including undergraduate pharmacy courses and continuing professional
education, including professional forums such as conferences, electronic
media, professional journals and other publications;
� pharmacists be encouraged to become more active partners of the RUM
Project, and that mechanisms be established to support individual
pharmacies in their activities, in particular those promoting the RUM
CHAPTER IV: KEY RESEARCH FINDINGS AND RECOMMENDATIONS
73
Project to consumers and clients. Such support may include financial
incentives and provision of resources for advertising in local media; and
� dissemination of consumer information through pharmacies be encouraged
by identification and promoting of pharmacy best practice and provision of
consumer promotional materials in a format that is most suitable for
delivery in the pharmacy context. For example, leaflets containing
consumer information can be made available without any implications to
everyday pharmacy practices, a poster with a promotional message can be
printed and displayed in community pharmacies.
4.13.3 With regard to other health professionals, it is essential to ensure that they have
access to consistent information about the RUM Project and practices relating to
safe disposal of unwanted and out-of-date medicines. This can be achieved by
promotion of relevant issues through professional organisations and forums. While
it is unlikely that primary care practitioners, doctors in particular, will actively
promote safe disposal of medicines, consumers may benefit from their doctor’s
enhanced knowledge of the program, for example in instances where consumers
actively seek information from their doctors about what to do with unwanted
medicines. This will particularly assist consumers aged 80+ and those who speak a
LOTE at home, as their utilisation of doctors as sources of relevant information is
greater than among other consumers.
4.13.4 Findings from RUMS imply the existence of some level of consumer awareness
about the RUM Project and safe disposal of unwanted and out-of-date medicines.
However, levels of awareness vary among population groups with different socio-
demographic characteristics, and sources of consumer information appear to be
inconsistent. In the context of QUM, the challenge is to introduce a systematic
approach to developing consumer awareness programs and activities to ensure
consumer access to consistent promotional information. It is, therefore,
recommended to develop basic consumer information in the context of QUM.
4.13.5 RUMS findings suggest that currently consumers have limited access to consistent
messages and information promoting the RUM Project and safe disposal of
unwanted and out-of-date medicines. It is recommended that basic consumer
information incorporating consistent key messages promoting the RUM Project and
safe disposal of medicines in the context of QUM be developed. The content of
such information should be utilised across awareness campaigns targeting various
RUMS REPORT
74
population groups. However, the format of promotional material could be changed
depending on the type of medium used. For example, written consumer information
may differ in format from consumer information used for media advertising.
4.13.6 RUMS identified several broader issues that should be included in the content of
community awareness campaigns and promotional information, as well as more
specific issues. Among broader issues are those explaining fundamental principles
of safe storage and disposal and explanation of the universality of the RUM Project.
It is recommended that a greater emphasis be placed on applicability of principles
of safe disposal on different kinds of medicines i.e. generics and proprietary
medicines, prescription and non-prescription medicines, medicines sold under
general and concessional categories. It is recommended that an extra dimension be
added to the existing motto of the RUM Project and that the present message be
extended from ‘ANY PHARMACY AT ANY TIME’ to ‘ANY MEDICINE TO
ANY PHARMACY AT ANY TIME’.
4.13.7 It is recommended that community awareness campaigns and activities be focused
on several consumer groups identified in RUMS. These include consumers who
currently are either more likely to return medicines to participating pharmacies and
those who seem to be less aware of practices of safe disposal. As RUMS findings
suggest women and consumers aged 65 years and over are more likely to return
medicines to community pharmacies, it is recommended that consumer awareness
activities be tailored to these groups. For both groups, a community development
approach may be useful, and both groups can be reached through relevant
community organisations such as women’s groups, neighbourhood houses, support
groups and carers associations. In addition, younger women seem to be best
targeted by media advertising.
4.13.8 RUMS also identified several groups of consumers who currently are less likely to
participate in the RUM Project and relevant practices. These special needs
consumer groups include consumers who:
� are living in solo households;
� were born overseas, in particular those born in NES countries; or
� speak LOTE at home.
RUMS findings suggest that a community development approach may also be
useful with regard to community awareness activities in relation to the special
CHAPTER IV: KEY RESEARCH FINDINGS AND RECOMMENDATIONS
75
needs groups. This can be achieved by involvement of associated community
groups and ethno-specific organisations.
4.13.9 RUMS data indicate that people born overseas, particularly in NES countries, and
those who speak LOTE at home tend to rely more than any other consumers on lay
sources of information about safe disposal of medicines, while underutilising media
and advertising. Underutilisation of media and advertising is likely to demonstrate
non-availability of culturally and linguistically appropriate resources. It is therefore
recommended that culturally and linguistically appropriate information materials be
developed, and that these be distributed through ethno-specific organisations, ethnic
media and bilingual health care providers.
4.13.10 With regard to specific therapeutic classes and medicines, RUMS findings unveil
issues of concern relating to broader QUM contexts, for example issues relating to
return of anti-infectives and SALBUTAMOL SULFATE. The issues uncovered here are
not confined to practices of medicinal return, but rather point to other practices
potentially jeopardising principles of QUM. For example, the high proportion of
SALBUTAMOL SULFATE returned unused suggests mismanagement of preventive
asthma medication. This is of particular concern due to the high proportion of
SALBUTAMOL SULFATE being prescribed to children and young adults. Therefore it
is recommended that relevant key stakeholders be informed about RUMS findings,
in particular those concerned with misuse of anti-infectives and asthma medication,
and that these stakeholders be encouraged to take this information into account in
relevant educational activities among health providers and the community.
_________________________
In conclusion, RUMS has been a complex project which has achieved an accurate description of a
representative sample of the unwanted and out-of date medicines returned by consumers to
community pharmacies; several influences on consumer practices of medicinal return and a range
of reasons for return. Given the complexity of the study, considerable effort was taken to test and
refine the RUMS approach. Extensive fieldwork arrangements allowed RUMS to achieve high
response rates. Several quality assurance processes were implemented to ensure the accuracy and
consistency of data obtained.
Findings from RUMS reveal several influences on consumer practices of medicinal return and a
range of reasons for return. RUMS results imply the existence of a certain level of consumer
awareness about the RUM Project and about safe disposal of unwanted and out-of-date medicines.
RUMS REPORT
76
It is important to emphasise here that the current Commonwealth agreement does not provide
funding for consumer awareness activities. Therefore, the success that the RUM Project has so far
achieved seems to rely exclusively on the considerable efforts of the RUM Project management
and the Board; the enthusiasm of participating pharmacists; the common sense of consumers; and,
to some extend, the support of the pharmaceutical industry. The challenge now lies in finding
effective ways of enhancing this existing consumer awareness in order to maximise the return, in
terms of QUM, for all parties involved.
RUMS findings suggest that consumer awareness activities are one area where a change in
approach is desirable. Such activities, tailored to the needs of specific population groups, are
critical in developing a broader understanding of the objectives of the RUM Project and have great
potential to drive consumer practices relating to the management of medicines. Findings from
RUMS have implications not only for community education in safe disposal of unwanted or out-
of-date medicines, but also for development of improved consumer understanding of broader
aspects of medicine use and storage.
REFERENCES
77
REFERENCES
Australian Bureau of Statistics 2004, 2001 Census Basic Community Profile and Snapshot, 205 Melbourne (Statistical Division), 3235.2.55.001 Population by Age and Sex, Victoria <http://www.abs.gov.au/Ausstats/[email protected]>
——2004, Year Book Australia, 1301.0 – 2004: Population. Population projections, <http://www.abs.gov.au/Ausstats/[email protected]>
——2002, 4364.0 National Health Survey – Summary of Results, Australia, <http://www.abs.gov.au/Ausstats/[email protected]>
——2002, Australian Social Trends 2002 Population – Population Composition: Older overseas-born Australians, <http://www.abs.gov.au/austats/[email protected]>
——1999, 4377.0 National Health Survey, Use of Medications, Australia, <http://www.abs.gov.au/Ausstats/[email protected]>
Australian Medicines Handbook 2004, Australian Medicines Handbook Proprietary Limited
Australian Pharmaceutical Index 2004, Sydney: IMS Health.
Baker, R.I., Coughlin, P.B., Gallus, A.S. et al. 2004, ‘Warfarin reversal: consensus guidelines, on behalf of the Australasian Society of Thrombosis and Haemostasis’, MJA, 2004, 181(9): 492–497.
Bensoussan, A., Myers, S.P., Wu, S.M., O’Connor, K. 2004, ‘Naturopathic and western herbal medicine practice in Australia – a workforce survey’, Complement Ther Med, 12: 17–27.
Birkett D.J. 2003, ‘Generics – equal or not?’, Aust Prescr, 26:85–7.
——et al. 1991, 'Profiles of antibacterial drug use in Australia. A report from the Drug Utilization Subcommittee of the Pharmaceutical Benefits Advisory Committee', MJA,155: 410–415.
Centre for Strategic Economic Studies 1999, Pharmaceuticals in Australia: Equity, cost, containment and industry development, Victoria University, Melbourne.
Commonwealth Department of Health and Ageing 2003, About the PBS <http://www.health.gov.au/internet/wcms/publishing.nsf/Content/health-pbs-general-aboutus.htm>
——2003, Australian Statistics on Medicines. 1999–2000, <www.health.gov.au/pbs/healthpro/pubs/pdf/asm00.pdf>
Commonwealth Department of Health and Aged Care 2000, National Medicines Policy 2000, Canberra: Commonwealth Department of Health and Aged Care
Commonwealth of Australia, 2004, Schedule of Pharmaceutical Benefits for Approved Pharmacists and Medical Practitioners, <www.health.gov.au/pbs>
Computachem Services, E-Newsletter 2001, Prescribing focus: Salbutamol sulfate inhaler, <http://www.computachem.com.au/enewsletter/ed36f.html>
Computachem Services, E-Newsletter 2001, Data Updates: Top 20 medications prescribed, <http://www.computachem.com.au/enewsletter/ed36f.html>
D'Alwis E. 2004, Presentation to the Generic Drug Industry Conference, ABN AMRO Generic Drug Industry Conference, <http://www.sigmaco.com.au>
De Santis, G. et al. 1994, ‘Improving the quality of antibiotic prescription patterns in general practice: the role of educational intervention.’ MJA, 160: 502–505
RUMS REPORT
78
Drug Utilisation Sub-Committee 2003, ‘Top 10 drugs’, Aust Prescr, 26:4
Gallus, A.S., Baker, R.I., Chong, B.H. et al. 2002, ‘Consensus guidelines for warfarin therapy’ Med J Aust, 172: 600–605
Halstead, P.J., Roughead, E.E., Rigby, K. et al. 1999, ‘Towards the safer use of warfarin II: results of a workshop’, J Qual Clin Pract., 19(1): 61–62
Harvey, K., Stewart, R. & Hemming, M. 1986, ‘Educational antibiotic prescribing’, MJA 145: 28–32
Hassali A, Stewart K. 2004, ‘Quality use of generic medicine’, Aust Prescr, 27: 80–1
Health Insurance Commission 2004, HIC Statistical Reporting, <http://www.hic.gov.au/cgi-bin>
Jackson, S.L., Peterson, G.M., Vial, J.H. 2004., ‘A community-based educational intervention to improve antithrombotic drug use in atrial fibrillation’, Ann Pharmacother, 38(11): 1794–9 (Epub 2004 Sep 28)
——et al. 2004, ‘Improving the outcomes of anticoagulation: an evaluation of home follow-up of warfarin initiation’, J Intern Med, 256(2):137–144
Levine, M.N., Raskob, G., Landefeld, S. et al. 1998, ‘Hemorrhagic complications of anticoagulant therapy’, Chest, 114: 511S–523S
MacLennan, A.H., Wilson, D.H., Taylor, A.W. 2002, ‘The escalating cost and prevalence of alternative medicines’, Prev Med, 35(2):166–73
Mcmanus, P. et al. 1997, ‘Antibiotic use in the Australian community’, MJA, 167: 124–127
Parliament of Australia 2003, The Pharmaceutical Benefits Scheme – an Overview, <http://www.aph.gov.au/library/intguide/SP/pbs.htm>
Pharmaceutical Benefits Pricing Authority 2004, Annual Report for the year ended 30 June 2003, Commonwealth Department of Health and Ageing, Canberra
Smeaton J. 2000, ‘The generics market’, Aust J Pharm, 81: 540–2
Therapeutic Goods Administration 2004, Medicines definitions, <http://www.tga.gov.au/docs/html/meddef.htm>
Turnidge, J. 1997, ‘Antibiotic use or misuse?’, MJA, 167: 116–117
APPENDICES
79
APPENDICES Appendix 1: Plain language statement for data collectors
Appendix 2: Plain language statement for consumers
Appendix 3: Consent form for data collectors
Appendix 4: Survey Completion Instruction Manual
Appendix 5: Covering letter to data collectors
Appendix 6: Pharmacy Guild districts and pharmacy locations in Melbourne
Appendix 7: A joint letter of the Pharmacy Guild and the RUM Project Appendix 8: Pharmacy Data Logbook
Appendix 9: Returned Medicines Survey (the survey)
Appendix 10: RUMS Data Coding Manual
Appendix 11: Medicines returned in RUMS by medicine name
Appendix 12: Medicines returned in RUMS by generic name
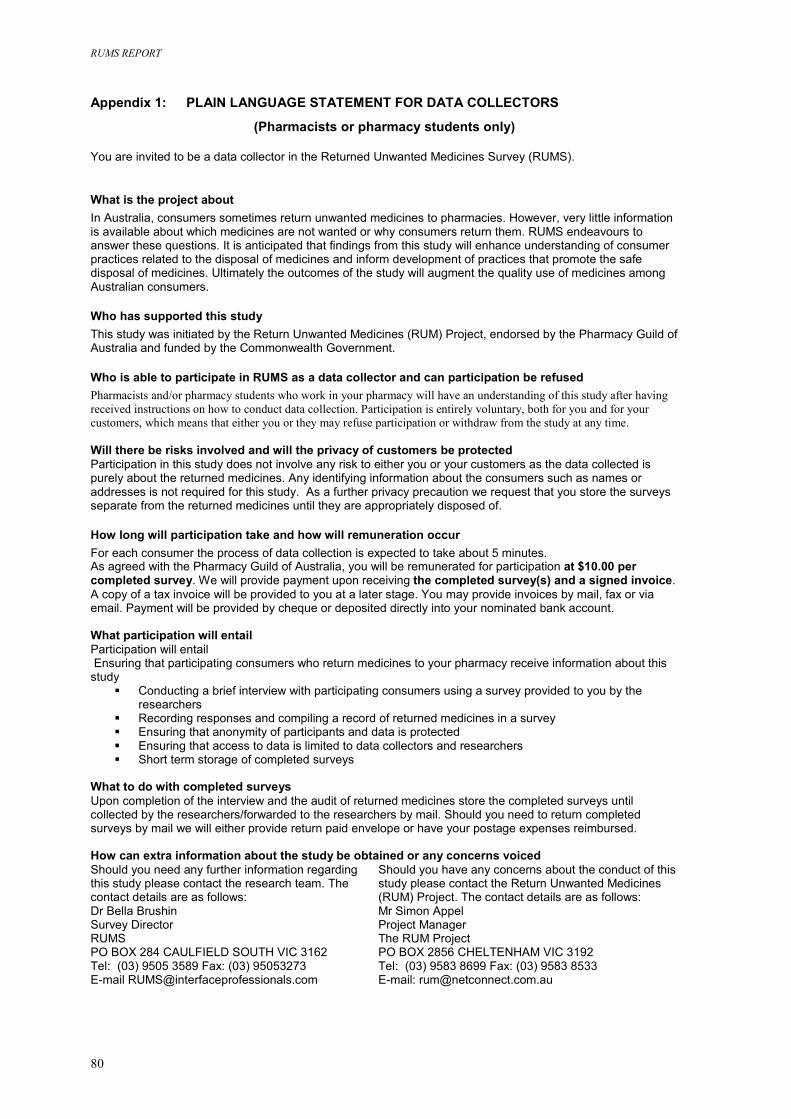
RUMS REPORT
80
Appendix 1: PLAIN LANGUAGE STATEMENT FOR DATA COLLECTORS
(Pharmacists or pharmacy students only) You are invited to be a data collector in the Returned Unwanted Medicines Survey (RUMS).
What is the project about In Australia, consumers sometimes return unwanted medicines to pharmacies. However, very little information is available about which medicines are not wanted or why consumers return them. RUMS endeavours to answer these questions. It is anticipated that findings from this study will enhance understanding of consumer practices related to the disposal of medicines and inform development of practices that promote the safe disposal of medicines. Ultimately the outcomes of the study will augment the quality use of medicines among Australian consumers.
Who has supported this study This study was initiated by the Return Unwanted Medicines (RUM) Project, endorsed by the Pharmacy Guild of Australia and funded by the Commonwealth Government.
Who is able to participate in RUMS as a data collector and can participation be refused Pharmacists and/or pharmacy students who work in your pharmacy will have an understanding of this study after having received instructions on how to conduct data collection. Participation is entirely voluntary, both for you and for your customers, which means that either you or they may refuse participation or withdraw from the study at any time. Will there be risks involved and will the privacy of customers be protected Participation in this study does not involve any risk to either you or your customers as the data collected is purely about the returned medicines. Any identifying information about the consumers such as names or addresses is not required for this study. As a further privacy precaution we request that you store the surveys separate from the returned medicines until they are appropriately disposed of.
How long will participation take and how will remuneration occur For each consumer the process of data collection is expected to take about 5 minutes. As agreed with the Pharmacy Guild of Australia, you will be remunerated for participation at $10.00 per completed survey. We will provide payment upon receiving the completed survey(s) and a signed invoice. A copy of a tax invoice will be provided to you at a later stage. You may provide invoices by mail, fax or via email. Payment will be provided by cheque or deposited directly into your nominated bank account. What participation will entail Participation will entail Ensuring that participating consumers who return medicines to your pharmacy receive information about this study
� Conducting a brief interview with participating consumers using a survey provided to you by the researchers
� Recording responses and compiling a record of returned medicines in a survey � Ensuring that anonymity of participants and data is protected � Ensuring that access to data is limited to data collectors and researchers � Short term storage of completed surveys
What to do with completed surveys Upon completion of the interview and the audit of returned medicines store the completed surveys until collected by the researchers/forwarded to the researchers by mail. Should you need to return completed surveys by mail we will either provide return paid envelope or have your postage expenses reimbursed. How can extra information about the study be obtained or any concerns voiced Should you need any further information regarding this study please contact the research team. The contact details are as follows:
Should you have any concerns about the conduct of this study please contact the Return Unwanted Medicines (RUM) Project. The contact details are as follows:
Dr Bella Brushin Survey Director RUMS PO BOX 284 CAULFIELD SOUTH VIC 3162 Tel: (03) 9505 3589 Fax: (03) 95053273 E-mail [email protected]
Mr Simon Appel Project Manager The RUM Project PO BOX 2856 CHELTENHAM VIC 3192 Tel: (03) 9583 8699 Fax: (03) 9583 8533 E-mail: [email protected]
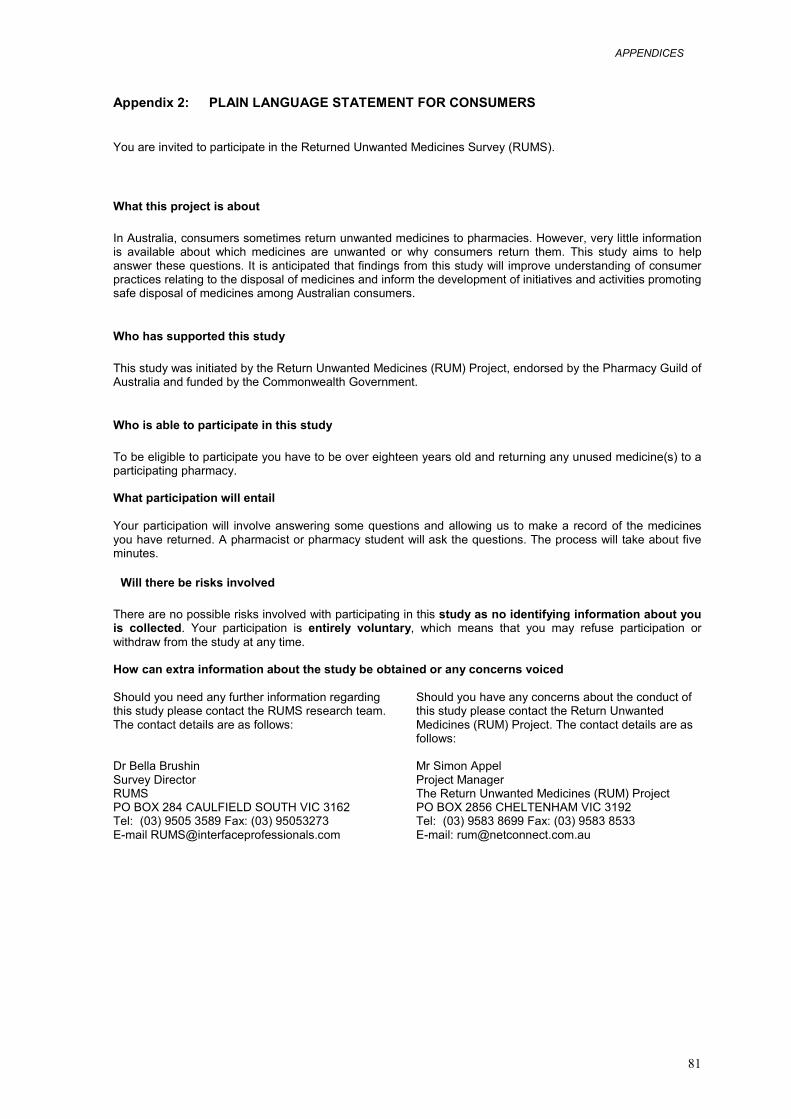
APPENDICES
81
Appendix 2: PLAIN LANGUAGE STATEMENT FOR CONSUMERS
You are invited to participate in the Returned Unwanted Medicines Survey (RUMS).
What this project is about In Australia, consumers sometimes return unwanted medicines to pharmacies. However, very little information is available about which medicines are unwanted or why consumers return them. This study aims to help answer these questions. It is anticipated that findings from this study will improve understanding of consumer practices relating to the disposal of medicines and inform the development of initiatives and activities promoting safe disposal of medicines among Australian consumers.
Who has supported this study This study was initiated by the Return Unwanted Medicines (RUM) Project, endorsed by the Pharmacy Guild of Australia and funded by the Commonwealth Government.
Who is able to participate in this study To be eligible to participate you have to be over eighteen years old and returning any unused medicine(s) to a participating pharmacy. What participation will entail Your participation will involve answering some questions and allowing us to make a record of the medicines you have returned. A pharmacist or pharmacy student will ask the questions. The process will take about five minutes.
Will there be risks involved There are no possible risks involved with participating in this study as no identifying information about you is collected. Your participation is entirely voluntary, which means that you may refuse participation or withdraw from the study at any time. How can extra information about the study be obtained or any concerns voiced Should you need any further information regarding this study please contact the RUMS research team. The contact details are as follows:
Should you have any concerns about the conduct of this study please contact the Return Unwanted Medicines (RUM) Project. The contact details are as follows:
Dr Bella Brushin Survey Director RUMS PO BOX 284 CAULFIELD SOUTH VIC 3162 Tel: (03) 9505 3589 Fax: (03) 95053273 E-mail [email protected]
Mr Simon Appel Project Manager The Return Unwanted Medicines (RUM) Project PO BOX 2856 CHELTENHAM VIC 3192 Tel: (03) 9583 8699 Fax: (03) 9583 8533 E-mail: [email protected]
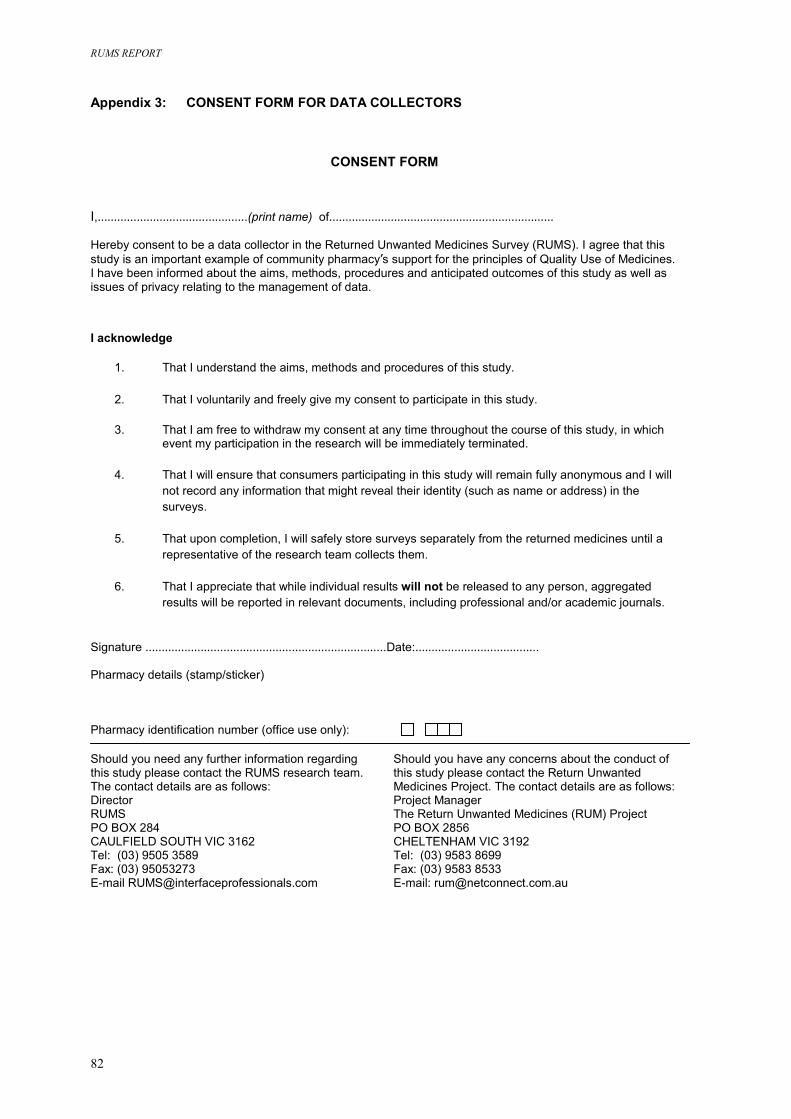
RUMS REPORT
82
Appendix 3: CONSENT FORM FOR DATA COLLECTORS
CONSENT FORM
I,……………………………………….(print name) of…………………………………………………………… Hereby consent to be a data collector in the Returned Unwanted Medicines Survey (RUMS). I agree that this study is an important example of community pharmacy’s support for the principles of Quality Use of Medicines. I have been informed about the aims, methods, procedures and anticipated outcomes of this study as well as issues of privacy relating to the management of data.
I acknowledge
1. That I understand the aims, methods and procedures of this study.
2. That I voluntarily and freely give my consent to participate in this study.
3. That I am free to withdraw my consent at any time throughout the course of this study, in which event my participation in the research will be immediately terminated.
4. That I will ensure that consumers participating in this study will remain fully anonymous and I will
not record any information that might reveal their identity (such as name or address) in the surveys.
5. That upon completion, I will safely store surveys separately from the returned medicines until a
representative of the research team collects them.
6. That I appreciate that while individual results will not be released to any person, aggregated results will be reported in relevant documents, including professional and/or academic journals.
Signature ………………………………………………………………..Date:……………………………….. Pharmacy details (stamp/sticker) Pharmacy identification number (office use only): Should you need any further information regarding this study please contact the RUMS research team. The contact details are as follows:
Should you have any concerns about the conduct of this study please contact the Return Unwanted Medicines Project. The contact details are as follows:
Director RUMS PO BOX 284 CAULFIELD SOUTH VIC 3162 Tel: (03) 9505 3589 Fax: (03) 95053273 E-mail [email protected]
Project Manager The Return Unwanted Medicines (RUM) Project PO BOX 2856 CHELTENHAM VIC 3192 Tel: (03) 9583 8699 Fax: (03) 9583 8533 E-mail: [email protected]
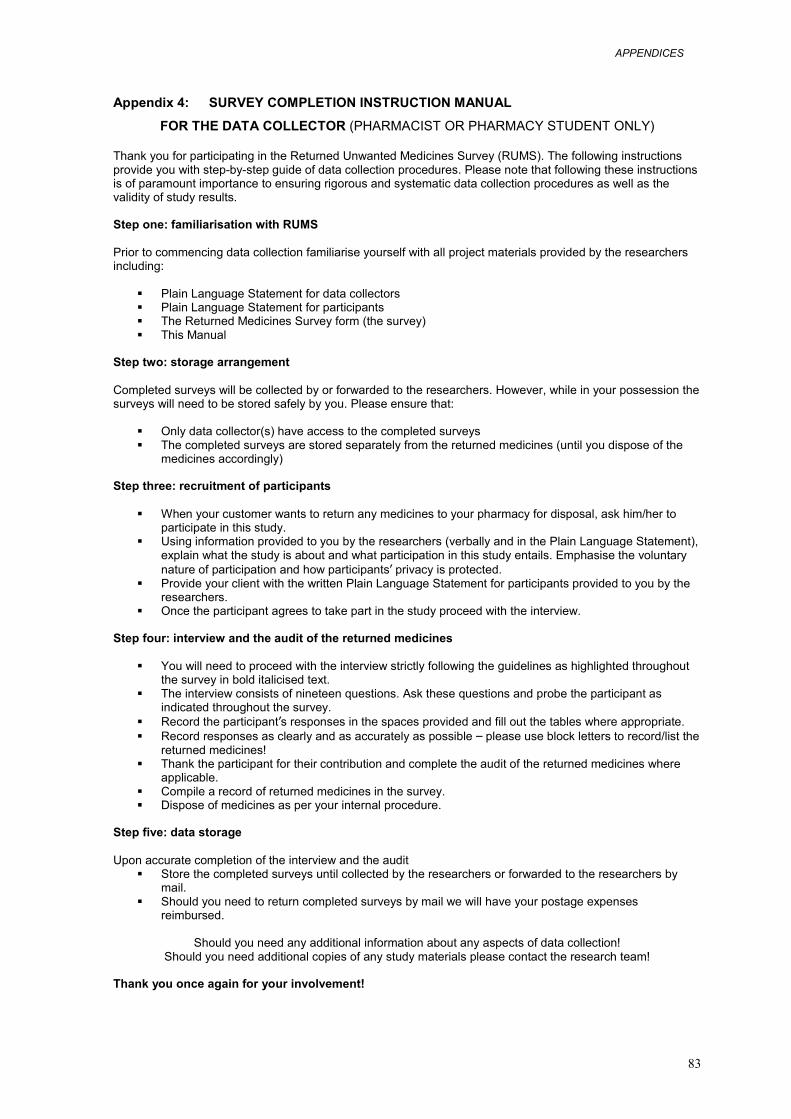
APPENDICES
83
Appendix 4: SURVEY COMPLETION INSTRUCTION MANUAL
FOR THE DATA COLLECTOR (PHARMACIST OR PHARMACY STUDENT ONLY) Thank you for participating in the Returned Unwanted Medicines Survey (RUMS). The following instructions provide you with step-by-step guide of data collection procedures. Please note that following these instructions is of paramount importance to ensuring rigorous and systematic data collection procedures as well as the validity of study results. Step one: familiarisation with RUMS Prior to commencing data collection familiarise yourself with all project materials provided by the researchers including:
� Plain Language Statement for data collectors � Plain Language Statement for participants � The Returned Medicines Survey form (the survey) � This Manual
Step two: storage arrangement Completed surveys will be collected by or forwarded to the researchers. However, while in your possession the surveys will need to be stored safely by you. Please ensure that:
� Only data collector(s) have access to the completed surveys � The completed surveys are stored separately from the returned medicines (until you dispose of the
medicines accordingly) Step three: recruitment of participants
� When your customer wants to return any medicines to your pharmacy for disposal, ask him/her to participate in this study.
� Using information provided to you by the researchers (verbally and in the Plain Language Statement), explain what the study is about and what participation in this study entails. Emphasise the voluntary nature of participation and how participants’ privacy is protected.
� Provide your client with the written Plain Language Statement for participants provided to you by the researchers.
� Once the participant agrees to take part in the study proceed with the interview. Step four: interview and the audit of the returned medicines
� You will need to proceed with the interview strictly following the guidelines as highlighted throughout the survey in bold italicised text.
� The interview consists of nineteen questions. Ask these questions and probe the participant as indicated throughout the survey.
� Record the participant’s responses in the spaces provided and fill out the tables where appropriate. � Record responses as clearly and as accurately as possible – please use block letters to record/list the
returned medicines! � Thank the participant for their contribution and complete the audit of the returned medicines where
applicable. � Compile a record of returned medicines in the survey. � Dispose of medicines as per your internal procedure.
Step five: data storage Upon accurate completion of the interview and the audit
� Store the completed surveys until collected by the researchers or forwarded to the researchers by mail.
� Should you need to return completed surveys by mail we will have your postage expenses reimbursed.
Should you need any additional information about any aspects of data collection!
Should you need additional copies of any study materials please contact the research team! Thank you once again for your involvement!
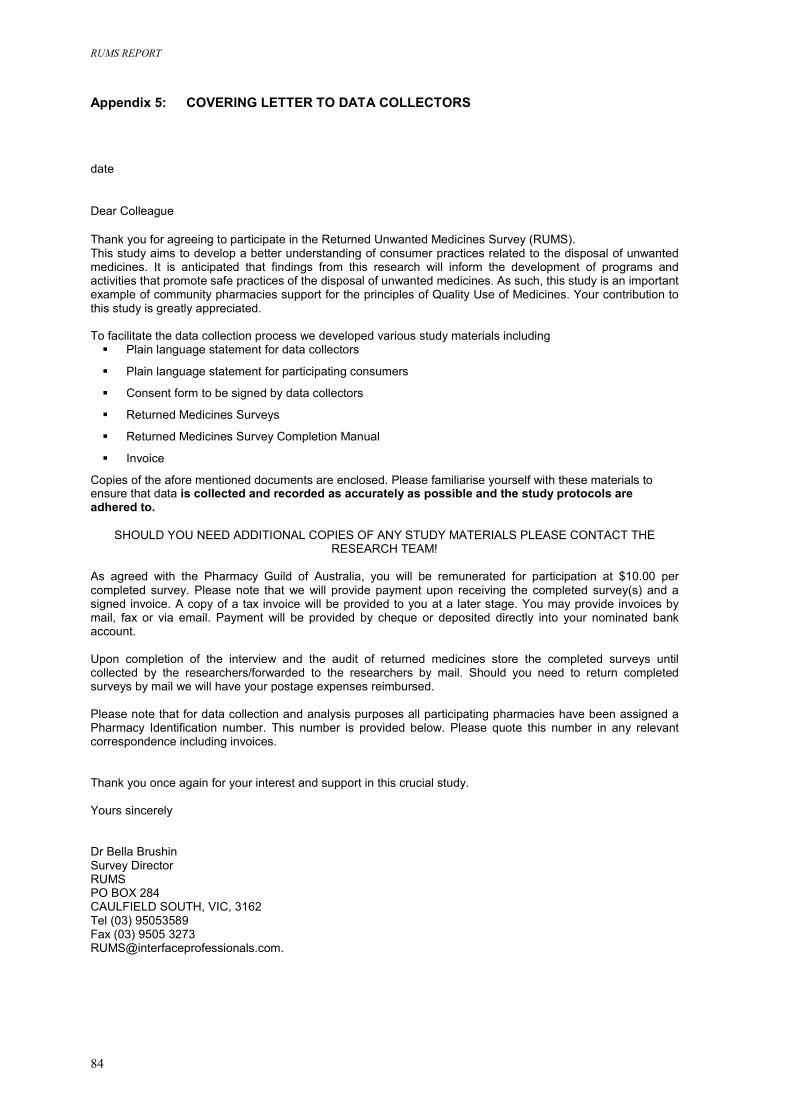
RUMS REPORT
84
Appendix 5: COVERING LETTER TO DATA COLLECTORS
date
Dear Colleague
Thank you for agreeing to participate in the Returned Unwanted Medicines Survey (RUMS). This study aims to develop a better understanding of consumer practices related to the disposal of unwanted medicines. It is anticipated that findings from this research will inform the development of programs and activities that promote safe practices of the disposal of unwanted medicines. As such, this study is an important example of community pharmacies support for the principles of Quality Use of Medicines. Your contribution to this study is greatly appreciated. To facilitate the data collection process we developed various study materials including � Plain language statement for data collectors
� Plain language statement for participating consumers
� Consent form to be signed by data collectors
� Returned Medicines Surveys
� Returned Medicines Survey Completion Manual
� Invoice
Copies of the afore mentioned documents are enclosed. Please familiarise yourself with these materials to ensure that data is collected and recorded as accurately as possible and the study protocols are adhered to.
SHOULD YOU NEED ADDITIONAL COPIES OF ANY STUDY MATERIALS PLEASE CONTACT THE RESEARCH TEAM!
As agreed with the Pharmacy Guild of Australia, you will be remunerated for participation at $10.00 per completed survey. Please note that we will provide payment upon receiving the completed survey(s) and a signed invoice. A copy of a tax invoice will be provided to you at a later stage. You may provide invoices by mail, fax or via email. Payment will be provided by cheque or deposited directly into your nominated bank account. Upon completion of the interview and the audit of returned medicines store the completed surveys until collected by the researchers/forwarded to the researchers by mail. Should you need to return completed surveys by mail we will have your postage expenses reimbursed. Please note that for data collection and analysis purposes all participating pharmacies have been assigned a Pharmacy Identification number. This number is provided below. Please quote this number in any relevant correspondence including invoices. Thank you once again for your interest and support in this crucial study. Yours sincerely Dr Bella Brushin Survey Director RUMS PO BOX 284 CAULFIELD SOUTH, VIC, 3162 Tel (03) 95053589 Fax (03) 9505 3273 [email protected].
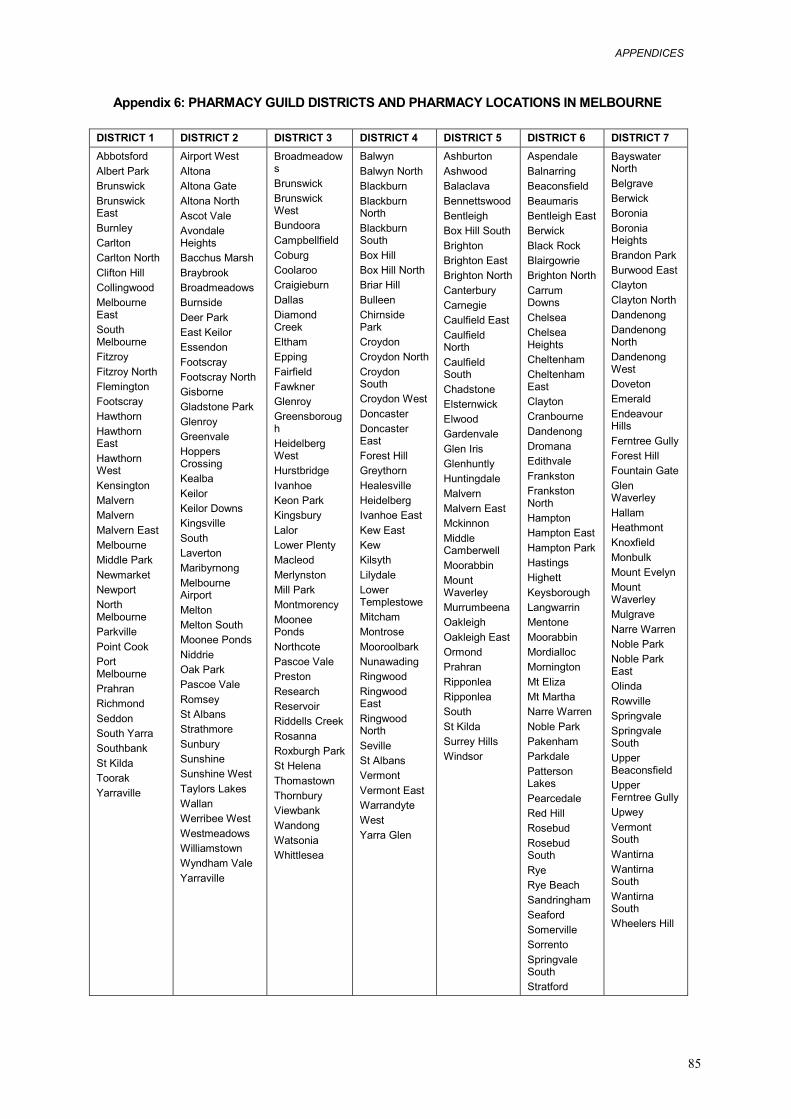
APPENDICES
85
Appendix 6: PHARMACY GUILD DISTRICTS AND PHARMACY LOCATIONS IN MELBOURNE
DISTRICT 1 DISTRICT 2 DISTRICT 3 DISTRICT 4 DISTRICT 5 DISTRICT 6 DISTRICT 7 Abbotsford Albert Park Brunswick Brunswick East Burnley Carlton Carlton North Clifton Hill Collingwood Melbourne East South Melbourne Fitzroy Fitzroy North Flemington Footscray Hawthorn Hawthorn East Hawthorn West Kensington Malvern Malvern Malvern East Melbourne Middle Park Newmarket Newport North Melbourne Parkville Point Cook Port Melbourne Prahran Richmond Seddon South Yarra Southbank St Kilda Toorak Yarraville
Airport West Altona Altona Gate Altona North Ascot Vale Avondale Heights Bacchus Marsh Braybrook Broadmeadows Burnside Deer Park East Keilor Essendon Footscray Footscray North Gisborne Gladstone Park Glenroy Greenvale Hoppers Crossing Kealba Keilor Keilor Downs Kingsville South Laverton Maribyrnong Melbourne Airport Melton Melton South Moonee Ponds Niddrie Oak Park Pascoe Vale Romsey St Albans Strathmore Sunbury Sunshine Sunshine West Taylors Lakes Wallan Werribee West Westmeadows Williamstown Wyndham Vale Yarraville
Broadmeadows Brunswick Brunswick West Bundoora Campbellfield Coburg Coolaroo Craigieburn Dallas Diamond Creek Eltham Epping Fairfield Fawkner Glenroy Greensborough Heidelberg West Hurstbridge Ivanhoe Keon Park Kingsbury Lalor Lower Plenty Macleod Merlynston Mill Park Montmorency Moonee Ponds Northcote Pascoe Vale Preston Research Reservoir Riddells Creek Rosanna Roxburgh Park St Helena Thomastown Thornbury Viewbank Wandong Watsonia Whittlesea
Balwyn Balwyn North Blackburn Blackburn North Blackburn South Box Hill Box Hill North Briar Hill Bulleen Chirnside Park Croydon Croydon North Croydon South Croydon West Doncaster Doncaster East Forest Hill Greythorn Healesville Heidelberg Ivanhoe East Kew East Kew Kilsyth Lilydale Lower Templestowe Mitcham Montrose Mooroolbark Nunawading Ringwood Ringwood East Ringwood North Seville St Albans Vermont Vermont East Warrandyte West Yarra Glen
Ashburton Ashwood Balaclava Bennettswood Bentleigh Box Hill South Brighton Brighton East Brighton North Canterbury Carnegie Caulfield East Caulfield North Caulfield South Chadstone Elsternwick Elwood Gardenvale Glen Iris Glenhuntly Huntingdale Malvern Malvern East Mckinnon Middle Camberwell Moorabbin Mount Waverley Murrumbeena Oakleigh Oakleigh East Ormond Prahran Ripponlea Ripponlea South St Kilda Surrey Hills Windsor
Aspendale Balnarring Beaconsfield Beaumaris Bentleigh East Berwick Black Rock Blairgowrie Brighton North Carrum Downs Chelsea Chelsea Heights Cheltenham Cheltenham East Clayton Cranbourne Dandenong Dromana Edithvale Frankston Frankston North Hampton Hampton East Hampton Park Hastings Highett Keysborough Langwarrin Mentone Moorabbin Mordialloc Mornington Mt Eliza Mt Martha Narre Warren Noble Park Pakenham Parkdale Patterson Lakes Pearcedale Red Hill Rosebud Rosebud South Rye Rye Beach Sandringham Seaford Somerville Sorrento Springvale South Stratford
Bayswater North Belgrave Berwick Boronia Boronia Heights Brandon Park Burwood East Clayton Clayton North Dandenong Dandenong North Dandenong West Doveton Emerald Endeavour Hills Ferntree Gully Forest Hill Fountain Gate Glen Waverley Hallam Heathmont Knoxfield Monbulk Mount Evelyn Mount Waverley Mulgrave Narre Warren Noble Park Noble Park East Olinda Rowville Springvale Springvale South Upper Beaconsfield Upper Ferntree Gully Upwey Vermont South Wantirna Wantirna South Wantirna South Wheelers Hill
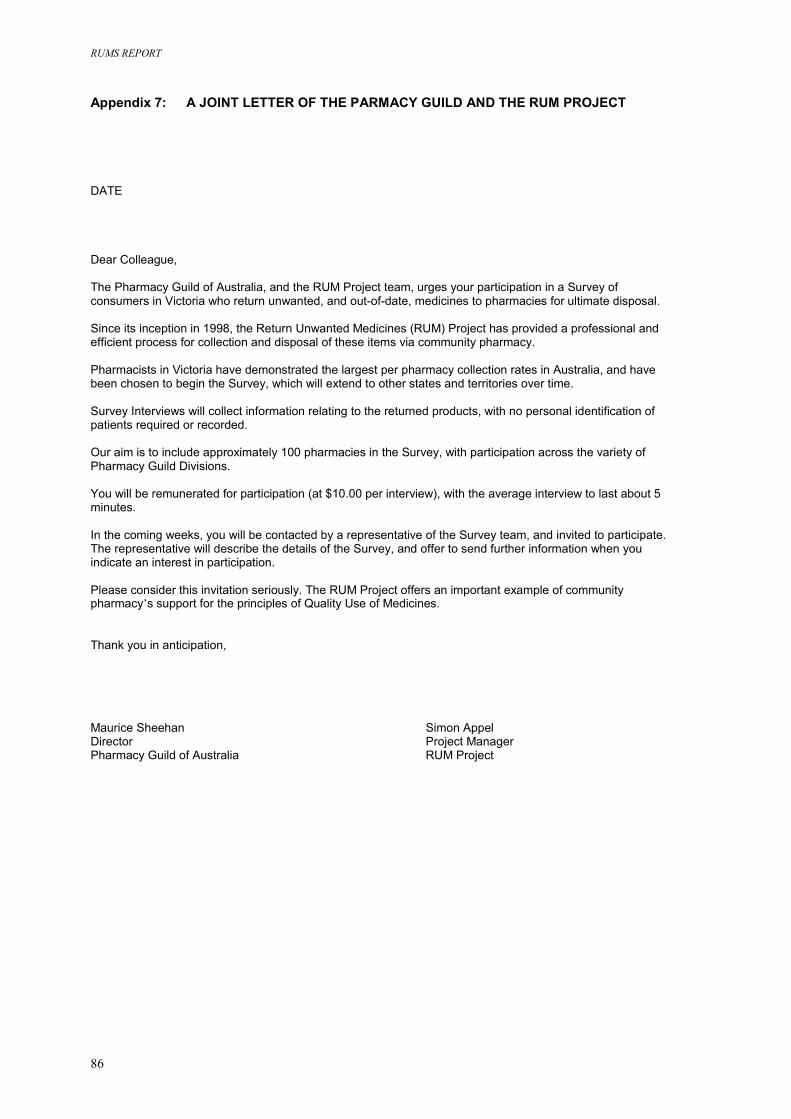
RUMS REPORT
86
Appendix 7: A JOINT LETTER OF THE PARMACY GUILD AND THE RUM PROJECT DATE Dear Colleague, The Pharmacy Guild of Australia, and the RUM Project team, urges your participation in a Survey of consumers in Victoria who return unwanted, and out-of-date, medicines to pharmacies for ultimate disposal. Since its inception in 1998, the Return Unwanted Medicines (RUM) Project has provided a professional and efficient process for collection and disposal of these items via community pharmacy. Pharmacists in Victoria have demonstrated the largest per pharmacy collection rates in Australia, and have been chosen to begin the Survey, which will extend to other states and territories over time. Survey Interviews will collect information relating to the returned products, with no personal identification of patients required or recorded. Our aim is to include approximately 100 pharmacies in the Survey, with participation across the variety of Pharmacy Guild Divisions. You will be remunerated for participation (at $10.00 per interview), with the average interview to last about 5 minutes. In the coming weeks, you will be contacted by a representative of the Survey team, and invited to participate. The representative will describe the details of the Survey, and offer to send further information when you indicate an interest in participation. Please consider this invitation seriously. The RUM Project offers an important example of community pharmacy’s support for the principles of Quality Use of Medicines. Thank you in anticipation, Maurice Sheehan Simon Appel Director Project Manager Pharmacy Guild of Australia RUM Project
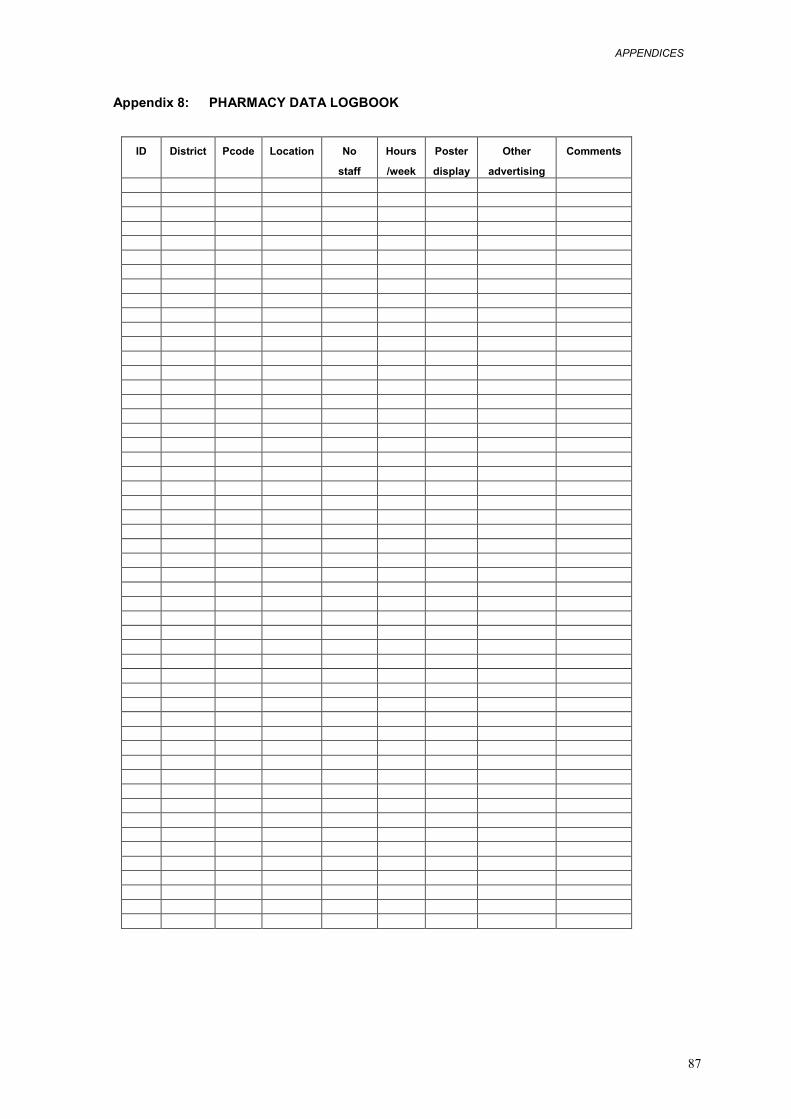
APPENDICES
87
Appendix 8: PHARMACY DATA LOGBOOK
ID District Pcode Location No
staff
Hours
/week
Poster
display
Other
advertising
Comments
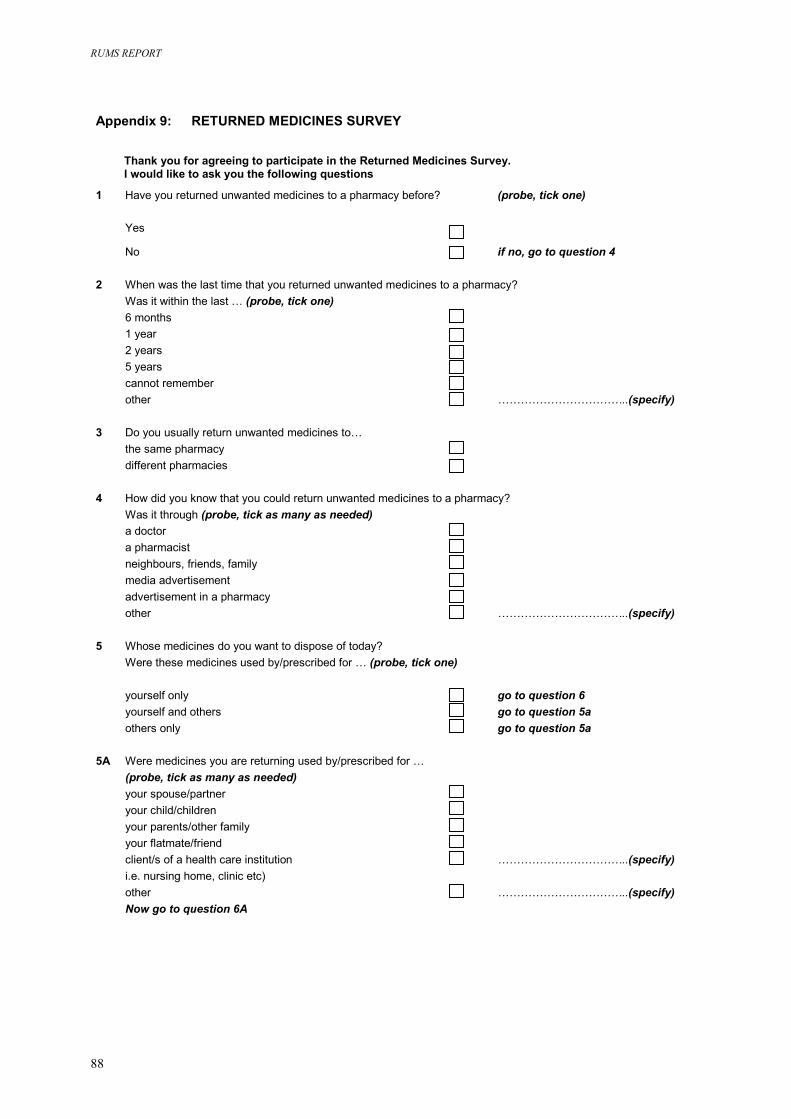
RUMS REPORT
88
Appendix 9: RETURNED MEDICINES SURVEY
1 Have you returned unwanted medicines to a pharmacy before? (probe, tick one) Yes
No 2 When was the last time that you returned unwanted medicines to Was it within the last … (probe, tick one) 6 months 1 year 2 years 5 years cannot remember other 3 Do you usually return unwanted medicines to… the same pharmacy different pharmacies 4 How did you know that you could return unwanted medicines to a Was it through (probe, tick as many as needed) a doctor a pharmacist neighbours, friends, family media advertisement advertisement in a pharmacy other 5 Whose medicines do you want to dispose of today? Were these medicines used by/prescribed for … (probe, tick on yourself only yourself and others others only 5A Were medicines you are returning used by/prescribed for … (probe, tick as many as needed) your spouse/partner your child/children your parents/other family your flatmate/friend client/s of a health care institution i.e. nursing home, clinic etc) other Now go to question 6A
Thank you for agreeing to participate in the Returned Medicines Survey. I would like to ask you the following questions
if no, go to question 4
a pharmacy?
……………………………..(specify)pharmacy?
……………………………..(specify)e)
go to question 6
go to question 5a go to question 5a ……………………………..(specify) ……………………………..(specify)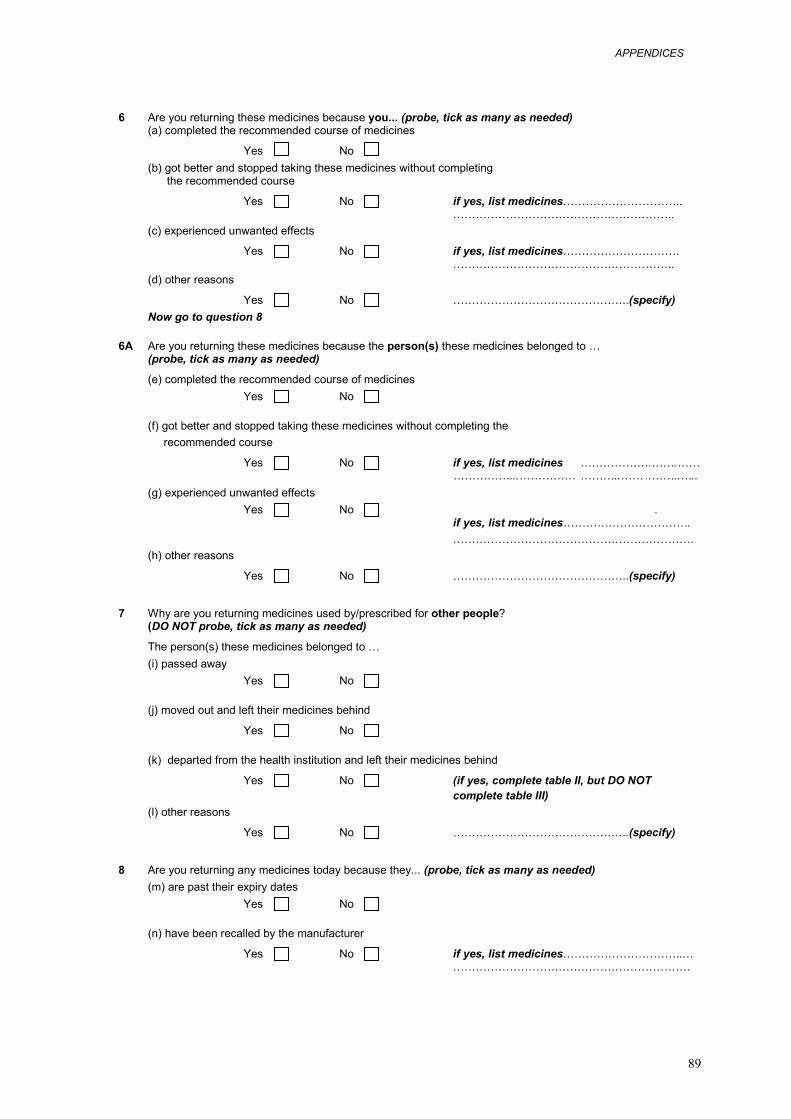
APPENDICES
89
6 Are you returning these medicines because you... (probe, tick as many as needed) (a) completed the recommended course of medicines
Yes No (b) got better and stopped taking these medicines without completing the recommended course
Yes No if yes, list medicines………………………….. ………………………………………………….. (c) experienced unwanted effects
Yes No if yes, list medicines…………………………. ………………………………………………….. (d) other reasons
Yes No ………………………………………..(specify) Now go to question 8
6A Are you returning these medicines because the person(s) these medicines belonged to … (probe, tick as many as needed)
(e) completed the recommended course of medicines Yes No (f) got better and stopped taking these medicines without completing the recommended course Yes No if yes, list medicines
……………...…………… ………………………..……
……….……………..…..
(g) experienced unwanted effects Yes No . if yes, list medicines……………………………. ………………………………………………………. (h) other reasons
Yes No ………………………………………..(specify)
7 Why are you returning medicines used by/prescribed for other people? (DO NOT probe, tick as many as needed)
The person(s) these medicines belonged to … (i) passed away Yes No (j) moved out and left their medicines behind
Yes No (k) departed from the health institution and left their medicines behind
Yes No (if yes, complete table II, but DO NOT complete table III) (l) other reasons
Yes No ………………………………………..(specify)
8 Are you returning any medicines today because they... (probe, tick as many as needed) (m) are past their expiry dates Yes No (n) have been recalled by the manufacturer
Yes No if yes, list medicines…………………………..…
………………………………………………………
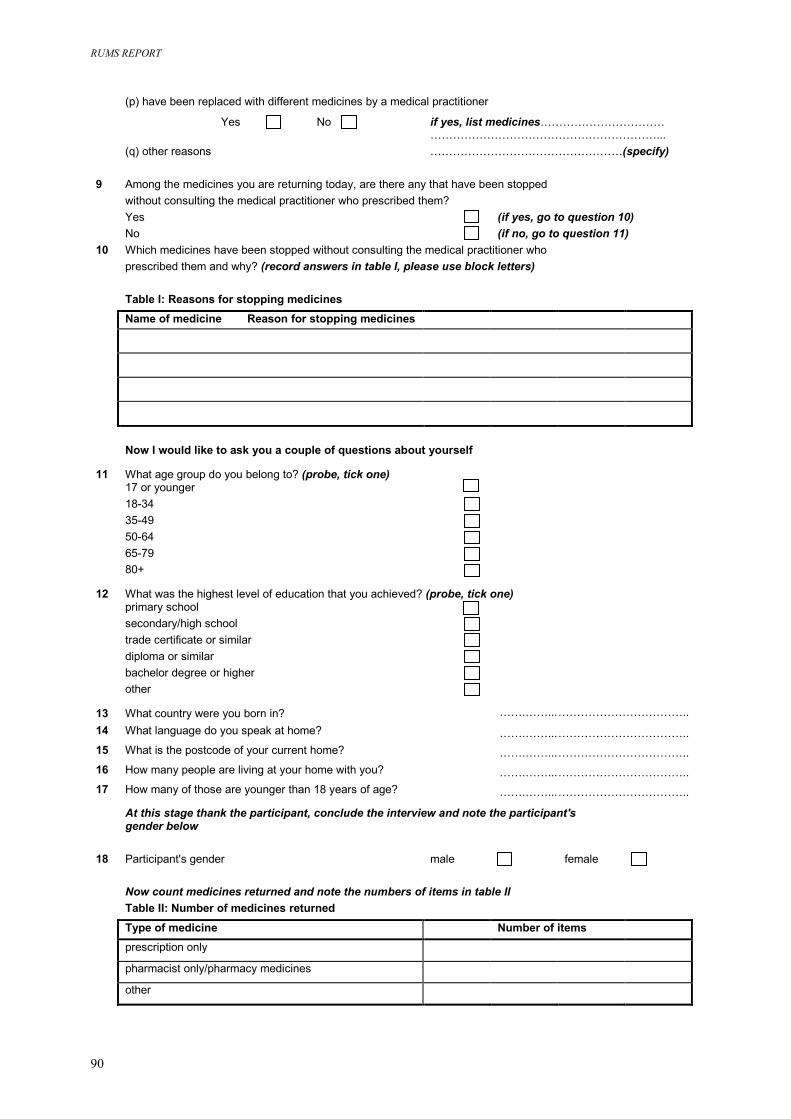
RUMS REPORT
90
(p) have been replaced with different medicines by a medical practitioner
Yes No if yes, list medicines…………………………… (q) other reasons 9 Among the medicines you ar without consulting the medic Yes No 10 Which medicines have been prescribed them and why? (r Table I: Reasons for stopp Name of medicine Rea
Now I would like to ask yo
11 What age group do you belo 17 or younger 18-34 35-49 50-64 65-79 80+
12 What was the highest level o primary school secondary/high school trade certificate or similar diploma or similar bachelor degree or higher other
13 What country were you born14 What language do you spea
15 What is the postcode of your
16 How many people are living
17 How many of those are youn
At this stage thank the par gender below 18 Participant's gender Now count medicines retu Table II: Number of medici Type of medicine prescription only
pharmacist only/pharmacy m
other
e returning todal practitioner w
stopped withouecord answer
ing medicinesson for stoppi
u a couple of q
ng to? (probe,
f education tha
in? k at home?
current home?
at your home w
ger than 18 ye
ticipant, concl
rned and note nes returned
edicines
……………………………………………………... ……………………………………………(specify)
ay, are there any that have been stopped ho prescribed them?
(if yes, go to question 10)
t consulting the medicals in table I, please use
ng medicines
uestions about yourse
tick one)
t you achieved? (probe,
ith you?
ars of age?
ude the interview and n
male
the numbers of items i
(if no, go to question 11)
practitioner who block letters)lf
ick one)
t
…….……...…………………………….. …….……...…………………………….. …….……...……………………………..
…….……...……………………………..
…….……...……………………………..
ote the participant's
female
n table
II
Number of items
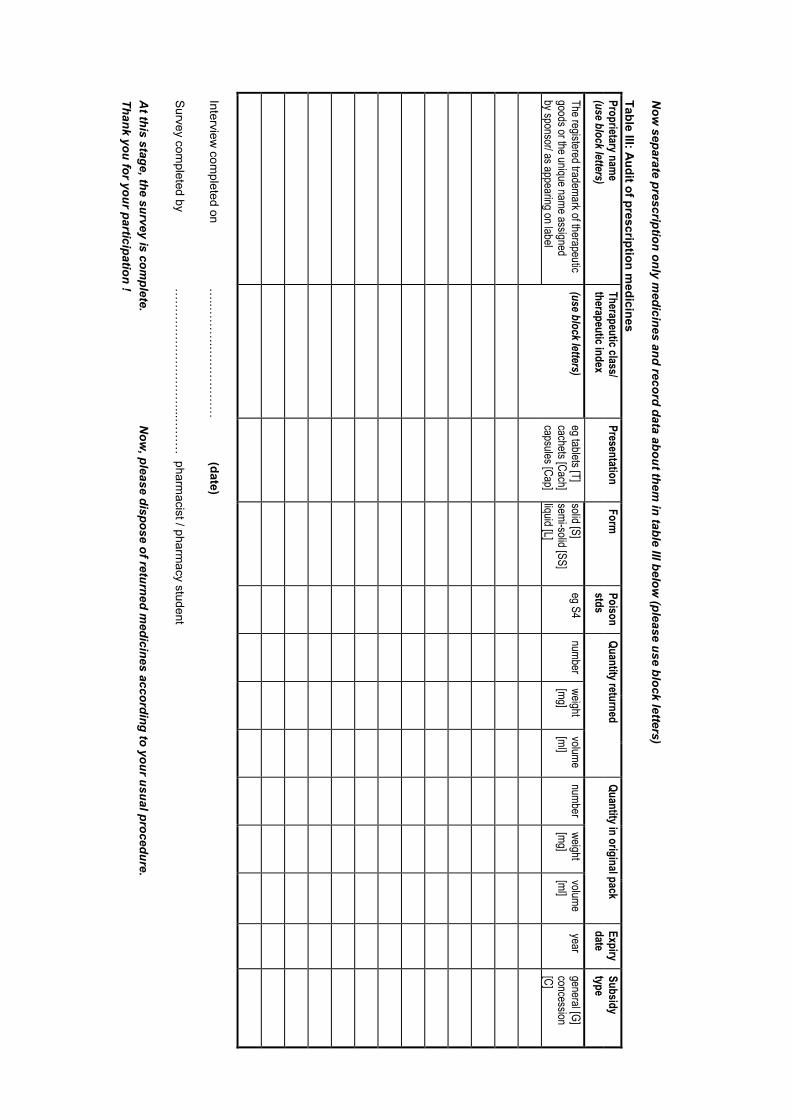
Now
separate prescription only medicines and record data about them
in table III below (please use block letters)
Table III: Audit of prescription m
edicines
Quantity in original pack Proprietary nam
e (use block letters)
Therapeutic class/ therapeutic index
Presentation Form
Poison stds
Quantity returned
Expiry date
Subsidy type
The registered trademark of therapeutic goods or the unique name assigned by sponsor/ as appearing on label
(use block letters) eg tablets [T] cachets [Cach] capsules [Cap]
solid [S] semi-solid [SS] liquid [L]
eg S4 number
weight [mg]
volume [ml]
number weight [mg]
volume [ml]
year general [G] concession [C]
Interview
completed on
…..…
……
.……
……
……
(date)
Survey com
pleted by …
……
……
……
……
…...…
……
pharmacist / pharm
acy student
A
t this stage, the survey is complete.
Now
, please dispose of returned medicines according to your usual procedure.
Thank you for your participation !
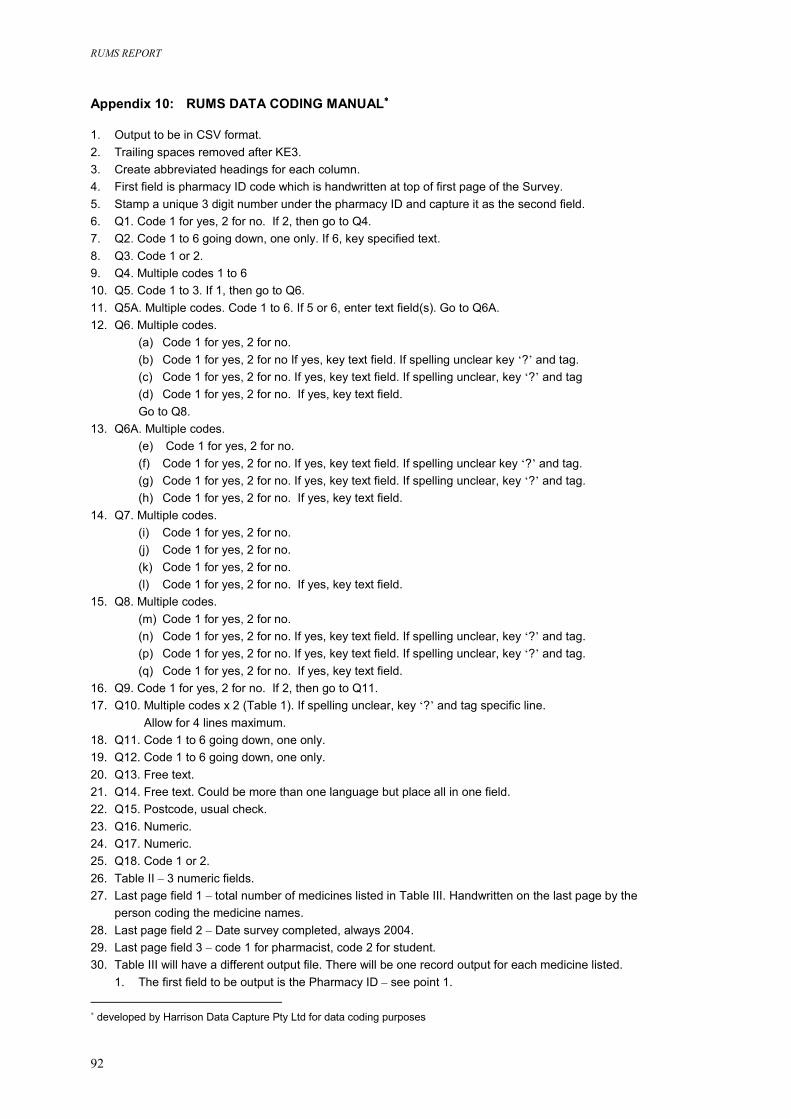
RUMS REPORT
92
Appendix 10: RUMS DATA CODING MANUAL∗∗∗∗ 1. Output to be in CSV format. 2. Trailing spaces removed after KE3. 3. Create abbreviated headings for each column. 4. First field is pharmacy ID code which is handwritten at top of first page of the Survey. 5. Stamp a unique 3 digit number under the pharmacy ID and capture it as the second field. 6. Q1. Code 1 for yes, 2 for no. If 2, then go to Q4. 7. Q2. Code 1 to 6 going down, one only. If 6, key specified text. 8. Q3. Code 1 or 2. 9. Q4. Multiple codes 1 to 6 10. Q5. Code 1 to 3. If 1, then go to Q6. 11. Q5A. Multiple codes. Code 1 to 6. If 5 or 6, enter text field(s). Go to Q6A. 12. Q6. Multiple codes.
(a) Code 1 for yes, 2 for no. (b) Code 1 for yes, 2 for no If yes, key text field. If spelling unclear key ‘?’ and tag. (c) Code 1 for yes, 2 for no. If yes, key text field. If spelling unclear, key ‘?’ and tag (d) Code 1 for yes, 2 for no. If yes, key text field. Go to Q8.
13. Q6A. Multiple codes. (e) Code 1 for yes, 2 for no. (f) Code 1 for yes, 2 for no. If yes, key text field. If spelling unclear key ‘?’ and tag. (g) Code 1 for yes, 2 for no. If yes, key text field. If spelling unclear, key ‘?’ and tag. (h) Code 1 for yes, 2 for no. If yes, key text field.
14. Q7. Multiple codes. (i) Code 1 for yes, 2 for no. (j) Code 1 for yes, 2 for no. (k) Code 1 for yes, 2 for no. (l) Code 1 for yes, 2 for no. If yes, key text field.
15. Q8. Multiple codes. (m) Code 1 for yes, 2 for no. (n) Code 1 for yes, 2 for no. If yes, key text field. If spelling unclear, key ‘?’ and tag. (p) Code 1 for yes, 2 for no. If yes, key text field. If spelling unclear, key ‘?’ and tag. (q) Code 1 for yes, 2 for no. If yes, key text field.
16. Q9. Code 1 for yes, 2 for no. If 2, then go to Q11. 17. Q10. Multiple codes x 2 (Table 1). If spelling unclear, key ‘?’ and tag specific line. Allow for 4 lines maximum. 18. Q11. Code 1 to 6 going down, one only. 19. Q12. Code 1 to 6 going down, one only. 20. Q13. Free text. 21. Q14. Free text. Could be more than one language but place all in one field. 22. Q15. Postcode, usual check. 23. Q16. Numeric. 24. Q17. Numeric. 25. Q18. Code 1 or 2. 26. Table II – 3 numeric fields. 27. Last page field 1 – total number of medicines listed in Table III. Handwritten on the last page by the
person coding the medicine names. 28. Last page field 2 – Date survey completed, always 2004. 29. Last page field 3 – code 1 for pharmacist, code 2 for student. 30. Table III will have a different output file. There will be one record output for each medicine listed.
1. The first field to be output is the Pharmacy ID – see point 1.
∗ developed by Harrison Data Capture Pty Ltd for data coding purposes
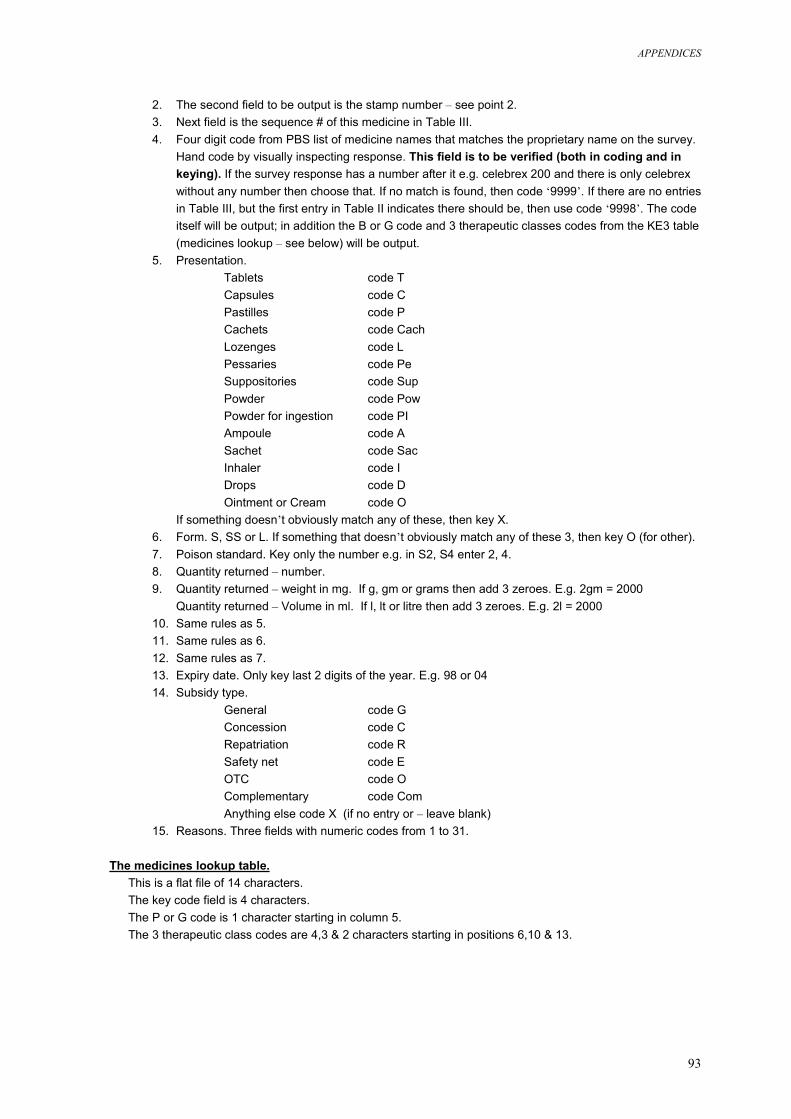
APPENDICES
93
2. The second field to be output is the stamp number – see point 2. 3. Next field is the sequence # of this medicine in Table III. 4. Four digit code from PBS list of medicine names that matches the proprietary name on the survey.
Hand code by visually inspecting response. This field is to be verified (both in coding and in keying). If the survey response has a number after it e.g. celebrex 200 and there is only celebrex without any number then choose that. If no match is found, then code ‘9999’. If there are no entries in Table III, but the first entry in Table II indicates there should be, then use code ‘9998’. The code itself will be output; in addition the B or G code and 3 therapeutic classes codes from the KE3 table (medicines lookup – see below) will be output.
5. Presentation. Tablets code T Capsules code C Pastilles code P Cachets code Cach Lozenges code L Pessaries code Pe Suppositories code Sup Powder code Pow Powder for ingestion code PI Ampoule code A Sachet code Sac Inhaler code I Drops code D Ointment or Cream code O
If something doesn’t obviously match any of these, then key X. 6. Form. S, SS or L. If something that doesn’t obviously match any of these 3, then key O (for other). 7. Poison standard. Key only the number e.g. in S2, S4 enter 2, 4. 8. Quantity returned – number. 9. Quantity returned – weight in mg. If g, gm or grams then add 3 zeroes. E.g. 2gm = 2000
Quantity returned – Volume in ml. If l, lt or litre then add 3 zeroes. E.g. 2l = 2000 10. Same rules as 5. 11. Same rules as 6. 12. Same rules as 7. 13. Expiry date. Only key last 2 digits of the year. E.g. 98 or 04 14. Subsidy type.
General code G Concession code C Repatriation code R Safety net code E OTC code O Complementary code Com Anything else code X (if no entry or – leave blank)
15. Reasons. Three fields with numeric codes from 1 to 31. The medicines lookup table.
This is a flat file of 14 characters. The key code field is 4 characters. The P or G code is 1 character starting in column 5. The 3 therapeutic class codes are 4,3 & 2 characters starting in positions 6,10 & 13.
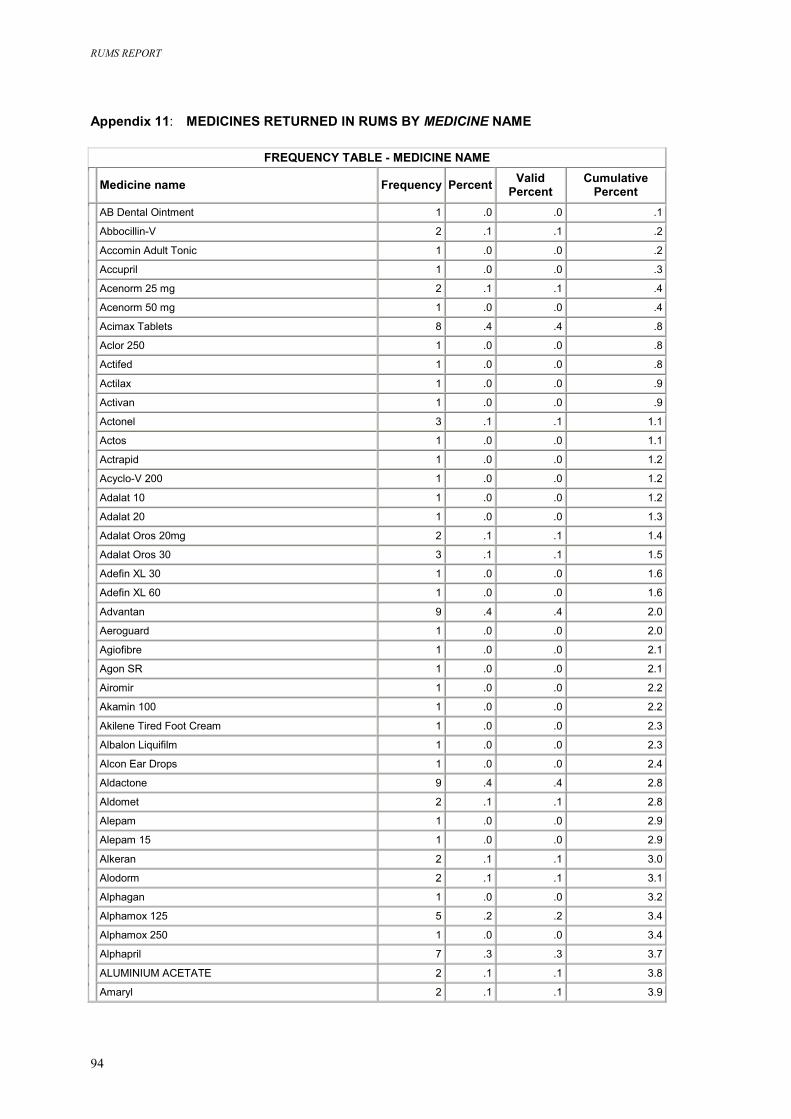
RUMS REPORT
94
Appendix 11: MEDICINES RETURNED IN RUMS BY MEDICINE NAME
FREQUENCY TABLE - MEDICINE NAME Medicine name Frequency Percent Valid
Percent Cumulative
Percent AB Dental Ointment 1 .0 .0 .1
Abbocillin-V 2 .1 .1 .2
Accomin Adult Tonic 1 .0 .0 .2
Accupril 1 .0 .0 .3
Acenorm 25 mg 2 .1 .1 .4
Acenorm 50 mg 1 .0 .0 .4
Acimax Tablets 8 .4 .4 .8
Aclor 250 1 .0 .0 .8
Actifed 1 .0 .0 .8
Actilax 1 .0 .0 .9
Activan 1 .0 .0 .9
Actonel 3 .1 .1 1.1
Actos 1 .0 .0 1.1
Actrapid 1 .0 .0 1.2
Acyclo-V 200 1 .0 .0 1.2
Adalat 10 1 .0 .0 1.2
Adalat 20 1 .0 .0 1.3
Adalat Oros 20mg 2 .1 .1 1.4
Adalat Oros 30 3 .1 .1 1.5
Adefin XL 30 1 .0 .0 1.6
Adefin XL 60 1 .0 .0 1.6
Advantan 9 .4 .4 2.0
Aeroguard 1 .0 .0 2.0
Agiofibre 1 .0 .0 2.1
Agon SR 1 .0 .0 2.1
Airomir 1 .0 .0 2.2
Akamin 100 1 .0 .0 2.2
Akilene Tired Foot Cream 1 .0 .0 2.3
Albalon Liquifilm 1 .0 .0 2.3
Alcon Ear Drops 1 .0 .0 2.4
Aldactone 9 .4 .4 2.8
Aldomet 2 .1 .1 2.8
Alepam 1 .0 .0 2.9
Alepam 15 1 .0 .0 2.9
Alkeran 2 .1 .1 3.0
Alodorm 2 .1 .1 3.1
Alphagan 1 .0 .0 3.2
Alphamox 125 5 .2 .2 3.4
Alphamox 250 1 .0 .0 3.4
Alphapril 7 .3 .3 3.7
ALUMINIUM ACETATE 2 .1 .1 3.8
Amaryl 2 .1 .1 3.9
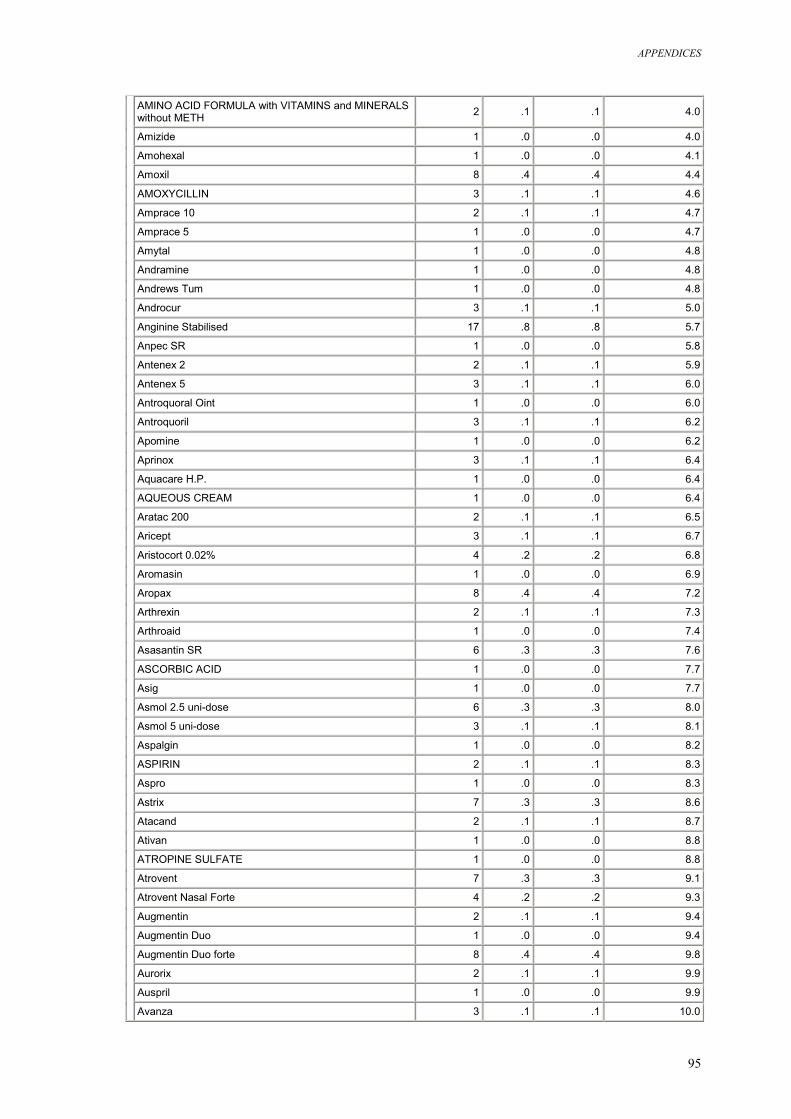
APPENDICES
95
AMINO ACID FORMULA with VITAMINS and MINERALS without METH 2 .1 .1 4.0
Amizide 1 .0 .0 4.0
Amohexal 1 .0 .0 4.1
Amoxil 8 .4 .4 4.4
AMOXYCILLIN 3 .1 .1 4.6
Amprace 10 2 .1 .1 4.7
Amprace 5 1 .0 .0 4.7
Amytal 1 .0 .0 4.8
Andramine 1 .0 .0 4.8
Andrews Tum 1 .0 .0 4.8
Androcur 3 .1 .1 5.0
Anginine Stabilised 17 .8 .8 5.7
Anpec SR 1 .0 .0 5.8
Antenex 2 2 .1 .1 5.9
Antenex 5 3 .1 .1 6.0
Antroquoral Oint 1 .0 .0 6.0
Antroquoril 3 .1 .1 6.2
Apomine 1 .0 .0 6.2
Aprinox 3 .1 .1 6.4
Aquacare H.P. 1 .0 .0 6.4
AQUEOUS CREAM 1 .0 .0 6.4
Aratac 200 2 .1 .1 6.5
Aricept 3 .1 .1 6.7
Aristocort 0.02% 4 .2 .2 6.8
Aromasin 1 .0 .0 6.9
Aropax 8 .4 .4 7.2
Arthrexin 2 .1 .1 7.3
Arthroaid 1 .0 .0 7.4
Asasantin SR 6 .3 .3 7.6
ASCORBIC ACID 1 .0 .0 7.7
Asig 1 .0 .0 7.7
Asmol 2.5 uni-dose 6 .3 .3 8.0
Asmol 5 uni-dose 3 .1 .1 8.1
Aspalgin 1 .0 .0 8.2
ASPIRIN 2 .1 .1 8.3
Aspro 1 .0 .0 8.3
Astrix 7 .3 .3 8.6
Atacand 2 .1 .1 8.7
Ativan 1 .0 .0 8.8
ATROPINE SULFATE 1 .0 .0 8.8
Atrovent 7 .3 .3 9.1
Atrovent Nasal Forte 4 .2 .2 9.3
Augmentin 2 .1 .1 9.4
Augmentin Duo 1 .0 .0 9.4
Augmentin Duo forte 8 .4 .4 9.8
Aurorix 2 .1 .1 9.9
Auspril 1 .0 .0 9.9
Avanza 3 .1 .1 10.0
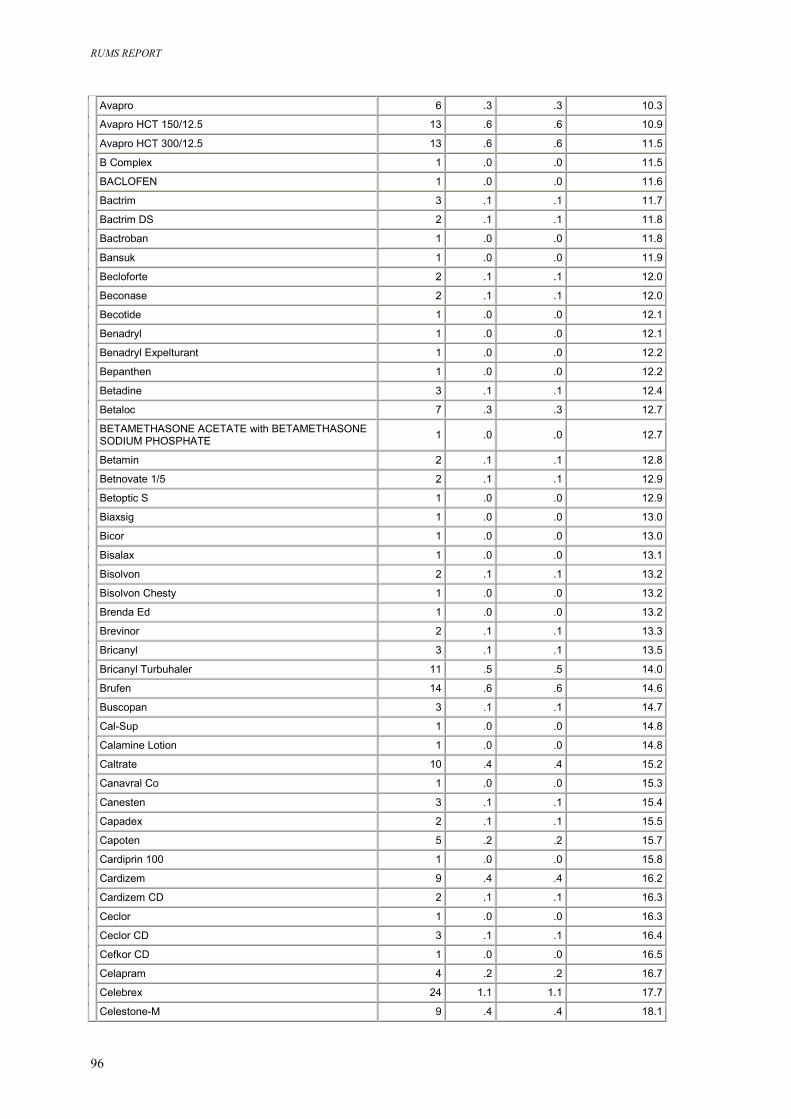
RUMS REPORT
96
Avapro 6 .3 .3 10.3
Avapro HCT 150/12.5 13 .6 .6 10.9
Avapro HCT 300/12.5 13 .6 .6 11.5
B Complex 1 .0 .0 11.5
BACLOFEN 1 .0 .0 11.6
Bactrim 3 .1 .1 11.7
Bactrim DS 2 .1 .1 11.8
Bactroban 1 .0 .0 11.8
Bansuk 1 .0 .0 11.9
Becloforte 2 .1 .1 12.0
Beconase 2 .1 .1 12.0
Becotide 1 .0 .0 12.1
Benadryl 1 .0 .0 12.1
Benadryl Expelturant 1 .0 .0 12.2
Bepanthen 1 .0 .0 12.2
Betadine 3 .1 .1 12.4
Betaloc 7 .3 .3 12.7
BETAMETHASONE ACETATE with BETAMETHASONE SODIUM PHOSPHATE 1 .0 .0 12.7
Betamin 2 .1 .1 12.8
Betnovate 1/5 2 .1 .1 12.9
Betoptic S 1 .0 .0 12.9
Biaxsig 1 .0 .0 13.0
Bicor 1 .0 .0 13.0
Bisalax 1 .0 .0 13.1
Bisolvon 2 .1 .1 13.2
Bisolvon Chesty 1 .0 .0 13.2
Brenda Ed 1 .0 .0 13.2
Brevinor 2 .1 .1 13.3
Bricanyl 3 .1 .1 13.5
Bricanyl Turbuhaler 11 .5 .5 14.0
Brufen 14 .6 .6 14.6
Buscopan 3 .1 .1 14.7
Cal-Sup 1 .0 .0 14.8
Calamine Lotion 1 .0 .0 14.8
Caltrate 10 .4 .4 15.2
Canavral Co 1 .0 .0 15.3
Canesten 3 .1 .1 15.4
Capadex 2 .1 .1 15.5
Capoten 5 .2 .2 15.7
Cardiprin 100 1 .0 .0 15.8
Cardizem 9 .4 .4 16.2
Cardizem CD 2 .1 .1 16.3
Ceclor 1 .0 .0 16.3
Ceclor CD 3 .1 .1 16.4
Cefkor CD 1 .0 .0 16.5
Celapram 4 .2 .2 16.7
Celebrex 24 1.1 1.1 17.7
Celestone-M 9 .4 .4 18.1
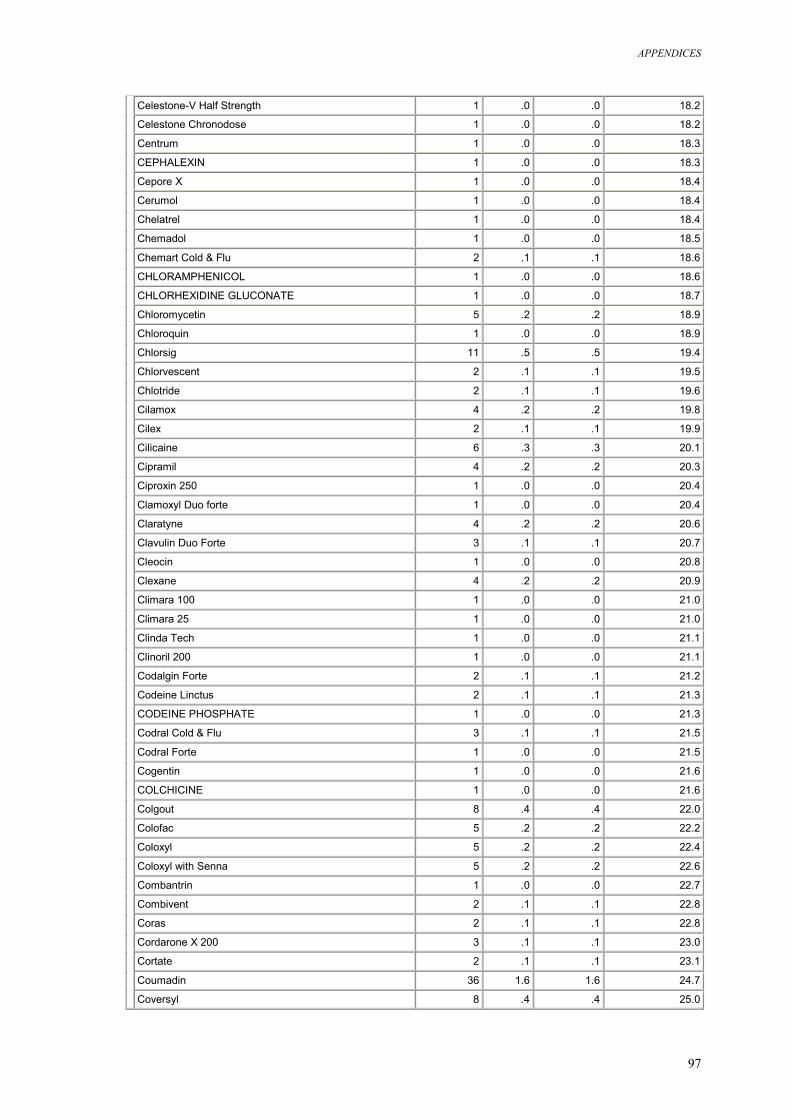
APPENDICES
97
Celestone-V Half Strength 1 .0 .0 18.2
Celestone Chronodose 1 .0 .0 18.2
Centrum 1 .0 .0 18.3
CEPHALEXIN 1 .0 .0 18.3
Cepore X 1 .0 .0 18.4
Cerumol 1 .0 .0 18.4
Chelatrel 1 .0 .0 18.4
Chemadol 1 .0 .0 18.5
Chemart Cold & Flu 2 .1 .1 18.6
CHLORAMPHENICOL 1 .0 .0 18.6
CHLORHEXIDINE GLUCONATE 1 .0 .0 18.7
Chloromycetin 5 .2 .2 18.9
Chloroquin 1 .0 .0 18.9
Chlorsig 11 .5 .5 19.4
Chlorvescent 2 .1 .1 19.5
Chlotride 2 .1 .1 19.6
Cilamox 4 .2 .2 19.8
Cilex 2 .1 .1 19.9
Cilicaine 6 .3 .3 20.1
Cipramil 4 .2 .2 20.3
Ciproxin 250 1 .0 .0 20.4
Clamoxyl Duo forte 1 .0 .0 20.4
Claratyne 4 .2 .2 20.6
Clavulin Duo Forte 3 .1 .1 20.7
Cleocin 1 .0 .0 20.8
Clexane 4 .2 .2 20.9
Climara 100 1 .0 .0 21.0
Climara 25 1 .0 .0 21.0
Clinda Tech 1 .0 .0 21.1
Clinoril 200 1 .0 .0 21.1
Codalgin Forte 2 .1 .1 21.2
Codeine Linctus 2 .1 .1 21.3
CODEINE PHOSPHATE 1 .0 .0 21.3
Codral Cold & Flu 3 .1 .1 21.5
Codral Forte 1 .0 .0 21.5
Cogentin 1 .0 .0 21.6
COLCHICINE 1 .0 .0 21.6
Colgout 8 .4 .4 22.0
Colofac 5 .2 .2 22.2
Coloxyl 5 .2 .2 22.4
Coloxyl with Senna 5 .2 .2 22.6
Combantrin 1 .0 .0 22.7
Combivent 2 .1 .1 22.8
Coras 2 .1 .1 22.8
Cordarone X 200 3 .1 .1 23.0
Cortate 2 .1 .1 23.1
Coumadin 36 1.6 1.6 24.7
Coversyl 8 .4 .4 25.0
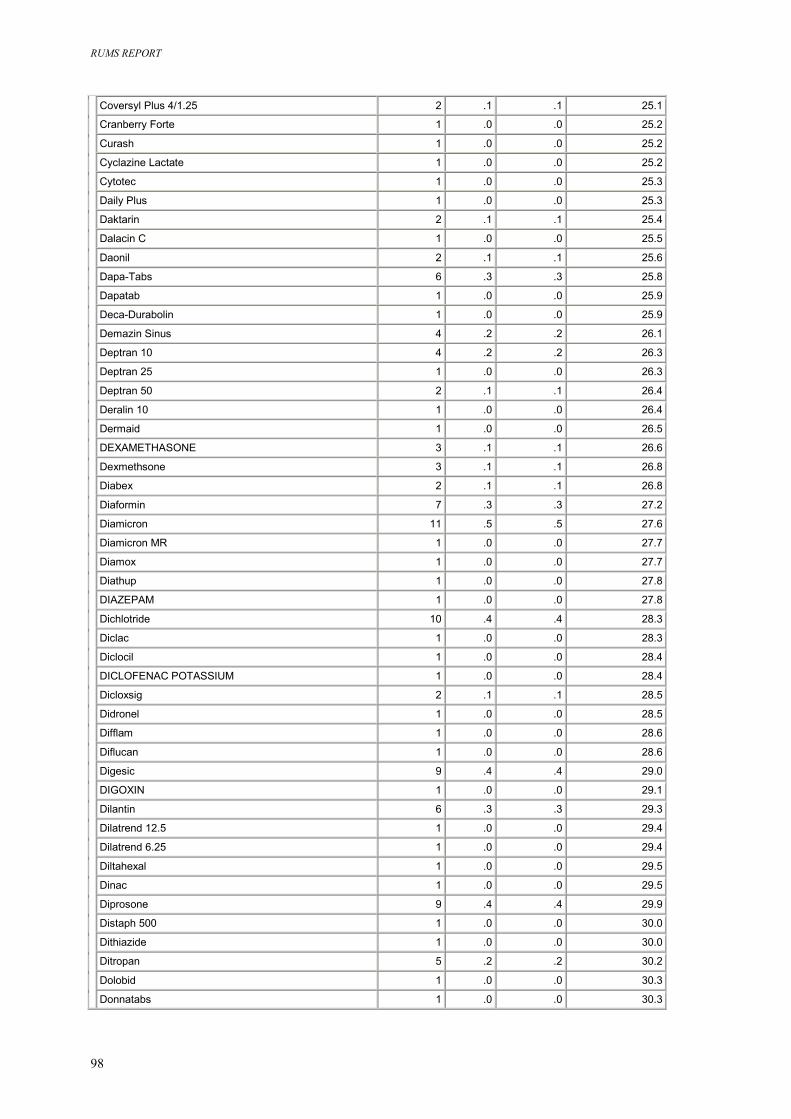
RUMS REPORT
98
Coversyl Plus 4/1.25 2 .1 .1 25.1
Cranberry Forte 1 .0 .0 25.2
Curash 1 .0 .0 25.2
Cyclazine Lactate 1 .0 .0 25.2
Cytotec 1 .0 .0 25.3
Daily Plus 1 .0 .0 25.3
Daktarin 2 .1 .1 25.4
Dalacin C 1 .0 .0 25.5
Daonil 2 .1 .1 25.6
Dapa-Tabs 6 .3 .3 25.8
Dapatab 1 .0 .0 25.9
Deca-Durabolin 1 .0 .0 25.9
Demazin Sinus 4 .2 .2 26.1
Deptran 10 4 .2 .2 26.3
Deptran 25 1 .0 .0 26.3
Deptran 50 2 .1 .1 26.4
Deralin 10 1 .0 .0 26.4
Dermaid 1 .0 .0 26.5
DEXAMETHASONE 3 .1 .1 26.6
Dexmethsone 3 .1 .1 26.8
Diabex 2 .1 .1 26.8
Diaformin 7 .3 .3 27.2
Diamicron 11 .5 .5 27.6
Diamicron MR 1 .0 .0 27.7
Diamox 1 .0 .0 27.7
Diathup 1 .0 .0 27.8
DIAZEPAM 1 .0 .0 27.8
Dichlotride 10 .4 .4 28.3
Diclac 1 .0 .0 28.3
Diclocil 1 .0 .0 28.4
DICLOFENAC POTASSIUM 1 .0 .0 28.4
Dicloxsig 2 .1 .1 28.5
Didronel 1 .0 .0 28.5
Difflam 1 .0 .0 28.6
Diflucan 1 .0 .0 28.6
Digesic 9 .4 .4 29.0
DIGOXIN 1 .0 .0 29.1
Dilantin 6 .3 .3 29.3
Dilatrend 12.5 1 .0 .0 29.4
Dilatrend 6.25 1 .0 .0 29.4
Diltahexal 1 .0 .0 29.5
Dinac 1 .0 .0 29.5
Diprosone 9 .4 .4 29.9
Distaph 500 1 .0 .0 30.0
Dithiazide 1 .0 .0 30.0
Ditropan 5 .2 .2 30.2
Dolobid 1 .0 .0 30.3
Donnatabs 1 .0 .0 30.3
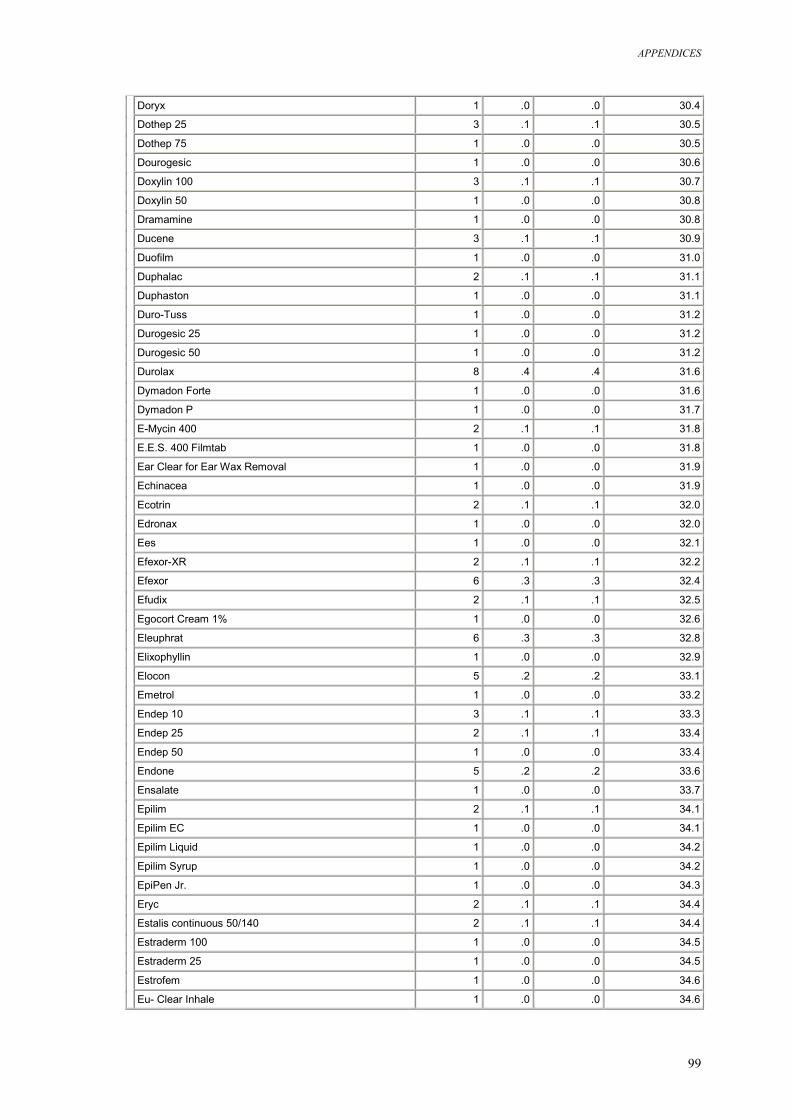
APPENDICES
99
Doryx 1 .0 .0 30.4
Dothep 25 3 .1 .1 30.5
Dothep 75 1 .0 .0 30.5
Dourogesic 1 .0 .0 30.6
Doxylin 100 3 .1 .1 30.7
Doxylin 50 1 .0 .0 30.8
Dramamine 1 .0 .0 30.8
Ducene 3 .1 .1 30.9
Duofilm 1 .0 .0 31.0
Duphalac 2 .1 .1 31.1
Duphaston 1 .0 .0 31.1
Duro-Tuss 1 .0 .0 31.2
Durogesic 25 1 .0 .0 31.2
Durogesic 50 1 .0 .0 31.2
Durolax 8 .4 .4 31.6
Dymadon Forte 1 .0 .0 31.6
Dymadon P 1 .0 .0 31.7
E-Mycin 400 2 .1 .1 31.8
E.E.S. 400 Filmtab 1 .0 .0 31.8
Ear Clear for Ear Wax Removal 1 .0 .0 31.9
Echinacea 1 .0 .0 31.9
Ecotrin 2 .1 .1 32.0
Edronax 1 .0 .0 32.0
Ees 1 .0 .0 32.1
Efexor-XR 2 .1 .1 32.2
Efexor 6 .3 .3 32.4
Efudix 2 .1 .1 32.5
Egocort Cream 1% 1 .0 .0 32.6
Eleuphrat 6 .3 .3 32.8
Elixophyllin 1 .0 .0 32.9
Elocon 5 .2 .2 33.1
Emetrol 1 .0 .0 33.2
Endep 10 3 .1 .1 33.3
Endep 25 2 .1 .1 33.4
Endep 50 1 .0 .0 33.4
Endone 5 .2 .2 33.6
Ensalate 1 .0 .0 33.7
Epilim 2 .1 .1 34.1
Epilim EC 1 .0 .0 34.1
Epilim Liquid 1 .0 .0 34.2
Epilim Syrup 1 .0 .0 34.2
EpiPen Jr. 1 .0 .0 34.3
Eryc 2 .1 .1 34.4
Estalis continuous 50/140 2 .1 .1 34.4
Estraderm 100 1 .0 .0 34.5
Estraderm 25 1 .0 .0 34.5
Estrofem 1 .0 .0 34.6
Eu- Clear Inhale 1 .0 .0 34.6
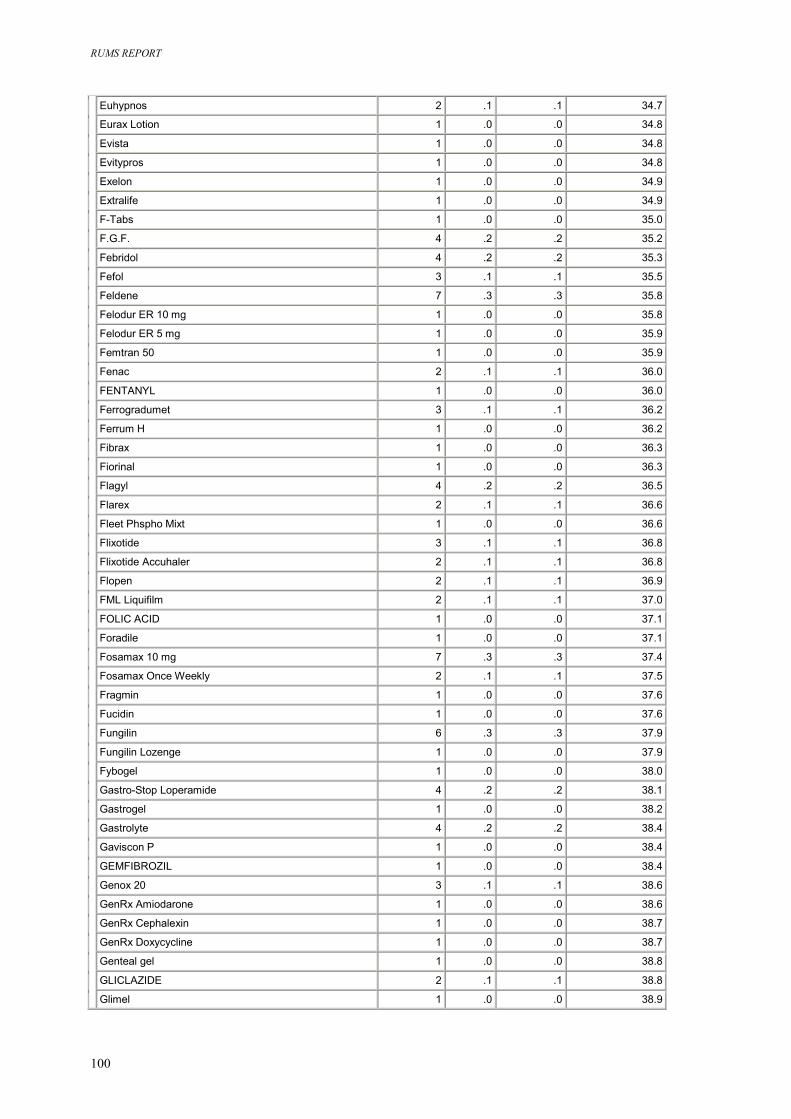
RUMS REPORT
100
Euhypnos 2 .1 .1 34.7
Eurax Lotion 1 .0 .0 34.8
Evista 1 .0 .0 34.8
Evitypros 1 .0 .0 34.8
Exelon 1 .0 .0 34.9
Extralife 1 .0 .0 34.9
F-Tabs 1 .0 .0 35.0
F.G.F. 4 .2 .2 35.2
Febridol 4 .2 .2 35.3
Fefol 3 .1 .1 35.5
Feldene 7 .3 .3 35.8
Felodur ER 10 mg 1 .0 .0 35.8
Felodur ER 5 mg 1 .0 .0 35.9
Femtran 50 1 .0 .0 35.9
Fenac 2 .1 .1 36.0
FENTANYL 1 .0 .0 36.0
Ferrogradumet 3 .1 .1 36.2
Ferrum H 1 .0 .0 36.2
Fibrax 1 .0 .0 36.3
Fiorinal 1 .0 .0 36.3
Flagyl 4 .2 .2 36.5
Flarex 2 .1 .1 36.6
Fleet Phspho Mixt 1 .0 .0 36.6
Flixotide 3 .1 .1 36.8
Flixotide Accuhaler 2 .1 .1 36.8
Flopen 2 .1 .1 36.9
FML Liquifilm 2 .1 .1 37.0
FOLIC ACID 1 .0 .0 37.1
Foradile 1 .0 .0 37.1
Fosamax 10 mg 7 .3 .3 37.4
Fosamax Once Weekly 2 .1 .1 37.5
Fragmin 1 .0 .0 37.6
Fucidin 1 .0 .0 37.6
Fungilin 6 .3 .3 37.9
Fungilin Lozenge 1 .0 .0 37.9
Fybogel 1 .0 .0 38.0
Gastro-Stop Loperamide 4 .2 .2 38.1
Gastrogel 1 .0 .0 38.2
Gastrolyte 4 .2 .2 38.4
Gaviscon P 1 .0 .0 38.4
GEMFIBROZIL 1 .0 .0 38.4
Genox 20 3 .1 .1 38.6
GenRx Amiodarone 1 .0 .0 38.6
GenRx Cephalexin 1 .0 .0 38.7
GenRx Doxycycline 1 .0 .0 38.7
Genteal gel 1 .0 .0 38.8
GLICLAZIDE 2 .1 .1 38.8
Glimel 1 .0 .0 38.9
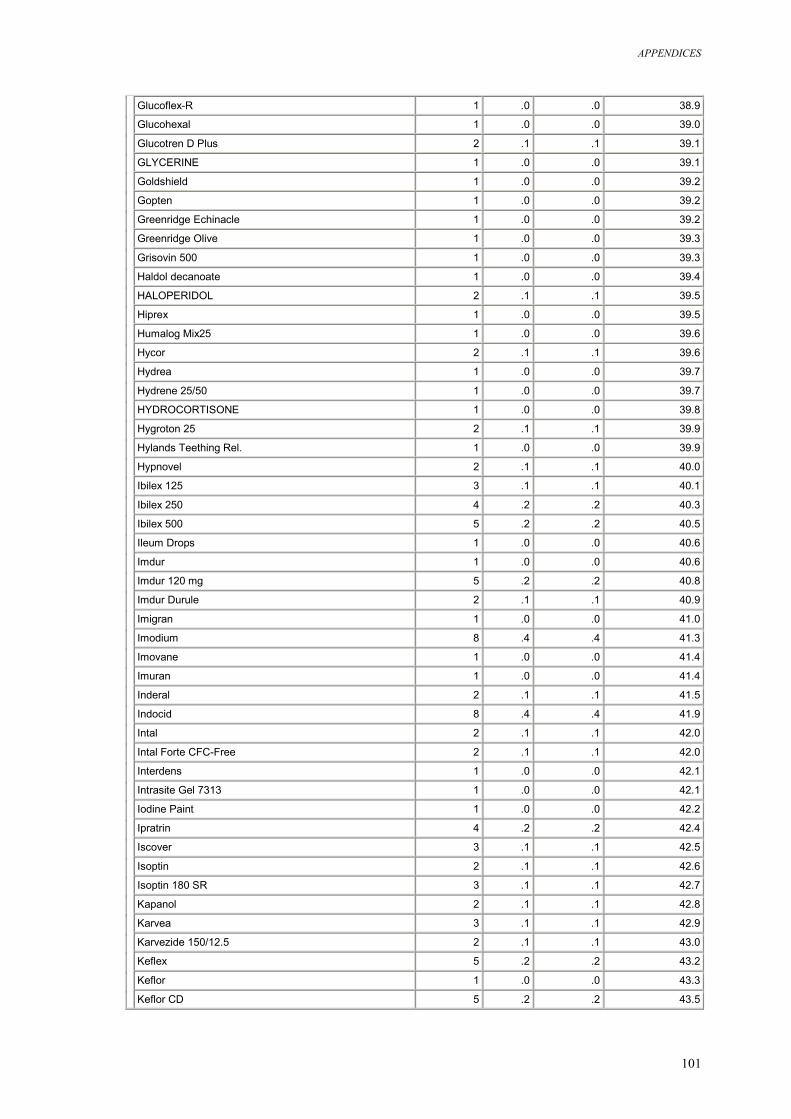
APPENDICES
101
Glucoflex-R 1 .0 .0 38.9
Glucohexal 1 .0 .0 39.0
Glucotren D Plus 2 .1 .1 39.1
GLYCERINE 1 .0 .0 39.1
Goldshield 1 .0 .0 39.2
Gopten 1 .0 .0 39.2
Greenridge Echinacle 1 .0 .0 39.2
Greenridge Olive 1 .0 .0 39.3
Grisovin 500 1 .0 .0 39.3
Haldol decanoate 1 .0 .0 39.4
HALOPERIDOL 2 .1 .1 39.5
Hiprex 1 .0 .0 39.5
Humalog Mix25 1 .0 .0 39.6
Hycor 2 .1 .1 39.6
Hydrea 1 .0 .0 39.7
Hydrene 25/50 1 .0 .0 39.7
HYDROCORTISONE 1 .0 .0 39.8
Hygroton 25 2 .1 .1 39.9
Hylands Teething Rel. 1 .0 .0 39.9
Hypnovel 2 .1 .1 40.0
Ibilex 125 3 .1 .1 40.1
Ibilex 250 4 .2 .2 40.3
Ibilex 500 5 .2 .2 40.5
Ileum Drops 1 .0 .0 40.6
Imdur 1 .0 .0 40.6
Imdur 120 mg 5 .2 .2 40.8
Imdur Durule 2 .1 .1 40.9
Imigran 1 .0 .0 41.0
Imodium 8 .4 .4 41.3
Imovane 1 .0 .0 41.4
Imuran 1 .0 .0 41.4
Inderal 2 .1 .1 41.5
Indocid 8 .4 .4 41.9
Intal 2 .1 .1 42.0
Intal Forte CFC-Free 2 .1 .1 42.0
Interdens 1 .0 .0 42.1
Intrasite Gel 7313 1 .0 .0 42.1
Iodine Paint 1 .0 .0 42.2
Ipratrin 4 .2 .2 42.4
Iscover 3 .1 .1 42.5
Isoptin 2 .1 .1 42.6
Isoptin 180 SR 3 .1 .1 42.7
Kapanol 2 .1 .1 42.8
Karvea 3 .1 .1 42.9
Karvezide 150/12.5 2 .1 .1 43.0
Keflex 5 .2 .2 43.2
Keflor 1 .0 .0 43.3
Keflor CD 5 .2 .2 43.5
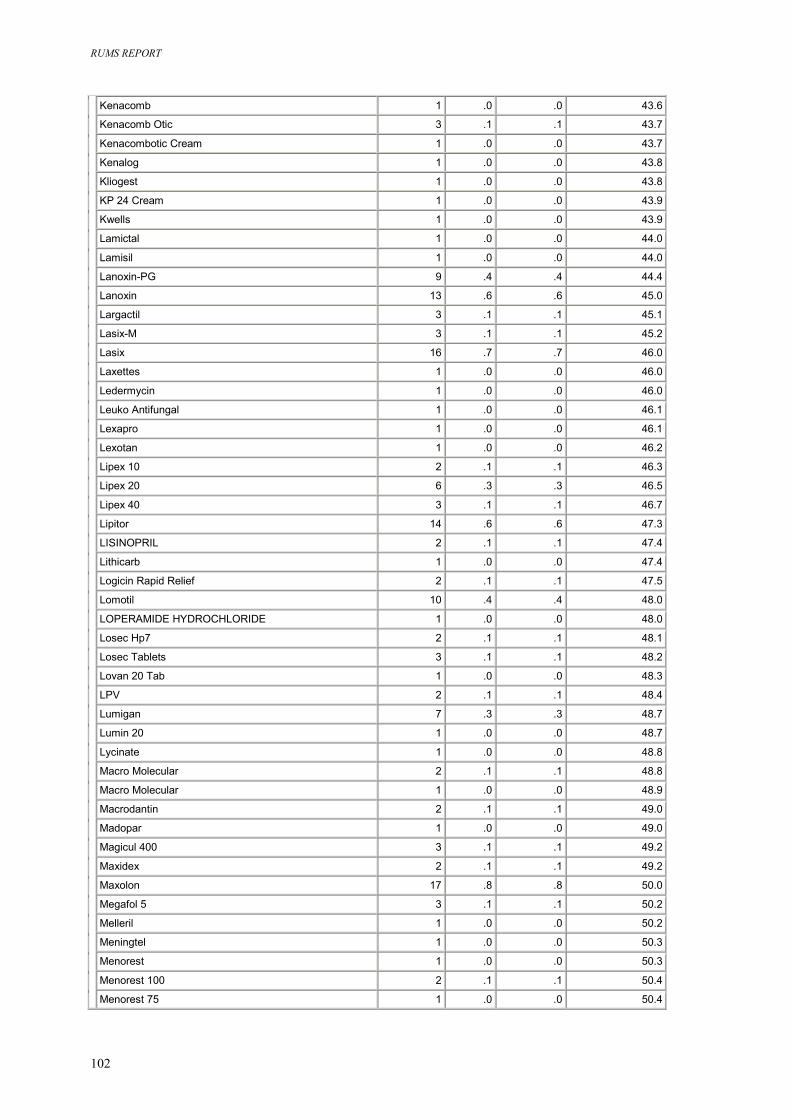
RUMS REPORT
102
Kenacomb 1 .0 .0 43.6
Kenacomb Otic 3 .1 .1 43.7
Kenacombotic Cream 1 .0 .0 43.7
Kenalog 1 .0 .0 43.8
Kliogest 1 .0 .0 43.8
KP 24 Cream 1 .0 .0 43.9
Kwells 1 .0 .0 43.9
Lamictal 1 .0 .0 44.0
Lamisil 1 .0 .0 44.0
Lanoxin-PG 9 .4 .4 44.4
Lanoxin 13 .6 .6 45.0
Largactil 3 .1 .1 45.1
Lasix-M 3 .1 .1 45.2
Lasix 16 .7 .7 46.0
Laxettes 1 .0 .0 46.0
Ledermycin 1 .0 .0 46.0
Leuko Antifungal 1 .0 .0 46.1
Lexapro 1 .0 .0 46.1
Lexotan 1 .0 .0 46.2
Lipex 10 2 .1 .1 46.3
Lipex 20 6 .3 .3 46.5
Lipex 40 3 .1 .1 46.7
Lipitor 14 .6 .6 47.3
LISINOPRIL 2 .1 .1 47.4
Lithicarb 1 .0 .0 47.4
Logicin Rapid Relief 2 .1 .1 47.5
Lomotil 10 .4 .4 48.0
LOPERAMIDE HYDROCHLORIDE 1 .0 .0 48.0
Losec Hp7 2 .1 .1 48.1
Losec Tablets 3 .1 .1 48.2
Lovan 20 Tab 1 .0 .0 48.3
LPV 2 .1 .1 48.4
Lumigan 7 .3 .3 48.7
Lumin 20 1 .0 .0 48.7
Lycinate 1 .0 .0 48.8
Macro Molecular 2 .1 .1 48.8
Macro Molecular 1 .0 .0 48.9
Macrodantin 2 .1 .1 49.0
Madopar 1 .0 .0 49.0
Magicul 400 3 .1 .1 49.2
Maxidex 2 .1 .1 49.2
Maxolon 17 .8 .8 50.0
Megafol 5 3 .1 .1 50.2
Melleril 1 .0 .0 50.2
Meningtel 1 .0 .0 50.3
Menorest 1 .0 .0 50.3
Menorest 100 2 .1 .1 50.4
Menorest 75 1 .0 .0 50.4
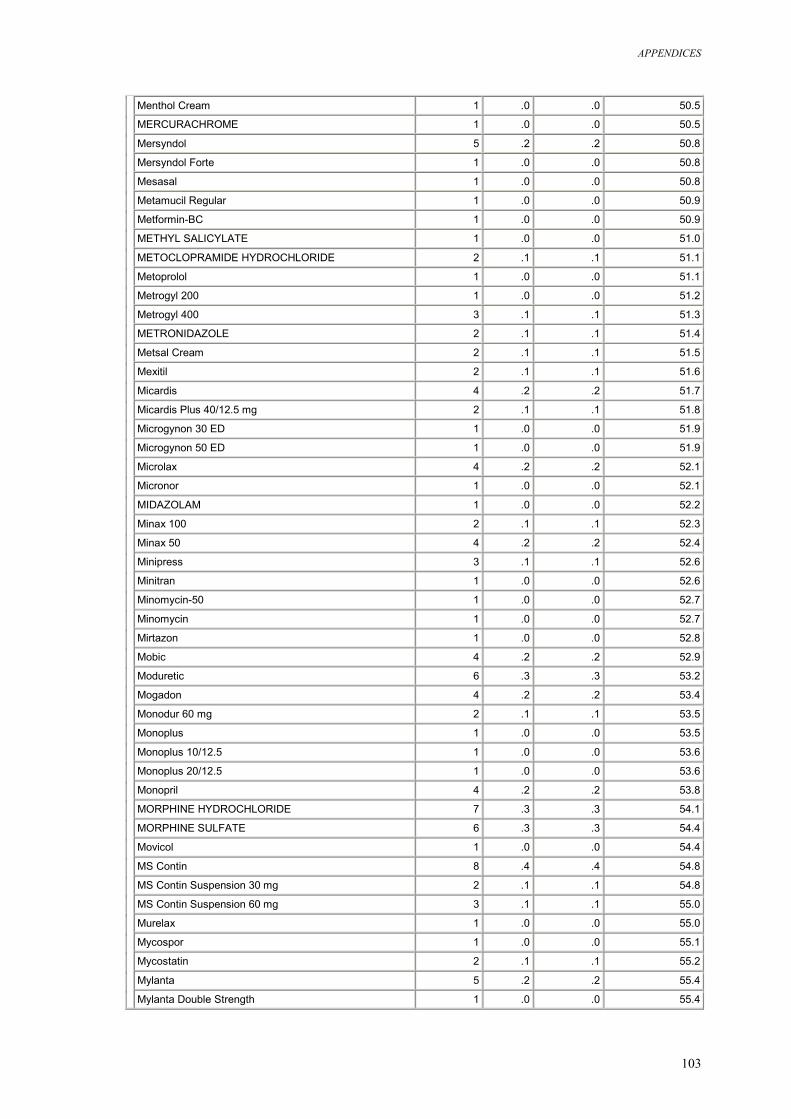
APPENDICES
103
Menthol Cream 1 .0 .0 50.5
MERCURACHROME 1 .0 .0 50.5
Mersyndol 5 .2 .2 50.8
Mersyndol Forte 1 .0 .0 50.8
Mesasal 1 .0 .0 50.8
Metamucil Regular 1 .0 .0 50.9
Metformin-BC 1 .0 .0 50.9
METHYL SALICYLATE 1 .0 .0 51.0
METOCLOPRAMIDE HYDROCHLORIDE 2 .1 .1 51.1
Metoprolol 1 .0 .0 51.1
Metrogyl 200 1 .0 .0 51.2
Metrogyl 400 3 .1 .1 51.3
METRONIDAZOLE 2 .1 .1 51.4
Metsal Cream 2 .1 .1 51.5
Mexitil 2 .1 .1 51.6
Micardis 4 .2 .2 51.7
Micardis Plus 40/12.5 mg 2 .1 .1 51.8
Microgynon 30 ED 1 .0 .0 51.9
Microgynon 50 ED 1 .0 .0 51.9
Microlax 4 .2 .2 52.1
Micronor 1 .0 .0 52.1
MIDAZOLAM 1 .0 .0 52.2
Minax 100 2 .1 .1 52.3
Minax 50 4 .2 .2 52.4
Minipress 3 .1 .1 52.6
Minitran 1 .0 .0 52.6
Minomycin-50 1 .0 .0 52.7
Minomycin 1 .0 .0 52.7
Mirtazon 1 .0 .0 52.8
Mobic 4 .2 .2 52.9
Moduretic 6 .3 .3 53.2
Mogadon 4 .2 .2 53.4
Monodur 60 mg 2 .1 .1 53.5
Monoplus 1 .0 .0 53.5
Monoplus 10/12.5 1 .0 .0 53.6
Monoplus 20/12.5 1 .0 .0 53.6
Monopril 4 .2 .2 53.8
MORPHINE HYDROCHLORIDE 7 .3 .3 54.1
MORPHINE SULFATE 6 .3 .3 54.4
Movicol 1 .0 .0 54.4
MS Contin 8 .4 .4 54.8
MS Contin Suspension 30 mg 2 .1 .1 54.8
MS Contin Suspension 60 mg 3 .1 .1 55.0
Murelax 1 .0 .0 55.0
Mycospor 1 .0 .0 55.1
Mycostatin 2 .1 .1 55.2
Mylanta 5 .2 .2 55.4
Mylanta Double Strength 1 .0 .0 55.4
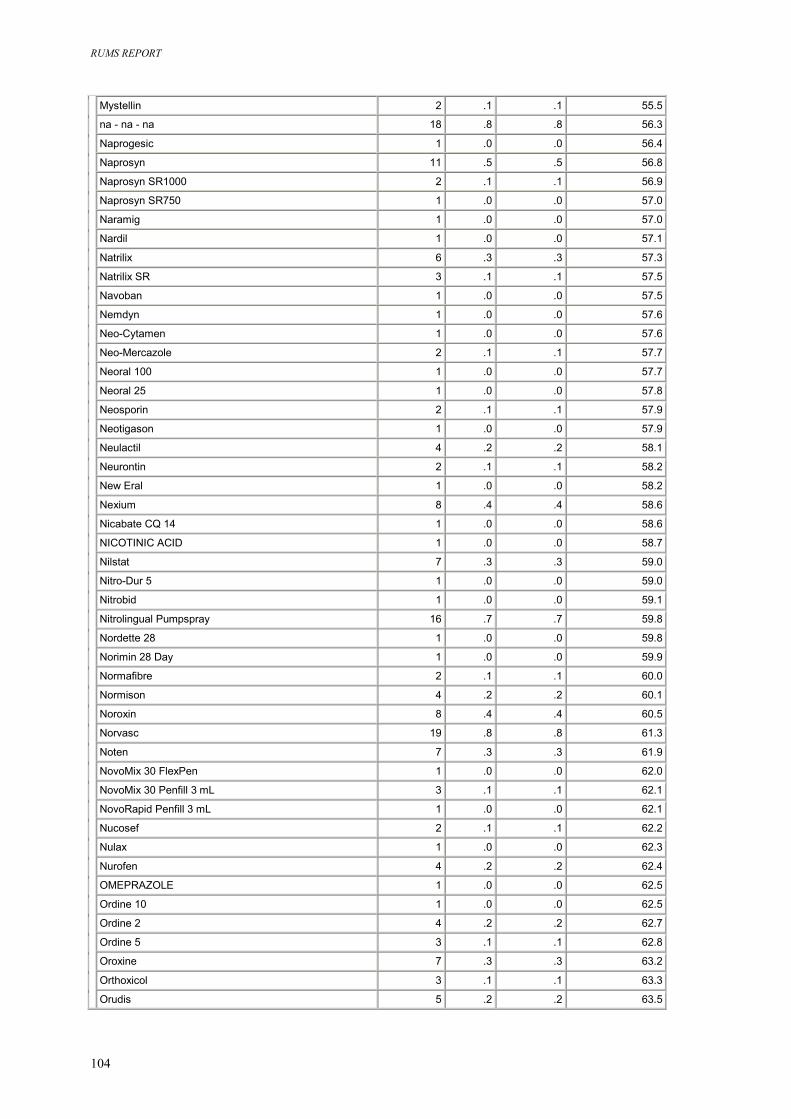
RUMS REPORT
104
Mystellin 2 .1 .1 55.5
na - na - na 18 .8 .8 56.3
Naprogesic 1 .0 .0 56.4
Naprosyn 11 .5 .5 56.8
Naprosyn SR1000 2 .1 .1 56.9
Naprosyn SR750 1 .0 .0 57.0
Naramig 1 .0 .0 57.0
Nardil 1 .0 .0 57.1
Natrilix 6 .3 .3 57.3
Natrilix SR 3 .1 .1 57.5
Navoban 1 .0 .0 57.5
Nemdyn 1 .0 .0 57.6
Neo-Cytamen 1 .0 .0 57.6
Neo-Mercazole 2 .1 .1 57.7
Neoral 100 1 .0 .0 57.7
Neoral 25 1 .0 .0 57.8
Neosporin 2 .1 .1 57.9
Neotigason 1 .0 .0 57.9
Neulactil 4 .2 .2 58.1
Neurontin 2 .1 .1 58.2
New Eral 1 .0 .0 58.2
Nexium 8 .4 .4 58.6
Nicabate CQ 14 1 .0 .0 58.6
NICOTINIC ACID 1 .0 .0 58.7
Nilstat 7 .3 .3 59.0
Nitro-Dur 5 1 .0 .0 59.0
Nitrobid 1 .0 .0 59.1
Nitrolingual Pumpspray 16 .7 .7 59.8
Nordette 28 1 .0 .0 59.8
Norimin 28 Day 1 .0 .0 59.9
Normafibre 2 .1 .1 60.0
Normison 4 .2 .2 60.1
Noroxin 8 .4 .4 60.5
Norvasc 19 .8 .8 61.3
Noten 7 .3 .3 61.9
NovoMix 30 FlexPen 1 .0 .0 62.0
NovoMix 30 Penfill 3 mL 3 .1 .1 62.1
NovoRapid Penfill 3 mL 1 .0 .0 62.1
Nucosef 2 .1 .1 62.2
Nulax 1 .0 .0 62.3
Nurofen 4 .2 .2 62.4
OMEPRAZOLE 1 .0 .0 62.5
Ordine 10 1 .0 .0 62.5
Ordine 2 4 .2 .2 62.7
Ordine 5 3 .1 .1 62.8
Oroxine 7 .3 .3 63.2
Orthoxicol 3 .1 .1 63.3
Orudis 5 .2 .2 63.5
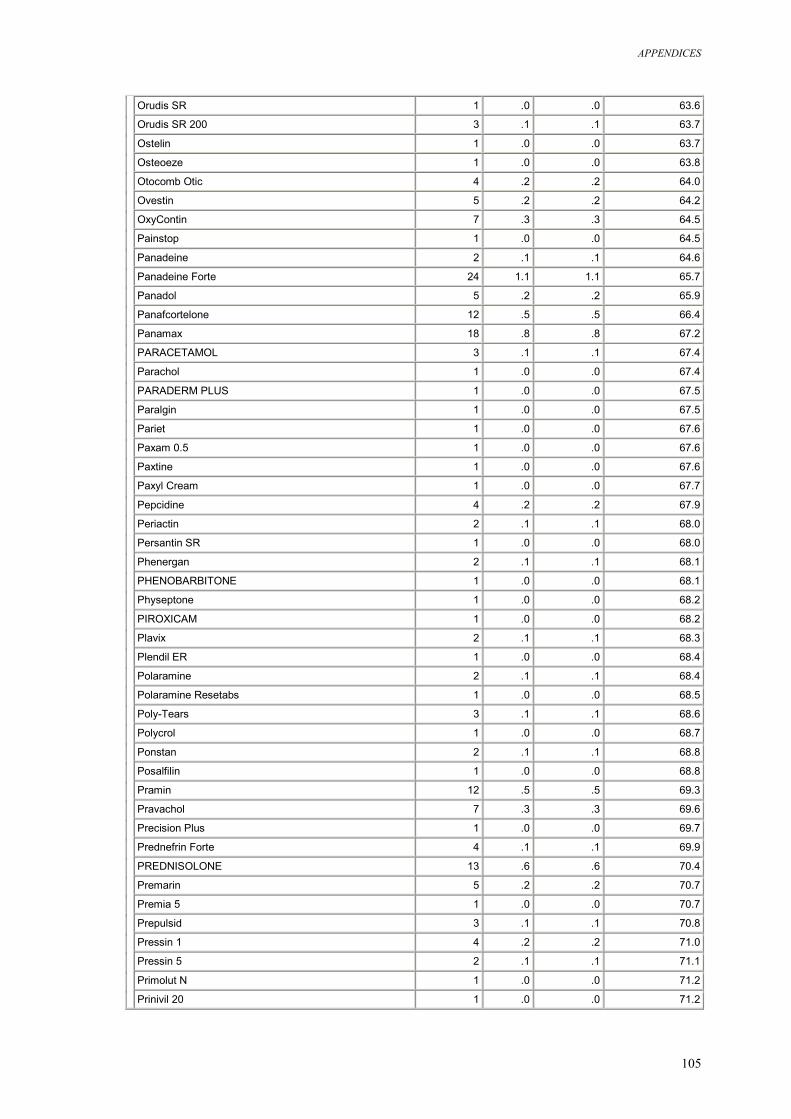
APPENDICES
105
Orudis SR 1 .0 .0 63.6
Orudis SR 200 3 .1 .1 63.7
Ostelin 1 .0 .0 63.7
Osteoeze 1 .0 .0 63.8
Otocomb Otic 4 .2 .2 64.0
Ovestin 5 .2 .2 64.2
OxyContin 7 .3 .3 64.5
Painstop 1 .0 .0 64.5
Panadeine 2 .1 .1 64.6
Panadeine Forte 24 1.1 1.1 65.7
Panadol 5 .2 .2 65.9
Panafcortelone 12 .5 .5 66.4
Panamax 18 .8 .8 67.2
PARACETAMOL 3 .1 .1 67.4
Parachol 1 .0 .0 67.4
PARADERM PLUS 1 .0 .0 67.5
Paralgin 1 .0 .0 67.5
Pariet 1 .0 .0 67.6
Paxam 0.5 1 .0 .0 67.6
Paxtine 1 .0 .0 67.6
Paxyl Cream 1 .0 .0 67.7
Pepcidine 4 .2 .2 67.9
Periactin 2 .1 .1 68.0
Persantin SR 1 .0 .0 68.0
Phenergan 2 .1 .1 68.1
PHENOBARBITONE 1 .0 .0 68.1
Physeptone 1 .0 .0 68.2
PIROXICAM 1 .0 .0 68.2
Plavix 2 .1 .1 68.3
Plendil ER 1 .0 .0 68.4
Polaramine 2 .1 .1 68.4
Polaramine Resetabs 1 .0 .0 68.5
Poly-Tears 3 .1 .1 68.6
Polycrol 1 .0 .0 68.7
Ponstan 2 .1 .1 68.8
Posalfilin 1 .0 .0 68.8
Pramin 12 .5 .5 69.3
Pravachol 7 .3 .3 69.6
Precision Plus 1 .0 .0 69.7
Prednefrin Forte 4 .1 .1 69.9
PREDNISOLONE 13 .6 .6 70.4
Premarin 5 .2 .2 70.7
Premia 5 1 .0 .0 70.7
Prepulsid 3 .1 .1 70.8
Pressin 1 4 .2 .2 71.0
Pressin 5 2 .1 .1 71.1
Primolut N 1 .0 .0 71.2
Prinivil 20 1 .0 .0 71.2
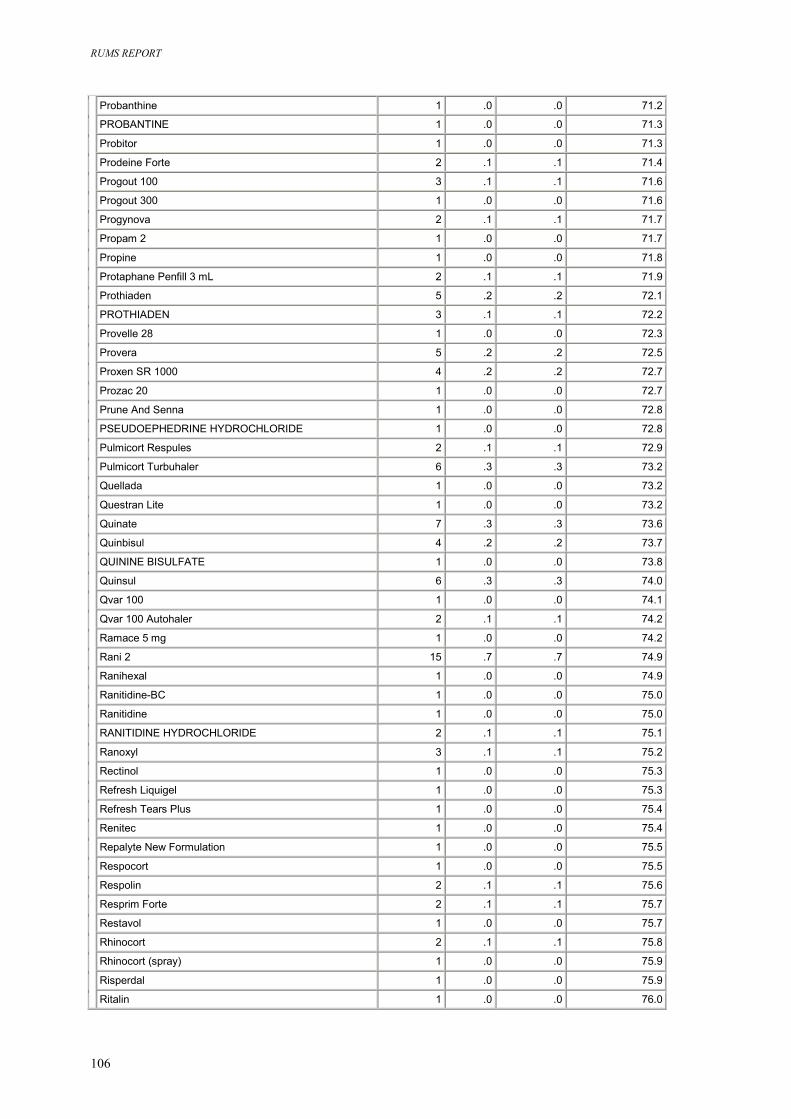
RUMS REPORT
106
Probanthine 1 .0 .0 71.2
PROBANTINE 1 .0 .0 71.3
Probitor 1 .0 .0 71.3
Prodeine Forte 2 .1 .1 71.4
Progout 100 3 .1 .1 71.6
Progout 300 1 .0 .0 71.6
Progynova 2 .1 .1 71.7
Propam 2 1 .0 .0 71.7
Propine 1 .0 .0 71.8
Protaphane Penfill 3 mL 2 .1 .1 71.9
Prothiaden 5 .2 .2 72.1
PROTHIADEN 3 .1 .1 72.2
Provelle 28 1 .0 .0 72.3
Provera 5 .2 .2 72.5
Proxen SR 1000 4 .2 .2 72.7
Prozac 20 1 .0 .0 72.7
Prune And Senna 1 .0 .0 72.8
PSEUDOEPHEDRINE HYDROCHLORIDE 1 .0 .0 72.8
Pulmicort Respules 2 .1 .1 72.9
Pulmicort Turbuhaler 6 .3 .3 73.2
Quellada 1 .0 .0 73.2
Questran Lite 1 .0 .0 73.2
Quinate 7 .3 .3 73.6
Quinbisul 4 .2 .2 73.7
QUININE BISULFATE 1 .0 .0 73.8
Quinsul 6 .3 .3 74.0
Qvar 100 1 .0 .0 74.1
Qvar 100 Autohaler 2 .1 .1 74.2
Ramace 5 mg 1 .0 .0 74.2
Rani 2 15 .7 .7 74.9
Ranihexal 1 .0 .0 74.9
Ranitidine-BC 1 .0 .0 75.0
Ranitidine 1 .0 .0 75.0
RANITIDINE HYDROCHLORIDE 2 .1 .1 75.1
Ranoxyl 3 .1 .1 75.2
Rectinol 1 .0 .0 75.3
Refresh Liquigel 1 .0 .0 75.3
Refresh Tears Plus 1 .0 .0 75.4
Renitec 1 .0 .0 75.4
Repalyte New Formulation 1 .0 .0 75.5
Respocort 1 .0 .0 75.5
Respolin 2 .1 .1 75.6
Resprim Forte 2 .1 .1 75.7
Restavol 1 .0 .0 75.7
Rhinocort 2 .1 .1 75.8
Rhinocort (spray) 1 .0 .0 75.9
Risperdal 1 .0 .0 75.9
Ritalin 1 .0 .0 76.0
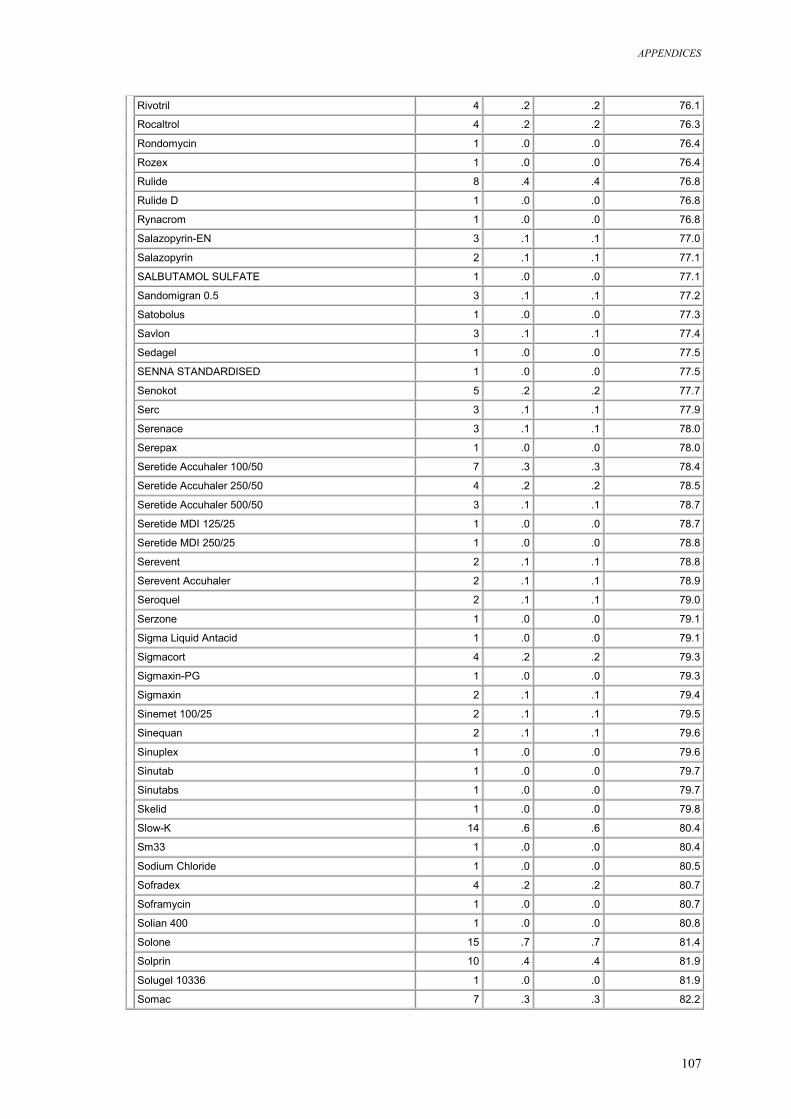
APPENDICES
107
Rivotril 4 .2 .2 76.1
Rocaltrol 4 .2 .2 76.3
Rondomycin 1 .0 .0 76.4
Rozex 1 .0 .0 76.4
Rulide 8 .4 .4 76.8
Rulide D 1 .0 .0 76.8
Rynacrom 1 .0 .0 76.8
Salazopyrin-EN 3 .1 .1 77.0
Salazopyrin 2 .1 .1 77.1
SALBUTAMOL SULFATE 1 .0 .0 77.1
Sandomigran 0.5 3 .1 .1 77.2
Satobolus 1 .0 .0 77.3
Savlon 3 .1 .1 77.4
Sedagel 1 .0 .0 77.5
SENNA STANDARDISED 1 .0 .0 77.5
Senokot 5 .2 .2 77.7
Serc 3 .1 .1 77.9
Serenace 3 .1 .1 78.0
Serepax 1 .0 .0 78.0
Seretide Accuhaler 100/50 7 .3 .3 78.4
Seretide Accuhaler 250/50 4 .2 .2 78.5
Seretide Accuhaler 500/50 3 .1 .1 78.7
Seretide MDI 125/25 1 .0 .0 78.7
Seretide MDI 250/25 1 .0 .0 78.8
Serevent 2 .1 .1 78.8
Serevent Accuhaler 2 .1 .1 78.9
Seroquel 2 .1 .1 79.0
Serzone 1 .0 .0 79.1
Sigma Liquid Antacid 1 .0 .0 79.1
Sigmacort 4 .2 .2 79.3
Sigmaxin-PG 1 .0 .0 79.3
Sigmaxin 2 .1 .1 79.4
Sinemet 100/25 2 .1 .1 79.5
Sinequan 2 .1 .1 79.6
Sinuplex 1 .0 .0 79.6
Sinutab 1 .0 .0 79.7
Sinutabs 1 .0 .0 79.7
Skelid 1 .0 .0 79.8
Slow-K 14 .6 .6 80.4
Sm33 1 .0 .0 80.4
Sodium Chloride 1 .0 .0 80.5
Sofradex 4 .2 .2 80.7
Soframycin 1 .0 .0 80.7
Solian 400 1 .0 .0 80.8
Solone 15 .7 .7 81.4
Solprin 10 .4 .4 81.9
Solugel 10336 1 .0 .0 81.9
Somac 7 .3 .3 82.2
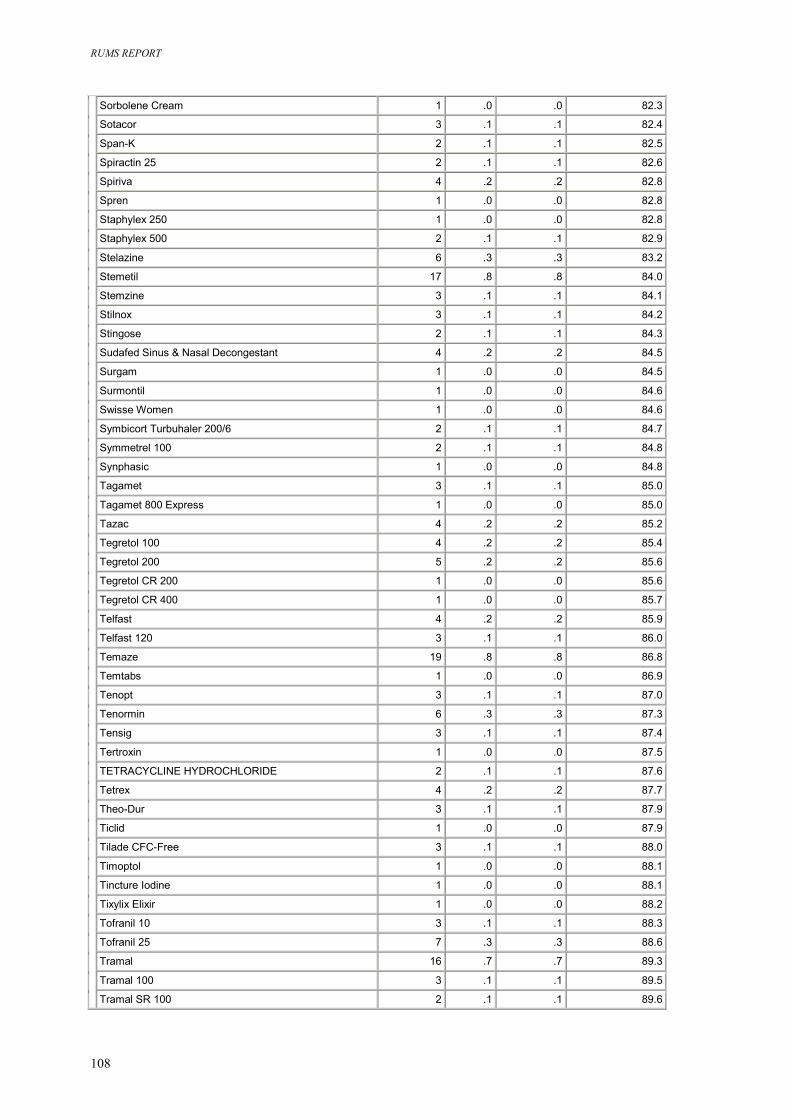
RUMS REPORT
108
Sorbolene Cream 1 .0 .0 82.3
Sotacor 3 .1 .1 82.4
Span-K 2 .1 .1 82.5
Spiractin 25 2 .1 .1 82.6
Spiriva 4 .2 .2 82.8
Spren 1 .0 .0 82.8
Staphylex 250 1 .0 .0 82.8
Staphylex 500 2 .1 .1 82.9
Stelazine 6 .3 .3 83.2
Stemetil 17 .8 .8 84.0
Stemzine 3 .1 .1 84.1
Stilnox 3 .1 .1 84.2
Stingose 2 .1 .1 84.3
Sudafed Sinus & Nasal Decongestant 4 .2 .2 84.5
Surgam 1 .0 .0 84.5
Surmontil 1 .0 .0 84.6
Swisse Women 1 .0 .0 84.6
Symbicort Turbuhaler 200/6 2 .1 .1 84.7
Symmetrel 100 2 .1 .1 84.8
Synphasic 1 .0 .0 84.8
Tagamet 3 .1 .1 85.0
Tagamet 800 Express 1 .0 .0 85.0
Tazac 4 .2 .2 85.2
Tegretol 100 4 .2 .2 85.4
Tegretol 200 5 .2 .2 85.6
Tegretol CR 200 1 .0 .0 85.6
Tegretol CR 400 1 .0 .0 85.7
Telfast 4 .2 .2 85.9
Telfast 120 3 .1 .1 86.0
Temaze 19 .8 .8 86.8
Temtabs 1 .0 .0 86.9
Tenopt 3 .1 .1 87.0
Tenormin 6 .3 .3 87.3
Tensig 3 .1 .1 87.4
Tertroxin 1 .0 .0 87.5
TETRACYCLINE HYDROCHLORIDE 2 .1 .1 87.6
Tetrex 4 .2 .2 87.7
Theo-Dur 3 .1 .1 87.9
Ticlid 1 .0 .0 87.9
Tilade CFC-Free 3 .1 .1 88.0
Timoptol 1 .0 .0 88.1
Tincture Iodine 1 .0 .0 88.1
Tixylix Elixir 1 .0 .0 88.2
Tofranil 10 3 .1 .1 88.3
Tofranil 25 7 .3 .3 88.6
Tramal 16 .7 .7 89.3
Tramal 100 3 .1 .1 89.5
Tramal SR 100 2 .1 .1 89.6
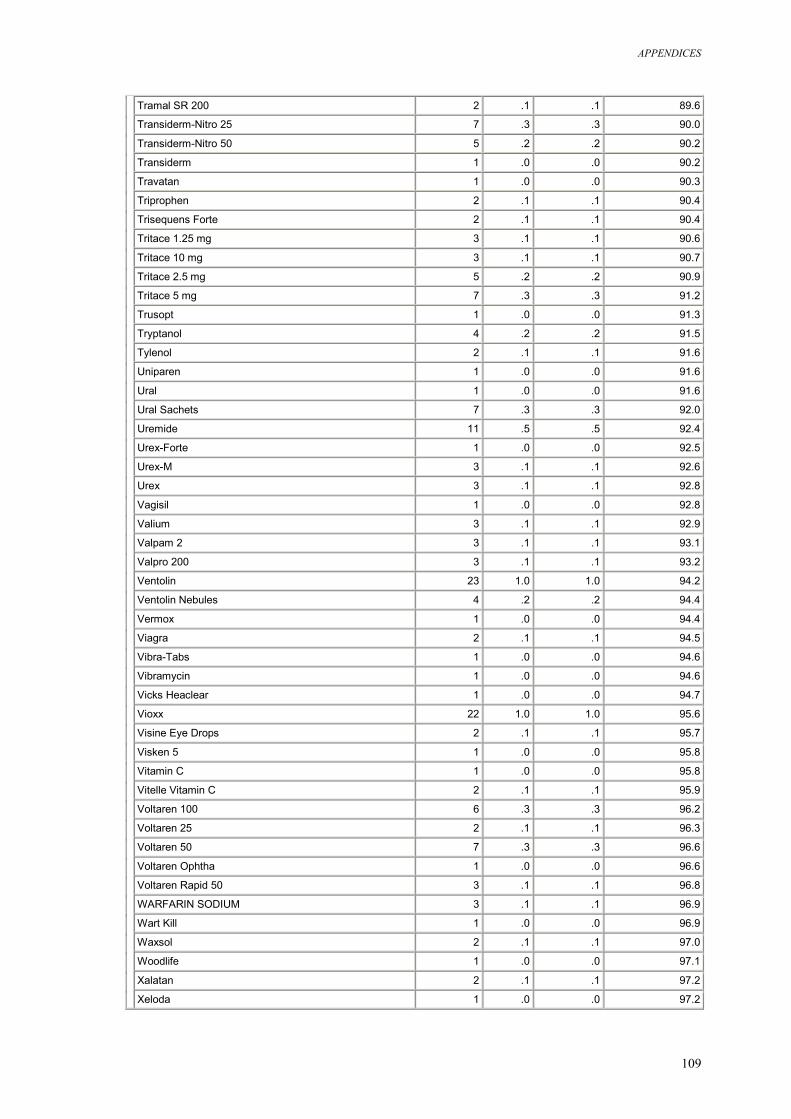
APPENDICES
109
Tramal SR 200 2 .1 .1 89.6
Transiderm-Nitro 25 7 .3 .3 90.0
Transiderm-Nitro 50 5 .2 .2 90.2
Transiderm 1 .0 .0 90.2
Travatan 1 .0 .0 90.3
Triprophen 2 .1 .1 90.4
Trisequens Forte 2 .1 .1 90.4
Tritace 1.25 mg 3 .1 .1 90.6
Tritace 10 mg 3 .1 .1 90.7
Tritace 2.5 mg 5 .2 .2 90.9
Tritace 5 mg 7 .3 .3 91.2
Trusopt 1 .0 .0 91.3
Tryptanol 4 .2 .2 91.5
Tylenol 2 .1 .1 91.6
Uniparen 1 .0 .0 91.6
Ural 1 .0 .0 91.6
Ural Sachets 7 .3 .3 92.0
Uremide 11 .5 .5 92.4
Urex-Forte 1 .0 .0 92.5
Urex-M 3 .1 .1 92.6
Urex 3 .1 .1 92.8
Vagisil 1 .0 .0 92.8
Valium 3 .1 .1 92.9
Valpam 2 3 .1 .1 93.1
Valpro 200 3 .1 .1 93.2
Ventolin 23 1.0 1.0 94.2
Ventolin Nebules 4 .2 .2 94.4
Vermox 1 .0 .0 94.4
Viagra 2 .1 .1 94.5
Vibra-Tabs 1 .0 .0 94.6
Vibramycin 1 .0 .0 94.6
Vicks Heaclear 1 .0 .0 94.7
Vioxx 22 1.0 1.0 95.6
Visine Eye Drops 2 .1 .1 95.7
Visken 5 1 .0 .0 95.8
Vitamin C 1 .0 .0 95.8
Vitelle Vitamin C 2 .1 .1 95.9
Voltaren 100 6 .3 .3 96.2
Voltaren 25 2 .1 .1 96.3
Voltaren 50 7 .3 .3 96.6
Voltaren Ophtha 1 .0 .0 96.6
Voltaren Rapid 50 3 .1 .1 96.8
WARFARIN SODIUM 3 .1 .1 96.9
Wart Kill 1 .0 .0 96.9
Waxsol 2 .1 .1 97.0
Woodlife 1 .0 .0 97.1
Xalatan 2 .1 .1 97.2
Xeloda 1 .0 .0 97.2
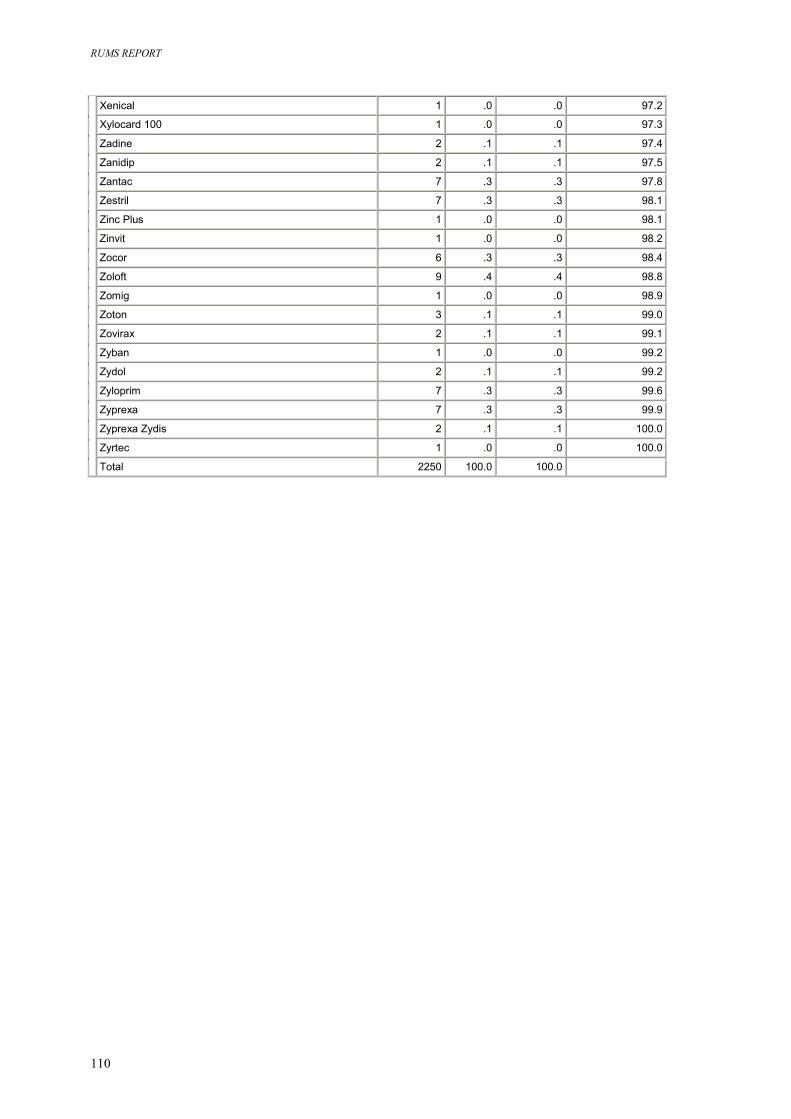
RUMS REPORT
110
Xenical 1 .0 .0 97.2
Xylocard 100 1 .0 .0 97.3
Zadine 2 .1 .1 97.4
Zanidip 2 .1 .1 97.5
Zantac 7 .3 .3 97.8
Zestril 7 .3 .3 98.1
Zinc Plus 1 .0 .0 98.1
Zinvit 1 .0 .0 98.2
Zocor 6 .3 .3 98.4
Zoloft 9 .4 .4 98.8
Zomig 1 .0 .0 98.9
Zoton 3 .1 .1 99.0
Zovirax 2 .1 .1 99.1
Zyban 1 .0 .0 99.2
Zydol 2 .1 .1 99.2
Zyloprim 7 .3 .3 99.6
Zyprexa 7 .3 .3 99.9
Zyprexa Zydis 2 .1 .1 100.0
Zyrtec 1 .0 .0 100.0
Total 2250 100.0 100.0
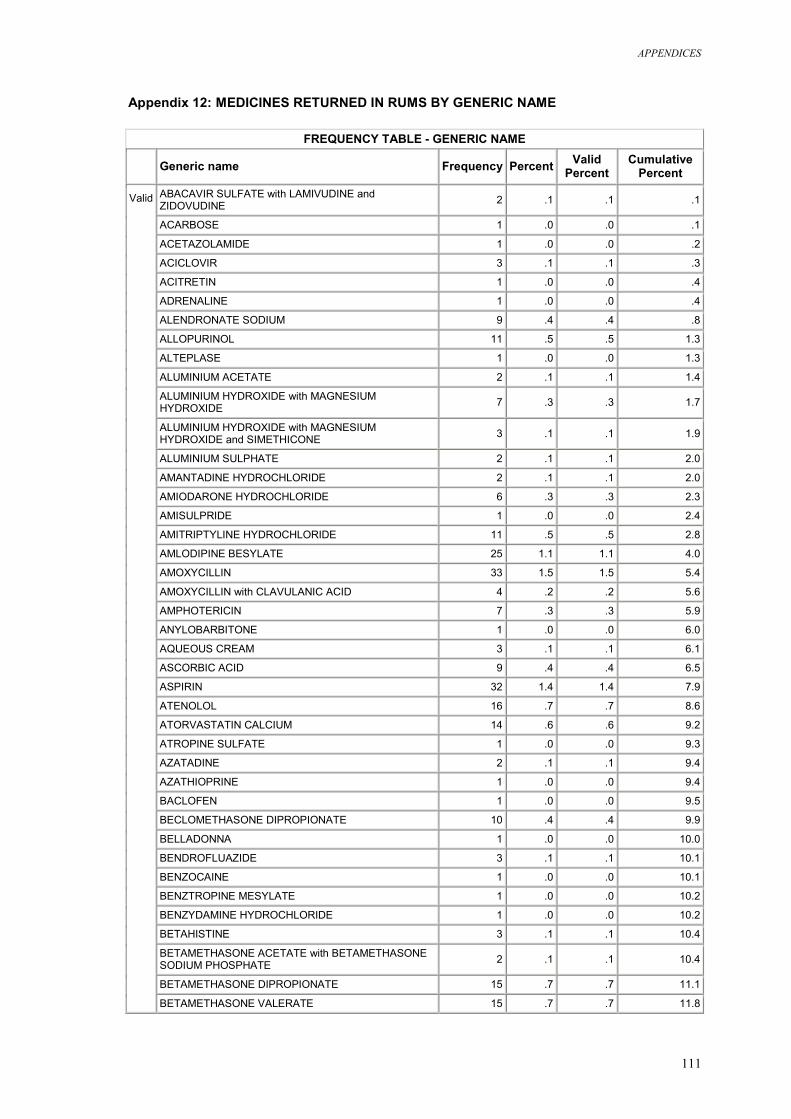
APPENDICES
111
Appendix 12: MEDICINES RETURNED IN RUMS BY GENERIC NAME
FREQUENCY TABLE - GENERIC NAME Generic name Frequency Percent Valid
Percent Cumulative
Percent ABACAVIR SULFATE with LAMIVUDINE and ZIDOVUDINE 2 .1 .1 .1
ACARBOSE 1 .0 .0 .1
ACETAZOLAMIDE 1 .0 .0 .2
ACICLOVIR 3 .1 .1 .3
ACITRETIN 1 .0 .0 .4
ADRENALINE 1 .0 .0 .4
ALENDRONATE SODIUM 9 .4 .4 .8
ALLOPURINOL 11 .5 .5 1.3
ALTEPLASE 1 .0 .0 1.3
ALUMINIUM ACETATE 2 .1 .1 1.4
ALUMINIUM HYDROXIDE with MAGNESIUM HYDROXIDE 7 .3 .3 1.7
ALUMINIUM HYDROXIDE with MAGNESIUM HYDROXIDE and SIMETHICONE 3 .1 .1 1.9
ALUMINIUM SULPHATE 2 .1 .1 2.0
AMANTADINE HYDROCHLORIDE 2 .1 .1 2.0
AMIODARONE HYDROCHLORIDE 6 .3 .3 2.3
AMISULPRIDE 1 .0 .0 2.4
AMITRIPTYLINE HYDROCHLORIDE 11 .5 .5 2.8
AMLODIPINE BESYLATE 25 1.1 1.1 4.0
AMOXYCILLIN 33 1.5 1.5 5.4
AMOXYCILLIN with CLAVULANIC ACID 4 .2 .2 5.6
AMPHOTERICIN 7 .3 .3 5.9
ANYLOBARBITONE 1 .0 .0 6.0
AQUEOUS CREAM 3 .1 .1 6.1
ASCORBIC ACID 9 .4 .4 6.5
ASPIRIN 32 1.4 1.4 7.9
ATENOLOL 16 .7 .7 8.6
ATORVASTATIN CALCIUM 14 .6 .6 9.2
ATROPINE SULFATE 1 .0 .0 9.3
AZATADINE 2 .1 .1 9.4
AZATHIOPRINE 1 .0 .0 9.4
BACLOFEN 1 .0 .0 9.5
BECLOMETHASONE DIPROPIONATE 10 .4 .4 9.9
BELLADONNA 1 .0 .0 10.0
BENDROFLUAZIDE 3 .1 .1 10.1
BENZOCAINE 1 .0 .0 10.1
BENZTROPINE MESYLATE 1 .0 .0 10.2
BENZYDAMINE HYDROCHLORIDE 1 .0 .0 10.2
BETAHISTINE 3 .1 .1 10.4
BETAMETHASONE ACETATE with BETAMETHASONE SODIUM PHOSPHATE 2 .1 .1 10.4
BETAMETHASONE DIPROPIONATE 15 .7 .7 11.1
Valid
BETAMETHASONE VALERATE 15 .7 .7 11.8
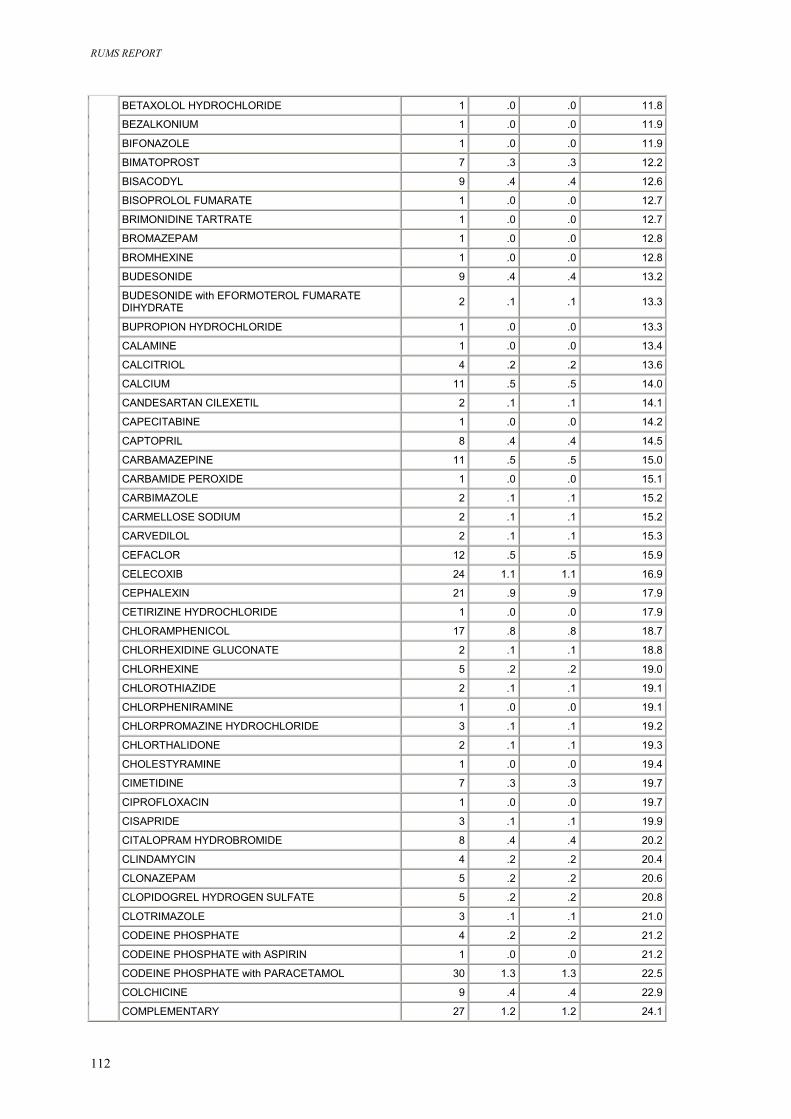
RUMS REPORT
112
BETAXOLOL HYDROCHLORIDE 1 .0 .0 11.8
BEZALKONIUM 1 .0 .0 11.9
BIFONAZOLE 1 .0 .0 11.9
BIMATOPROST 7 .3 .3 12.2
BISACODYL 9 .4 .4 12.6
BISOPROLOL FUMARATE 1 .0 .0 12.7
BRIMONIDINE TARTRATE 1 .0 .0 12.7
BROMAZEPAM 1 .0 .0 12.8
BROMHEXINE 1 .0 .0 12.8
BUDESONIDE 9 .4 .4 13.2
BUDESONIDE with EFORMOTEROL FUMARATE DIHYDRATE 2 .1 .1 13.3
BUPROPION HYDROCHLORIDE 1 .0 .0 13.3
CALAMINE 1 .0 .0 13.4
CALCITRIOL 4 .2 .2 13.6
CALCIUM 11 .5 .5 14.0
CANDESARTAN CILEXETIL 2 .1 .1 14.1
CAPECITABINE 1 .0 .0 14.2
CAPTOPRIL 8 .4 .4 14.5
CARBAMAZEPINE 11 .5 .5 15.0
CARBAMIDE PEROXIDE 1 .0 .0 15.1
CARBIMAZOLE 2 .1 .1 15.2
CARMELLOSE SODIUM 2 .1 .1 15.2
CARVEDILOL 2 .1 .1 15.3
CEFACLOR 12 .5 .5 15.9
CELECOXIB 24 1.1 1.1 16.9
CEPHALEXIN 21 .9 .9 17.9
CETIRIZINE HYDROCHLORIDE 1 .0 .0 17.9
CHLORAMPHENICOL 17 .8 .8 18.7
CHLORHEXIDINE GLUCONATE 2 .1 .1 18.8
CHLORHEXINE 5 .2 .2 19.0
CHLOROTHIAZIDE 2 .1 .1 19.1
CHLORPHENIRAMINE 1 .0 .0 19.1
CHLORPROMAZINE HYDROCHLORIDE 3 .1 .1 19.2
CHLORTHALIDONE 2 .1 .1 19.3
CHOLESTYRAMINE 1 .0 .0 19.4
CIMETIDINE 7 .3 .3 19.7
CIPROFLOXACIN 1 .0 .0 19.7
CISAPRIDE 3 .1 .1 19.9
CITALOPRAM HYDROBROMIDE 8 .4 .4 20.2
CLINDAMYCIN 4 .2 .2 20.4
CLONAZEPAM 5 .2 .2 20.6
CLOPIDOGREL HYDROGEN SULFATE 5 .2 .2 20.8
CLOTRIMAZOLE 3 .1 .1 21.0
CODEINE PHOSPHATE 4 .2 .2 21.2
CODEINE PHOSPHATE with ASPIRIN 1 .0 .0 21.2
CODEINE PHOSPHATE with PARACETAMOL 30 1.3 1.3 22.5
COLCHICINE 9 .4 .4 22.9
COMPLEMENTARY 27 1.2 1.2 24.1
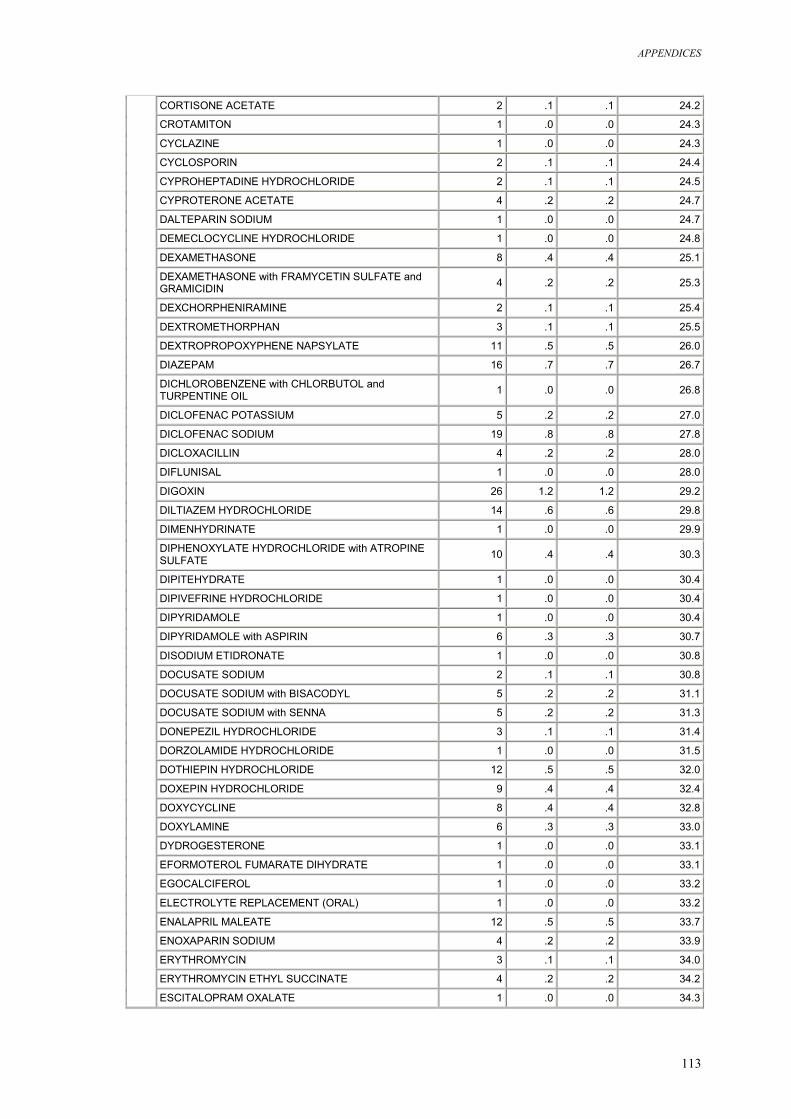
APPENDICES
113
CORTISONE ACETATE 2 .1 .1 24.2
CROTAMITON 1 .0 .0 24.3
CYCLAZINE 1 .0 .0 24.3
CYCLOSPORIN 2 .1 .1 24.4
CYPROHEPTADINE HYDROCHLORIDE 2 .1 .1 24.5
CYPROTERONE ACETATE 4 .2 .2 24.7
DALTEPARIN SODIUM 1 .0 .0 24.7
DEMECLOCYCLINE HYDROCHLORIDE 1 .0 .0 24.8
DEXAMETHASONE 8 .4 .4 25.1
DEXAMETHASONE with FRAMYCETIN SULFATE and GRAMICIDIN 4 .2 .2 25.3
DEXCHORPHENIRAMINE 2 .1 .1 25.4
DEXTROMETHORPHAN 3 .1 .1 25.5
DEXTROPROPOXYPHENE NAPSYLATE 11 .5 .5 26.0
DIAZEPAM 16 .7 .7 26.7
DICHLOROBENZENE with CHLORBUTOL and TURPENTINE OIL 1 .0 .0 26.8
DICLOFENAC POTASSIUM 5 .2 .2 27.0
DICLOFENAC SODIUM 19 .8 .8 27.8
DICLOXACILLIN 4 .2 .2 28.0
DIFLUNISAL 1 .0 .0 28.0
DIGOXIN 26 1.2 1.2 29.2
DILTIAZEM HYDROCHLORIDE 14 .6 .6 29.8
DIMENHYDRINATE 1 .0 .0 29.9
DIPHENOXYLATE HYDROCHLORIDE with ATROPINE SULFATE 10 .4 .4 30.3
DIPITEHYDRATE 1 .0 .0 30.4
DIPIVEFRINE HYDROCHLORIDE 1 .0 .0 30.4
DIPYRIDAMOLE 1 .0 .0 30.4
DIPYRIDAMOLE with ASPIRIN 6 .3 .3 30.7
DISODIUM ETIDRONATE 1 .0 .0 30.8
DOCUSATE SODIUM 2 .1 .1 30.8
DOCUSATE SODIUM with BISACODYL 5 .2 .2 31.1
DOCUSATE SODIUM with SENNA 5 .2 .2 31.3
DONEPEZIL HYDROCHLORIDE 3 .1 .1 31.4
DORZOLAMIDE HYDROCHLORIDE 1 .0 .0 31.5
DOTHIEPIN HYDROCHLORIDE 12 .5 .5 32.0
DOXEPIN HYDROCHLORIDE 9 .4 .4 32.4
DOXYCYCLINE 8 .4 .4 32.8
DOXYLAMINE 6 .3 .3 33.0
DYDROGESTERONE 1 .0 .0 33.1
EFORMOTEROL FUMARATE DIHYDRATE 1 .0 .0 33.1
EGOCALCIFEROL 1 .0 .0 33.2
ELECTROLYTE REPLACEMENT (ORAL) 1 .0 .0 33.2
ENALAPRIL MALEATE 12 .5 .5 33.7
ENOXAPARIN SODIUM 4 .2 .2 33.9
ERYTHROMYCIN 3 .1 .1 34.0
ERYTHROMYCIN ETHYL SUCCINATE 4 .2 .2 34.2
ESCITALOPRAM OXALATE 1 .0 .0 34.3
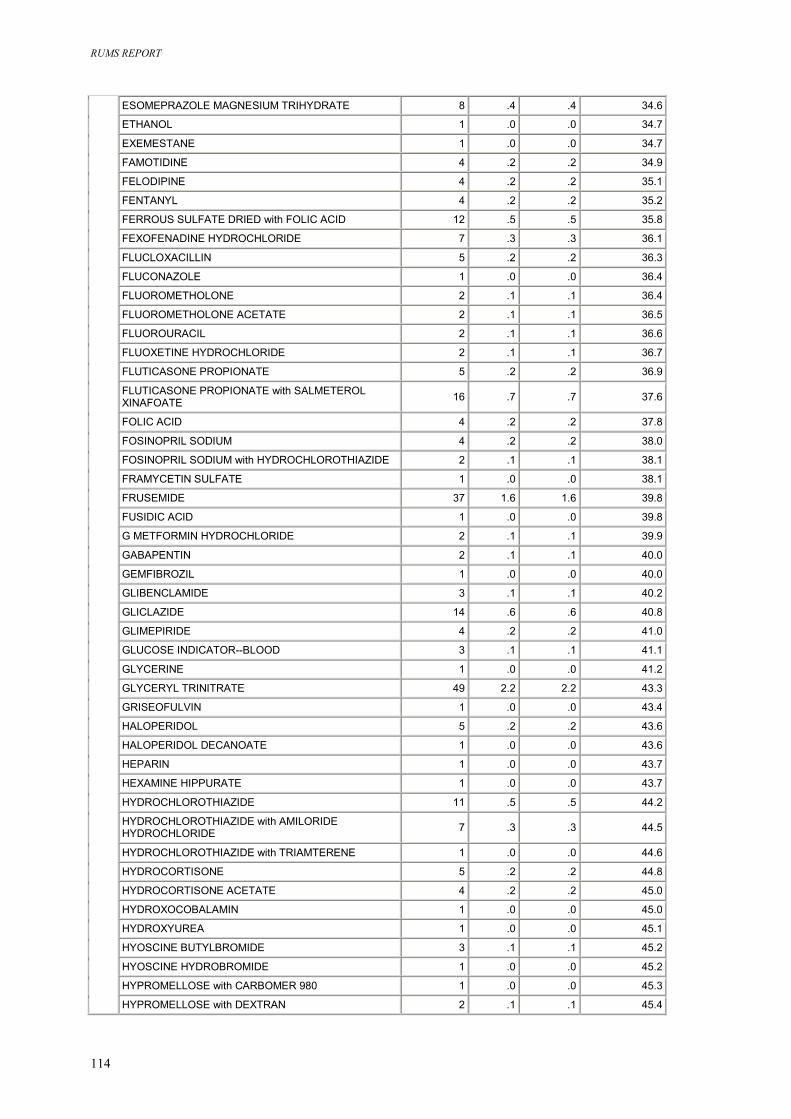
RUMS REPORT
114
ESOMEPRAZOLE MAGNESIUM TRIHYDRATE 8 .4 .4 34.6
ETHANOL 1 .0 .0 34.7
EXEMESTANE 1 .0 .0 34.7
FAMOTIDINE 4 .2 .2 34.9
FELODIPINE 4 .2 .2 35.1
FENTANYL 4 .2 .2 35.2
FERROUS SULFATE DRIED with FOLIC ACID 12 .5 .5 35.8
FEXOFENADINE HYDROCHLORIDE 7 .3 .3 36.1
FLUCLOXACILLIN 5 .2 .2 36.3
FLUCONAZOLE 1 .0 .0 36.4
FLUOROMETHOLONE 2 .1 .1 36.4
FLUOROMETHOLONE ACETATE 2 .1 .1 36.5
FLUOROURACIL 2 .1 .1 36.6
FLUOXETINE HYDROCHLORIDE 2 .1 .1 36.7
FLUTICASONE PROPIONATE 5 .2 .2 36.9
FLUTICASONE PROPIONATE with SALMETEROL XINAFOATE 16 .7 .7 37.6
FOLIC ACID 4 .2 .2 37.8
FOSINOPRIL SODIUM 4 .2 .2 38.0
FOSINOPRIL SODIUM with HYDROCHLOROTHIAZIDE 2 .1 .1 38.1
FRAMYCETIN SULFATE 1 .0 .0 38.1
FRUSEMIDE 37 1.6 1.6 39.8
FUSIDIC ACID 1 .0 .0 39.8
G METFORMIN HYDROCHLORIDE 2 .1 .1 39.9
GABAPENTIN 2 .1 .1 40.0
GEMFIBROZIL 1 .0 .0 40.0
GLIBENCLAMIDE 3 .1 .1 40.2
GLICLAZIDE 14 .6 .6 40.8
GLIMEPIRIDE 4 .2 .2 41.0
GLUCOSE INDICATOR--BLOOD 3 .1 .1 41.1
GLYCERINE 1 .0 .0 41.2
GLYCERYL TRINITRATE 49 2.2 2.2 43.3
GRISEOFULVIN 1 .0 .0 43.4
HALOPERIDOL 5 .2 .2 43.6
HALOPERIDOL DECANOATE 1 .0 .0 43.6
HEPARIN 1 .0 .0 43.7
HEXAMINE HIPPURATE 1 .0 .0 43.7
HYDROCHLOROTHIAZIDE 11 .5 .5 44.2
HYDROCHLOROTHIAZIDE with AMILORIDE HYDROCHLORIDE 7 .3 .3 44.5
HYDROCHLOROTHIAZIDE with TRIAMTERENE 1 .0 .0 44.6
HYDROCORTISONE 5 .2 .2 44.8
HYDROCORTISONE ACETATE 4 .2 .2 45.0
HYDROXOCOBALAMIN 1 .0 .0 45.0
HYDROXYUREA 1 .0 .0 45.1
HYOSCINE BUTYLBROMIDE 3 .1 .1 45.2
HYOSCINE HYDROBROMIDE 1 .0 .0 45.2
HYPROMELLOSE with CARBOMER 980 1 .0 .0 45.3
HYPROMELLOSE with DEXTRAN 2 .1 .1 45.4
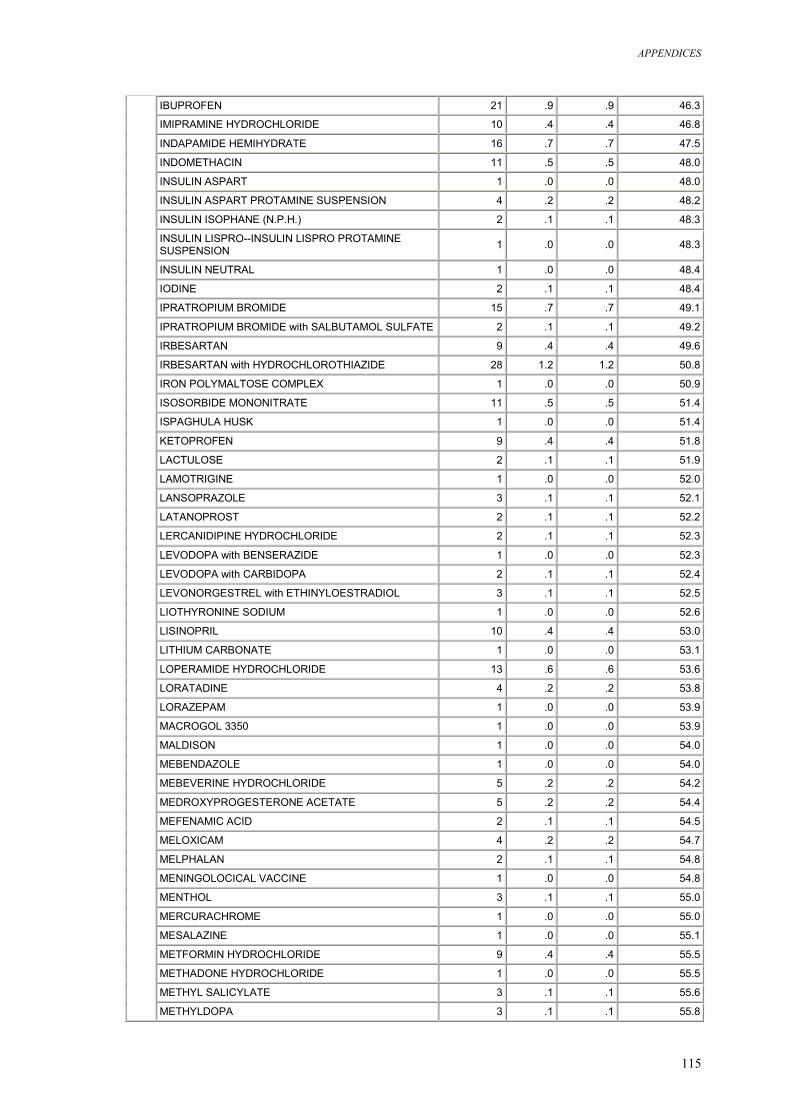
APPENDICES
115
IBUPROFEN 21 .9 .9 46.3
IMIPRAMINE HYDROCHLORIDE 10 .4 .4 46.8
INDAPAMIDE HEMIHYDRATE 16 .7 .7 47.5
INDOMETHACIN 11 .5 .5 48.0
INSULIN ASPART 1 .0 .0 48.0
INSULIN ASPART PROTAMINE SUSPENSION 4 .2 .2 48.2
INSULIN ISOPHANE (N.P.H.) 2 .1 .1 48.3
INSULIN LISPRO--INSULIN LISPRO PROTAMINE SUSPENSION 1 .0 .0 48.3
INSULIN NEUTRAL 1 .0 .0 48.4
IODINE 2 .1 .1 48.4
IPRATROPIUM BROMIDE 15 .7 .7 49.1
IPRATROPIUM BROMIDE with SALBUTAMOL SULFATE 2 .1 .1 49.2
IRBESARTAN 9 .4 .4 49.6
IRBESARTAN with HYDROCHLOROTHIAZIDE 28 1.2 1.2 50.8
IRON POLYMALTOSE COMPLEX 1 .0 .0 50.9
ISOSORBIDE MONONITRATE 11 .5 .5 51.4
ISPAGHULA HUSK 1 .0 .0 51.4
KETOPROFEN 9 .4 .4 51.8
LACTULOSE 2 .1 .1 51.9
LAMOTRIGINE 1 .0 .0 52.0
LANSOPRAZOLE 3 .1 .1 52.1
LATANOPROST 2 .1 .1 52.2
LERCANIDIPINE HYDROCHLORIDE 2 .1 .1 52.3
LEVODOPA with BENSERAZIDE 1 .0 .0 52.3
LEVODOPA with CARBIDOPA 2 .1 .1 52.4
LEVONORGESTREL with ETHINYLOESTRADIOL 3 .1 .1 52.5
LIOTHYRONINE SODIUM 1 .0 .0 52.6
LISINOPRIL 10 .4 .4 53.0
LITHIUM CARBONATE 1 .0 .0 53.1
LOPERAMIDE HYDROCHLORIDE 13 .6 .6 53.6
LORATADINE 4 .2 .2 53.8
LORAZEPAM 1 .0 .0 53.9
MACROGOL 3350 1 .0 .0 53.9
MALDISON 1 .0 .0 54.0
MEBENDAZOLE 1 .0 .0 54.0
MEBEVERINE HYDROCHLORIDE 5 .2 .2 54.2
MEDROXYPROGESTERONE ACETATE 5 .2 .2 54.4
MEFENAMIC ACID 2 .1 .1 54.5
MELOXICAM 4 .2 .2 54.7
MELPHALAN 2 .1 .1 54.8
MENINGOLOCICAL VACCINE 1 .0 .0 54.8
MENTHOL 3 .1 .1 55.0
MERCURACHROME 1 .0 .0 55.0
MESALAZINE 1 .0 .0 55.1
METFORMIN HYDROCHLORIDE 9 .4 .4 55.5
METHADONE HYDROCHLORIDE 1 .0 .0 55.5
METHYL SALICYLATE 3 .1 .1 55.6
METHYLDOPA 3 .1 .1 55.8
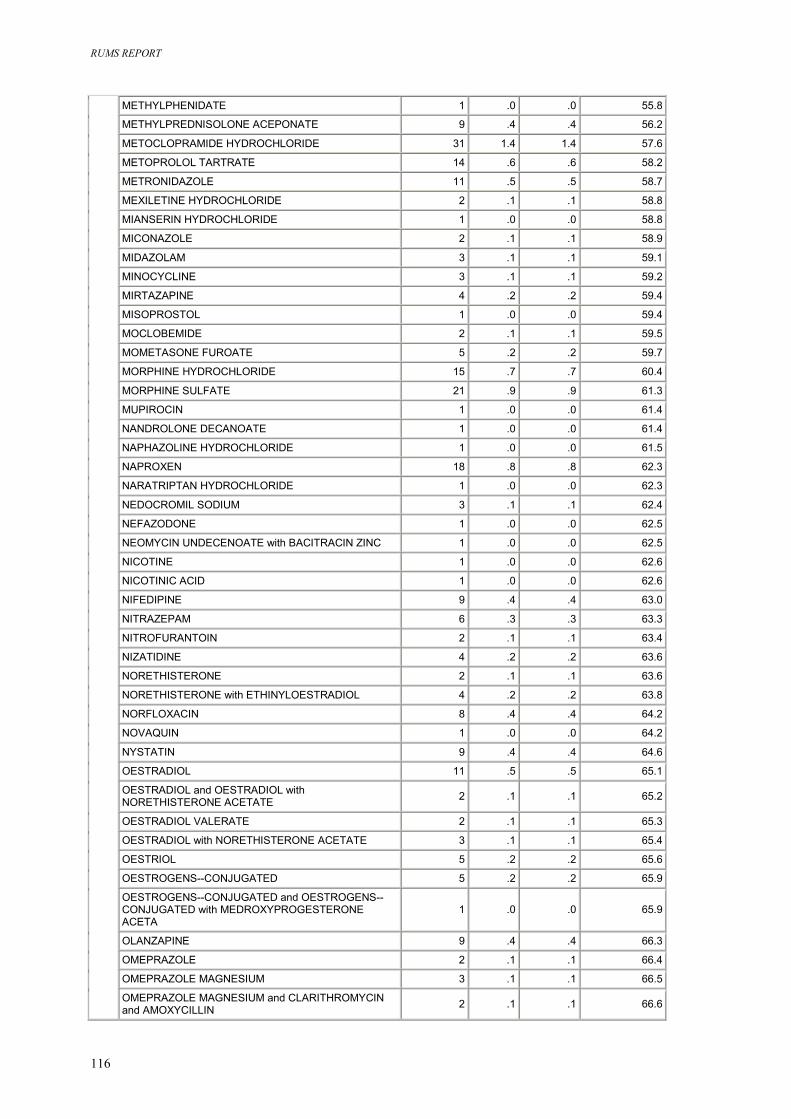
RUMS REPORT
116
METHYLPHENIDATE 1 .0 .0 55.8
METHYLPREDNISOLONE ACEPONATE 9 .4 .4 56.2
METOCLOPRAMIDE HYDROCHLORIDE 31 1.4 1.4 57.6
METOPROLOL TARTRATE 14 .6 .6 58.2
METRONIDAZOLE 11 .5 .5 58.7
MEXILETINE HYDROCHLORIDE 2 .1 .1 58.8
MIANSERIN HYDROCHLORIDE 1 .0 .0 58.8
MICONAZOLE 2 .1 .1 58.9
MIDAZOLAM 3 .1 .1 59.1
MINOCYCLINE 3 .1 .1 59.2
MIRTAZAPINE 4 .2 .2 59.4
MISOPROSTOL 1 .0 .0 59.4
MOCLOBEMIDE 2 .1 .1 59.5
MOMETASONE FUROATE 5 .2 .2 59.7
MORPHINE HYDROCHLORIDE 15 .7 .7 60.4
MORPHINE SULFATE 21 .9 .9 61.3
MUPIROCIN 1 .0 .0 61.4
NANDROLONE DECANOATE 1 .0 .0 61.4
NAPHAZOLINE HYDROCHLORIDE 1 .0 .0 61.5
NAPROXEN 18 .8 .8 62.3
NARATRIPTAN HYDROCHLORIDE 1 .0 .0 62.3
NEDOCROMIL SODIUM 3 .1 .1 62.4
NEFAZODONE 1 .0 .0 62.5
NEOMYCIN UNDECENOATE with BACITRACIN ZINC 1 .0 .0 62.5
NICOTINE 1 .0 .0 62.6
NICOTINIC ACID 1 .0 .0 62.6
NIFEDIPINE 9 .4 .4 63.0
NITRAZEPAM 6 .3 .3 63.3
NITROFURANTOIN 2 .1 .1 63.4
NIZATIDINE 4 .2 .2 63.6
NORETHISTERONE 2 .1 .1 63.6
NORETHISTERONE with ETHINYLOESTRADIOL 4 .2 .2 63.8
NORFLOXACIN 8 .4 .4 64.2
NOVAQUIN 1 .0 .0 64.2
NYSTATIN 9 .4 .4 64.6
OESTRADIOL 11 .5 .5 65.1
OESTRADIOL and OESTRADIOL with NORETHISTERONE ACETATE 2 .1 .1 65.2
OESTRADIOL VALERATE 2 .1 .1 65.3
OESTRADIOL with NORETHISTERONE ACETATE 3 .1 .1 65.4
OESTRIOL 5 .2 .2 65.6
OESTROGENS--CONJUGATED 5 .2 .2 65.9
OESTROGENS--CONJUGATED and OESTROGENS--CONJUGATED with MEDROXYPROGESTERONE ACETA
1 .0 .0 65.9
OLANZAPINE 9 .4 .4 66.3
OMEPRAZOLE 2 .1 .1 66.4
OMEPRAZOLE MAGNESIUM 3 .1 .1 66.5
OMEPRAZOLE MAGNESIUM and CLARITHROMYCIN and AMOXYCILLIN 2 .1 .1 66.6
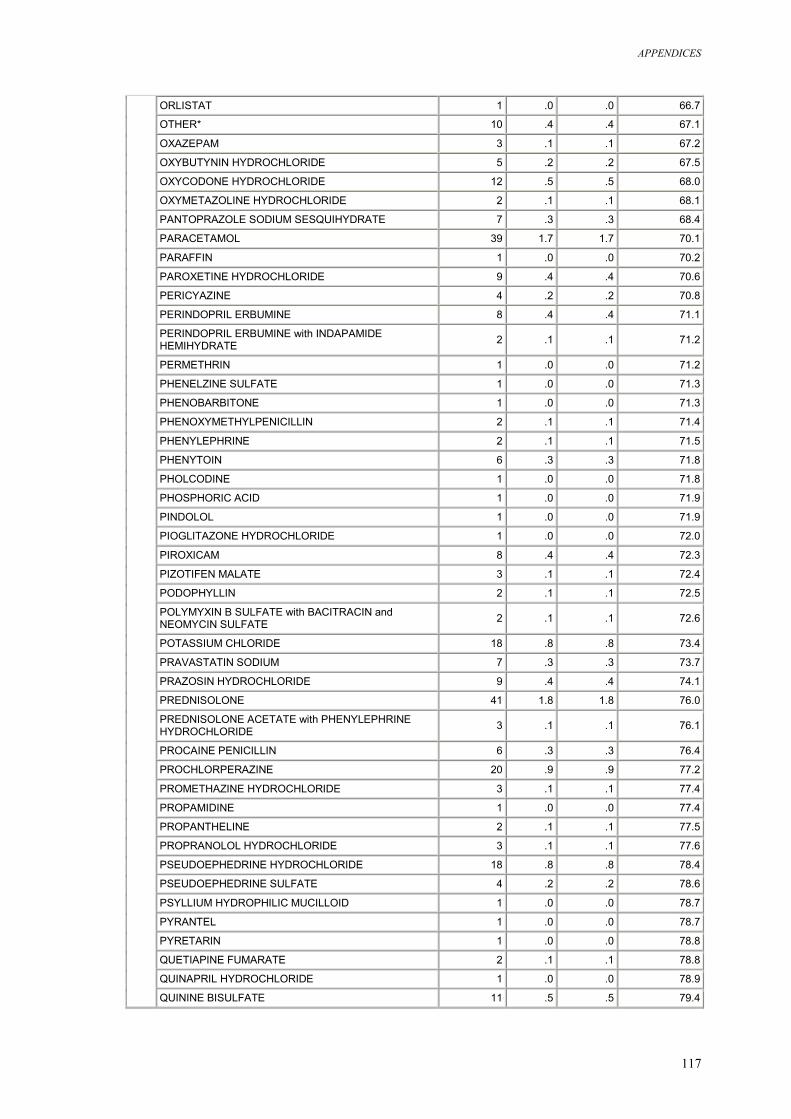
APPENDICES
117
ORLISTAT 1 .0 .0 66.7
OTHER* 10 .4 .4 67.1
OXAZEPAM 3 .1 .1 67.2
OXYBUTYNIN HYDROCHLORIDE 5 .2 .2 67.5
OXYCODONE HYDROCHLORIDE 12 .5 .5 68.0
OXYMETAZOLINE HYDROCHLORIDE 2 .1 .1 68.1
PANTOPRAZOLE SODIUM SESQUIHYDRATE 7 .3 .3 68.4
PARACETAMOL 39 1.7 1.7 70.1
PARAFFIN 1 .0 .0 70.2
PAROXETINE HYDROCHLORIDE 9 .4 .4 70.6
PERICYAZINE 4 .2 .2 70.8
PERINDOPRIL ERBUMINE 8 .4 .4 71.1
PERINDOPRIL ERBUMINE with INDAPAMIDE HEMIHYDRATE 2 .1 .1 71.2
PERMETHRIN 1 .0 .0 71.2
PHENELZINE SULFATE 1 .0 .0 71.3
PHENOBARBITONE 1 .0 .0 71.3
PHENOXYMETHYLPENICILLIN 2 .1 .1 71.4
PHENYLEPHRINE 2 .1 .1 71.5
PHENYTOIN 6 .3 .3 71.8
PHOLCODINE 1 .0 .0 71.8
PHOSPHORIC ACID 1 .0 .0 71.9
PINDOLOL 1 .0 .0 71.9
PIOGLITAZONE HYDROCHLORIDE 1 .0 .0 72.0
PIROXICAM 8 .4 .4 72.3
PIZOTIFEN MALATE 3 .1 .1 72.4
PODOPHYLLIN 2 .1 .1 72.5
POLYMYXIN B SULFATE with BACITRACIN and NEOMYCIN SULFATE 2 .1 .1 72.6
POTASSIUM CHLORIDE 18 .8 .8 73.4
PRAVASTATIN SODIUM 7 .3 .3 73.7
PRAZOSIN HYDROCHLORIDE 9 .4 .4 74.1
PREDNISOLONE 41 1.8 1.8 76.0
PREDNISOLONE ACETATE with PHENYLEPHRINE HYDROCHLORIDE 3 .1 .1 76.1
PROCAINE PENICILLIN 6 .3 .3 76.4
PROCHLORPERAZINE 20 .9 .9 77.2
PROMETHAZINE HYDROCHLORIDE 3 .1 .1 77.4
PROPAMIDINE 1 .0 .0 77.4
PROPANTHELINE 2 .1 .1 77.5
PROPRANOLOL HYDROCHLORIDE 3 .1 .1 77.6
PSEUDOEPHEDRINE HYDROCHLORIDE 18 .8 .8 78.4
PSEUDOEPHEDRINE SULFATE 4 .2 .2 78.6
PSYLLIUM HYDROPHILIC MUCILLOID 1 .0 .0 78.7
PYRANTEL 1 .0 .0 78.7
PYRETARIN 1 .0 .0 78.8
QUETIAPINE FUMARATE 2 .1 .1 78.8
QUINAPRIL HYDROCHLORIDE 1 .0 .0 78.9
QUININE BISULFATE 11 .5 .5 79.4
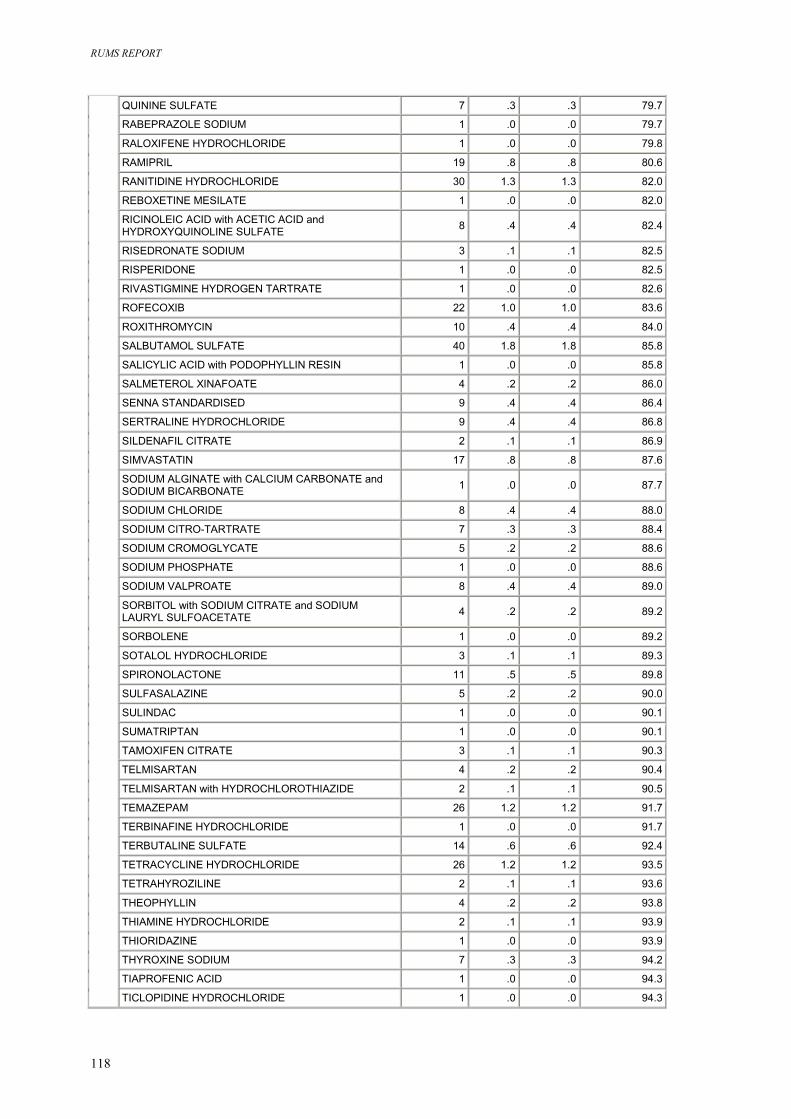
RUMS REPORT
118
QUININE SULFATE 7 .3 .3 79.7
RABEPRAZOLE SODIUM 1 .0 .0 79.7
RALOXIFENE HYDROCHLORIDE 1 .0 .0 79.8
RAMIPRIL 19 .8 .8 80.6
RANITIDINE HYDROCHLORIDE 30 1.3 1.3 82.0
REBOXETINE MESILATE 1 .0 .0 82.0
RICINOLEIC ACID with ACETIC ACID and HYDROXYQUINOLINE SULFATE 8 .4 .4 82.4
RISEDRONATE SODIUM 3 .1 .1 82.5
RISPERIDONE 1 .0 .0 82.5
RIVASTIGMINE HYDROGEN TARTRATE 1 .0 .0 82.6
ROFECOXIB 22 1.0 1.0 83.6
ROXITHROMYCIN 10 .4 .4 84.0
SALBUTAMOL SULFATE 40 1.8 1.8 85.8
SALICYLIC ACID with PODOPHYLLIN RESIN 1 .0 .0 85.8
SALMETEROL XINAFOATE 4 .2 .2 86.0
SENNA STANDARDISED 9 .4 .4 86.4
SERTRALINE HYDROCHLORIDE 9 .4 .4 86.8
SILDENAFIL CITRATE 2 .1 .1 86.9
SIMVASTATIN 17 .8 .8 87.6
SODIUM ALGINATE with CALCIUM CARBONATE and SODIUM BICARBONATE 1 .0 .0 87.7
SODIUM CHLORIDE 8 .4 .4 88.0
SODIUM CITRO-TARTRATE 7 .3 .3 88.4
SODIUM CROMOGLYCATE 5 .2 .2 88.6
SODIUM PHOSPHATE 1 .0 .0 88.6
SODIUM VALPROATE 8 .4 .4 89.0
SORBITOL with SODIUM CITRATE and SODIUM LAURYL SULFOACETATE 4 .2 .2 89.2
SORBOLENE 1 .0 .0 89.2
SOTALOL HYDROCHLORIDE 3 .1 .1 89.3
SPIRONOLACTONE 11 .5 .5 89.8
SULFASALAZINE 5 .2 .2 90.0
SULINDAC 1 .0 .0 90.1
SUMATRIPTAN 1 .0 .0 90.1
TAMOXIFEN CITRATE 3 .1 .1 90.3
TELMISARTAN 4 .2 .2 90.4
TELMISARTAN with HYDROCHLOROTHIAZIDE 2 .1 .1 90.5
TEMAZEPAM 26 1.2 1.2 91.7
TERBINAFINE HYDROCHLORIDE 1 .0 .0 91.7
TERBUTALINE SULFATE 14 .6 .6 92.4
TETRACYCLINE HYDROCHLORIDE 26 1.2 1.2 93.5
TETRAHYROZILINE 2 .1 .1 93.6
THEOPHYLLIN 4 .2 .2 93.8
THIAMINE HYDROCHLORIDE 2 .1 .1 93.9
THIORIDAZINE 1 .0 .0 93.9
THYROXINE SODIUM 7 .3 .3 94.2
TIAPROFENIC ACID 1 .0 .0 94.3
TICLOPIDINE HYDROCHLORIDE 1 .0 .0 94.3
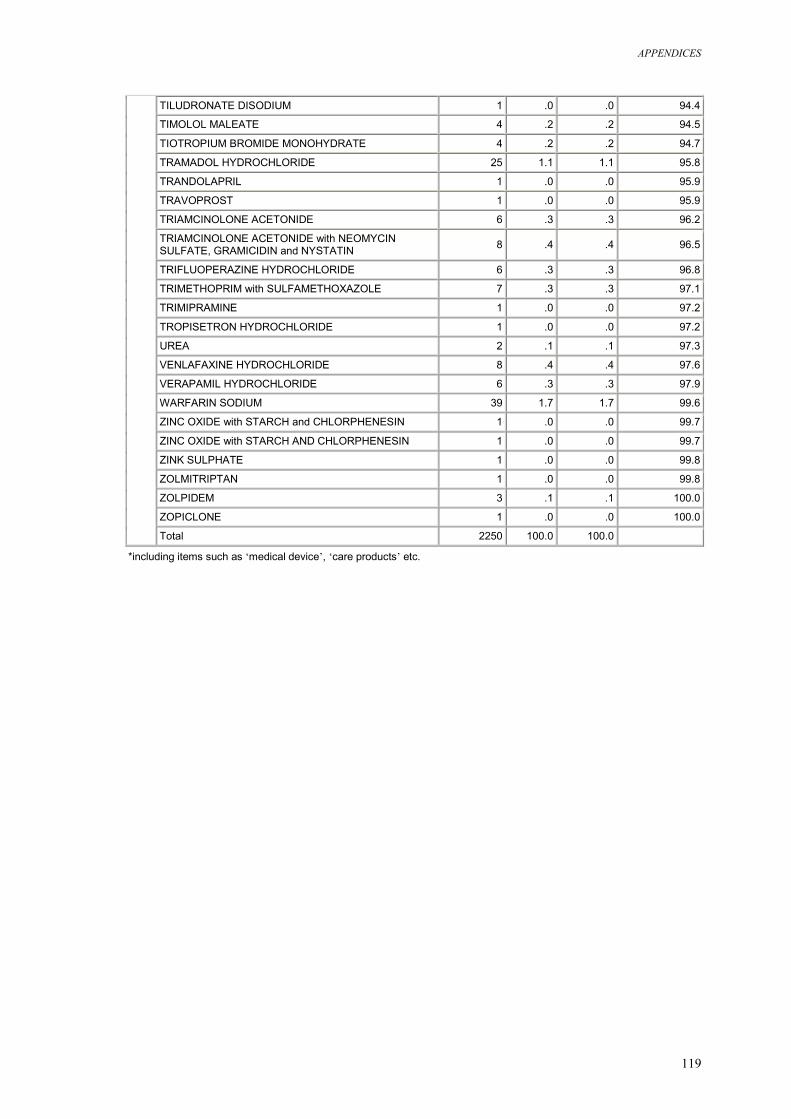
APPENDICES
119
TILUDRONATE DISODIUM 1 .0 .0 94.4
TIMOLOL MALEATE 4 .2 .2 94.5
TIOTROPIUM BROMIDE MONOHYDRATE 4 .2 .2 94.7
TRAMADOL HYDROCHLORIDE 25 1.1 1.1 95.8
TRANDOLAPRIL 1 .0 .0 95.9
TRAVOPROST 1 .0 .0 95.9
TRIAMCINOLONE ACETONIDE 6 .3 .3 96.2
TRIAMCINOLONE ACETONIDE with NEOMYCIN SULFATE, GRAMICIDIN and NYSTATIN 8 .4 .4 96.5
TRIFLUOPERAZINE HYDROCHLORIDE 6 .3 .3 96.8
TRIMETHOPRIM with SULFAMETHOXAZOLE 7 .3 .3 97.1
TRIMIPRAMINE 1 .0 .0 97.2
TROPISETRON HYDROCHLORIDE 1 .0 .0 97.2
UREA 2 .1 .1 97.3
VENLAFAXINE HYDROCHLORIDE 8 .4 .4 97.6
VERAPAMIL HYDROCHLORIDE 6 .3 .3 97.9
WARFARIN SODIUM 39 1.7 1.7 99.6
ZINC OXIDE with STARCH and CHLORPHENESIN 1 .0 .0 99.7
ZINC OXIDE with STARCH AND CHLORPHENESIN 1 .0 .0 99.7
ZINK SULPHATE 1 .0 .0 99.8
ZOLMITRIPTAN 1 .0 .0 99.8
ZOLPIDEM 3 .1 .1 100.0
ZOPICLONE 1 .0 .0 100.0
Total 2250 100.0 100.0
*including items such as ‘medical device’, ‘care products’ etc.