retracted: impacts of past climate variability on marine ecosystems: lessons from sediment records
TRANSCRIPT
Journal of Marine Systems xxx (2009) xxx–xxx
MARSYS-01783; No of Pages 10
Contents lists available at ScienceDirect
Journal of Marine Systems
j ourna l homepage: www.e lsev ie r.com/ locate / jmarsys
ARTICLE IN PRESS
Impacts of past climate variability on marine ecosystems:Lessons from sediment records
Kay-Christian Emeis a,⁎, Bruce P. Finney b, Raja Ganeshram c, Dimitri Gutiérrez d, Bo Poulsen e, Ulrich Struck f
a Institut fuer Biogeochemie und Meereschemie, Universität Hamburg, Bundesstr. 55, 20146 Hamburg, Germanyb Idaho State University, Dept. of Biological Sciences, 921 S. 8th Ave., Stop 8007, Pocatello, ID 83209-8007, USAc School of GeoSciences, University of Edinburgh, Grant Institute of Geology, West Mains Road, Edinburgh, EH9 3JW, Scotland, UKd Instituto del Mar del Perú Esquina Gamarra y General Valle S/N Chucuito-Callao, Perue Roskilde University Universitetsvej 1 3.2.117, DK-4000 Roskilde, Denmarkf Museum für Naturkunde, Berlin, Invalidenstraße 43, 10115 Berlin, Germany
⁎ Corresponding author. Tel.: +49 40 42838 4992; faE-mail address: [email protected] (K.-C. Emeis).
0924-7963/$ – see front matter © 2009 Elsevier B.V. Adoi:10.1016/j.jmarsys.2008.12.012
Please cite this article as: Emeis, K.-C., et al.,of Marine Systems (2009), doi:10.1016/j.jm
a b s t r a c t
a r t i c l e i n f oArticle history:
Sediment records and histo Received 9 July 2007Received in revised form 2 December 2007Accepted 4 December 2008Available online xxxxKeywords:ProxyUpwellingNitrogen isotopesFish scalesPaleo climateHumboldt CurrentBenguela Current
rical accounts are the only source of information on marine ecosystem status andvariability at higher trophic levels before scientific observations began. Most reconstructions ofpaleoenvironments and higher ecosystem levels are based on measurable proxies in these sedimentaryarchives, ideally those that are directly and robustly related to environmental or biological variables ofinterest. Depositional characteristics place some constraints on the types of environments where proxy-based investigations into the dynamics of higher levels of marine ecosystems can be done and many proxymethods have large error ranges. But although sedimentary proxy records are often plagued by datinguncertainties and although proxies for higher ecosystem levels are scarce, the few studies performed in lakesand coastal upwelling environments have already yielded some fascinating insights into spatial and temporalscales of ecosystem variability in the past. Most available records are low-pass filtered with a bias to longer-term changes, which limits the window of detection to (interannual)-decades to centuries or even longer.Available data suggest pervasive bottom-up control of marine ecosystems in response to relatively subtlechanges in external forcing, which telescopes into very high variability on higher trophic levels. Many paleo-curves suggest cyclicities or thresholds, which point to either cyclic external drivers or non-linear reactions.In particular, response of higher trophic levels to changes at the base of ecosystems appears to be highly non-linear and shows variations of several orders of magnitude, as exemplified by fish stocks in several areas(Baltic Sea, North Sea, upwelling systems, lakes in Canada) from historical records, observations andsediment archives.
© 2009 Elsevier B.V. All rights reserved.
1. Introduction
Information on historic states of marine ecosystems can beassembled from two main sources: paleoceanographic data fromnatural archives of marine sediments and from historical accounts onpast fisheries before the industrial fisheries developed. Environmentalreconstructions from sediments provide the only means of directmeasurements of ancient conditions, or validation data sets forreconstructions from numerical models. They allow – with methodo-logical caveats – the reconstruction of the history of natural climateforcing mechanisms and their effects on the physical environment. Ofconsiderable interest is the extent to which past climates can beconsidered analogues, or be proxies, for future climate variability andthe resultingmarine ecosystem responses. Sediment analysis providesinformation on past ocean temperatures, salinities, nutrient content
x: +49 40 42838 6347.
ll rights reserved.
Impacts of past climate variaarsys.2008.12.012
and carbon export flux, and sediment records used as time series (atone location through time) or in time slice reconstructions (at onetime in the past over an area) are used – among others – to inferchanges in circulation patterns, biogeochemistry, and floristic/faunistic boundaries. High resolution studies on micro-fossils andgeochemical tracers are used to reconstruct past patterns of food weband productivity changes. Varved sediments, which are often situatedin suboxic/anoxic depth intervals of eastern boundary regions of thevarious ocean basins, are ideal archives for these reconstructions.
Key questions directed towards paleoceanographic research fromscientists interested in reconstructions of past ecosystems are:
– What are the patterns of ocean climate variability of differentmarine systems in the past (the Holocene, the last 10,000 years) asreconstructed from different marine proxies?
– Can we reconstruct realistic historical patterns of food-web andproductivity changes and gauge possible impacts on higher trophiclevels from sediment and historical archives?
bility on marine ecosystems: Lessons from sediment records, Journal

2 K.-C. Emeis et al. / Journal of Marine Systems xxx (2009) xxx–xxx
ARTICLE IN PRESS
– To what extent were fluctuations of historic fisheries forced byclimate variability and by human fishing activities? Are thereteleconnection patterns between different fisheries (i) within thesame ocean basin and (ii) between different ocean basins?
– What were the physical driving forces of fluctuations of marineecosystems?
– What were the physical driving forces of historic abundancechanges of unfished populations as recorded from fish scales invarved sediments of eastern boundary currents?
The group assembled during the GLOBEC Workshop took on thechallenge posed by these questions and defined three main questionsthat were discussed in the group sessions:
1) Do we have the necessary hind casting capabilities to confidentlyreconstruct higher trophic levels in past ecosystems?
2) What are characteristics of ecosystem variability at higher trophiclevels, also in the time domain, from historical and sedimentrecords?
3) What are the mechanisms leading to ecosystem variability, whatare typical space and time scales, and can paleo-records help toidentify them?
In the following, we briefly sum up the discussion on thesequestions, and illustrate our data basis by brief summaries pertinentto systems within our expertise.
2. Do we have the necessary hind casting capabilities toconfidently reconstruct higher trophic levels in past ecosystems?
Any attempt to reconstruct past ecosystem variability hinges onthe quality of and on our ability to correctly interpret sedimentary andhistorical records. This ability is limited by the tools of thepaleoceanographic trade: Proxies, which are measurable in sediments(or recovered from historical records) and are related to environ-mental or ecosystem variables which we cannot measure but need toknow for deciphering the past. In the ideal case, these proxies arecausally and linearly linked to the desired environmental variable, andsignificant effort goes into the development and improvement of suchproxies by calibration to present-day climatologies and/or observa-tions (Fischer and Wefer, 1999).
The use of proxies is inherently plagued by uncertainties, andbesides themoremethodological problems of unambiguous establish-ment of cause-and-effect and calibration, three issues limit our tools:
1) The overprinting of the record in the course of early sedimentformation (diagenesis), which changesmany of the records in theirtemporal characteristics and in their quality. Diagenesis is an issuewith several aspects: changes in composition during physical,chemical and microbiological processing of sediments in thecourse of several hundreds to thousands of years frequently resultsin selective preservation of sediment components, or theirtransformation into different sediment components (Fischer andWefer, 1999, and references therein).
2) The possibility that many proxies in use have been calibrated in anon-analogue situation (“the anthropocene”; Crutzen and Stoer-mer, 2000), and that the observed Present is not necessarily a keyto the Past. Most often, sediments used for the calibration integratesignals of several hundreds of years to millennia (depending onsedimentation rate) and climatological atlases that are used toestablish the relationship between proxy and environmentalvariable usually span the last few decades only. This results in aloss of high-frequency variability in sediment records.
3) Statistical considerations (von Storch et al., 2004), which suggestthat error propagation limits our ability to recognize high-frequency variability in past proxy records.
Please cite this article as: Emeis, K.-C., et al., Impacts of past climate variaof Marine Systems (2009), doi:10.1016/j.jmarsys.2008.12.012
Apromising strategy to avoid problemswith individual proxies is tocombine several proxies with known and unknown uncertainties inmulti-proxy environmental reconstructions. In an optimal case,several of such multi-proxy records are aligned along environmentalgradients and show coherent patterns in the amplitude of naturalvariability through time. In the future, the plausibility of such dis-tributed multi-proxy records will increasingly be evaluated withcoupled models.
With all these caveats, proxies are the best we have. For acomprehensive overview of commonly used proxies, their applicationand their limitations the reader is referred to the book by Fischer andWefer (1999) where also abundant references on the developmentand history of different proxy variables are given.
A first set of proxies are those that enable us to confidently recon-struct physical conditions, such as salinity, wind strength, and tem-perature, in the past. This set also encompasses floral and faunalassemblages, which – based on their occurrence in the present ocean –
are confined by certain salinity and temperature limits that areevaluated by statistical methods. Confidence in the acuity andprecision of these temperature and salinity proxies is quite high, inpart due to the efforts that have over the last decades gone intotheir development. Due to the increasing complexity of processesbeyond the physical state of ecosystems, proxies indicative of chemicalconditions (e.g., nutrient element and oxygen content) and lowertrophic levels of ecosystems (e.g., primary production, export produc-tion) are more uncertain, but are still widely used. Examples are15N/14N ratios in sediments as indicators of nutrient utilization(Altabet and Francois, 1994), reconstructions of export productionlevels from accumulation rates of organic carbon (Suess, 1980), orcensus counts of indicator species for environmental reconstructions(Koning et al., 2001). All these proxies suffer from post-depositionalmodifications.
An added problem to the shortcomings of proxy records ischronology; it is often exceedingly difficult to date sediment recordsproperly and with acceptable error margins and this limits resolutionof variability in many records to variability with characteristicduration of (decades)/centuries and longer.
In the absence of unambiguous varves – which is the ideal casebecause varves record seasonal and annual variability, but arerestricted to anoxic settings – there are method-related problemsand discontinuities in the dating methods used for historical timespans and the last millennia. Time markers include 137Cs spikes (frombomb testing and Chernobyl) and 241Am from 241Pu decay. In sometransport-dominated sedimentary environments, the radiogenic andparticle reactive isotopes are transported with bulk sediment. The210Pb method is widely used for up to 100–150 years, but the datingconfidence is low in older layers. There is a methodological gap in ageranges between 210Pb (100–150 years) and 14C and rarely do ageestimates from these two methods match. Dating with the radio-carbon method again has a host of problems, although the instru-mental error has declined significantly since AMS (accelerator massspectrometry) has become the standard method (e.g., Stuiver et al.,1998). Among the problems are: unknown or variable reservoir ages,age differences between different phases that are dated (bones,carbonate, acid residues, individual molecular markers etc), andadmixtures of old carbon from reworking of sediments,
To reconstruct ecosystems beyond physical and chemical proper-ties, we have to rely on remains of groups of organisms, such asmolecules only produced by a certain group of phytoplankton, shells,tests, indirect isotope evidence for habitat and environmental charac-teristics, etc. These remains represent mainly the lower trophic levels,as these contribute significantly to sediments and organic carbon insediment archives. Data on the structure and productivity of lowertrophic levels in sediments thus is commonly published, but therecords are often biased by diagenesis (differential dissolution,microbial degradation of organic carbon). However, they still are
bility on marine ecosystems: Lessons from sediment records, Journal
3K.-C. Emeis et al. / Journal of Marine Systems xxx (2009) xxx–xxx
ARTICLE IN PRESS
widely used to infer changes in community structure of phytoplank-ton, in productivity and in the spatial/temporal variability of thephytoplankton population (Schubert et al., 1998; Zonneveld et al.,2007).
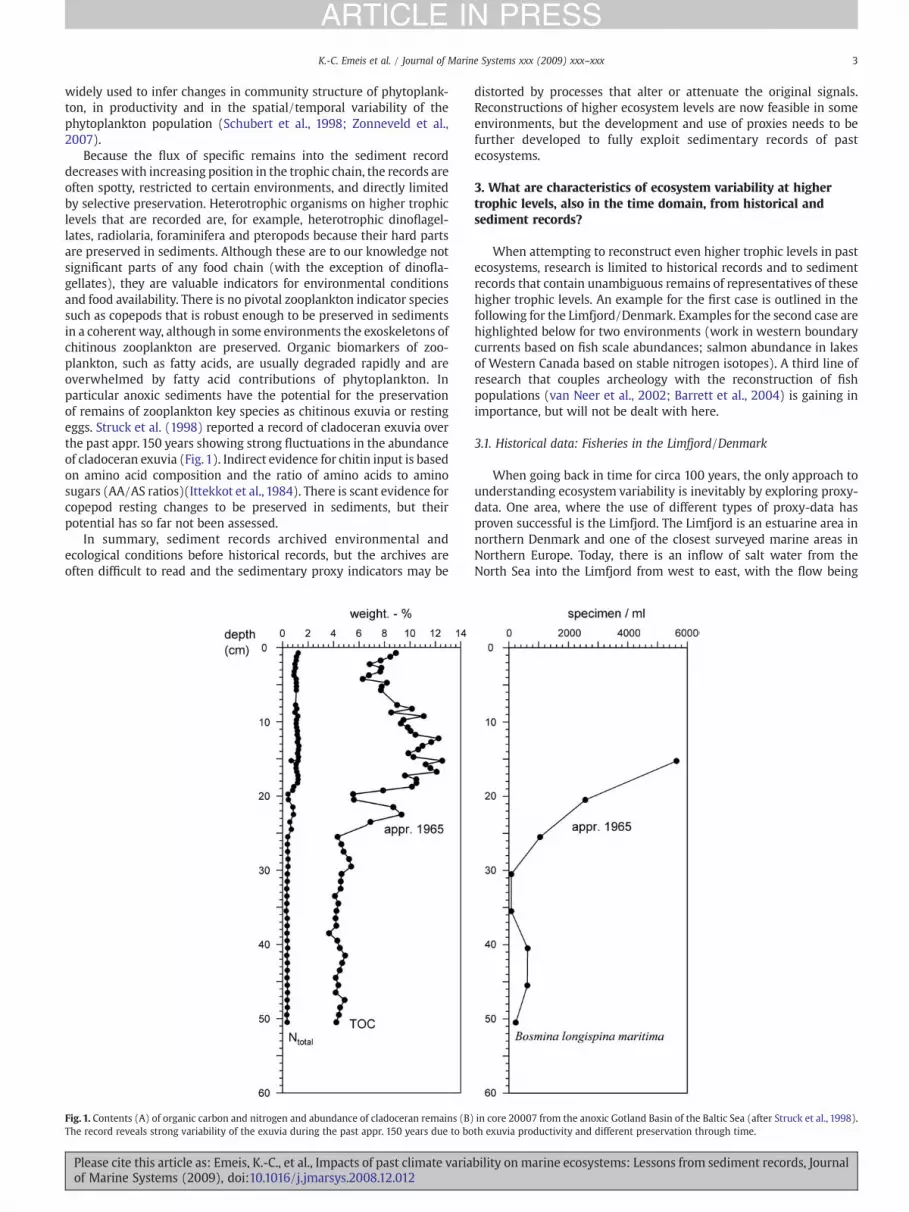
Because the flux of specific remains into the sediment recorddecreases with increasing position in the trophic chain, the records areoften spotty, restricted to certain environments, and directly limitedby selective preservation. Heterotrophic organisms on higher trophiclevels that are recorded are, for example, heterotrophic dinoflagel-lates, radiolaria, foraminifera and pteropods because their hard partsare preserved in sediments. Although these are to our knowledge notsignificant parts of any food chain (with the exception of dinofla-gellates), they are valuable indicators for environmental conditionsand food availability. There is no pivotal zooplankton indicator speciessuch as copepods that is robust enough to be preserved in sedimentsin a coherent way, although in some environments the exoskeletons ofchitinous zooplankton are preserved. Organic biomarkers of zoo-plankton, such as fatty acids, are usually degraded rapidly and areoverwhelmed by fatty acid contributions of phytoplankton. Inparticular anoxic sediments have the potential for the preservationof remains of zooplankton key species as chitinous exuvia or restingeggs. Struck et al. (1998) reported a record of cladoceran exuvia overthe past appr. 150 years showing strong fluctuations in the abundanceof cladoceran exuvia (Fig. 1). Indirect evidence for chitin input is basedon amino acid composition and the ratio of amino acids to aminosugars (AA/AS ratios)(Ittekkot et al., 1984). There is scant evidence forcopepod resting changes to be preserved in sediments, but theirpotential has so far not been assessed.
In summary, sediment records archived environmental andecological conditions before historical records, but the archives areoften difficult to read and the sedimentary proxy indicators may be
Fig. 1. Contents (A) of organic carbon and nitrogen and abundance of cladoceran remains (B)The record reveals strong variability of the exuvia during the past appr. 150 years due to bo
Please cite this article as: Emeis, K.-C., et al., Impacts of past climate variaof Marine Systems (2009), doi:10.1016/j.jmarsys.2008.12.012
distorted by processes that alter or attenuate the original signals.Reconstructions of higher ecosystem levels are now feasible in someenvironments, but the development and use of proxies needs to befurther developed to fully exploit sedimentary records of pastecosystems.
3. What are characteristics of ecosystem variability at highertrophic levels, also in the time domain, from historical andsediment records?
When attempting to reconstruct even higher trophic levels in pastecosystems, research is limited to historical records and to sedimentrecords that contain unambiguous remains of representatives of thesehigher trophic levels. An example for the first case is outlined in thefollowing for the Limfjord/Denmark. Examples for the second case arehighlighted below for two environments (work in western boundarycurrents based on fish scale abundances; salmon abundance in lakesof Western Canada based on stable nitrogen isotopes). A third line ofresearch that couples archeology with the reconstruction of fishpopulations (van Neer et al., 2002; Barrett et al., 2004) is gaining inimportance, but will not be dealt with here.
3.1. Historical data: Fisheries in the Limfjord/Denmark
When going back in time for circa 100 years, the only approach tounderstanding ecosystem variability is inevitably by exploring proxy-data. One area, where the use of different types of proxy-data hasproven successful is the Limfjord. The Limfjord is an estuarine area innorthern Denmark and one of the closest surveyed marine areas inNorthern Europe. Today, there is an inflow of salt water from theNorth Sea into the Limfjord from west to east, with the flow being
in core 20007 from the anoxic Gotland Basin of the Baltic Sea (after Struck et al., 1998).th exuvia productivity and different preservation through time.
bility on marine ecosystems: Lessons from sediment records, Journal

Fig. 2. Sardine and anchovy SDRs in the Santa Barbara Basin from Kasten core SBKC9110–1301. Lines are three term smoothing of five-year intervals (redrawn afterBaumgartner et al., 1992 from Field et al., 2006). There relationship between SDR of eachspecies is very weak, but positive and significant (r2=0.03, pb0.005).
4 K.-C. Emeis et al. / Journal of Marine Systems xxx (2009) xxx–xxx
ARTICLE IN PRESS
approximately 8–9 km3 annually. The inflow is controlled by thedominant westerly winds. The fjord has been open to salt water fromthe North Sea since February 1825, when a large winter storm cutthrough the narrow stretch of land, Agger Tange, in the west, whichpreviously has sealed off the fjord from the sea. Analyses of sedimentcores from the Limfjord have enabled a reconstruction of the historicalfauna of the last 3000 years (Christensen et al., 2004). Faunal remainsdocument different phases of levels of salinity in the Limfjord. Untilapproximately 1100–1200 AD the Limfjord was a strait with salinitylevels of 33 psu, close to the salinity level in the North Sea. Thereafter,the Agger Tange was formed and the Limfjord turned into a brackishfiord,whose only connection to open seawas through a narroweasternentrance from the Kattegat at Hals. A minor rise in salinity to c. 20 psuoccurred some time between 1500 and 1700 (Christensen et al., 2004).
These results from sediment cores are supported by evidence fromwritten sources. When Canute the Great sailed into the Limfjord in1027 AD, historical records reveal that he used its western entrance,which closed around 1200 AD (Saxo Grammaticus, 2000; original 12thcentury). This corresponds with the sediment records of a closing ofthe western entrance around this time. When it comes to the briefreopening of the Agger Tange, a couple of breaches are mentioned inhistorical records of this period, but the most likely breach to have ledto the increase in salinity took place in 1624 (Berntsen, 1650–1656).The Danish topographer, Arent Berntsen, who visited the Limfjord inthe 1630s, reported how the fresh water fish were dying and washedashore due to the influx of saline water, which in turn brought in codand plaice. However, the breach was only short lived, and the isthmusat Agger rebuilt itself again in the mid 1630s (Berntsen, 1650–1656).Similarly the breach of 1825 following a storm on the night between 2and 3 February is well recorded in written documents (Rasmussen,1968).
Limfjord estuary was intensively exploited commercially since atleast the late 17th century. Especially for the herring fisheries thearchival data allowed for a reconstruction and standardization intometric tonnes of the total removal of herring form the Limfjordsupplemented by time series of effort and CPUE for individual fishers(Poulsen et al., 2007). The result revealed two periods, the first half ofthe 18th century and the 1810s and 1820s, when the size of the herringfishery was comparable to the size of the any modern 20th centurycatch of herring in the Limfjord. Moreover, the fluctuations in fishingeffort and catches in these periods seem to reflect changes in stockfluctuations. Especially the collapse of the herring fishery from 1829onwards was spectacular and well documented. The North Sea breachof Agger Tange in 1825 had profound impact on the Limfjord fisheries.The disappearance of thewhitefish and a fifteen year long crisis for theeel fisheries can both be associated with the North Sea breach. Withthe herring fisheries though, the evidence is less clear. The detailedinformation on the herring fisheries in custom records, account books,tax registers and contemporary commentaries from natural historiansas well as later historical writing on this topic allow for at least fivedifferent explanations. Noteworthy is the possibility of fishingmortality as a decisive factor for the decline of this essentially pre-modern fishery (Poulsen and Holm, submitted).
This is an example of how the sedimentary and archival evidencesare mutually re-enforcing when it comes to determining the salinityand the Limfjord and its hydrographical relationship to the North Seaand the Kattegat. With regards to the effect of these changes on thehigher trophic levels, historical record on the changing fates of com-mercially exploited fish populations adds an extra dimension to this.
The analysis of the fate of these fisheries, however, is possible onlythrough the combination of such different types of proxy-data. Theresults showed a direct connection between abrupt changes in salinityand the abundance of eel and whitefish. However, when it comes tothe more gradual changes in levels of CPUE for herring within thebrackish period lasting until 1825 the proxy records for environmentalchange cannot be directly linked to the fate of the fisheries.
Please cite this article as: Emeis, K.-C., et al., Impacts of past climate variaof Marine Systems (2009), doi:10.1016/j.jmarsys.2008.12.012
3.2. Sedimentary fish scale records
One direct, but not necessarily straightforward, form of indicatorspecies utilisation for fish stock reconstructions in the absence ofwritten records is to use sedimentaryfish scale records offish that shedtheir scales (for example: sardine, anchovy, hake, horse mackerel).Another is to analyse archaeological remains. Both are not simplemethods to use, because the influences that determine the abundanceof fish scales in sediments or kitchen middens are not entirely clear:fish can shed their scales when attacked by a predator. Fish scaledeposition rates can be calibrated for historical population biomassestimates as demonstrated by Baumgartner et al. (1992). In addition,only few regions in the global ocean have suitable delivery rates to thesediment and sedimentary environments where fish scales arepreserved as sedimentary archives. Usually, fish populations arelarge enough only in eastern boundary upwelling systems to deliversufficient scales to sediments (Suess, 1981), and studies so far haveconcentrated on eastern boundary current systems of North and SouthAmerica (DeVries and Pearcy,1982;Markgraf et al., 2000;Milessi et al.,2005; Gutiérrez et al., 2008; Valdés et al., 2008), in the Benguelacurrent system off Namibia, southwest Africa (Shackleton, 1987;McLachlan, 1994; Struck et al., 2002), and in suitable environmentsof the CanadianWest Coast (Wright et al., 2005; Patterson et al., 2005).
3.3. The early work on fish scales
Fish scales as indicators of variability in pelagic fish populationswere firstly used in the innovative work of Soutar (1967) and Soutarand Isaacs (1969). They quantified changes in the numbers of scales ofsardines and anchovies deposited to the sediments during differentdecades in time by sifting different layers of Santa Barbara Basin (SBB)sediments. The short lived small pelagics such as anchovies andsardines have highly variable recruitment depending on environmen-tal conditions and they are ideal for considering the extreme effects ofenvironmental change on fish populations (Hunter and Alheit, 1995).
ENSO variability was just becoming recognized as having animpact on circulation, biogeochemistry, and ecosystems that could bediscernable over meso-scale variability when fish scale depositionrates to the SBB were first reported (Soutar and Isaacs, 1969).Nonetheless, the Holocene was generally considered a stable timeperiod. Scepticism remained over the significance of changes in thenumber of scales from a single core taken from a single point in theocean. Baumgartner et al. (1992) showed that the results of severalcores from the SBB were consistent with one another, and could beused to define multiple collapses and expansions of sardines overinterdecadal timescales (Fig. 2). The variability in small pelagicsdefined by Baumgartner et al. (1992) was a convincing illustrationthat a shift in climate and ecosystems which occurred in the mid-1970s was not unlike variability seen in the geological record.However, since it is clear that there is some influence of the warmingtrend on the late 20th century variability (Field et al., 2006),understanding variability and shifts on centennial and millennialtimescales and prior warm periods may become of increasing interest.
bility on marine ecosystems: Lessons from sediment records, Journal

5K.-C. Emeis et al. / Journal of Marine Systems xxx (2009) xxx–xxx
ARTICLE IN PRESS
Since the introductory work of Soutar and Isaacs (1969), evidencefrom fish scales, archaeological research, and other means of inferringpopulation variability have revealed numerous insights into oceanecosystem variability (Finney et al., 2002; Sandweiss et al., 2004;Gutiérrez et al., 2008).
3.4. Recent studies on fish scales in the Benguela upwelling area
Struck et al. (2004)mapped the amount and type offish scales in 20surface sediment stations from the diatomaceousmudbelt on the shelfoffshore Namibia (19°–24° S). Most abundant were scales of fourdifferent fish species: sardine (Sardinops sagax), anchovy (Engrauliscapensis), hake (Merluccius capensis/paradoxus), and horse mackerel(Trachurus capensis), albeit in strongly variable amounts. The totalnumber of scales was highest in samples from approximately 70 mwater depth, suggesting either physical (sediment winnowing) orchemical (preservation of chitin) influences, in addition to changes inthe distribution and abundance of the population. Scales of sardinesdominate the assemblage, whichwas attributed to both stability of thescale architecture and the high abundance of sardine in the coastalupwelling ecosystem. The peak abundance of sardine and total scalescorresponded to an area of high biological productivity northwest offWalvis Bay. The stable nitrogen isotope composition (δ15N) in fishscales clearly reflected the trophic level inhabitedby the fourfish speciesrepresented by scales in the surface sediments (Fig. 3; Struck et al.,2004). The δ15N of sardine scales suggested an intermediate position inthe food chain between a consumer of first and second order. Theaverage δ15N signature of anchovy scales suggested a higher position(second order consumer) in the food web. δ15N of hake and horsemackerel indicated that they are in even higher trophic positions.
Extending the present-day pattern of scale assemblages tosediment records of the last 5000 years, Schmitz (2005) (Fig. 4)found conspicuous rhythms in scale abundance and assemblagecomposition in several dated sediment cores, similar to thosepreviously described by McLachlan (1994) from the same region.Struck et al. (in prep) attribute this variability to productivity changesand changes in climatic forcing; indication for a change in forcingcomes from SST reconstructions for the same sediment record(Baumgartner et al., 2004). Scales of sardines and anchovies dominatethe records off Namibia and vary antagonistically, as they do in otherrecords from the area (McLachlan, 1994; Schmitz, 2005; Struck andAltenbach, 2006) and in the east Pacific records (Baumgartner et al.,1992); in addition, scales of horse mackerel and hake were found. Alldata so far suggest that populations varied considerably in size (scaleabundance) and trophic position (nitrogen isotopes) in pre-fisheriestime. After 5000 year BP the paleo SST-record has low variability
Fig. 3. Tailed box plots of δ15N-data of fish scales (modified from Struck et al., 2004) from diffThe N-isotope signature in fish scales indicates the position of fish in the food chain relativesuspended particulate nitrogen from the coastal upwelling system off Namibia, which refle
Please cite this article as: Emeis, K.-C., et al., Impacts of past climate variaof Marine Systems (2009), doi:10.1016/j.jmarsys.2008.12.012
whereas fish scale accumulation rates in the same records exhibitvariations of almost three orders of magnitude (Fig. 4).
3.5. Isotope mass-balance records
On the highest trophic levels and in particular circumstances, themass impact of a particular organism on local nutrient element cyclesis so high as to be recorded in the sediment record or nutrient budget.As reported in the contribution by Finney et al. (2008-this issue) theimpact of salmonnecromass on the nitrogen balance of spawning lakesis so large that there is an effect on the isotopic composition ofsedimentary nitrogen. High resolution (~5 year) sediment recordsspanning the past 300 years for five different salmon stocks in twoimportant regions of Alaska were presented in Finney et al. (2000).These records show similar trends within and between regions.Significant variability precedes the onset of commercial fisheries in theregion. The similarity of records was thus attributed to the commonforcing by regional climatic change (Finney et al., 2000). Though thevariability in abundance was not statistically defined and the recordswere too short to adequately define any periodicity, large changes insalmon populations clearly occurred over timescales of 50–100 years.
Fish stock reconstructions from historical records are possible onlywhere bookkeeping was part of the trade or where indirect evidencecan unambiguously be linked to abundance and composition ofpopulations. Successful reconstructions from sediments are restrictedto certain environments with sufficient accumulation rates of fishremains and preservation potential, or where mass fluxes of materialswere significantly influenced by fish populations.
4. What are the mechanisms leading to ecosystem variability,what are typical space and time scales, and can paleo-records helpto identify them?
4.1. Global and regional climate variability in the Holocene
Global coupledmodels give thebest, integratedviewof the evolutionin the Holocene, whereas regional changes of individual ecosystemscan best be interpreted from sediment records and observations.Transient simulations of global climate evolution over millennia are inthe making, but results at present are restricted to stationary modelscovering the hypsithermal (early Holocene, around 9000–6000 yearsago), the period around 3000 years ago, and themodern situation (pre-industrial),which in themodels is usedas the control againstwhichpastchanges are evaluated (Mikolajewicz et al., 2003; Schurgers et al., 2006).
Main effects on global climate and ecosystem boundary conditionsafter the deglaciationwere changes in sea level (until appr. 6000 yearsago), which effectively createdmany of the nearshore ecosystems, and
erent fish species from surface sediments from the diatomaceous mud belt off Namibia.to their prime food source (Struck et al., 2004). Also indicated is the δ15N-signature ofcts presumably the N-isotopic composition of the first trophic level (phytoplankton).
bility on marine ecosystems: Lessons from sediment records, Journal

Fig. 4. Paleo SST-and δ15N records of core SL226620 from the Benguela upwelling area and fish scale deposition rates (n m−2 a−1) (after Schmitz, 2005). MUC=Multicorer,SL=gravity corer interval. + signs mark depths of age tie points (14-C analyses).
6 K.-C. Emeis et al. / Journal of Marine Systems xxx (2009) xxx–xxx
ARTICLE IN PRESS
changes of net annual and seasonal insolation patterns due to changesin Earth's orbit around the sun. Other influences, such as solar andvolcanic activity, were of subordinate importance on the time scale ofseveral millennia. The modelled global effects of changing insolationwere significantlywarmed SST in latitudes N30° N and N60°S, resultingin a decrease of deep-water formation on a global scale, and increase instratification that decreased convective regeneration of nutrients tothe euphotic zone. Although physical upwelling intensity wasenhanced due to strengthened trade and monsoonwinds, the upwardtransport of nutrients was reduced due to changes in intermediatewater origin and age (U. Mikolajewicz, pers. comm. 2007).
Please cite this article as: Emeis, K.-C., et al., Impacts of past climate variaof Marine Systems (2009), doi:10.1016/j.jmarsys.2008.12.012
The inherently smooth changes in global insolation, however, arenot imaged in matchingly smooth regional (and global) paleoclimatearchives. Rapid climate changes, usually of a pattern with coolingpoles and drier/wetter tropics, of global extent are noted between9000–8000, 6000–5000, 4200–3800, 3200–2500, 1200–1000, andsince 600 calendar years BP (Mayewski et al., 2004). Most of these areattributed to contractions of the low-latitude atmospheric circulationsystem, and associated changes in moisture transport. Of all possibleforcing mechanisms, Mayewski et al. (2004) identified solar varia-bility as the most likely modulator of insolation, and thus as theunderlying cause for rapid climate change.
bility on marine ecosystems: Lessons from sediment records, Journal

7K.-C. Emeis et al. / Journal of Marine Systems xxx (2009) xxx–xxx
ARTICLE IN PRESS
Many individual sediment records from ocean margin ecosystemshave been evaluated for variability in forcing and physical boundaryconditions in the time domain. When the relative impacts of secular,decadal, interannual climate and ecosystem variability on sedimentrecords can be evaluated (a matter of temporal resolution and signalstrength), there consistently appears to be significantly more vari-ability in secular/millennial than in the decadal/interannual band inmost sediment cores. Furthermore, variability appears to increase aswe go forward in time, which can be attributed to signal attenuationby ongoing diagenesis. Those few sediments that show unambiguousvariability on annual time scales are usually deposited under very
Fig. 5. Lamination- and accumulation proxy record of core NAM1 from the Benguela upwelliBulkAR) are accompanied by pronounced lamination indicative of anoxic conditions while p(Kristen, 2003).
Please cite this article as: Emeis, K.-C., et al., Impacts of past climate variaof Marine Systems (2009), doi:10.1016/j.jmarsys.2008.12.012
specific conditions of anoxia in near-bottom waters, resulting invarved sediments that reflect seasonal changes in the flux of dominantsediment components and absence of benthic activity that normallyeradicates the flux differences. Continuously varved records arescarce, however, and most environments that vary in oxygenationdisplay a distinct change in the quality of sediment records attransitions between oxic and anoxic intervals of deposition.
The “on/off” variability caused by the overriding effect of bottom-water oxygen levels is illustrated by a lamination record from core“NAM1” (Fig. 5) from the Benguela coastal upwelling area. Here theTOC-accumulation rates show co-variations with the frequency of
ng area. Phases of high accumulation rates of bulk sediments of organic carbon (TOCAR,hases of low AR reveal little or no lamination indicative for bottom water oxygenation
bility on marine ecosystems: Lessons from sediment records, Journal

Fig. 6. Evolution of sedimentary fluxes calculated in two sediment cores collected in theBay of Antofagasta (23° S), at about 80 m of water depth; a) standardized anomaly ofthe first principal component of sedimentary proxies interpreted as a primaryproduction index; b) TOC fluxes; c) carbonate fluxes; and d) fluxes of Chaetocerosresting spores, which is the dominant component of the upwelling diatom assemblage.Modified from Vargas et al. (2004).
8 K.-C. Emeis et al. / Journal of Marine Systems xxx (2009) xxx–xxx
ARTICLE IN PRESS
lamination versus homogenous sediments in the core record (Kristen,2003). The alternation between laminated and homogeneous sedimentmirrors the transition of a threshold value in oxygen content of bottomwater, and lamination indicates a stable mode of high productivityaccompanied by strong oxygen consumption duringmicrobial reminer-alization of organic matter at the sea floor. Homogeneous sedimentsreflect reduced productivity and presence of oxygen at the sea floor dueto lower oxygen consumption by remineralizing microbes.
However, due to different remineralization rates for the twomodesof sedimentation (oxic or anoxic), quantitative reconstruction ofproductivity on the basis of accumulation rates (e. g., accumulationrates of organic carbon or fish scales) is strongly biased and the twomodes are definitely not comparable. For this reason the records mustbe interpreted with care and other (not sedimentation-rate depen-dent) proxies should be applied to cross check the results.
Another area where work on reconstruction of fish stocks has reliedon sediment records is the coastal upwelling area offshore Peru.Sediment cores collected in Mejillones Bay (23° S, northern Chile) andoff Pisco, Peru (14°07′ S), spanning at least the past 300 years, exhibitsignificant interdecadal variability in TOC contents as well as a markedsecular shift at the late mid-nineteenth century (Vargas et al., 2004,2007; Gutiérrez et al., 2006, 2008; Valdés et al., 2008). Interdecadalvariability of TOC fluxes off Antofagasta can be interpreted as resultingfrom changes in the upwelling intensity or in the amplitude of theupwelling season off northern Chile (Vargas et al., 2004).
The secular shift of TOC consists of the onset of positive trends ofTOC content and/or TOC fluxes at ca. AD 1870. Secular shifts are alsoexpressed as changes in the lamination style, a decrease in the contentof terrigenous material, and variations in the dominance of diatomassemblages, suggesting that diagenesis did not play the major role ondriving these downcore changes (Vargas et al., 2004; Gutiérrez et al.,2006, 2008). On the other hand, even if the sediments are not varved,the laminations can sometimes record the imprint of interannualvariability, e.g. strong ENSO events that are expressed as significantchanges in the content and abundance of terrigenous minerals,resulting from an enhanced terrestrial runoff coupled with a higherintensity of subsurface circulation (Gutiérrez et al., 2006) (Fig. 6).
Within the HCE (Humboldt Current Ecosystem), two “anchovyregimes” (one ending in the late 1960s, the other one starting in themid 1980s) separated by a “sardine regime” (from around 1970 to themid 1980s) have been proposed (Alheit and Ñiquen, 2004; Alheit andBakun, this issue). High-resolution (decadal or sub-decadal resolu-tion) studies on sediment cores off Peru are still scarce and, due todating uncertainties, are limited to the past 150 to ~300 years(Schwartzlose et al., 1999; Gutiérrez et al., 2006) (Fig. 6). Thereforecyclicity assessment on the multidecadal or secular bands cannot beproperly achieved at the current state of knowledge. A sediment corespanning the past 150 years (Schwartzlose et al., 1999) in fact showeda large multidecadal decrease in the anchovy scale deposition rates(SDR) in the early twentieth century, associated with a higherdeposition of sardine scales for the same period. But this increaseddeposition of sardine scales was not continuous and never attainedthe same magnitude as the anchovy SDR. Sediment cores analyzed byDeVries and Pearcy (1982) and Gutiérrez et al. (2008) revealed largefluctuations in the SDR of all the fish species considered; thesefluctuations may have been forced by climate in aperiodic secularperiods of global cooling during the past 700 to 2500 years.
4.2. What are the ranges of ecosystem variability from paleo-records?
From all available records, changes in the physical environmentand on basic ecosystem levels have been subtle over the last twomillennia: sea surface temperatures and sea surface salinities in mostregions that have been studied changed by at most 10% (SST 2 °C, SSS3–5 psu). Primary productivity (aside from the effects of diageneticbreakdown, different resilience of tests and dating artifacts) in these
Please cite this article as: Emeis, K.-C., et al., Impacts of past climate variaof Marine Systems (2009), doi:10.1016/j.jmarsys.2008.12.012
regional to local environments may have fluctuated by 20–30%. Local/regional variability was most likely higher (due to spatial gradientsand shifts) but current proxy records cannot resolve these small-scalepatterns. Spatial variability is high in many regional systems, andgradients in many upwelling systems are steep at any one point intime, so that lateral shifts simulate changes in intensity even thoughthe performance of the system as a whole has not changed.
Emeis et al. (2009) mapped surface-sediment patterns of proxiesfor physical (sea surface temperature/SST from alkenone unsaturationindexes) and nutrient (δ15N on bulk sedimentary N) variables on theshelf offshore Namibia. Their present-day surface-sediment patternsoutline the coastal upwelling cells and filaments and associated highproductivity areas. Analysed in an array of dated sediment cores, thespatial patterns of SST suggest long-term (N100 years) variability inthe location and intensity of individual upwelling cells, with anamplitude of SST variations b2 °C. The patterns of δ15N outline an areaof intense denitrification near the coast, and advection of water withlow oxygen concentrations in the undercurrent from the North. δ15Nexhibits considerable downcore variability, in particular over the last50 years. The pivotal property that links the physical domain in thecoastal upwelling area offshore Namibia to the chemical and eco-system domains is the oxygen content of the water column, which isaffected by physical forcing and internal biogeochemical processes.Based on observation time series, intense variability in forcing and inupwelling intensity have been recognized. Likewise, the oxygensupply to the shelf appears to have undergone significant changes.Sedimentary archives suggest that SST variability over the last several
bility on marine ecosystems: Lessons from sediment records, Journal

9K.-C. Emeis et al. / Journal of Marine Systems xxx (2009) xxx–xxx
ARTICLE IN PRESS
thousands of years was within the bounds of today's conditions, but thatregional heterogeneity in SST and biogeochemical conditions wassignificant. The variability appears to be governed by differences inextent of denitrification and thus of the shelf oxygen balance, whichappears to have deteriorated in the last 50 years. Together, the datasuggest that SST and denitrification conditions have remained inthe narrow bounds outlined by today's patterns in surface sediments,but that spatially small variability in upwelling intensity andmake-up ofupwelling feedwaters induced considerable changes in the lower trophiclevels of the coastal upwelling ecosystem over the last 6000 years.
Available data of TOC flux variation off northern Chile during thepast 250 years indicate a variability in a factor of two in this proxy(Fig. 6) (Vargas et al., 2004). A similar range of variation is observed inthe upper continental margin off Central Peru (Gutiérrez et al., 2008).The secular shift in TOC fluxes off northern Chile and off Central Peruare contemporaneous to the end of the Little Ice Age (LIA), when seasurface temperatures in the Tropical Western Pacific became cooler,according to paleo-temperature reconstructions from coral records(Hendy et al., 2002), and the tropical Pacific switched from ‘El Niño-like’ to ‘La Niña-like’ conditions (Yamamoto, 2004). More signals ofsecular changes of the Humboldt system were provided by DeVriesand Schrader (1981) and DeVries and Pearcy (1982), who studiedsediment cores at coarse resolution (ca. 50 years) for diatomassemblages and fish scale deposition rates off Central Peru, includingcontinuous records from the past 600±100 years and from ca. 1800–2500 yr. BP. They reported decreases of the overall fish scaledeposition rates, associated to a higher temporal variability of thedominant diatom assemblages (upwelling vs. oceanic), during periodsof ‘global’ cooling, including the LIA.
These changes would be consistent with a weakened or moresoutherly position of the Intertropical Convergence Zone, leading towetter conditions in the continent (Baker, 2002), deepened thermo-cline and a higher influence of oceanic waters near the coast, resultingin an average lower productivity in the Peruvian system (DeVries andPearcy, 1982; Gutiérrez et al., 2008). Reduced values of fish SDR fluxesduring the LIA that are observed in recently collected box cores off Peru(Gutiérrez et al., 2008) could have been driven by a general reducedprimary productivity and enhanced dissolution processes, as resultingfrom higher bottom water oxygenation and reduced sedimentationrates (Gutiérrez et al., 2008; Diaz-Ochoa et al., in press).
Off Peru, instrumental records from the COADS database (Fig. 7)indicate a significant positive trend of the alongshore wind stress from1950onwards (Jahnckeet al., 2004). On the otherhand,Montecinos et al.(2003) observed a positive trend in the offshore SST, but the SST fromcoastal stations off Peru and Chile either exhibited a smaller positivetrend or even negative trends, at Callao (12° S) and Caldera (27° S). Theonshore–offshore difference in the SST trendsmay be consistent with anintensification of coastal upwelling for the same period (Montecinoset al., 2003). Another oceanographic indicator, the thermocline depth,also showed positive trends along the Peru–Chile coast, but with high
Fig. 7. Variation of the alongshore wind stress from the COADS database off Peru. Thealongshore wind stress from COADS (a, filled circles) is compared with previouslyderived estimates from empirical data in maritime report files for a similar area (a, opencircles). Modified from Jahncke et al. (2004).
Please cite this article as: Emeis, K.-C., et al., Impacts of past climate variaof Marine Systems (2009), doi:10.1016/j.jmarsys.2008.12.012
local variability in their amplitudes, varying from 6 to 30 m in 50 years(Pizarro andMontecinos, 2004). Superimposed on these50 year positivetrends, SST and the thermocline depths also exhibit significantinterdecadal variability, that is more important in higher latitudes(Montecinos et al., 2003; Pizarro and Montecinos, 2004).
To detect so-called “regime shifts” such as reported by Alheit andNiquen (2004) in natural ecosystemvariability inpaleo records is quitedifficult. One reason is that typically only one or two records from oneLE (“large ecosystem”) are studied. Additionally, inmost cases only oneor few ecosystem variables are reconstructed from sedimentaryproxies. Only studies with a spatially distributed number of sedimentcores from on LE can offer time-dependent proxy patterns goodenough to separate natural variability from real regime shifts. Potentialsites for this kind of study are the Benguela Upwelling System, where adiatomaceous mud belt covers the shelf area of the coastal upwellingarea, the Santa Barbara Basin, and anoxic areas off Chile and Peru.However, in most cases the paleo records are either not spatiallydistributed or lack enough proxy data to reconstruct physical andecological ecosystem variability. It will be a great challenge for futurescientific work to gather research capacities on one distinct LE toproducemulti proxy records in a good spatial and temporal resolution.
5. Conclusions
Response of higher trophic levels to changes at the base ofecosystems appears to be highly non-linear and shows variations ofseveral orders of magnitude, as exemplified by fish stocks in severalareas (Baltic Sea, North Sea, upwelling systems, lakes in Canada) fromhistorical records, observations and sediment archives. The tendency inthe group's discussion is for bottom-up control of marine ecosystems asthe dominant reason for the high rate of variability on higher trophiclevels: In our opinion, small changes in the physical environment causechanges in biogeochemical cycles, for example by alternating oxic/anoxic conditions in coastal upwelling settings and in silled basins,which have significant impacts on nutrient ratios. These in turn maydetermine both the assemblage composition and biomass of primaryproducers and zooplankton. In our opinion, higher trophic levels inmany areas are affected primarily by food availability (herring, salmon)and by “collateral damage” in the wake of physical/biogeochemicalprocesses (for example by sub-optimal conditions for spawning at lowoxygen conditions, mass mortalities due to H2S in the water column).
Shapes of paleo-curves suggest cyclicities or thresholds, whichpoint to either cyclic external drivers or non-linear reactions. Mostavailable records are low-pass filtered with a bias to longer-termchanges, which limits the window of detection to (interannual)-decades to centuries or even longer. In this discussion, the group alsotouched on the question whether there are any stable modes inmarine ecosystems at all. Many records suggest that stochastic statechanges occur, and that “mean states” are rarely realized – mostrecords are above or below averages for most of the time.
Occasionally the sediment work opens new vistas on processesthat were not recognized in observational records (cycle length), butalso because geologists and biologists tackle ecosystem processesfrom different angles. Geologists inherently believe that environmentsand ecosystems are constantly changing. At present we can onlyextrapolate from cyclic records and can estimate the boundaries ofvariations under pristine conditions. The pre-anthropogenic situationis the “control” for the human experiment with global change. In thiscontext, there is understandable interest in the question if marineecosystems have been substantially different before human impact, sothat we invariably deal with no-analog situations when studyingmodern ecosystems and extrapolate to pristine conditions.
The group thinks that the most fertile direction of future research isthe combination of sediment/historical archives and process/ rateunderstanding gained from historical/sediment archives with ecosys-temmodels. This approach also encompasses zooarcheologicalmethods
bility on marine ecosystems: Lessons from sediment records, Journal

10 K.-C. Emeis et al. / Journal of Marine Systems xxx (2009) xxx–xxx
ARTICLE IN PRESS
and approaches. The models are used as “what if” integrators, theboundary conditions given by reconstructions from archives that in turncan be tested for plausibility by the models. Then the most plausiblemodel configurations/boundary conditions can be extrapolated fromIPCC scenario runs or the like.
References
Alheit, J., Niquen, M., 2004. Regime shifts in the Humboldt Current ecosystem. Progressin Oceanography, 60, 201–222.
Alheit, J., Bakun, A., this issue. Population synchronies within and between oceanbasins: apparent teleconnections and implications as to physical–biological linkagemechanisms. J. Mar. Syst.
Altabet, M.A., Francois, R., 1994. Sedimentary nitrogen isotopic ratio as a recorder forsurface ocean nutrient utilization. Global Biogeochemical Cycles 8, 103–116.
Baker, P.A., 2002. Trans-Atlantic climate connections. Science 296, 67–68.Barrett, J.H., Locker, A.M., Roberts, C.M., 2004. 'Dark Age Economics' revisited: the
English fish bone evidence AD 600–1600. Antiquity 78, 618–636.Baumgartner, T.R., Soutar, A., Ferreira-Bartrina, V., 1992. Reconstruction of the history of
Pacific sardine and Northern Anchovy populations over the past two millenia fromsediments of the Santa Barbara Basin, California. CalCOFI Rep. 33, 24–40.
Baumgartner, T., Struck, U., Alheit, J., 2004. Interdecadal to multi-centennial variabilityin marine fish populations. Pages Newsletter, 12 (1), 19–23.
Berntsen, A., 1650–1656. Danmarckis oc Norgis Fructbar Herlighed. (Reprinted andpublished by Selskabet for Udgivelse af Kilder til dansk Historie, 1971, firstpublished by Peder Hase, University of Copenhagen).
Christensen, J.T., Cedhagen, T., Hylleberg, J., 2004. Late-Holocene salinity changes in TheLimfjord, Denmark. Sarsia 89, 379–387.
Crutzen, P.J., Stoermer, E.F., 2000. The “Anthropocene”. Global ChangeNewsletter41,12–13.DeVries, T.J., Pearcy, W.G., 1982. Fish debris in sediments of the upwelling zone off
central Peru: a late Quaternary record. Deep Sea Research 29, 87–109.DeVries, T.J., Schrader, H., 1981. Variation of upwelling/oceanic conditions during the
latest Pleistocene through Holocene off the central Peruvian coat: a diatom record.Marine Micropaleontology 6, 157–167.
Díaz-Ochoa, J.A., Lange, C.B., Pantoja, S., De Lange, G.J., Gutiérrez, D., Muñoz, P.,Salamanca, M., 2009. Preservation of fish scales in sediments from off Callao, centralPeru. Deep-Sea Research II. doi:10.1016/j.dsr2.2008.09.015.
Emeis, K.-C., Struck, U., Leipe, T., Ferdelmann, T.G., 2009. Variability in upwelling intensityand nutrient regime in the coastal upwelling system offshore Namibia: results fromsediment archives. International Journal of Earth Sciences 98 (2), 309–326.
Field, D.B., Baumgartner, T.R., Charles, C.D., Ferreira-Bartina, V., Ohman,M.D., 2006. Planktonicforaminfera of the California Current reflect 20th-Century warming. Science 311, 63–66.
Finney, B.P., Gregory-Eaves, I., Sweetman, J., Douglas, M.S.V., Smol, J., 2000. Impacts ofclimatic change and fishing on pacific salmon abundance over the past 300 years.Science 290, 795–799.
Finney, B.P., Gregory-Eaves, I., Douglas, M.S.V., Smol, J.P., 2002. Fisheries productivity inthe northeastern Pacific Ocean over the past 2,200 years. Nature 416, 729–733.
Finney, B., Alheit, J., Emeis, K.C., Struck, U., 2008-this issue. Paleoecological studies onvariability in marine fish populations: a long-term perspective on the impacts ofclimatic change on marine ecosystems. J. Mar. Syst.
Fischer, G., Wefer, G. (Eds.), 1999. Use of Proxies in Paleoceanography. Springer-Verlag,Berlin, Heidelberg, p. 735.
Gutiérrez, D., Sifeddine, A., Reyss, J.L., Vargas, G., Velazco, F., Salvatteci, R., Ferreira, V.,Ortlieb, L., Field, D., Baumgartner, T., Boussafir, M., Boucher, H., Valdés, J., Marinovic,L., Soler, P., Tapia, P., 2006. Anoxic sediments off Central Peru record interannual tomultidecadal changes of climate and upwelling ecosystem during the last twocenturies. Advances in Geosciences 6, 119–125.
Gutiérrez, D., Sifeddine, A., Field, D., Ortlieb, L., Vargas, G., Chávez, F., Velazco, F., Ferreira,V., Tapia, P., Salvatteci, R., Boucher, H., Morales, M., Valdés, J., Reyss, J.-L.,Campusano, A., Boussafir, M., Mandeng-Yogo, M., García, M., Baumgartner, T.,2008. Rapid reorganization in ocean biogeochemistry off Peru towards the end ofthe Little Ice Age. Biogeosciences Discussions 5, 3919–3943.
Hendy, E.J., Gagan, M.K., Alibert, C.A., McCulloch, M.T., Lough, J.M., Isdale, P.J., 2002.Abrupt decrease in tropical Pacific Sea surface salinity at end of Little Ice Age.Science 295, 1511–1514.
Hunter, J.R., Alheit, J., 1995. International GLOBEC Small Pelagic Fishes and ClimateChange program. GLOBEC Report No. 8, 72 pp.
Ittekkot, V., Deuser,W.G.,Degens, E.T.,1984. Seasonality in thefluxesof sugars, aminoacids,and amino sugars to the deep ocean: Sargasso Sea. Deep-Sea Research 31, 1057–1069.
Jahncke, J., Checkley, D., Hunt, G.L., 2004. Trends in carbon flux to seabirds in thePeruvian upwelling system: effects of wind and fisheries on population regulation.Fisheries Oceanography 13, 208–223.
Koning, E., van Iperen, J.N., van Raaphorst, E., Helder, W., 2001. Selective preservation ofupwelling-indicating diatoms in sediments off Somalia, NW Indian Ocean. Deep SeaResearch Part I: Oceanographic Research Papers 48, 2473–2495.
Kristen, I., 2003. Paläoklimatologische Untersuchungen im Auftriebsgebiet vor Namibia.Diplomarbeit Thesis, Ludwig Maximilians Universität, München, 48 pp.
Markgraf, V., Baumgartner, T.R., Bradbury, J.P., Diaz, H.F., Dunbar, R.B., Luckmann, B.H.,Seltzer, G.O., Swetnam, T.W., Villalba, R., 2000. Paleoclimate reconstruction alongthe Pole-Equator-Pole transect of the Americas (PEP1). Quaternary Science Reviews19, 125–140.
Mayewski, P.A., et al., 2004. Holocene climate variability. Quaternary Research 62,243–255.
Please cite this article as: Emeis, K.-C., et al., Impacts of past climate variaof Marine Systems (2009), doi:10.1016/j.jmarsys.2008.12.012
McLachlan, A.J.,1994. Fish population dynamics assessed using sediment box cores fromthe southeastern Atlantic Ocean. Masters Thesis, Natal University, Natal, 90 pp.
Mikolajewicz, U., Scholze, M., Voss, R., 2003. Simulating near-equilibrium climate andvegetation for 6000 cal. years BP. The Holocene 13, 319–326.
Milessi, A., Sellanes, J., Gallardo, V., Lange, C., 2005. Osseous skeletal material and fishscales in marine sediments under the oxygen minimum zone off northern andcentral Chile. Estuarine and Coastal Shelf Science, 64, 185–190.
Montecinos, A., Purca, S., Pizarro, O., 2003. Interannual-to-interdecadal sea surfacetemperature variability along the western coast of South America. GeophysicalResearch Letters 30 (11), 1570. doi:10.1029/2003GL017345.
Patterson, R.T., Prokoph, A., Kumar, A., Chang, A.S., Roe, H.M., 2005. Late Holocenevariability in pelagic fish scales and dinoflagellate cysts along the west coast ofVancouver Island, NE Pacific Ocean. Marine Micropaleontology 55 (3–4), 183–204.
Pizarro, O.,Montecinos, A., 2004. Interdecadal variability of the thermocline along thewestcoast of South America. Geophys. Res. Lett. 31, L20307. doi:10.1029/2004GL020998.
Poulsen, B., Holm, P., MacKenzie, B.R., 2007. A long-term (1667–1860) perspective onimpacts of fishing and environmental variability on fisheries for herring, eel andwhitefish in the Limfjord, Denmark. Fisheries Research 87, 181–195.
Rasmussen, H., 1968. Limfjordsfiskeriet før 1825. The National Museum, Copenhagen.Sandweiss, D.H., Maasch, K.A., Chai, F., Andrus, C.F.T., Reitz, E.J., 2004. Geoarcheological
evidence for multidecadal natural climatic variability and ancient Peruvianfisheries. Quaternary Research 61 (3), 330–334.
Saxo Grammaticus, 2000 (original 12th century). Saxos Danmarkshistorie , translatedby Peter Zeeberg from latin manuscript: Gesta Danorum. Det Danske Sprog-ogLitteraturselskab and G.E.C. Gads Forlag., Gylling.
Schmitz, S., 2005. Paleoceanographic Reconstructions of the last 5000 years in theupwelling area off Namibia bymeans of stable isotopes (d15N/d18O/d13C) and fishscale statistics. Diploma Thesis, Ludwig Maximilians Universität, Munich, 62 pp.
Schubert, C.J., et al., 1998. Stable phytoplankton community structure in the Arabian Seaover the past 200,000 years. Nature 394 (6693), 563–566.
Schurgers, G., Mikolajewicz, U., Gröger, M., Maier-Reimer, E., Vizcaíno, M., Winguth, A.,2006. Dynamics of the terrestrial biosphere, climate and atmospheric CO2concentration during interglacials: a comparison between Eemian and Holocene.Climates of the Past 2, 205–220.
Schwartzlose, R.A., et al., 1999. Worldwide large-scale fluctuations of sardine andanchovy populations. South African Journal of Marine Science 21, 289–347.
Shackleton, L.Y., 1987. A comparative study of fossil fish scale from three upwellingregions. South African Journal of Marine Science 5, 79–84.
Soutar, A., 1967. The accumulation of fish debris in certain California sediments.California Cooperative Oceanic Fisheries Investigations 11, 136–142.
Soutar, A., Isaacs, J.D., 1969. History of fish populations inferred from fish scales inanaerobic sediments off California. CalCOFI Rep. 13, 63–70.
Struck, U., Altenbach, A.V., 2006. Palaeoclimatological investigations in upwellingsediments off Namibia. In: H. Leser (Ed.), The Changing Culture and Nature ofNamibia: Case Studies. The Sixth Namibia Workshop Basel 2005; In Honour ofDr. h.c. Carl Schlettwein (1925–2005). Publishing House Basler Afrika Biblio-graphien, Basel- Windhoek, pp. 165–169.
Struck, U., Voss, M., Mumm, N., von Bodungen, B., 1998. Stable isotopes of nitrogen infossil cladoceran exoskeletons: implications for nitrogen sources in the Baltic Seaduring the last century. Naturwissenschaften 85 (12), 597–603.
Struck, U., Emeis, K.-C., Alheit, J., Schneider, R., Eichner, C., Altenbach, A.-V., 2002. Changes oftheupwelling rate of nitratepreserved in thed15N-signatureof sediments andfish scalesfrom the diatomaceous mud belt off Namibia. GeoBios 35, 3–11 (EPA-special issue).
Struck, U., Altenbach, A.V., Alheit, J., Heyn, T., Emeis, K.-C., 2004. Distribution andnitrogen isotope ratios of fish scales in surface sediments from the upwelling areaoff Namibia. Zittelliana 44 (A), 125–132.
Stuiver, M., Reimer, P.J., Braziunas, T.F., 1998. High-precision radiocarbon age calibrationfor terrestrial and marine samples. Radiocarbon 40, 1127–1151.
Suess, E., 1980. Particulate organic carbon flux in the oceans: surface productivity andoxygen utilization. Nature 288, 260–263.
Suess, E., 1981. Phosphate regeneration from sediments of the Peru continental marginby dissolution of fish debris. Geochimica et Cosmochimica Acta 45, 577–588.
vanNeer,W., Ervynck,A., Bolle, L.J.,Millner, R.S., Rijnsdorp, A.D., 2002. Fish otoliths and theirrelevance to archaeologyan analysis ofmedieval, post-medieval and recentmaterial ofplaice, cod and haddock from the North Sea. Environmental Archaeology 7, 61–76.
Valdés, J., Ortlieb, L., Gutiérrez, D., Marinovic, L., Vargas, G., Sifeddine, A., 2008. A 250years – sedimentary record of sardine and anchovy scale deposition in MejillonesBay, 23°S, Northern Chile. Progress in Oceanography 79, 198–207.
Vargas, G., Ortlieb, L., Pichon, J.J., Bertaux, J., Pujosa, M., 2004. Sedimentary facies andhigh resolution primary production inferences from laminated diatomacoussediments off northern Chile (23°). Marine Geology 211, 79–99.
Vargas, G., Pantoja, S., Rutllant, J.A., Lange, C.B., Ortlieb, L., 2007. Enhancement of coastalupwelling and interdecadal ENSO-like variability in the Peru–Chile Current sincelate 19th century. Geophysical Research Letters 34, L13607.
von Storch, H., Zorita, E., Jones, J.M., Dimitriev, Y., González-Rouco, F., Tett, S.F.B., 2004.Reconstructing past climate from noisy data. Science 306, 679–682.
Wright, C.A., Dallimore, A., Thomson, R.E., Patterson, R.T., Ware, D.M., 2005. LateHolocene paleofish populations in Effingham Inlet, British Columbia, Canada.Palaeogeography, Palaeoclimatology, Palaeoecology 224 (4), 367–384.
Yamamoto, M., 2004. Have the tropical pacific ocean–atmosphere interactions behavedas a driver of centennial-to orbital-scale climate changes? In: Shiyomi, M.,Kawahata, H., Koizumi, H., Tsuda, A., Awaya, J. (Eds.), Global Environmental Changein the Ocean and on Land, pp. 265–278.
Zonneveld, K.A.F., Bockelmann, F., Holzwarth, U., 2007. Selective preservation of organic-walled dinoflagellate cysts as a tool to quantify past net primary production andbottom water oxygen concentrations. Marine Geology 237 (3–4), 109–126.
bility on marine ecosystems: Lessons from sediment records, Journal