retinal binding during folding and assembly of the membrane protein bacteriorhodopsin †
TRANSCRIPT
Retinal Binding during Folding and Assembly of the Membrane ProteinBacteriorhodopsin†
Paula J. Booth,*,‡,§ Amjad Farooq,‡,§ and Sabine L. Flitsch|,⊥
Department of Biochemistry and Dyson Perrins Laboratory, UniVersity of Oxford, Oxford OX1, U.K.
ReceiVed January 18, 1996; ReVised Manuscript ReceiVed March 5, 1996X
ABSTRACT: The factors driving folding and assembly of integral membrane proteins are largely unknown.In order to determine the role that the retinal chromophore plays in assembly of bacteriorhodopsin, wehave determined the kinetics and thermodynamics of retinal binding during regeneration of bacterio-rhodopsin, from denatured apoprotein,in Vitro. Regeneration is initiated by rapid, stopped-flow, mixingof the denatured apoprotein bacterioopsin in sodium dodecyl sulfate micelles with mixed detergent/lipidmicelles containing retinal. Regeneration kinetics are measured by time-resolving changes in proteinfluorescence. The dependence of each kinetic component on retinal concentration is determined. Onlyone experimentally observed rate constant is dependent on retinal concentration, leading to identificationof only one second-order reaction involving retinal and bacterioopsin. This reaction occurs after a rate-limiting step in bacterioopsin folding, and results in formation of a noncovalent retinal/protein complex.The free energy change of this retinal binding step is determined, showing that thermodynamic informationcan be obtained on transient intermediates involved in membrane protein regeneration.
The correct assembly of proteins which are integral tobiological membranes is vital for membrane function. Likemost proteins, membrane proteins are unable to functionunless folded into a specific, three-dimensional shape.Although there has been progress toward understanding thisprecise folding for water-soluble proteins (Matthews, 1993),there is little information for integral membrane proteins.Bacteriorhodopsin provides an ideal model system for a studyof membrane protein folding kinetics (Huang et al., 1981;London & Khorana, 1982; Booth et al., 1995). This integralmembrane protein is the only protein present in the purplemembrane ofHalobacteria salinaria, where it functions asa light-driven proton pump (Stoeckenius & Bogomolni,1982).Bacteriorhodopsin is one of the few membrane proteins
for which a high-resolution structure is known (Hendersonet al., 1990). The protein is 248 amino acids long andconsists of 7 transmembrane helices connected by shortextramembranous loops. A retinal chromophore is covalentlybound within the seven helix bundle via a protonated Schiff-base linkage to Lys-216. Bacteriorhodopsin is part of afamily of retinal binding proteins which includes the mam-malian vision receptor rhodopsin, and for which it is oftenused as a model system (Oesterhelt & Tittor, 1989; Khorana,1993). The function of both bacteriorhodopsin and rhodopsinis reliant on photoisomerization of retinal. Retinal undergoesthermal reisomerization while remaining bound to bacterio-rhodopsin; however, in the case of rhodopsin, retinal has to
be expelled from its binding site for reisomerization (Birge,1990). Thus, incorporation of retinal and regeneration ofrhodopsin are key to the action of the vision receptor.Indeed, the action of many membrane-bound receptors isdependent on the binding of a small molecular cofactor whichin the case of G-protein receptors is an agonist or antagonist.Rhodopsin itself is a member of the large family of G-proteinreceptors (Hargrave, 1991). These receptors seem to possessstructures which, although not identical to that of bacteri-orhodopsin, are based on seven transmembrane helices(Hargrave, 1991; Schertler et al., 1993; Donnelly & Findlay,1994). It has been speculated by analogy with the retinalbinding proteins that the seven helices of the G-proteinreceptors also form their cofactor binding pockets, givingbinding pockets that are surprisingly similar, in view of thevariety of cofactor structure and the fact that rhodopsin isthe only G-protein receptor to bind its cofactor covalently(Oprian, 1992; Savarese & Fraser, 1992).
Bacteriorhodopsin can be spontaneously refolded to anative state from a denatured statein Vitro (Huang et al.,1981; London & Khorana, 1982), allowing its assemblykinetics to be studied (London & Khorana, 1982; Booth etal., 1995). Indeed, it is one of the few membrane proteinsfor which this is possible; to date, spontaneous refolding hasonly been shown for two other membrane proteins: porins(Eisele & Rosenbuch, 1990) and the major light-harvestingcomplex of green plants (Plumley & Schmidt, 1987; Paulsenet al., 1990). Bacteriorhodopsin can be refolded from adenatured state to a state with native secondary structure inthe absence of retinal (London & Khorana, 1982; Popot etal., 1987), implying that retinal does not initiate proteinfolding. Addition of retinal to this partially folded stateregenerates bacteriorhodopsin, in a reaction that consists ofat least two stages: first, noncovalent binding of retinal inits binding site; and second, formation of the Schiff base(London & Khorana, 1982; Popot et al., 1987; Booth et al.,
† This work was supported by the BBSRC (studentship to A.F. andGrant GR/J67857) and the Royal Society. P.J.B. is Rosenheim ResearchFellow of the Royal Society.* To whom correspondence should be addressed.‡ Department of Biochemistry.§ Present address: Department of Biochemistry, Imperial College
of Science, Technology & Medicine, London, SW7 2AY, U.K.| Dyson Perrins Laboratory.⊥ Present address: Chemistry Department, University of Edinburgh,
Edinburgh EH9 3JJ, U.K.X Abstract published inAdVance ACS Abstracts,April 15, 1996.
5902 Biochemistry1996,35, 5902-5909
S0006-2960(96)00129-8 CCC: $12.00 © 1996 American Chemical Society
+ +
+ +

1995). Retinal binding to bleached purple membrane, orbleached, monomeric, bacteriorhodopsin, also seems to occurin two similar stages (Oesterhelt et al., 1973; Oesterhelt &Schuhmann, 1974; Schreckenbach et al., 1977).
We have recently reported a kinetic study of bacterio-rhodopsin assembly with millisecond time resolution (Boothet al., 1995). Folding was initiated by a stopped-flowmethod, whereby a denatured state of bacteriorhodopsin, insodium dodecyl sulfate (SDS)1 detergent micelles, wasrapidly mixed with renaturing, mixed dimyristoylphosphatid-ylcholine (DMPC)/CHAPSmicelles containing retinal (Boothet al., 1995). Changes in protein fluorescence were used tofollow protein folding and assembly. These experimentsindicated several kinetic phases to the regeneration. A veryfast, 250 s-1, phase accompanied mixing of the SDS andDMPC/CHAPS micelles, while phases of the order of 1.2-2.0 and 0.067 s-1 were assigned to formation of partiallyfolded apoprotein intermediates (I1 and I2). Other phaseswere resolved for retinal binding, about 2.0 s-1 for non-covalent binding, and 0.02 and 0.0014 s-1 for subsequentSchiff-base formation. The following, tentative, reactionscheme for bacteriorhodopsin regeneration was suggested:bOf I1f I2f IR f bR. I2 was presumed to correspond tothe state with native secondary structure which accumulatesin the absence of retinal (London & Khorana, 1982), andretinal was proposed to bind only to I2, resulting in formationof a noncovalent, retinal/protein intermediate, IR. However,it was not possible to rule out that retinal bound earlier duringassembly (for example to I1, or before all secondary structurehas formed), nor to confirm that I1 and I2 were formedsequentially. In addition, the use of fluorescence spectros-copy to monitor changes in protein fluorescence duringfolding and regeneration gives little information on associatedprotein structural changes. However, if thermodynamicinformation on transient regeneration intermediates can beobtained, this can be combined with site-directed mutagenesismethods to give information on the structures of intermedi-ates (Bycroft et al., 1990; Matouschek et al., 1990).
Here, we show how thermodynamic information can beobtained on intermediates involved in bacteriorhodopsinregeneration by investigating the role that retinal plays inthe regeneration process. In order to identify retinal bindingstep(s), we have investigated the dependence of eachregeneration kinetic on retinal concentration. Addition ofretinal at different times during protein folding and assemblyconfirms that retinal binding is preceded by a slower, proteinfolding event. These studies identify only one second-orderretinal, protein reaction, confirming that retinal only bindsto the intermediate I2 . The free energy of this retinal bindingreaction can be estimated, giving information on the rolethat retinal plays in driving regeneration of bacteriorhodopsin.
MATERIALS AND METHODS
Materials. L-R-1,2-Dimyristoylphosphatidylcholine (DMPC)was obtained from Avanti Phospholipids, 3-[(3-cholami-dopropyl)dimethylammonio]-1-propanesulfonate (CHAPS)was from Calbiochem, and SDS (electrophoresis grade) and
all-trans-retinal were from Sigma. All other reagents andchemicals were of analytical grade.Mixed DMPC/CHAPS micelles were prepared by stirring
2% (w/v) DMPC in 50 mM sodium phosphate buffer, pH 6,for 2 h at room temperature. CHAPS was then added to2% (w/v) final concentration and the mixture sonicated in abath sonicator for 30 min. The resulting clear, micellarsolution could be stored at 4°C for several days.Retinal was dissolved in ethanol (Analar), and the con-
centration was determined from the absorbance at 380 nmusing an extinction coefficient of 42 800 cm-1 M-1 (Rehorek& Heyn, 1979). Retinal was stored in ethanol at-70 °C,in the dark under argon, for up to 1 month. Retinal wasalways handled in dim or red light.Preparation of Bacterioopsin.Bacteriorhodopsin was
isolated as purple membrane fromHalobacterium salinarium(strain S9) according to the method of Oesterhelt andStoeckenius (1974). The strain was maintained on platesof the growth medium containing 2% agar, and transferredevery 2 or 3 months. Plates were incubated at 37°C for 2weeks, and stored at 4°C. Liquid/shake cultures were growndirectly from bright purple colonies, at 37°C in the dark, inmedium containing Oxoid peptone; 700 mL cultures (inocu-lated with about 50 mL) were shaken in 2 L flasks at 100-120 rpm, and cells were harvested after about 3-4 days whenabsorbances at 560 and 660 nm were 1.5-2 and 1-1.5,respectively (late log phase). Sucrose density gradients wererun on all-purple membrane preparations, which were thenstored at 4°C as an aqueous suspension (20-40 mg‚mL-1),containing 0.025% azide. Typical yields of purified purplemembrane were 20 mg‚L-1.Delipidated, denatured bacterioopsin (bO) in SDS was
prepared from purple membrane by the method of Braimanet al. (1987). Briefly, an aqueous suspension of purplemembrane was mixed with an organic solvent containingchloroform/methanol/triethylamine (100:100:1 volume ratio)to achieve a single phase (solvent/aqueous suspension, about8:1). Hydroxylamine was added to remove retinal, and phaseseparation was effected by addition of a buffer containing0.1 M phosphate, pH 6.0 (buffer to solvent volume ratio,about 1:1). Delipidated bO was recovered as described(Braiman et al., 1987). Phase separation and recovery ofthe protein interphase were repeated twice. The final wetpellet of delipidated bO was taken up directly in an aqueoussolution of SDS (5% w/v) to give a final SDS:protein ratio(w/w) of 5:1 (SDS concentration about 1% w/v). Thisrequired vigorous stirring to disperse the wet bO pellet,followed by centrifugation to remove any insoluble material.The final SDS-solubilized bO was stored at-20 °C.Alternatively, the wet bO pellet was transferred to SDS byredissolving the pellet in the minimum volume of chloroform/methanol/triethylamine solvent, and then adding aqueousSDS. The solvent was then evaporated in a SAVANTSPEEDVAC and the dry powder stored at-20 °C. SeveralbO preparations were obtained from one preparation ofpurple membrane. About 50% of the protein present in thepurple membrane was recovered as bO in SDS.All procedures involving organic solvents were done in
clean, dry glassware.Steady-State Spectroscopy.Absorption measurements
were made with a UVIKON 930 or Aminco DW2000spectrophotometer with a 2 nm bandwidth and 1 cm pathlength. Fluorescence measurements were made with a Perkin
1 Abbreviations: bO, bacterioopsin; CHAPS, 3-[(3-cholamidoprop-yl)dimethylammonio]-1-propanesulfonate; DMPC,L-R-1,2-dimyris-toylphosphatidylcholine; FWHM, full width half-maximum; SDS,sodium dodecyl sulfate.
Folding and Assembly of Bacteriorhodopsin Biochemistry, Vol. 35, No. 18, 19965903
+ +
+ +

Elmer LS50 spectrometer, with excitation at 290 nm, andexcitation and emission bandwidths of 2.5 nm. Fluorescenceyields are the integrals of the fluorescence band from 300to 500 nm.Bacteriorhodopsin was regenerated from bO as described
previously (Huang et al., 1981; London & Khorana, 1982).Briefly, 8 µM bO in 0.4 or 0.2% SDS/50 mM sodiumphosphate buffer (pH 6) was mixed with an equal volumeof DMPC (2% w/v)/CHAPS (2% w/v) micelles, containingall-trans-retinal (added from ethanol stock, final ethanolconcentration<0.5%). Final protein concentration was 4µM, and final retinal concentration was between 0 and 8µM. Alternatively, bO in SDS was allowed to equilibratewith DMPC/CHAPS micelles for 30 min (resulting in theformation of “bO/I2”) prior to retinal addition. Absorptionand fluorescence spectra of regenerated bacteriorhodopsinwere measured after overnight incubation in the dark at 22°C. Regeneration yields were determined from the ratio ofthe concentration of regenerated bacteriorhodopsin to theinitial concentration of bO. bO concentration was deter-mined prior to addition of DMPC/CHAPS micelles, usingan extinction coefficient for bO in SDS of 66 000 cm-1 M-1,at 280 nm (Huang et al., 1981). The concentration ofregenerated bacteriorhodopsin was determined using anextinction coefficient of 55 300 cm-1 M-1 at 555 nm (seeResults). Identical regeneration yields were found forsamples with final SDS concentrations of 0.1% and 0.2%.All procedures and measurements were performed in the
dark or dim light at 22°C.Time-ResolVed Measurements.Experiments were per-
formed using an Applied Photophysics SX.17MV stopped-flow spectrometer with a dead time of∼1.4 ms, at 22°C.Excitation was at 290 nm (1 nm bandwidth). Emission wascollected above 305 nm using a cutoff filter. Final concen-trations in the stopped-flow cuvette were 2µM protein, 1%(w/v) DMPC and CHAPS, and 0.1% (w/v) SDS.For experiments involving initiation of protein refolding
from bO, 4 µM bO in 0.2% (w/v) SDS/50 mM sodiumphosphate buffer, pH 6, was mixed with an equal volume of2% (w/v) DMPC/2% (w/v) CHAPS micelles, pH 6. Retinalwas included in the micelles where indicated. Addition ofretinal at various times during protein refolding involvedpremixing (in the stopped-flow spectrometer) 8µM bO in0.2% SDS/50 mM sodium phosphate buffer, pH 6, with anequal volume of 2% (w/v) DMPC/2% (w/v) CHAPS mi-celles, pH 6. After a preset delay time, this was rapidlymixed (by stopped-flow) with retinal in 1% DMPC, 1%CHAPS, and 0.1% SDS micelles, pH 6. Delay timesbetween 10 ms and 30 min were used. For a delay time of30 min, premixing of bO in SDS with DMPC/CHAPSmicelles was performed manually rather than by stopped-flow. Retinal concentration was varied between 0 and 64µM.All procedures and measurements were performed in the
dark or dim light at 22°C.Data Collection and Analysis.Experimentally determined
rate constants (ν) were calculated by iterative reconvolutionbased on the Marquardt fitting algorithm, assuming multi-exponential kinetics. The quality of fits was judged by plotsof the weighted residuals. Time-resolved fluorescence datawere collected over several time scales (50 ms to 1000 sfull scale with 4000 data points per scale, and an electronicfilter about 1/10000th of the total time scale). Experimen-
tally determined rate constants were determined from fits todata (average of 2, 4, or 16 transients) over different times:50 ms for the fast rise; 1 s forν1; 50 s forν2 andν3; 10 s forν4 andν5; 1000 s forν6.Data were also fit directly to a reaction scheme (see
Results), in a global analysis, using the GLINT analysisprogram (Applied Photophysics, U.K.). Again data were fitover different time scales.All errors are quoted to one standard deviation.
RESULTS
Regeneration Yields.Bacterioopsin (bO) in SDS wasmixed with renaturing, DMPC/CHAPS, micelles containingretinal. Recovery of the native-like chromophore absorbancewas determined after overnight incubation in the dark (seeMaterials and Methods). Figure 1 shows the change inchromophore absorption as a function of added retinal. Alsoshown are the results obtained when retinal was added toapoprotein which had been allowed to incubate in mixedDMPC/CHAPS/SDS micelles for 30 min. This latter statereflects bO in equilibrium with I2 (see Discussion), and willbe referred to as bO/I2. In both cases, the chromophoreabsorption band maximum and FWHM were independentof retinal concentration, and were 554.6( 0.5 nm and 110( 2 nm, respectively (errors quoted for a 1:1 protein:retinalmole ratio). Figure 1 shows that for both bO and bO/I2, thechromophore absorbance increases linearly with retinalconcentration, until a maximum absorbance is reached. Thislatter absorbance reflects the maximum yield of regenerated,native-like chromophore, and hence of regenerated bacterio-rhodopsin. The maximum chromophore absorbance isreached at a retinal concentration of about 3.5µM, which isonly slightly less than the bacterioopsin concentration of 4µM. Thus, in line with previous reports (Huang et al., 1981;London & Khorana, 1982; Braiman et al., 1987), nearly allthe bacterioopsin in our samples binds retinal to regenerate
FIGURE 1: Changes in chromophore absorbance and proteinfluorescence as a function of retinal concentration, on regenerationof bacteriorhodopsin. (O andb). Changes in absorbance at 555nm on regeneration of bR from bO and bO/I2, respectively. (4 and(). Changes in yield of protein fluorescence band on regenerationof bR from bO and bO/I2, respectively. Each data point representsmeasurements on separate bO samples (from the same bO prepara-tion), to which retinal was added simultaneously. Bacteriorhodopsinwas then regenerated overnight in the dark at 22°C, at a proteinconcentration 4µM. Data for regeneration from bO are the averageof three different bO preparations; error bars are shown to onestandard deviation.
5904 Biochemistry, Vol. 35, No. 18, 1996 Booth et al.
+ +
+ +

bacteriorhodopsin. The binding curves essentially consistof two straight lines, which implies that in the linear region,prior to reaching the maximum absorbance, every retinalwhich is added binds (Rehorek & Heyn, 1979). Hence,assuming a 1:1 retinal/bacterioopsin stoichiometry, a chro-mophore extinction coefficient can be calculated from thegradient of the binding curve in this linear region, giving avalue of 55 300( 800 M-1 cm-1 at 555 nm. This extinctioncoefficient of 55 300 M-1 cm-1 is effectively for “dark-adapted” samples, and is in good agreement with that of56 600 M-1 cm-1 at 558 nm which has previously beenreported for this refolding system (with slightly differentratios of protein, DMPC/CHAPS, and SDS) (Brouillette etal., 1989). The accuracy of the extinction coefficient forregenerated bacteriorhodopsin determined here is dependenton accurate knowledge of the concentration of retinal, ratherthan on accurate knowledge of either the protein concentra-tion or the yield of regenerated bacteriorhodopsin (Rehorek& Heyn, 1979). The concentration of free retinal in ethanolwas calculated using an extinction coefficient of 42 800 M-1
cm-1 at 380 nm (Rehorek & Heyn, 1979).The yield of bacteriorhodopsin regenerated from bO was
determined from the concentration of regenerated bacterio-rhodopsin, compared to the initial concentration of bO (seeMaterials and Methods). An average of five different bOpreparations gave a regeneration yield of 88( 16%. Thespread observed in regeneration yields seems to reflect theease with which the delipidated bO dissolved in SDS.Regeneration yields of 98( 2% were observed for bOpreparations where the wet bO pellet dissolved in SDS afteronly 1 or 2 h of stirring. However, after some delipidations(even when the same batch of purple membrane was used),the wet bO pellet took longer to dissolve in SDS (up to 12h), and this resulted in lower regeneration yields, of about70%. An alternative method of dissolving bO in SDSinvolved drying down a mixture of bO and SDS in organicsolvent (see Materials and Methods), and then dissolving theresulting bO/SDS powder in water. The bO/SDS mixturedid not always redissolve well, and lower regeneration yieldswere observed if the mixture had to be stirred for severalhours. All kinetic experiments reported here were performedon two or three different bO preparations which exhibitedregeneration yields of 98( 2% (although no difference inexperimentally observed rate constants was found if prepara-tions with lower regeneration yields were used).
Figure 1 also shows the changes in the intrinsic proteinfluorescence as a function of retinal concentration, whenretinal was added to both bO and bO/I2. In both cases,protein fluorescence is quenched by retinal, as a result ofenergy transfer from protein tryptophans to retinal (Pollandet al., 1986). The fluorescence maximum was 337.1( 0.6nm, and the FWHM 55.9( 0.3 nm (errors for a 1:1 retinal:protein mole ratio), both being independent of retinalconcentration. The dependence of fluorescence yield onretinal mirrors the change in chromophore absorbance (Figure1). As the concentration of retinal is increased, a lineardecrease in fluorescence is observed until a minimumfluorescence is reached. Thus, quenching of protein fluo-rescence by retinal provides a convenient assay of retinalbinding and bacteriorhodopsin regeneration.Regeneration Kinetics.The kinetics of bacteriorhodopsin
regeneration were determined as described previously (Boothet al., 1995). Regeneration was initiated by a rapid mixing,stopped-flow technique, and the accompanying changes inprotein fluorescence were time-resolved. Table 1 showsresults for three processes: overall regeneration (bOfbR),for which bO in SDS was mixed with DMPC/CHAPSmicelles containing retinal (protein to retinal mole ratio 1:1);refolding in the absence of retinal (bOfI2), for which bOin SDS was mixed with DMPC/CHAPS micelles; and retinalbinding (bO/I2fbR), for which bO in SDS was preincubatedfor 30 min in DMPC/CHAPS micelles, prior to mixing withDMPC/CHAPS micelles containing retinal (protein to retinalmole ratio 1:1). Table 1 shows experimentally determinedrate constants obtained by fitting fluorescence data (ondifferent time scales) to sums of exponentials (see Materialsand Methods).Data shown in Table 1 are essentially identical to those
previously reported (Booth et al., 1995) for a protein:retinalratio of 1:3, and where bO/I2 was formed by incubation ofbO in DMPC/CHAPS micelles for several hours rather than30 min as here. In this previous study, we reported that bothformation of I2 (ν2 andν3) and noncovalent retinal binding(ν4 and ν5) approximated to monoexponential processes.However, the higher signal to noise obtained in the datapresented here (Figures 2 and 3), as a result of higher lightlevels, indicates that more than one exponential is requiredto fit the data for each process. Biexponential fits to dataaccompanying noncovalent retinal binding (ν4 andν5), overtime scales of 5 s and 10 s full scale, did not give random
Table 1: Experimentally Determined Rate Constants for Bacteriorhodopsin Regeneration
origin of component
formation ofapoprotein
intermediate I2
noncovalent retinalbinding & formation of
intermediate IRprocess
amplitudechange in
deadtimea (%)micelle mixingfast rise (s-1)b
formation of I1ν1 (s-1)b ν2 (s-1)b ν3 (s-1)b ν4 (s-1)b ν5 (s-1)b
Schiff-base formation ®eneration of bR
ν6 (s-1)b,d
bOfbR -109 200(-14) 2.2(4) 0.14(69)c 0.043(62)c * e * 0.007(54)bOfI2 -114 250(-14) 7.1(1) 0.13(-4) 0.029(-15) * * *bO/I2fbR * * * * 1.6 (64)
c 0.56(97)c 0.005(37)aChange in fluorescence amplitude during∼1.5 ms mixing deadtime, i.e., difference between denatured bO in SDS and initial amplitude of bO
in DMPC/CHAPS/SDS micelles,∼1.5 ms after mixing. Amplitudes are relative to the total fluorescence amplitude change measured in the stopped-flow cuvette, from the starting state (denatured bO in SDS) to the end state (regenerated bR).b Experimentally determined rate constants are fromfitting data (on different detection time scales) to sums of exponentials (see Materials and Methods). Relative fluorescence amplitudes, in percent,are shown, in parentheses, as subscripts to rate constants. Amplitudes are relative to the total fluorescence amplitude change from denatured bOin SDS to regenerated bR.c Values quoted are only a guide to the magnitude of these components. Data do not fit well to sums of exponentials,see text.d Values quoted are only a guide to the magnitude of this component. Measurements on a longer time scale indicated Schiff-base formationwas biexponential, as previously reported. However, with 1000 s full scale, this process is adequately represented by a single exponential. Theamplitude quoted is slightly less than that observed over longer time scales.e *, Component not detected.
Folding and Assembly of Bacteriorhodopsin Biochemistry, Vol. 35, No. 18, 19965905
+ +
+ +

residuals. This reflects the second-order retinal/proteinreaction under study, that is not well approximated by a sumof exponentials at a 1:1 retinal to protein ratio (see belowand Discussion). Rate constantsν4 andν5 are given in Table1 only as a guide to the approximate rate of noncovalentretinal binding. Similarly, fits to data for bOfbR suggestedthe overall regeneration process is not correctly modelledby a sum of exponentials, again reflecting the second-orderretinal binding step (see below and Discussion).Regeneration Kinetics as a Function of Retinal Concen-
tration. Time-resolved fluorescence curves were also mea-sured for bacteriorhodopsin regeneration at several differentretinal concentrations between 0 and 2µM (protein to retinalmole ratios, 1:0 to 1:1), three of which are shown in Figure2. In the absence of retinal (Figure 2A), an overall increasein fluorescence is observed reflecting formation of I2 (Table1, bOfI2) (Booth et al., 1995). Increasing the concentrationof retinal highlights the retinal binding step. The largeramplitude of the fluorescence quenching caused by retinalbinding [as compared to the fluorescence changes associated
with I2 formation (Figure 2 and table 1)] means that bindingis seen as an initial decrease in fluorescence at rate-limitingretinal concentrations (inset Figure 2B). At a 1:1 protein:retinal mole ratio (Figure 2C), an overall decrease influorescence is observed which corresponds to formation ofbR (Table 1, bOfbR) (London & Khorana, 1982; Booth etal., 1995). Data were also collected over different time scales(ranging from 50 ms to 100 s full scale; see Materials andMethods) to investigate the effect of retinal on the fasterregeneration kinetics. Retinal had no effect on either therate constant or the amplitude of componentν1 (data notshown).Retinal was also added at various times during the
regeneration process; i.e., bO was premixed with DMPC/CHAPS micelles for a certain “delay” time prior to theaddition of retinal. Delay times ranging from 0.1 s to 30min were used, and for each delay time, the concentrationof retinal was varied between protein to retinal mole ratiosof 0:1 and 1:1. As above, data were collected over a rangeof time scales.Addition of retinal after delays of up to 1 s gave essentially
identical results to those for a zero delay time (i.e., additionof retinal to bO), except that componentν1 was not observedwith a delay time of 1 s. The results obtained with a delaytime of 100 s were the same as those obtained with a delayof 30 min (Figure 3), the latter corresponding to addition ofretinal to bO/I2. Data obtained with delay times between 1and 50 s (data not shown) agreed with the reaction schemebelow.
FIGURE 2: Dependence of regeneration kinetics on retinal concen-tration, for addition of retinal to bO. Protein to retinal mole ratios:(A) 1:0; (B) 4:1; (C) 1:1. The inset to (b) shows they-axis scaleexpanded. Continuous line, experimental data; (O) theoretical curvesobtained by modelling the experimental data with the reactionscheme given under Discussion. Experimental data collected over1000 s, only first 250 s shown. Curves are averages of twotransients. Fluorescence in arbitrary units, scales directly comparablebetween curves.
FIGURE 3: Dependence of regeneration kinetics on retinal concen-tration, for addition of retinal to bO/I2 (i.e., for a delay time of 30min). Protein to retinal mole ratios: (A) 1:0; (B) 4:1; (C) 1:1. Datacollected over 50 s. Curves are averages of four transients.Fluorescence in arbitrary units, scales directly comparable betweencurves.
5906 Biochemistry, Vol. 35, No. 18, 1996 Booth et al.
+ +
+ +
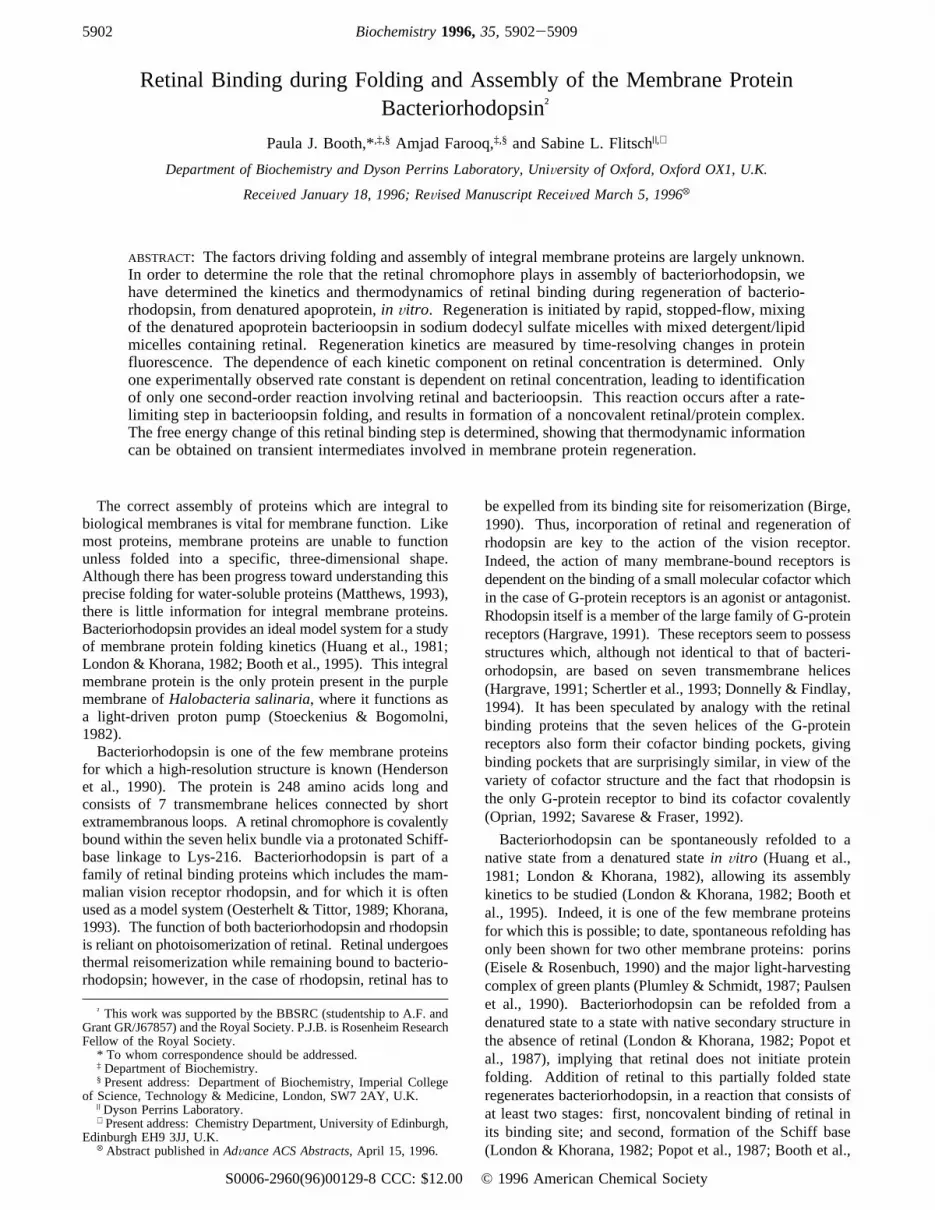
The dependence of the kinetics accompanying bO/I2fbR(i.e., for a delay of 30 min) on retinal was also determinedwhen retinal was in excess (protein to retinal mole ratiosranging from 1:4 to 1:32). Biexponential kinetics havepreviously been reported for Schiff-base formation (Huanget al., 1981; London & Khorana, 1982; Booth et al., 1995).In order to determine the dependence of both of theseexperimentally determined rate constants on retinal, datareflecting Schiff-base formation were fit to two exponentials(ν6 and ν7). Figure 4 shows the dependence of theexperimentally observed rate constants for noncovalentretinal binding (ν4 andν5) and Schiff-base formation (ν6 andν7) on retinal concentration.
DISCUSSION
Yield of Regenerated Bacteriorhodopsin.Functional bac-teriorhodopsin is characterized by its ability to pump protonsacross a membrane or lipid bilayer in response to illumination(Stoeckenius & Bogomolni, 1982; Oesterhelt & Tittor, 1989;Birge, 1990). It has previously been reported that bacterio-rhodopsin regenerated in DMPC/CHAPS/SDS micellesexhibits the characteristic photoreactions of the protonpumping cycle (Braiman et al., 1987), and this is reflectedin a native-like chromophore absorption band. The extentof recovery of a native-like chromophore absorption bandon regeneration of bacteriorhodopsin therefore provides aconvenient measure of the yield of regenerated bacterio-
rhodopsin (Oesterhelt & Schuhmann, 1974; Huang et al.,1981). The yield of bacteriorhodopsin, regenerated from adenatured state in SDS in renaturing DMPC/CHAPS mi-celles, at pH 6 and 22°C, is 88( 16%, in agreement withprevious studies (Huang et al., 1981; London & Khorana,1982; Braiman et al., 1987). Addition of retinal later duringbacteriorhodopsin regeneration (e.g., after 30 min, to bO/I2)results in an identical regeneration yield.A spread in regeneration yield is observed between
different bO preparations which seems to result from thedelipidation process and subsequent SDS solubilization:about 95% regeneration is found if the delipidated bOdissolves readily in SDS; otherwise, lower yields areobserved. Therefore, the small percentage of protein whichdoes not regenerate bacteriorhodopsin most likely representsan irreversibly aggregated state in SDS, which does notcontribute to the observed regeneration kinetics. Alterna-tively, one (or more) of the kinetic components we observemay correspond to formation of an aggregated/misfoldedstate which cannot regenerate bacteriorhodopsin (indeed thelatter may be the origin ofν5), or to heterogeneity in proteinpreparations.Reaction Scheme for Regeneration of Bacteriorhodopsin.
Several kinetic phases are observed on regeneration ofbacteriorhodopsin. In order to determine which phases aredependent on retinal, and reflect a reaction between retinaland protein, we have studied the regeneration kinetics atdifferent retinal concentrations. Previous work has suggestedthat a slow protein folding step precedes retinal binding(London & Khorana, 1982), which makes the latter processdifficult to resolve when retinal is added to bacterioopsin atthe start of regeneration (Booth et al., 1995). In order toovercome this difficulty, we have also added retinal at varioustimes during regeneration, and investigated the reaction ofretinal with each transient intermediate involved in bacterio-rhodopsin regeneration.The data presented here support the following reaction
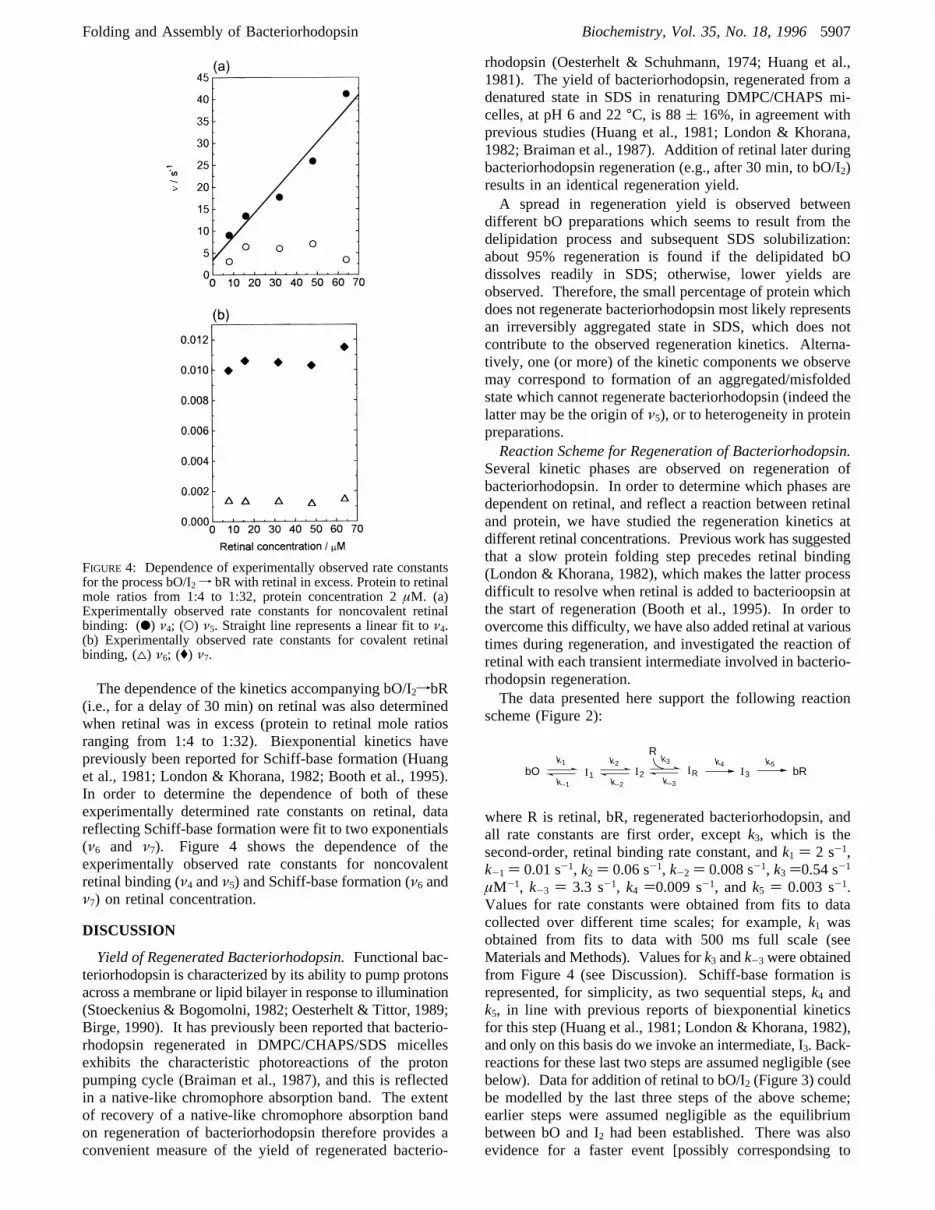
scheme (Figure 2):
where R is retinal, bR, regenerated bacteriorhodopsin, andall rate constants are first order, exceptk3, which is thesecond-order, retinal binding rate constant, andk1 ) 2 s-1,k-1 ) 0.01 s-1, k2 ) 0.06 s-1, k-2 ) 0.008 s-1, k3 )0.54 s-1µM-1, k-3 ) 3.3 s-1, k4 )0.009 s-1, andk5 ) 0.003 s-1.Values for rate constants were obtained from fits to datacollected over different time scales; for example,k1 wasobtained from fits to data with 500 ms full scale (seeMaterials and Methods). Values fork3 andk-3 were obtainedfrom Figure 4 (see Discussion). Schiff-base formation isrepresented, for simplicity, as two sequential steps,k4 andk5, in line with previous reports of biexponential kineticsfor this step (Huang et al., 1981; London & Khorana, 1982),and only on this basis do we invoke an intermediate, I3. Back-reactions for these last two steps are assumed negligible (seebelow). Data for addition of retinal to bO/I2 (Figure 3) couldbe modelled by the last three steps of the above scheme;earlier steps were assumed negligible as the equilibriumbetween bO and I2 had been established. There was alsoevidence for a faster event [possibly correspondsing to
FIGURE 4: Dependence of experimentally observed rate constantsfor the process bO/I2 f bR with retinal in excess. Protein to retinalmole ratios from 1:4 to 1:32, protein concentration 2µM. (a)Experimentally observed rate constants for noncovalent retinalbinding: (b) ν4; (O) ν5. Straight line represents a linear fit toν4.(b) Experimentally observed rate constants for covalent retinalbinding, (4) ν6; (() ν7.
bO I1 I2 IR
R
I3 bRk1
k–1
k2
k–2
k3
k–3
k4 k5
Folding and Assembly of Bacteriorhodopsin Biochemistry, Vol. 35, No. 18, 19965907
+ +
+ +

k(obs)5], and good fits of data with bO/I2 as the starting pointto the above reaction scheme were only obtained when thefirst 200 ms was ignored.One of the key features of the above reaction scheme is
that formation of I2 is slower than subsequent retinal binding(k2 is about 0.06 s-1, whereask3 is about 0.54 s-1 µM-1;Figure 2). This slow formation of I2 makes it difficult toresolve the rate constant associated with the subsequentretinal binding, as well as the nature of the dependence ofthis latter rate constant on retinal concentration. Additionof retinal after the equilibrium between bO and I2 isestablished (i.e., addition of retinal to bO/I2) allows the retinalbinding step to be clearly observed. Increasing the concen-tration of retinal added to bO/I2 results in an increase in theamplitude of the fluorescence quenching which accompaniesretinal binding (Figure 3).In the simplest case, the reaction of retinal and bO/I2
follows second-order kinetics. When retinal is in excess,this reaction will exhibit pseudo-first-order kinetics, whichsimplifies the integrated rate law to (Fersht, 1985)
Hence, the experimentally observed rate constant,ν, forthe retinal/protein reaction will increase linearly with retinalconcentration. The studies reported here, with excess retinal,show that only one experimentally observed rate constant,ν4, exhibits a linear dependence on retinal concentration(Figure 4a), identifying it as the second-order retinal bindingstep. This rate corresponds to that previously assigned toformation of a noncovalent retinal/protein intermediate, IR
(Booth et al., 1995). As expected from our reaction scheme,and as previously reported (London & Khorana, 1982),neither of the rates observed for Schiff-base formation varywith retinal concentration (Figure 4b).Therefore, we find only one experimentally determined
rate constant (ν4) to be dependent on retinal. No dependenceon retinal was found for the process bOf I1, and identicalresults were found whether retinal was added to bO, duringthe reaction bOf I1, or effectively to I1 (i.e., for delays ofup to 1 s). Hence, we find no evidence that retinal binds toeither bO or I1. The experiments reported here are relianton identification of retinal binding through quenching ofprotein fluorescence. It is possible that there is more thanone retinal binding step, but for some reason it is notaccompanied by quenching of protein fluorescence. How-ever, preliminary absorption data, which follow the changesin the absorption band of retinal during bacteriorhodopsinregeneration, are also consistent with the reaction schemereported here (unpublished results).Thermodynamics of Retinal Binding.Values for the
second-order rate constant,k3, for retinal binding and thefirst-order retinal dissociation constant,k-3, can be calculatedfrom Figure 4a using eq 2. Values of 0.54 s-1 µM-1 and3.3 s-1 are obtained fork3 and k-3, respectively. Theequilibrium constant,K, for the retinal binding reactionshown in eq 1 can be calculated fromk3/k-3 as 0.16µM-1,giving a∆G of -30 kJ‚mol-1 (at pH 6 and 295 K). Themain assumption in this calculation is that the reaction shown
in eq 1 can be treated as a quasi-static equilibrium. This islikely to be true with regard to depopulation of the equilib-rium through formation of bacteriorhodopsin, as this latterprocess occurs with rate constants orders of magnitudesslower thank3 and k-3. It is also assumed that bO is inequilibrium with I2. Again, this is a reasonable assumptionsince we obtain essentially identical results for addition ofretinal to bO which has been allowed to equilibrate with I2
for 100 s, 30 min, or several hours. In future studies, weshall investigate the equilibrium between bO and I2 in moredetail.
An enthalpy change of about-400 kJ‚mol-1 has beenreported for the equilibrium between apoprotein and bR, inlipid vesicles, where apoprotein was formed by bleachingbacteriorhodopsin (Kahn et al., 1992). The free energychange of -30 kJ‚mol-1 reported here relates to theequilibrium between bO/I2 and the intermediate IR (whereretinal is noncovalently bound). Although the two apoproteinstates, bO/I2 and the bleached state of bacteriorhodopsin, arenot necessarily equivalent, a comparison of our free energychange, of-30 kJ‚mol-1, with the enthalpy change of-400kJ‚mol-1 (assuming a negligible, or favorable, entropycontribution) suggests that further stabilization of bacterio-rhodopsin occurs during Schiff-base formation, when retinalbinds covalently in its pocket.
A theoretical model has been proposed for the folding ofhelical membrane proteins, largely based on earlier renatur-ation experiments on bacteriorhodopsin (Popot et al., 1987;Popot & Engelman, 1990). In this model, the foldingproblem is simplified to two stages; first, inherently stabletransmembrane helices form, and second, these helices packtogether to give functional protein. In terms of this model,the kinetics discussed here most likely relate to the second,helix-packing, stage. Factors which may drive transmem-brane helix association include retinal binding, externalconstraints provided by helix-connecting loops, and packingeffects (helix-helix and lipid-lipid packing being favoredover helix-lipid packing) (Popot & Engelman, 1990; Lem-mon & Engelman, 1994). Of these, the latter is thought tobe the predominant driving force for transmembrane helixassociation (Lemmon & Engelman, 1994). Extramembra-nous loops are thought to be relatively unimportant, andindeed it is possible to regenerate bacteriorhodopsin evenwhen one or two of the extramembranous loops are cleaved(Huang et al., 1981; Liao et al., 1983; Popot et al., 1987).Not only can bacterioopsin fold in the absence of retinal toa state with native secondary structure (London & Khorana,1982), but also retinal binding has been found to make onlya small contribution to bacteriorhodopsin’s stability, itscontribution being about the same as that of two of theextramembranous loops (Kahn et al., 1992). These earlierresults, together with the data presented here, suggest thatalthough retinal binding does not initiate protein folding noris a major driving force for helix association, it is the drivingforce for regeneration of bacteriorhodopsin from partiallyfolded apoprotein (I2). In the absence of retinal, an equi-librium is established between bO and I2, and it is retinalbinding which drives the reaction to completion. How thestructure of I2 relates to that of bacteriorhodopsin is currentlyunder investigation.
(bO/I2) + R y\zk3
k-3IR (1)
ν ) k-3 + k3[R] (2)
5908 Biochemistry, Vol. 35, No. 18, 1996 Booth et al.
+ +
+ +

CONCLUSION
The retinal binding studies presented here detect only onesecond-order reaction, which reflects binding of retinal topartially folded apoprotein, and allows the free energy changefor this binding to be estimated. Thus, it is possible to obtainthermodynamic information on transient intermediates in-volved in regeneration of a membrane protein. Furtherstudies should allow us to build up a more complete pictureof the energetics of the regeneration process for bacterio-rhodopsin. When coupled with site-directed mutagenesismethods (Braiman et al., 1987; Khorana, 1988; Soppa &Oesterhelt, 1989; Krebs et al., 1991), this opens the way formapping out structures of intermediates involved inbacteriorhodopsin regeneration, as has been elegantly shownfor water-soluble proteins (Matouschek et al., 1990).
ACKNOWLEDGMENT
We thank David Klug for helpful discussions and criticalreading of the manuscript, and Mark Fricker, Alison Telfer,and James Barber for help with steady-state fluorescence andabsorption measurements. We are also grateful to TonyWatts and David Harris for their interest and support.
REFERENCES
Birge, R. R. (1990)Biochim. Biophys. Acta 1016, 293-327.Booth, P. J., Flitsch, S. L., Stern, L. J., Greenhalgh, D. A., Kim, P.S., & Khorana, H. G. (1995)Nat. Struct. Biol. 2, 139-143.
Braiman, M. S., Stern, L. J., Chao, B. H., & Khorana, H. G. (1987)J. Biol. Chem. 262, 9271-9276.
Brouillette, C. G., McMichens, R. B., Stern, L. J., & Khorana, H.G. (1989)Proteins: Struct., Funct., Genet. 5, 38-46.
Bycroft, M., Matouschek, A., Kellis, J. T., Jr., Serrano, L., & Fersht,A. R. (1990)Nature 346, 488-490.
Donnelly, D., & Findlay, J. B. C. (1994)Curr. Opin. Struct. Biol.4, 582-589.
Eisele, J.-L., & Rosenbuch, J. P. (1990)J. Biol. Chem. 265, 10217-10220.
Fersht, A. (1985)Enzyme structure and mechanism, W. H. Freeman& Co., New York.
Hargrave, P. A. (1991)Curr. Opin. Struct. Biol. 1, 575-581.Henderson, R., Baldwin, J. M., Ceska, T. A., Zemlin, F., Beckmann,E., & Downing, K. H. (1990)J. Mol. Biol. 213, 899-929.
Huang, K.-S., Bayley, H., Liao, M.-J., London, E., & Khorana, H.G. (1981)J. Biol. Chem. 256, 3802-3809.
Kahn, T. W., Sturtevant, J. M., & Engelman, D. M. (1992)Biochemistry 31, 8829-8839.
Khorana, H. G. (1988)J. Biol. Chem. 263, 7439-7442.Khorana, H. G. (1993)Proc. Natl. Acad. Sci. U.S.A. 90, 1166-1171.
Krebs, M. P., Hauss, T., Heyn, M. P., Rajbhandary, U. L., &Khorana, H. G. (1991)Proc. Natl. Acad. Sci. U.S.A. 88, 859-863.
Lemmon, M. A., & Engelman, D. M. (1994)Q. ReV. Biophys. 27,157-218.
Liao, M.-J., London, E., & Khorana, H. G. (1983)J. Biol. Chem.258, 9949-9955.
London, E., & Khorana, H. G. (1982)J. Biol. Chem. 257, 7003-7011.
Matouschek, A., Kellis, J. T., Jr., Serrano, L., Bycroft, M., & Fersht,A. R. (1990)Nature 346, 440-445.
Matthews, C. R. (1993)Annu. ReV. Biochem. 62, 653-683.Oesterhelt, D., & Schuhmann, L. (1974)FEBS Lett. 44, 262-265.Oesterhelt, D., & Stoeckenius, W. (1974)Methods Enzymol. 31,667-679.
Oesterhelt, D., & Tittor, J. (1989)Trends Biochem. Sci. 14, 57-61.
Oprian, D. D. (1992)J. Bioenerg. Biomembr. 24, 211-217.Paulsen, H., Ru¨mler, U., & Rudiger, W. (1990)Planta 181, 204-211.
Plumley, F. G., & Schmidt, G. W. (1987)Proc. Natl. Acad. Sci.U.S.A. 84, 146-150.
Polland, H. J., Franz, M. A., Zinth, W., Kaiser, W., & Oesterhelt,D. (1986)Biochim. Biophys. Acta 851, 407-415.
Popot, J.-L., & Engelman, D. M. (1990)Biochemistry 29, 4031-4037.
Popot, J.-L., Gerchman, S.-E., & Engelman, D. M. (1987)J. Mol.Biol. 198, 655-676.
Rehorek, M., & Heyn, M. P. (1979)Biochemistry 18, 4977-4983.Savarese, T. M., & Fraser, C. M. (1992)Biochem. J. 283, 1-19.Schertler, G. F. X., Villa, C., & Henderson, R. (1993)Nature 362,770-772.
Soppa, J., & Oesterhelt, D. (1989)J. Biol. Chem. 264, 13043-13048.
Stoeckenius, W., & Bogomolni, R. A. (1982)Annu. ReV. Biochem.52, 587-616.
BI960129E
Folding and Assembly of Bacteriorhodopsin Biochemistry, Vol. 35, No. 18, 19965909
+ +
+ +