research symposium - uva wellassa university
TRANSCRIPT

5th
Research Symposium
“Value Addition for Sustainable Development”
PROCEEDINGS
Uva Wellassa University of Sr Lanka
Passara Road
Badulla- 90000
Sri Lanka
January 29 & 30, 2015
Copyright © 2015 by Uva Wellassa University
All rights reserved. No part of this publications may be reproduced, stored in a
retrieveal system, or transmitted in any form or by any means, electronic,
mechanical, photocopying or otherwise, without the prior permission of the
copyright owner, the Vice Chancellor, Uva Wellassa University, Sri Lanka.
ISBN 978-955-0481-08-8
Published by:
Uva Wellassa University
Passara Road
Badulla- 90000
Sri Lanka
Content
Message from the Chancellor ………………………………………………….
i
Message from the Vice Chancellor …………………………………………….
ii
Message from the Chairperson of the 5th Research Symposium ………………
iii
Keynote Speech ………………………………………………………………..
v
Review Pannel ………………………………………………………………… vii
Symposium Organizing Committee …………………………………………… viii
5th Research Symposium- Programme ………………………………………… x
Acknowledgement …………………………………………………………….. xiii
Proceedings of the 5th Research Symposium of Uva Wellassa University, January, 29-30, 2015
i
Message from the Chancellor
I am delighted to send this message of greeting as the
Chancellor to the 5th Research Symposium organized by the
Uva Wellassa Univesity of Sri Lanka. I sincerely thank the
Vice Chancellor for inviting me to send a message and to
participate in this symposium as the Chief Guest. This year
the theme of the symposium has been chosen as “Value
Addition for Sustainable Development”, which is timely
and relevant theme of great consequence. The theme is also
in line with the vision and mission of Uva Wellassa
University. The university organizes this research symposium to disseminate the
knowledge gathered through research activities of its students and the staff members
to a wider academic community in the country. Organizing such activities uplift the
face of the university as well as the Uva region. With the Government of Sri Lanka
having a strong commitment to the promotion of research and dissemination of
knowledge on important areas of economic and social progress, it is commendable
that the Uva Wellassa University, an emerging university, organized a national level
symposium on a relevant theme harmonized with the objectives of the Government.
This will provide valuable opportunities for researchers to present new research and
knowledge on topics of global importance addressed by many disciplines of study
available at the university. I would like to personally welcome each of the
participants to this important gathering who will share their experiences and
research findings for the benefit of the participants.
I would also like to thank each one of the participants for attending our conference
and the resource personal for sharing their expertise and experience. I sincerely
hope that your deliberations will help us to positively contribute towards sustainable
development through value addition. Finally let me to offer my sincere thanks to
dedicated symposium organizing team, office staff, sponsors and volunteers for
their support and contribution for organizing this event.
May triple gems bless you
Bengamuwe Sri Dammadinna Nayaka Thero
Chancellor
Uva Wellassa University
Badulla
Sri Lanka
Proceedings of the 5th Research Symposium of Uva Wellassa University, January, 29-30, 2015
ii
Message from the Vice Chancellor
Uva Wellassa University of Sri Lanka is standing in front of
its next milestone, the 5th Research symposium 2015 with
the theme ”Value Addition for Sustainable Development”.
It is with great pleasure and keenness I deliver this message
as the Vice Chancellor of Uva Wellassa University, the
Centre of Excellence for Value Addition. First of all, I
would like to extend my appreciation to the many young
researches who submitted high-quality papers for this
symposium. In addition, I am particularly honored to be
joined in this event by very distinguished eminent scholars, chairpersons, panelists,
editorial board and the organizing committee.
Uva Wellassa University is the so-called experimentation setup to be a new
paradigm in Sri Lankan higher education system. It is a think tank of Sri Lanka. Our
university equips its young entrepreneurs with best possible tools to become expert
skeptics when they face the society which demands effective action towards
national development. Its graduates are the fruits of this concept and successful end-
product of the experimentation of Sri Lankan higher education system.
This research symposium provides an appropriate and timely platform to bring
together such young and promising researchers to present their work, interact with
and learn from each other on innovative theoretical and evidence-based research.
Research is formalized curiosity which creates new knowledge. Research is also to
see what everybody else has seen, and to think what nobody else has thought.
Therefore, for researchers, it is very useful to frequently attend and present their
recent research papers at conferences and seminars, and receive feedback and
comments.
Further, the government, industry, academia and international organizations have a
responsibility to support and nurture our young and early-career researchers. This
will lead to realize their full potential. In turn the fruits of this research will lead to
the development of the country by adding value to its natural resources.
Dr. G. Chandrasena
Vice Chancellor
Uva Wellassa University
Badulla
Sri Lanka
Proceedings of the 5th Research Symposium of Uva Wellassa University, January, 29-30, 2015
iii
Message from the Chairperson of the 5th Research
Symposium
I am indeed privileged to write a massage to the 5th
Research Symposium of Uva Wellassa University to be
held on 29th and 30
th of January 2015 at the university
premises under the theme of “value addition for
sustainable development”. Value addition aimed at
sustainable development is an important area of work
necessary to conduct in order to overcome the societal
challenges faced by the human being today. Realizing
this key collective social need, UWU organized its 5th
research symposium to showcase the research activities
of the final year undergraduates, academic and administrative staff members to a
wider academic community with an aim to stimulate, promote and strengthen the
research vote at UWU and its academic culture by giving an opportunity to its
members to interact and collaborate with leading researchers working outside the
university.
Over the past four (04) research symposia, research activities at the university have
considerably grown up from its nursling status. Today we are holding our 5th
research symposium, where in addition to final year undergraduate's research
presentations, a substantial number of speeches are given by members of the
academia. We highly appreciate members of the academic community who
contributed to this event by sending their novel research findings to our symposium.
Having contributions from academia encourages our journey to develop a robust
research culture at UWU. We look forward to improve and keep sustained this in
future. In this symposium, we have organized number of parallel technical sessions
covering all our eleven (11) degree programs and a poster session. More than 200
presenters are expected to present their research findings in these sessions which we
truly believe will be exploited by the participants to create a platform to exchange
and discuss valuable scientific ideas to be developed later into more meaningful
interactions.
Proceedings of the 5th Research Symposium of Uva Wellassa University, January, 29-30, 2015
iv
I wish to express our deep gratitude to Chancellor Most Venerable Bengamuwe Sri
Dammadinna Nayaka Thero for his generous endowment to make this event
success. I also wish to extend my sincere gratefulness to the Manager, Bank of
Ceylon, Badulla for being the main sponsor of our event. My thanks are also due to
Hemsons (Pvt) Ltd, Analytical Instruments, Organic Trading, Techno Instruments,
Rajarata Tiles and People's Bank, Badulla for sponsoring and extending their
generous support to make this event a success. I also take this opportunity to thank
you the symposium organizing committee, specially the secretary, faculty
coordinators and activity coordinators who worked hard with great enthusiasm and
dedication amidst so many obstacles to organize this event successfully. Last but
not least, I extend my thankfulness to Vice Chancellor, Registrar and all academic
and administrative staff members of UWU and members of the review panel for
their continued support to make this event success.
I wish the 5th research symposium of UWU to be a great success.
Dr. A. R. Kumarasinghe
Chairperson of the 5th
Research Symposium
Uva Wellassa University
Badulla
Sri Lanka
Proceedings of the 5th Research Symposium of Uva Wellassa University, January, 29-30, 2015
v
Keynote Speech
The economic potential of nanotechnology
Nanotechnology can be defined as research and
development at the atomic or molecular scale
involving the manipulation of manufacturing
structures less than 100 nm; it is also an enabling
technology bringing into collaboration, ideas in
chemistry, physics and biology mixed and blended
with engineering and medicine. Scientists and
engineers have shown a great interest in
nanotechnologies because at sizes below 100 nm, the
fundamental chemical or electrical properties of materials can change. For example,
silver metal used in jewelry is typically inert, however, at the nanoscale, it becomes
chemically more active possessing antibacterial properties. Such useful changes in
property have become the catalyst for predictions of a range of fundamental new
advances in chemistry and physics over the next 10 – 50 years, mostly in the
domains of new materials, the environment, in medicine and information
technology.
Fundamental building blocks of nanotechnology are nanomaterials, which have
novel optical, electric or magnetic properties. They are semiconductors, metals,
metal oxides, carbon materials and organics. The emerging commercial growth
areas in nanotechnology are nanomaterials and nanomaterials processing,
nanobiotechnology, software, nanophotonics, nanoelectronics and
nanoinstrumentation. Nanomaterials and nanomaterials processing companies
develop the materials and methods to manipulate and manufacture products based
on nano materials.
Globally, nanotechnology is projected to have applications in many sectors. It has
been incorporated into tyres, toothpaste, sun cream, tennis rackets, shirts, trousers,
CD payers etc. It makes day today consumer goods such as smaller, lighter, faster
and cheaper.
Currently, nanocomposites which are used in packaging, food, drinks, electronics
and pharmaceuticals have about a 5 billion (USD)global market; nanofibers used in
electronics, aerospace, energy and medical areas is about 1 billion (USD); carbon
nanotubes used in electronics, energy and medicine is around 1.3 billion (USD);
quantum dots which have applications in solar cells, biological labelling has a
Proceedings of the 5th Research Symposium of Uva Wellassa University, January, 29-30, 2015
vi
global market of 1 billion (USD); nanocoatings used in thin films, engineered
surfaces applied across electronics and chemical engineering applications is about
10 billion (USD); and nanoparticles such as metal oxides – silica, alumina, titania,
iron oxide etc. is about 12 billion (USD). Like any technology, nanotechnology's
advances will depend on available venture capital funding. Risk debates related to
possible dangers of nanoparticles which emerged around 2000, still remain in the
public domain. Life cycle analysis of nanomaterials is essential as research is
progressing.
Prof. Veranja Karunaratne
Associate Director/Research & Strategic Relations
Sri Lanka Institute of Nanotechnology (Pvt) Ltd.
Nano Technology & Science Park
Mahenwatte, Pitipana
Homagama
Sri Lanka
Proceedings of the 5th Research Symposium of Uva Wellassa University, January, 29-30, 2015
vii
Review Pannel
Dr. G. Chandrasena
Dr.(Ms.) S.C. Jayamanne
Dr. A.M.A.N.B.Attanayake
Dr. P.I.N. Fernando
Dr. A.R. Kumarasinghe
Dr. P.M. Sirimanne
Dr. K.B. Wijesekara
Dr. B.A.J.K. Premachandra
Dr. (Ms.) C.K. Jayasuriya
Dr. U.P.L.Mangalika
Prof. DeepthiYakandawala
Prof. D.S. Jayakody
Dr. W.K. Athula C. Ganapala
Dr. H.R.N. Peris
Dr. E.P.S.K. Ediriweera
Dr. (Ms.) L.M.H.R. Alwis
Dr. D.K.D.D. Jayasena
Dr. E.D.N.S. Abeyrathne
Dr. H.M.S.K. Herath
Dr. H.M.J.C. Pitawala
Dr. W.A.J.P. Wijesingha
Dr. K.G. Premathilake
Dr. N.P. Premachandra
Dr. W.K.I.L. Wanniarachchi
Dr. (Ms.) D.D.C. Wanniarachchi
Dr. (Ms.) K.W.S.N. Kumari
Dr. P.H.T. Kumara
Dr. R.R.M.K.K. Wijesundara
Ms. T.H.N.G. Amaraweera
Mr. N.P.P. Liyanage
Mr. R.A.P.I.S. Dharmadasa
Ms. M.M.S.N. Premetilake
Ms. P.B.A.I.K. Bulumulla
Proceedings of the 5th Research Symposium of Uva Wellassa University, January, 29-30, 2015
viii
Symposium Organizing Committee
Symposium Coordinator Dr. A.R. Kumarasinghe
Symposium Secretary Dr. (Ms.) K.W.S.N. Kumari
Faculty Coordinators
Faculty of Animal Science
& Export Agriculture Dr. E.D.N.S. Abeyrathne
Faculty of Management Ms. H.M.W.M. Herath
Faculty of Science & Technology Dr. H.M.J.C. Pitawala
Activity Coordinators
Organizing and Arranging Halls Dr. W.A.J.P. Wijesinghe
Fund Raising Dr. H.M.J.C. Pitawala
Arranging Logistic Activities Mr. Nishantha Nawela
Organizing and Sending Invitations Dr. D.K.D.D. Jayasena
Organizing Media, Photography
and Font-desk activities Ms. H.M.W.M. Herath
Organizing Proceedings &
Symposium Programme Book Dr. (Ms.) K.W.S.N. Kumari
Preparing Symposium Dockets Dr. N.P. Premachandra
Printing Tasks Dr. W.K.I.L. Wanniarachchi
Organizing Hospitality Activities Ms. R.M.C.W.M. Rathnayake
Preparation of Budget Mr. K.G. Liyange
Organizing of Souvenirs,
Medals & Certificates Dr. (Ms.) D.D.C. Wanniarachchi
Proceedings of the 5th Research Symposium of Uva Wellassa University, January, 29-30, 2015
ix
Poster Session Preparation Dr. E. D. N. S. Abeyrathne
Web Page Development Mr. S. T. C. I. Wimaladharma
Editorial Board
Chief Editor Dr. A.R. Kumarasinghe
Sub-Editor Dr. (Ms.) K.W.S.N. Kumari
Members Dr. W.K.I.L. Wanniarachchi
Mr. S.T.C.I. Wimaladharma
Degree Programme Coordinators
ANS Ms. M.S. Kurukulasuriya
AQT Ms. R.M.G.N. Rajapaksha & Ms. T.H. Ranahewa
EAG Ms. H.A.S.L. Jayasinghe
TEA Ms. R.M.S.D. Rathnayake & Ms. A.G.A.W. Alakolanga
PLT Ms. H.K.S.G. Gunadasa
SCT Ms. C.M. Peris
MRT Mr. J.T. Cooray
CST Mr. D.G.R.V.L.B. Thambawita
IIT Ms. H.M.U.S.K. Herath
ENM Ms. W.M.P.G.C. Weerakoon & Ms. S.F. Fasana
HTE Ms. A.K.A. Damunupola
Office Assistance Mr. S.M.C.P. Samarakoon
Proceedings of the 5th Research Symposium of Uva Wellassa University, January, 29-30, 2015
x
5th Research Symposium - Programme
Day 01: January 29, 2015
Inaugural Session
Venue: Main Lecture Theater (MLT)
08.00 a.m. Registration
09.00 a.m. Lighting Oil Lamp
National Anthem
University Anthem
Chief Guest Most Venerable Bengamuwe Sri Dhammadinna Nayake Thero/
Chancellor, Uva Wellassa University
Chairperson Dr. G. Chandrasena / Vice Chancellor, Uva Wellassa University
09.15 a.m. Welcome Address by Dr. A. R. Kumarasinghe
Symposium Coordinator/ 5th Research Symposium and Chairman/
Research Committee
09.20 a.m. Address by Dr. G. Chandrasena
Vice Chancellor, Uva Wellassa University
09.25 a.m. Address by the Keynote Speaker, Prof. Veranja Karunaratne,
Associate Director/ Research & Strategic Relations, Sri Lanka
Institute of Nanotechnology (Pvt) Ltd. and Senior Professor of
Chemistry/ University of Peradeniya
10.10 a.m. Highlights of the 5th Research Symposium
10.30 a.m. Vote of thanks by Dr. K. W. Sandya N. Kumari
Symposium Secretary/ 5th Research Symposium
10.35 a.m. Tea

Proceedings of the 5th Research Symposium of Uva Wellassa University, January, 29-30, 2015
xi
Programme Contd.
11.00 a.m. Parallel Technical Sessions
01.00 p.m. Lunch
02.00 p.m. Technical Sessions Contd.
04.00 p.m. Poster Sessions and Tea
07.00 p.m. Symposium Dinner
Day 02: January 30, 2015
09.00 a.m. Session Keynote Address
09.30 a.m. Parallel Technical Sessions
01.00 p.m. Lunch
02.00 p.m. UWU staff Research Presentation at MLT
Award Ceremony
Venue: Main Lecture Theater (MLT)
Chairperson Dr. G. Chandrasena
Vice Chancellor, Uva Wellassa University
03.00 p.m. Overview of the 5th Research Symposium
Dr. A. R. Kumarasinghe
Symposium Coordinator, 5th Research Symposium/ Chairman,
UWU Research Committee
03.10 p.m. Address by Dr. G. Chandrasena
Vice Chancellor, Uva Wellassa University of Sri Lanka

Proceedings of the 5th Research Symposium of Uva Wellassa University, January, 29-30, 2015
xii
Programme Contd.
03.15 p.m. Presentation of Awards
03.40 p.m. Vote of Thanks by Dr. K. W. Sandya N. Kumari
Symposium Secretary, 5th Research Symposium
03.45 p.m. Tea
Proceedings of the 5th Research Symposium of Uva Wellassa University, January, 29-30, 2015
xiii
Acknowledgement
The Vice Chancellor, the Symposium Coordinator
and the Symposium Organizing Committee
extend their sincere appreciation to the following for the support and the assistance
given in numerous ways to make the 5th Research Symposium
a success
The Chancellor, Most Venerable Bengamuwe Sri Dhammadinna Nayake
Thero
The Authors of the papers and their Research Supervisors
The Editorial Board
The Chairpersons and Judges of Technical Sessions
The Chief Guest
The Keynote Speakers
All Activity Coordinators, Degree Programme Coordinators and Committee
Members of Sub Committees
The Academic and Administrative Staff of UvaWellassa University
Financial support by Bank of Ceylon, all other Sponsors and Contributors
All the Participants
Proceedings of the Research Symposium of Uva Wellassa University, January 29-30, 2015
Technical Session – Animal Science
Table of Contents
Oral Session
Effect of different aerobic and anoxic time periods on the effluent
water quality of a sequence batch reactor in a meat processing plant1
Development of Avocado (Persea americana) Incorporated Set
Yoghurt ................................................................................................................... 4
Production characteristics and technical efficiency of buffalo
farmers in Thanamalwila veterinary division ............................................ 7
Development of drinking yoghurt by incorporating corn (Zea mays)
milk and corn seeds ........................................................................................... 10
Effect of tropical forages on growth performance and carcass quality
of rabbits ............................................................................................................... 13
Diversity and antibiotic resistance patterns of Lactobacillus species
in traditional curd in Sri Lanka .................................................................... 17
A preliminary study on Milk Urea Nitrogen values of the Ambewela
farm ........................................................................................................................ 20
Comparison of broiler chick performance in single stage incubation
and multi stage incubation .............................................................................. 23
Potential to use extracts from Lawsonia inermis (Marathondhi)
leaves and Emblica officinalis (Nelli) fruits as tannin agents in
leather manufacturing ...................................................................................... 26
Performance evaluation of different broiler strains under
environmental controlled broiler house in Sri Lanka ............................ 29
Development of Fishmeal using Knifefish Chitala ornata ..................... 32
A study on microbial contaminations, sources and preventive
measures in salted butter production in a commercial dairy plant ... 34
Proceedings of the Research Symposium of Uva Wellassa University, January 29-30, 2015
A Study on Crocodile Behavior (Crocodylus palustris) and Public
Value Orientation in Ethimale of Monaragala District ......................... 37
Development of Tomato (Solanum lycopersicum) Incorporated Fish
Nuggets .................................................................................................................. 40
Analysis of Consumer Food Safety Knowledge and Practices in
Rathnapura .......................................................................................................... 43
A study on shelf life of export oriented fresh chilled Yellowfin tuna
loins in relation to histamine content ........................................................... 46
Poster Session
Development of Finger millet (Eleusinecoracana) incorporated
symbiotic drinking yoghurt ............................................................................ 49
Development of soursop pulp (Annonamuricata) incorporated
fermented sweet cream buttermilk beverage ............................................ 53
Development of fruit (Musa spp.) puree incorporated synbiotic
stirred yoghurt .................................................................................................... 57
Quail egg consumption: patterns, preferences and perceptions
among consumers in Galle district, Sri Lanka ......................................... 61
Proceedings of the Research Symposium of Uva Wellassa University, January 29-30, 2015
1
Effect of different aerobic and anoxic time periods on the
effluent water quality of a sequence batch reactor in a meat
processing plant
K.P.W. Kahandawa, A.M.N.L. Abesinghe, A.M. Samaraweera
Faculty of Animal Science and Export Agriculture, Uva Wellassa University of Sri Lanka
and
J.K. Dissanayake
CIC Poultry Farms Pvt Ltd, Horakandawila, Badalgama, Sri Lanka
Introduction
A large amount of slaughterhouse wastewater is generated during meat product
manufacturing. It contains high concentrations of organic matter, oil and grease and
nitrogenous compounds. Hence, releasing waste water to the environment causes many
environmental problems such as contamination of groundwater and eutrophication of surface
waters (Rodriguez et al., 2010). The treatment of waste water is especially important in this
view. Treatment of wastewater by means of biological process has been widely implemented
from urban to industrial wastewater. Sequencing batch reactor (SBR) is a modification of
activated sludge process and operates by a cycle of periods consisting of fill, react
(alternatively aerobic and anoxic periods), settle, decant, and idle (Mahvi, 2008).
In the SBR process there is no standard time combination for aerobic and anoxic period. It
will depend on the effluent waste water components and vary plant to plant. Currently aerobic
and anoxic period is operated as 2 hr aerobic and 1 hour anoxic period in the waste water
treatment plant of CIC meat processing company. The present investigation was undertaken
to study best time combination of aerobic and anoxic time period for simultaneous carbon
oxidation, nitrification and denitrification performance of sequencing batch reactor to treat
slaughterhouse wastewater.
Methodology
The current study was carried out at CIC Poultry Farms Pvt Ltd (Processing Plant),
Badalgama. Laboratory analysis was done at CIC Processing Plant Laboratory and Uva
Wellassa University laboratories. Model structure of aeration tank which has the capacity of
600 L was used to conduct the research experiments. 180 mL of sludge from SBR unit in CIC
meat processing plant and 420 mL volume of wastewater was fed to tank each day of the
treatment. Air was supplied to the reactor during aerobic phase of react period with the help
of diffused aeration system and Anoxic conditions were maintained by switching off the
aerators. Eight different combinations of aerobic and anoxic periods were used. Every
sequence was operated totally for 20 hrs of react period by alternating the aerobic and anoxic
period according to selected different time combinations (Table 01).
Proceedings of the Research Symposium of Uva Wellassa University, January 29-30, 2015
2
Table 01: Selected time Combinations for Aerobic and Anoxic time periods
Control T1 T2 T3 T4 T5 T6 T7 T8
Aerobic (Hours) 2 2 3 3 4 4 4 4
Anoxic (Hours) 1 2 1 2 1 2 3 4
The best combination of aerobic and anoxic time period was determined by analyzing water
quality parameters as, COD, BOD, ammonium nitrogen, total nitrogen, TSS, TDS and pH. Complete Randomized Design (CRD) was conducted and data obtained from chemical and
physical tests were analyzed using analysis of variance (ANOVA) using the General Linear
Model (GLM) procedure of SAS (SAS Institute Inc., 2000). Significant means of treatments
were separated using the Least Significant Difference (P< 0.05) test.
Results and Discussion
There was a significant difference (P<0.05) between aerobic and anoxic time combinations
regarding COD removal, BOD removal, TN removal and ammonium nitrogen removal. 4 hour
aerobic and 2 hour anoxic period showed higher COD removal (95%), BOD removal (90%),
TN removal (89%), and ammonium nitrogen removal (92%). There was no significant
difference (P>0.05) regarding phosphorus removal, TSS removal and TDS removal among
different aerobic and anoxic time combinations.
Highest COD and BOD removal occurred in 4 hour aerobic and 2 hour anoxic cycle. Second
highest COD removal (92%) was achieved during 4-1 react period. This might be due to
during 4-2 hr and 4-1 sequence total aerobic react time is higher than other react cycles.
Therefore, longer aeration was achieved. Longer aeration period has been found to be
effective in achieving higher degree of nitrification and COD, BOD removal according to the
findings of Debsarkar et al. (2006).
Due to less total aeration time in 4-3 and 4-4 hr cycles, less COD and BOD removal was
achieved. That means one cycle was alternatively operated for 20 hrs totally and in the 4-3
and 4-4 cycles has high anoxic time periods. Therefore, less COD and BOD removal occurred
(Kundu et al., 2013).
Treatment 6 (4-2) is significantly different from other treatments and also treatment 5 has high
BOD removal. This may be due to long aeration time and effective denitrification. According
to Kishida et al. (2003), BOD concentration of the effluent was relatively high because the
oxygen demand by nitrifying bacteria increased the total BOD, when the NH,-N concentration
of the effluent was too high (average = 187.1 mg/L). NH,-N concentration of the effluent was
high due to partial denitrification. According to this experiment ammonium nitrogen
concentration also affect to the BOD removal. And treatment 6 had low level of ammonium
nitrogen concentration in effluent water (1.048 mg/L 1.07 mg/L).
Longer aeration period (5 hour) has been found to be effective in achieving higher degree of
nitrification from Debsarkar et al. (2006). But according to preliminary study at the middle of
Proceedings of the Research Symposium of Uva Wellassa University, January 29-30, 2015
3
5th hour pH is reached to 6.9, but optimum pH for nitrification is 8.2. Therefore, in this
experiment longest aeration time per one cycle was selected as 4 hr.
According to the statistical analysis, there is no significant difference (P> 0.05) between
different aerobic, anoxic time combinations and total dissolved solid and total suspended
solids removal. This might be due to activated sludge treatment is not intended to remove
dissolved or suspended solids (Sustarsic, 2009).
Conclusions
The combination of 4 hours aerobic react period and 2 hours anoxic react period has been
found to be optimum from the view point of both nitrification and denitrification, and COD,
BOD removal. When total aeration time period is low, removal of COD, BOD is not efficient
in 4 hr aerobic – 4 hr anoxic and 4 hr aerobic – 3 hr anoxic time combinations.
Acknowledgment
CIC meat Processing plant, Horakandawila is acknowledged for the facilities provided.
References
Debsarkar, A., Kundu P. and Mukherjee, S. (2006). Sequencing Batch Reactor (SBR)
treatment for simultaneous organic carbon and nitrogen removal- A laboratory study. Journal
of environmental science & engineering, 48: 169-174.
Kishida, N., Kim, J.H., Chen, M., Sasaki, H. and Sud, R. (2003). Effectiveness of oxidation-
reduction potential and pH as monitoring and control parameters for nitrogen removal in
swine wastewater treatment by sequencing batch reactors. Journal of BioScience and
Bioengineering, 96:3.
Kundu P., Debsarkar, A. and Mukherjee, S. (2013). Simultaneous oxidation of organic carbon,
nitrification and denitrification in a sequential batch reactor for treatment of slaughter house
wastewater. International Journal of Environmental Engineering Research, 2: 69-80.
Mahvi, A.H. (2008). Sequencing batch reactor: A promising technology in wastewater
treatment. Iran, 5:79-90.
Rodriguez, D.C., Pino, N. and Penuela, G. (2010). Monitoring the removal of nitrogen by
applying a nitrification–denitrification process in a Sequencing Batch Reactor (SBR). 102(3):
2316-21.
SAS Institute Inc. (2000). SAS 9.1.3 Help and Documentation, SAS Institute Inc.
Sustarsic, M. (2009). Wastewater treatment: understanding the Activated sludge process,
Available at: < www.aiche.org/cep>, [viewed on 4 Aug, 2014].
Proceedings of the Research Symposium of Uva Wellassa University, January 29-30, 2015
4
Development of Avocado (Persea americana) Incorporated Set
Yoghurt
W.M.A.A. Kulasinghe, A.M.N.L. Abesinghe
Faculty of Animal Science and Export Agriculture, Uva Wellassa University of Sri Lanka
and
L.K.A. Gunawardhane
Lucky Lanka Milk Processing Company Limited, Sri Lanka
Introduction
Yoghurt is one of the best known of all cultured-milk products in the world. According to SLS
standards (1989) Streptococcus thermophillus and Lactobacillus bulgaricus are used to
convert lactose in milk in to lactic acid during yoghurt production. Fruit yoghurt is produce
by adding fruits and their nectars, jams, marmalade, fruit jellies, fruit drinks, fruit syrups and
concentrated fruit drinks to yoghurt or cultured pasteurized milk and fruit yoghurts enhances
versatility of taste, color and texture for the consumer (Chandan and Shahani, 1993).
Avocado (Persea americana) is a fruit which is having a very good nutrient profile and thus
incorporation endorses the healthy image of yoghurts. However, incorporation of avocado in
to set yoghurt is limited by enzymatic browning or formation of brown color melaniodins
from polyphenol oxidase enzyme in avocado (Bindesh, 2010). Pauker et al. (1992) have found
incorporation of avocado in to yogurt in the form of fresh avocado pulp is impossible due to
enzymatic browning. Therefore, control of enzymatic browning is essential in producing
avocado incorporated set yoghurt. Current study was carried out to develop avocado
incorporated set yoghurt that is having an adjusted solid content based on sensory properties
and controlling enzymatic browning of avocado pulp.
Methodology
Market available fresh ripened avocados (Fuerte variety) were manually peeled and crushed
in to a smooth pulp. It was divided in to seven samples with same weight and preserved using
several preserving and enzymatic browning control methods such as 1% citric acid, 1% (w/w)
ascorbic acid (Patricia et al., 1993), 1% (w/w) citric acid and 1% (w/w) ascorbic acid together
(Lopez, 2001), 0.1% (w/w) sodium benzoate (Patricia et al., 1993), 0.1% (w/w) potassium
sorbate (Singha, 2011), heat treatment at 40 ºC temperature for 30 minutes (Cantwell, 1992)
and preparation of avocado pulp as a jam (Connelly, 2013). The best avocado pulp preserving
method (least color changing treatment) was selected by conducting a sensory evaluation
using 30 untrained panelists.
The selected method of preserving avocado pulp (avocado jam) was used in preparation of
avocado incorporated set yoghurt. Yoghurt mix preparation was done according to Pande
(2010). Preliminary trials were used to select the appropriate level of ingredients (avocado
Proceedings of the Research Symposium of Uva Wellassa University, January 29-30, 2015
5
jam, sugar and gelatin). Sugar and gelatin levels were finalized after having several sensory
trials using 30 untrained panelists. Potassium sorbate 0.03% (w/w) was added to the final
mixture as preservative (SLS Standards, 1989) and homogenized using a beater (National™,
MK-H100N). Inoculation of lactic acid bacteria culture of YC 350 freeze dried (DVS) was
done at 45 °C temperature. Then mixture was poured in to 80 mL plastic yoghurt cups and
incubated at 42 ±2 ˚C for 4 hours. Each treatment consisted with three replicates.
Total plate count, coliform bacteria count, yeast and mold count, pH, titratable acidity and
peroxide value of selected avocado incorporated set yoghurt and avocado jam was tested at
1st, 3rd, 5th, 7th, 9th and 11th day under refrigerated storage. A proximate analysis was done to
determine the composition of the avocado incorporated set yoghurt.
Results and Discussion
Addition of 50% (w/w) sugar in to avocado pulp showed lowest brown color development
(P<0.05). Added sugar may have reduced the water activity of the avocado pulp. Enzymes
require certain level of water in their structures to maintain their natural conformation,
allowing them to deliver their full functionality. Therefore, presence of 50% sugar inhibits the
activity of polyphenol oxidase enzyme. Adding more than 50% of sugar, crystalize sugar in
the avocado pulp which gives undesirable consistency. Twenty percent of avocado jam
incorporation level shows the best results according to the sensory evaluation (P<0.05).
Total plate count, yeast and mold and coliform counts of the avocado incorporated set yoghurt
were not exceeding SLS standards for set yoghurt during 11 days of refrigerated storage.
Titratable acid percentage of avocado jam has increased from 1.22±0.07 to 1.4±0.07 during
day 1 to day 11 (P<0.05). It may be due to conversion of fermentable sugars in to acids by
microorganisms available in avocado jam. Further, titratable acid percentage of avocado
incorporated set yoghurt increased from 0.86±0.03 to 0.94±0.03 during 11 days storage period
(P<0.05). This is due to the presence of live lactic acid bacteria in culture which ferment
lactose in milk to lactic acid with the time (Chandan and Kilara, 2013). pH of avocado jam
and pH of avocado incorporated set yoghurt was reduced from 3.52±0.06 to 3.35±0.06 and
from 4±0.03 to 3.91±0.03, respectively during day 1 to day11. Increasing acidity results in
decreasing pH level in the product.
No fatty acid oxidation was detected in the avocado jam during storage period of 11 days.
Avocado incorporated set yoghurt started free radicle formation and rancidity development
7th day of storage onwards. Moreover, it shows increasing browning effect. Since, avocado is
a fruit with high fat and it contains considerable level of fatty acids, there is a potential to
observe oxidation in this product. Statistical analysis showed that enzymatic browning has an
influence on the increment of changing rapidity of titratable acidity, pH and peroxide value.
Further, it showed fatty acid oxidation and pH are not related. In the view of avocado
incorporated set yoghurt and avocado jam, avocado jam is having very low water activity due
to saturated sugar solution. Avocado incorporated set yoghurt is having an environment with
increasing acidity and decreasing pH with lactic acid fermentation. Water activity of avocado
incorporated set yoghurt also very high compared to avocado jam. These factors may have
influenced on the observed color change in avocado incorporated set yoghurt.
Proceedings of the Research Symposium of Uva Wellassa University, January 29-30, 2015
6
Proximate analysis of avocado incorporated set yoghurt showed that there is a significant
difference with plain yoghurt (P<0.05). Fat (3.6±0.42%), fiber (0.3±0.21%), ash (0.9±0.14%),
protein (3.5±0.07%) and total solids (16.10±1.31%) in avocado incorporated set yoghurt is
comparatively higher than available fat (3.0±0.42%), fiber (00±0.21%), ash (0.7±0.14%),
protein (3.4±0.07%) and solids (14.24±1.31%) in plain yoghurt.
Conclusion
Avocado incorporated set yoghurt is more nutritious compared to set yoghurt as it has included
with more protein, minerals and fiber. There is a relationship between enzymatic browning
and fatty acid oxidation. Further studies are required to identify how enzymatic browning and
fatty acid oxidation relates with each other and to extend the shelf life of avocado incorporated
set yoghurt.
References
Bindesh. (2010). Scientific Adventures with Food, [Online] Available at:<
http://desigrub.com/tag/enzymatic-browning-of-avocados> [Accessed 21st April 2014].
Chandan, R.C. and Kilara, A. (2013). Manufacturing Yogurt and Fermented Milks. [pdf]
Available at:<http://food5450.groupb.wikispaces.com/file/view/Manufacturing+Yogurt+and
+Fermented+Milks.pdf> [Accessed on 31st May 2014].
Chandan, R.C. and Shahani, K.M. (1993). Dairy Science and Technology Handbook: Product
Manufacturing, Vol. 2.
Lopez, V.M.G. (2011). Inhibition of Surface Browning, Cut Avocado.[pdf] Available at:
<http://www.aseanfood.info/Articles/11025015.pdf> [Accessed on 7th May 2014].
Pande, G. (2010). Yogurt/Yoghurt. [pdf] Available at: <http://server.fst.uga.edu/
kerr/DWBrooks/Food%20Stucture%20Projects/Yogurt.pdf> [Accessed on 2nd June 2014].
Patricia, G., Gonzalez, L.D., Barrett, D.M., Wrolstad, R.E. and Durst, R.W. (1993). Enzymatic
Browning Inhibited in Fresh and Dried Apple Rings by Pineapple Juice. [pdf] Available at: <
http://ucanr.edu/datastoreFiles/234-390.pdf>[Accessed on 15th May 2014].
Pauker, R., Bernstein, S., Popelf, G. and Rosenthalf, T. (1992). An assessment of processing
potential of avocado fruit. [pdf] Available at: <http://www. avocadosource.com/CAS
_Yearbooks/CAS_76_1992/CAS_1992_PG_137-144.pdf> [Accessed on 15th May 2014].
Singha, R. (2011). How to Use Potassium Sorbate. [Online] Available at: <http://www.
buzzle.com/articles/how-to-use-potassium-sorbate.html> [Accessed 0n 31st May 2014].
Sri Lanka Standards. (1989). Specification for fermented milk products 824: Part 2. Sri Lanka
Standards Institution, Colombo.
Proceedings of the Research Symposium of Uva Wellassa University, January 29-30, 2015
7
Production characteristics and technical efficiency of buffalo
farmers in Thanamalwila veterinary division
M.B.J.G.R. Malcolm, A.M. Samaraweera, R.M.S.D. Rathnayake
Faculty of Animal Science and Export Agriculture, Uva Wellassa University of Sri Lanka
Introduction
At present milk production from large ruminants only meet 17% of the countries requirements
(Ministry of livestock and rural community development, 2012). According to Department of
animal production and health (2012) Thanamalwila Veterinary division (VD) in Moneragala
district has the highest buffalo population in Uva province which is well established over
cattle rearing and plays an important role in income generation of rural farm households.
Therefore, this study was conducted to identify the important socio-economic determinants of
milk production and to estimate the technical efficiency of dairy production in Thanamalwila
VD.
Materials and methods
Study was conducted in Thanamalwila VD. Fifty buffalo farmers were selected using multi
stage sampling technique. Random numbers of buffalo farms were selected from each Grama
Niladhari division to field survey based on buffalo farm population. Rearing buffalo as
primary and secondary income source was the selected criteria for buffalo farmers. Primary
data were collected using pre tested structured questionnaire and following models were used
in the analysis of stochastic production function and inefficiency model. Then, data were
analyzed using Minitab 14 and STATA 11 software packages.
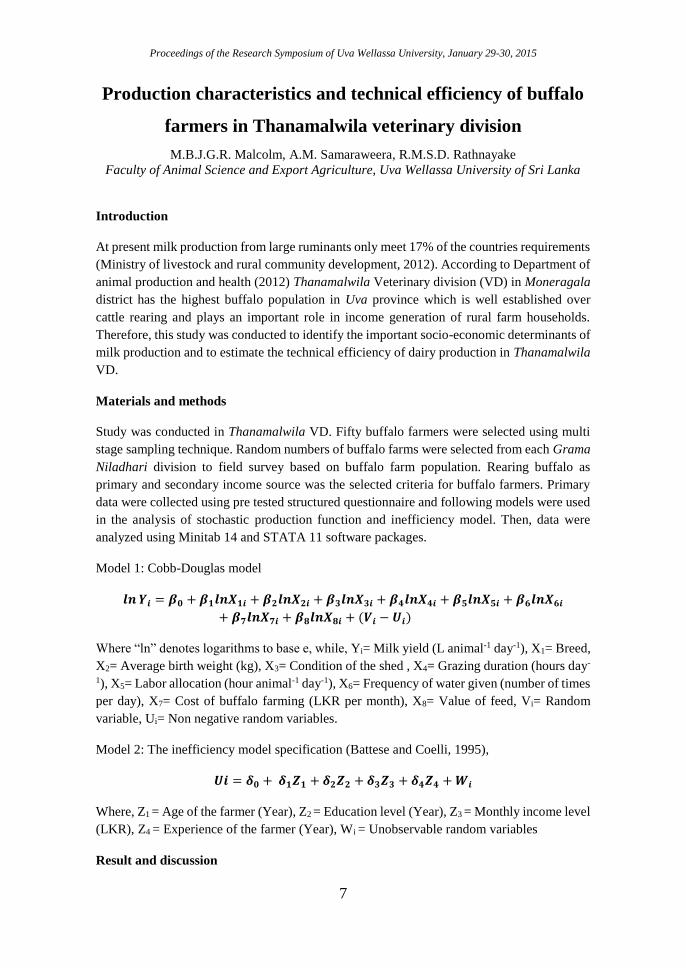
Model 1: Cobb-Douglas model
𝒍𝒏 𝒀𝒊 = 𝜷𝟎 + 𝜷𝟏𝒍𝒏𝑿𝟏𝒊 + 𝜷𝟐𝒍𝒏𝑿𝟐𝒊 + 𝜷𝟑𝒍𝒏𝑿𝟑𝒊 + 𝜷𝟒𝒍𝒏𝑿𝟒𝒊 + 𝜷𝟓𝒍𝒏𝑿𝟓𝒊 + 𝜷𝟔𝒍𝒏𝑿𝟔𝒊
+ 𝜷𝟕𝒍𝒏𝑿𝟕𝒊 + 𝜷𝟖𝒍𝒏𝑿𝟖𝒊 + (𝑽𝒊 − 𝑼𝒊)
Where “ln” denotes logarithms to base e, while, Yi= Milk yield (L animal-1 day-1), X1= Breed,
X2= Average birth weight (kg), X3= Condition of the shed , X4= Grazing duration (hours day-
1), X5= Labor allocation (hour animal-1 day-1), X6= Frequency of water given (number of times
per day), X7= Cost of buffalo farming (LKR per month), X8= Value of feed, Vi= Random
variable, Ui= Non negative random variables.
Model 2: The inefficiency model specification (Battese and Coelli, 1995),
𝑼𝒊 = 𝜹𝟎 + 𝜹𝟏𝒁𝟏 + 𝜹𝟐𝒁𝟐 + 𝜹𝟑𝒁𝟑 + 𝜹𝟒𝒁𝟒 + 𝑾𝒊
Where, Z1 = Age of the farmer (Year), Z2 = Education level (Year), Z3 = Monthly income level
(LKR), Z4 = Experience of the farmer (Year), Wi = Unobservable random variables
Result and discussion
Proceedings of the Research Symposium of Uva Wellassa University, January 29-30, 2015
8
All the buffalo farmers in the sample were male and majority was belonged to 21-30 age
category (30%) and a high proportion (62%) of buffalo farmers had education up to grade 10.
Only 6% of respondents had the education level beyond GCE ordinary level.
Most of the villages (98%) reared both local as well as exotic river type buffalo breeds and
the preferable breed combination was local buffalo and Murrah or Niliravi cross breds. Only
2% of farmers reared solely local buffaloes. Herd size ranged between 2-185 animals and
majority of respondents (38%) had a herd size of 21-40. Moreover, the predominant
management system (94%) was the extensive management system. Interestingly, one farmer
(2%) has practiced the intensive management system. Moreover, 6% of farmers practiced
artificial inseminations (AI) in their breeding program. Feed availability, water availability,
changes in rainfall pattern, and land availability were the most serious constraints faced by
respondents. Elephant attack and illegal smuggling were also critical problems in buffalo
farming in the area.
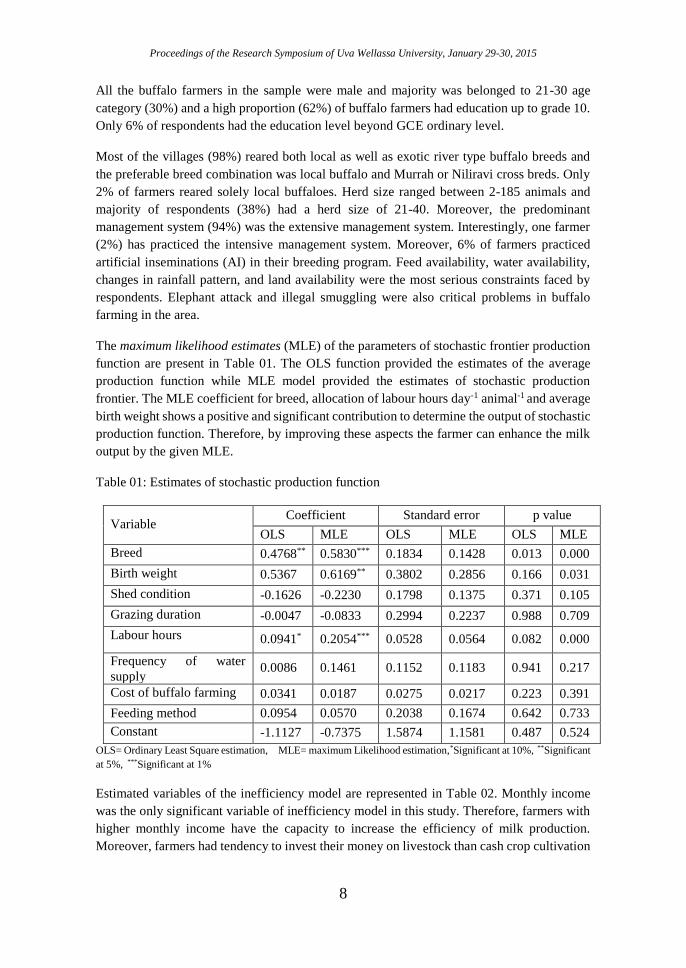
The maximum likelihood estimates (MLE) of the parameters of stochastic frontier production
function are present in Table 01. The OLS function provided the estimates of the average
production function while MLE model provided the estimates of stochastic production
frontier. The MLE coefficient for breed, allocation of labour hours day-1 animal-1 and average
birth weight shows a positive and significant contribution to determine the output of stochastic
production function. Therefore, by improving these aspects the farmer can enhance the milk
output by the given MLE.
Table 01: Estimates of stochastic production function
Variable Coefficient Standard error p value
OLS MLE OLS MLE OLS MLE
Breed 0.4768** 0.5830*** 0.1834 0.1428 0.013 0.000
Birth weight 0.5367 0.6169** 0.3802 0.2856 0.166 0.031
Shed condition -0.1626 -0.2230 0.1798 0.1375 0.371 0.105
Grazing duration -0.0047 -0.0833 0.2994 0.2237 0.988 0.709
Labour hours 0.0941* 0.2054*** 0.0528 0.0564 0.082 0.000
Frequency of water
supply 0.0086 0.1461 0.1152 0.1183 0.941 0.217
Cost of buffalo farming 0.0341 0.0187 0.0275 0.0217 0.223 0.391
Feeding method 0.0954 0.0570 0.2038 0.1674 0.642 0.733
Constant -1.1127 -0.7375 1.5874 1.1581 0.487 0.524
OLS= Ordinary Least Square estimation, MLE= maximum Likelihood estimation,*Significant at 10%, **Significant
at 5%, ***Significant at 1%
Estimated variables of the inefficiency model are represented in Table 02. Monthly income
was the only significant variable of inefficiency model in this study. Therefore, farmers with
higher monthly income have the capacity to increase the efficiency of milk production.
Moreover, farmers had tendency to invest their money on livestock than cash crop cultivation
Proceedings of the Research Symposium of Uva Wellassa University, January 29-30, 2015
9
because they considered cash crop cultivation as relatively risky business due to dry climatic
condition in the area.
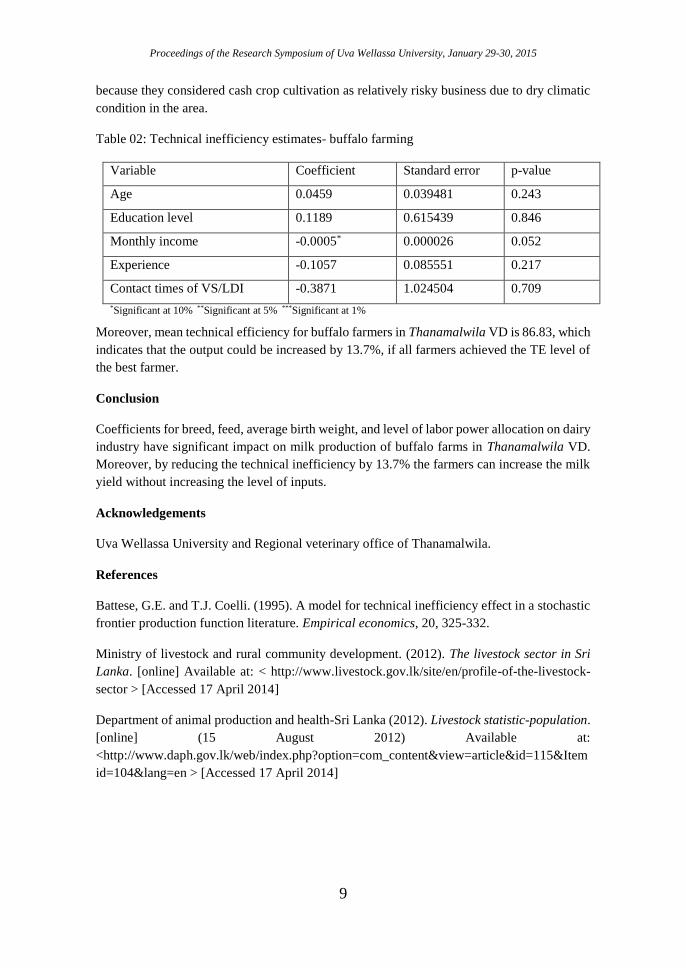
Table 02: Technical inefficiency estimates- buffalo farming
Variable Coefficient Standard error p-value
Age 0.0459 0.039481 0.243
Education level 0.1189 0.615439 0.846
Monthly income -0.0005* 0.000026 0.052
Experience -0.1057 0.085551 0.217
Contact times of VS/LDI -0.3871 1.024504 0.709
*Significant at 10% **Significant at 5% ***Significant at 1%
Moreover, mean technical efficiency for buffalo farmers in Thanamalwila VD is 86.83, which
indicates that the output could be increased by 13.7%, if all farmers achieved the TE level of
the best farmer.
Conclusion
Coefficients for breed, feed, average birth weight, and level of labor power allocation on dairy
industry have significant impact on milk production of buffalo farms in Thanamalwila VD.
Moreover, by reducing the technical inefficiency by 13.7% the farmers can increase the milk
yield without increasing the level of inputs.
Acknowledgements
Uva Wellassa University and Regional veterinary office of Thanamalwila.
References
Battese, G.E. and T.J. Coelli. (1995). A model for technical inefficiency effect in a stochastic
frontier production function literature. Empirical economics, 20, 325-332.
Ministry of livestock and rural community development. (2012). The livestock sector in Sri
Lanka. [online] Available at: < http://www.livestock.gov.lk/site/en/profile-of-the-livestock-
sector > [Accessed 17 April 2014]
Department of animal production and health-Sri Lanka (2012). Livestock statistic-population.
[online] (15 August 2012) Available at:
<http://www.daph.gov.lk/web/index.php?option=com_content&view=article&id=115&Item
id=104&lang=en > [Accessed 17 April 2014]
Proceedings of the Research Symposium of Uva Wellassa University, January 29-30, 2015
10
Development of drinking yoghurt by incorporating corn (Zea
mays) milk and corn seeds
R.I.W. Mendis, A.M.N.L. Abesinghe, A.M. Samaraweera
Faculty of Animal Science and Export Agriculture, Uva Wellassa University of Sri Lanka
and
L.K.A. Gunawardhane
Lucky Lanka Milk Processing Company Limited, Sri Lanka
Introduction
Cereal grains are considered as important sources of dietary proteins, carbohydrates, vitamins,
minerals and fiber for people all over the world (Chavan and Kadam, 1989). Corn (Zea mays)
is locally grown cereal that can be purchased at low price from several areas in Sri Lanka.
Corn milk is considered as a new innovation, especially in making yoghurt based products.
Vegetable based corn milk yoghurt is an alternative to substitute the cow milk based yoghurt.
Drinking yogurt is the fastest growing food and beverage category in worldwide (Yasni and
Maulidya, 2013). However, still value added drinking yoghurts are rare in Sri Lankan market.
Adding cereal grains is a perfect way to upgrade a drink to a nutritious breakfast. Therefore,
this study was conducted to develop yoghurt by incorporating corn (Zea mays) milk and corn
seed to cow milk.
Methodology
The study was carried out at Lucky Lanka Milk Processing Com. Ltd (LLMP), Matara and
Uva Wellassa University. Six experimental trials with different treatments were conducted. In
trial I, mature fresh corn seeds, mature boiled corn seeds and germinated corn seeds were
separately used to extract corn milk and the best extract of corn milk was evaluated by sensory
properties (odor, taste, color and mouth feel) using untrained panelist. In trial II the most
compatible sugar (8%, 9% and 10% w/v) and gelatin (0%, 0.2% and 0.4% w/v) levels for
different corn milk percentages (5%, 10%, 15% and 20% w/v) were identified. After selection
of appropriate combinations of sugar and gelatin levels, trial III was done to select the best
corn milk incorporation level by narrow downing the corn milk percentages (6%, 8%, 10%,
12% and 14%). Preserved in sugar syrup and boiled corn seeds were crushed into two sizes
(> 3.15 mm and 2 mm –3. 15 mm) to prepare different types of corn seeds. Trial IV was
carried out to select best corn seeds particles on the textural basis and trial V was done to
assess the consumer acceptability for the presence of corn seeds in the corn milk incorporated
drinking yoghurt. Finally three treatments (trial VI) were prepared and evaluated on sensory,
chemical and microbiological properties. The sensory evaluation was done using 35 untrained
panelists. In chemical analysis, proximate analysis (moisture content, crude fat, total solid,
crude protein, ash and crude fiber content) was conducted. pH value and titratable acidity were
evaluated and microbiological analysis was done for Yeast and Moulds, and Escherichia coli
for three weeks in one day interval. The sensory data were analyzed using Friedman
Proceedings of the Research Symposium of Uva Wellassa University, January 29-30, 2015
11
nonparametric test. Complete Randomized Design was conducted and data obtained from
chemical and microbiological tests were analyzed by Analysis of Variance using the General
Linear Model procedure of SAS. Significant means of treatments were separated using the
Least Significant Difference test (P< 0.05).
Result and Discussion
In trial I, boiled corn seeds (mature) based method was selected to extract corn milk. Other
two methods were rejected due to the unpleasant odour and taste which may be due to the
activation of various food enzymes and breaking down the higher molecular components to
simple molecules during germination.
Eight per cent sugar (w/v) for 5% corn milk (w/v) and 10% sugar (w/v) for other 10%, 15%
and 20% corn milk (w/v) incorporation levels were selected due to desirable sweetness. The
gelatin level (w/v) was selected as 0% due to the presence of appropriate drinking yoghurt
properties including texture, mouth feel, appearance and viscosity. The whey separation has
been prevented by stabilizing effect of corn starch in corn milk.
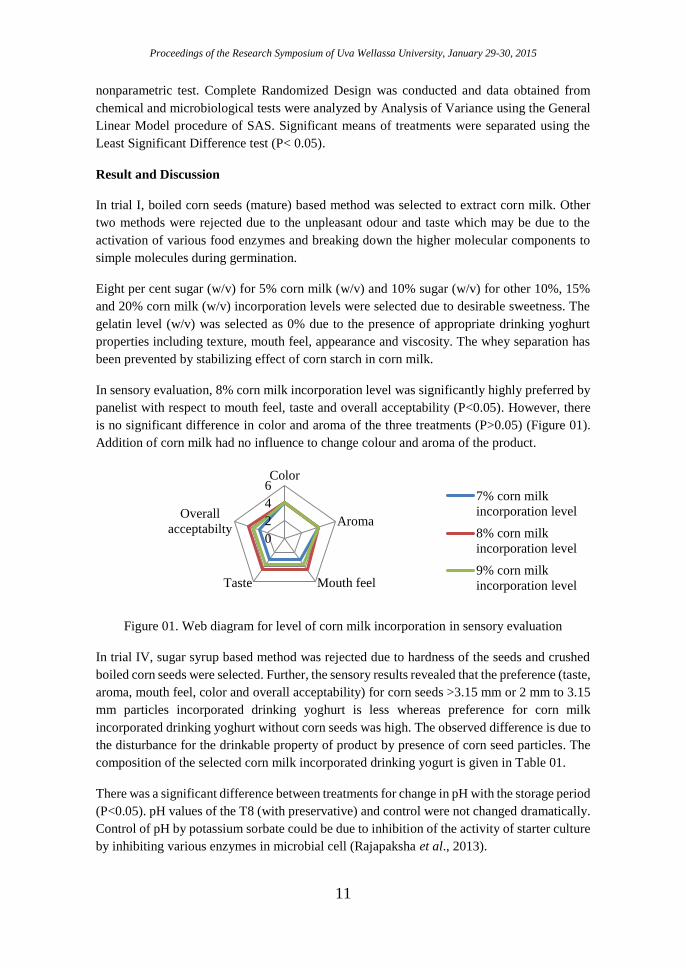
In sensory evaluation, 8% corn milk incorporation level was significantly highly preferred by
panelist with respect to mouth feel, taste and overall acceptability (P<0.05). However, there
is no significant difference in color and aroma of the three treatments (P>0.05) (Figure 01).
Addition of corn milk had no influence to change colour and aroma of the product.
Figure 01. Web diagram for level of corn milk incorporation in sensory evaluation
In trial IV, sugar syrup based method was rejected due to hardness of the seeds and crushed
boiled corn seeds were selected. Further, the sensory results revealed that the preference (taste,
aroma, mouth feel, color and overall acceptability) for corn seeds >3.15 mm or 2 mm to 3.15
mm particles incorporated drinking yoghurt is less whereas preference for corn milk
incorporated drinking yoghurt without corn seeds was high. The observed difference is due to
the disturbance for the drinkable property of product by presence of corn seed particles. The
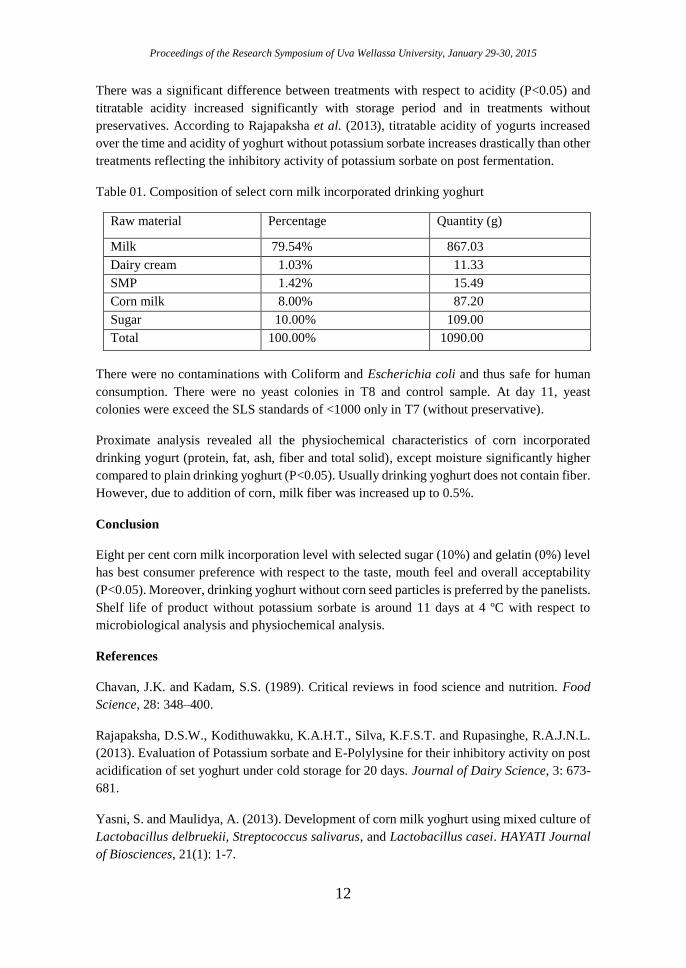
composition of the selected corn milk incorporated drinking yogurt is given in Table 01.
There was a significant difference between treatments for change in pH with the storage period
(P<0.05). pH values of the T8 (with preservative) and control were not changed dramatically.
Control of pH by potassium sorbate could be due to inhibition of the activity of starter culture
by inhibiting various enzymes in microbial cell (Rajapaksha et al., 2013).
0
2
4
6Color
Aroma
Mouth feelTaste
Overall
acceptabilty
7% corn milk
incorporation level
8% corn milk
incorporation level
9% corn milk
incorporation level
Proceedings of the Research Symposium of Uva Wellassa University, January 29-30, 2015
12
There was a significant difference between treatments with respect to acidity (P<0.05) and
titratable acidity increased significantly with storage period and in treatments without
preservatives. According to Rajapaksha et al. (2013), titratable acidity of yogurts increased
over the time and acidity of yoghurt without potassium sorbate increases drastically than other
treatments reflecting the inhibitory activity of potassium sorbate on post fermentation.
Table 01. Composition of select corn milk incorporated drinking yoghurt
Raw material Percentage Quantity (g)
Milk 79.54% 867.03
Dairy cream 1.03% 11.33
SMP 1.42% 15.49
Corn milk 8.00% 87.20
Sugar 10.00% 109.00
Total 100.00% 1090.00
There were no contaminations with Coliform and Escherichia coli and thus safe for human
consumption. There were no yeast colonies in T8 and control sample. At day 11, yeast
colonies were exceed the SLS standards of <1000 only in T7 (without preservative).
Proximate analysis revealed all the physiochemical characteristics of corn incorporated
drinking yogurt (protein, fat, ash, fiber and total solid), except moisture significantly higher
compared to plain drinking yoghurt (P<0.05). Usually drinking yoghurt does not contain fiber.
However, due to addition of corn, milk fiber was increased up to 0.5%.
Conclusion
Eight per cent corn milk incorporation level with selected sugar (10%) and gelatin (0%) level
has best consumer preference with respect to the taste, mouth feel and overall acceptability
(P<0.05). Moreover, drinking yoghurt without corn seed particles is preferred by the panelists.
Shelf life of product without potassium sorbate is around 11 days at 4 ºC with respect to
microbiological analysis and physiochemical analysis.
References
Chavan, J.K. and Kadam, S.S. (1989). Critical reviews in food science and nutrition. Food
Science, 28: 348–400.
Rajapaksha, D.S.W., Kodithuwakku, K.A.H.T., Silva, K.F.S.T. and Rupasinghe, R.A.J.N.L.
(2013). Evaluation of Potassium sorbate and E-Polylysine for their inhibitory activity on post
acidification of set yoghurt under cold storage for 20 days. Journal of Dairy Science, 3: 673-
681.
Yasni, S. and Maulidya, A. (2013). Development of corn milk yoghurt using mixed culture of
Lactobacillus delbruekii, Streptococcus salivarus, and Lactobacillus casei. HAYATI Journal
of Biosciences, 21(1): 1-7.
Proceedings of the Research Symposium of Uva Wellassa University, January 29-30, 2015
13
Effect of tropical forages on growth performance and carcass
quality of rabbits
F.S. Mohamed, E.D.N.S. Abeyrathne
Uva Wellassa University, Badulla, Sri lanka
Introduction
Rabbit (Oryctolagus cuniculus) is a small mono-gastric animal which has a very small body
size and an efficient reproductive ability. Backyard rabbit keeping supplies additional protein
with low investment and labor inputs. Rabbit meat has many nutritional benefits which include
high protein, low cholesterol and high palatability (Samkol and Lukefahr, 2008).The major
problem with rabbit production is high feeding cost (Lebas et al., 1997). Feeding cost for
rabbits account more than 75% of total cost of production. At present there is a competition
for protein sources between man and animals (Jiya et al., 2011). Rabbits are herbivores and
can be successfully raised on diets with low in grains and high in roughage. Therefore tropical
legumes can be used as an alternative for fed rabbits. The objective of this study was to
determine the growth performance, carcass quality of weaner rabbits with diet containing
forage supplements and commercial layer pellet.
Methodology
The experiment was carried out at Uva Wellassa University, Badulla. Sixteen (16) weaned
cross bred rabbits, mixed sexes were used for the feeding trial which conducted for 45-days.
All rabbits selected which were born on same day,a few from same litter. Rabbits were
grouped according to Complete Randomized Block Design (CRBD) with four replicates, 2
males and 2 females for each diet group. Ration for all the diets were formulated according
to the nutritional requirement of grower rabbit. Maximum inclusion levels for the selected
leaves also considered. All animals were kept for an adaptation period during the adaptation
period rabbits were fed with only the control diet (Prima layer pellet) with fresh guinea grass
(Panicum maximum). The experimental diet was introduced gradually for 8 days. Water was
supplied ad-libitum for each rabbit. Guinea grass (Panicum maximum), Erythrina leaves
(Erythrina indica), Cassava leaves (Manihot esculenta Crantz) and Leucaena leaves
(Leucaena leucocephala) were harvested from the surrounding environment of the university
premises. Guinea grass was harvested one week before feeding to the animals and hay was
made by keeping under sun. Erythrina leaves, Cassava leaves and Leucaena leaves were
harvested three to four days before feeding rabbits. Those harvested leaves were chopped and
wilted until constant weight was gained. Wilted leaves and dried grass were stored under dry
condition. Diet 1 = Only layer pellet 100% (control), Diet 2 = Layer pellet 70%, Erythrina
indica 20%, Panicum maximum 10%, Diet 3 = Layer pellet 65%, Manihot esculenta Crantz
20%, Panicum maximum 15% and Diet 4 = Layer pellet 92%, Leucaena leucocephala 7%,
Panicum maximum 1%. Data were collected on body weight and weight gains, feed intake
and Feed Conversion Ratio (FCR).
Proceedings of the Research Symposium of Uva Wellassa University, January 29-30, 2015
14
Two rabbits (one male and one female) from each group were slaughtered for carcass quality
evaluation. After 45 days of feeding trial two rabbits (one male and one female) from each
treatment group was slaughtered. Hot carcass weight, pH, Length of carcass, dressing
percentage was evaluated under carcass quality parameters. Chemical composition of
carcasses was analyzed for proximate constituents according to AOAC, 2002 method. Sensory
evaluation of boiled meat samples were evaluated using 15 semi trained panelists.
Collected data was analyzed using Analysis of variance (one way ANOVA and two way
ANOVA) - Minitab 16 statistical software package. Analysis of variance fallowed by a mean
separation procedure using Tukey’s test. Sensory analysis was done by using non parametric
analysis of Friedman test.
Result and discussion
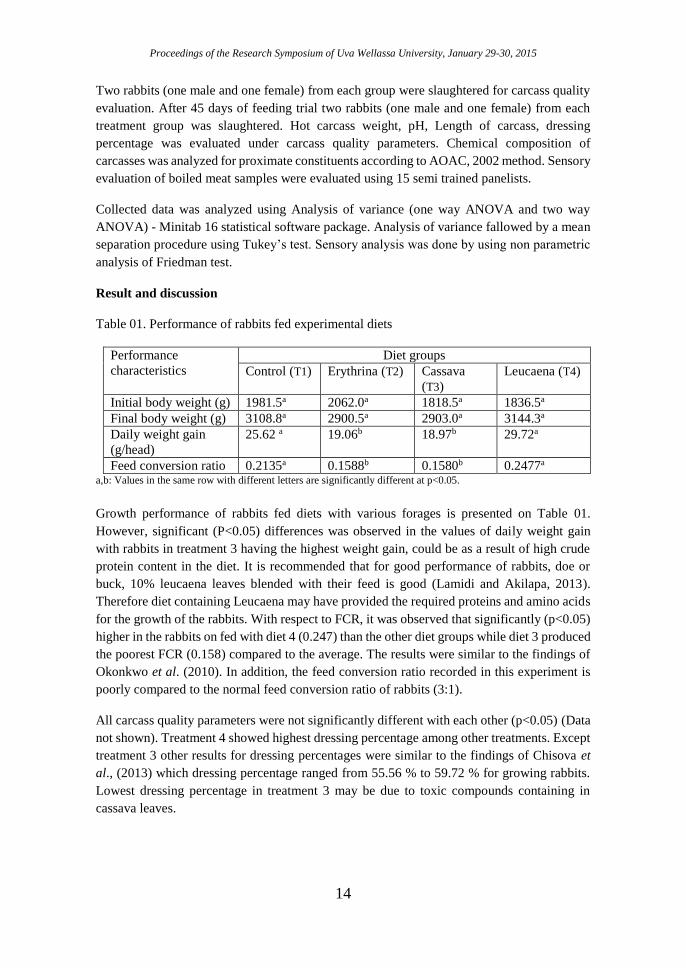
Table 01. Performance of rabbits fed experimental diets
Performance
characteristics
Diet groups
Control (T1) Erythrina (T2) Cassava
(T3)
Leucaena (T4)
Initial body weight (g) 1981.5a 2062.0a 1818.5a 1836.5a
Final body weight (g) 3108.8a 2900.5a 2903.0a 3144.3a
Daily weight gain
(g/head)
25.62 a 19.06b 18.97b 29.72a
Feed conversion ratio 0.2135a 0.1588b 0.1580b 0.2477a a,b: Values in the same row with different letters are significantly different at p<0.05.
Growth performance of rabbits fed diets with various forages is presented on Table 01.
However, significant (P<0.05) differences was observed in the values of daily weight gain
with rabbits in treatment 3 having the highest weight gain, could be as a result of high crude
protein content in the diet. It is recommended that for good performance of rabbits, doe or
buck, 10% leucaena leaves blended with their feed is good (Lamidi and Akilapa, 2013).
Therefore diet containing Leucaena may have provided the required proteins and amino acids
for the growth of the rabbits. With respect to FCR, it was observed that significantly (p<0.05)
higher in the rabbits on fed with diet 4 (0.247) than the other diet groups while diet 3 produced
the poorest FCR (0.158) compared to the average. The results were similar to the findings of
Okonkwo et al. (2010). In addition, the feed conversion ratio recorded in this experiment is
poorly compared to the normal feed conversion ratio of rabbits (3:1).
All carcass quality parameters were not significantly different with each other (p<0.05) (Data
not shown). Treatment 4 showed highest dressing percentage among other treatments. Except
treatment 3 other results for dressing percentages were similar to the findings of Chisova et
al., (2013) which dressing percentage ranged from 55.56 % to 59.72 % for growing rabbits.
Lowest dressing percentage in treatment 3 may be due to toxic compounds containing in
cassava leaves.
Proceedings of the Research Symposium of Uva Wellassa University, January 29-30, 2015
15
Sensory results showed that Erythrina indica incorporated diet fed rabbits meat was much
preferred than others. Results of sensory evaluation were same for both male and female
rabbits.
When consider proximate composition of rabbit meat, Crude protein content was varying
between 81.2 to 88.3 % (dry matter basis). Results were differ when consider male and female
animals. There is a less variation in fat content of both male and female animals regarding
four diets (6.2% - 7.1%). Results of fat and moisture content were similar to the findings of
Zotte (2002).
Conclusion
Smaller herbivores can persist on small quantities of food on the condition that the plants are
of high nutritional quality. Supplementation of concentrate with forage in the diet of rabbits
is cost effective. Leucaena leucocephala, Manihot esculenta Crantz and Erythrina indica
forages can be included in rabbit’s diet with recommended levels without any adverse effect.
Sensory results showed that Erythrina indica incorporated diet fed rabbits meat was much
preferred than others.
Carcass quality evaluation proved that Leucaena leucocephala incorporated diet fed rabbits
had highest dressing percentage which showed high weight gain. But proximate composition
of rabbit meat was not showed a high variation regarding four diets.
References
Chisowa, D.M, Mtimuni, J.P, Phoya, R.K.D. and Chagunda, M.G.G. (2013). Evaluation of
carcass quality of growing rabbits (Oryctolagus cunniculus) fed Soybean (Glycine max),
Cowpea (Vigna unguiculata) and Pigeon Pea (Cajanus cajan). Europian Academic Research
(E journal) 1.
Coudert, P, Lebas, F, Rochambeau de, H. and Thebault, R.G. (1997). The rabbit Husbandry,
health and production. Food and Agriculture Organization of the United Nations. Rome.
Jiya, EZ, Ijaiya, A.T, Oguche, K.O, Afolayan, F.O., Abdulkadi, B and Shehu, B.M. (2011).
Growth performance and nutrient utilization of weaned rabbits fed with diets in which palm
kernel cake (PKC) was replaced with cooked tallow (Detarium microcarpum) seed meal.
Animal and Veterinary Research, 3:7 – 10.
Lamidi, W.A. and Akilapa, T.P. (2013). Performance characteristics of rabbits fed with
Leucaena leaf meal based diet in natural housing system. Agricultural Science Research
Journal, 3(5):144- 151.
Okonkwo, J.C., Okonkwo, I.F. and Umerie, S.C. (2010). Replacement of feed concentrate
with graded levels of cassava leaf meal in the diet of growing rabbits: effect on feed and
growth parameters. Pakistan Journal of Nutrition, 9 (2):116-119.

Proceedings of the Research Symposium of Uva Wellassa University, January 29-30, 2015
16
Samkol, P. and Lukefahr, S.D. (2008). A challenging role for organic rabbit production
towards poverty alleviation in South East Asia. 9th World Rabbit Congress. Verona, Italy.
Zotte, A.D. (2002). Perception of rabbit meat quality and major factors influencing the rabbit
carcass and meat quality. Livestock production sciences, 11-32.
Proceedings of the Research Symposium of Uva Wellassa University, January 29-30, 2015
17
Diversity and antibiotic resistance patterns of Lactobacillus
species in traditional curd in Sri Lanka
T. Paranagama, C.P. Kodikara, G.D.D.K. Gunasena
Department of Microbiology, Faculty of Science, University of Kelaniya, Sri Lanka.
Introduction
Lactobacillus is a genus which comprises of more than 50 species as described in the Bergey’s
Manual of Systematic Bacteriology (2009) Lactobacilli are Gram-positive, non-spore-
forming rods or coccobacilli. They are generally considered as apathogenic, fastidious
bacteria and one of their main habitats is fermented dairy products.
In their fermentative pathways, main metabolic end product is Lactic acid. The fermentation
process of Lactobacillus increases the shelf-life of the fermented dairy product, as well as
adds the taste and improves the digestibility of milk. There are adequate evidences to prove
that traditionally fermented milk products have been produced for a long time in different
countries. Curd (Sri Lanka and India), Kefer (Russia), Yakult, Yogurt, Kumisss (Russia),
Tarhana (Turkey) are some examples.
There are Lactobacillus species that have achieved GRAS (Generally Recognized as Safe) or
QPS (Qualified Presumption of Safety) status. However, during the past few decades there
has been an emerging concern on spreading the antibiotic resistance in the environment. Due
to the increasing use of antibiotics and disposing them in to the environment in a considerably
inappropriate manner, concerns have arisen on the possibility and probability of spreading the
antibiotic resistance genes to Lactobacillus in fermented food (Farthing, 2004). The main
threat associated with these bacteria is that they can transfer resistance genes to pathogenic
bacteria as well as to the commensal flora in the intestinal tract. A number of initiatives have
been recently launched across the globe to address the biosafety concerns of starter cultures
and probiotic microorganisms. The European Food safety Authority (2007) considers
transferable antibiotic resistances as a safety concern. Many studies have detected the acquired
antibiotic resistance in fermented food products. Nevertheless, the tetracycline resistance was
shown to be able to transferred in vitro to Enterococcous faecalis from Lactobacillus species
isolated from fermented sausages (Gevers et al., 2003).
The objective of this study was to find out the diversity of Lactobacillus species in curd
prepared by small and medium scale producers in Sri Lanka and to detect their antibiotic
resistances.
Methodology
Total number of 32 curd samples representing different areas of the country were collected
from small and medium scale produces (SMS) who do not use starter cultures directly for the
process. Samples were enriched in modified Man Rogosa Sharpe broth at 370C at room
temperature for 24 h, under anaerobic conditions and plated on modified MRS agar medium
Proceedings of the Research Symposium of Uva Wellassa University, January 29-30, 2015
18
using agar overlay technique and incubated at 370C, for 24-36 h under anaerobic conditions.
Lactobacillus delbrueckii subsp. bulgaricus was used as the positive control. Morphologically
different colonies were isolated. Identification of the different strains were carried out using
morphological and biochemical tests according to the Bergey’s Manual of Systematic
Bacteriology. For the detection of antibiotic resistances, agar overlay disc diffusion method
(Charteris et al., 1998 ) was followed. The bacterial cultures used for this test were grown
overnight in modified MRS broth and the densities were adjusted to OD590nm = 0.1 using
spectrophotometer in order to obtain consistent growth. Penicillin G(P10),Tetracycline
(TE30), Erythromycin (E15), Bacitracin (B10), Rifampicin (RD30) Nalidixic Acid (NA30),
Vancomycin (VA30) and Polymixine B (PB300) were selected as the test antibiotics.
Results
For morphological characteristics, shape and colour of the colonies, Gram’s reaction, shape
and arrangement of cells, motility and endospore formation were observed. For the
biochemical characteristics, reaction in the Gibson’s medium, oxidase test, catalase test,
Arginine utilization, sugar fermentation tests (Arabinose, Cellobioose , Esculin, Galactose,
Maltose, Mannose, Melibiose, Raffinose, Ribose, Sucrose, Trehalose, Xylose, Salicin,
Sorbitol, Mannitol, Rhamnose, Lactose ) were detected.
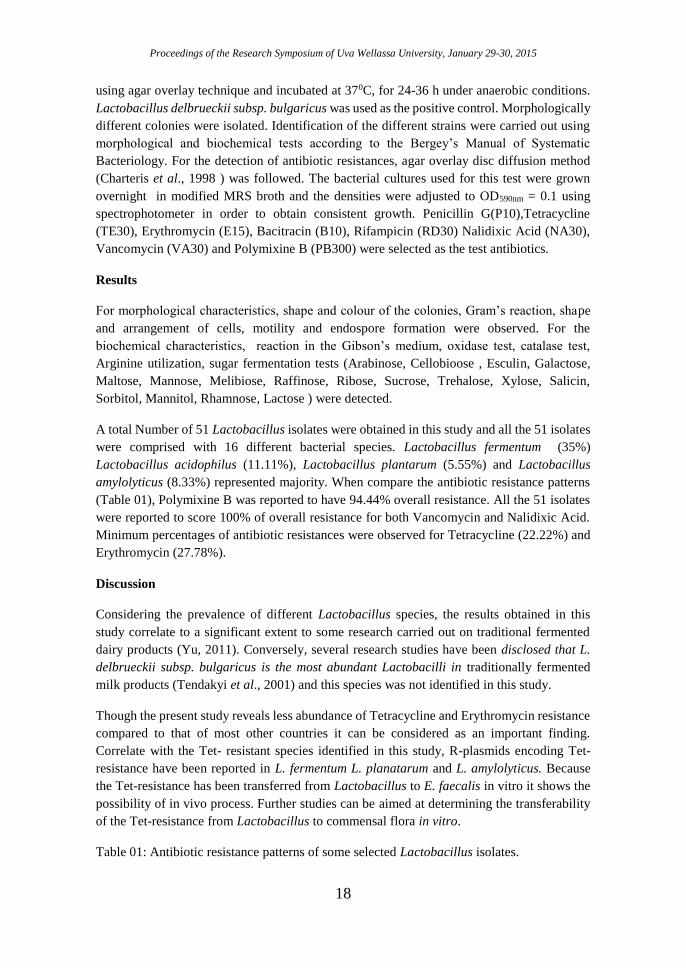
A total Number of 51 Lactobacillus isolates were obtained in this study and all the 51 isolates
were comprised with 16 different bacterial species. Lactobacillus fermentum (35%)
Lactobacillus acidophilus (11.11%), Lactobacillus plantarum (5.55%) and Lactobacillus
amylolyticus (8.33%) represented majority. When compare the antibiotic resistance patterns
(Table 01), Polymixine B was reported to have 94.44% overall resistance. All the 51 isolates
were reported to score 100% of overall resistance for both Vancomycin and Nalidixic Acid.
Minimum percentages of antibiotic resistances were observed for Tetracycline (22.22%) and
Erythromycin (27.78%).
Discussion
Considering the prevalence of different Lactobacillus species, the results obtained in this
study correlate to a significant extent to some research carried out on traditional fermented
dairy products (Yu, 2011). Conversely, several research studies have been disclosed that L.
delbrueckii subsp. bulgaricus is the most abundant Lactobacilli in traditionally fermented
milk products (Tendakyi et al., 2001) and this species was not identified in this study.
Though the present study reveals less abundance of Tetracycline and Erythromycin resistance
compared to that of most other countries it can be considered as an important finding.
Correlate with the Tet- resistant species identified in this study, R-plasmids encoding Tet-
resistance have been reported in L. fermentum L. planatarum and L. amylolyticus. Because
the Tet-resistance has been transferred from Lactobacillus to E. faecalis in vitro it shows the
possibility of in vivo process. Further studies can be aimed at determining the transferability
of the Tet-resistance from Lactobacillus to commensal flora in vitro.
Table 01: Antibiotic resistance patterns of some selected Lactobacillus isolates.
Proceedings of the Research Symposium of Uva Wellassa University, January 29-30, 2015
19
Isolate
No Species Tet Ery Bac Rif Pen Poly Nali Van
L43 L. planatarum R S S R R R R R
L3 L. planatarum S S R MS R R R R
K1 L. amylolyticus R R R R R R R R
K2 L. amylolyticus R R R R R R R R
L25 L. fermentum R R R R R R R R
M2 L. fermentum R R R R R R R R
L11 L. fermentum R R S R R R R R
L8 L.frintoshensis R R R R R R R R
L29 L. gastricus S R R R R R R R
Tcb L. acidophilus S S R R R R R R S; Sensitive, R; Resistant, MS; Moderatly sensitive
Tet; Tetracycline, Ery; Erythromycin, Bac; Bacitracin, Rif; Rifampicin, Pen; Penicillin G, Poly; Polymixine B, Nal; Nalidixic acid, Van; Vancomycin
Conclusions
16 different Lactobacillus species were isolated. Lactobacillus fermentum was the most
abundant organism. Minimum percentages of antibiotic resistances were observed for
Tetracycline and Erythromycin while maximum percentages of resistances were observed for
Nalidixic Acid and Vancomycin. The relatively high percentage of vancomycin resistance
(85%) is due to the fact that the majority of the lactobacilli are intrinsically resistant to this
glycopeptide.
References
Charteris, W.P., Kelly, P. M., Morelli, L. and Collins, J.K. (1998). Antibiotic susceptibility of
potentially probiotic Lactobacillus species. International Journal of Food Protection, 61:
1636–1643.
Gevers, D., Huys, G. and Swings, J. (2003). In vitro conjugal transfer of tetracycline resistance
from Lactobacillus isolates to other Gram positive bacteria. FEMS Microbiology Letters,
225:125-130.
Vos, P., Garrity, G., Jones, D., Krieg, N.R., Ludwig, W., Rainey, F.A., Schleifer, K.H. and
Whitman, W. (2009). Bergey's Manual of Systematic Bacteriology : The Firmicutes, 2nd edi,
Vol 3. Williams & Wilkins.
Proceedings of the Research Symposium of Uva Wellassa University, January 29-30, 2015
20
A preliminary study on Milk Urea Nitrogen values of the
Ambewela farm
K.K.T.N. Ranaweera, Maheshika S. Kurukulasuriya, A.M. Samaraweera
Faculty of Animal Science and Export Agriculture, Uva Wellassa University of Sri Lanka
and
N. Priyankarage, and U.P.L. Mangalika
Veterinary Research Institute, Peradeniya, Sri Lanka
Introduction
Feeding management is a key factor in profit maximizing of a dairy farm. Milk Urea Nitrogen
(MUN) is a tool that measures the efficiency of protein and carbohydrate feeding to milking
cows (Jonker et al., 1999). Implementing routine use of MUN on dairy farms could reduce
nutrient loading to natural environments and improve farm profitability (Jonker et al., 2002).
According to Kohn (2007) dairy herds should have MUN concentrations between 8 to 12 mg
dL-1. However, the MUN values could be affected by many factors such as environment,
breed, feed, season, etc. (Godden et al., 2001). Hence the use of 8 to 12 mg dL-1 MUN values
to evaluate the dairy herds in the Sri Lanka would be inappropriate, since there were no studies
carried out in to determine the baselines of MUN values in Sri Lanka. Therefore, this study
has been carried out as a preliminary study, to study about the prevailing MUN values of one
of the commercial dairy farm in Sri Lanka.
Methodology
The study was conducted at Ambewela farm and Veterinary Research Institute, Sri Lanka.
Four groups of the milking herd in the Ambewela farm (treatments) which have been made
based on the production levels of the cows were used to collect milk samples. Samples from
each group were taken once in fortnight during three months’ experimental period. During
each sample collection, 15 cows were selected randomly from each group and 50 mL of milk
from each cow was obtained after complete milking. Milk from five cows belonging to each
group was pooled. Hence, each treatment consisted with three replicates. Milk fat was
analyzed using the Gerber method. Solids-non-fat (SNF), protein, salts and lactose contents
were measured using a portable ultrasonic milk analyzer (Lactoscan MCC, Milkotronic Ltd.,
Bulgaria). Lacto meter was used to measure the milk specific gravity. The urea content in milk
was estimated according to the method described by Malik and Sirohi (1998) and the optical
density of the sample was measured at 450 nm using the spectrophotometer (Cary 50 Conc -
10069600, Agilent Technologies, Australia). In the statistical analysis, according to the
normality of the sample data test by Anderson-Darling test, the relationships were evaluated
using multiple regression analysis or Spearman Rank Correlation Coefficient. STATA® S/E
11.2 and Minitab® 17 software were used in statistical analysis of the data. The MUN levels
were interpreted based on the current recommended levels of Kohn (2007).
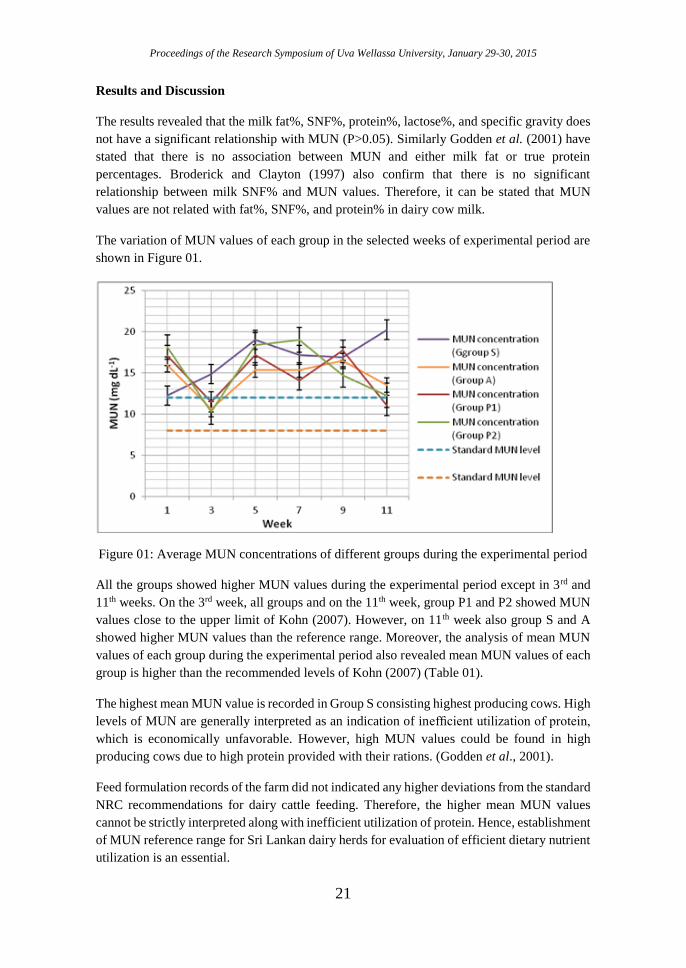
Proceedings of the Research Symposium of Uva Wellassa University, January 29-30, 2015
21
Results and Discussion
The results revealed that the milk fat%, SNF%, protein%, lactose%, and specific gravity does
not have a significant relationship with MUN (P>0.05). Similarly Godden et al. (2001) have
stated that there is no association between MUN and either milk fat or true protein
percentages. Broderick and Clayton (1997) also confirm that there is no significant
relationship between milk SNF% and MUN values. Therefore, it can be stated that MUN
values are not related with fat%, SNF%, and protein% in dairy cow milk.
The variation of MUN values of each group in the selected weeks of experimental period are
shown in Figure 01.
Figure 01: Average MUN concentrations of different groups during the experimental period
All the groups showed higher MUN values during the experimental period except in 3rd and
11th weeks. On the 3rd week, all groups and on the 11th week, group P1 and P2 showed MUN
values close to the upper limit of Kohn (2007). However, on 11th week also group S and A
showed higher MUN values than the reference range. Moreover, the analysis of mean MUN
values of each group during the experimental period also revealed mean MUN values of each
group is higher than the recommended levels of Kohn (2007) (Table 01).
The highest mean MUN value is recorded in Group S consisting highest producing cows. High
levels of MUN are generally interpreted as an indication of inefficient utilization of protein,
which is economically unfavorable. However, high MUN values could be found in high
producing cows due to high protein provided with their rations. (Godden et al., 2001).
Feed formulation records of the farm did not indicated any higher deviations from the standard
NRC recommendations for dairy cattle feeding. Therefore, the higher mean MUN values
cannot be strictly interpreted along with inefficient utilization of protein. Hence, establishment
of MUN reference range for Sri Lankan dairy herds for evaluation of efficient dietary nutrient
utilization is an essential.
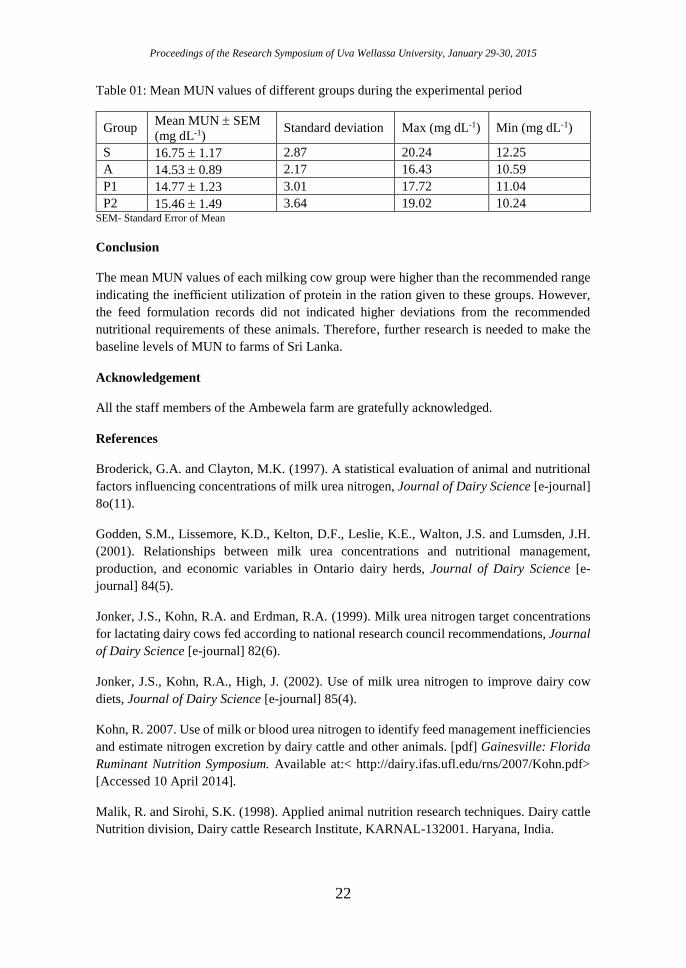
Proceedings of the Research Symposium of Uva Wellassa University, January 29-30, 2015
22
Table 01: Mean MUN values of different groups during the experimental period
Group Mean MUN SEM
(mg dL-1) Standard deviation Max (mg dL-1) Min (mg dL-1)
S 16.75 1.17 2.87 20.24 12.25
A 14.53 0.89 2.17 16.43 10.59
P1 14.77 1.23 3.01 17.72 11.04
P2 15.46 1.49 3.64 19.02 10.24 SEM- Standard Error of Mean
Conclusion
The mean MUN values of each milking cow group were higher than the recommended range
indicating the inefficient utilization of protein in the ration given to these groups. However,
the feed formulation records did not indicated higher deviations from the recommended
nutritional requirements of these animals. Therefore, further research is needed to make the
baseline levels of MUN to farms of Sri Lanka.
Acknowledgement
All the staff members of the Ambewela farm are gratefully acknowledged.
References
Broderick, G.A. and Clayton, M.K. (1997). A statistical evaluation of animal and nutritional
factors influencing concentrations of milk urea nitrogen, Journal of Dairy Science [e-journal]
8o(11).
Godden, S.M., Lissemore, K.D., Kelton, D.F., Leslie, K.E., Walton, J.S. and Lumsden, J.H.
(2001). Relationships between milk urea concentrations and nutritional management,
production, and economic variables in Ontario dairy herds, Journal of Dairy Science [e-
journal] 84(5).
Jonker, J.S., Kohn, R.A. and Erdman, R.A. (1999). Milk urea nitrogen target concentrations
for lactating dairy cows fed according to national research council recommendations, Journal
of Dairy Science [e-journal] 82(6).
Jonker, J.S., Kohn, R.A., High, J. (2002). Use of milk urea nitrogen to improve dairy cow
diets, Journal of Dairy Science [e-journal] 85(4).
Kohn, R. 2007. Use of milk or blood urea nitrogen to identify feed management inefficiencies
and estimate nitrogen excretion by dairy cattle and other animals. [pdf] Gainesville: Florida
Ruminant Nutrition Symposium. Available at:< http://dairy.ifas.ufl.edu/rns/2007/Kohn.pdf>
[Accessed 10 April 2014].
Malik, R. and Sirohi, S.K. (1998). Applied animal nutrition research techniques. Dairy cattle
Nutrition division, Dairy cattle Research Institute, KARNAL-132001. Haryana, India.
Proceedings of the Research Symposium of Uva Wellassa University, January 29-30, 2015
23
Comparison of broiler chick performance in single stage
incubation and multi stage incubation
H.W.P. Samarawickrama, R.M.H. Tharangani Faculty of Animal Science and Export Agriculture, Uva Wellassa University of Sri Lanka
and
G.A.S.N. Gamlath
Bairaha Farms PLC, Ellakkala, Pasyala, Sri Lanka
Introduction
Among livestock industries, poultry sector is widely spread throughout Sri Lanka. Chickens
raised for meat purpose are broilers. In current broiler market, the competition is high. To face
this competition, companies need to have strong production line with the companies. The main
input of the broiler industry is day old chicks. The commercial operations depend on the
hatcheries for the supplying of day old chicks. Hence, the hatchery should have considerable
capacity to produce required amount of chicks to fulfill the demand using artificial incubation.
Currently, the commercial markets have Single Stage (SS) and Multi Stage (MS) incubators.
According to the specialists in the industry, the SS machines are more effective and efficient
than the MS machine. To meet the competition successfully company need to establish an
efficient machine type in incubation procedure. Therefore, the primary objective of this
research is to compare the performance of broilers incubate in SS and MS incubators and to
investigate the effect of SS and MS incubation on chick quality.
Methodology
The hatching eggs were obtained from Cobb 500 female × Cobb 500 male broiler breeders at
54 and 64 week old age. The collected eggs were graded using egg grading machine. The eggs
weighing 63 g – 80 g were selected in present study. The setter trays were taken from top,
middle and bottom positions from both SS and MS machines. Setter trolleys were set in the
Petersime® SS setter machine and Petersime® MS setter machine. After 18 days, incubated
eggs were transferred to the hatcher baskets. At the transferring, the weight was measured and
recorded. Weight loss was calculated. The hatcher trolleys were placed in Petersime® hatcher
machines.
Chick pullout (hatch-out) was obtained at the 21 day of incubation. Live hatched chicks were
counted and recorded separately. Thirty newly hatched chicks were selected randomly from
the hatcher baskets. The hatch residuals were collected separately, stocks in egg trays and
tagged them for break out analysis. Death chicks were recorded separately. Chick weight was
measures separately in the replications by using weighing scale and recorded. Chick length
was measured using standard chick ruler and recorded in centimetres. Pasgar© scoring method
was done to analysis chick quality. Breakout analysis was done using hatch residuals. Then
chicks were sent through the chick grading and counting machine. Chicks were packed in
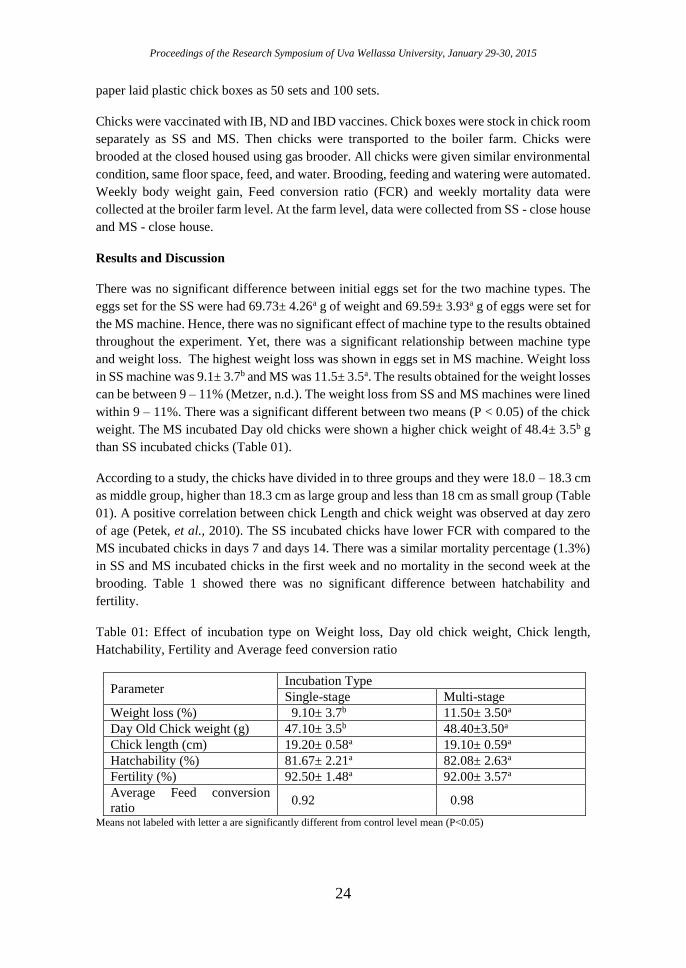
Proceedings of the Research Symposium of Uva Wellassa University, January 29-30, 2015
24
paper laid plastic chick boxes as 50 sets and 100 sets.
Chicks were vaccinated with IB, ND and IBD vaccines. Chick boxes were stock in chick room
separately as SS and MS. Then chicks were transported to the boiler farm. Chicks were
brooded at the closed housed using gas brooder. All chicks were given similar environmental
condition, same floor space, feed, and water. Brooding, feeding and watering were automated.
Weekly body weight gain, Feed conversion ratio (FCR) and weekly mortality data were
collected at the broiler farm level. At the farm level, data were collected from SS - close house
and MS - close house.
Results and Discussion
There was no significant difference between initial eggs set for the two machine types. The
eggs set for the SS were had 69.73± 4.26a g of weight and 69.59± 3.93a g of eggs were set for
the MS machine. Hence, there was no significant effect of machine type to the results obtained
throughout the experiment. Yet, there was a significant relationship between machine type
and weight loss. The highest weight loss was shown in eggs set in MS machine. Weight loss
in SS machine was 9.1± 3.7b and MS was 11.5± 3.5a. The results obtained for the weight losses
can be between 9 – 11% (Metzer, n.d.). The weight loss from SS and MS machines were lined
within 9 – 11%. There was a significant different between two means (P < 0.05) of the chick
weight. The MS incubated Day old chicks were shown a higher chick weight of 48.4± 3.5b g
than SS incubated chicks (Table 01).
According to a study, the chicks have divided in to three groups and they were 18.0 – 18.3 cm
as middle group, higher than 18.3 cm as large group and less than 18 cm as small group (Table
01). A positive correlation between chick Length and chick weight was observed at day zero
of age (Petek, et al., 2010). The SS incubated chicks have lower FCR with compared to the
MS incubated chicks in days 7 and days 14. There was a similar mortality percentage (1.3%)
in SS and MS incubated chicks in the first week and no mortality in the second week at the
brooding. Table 1 showed there was no significant difference between hatchability and
fertility.
Table 01: Effect of incubation type on Weight loss, Day old chick weight, Chick length,
Hatchability, Fertility and Average feed conversion ratio
Parameter Incubation Type
Single-stage Multi-stage
Weight loss (%) 9.10± 3.7b 11.50± 3.50a
Day Old Chick weight (g) 47.10± 3.5b 48.40±3.50a
Chick length (cm) 19.20± 0.58a 19.10± 0.59a
Hatchability (%) 81.67± 2.21a 82.08± 2.63a
Fertility (%) 92.50± 1.48a 92.00± 3.57a
Average Feed conversion
ratio 0.92 0.98
Means not labeled with letter a are significantly different from control level mean (P<0.05)
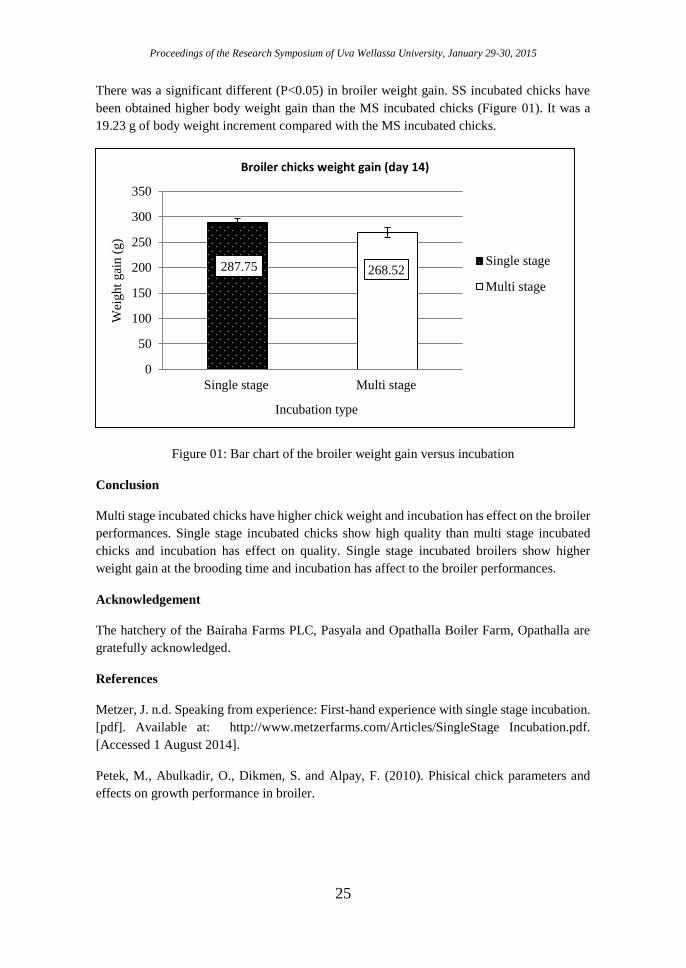
Proceedings of the Research Symposium of Uva Wellassa University, January 29-30, 2015
25
There was a significant different (P<0.05) in broiler weight gain. SS incubated chicks have
been obtained higher body weight gain than the MS incubated chicks (Figure 01). It was a
19.23 g of body weight increment compared with the MS incubated chicks.
Figure 01: Bar chart of the broiler weight gain versus incubation
Conclusion
Multi stage incubated chicks have higher chick weight and incubation has effect on the broiler
performances. Single stage incubated chicks show high quality than multi stage incubated
chicks and incubation has effect on quality. Single stage incubated broilers show higher
weight gain at the brooding time and incubation has affect to the broiler performances.
Acknowledgement
The hatchery of the Bairaha Farms PLC, Pasyala and Opathalla Boiler Farm, Opathalla are
gratefully acknowledged.
References
Metzer, J. n.d. Speaking from experience: First-hand experience with single stage incubation.
[pdf]. Available at: http://www.metzerfarms.com/Articles/SingleStage Incubation.pdf.
[Accessed 1 August 2014].
Petek, M., Abulkadir, O., Dikmen, S. and Alpay, F. (2010). Phisical chick parameters and
effects on growth performance in broiler.
287.75 268.52
0
50
100
150
200
250
300
350
Single stage Multi stage
Wei
ght
gai
n (
g)
Incubation type
Broiler chicks weight gain (day 14)
Single stage
Multi stage
Proceedings of the Research Symposium of Uva Wellassa University, January 29-30, 2015
26
Potential to use extracts from Lawsonia inermis
(Marathondhi) leaves and Emblica officinalis (Nelli) fruits as
tannin agents in leather manufacturing
S.M.D.S.C. Senaratne, A.M. Samaraweera
Faculty of Animal Science and Export Agriculture, Uva Wellassa University of Sri Lanka
and
A.W. Wickramasingha
Ceylon Leather Products,115/1,Kelaniganga Mill Rd, Colombo 15.
Introduction
In Sri Lanka mainly mimosa bark powder and chesnut powder are used to produce vegetable
tanned leather. However, these tannin agents can produce limited number of colors and are
imported to Sri Lanka with high import cost. As a result, final vegetable tanned leather
products become high in price. Thus, it is necessary to find out locally available, low cost
tannin agents to produce vegetable tanned leathers. Emblica officinalis (Nelli) fruits and
Lawsonia inermis (Marathondi) leaves are two such locally available tannin agents with
considerably high tannin content (nelli fruits-18-35 % (Pushpakumara and Heenkenda, 2012)
and Marathondi leaves- 11.12% (Musa, 2012). Therefore, the objective of the present study
was to assess the quality of leather prepared using locally available tanning agents,
Marathondhi leaves and Nelli fruit extracts.
Methodology
3.6 kg of marathondi leaves and 1.2 kg of nelli fruits were first crushed and ground separately.
Then it was mixed with 3 L of water and was filtered into separate containers. Same tannin
concentration (5 backometer value) was maintained in all containers. Further, a mimosa
solution with same concentration was prepared as the control.
Then, the buffalo hides were, soaked, dehaired and delimed and partial pickling was also done
prior to the tanning according to the leather manufacturing procedure of Ceylon Leather
Products PLC. Then, nine hide pieces with 6 x 7 inch was selected from same area of these
buffalo hides. Weight and thicknesses of each piece was measured and recorded. After that,
solutions were added into separate containers and three pieces of hide were dipped in each
container.
After hides were dipped, concentration of each solution was increased by 5 backo every four
days up to four weeks. Tannin penetration was also measured until it obtains 3 mm. After
finishing process, physical parameters, mean penetration rate (mm/day), thickness, mean yield
of the leather (%) and mean tensile strength was measured in all treatments and was compared
with control. Completely Randomized Design (CRD) was used to allocate treatments and data
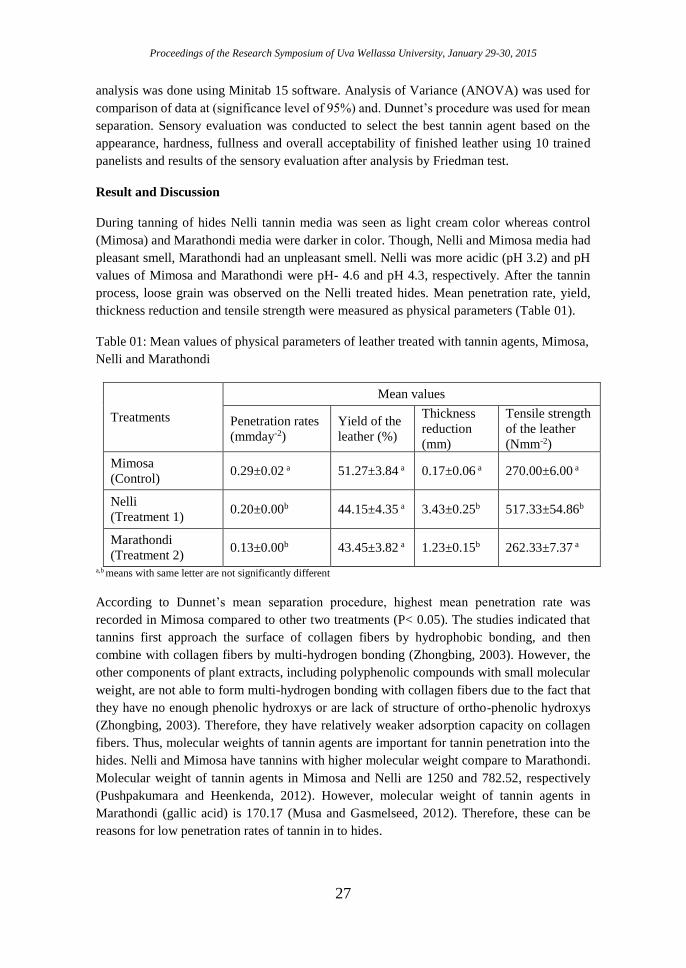
Proceedings of the Research Symposium of Uva Wellassa University, January 29-30, 2015
27
analysis was done using Minitab 15 software. Analysis of Variance (ANOVA) was used for
comparison of data at (significance level of 95%) and. Dunnet’s procedure was used for mean
separation. Sensory evaluation was conducted to select the best tannin agent based on the
appearance, hardness, fullness and overall acceptability of finished leather using 10 trained
panelists and results of the sensory evaluation after analysis by Friedman test.
Result and Discussion
During tanning of hides Nelli tannin media was seen as light cream color whereas control
(Mimosa) and Marathondi media were darker in color. Though, Nelli and Mimosa media had
pleasant smell, Marathondi had an unpleasant smell. Nelli was more acidic (pH 3.2) and pH
values of Mimosa and Marathondi were pH- 4.6 and pH 4.3, respectively. After the tannin
process, loose grain was observed on the Nelli treated hides. Mean penetration rate, yield,
thickness reduction and tensile strength were measured as physical parameters (Table 01).
Table 01: Mean values of physical parameters of leather treated with tannin agents, Mimosa,
Nelli and Marathondi
Treatments
Mean values
Penetration rates
(mmday-2)
Yield of the
leather (%)
Thickness
reduction
(mm)
Tensile strength
of the leather
(Nmm-2)
Mimosa
(Control) 0.29±0.02 a 51.27±3.84 a 0.17±0.06 a 270.00±6.00 a
Nelli
(Treatment 1) 0.20±0.00b 44.15±4.35 a 3.43±0.25b 517.33±54.86b
Marathondi
(Treatment 2) 0.13±0.00b 43.45±3.82 a 1.23±0.15b 262.33±7.37 a
a,b means with same letter are not significantly different
According to Dunnet’s mean separation procedure, highest mean penetration rate was
recorded in Mimosa compared to other two treatments (P< 0.05). The studies indicated that
tannins first approach the surface of collagen fibers by hydrophobic bonding, and then
combine with collagen fibers by multi-hydrogen bonding (Zhongbing, 2003). However, the
other components of plant extracts, including polyphenolic compounds with small molecular
weight, are not able to form multi-hydrogen bonding with collagen fibers due to the fact that
they have no enough phenolic hydroxys or are lack of structure of ortho-phenolic hydroxys
(Zhongbing, 2003). Therefore, they have relatively weaker adsorption capacity on collagen
fibers. Thus, molecular weights of tannin agents are important for tannin penetration into the
hides. Nelli and Mimosa have tannins with higher molecular weight compare to Marathondi.
Molecular weight of tannin agents in Mimosa and Nelli are 1250 and 782.52, respectively
(Pushpakumara and Heenkenda, 2012). However, molecular weight of tannin agents in
Marathondi (gallic acid) is 170.17 (Musa and Gasmelseed, 2012). Therefore, these can be
reasons for low penetration rates of tannin in to hides.
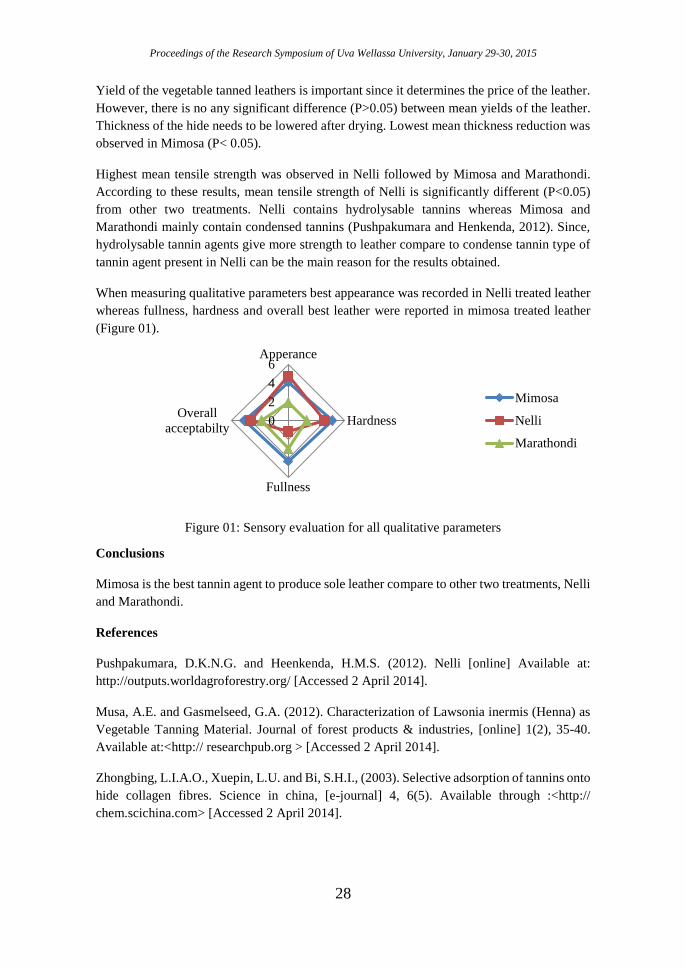
Proceedings of the Research Symposium of Uva Wellassa University, January 29-30, 2015
28
Yield of the vegetable tanned leathers is important since it determines the price of the leather.
However, there is no any significant difference (P>0.05) between mean yields of the leather.
Thickness of the hide needs to be lowered after drying. Lowest mean thickness reduction was
observed in Mimosa (P< 0.05).
Highest mean tensile strength was observed in Nelli followed by Mimosa and Marathondi.
According to these results, mean tensile strength of Nelli is significantly different (P<0.05)
from other two treatments. Nelli contains hydrolysable tannins whereas Mimosa and
Marathondi mainly contain condensed tannins (Pushpakumara and Henkenda, 2012). Since,
hydrolysable tannin agents give more strength to leather compare to condense tannin type of
tannin agent present in Nelli can be the main reason for the results obtained.
When measuring qualitative parameters best appearance was recorded in Nelli treated leather
whereas fullness, hardness and overall best leather were reported in mimosa treated leather
(Figure 01).
Figure 01: Sensory evaluation for all qualitative parameters
Conclusions
Mimosa is the best tannin agent to produce sole leather compare to other two treatments, Nelli
and Marathondi.
References
Pushpakumara, D.K.N.G. and Heenkenda, H.M.S. (2012). Nelli [online] Available at:
http://outputs.worldagroforestry.org/ [Accessed 2 April 2014].
Musa, A.E. and Gasmelseed, G.A. (2012). Characterization of Lawsonia inermis (Henna) as
Vegetable Tanning Material. Journal of forest products & industries, [online] 1(2), 35-40.
Available at:<http:// researchpub.org > [Accessed 2 April 2014].
Zhongbing, L.I.A.O., Xuepin, L.U. and Bi, S.H.I., (2003). Selective adsorption of tannins onto
hide collagen fibres. Science in china, [e-journal] 4, 6(5). Available through :<http://
chem.scichina.com> [Accessed 2 April 2014].
0
2
4
6Apperance
Hardness
Fullness
Overall
acceptabilty
Mimosa
Nelli
Marathondi
Proceedings of the Research Symposium of Uva Wellassa University, January 29-30, 2015
29
Performance evaluation of different broiler strains under
environmental controlled broiler house in Sri Lanka
S. Abiramy, R.M.H. Tharangani
Faculty of Animal Science and Export Agriculture, Uva Wellassa University of Sri Lanka
and
S. Chandana
CIC poultry farms PLC, Molahena Estate, Alugola, Sri Lanka
Introduction
Broilers are bred and rose specifically for meat production. Hubbard breed is mainly used to
produce meat in large scale farms. They are imported from Europe. CIC farm is one of the
large scale farms in Sri Lanka and they are rearing two different strains; Hubbard Flex and F
15 under environmental controlled broiler house system. The aim of this study is to compare
and find the best strain in assessment of body weight, growth rate, mortality and feed
conversion ratio between Hubbard Flex and F 15.
Methodology
The experiment was conducted in closed house at C.I.C. poultry farms (Pvt.) during 2nd May
to 14th June 2014. Five hundred day old broiler chicks (Hubbard Flex and F 15) from hatchery
were used in the total experiment. Each (250 Flex + 250 F 15) were considered as two
treatments. Each treatment was divided into 5 subgroups as replicates as fifty birds per each.
Separation was made without including automated feeder line by using plastic boxes.
Before placing, initial weight of the premium category birds were recorded and then adequate
amount of feed was given separately. According to the space requirement feeders and waters
were used to each separation. Unlimited feeding was done throughout the study period (42
days). All the birds were vaccinated through drinking water against Newcastle disease and
Gumboro disease. Same conditions and feed were maintained for each group.
Group feed intake, Average body weight were measured daily until slaughtered at 42nd day.
Average weight gain and Feed Conversion Ratio (FCR) of bird was calculated during period
of growing birds. Mortality, if any, during the rearing period was recorded. Feed intake was
calculated as the difference between the amount of feed supplied and the amount of feed that
remained at the end of each feeding period. Feed conversion (feed: gain ratio) was calculated
as the ratio between feed intake and body weight gain every day. The experimental data were
processed and analyzed using Microsoft Office Excel (2007) and Minitab16 software.
Performances of two groups were compared using two sample t tests. Mean comparison was
used to find the best strain in performance.
Result and Discussion
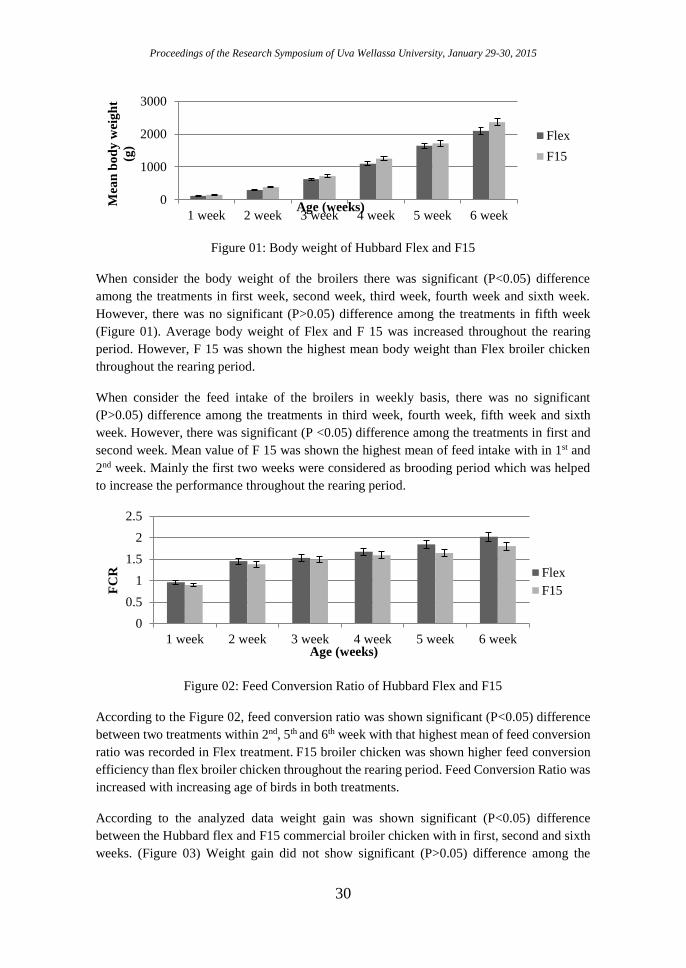
Proceedings of the Research Symposium of Uva Wellassa University, January 29-30, 2015
30
Figure 01: Body weight of Hubbard Flex and F15
When consider the body weight of the broilers there was significant (P<0.05) difference
among the treatments in first week, second week, third week, fourth week and sixth week.
However, there was no significant (P>0.05) difference among the treatments in fifth week
(Figure 01). Average body weight of Flex and F 15 was increased throughout the rearing
period. However, F 15 was shown the highest mean body weight than Flex broiler chicken
throughout the rearing period.
When consider the feed intake of the broilers in weekly basis, there was no significant
(P>0.05) difference among the treatments in third week, fourth week, fifth week and sixth
week. However, there was significant (P <0.05) difference among the treatments in first and
second week. Mean value of F 15 was shown the highest mean of feed intake with in 1st and
2nd week. Mainly the first two weeks were considered as brooding period which was helped
to increase the performance throughout the rearing period.
Figure 02: Feed Conversion Ratio of Hubbard Flex and F15
According to the Figure 02, feed conversion ratio was shown significant (P<0.05) difference
between two treatments within 2nd, 5th and 6th week with that highest mean of feed conversion
ratio was recorded in Flex treatment. F15 broiler chicken was shown higher feed conversion
efficiency than flex broiler chicken throughout the rearing period. Feed Conversion Ratio was
increased with increasing age of birds in both treatments.
According to the analyzed data weight gain was shown significant (P<0.05) difference
between the Hubbard flex and F15 commercial broiler chicken with in first, second and sixth
weeks. (Figure 03) Weight gain did not show significant (P>0.05) difference among the
0
1000
2000
3000
1 week 2 week 3 week 4 week 5 week 6 week
Mea
n b
od
y w
eig
ht
(g)
Age (weeks)
Flex
F15
0
0.5
1
1.5
2
2.5
1 week 2 week 3 week 4 week 5 week 6 week
FC
R
Age (weeks)
Flex
F15
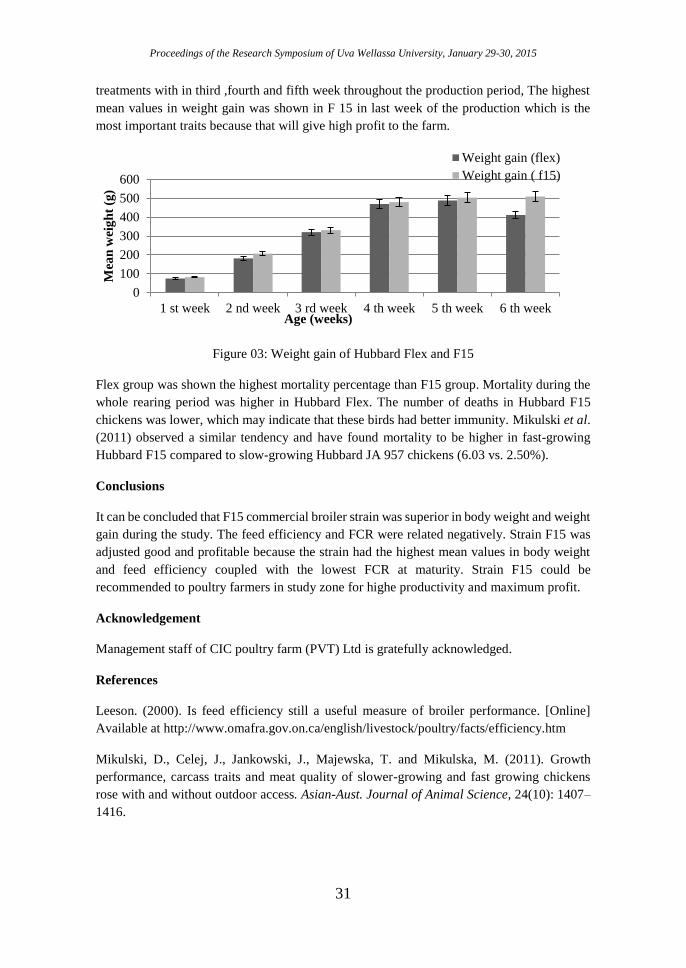
Proceedings of the Research Symposium of Uva Wellassa University, January 29-30, 2015
31
treatments with in third ,fourth and fifth week throughout the production period, The highest
mean values in weight gain was shown in F 15 in last week of the production which is the
most important traits because that will give high profit to the farm.
Figure 03: Weight gain of Hubbard Flex and F15
Flex group was shown the highest mortality percentage than F15 group. Mortality during the
whole rearing period was higher in Hubbard Flex. The number of deaths in Hubbard F15
chickens was lower, which may indicate that these birds had better immunity. Mikulski et al.
(2011) observed a similar tendency and have found mortality to be higher in fast-growing
Hubbard F15 compared to slow-growing Hubbard JA 957 chickens (6.03 vs. 2.50%).
Conclusions
It can be concluded that F15 commercial broiler strain was superior in body weight and weight
gain during the study. The feed efficiency and FCR were related negatively. Strain F15 was
adjusted good and profitable because the strain had the highest mean values in body weight
and feed efficiency coupled with the lowest FCR at maturity. Strain F15 could be
recommended to poultry farmers in study zone for highe productivity and maximum profit.
Acknowledgement
Management staff of CIC poultry farm (PVT) Ltd is gratefully acknowledged.
References
Leeson. (2000). Is feed efficiency still a useful measure of broiler performance. [Online]
Available at http://www.omafra.gov.on.ca/english/livestock/poultry/facts/efficiency.htm
Mikulski, D., Celej, J., Jankowski, J., Majewska, T. and Mikulska, M. (2011). Growth
performance, carcass traits and meat quality of slower-growing and fast growing chickens
rose with and without outdoor access. Asian-Aust. Journal of Animal Science, 24(10): 1407–
1416.
0
100
200
300
400
500
600
1 st week 2 nd week 3 rd week 4 th week 5 th week 6 th week
Mea
n w
eig
ht
(g)
Age (weeks)
Weight gain (flex)
Weight gain ( f15)
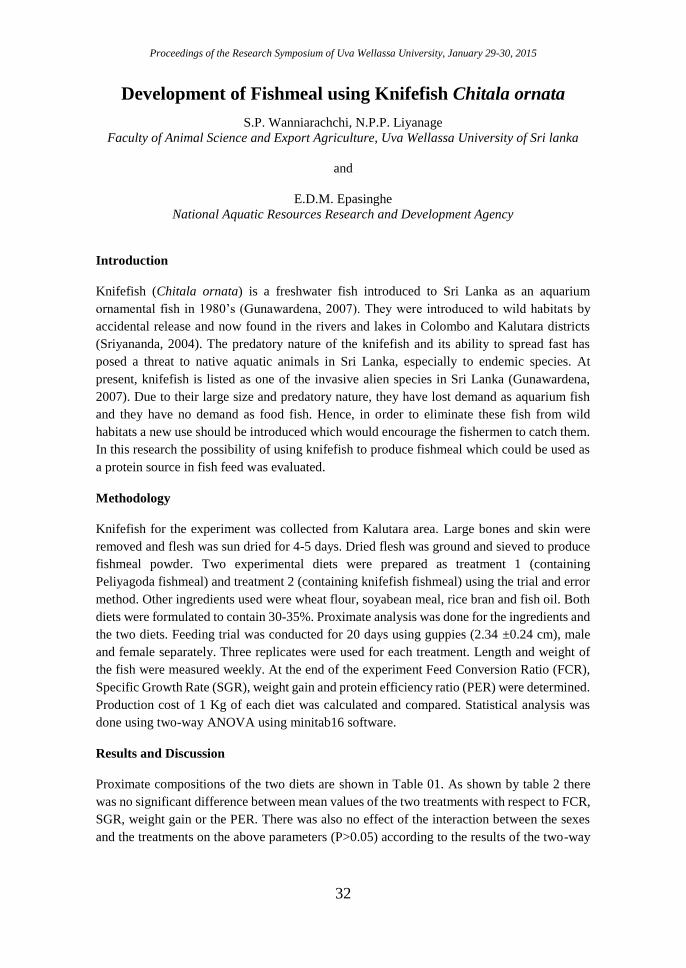
Proceedings of the Research Symposium of Uva Wellassa University, January 29-30, 2015
32
Development of Fishmeal using Knifefish Chitala ornata
S.P. Wanniarachchi, N.P.P. Liyanage
Faculty of Animal Science and Export Agriculture, Uva Wellassa University of Sri lanka
and
E.D.M. Epasinghe
National Aquatic Resources Research and Development Agency
Introduction
Knifefish (Chitala ornata) is a freshwater fish introduced to Sri Lanka as an aquarium
ornamental fish in 1980’s (Gunawardena, 2007). They were introduced to wild habitats by
accidental release and now found in the rivers and lakes in Colombo and Kalutara districts
(Sriyananda, 2004). The predatory nature of the knifefish and its ability to spread fast has
posed a threat to native aquatic animals in Sri Lanka, especially to endemic species. At
present, knifefish is listed as one of the invasive alien species in Sri Lanka (Gunawardena,
2007). Due to their large size and predatory nature, they have lost demand as aquarium fish
and they have no demand as food fish. Hence, in order to eliminate these fish from wild
habitats a new use should be introduced which would encourage the fishermen to catch them.
In this research the possibility of using knifefish to produce fishmeal which could be used as
a protein source in fish feed was evaluated.
Methodology
Knifefish for the experiment was collected from Kalutara area. Large bones and skin were
removed and flesh was sun dried for 4-5 days. Dried flesh was ground and sieved to produce
fishmeal powder. Two experimental diets were prepared as treatment 1 (containing
Peliyagoda fishmeal) and treatment 2 (containing knifefish fishmeal) using the trial and error
method. Other ingredients used were wheat flour, soyabean meal, rice bran and fish oil. Both
diets were formulated to contain 30-35%. Proximate analysis was done for the ingredients and
the two diets. Feeding trial was conducted for 20 days using guppies (2.34 ±0.24 cm), male
and female separately. Three replicates were used for each treatment. Length and weight of
the fish were measured weekly. At the end of the experiment Feed Conversion Ratio (FCR),
Specific Growth Rate (SGR), weight gain and protein efficiency ratio (PER) were determined.
Production cost of 1 Kg of each diet was calculated and compared. Statistical analysis was
done using two-way ANOVA using minitab16 software.
Results and Discussion
Proximate compositions of the two diets are shown in Table 01. As shown by table 2 there
was no significant difference between mean values of the two treatments with respect to FCR,
SGR, weight gain or the PER. There was also no effect of the interaction between the sexes
and the treatments on the above parameters (P>0.05) according to the results of the two-way
Proceedings of the Research Symposium of Uva Wellassa University, January 29-30, 2015
33
ANOVA. Therefore, it is possible to use knifefish fishmeal as a substitute for Peliyagoda
fishmeal in fish diets.
Table 01: Proximate composition of experimental diets
Component Treatment 1 (%) Treatment 2 (%)
Protein 33.30±0.34 35.29±1.74
Lipid 7.98±0.22 4.25±0.43
Moisture 2.34±0.42 2.27±0.16
Ash 22.05±0.10 15.82±0.23 Treatment 1- diet with Peliyagoda fishmeal, Treatment 2- diet with Knifefish fishmeal
Table 02: Mean values of the parameters
Treatment Sex FCR SGR WG PER
Treatment 1 Male 3.46 ±0.40 1.82 ±0.41 0.05 ±0.01 2.3 ±0.29
Treatment 1 Female 2.00 ±1.30 1.71 ±0.52 0.05 ±0.01 1.8 ±0.11
Treatment 2 Male 2.61 ±0.33 2.28 ±0.33 0.06 ±0.01 2.2 ±0.98
Treatment 2 Female 2.00 ±1.10 1.95 ±0.06 0.05 ±0.00 2.7 ±1.14
FCR- feed conversion ratio, SGR- specific growth rate, WG- weight gain, PER- protein efficiency ratio
When the production costs of 1 Kg of each diet were compared, it was more expensive to
produce the diet with knifefish fishmeal than with Peliyagoda fishmeal. This was due to the
high cost incurred on the production of knifefish fishmeal. If the whole fish was used for the
production of fishmeal instead of using only the flesh, cost of production could be reduced.
However results of the proximate analysis showed higher ash content in Peliyagoda fishmeal
(26.6±0.25) which shows that it contained higher amounts of impurities in contrast to the
composition of knifefish fishmeal (7.55±0.07) which contained only the flesh of the fish.
Conclusion
Knifefish fishmeal and Peliyagoda fishmeal have similar protein efficiency ratios and similar
effect on growth of guppy. Therefore it is suitable to be used as a protein source in guppy
feed. Domestic production of feed using knifefish fishmeal by fishermen could be encouraged.
Reference
Gunawardena, J. (2007). Knifefish a massive threat with an enormous appetite. The Island
[Online]. Available: http:// www.island.lk/2007/10/01/L1.pdf [Accessed 09.04.2014].
Sriyananda, S. (2004). Diyawanna fish face death. Sunday Observer [Online]. Available:
http://www.sundayobserver.lk/2004/06/13/fea19.html [Accessed 12.04.2014].
Proceedings of the Research Symposium of Uva Wellassa University, January 29-30, 2015
34
A study on microbial contaminations, sources and preventive
measures in salted butter production in a commercial dairy plant
T.D.G. Wickramanayaka, E.D.N.S. Abeyrathne
Faculty of Animal Science and Export Agriculture, Uva Wellassa University of Sri Lanka
Introduction
Dairy fat spreads are milk products relatively rich in fat in the form of a spreadable emulsion
principally of the type of water-in-milk fat that remains in solid phase at a temperature of 20
°C (Codex Standard for Dairy Fat Spreads, 2006). There are two kinds of butter as sweet
cream and ripened-cream. Sweet cream butter may or may not contain salt (Fernandes, 2008).
To overcome the high demand of butter, a reputed dairy company in Sri Lanka engages in
manufacturing salted butter. However, finish product frequently contain high microbial load
before releasing to the packing which leads to quick rancidity. Consequently, it has become a
problem to the company to obtain a profit. Therefore, this research was carried out to assess
microbiological quality at different production steps to determine the sources of microbial
contamination in salted butter production.
Methodology
A preliminary study was carried out to identify possible sample collection points including
swab sampling points during production process. Samples were collected from raw cream,
before and after pasteurization, after aging, during churning, final product, and wash water of
butter granules and the churner. Swab samples were collected from cream and aging vats,
hands of permanent workers (randomly), and inside and outside of the churner. Time and
temperature during storage of cream in the cream vat, pasteurization and aging were recorded.
Sample collection procedure was repeated for every batch up to identification of the
contamination points. Quality of samples was evaluated by performing microbiological tests
(total colony count, Coliform and fecal Coliform). According to the test results, contamination
points were identified and microbiological (E. coli, yeast, and moulds), chemical (free fatty
acid level of the final products) and physical (foreign matter observed from naked eye)
properties were further analyzed. Entire tests were conducted in triplicate according to the
analytical testing procedure of company. Data were finally analyzed by mean value
comparison using Microsoft Excel 2013. Further, analyzed data were compared with the
standards (SLS 279:1988).
Results and Discussion
According to the preliminary analysis, raw cream was stored for 4-5 hours at 7-8 °C in a cream
vat. Mean total colony count in raw cream of seven batches was ranged from 110×106 to
127×106 cfu/g and Coliform and fecal Coliform bacteria were detected in all samples tested.
After pasteurization (95 °C, 20 minutes), mean total colony count of all samples were lower
than 104 cfu ⁄g and after aging (5-7 °C, 12 hours) (Table 01). Coliform and fecal Coliform
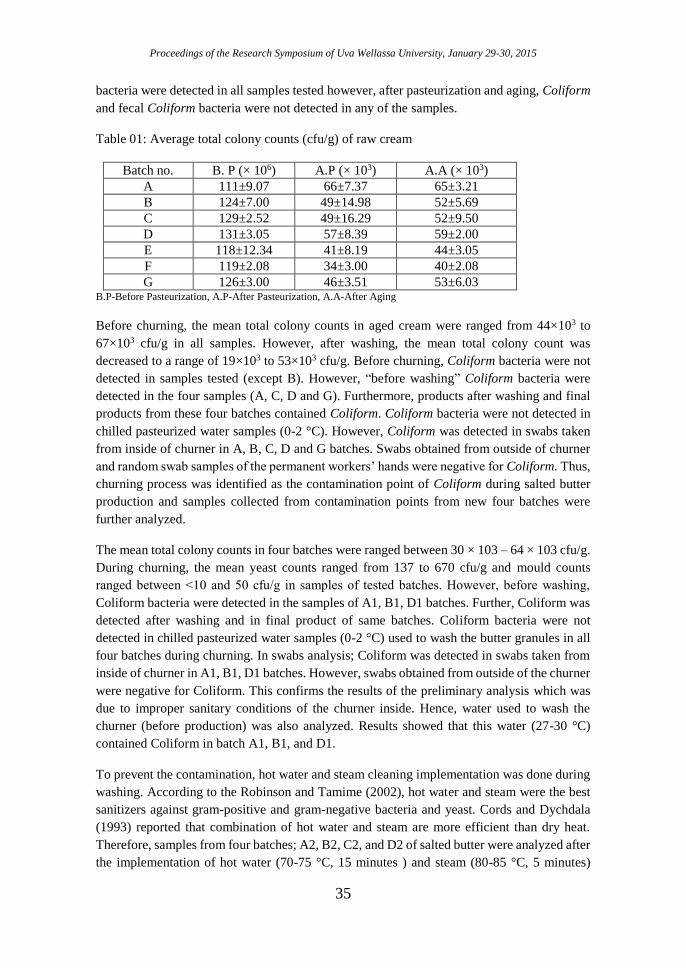
Proceedings of the Research Symposium of Uva Wellassa University, January 29-30, 2015
35
bacteria were detected in all samples tested however, after pasteurization and aging, Coliform
and fecal Coliform bacteria were not detected in any of the samples.
Table 01: Average total colony counts (cfu/g) of raw cream
Batch no. B. P (× 106) A.P (× 103) A.A (× 103)
A 111±9.07 66±7.37 65±3.21
B 124±7.00 49±14.98 52±5.69
C 129±2.52 49±16.29 52±9.50
D 131±3.05 57±8.39 59±2.00
E 118±12.34 41±8.19 44±3.05
F 119±2.08 34±3.00 40±2.08
G 126±3.00 46±3.51 53±6.03 B.P-Before Pasteurization, A.P-After Pasteurization, A.A-After Aging
Before churning, the mean total colony counts in aged cream were ranged from 44×103 to
67×103 cfu/g in all samples. However, after washing, the mean total colony count was
decreased to a range of 19×103 to 53×103 cfu/g. Before churning, Coliform bacteria were not
detected in samples tested (except B). However, “before washing” Coliform bacteria were
detected in the four samples (A, C, D and G). Furthermore, products after washing and final
products from these four batches contained Coliform. Coliform bacteria were not detected in
chilled pasteurized water samples (0-2 °C). However, Coliform was detected in swabs taken
from inside of churner in A, B, C, D and G batches. Swabs obtained from outside of churner
and random swab samples of the permanent workers’ hands were negative for Coliform. Thus,
churning process was identified as the contamination point of Coliform during salted butter
production and samples collected from contamination points from new four batches were
further analyzed.
The mean total colony counts in four batches were ranged between 30 × 103 – 64 × 103 cfu/g.
During churning, the mean yeast counts ranged from 137 to 670 cfu/g and mould counts
ranged between ˂10 and 50 cfu/g in samples of tested batches. However, before washing,
Coliform bacteria were detected in the samples of A1, B1, D1 batches. Further, Coliform was
detected after washing and in final product of same batches. Coliform bacteria were not
detected in chilled pasteurized water samples (0-2 °C) used to wash the butter granules in all
four batches during churning. In swabs analysis; Coliform was detected in swabs taken from
inside of churner in A1, B1, D1 batches. However, swabs obtained from outside of the churner
were negative for Coliform. This confirms the results of the preliminary analysis which was
due to improper sanitary conditions of the churner inside. Hence, water used to wash the
churner (before production) was also analyzed. Results showed that this water (27-30 °C)
contained Coliform in batch A1, B1, and D1.
To prevent the contamination, hot water and steam cleaning implementation was done during
washing. According to the Robinson and Tamime (2002), hot water and steam were the best
sanitizers against gram-positive and gram-negative bacteria and yeast. Cords and Dychdala
(1993) reported that combination of hot water and steam are more efficient than dry heat.
Therefore, samples from four batches; A2, B2, C2, and D2 of salted butter were analyzed after
the implementation of hot water (70-75 °C, 15 minutes ) and steam (80-85 °C, 5 minutes)
Proceedings of the Research Symposium of Uva Wellassa University, January 29-30, 2015
36
cleaning. Further, samples from six batches; A3, B3, C3, D3, E3, and F3 of salted butter were
analyzed after implementation of hot water and steam treatment as above. In wash water
analysis; Coliform bacteria was not detected in both samples. In swabs analysis; Coliform
bacteria was not detected in swabs taken from the inside and outside of churner. With the
increasing water temperature, the mean total colony count was reduced in both tested batches.
Yeast and moulds counts were within the standard level except B2. After implementation of
hot water and steam treatments, samples of tested batches were within the standard level.
Coliform were not detected in all samples tested. White (1996) stated that, Coliforms were
destroyed by pasteurization therefore according to the analysis; product had not been
contaminated after pasteurization, due to implementation of hot water and steam.
In chemical analysis; before implementation of the hot water and steam, the mean free fatty
acid level of the final products were ranged between 0.22 and 0.52 and only one batch was
within the standard level among the tested batches. After implementation of hot water (70-75
°C) and steam, it was ranged between 0.29 and 0.40 and after implementation of 75-80 °C hot
water and steam; it was ranged between 0.24 and 0.30. Accordingly eight batches (among ten
batches) were within the standard level. Moreover, with the temperature increment of the wash
water, free fatty acid level of the final product was lower than the previous. Furthermore, no
physical contaminants were observed in all tested batches.
Conclusion
Water used to wash churner was the main contamination source of Coliform in salted butter
production. Microbiological and chemical quality of salted butter can be improved by using
hot water (75-80 °C, 15 minutes) and steam (80-85 °C, 5 minutes) for cleaning the churner.
References
Codex Standards 253 (2006). Codex Standard for Dairy Fat Spreads. Codex Standards
Institution, Rome.
Cords, B.R., Dychdala, G.R. and Richter, F.L. (2001). Cleaning and Sanitizing in Milk
Production and Processing, in Marth, E. H., Steele, J. L. (ed.) Applied Dairy Microbiology.
New York: Marcel Dekker, pp. 127–150.
Fernandes, R. (2008). Butter and dairy spreads, in Fernandes, R. (ed.) Microbiology
Handbook Dairy Products. Surrey: Leatherhead Publishing, pp. 49-57.
Robinson, R.K., and Tamime, A.Y. (2002). Maintaining A Clean Working Environment, in
Robinson, R.K. (ed.) Dairy Microbiology.Vol 2. London: Elsevier, pp. 561-586.
Sri Lanka Standards 279 (1988). Butter. Sri Lanka Standards Institution, Colombo.
White, C.H. (1996). Microbiological testing in the dairy industry, Food Testing Anal 2(Aug–
Sept), 22.
Proceedings of the Research Symposium of Uva Wellassa University, January 29-30, 2015
37
A Study on Crocodile Behavior (Crocodylus palustris) and
Public Value Orientation in Ethimale of Monaragala District
W.G.R.I. Wijethilaka, A.M. Samaraweera, A.M.N.L. Abesinghe
Faculty of Animal Science and Export Agriculture, Uva Wellassa University of Sri Lanka
Introduction
Mugger crocodile (Crocodylus palustris) is principally restricted to Indian subcontinent and
the highest number is recorded in Sri Lanka (Da Silva and Lenin, 2010). Crocodylus palustris
is categorized as a vulnerable species in IUCN red list (2011). Furthermore, due to destruction
of their natural habitats, illegal hunting, fishing activities and crocodile attacks during sand
mining, bathing and washing, there is an emergence of this interaction as a human-crocodile
conflict. Though the existence of considerable number of C. palustris is recorded in Uva less
literature is available on their status in Uva Province of Sri Lanka. Therefore, this study was
conducted to understand people’s attitudes, risks, believes and practices towards human
crocodile conflict and to study the behavior of crocodile in Ethimale area.
Methodology
The study was conducted in villages surrounding eight perennial and seasonal tanks (Doser
tank, Wattarama tank, Kotiyagala tank, Heekaduwa tank 1 and 2, Karadandara tank,
Karakolagaswewa tank and Vila oya) at Ethimale of Monaragala district from May to August
2014. Ninety four individuals were interviewed using a pre-tested structured questionnaire
including farmers, fishermen and villagers to determine their awareness, knowledge,
practices, believes and attitudes regarding C. palustris. The information on purpose, frequency
and duration of water body usage by the villages, crocodile population, their approximate
size, migration and their availability throughout the year in the area was gathered through the
questionnaire. Moreover, the practices of the people and attitudes regarding crocodiles were
identified by gathering information on crocodile attacks, financial damages, people’s reaction
when seen crocodiles, offending actions, benefits/uses of crocodiles and threats face by
crocodiles. Presence of fecal pellets, footprints, smashed vegetation and cleared basking areas
were observed to study the migration and basking behavior. Data analysis was carried out by
Microsoft Excel and map was created using ArcGIS software including crocodile migration
paths.
Results and Discussion
Awareness of the people
The main water sources of Ethimale were tanks and Vila oya. Therefore, around 97% of the
respondents used tanks for their needs daily. Moreover, most of households are by or close to
the tanks which explains their close relation with the crocodiles.
Knowledge of the people regarding crocodiles
Proceedings of the Research Symposium of Uva Wellassa University, January 29-30, 2015
38
Sixty eight percent of the respondents considered that crocodiles were useful and 32% of
respondents believed that crocodiles were not useful or did not know the ecological roles
played by the crocodiles. According to them, consumption of crocodile meat and egg are the
major uses. Around 53% of the respondents have eaten crocodile meat while 5.3% have
consumed crocodile eggs. Though few had heard the uses of crocodile hide they have not done
any hide processing.
Though the respondents have seen crocodiles throughout the day, crocodiles were common
on tank sides especially in the morning (6.00 to 8.00 a.m.) and evening (5.30 to 7.00 p.m.). Based on the observations of the respondents, highest crocodile number was reported from
Kotiyagala tank (20 to 25), followed by Heekaduwa tank-1 (15 to 20) and Heekaduwa tank-2
(10 to 15). Regarding the approximate length of the largest crocodile seen by the respondents,
majority (62%) of has seen largest crocodile in between 2-3 m in length.
Nesting season, i.e., from June to August of Crocodylus palustris coincides with the dry
season in Monaragala (June to September) (Department of meteorology statistics, 2014).
Therefore, the hatching of eggs takes place with the beginning of the rainy season. Around
45% of the respondents have seen crocodile nesting sites at tank bunds, Vila oya sides, canal
sides, Vila oya anicut and jungle area which close to tanks.However, 11% of respondents have
seen Water Monitors (Varanus salvator) and Land Monitor (Varanus bengalensis) as main
predators of crocodile eggs.
Among the crocodile deaths observed by the respondents, most of the recorded crocodile
deaths were due to human actions such as shooting and hitting when the crocodiles attack to
the fishing nets (Specially for hatchlings). Two crocodile attacks to the fishermen while
fishing were reported. However, 37% of the respondents have faced some financial damages
from the crocodiles as damage to livestock (especially to calves) (37%), loss of fish yield
(29%), fish net damage and damage to pet animals. Among them damage to livestock and
damage to net and loss of fish yield were common. Moreover, threat from crocodiles was
reported as one reason to refrain youngsters from fishery.
Attitudes regarding crocodiles
Though 77% of the respondents have agreed that the crocodiles have become threat to fishery
or daily uses of the water body, 73% of the respondents still believe that conservation
programs for crocodiles are essential, since they believe that the number of crocodiles are
depleting annually. Moreover, they have suggested translocation of crocodiles (to large tanks,
national parks and zoo) and ecotourism to minimize the human crocodile conflict may be due
to the ethical reasons since all the respondents are Buddhists.
Crocodile migration and basking behavior
Crocodiles were migrated during the dry season and they were returned to their original
habitats at the beginning of the rainy season. Therefore, crocodile migration was highest
during August where all most all the seasonal tanks were dried and low water level was
observed in perennial tanks. With the beginning of rainy season in September, crocodiles were
returned to their original habitats.
Proceedings of the Research Symposium of Uva Wellassa University, January 29-30, 2015
39
Crocodiles were basked commonly during 6.00 am to 9.30 am under direct sun light (average
33°C daily temperature) in open areas such as dead trees in water, on the Vila oya river bank,
tank sides/bund and surrounding rocks. With the high day time temperature, they were moved
to the tank bottom and come to the top only for breathing meanwhile some crocodiles were
moved to burrows.
Recommendations to solve human crocodile conflict and conservation
To minimize human-crocodile conflict conducting awareness program to villagers including
conservation and laws related, installation and maintenance of crocodile excluding areas at
bathing places, installing warning sign boards and translocation of crocodiles which trap to
fish nets can be done. The crocodile conservation can be done to some extent by sharing
conservation and management responsibility among local community. The crocodiles can be
an attraction of visitors and create employment opportunities for the local community. Eco-
tourism may be a good solution for involving people with their traditional knowledge about
crocodile conservation and will be helpful to uplift the local socio-economic conditions. Other
than eco-tourism, protection of nesting habitats, initiation of crocodile parks or sanctuary,
conservation education and public awareness also can be practiced.
Conclusion
Majority of the villagers have sound knowledge regarding crocodile population, behavior,
migration patterns and availability. Since almost all the people were engaged with the tanks
for their daily needs and majority was farmers and fishermen. Though there are several
livestock attacks and economic losses from crocodiles no fatal attacks recorded to people.
Therefore, majority of the people in Ethimale was having a positive attitudes regarding
conservation of crocodiles.
References
De Silva, A. (2013). The Crocodiles of Sri Lanka. A.M.P. print shop, Gampaha, Sri Lank.
Da Silva, A. and Lenin, J. (2010). Mugger Crocodile-Crocodylus palustris. Pp. 94-98. In:
Manolis, S.C. and Stevenson, C. (Eds.), Crocodiles: Status Survey and Conservation Action
Plan, Crocodile Specialist Group: Darwin.
IUCN Red List of Threatened Species. (2007). Available at: https://www.iucnredlist.org
[Accessed 3rd April 2014].
IUCN Red List of Threatened Species. (2011). Available at: https://www.iucnredlist.org
[Accessed 3rd April 2014].
Ross, J.P. (1998). Crocodiles: Status Survey and Conservation Action Plan. IUCN/SSC
Crocodile Specialist Group, IUCN, Gland, Switzerland and Cambridge, Information Press,
Oxford, UK.
Proceedings of the Research Symposium of Uva Wellassa University, January 29-30, 2015
40
Development of Tomato (Solanum lycopersicum) Incorporated
Fish Nuggets
R.W.M.E.D. Perera, E.D.N.S. Abeyrathne
Faculty of Animal Science and Export Agriculture, Uva Wellassa University of Sri Lanka
and
N. Lalantha
Keells Food Products PLC, Minuwangoda Road, Ekala, Ja-Ela, Sri Lanka
Introduction
Modern consumers prefer processed foods and the changes in consumer life styles have
resulted in increasing demands for ready-to-eat and ready-to-cook seafood products
(Venugopal, 2005). But due to high post-harvest losses and busy life style fish consumption
has reduced gradually in Sri Lanka. Therefore value added fish products have become familiar
among most consumers (Sri Lanka Fisheries Year Book, 2009). Fish nuggets are formed meat
product in ready-to-cook form and it is a good substitute for above situations.
Most of the people nowadays concern more about their health and prefer to have healthier
diets. Tomato is considered as one of the healthiest vegetable and fruit in the world (American
Cancer Society, 2014). Tomato contains carbohydrates and several vitamins such as Vitamin
A, Thiamine, Niacin, Vitamin B6, Vitamin C and Vitamin E. In addition, tomatoes possess
one of the most powerful antioxidants, lycopene (Choski and Joshi 2007; Kavanaugh et al.,
2007). It has shown a wide variety of positive health benefits, including a reduced risk of
cancer (American Cancer Society, 2014). Therefore tomato incorporated fish nuggets contain
more health benefits and deliciousness due to incorporation of tomato. On the other hand, the
production of value added fish products using locally available resources is important for the
wide range of consumers and manufactures and it is also important to fulfill the market gap
by production of healthier fish based formed meat product in ready-to-cook or ready-to-eat
forms. The objective of this research is to develop a tomato (Solanum lycopersicum)
incorporated fish nugget with higher levels of antioxidants.
Methodology
Initially, the basic composition of fish nuggets was determined. The ingredients for fish
nuggets were identified and new recipes were formulated based on different fish percentages
(30%, 35%, 40% and 45%). After production fish nuggets, a sensory evaluation was carried
out using 10 trained panelists to find the best combination. For selection of the best heat
treatment for tomatoes, keeping qualities (pH, titratable acidity, moisture content and salt
content) and sensory qualities of different heat treated tomato pastes were evaluated. Boiling
(10 min, 100 oC), microwave-cooking (50 s, 800 W) and steaming (10 min) were selected as
the best heat treatments (Kamiloglu et al., 2013). After selecting the best heat treatment for
tomatoes, the best level of tomato paste to be incorporated in to the selected fish nugget recipe
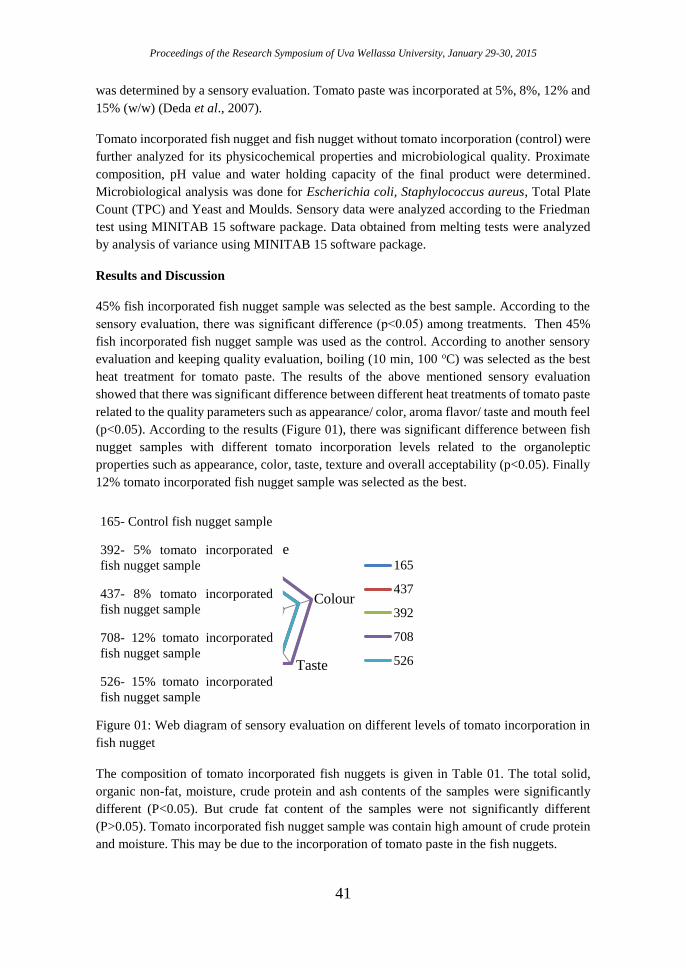
Proceedings of the Research Symposium of Uva Wellassa University, January 29-30, 2015
41
was determined by a sensory evaluation. Tomato paste was incorporated at 5%, 8%, 12% and
15% (w/w) (Deda et al., 2007).
Tomato incorporated fish nugget and fish nugget without tomato incorporation (control) were
further analyzed for its physicochemical properties and microbiological quality. Proximate
composition, pH value and water holding capacity of the final product were determined.
Microbiological analysis was done for Escherichia coli, Staphylococcus aureus, Total Plate
Count (TPC) and Yeast and Moulds. Sensory data were analyzed according to the Friedman
test using MINITAB 15 software package. Data obtained from melting tests were analyzed
by analysis of variance using MINITAB 15 software package.
Results and Discussion
45% fish incorporated fish nugget sample was selected as the best sample. According to the
sensory evaluation, there was significant difference (p˂0.05) among treatments. Then 45%
fish incorporated fish nugget sample was used as the control. According to another sensory
evaluation and keeping quality evaluation, boiling (10 min, 100 oC) was selected as the best
heat treatment for tomato paste. The results of the above mentioned sensory evaluation
showed that there was significant difference between different heat treatments of tomato paste
related to the quality parameters such as appearance/ color, aroma flavor/ taste and mouth feel
(p<0.05). According to the results (Figure 01), there was significant difference between fish
nugget samples with different tomato incorporation levels related to the organoleptic
properties such as appearance, color, taste, texture and overall acceptability (p<0.05). Finally
12% tomato incorporated fish nugget sample was selected as the best.
Figure 01: Web diagram of sensory evaluation on different levels of tomato incorporation in
fish nugget
The composition of tomato incorporated fish nuggets is given in Table 01. The total solid,
organic non-fat, moisture, crude protein and ash contents of the samples were significantly
different (P<0.05). But crude fat content of the samples were not significantly different
(P>0.05). Tomato incorporated fish nugget sample was contain high amount of crude protein
and moisture. This may be due to the incorporation of tomato paste in the fish nuggets.
01234
Apperance
Colour
TasteTexture
Overall
Acceptability
165
437
392
708
526
165- Control fish nugget sample
392- 5% tomato incorporated
fish nugget sample
437- 8% tomato incorporated
fish nugget sample
708- 12% tomato incorporated
fish nugget sample
526- 15% tomato incorporated
fish nugget sample
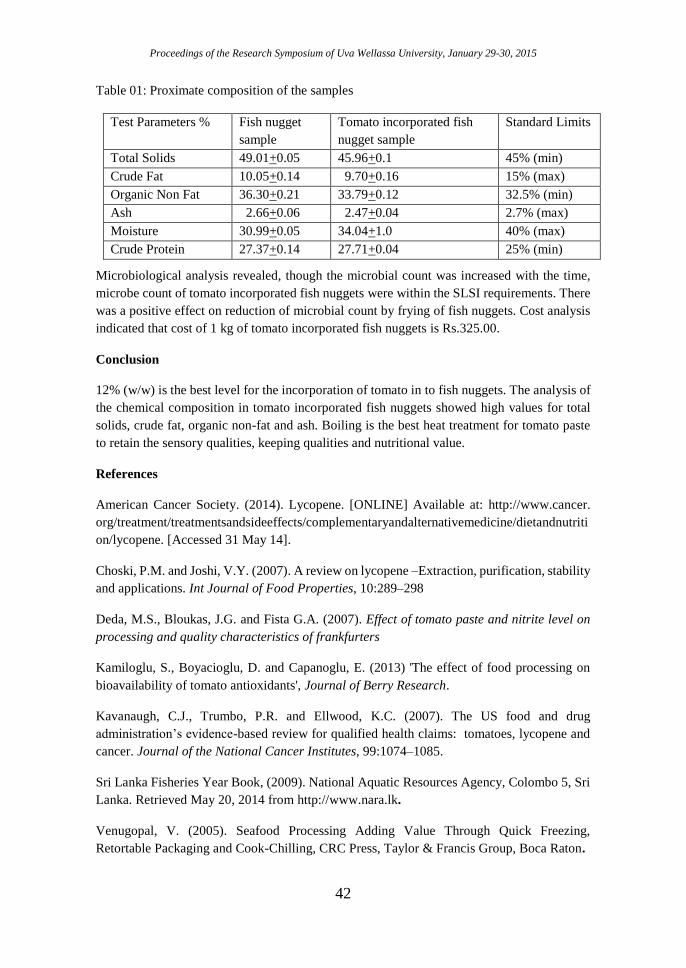
Proceedings of the Research Symposium of Uva Wellassa University, January 29-30, 2015
42
Table 01: Proximate composition of the samples
Test Parameters % Fish nugget
sample
Tomato incorporated fish
nugget sample
Standard Limits
Total Solids 49.01+0.05 45.96+0.1 45% (min)
Crude Fat 10.05+0.14 9.70+0.16 15% (max)
Organic Non Fat 36.30+0.21 33.79+0.12 32.5% (min)
Ash 2.66+0.06 2.47+0.04 2.7% (max)
Moisture 30.99+0.05 34.04+1.0 40% (max)
Crude Protein 27.37+0.14 27.71+0.04 25% (min)
Microbiological analysis revealed, though the microbial count was increased with the time,
microbe count of tomato incorporated fish nuggets were within the SLSI requirements. There
was a positive effect on reduction of microbial count by frying of fish nuggets. Cost analysis
indicated that cost of 1 kg of tomato incorporated fish nuggets is Rs.325.00.
Conclusion
12% (w/w) is the best level for the incorporation of tomato in to fish nuggets. The analysis of
the chemical composition in tomato incorporated fish nuggets showed high values for total
solids, crude fat, organic non-fat and ash. Boiling is the best heat treatment for tomato paste
to retain the sensory qualities, keeping qualities and nutritional value.
References
American Cancer Society. (2014). Lycopene. [ONLINE] Available at: http://www.cancer.
org/treatment/treatmentsandsideeffects/complementaryandalternativemedicine/dietandnutriti
on/lycopene. [Accessed 31 May 14].
Choski, P.M. and Joshi, V.Y. (2007). A review on lycopene –Extraction, purification, stability
and applications. Int Journal of Food Properties, 10:289–298
Deda, M.S., Bloukas, J.G. and Fista G.A. (2007). Effect of tomato paste and nitrite level on
processing and quality characteristics of frankfurters
Kamiloglu, S., Boyacioglu, D. and Capanoglu, E. (2013) 'The effect of food processing on
bioavailability of tomato antioxidants', Journal of Berry Research.
Kavanaugh, C.J., Trumbo, P.R. and Ellwood, K.C. (2007). The US food and drug
administration’s evidence-based review for qualified health claims: tomatoes, lycopene and
cancer. Journal of the National Cancer Institutes, 99:1074–1085.
Sri Lanka Fisheries Year Book, (2009). National Aquatic Resources Agency, Colombo 5, Sri
Lanka. Retrieved May 20, 2014 from http://www.nara.lk.
Venugopal, V. (2005). Seafood Processing Adding Value Through Quick Freezing,
Retortable Packaging and Cook-Chilling, CRC Press, Taylor & Francis Group, Boca Raton.
Proceedings of the Research Symposium of Uva Wellassa University, January 29-30, 2015
43
Analysis of Consumer Food Safety Knowledge and Practices
in Rathnapura
G.D.H.P. Dharmasiri, P. Sivashankar, I.C. Hettiarachchi, R.P. Mahaliyanaarachchi
Faculty of Agricultural Sciences, Sabaragamuwa university of Sri Lanka
Introduction
Food safety is a scientific discipline describing handling, preparation, and storage of food in
ways that prevent food borne illness. Unsafe food is the likely vector of multiple biological,
chemical or physical hazards and certainly of several nutritional problems. Consumers are
the end-users of food chain. With their attitudes, knowledge, age, sex, income level and social
status food safety knowledge and practices are different. According to the World Health
Organization (WHO), up to 30% of the population of developed countries are affected by food
borne illness each year; more than 75 million people get sick from food related illnesses in
the USA resulting in 325,000 hospitalizations and 5,000 deaths annually (WHO, 2007). The
problem is expected to be even more severe in developing countries.
Now Sri Lanka is more concern about food safety and handling practices. There are many
rules and regulations. Food Act No. 26 of 1980: This Act controls, manufacture, importation,
transport, sale, distribution, advertisement labeling of food. Sri Lankan food & beverage
products comply with international standards such as ISO 9000, ISO 22000, HACCP, Halal,
Kosher, Organic etc. In Sri Lanka also have many of food borne diseases, but they are not
reported often. But mainly diarrhoeal diseases are the prominent. This study assesses the
consumer food safety knowledge and the practices among the Rathnapura households.
Methodology
A survey strategy was used in the research. Target population was the entire household in
Rathnapura district 301,876 .Thought it was large to do an investigation within limited time
period and inadequate financial budget, multi stage random sampling technique was employed
to select appropriate sample to evaluate the objectives of this study. Eventually 120 household
were selected as the sample size where can meet 95% confidential level.
Five key principles of Food safety by WHO, are used to find out consumer knowledge level
in food safety. The association between socio economic characteristics and knowledge on
food safety was revealed by applying chi-square test. Prevailing food safety measures were
identified by using significant measures like smell, appearance, special package, and price and
quality certificates. Consumer food safety knowledge was evaluated with household
experiences of physical symptoms associate with food borne illness. And also food
preparation, purchasing and storage practices were used to identify food safety knowledge and
practices of consumers. Analysis was done by using Minitab 14.0 software package and
Microsoft Excel.
Results and Discussion
Proceedings of the Research Symposium of Uva Wellassa University, January 29-30, 2015
44
Descriptive statistics for the sample were produced using descriptive statistical analysis. The
purpose of generating descriptive statistics was to describe the demographic characteristics of
the sample.56% females and 44% males are in the sample. To prevent contamination of food
with pathogens spreading from people, pets and pests, separate raw and cooked foods to
prevent contaminating the cooked foods, cook foods for the appropriate length of time and at
the appropriate temperature to kill pathogens, store food at the proper temperature, do use safe
water and cooked materials. Majority of consumer’s (58%) food safety knowledge level was
low. 30% of consumers were had high food safety knowledge level.12% had medium level
knowledge on food safety.
Food safety measures were identified by the study as smell, appearance, special package, and
price and quality certificates. Among them 12% considered price, appearance and smell as
important factors.7% were merely concern about one factor of them. Smell, package and
special offer were identified by 10% of consumers. And also 10% of them were concerned
about all measures. Among respondents 63% selected food items without considering about
quality certification. The association between socio economic characteristics and knowledge
on food safety was analyzed by using chi-square analysis. Income level had significant
association with food safety knowledge of consumers. Education level did not show any
association on food safety knowledge.
95% of respondents had experienced with any of the food borne illnesses. This shows that
consumers have low confident on food safety and how to protect their family from food borne
illnesses. Daniels (1998) verified that consumers who considered themselves knowledgeable
make food handling errors.
By considering food safety practices on storage and preparation, 53% of consumers agreed
that peeled and chopped fruits and vegetables kept in open air for long time cause
contamination. But 23% strongly agreed that before using vegetables and fruits, they should
be soaked in salt water. Only 10% kept cooled vegetables and fruits in open air more than one
hour. In purchasing fish, 8% of consumers observed red color gills, discoloration and
brightness of eyes. Majority were concerned on one factor. And also 48% were concerned
about cleanliness of preparation and operator. Storage period of fish and usage were not
concerned by consumers of 36%.some consumers never keep cooked meat and raw meat at
the same place in refrigerator (34%). Cleaning of food preparation area with soap and water
was practiced by only 6%. Washing the cutting board with water, used to chop vegetables or
cut raw meat was practiced by 8% of consumers (Table 01).
Lack of knowledge is likely to lead to inappropriate food handling behaviors. Generally,
consumer’s knowledge has been found to be inadequate to ensure that food preparation in the
home minimizes the risk of food borne illness. Personal hygiene and cleanliness of surfaces
where food is prepared were identified as practices that have to be developed. Nearly 48%
consumers were concern on personal hygiene highly,
Table 01: Descriptive on Food preparation practices
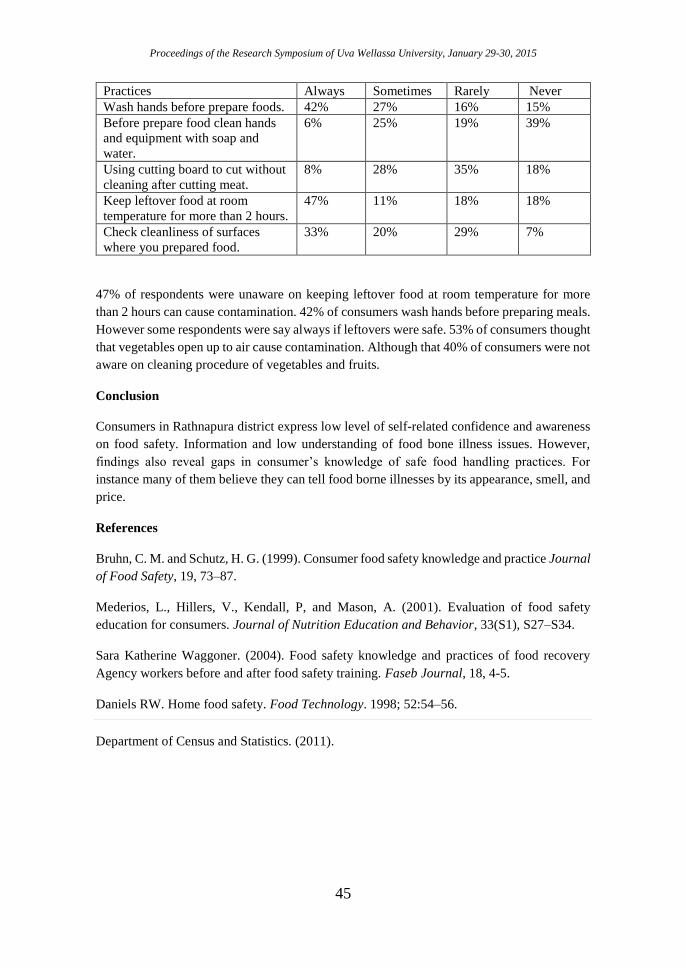
Proceedings of the Research Symposium of Uva Wellassa University, January 29-30, 2015
45
Practices Always Sometimes Rarely Never
Wash hands before prepare foods. 42% 27% 16% 15%
Before prepare food clean hands
and equipment with soap and
water.
6% 25% 19% 39%
Using cutting board to cut without
cleaning after cutting meat.
8% 28% 35% 18%
Keep leftover food at room
temperature for more than 2 hours.
47% 11% 18% 18%
Check cleanliness of surfaces
where you prepared food.
33% 20% 29% 7%
47% of respondents were unaware on keeping leftover food at room temperature for more
than 2 hours can cause contamination. 42% of consumers wash hands before preparing meals.
However some respondents were say always if leftovers were safe. 53% of consumers thought
that vegetables open up to air cause contamination. Although that 40% of consumers were not
aware on cleaning procedure of vegetables and fruits.
Conclusion
Consumers in Rathnapura district express low level of self-related confidence and awareness
on food safety. Information and low understanding of food bone illness issues. However,
findings also reveal gaps in consumer’s knowledge of safe food handling practices. For
instance many of them believe they can tell food borne illnesses by its appearance, smell, and
price.
References
Bruhn, C. M. and Schutz, H. G. (1999). Consumer food safety knowledge and practice Journal
of Food Safety, 19, 73–87.
Mederios, L., Hillers, V., Kendall, P, and Mason, A. (2001). Evaluation of food safety
education for consumers. Journal of Nutrition Education and Behavior, 33(S1), S27–S34.
Sara Katherine Waggoner. (2004). Food safety knowledge and practices of food recovery
Agency workers before and after food safety training. Faseb Journal, 18, 4-5.
Daniels RW. Home food safety. Food Technology. 1998; 52:54–56.
Department of Census and Statistics. (2011).
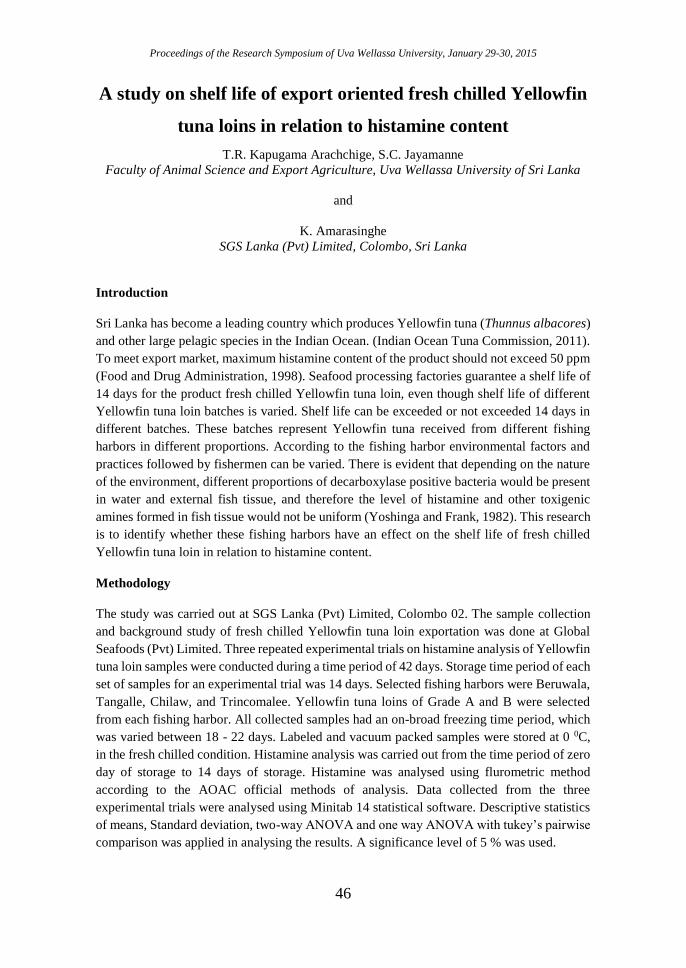
Proceedings of the Research Symposium of Uva Wellassa University, January 29-30, 2015
46
A study on shelf life of export oriented fresh chilled Yellowfin
tuna loins in relation to histamine content
T.R. Kapugama Arachchige, S.C. Jayamanne
Faculty of Animal Science and Export Agriculture, Uva Wellassa University of Sri Lanka
and
K. Amarasinghe
SGS Lanka (Pvt) Limited, Colombo, Sri Lanka
Introduction
Sri Lanka has become a leading country which produces Yellowfin tuna (Thunnus albacores)
and other large pelagic species in the Indian Ocean. (Indian Ocean Tuna Commission, 2011).
To meet export market, maximum histamine content of the product should not exceed 50 ppm
(Food and Drug Administration, 1998). Seafood processing factories guarantee a shelf life of
14 days for the product fresh chilled Yellowfin tuna loin, even though shelf life of different
Yellowfin tuna loin batches is varied. Shelf life can be exceeded or not exceeded 14 days in
different batches. These batches represent Yellowfin tuna received from different fishing
harbors in different proportions. According to the fishing harbor environmental factors and
practices followed by fishermen can be varied. There is evident that depending on the nature
of the environment, different proportions of decarboxylase positive bacteria would be present
in water and external fish tissue, and therefore the level of histamine and other toxigenic
amines formed in fish tissue would not be uniform (Yoshinga and Frank, 1982). This research
is to identify whether these fishing harbors have an effect on the shelf life of fresh chilled
Yellowfin tuna loin in relation to histamine content.
Methodology
The study was carried out at SGS Lanka (Pvt) Limited, Colombo 02. The sample collection
and background study of fresh chilled Yellowfin tuna loin exportation was done at Global
Seafoods (Pvt) Limited. Three repeated experimental trials on histamine analysis of Yellowfin
tuna loin samples were conducted during a time period of 42 days. Storage time period of each
set of samples for an experimental trial was 14 days. Selected fishing harbors were Beruwala,
Tangalle, Chilaw, and Trincomalee. Yellowfin tuna loins of Grade A and B were selected
from each fishing harbor. All collected samples had an on-broad freezing time period, which
was varied between 18 - 22 days. Labeled and vacuum packed samples were stored at 0 0C,
in the fresh chilled condition. Histamine analysis was carried out from the time period of zero
day of storage to 14 days of storage. Histamine was analysed using flurometric method
according to the AOAC official methods of analysis. Data collected from the three
experimental trials were analysed using Minitab 14 statistical software. Descriptive statistics
of means, Standard deviation, two-way ANOVA and one way ANOVA with tukey’s pairwise
comparison was applied in analysing the results. A significance level of 5 % was used.
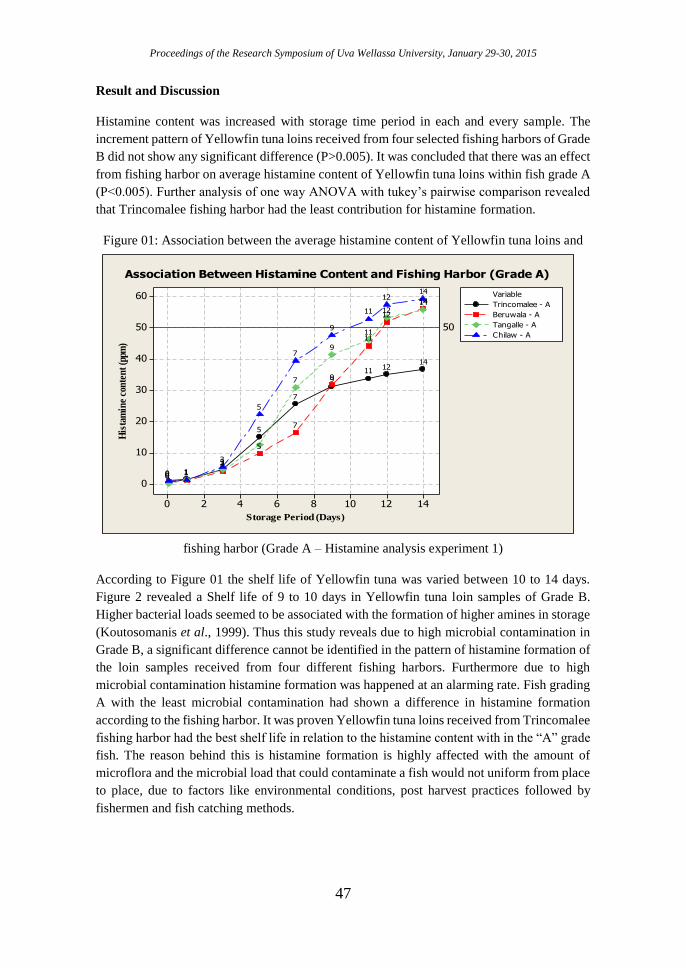
Proceedings of the Research Symposium of Uva Wellassa University, January 29-30, 2015
47
Result and Discussion
Histamine content was increased with storage time period in each and every sample. The
increment pattern of Yellowfin tuna loins received from four selected fishing harbors of Grade
B did not show any significant difference (P>0.005). It was concluded that there was an effect
from fishing harbor on average histamine content of Yellowfin tuna loins within fish grade A
(P<0.005). Further analysis of one way ANOVA with tukey’s pairwise comparison revealed
that Trincomalee fishing harbor had the least contribution for histamine formation.
Figure 01: Association between the average histamine content of Yellowfin tuna loins and
fishing harbor (Grade A – Histamine analysis experiment 1)
According to Figure 01 the shelf life of Yellowfin tuna was varied between 10 to 14 days.
Figure 2 revealed a Shelf life of 9 to 10 days in Yellowfin tuna loin samples of Grade B.
Higher bacterial loads seemed to be associated with the formation of higher amines in storage
(Koutosomanis et al., 1999). Thus this study reveals due to high microbial contamination in
Grade B, a significant difference cannot be identified in the pattern of histamine formation of
the loin samples received from four different fishing harbors. Furthermore due to high
microbial contamination histamine formation was happened at an alarming rate. Fish grading
A with the least microbial contamination had shown a difference in histamine formation
according to the fishing harbor. It was proven Yellowfin tuna loins received from Trincomalee
fishing harbor had the best shelf life in relation to the histamine content with in the “A” grade
fish. The reason behind this is histamine formation is highly affected with the amount of
microflora and the microbial load that could contaminate a fish would not uniform from place
to place, due to factors like environmental conditions, post harvest practices followed by
fishermen and fish catching methods.
Storage Period (Days)
His
tam
ine
con
ten
t (p
pm)
14121086420
60
50
40
30
20
10
0
50
Variable
Tangalle - A
Chilaw - A
Trincomalee - A
Beruwala - A
1412
119
7
5
3
10
14
12
11
9
7
5
310
1412
11
9
7
5
3
10
1412
11
9
7
5
3
10
Association Between Histamine Content and Fishing Harbor (Grade A)
Proceedings of the Research Symposium of Uva Wellassa University, January 29-30, 2015
48
Storage Period (Days)
His
tam
ine
con
ten
t (p
pm)
14121086420
120
100
80
60
40
20
0
50
Variable
Tangalle - B
Chilaw - B
Trincomalee - B
Beruwala - B
14
12
11
9
7
5
310
14
12
11
9
7
5
310
14
12
11
9
7
5
310
14
12
11
9
7
5
310
Association Between Histamine Content and Fishing Harbor (Grade B)
Figure 02: Association between average histamine content of Yellowfin tuna loins and fishing
harbor (Grade B - Histamine analysis experiment 1)
Conclusions
Shelf life of fresh chilled Yellowfin tuna loins, in relation to histamine content was highly
dependent on the fish grading rather than the conditions of the fishery harbor.
Acknowledgement
Laboratory facilities provided by the SGS Lanka (Pvt) Limited, Colombo are acknowledged.
References
Food and Drug Administration, (1998). Fish and fishery products hazards and control
guidance. [Brochure]. US. Department of Health and Human Services. Public Health Services,
Nutrition Office of Seafood.
Indian Ocean Tuna Commision, (2011). Yellowfin tuna executive summary, Retrieved July
19, 2014, from the World Wide Web:http://www.iotc.org/documents/yellowfin-
tunaexecutive summary
Koutsoumanis K., Lampropoulou K., and Nychas G.J.E. (1999). Biogenic amines and sensory
changes associated with the microflora of the Mediterranean Gilt- Head sea bream (Sparus
aurata) Stored at 0, 8 and 15 0C. Journal of Food Production, 62:398- 402.
Yoshinga H. and Frank H.A. (1982). Histamine producing bacteria in decomposing Skipjack
tuna ( Katsuwonas pelamis). Applied Environmental Microbiology, 44:447-452.
Proceedings of the Research Symposium of Uva Wellassa University, January 29-30, 2015
49
Development of Finger millet (Eleusinecoracana)
incorporated symbiotic drinking yoghurt
H.K.T. Awanthika, A.M.N.L. Abesinghe
Faculty of Animal Science and Export Agriculture, UvaWellassa University of Sri Lanka
and
U. De Silva
Ceylon cold stores PLC, Samadaragahawatta ,Ranala, Sri Lanka
Introduction
Sri Lankan yogurt market is characterized by intense competition prompting leading players
to differentiate themselves by focusing on health benefits, branding, and incorporation of
different ingredients. Yoghurt is a popular fermented dairy product due to its health benefits
as a functional food in addition to its nutritional benefits (Robinson and Tamime, 1999). High
calorie yogurt drink that contains any kind of a cereal powder is completely a new product
concept to the Sri Lankan market. Therefore, the objective of the current study was to develop
a health beneficial probiotic drinking yoghurt by incorporating finger millet as a cereal which
can be used as a breakfast food, sport supplement and also as a weaned food for toddlers.
Nutritionally, finger millet is used as a whole grain, it is higher in protein and minerals in
comparison to all other cereals and millets. Accroding to previous studies, finger millet is also
known for several health benefits such as anti-diabetic, antitumerogenic, atherosclerogenic
effects, antioxidant and antimicrobial properties which are mainly attributed due to its
polyphenol and dietary fiber contents (Dykes and Rooney, 2007; Chethan, 2008). Therefore
this study was conducted to develop a cereal based probiotic yoghurt drink which can be
promoted as a natural source of high calorie that can be consumed as an alternative for the
imported, artificial and expensive sport nutrition’s and weaned foods.
Methodology
The study was conducted at the research and development and quality assurance laboratories
in Ceylon cold stores PLC, Ranala, Kaduwela. In the preliminary trial 1 most compatible sugar
percentages for different incorporation levels of finger millet flour from the three experimental
forms (roasted flour, germinated flour and raw slurry) were selected. Then preliminary trial 2
was carried out using ranking method to select the best finger millet incorporation levels (4
%, 5 %, 6%, 7% and 8 % (w/w)) for each incorporation form. The best sugar percentages and
incorporation levels of finger millet from preliminary trials were used in next steps of
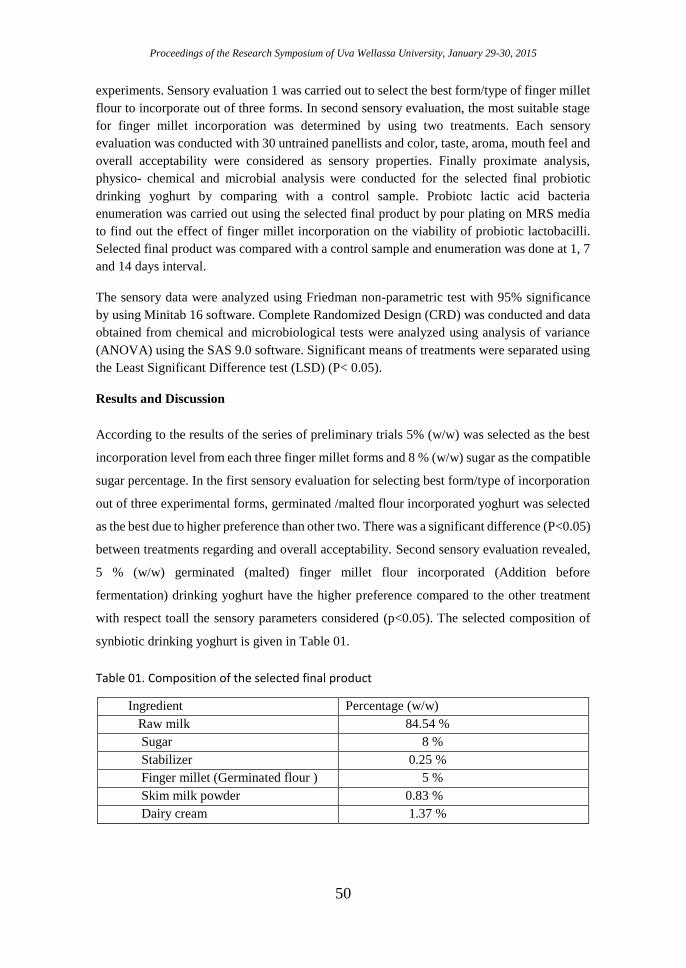
Proceedings of the Research Symposium of Uva Wellassa University, January 29-30, 2015
50
experiments. Sensory evaluation 1 was carried out to select the best form/type of finger millet
flour to incorporate out of three forms. In second sensory evaluation, the most suitable stage
for finger millet incorporation was determined by using two treatments. Each sensory
evaluation was conducted with 30 untrained panellists and color, taste, aroma, mouth feel and
overall acceptability were considered as sensory properties. Finally proximate analysis,
physico- chemical and microbial analysis were conducted for the selected final probiotic
drinking yoghurt by comparing with a control sample. Probiotc lactic acid bacteria
enumeration was carried out using the selected final product by pour plating on MRS media
to find out the effect of finger millet incorporation on the viability of probiotic lactobacilli.
Selected final product was compared with a control sample and enumeration was done at 1, 7
and 14 days interval.
The sensory data were analyzed using Friedman non-parametric test with 95% significance
by using Minitab 16 software. Complete Randomized Design (CRD) was conducted and data
obtained from chemical and microbiological tests were analyzed using analysis of variance
(ANOVA) using the SAS 9.0 software. Significant means of treatments were separated using
the Least Significant Difference test (LSD) (P< 0.05).
Results and Discussion
According to the results of the series of preliminary trials 5% (w/w) was selected as the best
incorporation level from each three finger millet forms and 8 % (w/w) sugar as the compatible
sugar percentage. In the first sensory evaluation for selecting best form/type of incorporation
out of three experimental forms, germinated /malted flour incorporated yoghurt was selected
as the best due to higher preference than other two. There was a significant difference (P<0.05)
between treatments regarding and overall acceptability. Second sensory evaluation revealed,
5 % (w/w) germinated (malted) finger millet flour incorporated (Addition before
fermentation) drinking yoghurt have the higher preference compared to the other treatment
with respect toall the sensory parameters considered (p<0.05). The selected composition of
synbiotic drinking yoghurt is given in Table 01.
Table 01. Composition of the selected final product
Ingredient Percentage (w/w)
Raw milk 84.54 %
Sugar 8 %
Stabilizer 0.25 %
Finger millet (Germinated flour ) 5 %
Skim milk powder 0.83 %
Dairy cream 1.37 %
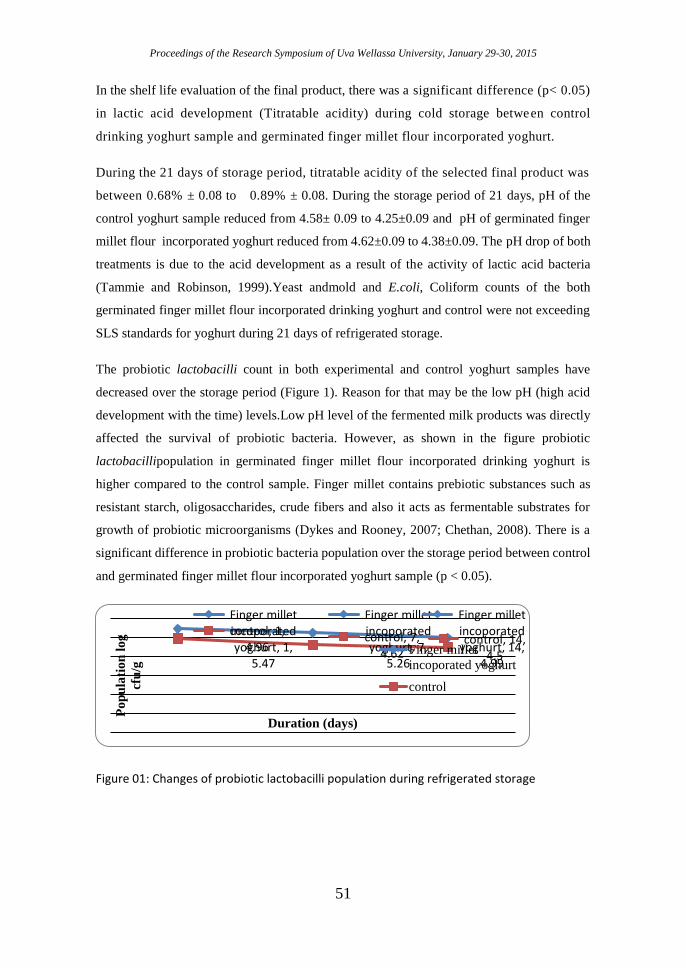
Proceedings of the Research Symposium of Uva Wellassa University, January 29-30, 2015
51
In the shelf life evaluation of the final product, there was a significant difference (p< 0.05)
in lactic acid development (Titratable acidity) during cold storage between control
drinking yoghurt sample and germinated finger millet flour incorporated yoghurt.
During the 21 days of storage period, titratable acidity of the selected final product was
between 0.68% ± 0.08 to 0.89% ± 0.08. During the storage period of 21 days, pH of the
control yoghurt sample reduced from 4.58± 0.09 to 4.25±0.09 and pH of germinated finger
millet flour incorporated yoghurt reduced from 4.62±0.09 to 4.38±0.09. The pH drop of both
treatments is due to the acid development as a result of the activity of lactic acid bacteria
(Tammie and Robinson, 1999).Yeast andmold and E.coli, Coliform counts of the both
germinated finger millet flour incorporated drinking yoghurt and control were not exceeding
SLS standards for yoghurt during 21 days of refrigerated storage.
The probiotic lactobacilli count in both experimental and control yoghurt samples have
decreased over the storage period (Figure 1). Reason for that may be the low pH (high acid
development with the time) levels.Low pH level of the fermented milk products was directly
affected the survival of probiotic bacteria. However, as shown in the figure probiotic
lactobacillipopulation in germinated finger millet flour incorporated drinking yoghurt is
higher compared to the control sample. Finger millet contains prebiotic substances such as
resistant starch, oligosaccharides, crude fibers and also it acts as fermentable substrates for
growth of probiotic microorganisms (Dykes and Rooney, 2007; Chethan, 2008). There is a
significant difference in probiotic bacteria population over the storage period between control
and germinated finger millet flour incorporated yoghurt sample (p < 0.05).
Figure 01: Changes of probiotic lactobacilli population during refrigerated storage
Finger millet incoporated yoghurt, 1,
5.47
Finger millet incoporated yoghurt, 7,
5.26
Finger millet incoporated yoghurt, 14,
4.99
control, 1, 4.96
control, 7, 4.62
control, 14, 4.5
Po
pu
lati
on
lo
g
cfu
/g
Duration (days)
Finger millet
incoporated yoghurt
control

Proceedings of the Research Symposium of Uva Wellassa University, January 29-30, 2015
52
Conclusions
5 % (w/w) finger millet flour incorporation level was selected as the best and
germinated/malted flour was selected as the best form of incorporation while addition of
finger millet before fermentation was determined as the most suitable stage of incorporation.
Further, the incorporation of finger millet into the yoghurt has enhanced the survival of
probiotic lactobacilli during refrigerated storage.
References
Chethan, S.(2008). Finger millet (Eleusinecoracana) seed polyphenols and their nutraceutical
potential. Ph.D. Thesis. University of Mysore, Mysore, India
Dykes, L., and Rooney, L. W. (2007). Phenolic compounds in cereal grains and their health
benefits. Cereal Foods World, 52(3):105–111.
Tamime, A.Y. and Robinson, R.K..(1999). Chapter 1 Historical background. In Tamime and
Robinson’s Yogurt: Science and Technology, 3rd ed.; Woodhead Publishing LTD:
Cambridge, UK, pp. 1–10.
Proceedings of the Research Symposium of Uva Wellassa University, January 29-30, 2015
53
Development of soursop pulp (Annonamuricata) incorporated
fermented sweet cream buttermilk beverage
K. Buddhadasa, A.M.N.L. Abesinghe
Faculty of Animal Science and Export Agriculture, UvaWellassa University of Sri Lanka
and
R.A.J.N.Luxman
Pellwatte Dairy Industies Limited, Buththala, Sri Lanka
Introduction
In Sri Lankan context buttermilk removed from the dairy processing plants considered as a
dairy waste and utilization of dairy by product is considerably low compared to other
countries. Sri Lankan market is still having a market gap for locally produce fermented
flavored milk base beverages. Buttermilk could be used to produce fermented milk beverages
replacing milk which would result in differentiated products. Buttermilk is also considered a
nutritious dairy ingredient that is saturated in milk fat globule membrane (MFGM)
components (Sodini et al., 2006). Addition of fruit juices or pulps is an attractive avenue for
the utilization of buttermilk. Soursop is one of the fruit spp. which can be incorporated to
manufacture beverages with good consumer demand. The fruit is rich in vitamin B, potassium,
fructose and vitamin C (Pamplona-Roger, 2005 cited in Ekaluo et al., 2013). Soursop fruit
is a proven cancer remedy for cancers of all types and broad spectrum antimicrobial agent for
both bacterial and fungal infections, antiparasitic activity, lower high blood pressure and is
used for depression and stress (Camiel et al., 2008).
Methodology
The current study was carried out at Pelwatte Dairy Industries Limited, Pelwette and
laboratory analysis was done at Pelwatte Dairy Indusries Limited and Uva Wellassa
University laboratories. Soursop pulp was prepared by flowing method. Fresh fully ripped
Soursop fruit was washed by chlorinated water and disinfected by using 70% of ethanol. Then
fruit was cut it to halves by using a sharp knife and seeds and blemishes were removed. After
that, flesh was scooped out using a clean stainless steel spoon and blended it using an electric
blender. Initially incubation time was standardized for the buttermilk base by incorporating
different levels of Skim Milk Powder. Several preliminary studies were done to select the best
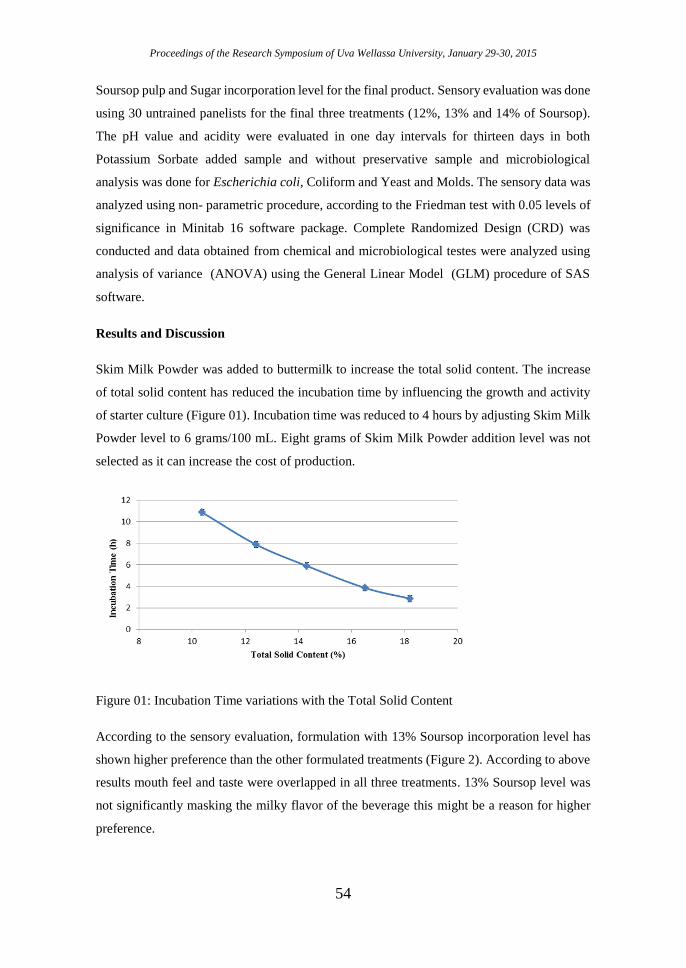
Proceedings of the Research Symposium of Uva Wellassa University, January 29-30, 2015
54
Soursop pulp and Sugar incorporation level for the final product. Sensory evaluation was done
using 30 untrained panelists for the final three treatments (12%, 13% and 14% of Soursop).
The pH value and acidity were evaluated in one day intervals for thirteen days in both
Potassium Sorbate added sample and without preservative sample and microbiological
analysis was done for Escherichia coli, Coliform and Yeast and Molds. The sensory data was
analyzed using non- parametric procedure, according to the Friedman test with 0.05 levels of
significance in Minitab 16 software package. Complete Randomized Design (CRD) was
conducted and data obtained from chemical and microbiological testes were analyzed using
analysis of variance (ANOVA) using the General Linear Model (GLM) procedure of SAS
software.
Results and Discussion
Skim Milk Powder was added to buttermilk to increase the total solid content. The increase
of total solid content has reduced the incubation time by influencing the growth and activity
of starter culture (Figure 01). Incubation time was reduced to 4 hours by adjusting Skim Milk
Powder level to 6 grams/100 mL. Eight grams of Skim Milk Powder addition level was not
selected as it can increase the cost of production.
Figure 01: Incubation Time variations with the Total Solid Content
According to the sensory evaluation, formulation with 13% Soursop incorporation level has
shown higher preference than the other formulated treatments (Figure 2). According to above
results mouth feel and taste were overlapped in all three treatments. 13% Soursop level was
not significantly masking the milky flavor of the beverage this might be a reason for higher
preference.
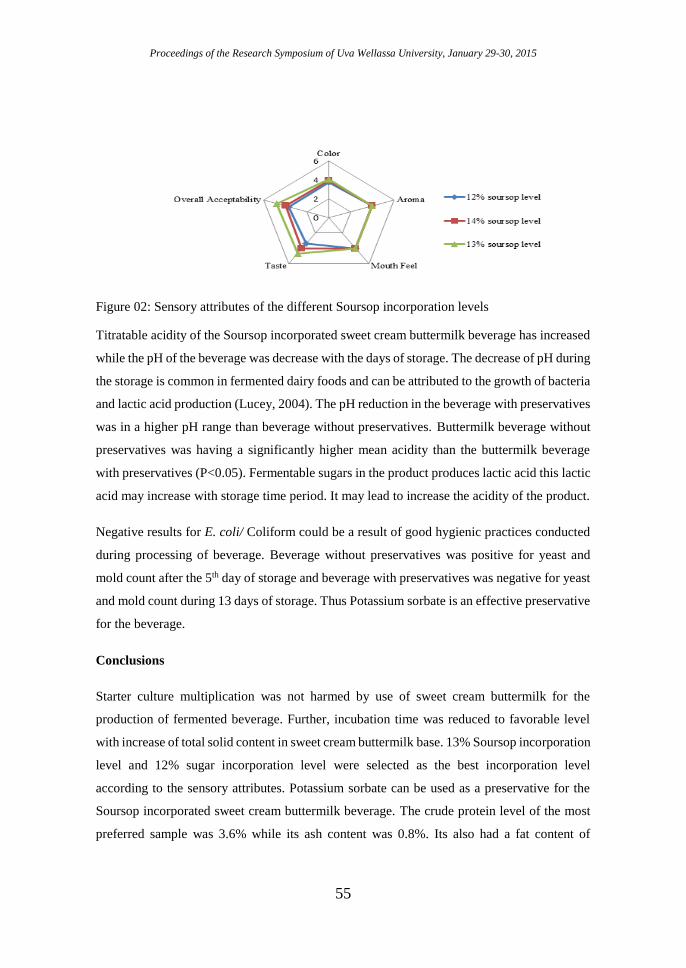
Proceedings of the Research Symposium of Uva Wellassa University, January 29-30, 2015
55
Figure 02: Sensory attributes of the different Soursop incorporation levels
Titratable acidity of the Soursop incorporated sweet cream buttermilk beverage has increased
while the pH of the beverage was decrease with the days of storage. The decrease of pH during
the storage is common in fermented dairy foods and can be attributed to the growth of bacteria
and lactic acid production (Lucey, 2004). The pH reduction in the beverage with preservatives
was in a higher pH range than beverage without preservatives. Buttermilk beverage without
preservatives was having a significantly higher mean acidity than the buttermilk beverage
with preservatives (P<0.05). Fermentable sugars in the product produces lactic acid this lactic
acid may increase with storage time period. It may lead to increase the acidity of the product.
Negative results for E. coli/ Coliform could be a result of good hygienic practices conducted
during processing of beverage. Beverage without preservatives was positive for yeast and
mold count after the 5th day of storage and beverage with preservatives was negative for yeast
and mold count during 13 days of storage. Thus Potassium sorbate is an effective preservative
for the beverage.
Conclusions
Starter culture multiplication was not harmed by use of sweet cream buttermilk for the
production of fermented beverage. Further, incubation time was reduced to favorable level
with increase of total solid content in sweet cream buttermilk base. 13% Soursop incorporation
level and 12% sugar incorporation level were selected as the best incorporation level
according to the sensory attributes. Potassium sorbate can be used as a preservative for the
Soursop incorporated sweet cream buttermilk beverage. The crude protein level of the most
preferred sample was 3.6% while its ash content was 0.8%. Its also had a fat content of
Proceedings of the Research Symposium of Uva Wellassa University, January 29-30, 2015
56
0.6%.Further studies should be done on the shelf stability of the Soursop incorporated sweet
cream buttermilk beverage.
References
Camiel, L.D. and Whelan, J.S. (2008). Tropical American plants in treatment of infectious
diseases. Journal of Dietary Supplements, 5(4), 349-72.
Ekaluo, U.B., Ikpeme, E.V., Ibiang, Y.B. and Omordia, F.O. (2013). Effect of Soursop
(Annona muricata L.) Fruit Extract on Sperm Toxicity Induced by Caffeine in Albino
Rats. Journal of Medical Sciences, 13, 67-71.
Lucey JA.2004. Cultured dairy products: An overview of their gelation and texture properties.
International Journal of Dairy Technology, 57, 77-84.
Sodini I., Morin P., Olabi A. and Jimenez-Flores, R. (2006). Compositional and functional
properties of buttermilk: a comparison between sweet, sour and whey buttermilk. Journal of
Dairy Science, 89, 525–536.
Proceedings of the Research Symposium of Uva Wellassa University, January 29-30, 2015
57
Development of fruit (Musa spp.) puree incorporated
synbiotic stirred yoghurt
G.H. Nanayakkara, A.M.N.L. Abesinghe
Faculty of Animal Science and Export Agriculture, UvaWellassa University of Sri Lanka
and
U. De Silva
Ceylon cold stores PLC, Samadaragahawatta ,Ranala, Sri Lanka
Introduction
Yoghurt is one of the most nutritious fermented milk products that can be used to enhance the
nutrition condition of people. It is obtained by introducing specific strains of Lactic acid
bacteria. The Lactic acid micro flora reduce risk of colon cancer (Foissy, 1983 cited in Huma,
2003), reduce the serum cholesterol level (Anderson and Gilliland, 1999 cited in Huma, 2003)
and also maintain the intestinal ecosystem (Saarela et al., 2002 cited in Huma, 2003).
Prebiotics are non-digestible food ingredients that improve the host health by selectively
stimulating the growth of certain beneficial microorganisms. Fructo-oligosaccharide is
prebiotic source that can be found in ripe banana around 2 mg/g. By incorporating banana
with yoghurt is best way to improve the health benefits and taste of the yoghurt. Stirred type
fruit yoghurt is one of the best products that can be used to gain consumer preference.
Therefore, this study was conducted to develop a Banana puree incorporated symbiotic stirred
yogurt.
Methodology
The current study was carried out at Ceylon Cold Stores PLC (CCS), Ranala, Kaduwela.
Laboratory analysis was done at CCS and laboratories in University of Kelaniya. First,
yoghurt base and the banana puree were prepared according to the predetermined recipe after
various preliminary trials. For final sensory evaluation, three treatments were used with three
replicates. The incorporation levels of fruit puree with yogurt base is given in table 01.
Table 01: Incorporation levels of fruit puree with yoghurt base
Treatment Yoghurt % (w/w) Fruit puree % (w/w)
1 86 14
2 85 15
3 84 16
Proceedings of the Research Symposium of Uva Wellassa University, January 29-30, 2015
58
Table 02: Composition of the Final stirred yogurt base
Ingredient % Weight (g) Fat (g) MSNF (g)
Raw Milk 92.67 1010.00 35.40 85.90
Fresh Cream 0.70 7.80 2.80 0.30
SMP 3.20 35.10 _ 33.90
Sugar 0.40 4.40 _ _
Gelatin 3.00 32.70 _ _
Total 100.00 1090.00 38.20 120.10
Table 03: Composition of Final Fruit puree
Ingredient Amount (w/w)
Banana (‘Anamalu’) 45%
Pineapple 15%
Cane sugar (white) 40%
Ascorbic acid 500 ppm
Then the best incorporation of fruit puree was determined by using five point hedonic scale
with 30 sensory panel. Physicochemical and microbiological properties were observed in the
selected best sample. Chemical composition (Moisture &crude fat) was tested. Titratable
acidity and pH were evaluated for 14 days period and microbiological analysis was done for
E.coli and Yeast and mould content. Also probiotic bacterial count was determined using Man
Rogosa Sharp Media. In addition effectiveness of the Potassium sorbate against yeast and
mould count was evaluated. The sensory data were analyzed using non-parametric procedure,
according to the Friedman test using Minitab 15 software programme. The data obtained from
physicochemical and microbiological tests were analyzed using analysis of variance
(ANOVA) using SAS 9.0 software programme. Significant means of treatments were
separated using Least Significant Difference (P<0.05).
Results and Discussion
The sensory evaluation with Friedman test revealed all sensory parameters were significantly
difference except color (P<0.05). The 15% incorporation level of fruit puree was obtained
higher estimated median value for taste and overall acceptability. After analysis, 15%
incorporation level of banana puree was selected as the best percentage for stirred yoghurt.
The composition of the final selected final stirred yogurt and composition of final fruit puree
is given in table 2 and table 3; respectively.
The microbilogical analysis revealed that the E. coli/ Coliform and yeast and mould count
were in acceptable range according to the SLSI standards. Preservative treatment was
significantly difference with without preservative treatment (P<0.05). Sorbic acid and/ or
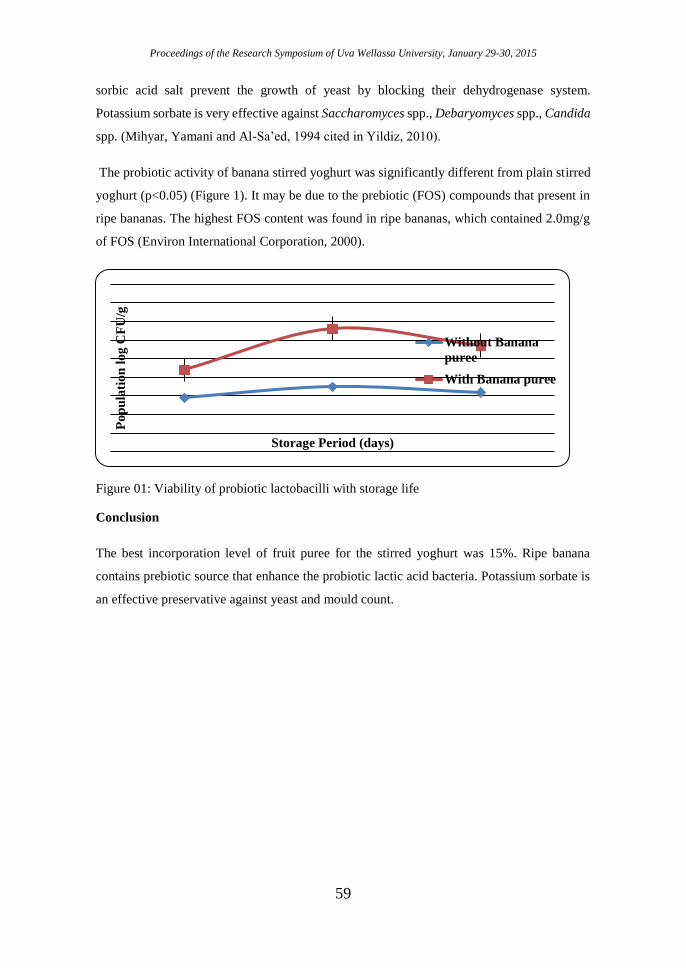
Proceedings of the Research Symposium of Uva Wellassa University, January 29-30, 2015
59
sorbic acid salt prevent the growth of yeast by blocking their dehydrogenase system.
Potassium sorbate is very effective against Saccharomyces spp., Debaryomyces spp., Candida
spp. (Mihyar, Yamani and Al-Sa’ed, 1994 cited in Yildiz, 2010).
The probiotic activity of banana stirred yoghurt was significantly different from plain stirred
yoghurt (p<0.05) (Figure 1). It may be due to the prebiotic (FOS) compounds that present in
ripe bananas. The highest FOS content was found in ripe bananas, which contained 2.0mg/g
of FOS (Environ International Corporation, 2000).
Figure 01: Viability of probiotic lactobacilli with storage life
Conclusion
The best incorporation level of fruit puree for the stirred yoghurt was 15%. Ripe banana
contains prebiotic source that enhance the probiotic lactic acid bacteria. Potassium sorbate is
an effective preservative against yeast and mould count.
Po
pu
lati
on
lo
g C
FU
/g
Storage Period (days)
Without Banana
puree
With Banana puree
Proceedings of the Research Symposium of Uva Wellassa University, January 29-30, 2015
60
References
Environ International Corporation (2000). Generally recognized as safenotification for short
chain fructooligosaccharide. Virginia: Kruger, C.L., <http://www.fda.gov/
ucm/groups/fdagovpublic/@fdagov-foodsgen/documents/document/ucm261587.pdf>
[Accessed 19 June 2014].
Huma, N., Hafeez, K. and Ahmad, I. (2003). Preparation and evaluation of apple stirred
yogurt. Pakistan Journal of Food Science, 13(3-4): 5-9.
Yildiz, F., (2010). Development and Manufacture of yogurt and Other Functional Dairy
Products, 6000 Broken Sound Parkway NW, Suite 300, Boca Raton, FL 33487-2742, CRC
Press.
Proceedings of the Research Symposium of Uva Wellassa University, January 29-30, 2015
61
Quail egg consumption: patterns, preferences and perceptions
among consumers in Galle district, Sri Lanka
H.M.W.N. Abeyrathna
Galle Advanced Technological Institute, Labuduwa, Akmeemana.
Introduction
Owing to the changing life style and food availability, Quail egg is being used as analternate
potential and acceptable egg source in many parts of the world. Regular consumption of quail
eggs helps fight against some diseases such as digestive tract disorders, tuberculosis, asthma,
diabetes and stomach ulcers, strengthen the immune system, promote memory health, increase
brain activity and stabilize the nervous system. Nutritional value of quail eggs is higher than
those offered by other eggs and contain high amount of antioxidants, minerals, and vitamins
and less amount of cholesterol (Tanasornet al.,2013).Compared to chicken eggs, there is a
limited body of scholarly literature in related to consumer behavior of quail eggs. Most
literature to do with quails and their eggs has focused on production and processing issues,
not consumer market studies. Therefore, present study was aimed to determine the quail egg
consumption patterns, preferences and perception among consumers in Galle district, Sri
Lanka.
Methodology
Ten Divisional secretariats (Akmeemana, Ambalangoda, Baddegama, Balapitiya, Bope-
poddala, Elpitiya, Galle four gravates, Habaraduwa, Thawalama and Yakkalamulla) in Galle
districts were purposively selected as the research area. 200 consumers, who toured to local
markets and supermarkets in those areas were purposively selected and
interviewed.Information related to consumers’ age, sex, education, occupation, income,
consumption pattern and attitude towards quail eggs were collected using a pre-tested
questionnaire with havingboth open and closed form questions. Primary data were processed
and analyzed using the Microsoft Office Excel (2003) and SPSS 20 package. The association
between demographic data and egg consumption pattern was tested using chi square, with a
p-value of less than 0.05 considered statistically significant.
Result and Discussion
As to present study produced data it is revealed that majority of the respondents (57%) did not
consumed quail eggs, while 43% consumed. Table 01, shows the relationship between
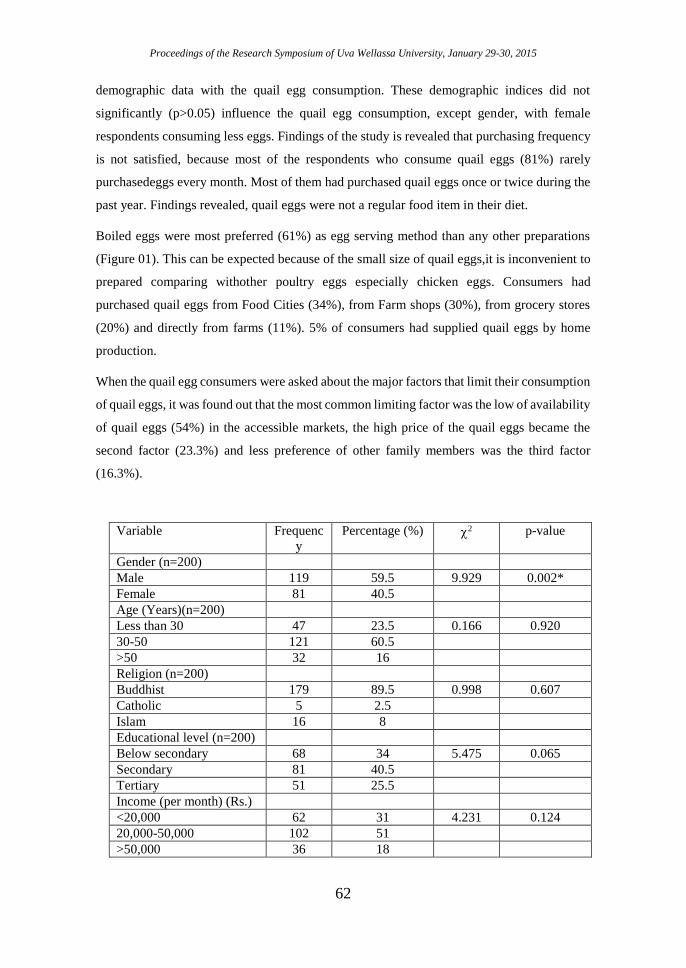
Proceedings of the Research Symposium of Uva Wellassa University, January 29-30, 2015
62
demographic data with the quail egg consumption. These demographic indices did not
significantly (p>0.05) influence the quail egg consumption, except gender, with female
respondents consuming less eggs. Findings of the study is revealed that purchasing frequency
is not satisfied, because most of the respondents who consume quail eggs (81%) rarely
purchasedeggs every month. Most of them had purchased quail eggs once or twice during the
past year. Findings revealed, quail eggs were not a regular food item in their diet.
Boiled eggs were most preferred (61%) as egg serving method than any other preparations
(Figure 01). This can be expected because of the small size of quail eggs,it is inconvenient to
prepared comparing withother poultry eggs especially chicken eggs. Consumers had
purchased quail eggs from Food Cities (34%), from Farm shops (30%), from grocery stores
(20%) and directly from farms (11%). 5% of consumers had supplied quail eggs by home
production.
When the quail egg consumers were asked about the major factors that limit their consumption
of quail eggs, it was found out that the most common limiting factor was the low of availability
of quail eggs (54%) in the accessible markets, the high price of the quail eggs became the
second factor (23.3%) and less preference of other family members was the third factor
(16.3%).
Variable Frequenc
y
Percentage (%) 2 p-value
Gender (n=200)
Male 119 59.5 9.929 0.002*
Female 81 40.5
Age (Years)(n=200)
Less than 30 47 23.5 0.166 0.920
30-50 121 60.5
>50 32 16
Religion (n=200)
Buddhist 179 89.5 0.998 0.607
Catholic 5 2.5
Islam 16 8
Educational level (n=200)
Below secondary 68 34 5.475 0.065
Secondary 81 40.5
Tertiary 51 25.5
Income (per month) (Rs.)
<20,000 62 31 4.231 0.124
20,000-50,000 102 51
>50,000 36 18
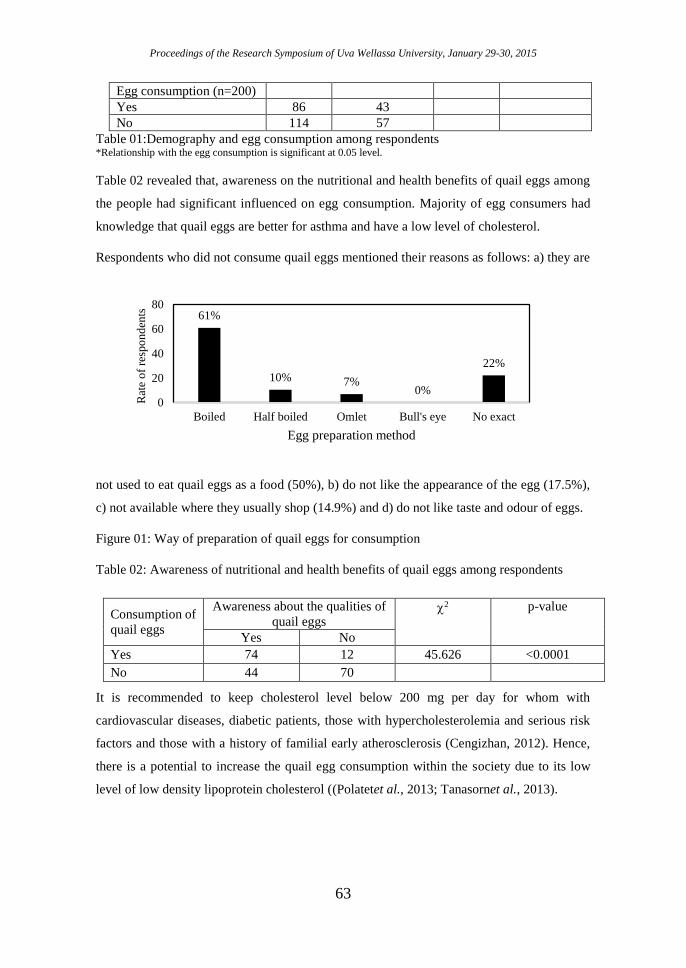
Proceedings of the Research Symposium of Uva Wellassa University, January 29-30, 2015
63
Table 01:Demography and egg consumption among respondents *Relationship with the egg consumption is significant at 0.05 level.
Table 02 revealed that, awareness on the nutritional and health benefits of quail eggs among
the people had significant influenced on egg consumption. Majority of egg consumers had
knowledge that quail eggs are better for asthma and have a low level of cholesterol.
Respondents who did not consume quail eggs mentioned their reasons as follows: a) they are
not used to eat quail eggs as a food (50%), b) do not like the appearance of the egg (17.5%),
c) not available where they usually shop (14.9%) and d) do not like taste and odour of eggs.
Figure 01: Way of preparation of quail eggs for consumption
Table 02: Awareness of nutritional and health benefits of quail eggs among respondents
Consumption of
quail eggs
Awareness about the qualities of
quail eggs 2 p-value
Yes No
Yes 74 12 45.626 <0.0001
No 44 70
It is recommended to keep cholesterol level below 200 mg per day for whom with
cardiovascular diseases, diabetic patients, those with hypercholesterolemia and serious risk
factors and those with a history of familial early atherosclerosis (Cengizhan, 2012). Hence,
there is a potential to increase the quail egg consumption within the society due to its low
level of low density lipoprotein cholesterol ((Polatetet al., 2013; Tanasornet al., 2013).
Egg consumption (n=200)
Yes 86 43
No 114 57
61%
10% 7%0%
22%
0
20
40
60
80
Boiled Half boiled Omlet Bull's eye No exact
Rat
e o
f re
spo
nd
ents
Egg preparation method
Proceedings of the Research Symposium of Uva Wellassa University, January 29-30, 2015
64
Conclusions
Quail egg consumption is low in the society. But there is a potential to enhance it as an
alternative egg source among the people. Effective promotion and advertising campaign about
the nutritional and health benefits for a healthy society should be organized to create well-
informed consumers. As well as quail egg production should be promote to increase the
availability of them.
Acknowledgement
I would like express my thanks to Director General of Sri Lanka Institute of Advanced
Technological Education for approving the research allowance to conduct this study.
References
Cengizhan, M., Ismail, D., Serdar, K. and Sahnur, E.D. (2012).Determination of egg
consumption and consumer habits in Turkey.Turkey journal of Veterinary and Animal
science, 36 (6):592-601.
Polat. E.S., Ozean. BC and garip.M. (2013). Fatty acid composition of yolk of nine poultry
species kept in their natural environment. Animal science papers and reports.3:363-368.
Tanasorn, T., Tungjaroenchai, W and Siriwong.(2013). Nutrient benefits of quail
(CoturnixCoturnix Japonica).International journal of science and research publications,3(5).
Proceedings of the Research Symposium of Uva Wellassa University, January 29-30, 2015
Technical Session - Aquatic Resources Technology
Table of Contents
Oral Session
Determination of a suitable growing medium and a commercial
fertilizer for Echinodorus parviflorus ‘Tropica’ in the nursery level . 1
Development of a suitable culture media for mass culture of Moina
macrocopa ................................................................................................. 4
Evaluation of the attitude and awareness of the international
resolution on responsible fishing: a case study on the multiday
fishermen of Matara ................................................................................ 7
Toxicity effects of trace metals on Zebra fish (Danio rerio) embryo 10
Development of micropropagation protocols for two aponogeton
species of Sri Lanka (Aponogeton crispus and Aponogeton natans) . 13
Consumption pattern of fish among households in Batticaloa District
................................................................................................................. 17
Isolation and incorporation of Nitrogenous compounds from Yellow
Fin Tuna (Thunnus albacares) to produce a fish flavored vegetable
burger ..................................................................................................... 21
Induced breeding of Silver Dollar (Metynnis hypsauchen) using
ovaprim ................................................................................................... 24
A comparative study on the effectiveness of gillnet and longline fishing
methods used by multi-day fishermen in Matara fisheries district .. 27
A review of export trade of indigenous aquatic plants species in Sri
Lanka and their conservation issues .................................................... 30
Development of garment leather from Yellowfin tuna (Thunnus
albacares) skin ........................................................................................ 33
Proceedings of the Research Symposium of Uva Wellassa University, January 29-30, 2015
Balancing the benefits of protein content and the risks of trace metal
toxicity exposure from Skipjack tuna (Katsuwonus pelamis)
consumption in Sri Lanka .................................................................... 36
Seashell processing: An emerging industry in Kinniya divisional
secretariat division of Trincomalee district ........................................ 39
Effect of growth regulators on in-vitro multiplication of Lagenandra
ovata and Lagenandra lancifolia ........................................................... 42
A preliminary study on the effectiveness of organic fertilizers for the
survival rate of Catla catla .................................................................... 45
Bio assay on effectiveness of the chemical hydrolyzation for
denaturing agrochemical contaminated wastewater ......................... 48
Preliminary study on mangrove diversity in Irakkandy lagoon,
Trincomalee ............................................................................................ 51
Poster Session
Analyze the Histamine level in various positions of the Histamine
developed Tuna fish ............................................................................... 54
A Geographic Information System (GIS) approach in identification of
the potential reservoirs for Giant Freshwater prawn (Macrobrachium
rosenbergii) culture: A case study in Moneragala district, Sri Lanka
................................................................................................................. 57
Study of water quality changes and growth of cultured edible oysters
(Crassostrea madrasensis), culture sites at Gagewadiya and
Kandakuliya in Puttlam district .......................................................... 60
Proceedings of the Research Symposium of Uva Wellassa University, January 29-30, 2015
1
Determination of a suitable growing medium and a commercial
fertilizer for Echinodorus parviflorus ‘Tropica’ in the nursery
level
K. Amarakoonge, B.V.A.S.M. Bambaranda and S.C. Jayamanne
Faculty of Animal Science and Export Agriculture, Uva Wellassa University of Sri Lanka
and
K.P.N.N.S. Jayarathne
Ornamental Fish Breeding and Training Center, Rambadagalla
Introdution
Aquatic Plant varieties have unique morphology and habitats as commercially important aquatic
plants. Dissanayakel., 2007). The most popular ornamental aquarium plants genera are Anubias,
Cryptocoryne, Echinodorous, Aponogeton, Hygrophyla, Bacopa, Hydrilla, Cabomba, Myriophyllum,
Lagenandra, Vallisneria and Elodea. Among these plant genera Cryptocoryne, Lagenandra,
Aponogeton and Echinodorous have important characteristics as aquarium plants in Sri Lanka. Echinodorus species have attractive green to mid green submerged leaves arranged in a rosette with
beautiful, white flowers occurring in an inflorescence (Muhlberg, 1982). Aquatic plants play a
significant role in the freshwater ecosystems worldwide. With time ecosystem may collapse without
aquatic plants due to wild collection. Therefore growing plants is solution for that. An aquatic plant
growing medium was essential for that. The growing mediums contain sand, silt and clay proportion
according to the ratio of the medium. Four different ratios were used as treatments (T). T1- Boggy
soil: Bricks particles T2- 3:1, Boggy soil 3: Sand 1, T3-Boggy soil: Top soil -3:1, T4-Top soil were
treatments. Growing medium should balance the aeration and water for maximum root growth and
physically support for the plant. Practical size of the growing medium should be with adequate pore
spaces between the particles (Bilderbackl., 2005)
Nutrition is a major factor for the plant growth. Therefore nutrient should be supplied in optimum
level at the correct time as fertilizers.
Methodology
The present study was carried out to investigate the effect of growing medium and fertilizer for the
growth of Echinodorus parviflorus‘Tropica’ National Aquaculture Development Authority
(NAQDA) Ornamental Fish Breeding and Training center in Rambadagalle Sri Lanka. Experiment
one was conducted to find out a suitable nursery medium for the E.parviflorus ‘Tropica’ plant. Boggy
soil, brick particles, sand and top soil were used. Using those growing substrate four types of media
used as treatments (T), T1- Boggy soil: Bricks particles T2- 3:1, Boggy soil 3: Sand 1, T3-Boggy
soil: Top soil -3:1, T4-Top soil were treatments. Experiment two four fertilizer mixture used as four
treatment of fertilizer, T1-N: P: K -4:2:1, T2- N: P: K -5:2:3,T3- N: P: K -3:1:1and T4- N: P: K -
20:20:20 were used during this study.
Uniform Echinodorus parviflorus ‘Tropica’ about 4.5 cm -6.5 cm heights, same age plants were
selected for the experiment. Old and rotted leaves were removed; leaving 5- 6 laves to remain. Old
and rotted roots also were trimmed, leaving the only healthy roots. Initial weights between 0.5 g - 1.5
g of plants were selected.Experiment one and two results were analyzed by using Minitab 16
computer package and significant differences between treatments were identified using Analysis Of
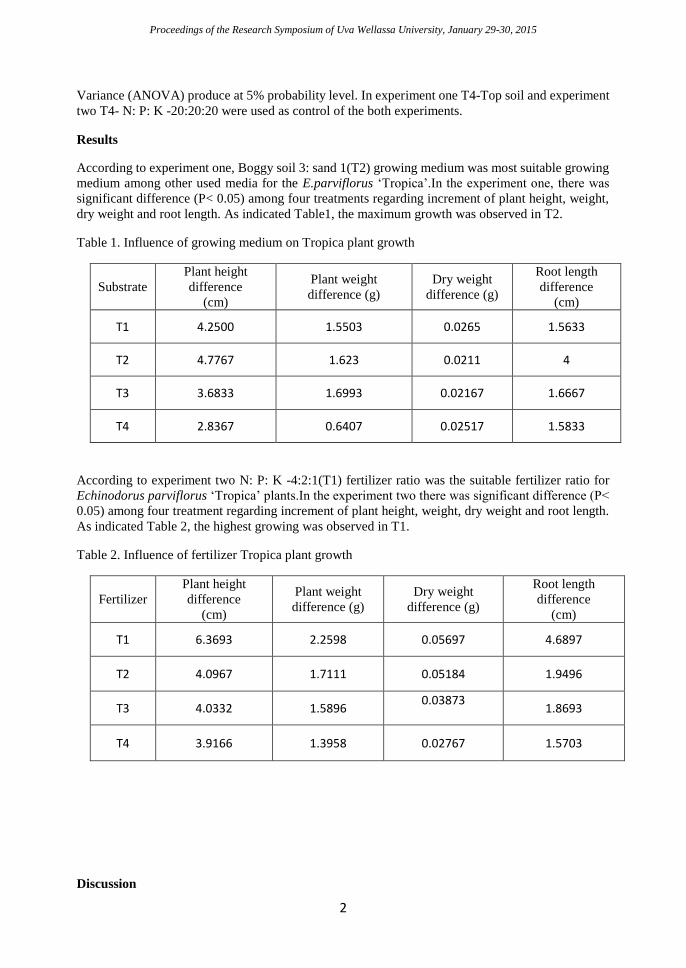
Proceedings of the Research Symposium of Uva Wellassa University, January 29-30, 2015
2
Variance (ANOVA) produce at 5% probability level. In experiment one T4-Top soil and experiment
two T4- N: P: K -20:20:20 were used as control of the both experiments.
Results
According to experiment one, Boggy soil 3: sand 1(T2) growing medium was most suitable growing
medium among other used media for the E.parviflorus ‘Tropica’.In the experiment one, there was
significant difference (P< 0.05) among four treatments regarding increment of plant height, weight,
dry weight and root length. As indicated Table1, the maximum growth was observed in T2.
Table 1. Influence of growing medium on Tropica plant growth
Substrate
Plant height
difference
(cm)
Plant weight
difference (g)
Dry weight
difference (g)
Root length
difference
(cm)
T1 4.2500 1.5503 0.0265 1.5633
T2 4.7767 1.623 0.0211 4
T3 3.6833 1.6993 0.02167 1.6667
T4 2.8367 0.6407 0.02517 1.5833
According to experiment two N: P: K -4:2:1(T1) fertilizer ratio was the suitable fertilizer ratio for
Echinodorus parviflorus ‘Tropica’ plants.In the experiment two there was significant difference (P<
0.05) among four treatment regarding increment of plant height, weight, dry weight and root length.
As indicated Table 2, the highest growing was observed in T1.
Table 2. Influence of fertilizer Tropica plant growth
Fertilizer
Plant height
difference
(cm)
Plant weight
difference (g)
Dry weight
difference (g)
Root length
difference
(cm)
T1 6.3693 2.2598 0.05697 4.6897
T2 4.0967 1.7111 0.05184 1.9496
T3 4.0332 1.5896 0.03873
1.8693
T4 3.9166 1.3958 0.02767 1.5703
Discussion
Proceedings of the Research Symposium of Uva Wellassa University, January 29-30, 2015
3
Based on the results obtained from the present study, it can be concluded that the parameters which
measured the growth of the Echinodorus paviflorus variety Tropica. Considering the analyses carried
out separately with four parameters, both experiments one and experiment two were able to found
out a suitable growing medium and a suitable fertilizer mixture for enhancing the growth of
Echinodorus parviflorus‘Tropica’.
Conclusions
Most suitable fertilizer ratio for growth of plant is N: P: K- 4: 2: 1 and most suitable growing medium
is the medium consist of Boggy soil: Sand- 3: 1.for Echinodorus parviflorus ‘Tropica’.
References
Disanayake C.,2007. Sustainable use of Cryptocoryne wendtii and Echinodorus cordifolius in the
aquaculture industry of Sri Lanka by micro propagation, Sri Lankan J.Aquat.Sci.12:89-101.
Muhlberg H., 1982.The Complete Guide to Water Plants. 2nd ed., EP Publishing Limited,
German,pp:214-247.
Bilderback T. E., 2005. Healthy substrates need physicals, HortTechnology. vol. 15, p. 747–751.
Proceedings of the Research Symposium of Uva Wellassa University, January 29-30, 2015
4
Development of a suitable culture media for mass culture of
Moina macrocopa
G. N. M. De Silva and S. C. Jayamanne
Faculty of Animal Science and Export Agriculture, Uva Wellassa University of Sri Lanka
and
W. P. R. Chandrarathna
Ornamental Fish Breeding and Training Centre, Rambadagalla, Sri Lanka
Introduction
Live food organisms contain of all the nutrients such as essential proteins, lipids, carbohydrates,
vitamins, minerals, amino acids and fatty acids (Das et al., 2012). Mostly, Artemia naupli is cultured
as live feed in large amounts in Sri Lanka. However, the high cost is a problem. In Sri Lanka, brine
shrimp can be replaced by Moina macrocopa. It is a cost effective live feed and important to find
out a cost effective culture medium to get the highest production of Moina macrocopa. Therefore,
this research was carried out to develop a suitable culture medium for mass culture of Moina
macrocopa.
Methodology
Two experiments were conducted to develop a suitable method for culturing Moina macrocopa in
National Aquaculture Development Authority (NAQDA) at Rambadagalla. Experiment 1 was
conducted to find out possible culture media and to determine its concentration for mass culture.
Experiment 2 was conducted to find out the best culture medium and its concentration for mass
culture of Moina macrocopa. All bottles and tanks used in experiments were cleaned, drained and
sun dried for two days and then filled with water, left for two days before using. Moina macrocopa
for all experiments were taken from stock culture developed in NAQDA Centre at Rambadagalla.
Pure culture of Chlorella vulgaris (1×10⁴ cells per 1 ml) was acquired from NAQDA Centre at
Rambadagalla. Filtered tap water was used in both experiments. In experiment 1, five culture media;
mineralized cow dung, steamed cow dung, 15 min. boiled chicken manure, 30 min. boiled chicken
manure, and 1 hr. boiled chicken manure were prepared with four different concentrations such as 5
g l-1, 10 g l-1, 15 g l-1and 20 g l-1. Different concentrations with various media tested with and without
adding Chlorella into the medium. As control, a medium only with Chlorella and water was
maintained. Three replicates from each treatment were maintained during experiment. Five
individuals of Moina macrocopa were inoculated into each bottle. After that, top of the bottles were
covered with a mosquito net to prevent entrance of undesired insects. They were allowed to stay 10
days and after that data were collected. Three samples from every tank were collected using 3 ml of
fine dropping pipette. Samples were taken from the surface to bottom at three random points.
Collected data (number of Moina macrocopa ) were analyzed using Minitab 16 software with
ANOVA, general linear model. According to the results of experiment 1, the positive culture media
and their concentrations were used in experiment 2.
Selected treatments were prepared as same as in experiment 1. 150 individuals of Moina macrocopa
were introduced into each tank. After ten days, 25 ml samples were taken as earlier and preserved
using two drops of 1.007 g cm-3 Lugol’s solution. Values of all tanks were recorded. Data were
analyzed as in experiment 1.
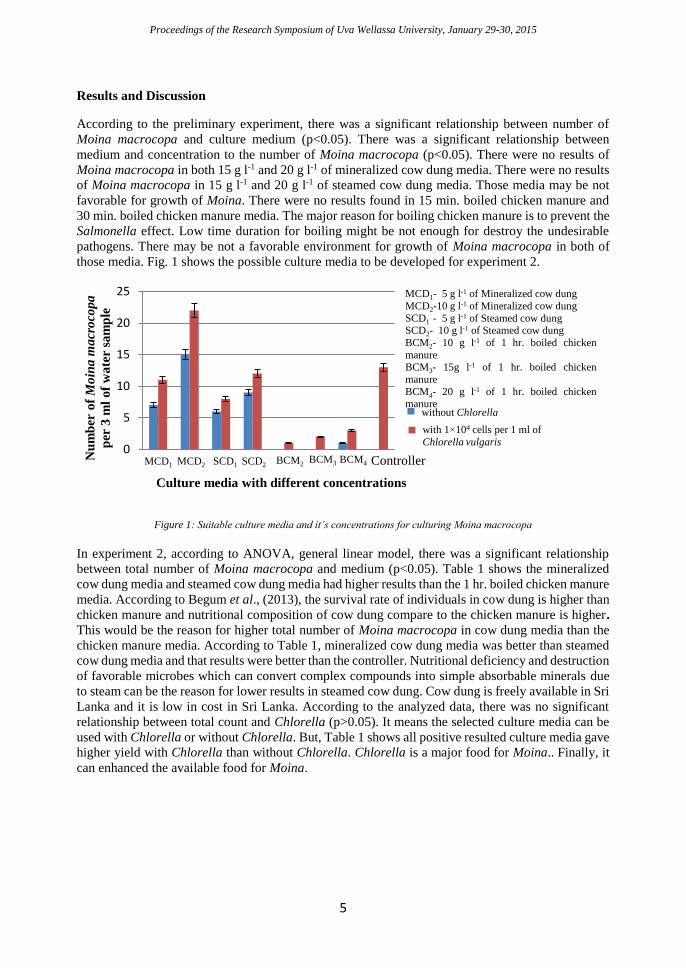
Proceedings of the Research Symposium of Uva Wellassa University, January 29-30, 2015
5
Results and Discussion
According to the preliminary experiment, there was a significant relationship between number of
Moina macrocopa and culture medium (p<0.05). There was a significant relationship between
medium and concentration to the number of Moina macrocopa (p<0.05). There were no results of
Moina macrocopa in both 15 g l-1 and 20 g l-1 of mineralized cow dung media. There were no results
of Moina macrocopa in 15 g l-1 and 20 g l-1 of steamed cow dung media. Those media may be not
favorable for growth of Moina. There were no results found in 15 min. boiled chicken manure and
30 min. boiled chicken manure media. The major reason for boiling chicken manure is to prevent the
Salmonella effect. Low time duration for boiling might be not enough for destroy the undesirable
pathogens. There may be not a favorable environment for growth of Moina macrocopa in both of
those media. Fig. 1 shows the possible culture media to be developed for experiment 2.
Figure 1: Suitable culture media and it’s concentrations for culturing Moina macrocopa
In experiment 2, according to ANOVA, general linear model, there was a significant relationship
between total number of Moina macrocopa and medium (p<0.05). Table 1 shows the mineralized
cow dung media and steamed cow dung media had higher results than the 1 hr. boiled chicken manure
media. According to Begum et al., (2013), the survival rate of individuals in cow dung is higher than
chicken manure and nutritional composition of cow dung compare to the chicken manure is higher.
This would be the reason for higher total number of Moina macrocopa in cow dung media than the
chicken manure media. According to Table 1, mineralized cow dung media was better than steamed
cow dung media and that results were better than the controller. Nutritional deficiency and destruction
of favorable microbes which can convert complex compounds into simple absorbable minerals due
to steam can be the reason for lower results in steamed cow dung. Cow dung is freely available in Sri
Lanka and it is low in cost in Sri Lanka. According to the analyzed data, there was no significant
relationship between total count and Chlorella (p>0.05). It means the selected culture media can be
used with Chlorella or without Chlorella. But, Table 1 shows all positive resulted culture media gave
higher yield with Chlorella than without Chlorella. Chlorella is a major food for Moina.. Finally, it
can enhanced the available food for Moina.
0
5
10
15
20
25
Nu
mb
er o
f M
oin
a m
acr
oco
pa
per
3 m
l o
f w
ate
r s
am
ple
Culture media with different concentrations
MCD1- 5 g l-1 of Mineralized cow dung
MCD2-10 g l-1 of Mineralized cow dung
SCD1 - 5 g l-1 of Steamed cow dungSCD2- 10 g l-1 of Steamed cow dung
BCM2- 10 g l-1 of 1 hr. boiled chicken
manureBCM3- 15g l-1 of 1 hr. boiled chicken
manure
BCM4- 20 g l-1 of 1 hr. boiled chickenmanure
MCD1 MCD2 SCD1 SCD2BCM2
BCM3 BCM4 Controller
without Chlorella
with 1×10⁴ cells per 1 ml of
Chlorella vulgaris
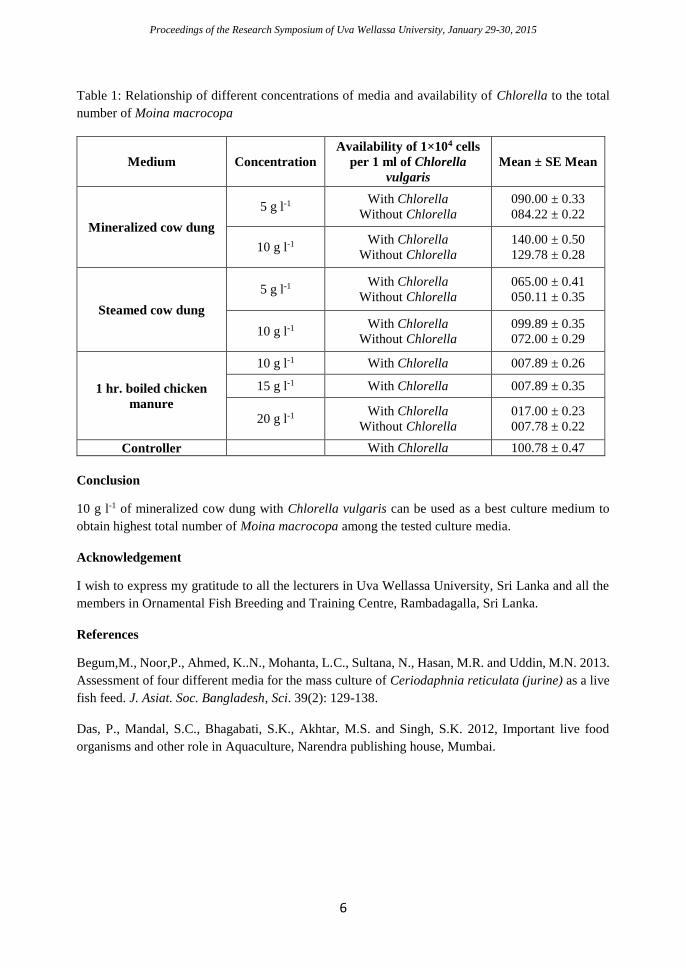
Proceedings of the Research Symposium of Uva Wellassa University, January 29-30, 2015
6
Table 1: Relationship of different concentrations of media and availability of Chlorella to the total
number of Moina macrocopa
Medium Concentration
Availability of 1×10⁴ cells
per 1 ml of Chlorella
vulgaris
Mean ± SE Mean
Mineralized cow dung
5 g l-1 With Chlorella
Without Chlorella
090.00 ± 0.33
084.22 ± 0.22
10 g l-1 With Chlorella
Without Chlorella
140.00 ± 0.50
129.78 ± 0.28
Steamed cow dung
5 g l-1 With Chlorella
Without Chlorella
065.00 ± 0.41
050.11 ± 0.35
10 g l-1 With Chlorella
Without Chlorella
099.89 ± 0.35
072.00 ± 0.29
1 hr. boiled chicken
manure
10 g l-1 With Chlorella 007.89 ± 0.26
15 g l-1 With Chlorella 007.89 ± 0.35
20 g l-1 With Chlorella
Without Chlorella
017.00 ± 0.23
007.78 ± 0.22
Controller With Chlorella 100.78 ± 0.47
Conclusion
10 g l-1 of mineralized cow dung with Chlorella vulgaris can be used as a best culture medium to
obtain highest total number of Moina macrocopa among the tested culture media.
Acknowledgement
I wish to express my gratitude to all the lecturers in Uva Wellassa University, Sri Lanka and all the
members in Ornamental Fish Breeding and Training Centre, Rambadagalla, Sri Lanka.
References
Begum,M., Noor,P., Ahmed, K..N., Mohanta, L.C., Sultana, N., Hasan, M.R. and Uddin, M.N. 2013.
Assessment of four different media for the mass culture of Ceriodaphnia reticulata (jurine) as a live
fish feed. J. Asiat. Soc. Bangladesh, Sci. 39(2): 129-138.
Das, P., Mandal, S.C., Bhagabati, S.K., Akhtar, M.S. and Singh, S.K. 2012, Important live food
organisms and other role in Aquaculture, Narendra publishing house, Mumbai.
Proceedings of the Research Symposium of Uva Wellassa University, January 29-30, 2015
7
Evaluation of the attitude and awareness of the international
resolution on responsible fishing: a case study on the multiday
fishermen of Matara
K.L.N. Dilini, I.U. Wickramaratne and N.P.P. Liyanage
Faculty of Animal Science and Export Agriculture, Uva Wellassa University of Sri Lanka
and
N.D.P. Gunawardane
Department of Fisheries and Aquatic Resources Development, New Secretariat Building,
Maligawatta ,Colombo 1
Introduction
Sri Lanka is an island, situated in the Indian Ocean between 6 – 100 N latitude and 80 – 820 E
longitudes. This island has approximately 1700 km long coastline and sovereign power for the 21,500
km2 territorial sea and an Exclusive Economic zone (EEZ) of 517,000 km2 (MFAR, 2013). Therefore
fisheries industry significantly contributes to the food security and the foreign exchange earnings of
Sri Lanka. This IUU fishing is a serious threat to the sustainability of fisheries in both national
jurisdictions and high seas. Therefore regional resolutions are implemented by the Indian Ocean Tuna
Commission (IOTC) to reduce these IUU fishing activities. Although there are laws and regulations,
many problems in the fisheries sector are caused due to lack of awareness of fishermen regarding
these implemented national and international laws. Therefore identification of awareness of
fishermen on these laws and regulations are very important before the implementation of awareness
programs. This study was done with the objectives of investigating international resolutions which
highly impact to Sri Lankan fisheries sector, investigate responses of fishermen on international
resolutions, identify and suggest procedures which can improve the awareness and behaviors of
fishermen on international resolutions.
Keywords: Illegal Unreported Unregulated (IUU) fishing, Indian Ocean Tuna Commission (IOTC),
International Resolutions
Methodology
Matara fisheries district was selected as the research area. The sample for the case study was selected
from multiday boat owners, crew members, skippers and other service providers of Matara fisheries
district through the Stratified random sampling. The sample size was determined using “Moving
average method”. Data was collected from both primary and secondary sources. Primary data was
collected from selected sample, through the questionnaire and interviews. The questionnaire was
prepared using international resolutions which developed by the IOTC. Both open ended questions
and closed ended questions were included in the questionnaire. Secondary data was collected from
sources of Department of Fisheries and Aquatic Resources and IOTC web site. Collected data was
analyzed using “Likert method” (Likert, 1932) and one way ANOVA (Analysis of Variance) at 95%
significant interval. “Minitab 16” software was used for analyzing all the collected data.
Results and Discussion
Proceedings of the Research Symposium of Uva Wellassa University, January 29-30, 2015
8
The sample size was selected as 105. According to the finalized results of the study, total mean of
awareness and attitude regarding these international resolutions is 3.38 ± 1.58. It means that the level
of awareness and attitude of fishermen of Matara fisheries district on these international resolutions
are medium. The statements used for the questionnaire have derived from the IOTC resolutions
(IOTC, 2013). The current awareness of stakeholders on these international resolutions is helped to
keep the Sri Lankan fishermen under the international resolutions. It helps to enhance the acceptance
for Sri Lankan fish and fish products in the international market. Not only that but also the awareness
on some resolutions are directly influenced on the management of fishery resources.
The community has a high level of knowledge (3.67 ≤ Mean Likert scale ≥ 5.00) on the statements
of importance of registration of fishing vessel, importance of having a flag in the fishing vessel,
importance to mark vessels according to the regulations (Resolution 01/02 relating to control of
fishing activities), importance of establishing a vessel monitoring program (Resolution 06/03), idea
about prohibition of bottom trawling and crossing sea boundaries without proper permission,
requirement of permission from the department for landing harvest at another country or for
exchanging harvest with the foreign vessels at sea (Resolution 12/05 on establishing a program for
transshipment by large scale fishing vessels), prohibition of catching endangered shark species and
sea turtles (Resolution 12/09 on the conservation of Thresher sharks and Resolution 12/04 on the
conservation of marine turtles) and preference of carrying equipment in the vessel which was used
for catching sea birds and sea turtles. The registration of fishing vessel and vessel marking according
to the regulations are already in place in the national regulations (1980). Therefore all of them have
to comply with the registration of fishing vessel and marking them according to the regulations for
having other subsidies and insurance.
The awareness was medium (2.34 ≤ Mean Likert scale ≥ 3.66) on the statements of importance of
maintaining a log book on board (Resolution 01/02), the requirement of providing information about
harvest to the Department of Fisheries, willingness to support the government officers, agree to carry
a department officer as an observer when they request, importance to inform navigation path for the
department or harbor (Resolution 05/03 and Resolution 10/11). According to the attitude of some
stakeholders, it is difficult to carry a department officer as an observer due to the limitation of space
in the vessel and several other difficulties. The idea of some skippers was important to maintain a log
book to have an idea in future regarding places and time of high densities of fish. It was considered
as an additional trouble for their hard occupation by others. According to the responses of
stakeholders, there are some people who unable to keep records on this log book due to inability of
writing.
The overall awareness was very low (1.00 ≤ Mean Likert scale ≥ 2.33) on the statements of
international trade barriers which are occurred to Sri Lankan fisheries sector due to the ignorance of
international resolutions, prohibition of large scale driftnets on the high seas in the IOTC area
(Resolution 12/12), closed area (Resolution 12/13). With the high sea fishing operation license,
printed material including the statements regarding the Resolution 12/12 has received by the boat
owners. Therefore regarding the prohibition of large scale driftnets on the high seas, there was
awareness among some people specially with the boat owners and skippers. But even the response of
these people was not agreed with the idea. According to them, 2.5 km length gill nets are not enough
to recover their fuel cost. The awareness of fishermen was very low regarding the closed area (Co-
ordinates 00 - 100 North, 400 - 600 East in the Indian Ocean during February month) for fishing
(Resolution 12/13 for the conservation and management of Tropical Tunas stocks in the IOTC area
of competence). Therefore the overall response for a closed area was seriously disagreed. But some
of the stakeholders believe it is necessary to have a closed area for the sustainability of fishery
resources.
Proceedings of the Research Symposium of Uva Wellassa University, January 29-30, 2015
9
Regarding six statements, there was a significant difference of the responses according to the types
of stakeholders. The identified major reasons for this significant difference are difference of the
participation level for the awareness programs and different attitudes among types of stakeholders.
Compared to the crew members, the awareness of boat owners and skippers were high. The reason
for this was identified as the high level of participation for the awareness programs while others are
engaging in fishing activities. The awareness of other service providers was very low. Because they
just consider on their occupation. It is better to use a media such as newspapers, television and mostly
the radio which is much closer to them. Other than using the mass media for the awareness programs,
it is better to display posters regarding these resolutions in the harbor premises, maintain a continuous
dialogue between the stakeholders and the government. It is identified the necessity to improve their
knowledge and literacy on new devices such as electronic means of communication.
The overall knowledge of fishermen of Beruwala is relatively in positive level (3.61± 1.28) about the
international resolutions (Madhushani, et al., 2013). But knowledge level of fishermen of Matara
fisheries district regarding international resolutions is medium. Therefore the level of implementing
awareness programs should be different from Beruwala to Matara. The required level of awareness
programs is high for the Matara fisheries district than for the Beruwala. Although there was awareness
regarding some resolutions in both Beruwala and Matara, they do not act according to them. Their
negative attitude regarding these resolutions is the reason for this. Therefore while improving
awareness regarding international resolutions, developing positive attitudes is very important. It is
necessary to improve the common knowledge of stakeholders regarding the international resolutions
and importance of these resolutions.
References
Department of Fisheries and Aquatic Resources, 2012. Fisheries statistics, [Online] Available at:
<http://www.fisheriesdept.gov.lk/fisheries_beta/index.php/statistics-on-fishing-fleet> [Accessed 16
April 2014].
Indian Ocean Tuna Commission, 2013, Report of implementation for the year 2013. [pdf] IOTC.
Available at: <www.iotc.org/sites/default/.../IOTC-2014-CoC11-IR25E-Sri_Lanka.pdf> [Accessed
14 June 2014].
Madhushani, H., Wickramarathne, I.U. and Gunawardane, N.D.P., 2013. Evaluation of the
Response to the International Resolution on Responsible Fishing: a case study on the fishermen of
Beruwala- Kalutara on evidence of IUU fishing. Undergraduate dissertation. Uva Wellassa
University.
Proceedings of the Research Symposium of Uva Wellassa University, January 29-30, 2015
10
Toxicity effects of trace metals on Zebra fish (Danio rerio)
embryo
M.F.A. Fasmina, S.C. Jayamanne, N.P.P. Liyanage and D.P.N. De Silva
Faculty of Animal Science and Export Agriculture, Uva Wellassa University of Sri Lanka
Introduction
Water quality deterioration is a major problem in the most of the countries, due to organic and
inorganic contaminants. Among all the toxicant trace metals are threaten to the aquatic ecosystem
and organisms. Metals are natural component of aquatic ecosystem. Trace metals such as Copper
(Cu), Zinc (Zn) and Chromium (Cr) are important for the metabolic and other biological activities of
lives whereas Mercury (Hg), Lead (Pb), Cadmium(Cd) are biologically non-essential metal that can
be toxic to biota even at very low concentration. High concentration of some essential trace metals
can be toxic when it exceeds the limits(Ebrahimi and Taherianfard, 2011).High accumulation of trace
metal in both biotic and abiotic components causes serious health consequences. Thus, assessment
of their toxicity has become an important component of water pollution monitoring. Now in most of
the toxicity studies Zebra fish (Danio rerio) embryo used as an alternative model for the fish acute
toxicity to determine the toxicity of pollutants. Therefore this study was focused on determination of
the acute toxicity of Cu, Zn, Cd, As, Pb and Hg that produce lethal effect on zebra fish embryos
during four day period.
Materials and Methodology
Zebra fish breeding was carried out and eggs were collected using a small pipette. The stock solution
of 1000 ppm of selected Cu, Zn, Pb, Cd, As and Hg were prepared a day before the test by dissolving
Copper sulfate (CuSO4.5H2O), Zinc sulfate (ZnSO4. 7H2O), Lead nitrate (Pb(NO3)2, Arsenic
pentoxide (As2O5), Cadmium chloride (CdCl2. ½ H2O) and Mercury chloride (HgCl2) in deionized
water. The working treatment solution was prepared daily by serial dilution of the stock solution.
Initially a range finding test was carried out in the nominal concentrations of (1000, 100, 10, 1 and
0.1 mgL-1) for 96 hours. Ten eggs per concentrations were used. Deionized water was used as a
negative control. Each treatment had three replicates. Acute Cu, Zn, Pb, As, Cd and Hg toxicity
experiments were performed for a 4-day period using Danio rerio embryo. Ten test concentrations
of Cu, Cd (0.025, 0.05, 0.1, 0.2, 0.4, 0.8, 1.6, 3.2, 6.4 and 10.0 mgL⁻1), Zn, Pb, As (2.0, 4.0, 8.0, 16.0,
32.0,64.0, 125.0,250.0, 500.0 and 1000.0 mgL⁻1) and Hg (0.002, 0.004, 0.008, 0.016, 0.032, 0.064,
0.125, 0.250, 0.500 and 1.0 mgL⁻1) were prepared by diluting the stock solution in deionized water.
Deionized water was used as negative control and as internal plate control. As a positive control
concentration of 15% ethanol(Hassan et al., 2008) was used with each embryo batch for testing.
Fertilized zebra fish embryos were immersed in the test solutions before cleavage, by the 16 cell-
stage. At least twice the number of eggs needed per treatment group (40 eggs) was randomly selected
and transferred into the respective concentrations and controls within the 90 minutes of post
fertilization. 24-well plates were filled with 2 mL per well freshly prepared test solutions. In each
plate twenty wells were used for test concentrations and four were used as internal plate control.
Another plate was used as positive control. The eggs in standard 24- well plate were covered by shelf
adhesive foil and maintain at a temperature to 26 ± 1 °C. The mortality of the fish eggs were recorded
at 24, 48, 72 and 96 hours of exposure using a stereo microscope with the indicator of lethality;
coagulation of fertilized egg, lack of somite formation, lack of detachment of the tail and lack of heart
beat as described in OECD/ OCDE 236, 2013; guideline for the test of chemical, Fish Embryo Acute
Toxicity (FET) tests. Dead eggs were removed immediately. Three replicates were performed
individually. In this study the acute toxic effect of each metal on the Danio rerio embryo was
Proceedings of the Research Symposium of Uva Wellassa University, January 29-30, 2015
11
determined by Probit Analysis LC50 determination method. Data analysis was performed by using
statistical software SPSS15.
Results and Discussion
According to the analysis in the range finding test, minimum concentration that can cause 100 %
mortality was recorded. Based on the result obtained, range for As, Pb and Zn is below the 1000.0
mgL-1, for Cd and Cu less than 10.0 mgL-1 and for Hg less than 1.0 mgL-1 . The relationship between
the metal concentration and mortality rate of each trace metal was recorded based on the four apical
endpoints. It shows that mortality rate is increasing with the increasing concentration and time of
exposure. Acute toxicity of As, Cd, Hg, Pb, Cu and Zn showed that mortality is directly proportional
to the concentration of the trace metals. The probit analysis revealed that there is a significance
difference between the trace metals and control group (P< 0.05).According to the analysis of median
lethal concentration (LC50), Hg is highly toxic to the Danio rerio embryo and followed by the Cu,
Cd, Zn, As and Pb. The toxicity trend of LC50 96 hrs observed was Hg (0.0217 mgL-1) < Cu (0.099
mgL-1) < Cd (0.407 mgL-1) < Zn (14.021 mgL-1) < As (34.840 mgL-1) <Pb (41.697 mgL-1). LC50 and
upper and lower confidence limits revealed a decreasing trend from 24 to 96 hrs(Table 1). Fish
embryo stage is highly sensitive to metal pollution. The chorion does not fully protect the embryo
against metal penetration. In this study, the most toxic trace metal to Danio rerio embryo is Hg. The
LC50values of Hg at 24, 48, 72 and 96 hrs wereless than 0.04 mgL-1.It shows that even at lower
concentration it can cause high mortality rate on Danio rerio embryo.
Table 2: Summarized LC50 value of trace metals on Danio rerio for a period of 24 – 96 hrs
Trace
metals
LC50 (95% confident limits – lower, upper)
24hrs 48hrs 72hrs 96hrs
Hg 0.0397
(0.0324,0.0488)
0.0229
(0.0245,0.0367)
0.0218
(0.0182,0.0263)
0.0217
(0.0180,0.0260)
Cu 0.1735
(0.1498,0.2011)
0.1306
(0.1128,0.1512)
0.0991
(0.0844,0.1157)
0.0991
(0.0844,0.1157)
Cd 0.5660
(0.4339,0.741)
0.464
(0.3505,0.613)
0.418
(0.3152,0.550)
0.407
(0.3072,0.536)
Zn 23.083
(18.871,28.13)
17.080
(13.936,20.801)
14.021
(11.347,17.147)
14.021
(11.347,17.147)
As 42.915
(36.223,50.97)
38.313
(32.007,45.98)
34.840
(28.903,42.08)
34.840
(28.903,42.08)
Pb 113.8
(88.5,149.6)
63.90
(50.81,81.0)
43.75
(35.75,53.71)
41.70
(33.97,51.34)
In Danio rerio embryo toxicity test several sub- lethal and teratogenic endpoints were observed. In
control no deformities were observed. Growth retardation, Shrinkage of chorion, Scoliosis,
Pericardial edema, Yolk sac edema, Lack of pigmentation, Tail deformities, Heamorrhages, missing
formation of lens and Lack of otoliths are the major deformities observed during the study. Growth
retardation is mainly caused by growth inhibitorsofCd and Cu (Sikorska and Wolnicki, 2006).
Skeletal deformities in fish are good bio indicators of pollution (Bengtsson, 1979; Lemly, 1997; cited
in Curtis, 2004). Damage of the vertebral column expressed as curvature of the larval body axis is
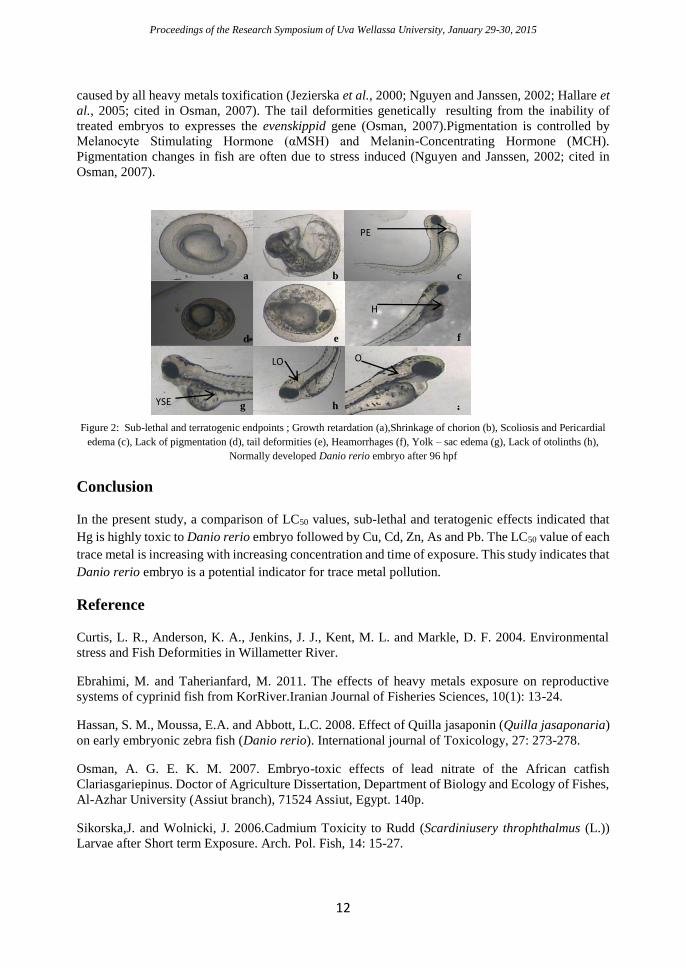
Proceedings of the Research Symposium of Uva Wellassa University, January 29-30, 2015
12
caused by all heavy metals toxification (Jezierska et al., 2000; Nguyen and Janssen, 2002; Hallare et
al., 2005; cited in Osman, 2007). The tail deformities genetically resulting from the inability of
treated embryos to expresses the evenskippid gene (Osman, 2007).Pigmentation is controlled by
Melanocyte Stimulating Hormone (αMSH) and Melanin-Concentrating Hormone (MCH).
Pigmentation changes in fish are often due to stress induced (Nguyen and Janssen, 2002; cited in
Osman, 2007).
Figure 2: Sub-lethal and terratogenic endpoints ; Growth retardation (a),Shrinkage of chorion (b), Scoliosis and Pericardial
edema (c), Lack of pigmentation (d), tail deformities (e), Heamorrhages (f), Yolk – sac edema (g), Lack of otolinths (h),
Normally developed Danio rerio embryo after 96 hpf
Conclusion
In the present study, a comparison of LC50 values, sub-lethal and teratogenic effects indicated that
Hg is highly toxic to Danio rerio embryo followed by Cu, Cd, Zn, As and Pb. The LC50 value of each
trace metal is increasing with increasing concentration and time of exposure. This study indicates that
Danio rerio embryo is a potential indicator for trace metal pollution.
Reference
Curtis, L. R., Anderson, K. A., Jenkins, J. J., Kent, M. L. and Markle, D. F. 2004. Environmental
stress and Fish Deformities in Willametter River.
Ebrahimi, M. and Taherianfard, M. 2011. The effects of heavy metals exposure on reproductive
systems of cyprinid fish from KorRiver.Iranian Journal of Fisheries Sciences, 10(1): 13-24.
Hassan, S. M., Moussa, E.A. and Abbott, L.C. 2008. Effect of Quilla jasaponin (Quilla jasaponaria)
on early embryonic zebra fish (Danio rerio). International journal of Toxicology, 27: 273-278.
Osman, A. G. E. K. M. 2007. Embryo-toxic effects of lead nitrate of the African catfish
Clariasgariepinus. Doctor of Agriculture Dissertation, Department of Biology and Ecology of Fishes,
Al-Azhar University (Assiut branch), 71524 Assiut, Egypt. 140p.
Sikorska,J. and Wolnicki, J. 2006.Cadmium Toxicity to Rudd (Scardiniusery throphthalmus (L.))
Larvae after Short term Exposure. Arch. Pol. Fish, 14: 15-27.
a b
d
c
f e
i h g
PE
YSE
LO
H
O
Proceedings of the Research Symposium of Uva Wellassa University, January 29-30, 2015
13
Development of micropropagation protocols for two
aponogeton species of Sri Lanka (Aponogeton crispus and
Aponogeton natans)
T.W.G.J.C Amarawansha, B.V.A.S. M. Bambaranda and S.C. Jayamanne
Faculty of Animal Science and Export Agriculture, Uva Wellassa University of Sri Lanka
and
H.M.I Herath
Royal Botanic Gardens, Peradeniya
Introduction
Sri Lanka being a tropical country contributes for a highly diversified flora and fauna. These climatic
conditions have become a critical factor for the occurrence of highly diversified aquatic flora as well.
Aponogeton is genus of aquatic plants which belongs to the family Aponogetonaceae. According to
Bruggen there are four Aponogeton species occur in Sri Lanka (Dassanayake and Fosberg, 1987).
Among these species Aponogeton jacobsenii and A. rigidifolius are endemic to Sri Lanka while A.
natans and A. crispus are native plants (Wijesundara and Shantha Siri, 2004).They are having a high
demand as an aquarium decorative plant in the export market. This study was carried out to develop
a micropropagation protocol for mass production of A. crispus and A. natans and A. jacobsenii
species.
Methodology
The study was carried out at tissue culture laboratory of Royal Botanic Gardens, Peradeniya. Mother
plants were collected from different areas of Sri Lanka. Experiments were done to determine
hormonal effect on shoot initiation and multiplication using rhizomes of Aponogeton crispus and A.
jacobsenii; leaf and leaf stalks of A. natans and A. jacobsenii and seeds of A. crispus and A. natans.
For the Sterilization of A. crispus and A. jacobsenii rhizomes were kept under running tap water for
3 hours and dipped in a fungicide for 30 minutes. Then disinfected using 20 % NaOCl (Clorox) with
2 drops of Tween twenty for 10 minutes and washed with 0.1 % HgCl2 for 7 minutes. Finally rhizomes
were washed 5 times thoroughly with distilled water per 5 minutes. For seeds sterilization seeds were
kept under running tap water for 10 minutes, disinfected using 5 % Clorox with 2 drops of Tween
twenty for 15 minutes and washed 3 times with distilled water. Three sterilization procedures were
carried out for leaves and leaf stalks. Firstly leaves kept under running tap water for 1 ½ hours and
dipped in fungicide (topsin) for half an hour. Then washed with 5 % of NaOCl (Clorox) for 10
minutes and washed with 0.1 % HgCl2 for 3 minutes. Finally leaves washed 3 times with distilled
water. Again sterilization procedure was tested by using 5 % NaOCl for 5 minutes and 0.1 % HgCl2
for 2 minutes. As the final method leaves were sterilized with 2 % of NaOCl for 2 minutes 0.1 %
HgCl2 for 1 minute. Basal full strength MS medium supplemented with 20 mgL-1 of sucrose and 7
gL-1 of agar was used. pH was adjusted to 5.6. Different levels of BAP and IAA hormones were tested
for the experiments (Figure 1, 2, 3). Cultures were maintained under controlled condition of 26 0 C
+/- 2 0 C temperatures and white fluorescent light with 16 hour photoperiod for shoot regeneration.
Ten replicates per each treatment were maintained and media without adding hormones used as the
control. Experiment was arranged in factorial Complete Randomized Design (CRD). Data analyzed
using ANOVA and Tukey’s Test using MINITAB 17 software.
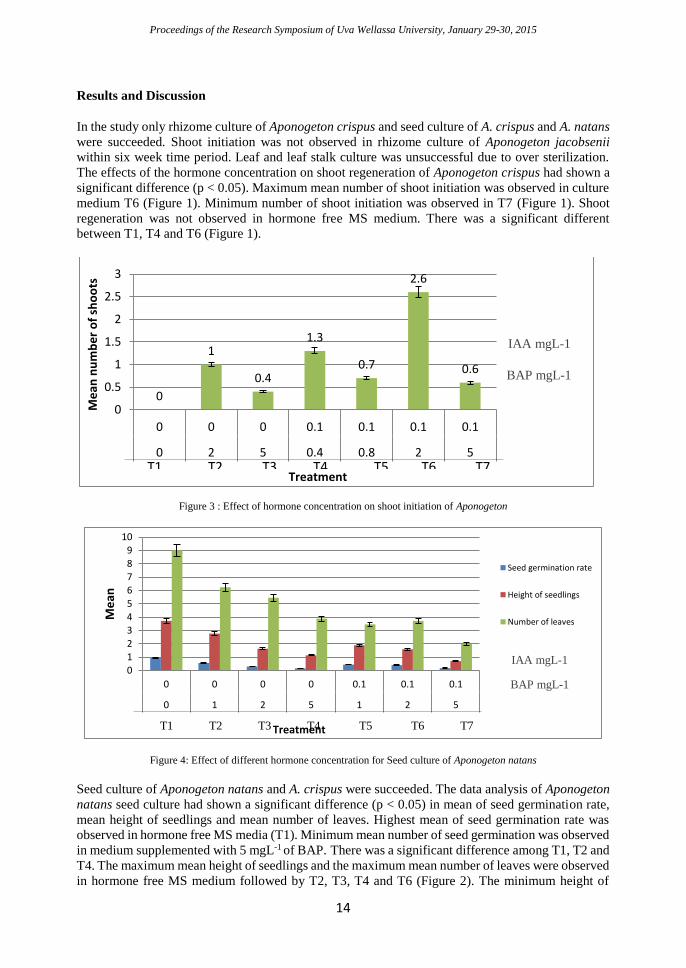
Proceedings of the Research Symposium of Uva Wellassa University, January 29-30, 2015
14
Results and Discussion
In the study only rhizome culture of Aponogeton crispus and seed culture of A. crispus and A. natans
were succeeded. Shoot initiation was not observed in rhizome culture of Aponogeton jacobsenii
within six week time period. Leaf and leaf stalk culture was unsuccessful due to over sterilization.
The effects of the hormone concentration on shoot regeneration of Aponogeton crispus had shown a
significant difference (p < 0.05). Maximum mean number of shoot initiation was observed in culture
medium T6 (Figure 1). Minimum number of shoot initiation was observed in T7 (Figure 1). Shoot
regeneration was not observed in hormone free MS medium. There was a significant different
between T1, T4 and T6 (Figure 1).
Figure 3 : Effect of hormone concentration on shoot initiation of Aponogeton
Figure 4: Effect of different hormone concentration for Seed culture of Aponogeton natans
Seed culture of Aponogeton natans and A. crispus were succeeded. The data analysis of Aponogeton
natans seed culture had shown a significant difference (p < 0.05) in mean of seed germination rate,
mean height of seedlings and mean number of leaves. Highest mean of seed germination rate was
observed in hormone free MS media (T1). Minimum mean number of seed germination was observed
in medium supplemented with 5 mgL-1 of BAP. There was a significant difference among T1, T2 and
T4. The maximum mean height of seedlings and the maximum mean number of leaves were observed
in hormone free MS medium followed by T2, T3, T4 and T6 (Figure 2). The minimum height of
0
1
0.4
1.3
0.7
2.6
0.6
0
0.5
1
1.5
2
2.5
3
0 0 0 0.1 0.1 0.1 0.1
0 2 5 0.4 0.8 2 5
Me
an n
um
be
r o
f sh
oo
ts
Treatment
BAP mgL-1
IAA mgL-1
T1 T2 T3 T4 T5 T6 T7
01234
56789
10
0 0 0 0 0.1 0.1 0.1
0 1 2 5 1 2 5
Me
an
Treatment
Seed germination rate
Height of seedlings
Number of leaves
T1 T2 T3 T4 T5 T6 T7
IAA mgL-1
BAP mgL-1
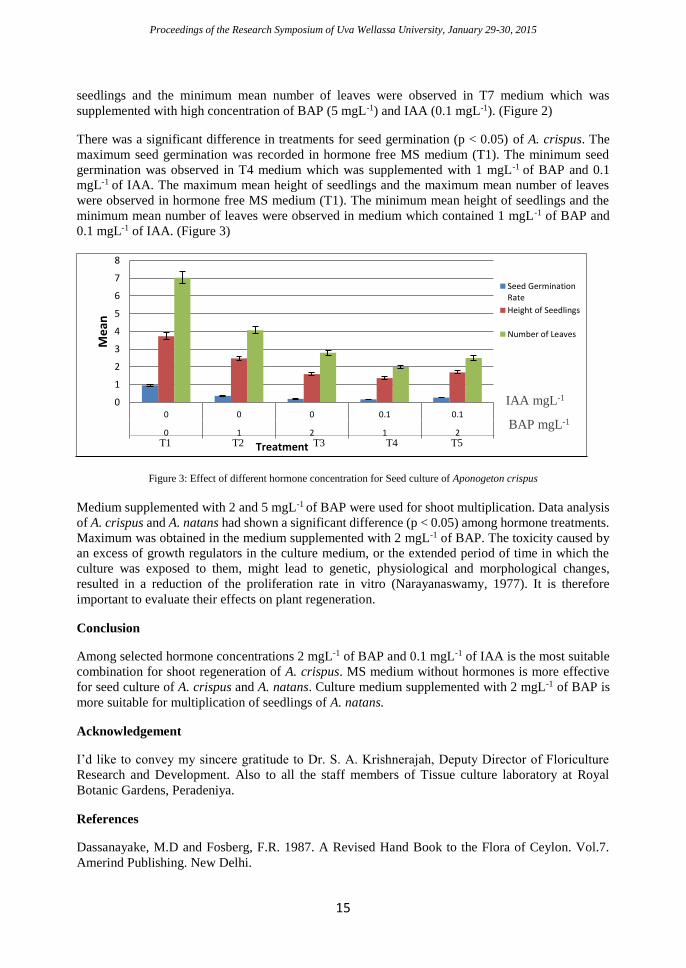
Proceedings of the Research Symposium of Uva Wellassa University, January 29-30, 2015
15
seedlings and the minimum mean number of leaves were observed in T7 medium which was
supplemented with high concentration of BAP (5 mgL-1) and IAA (0.1 mgL-1). (Figure 2)
There was a significant difference in treatments for seed germination (p < 0.05) of A. crispus. The
maximum seed germination was recorded in hormone free MS medium (T1). The minimum seed
germination was observed in T4 medium which was supplemented with 1 mgL-1 of BAP and 0.1
mgL-1 of IAA. The maximum mean height of seedlings and the maximum mean number of leaves
were observed in hormone free MS medium (T1). The minimum mean height of seedlings and the
minimum mean number of leaves were observed in medium which contained 1 mgL-1 of BAP and
0.1 mgL-1 of IAA. (Figure 3)
Figure 3: Effect of different hormone concentration for Seed culture of Aponogeton crispus
Medium supplemented with 2 and 5 mgL-1 of BAP were used for shoot multiplication. Data analysis
of A. crispus and A. natans had shown a significant difference (p < 0.05) among hormone treatments.
Maximum was obtained in the medium supplemented with 2 mgL-1 of BAP. The toxicity caused by
an excess of growth regulators in the culture medium, or the extended period of time in which the
culture was exposed to them, might lead to genetic, physiological and morphological changes,
resulted in a reduction of the proliferation rate in vitro (Narayanaswamy, 1977). It is therefore
important to evaluate their effects on plant regeneration.
Conclusion
Among selected hormone concentrations 2 mgL-1 of BAP and 0.1 mgL-1 of IAA is the most suitable
combination for shoot regeneration of A. crispus. MS medium without hormones is more effective
for seed culture of A. crispus and A. natans. Culture medium supplemented with 2 mgL-1 of BAP is
more suitable for multiplication of seedlings of A. natans.
Acknowledgement
I’d like to convey my sincere gratitude to Dr. S. A. Krishnerajah, Deputy Director of Floriculture
Research and Development. Also to all the staff members of Tissue culture laboratory at Royal
Botanic Gardens, Peradeniya.
References
Dassanayake, M.D and Fosberg, F.R. 1987. A Revised Hand Book to the Flora of Ceylon. Vol.7.
Amerind Publishing. New Delhi.
0
1
2
3
4
5
6
7
8
0 0 0 0.1 0.1
0 1 2 1 2
Me
an
Treatment
Seed GerminationRate
Height of Seedlings
Number of Leaves
T1 T2 T3 T4 T5
IAA mgL-1
BAP mgL-1

Proceedings of the Research Symposium of Uva Wellassa University, January 29-30, 2015
16
Narayanaswamy, S. 1977. Regeneration of plants from tissue cultures. In: Applied and Fundamental
Aspects of Plant Cell Tissue and Organ Culture, 179-248.
Wijesundara, D. S. A., and Shantha, S. 2004. Some selected Aquatic Ornamental Plants of Sri Lanka.
Eds. Technology Watch Centre, Colombo, Sri Lanka. . 4-14
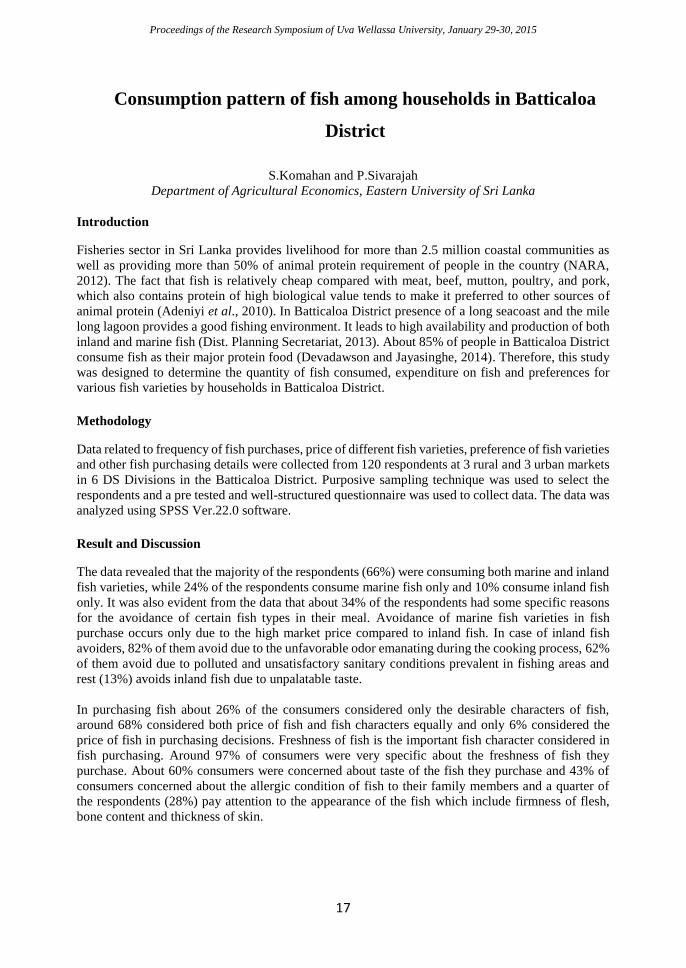
Proceedings of the Research Symposium of Uva Wellassa University, January 29-30, 2015
17
Consumption pattern of fish among households in Batticaloa
District
S.Komahan and P.Sivarajah
Department of Agricultural Economics, Eastern University of Sri Lanka
Introduction
Fisheries sector in Sri Lanka provides livelihood for more than 2.5 million coastal communities as
well as providing more than 50% of animal protein requirement of people in the country (NARA,
2012). The fact that fish is relatively cheap compared with meat, beef, mutton, poultry, and pork,
which also contains protein of high biological value tends to make it preferred to other sources of
animal protein (Adeniyi et al., 2010). In Batticaloa District presence of a long seacoast and the mile
long lagoon provides a good fishing environment. It leads to high availability and production of both
inland and marine fish (Dist. Planning Secretariat, 2013). About 85% of people in Batticaloa District
consume fish as their major protein food (Devadawson and Jayasinghe, 2014). Therefore, this study
was designed to determine the quantity of fish consumed, expenditure on fish and preferences for
various fish varieties by households in Batticaloa District.
Methodology
Data related to frequency of fish purchases, price of different fish varieties, preference of fish varieties
and other fish purchasing details were collected from 120 respondents at 3 rural and 3 urban markets
in 6 DS Divisions in the Batticaloa District. Purposive sampling technique was used to select the
respondents and a pre tested and well-structured questionnaire was used to collect data. The data was
analyzed using SPSS Ver.22.0 software.
Result and Discussion
The data revealed that the majority of the respondents (66%) were consuming both marine and inland
fish varieties, while 24% of the respondents consume marine fish only and 10% consume inland fish
only. It was also evident from the data that about 34% of the respondents had some specific reasons
for the avoidance of certain fish types in their meal. Avoidance of marine fish varieties in fish
purchase occurs only due to the high market price compared to inland fish. In case of inland fish
avoiders, 82% of them avoid due to the unfavorable odor emanating during the cooking process, 62%
of them avoid due to polluted and unsatisfactory sanitary conditions prevalent in fishing areas and
rest (13%) avoids inland fish due to unpalatable taste.
In purchasing fish about 26% of the consumers considered only the desirable characters of fish,
around 68% considered both price of fish and fish characters equally and only 6% considered the
price of fish in purchasing decisions. Freshness of fish is the important fish character considered in
fish purchasing. Around 97% of consumers were very specific about the freshness of fish they
purchase. About 60% consumers were concerned about taste of the fish they purchase and 43% of
consumers concerned about the allergic condition of fish to their family members and a quarter of
the respondents (28%) pay attention to the appearance of the fish which include firmness of flesh,
bone content and thickness of skin.
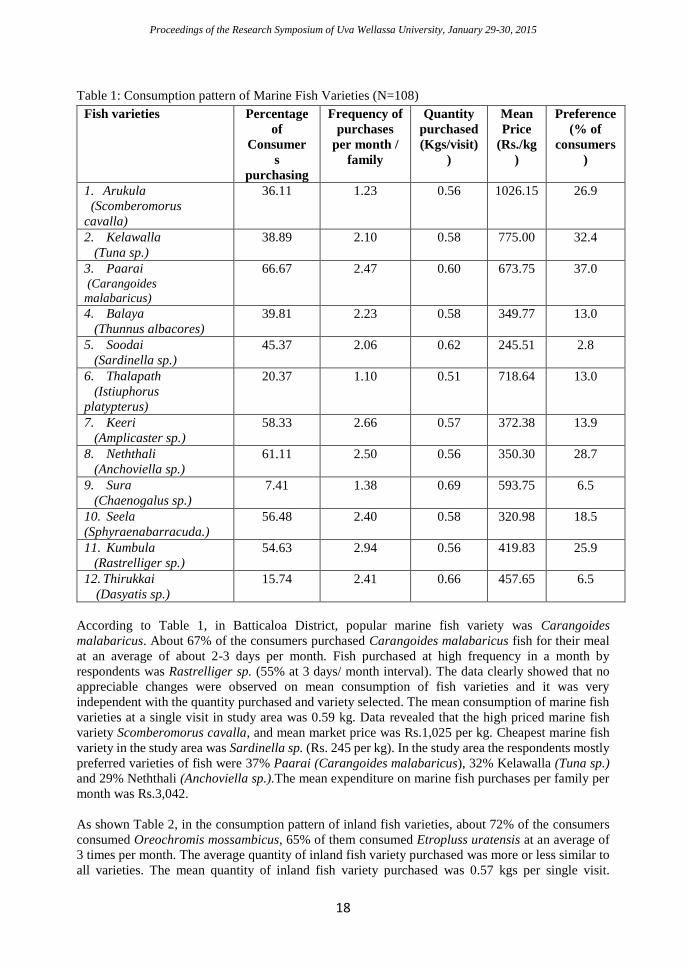
Proceedings of the Research Symposium of Uva Wellassa University, January 29-30, 2015
18
Table 1: Consumption pattern of Marine Fish Varieties (N=108)
Fish varieties Percentage
of
Consumer
s
purchasing
Frequency of
purchases
per month /
family
Quantity
purchased
(Kgs/visit)
)
Mean
Price
(Rs./kg
)
Preference
(% of
consumers
)
1. Arukula
(Scomberomorus
cavalla)
36.11 1.23 0.56 1026.15 26.9
2. Kelawalla
(Tuna sp.)
38.89 2.10 0.58 775.00 32.4
3. Paarai (Carangoides
malabaricus)
66.67 2.47 0.60 673.75 37.0
4. Balaya
(Thunnus albacores)
39.81 2.23 0.58 349.77 13.0
5. Soodai
(Sardinella sp.)
45.37 2.06 0.62 245.51 2.8
6. Thalapath
(Istiuphorus
platypterus)
20.37 1.10 0.51 718.64 13.0
7. Keeri
(Amplicaster sp.)
58.33 2.66 0.57 372.38 13.9
8. Neththali
(Anchoviella sp.)
61.11 2.50 0.56 350.30 28.7
9. Sura
(Chaenogalus sp.)
7.41 1.38 0.69 593.75 6.5
10. Seela
(Sphyraenabarracuda.)
56.48 2.40 0.58 320.98 18.5
11. Kumbula
(Rastrelliger sp.) 54.63 2.94 0.56 419.83 25.9
12. Thirukkai
(Dasyatis sp.)
15.74 2.41 0.66 457.65 6.5
According to Table 1, in Batticaloa District, popular marine fish variety was Carangoides
malabaricus. About 67% of the consumers purchased Carangoides malabaricus fish for their meal
at an average of about 2-3 days per month. Fish purchased at high frequency in a month by
respondents was Rastrelliger sp. (55% at 3 days/ month interval). The data clearly showed that no
appreciable changes were observed on mean consumption of fish varieties and it was very
independent with the quantity purchased and variety selected. The mean consumption of marine fish
varieties at a single visit in study area was 0.59 kg. Data revealed that the high priced marine fish
variety Scomberomorus cavalla, and mean market price was Rs.1,025 per kg. Cheapest marine fish
variety in the study area was Sardinella sp. (Rs. 245 per kg). In the study area the respondents mostly
preferred varieties of fish were 37% Paarai (Carangoides malabaricus), 32% Kelawalla (Tuna sp.)
and 29% Neththali (Anchoviella sp.).The mean expenditure on marine fish purchases per family per
month was Rs.3,042.
As shown Table 2, in the consumption pattern of inland fish varieties, about 72% of the consumers
consumed Oreochromis mossambicus, 65% of them consumed Etropluss uratensis at an average of
3 times per month. The average quantity of inland fish variety purchased was more or less similar to
all varieties. The mean quantity of inland fish variety purchased was 0.57 kgs per single visit.
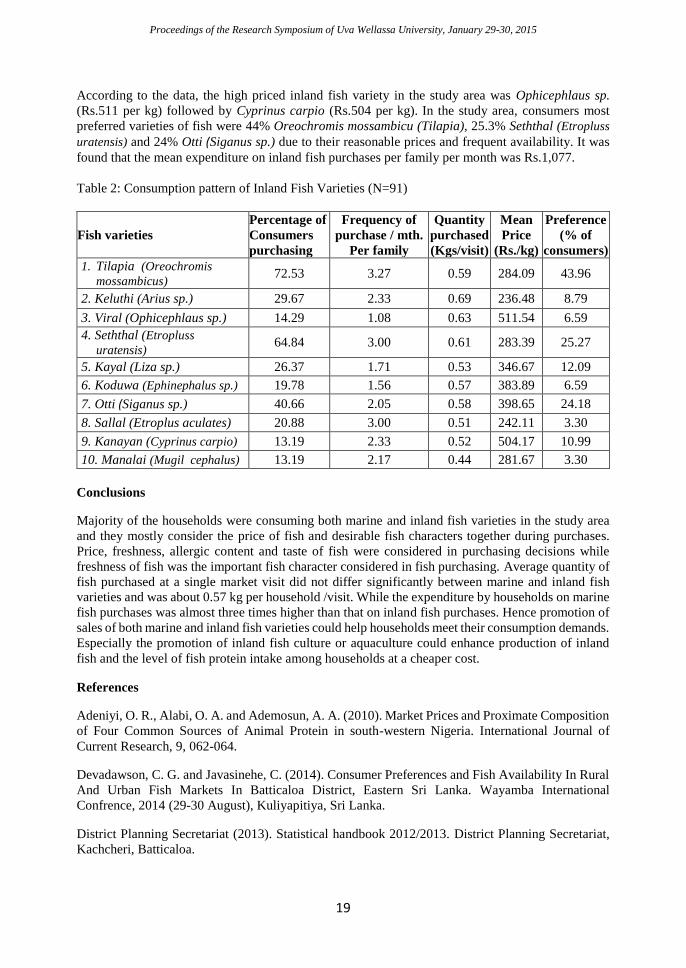
Proceedings of the Research Symposium of Uva Wellassa University, January 29-30, 2015
19
According to the data, the high priced inland fish variety in the study area was Ophicephlaus sp.
(Rs.511 per kg) followed by Cyprinus carpio (Rs.504 per kg). In the study area, consumers most
preferred varieties of fish were 44% Oreochromis mossambicu (Tilapia), 25.3% Seththal (Etropluss
uratensis) and 24% Otti (Siganus sp.) due to their reasonable prices and frequent availability. It was
found that the mean expenditure on inland fish purchases per family per month was Rs.1,077.
Table 2: Consumption pattern of Inland Fish Varieties (N=91)
Fish varieties
Percentage of
Consumers
purchasing
Frequency of
purchase / mth.
Per family
Quantity
purchased
(Kgs/visit)
Mean
Price
(Rs./kg)
Preference
(% of
consumers)
1. Tilapia (Oreochromis
mossambicus) 72.53 3.27 0.59 284.09 43.96
2. Keluthi (Arius sp.) 29.67 2.33 0.69 236.48 8.79
3. Viral (Ophicephlaus sp.) 14.29 1.08 0.63 511.54 6.59
4. Seththal (Etropluss
uratensis) 64.84 3.00 0.61 283.39 25.27
5. Kayal (Liza sp.) 26.37 1.71 0.53 346.67 12.09
6. Koduwa (Ephinephalus sp.) 19.78 1.56 0.57 383.89 6.59
7. Otti (Siganus sp.) 40.66 2.05 0.58 398.65 24.18
8. Sallal (Etroplus aculates) 20.88 3.00 0.51 242.11 3.30
9. Kanayan (Cyprinus carpio) 13.19 2.33 0.52 504.17 10.99
10. Manalai (Mugil cephalus) 13.19 2.17 0.44 281.67 3.30
Conclusions
Majority of the households were consuming both marine and inland fish varieties in the study area
and they mostly consider the price of fish and desirable fish characters together during purchases.
Price, freshness, allergic content and taste of fish were considered in purchasing decisions while
freshness of fish was the important fish character considered in fish purchasing. Average quantity of
fish purchased at a single market visit did not differ significantly between marine and inland fish
varieties and was about 0.57 kg per household /visit. While the expenditure by households on marine
fish purchases was almost three times higher than that on inland fish purchases. Hence promotion of
sales of both marine and inland fish varieties could help households meet their consumption demands.
Especially the promotion of inland fish culture or aquaculture could enhance production of inland
fish and the level of fish protein intake among households at a cheaper cost.
References
Adeniyi, O. R., Alabi, O. A. and Ademosun, A. A. (2010). Market Prices and Proximate Composition
of Four Common Sources of Animal Protein in south-western Nigeria. International Journal of
Current Research, 9, 062-064.
Devadawson, C. G. and Javasinehe, C. (2014). Consumer Preferences and Fish Availability In Rural
And Urban Fish Markets In Batticaloa District, Eastern Sri Lanka. Wayamba International
Confrence, 2014 (29-30 August), Kuliyapitiya, Sri Lanka.
District Planning Secretariat (2013). Statistical handbook 2012/2013. District Planning Secretariat,
Kachcheri, Batticaloa.

Proceedings of the Research Symposium of Uva Wellassa University, January 29-30, 2015
20
NARA (2012). Fishery Industry Outlook, Retrieved May 20, 2014
http://www.nara.ac.lk/12/fisheries%20outlook/index1.html
Proceedings of the Research Symposium of Uva Wellassa University, January 29-30, 2015
21
Isolation and incorporation of Nitrogenous compounds from
Yellow Fin Tuna (Thunnus albacares) to produce a fish flavored
vegetable burger
P.D.A. Jeewantha and E.D.N.S. Abeyrathne
Faculty of Animal Science and Export Agriculture, Uva Wellassa University of Sri Lanka.
Introduction
Fish processing industry is increasing continuously in the world Thunnus albacares is a one of the
major fish used bymany processing companies. Value added products are produced using tuna which
include tuna steaks, tuna loin, tuna fillets, tuna blocks and canned tuna. At processing, trimmings are
resulted as waste and discharged without any utilization. Hence, maximum utilization of fish waste
is important. There are many nitrogenous compounds present in fish flesh. Nitrogenous compounds
play an important role in flavor and taste of fish. Fish flavor components are non-protein-nitrogen
compounds such as ammonia, monomethylamines, dimethylamines, trimethilamines,
trimethilamonia bases (trimethylamine oxide and betaines), and guanidine derivatives such as
creatine and argenine (Teerasuntonwat and Raksakulthai, 1995).Soya bean and chick pea can be used
to produce vegetable burger sinceboth contain high amounts of protein. Soya bean contains 38% to
42% protein (Balasubramaniyan and Palaniappan, 2004). Chickpea has significant amounts of all
essential amino acids and is rich in nutritionally important unsaturated fatty acids such as linoleic and
oleic acid (Jukanti, 2012).The objectives of this study was to find out the ways to maximize the
utilization of fish waste generated in fish processing industry and to use them to extract flavor
compounds in order to incorporate it in to a vegetable burger.
Methodology
Vegetable burger was prepared using soya and chick pea as the main ingredients. Dried soya bean
was steamed at 80°C for 20 minutes and ground using a grinder (IS 4250,Jaipan family mate, India).
Weighed ingredients were mixed and the pulp was made. Prepared mixture was then cooked in a
steamer (WP5525, WIPRO, China) at 80°C for 20 minutes. Ingredients level of the burger was
determined by preliminary sensory evaluations keeping soy and chick pea flour levels constant.
For determination of best combination of soya and chick pea flour, 5 recipes of vegetable burger were
prepared by decreasing the soya level from 100% to 0% and increasing the chick pea level from 0%
to 100% while keeping the other ingredients constant. Thirty untrained panelists were used to select
the best formula for the burger. Fish flavor was extracted according to the method of Teerasuntonwat
and Raksakulthai (1995) with some modifications. Yellow fin tuna trimmings were cut in to small
pieces and ground using the grinder (Jaipan family mate) with 1% (w/v) NaCl (Fluka, England).
Blended samples were transferred in to a 1000 mL beaker (PYREX, England) and heated at 60°Cfor
15 minutes using a stirrer (SR No:67702, VELP® SCINTIFICA, Europe). Heated samples were
filtered using Whatman No: 4 filter papers. Filtration was dialysised to remove salt. Extracted fish
flavor was kept under freezing condition and used instead of water (28%) in vegetable burger
preparation.
For determination of best concentration to extract volatile compounds series different concentrations
(w/v) of NaCl (0.1%, 1%, 5% and 10%) were prepared. Vegetable burger was prepared using the
recipe developed and separated dialysis solutions. Best NaCl concentration was determined by a
sensory evaluation test using 30 untrained panelists. Sensory evaluation data were statistically
analyzed using non parametric Friedman test in Minitab 16. Lipid oxidation, pH value and proximate
composition were determined in triplicate during 30 days of storage at 4°C.Microbiology tests were
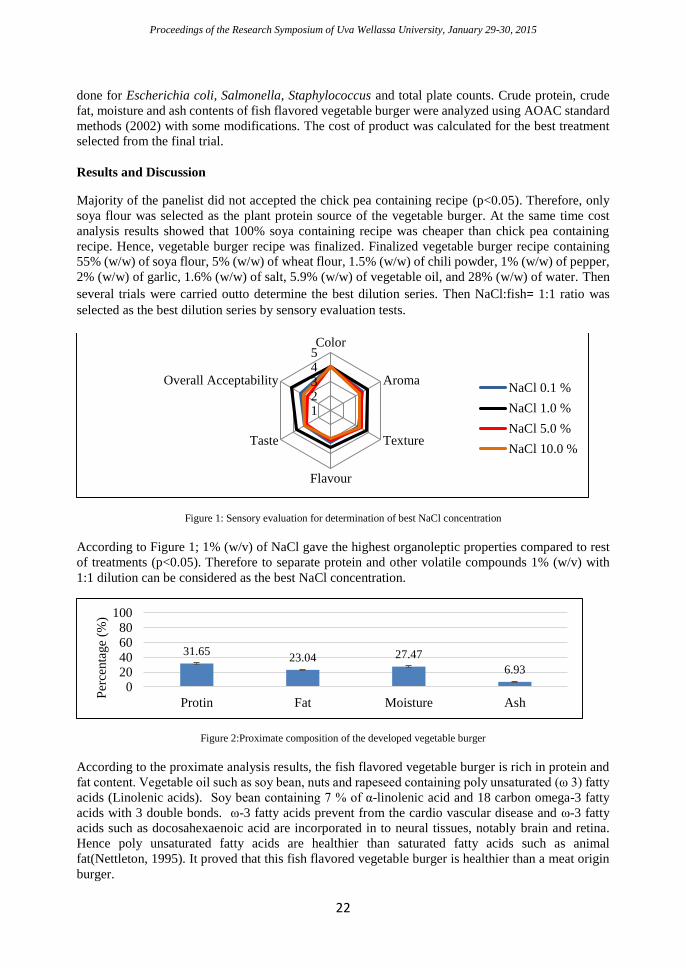
Proceedings of the Research Symposium of Uva Wellassa University, January 29-30, 2015
22
done for Escherichia coli, Salmonella, Staphylococcus and total plate counts. Crude protein, crude
fat, moisture and ash contents of fish flavored vegetable burger were analyzed using AOAC standard
methods (2002) with some modifications. The cost of product was calculated for the best treatment
selected from the final trial.
Results and Discussion
Majority of the panelist did not accepted the chick pea containing recipe (p<0.05). Therefore, only
soya flour was selected as the plant protein source of the vegetable burger. At the same time cost
analysis results showed that 100% soya containing recipe was cheaper than chick pea containing
recipe. Hence, vegetable burger recipe was finalized. Finalized vegetable burger recipe containing
55% (w/w) of soya flour, 5% (w/w) of wheat flour, 1.5% (w/w) of chili powder, 1% (w/w) of pepper,
2% (w/w) of garlic, 1.6% (w/w) of salt, 5.9% (w/w) of vegetable oil, and 28% (w/w) of water. Then
several trials were carried outto determine the best dilution series. Then NaCl:fish= 1:1 ratio was
selected as the best dilution series by sensory evaluation tests.
Figure 1: Sensory evaluation for determination of best NaCl concentration
According to Figure 1; 1% (w/v) of NaCl gave the highest organoleptic properties compared to rest
of treatments (p<0.05). Therefore to separate protein and other volatile compounds 1% (w/v) with
1:1 dilution can be considered as the best NaCl concentration.
Figure 2:Proximate composition of the developed vegetable burger
According to the proximate analysis results, the fish flavored vegetable burger is rich in protein and
fat content. Vegetable oil such as soy bean, nuts and rapeseed containing poly unsaturated (ω 3) fatty
acids (Linolenic acids). Soy bean containing 7 % of α-linolenic acid and 18 carbon omega-3 fatty
acids with 3 double bonds. ω-3 fatty acids prevent from the cardio vascular disease and ω-3 fatty
acids such as docosahexaenoic acid are incorporated in to neural tissues, notably brain and retina.
Hence poly unsaturated fatty acids are healthier than saturated fatty acids such as animal
fat(Nettleton, 1995). It proved that this fish flavored vegetable burger is healthier than a meat origin
burger.
12345Color
Aroma
Texture
Flavour
Taste
Overall AcceptabilityNaCl 0.1 %
NaCl 1.0 %
NaCl 5.0 %
NaCl 10.0 %
31.6523.04 27.47
6.93
020406080
100
Protin Fat Moisture Ash
Per
centa
ge
(%)
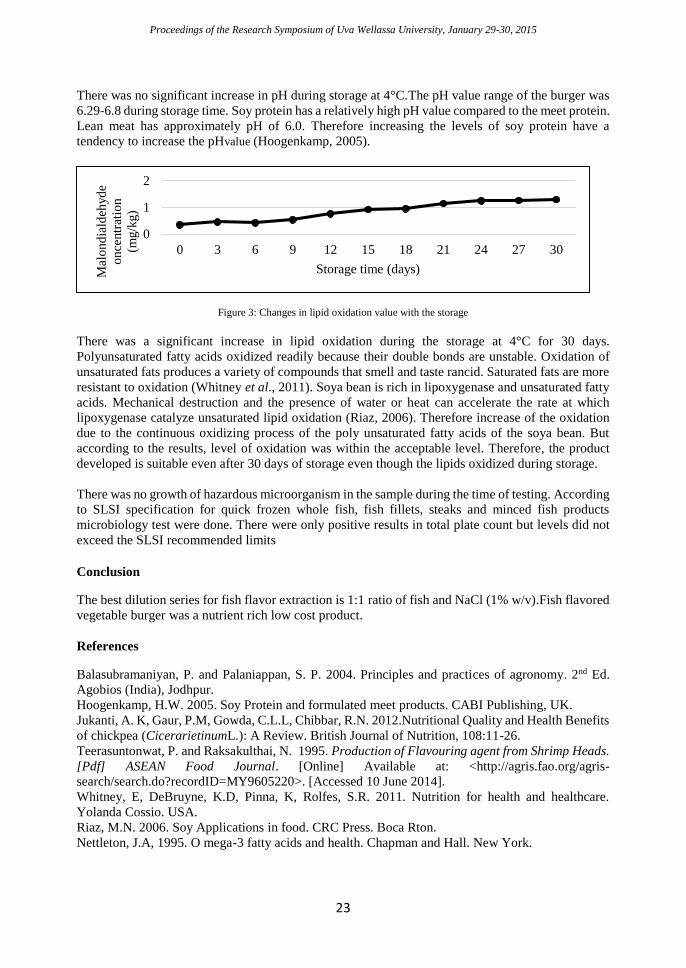
Proceedings of the Research Symposium of Uva Wellassa University, January 29-30, 2015
23
There was no significant increase in pH during storage at 4°C.The pH value range of the burger was
6.29-6.8 during storage time. Soy protein has a relatively high pH value compared to the meet protein.
Lean meat has approximately pH of 6.0. Therefore increasing the levels of soy protein have a
tendency to increase the pHvalue (Hoogenkamp, 2005).
Figure 3: Changes in lipid oxidation value with the storage
There was a significant increase in lipid oxidation during the storage at 4°C for 30 days.
Polyunsaturated fatty acids oxidized readily because their double bonds are unstable. Oxidation of
unsaturated fats produces a variety of compounds that smell and taste rancid. Saturated fats are more
resistant to oxidation (Whitney et al., 2011). Soya bean is rich in lipoxygenase and unsaturated fatty
acids. Mechanical destruction and the presence of water or heat can accelerate the rate at which
lipoxygenase catalyze unsaturated lipid oxidation (Riaz, 2006). Therefore increase of the oxidation
due to the continuous oxidizing process of the poly unsaturated fatty acids of the soya bean. But
according to the results, level of oxidation was within the acceptable level. Therefore, the product
developed is suitable even after 30 days of storage even though the lipids oxidized during storage.
There was no growth of hazardous microorganism in the sample during the time of testing. According
to SLSI specification for quick frozen whole fish, fish fillets, steaks and minced fish products
microbiology test were done. There were only positive results in total plate count but levels did not
exceed the SLSI recommended limits
Conclusion
The best dilution series for fish flavor extraction is 1:1 ratio of fish and NaCl (1% w/v).Fish flavored
vegetable burger was a nutrient rich low cost product.
References
Balasubramaniyan, P. and Palaniappan, S. P. 2004. Principles and practices of agronomy. 2nd Ed.
Agobios (India), Jodhpur.
Hoogenkamp, H.W. 2005. Soy Protein and formulated meet products. CABI Publishing, UK.
Jukanti, A. K, Gaur, P.M, Gowda, C.L.L, Chibbar, R.N. 2012.Nutritional Quality and Health Benefits
of chickpea (CicerarietinumL.): A Review. British Journal of Nutrition, 108:11-26.
Teerasuntonwat, P. and Raksakulthai, N. 1995. Production of Flavouring agent from Shrimp Heads.
[Pdf] ASEAN Food Journal. [Online] Available at: <http://agris.fao.org/agris-
search/search.do?recordID=MY9605220>. [Accessed 10 June 2014].
Whitney, E, DeBruyne, K.D, Pinna, K, Rolfes, S.R. 2011. Nutrition for health and healthcare.
Yolanda Cossio. USA.
Riaz, M.N. 2006. Soy Applications in food. CRC Press. Boca Rton.
Nettleton, J.A, 1995. O mega-3 fatty acids and health. Chapman and Hall. New York.
0
1
2
0 3 6 9 12 15 18 21 24 27 30
Mal
ond
iald
ehyd
e
once
ntr
atio
n
(mg/k
g)
Storage time (days)
Proceedings of the Research Symposium of Uva Wellassa University, January 29-30, 2015
24
Induced breeding of Silver Dollar (Metynnis hypsauchen) using
ovaprim
K.A.J.L. Kodisinghe and S.C. Jayamanne
Faculty of Animal Science and Export Agriculture, Uva Wellassa University of Sri Lanka
and
A.H.M.S.S.K. Abeysinghe
National Zoological Gardens, Anagarika Dharmapala Mawatha, Dehiwala, Sri Lanka
Introduction
Production of ornamental fish is a rapidly growing sector of the aquaculture industry (Tlusty, 2001).
Among the ornamental fish production in Sri Lanka, exotic ornamental fishes have a significant
demand in the market.Silver Dollar (Metynnishypsauchen) which was originated from South America
is such kind of exotic ornamental fish in Sri Lanka that a higher demand has been achieved. Silver
Dollar is not breeding very often in Sri Lankasince it takes a longer spawning period. To avoid that
problem, the fish can be bred artificially. Among all the artificial breeding methods, induced breeding
by hormone administration is the most reliable method (Yanong, et al., 2013). In this study attempts
were made to develop induced breeding of Silver Dollar (Metynnis hypsauchen) in Sri Lankan
environmentusing inducing hormone “Ovaprim”.
Materials and method
Sexually matured and healthy Silver Dollar brooders were selected based on the external features.
Eighteen pairs in same age were randomly collected and conditioned. Then Ovaprim as a single dose
by intramuscular injection at a dosage of 0.2 mlkg-1, 0.3 mlkg-1, 0.4 mlkg-1, 0.5 mlkg-1 and 0.6 mlkg-
1 of body weight was administered to the brooders. Natural spawningwas also allowed without
inducing by Ovaprim as a control. After the hormonal injection, the best range of Ovaprim dose to
have least response time and better breeding performance of Silver Dollar was determined based on
response time (hours). Relative fecundity, post mortality rate of brooders and water quality
parameters in experimental tanks were also monitored.Data analysis was done by one way ANOVA
and Tukey test.
Results and Discussion
The effects of different doses on the breeding performance of Silver Dollar are shown in Table
1.Salmon gonadotropin releasing hormone analogue sGnRHa (Ovaprim) successfully induced
spawning in Silver Dollar (Metynnis hypsauchen). Five different Ovaprim doses supported the
spawning activity and the breeding performance was favored by lower and middle inclusion level of
Ovaprim dose in the experiment.
Ovaprim is a well-known commercial spawning aid which is mostly used in induced breeding of fish
(Anonymous, 2012). It has been used in successful manner for several fish families (Hill et al., 2005).
In the present study,all the brooders spawned, except the brooders which were injected with 0.6 ml
kg-1 of body weight Ovaprim. Among those 6 treatments, the least response time was recorded with
0.3 ml kg-1 of body weight Ovaprim as 5.66 hours. The maximum response time was observed in
naturally spawned pairs as 632 hours (27 days). According to the literature, 0.5 ml kg-1 of body weight
is the standard Ovaprim dose for fish (Hill et al., 2005). However, in the case of Silver dollar, 0.3 ml
kg-1 of body weight is the best dose to have the minimum response time (Table 1).
Proceedings of the Research Symposium of Uva Wellassa University, January 29-30, 2015
25
Table 1: Breeding performance of Silver dollar induced with Ovaprim P
ara
met
er Dose 1
(0 ml kg-
1 OP)
Dose 2
(0.2 ml
kg-1 OP)
Dose 3
(0.3 ml
kg-1 OP)
Dose 4
(0.4 ml
kg-1 OP)
Dose 5
(0.5 ml
kg-1 OP)
Dose 6
(0.6 ml
kg-1 OP)
P
value
RT
(hrs)
632±
146.60a
6.33±
0.57b
5.66±
0.28b
9.50±
0.50b
7.00±
0.50b
0.00±
0.00b
0.000
RF 4.63±
1.86ab
3.61±
1.32ab
2.19±
1.20bc
5.22±
0.30a
6.43±
0.50a
0.00±
0.00c
0.000
[Values are presented as means ± S.D., means in each raw with different superscripts are significantly different from each
other. (OP: Ovaprim; RT: Response time; RF: Relative fecundity)]
The maximum relative fecundity was observed with 0.5 ml kg-1 of body weight Ovaprim (Table 1).
Dose range between 0.4ml kg-1 - 0.5 ml kg-1 of body weight could be identified as the better range
to have a higher fecundity. Because of that, further studies should be followed to identify the best
dosage which is occurred between 0.4 ml kg-1 - 0.5 ml kg-1 of body weight Ovaprim. Spawning has
not occurred with 0.6 ml kg-1 of body weight Ovaprim (Table 1). It indicates that, dosage beyond 0.5
ml kg-1 of body weight Ovaprim might not be effective in breeding of Silver Dollar. The use of
Ovaprim as a spawning aid in ornamental fish was surveyed in the United States, and they have found
that some species may not be responsive to the GnRHa in Ovaprim or may require application under
a different protocol (Hill et al., 2005). Based on the literature and the obtained results of the present
study, a comparatively medium level of Ovaprim dose (0.4ml kg-1– 0.5 ml kg-1) can be recommended
for a higher relative fecundity.
The survival rate of brooders was 100 % after Ovaprim was injected. According to the observation,
the hormone dosage range which was used for the present study might not be harmful and there was
no negative effect to Silver Dollar. Achionye and Obaroh, (2012) have found that procedure of
injection, quality of the hormone and degradation of water quality during holding and handling of
fish affect to the post mortality of brooders. At the present study, conditioning and domesticating
brooders before hormone injecting, maintaining water quality, supplying nutritious feeds, using
quality hormone and reduced handlings of fish due to the single dose administration to both sexes
might have affected for this decreasing of post mortality of brood fish (More et al., 2010). There was
no any significant difference (P > 0.05) in water temperature, Dissolved oxygen and pH in six
different treatment tanks.
Since a successful result could be obtained through the study, following further studies and providing
the facilities for practicing induced breeding of Silver Dollar using Ovaprim can be done to make
Silver Dollar available to breeders and producers for mass scale production. Because, considering the
relatively simple technique involved, this activity has the potential to create adequate job
opportunities, increase export earnings as well as develop the ornamental fish industry in Sri Lanka.
Conclusions
Minimum spawning time in Silver Dollar can be achieved by 0.3 ml kg-1 of body weight and
maximum relative fecundity can be obtained with 0.5 ml kg-1body weight Ovaprim. From the
Proceedings of the Research Symposium of Uva Wellassa University, January 29-30, 2015
26
available references along with the present study on the induced breeding of the Silver Dollar, it was
observed that better breeding performances were achieved from a comparatively lower dosage of
Ovaprim.
Acknowledgement
The acknowledgement of authors is given to Uva Wellassa University andNational Zoological
Gardens, Sri Lankafor their support and encouragementfor success of the research.
References
Achionye, C. G. and Obaroh, I. 2012. Ovaprim doses effects on eggs of African mudfish Clarias
gariepinus. International Journal of Life Science and Pharma Research. 2(2): 1-9.
Anonymous. 2012. Induced Breeding with Ovaprim. Available at:
<http://agropedia.iitk.ac.in/content/induced-breeding-fish-ovaprim> [Accessed 12 May 2014].
Hill, J. E, Baldwin, J.D, Graves, J.S, Leonard, R, Powell, J. F. F. and Watson, C. A. 2005. Preliminary
observations of topical gill application of reproductive hormones for induced spawning of a tropical
ornamental fish. North American Journal of Aquaculture. 67:7–9.
More, P. R. 2010. Comparative Study of Synthetic Hormones Ovaprim and Carp Pituitary Extract
Used in Induced Breeding of Indian Major Carps. Libyan Agriculture Research Center Journal
International. 1(5): 288-295.
Tlusty, M. 2002. The benefits and risks of aquacultural production for the aquarium trade.
Aquaculture. 205. 203– 219.
Yanong, R.P.E, Martinez, S. and Watson, C.A.2009. Use of Ovaprim in Ornamental Fish
Aquaculture. Available at: http://edis.ifas.ufl.edu [Accessed 05 May 2014].
Proceedings of the Research Symposium of Uva Wellassa University, January 29-30, 2015
27
A comparative study on the effectiveness of gillnet and longline
fishing methods used by multi-day fishermen in Matara
fisheries district
M.I. Jathunga, I.U. Wickramaratne and N.P.P. Liyanage
Faculty of Animal Science and Export Agriculture, Uva Wellassa University of Sri Lanka
and
N.D.P. Gunawardane
Departments of Fisheries and Aquatic Resources, New Secretariat Building, Maligawatta,
Colombo 1
Introduction
The fisheries sector of Sri Lanka is a primary source of animal protein production. According to the
high rate of population growth in Sri Lanka, fish food demand is increasing. To fulfill this increasing
demand, there should be an effective fishing method for high rate of exploitation and exploited
resources should be high quality and high value for the better utilization. In the late 1980s, Sri Lankan
state introduced multiday offshore fishing vessels for the development of Sri Lankan offshore
fisheries (Kariyawasam, 2010). The gillnet fishery and the longline fishery is the common fishing
methods used in the deep sea fishing in Sri Lanka. According to the DFAR statistics in 2013, Matara
fisheries district is one of the districts which provide high fish production to the nation. The gillnet
fishery is most commonly used fishing method in multiday boats fishermen in Matara fisheries
district and they do not engage in longline fishery very much. The identification of the suitable fishing
methods is important to increase production level, quality of the production and income of the
multiday fishermen. Therefore the present study is focused on comparison of the effectiveness of
gillnet fishing and longline fishing methods as a deep sea fishing method used by multiday fishermen
in Matara district.
Materials and Methodology
The data were collected from multiday fishing boats in “Dondra” fisheries harbor from 1st of May to
14th of June 2014. The sample size was determined by “Moving average method” and the total
landings and fishing methods of 66 multiday boats were collected accordingly. Catch and effort data,
income of the fishermen and quality of the landing were collected using prepared data sheets. The
catch and effort data collection sheet was consisted of data regarding the duration of the fishing, the
fishing techniques (gear) used in the trip, total catch per day, the species composition of the catch in
number and/ or weight, gear information (length of net, mesh size, number of hooks per long line,
soaking time,) vessel information (storage facilities, hauling technique, length of boats). The income
data collection sheet was consisted of species composition, total weight of each fish species and price
of the fish in particular day. Organoleptic survey has been done in order to determine the quality of
the fish yield of each boat. According to the organoleptic evaluation, nature of the fish skin, nature
of the gill, eye appearance and consistency of flesh were evaluated. The quality of the fish has been
evaluated by scoring them according to the level of quality. Then mean of the score of the quality
parameter was calculated to determine quality of the harvest in each multi-day boat. The collected
data have been analyzed by using “Microsoft excel-2010” and compared with “One-way ANOVA
table” by using “Minitab 16” software.
Proceedings of the Research Symposium of Uva Wellassa University, January 29-30, 2015
28
Results and Discussion
According to the study, there were 3 types of main fishing methods which were used by multi-day
fishermen in Matara fisheries district. They are, gillnet, longline and combination of gillnet and
longline fishing methods. There were 39.4% multiday fishing boats which used only gill net, 22.7%
multiday fishing boats which used only long line and 37.8% fishing boats which used a combination
of gillnet and long line. Mainly tuna and tuna like species were targeted in the study. The total catches
of the different fishing gears were taken as weight of harvest per boat day. According to the results,
the mean catch per boat day of the gill net, long line and combination of the longline and gill net were
133.7 kg, 94.2 kg, and 165.1 kg respectively. Therefore the multiday boats which used combination
of gillnet and longline fishing method gained significantly higher yield than that of gillnet and
longline fishing methods. The lower mean catch per boat day was gained by the longline fishing
method.
When considering main fish species which were caught by each fishing gear, the mean catches per
boat day of Skipjack tuna (Katsuwonus pelamis) were 62.11 kg, and 64.76 kg respectively for gill
net, and combination of the gill net and longline. In Matara fisheries district there were no multiday
fishermen who used longline fishing method to catch skipjack tuna. The mean catches per boat day
for yellow fin tuna (Thunnus albacares) were 7.05 kg, 79.39 kg and 70.56 kg respectively for gillnet,
longline and combination of gillnet and long line. Similarly the mean catches per boat day of frigate
tuna (Auxis thazard) were 12.29 kg, and 70.56 kg in gillnet, and combination of gillnet and longline
respectively. There was no frigate tuna catch in long line fishery. According to this result, mainly
long line fishing gear was used to harvest yellow fin tuna. The skipjack tuna and frigate tuna were
harvested by using gillnet fishing method.
When considering income of the multiday fishermen, the mean of the total income of multi-day
fishermen who harvested fish using gill net, longline and combination of gillnet and longline is Rs
300,577.00, Rs 1,251,567.00 and Rs 1,068,474.00, respectively. The highest income was gained by
the multi-day fishermen who used longline fishing method and the lowest income was gained by
fishermen who used gillnet fishing method, among the three fishing methods.
According to the organoleptic survey data, the quality of the fish in gill net, long line and combination
of gill net and long line fishing methods were 1.99 0.41,2.32 0.31 and 2.04 0.39,respectively.
The quality of the fish was high in fish which were harvested by longline and quality was low in fish
which were harvested by gillnet.
In the ANOVA test, there was not significant different between gear categories and the total catch
per boat day (P>0.05). But, there was a significant different between gear categories and catch per
boat day of tuna and tuna like species (P<0.05). Similarly, there were significant differences between
gear categories and income of the fishermen and also gear categories and quality of fish (P<0.05).
According to these result, it shows gear categories are not significantly affect on the total catches per
boat day but it significantly affect for the catches of tuna and tuna like species, income of the
fishermen and quality of fish.
According to the above results, the gillnet fishing method has recorded, high catch, low income and
low quality fish and long line fishing method has recorded low catch, high income and high quality
fish while combination of gillnet and long line fishing method has recorded high catch, medium
income and medium quality fish.
But the ANOVA result showed total catch per boat day was not significantly affected by fishing gear
categories. Therefore, though they have similar amount of fish harvest, multi-day boat fishermen who
used longline fishing method has had high income and high quality fish than other two types of
fishing methods. The analysis of catch composition of tuna and tuna like species showed that long
Proceedings of the Research Symposium of Uva Wellassa University, January 29-30, 2015
29
line fishing method is much more species selective fishing gear than other two types of fishing
methods. It is used to catch only target fish species which having high commercial value. And also,
the amount of fish discarded by the longline is less than that of gillnet due to harvest of high quality
fish in longline fishing method. The reason is that the fish remain alive for much longer period when
hooked than when gilled (Santoset al., 2002). Because of that reason, the quality of the fish that
harvested by longline is higher than gillnet fishing method. Because of their high quality, the value
of the fish increases and fishermen obtained higher income with the longline fishing method.
Conclusion
When considering all these aspects, it can be suggested that the longline fishing method is an effective
fishing method for multi-day fishermen in deep sea fishing at Matara fisheries district comparatively.
And the longline fishing method can be used to harvest other targeted fish species by changing bait
types and hook size.
References
Department of Fisheries and Aquatic Resources. 2013. Fisheries statistics. [Online] Available at
:<http://www.fisheriesdept.gov.lk.> [Accessed 3 April 2014].
Kariyawasam, L.A. 2010. Deep sea fishing in Sri Lanka, National Aquatic Research and
development Agency in Sri Lanka. [Pdf] available at:
<http://ir.library.oregonstate.edu/xmlui/bitstream/handle/1957/39142/313.pdf?sequence=1>
[Accessed on: 02/04/2014]
Santos, N.M., Gaspar, M.B., Monteiro, C.C., Vasconcelos, P., 2002.Gillnet and long-line catch
comparison in a hake fishery: the case of southern Portugal. Scientia Marina, 66(4):439-440.
Proceedings of the Research Symposium of Uva Wellassa University, January 29-30, 2015
30
A review of export trade of indigenous aquatic plants species in
Sri Lanka and their conservation issues
R.D.C. Bandaranayake, B.V.A.M.S. Bambaranda and S.C. Jayamanne
Faculty of Animal Science and Export Agriculture, Uva Wellassa University of Sri Lanka
and
R. D. A. M. G. Niyarepola
Biodiversity, Cultural and national Heritage Protection Division of Sri Lanka Customs, Customs
House, No 40, Main Street, Colombo 11
Introduction
Aquatic plants are adapted to aquatic environments and are required special adaptations for living
submerged in water or at the water’s surface. In addition to various ecological and industrial values,
most of aquatic plants are having ornamental value. Due to the ornamental value of the aquatic plants,
they have a huge demand and are exported from Sri Lanka. Along with ornamental fish industry,
aquatic plants are introduced and exported as a simultaneous industry. Present study was intended to
analyze and evaluate the trade of ornamental aquatic plants in Sri Lanka with a particular focus on
indigenous species. The objectives of the study are determine the exported species and their
quantities, the actual foreign exchange earnings, identify the conservation issues related to indigenous
species, identify the trends to occur irregularities in exportation procedure and propose suitable.
Materials and Methods
Exported aquatic plants species data and their quantities were extracted from the Customs Goods
Declaration Forms (CusDec) submitted by the ornamental aquatic plants exporters to the Air Cargo
Terminal in Katunayake under the Department of Sri Lanka Customs. The Customs Goods
Declaration Forms submitted during the period of one year from 1st March 2013 to 28th February 2014
were analyzed. A questionnaire was also used to gather information regarding the conservation issues
through ornamental aquatic plants exporters, Custom officers at frontier and local villagers.
Results and Discussion
During the one year period from 1st March 2013 to 28th February in 2014, a total of 218 species of
aquatic plants has been exported to 43 countries from Sri Lanka. Among the total, 176 species were
indigenous, 1 species was endemic. When considering the total quantities of exported indigenous
aquatic plants during the one year period, the most common species exported was the Dracaena
sanderiana white (168185 individuals) and Lobelia cardinalis “small leaf”(4 individuals) was the
species exported in least quantities. During the one year study period, 1504531 individuals of aquatic
plants and 2047620 all types of live plants have been exported from Sri Lanka. When considering the
proportions of species exported during one year period, the endemics consist of 0.04%
(685individuals) and other indigenous species consisted of 80.91%(1217353individuals) among all
other aquatic plants. The proportion of indigenous aquatic plants species consisted of 59.45% and
endemics consisted of 0.03% among exported all types of live plants from Sri Lanka. And the
proportion of exported aquatic plants to all live plants is 73.47% from Sri Lanka during my study
period.
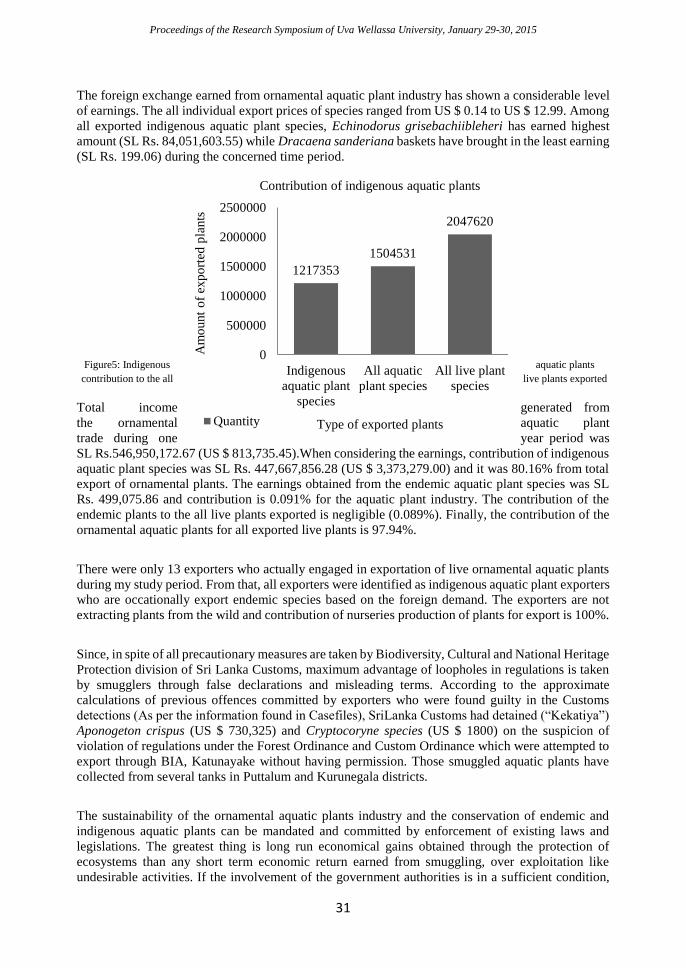
Proceedings of the Research Symposium of Uva Wellassa University, January 29-30, 2015
31
The foreign exchange earned from ornamental aquatic plant industry has shown a considerable level
of earnings. The all individual export prices of species ranged from US $ 0.14 to US $ 12.99. Among
all exported indigenous aquatic plant species, Echinodorus grisebachiibleheri has earned highest
amount (SL Rs. 84,051,603.55) while Dracaena sanderiana baskets have brought in the least earning
(SL Rs. 199.06) during the concerned time period.
Figure5: Indigenous aquatic plants
contribution to the all live plants exported
Total income generated from
the ornamental aquatic plant
trade during one year period was
SL Rs.546,950,172.67 (US $ 813,735.45).When considering the earnings, contribution of indigenous
aquatic plant species was SL Rs. 447,667,856.28 (US $ 3,373,279.00) and it was 80.16% from total
export of ornamental plants. The earnings obtained from the endemic aquatic plant species was SL
Rs. 499,075.86 and contribution is 0.091% for the aquatic plant industry. The contribution of the
endemic plants to the all live plants exported is negligible (0.089%). Finally, the contribution of the
ornamental aquatic plants for all exported live plants is 97.94%.
There were only 13 exporters who actually engaged in exportation of live ornamental aquatic plants
during my study period. From that, all exporters were identified as indigenous aquatic plant exporters
who are occationally export endemic species based on the foreign demand. The exporters are not
extracting plants from the wild and contribution of nurseries production of plants for export is 100%.
Since, in spite of all precautionary measures are taken by Biodiversity, Cultural and National Heritage
Protection division of Sri Lanka Customs, maximum advantage of loopholes in regulations is taken
by smugglers through false declarations and misleading terms. According to the approximate
calculations of previous offences committed by exporters who were found guilty in the Customs
detections (As per the information found in Casefiles), SriLanka Customs had detained (“Kekatiya”)
Aponogeton crispus (US $ 730,325) and Cryptocoryne species (US $ 1800) on the suspicion of
violation of regulations under the Forest Ordinance and Custom Ordinance which were attempted to
export through BIA, Katunayake without having permission. Those smuggled aquatic plants have
collected from several tanks in Puttalum and Kurunegala districts.
The sustainability of the ornamental aquatic plants industry and the conservation of endemic and
indigenous aquatic plants can be mandated and committed by enforcement of existing laws and
legislations. The greatest thing is long run economical gains obtained through the protection of
ecosystems than any short term economic return earned from smuggling, over exploitation like
undesirable activities. If the involvement of the government authorities is in a sufficient condition,
1217353
1504531
2047620
0
500000
1000000
1500000
2000000
2500000
Indigenous
aquatic plant
species
All aquatic
plant species
All live plant
species
Am
ount
of
exp
ort
ed p
lants
Type of exported plants
Contribution of indigenous aquatic plants
Quantity
Proceedings of the Research Symposium of Uva Wellassa University, January 29-30, 2015
32
the due revenues from the trade can be increased. But the legal status behind the export of endemic
plants species hampers their development and therefore, investments are worthless until legal status
are cleared and positively regulated. Adequate culture techniques are not practiced by the exporters
to boost the industry with new technology and conservation of the endangered species. The major
factors which are responsible for the depletion of water plants from the natural environment are
deforestation, constructions, sand and gem mining, bad practices of fish harvesting methods,
agricultural and industrial wastes, over exploitation and invasive species. Therefore the government
should involve for collaborate all those parties for a sustainable trade of aquatic plants in Sri Lanka
and awareness should be created among all stake holders of ornamental aquatic plants industry
including officers at frontiers, exporters, farmers, students, conservationists and all related agencies.
Conclusion
During the period of one year from 1st March 2013 to 28th February 2014, 176 aquatic plants species
were indigenous out of all 218 species identified. The quantity of exported indigenous aquatic plants
species has shown a considerable proportion to exported aquatic plants species, 80.91%. It is
noteworthy to highlight that 73.47% of the entire export quantity of annual live plants trade consist
of aquatic plants species. The calculated actual foreign exchange earnings from exported indigenous
aquatic plants species was 80.16%. The main causative factors should be minimized to address
conservation issues such as constructions, deforestation, sand and gem mining, industrial and
agricultural wastes and invasive species. Based on the gathered information from the exporters, there
are no exporters who practice wild collection of endemic species. The irregularities at the exportation
procedure are taken place basically due to false declarations and misleading terms. Therefore, the
laws and regulations should be enforced and monitored to avoid misconducts and corruptions.
Acknowledgement
Firstly I would like to convey my greatest gratitude to Head, Department of Animal Science Dr. S.C.
Jayamanne and to my internal supervisors, Mrs. B. V. A. S. M. Bambaranda and Dr. S. C. Jayamanne.
Then special thanks all the staff members of the Aquatic Resources Technology degree program. And
I convey my special gratitude to my external supervisor Mr. R.D.A.M.G. Niyarepola, Deputy
Director of Customs who strengthened me with his advice and guidelines during my research period.
Also, I want to thank Dr. W. M. H. K. Wijenayake, for his kind guidance and support during my
research.
References
I.U.C.N.2007.Red list of Threatened species. The World Conservation Union (IUCN) and Ministry
of Environment and Natural Resources, Colombo, Sri Lanka.
Yakandawala, D. and Yakandawala, K. 2007. Ornamental aquatics: potential weeds in aquatic
ecosystems. Proceeding of the 21st Asian Pacific weed Science Society Conference, Colombo, Sri
Lanka: 222-225.
Proceedings of the Research Symposium of Uva Wellassa University, January 29-30, 2015
33
Development of garment leather from Yellowfin tuna (Thunnus
albacares) skin
E.M.B.S. Eakanayake and S.C. Jayamanne
Faculty of Animal Science and Export Agriculture, Uva Wellassa University of Sri Lanka
and
W. Wickramasinghe
Ceylon Leather Product PLC, No 115/1, Kelaniganga Mill Road, Mattakkuliya, Sri Lanka
Introduction
Leather is defined as hide or skin with its original fibrous structure more or less intact, tanned to
prevent putrefaction (Covington, 2009). Due to tanning, skins that have been processed to prevent
putrefaction retain its characteristics such as flexibility and toughness. Hides and skins from cattle,
buffalo, sheep, pig, goat, horse, crocodile, snake and fish are used for leather production. When
considering the fish leather, fish skins are used for production of leather after tanning and re-tanning
processes. Texture of fish leather depends on pocket size of the scales. Presently, carp, pacific salmon,
bass, sturgeon, shark, tuna, catfish, salmon, tilapia and several other fish species are taken for leather
production. Garment leather is tanned with chrome and treated with softeners. The quality of the
garment leather should be thin enough to use on garments and it should feels softer and smoother
than any other types of leather. These types of leathers are made from the top-grain of a hide. Good
stitch tensile strength and light weight are some other characters of garment leathers. Cow hide and
skins from deer, pig and lamb are commonly used for garment leather manufacturing. But there is a
potential to develop garment leather from fish skin similar to other garment leathers. The present
study was carried out to add value to waste generated during the Yellowfin tuna (Thunnus albacares)
fish processing and promote a fish leather production in Sri Lanka through developing garment type
leather using discarded skins. At present, hides and skins from cattle, buffalo, sheep and goat are used
for leather production. In addition, fish species including carp, pacific salmon, shark, tuna, catfish
and tilapia are taken for leather production in the world. The objectives of this study were to find out
the best fat liquor percentage to obtain maximum softness of chrome-tanned Yellowfin tuna fish
leather and to find out the best tanning method for garment leather production from Yellowfin tuna
skin.
Methodology
The current study was carried out at the tannery of Ceylon Leather Product PLC (CLP), Mattakkuliya.
Tuna skins were collected from the processing factory of Jay Sea Food (Pvt) Ltd in Ja-Ela. Two
experiments were carried out to find out best fat liquor concentration and best tanning method. In
experiment 1, yellowfin tuna skins were treated with 33% basic chromium sulphate and five different
concentrations (12%, 14%, 16%, 18% and 20%) of fat liquors (on weight of pelt). In experiment 2,
yellowfin tuna skins were treated with four different tanning methods (Full chrome tanning, full
vegetable tanning and two types of semi chrome tanning methods - vegetable tanned skins directly
tanned with chrome and vegetable tanned skins tanned with chrome after stripping with NaHCO3).
Before initiating the experiments pre-trial was conducted to find out the optimum conditions for
liming. Six pieces of raw skins were immersed in solutions of 0.25%, 0.5% and 1% Na2S, 6%
Ca(OH)2 and 200% water (on weight of skins). One day after, skins were taken out and scales and
flesh were removed. Then, skins were kept for another 5 days in a new 6% Ca(OH)2 solution. Weight
Proceedings of the Research Symposium of Uva Wellassa University, January 29-30, 2015
34
and the physical conditions (scale pockets, colour and plumpness) of the skin were observed daily.
After identifying the optimum conditions for liming 40 skins were subjected to 8 production process
steps (liming, de-liming, pickling, tanning, basifying, fat-liquoring, fixing, drying and dying).
Experiment 1 was done in fat-liquoring step and experiment 2 was done in tanning step. Then, the
dried leathers were dyed and waxed. Finally softness, feel, tensile strength, tear strength and stitch
tear strength were measured in developed leathers. Physical evaluation was done to check softness
and feel by ten expertise. Tensile strength, tear strength and stitch tear strength were done using
universal testing machine. This experiment was designed according to Complete Randomized Design
(CRD). The collected data were analyzed using Friedman test and one-way ANOVA in MINITAB
16 and SPSS 22 statistical analyzing software to find out the significant difference between
treatments. Mean separation was done using pairwise comparison.
Chemicals percentages were weighted according to the weight of skins, used in experiment 1 and 2.
Results and Discussion
According to pre-trial, 0.5% Na2S solution was identified for descaling with 6% Ca(OH)2 and 200%
H2O. For liming it was identified that immersing for 4 days is the best method in 6% Ca(OH)2 and
200% H2O solution.
In experiment 1 (from the five different concentrations of fat liquors), there was a significant effect
on treatment method on tensile strength, tear strength and stitch tear strength (P<0.05). Maximum
tensile strength and tear strength values were observed in 16% fat-liquored leather with average
values of 23.46 ± 6.06 N/mm2 and 401.59 ± 77.75 N/mm, respectively meanwhile 18% fat-liquored
leather showed the highest stitch tear strength (187.91 ± 5.39 N/mm). There was a significant
treatment effect on softness of leather (P<0.05) and on feel of leather (P<0.05). According to the
ranking values, treatment 4 (18% fat liquor) showed the best response for softness (Ranking value=
46.5) and feel (Ranking value = 47.0) compared with the other treatments.
While adding fat-liquors, it improves the tensile strength of leathers (Tex Biosciences, 2008). But
increasing the fat liquor concentration further leads to decreasing of the ability to make fine emulsion
as well as reduction of the ability of fat liquor penetration in to collagen fiber. Hence, softness is
reduced when increasing the fat liquor concentration therefore, the hardness of leather is increased
(Gutterres and Melo dos Santos, 2009). It may be the reason for reduction of tensile strength.
Increasing and again decreasing of the values of tear strength and stitch tear strength may be due to
the decreasing of the ability to make fine emulsion. Hence, ability of fat liquor penetration in to
collagen fibers was decreased. The reason for increasing softness might be fat liquor which acts as a
lubricant in between collagen fibers (Gutterres and Melo dos Santos, 2009). Reason for increasing
and again decreasing the softness maybe due to the decreasing of the ability to make fine emulsion.
Therefore, the ability of fat liquor penetration in to collagen fibers is decreased. Hence, it can be
suggested to use 18% fat liquor concentration to produce garment type leather from yellowfin tuna
skin.
From the four tanning methods studied in experiment 2, there was no significant effect of treatment
on tensile strength (P>0.05). But full chrome tanned leather showed the highest value for tensile
strength (22.56 ± 0.86 N/mm2). When considering the tear strength there was no significant effect of
treatment (P>0.05). Highest value of tear strength showed the full chrome tanned leather (373.75 ±
23.20 N/mm). But there was a significant effect of treatment on stitch tear strength (P<0.05). Highest
value of stitch tear strength showed the full chrome tanned leather (187.91 ± 5.39 N/mm). There was
a significant treatment effect on softness of leather and on feel of leather (P<0.05). In addition, the
highest ranking value for softness (30.0) was observed in full-chrome tanned leather. Hence, it can
Proceedings of the Research Symposium of Uva Wellassa University, January 29-30, 2015
35
be suggested to use full chrome tanning with 18% fat-liquor concentration to produce garment type
leather from yellowfin tuna skin.
There was no effect from fat liquor concentration and surface treatment on tensile strength, tear
strength, stitch tear strength, softness and feel due to equal fat liquor concentration (18%) and surface
treatment (wax). Reason for no significant effect of treatment on tensile strength and tear strength
might be due to the reason that tensile strength and tear strength are only dependent on the fiber
structure of the skin. Fish skin has a cross fiber structure (Hebrank and Hebrank, 1986). Reason for
high value for stitch tear strength might be due to the high amount of covalent bonds between
chromium sulphate and collagen fibers in full chrome tanned leather. Vegetable tanned leather
hardness was higher than the chrome tanned leather. Hence, softness is higher in full chromed tanned
leather than the vegetable tanned leather. When considering the tanning agents chromium sulphate
makes covalent bonds with collagen fibers and mimosa acts as a filling agent between collagen fibers.
Conclusion
According to the results obtained in this study, the best fat-liquor concentration was 18% to prepare
soft garment leather from yellowfin tuna skin. The most effective tanning method was the full chrome
tanning compared to full vegetable tanning and semi tanning methods. Using this combination a
marketable garment leather from yellowfin tuna skin can be produced. This could be used to produce
commercially valuable products such as ready-made garments.
References
Covington, A.D., 2009. Tanning Chemistry: The Science of Leather. The Royal Society of
Chemistry, Cambridge.
Gutterres, M. and Melo dos santos, L. 2009. Study of Fatliquoring Parameters Using Experimental
Design. Journal of the Society of Leather Technologists and Chemists, 93(5):171-175.
Hebrank, M.R. and Hebrank, J.H. 1986. The Mechanics of Fish Skin: Lack of an "External Tendon"
Role in Two Teleosts. Biological Bulletin, 171: 236 - 247.
Tex Biosciences, 2008. Product Information. Tex Biosciences Publishing, Chennai.
Proceedings of the Research Symposium of Uva Wellassa University, January 29-30, 2015
36
Balancing the benefits of protein content and the risks of trace
metal toxicity exposure from Skipjack tuna (Katsuwonus
pelamis) consumption in Sri Lanka
A.S. Mahaliyana, N.P.P. Liyanage and S.C. Jayamanne
Faculty of Animal Science and Export Agriculture, Uva Wellassa University of Sri Lanka
and
B.K.K.K. Jinadasa
Institute of Post-Harvest Technology, National Aquatic Resources Research and Development
Agency, Colombo15, Sri Lanka
Introduction
Fish is considered as an excellent source of protein that can provide immense health benefits to human
being. Protein is the major nutrient in fish consumption and it is highly digestible and consist all the
essential amino acids. However, recent claims that marine fish are contaminated with trace metals
exceeding the recommended maximum allowable limits have raised concerns among consumers
regarding fish consumption. This may lead to rejection of marine fish both by local and export
markets (Liyanage, 2009) as fish contaminated with toxic trace metal can lead to acute and chronic
effects in human being. In the present study, protein content and major toxic trace metal
concentrations in skipjack tuna (Katsuwonus pelamis) which is a major commercial marine fish
species were studied with the aim of assessing benefits and risks in consumption of skipjack tuna in
Sri Lanka.
Materials and Methods
Samples of skipjack tuna fish (n = 44) were collected to represent all fish landing site areas around
Sri Lanka during April-July, 2014. Concentrations of toxic trace metals Hg, Cd, Pb and As were
analysed individually for all the samples while the protein content analysis was carried out for
composite samples that were prepared based on gender and standard length of each fish. Crude
protein content was analysed according to 928.08, AOAC 2000 standard method. Crude protein
content was determined using UDK 132 (VELP Scientifica, Usmate, Italy) semi-automated Kjeltec
system. All composite samples were analysed in triplicates. Hg, Cd, Pb and As trace metal
concentrations were analysed by Atomic Absorption Spectrophotometer (AAS; Varian240 FS,
Varian Inc., Australia) following the standard method in AOAC 1998. All analyses were strictly
adhered with quality control procedures. Protein content of skipjack tuna was assessed in terms of
benefits with reference to its Recommended Dietary Allowance (RDA) value whereas the toxicity of
each trace metal was assessed based on the stipulated Provisional Tolerable Weekly Intake (PTWI)
with the Probable Weekly Intake (PWI) values. Average consumption of skipjack tuna flesh in Sri
Lanka was considered as 2.8 g/person/day (MFARD, 2013) and the average body weight of a Sri
Lankan adult person was assumed as 55 kg. In addition, resulted mean toxic trace metal
concentrations were compared with the established maximum allowable limits for toxic trace metals
in Sri Lanka and European Union standards for skipjack tuna.
Proceedings of the Research Symposium of Uva Wellassa University, January 29-30, 2015
37
Results and Discussion
In order to determine the recovery percentage in crude protein analysis, spiked samples with
(NH4)2SO4 were used and the recovery values were maintained within the acceptable range of 90-
110%. The method of trace metal analysis was evaluated for its suitability in terms of their respective
Limit Of Detection (LOD) and recovery levels using spiked samples and certified quality control
materials. Calculated recovery values for all the trace metals were within the expected recovery range
of 80%-120%.
The mean standard length of the analysed skipjack tuna fish was 47.4±3.9 cm and the range was 36-
56 cm whereas the mean total weight was 2.2±0.5 kg and it had a variation of 1.1 - 4.2 kg. Among
the analysed specimens 24 were males and 20 were females.
Table 1: Protein content (%) of the flesh of skipjack tuna and other major tuna species*
Skipjack tuna a Yellowfin tunab Bigeye tunab
Crude protein 24.13±2.01 23.52±0.61 23.72±0.16
* Data are expressed as mean±SD on a fresh weight basis
a The present study b Peng et al., 2013
As per the results obtained, skipjack tuna is a good source of protein (Table 1). The resulted
percentage value for protein content of skipjack tuna was compared with the values recorded by Peng
et al., 2013 for other major commercially important tuna species; yellowfin and bigeye tuna (Table
1). This shows that skipjack tuna is similar in terms of protein content; the major targeted nutrient in
fish, with yellowfin and bigeye tuna. The resulted percentage value in this study for crude protein
content in skipjack tuna slightly differs with the results of certain previous studies. This could be due
to the variation of protein content in fish according to the seasonal changes as described by Clucas
and Ward, 1996. Although skipjack tuna is a rich source of protein, the obtained value for the
contribution for RDA value was lower (1.2%). The major reason to gain this lower value is the
average skipjack tuna consumption in Sri Lanka is still a lower value (2.8 g/person/day).
Table 2: Provisional Tolerable Weekly Intake (PTWI) and Probable Weekly Intake (PWI) values of
Hg, Cd, Pb and As
* WHO/FAO Joint Expert Committee on Food Additives and Contaminants
According to the results of the present study, all the recorded mean values for toxic trace metal
concentrations were lower (0.13±0.06 Hg, 0.02±0.01 Cd, 0.01±0.01 Pb and 0.92±1.12 As in mg/kg).
All the recorded mean values were well below the established maximum allowable limits for toxic
trace metals in Sri Lanka and European Union standards in terms of seafood safety. The resulting of
lower concentrations for all the toxic trace metals could be due to the reason that skipjack tuna is a
Toxic trace
metal
PTWI* (mg/kg of body
weight )
Provisional Tolerable
Weekly Intake (mg)
Probable Weekly
Intake (mg)
Hg 0.005 0.275 0.0025
Cd 0.007 0.385 0.0003
Pb 0.025 1.375 0.0001
As 0.015 0.825 0.0180
Proceedings of the Research Symposium of Uva Wellassa University, January 29-30, 2015
38
short lived animal which has a less potential for bioaccumulation. All the calculated PWI values were
well below the estimated PTWI values (Table 2). This indicates that skipjack tuna does not contain a
health risk on human due to trace metal toxicity.
In recent past several researchers have claimed that most of the major and popular marine food fish
such as yellowfin tuna, bigeye tuna, sward and certain marlin fish have an increased risk of trace
metal toxicity (Kojadinovic et al., 2007; Jinadasa et al., 2014). In addition, the market values of these
major marine food fish are very high with compare to skipjack tuna (MFARD, 2014). As per the
results of this study, skipjack tuna is a good source of protein which does not contain any health risk
due to trace metal toxicity and can be accessed by consumers for a cheaper price.
Conclusion
Skipjack tuna is a good protein source as same as the majorly attracted other tuna species such as
yellowfin and bigeye tuna by the fish consumers. Skipjack tuna does not pose any health risk due to
trace metal toxicity by Hg, Cd, Pb and As.
Acknowledgement
National Aquatic Resources Research and development Agency (NARA) is acknowledged for the
financial assistance and the staff of analytical chemistry laboratory, NARA is acknowledged for their
assistance in sample analysis.
References
Clucas, C. J. and Ward, A.R. 1996. Post-harvest Fisheries Development - A Guide to Handling
Preservation Process and Quality, NRI publication, Natural Resources Institute, Kent.
Jinadasa, B. K. K. K., Ahmad, S. B. N., Edirisinghe, E. M. R. K. B., and Wicramasinghe, I. 2014.
Mercury content in yellowfin tuna (Thunnus albacares) and swordfish (Xiphias gladius) and
estimation of mercury intake. Journal of Food Security, 2(1):23-26.
Kojadinovic, J., Potier, M., Le Corre, M., Cosson, R. P. and Bustamante, P. 2007. Bioaccumulation
of trace elements in pelagic fish from the Western Indian Ocean. Environmental Pollution,
146(2):548-566.
Liyanage, C. 2009. Heavy metal accumulation in Sri Lanka. How lead, mercury, cadmium
contaminates your body? ejustice. [blog] 30 September 2009. Available at: http://cej-
ejustice.blogspot.com/2009/09/heavy-metal-accumulation-in-sri-lanka.html [Accessed 21
September 2014].
Ministry of Fisheries and Aquatic Resources Development (MFARD), 2013. Fisheries Statistics. [online] Available at: http://www.fisheries.gov.lk/content.php?cnid=ststc [Accessed 21 September
2014].
Ministry of Fisheries and Aquatic Resources Development (MFARD), 2014. Latest prices of fish. [online] Available at: http://www.fisheries.gov.lk/default.php?sin=0 [Accessed 21 September
2014].
Peng, S., Chen, C., Shi, Z. and Wang, L. 2013. Amino acid and fatty acid composition of the
muscle tissue of yellowfin tuna (Thunnus albacares) and bigeye tuna (Thunnus obesus). Nature,
1(4):42-45.
Proceedings of the Research Symposium of Uva Wellassa University, January 29-30, 2015
39
Seashell processing: An emerging industry in Kinniya divisional
secretariat division of Trincomalee district
A. H. Sajitha and Thivahary Geretharan
Faculty of Agriculture, Eastern University, Sri Lanka
Introduction
The seashell processing industry functions by grinding the seashells for production of lime for
building construction purposes and for making poultry feed (Fisheries Year Book, 2007).The low
income people in the Kinniya Divisional Secretariat (DS) division collect seashells to earn money for
their daily living. The people who are engaged in this industry earn sufficient income (Sunday
Observer, 2012). Seashell deposits are available in Kakkamunai village of Kinniya DS division,
which is located closer to the mouth of Thampalagamam Bay, which is enriched with bivalves. Shell
mining has taken place for last three decades in a sustainable manner. There is a high demand for
shells from the poultry feed industry, thus generating a good income from this activity (Minerals Year
Book, 2007). In this context a survey was carried out to study this emerging industry in Kinniya DS
division of Trincomalee district.
Methodology
This study was carried out during the months of April and May, 2014 in ten villages in Kinniya DS
division. Using random sampling procedure, a total of 90 seashell processors were selected, which
includes collectors, grinders, transporters, loaders and mill owners and a structured interview
schedule was used to collect the information through personal interview at their home and seashell
processing mills. Collected data were analyzed using the SPSS package.
Result and Discussion
Personal and socio-economic characteristics of seashell processors in Kinniya DS division of
Trincomalee district revealed that all the seashell processors (100%) were males. Young age and
middle age categories were same (40%). 80% were under primary level of education. Majority
(68.9%) of the respondents depended mainly on seashell industry. More than half (54.5%) of seashell
processors belonged to medium income group of Rs.20, 000 to Rs. 40,000 per month. Majority of
respondents (87.8%) were part time workers. Majority (85.6%) of respondents had 5 to 10 years
experience in seashell processing. Only 11.1% respondents had organizational membership; because
the mill owners only had the membership with social organizations. The seashell processors have not
participated in any extension activity related to seashell processing.
All the respondents (100%) indicated that seashell collection was the most difficult work in seashell
processing. Among the people who involved in seashell collection, most of them obtained medium
income of Rs.1000 - Rs.1500 per day. Most of people who involved in seashell grinding obtained
high income (Rs. 420 per bag) from seashell grinding per day. Majority (91.1%) of the respondents
involved in seashell industry were rural people. All the respondents (100%) were in the view that the
overall business condition of the industry is good. All (100%) of respondents reported that the ground
seashell bags were marketed directly to the consumers. The demand for ground seashells is high in
Kurunagale district. Kandy, Matala, Puttalam, Kalutara, Colombo, Avissawella and Galle are the
other places getting ground seashells from Kinniya mills.
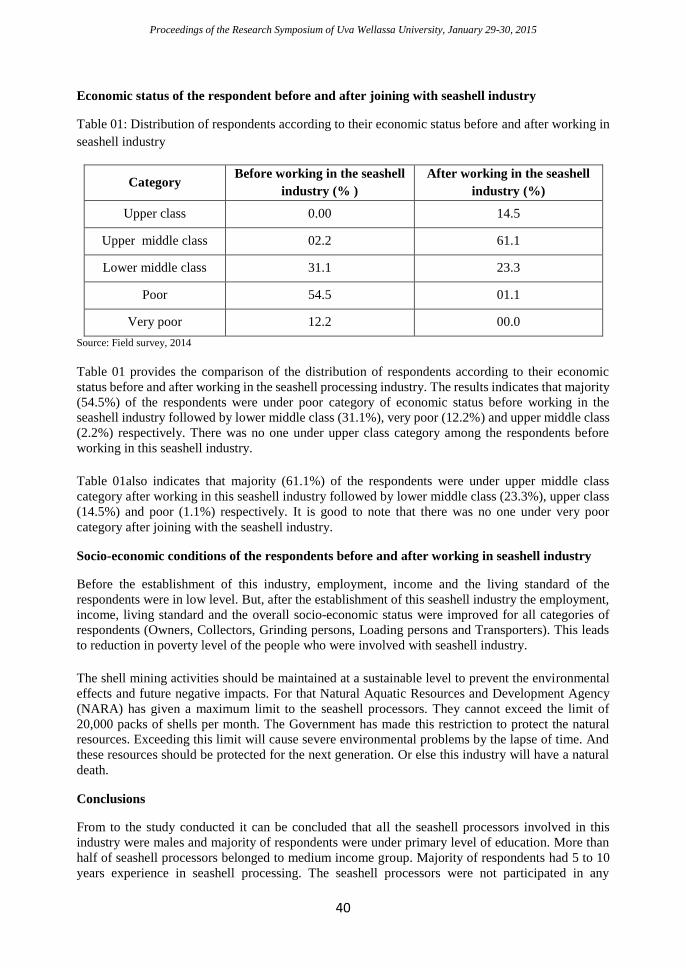
Proceedings of the Research Symposium of Uva Wellassa University, January 29-30, 2015
40
Economic status of the respondent before and after joining with seashell industry
Table 01: Distribution of respondents according to their economic status before and after working in
seashell industry
Category Before working in the seashell
industry (% )
After working in the seashell
industry (%)
Upper class 0.00 14.5
Upper middle class 02.2 61.1
Lower middle class 31.1 23.3
Poor 54.5 01.1
Very poor 12.2 00.0
Source: Field survey, 2014
Table 01 provides the comparison of the distribution of respondents according to their economic
status before and after working in the seashell processing industry. The results indicates that majority
(54.5%) of the respondents were under poor category of economic status before working in the
seashell industry followed by lower middle class (31.1%), very poor (12.2%) and upper middle class
(2.2%) respectively. There was no one under upper class category among the respondents before
working in this seashell industry.
Table 01also indicates that majority (61.1%) of the respondents were under upper middle class
category after working in this seashell industry followed by lower middle class (23.3%), upper class
(14.5%) and poor (1.1%) respectively. It is good to note that there was no one under very poor
category after joining with the seashell industry.
Socio-economic conditions of the respondents before and after working in seashell industry
Before the establishment of this industry, employment, income and the living standard of the
respondents were in low level. But, after the establishment of this seashell industry the employment,
income, living standard and the overall socio-economic status were improved for all categories of
respondents (Owners, Collectors, Grinding persons, Loading persons and Transporters). This leads
to reduction in poverty level of the people who were involved with seashell industry.
The shell mining activities should be maintained at a sustainable level to prevent the environmental
effects and future negative impacts. For that Natural Aquatic Resources and Development Agency
(NARA) has given a maximum limit to the seashell processors. They cannot exceed the limit of
20,000 packs of shells per month. The Government has made this restriction to protect the natural
resources. Exceeding this limit will cause severe environmental problems by the lapse of time. And
these resources should be protected for the next generation. Or else this industry will have a natural
death.
Conclusions
From to the study conducted it can be concluded that all the seashell processors involved in this
industry were males and majority of respondents were under primary level of education. More than
half of seashell processors belonged to medium income group. Majority of respondents had 5 to 10
years experience in seashell processing. The seashell processors were not participated in any
Proceedings of the Research Symposium of Uva Wellassa University, January 29-30, 2015
41
extension activity related to seashell processing. Majority of respondents involved in seashell
industry were rural people and majority of them were poor before working in this seashell industry
and presently majority were under upper middle class. The living standard and the overall socio-
economic status of people were low before the establishment of this seashell industry, but after the
establishment of this seashell industry those conditions were improved. And the poverty level was
decreased after the establishment of this seashell industry. Over seashell mining leads to
environmental adverse effects. Therefore, to prevent those effects shell mining should be maintained
at a sustainable level.
References
Minerals Yearbook of Sri Lanka (2007), Geological Survey and Mines Bureau, Sri Lanka
Sunday Observer (2014). Seashell processing underway in Kinniya. Retrieved on February 26, 2014,
from the World Wide Web: http:// www.sundayobserver.lk
Proceedings of the Research Symposium of Uva Wellassa University, January 29-30, 2015
42
Effect of growth regulators on in-vitro multiplication of
Lagenandra ovata and Lagenandra lancifolia
W. M. A. Senavirathne, Mrs. B. V. A. S. M. Bambaranda and Dr.S.C.Jayamanne
Faculty of Animal Science and Export Agriculture, Uva Wellassa University of Sri Lanka
and
Dr. S. A. Krishnarajah
Royal Botanic Gardens, Peradeniya, Sri Lanka
Introduction
Sri Lanka is a country which consists with number of endemic aquatic plants. These endemic aquatic
plants are having high demand in aquatic plant industry (Galapitagedra, n.d.). Due to the lack of
effective propagation methods plant collectors collect plant from wild to fulfill the market demand.
It leads to the depletion of natural plant stock and bio diversity. Lagenandra species only can observe
in Sri Lanka, Southern India and Bangladesh (Dassanayake et. al., 2001). In Sri Lanka there are seven
species and six species are considered as endemic. Red List of International Union for the
Conservation of Nature in 2013, categorized five of those endemic species under the highly
threatened category. Main purpose of this study is to develop a proper method for micro propagation
of Lagenandra ovata and Lagenandra lancifolia to overcome inadequate supply and depletion of
natural plant stock. Present study was carried out to evaluate effect of different hormone
concentrations in basal media for shoot initiation and multiplication of rhizome explants,to identify
the best explant of L. lancifolia for micro propagation and to identify the best medium for L. ovata
seed culture.
Methodology
Present study was carried out at Royal Botanic Gardens, Peradeniya. Seven experiments were
conducted in order to achieve the objectives of the study. Explants of L. ovata (rhizome and seeds)
and L. lancifolia (rhizome and smaller plantlets) were sterilized using standard procedures. L. ovata
rhizomes were placed in Ms Semi-solid media with different cytokinins such as BAP, Kinetin and
TDZ with the presence of IAA. Different concentrations of BAP and Kinetin such as 0.4, 0.8, 2, 5
and 8 mgl-1 and 0.4, 0.8, 1.6 and 2 mgl-1 of TDZ were used. Grown plants of L. ovata were transferred
in to multiplication media with 1, 2 and 3 mgl-1 BAP hormone concentrations. Smaller plantlets of L.
lancifolia were placed in MS semi solid media with and without growth regulators. Different
concentrations of cytokinins such as 0.4 and 0.8 mgl-1 of BAP and Kinetin concentrations and IAA
were added to the medium. Grown Plantlets of L. lancifolia were transferred in to multiplication
medium with 1, 2 and 3 mgl-1 BAP hormone levels. Survival rate of L. lancifolia plantlets and
rhizomes were measured weekly in order to identify the best explant. The best medium for L. ovata
seed germination was identified by placing seeds in different media such as; solid medium, semi-
solid medium, liquid medium and sterilized distilled water medium. After the germination seeds were
transferred in to solid or semi-solid medium for further growth.
Results and Discussion
This study shows the importance of growth regulators for the shoot initiation of L. ovata rhizome
culture. According to the one way ANOVA, there was a significant effect (p<0.05) of growth
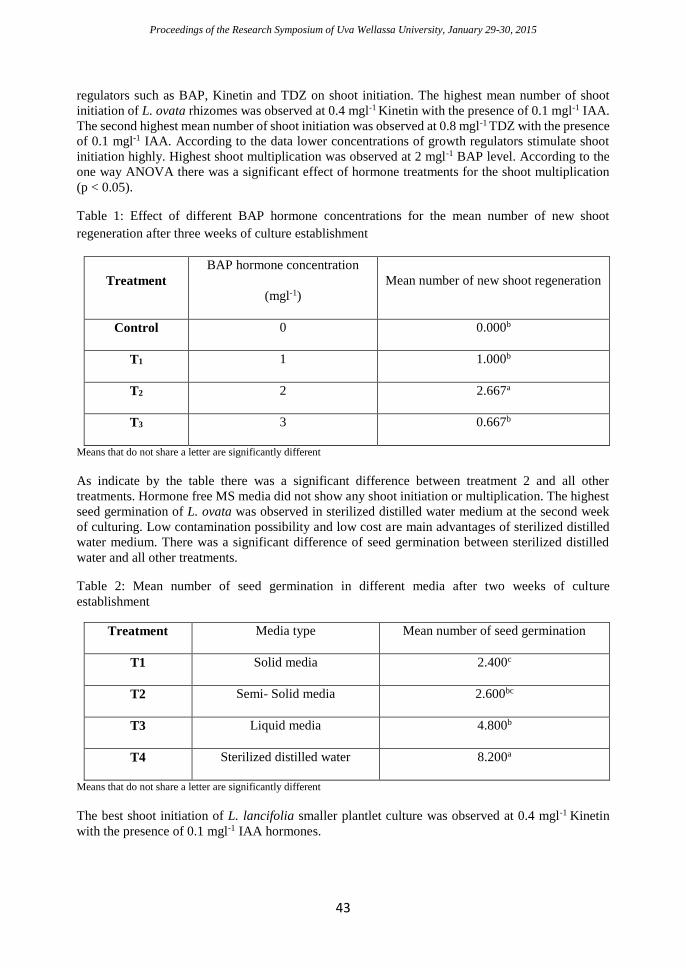
Proceedings of the Research Symposium of Uva Wellassa University, January 29-30, 2015
43
regulators such as BAP, Kinetin and TDZ on shoot initiation. The highest mean number of shoot
initiation of L. ovata rhizomes was observed at 0.4 mgl-1 Kinetin with the presence of 0.1 mgl-1 IAA.
The second highest mean number of shoot initiation was observed at 0.8 mgl-1 TDZ with the presence
of 0.1 mgl-1 IAA. According to the data lower concentrations of growth regulators stimulate shoot
initiation highly. Highest shoot multiplication was observed at 2 mgl-1 BAP level. According to the
one way ANOVA there was a significant effect of hormone treatments for the shoot multiplication
(p < 0.05).
Table 1: Effect of different BAP hormone concentrations for the mean number of new shoot
regeneration after three weeks of culture establishment
Treatment
BAP hormone concentration
(mgl-1)
Mean number of new shoot regeneration
Control 0 0.000b
T1 1 1.000b
T2 2 2.667a
T3 3 0.667b
Means that do not share a letter are significantly different
As indicate by the table there was a significant difference between treatment 2 and all other
treatments. Hormone free MS media did not show any shoot initiation or multiplication. The highest
seed germination of L. ovata was observed in sterilized distilled water medium at the second week
of culturing. Low contamination possibility and low cost are main advantages of sterilized distilled
water medium. There was a significant difference of seed germination between sterilized distilled
water and all other treatments.
Table 2: Mean number of seed germination in different media after two weeks of culture
establishment
Treatment Media type Mean number of seed germination
T1 Solid media 2.400c
T2 Semi- Solid media 2.600bc
T3 Liquid media 4.800b
T4 Sterilized distilled water 8.200a
Means that do not share a letter are significantly different
The best shoot initiation of L. lancifolia smaller plantlet culture was observed at 0.4 mgl-1 Kinetin
with the presence of 0.1 mgl-1 IAA hormones.
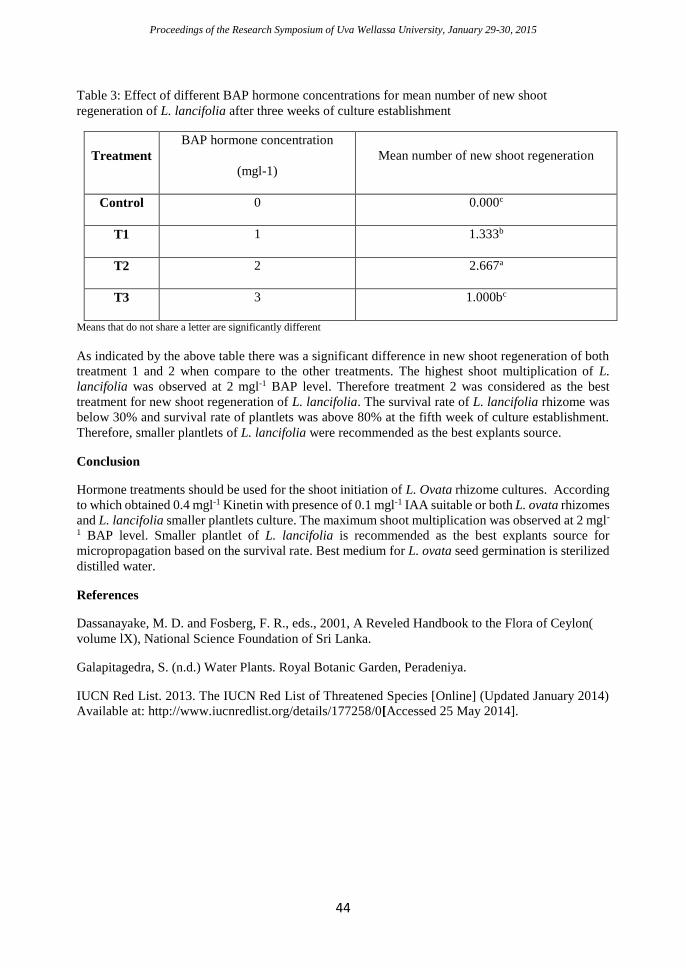
Proceedings of the Research Symposium of Uva Wellassa University, January 29-30, 2015
44
Table 3: Effect of different BAP hormone concentrations for mean number of new shoot
regeneration of L. lancifolia after three weeks of culture establishment
Treatment
BAP hormone concentration
(mgl-1)
Mean number of new shoot regeneration
Control 0 0.000c
T1 1 1.333b
T2 2 2.667a
T3 3 1.000bc
Means that do not share a letter are significantly different
As indicated by the above table there was a significant difference in new shoot regeneration of both
treatment 1 and 2 when compare to the other treatments. The highest shoot multiplication of L.
lancifolia was observed at 2 mgl-1 BAP level. Therefore treatment 2 was considered as the best
treatment for new shoot regeneration of L. lancifolia. The survival rate of L. lancifolia rhizome was
below 30% and survival rate of plantlets was above 80% at the fifth week of culture establishment.
Therefore, smaller plantlets of L. lancifolia were recommended as the best explants source.
Conclusion
Hormone treatments should be used for the shoot initiation of L. Ovata rhizome cultures. According
to which obtained 0.4 mgl-1 Kinetin with presence of 0.1 mgl-1 IAA suitable or both L. ovata rhizomes
and L. lancifolia smaller plantlets culture. The maximum shoot multiplication was observed at 2 mgl-
1 BAP level. Smaller plantlet of L. lancifolia is recommended as the best explants source for
micropropagation based on the survival rate. Best medium for L. ovata seed germination is sterilized
distilled water.
References
Dassanayake, M. D. and Fosberg, F. R., eds., 2001, A Reveled Handbook to the Flora of Ceylon(
volume lX), National Science Foundation of Sri Lanka.
Galapitagedra, S. (n.d.) Water Plants. Royal Botanic Garden, Peradeniya.
IUCN Red List. 2013. The IUCN Red List of Threatened Species [Online] (Updated January 2014)
Available at: http://www.iucnredlist.org/details/177258/0[Accessed 25 May 2014].
Proceedings of the Research Symposium of Uva Wellassa University, January 29-30, 2015
45
A preliminary study on the effectiveness of organic fertilizers
for the survival rate of Catla catla
K.G.M. Prabhani and N.P.P. Liyanage
Faculty of Animal Science and Export Agriculture, Uva Wellassa University of Sri Lanka
and
K.M.D.M. Somarathna
Aquaculture Development Center, National Aquaculture Development Authority (NAQDA),
Udawalawa
Introduction
Fish can be considered as one of the main sources of animal protein (26.2%) in human diet (Khan et
al., 2004). Fish also become a popular source of food in Asia and developing countries. Both
aquaculture and fisheries activities conducting in marine and inland waters, cater the protein
requirement of people in Sri Lanka. Indian and Chinese Carp species are commonly used today in
inland aquaculture. Catla catla (Catla) is a zooplankton feeding Indian major carp species which was
introduced to reservoirs in Sri Lanka to uplift the inland fishery production. This species has become
a very popular fish species among the fish farmers due to higher growth rate, ability to co-exist with
other major carps and consumer preference. Aquaculture Development Center (AQDC), Udawalawa
belongs to National Aquaculture Development Authority (NAQDA) is producing fish seeds of carp
species including Catla, for the development of inland aquaculture and fisheries. The problem
identified in fish seed production in the AQDCs was the low survival rate of Catla at rearing of post
larvae (PL) to fry stage. Moreover, it was observed that survival rate in mud ponds is lower than the
survival rates in cement tanks. In the AQDC Udawalawa, cow dung is commonly used for
fertilization of rearing tanks and ponds. This study was carried out to find out what the best effective
organic fertilizer for the higher survival rate and growth of Catla catla. Cow dung, Leucaena
leucocephala (Ipilipil) and Oriza sativa (rice) straw were selected as organic fertilizers as they are of
low cost and readily available in the area of the study.
Materials and Methods
The experiment was conducted in nursery ponds (mud ponds) and nursery cement tanks in AQDC,
Udawalawa. A mud pond and a cement tank which were already fertilized during five days (as normal
practice in the AQDC) using cow dung (250g/m2) were selected and plankton densities (individuals
per liter) were recorded by assuming ponds were reached optimum plankton density. Mean value of
those densities was calculated and used as baseline value. Dried cow dung (250g/m2) was selected as
control for the study as it was the normal practice in the AQDC. Rice straw (30g/m2) and dried Ipilipil
(30g/m2) were the selected treatments for the study. These are the commonly used fertilizer
concentrations in the field. Initially, the time taken to reach the plankton density to the baseline value
was recorded for Rice straw and Ipilipil fertilizer types.
The surrounding of three mud ponds was cleaned and four hapa net cages were fixed to the bottom
of the three mud ponds to prepare four replicates. All the four replicates were fixed in same way to
maintain the same volume of water. Firstly the ponds were filled up to 50 cm with water. Complete
Randomized Design (CRD) was conducted as the experimental design.
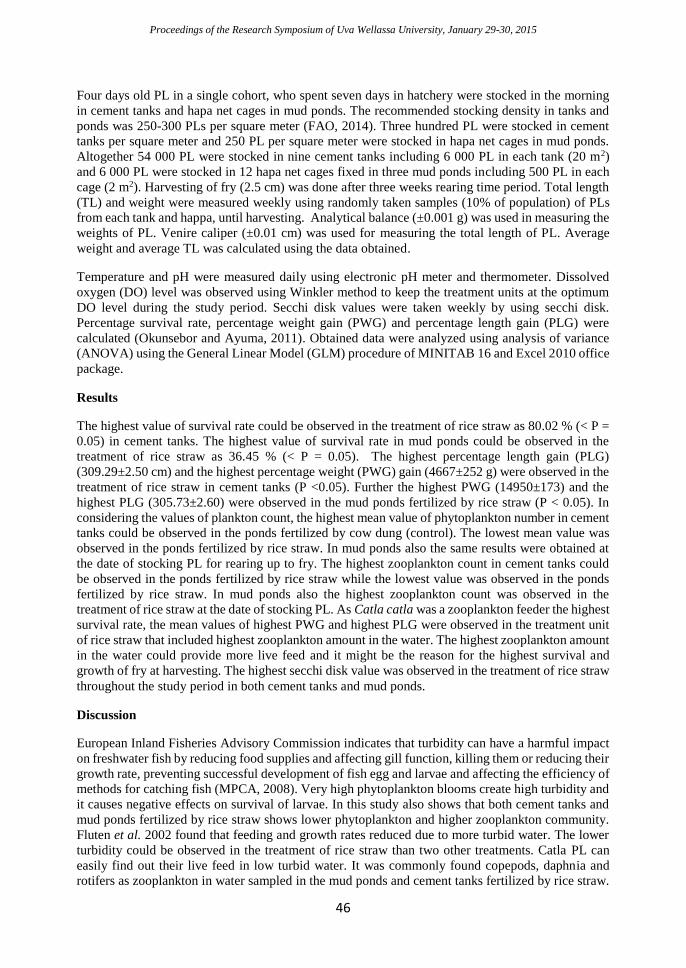
Proceedings of the Research Symposium of Uva Wellassa University, January 29-30, 2015
46
Four days old PL in a single cohort, who spent seven days in hatchery were stocked in the morning
in cement tanks and hapa net cages in mud ponds. The recommended stocking density in tanks and
ponds was 250-300 PLs per square meter (FAO, 2014). Three hundred PL were stocked in cement
tanks per square meter and 250 PL per square meter were stocked in hapa net cages in mud ponds.
Altogether 54 000 PL were stocked in nine cement tanks including 6 000 PL in each tank (20 m2)
and 6 000 PL were stocked in 12 hapa net cages fixed in three mud ponds including 500 PL in each
cage (2 m2). Harvesting of fry (2.5 cm) was done after three weeks rearing time period. Total length
(TL) and weight were measured weekly using randomly taken samples (10% of population) of PLs
from each tank and happa, until harvesting. Analytical balance (±0.001 g) was used in measuring the
weights of PL. Venire caliper (±0.01 cm) was used for measuring the total length of PL. Average
weight and average TL was calculated using the data obtained.
Temperature and pH were measured daily using electronic pH meter and thermometer. Dissolved
oxygen (DO) level was observed using Winkler method to keep the treatment units at the optimum
DO level during the study period. Secchi disk values were taken weekly by using secchi disk.
Percentage survival rate, percentage weight gain (PWG) and percentage length gain (PLG) were
calculated (Okunsebor and Ayuma, 2011). Obtained data were analyzed using analysis of variance
(ANOVA) using the General Linear Model (GLM) procedure of MINITAB 16 and Excel 2010 office
package.
Results
The highest value of survival rate could be observed in the treatment of rice straw as 80.02 % (< P =
0.05) in cement tanks. The highest value of survival rate in mud ponds could be observed in the
treatment of rice straw as 36.45 % (< P = 0.05). The highest percentage length gain (PLG)
(309.29±2.50 cm) and the highest percentage weight (PWG) gain (4667±252 g) were observed in the
treatment of rice straw in cement tanks (P <0.05). Further the highest PWG (14950±173) and the
highest PLG (305.73±2.60) were observed in the mud ponds fertilized by rice straw (P < 0.05). In
considering the values of plankton count, the highest mean value of phytoplankton number in cement
tanks could be observed in the ponds fertilized by cow dung (control). The lowest mean value was
observed in the ponds fertilized by rice straw. In mud ponds also the same results were obtained at
the date of stocking PL for rearing up to fry. The highest zooplankton count in cement tanks could
be observed in the ponds fertilized by rice straw while the lowest value was observed in the ponds
fertilized by rice straw. In mud ponds also the highest zooplankton count was observed in the
treatment of rice straw at the date of stocking PL. As Catla catla was a zooplankton feeder the highest
survival rate, the mean values of highest PWG and highest PLG were observed in the treatment unit
of rice straw that included highest zooplankton amount in the water. The highest zooplankton amount
in the water could provide more live feed and it might be the reason for the highest survival and
growth of fry at harvesting. The highest secchi disk value was observed in the treatment of rice straw
throughout the study period in both cement tanks and mud ponds.
Discussion
European Inland Fisheries Advisory Commission indicates that turbidity can have a harmful impact
on freshwater fish by reducing food supplies and affecting gill function, killing them or reducing their
growth rate, preventing successful development of fish egg and larvae and affecting the efficiency of
methods for catching fish (MPCA, 2008). Very high phytoplankton blooms create high turbidity and
it causes negative effects on survival of larvae. In this study also shows that both cement tanks and
mud ponds fertilized by rice straw shows lower phytoplankton and higher zooplankton community.
Fluten et al. 2002 found that feeding and growth rates reduced due to more turbid water. The lower
turbidity could be observed in the treatment of rice straw than two other treatments. Catla PL can
easily find out their live feed in low turbid water. It was commonly found copepods, daphnia and
rotifers as zooplankton in water sampled in the mud ponds and cement tanks fertilized by rice straw.
Proceedings of the Research Symposium of Uva Wellassa University, January 29-30, 2015
47
That might be the reason for highest survival rate and growth (PWG and PLG) of Catla catla as a
zooplankton feeder in the units fertilized by rice straw.
Shahabuddin et al., 2012 mentioned that rice straw extract showed allelopathic activity to Microcystis
to improve the water quality. Few researches have been explored the potential of using rice straw to
improve water quality, algal control and enhance Tilapia fish production. It was found that covering
pond dikes with rice straw reduced the clay turbidity and enhanced growth of Tilapia. Therefore, use
of rice straw should be one of the best alternatives for water quality management and microbial
production. Above mentioned details will cause low turbidity, improve water quality, maintain
phytoplankton density and leads to high survival and better growth of Catla fry. PL could find their
feed of zooplankton easily in clear water.
As mentioned by Kasper, 2012 most fish survive 2-5 ppm DO level, but the growth may be retarded
if the above level continues for some period. Throughout the study period the DO level was higher
than 5 ppm. It emphasizes that rice straw might not cause for the reduction of DO and rice straw
could provide favorable condition for higher growth and survival of Catla catla. Therefore in
fertilizing ponds or cement tanks using rice straw in rearing Catla catla (PL to fry), provides live
feed through better zooplankton growth and maintain better water quality with lower turbidity.
Ultimately it leads to the better growth and higher survival of Catla catla fry comparing with other
two fertilizers
Conclusion
The highest survival rate could be observed in PL to fry rearing in the mud ponds as well as in cement
tanks that were fertilized with Rice straw and the highest growth rate could be observed in the mud
ponds and in cement tanks that were fertilized with Rice straw
Reference
Kasper,2012. Water Quality Requirement for Aquaculture. FAS [online] Available at:
<http://content.hccfl.edu/facultyinfo/ckasper/files/C299FC28A7FD4E4F95DA7FB1D1EAE967.ppt
> [Accessed on 26 July 2014]
Khan, N. et al., 2011. Effect of Artificial Diet and Culture Systems on Sensory Quality of Fried Fish
Flesh of Indian Major Carps. Pakistan J. Zool., vol. 43(6), pp. 1177-1182, 2011.
Minnesota Pollution Control Agency, 2008. Turbidity: Description, Impact on Water Quality,
Sources, Measures - A General Overview. Online Available at:<
http://www.pca.state.mn.us/index.php/view-document.html?gid=7854> [Accessed on 5 August
2014]
Okunsebor,S.A. and Ayuma, V., 2011. Growth, survival rate and condition factor
of Heteroclarias hatchlings fed cultured Moinamicrura, shell free artemia and combination of both as
starter feed. Nasarawa State University. Nasarawa State [online] Available at:
<http://www.lrrd.org/lrrd23/3/okun23062.htm> Accessed on [3 July 2014]
Shahabuddin, A. M. et al., 2012. Study about the Effect of Rice Straw Mat on Water Quality
Parameters, Plankton Production and Mitigation of Clay Turbidity in Earthen Fish Ponds. Asian
Institute of Technology (AIT), Pathumthani 12120, Thailand
Thomas, D. N., n.d. Phytoplankton Growth – Literature for the basics. Finnish Environment Institute.
Bangor University, HelsinkShahabuddin, A. M. et al., 2012. Study about the Effect of Rice Straw
Mat on Water Quality Parameters, Plankton Production and Mitigation of Clay Turbidity in Earthen
Fish Ponds. Asian Institute of Technology (AIT), Pathumthani 12120, Thailand
Thomas, D. N., n.d. Phytoplankton Growth – Literature for the basics. Finnish Environment Institute.
Bangor University, Helsinki.
Proceedings of the Research Symposium of Uva Wellassa University, January 29-30, 2015
48
Bio assay on effectiveness of the chemical hydrolyzation for
denaturing agrochemical contaminated wastewater
G.M.G.M.M Wickrama, R.M.G .N Rajapakshae and N.P.P Liyanage
Faculty of Animal Science and Export Agriculture, Uva Wellassa University of Sri Lanka
and
W.R.K Fonseka
Industrial Technology Institute, Colombo 07.
Introduction
Pesticides provide the primary means for controlling organisms that compete with man for food
and fiber, livestock and crops. Global insecticide use in 2007 has been estimated 404 000 metric
tons of active ingredient (Grube et al. 2011). The agricultural sector is the primary user of
pesticides, consuming over four million tons of pesticides annually (Chen et al. 2009 and Chevillard
et al. 2012). Most agrochemicals imperviousness to microbial degradation and has tendency to
bio-accumulate in the soil fauna and flora. Water contamination has turned into a significant
danger to the presence of living life forms in aquatic environment and aquatic organisms are
highly susceptible for the agrochemical lethality. Many studies have shown the toxicity effect of
agrochemical, but few studies have done to investigate the effectiveness of those treatment
methods. Since the usage of agrochemical cannot be banded, best thing is finding a suitable
method to detoxify them and understand the effectiveness of the particular method. Hydrolysis is a
chemical reaction in which natural constituents respond with water and break into more diminutive
(and less toxic) compounds. Fundamentally, hydrolysis is a destructive technology in which the
original molecule forms two or more new molecules (EPA, 1993). Hydrolysis could be a viable
treatment technology for agrochemical wastewater. In this study the effectiveness of the alkaline
hydrolysis was estimated by using field data which were taken from the effluent treated plant
(ETF) of agrochemical formulation and repacking industry, and also a bio assay was used to
analyze the effect to the aquatic species from the treatment method.
Methodology
To check the effectiveness of “ Alkaline Hydrolysis” method, samples were collected from a
wastewater effluent treated plant in pesticide repacking and formulation industry. Samples were
collected from raw water and treated tanks and measured Chemical Oxygen Demand (COD),
Total Suspended Solid (TSS) and pesticide active ingredients (Glyposate, MCPA, Profenofos).
The samples were analyzed according to the American Public Health Association (APHA 2540
D, 2014) standard methods. All analysis w e r e carried out at Environment Technology Section
(ETS) and Chemical and Microbiological Laboratory (CML) section in Industrial Technology
Institute (ITI).Those parameters were compared and checked the reduction efficiency. To check
the effect to the aquatic ecosystems after applying the treatment “Guppy” (Poicelia reticulatae)
were used for a bio assay. Behaviors and mortality rates were evaluated after introducing
them to the treated effluent. One hundred fifty specimens of P. reticulatae with mean length of 2.5
±0.5 cm and mean weight 0.2 ±0.5 were collected from the drainage canals with scoop nets and
carried to the laboratory in a doubled polythene bags half filled with water from the source.
They were kept in fifteen holding tanks (30X30X30 cm). One quarter 1/4 were filled with de
chlorinated tap water and allowed to acclimatize to experimental environment condition: 300 C, pH
7.8 for 1 week before applying treated effluent. Ten fish per tank were stocked (With active
animals in each) Physico-chemical parameters such as DO, Temperature. pH of the test media were
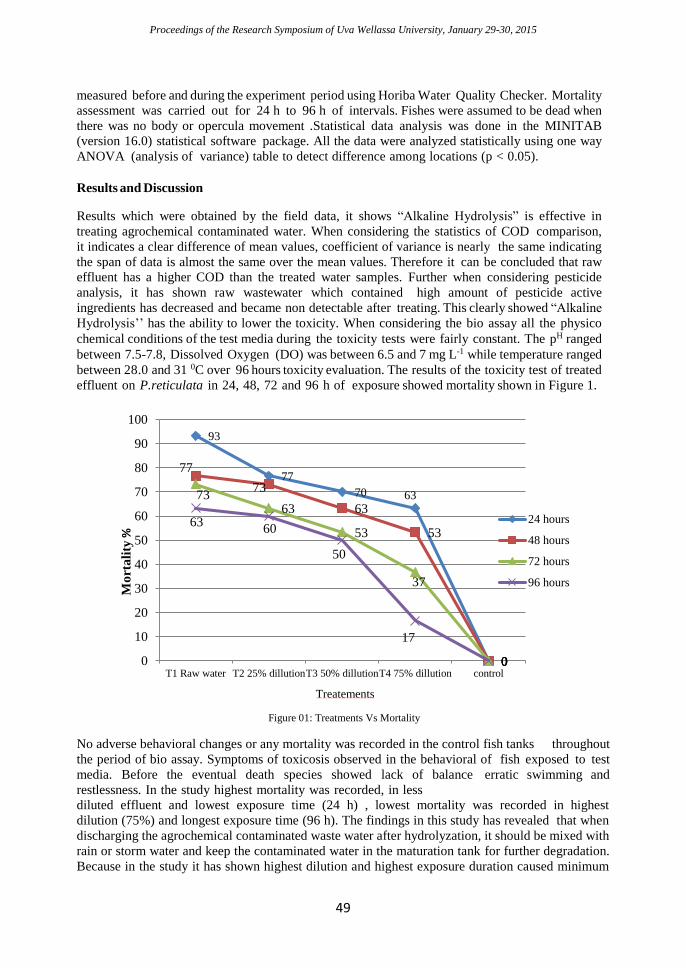
Proceedings of the Research Symposium of Uva Wellassa University, January 29-30, 2015
49
measured before and during the experiment period using Horiba Water Quality Checker. Mortality
assessment was carried out for 24 h to 96 h of intervals. Fishes were assumed to be dead when
there was no body or opercula movement .Statistical data analysis was done in the MINITAB
(version 16.0) statistical software package. All the data were analyzed statistically using one way
ANOVA (analysis of variance) table to detect difference among locations (p < 0.05).
Results and Discussion
Results which were obtained by the field data, it shows “Alkaline Hydrolysis” is effective in
treating agrochemical contaminated water. When considering the statistics of COD comparison,
it indicates a clear difference of mean values, coefficient of variance is nearly the same indicating
the span of data is almost the same over the mean values. Therefore it can be concluded that raw
effluent has a higher COD than the treated water samples. Further when considering pesticide
analysis, it has shown raw wastewater which contained high amount of pesticide active
ingredients has decreased and became non detectable after treating. This clearly showed “Alkaline
Hydrolysis’’ has the ability to lower the toxicity. When considering the bio assay all the physico
chemical conditions of the test media during the toxicity tests were fairly constant. The pH ranged
between 7.5-7.8, Dissolved Oxygen (DO) was between 6.5 and 7 mg L-1 while temperature ranged
between 28.0 and 31 0C over 96 hours toxicity evaluation. The results of the toxicity test of treated
effluent on P.reticulata in 24, 48, 72 and 96 h of exposure showed mortality shown in Figure 1.
Figure 01: Treatments Vs Mortality
No adverse behavioral changes or any mortality was recorded in the control fish tanks throughout
the period of bio assay. Symptoms of toxicosis observed in the behavioral of fish exposed to test
media. Before the eventual death species showed lack of balance erratic swimming and
restlessness. In the study highest mortality was recorded, in less
diluted effluent and lowest exposure time (24 h) , lowest mortality was recorded in highest
dilution (75%) and longest exposure time (96 h). The findings in this study has revealed that when
discharging the agrochemical contaminated waste water after hydrolyzation, it should be mixed with
rain or storm water and keep the contaminated water in the maturation tank for further degradation.
Because in the study it has shown highest dilution and highest exposure duration caused minimum
93
77
70 63
0
77
73
63
53
0
7363
53
37
0
6360
50
17
00
10
20
30
40
50
60
70
80
90
100
T1 Raw water T2 25% dillutionT3 50% dillutionT4 75% dillution control
Mo
rta
lity
%
Treatements
24 hours
48 hours
72 hours
96 hours
Proceedings of the Research Symposium of Uva Wellassa University, January 29-30, 2015
50
mortality. According to the results which were obtained from bio-assay to avoid the effect to the
ecosystem, dilution should be done. Therefore before discharging treated water to the outer
ecosystems, it should be subjected to proper dilution. Then the negative effect to the ecosystems can
be minimized. This study showed that at 96 h exposure in high dilution (75%) caused minimum
mortality. Toxicity has shown to increase with lowering the dilution. The exposure of P.reticulata to
treated wastewater which was contaminated by agrochemical (Profenofos) exhibited aggressive
behavior, rapid gulping water, increased opercular movements. P.reticulata was stressed
progressively with the time before death. Analysis of Variance (ANOVA) showed that there was
significant
difference (p<0.005) in the quantal response at 24, 48, 72 and 96 hours of exposure in each dilution
level. The findings in this study have revealed that agrochemical is toxic to fish and suitable treatment
method can detoxify the toxicity of them. Establishing proper treatment methods are highly
recommended for contaminated areas.
Conclusion
Study is suggested toxicity depends on dilution and exposure time. Alkaline hydrolyzation is one of
the best treatment methods that can be applied to the agrochemical contaminated areas. Most suitable
option that can be taken to alter the problem is keeping the treated effluent in a maturation tank for
one month like period and mixed that with rain or storm water with a suitable dilution factor before
discharge to the natural environment. Therefore the toxicity and remaining active ingredients can be
degraded naturally with the time. And by the time it will be subjected to natural hydrolysis also. This
will reduce further bioaccumulation in ecosystems.
Acknowledgement
Laboratory facilities provided by the Industrial Technology Institute is acknowledged.
Reference
Chen, S, Liu C., Peng, Hu, M. and Zhong G. (2012). Biodegradation of chlorpyrifos and its hydrolysis
product 3,5,6-trichloro-2-pyridinol by a new fungal strain Cladosporium cladosporioides. Hu-01.
PLoS ONE 7, 1-12.
Chevillard ,A., Coussy, H., A. Guillard, Gontard, N. and Gastaldi, E. (2012). Investigating the
biodegradation pattern of an ecofriendly pesticide delivery system based on wheat gluten and
organically modified montmorillonites. Polym. Degrad. Stabil. 97, 2060- 2068.
Grube ,A., Donaldson ,D., Kiely T. and Wu L. (2011). Pesticides industry sales and usage: 2006 and
2007 Market Estimates. U.S. Environmental Protection Agency; Washington, D.C., United States of
America. 1-33.
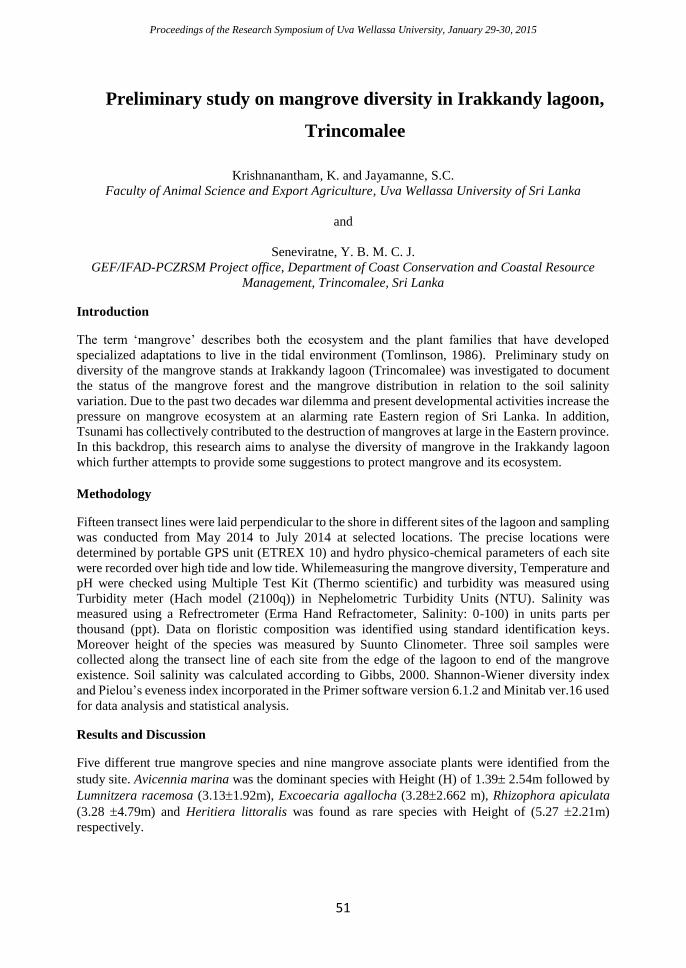
Proceedings of the Research Symposium of Uva Wellassa University, January 29-30, 2015
51
Preliminary study on mangrove diversity in Irakkandy lagoon,
Trincomalee
Krishnanantham, K. and Jayamanne, S.C.
Faculty of Animal Science and Export Agriculture, Uva Wellassa University of Sri Lanka
and
Seneviratne, Y. B. M. C. J.
GEF/IFAD-PCZRSM Project office, Department of Coast Conservation and Coastal Resource
Management, Trincomalee, Sri Lanka
Introduction
The term ‘mangrove’ describes both the ecosystem and the plant families that have developed
specialized adaptations to live in the tidal environment (Tomlinson, 1986). Preliminary study on
diversity of the mangrove stands at Irakkandy lagoon (Trincomalee) was investigated to document
the status of the mangrove forest and the mangrove distribution in relation to the soil salinity
variation. Due to the past two decades war dilemma and present developmental activities increase the
pressure on mangrove ecosystem at an alarming rate Eastern region of Sri Lanka. In addition,
Tsunami has collectively contributed to the destruction of mangroves at large in the Eastern province.
In this backdrop, this research aims to analyse the diversity of mangrove in the Irakkandy lagoon
which further attempts to provide some suggestions to protect mangrove and its ecosystem.
Methodology
Fifteen transect lines were laid perpendicular to the shore in different sites of the lagoon and sampling
was conducted from May 2014 to July 2014 at selected locations. The precise locations were
determined by portable GPS unit (ETREX 10) and hydro physico-chemical parameters of each site
were recorded over high tide and low tide. Whilemeasuring the mangrove diversity, Temperature and
pH were checked using Multiple Test Kit (Thermo scientific) and turbidity was measured using
Turbidity meter (Hach model (2100q)) in Nephelometric Turbidity Units (NTU). Salinity was
measured using a Refrectrometer (Erma Hand Refractometer, Salinity: 0-100) in units parts per
thousand (ppt). Data on floristic composition was identified using standard identification keys.
Moreover height of the species was measured by Suunto Clinometer. Three soil samples were
collected along the transect line of each site from the edge of the lagoon to end of the mangrove
existence. Soil salinity was calculated according to Gibbs, 2000. Shannon-Wiener diversity index
and Pielou’s eveness index incorporated in the Primer software version 6.1.2 and Minitab ver.16 used
for data analysis and statistical analysis.
Results and Discussion
Five different true mangrove species and nine mangrove associate plants were identified from the
study site. Avicennia marina was the dominant species with Height (H) of 1.392.54m followed by
Lumnitzera racemosa (3.131.92m), Excoecaria agallocha (3.282.662 m), Rhizophora apiculata
(3.28 4.79m) and Heritiera littoralis was found as rare species with Height of (5.27 2.21m)
respectively.
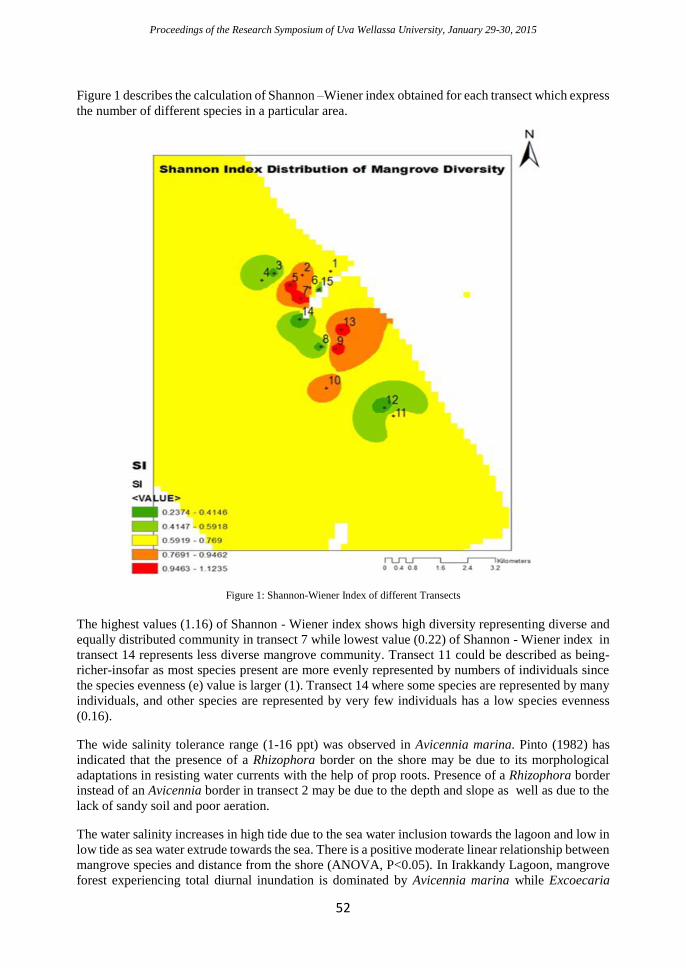
Proceedings of the Research Symposium of Uva Wellassa University, January 29-30, 2015
52
Figure 1 describes the calculation of Shannon –Wiener index obtained for each transect which express
the number of different species in a particular area.
Figure 1: Shannon-Wiener Index of different Transects
The highest values (1.16) of Shannon - Wiener index shows high diversity representing diverse and
equally distributed community in transect 7 while lowest value (0.22) of Shannon - Wiener index in
transect 14 represents less diverse mangrove community. Transect 11 could be described as being-
richer-insofar as most species present are more evenly represented by numbers of individuals since
the species evenness (e) value is larger (1). Transect 14 where some species are represented by many
individuals, and other species are represented by very few individuals has a low species evenness
(0.16).
The wide salinity tolerance range (1-16 ppt) was observed in Avicennia marina. Pinto (1982) has
indicated that the presence of a Rhizophora border on the shore may be due to its morphological
adaptations in resisting water currents with the help of prop roots. Presence of a Rhizophora border
instead of an Avicennia border in transect 2 may be due to the depth and slope as well as due to the
lack of sandy soil and poor aeration.
The water salinity increases in high tide due to the sea water inclusion towards the lagoon and low in
low tide as sea water extrude towards the sea. There is a positive moderate linear relationship between
mangrove species and distance from the shore (ANOVA, P<0.05). In Irakkandy Lagoon, mangrove
forest experiencing total diurnal inundation is dominated by Avicennia marina while Excoecaria
Proceedings of the Research Symposium of Uva Wellassa University, January 29-30, 2015
53
agallocha dominated sites that are not completely inundated. Amarasinghe et al. (2013) has found
that Avicennia marina do not grow in fresh water and may be obligate halophytes. Also Excoecaria
agallocha, survives well in fresh water and may not have obligatory requirement for salt beyond trace
amount.
There is a significant difference between soil salinity and distance from the shore (ANOVA, P<0.05).
Low frequency and duration of tidal inundation can be cited as the probable reason for low soil
salinity at the landward sites (Joshi and Ghose, 2003). As indicated by the results, decreasing salinity
with increasing distance is not observed in some places. The reason can be the evaporation occurred
when the temperature is raised. In contrast, frequent inundation permanently saturates the soil with
seawater salt content.
There is a negative weak linear relationship between soil salinity and height of the mangrove tree
(ANOVA, P<0.05) since low-saline mangrove forests usually show a more luxuriant growth than the
high-saline ones (De Silva and de Silva, 1998). There is a negative moderate linear relationship
between soil salinity and mangrove species (correlations, P<0.05).
Conclusion
The results of the study indicate Irakkandy lagoon consists of low biological diversity of mangroves
compared to Negombo, Chilaw and Puttalam lagoons but is extremely valuable as a living mangrove
forest due to its extent.
References
Amarasinghe, M., Perera, K. and Somaratna, S. 2013.Vegetation Structure and Species Distribution
of Mangroves along a Soil Salinity Gradient in a Micro Tidal Estuary on the North-western Coast of
Sri Lanka. American Journal of Marine Science, 1(1):7-15.
De Silva, M. and De Silva, P. 1998. Status, diversity and conservation of the mangrove forests of Sri
Lanka. Journal of South Asian Natural History, 3(1):79-102.
Pinto, M. L. 1982. Distribution and zonation of mangroves in the Nothern part of the Negombo
lagoon (Sri Lanka), Journal of the National Science Council of Sri Lanka, 10 (2): 245-255.
Tomlinson, P.B.1986. The botany of mangroves. Cambridge, UK, Cambridge University Press.
Proceedings of the Research Symposium of Uva Wellassa University, January 29-30, 2015
54
Analyze the Histamine level in various positions of the
Histamine developed Tuna fish
K.S.H. Kalubowila and N.P.P. Liyanage
Faculty of Animal Science and Export Agriculture, Uva Wellassa University of Sri Lanka
and
A. Perera
Jay sea foods processing (pvt) Ltd, Kepumgoda, Sri Lanka
Introduction
Sea food processing industry is a high income generating field in Sri Lanka and it brings high foreign
exchange to the country. Big eye tuna (Thunnus obesus) and yellow fin tuna (Thunnus albacares)
are the major tuna types which are exported by Sri Lanka to the international market. (FAO,
2014).However the presence of Histamine is the problematic factor inTuna fish processing industry
which leads the industry to many health issues and income losses.
Histamine is a chemical compound created from histidine and enteric bacteria are capable of
transforming histidine to histamine by the enzyme decarboxylase. Once histamine is formed, it
cannot be not destroyed by freezing, cooking, smoking, curing or canning. Histamine level of more
than 5mg/100g is classified as unsafe by U.S. Food and Drug Administration. (Ebrahimet al.,
2012).Histamine level varies position of the tuna fish body. Hence this research was carried out to
identify and analyze the Histamine level in various positions of the Histamine developed tuna fish.
Methodology
Survey was done to select the positions of taking samples from tuna fish. 15 fresh fish processing
companies were selected and questionnaire was given. Three positions were selected based on the
questionnaire filled by the fish processing companies. Three positions of the tuna fish were selected,
beneath the pectoral fin of the fish, near the belly area and the tail end respectively and thirty tuna
fish were subjected to Histamine test individually. ELISA method and histaminevertox test kit were
used to analyze the histamine levels in the tuna fish.Sample preparation, sample extraction, sample
dilution and Histamine testing are the major steps done in ELISA method. Collected data were
analyzed by using Minitab 17 software.Highest mean values and variance values were taken from
those positions. Non parametric Mann-Whitney test was done to find out the significant different
among positions.
Results and Discussion
Highest mean values and variance values were taken from those positions.
High Histamine was recorded in the belly area due to the most of the bacteria which responsible for
converting Histidine to Histamine, lived in the gut of tuna fish. Through poor post-harvest
techniques, low hygiene practices, bad catching method, bad killing methods and bad handling
methods could expose the gut material to the fish muscles and so enteric bacteria easily release the
Histidine decarboxylase enzyme to Histidine free specific amino acid and then forming Histamine
(Koohdaret al., 2010).This reaction cannot be stopped and can only be controlled. Usually low
histamine levels could be observed from gilled and gutted fish because gilled and gutted fish had
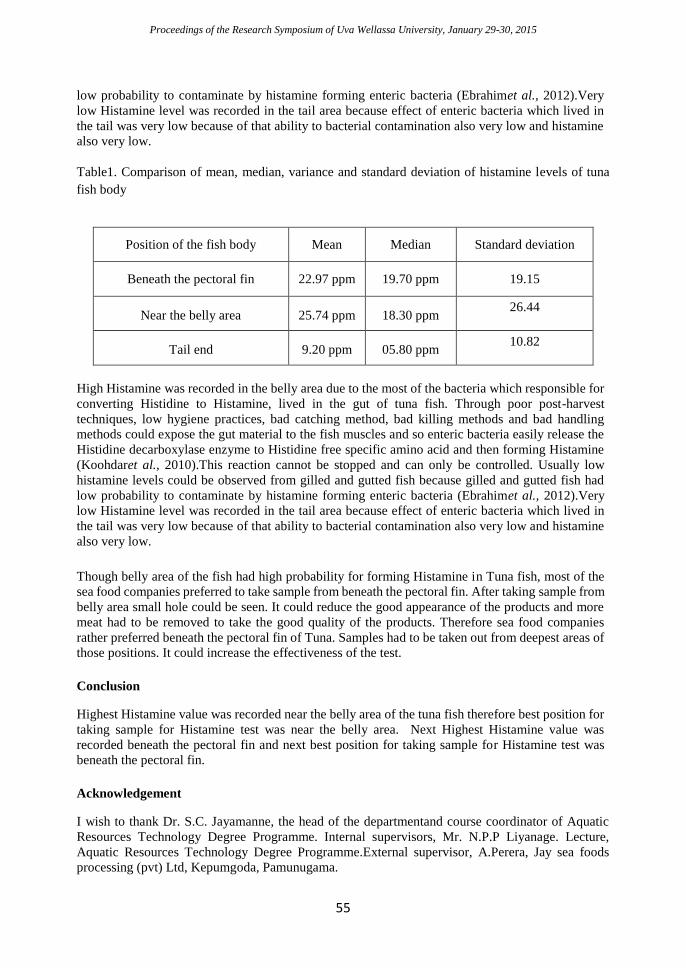
Proceedings of the Research Symposium of Uva Wellassa University, January 29-30, 2015
55
low probability to contaminate by histamine forming enteric bacteria (Ebrahimet al., 2012).Very
low Histamine level was recorded in the tail area because effect of enteric bacteria which lived in
the tail was very low because of that ability to bacterial contamination also very low and histamine
also very low.
Table1. Comparison of mean, median, variance and standard deviation of histamine levels of tuna
fish body
High Histamine was recorded in the belly area due to the most of the bacteria which responsible for
converting Histidine to Histamine, lived in the gut of tuna fish. Through poor post-harvest
techniques, low hygiene practices, bad catching method, bad killing methods and bad handling
methods could expose the gut material to the fish muscles and so enteric bacteria easily release the
Histidine decarboxylase enzyme to Histidine free specific amino acid and then forming Histamine
(Koohdaret al., 2010).This reaction cannot be stopped and can only be controlled. Usually low
histamine levels could be observed from gilled and gutted fish because gilled and gutted fish had
low probability to contaminate by histamine forming enteric bacteria (Ebrahimet al., 2012).Very
low Histamine level was recorded in the tail area because effect of enteric bacteria which lived in
the tail was very low because of that ability to bacterial contamination also very low and histamine
also very low.
Though belly area of the fish had high probability for forming Histamine in Tuna fish, most of the
sea food companies preferred to take sample from beneath the pectoral fin. After taking sample from
belly area small hole could be seen. It could reduce the good appearance of the products and more
meat had to be removed to take the good quality of the products. Therefore sea food companies
rather preferred beneath the pectoral fin of Tuna. Samples had to be taken out from deepest areas of
those positions. It could increase the effectiveness of the test.
Conclusion
Highest Histamine value was recorded near the belly area of the tuna fish therefore best position for
taking sample for Histamine test was near the belly area. Next Highest Histamine value was
recorded beneath the pectoral fin and next best position for taking sample for Histamine test was
beneath the pectoral fin.
Acknowledgement
I wish to thank Dr. S.C. Jayamanne, the head of the departmentand course coordinator of Aquatic
Resources Technology Degree Programme. Internal supervisors, Mr. N.P.P Liyanage. Lecture,
Aquatic Resources Technology Degree Programme.External supervisor, A.Perera, Jay sea foods
processing (pvt) Ltd, Kepumgoda, Pamunugama.
Position of the fish body Mean Median Standard deviation
Beneath the pectoral fin 22.97 ppm 19.70 ppm 19.15
Near the belly area 25.74 ppm 18.30 ppm 26.44
Tail end 9.20 ppm 05.80 ppm 10.82
Proceedings of the Research Symposium of Uva Wellassa University, January 29-30, 2015
56
References
Ebrahim, R., Nayebpour, F., and Alian, F., 2012. Determination of Histamine in canned Tuna fish
using ELISA method, Thesis. Islamic Azad University, Iran. 65, Pp- 34-40.
Fletcher, G. C., Summers, G., Winchester, R. V., & Wong, R. J., 1995. Histamine and histidine in
New Zealand marine fish and shellfish species, particularly kahawai (Arripistrutta). Journal of
Aquatic Food Product Technology, 4(2), Pp 53-74.
Koohdar, V. A., Razavilar, V., Motalebi, A. A., Mosakhani, F., &Valinassab, T., 2011. Isolation and
Identification of Histamine-forming bacteria in frozen Skipjack tuna (Katsuwonuspelamis). Iranian
Journal of Fisheries Sciences, 10(4), Pp. 678-688.
Taylor, S. L., &Eitenmiller, R. R., 1986. Histamine food poisoning: toxicology and clinical
aspects. CRC Critical Reviews in Toxicology, 17(2), Pp.91-128.
Proceedings of the Research Symposium of Uva Wellassa University, January 29-30, 2015
57
A Geographic Information System (GIS) approach in
identification of the potential reservoirs for Giant Freshwater
prawn (Macrobrachium rosenbergii) culture: A case study in
Moneragala district, Sri Lanka
R.A.C. Nisansala and R.M.C.W.M. Rathnayake
Faculty of Animal Science and Export Agriculture, Uva Wellassa University of Sri Lanka
Introduction
Culture Based Fishery (CBF) is a better approach to overcome poverty and malnutrition in
Moneragala District since the district is enriched with large number of village reservoirs and minor
perennial reservoirs. Introducing a valuable, high demanding and protein rich species such as Giant
Fresh Water Prawn (Macrobrachium rosenbergii) through CBF is the best way to get the maximum
utilization of these natural resources. Current practice of stock enhancement of Macrobrachium
rosenbergii in reservoirs has resulted a heavy loss of stock and low returns. Therefore it needs a
careful selection of potential reservoirs prior to stocking of post larvae.
As a tool in decision making, Geographic Information System (GIS) is still a new concept for CBF
in Sri Lanka for aquaculture planning. The main intent of this study was to highlight the role of GIS
in identifying potential reservoirs for stock enhancement of Macrobrachium rosenbergii under inland
CBF in Moneragala District, Sri Lanka by developing a map.
Methodology
Nineteen minor perennial reservoirs distributed over nine divisional secretariat divisions in
Moneragala District were visited during the dry season as the sample. Climate (Rainfall,
Temperature), Bio-physical (Elevation) and Water quality (pH, Temperature, Hardness, Alkalinity,
Dissolved Oxygen, transparency) and Socio-economic factors (proximity to roads and village, land
use, poverty and population) were identified as influential factors for Macrobrachium rosenbergii
culture based fishery. Data were collected from field surveys and responsible government institutes.
Water quality parameters were tested on site and the university laboratory. In order to generate
thematic layers for above each factors Interpolation techniques were applied for climate, elevation
and water quality data; Population and poverty were considered in respective to DS divisions;
multiple ring buffers were created for the proximity factors. Each factor was classified according to
four suitability scales; very suitable, suitable, moderately suitable and unsuitable. Land use types in
the district land use map were classified according to their suitability. Factors were ranked according
to their relative influence on Macrobrachium rosenbergii fishery and weights were assigned
according to their relative influence using the method of “Rank Sum”. Finally, all thematic layers
were integrated in ArcGIS 10.1 (Esri, 2012) environment to generate the potential map.
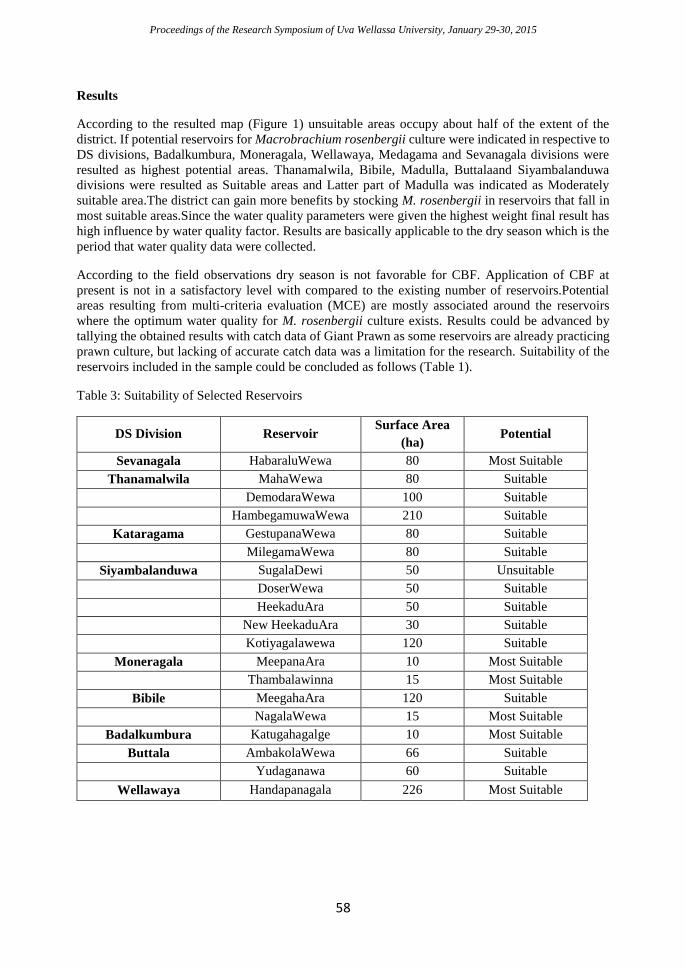
Proceedings of the Research Symposium of Uva Wellassa University, January 29-30, 2015
58
Results
According to the resulted map (Figure 1) unsuitable areas occupy about half of the extent of the
district. If potential reservoirs for Macrobrachium rosenbergii culture were indicated in respective to
DS divisions, Badalkumbura, Moneragala, Wellawaya, Medagama and Sevanagala divisions were
resulted as highest potential areas. Thanamalwila, Bibile, Madulla, Buttalaand Siyambalanduwa
divisions were resulted as Suitable areas and Latter part of Madulla was indicated as Moderately
suitable area.The district can gain more benefits by stocking M. rosenbergii in reservoirs that fall in
most suitable areas.Since the water quality parameters were given the highest weight final result has
high influence by water quality factor. Results are basically applicable to the dry season which is the
period that water quality data were collected.
According to the field observations dry season is not favorable for CBF. Application of CBF at
present is not in a satisfactory level with compared to the existing number of reservoirs.Potential
areas resulting from multi-criteria evaluation (MCE) are mostly associated around the reservoirs
where the optimum water quality for M. rosenbergii culture exists. Results could be advanced by
tallying the obtained results with catch data of Giant Prawn as some reservoirs are already practicing
prawn culture, but lacking of accurate catch data was a limitation for the research. Suitability of the
reservoirs included in the sample could be concluded as follows (Table 1).
Table 3: Suitability of Selected Reservoirs
DS Division Reservoir Surface Area
(ha) Potential
Sevanagala HabaraluWewa 80 Most Suitable
Thanamalwila MahaWewa 80 Suitable
DemodaraWewa 100 Suitable
HambegamuwaWewa 210 Suitable
Kataragama GestupanaWewa 80 Suitable
MilegamaWewa 80 Suitable
Siyambalanduwa SugalaDewi 50 Unsuitable
DoserWewa 50 Suitable
HeekaduAra 50 Suitable
New HeekaduAra 30 Suitable
Kotiyagalawewa 120 Suitable
Moneragala MeepanaAra 10 Most Suitable
Thambalawinna 15 Most Suitable
Bibile MeegahaAra 120 Suitable
NagalaWewa 15 Most Suitable
Badalkumbura Katugahagalge 10 Most Suitable
Buttala AmbakolaWewa 66 Suitable
Yudaganawa 60 Suitable
Wellawaya Handapanagala 226 Most Suitable
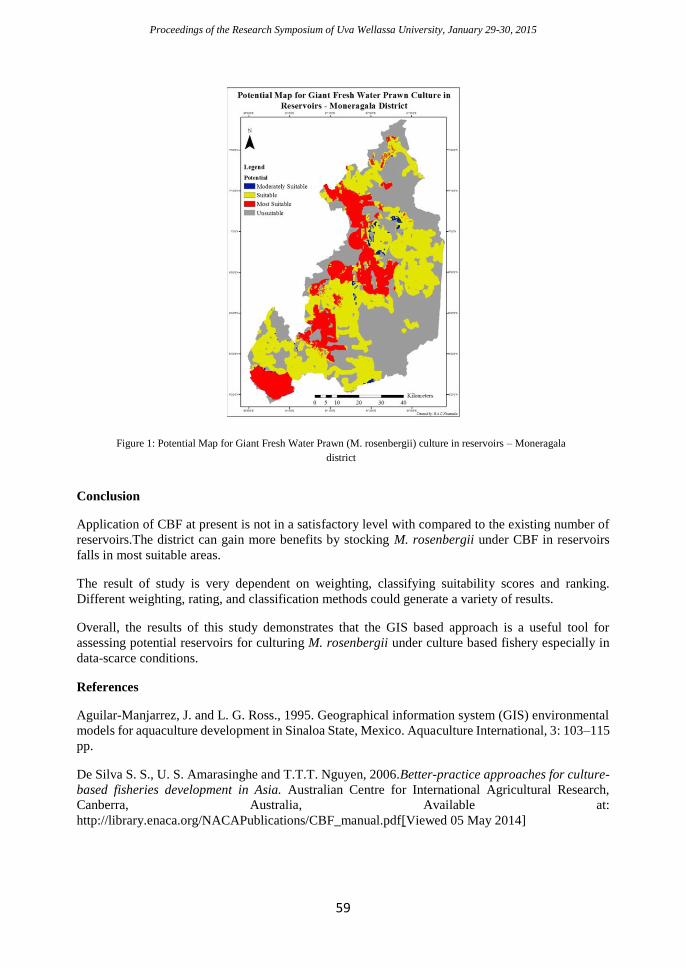
Proceedings of the Research Symposium of Uva Wellassa University, January 29-30, 2015
59
Conclusion
Application of CBF at present is not in a satisfactory level with compared to the existing number of
reservoirs.The district can gain more benefits by stocking M. rosenbergii under CBF in reservoirs
falls in most suitable areas.
The result of study is very dependent on weighting, classifying suitability scores and ranking.
Different weighting, rating, and classification methods could generate a variety of results.
Overall, the results of this study demonstrates that the GIS based approach is a useful tool for
assessing potential reservoirs for culturing M. rosenbergii under culture based fishery especially in
data-scarce conditions.
References
Aguilar-Manjarrez, J. and L. G. Ross., 1995. Geographical information system (GIS) environmental
models for aquaculture development in Sinaloa State, Mexico. Aquaculture International, 3: 103–115
pp.
De Silva S. S., U. S. Amarasinghe and T.T.T. Nguyen, 2006.Better-practice approaches for culture-
based fisheries development in Asia. Australian Centre for International Agricultural Research,
Canberra, Australia, Available at:
http://library.enaca.org/NACAPublications/CBF_manual.pdf[Viewed 05 May 2014]
Figure 1: Potential Map for Giant Fresh Water Prawn (M. rosenbergii) culture in reservoirs – Moneragala
district
Proceedings of the Research Symposium of Uva Wellassa University, January 29-30, 2015
60
Study of water quality changes and growth of cultured edible
oysters (Crassostrea madrasensis), culture sites at Gagewadiya
and Kandakuliya in Puttlam district
H.I. Wijayananda, R.M.G.N. Rajapaksha and N.P.P. Liyanage
Faculty of Animal Science and Export Agriculture, Uva Wellassa University of Sri Lanka
and
H.M.P. Kithsiri, S. Corea, G.R.H. Rupika and U. Fernando
National Aquatic Resources Research and Development Agency
and
T. Dejager
International Development Research Center
Introduction
Global bivalve production from aquaculture has consistently increased over the years. Sri Lanka is a
country which has vast natural resources and suitable environmental conditions for aquaculture.
Therefore it has a great potential for develop and contribute to national fish and shellfish production.
Although the bivalve industry is highly developed industry in East Asian region finfish and shellfish,
specially mollusk and sea cucumbers cultures are at very initial stage in Sri Lanka (Samarasundera,
2010).Sustainable utilization of unexploited high demand finfish and shellfish species are a good
alternative to develop the industry. Oysters are nutritious, still unexploited fishery resources in Sri
Lanka. Which has good export demand worldwide. Although Sri Lanka have required resources
naturally to uplift the industry in large scale, lack of information, limited supply of seeds and lack of
trained personals are act as major constraints (FAO, 2006). The success of bivalve culture greatly
depends on suitable environmental factors that ensure both optimal growth and quality as well as
ensure food safety (FAO, 2006). Kandakuliya and Gagewadiya areas are blessed with natural oyster
resources but which are not used commercial scale at present. Therefore the two locations have
significant possibility to conduct oyster culture in large scale which providing self-employment
opportunities for fisher communities. The study of water quality changes and growth of edible oysters
(Crassostrea madrasensis) culture, sites at Gagewadiya and Kandakuliya in Puttlam district was
carried out to investigate the possibility of establish these culture in commercial scale.
Methodology
The research project was conducted in two experimental sites (Gagewadiya and Kandakuliya), locates
in Puttlam district, Sri Lanka. Field data were collected during October 2013 to July 2014from pre-
establish two experimental culture sites. There were four sampling points in each site separately K1, K2,K3, K4in Kandakuliya and G1, G2, G3, G4in Gagewadiya. Water quality data, growth data and
phytoplankton data were collected each site separately. Water quality and phytoplankton data were collected twice a month, and growth data were collected once a month during the studied period.
Temperature, pH, salinity, transparency were recorded as onsite measurements. Further analysis were
conducted for nitrite, nitrate, phosphate and ammonia using DR-4000U spectrophotometer according to standard procedures of Parsons et al., 1984. Unionized ammonia levels were calculated using total
Proceedings of the Research Symposium of Uva Wellassa University, January 29-30, 2015
61
ammonia levels. Phytoplankton samples were collected using phytoplankton net (50 µm mesh
size).The samples were examined under light microscope and identified to genus level using identification keys (Newell and Newell, 1963; Rebert, 2003; Swadling, 2008; Verlencar and
Somshekar, 2004).Length (distance between the end of umbo and the ventral shell margin) and width (length at the widest axis of the body) were taken as growth parameters. Twenty five C. madrasensis
organisms were used to take measurements from each site separately, for the growth study.
Both primary and secondary data were used to analysis. Secondary data were taken from IDRC oyster
research and culture programme. Minitab 16 statistical package was used to data analysis. All data
were analyzed statistically using one way ANOVA (Turkey test) for all selected locations. Person
product movement correlation coefficient analysis was done between water quality parameters and
growth of oysters to find whether there were significant relationship between those variables.
Results and Discussion
According to the water quality study there were no significant difference (P ≥ 0.05) in nitrite, nitrate,
phosphate, unionized ammonia, temperature, pH, depth and transparency at Kandakuliya and Gagewadiya except salinity during the studied period. All water quality parameters were in
acceptable range for oyster culture. Gagewadiya (2-29 ppt) showed lower salinity and wide salinity
variation than Kandakuliya (25 -43 ppt), as this site receives fresh water from “kalaoya”. Rapid decline of salinity which make unfavorable for cultured oysters were observed in November 2013
and April 2014 at Gagewadiya. It was 2 ppt and 4 ppt respectively. This lower salinity was resulted
from increased fresh water discharge from “kalaoya”catchment area. According to Sasikumar et al. (2007) Crassostrea madarasensis species can tolerate salinity changes from 0-40 ppt. However if
these unfavorable salinities were exist longer period oyster spats can be transferred to other sites with optimum salinity. Finally it will help to increase the growth rate of C. madrasensis in that site.
According to growth study, there was no significant difference (P≤ 0.05) in growth rates (length and
width) of Crassostrea madarasensis at Kandakuliya and Gagewadiya. Since the water quality
parameters in both sites were nearly equal to each other, growth in both sites were similar. Even
though there were no significant difference (P≤ 0.05) in growth, organisms in Gagewadiya site shown
slightly higher growth than Kandakuliya. This is because of favorable aquatic environment for oysters
in Gagewadiya than Kandakuliya. That creates by nutrition rich fresh water comes from
“kalaoya”.Finally it cause to higher growth rate of the oysters in Gagewadiya than Kandakuliya.
Correlation analysis revealed that, there was no significant relationship (P ≥0.05) between growth of
C. madrasensis with nitrite, phosphate, unionized ammonia, pH and salinity levels. Nitrate,
temperature and transparency have significant relationship (P ≤ 0.05) with growth (length and width)
of C. madrasensis. Nitrate cause to growth of phytoplankton in the surrounding water, which is
primary food source for oysters. Therefore it directly affect to the growth of oysters. No harmful algal
species were recorded during the studied period.
Conclusion
Salinity levels in both Gagewadiya and Kandakuliya were in tolerable levelfor C. madrasensis during
the studied period. The absence of toxic algae (dianofllagelates) at both sites and suitable ranges of
temperature, pH, transparency, nitrite, nitrate, phosphate, and unionized ammonia levels suggest that
Kandakuliya and Gagewadiya areas are suitable for commercial oyster culture practices. According
to growth study, C. madrasensis growth in Gagewadiya site shows slightly higher growth rate than
Kandakuliya site. Therefore Gagewadiya site can be recommended as best site among those two sites.
Acknowledgment
Proceedings of the Research Symposium of Uva Wellassa University, January 29-30, 2015
62
We would like to express our heartfelt gratitude to all the people in IARAD and ESD divisions in
National Aquatic Resources Research and Development Agency, who gave their tremendous help to
successfully completion of this research work. Further we like to extend our sincere gratitude to
International Development Research Center (IDRC) for providing grants to conduct the research
work.
References
FAO, 2006, Inland Water Resources and Aquaculture Service, Fishery Resources Division, FAO
Fisheries Department, Rome, Italy.
Sasikumar et al., 2007. Influence of Environmental factors on growth rate of Crassostreamadrasensis
(Preston) in suspended culture.
Samarasudera S.G, 2012. NARA sets action plan to develop fish industry. [Online] available
at:http://www.sundayobserver.lk/2012/06/24/fea12.asp[Accessed 05 May 2014].
Proceedings of the Research Symposium of UvaWellassa University, January 29-30, 2015
Technical Session - Export Agriculture
Table of Contents
Oral Session
In vitro antifungal activity of selected medicinal plant extracts against
selected postharvest pathogens in fruits and vegetables ........................... 1
Technical efficiency of Mirahawatte organic tea smallholders: a
stochastic frontier approach ........................................................................ 4
Assessment of oil yield and quality in cinnamon (Cinnamomum
zeylanicum Blume) leaves under different severity levels of two types of
leaf galls ......................................................................................................... 8
Development of low Glycemic Index bread using a composite flour
mixture ........................................................................................................ 11
Development of a protocol for in-vitro propagation of black pepper
(Piper nigrum L.) local selections .............................................................. 14
Analysis of technical efficiency of pepper growers in Kandy district ... 17
Feasibility study for direct planting of in vitro potato (Solanum
tuberosum L.) varieties Granola and Golden Star in aeroponic system 21
Labour migration and paddy production; a comparative analysis ....... 24
Effect of nitrogen fertilization on nitrate accumulation in radish
(Raphunus sativus) and beetroot (Beta vulgaris) ...................................... 27
Development of stirred type fruit yoghurt using wood apple (Limonia
acidissima) ................................................................................................... 30
Investigating the factors that influenced the excess use of pesticides by
the vegetable farmers in Badulla and Nuwara-Eliya districts ............... 34
Mapping soil chemical properties and leaf quality parameters relation
to tobacco production in Sri Lanka: a GIS approach ............................. 38
Willingness to adopt chemical leasing service by vegetable farming in
Nuwara Eliya district, Sri Lanka .............................................................. 42
Analysis of combining ability and heterosis in tomato (solanum
lycopersicum) using full diallel cross ......................................................... 46
Proceedings of the Research Symposium of UvaWellassa University, January 29-30, 2015
Preservation of tomato (Lycopersicon esculentum) ................................. 49
by dehydration for product development and utilization ....................... 49
Study on response of rice varieties to different nitrogen fertilizer levels
...................................................................................................................... 52
Factors affecting on the integrity and sealing of flexible packaging ..... 55
Selection of an effective biofilmed biofertilizer formulation and best
potting medium for anthurium (Anthurium andraeanum) ..................... 58
Studying the effects of Paracoccus marginatus (Mealybug) attack on
forming of Tagets spp. (Indian Marigold) flower ..................................... 61
Consumer preference for quality attributes of rice ................................ 64
Poster Session
Determination of microbial quality and quantity of stored cinnamon
quills ............................................................................................................. 67
Development of ready to serve drink from gotukola .............................. 71
(Centella asiatica) ........................................................................................ 71
Satisfaction of Low Country vegetable farmers about the agricultural
extension service in Sri Lanka ................................................................... 74
Nitrogen and potassium fertilizer response on growth and yield of
hybrid Luffa –Naga f1 variety ................................................................... 79
Patterns of fresh fruit consumption of households in Kurunegala ........ 82
Farmers perception on cultivating medicinal plants as an agribusiness
venture: a study at Pambahinna agrarian services division ................... 85
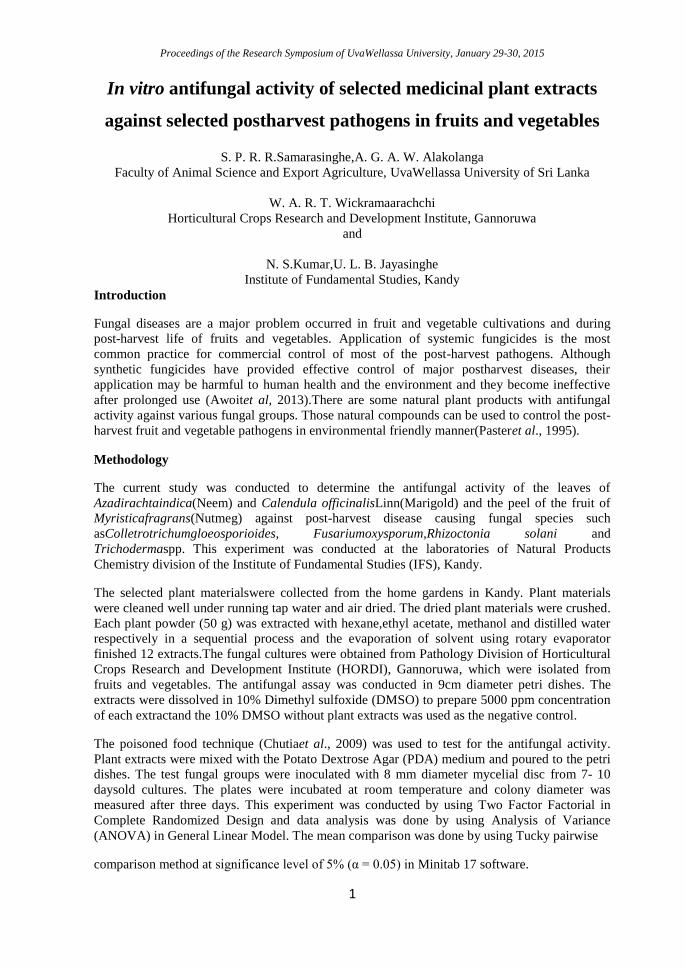
Proceedings of the Research Symposium of UvaWellassa University, January 29-30, 2015
1
In vitro antifungal activity of selected medicinal plant extracts
against selected postharvest pathogens in fruits and vegetables
S. P. R. R.Samarasinghe,A. G. A. W. Alakolanga
Faculty of Animal Science and Export Agriculture, UvaWellassa University of Sri Lanka
W. A. R. T. Wickramaarachchi
Horticultural Crops Research and Development Institute, Gannoruwa
and
N. S.Kumar,U. L. B. Jayasinghe
Institute of Fundamental Studies, Kandy
Introduction
Fungal diseases are a major problem occurred in fruit and vegetable cultivations and during
post-harvest life of fruits and vegetables. Application of systemic fungicides is the most
common practice for commercial control of most of the post-harvest pathogens. Although
synthetic fungicides have provided effective control of major postharvest diseases, their
application may be harmful to human health and the environment and they become ineffective
after prolonged use (Awoitet al, 2013).There are some natural plant products with antifungal
activity against various fungal groups. Those natural compounds can be used to control the post-
harvest fruit and vegetable pathogens in environmental friendly manner(Pasteret al., 1995).
Methodology
The current study was conducted to determine the antifungal activity of the leaves of
Azadirachtaindica(Neem) and Calendula officinalisLinn(Marigold) and the peel of the fruit of
Myristicafragrans(Nutmeg) against post-harvest disease causing fungal species such
asColletrotrichumgloeosporioides, Fusariumoxysporum,Rhizoctonia solani and
Trichodermaspp. This experiment was conducted at the laboratories of Natural Products
Chemistry division of the Institute of Fundamental Studies (IFS), Kandy.
The selected plant materialswere collected from the home gardens in Kandy. Plant materials
were cleaned well under running tap water and air dried. The dried plant materials were crushed.
Each plant powder (50 g) was extracted with hexane,ethyl acetate, methanol and distilled water
respectively in a sequential process and the evaporation of solvent using rotary evaporator
finished 12 extracts.The fungal cultures were obtained from Pathology Division of Horticultural
Crops Research and Development Institute (HORDI), Gannoruwa, which were isolated from
fruits and vegetables. The antifungal assay was conducted in 9cm diameter petri dishes. The
extracts were dissolved in 10% Dimethyl sulfoxide (DMSO) to prepare 5000 ppm concentration
of each extractand the 10% DMSO without plant extracts was used as the negative control.
The poisoned food technique (Chutiaet al., 2009) was used to test for the antifungal activity.
Plant extracts were mixed with the Potato Dextrose Agar (PDA) medium and poured to the petri
dishes. The test fungal groups were inoculated with 8 mm diameter mycelial disc from 7- 10
daysold cultures. The plates were incubated at room temperature and colony diameter was
measured after three days. This experiment was conducted by using Two Factor Factorial in
Complete Randomized Design and data analysis was done by using Analysis of Variance
(ANOVA) in General Linear Model. The mean comparison was done by using Tucky pairwise
comparison method at significance level of 5% (α = 0.05) in Minitab 17 software.
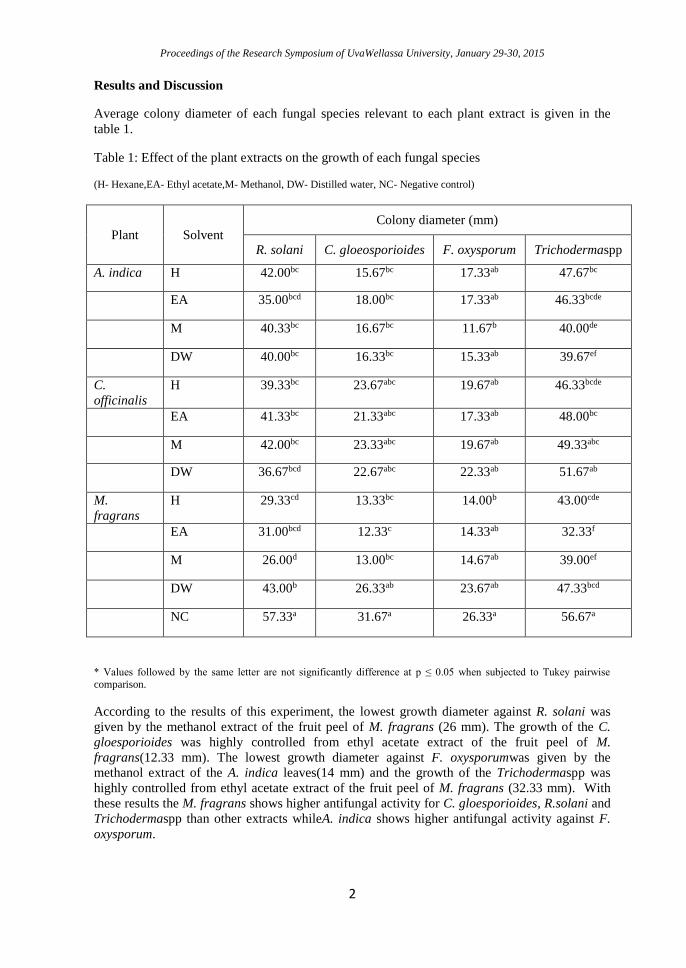
Proceedings of the Research Symposium of UvaWellassa University, January 29-30, 2015
2
Results and Discussion
Average colony diameter of each fungal species relevant to each plant extract is given in the
table 1.
Table 1: Effect of the plant extracts on the growth of each fungal species
(H- Hexane,EA- Ethyl acetate,M- Methanol, DW- Distilled water, NC- Negative control)
* Values followed by the same letter are not significantly difference at p ≤ 0.05 when subjected to Tukey pairwise
comparison.
According to the results of this experiment, the lowest growth diameter against R. solani was
given by the methanol extract of the fruit peel of M. fragrans (26 mm). The growth of the C.
gloesporioides was highly controlled from ethyl acetate extract of the fruit peel of M.
fragrans(12.33 mm). The lowest growth diameter against F. oxysporumwas given by the
methanol extract of the A. indica leaves(14 mm) and the growth of the Trichodermaspp was
highly controlled from ethyl acetate extract of the fruit peel of M. fragrans (32.33 mm). With
these results the M. fragrans shows higher antifungal activity for C. gloesporioides, R.solani and
Trichodermaspp than other extracts whileA. indica shows higher antifungal activity against F.
oxysporum.
Plant Solvent Colony diameter (mm)
R. solani C. gloeosporioides F. oxysporum Trichodermaspp
A. indica H 42.00bc 15.67bc 17.33ab 47.67bc
EA 35.00bcd 18.00bc 17.33ab 46.33bcde
M 40.33bc 16.67bc 11.67b 40.00de
DW 40.00bc 16.33bc 15.33ab 39.67ef
C.
officinalis
H 39.33bc 23.67abc 19.67ab 46.33bcde
EA 41.33bc 21.33abc 17.33ab 48.00bc
M 42.00bc 23.33abc 19.67ab 49.33abc
DW 36.67bcd 22.67abc 22.33ab 51.67ab
M.
fragrans
H 29.33cd 13.33bc 14.00b 43.00cde
EA 31.00bcd 12.33c 14.33ab 32.33f
M 26.00d 13.00bc 14.67ab 39.00ef
DW 43.00b 26.33ab 23.67ab 47.33bcd
NC 57.33a 31.67a 26.33a 56.67a
Proceedings of the Research Symposium of UvaWellassa University, January 29-30, 2015
3
Conclusions
The best antifungal extract against R. solani is methanol extract of fruit peel ofM. fragrans and
the best antifungal extract against C. gloeosporioides and Trichodermaspp is ethyl acetate
extract of fruit peel of M. fragrans plant. The best antifungal extract against F. oxysporum is
methanol extract of A. indica plant.
References
Awoite, T. M., Olorunfemi, M. F., Ajani, A. O. and Oyelakin, M. O. (2013).Studies on fungi
associated with post-harvest spoilage of pawpaw Carica papaya fruit, IOSR Journal of Pharmacy
and Biological Sciences (IOSR-JPBS), 4, 1-4.
Chutia, M., Bhuyan, P. D., Pathak, M. G., Sarma, T. C. &Boruah, P. (2009).Antifungal activity
and chemical composition of Citrus reticulata Blanco essential oil against phytopathogens from
North East India, LWT - Food Science and Technology 42, 777–780.
Paster, N., Menasherov, M., Ravid, U. &Juven B. (1995). Antifungal activity of oregano and
thyme essential oils applied as fumigants against fungi attacking stored grain. Journal of Food
Protection, 58, 81−85.
Proceedings of the Research Symposium of UvaWellassa University, January 29-30, 2015
4
Technical efficiency of Mirahawatte organic tea smallholders: a
stochastic frontier approach
K. R. S. Chathurangi and R. M. S. D. Rathnayaka
Faculty of Animal Science and Export Agriculture, UvaWellassa University of Sri Lanka
Introduction
Organic agriculture is now becoming very famous among Sri Lankan farmers as it is able to
catch more foreign exchange to the country. World public is more concerning on sustainable
agro-product consumption to secure the economic, environmental and social benefits. Tea is one
of the most prominent organic export crops in Sri Lanka. The relevant actions need to take to
develop the organic tea production in the country. Before moving to that, most effective solution
to upgrade the production is increasing the technical efficiency; ability to produce maximum
output using existence inputs and technology. Measuring the technical efficiency will prove the
actual sustainability of tea industry in economics terms.
Sri Lanka tea industry consists with estate sector and tea smallholdings. Contribution from the
tea smallholders to the national tea production was 72% in 2013 (Ministry of Plantation
Industries, 2013).As tea smallholders play a major role in Sri Lankan economy, analyzing
technical efficiency is imperative. Main objectives targeted to measure the value of technical
efficiency of tea smallholders in Mirahawatte and to find out the determinants of technical
efficiency of organic tea smallholders in Mirahawatte.
Methodology
Technical efficiency of Mirahawatte organic tea smallholders were measuredin this study with
71 organic tea small holders registered under Marginalized Organic Producer’s Association.
Stochastic frontier model was used to estimate the technical efficiency. Primary and secondary
panel data were collected during the period of 2011/2012 to 2013/2014. Technical efficiency
was estimated by a stochastic frontier function using a Cobb-Douglas model, incorporating
technical inefficiency effect model. In Cobb-Douglas model effect of eight inputs against output
was measured. In technical inefficiency function, sixteen variables were identified as efficiency
components oftechnical inefficiency. Data ware analyzed using STATA version 11 and frontier
4.1c computer programme.
𝑌𝑖𝑡 = 𝑒𝑥𝑝(𝑥𝑖𝑡𝛽 + 𝑉𝑖𝑡 − 𝑈𝑖𝑡); (Battese andCoelli, 1995)
Cobb-Douglas model specification is,
𝑙𝑛(𝑌𝑖𝑡) = 𝛽0 + 𝛽1𝑙𝑛(𝑥1)𝑖𝑡 + 𝛽2𝑙𝑛(𝑥2)𝑖𝑡 + 𝛽3𝑙𝑛(𝑥3)𝑖𝑡 + 𝛽4𝑙𝑛(𝑥4)𝑖𝑡 + 𝛽5𝑙𝑛(𝑥5)𝑖𝑡 + 𝛽6𝑙𝑛(𝑥6)𝑖𝑡+ 𝛽7𝑙𝑛(𝑥7)𝑖𝑡
+𝛽8𝑙𝑛(𝑥8)𝑖𝑡 + 𝑉𝑖𝑡 − 𝑈𝑖𝑡
Specification of technical efficiency function is,
𝑈𝑖𝑡 = 𝛿0 + 𝛿1(𝑍1)𝑖𝑡 + 𝛿2(𝑍2)𝑖𝑡 + 𝛿3(𝑍3)𝑖𝑡 + 𝛿4(𝑍4)𝑖𝑡 + 𝛿5(𝑍5)𝑖𝑡 + 𝛿6(𝑍6)𝑖𝑡 + 𝛿7(𝑍7)𝑖𝑡+ 𝛿8(𝑍8)𝑖𝑡 + 𝛿9(𝑍9)𝑖𝑡 + 𝛿10(𝑍10)𝑖𝑡 + 𝛿11(𝑍11)𝑖𝑡 + 𝛿12(𝑍12)𝑖𝑡 + 𝛿13(𝑍13)𝑖𝑡+ 𝛿14(𝑍14)𝑖𝑡 + 𝛿15(𝑍15)𝑖𝑡 + 𝛿16(𝑍16)𝑖𝑡 +𝑊𝑖𝑡
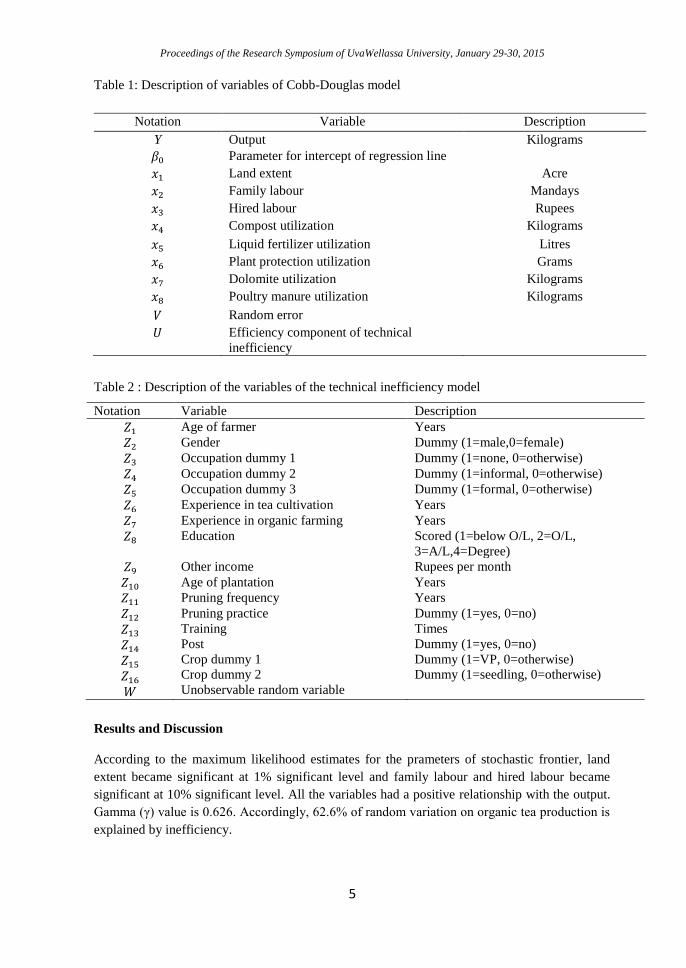
Proceedings of the Research Symposium of UvaWellassa University, January 29-30, 2015
5
Table 1: Description of variables of Cobb-Douglas model
Notation Variable Description
Y Output Kilograms
𝛽0 Parameter for intercept of regression line
𝑥1 Land extent Acre
𝑥2 Family labour Mandays
𝑥3 Hired labour Rupees
𝑥4 Compost utilization Kilograms
𝑥5 Liquid fertilizer utilization Litres
𝑥6 Plant protection utilization Grams
𝑥7 Dolomite utilization Kilograms
𝑥8 Poultry manure utilization Kilograms
𝑉 Random error
𝑈 Efficiency component of technical
inefficiency
Table 2 : Description of the variables of the technical inefficiency model
Notation Variable Description
𝑍1 Age of farmer Years
𝑍2 Gender Dummy (1=male,0=female)
𝑍3 Occupation dummy 1 Dummy (1=none, 0=otherwise)
𝑍4 Occupation dummy 2 Dummy (1=informal, 0=otherwise)
𝑍5 Occupation dummy 3 Dummy (1=formal, 0=otherwise)
𝑍6 Experience in tea cultivation Years
𝑍7 Experience in organic farming Years
𝑍8 Education Scored (1=below O/L, 2=O/L,
3=A/L,4=Degree)
𝑍9 Other income Rupees per month
𝑍10 Age of plantation Years
𝑍11 Pruning frequency Years
𝑍12
𝑍13
𝑍14
𝑍15
𝑍16
𝑊
Pruning practice
Training
Post
Crop dummy 1
Crop dummy 2
Unobservable random variable
Dummy (1=yes, 0=no)
Times
Dummy (1=yes, 0=no)
Dummy (1=VP, 0=otherwise)
Dummy (1=seedling, 0=otherwise)
Results and Discussion
According to the maximum likelihood estimates for the prameters of stochastic frontier, land
extent became significant at 1% significant level and family labour and hired labour became
significant at 10% significant level. All the variables had a positive relationship with the output.
Gamma (γ) value is 0.626. Accordingly, 62.6% of random variation on organic tea production is
explained by inefficiency.
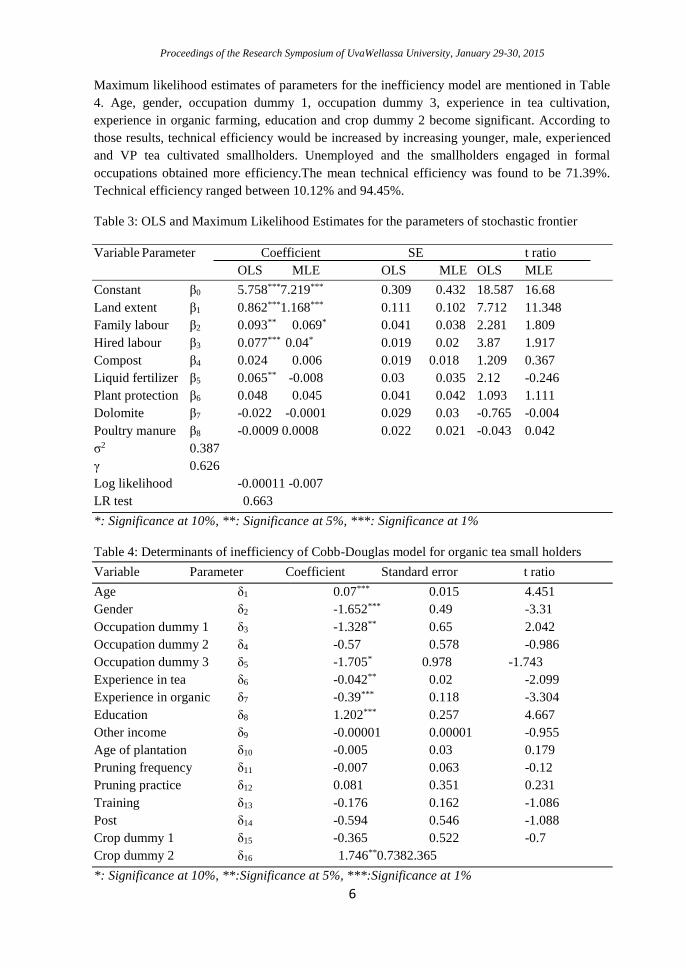
Proceedings of the Research Symposium of UvaWellassa University, January 29-30, 2015
6
Maximum likelihood estimates of parameters for the inefficiency model are mentioned in Table
4. Age, gender, occupation dummy 1, occupation dummy 3, experience in tea cultivation,
experience in organic farming, education and crop dummy 2 become significant. According to
those results, technical efficiency would be increased by increasing younger, male, experienced
and VP tea cultivated smallholders. Unemployed and the smallholders engaged in formal
occupations obtained more efficiency.The mean technical efficiency was found to be 71.39%.
Technical efficiency ranged between 10.12% and 94.45%.
Table 3: OLS and Maximum Likelihood Estimates for the parameters of stochastic frontier
Variable Parameter Coefficient SE t ratio
OLS MLE OLS MLE OLS MLE
Constant β0 5.758***7.219*** 0.309 0.432 18.587 16.68
Land extent β1 0.862***1.168*** 0.111 0.102 7.712 11.348
Family labour β2 0.093** 0.069* 0.041 0.038 2.281 1.809
Hired labour β3 0.077*** 0.04* 0.019 0.02 3.87 1.917
Compost β4 0.024 0.006 0.019 0.018 1.209 0.367
Liquid fertilizer β5 0.065** -0.008 0.03 0.035 2.12 -0.246
Plant protection β6 0.048 0.045 0.041 0.042 1.093 1.111
Dolomite β7 -0.022 -0.0001 0.029 0.03 -0.765 -0.004
Poultry manure β8 -0.0009 0.0008 0.022 0.021 -0.043 0.042
σ2 0.387
γ 0.626
Log likelihood -0.00011 -0.007
LR test 0.663
*: Significance at 10%, **: Significance at 5%, ***: Significance at 1%
Table 4: Determinants of inefficiency of Cobb-Douglas model for organic tea small holders
Variable Parameter Coefficient Standard error t ratio
Age δ1 0.07*** 0.015 4.451
Gender δ2 -1.652*** 0.49 -3.31
Occupation dummy 1 δ3 -1.328** 0.65 2.042
Occupation dummy 2 δ4 -0.57 0.578 -0.986
Occupation dummy 3 δ5 -1.705* 0.978 -1.743
Experience in tea δ6 -0.042** 0.02 -2.099
Experience in organic δ7 -0.39*** 0.118 -3.304
Education δ8 1.202*** 0.257 4.667
Other income δ9 -0.00001 0.00001 -0.955
Age of plantation δ10 -0.005 0.03 0.179
Pruning frequency δ11 -0.007 0.063 -0.12
Pruning practice δ12 0.081 0.351 0.231
Training δ13 -0.176 0.162 -1.086
Post δ14 -0.594 0.546 -1.088
Crop dummy 1 δ15 -0.365 0.522 -0.7
Crop dummy 2 δ16 1.746**0.7382.365
*: Significance at 10%, **:Significance at 5%, ***:Significance at 1%
Proceedings of the Research Symposium of UvaWellassa University, January 29-30, 2015
7
Conclusion
There is still 28.61% of remaining potential to develop the output levels without increasing input
levels and technology. Several policy recommendations can be given. Empowering policies to
attract especially young people and females, organizing special extension programmes for elder
smallholders, arranging regular meetings among farmer groups to share knowledge from
experienced farmers and government involvement to increase replanting subsidy are the
identified recommendations.
References
Battesse, G. E and Coelli, T. J. (1995). A Model for Technical Inefficiency Effects in a
Stochastic Frontier Production Function For Panel Data. Empirical Economics, 325-332.
Ministry of Plantation Industries. (2013). Progress Report, Colombo.
Proceedings of the Research Symposium of UvaWellassa University, January 29-30, 2015
8
Assessment of oil yield and quality in cinnamon (Cinnamomum
zeylanicum Blume) leaves under different severity levels of two
types of leaf galls
N. P. Daladawatta, G. Chandrasena, A. N. R. Weerawansha
Faculty of Animal Science and Export Agriculture, UvaWellassa University of Sri Lanka
and
G. G. Jayasinghe,
National Cinnamon Research and Training Center, Palolpitiya, Thihagoda, Matara
Introduction
Leaf gall infestation in cinnamon, is one of the prominent pest damage found in cinnamon
cultivations. In cinnamon, two conspicuous leaf gall types are available. They are upper leaf
galls caused by jumping plant louse (Trioza cinnamomi), a homopteran and lower leaf galls
caused by Eriophyes boisi, a mite belongs to family Eriophyidae. Two pests are plant sappers
and form galls on leaf blade as their habitats. The feeding by Eriophyes boisi or Trioza
cinnamomi causes abnormal cell development and formation of galls. Each gall type is identical
and their dimensions are variable. The galls are solitary and widespread on the leaf blade but are
not on the veins. These Gall forming pests generally do little damage to plants and its bark yield
because the affected parts are able to carry out photosynthesis with near normal efficiency. But
cinnamon leaf oil yield and its quality may be changed significantly due to gall forming (Perera
et. al., 1985; Prematilaka and Dharmadasa, 1995). Therefore this study was conducted to
determine the effect of two different leaf galls in cinnamon leaves under different severity levels
on the leaf oil content and quality of oil.
Methodology
Cinnamon leaf samples infested with two types of galls, were collected from a field in
Palolpitiya, Matara. Leaves only suffered from upper and lower gall infestations were harvested
separately and categorized each of them into five pre-determined severity levels for oil
extraction. Four severity levels of upper leaf gall infestation 1-50, 51 – 100, 101 – 150 and more
than 151 galls per leaf and four severity levels of lower leaf gall infestation 1-15, 16 – 30, 31 –
45 and more than 46 galls per leaf were compared with cinnamon leaves without galls
separately. Five treatments were assigned in randomized complete block design with five
replicates. 50 g of air dried cinnamon leaf sample taken from each severity level was weighed
and all the galls in the sample were isolated and weighed. Weight of galls in each severity level
was expressed as a percentage to the whole sample weight. Each sample was subjected to extract
leaf oil by hydro distillation. Amount of the major chemical components present in the extracted
oil samples were measured by performing Gas Liquid Chromatography (GLC). Oil content and
quality were subjected to analysis of variance and regression analysis by SAS programme.
Results and Discussion
Thus it revealed that leaf oil contents were significantly different with the intensity of upper gall
infestation (Table 1). It was observed that cinnamon leaf oil content had been lost from 10.48%
at 25.62% severity to 74.26% at 97.26% severity. Same trend was observed in the case of lower
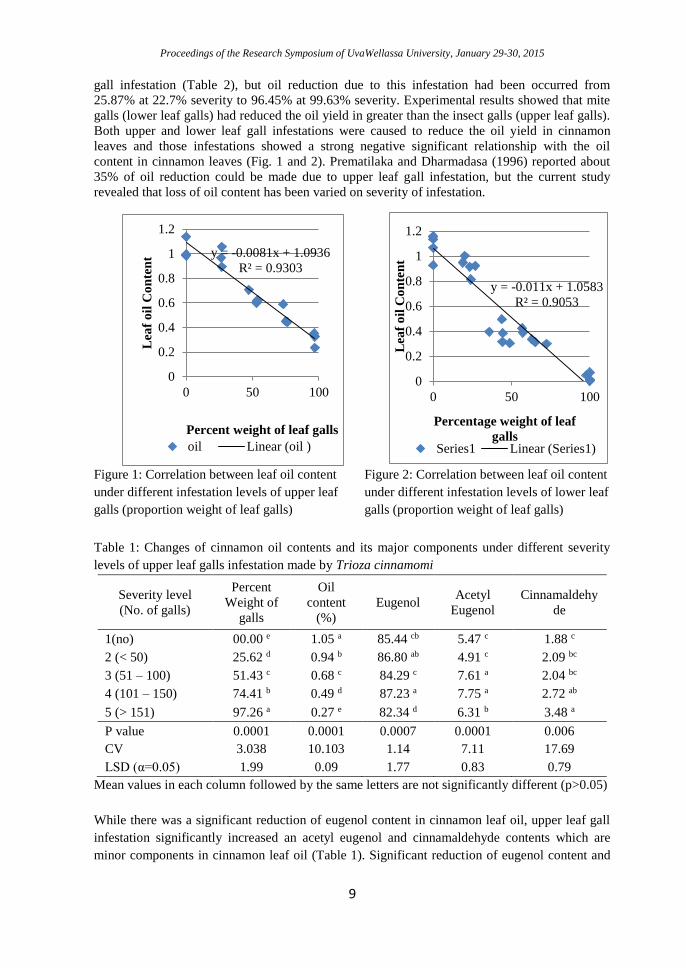
Proceedings of the Research Symposium of UvaWellassa University, January 29-30, 2015
9
gall infestation (Table 2), but oil reduction due to this infestation had been occurred from
25.87% at 22.7% severity to 96.45% at 99.63% severity. Experimental results showed that mite
galls (lower leaf galls) had reduced the oil yield in greater than the insect galls (upper leaf galls).
Both upper and lower leaf gall infestations were caused to reduce the oil yield in cinnamon
leaves and those infestations showed a strong negative significant relationship with the oil
content in cinnamon leaves (Fig. 1 and 2). Prematilaka and Dharmadasa (1996) reported about
35% of oil reduction could be made due to upper leaf gall infestation, but the current study
revealed that loss of oil content has been varied on severity of infestation.
Figure 1: Correlation between leaf oil content
under different infestation levels of upper leaf
galls (proportion weight of leaf galls)
Figure 2: Correlation between leaf oil content
under different infestation levels of lower leaf
galls (proportion weight of leaf galls)
Table 1: Changes of cinnamon oil contents and its major components under different severity
levels of upper leaf galls infestation made by Trioza cinnamomi
Severity level
(No. of galls)
Percent
Weight of
galls
Oil
content
(%)
Eugenol Acetyl
Eugenol
Cinnamaldehy
de
1(no) 00.00 e 1.05 a 85.44 cb 5.47 c 1.88 c
2 (< 50) 25.62 d 0.94 b 86.80 ab 4.91 c 2.09 bc
3 (51 – 100) 51.43 c 0.68 c 84.29 c 7.61 a 2.04 bc
4 (101 – 150) 74.41 b 0.49 d 87.23 a 7.75 a 2.72 ab
5 (> 151) 97.26 a 0.27 e 82.34 d 6.31 b 3.48 a
P value 0.0001 0.0001 0.0007 0.0001 0.006
CV 3.038 10.103 1.14 7.11 17.69
LSD (α=0.05) 1.99 0.09 1.77 0.83 0.79
Mean values in each column followed by the same letters are not significantly different (p>0.05)
While there was a significant reduction of eugenol content in cinnamon leaf oil, upper leaf gall
infestation significantly increased an acetyl eugenol and cinnamaldehyde contents which are
minor components in cinnamon leaf oil (Table 1). Significant reduction of eugenol content and
y = -0.011x + 1.0583
R² = 0.9053
0
0.2
0.4
0.6
0.8
1
1.2
0 50 100L
eaf
oil
Co
nte
nt
Percentage weight of leaf
gallsSeries1 Linear (Series1)
y = -0.0081x + 1.0936
R² = 0.9303
0
0.2
0.4
0.6
0.8
1
1.2
0 50 100
Lea
f o
il C
on
ten
t
Percent weight of leaf galls
oil Linear (oil )
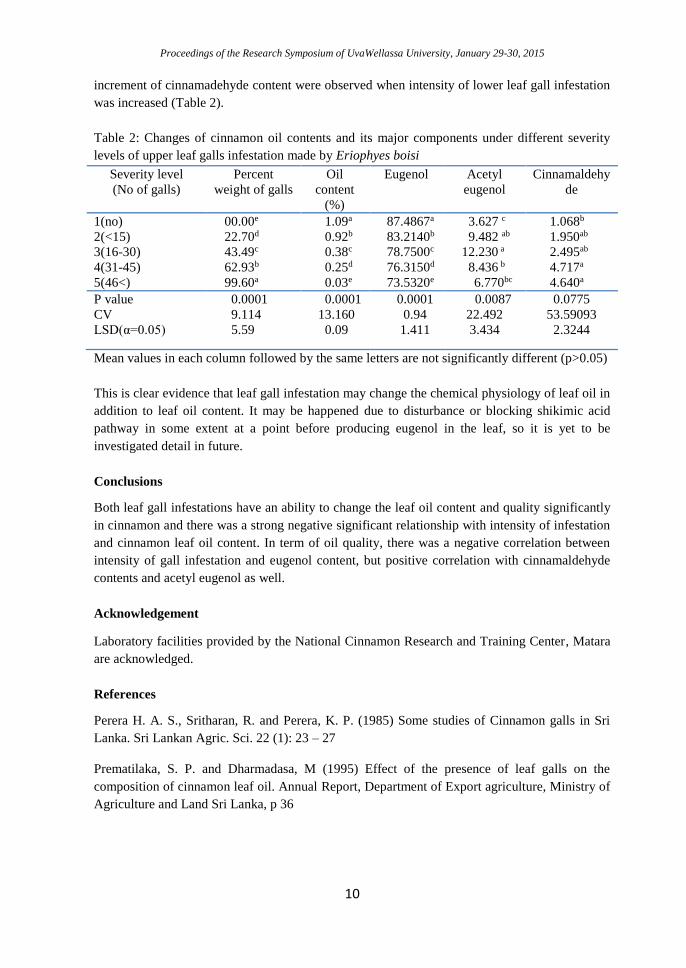
Proceedings of the Research Symposium of UvaWellassa University, January 29-30, 2015
10
increment of cinnamadehyde content were observed when intensity of lower leaf gall infestation
was increased (Table 2).
Table 2: Changes of cinnamon oil contents and its major components under different severity
levels of upper leaf galls infestation made by Eriophyes boisi
Severity level
(No of galls)
Percent
weight of galls
Oil
content
(%)
Eugenol Acetyl
eugenol
Cinnamaldehy
de
1(no) 00.00e 1.09a 87.4867a 3.627 c 1.068b
2(<15) 22.70d 0.92b 83.2140b 9.482 ab 1.950ab
3(16-30) 43.49c 0.38c 78.7500c 12.230 a 2.495ab
4(31-45) 62.93b 0.25d 76.3150d 8.436 b 4.717a
5(46<) 99.60a 0.03e 73.5320e 6.770bc 4.640a
P value
CV
LSD(α=0.05)
0.0001
9.114
5.59
0.0001
13.160
0.09
0.0001
0.94
1.411
0.0087
22.492
3.434
0.0775
53.59093
2.3244
Mean values in each column followed by the same letters are not significantly different (p>0.05)
This is clear evidence that leaf gall infestation may change the chemical physiology of leaf oil in
addition to leaf oil content. It may be happened due to disturbance or blocking shikimic acid
pathway in some extent at a point before producing eugenol in the leaf, so it is yet to be
investigated detail in future.
Conclusions
Both leaf gall infestations have an ability to change the leaf oil content and quality significantly
in cinnamon and there was a strong negative significant relationship with intensity of infestation
and cinnamon leaf oil content. In term of oil quality, there was a negative correlation between
intensity of gall infestation and eugenol content, but positive correlation with cinnamaldehyde
contents and acetyl eugenol as well.
Acknowledgement
Laboratory facilities provided by the National Cinnamon Research and Training Center, Matara
are acknowledged.
References
Perera H. A. S., Sritharan, R. and Perera, K. P. (1985) Some studies of Cinnamon galls in Sri
Lanka. Sri Lankan Agric. Sci. 22 (1): 23 – 27
Prematilaka, S. P. and Dharmadasa, M (1995) Effect of the presence of leaf galls on the
composition of cinnamon leaf oil. Annual Report, Department of Export agriculture, Ministry of
Agriculture and Land Sri Lanka, p 36
Proceedings of the Research Symposium of UvaWellassa University, January 29-30, 2015
11
Development of low Glycemic Index bread using a composite
flour mixture
K.W Thilakarathna, W.A.J.P.Wijesinghe
Faculty of AnimalScience and Export Agriculture, UvaWellassa University of Sri Lanka
and
K,H.Sarananda
Food Research Unit, Department of Agriculture, Gannoruwa, Peradeniya
Introduction
Composite flour technology is initially referred to process of mixing wheat flour with cereal and
legume flour for making bread and biscuits. However, the term can also be used with regard to
mixing of non-wheat flours, roots and tubers or other raw materials (Singh and Raguvanshi,
2011).Bread is a product obtained by baking yeast leavened dough prepared from wheat flour
and with or without the addition of ingredients and permitted additives (SLS 141: 1992). The
Glycemic Index (GI) of a food refers to the effect the food has on the body’s blood sugar levels.
Modern day people seek to avoid wheat flour bread, due to health risk. There is growing interest
about nutrients content in bread using composite flour technology. Therefore, this research was
carried out to develop low Glycemic Index bread as a solution for various health effects occurred
due to the consumption of wheat bread.
Methodology
The current study was carried out at Food Research Unit, Gannoruwa. Six experimental trials
with different treatments were conducted during this study. Finally three treatments were
prepared and evaluated on sensory and microbial analysis. 10%, 12% and 14% finger millet
incorporated, treatments were used for sensory evaluation. The sensory evaluation was done
using 15 semi trained panelists. In chemical analysis, proximate composition was determined for
moisture content, fat, crude protein, ash, fiber, total carbohydrate and calcium. Specific volume
was measured in selected three bread dough and bread samples using Modified Rapeseed
Displacement Method. Texture was measured using a penetrometer for selected bread sample
from sensory evaluation. Microbiological analysis was done for Escherichia coli, Total Plate
Count (TPC), yeast and mould. Self-life determination was done by stored normal temperature
with polythene wrap and without polythene wrap. Glycemic Index was measured using ten
healthy volunteers in Food Research unit
Result and Discussion
According to the sensory evaluation, the 12% finger millet incorporated bread was selected as
best bread sample by giving good texture, taste, aroma and colour.
According to the figure 01, just after baked mean pressure become 0.83 kg. Then texture was
soft. The pressure gradually increased with the time. With the time texture become harder than
just after baked. After two hours mean pressure was 16.67 kg. Texture is mainly governed by
gluten percentage. High gluten content gives soft texture due to gluten network. In this bread,
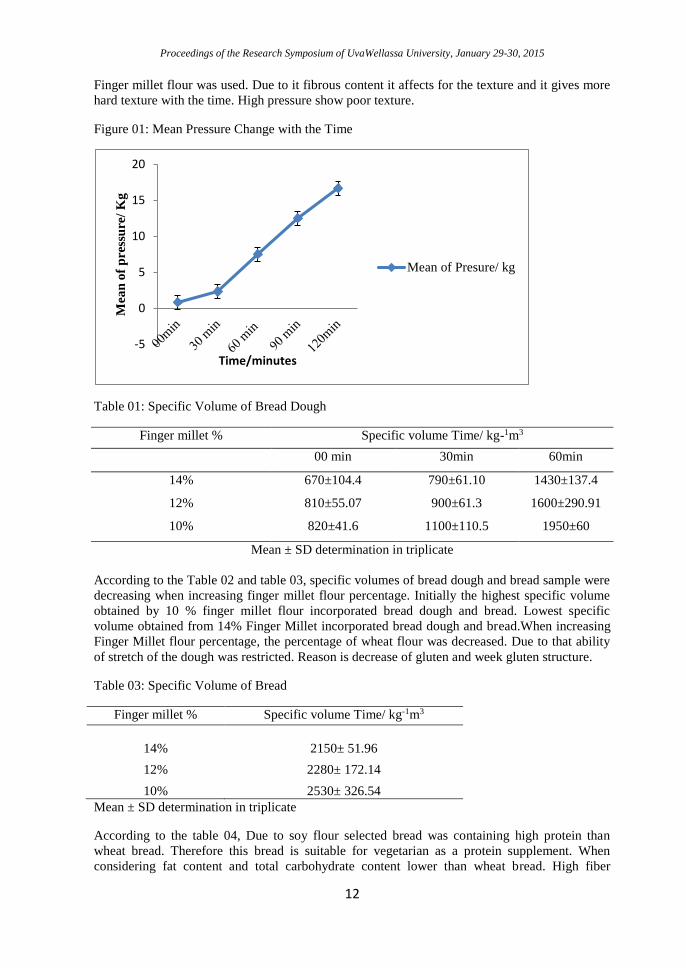
Proceedings of the Research Symposium of UvaWellassa University, January 29-30, 2015
12
Finger millet flour was used. Due to it fibrous content it affects for the texture and it gives more
hard texture with the time. High pressure show poor texture.
Figure 01: Mean Pressure Change with the Time
Table 01: Specific Volume of Bread Dough
Finger millet % Specific volume Time/ kg-1m3
00 min 30min 60min
14%
12%
10%
670±104.4
810±55.07
820±41.6
790±61.10
900±61.3
1100±110.5
1430±137.4
1600±290.91
1950±60
Mean ± SD determination in triplicate
According to the Table 02 and table 03, specific volumes of bread dough and bread sample were
decreasing when increasing finger millet flour percentage. Initially the highest specific volume
obtained by 10 % finger millet flour incorporated bread dough and bread. Lowest specific
volume obtained from 14% Finger Millet incorporated bread dough and bread.When increasing
Finger Millet flour percentage, the percentage of wheat flour was decreased. Due to that ability
of stretch of the dough was restricted. Reason is decrease of gluten and week gluten structure.
Table 03: Specific Volume of Bread
Finger millet % Specific volume Time/ kg-1m3
14% 2150± 51.96
12% 2280± 172.14
10% 2530± 326.54
Mean ± SD determination in triplicate
According to the table 04, Due to soy flour selected bread was containing high protein than
wheat bread. Therefore this bread is suitable for vegetarian as a protein supplement. When
considering fat content and total carbohydrate content lower than wheat bread. High fiber
-5
0
5
10
15
20
Mea
n o
f p
ress
ure
/ K
g
Time/minutes
Mean of Presure/ kg
Proceedings of the Research Symposium of UvaWellassa University, January 29-30, 2015
13
content good for the diabetic patients because it helps for low digestibility. This bread contain
high amount of calcium. Thus this bread formula gives good supplement of calcium. Finger
millet flour content is the main reason for this high calcium percentage.
Table 04: Proximate Analysis
Proximate Composition Selected bread sample Wheat bread*
Moisture % 31.2 40
Ash% 3.5 0.1
Crude Protein% 20.3 10.49
Ether Extract ( Fat)% 8.6 11.8
Crude Fiber % 2.9 0.25
Calcium g/kg 2.7 0.13
Total Carbohydrate% 33.5 73.5
*Source: SLS 141: 1992 and Tiimub, 2013
TPC in the samples and presence of yeast and mould in samples complied with the requirement
of Sri Lankan Standard (SLS). Zero E.colishows the safe of consumer.There was no detectable
moulds growth on breads, Wrapped using 150 gage polythene, during the first 48 hours from
baking. There was detectable microbial growth under normal room temperature after 48 hours of
baking.GI for the prepared bread sample was 57. Then this bread is included in Moderate
Glycemic Index food. Moderate Glycemic Index foods are good for the diabetic patients.
Therefore, prepared bread is good for diabetic patients.
Conclusions
Prepared bread has best nutritional profile and it is safe and helps to protect healthiness of
consumers with good sensory properties. This bread can be used as balance diet for children and
adults.According to the Glycemic Index value prepared bread is good for healthy consumers as
well as diabetic patients.
Acknowledgement
Laboratory facilities provided by the Food Research Unit, Gannoruwa,are acknowledged.
References
Singh, P.,andRaghuvanshi, R.S., 2011 Finger millet for food and nutritional security. African
Journal of Food Science Vol. 6(4), pp. 77-84, [Online] Available at http://
www.academicjournals.org.
Tiimub, B.M., 2013Proximate analyses of three brands of bread under different storage
conditions available on the Ghanaian market.Food Science and Quality Management[Online]
Available at http://www.iiste.org.
Proceedings of the Research Symposium of UvaWellassa University, January 29-30, 2015
14
Development of a protocol for in-vitro propagation of black
pepper (Piper nigrum L.) local selections
S.G.H.C.K. Dissanayake, L.M.H.R. Alwis, H.A.S.L. Jayasinghe
Faculty of Animal Science and Export Agriculture, UvaWellassa University of Sri Lanka
and
A.M.C.I.M. Attanayake, J.M. Seneviratne
Central Research Station, Department of Export Agriculture, Matale, Sri Lanka
Introduction
Black pepper (Piper nigrum L.) belongs to family Piperaceae and it is one of the most
economically important spice crops in the world (Srinivasan, 2007; Mathew et al., 2001).
Unavailability of sufficient mother plant stock in the field, obtaining basal runners for
propagation and less success and multiplication rate of the high yielding local pepper cultivars
are the major problems faced by the farmers who cultivate. Being in vitro propagation a
promising option, this study was focused to develop a suitable protocol for in vitro propagation
of black pepper local selections.
Methodology
This research was carried out at Central Research Station, Department of Export Agriculture,
Matale. Four experiments were conducted during the research period. Experiment one was
conducted to find out the suitable surface sterilization method for the sterilization of black
pepper shoot tips. Selecting of appropriate media for the culture establishment of black pepper
shoot tips were carried out in second experiment using 1/3Murashige and Skoog (MS) medium
and 1/2 Woody Plant Medium (WPM).Experiment three was conducted to find out suitable
combination of auxin and cytokinin for the shoot multiplication of black pepper local selections.
In fourth experiment, priority was given for the selection of best media and hormonal
combination for the callus initiation of TG7 black pepper local selection. Full and half strength
MS media were used as the culture media and two different concentration levels of kinetin and
NAA were used as the growth regulators. Complete Randomized Design (CRD) was used as the
experimental design. ANOVA was used to analyze the statistical difference of parametric data
and non-parametric data were subjected for logarithmic transformation. SAS statistical software
was used to analyze the data and mean separation was performed using Least Significant
Difference (LSD).
Results and Discussion
As the results summarized in Table 1, sterilization using 10%- 20% Clorox for five to ten
minutes (T1 to T5) showed higher percentages of bacterial contamination (40 to 80 %). Lower
percentages of fungal contamination was observed in T4 to T8 within the period of three to five
days (3% to 7%).The highest survival percentage (66.6 %) was reported in T8, 0.04 % HgCl2
for five minutes. Similarly, the lowest percentages of bacterial and fungal contamination were
observed in T8. The highest percentage of phenolic browning (80%) was shown in T6 and
lowest percentage of phenolic browning (10.0%) was observed in T2, i.e. 10% Clorox for 10
minutes within four to seven days.
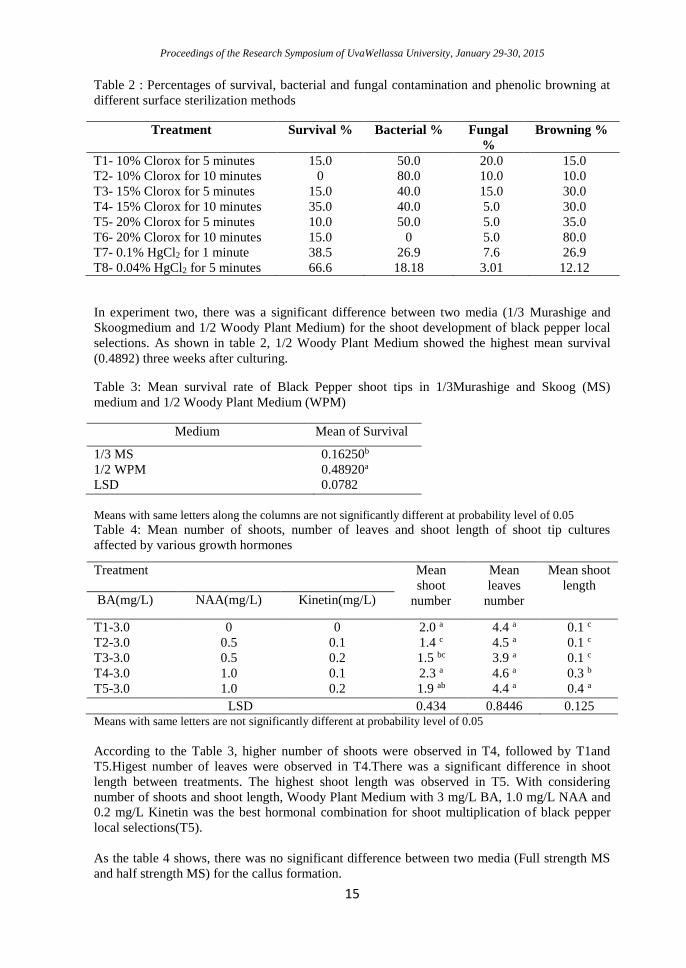
Proceedings of the Research Symposium of UvaWellassa University, January 29-30, 2015
15
Table 2 : Percentages of survival, bacterial and fungal contamination and phenolic browning at
different surface sterilization methods
Treatment Survival % Bacterial % Fungal
%
Browning %
T1- 10% Clorox for 5 minutes 15.0 50.0 20.0 15.0
T2- 10% Clorox for 10 minutes 0 80.0 10.0 10.0
T3- 15% Clorox for 5 minutes 15.0 40.0 15.0 30.0
T4- 15% Clorox for 10 minutes 35.0 40.0 5.0 30.0
T5- 20% Clorox for 5 minutes 10.0 50.0 5.0 35.0
T6- 20% Clorox for 10 minutes 15.0 0 5.0 80.0
T7- 0.1% HgCl2 for 1 minute 38.5 26.9 7.6 26.9
T8- 0.04% HgCl2 for 5 minutes 66.6 18.18 3.01 12.12
In experiment two, there was a significant difference between two media (1/3 Murashige and
Skoogmedium and 1/2 Woody Plant Medium) for the shoot development of black pepper local
selections. As shown in table 2, 1/2 Woody Plant Medium showed the highest mean survival
(0.4892) three weeks after culturing.
Table 3: Mean survival rate of Black Pepper shoot tips in 1/3Murashige and Skoog (MS)
medium and 1/2 Woody Plant Medium (WPM)
Medium Mean of Survival
1/3 MS 0.16250b
1/2 WPM
LSD
0.48920a
0.0782
Means with same letters along the columns are not significantly different at probability level of 0.05
Table 4: Mean number of shoots, number of leaves and shoot length of shoot tip cultures
affected by various growth hormones
Means with same letters are not significantly different at probability level of 0.05
According to the Table 3, higher number of shoots were observed in T4, followed by T1and
T5.Higest number of leaves were observed in T4.There was a significant difference in shoot
length between treatments. The highest shoot length was observed in T5. With considering
number of shoots and shoot length, Woody Plant Medium with 3 mg/L BA, 1.0 mg/L NAA and
0.2 mg/L Kinetin was the best hormonal combination for shoot multiplication of black pepper
local selections(T5).
As the table 4 shows, there was no significant difference between two media (Full strength MS
and half strength MS) for the callus formation.
Treatment Mean
shoot
number
Mean
leaves
number
Mean shoot
length BA(mg/L) NAA(mg/L) Kinetin(mg/L)
T1-3.0 0 0 2.0 a 4.4 a 0.1 c
T2-3.0 0.5 0.1 1.4 c 4.5 a 0.1 c
T3-3.0 0.5 0.2 1.5 bc 3.9 a 0.1 c
T4-3.0 1.0 0.1 2.3 a 4.6 a 0.3 b
T5-3.0 1.0 0.2 1.9 ab 4.4 a 0.4 a
LSD 0.434 0.8446 0.125
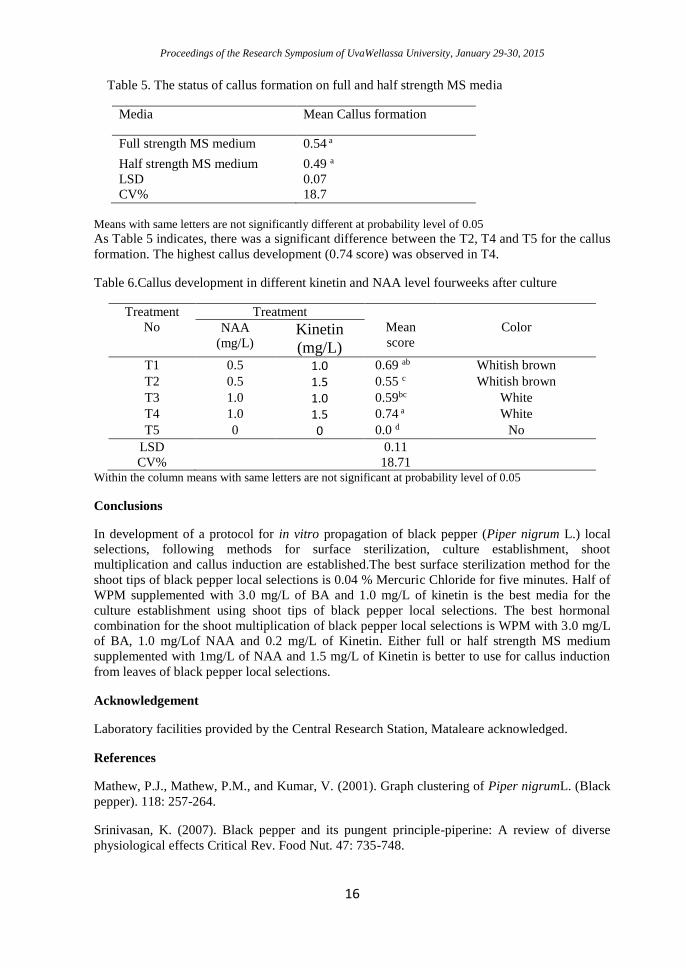
Proceedings of the Research Symposium of UvaWellassa University, January 29-30, 2015
16
Table 5. The status of callus formation on full and half strength MS media
Media Mean Callus formation
Full strength MS medium 0.54 a
Half strength MS medium
LSD
CV%
0.49 a
0.07
18.7
Means with same letters are not significantly different at probability level of 0.05
As Table 5 indicates, there was a significant difference between the T2, T4 and T5 for the callus
formation. The highest callus development (0.74 score) was observed in T4.
Table 6.Callus development in different kinetin and NAA level fourweeks after culture
Treatment
No
Treatment
Mean
score
Color NAA
(mg/L) Kinetin
(mg/L) T1 0.5 1.0 0.69 ab Whitish brown
T2 0.5 1.5 0.55 c Whitish brown
T3 1.0 1.0 0.59bc White
T4 1.0 1.5 0.74 a White
T5 0 0 0.0 d No
LSD 0.11
CV% 18.71 Within the column means with same letters are not significant at probability level of 0.05
Conclusions
In development of a protocol for in vitro propagation of black pepper (Piper nigrum L.) local
selections, following methods for surface sterilization, culture establishment, shoot
multiplication and callus induction are established.The best surface sterilization method for the
shoot tips of black pepper local selections is 0.04 % Mercuric Chloride for five minutes. Half of
WPM supplemented with 3.0 mg/L of BA and 1.0 mg/L of kinetin is the best media for the
culture establishment using shoot tips of black pepper local selections. The best hormonal
combination for the shoot multiplication of black pepper local selections is WPM with 3.0 mg/L
of BA, 1.0 mg/Lof NAA and 0.2 mg/L of Kinetin. Either full or half strength MS medium
supplemented with 1mg/L of NAA and 1.5 mg/L of Kinetin is better to use for callus induction
from leaves of black pepper local selections.
Acknowledgement
Laboratory facilities provided by the Central Research Station, Mataleare acknowledged.
References
Mathew, P.J., Mathew, P.M., and Kumar, V. (2001). Graph clustering of Piper nigrumL. (Black
pepper). 118: 257-264.
Srinivasan, K. (2007). Black pepper and its pungent principle-piperine: A review of diverse
physiological effects Critical Rev. Food Nut. 47: 735-748.
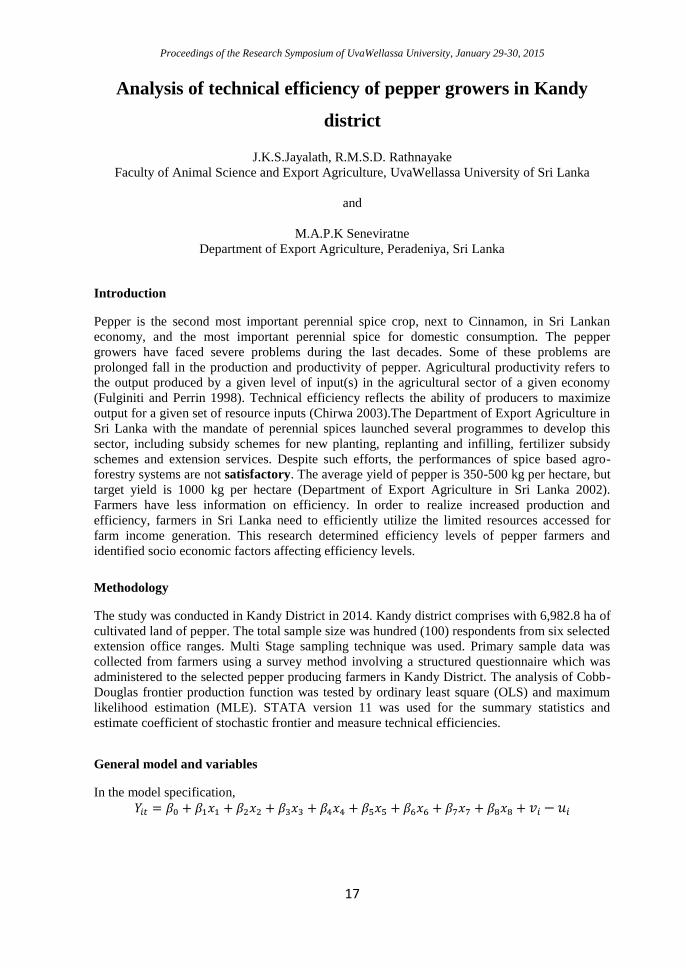
Proceedings of the Research Symposium of UvaWellassa University, January 29-30, 2015
17
Analysis of technical efficiency of pepper growers in Kandy
district
J.K.S.Jayalath, R.M.S.D. Rathnayake
Faculty of Animal Science and Export Agriculture, UvaWellassa University of Sri Lanka
and
M.A.P.K Seneviratne
Department of Export Agriculture, Peradeniya, Sri Lanka
Introduction
Pepper is the second most important perennial spice crop, next to Cinnamon, in Sri Lankan
economy, and the most important perennial spice for domestic consumption. The pepper
growers have faced severe problems during the last decades. Some of these problems are
prolonged fall in the production and productivity of pepper. Agricultural productivity refers to
the output produced by a given level of input(s) in the agricultural sector of a given economy
(Fulginiti and Perrin 1998). Technical efficiency reflects the ability of producers to maximize
output for a given set of resource inputs (Chirwa 2003).The Department of Export Agriculture in
Sri Lanka with the mandate of perennial spices launched several programmes to develop this
sector, including subsidy schemes for new planting, replanting and infilling, fertilizer subsidy
schemes and extension services. Despite such efforts, the performances of spice based agro-
forestry systems are not satisfactory. The average yield of pepper is 350-500 kg per hectare, but
target yield is 1000 kg per hectare (Department of Export Agriculture in Sri Lanka 2002).
Farmers have less information on efficiency. In order to realize increased production and
efficiency, farmers in Sri Lanka need to efficiently utilize the limited resources accessed for
farm income generation. This research determined efficiency levels of pepper farmers and
identified socio economic factors affecting efficiency levels.
Methodology
The study was conducted in Kandy District in 2014. Kandy district comprises with 6,982.8 ha of
cultivated land of pepper. The total sample size was hundred (100) respondents from six selected
extension office ranges. Multi Stage sampling technique was used. Primary sample data was
collected from farmers using a survey method involving a structured questionnaire which was
administered to the selected pepper producing farmers in Kandy District. The analysis of Cobb-
Douglas frontier production function was tested by ordinary least square (OLS) and maximum
likelihood estimation (MLE). STATA version 11 was used for the summary statistics and
estimate coefficient of stochastic frontier and measure technical efficiencies.
General model and variables
In the model specification,
𝑌𝑖𝑡 = 𝛽0 + 𝛽1𝑥1 + 𝛽2𝑥2 + 𝛽3𝑥3 + 𝛽4𝑥4 + 𝛽5𝑥5 + 𝛽6𝑥6 + 𝛽7𝑥7 + 𝛽8𝑥8 + 𝑣𝑖 − 𝑢𝑖
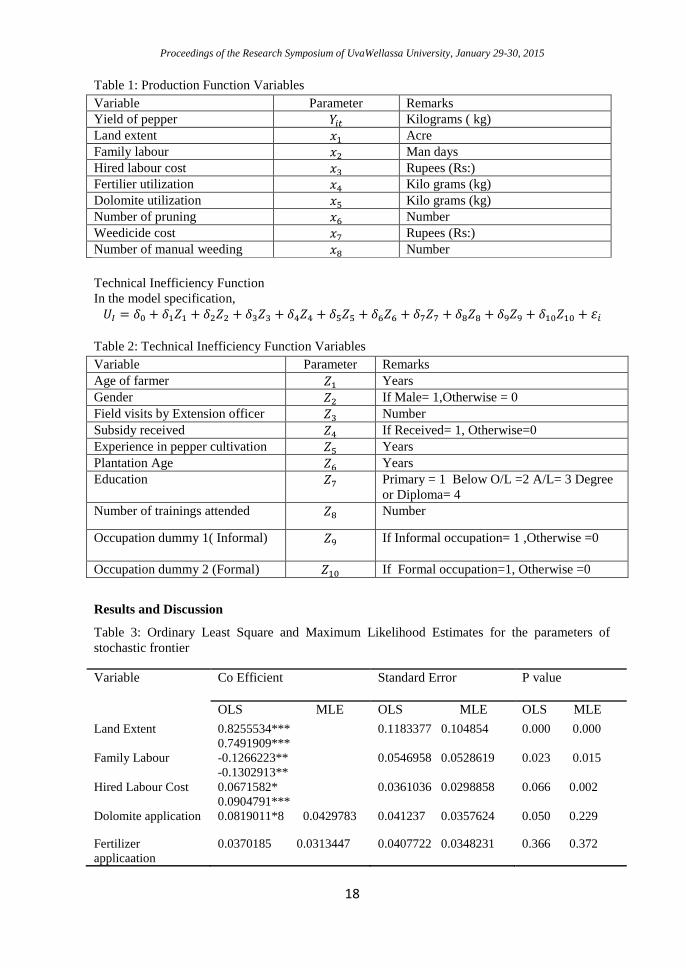
Proceedings of the Research Symposium of UvaWellassa University, January 29-30, 2015
18
Table 1: Production Function Variables
Variable Parameter Remarks
Yield of pepper 𝑌𝑖𝑡 Kilograms ( kg)
Land extent 𝑥1 Acre
Family labour 𝑥2 Man days
Hired labour cost 𝑥3 Rupees (Rs:)
Fertilier utilization 𝑥4 Kilo grams (kg)
Dolomite utilization 𝑥5 Kilo grams (kg)
Number of pruning 𝑥6 Number
Weedicide cost 𝑥7 Rupees (Rs:)
Number of manual weeding 𝑥8 Number
Technical Inefficiency Function
In the model specification,
𝑈𝐼 = 𝛿0 + 𝛿1𝑍1 + 𝛿2𝑍2 + 𝛿3𝑍3 + 𝛿4𝑍4 + 𝛿5𝑍5 + 𝛿6𝑍6 + 𝛿7𝑍7 + 𝛿8𝑍8 + 𝛿9𝑍9 + 𝛿10𝑍10 + 휀𝑖 Table 2: Technical Inefficiency Function Variables
Variable Parameter Remarks
Age of farmer 𝑍1 Years
Gender 𝑍2 If Male= 1,Otherwise = 0
Field visits by Extension officer 𝑍3 Number
Subsidy received 𝑍4 If Received= 1, Otherwise=0
Experience in pepper cultivation 𝑍5 Years
Plantation Age 𝑍6 Years
Education 𝑍7 Primary = 1 Below O/L =2 A/L= 3 Degree
or Diploma= 4
Number of trainings attended 𝑍8 Number
Occupation dummy 1( Informal) 𝑍9 If Informal occupation= 1 ,Otherwise =0
Occupation dummy 2 (Formal) 𝑍10 If Formal occupation=1, Otherwise =0
Results and Discussion
Table 3: Ordinary Least Square and Maximum Likelihood Estimates for the parameters of
stochastic frontier
Variable Co Efficient Standard Error
P value
OLS MLE OLS MLE OLS MLE
Land Extent 0.8255534***
0.7491909***
0.1183377 0.104854 0.000 0.000
Family Labour -0.1266223**
-0.1302913**
0.0546958 0.0528619 0.023 0.015
Hired Labour Cost 0.0671582*
0.0904791***
0.0361036 0.0298858 0.066 0.002
Dolomite application 0.0819011*8 0.0429783 0.041237 0.0357624 0.050 0.229
Fertilizer
applicaation
0.0370185 0.0313447 0.0407722 0.0348231 0.366 0.372
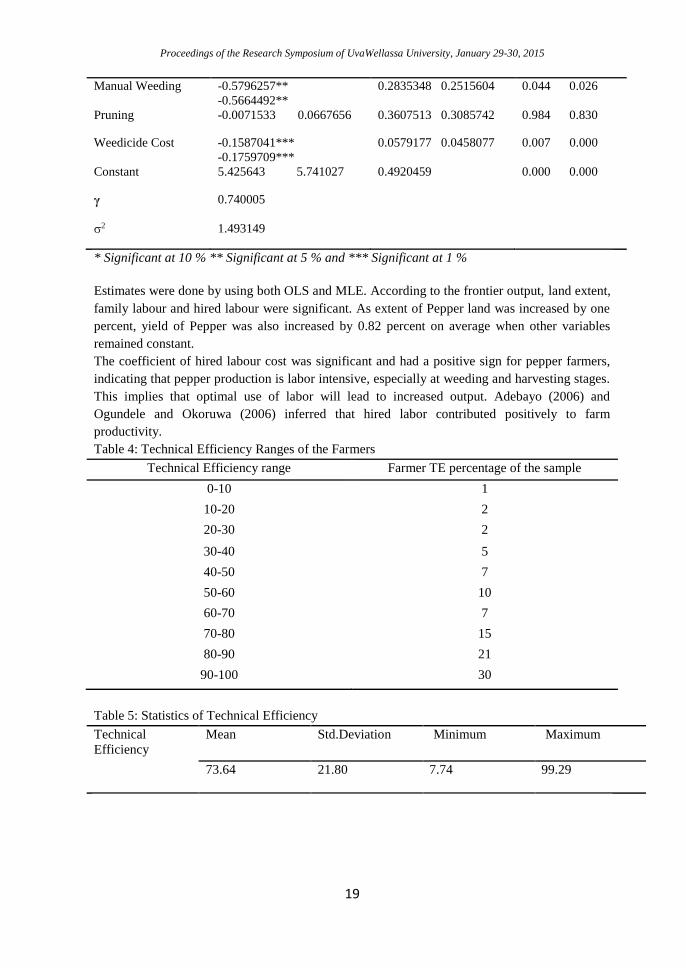
Proceedings of the Research Symposium of UvaWellassa University, January 29-30, 2015
19
Manual Weeding -0.5796257**
-0.5664492**
0.2835348 0.2515604 0.044 0.026
Pruning -0.0071533 0.0667656 0.3607513 0.3085742 0.984 0.830
Weedicide Cost -0.1587041***
-0.1759709***
0.0579177 0.0458077 0.007 0.000
Constant 5.425643 5.741027 0.4920459 0.000 0.000
γ 0.740005
σ2 1.493149
* Significant at 10 % ** Significant at 5 % and *** Significant at 1 %
Estimates were done by using both OLS and MLE. According to the frontier output, land extent,
family labour and hired labour were significant. As extent of Pepper land was increased by one
percent, yield of Pepper was also increased by 0.82 percent on average when other variables
remained constant.
The coefficient of hired labour cost was significant and had a positive sign for pepper farmers,
indicating that pepper production is labor intensive, especially at weeding and harvesting stages.
This implies that optimal use of labor will lead to increased output. Adebayo (2006) and
Ogundele and Okoruwa (2006) inferred that hired labor contributed positively to farm
productivity.
Table 4: Technical Efficiency Ranges of the Farmers
Technical Efficiency range Farmer TE percentage of the sample
0-10 1
10-20 2
20-30 2
30-40 5
40-50 7
50-60 10
60-70 7
70-80 15
80-90 21
90-100 30
Table 5: Statistics of Technical Efficiency
Technical
Efficiency
Mean Std.Deviation Minimum Maximum
73.64
21.80
7.74
99.29
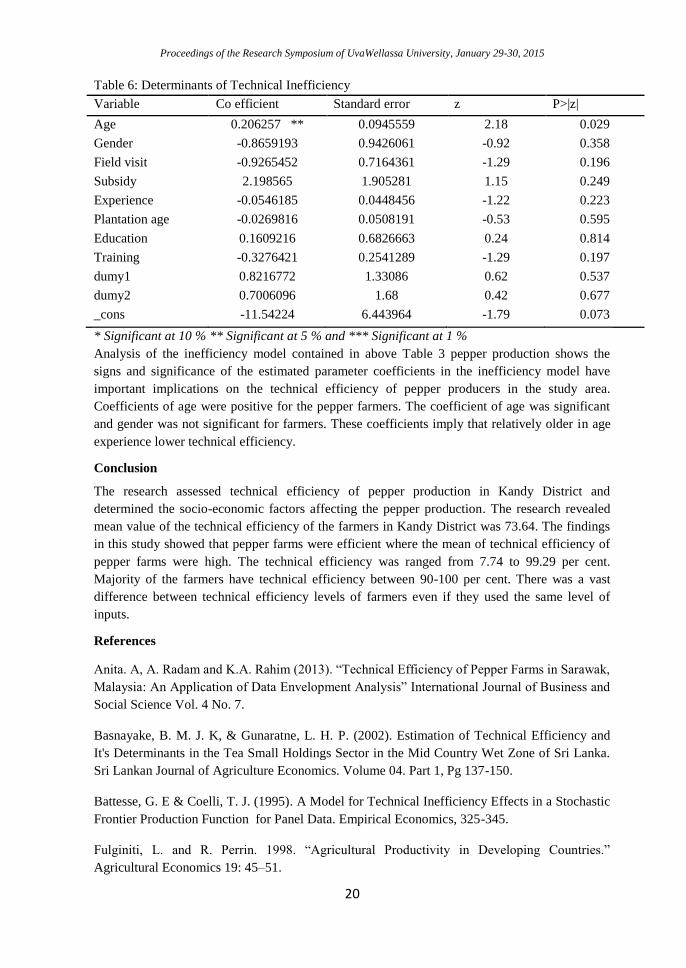
Proceedings of the Research Symposium of UvaWellassa University, January 29-30, 2015
20
Table 6: Determinants of Technical Inefficiency
Variable Co efficient Standard error z P>|z|
Age 0.206257 ** 0.0945559 2.18 0.029
Gender -0.8659193 0.9426061 -0.92 0.358
Field visit -0.9265452 0.7164361 -1.29 0.196
Subsidy 2.198565 1.905281 1.15 0.249
Experience -0.0546185 0.0448456 -1.22 0.223
Plantation age -0.0269816 0.0508191 -0.53 0.595
Education 0.1609216 0.6826663 0.24 0.814
Training -0.3276421 0.2541289 -1.29 0.197
dumy1 0.8216772 1.33086 0.62 0.537
dumy2 0.7006096 1.68 0.42 0.677
_cons -11.54224 6.443964 -1.79 0.073
* Significant at 10 % ** Significant at 5 % and *** Significant at 1 %
Analysis of the inefficiency model contained in above Table 3 pepper production shows the
signs and significance of the estimated parameter coefficients in the inefficiency model have
important implications on the technical efficiency of pepper producers in the study area.
Coefficients of age were positive for the pepper farmers. The coefficient of age was significant
and gender was not significant for farmers. These coefficients imply that relatively older in age
experience lower technical efficiency.
Conclusion
The research assessed technical efficiency of pepper production in Kandy District and
determined the socio-economic factors affecting the pepper production. The research revealed
mean value of the technical efficiency of the farmers in Kandy District was 73.64. The findings
in this study showed that pepper farms were efficient where the mean of technical efficiency of
pepper farms were high. The technical efficiency was ranged from 7.74 to 99.29 per cent.
Majority of the farmers have technical efficiency between 90-100 per cent. There was a vast
difference between technical efficiency levels of farmers even if they used the same level of
inputs.
References
Anita. A, A. Radam and K.A. Rahim (2013). “Technical Efficiency of Pepper Farms in Sarawak,
Malaysia: An Application of Data Envelopment Analysis” International Journal of Business and
Social Science Vol. 4 No. 7.
Basnayake, B. M. J. K, & Gunaratne, L. H. P. (2002). Estimation of Technical Efficiency and
It's Determinants in the Tea Small Holdings Sector in the Mid Country Wet Zone of Sri Lanka.
Sri Lankan Journal of Agriculture Economics. Volume 04. Part 1, Pg 137-150.
Battesse, G. E & Coelli, T. J. (1995). A Model for Technical Inefficiency Effects in a Stochastic
Frontier Production Function for Panel Data. Empirical Economics, 325-345.
Fulginiti, L. and R. Perrin. 1998. “Agricultural Productivity in Developing Countries.”
Agricultural Economics 19: 45–51.
Proceedings of the Research Symposium of UvaWellassa University, January 29-30, 2015
21
Feasibility study for direct planting of in vitro potato (Solanum
tuberosum L.) varieties Granola and Golden Star in aeroponic
system
A.P.Wijesinghe, L.M.H.R.Alwis, H.A.S.L.Jayasinghe,
Faculty of Animal Science and Export Agriculture, UvaWellassa University of Sri Lanka
and
M.M.Nugaliyadda
Agriculture Research & Development Centre Sita Eliya, Nuwara Eliya
Introduction
The major constraints in potato cultivation are high seed cost, poor seed quality, unavailability
of quality seeds at correct time for planting, frequent application of fungicides to control late
blight disease, misappropriation of agrochemicals and limitation of suitable land. The total seed
potato requirement in Sri Lanka is about 22,500mt per annum. Total annual importation of seed
potato is about 7000mt and the Department of Agriculture produces about 400mt of high
generation seed potato per annum. The rest of the seed potato requirement of about 60% is
fulfilled by farmers own seed production. Seed potatoes are the most costly input having 53% of
the total cost of production.Main objective is to study the feasibility of direct planting of Granola
and Golden star in vitro plants in aeroponic system. Other objective is to identify the suitable
liquid media for hardening of in vitro potato plants.
Materials and method
The planting materials which were used in research are In vitro potato plants, MS media, Albert
solution and aeroponic system. First culture media was prepared for in vitro potato plants. Stock
solution was measured to prepare MS medium. Then 0.1g of myo-inositol, 30g of sugar, 1g of
charcoal and 9g of agar were measured and mixed well. Solution was diluted up to the 1l. pH
was measured and adjusted up to 5.75. Culture bottles were filled by solution up to 30ml. Bottles
were allowed for settle.In vitro plants were cut with node and cuttings were placed in culture
bottles. Then bottles were labeled and placed in the culture room. Cultured bottles were kept for
one month period.
Half MS, full MS and Albert solution were prepared. pH was measured in MS solutions and
adjusted to 5.75. Electrical conductivity was adjusted up to 1.7 in Albert solution. Six treatments
were taken. (Golden star in 1/2 MS medium as treatment 1, golden star in MS medium as
treatment 2, golden star in Albert solution as treatment 3, granola in 1/2 MS medium as
treatment 4, granola in MS medium as treatment 5, granola in Albert solution as treatment 6)
Data were collected at one week intervals. Mean shoot length, mean root length and mean
number of roots were taken as the parameters. (In this research increment of growth was
measured for each parameters)
Albert solution was prepared for 250l of tank (EC-1.643 ms/cm). Electrical conductivity was
adjusted up to the range of 1.5 to 2.0 ms/cm. Acclimatized plants were dipped in Thiram (2g/l).
Then plants were placed in aeroponic system. Aeroponic system was adjusted to spray five
second with once in five minutes at day time and once in fifteen minutes at night in first three
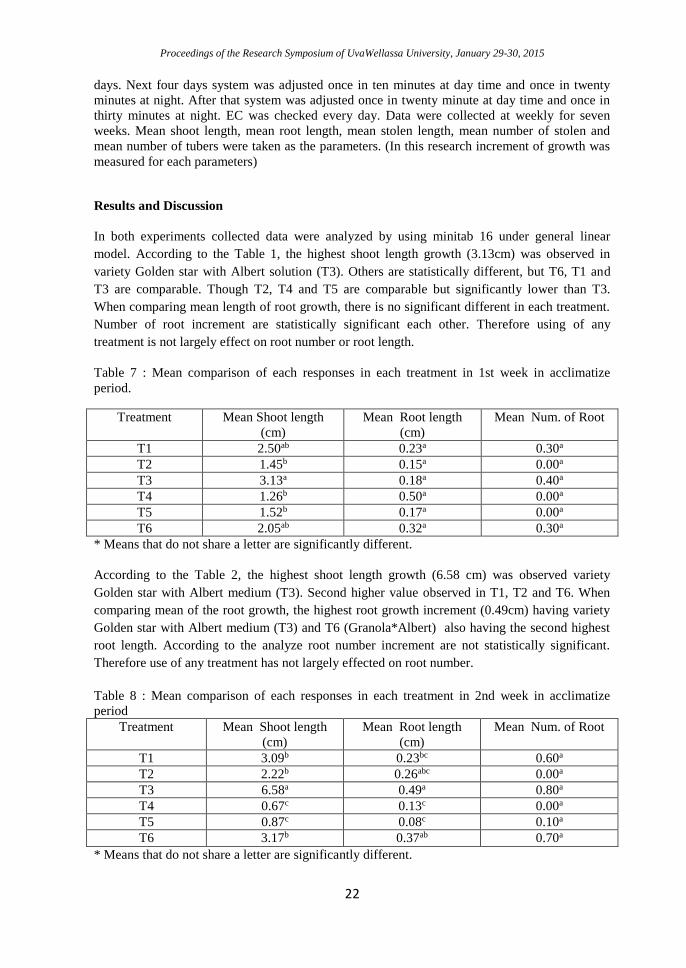
Proceedings of the Research Symposium of UvaWellassa University, January 29-30, 2015
22
days. Next four days system was adjusted once in ten minutes at day time and once in twenty
minutes at night. After that system was adjusted once in twenty minute at day time and once in
thirty minutes at night. EC was checked every day. Data were collected at weekly for seven
weeks. Mean shoot length, mean root length, mean stolen length, mean number of stolen and
mean number of tubers were taken as the parameters. (In this research increment of growth was
measured for each parameters)
Results and Discussion
In both experiments collected data were analyzed by using minitab 16 under general linear
model. According to the Table 1, the highest shoot length growth (3.13cm) was observed in
variety Golden star with Albert solution (T3). Others are statistically different, but T6, T1 and
T3 are comparable. Though T2, T4 and T5 are comparable but significantly lower than T3.
When comparing mean length of root growth, there is no significant different in each treatment.
Number of root increment are statistically significant each other. Therefore using of any
treatment is not largely effect on root number or root length.
Table 7 : Mean comparison of each responses in each treatment in 1st week in acclimatize
period.
Treatment Mean Shoot length
(cm)
Mean Root length
(cm)
Mean Num. of Root
T1 2.50ab 0.23a 0.30a
T2 1.45b 0.15a 0.00a
T3 3.13a 0.18a 0.40a
T4 1.26b 0.50a 0.00a
T5 1.52b 0.17a 0.00a
T6 2.05ab 0.32a 0.30a
* Means that do not share a letter are significantly different.
According to the Table 2, the highest shoot length growth (6.58 cm) was observed variety
Golden star with Albert medium (T3). Second higher value observed in T1, T2 and T6. When
comparing mean of the root growth, the highest root growth increment (0.49cm) having variety
Golden star with Albert medium (T3) and T6 (Granola*Albert) also having the second highest
root length. According to the analyze root number increment are not statistically significant.
Therefore use of any treatment has not largely effected on root number.
Table 8 : Mean comparison of each responses in each treatment in 2nd week in acclimatize
period
Treatment Mean Shoot length
(cm)
Mean Root length
(cm)
Mean Num. of Root
T1 3.09b 0.23bc 0.60a
T2 2.22b 0.26abc 0.00a
T3 6.58a 0.49a 0.80a
T4 0.67c 0.13c 0.00a
T5 0.87c 0.08c 0.10a
T6 3.17b 0.37ab 0.70a
* Means that do not share a letter are significantly different.
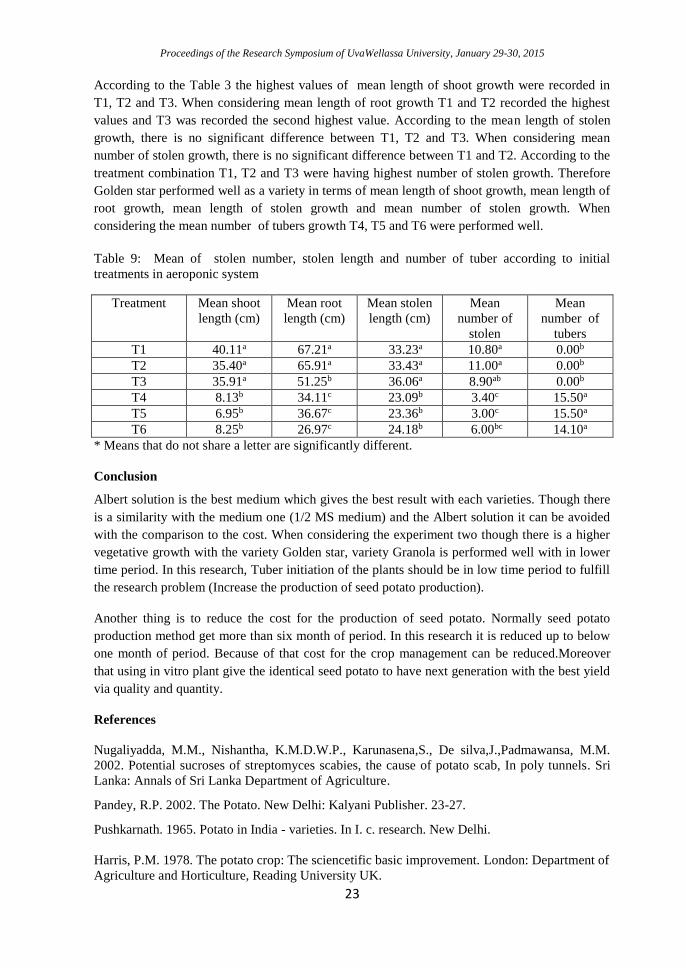
Proceedings of the Research Symposium of UvaWellassa University, January 29-30, 2015
23
According to the Table 3 the highest values of mean length of shoot growth were recorded in
T1, T2 and T3. When considering mean length of root growth T1 and T2 recorded the highest
values and T3 was recorded the second highest value. According to the mean length of stolen
growth, there is no significant difference between T1, T2 and T3. When considering mean
number of stolen growth, there is no significant difference between T1 and T2. According to the
treatment combination T1, T2 and T3 were having highest number of stolen growth. Therefore
Golden star performed well as a variety in terms of mean length of shoot growth, mean length of
root growth, mean length of stolen growth and mean number of stolen growth. When
considering the mean number of tubers growth T4, T5 and T6 were performed well.
Table 9: Mean of stolen number, stolen length and number of tuber according to initial
treatments in aeroponic system
Treatment Mean shoot
length (cm) Mean root
length (cm) Mean stolen
length (cm) Mean
number of
stolen
Mean
number of
tubers
T1 40.11a 67.21a 33.23a 10.80a 0.00b
T2 35.40a 65.91a 33.43a 11.00a 0.00b
T3 35.91a 51.25b 36.06a 8.90ab 0.00b
T4 8.13b 34.11c 23.09b 3.40c 15.50a
T5 6.95b 36.67c 23.36b 3.00c 15.50a
T6 8.25b 26.97c 24.18b 6.00bc 14.10a
* Means that do not share a letter are significantly different.
Conclusion
Albert solution is the best medium which gives the best result with each varieties. Though there
is a similarity with the medium one (1/2 MS medium) and the Albert solution it can be avoided
with the comparison to the cost. When considering the experiment two though there is a higher
vegetative growth with the variety Golden star, variety Granola is performed well with in lower
time period. In this research, Tuber initiation of the plants should be in low time period to fulfill
the research problem (Increase the production of seed potato production).
Another thing is to reduce the cost for the production of seed potato. Normally seed potato
production method get more than six month of period. In this research it is reduced up to below
one month of period. Because of that cost for the crop management can be reduced.Moreover
that using in vitro plant give the identical seed potato to have next generation with the best yield
via quality and quantity.
References
Nugaliyadda, M.M., Nishantha, K.M.D.W.P., Karunasena,S., De silva,J.,Padmawansa, M.M.
2002. Potential sucroses of streptomyces scabies, the cause of potato scab, In poly tunnels. Sri
Lanka: Annals of Sri Lanka Department of Agriculture.
Pandey, R.P. 2002. The Potato. New Delhi: Kalyani Publisher. 23-27.
Pushkarnath. 1965. Potato in India - varieties. In I. c. research. New Delhi.
Harris, P.M. 1978. The potato crop: The sciencetific basic improvement. London: Department of
Agriculture and Horticulture, Reading University UK.
Proceedings of the Research Symposium of UvaWellassa University, January 29-30, 2015
24
Labour migration and paddy production; a comparative
analysis
H.M.M.K. Haluwana and R. A. P. I. S. Dharmadasa
Faculty of Animal Science and Export Agriculture, UvaWellassa University of Sri Lanka
Introduction
Migration can be identified as the flow or movement of people from the place of origin to the
other surrounding, whether inside or outside the country with various reasons. Migration plays a
major role in the economic development of Sri Lanka. In recent years, the outflow of Sri Lankan
workers has shown an increasing trend. Sri Lanka is predominantly an agricultural country and
paddy sector receives the highest priority in development agenda in Sri Lanka, as rice is the
staple food in the country. At present Sri Lankan paddy sector suffers from many constraints
such as scarcity of arable land, high cost of inputs and scarcity of labour (Ranathunga, 2011).
Scarcity of labour for paddy production occurs mainly due to labour migration (Paris.et.al,
2009). In many studies, researchers find out the various impacts of migration. But it is very
fewer Sri Lankan studies on examine the impact of labour migration on paddy production. In
this context the objectives of the study were (i) to find out the impact of labour migration on
paddy production and (ii) to estimate the production function of paddy in relation to the labour
migration.
Methodology
Research was carried out Galaha, Thalathuoya and MarassanaGovijanaseva divisions under the
Pathahewahata Divisional Secretariat division in Kandy District. Multi stage sampling technique
was used to select 150 paddy farm families from selected area. Multi stage sample was surveyed
based on a semi structured pre-tested questionnaire to gather necessary information. Both
descriptive and inferential statistics were used to analysis the data. Descriptive statistical
methods were used to describe the characteristics of the sample such as demographic
information about paddy farmers and migrants, production details in paddy and labour usage in
paddy cultivation. Cobb-Douglas Production function was used for econometrics
analysis.(Nonthakot and Villano, 2008).
Empirical model : lnY = β0 +βiln(X i) + i
The Y is the yearly output from paddy production in kilograms. Xi denotes the vector of
independent variables such as family labour input, land extend, yearly fixed capital, fertilizer
inputs, seed quantity, land quality and household type. In paddy production labour is used under
three categories, family labour, hired labour and exchange labour. Among those categories
family labour was used for the empirical model. Labour input was measured in man days.
Variable of land extend was measured by acre. Yearly fixed capital gives the real value of all
machinery, equipment, and value of land in rupees. Variable of fertilizer input shows the amount
of fertilizer usage per year in kilograms. Variable of the seed quantity shows the quantity of seed
paddy used for cultivation in kilograms. Land quality is a dummy variable distinguishing
whether it is irrigated land or not. Household type is a dummy variable indicating the household
with at least one out migrant. The references group is the household without any out migrant.ɛi
is the stochastic disturbance term.
Results and Discussion
According to descriptive statistics, nearly 78% in the sample was male and the rest 22% were
female. Most of farmers in the sample were older than 40 years. 58% farmers of the sample were
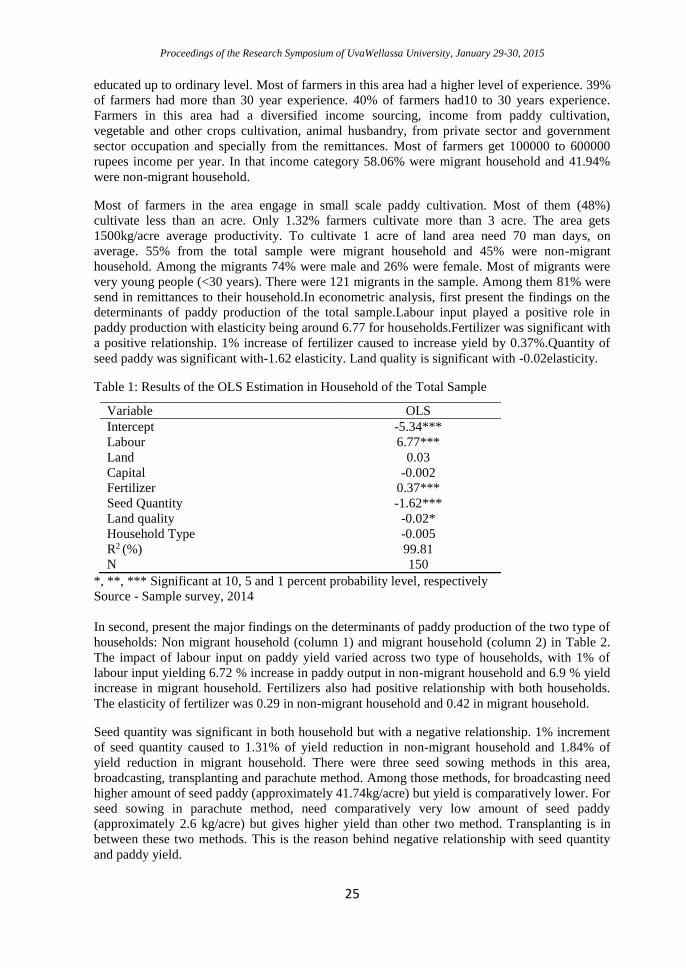
Proceedings of the Research Symposium of UvaWellassa University, January 29-30, 2015
25
educated up to ordinary level. Most of farmers in this area had a higher level of experience. 39%
of farmers had more than 30 year experience. 40% of farmers had10 to 30 years experience.
Farmers in this area had a diversified income sourcing, income from paddy cultivation,
vegetable and other crops cultivation, animal husbandry, from private sector and government
sector occupation and specially from the remittances. Most of farmers get 100000 to 600000
rupees income per year. In that income category 58.06% were migrant household and 41.94%
were non-migrant household.
Most of farmers in the area engage in small scale paddy cultivation. Most of them (48%)
cultivate less than an acre. Only 1.32% farmers cultivate more than 3 acre. The area gets
1500kg/acre average productivity. To cultivate 1 acre of land area need 70 man days, on
average. 55% from the total sample were migrant household and 45% were non-migrant
household. Among the migrants 74% were male and 26% were female. Most of migrants were
very young people (<30 years). There were 121 migrants in the sample. Among them 81% were
send in remittances to their household.In econometric analysis, first present the findings on the
determinants of paddy production of the total sample.Labour input played a positive role in
paddy production with elasticity being around 6.77 for households.Fertilizer was significant with
a positive relationship. 1% increase of fertilizer caused to increase yield by 0.37%.Quantity of
seed paddy was significant with-1.62 elasticity. Land quality is significant with -0.02elasticity.
Table 1: Results of the OLS Estimation in Household of the Total Sample
Variable OLS
Intercept -5.34***
Labour 6.77***
Land 0.03
Capital -0.002
Fertilizer 0.37***
Seed Quantity -1.62***
Land quality
Household Type
-0.02*
-0.005
R2 (%) 99.81
N 150
*, **, *** Significant at 10, 5 and 1 percent probability level, respectively
Source - Sample survey, 2014
In second, present the major findings on the determinants of paddy production of the two type of
households: Non migrant household (column 1) and migrant household (column 2) in Table 2.
The impact of labour input on paddy yield varied across two type of households, with 1% of
labour input yielding 6.72 % increase in paddy output in non-migrant household and 6.9 % yield
increase in migrant household. Fertilizers also had positive relationship with both households.
The elasticity of fertilizer was 0.29 in non-migrant household and 0.42 in migrant household.
Seed quantity was significant in both household but with a negative relationship. 1% increment
of seed quantity caused to 1.31% of yield reduction in non-migrant household and 1.84% of
yield reduction in migrant household. There were three seed sowing methods in this area,
broadcasting, transplanting and parachute method. Among those methods, for broadcasting need
higher amount of seed paddy (approximately 41.74kg/acre) but yield is comparatively lower. For
seed sowing in parachute method, need comparatively very low amount of seed paddy
(approximately 2.6 kg/acre) but gives higher yield than other two method. Transplanting is in
between these two methods. This is the reason behind negative relationship with seed quantity
and paddy yield.
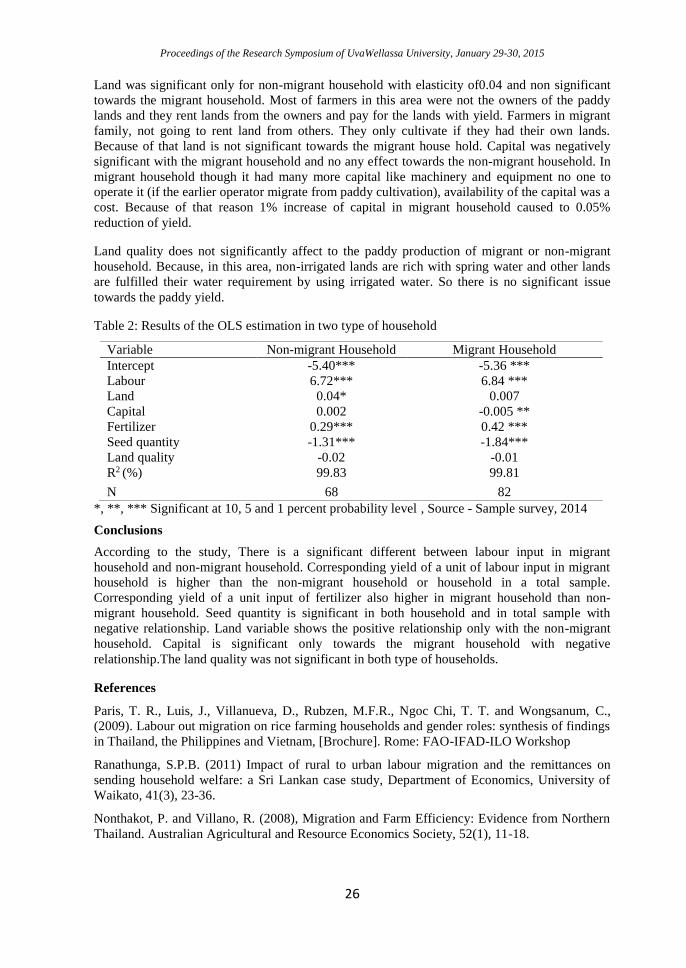
Proceedings of the Research Symposium of UvaWellassa University, January 29-30, 2015
26
Land was significant only for non-migrant household with elasticity of0.04 and non significant
towards the migrant household. Most of farmers in this area were not the owners of the paddy
lands and they rent lands from the owners and pay for the lands with yield. Farmers in migrant
family, not going to rent land from others. They only cultivate if they had their own lands.
Because of that land is not significant towards the migrant house hold. Capital was negatively
significant with the migrant household and no any effect towards the non-migrant household. In
migrant household though it had many more capital like machinery and equipment no one to
operate it (if the earlier operator migrate from paddy cultivation), availability of the capital was a
cost. Because of that reason 1% increase of capital in migrant household caused to 0.05%
reduction of yield.
Land quality does not significantly affect to the paddy production of migrant or non-migrant
household. Because, in this area, non-irrigated lands are rich with spring water and other lands
are fulfilled their water requirement by using irrigated water. So there is no significant issue
towards the paddy yield.
Table 2: Results of the OLS estimation in two type of household
Variable Non-migrant Household Migrant Household
Intercept -5.40*** -5.36 ***
Labour 6.72*** 6.84 ***
Land 0.04* 0.007
Capital 0.002 -0.005 **
Fertilizer 0.29*** 0.42 ***
Seed quantity -1.31*** -1.84***
Land quality -0.02 -0.01
R2 (%) 99.83 99.81
N 68 82
*, **, *** Significant at 10, 5 and 1 percent probability level , Source - Sample survey, 2014
Conclusions
According to the study, There is a significant different between labour input in migrant
household and non-migrant household. Corresponding yield of a unit of labour input in migrant
household is higher than the non-migrant household or household in a total sample.
Corresponding yield of a unit input of fertilizer also higher in migrant household than non-
migrant household. Seed quantity is significant in both household and in total sample with
negative relationship. Land variable shows the positive relationship only with the non-migrant
household. Capital is significant only towards the migrant household with negative
relationship.The land quality was not significant in both type of households.
References
Paris, T. R., Luis, J., Villanueva, D., Rubzen, M.F.R., Ngoc Chi, T. T. and Wongsanum, C.,
(2009). Labour out migration on rice farming households and gender roles: synthesis of findings
in Thailand, the Philippines and Vietnam, [Brochure]. Rome: FAO-IFAD-ILO Workshop
Ranathunga, S.P.B. (2011) Impact of rural to urban labour migration and the remittances on
sending household welfare: a Sri Lankan case study, Department of Economics, University of
Waikato, 41(3), 23-36.
Nonthakot, P. and Villano, R. (2008), Migration and Farm Efficiency: Evidence from Northern
Thailand. Australian Agricultural and Resource Economics Society, 52(1), 11-18.
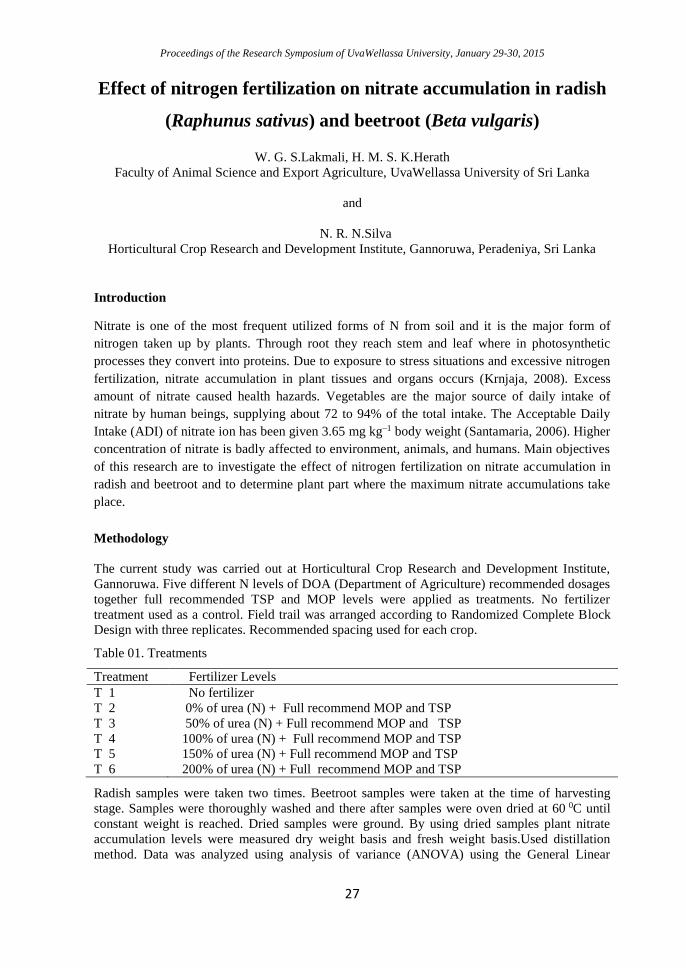
Proceedings of the Research Symposium of UvaWellassa University, January 29-30, 2015
27
Effect of nitrogen fertilization on nitrate accumulation in radish
(Raphunus sativus) and beetroot (Beta vulgaris)
W. G. S.Lakmali, H. M. S. K.Herath
Faculty of Animal Science and Export Agriculture, UvaWellassa University of Sri Lanka
and
N. R. N.Silva
Horticultural Crop Research and Development Institute, Gannoruwa, Peradeniya, Sri Lanka
Introduction
Nitrate is one of the most frequent utilized forms of N from soil and it is the major form of
nitrogen taken up by plants. Through root they reach stem and leaf where in photosynthetic
processes they convert into proteins. Due to exposure to stress situations and excessive nitrogen
fertilization, nitrate accumulation in plant tissues and organs occurs (Krnjaja, 2008). Excess
amount of nitrate caused health hazards. Vegetables are the major source of daily intake of
nitrate by human beings, supplying about 72 to 94% of the total intake. The Acceptable Daily
Intake (ADI) of nitrate ion has been given 3.65 mg kg–1 body weight (Santamaria, 2006). Higher
concentration of nitrate is badly affected to environment, animals, and humans. Main objectives
of this research are to investigate the effect of nitrogen fertilization on nitrate accumulation in
radish and beetroot and to determine plant part where the maximum nitrate accumulations take
place.
Methodology
The current study was carried out at Horticultural Crop Research and Development Institute,
Gannoruwa. Five different N levels of DOA (Department of Agriculture) recommended dosages
together full recommended TSP and MOP levels were applied as treatments. No fertilizer
treatment used as a control. Field trail was arranged according to Randomized Complete Block
Design with three replicates. Recommended spacing used for each crop.
Table 01. Treatments
Treatment Fertilizer Levels
T 1 No fertilizer
T 2 0% of urea (N) + Full recommend MOP and TSP
T 3 50% of urea (N) + Full recommend MOP and TSP
T 4 100% of urea (N) + Full recommend MOP and TSP
T 5 150% of urea (N) + Full recommend MOP and TSP
T 6 200% of urea (N) + Full recommend MOP and TSP
Radish samples were taken two times. Beetroot samples were taken at the time of harvesting
stage. Samples were thoroughly washed and there after samples were oven dried at 60 0C until
constant weight is reached. Dried samples were ground. By using dried samples plant nitrate
accumulation levels were measured dry weight basis and fresh weight basis.Used distillation
method. Data was analyzed using analysis of variance (ANOVA) using the General Linear
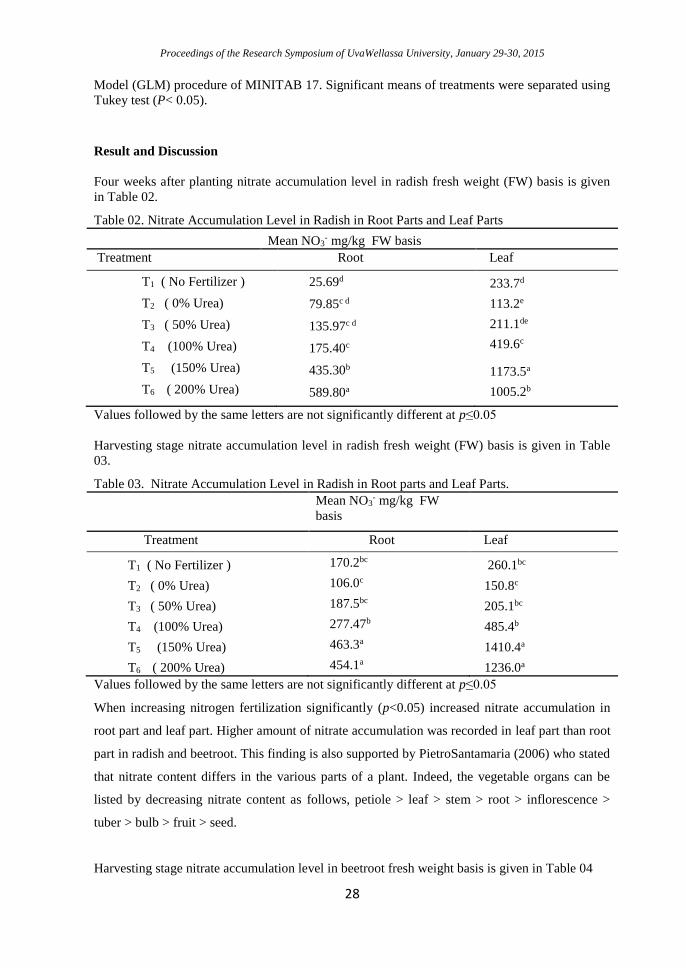
Proceedings of the Research Symposium of UvaWellassa University, January 29-30, 2015
28
Model (GLM) procedure of MINITAB 17. Significant means of treatments were separated using
Tukey test (P< 0.05).
Result and Discussion
Four weeks after planting nitrate accumulation level in radish fresh weight (FW) basis is given
in Table 02.
Table 02. Nitrate Accumulation Level in Radish in Root Parts and Leaf Parts
Mean NO3- mg/kg FW basis
Treatment Root Leaf
T1 ( No Fertilizer )
T2 ( 0% Urea)
T3 ( 50% Urea)
T4 (100% Urea)
T5 (150% Urea)
T6 ( 200% Urea)
25.69d
79.85c d
135.97c d
175.40c
435.30b
589.80a
233.7d
113.2e
211.1de
419.6c
1173.5a
1005.2b
Values followed by the same letters are not significantly different at p≤0.05
Harvesting stage nitrate accumulation level in radish fresh weight (FW) basis is given in Table
03.
Table 03. Nitrate Accumulation Level in Radish in Root parts and Leaf Parts.
Mean NO3- mg/kg FW
basis
Treatment Root Leaf
T1 ( No Fertilizer )
T2 ( 0% Urea)
T3 ( 50% Urea)
T4 (100% Urea)
T5 (150% Urea)
T6 ( 200% Urea)
170.2bc
106.0c
187.5bc
277.47b
463.3a
454.1a
260.1bc
150.8c
205.1bc
485.4b
1410.4a
1236.0a
Values followed by the same letters are not significantly different at p≤0.05
When increasing nitrogen fertilization significantly (p<0.05) increased nitrate accumulation in
root part and leaf part. Higher amount of nitrate accumulation was recorded in leaf part than root
part in radish and beetroot. This finding is also supported by PietroSantamaria (2006) who stated
that nitrate content differs in the various parts of a plant. Indeed, the vegetable organs can be
listed by decreasing nitrate content as follows, petiole > leaf > stem > root > inflorescence >
tuber > bulb > fruit > seed.
Harvesting stage nitrate accumulation level in beetroot fresh weight basis is given in Table 04
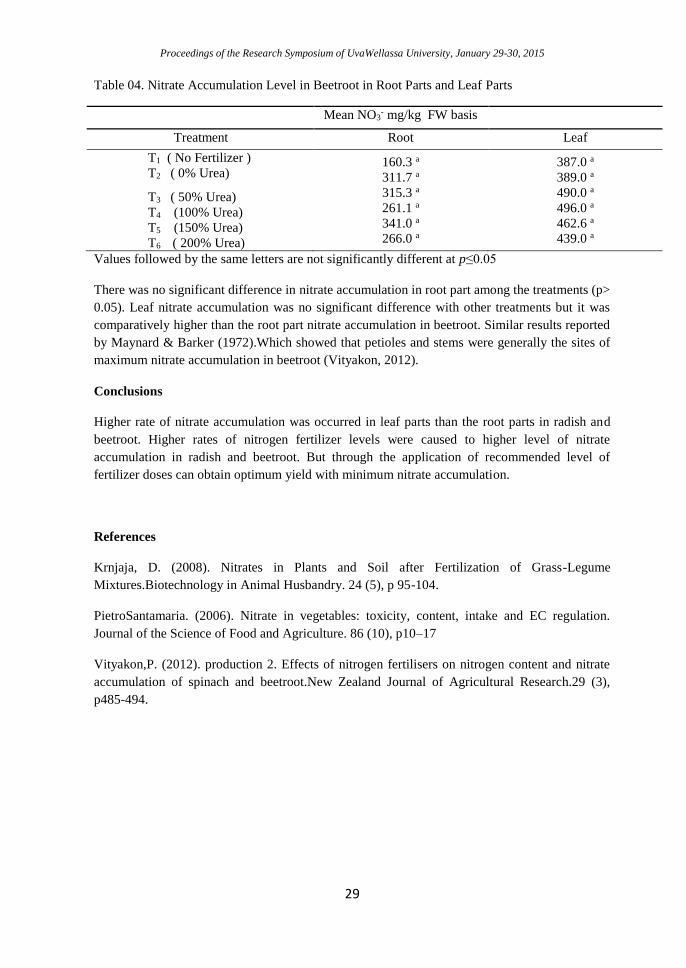
Proceedings of the Research Symposium of UvaWellassa University, January 29-30, 2015
29
Table 04. Nitrate Accumulation Level in Beetroot in Root Parts and Leaf Parts
Mean NO3- mg/kg FW basis
Treatment Root Leaf
T1 ( No Fertilizer )
T2 ( 0% Urea)
T3 ( 50% Urea)
T4 (100% Urea)
T5 (150% Urea)
T6 ( 200% Urea)
160.3 a
311.7 a
315.3 a
261.1 a
341.0 a
266.0 a
387.0 a
389.0 a
490.0 a
496.0 a
462.6 a
439.0 a
Values followed by the same letters are not significantly different at p≤0.05
There was no significant difference in nitrate accumulation in root part among the treatments (p>
0.05). Leaf nitrate accumulation was no significant difference with other treatments but it was
comparatively higher than the root part nitrate accumulation in beetroot. Similar results reported
by Maynard & Barker (1972).Which showed that petioles and stems were generally the sites of
maximum nitrate accumulation in beetroot (Vityakon, 2012).
Conclusions
Higher rate of nitrate accumulation was occurred in leaf parts than the root parts in radish and
beetroot. Higher rates of nitrogen fertilizer levels were caused to higher level of nitrate
accumulation in radish and beetroot. But through the application of recommended level of
fertilizer doses can obtain optimum yield with minimum nitrate accumulation.
References
Krnjaja, D. (2008). Nitrates in Plants and Soil after Fertilization of Grass-Legume
Mixtures.Biotechnology in Animal Husbandry. 24 (5), p 95-104.
PietroSantamaria. (2006). Nitrate in vegetables: toxicity, content, intake and EC regulation.
Journal of the Science of Food and Agriculture. 86 (10), p10–17
Vityakon,P. (2012). production 2. Effects of nitrogen fertilisers on nitrogen content and nitrate
accumulation of spinach and beetroot.New Zealand Journal of Agricultural Research.29 (3),
p485-494.
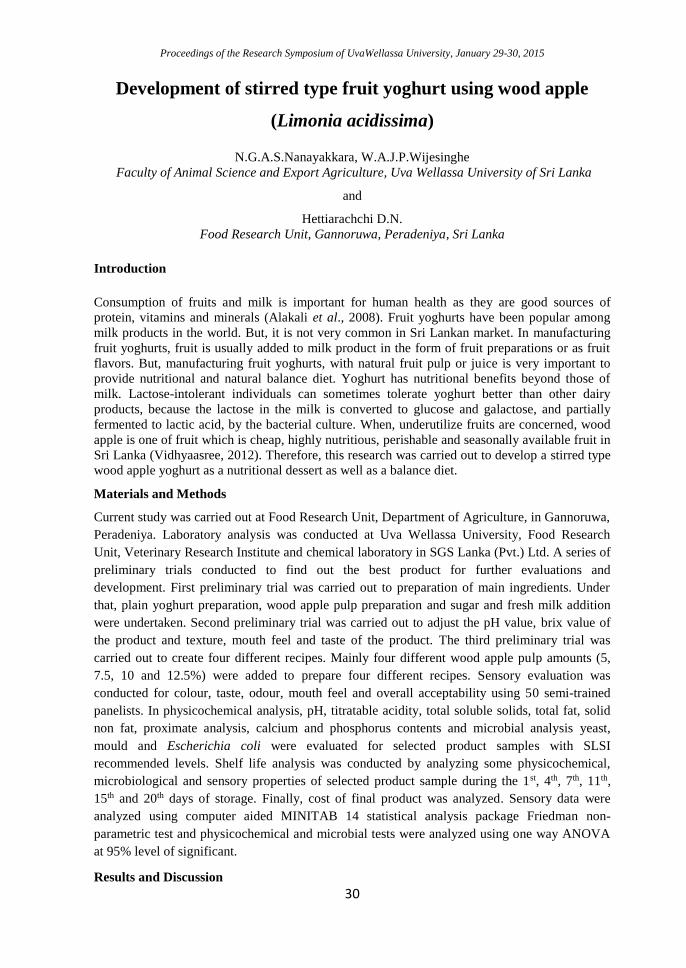
Proceedings of the Research Symposium of UvaWellassa University, January 29-30, 2015
30
Development of stirred type fruit yoghurt using wood apple
(Limonia acidissima)
N.G.A.S.Nanayakkara, W.A.J.P.Wijesinghe
Faculty of Animal Science and Export Agriculture, Uva Wellassa University of Sri Lanka
and
Hettiarachchi D.N.
Food Research Unit, Gannoruwa, Peradeniya, Sri Lanka
Introduction
Consumption of fruits and milk is important for human health as they are good sources of
protein, vitamins and minerals (Alakali et al., 2008). Fruit yoghurts have been popular among
milk products in the world. But, it is not very common in Sri Lankan market. In manufacturing
fruit yoghurts, fruit is usually added to milk product in the form of fruit preparations or as fruit
flavors. But, manufacturing fruit yoghurts, with natural fruit pulp or juice is very important to
provide nutritional and natural balance diet. Yoghurt has nutritional benefits beyond those of
milk. Lactose-intolerant individuals can sometimes tolerate yoghurt better than other dairy
products, because the lactose in the milk is converted to glucose and galactose, and partially
fermented to lactic acid, by the bacterial culture. When, underutilize fruits are concerned, wood
apple is one of fruit which is cheap, highly nutritious, perishable and seasonally available fruit in
Sri Lanka (Vidhyaasree, 2012). Therefore, this research was carried out to develop a stirred type
wood apple yoghurt as a nutritional dessert as well as a balance diet.
Materials and Methods
Current study was carried out at Food Research Unit, Department of Agriculture, in Gannoruwa,
Peradeniya. Laboratory analysis was conducted at Uva Wellassa University, Food Research
Unit, Veterinary Research Institute and chemical laboratory in SGS Lanka (Pvt.) Ltd. A series of
preliminary trials conducted to find out the best product for further evaluations and
development. First preliminary trial was carried out to preparation of main ingredients. Under
that, plain yoghurt preparation, wood apple pulp preparation and sugar and fresh milk addition
were undertaken. Second preliminary trial was carried out to adjust the pH value, brix value of
the product and texture, mouth feel and taste of the product. The third preliminary trial was
carried out to create four different recipes. Mainly four different wood apple pulp amounts (5,
7.5, 10 and 12.5%) were added to prepare four different recipes. Sensory evaluation was
conducted for colour, taste, odour, mouth feel and overall acceptability using 50 semi-trained
panelists. In physicochemical analysis, pH, titratable acidity, total soluble solids, total fat, solid
non fat, proximate analysis, calcium and phosphorus contents and microbial analysis yeast,
mould and Escherichia coli were evaluated for selected product samples with SLSI
recommended levels. Shelf life analysis was conducted by analyzing some physicochemical,
microbiological and sensory properties of selected product sample during the 1st, 4th, 7th, 11th,
15th and 20th days of storage. Finally, cost of final product was analyzed. Sensory data were
analyzed using computer aided MINITAB 14 statistical analysis package Friedman non-
parametric test and physicochemical and microbial tests were analyzed using one way ANOVA
at 95% level of significant.
Results and Discussion
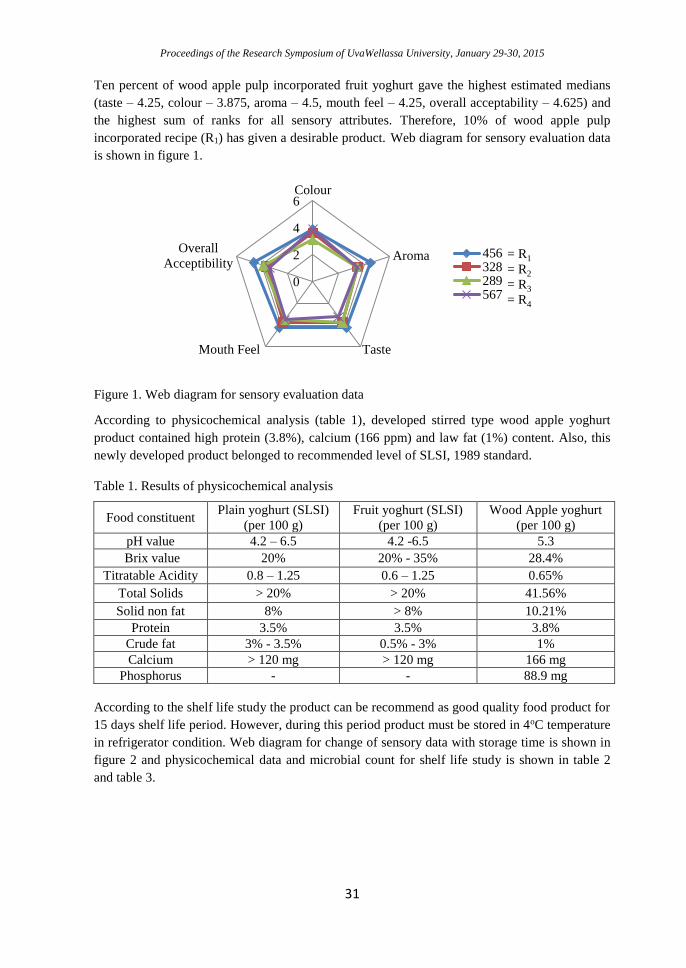
Proceedings of the Research Symposium of UvaWellassa University, January 29-30, 2015
31
Ten percent of wood apple pulp incorporated fruit yoghurt gave the highest estimated medians
(taste – 4.25, colour – 3.875, aroma – 4.5, mouth feel – 4.25, overall acceptability – 4.625) and
the highest sum of ranks for all sensory attributes. Therefore, 10% of wood apple pulp
incorporated recipe (R1) has given a desirable product. Web diagram for sensory evaluation data
is shown in figure 1.
Figure 1. Web diagram for sensory evaluation data
According to physicochemical analysis (table 1), developed stirred type wood apple yoghurt
product contained high protein (3.8%), calcium (166 ppm) and law fat (1%) content. Also, this
newly developed product belonged to recommended level of SLSI, 1989 standard.
Table 1. Results of physicochemical analysis
Food constituent Plain yoghurt (SLSI)
(per 100 g)
Fruit yoghurt (SLSI)
(per 100 g)
Wood Apple yoghurt
(per 100 g)
pH value 4.2 – 6.5 4.2 -6.5 5.3
Brix value 20% 20% - 35% 28.4%
Titratable Acidity 0.8 – 1.25 0.6 – 1.25 0.65%
Total Solids > 20% > 20% 41.56%
Solid non fat 8% > 8% 10.21%
Protein 3.5% 3.5% 3.8%
Crude fat 3% - 3.5% 0.5% - 3% 1%
Calcium > 120 mg > 120 mg 166 mg
Phosphorus - - 88.9 mg
According to the shelf life study the product can be recommend as good quality food product for
15 days shelf life period. However, during this period product must be stored in 4oC temperature
in refrigerator condition. Web diagram for change of sensory data with storage time is shown in
figure 2 and physicochemical data and microbial count for shelf life study is shown in table 2
and table 3.
0
2
4
6Colour
Aroma
TasteMouth Feel
Overall
Acceptibility456328289567
= R1
= R2
= R3
= R4
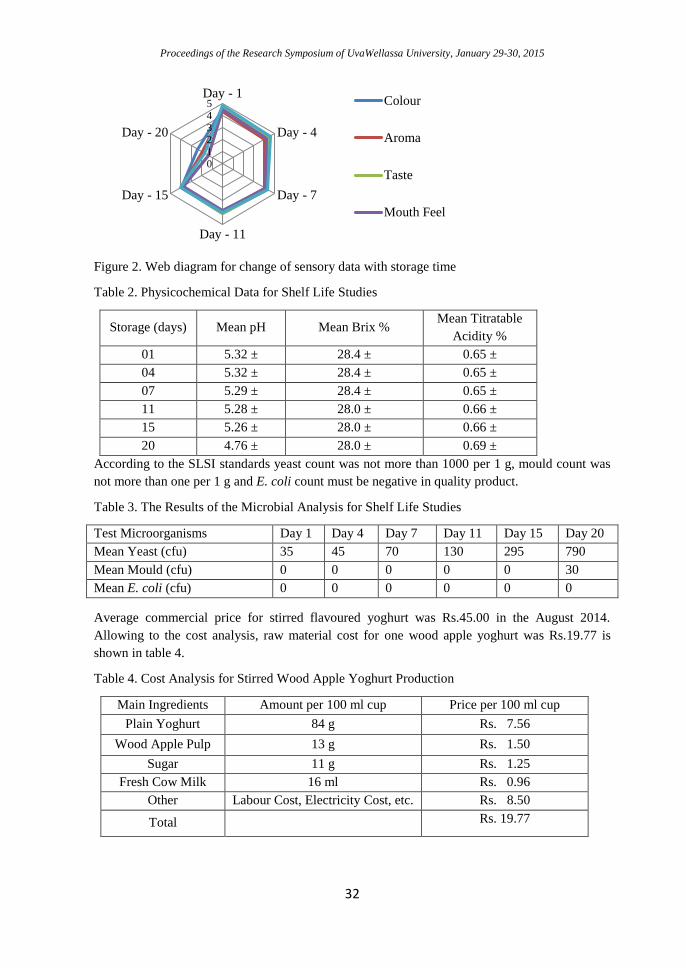
Proceedings of the Research Symposium of UvaWellassa University, January 29-30, 2015
32
Figure 2. Web diagram for change of sensory data with storage time
Table 2. Physicochemical Data for Shelf Life Studies
Storage (days) Mean pH Mean Brix % Mean Titratable
Acidity %
01 5.32 ± 28.4 ± 0.65 ±
04 5.32 ± 28.4 ± 0.65 ±
07 5.29 ± 28.4 ± 0.65 ±
11 5.28 ± 28.0 ± 0.66 ±
15 5.26 ± 28.0 ± 0.66 ±
20 4.76 ± 28.0 ± 0.69 ±
According to the SLSI standards yeast count was not more than 1000 per 1 g, mould count was
not more than one per 1 g and E. coli count must be negative in quality product.
Table 3. The Results of the Microbial Analysis for Shelf Life Studies
Test Microorganisms Day 1 Day 4 Day 7 Day 11 Day 15 Day 20
Mean Yeast (cfu) 35 45 70 130 295 790
Mean Mould (cfu) 0 0 0 0 0 30
Mean E. coli (cfu) 0 0 0 0 0 0
Average commercial price for stirred flavoured yoghurt was Rs.45.00 in the August 2014.
Allowing to the cost analysis, raw material cost for one wood apple yoghurt was Rs.19.77 is
shown in table 4.
Table 4. Cost Analysis for Stirred Wood Apple Yoghurt Production
Main Ingredients Amount per 100 ml cup Price per 100 ml cup
Plain Yoghurt 84 g Rs. 7.56
Wood Apple Pulp 13 g Rs. 1.50
Sugar 11 g Rs. 1.25
Fresh Cow Milk 16 ml Rs. 0.96
Other Labour Cost, Electricity Cost, etc. Rs. 8.50
Total Rs. 19.77
012345
Day - 1
Day - 4
Day - 7
Day - 11
Day - 15
Day - 20
Colour
Aroma
Taste
Mouth Feel
Proceedings of the Research Symposium of UvaWellassa University, January 29-30, 2015
33
Conclusions
Ripe wood apple pulp can be introduced to yoghurt given the health benefits, higher sensory,
physicochemical and microbiological properties. The selected best sample, 10% of ripe wood
apple pulp gave acceptable results as SLSI standards. The product can be recommended as a
quality food product for 15 days period under 4oC temperature in refrigerator condition.
Acknowledgment
The great assistance provided by the staff of Food Research Unit, Mr. P.D.S. Kulathilaka,
Research and Development Executive, SGS Lanka Pvt. Ltd., Veterinary Research Institute,
Underutilized Fruit Crop Research Institute, Biology Laboratory of Uva Wellassa University are
highly acknowledged for their commitment to make this research study a success.
References
Alakali, J.S., Okonkwo, T.M. and Iordye, E.M., 2008. Effect of stabilizes on the
physicochemical and sensory attributes of thermized yoghurt, African Source of Biotechnology
7: 158-163.
AOAC 1985, Official methods of analysis, 16th edition, Association of Official Analytical
Chemists, Washington DC
Vidhyaasree (2012) Wood apple – nutrition value, benefits, and how to eat. Retrieved April 3,
2014 from the World Wide Web: http://www.gogreenguyz.com/fruitsology/wood-apple-
nutrition-value-benefits-and-how-to-eat.html
Proceedings of the Research Symposium of UvaWellassa University, January 29-30, 2015
34
Investigating the factors that influenced the excess use of
pesticides by the vegetable farmers in Badulla and Nuwara-Eliya
districts
M. T. D. C. Perera and M. G. P. P. Mahindarathne
Faculty of Animal Science and Export Agriculture, Uva Wellassa University of Sri Lanka
Introduction
Pesticides are the results of modern technology and synthetic organic poisons used to
exterminate specific organisms by inhibiting certain vital functions. They are applied
predominately to kill or control weeds, insect pests and animals. Pesticides are widely used
because of ease of application, high efficiency, temporary economic return and etc.
(Nagenthirarajah and Thiruchelvam, 2008). When pesticides are help to farmers to get high
production, massive usage of pesticides have been reported in many of commercial cultivations
in whole around the world (Wilson and Tiddsell, 2001). Similar to many developing countries,
pesticide related issues in Sri Lanka have become a major concern in the present day context.
Majority of cases have been occurred due to the excessive usage of pesticides. Excess uses of
pesticides have severe effects on environment and human health that may lead to an immediate
and long term effects.
Therefore it is important to identify the factors effect on excess use of pesticides which can help
to overcome the intensive use of pesticides over the years in vegetable cultivation. In this
context, the objectives of the study were (i) To investigate the farmers’ level of awareness in use
of pesticides and (ii) To investigate the factors that cause to excess use of pesticides.
Methodology
The research was carried out in up country vegetable growing areas of Badulla and Nuwara
Eliya district. Bandarawela, Welimada and Nuwara-Eliya Divisional Secretariat divisions were
selected as the study area. Stratified random sampling technique was used to select 600
vegetable farmers from Nuwara-Eliya, Walimada and Bandarawela Divisional Secretariat
divisions. Information were collected from farmers based on a semi structured pre-tested
questionnaire. Both descriptive statistical method and binary logistic regression technique were
used to analyze the data. Minitab 15 Statistical Software was used to get the output of binary
logistic analysis. The variables defined for the empirical model are shown in Table 1.
Empirical model
Y=β0 +β1LEX+β2CT+β3UHL+β4UFM+β5SI+β6THI+β7CP+β8AGE+β9EDUL+β10 EXP+β11ND+β12SF+β13TF+β14PLF+β15MF+β16FA+εi……………..(1)
Where, β0 to β16 = coefficients; εi = error terms
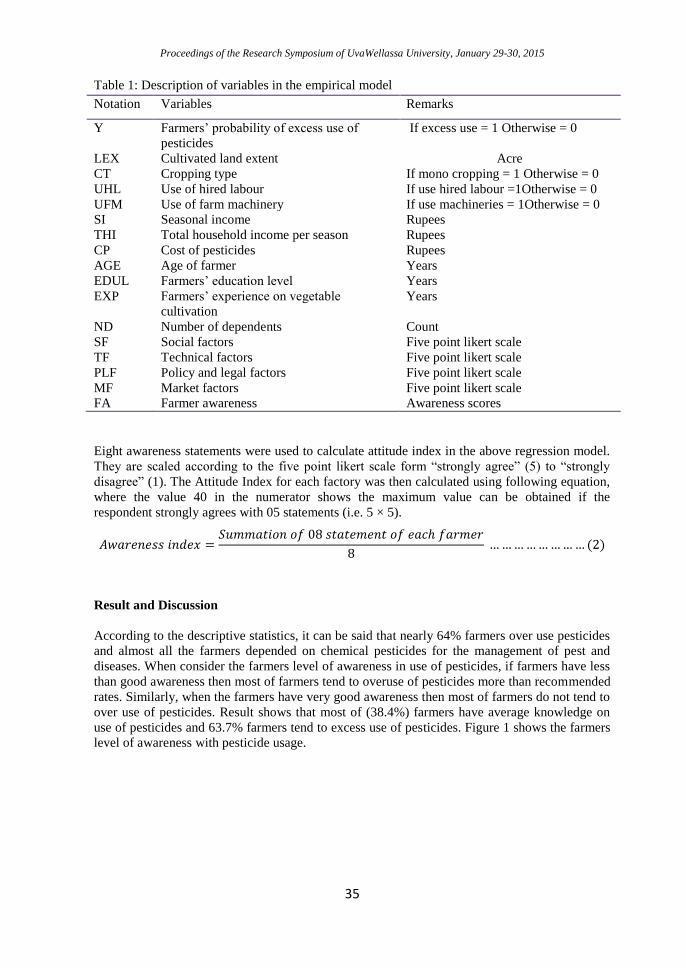
Proceedings of the Research Symposium of UvaWellassa University, January 29-30, 2015
35
Table 1: Description of variables in the empirical model
Notation Variables Remarks
Y Farmers’ probability of excess use of
pesticides
If excess use = 1 Otherwise = 0
LEX
CT
Cultivated land extent
Cropping type
Acre
If mono cropping = 1 Otherwise = 0
UHL Use of hired labour If use hired labour =1Otherwise = 0
UFM Use of farm machinery If use machineries = 1Otherwise = 0
SI Seasonal income Rupees
THI Total household income per season Rupees
CP Cost of pesticides Rupees
AGE Age of farmer Years
EDUL Farmers’ education level Years
EXP Farmers’ experience on vegetable
cultivation
Years
ND Number of dependents Count
SF Social factors Five point likert scale
TF Technical factors Five point likert scale
PLF Policy and legal factors Five point likert scale
MF Market factors Five point likert scale
FA Farmer awareness Awareness scores
Eight awareness statements were used to calculate attitude index in the above regression model.
They are scaled according to the five point likert scale form “strongly agree” (5) to “strongly
disagree” (1). The Attitude Index for each factory was then calculated using following equation,
where the value 40 in the numerator shows the maximum value can be obtained if the
respondent strongly agrees with 05 statements (i.e. 5 × 5).
𝐴𝑤𝑎𝑟𝑒𝑛𝑒𝑠𝑠𝑖𝑛𝑑𝑒𝑥 =𝑆𝑢𝑚𝑚𝑎𝑡𝑖𝑜𝑛𝑜𝑓08𝑠𝑡𝑎𝑡𝑒𝑚𝑒𝑛𝑡𝑜𝑓𝑒𝑎𝑐ℎ𝑓𝑎𝑟𝑚𝑒𝑟
8……………………(2)
Result and Discussion
According to the descriptive statistics, it can be said that nearly 64% farmers over use pesticides
and almost all the farmers depended on chemical pesticides for the management of pest and
diseases. When consider the farmers level of awareness in use of pesticides, if farmers have less
than good awareness then most of farmers tend to overuse of pesticides more than recommended
rates. Similarly, when the farmers have very good awareness then most of farmers do not tend to
over use of pesticides. Result shows that most of (38.4%) farmers have average knowledge on
use of pesticides and 63.7% farmers tend to excess use of pesticides. Figure 1 shows the farmers
level of awareness with pesticide usage.
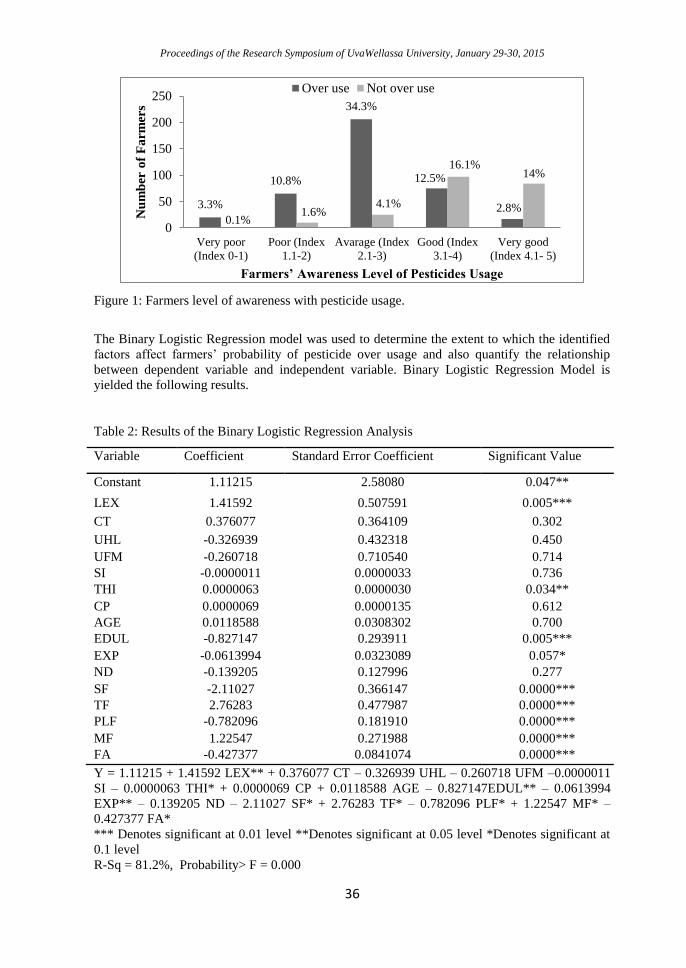
Proceedings of the Research Symposium of UvaWellassa University, January 29-30, 2015
36
Figure 1: Farmers level of awareness with pesticide usage.
The Binary Logistic Regression model was used to determine the extent to which the identified
factors affect farmers’ probability of pesticide over usage and also quantify the relationship
between dependent variable and independent variable. Binary Logistic Regression Model is
yielded the following results.
Table 2: Results of the Binary Logistic Regression Analysis
Variable Coefficient Standard Error Coefficient Significant Value
Constant 1.11215 2.58080 0.047**
LEX 1.41592 0.507591 0.005***
CT 0.376077 0.364109 0.302
UHL -0.326939 0.432318 0.450
UFM -0.260718 0.710540 0.714
SI -0.0000011 0.0000033 0.736
THI 0.0000063 0.0000030 0.034**
CP 0.0000069 0.0000135 0.612
AGE 0.0118588 0.0308302 0.700
EDUL -0.827147 0.293911 0.005***
EXP -0.0613994 0.0323089 0.057*
ND -0.139205 0.127996 0.277
SF -2.11027 0.366147 0.0000***
TF 2.76283 0.477987 0.0000***
PLF -0.782096 0.181910 0.0000***
MF 1.22547 0.271988 0.0000***
FA -0.427377 0.0841074 0.0000***
Y = 1.11215 + 1.41592 LEX** + 0.376077 CT – 0.326939 UHL – 0.260718 UFM –0.0000011
SI – 0.0000063 THI* + 0.0000069 CP + 0.0118588 AGE – 0.827147EDUL** – 0.0613994
EXP** – 0.139205 ND – 2.11027 SF* + 2.76283 TF* – 0.782096 PLF* + 1.22547 MF* –
0.427377 FA*
*** Denotes significant at 0.01 level **Denotes significant at 0.05 level *Denotes significant at
0.1 level
R-Sq = 81.2%, Probability> F = 0.000
3.3%
10.8%
34.3%
12.5%
2.8%0.1%
1.6%4.1%
16.1%14%
0
50
100
150
200
250
Very poor
(Index 0-1)
Poor (Index
1.1-2)
Avarage (Index
2.1-3)
Good (Index
3.1-4)
Very good
(Index 4.1- 5)
Nu
mb
er o
f F
arm
ers
Farmers’ Awareness Level of Pesticides Usage
Over use Not over use
Proceedings of the Research Symposium of UvaWellassa University, January 29-30, 2015
37
The model can be used to explain 81.2% of the variation of factors. Therefore this model is
suitable to investigating the factors that influenced the excess use of pesticides.
Conclusion
According to the study most of farmers have “average level” (awareness index= 2.1-3) of
awareness in pesticide usage. As well results revealed that when the farmers’ awareness was
higher than “average level”, there was less probability on excess use of pesticides and when
farmers have “average level” or less than “average level” (awareness index < 3.1) awareness on
pesticide usage, there was high probability on excess use of pesticides. Alsothe study indicate
that Land extent, Total household income, Educational level, Farmers experience, Social factors,
Technical factors, Policy and legal factors, market factors and farmers awareness are the factors
which significantly affect to the excess use of pesticides.
References
Nagenthirarajah, S., and Thiruchelvam, S. (2008). Knowledge of Farmers about Pest
Management Practices in Pambaimadu, Vavuniya District: An Ordered Probit Model Approach.
Sabaramuwa University Journal, 8(1), 79-89.
Wilson C., and Tisdell C. (2001). Why farmers continue to use pesticides despite environmental,
health and sustainability costs,School of Economics, The University of Queensland, 36(1), 449-
462.
Proceedings of the Research Symposium of UvaWellassa University, January 29-30, 2015
38
Mapping soil chemical properties and leaf quality parameters
relation to tobacco production in Sri Lanka: a GIS approach
H.C. Marasinghe, R.M.C.W. M. Rathnayake
Faculty of Animal Science and Export Agriculture, UvaWellassa University of Sri Lanka
and
N.N.R Abeysekara
Ceylon Tobacco Company
Introduction
Tobacco (Nicotianatabacum L) holds an unparalleled position among crop plants and in overall
terms, the status achieved by this single species is truly remarkable (Akehurst, 1981). This crop
significantly influences on world trade as a leaf basis product and is also a commercially widely
grown crop as a non–food field crop (Akehurst, 1981).The chemistry and fertility of soils greatly
influence the tobacco plant growth, leaf size, yield and physical, chemical and manufacturing
properties of tobacco leaf.Among factors that influence on tobacco productivity, soil fertility and
fertilizer use contribute nearly 50% of the yield and quality improvement of tobacco crop
(Krishnamurthy and Deosingh, 2002).
Thus, by changing the soil properties and water quality, the yield and the quality of the final
product can be greatly changed. Identifying lands with suitable soil propertiesfor the cultivation
will help to understand the correct fertilizer application. Fertilizer recommendation based on soil
test is important for improving the fertilizer use efficiency and thereby to increase the yield and
quality of tobacco.
An understanding of spatial distribution of soil properties in the field is important for refining
agricultural management practices. Soil variability is the outcome of many processes acting and
interacting across a continuum of spatial and temporal scales and inherently scale-dependent
(Cambardella et al., 1994).
Therefore, the study of relationship between the soil chemical properties and leaf quality can
provide a scientific basis to find potential lands for quality tobacco production.This research
presents the future potential tobacco growing areas based on the tobacco leaf quality
distribution.
Materials and methodology
In this study,Galewala and Mahiyanganaya tobacco growing areas were chosen as sample
area.Data were collected from primary and secondary sources. Soil property data which
wererecorded Ceylon tobacco company’s (CTC) lab reports were collected as secondary data.
Global Positioning System (GPS) coordinates were taken fromthe field as primary data. Soil
analysis was undertaken by collecting soil samples in studyareas from 15 cm deep from the soil
surface. The soil samples were collected from ten different places of one land with
approximately 1kg of weight. Soil samples were analyzed for pH, organic matter, electrical
conductivity, soil texture, calcium, magnesium, potassium, sodium, calcium/magnesium ratio,
magnesium/potassium ratio, phosphorous, acid saturation, cupper, ferrus, manganese and zinc.
Leaf quality data were taken from the CTC lab reports and identified the leaf nicotine
percentage, chloride percentage and sugar percentages from the plants in selected locations.
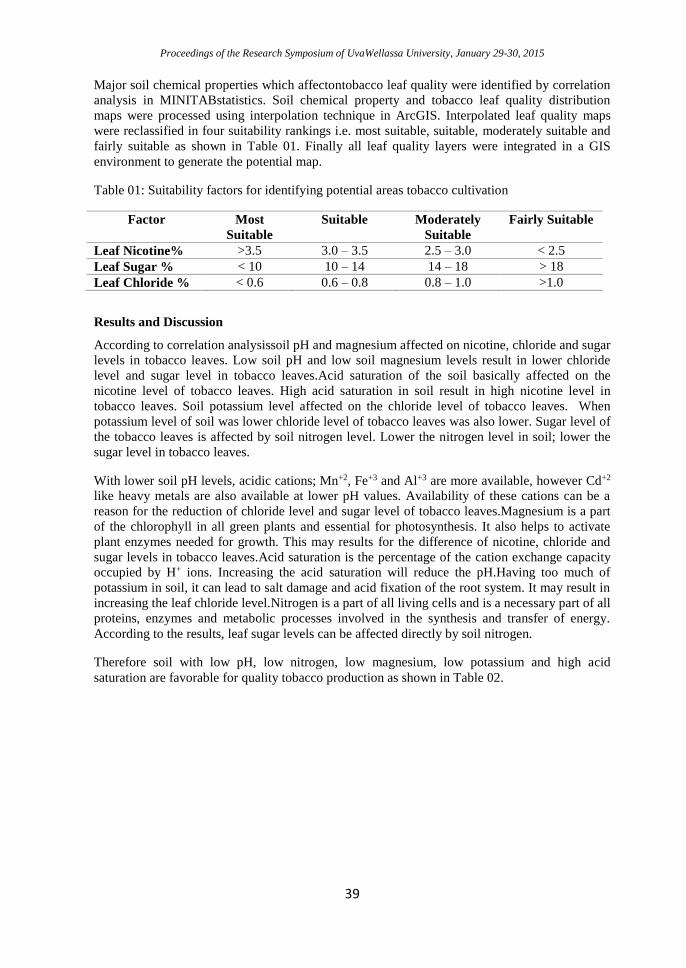
Proceedings of the Research Symposium of UvaWellassa University, January 29-30, 2015
39
Major soil chemical properties which affectontobacco leaf quality were identified by correlation
analysis in MINITABstatistics. Soil chemical property and tobacco leaf quality distribution
maps were processed using interpolation technique in ArcGIS. Interpolated leaf quality maps
were reclassified in four suitability rankings i.e. most suitable, suitable, moderately suitable and
fairly suitable as shown in Table 01. Finally all leaf quality layers were integrated in a GIS
environment to generate the potential map.
Table 01: Suitability factors for identifying potential areas tobacco cultivation
Factor Most
Suitable
Suitable Moderately
Suitable
Fairly Suitable
Leaf Nicotine% >3.5 3.0 – 3.5 2.5 – 3.0 < 2.5
Leaf Sugar % < 10 10 – 14 14 – 18 > 18
Leaf Chloride % < 0.6 0.6 – 0.8 0.8 – 1.0 >1.0
Results and Discussion
According to correlation analysissoil pH and magnesium affected on nicotine, chloride and sugar
levels in tobacco leaves. Low soil pH and low soil magnesium levels result in lower chloride
level and sugar level in tobacco leaves.Acid saturation of the soil basically affected on the
nicotine level of tobacco leaves. High acid saturation in soil result in high nicotine level in
tobacco leaves. Soil potassium level affected on the chloride level of tobacco leaves. When
potassium level of soil was lower chloride level of tobacco leaves was also lower. Sugar level of
the tobacco leaves is affected by soil nitrogen level. Lower the nitrogen level in soil; lower the
sugar level in tobacco leaves.
With lower soil pH levels, acidic cations; Mn+2, Fe+3 and Al+3 are more available, however Cd+2
like heavy metals are also available at lower pH values. Availability of these cations can be a
reason for the reduction of chloride level and sugar level of tobacco leaves.Magnesium is a part
of the chlorophyll in all green plants and essential for photosynthesis. It also helps to activate
plant enzymes needed for growth. This may results for the difference of nicotine, chloride and
sugar levels in tobacco leaves.Acid saturation is the percentage of the cation exchange capacity
occupied by H+ ions. Increasing the acid saturation will reduce the pH.Having too much of
potassium in soil, it can lead to salt damage and acid fixation of the root system. It may result in
increasing the leaf chloride level.Nitrogen is a part of all living cells and is a necessary part of all
proteins, enzymes and metabolic processes involved in the synthesis and transfer of energy.
According to the results, leaf sugar levels can be affected directly by soil nitrogen.
Therefore soil with low pH, low nitrogen, low magnesium, low potassium and high acid
saturation are favorable for quality tobacco production as shown in Table 02.
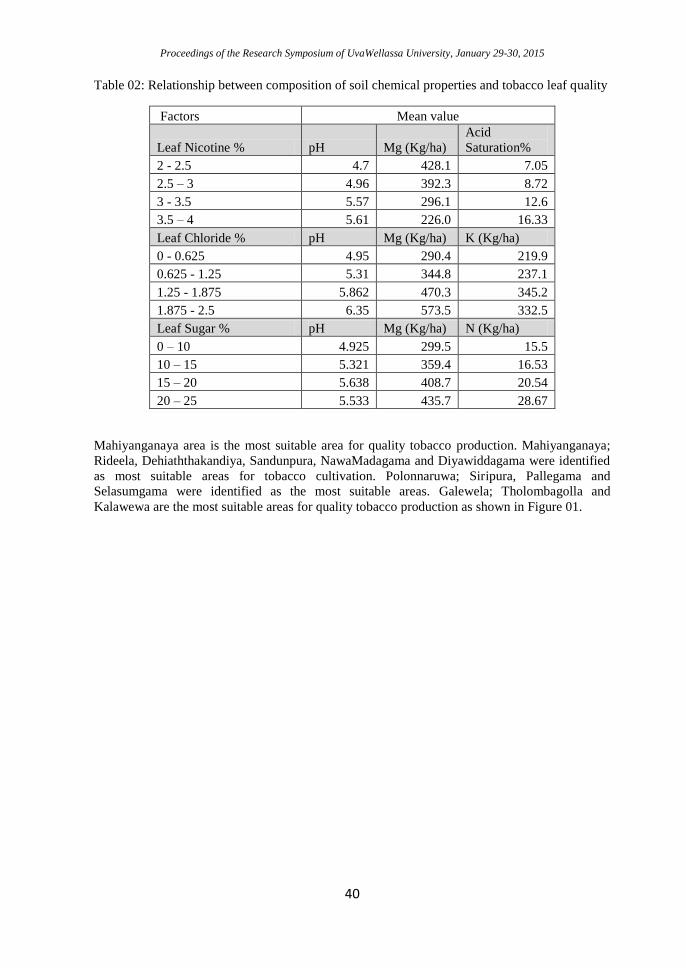
Proceedings of the Research Symposium of UvaWellassa University, January 29-30, 2015
40
Table 02: Relationship between composition of soil chemical properties and tobacco leaf quality
Factors Mean value
Leaf Nicotine % pH Mg (Kg/ha)
Acid
Saturation%
2 - 2.5 4.7 428.1 7.05
2.5 – 3 4.96 392.3 8.72
3 - 3.5 5.57 296.1 12.6
3.5 – 4 5.61 226.0 16.33
Leaf Chloride % pH Mg (Kg/ha) K (Kg/ha)
0 - 0.625 4.95 290.4 219.9
0.625 - 1.25 5.31 344.8 237.1
1.25 - 1.875 5.862 470.3 345.2
1.875 - 2.5 6.35 573.5 332.5
Leaf Sugar % pH Mg (Kg/ha) N (Kg/ha)
0 – 10 4.925 299.5 15.5
10 – 15 5.321 359.4 16.53
15 – 20 5.638 408.7 20.54
20 – 25 5.533 435.7 28.67
Mahiyanganaya area is the most suitable area for quality tobacco production. Mahiyanganaya;
Rideela, Dehiaththakandiya, Sandunpura, NawaMadagama and Diyawiddagama were identified
as most suitable areas for tobacco cultivation. Polonnaruwa; Siripura, Pallegama and
Selasumgama were identified as the most suitable areas. Galewela; Tholombagolla and
Kalawewa are the most suitable areas for quality tobacco production as shown in Figure 01.
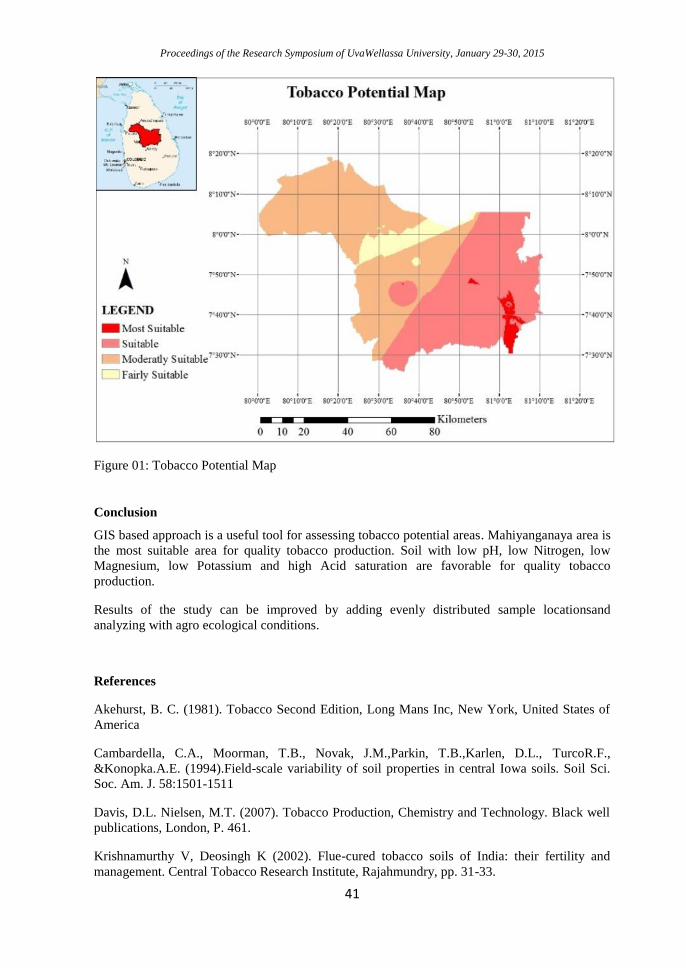
Proceedings of the Research Symposium of UvaWellassa University, January 29-30, 2015
41
Figure 01: Tobacco Potential Map
Conclusion
GIS based approach is a useful tool for assessing tobacco potential areas. Mahiyanganaya area is
the most suitable area for quality tobacco production. Soil with low pH, low Nitrogen, low
Magnesium, low Potassium and high Acid saturation are favorable for quality tobacco
production.
Results of the study can be improved by adding evenly distributed sample locationsand
analyzing with agro ecological conditions.
References
Akehurst, B. C. (1981). Tobacco Second Edition, Long Mans Inc, New York, United States of
America
Cambardella, C.A., Moorman, T.B., Novak, J.M.,Parkin, T.B.,Karlen, D.L., TurcoR.F.,
&Konopka.A.E. (1994).Field-scale variability of soil properties in central Iowa soils. Soil Sci.
Soc. Am. J. 58:1501-1511
Davis, D.L. Nielsen, M.T. (2007). Tobacco Production, Chemistry and Technology. Black well
publications, London, P. 461.
Krishnamurthy V, Deosingh K (2002). Flue-cured tobacco soils of India: their fertility and
management. Central Tobacco Research Institute, Rajahmundry, pp. 31-33.
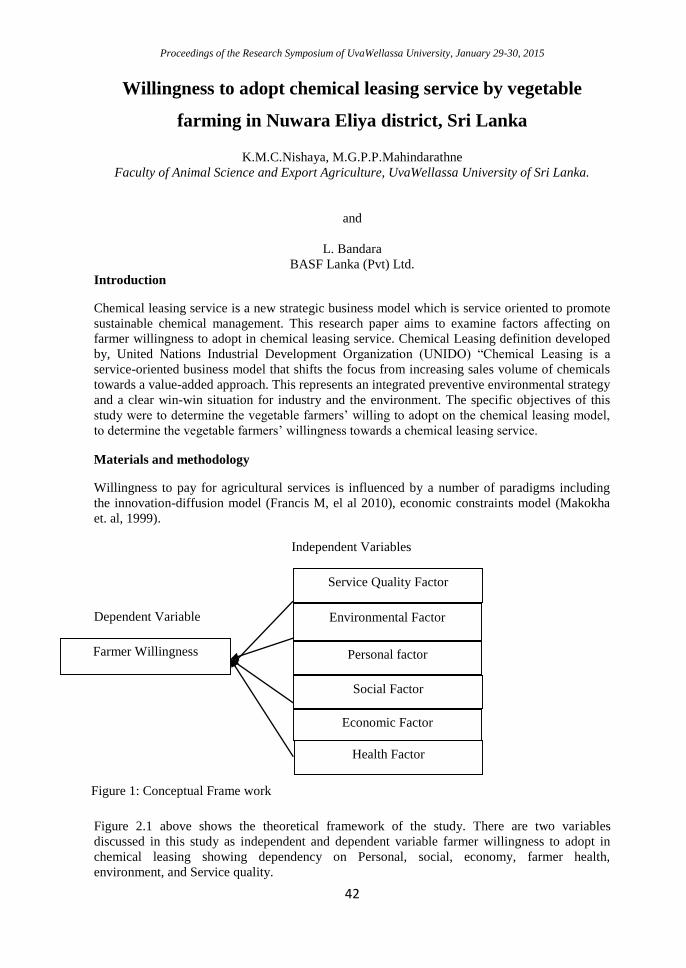
Proceedings of the Research Symposium of UvaWellassa University, January 29-30, 2015
42
Willingness to adopt chemical leasing service by vegetable
farming in Nuwara Eliya district, Sri Lanka
K.M.C.Nishaya, M.G.P.P.Mahindarathne
Faculty of Animal Science and Export Agriculture, UvaWellassa University of Sri Lanka.
and
L. Bandara
BASF Lanka (Pvt) Ltd.
Introduction
Chemical leasing service is a new strategic business model which is service oriented to promote
sustainable chemical management. This research paper aims to examine factors affecting on
farmer willingness to adopt in chemical leasing service. Chemical Leasing definition developed
by, United Nations Industrial Development Organization (UNIDO) “Chemical Leasing is a
service-oriented business model that shifts the focus from increasing sales volume of chemicals
towards a value-added approach. This represents an integrated preventive environmental strategy
and a clear win-win situation for industry and the environment. The specific objectives of this
study were to determine the vegetable farmers’ willing to adopt on the chemical leasing model,
to determine the vegetable farmers’ willingness towards a chemical leasing service.
Materials and methodology
Willingness to pay for agricultural services is influenced by a number of paradigms including
the innovation-diffusion model (Francis M, el al 2010), economic constraints model (Makokha
et. al, 1999).
Independent Variables
Dependent Variable
Figure 2.1 above shows the theoretical framework of the study. There are two variables
discussed in this study as independent and dependent variable farmer willingness to adopt in
chemical leasing showing dependency on Personal, social, economy, farmer health,
environment, and Service quality.
Farmer Willingness
Service Quality Factor
Environmental Factor
Personal factor
Social Factor
Economic Factor
Health Factor
Figure 1: Conceptual Frame work
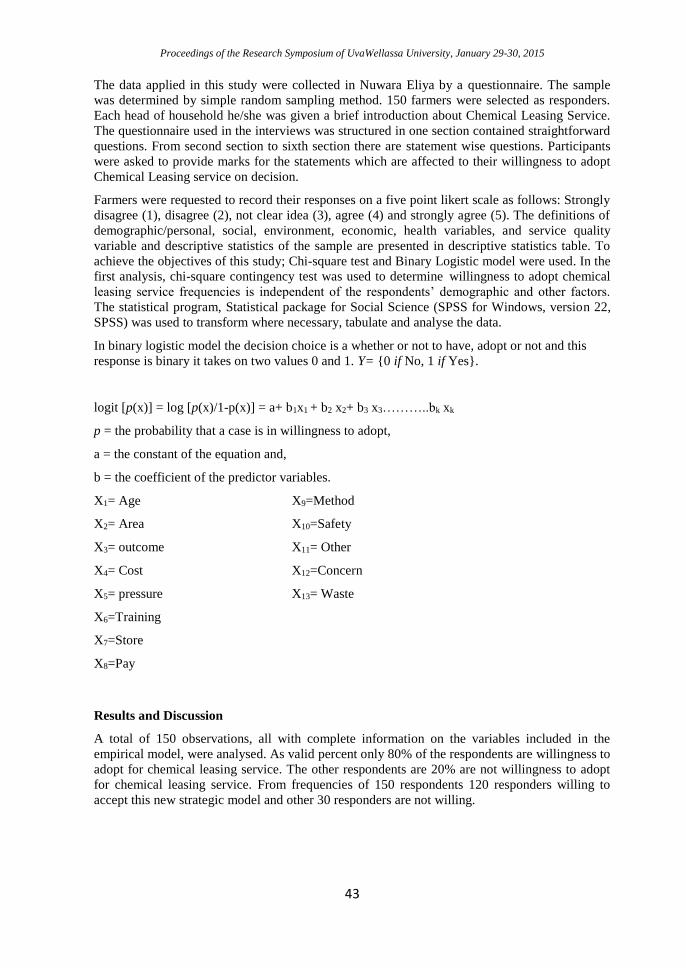
Proceedings of the Research Symposium of UvaWellassa University, January 29-30, 2015
43
The data applied in this study were collected in Nuwara Eliya by a questionnaire. The sample
was determined by simple random sampling method. 150 farmers were selected as responders.
Each head of household he/she was given a brief introduction about Chemical Leasing Service.
The questionnaire used in the interviews was structured in one section contained straightforward
questions. From second section to sixth section there are statement wise questions. Participants
were asked to provide marks for the statements which are affected to their willingness to adopt
Chemical Leasing service on decision.
Farmers were requested to record their responses on a five point likert scale as follows: Strongly
disagree (1), disagree (2), not clear idea (3), agree (4) and strongly agree (5). The definitions of
demographic/personal, social, environment, economic, health variables, and service quality
variable and descriptive statistics of the sample are presented in descriptive statistics table. To
achieve the objectives of this study; Chi-square test and Binary Logistic model were used. In the
first analysis, chi-square contingency test was used to determine willingness to adopt chemical
leasing service frequencies is independent of the respondents’ demographic and other factors.
The statistical program, Statistical package for Social Science (SPSS for Windows, version 22,
SPSS) was used to transform where necessary, tabulate and analyse the data.
In binary logistic model the decision choice is a whether or not to have, adopt or not and this
response is binary it takes on two values 0 and 1. Y= {0 if No, 1 if Yes}.
logit [p(x)] = log [p(x)/1-p(x)] = a+ b1x1 + b2 x2+ b3 x3………..bk xk
p = the probability that a case is in willingness to adopt,
a = the constant of the equation and,
b = the coefficient of the predictor variables.
X1= Age X9=Method
X2= Area X10=Safety
X3= outcome X11= Other
X4= Cost X12=Concern
X5= pressure X13= Waste
X6=Training
X7=Store
X8=Pay
Results and Discussion
A total of 150 observations, all with complete information on the variables included in the
empirical model, were analysed. As valid percent only 80% of the respondents are willingness to
adopt for chemical leasing service. The other respondents are 20% are not willingness to adopt
for chemical leasing service. From frequencies of 150 respondents 120 responders willing to
accept this new strategic model and other 30 responders are not willing.
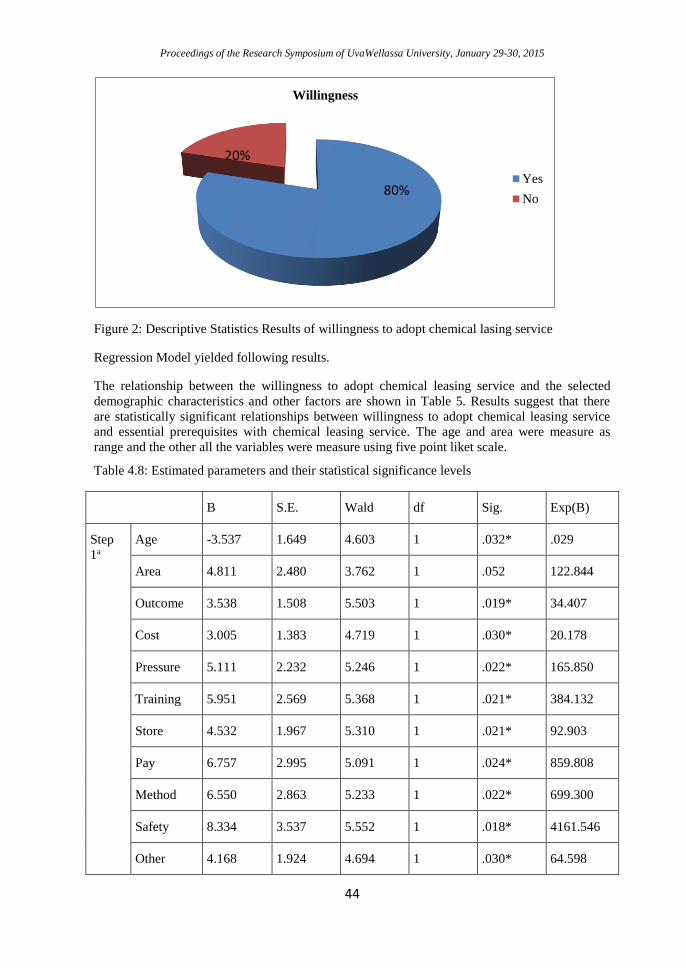
Proceedings of the Research Symposium of UvaWellassa University, January 29-30, 2015
44
Figure 2: Descriptive Statistics Results of willingness to adopt chemical lasing service
Regression Model yielded following results.
The relationship between the willingness to adopt chemical leasing service and the selected
demographic characteristics and other factors are shown in Table 5. Results suggest that there
are statistically significant relationships between willingness to adopt chemical leasing service
and essential prerequisites with chemical leasing service. The age and area were measure as
range and the other all the variables were measure using five point liket scale.
Table 4.8: Estimated parameters and their statistical significance levels
B S.E. Wald df Sig. Exp(B)
Step
1a
Age -3.537 1.649 4.603 1 .032* .029
Area 4.811 2.480 3.762 1 .052 122.844
Outcome 3.538 1.508 5.503 1 .019* 34.407
Cost 3.005 1.383 4.719 1 .030* 20.178
Pressure 5.111 2.232 5.246 1 .022* 165.850
Training 5.951 2.569 5.368 1 .021* 384.132
Store 4.532 1.967 5.310 1 .021* 92.903
Pay 6.757 2.995 5.091 1 .024* 859.808
Method 6.550 2.863 5.233 1 .022* 699.300
Safety 8.334 3.537 5.552 1 .018* 4161.546
Other 4.168 1.924 4.694 1 .030* 64.598
Willingness
Yes
No80%
20%
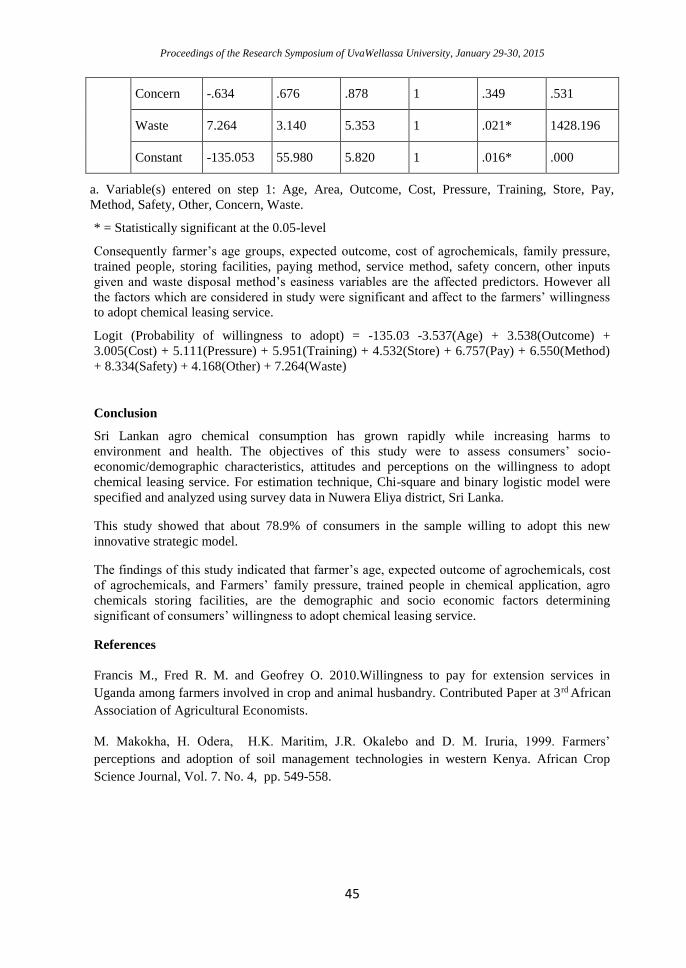
Proceedings of the Research Symposium of UvaWellassa University, January 29-30, 2015
45
Concern -.634 .676 .878 1 .349 .531
Waste 7.264 3.140 5.353 1 .021* 1428.196
Constant -135.053 55.980 5.820 1 .016* .000
a. Variable(s) entered on step 1: Age, Area, Outcome, Cost, Pressure, Training, Store, Pay,
Method, Safety, Other, Concern, Waste.
* = Statistically significant at the 0.05-level
Consequently farmer’s age groups, expected outcome, cost of agrochemicals, family pressure,
trained people, storing facilities, paying method, service method, safety concern, other inputs
given and waste disposal method’s easiness variables are the affected predictors. However all
the factors which are considered in study were significant and affect to the farmers’ willingness
to adopt chemical leasing service.
Logit (Probability of willingness to adopt) = -135.03 -3.537(Age) + 3.538(Outcome) +
3.005(Cost) + 5.111(Pressure) + 5.951(Training) + 4.532(Store) + 6.757(Pay) + 6.550(Method)
+ 8.334(Safety) + 4.168(Other) + 7.264(Waste)
Conclusion
Sri Lankan agro chemical consumption has grown rapidly while increasing harms to
environment and health. The objectives of this study were to assess consumers’ socio-
economic/demographic characteristics, attitudes and perceptions on the willingness to adopt
chemical leasing service. For estimation technique, Chi-square and binary logistic model were
specified and analyzed using survey data in Nuwera Eliya district, Sri Lanka.
This study showed that about 78.9% of consumers in the sample willing to adopt this new
innovative strategic model.
The findings of this study indicated that farmer’s age, expected outcome of agrochemicals, cost
of agrochemicals, and Farmers’ family pressure, trained people in chemical application, agro
chemicals storing facilities, are the demographic and socio economic factors determining
significant of consumers’ willingness to adopt chemical leasing service.
References
Francis M., Fred R. M. and Geofrey O. 2010.Willingness to pay for extension services in
Uganda among farmers involved in crop and animal husbandry. Contributed Paper at 3rd African
Association of Agricultural Economists.
M. Makokha, H. Odera, H.K. Maritim, J.R. Okalebo and D. M. Iruria, 1999. Farmers’
perceptions and adoption of soil management technologies in western Kenya. African Crop
Science Journal, Vol. 7. No. 4, pp. 549-558.
Proceedings of the Research Symposium of UvaWellassa University, January 29-30, 2015
46
Analysis of combining ability and heterosis in tomato (solanum
lycopersicum) using full diallel cross
R.G.Y.H.Jayarathna, L.M.H.RAlwis.
Faculty of Animal Science and Export Agriculture, Uva Wellassa University of Sri Lanka
and
H.HemalFonseka, H.M.V.T.Welegama
Horticultural Crop Research and Development Institute, Gannoruwa, Sri Lanka
Introduction
Tomato (Solanumlycopersicum) is the second most important vegetable crop next to potato.
Tomato being one of the popular vegetable crops in Sri Lanka is preferred by farmers due to
high economic returns, export potentials and nutritive value. Tomato is a rich source of vitamin
A, C and minerals like Ca, P and Fe (Dhaliwalet al., 2003). Tomatoes are major contributors of
antioxidants such as carotenoids (especially, lycopene and β-carotene), phenolics, ascorbic acid
(vitamin C) and small amounts of vitamin E in daily diets (Raiet al., 2012).
In Sri Lanka, tomato is cultivated in more than 7137 ha, producing nearly 73917 t/year.
(Department of Agriculture, 2010) The record lower yields are attributed to multiple of factors
inclusive of elevated and frequent incidences of pest and diseases and inadequate accessibility to
quality seeds (Ceylon Chamber of Commerce, 2011).
Most improvement programmes of many crops use diallel analyses as they provide breeders
information on the genetic value of varieties as parents and to assess the gene action which can
be directed at improving yield and other related quantitative characters (Vianaet al., 2001).
Therefore, an understanding of the genetic control of characters and role of non-allelic
interaction is essential to the breeder when deciding of the selection method and breeding
procedure to follow (Esmail, 2007). From diallel analysis, plant breeders are able to gather
information on heterosis and effect due to maternal, General Combining Ability (GCA) and
Specific Combining Ability (SCA) of parents in crosses (Glover et al., 2005).
Materials and method
Parents were obtained from the germplasm of the Plant Genetic Resource Centre (PGRC),
Gannoruwa, Peradeniya.Seeds of the all possible crosses, reciprocals and Bhathiya were
obtained from the Horticultural Crop Research and Development Institute (HoRDI), Gannoruwa
from the maha season 2013/2014. All possible crosses and parents were shown in table 01.
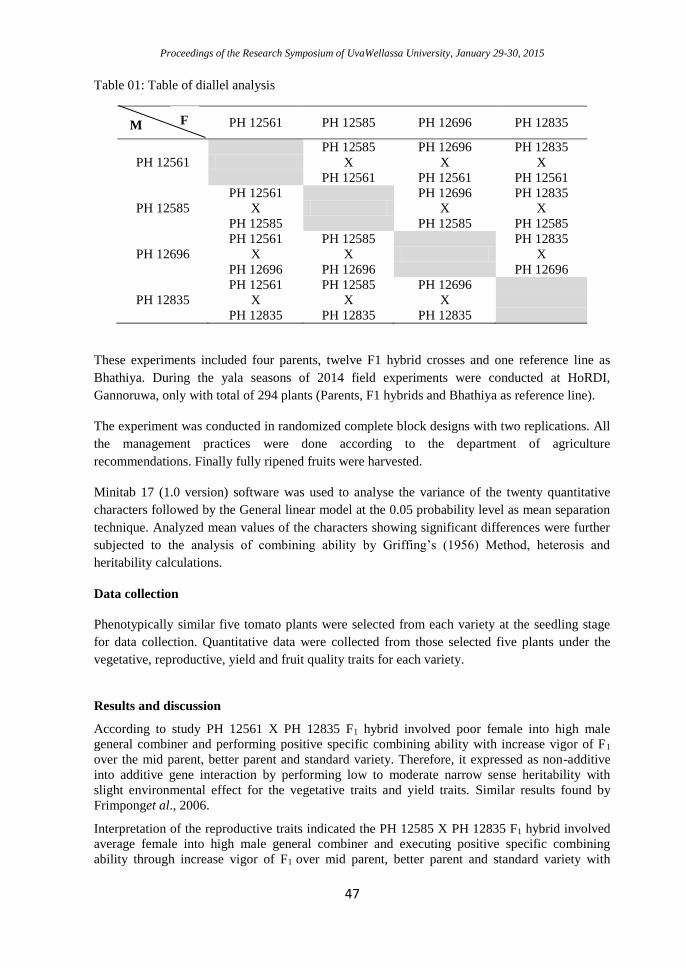
Proceedings of the Research Symposium of UvaWellassa University, January 29-30, 2015
47
Table 01: Table of diallel analysis
PH 12561 PH 12585 PH 12696 PH 12835
PH 12561
PH 12585
X
PH 12561
PH 12696
X
PH 12561
PH 12835
X
PH 12561
PH 12585
PH 12561
X
PH 12585
PH 12696
X
PH 12585
PH 12835
X
PH 12585
PH 12696
PH 12561
X
PH 12696
PH 12585
X
PH 12696
PH 12835
X
PH 12696
PH 12835
PH 12561
X
PH 12835
PH 12585
X
PH 12835
PH 12696
X
PH 12835
These experiments included four parents, twelve F1 hybrid crosses and one reference line as
Bhathiya. During the yala seasons of 2014 field experiments were conducted at HoRDI,
Gannoruwa, only with total of 294 plants (Parents, F1 hybrids and Bhathiya as reference line).
The experiment was conducted in randomized complete block designs with two replications. All
the management practices were done according to the department of agriculture
recommendations. Finally fully ripened fruits were harvested.
Minitab 17 (1.0 version) software was used to analyse the variance of the twenty quantitative
characters followed by the General linear model at the 0.05 probability level as mean separation
technique. Analyzed mean values of the characters showing significant differences were further
subjected to the analysis of combining ability by Griffing’s (1956) Method, heterosis and
heritability calculations.
Data collection
Phenotypically similar five tomato plants were selected from each variety at the seedling stage
for data collection. Quantitative data were collected from those selected five plants under the
vegetative, reproductive, yield and fruit quality traits for each variety.
Results and discussion
According to study PH 12561 X PH 12835 F1 hybrid involved poor female into high male
general combiner and performing positive specific combining ability with increase vigor of F1
over the mid parent, better parent and standard variety. Therefore, it expressed as non-additive
into additive gene interaction by performing low to moderate narrow sense heritability with
slight environmental effect for the vegetative traits and yield traits. Similar results found by
Frimponget al., 2006.
Interpretation of the reproductive traits indicated the PH 12585 X PH 12835 F1 hybrid involved
average female into high male general combiner and executing positive specific combining
ability through increase vigor of F1 over mid parent, better parent and standard variety with
F M
Proceedings of the Research Symposium of UvaWellassa University, January 29-30, 2015
48
expression of the additive into additive gene interaction by performing low narrow sense
heritability with low environmental effect.
In pursue of the research study, PH 12561 X PH 12696 F1 hybrid elaborated poor female into
high male general combiner and performing positive specific combining ability with increase
vigor of F1 over the mid parent, better parent and standard variety. Therefore, it interpreted as
non-additive into additive gene interaction by performing low to moderate narrow sense
heritability with slight environmental effect for the fruit quality traits.
Most of the considered quantitative traits were slightly affected by the environment due to the
estimation of moderate narrow sense heritability values.
Conclusion
In pursue of the research study, PH 12835 parent interpreted as the best open pollinated parent.
PH 12561 X PH 12835 F1 hybrid indicated as the best F1 hybrid for the vegetative and yield
traits. PH 12561 X PH 12696 F1 hybrid indicated as the best F1 hybrid for the fruit quality traits.
References
Ceylon Chamber of Commerce.(2011). Fruits and Vegetables. Available: http://www.google.lk/
url?sa=t&rct=j&q=&esrc=s&source=web&cd=2&ved=0CCMQFjAB&url=http%3A%2F%2Fre
gionalblog.chamber.lk%2Fwp-content%2Fuploads%2F2011%2F02%2FSector_brief_Fruits_
Vegetables_2011.pdf&ei=jPM. Last accessed 22th April 2014.
Department of Agriculture (2010).Annual Performance Report 2010. Available: http://www.
google.lk/url?sa=t&rct=j&q=&esrc=s&source=web&cd=5&ved=0CDoQFjAE&url=http%3A%
2F%2Fwww.parliament.lk%2Fuploads%2Fdocuments%2Fpaperspresented%2Fperformance_re
port_department_of_agriculture_pe. Last accessed 19th April 2014.
Dhaliwal, M. S. Singh. S. and Cheema. D. S. 2003. Line x tester analysis for yield and
processing attributes in tomato. J. Res ., 40(1): 49-53.
Esmail R.M., 2007. Genetic analysis of yield and its contributing traits in two intra specific
cotton crosses. J Apple Sci Res 3, 2075-2080.
Glover M. A, Willmot D. B, Darrah L. L, Bruce E. H. and Zhu X. (2005).Diallel analysis of
agronomic traits using Chinese and US maize germplasm. Crop Sci. 45: 1096-1102.
Rai, G. K., Kumar, R., Singh, A. K., Rai, P. K., Rai, M., Chaturvedi, A. K.And Rai, A. B., 2012.
Changes in Antioxidant and Phytochemical Properties of Tomato (Lycopersiconesculentum
Mill.) under Ambient Condition .Changes in Antioxidant and Phytochemical Properties of
Tomato.44 (2), p667-670.
Viana J. M. S, Cruz C. D, Cardoso A. A (2001).Theory and analysis of partial diallel
crosses.Parents and F2 generations.Acta Sci., 23: 627-634.
Proceedings of the Research Symposium of UvaWellassa University, January 29-30, 2015
49
Preservation of tomato (Lycopersicon esculentum)
by dehydration for product development and utilization
T. M. A. N Weerasinghe, W. A. J. P. Wijesinghe, M. P. M.Arachchi,
Faculty of Animal Science and Export Agriculture, UvaWellassa University of Sri Lanka
and
K. H.Srananda
Food Research Unit, Department of Agriculture, Gannoruwa, Peradeniya, Sri Lanka
Introduction
Tomato growers in the world experience high postharvest losses of fresh tomato supported by
high perishability and low price of tomato during the peak production seasons due to production
surplus and low product utilization of preserved tomato. Compared to the trends in the food
industry the demand for dehydrated tomato is increasing rapidly both in domestic and in
international markets (Purseglove et al., 2001). Dehydrated tomato topping is a condiment
comprises with dehydrated tomato slices use to enhance the flavor and texture of salads, ranging
from simple green salads to more elaborate versions.
Main objective of the study is the Preservation of Tomato (Lycopersicon esculentum) by
dehydration for product development and product utilization. Specific objectives are dehydration
using hot air drying, analysis of sensory, microbial and physiochemical parameters of dried
samples and possibility of using dehydrated products for new product development and product
utilization.
Materials and methodology
The material used for this study is just ripen tomato (Lycopersicon esculentum) belongs to
variety “Pathma”.Preliminary studies were carried out to determine the best methods steaming
and non-steaming methods. Best salt concentration was selected based upon the microbial
counts and the moisture content. Best Sodium Meta bisulphite was selected based upon the
organoleptic properties.
10g of dehydrated tomato, 50g of sugar, 400mL of water, 20g of Corn flour, 15mL of vinegar,
10mL of citric acid were used according to the developed methodology. Dehydrated tomato
topping with brix value 25 was developed using the methods developed through the preliminary
trials. Brix value was adjusted to 25 during cooking. Final product was stored under room
temperature in sterilized glass bottles.
The microbial evaluation, proximate analysis, analysis for organoleptic properties and physico -
chemical analysis for final product was conducted to ensure the product safety and quality.
Results and Discussion
Microbiological tests
Microbiological tests were carried by the Veterinary Research Institute (VRI), Peradeniya to
ensure the safety of the final product for the consumers.
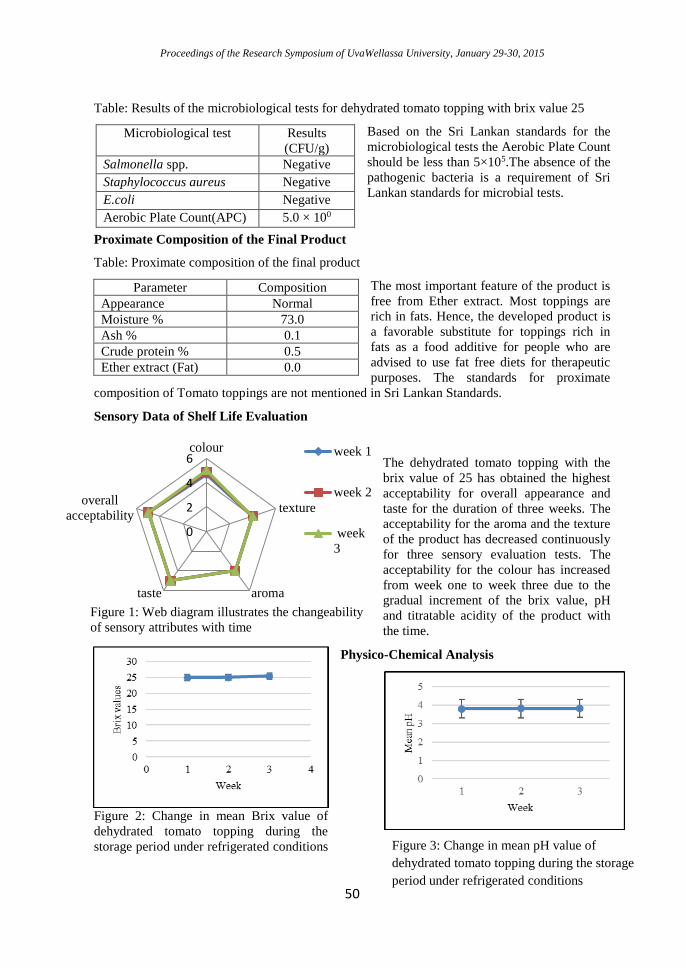
Proceedings of the Research Symposium of UvaWellassa University, January 29-30, 2015
50
0
2
4
6colour
texture
aromataste
overall
acceptability
week 1
week 2
week
3
Figure 1: Web diagram illustrates the changeability
of sensory attributes with time
Table: Results of the microbiological tests for dehydrated tomato topping with brix value 25
Based on the Sri Lankan standards for the
microbiological tests the Aerobic Plate Count
should be less than 5×10⁵.The absence of the
pathogenic bacteria is a requirement of Sri
Lankan standards for microbial tests.
Proximate Composition of the Final Product
Table: Proximate composition of the final product
The most important feature of the product is
free from Ether extract. Most toppings are
rich in fats. Hence, the developed product is
a favorable substitute for toppings rich in
fats as a food additive for people who are
advised to use fat free diets for therapeutic
purposes. The standards for proximate
composition of Tomato toppings are not mentioned in Sri Lankan Standards.
Sensory Data of Shelf Life Evaluation
The dehydrated tomato topping with the
brix value of 25 has obtained the highest
acceptability for overall appearance and
taste for the duration of three weeks. The
acceptability for the aroma and the texture
of the product has decreased continuously
for three sensory evaluation tests. The
acceptability for the colour has increased
from week one to week three due to the
gradual increment of the brix value, pH
and titratable acidity of the product with
the time.
Physico-Chemical Analysis
Figure 2: Change in mean Brix value of
dehydrated tomato topping during the
storage period under refrigerated conditions
Microbiological test Results
(CFU/g)
Salmonella spp. Negative
Staphylococcus aureus Negative
E.coli Negative
Aerobic Plate Count(APC) 5.0 × 100
Parameter Composition
Appearance Normal
Moisture % 73.0
Ash % 0.1
Crude protein % 0.5
Ether extract (Fat) 0.0
Figure 3: Change in mean pH value of
dehydrated tomato topping during the storage
period under refrigerated conditions
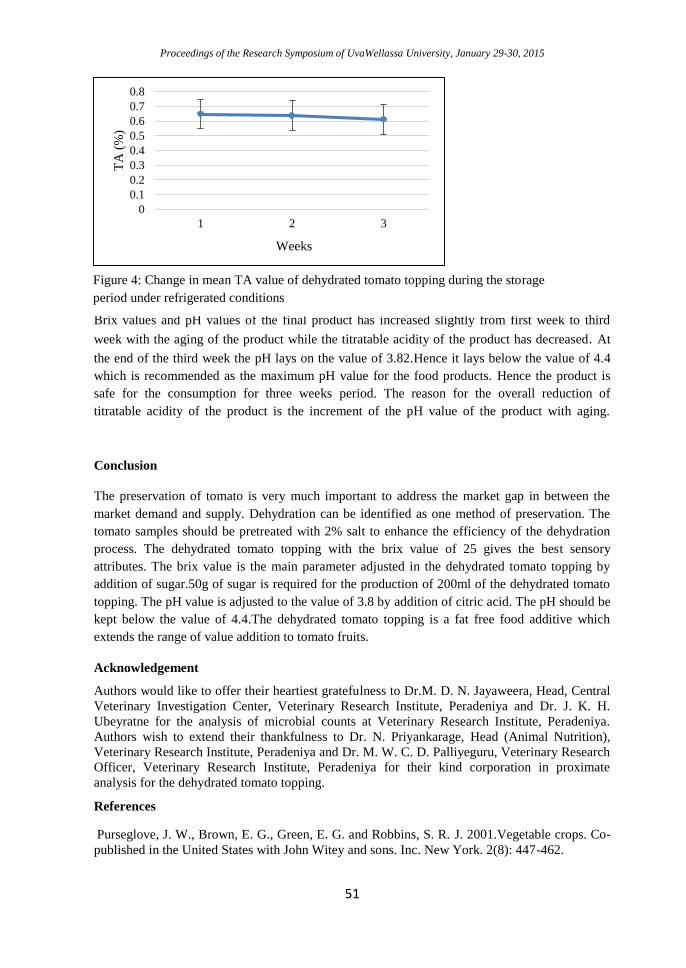
Proceedings of the Research Symposium of UvaWellassa University, January 29-30, 2015
51
Brix values and pH values of the final product has increased slightly from first week to third
week with the aging of the product while the titratable acidity of the product has decreased. At
the end of the third week the pH lays on the value of 3.82.Hence it lays below the value of 4.4
which is recommended as the maximum pH value for the food products. Hence the product is
safe for the consumption for three weeks period. The reason for the overall reduction of
titratable acidity of the product is the increment of the pH value of the product with aging.
Conclusion
The preservation of tomato is very much important to address the market gap in between the
market demand and supply. Dehydration can be identified as one method of preservation. The
tomato samples should be pretreated with 2% salt to enhance the efficiency of the dehydration
process. The dehydrated tomato topping with the brix value of 25 gives the best sensory
attributes. The brix value is the main parameter adjusted in the dehydrated tomato topping by
addition of sugar.50g of sugar is required for the production of 200ml of the dehydrated tomato
topping. The pH value is adjusted to the value of 3.8 by addition of citric acid. The pH should be
kept below the value of 4.4.The dehydrated tomato topping is a fat free food additive which
extends the range of value addition to tomato fruits.
Acknowledgement
Authors would like to offer their heartiest gratefulness to Dr.M. D. N. Jayaweera, Head, Central
Veterinary Investigation Center, Veterinary Research Institute, Peradeniya and Dr. J. K. H.
Ubeyratne for the analysis of microbial counts at Veterinary Research Institute, Peradeniya.
Authors wish to extend their thankfulness to Dr. N. Priyankarage, Head (Animal Nutrition),
Veterinary Research Institute, Peradeniya and Dr. M. W. C. D. Palliyeguru, Veterinary Research
Officer, Veterinary Research Institute, Peradeniya for their kind corporation in proximate
analysis for the dehydrated tomato topping.
References
Purseglove, J. W., Brown, E. G., Green, E. G. and Robbins, S. R. J. 2001.Vegetable crops. Co-
published in the United States with John Witey and sons. Inc. New York. 2(8): 447-462.
0
0.1
0.2
0.3
0.4
0.5
0.6
0.7
0.8
1 2 3
TA
(%
)
Weeks
Figure 4: Change in mean TA value of dehydrated tomato topping during the storage
period under refrigerated conditions
Proceedings of the Research Symposium of UvaWellassa University, January 29-30, 2015
52
Study on response of rice varieties to different nitrogen fertilizer
levels
H.V.C Priyadarshanee, L. M. H. R Alwis
Faculty of Animal Science and Export Agriculture, UvaWellassa University of Sri Lanka
and
D.N. Sirisena
Rice Research and Development Institute, Batalagoda, Sri Lanka
Introduction
Rice (Oryza sativa L.) is the single most important crop and the staple food of more than three
billion people or more than half of the world’s population. Paddy is cultivated as a wetland crop
in all districts. Direct or indirect involvement for paddy sector is more than 30 % of the total
labour force (Wickramasinhe and Wijewardena, 2000). Rice provides 45% total calorie and 40%
total protein requirement of an average Sri Lankan (Department of Agriculture,2010).The
areaunder paddy production in yalaand maha was 1,671,054 Mt and 2,629,566 Mt respectively
(Department of Census and Statistics, 2010). Nitrogen, phosphorous and potassium are the three
major nutrients required for the rice plant. Nitrogen (N) is one of the essential macro -nutrients
for rice growth and one of the main factors to be considered for developing a high-yielding rice
cultivar. Nitrogen increases plant height, panicle number, leaf size, spikelet number, and number
of filled spikelets, which largely determine the yield capacity of a rice plant. Panicle number is
largely influenced by the number of tillers that develop during the vegetative stage. Rice plants
require nitrogen during the tillering stage to ensure a sufficient number of panicles and
reproductive to grain filling. Nitrogen imbalance in soil produces low fertilizer use efficiency,
low yields and low farmer profit.Main nitrogen loss mechanisms are volatilization of ammonia
(NH3), leaching loss of nitrate (NO3-), loss through denitrification and soil erosion (Choudhury
and Kennedy, 2005).Therefore, optimum level of nitrogen fertilizer should be applied to get
maximum yield of paddy cultivation and utilize nitrogen fertilizers effectively (Fageria and
Baligar, 2003).
Materials and Methods
This study was conducted at the Rice Research Development Institute (RRDI) at Batalagoda in
Kurunagala district, Sri Lanka. Fertilizers used were urea as the Nitrogen source, and others;
Triple super phosphate and Murate of Potash. The experiment was comprised with sixteen
treatments. Nitrogen fertilizer was applied as 0, 50, 100 and150 kg N ha-1. Four rice varieties,
Bg 1350 (V1), Bg 997 (V2), Bg 379-2 (V3) and Bg 450 (V4) were tested. These four rice
varieties are in age group of four to four and half months.Sixty four plots were arranged
according to the split plot design with sixteen treatments and four replicates.
Plant height, number of tillers per hill, plant greenness, number of days for 100 % flowering of
rice varieties, dry weight of shoot parts, plant nitrogen content, number of panicles per hill and
grain yield were measured against different nitrogen levels.
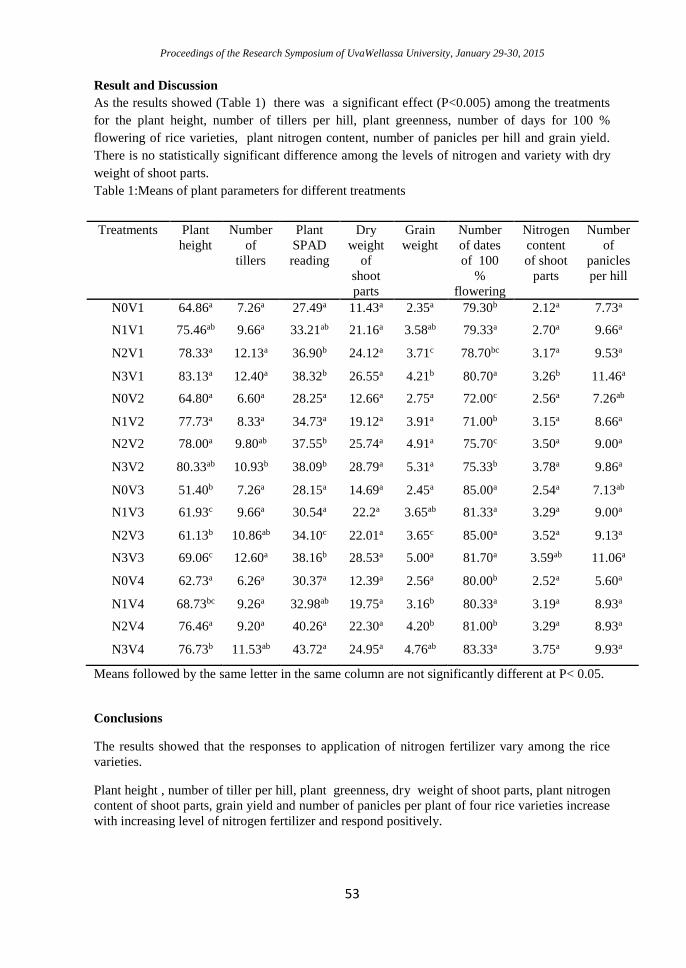
Proceedings of the Research Symposium of UvaWellassa University, January 29-30, 2015
53
Result and Discussion
As the results showed (Table 1) there was a significant effect (P<0.005) among the treatments
for the plant height, number of tillers per hill, plant greenness, number of days for 100 %
flowering of rice varieties, plant nitrogen content, number of panicles per hill and grain yield.
There is no statistically significant difference among the levels of nitrogen and variety with dry
weight of shoot parts.
Table 1:Means of plant parameters for different treatments
Means followed by the same letter in the same column are not significantly different at P< 0.05.
Conclusions
The results showed that the responses to application of nitrogen fertilizer vary among the rice
varieties.
Plant height , number of tiller per hill, plant greenness, dry weight of shoot parts, plant nitrogen
content of shoot parts, grain yield and number of panicles per plant of four rice varieties increase
with increasing level of nitrogen fertilizer and respond positively.
Treatments Plant
height
Number
of
tillers
Plant
SPAD
reading
Dry
weight
of
shoot
parts
Grain
weight
Number
of dates
of 100
%
flowering
Nitrogen
content
of shoot
parts
Number
of
panicles
per hill
N0V1 64.86a 7.26a 27.49a 11.43a 2.35a 79.30b 2.12a 7.73a
N1V1 75.46ab 9.66a 33.21ab 21.16a 3.58ab 79.33a 2.70a 9.66a
N2V1 78.33a 12.13a 36.90b 24.12a 3.71c 78.70bc 3.17a 9.53a
N3V1 83.13a 12.40a 38.32b 26.55a 4.21b 80.70a 3.26b 11.46a
N0V2 64.80a 6.60a 28.25a 12.66a 2.75a 72.00c 2.56a 7.26ab
N1V2 77.73a 8.33a 34.73a 19.12a 3.91a 71.00b 3.15a 8.66a
N2V2 78.00a 9.80ab 37.55b 25.74a 4.91a 75.70c 3.50a 9.00a
N3V2 80.33ab 10.93b 38.09b 28.79a 5.31a 75.33b 3.78a 9.86a
N0V3 51.40b 7.26a 28.15a 14.69a 2.45a 85.00a 2.54a 7.13ab
N1V3 61.93c 9.66a 30.54a 22.2a 3.65ab 81.33a 3.29a 9.00a
N2V3 61.13b 10.86ab 34.10c 22.01a 3.65c 85.00a 3.52a 9.13a
N3V3 69.06c 12.60a 38.16b 28.53a 5.00a 81.70a 3.59ab 11.06a
N0V4 62.73a 6.26a 30.37a 12.39a 2.56a 80.00b 2.52a 5.60a
N1V4 68.73bc 9.26a 32.98ab 19.75a 3.16b 80.33a 3.19a 8.93a
N2V4 76.46a 9.20a 40.26a 22.30a 4.20b 81.00b 3.29a 8.93a
N3V4 76.73b 11.53ab 43.72a 24.95a 4.76ab 83.33a 3.75a 9.93a
Proceedings of the Research Symposium of UvaWellassa University, January 29-30, 2015
54
References
Choudhury, A. T. M. A. and Kennedy, I. R. 2005. Nitrogen Fertilizer Losses from Rice soils and
Control of Environmental pollution Problems. Communications in Soil Science and Plant
Analysis, 36: pp 1625–1639.
Department of Agriculture.2010. Retrieved June 15,2014, from World Wide Web:
http://www.agridept.gov.lk.
Department of Census and Statistics. 2010. Agriculture and Environment Statistics Division.
Retrieved Sep 5,2014, from world wide web:http://www.statistics.gov.lk/agriculture/index.htm.
Fageria, N.K. and Baligar, V.C. 2003. Methodology for evaluation of lowland rice genotypes
for nitrogen use efficincy. J. Plant Nutrient. 26:1315-1333.
Wickramasinghe, W.M.A.D.B. and Wijewardena, J.D.H. 2000. Soil and nutrient management
for increasing soil fertility towards increased rice productivity in Sri Lanka.Annual Symposium
of the Department of Agriculture Sri Lanka. 2:465-482.
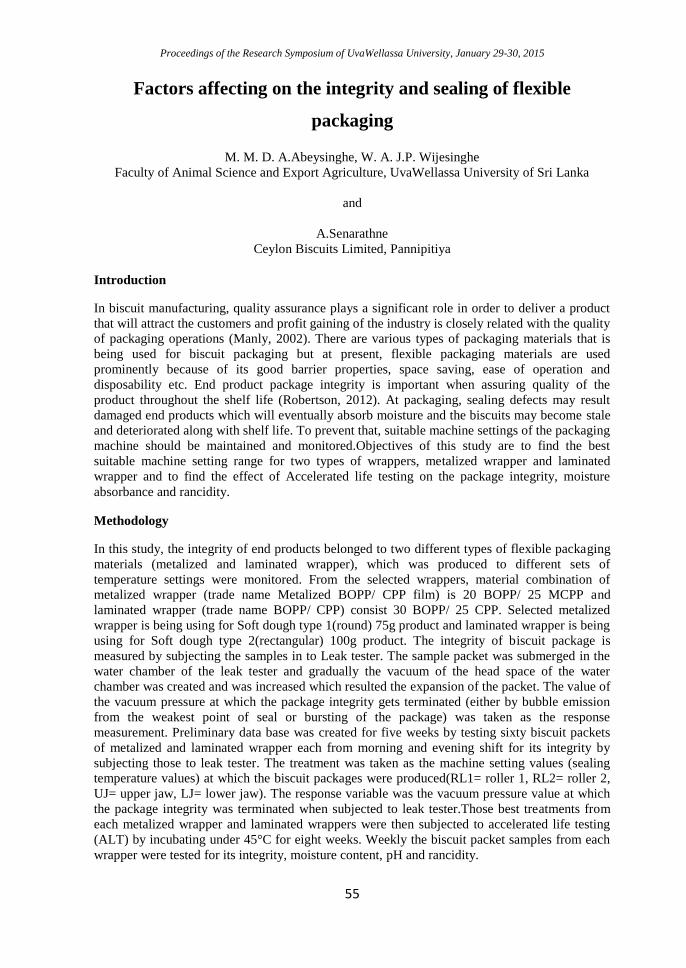
Proceedings of the Research Symposium of UvaWellassa University, January 29-30, 2015
55
Factors affecting on the integrity and sealing of flexible
packaging
M. M. D. A.Abeysinghe, W. A. J.P. Wijesinghe
Faculty of Animal Science and Export Agriculture, UvaWellassa University of Sri Lanka
and
A.Senarathne
Ceylon Biscuits Limited, Pannipitiya
Introduction
In biscuit manufacturing, quality assurance plays a significant role in order to deliver a product
that will attract the customers and profit gaining of the industry is closely related with the quality
of packaging operations (Manly, 2002). There are various types of packaging materials that is
being used for biscuit packaging but at present, flexible packaging materials are used
prominently because of its good barrier properties, space saving, ease of operation and
disposability etc. End product package integrity is important when assuring quality of the
product throughout the shelf life (Robertson, 2012). At packaging, sealing defects may result
damaged end products which will eventually absorb moisture and the biscuits may become stale
and deteriorated along with shelf life. To prevent that, suitable machine settings of the packaging
machine should be maintained and monitored.Objectives of this study are to find the best
suitable machine setting range for two types of wrappers, metalized wrapper and laminated
wrapper and to find the effect of Accelerated life testing on the package integrity, moisture
absorbance and rancidity.
Methodology
In this study, the integrity of end products belonged to two different types of flexible packaging
materials (metalized and laminated wrapper), which was produced to different sets of
temperature settings were monitored. From the selected wrappers, material combination of
metalized wrapper (trade name Metalized BOPP/ CPP film) is 20 BOPP/ 25 MCPP and
laminated wrapper (trade name BOPP/ CPP) consist 30 BOPP/ 25 CPP. Selected metalized
wrapper is being using for Soft dough type 1(round) 75g product and laminated wrapper is being
using for Soft dough type 2(rectangular) 100g product. The integrity of biscuit package is
measured by subjecting the samples in to Leak tester. The sample packet was submerged in the
water chamber of the leak tester and gradually the vacuum of the head space of the water
chamber was created and was increased which resulted the expansion of the packet. The value of
the vacuum pressure at which the package integrity gets terminated (either by bubble emission
from the weakest point of seal or bursting of the package) was taken as the response
measurement. Preliminary data base was created for five weeks by testing sixty biscuit packets
of metalized and laminated wrapper each from morning and evening shift for its integrity by
subjecting those to leak tester. The treatment was taken as the machine setting values (sealing
temperature values) at which the biscuit packages were produced(RL1= roller 1, RL2= roller 2,
UJ= upper jaw, LJ= lower jaw). The response variable was the vacuum pressure value at which
the package integrity was terminated when subjected to leak tester.Those best treatments from
each metalized wrapper and laminated wrappers were then subjected to accelerated life testing
(ALT) by incubating under 45°C for eight weeks. Weekly the biscuit packet samples from each
wrapper were tested for its integrity, moisture content, pH and rancidity.
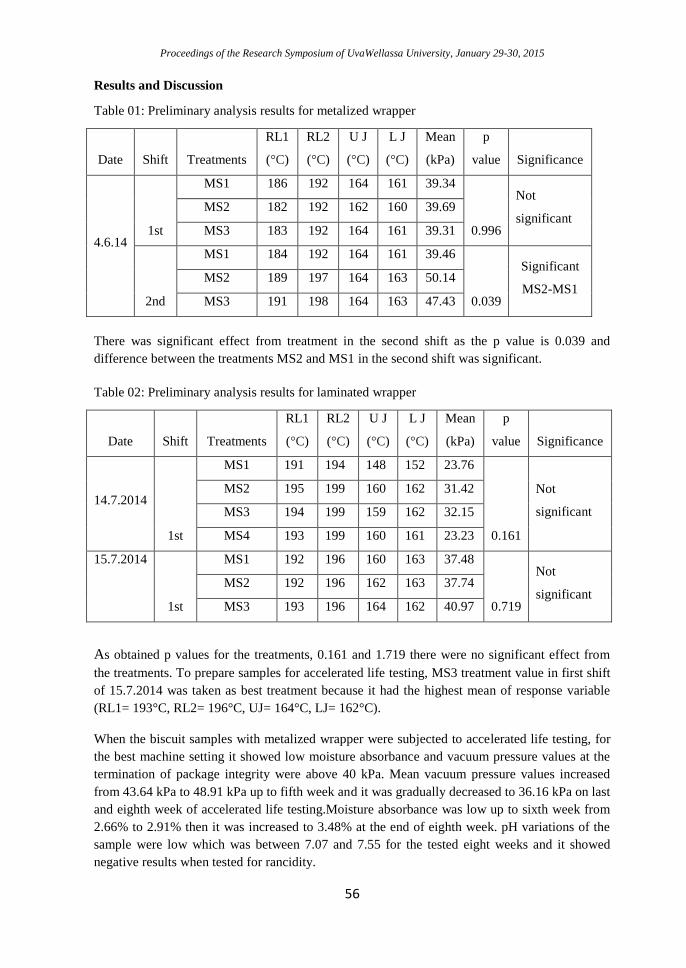
Proceedings of the Research Symposium of UvaWellassa University, January 29-30, 2015
56
Results and Discussion
Table 01: Preliminary analysis results for metalized wrapper
Date Shift Treatments
RL1
(°C)
RL2
(°C)
U J
(°C)
L J
(°C)
Mean
(kPa)
p
value Significance
4.6.14 1st
MS1 186 192 164 161 39.34
0.996
Not
significant MS2 182 192 162 160 39.69
MS3 183 192 164 161 39.31
2nd
MS1 184 192 164 161 39.46
0.039
Significant
MS2-MS1 MS2 189 197 164 163 50.14
MS3 191 198 164 163 47.43
There was significant effect from treatment in the second shift as the p value is 0.039 and
difference between the treatments MS2 and MS1 in the second shift was significant.
Table 02: Preliminary analysis results for laminated wrapper
Date Shift Treatments
RL1
(°C)
RL2
(°C)
U J
(°C)
L J
(°C)
Mean
(kPa)
p
value Significance
14.7.2014
1st
MS1 191 194 148 152 23.76
0.161
Not
significant
MS2 195 199 160 162 31.42
MS3 194 199 159 162 32.15
MS4 193 199 160 161 23.23
15.7.2014
1st
MS1 192 196 160 163 37.48
0.719
Not
significant MS2 192 196 162 163 37.74
MS3 193 196 164 162 40.97
As obtained p values for the treatments, 0.161 and 1.719 there were no significant effect from
the treatments. To prepare samples for accelerated life testing, MS3 treatment value in first shift
of 15.7.2014 was taken as best treatment because it had the highest mean of response variable
(RL1= 193°C, RL2= 196°C, UJ= 164°C, LJ= 162°C).
When the biscuit samples with metalized wrapper were subjected to accelerated life testing, for
the best machine setting it showed low moisture absorbance and vacuum pressure values at the
termination of package integrity were above 40 kPa. Mean vacuum pressure values increased
from 43.64 kPa to 48.91 kPa up to fifth week and it was gradually decreased to 36.16 kPa on last
and eighth week of accelerated life testing.Moisture absorbance was low up to sixth week from
2.66% to 2.91% then it was increased to 3.48% at the end of eighth week. pH variations of the
sample were low which was between 7.07 and 7.55 for the tested eight weeks and it showed
negative results when tested for rancidity.
Proceedings of the Research Symposium of UvaWellassa University, January 29-30, 2015
57
There was no treatment effect from the laminated wrapper and samples for accelerated life
testing were produced according to the machine setting which gave the highest mean vacuum
pressure value when checked for the package integrity. In accelerated life testing, mean vacuum
pressure values showed minimum variation unlike the data obtained for metalized wrapper and
the mean vacuum pressure values were within the range of 40.57 – 41.54 kPa. Moisture content
gradually increased from 2.36% to 2.69%but pH values decreased from 7.84 to 6.68. There was
slight indication of rancidity on the last week of testing
Conclusions
Best machine setting for metalized wrapper was MS2 with temperature values in °C, RL1= 189,
RL2= 197, UJ= 164, LJ= 163 and best machine setting for laminated wrapper was RL1= 193°C,
RL2= 196°C, UJ= 164°C and LJ= 162°C.
Weakest sealing point for metalized wrapper was middle of center seal and for laminated
wrapper it was the serrated edge of cutter seal.
Acknowledgement
Internal supervisors, Dr. W. A. J. P. Wijesinghe, Senior Lecturer, Faculty of Animal Science and
Export Agriculture and Mr. A. N. R. Weerawansa, Lecturer, Faculty of Animal Science and
Export Agriculture, UvaWellassa University.
External Supervisor, Mr. AnuraSenarathne, General Manager (Research and Development and
Quality Assurance) of Ceylon Biscuits Limited, Pannipitiya.
Dr. G. Chandrasena, Dean of Faculty of Animal Science and Export Agriculture and Dr. L. M.
H. R. Alwis, Head of the Department of Export Agriculture, UvaWellassa University.
Dr. SamanHerath, the coordinator of final year research project for Export Agriculture degree
programme, UvaWellassa University.
References
Manley, Duncan J. R. (2000). Technology of Biscuits, Crackers and Cookies, Third Edition,
Woodhead Publishing Ltd, London
Packaging of Cereals, Snack Food and Confectionary. In: Robertson, Gordon L. (ed) (2012).
Food Packaging: Principles and Practice. CRC Press, USA
Proceedings of the Research Symposium of UvaWellassa University, January 29-30, 2015
58
Selection of an effective biofilmed biofertilizer formulation and
best potting medium for anthurium (Anthurium andraeanum)
R.M.D.C. Rathnayake, H.K.S.G. Gunadasa, H.A.S.L Jayasinghe
Faculty of Animal Science and Export Agriculture, Uva Wellassa University of Sri Lanka
and
K.A.C.N. Seneviratne
National Botanic Gardens, Peradeniya, Sri Lanka.
Introduction
Anthurium is identified as one of the crops prioritized for the development and export promotion
in Sri Lanka (Kelegama, 2001). Optimum growth and flowering of Anthurium mainly depend on
potting medium, fertilizer and light levels (Higaki et al, 1994). Potting medium rich in nutrients
and effective fertilizers can be used for the optimum growth of this plant. Beneficial biofilm
based biofertilizers called biofilmed biofertilizers (BFBFs) have been introduced recently
(Seneviratne et al., 2010). Present study was focused to select an effective biofilmed biofertilizer
formulation and evaluate the comparative effect of different potting media on vegetative growth
of Anthurium andreanum plant.
Methodology
The present study was carried out at the Royal Botanic Gardens, Peradeniya. Two experiments
with different treatments were conducted during this study. First experiment was conducted
under shade house conditions with different fertilizer treatments; 50 % chemical fertilizer (CF),
50 % CF + BFBF and100 % CF recommended for Anthurium was selected as the control. In the
second experiment, four different potting media (inert particle mixture, coir chips, leaf litter with
sand, control) were used and the existing potting medium, which was used at the Royal Botanic
Gardens, Peradeniya was taken as the control. Different BFBF with 50 % CF application was
under taken at one week interval for the plants of the first experiment and 50 % CF application
was under taken at one week interval for the plants of second experiment. Initial data were
collected before the plants establishment and final vegetative growth parameters were measured
after three months of plant establishment in both experiments. Plant height (cm), plant weight
(g), total root length (cm), leaf number, leaf area, root number and the chlorophyll content were
considered as the vegetative growth parameters. Treatments were arranged in a Complete
Randomized Design (CRD). Mean separation was conducted using the Tukey method (P< 0.05).
MINITAB 16 statistical package (Minitab Inc.) was used for data analysis in both experiments.
Results and Discussion
Experiment 01
As indicated in the Table 1, treatment 16 (BF4 alone treatment) recorded the highest rank value
over the other 16 treatments. Thus, the treatment 16 was effective in the increment of all
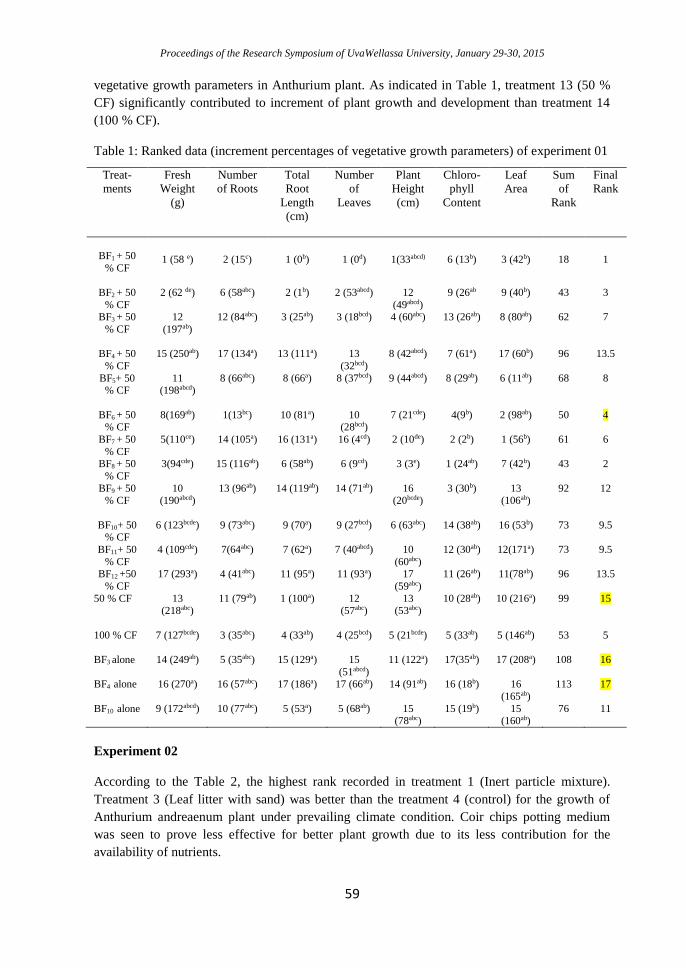
Proceedings of the Research Symposium of UvaWellassa University, January 29-30, 2015
59
vegetative growth parameters in Anthurium plant. As indicated in Table 1, treatment 13 (50 %
CF) significantly contributed to increment of plant growth and development than treatment 14
(100 % CF).
Table 1: Ranked data (increment percentages of vegetative growth parameters) of experiment 01
Experiment 02
According to the Table 2, the highest rank recorded in treatment 1 (Inert particle mixture).
Treatment 3 (Leaf litter with sand) was better than the treatment 4 (control) for the growth of
Anthurium andreaenum plant under prevailing climate condition. Coir chips potting medium
was seen to prove less effective for better plant growth due to its less contribution for the
availability of nutrients.
Treat-
ments
Fresh
Weight
(g)
Number
of Roots
Total
Root
Length
(cm)
Number
of
Leaves
Plant
Height
(cm)
Chloro-
phyll
Content
Leaf
Area
Sum
of
Rank
Final
Rank
BF1 + 50
% CF 1 (58 e) 2 (15c) 1 (0b) 1 (0d) 1(33abcd) 6 (13b) 3 (42b) 18 1
BF2 + 50
% CF
2 (62 de)
6 (58abc)
2 (1b)
2 (53abcd)
12
(49abcd)
9 (26ab
9 (40b)
43
3
BF3 + 50
% CF
12
(197ab)
12 (84abc) 3 (25ab) 3 (18bcd) 4 (60abc) 13 (26ab) 8 (80ab) 62 7
BF4 + 50
% CF
15 (250ab)
17 (134a) 13 (111a) 13
(32bcd)
8 (42abcd) 7 (61a) 17 (60b) 96 13.5
BF5+ 50 % CF
11 (198abcd)
8 (66abc) 8 (66a) 8 (37bcd) 9 (44abcd) 8 (29ab) 6 (11ab) 68 8
BF6 + 50 % CF
8(169ab) 1(13bc) 10 (81a) 10 (28bcd)
7 (21cde) 4(9b) 2 (98ab) 50 4
BF7 + 50
% CF
5(110ce) 14 (105a) 16 (131a) 16 (4cd) 2 (10de) 2 (2b) 1 (56b) 61 6
BF8 + 50
% CF
3(94cde) 15 (116ab) 6 (58ab) 6 (9cd) 3 (3e) 1 (24ab) 7 (42b) 43 2
BF9 + 50 % CF
10 (190abcd)
13 (96ab) 14 (119ab) 14 (71ab) 16 (20bcde)
3 (30b) 13 (106ab)
92 12
BF10+ 50 % CF
6 (123bcde)
9 (73abc) 9 (70a) 9 (27bcd) 6 (63abc) 14 (38ab) 16 (53b) 73 9.5
BF11+ 50
% CF
4 (109cde) 7(64abc) 7 (62a) 7 (40abcd) 10
(60abc)
12 (30ab) 12(171a) 73 9.5
BF12 +50
% CF
17 (293a) 4 (41abc) 11 (95a) 11 (93a) 17
(59abc)
11 (26ab) 11(78ab) 96 13.5
50 % CF 13 (218abc)
11 (79ab) 1 (100a) 12 (57abc)
13 (53abc)
10 (28ab) 10 (216a) 99 15
100 % CF 7 (127bcde)
3 (35abc) 4 (33ab) 4 (25bcd) 5 (21bcde) 5 (33ab) 5 (146ab) 53 5
BF3 alone 14 (249ab)
5 (35abc) 15 (129a) 15
(51abcd)
11 (122a) 17(35ab) 17 (208a) 108 16
BF4 alone 16 (270a) 16 (57abc) 17 (186a) 17 (66ab) 14 (91ab) 16 (18b) 16
(165ab)
113 17
BF10 alone 9 (172abcd)
10 (77abc) 5 (53a) 5 (68ab) 15 (78abc)
15 (19b) 15 (160ab)
76 11
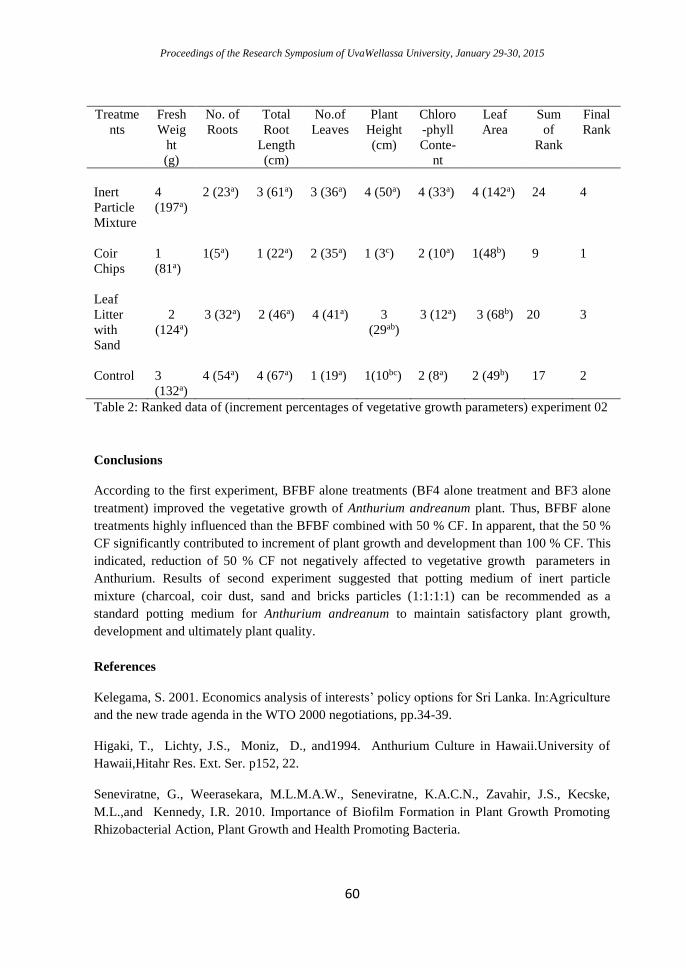
Proceedings of the Research Symposium of UvaWellassa University, January 29-30, 2015
60
Table 2: Ranked data of (increment percentages of vegetative growth parameters) experiment 02
Conclusions
According to the first experiment, BFBF alone treatments (BF4 alone treatment and BF3 alone
treatment) improved the vegetative growth of Anthurium andreanum plant. Thus, BFBF alone
treatments highly influenced than the BFBF combined with 50 % CF. In apparent, that the 50 %
CF significantly contributed to increment of plant growth and development than 100 % CF. This
indicated, reduction of 50 % CF not negatively affected to vegetative growth parameters in
Anthurium. Results of second experiment suggested that potting medium of inert particle
mixture (charcoal, coir dust, sand and bricks particles (1:1:1:1) can be recommended as a
standard potting medium for Anthurium andreanum to maintain satisfactory plant growth,
development and ultimately plant quality.
References
Kelegama, S. 2001. Economics analysis of interests’ policy options for Sri Lanka. In:Agriculture
and the new trade agenda in the WTO 2000 negotiations, pp.34-39.
Higaki, T., Lichty, J.S., Moniz, D., and1994. Anthurium Culture in Hawaii.University of
Hawaii,Hitahr Res. Ext. Ser. p152, 22.
Seneviratne, G., Weerasekara, M.L.M.A.W., Seneviratne, K.A.C.N., Zavahir, J.S., Kecske,
M.L.,and Kennedy, I.R. 2010. Importance of Biofilm Formation in Plant Growth Promoting
Rhizobacterial Action, Plant Growth and Health Promoting Bacteria.
Treatme
nts
Fresh
Weig
ht
(g)
No. of
Roots
Total
Root
Length
(cm)
No.of
Leaves
Plant
Height
(cm)
Chloro
-phyll
Conte-
nt
Leaf
Area
Sum
of
Rank
Final
Rank
Inert
Particle
Mixture
4
(197a)
2 (23a) 3 (61a) 3 (36a) 4 (50a) 4 (33a) 4 (142a) 24 4
Coir
Chips
1
(81a)
1(5a) 1 (22a) 2 (35a) 1 (3c) 2 (10a) 1(48b) 9 1
Leaf
Litter
with
Sand
2
(124a)
3 (32a)
2 (46a)
4 (41a)
3
(29ab)
3 (12a)
3 (68b)
20
3
Control 3
(132a)
4 (54a) 4 (67a) 1 (19a) 1(10bc) 2 (8a) 2 (49b) 17 2
Proceedings of the Research Symposium of UvaWellassa University, January 29-30, 2015
61
Studying the effects of Paracoccus marginatus (Mealybug)
attack on forming of Tagets spp. (Indian Marigold) flower
P.C.D. Perera and Nilanthi Dahanayake
Department of Agricultural Biology, Faculty of Agriculture, University of Ruhuna, Mapalana,
Kamburupitiya, Sri Lanka.
Introduction
Merigold (Asteraceae: Tagets spp.) is native plant to America and Mexico which is introduced
to Sri Lanka for ornamentation. Widely grows in home gardens throughout the country,
cultivates for cut-flowers and use as insects repellant (Vennila et al., 2011). The plant use to
medicinal remedies and cultivates as a food crops in some other countries but not in Sri Lanka.
Managing Mealybug (Hemiptera: Pseudococcidae; Paracoccus marginatus) insects presents
unique challenges. Mealybugs are polyphagous and multiply on different hosts. These have been
recorded on many plant species including field crops, vegetables, ornamentals, weeds, bushes
and trees in Sri Lanka. Important host plants include okra, holly hock, brinjal, potato, maize,
sorghum, groundnut, pigeon pea, sunflower, beetroot, mulberry, Amaranthus spp, Marigold and
cucurbits (Anon, 2008). The severity of problem may be estimated from the fact that this insect
produces as many as 15 generations per year. The nymphs and adults suck plant sap from tender
shoots, leaves and even hard tissues including main stem and branches and cause damage (Anon,
2008) which cause direct plant injury by feeding on plant fluids or sap in the vascular tissues,
primarily the phloem or mesophyll or both, with their piercing-sucking mouthparts. In addition,
Mealybugs excrete a clear sticky liquid called honeydew which serves as a growing medium for
black sooty mold fungi that is secreted on to the leaves which interferes with photosynthesis
(Lysandrou et al., 2012). As a result of Mealybug attack, plants become stunted and in severe
cases may die. They may also inject a toxin. This may cause leaf yellowing, plant stunting, and
wilting. Mealybugs are also capable of transmitting diseases, including viruses. Mealybugs tend
to congregate in large numbers at leaf junctures where the petiole meets the stem, on leaf
undersides, on stem tips, and under the leaf sheaths. Mealybug is origin in Central America
(Williams and Granara, 1992) has its spread at the Caribbean and Ecuador, Chile, Argentina,
Brazil, Pakista, India, Nigeria, China, Australia and Sri Lanka (Prishanthini and Laxmi, 2009).
Such a vast and fast distribution of Mealybug across the globe largely during the past few years
and its economic damage to several crops make it necessary to characterize the ecological
factors associated with the pest. In this study, evaluate Mealybug attack on the damage of
marigold flower forming.
Materials and Methods
Seeds of Indian Merigold were purchased from the Seed and Planting Material Division,
Huggala botanical garden, Sri Lanka. In this study was conducted in green house at the
Department of Agriculture Biology, Faculty of Agriculture, University of Ruhuna, Mapalana,
Kamburupitiya, Sri Lanka. Four pot replicates were conducted on Merigold plants that was
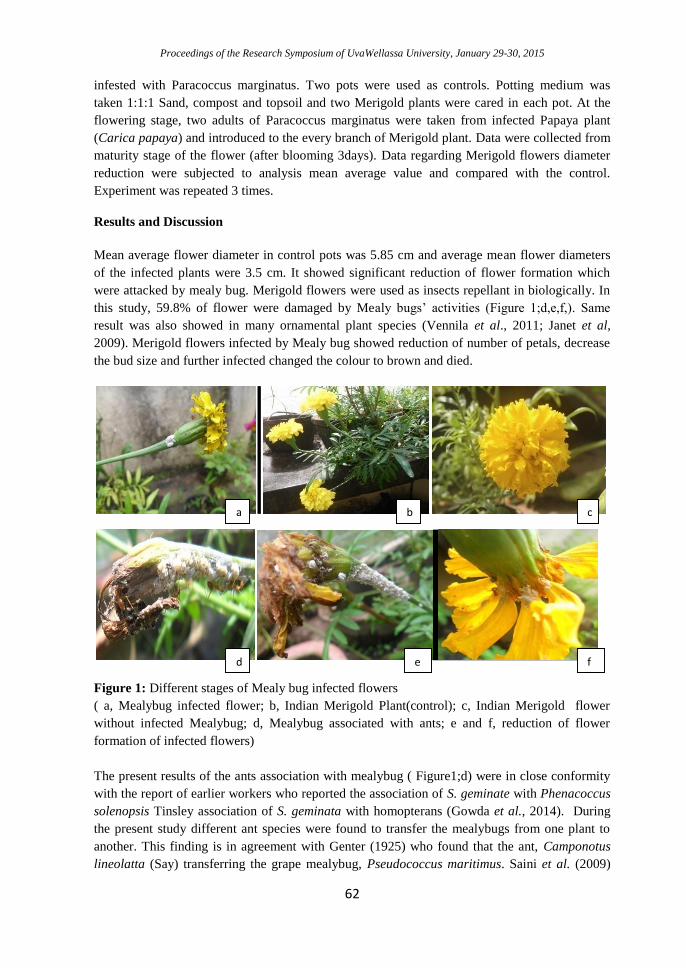
Proceedings of the Research Symposium of UvaWellassa University, January 29-30, 2015
62
infested with Paracoccus marginatus. Two pots were used as controls. Potting medium was
taken 1:1:1 Sand, compost and topsoil and two Merigold plants were cared in each pot. At the
flowering stage, two adults of Paracoccus marginatus were taken from infected Papaya plant
(Carica papaya) and introduced to the every branch of Merigold plant. Data were collected from
maturity stage of the flower (after blooming 3days). Data regarding Merigold flowers diameter
reduction were subjected to analysis mean average value and compared with the control.
Experiment was repeated 3 times.
Results and Discussion
Mean average flower diameter in control pots was 5.85 cm and average mean flower diameters
of the infected plants were 3.5 cm. It showed significant reduction of flower formation which
were attacked by mealy bug. Merigold flowers were used as insects repellant in biologically. In
this study, 59.8% of flower were damaged by Mealy bugs’ activities (Figure 1;d,e,f,). Same
result was also showed in many ornamental plant species (Vennila et al., 2011; Janet et al,
2009). Merigold flowers infected by Mealy bug showed reduction of number of petals, decrease
the bud size and further infected changed the colour to brown and died.
Figure 1: Different stages of Mealy bug infected flowers
( a, Mealybug infected flower; b, Indian Merigold Plant(control); c, Indian Merigold flower
without infected Mealybug; d, Mealybug associated with ants; e and f, reduction of flower
formation of infected flowers)
The present results of the ants association with mealybug ( Figure1;d) were in close conformity
with the report of earlier workers who reported the association of S. geminate with Phenacoccus
solenopsis Tinsley association of S. geminata with homopterans (Gowda et al., 2014). During
the present study different ant species were found to transfer the mealybugs from one plant to
another. This finding is in agreement with Genter (1925) who found that the ant, Camponotus
lineolatta (Say) transferring the grape mealybug, Pseudococcus maritimus. Saini et al. (2009)
a b c
d f e
Proceedings of the Research Symposium of UvaWellassa University, January 29-30, 2015
63
also noticed that ants were responsible for quick colonization of P. solenopsis to new areas.
Smith (1928) reported that ants collected during the surveys comprised Tapinoma sessile Say,
Pheidole sp., and Technomyrmex sp. (Hymenoptera: Formicidae).
Conclusion
Mealybugs severly damage to Indian Merigold flower production. Researchers and farmers
should have to use control measures to prevent Mealybug and ants entering to the plantation.
Special attention should be paid when growing Marigold in the crop field as an insect repellant.
References
Anon. 2008. Mealy Bug: a new threat to cotton production in Pakistan and India. The ICAC
Recorder, International Cotton Advisory Committee, Tech Inf. Sect. Vol. XXVI(2):15-19.
Genter, L. G., 1925. Some important grape insects. Michigan Agric. Expt. Sta. Spec. Bull., 14:
19-23.
Gowda, B. G., Chakravarthy, A. K., Jagadish, K. S. and. Kandakoor, S. B., 2014. Ecology and
distribution of papaya mealybug, Paracoccus marginatus Williams and Granara De Willink
(Hemiptera: Pseudococcidae) in South Karnataka, Current Biotica, 7(4): 266-274.
Janet, J. K., Kinzer, K. and Smith, R., 2009. Houseplants; Proper Care and Management of Pest
Problems, NDSU extension service, North Dakota State University and U.S. Department of
Agriculture cooperating. Available online: www.ag.ndsu.edu.
Lysandrou, M., Ahmad, M. and Longhurst C., 2012. Management of mealybug, phenacoccus
solenopsis tinsley in cotton with a new sap feeding insecticide “SULFOXAFLOR”, J. Agric.
Res., 50(4) :494-496.
Prishanthini, M. and Laxmi V.M., 2009. The Phenococcus solenopsis. Department of Zoology,
Eastern University, Sri Lanka. Available online: http://www.dailynews.lk/2009/07/01/fea30.asp.
Saini, R. K., Palaram, S. S. and Rohilla, H. R., 2009. Mealybug, Phenacoccus solenopsis Tinsley
and its survival in cotton ecosystem in Haryana. In: Proc. Nat. Symp. Bt Cotton: Opportunities
and Prospects, Central Institute of Cotton Research, Nagpur, November 17-19: 150.
Smith, M. R., 1928. The biology of Tapinoma sessile Say, an important house-infesting ant.
Ann. Entomol. Soc. Am. XXI: 307-330.
Vennila, S., Prasad, Y.G., Prabhaka,r M., Kumar, R., Nagrare V., Amuth, M., Dharajyothi,
Agarwa,l M., Sreedevi, G., Venkateswarlu B., Kranthi, K.R. and Bambawale, O.M., 2011,
Spatio-temporal Distribution of Host Plants of Cotton Mealybug, Phenacoccus solenopsis
Tinsley in India, Technical Bulletin No. 26, National Centre for Integrated Pest Management,
New Delhi: 50-62.
Williams, D.J. and Granara de Willink, M.C., 1992. Mealybugs of Central and South America,
CAB International: 635.
Proceedings of the Research Symposium of UvaWellassa University, January 29-30, 2015
64
Consumer preference for quality attributes of rice
W.G.D.L.C.Wijesinghe, R.A.P.I.S.Dharmadasa
Faculty of Animal Science and Export Agriculture, Uva Wellassa University of Sri Lanka
and
Walisinghe B. R
Rice Research and Development Institute, Bathalagoda, Ibbagamuwa
Introduction
Paddy cultivation serves as the major coping strategy for 800,000 families in Sri Lanka. The
average paddy productivity has reached to 4.3 t/ha in 2013 while the annual per capita
consumption is 116 kg/year (DCSL, 2013). Rice remains as the staple food of the country and
the consumers have different preference for different quality attributes of rice through which
they derive consumer utility. Hence, it is important to identify the quality attributes of rice
preferred by different consumer segments. This information is of vital importance for farmers to
enhance the supply catering to the consumer demand. Therefore, the main objective of this study
was to identify different rice quality attributes and their levels as valued by the consumer choice.
Methodology
The study was conducted in Gampaha District in 2014 with 63 consumers selected using
stratified random sampling. Four quality attributes and three levels per each were selected using
focus group discussion. A fractional factorial design (1/3) was used to reduce the full profile.
Data was collected using Semi structured pre-tested conjoint questionnaire. The significance of
the selected attributes was tested using ANOVA and part-worth utilities were estimated by a
logistic regression. The relative importance of each attributes was also calculated.
Empirical model
Consumer preference is non parametric attribute. Conjoint analysis (CA) is the most widely used
method to analyse consumer preference. A set of hypothetical products is defined by combining
product attributes at various levels. Consumers are asked to evaluate their overall preference
rating or ranking of the hypothetical products. The final step of CA involves choosing an
appropriate composition model and estimating the buyer’s part-worth utilities (Harrison, 1998).
Part-Worth Utility Model
𝑅𝑖 = 𝐺 +𝑊1𝐷1 +𝑊2𝐷2 + 𝑊3𝐷3 + 𝑊4𝐷4 +𝑊5𝐷5 +𝑊6𝐷6 +𝑊7𝐷7 +𝑊8𝐷8 +𝑒𝑖…………(4)
𝑅𝑖 = preference rating for the ith respondent
𝑊𝑖, i = 1,2..n are part-worth estimates associated with respective levels of product attributes.
𝐷𝑖 , i = 1,2..n are dummy variables for significant levels of attributes
𝑒𝑖 = error term
Relative Importance (RI)
RI = (Utility Range/ Σ utility ranges of all attributes) *100
Random Utility Theory
Once the data are choice-based, researchers use random-utility models in which the basic idea is
the assumption of utility maximization (Hauser and Rao, 2002). The attributes and levels are
Proceedings of the Research Symposium of UvaWellassa University, January 29-30, 2015
65
described in Table 1. Attributes were selected using focus group discussion. Each selected
attributes consist with 3 levels.
Table 1: Description of attributes
Degree of Milling
Attributes
Shape
Tenderness
Price
Levels
Brown
Partially Polished
Fully Polished
Short Round
Long Bold
Long Slender
Soft
Average
Hard
<Rs.60/kg
Rs.60-70/kg
>Rs 70/kg
Results and Discussion
Among the Selected 63 rice consumers there was a large portion of female rice consumers (65%)
where as a little portion of male rice consumers (35%) were participated for the survey. Most of
the consumers (65%) were between the age of 25 – 50 years, 25% of participants were below 25
years and remain 10% was over 50 years old.
When consider about the rice consumption majority (56%) of the sample is consuming rice for
all three meals and 44% of consumers consume rice only twice a day. Among the respondents
52% make the decision to purchase rice for their families. The significance of the selected
attributes are shown in Table 2.
Table 2: ANOVA Results for quality attributes
Attribute Degrees of
Freedom
Sum of
Squares
Mean
Sum
Squares
F Value Pr>F
Degrees of
Milling
Shape
Tenderness
Price
2
2
2
2
1045.25
6.81
8.43
5.13
522.62
3.40
4.21
2.56
96.46
0.63
0.78
0.47
<0.0001
0.53
0.46
0.62
P=0.05, N=63
According to the results (Table 2), degrees of milling attribute was significant (p<0.05) while
shape, tenderness and price attributes were not significant (p<0.05). This indicates that, degree
of milling is highly valued by the consumers when they purchase rice. Further, interaction
effects were not significant at 95% confidence interval.
According to the results (Table 3), “Brown” and “fully polished” levels were significant while
none of the rest of the attribute levels were significant. Consumers have negative preference over
brown rice and positive preference for fully polished rice. Once a consumer purchases one unit
of brown rice in his consumer basket, the utility is decreased by 1.74 units. On the contrary,
fully-polished rice is placed in the market basket his utility is increased by 1.62 units.
Proceedings of the Research Symposium of UvaWellassa University, January 29-30, 2015
66
Table 3: Part-worth estimates of levels in quality attributes
Attribute Level Estimate Z value P>Z
Degree of milling Brown -1.74 -12.77 0.000
Partially-polished 0.12 1.13 0.260
Fully-polished 1.62 11.64 0.000
Shape Short-Round 0.06 0.56 0.577
Long-Bold -0.01 -0.14 0.888
Long-Slender -0.04 -0.42 0.577
Tenderness Soft -0.13 -1.25 0.211
Medium 0.05 0.51 0.608
Hard 0.08 0.74 0.211
Price < Rs.60/kg 0.05 0.46 0.648
Rs.60-70/kg 0.07 0.63 0.526
> Rs.70/kg -0.02 -1.09 0.526 Pseudo R2 = 0.0918. P=0.05, N=66
Relative Importance of Attributes
Table 4: Relative Importance of each attribute
Attribute Utility Range Relative Importance (%)
Degree of Milling 3.354 89.3
Shape 0.102 2.7
Tenderness 0.206 5.4
Price 0.094 2.4
The most important attribute among the selected, is degree of milling. Consumers do not pay
much attention on other quality attributes of rice: shape, tenderness, and price in this particular
consumer segment.
Conclusions
The study revealed that, degree of milling is the most important factor while the shape,
tenderness and price of rice were not significantly affecting consumer choice in this market
segment. Since this consumer segment is from urban profile, consumer choice has become price
insensitive. They pay more attention over rice processing in making a purchasing decision.
Consumers have negative preference for brown rice and positive preference for fully polished
rice. Although, shape of the grain, tenderness of cooked rice, and price attributes were not
significant, testing the same with different consumer segments while incorporating differently
selected attributes may shed lights on estimating consumer preference more coherently.
References
Harrison R.W., Ozayan A. and Meyers S.P. (1998), A Conjoint Analysis of New Food Products
from Underutilized Small Crawfish, Journal of Agricultural and Applied Economics, 30,2,
Southern Agricultural Economics Association, 257-265
Hauser J.R., and V.R. Rao (2002). Conjoint Analysis, Related Modeling, and Applications.
Chapter prepared for Advances in Marketing Research: Progress and Prospects, A Tribute to
Paul Green’s Contributions to Marketing Research Methodology, Massachusetts Institute of
Technology, Cornell University.
Official website of the Department of Census and Statistics Sri Lanka.2014.Agriculture Home.
Retrieved July 14, 2014, from the World Wide http:/www.statistics.gov.lk/agriculture/index.htm
Proceedings of the Research Symposium of UvaWellassa University, January 29-30, 2015
67
Determination of microbial quality and quantity of stored
cinnamon quills
S. M. Pathirana, G. Chandrasena, A. N. R. Weerawansha
Faculty of Animal Science and Export Agriculture, Uva Wellassa University of Sri Lanka
and
G.G. Jayasinghe,
National Cinnamon Research and Training Center, Palolpitiya, Thihagoda, Matara
Introduction
Since Cinnamon is one of the major spicecrops in Sri Lanka, maintenance of the quality of the
processed cinnamon is very important. Microbial infection of processed cinnamon quills makes
lowquality final product leading the product less demandedand high post-harvest losses. The
prevailing solution for the microbial infection is fumigation of sulfur and it is not acceptable in
many countries due to its harmful effects for consumer health. Therefore identification of
common types of microbes on quills and determination offavourable conditions for microbial
growth is very important to apply effective control measures.
Methodology
Experiments were conducted to identify the particular types of fungi that thrive on cinnamon
quills and the effect of moisture content, relative humidity, temperature and the storage period to
the microbial growth. Cinnamon quills were collected from three different placesjust after
processing. The moisture contents of the samples were measured in three days interval using
gravimetricmethod. Average relative humidity and ambient temperature were also recorded each
period. In quantification process, the number of colony forming units of fungi and bacteria in
cinnamon quills were counted separately using colony counter.1g of powdered sample of
cinnamon was dissolved in 10ml of distilled sterilized water and 200μl of the solution was
poured in to the culture plates. It was allowed to incubate under the room temperature for about
three days and colony count of fungi and bacteria were taken.The culture plates with microbial
colonies were allowed to incubate further to obtain pure cultures of fungi by frequent sub
culturing. Colony characteristics were observed with the time.The pure cultures of fungi were
used to prepare slide cultures for microscopic identification highlighting the distinguishing
characteristics (Funder, 1953; Cappuccino and Sherman 1996).
Results and Discussion
According to the morphological and microscopic observations, Rhizopus sp., Penicillium sp.,
Aspergillus niger, Aspergillus flavus were the most common types of fungi encountered on
cinnamon quills. In addition to those types Trichoderma sp. was appeared in the samples taken
from one farmer place. It may be happened when peeled cinnamon had been kept in ground for
drying and due to bad sanitary conditions in processing place.
Proceedings of the Research Symposium of UvaWellassa University, January 29-30, 2015
68
Rhizopus sp. was rapidly growing white coloured fungus with cottony and fuzzy aerial
mycelium. The color of the colony was white initially and turned grey to yellowish brown with
time. It was grown as filamentous, branching coenocytichypha without cross-walls. Sporangia
were developed on the long stalks raised as groups from nodes directly above the rhizoids.
Unicellular ovoid, hyaline and striated sporangiospores were produced by Rhizopus species and
they were grown as root like rhizoids initiallyand finally grown as large mycelium. Penicillium
colonies were initially appeared in white colourand become blue green, gray green and then gray
in colour respectively. It was grown as a thallus with typical characteristic of a highly branched
network of multinucleate, septate, and usually colorless.Many-branched conidia sprout on the
mycelia, bearing individually constricted conidiospores. Aspergillus flavus colonies were
initially appeared in yellowish whitecolour and changed to olive green, dark green and brownish
green respectively.Hyphae grew as a thread-like structure and they were septate and hyaline. The
asexual spores,conidispores, produced in conidia were rough and dark.Aspergillus niger colonies
were initially white and become brownish with white reverse and brownish black colour
respectively covering the entire plate.Morphology of Aspergillus niger showed large, globose,
dark brown conidial heads, which become radiate. Conidiophores are smooth-walled, hyaline or
turning dark towards the vesicle. Conidial heads are biseriatewith the phialides, often septate.
Conidia are globose, dark brown and rough-walled.Trichoderma colonies were wooly and the
initialcolor is white. As the conidia are formed, yellow-green patches become visible making
concentric rings.Conidiosphores were erect, smooth and penicillately branched. Globose conidia
were developed on philides produced in the opposite direction in each point.
At the beginning the fungal infections of stored cinnamon were very low due to lack of enough
inoculums, even though preferable higher moisture contents for fungal growth were retained in
stored cinnamon quills. Next 10 days rapid increments of fungal colony forming units were
observed because preferable moisture contents were retained further in cinnamon quills. Fungal
infection was increased at 10 to 20 days also, but in negative rate due to desirable moisture
contents were still remained in the cinnamon quills. Moisture content in the cinnamon quills
were below 20 % after 20 to 30 days after processing and in this period fungal contaminations
were gradually declined. When the moisture content was reached below 12% in storage
cinnamon, fungal infection was at a minimum level. If the moisture level is reduced to below
12% in storage cinnamon as soon as possible, fungal infection can be controlled efficiently.
The most interesting phenomenon was the symbiotic relationship between fungal growth and
bacterial growth (Figure1).There was very strong significant positive correlation between fungal
and bacterial infections (r = 0.912, p = 0.0001). Bacterial contamination never had been occurred
without fungal infection. Bacterial colonies were appeared in the culture plates used to have the
fungal colonies separately, even though those were treated with antibiotics to retard the bacterial
growth.When fungal infection is terminated by managing moisture content, the bacterial
infection is automatically reduced (Figure 2).
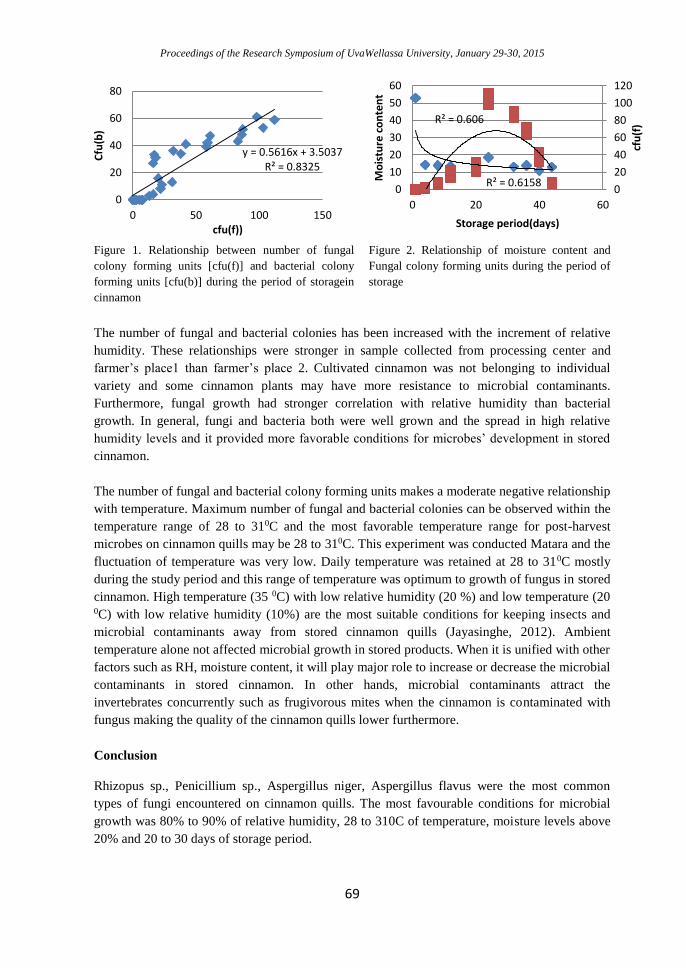
Proceedings of the Research Symposium of UvaWellassa University, January 29-30, 2015
69
Figure 1. Relationship between number of fungal
colony forming units [cfu(f)] and bacterial colony
forming units [cfu(b)] during the period of storagein
cinnamon
Figure 2. Relationship of moisture content and
Fungal colony forming units during the period of
storage
The number of fungal and bacterial colonies has been increased with the increment of relative
humidity. These relationships were stronger in sample collected from processing center and
farmer’s place1 than farmer’s place 2. Cultivated cinnamon was not belonging to individual
variety and some cinnamon plants may have more resistance to microbial contaminants.
Furthermore, fungal growth had stronger correlation with relative humidity than bacterial
growth. In general, fungi and bacteria both were well grown and the spread in high relative
humidity levels and it provided more favorable conditions for microbes’ development in stored
cinnamon.
The number of fungal and bacterial colony forming units makes a moderate negative relationship
with temperature. Maximum number of fungal and bacterial colonies can be observed within the
temperature range of 28 to 310C and the most favorable temperature range for post-harvest
microbes on cinnamon quills may be 28 to 310C. This experiment was conducted Matara and the
fluctuation of temperature was very low. Daily temperature was retained at 28 to 310C mostly
during the study period and this range of temperature was optimum to growth of fungus in stored
cinnamon. High temperature (35 0C) with low relative humidity (20 %) and low temperature (20 0C) with low relative humidity (10%) are the most suitable conditions for keeping insects and
microbial contaminants away from stored cinnamon quills (Jayasinghe, 2012). Ambient
temperature alone not affected microbial growth in stored products. When it is unified with other
factors such as RH, moisture content, it will play major role to increase or decrease the microbial
contaminants in stored cinnamon. In other hands, microbial contaminants attract the
invertebrates concurrently such as frugivorous mites when the cinnamon is contaminated with
fungus making the quality of the cinnamon quills lower furthermore.
Conclusion
Rhizopus sp., Penicillium sp., Aspergillus niger, Aspergillus flavus were the most common
types of fungi encountered on cinnamon quills. The most favourable conditions for microbial
growth was 80% to 90% of relative humidity, 28 to 310C of temperature, moisture levels above
20% and 20 to 30 days of storage period.
R² = 0.6158
R² = 0.606
0
20
40
60
80
100
120
0
10
20
30
40
50
60
0 20 40 60
cfu
(f)
Mo
istu
re c
on
ten
t
Storage period(days)
y = 0.5616x + 3.5037R² = 0.8325
0
20
40
60
80
0 50 100 150
Cfu
(b)
cfu(f))
Proceedings of the Research Symposium of UvaWellassa University, January 29-30, 2015
70
Acknowledgement
I offer my sincere gratitude to my external supervisor Dr. G. G. Jayasinghe , Internal supervisors
Dr. G. Chandrasena and Mr. A.N.R Weerawansha.
References
Cappuccino,J. and Sherman, N. 1996.Microbiology, A laboratory manual. 4th ed. New York:
Rockland community college.P 22-26.
Funder, S. 1953 .Practical mycology, manual for identification of fungi. 3rd ed. New York:
Hafner publishing company. P 16- 23.
Jayasinghe, G. G. 2012. Identification and management of stored product pest of cinnamon
quills (CinnamomumzeylanicumBlume). Proceeding of the symposium on Minor Export Crops
(Ed: B. Marambe), 16 – 17 August 2012, Peradeniya, Sri Lanka, P95 -100.
Proceedings of the Research Symposium of UvaWellassa University, January 29-30, 2015
71
Development of ready to serve drink from gotukola
(Centella asiatica)
G. G. N. T. Ariyasinghe, W. A. J. P. Wijesinghe
Faculty of Animal Science and Export Agriculture, UvaWellassa University of Sri Lanka
and
D. N. Hettiarachchi
Foood Research Unit, Department of Agriculture, Gannoruwa, Peredeniya,Sri Lanka
Introduction
Gotukola (Centellaasiatica) is one of the valuable medicinal herbs and it has several food and
beverage applications in many countries of the world. It is used by Sri Lankan people mainly as
a leafy vegetable. C. asiatica is a good source of antioxidants and famous for its neuroprotective
effect (Hashim, 2011). In addition, this herb is also used for treating in numerous kinds of
diseases due to its rich phytochemical composition mainly asiaticoside, asiatic acid,
madecassoside and madecassic acid (Tiwari et al., 2011). However, there is no any value added
product in Sri Lankan market purely produced from Gotukola. Ready to serve drinks (RTS) are
becoming popular recently in all over the world. This is an effort to develop leaf based ready to
serve drink from Gotukola with acceptable quality standards. Creeping typeGotukola
(HeenGotukola) was used for this study due to its nutritional value and to reduce its wastage by
introducing a value added product.
Materials and Methods
Current study was carried out at Food Research Unit, Gannoruwa, Peradeniya. Laboratory
analysis was conducted at Laboratories of UvaWellassa University and laboratories of
Veterinary Research Institute, Gannoruwa. Six preliminary trials were carried out to develop
four different recipes by changing the percentage of leaf amount by mass as 5%, 7.5%, 10% and
12.5% with constant amount of other ingredients. First quality leaves were selected with stalk
and washed properly. Leaves were dipped in Clorox (Sodium Hypochlorite / NaClO) added
water for one minute. Then leaves were washed from pure water and leaf extract was separated
after grinding. Leaf extract was mixed with prepared sugar syrup and heated up to 80˚C. Citric
acid was added while preparing the sugar syrup. In each recipe quality standards of RTS drink
like pH, brix and titratable acidity were tested according to SLS 729: 2010, to ensure whether
product is fulfilled the quality requirements of RTS drink. Sensory evaluation was carried out
using 5 point hedonic scale to select the best recipe from the developed four recipes. It was
conducted for colour, taste, odour, mouth feel and overall acceptability using 25 semi trained
panelists. Proximate analysis was carried out according to the method of AOAC for the product
selected through sensory evaluation. Total polyphenol content was determined according to the
method of ISO 14502 -1. Determination of yeast and mold, Escherichia coli and total plate
count test were carried out under the microbial analysis of the final product. Shelf life evaluation
for the final product was carried out for one month period under refrigerated storage conditions.
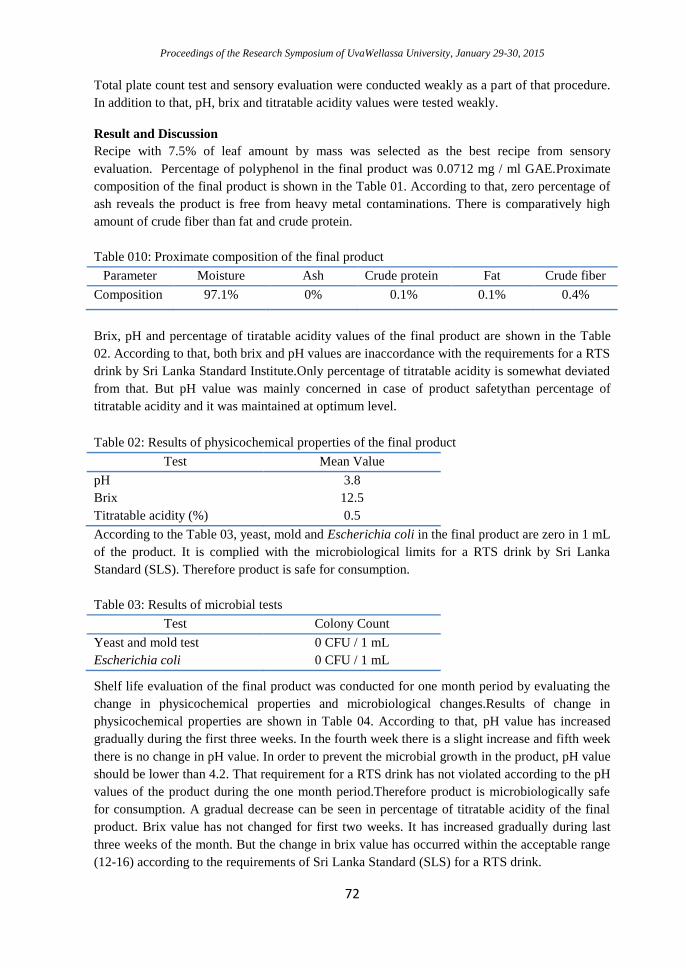
Proceedings of the Research Symposium of UvaWellassa University, January 29-30, 2015
72
Total plate count test and sensory evaluation were conducted weakly as a part of that procedure.
In addition to that, pH, brix and titratable acidity values were tested weakly.
Result and Discussion
Recipe with 7.5% of leaf amount by mass was selected as the best recipe from sensory
evaluation. Percentage of polyphenol in the final product was 0.0712 mg / ml GAE.Proximate
composition of the final product is shown in the Table 01. According to that, zero percentage of
ash reveals the product is free from heavy metal contaminations. There is comparatively high
amount of crude fiber than fat and crude protein.
Table 010: Proximate composition of the final product
Parameter Moisture Ash Crude protein Fat Crude fiber
Composition 97.1% 0% 0.1% 0.1% 0.4%
Brix, pH and percentage of tiratable acidity values of the final product are shown in the Table
02. According to that, both brix and pH values are inaccordance with the requirements for a RTS
drink by Sri Lanka Standard Institute.Only percentage of titratable acidity is somewhat deviated
from that. But pH value was mainly concerned in case of product safetythan percentage of
titratable acidity and it was maintained at optimum level.
Table 02: Results of physicochemical properties of the final product
Test Mean Value
pH 3.8
Brix 12.5
Titratable acidity (%) 0.5
According to the Table 03, yeast, mold and Escherichia coli in the final product are zero in 1 mL
of the product. It is complied with the microbiological limits for a RTS drink by Sri Lanka
Standard (SLS). Therefore product is safe for consumption.
Table 03: Results of microbial tests
Test Colony Count
Yeast and mold test 0 CFU / 1 mL
Escherichia coli 0 CFU / 1 mL
Shelf life evaluation of the final product was conducted for one month period by evaluating the
change in physicochemical properties and microbiological changes.Results of change in
physicochemical properties are shown in Table 04. According to that, pH value has increased
gradually during the first three weeks. In the fourth week there is a slight increase and fifth week
there is no change in pH value. In order to prevent the microbial growth in the product, pH value
should be lower than 4.2. That requirement for a RTS drink has not violated according to the pH
values of the product during the one month period.Therefore product is microbiologically safe
for consumption. A gradual decrease can be seen in percentage of titratable acidity of the final
product. Brix value has not changed for first two weeks. It has increased gradually during last
three weeks of the month. But the change in brix value has occurred within the acceptable range
(12-16) according to the requirements of Sri Lanka Standard (SLS) for a RTS drink.
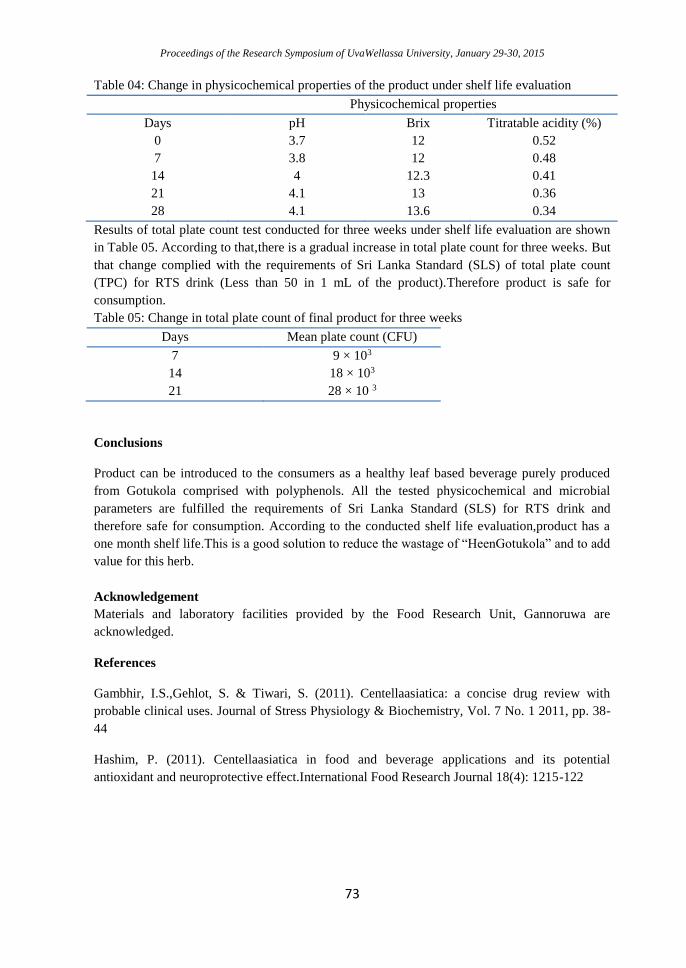
Proceedings of the Research Symposium of UvaWellassa University, January 29-30, 2015
73
Table 04: Change in physicochemical properties of the product under shelf life evaluation
Physicochemical properties
Days pH Brix Titratable acidity (%)
0 3.7 12 0.52
7 3.8 12 0.48
14 4 12.3 0.41
21 4.1 13 0.36
28 4.1 13.6 0.34
Results of total plate count test conducted for three weeks under shelf life evaluation are shown
in Table 05. According to that,there is a gradual increase in total plate count for three weeks. But
that change complied with the requirements of Sri Lanka Standard (SLS) of total plate count
(TPC) for RTS drink (Less than 50 in 1 mL of the product).Therefore product is safe for
consumption.
Table 05: Change in total plate count of final product for three weeks
Days Mean plate count (CFU)
7 9 × 10³
14 18 × 103
21 28 × 10 3
Conclusions
Product can be introduced to the consumers as a healthy leaf based beverage purely produced
from Gotukola comprised with polyphenols. All the tested physicochemical and microbial
parameters are fulfilled the requirements of Sri Lanka Standard (SLS) for RTS drink and
therefore safe for consumption. According to the conducted shelf life evaluation,product has a
one month shelf life.This is a good solution to reduce the wastage of “HeenGotukola” and to add
value for this herb.
Acknowledgement
Materials and laboratory facilities provided by the Food Research Unit, Gannoruwa are
acknowledged.
References
Gambhir, I.S.,Gehlot, S. & Tiwari, S. (2011). Centellaasiatica: a concise drug review with
probable clinical uses. Journal of Stress Physiology & Biochemistry, Vol. 7 No. 1 2011, pp. 38-
44
Hashim, P. (2011). Centellaasiatica in food and beverage applications and its potential
antioxidant and neuroprotective effect.International Food Research Journal 18(4): 1215-122
Proceedings of the Research Symposium of UvaWellassa University, January 29-30, 2015
74
Satisfaction of Low Country vegetable farmers about the
agricultural extension service in Sri Lanka
L.K.C.K. Gunasekara, M.G.P.P. Mahindarathna
Faculty of Animal Science and Export Agricutlture, UvaWellassa University of Sri Lanka
and
L. Bandara
BASF Lanka (Pvt) Ltd.
Introduction
In Sri Lanka public sector organizations are the major party of extension delivery. The
agricultural extension service in Sri Lanka was a greater service offering to all type of the
farmers equally, irrespective of scale of farming. This service was started with the establishment
of Department of Agriculture (DOA). The service was given by the DOA, agricultural research
institutions and other agricultural related institutions in the state sector as public commodity. But
this has reached to the critical stage. Large sum of public funds need to maintain and conduct the
service. Due to the shortage of funds, government has to continue this service under big
pressure. In this situation, due to lack of efficiency, effectiveness and not devoting sufficiently to
the agriculture development of country government extension services are criticized as wasting
public money (Mahaliyanarachchi, 2002)
This study was completed to find the satisfaction of low- country vegetable farmers on
agriculture extension service in Sri Lanka. Objectives of the study were to determine satisfaction
of farmers about the extension services, investigate factors which affect the satisfaction of
farmers and find out extension needs of low- country vegetable farmers.
Materials and methodology
This study was conducted in Anuradhapura and Monaragala districts where high productions of
low- country vegetables are taken place throughout the year. Sample size was 200 farmers. Data
were gathered using semi structured questionnaire. Semi- structured questionnaire was consisted
to sought information on demographic characteristics of farmer (age, gender, education level,
marital status etc.), information related farm (land extent, type of labour etc), information related
to the extension service (frequency of the visit by the extension agent, methods of extension,
teaching skills of the agent, communication skills of the agent and satisfaction of the farmers
etc.)
Independent variables which were used to test hypotheses were subjected to judge by the
respondents. The statement on a 5 point Likert scale of Strongly Agree (SA), Agree (A),
Undecided (U), Disagree (D) Strongly Disagree (SA) and scores of 5, 4,3,2,1 were assigned to
the corresponding responses for positive statement and the reversed scores for the negative
statements. Using the minimum score of (1) and maximum score of (5): Dependent variable was
Satisfaction of farmers: Satisfaction is the dependent variable which was inquired from the
respondents directly. Farmers were asked to mention overall satisfaction about extension service.
(1) Satisfied (2) Not Satisfied.
Data collection was done by the researcher. Personal interview was used to collect data
according to the semi structured questionnaire. Sampled farmers of two districts were
interviewed through field survey. Collected data were arranged, coded and analyzed through the
use of Statistical Package for the Social Sciences (SPSS) computer programme. Both descriptive
Proceedings of the Research Symposium of UvaWellassa University, January 29-30, 2015
75
and inferential statistical tools were used to analyze the data.Descriptive statistical tools used
were frequency counts, percentages and mean.Inferential statistical tool was used to test the
hypotheses of the study.Chi-squire test was used to measure the significant relationship between
independent variables in the model and dependent variable in the model.
Logistic Regression Analysis used to test amount of variability of the dependent variables that
could be explained by the independent variables. The regression coefficients identified and
estimated how variable input included in the model best explained the variability on output.
The model is:
Log (p)= 𝜷0+ 𝜷1 X1+𝜷2 X2+ 𝜷3X 3+𝜷4 X 4 +𝜷5X5+ 𝜷6X6+𝜷7X7, 𝜷8X8, ...𝜷12X 12
Log (p) – probability of being satisfied or not
𝜷1…….𝜷12 – Coefficients
𝜷0 - Constant
X1- Extension source
X2- Frequency of visit
X3- Appropriateness of Extension method
X4- Perceived Qualifications of extension Agent
X5- Perceived practical knowledge of extension agent
X6- Adequate information delivery
X7- Timely information delivery
X8- Trustworthiness of extension agent
X9- Peer presence for decision making
X10- Continuity of extension service
X11- fairness of extension service
X12- Dealer presence for decision making.
Results and Discussion
Demographic characteristics of farmers
Majority (42% of total sample) of farmers is more than 50 years and 78% of farmers are male
respondents. According to the findings only 5% of the farmers are single where 95% of the
farmers are belongs to the married group. Highestproportion (48% of the total sample) of the
respondents is able to get secondary education. Only 26% of the total sample is in no formal
education group. 67.5% of the total sample is highest proportion in experience more than 15
years. Majority of the farmers are engaged in farming in full time. Approximately 84% farmers
are members of any kind of agricultural organization. Approximately 35.5% of the sample of
farmers has 1.5- 2.5 acres of land extent. Most of the farmers use family labours for their
farming activities. According to the results own land percentage is 82.5% and other land
percentage is 17.5%.
1
Proceedings of the Research Symposium of UvaWellassa University, January 29-30, 2015
76
Extension Source Related Characteristics
Highest proportion (57%) of the farmers is get information from government extension source
only. Nearly 30.5% of farmers useonly their own experience for cultivation. Approximately
4.5% of farmers areget information from both government and private input supply companies
while 3.5% of farmers are get information only from private input supply company. And also
3% of farmers areget information from both government and non-government organizations.
Only 1.5% of farmers are get information from non- government organization.Nearly 60% of
farmers are experienced no visits by extension agents of their fields. Nearly 19.5% of farmers
are able to get extension agent’s visit when farmers required. Approximately 10% of total
farmers arevisited by the extensionagent once per month while 5.5% of the farmers are visited
by the extension agent twice per month. Only 5% of the farmers are experienced extension
agent’s contact thrice per month. Most (57%) of the farmers are required information regarding
pest and diseases only. All information is needed by the 39.5% of total sample while agronomic
practices and irrigation information required by 1% of total farmers and selection of crops for
cultivation are required by 0.5% of total farmers. Most of the farmers use new hybrid varieties
for their cultivation..
Social Behavior of Farmers
Approximately 45.5% of total farmers were strongly agreed that they rely on peer farmer’s
decision. Nearly 32% of farmers were agreed that they considered peer farmers as good decision
body. Only 17% of farmers were disagreed about above condition while 3% and 5% of farmers
had no idea and strongly disagreement accordingly.According to the data 20% of farmers were
agreed that dealer was considerable decision making body for their cultivation. Approximately
14% of farmers were strongly agreed about above condition. Nearly 10% of farmers had no idea.
Majority of farmers were disagreed. It was approximately 50%. Nearly 6% of farmers were
strongly disagreed about above statement.
Satisfaction of Farmers on Agricultural extension sources
Most of the farmers were not satisfied about the extension sources. It was about 66.5%. Minority
of farmers were satisfied about the extension sources. It was nearly 33.5%.According to the chi-
squire test Extension source, frequency of visit by extension agent, appropriateness of extension
methods, perceived qualification of extension agent, perceived practical knowledge of extension
agent, adequate information delivery, timely information delivery, trustworthiness of extension
agent, peer presence for decision making, continuity of extension agent, fairness of extension
service, buyer presence for decision making variables were significant at 95% confident interval.
From above variables Binary Regression was run.
Binary Regression Model yielded following results.
According to the model summery pseudo R2 is 62.9% and 87.2%. -2 Log likelihood also smaller
and near to zero. Therefore goodness of model is in considerable level.
2
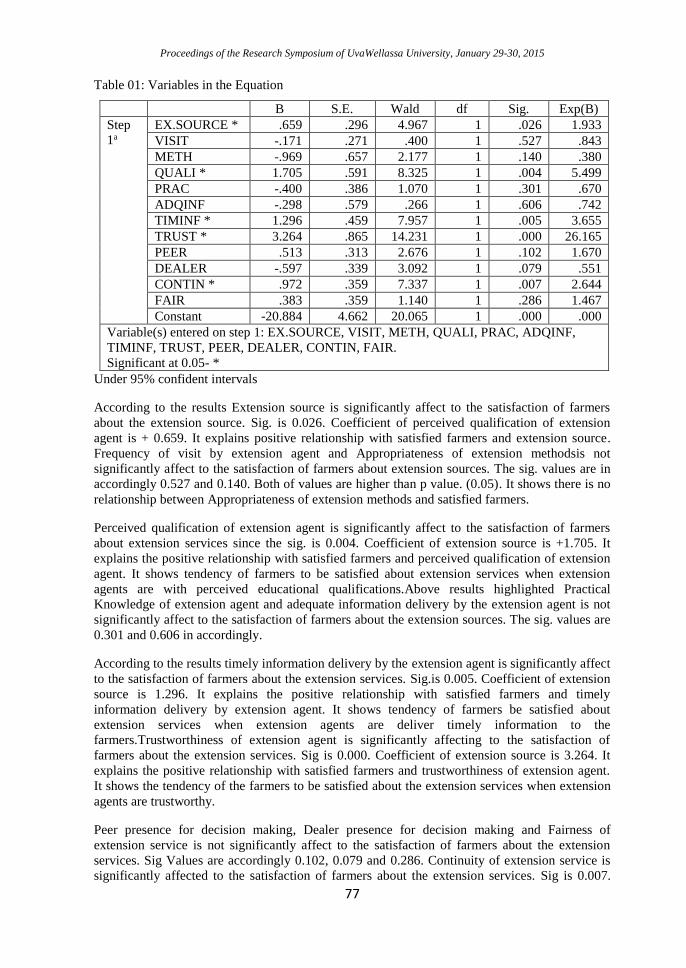
Proceedings of the Research Symposium of UvaWellassa University, January 29-30, 2015
77
Table 01: Variables in the Equation
B S.E. Wald df Sig. Exp(B)
Step
1a
EX.SOURCE * .659 .296 4.967 1 .026 1.933
VISIT -.171 .271 .400 1 .527 .843
METH -.969 .657 2.177 1 .140 .380
QUALI * 1.705 .591 8.325 1 .004 5.499
PRAC -.400 .386 1.070 1 .301 .670
ADQINF -.298 .579 .266 1 .606 .742
TIMINF * 1.296 .459 7.957 1 .005 3.655
TRUST * 3.264 .865 14.231 1 .000 26.165
PEER .513 .313 2.676 1 .102 1.670
DEALER -.597 .339 3.092 1 .079 .551
CONTIN * .972 .359 7.337 1 .007 2.644
FAIR .383 .359 1.140 1 .286 1.467
Constant -20.884 4.662 20.065 1 .000 .000
Variable(s) entered on step 1: EX.SOURCE, VISIT, METH, QUALI, PRAC, ADQINF,
TIMINF, TRUST, PEER, DEALER, CONTIN, FAIR.
Significant at 0.05- *
Under 95% confident intervals
According to the results Extension source is significantly affect to the satisfaction of farmers
about the extension source. Sig. is 0.026. Coefficient of perceived qualification of extension
agent is + 0.659. It explains positive relationship with satisfied farmers and extension source.
Frequency of visit by extension agent and Appropriateness of extension methodsis not
significantly affect to the satisfaction of farmers about extension sources. The sig. values are in
accordingly 0.527 and 0.140. Both of values are higher than p value. (0.05). It shows there is no
relationship between Appropriateness of extension methods and satisfied farmers.
Perceived qualification of extension agent is significantly affect to the satisfaction of farmers
about extension services since the sig. is 0.004. Coefficient of extension source is +1.705. It
explains the positive relationship with satisfied farmers and perceived qualification of extension
agent. It shows tendency of farmers to be satisfied about extension services when extension
agents are with perceived educational qualifications.Above results highlighted Practical
Knowledge of extension agent and adequate information delivery by the extension agent is not
significantly affect to the satisfaction of farmers about the extension sources. The sig. values are
0.301 and 0.606 in accordingly.
According to the results timely information delivery by the extension agent is significantly affect
to the satisfaction of farmers about the extension services. Sig.is 0.005. Coefficient of extension
source is 1.296. It explains the positive relationship with satisfied farmers and timely
information delivery by extension agent. It shows tendency of farmers be satisfied about
extension services when extension agents are deliver timely information to the
farmers.Trustworthiness of extension agent is significantly affecting to the satisfaction of
farmers about the extension services. Sig is 0.000. Coefficient of extension source is 3.264. It
explains the positive relationship with satisfied farmers and trustworthiness of extension agent.
It shows the tendency of the farmers to be satisfied about the extension services when extension
agents are trustworthy.
Peer presence for decision making, Dealer presence for decision making and Fairness of
extension service is not significantly affect to the satisfaction of farmers about the extension
services. Sig Values are accordingly 0.102, 0.079 and 0.286. Continuity of extension service is
significantly affected to the satisfaction of farmers about the extension services. Sig is 0.007.
Proceedings of the Research Symposium of UvaWellassa University, January 29-30, 2015
78
Coefficient of continuity of extension service is 0.972. It explains the positive relationship with
satisfied farmers and continuity of service. It shows tendency of farmers to be satisfied about
extension services when extension agents are increase continuity of service.
Equation
Logit(Satisfaction) = -20.884 + 0.659(Extension source) + 1.705(Perceived qualification) +
1.296(Timely information delivery) + 3.264(Trustworthiness of agent) + 0.972(continuity of
service)
Conclusion
Majority of low country vegetable farmers are not satisfiedabout agricultural extension services
in Sri Lanka. According to the finding of the study, Timeliness of information, trustworthiness
of extension agent, perceived qualification of extension agent, extension source and continuity
of extension source are the variables which are significantly affect to the satisfaction of
extension service.
References
Rohana P. Mahaliyanarachchi, agricultural extension services in sri lanka, BeraterInnen News
2/2002
Saravanan, R. and N.S.S Gowda (1999). Development of Scale to Measure Attitudes towards
Privatization of Agricultural Extension Service.Tropical Agricultural Research, 11:190-198.
Malkanthi, S.H.P. and R.P. Mahaliyanaarachchi (2001). Attitudes of the Farmers and
Agricultural Officers on Privatization of Extension Service in Upcountry Vegetable Sector in Sri
Lanka, Tropical Agricultural Research, 13:319-327.
3
Proceedings of the Research Symposium of UvaWellassa University, January 29-30, 2015
79
Nitrogen and potassium fertilizer response on growth and yield
of hybrid Luffa –Naga f1 variety
D.R.T.N.K Dissanayake,H.M.S.K. Herath,H.K.S.G.Gunadasa
Faculty of Animal Science and Export Agriculture, UvaWellassa University of Sri Lanka.
and
P.Weerasinghe
Horticultural Crops Research and Development Institute, Gannoruwa, Peradeniya. Sri Lanka
Introduction
Luffa is a tropical and subtropical vegetable, belongs to family Cucurbiteceae. It is
predominantly monoecious in sex expression and provides an ample scope for utilization of
hybrid vigor. Hybrid varieties develop through open pollination, produce higher yields due to its
hybrid vigor. Naga F1 hybrid variety consists number of desirable traits other than higher yield
such as strong and vigorous plants, fruits with long deep ridges, attractive green color fruits
,better fruit weight, length and early maturity compared to the local Luffa
cultivars.Unavailability of fertilizer recommendations for hybrid cucurbit vegetables leads to an
excess fertilizer application causing a vital environmental issue that creates undesirable impacts
on nature and the human health.
Main Objective of this research is to determine effect of different nitrogen and potassium
fertilizer rates on growth and yield of Naga F1 Variety. Other objectives are, to evaluate specific
growth parameters and yield, to identify the optimum nitrogen and potassium fertilizer levels
based on growth and yield of hybrid Luffa variety. As well as to formulate the general fertilizer
recommendation for hybrid Luffa -Naga F1 variety.
Methodology
Hybrid Luffa - Naga F1 variety seeds were used as planting material. The experiment consisted
of nine treatments involving three nitrogen fertilizer levels and three potassium fertilizer levels
based on recommendation of the Department of Agriculture for local Luffa varieties.
Recommended dosage of phosphorous fertilizer level was applied for each treatment.Fertilizers
were applied at the basal dressing and two top dressings in three week intervals accordingly.
Fertilizer sources for N, K and P are Urea, Muriate of Potash (MOP) and Triple Super Phosphate
(TSP) respectively. The study was carried out in randomized complete block design.
Field experiment was conducted in order to obtain growth and yield parameters of Naga F 1
variety. Plant growth parameters were leaf number per vine and vine length at 1st, 2nd and 3rd
weeks after planting intervals. Yield attributes were fruit girth, fruit length, yield per vine, yield
per hectare up to ten consequent harvest. Laboratory analysis were performed in order to
determine initial soil composition andnitrogen and potassium contents in leaves and fruitsat peak
harvesting stage. Data were analyzed using Minitab 17 statistical software. Treatment means
differences were evaluated by Tukey mean comparison tests at 0.05 significant level.
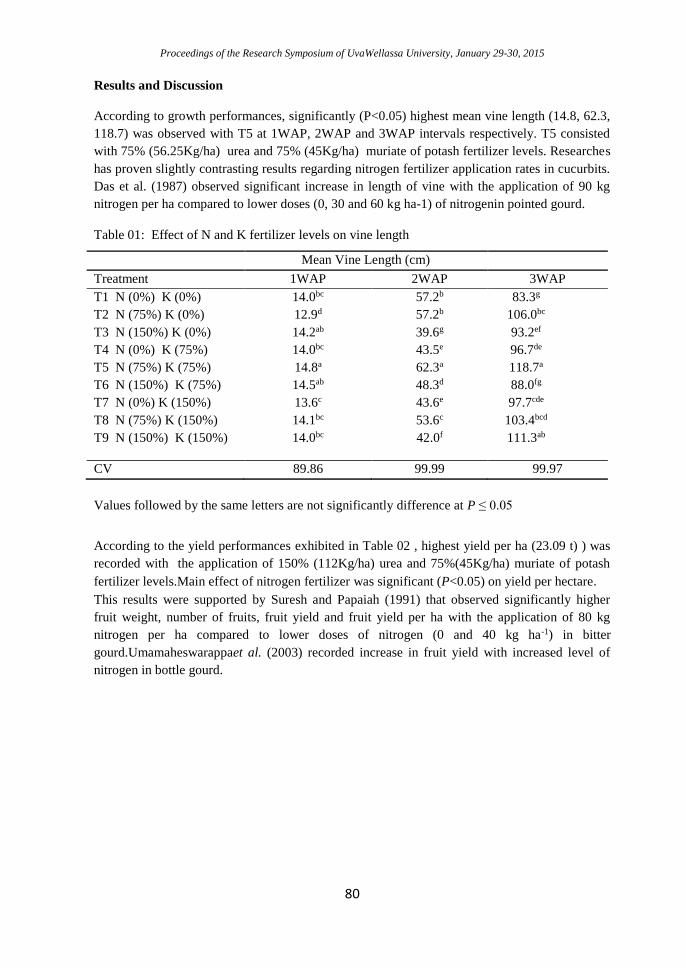
Proceedings of the Research Symposium of UvaWellassa University, January 29-30, 2015
80
Results and Discussion
According to growth performances, significantly (P<0.05) highest mean vine length (14.8, 62.3,
118.7) was observed with T5 at 1WAP, 2WAP and 3WAP intervals respectively. T5 consisted
with 75% (56.25Kg/ha) urea and 75% (45Kg/ha) muriate of potash fertilizer levels. Researches
has proven slightly contrasting results regarding nitrogen fertilizer application rates in cucurbits.
Das et al. (1987) observed significant increase in length of vine with the application of 90 kg
nitrogen per ha compared to lower doses (0, 30 and 60 kg ha-1) of nitrogenin pointed gourd.
Table 01: Effect of N and K fertilizer levels on vine length
Values followed by the same letters are not significantly difference at P ≤ 0.05
According to the yield performances exhibited in Table 02 , highest yield per ha (23.09 t) ) was
recorded with the application of 150% (112Kg/ha) urea and 75%(45Kg/ha) muriate of potash
fertilizer levels.Main effect of nitrogen fertilizer was significant (P<0.05) on yield per hectare.
This results were supported by Suresh and Papaiah (1991) that observed significantly higher
fruit weight, number of fruits, fruit yield and fruit yield per ha with the application of 80 kg
nitrogen per ha compared to lower doses of nitrogen (0 and 40 kg ha-1) in bitter
gourd.Umamaheswarappaet al. (2003) recorded increase in fruit yield with increased level of
nitrogen in bottle gourd.
Mean Vine Length (cm)
Treatment 1WAP 2WAP 3WAP
T1 N (0%) K (0%)
T2 N (75%) K (0%)
T3 N (150%) K (0%)
T4 N (0%) K (75%)
T5 N (75%) K (75%)
T6 N (150%) K (75%)
T7 N (0%) K (150%)
T8 N (75%) K (150%)
T9 N (150%) K (150%)
14.0bc
12.9d
14.2ab
14.0bc
14.8a
14.5ab
13.6c
14.1bc
14.0bc
57.2b
57.2b
39.6g
43.5e
62.3a
48.3d
43.6e
53.6c
42.0f
83.3g
106.0bc
93.2ef
96.7de
118.7a
88.0fg
97.7cde
103.4bcd
111.3ab
CV 89.86 99.99 99.97
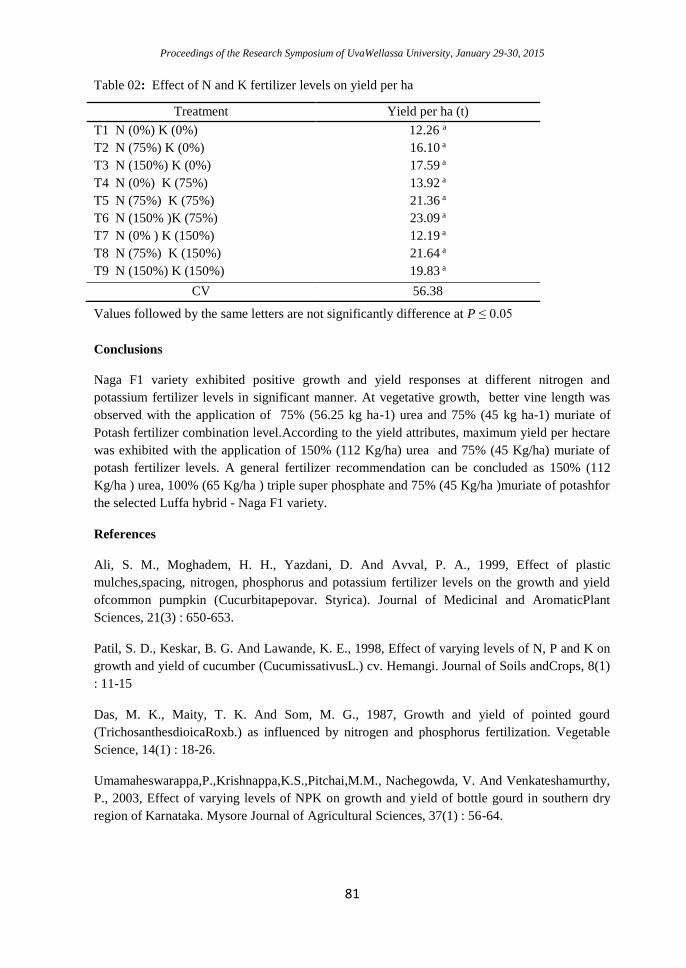
Proceedings of the Research Symposium of UvaWellassa University, January 29-30, 2015
81
Table 02: Effect of N and K fertilizer levels on yield per ha
Values followed by the same letters are not significantly difference at P ≤ 0.05
Conclusions
Naga F1 variety exhibited positive growth and yield responses at different nitrogen and
potassium fertilizer levels in significant manner. At vegetative growth, better vine length was
observed with the application of 75% (56.25 kg ha-1) urea and 75% (45 kg ha-1) muriate of
Potash fertilizer combination level.According to the yield attributes, maximum yield per hectare
was exhibited with the application of 150% (112 Kg/ha) urea and 75% (45 Kg/ha) muriate of
potash fertilizer levels. A general fertilizer recommendation can be concluded as 150% (112
Kg/ha ) urea, 100% (65 Kg/ha ) triple super phosphate and 75% (45 Kg/ha )muriate of potashfor
the selected Luffa hybrid - Naga F1 variety.
References
Ali, S. M., Moghadem, H. H., Yazdani, D. And Avval, P. A., 1999, Effect of plastic
mulches,spacing, nitrogen, phosphorus and potassium fertilizer levels on the growth and yield
ofcommon pumpkin (Cucurbitapepovar. Styrica). Journal of Medicinal and AromaticPlant
Sciences, 21(3) : 650-653.
Patil, S. D., Keskar, B. G. And Lawande, K. E., 1998, Effect of varying levels of N, P and K on
growth and yield of cucumber (CucumissativusL.) cv. Hemangi. Journal of Soils andCrops, 8(1)
: 11-15
Das, M. K., Maity, T. K. And Som, M. G., 1987, Growth and yield of pointed gourd
(TrichosanthesdioicaRoxb.) as influenced by nitrogen and phosphorus fertilization. Vegetable
Science, 14(1) : 18-26.
Umamaheswarappa,P.,Krishnappa,K.S.,Pitchai,M.M., Nachegowda, V. And Venkateshamurthy,
P., 2003, Effect of varying levels of NPK on growth and yield of bottle gourd in southern dry
region of Karnataka. Mysore Journal of Agricultural Sciences, 37(1) : 56-64.
Treatment Yield per ha (t)
T1 N (0%) K (0%)
T2 N (75%) K (0%)
T3 N (150%) K (0%)
T4 N (0%) K (75%)
T5 N (75%) K (75%)
T6 N (150% )K (75%)
T7 N (0% ) K (150%)
T8 N (75%) K (150%)
T9 N (150%) K (150%)
12.26 a
16.10 a
17.59 a
13.92 a
21.36 a
23.09 a
12.19 a
21.64 a
19.83 a
CV 56.38
Proceedings of the Research Symposium of UvaWellassa University, January 29-30, 2015
82
Patterns of fresh fruit consumption of households in Kurunegala
A.M.I.P Abeysinghe, I.C. Hettiarachchi, P. Sivashankar, R.P Mahaliyanaarachchi
Faculty of Agricultural Sciences, Sabaragamuwa university of Sri Lanka
Introduction
Agriculture is the most common vocation of the Sri Lankan. Different varieties of fruits are
cultivated in Sri Lanka’s varied agro-climatic regions. Fruits play a major role in the well-being
of consumers. Consumption of fruits contributes to an increase in the nutritional level of people.
The food pyramid developed by the United States Department of Agriculture (USDA)
recommends, 2-4 servings of fruits per day (Life clinic international, 2010). According to MRI
the daily per capita requirement of fruits for a balanced diet should be 30‐40 g (edible portion),
which is approximately equivalent to 25‐40 kg fresh fruit per head per year. However, Sri
Lanka’s per capita consumption of fruits and vegetables remains far below the required average
daily intake (Ceylon Chamber of Commerce, 2010). In the process of enhancing fruit
consumption, it is very useful to consider the needs, preferences and behavior of consumers. The
main objective of this study is to find demand for different fruit types and the factors that
influence households consuming of different fruit types.
Methodology
A deductive research approach was followed. Survey strategy was used as a research strategy.
Primary Data were collected through an interviewer administered questionnaires and most
research questions had descriptive purposes. Before collecting data pilot test was used to identify
the problems while responding to the questionnaires. Kurunegala District in North Western
Province, was selected as the research area. It consists of 30 Divisional Secretariats, 1610 Grama
Niladari Divisions and 4476 total Villages (Department of Census and Statistics, 2009).
Kurunegala district has 412,897 households (District Statistical Branch, Kurunegala). The
sample size was about 153 households which are from Kurunegala District. The stratified
random sampling technique was used as sampling method to select households Types of fresh
fruit consumption among different households and consumption frequency of different fruit
types were analyzed by descriptive analysis. Chi-square Test was the statistical analytical tool
applied in identification of consumption pattern of across various household groups. Microsoft
Excel and Minitab 14.0 Software programs were used to analyze the data.
Results and Discussion
Results reveal that there is no significant difference between three types of locality groups
(urban, semi urban and rural) when they are consuming fruits. But rural residents had low
expenditure on fruits compared to the urban and semi-urban resident, due to varieties of local
fruit available in their home garden. Banana, papaw, mangoes and pineapple are the major fruits
consumed in the Kurunegala District. The majority of the respondent did not intake fruit as daily
consuming food. In Household fruit consumption, those who do not consume fruits daily,
consume fruits around 3-4 days per week. In the study household banana consumption was 3
days per week while papaya, mango, and pineapple are consumed 2-3 days in a week. According
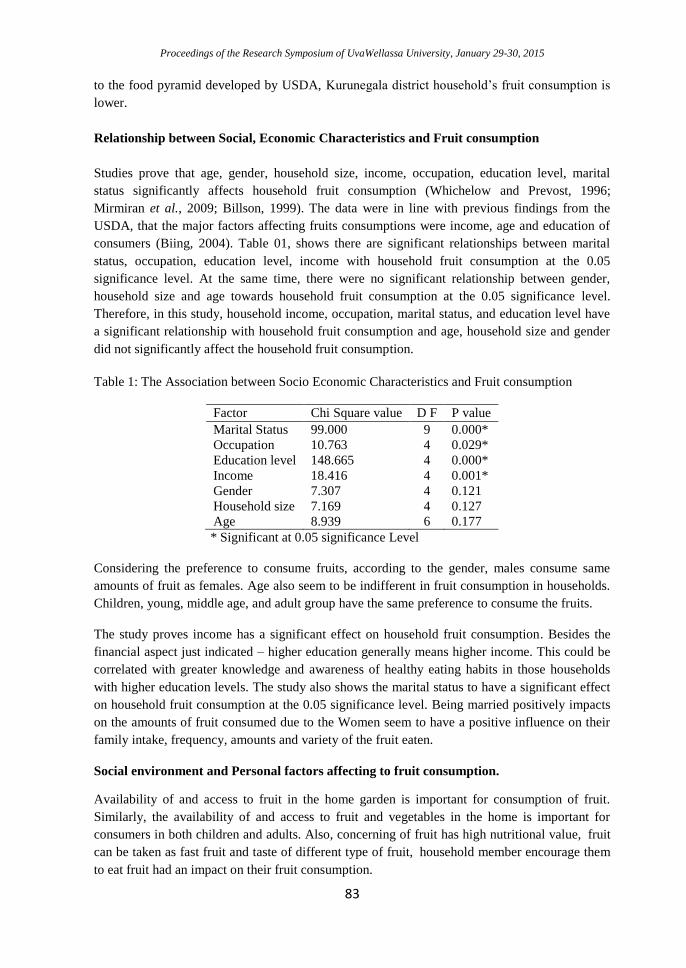
Proceedings of the Research Symposium of UvaWellassa University, January 29-30, 2015
83
to the food pyramid developed by USDA, Kurunegala district household’s fruit consumption is
lower.
Relationship between Social, Economic Characteristics and Fruit consumption
Studies prove that age, gender, household size, income, occupation, education level, marital
status significantly affects household fruit consumption (Whichelow and Prevost, 1996;
Mirmiran et al., 2009; Billson, 1999). The data were in line with previous findings from the
USDA, that the major factors affecting fruits consumptions were income, age and education of
consumers (Biing, 2004). Table 01, shows there are significant relationships between marital
status, occupation, education level, income with household fruit consumption at the 0.05
significance level. At the same time, there were no significant relationship between gender,
household size and age towards household fruit consumption at the 0.05 significance level.
Therefore, in this study, household income, occupation, marital status, and education level have
a significant relationship with household fruit consumption and age, household size and gender
did not significantly affect the household fruit consumption.
Table 1: The Association between Socio Economic Characteristics and Fruit consumption
Factor Chi Square value D F P value
Marital Status 99.000 9 0.000*
Occupation 10.763 4 0.029*
Education level 148.665 4 0.000*
Income 18.416 4 0.001*
Gender 7.307 4 0.121
Household size 7.169 4 0.127
Age 8.939 6 0.177
* Significant at 0.05 significance Level
Considering the preference to consume fruits, according to the gender, males consume same
amounts of fruit as females. Age also seem to be indifferent in fruit consumption in households.
Children, young, middle age, and adult group have the same preference to consume the fruits.
The study proves income has a significant effect on household fruit consumption. Besides the
financial aspect just indicated – higher education generally means higher income. This could be
correlated with greater knowledge and awareness of healthy eating habits in those households
with higher education levels. The study also shows the marital status to have a significant effect
on household fruit consumption at the 0.05 significance level. Being married positively impacts
on the amounts of fruit consumed due to the Women seem to have a positive influence on their
family intake, frequency, amounts and variety of the fruit eaten.
Social environment and Personal factors affecting to fruit consumption.
Availability of and access to fruit in the home garden is important for consumption of fruit.
Similarly, the availability of and access to fruit and vegetables in the home is important for
consumers in both children and adults. Also, concerning of fruit has high nutritional value, fruit
can be taken as fast fruit and taste of different type of fruit, household member encourage them
to eat fruit had an impact on their fruit consumption.
Proceedings of the Research Symposium of UvaWellassa University, January 29-30, 2015
84
Conclusion
Banana, papaw, mangoes and pineapple are the major fruits consumed in the Kurunegala
District. In Kurunegala district, Household fresh fruit consumption is averagely five to six fruit
species per 3-4 days a week. Results showed that fruit servings per week have a significant
relationship with education, monthly income, marital status, and occupation. Gender, Household
size and age do not significantly affect the consumption of fruit. Marital status seems to play a
significant role in the consumption of fruit. Being married is associated with increased fruit
intake while being single/ divorced/ separated is associated with lower levels of fruit
consumption. Low-income households spend less than higher income households on fruits.
Therefore, understanding the consumption difference between income groups is important for
targeting interventions for healthy eating. However, high costs may negatively impact on fruit
intake levels. This does not only concern low income groups. Also, people with higher incomes
perceive price as a barrier to consumption of these foods. Individual preferences, parental intake
and home availability/accessibility towards fruit have an impact on consumption levels. The
study proved Home gardens are a rich source of fruits, and have the potential of improving both
intake and diversity of fruits in the diet.
References
Billson, H., Pryer, J. & Nichols, R. (1999). Variation in fruit and vegetable consumption among
adults in Britain. An analysis from the dietary and nutritional survey of British adults. European
Journal of Clinical Nutrition, 53, 946-952. Retrieved February, 2014, from the World Wide
Web: https://books.google.lk
Biing, H. L. (2004). Fruit and vegetable consumption looking ahead to 2020. European Journal
of Clinical Nutrition, 53, 946-952. Retrieved March, 2014, from the World Wide Web: www.fama.gov.my
Ceylon chamber of commerce. (February, 2011) Sector brief fruit and vegetables, 3-4. Retrieved
March, 2014, from the World Wide Web: regionalblog.chamber.lk
Department of Census and Statistics. (2013). Ministry of Finance and Planning Sri Lanka:
Household Income and Expenditure Survey 2012/13 Preliminary Report”. Retrieved March,
2014, from the World Wide Web: www.statistics.gov.lk
Mirmiran P, Noori N, Zavareh MB, Azizi F. 2009. Fruit and vegetable consumption and risk
factors for cardiovascular disease. Metabolism, 58(4):460-468. Retrieved March, 2014, from the
World Wide Web: www.ncbi.nlm.nih.gov
Whichelow, M. and Prevost, A. T. (1996). Dietary patterns and their associations with
demographic, lifestyle and health variables in a random sample of British adults. British Journal
of Nutrition, 76:17-30,Retrieved March, 2014, from the Worldwide Web: her.oxfordjournals.org
The U.S. Department of Agriculture's (USDA's), U.S. Food and Drug Administration (February, 2010). Nutrient Database, 91 (2), 487-93. Retrieved March, 2014, from the World Wide Web: ods.od.nih.gov
Proceedings of the Research Symposium of UvaWellassa University, January 29-30, 2015
85
Farmers perception on cultivating medicinal plants as an
agribusiness venture: a study at Pambahinna agrarian services
division
T.M Liyanagamage, I.C. Hettiarachchi, P. Sivashankar, R.P Mahaliyanaarachchi
Faculty of Agricultural Sciences, Sabaragamuwa university of Sri Lanka
Abstract
Medicinal plants have been used in Sri Lanka for many purposes since early civilization.
Recently both national and international demand for ayrvedic medicinal materials has been
increased due to increased health awareness. But unfortunately Sri Lankan cultivations presently
do not at least provide for the demand for the country itself, this leads to import many plants
from countries like India, Pakistan and Dubai. Therefore the propose of this research was to
identify farmers perception on medicinal plant cultivation as an agribusiness which could be an
important perspective to develop this sector. This research was particularly carried in
Pambahinna Agrarian Services Division. In the research questions farmers experience and
knowledge on medicinal plant, awareness on markets, potentials and constrains of this industry
was discussed. A survey was conducted among randomly selected sample of 111 farmers within
10 GN (gramasewa niladari) divisions and obtain information through an interviewer
administrated structured questionnaire. Data analyzing was done using mini tab 14 and MS
Excel using descriptive statistics, graphical explanations, and chi square test. Concerning on
awareness, many farmers were aware about the value of medicinal materials but they lack
information about such agribusinesses so they lack motivation and inspiration
Key words: Perception, Medicinal plants, Agribusiness
Introduction
Common medicines like ginger, garlic, and coriander were used by ancient physicians and used
by the people even today. In fact the chemicals used in western drugs were originally extracted
from medicinal plants. There is a current trend evolving in many developed and developing
countries to move back to old traditions in medicine and especially in beauty culture. The
national demand for medicinal plant materials was 3,864,760 kg in 2000 and approximately
1,509,201 kg of this amount were imported to meet the national demand at a cost of about Rs. 13
million (Abeywardana, N and Hettiarachchi, J. K., 2001). Hence great potential exists to
organize the cultivation medicinal plants on commercial scale to increase the domestic supply of
raw materials (Joseph and Abeysekera, 2004; Gunasena et al., 2004). This paper looks at the
farmers’ willingness to cultivate medicinal plants as an agribusiness venture and to find out the
potentials and constraints in medicinal plant cultivation.

Proceedings of the Research Symposium of UvaWellassa University, January 29-30, 2015
86
Objectives
Broad objective
My broad objective is to find out farmer perception on planting medicinal plants as an
agribusiness.
Specific objectives
To find out the level of experience and knowledge available within the farmer
community on medicinal plant cultivation that would help them for easy adaptation
process.
To assess the level of farmer awareness on market demand, price and buyers of
medicinal plants.
To discover the potentials and constrains of this agribusiness in farmers point of view.
To determine the farmers perception towards this business.
Methodology
Research Design
• Research approach - Deductive research approach
• Type of the research - Descriptive
• Research strategy - Survey strategy
Target Population
• Target population was farmers in ten GN divisions in Pambahinna agrarian services
division
Sampling Technique
• Systemic sampling
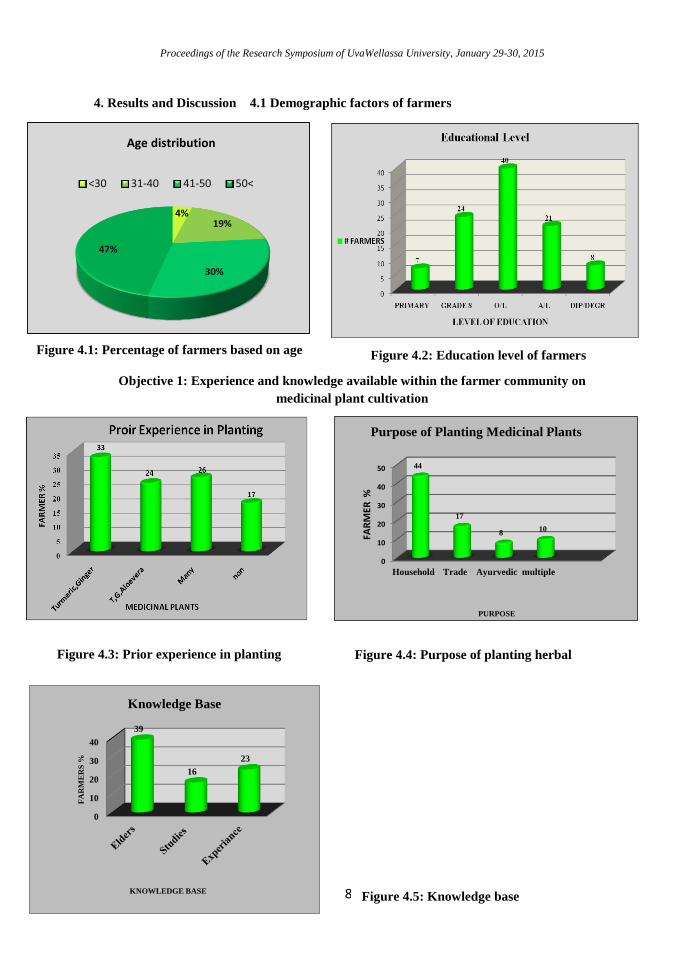
Proceedings of the Research Symposium of UvaWellassa University, January 29-30, 2015
87
4%19%
30%
47%
<30 31-40 41-50 50<
Age distribution
0
10
20
30
40
50
Household Trade Ayurvedic multiple
44
17
810
FAR
MER
%
PURPOSE
0
10
20
30
40
39
16
23
FA
RM
ER
S %
KNOWLEDGE BASE
Knowledge Base
Figure 4.3: Prior experience in planting
4. Results and Discussion 4.1 Demographic factors of farmers
Figure 4.1: Percentage of farmers based on age
Objective 1: Experience and knowledge available within the farmer community on
medicinal plant cultivation
Figure 4.2: Education level of farmers
Purpose of Planting Medicinal Plants
Figure 4.4: Purpose of planting herbal
plants
Figure 4.5: Knowledge base
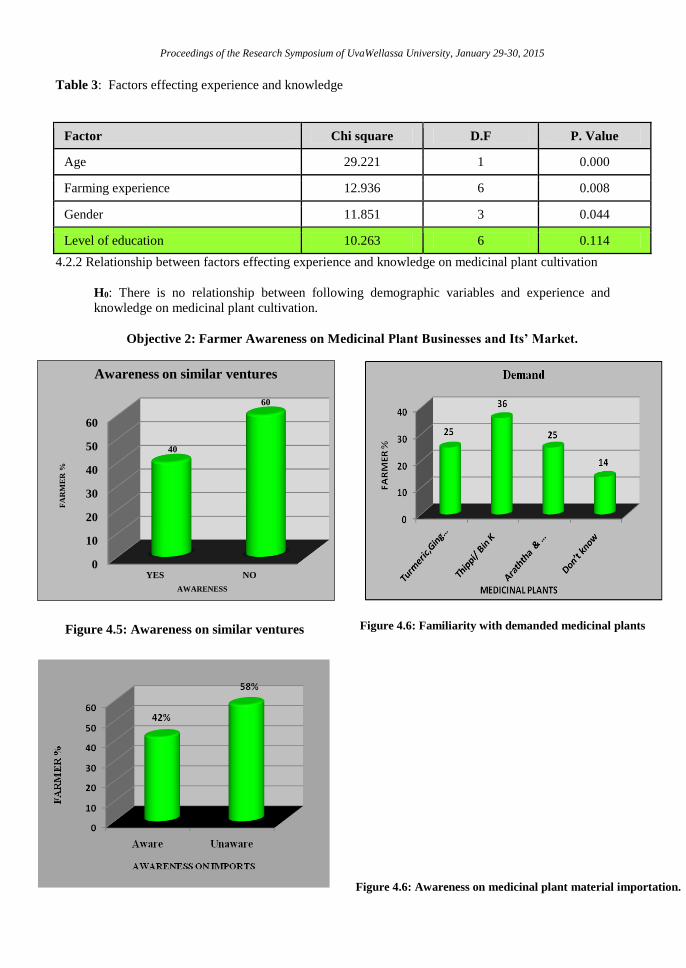
Proceedings of the Research Symposium of UvaWellassa University, January 29-30, 2015
88
0
10
20
30
40
50
60
YES NO
40
60
FA
RM
ER
%
AWARENESS
Awareness on similar ventures
Table 3: Factors effecting experience and knowledge
4.2.2 Relationship between factors effecting experience and knowledge on medicinal plant cultivation
H0: There is no relationship between following demographic variables and experience and
knowledge on medicinal plant cultivation.
Objective 2: Farmer Awareness on Medicinal Plant Businesses and Its’ Market.
Figure 4.5: Awareness on similar ventures
Factor Chi square D.F P. Value
Age 29.221 1 0.000
Farming experience 12.936 6 0.008
Gender 11.851 3 0.044
Level of education 10.263 6 0.114
Figure 4.6: Familiarity with demanded medicinal plants
ssmaterials in the market
Figure 4.6: Awareness on medicinal plant material importation.
in
the market
Figure 4.6: Familiarity with demanded medicinal plants
ssmaterials in the market Figure 4.6: Familiarity with demanded medicinal plants
ssmaterials in the market
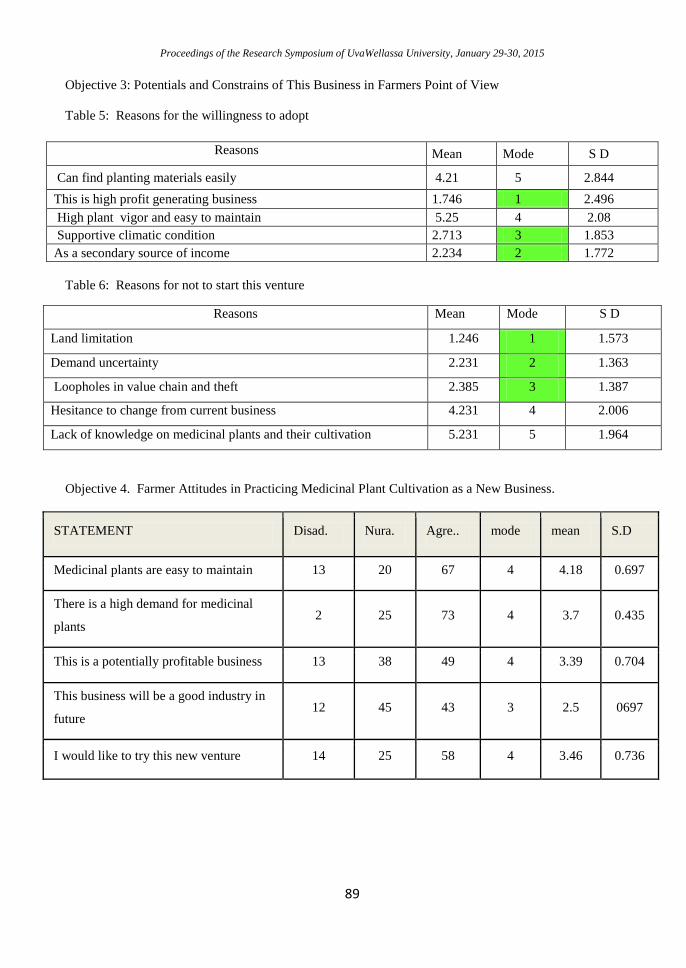
Proceedings of the Research Symposium of UvaWellassa University, January 29-30, 2015
89
Objective 3: Potentials and Constrains of This Business in Farmers Point of View
Table 5: Reasons for the willingness to adopt
Table 6: Reasons for not to start this venture
Objective 4. Farmer Attitudes in Practicing Medicinal Plant Cultivation as a New Business.
STATEMENT Disad. Nura. Agre.. mode mean S.D
Medicinal plants are easy to maintain 13 20 67 4 4.18 0.697
There is a high demand for medicinal
plants 2 25 73 4 3.7 0.435
This is a potentially profitable business 13 38 49 4 3.39 0.704
This business will be a good industry in
future 12 45 43 3 2.5 0697
I would like to try this new venture 14 25 58 4 3.46 0.736
Reasons Mean Mode S D
Can find planting materials easily 4.21 5 2.844
This is high profit generating business 1.746 1 2.496
High plant vigor and easy to maintain 5.25 4 2.08
Supportive climatic condition 2.713 3 1.853
As a secondary source of income 2.234 2 1.772
Reasons Mean Mode S D
Land limitation 1.246 1 1.573
Demand uncertainty 2.231 2 1.363
Loopholes in value chain and theft 2.385 3 1.387
Hesitance to change from current business 4.231 4 2.006
Lack of knowledge on medicinal plants and their cultivation 5.231 5 1.964
Proceedings of the Research Symposium of UvaWellassa University, January 29-30, 2015
90
Conclusion
Majority of the farmers have enough capacity and will to engage in this business. If they are provided
with a slight assurance on buyers, necessary information on the market. And if they are aware of the
shortage of supply in national level, there could be a possibility of getting more farmers involved in
medicinal plant cultivation as a venture or as an additional income source. Therefore, it is
recommended from this study to create awareness on the potential of growing medicinal plants as a
venture will encourage them to grow medicinal plants.
References
Abeywardana, N and Hettiarachchi, J. K (2001) “Statistics on the National Demand for
MedicinalPlants”,Sri Lanka Conversation and Sustainable Use of Medicinal Plants
Project, report submitted to IUCN The World Conservarion Union, Sri Lanka.
Joseph, K. D. S. M. and Abeysekera, S, (2004). Medicinal plants Cultivation technology, Part I
and II. Sri Lanka Conversation and Sustainable Use of Medicinal Plants Project, Kohuwala.
Gunasena, H . P . M. ; Pushpakumara , D . K . N . G . and Piyasena , H . D . A . S . (2003).
Development of propagation technique and nursery practices for Asamodagam , Senehekola and
Lanka Thuwarala , Final report of the research project funded by Sri Lanka Conservation and
Sustainable use of Medicinal Plants Project, Postgraduate Institute of Agriculture, Peradeniya.
Proceedings of the Research Symposium of Uva Wellassa University, January 29-30, 2015
Technical Session - Palm & Latex Technology and Value
Addition
Table of Contents
Oral Session
Effect of vulcanizing and antioxidant systems on aged tensile properties of
MicrOptic gloves .......................................................................................................... 1
Property variation of centrifuged latex at different maturity stages in glove
manufacturing .............................................................................................................. 5
Effect of different types of fillers on properties of natural rubber latex foam
........................................................................................................................................ 10
Factors Affecting Farmers' Willingness to Pay for Jatropha Biodiesel ........ 14
Youth perception to undertake the management of small scale rubber
plantations ................................................................................................................... 18
Influence of Socio Economic Factors on Acceptance of Genetically Modified
Foods ............................................................................................................................. 22
Visco-elastic properties of OMMT filled fractioned bleached crepe rubber
........................................................................................................................................ 26
Effect of Canopus 100 processing oil on the blooming effect of solid tyres .. 31
Improvement of productivity of soft dough biscuits by regulating
temperature and quantity of the palm olein ........................................................ 34
Development of activated carbon included natural rubber latex pillow ...... 37
Effect of palmyrah coir dust on physicochemical properties of potting
media and on growth and yield of chilli ............................................................... 40
Effect of graphite derivatives on mechanical and functional properties of
nitrile rubber nano composite ................................................................................ 43
Optimization the physical properties of carbon black filled tread compound
by replacement with silica ....................................................................................... 46
Studies on copra drying for white coconut oil production ............................... 50

Proceedings of the Research Symposium of Uva Wellassa University, January 29-30, 2015
Poster Session
Study of later separation time duration of coconut milk in storage tanks
during coconut milk powder production ............................................................. 53
Performance of coconut kernel residue oil as a processing oil in carbon
black filled natural rubber composites ................................................................. 56
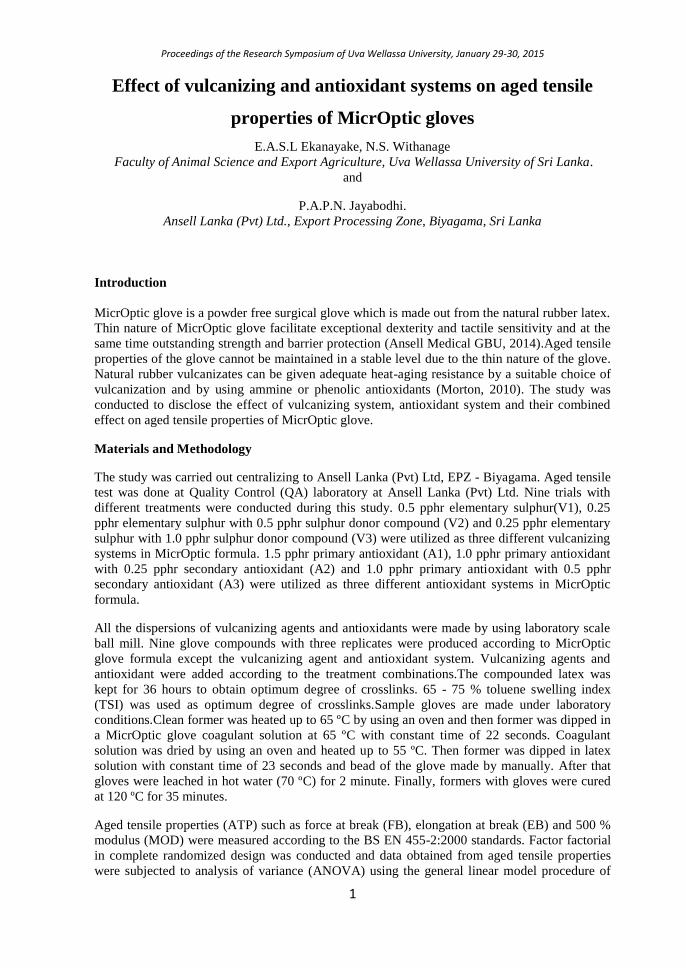
Proceedings of the Research Symposium of Uva Wellassa University, January 29-30, 2015
1
Effect of vulcanizing and antioxidant systems on aged tensile
properties of MicrOptic gloves
E.A.S.L Ekanayake, N.S. Withanage
Faculty of Animal Science and Export Agriculture, Uva Wellassa University of Sri Lanka.
and
P.A.P.N. Jayabodhi.
Ansell Lanka (Pvt) Ltd., Export Processing Zone, Biyagama, Sri Lanka
Introduction
MicrOptic glove is a powder free surgical glove which is made out from the natural rubber latex.
Thin nature of MicrOptic glove facilitate exceptional dexterity and tactile sensitivity and at the
same time outstanding strength and barrier protection (Ansell Medical GBU, 2014).Aged tensile
properties of the glove cannot be maintained in a stable level due to the thin nature of the glove.
Natural rubber vulcanizates can be given adequate heat-aging resistance by a suitable choice of
vulcanization and by using ammine or phenolic antioxidants (Morton, 2010). The study was
conducted to disclose the effect of vulcanizing system, antioxidant system and their combined
effect on aged tensile properties of MicrOptic glove.
Materials and Methodology
The study was carried out centralizing to Ansell Lanka (Pvt) Ltd, EPZ - Biyagama. Aged tensile
test was done at Quality Control (QA) laboratory at Ansell Lanka (Pvt) Ltd. Nine trials with
different treatments were conducted during this study. 0.5 pphr elementary sulphur(V1), 0.25
pphr elementary sulphur with 0.5 pphr sulphur donor compound (V2) and 0.25 pphr elementary
sulphur with 1.0 pphr sulphur donor compound (V3) were utilized as three different vulcanizing
systems in MicrOptic formula. 1.5 pphr primary antioxidant (A1), 1.0 pphr primary antioxidant
with 0.25 pphr secondary antioxidant (A2) and 1.0 pphr primary antioxidant with 0.5 pphr
secondary antioxidant (A3) were utilized as three different antioxidant systems in MicrOptic
formula.
All the dispersions of vulcanizing agents and antioxidants were made by using laboratory scale
ball mill. Nine glove compounds with three replicates were produced according to MicrOptic
glove formula except the vulcanizing agent and antioxidant system. Vulcanizing agents and
antioxidant were added according to the treatment combinations.The compounded latex was
kept for 36 hours to obtain optimum degree of crosslinks. 65 - 75 % toluene swelling index
(TSI) was used as optimum degree of crosslinks.Sample gloves are made under laboratory
conditions.Clean former was heated up to 65 ºC by using an oven and then former was dipped in
a MicrOptic glove coagulant solution at 65 ºC with constant time of 22 seconds. Coagulant
solution was dried by using an oven and heated up to 55 ºC. Then former was dipped in latex
solution with constant time of 23 seconds and bead of the glove made by manually. After that
gloves were leached in hot water (70 ºC) for 2 minute. Finally, formers with gloves were cured
at 120 ºC for 35 minutes.
Aged tensile properties (ATP) such as force at break (FB), elongation at break (EB) and 500 %
modulus (MOD) were measured according to the BS EN 455-2:2000 standards. Factor factorial
in complete randomized design was conducted and data obtained from aged tensile properties
were subjected to analysis of variance (ANOVA) using the general linear model procedure of
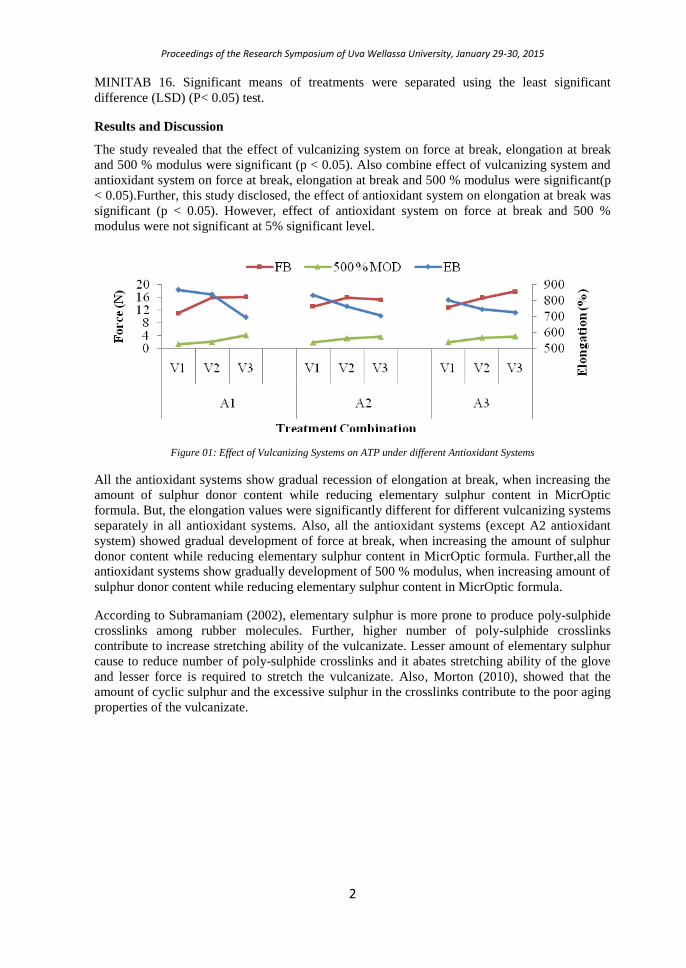
Proceedings of the Research Symposium of Uva Wellassa University, January 29-30, 2015
2
MINITAB 16. Significant means of treatments were separated using the least significant
difference (LSD) (P< 0.05) test.
Results and Discussion
The study revealed that the effect of vulcanizing system on force at break, elongation at break
and 500 % modulus were significant (p < 0.05). Also combine effect of vulcanizing system and
antioxidant system on force at break, elongation at break and 500 % modulus were significant(p
< 0.05).Further, this study disclosed, the effect of antioxidant system on elongation at break was
significant (p < 0.05). However, effect of antioxidant system on force at break and 500 %
modulus were not significant at 5% significant level.
Figure 01: Effect of Vulcanizing Systems on ATP under different Antioxidant Systems
All the antioxidant systems show gradual recession of elongation at break, when increasing the
amount of sulphur donor content while reducing elementary sulphur content in MicrOptic
formula. But, the elongation values were significantly different for different vulcanizing systems
separately in all antioxidant systems. Also, all the antioxidant systems (except A2 antioxidant
system) showed gradual development of force at break, when increasing the amount of sulphur
donor content while reducing elementary sulphur content in MicrOptic formula. Further,all the
antioxidant systems show gradually development of 500 % modulus, when increasing amount of
sulphur donor content while reducing elementary sulphur content in MicrOptic formula.
According to Subramaniam (2002), elementary sulphur is more prone to produce poly-sulphide
crosslinks among rubber molecules. Further, higher number of poly-sulphide crosslinks
contribute to increase stretching ability of the vulcanizate. Lesser amount of elementary sulphur
cause to reduce number of poly-sulphide crosslinks and it abates stretching ability of the glove
and lesser force is required to stretch the vulcanizate. Also, Morton (2010), showed that the
amount of cyclic sulphur and the excessive sulphur in the crosslinks contribute to the poor aging
properties of the vulcanizate.
Proceedings of the Research Symposium of Uva Wellassa University, January 29-30, 2015
3
Figure 02: Effect of Antioxidant Systems on ATP under different Vulcanizing Systems
V1 and V2 vulcanizing systems showed gradual recession of elongation at break, when
increasing the amount of secondary antioxidant content while reducing the primary antioxidant
content in MicrOptic formula. But, the V3 vulcanizing system showed development of
elongation at break, when increasing the amount of secondary antioxidant content while
reducing the primary antioxidant content in MicrOptic formula. Also,V2 and V3 vulcanizing
systems showed development of force at break, when increasing the amount of secondary
antioxidant content while reducing the primary antioxidant content in MicrOptic formula.
Further, V1 and V2 vulcanizing systems showed development of 500 % modulus, when
increasing amount of secondary antioxidant content while reducing primary antioxidant content
in MicrOptic formula. But, the V3 vulcanizing system shows recession of 500 % modulus, when
increasing the amount of secondary antioxidant content while reducing the primary antioxidant
content in MicrOptic formula.
According to Brydson (1988), polyphenolic antioxidants are bound with the rubber molecules
and a heavy network is produced compared to hindered phenolic antioxidants. Inducing a heavy
network nature among the rubber molecules was reduced the stretching ability of the
vulcanizate. According to Subramaniam (2002), the simple hindered phenolic antioxidants do
not show particularly good heat resistance and equivalent molecular weight are more volatile
than the polyphenolic antioxidants. He also presented that higher molecular weight and less
volatile polyphenols show better antioxidant properties compare to simple hindered phenols.
Conclusions
The study revealed that the possibility of improving aged tensile properties of MicrOptic glove
manufactured using only elementary sulphur and primary antioxidant by combining elementary
sulphur with sulphur donor compound as the vulcanizing system and primary antioxidant with
secondary antioxidant as the antioxidant system.
References
Morton, M. (2010). Rubber technology. 3rd edn., Netherlands: Springer.
Subramaniam, K. (2002). Fundamentals of rubber technology. Colombo: Subramaniam, K..
Brydson, J.A. (1988). Rubber materials and their compounds. UK: Elsevier Science Publishers
LTD.Ansell Medical GBU (2014). Encore® MicrOptic®. Retrieved May 05, 2014, from the
World Wide

Proceedings of the Research Symposium of Uva Wellassa University, January 29-30, 2015
4
Web:http://www.ansellhealthcare.com/temps/products/surgical/powder_free_latex/encore_micro
ptic.cfm
Proceedings of the Research Symposium of Uva Wellassa University, January 29-30, 2015
5
Property variation of centrifuged latex at different maturity
stages in glove manufacturing
I.D.H.C. Iddamalgoda, N.S.Withanage, N.R.Weerawansa
Faculty of Animal Science and Export Agriculture, Uva Wellassa University of Sri Lanka
A.P. Atthanayaka
Rubber Research Institute, Thelawala road, Rathmalana
and
P.H.S. Kumara
Lalan Rubbers (Pvt) Ltd
Introduction
In the glove manufacturing industry, quality of the centrifuged latex is highly concerned.
Properties of the centrifuge latex can be deviate from the acceptable level with the maturity.
Therefore study of the variation of both chemical and physio mechanical properties of centrifuge
latex with the maturity is very much important for the manufacturers of latex products (Riyajan,
2009). Normally it is not possible to obtain the required amount of field latex for the
centrifugation due to the rainy season in the country. But the manufactures of latex gloves have
to maintain their production without discarding any order of the buyers. To overcome this
problem, manufacture has to concentrate an alternative way for the glove manufacturing.
Therefore low matured latex is also used in some extent while mixing with the matured latex
during the compounding.
Main objective is to determine the usage of low maturity latex (before 21 days maturity) for the
production of house hold glove manufacturing while studying the properties of centrifuged and
compounded latex at different maturity stages.
Methodology:
Centrifuged latex was obtained from the Centrifuge unitof Lalan Rubbers pvt Ltd at
Warakapola. Freshly produced centrifuged latex was selected to conduct the research activities.
Different maturity periods were set as treatments for research study and seven treatments were
applied to get results. During this experiment, changes of both chemical and physiomechanical
properties of centrifuged latex were evaluated at different maturity stages. Experiment was
started after 5 days maturity of centrifuged latex and continued up to 65 days maturity periods.
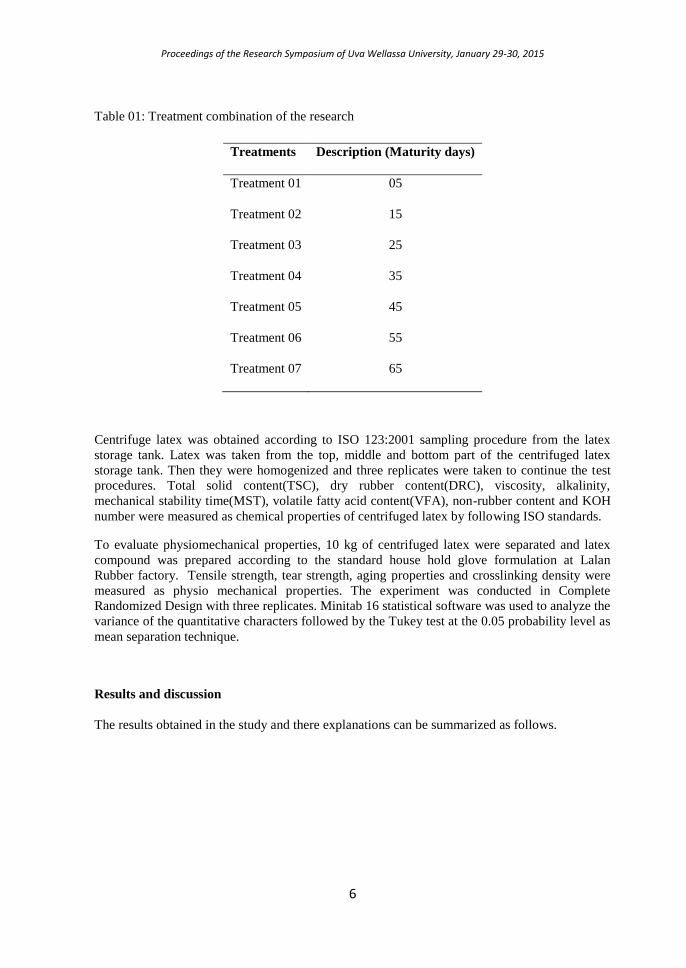
Proceedings of the Research Symposium of Uva Wellassa University, January 29-30, 2015
6
Table 01: Treatment combination of the research
Centrifuge latex was obtained according to ISO 123:2001 sampling procedure from the latex
storage tank. Latex was taken from the top, middle and bottom part of the centrifuged latex
storage tank. Then they were homogenized and three replicates were taken to continue the test
procedures. Total solid content(TSC), dry rubber content(DRC), viscosity, alkalinity,
mechanical stability time(MST), volatile fatty acid content(VFA), non-rubber content and KOH
number were measured as chemical properties of centrifuged latex by following ISO standards.
To evaluate physiomechanical properties, 10 kg of centrifuged latex were separated and latex
compound was prepared according to the standard house hold glove formulation at Lalan
Rubber factory. Tensile strength, tear strength, aging properties and crosslinking density were
measured as physio mechanical properties. The experiment was conducted in Complete
Randomized Design with three replicates. Minitab 16 statistical software was used to analyze the
variance of the quantitative characters followed by the Tukey test at the 0.05 probability level as
mean separation technique.
Results and discussion
The results obtained in the study and there explanations can be summarized as follows.
Treatments Description (Maturity days)
Treatment 01 05
Treatment 02 15
Treatment 03 25
Treatment 04 35
Treatment 05 45
Treatment 06 55
Treatment 07 65
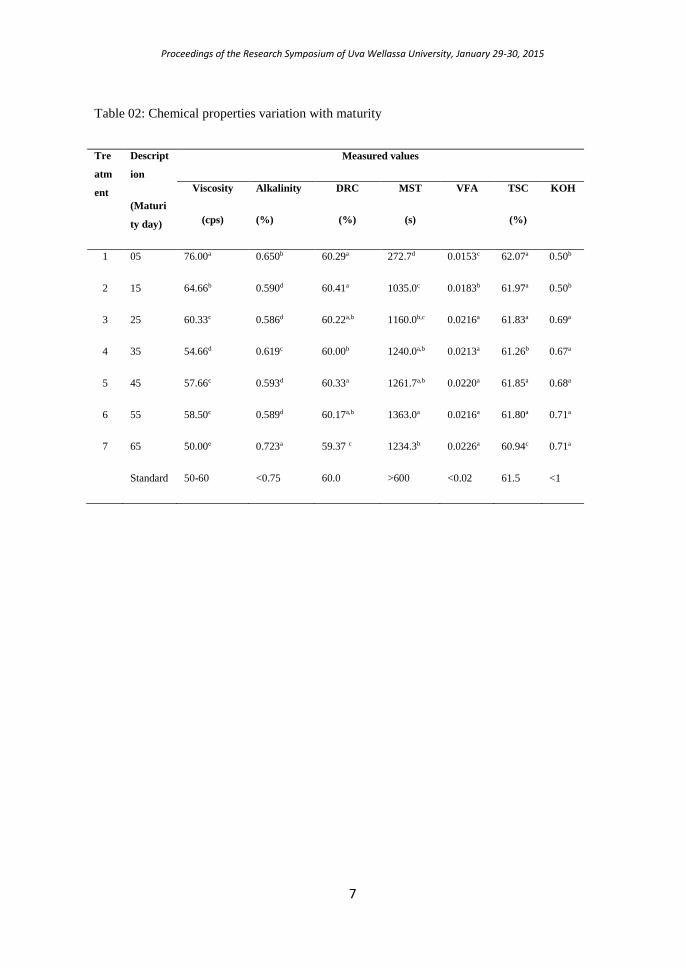
Proceedings of the Research Symposium of Uva Wellassa University, January 29-30, 2015
7
Table 02: Chemical properties variation with maturity
Tre
atm
ent
Descript
ion
(Maturi
ty day)
Measured values
Viscosity
(cps)
Alkalinity
(%)
DRC
(%)
MST
(s)
VFA
TSC
(%)
KOH
1 05 76.00a 0.650b 60.29a 272.7d 0.0153c 62.07a 0.50b
2 15 64.66b 0.590d 60.41a 1035.0c 0.0183b 61.97a 0.50b
3 25 60.33c 0.586d 60.22a,b 1160.0b,c 0.0216a 61.83a 0.69a
4 35 54.66d 0.619c 60.00b 1240.0a,b 0.0213a 61.26b 0.67a
5 45 57.66c 0.593d 60.33a 1261.7a,b 0.0220a 61.85a 0.68a
6 55 58.50c 0.589d 60.17a,b 1363.0a 0.0216a 61.80a 0.71a
7 65 50.00e 0.723a 59.37 c 1234.3b 0.0226a 60.94c 0.71a
Standard 50-60 <0.75 60.0 >600 <0.02 61.5 <1
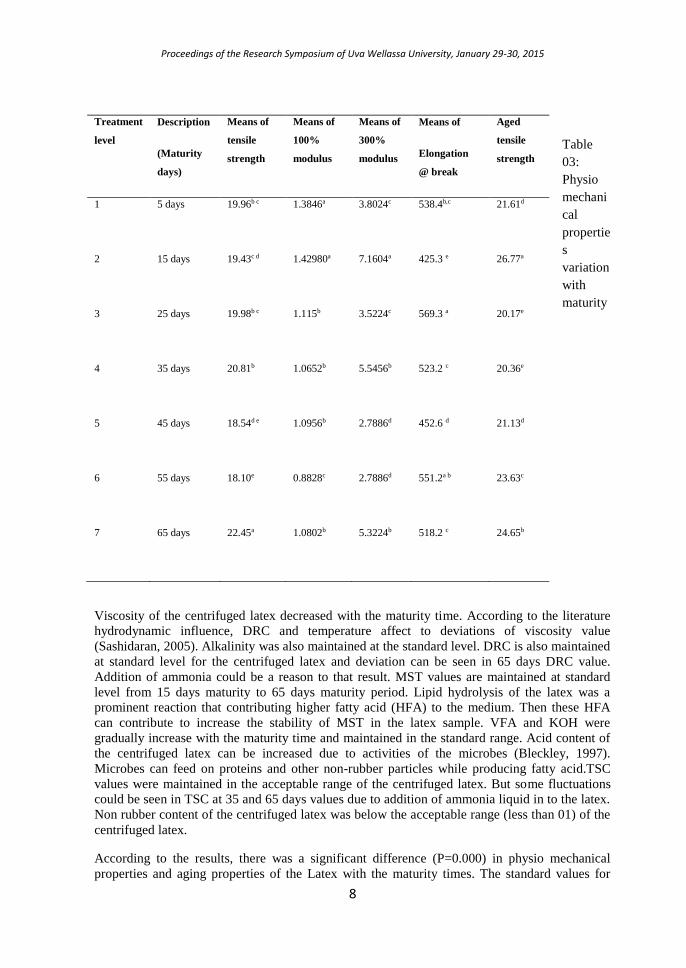
Proceedings of the Research Symposium of Uva Wellassa University, January 29-30, 2015
8
Table
03:
Physio
mechani
cal
propertie
s
variation
with
maturity
Viscosity of the centrifuged latex decreased with the maturity time. According to the literature
hydrodynamic influence, DRC and temperature affect to deviations of viscosity value
(Sashidaran, 2005). Alkalinity was also maintained at the standard level. DRC is also maintained
at standard level for the centrifuged latex and deviation can be seen in 65 days DRC value.
Addition of ammonia could be a reason to that result. MST values are maintained at standard
level from 15 days maturity to 65 days maturity period. Lipid hydrolysis of the latex was a
prominent reaction that contributing higher fatty acid (HFA) to the medium. Then these HFA
can contribute to increase the stability of MST in the latex sample. VFA and KOH were
gradually increase with the maturity time and maintained in the standard range. Acid content of
the centrifuged latex can be increased due to activities of the microbes (Bleckley, 1997).
Microbes can feed on proteins and other non-rubber particles while producing fatty acid.TSC
values were maintained in the acceptable range of the centrifuged latex. But some fluctuations
could be seen in TSC at 35 and 65 days values due to addition of ammonia liquid in to the latex.
Non rubber content of the centrifuged latex was below the acceptable range (less than 01) of the
centrifuged latex.
According to the results, there was a significant difference (P=0.000) in physio mechanical
properties and aging properties of the Latex with the maturity times. The standard values for
Treatment
level
Description
(Maturity
days)
Means of
tensile
strength
Means of
100%
modulus
Means of
300%
modulus
Means of
Elongation
@ break
Aged
tensile
strength
1 5 days 19.96b c 1.3846a
3.8024c
538.4b,c
21.61d
2 15 days 19.43c d 1.42980a
7.1604a
425.3 e
26.77a
3 25 days 19.98b c 1.115b
3.5224c
569.3 a
20.17e
4 35 days 20.81b 1.0652b
5.5456b
523.2 c
20.36e
5 45 days 18.54d e 1.0956b
2.7886d
452.6 d
21.13d
6 55 days 18.10e 0.8828c
2.7886d
551.2a b
23.63c
7 65 days 22.45a 1.0802b
5.3224b
518.2 c
24.65b
Proceedings of the Research Symposium of Uva Wellassa University, January 29-30, 2015
9
tensile strength before and after aging for household gloves are minimum 10 MPa (N/mm2) and
minimum 7.5 MPa respectively. According to the results both unaged and aged tensile strength
values were higher than standard values. Maximum tensile strength can be seen in 65 days
matured latex film. Crosslinking density was between 1×10¹⁷ - 3×10¹⁷ crosslinks/g after 25 days
maturity.
Conclusions
The results achieved through the research showed that the chemical and physio mechanical
properties of 15 days matured centrifuged latex were also in the ideal range for the house hold
glove manufacturing. Therefore, it is not needed to delay the production until 21 days maturity
of centrifuged latex and then it will help to reduce the cost of storage, improve the cash flow and
to increase the efficiency of production.
Further, ideal chemical and physio mechanical properties were showed up to 65 days maturity of
the centrifuged latex. Therefore, centrifuged latex could be used between the 15 to 65 days
maturity range for the house hold glove manufacturing.
References
Blackley, D.C. (1997). Polymer Lattices science and technology (volume 2).2nd edition,
Chapman and Hall, London.
Riyajan, S. A. and Santipanusopon, S. (2009). ‘Effect of field natural rubber latex with different
ammonia contents and storage period on physical properties of latex concentrate, stability of
skim latex and dipped film’.Physics Procedia2.127–134.
Sasidharan, K. K. (2005). Effect of the Vulcanization Time and Storage on the Stability and
Physical Properties of Sulfur - Prevulcanized Natural Rubber Latex.Journal of Applied Polymer
Science,Vol.97, 1804 - 1811.
[Online] Available at: http://dyuthi.cusat.ac.in/xmlui/bitstream/handle/purl/803 [Accessed on 18
April 2014].
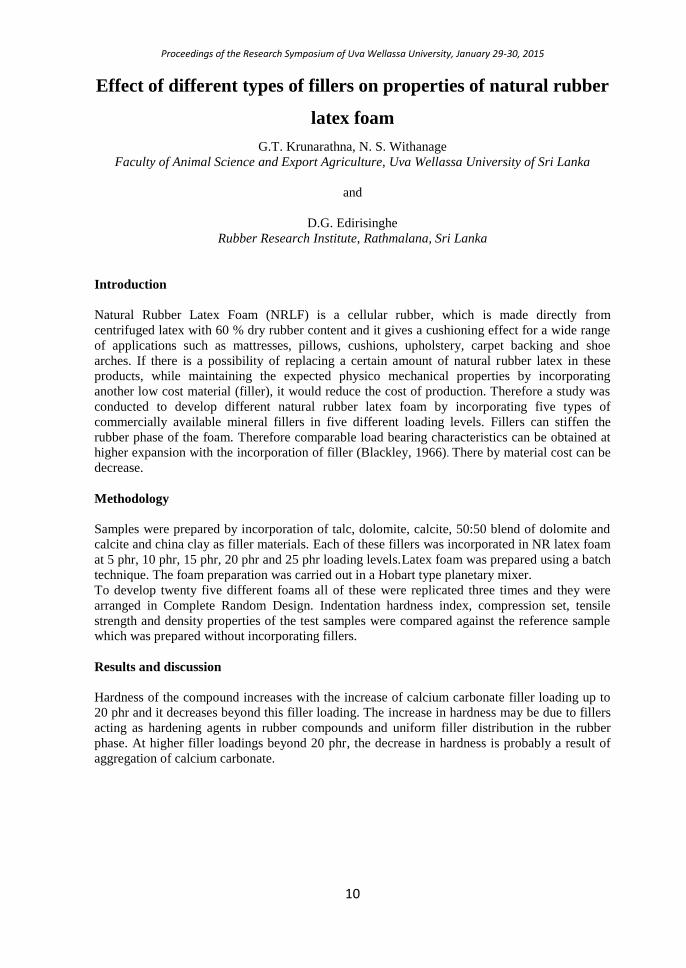
Proceedings of the Research Symposium of Uva Wellassa University, January 29-30, 2015
10
Effect of different types of fillers on properties of natural rubber
latex foam
G.T. Krunarathna, N. S. Withanage
Faculty of Animal Science and Export Agriculture, Uva Wellassa University of Sri Lanka
and
D.G. Edirisinghe
Rubber Research Institute, Rathmalana, Sri Lanka
Introduction
Natural Rubber Latex Foam (NRLF) is a cellular rubber, which is made directly from
centrifuged latex with 60 % dry rubber content and it gives a cushioning effect for a wide range
of applications such as mattresses, pillows, cushions, upholstery, carpet backing and shoe
arches. If there is a possibility of replacing a certain amount of natural rubber latex in these
products, while maintaining the expected physico mechanical properties by incorporating
another low cost material (filler), it would reduce the cost of production. Therefore a study was
conducted to develop different natural rubber latex foam by incorporating five types of
commercially available mineral fillers in five different loading levels. Fillers can stiffen the
rubber phase of the foam. Therefore comparable load bearing characteristics can be obtained at
higher expansion with the incorporation of filler (Blackley, 1966). There by material cost can be
decrease.
Methodology
Samples were prepared by incorporation of talc, dolomite, calcite, 50:50 blend of dolomite and
calcite and china clay as filler materials. Each of these fillers was incorporated in NR latex foam
at 5 phr, 10 phr, 15 phr, 20 phr and 25 phr loading levels.Latex foam was prepared using a batch
technique. The foam preparation was carried out in a Hobart type planetary mixer.
To develop twenty five different foams all of these were replicated three times and they were
arranged in Complete Random Design. Indentation hardness index, compression set, tensile
strength and density properties of the test samples were compared against the reference sample
which was prepared without incorporating fillers.
Results and discussion
Hardness of the compound increases with the increase of calcium carbonate filler loading up to
20 phr and it decreases beyond this filler loading. The increase in hardness may be due to fillers
acting as hardening agents in rubber compounds and uniform filler distribution in the rubber
phase. At higher filler loadings beyond 20 phr, the decrease in hardness is probably a result of
aggregation of calcium carbonate.
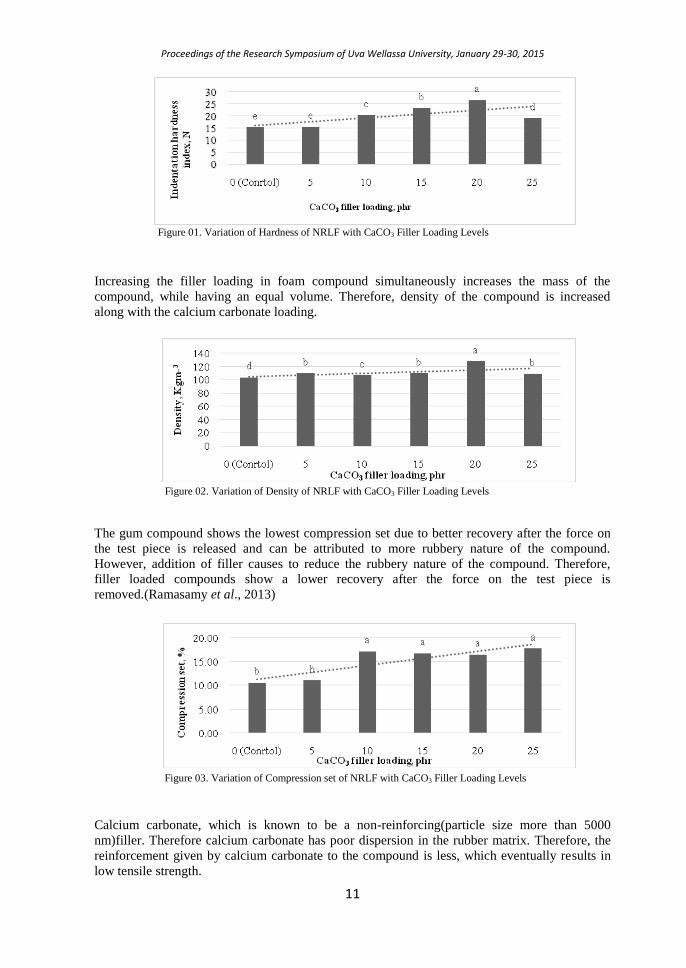
Proceedings of the Research Symposium of Uva Wellassa University, January 29-30, 2015
11
Increasing the filler loading in foam compound simultaneously increases the mass of the
compound, while having an equal volume. Therefore, density of the compound is increased
along with the calcium carbonate loading.
The gum compound shows the lowest compression set due to better recovery after the force on
the test piece is released and can be attributed to more rubbery nature of the compound.
However, addition of filler causes to reduce the rubbery nature of the compound. Therefore,
filler loaded compounds show a lower recovery after the force on the test piece is
removed.(Ramasamy et al., 2013)
Calcium carbonate, which is known to be a non-reinforcing(particle size more than 5000
nm)filler. Therefore calcium carbonate has poor dispersion in the rubber matrix. Therefore, the
reinforcement given by calcium carbonate to the compound is less, which eventually results in
low tensile strength.
Figure 01. Variation of Hardness of NRLF with CaCO3 Filler Loading Levels
Figure 02. Variation of Density of NRLF with CaCO3 Filler Loading Levels
Figure 03. Variation of Compression set of NRLF with CaCO3 Filler Loading Levels
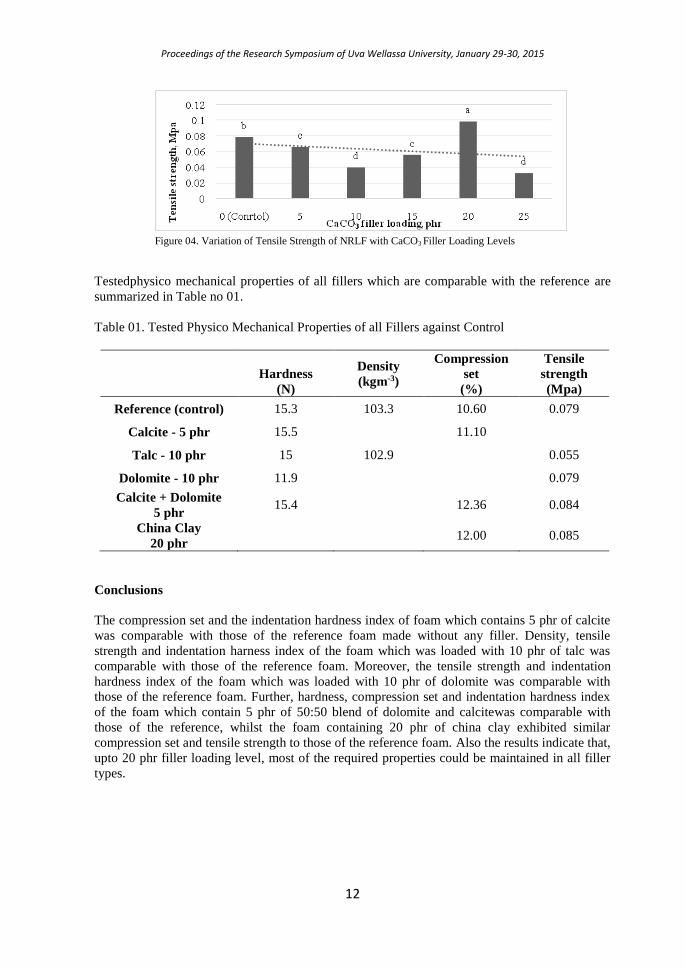
Proceedings of the Research Symposium of Uva Wellassa University, January 29-30, 2015
12
Testedphysico mechanical properties of all fillers which are comparable with the reference are
summarized in Table no 01.
Table 01. Tested Physico Mechanical Properties of all Fillers against Control
Hardness
(N)
Density
(kgm-3)
Compression
set
(%)
Tensile
strength
(Mpa)
Reference (control) 15.3 103.3 10.60 0.079
Calcite - 5 phr 15.5 11.10
Talc - 10 phr 15 102.9 0.055
Dolomite - 10 phr 11.9 0.079
Calcite + Dolomite
5 phr 15.4 12.36 0.084
China Clay
20 phr 12.00 0.085
Conclusions
The compression set and the indentation hardness index of foam which contains 5 phr of calcite
was comparable with those of the reference foam made without any filler. Density, tensile
strength and indentation harness index of the foam which was loaded with 10 phr of talc was
comparable with those of the reference foam. Moreover, the tensile strength and indentation
hardness index of the foam which was loaded with 10 phr of dolomite was comparable with
those of the reference foam. Further, hardness, compression set and indentation hardness index
of the foam which contain 5 phr of 50:50 blend of dolomite and calcitewas comparable with
those of the reference, whilst the foam containing 20 phr of china clay exhibited similar
compression set and tensile strength to those of the reference foam. Also the results indicate that,
upto 20 phr filler loading level, most of the required properties could be maintained in all filler
types.
Figure 04. Variation of Tensile Strength of NRLF with CaCO3 Filler Loading Levels

Proceedings of the Research Symposium of Uva Wellassa University, January 29-30, 2015
13
References
Blackley, D.C. (1966). Polymer Lattices Science and Technology. Springer, London. pp 307 –
321
Ramasamy, S., Ismail, H. & Munusamy, Y. (2013). ‘Effect of Rice Husk Powder on
Compression Behavior and Thermal Stability of Natural Rubber Latex Foam’, Bio
Resources. 8(3), 4258 – 4269.
Rubber Research Institute of Sri Lanka. (2003). Rubber Handbook Volume 02: Rubber
Processing Technology, United Printers, Moratuwa. pp 124 - 125
Proceedings of the Research Symposium of Uva Wellassa University, January 29-30, 2015
14
Factors Affecting Farmers' Willingness to Pay for Jatropha
Biodiesel
P Sivashankar 1Postgraduate Institute of Agriculture, University of Peradeniya
and
J Weerahewa, DKNG Pushpakumara, LW Galagedara
Faculty of Agriculture, University of Peradeniya, Sri Lanka
Introduction
Sri Lanka in its principle policy aims to produce at least 20% of energy requirement by
renewable energy source by 2020. Still not much attention has been paid on bio fuels.
Jatropha curcas L. is found to be a potential alternative source of renewable energy
since its cultivation and oil extraction contribute to sustainable development, poverty
alleviation, combating of desertification, reduction of greenhouse gas emissions and
women empowerment in developing countries (Pushpakumara et al, 2008, and Francis
et al, 2005). Jatropha has various socio-economic benefits which makes it more
economical when cultivated on commercial scale. Like other vegetable oils, Jatropha
oil can be used directly in modified diesel engines for automobile applications. Its
adaptability to marginal conditions is an advantageous feature, which other oil
producing crops do not have (Pushpakumara et al, 2008), thus it has the ability to
reclaim problematic lands and restore eroded areas (Francis et al 2005). Jatropha
originated biodiesel is less expensive to produce than other energy crops such as
rapeseed and soybeans. This study looks at the demand for Jatropha produced
biodiesel. Initially, it is unlikely to be used as a substitute for diesel. Jatropha biodiesel
or Straight oil can be used at village level to operate farm machinery and for day to day
activities at small scale. If there exist a willingness from farmers to use biodiesel at
least in short term then Jatropha could be used as an additional income source. By-
products of Jatropha biodiesel can also be sold. Thus this study looks at what factors
affect rural farmers' willingness to pay for Jatropha biodiesel.
Methodology
Welfare estimation is based on Indirect utility and Minimum expenditure functions. Lancaster's
(1971) theoretical model for demand estimation is expanded to include other empirical variables.
Contingent Valuation Method (CVM) can be viewed as a direct measure of welfare change.
WTP as a function of,
………………….. (1)
where, Y income, P is a price vector, Z is a vector of socioeconomic variables, and Q0
and Q1 are the environmental quality at status quo and improved levels respectively.
Proceedings of the Research Symposium of Uva Wellassa University, January 29-30, 2015
15
Since bid is a binary outcome a logit regression was employed assuming binomial
distribution.
…………………… (2)
Denoting the willingness to pay determinants as a vector, X, then for each respondent j=1…. N in
the sample, the latent variable, WTP*, can be written as in equation above for a single bounded
model. β is the vector of parameters estimated. In this model the dependent variable was the
level of willingness to pay for Jatropha Biodiesel. Numeric value of one was assigned to
respondents who were willing to pay for Jatropha biodiesel and zero was assigned to the
respondents who were not willing to pay for Biodiesel. Socio economics characteristics and
attitudes about environment were used as independent variables. A survey was conducted in
Hasalaka, Kandy covering 310 farmer households to estimate the WTP for Jatropha diesel and
the factors affecting their decisions.
Results and Discussion
The below table 1 summarizes the results of the logit regression for WTP for Jatropha biodiesel.
According to the results, males are 49% less likely to go for Jatropha biodiesel than females.
People with higher age are less likely to pay for Jatropha biodiesel when compared to younger
respondents. A one year increase in age decreases the likelihood to select biodiesel by 0.4%.
Socioeconomic variables like marital status, total income, and employment did not show any
significant relationship. Respondents who have heard about global warming are 11% less likely
to pay for biodiesel and people know about global warming are 36% less likely to buy biodiesel
than the reference group. They may be educated and knows about global warming. Thus, they
might have an idea about other alternative fuels which might affect their answers. It is human
nature that when people are presented with information, the uneducated might buy without any
scepticism, whereas educated people may be having doubts as they too think about the
possibility of making biodiesel once they are informed about this. Proper income earners might
not want them into risks. So, they might stick to the conventional diesel given its availability
around the country. Some may already get an additional income through other investments in
their land.
People who have land to cultivate other crops are 11% less likely to go for Jatropha
biodiesel. When the energy cost increase by one rupee likelihood of choosing biodiesel
increases by 0.011%. It should be reminded that energy cost is a continuous variable
and it accounts for the expenditure incurred in fuel plus monthly electricity expenditure.
When people spend too much on an item, they will seek for any alternative substitutes
at lower price. Rational people with limited resources will buy those resources which
are highly demanded even by paying some additional amounts. Households where
women participate in household decision making are 18% more likely to choose
biodiesel. In Sri Lanka, household chores are governed by females they may be more
cautious to reduce their total family expenditure per month. An Rs 1000 increase in
energy cost will increase the likelihood to pay for biodiesel by 11%. Households with
food insecurity are 22% less likely to choose biodiesel. The intuition here is whenever a
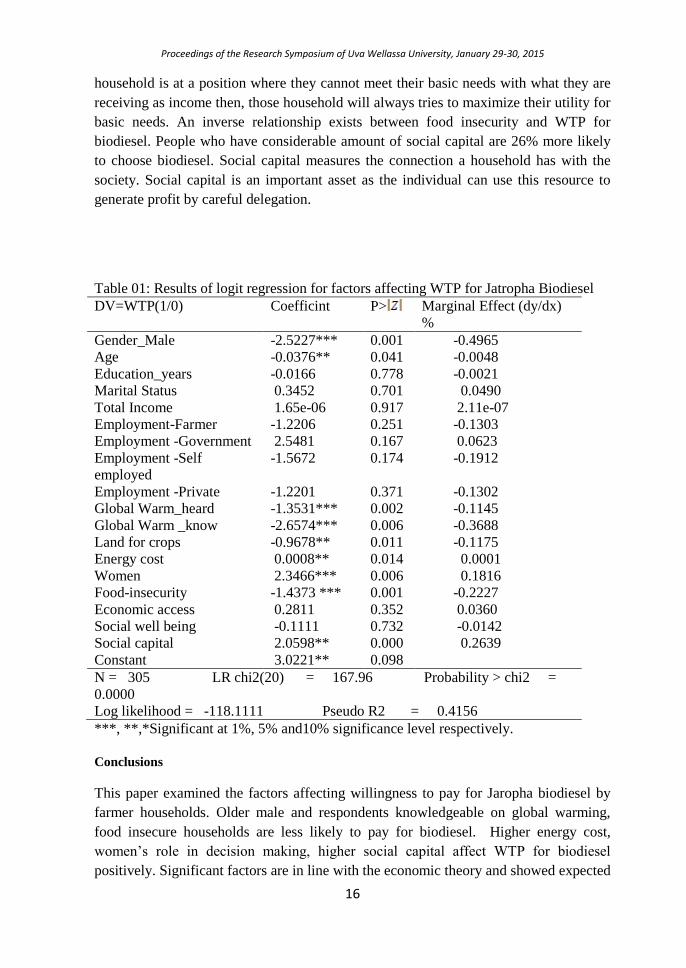
Proceedings of the Research Symposium of Uva Wellassa University, January 29-30, 2015
16
household is at a position where they cannot meet their basic needs with what they are
receiving as income then, those household will always tries to maximize their utility for
basic needs. An inverse relationship exists between food insecurity and WTP for
biodiesel. People who have considerable amount of social capital are 26% more likely
to choose biodiesel. Social capital measures the connection a household has with the
society. Social capital is an important asset as the individual can use this resource to
generate profit by careful delegation.
Table 01: Results of logit regression for factors affecting WTP for Jatropha Biodiesel
DV=WTP(1/0) Coefficint P> Marginal Effect (dy/dx)
%
Gender_Male -2.5227*** 0.001 -0.4965
Age -0.0376** 0.041 -0.0048
Education_years -0.0166 0.778 -0.0021
Marital Status 0.3452 0.701 0.0490
Total Income 1.65e-06 0.917 2.11e-07
Employment-Farmer -1.2206 0.251 -0.1303
Employment -Government 2.5481 0.167 0.0623
Employment -Self
employed
-1.5672 0.174 -0.1912
Employment -Private -1.2201 0.371 -0.1302
Global Warm_heard -1.3531*** 0.002 -0.1145
Global Warm _know -2.6574*** 0.006 -0.3688
Land for crops -0.9678** 0.011 -0.1175
Energy cost 0.0008** 0.014 0.0001
Women 2.3466*** 0.006 0.1816
Food-insecurity -1.4373 *** 0.001 -0.2227
Economic access 0.2811 0.352 0.0360
Social well being -0.1111 0.732 -0.0142
Social capital 2.0598** 0.000 0.2639
Constant 3.0221** 0.098
N = 305 LR chi2(20) = 167.96 Probability > chi2 =
0.0000
Log likelihood = -118.1111 Pseudo R2 = 0.4156
***, **,*Significant at 1%, 5% and10% significance level respectively.
Conclusions
This paper examined the factors affecting willingness to pay for Jaropha biodiesel by
farmer households. Older male and respondents knowledgeable on global warming,
food insecure households are less likely to pay for biodiesel. Higher energy cost,
women’s role in decision making, higher social capital affect WTP for biodiesel
positively. Significant factors are in line with the economic theory and showed expected
Proceedings of the Research Symposium of Uva Wellassa University, January 29-30, 2015
17
signs. One caveat is that when people are given an opportunity to increase their income,
farmers might agree even without analyzing the possibility of such a venture given their
experiences in farming.
Acknowledgement
Authors acknowledge the NSF Grant No: RG/2009/Biofuel 002 to carry out his study. References
Francis G, Edinger R, Becker K, (2005) “A concept for simultaneous wasteland
reclamation, fuel production, and socio- economic development in degraded areas in
India: Need, potential and perspectives of Jatropha plantations”, Natural Resource
Forum, Vol 29, Pp 12-24
Lancaster, K., (1971). A new approach to consumer theory. Journal of Political
Economy, vol 74(2), 132-157.
Pushpakumara, D.K.N.G., Gunasena H.P.M., and Singh, V.P. (2008) (eds.), “Jatropha (Jatropha
curcas L.): A Potential Biodiesel Crop for Sri Lanka”, The World Agroforestry Centre, South
Asia Office, New Delhi, India and National Multipurpose Tree Species Research Network of Sri
Lanka.
Proceedings of the Research Symposium of Uva Wellassa University, January 29-30, 2015
18
Youth perception to undertake the management of small scale
rubber plantations
P.H.J. Patabendi and G.M.P.P. Mahindarathna
Faculty of Animal Science and Export Agriculture, Uva Wellassa University of Sri Lanka
Introduction
Sri Lanka is one of the nine major producers of natural rubber in the world. Kegalle, Kalutara
and Rathnapura are the major rubber growing districts in Sri Lanka. These districts recorded the
highest significance in terms of cultivated area. Small holders are the persons who are holding
below 50 acres in extent. Most of the rubber lands in Sri Lanka are owned by small holders. The
extent of land area under small holders is about 79,395 hectares out of total rubber land extent in
2010 (Census of Rubber Lands, 2010).Therefore, smallholder sector is responsible for a major
share of Sri Lanka's contribution to world's natural rubber output. However, declining rubber
extent is an issue of national concern to Sri Lanka (Wijesuriya et al., 2006). Youth participation
in agriculture for its sustained contribution to a nation's development is crucial (Ahaibwe, et al,.
2013). Therefore, this research was carried out to determine the perception of youth regarding
undertake the management of small scale rubberplantations to maintain the continuity and
toidentify the constraints of youth to involve with themanagement of these rubber plantations.
Methodology
The research was conducted in three Rubber Development Officer (RDO) divisions in Kalutara
district which are named as Agalawatta, Bulathsinhala and Dodangoda. The population of this
study is all the small scale rubberplantation ownersand their youthwho are in age between 18- 35
years in Kalutara district. One hundred twenty youth and one hundred twenty small scale rubber
plantation owners were used as respondents for the study. Forty plantation owners and forty
youth were randomly selected from each three RDO divisions forthe data collection. Two
questionnaires were prepared for the owners of the plantations and youth in their families.
Responsevariable of the study was youth perception of engage with rubber plantation
management. The contextual variables were carrer ambition, other job opportunities, attitude,
credit feasibility, recognition, parental consent, income, risk, price fluctuation, labour shortage
and busy lifestyle. Characteristics of the plantation such as land extent, vision of doing rubber
plantation management, gaining of government subsidy and kind ship of the plantation are
covered in the questionnaire of owners. Response variable and the contextual variables were
measured in five point likert scale(Strongly disagree, Disagree, Not decided, Agree, Strongly
disagree). Data analysis was done using Descriptive statistics and multiple regression techniques
by Minitab 14 statistical software package.
Results and Discussion
Around 56 % of youth were already engaged in rubber plantation management and helped to
maintain the continuity of their plantations. Other 44 % of youth in the sample were not engaged
with rubber plantation management activities.
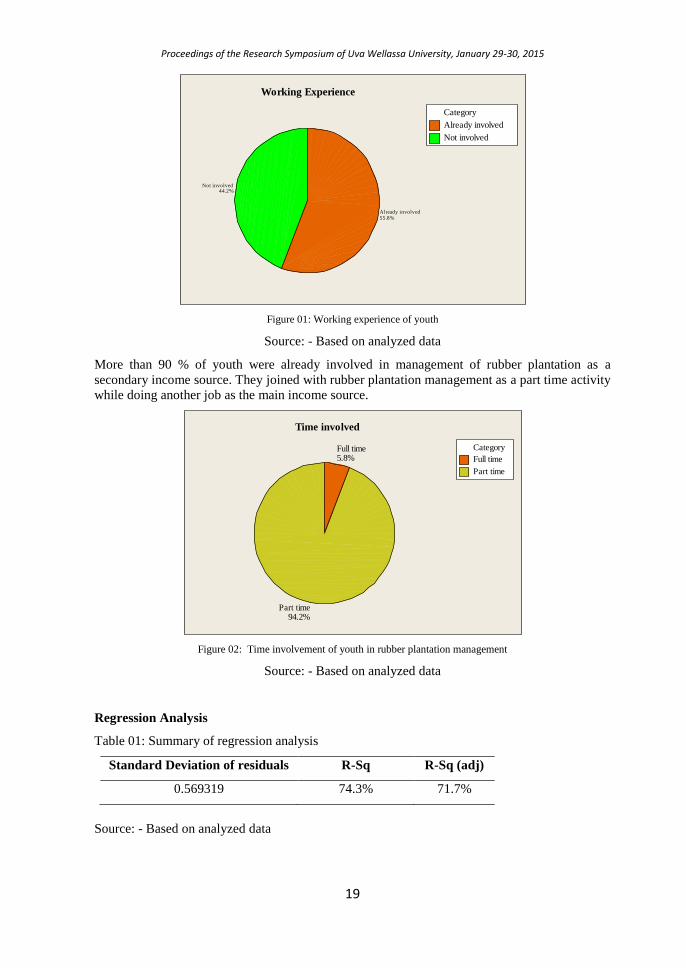
Proceedings of the Research Symposium of Uva Wellassa University, January 29-30, 2015
19
44.2%Not involved
55.8%Already involved
Category
Already involved
Not involved
Working Experience
Figure 01: Working experience of youth
Source: - Based on analyzed data
More than 90 % of youth were already involved in management of rubber plantation as a
secondary income source. They joined with rubber plantation management as a part time activity
while doing another job as the main income source.
94.2%Part time
5.8%Full time Category
Full time
Part time
Time involved
Figure 02: Time involvement of youth in rubber plantation management
Source: - Based on analyzed data
Regression Analysis
Table 01: Summary of regression analysis
Standard Deviation of residuals R-Sq R-Sq (adj)
0.569319 74.3% 71.7%
Source: - Based on analyzed data
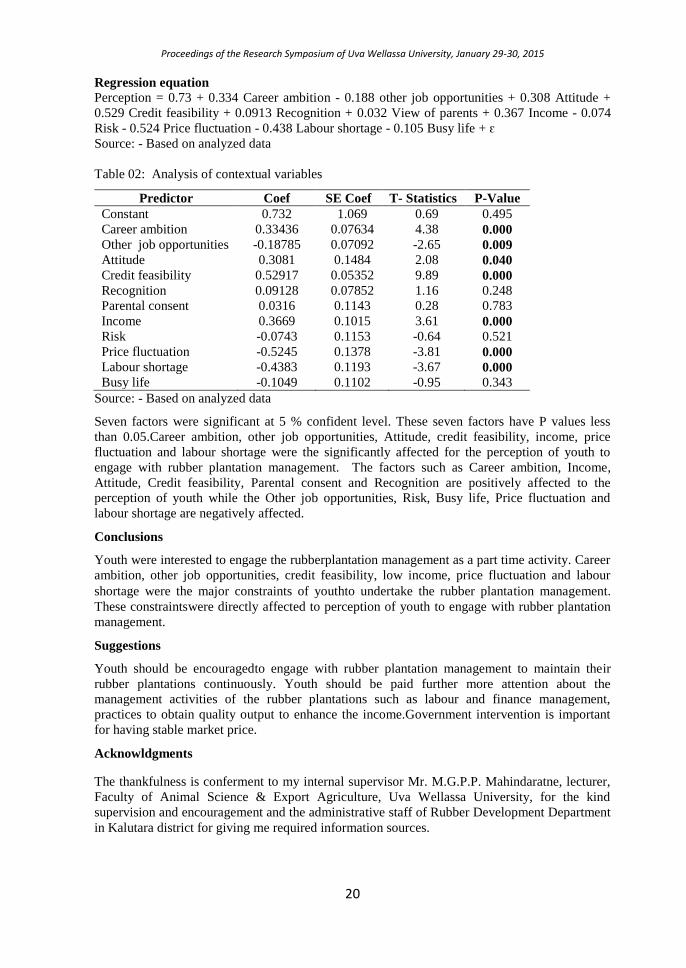
Proceedings of the Research Symposium of Uva Wellassa University, January 29-30, 2015
20
Regression equation Perception = 0.73 + 0.334 Career ambition - 0.188 other job opportunities + 0.308 Attitude +
0.529 Credit feasibility + 0.0913 Recognition + 0.032 View of parents + 0.367 Income - 0.074
Risk - 0.524 Price fluctuation - 0.438 Labour shortage - 0.105 Busy life + ԑ
Source: - Based on analyzed data
Table 02: Analysis of contextual variables
Predictor Coef SE Coef T- Statistics P-Value
Constant 0.732 1.069 0.69 0.495
Career ambition 0.33436 0.07634 4.38 0.000 Other job opportunities -0.18785 0.07092 -2.65 0.009 Attitude 0.3081 0.1484 2.08 0.040 Credit feasibility 0.52917 0.05352 9.89 0.000 Recognition 0.09128 0.07852 1.16 0.248
Parental consent 0.0316 0.1143 0.28 0.783
Income 0.3669 0.1015 3.61 0.000 Risk -0.0743 0.1153 -0.64 0.521
Price fluctuation -0.5245 0.1378 -3.81 0.000 Labour shortage -0.4383 0.1193 -3.67 0.000 Busy life -0.1049 0.1102 -0.95 0.343
Source: - Based on analyzed data
Seven factors were significant at 5 % confident level. These seven factors have P values less
than 0.05.Career ambition, other job opportunities, Attitude, credit feasibility, income, price
fluctuation and labour shortage were the significantly affected for the perception of youth to
engage with rubber plantation management. The factors such as Career ambition, Income,
Attitude, Credit feasibility, Parental consent and Recognition are positively affected to the
perception of youth while the Other job opportunities, Risk, Busy life, Price fluctuation and
labour shortage are negatively affected.
Conclusions
Youth were interested to engage the rubberplantation management as a part time activity. Career
ambition, other job opportunities, credit feasibility, low income, price fluctuation and labour
shortage were the major constraints of youthto undertake the rubber plantation management. These constraintswere directly affected to perception of youth to engage with rubber plantation
management.
Suggestions
Youth should be encouragedto engage with rubber plantation management to maintain their
rubber plantations continuously. Youth should be paid further more attention about the
management activities of the rubber plantations such as labour and finance management,
practices to obtain quality output to enhance the income.Government intervention is important
for having stable market price.
Acknowldgments
The thankfulness is conferment to my internal supervisor Mr. M.G.P.P. Mahindaratne, lecturer,
Faculty of Animal Science & Export Agriculture, Uva Wellassa University, for the kind
supervision and encouragement and the administrative staff of Rubber Development Department
in Kalutara district for giving me required information sources.

Proceedings of the Research Symposium of Uva Wellassa University, January 29-30, 2015
21
References
Ahaibwe, G., Mbowa, S. and Lwanga, M.M. (2013). Youth Engagement in Agriculture in
Uganda: Challenges and Prospects. Economic Policy Research Centre – EPRC. 6, 1 – 36.
Census of Rubber Lands, (2010 / 2011). Department of Rubber Development, Sri Lanka.
Wijesuriya, W, Dissanayake, D.M.A.P., Herath H.M.L.K. and Gunaratne, P.K.K.S. (2011).
Constraints in SustainableRubber Farming in the Moneragala District.Journal of the Rubber
Research Institute of Sri Lanka 91, 61 – 73.
Proceedings of the Research Symposium of Uva Wellassa University, January 29-30, 2015
22
Influence of Socio Economic Factors on Acceptance of
Genetically Modified Foods
Y.A.P.K. Dayasena
Postgraduate Institute of Science, University of Peradeniya Sri Lanka
and
P. Sivashankar, I.C. Hettiarachchi
Faculty of Agricultural Sciences, Sabaragamuwa University of Sri Lanka
Introduction
Genetically Modified (GM) foods are produced from crops and animals where the genes have
been altered in that species for a favorable trait. This trait could be favorable to consumers or for
farmers (Wachenheim, 2004). GM foods have become quite common in many countries though
they are not available in Sri Lanka. Given the rate of usage of GM foods in the world, in near
future Sri Lanka also will be using GM foods in the market. Contrastingly, there is a growing
concern in consuming GM foods or related products where GM foods are used as inputs. Since
there is no scientific proof for the side effects of GM foods consumption, it is always linked with
increasing health problems which occur to millions of people daily in the world. Given this
context, this pilot study attempts to study the acceptance of GM foods by Sri Lankan consumers
if they are introduced to Sri Lanka and more specifically which cohort of Socio-demographic
group prefers GM foods (Deodhar et al., 2007; Kimenju and De Groote, 2008). This would
support the companies and policy makers to readjust their preferences and policy formulations
(Moro and Boccaletti, 2000; Huang et al., 2006.
Methodology
A group of 120 Agriculture undergraduates from Sabaragamuwa University of Sri Lanka were
chosen for the study. Rather than the general consumers university students are familiar with
GM foods and most probably they will be the society in the years to come when GM foods
become a common good in the market. Further the present consumers might not be familiar with
the GM concepts and interviewing the people with understanding on GM is costly and time
taking activity. They are also a subset of consumers in the general market. Further university
cohort represents different people from different socio-economic background. Participation was
voluntary. Questionnaire included sections on socio-economic factors, Knowledge, awareness
and perceptions on GM foods, and their willingness to consume GM foods. Descriptive analysis
and non parametric tests (chi square analysis and t tests) were performed to check the
relationship between preference for GM foods and socio economic and demographic
determinants.
Results and Discussion
Majority of the sample are female (64.4%). About 52% are final year students followed by
32.5% of third year students. Most of them come from Semi urban areas (56.8%) and 27% are
ruralites. About 43.2% of the households are earning a monthly income of between Rs. 25,000
Proceedings of the Research Symposium of Uva Wellassa University, January 29-30, 2015
23
to Rs. 40,000. Around 21% of them are getting a monthly house hold income above Rs. 40,000.
56% of respondents think that GM foods are beneficial. If GM foods are introduced in Sri
Lanka, 56% say that they will not buy.
Table 1 shows the association between familiarity with GM techniques and factors like gender,
income, location/residence and year of study. There exist a relationship between familiarity of
GM foods and gender, whereas no relationship with familiarity on recombinant technology and
hybrid breeding. As expected all the three statements show an association with year of study.
Usually it is expected that with higher education in the sciences field they tend to show much
familiarity with subjects like this. Income and residence suggest that there is a mixed result in
association with GM foods, Recombinant technology, and hybrid breeding.
Table 01: Chi Square results on Familiarity about GM related techniques
Variable Grouping
variable
Level Chi
Square
Significance
Level
Familiarity with Genetically Modified Food Gender 2 12.142 0.002*
Familiarity with Genetically Modified Food Year of
study
4 16.295 0.012*
Familiarity with recombinant DNA technology Year of
study
4 21.111 0.002*
Familiarity with Hybrid breeding Year of
study
4 15.433 0.017*
Familiarity with Genetically Modified Food Monthly
Income
5 11.769 0.019*
Familiarity with recombinant DNA technology Monthly
Income
5 10.692 0.220
Familiarity with Hybrid breeding Monthly
Income
5 10.147 0.255
Familiarity with Genetically Modified Food Residence 3 8.060 0.089
Familiarity with recombinant DNA technology Residence 3 14.548 0.006*
Familiarity with Hybrid breeding Residence 3 13.444 0.009*
Table 2 depicts the association between gender and perceptions on GM foods. Except statements
on a) benefits of GM foods, b) buying nutritionally enhanced food, and c) GM foods can cause
damage to health, other statements are not statistically different between male and female
respondents.
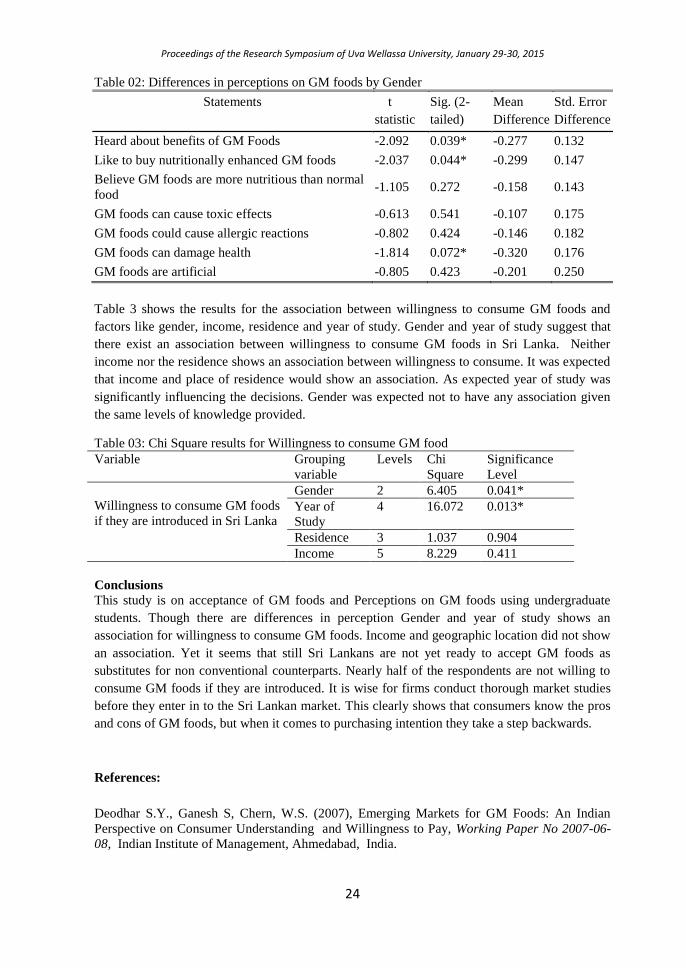
Proceedings of the Research Symposium of Uva Wellassa University, January 29-30, 2015
24
Table 02: Differences in perceptions on GM foods by Gender
Statements t
statistic
Sig. (2-
tailed)
Mean
Difference
Std. Error
Difference
Heard about benefits of GM Foods -2.092 0.039* -0.277 0.132
Like to buy nutritionally enhanced GM foods -2.037 0.044* -0.299 0.147
Believe GM foods are more nutritious than normal
food -1.105 0.272 -0.158 0.143
GM foods can cause toxic effects -0.613 0.541 -0.107 0.175
GM foods could cause allergic reactions -0.802 0.424 -0.146 0.182
GM foods can damage health -1.814 0.072* -0.320 0.176
GM foods are artificial -0.805 0.423 -0.201 0.250
Table 3 shows the results for the association between willingness to consume GM foods and
factors like gender, income, residence and year of study. Gender and year of study suggest that
there exist an association between willingness to consume GM foods in Sri Lanka. Neither
income nor the residence shows an association between willingness to consume. It was expected
that income and place of residence would show an association. As expected year of study was
significantly influencing the decisions. Gender was expected not to have any association given
the same levels of knowledge provided.
Table 03: Chi Square results for Willingness to consume GM food
Variable Grouping
variable
Levels Chi
Square
Significance
Level
Willingness to consume GM foods
if they are introduced in Sri Lanka
Gender 2 6.405 0.041*
Year of
Study
4 16.072 0.013*
Residence 3 1.037 0.904
Income 5 8.229 0.411
Conclusions
This study is on acceptance of GM foods and Perceptions on GM foods using undergraduate
students. Though there are differences in perception Gender and year of study shows an
association for willingness to consume GM foods. Income and geographic location did not show
an association. Yet it seems that still Sri Lankans are not yet ready to accept GM foods as
substitutes for non conventional counterparts. Nearly half of the respondents are not willing to
consume GM foods if they are introduced. It is wise for firms conduct thorough market studies
before they enter in to the Sri Lankan market. This clearly shows that consumers know the pros
and cons of GM foods, but when it comes to purchasing intention they take a step backwards.
References:
Deodhar S.Y., Ganesh S, Chern, W.S. (2007), Emerging Markets for GM Foods: An Indian
Perspective on Consumer Understanding and Willingness to Pay, Working Paper No 2007-06-
08, Indian Institute of Management, Ahmedabad, India.

Proceedings of the Research Symposium of Uva Wellassa University, January 29-30, 2015
25
Huang J, Qiu H, Bai J, Pray C., (2006), Awareness, Acceptance of and Willingness to Buy
Genetically Modified Foods in Urban China, Appetite Vol 46, Pp. 144-151.
Kimenju S.K and De Groote H (2008), Consumer Willingness to Pay for Genetically Modified
Food in Kenya, Agricultural Economics Vol 38, Pp. 35–46
Moro D and Boccaletti S, (2000), Consumer Willingness To Pay for GM Food Products in Italy,
AgBioForum, Vol. 3(4), Pp 259-267
Wachenheim, C.J (2004), Consumer Acceptance of Genetically Modified Food Products,
AgBiotechNet Vol. 6, ABN 126, , CABI Publishing Pp 1 –6
Proceedings of the Research Symposium of Uva Wellassa University, January 29-30, 2015
26
Visco-elastic properties of OMMT filled fractioned bleached
crepe rubber
H.G.I.M. Wijesinghe, A.G.A.W. Alakolanga, N.S. Withanage
Faculty of Animal Science and Export Agriculture, Uva Wellassa University of Sri Lanka
and
U.N. Ratnayake
Rubber Research Institute, Thelawala Road, Ratmalane, Sri Lanka
Introduction
Natural Rubber (NR) latex tapped from Hevea brasiliensis converts into an important
engineering material for different applications. NR latex pale crepe, the purest form of NR
produced by Sri Lanka, is mainly used in pharmaceutical and surgical applications, infant toys,
food contact rubber articles and adhesives, (Senevirthne and Kumara, 2003). Natural Rubber has
a higher greenstrength as but it is soft and has lower dimension stability (Cohan and Spielman,
1948) which is one of the major draw backs in NR for engineering application.
Recently, Nanoclays such as montmorillonite clay are attracted as an alternative filler to achieve
the reinforcement of rubber compounds by replacing conventional fillers (Ratnayake and Peiris,
2010). Study the effect of Organo-montmorillonite (OMMT) on the visco elastic properties of
fractioned bleached crepe rubber will helpful for the advancement of the raw rubber industry as
value addition. In this study, OMMT dispersion in the rubber matrix has studied not only by
Mooney viscosity and stress relaxation properties but also by the physical properties of
vulcanizates. Therefore this study may help to have an advantage for the development of crepe
rubber industry and product manufacturing industry in Sri Lanka.
Material and Methods
NR field latex was obtained from NR processing factory at Rubber Research Institute,
Dartonfield, Agalawaththe. Montmorillonite clay modified with quaternary alkyl ammonium salt
(OMMT)was used as the nanofiller. Other general chemicals and laboratory equipment were
obtained from Rubber Research Institute, Rathmalana.
Initially, 5%(w/w) aqueous dispersion of OMMT was prepared using a surface active agent as a
dispersing agent. Latex mixing/intercalation method(Gatos and Kocsis, 2010) was carried out to
prepare OMMT filled fractioned bleached crepe rubber (OFBCR). Dry rubber content (DRC) of
fractionated bleached latex was diluted up to 10% and subsequently OMMT dispersion was
incorporated to latex samples at OMMTloading from 0 to 8 phr with an interval of 2 phr, with
simultaneous stirring.Standard latex crepe manufacturing procedure was adopted to prepare
OFBCR (Senevirthne and Kumara, 2003). Laces were dried in the drying tower at 34°C for three
days. Complete randomized design was applied to assign treatments, T0(0 phr), T2 (2 phr), T4 (4
phr), T6 (6 phr) and T8 (8 phr).
The NR was characterized based on DRC and the OMMT was characterized by the ash content.
Money viscosity and stress relaxation of OFBCRs were measured according to the [ISO/R 289-
1963] by the Ektron Mooney viscometer. Then the OFBCR samples were compounded
according to the pre-determined formulation. Curing characteristics of the OFBCR samples were
measured by using MDR 2000 (moving die rheometer, M/S Alpha Technologies, USA) at
Proceedings of the Research Symposium of Uva Wellassa University, January 29-30, 2015
27
150°C according to the ISO 3417:2008 procedure. OFBCR samples were moulded by hydraulic
hot press at 150°C temperature and 20MPa pressure for optimum cure time derived from the
cure characteristics data.The tensile properties of OFBCR samples were determined by “Instron
3300 Series” material testing machine at a crosshead speed of 500 mm/min as per ISO 37:2011.
The hardness of the samples were determined using Elastocon bares digi hardness tester
according to the ISO 48:2010. Compression set at constant strain was measured according to
ISO 815-1:2008 test method andtear strength of OFBCR samples were determined by “Instron
3300 Series” material testing machine at a crosshead speed of 500 mm/min according to ISO 34-
1:2011. All tests were carried out at 27±2°C and each test was replicated at least 3 times. Data
were analyzed by using the Minitab 16 statistical software with the use of General Liner Model
(GLM) with Tukey’s all pair wise comparison tests at 95% confidence interval.
Results and Discussion
Field latex used for the preparation of nano crepe rubber showed the dry rubber content of 30%.
OMMT clay has modified with quaternary alkyl ammonium salts. The ignition weight loss of
OMMT is 43%–48%. Ash content of clay is 52%-58%. This ash content represents the amount
of silicates and other inorganic metal amount in the clay. Ignition weight loss is correlated to the
amount of quaternary ammonium alkyl modifier and adsorbed moisture amount in the clay.
Mooney viscometer is an instrument to measure the 'stiffness' of uncured compounds, the result
of that viscosity is called as Mooney viscosity at ML 1+4 (100°C). Mooney stress relaxation
coefficient is the slope of the power law model when it is in logarithmic scale (log M = a(log t)
+ log k) where M- torque units from the Mooney stress relaxation test, k- a constant equal to
torque 1 s after the rotor has stopped, ‘a’- an exponent that measures the rate of stress relaxation
and t- testing time. Also elasticity of rubber material is inversely proportionate to the
‘a’andlower elasticity improves the mixing of rubber and processing, especially extrusion and
calendaring. Malac J., (2009).
Clay loading level (phr) has significantly affected to the Mooney viscosity expressed as ML
(1+4) 100°C of OFBCR samples (p-0.000). Only T6 and T8 has not indicated a significant
difference (p-0.0569) between them with respect the Mooney viscosity but all other treatment
levels are significantly different among (p-0.000). Mooney viscosities for T0, T2, T4, T6 and T8
are presented in Figure 1. The reason for the reduction of Mooney viscosity is, when increasing
the OMMT loading, the plasticization of rubber material by OMMT and may possibly be the
chain slippage over the clay platelets (Kader et al., 2010).
As reported in Figure 2, the stress relaxation coefficient has increased up to 4 phr and there after
it reduces. The maximum stress relaxation coefficient has indicated at the 4 phr clay loading
level, therefore, it can be concluded that OFBCR with 4 phr OMMT clay loading has a better
processability than other samples. Long relaxation times and high amplitudes of stress relaxation
suggest the mechanism of structural relaxation involving large-scale displacements of isolated
clusters of nanoparticles within the rubber matrix and vice versa (Dick, 2010).
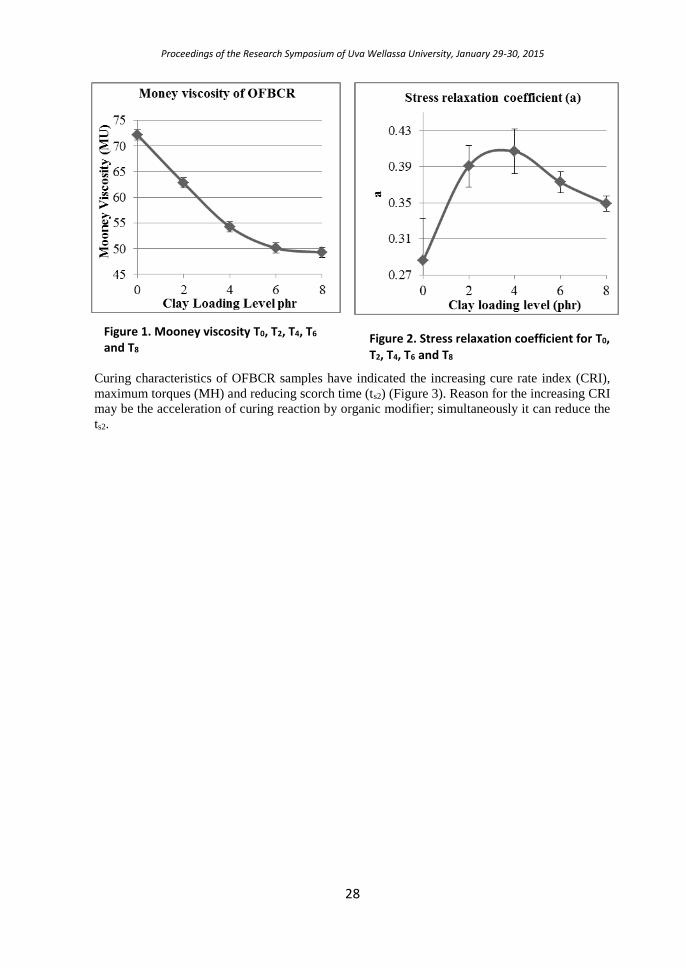
Proceedings of the Research Symposium of Uva Wellassa University, January 29-30, 2015
28
Curing characteristics of OFBCR samples have indicated the increasing cure rate index (CRI),
maximum torques (MH) and reducing scorch time (ts2) (Figure 3). Reason for the increasing CRI
may be the acceleration of curing reaction by organic modifier; simultaneously it can reduce the
ts2.
Figure 1. Mooney viscosity T0, T2, T4, T6 and T8
Figure 2. Stress relaxation coefficient for T0, T2, T4, T6 and T8
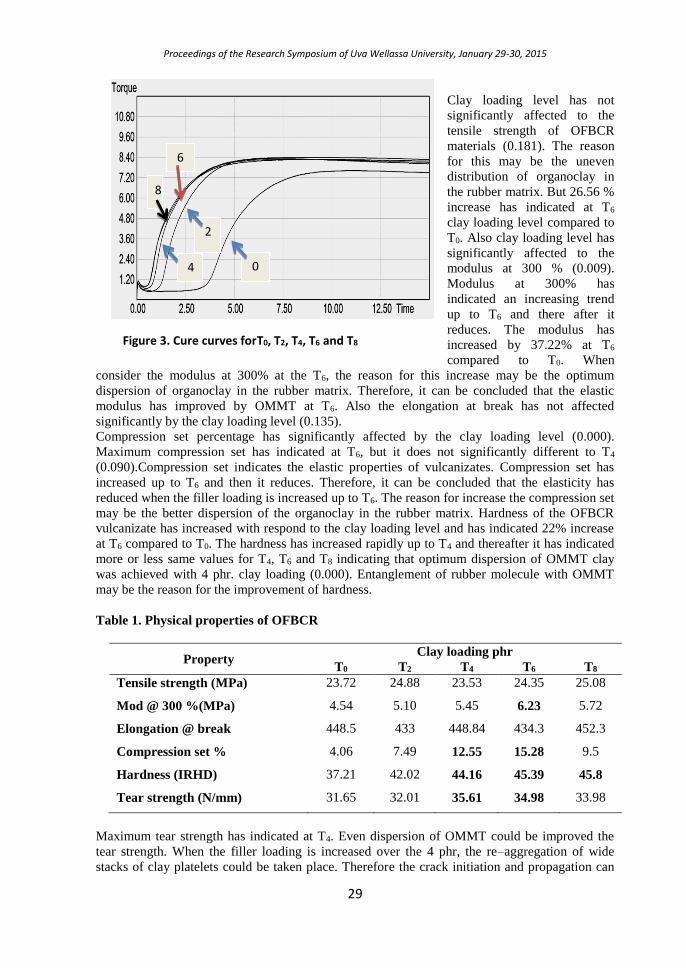
Proceedings of the Research Symposium of Uva Wellassa University, January 29-30, 2015
29
0
2
4
6
8
Figure 3. Cure curves forT0, T2, T4, T6 and T8
Clay loading level has not
significantly affected to the
tensile strength of OFBCR
materials (0.181). The reason
for this may be the uneven
distribution of organoclay in
the rubber matrix. But 26.56 %
increase has indicated at T6
clay loading level compared to
T0. Also clay loading level has
significantly affected to the
modulus at 300 % (0.009).
Modulus at 300% has
indicated an increasing trend
up to T6 and there after it
reduces. The modulus has
increased by 37.22% at T6
compared to T0. When
consider the modulus at 300% at the T6, the reason for this increase may be the optimum
dispersion of organoclay in the rubber matrix. Therefore, it can be concluded that the elastic
modulus has improved by OMMT at T6. Also the elongation at break has not affected
significantly by the clay loading level (0.135). Compression set percentage has significantly affected by the clay loading level (0.000).
Maximum compression set has indicated at T6, but it does not significantly different to T4
(0.090).Compression set indicates the elastic properties of vulcanizates. Compression set has
increased up to T6 and then it reduces. Therefore, it can be concluded that the elasticity has
reduced when the filler loading is increased up to T6. The reason for increase the compression set
may be the better dispersion of the organoclay in the rubber matrix. Hardness of the OFBCR
vulcanizate has increased with respond to the clay loading level and has indicated 22% increase
at T6 compared to T0. The hardness has increased rapidly up to T4 and thereafter it has indicated
more or less same values for T4, T6 and T8 indicating that optimum dispersion of OMMT clay
was achieved with 4 phr. clay loading (0.000). Entanglement of rubber molecule with OMMT
may be the reason for the improvement of hardness.
Table 1. Physical properties of OFBCR
Property Clay loading phr
T0 T2 T4 T6 T8
Tensile strength (MPa) 23.72 24.88 23.53 24.35 25.08
Mod @ 300 %(MPa) 4.54 5.10 5.45 6.23 5.72
Elongation @ break 448.5 433 448.84 434.3 452.3
Compression set % 4.06 7.49 12.55 15.28 9.5
Hardness (IRHD) 37.21 42.02 44.16 45.39 45.8
Tear strength (N/mm) 31.65 32.01 35.61 34.98 33.98
Maximum tear strength has indicated at T4. Even dispersion of OMMT could be improved the
tear strength. When the filler loading is increased over the 4 phr, the re–aggregation of wide
stacks of clay platelets could be taken place. Therefore the crack initiation and propagation can
Proceedings of the Research Symposium of Uva Wellassa University, January 29-30, 2015
30
be accelerated by reducing the tortuous path length.Shortening the stack-stack distance can lead
to a greater resistance to crack propagation (Gatos and Kocsis, 2010). Due to the high aspect
ratio of the clays their optimum dispersion is reached at a smaller amount (Gatos and Kocsis,
2010).
Conclusions
According to the Mooney stress relaxation information, clay loading levels at 4 phr (T4) have
indicated better processability as filled raw rubber material called OFBCR. Also physical
properties have shown that T4 and T6 treatments have given optimum dispersion of OMMT in
rubber matrices.
Acknowledgments
Authors would like to acknowledge the technical support and the materials given by the Rubber
Research Institute, Ratmalana and University of Uva Wellassa, Sri Lanka.
References
Cohan, L.H. and. Spielman, R. (1948).Indu. Eng. Chem 40: 2204.
Gatos, K.G. and Kocsis, J.K. (2010). Rubber/Clay Nanocomposites: Preparation, Properties and
Applications. In: Sabu Thomas, Ranimol Stephen Rubber Nanocomposites. Singapore: John
Wiley & Sons (Asia) Pte Ltd. 169 - 175.
Malac, J. (2009). Viscosity, Relaxation and Stability of Natural Rubber. The Open
Macromolecules Journal,3, 41-44. Retrieved August 22, 2014, from the World Wide
Web:http://www.benthamopen.com/tomacroj/articles/V003/41TOMACROJ.pdf
Ratnayake U.N. and Peiris, C. (2010). Natural Rubber/Layered Silicate Nanocomposite for
Building Applications. InternationalConference on Sustainable Built Environment,69-76.
Retrieved May 27, 2014, from the World Wide
Web:http://www.civil.mrt.ac.lk/conference/ICSBE_2010/vol_03/11.pdf
Senevirthne W.M.G. andKumara P.H.S. (2003)Handbook of Rubber–Processing Technology:
Pale crepe and Sole crepe.(2), 34-57. United Printers, Moratuwa.
Proceedings of the Research Symposium of Uva Wellassa University, January 29-30, 2015
31
Effect of Canopus 100 processing oil on the blooming effect of
solid tyres
N.N.H.A.R. Lathika, S.M.I.P.G Bandara, G. Chandrasena
Faculty of Animal Science and Export Agriculture, Uva Wellassa University of Sri Lanka
and
H.D.G Sumudumalie
Samson Rubber Products (Pvt) Ltd, Galle, Sri Lanka
Introduction
Solid tyres are popular in the industrial world. These types of tires are primarilyused for
industrial or light commercial applications such as light industrial and personal use vehicles
(Blanc et al., 1988).
Samson Rubber Products (Pvt) Ltd produces industrial solid tyres by using two rubber
compounds namely ST 1125 compound and ST 9048 compound. ST 1125 compound is used to
make the inner part of the tyre. ST 9048 compound is used to make the outer part of the tyre.
Because, ST 9048 compound is more expensive than ST 1125 compound.
To obtain a good quality tyre, the rubber compound must be calendared on the day itself.
Calendering is done to have ancompound sheet of uniform thickness for easy maintenance of the
shape of the solid tyre. But, certain time period is needed to calendar the compounds. Sheets
cannot be kept more than 24 hours after calendaring. Because some yellowish marks may appear
on the surface of the solid tyres after manufacturing which is known as ‘blooming effect’. It
highly affects on the final quality of the solid tyre.
If the blooming effect can be overcome, the calendared sheets can be kept for certain period until
solid tyre manufacturing process is started without affecting the quality of the solid tyre. As a
result, the solid tyre manufacturing can be undertaken in a continuous mannar. Generally,
blooming effect is occurred during vulcanization after two days of calendaring the compounds.
During this period, it will move to the outer surface.
Previous research projects carried out on this topic were found that sulphur is not a root course of
the blooming effect. This yellow blooming may occurre due to the ingredients contained in ST
9048 compound. Generally, processing oil is added to improve the processability of the
compound. In solid tyre manufacturing, the processing oil called ‘Canopus 100’ is used which is
one of the highly refined paraffinic mineral oils. This research is an attempt to determine the
effect of Canopus 100 processing oil which is one of the ingredients contained in the ST 9048
compound on the blooming effect of solid tyres.
Methodology
Seven ST 9048 compound samples were prepared in various phr(Parts Per Hundred Rubber)
level of the Canopus 100. The phr level of the oil was varied in a range of 0phr to 3 phr (0 phr,
0.5 phr, 1.0 phr, 1.5 phr, 2.0 phr, 2.5 phr, 3.0 phr). Each treatment was tested in five replicates.
Completely randomized design was used as the experimental design. Response variable was the
area affected due to the blooming effect.
Then, compounds were calendared using the calendar machine to make the compounds as sheets
for easy maintenance and production. The required amount of the compounds were weighed
using the balance. The weight of the 1125 compound sample was 4.9kg and the weight of the
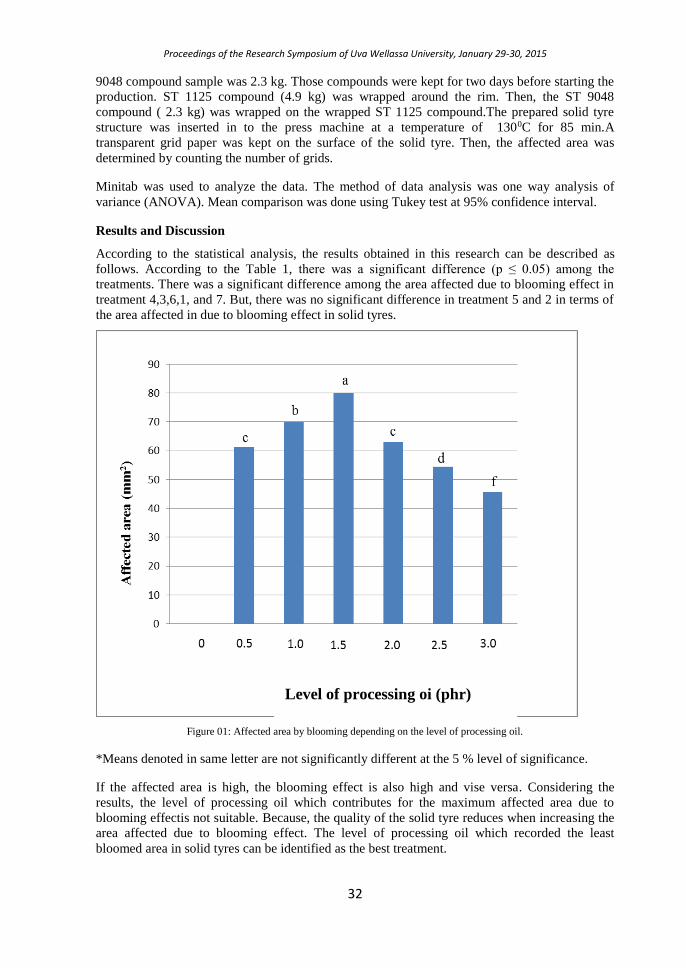
Proceedings of the Research Symposium of Uva Wellassa University, January 29-30, 2015
32
9048 compound sample was 2.3 kg. Those compounds were kept for two days before starting the
production. ST 1125 compound (4.9 kg) was wrapped around the rim. Then, the ST 9048
compound ( 2.3 kg) was wrapped on the wrapped ST 1125 compound.The prepared solid tyre
structure was inserted in to the press machine at a temperature of 1300C for 85 min.A
transparent grid paper was kept on the surface of the solid tyre. Then, the affected area was
determined by counting the number of grids.
Minitab was used to analyze the data. The method of data analysis was one way analysis of
variance (ANOVA). Mean comparison was done using Tukey test at 95% confidence interval.
Results and Discussion
According to the statistical analysis, the results obtained in this research can be described as
follows. According to the Table 1, there was a significant difference (p ≤ 0.05) among the
treatments. There was a significant difference among the area affected due to blooming effect in
treatment 4,3,6,1, and 7. But, there was no significant difference in treatment 5 and 2 in terms of
the area affected in due to blooming effect in solid tyres.
Figure 01: Affected area by blooming depending on the level of processing oil.
*Means denoted in same letter are not significantly different at the 5 % level of significance.
If the affected area is high, the blooming effect is also high and vise versa. Considering the
results, the level of processing oil which contributes for the maximum affected area due to
blooming effectis not suitable. Because, the quality of the solid tyre reduces when increasing the
area affected due to blooming effect. The level of processing oil which recorded the least
bloomed area in solid tyres can be identified as the best treatment.
Level of processing oi (phr)
Proceedings of the Research Symposium of Uva Wellassa University, January 29-30, 2015
33
According to Figure1, specific pattern was clearly identified between the level of processing oil
and the area affected due to blooming. When the phr level of processing oil was increased, the
area affected due to blooming effect was significantly increased. Maximum affected area was
observed in the treatment 4 in which the level of processing oil was 1.5 phr. Because, silica
bonds are highly activated at the 1.5 phr level of processing oil. Therefore, those silica bonds are
made cross links with the processing oil at that range of processing oil. Therefore, the blooming
effect can be seen on the surface of the soildtyres (Subramaniam and Encyclo, 1988).When the
phr level of processing oil was increased further, the affected area due to blooming was
significantly decreased.
The least affected area due to blooming effect was observed in the treatment 7 in which the level
of processing oil was 3 phr. Therefore, processing oil with a phr level of 3 was the best treatment
out of the seven different levels of Canopus 100 processing oil tested. Also, that is the currently
using concentration of processing oil in the solid tyre industry. Because, it is the optimum phr
value of processing oil used in solid tyre industry to improve the properties of the compound.
The processing oil used at the level of 3 phrimproves the processability of rubbers and rubber
compounds while increasing the bulk of rubber to reduce the cost of oil-extended rubbers.
According to Subramaniam (2012),following specific requirements namely low viscosity and
elasticity, less power consumption and aid dispersion of fillers are shown at the low dosage of 3
phr. In addition to those, the following additional requirements are also met at the level of 3 phr
of processing oil such as not affecting the intended properties of finished products and acting at
low dosage level.
Conclusions
The results of the research revealed that there is an effect of Canopus 100 processing oil on
blooming effect of solid tyres. Three phr level of processing oil is the best among the different
levels of Canopus 100 processing oil tested. And also three phr level of processing oil is the
optimum value to incorporate with ST 9048 compound to obtain a high quality solid tyre
References
Blanc, J. L., Lloyd, D.G. (1988). Rubber world.William publication.
Subramaniam, A., Encyclo, E. (1988). Polymer science.England publication.
Subramaniam, K. (2012). Basic chemistry and technology of polymers.Sarasavi publications.
Proceedings of the Research Symposium of Uva Wellassa University, January 29-30, 2015
34
Improvement of productivity of soft dough biscuits by regulating
temperature and quantity of the palm olein
K.W.A. Bandara, W.A.J. P. Wijesinghe
Faculty of Animal Science and Export Agriculture, Uva Wellassa University of Sri Lanka
and
J.M.S.C. Samarasinghe
Ceylon Biscuit Ltd, P.O. Box 3, Pannipitiya, Makumbura, Sri Lanka
Introduction
Biscuit is a small baked product made principally from flour, sugar and fat (Sonia et al., 2007).
According to the type of the dough biscuits can be categorized as soft dough and hard dough
biscuits. Analysis and quantification of the quality, for the purpose of controlling its parameters
and acting on it in real time, remain the prime objectives of the biscuit industry. Palm olein is
widely used in food manufacturing industry due to its good resistance to oxidation and formation
of breakdown products at frying temperatures and longer shelf life of finished products.Usage of
palm olein to build up the specific quality on soft dough biscuits is a major concern in the
manufacturing plant. In order to maintain the given specification currently add high amount of
oil to the dough. Addition of high amount of olein will increase the cost of production. As well
palm olein temperatures also contribute to the quality characteristics of final output. Therefore
prime objective of this study is to investigate the impact of the palm olein temperature and
quantity on soft dough biscuits (Milk Shorties) without compromising the quality of biscuits
thereby reducing the cost of production.
Materials and Methods
Two factors, palm olein quantity and palm olein temperature and their combinations were used
to test the effect for the final biscuit quality. In order to study the influence of temperature
regulation (34 °C, 32 °C and 30 °C) and the amount of the incorporated palm olein ( 56 kg, 54
kg, 52 kg and 50 kg) on the biscuit characteristics; twelve different treatments were conducted.
Palm olein temperature was regulated by using the oil heating system in mixing area. Moreover,
all twelve treatments were subjected to similar conditions until biscuits were packed.Samples
were collected from three dough of each combination by using simple random sampling method.
There were three replicates per each twelve treatments.All treatments were subjected to detect
the objective quality characteristics such as raw weight, baked weight, baked height, moisture
content (Infra-red moisture analyzer), pH, hardness, total fat content (Soxhlet extraction method)
and packet weight. Out of the twelve treatments the best treatment was chosen for the sensory
evaluation by 30 untrained panelists.
Results and Discussion
The effect on twelve different treatments for biscuit quality parameters shown in the Table 1.
According to the results with the reduction of amount of palm olein the raw weight, baked
weight, moisture content and total fat content of biscuits were gradually decreased while
increased the baked height and the hardness of the biscuits.Weight and height were found to be
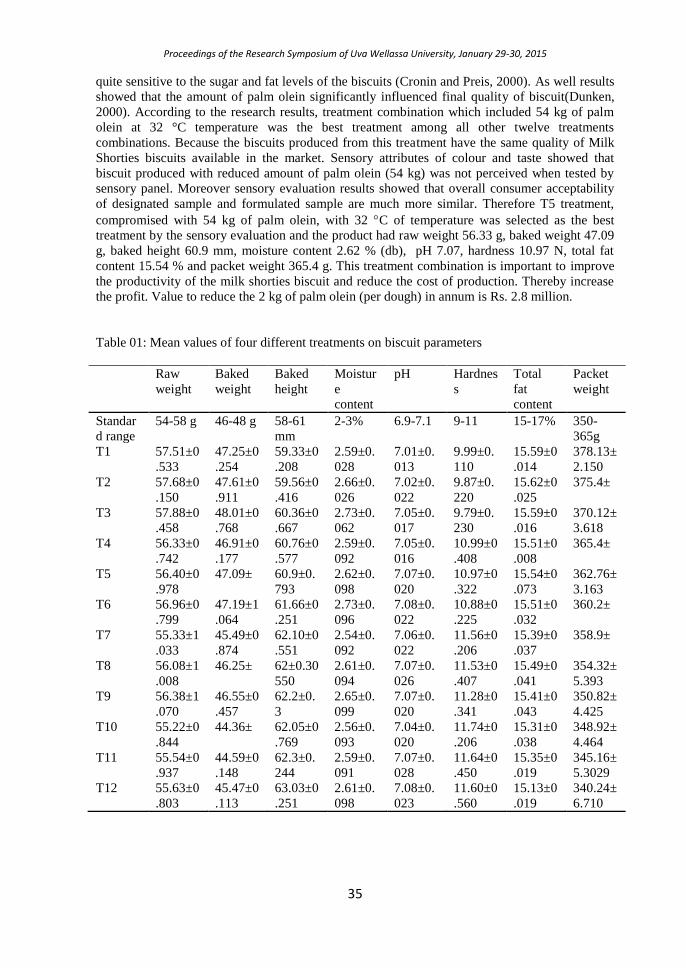
Proceedings of the Research Symposium of Uva Wellassa University, January 29-30, 2015
35
quite sensitive to the sugar and fat levels of the biscuits (Cronin and Preis, 2000). As well results
showed that the amount of palm olein significantly influenced final quality of biscuit(Dunken,
2000). According to the research results, treatment combination which included 54 kg of palm
olein at 32 °C temperature was the best treatment among all other twelve treatments
combinations. Because the biscuits produced from this treatment have the same quality of Milk
Shorties biscuits available in the market. Sensory attributes of colour and taste showed that
biscuit produced with reduced amount of palm olein (54 kg) was not perceived when tested by
sensory panel. Moreover sensory evaluation results showed that overall consumer acceptability
of designated sample and formulated sample are much more similar. Therefore T5 treatment,
compromised with 54 kg of palm olein, with 32 C of temperature was selected as the best
treatment by the sensory evaluation and the product had raw weight 56.33 g, baked weight 47.09
g, baked height 60.9 mm, moisture content 2.62 % (db), pH 7.07, hardness 10.97 N, total fat
content 15.54 % and packet weight 365.4 g. This treatment combination is important to improve
the productivity of the milk shorties biscuit and reduce the cost of production. Thereby increase
the profit. Value to reduce the 2 kg of palm olein (per dough) in annum is Rs. 2.8 million.
Table 01: Mean values of four different treatments on biscuit parameters
Raw
weight
Baked
weight
Baked
height
Moistur
e
content
pH Hardnes
s
Total
fat
content
Packet
weight
Standar
d range
54-58 g 46-48 g 58-61
mm
2-3% 6.9-7.1 9-11 15-17% 350-
365g
T1 57.51±0
.533
47.25±0
.254
59.33±0
.208
2.59±0.
028
7.01±0.
013
9.99±0.
110
15.59±0
.014
378.13±
2.150
T2 57.68±0
.150
47.61±0
.911
59.56±0
.416
2.66±0.
026
7.02±0.
022
9.87±0.
220
15.62±0
.025
375.4±
T3 57.88±0
.458
48.01±0
.768
60.36±0
.667
2.73±0.
062
7.05±0.
017
9.79±0.
230
15.59±0
.016
370.12±
3.618
T4 56.33±0
.742
46.91±0
.177
60.76±0
.577
2.59±0.
092
7.05±0.
016
10.99±0
.408
15.51±0
.008
365.4±
T5 56.40±0
.978
47.09± 60.9±0.
793
2.62±0.
098
7.07±0.
020
10.97±0
.322
15.54±0
.073
362.76±
3.163
T6 56.96±0
.799
47.19±1
.064
61.66±0
.251
2.73±0.
096
7.08±0.
022
10.88±0
.225
15.51±0
.032
360.2±
T7 55.33±1
.033
45.49±0
.874
62.10±0
.551
2.54±0.
092
7.06±0.
022
11.56±0
.206
15.39±0
.037
358.9±
T8 56.08±1
.008
46.25± 62±0.30
550
2.61±0.
094
7.07±0.
026
11.53±0
.407
15.49±0
.041
354.32±
5.393
T9 56.38±1
.070
46.55±0
.457
62.2±0.
3
2.65±0.
099
7.07±0.
020
11.28±0
.341
15.41±0
.043
350.82±
4.425
T10 55.22±0
.844
44.36± 62.05±0
.769
2.56±0.
093
7.04±0.
020
11.74±0
.206
15.31±0
.038
348.92±
4.464
T11 55.54±0
.937
44.59±0
.148
62.3±0.
244
2.59±0.
091
7.07±0.
028
11.64±0
.450
15.35±0
.019
345.16±
5.3029
T12 55.63±0
.803
45.47±0
.113
63.03±0
.251
2.61±0.
098
7.08±0.
023
11.60±0
.560
15.13±0
.019
340.24±
6.710
Proceedings of the Research Symposium of Uva Wellassa University, January 29-30, 2015
36
Conclusions
54 kg of palm oleinat 32C is the best treatment to obtain Milk shorties biscuits cost effectively
and without compromising final quality of the biscuits.
References
Cronin, K. and Preis, C. 2000. A statistical analysis of biscuit physical properties as affected by
baking. Journal of Food Engineering 46: 217-225
Dunken, M. (2000).Biscuit, cookie and cracker manufacturing manuals. England: Woodhead
Publishing Limited.
Sonia, C. Manzocco, L. and Kravina, G. 2007. Shelf-life modeling of bakery products by using
oxidation indices. Journal of Agriculture Food Chemistry 55: 204-209
Proceedings of the Research Symposium of Uva Wellassa University, January 29-30, 2015
37
Development of activated carbon included natural rubber latex
pillow
B.A.D.U.P.Bulathsinghala, N.S.Withanage
Faculty of Animal Science and Export Agriculture, Uva Wellassa University of Sri Lanka
and
U.H.T.P. Samaraweera
Richard Pieris Natural Foams pvt Ltd, Export Processing Zone, Biyagama, Sri Lanka
Introductıon
Latex is a milky white liquid tapped from the trunks of rubber trees (Hevea brasiliensis) and then
combined with water to create a thick suspension. In manufacturing natural latex foam rubber,
the latex suspension is whipped to a froth and poured into carousel moulds, onto a conveyor, or
into sheets and then heated to the point of vulcanization (Polyurethane Foam Association, 2000).
Activated carbon(AC) is a non-graphite form of carbon which could be produced from any
carbonaceous material. AC manufactured from coconut shell is considered superior to those
obtained from other sources mainly because of small macro pores structure which renders it
more effective for the adsorption of gas/vapour and for the removal of colour and odour of
compounds (Coconut Development Board, 2013). AC has numerous applications due to its
higher adsorption property. Thus it is capable to adsorbing volatile organic compounds
which are also air pollutant in the atmosphere.
The incorporation of activated carbon into natural rubber latex foam pillow can provide
volatile organic compounds adsorption property apart from its cushioning effect. Many
volatile organic compounds are toxic, posing a high risk to human health as a result of their
widespread use and occurrence in laboratory, home and also workplace envi ronments
(Magureanu, Mandache, Eloy, Gaigneaux and Parvulescu, 2005).
Therefore natural rubber latex foam pillow currently available in Sri Lankan market can be
successfully value added by incorporating coconut shell based activated carbon to get the
similar cushioning effects together with air purification ability upto a certain level .
Methodology
The current study was carried out at Richard Pieris Natural Foam (RPNF) Ltd, Malwana,
Biyagama. Laboratory tests were done at RPNF, Richard Pieris Company plc and Bureau Veritas
Consumer Product Services Sri Lanka (Pvt) Ltd laboratories. Two experimental trials with
different treatments were conducted during this study. Experimental trial I was carried out to find
out the appropriate activated carbon level suitable for the natural rubber latex foam pillow. It was
compromised with eight treatment levels having 0% to 7% activated carbon levels with other
compounding ingredients as different treatments levels. Each treatment was replicated 3 times.
Experimental trial II was done in order to find the air purification ability with respect to acetone
adsorption capacity. In experiment II, both the control which has 0% activated carbon and 2% of
AC treated pillow were used to investigate the acetone (a VOC) adsorption capacity. Both
treatments were replicated 3 times. Complete Randomized Design (CRD) was conducted and
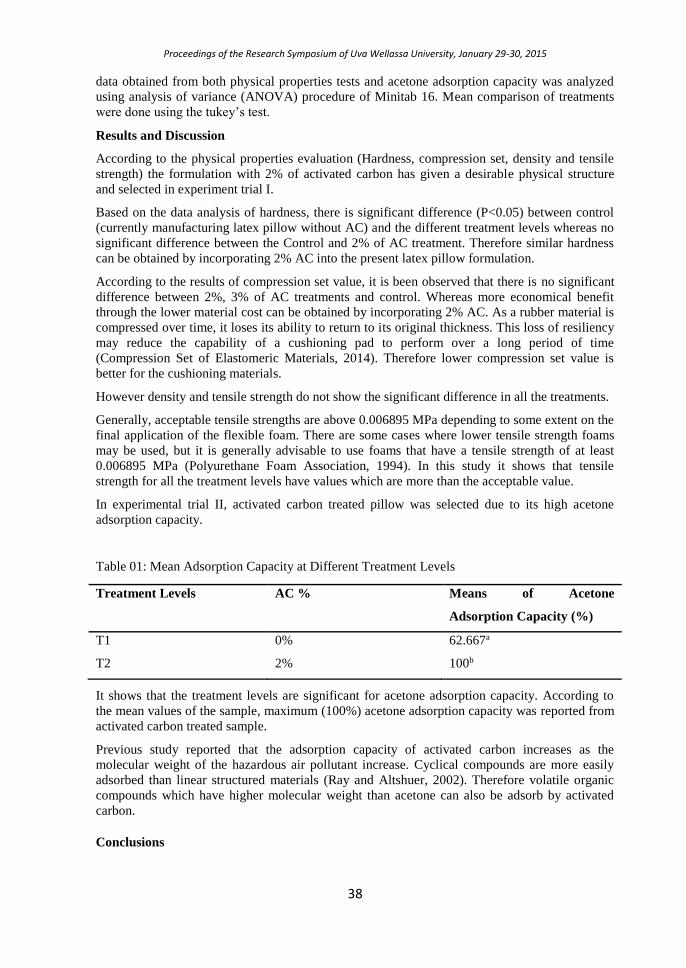
Proceedings of the Research Symposium of Uva Wellassa University, January 29-30, 2015
38
data obtained from both physical properties tests and acetone adsorption capacity was analyzed
using analysis of variance (ANOVA) procedure of Minitab 16. Mean comparison of treatments
were done using the tukey’s test.
Results and Discussion
According to the physical properties evaluation (Hardness, compression set, density and tensile
strength) the formulation with 2% of activated carbon has given a desirable physical structure
and selected in experiment trial I.
Based on the data analysis of hardness, there is significant difference (P<0.05) between control
(currently manufacturing latex pillow without AC) and the different treatment levels whereas no
significant difference between the Control and 2% of AC treatment. Therefore similar hardness
can be obtained by incorporating 2% AC into the present latex pillow formulation.
According to the results of compression set value, it is been observed that there is no significant
difference between 2%, 3% of AC treatments and control. Whereas more economical benefit
through the lower material cost can be obtained by incorporating 2% AC. As a rubber material is
compressed over time, it loses its ability to return to its original thickness. This loss of resiliency
may reduce the capability of a cushioning pad to perform over a long period of time
(Compression Set of Elastomeric Materials, 2014). Therefore lower compression set value is
better for the cushioning materials.
However density and tensile strength do not show the significant difference in all the treatments.
Generally, acceptable tensile strengths are above 0.006895 MPa depending to some extent on the
final application of the flexible foam. There are some cases where lower tensile strength foams
may be used, but it is generally advisable to use foams that have a tensile strength of at least
0.006895 MPa (Polyurethane Foam Association, 1994). In this study it shows that tensile
strength for all the treatment levels have values which are more than the acceptable value.
In experimental trial II, activated carbon treated pillow was selected due to its high acetone
adsorption capacity.
Table 01: Mean Adsorption Capacity at Different Treatment Levels
Treatment Levels AC % Means of Acetone
Adsorption Capacity (%)
T1 0% 62.667a
T2 2% 100b
It shows that the treatment levels are significant for acetone adsorption capacity. According to
the mean values of the sample, maximum (100%) acetone adsorption capacity was reported from
activated carbon treated sample.
Previous study reported that the adsorption capacity of activated carbon increases as the
molecular weight of the hazardous air pollutant increase. Cyclical compounds are more easily
adsorbed than linear structured materials (Ray and Altshuer, 2002). Therefore volatile organic
compounds which have higher molecular weight than acetone can also be adsorb by activated
carbon.
Conclusions
Proceedings of the Research Symposium of Uva Wellassa University, January 29-30, 2015
39
Presently available natural rubber latex foam pillow can be successfully value added by
incorporating 2% of coconut shell based activated carbon to get VOC adsorption capacity upto
certain level while maintain the cushioning effect.
The developed AC incorporated pillow can be successfully used as an adsorption source of VOC
in environment to reduce the possible air pollution while getting the cushioning effect too.
References
Coconut Development Board. (2013). Activated Carbon Processing Technology. Kochi:
Government of India. Retrieved April 23, 2014 from http://coconutboard.nic.in
Compression Set of Elastomeric Materials. (2014). Retrieved August 13, 2013, from
http://www.stockwell.com/compression-set-testing.php.
Magureanu, M., Mandache, N.B., Eloy, P., Gaigneaux, E.M. and Parvulescu, V.I. (2005).
Plasma-assisted catalysis for volatile organic compounds abatement. Applied catalysis B:
Environmental. India.
Polyurethane Foam Association. (1994). Information on flexible polyurethane foam. Wayne.
Retrieved August 13, 2014, from http://www.pfa.org.
Polyurethane Foam Association. (2000). Information on flexible polyurethane foam. Wayne.
Retrieved August 30, 2014, from http://www.pfa.org.
Ray, I. and Altshuer, B. (2002). Economical Removal of Malodorous and Toxic Organics.
Adsorption with Activated Carbon. Westfield, NJ.
Proceedings of the Research Symposium of Uva Wellassa University, January 29-30, 2015
40
Effect of palmyrah coir dust on physicochemical properties of
potting media and on growth and yield of chilli
S. Puthisigamani, H.A.S.L Jayasinghe, H.K.S.G. Gunadasa
Faculty of Animal Science and Export Agriculture, Uva Wellassa University of Sri Lanka
and
A.M. Nilushiny, S. Sri Vijeindran
Palmyrah Research Institute, Jaffna, Sri Lanka
Introduction
Palmyrah (Borassus flabellifer) coir dust is a major by-product of the fibre industry. Coir waste
or coir pith is generally a mixture of dust, bits and fibres of shortlength that is rejected during the
process of coir extraction. Coir dust is a spongy material which can absorb ample quantity of
water compared to its weight and it is a valuable carbon source which could be used in
agriculture to maintain and improve the organic matter content of depleted soils(Vidhana
Arachchi and Somasin, 1997). Organic matter can improve the soil properties in long run
(Kularathne et al., 2005).Although Palmyrah coir dust is a very useful carbon source for
agriculture, it is wasted by burning at the factory. No studies have been undertaken to investigate
the beneficial effects of palmyrah coir dust which can be used in agriculture. This research was
conducted to study the effect of palmyrah coir dust on physicochemical properties of potting
media and on growth & yield of capsicum.
Methodology
A pot experiment was carried out at Palmyrah Research Institute, Jaffna under greenhouse
conditions(temperature 30.1 oC and relative humidity 80.9 % during day time). Six treatments
were used: T1:-control (soil alone), T2:- palmyrah coir dust: soil (1:1), T3:- palmyrah coir dust:
soil (1:3), T4:-palmyrah coir dust: soil: sand (2:1:1), T5:- palmyrah coir dust: soil: sand (1:2:1),
T6:- palmyrah coir dust: soil: sand (1:1:2). The experiment was laid in a Complete Randomized
Design (CRD) with three replicates. Hungarian Yellow Wax variety was selected as the test crop
considering its short harvesting period.Potting media were prepared by mixing palmyrah coir
dust, soil and sand in a different ratio on weight basis according to the treatments. All agronomic
practices were undertaken according to the guidelines provided by the Department of Agriculture
(DAO, 2006). Plant height (cm), crop yield (g), bulk density (g/cm3), porosity (%), water
retention (% wt), pH, electrical conductivity (µs/cm), cation exchange capacity (meq/100g),
available nitrogen (%), available phosphorus (%), organic carbon (%), exchangeable calcium (%)
and exchangeable magnesium (%) were measured. Data was analyzed using SAS software
package and the mean separation was done by Least Significant Difference (LSD) at p=0.05
probability level.
Results and Discussion
Significantly, the highest bulk density (1.41± 0.05 g/cm3) was recorded in the control treatment
(T1). As given in Table 1, the lowest porosity (88.63 ± 0.05 %) and the lowest water retention
(33.64 ± 0.05 %) were recorded in control treatment (T1). The highest porosity (95.75 ± 0.05 %)
and the highest water retention (153.26 ± 0.05 %) were recorded in T4 treatment (palmyrah coir
dust: soil: sand 2:1:1) followed by T5 treatment and T3 treatment at 5 % probability level.
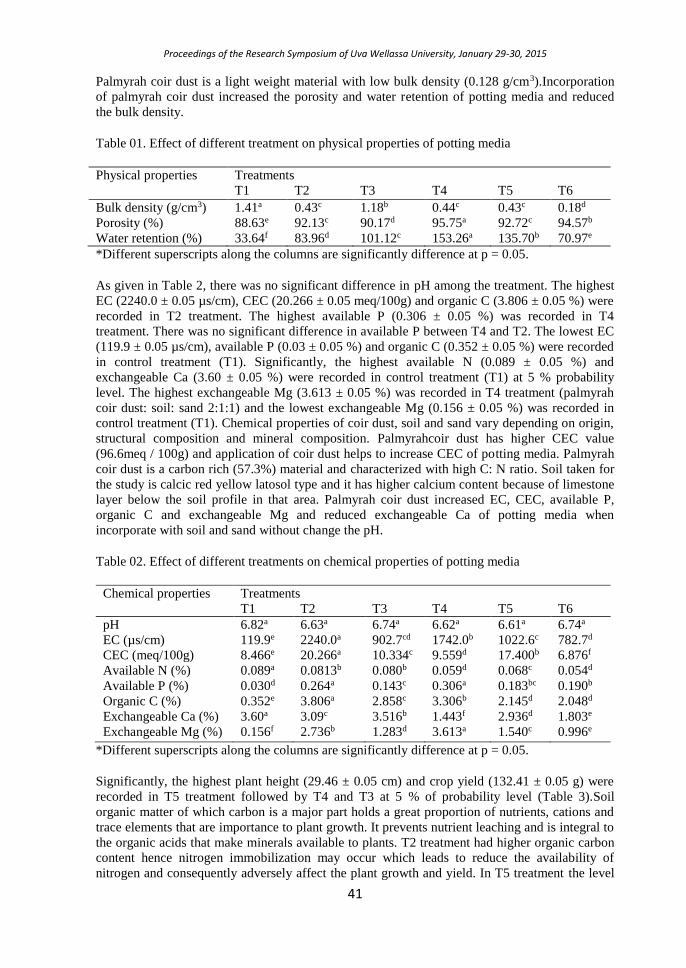
Proceedings of the Research Symposium of Uva Wellassa University, January 29-30, 2015
41
Palmyrah coir dust is a light weight material with low bulk density (0.128 g/cm3).Incorporation
of palmyrah coir dust increased the porosity and water retention of potting media and reduced
the bulk density.
Table 01. Effect of different treatment on physical properties of potting media
Physical properties Treatments
T1 T2 T3 T4 T5 T6
Bulk density (g/cm3) 1.41a 0.43c 1.18b 0.44c 0.43c 0.18d
Porosity (%) 88.63e 92.13c 90.17d 95.75a 92.72c 94.57b
Water retention (%) 33.64f 83.96d 101.12c 153.26a 135.70b 70.97e
*Different superscripts along the columns are significantly difference at p = 0.05.
As given in Table 2, there was no significant difference in pH among the treatment. The highest
EC (2240.0 ± 0.05 µs/cm), CEC (20.266 ± 0.05 meq/100g) and organic C (3.806 ± 0.05 %) were
recorded in T2 treatment. The highest available P (0.306 ± 0.05 %) was recorded in T4
treatment. There was no significant difference in available P between T4 and T2. The lowest EC
(119.9 ± 0.05 µs/cm), available P (0.03 ± 0.05 %) and organic C (0.352 ± 0.05 %) were recorded
in control treatment (T1). Significantly, the highest available N (0.089 ± 0.05 %) and
exchangeable Ca (3.60 ± 0.05 %) were recorded in control treatment (T1) at 5 % probability
level. The highest exchangeable Mg (3.613 ± 0.05 %) was recorded in T4 treatment (palmyrah
coir dust: soil: sand 2:1:1) and the lowest exchangeable Mg (0.156 ± 0.05 %) was recorded in
control treatment (T1). Chemical properties of coir dust, soil and sand vary depending on origin,
structural composition and mineral composition. Palmyrahcoir dust has higher CEC value
(96.6meq / 100g) and application of coir dust helps to increase CEC of potting media. Palmyrah
coir dust is a carbon rich (57.3%) material and characterized with high C: N ratio. Soil taken for
the study is calcic red yellow latosol type and it has higher calcium content because of limestone
layer below the soil profile in that area. Palmyrah coir dust increased EC, CEC, available P,
organic C and exchangeable Mg and reduced exchangeable Ca of potting media when
incorporate with soil and sand without change the pH.
Table 02. Effect of different treatments on chemical properties of potting media
Chemical properties Treatments
T1 T2 T3 T4 T5 T6
pH 6.82a 6.63a 6.74a 6.62a 6.61a 6.74a
EC (µs/cm) 119.9e 2240.0a 902.7cd 1742.0b 1022.6c 782.7d
CEC (meq/100g) 8.466e 20.266a 10.334c 9.559d 17.400b 6.876f
Available N (%) 0.089a 0.0813b 0.080b 0.059d 0.068c 0.054d
Available P (%) 0.030d 0.264a 0.143c 0.306a 0.183bc 0.190b
Organic C (%) 0.352e 3.806a 2.858c 3.306b 2.145d 2.048d
Exchangeable Ca (%) 3.60a 3.09c 3.516b 1.443f 2.936d 1.803e
Exchangeable Mg (%) 0.156f 2.736b 1.283d 3.613a 1.540c 0.996e
*Different superscripts along the columns are significantly difference at p = 0.05.
Significantly, the highest plant height (29.46 ± 0.05 cm) and crop yield (132.41 ± 0.05 g) were
recorded in T5 treatment followed by T4 and T3 at 5 % of probability level (Table 3).Soil
organic matter of which carbon is a major part holds a great proportion of nutrients, cations and
trace elements that are importance to plant growth. It prevents nutrient leaching and is integral to
the organic acids that make minerals available to plants. T2 treatment had higher organic carbon
content hence nitrogen immobilization may occur which leads to reduce the availability of
nitrogen and consequently adversely affect the plant growth and yield. In T5 treatment the level
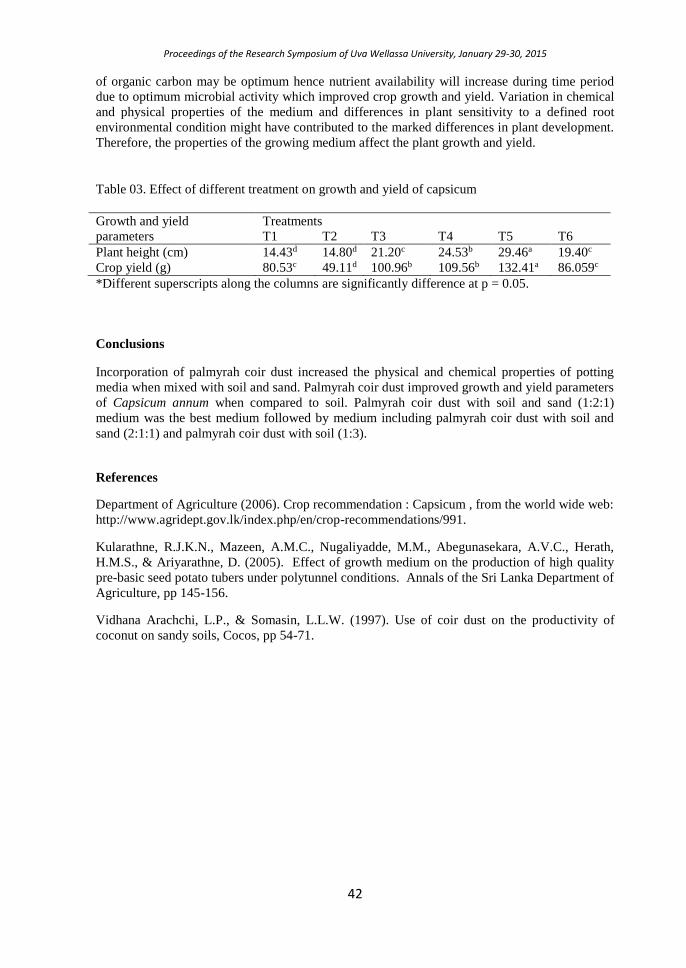
Proceedings of the Research Symposium of Uva Wellassa University, January 29-30, 2015
42
of organic carbon may be optimum hence nutrient availability will increase during time period
due to optimum microbial activity which improved crop growth and yield. Variation in chemical
and physical properties of the medium and differences in plant sensitivity to a defined root
environmental condition might have contributed to the marked differences in plant development.
Therefore, the properties of the growing medium affect the plant growth and yield.
Table 03. Effect of different treatment on growth and yield of capsicum
Growth and yield
parameters
Treatments
T1 T2 T3 T4 T5 T6
Plant height (cm) 14.43d 14.80d 21.20c 24.53b 29.46a 19.40c
Crop yield (g) 80.53c 49.11d 100.96b 109.56b 132.41a 86.059c
*Different superscripts along the columns are significantly difference at p = 0.05.
Conclusions
Incorporation of palmyrah coir dust increased the physical and chemical properties of potting
media when mixed with soil and sand. Palmyrah coir dust improved growth and yield parameters
of Capsicum annum when compared to soil. Palmyrah coir dust with soil and sand (1:2:1)
medium was the best medium followed by medium including palmyrah coir dust with soil and
sand (2:1:1) and palmyrah coir dust with soil (1:3).
References
Department of Agriculture (2006). Crop recommendation : Capsicum , from the world wide web:
http://www.agridept.gov.lk/index.php/en/crop-recommendations/991.
Kularathne, R.J.K.N., Mazeen, A.M.C., Nugaliyadde, M.M., Abegunasekara, A.V.C., Herath,
H.M.S., & Ariyarathne, D. (2005). Effect of growth medium on the production of high quality
pre-basic seed potato tubers under polytunnel conditions. Annals of the Sri Lanka Department of
Agriculture, pp 145-156.
Vidhana Arachchi, L.P., & Somasin, L.L.W. (1997). Use of coir dust on the productivity of
coconut on sandy soils, Cocos, pp 54-71.
Proceedings of the Research Symposium of Uva Wellassa University, January 29-30, 2015
43
Effect of graphite derivatives on mechanical and functional
properties of nitrile rubber nano composite
P. C Rajapaksha, A.G.A.W. Alakolanga, A.N.Weerawansha
Facultym of Animal Science and Export Agriculture, Uva Wellassa University of Sri Lanka.
U.N Rathnayake
Rubber Resarch Institute, Rathmalana, Sri Lanka
Introduction
The conducting polymers and polymeric composites have attracted considerable attention in
recent years because of their breadth applications in advanced technologies, for example, in
antistatic coatings, electromagnetic shielding. For all applications, elastomers are reinforced with
fillers to promote their performance by incorporating materials such as silica, clay, carbon
blacks, etc. Graphite is a layered material with high aspect ratio in its exfoliated state; it is also
considered as one of the strongest materials per unit weight and has unique functional properties
such as good electrical and thermal conductivities, and good lubricating properties. In other side
graphene have recently received significant attention due to its outstanding electronic,
mechanical and thermal properties. NBR-based Nano composite was prepared and mechanical
and functional properties were studied. The dispersion of the filler in the polymer matrix was
studied using the Transmitted light metrological microscope.
Methodology
Two different experimental trials (Preparation of NBR/Graphite composite and NBR/Graphene
Nano composite) with different treatments (Phr levels) were conducted during this study. Nitrile
rubber composites were prepared accordance with Brabender Plasticorder (Model: PL-2000; 26
manufacturers: ArtisanTM Technology Group).
Table 01: Formulation used for the filler loading NBR composite and NBR nanocomposite
Phr* - Parts per hundred parts of rubber
Measurement of Electrical properties of the vulcanizates
Materials (phr)*
Formulation
NBR0 NBR3 NBR6 NBR9 NBR12 NBR15 NBR18
NBR 100 100 100 100 100 100 100
Zno 4 4 4 4 4 4 4
Stearic acid 1 1 1 1 1 1 1
Graphene / Graphite 0 3 6 9 12 15 18
IPPD 0.5 0.5 0.5 0.5 0.5 0.5 0.5
TBBS 1.5 1.5 1.5 1.5 1.5 1.5 1.5
TMTM 0.5 0.5 0.5 0.5 0.5 0.5 0.5
Sulphur 2 2 2 2 2 2 2
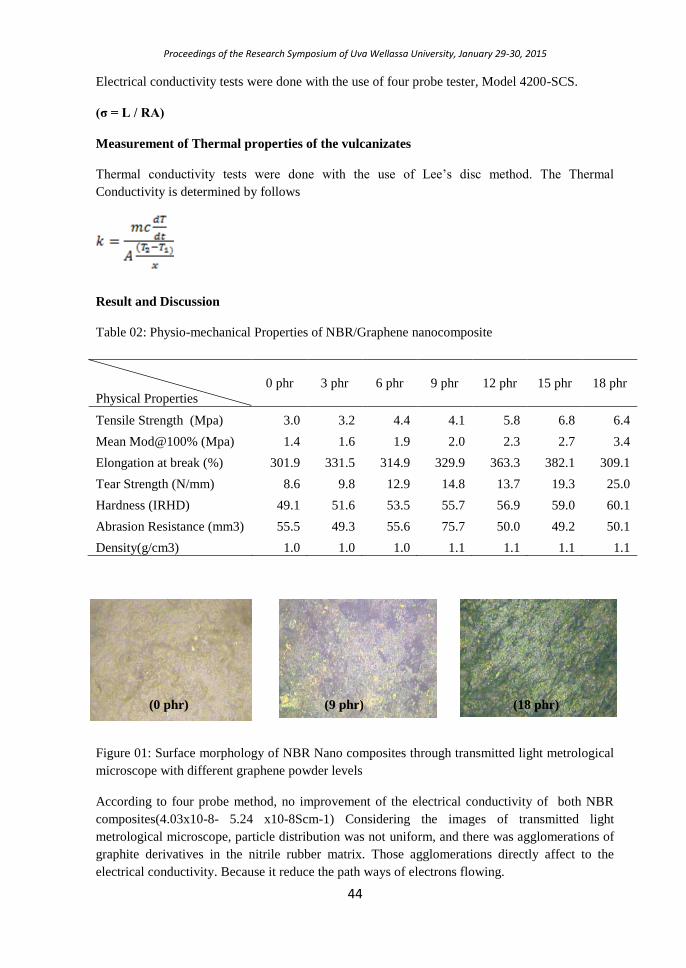
Proceedings of the Research Symposium of Uva Wellassa University, January 29-30, 2015
44
Electrical conductivity tests were done with the use of four probe tester, Model 4200-SCS.
(σ = L / RA)
Measurement of Thermal properties of the vulcanizates
Thermal conductivity tests were done with the use of Lee’s disc method. The Thermal
Conductivity is determined by follows
Result and Discussion
Table 02: Physio-mechanical Properties of NBR/Graphene nanocomposite
Physical Properties
0 phr 3 phr 6 phr 9 phr 12 phr 15 phr 18 phr
Tensile Strength (Mpa) 3.0 3.2 4.4 4.1 5.8 6.8 6.4
Mean Mod@100% (Mpa) 1.4 1.6 1.9 2.0 2.3 2.7 3.4
Elongation at break (%) 301.9 331.5 314.9 329.9 363.3 382.1 309.1
Tear Strength (N/mm) 8.6 9.8 12.9 14.8 13.7 19.3 25.0
Hardness (IRHD) 49.1 51.6 53.5 55.7 56.9 59.0 60.1
Abrasion Resistance (mm3) 55.5 49.3 55.6 75.7 50.0 49.2 50.1
Density(g/cm3) 1.0 1.0 1.0 1.1 1.1 1.1 1.1
(0 phr) (9 phr) (18 phr)
Figure 01: Surface morphology of NBR Nano composites through transmitted light metrological
microscope with different graphene powder levels
According to four probe method, no improvement of the electrical conductivity of both NBR
composites(4.03x10⁻⁸- 5.24 x10⁻⁸Scm-1) Considering the images of transmitted light
metrological microscope, particle distribution was not uniform, and there was agglomerations of
graphite derivatives in the nitrile rubber matrix. Those agglomerations directly affect to the
electrical conductivity. Because it reduce the path ways of electrons flowing.
Proceedings of the Research Symposium of Uva Wellassa University, January 29-30, 2015
45
Thermal conductivity of NBR/graphene Nano composite was higher than that NBR/graphite
composite. But there was no better improvement to the nitrile rubber. According to literature, the
key problem is the scattering of phonons at the interface of the dissimilar phases, the
imperfection of particle/particle contacts, may responsible to the observed effects. Usually better
results are achieved, if micro- and nano-fillers are combined, where the inter-particle polymer
layers may be bridged over by nano-particles. (Minha et al, 2013)
Conclusions
Effect of graphite and graphene powder content on physical properties of NBR composite and
Nano composites was studied. Overall results show that graphene filled Nano composites
exhibited higher mechanical properties than graphite filled NBR composites.
Effect of graphite and graphene powder content on electrical conductivity of NBR composite and
nanocomposites were studied. According to the results there was no any better improvement of
electrical conductivity of graphite derivatives filled nitrile rubber compounds.
Results clearly demonstrated that thermal conductivity of NBR compound was not largely
improved. Uneven dispersion of graphite derivatives through the NBR rubber matrix directly
affect to the poor improvement of thermal conductivity.
Acknowledgements
Laboratory facilities provided by the Rubber research institute, ratmalana and Moratuwa
University are acknowledged.
References
Minha, S., Lae Lee a, H., Sung-Goo, L., Gak Kim a, B., Kim a, Y.S., Wona, J.C., Choi b, W.J.,
Lee, D.C., Kim d, J., Yoo, Y. (2013) 'Thermal conductivity of graphite filled liquid crystal
polymer composites and theoretical predictions', Composites Science and Technology, pp. 113–
119
46
Optimization the physical properties of carbon black filled tread
compound by replacement with silica
W.P.M.D.A Perera, A.G.A.W Alakolanga, A.N.Weerawansha
Faculty of Animal Science and Export Agriculture, Uva Wellassa University of Sri Lanka
and
S. Kularathna Loadstar (Pvt) Ltd. Gampaha road, Ekala, Sri Lanka
Introduction In tire industry, carbon black (CB) is a widely used filler all over the world (Studebaker, 1965). Being a product made out of petroleum, there would be scarcity issue with the time, if continue to use in which it is being used today. It is a high time to look at feasibility of replacing CB with an alternative such as silica partially/fully as a solution for foreseen scarcity. Compared to CB, there won’t be scarcity as due to the fact it is made out of quartz (SiO2) which is readily available in earth crust. In this research, an attempt has been made to study the feasibility to go for possible replacement with silica while meeting the physical property requirement of a tread compound.
Methodology The current study was carried out at Loadstar (Pvt) Ltd, Ekala. This study was conducted as two
separate experiments. In experiment I, optimum CB/Silica combination which gives overall physical properties was evaluated. Five tread compounds were prepared. Each compound has the
same ingredient except filler amount. Total filler amount was kept constant at 50 phr level. Carbon black and powder silica was varied in the ranged from 0 to 50 phr level to prepare the
tread compounds with different CB/Silica ratios. Weight of all ingredients in the recipes was in
units of per hundred rubbers. Batch weight was 1100 kg. Compound without silica was treated as the reference compound. The compounds were named as Si0, Si15, Si25, Si35 and Si50 to
indicate the amount of silica incorporated in the compounds. Silane was added when
incorporation of silica as 1 phr of Silane for 8 phr of silica as the coupling agent. Experiment II was carried out to find out the effective silica type in order to optimize the physical properties.
Better treatment combination from the experiment I was selected and it has been treated with three silica types (Powder silica, Hi-sil 243 and New-sil 155). Physical properties such as: tensile
strength, tearing, abrasion resistance, 300 % modulus, elongation at break, hardness and rebound
resilience and cure characteristics were measured in both experiments. Four replicates were used for each test. Data was analyzed with one way ANOVA using Minitab 16 statistical software and
mean comparison was done using Tukey test. Results and Discussion According to the previous studies it shows that the increasing silica loading tends to increase in
the cure time (t90) and scorch time (ts2) of the rubber vulcanizates (Okel and Waddell, 1994). These properties have increased with increasing silica. At 15 phr level of silica, it tends to reduce the scorch protection. This can be due to the insufficient coupling of silane with silica during compounding. Higher processing safety obtained as silica loading high due to formation of

47
1
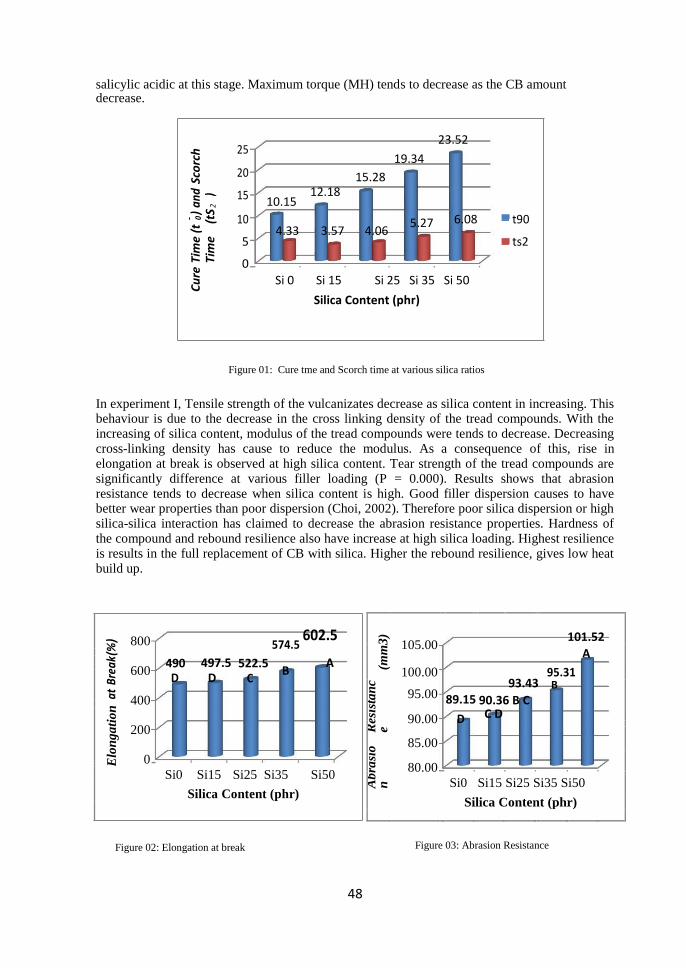
48
salicylic acidic at this stage. Maximum torque (MH) tends to decrease as the CB amount decrease.
Sco
rch
and
)
2
) (t
S
9 0
Tim
e (t
Ti
me
Cu
re
25 23.52
19.34
20
15.28
15 12.18
10.15
10
5.27 6.08
t90
4.33 3.57 4.06
5
ts2
0
Si 0
Si 15
Si 25 Si 35 Si 50
Silica Content (phr)
Figure 01: Cure tme and Scorch time at various silica ratios
In experiment I, Tensile strength of the vulcanizates decrease as silica content in increasing. This behaviour is due to the decrease in the cross linking density of the tread compounds. With the increasing of silica content, modulus of the tread compounds were tends to decrease. Decreasing cross-linking density has cause to reduce the modulus. As a consequence of this, rise in elongation at break is observed at high silica content. Tear strength of the tread compounds are significantly difference at various filler loading (P = 0.000). Results shows that abrasion resistance tends to decrease when silica content is high. Good filler dispersion causes to have better wear properties than poor dispersion (Choi, 2002). Therefore poor silica dispersion or high silica-silica interaction has claimed to decrease the abrasion resistance properties. Hardness of the compound and rebound resilience also have increase at high silica loading. Highest resilience is results in the full replacement of CB with silica. Higher the rebound resilience, gives low heat build up.
(%) 800 574.5
602.5
Bre
ak
600 490 497.5 522.5
B A
D D C
at
400
Elo
ng
ati
on
200
0
Si0 Si15 Si25 Si35 Si50
Silica Content (phr)
Figure 02: Elongation at break
(mm
3)
105.00 101.52
A
100.00 93.43
95.31
Res
ista
nc
e
95.00 B
89.15 90.36 B C
90.00 D C D
85.00
Ab
rasi
on
80.00
Si0 Si15 Si25 Si35 Si50
Silica Content (phr)
Figure 03: Abrasion Resistance
Proceedings of the Research Symposium of Uva Wellassa University, January 29-30, 2015
49
In experiment II, 25 phr of CB and 25 phr of silica treatment combination was treated with three silica type. Results reveal that tensile strength, tearing, abrasion resistance, 300 % modulus, hardness and rebound resilience show significant difference as P-values are less than ∞ according to one-way ANOVA. Apart from these physical properties, elongation at break do not show significant difference.
Table 01: Physical properties of CB 25/ Si 25 compound at different Silica type
Properties Powder silica Hi-sil 243 New-sil 155
Tensile strength 238.19 237.01 231.03 Tearing 64.66 62.81 67.33 Modulus 300% 110.47 109.69 102.86 Elongation 522 513.75 510 Abrasion resistance 93.43 103.39 93.86 Rebound resilience 47 48.50 49.75 Hardness 65.25 64.25 61.75
Conclusions
As CB and silica has two different chemistry, this replacement result both failure and improved properties. Partial silica replacement is better than the full replacement to this tread formulation. It can be concluded that vulcanizate having 25 phr of CB and 25 phr of silica better overall mechanical properties. Hi sil 243 is the effective silica type compare to other studied silica.
References
Choi, S., Changwoon, N., Seung, G. L., Chang, W. J. (2003). Effect of Filler- Filler Interaction on Rheological Behavior of Natural Rubber Compound filled with both Carbon Black and Silica, Vol 52, p 23-28
Choi, S. (2002). Journal Appl. Polym. Sci., 83, 2609
Okel, T. A., Waddell, W. H. (1994). Rubber Chem. Technol, 67, 217
Rattanasom, N., Saowapark, T., Deeprasertkul, C. (2007). Reinforcement of natural rubber with silica/carbon black hybrid filler, Polymer Testing 26, 369-377
Studebaker, M., (1965). Compounding with carbon black. In: Kraus, G. (Ed.), Reinforcement of Elastomers. Interscience Pulishers, New York
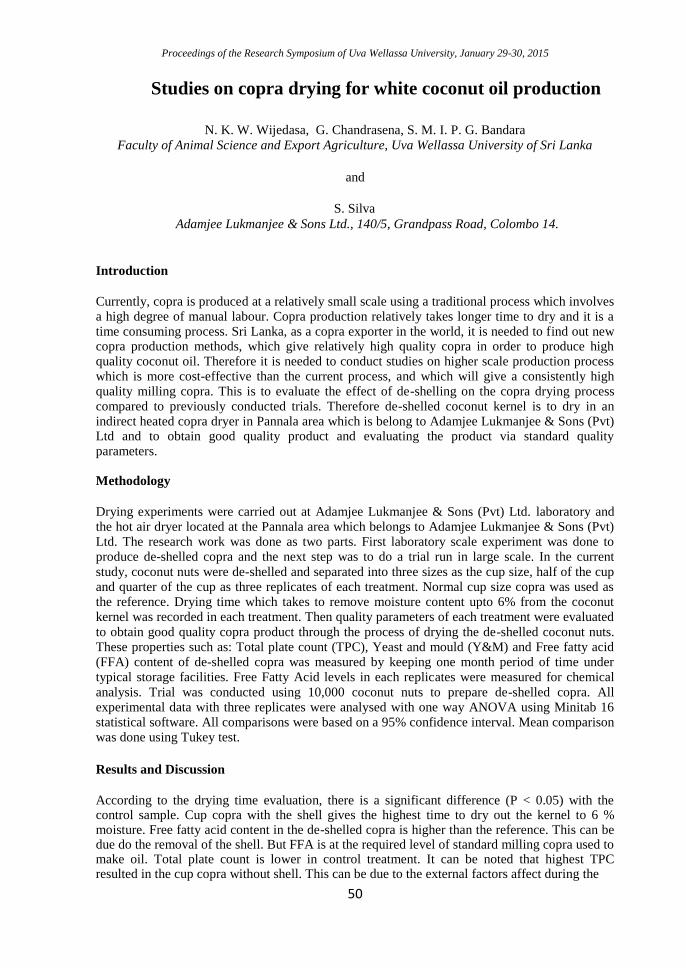
Proceedings of the Research Symposium of Uva Wellassa University, January 29-30, 2015
50
Studies on copra drying for white coconut oil production
N. K. W. Wijedasa, G. Chandrasena, S. M. I. P. G. Bandara
Faculty of Animal Science and Export Agriculture, Uva Wellassa University of Sri Lanka
and
S. Silva Adamjee Lukmanjee & Sons Ltd., 140/5, Grandpass Road, Colombo 14.
Introduction Currently, copra is produced at a relatively small scale using a traditional process which involves a high degree of manual labour. Copra production relatively takes longer time to dry and it is a time consuming process. Sri Lanka, as a copra exporter in the world, it is needed to find out new copra production methods, which give relatively high quality copra in order to produce high quality coconut oil. Therefore it is needed to conduct studies on higher scale production process which is more cost-effective than the current process, and which will give a consistently high quality milling copra. This is to evaluate the effect of de-shelling on the copra drying process compared to previously conducted trials. Therefore de-shelled coconut kernel is to dry in an indirect heated copra dryer in Pannala area which is belong to Adamjee Lukmanjee & Sons (Pvt) Ltd and to obtain good quality product and evaluating the product via standard quality parameters. Methodology Drying experiments were carried out at Adamjee Lukmanjee & Sons (Pvt) Ltd. laboratory and the hot air dryer located at the Pannala area which belongs to Adamjee Lukmanjee & Sons (Pvt) Ltd. The research work was done as two parts. First laboratory scale experiment was done to produce de-shelled copra and the next step was to do a trial run in large scale. In the current
study, coconut nuts were de-shelled and separated into three sizes as the cup size, half of the cup and quarter of the cup as three replicates of each treatment. Normal cup size copra was used as the reference. Drying time which takes to remove moisture content upto 6% from the coconut kernel was recorded in each treatment. Then quality parameters of each treatment were evaluated
to obtain good quality copra product through the process of drying the de-shelled coconut nuts. These properties such as: Total plate count (TPC), Yeast and mould (Y&M) and Free fatty acid (FFA) content of de-shelled copra was measured by keeping one month period of time under typical storage facilities. Free Fatty Acid levels in each replicates were measured for chemical
analysis. Trial was conducted using 10,000 coconut nuts to prepare de-shelled copra. All experimental data with three replicates were analysed with one way ANOVA using Minitab 16 statistical software. All comparisons were based on a 95% confidence interval. Mean comparison was done using Tukey test. Results and Discussion According to the drying time evaluation, there is a significant difference (P < 0.05) with the control sample. Cup copra with the shell gives the highest time to dry out the kernel to 6 % moisture. Free fatty acid content in the de-shelled copra is higher than the reference. This can be due do the removal of the shell. But FFA is at the required level of standard milling copra used to make oil. Total plate count is lower in control treatment. It can be noted that highest TPC resulted in the cup copra without shell. This can be due to the external factors affect during the
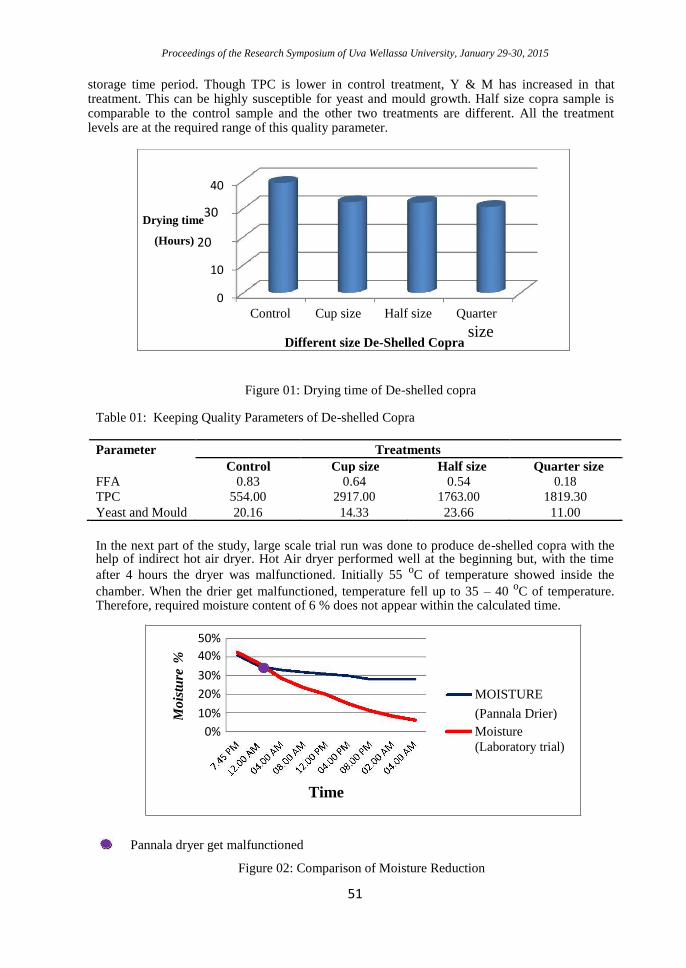
Proceedings of the Research Symposium of Uva Wellassa University, January 29-30, 2015
51
storage time period. Though TPC is lower in control treatment, Y & M has increased in that treatment. This can be highly susceptible for yeast and mould growth. Half size copra sample is comparable to the control sample and the other two treatments are different. All the treatment levels are at the required range of this quality parameter.
40
Drying time30
(Hours) 20
10
0 Control Cup size Half size Quarter
Different size De-Shelled Copra size
Figure 01: Drying time of De-shelled copra
Table 01: Keeping Quality Parameters of De-shelled Copra Parameter Treatments
Control Cup size Half size Quarter size
FFA 0.83 0.64 0.54 0.18
TPC 554.00 2917.00 1763.00 1819.30
Yeast and Mould 20.16 14.33 23.66 11.00
In the next part of the study, large scale trial run was done to produce de-shelled copra with the help of indirect hot air dryer. Hot Air dryer performed well at the beginning but, with the time
after 4 hours the dryer was malfunctioned. Initially 55 oC of temperature showed inside the
chamber. When the drier get malfunctioned, temperature fell up to 35 – 40 oC of temperature.
Therefore, required moisture content of 6 % does not appear within the calculated time.
50%
%
40%
Mois
ture
30%
20% MOISTURE
10% (Pannala Drier)
0% Moisture
(Laboratory trial)
Time
Pannala dryer get malfunctioned
Figure 02: Comparison of Moisture Reduction
Proceedings of the Research Symposium of Uva Wellassa University, January 29-30, 2015
52
Conclusions These studies covers on advance test methods related to copra production. Instead of the conventional process of copra drying, new studies were carried out by using indirect heated hot air dryers. This method helps to produce copra within short period of time compare to conventional drying. Cup size of de-shelled copra is easy of processing and handling compare to other two sizes. References Head, S. W. (1991). Studies on the quality deterioration of copra. A Report for the Project 'UK-RP Reduction in Aflatoxin Contamination of Copra in the Philippines', Philippine Coconut Authority, Quezon City. Marikkar, J. M. N., Banu, M. K. I., Yalegama, C. (2009). Evaluation of the modified-ceylon copra kiln for accelerated production of ball copra, International Food Research Journal 16: 175-181. Nathanael, W. R. N. (1965). Some Aspects of Copra Deterioration. Ceylon Cocon. Quart. 16, 111-120. Nathanael, W. R. N. (1966). Moisture and other quality features in copra. Ceylon coconut quarterly, 17 1-41.
Proceedings of the Research Symposium of Uva Wellassa University, January 29-30, 2015
53
Study of later separation time duration of coconut milk in storage
tanks during coconut milk powder production
K. D. M. L Ranasinghe, W. A. J. P. Wijesinghe,
Faculty of Animal science and Export Agriculture, Uva Wellassa University of Sri Lanka
L.L.W.C. Yalegama
Coconut Processing Division, Coconut Research Institute, Lunuwila
and
K.J. Gamage
Nestle Lanka plc., Kurunegala Factory, Kurunegala
Introduction
Coconut milk is a milky fluid obtained by manual or mechanical extraction of fresh coconut kernel
with or without addition of water. It is a white, opaque protein-oil-water emulsion and essentially
free from fiber. Coconut milk powder is a preservation method for coconut milk and also coconut
milk powder substitute for coconut milk. In coconut milk powder production, coconut milk store in
milk tanks during storage coconut milk destabilize and separate in to layers (cream phase, fat phase
and aqueous phase). This layer separation adversely affect to the quality of the spray dried coconut
milk powder. Therefore coconut milk layer separation in storage tanks is a major problem in the
production of spray dried coconut milk powder. To overcome this problem some modification of
the processing line were studied in the present work.
Methodology
Effect of homogenization and use of a stabilizer prior to storage were tested. Sodium Caseinate was
used as emulsifier. To find out optimum Sodium Caseinate percentage five different Sodium
Caseinate percentages were used (0.5%, 1.0%, 1.5%, 2.0%, and 2.5%). With those percentages
coconut milk homogenized and stored for 24 hours and separation heights were measured. Quality
of the coconut milk powder was compared with the existing production line. All spray dried
samples were tested for fat and moisture.
Results and Discussion
According to the results of this experiment the “p” value of pH was 0.215 (0.05 < 0.215). There
was no significantly different between pH values of coconut milk treated by different percentages
of Sodium Caseinate. The “p” value of separation height of coconut milk was 0.000 (0.05 > 0.000).
There is a significantly differences between pH values of coconut milk. Separation height of T1 and
T2 were significantly different from T2, T3, T4 and T5. T1 and T2 also significantly different from
each other. T3, T4, and T5 were not significantly different each other and mean value of T3, T4 and
T5 were 0.000. There were no separation T3, T4 and T5. Reason was T3, T4, and T5 were treated
with Sodium Caseinate and homogenized. (T1, T2, T3, T4, T5 all are different treatment levels)
Table 01: Different Treatments
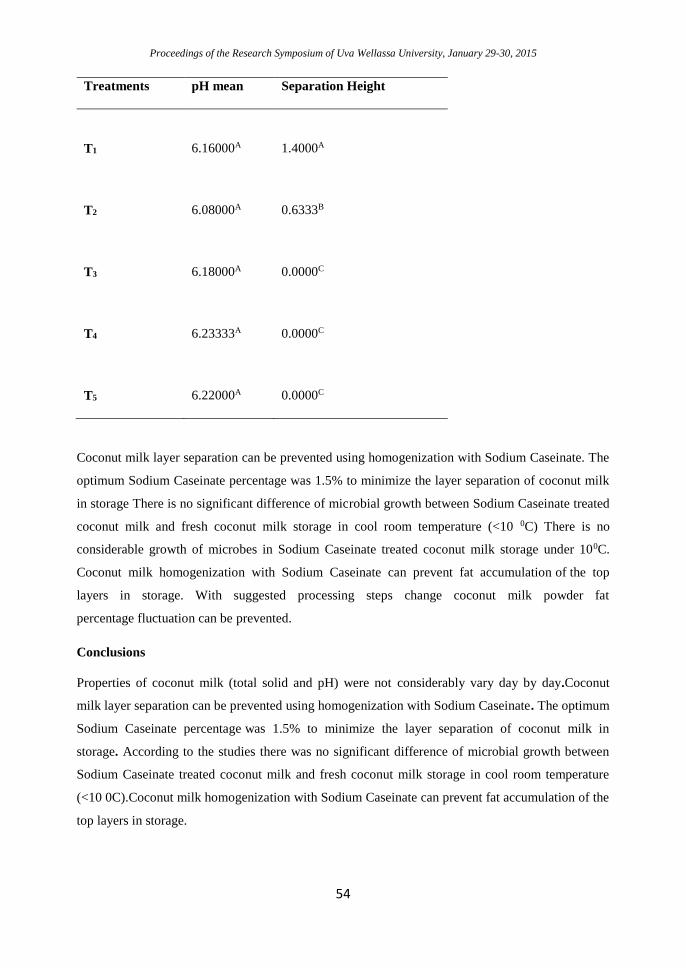
Proceedings of the Research Symposium of Uva Wellassa University, January 29-30, 2015
54
Treatments pH mean Separation Height
T1
6.16000A
1.4000A
T2
6.08000A
0.6333B
T3
6.18000A
0.0000C
T4
6.23333A
0.0000C
T5
6.22000A
0.0000C
Coconut milk layer separation can be prevented using homogenization with Sodium Caseinate. The
optimum Sodium Caseinate percentage was 1.5% to minimize the layer separation of coconut milk
in storage There is no significant difference of microbial growth between Sodium Caseinate treated
coconut milk and fresh coconut milk storage in cool room temperature (<10 0C) There is no
considerable growth of microbes in Sodium Caseinate treated coconut milk storage under 100C.
Coconut milk homogenization with Sodium Caseinate can prevent fat accumulation of the top
layers in storage. With suggested processing steps change coconut milk powder fat
percentage fluctuation can be prevented.
Conclusions
Properties of coconut milk (total solid and pH) were not considerably vary day by day.Coconut
milk layer separation can be prevented using homogenization with Sodium Caseinate. The optimum
Sodium Caseinate percentage was 1.5% to minimize the layer separation of coconut milk in
storage. According to the studies there was no significant difference of microbial growth between
Sodium Caseinate treated coconut milk and fresh coconut milk storage in cool room temperature
(<10 0C).Coconut milk homogenization with Sodium Caseinate can prevent fat accumulation of the
top layers in storage.

Proceedings of the Research Symposium of Uva Wellassa University, January 29-30, 2015
55
References
Abbas, K. A. (2010). The Significance of Glass Transition Temperature in Processing of Selected
Fried Food Products: A Review. Modern Applied Science. 4 (5), 2-5.
Gonzalez, O. N. (1991) Coconut milk.Philippine Journal of Coconut Studies, 56(2): 47-55.
Hassan, M. A. (1985). Production of Spray-Dried Coconut Milk Powder.Pertanika. 8(1) (2), 127-
130.
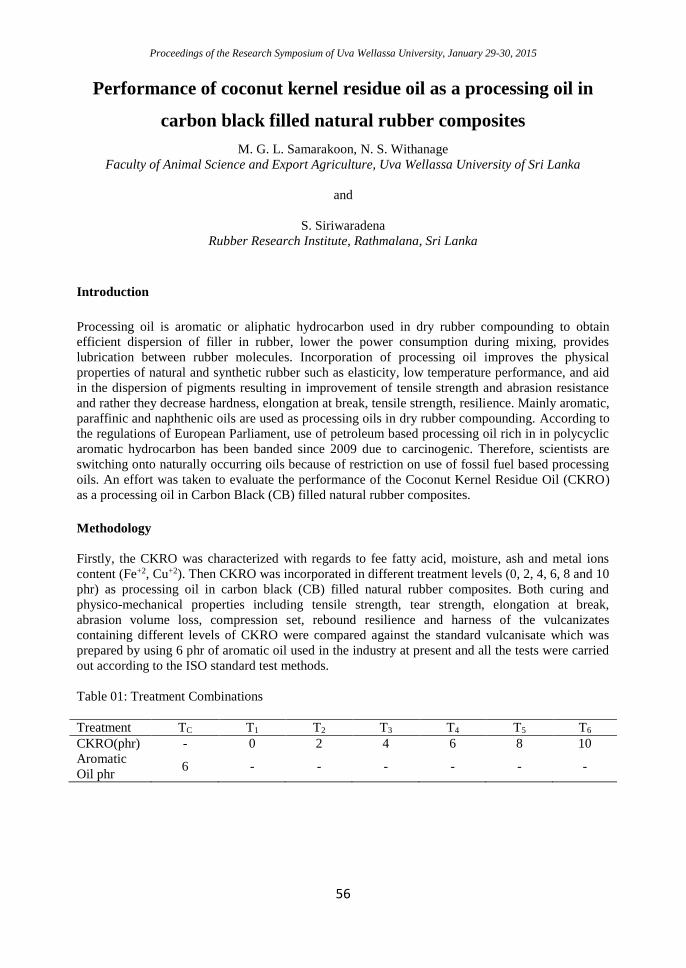
Proceedings of the Research Symposium of Uva Wellassa University, January 29-30, 2015
56
Performance of coconut kernel residue oil as a processing oil in
carbon black filled natural rubber composites
M. G. L. Samarakoon, N. S. Withanage
Faculty of Animal Science and Export Agriculture, Uva Wellassa University of Sri Lanka
and
S. Siriwaradena
Rubber Research Institute, Rathmalana, Sri Lanka
Introduction
Processing oil is aromatic or aliphatic hydrocarbon used in dry rubber compounding to obtain
efficient dispersion of filler in rubber, lower the power consumption during mixing, provides
lubrication between rubber molecules. Incorporation of processing oil improves the physical
properties of natural and synthetic rubber such as elasticity, low temperature performance, and aid
in the dispersion of pigments resulting in improvement of tensile strength and abrasion resistance
and rather they decrease hardness, elongation at break, tensile strength, resilience. Mainly aromatic,
paraffinic and naphthenic oils are used as processing oils in dry rubber compounding. According to
the regulations of European Parliament, use of petroleum based processing oil rich in in polycyclic
aromatic hydrocarbon has been banded since 2009 due to carcinogenic. Therefore, scientists are
switching onto naturally occurring oils because of restriction on use of fossil fuel based processing
oils. An effort was taken to evaluate the performance of the Coconut Kernel Residue Oil (CKRO)
as a processing oil in Carbon Black (CB) filled natural rubber composites.
Methodology
Firstly, the CKRO was characterized with regards to fee fatty acid, moisture, ash and metal ions
content (Fe+2, Cu+2). Then CKRO was incorporated in different treatment levels (0, 2, 4, 6, 8 and 10
phr) as processing oil in carbon black (CB) filled natural rubber composites. Both curing and
physico-mechanical properties including tensile strength, tear strength, elongation at break,
abrasion volume loss, compression set, rebound resilience and harness of the vulcanizates
containing different levels of CKRO were compared against the standard vulcanisate which was
prepared by using 6 phr of aromatic oil used in the industry at present and all the tests were carried
out according to the ISO standard test methods.
Table 01: Treatment Combinations
Treatment TC T1 T2 T3 T4 T5 T6
CKRO(phr) - 0 2 4 6 8 10
Aromatic
Oil phr 6 - - - - - -
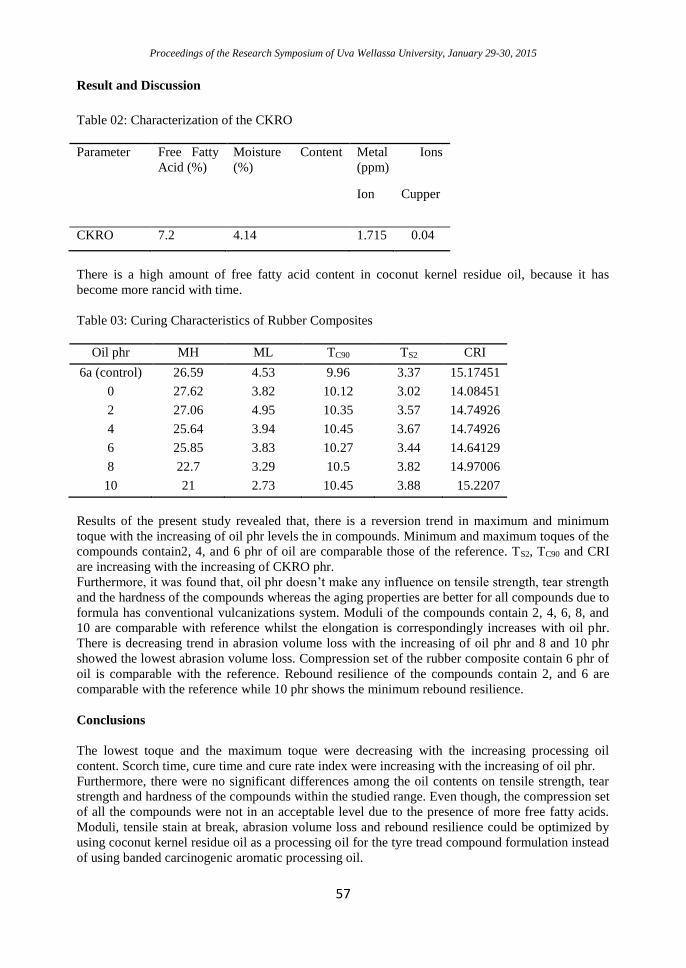
Proceedings of the Research Symposium of Uva Wellassa University, January 29-30, 2015
57
Result and Discussion
Table 02: Characterization of the CKRO
Parameter Free Fatty
Acid (%)
Moisture Content
(%)
Metal Ions
(ppm)
Ion Cupper
CKRO 7.2 4.14 1.715 0.04
There is a high amount of free fatty acid content in coconut kernel residue oil, because it has
become more rancid with time.
Table 03: Curing Characteristics of Rubber Composites
Oil phr MH ML TC90 TS2 CRI
6a (control) 26.59 4.53 9.96 3.37 15.17451
0 27.62 3.82 10.12 3.02 14.08451
2 27.06 4.95 10.35 3.57 14.74926
4 25.64 3.94 10.45 3.67 14.74926
6 25.85 3.83 10.27 3.44 14.64129
8 22.7 3.29 10.5 3.82 14.97006
10 21 2.73 10.45 3.88 15.2207
Results of the present study revealed that, there is a reversion trend in maximum and minimum
toque with the increasing of oil phr levels the in compounds. Minimum and maximum toques of the
compounds contain2, 4, and 6 phr of oil are comparable those of the reference. TS2, TC90 and CRI
are increasing with the increasing of CKRO phr.
Furthermore, it was found that, oil phr doesn’t make any influence on tensile strength, tear strength
and the hardness of the compounds whereas the aging properties are better for all compounds due to
formula has conventional vulcanizations system. Moduli of the compounds contain 2, 4, 6, 8, and
10 are comparable with reference whilst the elongation is correspondingly increases with oil phr.
There is decreasing trend in abrasion volume loss with the increasing of oil phr and 8 and 10 phr
showed the lowest abrasion volume loss. Compression set of the rubber composite contain 6 phr of
oil is comparable with the reference. Rebound resilience of the compounds contain 2, and 6 are
comparable with the reference while 10 phr shows the minimum rebound resilience.
Conclusions
The lowest toque and the maximum toque were decreasing with the increasing processing oil
content. Scorch time, cure time and cure rate index were increasing with the increasing of oil phr.
Furthermore, there were no significant differences among the oil contents on tensile strength, tear
strength and hardness of the compounds within the studied range. Even though, the compression set
of all the compounds were not in an acceptable level due to the presence of more free fatty acids.
Moduli, tensile stain at break, abrasion volume loss and rebound resilience could be optimized by
using coconut kernel residue oil as a processing oil for the tyre tread compound formulation instead
of using banded carcinogenic aromatic processing oil.
Proceedings of the Research Symposium of Uva Wellassa University, January 29-30, 2015
58
Acknowledgements
Especially, I would like to express my heartfelt gratitude to Mr. Pradeep Fenando, Research and
Development Executive at Associated Motor Ways (PVT) Limited, Kaluthara South for facilitating
me to compound in their laboratory. Finally I express my sincere thanks to my parent and friends
who supported me in numerous ways to complete my research project successfully.
References
Blackly, D. C. (1997). Polymer lattices science and technology. 2nd edition, chapmen and hall,
London, pp. 34– 40.
Costa, H. M., Visconte, L. L. Y. and Nunes, R. C. R. (2004). ‘Rice husk ash filled natural rubber
compounds’, Int. J. Polymer. 475–497.
Dasgupta, S., Agrawal, S. L., Bandyopadhyay, S., Chakraborty, S., Mukhopadhyay, R., Malkani,
R.K. and Ameta, S.C. (2007). ‘Characterization of eco-friendly processing aids for rubber
compound’, Polymer Testing. 26(4): 489-500.
Datta, R. N. (2002). Rubber curing systems, Rapra review reports. 12(12): 3-32.
Edirisinghe, D. G., Karunanayake, L., Ganga, C. and Mahanama, M. K. (2011). Epoxidized
vegetable oils as processing aids and activators in carbon-black filled natural rubber compounds.
[Online]. Available at: http://www.sljol.info/index.php/JNSFSL/article/view/3628 html (Accessed
on: 19. April. 2014).
Karunanayake, L., Gamage, P. K. and O’Brien, M. (2009). Epoxidation of some vegetable oils and
their hydrolysed products with peroxyformic acid - optimised to industrial scale. [Online].
Available at:http://www.sljol.info/index.php/JNSFSL/article/view/1469html (Accessed:
20.April.2014).
Kundu, P. P. (2000). ‘Improvement of filler-rubber interaction by the coupling action of vegetable
oil in carbon black reinforced rubber’, Journal of Applied Polymer Science. 75(6): 735–739.
Nandanan, R. P., Sunil, V. and Kutty, K. N. (2007). A Study on the Use of Coconut Oil as
Plasticiser in Natural Rubber Compounds. [Online]. Available at:
http://dyuthi.cusat.ac.in/xmlui/handle/purl/891 html (Accessed: 18. April. 2014).
Subramanium, K. (2002). Fundamentals of Rubber Technology. Kumaran press, Colombo. pp. 82-
94.
Technical Session - Tea Technology and Value Addition
Table of Contents
Oral Session
Impact of good agricultural practices on technical efficiency of Tea small
holders ................................................................................................ 1
Factors affecting on tourists’ buying behavior of Ceylon Tea .................. 6
Determinants of Poverty in Tea Estate Workers in Nuwara Eliya District
......................................................................................................... 10
Remittance and investment of Tea small holders in Uva region ............. 14
Awareness and adoption of recommended technologies and management
practices by the Tea small holders ....................................................... 17
Analysis of factors affecting for Tea buyers’ level of trust on Tea brokers
......................................................................................................... 20
Development of Green Tea incorporated Ayurvedic toothpaste ............. 23
Effect of Black Tea adulteration on quality parameters of Black Tea ..... 26
Effect of thermal time on shoot growth and development of low grown Tea
[Camellia sinensis (L.) O. Kuntze] in Sri Lanka .................................... 29
Investigating the causes for poor control of Crassocephalum crepidioides
(Thandam pillu) weed by Glyphosate in the Uva region ........................ 34
Development of Tea incorporated Jackfruit ( Artocarpus heterophyllus
Lam ) cordial ..................................................................................... 37
Factors affecting the level of effectiveness of dryers used in Sri Lankan tea
manufacturing ................................................................................... 40
Effect of Tea bag materials on physical and chemical quality parameters
of Black Tea during storage ................................................................ 43
Development of a biscuit enriched with Tea polyphenols....................... 48
Development of Black Tea incorporated tomato sauce .......................... 51
Development of Green Tea incorporated instant herbal porridge mixture
......................................................................................................... 54
Effect of dolomite application on available phosphorus status in Tea soils
......................................................................................................... 57
Determinants of absenteeism in tea plantation workers (Case study in
selected tea estate in Badulla).............................................................. 60
Determinants of income diversification in Tea estates households in
Badulla district .................................................................................. 63
Investigating the Causes for Poor Control of Erigeron sumatrensis
(Alawangupillu) by Glyphosate in the Uva Region ................................ 66
Poster Session
Clientele satisfaction towards the services rendered by government to the
tea small holding sector ...................................................................... 70
Firewood energy utilization in different dryers used in Tea processing .. 74
Protocol for callus induction of Camellia japonica L. (Tea rose) ............. 77
Distribution and accumulation of selected heavy metals in Tea plants .... 83
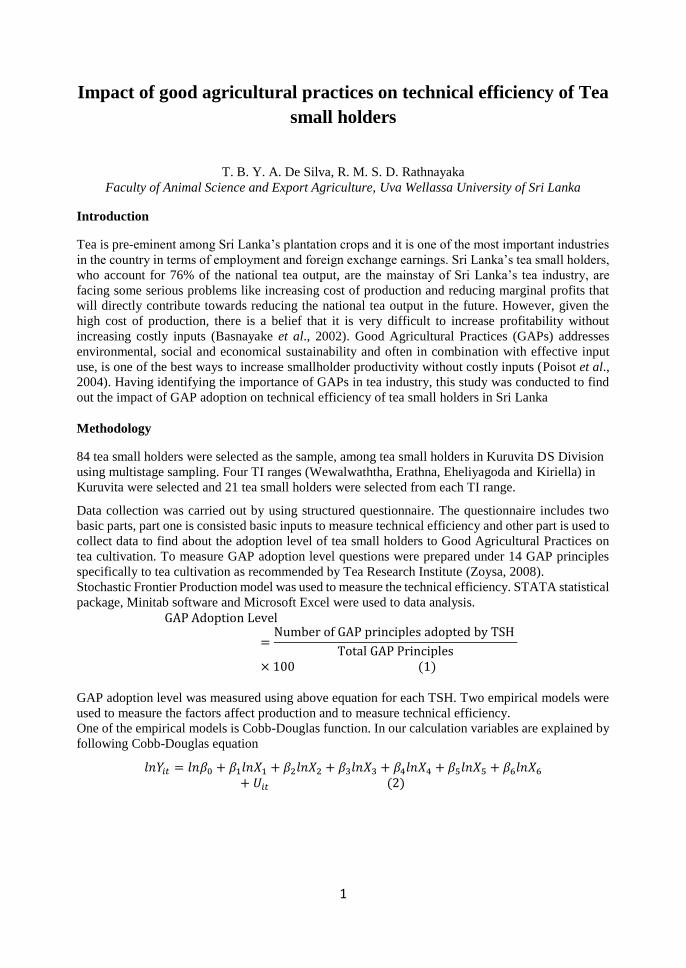
1
Impact of good agricultural practices on technical efficiency of Tea
small holders
T. B. Y. A. De Silva, R. M. S. D. Rathnayaka
Faculty of Animal Science and Export Agriculture, Uva Wellassa University of Sri Lanka
Introduction
Tea is pre-eminent among Sri Lanka’s plantation crops and it is one of the most important industries
in the country in terms of employment and foreign exchange earnings. Sri Lanka’s tea small holders,
who account for 76% of the national tea output, are the mainstay of Sri Lanka’s tea industry, are
facing some serious problems like increasing cost of production and reducing marginal profits that
will directly contribute towards reducing the national tea output in the future. However, given the
high cost of production, there is a belief that it is very difficult to increase profitability without
increasing costly inputs (Basnayake et al., 2002). Good Agricultural Practices (GAPs) addresses
environmental, social and economical sustainability and often in combination with effective input
use, is one of the best ways to increase smallholder productivity without costly inputs (Poisot et al.,
2004). Having identifying the importance of GAPs in tea industry, this study was conducted to find
out the impact of GAP adoption on technical efficiency of tea small holders in Sri Lanka
Methodology
84 tea small holders were selected as the sample, among tea small holders in Kuruvita DS Division
using multistage sampling. Four TI ranges (Wewalwaththa, Erathna, Eheliyagoda and Kiriella) in
Kuruvita were selected and 21 tea small holders were selected from each TI range.
Data collection was carried out by using structured questionnaire. The questionnaire includes two
basic parts, part one is consisted basic inputs to measure technical efficiency and other part is used to
collect data to find about the adoption level of tea small holders to Good Agricultural Practices on
tea cultivation. To measure GAP adoption level questions were prepared under 14 GAP principles
specifically to tea cultivation as recommended by Tea Research Institute (Zoysa, 2008).
Stochastic Frontier Production model was used to measure the technical efficiency. STATA statistical
package, Minitab software and Microsoft Excel were used to data analysis.
GAP Adoption Level
=Number of GAP principles adopted by TSH
Total GAP Principles
× 100 (1)
GAP adoption level was measured using above equation for each TSH. Two empirical models were
used to measure the factors affect production and to measure technical efficiency.
One of the empirical models is Cobb-Douglas function. In our calculation variables are explained by
following Cobb-Douglas equation
𝑙𝑛𝑌𝑖𝑡 = 𝑙𝑛𝛽0 + 𝛽1𝑙𝑛𝑋1 + 𝛽2𝑙𝑛𝑋2 + 𝛽3𝑙𝑛𝑋3 + 𝛽4𝑙𝑛𝑋4 + 𝛽5𝑙𝑛𝑋5 + 𝛽6𝑙𝑛𝑋6
+ 𝑈𝑖𝑡 (2)
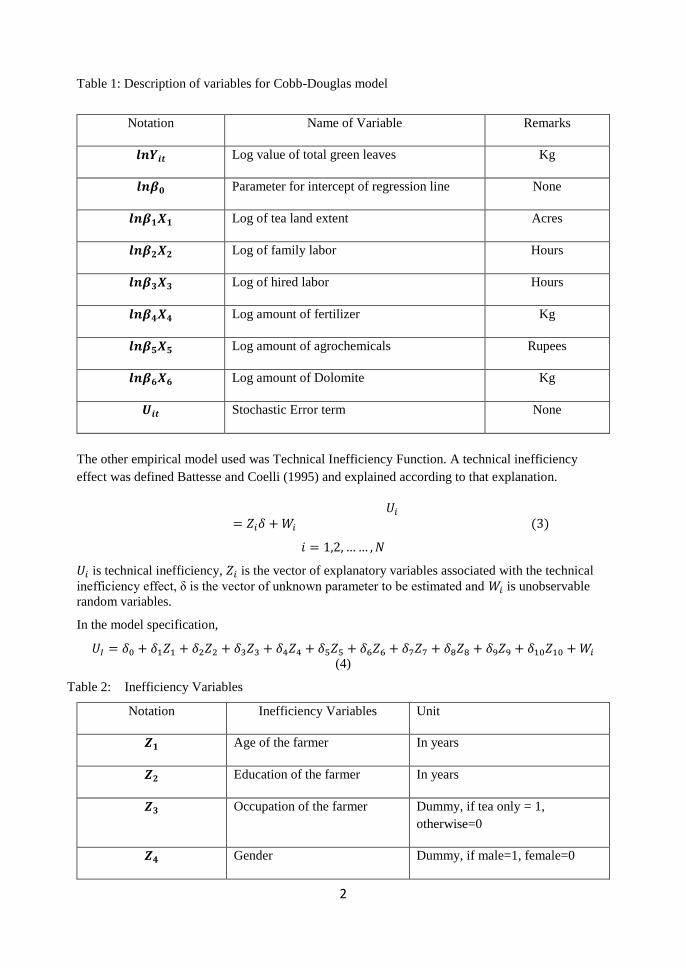
2
Table 1: Description of variables for Cobb-Douglas model
Notation Name of Variable Remarks
𝒍𝒏𝒀𝒊𝒕 Log value of total green leaves Kg
𝒍𝒏𝜷𝟎 Parameter for intercept of regression line None
𝒍𝒏𝜷𝟏𝑿𝟏 Log of tea land extent Acres
𝒍𝒏𝜷𝟐𝑿𝟐 Log of family labor Hours
𝒍𝒏𝜷𝟑𝑿𝟑 Log of hired labor Hours
𝒍𝒏𝜷𝟒𝑿𝟒 Log amount of fertilizer Kg
𝒍𝒏𝜷𝟓𝑿𝟓 Log amount of agrochemicals Rupees
𝒍𝒏𝜷𝟔𝑿𝟔 Log amount of Dolomite Kg
𝑼𝒊𝒕 Stochastic Error term None
The other empirical model used was Technical Inefficiency Function. A technical inefficiency
effect was defined Battesse and Coelli (1995) and explained according to that explanation.
𝑈𝑖
= 𝑍𝑖𝛿 + 𝑊𝑖 (3)
𝑖 = 1,2, … … , 𝑁
𝑈𝑖 is technical inefficiency, 𝑍𝑖 is the vector of explanatory variables associated with the technical
inefficiency effect, δ is the vector of unknown parameter to be estimated and 𝑊𝑖 is unobservable
random variables.
In the model specification,
𝑈𝐼 = 𝛿0 + 𝛿1𝑍1 + 𝛿2𝑍2 + 𝛿3𝑍3 + 𝛿4𝑍4 + 𝛿5𝑍5 + 𝛿6𝑍6 + 𝛿7𝑍7 + 𝛿8𝑍8 + 𝛿9𝑍9 + 𝛿10𝑍10 + 𝑊𝑖
(4)
Table 2: Inefficiency Variables
Notation Inefficiency Variables Unit
𝒁𝟏 Age of the farmer In years
𝒁𝟐 Education of the farmer In years
𝒁𝟑 Occupation of the farmer Dummy, if tea only = 1,
otherwise=0
𝒁𝟒 Gender Dummy, if male=1, female=0
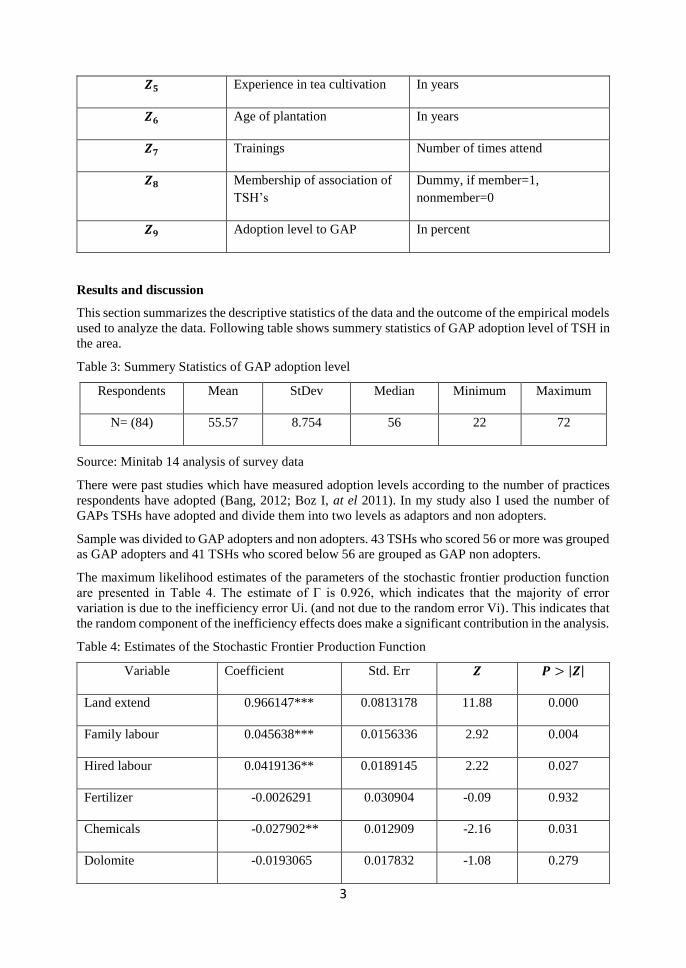
3
𝒁𝟓 Experience in tea cultivation In years
𝒁𝟔 Age of plantation In years
𝒁𝟕 Trainings Number of times attend
𝒁𝟖 Membership of association of
TSH’s
Dummy, if member=1,
nonmember=0
𝒁𝟗 Adoption level to GAP In percent
Results and discussion
This section summarizes the descriptive statistics of the data and the outcome of the empirical models
used to analyze the data. Following table shows summery statistics of GAP adoption level of TSH in
the area.
Table 3: Summery Statistics of GAP adoption level
Respondents Mean StDev Median Minimum Maximum
N= (84) 55.57 8.754 56 22 72
Source: Minitab 14 analysis of survey data
There were past studies which have measured adoption levels according to the number of practices
respondents have adopted (Bang, 2012; Boz I, at el 2011). In my study also I used the number of
GAPs TSHs have adopted and divide them into two levels as adaptors and non adopters.
Sample was divided to GAP adopters and non adopters. 43 TSHs who scored 56 or more was grouped
as GAP adopters and 41 TSHs who scored below 56 are grouped as GAP non adopters.
The maximum likelihood estimates of the parameters of the stochastic frontier production function
are presented in Table 4. The estimate of Γ is 0.926, which indicates that the majority of error
variation is due to the inefficiency error Ui. (and not due to the random error Vi). This indicates that
the random component of the inefficiency effects does make a significant contribution in the analysis.
Table 4: Estimates of the Stochastic Frontier Production Function
Variable Coefficient Std. Err 𝒁 𝑷 > |𝒁|
Land extend 0.966147*** 0.0813178 11.88 0.000
Family labour 0.045638*** 0.0156336 2.92 0.004
Hired labour 0.0419136** 0.0189145 2.22 0.027
Fertilizer -0.0026291 0.030904 -0.09 0.932
Chemicals -0.027902** 0.012909 -2.16 0.031
Dolomite -0.0193065 0.017832 -1.08 0.279
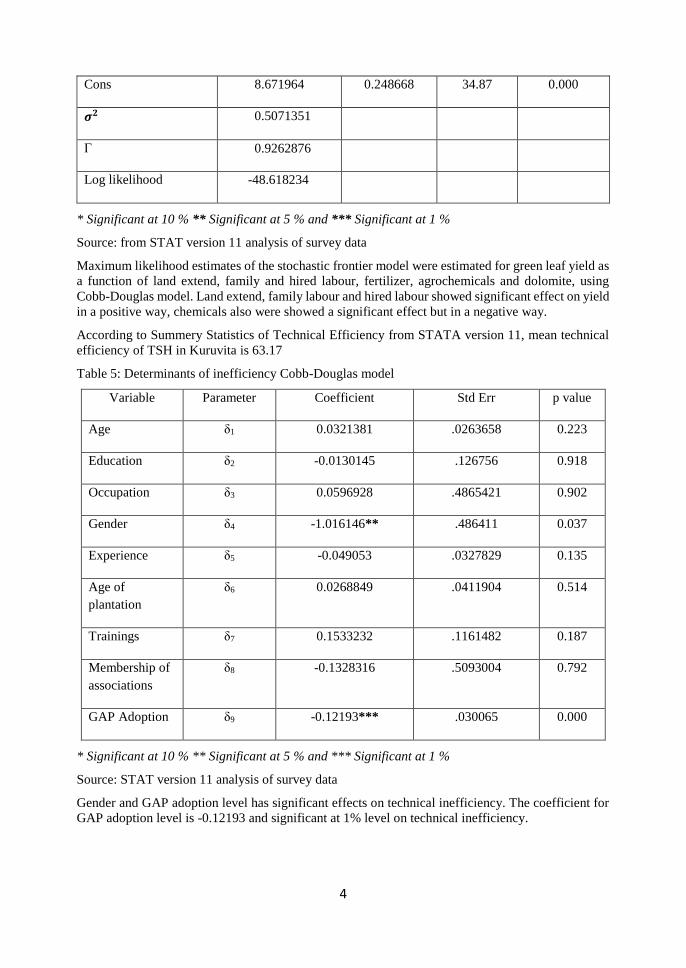
4
Cons 8.671964 0.248668 34.87 0.000
𝝈𝟐 0.5071351
Γ 0.9262876
Log likelihood -48.618234
* Significant at 10 % ** Significant at 5 % and *** Significant at 1 %
Source: from STAT version 11 analysis of survey data
Maximum likelihood estimates of the stochastic frontier model were estimated for green leaf yield as
a function of land extend, family and hired labour, fertilizer, agrochemicals and dolomite, using
Cobb-Douglas model. Land extend, family labour and hired labour showed significant effect on yield
in a positive way, chemicals also were showed a significant effect but in a negative way.
According to Summery Statistics of Technical Efficiency from STATA version 11, mean technical
efficiency of TSH in Kuruvita is 63.17
Table 5: Determinants of inefficiency Cobb-Douglas model
Variable Parameter Coefficient Std Err p value
Age δ1 0.0321381 .0263658 0.223
Education δ2 -0.0130145 .126756 0.918
Occupation δ3 0.0596928 .4865421 0.902
Gender δ4 -1.016146** .486411 0.037
Experience δ5 -0.049053 .0327829 0.135
Age of
plantation
δ6 0.0268849 .0411904 0.514
Trainings δ7 0.1533232 .1161482 0.187
Membership of
associations
δ8 -0.1328316 .5093004 0.792
GAP Adoption δ9 -0.12193*** .030065 0.000
* Significant at 10 % ** Significant at 5 % and *** Significant at 1 %
Source: STAT version 11 analysis of survey data
Gender and GAP adoption level has significant effects on technical inefficiency. The coefficient for
GAP adoption level is -0.12193 and significant at 1% level on technical inefficiency.
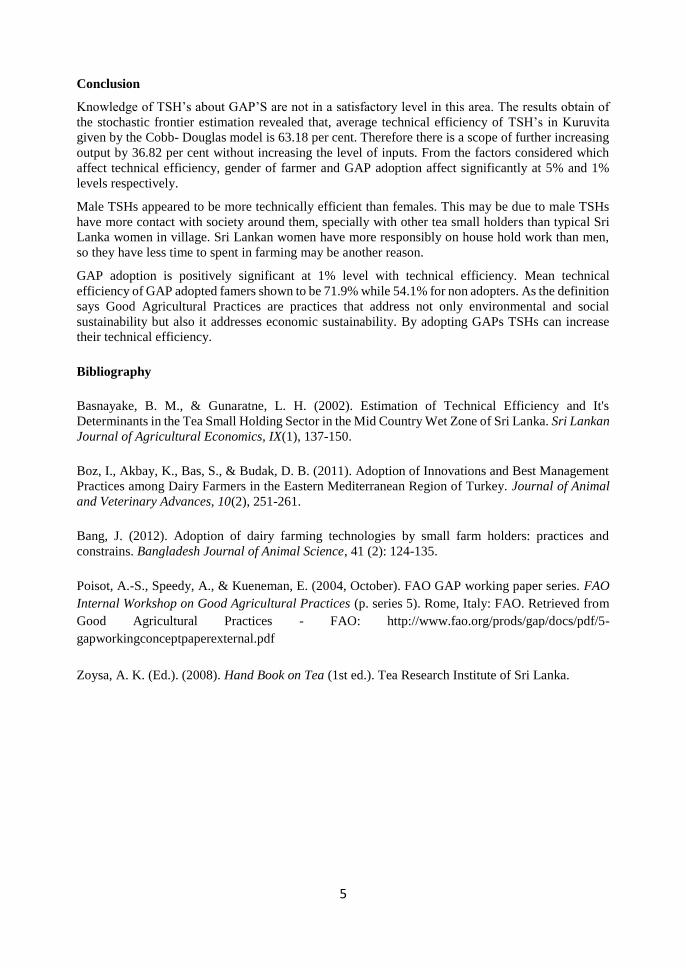
5
Conclusion
Knowledge of TSH’s about GAP’S are not in a satisfactory level in this area. The results obtain of
the stochastic frontier estimation revealed that, average technical efficiency of TSH’s in Kuruvita
given by the Cobb- Douglas model is 63.18 per cent. Therefore there is a scope of further increasing
output by 36.82 per cent without increasing the level of inputs. From the factors considered which
affect technical efficiency, gender of farmer and GAP adoption affect significantly at 5% and 1%
levels respectively.
Male TSHs appeared to be more technically efficient than females. This may be due to male TSHs
have more contact with society around them, specially with other tea small holders than typical Sri
Lanka women in village. Sri Lankan women have more responsibly on house hold work than men,
so they have less time to spent in farming may be another reason.
GAP adoption is positively significant at 1% level with technical efficiency. Mean technical
efficiency of GAP adopted famers shown to be 71.9% while 54.1% for non adopters. As the definition
says Good Agricultural Practices are practices that address not only environmental and social
sustainability but also it addresses economic sustainability. By adopting GAPs TSHs can increase
their technical efficiency.
Bibliography
Basnayake, B. M., & Gunaratne, L. H. (2002). Estimation of Technical Efficiency and It's
Determinants in the Tea Small Holding Sector in the Mid Country Wet Zone of Sri Lanka. Sri Lankan
Journal of Agricultural Economics, IX(1), 137-150.
Boz, I., Akbay, K., Bas, S., & Budak, D. B. (2011). Adoption of Innovations and Best Management
Practices among Dairy Farmers in the Eastern Mediterranean Region of Turkey. Journal of Animal
and Veterinary Advances, 10(2), 251-261.
Bang, J. (2012). Adoption of dairy farming technologies by small farm holders: practices and
constrains. Bangladesh Journal of Animal Science, 41 (2): 124-135.
Poisot, A.-S., Speedy, A., & Kueneman, E. (2004, October). FAO GAP working paper series. FAO
Internal Workshop on Good Agricultural Practices (p. series 5). Rome, Italy: FAO. Retrieved from
Good Agricultural Practices - FAO: http://www.fao.org/prods/gap/docs/pdf/5-
gapworkingconceptpaperexternal.pdf
Zoysa, A. K. (Ed.). (2008). Hand Book on Tea (1st ed.). Tea Research Institute of Sri Lanka.
6
Factors affecting on tourists’ buying behavior of Ceylon Tea
M. N. C. Mudhannayake, M. G. P. P. Mahindarathne
Faculty of Animal Science and Export Agriculture, Uva Wellassa University of Sri Lanka
Introduction
Worldwide tea production and consumption have increased over the past decades. According to
statistics provided by the Sri Lanka Tea Board, Sri Lanka is the 3rd largest exporter and the 4th largest
producer of tea in the world (Sri Lanka Tea Board 2011). However, Sri Lanka still continues to retain
its position as the main source of orthodox black tea in the world with the image of Ceylon tea
enhanced by its unique specialty character.
Meanwhile, Sri Lanka is one of very attractive destinations among the tourists all over the world. Sri
Lanka Tourism has boomed to a new milestone of one million arrivals in 2012, which is an all-time
high figure in the history of the country (Sri Lanka Tourism Development Authority 2012). Ceylon
tea attracted a whole new group of customers who were traditionally non-customers in the industry.
Times are fast changing, and the people are no longer looking for the cheapest beverages. They are
moving away from low quality tea to a quality product. With this background Ceylon tea is being
popular among tourists coming to Sri Lanka.
The local value added tea market is led by multinational players and small holders. All of these brands
cater to low and middle income category consumers, who purchase tea for value for money. In
addition to these players, there are plenty of small time cottage tea players who sell unbranded/loose
tea (Prematunga 2009). Merely a few brands are targeting this consumer segment currently. Such
brands also have no idea about tourists buying behavior of Ceylon tea.
Consumer buying behavior has been always of great interest to marketers. The knowledge of
consumer behavior helps the marketer to understand how consumers think, feel and select from
alternatives like products and brands and how the consumers are influenced by their environment,
the reference groups, family, and salespersons and so on. The consumer’s buying behavior is
influenced by many factors. Most of these factors are uncontrollable and beyond the hands of
marketers. An important marketing implication is that there is a growing demand to understand
tourists’ buying behavior in Sri Lanka. Particularly in the context of Ceylon tea this is sort of
significant. Understanding the tourists’ buying behavior of Ceylon tea is truly significant to the
increment of sales and it functions as an indirect communication tool as well. However, despite its
obvious importance, there appears to be a serious lack of formal understanding of tourists’ buying
behavior by both academics and practitioners. Thus, there is an immediate need of systematic
research and scientific understanding of this topic.
Methodology
Data were collected through a survey by giving a structured questionnaire to 160 tourists who bought
Ceylon tea from three tea centers located in Kandy district. Judgment sampling technique was used
to select Kandy as the location of the study since it is one of the major tourist destinations in Sri
Lanka. Further, Kandy is known as the most famous city among tourist for Ceylon tea. Among all
the identified tea outlets in Kandy district, four tea centers were selected using random sample
method. Data was collected from consumers on the basis of first come, first served (FCFS).
Primary data was collected through a self-administered questionnaire among the tourist consumers
of Ceylon tea. The questionnaire was consisted of three sections. Section 01 was consisted questions
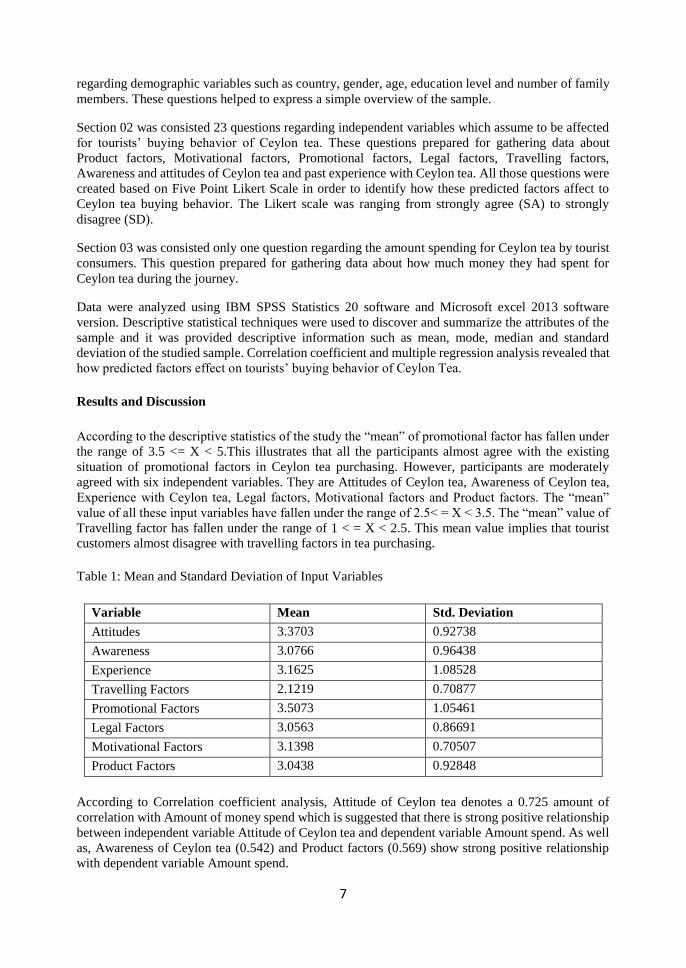
7
regarding demographic variables such as country, gender, age, education level and number of family
members. These questions helped to express a simple overview of the sample.
Section 02 was consisted 23 questions regarding independent variables which assume to be affected
for tourists’ buying behavior of Ceylon tea. These questions prepared for gathering data about
Product factors, Motivational factors, Promotional factors, Legal factors, Travelling factors,
Awareness and attitudes of Ceylon tea and past experience with Ceylon tea. All those questions were
created based on Five Point Likert Scale in order to identify how these predicted factors affect to
Ceylon tea buying behavior. The Likert scale was ranging from strongly agree (SA) to strongly
disagree (SD).
Section 03 was consisted only one question regarding the amount spending for Ceylon tea by tourist
consumers. This question prepared for gathering data about how much money they had spent for
Ceylon tea during the journey.
Data were analyzed using IBM SPSS Statistics 20 software and Microsoft excel 2013 software
version. Descriptive statistical techniques were used to discover and summarize the attributes of the
sample and it was provided descriptive information such as mean, mode, median and standard
deviation of the studied sample. Correlation coefficient and multiple regression analysis revealed that
how predicted factors effect on tourists’ buying behavior of Ceylon Tea.
Results and Discussion
According to the descriptive statistics of the study the “mean” of promotional factor has fallen under
the range of 3.5 <= X < 5.This illustrates that all the participants almost agree with the existing
situation of promotional factors in Ceylon tea purchasing. However, participants are moderately
agreed with six independent variables. They are Attitudes of Ceylon tea, Awareness of Ceylon tea,
Experience with Ceylon tea, Legal factors, Motivational factors and Product factors. The “mean”
value of all these input variables have fallen under the range of 2.5< = X < 3.5. The “mean” value of
Travelling factor has fallen under the range of 1 < = X < 2.5. This mean value implies that tourist
customers almost disagree with travelling factors in tea purchasing.
Table 1: Mean and Standard Deviation of Input Variables
Variable Mean Std. Deviation
Attitudes 3.3703 0.92738
Awareness 3.0766 0.96438
Experience 3.1625 1.08528
Travelling Factors 2.1219 0.70877
Promotional Factors 3.5073 1.05461
Legal Factors 3.0563 0.86691
Motivational Factors 3.1398 0.70507
Product Factors 3.0438 0.92848
According to Correlation coefficient analysis, Attitude of Ceylon tea denotes a 0.725 amount of
correlation with Amount of money spend which is suggested that there is strong positive relationship
between independent variable Attitude of Ceylon tea and dependent variable Amount spend. As well
as, Awareness of Ceylon tea (0.542) and Product factors (0.569) show strong positive relationship
with dependent variable Amount spend.
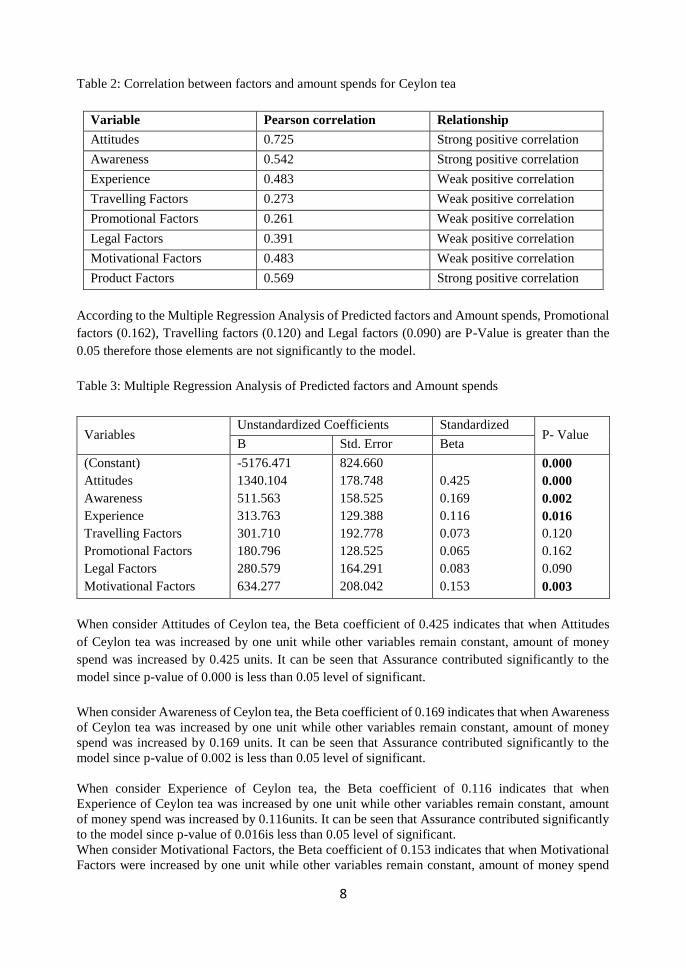
8
Table 2: Correlation between factors and amount spends for Ceylon tea
Variable Pearson correlation Relationship
Attitudes 0.725 Strong positive correlation
Awareness 0.542 Strong positive correlation
Experience 0.483 Weak positive correlation
Travelling Factors 0.273 Weak positive correlation
Promotional Factors 0.261 Weak positive correlation
Legal Factors 0.391 Weak positive correlation
Motivational Factors 0.483 Weak positive correlation
Product Factors 0.569 Strong positive correlation
According to the Multiple Regression Analysis of Predicted factors and Amount spends, Promotional
factors (0.162), Travelling factors (0.120) and Legal factors (0.090) are P-Value is greater than the
0.05 therefore those elements are not significantly to the model.
Table 3: Multiple Regression Analysis of Predicted factors and Amount spends
When consider Attitudes of Ceylon tea, the Beta coefficient of 0.425 indicates that when Attitudes
of Ceylon tea was increased by one unit while other variables remain constant, amount of money
spend was increased by 0.425 units. It can be seen that Assurance contributed significantly to the
model since p-value of 0.000 is less than 0.05 level of significant.
When consider Awareness of Ceylon tea, the Beta coefficient of 0.169 indicates that when Awareness
of Ceylon tea was increased by one unit while other variables remain constant, amount of money
spend was increased by 0.169 units. It can be seen that Assurance contributed significantly to the
model since p-value of 0.002 is less than 0.05 level of significant.
When consider Experience of Ceylon tea, the Beta coefficient of 0.116 indicates that when
Experience of Ceylon tea was increased by one unit while other variables remain constant, amount
of money spend was increased by 0.116units. It can be seen that Assurance contributed significantly
to the model since p-value of 0.016is less than 0.05 level of significant.
When consider Motivational Factors, the Beta coefficient of 0.153 indicates that when Motivational
Factors were increased by one unit while other variables remain constant, amount of money spend
Variables Unstandardized Coefficients Standardized
Coefficients P- Value
B Std. Error Beta
(Constant)
Attitudes
Awareness
Experience
Travelling Factors
Promotional Factors
Legal Factors
Motivational Factors
Product Factors
-5176.471
1340.104
511.563
313.763
301.710
180.796
280.579
634.277
629.754
824.660
178.748
158.525
129.388
192.778
128.525
164.291
208.042
166.259
0.425
0.169
0.116
0.073
0.065
0.083
0.153
0.200
0.000
0.000
0.002
0.016
0.120
0.162
0.090
0.003
0.000
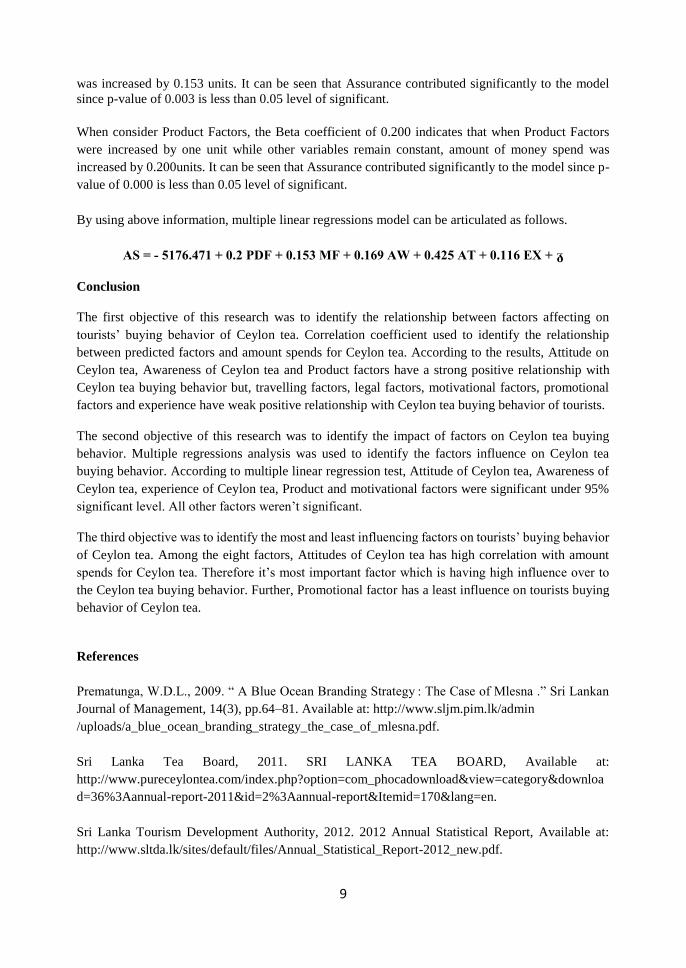
9
was increased by 0.153 units. It can be seen that Assurance contributed significantly to the model
since p-value of 0.003 is less than 0.05 level of significant.
When consider Product Factors, the Beta coefficient of 0.200 indicates that when Product Factors
were increased by one unit while other variables remain constant, amount of money spend was
increased by 0.200units. It can be seen that Assurance contributed significantly to the model since p-
value of 0.000 is less than 0.05 level of significant.
By using above information, multiple linear regressions model can be articulated as follows.
AS = - 5176.471 + 0.2 PDF + 0.153 MF + 0.169 AW + 0.425 AT + 0.116 EX + ᵹ
Conclusion
The first objective of this research was to identify the relationship between factors affecting on
tourists’ buying behavior of Ceylon tea. Correlation coefficient used to identify the relationship
between predicted factors and amount spends for Ceylon tea. According to the results, Attitude on
Ceylon tea, Awareness of Ceylon tea and Product factors have a strong positive relationship with
Ceylon tea buying behavior but, travelling factors, legal factors, motivational factors, promotional
factors and experience have weak positive relationship with Ceylon tea buying behavior of tourists.
The second objective of this research was to identify the impact of factors on Ceylon tea buying
behavior. Multiple regressions analysis was used to identify the factors influence on Ceylon tea
buying behavior. According to multiple linear regression test, Attitude of Ceylon tea, Awareness of
Ceylon tea, experience of Ceylon tea, Product and motivational factors were significant under 95%
significant level. All other factors weren’t significant.
The third objective was to identify the most and least influencing factors on tourists’ buying behavior
of Ceylon tea. Among the eight factors, Attitudes of Ceylon tea has high correlation with amount
spends for Ceylon tea. Therefore it’s most important factor which is having high influence over to
the Ceylon tea buying behavior. Further, Promotional factor has a least influence on tourists buying
behavior of Ceylon tea.
References
Prematunga, W.D.L., 2009. “ A Blue Ocean Branding Strategy : The Case of Mlesna .” Sri Lankan
Journal of Management, 14(3), pp.64–81. Available at: http://www.sljm.pim.lk/admin
/uploads/a_blue_ocean_branding_strategy_the_case_of_mlesna.pdf.
Sri Lanka Tea Board, 2011. SRI LANKA TEA BOARD, Available at:
http://www.pureceylontea.com/index.php?option=com_phocadownload&view=category&downloa
d=36%3Aannual-report-2011&id=2%3Aannual-report&Itemid=170&lang=en.
Sri Lanka Tourism Development Authority, 2012. 2012 Annual Statistical Report, Available at:
http://www.sltda.lk/sites/default/files/Annual_Statistical_Report-2012_new.pdf.
10
Determinants of Poverty in Tea Estate Workers in Nuwara Eliya
District
K. M. D. L. Wijerathne, R. A. P. I. S. Dharmadasa
Faculty of Animal Science and Export Agriculture, Uva Wellassa University of Sri Lanka
and
H. W. Shyamalie, B. M. N. C. Karunarathna and H. M. C. G. Pilapitiya
Tea Research Institute, Talawakelle, Sri Lanka
Introduction
As a developing country, poverty is a major issue in Sri Lanka. The poverty or poor is expressed as
lack of access to basic human needs, including food, safe drinking water, sanitation facilities, health,
shelter, education etc. The poverty line specifies the minimum standard of living condition in the
society to which everybody should be entitled. However, income level and other facilities available
to people in the different sectors may vary. Also, the household living standard has a strong
relationship with the poverty of the people. NuwaraEliya district is one of the major tea growing areas
in Sri Lanka. Of the total population in NuwaraEliya district (706,588), 53.6 % of the population is
belonged to estate sector (Central Bank, 2013). Knowing the socio-economic factors which affect to
poverty in estate sector is vital to find the strategies for improving their living conditions. Therefore,
this study attempts to identify the determinants of poverty in estate sector. The results of the study
will be useful to make policies and suggestions to improve their living conditions of estate workers
in NuwaraEliya district.
Methodology
The present study was conducted in tea growing locations of NuwaraEliya district. There are five
District Secretariat (DS) divisions in NuwaraEliya District and of them, NuwaraEliya DS division
was purposely selected for the study, since the highest estate population is recorded in this DS
division (Central Bank, 2013). Multi stage sampling method was used for the selection of tea estates
and systematic sampling technique was used to select the respondents. Out of seventy two
GramaNiladari divisions, four GramaNiladari divisions were randomly selected. An estate was
randomly selected from each selected GramaNiladhari division. Fifty workers were selected from
each estate for the survey and total sample size was 200 estate workers. Primary data relating to
various parameters of socio - economic status were gathered through well designed and pre tested
questionnaire. The secondary information was collected from various published/unpublished sources.
Tabular and regression techniques were employed to analyse the data. Binary Logistic regression
model was employed to identify the determinants of poverty.
A poverty level (poor or non - poor) was decided by using the real per capita expenditure as a cut off
point corresponding to Sri Lanka Official Poverty Line (OPL) Rs. 3924 in 2014 August (Department
of Censes and Statistic, 2014).
The Binary Logistic regression model could be expressed as
Y = β0
+ β1
X1 + β2
X2 + β3
X3 + β4
X4 + β5
X5 + β6
X6 + β7
X7 + β8
X8 + β9X9 + β
10X10 + ε
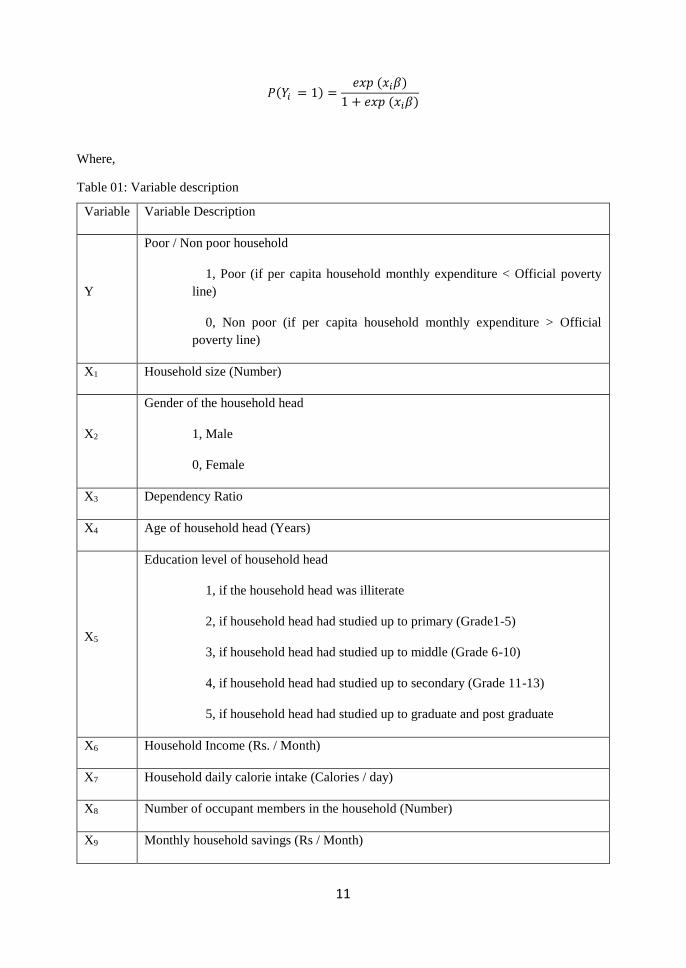
11
𝑃(𝑌𝑖 = 1) =𝑒𝑥𝑝 (𝑥𝑖𝛽)
1 + 𝑒𝑥𝑝 (𝑥𝑖𝛽)
Where,
Table 01: Variable description
Variable Variable Description
Y
Poor / Non poor household
1, Poor (if per capita household monthly expenditure < Official poverty
line)
0, Non poor (if per capita household monthly expenditure > Official
poverty line)
X1 Household size (Number)
X2
Gender of the household head
1, Male
0, Female
X3 Dependency Ratio
X4 Age of household head (Years)
X5
Education level of household head
1, if the household head was illiterate
2, if household head had studied up to primary (Grade1-5)
3, if household head had studied up to middle (Grade 6-10)
4, if household head had studied up to secondary (Grade 11-13)
5, if household head had studied up to graduate and post graduate
X6 Household Income (Rs. / Month)
X7 Household daily calorie intake (Calories / day)
X8 Number of occupant members in the household (Number)
X9 Monthly household savings (Rs / Month)
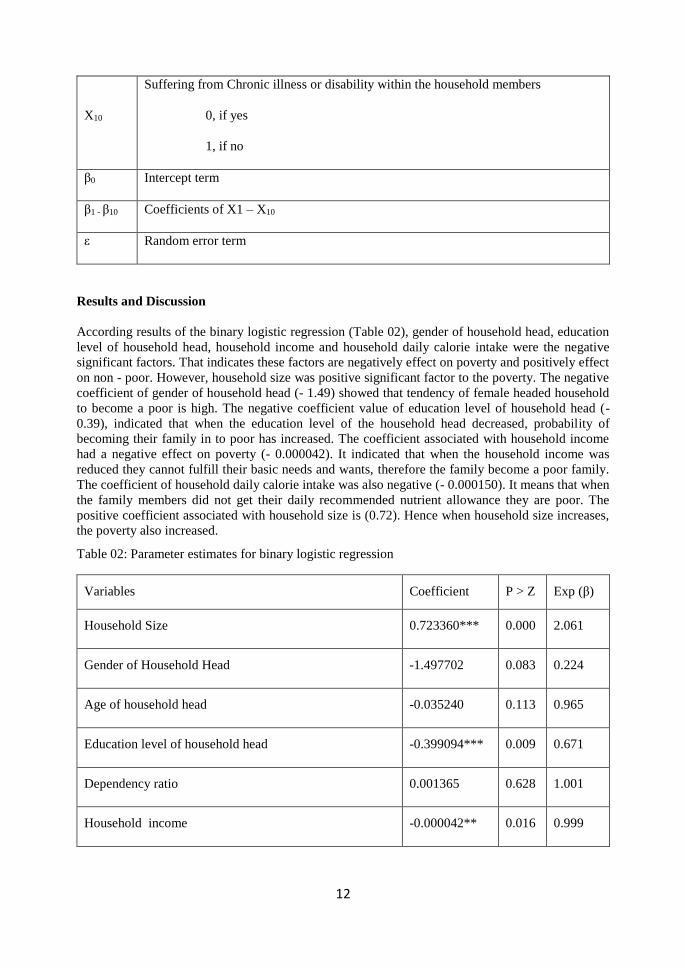
12
X10
Suffering from Chronic illness or disability within the household members
0, if yes
1, if no
β0 Intercept term
β1 - β10 Coefficients of X1 – X10
ε Random error term
Results and Discussion
According results of the binary logistic regression (Table 02), gender of household head, education
level of household head, household income and household daily calorie intake were the negative
significant factors. That indicates these factors are negatively effect on poverty and positively effect
on non - poor. However, household size was positive significant factor to the poverty. The negative
coefficient of gender of household head (- 1.49) showed that tendency of female headed household
to become a poor is high. The negative coefficient value of education level of household head (-
0.39), indicated that when the education level of the household head decreased, probability of
becoming their family in to poor has increased. The coefficient associated with household income
had a negative effect on poverty (- 0.000042). It indicated that when the household income was
reduced they cannot fulfill their basic needs and wants, therefore the family become a poor family.
The coefficient of household daily calorie intake was also negative (- 0.000150). It means that when
the family members did not get their daily recommended nutrient allowance they are poor. The
positive coefficient associated with household size is (0.72). Hence when household size increases,
the poverty also increased.
Table 02: Parameter estimates for binary logistic regression
Variables Coefficient P > Z Exp (β)
Household Size 0.723360*** 0.000 2.061
Gender of Household Head -1.497702 0.083 0.224
Age of household head -0.035240 0.113 0.965
Education level of household head -0.399094*** 0.009 0.671
Dependency ratio 0.001365 0.628 1.001
Household income -0.000042** 0.016 0.999
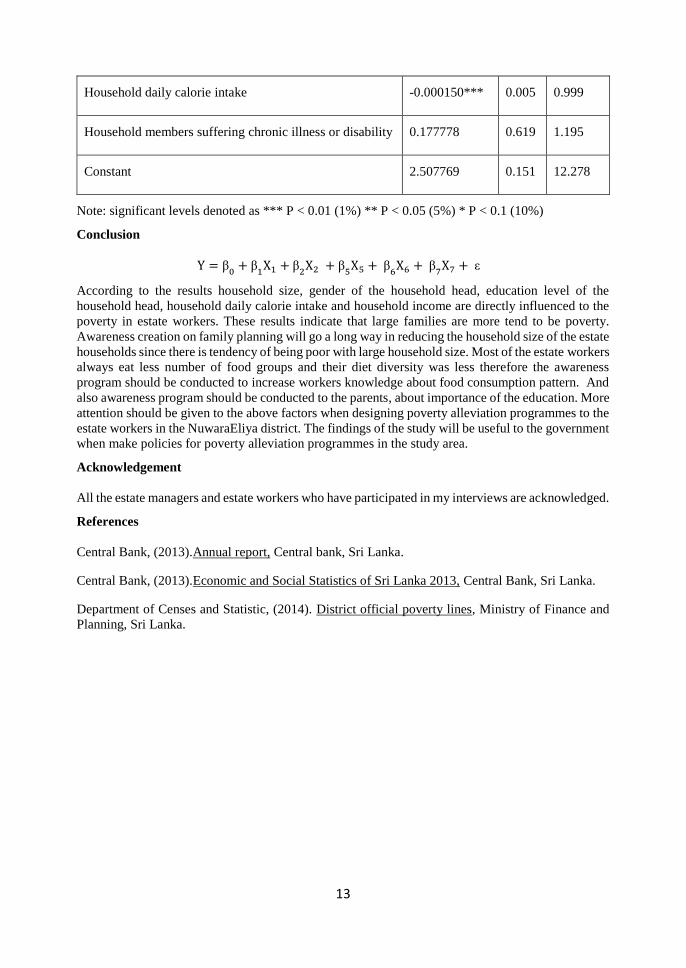
13
Household daily calorie intake -0.000150*** 0.005 0.999
Household members suffering chronic illness or disability 0.177778 0.619 1.195
Constant 2.507769 0.151 12.278
Note: significant levels denoted as *** P < 0.01 (1%) ** P < 0.05 (5%) * P < 0.1 (10%)
Conclusion
Y = β0
+ β1
X1 + β2
X2 + β5
X5 + β6
X6 + β7
X7 + ε
According to the results household size, gender of the household head, education level of the
household head, household daily calorie intake and household income are directly influenced to the
poverty in estate workers. These results indicate that large families are more tend to be poverty.
Awareness creation on family planning will go a long way in reducing the household size of the estate
households since there is tendency of being poor with large household size. Most of the estate workers
always eat less number of food groups and their diet diversity was less therefore the awareness
program should be conducted to increase workers knowledge about food consumption pattern. And
also awareness program should be conducted to the parents, about importance of the education. More
attention should be given to the above factors when designing poverty alleviation programmes to the
estate workers in the NuwaraEliya district. The findings of the study will be useful to the government
when make policies for poverty alleviation programmes in the study area.
Acknowledgement
All the estate managers and estate workers who have participated in my interviews are acknowledged.
References
Central Bank, (2013).Annual report, Central bank, Sri Lanka.
Central Bank, (2013).Economic and Social Statistics of Sri Lanka 2013, Central Bank, Sri Lanka.
Department of Censes and Statistic, (2014). District official poverty lines, Ministry of Finance and
Planning, Sri Lanka.
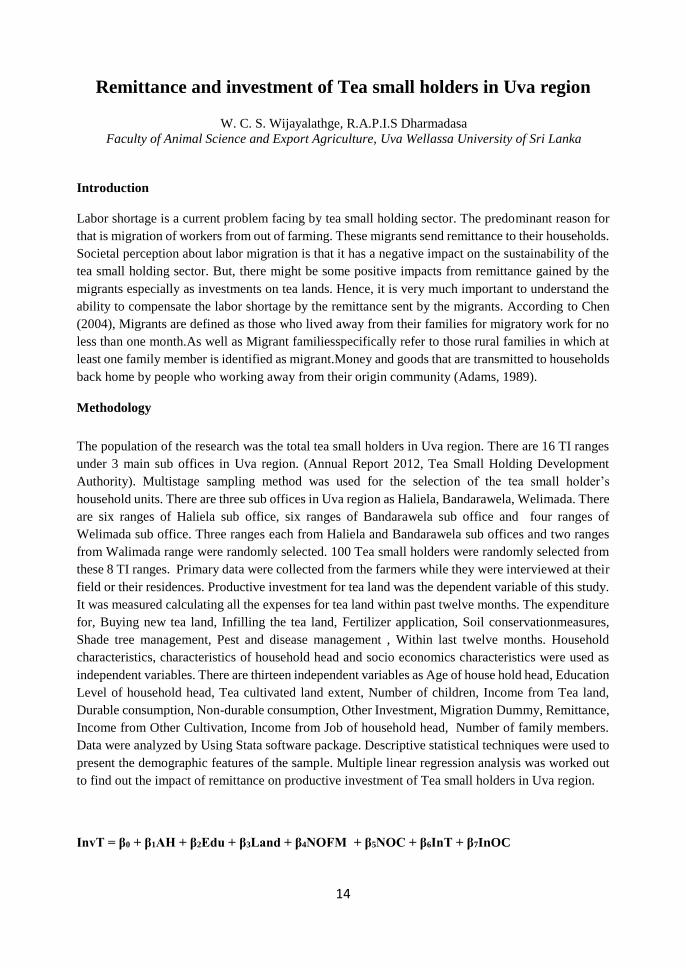
14
Remittance and investment of Tea small holders in Uva region
W. C. S. Wijayalathge, R.A.P.I.S Dharmadasa
Faculty of Animal Science and Export Agriculture, Uva Wellassa University of Sri Lanka
Introduction
Labor shortage is a current problem facing by tea small holding sector. The predominant reason for
that is migration of workers from out of farming. These migrants send remittance to their households.
Societal perception about labor migration is that it has a negative impact on the sustainability of the
tea small holding sector. But, there might be some positive impacts from remittance gained by the
migrants especially as investments on tea lands. Hence, it is very much important to understand the
ability to compensate the labor shortage by the remittance sent by the migrants. According to Chen
(2004), Migrants are defined as those who lived away from their families for migratory work for no
less than one month.As well as Migrant familiesspecifically refer to those rural families in which at
least one family member is identified as migrant.Money and goods that are transmitted to households
back home by people who working away from their origin community (Adams, 1989).
Methodology
The population of the research was the total tea small holders in Uva region. There are 16 TI ranges
under 3 main sub offices in Uva region. (Annual Report 2012, Tea Small Holding Development
Authority). Multistage sampling method was used for the selection of the tea small holder’s
household units. There are three sub offices in Uva region as Haliela, Bandarawela, Welimada. There
are six ranges of Haliela sub office, six ranges of Bandarawela sub office and four ranges of
Welimada sub office. Three ranges each from Haliela and Bandarawela sub offices and two ranges
from Walimada range were randomly selected. 100 Tea small holders were randomly selected from
these 8 TI ranges. Primary data were collected from the farmers while they were interviewed at their
field or their residences. Productive investment for tea land was the dependent variable of this study.
It was measured calculating all the expenses for tea land within past twelve months. The expenditure
for, Buying new tea land, Infilling the tea land, Fertilizer application, Soil conservationmeasures,
Shade tree management, Pest and disease management , Within last twelve months. Household
characteristics, characteristics of household head and socio economics characteristics were used as
independent variables. There are thirteen independent variables as Age of house hold head, Education
Level of household head, Tea cultivated land extent, Number of children, Income from Tea land,
Durable consumption, Non-durable consumption, Other Investment, Migration Dummy, Remittance,
Income from Other Cultivation, Income from Job of household head, Number of family members.
Data were analyzed by Using Stata software package. Descriptive statistical techniques were used to
present the demographic features of the sample. Multiple linear regression analysis was worked out
to find out the impact of remittance on productive investment of Tea small holders in Uva region.
InvT = β0 + β1AH + β2Edu + β3Land + β4NOFM + β5NOC + β6InT + β7InOC
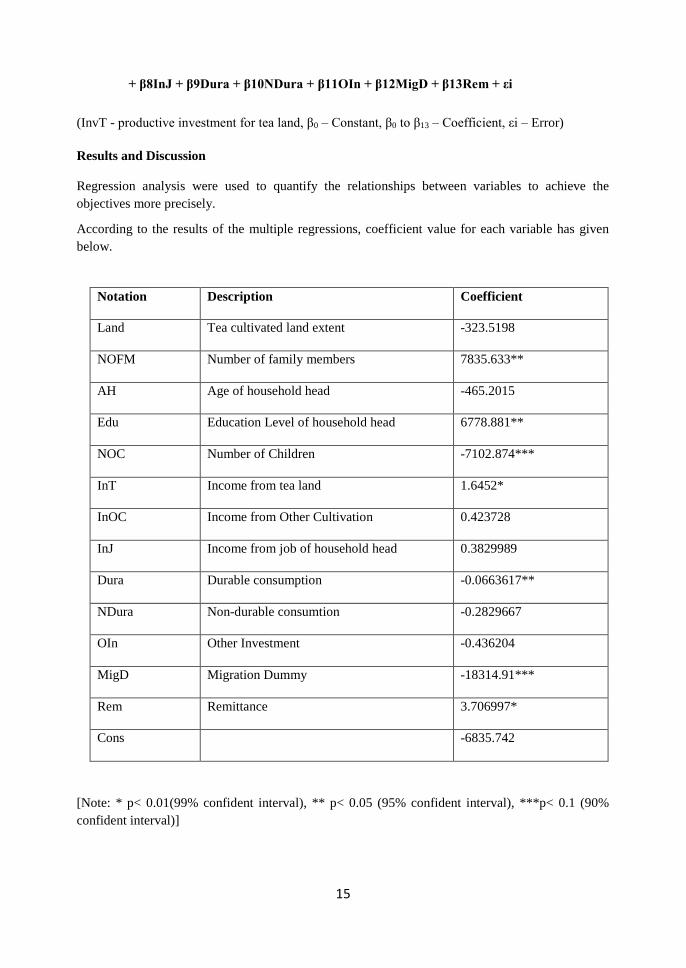
15
+ β8InJ + β9Dura + β10NDura + β11OIn + β12MigD + β13Rem + εi
(InvT - productive investment for tea land, β0 – Constant, β0 to β13 – Coefficient, εi – Error)
Results and Discussion
Regression analysis were used to quantify the relationships between variables to achieve the
objectives more precisely.
According to the results of the multiple regressions, coefficient value for each variable has given
below.
Notation Description Coefficient
Land Tea cultivated land extent -323.5198
NOFM Number of family members 7835.633**
AH Age of household head -465.2015
Edu Education Level of household head 6778.881**
NOC Number of Children -7102.874***
InT Income from tea land 1.6452*
InOC Income from Other Cultivation 0.423728
InJ Income from job of household head 0.3829989
Dura Durable consumption -0.0663617**
NDura Non-durable consumtion -0.2829667
OIn Other Investment -0.436204
MigD Migration Dummy -18314.91***
Rem Remittance 3.706997*
Cons -6835.742
[Note: * p< 0.01(99% confident interval), ** p< 0.05 (95% confident interval), ***p< 0.1 (90%
confident interval)]
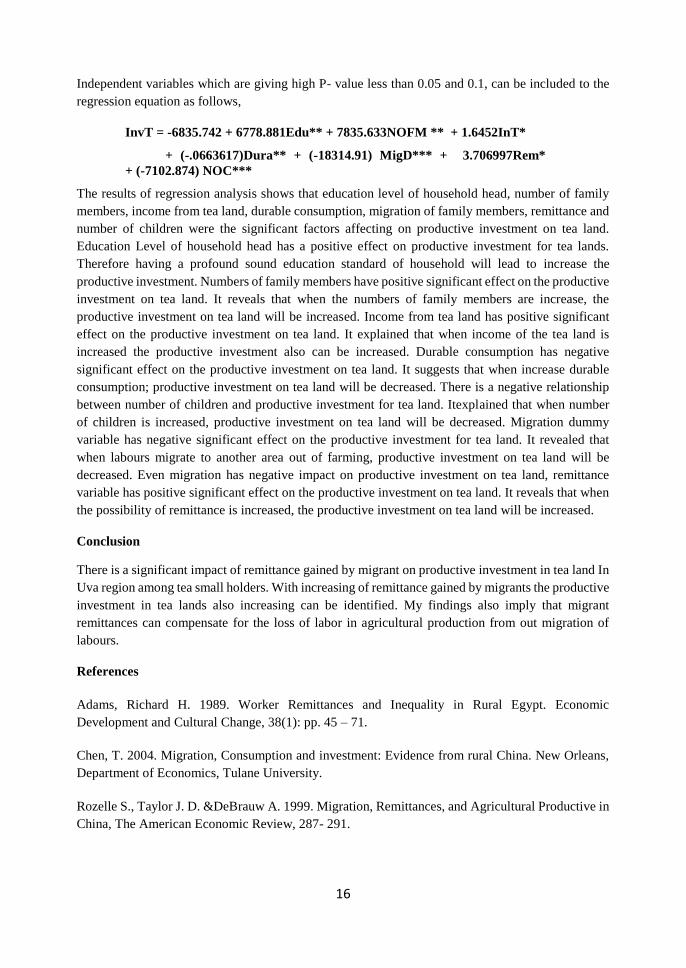
16
Independent variables which are giving high P- value less than 0.05 and 0.1, can be included to the
regression equation as follows,
InvT = -6835.742 + 6778.881Edu** + 7835.633NOFM ** + 1.6452InT*
+ (-.0663617)Dura** + (-18314.91) MigD*** + 3.706997Rem*
+ (-7102.874) NOC***
The results of regression analysis shows that education level of household head, number of family
members, income from tea land, durable consumption, migration of family members, remittance and
number of children were the significant factors affecting on productive investment on tea land.
Education Level of household head has a positive effect on productive investment for tea lands.
Therefore having a profound sound education standard of household will lead to increase the
productive investment. Numbers of family members have positive significant effect on the productive
investment on tea land. It reveals that when the numbers of family members are increase, the
productive investment on tea land will be increased. Income from tea land has positive significant
effect on the productive investment on tea land. It explained that when income of the tea land is
increased the productive investment also can be increased. Durable consumption has negative
significant effect on the productive investment on tea land. It suggests that when increase durable
consumption; productive investment on tea land will be decreased. There is a negative relationship
between number of children and productive investment for tea land. Itexplained that when number
of children is increased, productive investment on tea land will be decreased. Migration dummy
variable has negative significant effect on the productive investment for tea land. It revealed that
when labours migrate to another area out of farming, productive investment on tea land will be
decreased. Even migration has negative impact on productive investment on tea land, remittance
variable has positive significant effect on the productive investment on tea land. It reveals that when
the possibility of remittance is increased, the productive investment on tea land will be increased.
Conclusion
There is a significant impact of remittance gained by migrant on productive investment in tea land In
Uva region among tea small holders. With increasing of remittance gained by migrants the productive
investment in tea lands also increasing can be identified. My findings also imply that migrant
remittances can compensate for the loss of labor in agricultural production from out migration of
labours.
References
Adams, Richard H. 1989. Worker Remittances and Inequality in Rural Egypt. Economic
Development and Cultural Change, 38(1): pp. 45 – 71.
Chen, T. 2004. Migration, Consumption and investment: Evidence from rural China. New Orleans,
Department of Economics, Tulane University.
Rozelle S., Taylor J. D. &DeBrauw A. 1999. Migration, Remittances, and Agricultural Productive in
China, The American Economic Review, 287- 291.
17
Awareness and adoption of recommended technologies and
management practices by the Tea small holders
W. A. B. S. Karunarathna, M. G. P. P. Mahindarathne
Faculty of Animal Science and Export Agriculture, Uva Wellassa University of Sri Lanka
Introduction
Tea (Camellia sinensis) is the world famous beverage next to the water and having numerous health
and socio economic benefits. Tea, the prominent crop of the plantation sector in Sri Lanka, grows in
many parts of the country (Mendis, 1992).Tea growers who have lands less than 10 acres in extent
are treated as “Tea small holdings” according the Tea Control act. The cultivation of tea is attractive
to small farmers because tea provides work and income throughout the year, requires relatively little
investment, and the risk of complete crop failure is small (Annual Report, Tea Small Holdings
Development Authority, 2012).As well as the Contribution of small holders to the Sri Lankan tea
sector is higher than the plantation sector and it is account for 71.4 % of the national tea output
(TSHDA, 2012). Therefore, application of scientific agricultural knowledge and technology
adaptation in the small holding tea sector is a vital investment to enhance the productivity and overall
performance of the tea industry.
Materials and methodology
Data were collected through a sample survey by giving a structured questionnaire to 8 tea inspector’s
(TI) ranges at Badulla administrative district and 150 small holders were randomly selected as the
respondents. The questionnaire was mainly formulated to identify the awareness, level of adoption,
and factors affecting to the level of adoption. The awareness was measured by percentage of aware
respondents. The adoption level was measured by using “Adoption index” and “Confident interval
method”. Adoption index was categorized in to three levels as low adoption, medium adoption and
high adoption. To identify the factors affecting to level of adoption, regression analysis was
conducted and “Adoption on Technology and recommended practiced” has been taken as the
dependent variable and data were collected for dependent variable under five categories as Machinery
usage, Planting materials, Field practices, Recommended tests and Extension services. For the
independent variables data were collected under nine categorical variables as Gender, Age level,
Education Level, Source of Income, Experience with Tea land, Land ownership, Land extent, Time
spending with tea land and Yield.
Data were analyzed using SPSS Software package and MS-Excel 2010 package. Descriptive statistics
were done to analyze the independent variables and by using regression and correlation analysis
factors affecting to the level of adoption was analyze and their strength was measured.
Results and Discussion
According to the study only 26 % of respondents have the awareness regarding machinery usage in
tea plucking and from them, 48.7 % belongs to year 40 – 50 age group. 79.3 % of the respondents
have awareness regarding the improved varieties. According to the study 64.7 % of the respondents
have an awareness regarding recommended tests like pH test, starch test which use at the field.
Extension services have been accounted under two categories as consulting services and E-consulting
services and according to the study 100 % of the respondents have an awareness on consulting
services while 36 % of the respondents have awareness on E-consulting services. According to the
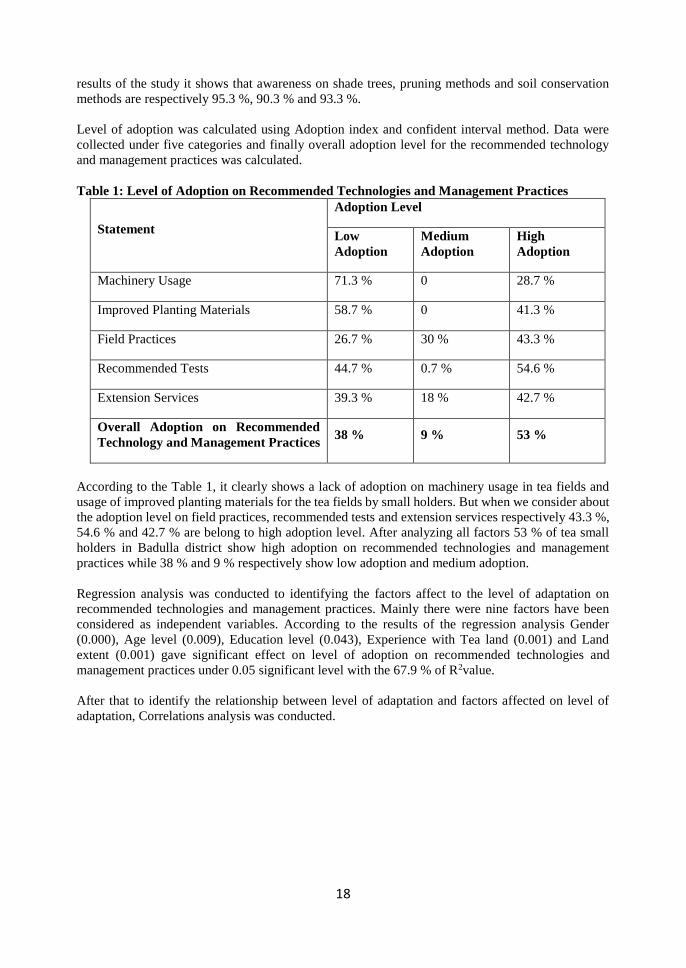
18
results of the study it shows that awareness on shade trees, pruning methods and soil conservation
methods are respectively 95.3 %, 90.3 % and 93.3 %.
Level of adoption was calculated using Adoption index and confident interval method. Data were
collected under five categories and finally overall adoption level for the recommended technology
and management practices was calculated.
Table 1: Level of Adoption on Recommended Technologies and Management Practices
Statement
Adoption Level
Low
Adoption
Medium
Adoption
High
Adoption
Machinery Usage 71.3 % 0 28.7 %
Improved Planting Materials 58.7 % 0 41.3 %
Field Practices 26.7 % 30 % 43.3 %
Recommended Tests 44.7 % 0.7 % 54.6 %
Extension Services 39.3 % 18 % 42.7 %
Overall Adoption on Recommended
Technology and Management Practices 38 % 9 % 53 %
According to the Table 1, it clearly shows a lack of adoption on machinery usage in tea fields and
usage of improved planting materials for the tea fields by small holders. But when we consider about
the adoption level on field practices, recommended tests and extension services respectively 43.3 %,
54.6 % and 42.7 % are belong to high adoption level. After analyzing all factors 53 % of tea small
holders in Badulla district show high adoption on recommended technologies and management
practices while 38 % and 9 % respectively show low adoption and medium adoption.
Regression analysis was conducted to identifying the factors affect to the level of adaptation on
recommended technologies and management practices. Mainly there were nine factors have been
considered as independent variables. According to the results of the regression analysis Gender
(0.000), Age level (0.009), Education level (0.043), Experience with Tea land (0.001) and Land
extent (0.001) gave significant effect on level of adoption on recommended technologies and
management practices under 0.05 significant level with the 67.9 % of R2value.
After that to identify the relationship between level of adaptation and factors affected on level of
adaptation, Correlations analysis was conducted.
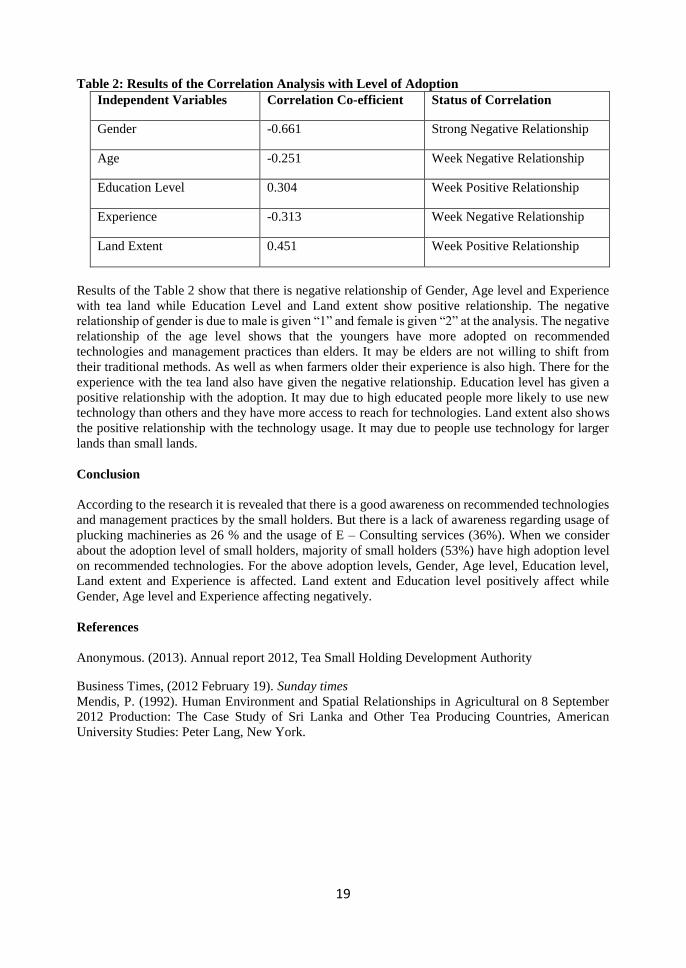
19
Table 2: Results of the Correlation Analysis with Level of Adoption
Independent Variables Correlation Co-efficient Status of Correlation
Gender -0.661 Strong Negative Relationship
Age -0.251 Week Negative Relationship
Education Level 0.304 Week Positive Relationship
Experience -0.313 Week Negative Relationship
Land Extent 0.451 Week Positive Relationship
Results of the Table 2 show that there is negative relationship of Gender, Age level and Experience
with tea land while Education Level and Land extent show positive relationship. The negative
relationship of gender is due to male is given “1” and female is given “2” at the analysis. The negative
relationship of the age level shows that the youngers have more adopted on recommended
technologies and management practices than elders. It may be elders are not willing to shift from
their traditional methods. As well as when farmers older their experience is also high. There for the
experience with the tea land also have given the negative relationship. Education level has given a
positive relationship with the adoption. It may due to high educated people more likely to use new
technology than others and they have more access to reach for technologies. Land extent also shows
the positive relationship with the technology usage. It may due to people use technology for larger
lands than small lands.
Conclusion
According to the research it is revealed that there is a good awareness on recommended technologies
and management practices by the small holders. But there is a lack of awareness regarding usage of
plucking machineries as 26 % and the usage of E – Consulting services (36%). When we consider
about the adoption level of small holders, majority of small holders (53%) have high adoption level
on recommended technologies. For the above adoption levels, Gender, Age level, Education level,
Land extent and Experience is affected. Land extent and Education level positively affect while
Gender, Age level and Experience affecting negatively.
References
Anonymous. (2013). Annual report 2012, Tea Small Holding Development Authority
Business Times, (2012 February 19). Sunday times
Mendis, P. (1992). Human Environment and Spatial Relationships in Agricultural on 8 September
2012 Production: The Case Study of Sri Lanka and Other Tea Producing Countries, American
University Studies: Peter Lang, New York.
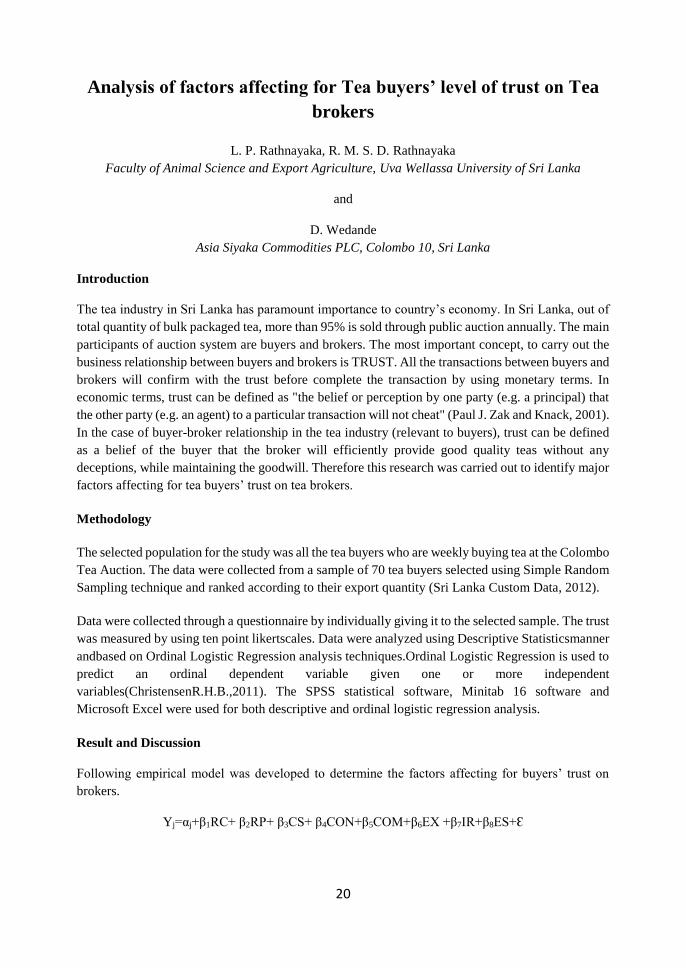
20
Analysis of factors affecting for Tea buyers’ level of trust on Tea
brokers
L. P. Rathnayaka, R. M. S. D. Rathnayaka
Faculty of Animal Science and Export Agriculture, Uva Wellassa University of Sri Lanka
and
D. Wedande
Asia Siyaka Commodities PLC, Colombo 10, Sri Lanka
Introduction
The tea industry in Sri Lanka has paramount importance to country’s economy. In Sri Lanka, out of
total quantity of bulk packaged tea, more than 95% is sold through public auction annually. The main
participants of auction system are buyers and brokers. The most important concept, to carry out the
business relationship between buyers and brokers is TRUST. All the transactions between buyers and
brokers will confirm with the trust before complete the transaction by using monetary terms. In
economic terms, trust can be defined as "the belief or perception by one party (e.g. a principal) that
the other party (e.g. an agent) to a particular transaction will not cheat" (Paul J. Zak and Knack, 2001).
In the case of buyer-broker relationship in the tea industry (relevant to buyers), trust can be defined
as a belief of the buyer that the broker will efficiently provide good quality teas without any
deceptions, while maintaining the goodwill. Therefore this research was carried out to identify major
factors affecting for tea buyers’ trust on tea brokers.
Methodology
The selected population for the study was all the tea buyers who are weekly buying tea at the Colombo
Tea Auction. The data were collected from a sample of 70 tea buyers selected using Simple Random
Sampling technique and ranked according to their export quantity (Sri Lanka Custom Data, 2012).
Data were collected through a questionnaire by individually giving it to the selected sample. The trust
was measured by using ten point likertscales. Data were analyzed using Descriptive Statisticsmanner
andbased on Ordinal Logistic Regression analysis techniques.Ordinal Logistic Regression is used to
predict an ordinal dependent variable given one or more independent
variables(ChristensenR.H.B.,2011). The SPSS statistical software, Minitab 16 software and
Microsoft Excel were used for both descriptive and ordinal logistic regression analysis.
Result and Discussion
Following empirical model was developed to determine the factors affecting for buyers’ trust on
brokers.
Yj=αj+β1RC+ β2RP+ β3CS+ β4CON+β5COM+β6EX +β7IR+β8ES+Ɛ
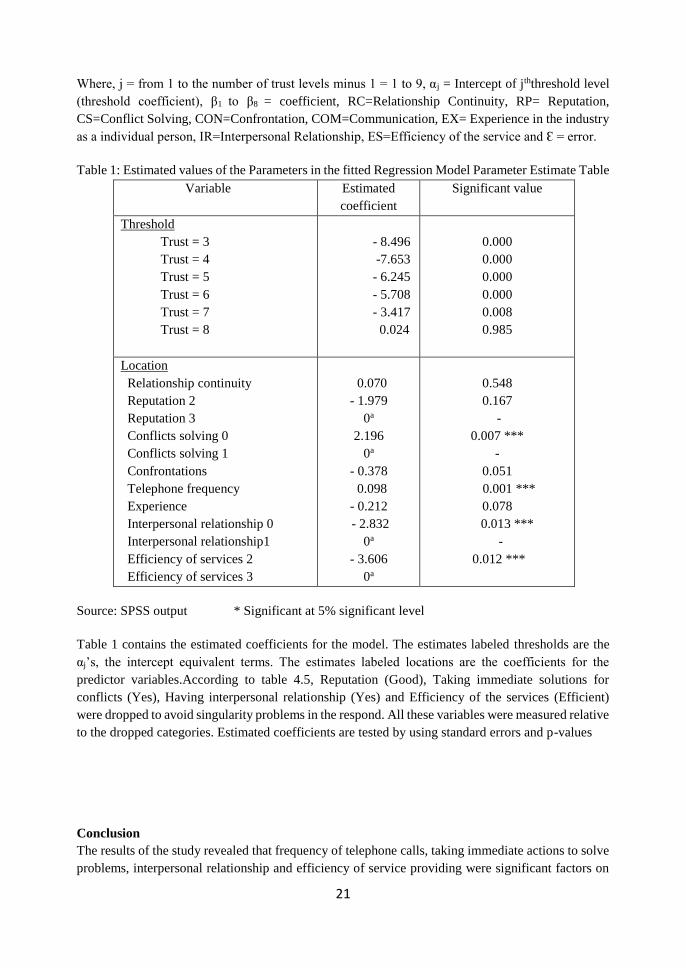
21
Where, j = from 1 to the number of trust levels minus 1 = 1 to 9, αj = Intercept of jththreshold level
(threshold coefficient), β1 to β8 = coefficient, RC=Relationship Continuity, RP= Reputation,
CS=Conflict Solving, CON=Confrontation, COM=Communication, EX= Experience in the industry
as a individual person, IR=Interpersonal Relationship, ES=Efficiency of the service and Ɛ = error.
Table 1: Estimated values of the Parameters in the fitted Regression Model Parameter Estimate Table
Variable Estimated
coefficient
Significant value
Threshold
Trust = 3
Trust = 4
Trust = 5
Trust = 6
Trust = 7
Trust = 8
- 8.496
-7.653
- 6.245
- 5.708
- 3.417
0.024
0.000
0.000
0.000
0.000
0.008
0.985
Location
Relationship continuity
Reputation 2
Reputation 3
Conflicts solving 0
Conflicts solving 1
Confrontations
Telephone frequency
Experience
Interpersonal relationship 0
Interpersonal relationship1
Efficiency of services 2
Efficiency of services 3
0.070
- 1.979
0a
2.196
0a
- 0.378
0.098
- 0.212
- 2.832
0a
- 3.606
0a
0.548
0.167
-
0.007 ***
-
0.051
0.001 ***
0.078
0.013 ***
-
0.012 ***
Source: SPSS output * Significant at 5% significant level
Table 1 contains the estimated coefficients for the model. The estimates labeled thresholds are the
αj’s, the intercept equivalent terms. The estimates labeled locations are the coefficients for the
predictor variables.According to table 4.5, Reputation (Good), Taking immediate solutions for
conflicts (Yes), Having interpersonal relationship (Yes) and Efficiency of the services (Efficient)
were dropped to avoid singularity problems in the respond. All these variables were measured relative
to the dropped categories. Estimated coefficients are tested by using standard errors and p-values
Conclusion
The results of the study revealed that frequency of telephone calls, taking immediate actions to solve
problems, interpersonal relationship and efficiency of service providing were significant factors on
22
the buyers’ level of trust on tea brokers at 5% significant level. Brokers should consider much on
significant factors, to increase the buyers’ trust level towards them by doing adjustments according
to the identified factors.Experience of buyer in the tea industry (number of years in the industry as a
buyer) is not affect to their trust on tea brokers. Therefore brokers should consider on all buyers
without any differences according their working period in the tea industry. Sometimes though a
broker is given more respect and consideration to experienced buyer, some new buyers will trust the
broker than old buyer. And when having trust, it is not difficult to continue the business relationship
with buyers.
References
Anonymous, 2012. Introductory Document, Asia Siyaka Commodities PLC
Anonymous, 2014. Weekly Tea Market Report, Sale No 23, Forbes & Walker Tea Brokers (Pvt) Ltd,
17-18 June 2014, Sri Lanka.
Paul J. Zak, Stephen Knack,. 2001. Trust and Growth. The Economic Journal 111:295-321
Unpublished, 2012. Analysis of Tea Exporters Jan-Dec 2012. Sri Lanka Custom Data.
Beugelsdijk, S., Van Schaik, T. 2005. Social capital and growth in European regions: an empirical
test. European Journal of Political Economy 21
Business Dictionary.com.The Buyer. Available at: http://ww.businessdictionary.com
Christensen, R. H. B. 2011. Ordinal Regression Models for Ordinal Data. Available at:
http://www.cran.r-project.org/package=ordinal/.
Dwyer, F.R., 1987. Output Sector Munificence Effects on the Internal Political Econ-omy of
Marketing Channels. Journal of Marketing Research 24:347
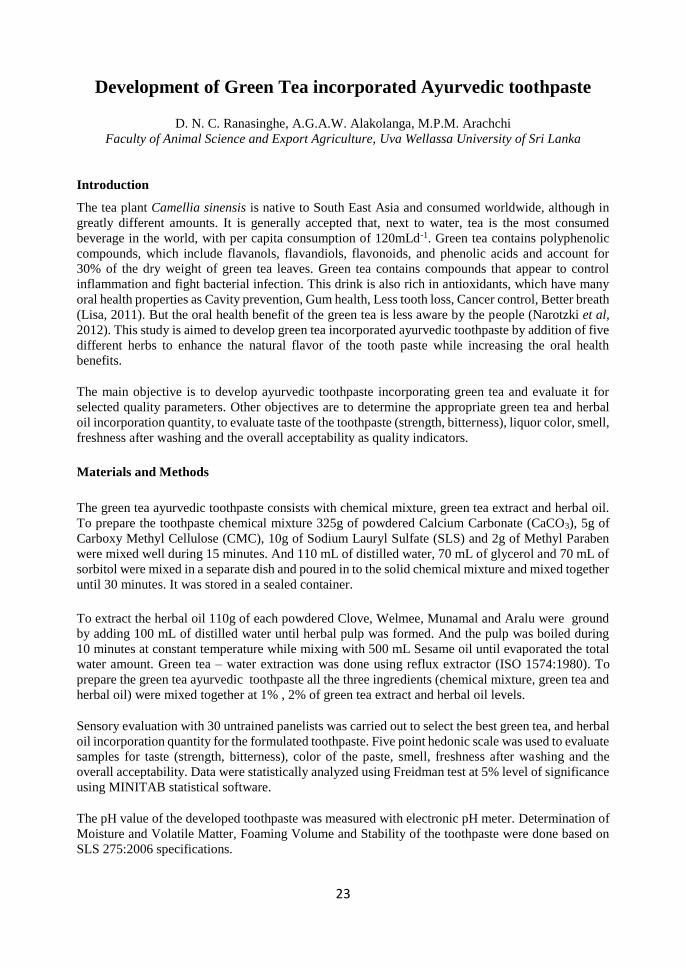
23
Development of Green Tea incorporated Ayurvedic toothpaste
D. N. C. Ranasinghe, A.G.A.W. Alakolanga, M.P.M. Arachchi
Faculty of Animal Science and Export Agriculture, Uva Wellassa University of Sri Lanka
Introduction
The tea plant Camellia sinensis is native to South East Asia and consumed worldwide, although in
greatly different amounts. It is generally accepted that, next to water, tea is the most consumed
beverage in the world, with per capita consumption of 120mLd-1. Green tea contains polyphenolic
compounds, which include flavanols, flavandiols, flavonoids, and phenolic acids and account for
30% of the dry weight of green tea leaves. Green tea contains compounds that appear to control
inflammation and fight bacterial infection. This drink is also rich in antioxidants, which have many
oral health properties as Cavity prevention, Gum health, Less tooth loss, Cancer control, Better breath
(Lisa, 2011). But the oral health benefit of the green tea is less aware by the people (Narotzki et al,
2012). This study is aimed to develop green tea incorporated ayurvedic toothpaste by addition of five
different herbs to enhance the natural flavor of the tooth paste while increasing the oral health
benefits.
The main objective is to develop ayurvedic toothpaste incorporating green tea and evaluate it for
selected quality parameters. Other objectives are to determine the appropriate green tea and herbal
oil incorporation quantity, to evaluate taste of the toothpaste (strength, bitterness), liquor color, smell,
freshness after washing and the overall acceptability as quality indicators.
Materials and Methods
The green tea ayurvedic toothpaste consists with chemical mixture, green tea extract and herbal oil.
To prepare the toothpaste chemical mixture 325g of powdered Calcium Carbonate (CaCO3), 5g of
Carboxy Methyl Cellulose (CMC), 10g of Sodium Lauryl Sulfate (SLS) and 2g of Methyl Paraben
were mixed well during 15 minutes. And 110 mL of distilled water, 70 mL of glycerol and 70 mL of
sorbitol were mixed in a separate dish and poured in to the solid chemical mixture and mixed together
until 30 minutes. It was stored in a sealed container.
To extract the herbal oil 110g of each powdered Clove, Welmee, Munamal and Aralu were ground
by adding 100 mL of distilled water until herbal pulp was formed. And the pulp was boiled during
10 minutes at constant temperature while mixing with 500 mL Sesame oil until evaporated the total
water amount. Green tea – water extraction was done using reflux extractor (ISO 1574:1980). To
prepare the green tea ayurvedic toothpaste all the three ingredients (chemical mixture, green tea and
herbal oil) were mixed together at 1% , 2% of green tea extract and herbal oil levels.
Sensory evaluation with 30 untrained panelists was carried out to select the best green tea, and herbal
oil incorporation quantity for the formulated toothpaste. Five point hedonic scale was used to evaluate
samples for taste (strength, bitterness), color of the paste, smell, freshness after washing and the
overall acceptability. Data were statistically analyzed using Freidman test at 5% level of significance
using MINITAB statistical software.
The pH value of the developed toothpaste was measured with electronic pH meter. Determination of
Moisture and Volatile Matter, Foaming Volume and Stability of the toothpaste were done based on
SLS 275:2006 specifications.
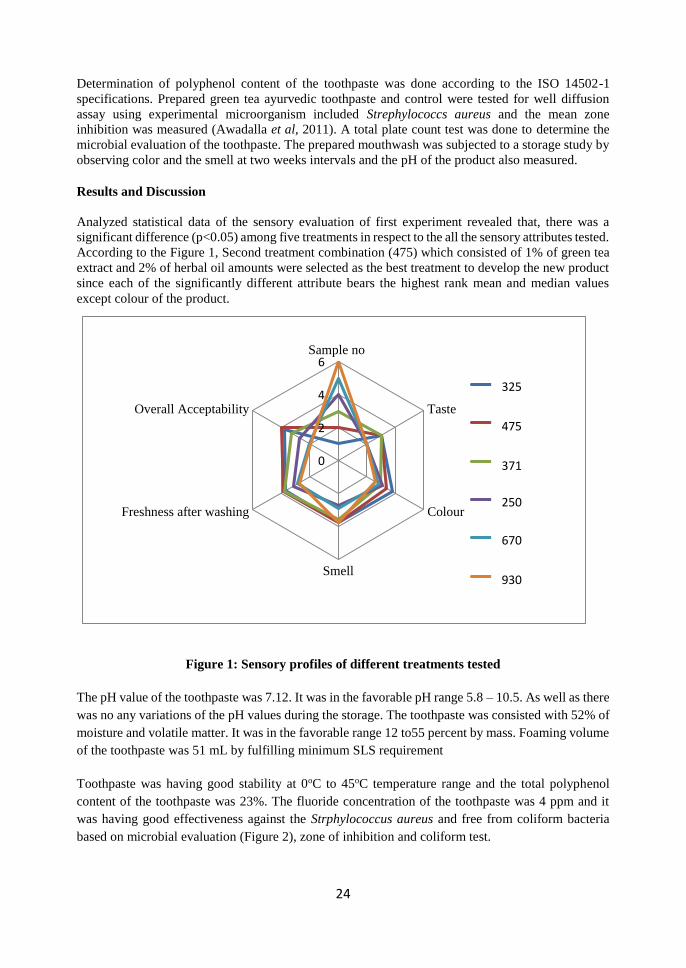
24
Determination of polyphenol content of the toothpaste was done according to the ISO 14502-1
specifications. Prepared green tea ayurvedic toothpaste and control were tested for well diffusion
assay using experimental microorganism included Strephylococcs aureus and the mean zone
inhibition was measured (Awadalla et al, 2011). A total plate count test was done to determine the
microbial evaluation of the toothpaste. The prepared mouthwash was subjected to a storage study by
observing color and the smell at two weeks intervals and the pH of the product also measured.
Results and Discussion
Analyzed statistical data of the sensory evaluation of first experiment revealed that, there was a
significant difference (p<0.05) among five treatments in respect to the all the sensory attributes tested.
According to the Figure 1, Second treatment combination (475) which consisted of 1% of green tea
extract and 2% of herbal oil amounts were selected as the best treatment to develop the new product
since each of the significantly different attribute bears the highest rank mean and median values
except colour of the product.
Figure 1: Sensory profiles of different treatments tested
The pH value of the toothpaste was 7.12. It was in the favorable pH range 5.8 – 10.5. As well as there
was no any variations of the pH values during the storage. The toothpaste was consisted with 52% of
moisture and volatile matter. It was in the favorable range 12 to55 percent by mass. Foaming volume
of the toothpaste was 51 mL by fulfilling minimum SLS requirement
Toothpaste was having good stability at 0oC to 45oC temperature range and the total polyphenol
content of the toothpaste was 23%. The fluoride concentration of the toothpaste was 4 ppm and it
was having good effectiveness against the Strphylococcus aureus and free from coliform bacteria
based on microbial evaluation (Figure 2), zone of inhibition and coliform test.
0
2
4
6Sample no
Taste
Colour
Smell
Freshness after washing
Overall Acceptability
Series1
Series2
Series3
Series4
Series5
Series6
325
475
250
670
930
371
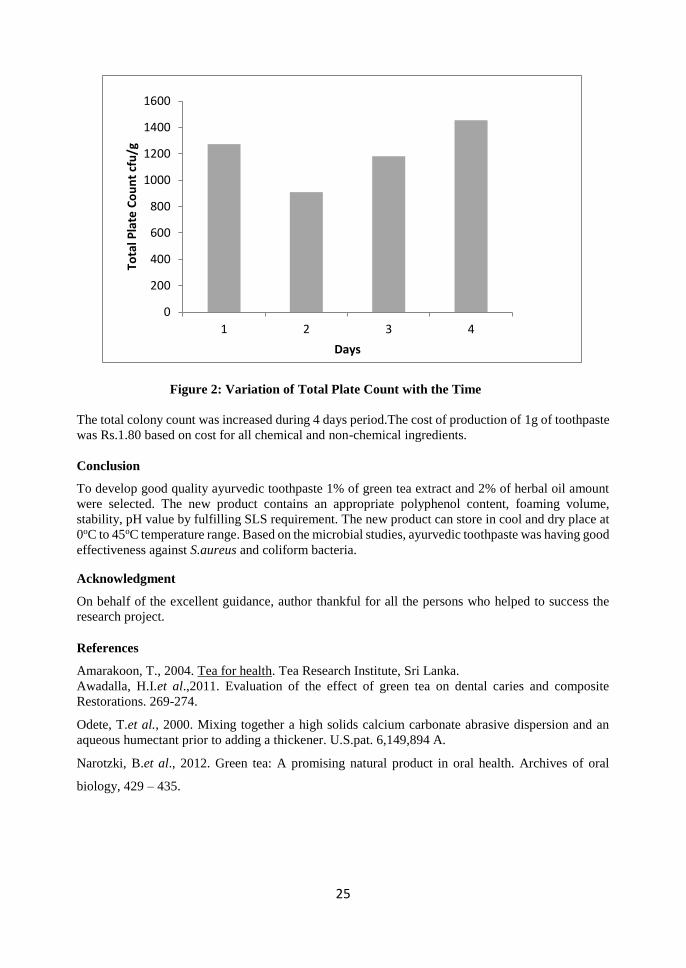
25
Figure 2: Variation of Total Plate Count with the Time
The total colony count was increased during 4 days period.The cost of production of 1g of toothpaste
was Rs.1.80 based on cost for all chemical and non-chemical ingredients.
Conclusion
To develop good quality ayurvedic toothpaste 1% of green tea extract and 2% of herbal oil amount
were selected. The new product contains an appropriate polyphenol content, foaming volume,
stability, pH value by fulfilling SLS requirement. The new product can store in cool and dry place at
0oC to 45oC temperature range. Based on the microbial studies, ayurvedic toothpaste was having good
effectiveness against S.aureus and coliform bacteria.
Acknowledgment
On behalf of the excellent guidance, author thankful for all the persons who helped to success the
research project.
References
Amarakoon, T., 2004. Tea for health. Tea Research Institute, Sri Lanka.
Awadalla, H.I.et al.,2011. Evaluation of the effect of green tea on dental caries and composite
Restorations. 269-274.
Odete, T.et al., 2000. Mixing together a high solids calcium carbonate abrasive dispersion and an
aqueous humectant prior to adding a thickener. U.S.pat. 6,149,894 A.
Narotzki, B.et al., 2012. Green tea: A promising natural product in oral health. Archives of oral
biology, 429 – 435.
0
200
400
600
800
1000
1200
1400
1600
1 2 3 4
Tota
l Pla
te C
ou
nt
cfu
/g
Days
26
Effect of Black Tea adulteration on quality parameters of Black
Tea
N.L.V.N. Priyadharshana, H.M.S.K. Herath
Faculty of Animal Science and Export Agriculture, Uva Wellassa University of Sri Lanka
And
M.A.N. Jayathilake
Sri Lanka Tea Board, Colombo, Sri Lanka
Introduction
Black tea is produced by withering, rolling, fermentation and drying from the tender shoots of
varieties of the species Camellia sinensis (L.) (ISO 3720, 2011). Black tea adulteration is a
particularly massive problem because of the universality of its consumption (Kariyawasam, 2014).
Since black tea is a pure beverage material, it should be free from extraneous matter, added colouring
matter and harmful substances (FSSAI, 2011). But sugar, ferrous sulphate and sodium bicarbonate
are added majorly to black tea during manufacturing to improve colour of tea particles and weight of
tea (Deshappriya, 2013; Kariyawasam 2014). The current study was carried out at Sri Lanka Tea
Board to investigate the effect of major adulterants on quality parameters of black tea.
Materials and Methods
Black tea manufacturing was carried out in Uva medium black tea manufacturing factory following
general requirements and steps (withering, rolling, fermentation and drying). 50% sugar, 10% sodium
bicarbonate and 10% ferrous sulphate solutions in mass fraction were treated separately to first dhools
as adulterants after rolling and kept it for fermentation. Those adulterated black tea samples and pure
black tea samples were analysed for quality parameters such as, total polyphenol content, moisture
content, total ash, water soluble ash, alkalinity of water soluble ash, water extract, total plate count,
total liquor colour and brightness.
These quality parameters were analysed in accredited analytical laboratory at Sri Lanka Tea Board
according to the ISO 14502-1: 2005 for total polyphenol content of black tea, ISO 1573: 1980 for
loss in mass at 103 ºC (moisture content), ISO 1575: 1987 for total ash, ISO 1576: 1988 for water
soluble ash and water insoluble ash, ISO 1578: 1975 for alkalinity of water soluble ash, ISO 1574:
1980 for water extract, SLS 516-1: 1991/ ISO 4833: 2003 for total plate count, spectrophotometric
method described by Roberts, and Smith (1963) for determination of total colour and brightness of
black tea. The data were statistically analyzed with ANOVA using Minitab statistical package. Mean
comparisons with control level (pure black tea) and multiple mean comparison were performed by
Dunnett simultaneous test and Tukey simultaneous test using General Linear model at 5 %
significance level.
Results and Discussion
Externally added sugar, sodium bicarbonate and ferrous sulphate significantly (p<0.05) affected on
total polyphenol content, total ash, water soluble ash, alkalinity of water soluble ash, water extract,
total colour, brightness and total plate count except on moisture content.
According to the Figure 1, the highest total polyphenol content (14.38 %) was recorded by pure black
tea while the lowest (8.81 %) was given by ferrous sulphate adulterated black tea. It was lower than
the ISO 3720 limit (9 %) which may be due to formation of Fe-Polyphenol complex during
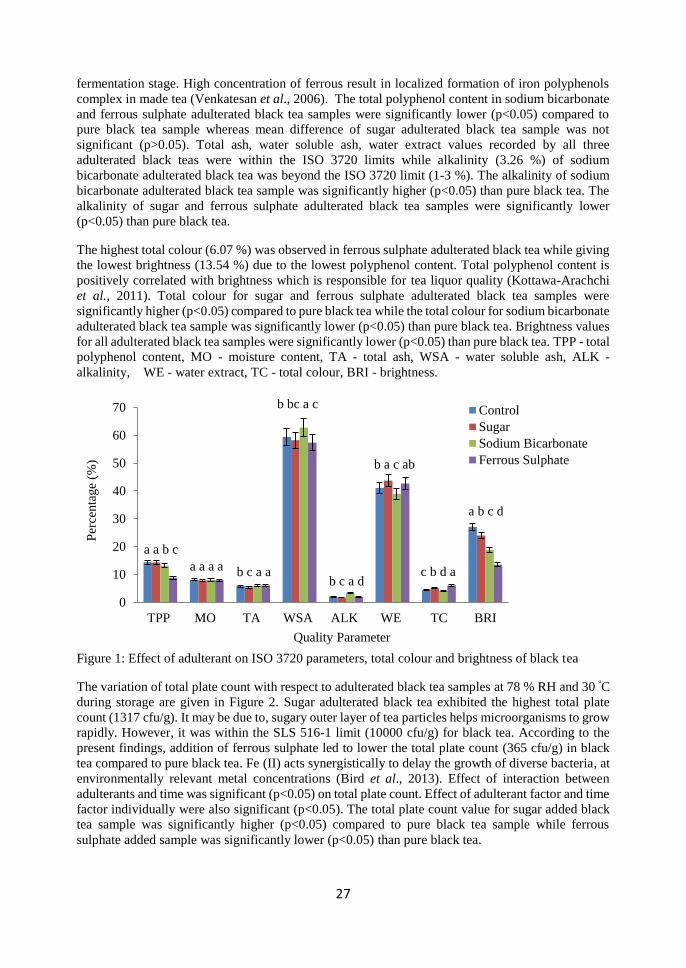
27
fermentation stage. High concentration of ferrous result in localized formation of iron polyphenols
complex in made tea (Venkatesan et al., 2006). The total polyphenol content in sodium bicarbonate
and ferrous sulphate adulterated black tea samples were significantly lower (p<0.05) compared to
pure black tea sample whereas mean difference of sugar adulterated black tea sample was not
significant (p>0.05). Total ash, water soluble ash, water extract values recorded by all three
adulterated black teas were within the ISO 3720 limits while alkalinity (3.26 %) of sodium
bicarbonate adulterated black tea was beyond the ISO 3720 limit (1-3 %). The alkalinity of sodium
bicarbonate adulterated black tea sample was significantly higher (p<0.05) than pure black tea. The
alkalinity of sugar and ferrous sulphate adulterated black tea samples were significantly lower
(p<0.05) than pure black tea.
The highest total colour (6.07 %) was observed in ferrous sulphate adulterated black tea while giving
the lowest brightness (13.54 %) due to the lowest polyphenol content. Total polyphenol content is
positively correlated with brightness which is responsible for tea liquor quality (Kottawa-Arachchi
et al., 2011). Total colour for sugar and ferrous sulphate adulterated black tea samples were
significantly higher (p<0.05) compared to pure black tea while the total colour for sodium bicarbonate
adulterated black tea sample was significantly lower (p<0.05) than pure black tea. Brightness values
for all adulterated black tea samples were significantly lower (p<0.05) than pure black tea. TPP - total
polyphenol content, MO - moisture content, TA - total ash, WSA - water soluble ash, ALK -
alkalinity, WE - water extract, TC - total colour, BRI - brightness.
Figure 1: Effect of adulterant on ISO 3720 parameters, total colour and brightness of black tea
The variation of total plate count with respect to adulterated black tea samples at 78 % RH and 30 ºC
during storage are given in Figure 2. Sugar adulterated black tea exhibited the highest total plate
count (1317 cfu/g). It may be due to, sugary outer layer of tea particles helps microorganisms to grow
rapidly. However, it was within the SLS 516-1 limit (10000 cfu/g) for black tea. According to the
present findings, addition of ferrous sulphate led to lower the total plate count (365 cfu/g) in black
tea compared to pure black tea. Fe (II) acts synergistically to delay the growth of diverse bacteria, at
environmentally relevant metal concentrations (Bird et al., 2013). Effect of interaction between
adulterants and time was significant (p<0.05) on total plate count. Effect of adulterant factor and time
factor individually were also significant (p<0.05). The total plate count value for sugar added black
tea sample was significantly higher (p<0.05) compared to pure black tea sample while ferrous
sulphate added sample was significantly lower (p<0.05) than pure black tea.
a a b c
b c a a
b bc a c
b c a d
b a c ab
c b d a
a b c d
a a a a
0
10
20
30
40
50
60
70
TPP MO TA WSA ALK WE TC BRI
Per
centa
ge
(%)
Quality Parameter
Control
Sugar
Sodium Bicarbonate
Ferrous Sulphate
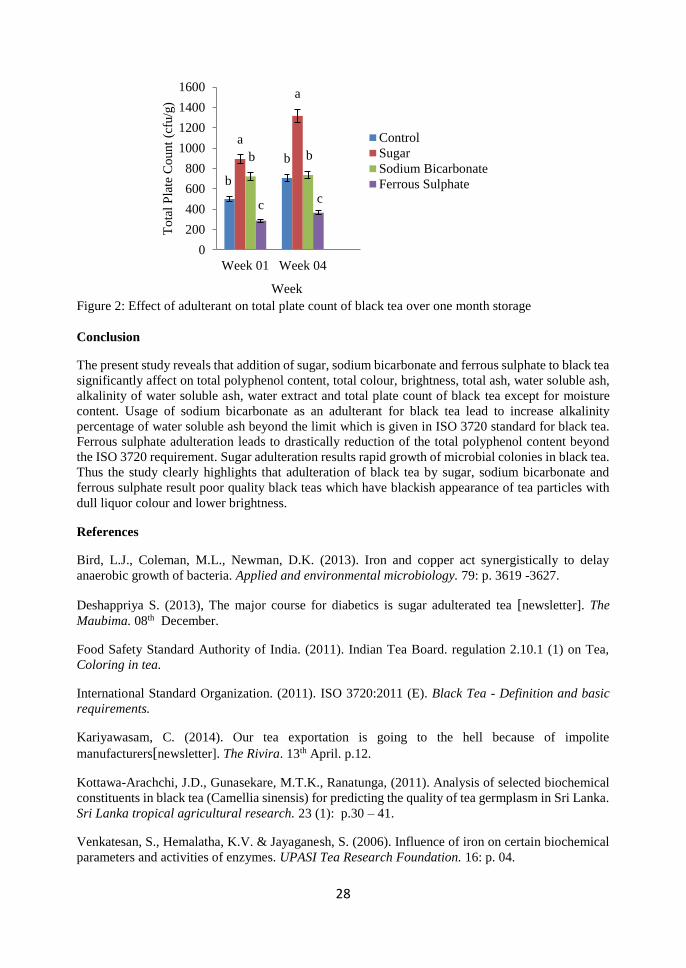
28
Figure 2: Effect of adulterant on total plate count of black tea over one month storage
Conclusion
The present study reveals that addition of sugar, sodium bicarbonate and ferrous sulphate to black tea
significantly affect on total polyphenol content, total colour, brightness, total ash, water soluble ash,
alkalinity of water soluble ash, water extract and total plate count of black tea except for moisture
content. Usage of sodium bicarbonate as an adulterant for black tea lead to increase alkalinity
percentage of water soluble ash beyond the limit which is given in ISO 3720 standard for black tea.
Ferrous sulphate adulteration leads to drastically reduction of the total polyphenol content beyond
the ISO 3720 requirement. Sugar adulteration results rapid growth of microbial colonies in black tea.
Thus the study clearly highlights that adulteration of black tea by sugar, sodium bicarbonate and
ferrous sulphate result poor quality black teas which have blackish appearance of tea particles with
dull liquor colour and lower brightness.
References
Bird, L.J., Coleman, M.L., Newman, D.K. (2013). Iron and copper act synergistically to delay
anaerobic growth of bacteria. Applied and environmental microbiology. 79: p. 3619 -3627.
Deshappriya S. (2013), The major course for diabetics is sugar adulterated tea [newsletter]. The
Maubima. 08th December.
Food Safety Standard Authority of India. (2011). Indian Tea Board. regulation 2.10.1 (1) on Tea,
Coloring in tea.
International Standard Organization. (2011). ISO 3720:2011 (E). Black Tea - Definition and basic
requirements.
Kariyawasam, C. (2014). Our tea exportation is going to the hell because of impolite
manufacturers[newsletter]. The Rivira. 13th April. p.12.
Kottawa-Arachchi, J.D., Gunasekare, M.T.K., Ranatunga, (2011). Analysis of selected biochemical
constituents in black tea (Camellia sinensis) for predicting the quality of tea germplasm in Sri Lanka.
Sri Lanka tropical agricultural research. 23 (1): p.30 – 41.
Venkatesan, S., Hemalatha, K.V. & Jayaganesh, S. (2006). Influence of iron on certain biochemical
parameters and activities of enzymes. UPASI Tea Research Foundation. 16: p. 04.
b
b
a
a
b b
cc
0
200
400
600
800
1000
1200
1400
1600
Week 01 Week 04
To
tal
Pla
te C
ount
(cfu
/g)
Week
Control
Sugar
Sodium Bicarbonate
Ferrous Sulphate
29
Effect of thermal time on shoot growth and development of low
grown Tea [Camellia sinensis (L.) O. Kuntze] in Sri Lanka
P. K. M. Prasadinie, H. A. S. L. Jayasinghe
Faculty of Animal Science and Export Agriculture, Uva Wellassa University of Sri Lanka
and
M. A. Wijeratne
Tea Research Institute, Low Country Station, Ratnapura, Sri Lanka.
Introduction
Tea [Camellia sinensis (L.) O. Kuntze] is an important beverage crop in Sri Lanka and it is a sector
where the country can take a lot of pride. The young, light green leaves, usually, the bud and the first
two to three leaves are harvested for tea production. Study the shoot growth pattern of tea is an
important element in tea physiology. It is difficult to predict leaf expansion and growth, based on
calendar days, because leaf initiation and expansion are highly temperature dependent (Ritchie and
Ne Smith, 1991). Because of the dependency on temperature, rate of shoot growth varies with
elevation. Therefore, growing degree days based on actual temperature is a simple and accurate
method to predict the occurrence of a certain developmental stage. Thus, thermal time can be used to
predict the developmental stage of a leaf, extension of a tea shoot and Leaf Area (LA) expansion of
shoot accurately.
This study was aimed to assess the variation in number of shoots at different developmental stages
in the bush with thermal time, estimate shoot extension of a developing and harvestable tea shoot as
a function of thermal time, estimate the Leaf Area (LA) of a developing and harvestable tea shoot as
a function of thermal time and estimate the number of days taken to reach different leaf
developmental stages of cultivar TRI 2025. This will provide an opportunity to estimate the shoot
extension and Leaf Area (LA) expansion of harvestable tea shoot and it will help to adjust field
management practices and to determine correct harvesting policies.
Materials and Methods
The field experiments were carried out at Field No 01, St. Joachim Estate, Tea Research Institute,
Ratnapura, Sri Lanka (latitude : 6ᴏ 40’ N; longitude : 80ᴏ 25’ E ) during mid of May to July 2014.
Elevation of the study location is 29 m amsl and belongs to Agro ecological region of WL2. The soil
group of the site belongs to Red Yellow Podzolic (Panabokke, 1996). The total rainfall was about
711 mm with a mean temperature of 28.5 ᴏC during the experimental period. TRI 2025 was used as
the planting material. Daily sunshine hours, rainfall, minimum maximum temperature was obtained
from the meteorological station at St. Joachim Estate, Ratnapura. In addition, soil moisture was
measured during the experimental period at weekly. Data analysis was done using MS-Excel and
Minitab 16 software.
In the first experiment, field observations were made for TRI 2025 using 1m2 sample size of plucking
table with ten bushes at homogeneous location. The numbers of shoots at different shoot
developmental stages in the bush (i.e. buds, bud with fish leaf, bud with one normal leaf, bud with
two normal leaves, bud with three normal leaves and banjies) were counted at seven days interval.
The accumulation of Thermal Time (TT) over the growing period was calculated using equations
developed by Robertson et al., 2002. It was considered that Tbase of 12.5 ᴏC (Carr and Stephens,
1992), TOpt 22 ᴏC (Amarathunga et al., 1999) and Tce 40 ᴏC (Carr, 1972) for TRI 2025.
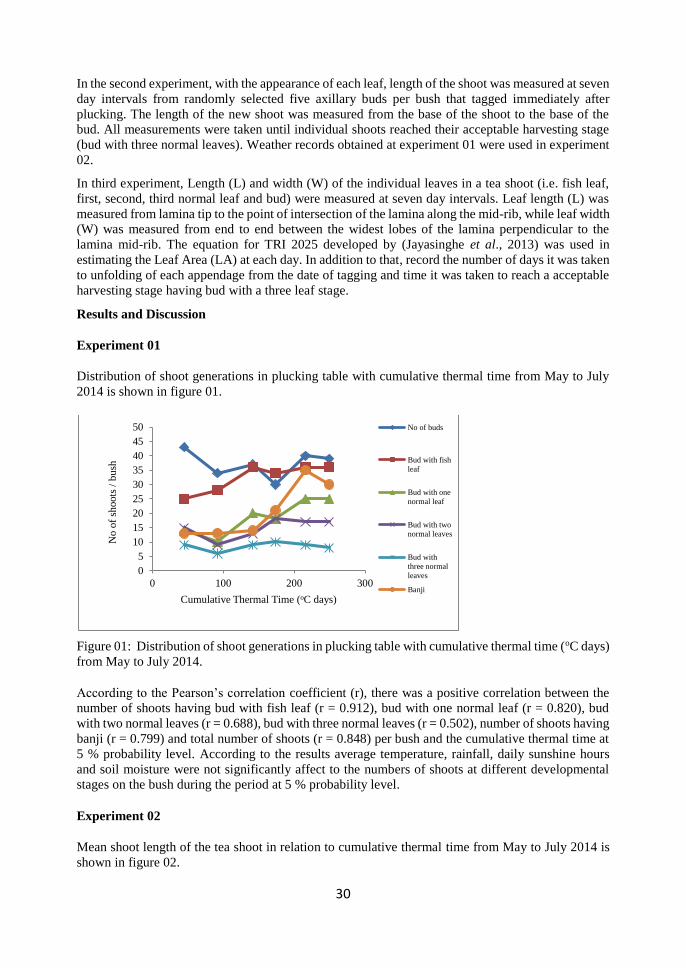
30
In the second experiment, with the appearance of each leaf, length of the shoot was measured at seven
day intervals from randomly selected five axillary buds per bush that tagged immediately after
plucking. The length of the new shoot was measured from the base of the shoot to the base of the
bud. All measurements were taken until individual shoots reached their acceptable harvesting stage
(bud with three normal leaves). Weather records obtained at experiment 01 were used in experiment
02.
In third experiment, Length (L) and width (W) of the individual leaves in a tea shoot (i.e. fish leaf,
first, second, third normal leaf and bud) were measured at seven day intervals. Leaf length (L) was
measured from lamina tip to the point of intersection of the lamina along the mid-rib, while leaf width
(W) was measured from end to end between the widest lobes of the lamina perpendicular to the
lamina mid-rib. The equation for TRI 2025 developed by (Jayasinghe et al., 2013) was used in
estimating the Leaf Area (LA) at each day. In addition to that, record the number of days it was taken
to unfolding of each appendage from the date of tagging and time it was taken to reach a acceptable
harvesting stage having bud with a three leaf stage.
Results and Discussion
Experiment 01
Distribution of shoot generations in plucking table with cumulative thermal time from May to July
2014 is shown in figure 01.
Figure 01: Distribution of shoot generations in plucking table with cumulative thermal time (oC days)
from May to July 2014.
According to the Pearson’s correlation coefficient (r), there was a positive correlation between the
number of shoots having bud with fish leaf (r = 0.912), bud with one normal leaf (r = 0.820), bud
with two normal leaves (r = 0.688), bud with three normal leaves (r = 0.502), number of shoots having
banji (r = 0.799) and total number of shoots (r = 0.848) per bush and the cumulative thermal time at
5 % probability level. According to the results average temperature, rainfall, daily sunshine hours
and soil moisture were not significantly affect to the numbers of shoots at different developmental
stages on the bush during the period at 5 % probability level.
Experiment 02
Mean shoot length of the tea shoot in relation to cumulative thermal time from May to July 2014 is
shown in figure 02.
0
5
10
15
20
25
30
35
40
45
50
0 100 200 300
No o
f sh
oots
/ b
ush
Cumulative Thermal Time (oC days)
No of buds
Bud with fish
leaf
Bud with one
normal leaf
Bud with two
normal leaves
Bud with
three normal
leaves
Banji
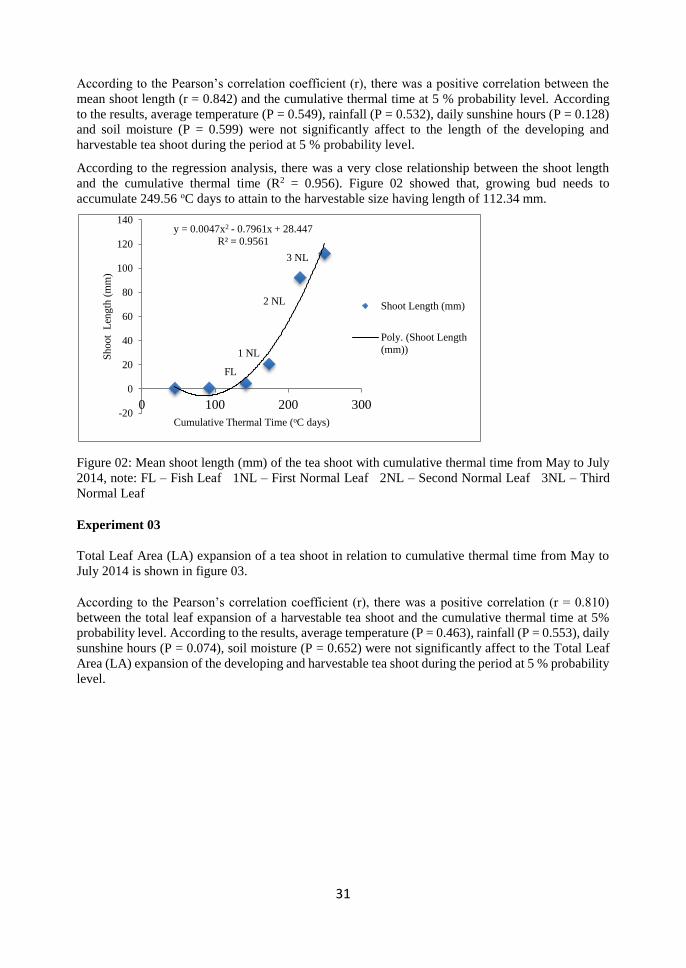
31
According to the Pearson’s correlation coefficient (r), there was a positive correlation between the
mean shoot length (r = 0.842) and the cumulative thermal time at 5 % probability level. According
to the results, average temperature (P = 0.549), rainfall (P = 0.532), daily sunshine hours (P = 0.128)
and soil moisture (P = 0.599) were not significantly affect to the length of the developing and
harvestable tea shoot during the period at 5 % probability level.
According to the regression analysis, there was a very close relationship between the shoot length
and the cumulative thermal time (R2 = 0.956). Figure 02 showed that, growing bud needs to
accumulate 249.56 ᴏC days to attain to the harvestable size having length of 112.34 mm.
Figure 02: Mean shoot length (mm) of the tea shoot with cumulative thermal time from May to July
2014, note: FL – Fish Leaf 1NL – First Normal Leaf 2NL – Second Normal Leaf 3NL – Third
Normal Leaf
Experiment 03
Total Leaf Area (LA) expansion of a tea shoot in relation to cumulative thermal time from May to
July 2014 is shown in figure 03.
According to the Pearson’s correlation coefficient (r), there was a positive correlation (r = 0.810)
between the total leaf expansion of a harvestable tea shoot and the cumulative thermal time at 5%
probability level. According to the results, average temperature (P = 0.463), rainfall (P = 0.553), daily
sunshine hours (P = 0.074), soil moisture (P = 0.652) were not significantly affect to the Total Leaf
Area (LA) expansion of the developing and harvestable tea shoot during the period at 5 % probability
level.
FL
1 NL
2 NL
3 NL
y = 0.0047x2 - 0.7961x + 28.447
R² = 0.9561
-20
0
20
40
60
80
100
120
140
0 100 200 300
Sh
oot
Len
gth
(m
m)
Cumulative Thermal Time (oC days)
Shoot Length (mm)
Poly. (Shoot Length
(mm))
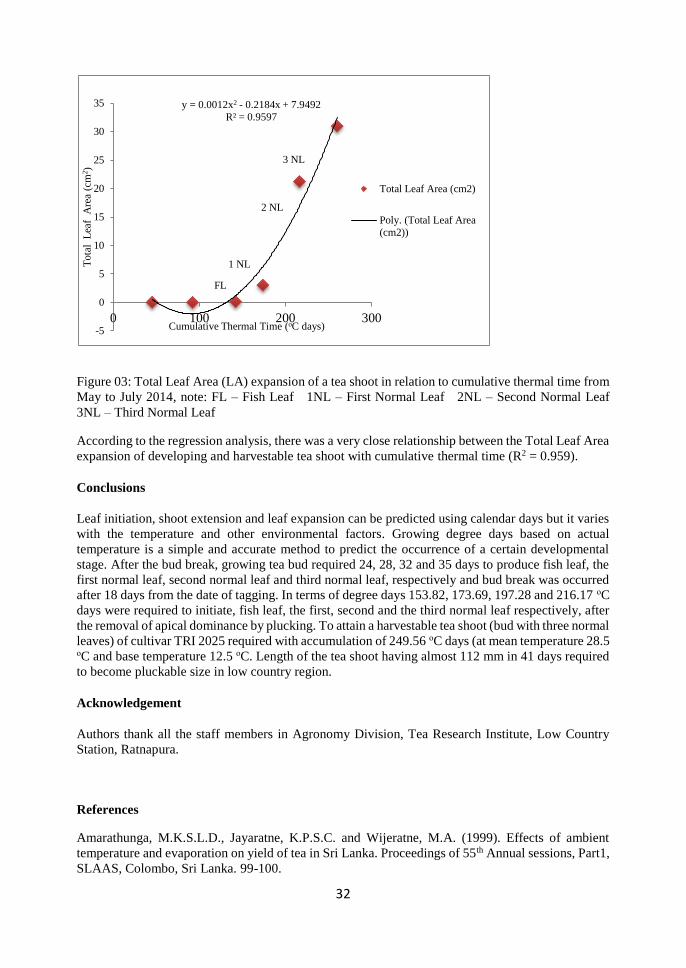
32
Figure 03: Total Leaf Area (LA) expansion of a tea shoot in relation to cumulative thermal time from
May to July 2014, note: FL – Fish Leaf 1NL – First Normal Leaf 2NL – Second Normal Leaf
3NL – Third Normal Leaf
According to the regression analysis, there was a very close relationship between the Total Leaf Area
expansion of developing and harvestable tea shoot with cumulative thermal time (R2 = 0.959).
Conclusions
Leaf initiation, shoot extension and leaf expansion can be predicted using calendar days but it varies
with the temperature and other environmental factors. Growing degree days based on actual
temperature is a simple and accurate method to predict the occurrence of a certain developmental
stage. After the bud break, growing tea bud required 24, 28, 32 and 35 days to produce fish leaf, the
first normal leaf, second normal leaf and third normal leaf, respectively and bud break was occurred
after 18 days from the date of tagging. In terms of degree days 153.82, 173.69, 197.28 and 216.17 ᴏC
days were required to initiate, fish leaf, the first, second and the third normal leaf respectively, after
the removal of apical dominance by plucking. To attain a harvestable tea shoot (bud with three normal
leaves) of cultivar TRI 2025 required with accumulation of 249.56 ᴏC days (at mean temperature 28.5 ᴏC and base temperature 12.5 ᴏC. Length of the tea shoot having almost 112 mm in 41 days required
to become pluckable size in low country region.
Acknowledgement
Authors thank all the staff members in Agronomy Division, Tea Research Institute, Low Country
Station, Ratnapura.
References
Amarathunga, M.K.S.L.D., Jayaratne, K.P.S.C. and Wijeratne, M.A. (1999). Effects of ambient
temperature and evaporation on yield of tea in Sri Lanka. Proceedings of 55th Annual sessions, Part1,
SLAAS, Colombo, Sri Lanka. 99-100.
FL
1 NL
2 NL
3 NL
y = 0.0012x2 - 0.2184x + 7.9492
R² = 0.9597
-5
0
5
10
15
20
25
30
35
0 100 200 300
Tota
l L
eaf
Are
a (c
m2)
Cumulative Thermal Time (oC days)
Total Leaf Area (cm2)
Poly. (Total Leaf Area
(cm2))

33
Carr, M.K.V. (1972). The climatic requirements of the tea plant. Experimental. Agriculture. 8: 1-14.
Carr, M.K.V, Stephens W. (1992). Climate, weather and the yield of tea. In: Willson KC, Clifford
MN (eds) Tea: Cultivation to Consumption. 1stedition. Chapman and Hall, London: 87-135.
Jayasinghe, H.A.S.L, Suriyagoda, L.D.B., Karunaratne, A.S., Wijeratne, M.A. (2013). Leaf
development and expansion tea [Camellia sinensis (L.) O. Kuntze] and their relationship with thermal
time: 1-6.
Panabokke, C.R. (1996). Soils and Agro ecological Environment of Sri Lanka. Colombo, Sri Lanka,
Natural Resources, Energy and Science Authority of Sri Lanka.
Smith, R.I., Harvey, F.J., Cannell, M.G.R. (1991). Pattern of tea shoot growth. Experimental
Agriculture. Vol. 26 (part 2): 197-208.
34
Investigating the causes for poor control of Crassocephalum
crepidioides (Thandam pillu) weed by Glyphosate in the Uva
region
A.G.S.Priyani, K.G. Prematilake
Faculty of Animal Science and Export Agriculture, Uva Wellassa University of Sri Lanka
Introduction
Weed management in tea field is great importance among other agronomic practices as weeds are the
number one pest and they can lower the productivity of tea by 10 to 50 percent due to their
competition for light, space, water and nutrients. Various weed management practices are used in tea
cultivation such as manual, mechanical, cultural, chemical, and biological methods. Chemical weed
control is the most convenient and effective methods among the various weed management
techniques available. Unlike manual weeding, chemical weed control minimizes soil erosion and
largely eliminates the loss of plant nutrients, which were carried away in the weeds removed from
the field and less labour required. Other than normal classifications, weeds can be grouped as
common weeds, hard-to-kill weeds and favorable herbs. Among the weeds Thandam pillu was
considered as a common weed, but it is becoming a hard-to-kill weed. It was already become resistant
to Paraquat herbicide and now there are complaints that it is difficult to control even by Glyphosate
herbicide. Recent investigations under up country conditions have shown that such poor control is
attributed to the dosage of Glyphosate applied and the age or growth phase of weeds, (Prematilake
and Nawarathne, unpublished). Therefore, the objective of the present study was to elucidate the
possible causes of poor control of Thandam pillu weed under Uva region.
Materials and methods
An experiment was carried out at the Uva Wellassa University during July-August 2014.
C.crepidioides weed plants at five different growth phases such as 3-4, 5-6, 7-8, 9-10 and > 10 leaf
phase, were collated from Ury Estate and they were planted randomly on raised beds, (30 plants per
each growth phase) and left for 2 weeks to established. Two Glyphosate (36%) dosages (5 ml/L and
3 ml/L) were sprayed on plants by isolating the plant to prevent contaminations with other plants. An
untreated Control was also maintained. Herbicide application was done as drenching application, by
using hand sprayer during morning. The degree of chlorosis, wilting of leaves, scorching and drying
of leaves and leaf fall occurred at 7, 14 and 21 days after application (DAA) of Glyphosate. Thandam
pillu weed was observed and rated. Dead plant percentage, dry weight of viable plants and recovery
of plants were recorded at 21 DAA.
Results and Discussion
Chlorosis was more prominent at 7 DAA and it occurred at significantly higher rate with Glyphosate
at 5 ml/L than at 3 ml/L at 3-4 and 5-6 leaf growth phases. Leaf wilting was more prominent at 14
and 21 DAA and it occurred at significantly higher rate with Glyphosate at 5 ml/L at all five growth
phases. Scorching and drying of leaves took place at the same rate with both Glyphosate at 5 ml/L
and at 3 ml/L at 3-4, 5-6 and 9-10 leaf growth phases. However, symptoms were more severe with
35
Glyphosate at 5 ml/L than at 3 ml/L at 7-8 and >10 leaf phases. Leaf fall also occurred more severely
with Glyphosate at 5 ml/L than at 3 ml/L at 7-8 leaf phase. Mean percentage of dead plants of
C.crepidioides was significantly higher with Glyphosate at 5ml/L than that of 3ml/L at all growth
phases. There was no death of the weed after phase 3 onwards with Glyphosate at 3ml/L and at phase
4 and 5 with Glyphosate at 5ml/L.
Table 01: Mean percentage of dead plants of C.crepidioides at different growth phases as affected
by two dosages of Glyphosate
Treatments Stage 1
(3-4 leaf)
Stage 2
(4-5 leaf)
Stage 3
(6-7 leaf)
Stage 4
(8-9 leaf)
Stage 5
(>10 leaf)
T1 (Gly: at 5
ml/L)
90 a 50 b 10 c 0 0
T2 (Gly: at 3
ml/L)
70 b 30 c 0 0 0
T3 (Control) 2 c 0 4 c 0 0
(Means followed by the same letter are not significantly different at P<0.05)
Mean dry weight per plant was not recorded at 3-4 and 5-6 leaf phases, but a lower weight was
recorded at mature phases above 6-8 leaf phase. There was no significant different in weight between
herbicide treatments and the Control. Poor response to Glyphosate at the maturity stages may be due
to the hairiness of the leaves and stems and leaf angel (erect) act as barrier to absorb herbicide in to
the plant.There was high recovery rate at latter phases in 3 ml/L Glyphosate treated plants
than Glyphosate at 5 ml/L treated weed plants.
Table 02: Mean recovery of C. crepidioides at different phases with two Glyphosate dosages
Treatments Stage 1
(3-4 leaf)
Stage 2
(4-5 leaf)
Stage 3
(6-7 leaf)
Stage 4
(8-9 leaf)
Stage 5
(>10 leaf)
T1 (Gly: at 5 ml/L) 0 c 0 c 0.2 b 0.3 b 0.3 b
T2 (Gly: at 3 ml/L) 0 c 0 c 0.2 b 0.2 b 0.5 a
T3 (Control) 0 c 0 c 0 c 0 c 0 c
(Means followed by the same letter are not significantly different at P<0.05)
Finally, C.crepidioides at early growth phases with 3-6 leaf is more susceptible to Glyphosate
herbicides and with higher dosage it is more susceptible for Glyphosate.
36
Conclusions
The degree of control of C. crepidioides weed is dependent upon the dosage of Glyphosate. The
higher the dosage the greater the controlling efficacy.The growth phase or maturity level of
C.crepidioides also a factor that cause to tolerate the control of Thandam pillu weed by Glyphosate
(36 %). The initial growth phase of C.crepidioides up to 6 leaf per plant phase is more susceptible for
Glyphosate.
References
Prematilake, K.G. and Nawarathna, W.P.A.S. (2010, Unpublished). Investigation on resistant
development in Crassocephalum crepidiodes (Benth) & Erigeron sumatrensis (Retz) for Glyphosate
herbicides. Bachelor Thesis. Faculty of Agriculture, University of Ruhuna, Sri Lanka
Rueppel, M.L., Brightwell, B.B. Schaefter, J. and Marvel, J.T. 1977. Metabolism and
degradation of glyphosate in soil and water. Journel of Agricultural and Food
Chemistry.25:517-528
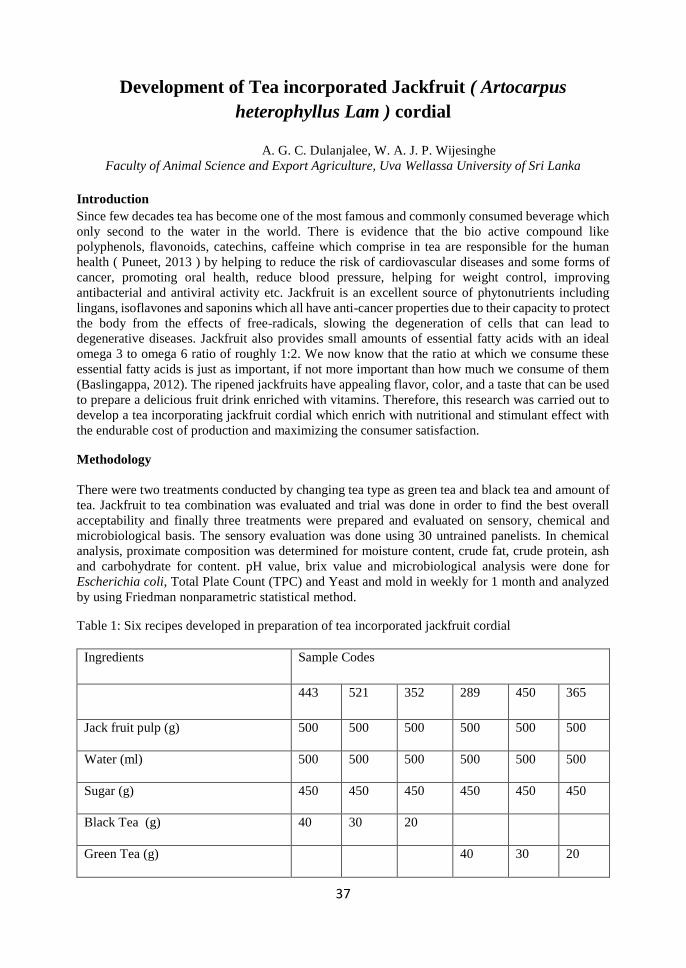
37
Development of Tea incorporated Jackfruit ( Artocarpus
heterophyllus Lam ) cordial
A. G. C. Dulanjalee, W. A. J. P. Wijesinghe
Faculty of Animal Science and Export Agriculture, Uva Wellassa University of Sri Lanka
Introduction
Since few decades tea has become one of the most famous and commonly consumed beverage which
only second to the water in the world. There is evidence that the bio active compound like
polyphenols, flavonoids, catechins, caffeine which comprise in tea are responsible for the human
health ( Puneet, 2013 ) by helping to reduce the risk of cardiovascular diseases and some forms of
cancer, promoting oral health, reduce blood pressure, helping for weight control, improving
antibacterial and antiviral activity etc. Jackfruit is an excellent source of phytonutrients including
lingans, isoflavones and saponins which all have anti-cancer properties due to their capacity to protect
the body from the effects of free-radicals, slowing the degeneration of cells that can lead to
degenerative diseases. Jackfruit also provides small amounts of essential fatty acids with an ideal
omega 3 to omega 6 ratio of roughly 1:2. We now know that the ratio at which we consume these
essential fatty acids is just as important, if not more important than how much we consume of them
(Baslingappa, 2012). The ripened jackfruits have appealing flavor, color, and a taste that can be used
to prepare a delicious fruit drink enriched with vitamins. Therefore, this research was carried out to
develop a tea incorporating jackfruit cordial which enrich with nutritional and stimulant effect with
the endurable cost of production and maximizing the consumer satisfaction.
Methodology
There were two treatments conducted by changing tea type as green tea and black tea and amount of
tea. Jackfruit to tea combination was evaluated and trial was done in order to find the best overall
acceptability and finally three treatments were prepared and evaluated on sensory, chemical and
microbiological basis. The sensory evaluation was done using 30 untrained panelists. In chemical
analysis, proximate composition was determined for moisture content, crude fat, crude protein, ash
and carbohydrate for content. pH value, brix value and microbiological analysis were done for
Escherichia coli, Total Plate Count (TPC) and Yeast and mold in weekly for 1 month and analyzed
by using Friedman nonparametric statistical method.
Table 1: Six recipes developed in preparation of tea incorporated jackfruit cordial
Ingredients Sample Codes
443 521 352 289 450 365
Jack fruit pulp (g) 500 500 500 500 500 500
Water (ml) 500 500 500 500 500 500
Sugar (g) 450 450 450 450 450 450
Black Tea (g) 40 30 20
Green Tea (g) 40 30 20
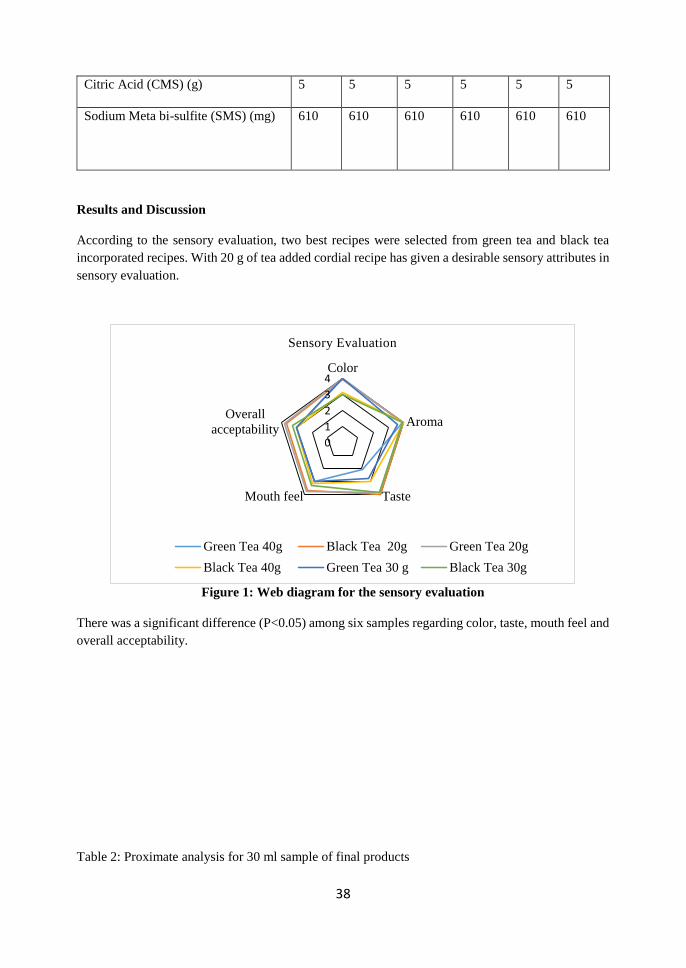
38
Citric Acid (CMS) (g) 5 5 5 5 5 5
Sodium Meta bi-sulfite (SMS) (mg)
610 610 610 610 610 610
Results and Discussion
According to the sensory evaluation, two best recipes were selected from green tea and black tea
incorporated recipes. With 20 g of tea added cordial recipe has given a desirable sensory attributes in
sensory evaluation.
Figure 1: Web diagram for the sensory evaluation
There was a significant difference (P<0.05) among six samples regarding color, taste, mouth feel and
overall acceptability.
Table 2: Proximate analysis for 30 ml sample of final products
0
1
2
3
4Color
Aroma
TasteMouth feel
Overall
acceptability
Sensory Evaluation
Green Tea 40g Black Tea 20g Green Tea 20g
Black Tea 40g Green Tea 30 g Black Tea 30g
39
Parameter Black tea incorporated Green tea incorporated
Moisture % 41.1 47.5
Ash % 0.5 0.3
Crude Protein % 1.0 0.7
Fat % 00 0.1
Carbohydrate % 57.4 51.4
As indicated by the Table 2, the highest moisture content and no fat was observed in green tea
incorporated cordial followed black tea incorporated cordial. Highest crude protein and ash content
was observed in black tea incorporated cordial.
The pH values of final products showed a slight elevation and it was between 4 to 5 pH levels. Total
soluble solids (Brix) value for black tea incorporated cordial and green tea incorporated cordial were
respectively 54º and 48º.
Total plate count in the samples complied with the requirement of Sri Lankan Standard (SLS). TPC
value of both green tea and black tea added cordial has increased in increasing rate during first week.
Then it has increased in decreasing rate with the time period. Yeast and mold and Escherichia coli
were absent in both samples for four week time period.
Green tea incorporated cordial was contained 0.94 mg/mL polyphenol and black tea incorporated
cordial was contained 0.72 mg/mL.
Conclusion
Tea incorporated jackfruit cordial can be produced from ripened jackfruit pulp and tea syrup, as a
value added product having 54º brix for black tea incorporated cordial and 48º brix for green tea
incorporated cordial. Black tea incorporated cordial consists with high nutritional value and zero fat.
There is no significant undesirable changes in final products within storage period. Microbiological
and chemical parameters in the recommended level.
Refferences
Shrikant Baslingappa Swami, N. J. Thakor, P. M. Haldankar, S. B. Kalse.,2012. Jackfruit and Its
Many Functional Components as Related to Human Health: A Review. Chemistry and Food Science
11: 565–576
Puneet, Aditi Sarawgi, Vinayak Karun, Anant G. Nigam, Samir Dutta, Nikhil Marwah., 2013.
Camellia sinensis (Tea): Implications and role in preventing dental decay: Pharmacognosy Review. 7(14): 152–156.
40
Factors affecting the level of effectiveness of dryers used in Sri
Lankan tea manufacturing
W.K.T. Ruwanka, A.N.R. Weerawansha, N.S. Withanage
Faculty of Animal Science and Export Agriculture, Uva Wellassa University of Sri Lanka
and
M.M.R. Pathmasiri
Sri Lanka Sustainable Energy Authority
Introduction
Tea production is basically a drying process of freshly harvested green tea leaves, reducing its
moisture content from about 75-83% down to 3%. In black tea manufacturing tea undergoes mainly
withering, rolling, fermenting, drying, grading and packaging processing steps. Sri Lanka mainly
produces tea by the Orthodox technology. Drying is the most expensive process in the manufacture
of tea (http://www.biriz.biz/cay/TeaSector2002). The capital investment on dryers is also the highest
among the different processing machines. There are three different types of tea dryers up to now
namely ECP (Endless Chain Pressure), FBD (Fluidized Bed Dryer) and combination dryers. ECP
dryer has been used in tea industry since 1907 and fluidized bed dryer was first developed for tea in
Sri Lanka in 1974 (Temple S.J., 2000). Tea dryers have its defined output as rated output. But
normally dryer machines give lower output (actual output) than rated output. There may be several
reasons affecting for dryer output deviation from rated output. Ultimately this would lead to poor
production and high cost of production to the tea factories.
Main objective is to find out the factors affecting for deviation of actual dryer output from rated dryer
output in different types of tea dryers.
Materials and Methodology
Effectiveness of three types of tea dryers was taken as dependent variable. Effectiveness of tea dryers
can be measured as the ratio between actual output and rated output. It will be finally taken as a
percentage value.
As independent variables four factors have been selected as moisture content of withered leaves
(wither percentage %), age of three types of dryers (Years), moisture of firewood used for drying
(firewood moisture) and dhool percentage taken after roll breaking process (first, second and third
dhool percentage).
The sampling frame was 37 tea dryers representing three manufacturing regions in Sri Lanka (Up
country, Mid country and Low country). There were 17 ECP dryers, 15 FBD dryers and 5
combination dryers in the sample. The data were collected for recent three months time period and
average values were taken finally. For the analysis descriptive, correlation and simple linear
regression was used.
Results and Discussion
According to descriptive statistics mean effectiveness of ECP, FBD and combination dryers were
85.88%, 89.83%, 91.53% respectively.
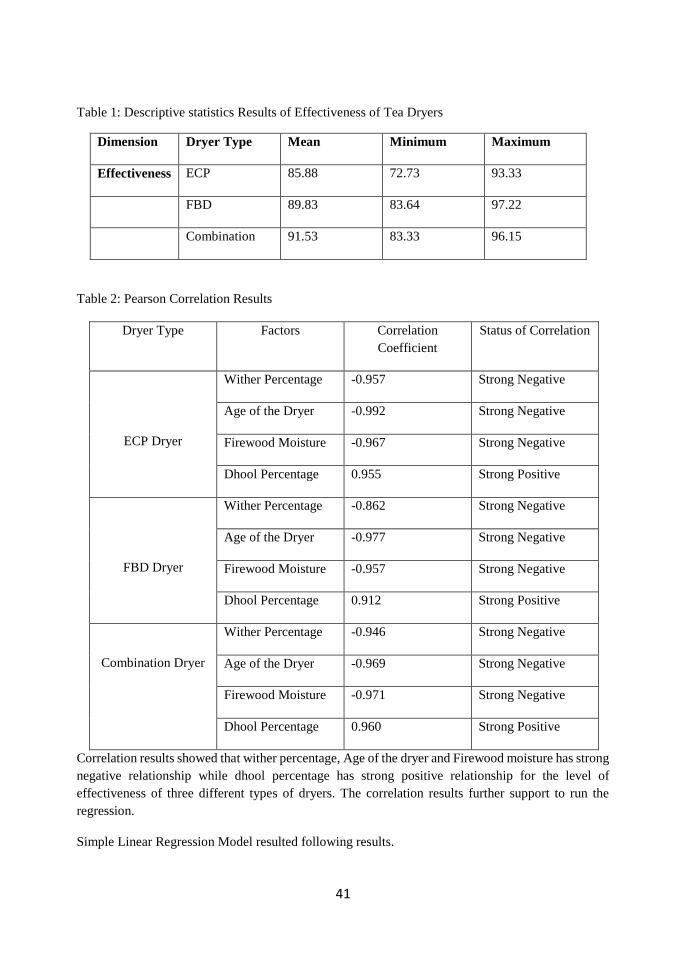
41
Table 1: Descriptive statistics Results of Effectiveness of Tea Dryers
Dimension Dryer Type Mean Minimum Maximum
Effectiveness ECP 85.88 72.73 93.33
FBD 89.83 83.64 97.22
Combination 91.53 83.33 96.15
Table 2: Pearson Correlation Results
Dryer Type Factors Correlation
Coefficient
Status of Correlation
ECP Dryer
Wither Percentage -0.957 Strong Negative
Age of the Dryer -0.992 Strong Negative
Firewood Moisture -0.967 Strong Negative
Dhool Percentage 0.955 Strong Positive
FBD Dryer
Wither Percentage -0.862 Strong Negative
Age of the Dryer -0.977 Strong Negative
Firewood Moisture -0.957 Strong Negative
Dhool Percentage 0.912 Strong Positive
Combination Dryer
Wither Percentage -0.946 Strong Negative
Age of the Dryer -0.969 Strong Negative
Firewood Moisture -0.971 Strong Negative
Dhool Percentage 0.960 Strong Positive
Correlation results showed that wither percentage, Age of the dryer and Firewood moisture has strong
negative relationship while dhool percentage has strong positive relationship for the level of
effectiveness of three different types of dryers. The correlation results further support to run the
regression.
Simple Linear Regression Model resulted following results.
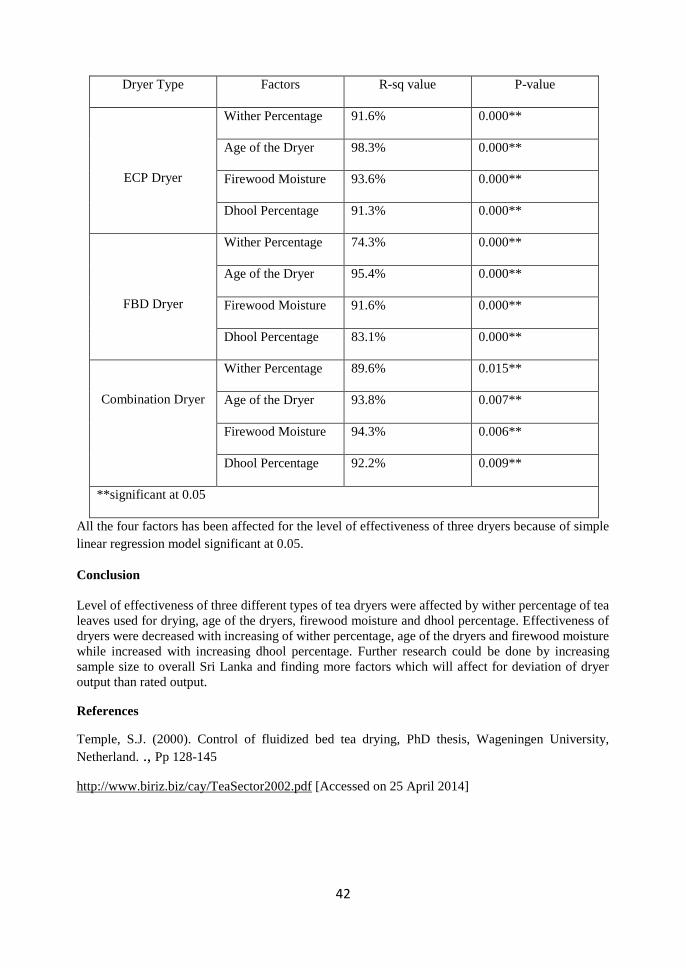
42
Dryer Type Factors R-sq value P-value
ECP Dryer
Wither Percentage 91.6% 0.000**
Age of the Dryer 98.3% 0.000**
Firewood Moisture 93.6% 0.000**
Dhool Percentage 91.3% 0.000**
FBD Dryer
Wither Percentage 74.3% 0.000**
Age of the Dryer 95.4% 0.000**
Firewood Moisture 91.6% 0.000**
Dhool Percentage 83.1% 0.000**
Combination Dryer
Wither Percentage 89.6% 0.015**
Age of the Dryer 93.8% 0.007**
Firewood Moisture 94.3% 0.006**
Dhool Percentage 92.2% 0.009**
**significant at 0.05
All the four factors has been affected for the level of effectiveness of three dryers because of simple
linear regression model significant at 0.05.
Conclusion
Level of effectiveness of three different types of tea dryers were affected by wither percentage of tea
leaves used for drying, age of the dryers, firewood moisture and dhool percentage. Effectiveness of
dryers were decreased with increasing of wither percentage, age of the dryers and firewood moisture
while increased with increasing dhool percentage. Further research could be done by increasing
sample size to overall Sri Lanka and finding more factors which will affect for deviation of dryer
output than rated output.
References
Temple, S.J. (2000). Control of fluidized bed tea drying, PhD thesis, Wageningen University,
Netherland. ., Pp 128-145
http://www.biriz.biz/cay/TeaSector2002.pdf [Accessed on 25 April 2014]
43
Effect of Tea bag materials on physical and chemical quality
parameters of Black Tea during storage P. C. S. Pathirana, A. G. A.W. Alakolanga, U. D. A. T. Premathilake
Faculty of Animal Science and Export Agriculture, Uva Wellassa University of Sri Lanka
Introduction
The tea (Camellia sinensis) produced in Sri Lanka is popular as “Ceylon tea” and has a higher demand
as ‘best quality tea’ in the international trade. Packing tea into bags in many forms has become very
popular because of convenience and it can be considered as an effective form of value addition.
Though tea bags are used as packaging strategy in order to protect the quality parameters of tea during
storage, while extending the shelf life, there are many quality claims against tea bag materials. The
other bad news is that paper tea bags may be just as bad, or worse, than the plastic ones because many
of them are treated with epichlorohydrin, a compound mainly used in the production of epoxy resins.
The purpose of this research was to evaluate effect of different types of tea bag packaging materials
on physical and chemical parameters of tea and selecting best tea bag packaging material.
Methodology
There are three types of tea bag materials as Paper, Soilon and Nylon that used to export tea in Sri
Lanka, were used for this research. Those tea bags contained black tea with same manufacturing date,
and also they were received from same tea exporting company. Each tea bag was consisting with
Broken Orange Pekoe Fannings (BOPF) grade of black tea and tea bags were in same shape, size and
same weight (2.5g) of tea. Each type of tea bag was packed in same size of sealed cardboard boxes
and they were stored in normal room temperature. Each box was consisted with 25 tea bags.
Tea bags were stored for three months duration. Every experiment was conducted three times at same
time intervals in each month of during storage period and data was collected in each month.
Experiments were conducted using selected physical and chemical quality parameters of black tea.
Moisture content, dry matter, brightness, total colour were measure as physical quality parameters
and total polyphenols, caffeine, thearubigin, theaflavin and thearubigin to theaflavin ratio was
measured as chemical quality parameters. Three replicates were carried out for each type of materials
in each experiment. Every experiment was conducted according to ISO procedures recommended for
black tea.
All data were expressed using descriptive statistics as means, standard deviations and coefficient of
variations of triplicate measurements and analysed by using Minitab 16 software. Significant effects
were tested by conducting two sample t-tests for each packaging materials by comparing with the
initial data set of each material separately. Values of P<0.05 were considered as significantly different
(α=0.05).
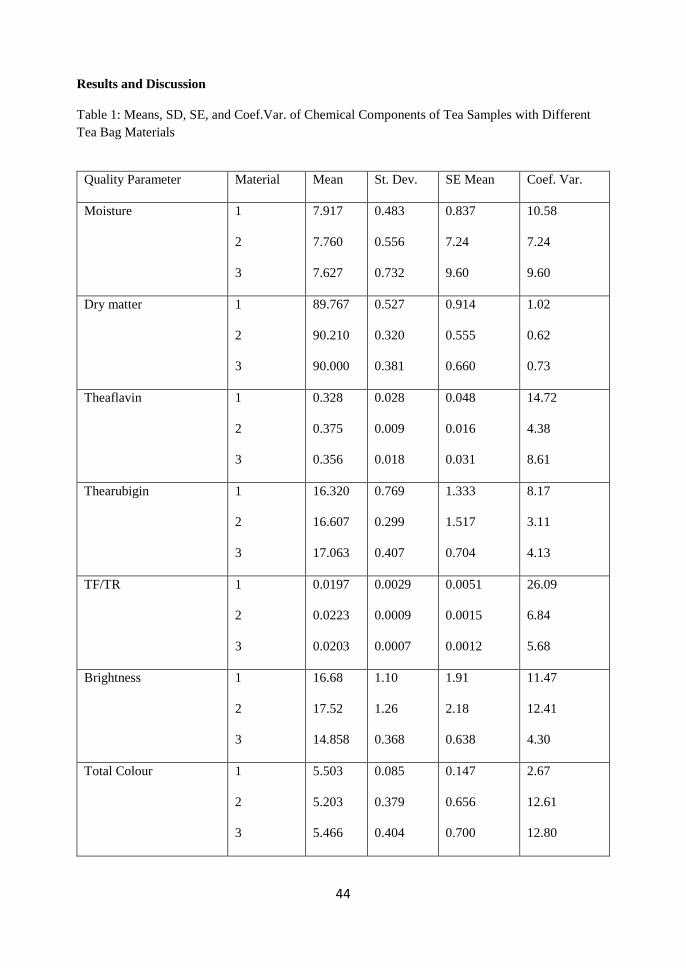
44
Results and Discussion
Table 1: Means, SD, SE, and Coef.Var. of Chemical Components of Tea Samples with Different
Tea Bag Materials
Quality Parameter Material Mean St. Dev. SE Mean Coef. Var.
Moisture 1
2
3
7.917
7.760
7.627
0.483
0.556
0.732
0.837
7.24
9.60
10.58
7.24
9.60
Dry matter 1
2
3
89.767
90.210
90.000
0.527
0.320
0.381
0.914
0.555
0.660
1.02
0.62
0.73
Theaflavin 1
2
3
0.328
0.375
0.356
0.028
0.009
0.018
0.048
0.016
0.031
14.72
4.38
8.61
Thearubigin 1
2
3
16.320
16.607
17.063
0.769
0.299
0.407
1.333
1.517
0.704
8.17
3.11
4.13
TF/TR 1
2
3
0.0197
0.0223
0.0203
0.0029
0.0009
0.0007
0.0051
0.0015
0.0012
26.09
6.84
5.68
Brightness 1
2
3
16.68
17.52
14.858
1.10
1.26
0.368
1.91
2.18
0.638
11.47
12.41
4.30
Total Colour 1
2
3
5.503
5.203
5.466
0.085
0.379
0.404
0.147
0.656
0.700
2.67
12.61
12.80
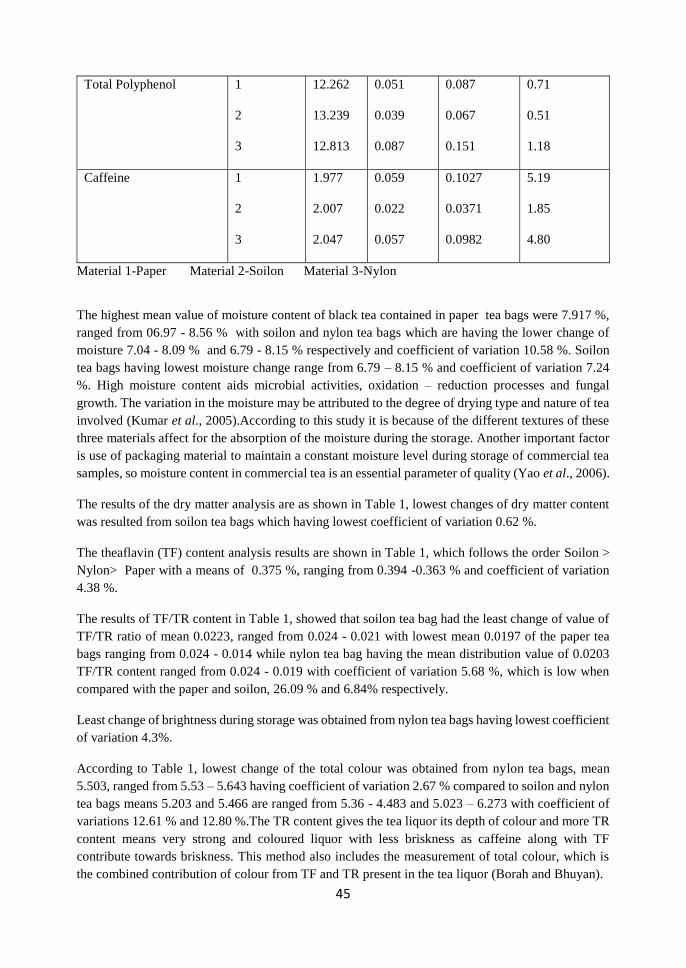
45
Material 1-Paper Material 2-Soilon Material 3-Nylon
The highest mean value of moisture content of black tea contained in paper tea bags were 7.917 %,
ranged from 06.97 - 8.56 % with soilon and nylon tea bags which are having the lower change of
moisture 7.04 - 8.09 % and 6.79 - 8.15 % respectively and coefficient of variation 10.58 %. Soilon
tea bags having lowest moisture change range from 6.79 – 8.15 % and coefficient of variation 7.24
%. High moisture content aids microbial activities, oxidation – reduction processes and fungal
growth. The variation in the moisture may be attributed to the degree of drying type and nature of tea
involved (Kumar et al., 2005).According to this study it is because of the different textures of these
three materials affect for the absorption of the moisture during the storage. Another important factor
is use of packaging material to maintain a constant moisture level during storage of commercial tea
samples, so moisture content in commercial tea is an essential parameter of quality (Yao et al., 2006).
The results of the dry matter analysis are as shown in Table 1, lowest changes of dry matter content
was resulted from soilon tea bags which having lowest coefficient of variation 0.62 %.
The theaflavin (TF) content analysis results are shown in Table 1, which follows the order Soilon >
Nylon> Paper with a means of 0.375 %, ranging from 0.394 -0.363 % and coefficient of variation
4.38 %.
The results of TF/TR content in Table 1, showed that soilon tea bag had the least change of value of
TF/TR ratio of mean 0.0223, ranged from 0.024 - 0.021 with lowest mean 0.0197 of the paper tea
bags ranging from 0.024 - 0.014 while nylon tea bag having the mean distribution value of 0.0203
TF/TR content ranged from 0.024 - 0.019 with coefficient of variation 5.68 %, which is low when
compared with the paper and soilon, 26.09 % and 6.84% respectively.
Least change of brightness during storage was obtained from nylon tea bags having lowest coefficient
of variation 4.3%.
According to Table 1, lowest change of the total colour was obtained from nylon tea bags, mean
5.503, ranged from 5.53 – 5.643 having coefficient of variation 2.67 % compared to soilon and nylon
tea bags means 5.203 and 5.466 are ranged from 5.36 - 4.483 and 5.023 – 6.273 with coefficient of
variations 12.61 % and 12.80 %.The TR content gives the tea liquor its depth of colour and more TR
content means very strong and coloured liquor with less briskness as caffeine along with TF
contribute towards briskness. This method also includes the measurement of total colour, which is
the combined contribution of colour from TF and TR present in the tea liquor (Borah and Bhuyan).
Total Polyphenol 1
2
3
12.262
13.239
12.813
0.051
0.039
0.087
0.087
0.067
0.151
0.71
0.51
1.18
Caffeine 1
2
3
1.977
2.007
2.047
0.059
0.022
0.057
0.1027
0.0371
0.0982
5.19
1.85
4.80
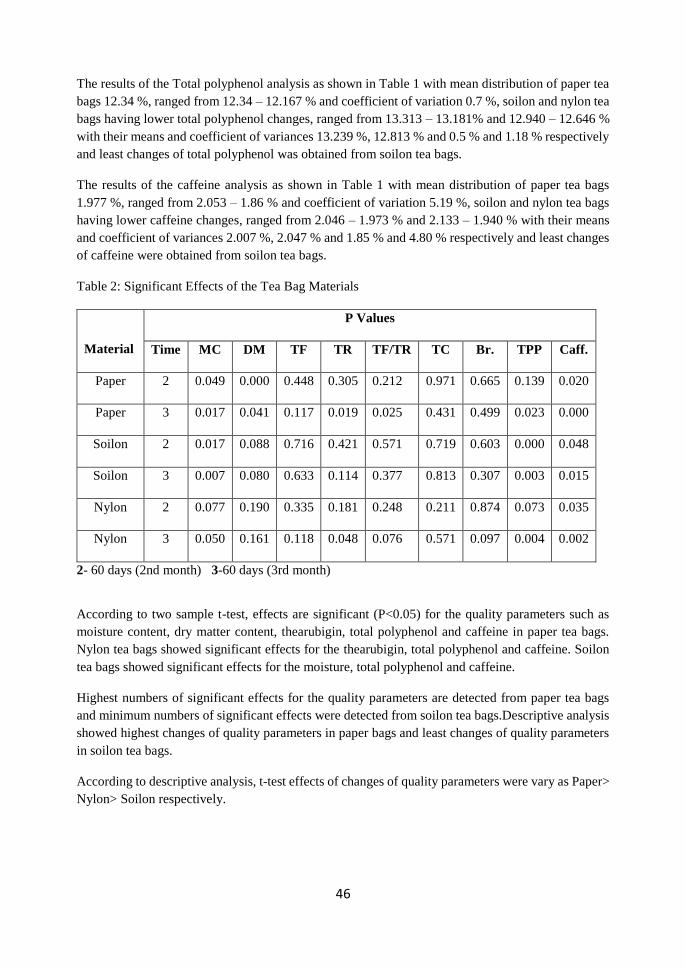
46
The results of the Total polyphenol analysis as shown in Table 1 with mean distribution of paper tea
bags 12.34 %, ranged from 12.34 – 12.167 % and coefficient of variation 0.7 %, soilon and nylon tea
bags having lower total polyphenol changes, ranged from 13.313 – 13.181% and 12.940 – 12.646 %
with their means and coefficient of variances 13.239 %, 12.813 % and 0.5 % and 1.18 % respectively
and least changes of total polyphenol was obtained from soilon tea bags.
The results of the caffeine analysis as shown in Table 1 with mean distribution of paper tea bags
1.977 %, ranged from 2.053 – 1.86 % and coefficient of variation 5.19 %, soilon and nylon tea bags
having lower caffeine changes, ranged from 2.046 – 1.973 % and 2.133 – 1.940 % with their means
and coefficient of variances 2.007 %, 2.047 % and 1.85 % and 4.80 % respectively and least changes
of caffeine were obtained from soilon tea bags.
Table 2: Significant Effects of the Tea Bag Materials
Material
P Values
Time MC DM TF TR TF/TR TC Br. TPP Caff.
Paper 2 0.049 0.000 0.448 0.305 0.212 0.971 0.665 0.139 0.020
Paper 3 0.017 0.041 0.117 0.019 0.025 0.431 0.499 0.023 0.000
Soilon 2 0.017 0.088 0.716 0.421 0.571 0.719 0.603 0.000 0.048
Soilon 3 0.007 0.080 0.633 0.114 0.377 0.813 0.307 0.003 0.015
Nylon 2 0.077 0.190 0.335 0.181 0.248 0.211 0.874 0.073 0.035
Nylon 3 0.050 0.161 0.118 0.048 0.076 0.571 0.097 0.004 0.002
2- 60 days (2nd month) 3-60 days (3rd month)
According to two sample t-test, effects are significant (P<0.05) for the quality parameters such as
moisture content, dry matter content, thearubigin, total polyphenol and caffeine in paper tea bags.
Nylon tea bags showed significant effects for the thearubigin, total polyphenol and caffeine. Soilon
tea bags showed significant effects for the moisture, total polyphenol and caffeine.
Highest numbers of significant effects for the quality parameters are detected from paper tea bags
and minimum numbers of significant effects were detected from soilon tea bags.Descriptive analysis
showed highest changes of quality parameters in paper bags and least changes of quality parameters
in soilon tea bags.
According to descriptive analysis, t-test effects of changes of quality parameters were vary as Paper>
Nylon> Soilon respectively.
47
Conclusion
The effects of packaging materials on each quality parameters are varied with the type of material.
These variations are mainly due to nature and permeability of the material. Permeable materials allow
moisture absorption with time if the moisture levels of the storage environment are not properly
controlled. Moisture absorption is high in nylon and paper materials compared to soilon. Changes in
Quality parameters of paper and nylon materials are comparatively higher than soilon. Compared to
nylon and paper materials, soilon showed minimum significant changes of the quality parameters
with minimum significant effects (P<0.05). According to descriptive and t-tests, can conclude
‘Soilon’ is the ‘best’ material for tea bags for these three months studying period.
References
Borah, S., Bhuyan, M., Quality indexing by machine vision during fermentation in black tea
manufacturing, Dept of Electronics, Tezpur University ,Assam India-784 028
Kumar, A., Nair, A.G.C., Reddly, A.V.R. and Garg, A.N., 2005. Availability of essential elements
in India and US tea brands. Food Chem. 89: 441-448
Yao, L.H., Jiang, Y.M., Caffin N, D’Arcy, B., Datta, N., Liu, X., Singanusong, R. and Xu Y.,
2006. Phenolic compounds in tea from Australian super markets. Food Chem 96: 614-620.
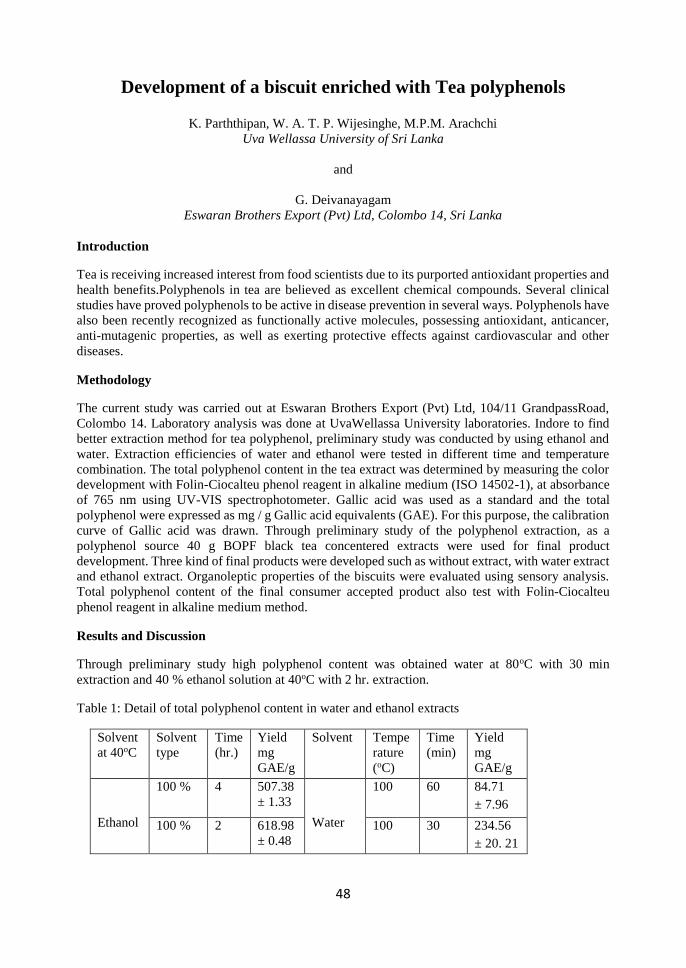
48
Development of a biscuit enriched with Tea polyphenols
K. Parththipan, W. A. T. P. Wijesinghe, M.P.M. Arachchi
Uva Wellassa University of Sri Lanka
and
G. Deivanayagam
Eswaran Brothers Export (Pvt) Ltd, Colombo 14, Sri Lanka
Introduction
Tea is receiving increased interest from food scientists due to its purported antioxidant properties and
health benefits.Polyphenols in tea are believed as excellent chemical compounds. Several clinical
studies have proved polyphenols to be active in disease prevention in several ways. Polyphenols have
also been recently recognized as functionally active molecules, possessing antioxidant, anticancer,
anti-mutagenic properties, as well as exerting protective effects against cardiovascular and other
diseases.
Methodology
The current study was carried out at Eswaran Brothers Export (Pvt) Ltd, 104/11 GrandpassRoad,
Colombo 14. Laboratory analysis was done at UvaWellassa University laboratories. Indore to find
better extraction method for tea polyphenol, preliminary study was conducted by using ethanol and
water. Extraction efficiencies of water and ethanol were tested in different time and temperature
combination. The total polyphenol content in the tea extract was determined by measuring the color
development with Folin-Ciocalteu phenol reagent in alkaline medium (ISO 14502-1), at absorbance
of 765 nm using UV-VIS spectrophotometer. Gallic acid was used as a standard and the total
polyphenol were expressed as mg / g Gallic acid equivalents (GAE). For this purpose, the calibration
curve of Gallic acid was drawn. Through preliminary study of the polyphenol extraction, as a
polyphenol source 40 g BOPF black tea concentered extracts were used for final product
development. Three kind of final products were developed such as without extract, with water extract
and ethanol extract. Organoleptic properties of the biscuits were evaluated using sensory analysis.
Total polyphenol content of the final consumer accepted product also test with Folin-Ciocalteu
phenol reagent in alkaline medium method.
Results and Discussion
Through preliminary study high polyphenol content was obtained water at 80oC with 30 min
extraction and 40 % ethanol solution at 40oC with 2 hr. extraction.
Table 1: Detail of total polyphenol content in water and ethanol extracts
Solvent
at 40oC
Solvent
type
Time
(hr.)
Yield
mg
GAE/g
Solvent Tempe
rature
(oC)
Time
(min)
Yield
mg
GAE/g
Ethanol
100 % 4 507.38
± 1.33
Water
100 60 84.71
± 7.96
100 % 2 618.98
± 0.48
100 30 234.56
± 20. 21
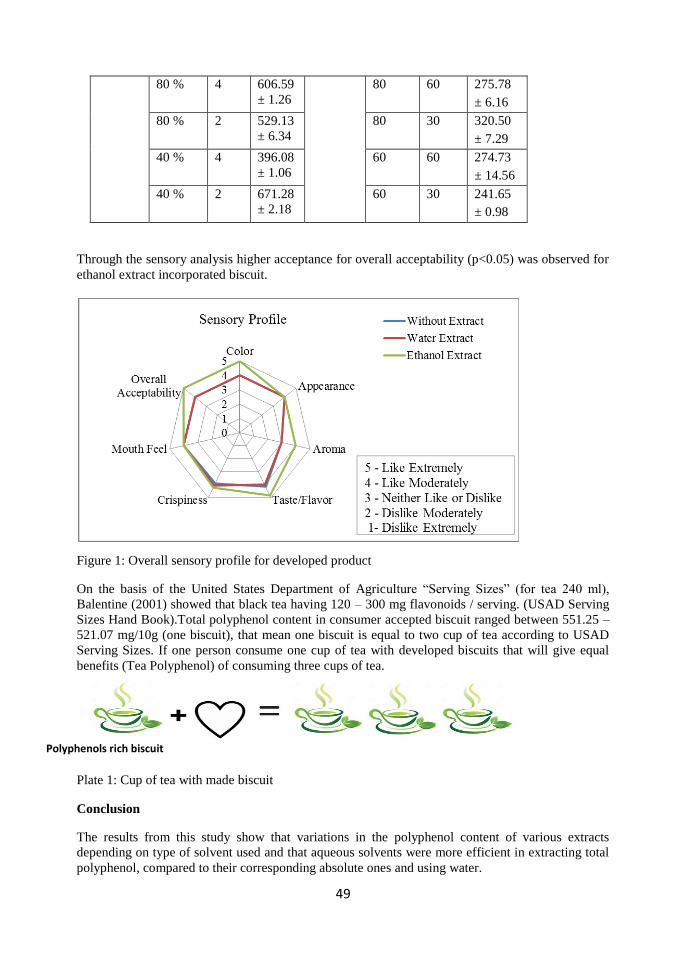
49
80 % 4 606.59
± 1.26
80 60 275.78
± 6.16
80 % 2 529.13
± 6.34
80 30 320.50
± 7.29
40 % 4 396.08
± 1.06
60 60 274.73
± 14.56
40 % 2 671.28
± 2.18
60 30 241.65
± 0.98
Through the sensory analysis higher acceptance for overall acceptability (p<0.05) was observed for
ethanol extract incorporated biscuit.
Figure 1: Overall sensory profile for developed product
On the basis of the United States Department of Agriculture “Serving Sizes” (for tea 240 ml),
Balentine (2001) showed that black tea having 120 – 300 mg flavonoids / serving. (USAD Serving
Sizes Hand Book).Total polyphenol content in consumer accepted biscuit ranged between 551.25 –
521.07 mg/10g (one biscuit), that mean one biscuit is equal to two cup of tea according to USAD
Serving Sizes. If one person consume one cup of tea with developed biscuits that will give equal
benefits (Tea Polyphenol) of consuming three cups of tea.
Plate 1: Cup of tea with made biscuit
Conclusion
The results from this study show that variations in the polyphenol content of various extracts
depending on type of solvent used and that aqueous solvents were more efficient in extracting total
polyphenol, compared to their corresponding absolute ones and using water.
Polyphenols rich biscuit
50
Present study indicated that ethanol extracts were accepted by consumers as a polyphenol rich source
in food product constituents, and might be an interest of wider usage as food components.
References
Scalbert A, Manach C, Morand C, Remesy C, Jimenez L. Dietary polyphenols and the prevention of
diseases. Crit Rev Food SciNutr 2005;45:287-306.
Nihal Turkmen, Y. SedatVelioglu , Ferda Sari, GokcePolat (2007) 'Effect of Extraction Conditions
on Measured Total Polyphenol Contents and Antioxidant and Antibacterial Activities of Black Tea',
molecules, 2007(12), pp. 484-496.
Lambert JD, Hong J, Yang GY, Liao J, Yang CS. Inhibition of carcinogenesis by polyphenols:
evidence from laboratory investigations. Am J ClinNutr 2005;81:284S-291S.
51
Development of Black Tea incorporated tomato sauce
D. W. N. G. Bandara, W. A. J. P. Wijesinghe, U. G. A. T. Premathilake
Faculty of Animal Science and Export Agriculture, Uva Wellassa University of Sri Lanka
and
B. Balamurali
J. V. Gokal Ceylon (Pvt) Ltd, Sedawatte Road, Wallampitiya
Introduction
Tea has a lot of health beneficial components and also considered an energy active booster. Current
trend is moving to the health benefits concepts and green production. Under this condition, there is a
huge demand for black tea sauce like products. There is a high demand for Sri Lankan black tea in
Global market due to some specific characteristics. But, still we are failing on tea value addition.
Therefore, improving value addition practices and new product development are more essential to
Sri Lanka to survive in the Global market.
Recently, research has focused on green tea. Green tea is loaded with the compound epigallocatechin
gallate (EGCg), a powerful anti-oxidant. Since the fermentation process used to make black tea
converts EGCg into other compounds, researchers assumed black tea had less health benefits than
green tea. However, recent studies indicate the compounds contained in black tea which are
theaflavins and thearubigens, do more than contribute to its dark color and distinctive flavor. They
also provide health benefits originally attributed solely to green tea (Herath, H.M.U.N., and De Silva,
D., (2006).
Objectives
The main objective in the present study was to black tea incorporated tomato sauce while the specific
objectives were to determine appropriate amount of ingredients to be added to the product and to
extend shelf life, in order to obtain the desired product quality.
Method
Small pieces of tomatoes and green chilies were mixed using a grinder and salt, chili, black tea brew,
honey, garlic and tamarind extraction were added into the mixture until it becomes a cream. The
cream was heated until it becomes tick. Then filled into the sterilized glass bottles by using hot filling
method. All microbial analysis and proximate analysis were conducted according to the SLSI
standard (260: 2008). Statistical analysis was undertaken according to the Friedman test under 5%
significance level, by using MINITAB – 16 software package and Microsoft – Excel package.
Results and Discussions
Table 1 given the Physico-chemical properties and proximate analysis of black tea incorporated
tomato sauce. According to proximate analysis, moisture content was 14 % and protein content was
0.5 %. Total soluble solid content of the product was 38. pH of the product was 4.42 and tritratable
acidity was 3.69 %. Total poly phenol content was 350 mg GAE/g. By doing sensory evaluation from
Friedman test from Minitab 16 software the product contained the best characters of sauce.
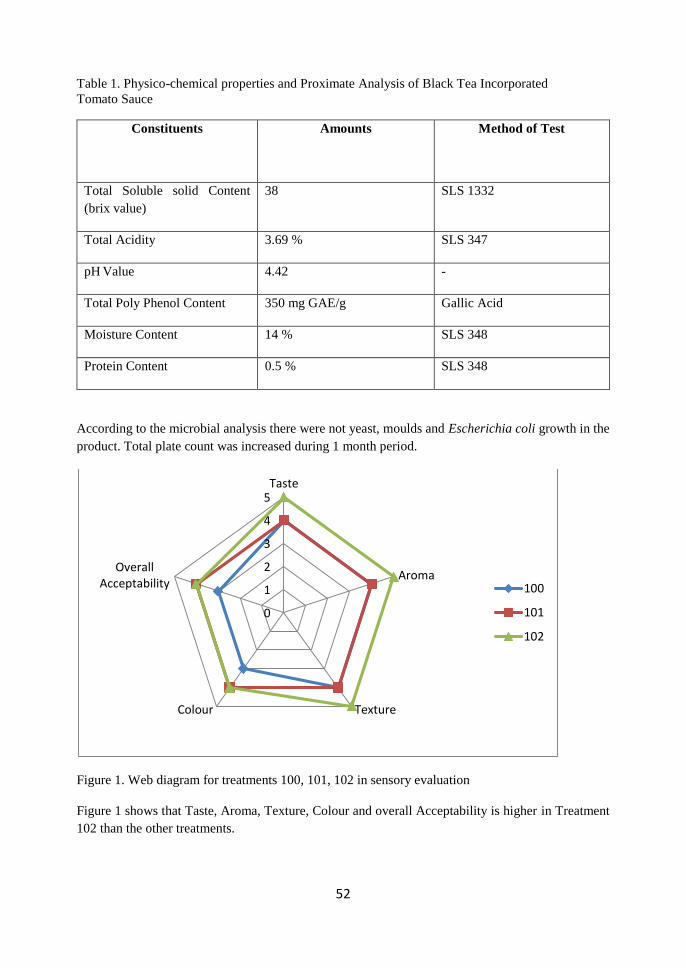
52
Table 1. Physico-chemical properties and Proximate Analysis of Black Tea Incorporated
Tomato Sauce
Constituents Amounts
Method of Test
Total Soluble solid Content
(brix value)
38 SLS 1332
Total Acidity 3.69 % SLS 347
pH Value 4.42 -
Total Poly Phenol Content 350 mg GAE/g Gallic Acid
Moisture Content 14 % SLS 348
Protein Content 0.5 % SLS 348
According to the microbial analysis there were not yeast, moulds and Escherichia coli growth in the
product. Total plate count was increased during 1 month period.
Figure 1. Web diagram for treatments 100, 101, 102 in sensory evaluation
Figure 1 shows that Taste, Aroma, Texture, Colour and overall Acceptability is higher in Treatment
102 than the other treatments.
0
1
2
3
4
5Taste
Aroma
TextureColour
OverallAcceptability 100
101
102
53
Conclusion and Suggestions
As a new value added product if it will reach to customers, it may contribute to more Sri Lankan
exports as well. Attraction from the child to the adult one to increase food appetite, low cost of
production, low purchasing cost and high market demand are the key benefits of the product. By
doing sensory evaluation from Friedman test from Minitab 16 software the product was include the
best characters of sauce.
Treatment 102 has been selected as best products through sensory evaluation, proximate analysis and
shelf life analysis. With reference to the microbial analysis, it can be concluded that the product have
more than two months of shelf life.
According to the statistical analysis, nutritional analysis and microbial analysis the product remains
under acceptable level of human consumption.
Reference
Herath, H.M.U.N., and De Silva, D., (2006). Strategies for Competitive Advantage in Value Added
Tea Marketing, Postgraduate Institute of Agriculture, University of Peradeniya, Sri Lanka.
54
Development of Green Tea incorporated instant herbal porridge
mixture
M.A.U.P. Munasinghe, W.A.J.P.Wijesinghe, P. U. S. Pieris
Faculty of Animal Science and Export Agriculture, Uva Wellassa University of Sri Lanka
Introduction
As the second largest tea exporter in the world, the greater portion of tea is exported as bulk tea.
Average price of bulk tea is lower than that of value added products (Ganewatta et al., 2005). There
are several types of teas which are producing with different processing methods such as, Black tea,
Green tea, Oolong tea and White tea. Among them, green tea is considered as the healthiest beverage
in the world. It is loaded with antioxidants and nutrients have powerful effects on the body. (Gunnars,
2014). Because of the bitter taste of green tea, most of the consumers do not prefer to consume green
tea alone. Herbal porridge which is considered indigenous to Sri Lanka, comprises with therapeutic
values and nutritious. In Ayurvedic medicine Osbekicaoctandera (heenbovitiya), Murrayakoenigi
(curry leaves) are highly recommended for the preparation of Herbal Porridge for Diabetes& heart
patients in traditional ayurvedic medicine. O. octandra is a very valuable and widely utilized plant
species in indigenous Ayurvedic medicine in Sri Lanka (Peiris et al., 2006).A study published in
the (Journal of Plant food for Nutrition), found that curry leaves have a great impact on the blood
sugar levels of diabetics (Sampath, 2014). It can be medicinally and economically more valuable to
develop green tea incorporated instant herbal porridge mixture by using natural resources. The
objectives of this research were:
— Develop a green tea incorporated instant herbal porridge mixture
— Find out the best ratio of dehydrated green leaf powder and green tea powder for
herbal porridge mixture
— Determine the Shelf life of the developed product
Materials and Methods
Heenbovitiya (Osbeckiaoctandra) leaves and curry leaves (Murrayakoenigi) were steam blanched
for two minutes separately and few minutes were allowed to drain excess water. Then leaves were
oven dried at 60°C. Finally, well dried leaves were grinded and sieved well to obtain fine leaf powder
for instant herbal porridge mixture. For the preparation of red rice for the instant herbal porridge
mixture, cleaned red rice was presoaked for 4 hours and oven dried at 80°C. Cleaned soya beans were
boiled for 25 minutes and oven dried at 80°C. Well dried soya beans were grinded to obtain fine
powder for the porridge mixture. All the prepared ingredients were blended with three different levels
of green tea powder (2.6, 3.6, 4.6g per cup) according to an Ayurvedic formula; the formula to prepare
25 cups of Kolakanda was rice 500g, fresh leaves 275g, soya bean 10g, raw garlic 10g, raw ginger
25g, salt 15g and water 5l (Gamlath et al., 2002).
The developed instant herbal porridge mixtures were evaluated for color, taste, aroma, texture and
overall acceptability using 30 untrained panelists. The responses were recorded according to 5 point
hedonic scale (5- extremely like to 1- extremely dislike). The sensory attributes were analyzed by
Friedman test in MINITAB 14 statistical package and samples were compared by using 5%
significant level.
Proximate analysis was carried out to determine the nutrient content of the selected best product
through sensory evaluation. Total polyphenol content was determined according to the method based
on ISO 14502 -1.
Detection of total plate count and yeast and mould were done during six weeks storage period. A
sample of 31.4g of developed product was reconstituted for 5 minutes with 200ml of distilled water
and 1ml of reconstituted sample was mixed with 9 ml of 0.1% peptone water in to test tube. After
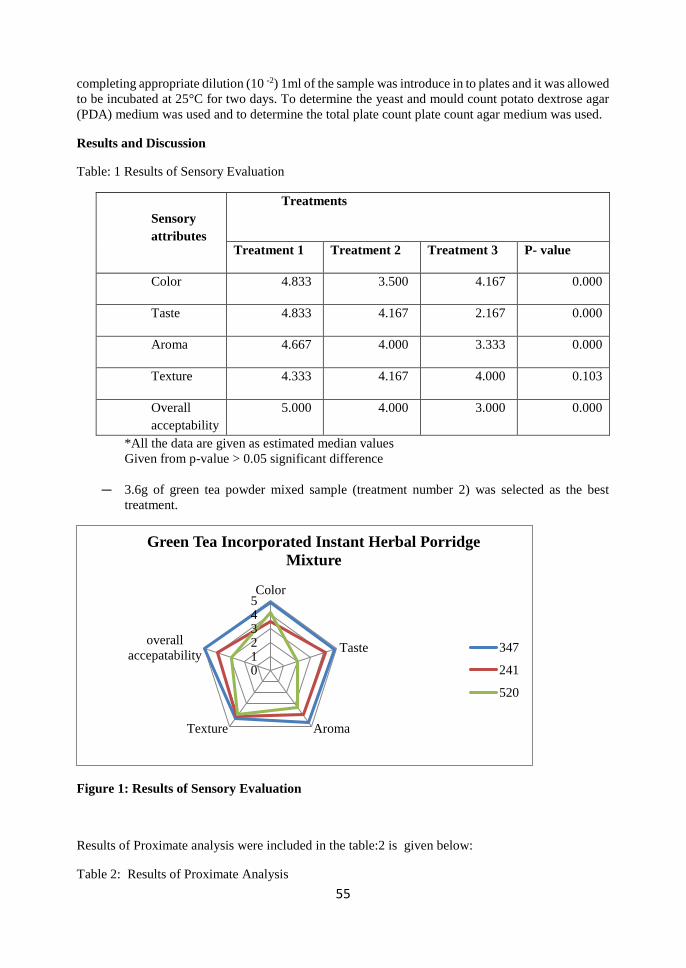
55
completing appropriate dilution (10 -2) 1ml of the sample was introduce in to plates and it was allowed
to be incubated at 25°C for two days. To determine the yeast and mould count potato dextrose agar
(PDA) medium was used and to determine the total plate count plate count agar medium was used.
Results and Discussion
Table: 1 Results of Sensory Evaluation
Sensory
attributes
Treatments
Treatment 1 Treatment 2 Treatment 3 P- value
Color 4.833 3.500 4.167 0.000
Taste 4.833 4.167 2.167 0.000
Aroma 4.667 4.000 3.333 0.000
Texture 4.333 4.167 4.000 0.103
Overall
acceptability
5.000 4.000 3.000 0.000
*All the data are given as estimated median values
Given from p-value > 0.05 significant difference
— 3.6g of green tea powder mixed sample (treatment number 2) was selected as the best
treatment.
Figure 1: Results of Sensory Evaluation
Results of Proximate analysis were included in the table:2 is given below:
Table 2: Results of Proximate Analysis
012345Color
Taste
AromaTexture
overall
accepatability
Green Tea Incorporated Instant Herbal Porridge
Mixture
347
241
520
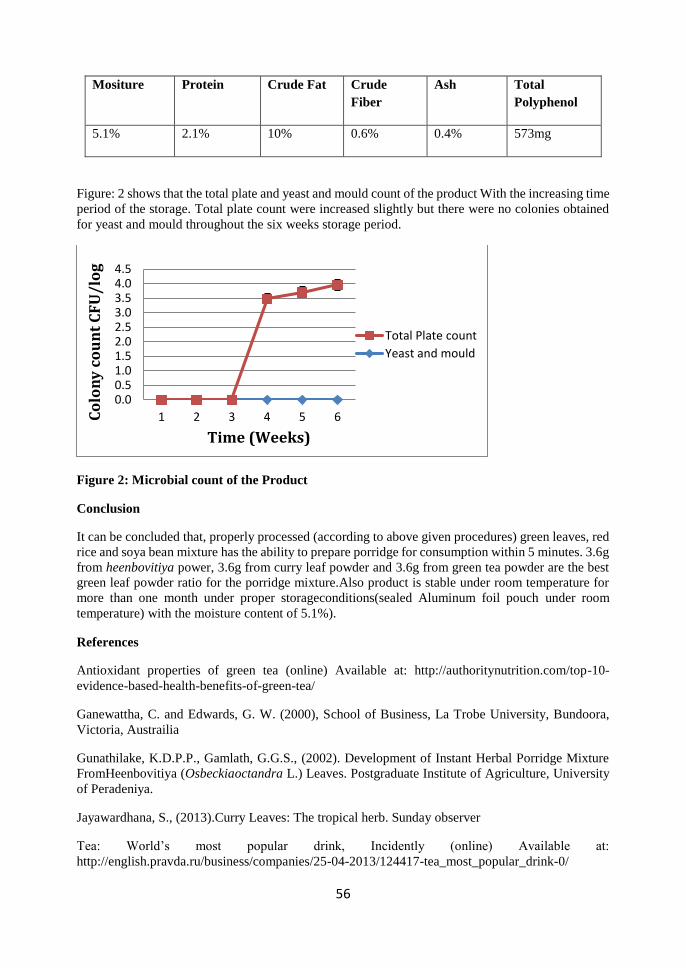
56
Mositure Protein Crude Fat Crude
Fiber
Ash Total
Polyphenol
5.1% 2.1% 10% 0.6% 0.4% 573mg
Figure: 2 shows that the total plate and yeast and mould count of the product With the increasing time
period of the storage. Total plate count were increased slightly but there were no colonies obtained
for yeast and mould throughout the six weeks storage period.
Figure 2: Microbial count of the Product
Conclusion
It can be concluded that, properly processed (according to above given procedures) green leaves, red
rice and soya bean mixture has the ability to prepare porridge for consumption within 5 minutes. 3.6g
from heenbovitiya power, 3.6g from curry leaf powder and 3.6g from green tea powder are the best
green leaf powder ratio for the porridge mixture.Also product is stable under room temperature for
more than one month under proper storageconditions(sealed Aluminum foil pouch under room
temperature) with the moisture content of 5.1%).
References
Antioxidant properties of green tea (online) Available at: http://authoritynutrition.com/top-10-
evidence-based-health-benefits-of-green-tea/
Ganewattha, C. and Edwards, G. W. (2000), School of Business, La Trobe University, Bundoora,
Victoria, Austrailia
Gunathilake, K.D.P.P., Gamlath, G.G.S., (2002). Development of Instant Herbal Porridge Mixture
FromHeenbovitiya (Osbeckiaoctandra L.) Leaves. Postgraduate Institute of Agriculture, University
of Peradeniya.
Jayawardhana, S., (2013).Curry Leaves: The tropical herb. Sunday observer
Tea: World’s most popular drink, Incidently (online) Available at:
http://english.pravda.ru/business/companies/25-04-2013/124417-tea_most_popular_drink-0/
0.00.51.01.52.02.53.03.54.04.5
1 2 3 4 5 6Co
lon
y c
ou
nt
CF
U/
log
Total Plate count
Yeast and mould
Time (Weeks)
57
Effect of dolomite application on available phosphorus status in
Tea soils
S.Kavitha, , K.Prapagar
Faculty of Agriculture, Eastern University, Sri Lanka
And
G.P.Gunarathne
Tea Research Institute. Talawakella, Sri Lanka
Introduction
Tea (Camellia sinensis L.) is an important economic crop grown on highly weathered Oxisols and
Ultisols in Sri Lanka. Phosphorus (P) is one of the most important macro nutrient that influencing
growth, yield and quality of tea (Zoysa, 1997). Phosphorus deficiency is a concern, and a problem,
in most tea soils. Research shows that over 70% of tea soils are P deficient (Lin et al., 1991). The
availability declines rapidly as the soil pH falls below 5.5 or rises above 7. Therefore, measuring the
soil pH helps the tea grower to adjust soil chemical condition suitable for nutrient uptake and plant
growth (Zoysa, 2008). Dolomite is recommended for amelioration of acidity in tea soils. Present
investigation was carried out to identify the effect of application of Dolomite on soil available
phosphorus status in Tea Growing Soils.
Methodology
Site Description: This field experiment was carried out at field No 17, Midland’s Lower Division,
Ratota. Midlands is an estate(s) and is located in Central Province Matale District of Sri Lanka.
Long term experiment was initiated in 2009. The experiment was carried out by using tea cultivar
TRI 2023.
Experimental Design: Field experiment was laid out in Randomized Complete Block Design
consisting of five treatments in different rate of Dolomite (tons/ha/pruning cycle) namely T1
(Absolutely control), T2 (1), T3 (2), T4 (3), T5 (4). Each treatment replicated thrice.
Soil sampling and Analysis: Soil samples of two depths 0-15 cm and 15-30 cm were collected from
the randomly selected places in each plot as a bulk and sub sample was taken from the bulk after the
mixing. pH of soil suspension was determined by using pH meter(ORION 510A model, USA) with
Ag/AgCl combined electrode. Soil available phosphorous was extracted by Borax solution ( pH 1.5)
and phosphorus was determined by vanadomolybdate blue method (Beater,1949).
Statistical Analysis
The data generated from the study was subjected to Analysis of Variance (ANOVA) and treatment
means were compared least significance difference at probability p< 0.05 using SAS statistical
package version 9.1(SAS Institute, 1999).
Result and Discussion
Effect of application of different rate of Dolomite on soil pH
The effect of different rate of dolomite on pH in soils of 0-15 cm and 15-30 cm depths are presented
in Table 1.Increasing trend in pH was observed with increasing dolomite rates at 0-15cm depth but it
was not significant among treatment means. The highest value of pH was observed in T5 and it
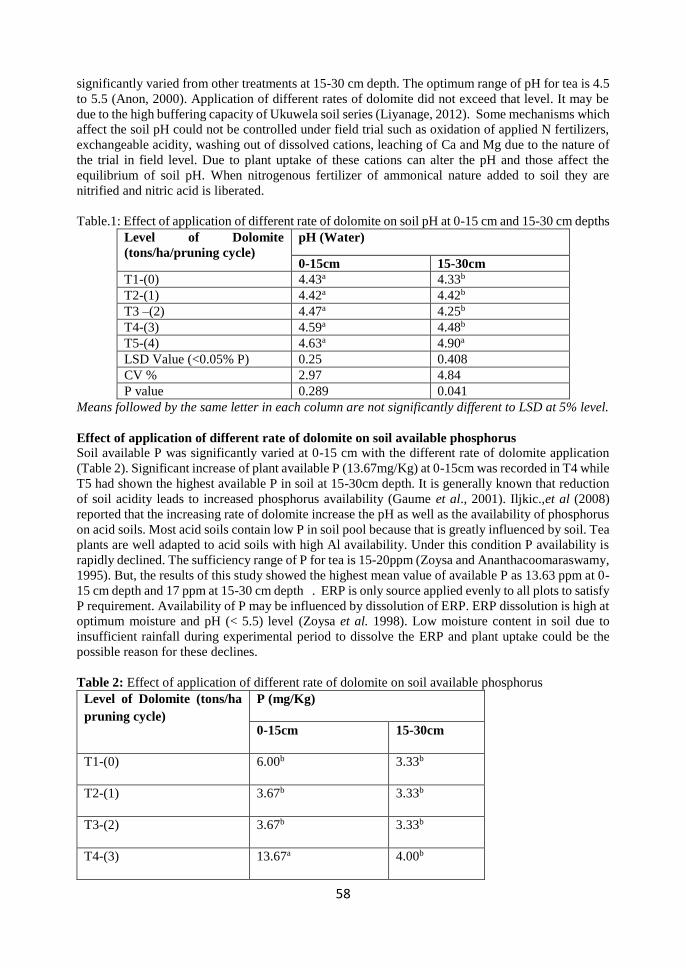
58
significantly varied from other treatments at 15-30 cm depth. The optimum range of pH for tea is 4.5
to 5.5 (Anon, 2000). Application of different rates of dolomite did not exceed that level. It may be
due to the high buffering capacity of Ukuwela soil series (Liyanage, 2012). Some mechanisms which
affect the soil pH could not be controlled under field trial such as oxidation of applied N fertilizers,
exchangeable acidity, washing out of dissolved cations, leaching of Ca and Mg due to the nature of
the trial in field level. Due to plant uptake of these cations can alter the pH and those affect the
equilibrium of soil pH. When nitrogenous fertilizer of ammonical nature added to soil they are
nitrified and nitric acid is liberated.
Table.1: Effect of application of different rate of dolomite on soil pH at 0-15 cm and 15-30 cm depths
Level of Dolomite
(tons/ha/pruning cycle)
pH (Water)
0-15cm 15-30cm
T1-(0) 4.43a 4.33b
T2-(1) 4.42a 4.42b
T3 –(2) 4.47a 4.25b
T4-(3) 4.59a 4.48b
T5-(4) 4.63a 4.90a
LSD Value (<0.05% P) 0.25 0.408
CV % 2.97 4.84
P value 0.289 0.041
Means followed by the same letter in each column are not significantly different to LSD at 5% level.
Effect of application of different rate of dolomite on soil available phosphorus
Soil available P was significantly varied at 0-15 cm with the different rate of dolomite application
(Table 2). Significant increase of plant available P (13.67mg/Kg) at 0-15cm was recorded in T4 while
T5 had shown the highest available P in soil at 15-30cm depth. It is generally known that reduction
of soil acidity leads to increased phosphorus availability (Gaume et al., 2001). Iljkic.,et al (2008)
reported that the increasing rate of dolomite increase the pH as well as the availability of phosphorus
on acid soils. Most acid soils contain low P in soil pool because that is greatly influenced by soil. Tea
plants are well adapted to acid soils with high Al availability. Under this condition P availability is
rapidly declined. The sufficiency range of P for tea is 15-20ppm (Zoysa and Ananthacoomaraswamy,
1995). But, the results of this study showed the highest mean value of available P as 13.63 ppm at 0-
15 cm depth and 17 ppm at 15-30 cm depth . ERP is only source applied evenly to all plots to satisfy
P requirement. Availability of P may be influenced by dissolution of ERP. ERP dissolution is high at
optimum moisture and pH (< 5.5) level (Zoysa et al. 1998). Low moisture content in soil due to
insufficient rainfall during experimental period to dissolve the ERP and plant uptake could be the
possible reason for these declines.
Table 2: Effect of application of different rate of dolomite on soil available phosphorus
Level of Dolomite (tons/ha
pruning cycle)
P (mg/Kg)
0-15cm 15-30cm
T1-(0) 6.00b 3.33b
T2-(1) 3.67b 3.33b
T3-(2) 3.67b 3.33b
T4-(3) 13.67a 4.00b
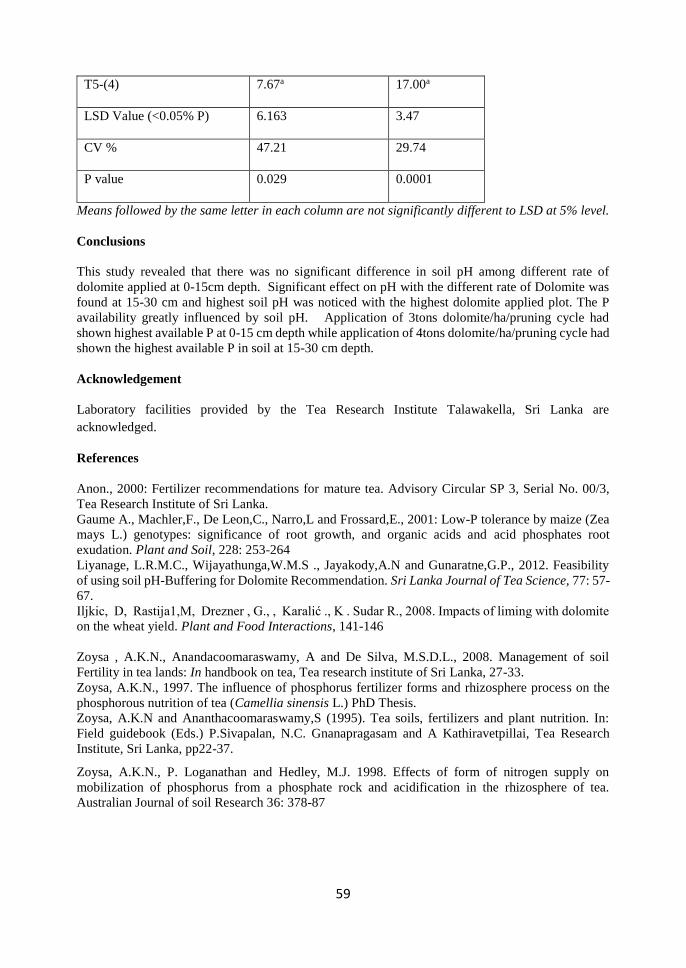
59
T5-(4) 7.67a 17.00a
LSD Value (<0.05% P) 6.163 3.47
CV % 47.21 29.74
P value 0.029 0.0001
Means followed by the same letter in each column are not significantly different to LSD at 5% level.
Conclusions
This study revealed that there was no significant difference in soil pH among different rate of
dolomite applied at 0-15cm depth. Significant effect on pH with the different rate of Dolomite was
found at 15-30 cm and highest soil pH was noticed with the highest dolomite applied plot. The P
availability greatly influenced by soil pH. Application of 3tons dolomite/ha/pruning cycle had
shown highest available P at 0-15 cm depth while application of 4tons dolomite/ha/pruning cycle had
shown the highest available P in soil at 15-30 cm depth.
Acknowledgement
Laboratory facilities provided by the Tea Research Institute Talawakella, Sri Lanka are
acknowledged.
References
Anon., 2000: Fertilizer recommendations for mature tea. Advisory Circular SP 3, Serial No. 00/3,
Tea Research Institute of Sri Lanka.
Gaume A., Machler,F., De Leon,C., Narro,L and Frossard,E., 2001: Low-P tolerance by maize (Zea
mays L.) genotypes: significance of root growth, and organic acids and acid phosphates root
exudation. Plant and Soil, 228: 253-264
Liyanage, L.R.M.C., Wijayathunga,W.M.S ., Jayakody,A.N and Gunaratne,G.P., 2012. Feasibility
of using soil pH-Buffering for Dolomite Recommendation. Sri Lanka Journal of Tea Science, 77: 57-
67.
Iljkic, D, Rastija1,M, Drezner , G., , Karalić ., K . Sudar R., 2008. Impacts of liming with dolomite
on the wheat yield. Plant and Food Interactions, 141-146
Zoysa , A.K.N., Anandacoomaraswamy, A and De Silva, M.S.D.L., 2008. Management of soil
Fertility in tea lands: In handbook on tea, Tea research institute of Sri Lanka, 27-33.
Zoysa, A.K.N., 1997. The influence of phosphorus fertilizer forms and rhizosphere process on the
phosphorous nutrition of tea (Camellia sinensis L.) PhD Thesis.
Zoysa, A.K.N and Ananthacoomaraswamy,S (1995). Tea soils, fertilizers and plant nutrition. In:
Field guidebook (Eds.) P.Sivapalan, N.C. Gnanapragasam and A Kathiravetpillai, Tea Research
Institute, Sri Lanka, pp22-37.
Zoysa, A.K.N., P. Loganathan and Hedley, M.J. 1998. Effects of form of nitrogen supply on
mobilization of phosphorus from a phosphate rock and acidification in the rhizosphere of tea.
Australian Journal of soil Research 36: 378-87
60
Determinants of absenteeism in tea plantation workers (Case study
in selected tea estate in Badulla)
R. M. P. S Rathnayake, R. A. P. I. S Dharmadasa
Faculty of Animal Science and Export Agriculture, Uva Wellassa University of Sri Lanka
Introduction
Absenteeism is a common problem in many industrial units, small or big, private or Government. It
can be defined as a single day of missed work (Martocchio&Jimeno 2003), an individual’s lack of
physical presence at a given location and time when there is a social expectation for him or her to be
there (Martocchio& Harrison, 1993) or non-attendance of employee for scheduled work (Gibson
1966, john 1978). Concerning tea sector in Sri Lanka, chronic absenteeism is one of the major
problems which may lead to out-migration in the long run (Institute of Social Development, 2008).
The labour situation on plantations has gone from one of surplus to deficit, with an annual decline at
the rate of 10% – 20% of the workforce (Institute of Social Development, 2008). This has caused the
privatized large-scale plantation or estate to afflict with low productivity and high cost of production
which resulted for continuous low profit margins (Institute of Social Development, 2008). Sri Lankan
tea production is mainly concentrated into seven regions and Uva region is having nine sub regions.
Among these, Telbadde estate is the largest entity in Badulla/Demodera/Hali-Ela sub region (Sri
Lanka Tea Board). According to the estate reports, Telbadde estate has one of the largest working
populations in this region as well as high rate of absenteeism. As the absenteeism has become
problematic to the estate in the short run as well as long run, this study attempts primarily to identify
the factors affecting the short run absenteeism.
Methodology
There are 161 holdings in estate sector all over the Badulla district (Statistical Information on
Plantation Crops, 2012). Among them one of the largest entities is Telbadde estate employing 1346
workers with 464.50 ha of land extent. This estate manly consists with six divisions. COBO and
Lower divisions are the farthest while Upper and West-Morland are the nearest divisions to the estate
office.
Table 01: Worker population in the divisions
Division Number of workers
Upper Division 293
Lower Division 163
Kendagolla Division 141
West-Morland Division 250
Malangamuwa Division 259
Cobo Division 149
Factory 91
Source: Progress Report – Telbedda estate, 2012
To find the determinants, primary data of 455 absentees for three months period were collected using
a questionnaire survey covering all six divisions. A multiple regression model was used to find the
determinants.
𝒀 = 𝜶 + 𝜷𝟏𝑿𝟏 + 𝜷𝟐𝑫𝟏 + 𝜷𝟑𝑫𝟐 + 𝜷𝟒𝑿𝟐 + 𝜷𝟓𝑿𝟑 + 𝜷𝟔𝑫𝟑 + 𝜷𝟕𝑫𝟒 + 𝜷𝟖𝑫𝟓 + 𝜷𝟗𝑫𝟔
+ 𝜷𝟏𝟎𝑫𝟕 + 𝜷𝟏𝟏𝑫𝟖 + 𝜷𝟏𝟐𝑫𝟗 + + 𝜷𝟏𝟑𝑫𝟏𝟎 + 𝜷𝟏𝟑𝑫𝟏𝟏 + 𝜺
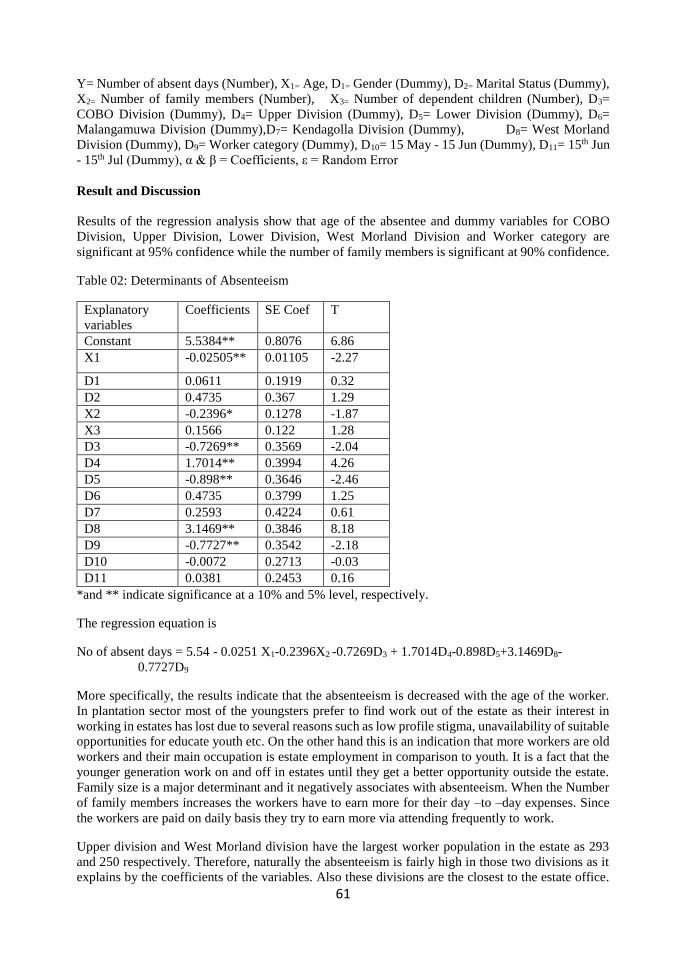
61
Y= Number of absent days (Number), X1= Age, D1= Gender (Dummy), D2= Marital Status (Dummy),
X2= Number of family members (Number), X3= Number of dependent children (Number), D3=
COBO Division (Dummy), D4= Upper Division (Dummy), D5= Lower Division (Dummy), D6=
Malangamuwa Division (Dummy),D7= Kendagolla Division (Dummy), D8= West Morland
Division (Dummy), D9= Worker category (Dummy), D10= 15 May - 15 Jun (Dummy), D11= 15th Jun
- 15th Jul (Dummy), α & β = Coefficients, ε = Random Error
Result and Discussion
Results of the regression analysis show that age of the absentee and dummy variables for COBO
Division, Upper Division, Lower Division, West Morland Division and Worker category are
significant at 95% confidence while the number of family members is significant at 90% confidence.
Table 02: Determinants of Absenteeism
*and ** indicate significance at a 10% and 5% level, respectively.
The regression equation is
No of absent days = 5.54 - 0.0251 X1-0.2396X2 -0.7269D3 + 1.7014D4-0.898D5+3.1469D8-
0.7727D9
More specifically, the results indicate that the absenteeism is decreased with the age of the worker.
In plantation sector most of the youngsters prefer to find work out of the estate as their interest in
working in estates has lost due to several reasons such as low profile stigma, unavailability of suitable
opportunities for educate youth etc. On the other hand this is an indication that more workers are old
workers and their main occupation is estate employment in comparison to youth. It is a fact that the
younger generation work on and off in estates until they get a better opportunity outside the estate.
Family size is a major determinant and it negatively associates with absenteeism. When the Number
of family members increases the workers have to earn more for their day –to –day expenses. Since
the workers are paid on daily basis they try to earn more via attending frequently to work.
Upper division and West Morland division have the largest worker population in the estate as 293
and 250 respectively. Therefore, naturally the absenteeism is fairly high in those two divisions as it
explains by the coefficients of the variables. Also these divisions are the closest to the estate office.
Explanatory
variables
Coefficients SE Coef T
Constant 5.5384** 0.8076 6.86
X1 -0.02505** 0.01105 -2.27
D1 0.0611 0.1919 0.32
D2 0.4735 0.367 1.29
X2 -0.2396* 0.1278 -1.87
X3 0.1566 0.122 1.28
D3 -0.7269** 0.3569 -2.04
D4 1.7014** 0.3994 4.26
D5 -0.898** 0.3646 -2.46
D6 0.4735 0.3799 1.25
D7 0.2593 0.4224 0.61
D8 3.1469** 0.3846 8.18
D9 -0.7727** 0.3542 -2.18
D10 -0.0072 0.2713 -0.03
D11 0.0381 0.2453 0.16
62
But COBO and Lower division shows a negative relationship with the absent days. These divisions
are located in the ends of the estate which are farthest to the office. Therefore the absenteeism in
divisions where it has more access to city and the facilities is higher than that of in farthest divisions
with less access to the urban area.
Worker category variable consist of residents and non-residents. 91% from the working population
in this estate are residents who live inside the estate. Therefore they have to attend for work in the
estate as it is the main source of their living. Therefore the variable, worker category, shows negative
relationship with number of absent days.
Conclusions
According to the results of the study the age, number of family members, divisions with largest
worker population locating nearest to the office (Upper and West Morland) and divisions farthest to
the office (Lower and COBO) and worker category are the determinants of absenteeism for the
workers in the selected tea estate.
Acknowledgement
All the staff members and workers in the estate are acknowledged.
References
Brooke, P.P., Price, J.L.1989.The determinants of employee absenteeism. An empirical test of a
causal mode, 62:p.1-19.
Institute of Social Development (2008). Sustainabili Tea. Report on Sri Lankan Tea Industry, p.5-65.
Khare, S., Vijay Kumar Chaudhary, V.K.2013. Absenteeism of Employee: Research Methodology.
International Journal of Mechanical, Civil, Automobile and Production Engineering, 3(4).
Ministry of Plantation Industries (2012). Statistical Information on Plantation Crops, p.4-12.
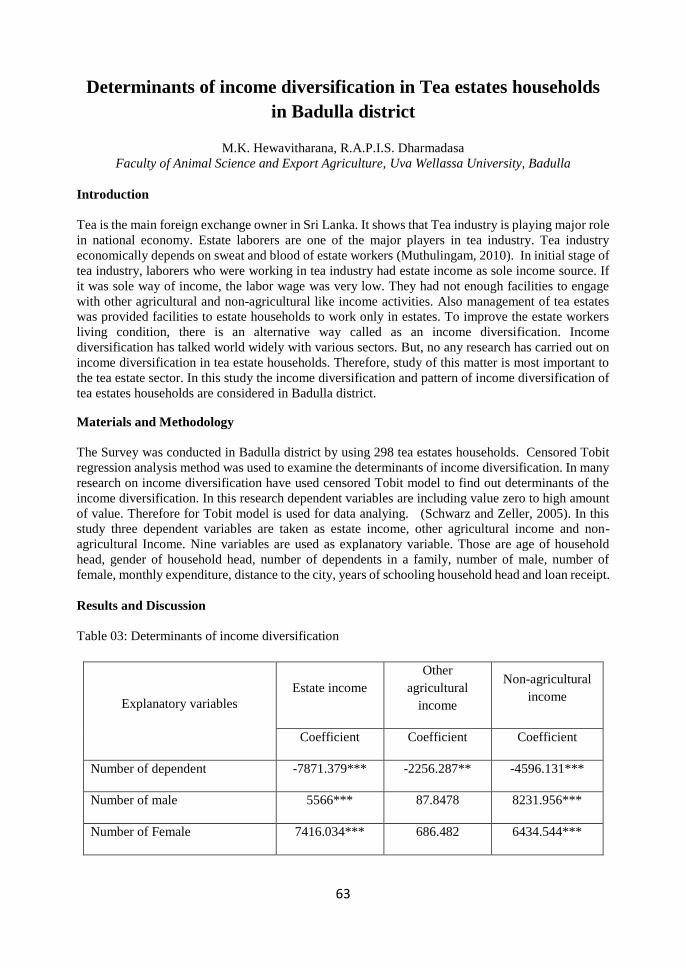
63
Determinants of income diversification in Tea estates households
in Badulla district
M.K. Hewavitharana, R.A.P.I.S. Dharmadasa
Faculty of Animal Science and Export Agriculture, Uva Wellassa University, Badulla
Introduction
Tea is the main foreign exchange owner in Sri Lanka. It shows that Tea industry is playing major role
in national economy. Estate laborers are one of the major players in tea industry. Tea industry
economically depends on sweat and blood of estate workers (Muthulingam, 2010). In initial stage of
tea industry, laborers who were working in tea industry had estate income as sole income source. If
it was sole way of income, the labor wage was very low. They had not enough facilities to engage
with other agricultural and non-agricultural like income activities. Also management of tea estates
was provided facilities to estate households to work only in estates. To improve the estate workers
living condition, there is an alternative way called as an income diversification. Income
diversification has talked world widely with various sectors. But, no any research has carried out on
income diversification in tea estate households. Therefore, study of this matter is most important to
the tea estate sector. In this study the income diversification and pattern of income diversification of
tea estates households are considered in Badulla district.
Materials and Methodology
The Survey was conducted in Badulla district by using 298 tea estates households. Censored Tobit
regression analysis method was used to examine the determinants of income diversification. In many
research on income diversification have used censored Tobit model to find out determinants of the
income diversification. In this research dependent variables are including value zero to high amount
of value. Therefore for Tobit model is used for data analying. (Schwarz and Zeller, 2005). In this
study three dependent variables are taken as estate income, other agricultural income and non-
agricultural Income. Nine variables are used as explanatory variable. Those are age of household
head, gender of household head, number of dependents in a family, number of male, number of
female, monthly expenditure, distance to the city, years of schooling household head and loan receipt.
Results and Discussion
Table 03: Determinants of income diversification
Explanatory variables
Estate income
Other
agricultural
income
Non-agricultural
income
Coefficient Coefficient Coefficient
Number of dependent -7871.379*** -2256.287** -4596.131***
Number of male 5566*** 87.8478 8231.956***
Number of Female 7416.034*** 686.482 6434.544***
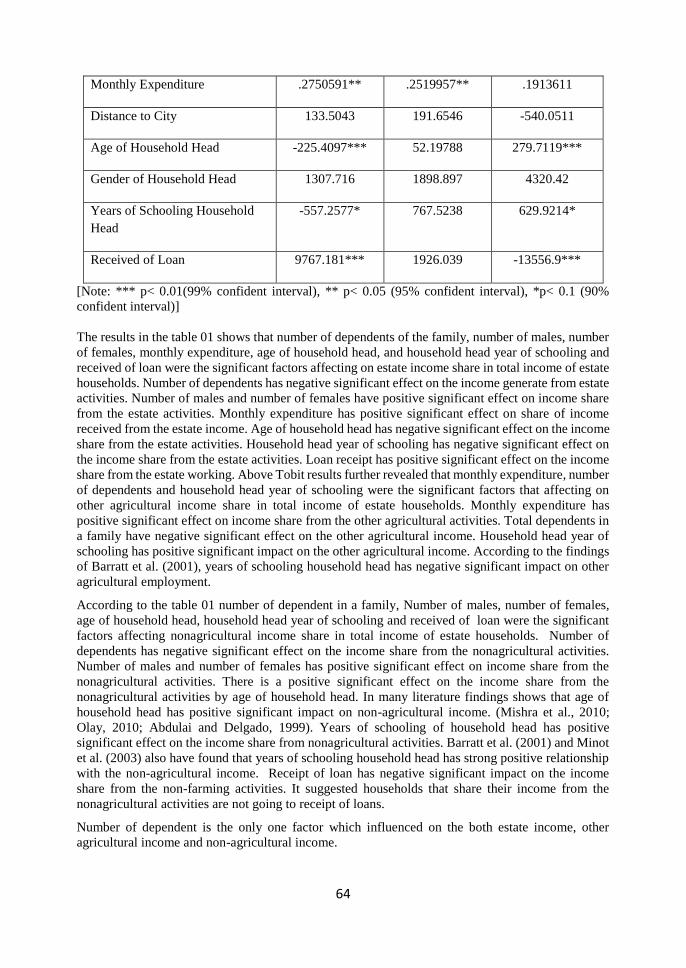
64
[Note: *** p< 0.01(99% confident interval), ** p< 0.05 (95% confident interval), *p< 0.1 (90%
confident interval)]
The results in the table 01 shows that number of dependents of the family, number of males, number
of females, monthly expenditure, age of household head, and household head year of schooling and
received of loan were the significant factors affecting on estate income share in total income of estate
households. Number of dependents has negative significant effect on the income generate from estate
activities. Number of males and number of females have positive significant effect on income share
from the estate activities. Monthly expenditure has positive significant effect on share of income
received from the estate income. Age of household head has negative significant effect on the income
share from the estate activities. Household head year of schooling has negative significant effect on
the income share from the estate activities. Loan receipt has positive significant effect on the income
share from the estate working. Above Tobit results further revealed that monthly expenditure, number
of dependents and household head year of schooling were the significant factors that affecting on
other agricultural income share in total income of estate households. Monthly expenditure has
positive significant effect on income share from the other agricultural activities. Total dependents in
a family have negative significant effect on the other agricultural income. Household head year of
schooling has positive significant impact on the other agricultural income. According to the findings
of Barratt et al. (2001), years of schooling household head has negative significant impact on other
agricultural employment.
According to the table 01 number of dependent in a family, Number of males, number of females,
age of household head, household head year of schooling and received of loan were the significant
factors affecting nonagricultural income share in total income of estate households. Number of
dependents has negative significant effect on the income share from the nonagricultural activities.
Number of males and number of females has positive significant effect on income share from the
nonagricultural activities. There is a positive significant effect on the income share from the
nonagricultural activities by age of household head. In many literature findings shows that age of
household head has positive significant impact on non-agricultural income. (Mishra et al., 2010;
Olay, 2010; Abdulai and Delgado, 1999). Years of schooling of household head has positive
significant effect on the income share from nonagricultural activities. Barratt et al. (2001) and Minot
et al. (2003) also have found that years of schooling household head has strong positive relationship
with the non-agricultural income. Receipt of loan has negative significant impact on the income
share from the non-farming activities. It suggested households that share their income from the
nonagricultural activities are not going to receipt of loans.
Number of dependent is the only one factor which influenced on the both estate income, other
agricultural income and non-agricultural income.
Monthly Expenditure .2750591** .2519957** .1913611
Distance to City 133.5043 191.6546 -540.0511
Age of Household Head -225.4097*** 52.19788 279.7119***
Gender of Household Head 1307.716 1898.897 4320.42
Years of Schooling Household
Head
-557.2577* 767.5238 629.9214*
Received of Loan 9767.181*** 1926.039 -13556.9***
65
Conclusion
Through this research we are mainly focused on the analyzing the determinants of tea estates
households income diversification. This study showed that tea estates households in Badulla district
had involved mainly in three income generating activities. Those are estate income, other agricultural
income and non-agricultural income. The regression analysis revealed that diversification of income
is determined by some socio economic factors. From those factors number dependents, number of
males and females, monthly expenditure, access of loan, age of household head, years of schooling
household heads are influenced on estate income. Other agricultural income activities are determined
by monthly expenditure and years of schooling household head. Number of males and females, age
of household head, years of schooling household head, number of children’s, number of dependents
and received of loan are determined the non-agricultural income. Only the Number of dependents is
influenced on both estates, other agricultural and non-agricultural income activities.
References
Abdulai, A. and Delgado, C.L. (1999). Determinants of nonfarm earnings of farm based husbands
and wives in Northern Ghana. American Journal of Agricultural Economics
Minot, N. (2003). Income Diversification and Poverty Patterns, trends, and policy implications in the
Northern Uplands of Vietnam, International Food Policy Research Institute
Muthulingam, P. (2010). The Tea Plantation Workers’ Museum & Archive. A Milestone in the
History of the Sri Lankan Tea Plantation Workers, Institute of Social Development.
Olale, E., Henson S. and Cranfield J. (2010). Determinants of Income Diversification among Fishing
Communities in Western Kenya. University of Guelph, Canada
Mishra, A. K.., Erickson, K.., Harris, M., Hallahan, C. and Uematsu, H. (2010). Determinants of
Farm Household Income Diversification in the United States: Evidence from Farm-Level Data.
Louisiana State University, Baton Rouge, Louisiana
66
Investigating the Causes for Poor Control of Erigeron sumatrensis
(Alawangupillu) by Glyphosate in the Uva Region
R. J. M. D. K. Ramanayaka, K. G. Prematilake
Faculty of Animal Science and Export Agriculture, Uva Wellassa University of Sri Lanka
Introduction
Erigeron sumatrensis (Alawangupillu) could be considered as a hard-to-kill weed in tea plantations
because it has become totally resistant to Paraquat (Marambe et al, 2002) and from the recent past,
there are claims that this weed shows a poor control also by Glyphosate (Prematilake, 2010). Recent
investigations under upcountry conditions have shown that such poor control of weed is attributed to
the dosages of Glyphosate applied and age or growth phase of weeds under up country conditions
(Prematilake and Nawaratne, 2010 ; Prematilake and Darshani, 2011) . Hence, this study was aimed
to determine the degree of control of E. sumatrensis weed at its different stages of growth by different
dosages of Glyphosate under the conditions of Uva region.
Materials and Methods
Plants of E. sumatrensis at five different growth phases, having 3-5, 6-8, 9-11, 12-14 and more than
15 leaves per plant, were collated from Ury Estate, Passara (30 plants from each of the five growth
phases) and planted them on a raised bed, randomly at a spacing of 50 x 50 cm. Plants were left on
beds for 2 weeks period to establish. Plants of each of the five growth phases were treated with two
dosages of Glyphosate (3ml/Land 5ml/L) at two weeks after planting. An untreated control was also
maintained. A drenching application of Glyphosate was given to each plant during morning time
using a hand sprayer. The experimental design was Complete Randomized Design with two factor
factorial with 2 replications.Visual injury symptoms in the weed (chlorosis of leaves, wilting of
leaves, drying and scorching of leaves and leaf fall) were observed and scored at 7, 14 and 21days
after application (DAA). The degree of damage on leaves and whole plant was taken in to account in
scoring using a scale (0 to 9).The viable plants were counted and the dry weight of above ground part
and roots were measured at 21 DAA.
Results and Discussion
All visual symptoms such as chlorosis, wilting, scorching and drying of leaves and leaf fall were
occurred at a higher intensity with Glyphosate at 5ml/L (2.75 L/ha) than the Glyphosate at 3 ml/L
(1.65L/ha). Chlorosis of leaves and wilting of leaves were most prominent at seven DAA and
scorching and drying of leaves and leaf fall prominent at 14 DAA.
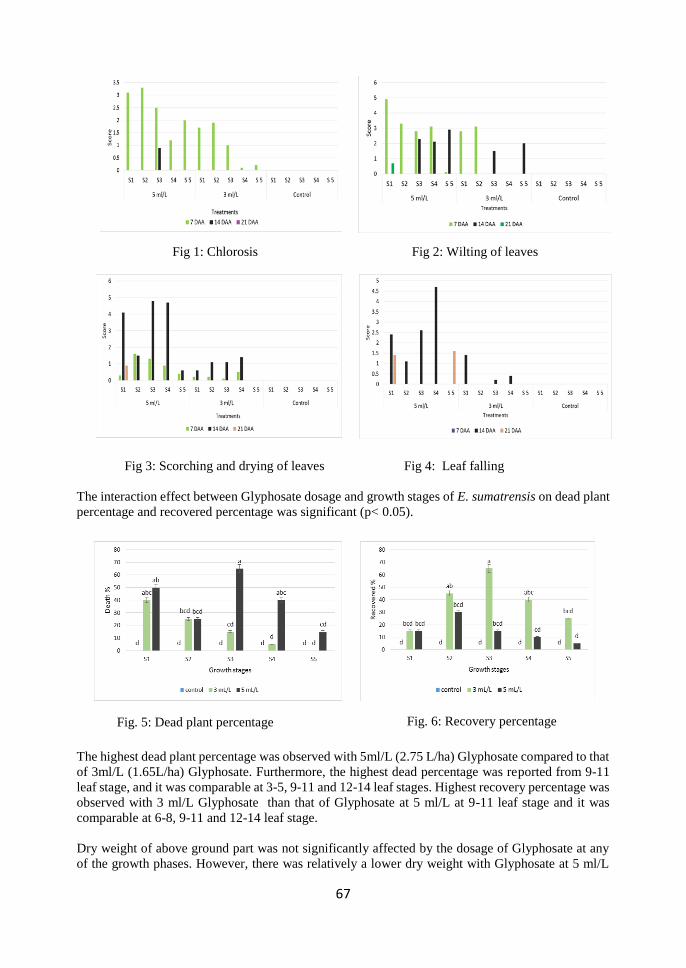
67
Fig 1: Chlorosis Fig 2: Wilting of leaves
Fig 3: Scorching and drying of leaves Fig 4: Leaf falling
The interaction effect between Glyphosate dosage and growth stages of E. sumatrensis on dead plant
percentage and recovered percentage was significant (p< 0.05).
The highest dead plant percentage was observed with 5ml/L (2.75 L/ha) Glyphosate compared to that
of 3ml/L (1.65L/ha) Glyphosate. Furthermore, the highest dead percentage was reported from 9-11
leaf stage, and it was comparable at 3-5, 9-11 and 12-14 leaf stages. Highest recovery percentage was
observed with 3 ml/L Glyphosate than that of Glyphosate at 5 ml/L at 9-11 leaf stage and it was
comparable at 6-8, 9-11 and 12-14 leaf stage.
Dry weight of above ground part was not significantly affected by the dosage of Glyphosate at any
of the growth phases. However, there was relatively a lower dry weight with Glyphosate at 5 ml/L
Fig. 5: Dead plant percentage Fig. 6: Recovery percentage
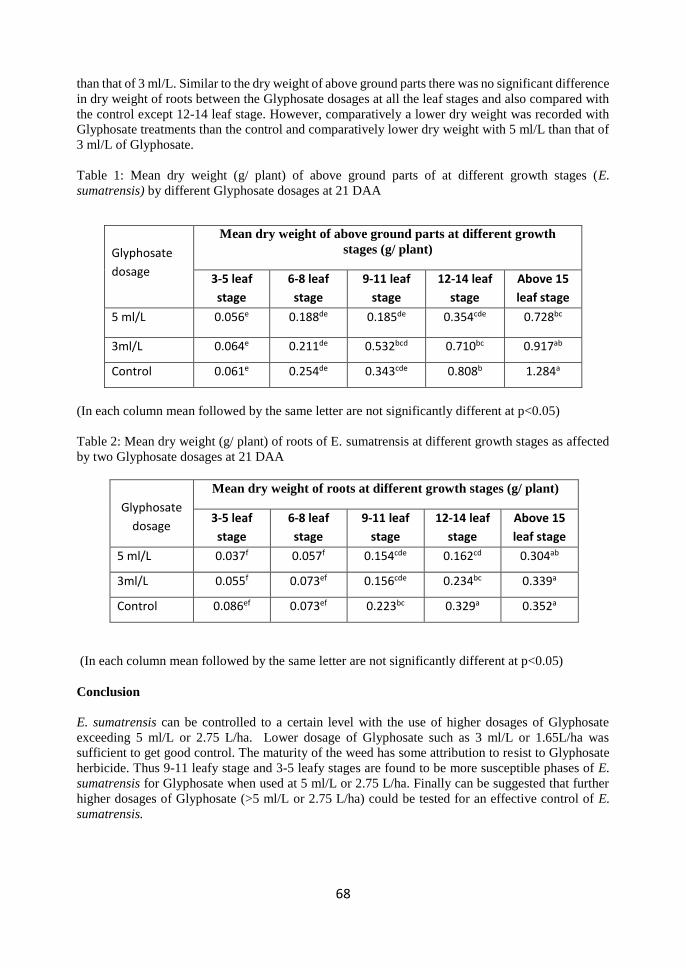
68
than that of 3 ml/L. Similar to the dry weight of above ground parts there was no significant difference
in dry weight of roots between the Glyphosate dosages at all the leaf stages and also compared with
the control except 12-14 leaf stage. However, comparatively a lower dry weight was recorded with
Glyphosate treatments than the control and comparatively lower dry weight with 5 ml/L than that of
3 ml/L of Glyphosate.
Table 1: Mean dry weight (g/ plant) of above ground parts of at different growth stages (E.
sumatrensis) by different Glyphosate dosages at 21 DAA
(In each column mean followed by the same letter are not significantly different at p<0.05)
Table 2: Mean dry weight (g/ plant) of roots of E. sumatrensis at different growth stages as affected
by two Glyphosate dosages at 21 DAA
Glyphosate
dosage
Mean dry weight of roots at different growth stages (g/ plant)
3-5 leaf
stage
6-8 leaf
stage
9-11 leaf
stage
12-14 leaf
stage
Above 15
leaf stage
5 ml/L 0.037f 0.057f 0.154cde 0.162cd 0.304ab
3ml/L 0.055f 0.073ef 0.156cde 0.234bc 0.339a
Control 0.086ef 0.073ef 0.223bc 0.329a 0.352a
(In each column mean followed by the same letter are not significantly different at p<0.05)
Conclusion
E. sumatrensis can be controlled to a certain level with the use of higher dosages of Glyphosate
exceeding 5 ml/L or 2.75 L/ha. Lower dosage of Glyphosate such as 3 ml/L or 1.65L/ha was
sufficient to get good control. The maturity of the weed has some attribution to resist to Glyphosate
herbicide. Thus 9-11 leafy stage and 3-5 leafy stages are found to be more susceptible phases of E.
sumatrensis for Glyphosate when used at 5 ml/L or 2.75 L/ha. Finally can be suggested that further
higher dosages of Glyphosate (>5 ml/L or 2.75 L/ha) could be tested for an effective control of E.
sumatrensis.
Glyphosate
dosage
Mean dry weight of above ground parts at different growth
stages (g/ plant)
3-5 leaf
stage
6-8 leaf
stage
9-11 leaf
stage
12-14 leaf
stage
Above 15
leaf stage
5 ml/L 0.056e 0.188de 0.185de 0.354cde 0.728bc
3ml/L 0.064e 0.211de 0.532bcd 0.710bc 0.917ab
Control 0.061e 0.254de 0.343cde 0.808b 1.284a

69
References
Marambe, B., Nissanka, S.P., Silva L. De, Ananadacoomaraswamy, A. and Priyanth, M.G.D.L. 2002.
Occurrence of paraquat- resistant Erigeron sumatrensis (Retz) in upcountry tea Lands in Sri Lanka.
Journal of Plant diseases and protection. Sconderheft XVIII. pp. 973-978.
Prematilake, K.G. and Nawarathna, W.P.A.S. 2010. In investigation on resistant development in
Crassocephalum crepidiodes (Benth) & Erigeron sumatrensis (Retz) for glyphosate herbicides.
Bachelor Thesis. Faculty of Agriculture, University of Ruhuna, Sri Lanka
Prematilake, K. G. and Darshani, S.A.N. 2011. In investigation on possible causes for poor control
of Erigeron sumatrensis (Retz) and Crassocephalum crepidiodes (Benth) by glyphosate herbicides.
Bachelor Thesis. Faculty of Agriculture, University of Ruhuna, Sri Lanka
70
Clientele satisfaction towards the services rendered by government
to the tea small holding sector H. A. C. M. Hangawatta, M. G. P. P. Mahindarathne
Faculty of Animal Science and Export Agriculture, Uva Wellassa University of Sri Lanka
Introduction
Tea is pre-eminent among Sri Lanka’s plantation crops and it is one of the most important industries
in the country in terms of employment and foreign exchange earnings (Basnayake , 2002). Next to
China and India, Sri Lanka is the oldest tea producing country in the world producing nearly for 150
years (Asopa, 2004). Over the years, the word Ceylon has become synonymous with quality tea.
The entire economic base of the country was centered on the plantation sector at the time when Sri
Lanka was gaining independence in1948; nearly 32% of GDP came from exports of plantation
crops, which contributed 92% of the total export earnings. The development of the small holder
sector, especially in the Low country helped to maintain the production level during the 1980’s
despite the deterioration of the estate sector production. The smallholder sector expanded very rapidly
and presently accounts more than half (76%) of the total production.(Annual Report, Tea Small
Holding Development Authority, 2012)
Small holders must receive current information and technology for effective management of their
production, marketing and financial decisions. Individual characteristics of producers affect on the
demand for information services while confidence in the information services is a central determinant
of the frequency at which a producer refers to the services. (Yapa and Ariyawardana,
2005).Coupled with the information, financial support is vital to expand and maintain the tea
production. This requirement is fulfilled through the subsidy policy of the government.
Tea small Holding authority is the institute established as the main supportive body to the small
holding sector. Other institutions that are responsible for tea are, namely, Tea Research Institute, Sri
Lanka Tea Board and Tea Commissioner’s Department.
So the research was conducted to identify the satisfaction level of the small holders towards the
services rendered by the government, to identify major factors that cause to farmers satisfaction, to
evaluate strong and weak areas of the government service procedure and to make suggestions to
overcome the weaknesses in government services.
Materials and methodology
Data were collected through a sample survey by giving structured questionnaire to randomly selected
150 small holders in 8 tea inspector’s (TI) ranges at Badulla administrative district .
The degree of satisfaction of the small holders was the dependent variable and it was measured with
respect to five different dimensions of the present government service. The dimensions considered
were quality of the service, relevancy of technologies/service, competency of extension personnel,
general usefulness/effect and characteristics of extension agent. Responses were obtained from five
point Likert scale with scores of 5, 4, 3, 2, 1.
Coded and scored data were analyzed by Using SPSS software package. Based on mean and standard
error, farmers were grouped in to three as less satisfied group, moderately satisfied group and highly
satisfied group. The cut-off points for this categorization was derived by using the formula “mean
(X) + or – 1.96 Standard Error (SE)” (V.S Sidhakaran, 2008).
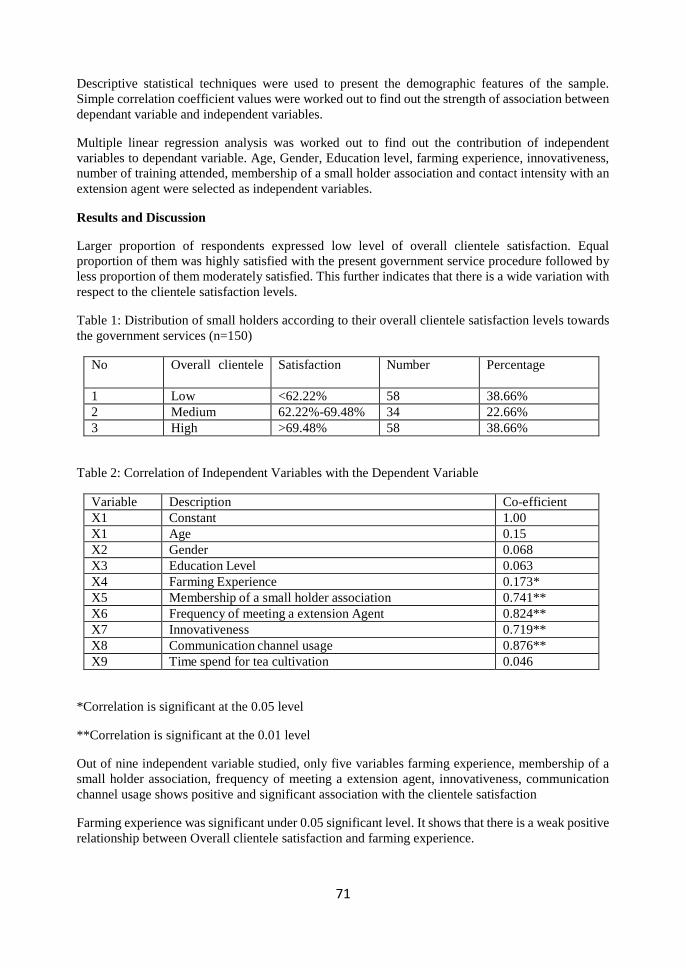
71
Descriptive statistical techniques were used to present the demographic features of the sample.
Simple correlation coefficient values were worked out to find out the strength of association between
dependant variable and independent variables.
Multiple linear regression analysis was worked out to find out the contribution of independent
variables to dependant variable. Age, Gender, Education level, farming experience, innovativeness,
number of training attended, membership of a small holder association and contact intensity with an
extension agent were selected as independent variables.
Results and Discussion
Larger proportion of respondents expressed low level of overall clientele satisfaction. Equal
proportion of them was highly satisfied with the present government service procedure followed by
less proportion of them moderately satisfied. This further indicates that there is a wide variation with
respect to the clientele satisfaction levels.
Table 1: Distribution of small holders according to their overall clientele satisfaction levels towards
the government services (n=150)
No Overall clientele
satisfaction level
Satisfaction
index
Number Percentage
1 Low <62.22% 58 38.66%
2 Medium 62.22%-69.48% 34 22.66%
3 High >69.48% 58 38.66%
Table 2: Correlation of Independent Variables with the Dependent Variable
Variable Description Co-efficient
X1 Constant 1.00
X1 Age 0.15
X2 Gender 0.068
X3 Education Level 0.063
X4 Farming Experience 0.173*
X5 Membership of a small holder association 0.741**
X6 Frequency of meeting a extension Agent 0.824**
X7 Innovativeness 0.719**
X8 Communication channel usage 0.876**
X9 Time spend for tea cultivation 0.046
*Correlation is significant at the 0.05 level
**Correlation is significant at the 0.01 level
Out of nine independent variable studied, only five variables farming experience, membership of a
small holder association, frequency of meeting a extension agent, innovativeness, communication
channel usage shows positive and significant association with the clientele satisfaction
Farming experience was significant under 0.05 significant level. It shows that there is a weak positive
relationship between Overall clientele satisfaction and farming experience.
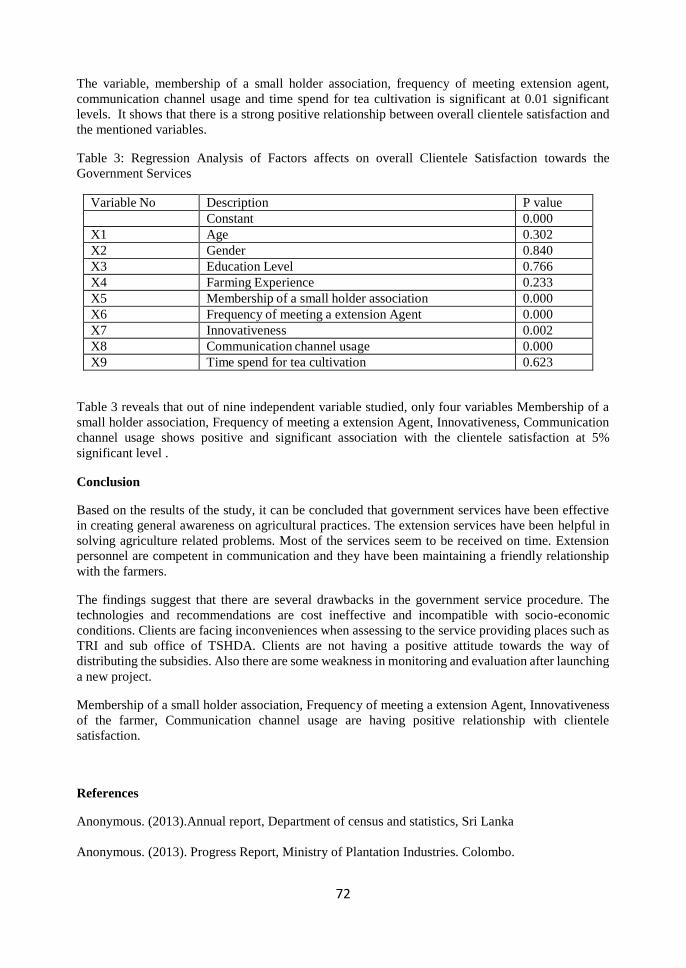
72
The variable, membership of a small holder association, frequency of meeting extension agent,
communication channel usage and time spend for tea cultivation is significant at 0.01 significant
levels. It shows that there is a strong positive relationship between overall clientele satisfaction and
the mentioned variables.
Table 3: Regression Analysis of Factors affects on overall Clientele Satisfaction towards the
Government Services
Variable No Description P value
Constant 0.000
X1 Age 0.302
X2 Gender 0.840
X3 Education Level 0.766
X4 Farming Experience 0.233
X5 Membership of a small holder association 0.000
X6 Frequency of meeting a extension Agent 0.000
X7 Innovativeness 0.002
X8 Communication channel usage 0.000
X9 Time spend for tea cultivation 0.623
Table 3 reveals that out of nine independent variable studied, only four variables Membership of a
small holder association, Frequency of meeting a extension Agent, Innovativeness, Communication
channel usage shows positive and significant association with the clientele satisfaction at 5%
significant level .
Conclusion
Based on the results of the study, it can be concluded that government services have been effective
in creating general awareness on agricultural practices. The extension services have been helpful in
solving agriculture related problems. Most of the services seem to be received on time. Extension
personnel are competent in communication and they have been maintaining a friendly relationship
with the farmers.
The findings suggest that there are several drawbacks in the government service procedure. The
technologies and recommendations are cost ineffective and incompatible with socio-economic
conditions. Clients are facing inconveniences when assessing to the service providing places such as
TRI and sub office of TSHDA. Clients are not having a positive attitude towards the way of
distributing the subsidies. Also there are some weakness in monitoring and evaluation after launching
a new project.
Membership of a small holder association, Frequency of meeting a extension Agent, Innovativeness
of the farmer, Communication channel usage are having positive relationship with clientele
satisfaction.
References
Anonymous. (2013).Annual report, Department of census and statistics, Sri Lanka
Anonymous. (2013). Progress Report, Ministry of Plantation Industries. Colombo.

73
Birkaeiser D.,Evenson R. E. and Feder G.,(1991),’The Economic Impact of Agricultural
Extension:A review,Economic Development and Cultural Change,39,pp. 607-650.
Sidhakaran V.S. (2008).Clientele Satisfaction towords the Extension Services Rendered by the
Government, Sri Lanka journal of Tea Science
Yapa K.D.A.J. and Ariyawardana A (2005). Willingness to Pay for a Fee-Based Extension
Service by Tea Smallholders in Galle District
74
Firewood energy utilization in different dryers used in Tea
processing
N.H.K. Chathurangi., N.S. Withanage
Faculty of Animal Science and Export Agriculture, Uva Wellassa University of Sri Lanka
and
M.M.R. Pathmasiri
Sri Lanka Sustainable Energy Authority
Introduction
Tea industry is one of the most key important drives in Sri Lankan economy. Sri Lanka Sustainable
Energy Authority is one of the important government institutions for energy management and
enhancing awareness and creating technical capacity on energy conservation in Sri Lanka. Tea
industry utilizes both electrical and thermal energy for its processing. The tea factories pre-
dominantly use fuel wood to meet their thermal energy needs, in the drying process, which is the
major transformation process in the tea industry. The lack of researchers on the energy utilization of
different dryers used in Sri Lankan tea industry and different types of dryers are used depending on
the production capacity of the tea factory.
The objectives of the research are to find out firewood energy utilization of different dryers and
performance of different dryers in Sri Lanka.
Materials and methodology
The research was carried out to Sustainable Energy Authority during the period from April to August
2014. Specific thermal energy utilization (MJ/kg) was used to measure the level of firewood
consumption for dryers and it was tested for different dryers, location and combustion technology.
Two factor factorial design was implemented as the experimental design where dryer type and
combustion technology were taken in to consideration .There are three types of dryer commonly used
in tea drying such as, conventional endless chain pressure type dryer (ECP), Fluidized bed drier
(FBD), and combination drier which works on a combination of ECP and FBD principles .There are
two types of combustion technologies used for tea drying such as, Boilers and furnace. Primary data
were collected from factory officers by providing the structural questionnaires. Secondary data were
also collected from the annual reports of Sri Lanka Sustainable Energy Authority and factory reports
of different tea factories. Collected sample was surveyed based on the factory records during 2012 to
2013 to gather necessary information. Factory observations were also was carried out to confirm the
accuracy of data that were collected by the interviews of factory officers and Factory managers.
Minitab 16 Statistical Software was used for both descriptive and interferential statistics. ANOVA
General linear model was used to analyze the variance of dryer output in relation to dryer types and
combustion technology. Collected data were analyzed using descriptive statistical methods.
Descriptive statistics were graphical explained with using of Microsoft Excel and Minitab software.
Pearson correlation was used to determine the association of consumption of firewood and total
production. The relationship of firewood consumption and total production were analyzed by using
simple regression technique.
Results and Discussion
According to descriptive statistics, firewood Energy Source was highly used in tea processing. The
result revealed that, 19% firewood and saw dust, 8% firewood and furnace oil, only 3% of firewood
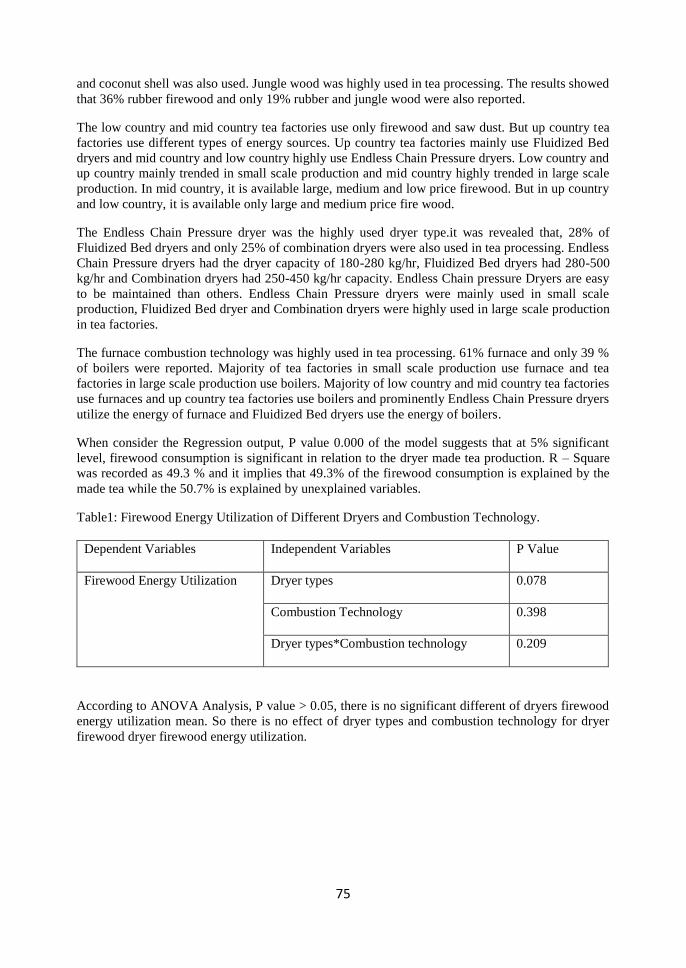
75
and coconut shell was also used. Jungle wood was highly used in tea processing. The results showed
that 36% rubber firewood and only 19% rubber and jungle wood were also reported.
The low country and mid country tea factories use only firewood and saw dust. But up country tea
factories use different types of energy sources. Up country tea factories mainly use Fluidized Bed
dryers and mid country and low country highly use Endless Chain Pressure dryers. Low country and
up country mainly trended in small scale production and mid country highly trended in large scale
production. In mid country, it is available large, medium and low price firewood. But in up country
and low country, it is available only large and medium price fire wood.
The Endless Chain Pressure dryer was the highly used dryer type.it was revealed that, 28% of
Fluidized Bed dryers and only 25% of combination dryers were also used in tea processing. Endless
Chain Pressure dryers had the dryer capacity of 180-280 kg/hr, Fluidized Bed dryers had 280-500
kg/hr and Combination dryers had 250-450 kg/hr capacity. Endless Chain pressure Dryers are easy
to be maintained than others. Endless Chain Pressure dryers were mainly used in small scale
production, Fluidized Bed dryer and Combination dryers were highly used in large scale production
in tea factories.
The furnace combustion technology was highly used in tea processing. 61% furnace and only 39 %
of boilers were reported. Majority of tea factories in small scale production use furnace and tea
factories in large scale production use boilers. Majority of low country and mid country tea factories
use furnaces and up country tea factories use boilers and prominently Endless Chain Pressure dryers
utilize the energy of furnace and Fluidized Bed dryers use the energy of boilers.
When consider the Regression output, P value 0.000 of the model suggests that at 5% significant
level, firewood consumption is significant in relation to the dryer made tea production. R – Square
was recorded as 49.3 % and it implies that 49.3% of the firewood consumption is explained by the
made tea while the 50.7% is explained by unexplained variables.
Table1: Firewood Energy Utilization of Different Dryers and Combustion Technology.
Dependent Variables Independent Variables P Value
Firewood Energy Utilization Dryer types 0.078
Combustion Technology 0.398
Dryer types*Combustion technology 0.209
According to ANOVA Analysis, P value > 0.05, there is no significant different of dryers firewood
energy utilization mean. So there is no effect of dryer types and combustion technology for dryer
firewood dryer firewood energy utilization.
76
Conclusion
The outcome of the study revealed that, about 70% of firewood and 44.4% jungle wood are mainly
used for the dryers used in the thermal energy. Majority of the studied tea factories use Endless Chain
Pressure dryers (47%) and the furnace combustion technology (61%).
Endless Chain Pressure dryers are mainly used in small scale production and Fluidized Bed dryer and
the Combination dryers are highly used in large scale production. The low country and up country
factories function towards a small scale production and while the mid country factories towards a
large scale production. Majority of small scale production tea factories use furnace and large scale
production tea factories use boilers.
The types of the dryers and the combustion technology do not affect significantly for the firewood
energy utilization.
References
De Silva, W. C. A., 1994. Status Review of Energy Utilization by the Tea Industry in Sri Lanka. Sri
Lanka Journal of Tea Science, TRI, vol.63, no. 2, pp.46-58.
De Silva, W. C. A., 1994. Some energy saving achievements of the tea industry in Sri Lanka. Sri
Lanka Journal of Tea Science, TRI , vol.63, no. 2, pp.59-69.
Upali, D. 1999. Utilization Of Fuel Wood and other Agricultural Residues as a Source of Energy in
the Industrial Sector of Sri Lanka, NERD Centre, Sri Lanka.
Zoyza, A. K. N. 2008. Hand Book on Tea, Tea Research Institute of Sri Lanka, Thalawakelle.
77
Protocol for callus induction of Camellia japonica L. (Tea rose)
H. L. T. Dilrukshika, L. M. H. R. Alwis
Faculty of Animal Science and Export Agriculture, Uva Wellassa University of Sri Lanka
Introduction
Camellia japonica (the Japanese Camellia) is one of the best known species of the genus Camellia.
Among the Camellia species, the economic value of the C. japonica ranks the highest due to its
beautiful ornamental flowers, edible uses (dried flowers, oil), medicinal uses (astringent,
antihaemorrhagic, haemostatic, salve and tonic) and material uses (dye, oil) (Salinero et al., 2012).
Although C. japonica has a high ornamental and medicinal value, it is not popular in tea cultivating
tropical agricultural country like Sri Lanka yet. Further, it was revealed that the difficulties of
propagating Tea Roses are significant and therefore growers discourage to propagate them. Also C.
japonica multiplication and improvement through seeds is rare due to poor seed set in the white and
pink varieties present in Sri Lanka. C. japonica is usually propagated only using stem cuttings in Sri
Lanka at present. But rooting was very poor in both pink and white varieties (Fernando and Alwis,
2013). But a good economic potential can be achieved in Sri Lanka due to its beautiful ornamental
flower which is having long life span if it is scientifically developed to get different colors and shapes.
Therefore, it is very important to in vitro propagation of C. japonica in large scale to commercially
enhance its real value especially in the up country and mid country regions of Sri Lanka.
Therefore this study was aimed to develop a protocol to induce the callus culture of Camellia japonica
L (Tea Rose).
Material and Methods
This research study was conducted at Tissue Culture laboratory at Uva Wellassa University during
the period of 22.04.2014 to 15.08.2014. The explants were collected from the Ury estates in
Balangoda Plantations and Hakgala Botanical Garden, Hakgala, Nuwara Eliya.
This study was conduct to develop an efficient protocol for rapid and prolific callus induction of
Camellia japonica (Tea Rose). In the first experiment, leaves and nodal segments used as explants.
Nine different combinations of 20% sodium hypochlorite for three different time durations (20
minutes, 30 minutes, 40 minutes ) and 70% ethanol for three different time durations (30 seconds, 1
minute, 1 and half minutes ) were used to select the best sterilization method. Number of
contaminated vessels were counted after one week. Above nine treatment combinations were
succeeded only for C. japonica leaves. Because of again used another nine different treatment
combinations for surface sterilization of nodes by adjusting soaking time duration in the 20% sodium
hypochlorite (35 minutes, 40 minutes, 45 minutes).
In the second experiment, leaves, nodal segments and un opened flower bud flower petals used as
explants. The sterilized explants were cultured on MS medium with three different hormone
combinations of 3-indolebutric acid (IBA) and 6-benzylamino purine (BAP) to investigate the effect
on callus induction.
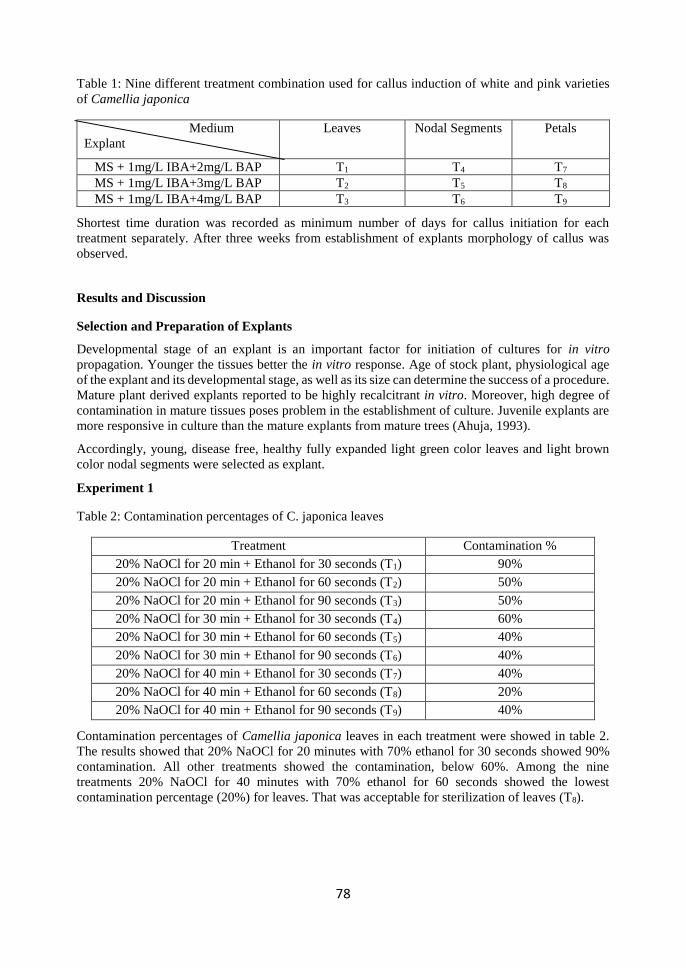
78
Table 1: Nine different treatment combination used for callus induction of white and pink varieties
of Camellia japonica
Medium
Explant
Leaves Nodal Segments Petals
MS + 1mg/L IBA+2mg/L BAP T1 T4 T7
MS + 1mg/L IBA+3mg/L BAP T2 T5 T8
MS + 1mg/L IBA+4mg/L BAP T3 T6 T9
Shortest time duration was recorded as minimum number of days for callus initiation for each
treatment separately. After three weeks from establishment of explants morphology of callus was
observed.
Results and Discussion
Selection and Preparation of Explants
Developmental stage of an explant is an important factor for initiation of cultures for in vitro
propagation. Younger the tissues better the in vitro response. Age of stock plant, physiological age
of the explant and its developmental stage, as well as its size can determine the success of a procedure.
Mature plant derived explants reported to be highly recalcitrant in vitro. Moreover, high degree of
contamination in mature tissues poses problem in the establishment of culture. Juvenile explants are
more responsive in culture than the mature explants from mature trees (Ahuja, 1993).
Accordingly, young, disease free, healthy fully expanded light green color leaves and light brown
color nodal segments were selected as explant.
Experiment 1
Table 2: Contamination percentages of C. japonica leaves
Treatment Contamination %
20% NaOCl for 20 min + Ethanol for 30 seconds (T1) 90%
20% NaOCl for 20 min + Ethanol for 60 seconds (T2) 50%
20% NaOCl for 20 min + Ethanol for 90 seconds (T3) 50%
20% NaOCl for 30 min + Ethanol for 30 seconds (T4) 60%
20% NaOCl for 30 min + Ethanol for 60 seconds (T5) 40%
20% NaOCl for 30 min + Ethanol for 90 seconds (T6) 40%
20% NaOCl for 40 min + Ethanol for 30 seconds (T7) 40%
20% NaOCl for 40 min + Ethanol for 60 seconds (T8) 20%
20% NaOCl for 40 min + Ethanol for 90 seconds (T9) 40%
Contamination percentages of Camellia japonica leaves in each treatment were showed in table 2.
The results showed that 20% NaOCl for 20 minutes with 70% ethanol for 30 seconds showed 90%
contamination. All other treatments showed the contamination, below 60%. Among the nine
treatments 20% NaOCl for 40 minutes with 70% ethanol for 60 seconds showed the lowest
contamination percentage (20%) for leaves. That was acceptable for sterilization of leaves (T8).
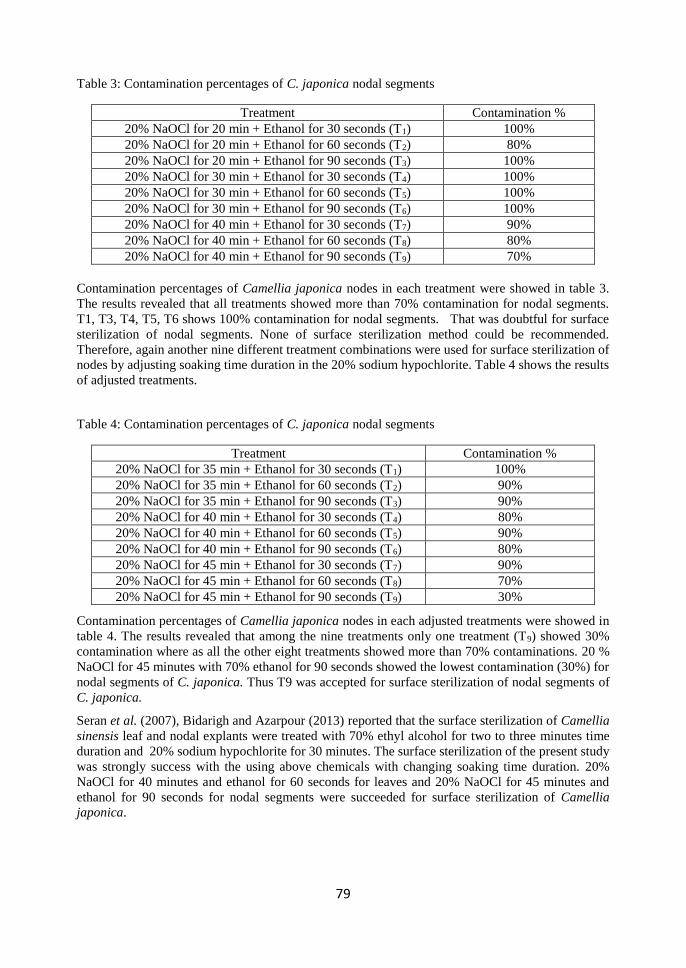
79
Table 3: Contamination percentages of C. japonica nodal segments
Treatment Contamination %
20% NaOCl for 20 min + Ethanol for 30 seconds (T1) 100%
20% NaOCl for 20 min + Ethanol for 60 seconds (T2) 80%
20% NaOCl for 20 min + Ethanol for 90 seconds (T3) 100%
20% NaOCl for 30 min + Ethanol for 30 seconds (T4) 100%
20% NaOCl for 30 min + Ethanol for 60 seconds (T5) 100%
20% NaOCl for 30 min + Ethanol for 90 seconds (T6) 100%
20% NaOCl for 40 min + Ethanol for 30 seconds (T7) 90%
20% NaOCl for 40 min + Ethanol for 60 seconds (T8) 80%
20% NaOCl for 40 min + Ethanol for 90 seconds (T9) 70%
Contamination percentages of Camellia japonica nodes in each treatment were showed in table 3.
The results revealed that all treatments showed more than 70% contamination for nodal segments.
T1, T3, T4, T5, T6 shows 100% contamination for nodal segments. That was doubtful for surface
sterilization of nodal segments. None of surface sterilization method could be recommended.
Therefore, again another nine different treatment combinations were used for surface sterilization of
nodes by adjusting soaking time duration in the 20% sodium hypochlorite. Table 4 shows the results
of adjusted treatments.
Table 4: Contamination percentages of C. japonica nodal segments
Treatment Contamination %
20% NaOCl for 35 min + Ethanol for 30 seconds (T1) 100%
20% NaOCl for 35 min + Ethanol for 60 seconds (T2) 90%
20% NaOCl for 35 min + Ethanol for 90 seconds (T3) 90%
20% NaOCl for 40 min + Ethanol for 30 seconds (T4) 80%
20% NaOCl for 40 min + Ethanol for 60 seconds (T5) 90%
20% NaOCl for 40 min + Ethanol for 90 seconds (T6) 80%
20% NaOCl for 45 min + Ethanol for 30 seconds (T7) 90%
20% NaOCl for 45 min + Ethanol for 60 seconds (T8) 70%
20% NaOCl for 45 min + Ethanol for 90 seconds (T9) 30%
Contamination percentages of Camellia japonica nodes in each adjusted treatments were showed in
table 4. The results revealed that among the nine treatments only one treatment (T9) showed 30%
contamination where as all the other eight treatments showed more than 70% contaminations. 20 %
NaOCl for 45 minutes with 70% ethanol for 90 seconds showed the lowest contamination (30%) for
nodal segments of C. japonica. Thus T9 was accepted for surface sterilization of nodal segments of
C. japonica.
Seran et al. (2007), Bidarigh and Azarpour (2013) reported that the surface sterilization of Camellia
sinensis leaf and nodal explants were treated with 70% ethyl alcohol for two to three minutes time
duration and 20% sodium hypochlorite for 30 minutes. The surface sterilization of the present study
was strongly success with the using above chemicals with changing soaking time duration. 20%
NaOCl for 40 minutes and ethanol for 60 seconds for leaves and 20% NaOCl for 45 minutes and
ethanol for 90 seconds for nodal segments were succeeded for surface sterilization of Camellia
japonica.
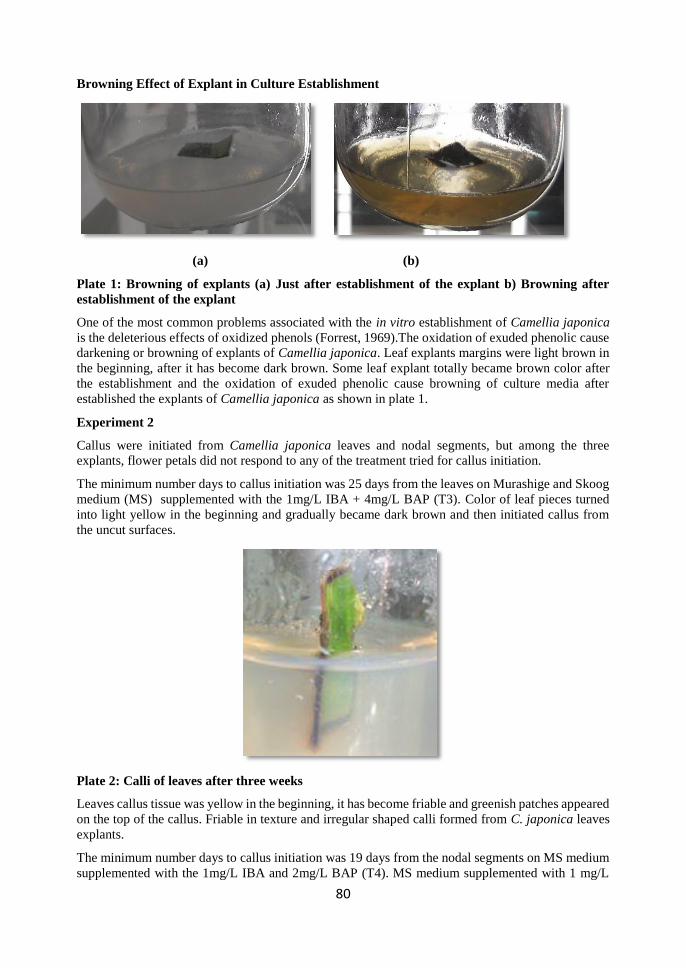
80
Browning Effect of Explant in Culture Establishment
(a) (b)
Plate 1: Browning of explants (a) Just after establishment of the explant b) Browning after
establishment of the explant
One of the most common problems associated with the in vitro establishment of Camellia japonica
is the deleterious effects of oxidized phenols (Forrest, 1969).The oxidation of exuded phenolic cause
darkening or browning of explants of Camellia japonica. Leaf explants margins were light brown in
the beginning, after it has become dark brown. Some leaf explant totally became brown color after
the establishment and the oxidation of exuded phenolic cause browning of culture media after
established the explants of Camellia japonica as shown in plate 1.
Experiment 2
Callus were initiated from Camellia japonica leaves and nodal segments, but among the three
explants, flower petals did not respond to any of the treatment tried for callus initiation.
The minimum number days to callus initiation was 25 days from the leaves on Murashige and Skoog
medium (MS) supplemented with the 1mg/L IBA + 4mg/L BAP (T3). Color of leaf pieces turned
into light yellow in the beginning and gradually became dark brown and then initiated callus from
the uncut surfaces.
Plate 2: Calli of leaves after three weeks
Leaves callus tissue was yellow in the beginning, it has become friable and greenish patches appeared
on the top of the callus. Friable in texture and irregular shaped calli formed from C. japonica leaves
explants.
The minimum number days to callus initiation was 19 days from the nodal segments on MS medium
supplemented with the 1mg/L IBA and 2mg/L BAP (T4). MS medium supplemented with 1 mg/L
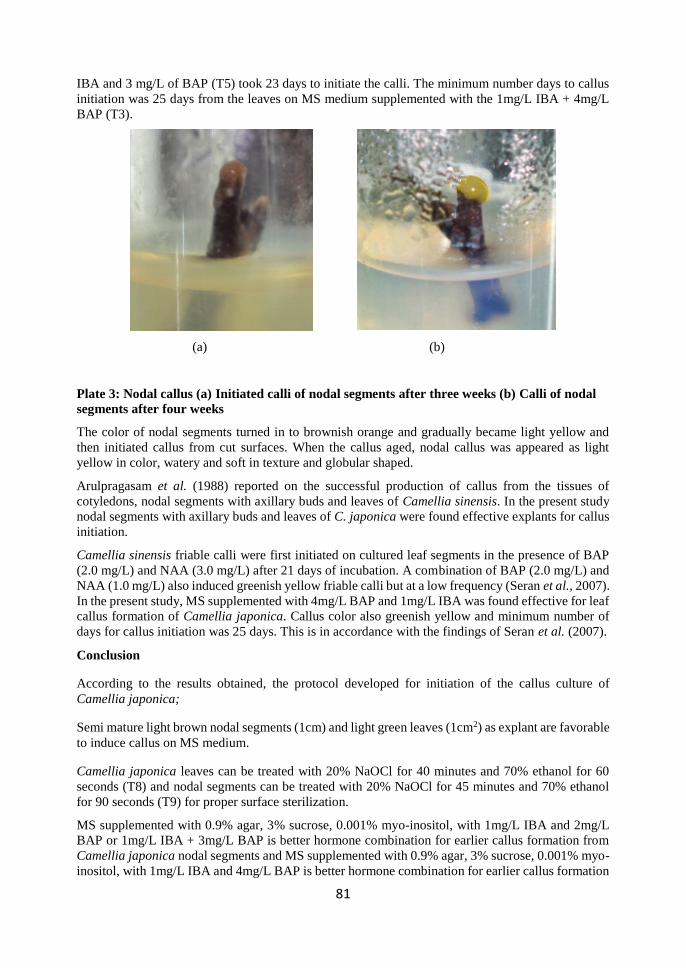
81
IBA and 3 mg/L of BAP (T5) took 23 days to initiate the calli. The minimum number days to callus
initiation was 25 days from the leaves on MS medium supplemented with the 1mg/L IBA + 4mg/L
BAP (T3).
(a) (b)
Plate 3: Nodal callus (a) Initiated calli of nodal segments after three weeks (b) Calli of nodal
segments after four weeks
The color of nodal segments turned in to brownish orange and gradually became light yellow and
then initiated callus from cut surfaces. When the callus aged, nodal callus was appeared as light
yellow in color, watery and soft in texture and globular shaped.
Arulpragasam et al. (1988) reported on the successful production of callus from the tissues of
cotyledons, nodal segments with axillary buds and leaves of Camellia sinensis. In the present study
nodal segments with axillary buds and leaves of C. japonica were found effective explants for callus
initiation.
Camellia sinensis friable calli were first initiated on cultured leaf segments in the presence of BAP
(2.0 mg/L) and NAA (3.0 mg/L) after 21 days of incubation. A combination of BAP (2.0 mg/L) and
NAA (1.0 mg/L) also induced greenish yellow friable calli but at a low frequency (Seran et al., 2007).
In the present study, MS supplemented with 4mg/L BAP and 1mg/L IBA was found effective for leaf
callus formation of Camellia japonica. Callus color also greenish yellow and minimum number of
days for callus initiation was 25 days. This is in accordance with the findings of Seran et al. (2007).
Conclusion
According to the results obtained, the protocol developed for initiation of the callus culture of
Camellia japonica;
Semi mature light brown nodal segments (1cm) and light green leaves (1cm2) as explant are favorable
to induce callus on MS medium.
Camellia japonica leaves can be treated with 20% NaOCl for 40 minutes and 70% ethanol for 60
seconds (T8) and nodal segments can be treated with 20% NaOCl for 45 minutes and 70% ethanol
for 90 seconds (T9) for proper surface sterilization.
MS supplemented with 0.9% agar, 3% sucrose, 0.001% myo-inositol, with 1mg/L IBA and 2mg/L
BAP or 1mg/L IBA + 3mg/L BAP is better hormone combination for earlier callus formation from
Camellia japonica nodal segments and MS supplemented with 0.9% agar, 3% sucrose, 0.001% myo-
inositol, with 1mg/L IBA and 4mg/L BAP is better hormone combination for earlier callus formation
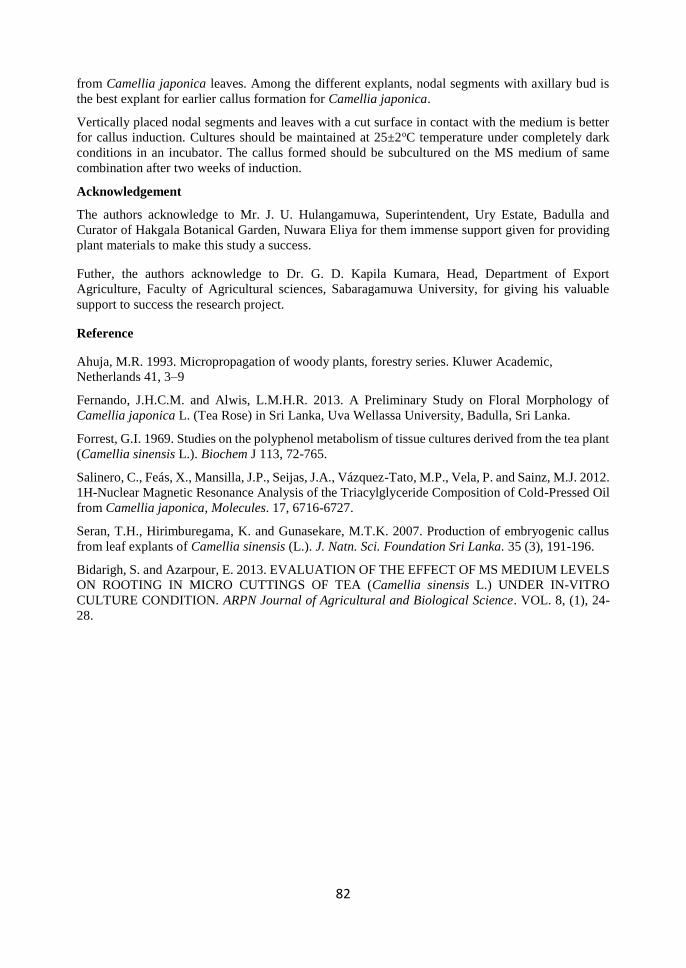
82
from Camellia japonica leaves. Among the different explants, nodal segments with axillary bud is
the best explant for earlier callus formation for Camellia japonica.
Vertically placed nodal segments and leaves with a cut surface in contact with the medium is better
for callus induction. Cultures should be maintained at 25±2oC temperature under completely dark
conditions in an incubator. The callus formed should be subcultured on the MS medium of same
combination after two weeks of induction.
Acknowledgement
The authors acknowledge to Mr. J. U. Hulangamuwa, Superintendent, Ury Estate, Badulla and
Curator of Hakgala Botanical Garden, Nuwara Eliya for them immense support given for providing
plant materials to make this study a success.
Futher, the authors acknowledge to Dr. G. D. Kapila Kumara, Head, Department of Export
Agriculture, Faculty of Agricultural sciences, Sabaragamuwa University, for giving his valuable
support to success the research project.
Reference
Ahuja, M.R. 1993. Micropropagation of woody plants, forestry series. Kluwer Academic,
Netherlands 41, 3–9
Fernando, J.H.C.M. and Alwis, L.M.H.R. 2013. A Preliminary Study on Floral Morphology of
Camellia japonica L. (Tea Rose) in Sri Lanka, Uva Wellassa University, Badulla, Sri Lanka.
Forrest, G.I. 1969. Studies on the polyphenol metabolism of tissue cultures derived from the tea plant
(Camellia sinensis L.). Biochem J 113, 72-765.
Salinero, C., Feás, X., Mansilla, J.P., Seijas, J.A., Vázquez-Tato, M.P., Vela, P. and Sainz, M.J. 2012.
1H-Nuclear Magnetic Resonance Analysis of the Triacylglyceride Composition of Cold-Pressed Oil
from Camellia japonica, Molecules. 17, 6716-6727.
Seran, T.H., Hirimburegama, K. and Gunasekare, M.T.K. 2007. Production of embryogenic callus
from leaf explants of Camellia sinensis (L.). J. Natn. Sci. Foundation Sri Lanka. 35 (3), 191-196.
Bidarigh, S. and Azarpour, E. 2013. EVALUATION OF THE EFFECT OF MS MEDIUM LEVELS
ON ROOTING IN MICRO CUTTINGS OF TEA (Camellia sinensis L.) UNDER IN-VITRO
CULTURE CONDITION. ARPN Journal of Agricultural and Biological Science. VOL. 8, (1), 24-
28.
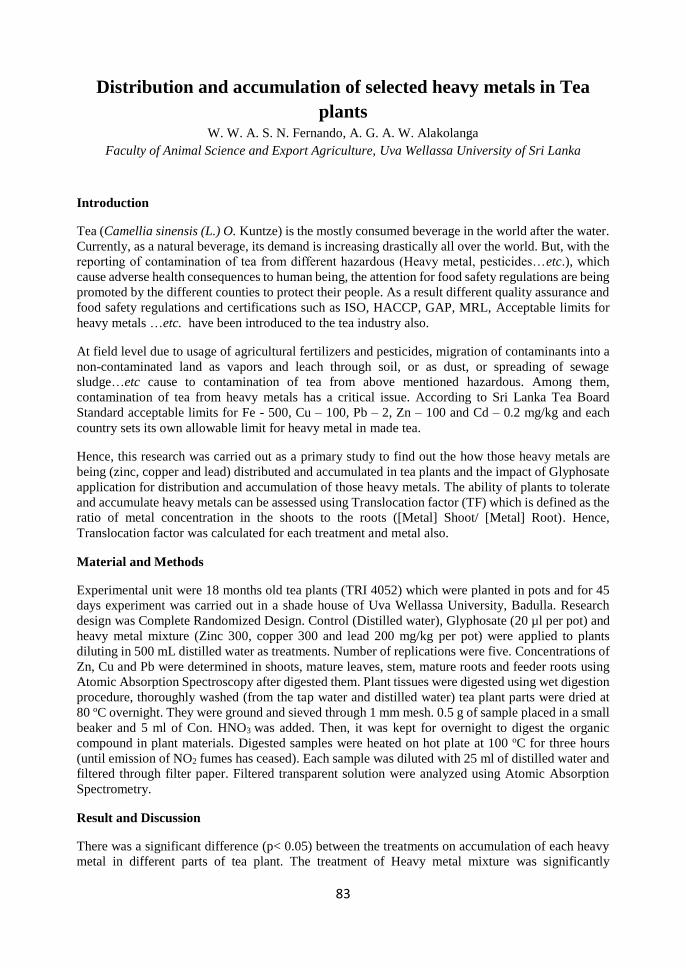
83
Distribution and accumulation of selected heavy metals in Tea
plants W. W. A. S. N. Fernando, A. G. A. W. Alakolanga
Faculty of Animal Science and Export Agriculture, Uva Wellassa University of Sri Lanka
Introduction
Tea (Camellia sinensis (L.) O. Kuntze) is the mostly consumed beverage in the world after the water.
Currently, as a natural beverage, its demand is increasing drastically all over the world. But, with the
reporting of contamination of tea from different hazardous (Heavy metal, pesticides…etc.), which
cause adverse health consequences to human being, the attention for food safety regulations are being
promoted by the different counties to protect their people. As a result different quality assurance and
food safety regulations and certifications such as ISO, HACCP, GAP, MRL, Acceptable limits for
heavy metals …etc. have been introduced to the tea industry also.
At field level due to usage of agricultural fertilizers and pesticides, migration of contaminants into a
non-contaminated land as vapors and leach through soil, or as dust, or spreading of sewage
sludge…etc cause to contamination of tea from above mentioned hazardous. Among them,
contamination of tea from heavy metals has a critical issue. According to Sri Lanka Tea Board
Standard acceptable limits for Fe - 500, Cu – 100, Pb – 2, Zn – 100 and Cd – 0.2 mg/kg and each
country sets its own allowable limit for heavy metal in made tea.
Hence, this research was carried out as a primary study to find out the how those heavy metals are
being (zinc, copper and lead) distributed and accumulated in tea plants and the impact of Glyphosate
application for distribution and accumulation of those heavy metals. The ability of plants to tolerate
and accumulate heavy metals can be assessed using Translocation factor (TF) which is defined as the
ratio of metal concentration in the shoots to the roots ([Metal] Shoot/ [Metal] Root). Hence,
Translocation factor was calculated for each treatment and metal also.
Material and Methods
Experimental unit were 18 months old tea plants (TRI 4052) which were planted in pots and for 45
days experiment was carried out in a shade house of Uva Wellassa University, Badulla. Research
design was Complete Randomized Design. Control (Distilled water), Glyphosate (20 µl per pot) and
heavy metal mixture (Zinc 300, copper 300 and lead 200 mg/kg per pot) were applied to plants
diluting in 500 mL distilled water as treatments. Number of replications were five. Concentrations of
Zn, Cu and Pb were determined in shoots, mature leaves, stem, mature roots and feeder roots using Atomic Absorption Spectroscopy after digested them. Plant tissues were digested using wet digestion
procedure, thoroughly washed (from the tap water and distilled water) tea plant parts were dried at
80 oC overnight. They were ground and sieved through 1 mm mesh. 0.5 g of sample placed in a small
beaker and 5 ml of Con. HNO3 was added. Then, it was kept for overnight to digest the organic
compound in plant materials. Digested samples were heated on hot plate at 100 oC for three hours
(until emission of NO2 fumes has ceased). Each sample was diluted with 25 ml of distilled water and
filtered through filter paper. Filtered transparent solution were analyzed using Atomic Absorption
Spectrometry.
Result and Discussion
There was a significant difference (p< 0.05) between the treatments on accumulation of each heavy
metal in different parts of tea plant. The treatment of Heavy metal mixture was significantly
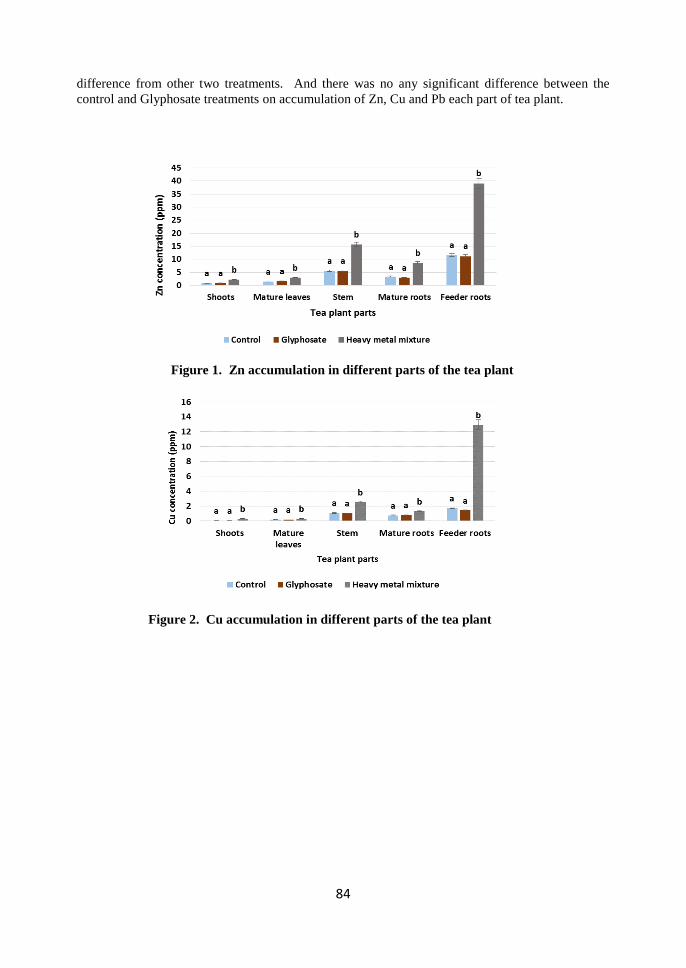
84
difference from other two treatments. And there was no any significant difference between the
control and Glyphosate treatments on accumulation of Zn, Cu and Pb each part of tea plant.
Figure 1. Zn accumulation in different parts of the tea plant
Figure 2. Cu accumulation in different parts of the tea plant
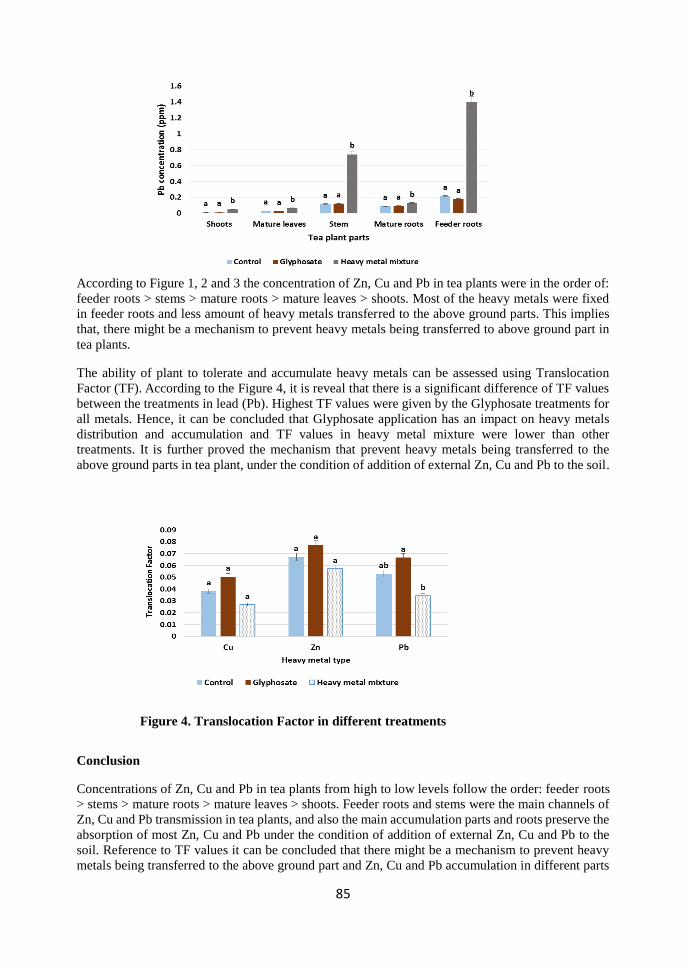
85
According to Figure 1, 2 and 3 the concentration of Zn, Cu and Pb in tea plants were in the order of:
feeder roots > stems > mature roots > mature leaves > shoots. Most of the heavy metals were fixed
in feeder roots and less amount of heavy metals transferred to the above ground parts. This implies
that, there might be a mechanism to prevent heavy metals being transferred to above ground part in
tea plants.
The ability of plant to tolerate and accumulate heavy metals can be assessed using Translocation
Factor (TF). According to the Figure 4, it is reveal that there is a significant difference of TF values
between the treatments in lead (Pb). Highest TF values were given by the Glyphosate treatments for
all metals. Hence, it can be concluded that Glyphosate application has an impact on heavy metals
distribution and accumulation and TF values in heavy metal mixture were lower than other
treatments. It is further proved the mechanism that prevent heavy metals being transferred to the
above ground parts in tea plant, under the condition of addition of external Zn, Cu and Pb to the soil.
Conclusion
Concentrations of Zn, Cu and Pb in tea plants from high to low levels follow the order: feeder roots
> stems > mature roots > mature leaves > shoots. Feeder roots and stems were the main channels of
Zn, Cu and Pb transmission in tea plants, and also the main accumulation parts and roots preserve the
absorption of most Zn, Cu and Pb under the condition of addition of external Zn, Cu and Pb to the
soil. Reference to TF values it can be concluded that there might be a mechanism to prevent heavy
metals being transferred to the above ground part and Zn, Cu and Pb accumulation in different parts
Figure 4. Translocation Factor in different treatments

86
of tea plant was not significant in Glyphosate treatment compare to control. But, Glyphosate
application has an impact on heavy metals distribution and accumulation in tea plant.
References
Chiroma, T. M., Abdulkarim, B. I. and Kefas, H. M. (2014). The Impact of Pesticide Application on
Heavy Metal (Cd, Pb and Cu) Levels in Spinach. Journal of Practices and Technologies. 1- 5.
The Perkin-Elmer Corporation. (1996). Analytical Methods for Atomic Absorption Spectroscopy.
United States of America. Perkin-Elmer Corporation.
Shi, Y., Ruan, J., Ma, L., Han, W. and Wang, F. (2008). Accumulation and distribution of arsenic
and cadmium by tea plants. Journal of Zhejiang University SCIENCE B, 9(3). 265-270