report of the swash lesbian, bisexual and queer women's
TRANSCRIPT
1
SWASH Report 2016, 2018, 2020
Julie Mooney-Somers, Rachel M. Deacon, Ania Anderst,
Luna Stephanie Ray Rybak, Afreen F. Akbany, Luka Philios,
Sophie Keeffe, Karen Price, Nicolas Parkhill
Report of the SWASH Lesbian, Bisexual and Queer Women’s Health Survey 2016, 2018, 2020
Women in contact with the Sydney LGBTIQ communities:
SWASH Report 2016, 2018, 2020
2020 Sydney Health Ethics, University of Sydney ISBN: 978-1-74210-475-1
This report is based on the 2020 round of the SWASH survey, which was run by Julie Mooney-Somers (Sydney Health Ethics, University of Sydney) and Rachel Deacon (Discipline of Addiction Medicine, Sydney Medical School, University of Sydney; and Drug & Alcohol Services, South Eastern Sydney Local Health District). During the 2020 survey, Nicolas Parkhill was the CEO at ACON.
Copies of this report are available from ACON:
Telephone: + 61 (0)2 9206 2000Email: [email protected]: acon.org.au
Queries about the research should be addressed to:
A/Prof Julie Mooney-SomersSydney Health Ethics, University of SydneyTelephone + 61 (0)2 9036 3412Email: [email protected]
Acknowledgments
Our deep gratitude to ACON for continued practical and financial support. A special thank you to SWASH Recruitment Coordinator Anna Barker and staff across all ACON programs who advised in the revision of the survey, recruitment, or the drafting of this report. This research could not have happened without their generosity, expertise, and commitment.
We acknowledge those who have sustained SWASH over its lifetime, in particular the LGBTIQ people whose knowledge and experience has encouraged us to make the questionnaire and the report better reflect their lives.
We thank all the people who completed the questionnaire in 2020.
We acknowledge and pay respects to the Traditional Owners and Custodians of all the lands and waters on which the SWASH survey was completed, and the Gadigal people of the Eora nation where ACON and the University of Sydney are based.
Suggested citation:
Mooney-Somers, J, Deacon, RM, Anderst, A, Rybak, LSR, Akbany, AF, Philios, L, Keeffe, S, Price, K, Parkhill, N (2020) Women in contact with the Sydney LGBTIQ communities: Report of the SWASH Lesbian, Bisexual and Queer Women’s Health Survey 2016, 2018, 2020. Sydney: Sydney Health Ethics, University of Sydney. ISBN: 978-1-74210-475-1
SWASH Report 2016, 2018, 2020
1. Executive Summary ............................................................................................................... 1
2. Background 4
3. Methods 53.1 Survey instrument 53.2 Sampling and recruitment 53.3 Analysis 6
4. Findings 74.1. Sample Characteristics 8
4.1.1 Age 84.1.2 Sexual identity 84.1.3 Gender identity 104.1.4 Intersex status 114.1.5 Children 124.1.6 Social attachment to LGBTIQ communities 124.1.7 Education, employment, and income 144.1.8 Ethnicity 164.1.9 Geographical location 17
4.2. Sexual practices, partners and relationships 184.2.1 Sexual practices 204.2.2 Sexual relationships 21
4.3. Tobacco, alcohol and illicit drug use 234.3.1 Tobacco use 234.3.2 Alcohol use 254.3.3 Illicit drug use 27
4.4 Health Status and Healthcare Experiences 294.4.1 Healthcare experiences 294.4.2 General health 314.4.3 Mental health 324.4.4 Preventive health practices 37
4.5. Experiences of violence and abuse 424.5.1 Intimate partner violence 424.5.2 Anti-LGBTIQ behaviour 43
5. References 45
Appendix 1: Questionnaires 47
Contents
1
SWASH Report 2016, 2018, 2020
1. Executive Summary
A lack of systematic, nuanced research on the health and wellbeing of Australian lesbian, bisexual and queer (LBQ) women (cis and trans) has been a significant barrier to understanding, recognising and addressing their health needs. A range of social, psychological and economic factors mean that this group has poorer health outcomes than their heterosexual peers. Stigma, family and community rejection, and discrimination towards LBQ women can impact on health and wellbeing, the delivery of health services, and their access to services. The inclusion of lesbian and bisexual women in the 2018 National Women’s Health Strategy1 and the 2018 NSW Women’s Strategy2 is recognition that while LBQ women share many health challenges with heterosexual women, some health problems may be more prevalent, risk factors may be different, and interventions may need to be tailored to the needs of this group. In NSW, the development of an LGBTI Health Strategy (due to be released in 2021) is an acknowledgment that health care systems need to consider how they provide health care to these populations to ensure equity of access and outcomes.
The SWASH survey is a comprehensive survey of important health issues relevant to lesbian, bisexual, queer and other non-heterosexual identifying women engaged with Sydney’s lesbian, gay, bisexual, transgender, intersex and queer (LGBTIQ) communities. SWASH has been run by researchers in collaboration with ACON every two years since 1996, and since 2009 has been run by researchers at the University of Sydney. The survey is regularly revised to reflect the needs of LGBTIQ communities and knowledge deficits identified through research literature. Where possible, questions are sourced from established national surveys.
Australian epidemiological data on the health and wellbeing of LBQ women remains limited. Sexuality and gender indicators are seldom included in large epidemiological surveys. Even when they are, data is often reported only by sexuality (e.g. LGB people vs heterosexual people) and not by sexuality and gender (e.g. LBQ women, GBQ men, heterosexual women, heterosexual men). SWASH provides a much-needed local evidence base to inform policy and best practice in healthcare and prevention for chronic diseases, mental health and wellbeing, sexual and reproductive health, and ageing.
This report presents results from the three most recent iterations of the survey conducted at the Mardi Gras Fair Day and other community events and venues during the Sydney Gay and Lesbian Mardi Gras seasons in 2016, 2018 and 2020. In 2020, 1588 lesbian, bisexual, queer and other non-heterosexually identifying women (cis and trans) and non-binary people returned valid surveys; an unprecedented number in the 24-year history of the SWASH survey.
This data provides unparalleled insights into the health of lesbian, bisexual, queer and other non-heterosexual identifying women aged 16 to 71 years who engaged with LGBTIQ communities in and around Sydney (where 85% of respondents reside). Our analyses highlight several areas of particular concern – many of which have persisted over time – where mainstream preventive health interventions that are inclusive of, or targeted to, LBQ women are needed.
2
SWASH Report 2016, 2018, 2020
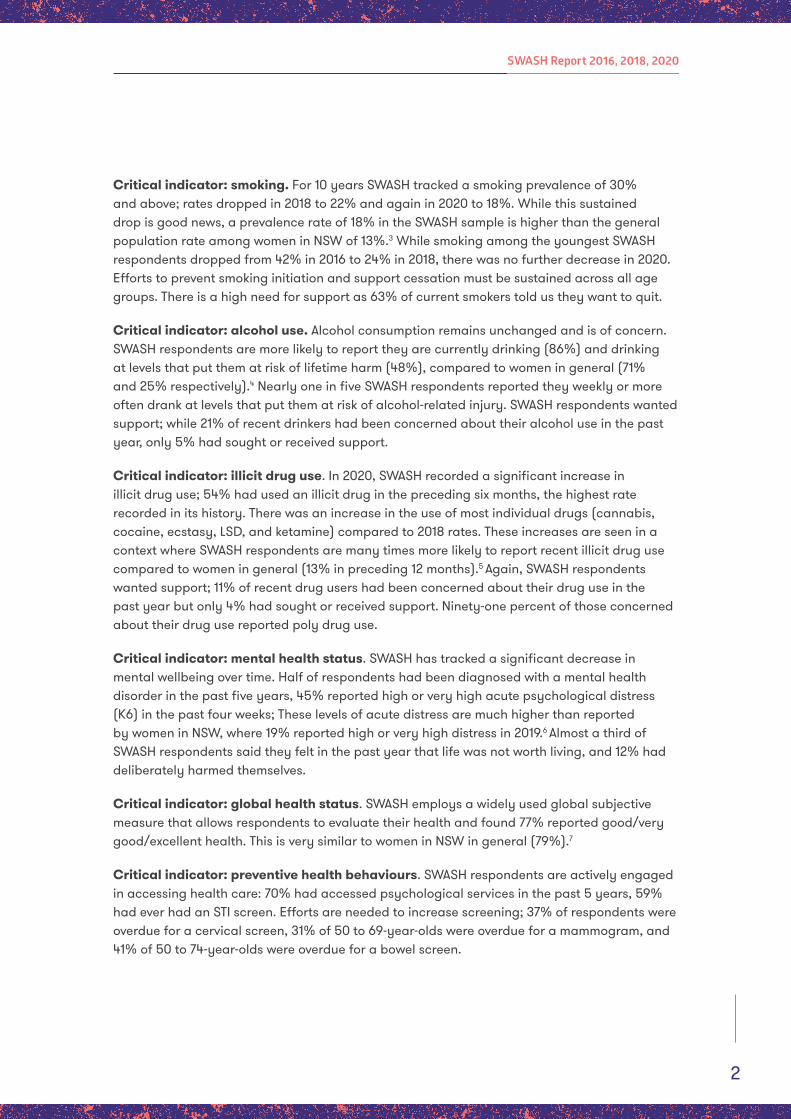
Critical indicator: smoking. For 10 years SWASH tracked a smoking prevalence of 30% and above; rates dropped in 2018 to 22% and again in 2020 to 18%. While this sustained drop is good news, a prevalence rate of 18% in the SWASH sample is higher than the general population rate among women in NSW of 13%.3 While smoking among the youngest SWASH respondents dropped from 42% in 2016 to 24% in 2018, there was no further decrease in 2020. Efforts to prevent smoking initiation and support cessation must be sustained across all age groups. There is a high need for support as 63% of current smokers told us they want to quit.
Critical indicator: alcohol use. Alcohol consumption remains unchanged and is of concern. SWASH respondents are more likely to report they are currently drinking (86%) and drinking at levels that put them at risk of lifetime harm (48%), compared to women in general (71% and 25% respectively).4 Nearly one in five SWASH respondents reported they weekly or more often drank at levels that put them at risk of alcohol-related injury. SWASH respondents wanted support; while 21% of recent drinkers had been concerned about their alcohol use in the past year, only 5% had sought or received support.
Critical indicator: illicit drug use. In 2020, SWASH recorded a significant increase in illicit drug use; 54% had used an illicit drug in the preceding six months, the highest rate recorded in its history. There was an increase in the use of most individual drugs (cannabis, cocaine, ecstasy, LSD, and ketamine) compared to 2018 rates. These increases are seen in a context where SWASH respondents are many times more likely to report recent illicit drug use compared to women in general (13% in preceding 12 months).5 Again, SWASH respondents wanted support; 11% of recent drug users had been concerned about their drug use in the past year but only 4% had sought or received support. Ninety-one percent of those concerned about their drug use reported poly drug use.
Critical indicator: mental health status. SWASH has tracked a significant decrease in mental wellbeing over time. Half of respondents had been diagnosed with a mental health disorder in the past five years, 45% reported high or very high acute psychological distress (K6) in the past four weeks; These levels of acute distress are much higher than reported by women in NSW, where 19% reported high or very high distress in 2019.6 Almost a third of SWASH respondents said they felt in the past year that life was not worth living, and 12% had deliberately harmed themselves.
Critical indicator: global health status. SWASH employs a widely used global subjective measure that allows respondents to evaluate their health and found 77% reported good/very good/excellent health. This is very similar to women in NSW in general (79%).7
Critical indicator: preventive health behaviours. SWASH respondents are actively engaged in accessing health care: 70% had accessed psychological services in the past 5 years, 59% had ever had an STI screen. Efforts are needed to increase screening; 37% of respondents were overdue for a cervical screen, 31% of 50 to 69-year-olds were overdue for a mammogram, and 41% of 50 to 74-year-olds were overdue for a bowel screen.
3
SWASH Report 2016, 2018, 2020
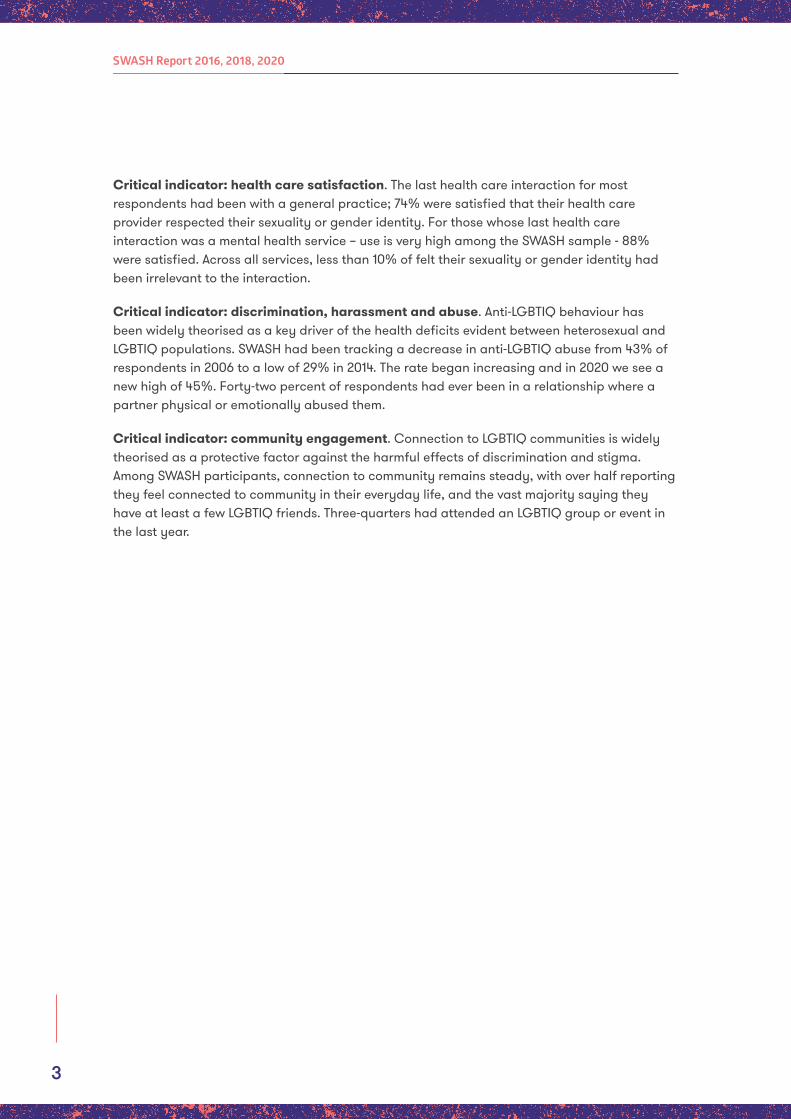
Critical indicator: health care satisfaction. The last health care interaction for most respondents had been with a general practice; 74% were satisfied that their health care provider respected their sexuality or gender identity. For those whose last health care interaction was a mental health service – use is very high among the SWASH sample - 88% were satisfied. Across all services, less than 10% of felt their sexuality or gender identity had been irrelevant to the interaction.
Critical indicator: discrimination, harassment and abuse. Anti-LGBTIQ behaviour has been widely theorised as a key driver of the health deficits evident between heterosexual and LGBTIQ populations. SWASH had been tracking a decrease in anti-LGBTIQ abuse from 43% of respondents in 2006 to a low of 29% in 2014. The rate began increasing and in 2020 we see a new high of 45%. Forty-two percent of respondents had ever been in a relationship where a partner physical or emotionally abused them.
Critical indicator: community engagement. Connection to LGBTIQ communities is widely theorised as a protective factor against the harmful effects of discrimination and stigma. Among SWASH participants, connection to community remains steady, with over half reporting they feel connected to community in their everyday life, and the vast majority saying they have at least a few LGBTIQ friends. Three-quarters had attended an LGBTIQ group or event in the last year.
4
SWASH Report 2016, 2018, 2020
SWASH is the longest running periodic survey of LBQ women’s health and wellbeing in the world. The first round of the SWASH survey (then called the Sydney Women and Sexual Health survey) was carried out in 1996, making this the thirteenth iteration. The initial SWASH survey was initiated by workers from two ACON projects - Women Partners of Gay and Bisexual Men, and the Gay and Lesbian Injecting Drug Use Project - who were faced with a lack of empirical evidence on which to base their intervention work. Concern had been voiced about the possibility of HIV spreading from gay men to the ‘general community’ so the first SWASH survey focused on sexual and injection-related HIV transmission risks. The survey was addressed to all women in social contact with gay and lesbian communities in Sydney. The scope broadened to a general health survey, and became focused on LBQ women. In 2020, we added new questions on bowel cancer screening, knowledge of PrEP, recent healthcare interactions, and use of electronic cigarettes.
A key strength of the SWASH data set is that we have asked the same core questions of LBQ women engaging with LGBTIQ communities, and we have done it in similar venues and events, every two years, at the same time of year. This allows us to track trends in the population of community engaged LBQ women. We take a cautious approach to changing the survey so as not to undermine our ability to capture changes. However, we work closely with ACON to respond to changes in the community, and to community expectations. For example, in 2018, we changed our approach to asking about survey respondents’ gender. In 2020, we standardised and expanded the range of gender options in all questions that refer to a partner (e.g. intimate partner violence). We also revised the way we conceptualise and ask about sexual practice. The survey questions about sexual partners and practices now specify specific body parts (where relevant) where previously they implicitly assumed body parts based on the gender of the partner. We will continue to engage with community to ensure the survey reflects the diversity of ways people describe their experiences, practices or identities.
One hundred and twenty-two non-binary people chose to participate in the survey. During post-data collection consultation we came to understand a number of motivations drove these decisions. Non-binary respondents may have felt connected to or aligned with ‘woman’ or ‘femininity’ as part of their gender identity, or have felt that SWASH was the best available means to communicate their health needs to ACON. Some may have participated as they have done so in the past, or participated as an act of community connection. We respect their decisions and have retained them in the SWASH sample. However, as the sample is strongly skewed towards non-binary people who were assigned female at birth, SWASH cannot provide specific insights into the health and wellbeing of non-binary people as a whole. To emphasise this, we describe the sample as ‘LBQ women and some non-binary people’. We name non-binary people to highlight that their identities, experience and needs are not equivalent to women’s. We support the development of research that better reflects the needs of all non-binary people.
This report presents results from the 2020 survey, with 2016 and 2018 data presented for comparison; the format follows previous survey iterations.8-13 Slight changes in sampling and question wording between iterations mean that differences between the years cannot be attributed solely to change over time. We make note of changes in questions and years when particular questions were not asked.
2. Background
5
SWASH Report 2016, 2018, 2020
3.1 Survey instrument
A 65-item self-complete questionnaire was used for the 2020 iteration; a few survey questions appeared for the first, some of which will likely not be repeated (see Appendix 1 for copies of the questionnaires). The questionnaire included items on demographics; sexual and gender identity; sense of connection to LGBTIQ communities; smoking, alcohol, and drug use; sexual health; general health; chronic illness and disability; mental health; experiences of anti-LGBTIQ behaviour, intimate partner violence; parenthood intentions; preventive health behaviour; and healthcare access and satisfaction. Responding to community feedback, and after consultation with community stakeholders, we changed the way the survey captured the gender of respondents’ sexual/intimate partners, and the way we asked about sexual practice.
3.2 Sampling and recruitment
SWASH is a repeated cross-sectional survey that takes place every two years in February during the Sydney Mardi Gras season. It employs a modified version of the Time-Location convenience sampling also used for the HIV behavioural surveillance undertaken by the Gay Community Periodic Survey.14 This venue-based method is often employed for populations that cluster in locations. We drew on ACON health promotion staff knowledge to identify venues and events likely to have a high concentration and diversity of LBQ women during the survey recruitment period. As in previous years, in 2020 the primary recruitment site was the Mardi Gras Fair Day – a highly significant community family day with entertainment, stalls, and food attended by up to 80,000 people. As a result of recruitment success at Mardi Gras Fair Day, we selected further recruitment sites that would enhance the diversity of the sample.
SWASH has always been a survey aimed at women (cisgender and transgender). To ensure recruitment was as open as possible, peer recruiters were instructed to offer a questionnaire to everyone they perceived might see ‘woman’ or ‘femininity’ as part or all of their gender identity, and allow individuals to decide if they wanted to participate. Recruitment took place in public spaces, and entertainment venues; potential respondents who did not want to complete the questionnaire could easily avoid our peer recruiters or simply refuse a verbal offer to contribute. Equally people who did want to participate could approach a peer recruiter, or at Fair Day, get a survey at the ACON stall. Because of practical difficulties, we have not calculated refusal rates.
In 2020 and 2018 we also ran the survey online using REDCap electronic data capture tools.15 The survey was open throughout March, going live immediately after face-to-face recruitment ceased, and advertised though ACON’s social media networks. Delaying online recruitment is designed to maintain our ability to compare SWASH face to face samples across iterations.
The SWASH survey ran as the COVID-19 pandemic unfolded. There were 10 reported cases of COVID-19 in Australia when face-to-face recruitment began, and 28 cases by the time it finished. During face-to-face recruitment there were minimal travel restrictions but no other constraints on everyday life in Australia. We judge the pandemic to have had little impact on 90% of the sample who completed paper surveys in February. When online recruitment began in early March, the first death and the first documented case of community transmission
3. Methods
6
SWASH Report 2016, 2018, 2020
in Australia had just occurred. By the time online recruitment closed, there were 4560 documented cases and 19 deaths in Australia. However, 80% of the online surveys were submitted in the first week of March before: Australian borders closed to non-residents, mass gatherings were banned, social distancing measures introduced, and non-essential services closed. That is, only a small proportion of the online sample (itself only 10% of the total sample) was generated in the context of major and harmful changes to employment, income, health, and social connection. It is for these reasons that we have kept the online surveys in the final sample.
3.3 Analysis
Data were entered from the coded questionnaires and loaded into SPSS v26.0 software for analysis. Data were cleaned and checked for internal consistency and, where inconsistencies were found, checked against the questionnaires. Additional comments and answers to open-ended questions were transferred from the questionnaires. Data are reported in tables and text as whole numbers (if the digit after the decimal point was five or greater we rounded up to the next whole number, and if it was less than five we simply removed the decimals). Whole numbers are easier to read and decimal points give an illusion of precision that is not relevant in this report. The analysis presented in this report is primarily descriptive, with cross-tabs and t-tests to confirm significant differences between subgroups; p values were calculated using Pearson’s chi-square statistic or Fisher’s exact test where appropriate (i.e. where the ‘expected’ number was very small).
The non-answer rate for some questions completed face-to-face was high, especially those requiring writing text rather than ticking a box. The online version of the survey contained controls alerting participants to non-completed questions (although respondents could skip most questions if they wished). We assume that many respondents simply left a question blank when it did not apply to them, rather than ticking the ‘no’ response. However, percentages have generally been calculated on the total sample, not on the question-specific response rate, which would have inflated the ‘yes’ percentages. Readers can interpret the ‘yes’ percentages as lower-bound estimates and judge for themselves whether the incomplete responses are likely to be similar to the complete responses or likely to mean ‘no’ or ‘not applicable’. Exceptions to this are tables reporting summaries of questions where respondents could select more than one item, and tables reporting sub-samples.
7
SWASH Report 2016, 2018, 2020
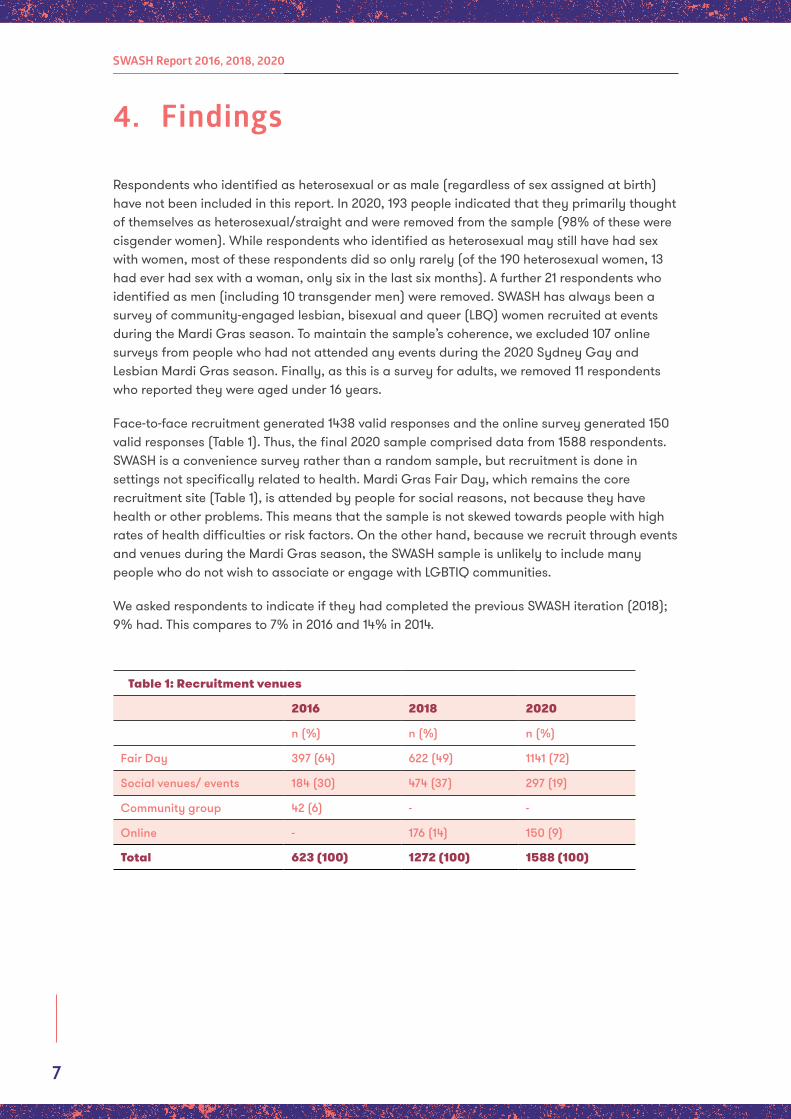
Respondents who identified as heterosexual or as male (regardless of sex assigned at birth) have not been included in this report. In 2020, 193 people indicated that they primarily thought of themselves as heterosexual/straight and were removed from the sample (98% of these were cisgender women). While respondents who identified as heterosexual may still have had sex with women, most of these respondents did so only rarely (of the 190 heterosexual women, 13 had ever had sex with a woman, only six in the last six months). A further 21 respondents who identified as men (including 10 transgender men) were removed. SWASH has always been a survey of community-engaged lesbian, bisexual and queer (LBQ) women recruited at events during the Mardi Gras season. To maintain the sample’s coherence, we excluded 107 online surveys from people who had not attended any events during the 2020 Sydney Gay and Lesbian Mardi Gras season. Finally, as this is a survey for adults, we removed 11 respondents who reported they were aged under 16 years.
Face-to-face recruitment generated 1438 valid responses and the online survey generated 150 valid responses (Table 1). Thus, the final 2020 sample comprised data from 1588 respondents. SWASH is a convenience survey rather than a random sample, but recruitment is done in settings not specifically related to health. Mardi Gras Fair Day, which remains the core recruitment site (Table 1), is attended by people for social reasons, not because they have health or other problems. This means that the sample is not skewed towards people with high rates of health difficulties or risk factors. On the other hand, because we recruit through events and venues during the Mardi Gras season, the SWASH sample is unlikely to include many people who do not wish to associate or engage with LGBTIQ communities.
We asked respondents to indicate if they had completed the previous SWASH iteration (2018); 9% had. This compares to 7% in 2016 and 14% in 2014.
Table 1: Recruitment venues
2016 2018 2020
n (%) n (%) n (%)
Fair Day 397 (64) 622 (49) 1141 (72)
Social venues/ events 184 (30) 474 (37) 297 (19)
Community group 42 (6) - -
Online - 176 (14) 150 (9)
Total 623 (100) 1272 (100) 1588 (100)
4. Findings
8
SWASH Report 2016, 2018, 2020
4.1. Sample Characteristics
4.1.1 Age
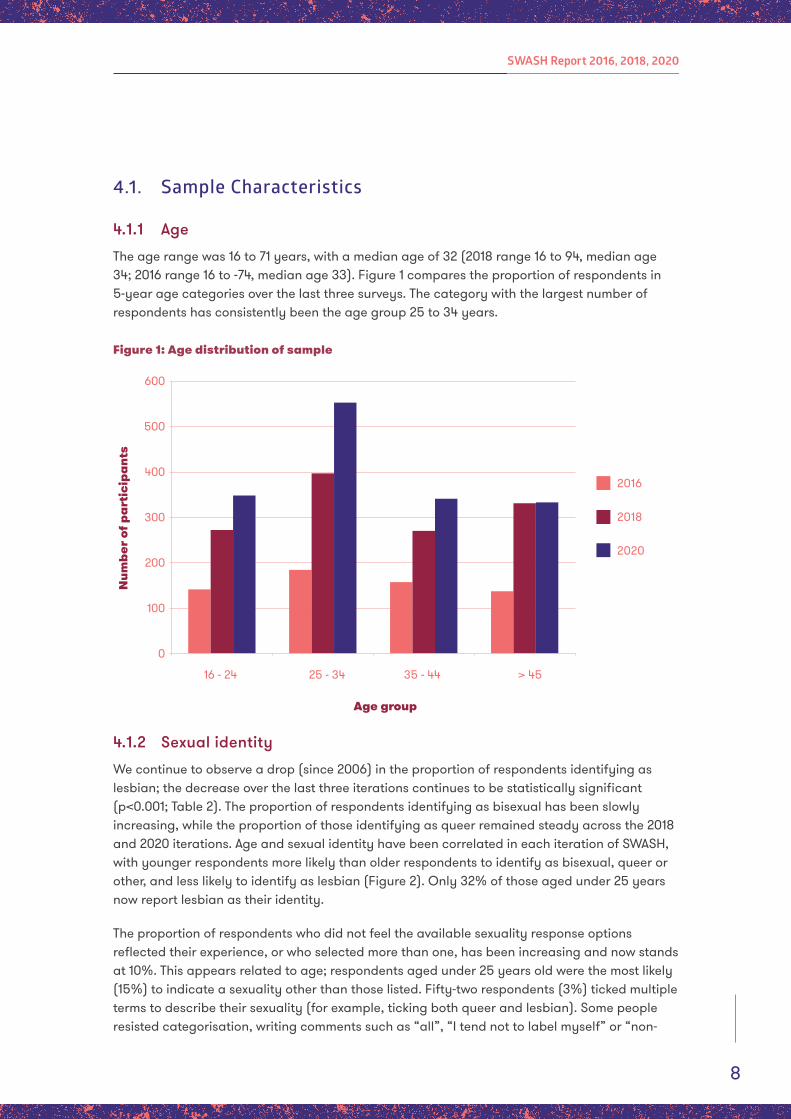
The age range was 16 to 71 years, with a median age of 32 (2018 range 16 to 94, median age 34; 2016 range 16 to -74, median age 33). Figure 1 compares the proportion of respondents in 5-year age categories over the last three surveys. The category with the largest number of respondents has consistently been the age group 25 to 34 years.
Figure 1: Age distribution of sample
0
100
200
300
400
500
600
16-24 25-34 35-44 >45
Num
ber
of p
arti
cipa
nts
Age group
2016
2018
2020
0
100
16 - 24 25 - 34 35 - 44 > 45
200
300
400
500
600
Age group
Num
ber
of p
arti
cipa
nts
0
100
16 - 24 25 - 34 35 - 44 > 45
200
300
400
500
600
Age group
Num
ber
of p
arti
cipa
nts
0
100
16 - 24 25 - 34 35 - 44 > 45
200
300
400
500
600
Age group
Num
ber
of p
arti
cipa
nts
2016
2018
2020
4.1.2 Sexual identity
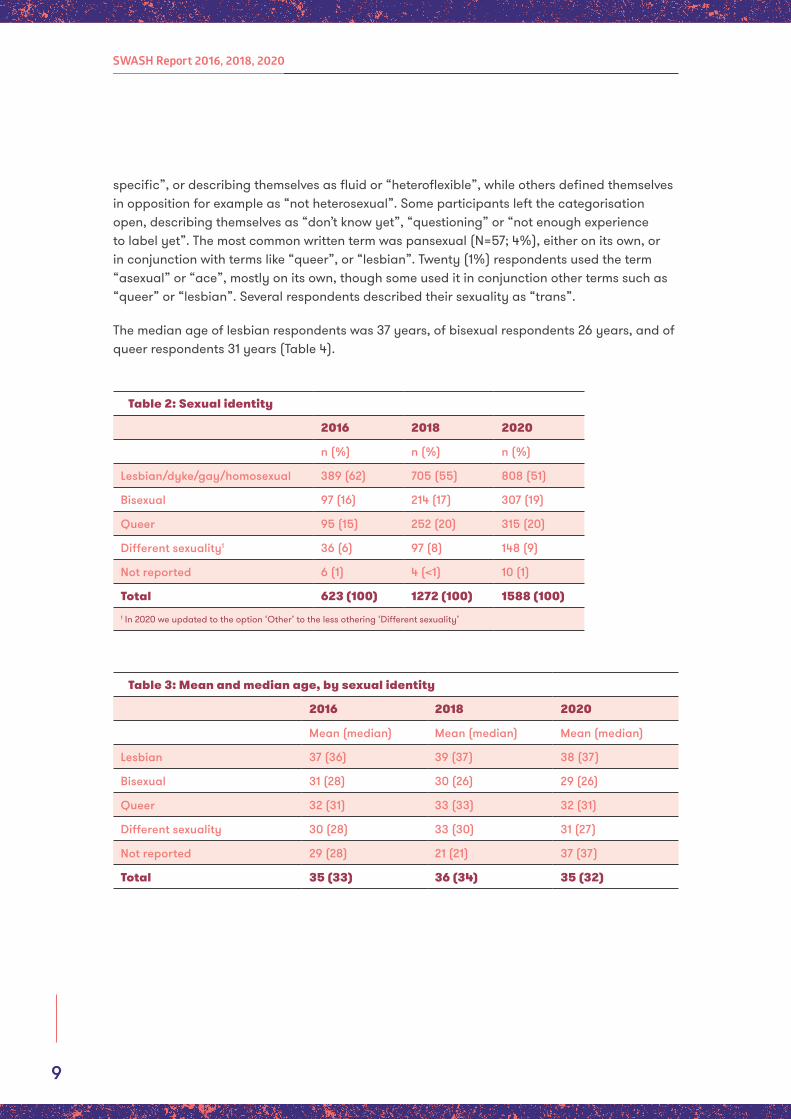
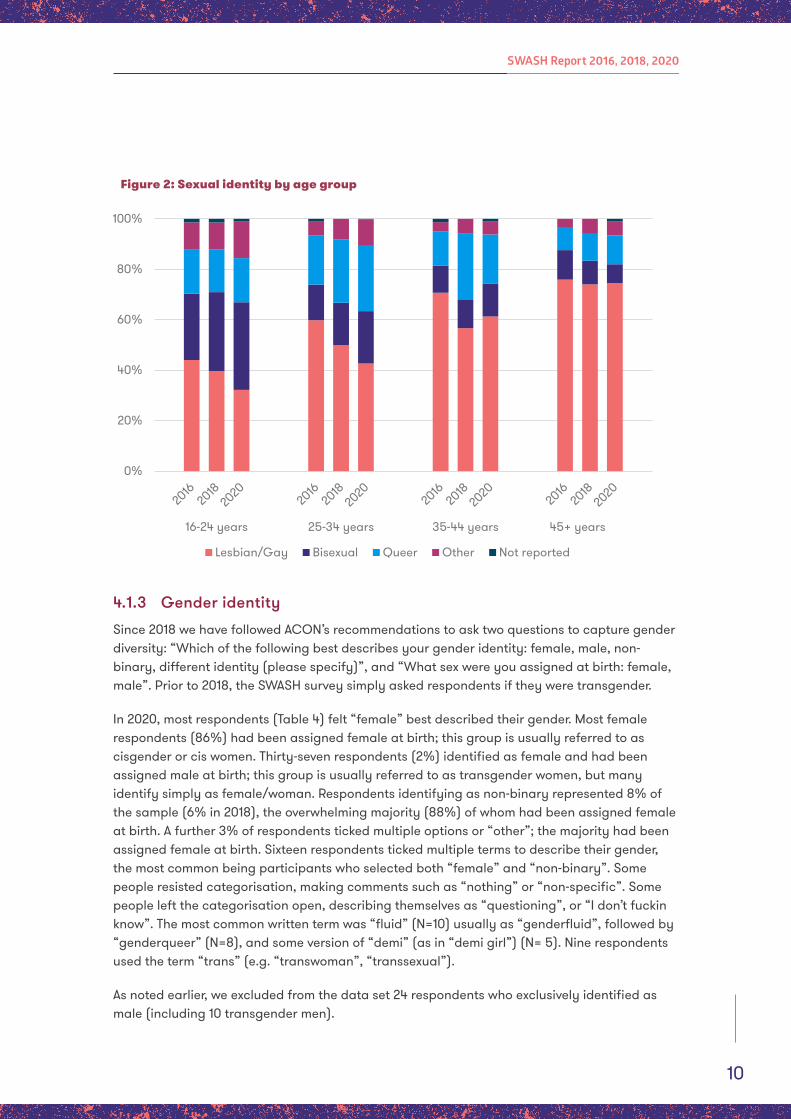
We continue to observe a drop (since 2006) in the proportion of respondents identifying as lesbian; the decrease over the last three iterations continues to be statistically significant (p<0.001; Table 2). The proportion of respondents identifying as bisexual has been slowly increasing, while the proportion of those identifying as queer remained steady across the 2018 and 2020 iterations. Age and sexual identity have been correlated in each iteration of SWASH, with younger respondents more likely than older respondents to identify as bisexual, queer or other, and less likely to identify as lesbian (Figure 2). Only 32% of those aged under 25 years now report lesbian as their identity.
The proportion of respondents who did not feel the available sexuality response options reflected their experience, or who selected more than one, has been increasing and now stands at 10%. This appears related to age; respondents aged under 25 years old were the most likely (15%) to indicate a sexuality other than those listed. Fifty-two respondents (3%) ticked multiple terms to describe their sexuality (for example, ticking both queer and lesbian). Some people resisted categorisation, writing comments such as “all”, “I tend not to label myself” or “non-
9
SWASH Report 2016, 2018, 2020
specific”, or describing themselves as fluid or “heteroflexible”, while others defined themselves in opposition for example as “not heterosexual”. Some participants left the categorisation open, describing themselves as “don’t know yet”, “questioning” or “not enough experience to label yet”. The most common written term was pansexual (N=57; 4%), either on its own, or in conjunction with terms like “queer”, or “lesbian”. Twenty (1%) respondents used the term “asexual” or “ace”, mostly on its own, though some used it in conjunction other terms such as “queer” or “lesbian”. Several respondents described their sexuality as “trans”.
The median age of lesbian respondents was 37 years, of bisexual respondents 26 years, and of queer respondents 31 years (Table 4).
Table 2: Sexual identity
2016 2018 2020
n (%) n (%) n (%)
Lesbian/dyke/gay/homosexual 389 (62) 705 (55) 808 (51)
Bisexual 97 (16) 214 (17) 307 (19)
Queer 95 (15) 252 (20) 315 (20)
Different sexuality1 36 (6) 97 (8) 148 (9)
Not reported 6 (1) 4 (<1) 10 (1)
Total 623 (100) 1272 (100) 1588 (100)1 In 2020 we updated to the option ‘Other’ to the less othering ‘Different sexuality’
Table 3: Mean and median age, by sexual identity
2016 2018 2020
Mean (median) Mean (median) Mean (median)
Lesbian 37 (36) 39 (37) 38 (37)
Bisexual 31 (28) 30 (26) 29 (26)
Queer 32 (31) 33 (33) 32 (31)
Different sexuality 30 (28) 33 (30) 31 (27)
Not reported 29 (28) 21 (21) 37 (37)
Total 35 (33) 36 (34) 35 (32)
10
SWASH Report 2016, 2018, 2020
Figure 2: Sexual identity by age group
0%
20%
40%
60%
80%
100%
16-24 years 25-34 years 35-44 years 45+ years
Lesbian/Gay Bisexual Queer Other Not reported
4.1.3 Gender identity
Since 2018 we have followed ACON’s recommendations to ask two questions to capture gender diversity: “Which of the following best describes your gender identity: female, male, non-binary, different identity (please specify)”, and “What sex were you assigned at birth: female, male”. Prior to 2018, the SWASH survey simply asked respondents if they were transgender.
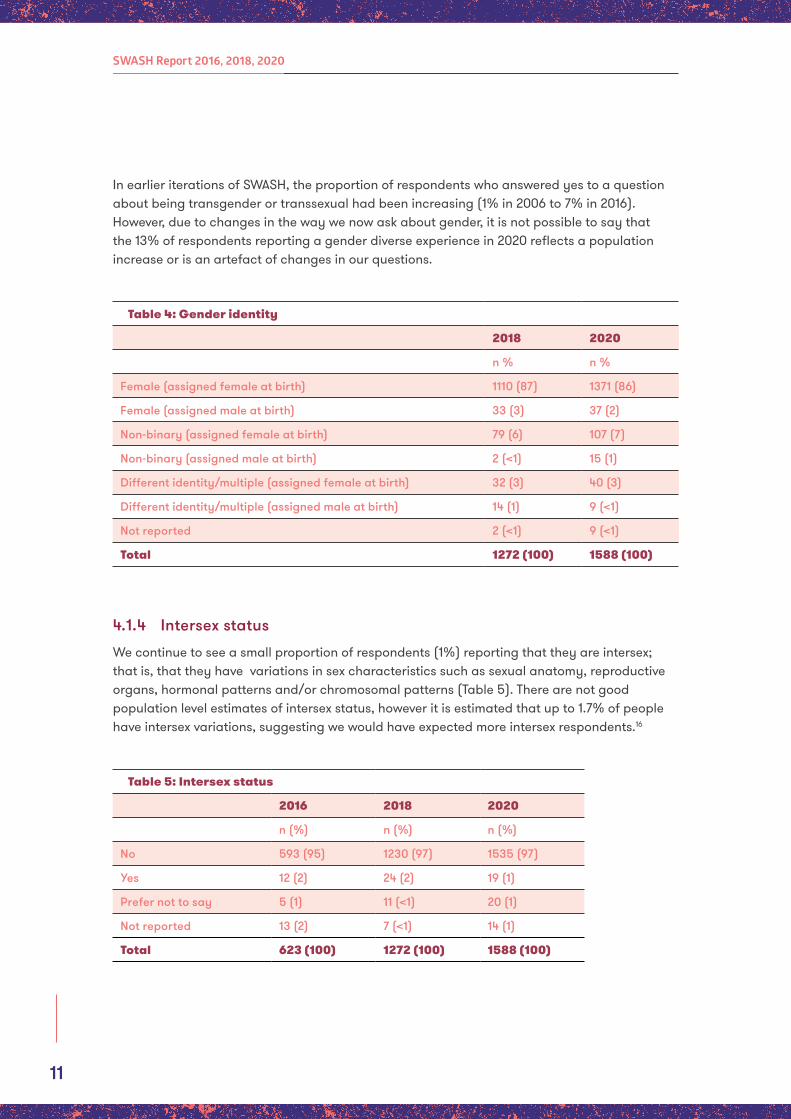
In 2020, most respondents (Table 4) felt “female” best described their gender. Most female respondents (86%) had been assigned female at birth; this group is usually referred to as cisgender or cis women. Thirty-seven respondents (2%) identified as female and had been assigned male at birth; this group is usually referred to as transgender women, but many identify simply as female/woman. Respondents identifying as non-binary represented 8% of the sample (6% in 2018), the overwhelming majority (88%) of whom had been assigned female at birth. A further 3% of respondents ticked multiple options or “other”; the majority had been assigned female at birth. Sixteen respondents ticked multiple terms to describe their gender, the most common being participants who selected both “female” and “non-binary”. Some people resisted categorisation, making comments such as “nothing” or “non-specific”. Some people left the categorisation open, describing themselves as “questioning”, or “I don’t fuckin know”. The most common written term was “fluid” (N=10) usually as “genderfluid”, followed by “genderqueer” (N=8), and some version of “demi” (as in “demi girl”) (N= 5). Nine respondents used the term “trans” (e.g. “transwoman”, “transsexual”).
As noted earlier, we excluded from the data set 24 respondents who exclusively identified as male (including 10 transgender men).
11
SWASH Report 2016, 2018, 2020
In earlier iterations of SWASH, the proportion of respondents who answered yes to a question about being transgender or transsexual had been increasing (1% in 2006 to 7% in 2016). However, due to changes in the way we now ask about gender, it is not possible to say that the 13% of respondents reporting a gender diverse experience in 2020 reflects a population increase or is an artefact of changes in our questions.
Table 4: Gender identity
2018 2020
n % n %
Female (assigned female at birth) 1110 (87) 1371 (86)
Female (assigned male at birth) 33 (3) 37 (2)
Non-binary (assigned female at birth) 79 (6) 107 (7)
Non-binary (assigned male at birth) 2 (<1) 15 (1)
Different identity/multiple (assigned female at birth) 32 (3) 40 (3)
Different identity/multiple (assigned male at birth) 14 (1) 9 (<1)
Not reported 2 (<1) 9 (<1)
Total 1272 (100) 1588 (100)
4.1.4 Intersex status
We continue to see a small proportion of respondents (1%) reporting that they are intersex; that is, that they have variations in sex characteristics such as sexual anatomy, reproductive organs, hormonal patterns and/or chromosomal patterns (Table 5). There are not good population level estimates of intersex status, however it is estimated that up to 1.7% of people have intersex variations, suggesting we would have expected more intersex respondents.16
Table 5: Intersex status
2016 2018 2020
n (%) n (%) n (%)
No 593 (95) 1230 (97) 1535 (97)
Yes 12 (2) 24 (2) 19 (1)
Prefer not to say 5 (1) 11 (<1) 20 (1)
Not reported 13 (2) 7 (<1) 14 (1)
Total 623 (100) 1272 (100) 1588 (100)
12
SWASH Report 2016, 2018, 2020
4.1.5 Children
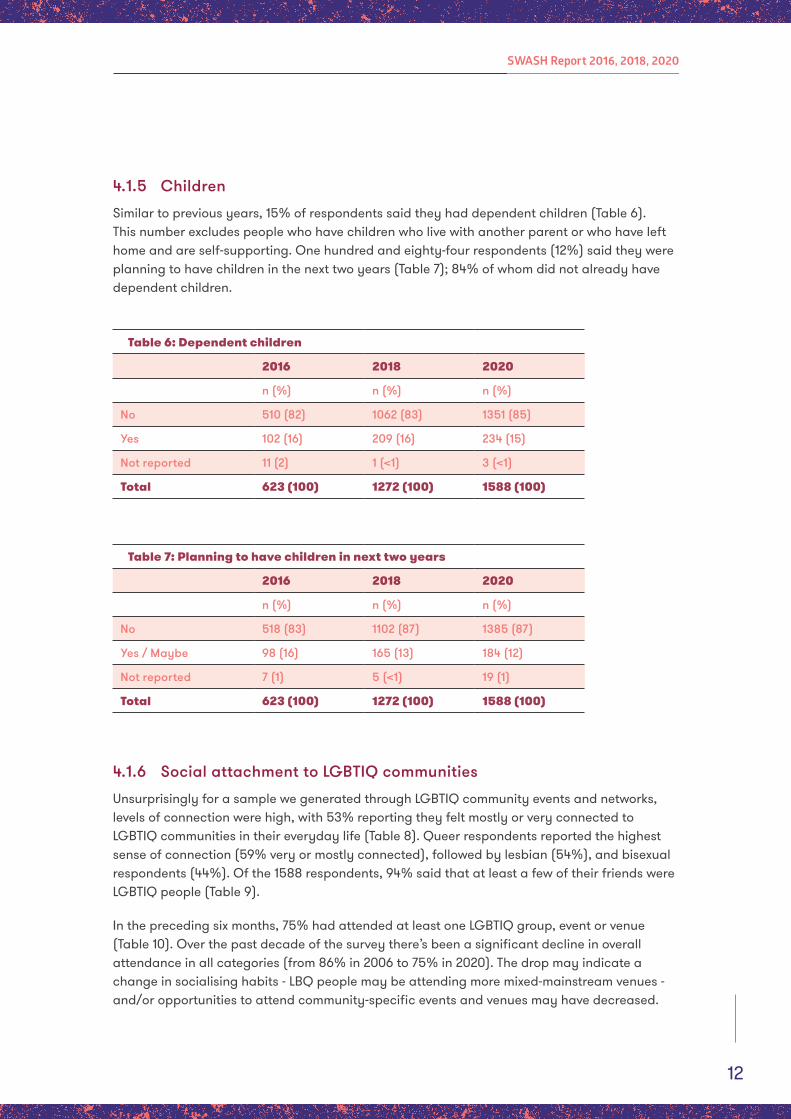
Similar to previous years, 15% of respondents said they had dependent children (Table 6). This number excludes people who have children who live with another parent or who have left home and are self-supporting. One hundred and eighty-four respondents (12%) said they were planning to have children in the next two years (Table 7); 84% of whom did not already have dependent children.
Table 6: Dependent children
2016 2018 2020
n (%) n (%) n (%)
No 510 (82) 1062 (83) 1351 (85)
Yes 102 (16) 209 (16) 234 (15)
Not reported 11 (2) 1 (<1) 3 (<1)
Total 623 (100) 1272 (100) 1588 (100)
Table 7: Planning to have children in next two years
2016 2018 2020
n (%) n (%) n (%)
No 518 (83) 1102 (87) 1385 (87)
Yes / Maybe 98 (16) 165 (13) 184 (12)
Not reported 7 (1) 5 (<1) 19 (1)
Total 623 (100) 1272 (100) 1588 (100)
4.1.6 Social attachment to LGBTIQ communities
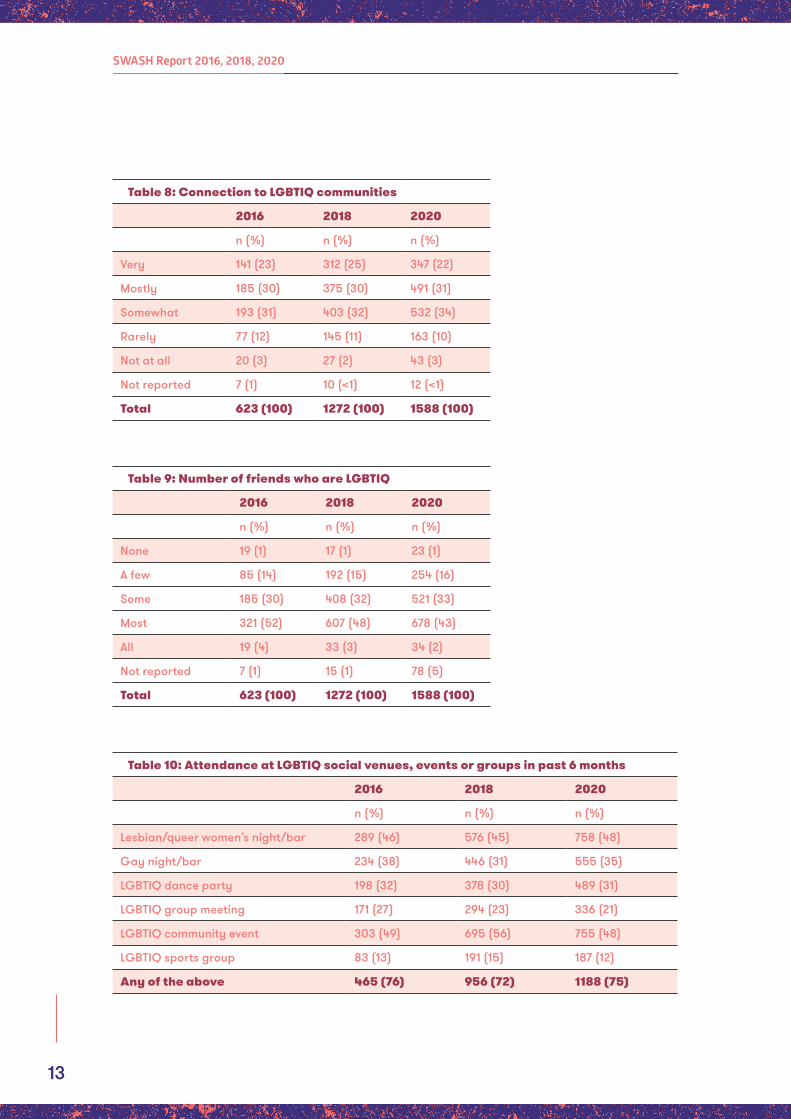
Unsurprisingly for a sample we generated through LGBTIQ community events and networks, levels of connection were high, with 53% reporting they felt mostly or very connected to LGBTIQ communities in their everyday life (Table 8). Queer respondents reported the highest sense of connection (59% very or mostly connected), followed by lesbian (54%), and bisexual respondents (44%). Of the 1588 respondents, 94% said that at least a few of their friends were LGBTIQ people (Table 9).
In the preceding six months, 75% had attended at least one LGBTIQ group, event or venue (Table 10). Over the past decade of the survey there’s been a significant decline in overall attendance in all categories (from 86% in 2006 to 75% in 2020). The drop may indicate a change in socialising habits - LBQ people may be attending more mixed-mainstream venues - and/or opportunities to attend community-specific events and venues may have decreased.
13
SWASH Report 2016, 2018, 2020
Table 8: Connection to LGBTIQ communities
2016 2018 2020
n (%) n (%) n (%)
Very 141 (23) 312 (25) 347 (22)
Mostly 185 (30) 375 (30) 491 (31)
Somewhat 193 (31) 403 (32) 532 (34)
Rarely 77 (12) 145 (11) 163 (10)
Not at all 20 (3) 27 (2) 43 (3)
Not reported 7 (1) 10 (<1) 12 (<1)
Total 623 (100) 1272 (100) 1588 (100)
Table 9: Number of friends who are LGBTIQ
2016 2018 2020
n (%) n (%) n (%)
None 19 (1) 17 (1) 23 (1)
A few 85 (14) 192 (15) 254 (16)
Some 185 (30) 408 (32) 521 (33)
Most 321 (52) 607 (48) 678 (43)
All 19 (4) 33 (3) 34 (2)
Not reported 7 (1) 15 (1) 78 (5)
Total 623 (100) 1272 (100) 1588 (100)
Table 10: Attendance at LGBTIQ social venues, events or groups in past 6 months
2016 2018 2020
n (%) n (%) n (%)
Lesbian/queer women’s night/bar 289 (46) 576 (45) 758 (48)
Gay night/bar 234 (38) 446 (31) 555 (35)
LGBTIQ dance party 198 (32) 378 (30) 489 (31)
LGBTIQ group meeting 171 (27) 294 (23) 336 (21)
LGBTIQ community event 303 (49) 695 (56) 755 (48)
LGBTIQ sports group 83 (13) 191 (15) 187 (12)
Any of the above 465 (76) 956 (72) 1188 (75)
14
SWASH Report 2016, 2018, 2020
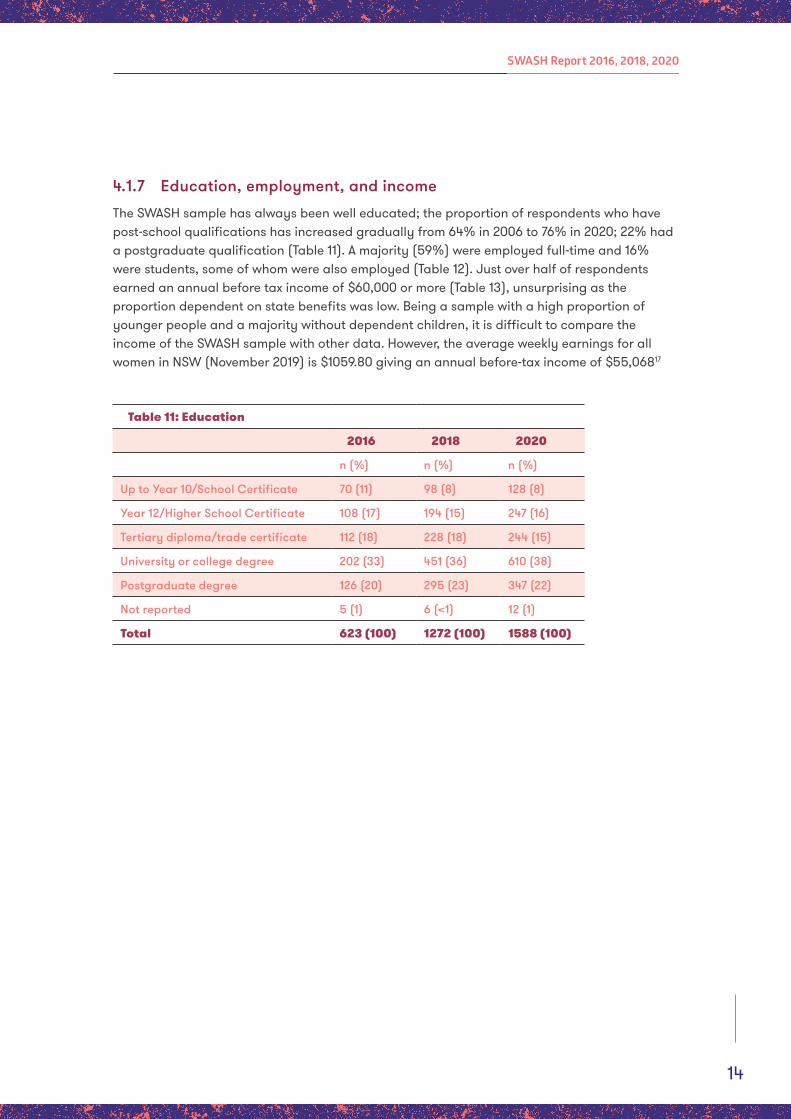
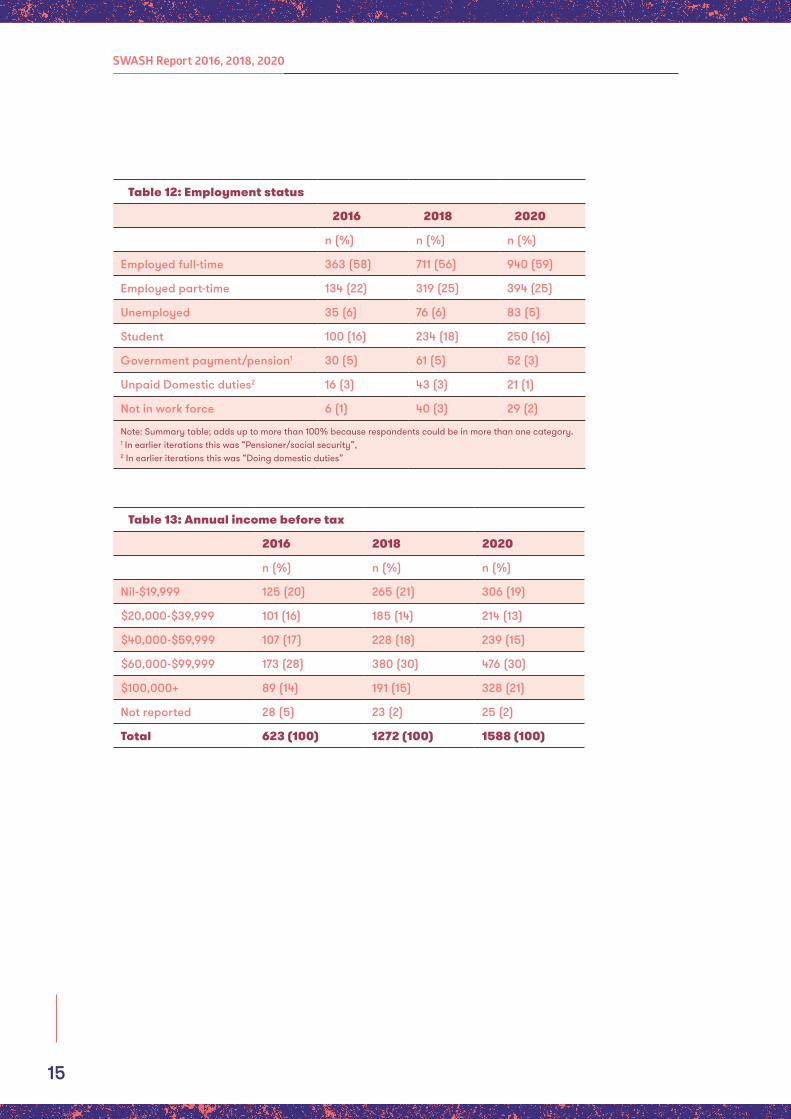
4.1.7 Education, employment, and income
The SWASH sample has always been well educated; the proportion of respondents who have post-school qualifications has increased gradually from 64% in 2006 to 76% in 2020; 22% had a postgraduate qualification (Table 11). A majority (59%) were employed full-time and 16% were students, some of whom were also employed (Table 12). Just over half of respondents earned an annual before tax income of $60,000 or more (Table 13), unsurprising as the proportion dependent on state benefits was low. Being a sample with a high proportion of younger people and a majority without dependent children, it is difficult to compare the income of the SWASH sample with other data. However, the average weekly earnings for all women in NSW (November 2019) is $1059.80 giving an annual before-tax income of $55,06817
Table 11: Education
2016 2018 2020
n (%) n (%) n (%)
Up to Year 10/School Certificate 70 (11) 98 (8) 128 (8)
Year 12/Higher School Certificate 108 (17) 194 (15) 247 (16)
Tertiary diploma/trade certificate 112 (18) 228 (18) 244 (15)
University or college degree 202 (33) 451 (36) 610 (38)
Postgraduate degree 126 (20) 295 (23) 347 (22)
Not reported 5 (1) 6 (<1) 12 (1)
Total 623 (100) 1272 (100) 1588 (100)
15
SWASH Report 2016, 2018, 2020
Table 12: Employment status
2016 2018 2020
n (%) n (%) n (%)
Employed full-time 363 (58) 711 (56) 940 (59)
Employed part-time 134 (22) 319 (25) 394 (25)
Unemployed 35 (6) 76 (6) 83 (5)
Student 100 (16) 234 (18) 250 (16)
Government payment/pension1 30 (5) 61 (5) 52 (3)
Unpaid Domestic duties2 16 (3) 43 (3) 21 (1)
Not in work force 6 (1) 40 (3) 29 (2)
Note: Summary table; adds up to more than 100% because respondents could be in more than one category. 1 In earlier iterations this was “Pensioner/social security”, 2 In earlier iterations this was “Doing domestic duties”
Table 13: Annual income before tax
2016 2018 2020
n (%) n (%) n (%)
Nil-$19,999 125 (20) 265 (21) 306 (19)
$20,000-$39,999 101 (16) 185 (14) 214 (13)
$40,000-$59,999 107 (17) 228 (18) 239 (15)
$60,000-$99,999 173 (28) 380 (30) 476 (30)
$100,000+ 89 (14) 191 (15) 328 (21)
Not reported 28 (5) 23 (2) 25 (2)
Total 623 (100) 1272 (100) 1588 (100)
16
SWASH Report 2016, 2018, 2020
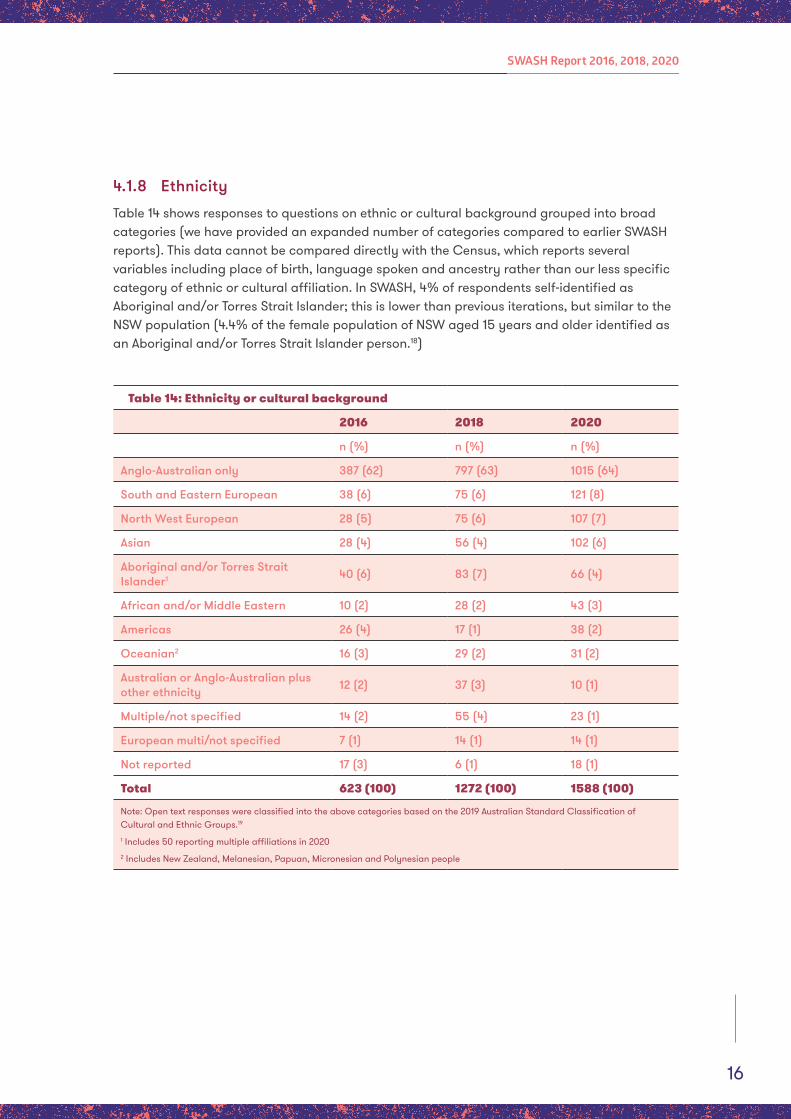
4.1.8 Ethnicity
Table 14 shows responses to questions on ethnic or cultural background grouped into broad categories (we have provided an expanded number of categories compared to earlier SWASH reports). This data cannot be compared directly with the Census, which reports several variables including place of birth, language spoken and ancestry rather than our less specific category of ethnic or cultural affiliation. In SWASH, 4% of respondents self-identified as Aboriginal and/or Torres Strait Islander; this is lower than previous iterations, but similar to the NSW population (4.4% of the female population of NSW aged 15 years and older identified as an Aboriginal and/or Torres Strait Islander person.18)
Table 14: Ethnicity or cultural background
2016 2018 2020
n (%) n (%) n (%)
Anglo-Australian only 387 (62) 797 (63) 1015 (64)
South and Eastern European 38 (6) 75 (6) 121 (8)
North West European 28 (5) 75 (6) 107 (7)
Asian 28 (4) 56 (4) 102 (6)
Aboriginal and/or Torres Strait Islander1 40 (6) 83 (7) 66 (4)
African and/or Middle Eastern 10 (2) 28 (2) 43 (3)
Americas 26 (4) 17 (1) 38 (2)
Oceanian2 16 (3) 29 (2) 31 (2)
Australian or Anglo-Australian plus other ethnicity 12 (2) 37 (3) 10 (1)
Multiple/not specified 14 (2) 55 (4) 23 (1)
European multi/not specified 7 (1) 14 (1) 14 (1)
Not reported 17 (3) 6 (1) 18 (1)
Total 623 (100) 1272 (100) 1588 (100)
Note: Open text responses were classified into the above categories based on the 2019 Australian Standard Classification of Cultural and Ethnic Groups.19
1 Includes 50 reporting multiple affiliations in 20202 Includes New Zealand, Melanesian, Papuan, Micronesian and Polynesian people
17
SWASH Report 2016, 2018, 2020
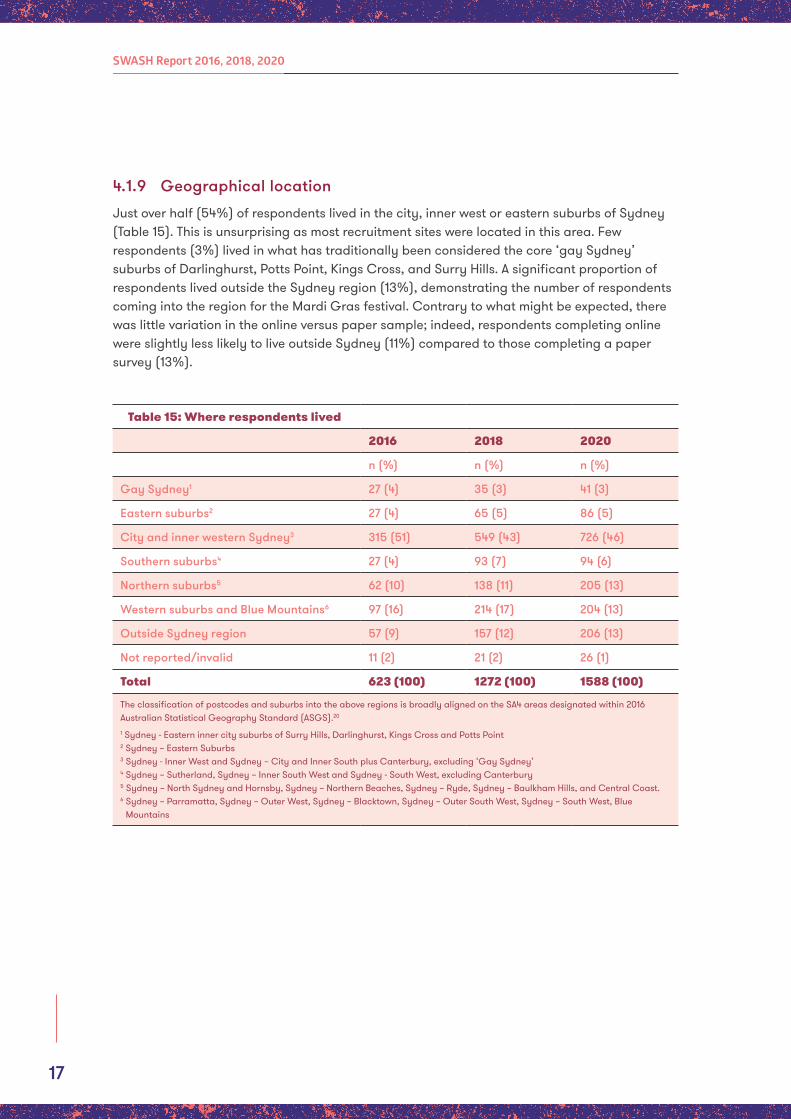
4.1.9 Geographical location
Just over half (54%) of respondents lived in the city, inner west or eastern suburbs of Sydney (Table 15). This is unsurprising as most recruitment sites were located in this area. Few respondents (3%) lived in what has traditionally been considered the core ‘gay Sydney’ suburbs of Darlinghurst, Potts Point, Kings Cross, and Surry Hills. A significant proportion of respondents lived outside the Sydney region (13%), demonstrating the number of respondents coming into the region for the Mardi Gras festival. Contrary to what might be expected, there was little variation in the online versus paper sample; indeed, respondents completing online were slightly less likely to live outside Sydney (11%) compared to those completing a paper survey (13%).
Table 15: Where respondents lived
2016 2018 2020
n (%) n (%) n (%)
Gay Sydney1 27 (4) 35 (3) 41 (3)
Eastern suburbs2 27 (4) 65 (5) 86 (5)
City and inner western Sydney3 315 (51) 549 (43) 726 (46)
Southern suburbs4 27 (4) 93 (7) 94 (6)
Northern suburbs5 62 (10) 138 (11) 205 (13)
Western suburbs and Blue Mountains6 97 (16) 214 (17) 204 (13)
Outside Sydney region 57 (9) 157 (12) 206 (13)
Not reported/invalid 11 (2) 21 (2) 26 (1)
Total 623 (100) 1272 (100) 1588 (100)
The classification of postcodes and suburbs into the above regions is broadly aligned on the SA4 areas designated within 2016 Australian Statistical Geography Standard (ASGS).20
1 Sydney - Eastern inner city suburbs of Surry Hills, Darlinghurst, Kings Cross and Potts Point2 Sydney – Eastern Suburbs3 Sydney - Inner West and Sydney – City and Inner South plus Canterbury, excluding ‘Gay Sydney’ 4 Sydney – Sutherland, Sydney – Inner South West and Sydney - South West, excluding Canterbury5 Sydney – North Sydney and Hornsby, Sydney – Northern Beaches, Sydney – Ryde, Sydney – Baulkham Hills, and Central Coast.6 Sydney – Parramatta, Sydney – Outer West, Sydney – Blacktown, Sydney – Outer South West, Sydney – South West, Blue
Mountains
18
SWASH Report 2016, 2018, 2020
4.2. Sexual practices, partners and relationships
In 2020 we changed the way we posed questions about sexual partners. We provided a list of six gender identity options and asked when the respondent last had sex with a person from each category. This is different to earlier iterations where we simply asked about sex with ‘a woman’ and sex with ‘a man’. The new questions required respondents to know or guess the gender of their sexual partners, and possibly decide how to categorise a partner whose gender identity changed since the sexual encounter.
There was a striking increase in the proportion of respondents reporting they had never had sex with anyone: 17%, compared to 5% in 2018. A quarter of respondents said they had never had sex with a woman, compared to 10% in 2018. There were no demographic changes to account for this striking change. Moreover, while 77% said they had ever had sex when we specified the gender identity of sexual partners, 82% reported they had engaged in specific sexual practices in the preceding six months. This is a much larger discrepancy than we see in previous iterations (for example, in 2018, 104 respondents reported they had never had sex with a woman but only two went on to report specific sex practices with a woman in the preceding six months). Further analysis reveals respondents showing this discrepancy between sexual partners and sexual practices were more likely to be older and more likely to be lesbian (compared to bisexual or queer). There were no differences in where they lived, their educational attainment, their sense of community connection or the LGBTIQ events they had attended. We believe the most likely explanation for the higher than usual proportion reporting they had never had sex with a sexual partner when gender identity was specified, is a misunderstanding about the terminology. This interpretation is supported by feedback from peer recruiters who reported that some respondents – and notably older respondents – asked them what the term “cisgender” meant. While the survey included definitions for the terms “cisgender”, “transgender” and “non-binary” the definitions were not beside the relevant question. When we piloted the survey, we did not find issues with these questions, but there were few older, lesbian women involved in this process. We will revise the way we ask these questions in 2022.
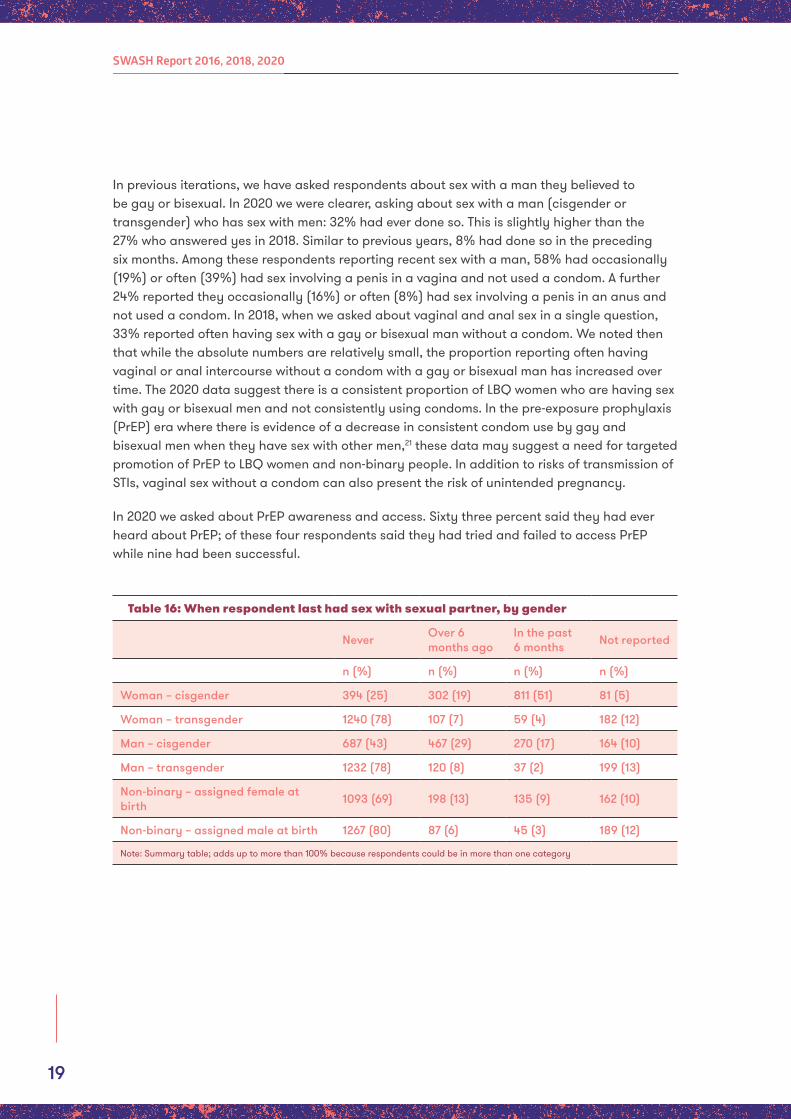
The great majority of respondents (71%) reported that they had ever had sex with a woman; 70% with a cisgender woman and 10% with a transgender woman (Table 16). Direct comparison to previous SWASH iterations is only indicative as we did not then ask specifically about gender identity. However, in 2018, 89% said they had ever had sex with a woman.
Forty nine percent of respondents reported that they had ever had sex with a man (Table 16); 46% with a cisgender man and 10% with a transgender man. Again, direct comparison to earlier SWASH iterations is only indicative as we did not then specify gender identity so we do not know if respondents included transgender men or not. However, in 2018, 66% said they had ever had sex with a man. The fact that a historical (or current) sexual relationship with a man remains a common experience for LBQ women is perhaps familiar and unremarkable to members of LGBTIQ communities. However, health service providers, policy makers and those designing STI prevention programs need to be aware that a significant proportion of women who do not identify as heterosexual are having sex with men, and consider the reach of their programs. Regardless of their sexual practices, LBQ respondents may not respond to health promotion campaigns directed at assumed heterosexual audiences.
19
SWASH Report 2016, 2018, 2020
In previous iterations, we have asked respondents about sex with a man they believed to be gay or bisexual. In 2020 we were clearer, asking about sex with a man (cisgender or transgender) who has sex with men: 32% had ever done so. This is slightly higher than the 27% who answered yes in 2018. Similar to previous years, 8% had done so in the preceding six months. Among these respondents reporting recent sex with a man, 58% had occasionally (19%) or often (39%) had sex involving a penis in a vagina and not used a condom. A further 24% reported they occasionally (16%) or often (8%) had sex involving a penis in an anus and not used a condom. In 2018, when we asked about vaginal and anal sex in a single question, 33% reported often having sex with a gay or bisexual man without a condom. We noted then that while the absolute numbers are relatively small, the proportion reporting often having vaginal or anal intercourse without a condom with a gay or bisexual man has increased over time. The 2020 data suggest there is a consistent proportion of LBQ women who are having sex with gay or bisexual men and not consistently using condoms. In the pre-exposure prophylaxis (PrEP) era where there is evidence of a decrease in consistent condom use by gay and bisexual men when they have sex with other men,21 these data may suggest a need for targeted promotion of PrEP to LBQ women and non-binary people. In addition to risks of transmission of STIs, vaginal sex without a condom can also present the risk of unintended pregnancy.
In 2020 we asked about PrEP awareness and access. Sixty three percent said they had ever heard about PrEP; of these four respondents said they had tried and failed to access PrEP while nine had been successful.
Table 16: When respondent last had sex with sexual partner, by gender
Never Over 6 months ago
In the past 6 months Not reported
n (%) n (%) n (%) n (%)
Woman – cisgender 394 (25) 302 (19) 811 (51) 81 (5)
Woman – transgender 1240 (78) 107 (7) 59 (4) 182 (12)
Man – cisgender 687 (43) 467 (29) 270 (17) 164 (10)
Man – transgender 1232 (78) 120 (8) 37 (2) 199 (13)
Non-binary – assigned female at birth 1093 (69) 198 (13) 135 (9) 162 (10)
Non-binary – assigned male at birth 1267 (80) 87 (6) 45 (3) 189 (12)
Note: Summary table; adds up to more than 100% because respondents could be in more than one category
20
SWASH Report 2016, 2018, 2020
4.2.1 Sexual practices
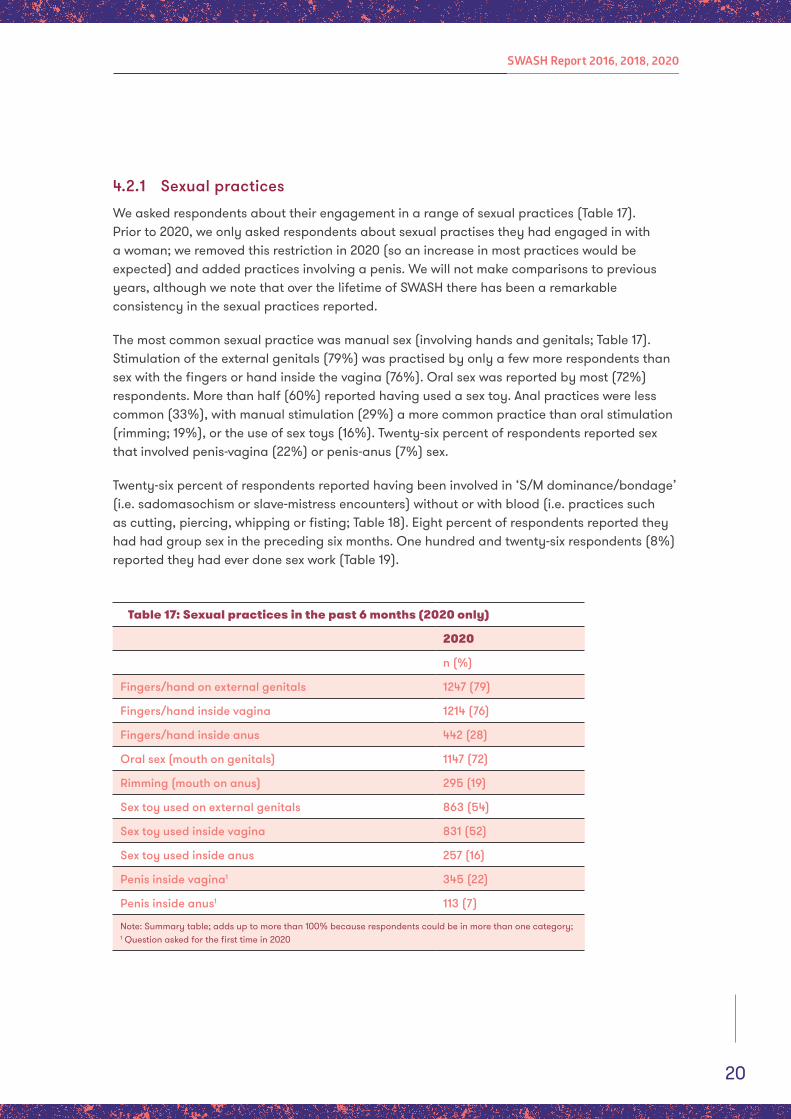
We asked respondents about their engagement in a range of sexual practices (Table 17). Prior to 2020, we only asked respondents about sexual practises they had engaged in with a woman; we removed this restriction in 2020 (so an increase in most practices would be expected) and added practices involving a penis. We will not make comparisons to previous years, although we note that over the lifetime of SWASH there has been a remarkable consistency in the sexual practices reported.
The most common sexual practice was manual sex (involving hands and genitals; Table 17). Stimulation of the external genitals (79%) was practised by only a few more respondents than sex with the fingers or hand inside the vagina (76%). Oral sex was reported by most (72%) respondents. More than half (60%) reported having used a sex toy. Anal practices were less common (33%), with manual stimulation (29%) a more common practice than oral stimulation (rimming; 19%), or the use of sex toys (16%). Twenty-six percent of respondents reported sex that involved penis-vagina (22%) or penis-anus (7%) sex.
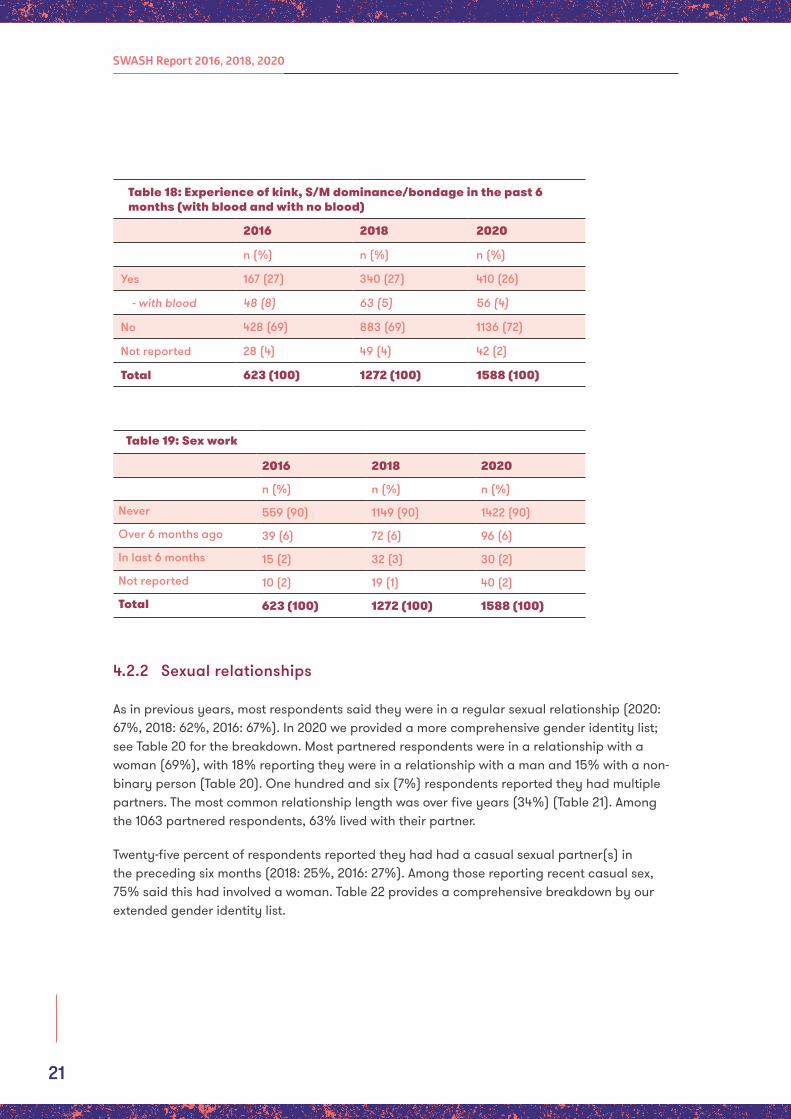
Twenty-six percent of respondents reported having been involved in ‘S/M dominance/bondage’ (i.e. sadomasochism or slave-mistress encounters) without or with blood (i.e. practices such as cutting, piercing, whipping or fisting; Table 18). Eight percent of respondents reported they had had group sex in the preceding six months. One hundred and twenty-six respondents (8%) reported they had ever done sex work (Table 19).
Table 17: Sexual practices in the past 6 months (2020 only)
2020
n (%)
Fingers/hand on external genitals 1247 (79)
Fingers/hand inside vagina 1214 (76)
Fingers/hand inside anus 442 (28)
Oral sex (mouth on genitals) 1147 (72)
Rimming (mouth on anus) 295 (19)
Sex toy used on external genitals 863 (54)
Sex toy used inside vagina 831 (52)
Sex toy used inside anus 257 (16)
Penis inside vagina1 345 (22)
Penis inside anus1 113 (7)
Note: Summary table; adds up to more than 100% because respondents could be in more than one category; 1 Question asked for the first time in 2020
21
SWASH Report 2016, 2018, 2020
Table 18: Experience of kink, S/M dominance/bondage in the past 6 months (with blood and with no blood)
2016 2018 2020
n (%) n (%) n (%)
Yes 167 (27) 340 (27) 410 (26)
- with blood 48 (8) 63 (5) 56 (4)
No 428 (69) 883 (69) 1136 (72)
Not reported 28 (4) 49 (4) 42 (2)
Total 623 (100) 1272 (100) 1588 (100)
Table 19: Sex work
2016 2018 2020
n (%) n (%) n (%)
Never 559 (90) 1149 (90) 1422 (90)
Over 6 months ago 39 (6) 72 (6) 96 (6)
In last 6 months 15 (2) 32 (3) 30 (2)
Not reported 10 (2) 19 (1) 40 (2)
Total 623 (100) 1272 (100) 1588 (100)
4.2.2 Sexual relationships
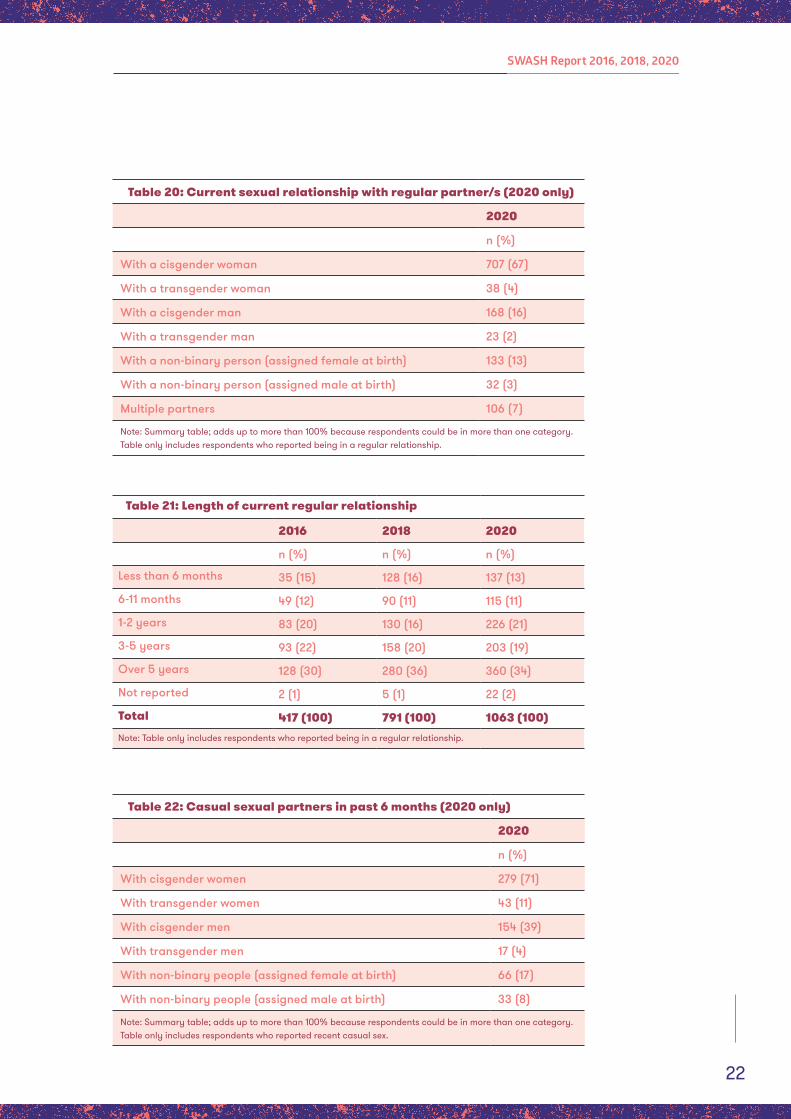
As in previous years, most respondents said they were in a regular sexual relationship (2020: 67%, 2018: 62%, 2016: 67%). In 2020 we provided a more comprehensive gender identity list; see Table 20 for the breakdown. Most partnered respondents were in a relationship with a woman (69%), with 18% reporting they were in a relationship with a man and 15% with a non-binary person (Table 20). One hundred and six (7%) respondents reported they had multiple partners. The most common relationship length was over five years (34%) (Table 21). Among the 1063 partnered respondents, 63% lived with their partner.
Twenty-five percent of respondents reported they had had a casual sexual partner(s) in the preceding six months (2018: 25%, 2016: 27%). Among those reporting recent casual sex, 75% said this had involved a woman. Table 22 provides a comprehensive breakdown by our extended gender identity list.
22
SWASH Report 2016, 2018, 2020
Table 20: Current sexual relationship with regular partner/s (2020 only)
2020
n (%)
With a cisgender woman 707 (67)
With a transgender woman 38 (4)
With a cisgender man 168 (16)
With a transgender man 23 (2)
With a non-binary person (assigned female at birth) 133 (13)
With a non-binary person (assigned male at birth) 32 (3)
Multiple partners 106 (7)
Note: Summary table; adds up to more than 100% because respondents could be in more than one category. Table only includes respondents who reported being in a regular relationship.
Table 21: Length of current regular relationship
2016 2018 2020
n (%) n (%) n (%)
Less than 6 months 35 (15) 128 (16) 137 (13)
6-11 months 49 (12) 90 (11) 115 (11)
1-2 years 83 (20) 130 (16) 226 (21)
3-5 years 93 (22) 158 (20) 203 (19)
Over 5 years 128 (30) 280 (36) 360 (34)
Not reported 2 (1) 5 (1) 22 (2)
Total 417 (100) 791 (100) 1063 (100)Note: Table only includes respondents who reported being in a regular relationship.
Table 22: Casual sexual partners in past 6 months (2020 only)
2020
n (%)
With cisgender women 279 (71)
With transgender women 43 (11)
With cisgender men 154 (39)
With transgender men 17 (4)
With non-binary people (assigned female at birth) 66 (17)
With non-binary people (assigned male at birth) 33 (8)
Note: Summary table; adds up to more than 100% because respondents could be in more than one category. Table only includes respondents who reported recent casual sex.
23
SWASH Report 2016, 2018, 2020
4.3. Tobacco, alcohol and illicit drug use
4.3.1 Tobacco use
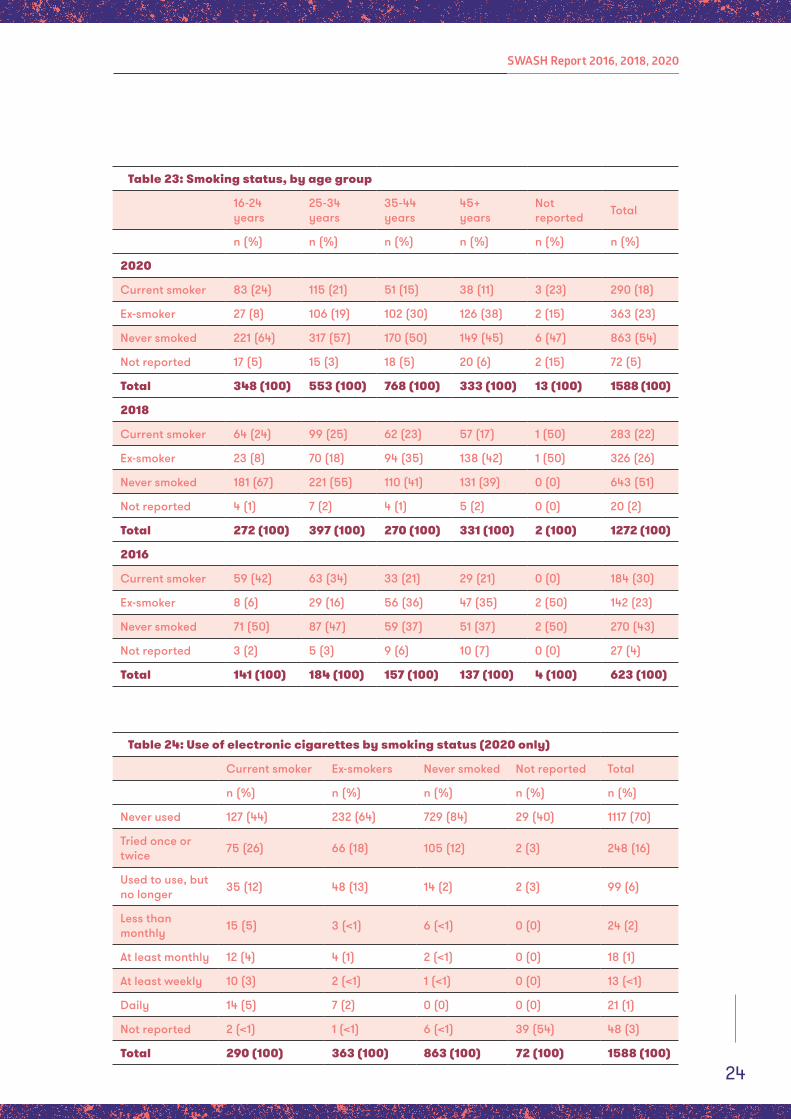
Eighteen percent of respondents were current tobacco smokers (Table 23), a marked drop from 30% in 2016 and 22% in 2018 (p<0.001). This rate remains significantly higher than the general population: in 2019, 13% of women in NSW smoked.3 The 2019 National Drug Strategy Household Survey (NDSHS) found lesbian, gay and respondents (unfortunately not disaggregated by gender) were 1.5 times more likely to smoke daily, compared to heterosexual respondents.22 Over time, the proportion of smokers reporting daily smoking has decreased in the SWASH sample, from 61% in 2016 to 41% in 2020. This sustained decrease tempers the caution we expressed in 2018 when we first reported this striking shift after a decade of little change. The 2019 NDSHS offers additional support, showing a marked reduction in daily smoking from 26% of lesbian, gay and bisexual respondents in 2010 to 17% in 2019.5 It remains unclear what explains this decrease, although it was preceded by the first tailored and targeted community smoking cessation campaign (a joint initiative by ACON and Cancer Institute NSW) in May 2016.23 There have since been LGBTIQ community campaigns run in Victoria.
SWASH has tracked a very high rate of smoking among younger respondents (Table 23). The striking decrease among 16 to 24-year-olds from 42% in 2016 to 24% in 2018, has not continued (2020: 24%). Smoking among all other age groups has continued to decrease.
Sixty-three percent of current smokers said they would like to quit or reduce their current level of smoking; this is similar to the 68% we found when we last asked this question in 2014 (although levels of smoking were much higher).
In 2020 we asked all respondents about their use of electronic cigarettes. Twenty-seven percent reported that they had ever used electronic cigarettes; only 2% of all respondents could be considered regular users (daily or weekly; Table XX). Current use was most common among respondents who also smoked tobacco. Just over half of current smokers (56%) had ever tried electronic cigarettes; 18% reported concurrent electronic and tobacco use. Sixty-four percent of ex-smokers had never used and only 4% said they currently used. Among respondents who had never smoked tobacco, less than 1% were current users of electronic cigarettes.
24
SWASH Report 2016, 2018, 2020
Table 23: Smoking status, by age group
16-24 years
25-34 years
35-44 years
45+ years
Not reported Total
n (%) n (%) n (%) n (%) n (%) n (%)
2020
Current smoker 83 (24) 115 (21) 51 (15) 38 (11) 3 (23) 290 (18)
Ex-smoker 27 (8) 106 (19) 102 (30) 126 (38) 2 (15) 363 (23)
Never smoked 221 (64) 317 (57) 170 (50) 149 (45) 6 (47) 863 (54)
Not reported 17 (5) 15 (3) 18 (5) 20 (6) 2 (15) 72 (5)
Total 348 (100) 553 (100) 768 (100) 333 (100) 13 (100) 1588 (100)
2018
Current smoker 64 (24) 99 (25) 62 (23) 57 (17) 1 (50) 283 (22)
Ex-smoker 23 (8) 70 (18) 94 (35) 138 (42) 1 (50) 326 (26)
Never smoked 181 (67) 221 (55) 110 (41) 131 (39) 0 (0) 643 (51)
Not reported 4 (1) 7 (2) 4 (1) 5 (2) 0 (0) 20 (2)
Total 272 (100) 397 (100) 270 (100) 331 (100) 2 (100) 1272 (100)
2016
Current smoker 59 (42) 63 (34) 33 (21) 29 (21) 0 (0) 184 (30)
Ex-smoker 8 (6) 29 (16) 56 (36) 47 (35) 2 (50) 142 (23)
Never smoked 71 (50) 87 (47) 59 (37) 51 (37) 2 (50) 270 (43)
Not reported 3 (2) 5 (3) 9 (6) 10 (7) 0 (0) 27 (4)
Total 141 (100) 184 (100) 157 (100) 137 (100) 4 (100) 623 (100)
Table 24: Use of electronic cigarettes by smoking status (2020 only)
Current smoker Ex-smokers Never smoked Not reported Total
n (%) n (%) n (%) n (%) n (%)
Never used 127 (44) 232 (64) 729 (84) 29 (40) 1117 (70)
Tried once or twice 75 (26) 66 (18) 105 (12) 2 (3) 248 (16)
Used to use, but no longer 35 (12) 48 (13) 14 (2) 2 (3) 99 (6)
Less than monthly 15 (5) 3 (<1) 6 (<1) 0 (0) 24 (2)
At least monthly 12 (4) 4 (1) 2 (<1) 0 (0) 18 (1)
At least weekly 10 (3) 2 (<1) 1 (<1) 0 (0) 13 (<1)
Daily 14 (5) 7 (2) 0 (0) 0 (0) 21 (1)
Not reported 2 (<1) 1 (<1) 6 (<1) 39 (54) 48 (3)
Total 290 (100) 363 (100) 863 (100) 72 (100) 1588 (100)
25
SWASH Report 2016, 2018, 2020
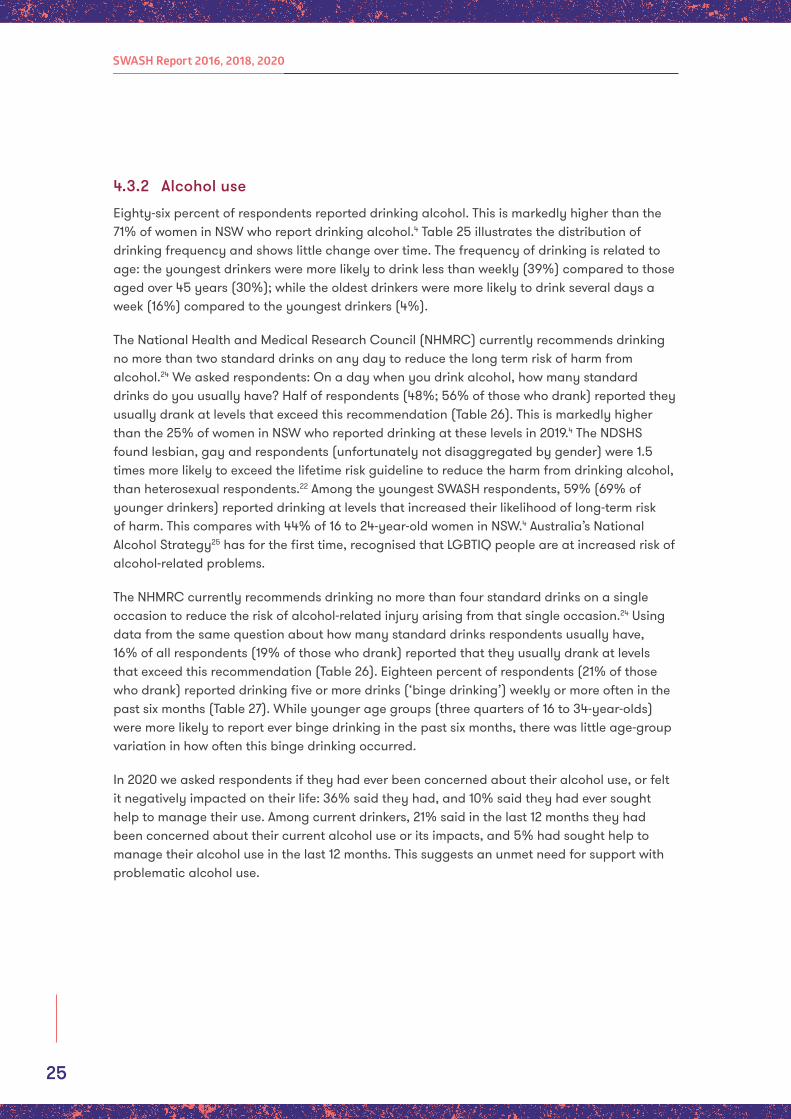
4.3.2 Alcohol use
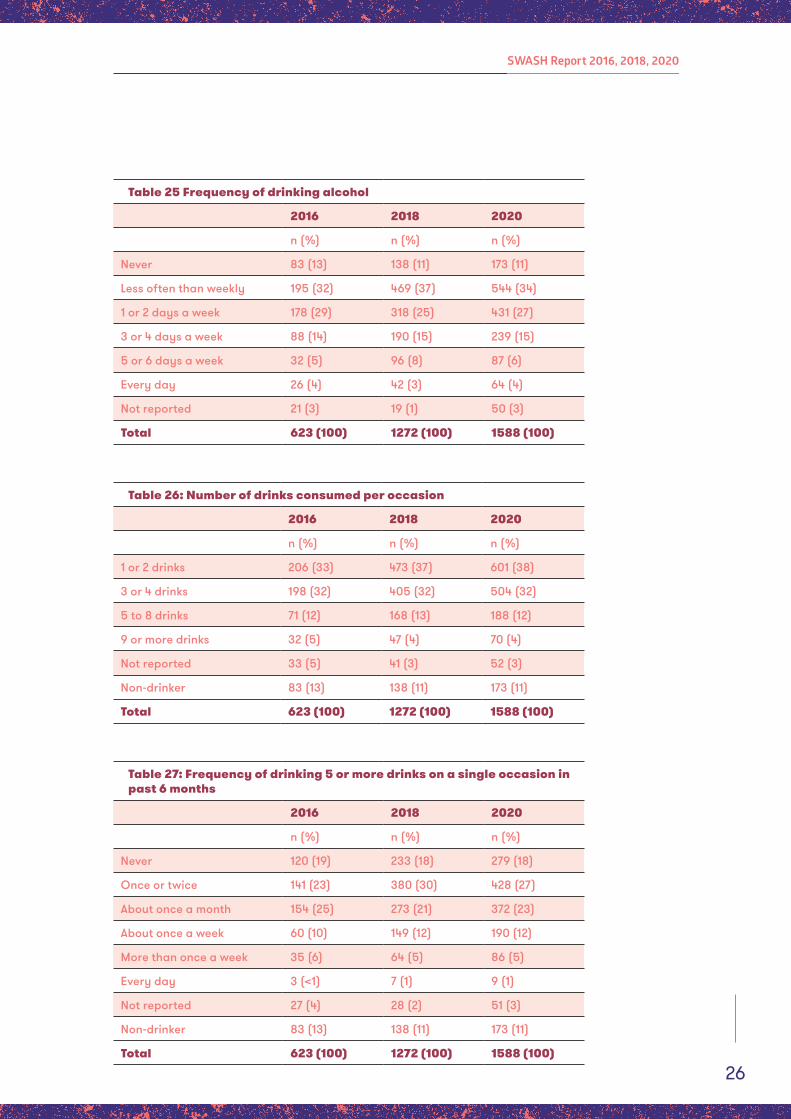
Eighty-six percent of respondents reported drinking alcohol. This is markedly higher than the 71% of women in NSW who report drinking alcohol.4 Table 25 illustrates the distribution of drinking frequency and shows little change over time. The frequency of drinking is related to age: the youngest drinkers were more likely to drink less than weekly (39%) compared to those aged over 45 years (30%); while the oldest drinkers were more likely to drink several days a week (16%) compared to the youngest drinkers (4%).
The National Health and Medical Research Council (NHMRC) currently recommends drinking no more than two standard drinks on any day to reduce the long term risk of harm from alcohol.24 We asked respondents: On a day when you drink alcohol, how many standard drinks do you usually have? Half of respondents (48%; 56% of those who drank) reported they usually drank at levels that exceed this recommendation (Table 26). This is markedly higher than the 25% of women in NSW who reported drinking at these levels in 2019.4 The NDSHS found lesbian, gay and respondents (unfortunately not disaggregated by gender) were 1.5 times more likely to exceed the lifetime risk guideline to reduce the harm from drinking alcohol, than heterosexual respondents.22 Among the youngest SWASH respondents, 59% (69% of younger drinkers) reported drinking at levels that increased their likelihood of long-term risk of harm. This compares with 44% of 16 to 24-year-old women in NSW.4 Australia’s National Alcohol Strategy25 has for the first time, recognised that LGBTIQ people are at increased risk of alcohol-related problems.
The NHMRC currently recommends drinking no more than four standard drinks on a single occasion to reduce the risk of alcohol-related injury arising from that single occasion.24 Using data from the same question about how many standard drinks respondents usually have, 16% of all respondents (19% of those who drank) reported that they usually drank at levels that exceed this recommendation (Table 26). Eighteen percent of respondents (21% of those who drank) reported drinking five or more drinks (‘binge drinking’) weekly or more often in the past six months (Table 27). While younger age groups (three quarters of 16 to 34-year-olds) were more likely to report ever binge drinking in the past six months, there was little age-group variation in how often this binge drinking occurred.
In 2020 we asked respondents if they had ever been concerned about their alcohol use, or felt it negatively impacted on their life: 36% said they had, and 10% said they had ever sought help to manage their use. Among current drinkers, 21% said in the last 12 months they had been concerned about their current alcohol use or its impacts, and 5% had sought help to manage their alcohol use in the last 12 months. This suggests an unmet need for support with problematic alcohol use.
26
SWASH Report 2016, 2018, 2020
Table 25 Frequency of drinking alcohol
2016 2018 2020
n (%) n (%) n (%)
Never 83 (13) 138 (11) 173 (11)
Less often than weekly 195 (32) 469 (37) 544 (34)
1 or 2 days a week 178 (29) 318 (25) 431 (27)
3 or 4 days a week 88 (14) 190 (15) 239 (15)
5 or 6 days a week 32 (5) 96 (8) 87 (6)
Every day 26 (4) 42 (3) 64 (4)
Not reported 21 (3) 19 (1) 50 (3)
Total 623 (100) 1272 (100) 1588 (100)
Table 26: Number of drinks consumed per occasion
2016 2018 2020
n (%) n (%) n (%)
1 or 2 drinks 206 (33) 473 (37) 601 (38)
3 or 4 drinks 198 (32) 405 (32) 504 (32)
5 to 8 drinks 71 (12) 168 (13) 188 (12)
9 or more drinks 32 (5) 47 (4) 70 (4)
Not reported 33 (5) 41 (3) 52 (3)
Non-drinker 83 (13) 138 (11) 173 (11)
Total 623 (100) 1272 (100) 1588 (100)
Table 27: Frequency of drinking 5 or more drinks on a single occasion in past 6 months
2016 2018 2020
n (%) n (%) n (%)
Never 120 (19) 233 (18) 279 (18)
Once or twice 141 (23) 380 (30) 428 (27)
About once a month 154 (25) 273 (21) 372 (23)
About once a week 60 (10) 149 (12) 190 (12)
More than once a week 35 (6) 64 (5) 86 (5)
Every day 3 (<1) 7 (1) 9 (1)
Not reported 27 (4) 28 (2) 51 (3)
Non-drinker 83 (13) 138 (11) 173 (11)
Total 623 (100) 1272 (100) 1588 (100)
27
SWASH Report 2016, 2018, 2020
4.3.3 Illicit drug use
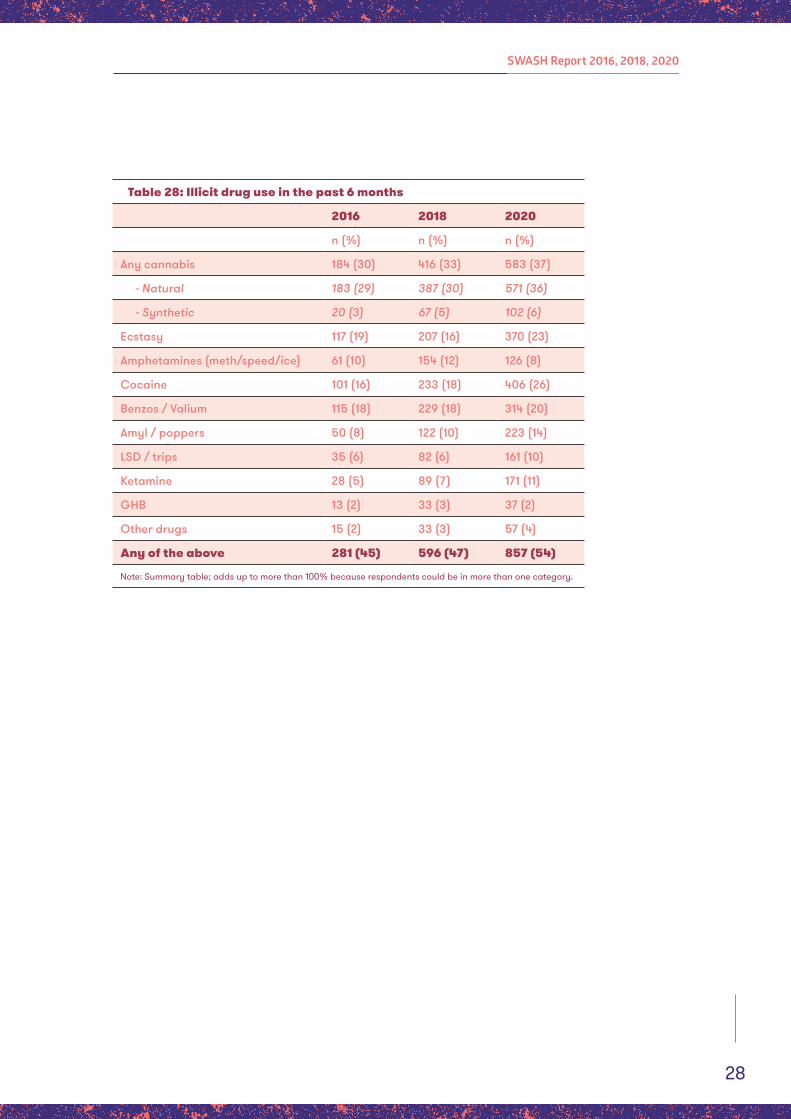
In the preceding six months, 54% of respondents had used any illicit drug, a significant increase from 47% in 2018 (p<0.001) (Table 28). Whilst the increase in reported drug use is clear across all age groups it is especially pronounced among 25 to 34-year-olds (up 9 percentage points since 2016) and 35 to 44-year-olds (up 10 percentage points since 2016). There has been a significant increase for most drugs including cannabis (up 4 percentage points since 2018, p<0.001; most notably among 25 to 34-year-olds), cocaine (up 8 percentage points since 2018, p<0.001; higher among 16 to 24 and 25 to 34-year-olds), ecstasy (up 7 percentage points p< 0.001; higher among 16 to 24 and 25 to 34-year-olds), amyl (up 4 percentage points since 2018, p<0.001; doubled among 16 to 24-year-olds), LSD (up 4% since 2018, p<0.001; doubled among 16 to 24-year-olds), and ketamine (up 4 percentage points since 2018, p<0.001). The only significant decrease was for amphetamines (down 4 percentage points since 2018, p<0.001) (Table 28). Fifty-four percent of respondents reported poly drug use. The most common ‘other drug’ use reported was nangs/bulbs (nitrous oxide), dex/dexis/dexamphetamines, and psilocybin/shrooms/mushrooms. Four percent of respondents indicated that they had ever injected drugs, with less than 1% doing so in the past six months; we have observed a downward trend for several SWASH survey iterations.
The NDSHS found lesbian, gay and respondents (unfortunately not disaggregated by gender) were more than twice as likely to report illicit drug use in the preceding 12 months.5 Examining the NDSHS data for women in detail (which will include some lesbian and bisexual women) shows that 13% reported using any illicit drug in the past 12 months, this compares to 54% of SWASH respondents reporting any illicit drug use in the past 6 months.26 The increases among SWASH respondents noted above are not evident in the NDSHS data for women. Without a sophisticated understanding of the drivers of illicit drug use in LBQ women and LGBTIQ communities more broadly, and the conditions under which these practices become problematic, interventions are unlikely to succeed. The 2017-2026 National Drug Strategy 27 recognised LGB people are at increased risk of drug-related problems.
In 2020 we asked respondents if they had ever been concerned about their drug use or felt it negatively impacted on their life: 17% said they had, and 7% said they had ever sought help to manage their use. Among respondents reporting recent drug use, 11% said in the last 12 months they had been concerned about their current drug use or its impacts, and 4% said they had sought help to manage their drug use in the last 12 months. The vast majority (91%) of those reporting recent concern regarding their drug use, reported poly drug use. These findings suggest an unmet need for support with problematic drug use.
28
SWASH Report 2016, 2018, 2020
Table 28: Illicit drug use in the past 6 months
2016 2018 2020
n (%) n (%) n (%)
Any cannabis 184 (30) 416 (33) 583 (37)
- Natural 183 (29) 387 (30) 571 (36)
- Synthetic 20 (3) 67 (5) 102 (6)
Ecstasy 117 (19) 207 (16) 370 (23)
Amphetamines (meth/speed/ice) 61 (10) 154 (12) 126 (8)
Cocaine 101 (16) 233 (18) 406 (26)
Benzos / Valium 115 (18) 229 (18) 314 (20)
Amyl / poppers 50 (8) 122 (10) 223 (14)
LSD / trips 35 (6) 82 (6) 161 (10)
Ketamine 28 (5) 89 (7) 171 (11)
GHB 13 (2) 33 (3) 37 (2)
Other drugs 15 (2) 33 (3) 57 (4)
Any of the above 281 (45) 596 (47) 857 (54)
Note: Summary table; adds up to more than 100% because respondents could be in more than one category.
29
SWASH Report 2016, 2018, 2020
4.4 Health Status and Healthcare Experiences
4.4.1 Healthcare experiences
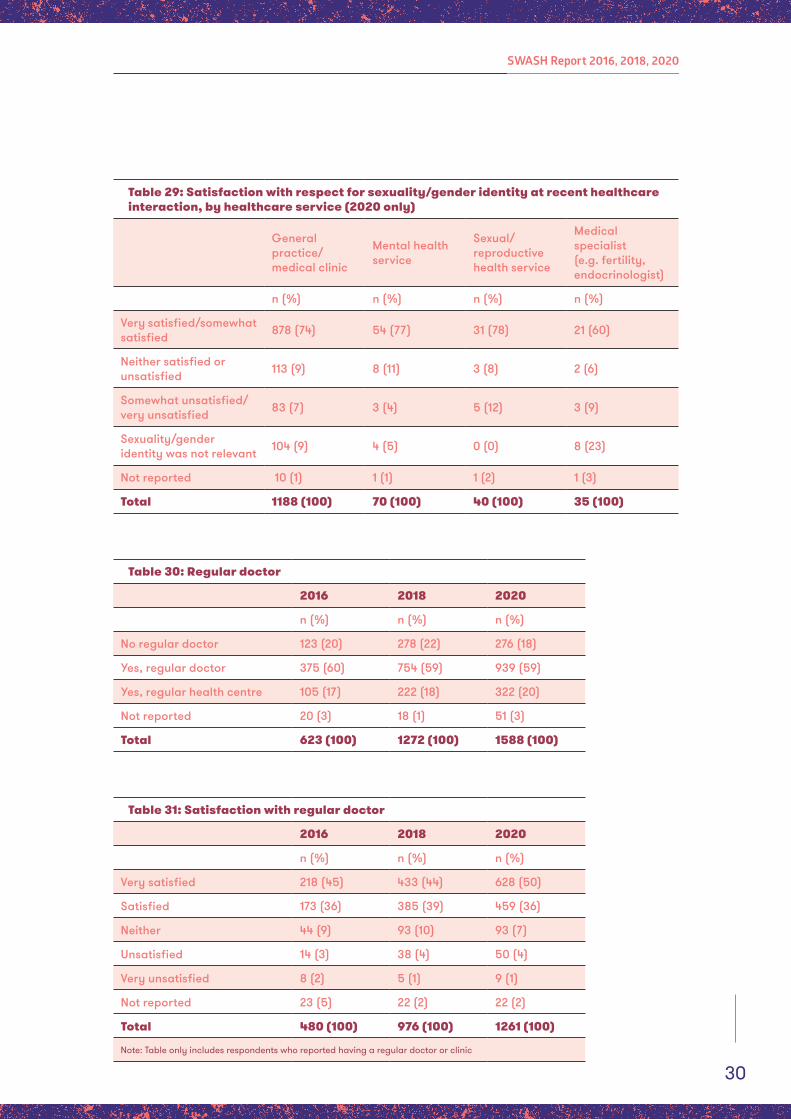
The 2018-2019 ABS Patient Experience Survey found most Australians had accessed health care in the preceding 12 months (88% of women had seen a GP, 38% a medical specialist and 69% another health professional).28 In 2020 we asked our respondents a specific question about how satisfied they were that staff at their most recent healthcare interaction had respected their sexuality and/or gender identity. In general, participants were very (52%) or somewhat (20%) satisfied. Looking across the most commonly used services (Table 29), most respondents were very or somewhat satisfied with how their sexuality/gender was respected. Satisfaction was lowest (60%) among those whose most recent interaction was with a medical specialist, and nearly a quarter felt their sexuality/gender had not been relevant to the interaction. Dissatisfaction with how staff had respected sexuality or gender was highest among those accessing sexual and reproductive health services (13%) and no respondent said their sexuality/gender had not been relevant to the interaction. Of particular importance for health care providers: only 10% of respondents felt that their sexuality or gender had not been relevant in their most recent interaction.
For several iterations of SWASH, the proportion of respondents who have a regular GP/doctor (59%) or health centre (20%) has been steady (Table 30). Half reported being very satisfied with their GP in general (this is different to the previous question about the respondent’s judgement of how well their sexuality/gender was respected in their most recent health care interaction; Table 31). While it does not have directly comparable questions, the 2018-2019 ABS Patient Experience Survey suggests very high levels of satisfaction among the general population: 75% of women said their GP had always listened to them and 82% said they had always shown them respect.28 SWASH respondents who were out to their regular GP were more likely to be very satisfied in general (57%, p<0.001) compared to those who were not out (32%). That is, while respondents were generally satisfied with the service they received, disclosing sexuality or gender identity was associated with a more positive evaluation of that service/relationship. It is important to restate that many SWASH participants are highly educated and well-resourced, so may be well placed to self-advocate. With the majority living in the inner suburbs of Sydney they likely have more opportunity to seek out respectful and knowledgeable healthcare than LBQ women and non-binary people in other regions.
30
SWASH Report 2016, 2018, 2020
Table 29: Satisfaction with respect for sexuality/gender identity at recent healthcare interaction, by healthcare service (2020 only)
General practice/medical clinic
Mental health service
Sexual/ reproductive health service
Medical specialist (e.g. fertility, endocrinologist)
n (%) n (%) n (%) n (%)
Very satisfied/somewhat satisfied 878 (74) 54 (77) 31 (78) 21 (60)
Neither satisfied or unsatisfied 113 (9) 8 (11) 3 (8) 2 (6)
Somewhat unsatisfied/very unsatisfied 83 (7) 3 (4) 5 (12) 3 (9)
Sexuality/gender identity was not relevant 104 (9) 4 (5) 0 (0) 8 (23)
Not reported 10 (1) 1 (1) 1 (2) 1 (3)
Total 1188 (100) 70 (100) 40 (100) 35 (100)
Table 30: Regular doctor
2016 2018 2020
n (%) n (%) n (%)
No regular doctor 123 (20) 278 (22) 276 (18)
Yes, regular doctor 375 (60) 754 (59) 939 (59)
Yes, regular health centre 105 (17) 222 (18) 322 (20)
Not reported 20 (3) 18 (1) 51 (3)
Total 623 (100) 1272 (100) 1588 (100)
Table 31: Satisfaction with regular doctor
2016 2018 2020
n (%) n (%) n (%)
Very satisfied 218 (45) 433 (44) 628 (50)
Satisfied 173 (36) 385 (39) 459 (36)
Neither 44 (9) 93 (10) 93 (7)
Unsatisfied 14 (3) 38 (4) 50 (4)
Very unsatisfied 8 (2) 5 (1) 9 (1)
Not reported 23 (5) 22 (2) 22 (2)
Total 480 (100) 976 (100) 1261 (100)
Note: Table only includes respondents who reported having a regular doctor or clinic
31
SWASH Report 2016, 2018, 2020
4.4.2 General health
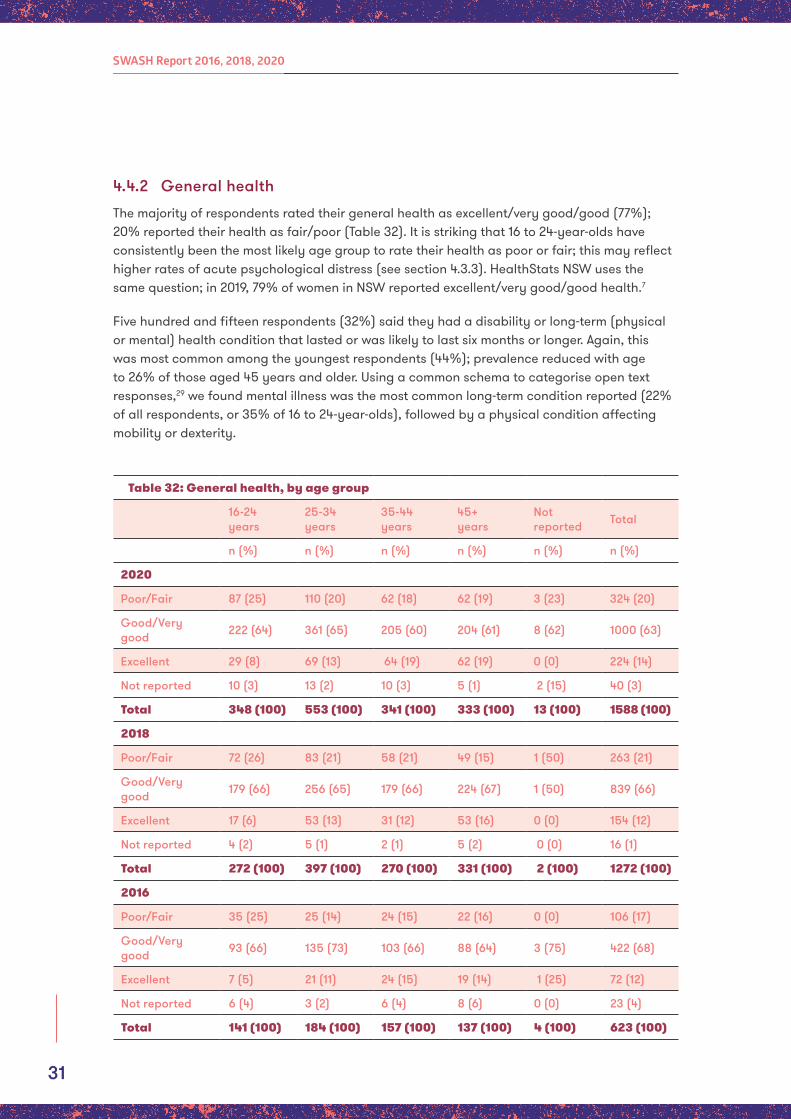
The majority of respondents rated their general health as excellent/very good/good (77%); 20% reported their health as fair/poor (Table 32). It is striking that 16 to 24-year-olds have consistently been the most likely age group to rate their health as poor or fair; this may reflect higher rates of acute psychological distress (see section 4.3.3). HealthStats NSW uses the same question; in 2019, 79% of women in NSW reported excellent/very good/good health.7
Five hundred and fifteen respondents (32%) said they had a disability or long-term (physical or mental) health condition that lasted or was likely to last six months or longer. Again, this was most common among the youngest respondents (44%); prevalence reduced with age to 26% of those aged 45 years and older. Using a common schema to categorise open text responses,29 we found mental illness was the most common long-term condition reported (22% of all respondents, or 35% of 16 to 24-year-olds), followed by a physical condition affecting mobility or dexterity.
Table 32: General health, by age group
16-24 years
25-34 years
35-44 years
45+ years
Not reported Total
n (%) n (%) n (%) n (%) n (%) n (%)
2020
Poor/Fair 87 (25) 110 (20) 62 (18) 62 (19) 3 (23) 324 (20)
Good/Very good 222 (64) 361 (65) 205 (60) 204 (61) 8 (62) 1000 (63)
Excellent 29 (8) 69 (13) 64 (19) 62 (19) 0 (0) 224 (14)
Not reported 10 (3) 13 (2) 10 (3) 5 (1) 2 (15) 40 (3)
Total 348 (100) 553 (100) 341 (100) 333 (100) 13 (100) 1588 (100)
2018
Poor/Fair 72 (26) 83 (21) 58 (21) 49 (15) 1 (50) 263 (21)
Good/Very good 179 (66) 256 (65) 179 (66) 224 (67) 1 (50) 839 (66)
Excellent 17 (6) 53 (13) 31 (12) 53 (16) 0 (0) 154 (12)
Not reported 4 (2) 5 (1) 2 (1) 5 (2) 0 (0) 16 (1)
Total 272 (100) 397 (100) 270 (100) 331 (100) 2 (100) 1272 (100)
2016
Poor/Fair 35 (25) 25 (14) 24 (15) 22 (16) 0 (0) 106 (17)
Good/Very good 93 (66) 135 (73) 103 (66) 88 (64) 3 (75) 422 (68)
Excellent 7 (5) 21 (11) 24 (15) 19 (14) 1 (25) 72 (12)
Not reported 6 (4) 3 (2) 6 (4) 8 (6) 0 (0) 23 (4)
Total 141 (100) 184 (100) 157 (100) 137 (100) 4 (100) 623 (100)
32
SWASH Report 2016, 2018, 2020
4.4.3 Mental health
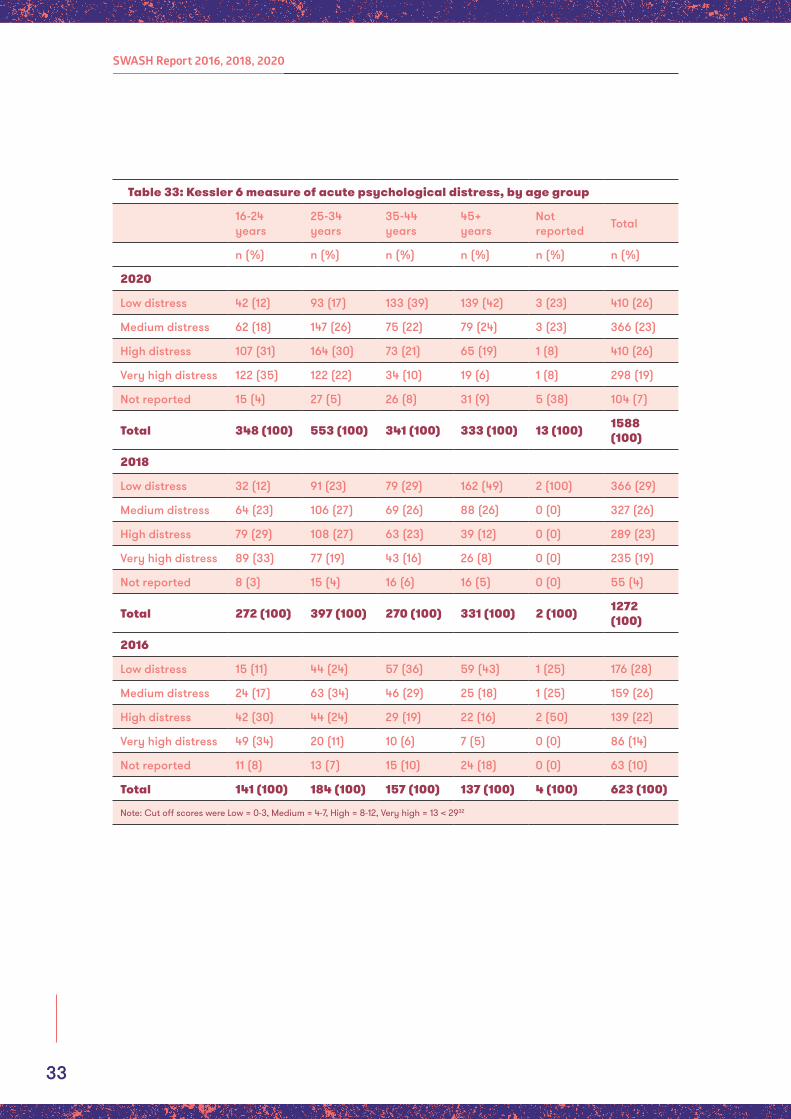
We use the Kessler 6 (K6) to measure non-specific psychological distress (e.g. feeling nervous, hopeless, restless, worthless) in the preceding four weeks.30 The proportion of respondents reporting high (26%) or very high (19%) acute distress has been rising steadily since we first introduced this standardised measure in 2006 (then 16%; Table 33). HealthStats NSW use the K10,31 which shows that in 2019 14% of women in NSW reported high and 6% reported very high levels of distress (an increase on 2017 levels).6 While the K6 and the K10 measures cannot be directly compared they indicate a considerable disparity in levels of distress.
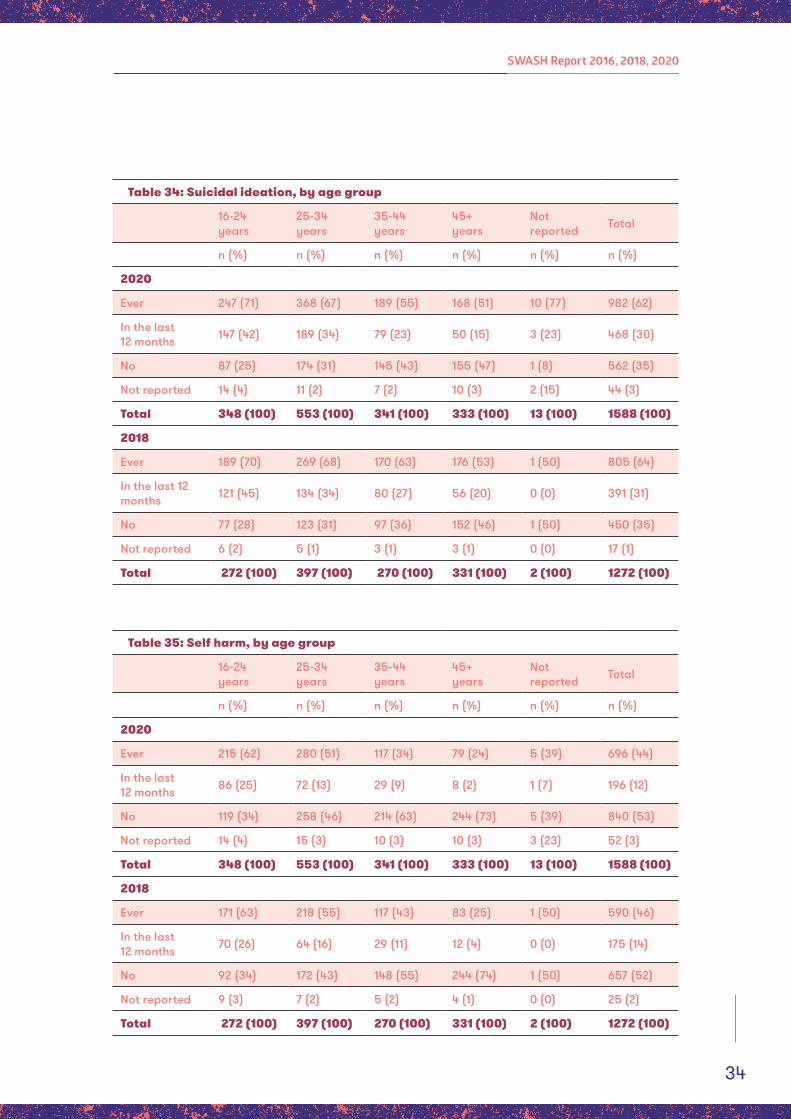
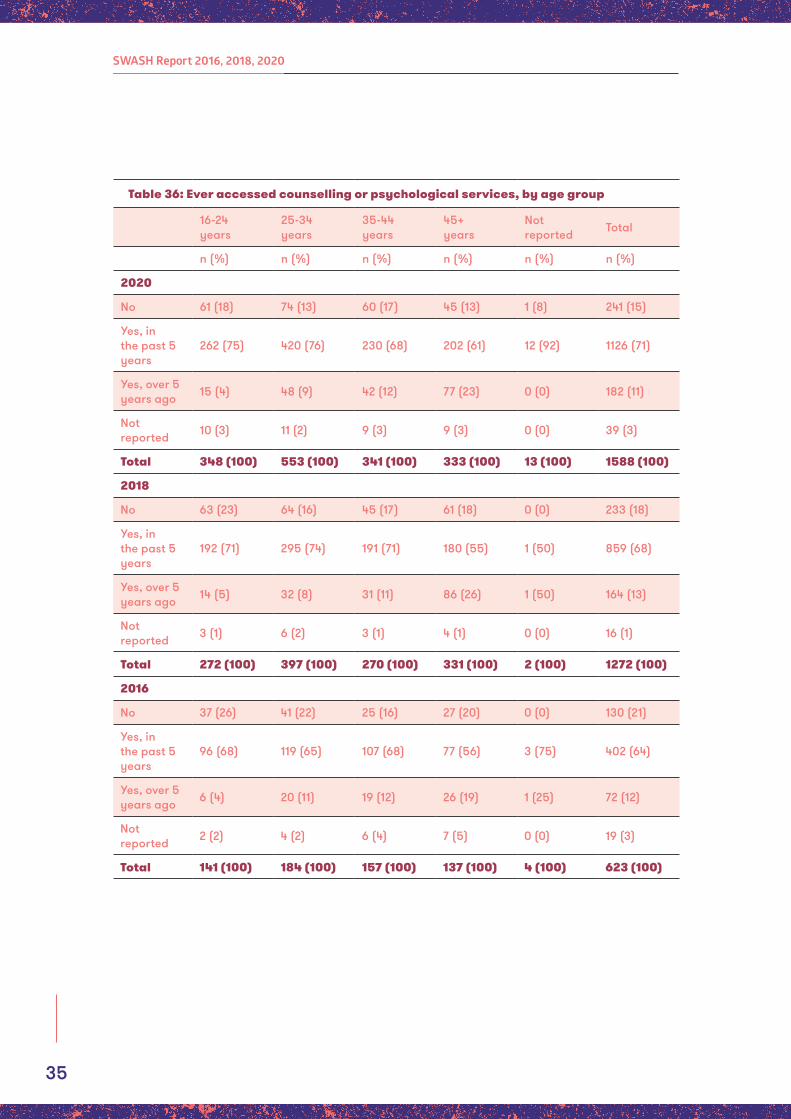
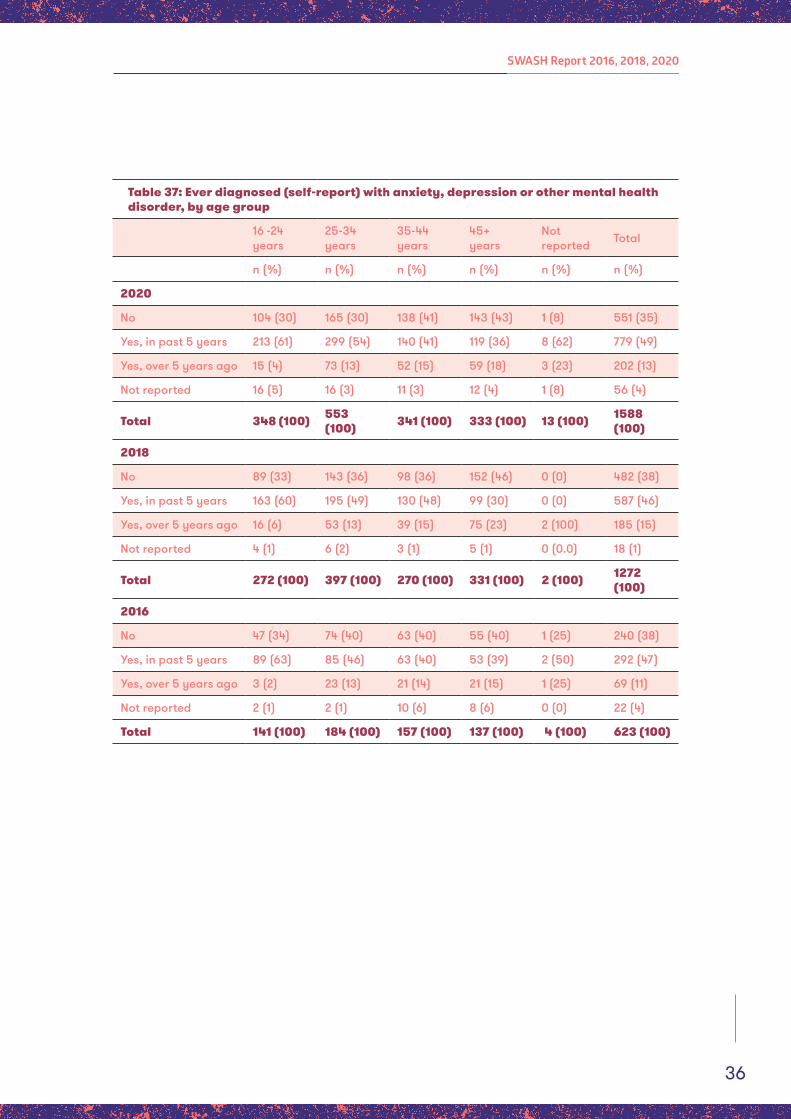
Reflecting the levels of acute distress reported, 30% of respondents said that in the preceding 12 months they had felt that life was not worth living (suicidal ideation; Table 34), and 12% said they had deliberately hurt themselves or done something they knew might harm or kill them (self-harm; Table 35). A majority of respondents (71%) had accessed mental health services in the last five years (Table 36), and 49% had received a diagnosis of depression, anxiety disorder or other mental health disorder (Table 37).
Psychological distress among 16 to 24-year-olds remains alarmingly high: 66% reported high/very high levels of acute distress (Table 33). This rate has remained steady over the last three iterations of the survey. Again comparing to data from HealthStats NSW: in 2019, 17% of 16 to 24-year-old women in NSW reported high and 11% reported very high levels of distress (an increase on 2017 levels).6 That is, a much higher proportion of young LBQ women are reporting acute psychological distress. Over the preceding 12 months, 42% of the youngest SWASH respondents had felt that life was not worth living, (Table 34) and 25% had deliberately hurt themselves or done something they knew might harm or kill them (Table 35). Three-quarters had accessed mental health services in the last five years (Table 36), and 61% had received a diagnosis of depression, anxiety disorder or other mental health disorder (Table 37).
33
SWASH Report 2016, 2018, 2020
Table 33: Kessler 6 measure of acute psychological distress, by age group
16-24 years
25-34 years
35-44 years
45+ years
Not reported Total
n (%) n (%) n (%) n (%) n (%) n (%)
2020
Low distress 42 (12) 93 (17) 133 (39) 139 (42) 3 (23) 410 (26)
Medium distress 62 (18) 147 (26) 75 (22) 79 (24) 3 (23) 366 (23)
High distress 107 (31) 164 (30) 73 (21) 65 (19) 1 (8) 410 (26)
Very high distress 122 (35) 122 (22) 34 (10) 19 (6) 1 (8) 298 (19)
Not reported 15 (4) 27 (5) 26 (8) 31 (9) 5 (38) 104 (7)
Total 348 (100) 553 (100) 341 (100) 333 (100) 13 (100) 1588 (100)
2018
Low distress 32 (12) 91 (23) 79 (29) 162 (49) 2 (100) 366 (29)
Medium distress 64 (23) 106 (27) 69 (26) 88 (26) 0 (0) 327 (26)
High distress 79 (29) 108 (27) 63 (23) 39 (12) 0 (0) 289 (23)
Very high distress 89 (33) 77 (19) 43 (16) 26 (8) 0 (0) 235 (19)
Not reported 8 (3) 15 (4) 16 (6) 16 (5) 0 (0) 55 (4)
Total 272 (100) 397 (100) 270 (100) 331 (100) 2 (100) 1272 (100)
2016
Low distress 15 (11) 44 (24) 57 (36) 59 (43) 1 (25) 176 (28)
Medium distress 24 (17) 63 (34) 46 (29) 25 (18) 1 (25) 159 (26)
High distress 42 (30) 44 (24) 29 (19) 22 (16) 2 (50) 139 (22)
Very high distress 49 (34) 20 (11) 10 (6) 7 (5) 0 (0) 86 (14)
Not reported 11 (8) 13 (7) 15 (10) 24 (18) 0 (0) 63 (10)
Total 141 (100) 184 (100) 157 (100) 137 (100) 4 (100) 623 (100)
Note: Cut off scores were Low = 0-3, Medium = 4-7, High = 8-12, Very high = 13 < 2932
34
SWASH Report 2016, 2018, 2020
Table 34: Suicidal ideation, by age group
16-24 years
25-34 years
35-44 years
45+ years
Not reported Total
n (%) n (%) n (%) n (%) n (%) n (%)
2020
Ever 247 (71) 368 (67) 189 (55) 168 (51) 10 (77) 982 (62)
In the last 12 months 147 (42) 189 (34) 79 (23) 50 (15) 3 (23) 468 (30)
No 87 (25) 174 (31) 145 (43) 155 (47) 1 (8) 562 (35)
Not reported 14 (4) 11 (2) 7 (2) 10 (3) 2 (15) 44 (3)
Total 348 (100) 553 (100) 341 (100) 333 (100) 13 (100) 1588 (100)
2018
Ever 189 (70) 269 (68) 170 (63) 176 (53) 1 (50) 805 (64)
In the last 12 months 121 (45) 134 (34) 80 (27) 56 (20) 0 (0) 391 (31)
No 77 (28) 123 (31) 97 (36) 152 (46) 1 (50) 450 (35)
Not reported 6 (2) 5 (1) 3 (1) 3 (1) 0 (0) 17 (1)
Total 272 (100) 397 (100) 270 (100) 331 (100) 2 (100) 1272 (100)
Table 35: Self harm, by age group
16-24 years
25-34 years
35-44 years
45+ years
Not reported Total
n (%) n (%) n (%) n (%) n (%) n (%)
2020
Ever 215 (62) 280 (51) 117 (34) 79 (24) 5 (39) 696 (44)
In the last 12 months 86 (25) 72 (13) 29 (9) 8 (2) 1 (7) 196 (12)
No 119 (34) 258 (46) 214 (63) 244 (73) 5 (39) 840 (53)
Not reported 14 (4) 15 (3) 10 (3) 10 (3) 3 (23) 52 (3)
Total 348 (100) 553 (100) 341 (100) 333 (100) 13 (100) 1588 (100)
2018
Ever 171 (63) 218 (55) 117 (43) 83 (25) 1 (50) 590 (46)
In the last 12 months 70 (26) 64 (16) 29 (11) 12 (4) 0 (0) 175 (14)
No 92 (34) 172 (43) 148 (55) 244 (74) 1 (50) 657 (52)
Not reported 9 (3) 7 (2) 5 (2) 4 (1) 0 (0) 25 (2)
Total 272 (100) 397 (100) 270 (100) 331 (100) 2 (100) 1272 (100)
35
SWASH Report 2016, 2018, 2020
Table 36: Ever accessed counselling or psychological services, by age group
16-24 years
25-34 years
35-44 years
45+ years
Not reported Total
n (%) n (%) n (%) n (%) n (%) n (%)
2020
No 61 (18) 74 (13) 60 (17) 45 (13) 1 (8) 241 (15)
Yes, in the past 5 years
262 (75) 420 (76) 230 (68) 202 (61) 12 (92) 1126 (71)
Yes, over 5 years ago 15 (4) 48 (9) 42 (12) 77 (23) 0 (0) 182 (11)
Not reported 10 (3) 11 (2) 9 (3) 9 (3) 0 (0) 39 (3)
Total 348 (100) 553 (100) 341 (100) 333 (100) 13 (100) 1588 (100)
2018
No 63 (23) 64 (16) 45 (17) 61 (18) 0 (0) 233 (18)
Yes, in the past 5 years
192 (71) 295 (74) 191 (71) 180 (55) 1 (50) 859 (68)
Yes, over 5 years ago 14 (5) 32 (8) 31 (11) 86 (26) 1 (50) 164 (13)
Not reported 3 (1) 6 (2) 3 (1) 4 (1) 0 (0) 16 (1)
Total 272 (100) 397 (100) 270 (100) 331 (100) 2 (100) 1272 (100)
2016
No 37 (26) 41 (22) 25 (16) 27 (20) 0 (0) 130 (21)
Yes, in the past 5 years
96 (68) 119 (65) 107 (68) 77 (56) 3 (75) 402 (64)
Yes, over 5 years ago 6 (4) 20 (11) 19 (12) 26 (19) 1 (25) 72 (12)
Not reported 2 (2) 4 (2) 6 (4) 7 (5) 0 (0) 19 (3)
Total 141 (100) 184 (100) 157 (100) 137 (100) 4 (100) 623 (100)
36
SWASH Report 2016, 2018, 2020
Table 37: Ever diagnosed (self-report) with anxiety, depression or other mental health disorder, by age group
16 -24 years
25-34 years
35-44 years
45+ years
Not reported Total
n (%) n (%) n (%) n (%) n (%) n (%)
2020
No 104 (30) 165 (30) 138 (41) 143 (43) 1 (8) 551 (35)
Yes, in past 5 years 213 (61) 299 (54) 140 (41) 119 (36) 8 (62) 779 (49)
Yes, over 5 years ago 15 (4) 73 (13) 52 (15) 59 (18) 3 (23) 202 (13)
Not reported 16 (5) 16 (3) 11 (3) 12 (4) 1 (8) 56 (4)
Total 348 (100) 553 (100) 341 (100) 333 (100) 13 (100) 1588
(100)
2018
No 89 (33) 143 (36) 98 (36) 152 (46) 0 (0) 482 (38)
Yes, in past 5 years 163 (60) 195 (49) 130 (48) 99 (30) 0 (0) 587 (46)
Yes, over 5 years ago 16 (6) 53 (13) 39 (15) 75 (23) 2 (100) 185 (15)
Not reported 4 (1) 6 (2) 3 (1) 5 (1) 0 (0.0) 18 (1)
Total 272 (100) 397 (100) 270 (100) 331 (100) 2 (100) 1272 (100)
2016
No 47 (34) 74 (40) 63 (40) 55 (40) 1 (25) 240 (38)
Yes, in past 5 years 89 (63) 85 (46) 63 (40) 53 (39) 2 (50) 292 (47)
Yes, over 5 years ago 3 (2) 23 (13) 21 (14) 21 (15) 1 (25) 69 (11)
Not reported 2 (1) 2 (1) 10 (6) 8 (6) 0 (0) 22 (4)
Total 141 (100) 184 (100) 157 (100) 137 (100) 4 (100) 623 (100)
37
SWASH Report 2016, 2018, 2020
4.4.4 Preventive health practices
From 1st December 2017, the National Cervical Screening Program increased the age at which screening should start from 18 years, to 24 years and nine months (and now ending at age 74). The recommended maximum time between screening tests increased from two years, to five years. The Pap smear test (looking for physical changes indicating cancer) was replaced by a Cervical Screening Test (CST; testing for the Human Papilloma Virus (HPV) that may lead to cancer). Anyone who had previously had a Pap smear test is due to attend for the new CST within two years, after which they would be on a five-year CST screening cycle.33 For SWASH 2020 we asked about “a cervical screen” but noted this was previously called “a Pap smear”. During this period of transition, we will continue to use the previous screening protocols (i.e. screening from age 18 and recommended every two years) until we have five years of data.31 Table 38 shows that 37% of respondents would be considered overdue for screening – that is, they were last screened more than three years ago, never had screening or were not sure when they last had a Pap smear. Screening rates under the renewed National Cervical Screening Program cannot be calculated until there is five years of data; that is, we cannot currently compare screening rates in the SWASH sample with the general population.
We continue to see a pattern of higher rates of never screened among respondents who report they had never had sex with a man (cisgender or transgender; 34%) compared to those who reported sex with a man (cisgender or transgender; 19%). HPV transmission only requires skin-to-skin contact35, and research demonstrates the prevalence of genital warts among women who have a sexual history with women is similar to that of exclusively heterosexual women.36 Yet, the idea that women who only have sex with women are at lower risk of cervical cancer persists37, including among Australian healthcare providers.38 ACON’s health promotion campaign The Inner Circle39 informed LGBTIQ+ communities of changes to the National Cervical Cancer Screening Program and raised awareness of the need for anyone with a cervix, regardless of gender identity or sexuality, to be screened. ACON also run, in partnership with Family Planning NSW, Check OUT, a community-led, peer-based cervical screening and sexual health clinic for LGBTIQ+ people.
BreastScreen NSW recommend a mammogram to screen for breast cancer every two years for 50 to 74-year old cisgender women, gender diverse people assigned female at birth who have not had gender affirming top surgery, and gender diverse people assigned male at birth who have been using gender-affirming hormones for five or more years40. These same groups can access a mammogram free of charge if they are aged 40 to 49 or over 74, but they are not directly invited. Since 2018, we asked respondents if they had ever had a mammogram: in 2020 88% of 50 to 74-year olds had. That is, 21% were overdue (last screened more than three years ago, never had a mammogram (9%) or were not sure if they had been screened; Table 39). According to HealthStats NSW, 51% of women aged between 50 and 69 years in the Sydney Local Health District (where most of the SWASH sample resides) had received a mammogram in 2015/2016.41 The equivalent two-year screening rate for SWASH respondents aged 50 and 69 years is 69%. Comparisons need to be qualified; the SWASH sample is different to the general population as it is highly urbanised, highly educated and less ethnically diverse. Other Australian studies asking LBQ women about mammography report rates both slightly higher or slightly lower than the general population.42, 43 ACON’s ongoing breast health campaign Our United Front (and prior to that, Talk Touch Test) has been promoting the importance of regular
38
SWASH Report 2016, 2018, 2020
breast screening through BreastScreen NSW. ACON and BreastScreen NSW have partnered to bring the BreastScreen mobile screening van to LGBTIQ community events, such as Sydney’s Fair Day.44
The National Bowel Cancer Screening Program recommends everyone is screened for bowel cancer starting on their 50th birthday, and then every two years until they turn 74 years of age. Screening is via a free immunochemical faecal occult blood test (iFOBT) that is mailed to people registered on Medicare; a sample is returned for testing. In 2020 we asked respondents aged 50 years and older if they had ever used a bowel screening home test kit: 77% had ever, while 59% had done so in the preceding two years (Table 40). Among the 22% who had never been screened, three-quarters had received but not returned a home test kit; this is a clear opportunity for health promotion. National bowel screening program data shows that among women aged between 50 and 74 years who were invited to participate in 2016/2017, 41% had done so (compared to 59% in SWASH).45 Again, comparisons need to be qualified; the SWASH sample is different to the general population as it is highly urbanised, highly educated and less ethnically diverse. To date no bowel cancer education programs have been directed at LBQ women (or indeed LGBTIQ people) in Australia. However, ACON has partnered with Cancer Institute NSW to develop a targeted bowel screening campaign for LGBTIQ people.
Rates of STI testing within the sample appear steady. Over half of respondents (59%) had ever had a test for an STI other than HIV; 18% had done so in the previous six months (Table 41). As in previous iterations, there is an association between STI testing and sex with men (cisgender or transgender): 77% of those who reported sex with a man also reported ever having an STI test compared to 41% of respondents who had never had sex with a man. Of those ever tested for an STI, 24% respondents had ever received an STI diagnosis. An STI diagnosis was more likely among respondents who reported ever having had sex with a man (28%) compared to those who had never had sex with a man (16%). HIV testing was lower, with 42% reporting they had ever had a test; less than 1% of respondents reported they were HIV positive.
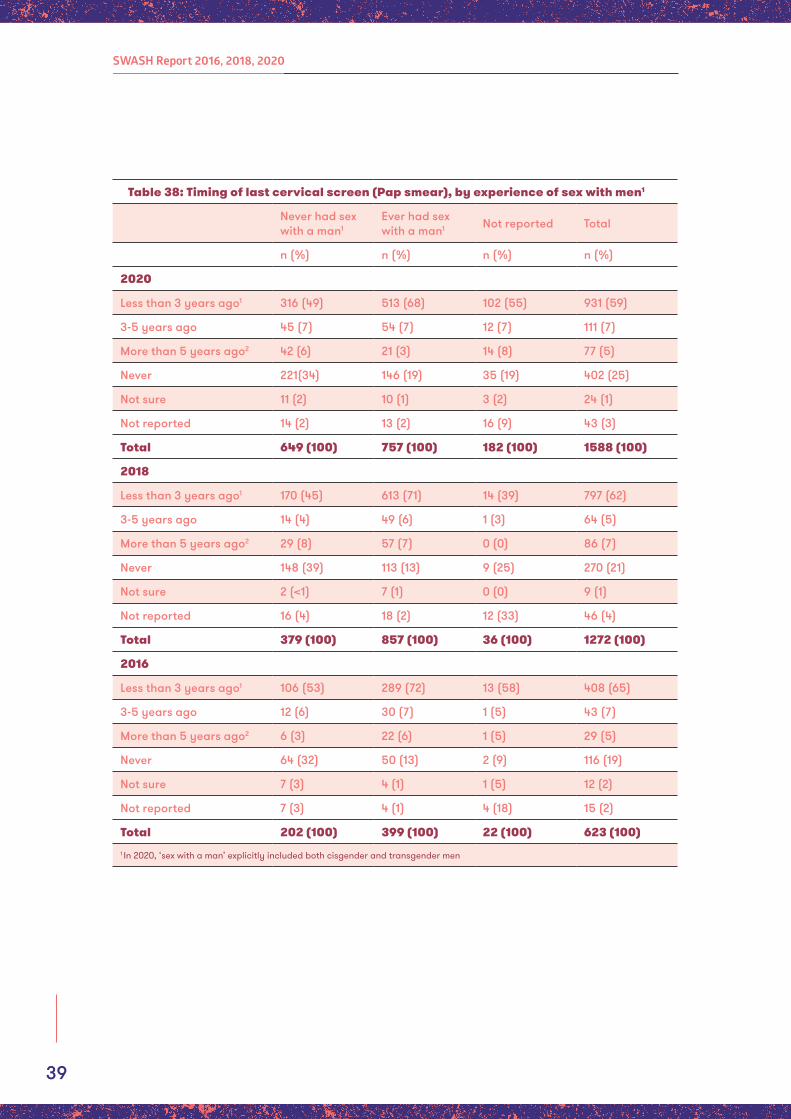
39
SWASH Report 2016, 2018, 2020
Table 38: Timing of last cervical screen (Pap smear), by experience of sex with men1
Never had sex with a man1
Ever had sex with a man1 Not reported Total
n (%) n (%) n (%) n (%)
2020
Less than 3 years ago1 316 (49) 513 (68) 102 (55) 931 (59)
3-5 years ago 45 (7) 54 (7) 12 (7) 111 (7)
More than 5 years ago2 42 (6) 21 (3) 14 (8) 77 (5)
Never 221(34) 146 (19) 35 (19) 402 (25)
Not sure 11 (2) 10 (1) 3 (2) 24 (1)
Not reported 14 (2) 13 (2) 16 (9) 43 (3)
Total 649 (100) 757 (100) 182 (100) 1588 (100)
2018
Less than 3 years ago1 170 (45) 613 (71) 14 (39) 797 (62)
3-5 years ago 14 (4) 49 (6) 1 (3) 64 (5)
More than 5 years ago2 29 (8) 57 (7) 0 (0) 86 (7)
Never 148 (39) 113 (13) 9 (25) 270 (21)
Not sure 2 (<1) 7 (1) 0 (0) 9 (1)
Not reported 16 (4) 18 (2) 12 (33) 46 (4)
Total 379 (100) 857 (100) 36 (100) 1272 (100)
2016
Less than 3 years ago1 106 (53) 289 (72) 13 (58) 408 (65)
3-5 years ago 12 (6) 30 (7) 1 (5) 43 (7)
More than 5 years ago2 6 (3) 22 (6) 1 (5) 29 (5)
Never 64 (32) 50 (13) 2 (9) 116 (19)
Not sure 7 (3) 4 (1) 1 (5) 12 (2)
Not reported 7 (3) 4 (1) 4 (18) 15 (2)
Total 202 (100) 399 (100) 22 (100) 623 (100)1 In 2020, ‘sex with a man’ explicitly included both cisgender and transgender men
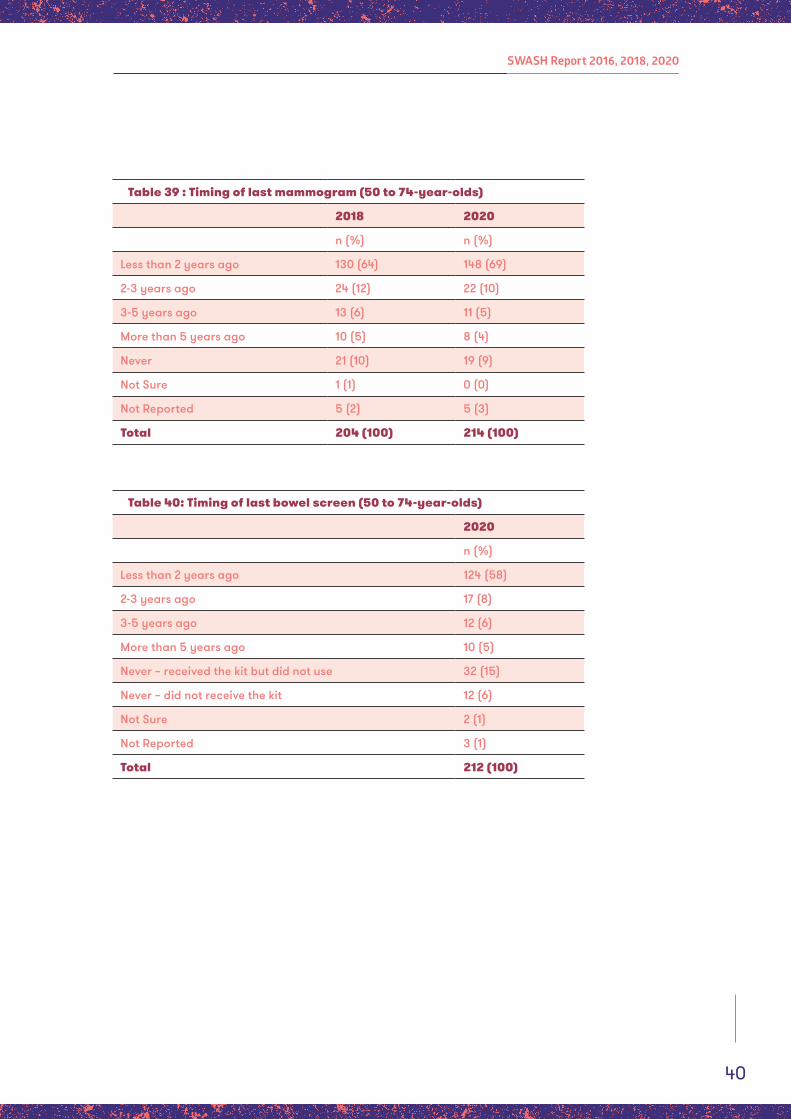
40
SWASH Report 2016, 2018, 2020
Table 39 : Timing of last mammogram (50 to 74-year-olds)
2018 2020
n (%) n (%)
Less than 2 years ago 130 (64) 148 (69)
2-3 years ago 24 (12) 22 (10)
3-5 years ago 13 (6) 11 (5)
More than 5 years ago 10 (5) 8 (4)
Never 21 (10) 19 (9)
Not Sure 1 (1) 0 (0)
Not Reported 5 (2) 5 (3)
Total 204 (100) 214 (100)
Table 40: Timing of last bowel screen (50 to 74-year-olds)
2020
n (%)
Less than 2 years ago 124 (58)
2-3 years ago 17 (8)
3-5 years ago 12 (6)
More than 5 years ago 10 (5)
Never – received the kit but did not use 32 (15)
Never – did not receive the kit 12 (6)
Not Sure 2 (1)
Not Reported 3 (1)
Total 212 (100)
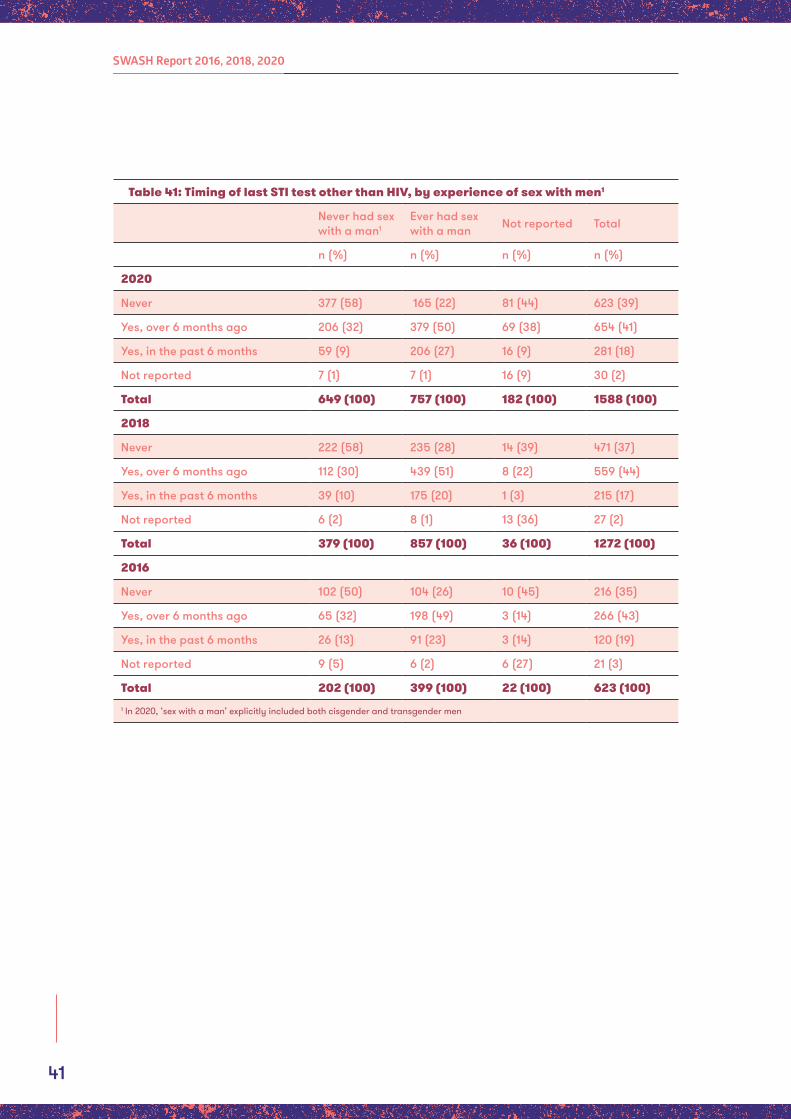
41
SWASH Report 2016, 2018, 2020
Table 41: Timing of last STI test other than HIV, by experience of sex with men1
Never had sex with a man1
Ever had sex with a man Not reported Total
n (%) n (%) n (%) n (%)
2020
Never 377 (58) 165 (22) 81 (44) 623 (39)
Yes, over 6 months ago 206 (32) 379 (50) 69 (38) 654 (41)
Yes, in the past 6 months 59 (9) 206 (27) 16 (9) 281 (18)
Not reported 7 (1) 7 (1) 16 (9) 30 (2)
Total 649 (100) 757 (100) 182 (100) 1588 (100)
2018
Never 222 (58) 235 (28) 14 (39) 471 (37)
Yes, over 6 months ago 112 (30) 439 (51) 8 (22) 559 (44)
Yes, in the past 6 months 39 (10) 175 (20) 1 (3) 215 (17)
Not reported 6 (2) 8 (1) 13 (36) 27 (2)
Total 379 (100) 857 (100) 36 (100) 1272 (100)
2016
Never 102 (50) 104 (26) 10 (45) 216 (35)
Yes, over 6 months ago 65 (32) 198 (49) 3 (14) 266 (43)
Yes, in the past 6 months 26 (13) 91 (23) 3 (14) 120 (19)
Not reported 9 (5) 6 (2) 6 (27) 21 (3)
Total 202 (100) 399 (100) 22 (100) 623 (100)1 In 2020, ‘sex with a man’ explicitly included both cisgender and transgender men
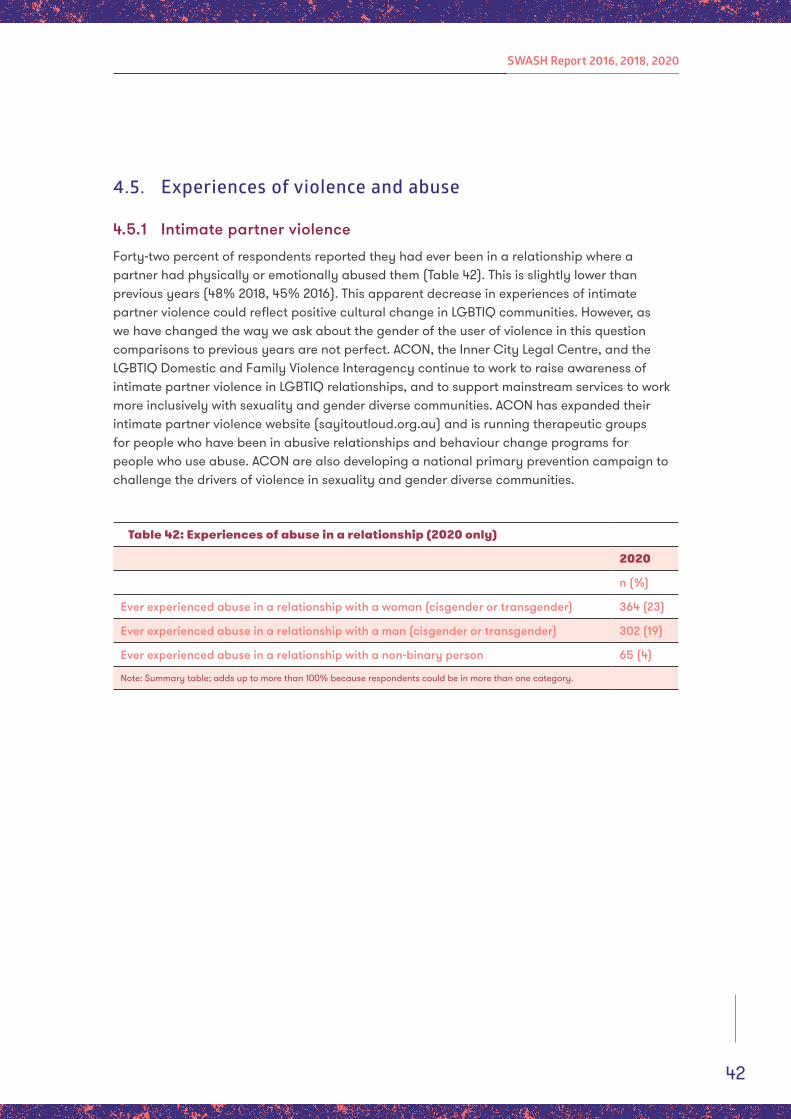
42
SWASH Report 2016, 2018, 2020
4.5. Experiences of violence and abuse
4.5.1 Intimate partner violence
Forty-two percent of respondents reported they had ever been in a relationship where a partner had physically or emotionally abused them (Table 42). This is slightly lower than previous years (48% 2018, 45% 2016). This apparent decrease in experiences of intimate partner violence could reflect positive cultural change in LGBTIQ communities. However, as we have changed the way we ask about the gender of the user of violence in this question comparisons to previous years are not perfect. ACON, the Inner City Legal Centre, and the LGBTIQ Domestic and Family Violence Interagency continue to work to raise awareness of intimate partner violence in LGBTIQ relationships, and to support mainstream services to work more inclusively with sexuality and gender diverse communities. ACON has expanded their intimate partner violence website (sayitoutloud.org.au) and is running therapeutic groups for people who have been in abusive relationships and behaviour change programs for people who use abuse. ACON are also developing a national primary prevention campaign to challenge the drivers of violence in sexuality and gender diverse communities.
Table 42: Experiences of abuse in a relationship (2020 only)
2020
n (%)
Ever experienced abuse in a relationship with a woman (cisgender or transgender) 364 (23)
Ever experienced abuse in a relationship with a man (cisgender or transgender) 302 (19)
Ever experienced abuse in a relationship with a non-binary person 65 (4)
Note: Summary table; adds up to more than 100% because respondents could be in more than one category.
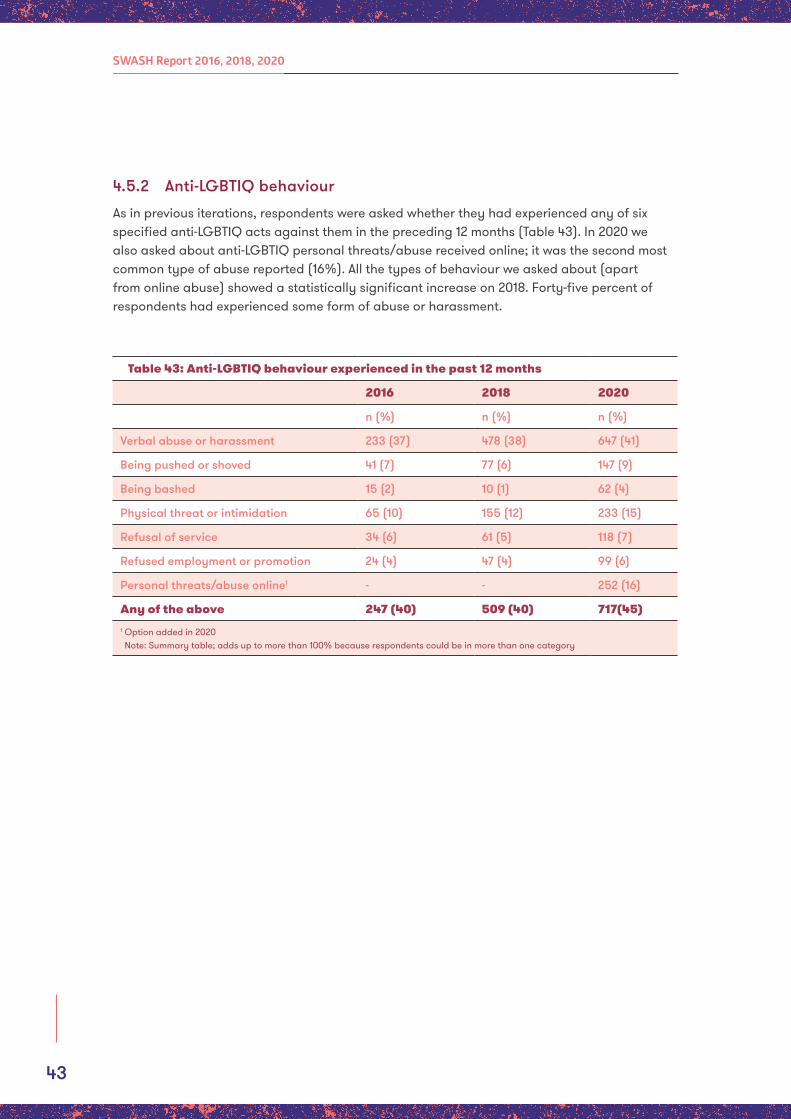
43
SWASH Report 2016, 2018, 2020
4.5.2 Anti-LGBTIQ behaviour
As in previous iterations, respondents were asked whether they had experienced any of six specified anti-LGBTIQ acts against them in the preceding 12 months (Table 43). In 2020 we also asked about anti-LGBTIQ personal threats/abuse received online; it was the second most common type of abuse reported (16%). All the types of behaviour we asked about (apart from online abuse) showed a statistically significant increase on 2018. Forty-five percent of respondents had experienced some form of abuse or harassment.
Table 43: Anti-LGBTIQ behaviour experienced in the past 12 months
2016 2018 2020
n (%) n (%) n (%)
Verbal abuse or harassment 233 (37) 478 (38) 647 (41)
Being pushed or shoved 41 (7) 77 (6) 147 (9)
Being bashed 15 (2) 10 (1) 62 (4)
Physical threat or intimidation 65 (10) 155 (12) 233 (15)
Refusal of service 34 (6) 61 (5) 118 (7)
Refused employment or promotion 24 (4) 47 (4) 99 (6)
Personal threats/abuse online1 - - 252 (16)
Any of the above 247 (40) 509 (40) 717(45)1 Option added in 2020 Note: Summary table; adds up to more than 100% because respondents could be in more than one category
44
SWASH Report 2016, 2018, 2020
45
SWASH Report 2016, 2018, 2020
5. References
1. Department of Health. National Women’s Health Strategy 2020-2030. Canberra: Commonwealth Government of Australia; 2018.
2 NSW Government. NSW Women’s Strategy 2018-2022: Advancing economic and social equality in NSW In: Department of Family and Community Services, editor. Sydney: NSW Government,; 2018.
3. Centre for Epidemiology and Evidence. HealthStats NSW: Smoking in adults Sydney: NSW Ministry of Health; 2020 [Available from: http://www.healthstats.nsw.gov.au/Indicator/beh_smo_age.
4. Centre for Epidemiology and Evidence. HealthStats NSW: Alcohol drinking in adults Sydney: NSW Ministry of Health; 2020 [Available from: http://www.healthstats.nsw.gov.au/Indicator/beh_alc_age/beh_alc_age.
5. Australian Institute of Health and Welfare. National Drug Strategy Household Survey 2019: in brief. Canberra AIHW; 2020.
6. Centre for Epidemiology and Evidence. HealthStats NSW: Psychological distress by Kessler 10 categories Sydney: NSW Ministry of Health; 2020 [Available from: http://www.healthstats.nsw.gov.au/Indicator/men_distr_type/men_distr_type_age.
7. Centre for Epidemiology and Evidence. HealthStats NSW: Self-rated health status Sydney: NSW Ministry of Health; 2020 [Available from: http://www.healthstats.nsw.gov.au/Indicator/bod_selfcat/bod_selfcat.
8. Mooney-Somers J, Deacon RM, Price K, Richters J, León de la Barra S, Schneider K, et al. Women in contact with the Sydney gay and lesbian community: Report of the Sydney Women and Sexual Health (SWASH) Survey 2006, 2008, 2010. Sydney: ACON & University of Sydney; 2012.
9. Richters J, Bebbington M, Prestage G, Ellard J, Cassar L. Women in contact with the gay and lesbian community: Sydney Women and Sexual Health survey 1996, 1998 and 2000 (Monograph 11/2001). Sydney: AIDS Council of New South Wales & NCHSR, UNSW; 2001.
10. Richters J, Song A, Prestage G, Clayton S, Turner R. Health of lesbian, bisexual and queer women in Sydney: The 2004 Sydney women and sexual health survey. Sydney: NCHSR, UNSW; 2005.
11. Mooney-Somers J, Deacon R, Klinner C, Richters J, Parkhill N. Women in contact with the gay and lesbian community in Sydney: Report of the Sydney Women and Sexual Health (SWASH) Survey 2006, 2008, 2010, 2012, 2014, 2016. Sydney: ACON & Sydney Health Ethics, University of Sydney; 2017.
12. Mooney-Somers J, Deacon R, Comfort J, Richters J, Parkhill N. Women in contact with the gay and lesbian community in Sydney: Report of the Sydney Women and Sexual Health (SWASH) Survey 2006, 2008, 2010 and 2012. Sydney: ACON & VELiM, University of Sydney; 2013.
13. Mooney-Somers J, Deacon R, Richters J, Parkhill N. Women in contact with the gay and lesbian community in Sydney: Report of the Sydney Women and Sexual Health (SWASH) Survey 2006, 2008, 2010, 2012, 2014. Sydney: ACON & VELiM, University of Sydney; 2015.
14. Zablotska IB, Kippax S, Grulich A, Holt M, Prestage G. Behavioural surveillance among gay men in Australia: methods, findings and policy implications for the prevention of HIV and other sexually transmissible infections. Sexual Health. 2011;8(3):272-9.
15. Harris PA, Taylor R, Thielke R, Payne J, Gonzalez N, Conde JG. Research electronic data capture (REDCap) – A metadata-driven methodology and workflow process for providing translational research informatics support. J Biomed Inform. 2009;42(2):377-81.
16. Jones T, Hart B, Carpenter M, Ansara G, Leonard W, Lucke J. Intersex: stories and statistics from Australia. Cambridge: Open Book Publishers; 2016.
17. Australian Bureau of Statistics. 6302.0 - Average Weekly Earnings, Australia (Nov 2019). Canberra: Australian Bureau of Statistics; 2019.
18. Australian Bureau of Statistics. 2016 Census of Population and Housing: Aboriginal and Torres Strait Islander Peoples Profile }(Catalogue number 2002.0). New South Wales. Canberra: Australian Bureau of Statistics; 2017.
19. Australian Bureau of Statistics. Australian Standard Classification of Cultural and Ethnic Groups (1249.0) 2016. Canberra: Australian Bureau of Statistics; 2019. Contract No.: 18 December 2019.
20. Australian Bureau of Statistics. Australian Statistical Geography Standard (ASGS): Volume 1 - Main Structure and Greater Capital City Statistical Areas (1270.0.55.001) 2016 Canberra: Australian Bureau of Statistics; 2016.
21. Holt M, Lea T, Mao L, Kolstee J, Zablotska I, Duck T, et al. Community-level changes in condom use and uptake of HIV pre-exposure prophylaxis by gay and bisexual men in Melbourne and Sydney, Australia: results of repeated behavioural surveillance in 2013–17. The Lancet HIV. 2018;5(8):e448-e56.
22. Australian Institute of Health and Welfare. National Drug Strategy Household Survey 2019. Canberra: AIHW; 2020.
23. ACON. Smoke Free Still Fierce Sydney: ACON; [Available from: https://www.acon.org.au/who-we-are-here-for/women/smoke-free-still-fierce-project/.
46
SWASH Report 2016, 2018, 2020
24. National Health and Medical Research Council. Australian Guidelines to Reduce Health Risks from Drinking Alcohol Canberra: National Health and Medical Research Council; 2009 [Available from: http://www.nhmrc.gov.au/guidelines/publications/ds10.
25. Department of Health. National Alcohol Strategy 2019–2028. Canberra: Commonwealth Government of Australia; 2019.
26. Australian Institute of Health and Welfare. National Drug Strategy Household Survey 2019: Supplementary tables. Canberra: AIHW; 2020.
27. Department of Health. The National Drug Strategy 2017–2026. Canberra: Commonwealth Government of Australia; 2017.
28. Australian Bureau of Statistics. Patient Experiences in Australia: Summary of Findings, 2018-19. Canberra: Australian Bureau of Statistics; 2019.
29. Australian Network on Disability. What is disability? Sydney: Australian Network on Disability; 2020 [Available from: https://www.and.org.au/pages/what-is-a-disability.html.
30. Furukawa T, Kessler R, Slade T, Andrews G. The performance of the K6 and K10 screening scales for psychological distress in the Australian National Survey of Mental Health and Well-Being. Psychological Medicine. 2003;33(02):357-62.
31. Australian Bureau of Statistics. Australian Health Survey: First Results, 2011–12 Table 4 Level of psychological distress. Canberra: Australian Bureau of Statistics; 2012.
32. Slade T, Grove R, Burgess P. Kessler Psychological Distress Scale: normative data from the 2007 Australian National Survey of Mental Health and Wellbeing supplement. Australian and New Zealand Journal of Psychiatry 2011;45:308-16.
33. Department of Health. National Cervical Screening Program Canberra: Commonwealth Government of Australia; n.d. [Available from: http://www.cancerscreening.gov.au/internet/screening/publishing.nsf/Content/cervical-screening-1.
34. NSW Cervical Screening Program. Do lesbians really need Pap tests? [brochure] n.d. [Available from: http://www.csp.nsw.gov.au/women/lesbians.html.
35. Marrazzo JM, Koutsky LA, Stine K, Kuypers J, Grubert T, Galloway D, et al. Genital human papillomavirus infection in women who have sex with women. J Infect Dis. 1998;178(6):1604-9.
36. Fethers K, Marks C, Mindel A, Estcourt CS. Sexually transmitted infections and risk behaviours in women who have sex with women. Sex Transm Infect. 2000;76(5):345-9.
37. Hyde Z, Comfort J, McManus A, Brown G, Howat P. Alcohol, tobacco and illicit drug use amongst same-sex attracted women: results from the Western Australian Lesbian and Bisexual Women’s Health and Well-Being Survey. BMC Public Health. 2009;9(1):317.
38. Brown R. More than just lip service - the report of the lesbian health information project. Melbourne: Royal Women’s Hospital; 2000.
39. ACON. The Inner Circle Sydney: ACON; 2018 [Available from: https://www.theinnercircle.org.au/.
40. Cancer Institute NSW. Information for trans and gender diverse people Sydney: Cancer Institute NSW; 2020 [Available from: https://www.breastscreen.nsw.gov.au/about-screening-mammograms/information-for-trans-and-gender-diverse-people/.
41. Centre for Epidemiology and Evidence. HealthStats NSW Sydney: Breast cancer screening NSW Ministry of Health; [24 October 2018]. Available from: http://www.healthstats.nsw.gov.au/Indicator/can_brstscr/can_brstscr_phn_snap
42. Brown R, McNair R, Szalacha L, Livingston PM, Hughes T. Cancer Risk Factors, Diagnosis and Sexual Identity in the Australian Longitudinal Study of Women’s Health. Women’s Health Issues. 2015;25(5):509-16.
43. Leonard W, Pitts M, Mitchell A, Lyons A, Smith A, Patel S, et al. Private Lives: A second national survey of the health and wellbeing of GLBTI Australians. Melbourne: Australian Research Centre in Sex, Health & Society, La Trobe University,; 2012.
44. ACON. Talk Touch Test Sydney: ACON; [Available from: https://www.acon.org.au/who-we-are-here-for/women/talk-touch-test/.
45. Australian Institute of Health and Welfare. National Bowel Cancer Screening Program. Canberra: Australian Institute of Health and Welfare; 2020
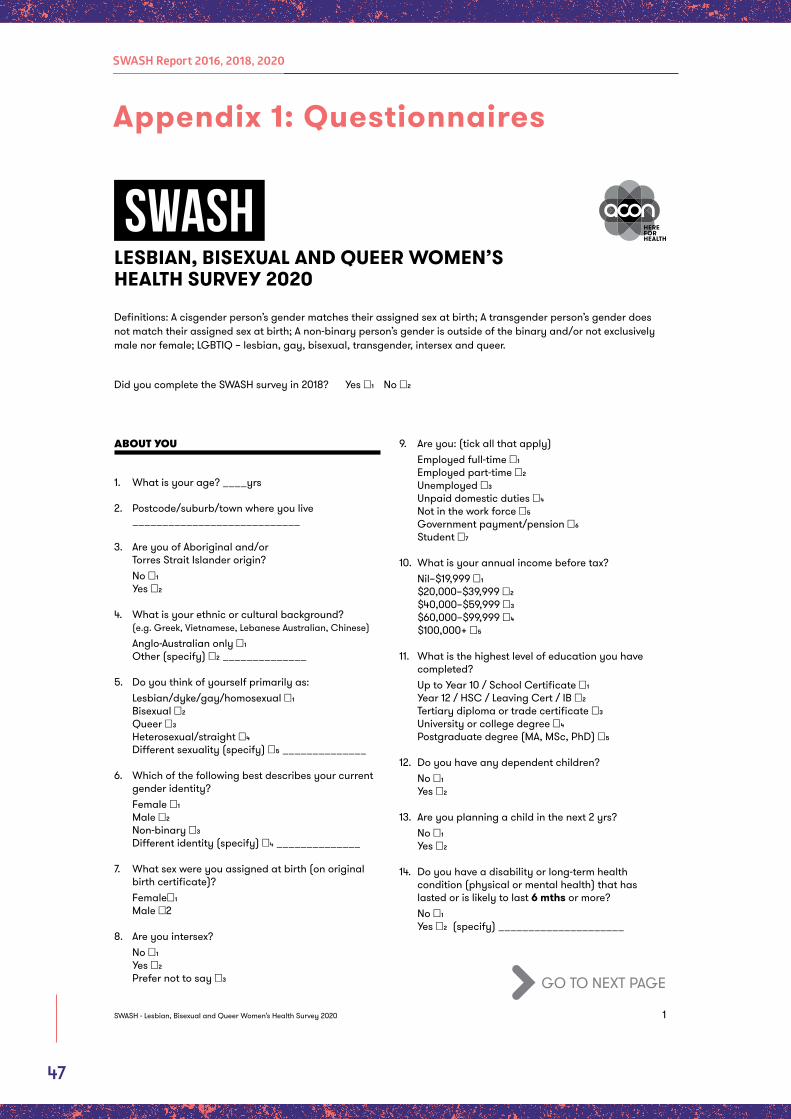
47
SWASH Report 2016, 2018, 2020
Appendix 1: Questionnaires
1SWASH - Lesbian, Bisexual and Queer Women’s Health Survey 2020
ABOUT YOU
1. What is your age? ____yrs
2. Postcode/suburb/town where you live ____________________________
3. Are you of Aboriginal and/or Torres Strait Islander origin? No □1Yes □2
4. What is your ethnic or cultural background? (e.g. Greek, Vietnamese, Lebanese Australian, Chinese)
Anglo-Australian only □1Other (specify) □2 ______________
5. Do you think of yourself primarily as:Lesbian/dyke/gay/homosexual □1Bisexual □2Queer □3Heterosexual/straight □4Different sexuality (specify) □5 ______________
6. Which of the following best describes your current gender identity? Female □1Male □2Non-binary □3Different identity (specify) □4 ______________
7. What sex were you assigned at birth (on original birth certificate)?Female□1Male □2
8. Are you intersex?No □1Yes □2Prefer not to say □3
9. Are you: (tick all that apply)Employed full-time □1Employed part-time □2Unemployed □3Unpaid domestic duties □4Not in the work force □5Government payment/pension □6Student □7
10. What is your annual income before tax?Nil–$19,999 □1$20,000–$39,999 □2$40,000–$59,999 □3$60,000–$99,999 □4$100,000+ □5
11. What is the highest level of education you have completed? Up to Year 10 / School Certificate □1Year 12 / HSC / Leaving Cert / IB □2Tertiary diploma or trade certificate □3University or college degree □4Postgraduate degree (MA, MSc, PhD) □5
12. Do you have any dependent children?No □1Yes □2
13. Are you planning a child in the next 2 yrs?No □1Yes □2
14. Do you have a disability or long-term health condition (physical or mental health) that has lasted or is likely to last 6 mths or more?No □1Yes □2 (specify) _____________________
SWASHLESBIAN, BISEXUAL AND QUEER WOMEN’S HEALTH SURVEY 2020
Definitions: A cisgender person’s gender matches their assigned sex at birth; A transgender person’s gender does not match their assigned sex at birth; A non-binary person’s gender is outside of the binary and/or not exclusively male nor female; LGBTIQ – lesbian, gay, bisexual, transgender, intersex and queer.
Did you complete the SWASH survey in 2018? Yes □1 No □2
GO TO NEXT PAGE
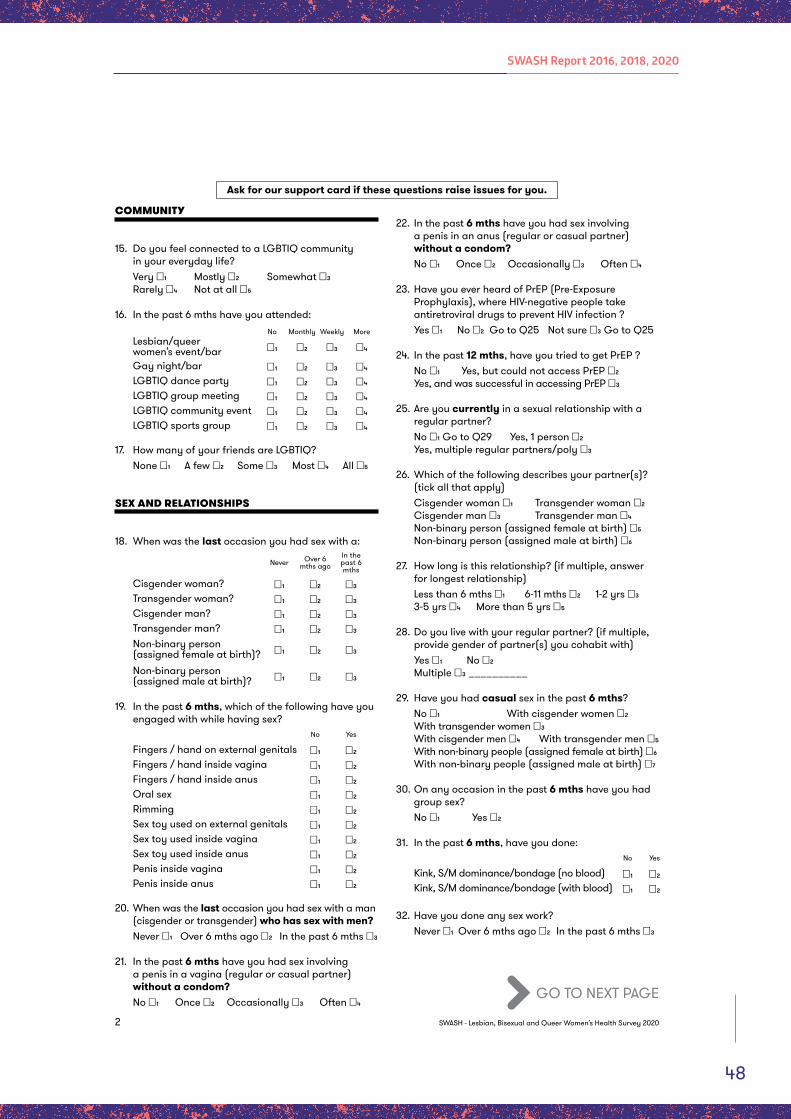
48
SWASH Report 2016, 2018, 2020
2 SWASH - Lesbian, Bisexual and Queer Women’s Health Survey 2020
COMMUNITY
15. Do you feel connected to a LGBTIQ community in your everyday life?Very □1 Mostly □2 Somewhat □3Rarely □4 Not at all □5
16. In the past 6 mths have you attended:No Monthly Weekly More
Lesbian/queer women’s event/bar □1 □2 □3 □4
Gay night/bar □1 □2 □3 □4LGBTIQ dance party □1 □2 □3 □4LGBTIQ group meeting □1 □2 □3 □4LGBTIQ community event □1 □2 □3 □4LGBTIQ sports group □1 □2 □3 □4
17. How many of your friends are LGBTIQ? None □1 A few □2 Some □3 Most □4 All □5
SEX AND RELATIONSHIPS
18. When was the last occasion you had sex with a:
Never Over 6 mths ago
In the past 6 mths
Cisgender woman? □1 □2 □3Transgender woman? □1 □2 □3Cisgender man? □1 □2 □3Transgender man? □1 □2 □3Non-binary person (assigned female at birth)? □1 □2 □3
Non-binary person (assigned male at birth)? □1 □2 □3
19. In the past 6 mths, which of the following have you engaged with while having sex?
No Yes
Fingers / hand on external genitals □1 □2Fingers / hand inside vagina □1 □2Fingers / hand inside anus □1 □2Oral sex □1 □2Rimming □1 □2Sex toy used on external genitals □1 □2Sex toy used inside vagina □1 □2Sex toy used inside anus □1 □2Penis inside vagina □1 □2Penis inside anus □1 □2
20. When was the last occasion you had sex with a man (cisgender or transgender) who has sex with men?
Never □1 Over 6 mths ago □2 In the past 6 mths □3
21. In the past 6 mths have you had sex involving a penis in a vagina (regular or casual partner) without a condom?
No □1 Once □2 Occasionally □3 Often □4
22. In the past 6 mths have you had sex involving a penis in an anus (regular or casual partner) without a condom?
No □1 Once □2 Occasionally □3 Often □4
23. Have you ever heard of PrEP (Pre-Exposure Prophylaxis), where HIV-negative people take antiretroviral drugs to prevent HIV infection ?
Yes □1 No □2 Go to Q25 Not sure □3 Go to Q25
24. In the past 12 mths, have you tried to get PrEP ? No □1 Yes, but could not access PrEP □2 Yes, and was successful in accessing PrEP □3
25. Are you currently in a sexual relationship with a regular partner?
No □1 Go to Q29 Yes, 1 person □2 Yes, multiple regular partners/poly □3
26. Which of the following describes your partner(s)? (tick all that apply)
Cisgender woman □1 Transgender woman □2 Cisgender man □3 Transgender man □4
Non-binary person (assigned female at birth) □5 Non-binary person (assigned male at birth) □6
27. How long is this relationship? (if multiple, answer for longest relationship)
Less than 6 mths □1 6-11 mths □2 1-2 yrs □3 3-5 yrs □4 More than 5 yrs □5
28. Do you live with your regular partner? (if multiple, provide gender of partner(s) you cohabit with)
Yes □1 No □2 Multiple □3 __________
29. Have you had casual sex in the past 6 mths? No □1 With cisgender women □2 With transgender women □3 With cisgender men □4 With transgender men □5 With non-binary people (assigned female at birth) □6
With non-binary people (assigned male at birth) □7
30. On any occasion in the past 6 mths have you had group sex?
No □1 Yes □2
31. In the past 6 mths, have you done:No Yes
Kink, S/M dominance/bondage (no blood) □1 □2Kink, S/M dominance/bondage (with blood) □1 □2
32. Have you done any sex work? Never □1 Over 6 mths ago □2 In the past 6 mths □3
GO TO NEXT PAGE
Ask for our support card if these questions raise issues for you.
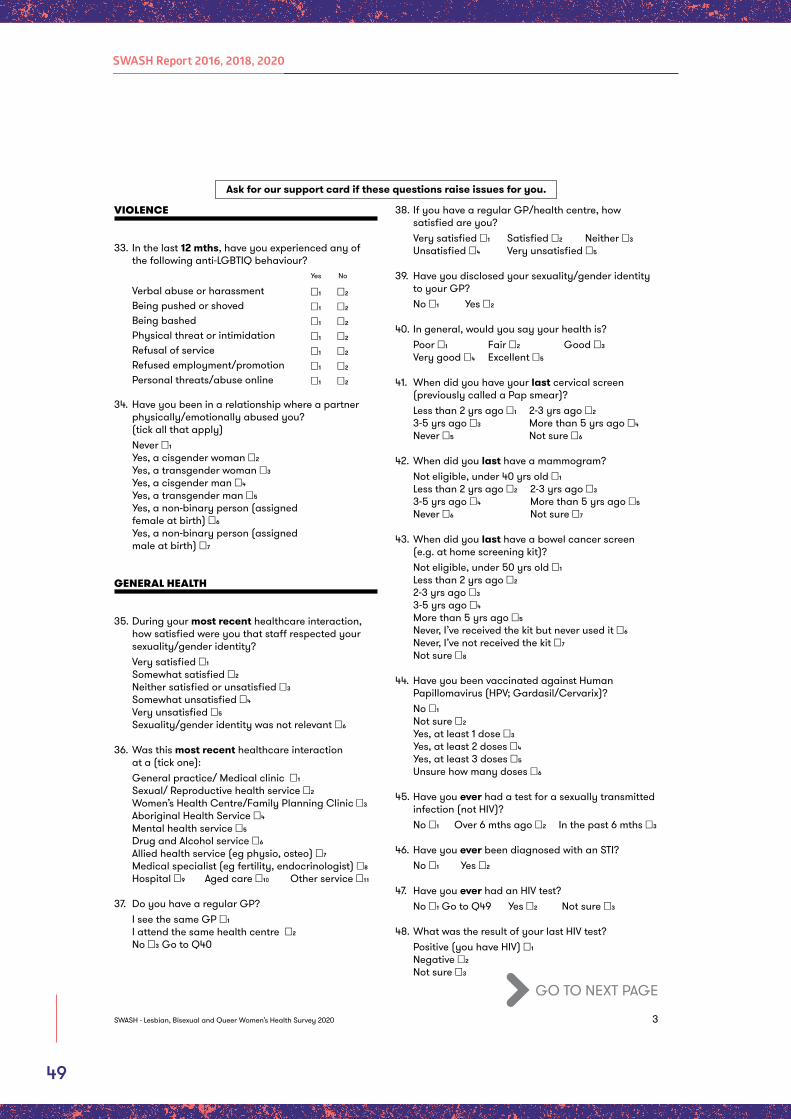
49
SWASH Report 2016, 2018, 2020
3SWASH - Lesbian, Bisexual and Queer Women’s Health Survey 2020
VIOLENCE
33. In the last 12 mths, have you experienced any of the following anti-LGBTIQ behaviour?
Yes No
Verbal abuse or harassment □1 □2Being pushed or shoved □1 □2Being bashed □1 □2Physical threat or intimidation □1 □2Refusal of service □1 □2Refused employment/promotion □1 □2Personal threats/abuse online □1 □2
34. Have you been in a relationship where a partner physically/emotionally abused you? (tick all that apply)
Never □1 Yes, a cisgender woman □2 Yes, a transgender woman □3 Yes, a cisgender man □4 Yes, a transgender man □5 Yes, a non-binary person (assigned
female at birth) □6 Yes, a non-binary person (assigned
male at birth) □7
GENERAL HEALTH
35. During your most recent healthcare interaction, how satisfied were you that staff respected your sexuality/gender identity?
Very satisfied □1 Somewhat satisfied □2 Neither satisfied or unsatisfied □3 Somewhat unsatisfied □4 Very unsatisfied □5 Sexuality/gender identity was not relevant □6
36. Was this most recent healthcare interaction at a (tick one):
General practice/ Medical clinic □1 Sexual/ Reproductive health service □2 Women’s Health Centre/Family Planning Clinic □3 Aboriginal Health Service □4 Mental health service □5 Drug and Alcohol service □6 Allied health service (eg physio, osteo) □7 Medical specialist (eg fertility, endocrinologist) □8 Hospital □9 Aged care □10 Other service □11
37. Do you have a regular GP? I see the same GP □1 I attend the same health centre □2 No □3 Go to Q40
38. If you have a regular GP/health centre, how satisfied are you?
Very satisfied □1 Satisfied □2 Neither □3 Unsatisfied □4 Very unsatisfied □5
39. Have you disclosed your sexuality/gender identity to your GP?
No □1 Yes □2
40. In general, would you say your health is? Poor □1 Fair □2 Good □3 Very good □4 Excellent □5
41. When did you have your last cervical screen (previously called a Pap smear)?
Less than 2 yrs ago □1 2-3 yrs ago □2 3-5 yrs ago □3 More than 5 yrs ago □4 Never □5 Not sure □6
42. When did you last have a mammogram? Not eligible, under 40 yrs old □1 Less than 2 yrs ago □2 2-3 yrs ago □3 3-5 yrs ago □4 More than 5 yrs ago □5 Never □6 Not sure □7
43. When did you last have a bowel cancer screen (e.g. at home screening kit)?
Not eligible, under 50 yrs old □1 Less than 2 yrs ago □2 2-3 yrs ago □3 3-5 yrs ago □4 More than 5 yrs ago □5 Never, I’ve received the kit but never used it □6
Never, I’ve not received the kit □7 Not sure □8
44. Have you been vaccinated against Human Papillomavirus (HPV; Gardasil/Cervarix)?
No □1 Not sure □2 Yes, at least 1 dose □3 Yes, at least 2 doses □4 Yes, at least 3 doses □5 Unsure how many doses □6
45. Have you ever had a test for a sexually transmitted infection (not HIV)?
No □1 Over 6 mths ago □2 In the past 6 mths □3
46. Have you ever been diagnosed with an STI? No □1 Yes □2
47. Have you ever had an HIV test? No □1 Go to Q49 Yes □2 Not sure □3
48. What was the result of your last HIV test? Positive (you have HIV) □1 Negative □2 Not sure □3
GO TO NEXT PAGE
Ask for our support card if these questions raise issues for you.
50
SWASH Report 2016, 2018, 2020
4 SWASH - Lesbian, Bisexual and Queer Women’s Health Survey 2020
PSYCHOLOGICAL HEALTH AND WELLBEING
49. Have you ever accessed a counsellor or psychiatrist? No □1 Yes, in past 5 yrs □2 Yes, over 5 yrs ago □3
50. Have you ever been diagnosed with depression, anxiety disorder or other mental health disorder?
No □1 Yes, in past 5 yrs □2 Yes, over 5 yrs ago □3
51. During the past 4 wks, how much of the time did you feel?
All of the time
Most of the time
Some of the time
A little of the time
None of the time
So sad nothing could cheer you up □1 □2 □3 □4 □5
Nervous □1 □2 □3 □4 □5Restless or fidgety □1 □2 □3 □4 □5Hopeless □1 □2 □3 □4 □5That everything was an effort □1 □2 □3 □4 □5
Worthless □1 □2 □3 □4 □5
52. Have you ever felt that life isn’t worth living? Yes, in last 12 mths □1 Yes, more than 12 mths ago □2 Never □3
53. Have you ever deliberately hurt yourself or done anything that you knew might have harmed or even killed you?
Yes, in last 12 mths □1 Yes, more than 12 mths ago □2 Never □3
SMOKING, DRINKING AND DRUG USE
54. How often, if at all, do you currently use electronic cigarettes?
Never used □1 Tried once or twice □2 Used to use them, but no longer □3 Less than monthly □4 At least monthly (not weekly) □5 At least weekly (not daily) □6 Daily □7
55. Do you currently smoke cigarettes or other tobacco?
Daily □1 More than weekly (not daily) □2 Less than weekly □3 Ex-smoker □4 Never smoked/less than 100 in lifetime □5 Go to Q57
56. Would you like to reduce or quit your current level of smoking?
No □1 Yes □2
57. How often do you normally drink alcohol? Never □1 Go to Q60 Less often than weekly □2 1 or 2 days a week □3 3-4 days a week □4 5-6 days a week □5 Every day □6
58. On a day when you drink alcohol, how many standard drinks do you usually have?
(1 drink = a small glass of wine, a middy of beer or a nip of spirits)
1-2 drinks □1 3-4 drinks □2 5-8 drinks □3 9-12 drinks □4 13-20 drinks □5 20+ drinks □6
59. In the past 6 mths, how often have you drunk 5 or more drinks on one occasion?
Never □1 Once or twice □2 About once a mnth □3 About once a week □4 More than once a week □5 Every day □6
60. Have you ever been concerned about your alcohol use or felt it negatively impacted on your life?
Never □3 Yes, more than 12 mths ago □2 Yes, in last 12 mths □1
61. Have you ever sought help to manage your alcohol use?
Never □3 Yes, more than 12 mths ago □2 Yes, in last 12 mths □1
62. How often have you used these drugs in the last 6 mths?
Never 1–5 times 6+ times
Benzos / Valium □1 □2 □3Amyl / poppers □1 □2 □3Natural cannabis □1 □2 □3Synthetic cannabis □1 □2 □3Ecstasy □1 □2 □3Amphetamines (speed/ice) □1 □2 □3Cocaine □1 □2 □3LSD / trips □1 □2 □3GHB □1 □2 □3Ketamine □1 □2 □3Any other drug (specify)________________ □1 □2 □3
63. Have you ever injected drugs? Never □1 Over 6 mths ago □2 In past 6 mths □3
64. Have you ever been concerned about your drug use or felt it negatively impacted on your life?
Never □3 Yes, more than 12 mths ago □2 Yes, in last 12 mths □1
65. Have you ever sought help to manage your drug use? Never □3 Yes, more than 12 mths ago □2 Yes, in last 12 mths □1
THANK YOU FOR TAKING THE TIME TO COMPLETE OUR SURVEY
Ask for our support card if these questions raise issues for you.
51
SWASH Report 2016, 2018, 2020
2018
SW
ASH
SU
RV
EY
LESB
IAN
, BIS
EXUA
L A
ND
QUE
ER W
OM
EN’S
HEA
LTH
SUR
VEY
DEF
INIT
ION
S: B
Y W
OM
AN
WE
MEA
N A
PER
SON
WH
O ID
ENTI
FIES
AS
A W
OM
AN
(BO
RN
FEM
ALE
OR
NO
W ID
ENTI
FIES
AS
FEM
ALE
). B
Y M
AN
WE
MEA
N A
PER
SON
WH
O ID
ENTI
FIES
AS
A M
AN
(BO
RN
MA
LE O
R N
OW
IDEN
TIFI
ES A
S M
ALE
).
BY L
GBT
IQ W
E M
EAN
LES
BIA
N, G
AY, B
ISEX
UAL,
TR
AN
SGEN
DER
, IN
TER
SEX
AN
D Q
UEE
R.
BEF
OR
E YO
U ST
AR
T
This
cod
e al
low
s us
to tr
ack
chan
ges
in h
ealth
ove
r tim
e.
(Thi
s w
ill N
OT
iden
tify
you.
)Fi
rst t
wo
lette
rs o
f firs
t nam
e
Firs
t tw
o le
tters
of s
urna
me
Did
you
com
plet
e th
e SW
ASH
surv
ey in
201
6? Y
es N
o
AB
OUT
YO
U1.
Wha
t is
your
age
?
year
s
2.
Post
code
/sub
urb/
tow
n w
here
you
live
____
____
___
3.
Are
you
of A
borig
inal
or
To
rres
Str
ait I
slan
der o
rigin
?N
o
1 Ye
s
2
4.
Wha
t is
your
eth
nic
or c
ultu
ral b
ackg
roun
d?
(e
.g. G
reek
, Vie
tnam
ese,
Leb
anes
e, C
hine
se)
An
glo-
Aust
ralia
n on
ly
1
Oth
er (s
peci
fy)
2 _
____
____
__
5.
Do
you
thin
k of
you
rsel
f prim
arily
as:
Le
sbia
n/dy
ke/g
ay/h
omos
exua
l 1
Bi
sexu
al
2
Que
er
3
Het
eros
exua
l/st
raig
ht
4
Oth
er (s
peci
fy)
5 __
____
____
_
6.
Whi
ch o
f the
se s
ix s
tate
men
ts b
est
de
scrib
es y
ou?
I hav
e fe
lt se
xual
ly a
ttra
cted
—
O
nly
to fe
mal
es, n
ever
to m
ales
1
M
ore
ofte
n to
fem
ales
, & a
t lea
st
on
ce to
a m
ale
2
Abou
t equ
ally
oft
en to
fem
ales
and
to m
ales
3
M
ore
ofte
n to
mal
es,
&
at le
ast o
nce
to a
fem
ale
4
Onl
y to
mal
es, n
ever
to fe
mal
es
5
To n
o on
e at
all
6
7. W
hich
of t
he fo
llow
ing
best
des
crib
es
yo
ur g
ende
r ide
ntity
?
Fem
ale
1
Mal
e
2
Non
-Bin
ary
3
Oth
er (s
peci
fy)
4 ___
____
____
8.
Wha
t gen
der w
ere
you
assi
gned
at b
irth?
Fe
mal
e
1
Mal
e
2
9.
Are
you
inte
rsex
?
No
1
Yes
2
Pr
efer
not
to s
ay
3
10.
Are
you:
(tic
k al
l tha
t app
ly)
Em
ploy
ed fu
ll-tim
e
1
Empl
oyed
par
t-tim
e
2
Unem
ploy
ed
3
Doi
ng d
omes
tic d
utie
s
4
Not
in th
e w
ork
forc
e
5
Pens
ione
r/so
cial
sec
urity
6
St
uden
t 7
11.
Wha
t is
your
ann
ual i
ncom
e be
fore
tax?
Nil–
$19,
999
1
$20,
000–
$39,
999
2
$40,
000–
$59,
999
3
$60,
000–
$99,
999
4
$100
,000
+
5
12.
Wha
t is
the
high
est l
evel
of e
duca
tion
you
have
com
plet
ed?
Up to
Yea
r 10
/ Sc
hool
Cer
tifica
te
1
Year
12 /
HSC
/ L
eavi
ng C
ert /
IB
2
Tert
iary
dip
lom
a or
trad
e ce
rtifi
cate
3
Un
iver
sity
or c
olle
ge d
egre
e
4
Post
grad
uate
deg
ree
(MA,
MSc
, PhD
) 5
13.
Do
you
have
any
dep
ende
nt c
hild
ren?
No
1
Yes
2
14.
Are
you
plan
ning
to h
ave
a ch
ild in
the
next
2 y
ears
?
No
1
Yes
2
15.
Do
you
have
a c
hron
ic (l
ong-
term
) illn
ess
or
di
sabi
lity?
(Ple
ase
spec
ify) _
____
____
__
No
1
Yes
2
52.
Dur
ing
the
past
4 w
ks, h
ow m
uch
of th
e tim
e di
d yo
u fe
el:
53.
Hav
e yo
u ev
er fe
lt th
at li
fe is
n’t w
orth
livi
ng?
Ye
s, in
the
last
12 m
onth
s;
1
Yes,
mor
e th
an 12
mon
ths
ago;
2
N
ever
3
54:
Hav
e yo
u ev
er d
elib
erat
ely
hurt
you
rsel
f or d
one
anyt
hing
that
you
kne
w m
ight
hav
e ha
rmed
or
even
kill
ed y
ou?
Ye
s, in
the
last
12 m
onth
s;
1
Yes,
mor
e th
an 12
mon
ths
ago;
2
N
ever
3
SMO
KIN
G, D
RIN
KIN
G A
ND
D
RUG
USE
55.
Do
you
curr
ently
sm
oke
ciga
rett
es o
r ot
her t
obac
co?
D
aily
1
M
ore
than
wee
kly
(not
dai
ly)
2
Less
than
wee
kly
3
Ex-s
mok
er
4
Nev
er s
mok
ed/l
ess
than
100
in li
fetim
e
5
56.
How
oft
en d
o yo
u no
rmal
ly d
rink
alco
hol?
N
ever
Go
to Q
58
1
Less
oft
en th
an w
eekl
y
2
1 or 2
day
s a
wee
k
3
3-4
days
a w
eek
4
5-6
days
a w
eek
5
Ever
y da
y
6
57.
On
a da
y w
hen
you
drin
k al
coho
l, ho
w m
any
st
anda
rd d
rinks
do
you
usua
lly h
ave?
(1
drin
k =
a sm
all g
lass
of w
ine,
a m
iddy
of
beer
or a
nip
of s
pirit
s)
1-2 d
rinks
1
3-
4 dr
inks
2
5-
8 dr
inks
3
9-
12 d
rinks
4
13
-20
drin
ks
5
20+
drin
ks
6
58.
In th
e pa
st 6
mth
s, h
ow o
ften
hav
e yo
u dr
unk
5 or
m
ore
drin
ks o
n on
e oc
casi
on?
N
ever
1
O
nce
or tw
ice
2
Abou
t onc
e a
mon
th
3
Abou
t onc
e a
wee
k
4
Mor
e th
an o
nce
a w
eek
5
Ever
y da
y
6
59.
H
ow o
ften
hav
e yo
u us
ed th
ese
drug
s in
the
last
6
mon
ths?
60.
For t
he d
rugs
bel
ow, w
here
did
you
usu
ally
take
th
em?
(Las
t 6 m
onth
s)
61.
Hav
e yo
u ev
er in
ject
ed d
rugs
?
Ne
ver
1 Ove
r 6 m
onth
s ago
2 I
n pa
st 6
mon
ths
3
62.
Hav
e yo
u ev
er s
ough
t sup
port
for a
dru
g an
d/or
al
coho
l iss
ue (y
our o
wn)
No
1 End
of s
urve
y Y
es
2 Go
to Q
63
63.
Whe
re d
id y
ou s
eek
supp
ort?
(tic
k al
l tha
t app
ly)
G
P
1
Cou
nsel
lor/
psyc
holo
gist
2
H
elpl
ine
3
Spec
ialis
t D&A
ser
vice
4
LG
BTI s
ervi
ce
5
C
omm
unity
org
anis
atio
n
6
Fr
iend
s/re
lativ
es
7
Self-
help
gro
ups
(AA/
NA/
SMAR
T)
8
Hos
pita
l/ED
9
Onl
ine/
apps
(spe
cify
) 10
____
____
___
O
ther
11_
____
____
__
64.
Whi
ch s
uppo
rt d
id y
ou fi
nd th
e m
ost h
elpf
ul?
G
P
1
Cou
nsel
lor/
psyc
holo
gist
2
H
elpl
ine
3
Spec
ialis
t D&A
ser
vice
4
LG
BTI s
ervi
ce
5
C
omm
unity
org
anis
atio
n
6
Fr
iend
s/re
lativ
es
7
Self-
help
gro
ups
(AA/
NA/
SMAR
T)
8
Hos
pita
l/ED
9
Onl
ine/
apps
(spe
cify
) 10
Oth
er
11 __
____
____
___
GO
TO
NEX
T PA
GE
Neve
r1–
5 Ti
mes
6+ T
imes
Benz
os /
Val
ium
1
2
3Am
yl /
pop
pers
1
2
3
Nat
ural
can
nabi
s
1
2
3Sy
nthe
tic c
anna
bis
1
2
3
Ecst
asy
1
2
3
Amph
etam
ines
1
2
3
Coc
aine
1
2
3
LSD
/ tr
ips
1
2
3
GH
B
1
2
3Ke
tam
ine
1
2
3
New
/em
ergi
ng p
sych
ostim
ulan
ts
1
2
3/A
ny o
ther
dru
g (p
leas
e
spec
ify)_
____
____
____
1
2
3
Yo
ur
ho
me
Frie
nds
hom
e/
priv
ate
party
Venu
e/
publ
ic p
arty
Befo
re/
durin
g se
x
Benz
os /
Val
ium
1
2
3
4N
atur
al c
anna
bis
1
2
3
4Ec
stas
y
1
2
3
4Am
phet
amin
es
1
2
3
4C
ocai
ne
1
2
3
4Al
coho
l
1
2
3
4
THAN
K YO
U FO
R TA
KIN
G T
HE
TIM
E TO
CO
MPL
ETE
OUR
SUR
VEY
All
Mos
t So
me
A lit
tleN
one
Ner
vous
1
2
3
4
5Re
stle
ss o
r fidg
ety
1
2
3
4
5H
opel
ess
1
2
3
4
5Ev
eryt
hing
was
an
effor
t
1
2
3
4
5W
orth
less
1
2
3
4
5Sa
d: n
othi
ng c
ould
ch
eer y
ou u
p
1
2
3
4
5
52
SWASH Report 2016, 2018, 2020
CO
MM
UNIT
Y
16.
Do
you
feel
con
nect
ed to
a LG
BTIQ
com
mun
ity
in y
our e
very
day
life?
Ve
ry
1
Mos
tly
2
Som
ewha
t 3
Ra
rely
4
N
ot a
t all
5
17.
In th
e pa
st 6
mth
s ha
ve y
ou a
tten
ded:
18.
How
man
y of
you
r frie
nds
are
LGBT
IQ?
N
one
1
A fe
w
2
Som
e
3
Mos
t 4
Al
l 5
SEX
AN
D R
ELA
TIO
NSH
IPS
19.
Whe
n w
as th
e la
st ti
me
you
had
sex
with
a w
oman
?
Nev
er
1 Go
to Q
23
Ove
r 6 m
ths
ago
2 Go
to Q
23
In th
e pa
st 6
mth
s
3
20.
In th
e pa
st 6
mth
s, h
ow m
any
wom
en h
ave
you
had
sex
with
?
Non
e
1
One
2
2-
5
3
6-10
4
M
ore
than
10
5
21.
In th
e la
st 4
wks
, how
man
y tim
es h
ave
you
had
se
x w
ith a
wom
an?
(writ
e a
num
ber)
____
____
___t
imes
22.
In th
e pa
st 6
mth
s, w
hich
of t
he fo
llow
ing
have
yo
u do
ne w
hile
hav
ing
sex
with
a w
oman
?
N
o Y
es
Fi
nger
s /
hand
on
exte
rnal
gen
itals
1
2
Fing
ers
/ ha
nd in
side
vag
ina
1
2
Fing
ers
/ ha
nd in
side
anu
s
1
2
O
ral s
ex (y
our m
outh
, her
gen
itals
)
1
2
O
ral s
ex (h
er m
outh
, you
r gen
itals
)
1
2
Ri
mm
ing
(her
mou
th, y
our a
nus)
1
2
Ri
mm
ing
(you
r mou
th, h
er a
nus)
1
2
Se
x to
y us
ed o
n ex
tern
al g
enita
ls
1
2
Se
x to
y us
ed in
side
vag
ina
1
2
Se
x to
y us
ed in
side
anu
s
1
2
23.
In th
e pa
st 6
mth
s, h
ave
you
done
:
No
Yes
Ki
nk, S
/M d
omin
ance
/bon
dage
1
2
(no
bloo
d)
Ki
nk, S
/M d
omin
ance
/bon
dage
1
2
(with
blo
od)
24.
Hav
e yo
u do
ne a
ny s
ex w
ork?
Nev
er
1
Ove
r 6 m
ths
ago
2
In th
e pa
st 6
mon
ths
3
25.
Whe
n w
as th
e la
st o
ccas
ion
you
had
sex
with
a
ga
y/ho
mos
exua
l/bi
sexu
al m
an?
N
ever
1 G
o to
Q27
Ove
r 6 m
ths
ago
2 Go
to Q
27
In
the
past
6 m
ths
3
26.
In th
e pa
st 6
mth
s ha
ve y
ou h
ad v
agin
al/a
nal
inte
rcou
rse
with
a g
ay/b
isex
ual m
an
(r
egul
ar o
r cas
ual p
artn
er) w
ithou
t a c
ondo
m?
N
ever
1 O
nce
2 Occ
asio
nally
3 O
ften
4
27.
Whe
n w
as th
e la
st o
ccas
ion
you
had
sex
with
a
stra
ight
/het
eros
exua
l man
?
Nev
er G
o to
Q29
1
O
ver 6
mth
s ag
o
2 Go
to Q
29
In
the
past
6 m
ths
3
28.
In th
e pa
st 6
mth
s ha
ve y
ou h
ad v
agin
al/a
nal
inte
rcou
rse
with
a s
trai
ght/
hete
rose
xual
man
(r
egul
ar o
r cas
ual p
artn
er) w
ithou
t a c
ondo
m?
N
ever
1
O
nce
2
Occ
asio
nally
3
O
ften
4
29.
Are
you
curr
ently
in a
sex
ual r
elat
ions
hip
with
a
regu
lar p
artn
er?
N
o
1 Go
to Q
31
A w
oman
2
A
man
3
M
ultip
le re
gula
r par
tner
s/po
ly
4
30.
How
long
is th
is re
latio
nshi
p?
Less
than
6 m
ths
1
6-11
mth
s
2
1-2 y
rs
3
3-5
yrs
4
Mor
e th
an 5
yrs
5
31.
Hav
e yo
u ha
d ca
sual
sex
in th
e pa
st 6
mth
s?
N
o
1
Yes,
with
wom
en
2
Yes,
with
men
3
Ye
s, w
ith b
oth
4
32.
On
any
occa
sion
in th
e pa
st 6
mth
s ha
ve y
ou
had
grou
p se
x w
hich
incl
uded
:
N
o Y
es
A
gay,
hom
osex
ual o
r bis
exua
l man
1
2
A st
raig
ht o
r het
eros
exua
l man
1
2
A w
oman
1
2
Kink
, S/M
dom
inan
ce/b
onda
ge
1
2
(no
bloo
d)
Ki
nk, S
/M d
omin
ance
/bon
dage
1
2
(with
blo
od)
VIO
LEN
CE
33.
In th
e la
st 12
mon
ths,
have
you
exp
erie
nced
any
of
the
follo
win
g an
ti-le
sbia
n, g
ay, b
i or t
rans
beh
avio
ur?
34.
Hav
e yo
u be
en in
a re
latio
nshi
p w
here
a p
artn
er
phys
ical
ly/e
mot
iona
lly a
buse
d yo
u?
Nev
er
1
Yes,
a m
an
2
Yes,
a w
oman
3
Ye
s, b
oth
4
GEN
ERA
L H
EALT
H35
. D
o yo
u ha
ve a
regu
lar G
P?
N
o G
o to
Q38
1
I s
ee th
e sa
me
GP
2
I att
end
the
sam
e he
alth
cen
tre
3
36.
If yo
u ha
ve a
regu
lar G
P, h
ow s
atis
fied
are
you?
Ve
ry s
atis
fied
1
Satis
fied
2
Nei
ther
3
Un
satis
fied
4
Very
uns
atis
fied
5
37.
Are
you
out t
o yo
ur G
P ab
out y
our
se
xual
ity/g
ende
r ide
ntity
?
N
o
1
Yes
2
38.
In g
ener
al, w
ould
you
say
you
r hea
lth is
?
Poor
1
Fa
ir
2
Goo
d
3
Very
goo
d
4
Exce
llent
5
39.
How
tall
are
you
with
out s
hoes
?___
____
__cm
s
40.
How
muc
h do
you
wei
gh?_
____
____
kgs
41.
If yo
u ar
e 40
+ ye
ars
old,
whe
n di
d yo
u la
st h
ave
a m
amm
ogra
m:
Le
ss th
an 2
yea
rs a
go
1
2-3
year
s ag
o
2
3-5
year
s ag
o
3
Mor
e th
an 5
yea
rs a
go
4
Nev
er
5
Don
’t kn
ow
6
42.
Whe
n di
d yo
u ha
ve y
our l
ast P
ap s
mea
r/
Cer
vica
l can
cer t
est?
Le
ss th
an 2
yrs
ago
1
2-
3 yr
s ag
o
2
3-5
yrs
ago
3
Mor
e th
an 5
yrs
ago
4
N
ever
5
N
ot s
ure
6
43.
If yo
u ha
ve N
OT
had
a Pa
p te
st in
the
last
3
year
s, p
leas
e te
ll us
why
:
Bein
g bu
sy/f
orge
tting
whe
n yo
ur n
ext t
est i
s du
e
1
Emba
rras
smen
t/aw
kwar
d na
ture
of t
he te
st
2
Fear
of P
ap te
sts
3
Oth
er (p
leas
e sp
ecify
): __
____
____
____
____
44.
Aust
ralia
’s ne
w c
ervi
cal s
cree
ning
pro
gram
will
al
low
som
e w
omen
to ta
ke th
eir o
wn
HPV
sam
ple
in a
hea
lthca
re s
ettin
g (n
ot a
t hom
e). W
ould
you
pr
efer
to d
o th
is, i
nste
ad o
f hav
ing
a ce
rvic
al
scre
enin
g te
st?
N
o
1 Ye
s
2 Un
sure
3
45.
Hav
e yo
u be
en v
acci
nate
d ag
ains
t Hum
an
Papi
llom
aviru
s (H
PV; G
arda
sil/
Cer
varix
)?
No,
nev
er
1
Not
sur
e
2
Yes,
at l
east
1 do
se
3
Yes,
at l
east
2 d
oses
4
Ye
s, a
t lea
st 3
dos
es
5
Yes,
uns
ure
how
man
y do
ses
6
46.
Hav
e yo
u ev
er h
ad a
test
for a
sex
ually
tran
smit-
ted
infe
ctio
n (n
ot H
IV)?
N
o
1
O
ver 6
mth
s ag
o
2
In th
e pa
st 6
mth
s
3
47.
Hav
e yo
u ev
er b
een
diag
nose
d w
ith a
n ST
I?
No
1
Yes
2
48.
Hav
e yo
u ev
er h
ad a
n H
IV a
ntib
ody
test
?
No
1 Go
to Q
50
Yes
2
Not
sur
e
3
49.
Wha
t was
the
resu
lt of
you
r las
t HIV
test
?
Posi
tive
(you
hav
e H
IV)
1
Neg
ativ
e
2
Not
sur
e
3
PSY
CH
OLO
GIC
AL
HEA
LTH
A
ND
WEL
LBEI
NG
50
. H
ave
you
ever
acc
esse
d a
coun
sello
r
or p
sych
iatr
ist?
N
o
1
Yes,
in p
ast 5
yrs
2
Ye
s, o
ver 5
yrs
ago
3
51.
Hav
e yo
u ev
er b
een
diag
nose
d w
ith d
epre
ssio
n,
anxi
ety
diso
rder
or o
ther
men
tal h
ealth
dis
orde
r?
No
1
Yes,
in p
ast 5
yrs
2
Ye
s, o
ver 5
yrs
ago
3
No
M
onth
ly
Wee
kly
Mor
eLe
sbia
n/qu
eer w
omen
s ev
ent/
bar
1
2
3
4
Gay
nig
ht/b
ar
1
2
3
4
LGBT
IQ d
ance
par
ty
1
2
3
4
LGBT
IQ g
roup
mee
ting
1
2
3
4
LGBT
IQ c
omm
unity
eve
nt
1
2
3
4
LGBT
IQ s
port
s gr
oup
1
2
3
4
No
Yes
No*
Y
es*
Verb
al a
buse
or h
aras
smen
t
1
2
3
4Be
ing
push
ed o
r sho
ved
1
2
3
4Be
ing
bash
ed
1
2
3
4Ph
ysic
al th
reat
or i
ntim
idat
ion
1
2
3
4Re
fusa
l of s
ervi
ce
1
2
3
4Re
fuse
d em
ploy
men
t/pr
omot
ion
1
2
3
4
GO
TO
NEX
T PA
GE
GO
TO
NEX
T PA
GE
*REP
OR
TED
T
O P
OLI
CE
53
SWASH Report 2016, 2018, 2020
SWA
SH
201
6,V
ersi
on 2
016.
0116
Dec
2015
Pag
e 1
of 2
SWA
SH -
Lesb
ian,
Bis
exua
l and
Q
ueer
Wom
en’s
Hea
lth S
urve
y 20
16D
efin
ition
s:B
y w
oman
we
mea
n a
pers
on w
ho id
entif
ies
as a
w
oman
(bor
n fe
mal
e or
now
iden
tifie
sas
fem
ale)
.By
man
we
mea
n a
pers
on w
ho id
entif
ies
as a
man
(bor
n m
ale
or n
ow
iden
tifie
sas
mal
e).B
y LG
BTI
Qw
e m
ean
lesb
ian,
gay
, bi
sexu
al, t
rans
gend
er, i
nter
sex
and
quee
r
Bef
ore
you
star
t:Th
isco
de a
llow
s us
to tr
ack
chan
ges
in
heal
th o
ver t
ime.
Thi
s w
ill N
OT
iden
tify
you .
Firs
t tw
o le
tters
of f
irst n
ame
and
surn
ame
Did
you
com
plet
e th
e SW
ASH
sur
vey
in 2
014 ?
Yes
1
Abo
ut Y
ou1.
Wha
t is
your
age
? __
____
____
__ye
ars
2.P
ostc
ode/
subu
rb/to
wn
whe
re y
ou li
ve__
____
____
____
____
3.A
re y
ou o
f Abo
rigin
al o
r Tor
res
Stra
it Is
land
er o
rigin
?N
o 1
Yes
2
4.W
hat i
s yo
ur e
thni
c or
cul
tura
l bac
kgro
und?
(e.g
. Gre
ek, V
ietn
ames
e, L
eban
ese,
Chi
nese
)A
nglo
-Aus
tralia
n on
ly
1O
ther
(spe
cify)
2__
_ ___
____
__
5.D
o yo
u th
ink
of y
ours
elf p
rimar
ily a
s:Le
sbia
n/dy
ke/g
ay/h
omos
exua
l 1
Bi s
exua
l 2
Que
er
3H
eter
osex
ual/s
traig
ht
4
Oth
er (s
pecif
y)5
____
____
____
____
____
_
6.W
hich
of t
hese
six
sta
tem
ents
bes
t des
crib
es
you?
I ha
ve fe
lt se
xual
ly a
ttrac
ted—
Onl
y to
fem
ales
, nev
er to
mal
es1
Mor
e of
ten
to fe
mal
es, a
nd a
t lea
st o
nce
to a
mal
e2
Abo
ut e
qual
ly o
ften
to fe
mal
es a
nd to
mal
es3
Mor
e of
ten
to m
ales
, and
at l
east
onc
e to
a fe
mal
e 4
Onl
y to
mal
es, n
ever
to fe
mal
es5
To n
o on
e at
all
6
7.A
re y
ou tr
ansg
ende
r or t
rans
sexu
al?
No
1Ye
s2
Pre
fer n
ot to
say
3
8.A
re y
ou in
ters
ex?
No
1Ye
s2
Pre
fer n
ot to
say
3
9.A
re y
ou: (
tick a
ll tha
t app
ly)E
mpl
oyed
full-
time
1
Em
ploy
ed p
art -t
ime
2U
nem
ploy
ed
3
Doi
ng d
omes
tic d
utie
s 4
Not
in th
e w
ork
forc
e 5
Pen
sion
er/s
ocia
l sec
urity
6
Stu
dent
7
10. W
hat i
s yo
ur a
nnua
l inc
ome
befo
re ta
x?N
il–$1
9,99
9 1
$20,
000 –
$39,
999
2$ 4
0,00
0–$5
9,99
93
$60,
000–
$99,
999
4$1
00,0
00+
5
11. W
hat i
s th
e hi
ghes
t lev
el o
f edu
catio
n yo
u ha
ve
com
plet
ed?
Up
to Y
ear 1
0 / S
choo
l Cer
tific
ate
1
Year
12
/ HS
C /
Leav
ing
Cer
t / IB
2
Terti
ary
dipl
oma
or tr
ade
certi
ficat
e3
Uni
vers
ity o
r col
lege
deg
ree
4
Pos
tgra
duat
e de
gree
(MA
, MS
c, P
hD)
5
12. D
o yo
u ha
ve a
ny d
epen
dent
chi
ldre
n?N
o 1
Yes
2
If ye
s, h
ow m
any?
____
_ ___
____
____
13. A
re y
ou p
lann
ing
to h
ave
a ch
ild in
the
next
2
yrs?
No
1Ye
s2
14. D
o yo
u ha
ve a
chr
onic
(lon
g-te
rm) i
llnes
s or
di
sabi
lity?
N
o 1
Yes
2
If ye
s, p
leas
e sp
ecify
:___
____
____
____
____
____
____
____
Com
mun
ity15
. Do
you
feel
con
nect
ed to
a L
GB
TIQ
com
mun
ity in
you
r ev
eryd
ay li
fe?
Ver
y 1
Mos
tly
2S
omew
hat
3R
arel
y 4
Not
at a
ll 5
16.
In th
e pa
st 6
mth
sha
ve y
ou
atte
nded
:N
oM
onth
lyW
eekl
yM
ore
Lesb
ian/
quee
r wom
en’s
ni
ght/b
ar1
23
4
Gay
nig
ht/b
ar1
23
4LG
BTQ
dan
ce p
arty
12
34
LGB
TQ g
roup
mee
ting
12
34
LGB
TQ c
omm
unity
eve
nt1
23
4
LGB
TQ s
ports
gro
up1
23
4
17. P
leas
e te
ll us
whe
re y
ou c
onne
ct w
ith L
GB
TIQ
com
mun
ity
or c
onte
nt o
nlin
e (s
ites,
pag
es, g
roup
s)__
____
____
____
____
____
____
____
____
____
____
____
____
____
____
____
__
18. H
ow m
any
of y
our f
riend
s ar
e LG
BT I
Q?
Non
e 1
A fe
w2
Som
e 3
Mos
t 4
All
5
Sex
and
rela
tions
hips
19.W
hen
was
the
last
tim
e yo
u ha
d se
x w
ith a
wom
an?
Nev
er
1Go
to Q
2 3
O
ver 6
mth
s ag
o 2
Go to
Q23
In th
e pa
st 6
mt h
s 3
20.In
the
past
6 m
ths,
how
man
y w
omen
hav
e yo
uha
d se
x w
ith?
Non
e1
One
22 -
53
6-10
4M
ore
than
10
5
21.In
the
last
4 w
ks, h
ow m
any
times
hav
e yo
u ha
d se
x w
ith a
wom
an?
(write
a nu
mber
)__
____
__tim
es
22.I
n th
e pa
st 6
mth
s, w
hich
of t
he fo
llow
ing
have
yo
u do
ne w
hile
hav
ing
sex
with
a w
oman
?N
oYe
s
Fing
ers
/ han
d on
ext
erna
l gen
itals
12
Fing
ers
/ han
d in
side
vag
ina
12
Fing
ers
/ han
d in
side
anu
s1
2O
ral s
ex (y
our m
outh
, her
gen
itals
)1
2O
ral s
ex (h
erm
outh
, you
r gen
itals
)1
2R
imm
ing
(her
mou
th, y
our a
nus)
12
Rim
min
g (y
our m
outh
, her
anu
s)1
2S
ex to
y us
ed o
n ex
tern
al g
enita
ls1
2S
ex to
y us
ed in
side
vag
ina
12
Sex
toy
used
insi
de a
nus
12
23.In
the
past
6 m
ths,
hav
e yo
u do
ne:
No
Yes
Kin
k, S
/M d
omin
ance
/bon
dage
(no
bloo
d)1
2K
ink,
S/M
dom
inan
ce/b
onda
ge (w
ith b
lood
)1
2
24. H
ave
you
done
any
sex
wor
k?N
ever
1
O
ver 6
mt h
s ag
o 2
In th
e pa
st 6
mth
s 3
25. W
hen
was
the
last
occ
asio
n yo
u ha
d se
x w
ith a
gay
/hom
osex
ual /b
isex
ual m
an?
Nev
er
1Go
to Q
2 7
Ove
r 6 m
ths
ago
2Go
to Q
2 7In
the
past
6 m
ths
3
26.In
the
past
6 m
ths
have
you
had
vag
inal
/ana
l int
erco
urse
w
ith a
gay
/bis
exua
l man
(reg
ular o
r cas
ual p
artne
r)w
ithou
taco
ndom
?N
ever
1O
nce
2O
ccas
iona
lly3
Ofte
n4
27. W
hen
was
the
last
occ
asio
n yo
u ha
d se
x w
ith a
str
aigh
t /het
eros
exua
l man
?N
ever
1
Go to
Q2 9
Ove
r 6 m
ths
ago
2Go
to Q
2 9In
the
past
6 m
ths
3
28.In
the
past
6 m
ths
have
you
had
vag
inal
/ana
l int
erco
urse
w
ith a
str
aigh
t/het
eros
exua
l man
(reg
ular o
r cas
ual p
artne
r)w
ithou
t a c
ondo
m?
Nev
er1
Onc
e2
Occ
asio
nally
3O
ften
4
29. A
re y
ou c
urre
ntly
in a
sex
ual r
elat
ions
hip
with
a re
gula
r par
tner
?N
o 1
Go to
Q3 1
A w
oman
2
A m
an
3M
ultip
le re
gula
r par
tner
s/po
ly
4
30.H
ow lo
ng is
this
rela
tions
hip?
Less
than
6
mth
s1
6-11
mth
s2
1-2
yrs
33-
5 yr
s4
Mor
e th
an
5 yr
s5
31.H
ave
you
had
casu
al s
ex in
the
past
6 m
ths ?
No
1Ye
s, w
ith w
omen
2
Yes,
with
men
3Ye
s, w
ith b
oth
4
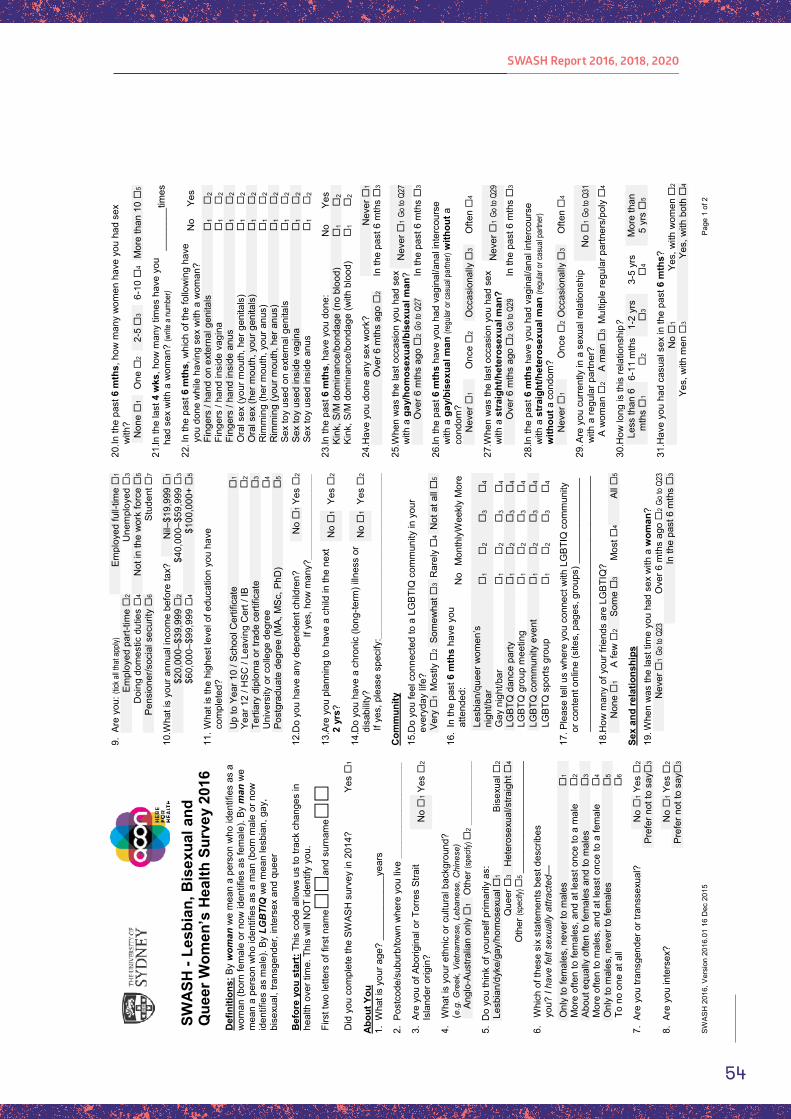
54
SWASH Report 2016, 2018, 2020
SWA
SH
201
6,V
ersi
on 2
016.
0116
Dec
2015
Pag
e 1
of 2
SWA
SH -
Lesb
ian,
Bis
exua
l and
Q
ueer
Wom
en’s
Hea
lth S
urve
y 20
16D
efin
ition
s:B
y w
oman
we
mea
n a
pers
on w
ho id
entif
ies
as a
w
oman
(bor
n fe
mal
e or
now
iden
tifie
sas
fem
ale)
.By
man
we
mea
n a
pers
on w
ho id
entif
ies
as a
man
(bor
n m
ale
or n
ow
iden
tifie
sas
mal
e).B
y LG
BTI
Qw
e m
ean
lesb
ian,
gay
, bi
sexu
al, t
rans
gend
er, i
nter
sex
and
quee
r
Bef
ore
you
star
t:Th
isco
de a
llow
s us
to tr
ack
chan
ges
in
heal
th o
ver t
ime.
Thi
s w
ill N
OT
iden
tify
you .
Firs
t tw
o le
tters
of f
irst n
ame
and
surn
ame
Did
you
com
plet
e th
e SW
ASH
sur
vey
in 2
014 ?
Yes
1
Abo
ut Y
ou1.
Wha
t is
your
age
? __
____
____
__ye
ars
2.P
ostc
ode/
subu
rb/to
wn
whe
re y
ou li
ve__
____
____
____
____
3.A
re y
ou o
f Abo
rigin
al o
r Tor
res
Stra
it Is
land
er o
rigin
?N
o 1
Yes
2
4.W
hat i
s yo
ur e
thni
c or
cul
tura
l bac
kgro
und?
(e.g
. Gre
ek, V
ietn
ames
e, L
eban
ese,
Chi
nese
)A
nglo
-Aus
tralia
n on
ly
1O
ther
(spe
cify)
2__
_ ___
____
__
5.D
o yo
u th
ink
of y
ours
elf p
rimar
ily a
s:Le
sbia
n/dy
ke/g
ay/h
omos
exua
l 1
Bi s
exua
l 2
Que
er
3H
eter
osex
ual/s
traig
ht
4
Oth
er (s
pecif
y)5
____
____
____
____
____
_
6.W
hich
of t
hese
six
sta
tem
ents
bes
t des
crib
es
you?
I ha
ve fe
lt se
xual
ly a
ttrac
ted—
Onl
y to
fem
ales
, nev
er to
mal
es1
Mor
e of
ten
to fe
mal
es, a
nd a
t lea
st o
nce
to a
mal
e2
Abo
ut e
qual
ly o
ften
to fe
mal
es a
nd to
mal
es3
Mor
e of
ten
to m
ales
, and
at l
east
onc
e to
a fe
mal
e 4
Onl
y to
mal
es, n
ever
to fe
mal
es5
To n
o on
e at
all
6
7.A
re y
ou tr
ansg
ende
r or t
rans
sexu
al?
No
1Ye
s2
Pre
fer n
ot to
say
3
8.A
re y
ou in
ters
ex?
No
1Ye
s2
Pre
fer n
ot to
say
3
9.A
re y
ou: (
tick a
ll tha
t app
ly)E
mpl
oyed
full-
time
1
Em
ploy
ed p
art -t
ime
2U
nem
ploy
ed
3
Doi
ng d
omes
tic d
utie
s 4
Not
in th
e w
ork
forc
e 5
Pen
sion
er/s
ocia
l sec
urity
6
Stu
dent
7
10. W
hat i
s yo
ur a
nnua
l inc
ome
befo
re ta
x?N
il–$1
9,99
9 1
$20,
000 –
$39,
999
2$ 4
0,00
0–$5
9,99
93
$60,
000–
$99,
999
4$1
00,0
00+
5
11. W
hat i
s th
e hi
ghes
t lev
el o
f edu
catio
n yo
u ha
ve
com
plet
ed?
Up
to Y
ear 1
0 / S
choo
l Cer
tific
ate
1
Year
12
/ HS
C /
Leav
ing
Cer
t / IB
2
Terti
ary
dipl
oma
or tr
ade
certi
ficat
e3
Uni
vers
ity o
r col
lege
deg
ree
4
Pos
tgra
duat
e de
gree
(MA
, MS
c, P
hD)
5
12. D
o yo
u ha
ve a
ny d
epen
dent
chi
ldre
n?N
o 1
Yes
2
If ye
s, h
ow m
any?
____
_ ___
____
____
13. A
re y
ou p
lann
ing
to h
ave
a ch
ild in
the
next
2
yrs?
No
1Ye
s2
14. D
o yo
u ha
ve a
chr
onic
(lon
g-te
rm) i
llnes
s or
di
sabi
lity?
N
o 1
Yes
2
If ye
s, p
leas
e sp
ecify
:___
____
____
____
____
____
____
____
Com
mun
ity15
. Do
you
feel
con
nect
ed to
a L
GB
TIQ
com
mun
ity in
you
r ev
eryd
ay li
fe?
Ver
y 1
Mos
tly
2S
omew
hat
3R
arel
y 4
Not
at a
ll 5
16.
In th
e pa
st 6
mth
sha
ve y
ou
atte
nded
:N
oM
onth
lyW
eekl
yM
ore
Lesb
ian/
quee
r wom
en’s
ni
ght/b
ar1
23
4
Gay
nig
ht/b
ar1
23
4LG
BTQ
dan
ce p
arty
12
34
LGB
TQ g
roup
mee
ting
12
34
LGB
TQ c
omm
unity
eve
nt1
23
4
LGB
TQ s
ports
gro
up1
23
4
17. P
leas
e te
ll us
whe
re y
ou c
onne
ct w
ith L
GB
TIQ
com
mun
ity
or c
onte
nt o
nlin
e (s
ites,
pag
es, g
roup
s)__
____
____
____
____
____
____
____
____
____
____
____
____
____
____
____
__
18. H
ow m
any
of y
our f
riend
s ar
e LG
BT I
Q?
Non
e 1
A fe
w2
Som
e 3
Mos
t 4
All
5
Sex
and
rela
tions
hips
19.W
hen
was
the
last
tim
e yo
u ha
d se
x w
ith a
wom
an?
Nev
er
1Go
to Q
2 3
O
ver 6
mth
s ag
o 2
Go to
Q23
In th
e pa
st 6
mt h
s 3
20.In
the
past
6 m
ths,
how
man
y w
omen
hav
e yo
uha
d se
x w
ith?
Non
e1
One
22 -
53
6-10
4M
ore
than
10
5
21.In
the
last
4 w
ks, h
ow m
any
times
hav
e yo
u ha
d se
x w
ith a
wom
an?
(write
a nu
mber
)__
____
__tim
es
22.I
n th
e pa
st 6
mth
s, w
hich
of t
he fo
llow
ing
have
yo
u do
ne w
hile
hav
ing
sex
with
a w
oman
?N
oYe
s
Fing
ers
/ han
d on
ext
erna
l gen
itals
12
Fing
ers
/ han
d in
side
vag
ina
12
Fing
ers
/ han
d in
side
anu
s1
2O
ral s
ex (y
our m
outh
, her
gen
itals
)1
2O
ral s
ex (h
erm
outh
, you
r gen
itals
)1
2R
imm
ing
(her
mou
th, y
our a
nus)
12
Rim
min
g (y
our m
outh
, her
anu
s)1
2S
ex to
y us
ed o
n ex
tern
al g
enita
ls1
2S
ex to
y us
ed in
side
vag
ina
12
Sex
toy
used
insi
de a
nus
12
23.In
the
past
6 m
ths,
hav
e yo
u do
ne:
No
Yes
Kin
k, S
/M d
omin
ance
/bon
dage
(no
bloo
d)1
2K
ink,
S/M
dom
inan
ce/b
onda
ge (w
ith b
lood
)1
2
24. H
ave
you
done
any
sex
wor
k?N
ever
1
O
ver 6
mt h
s ag
o 2
In th
e pa
st 6
mth
s 3
25. W
hen
was
the
last
occ
asio
n yo
u ha
d se
x w
ith a
gay
/hom
osex
ual /b
isex
ual m
an?
Nev
er
1Go
to Q
2 7
Ove
r 6 m
ths
ago
2Go
to Q
2 7In
the
past
6 m
ths
3
26.In
the
past
6 m
ths
have
you
had
vag
inal
/ana
l int
erco
urse
w
ith a
gay
/bis
exua
l man
(reg
ular o
r cas
ual p
artne
r)w
ithou
taco
ndom
?N
ever
1O
nce
2O
ccas
iona
lly3
Ofte
n4
27. W
hen
was
the
last
occ
asio
n yo
u ha
d se
x w
ith a
str
aigh
t /het
eros
exua
l man
?N
ever
1
Go to
Q2 9
Ove
r 6 m
ths
ago
2Go
to Q
2 9In
the
past
6 m
ths
3
28.In
the
past
6 m
ths
have
you
had
vag
inal
/ana
l int
erco
urse
w
ith a
str
aigh
t/het
eros
exua
l man
(reg
ular o
r cas
ual p
artne
r)w
ithou
t a c
ondo
m?
Nev
er1
Onc
e2
Occ
asio
nally
3O
ften
4
29. A
re y
ou c
urre
ntly
in a
sex
ual r
elat
ions
hip
with
a re
gula
r par
tner
?N
o 1
Go to
Q3 1
A w
oman
2
A m
an
3M
ultip
le re
gula
r par
tner
s/po
ly
4
30.H
ow lo
ng is
this
rela
tions
hip?
Less
than
6
mth
s1
6-11
mth
s2
1-2
yrs
33-
5 yr
s4
Mor
e th
an
5 yr
s5
31.H
ave
you
had
casu
al s
ex in
the
past
6 m
ths ?
No
1Ye
s, w
ith w
omen
2
Yes,
with
men
3Ye
s, w
ith b
oth
4
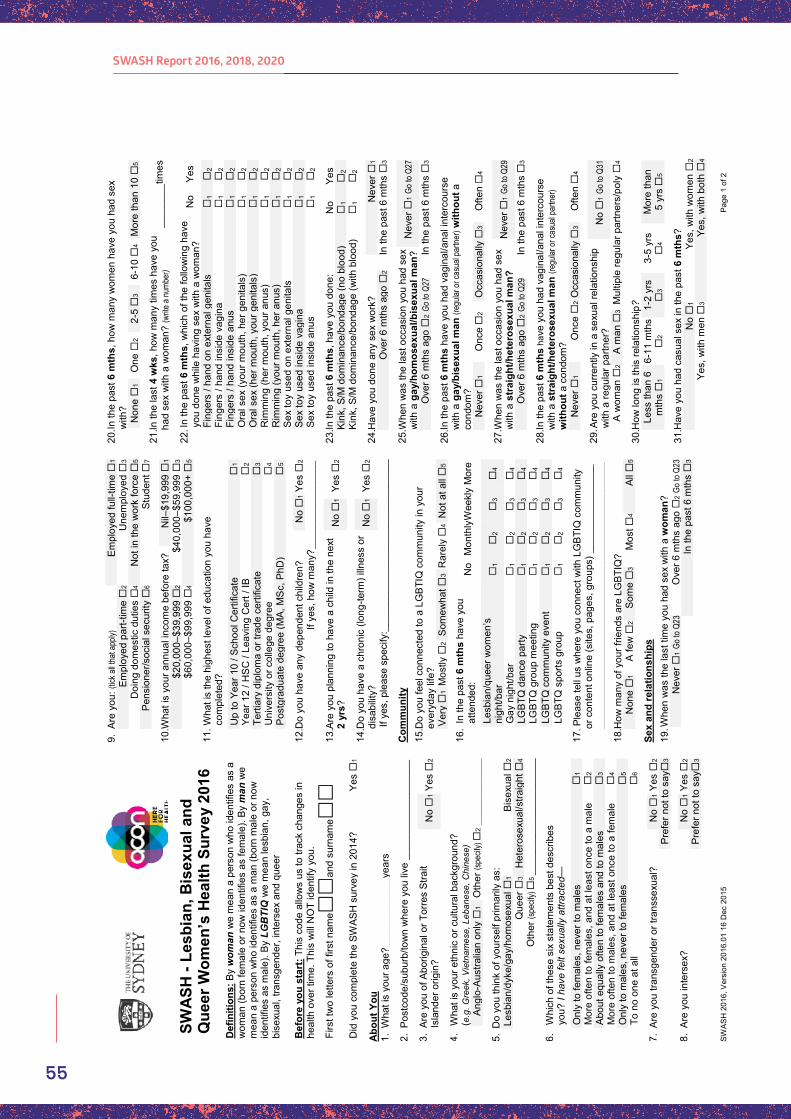
55
SWASH Report 2016, 2018, 2020
SWA
SH
201
6,V
ersi
on 2
016.
0116
Dec
2015
Pag
e 1
of 2
SWA
SH -
Lesb
ian,
Bis
exua
l and
Q
ueer
Wom
en’s
Hea
lth S
urve
y 20
16D
efin
ition
s:B
y w
oman
we
mea
n a
pers
on w
ho id
entif
ies
as a
w
oman
(bor
n fe
mal
e or
now
iden
tifie
sas
fem
ale)
.By
man
we
mea
n a
pers
on w
ho id
entif
ies
as a
man
(bor
n m
ale
or n
ow
iden
tifie
sas
mal
e).B
y LG
BTI
Qw
e m
ean
lesb
ian,
gay
, bi
sexu
al, t
rans
gend
er, i
nter
sex
and
quee
r
Bef
ore
you
star
t:Th
isco
de a
llow
s us
to tr
ack
chan
ges
in
heal
th o
ver t
ime.
Thi
s w
ill N
OT
iden
tify
you .
Firs
t tw
o le
tters
of f
irst n
ame
and
surn
ame
Did
you
com
plet
e th
e SW
ASH
sur
vey
in 2
014 ?
Yes
1
Abo
ut Y
ou1.
Wha
t is
your
age
? __
____
____
__ye
ars
2.P
ostc
ode/
subu
rb/to
wn
whe
re y
ou li
ve__
____
____
____
____
3.A
re y
ou o
f Abo
rigin
al o
r Tor
res
Stra
it Is
land
er o
rigin
?N
o 1
Yes
2
4.W
hat i
s yo
ur e
thni
c or
cul
tura
l bac
kgro
und?
(e.g
. Gre
ek, V
ietn
ames
e, L
eban
ese,
Chi
nese
)A
nglo
-Aus
tralia
n on
ly
1O
ther
(spe
cify)
2__
_ ___
____
__
5.D
o yo
u th
ink
of y
ours
elf p
rimar
ily a
s:Le
sbia
n/dy
ke/g
ay/h
omos
exua
l 1
Bi s
exua
l 2
Que
er
3H
eter
osex
ual/s
traig
ht
4
Oth
er (s
pecif
y)5
____
____
____
____
____
_
6.W
hich
of t
hese
six
sta
tem
ents
bes
t des
crib
es
you?
I ha
ve fe
lt se
xual
ly a
ttrac
ted—
Onl
y to
fem
ales
, nev
er to
mal
es1
Mor
e of
ten
to fe
mal
es, a
nd a
t lea
st o
nce
to a
mal
e2
Abo
ut e
qual
ly o
ften
to fe
mal
es a
nd to
mal
es3
Mor
e of
ten
to m
ales
, and
at l
east
onc
e to
a fe
mal
e 4
Onl
y to
mal
es, n
ever
to fe
mal
es5
To n
o on
e at
all
6
7.A
re y
ou tr
ansg
ende
r or t
rans
sexu
al?
No
1Ye
s2
Pre
fer n
ot to
say
3
8.A
re y
ou in
ters
ex?
No
1Ye
s2
Pre
fer n
ot to
say
3
9.A
re y
ou: (
tick a
ll tha
t app
ly)E
mpl
oyed
full-
time
1
Em
ploy
ed p
art -t
ime
2U
nem
ploy
ed
3
Doi
ng d
omes
tic d
utie
s 4
Not
in th
e w
ork
forc
e 5
Pen
sion
er/s
ocia
l sec
urity
6
Stu
dent
7
10. W
hat i
s yo
ur a
nnua
l inc
ome
befo
re ta
x?N
il–$1
9,99
9 1
$20,
000 –
$39,
999
2$ 4
0,00
0–$5
9,99
93
$60,
000–
$99,
999
4$1
00,0
00+
5
11. W
hat i
s th
e hi
ghes
t lev
el o
f edu
catio
n yo
u ha
ve
com
plet
ed?
Up
to Y
ear 1
0 / S
choo
l Cer
tific
ate
1
Year
12
/ HS
C /
Leav
ing
Cer
t / IB
2
Terti
ary
dipl
oma
or tr
ade
certi
ficat
e3
Uni
vers
ity o
r col
lege
deg
ree
4
Pos
tgra
duat
e de
gree
(MA
, MS
c, P
hD)
5
12. D
o yo
u ha
ve a
ny d
epen
dent
chi
ldre
n?N
o 1
Yes
2
If ye
s, h
ow m
any?
____
_ ___
____
____
13. A
re y
ou p
lann
ing
to h
ave
a ch
ild in
the
next
2
yrs?
No
1Ye
s2
14. D
o yo
u ha
ve a
chr
onic
(lon
g-te
rm) i
llnes
s or
di
sabi
lity?
N
o 1
Yes
2
If ye
s, p
leas
e sp
ecify
:___
____
____
____
____
____
____
____
Com
mun
ity15
. Do
you
feel
con
nect
ed to
a L
GB
TIQ
com
mun
ity in
you
r ev
eryd
ay li
fe?
Ver
y 1
Mos
tly
2S
omew
hat
3R
arel
y 4
Not
at a
ll 5
16.
In th
e pa
st 6
mth
sha
ve y
ou
atte
nded
:N
oM
onth
lyW
eekl
yM
ore
Lesb
ian/
quee
r wom
en’s
ni
ght/b
ar1
23
4
Gay
nig
ht/b
ar1
23
4LG
BTQ
dan
ce p
arty
12
34
LGB
TQ g
roup
mee
ting
12
34
LGB
TQ c
omm
unity
eve
nt1
23
4
LGB
TQ s
ports
gro
up1
23
4
17. P
leas
e te
ll us
whe
re y
ou c
onne
ct w
ith L
GB
TIQ
com
mun
ity
or c
onte
nt o
nlin
e (s
ites,
pag
es, g
roup
s)__
____
____
____
____
____
____
____
____
____
____
____
____
____
____
____
__
18. H
ow m
any
of y
our f
riend
s ar
e LG
BT I
Q?
Non
e 1
A fe
w2
Som
e 3
Mos
t 4
All
5
Sex
and
rela
tions
hips
19.W
hen
was
the
last
tim
e yo
u ha
d se
x w
ith a
wom
an?
Nev
er
1Go
to Q
2 3
O
ver 6
mth
s ag
o 2
Go to
Q23
In th
e pa
st 6
mt h
s 3
20.In
the
past
6 m
ths,
how
man
y w
omen
hav
e yo
uha
d se
x w
ith?
Non
e1
One
22 -
53
6-10
4M
ore
than
10
5
21.In
the
last
4 w
ks, h
ow m
any
times
hav
e yo
u ha
d se
x w
ith a
wom
an?
(write
a nu
mber
)__
____
__tim
es
22.I
n th
e pa
st 6
mth
s, w
hich
of t
he fo
llow
ing
have
yo
u do
ne w
hile
hav
ing
sex
with
a w
oman
?N
oYe
s
Fing
ers
/ han
d on
ext
erna
l gen
itals
12
Fing
ers
/ han
d in
side
vag
ina
12
Fing
ers
/ han
d in
side
anu
s1
2O
ral s
ex (y
our m
outh
, her
gen
itals
)1
2O
ral s
ex (h
erm
outh
, you
r gen
itals
)1
2R
imm
ing
(her
mou
th, y
our a
nus)
12
Rim
min
g (y
our m
outh
, her
anu
s)1
2S
ex to
y us
ed o
n ex
tern
al g
enita
ls1
2S
ex to
y us
ed in
side
vag
ina
12
Sex
toy
used
insi
de a
nus
12
23.In
the
past
6 m
ths,
hav
e yo
u do
ne:
No
Yes
Kin
k, S
/M d
omin
ance
/bon
dage
(no
bloo
d)1
2K
ink,
S/M
dom
inan
ce/b
onda
ge (w
ith b
lood
)1
2
24. H
ave
you
done
any
sex
wor
k?N
ever
1
O
ver 6
mt h
s ag
o 2
In th
e pa
st 6
mth
s 3
25. W
hen
was
the
last
occ
asio
n yo
u ha
d se
x w
ith a
gay
/hom
osex
ual /b
isex
ual m
an?
Nev
er
1Go
to Q
2 7
Ove
r 6 m
ths
ago
2Go
to Q
2 7In
the
past
6 m
ths
3
26.In
the
past
6 m
ths
have
you
had
vag
inal
/ana
l int
erco
urse
w
ith a
gay
/bis
exua
l man
(reg
ular o
r cas
ual p
artne
r)w
ithou
taco
ndom
?N
ever
1O
nce
2O
ccas
iona
lly3
Ofte
n4
27. W
hen
was
the
last
occ
asio
n yo
u ha
d se
x w
ith a
str
aigh
t /het
eros
exua
l man
?N
ever
1
Go to
Q2 9
Ove
r 6 m
ths
ago
2Go
to Q
2 9In
the
past
6 m
ths
3
28.In
the
past
6 m
ths
have
you
had
vag
inal
/ana
l int
erco
urse
w
ith a
str
aigh
t/het
eros
exua
l man
(reg
ular o
r cas
ual p
artne
r)w
ithou
t a c
ondo
m?
Nev
er1
Onc
e2
Occ
asio
nally
3O
ften
4
29. A
re y
ou c
urre
ntly
in a
sex
ual r
elat
ions
hip
with
a re
gula
r par
tner
?N
o 1
Go to
Q3 1
A w
oman
2
A m
an
3M
ultip
le re
gula
r par
tner
s/po
ly
4
30.H
ow lo
ng is
this
rela
tions
hip?
Less
than
6
mth
s1
6-11
mth
s2
1-2
yrs
33-
5 yr
s4
Mor
e th
an
5 yr
s5
31.H
ave
you
had
casu
al s
ex in
the
past
6 m
ths ?
No
1Ye
s, w
ith w
omen
2
Yes,
with
men
3Ye
s, w
ith b
oth
4
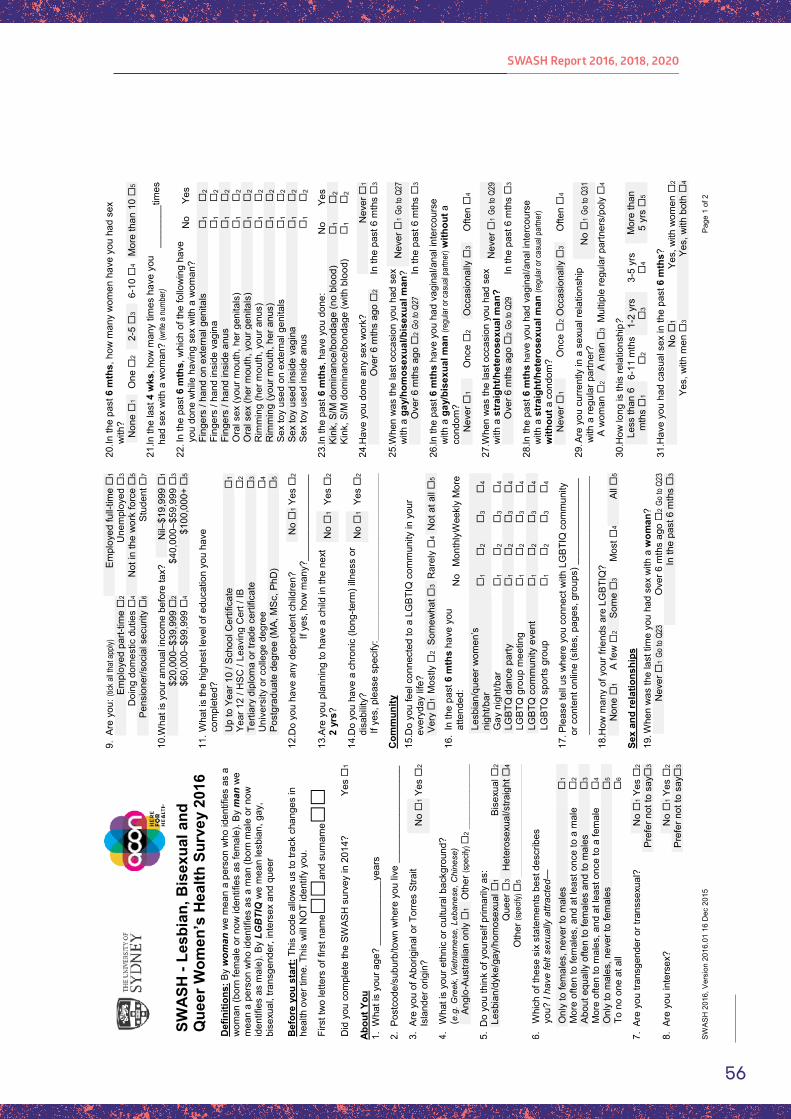
56
SWASH Report 2016, 2018, 2020
SWA
SH
201
6,V
ersi
on 2
016.
0116
Dec
2015
Pag
e 1
of 2
SWA
SH -
Lesb
ian,
Bis
exua
l and
Q
ueer
Wom
en’s
Hea
lth S
urve
y 20
16D
efin
ition
s:B
y w
oman
we
mea
n a
pers
on w
ho id
entif
ies
as a
w
oman
(bor
n fe
mal
e or
now
iden
tifie
sas
fem
ale)
.By
man
we
mea
n a
pers
on w
ho id
entif
ies
as a
man
(bor
n m
ale
or n
ow
iden
tifie
sas
mal
e).B
y LG
BTI
Qw
e m
ean
lesb
ian,
gay
, bi
sexu
al, t
rans
gend
er, i
nter
sex
and
quee
r
Bef
ore
you
star
t:Th
isco
de a
llow
s us
to tr
ack
chan
ges
in
heal
th o
ver t
ime.
Thi
s w
ill N
OT
iden
tify
you .
Firs
t tw
o le
tters
of f
irst n
ame
and
surn
ame
Did
you
com
plet
e th
e SW
ASH
sur
vey
in 2
014 ?
Yes
1
Abo
ut Y
ou1.
Wha
t is
your
age
? __
____
____
__ye
ars
2.P
ostc
ode/
subu
rb/to
wn
whe
re y
ou li
ve__
____
____
____
____
3.A
re y
ou o
f Abo
rigin
al o
r Tor
res
Stra
it Is
land
er o
rigin
?N
o 1
Yes
2
4.W
hat i
s yo
ur e
thni
c or
cul
tura
l bac
kgro
und?
(e.g
. Gre
ek, V
ietn
ames
e, L
eban
ese,
Chi
nese
)A
nglo
-Aus
tralia
n on
ly
1O
ther
(spe
cify)
2__
_ ___
____
__
5.D
o yo
u th
ink
of y
ours
elf p
rimar
ily a
s:Le
sbia
n/dy
ke/g
ay/h
omos
exua
l 1
Bi s
exua
l 2
Que
er
3H
eter
osex
ual/s
traig
ht
4
Oth
er (s
pecif
y)5
____
____
____
____
____
_
6.W
hich
of t
hese
six
sta
tem
ents
bes
t des
crib
es
you?
I ha
ve fe
lt se
xual
ly a
ttrac
ted—
Onl
y to
fem
ales
, nev
er to
mal
es1
Mor
e of
ten
to fe
mal
es, a
nd a
t lea
st o
nce
to a
mal
e2
Abo
ut e
qual
ly o
ften
to fe
mal
es a
nd to
mal
es3
Mor
e of
ten
to m
ales
, and
at l
east
onc
e to
a fe
mal
e 4
Onl
y to
mal
es, n
ever
to fe
mal
es5
To n
o on
e at
all
6
7.A
re y
ou tr
ansg
ende
r or t
rans
sexu
al?
No
1Ye
s2
Pre
fer n
ot to
say
3
8.A
re y
ou in
ters
ex?
No
1Ye
s2
Pre
fer n
ot to
say
3
9.A
re y
ou: (
tick a
ll tha
t app
ly)E
mpl
oyed
full-
time
1
Em
ploy
ed p
art -t
ime
2U
nem
ploy
ed
3
Doi
ng d
omes
tic d
utie
s 4
Not
in th
e w
ork
forc
e 5
Pen
sion
er/s
ocia
l sec
urity
6
Stu
dent
7
10. W
hat i
s yo
ur a
nnua
l inc
ome
befo
re ta
x?N
il–$1
9,99
9 1
$20,
000 –
$39,
999
2$ 4
0,00
0–$5
9,99
93
$60,
000–
$99,
999
4$1
00,0
00+
5
11. W
hat i
s th
e hi
ghes
t lev
el o
f edu
catio
n yo
u ha
ve
com
plet
ed?
Up
to Y
ear 1
0 / S
choo
l Cer
tific
ate
1
Year
12
/ HS
C /
Leav
ing
Cer
t / IB
2
Terti
ary
dipl
oma
or tr
ade
certi
ficat
e3
Uni
vers
ity o
r col
lege
deg
ree
4
Pos
tgra
duat
e de
gree
(MA
, MS
c, P
hD)
5
12. D
o yo
u ha
ve a
ny d
epen
dent
chi
ldre
n?N
o 1
Yes
2
If ye
s, h
ow m
any?
____
_ ___
____
____
13. A
re y
ou p
lann
ing
to h
ave
a ch
ild in
the
next
2
yrs?
No
1Ye
s2
14. D
o yo
u ha
ve a
chr
onic
(lon
g-te
rm) i
llnes
s or
di
sabi
lity?
N
o 1
Yes
2
If ye
s, p
leas
e sp
ecify
:___
____
____
____
____
____
____
____
Com
mun
ity15
. Do
you
feel
con
nect
ed to
a L
GB
TIQ
com
mun
ity in
you
r ev
eryd
ay li
fe?
Ver
y 1
Mos
tly
2S
omew
hat
3R
arel
y 4
Not
at a
ll 5
16.
In th
e pa
st 6
mth
sha
ve y
ou
atte
nded
:N
oM
onth
lyW
eekl
yM
ore
Lesb
ian/
quee
r wom
en’s
ni
ght/b
ar1
23
4
Gay
nig
ht/b
ar1
23
4LG
BTQ
dan
ce p
arty
12
34
LGB
TQ g
roup
mee
ting
12
34
LGB
TQ c
omm
unity
eve
nt1
23
4
LGB
TQ s
ports
gro
up1
23
4
17. P
leas
e te
ll us
whe
re y
ou c
onne
ct w
ith L
GB
TIQ
com
mun
ity
or c
onte
nt o
nlin
e (s
ites,
pag
es, g
roup
s)__
____
____
____
____
____
____
____
____
____
____
____
____
____
____
____
__
18. H
ow m
any
of y
our f
riend
s ar
e LG
BT I
Q?
Non
e 1
A fe
w2
Som
e 3
Mos
t 4
All
5
Sex
and
rela
tions
hips
19.W
hen
was
the
last
tim
e yo
u ha
d se
x w
ith a
wom
an?
Nev
er
1Go
to Q
2 3
O
ver 6
mth
s ag
o 2
Go to
Q23
In th
e pa
st 6
mt h
s 3
20.In
the
past
6 m
ths,
how
man
y w
omen
hav
e yo
uha
d se
x w
ith?
Non
e1
One
22 -
53
6-10
4M
ore
than
10
5
21.In
the
last
4 w
ks, h
ow m
any
times
hav
e yo
u ha
d se
x w
ith a
wom
an?
(write
a nu
mber
)__
____
__tim
es
22.I
n th
e pa
st 6
mth
s, w
hich
of t
he fo
llow
ing
have
yo
u do
ne w
hile
hav
ing
sex
with
a w
oman
?N
oYe
s
Fing
ers
/ han
d on
ext
erna
l gen
itals
12
Fing
ers
/ han
d in
side
vag
ina
12
Fing
ers
/ han
d in
side
anu
s1
2O
ral s
ex (y
our m
outh
, her
gen
itals
)1
2O
ral s
ex (h
erm
outh
, you
r gen
itals
)1
2R
imm
ing
(her
mou
th, y
our a
nus)
12
Rim
min
g (y
our m
outh
, her
anu
s)1
2S
ex to
y us
ed o
n ex
tern
al g
enita
ls1
2S
ex to
y us
ed in
side
vag
ina
12
Sex
toy
used
insi
de a
nus
12
23.In
the
past
6 m
ths,
hav
e yo
u do
ne:
No
Yes
Kin
k, S
/M d
omin
ance
/bon
dage
(no
bloo
d)1
2K
ink,
S/M
dom
inan
ce/b
onda
ge (w
ith b
lood
)1
2
24. H
ave
you
done
any
sex
wor
k?N
ever
1
O
ver 6
mt h
s ag
o 2
In th
e pa
st 6
mth
s 3
25. W
hen
was
the
last
occ
asio
n yo
u ha
d se
x w
ith a
gay
/hom
osex
ual /b
isex
ual m
an?
Nev
er
1Go
to Q
2 7
Ove
r 6 m
ths
ago
2Go
to Q
2 7In
the
past
6 m
ths
3
26.In
the
past
6 m
ths
have
you
had
vag
inal
/ana
l int
erco
urse
w
ith a
gay
/bis
exua
l man
(reg
ular o
r cas
ual p
artne
r)w
ithou
taco
ndom
?N
ever
1O
nce
2O
ccas
iona
lly3
Ofte
n4
27. W
hen
was
the
last
occ
asio
n yo
u ha
d se
x w
ith a
str
aigh
t /het
eros
exua
l man
?N
ever
1
Go to
Q2 9
Ove
r 6 m
ths
ago
2Go
to Q
2 9In
the
past
6 m
ths
3
28.In
the
past
6 m
ths
have
you
had
vag
inal
/ana
l int
erco
urse
w
ith a
str
aigh
t/het
eros
exua
l man
(reg
ular o
r cas
ual p
artne
r)w
ithou
t a c
ondo
m?
Nev
er1
Onc
e2
Occ
asio
nally
3O
ften
4
29. A
re y
ou c
urre
ntly
in a
sex
ual r
elat
ions
hip
with
a re
gula
r par
tner
?N
o 1
Go to
Q3 1
A w
oman
2
A m
an
3M
ultip
le re
gula
r par
tner
s/po
ly
4
30.H
ow lo
ng is
this
rela
tions
hip?
Less
than
6
mth
s1
6-11
mth
s2
1-2
yrs
33-
5 yr
s4
Mor
e th
an
5 yr
s5
31.H
ave
you
had
casu
al s
ex in
the
past
6 m
ths ?
No
1Ye
s, w
ith w
omen
2
Yes,
with
men
3Ye
s, w
ith b
oth
4
SWASH Report 2016, 2018, 2020