removal efficiency of a constructed wetland for wastewater treatment according to vegetation...
TRANSCRIPT
www.elsevier.com/locate/chemosphere
Chemosphere 68 (2007) 1105–1113
Removal efficiency of a constructed wetland for wastewatertreatment according to vegetation dominance
M.A. Maine a,b,*, N. Sune a, H. Hadad a,b, G. Sanchez a, C. Bonetto b,c
a Quımica Analıtica, Facultad de Ingenierıa Quımica, Universidad Nacional del Litoral, Santiago del Estero 2829 (3000), Santa Fe, Argentinab Consejo Nacional de Investigaciones Cientıficas y Tecnicas (CONICET), Argentina
c Instituto de Limnologıa Ringuelet. Av. Calchaquı Km. 23.5 (1888), Florencio Varela, Buenos Aires, Argentina
Received 10 November 2006; received in revised form 24 January 2007; accepted 25 January 2007Available online 7 March 2007
Abstract
A free water surface wetland was built to treat wastewater containing metals (Cr, Ni and Zn) and nutrients from a tool factory inSanto Tome, Santa Fe, Argentina. Eichhornia crassipes became dominant and covered about 80% of the surface throughout the firstyear, and decreased progressively until its disappearance. When water depth was lowered Typha domingensis steadily increased plantcover and attained 30% of the surface by the end of the study. While E. crassipes was dominant, the wetland retained 62% of the incom-ing Cr and 48% of the Ni. NO�3 and NO�2 , were also removed (65% and 78%, respectively), while dissolved inorganic phosphate (i-Pdiss)and NHþ4 were not removed. Zn was below 50 lg l�1 in both the influent and effluent. Metal concentration in the sediments did notincrease and retention was mediated through macrophytes uptake. During the period of E. crassipes decline the wetland retained49% of the incoming Cr, 45% of Ni, 58% NO�3 , 94% NO�2 , 58% NHþ4 and 47% i-Pdiss. Cr, Ni and Zn in the bottom sediment increasedin the inlet but not in the outlet. Since T. domingensis became dominant, retention was 58% Cr, 48% Ni and 64% i-Pdiss, while 79% NO�3 ,84% NO�2 and 13% NHþ4 were removed. Metals in the bottom sediment increased in the inlet. In spite of the significant growth ofE. crassipes at the beginning, T. domingensis remained after most of the transplanted macrophytes had disappeared. Macrophyte disap-pearance could be related to the overall toxicity of several environmental constrains as high pH and conductivity, metal concentration,and sulphide presence.� 2007 Elsevier Ltd. All rights reserved.
Keywords: Metals; Nutrients; Constructed wetland; Effluents
1. Introduction
Constructed wetlands constitute complex ecosystems,the biological and physical components which interact toprovide a mechanical and biogeochemical filter capableof removing many contaminants. They were initially uti-lized for nutrient removal in domiciliary and municipal
0045-6535/$ - see front matter � 2007 Elsevier Ltd. All rights reserved.
doi:10.1016/j.chemosphere.2007.01.064
* Corresponding author. Address: Quımica Analıtica, Facultad deIngenierıa Quımica, Universidad Nacional del Litoral, Santiago delEstero 2829 (3000), Santa Fe, Argentina. Tel.: +54 342 4571164x2515;fax: +54 342 4571162.
E-mail addresses: [email protected] (M.A. Maine), [email protected] (C. Bonetto).
sewage, storm water and agricultural runoff displaying awide range of removal efficiencies (Hammer, 1989; Mosh-iri, 1993; Kadlec and Knight, 1996; Vymazal et al., 1998;Kadlec et al., 2000). At present, the application of wetlandsfor industrial wastewater treatment represents a promisingalternative. Bahco metallurgic factory constructed a small-scale experimental wetland to assess the feasibility of treat-ing wastewater from the Santo Tome, Santa Fe (Argentina)tool factory. The wetland, which was 6 m long, 3 m wideand 0.3 m deep, retained 81%, 66% and 59% of the incom-ing Cr, Ni and Zn, respectively, and removed 84% and 75%of the inorganic nitrogen and dissolved inorganic phos-phate (i-Pdiss) from the incoming wastewater (Maineet al., 2005). However, present experience in Argentina
1106 M.A. Maine et al. / Chemosphere 68 (2007) 1105–1113
remains largely unreported. In principle, the conditions arefavorable since low population densities are found togetherwith a large availability of marginal land close to the cities.The central and northern part of the country has mild win-ters, allowing extended growth periods for the vegetation.Macrophytes are assumed to be the main biologicalcomponent of wetlands. They not only assimilate pollu-tants directly into their tissues, but also act as catalystsfor purification reactions by increasing the environmentdiversity in the rhizosphere promoting a variety of chemi-cal and biochemical reactions that enhance purification(Jenssen et al., 1993). Eichhornia crassipes (Mart.) Solms.is commonly used in constructed wetlands because of itsfast growth rate and large uptake of nutrients and conta-minants (Tchobanoglous et al., 1989; Vesk and Allaway,1997). It attains dense stands in the floodplain wetlandsof the Middle Parana River close to the study site. Typha
domingensis Pers. is a rooted macrophyte that had demon-strated to be highly efficient in the accumulation of nutri-ents and contaminants in natural and constructedwetlands (Gersberg et al., 1986; Ellis et al., 1994; Manioset al., 2003).
Because of the high removal efficiency attained in thesmall-scale experimental wetland a large-scale wetlandwas constructed at Bahco S.A. for the wastewater treat-ment of the whole factory. The large-scale wetland hasnow been in operation for more than two years. Plantgrowth showed three different periods, the first one domi-nated by E. crassipes, followed by a decline period and asubsequent period of dominance of T. domingensis. Theremoval efficiency and plant growth were studied fromthe beginning of the wetland operation. The results arecompared with those from the previous small-scale proto-type and the observed differences are discussed.
2. Study site
A free water surface wetland was constructed at theBahco Argentina metallurgic plant, located in Santo Tome,Santa Fe, Argentina (S 31�40 0; W 60�47 0). It is 50 m long,40 m wide and 0.5–0.8 m deep, with a central baffle divid-ing it into two identical sections forcing the effluent tocover double the distance, reaching a 5:1 length–widthratio. Mean wastewater discharge was 100 m3 d�1 through-out the experiment. Water residence time ranged from 7 to12 d. The wetland was rendered impermeable by means ofbentonite to reach a hydraulic conductivity of 10�7 ms�1
(five compacted layers of bentonite – approximate totaldepth: 0.6 m). One meter of soil was placed on the benton-ite layer. Several locally available macrophytes were trans-planted into the wetland: E. crassipes, T. domingensis andPontederia cordata L.
The wetland receives the wastewater through a PVCpipe provided with a perpendicular distribution pipe withholes poked at regular intervals in order to allow theentrance of water in a wide and uniform way. The effluent,
after passing through the wetland, is led by an excavatedchannel into a 1.5 ha pond (3–5 m depth).
Both wastewater from the industrial processes and sew-age from the factory were treated together. It was expectedthat high nutrient concentrations could increase macro-phyte tolerance to the toxic wastewater (Manios et al.,2003). Effluents reached the wetland after a primary treat-ment (precipitation, sieving and decantation). During thefirst stage (five months) of the wetland operation onlydiluted sewage of the factory was poured. The compositionof the effluent was 25 m3 d�1 of sewage + 75 m3 d�1 of lakewater. Later, industrial wastewater and sewage were trea-ted together (25 m3 d�1 of sewage + 75 m3 d�1 of industrialwastewater).
Macrophytes in the nearby undisturbed ponds of theMiddle Parana River floodplain were also sampled in orderto compare their biomass with those of the studied con-structed wetland. E. crassipes was sampled in a pond ofapproximately 0.25 ha with a depth of 50 cm. T. domingen-
sis was collected from a floodplain wetland, showing inter-mittent contact with a Parana River branch, where it grewin dense monoespecific stands.
3. Material and methods
3.1. Water
Thirty six samples of the influent and effluent were takenfrom March 2003 until December 2004. Sampling fre-quency was about every two weeks from March to October2003 and roughly monthly since then. Samples were takenby triplicate.
Conductivity was measured with an YSI 33 conduc-tometer, dissolved oxygen (DO) with a Horiba OM-14portable meter and pH with an Orion pH-meter. Watersamples were filtered through Millipore membrane filters(0.45 lm) for dissolved P and N determinations. Chemicalanalyses were performed following APHA (1998); NO�2was determined by coupling diazotation followed by a col-orimetric technique, NHþ4 and NO�3 by potentiometry(Orion ion selective electrodes, sensitivity: 0.01 mg l�1 ofN, reproducibility: ±2%), total Kjeldahl nitrogen (TKN)by the Kjeldahl method. i-Pdiss was determined by thecolorimetric molybdenum blue method (Murphy andRiley, 1962). Ca2+ and Mg2+ were determined by EDTAtitration. Na+ and K+ were determined by flame emissionphotometry. Alkalinity (carbonate and bicarbonate) wasmeasured by HCl titration. Cl� was determined by theargentometric method. SO2�
4 was assessed by turbidimetry.Chemical oxygen demand (COD) was determined by theopen reflux method and biochemical oxygen demand(BOD) by the 5-d BOD test (APHA, 1998). Total Fe, Cr,Ni and Zn concentrations were determined in watersamples by atomic absorption spectrometry (by flameor electrothermal atomization, according to the sampleconcentration, Perkin–Elmer 5000), following APHA(1998).
Mar Apr
May Ju
n JulAugSep Oct
NovDecFebMar Apr
May Ju
n JulAugSep Oct
NovDec
0
10
20
30
40
50
60
70
80 T. domingensisP. cordataE. crassipes
Co
ver
(%)
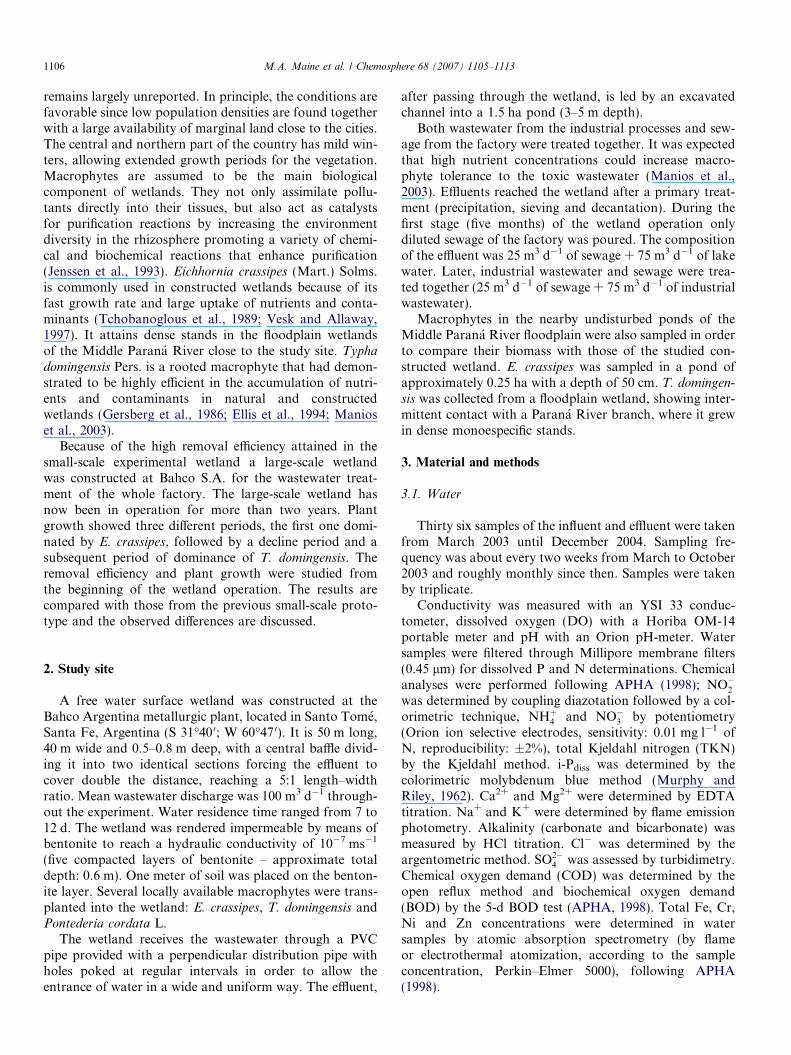
Fig. 1. Macrophyte cover in the wetland throughout the studied period.
M.A. Maine et al. / Chemosphere 68 (2007) 1105–1113 1107
Statistical significance between influent and effluent con-centrations was assessed using a mean comparison test(p < 0.05).
3.2. Sediment
Cr, Ni and Zn concentrations were determined monthlyor bimonthly in the inlet and outlet areas of the wetland.Sediment samples were collected using a 4-cm diameterPVC corer by triplicate. All the samples were transportedto the laboratory in the cold. Samples were digested withan HClO4:HNO3:HCl (7:5:2) mixture. Cr, Ni and Zn weredetermined in the digests by atomic absorption spectrome-try (Perkin–Elmer 5000).
ANOVA analysis was performed to evaluate the influ-ence of time on metal concentrations. Duncan’s test wasused to differentiate means when appropriate. A level ofp < 0.05 was used in all comparisons.
3.3. Macrophytes
Macrophytes were sampled monthly with a 0.50 · 0.50 msquare sampler following Vesk and Allaway (1997). Fourreplicates were taken in each sampling. The macrophyteswere then harvested and sorted by species in the laboratory,washed, separated between above (steams and leaves) andbelowground parts (roots of floating species and roots plusrhizomes of emergent macrophytes). Cr, Ni and Zn in rootsand leaves were determined in the same way as in sedimentsamples. To measure dry weight, plants were dried at 105 �Cuntil constant weight (APHA, 1998). Plant cover was visu-ally estimated measuring the area occupied by each speciesin the wetland. Statistical significance between plant para-meters in natural and constructed wetlands was assessedusing a mean comparison test (p < 0.05).
4. Results
4.1. Vegetation development
E. crassipes became dominant and covered about 80% ofthe surface throughout March 2003 to January 2004 anddecreased progressively until its disappearance over the fol-lowing six months (Fig. 1). In September 2003 roughly 20%of the biomass was harvested. In January 2004 the wetlandwas emptied for a few days, but the plants remainedanchored in the mud, without apparent damage. E. crassi-
pes decreased progressively since then to attain a very smallcover in July 2004. In August 2004, the wetland was emp-tied again, the few remaining floating macrophytes wereharvested and soil was added in two strips of 2 m wide, per-pendicular to the water circulation. When the wetland wasrefilled, the water depth at the strips was 0.3 m, in order tofavor T. domingensis growth. Both, T. domingensis andE. crassipes were again transplanted in August 2004.Although E. crassipes showed some initial growth, it soondecreased again.
E. crassipes biomass was significantly higher in the wet-land than in the undisturbed natural environment along2003 without differences between the inlet and outlet(Fig. 2). Since December 2003 biomass remained lowerthan in the natural environment showing a decreasingtrend parallel to that of plant cover. P. cordata developedas an accompanying species attaining a cover lower than5% along 2003 and disappeared in May 2004 (Fig. 1).T. domingensis developed in the borders covering roughly4–13% of the wetland surface along 2003 (Fig. 1). AfterAugust 2004 plant cover steadily increased to attainroughly 30% of the surface at the end of 2004. T. doming-
ensis biomass (Fig. 2) was significantly higher in the wet-land than in the undisturbed natural wetland during allthe studied period. The experimental period was, therefore,divided in the three successive stages described for the veg-etation development: E. crassipes dominance, E. crassipes
decline and T. domingensis dominance.
4.2. Wetland retention
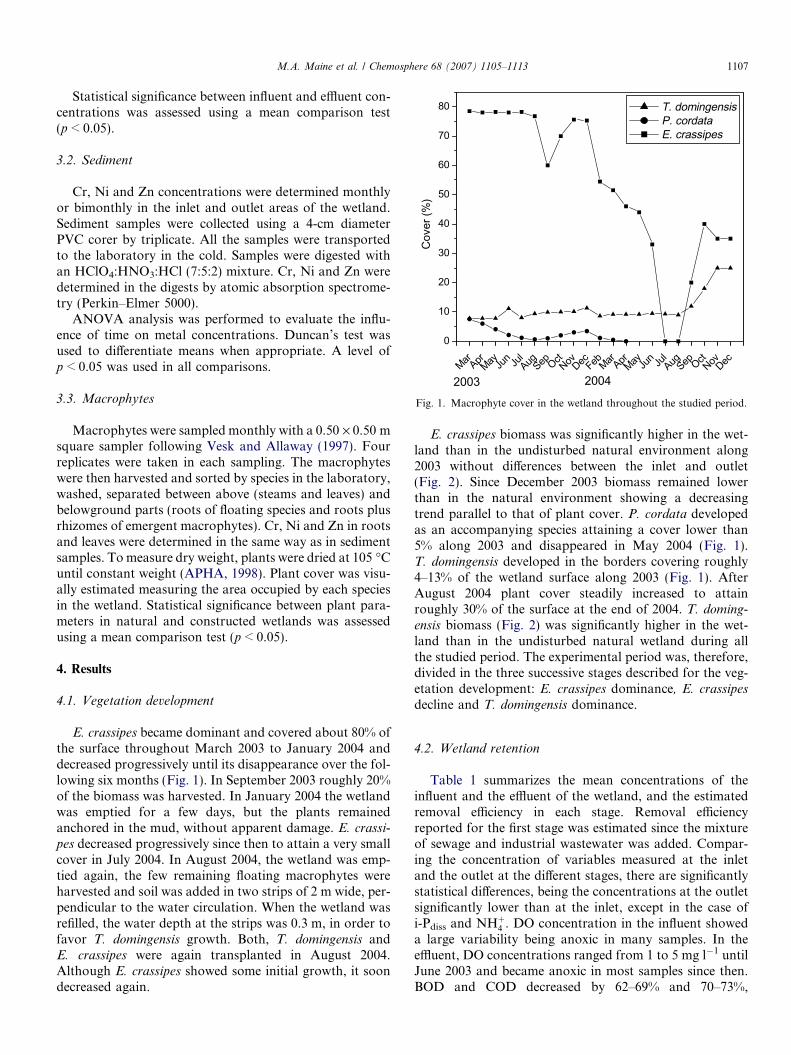
Table 1 summarizes the mean concentrations of theinfluent and the effluent of the wetland, and the estimatedremoval efficiency in each stage. Removal efficiencyreported for the first stage was estimated since the mixtureof sewage and industrial wastewater was added. Compar-ing the concentration of variables measured at the inletand the outlet at the different stages, there are significantlystatistical differences, being the concentrations at the outletsignificantly lower than at the inlet, except in the case ofi-Pdiss and NHþ4 . DO concentration in the influent showeda large variability being anoxic in many samples. In theeffluent, DO concentrations ranged from 1 to 5 mg l�1 untilJune 2003 and became anoxic in most samples since then.BOD and COD decreased by 62–69% and 70–73%,

0
1000
2000
3000
Abo
vegr
ound
bio
mas
s (g
d.w
. m-2
)
Inlet Outlet Undisturbed
environment
0
1000
2000
3000
T. domingensis
Mar
May Ju
n JulAugSep Oct
NovDecFebMar Apr Ju
n JulOct
Dec
0
1000
2000
3000
Bel
owgr
ound
bio
mas
s (g
d.w
. m-2
)
E. crassipes
Bel
owgr
ound
bio
mas
s (g
d.w
. m-2
)A
bove
grou
nd b
iom
ass
(g d
.w.
m-2
)E. crassipes
Mar
May Ju
n JulAugSep Oct
NovDecFebMar Apr Ju
n JulOct
Dec
0
1000
2000
3000
T. domingensis
Fig. 2. E. crassipes and T. domingensis biomass in the wetland compared with a nearby undisturbed natural environment.
1108 M.A. Maine et al. / Chemosphere 68 (2007) 1105–1113
respectively, in the effluent. Water pH decreased from 7.2to 10.8 in the influent to 6.9–8.1 in the effluent without dif-ferences among the several vegetation stages. Mean Caconcentrations decreased in the effluent, being retentionlarger in the samples in which the pH of the incoming waterwas higher (9.2–10.2). On the contrary, concentrationswere often higher in the effluent when the pH of the incom-ing water was lower (7.2–7.6).
i-Pdiss concentrations in the influent showed a large vari-ation range. Concentrations were lower when water pH wasabove 9. i-Pdiss was 5% higher throughout the E. crassipes
dominance but was removed for 47% and 64% through theE. crassipes decline and T. domingensis dominance, respec-tively. Similarly, NHþ4 concentration was 27% higher inthe outlet during E. crassipes dominance but decreased58% and 13% during the following E. crassipes declineand T. domingensis dominance periods, respectively.NO�3 ;NO�2 , and SO2�
4 were removed 58–79%, 78–94% and31–39%, respectively, at the effluent irrespective of plantcover.
Total alkalinity decreased in the effluent along theE. crassipes dominance and was larger in the effluent inthe following periods. Fe, Ni and Cr were retained by
79–80%, 45–48% and 49–62%, respectively, without differ-ences in the three vegetation stages. Zn concentration wasbelow 50 lg l�1 in both influent and effluent along thestudy period.
4.3. Metal concentration in plants and sediment
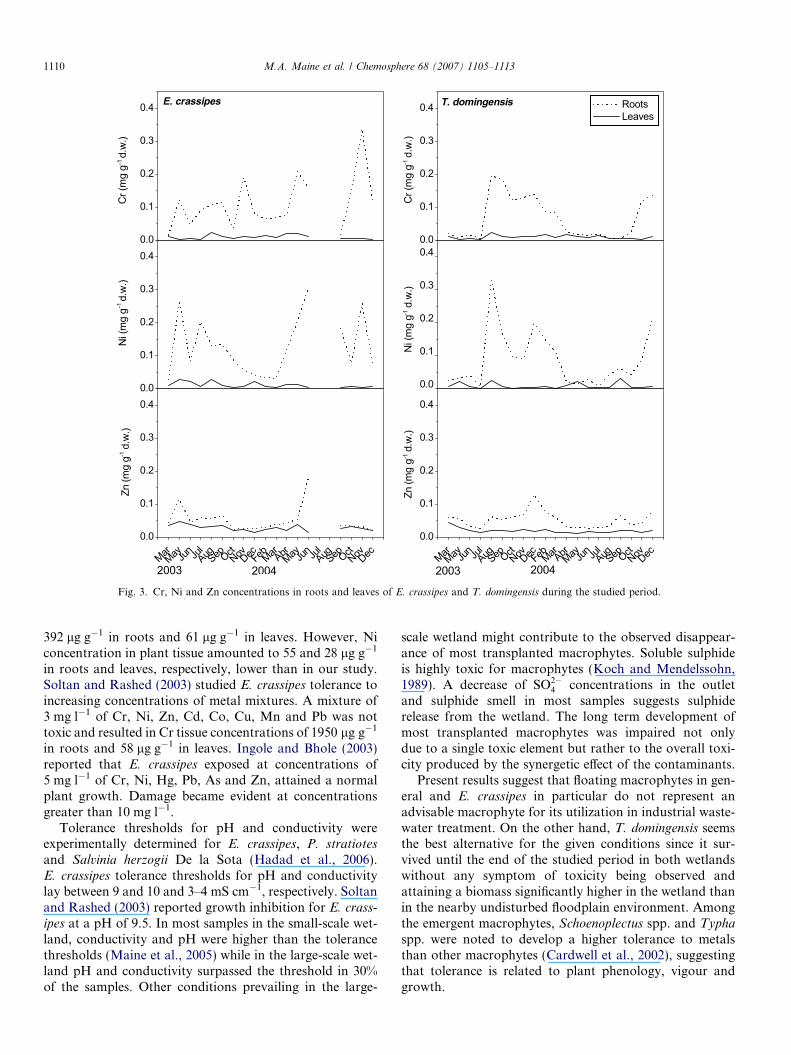
Metal concentration in plant tissue was significantlyhigher in roots than in leaves (Fig. 3). Large temporal vari-ations were observed in roots along the studied period.Maximum Ni and Zn tissue concentrations in E. crassipes
were determined in the last sampling before its disappear-ance in July 2004 and Cr in the sampling previous to thelast. All three metals attained higher concentrations inT. domingensis roots in August, December 2003 andDecember 2004.
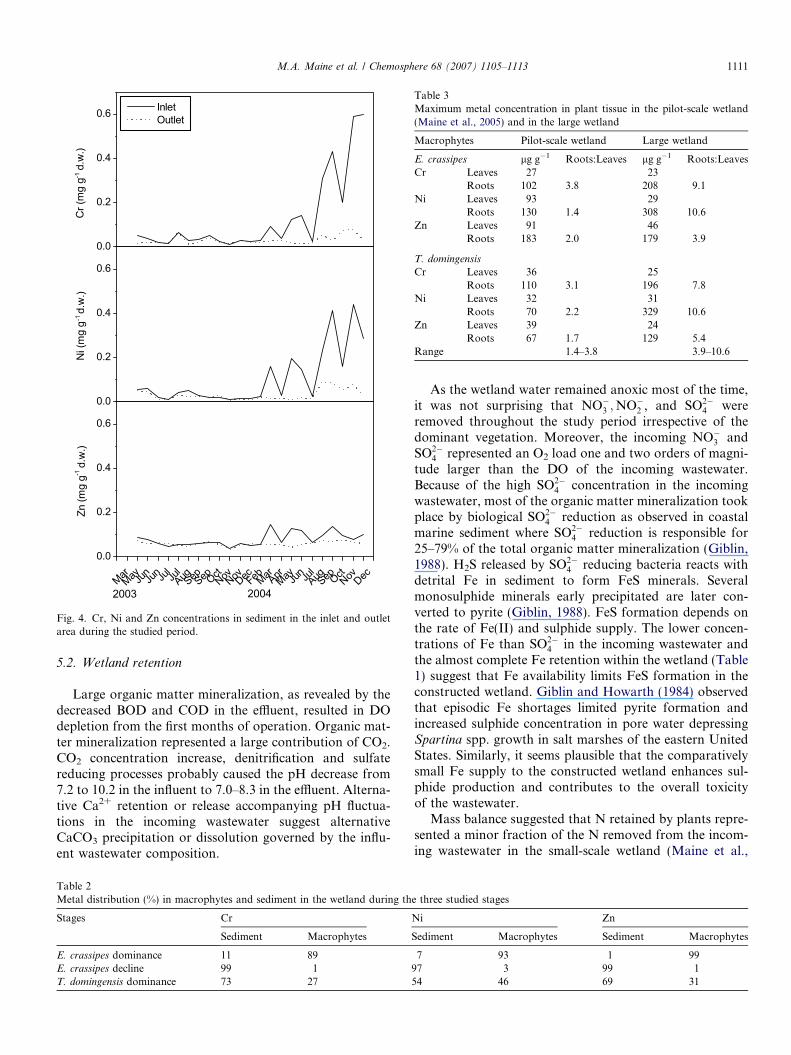
During the E. crassipes dominance phase, Cr, Ni and Znconcentrations in bottom sediments did not change signif-icantly (p < 0.05) (Fig. 4). Some higher concentrations wereobserved in the inlet area in March–June 2004 during theE. crassipes decline stage and yet significantly higherconcentrations were determined in the inlet during theT. domingensis increasing stage (p < 0.05).
Tab
le1
Mea
nw
ater
com
po
siti
on
of
the
infl
uen
tan
dth
eeffl
uen
to
fth
ew
etla
nd
thro
ugh
the
thre
esu
cces
sive
stag
eso
fve
geta
tio
nd
evel
op
men
tan
dth
eco
mp
aris
on
wit
hth
em
easu
red
vari
able
sin
the
pil
ot-
scal
ew
etla
nd
(Mai
ne
etal
.,20
05)
Var
iab
les
Co
nst
ruct
edw
etla
nd
Pil
ot-
scal
ew
etla
nd
E.
cra
ssip
esd
om
inan
ceE
.cr
ass
ipes
rece
de
T.
do
min
gen
sis
do
min
ance
Infl
uen
tE
fflu
ent
Rem
ova
l(%
)In
flu
ent
Effl
uen
tR
emo
val
(%)
Infl
uen
tE
fflu
ent
Rem
ova
l(%
)In
flu
ent
Effl
uen
tR
emo
val(
%)
pH
8.8
±1.
17.
3±
0.3
8.8
±1.
27.
7±
0.2
8.0
±0.
87.
7±
0.2
10.1
±1.
547.
98±
0.59
9C
on
du
ctiv
ity
2958
±21
8113
27±
638
2371
±10
3516
64±
349
3468
±14
6221
75±
194
5130
±14
6531
20±
1506
DO
(mg
l�1)
2.6
±2.
51.
4±
1.8
1.0
±2.
41.
2±
3.1
0.7
±1.
50.
2±
0.3
6.2
±3.
13.
2±
1.7
BO
D(m
gl�
1)
43±
2513
±10
6553
±30
12.0
±7.
969
42±
1615
±4.
662
136
±10
815
±9.
878
CO
D(m
gl�
1)
200
±14
041
±20
7016
4±
174
29.0
±24
.971
101
±62
31±
13.3
7327
6±
160
40±
1678
i-P
dis
s(m
gl�
1P
)0.
19±
0.15
0.19
±0.
13�
50.
11±
0.12
0.03
±0.
0247
0.17
±0.
080.
03±
0.01
640.
55±
0.69
0.14
±0.
1575
NO� 3ðm
gl�
1N
O� 3Þ
17±
183
±2
6513
.5±
11.1
3.4
±3.
158
12±
8.3
2.5
±0.
779
20±
19.8
1.5
±0.
8788
NO� 2ðm
gl�
1N
O� 2Þ
0.77
±1.
010.
08±
0.21
780.
77±
0.66
0.04
±0.
0994
0.44
±0.
640.
06±
0.05
842.
2±
3.15
0.15
±0.
2485
NH� 4ðm
gl�
1N
H� 4Þ
2±
2.5
2.2
±3.
7�
272.
0±
1.1
1.1
±1.
258
3.6
±2.
92.
9±
1.9
132.
2±
1.4
2.1
±2.
713
SO
2� 4ðm
gl�
1Þ
985
±73
642
3±
211
3764
7±
650
473
±21
031
1661
±10
4374
0±
228
3914
40±
470
929
±41
535
CaC
O3
(mg
l�1)
472
±29
724
7±
8332
300
±14
932
5±
63–
206
±12
027
8±
27–
519
±95
671
±10
6–
Ca2
+(m
gl�
1)
162
±16
544
±14
4191
±45
85±
4419
182
±11
888
±25
3617
1±
7897
±62
41F
e(m
gl�
1)
14.4
±17
.60.
35±
0.34
792.
8±
3.6
0.12
±0.
1179
2.4
±0.
70.
09±
0.04
809.
09±
10.7
0.21
±0.
1982
Cr
(lg
l�1)
14±
3.3
2.0
±0.
962
4.0
±2.
22.
0±
0.4
4913
±24
5.0
±1.
158
127
±19
513
±25
81N
i(l
gl�
1)
15±
138.
0±
5.8
4810
±7.
84.
0±
1.0
4547
±41
27±
5.0
4818
1±
211
51±
6366
Co
nd
uct
ivit
yis
exp
ress
edin
lmh
ocm�
1.
M.A. Maine et al. / Chemosphere 68 (2007) 1105–1113 1109
Table 2 compares the metal retention percentages ofsediment and macrophytes in the successive vegetationstages. During E. crassipes dominance, macrophytesaccount for most of the retained metals. During theE. crassipes decline stage, metals were accumulated in thesediment. In the T. domingensis dominance stage, metalsaccumulated both in sediment and macrophytes, but theirconcentration was higher in sediment.
5. Discussion
5.1. Vegetation development
The development of the vegetation in both the small-scale prototype (Hadad et al., 2006) and the large-scalewetland showed the same pattern but occurred at a differ-ent time scale. In the former, E. crassipes and Pistia strati-
otes L. started active growth attaining roughly 60% coverin three months. However, they soon started to decayand disappeared from the wetland in the sixth month. Inthe latter, E. crassipes covered most of the surface foralmost a year. The following E. crassipes decline stage tookanother six months. After emptying the wetland and add-ing more soil, E. crassipes again started active growthattaining 40% cover but soon started to decline again(Fig. 1). Metal and nutrient concentration, pH and conduc-tivity in the incoming wastewater were higher in the small-scale prototype. Table 3 shows Cr, Ni and Zn concentra-tions in E. crassipes tissues in the last sampling beforedisappearance in both wetlands and in T. domingensis atthe end of the studied period in the small-scale wetlandand at the maximum concentration in the large-scale wet-land. Cr, Ni and Zn concentrations were higher in the rootsand lower in the leaves of the large-scale wetland than inthe pilot scale wetland, except for Zn in the roots ofE. crassipes. Metal translocation from roots to leaves waslarger at the most toxic condition prevailing in the small-scale wetland, and lower at the less toxic condition in thelarge-scale wetland.
Newly formed biomass during the growing period con-tributed to dilute the metal concentration in tissues. How-ever, metal concentration decreased simultaneously withT. domingensis belowground biomass from Septemberto December, suggesting selective allocation of metals tosenescent tissues as observed by Villar et al. (1999) in nat-ural floodplain marshes of the Parana River.
Metal concentration in the incoming wastewater (Table1) as well as plant tissue (Table 3) measured in this studylooks modest as compared with concentrations reportedin the literature. Ellis et al. (1994) reported an order of mag-nitude higher Zn concentration in Typha latifolia roots(700 lg g�1 dry weight) in a natural wetland receiving stormwater loads in London. Manios et al. (2003) compared chlo-rophyll concentration of plants exposed to different metalconcentrations, reporting threshold damage for a mixtureof Cd, Cu, Ni, Pb and Zn of 4, 80, 40, 40 and 80 mg l�1,respectively. Zn concentration in plant tissue was
0.0
0.1
0.2
0.3
0.4
Zn
(mg
g-1 d
.w.)
Ni (
mg
g-1 d
.w.)
Cr
(mg
g-1 d
.w.)
Zn
(mg
g-1 d
.w.)
Ni (
mg
g-1 d
.w.)
Cr
(mg
g-1 d
.w.)
Roots Leaves
0.0
0.1
0.2
0.3
0.4 T. domingensis
0.0
0.1
0.2
0.3
0.4
0.0
0.1
0.2
0.3
0.4
E. crassipes
MarM
ayJun Ju
lAugSepOct
NovDecFebM
arAbrM
ayJun Ju
lAugSepOct
NovDec
0.0
0.1
0.2
0.3
0.4
MarM
ayJun Ju
lAugSepOct
NovDecFebM
arAbrM
ayJun Ju
lAugSepOct
NovDec
0.0
0.1
0.2
0.3
0.4
Fig. 3. Cr, Ni and Zn concentrations in roots and leaves of E. crassipes and T. domingensis during the studied period.
1110 M.A. Maine et al. / Chemosphere 68 (2007) 1105–1113
392 lg g�1 in roots and 61 lg g�1 in leaves. However, Niconcentration in plant tissue amounted to 55 and 28 lg g�1
in roots and leaves, respectively, lower than in our study.Soltan and Rashed (2003) studied E. crassipes tolerance toincreasing concentrations of metal mixtures. A mixture of3 mg l�1 of Cr, Ni, Zn, Cd, Co, Cu, Mn and Pb was nottoxic and resulted in Cr tissue concentrations of 1950 lg g�1
in roots and 58 lg g�1 in leaves. Ingole and Bhole (2003)reported that E. crassipes exposed at concentrations of5 mg l�1 of Cr, Ni, Hg, Pb, As and Zn, attained a normalplant growth. Damage became evident at concentrationsgreater than 10 mg l�1.
Tolerance thresholds for pH and conductivity wereexperimentally determined for E. crassipes, P. stratiotes
and Salvinia herzogii De la Sota (Hadad et al., 2006).E. crassipes tolerance thresholds for pH and conductivitylay between 9 and 10 and 3–4 mS cm�1, respectively. Soltanand Rashed (2003) reported growth inhibition for E. crass-
ipes at a pH of 9.5. In most samples in the small-scale wet-land, conductivity and pH were higher than the tolerancethresholds (Maine et al., 2005) while in the large-scale wet-land pH and conductivity surpassed the threshold in 30%of the samples. Other conditions prevailing in the large-
scale wetland might contribute to the observed disappear-ance of most transplanted macrophytes. Soluble sulphideis highly toxic for macrophytes (Koch and Mendelssohn,1989). A decrease of SO2�
4 concentrations in the outletand sulphide smell in most samples suggests sulphiderelease from the wetland. The long term development ofmost transplanted macrophytes was impaired not onlydue to a single toxic element but rather to the overall toxi-city produced by the synergetic effect of the contaminants.
Present results suggest that floating macrophytes in gen-eral and E. crassipes in particular do not represent anadvisable macrophyte for its utilization in industrial waste-water treatment. On the other hand, T. domingensis seemsthe best alternative for the given conditions since it sur-vived until the end of the studied period in both wetlandswithout any symptom of toxicity being observed andattaining a biomass significantly higher in the wetland thanin the nearby undisturbed floodplain environment. Amongthe emergent macrophytes, Schoenoplectus spp. and Typha
spp. were noted to develop a higher tolerance to metalsthan other macrophytes (Cardwell et al., 2002), suggestingthat tolerance is related to plant phenology, vigour andgrowth.
MarM
ayJunJu
nJulJu
lAugSepSepOct
NovNovDecFebMarApr
MayJu
nJulAugSepOct
NovDec
0.0
0.2
0.4
0.6
Inlet Outlet
0.0
0.2
0.4
0.6
Zn
(mg
g-1 d
.w.)
Ni (
mg
g-1 d
.w.)
Cr
(mg
g-1 d
.w.)
0.0
0.2
0.4
0.6
20042003
Fig. 4. Cr, Ni and Zn concentrations in sediment in the inlet and outletarea during the studied period.
Table 3Maximum metal concentration in plant tissue in the pilot-scale wetland(Maine et al., 2005) and in the large wetland
Macrophytes Pilot-scale wetland Large wetland
E. crassipes lg g�1 Roots:Leaves lg g�1 Roots:LeavesCr Leaves 27 23
Roots 102 3.8 208 9.1Ni Leaves 93 29
Roots 130 1.4 308 10.6Zn Leaves 91 46
Roots 183 2.0 179 3.9
T. domingensis
Cr Leaves 36 25Roots 110 3.1 196 7.8
Ni Leaves 32 31Roots 70 2.2 329 10.6
Zn Leaves 39 24Roots 67 1.7 129 5.4
Range 1.4–3.8 3.9–10.6
M.A. Maine et al. / Chemosphere 68 (2007) 1105–1113 1111
5.2. Wetland retention
Large organic matter mineralization, as revealed by thedecreased BOD and COD in the effluent, resulted in DOdepletion from the first months of operation. Organic mat-ter mineralization represented a large contribution of CO2.CO2 concentration increase, denitrification and sulfatereducing processes probably caused the pH decrease from7.2 to 10.2 in the influent to 7.0–8.3 in the effluent. Alterna-tive Ca2+ retention or release accompanying pH fluctua-tions in the incoming wastewater suggest alternativeCaCO3 precipitation or dissolution governed by the influ-ent wastewater composition.
Table 2Metal distribution (%) in macrophytes and sediment in the wetland during th
Stages Cr
Sediment Macrophytes
E. crassipes dominance 11 89E. crassipes decline 99 1T. domingensis dominance 73 27
As the wetland water remained anoxic most of the time,it was not surprising that NO�3 ;NO�2 , and SO2�
4 wereremoved throughout the study period irrespective of thedominant vegetation. Moreover, the incoming NO�3 andSO2�
4 represented an O2 load one and two orders of magni-tude larger than the DO of the incoming wastewater.Because of the high SO2�
4 concentration in the incomingwastewater, most of the organic matter mineralization tookplace by biological SO2�
4 reduction as observed in coastalmarine sediment where SO2�
4 reduction is responsible for25–79% of the total organic matter mineralization (Giblin,1988). H2S released by SO2�
4 reducing bacteria reacts withdetrital Fe in sediment to form FeS minerals. Severalmonosulphide minerals early precipitated are later con-verted to pyrite (Giblin, 1988). FeS formation depends onthe rate of Fe(II) and sulphide supply. The lower concen-trations of Fe than SO2�
4 in the incoming wastewater andthe almost complete Fe retention within the wetland (Table1) suggest that Fe availability limits FeS formation in theconstructed wetland. Giblin and Howarth (1984) observedthat episodic Fe shortages limited pyrite formation andincreased sulphide concentration in pore water depressingSpartina spp. growth in salt marshes of the eastern UnitedStates. Similarly, it seems plausible that the comparativelysmall Fe supply to the constructed wetland enhances sul-phide production and contributes to the overall toxicityof the wastewater.
Mass balance suggested that N retained by plants repre-sented a minor fraction of the N removed from the incom-ing wastewater in the small-scale wetland (Maine et al.,
e three studied stages
Ni Zn
Sediment Macrophytes Sediment Macrophytes
7 93 1 9997 3 99 154 46 69 31
1112 M.A. Maine et al. / Chemosphere 68 (2007) 1105–1113
2005). Denitrification may represent the major removalprocess given the observed DO depletion. Consistently,several different studies have shown denitrification to be amajor pathway in wetlands. D’Angelo and Reddy (1993)determined that most of the 15N–NO�3 (roughly 90%)applied to sediment-water cores were lost by denitrifica-tion. Reddy et al. (1989) measured large denitrificationrates in the rhizosphere of emergent macrophytes of deltaicmarshes. Matheson et al. (2002) performed 15N balancesin wetland microcosms estimating that denitrificationaccounted for 61% of the NO�3 load, 25% was retainedin the soil, and 14% was stored in the vegetation biomass.Minzoni et al. (1988) measured large N losses throughdenitrification in rice field enclosures, and Goltermanet al. (1988) confirmed the results by mass balances per-formed in experimental plots.
NHþ4 showed a different behaviour at the differentphases of the vegetation development. E. crassipes producea large amount of detritus, which decomposes in the anoxicbottom reducing the redox potential in the water col-umn. Organic matter mineralization represents a sourceof NHþ4 , which is not nitrified because of DO depletionand therefore NHþ4 was often higher in the effluent thanin the influent. During the E. crassipes decline period,decreased plant cover likely allowed planktonic and peri-phytic growth and higher O2 contribution from the atmo-sphere to the water column. Emergent macrophytes areknown to release O2 from the roots producing a strongpositive effect on nitrifying bacteria in the rhizosphere(Bodelier et al., 1996). ANAMMOX process (acronymfor: ANaerobic AMMonia Oxidation; Sliekers et al.,2002) has been shown to be a quantitatively importantpathway in reactors (Sliekers et al., 2002), wastewater(Strous et al., 2002) and marine sediments (Thamdrupand Dalsgaard, 2002). The simultaneous occurrence of par-tial NHþ4 oxidation and denitrification likely accounted forthe observed NHþ4 removal through the E. crassipes declineand T. domingensis dominance phases. The pattern of NHþ4removal as T. domingensis cover increased is consistentwith the observed NHþ4 removal in the small-scale proto-type in which T. domingensis was dominant (Maine et al.,2005).
The low i-Pdiss concentrations in the influent in coinci-dence with high pH, Ca2+ and carbonate suggest co-preci-pitation with CaCO3. An increase of the calcium-bound Pfraction in the bottom sediments at the inlet was observedin the small-scale wetland prototype (Maine et al., 2005) aswell as in the large-scale wetland (Maine et al., 2007).
As pH decreases, i-Pdiss sorption to carbonates decreaseswhile adsorption to Fe oxy hydroxides increases(Golterman, 1995). However, DO depletion preventedadsorption to iron, resulting in often higher i-Pdiss concen-trations in the effluent throughout the period of E. crassipes
dominance. Mineralization of organic matter contributedto the observed increased concentration in the effluent.During the E. crassipes decline and the T. domingensis
dominance stages i-Pdiss was retained within the wetland.
As previously stated, enhanced phytoplanktonic and peri-phytic growth and O2 transfer from the atmosphere as wellas O2 release by emergent macrophyte roots probably cre-ated niches of high redox potential where i-Pdiss might havebeen adsorbed onto Fe oxy hydroxides and later settled onthe bottom sediment.
Cr, Ni and Zn concentrations in the bottom sedimentdid not increase through the E. crassipes dominance phasein spite of the fact that between influent and effluent con-centrations revealed wetland retention. E. crassipes covered80% of the wetland and was responsible for the high metal-removal. Floating macrophytes may easily be harvested,leading to fast metal removal rates. Through the E. crassi-
pes decline and T. domingensis dominance stages, a trend toincrease bottom sediment concentration became evident. Inthe E. crassipes decline stage, sediment accounted for 97–99% of the metal removal, while in the last stage thesediment was the responsible for 54–73%. Although Znconcentration in the influent and effluent remained belowdetection limits in most samplings, sediment accumulationduring the E. crassipes decline and T. domingensis domi-nance suggest that the wetland effectively retained Zn atthe later stages.
6. Conclusions
The large-scale constructed wetland retained metals effi-ciently. Three successive phases of vegetation developmentwere observed and three different patterns of metal reten-tion were attained. During the E. crassipes dominance,metals were retained in the macrophyte biomass, duringE. crassipes decline period metals were retained in the sed-iment and in the T. domingensis dominance period, metalswere retained mainly in sediment but, a 27% Cr to 46% Niwas also retained in the macrophyte biomass. NO�3 andSO2�
4 were removed in the three vegetation stages. i-Pdiss
and NHþ4 were not efficiently removed during the E. crassi-
pes dominance and were retained in the following stages.In spite of the significant growth of E. crassipes at the
beginning, a dense stand of T. domingensis remained aftermost of the transplanted macrophytes had disappeared.Macrophyte disappearance could be related to the overalltoxicity of several environmental constrains as highpH and conductivity, metal concentration, and sulphidepresence.
Because of its higher tolerance and efficient nutrientand metal removal T. domingensis is the best choice totreat wastewater of high pH and conductivity with heavymetals, a common result from many industrial processes.T. domingensis development could be favored by regulat-ing water level, attaining best growth at 30 cm depth.The high biomass attained without any symptom of toxic-ity and the comparatively low metal concentration inplant tissue in T. domingensis after two years operationsuggest that the wetland could continue in operation fora long time representing a long term sustainable wastewa-ter treatment.
M.A. Maine et al. / Chemosphere 68 (2007) 1105–1113 1113
Acknowledgements
The authors thank Bahco Argentina S.A. for allowing todevelop this constructed wetland on their plant in SantoTome, Santa Fe, Argentina, the Consejo Nacional deInvestigaciones Cientıficas y Tecnicas (CONICET) andUniversidad Nacional del Litoral, CAI + D Project forproviding funds for this work.
References
APHA, 1998. Standard Methods for the Examination of Water andWastewater. American Public Health Association, New York, p.1268.
Bodelier, P., Libochant, A.J., Blom, C., Laanbroek, H., 1996. Dynamicsof nitrification and denitrification in root-oxygenated sediments andadaptation of ammonia oxidizing bacteria to low-oxygen or anoxichabitats. Appl. Environ. Microbiol. 62, 4100–4107.
Cardwell, A., Hawker, D., Greenway, M., 2002. Metal accumulation inmacrophytes from Southeast Queensland, Australia. Chemosphere 48,653–663.
D’Angelo, E., Reddy, K., 1993. Ammonium oxidation and nitratereduction in sediment of a hypereutrophic lake. Soil. Sci. Soc. Am.J. 57, 1156–1163.
Ellis, J., Shutes, R., Revitt, D., Zhang, T., 1994. Use of macrophytes forpollution treatment in urban wetlands. Conserv. Recycling 11, 1–12.
Gersberg, R.M., Elkins, B.V., Lyon, S.R., Goldman, C.R., 1986. Role ofaquatic plants in wastewater treatment by artificial wetlands. WaterRes. 20, 363–368.
Giblin, A., 1988. Pyrite formation in marshes during early diagenesis.Geomicrobiol. J. 6, 77–97.
Giblin, A., Howarth, R., 1984. Pore water evidence for a dynamicsedimentary iron cycle in salt marshes. Limnol. Oceanogr. 29, 47–63.
Golterman, H.L., 1995. The labyrinth of nutrient cycles and buffers inwetlands: results based on research in the Camargue (SouthernFrance). Hydrobiologia 315, 39–58.
Golterman, H., Bonetto, C., Minzoni, F., 1988. The nitrogen cycle inshallow water sediment systems of rice fields. Part III: The influence ofN-application on the yield of rice. Hydrobiologia 159, 211–217.
Hadad, H., Maine, M.A., Bonetto, C., 2006. Macrophyte growth in apilot-scale constructed wetland for industrial wastewater treatment.Chemosphere 63, 1744–1753.
Hammer, D.A., 1989. Constructed Wetlands for Wastewater Treatment.Lewis Publishers Inc., Chelsea, MI.
Ingole, N.W., Bhole, A.G., 2003. Removal of heavy metals from aqueoussolution by water hyacinth (Eichhornia crassipes). J. Water. Res.Technol. 52, 119–128.
Jenssen, P., Maehlum, T., Krogstad, T., 1993. Potential use of constructedwetlands for wastewater treatment in northern environments. Water.Sci. Technol. 28, 149–157.
Kadlec, R.H., Knight, R.L., 1996. Treatment Wetlands. Lewis Publishers,Boca Raton, Florida.
Kadlec, R.H., Knight, R.L., Vymazal, J., Brix, H., Cooper, P., Haberl, R.,2000. Constructed Wetlands for Pollution Control: Processes, Perfor-
mance, Design and Operation. IWA Specialist Group on Use ofMacrophytes in Water Pollution Control. IWA Publishing, 156 pp.
Koch, M., Mendelssohn, I., 1989. Sulphide as a soil phytotoxin:differential responses in two marsh species. J. Ecol. 77, 565–578.
Maine, M.A., Sune, N., Hadad, H., Sanchez, G., Bonetto, C., 2005.Phosphate and metal retention in a small-scale constructed wetland forwastewater treatment. In: Golterman, H., Serrano, L. (Eds.), Phos-phate in Sediment. Proceedings 4th International Symposium. Back-huys, Leiden, pp. 21–32.
Maine, M.A., Sune, N., Hadad, H., Sanchez, G., 2007. Temporal andspatial variation of phosphate distribution in the sediment of a freesurface water constructed wetland. Sci. Total Environ.
Manios, T., Stentiford, E., Millner, P., 2003. The effect of heavy metalsaccumulation on the chlorophyll concentration of Typha latifolia
plants, growing in a substrate containing sewage sludge compost andwatered with metaliferus water. Ecol. Eng. 20, 65–74.
Matheson, F., Nguyen, M., Cooper, A., Burt, T., Bull, E., 2002. Fate of15N-nitrate in unplanted, planted and harvested riparian wetland soilmicrocosms. Ecol. Eng. 19, 249–264.
Minzoni, F., Bonetto, C., Golterman, H., 1988. The nitrogen cycle inshallow water sediment systems of rice fields. Part I: The denitrificationprocess. Hydrobiologia 159, 189–202.
Moshiri, G.A., 1993. Constructed Wetlands for Water Quality Improve-ment. Lewis Publishers Inc., Chelsea, MI.
Murphy, J., Riley, J., 1962. A modified single solution method fordetermination of phosphate in natural waters. Anal. Chim. Acta 27,31–36.
Reddy, K., Patrick, W., Lindau, C., 1989. Nitrification–denitrification atthe plant root-sediment interface in wetlands. Limnol. Oceanogr. 34,1004–1013.
Sliekers, A., Derwort, N., Campos-Gomez, J., Strous, M., Kuenen, J.,Jetten, M., 2002. Completely autotrophic nitrogen removal over nitritein one single reactor. Water Res. 36, 2475–2482.
Soltan, M., Rashed, M., 2003. Laboratory study on the survival ofEichhornia crassipes under several conditions of heavy metal concen-trations. Adv. Environ. Res. 7, 321–334.
Strous, M., Kuenen, G., Fuerst, J., Wagner, M., Jetten, M., 2002. Theanammox case: a new experimental manifesto for microbiologicalecophysiology. A. Van Leeuw J. Microb. 81, 693–702.
Tchobanoglous, G., Maitski, F., Thompson, K., Chadwick, T., 1989.Evolution and performance of city of San Diego pilot-scale aquaticwastewater treatment system using water hyacinths. Res. J. WaterPollut. Control Fed. 61, 1625–1635.
Thamdrup, B., Dalsgaard, T., 2002. Production of N2 through anaerobicammonium oxidation coupled to nitrate reduction in marine sedi-ments. Appl. Environ. Microbiol. 68, 1312–1318.
Vesk, P., Allaway, W., 1997. Spatial variation of copper and leadconcentrations of Eichhornia crassipes plants in a wetland receivingurban run-off. Aquat. Bot. 59, 33–44.
Villar, C., Stripeiskis, J., Tudino, M., D’huicque, L., Troccoli, O.,Bonetto, C., 1999. Trace metal concentrations in coastal marshes ofthe Lower Parana River and the Rıo de la Plata Estuary. Hydrobi-ologia 397, 187–195.
Vymazal, J., Brix, H., Cooper, P.F., Green, M.B., Haberl, R., 1998.Constructed Wetlands for Wastewater Treatment in Europe. BackhuysPublishers, Leiden, p. 366.