rem 2019 proficiency test on gross alpha/beta activity
TRANSCRIPT
REM 2019 proficiency test on gross alpha/beta activity concentration in drinking water
JRC REM2019 PT
Viktor Jobbágy, Edmond Dupuis, Håkan Emteborg, Mikael Hult
2021
EUR 30822 EN
This publication is a Technical report by the Joint Research Centre (JRC), the European Commission’s science and knowledge service. It
aims to provide evidence-based scientific support to the European policymaking process. The scientific output expressed does not imply a policy position of the European Commission. Neither the European Commission nor any person acting on behalf of the Commission is responsible for the use that might be made of this publication. For information on the methodology and quality underlying the data used
in this publication for which the source is neither Eurostat nor other Commission services, users should contact the referenced source. The designations employed and the presentation of material on the maps do not imply the expression of any opinion whatsoever on the part of the European Union concerning the legal status of any country, territory, city or area or of its authorities, or concerning the delimitation
of its frontiers or boundaries. Contact information
Name: Viktor Jobbágy Address: Joint Research Centre (JRC), Retieseweg 111, B-2440 Geel, Belgium Email: [email protected]
Tel.: +32 (0)14 571 251 EU Science Hub
https://ec.europa.eu/jrc
JRC121498
EUR 30822 EN
PDF ISBN 978-92-76-41388-2 ISSN 1831-9424 doi:10.2760/069173
Luxembourg: Publications Office of the European Union, 2021
© European Atomic Energy Community, 2021
The reuse policy of the European Commission is implemented by the Commission Decision 2011/833/EU of 12 December 2011 on the reuse of Commission documents (OJ L 330, 14.12.2011, p. 39). Except otherwise noted, the reuse of this document is authorised under
the Creative Commons Attribution 4.0 International (CC BY 4.0) licence (https://creativecommons.org/licenses/by/4.0/). This means that reuse is allowed provided appropriate credit is given and any changes are indicated. For any use or reproduction of photos or other material that is not owned by the EU, permission must be sought directly from the copyright holders.
All content © European Atomic Energy Community, 2021, except: Cover image water pouring into glass © alter_photo - stock.adobe.com,
Cover image researcher working on the digital tablet © angellodeco - stock.adobe.com
How to cite this report: Viktor Jobbágy, Edmond Dupuis, Håkan Emteborg, Mikael Hult, Technical report on REM 2019 proficiency test on gross alpha/beta activity concentration in drinking water, EUR 30822 EN, Publications Office of the European Union, Luxembourg, 2021, ISBN 978-92-76-41388-2, doi:10.2760/069173, JRC121498.
i
Contents
Foreword ..................................................................................................................................................................................................................................................................... 3
Acknowledgements .......................................................................................................................................................................................................................................... 4
Abstract ....................................................................................................................................................................................................................................................................... 5
1 Introduction, policy context.............................................................................................................................................................................................................. 6
2 Project management and organisation details ............................................................................................................................................................ 7
2.1 Responsibilities and roles .................................................................................................................................................................................................... 7
2.2 Subcontractors, collaborators .......................................................................................................................................................................................... 7
2.3 Participating organisations, participation fee .................................................................................................................................................. 7
2.4 Timeline and announcements ......................................................................................................................................................................................... 8
2.5 PT reference materials ........................................................................................................................................................................................................... 8
2.6 Logistics: packaging and shipment ............................................................................................................................................................................ 9
2.7 Reporting of the results ..................................................................................................................................................................................................... 11
2.8 Questionnaire ............................................................................................................................................................................................................................... 11
2.9 Data treatment ........................................................................................................................................................................................................................... 11
2.10 Use of proficiency testing results by participants and accreditation bodies .................................................................. 11
3 Proficiency test reference materials: processing and characterisation ............................................................................................. 12
3.1 PT reference material production and processing .................................................................................................................................... 12
3.1.1 Vessels for homogenisation and processing ............................................................................................................................... 12
3.1.2 Production and processing ............................................................................................................................................................................ 12
3.2 Gross alpha/beta activity measurements ......................................................................................................................................................... 13
3.2.1 Measurements performed at SCK CEN ............................................................................................................................................. 13
3.2.2 Measurements performed at JRC-Geel............................................................................................................................................. 14
3.3 Radionuclide-specific measurements ................................................................................................................................................................... 14
3.3.1 Alpha-particle spectrometry measurements of uranium isotopes and Am-241...................................... 14
3.3.2 40K measurement with gamma-ray spectrometry ................................................................................................................. 14
3.4 Summary of the radionuclide-specific and gross activity concentration results ........................................................ 15
3.5 Homogeneity study ................................................................................................................................................................................................................. 18
3.6 Stability study .............................................................................................................................................................................................................................. 21
3.7 Assigned values and the standard deviation for proficiency assessment ........................................................................ 21
3.8 Metrological traceability .................................................................................................................................................................................................... 22
4 Participants' results, scores and evaluation of results ...................................................................................................................................... 23
4.1 Youden plots.................................................................................................................................................................................................................................. 32
4.2 Sorted results ............................................................................................................................................................................................................................... 35
4.3 PomPlots ........................................................................................................................................................................................................................................... 49
4.4 Comparison of REM2019 PT and REM2012 ILC ......................................................................................................................................... 51
5 Information on the participating laboratories: organisational and technical details ............................................................ 52
5.1 Methods used by the participating laboratories ......................................................................................................................................... 54
ii
5.2 Participants’ feedback ......................................................................................................................................................................................................... 55
5.3 Follow-up workshop ............................................................................................................................................................................................................... 57
5.4 Reported impacts of this PT ........................................................................................................................................................................................... 58
5.4.1 A detailed impact case...................................................................................................................................................................................... 58
6 Best practices and recommended methods ................................................................................................................................................................. 60
6.1 Recommended methods .................................................................................................................................................................................................... 63
7 Summary, key findings ..................................................................................................................................................................................................................... 65
7.1 Recommendations: method harmonisation and collaborations .................................................................................................. 66
7.2 Future planning .......................................................................................................................................................................................................................... 66
References ............................................................................................................................................................................................................................................................. 67
List of abbreviations, acronyms and definitions ............................................................................................................................................................... 69
List of figures ..................................................................................................................................................................................................................................................... 70
List of tables ........................................................................................................................................................................................................................................................ 72
Annexes .................................................................................................................................................................................................................................................................... 73
Annex 1. Nomination request, e-mail, invitation letter ...................................................................................................................................... 73
Annex 2. Registration instructions ......................................................................................................................................................................................... 78
Annex 3. Reporting instructions ................................................................................................................................................................................................ 80
Annex 4. Accompanying letter ................................................................................................................................................................................................... 83
Annex 5. Sample receipt form ................................................................................................................................................................................................... 89
Annex 6. List of participating laboratories ..................................................................................................................................................................... 90
Annex 7. Questionnaire ................................................................................................................................................................................................................. 113
Annex 8. Feedback and comments from the questionnaire ...................................................................................................................... 119
Annex 9. Communication on preliminary results (e-mails) ......................................................................................................................... 124
Annex 10. Summary table on participants’ scores ............................................................................................................................................. 126
Annex 11. Calculation of performance evaluation scores ........................................................................................................................... 157
Annex 12. The PomPlot interpretation ............................................................................................................................................................................ 158
3
Foreword
This report focuses on the technical evaluation of the REM (Radioactivity Environmental Monitoring) 2019 gross alpha/beta activity concentration measurements in drinking water proficiency test. It contains details on the material characterisation, performance evaluation (the key scores of the participants), information on the participants’ organisation, the applied analytical methods and feedback from participants.
The REM 2019 proficiency test was performed within the institutional work programme of the JRC Directorate G (Nuclear Safety and Security) as described in the H-2020 JRC-Work Package SELMER (Support to European Laboratories Measuring Environmental Radioactivity) in and the JRC-Project SARA (Science Applications of Radionuclides and Actinide materials). It is conducted on request of DG ENER to support their work in implementing Article 35 and 36 of the Euratom Treaty and thereby also supporting Article 39.

4
Acknowledgements
The authors want to express their sincere appreciation to all the 154 participating laboratories (listed in Annex 6) for their active collaboration.
This proficiency test exercise would not have been completed without the commitment and cooperation of Edmond Dupuis1, Michel Bruggeman and his technical staff from the Low-level Radioactivity Measurements (LRM) expert group at SCK CEN (Belgian Nuclear Research Centre in Mol, Belgium) for doing gross alpha/beta measurements and nuclide specific analysis.
Also many thanks to the following JRC colleagues for supporting the PT exercise:
JRC-Geel, F.6 Reference Materials Unit: Håkan Emteborg, Irma Huybrechts, Diana Vernelen, Heidi Dierckx (Tecnubel) and John Seghers for material processing, packing and providing temporary storage rooms,
Members of the advisory group (Head of Unit ad interim: Arjan Plompen, 17043 Quality management: Petya Malo, Project Leader: Mikael Hult, Statistical advisor: Stefaan Pommé, Jan Paepen, External advisor: Piotr Robouch from JRC-Geel Directorate F.5 Food & Feed Compliance Unit),
JRC-Geel, F.5 Food & Feed Compliance Unit: James Snell and Geert Van Britsom for performing complimentary ICP-OES elemental analysis
Radionuclide Metrology team in JRC-Geel Unit G.2. Standards for Nuclear Safety, Security and Safeguards for helping in many stages of this PT project (in particular Heiko Stroh, Petya Malo, Jan Paepen and Gerd Marissens),
Georgios Dalakoglou, Giacomo Maretti and Patrick Vande Paer, JRC-Geel Health Physics Service,
Heiko Stroh, Mikael Hult, Gerd Marissens JRC-Geel, Directorate G.2 for gamma-ray spectrometry measurements,
JRC-Geel Directorate R.6 Resource Management Geel, Central Store staff: Pascal Vergucht, Sigrid Beutels, Ellen Weckx.
Brigitte Fontenelle JRC-Geel, Directorate F.6 Reference Materials Unit,
Aneta Stroh JRC-Geel, Directorate F.5 Food & Feed Compliance Unit for providing support linked to on-line reporting,
Maurizio Forte, Rosella Rusconi from ARPA-Lombardia (Italy), Jasmina Kozar-Logar from the Josef Stefan Institute (Slovenia) and Simon O'Toole from the Environmental Protection Agency (EPA in Ireland) for the discussions and comments.
Sándor Tarján from the International Atomic Energy Agency, Terrestrial Environment Laboratory for forwarding the REM2019 PT announcement to the European members of the ALMERA network,
Gilles Oehler and Arnaud Collignon at Spadel,
Marc de Cort from JRC-Ispra, G10 Knowledge For Nuclear Safety, Security and Safeguards unit,
Vesa Tanner and Michael Hübel from European Commission Directorate General Energy, (DG ENER) D.3 Radiation protection and nuclear safety unit for the good collaboration in implementing Article 35.
Authors
Viktor Jobbágy, Edmond Dupuis, Håkan Emteborg, Mikael Hult
1 Since July 2021 freelance expert and available at [email protected]
5
Abstract
A large scale Europe-wide proficiency test (sometimes referred to as REM2019 PT) on the determination of the gross alpha/beta activity concentration in drinking water was organised by JRC-Geel. The 154 participating environmental radioactivity monitoring laboratories were either nominated by their corresponding national authorities or invited by JRC to participate.
One spiked water sample (JRC-GAB2) and a commercially available natural mineral water (JRC-GAB1) were selected as reference materials for this proficiency test after initial testing using nuclide-specific analyses and gross alpha/beta measurements. The JRC-GAB1 reference material (mineral water) had intermediate mineral content and gross activity above the parametric values defined in the E-DWD (Euratom Drinking Water Directive). The original mineral water was collected from a natural water source in France.
Reference values were established in collaboration between the JRC-Geel and the Belgian Nuclear Research Centre (SCK CEN). The homogeneity, short-and long term stability of the batch of distributed PT reference materials were checked, their contribution to the uncertainty of the reference value was assessed.
The assigned reference value for the spiked PT reference material was established by gravimetric spiking (often referred to as formulation by weighing). For the natural PT reference material, the assigned reference value for gross-alpha activity was established by radionuclide specific analysis whilst the gross-beta reference value was established by calculating the gross activity from several reference measurements using the power-moderated mean of the individual measurement results. For the homogeneity and short term stability study, three independent measurement methods were used: alpha-particle spectrometry (AS), liquid scintillation counting (LSC) and inductively coupled plasma-optical emission spectrometry (ICP-OES). The uncertainty of the reference values includes the uncertainty related to stability, between-bottle homogeneity and characterisation of PT reference samples.
The performance of each participating laboratory was evaluated with respect to the reference value using relative deviations, z-score and zeta-score. Additionally, Youden plots and PomPlots were made to visualise reported data in comparison to the reference values. The reported results were evaluated and grouped by analytical methods to check for method dependency, accreditation, radionuclides used for efficiency calibration, time delay and if documented ISO standards were followed.
It was found that the close to 50% of the gross activity results still deviate more than the standard deviation
for proficiency assessment (PT) which was set to 30% for JRC-GAB1 sample and 20% for JRC-GAB2 sample, respectively. The general measurement performance is thus not satisfactory regardless of the methods used. This suggests that the existing analytical procedures and international standards need to be critically revised and harmonised for gross alpha/beta measurement in order to obtain more reliable and comparable measurement results. Furthermore, when the reported value with its uncertainty was evaluated using the zeta score, even fewer acceptable scores were found: 41% and 55% for gross alpha activity concentration; 38% and 62% for gross beta activity concentration in JRC-GAB1 and JRC-GAB2 PT reference materials, respectively. A key problem is that many variables influence and might interfere gross activity measurements. This makes it difficult to keep the analytical conditions under control and can lead to poor repeatability which affects accuracy as well. Therefore, it is of great importance to harmonise methods by fixing as many parameters as possible via true standardisation of the analytical methods.
However, in certain cases the performance of methods using LSC and proportional counting techniques seems to be better than those based on solid state scintillation counters or other detectors. On the basis of the 14 best and most consistently performing participants (or methods), JRC is proposing “Best practices” to follow briefly in this report.

6
1 Introduction, policy context
This is a detailed technical report describing a large scale Europe-wide proficiency test (referred to as "REM2019 PT") on gross alpha/beta activity concentration measurements in water organised by the European Commission's Joint Research Centre in Geel, Belgium (JRC-Geel). The purpose of the REM2019 PT was to assess the analytical capabilities of European environmental radioactivity monitoring laboratories on the determination of gross alpha/beta activity concentration in drinking waters.
The REM2019 PT was organised on request of the EU member states’ Euratom article 35/36 experts with the approval of the European Commission's Directorate-General for Energy (DG-ENER) as a repetition of the REM2012 exercise (Jobbágy et al., 2015, 2016). This European scale PT supports the EURATOM Drinking Water Directive (EURATOM, 2013)2 (referred to as the E-DWD) and was considered as a high priority project after the outcomes of the REM2012 PT.
The G.2 unit of JRC-Geel organises on request of DG-ENER regularly proficiency tests (PTs) involving laboratories that monitor radioactivity in the environment. These support the implementation of the Euratom Treaty Articles 35 and 39. The aim is to check comparability of measurement results and verification of data submitted to the European Commission (EC) by European Union (EU) Member States (following Article 36). These PTs are usually linked to regulation dealing with radioactivity in environmental matrices, food or feed. One of the fundamental EU directives in this field is the E-DWD, which covers several naturally occurring radionuclides and gross alpha and gross beta activity concentration due to their impact on human health.
Two types of PT reference materials were distributed to participants: (i) a natural mineral water containing naturally occurring radionuclides and minerals, named JRC-GAB1, and (ii) a spiked water sample prepared gravimetrically by spiking of demineralised laboratory water at JRC-Geel, named JRC-GAB2.
In total, 154 participants registered for this PT. Out of 154 participants 145 submitted at least one gross alpha/beta activity concentration measurement result which totalled 709 individual measurement results. In addition to the gross alpha and gross beta activity concentrations, we requested the participants to determine the total dissolved solid (TDS) content of the PT reference materials which gives information about the mineralisation of the water samples.
Due to the coronavirus pandemic, the initial deadline for reporting (20 March 2020) was extended by two month (17 June 2020) to allow participants to submit their measurement results. Since another closure was introduced at JRC-Geel in July 2020 and priority was given to quality management related tasks (e.g. accreditation) until February 2021, the preparation of the PT report was put on hold.
Some of the REM PTs organised prior to JRC-involvement in 2003 displayed some deficiencies related to the lack of metrological traceability, a missing or incomplete homogeneity and/or stability study of the material. This PT provides reference materials with homogeneity and stability tested according to ISO Guide 35:2017, ISO 13528:2015 and included interference-free material with metrological traceable reference values from measurements/certificated of individual radionuclides.
The REM2019 PT followed the ISO Guide 35:2017, ISO 17034:2016, ISO/IEC 17043:2010 and ISO 13528:2015 standards on characterisation of reference materials, production of reference materials, organising proficiency tests and performance assessments, respectively. The gamma-ray spectrometry measurements at JRC-Geel were done according to ISO/IEC 17025:2017, the gross alpha/beta measurements and the methods for U, Pb-210, Ra-226 and Ra-228 measurements at SCK CEN are under ISO/IEC 17025:2017 accreditation.
This report focuses on the technical details of the PT preparation, data evaluation and analysis. Furthermore, the questionnaire associated with this PT is evaluated and the participants’ feedback is presented.
As a very important milestone, this project passed a rigorous assessment during an external audit by the Belgian Accreditation Body (BELAC) in February 2021 as part of the JRC Directorate G.2 accreditation procedure for ISO/IEC 17043:2010.
2 Council Directive 2013/51/EURATOM of 22 October 2013 Laying Down Requirements for the Protection of the Health
of the General Public with Regard to Radioactive Substances in Water Intended for Human Consumption.

7
2 Project management and organisation details
2.1 Responsibilities and roles
The REM2019 PT was organised by the European Commission, Joint Research Centre (JRC-Geel), Retieseweg 111, B-2440 Geel, Belgium.
The communication between the organiser and the participants was mainly done using the functional mail account: [email protected].
The responsibilities amongst the involved staff of the organiser:
Viktor Jobbágy: PT coordinator, packing, logistics, liquid scintillation counting and alpha-particle spectrometry analysis, reporting. main author of report.
Mikael Hult: team leader, gamma-ray spectrometry and quality control.
Håkan Emteborg: team leader, PT reference material processing and storage,
Petya Malo: logistics assistant, administration, quality control.
Heiko Stroh: packing, logistics, gamma-ray spectrometry analysis.
Gerd Marissens: packing, gamma-ray spectrometry, logistics.
Jan Paepen: packing, data validation of participants’ performance.
Piotr Robouch: quality control, data validation of participants’ performance.
Katarzyna Sobiech-Matura: internal review of the report.
Ulf Jacobsson: G.2 Unit Quality Officer, developer of the REMPES application.
Advisory group members: Arjan Plompen Head of Unit ad interim, Petya Malo ISO 17043 Quality management, Mikael Hult as Team Leader, Jan Paepen and Stefaan Pommé as Statistical advisors, Piotr Robouch as External advisor.
2.2 Subcontractors, collaborators
JRC-Geel subcontracted some of the tasks to other JRC directorates and an external expert institute in the field. The main contacts and the name of each collaborating entity are listed below:
Edmond Dupuis and Michel Bruggeman: SCK CEN (Belgian Nuclear Research Centre in Mol, Belgium): performing preliminary material characterisation, radionuclide specific and gross activity measurements. SCK CEN is accredited according to ISO/IEC 17025:2017 to perform gross alpha and beta activity measurements in waters,
Håkan Emteborg (JRC-Geel, F.6 Reference Materials Unit): PT reference material processing, packing and providing temporary sample storage rooms. JRC-Geel Dir.F.6 is an accredited Certified Reference Materials producer according to ISO 17034:2016,
James Snell (JRC-Geel, F.5 Food & Feed Compliance Unit): performing complimentary ICP-OES elemental analysis.
Edmond Dupuis from SCK CEN actively contributed to the REM2019 PT by enabling access to the natural mineral water sample, performing preliminary material characterisation, radionuclide specific measurements and giving technical support throughout the PT. The measurement results from SCK CEN were either used to confirm the JRC-Geel measurement results or used solely for assigning reference value.
2.3 Participating organisations, participation fee
The participation in the PT was based predominantly on nominations and direct invitation by either JRC or the International Atomic Energy Agency (IAEA) through their network. Priority was given to the environmental radioactivity monitoring laboratories nominated by the EU member states’ Euratom article 35/36 contact points and authorities. In total 154 laboratories from all over Europe participated in the PT (from 26 EU countries and 11 EU associated countries). In addition to the registered organisations, JRC-Geel received

8
additional participation requests by e-mail. Unfortunately, these requests were rejected because they were either received after the registration deadline or participation requests were coming outside Europe (USA, African or Asian countries) where other financial or logistics issues could have emerged (e.g. customs). The full list of all registered laboratories with their affiliations is presented in Annex 6.
Participation in this PT was free of charge. All costs regarding the PT organisation were covered by the PT coordinator organisation (JRC-Geel), except the sample analysis related costs.
2.4 Timeline and announcements
Table 1 shows the REM 2019 PT tentative time line.
Table 1. Timeline of the REM2019 PT exercise.
September 2018 EC Directorate for Energy and EURATOM Art. 35-36 experts’ meeting: request to JRC
July-Aug 2019 JRC-Geel contacted national authorities, laboratories requesting nominations and expression of interest
3 September 2019 Invitation letter sent to the nominated/interested laboratories
14 and 25 September 2019 Registration deadline
7-14 January 2020 PT material shipment to participants
20 March 2020 Initial submission deadline for laboratories’ results and questionnaire
17 June 2020 Extended submission deadline due to Covid-19 situation
3 September 2020 Preliminary results sent to participants
4-6 May 2021 Follow-up virtual-workshop on REM2019 PT
2021 Technical report (“Final report”)
The announcements and communication documents are presented in Annex 1-6.
Note: Due to the coronavirus pandemic many laboratories running at limited capacity so the initial deadline for reporting (20 March 2020) was extended until 17 June 2020, to allow participants to perform measurements and submit their measurement result. Since another closure was introduced at JRC-Geel in July 2020, the preparation of this PT report was further delayed.
2.5 PT reference materials
To run a representative PT, the selection of test items (PT reference materials) is a crucial step. Therefore, our first objective was to select waters as close to the samples European laboratories usually measure as possible. For this reason, an initial radioanalytical survey to study the naturally occurring alpha emitting radionuclides was carried out in some different mineral waters from the European market. The activity concentrations of the most abundant naturally occurring alpha-emitting radionuclides (226Ra, 210Po, 234U, 235U, 238U and 228Th) were determined. In order to find representative water samples of natural origin for the gross alpha/beta PT, the following important parameters were taken into account during the PT reference material selection: activity concentration of the alpha-emitting radionuclides, salinity and the chemical composition. In

9
terms of salinity, the selected PT test items were preferably in the range where the majority of drinking waters are (~50-1500 mg L-1). It was also decided that apart from a natural matrix water, a spiked PT reference material would be prepared gravimetrically. The latter sample is one step away from the natural samples the European monitoring labs are measuring in their daily work but the reference activity concentration will have a lower uncertainty so it is useful to combine the two types of samples in a PT. Thus in total two types of waters were selected as PT reference materials, a natural origin mineral water (JRC-GAB1) and a deionised water that was spiked (JRC-GAB2) with alpha and beta emitting radionuclides and inactive inorganic salts to better represent typical water sample3.
Monitoring laboratories have to be confident in measuring activities near the screening levels of the recent WHO guidelines and E-DWD (WHO, 2017; EC, 2013) and should meet the recommendations on detection limits. Therefore, we selected the PT samples considering these performance quality parameters as shown in Table 2.
Table 2. Sources and parameters used for establishing requirements for the REM2019 PT water selection.
Parameter Activity concentration (Bq L-1) References
Limit of detection
0.02-0.1 ISO 9696:2007; ISO 9697:2008
Gross 0.04; Gross = 0.4 EC, 2013
Screening levels Gross0.5; Gross = 1 WHO, 2017
Gross0.1; Gross = 1 EC, 2013
Each water sample was filled in a 1-L bottle (See chapter 2.6). After filling, each bottle was wiped dry carefully using towels and paper tissues. There was approximately 1 kg of water in each bottle which was controlled with a balance during dispensing. This volume was expected to be sufficient for typical gross activity analyses.
Major chemical characterisation of both PT reference materials was performed. They contained calcium, magnesium, sodium, potassium, chlorides and nitrates and non-interfering trace elements as carriers. Both
water samples were acidified with nitric acid to adjust pH 1-2 following ISO 5667-3:2018 (section A.5). A detailed description of the preparation of the PT reference materials is described in Chapter 3.1.
JRC-GAB1 PT reference material contained only naturally occurring alpha - and beta emitting radionuclides. JRC-GAB2 PT reference material contained mainly artificial (anthropogenic) alpha - and beta emitting radionuclides with 40K being the only naturally occurring radionuclide in the form of KCl (Merck, analytical grade, K assay content 99.5%).
2.6 Logistics: packaging and shipment
The PT reference materials were filled into regular acid proof 1L high-density polyethylene (HDPE) sample storage laboratory bottles. Crimp films were used to cover the screw caps serving as anti-tamper seal. They were in two different colours to facilitate visual identification of the two different PT samples.
The individual PT test items assigned to different studies (homogeneity, stability and reference value) were selected using a random stratified selection strategy covering the whole batch. The selection was made using the Sample Number Assignment Program (SNAP) developed and validated at JRC-Geel. The 460 individual units of PT reference materials were split in the following way:
308 units per PT sample were sent to the participants,
10 units per PT sample were assigned for the homogeneity study and assigning reference value (JRC-GAB1) or verifying formulation/spiking (JRC-GAB2),
6 units per PT sample were used in the stability study,
96 units per PT sample served as back-up.
3 More details on the PT sample selection for the previous PT are described elsewhere (Jobbágy et al., 2013).
10
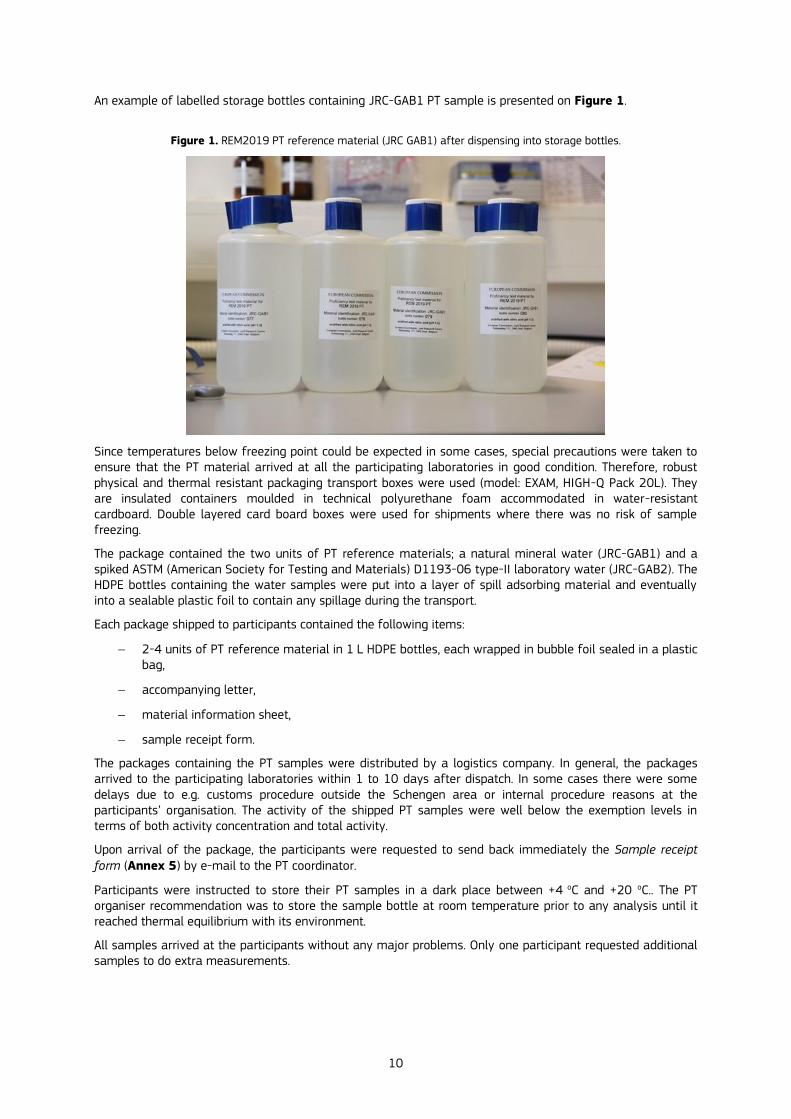
An example of labelled storage bottles containing JRC-GAB1 PT sample is presented on Figure 1.
Figure 1. REM2019 PT reference material (JRC GAB1) after dispensing into storage bottles.
Since temperatures below freezing point could be expected in some cases, special precautions were taken to ensure that the PT material arrived at all the participating laboratories in good condition. Therefore, robust physical and thermal resistant packaging transport boxes were used (model: EXAM, HIGH-Q Pack 20L). They are insulated containers moulded in technical polyurethane foam accommodated in water-resistant cardboard. Double layered card board boxes were used for shipments where there was no risk of sample freezing.
The package contained the two units of PT reference materials; a natural mineral water (JRC-GAB1) and a spiked ASTM (American Society for Testing and Materials) D1193-06 type-II laboratory water (JRC-GAB2). The HDPE bottles containing the water samples were put into a layer of spill adsorbing material and eventually into a sealable plastic foil to contain any spillage during the transport.
Each package shipped to participants contained the following items:
2-4 units of PT reference material in 1 L HDPE bottles, each wrapped in bubble foil sealed in a plastic bag,
accompanying letter,
material information sheet,
sample receipt form.
The packages containing the PT samples were distributed by a logistics company. In general, the packages arrived to the participating laboratories within 1 to 10 days after dispatch. In some cases there were some delays due to e.g. customs procedure outside the Schengen area or internal procedure reasons at the participants’ organisation. The activity of the shipped PT samples were well below the exemption levels in terms of both activity concentration and total activity.
Upon arrival of the package, the participants were requested to send back immediately the Sample receipt form (Annex 5) by e-mail to the PT coordinator.
Participants were instructed to store their PT samples in a dark place between +4 oC and +20 oC.. The PT organiser recommendation was to store the sample bottle at room temperature prior to any analysis until it reached thermal equilibrium with its environment.
All samples arrived at the participants without any major problems. Only one participant requested additional samples to do extra measurements.
11
2.7 Reporting of the results
The reporting of laboratory results was done via the JRC online reporting tool. Participants were requested to fill in the online questionnaire about their organisation and technical details of the analytical method(s) used. The link was sent via e-mail to the participants.
Participants were asked to submit their results via the following weblink using the personalised password key provided to each participant: https://web.jrc.ec.europa.eu/ilcReportingWeb
Participants had the opportunity to report results obtained by different analytical methods following the organiser’s instructions including:
the measurement technique used,
one mean result per measurement technique (in mBq/L),
associated uncertainty and the coverage factor of k.
Note on reference date: in theory, decay correction is not possible for gross alpha/beta parameters. Therefore, reference date was not given.
2.8 Questionnaire
Participants were asked to fill in a questionnaire (Annex 7) which was composed of four main parts concerning the information on the laboratory, experience, technical details on measurement methods, feedback. Information provided in the questionnaire was used to evaluate the results of the proficiency test in detail. The questionnaire was available via the following link on the REM2019 PT result reporting website:
https://web.jrc.ec.europa.eu/ilcReportingWeb
2.9 Data treatment
All results were treated confidentially; identities were and will be kept anonymous even beyond the PT exercise. However, the results and performance of each nominated laboratory will be made available to the laboratory, its national representative(s) (the nominating authority) and to the relevant services of the European Commission at Directorate General for Energy as announced in the invitation e-mail (Annex 1).
Participants had to agree with our data treatment and privacy policy during the registration to comply with the European General Data Protection Regulation (GDPR). The participants were informed that the name of the organisation will appear in the final report.
2.10 Use of proficiency testing results by participants and accreditation bodies
The results and scores of a proficiency testing exercise should be used as described in Clause C.4 and C.5 of the ISO/IEC 17043:2010. The aforementioned clauses warn the laboratories and accreditation bodies to use proficiency testing (especially results from only one PT) as the only tool in the accreditation processes to determine competence. Performance scores from a PT are momentary evidence of competence for that particular exercise and may not necessarily reflect general long-term competence of a laboratory.

12
3 Proficiency test reference materials: processing and characterisation
3.1 PT reference material production and processing
The reference material processing and their treatment was identical for both PT-materials. The vessels used for PT reference material homogenisation and production steps are described in sub-chapter 3.1.1 and 3.1.2.
3.1.1 Vessels for homogenisation and processing
There were two large volume custom-made vessels used for homogenisation and processing (one vessel for each material) (Teblick, Antwerp, BE). Each vessel fulfils the requirements for trace elements in water reference materials since they can be rigorously cleaned with a sequence of strong acid and Type I ultrapure water. The wall of the vessels is a sandwich construction and consists of glass fibre reinforced plastic (GRP) as outer liner and Teflon® PFA (perfluoroalkoxy copolymer resin) as an inner liner. The dimensions of these vessels are such that the Dyna-mixer CM500 (WAB, Basel - Switzerland) can be used for easy cleaning of these vessels between projects. Consequently before filling with the water and the Type II pure water, the vessels were rinsed with >50 L Type II pure water and placed in the Dyna-mixer CM500. The whole system, when comprising of four inter-connected vessels, allows homogenisation of up to 2 m3 of water at the same time. The pneumatically driven bellow-pumps (Iwaki FS-30-HT2) are made so that all parts in contact with the water are made of PFA or PTFE. The vessels are also equipped with a level sensor and via a feedback circuit the pumping speed is individually controlled so that the level stays the same in all vessels during recirculation. A full re-circulation of 2 m3 can be achieved in approximately one hour with a flow of about 30 L/min per pump.
3.1.2 Production and processing
The natural mineral water sample (JRC-GAB1) was provided by a mineral water supplier in a 1 m3 transport container, whilst the water for JRC-GAB2 was produced in-house as described in the next paragraphs.
JRC-GAB1 PT reference material was produced from a commercial mineral water from France. For the homogenisation, one of the PFA-lined vessel with approximately 550 L was filled with the mineral water
which was acidified to pH = 1.4 ± 0.1with analytical grade concentrated HNO3. The acidified water was re-circulated for few days at 15 L/min using the inert Iwaki bellow pumps. During filling an intermediate PFA buffer tank of 20 L was used and the water was pumped from the main tank into the buffer tank. The buffer tank was placed inside a clean bench and the water bottles were filled automatically when placed on a balance subsequently reaching a mass set-point. Prior to filling, the buffer tank was rinsed with 2 x 10 L of Type I water (18.2 MΩ cm, 0.056 µS/cm at 25 °C and TOC < 5 ng/mL) from a Milli-Q Advantage system (Millipore, Billerica, MA, USA) and 20 L of mineral water. In this manner 460 bottles were filled. The 1-L bottles were made of high density polyethylene (HDPE) with a leak-proof HDPE-screw cap (Nalgene).
JRC-GAB2 PT reference material was a spiked Type II water from a Millipore ELIX-35 system (>5 MΩ cm, 0.2 µS/cm at 25 °C and TOC < 30 ng/mL) with added inorganic salt mixture composed by KCl (Merck, assay content 99.5%), NaCl, CaCl2, MgCl2, Sm(NO3)3 and Sr(NO3)2. During several days, 500 L of Type II water was collected in portions into the main PFA-lined drum of 550 L. Subsequently the preliminary weighed salt mixture was added. Thereafter, analytical grade concentrated nitric acid was added to obtain the desired pH
(pH = 1.4 0.1) followed by 90Sr/90Y and 241Am spikes from standardized solutions. The 90Sr/90Y with massic
activity of (121.4 1.0) Bq/g, and 241Am (80.99 0.40) Bq/g, radioactive solutions were standardized at the Czech Metrology Institute (Eurostandard). Reference date for both standardised solutions was 10 September 2019. The contents were thereafter mixed as previously described using the Iwaki inert bellows pump of the water handling system for 16 hours at 15 L/min. Subsequently, 460 of the 1-L HDPE bottles (Nalgene) were filled in the same way as for JRC-GAB1 reference material.
For both type of reference materials crimp films were used to cover the screw caps of the bottled materials serving as anti-tamper seal. The crimp films were used in two different colours to facilitate visual identification of the two PT reference materials.
After bottling, the PT reference materials were transported into their interim storage room within JRC-Geel premises. PT reference materials were stored in a dark and dry storage place at 4 oC.
Information on the radionuclide composition and chemical composition of the REM2019 PT samples are presented in Table 3 and in Table 4.

13
Table 3. The radionuclide composition and total dissolved solid contents of the REM2019 PT reference materials
(uncertainties at k=1).
JRC-GAB1 (Natural matrix) JRC-GAB2 (QC Spiked water)
Total dissolved solids content: (966 ± 27) mg/L Total dissolved solids content: (356 ± 20) mg/L
Source of alpha activity contribution: 234U and 238U Source of alpha activity contribution: 241Am
Source of beta activity contribution: 40K, 234Th, 234Pa Source of beta activity contribution: 40K, 90Sr/90Y in equilibrium
Table 4. The chemical composition and concentration of JRC-GAB2 PT reference material from gravimetric weighing. The
relative standard uncertainty on the chemical concentration was approximately 1.0%.
Chemical
element/ion Weighed amount (g)
Chemical concentration
(mg/L)
Na (sodium) 19.650 38.1
Ca (calcium) 23.140 44.9
Sr (strontium) 4.160 8.1
Mg (magnesium) 10.750 20.8
K* (potassium) 8.890 17.2
Sm (samarium) 0.611 1.2
Cl (chlorine) 110.660 214.5
𝑁𝑂3−
(nitrate) 5.900 11.4
Reference values for JRC-GAB2 PT reference material were determined by using gravimetric approach, where the standardized solutions were weighed on a calibrated balance which is traceable to the BIPM (SI) standard kilogram via JRC-Geel standard kilogram. The uncertainty on the weighing was approximately 0.1%.
3.2 Gross alpha/beta activity measurements
3.2.1 Measurements performed at SCK CEN
The gross alpha/beta activity measurements in water samples performed at SCK CEN were based on ISO 10704:2019 standard evaporation and co-precipitation approaches. The direct evaporation method using an automatic evaporator where 200-250 mL of water was directly evaporated on the cup before being measured in a ZnS counter and or in a proportional counter. Another applied approach was to pre-concentrate samples with the Buchi Syncore system and after, evaporate it on a planchet to obtain a homogenous dry deposit. Thanks to a self-absorption curve, a correction factor was calculated and used in order to be able to convert this activity into activity concentration values. Sample preparation started with evaporation of 250 mL sample. To keep all the soluble materials in solution, 5 mL of 10 % acetic acid were added and evaporated under vacuum in a BuchiSyncore Analyst system with a flush back option. With this system all the activity and salt were concentrated in a small volume of about 3 mL. This sample volume was transferred into a stainless steel planchet and the water was dried on a (glass-ceramic) hotplate until complete dryness. The residue was weighed and measured with the gross alpha/beta system.
Detector system for gross alpha counting: 5 inch (1 inch 2.54 cm) ZnS(Ag) low background detector. To reduce the background of the counter, the counting cell is flushed with a low flow of dry nitrogen gas. Typical
measurement time: 5 10000 s and 10 10000 s. Alpha background: 0.04 – 0.09 cpm.

14
Detector system for gross beta counting: the samples were counted in a proportional counter 5 inch very low background Canberra LB4200 and low background Canberra Tennelec LB 5500 with sample changer. Typical
measurement time: 6 3000 s and 10 6000 s. Beta background: < 2.5 cpm. For quality check purposes background is measured before and after each sample measurement. The efficiency of all the counters is controlled each month with a certified source made at SCK·CEN. Radionuclides used for calibration: 239Pu for alpha and 90Sr/90Y for beta. Self-absorption factor is determined by using NaNO3.
3.2.2 Measurements performed at JRC-Geel
The JRC-Geel method for the determination of gross alpha/beta activity concentrations in water samples was based on the ISO 11704:2018 standard. In the sample concentration step approximately an aliquot of 250-500 g of water was weighed into a glass beaker and acidified to approximately pH 2 using nitric acid if not acidified before. The sample was gently evaporated to approximately 20-30 mL on an electrical plate at maximum 80 oC . The beaker was cooled down and the remaining water was weighed. Then, an aliquot of 10 mL of water sample was dispensed into a 20 mL low-diffusion polyethylene liquid scintillation vial containing 10 mL of Ultima Gold AB liquid scintillation cocktail. A vial was closed with a cap and shaken vigorously by hand for 30 seconds. The LSC vial was placed into a cooled tray of the liquid scintillation (LS) counter for minimum 3 hours to reduce events from photoluminescence. Then samples were measured for 6 hours and the alpha/beta spectrum was recorded using the low background Quantulus 1220 counter (Perkin Elmer). Alpha particles were counted in a window between channels 500 - 1000, and beta particles were registered in a window between channels 50 - 900.
Before measuring a batch of samples the LS counter’s pulse shape analyser (PSA) value of the alpha/beta discriminator was adjusted by dispensing known activities of alpha emitting (241Am) and beta emitting (90Sr/90Y) radionuclide standard solution to a concentrated water sample and measuring alpha and beta spectra. For both water samples (JRC-GAB1 and JRC-GAB2) the optimum PSA values were found to be 70. Thus the same settings were used for the LSC measurements.
Similarly, alpha and beta counting efficiencies were determined by dispensing a known activity of alpha or beta emitting radionuclide standard solution to thermally pre-concentrated water samples. Alpha counting efficiency (referred to 241Am) was 0.98 ± 0.01, and beta counting efficiency (referred to 90Sr/90Y) was 0.96 ± 0.01. The alpha to beta spillover values for JRC-GAB1 and JRC-GAB2 samples were 1.12% and 1.24%, respectively. The beta to alpha spillover values for JRC-GAB1 and JRC-GAB2 samples were 0.97% and 0.89%, respectively.
Blank samples were prepared the same way as the routine samples. An aliquot of 10 ml pre-concentrated de-ionized water sample was dispensed into a 20 mL low-diffusion polyethylene liquid scintillation vial and mixed with 10 mL of Ultima Gold AB scintillation cocktail. Blank samples were measured before and after measuring a batch of samples.
3.3 Radionuclide-specific measurements
3.3.1 Alpha-particle spectrometry measurements of uranium isotopes and 241Am
For both PT water samples a known amount of tracers (232U for JRC-GAB1 samples or 243Am for JRC-GAB2 samples) were added gravimetrically before the pre-concentration step. Pre-concentration of radionuclides was done prior to the separation phase from 0.5 L water samples by Fe(OH)3 co-precipitation. The precipitate was dissolved in 15 mL 8 mol/L or 3 mol/L HNO3 and loaded onto the extraction chromatography columns. TEVA, UTEVA and DGA solid phase extraction chromatographic resins were used for the sequential separation of U isotopes and Am from the interfering radionuclides and matrix elements.
Sources for alpha-particle spectrometry were prepared by electrodeposition from H2SO4/NaHSO4/NH4SO4 media, uranium isotopes and 241Am were electrodeposited onto stainless steel discs and measured by alpha-particle spectrometry. The detailed analytical procedures are described elsewhere (Jobbágy et al., 2013; Groska et al., 2016).
3.3.2 40K measurement with gamma-ray spectrometry
The water from three bottles for each of JRC-GAB1 and JRC-GAB2 were measured using gamma-ray spectrometry. The measurements were performed both in the 225 m deep underground laboratory HADES (Hult et al., 2021) and above ground at JRC-Geel. Due to the low count-rates, only the measurements from

15
detector Ge-5 in HADES were used for quantification. It is a 50% relative efficiency planar detector with a thin top deadlayer (so-called BEGe-detector). The count rates for 40K in both water samples were low which indicated very long measurement times (about 1 week per measurement) were needed with this technique but it is very robust as it requires no pre-treatment of the sample (water). The full energy peak efficiency curve was derived from a reference sample (liquid solution of mixed radionuclides) from NPL (National Physics Laboratory, UK). The efficiency transfer to correct for small differences in filling height was performed using the Monte Carlo code EGSnrc. The reported uncertainties are the combined standard uncertainties (k = 1) with major components being counting statistics and the full energy peak efficiency. The massic activities of 40K (as average of three bottles) are reported in Table 5. Due to the relatively high uncertainty (due to low count-rate) the value for JRC-GAB1 was not included in the determination of the reference values but served as a robust check of other methods. In addition, these measurements served to confirm the absence of other (gamma-ray emitting) radioactive impurities.
Table 5. Massic activities of 40K from underground gamma-ray spectrometry.
Sample Massic activity (k=1)
JRC-GAB1 (290 ± 100) mBq·kg-1
JRC-GAB2 (480 ± 80) mBq·kg-1
3.4 Summary of the radionuclide-specific and gross activity concentration
results
It was important to confirm the radionuclide composition of the two PT samples in order to ensure that interference free measurements can be performed. The radionuclide-specific and gross activity measurements were done using independent measurement methods at JRC and SCK CEN. The measurement results of the individual radionuclides and gross alpha/beta activity concentration for JRC-GAB1 and JRC-GAB2 samples are summarised in Table 6 and Table 7, respectively.
16
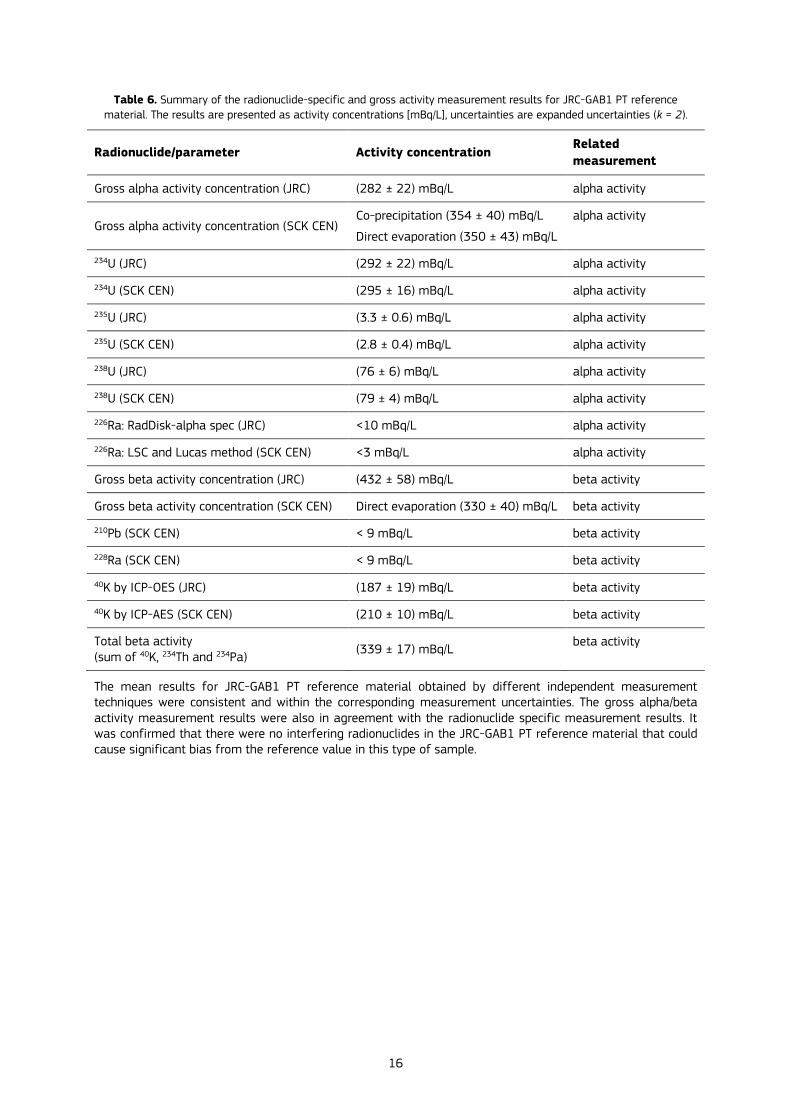
Table 6. Summary of the radionuclide-specific and gross activity measurement results for JRC-GAB1 PT reference
material. The results are presented as activity concentrations [mBq/L], uncertainties are expanded uncertainties (k = 2).
Radionuclide/parameter Activity concentration Related
measurement
Gross alpha activity concentration (JRC) (282 ± 22) mBq/L alpha activity
Gross alpha activity concentration (SCK CEN) Co-precipitation (354 ± 40) mBq/L
Direct evaporation (350 ± 43) mBq/L
alpha activity
234U (JRC) (292 ± 22) mBq/L alpha activity
234U (SCK CEN) (295 ± 16) mBq/L alpha activity
235U (JRC) (3.3 ± 0.6) mBq/L alpha activity
235U (SCK CEN) (2.8 ± 0.4) mBq/L alpha activity
238U (JRC) (76 ± 6) mBq/L alpha activity
238U (SCK CEN) (79 ± 4) mBq/L alpha activity
226Ra: RadDisk-alpha spec (JRC) <10 mBq/L alpha activity
226Ra: LSC and Lucas method (SCK CEN) <3 mBq/L alpha activity
Gross beta activity concentration (JRC) (432 ± 58) mBq/L beta activity
Gross beta activity concentration (SCK CEN) Direct evaporation (330 ± 40) mBq/L beta activity
210Pb (SCK CEN) < 9 mBq/L beta activity
228Ra (SCK CEN) < 9 mBq/L beta activity
40K by ICP-OES (JRC) (187 ± 19) mBq/L beta activity
40K by ICP-AES (SCK CEN) (210 ± 10) mBq/L beta activity
Total beta activity (sum of 40K, 234Th and 234Pa)
(339 ± 17) mBq/L beta activity
The mean results for JRC-GAB1 PT reference material obtained by different independent measurement techniques were consistent and within the corresponding measurement uncertainties. The gross alpha/beta activity measurement results were also in agreement with the radionuclide specific measurement results. It was confirmed that there were no interfering radionuclides in the JRC-GAB1 PT reference material that could cause significant bias from the reference value in this type of sample.
17
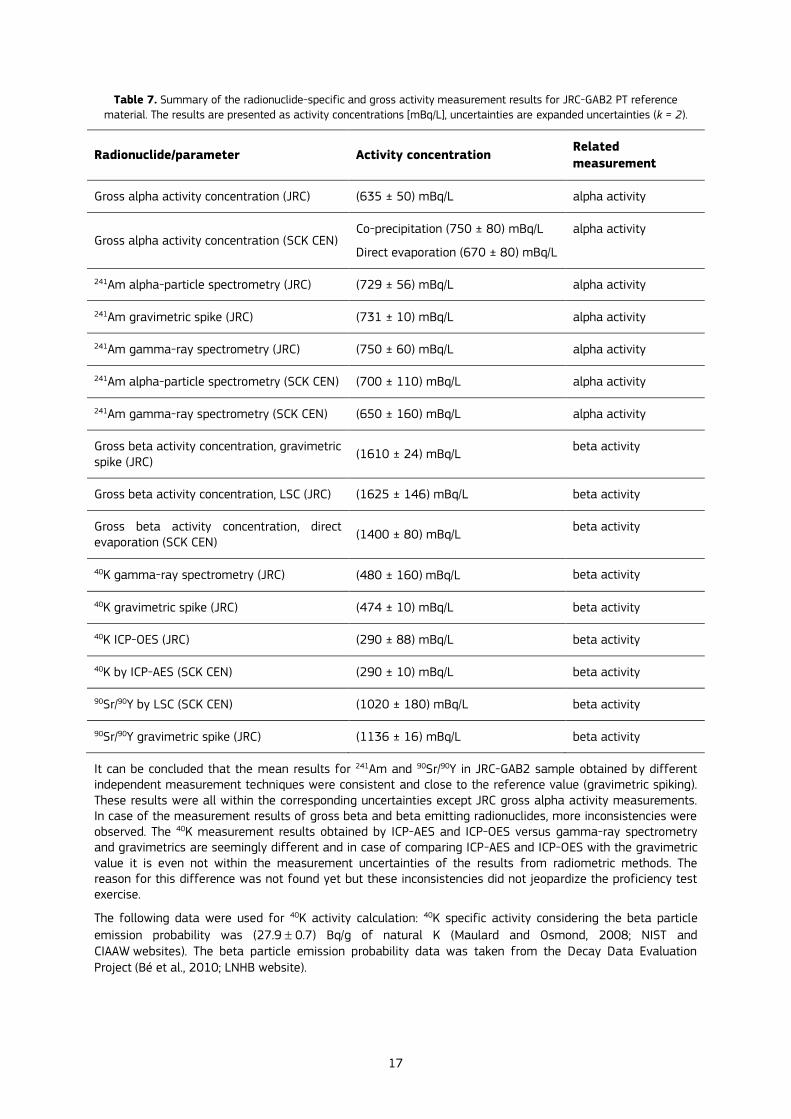
Table 7. Summary of the radionuclide-specific and gross activity measurement results for JRC-GAB2 PT reference
material. The results are presented as activity concentrations [mBq/L], uncertainties are expanded uncertainties (k = 2).
Radionuclide/parameter Activity concentration Related
measurement
Gross alpha activity concentration (JRC) (635 ± 50) mBq/L alpha activity
Gross alpha activity concentration (SCK CEN) Co-precipitation (750 ± 80) mBq/L
Direct evaporation (670 ± 80) mBq/L
alpha activity
241Am alpha-particle spectrometry (JRC) (729 ± 56) mBq/L alpha activity
241Am gravimetric spike (JRC) (731 ± 10) mBq/L alpha activity
241Am gamma-ray spectrometry (JRC) (750 ± 60) mBq/L alpha activity
241Am alpha-particle spectrometry (SCK CEN) (700 ± 110) mBq/L alpha activity
241Am gamma-ray spectrometry (SCK CEN) (650 ± 160) mBq/L alpha activity
Gross beta activity concentration, gravimetric spike (JRC)
(1610 ± 24) mBq/L beta activity
Gross beta activity concentration, LSC (JRC) (1625 ± 146) mBq/L beta activity
Gross beta activity concentration, direct evaporation (SCK CEN)
(1400 ± 80) mBq/L beta activity
40K gamma-ray spectrometry (JRC) (480 ± 160) mBq/L beta activity
40K gravimetric spike (JRC) (474 ± 10) mBq/L beta activity
40K ICP-OES (JRC) (290 ± 88) mBq/L beta activity
40K by ICP-AES (SCK CEN) (290 ± 10) mBq/L beta activity
90Sr/90Y by LSC (SCK CEN) (1020 ± 180) mBq/L beta activity
90Sr/90Y gravimetric spike (JRC) (1136 ± 16) mBq/L beta activity
It can be concluded that the mean results for 241Am and 90Sr/90Y in JRC-GAB2 sample obtained by different independent measurement techniques were consistent and close to the reference value (gravimetric spiking). These results were all within the corresponding uncertainties except JRC gross alpha activity measurements. In case of the measurement results of gross beta and beta emitting radionuclides, more inconsistencies were observed. The 40K measurement results obtained by ICP-AES and ICP-OES versus gamma-ray spectrometry and gravimetrics are seemingly different and in case of comparing ICP-AES and ICP-OES with the gravimetric value it is even not within the measurement uncertainties of the results from radiometric methods. The reason for this difference was not found yet but these inconsistencies did not jeopardize the proficiency test exercise.
The following data were used for 40K activity calculation: 40K specific activity considering the beta particle
emission probability was (27.9 0.7) Bq/g of natural K (Maulard and Osmond, 2008; NIST and CIAAW websites). The beta particle emission probability data was taken from the Decay Data Evaluation Project (Bé et al., 2010; LNHB website).

18
3.5 Homogeneity study
Since inhomogeneity may occur within a batch and can lead to discrepant results, it had to be demonstrated that these samples are identical within the whole batch such that each laboratory receives samples with the same parameters. Therefore, a homogeneity study between bottles was necessary to establish its contribution to the uncertainty budget of the reference values. The uncertainty budget was built with respect to all contributing parameters like weighing, volumetric measurements, counting statistics and homogeneity.
Both PT waters were homogenised for several days and bottled at JRC-Geel in November and December 2019 as described in Chapter 3.1. For the homogeneity study a random stratified method was used to select bottles to avoid systematic errors within the batch. Bottles were selected with the help of SNAP excel application developed at Reference Materials Unit at JRC-Geel. From each batch of water, ten bottles were randomly selected and analysed using gross activity measurements and radionuclide specific analysis of the natural origin or artificial alpha and beta emitting radionuclides used for spiking as presented in Table 8.
Table 8. Parameters/analytes checked during the homogeneity and stability studies.
PT reference material Parameters checked
JRC-GAB1 Gross alpha/beta activity; uranium isotopes, stable K
JRC-GAB2 Gross alpha/beta activity; 241Am, stable K and Sr
The homogeneity and the short term stability of the radionuclides in the matrix was evaluated using the SoftCRM software version 2.0.21 (Linsinger et al., 2001; Bonas et al., 2003) following the certification principles for reference materials as given in ISO Guide 35:2006 and ISO Guide 35:2017. According to the software, all individual results were normally and unimodally distributed. SoftCRM did not identify any
measurement results as outlier at a level of significance = 0.05 using the single Grubbs' test. Therefore, the whole batch was considered homogeneous and retained for further analysis and use. The homogeneity study was performed by alpha-particle spectrometry after radiochemical sample preparation and ICP-OES technique for stable K and Sr measurements. The results were then evaluated by a one-way analysis of variance (ANOVA). The between-bottle standard deviation sbb and within bottle standard deviation swb were calculated with the following formulae (ISO 35, 2017)
n
MSMSs withinbetween
bb
and withinwb MSs (1)
Where:
MSbetween is the between bottle variance,
MSwithin is the within bottle variance of the measurements used in the between-bottle homogeneity study,
n is the number of observations per group.
The inhomogeneity that could be hidden by the method repeatability is calculated by the following formula (ISO 35, 2017):
4
2
withinMS
within*
bbn
MSu
(2)
Where:
MSwithin is the degree of freedom of MSwithin.
This expression is based on the consideration that a confidence interval can be established for sbb, and that the half-width of the 95% confidence interval, converted to a standard uncertainty, can be taken as a measure of the impact of the repeatability of the method on the estimate of sbb (ISO 35, 2017).
19
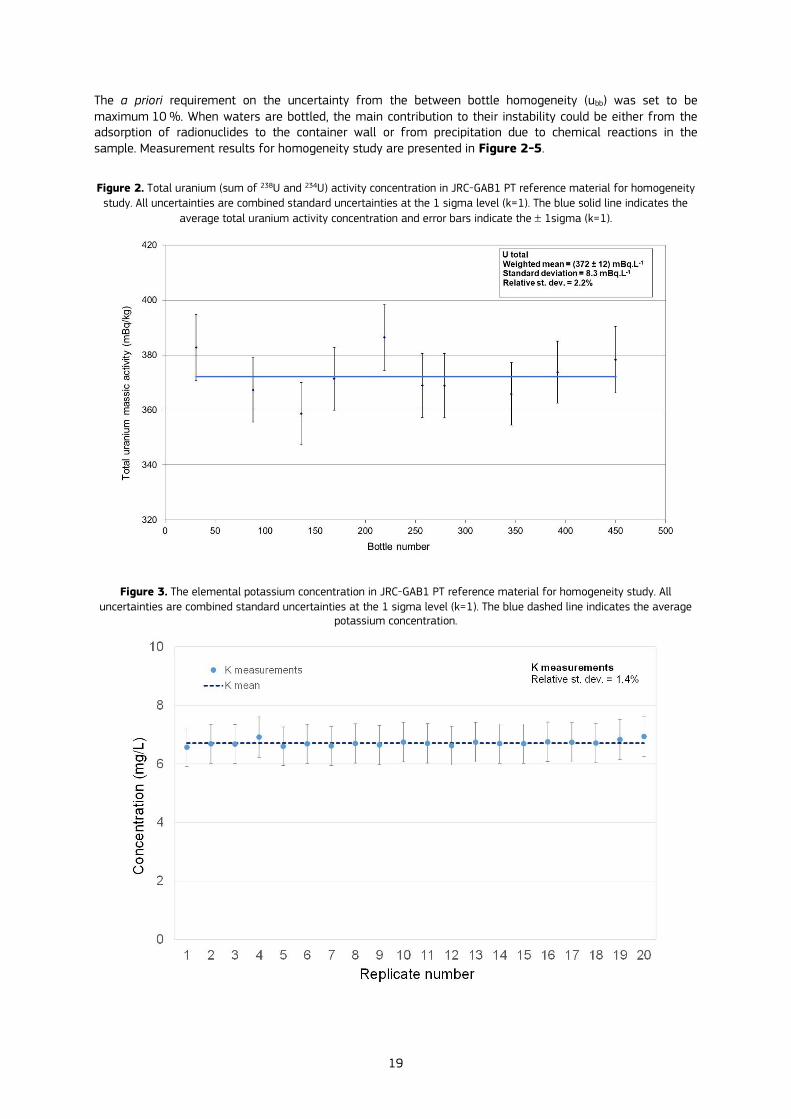
The a priori requirement on the uncertainty from the between bottle homogeneity (ubb) was set to be maximum 10 %. When waters are bottled, the main contribution to their instability could be either from the adsorption of radionuclides to the container wall or from precipitation due to chemical reactions in the sample. Measurement results for homogeneity study are presented in Figure 2-5.
Figure 2. Total uranium (sum of 238U and 234U) activity concentration in JRC-GAB1 PT reference material for homogeneity
study. All uncertainties are combined standard uncertainties at the 1 sigma level (k=1). The blue solid line indicates the
average total uranium activity concentration and error bars indicate the 1sigma (k=1).
Figure 3. The elemental potassium concentration in JRC-GAB1 PT reference material for homogeneity study. All
uncertainties are combined standard uncertainties at the 1 sigma level (k=1). The blue dashed line indicates the average potassium concentration.

20
Figure 4. The 241Am activity concentration in JRC-GAB2 PT reference material for homogeneity study. All uncertainties are
combined standard uncertainties at the 1 sigma level (k=1). The blue solid line indicates the average total uranium activity
concentration and error bars indicate the 1sigma (k=1).
Figure 5. The elemental potassium and strontium concentration in JRC-GAB2 PT reference material for homogeneity
study. All uncertainties are combined standard uncertainties at the 1 sigma level (k=1). The blue dashed line indicates the average potassium concentration and the orange dashed line indicates the average strontium concentration.

21
3.6 Stability study
According to the ISO/IEC 17043:2010 and ISO 13528:2015 standards, the uncertainty from a stability study originates from two types of stability:
The short-term stability of the PT reference materials which is related to sample transport (i.e. transport between the PT provider and the participants).
The long-term stability of the PT reference materials is linked to sample storage.
The uncertainty contribution from short- and long-term stability of the material to the uncertainty on the reference values was determined. There are chemical processes that may lead to increased uncertainty from instability apart from decay. These are adsorption of radionuclides to the sampling container material, chemical precipitation or co-precipitation of radionuclides and due to biological activities in the sample.
The short term stability was checked by measuring PT samples before and after shipment. Short term stability analysis was done when a small aliquot of PT sample was taken from the 1 L bottle and analysed using gross alpha/beta activity concentration measurements.
The first stability measurements were done already before shipping the PT reference materials and the last stability samples were measured two weeks after the result submission deadline. During long term stability testing, five bottles (n = 5) were placed in a temperature controlled climate chamber (Memmert GmbH) and kept at 4 oC and one bottle was stored at ambient temperature (around 20 oC) in a laboratory room. Long-term stability of the PT reference materials were studied by measuring activity concentrations of uranium isotopes in JRC-GAB1 and 241Am in JRC-GAB2 PT samples, respectively. In addition, gross alpha/beta activity concentration measurements were performed on both PT samples by liquid scintillation counting according to ISO 11704:2017. The stability study covered the whole period between sample processing and result submission deadline to confirm that there was no loss of radionuclides other than from the radioactive decay during the PT exercise. The potential loss of radionuclides can be hidden by the method repeatability. Therefore when the uncertainty components from stability studies are established, one has to correct for repeatability during calculation as the SoftCRM software does. On the basis of the SoftCRM calculation data the uncertainties due to transport and storage conditions (i.e. short term and long term stability) were found to be < 7.0% as summarised in Table 10 in Section 3.4.
3.7 Assigned values and the standard deviation for proficiency assessment
The reference gross alpha and beta activity concentration values 𝑥PT were calculated from the power-moderated mean (Pommé and Keightley, 2015) of a series of reference measurements in case of JRC-GAB1 water. While the reference gross alpha and beta activity concentration values 𝑥PT were calculated from the formulation (gravimetric spiking) for JRC-GAB2 water. By principle, decay correction is not possible on gross alpha/beta activities. Therefore, a reference date is not given.
The combined uncertainty 𝑢(𝑥PT) of the assigned reference values can be estimated as
𝑢(𝑥PT ) = 𝑘× 𝑢𝑐ℎ𝑎𝑟2 +𝑢𝑏𝑏
2 + 𝑢𝑠𝑡𝑠2 +𝑢𝑙𝑡𝑠
2
where
k: coverage factor (k=1) at 68% confidence interval,
𝑢(𝑥PT): combined standard uncertainty from the characterisation study,
𝑢𝑏𝑏 : uncertainty related to possible between bottles inhomogeneity,
𝑢𝑠𝑡𝑠 : uncertainty related to the possible short-term instability of the samples,
𝑢𝑙𝑡𝑠 : uncertainty related to the possible long-term stability of the samples.
The relevant parameters needed for calculating scores were: the reference values/assigned values 𝑥PT of the proficiency test samples, its associated combined standard uncertainty 𝑢(𝑥PT) and the standard deviation for proficiency assessment 𝜎PT as presented in Table 9. The standard deviation for proficiency assessment 𝜎PT
was set to 30 % for PT reference material JRC-GAB1 and to 20 % for PT reference material JRC-GAB2, respectively. The 𝜎PT for JRC-GAB1 was chosen higher than for JRC-GAB2 since JRC-GAB1 is a natural water
22
with lower gross activities. JRC-GAB2 is an easier-to-measure, gravimetrically spiked PT sample, free from interferences and with elevated gross activities compared to JRC-GAB1.
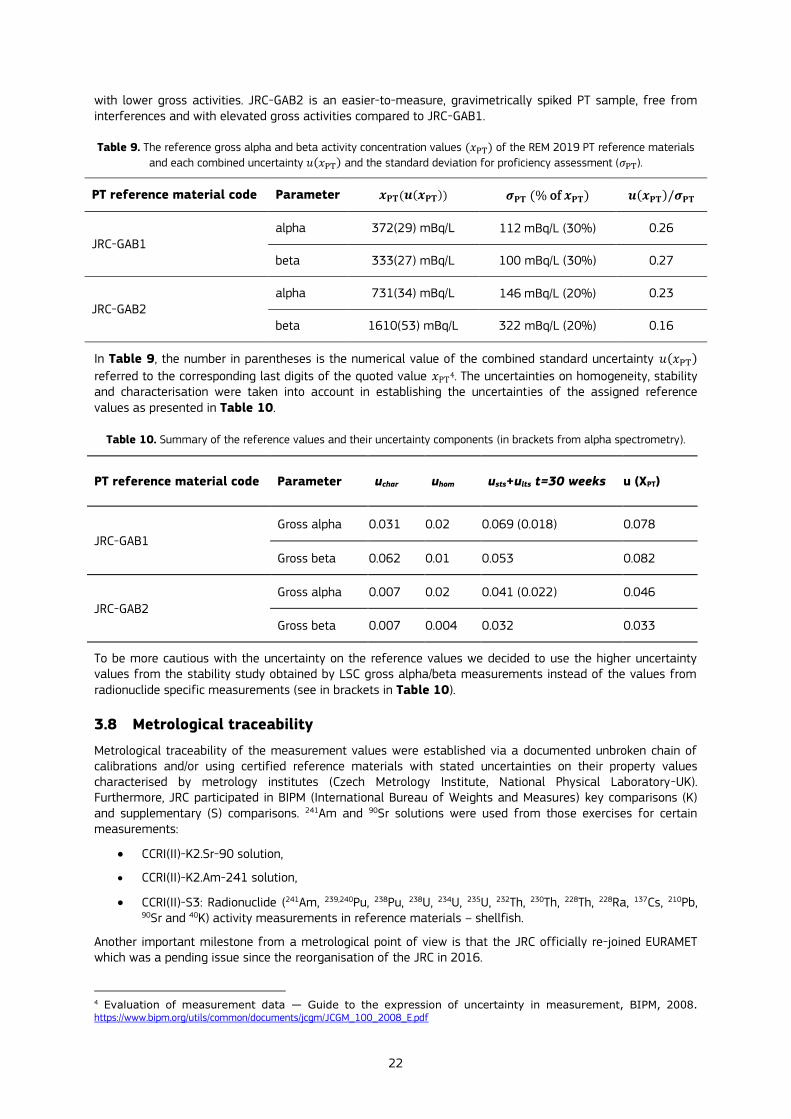
Table 9. The reference gross alpha and beta activity concentration values (𝑥PT) of the REM 2019 PT reference materials
and each combined uncertainty 𝑢(𝑥PT) and the standard deviation for proficiency assessment (𝜎PT).
PT reference material code Parameter 𝒙𝐏𝐓(𝒖(𝒙𝐏𝐓)) 𝝈𝐏𝐓 (% of 𝒙𝐏𝐓) 𝒖(𝒙𝐏𝐓)/𝝈𝐏𝐓
JRC-GAB1 alpha 372(29) mBq/L 112 mBq/L (30%) 0.26
beta 333(27) mBq/L 100 mBq/L (30%) 0.27
JRC-GAB2 alpha 731(34) mBq/L 146 mBq/L (20%) 0.23
beta 1610(53) mBq/L 322 mBq/L (20%) 0.16
In Table 9, the number in parentheses is the numerical value of the combined standard uncertainty 𝑢(𝑥PT)
referred to the corresponding last digits of the quoted value 𝑥PT4. The uncertainties on homogeneity, stability and characterisation were taken into account in establishing the uncertainties of the assigned reference values as presented in Table 10.
Table 10. Summary of the reference values and their uncertainty components (in brackets from alpha spectrometry).
PT reference material code Parameter uchar uhom usts+ults t=30 weeks u (XPT)
JRC-GAB1
Gross alpha 0.031 0.02 0.069 (0.018) 0.078
Gross beta 0.062 0.01 0.053 0.082
JRC-GAB2
Gross alpha 0.007 0.02 0.041 (0.022) 0.046
Gross beta 0.007 0.004 0.032 0.033
To be more cautious with the uncertainty on the reference values we decided to use the higher uncertainty values from the stability study obtained by LSC gross alpha/beta measurements instead of the values from radionuclide specific measurements (see in brackets in Table 10).
3.8 Metrological traceability
Metrological traceability of the measurement values were established via a documented unbroken chain of calibrations and/or using certified reference materials with stated uncertainties on their property values characterised by metrology institutes (Czech Metrology Institute, National Physical Laboratory-UK). Furthermore, JRC participated in BIPM (International Bureau of Weights and Measures) key comparisons (K) and supplementary (S) comparisons. 241Am and 90Sr solutions were used from those exercises for certain measurements:
CCRI(II)-K2.Sr-90 solution,
CCRI(II)-K2.Am-241 solution,
CCRI(II)-S3: Radionuclide (241Am, 239,240Pu, 238Pu, 238U, 234U, 235U, 232Th, 230Th, 228Th, 228Ra, 137Cs, 210Pb, 90Sr and 40K) activity measurements in reference materials – shellfish.
Another important milestone from a metrological point of view is that the JRC officially re-joined EURAMET which was a pending issue since the reorganisation of the JRC in 2016.
4 Evaluation of measurement data — Guide to the expression of uncertainty in measurement, BIPM, 2008. https://www.bipm.org/utils/common/documents/jcgm/JCGM_100_2008_E.pdf

23
4 Participants' results, scores and evaluation of results
In total, 154 participants of which 140 from the European Union Member States registered for this PT. From the 154 participants, 145 submitted at least one measurement result which totalled 709 individual measurement results. This chapter presents the evaluation of the participants' performance using their calculated performance scores.
The participants were requested to submit their results together with their combined standard uncertainties indicating the coverage factor (k) they used. To be able to compare the submitted results adequately, the organiser recalculated (when necessary) the reported uncertainties so that the same coverage factor is employed in all the graphs of this report.
We have to note that for JRC-GAB1 there were 7 and 11 “less-than” values for gross alpha and gross beta activity concentration, respectively. No less-than values were reported for sample JRC-GAB2. For “less-than” values, no scores (percentage deviation, z-score and zeta-score) could be calculated.
ISO 13238:2015 (Annex 10) requires the uncertainty of the assigned value 𝑢(𝑥PT) to be smaller than 0.3 𝜎PT
for enabling the organiser to express the laboratory performance in terms of 𝑧𝑖- and 𝑧𝑒𝑡𝑎𝑖-scores. This was the case for all four 𝜎PT of this PT (see last column of Table 9). The detailed calculation of performance
evaluation scores including formulae is presented in Annex 11.
The z-score divides each participant's deviation from the assigned value with the standard deviation of the
proficiency test assessment (PT).
The ζ-score states whether the laboratory's result agrees with the assigned value considering both the reported uncertainty and the uncertainty of the assigned value. An unsatisfactory ζ-score can be caused by an inappropriate estimation of either the reported value or its uncertainty, or both.
The interpretation of the 𝒛𝒊-score and 𝒛𝒆𝒕𝒂𝒊-score was done according to ISO 13528:2015. The following scores and colour codes are used in Figure 6 and Table 21-23 in Annex 10 (in parenthesis the ISO/IEC 17043:2010 synonym is given):
|score| ≤ 2 acceptable (or satisfactory) performance (green),
2 < |score| < 3 warning (or questionable) signal (yellow),
|score| ≥ 3 unacceptable (or unsatisfactory) performance (red).
For the percentage deviation a value is acceptable if the reported value is within ±PT, i.e within ±30% of the assigned value for JRC-GAB1 and within 20% of the assigned value for JRC-GAB2.
The gross alpha and beta activity concentrations 𝑥𝑖 in mBq/L are plotted in ascending order in Figure 6. (JRC-
GAB1 gross alpha), Figure 7 (JRC-GAB1 gross beta), Figure 8 (JRC-GAB2 gross alpha) and Figure 9 (JRC-
GAB2 gross beta). The uncertainties reported by the participants are presented as expanded uncertainties 𝑈(𝑥𝑖), with 𝑘 = 2.
The solid red line on the S-plots indicates the reference gross alpha or beta activity concentration (assigned value, 𝑥PT). The dashed red lines show the expanded uncertainty 𝑈(𝑥PT) (with 𝑘 = 2) of the reference value, while the blue short-dashed lines represent the acceptance range 𝑥PT ± 2 𝜎PT for 𝑧𝑖-scores.
Results without error bars on the S-plots (symbols at the right side of each graphs) represent results reported by the participants as "less-than" values.

24
Figure 6. The gross alpha activity concentration measurement results for JRC-GAB1 PT reference material, as reported by the participants, 𝑥𝑖 , and their expanded uncertainty 𝑈(𝑥𝑖), 𝑘 = 2.
Solid red line: reference value (𝑥PT). Red dashed lines: assigned range (𝑥PT ± 𝑈(𝑥PT), 𝑘 = 2). Blue dashed lines: 𝑥PT ± 2 𝜎PT acceptance range.
Gro
ss a
lph
a ac
tivi
ty c
on
cen
trat
ion
[m
Bq
/L]

25
Figure 7. The gross beta activity concentration measurement results for JRC-GAB1 PT reference material, as reported by the participants, 𝑥𝑖 , and their expanded uncertainty 𝑈(𝑥𝑖), 𝑘 =
2.Solid red line: reference value (𝑥PT). Red dashed lines: assigned range (𝑥PT ± 𝑈(𝑥PT), 𝑘 = 2). Blue dashed lines: 𝑥PT ± 2 𝜎PT acceptance range.
Gro
ss b
eta
acti
vity
co
nce
ntr
atio
n [
mB
q/L
]

26
Figure 8. The gross alpha activity concentration measurement results for JRC-GAB2 PT reference material, as reported by the participants, 𝑥𝑖 , and their expanded uncertainty 𝑈(𝑥𝑖), 𝑘 = 2.
Solid red line: reference value (𝑥PT). Red dashed lines: assigned range (𝑥PT ± 𝑈(𝑥PT), 𝑘 = 2). Blue dashed lines: 𝑥PT ± 2 𝜎PT acceptance range.
Gro
ss a
lph
a ac
tivi
ty c
on
cen
trat
ion
[m
Bq
/L]

27
Figure 9. The gross beta activity concentration measurement results for JRC-GAB2 PT reference material, as reported by the participants, 𝑥𝑖 , and their expanded uncertainty 𝑈(𝑥𝑖), 𝑘 = 2.
Solid red line: reference value (𝑥PT). Red dashed lines: assigned range (𝑥PT ± 𝑈(𝑥PT), 𝑘 = 2). Blue dashed lines: 𝑥PT ± 2 𝜎PT acceptance range.
Gro
ss b
eta
acti
vity
co
nce
ntr
atio
n [
mB
q/L
]
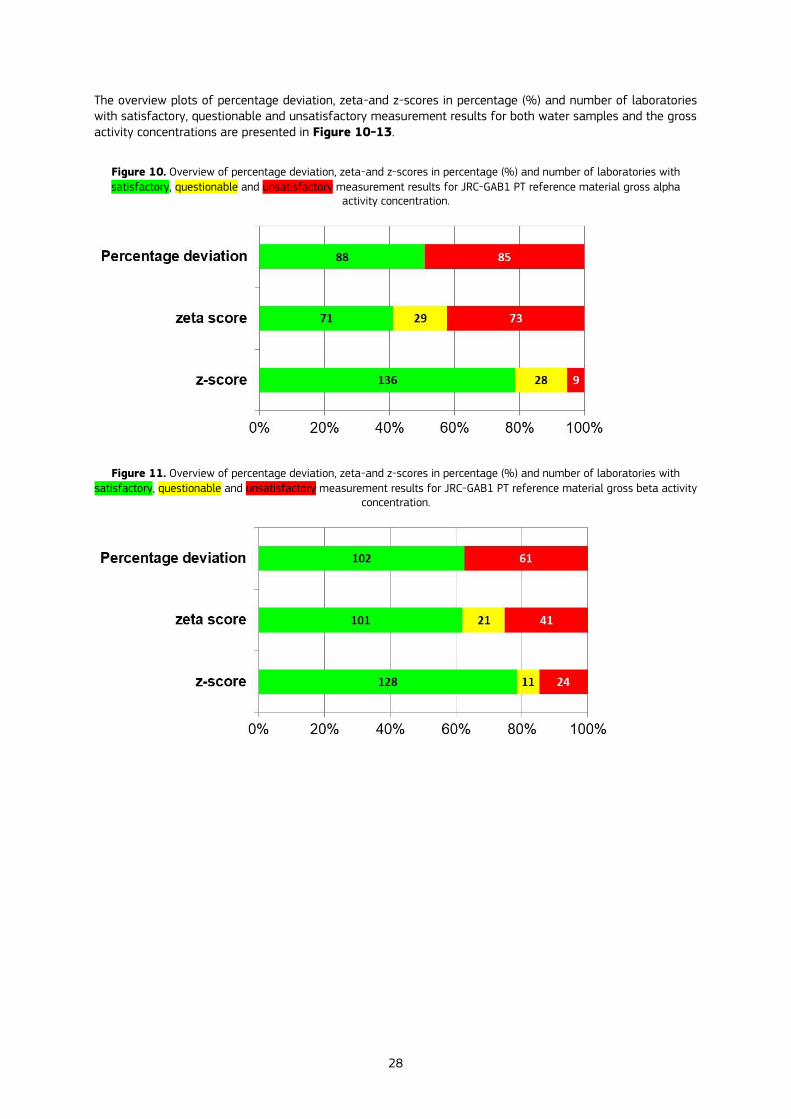
28
The overview plots of percentage deviation, zeta-and z-scores in percentage (%) and number of laboratories with satisfactory, questionable and unsatisfactory measurement results for both water samples and the gross activity concentrations are presented in Figure 10-13.
Figure 10. Overview of percentage deviation, zeta-and z-scores in percentage (%) and number of laboratories with
satisfactory, questionable and unsatisfactory measurement results for JRC-GAB1 PT reference material gross alpha activity concentration.
Figure 11. Overview of percentage deviation, zeta-and z-scores in percentage (%) and number of laboratories with
satisfactory, questionable and unsatisfactory measurement results for JRC-GAB1 PT reference material gross beta activity concentration.

29
Figure 12. Overview of percentage deviation, zeta-and z-scores in percentage (%) and number of laboratories with
satisfactory, questionable and unsatisfactory measurement results for JRC-GAB2 PT reference material gross alpha activity concentration.
Figure 13. Overview of percentage deviation, zeta-and z-scores in percentage (%) and number of laboratories with
satisfactory, questionable and unsatisfactory measurement results for JRC-GAB2 PT reference material gross beta activity concentration.
We observed that many reported results deviate by several orders of magnitude from the reference values. A general conclusion for all four parameters in this exercise is that only around 50% of the submitted results were satisfactory for percentage deviation and zeta score. The success rate for z-score was much higher thanks to the interpretation of this score, as it extends by two times the standard deviation for proficiency tests, i.e. “acceptance range”. In the context of reducing the number of blunders or grand errors5 in the EU, it is useful to compare the ratio of maximum to minimum reported gross activity concentrations as presented in Table 11. The number of satisfactory percentage deviation (D%) and zeta scores together with the number
of laboratories are collected in Table 12.
Table 11. Ratio of the reported maximum to minimum gross activity concentrations. (Not including results reported as
detection limits)
Parameter Amax/ Amin
JRC-GAB1 JRC-GAB2
Gross alpha activity 1.96×10⁷ 7.30×10³
Gross beta activity 4.52×10⁷ 5.11×10⁶
5 We define a blunder or grand error as a single error that generates an erroneous result by at least a factor 10
and can be to write mBq instead of Bq or to lose a digit like for example writing 100 instead of 1000.
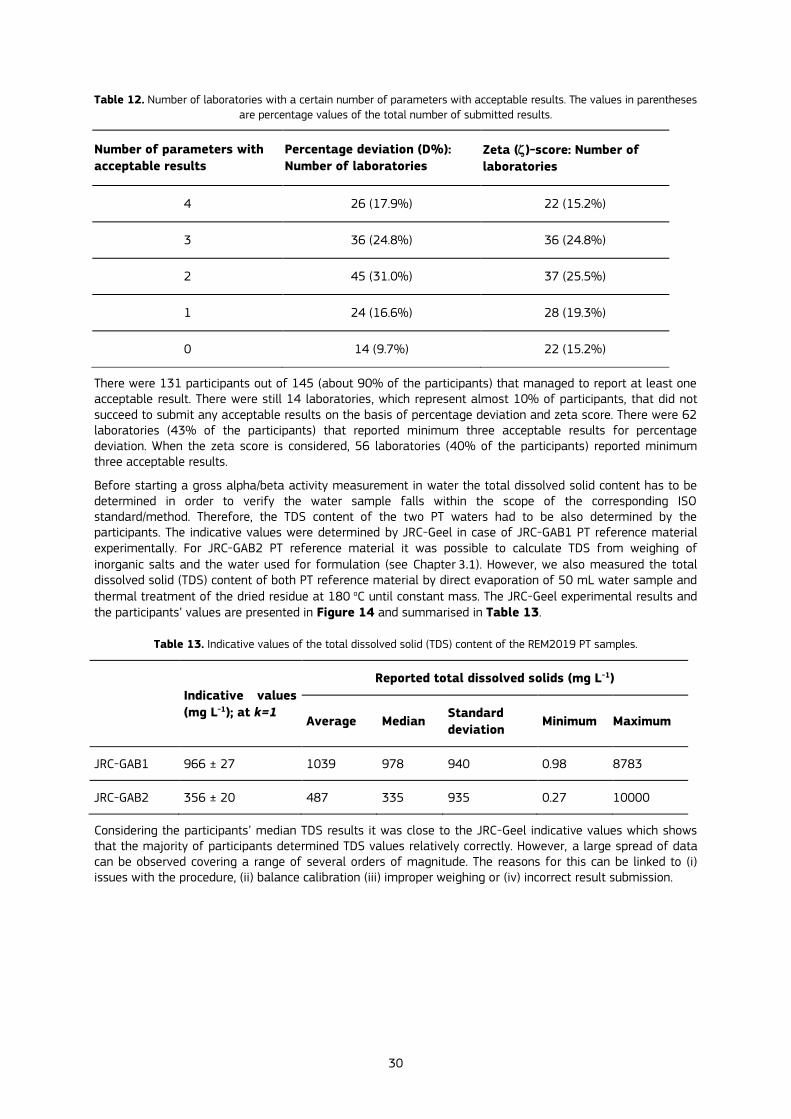
30
Table 12. Number of laboratories with a certain number of parameters with acceptable results. The values in parentheses
are percentage values of the total number of submitted results.
Number of parameters with
acceptable results
Percentage deviation (D%):
Number of laboratories Zeta ()-score: Number of
laboratories
4 26 (17.9%) 22 (15.2%)
3 36 (24.8%) 36 (24.8%)
2 45 (31.0%) 37 (25.5%)
1 24 (16.6%) 28 (19.3%)
0 14 (9.7%) 22 (15.2%)
There were 131 participants out of 145 (about 90% of the participants) that managed to report at least one acceptable result. There were still 14 laboratories, which represent almost 10% of participants, that did not succeed to submit any acceptable results on the basis of percentage deviation and zeta score. There were 62 laboratories (43% of the participants) that reported minimum three acceptable results for percentage deviation. When the zeta score is considered, 56 laboratories (40% of the participants) reported minimum three acceptable results.
Before starting a gross alpha/beta activity measurement in water the total dissolved solid content has to be determined in order to verify the water sample falls within the scope of the corresponding ISO standard/method. Therefore, the TDS content of the two PT waters had to be also determined by the participants. The indicative values were determined by JRC-Geel in case of JRC-GAB1 PT reference material experimentally. For JRC-GAB2 PT reference material it was possible to calculate TDS from weighing of inorganic salts and the water used for formulation (see Chapter 3.1). However, we also measured the total dissolved solid (TDS) content of both PT reference material by direct evaporation of 50 mL water sample and thermal treatment of the dried residue at 180 oC until constant mass. The JRC-Geel experimental results and the participants’ values are presented in Figure 14 and summarised in Table 13.
Table 13. Indicative values of the total dissolved solid (TDS) content of the REM2019 PT samples.
Indicative values
(mg L-1); at k=1
Reported total dissolved solids (mg L-1)
Average Median Standard
deviation Minimum Maximum
JRC-GAB1 966 ± 27 1039 978 940 0.98 8783
JRC-GAB2 356 ± 20 487 335 935 0.27 10000
Considering the participants’ median TDS results it was close to the JRC-Geel indicative values which shows that the majority of participants determined TDS values relatively correctly. However, a large spread of data can be observed covering a range of several orders of magnitude. The reasons for this can be linked to (i) issues with the procedure, (ii) balance calibration (iii) improper weighing or (iv) incorrect result submission.

31
Figure 14. The laboratory results for total dissolved solid content for JRC-GAB1 (upper graph) and JRC-GAB2 (lower
graph). The solid red lines: the indicative values; the dashed blue lines: standard uncertainties (± u at k = 1).
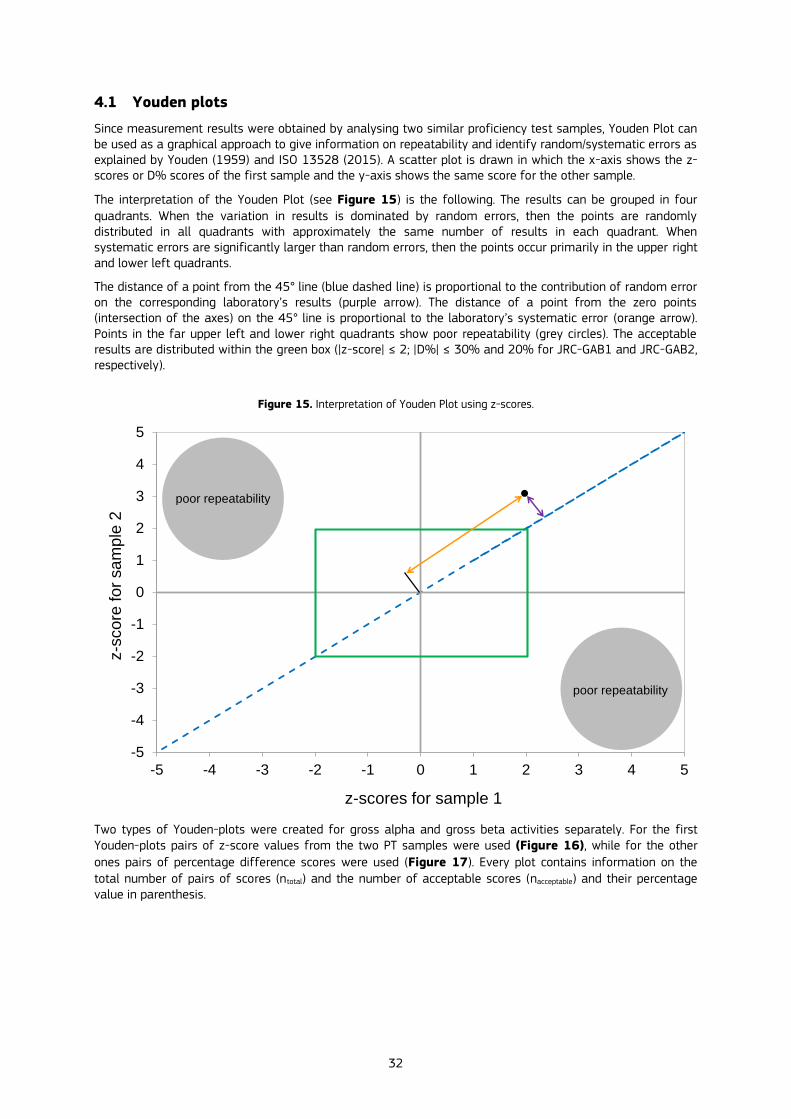
32
4.1 Youden plots
Since measurement results were obtained by analysing two similar proficiency test samples, Youden Plot can be used as a graphical approach to give information on repeatability and identify random/systematic errors as explained by Youden (1959) and ISO 13528 (2015). A scatter plot is drawn in which the x-axis shows the z-scores or D% scores of the first sample and the y-axis shows the same score for the other sample.
The interpretation of the Youden Plot (see Figure 15) is the following. The results can be grouped in four quadrants. When the variation in results is dominated by random errors, then the points are randomly distributed in all quadrants with approximately the same number of results in each quadrant. When systematic errors are significantly larger than random errors, then the points occur primarily in the upper right and lower left quadrants.
The distance of a point from the 45° line (blue dashed line) is proportional to the contribution of random error on the corresponding laboratory’s results (purple arrow). The distance of a point from the zero points (intersection of the axes) on the 45° line is proportional to the laboratory’s systematic error (orange arrow). Points in the far upper left and lower right quadrants show poor repeatability (grey circles). The acceptable results are distributed within the green box (|z-score| ≤ 2; |D%| ≤ 30% and 20% for JRC-GAB1 and JRC-GAB2, respectively).
Figure 15. Interpretation of Youden Plot using z-scores.
Two types of Youden-plots were created for gross alpha and gross beta activities separately. For the first Youden-plots pairs of z-score values from the two PT samples were used (Figure 16), while for the other
ones pairs of percentage difference scores were used (Figure 17). Every plot contains information on the total number of pairs of scores (ntotal) and the number of acceptable scores (nacceptable) and their percentage value in parenthesis.
-5
-4
-3
-2
-1
0
1
2
3
4
5
-5 -4 -3 -2 -1 0 1 2 3 4 5
z-scores for sample 1
z-s
core
for
sa
mple
2
poor repeatability
poor repeatability

33
Figure 16. Youden Plot of z-scores for REM2019 PT gross alpha and gross beta activity concentration measurement
results. The acceptable results are spread within the green box.
-10
-8
-6
-4
-2
0
2
4
6
8
10
-10 -8 -6 -4 -2 0 2 4 6 8 10
z-score for JRC-GAB1 sample
z-s
co
re fo
r JR
C-G
AB
2 s
am
ple
REM2019-Gross alphantotal= 174nacceptable= 119 (68%)
-10
-8
-6
-4
-2
0
2
4
6
8
10
-10 -8 -6 -4 -2 0 2 4 6 8 10
z-score for JRC-GAB1 sample
z-s
core
for
JR
C-G
AB
2 s
am
ple
REM2019-Gross betantotal= 163nacceptable= 119 (73%)

34
Figure 17. Youden Plot of percentage deviation (D%) for REM2019 PT gross alpha and gross beta activity concentration
measurement results. The acceptable results are spread within the green box.
As seen in Figure 16, the majority of data is within the acceptance range in the Youden plots using z-scores.
However, for the percentage deviation (Figure 17) the trend is the opposite, around 60%-70% of the results are outside the acceptance range.
-100
-80
-60
-40
-20
0
20
40
60
80
100
-100 -80 -60 -40 -20 0 20 40 60 80 100
GAB1 sample-percentage difference (D%)
GA
B2
sa
mp
le-p
erc
enta
ge
diffe
ren
ce
(D
%) REM2019-Gross alpha
ntotal=173nacceptable= 73 (42%)
-100
-80
-60
-40
-20
0
20
40
60
80
100
-100 -80 -60 -40 -20 0 20 40 60 80 100
GAB1 sample-percentage difference (D%)
GA
B2
sa
mp
le-p
erc
enta
ge
diffe
ren
ce
(D
%) REM2019-Gross beta
ntotal= 162nacceptable= 54 (33.3%)

35
4.2 Sorted results
Results were also sorted on the basis of counting technique, use of written standard, ISO/IEC 17025:2017 (or any predecessor, which is labelled as ISO 17025) accreditation, radionuclides used for efficiency calibration and the time delay between sample preparation and counting which presented in this chapter. The first parameter to analyse is the use of written ISO standards in combination with the counting techniques (liquid scintillation counter, proportional counter, solid-state scintillator) as shown in Figure 18-20. The percentage reported acceptable percentage deviation scores, zeta scores and the average bias from the reference values are presented comparing the non-sorted global pool of reported data (all data) to the sorted results as a function of counting techniques where all data is considered and in the next columns with the counting technique and use of ISO standard.
Figure 18. Sorted results for JRC-GAB1 PT reference material gross alpha and gross beta activity concentration
measurements as a function of detection technique and use of ISO method. Percentage of acceptable results for percentage deviation, zeta score and average bias from reference values are presented.
51%
76% 78%
41%45%
38%41%41%
67%72%
34%38%
22% 23%
-26%
-10% -9%
-31%-28%
-42% -42%
-60%
-40%
-20%
0%
20%
40%
60%
80%
100%GAB1 Gross alpha
Acceptable data in % (D%)
Acceptable data in %(zeta<2)
Bias from reference (%)
all data LSC all LSC ISO Proportionalcounter
Proportionalcounter ISO
Solid scintISO
Solid scint
63%
22%
16%
77%80%
47%
43%
62%
37%
31%
72%75%
32%
43%
7%
54%
62%
-3%-5%
26%
8%
-10%
0%
10%
20%
30%
40%
50%
60%
70%
80%
90%
All data LSC LSC ISO Proportionalcount
Proportionalcount ISO
Solidscintillation
Solidscintillation
ISO
GAB1 Gross beta
Acceptable data in % (D%)
Acceptable data in % (zeta<2)
Bias from reference (%)

36
Figure 19. Sorted results for JRC-GAB2 PT reference material gross alpha and gross beta activity concentration
measurements as a function of detection technique and use of ISO method. Percentage of acceptable results for percentage deviation, zeta score and average bias from reference values are presented.
As seen, regardless the counting techniques there is a slightly improved performance in all three parameters when written ISO standard methods were followed. In case of JRC-GAB1 gross beta activity measurement the LSC technique was seriously underperforming. It might happen that this was due to calibration-settings issues rather than interference from sample composition. The reason for this bias and performance is still under investigation. Another interesting point to scrutinise from quality control point of view is ISO 17025 accreditation. In the next section measurement data is presented in S-plots separating the results of non-accredited laboratories from the results of accredited laboratories (Figure 20-24). On the bar charts (Figure
24-28), the percentage reported acceptable percentage deviation scores, zeta scores and the average bias from the reference values are presented comparing the non-sorted global pool of reported data (all data) to the results with- and without accreditation.
55%
82% 84%
46%
53%
42%
52%55%
77% 77%
51%
61%
36%
48%
-7%-2% -1%
-13%-8%
-20%
-13%
-40%
-20%
0%
20%
40%
60%
80%
100%
All data LSC LSC ISO Proportionalcount
Proportionalcount ISO
Solidscintillation
Solidscintillation
ISO
GAB2 Gross alpha
Acceptable data in % (D%)
Acceptable data in % (zeta<2)
Bias from reference (%)
51%
79%84%
47%
54%
5% 7%
38%
72% 74%
31%
39%
0% 0%
-17%
-3% -1%
-20% -19%
-27% -25%
-40%
-20%
0%
20%
40%
60%
80%
100%
All data LSC LSC ISO Proportionalcount
Proportionalcount ISO
Solidscintillation
Solidscintillation
ISO
GAB2 Gross beta
Acceptable data in % (D%)
Acceptable data in % (zeta<2)
Bias from reference (%)

37
Figure 20. Sorted results for JRC-GAB1 PT reference material gross alpha activity concentration measurements as a function of ISO 17025 accreditation.
0
100
200
300
400
500
600
700
800
900
1000
1100
1200
1300
8416.36 REM 2019 PT
JRC-GAB1 gross alpha
Accredited laboratories Non-accredited laboratories
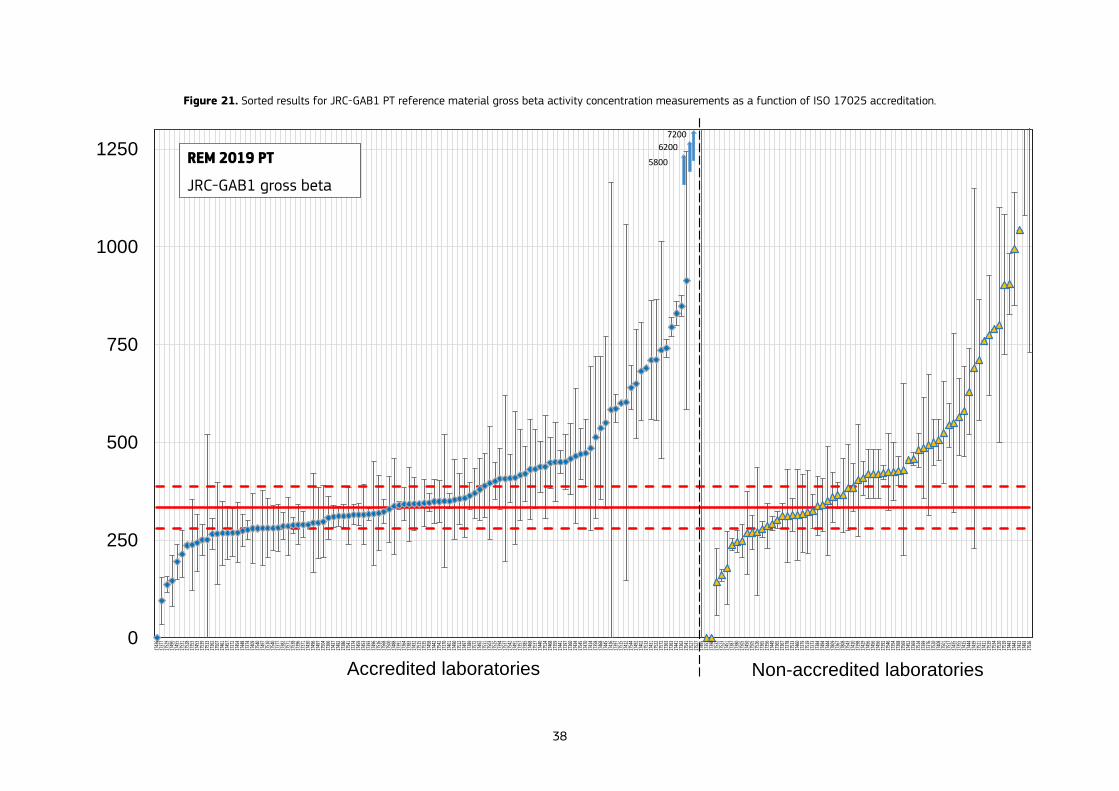
38
Figure 21. Sorted results for JRC-GAB1 PT reference material gross beta activity concentration measurements as a function of ISO 17025 accreditation.
0
250
500
750
1000
12507200
REM 2019 PT
JRC-GAB1 gross beta
Accredited laboratories Non-accredited laboratories
5800
6200
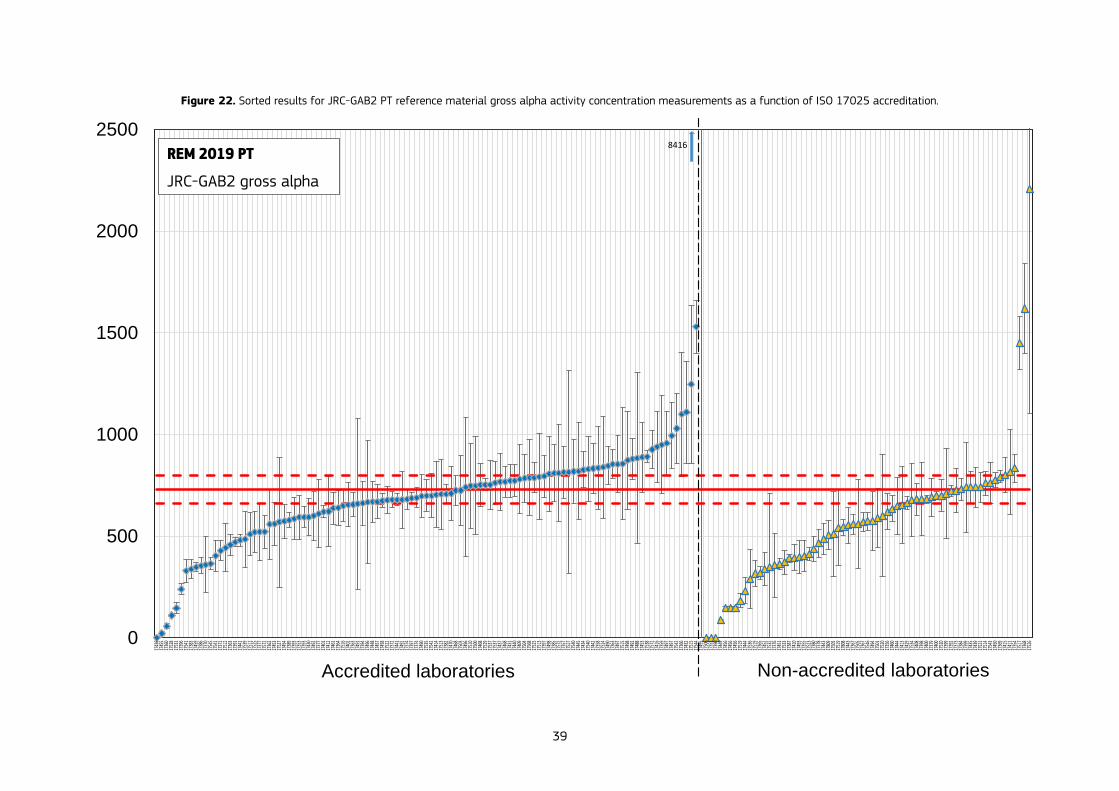
39
Figure 22. Sorted results for JRC-GAB2 PT reference material gross alpha activity concentration measurements as a function of ISO 17025 accreditation.
0
500
1000
1500
2000
25008416
REM 2019 PT
JRC-GAB2 gross alpha
Accredited laboratories Non-accredited laboratories

40
Figure 23. Sorted results for JRC-GAB2 PT reference material gross beta activity concentration measurements as a function of ISO 17025 accreditation.
0
500
1000
1500
2000
2500 7200
REM 2019 PT
JRC-GAB2 gross beta
Accredited laboratories Non-accredited laboratories
4610
5600
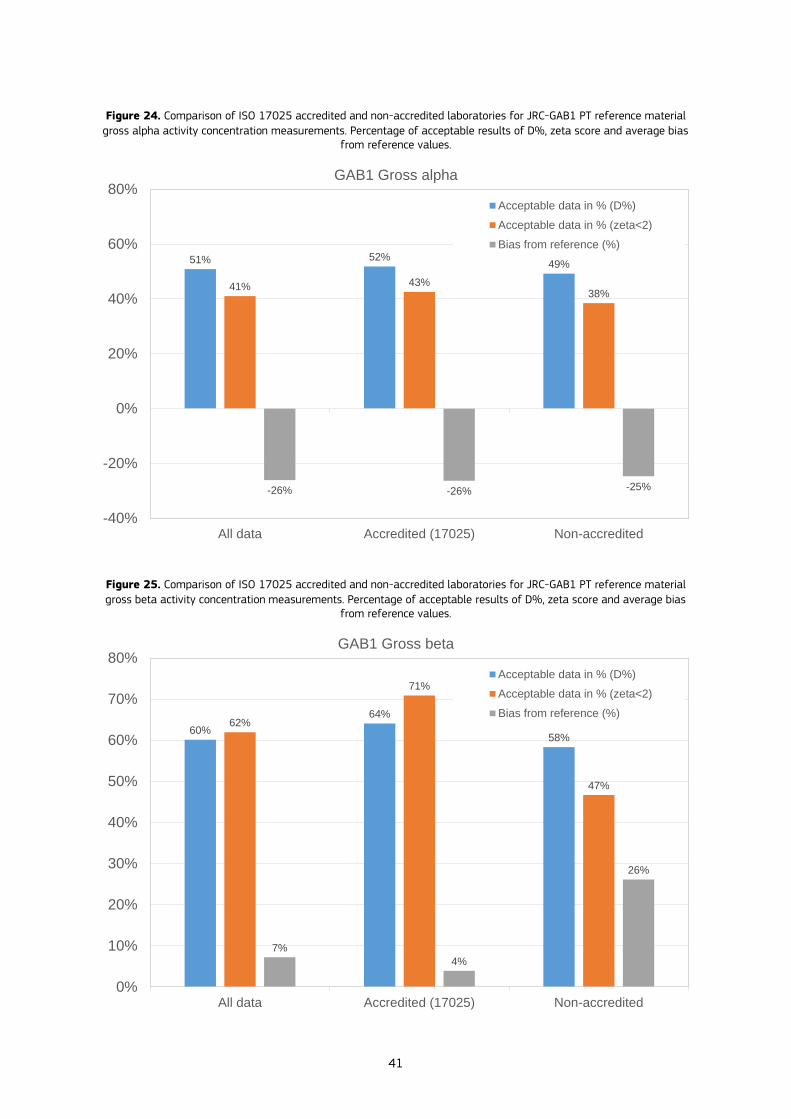
41
Figure 24. Comparison of ISO 17025 accredited and non-accredited laboratories for JRC-GAB1 PT reference material
gross alpha activity concentration measurements. Percentage of acceptable results of D%, zeta score and average bias from reference values.
Figure 25. Comparison of ISO 17025 accredited and non-accredited laboratories for JRC-GAB1 PT reference material
gross beta activity concentration measurements. Percentage of acceptable results of D%, zeta score and average bias from reference values.
51% 52%49%
41% 43%38%
-26% -26% -25%
-40%
-20%
0%
20%
40%
60%
80%
All data Accredited (17025) Non-accredited
GAB1 Gross alpha
Acceptable data in % (D%)
Acceptable data in % (zeta<2)
Bias from reference (%)
60%
64%
58%
62%
71%
47%
7%
4%
26%
0%
10%
20%
30%
40%
50%
60%
70%
80%
All data Accredited (17025) Non-accredited
GAB1 Gross beta
Acceptable data in % (D%)
Acceptable data in % (zeta<2)
Bias from reference (%)

42
Figure 26. Comparison of ISO 17025 accredited and non-accredited laboratories for JRC-GAB2 PT reference material
gross alpha activity concentration measurements. Percentage of acceptable results of D%, zeta score and average bias from reference values.
Figure 27. Comparison of ISO 17025 accredited and non-accredited laboratories for JRC-GAB2 PT reference material
gross beta activity concentration measurements. Percentage of acceptable results of D%, zeta score and average bias from reference values.
Results sorted on the basis of radionuclides used for alpha and beta counting efficiency calibration are presented in Figure 28-31.
51%54%
48%
38%36%
42%
-17% -17% -16%
-40%
-20%
0%
20%
40%
60%
80%
All data Accredited (17025) Non-accredited
GAB2 Gross beta
Acceptable data in % (D%)
Acceptable data in % (zeta<2)
Bias from reference (%)
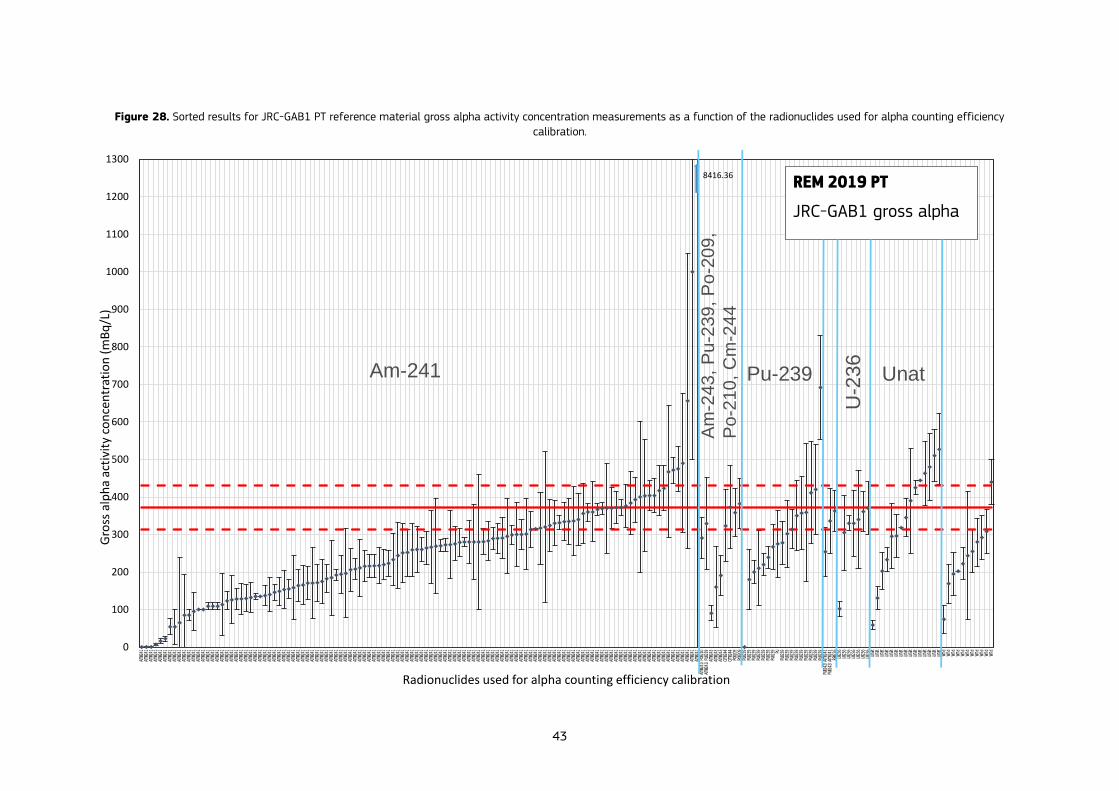
43
Figure 28. Sorted results for JRC-GAB1 PT reference material gross alpha activity concentration measurements as a function of the radionuclides used for alpha counting efficiency
calibration.
0
100
200
300
400
500
600
700
800
900
1000
1100
1200
1300
Gro
ss a
lph
a ac
tivi
ty c
on
cen
trat
ion
(m
Bq
/L)
Radionuclides used for alpha counting efficiency calibration
8416.36REM 2019 PT
JRC-GAB1 gross alpha
Unat
U-2
36
Pu-239
Am
-243,
Pu
-239,
Po
-20
9,
Po
-210,
Cm
-24
4
Am-241
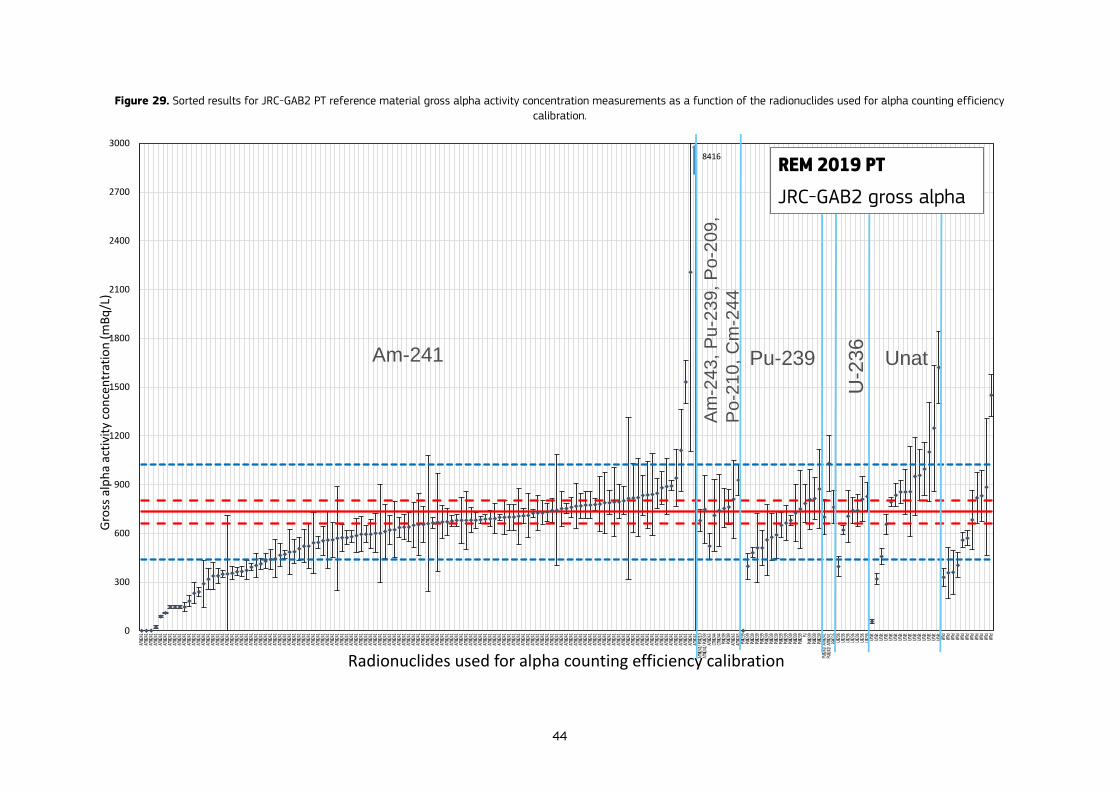
44
Figure 29. Sorted results for JRC-GAB2 PT reference material gross alpha activity concentration measurements as a function of the radionuclides used for alpha counting efficiency
calibration.
0
300
600
900
1200
1500
1800
2100
2400
2700
3000
Gro
ss a
lph
a ac
tivi
ty c
on
cen
trat
ion
(m
Bq
/L)
Radionuclides used for alpha counting efficiency calibration
8416
REM 2019 PT
JRC-GAB2 gross alpha
Unat
U-2
36
Pu-239
Am
-24
3,
Pu
-23
9,
Po
-20
9,
Po
-21
0,
Cm
-24
4
Am-241
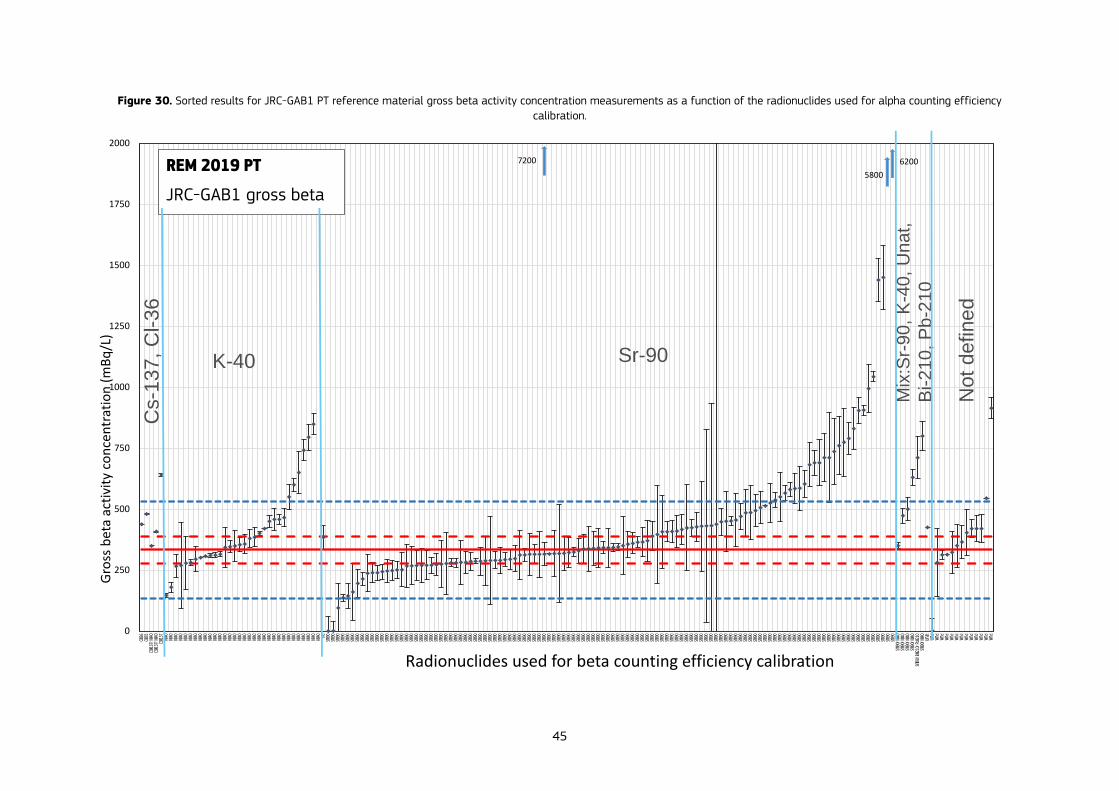
45
Figure 30. Sorted results for JRC-GAB1 PT reference material gross beta activity concentration measurements as a function of the radionuclides used for alpha counting efficiency
calibration.
0
250
500
750
1000
1250
1500
1750
2000
Gro
ss b
eta
acti
vity
co
nce
ntr
atio
n (
mB
q/L
)
Radionuclides used for beta counting efficiency calibration
7200 6200
5800REM 2019 PT
JRC-GAB1 gross beta
K-40
Cs-1
37
, C
l-36
Sr-90
Mix
:Sr-
90,
K-4
0,
Unat,
Bi-
21
0,
Pb
-21
0
Not
defin
ed

46
Figure 31. Sorted results for JRC-GAB2 PT reference material gross beta activity concentration measurements as a function of the radionuclides used for alpha counting efficiency
calibration.
0
300
600
900
1200
1500
1800
2100
2400
2700
3000
Gro
ss b
eta
acti
vity
co
nce
ntr
atio
n (
mB
q/L
)
Radionuclides used for beta counting efficiency calibration
7200 5600
4610REM 2019 PT
JRC-GAB2 gross beta
K-40
Cs-1
37
, C
l-36
Sr-90
Mix
:Sr-
90
, K
-40
, U
na
t,
Bi-2
10
, P
b-2
10
Not
defin
ed
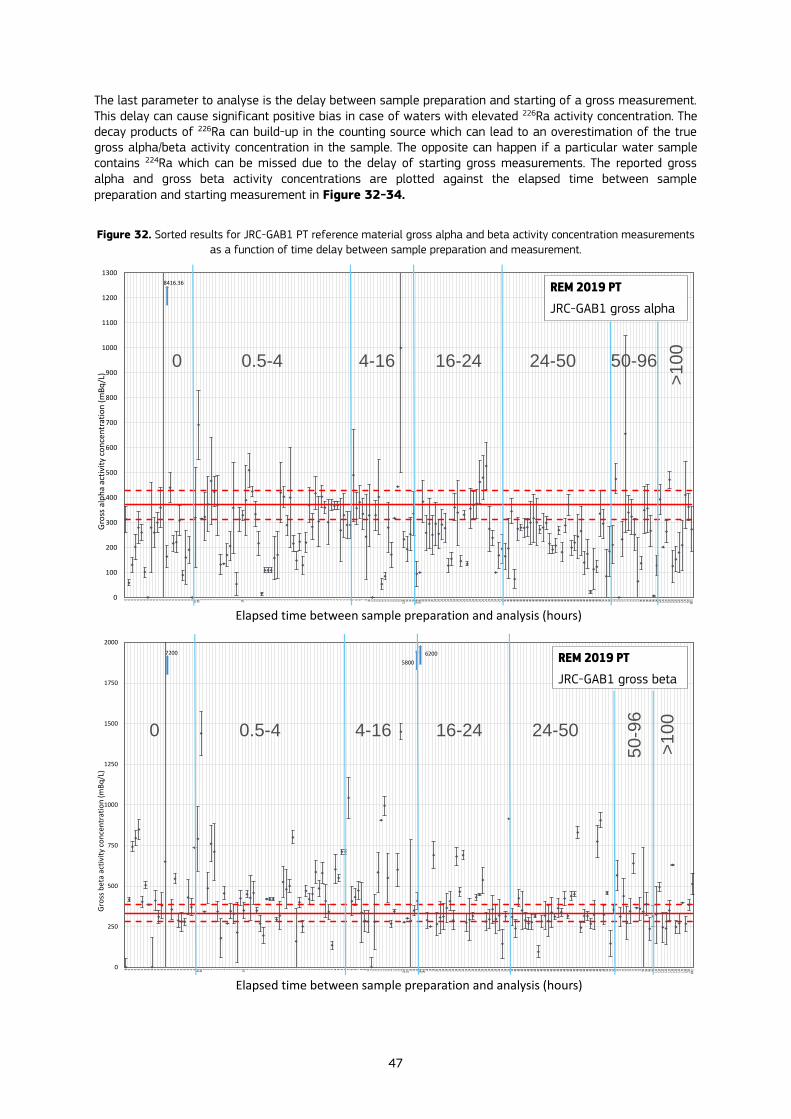
47
The last parameter to analyse is the delay between sample preparation and starting of a gross measurement. This delay can cause significant positive bias in case of waters with elevated 226Ra activity concentration. The decay products of 226Ra can build-up in the counting source which can lead to an overestimation of the true gross alpha/beta activity concentration in the sample. The opposite can happen if a particular water sample contains 224Ra which can be missed due to the delay of starting gross measurements. The reported gross alpha and gross beta activity concentrations are plotted against the elapsed time between sample preparation and starting measurement in Figure 32-34.
Figure 32. Sorted results for JRC-GAB1 PT reference material gross alpha and beta activity concentration measurements
as a function of time delay between sample preparation and measurement.
0
100
200
300
400
500
600
700
800
900
1000
1100
1200
1300
Gro
ss a
lph
a ac
tivi
ty c
on
cen
trat
ion
(m
Bq
/L)
Elapsed time between sample preparation and analysis (hours)
8416.36 REM 2019 PT
JRC-GAB1 gross alpha
0 0.5-4 4-16 16-24 24-50 50-96
>1
00
0
250
500
750
1000
1250
1500
1750
2000
Gro
ss b
eta
acti
vity
co
nce
ntr
atio
n (
mB
q/L
)
Elapsed time between sample preparation and analysis (hours)
7200 6200
5800 REM 2019 PT
JRC-GAB1 gross beta
0 0.5-4 4-16 16-24 24-50
50-9
6
>1
00
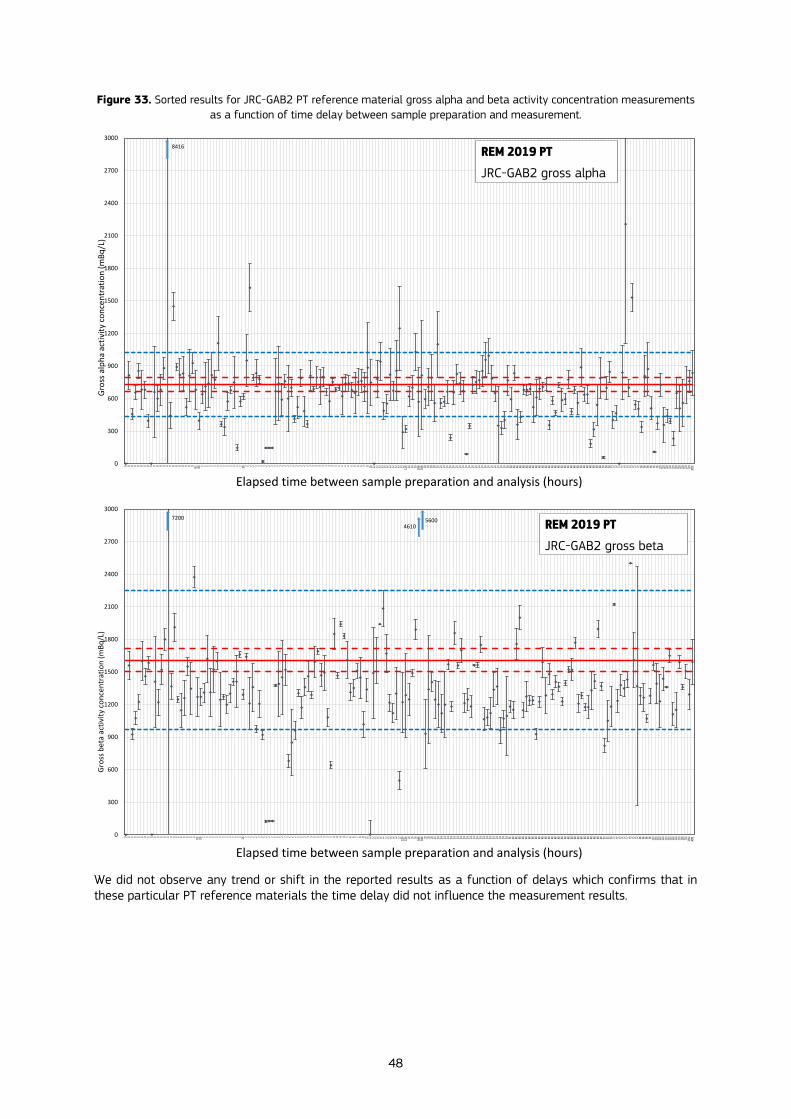
48
Figure 33. Sorted results for JRC-GAB2 PT reference material gross alpha and beta activity concentration measurements
as a function of time delay between sample preparation and measurement.
We did not observe any trend or shift in the reported results as a function of delays which confirms that in these particular PT reference materials the time delay did not influence the measurement results.
0
300
600
900
1200
1500
1800
2100
2400
2700
3000
Gro
ss a
lph
a ac
tivi
ty c
on
cen
trat
ion
(m
Bq
/L)
Elapsed time between sample preparation and analysis (hours)
8416REM 2019 PT
JRC-GAB2 gross alpha
0
300
600
900
1200
1500
1800
2100
2400
2700
3000
Gro
ss b
eta
acti
vity
co
nce
ntr
atio
n (
mB
q/L
)
Elapsed time between sample preparation and analysis (hours)
7200 56004610 REM 2019 PT
JRC-GAB2 gross beta
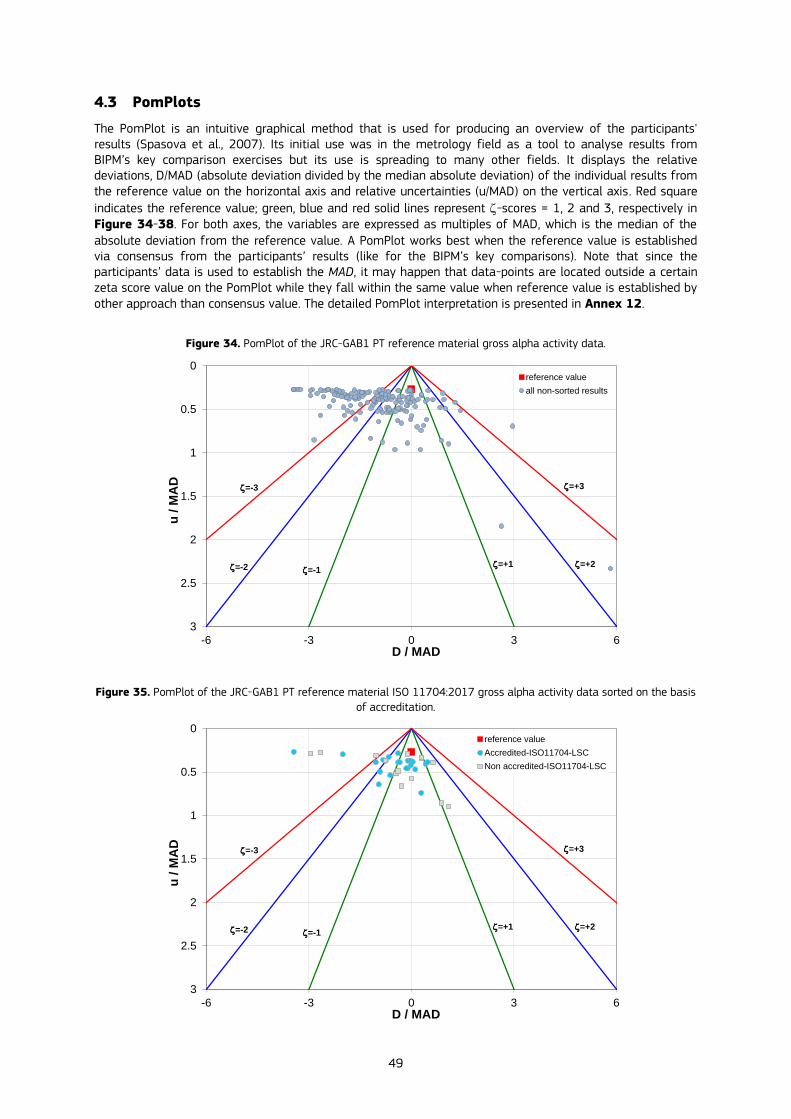
49
4.3 PomPlots
The PomPlot is an intuitive graphical method that is used for producing an overview of the participants' results (Spasova et al., 2007). Its initial use was in the metrology field as a tool to analyse results from BIPM’s key comparison exercises but its use is spreading to many other fields. It displays the relative deviations, D/MAD (absolute deviation divided by the median absolute deviation) of the individual results from the reference value on the horizontal axis and relative uncertainties (u/MAD) on the vertical axis. Red square
indicates the reference value; green, blue and red solid lines represent -scores = 1, 2 and 3, respectively in Figure 34-38. For both axes, the variables are expressed as multiples of MAD, which is the median of the absolute deviation from the reference value. A PomPlot works best when the reference value is established via consensus from the participants’ results (like for the BIPM’s key comparisons). Note that since the participants’ data is used to establish the MAD, it may happen that data-points are located outside a certain zeta score value on the PomPlot while they fall within the same value when reference value is established by other approach than consensus value. The detailed PomPlot interpretation is presented in Annex 12.
Figure 34. PomPlot of the JRC-GAB1 PT reference material gross alpha activity data.
Figure 35. PomPlot of the JRC-GAB1 PT reference material ISO 11704:2017 gross alpha activity data sorted on the basis
of accreditation.
0
0.5
1
1.5
2
2.5
3
-6 -3 0 3 6
u / M
AD
D / MAD
reference value
all non-sorted results
=+1 =+2
=+3
=-1=-2
=-3
0
0.5
1
1.5
2
2.5
3
-6 -3 0 3 6
u / M
AD
D / MAD
reference value
Accredited-ISO11704-LSC
Non accredited-ISO11704-LSC
=+1 =+2
=+3
=-1=-2
=-3

50
Figure 36. PomPlot of the JRC-GAB1 PT reference material gross beta activity data non-sorted.
Figure 37. PomPlot of the JRC-GAB1 PT reference material ISO 11704:2017 gross beta activity data sorted on the basis
of accreditation.
0
0.5
1
1.5
2
2.5
3
-6 -3 0 3 6
u / M
AD
D / MAD
reference value
non-sorted results=+1 =+2
=+3
=-1=-2
=-3
0
0.5
1
1.5
2
2.5
3
-6 -3 0 3 6
u / M
AD
D / MAD
reference value
Accredited-ISO10704-Proportional counter
Accredited-ISO10704-solidstate scintillation
Non accredited-ISO10704-Proportional counter
=+1 =+2
=+3
=-1=-2
=-3
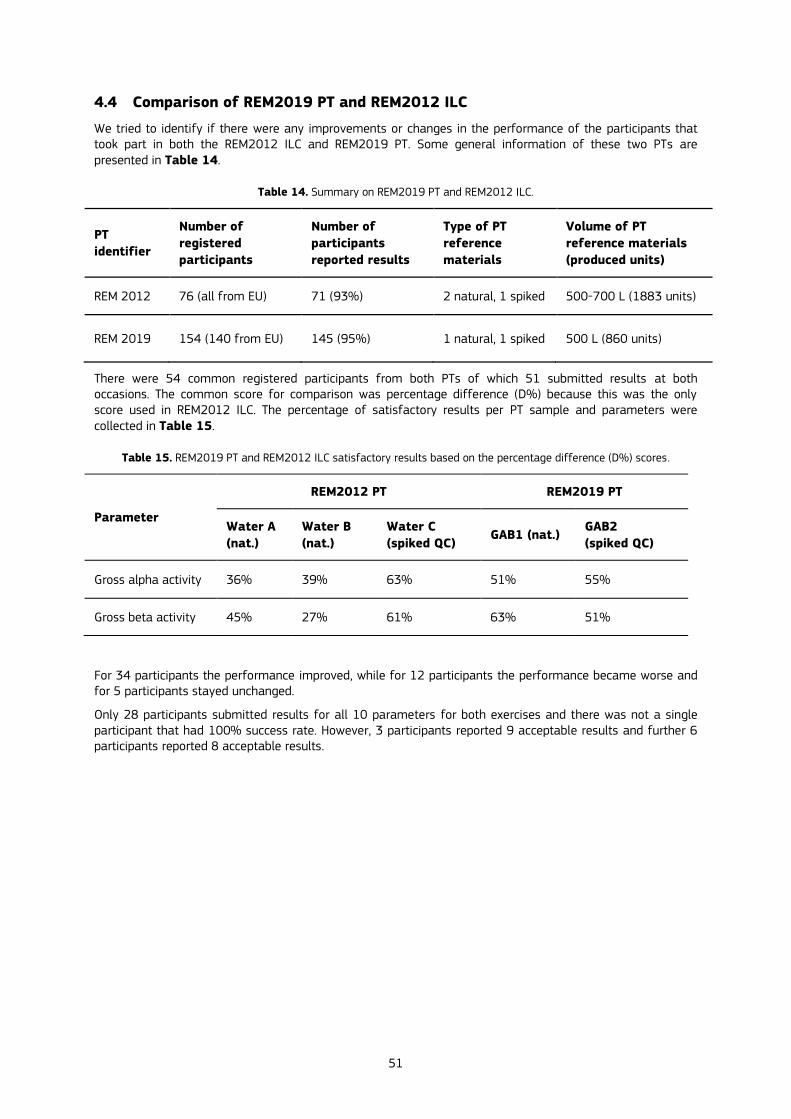
51
4.4 Comparison of REM2019 PT and REM2012 ILC
We tried to identify if there were any improvements or changes in the performance of the participants that took part in both the REM2012 ILC and REM2019 PT. Some general information of these two PTs are presented in Table 14.
Table 14. Summary on REM2019 PT and REM2012 ILC.
PT
identifier
Number of
registered
participants
Number of
participants
reported results
Type of PT
reference
materials
Volume of PT
reference materials
(produced units)
REM 2012 76 (all from EU) 71 (93%) 2 natural, 1 spiked 500-700 L (1883 units)
REM 2019 154 (140 from EU) 145 (95%) 1 natural, 1 spiked 500 L (860 units)
There were 54 common registered participants from both PTs of which 51 submitted results at both occasions. The common score for comparison was percentage difference (D%) because this was the only score used in REM2012 ILC. The percentage of satisfactory results per PT sample and parameters were collected in Table 15.
Table 15. REM2019 PT and REM2012 ILC satisfactory results based on the percentage difference (D%) scores.
Parameter
REM2012 PT REM2019 PT
Water A
(nat.)
Water B
(nat.)
Water C
(spiked QC) GAB1 (nat.)
GAB2
(spiked QC)
Gross alpha activity 36% 39% 63% 51% 55%
Gross beta activity 45% 27% 61% 63% 51%
For 34 participants the performance improved, while for 12 participants the performance became worse and for 5 participants stayed unchanged.
Only 28 participants submitted results for all 10 parameters for both exercises and there was not a single participant that had 100% success rate. However, 3 participants reported 9 acceptable results and further 6 participants reported 8 acceptable results.
52
5 Information on the participating laboratories: organisational and
technical details
The participants were requested to fill in a questionnaire (Annex 7). In this questionnaire the PT coordinator requested information on the participant laboratories' (i) experience, (ii) technical details on their methods and (iii) involvement in standardisation processes. The participants were also given the opportunity to give feedback and comments on the organisation of the PT. All feedback will, if relevant, be considered in the future PTs. The participants were requested to use their routine analytical procedures. They were free to choose the analytical method. The information in this chapter was provided in the questionnaire by 145 participants.
It has to be noted that for some questions more replies can be counted than the total number of participants which is due to the possibility of multiple-choice selection options and in certain cases laboratories also replied to questions non-applicable to them.
Information on accreditation, application of documented standards:
88 out of 145 have ISO 17025 accreditation
54 are involved in international/national standardisation processes, and from the non-involved organisations 91 (i.e. all) would like to be involved,
Note: During the follow-up workshop it was explained how to take the first steps to join standardisation process.
91 out of 145 performed their analysis according to an ISO standard.
31 followed other standard methods (e.g. EPA, ASTM, national or in-house developed standards)
Type of laboratory:
Measurements of radioactivity in the environment: 125 participants
Research and development: 40 participants
Private commercial company: 12 participants
Monitoring of nuclear facilities: 33
Water supply company: 4 participants
Other: 8
Laboratory working according to a quality management system?
139 organisations work according to a quality management system. The most commonly used ones are: ISO 17025, ISO 9000 series, ISO 14000, ISO 14001, EN 45000 series, and some reported “internal”.
How long is gross alpha/beta activity analysis performed routinely at your organisation (in
years)?
Laboratories have been dealing with gross alpha/beta activity in water analysis between 0 and 60 years with an average of 21 years.
How many measurements of this type does your laboratory perform per year?
< 50: 25 participants
50-100: 36 participants
100-250: 29 participants
250-500: 19 participants
500-1000: 26 participants
>1000: 10 participants
From minimum 1 measurement up to 8000 measurements per year (in total approximately 70540 gross alpha/beta measurements are performed at the participants’ laboratories).

53
How many individual gross alpha/beta samples can you measure in the same time?
Laboratories can measure between 1 and 360 samples in the same time with a median of 48 samples.
The typical test sample volume needed for a single analysis (in mL)
Minimum sample volume was 8 mL and maximum 5000 mL water sample with a median of 250 mL.
Acidifying the sample is part of the procedure
113 participants said acidification is part of the routine procedure and 32 replied no.
Having a procedure to treat hygroscopic residues
40 participant have procedure, while 71 participant indicated that they do not have procedure to treat hygroscopic residues. 32 replied not applicable.
Applying quenching correction
17 participant applied, while 65 participant did not apply quench correction. 63 replied not applicable.
Correction for surface density of the prepared source
50 participant made correction for surface density, 64 participant did not make correction. 31 replied not applicable.
The time delay between finishing sample preparation and starting gross measurements
The delay varied between 0 and 3001 hours with an average 66 hours.
Membership in analytical networks.
National/regional analytical network: 93 participants
IAEA-ALMERA network: 48 participants
European NORM network: 5 participants
Other networks (listed below): 12 participants
PROCORAD (Association for the Promotion of Quality Control in Radiotoxicological Analysis)
RIMNET (Radioactive Incident Monitoring Network, UK)
UNE - ASOCIACIÓN ESPAÑOLA DE NORMALIZACIÓN
CTBTO
EDF
University network
Not specified
Not members of networks: 8 participants
How did you learn about this PT?
Nominated by national authorities/contact points: 82 participants
Invited by the JRC: 50 participants
Announced by the IAEA: 23 participants
from the JRC website (https://remon.jrc.ec.europa.eu/Services/Proficiency-Tests): 11 participants
Some laboratories got information about this PT from multiple channels.

54
5.1 Methods used by the participating laboratories
Details of the methods used by the participating laboratories including sample preparation and efficiency calibration approaches, background-blank sample preparation are given in the next paragraphs.
Sample preparation and measurement techniques
Direct measurement after evaporation: 107 participants
Thermal pre-concentration for liquid scintillation counting: 26 participants
Co-precipitation: 15 participants
Direct measurement with liquid scintillation counting: 12 participants
Other (not specified): 5 participants.
Note: 18 participants indicated using multiple sample preparation methods.
gas-flow proportional counter: 93 participants
liquid scintillation counter: 39 participants
solid-stated scintillation counter: 28 participants
Other (not specified): 29 participants.
Note: 20 participants indicated using multiple counting techniques.
Efficiency calibration approaches
Majority of participants followed efficiency calibration procedures described in standards
Radionuclides used for alpha efficiency calibration: 209Po, 210Po, 226Ra, 236U, Unat, 239Pu, 241Am, 243Am, 244Cm, 242Pu
Radionuclides used for beta calibration: 36Cl, 35Cl(?), 40K, 90Sr, 137Cs, 210Bi, 210Pb, Unat
TDCR approach for LSC was also used
Detection limits
Comparing the reported gross alpha/beta detection limits with the detection limits given in the E-DWD it can be noted that there are laboratories not complying with that requirements Table 16. There were 29 and 5 participants that reported higher limit of detections than what is stated in the E-DWD for gross alpha and gross beta activity concentration, respectively.
Table 16. Limit of detection of gross alpha/beta activity concentrations reported by the participant laboratories in mBq L-1
Description Gross alpha activity
concentration
Gross beta activity
concentration
Reported limit of detection range (The numbers in brackets are probable blunders)
1– 1000 (0-20000) 1 – 790 (0-54000)
Median 24 50
Average 43 (without blunders) 90 (without blunders)
Limit of detection (mBq L-1) from the Euratom Drinking Water Directive (EC, 2013)
40 400

55
Background-blank preparations
There were six different background-blank sample preparation approaches reported as listed below. In addition to that, a few participants mentioned that they do not prepare any blank or background samples.
pure demineralised water
acidified demineralised water
demineralised water and adding salts (CaSO4)
demineralised water with same water:cocktail ratio as samples
empty planchet
empty detector
no blank at all: 6 participants
5.2 Participants’ feedback
The participants had the opportunity to comment any aspect of the proficiency test. In general positive feedback was received from the participants. Participants appreciated this PT as seen from their evaluation scores (average score given by the participants was 8.9 out of 10) which is positive but there is still room for improvement. The proposals to improve the organisation of a gross activity-in-water PT are listed below. A note from the PT organiser is given in italic after each comment (when relevant). The full list of comments as submitted by the participants is presented in Annex 8.
Remarks
Samples are too much acidified
Organiser’s comment: samples were acidified to comply with the ISO 5667-3:2018(EN) A.5 section saying acidify to pH<2 with HNO3 but do not acidify if sample is immediately processed after sampling. Since samples were stored for some weeks, sample preservation was needed.
Covid-19: not enough time to perform the analysis
Organiser’s comment: we continuously evaluated the Covid situation in the course of the reporting phase and decided to extend the reporting deadline by three months. We believe it was sufficiently enough time for doing the analysis.
Some initial problems with the reporting software
Organiser’s comment: it was solved very soon after notifying us.
Concentration of the samples GAB1 and GAB2 is not typical for drinking water
Organiser’s comment: it is difficult to find or prepare a fit for all/typical average drinking water sample since the geological/hydrogeological property of aquifers are very diverse in Europe even within a country. However, we aimed to provide waters with moderate but slightly elevated salinity (Low-intermediate mineral content: 50-1500 mg/L).
Residue from sample JRC-GAB2 has an elastic consistency, difficult to spread in the counting tray
Organiser’s comment: it might be also due to the method applied.
GAB2 gross beta gave not repeatable results, despite several tests
Gross beta is misleading: not clear if low-energy betas (40K, 3H) are included or not
Organiser’s comment: it is also one of the pitfalls of gross methods. Certain methods do not include some of the radionuclides (e.g. ISO 10704 co-precipitation approach excludes 40K during the sample preparation), therefore they are in principle already biased. Also, consider the difference between residual beta and gross beta activity concentration.
56
Provide questionnaire for different measurement procedures
Organiser’s comment: it was limitations of the on-line reporting tool. Hopefully, after the upgrade of the reporting system, it will be also possible.
Questionnaire and reporting files sometimes unclear
Organiser’s comment: we try to improve the clarity of our documents and tools. However, the menu and the text on the on-line tool is given by the software developers we cannot change it.
Announcements for sample shipping was too immediate
Organiser’s comment: we believe it was properly communicated and in a timely manner. Participants were informed two times about the delivery dates: 1) on 22 November 2019 (i.e. few weeks before shipment took place). 2) on 13 January 2020 a reminder was sent to the participants that we started shipping the samples. We also indicated the shipment dates in our email when laboratories were first contacted.
Suggestions
Provide non-acidified samples
Organiser’s comment: see our comments on acidification in the previous section (Remarks). We had to do proper sample preservation to comply with the ISO 5667-3:2018(EN).
Paper copies for reporting template/questionnaire
Organiser’s comment: We prefer going paperless to save resources and to keep track on the date of reporting. Papers might be lost during the postal service or mislaid at the participant laboratory.
Quantity of sample should be larger
Organiser’s comment: considering the replies from the questionnaire, we can conclude that sample quantity was appropriate. The typical sample volume needed for a single measurement was 250 mL (median value).
Send a single bottle package
Organiser’s comment: Package containing more bottles are more economical options saving more CO2 and money.
Add questions about number of replicates, counting statistics
Organiser’s comment: we consider this comment. However, we wanted to keep the questionnaire as simple and short as possible. During the REM 2012 ILC exercise we asked for more details about counting statistics and replicates, detection limit calculations and participants found that too heavy and exhausting to fill in.
Organise this PT more frequently
Organiser’s comment: we would like to organise PTs more frequently and keep some in the regular PT scheme but due to the current staff limitations and available resources JRC-Geel can organise maximum one PT per year in the field of environmental radioactivity which includes many different matrices and radionuclides.

57
Further comments, appreciations
General feedback from participants: it was a well-organized PT
Overall satisfaction score: 8.9 out of 10,
Flexibility due to Covid situation was appreciated (submission deadline extension twice)
PT was useful regarding the QA system
PT was used for method validation
Educating PT exercise for new-in-the-field laboratories
PT helped to identify errors linked to method and calculation,
Concentrations were within normal operation range
Sample quantity was sufficient for doing multiple analyses
Quick email answers/immediate communication was highly appreciated
Instructions were clear enough,
Delivery and packaging were fast and very robust
All the needed information was provided in advance
The documents were of high quality, clear and very detailed.
Many participants are interested in future JRC PTs
5.3 Follow-up workshop
A virtual-workshop dedicated to the REM2019 proficiency test was organised by the JRC G.2 unit Radionuclide Metrology team between 4-6 May 2021. The objective of this workshop was to gather REM 2019 participants and discuss related hot topics with the aim to improve the level of radiation monitoring in Europe to ensure the health and safety of citizens.
This virtual event attracted 140 registered participants from 26 European countries representing environmental radioactivity monitoring laboratories, metrology institutes, universities, regulatory bodies, Euratom Article 35-36 experts, colleagues from JRC Dir.F and Directorate General for Energy (DG-ENER). During the three-day event, presentations were given by invited speakers and also participants had the opportunity to present their work on linked to the following topics:
REM2019 Proficiency Test evaluation
Quality assurance, proficiency tests in Europe
Best practice, method harmonisation and standardisation efforts
General staff issues in Europe: resources, trainings, “next-generation”
JRC future policy support activities
In addition to the aforementioned topics, there were very constructive discussions during the workshop concerning education of future generation, retirement of proficient analysts/expert needs of hands-on trainings to improve proficiency. A question could be also raised: Are the current resources (human and financial) sufficient to operate environmental monitoring laboratories or are they at risk of being closed or operate in a way that jeopardize health & safety of the citizens? Usually governments/public need services of the laboratories urgently in case of emergency but under normal conditions they are “invisible”/unrecognised. After the discussions the following requests/conclusions could be drawn linked to proficiency tests, gross methods and radionuclide specific methods:
the gross alpha and beta methods should be harmonised in Europe
Collect information from PT participants on rapid radionuclide specific methods compare them to gross methods. Select “best ones” in terms of cost, time and complexity.
JRC should consider including indicative dose (ID) calculation as part of the PT.
A list of PT providers in Europe would be useful.
58
JRC’s comment: there are websites of PTs on the internet (e.g. EPTIS website) as highlighted by the workshop participants. The participants also named some PT providers from Europe. A document with these PT providers were drafted and circulated to the workshop participants immediately after the workshop. This list is planned to be made available on the REMON website6 where the JRC PTs are summarized.
A discussion was about the requirements on how to give characteristic limits (decision threshold, detection limit and limits of the coverage interval) in measurement reports. The ISO standards dealing with radioactivity in water measurements recommend the use of ISO 11929:2019 standard which according to many participants does not reflect the real situation, the formulae are too complicated and taking a lot of space in a measurement report. Clients have problems already to understand the meaning of uncertainty and the situation gets more complicated (even for the laboratory personnel) with the introduction of characteristic limits following the ISO 11929:2019 standard.
At last but not least, the participants emphasised the importance of JRC as an impartial and
competent organisation in the field of proficiency testing and its efforts were appreciated.
Considering the policy impact and the importance of proficiency tests from quality assurance
point of view a strong request was expressed by both the “nuclear and non-nuclear” Member
States to continue this important task in future.
The JRC G.2 Unit-Radionuclide Metrology team was seeking for more feedback from Member States’ authorities and REM PT participants in form of letter of support in which they could specify how they see these services and if they are important to authorities, nominating bodies and the radioactivity monitoring laboratories in the corresponding country. This feedback was needed to support JRC G.2 unit’s activity within JRC evaluation of the JRC activities within the framework programme Horizon-2020. Another reason for seeking for written support is linked to the new budget cuts of JRC’s Euratom programme and therefore many activities are at risk of being stopped. A continuation of the REM proficiency tests depends ultimately on how member states value this work.
5.4 Reported impacts of this PT
Participants could already use the PT results or the PT reference materials to improve the quality and reliability of their analytical results. Many participants reported that they could use the REM2019 PT preliminary report (which included the reference values and laboratory scores) to support their quality management system and accreditation efforts by showing their scores during external accreditation assessments. The main impacts of this PT were linked to the followings:
PT was important regarding the quality system and the accreditation procedure (i.e. to maintain or to gain accreditation),
Method validation,
Useful learning exercise for participants that are new in the field,
Helped to highlight calculation or method related errors.
5.4.1 A detailed impact case
A concrete detailed impact case including corrective actions as a positive example is given below. The PT organisers would like to thank the anonymous participant7 for this very important and thorough description.
A participant from an EU member state developed and validated a new method for the measurement of ‘Gross Alpha and Beta Activity Concentration in Non-Saline Water’ by a liquid scintillation counting method based on IS0 11704:2015. The method was routinely used for the analysis of drinking water under the national monitoring programme for radioactivity in drinking water since April 2017. By the first quarter of 2020, over 650 water samples had been analysed for gross alpha/beta activity where none of the results exceeded the corresponding gross activity screening levels, contrary to results from previous surveys.
In early 2020, an error was identified in the calculation of gross alpha/beta activity as a result of participation in the European Commission’s Joint Research Centre REM2019 PT. All historical data back to 2017 was reviewed and the method was revalidated to confirm that the new method complied with the analytical
6 https://remon.jrc.ec.europa.eu/Services/Proficiency-Tests 7 The identity of the participant is undisclosed for confidentiality reasons.

59
performance characteristics laid down in Annex III/Part 3 of the Euratom Drinking Water Directive (Council Directive 2013/51).
Besides the JRC REM2019 PT, this laboratory participated in another PT in the same period. The results submitted by the participant for the JRC PT and the other PT were both evaluated as ‘satisfactory’ for gross alpha and gross beta measurements.
All stakeholders (authorities, water supplies and other clients) were informed about the calculation error and the previous reports were withdrawn. The participant requested the relevant local authorities and water supplies to resample sources with elevated values to re-measure them according to the new validated method.
The participant re-issued all previous reports for the period of 2017-2020 and the national monitoring programme for radioactivity in drinking water resumed in September 2020 employing the new gross alpha/beta activity measurement method.

60
6 Best practices and recommended methods
Taking the percentage deviation (D%) and zeta scores into consideration separately 26 and 22 laboratories could submit acceptable results for all four parameters, respectively. However, there are only 14 participants that have acceptable results when combining the percentage deviation and zeta scores of all four parameters.
In case of evaluating the joint performances from both REM2012 and REM2019 proficiency tests (in total ten parameters reported) only 3 laboratories showed outstanding performance with reporting 9 acceptable results out of 10 (Table 17). There were another 6 laboratories that managed to submit 8 acceptable results.
Table 17. Best performing laboratories in the REM2012ILC and REM2019 PT joint evaluation on the basis of percentage
differences and zeta scores.
REM2019 PT
ID
Number of acceptable results
(maximum 10)
Number of acceptable zeta scores
(maximum 4) (only for REM2019)
17434 9 4
17503 9 4
17568 9 3
17354 8 2
17357 8 4
17394 8 3
17409 8 4
17431 8 3
17538 8 1
The data from the best-performing 14 laboratories from the REM2019 PT and another 4 best performing laboratories (bold in Table 17) from the combined REM2012-REM2019 PTs are presented in Table 18 and
Table 19, respectively. These data were further analysed in order to find parameters or conditions that lead to outstanding performance. We have to note that these 14 laboratories might not have always provided the most accurate results (i.e. closest to the reference values) but they were consistent, always within the standard deviations of the proficiency test and provided realistic uncertainties as well.

61
Table 18. Information on the best performing laboratories and their methods.
Lab ID Accredited
(17025)
Standard
technique
Sample preparation Measurement technique Alpha
calibration
Beta
calibration
17357 a) yes ISO 10704 Direct measurement after evaporation, coprecipitation a) gas-flow proportional counter, c) solid-state scintillation counter
239Pu 90Sr
17373 b) no Other Direct measurement after evaporation, coprecipitation a) gas-flow proportional counter, c) solid-state scintillation counter
241Am 90Sr
17379 b) no ISO 10704 Direct measurement after evaporation a) gas-flow proportional counter 241Am 90Sr
17385 a) yes ISO 11704 Thermal preconcentration for liquid scintillation counting b) liquid scintillation counter 236U 40K
17409 a) yes ISO 11704 Thermal preconcentration for liquid scintillation counting b) liquid scintillation counter 241Am 90Sr
17468 a) yes ISO 11704, Other
Thermal preconcentration for liquid scintillation counting b) liquid scintillation counter 241Am 90Sr
17491 a) yes ISO 10704 Direct measurement after evaporation a) gas-flow proportional counter 241Am 90Sr
17492 a) yes ISO 11704, not applicable
Direct measurement after evaporation, Thermal preconcentration for liquid scintillation counting, coprecipitation
a) gas-flow proportional counter, b) liquid scintillation counter
241Am 40K
17500 a) yes ISO 10704 Direct measurement after evaporation a) gas-flow proportional counter 239Pu 90Sr
17503 a) yes ISO 10704 Direct measurement after evaporation a) gas-flow proportional counter 239Pu 90Sr
17513 a) yes ISO 9696 Direct measurement after evaporation, other a) gas-flow proportional counter 241Am 90Sr
17537 a) yes not applicable Direct measurement after evaporation, Direct measurement with liquid scintillation counting
b) liquid scintillation counter 209Po 90Sr
17542 a) yes ISO 9696, ISO 9697
Direct measurement after evaporation a) gas-flow proportional counter 242Pu, 241Am 137Cs, 40K
17543 b) no not applicable Thermal preconcentration for liquid scintillation counting b) liquid scintillation counter 226Ra Not defined

62
Table 19. Information on the best performing laboratories and their methods from the REM2012 ILC and REM2019 PT joint evaluation.
Lab ID Accredited
(17025)
Standard
technique
Sample preparation Measurement technique Alpha
calibration
Beta
calibration
17434 a) yes ISO 11704 Thermal preconcentration for liquid scintillation counting b) liquid scintillation counter 236U 40K
17568 a) yes not applicable Direct measurement after evaporation, Direct measurement with liquid scintillation counting
a) gas-flow proportional counter, b) liquid scintillation counter
241Am Not defined
17394 a) yes ISO 10704 Direct measurement after evaporation a) gas-flow proportional counter 239Pu 90Sr
17431 a) yes ISO 11704 Direct measurement with liquid scintillation counting b) liquid scintillation counter 241Am 90Sr

63
After reviewing the information from these most consistently performing 14 methods/organisations, we attempt to propose “Best practices”. The most relevant information we used as the basis of this evaluation were: possession of ISO 17025 accreditation, following a written standard, measurement technique, sample preparation approach, radionuclides used for counting efficiency calibration. First number represents the number of cases from REM2019 PT, after the plus (+) symbol the number shows the cases from REM2012 ILC.
Having 17025 accreditation
accredited: 11+4 cases
non-accredited: 3 cases
Using standard technique
– ISO 10704: 5+1 cases
– ISO 11704: 4+2 cases
– ISO 9696: 2 cases
– ISO 9697: 1 case
– Other: 2 case; Not applicable: 3+1 cases
Measurement technique
– gas-flow proportional counter: 9 cases
– liquid scintillation counter: 6 cases
– solid scintillation counter: 2 cases
Sample preparation
– Direct measurement after evaporation: 10+2 cases
– Thermal pre-concentration for LSC: 5+1 cases
– Co-precipitation: 3 cases
– Direct measurement with LSC: 1+2 cases
– Other: 1 case
Alpha efficiency calibration, self-absorption correction
– 241Am: 8+2 cases
– 239Pu: 3+1 cases
– 236U: 2 cases
– 209Po, 242Pu, 226Ra: 1 case
Beta efficiency calibration, self-absorption correction
– 90Sr: 10+2 cases
– 40K: 3+1 cases
– 137Cs, not defined: 1+1 case
6.1 Recommended methods
On the basis of the aforementioned information and the frequency of a parameter appeared in the Table 18 and
Table 19 from the most consistently performing laboratories, the following practices can be recommended as
summarised in Table 20.
We propose that the laboratory should follow a documented standard method, either ISO 10704 or ISO 11704. Sample preparation is done by either direct measurement with gas flow proportional counter after evaporation or thermal pre-concentration for liquid scintillation counting. The following radionuclides are preferred for counting efficiency calibration, self-absorption and quench correction: 241Am or 239Pu; 90Sr or 40K.
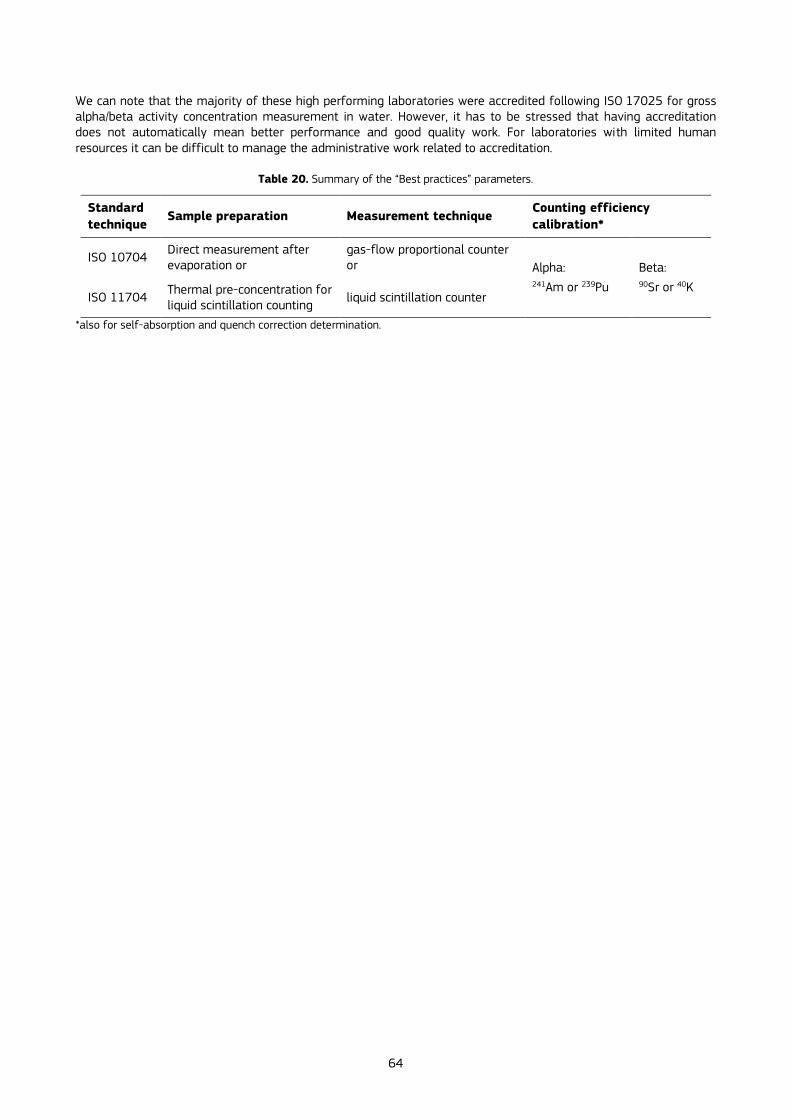
64
We can note that the majority of these high performing laboratories were accredited following ISO 17025 for gross alpha/beta activity concentration measurement in water. However, it has to be stressed that having accreditation does not automatically mean better performance and good quality work. For laboratories with limited human resources it can be difficult to manage the administrative work related to accreditation.
Table 20. Summary of the “Best practices” parameters.
Standard
technique Sample preparation Measurement technique
Counting efficiency
calibration*
ISO 10704 Direct measurement after evaporation or
gas-flow proportional counter or Alpha:
241Am or 239Pu
Beta: 90Sr or 40K
ISO 11704 Thermal pre-concentration for liquid scintillation counting
liquid scintillation counter
*also for self-absorption and quench correction determination.
65
7 Summary, key findings
In Europe today, gross alpha/beta activity concentration measurements in (drinking) water are still not reaching a satisfactory quality level because almost 50% of the results deviated more than accepted in this PT. On the basis of the percentage deviation score the acceptable scores varied between 51% and 63%. The situation seemed to be better when z-scores are compared with acceptable scores between 75%-87% success rate. This need some caution since z-score is interpreted in a way that the acceptance range is doubled comparing to percentage deviation. However, in case of zeta-score when reported uncertainties are also used for performance evaluation success rate was decreased between 38% and 62%.
Only 14 participants had acceptable performance with regards to percentage deviation and zeta score for all 4 parameters to report. There were 14 participants that could not report any acceptable result at all. Therefore, to some extent, the same conclusions are valid for the REM2019 PT as for the REM2012 ILC. Gross methods should be used with caution due to the numerous sources of interferences and there is a need for true standardisation/harmonisation (Jobbágy et al, 2016). However, comparing the two exercises (REM2019 PT and REM2012 ILC) some small improvements were noticed in performances especially in case of the natural water analysis on one hand but on the other hand worse performance was observed in case of the quality control (spiked) sample. As an average it shows no improvement.
At first glance it was difficult to identify superior method(s) but analysing the data thoroughly from the most consistently performing 14 methods/organisations “Best practices” can be proposed.
Following ISO standards for gross alpha/beta activity measurements in water could be a possible reason for improved performance in comparison to results from non-standard methods.
Method pitfalls
As was observed, gross methods were not performing with the desired accuracy and in some cases they fail to detect certain radionuclides. They give only "activity index numbers" rather than an approximate activity concentration, as explained by Schönhofer (2012) and re-confirmed by the data spread from this proficiency test as well after the REM2012 ILC exercise. The difference between laboratory results were between two to seven orders of magnitude, which falls far outside the measurement uncertainties.
The large spread of the results may be due to influencing factors during both the sample preparation and the measurement procedure. These influencing factors cannot generally be predicted and it is already difficult to define the measurand for gross activity analysis since the radionuclide composition of the sample is a priory not known.
On top of it, this is probably the only radiometric method where just metrological traceability cannot be established (except for reference materials) due to the lack of measurands. Measurement values are linked to particular sources/radionuclides used for gross alpha/beta efficiency calibration. Using different radionuclides would give different measurement result. Many different radionuclides used for calibration cover a wide energy range, which may be another reason for scattered results.
Since many combinations/variations of parameters are possible and might vary from one laboratory to another, it is not surprising that results show large spread.
In certain cases even using the same ISO standard method in different laboratories does not guarantee comparable results which shows poor method reproducibility.
The most important pitfalls and sources of interferences of the gross alpha/beta methods are related to (i) sample preparation methods (loss of volatile radionuclides), (ii) time delay between sample preparation and measurement (decay of 224Ra or ingrowth of radon and its progenies from 226Ra), (iii) detection technique and (iv) radionuclides used for counting efficiency calibration as detailed in a journal article by Jobbágy et al. (2014).
Other parameters like incorrect quench correction or alpha/beta discrimination for LSC can also introduce bias. In case of co-precipitation sample preparation approach 40K is not co-precipitated and therefore excluded from the gross beta results (residual beta activity) unlike in case of direct evaporation or LSC where 40K contributes to the gross beta activity. When using direct evaporation approach then source matrix and uniformity, surface density (i.e. self-absorption) and hygroscopic property of the sample play important roles.
The outcome of the analysis is certainly also influenced by the proficiency and skills of laboratory personnel. For certain techniques, especially the ones involving radiochemistry, it takes many years to reach the necessary level and obtain the necessary know-how. Hands on lab trainings are needed to train junior staff members or those analysts that are new in the field. Knowledge transfer from experienced professionals to junior staff already starts at undergraduate level. Another issue is how to attract, and later keep, the younger generation in this field.
66
Points of attention on reporting
There were some apparent blunders among the measurement results. These blunders are incorrectly reported measurement results where errors were made by placing the decimals at the incorrect place or measurement units. Since reporting is part of a PT exercise and also the analytical service, it is very important to pay attention to these details e.g. having a proper reporting review procedure or simply reading the PT reporting requirements.
Other important points to check are if counting efficiency calibration, quench correction, pulse discrimination, determination of self-absorption factor were done properly and if decay correction of the calibration source was performed. Whenever possible, the analysts should use certified/standardised materials with proper certificate from a trusted provider. Last but not least, the uncertainty budgets need to be checked and identification of all possible significant components introduced.
Policy aspect
Regarding policy impact of this PT: A minor revision of the E-DWD would be desirable to put more emphasis on promoting radionuclide specific analysis at least as part of a zero baseline study and periodical (annual or seasonal) surveys. Furthermore, considering the current trend in drinking water consumption habits in Europe, mineral water as water category should be included in the scope of the E-DWD.
7.1 Recommendations: method harmonisation and collaborations
For these aforementioned reasons, we recommend that gross alpha/beta methods are preferably not to be used as a standalone method to assess internal dose exposure or risk from radiation from water consumption. Gross measurement should be used for monitoring as a complementary or substitute method for radionuclide specific methods, once the radionuclide composition is known from radionuclide specific analysis.
We recommend (i) following strictly standardised procedures for sample preparation and measurement, (ii) to be aware of all decay and chemical processes that may affect the measurement, (iii) to test and validate methods and (iv) to build realistic uncertainty budgets.
The advantage of using liquid scintillation counting detection technique is that not only gives it quantitative information but semi-qualitative can be achieved as well from the alpha-beta spectrum.
Collaborative trials are desired to test gross methods under very rigorous truly standardised conditions to be able to conclude their accuracy, repeatability, analytical sensitivity and specificity. Furthermore detailed studies are needed to compare the cost, time effectiveness and other performance criteria of radionuclide specific- and gross alpha/beta measurement methods to be able to select fit for the purpose method(s) meeting the requirements of the different legislative/policy documents and of course the environmental radioactivity monitoring community. JRC could play a central role to coordinate such a trial involving external expert organisations in the field.
7.2 Future planning
To plan the JRC unit G.2 activity better in the course of the DG-ENER EURATOM Article 35-36 virtual-meeting in October 2020 and the JRC REM virtual workshop in May 2021 participants were requested to send their priorities on the JRC future PTs. The following PTs were mentioned by the Article 35-36 experts and participants:
Radon-in-water PT and sampling exercise,
Sr-90, Cs-137 in whey sample,
U- and Ra isotopes, Po-210/Pb-210 in water,
Repetition of gross alpha/beta activity in water PT,
PT for PT providers as JRC proposed.
JRC-Geel in consultation with DG-ENER will take into account these requests from the Article 35 Expert group and REM PT participants when planning the upcoming proficiency tests.

67
References
Bé, M.-M., Chistè, V., Dulieu, C., Mougeot, X., Browne, E., Chechev, V., Kuzmenko, N., Kondev, F., Luca, A., Galán, M., Nichols, A.L., Arinc, A., Huang, X., Table of Radionuclides (Vol.5 - A = 22 to 244), Monographie BIPM-5, Vol.5., Bureau International des Poids et Mesures (2010), ISBN 92-822-2230-6 (Vol. 5)
Bonas, G., Zervou, M., Papaeoannou, T., Lees, M., 'SoftCRM': A new software for the certification of reference materials, Accred Qual. Assur., 8, 2003, pp. 101-107.
CIAAW (the Commission on Isotopic Abundances and Atomic Weights), Isotopic compositions of the elements 2019. Available online at https://www.ciaaw.org/isotopic-abundances.htm (accessed on 24/06/2021)
EC, 2013. European Union Council Directive 2013/51/Euratom of 22 October 2013 laying down requirements for the protection of the health of the general public with regard to radioactive substances in water intended for human consumption.
Groska, J., Vajda, N., Molnar, Z., Bokori, E., Szeredy, P. and Zagyvai, M., ‘Determination of actinides in radioactive waste after separation on a single DGA resin column’, J. Radioanal.Nucl. Chem., 309 (3), 2016, pp. 1145–1158.
GUM, 2008. Evaluation of measurement data — Guide to the expression of uncertainty in measurement. BIPM, IEC, IFCC, ILAC, ISO, IUPAC, IUPAP, OIML. Document JCGM 100:2008, GUM 1995 with minor corrections. Online available at www.bipm.org
Hult, M., Lutter, G., Marissens, G. and Stroh, H., JRC “Serving policy and science at the HADES underground research facility - a casebook”, EUR 30207 EN, Publications Office of the European Union, Luxembourg, 2020, ISBN 978-92-76-18589-5, doi:10.2760/056079, JRC120311.
ISO 5667-1:2006: Water quality -- Sampling -- Part 1: Guidance on the design of sampling programmes and sampling techniques
ISO 5667-3:2012: Water quality -- Sampling -- Part 3: Preservation and handling of water samples
ISO 9696, 2017. Water quality: Measurement of Gross Alpha Activity in Non-Saline Water − Thick Source Method. International Organization for Standardization, Geneva, Switzerland.
ISO 9697, 2018. Water Quality: Measurement of Gross Beta Activity in Non-Saline Water. International Organization for Standardization, Geneva, Switzerland.
ISO 10704, 2019. Water quality: Measurement of gross alpha and gross beta activity in non-saline water − Thin source deposit method. International Organization for Standardization, Geneva, Switzerland.
ISO 11704, 2018. Water quality: Measurement of gross alpha and beta activity concentration in non-saline water - Liquid scintillation counting method. International Organization for Standardization, Geneva, Switzerland.
ISO 11929:2019 Part 1-3: Determination of the characteristic limits (decision threshold, detection limit and limits of the confidence interval) for measurements of ionizing radiation — Fundamentals and application. International Organization for Standardization, Geneva.
ISO 13528:2015: Statistical methods for use in proficiency testing by interlaboratory comparison, International Organization for Standardization, Geneva.
ISO/IEC 17043:2010: Conformity assessment -- General requirements for proficiency testing. International Organization for Standardization, Geneva.
ISO/IEC Guide 35:2017: Reference materials — Guidance for characterization and assessment of homogeneity and stability. International Organization for Standardization, Geneva.
Jobbágy, V., Wätjen, U., Merešova, J. "Current status of gross alpha/beta activity analysis in water samples: A short overview of methods". J. Radioanal. Nucl. Chem. 286 (2010), 393-399.
Jobbágy, V., Dirican, A., Wätjen, U. "Radiochemical characterization of mineral waters for a European interlaboratory comparison".Microchem. J.110 (2013), 675-680.
Jobbágy, V., Merešova, J., Wätjen, U. "Critical remarks on gross alpha/beta activity analysis in drinking waters: Conclusions from a European interlaboratory comparison". Appl. Radiat. Isot.,87 (2014), 429-434.
Jobbágy, V., Merešová, J., Dupuis, E., Kwakman, P., Altzitzoglou, T., Rožkov, A., Hult, M., Emteborg, H., Wätjen, U."Results of a European interlaboratory comparison on gross alpha/beta activity determination in drinking water", Journal of Radioanalytical and Nuclear Chemistry, 306 (1) (2015), 325–331
68
Jobbágy V., Merešová J., Altzitzoglou T., Hult M., Malo P., Wätjen U. Evaluation of the 2012 EC interlaboratory comparison on gross alpha/beta activity concentration in drinking water, EUR 28351, 2016, doi:10.2789/573272
Linsinger, T.P.J., Pawels, J., Lamberty, A., Schimmel, H.G., van der Veen, A.M.H., Siekmann, L. (2001). Estimating the uncertainty of stability for matrix CRMs. Anal. Bioanal. Chem. 370, 183-188.
LNHB website (accessed 24/06/2021): http://www.lnhb.fr/nuclides/K-40_tables.pdf
Maulard, A., Osmond, M., Calculation of 40K contribution to gross beta, IRSN (L'Institut de Radioprotection et de Sûreté Nucléaire, France) DEI/STEME technical note 2008-4, 2008
NIST website (accessed 24/06/2021): https://physics.nist.gov/cgi-bin/Compositions/stand_alone.pl?ele=K&ascii=html&isotype=some
Pommé, S., Keightley, J., Determination of a reference value and its uncertainty through a power-moderated mean, Metrologia, 52, 2015, pp. S200-S212.
Rozkov, A., 2014. Measurement of gross alpha/beta activity concentrations in water using liquid scintillation counting technique, Geel (Belgium): European Commission - Joint Research Centre (JRC) - Institute for Reference Materials and Measurements (JRC-GEEL); 2013. JRC87435.
Schönhofer, F., 2012. An LSC approach to improve (???) or better replace gross alpha and/or beta measurements. In: III. Terrestrial Radionuclides in Environment International Conference on Environmental Protection, Veszprém (Hungary), 16-18 May.
WHO, 2017. World Health Organization, Guidelines for drinking-water quality. Fourth edition. World Health Organization, Geneva, Switzerland.
Youden WJ (1959) Graphical diagnosis of interlaboratory test results. Industrial Quality Control, 15, 24-28.

69
List of abbreviations, acronyms and definitions
activity concentration* activity per unit volume
assigned value also called reference value
BIPM Bureau International des Poids et Mesures
cpm counts per minute
D (%) percentage deviation between the reported and the reference massic activity
DG ENER European Commission’s Directorate-General for Energy
EURATOM European Atomic Energy Community
GUM Guide to the Expression of Uncertainty in Measurement
HDPE High Density Polyethylene
IEC International Electrotechnical Commission
ILC interlaboratory comparison
ISO International Standardization Organization
JRC Joint Research Centre (of the European Commission)
k coverage factor according to GUM
LS liquid scintillation
LSC liquid scintillation counting
MAD Median Absolute Deviation
massic activity* activity per unit mass
MILC Management of ILC. (JRC’s online tool for reporting ILC-results)
MS member states of the European Union
PFA Perfluoroalkoxy alkane
PTFE Polytetrafluoroethylene
PSA pulse-shape analyser
PT proficiency test
SCK CEN Belgian nuclear research centre
SI Système International d'Unités, International System of Units
U expanded uncertainty according to GUM
u standard uncertainty according to GUM
U(xlab) expanded uncertainty of average laboratory result
u(xlab) standard uncertainty of average laboratory result
U(XPT) expanded uncertainty of reference value
u(XPT) standard uncertainty of reference value
WHO World Health Organization
xlab mean laboratory result of activity concentration
XPT reference value of activity concentration
PT the standard deviation for proficiency assessment
z-score compares each participant's deviation from the assigned value with the standard deviation
of the proficiency test assessment (PT).
ζ-score The zeta-score states whether a laboratory's result agrees with the assigned value considering both the reported uncertainty and the uncertainty of the reference value.
The term “test item” is used in standards; “reference material” and “”water sample” are wordings used when being more precise and less formal and less abstract/general.
* In this report, the matrix was water, which has a density very close to 1 kg/dm3. Although we clearly distinguish between massic activity (Bq/kg) and activity concentration (Bq/L), their numerical value would be almost identical.
70
List of figures
Figure 1. REM2019 PT reference material (JRC GAB1) after dispensing into storage bottles. ................................................... 10
Figure 2. Total uranium (sum of 238U and 234U) activity concentration in JRC-GAB1 PT reference material for homogeneity study. All uncertainties are combined standard uncertainties at the 1 sigma level (k=1). The blue solid
line indicates the average total uranium activity concentration and error bars indicate the 1sigma (k=1). ................... 19
Figure 3. The elemental potassium concentration in JRC-GAB1 PT reference material for homogeneity study. All uncertainties are combined standard uncertainties at the 1 sigma level (k=1). The blue dashed line indicates the average potassium concentration. ....................................................................................................................................................................................... 19
Figure 4. The 241Am activity concentration in JRC-GAB2 PT reference material for homogeneity study. All uncertainties are combined standard uncertainties at the 1 sigma level (k=1). The blue solid line indicates the
average total uranium activity concentration and error bars indicate the 1sigma (k=1). ........................................................... 20
Figure 5. The elemental potassium and strontium concentration in JRC-GAB2 PT reference material for homogeneity study. All uncertainties are combined standard uncertainties at the 1 sigma level (k=1). The blue dashed line indicates the average potassium concentration and the orange dashed line indicates the average strontium concentration. .................................................................................................................................................................................................................................... 20
Figure 6. The gross alpha activity concentration measurement results for JRC-GAB1 PT reference material, as
reported by the participants, 𝑥𝑖, and their expanded uncertainty 𝑈𝑥𝑖, 𝑘 = 2. Solid red line: reference value (𝑥PT). Red dashed lines: assigned range (𝑥PT ± 𝑈𝑥PT, 𝑘 = 2). Blue dashed lines: 𝑥PT ± 2 𝜎PT acceptance range........................ 24
Figure 7. The gross beta activity concentration measurement results for JRC-GAB1 PT reference material, as
reported by the participants, 𝑥𝑖, and their expanded uncertainty 𝑈𝑥𝑖, 𝑘 = 2.Solid red line: reference value (𝑥PT). Red dashed lines: assigned range (𝑥PT ± 𝑈𝑥PT, 𝑘 = 2). Blue dashed lines: 𝑥PT ± 2 𝜎PT acceptance range........................ 25
Figure 8. The gross alpha activity concentration measurement results for JRC-GAB2 PT reference material, as
reported by the participants, 𝑥𝑖, and their expanded uncertainty 𝑈𝑥𝑖, 𝑘 = 2. Solid red line: reference value (𝑥PT). Red dashed lines: assigned range (𝑥PT ± 𝑈𝑥PT, 𝑘 = 2). Blue dashed lines: 𝑥PT ± 2 𝜎PT acceptance range........................ 26
Figure 9. The gross beta activity concentration measurement results for JRC-GAB2 PT reference material, as
reported by the participants, 𝑥𝑖, and their expanded uncertainty 𝑈𝑥𝑖, 𝑘 = 2. Solid red line: reference value (𝑥PT). Red dashed lines: assigned range (𝑥PT ± 𝑈𝑥PT, 𝑘 = 2). Blue dashed lines: 𝑥PT ± 2 𝜎PT acceptance range........................ 27
Figure 10. Overview of percentage deviation, zeta-and z-scores in percentage (%) and number of laboratories with satisfactory, questionable and unsatisfactory measurement results for JRC-GAB1 PT reference material gross alpha activity concentration. .................................................................................................................................................................................................................. 28
Figure 11. Overview of percentage deviation, zeta-and z-scores in percentage (%) and number of laboratories with satisfactory, questionable and unsatisfactory measurement results for JRC-GAB1 PT reference material gross beta activity concentration. .................................................................................................................................................................................................................. 28
Figure 12. Overview of percentage deviation, zeta-and z-scores in percentage (%) and number of laboratories with satisfactory, questionable and unsatisfactory measurement results for JRC-GAB2 PT reference material gross alpha activity concentration. .................................................................................................................................................................................................................. 29
Figure 13. Overview of percentage deviation, zeta-and z-scores in percentage (%) and number of laboratories with satisfactory, questionable and unsatisfactory measurement results for JRC-GAB2 PT reference material gross beta activity concentration. .................................................................................................................................................................................................................. 29
Figure 14. The laboratory results for total dissolved solid content for JRC-GAB1 (upper graph) and JRC-GAB2 (lower
graph). The solid red lines: the indicative values; the dashed blue lines: standard uncertainties (± u at k = 1). ............... 31
Figure 15. Interpretation of Youden Plot using z-scores. .................................................................................................................................... 32
Figure 16. Youden Plot of z-scores for REM2019 PT gross alpha and gross beta activity concentration measurement results. The acceptable results are spread within the green box. .................................................................................................................... 33
Figure 17. Youden Plot of percentage deviation (D%) for REM2019 PT gross alpha and gross beta activity concentration measurement results. The acceptable results are spread within the green box.................................................... 34
Figure 18. Sorted results for JRC-GAB1 PT reference material gross alpha and gross beta activity concentration measurements as a function of detection technique and use of ISO method. Percentage of acceptable results for percentage deviation, zeta score and average bias from reference values are presented............................................................. 35
71
Figure 19. Sorted results for JRC-GAB2 PT reference material gross alpha and gross beta activity concentration
measurements as a function of detection technique and use of ISO method. Percentage of acceptable results for percentage deviation, zeta score and average bias from reference values are presented............................................................. 36
Figure 20. Sorted results for JRC-GAB1 PT reference material gross alpha activity concentration measurements as a function of ISO 17025 accreditation. ................................................................................................................................................................................. 37
Figure 21. Sorted results for JRC-GAB1 PT reference material gross beta activity concentration measurements as a
function of ISO 17025 accreditation. ................................................................................................................................................................................. 38
Figure 22. Sorted results for JRC-GAB2 PT reference material gross alpha activity concentration measurements as a function of ISO 17025 accreditation. ................................................................................................................................................................................. 39
Figure 23. Sorted results for JRC-GAB2 PT reference material gross beta activity concentration measurements as a function of ISO 17025 accreditation. ................................................................................................................................................................................. 40
Figure 24. Comparison of ISO 17025 accredited and non-accredited laboratories for JRC-GAB1 PT reference material gross alpha activity concentration measurements. Percentage of acceptable results of D%, zeta score and average bias from reference values. .................................................................................................................................................................................. 41
Figure 25. Comparison of ISO 17025 accredited and non-accredited laboratories for JRC-GAB1 PT reference
material gross beta activity concentration measurements. Percentage of acceptable results of D%, zeta score and average bias from reference values. .................................................................................................................................................................................. 41
Figure 26. Comparison of ISO 17025 accredited and non-accredited laboratories for JRC-GAB2 PT reference material gross alpha activity concentration measurements. Percentage of acceptable results of D%, zeta score and average bias from reference values. .................................................................................................................................................................................. 42
Figure 27. Comparison of ISO 17025 accredited and non-accredited laboratories for JRC-GAB2 PT reference material gross beta activity concentration measurements. Percentage of acceptable results of D%, zeta score and average bias from reference values. .................................................................................................................................................................................. 42
Figure 28. Sorted results for JRC-GAB1 PT reference material gross alpha activity concentration measurements as a
function of the radionuclides used for alpha counting efficiency calibration. ......................................................................................... 43
Figure 29. Sorted results for JRC-GAB2 PT reference material gross alpha activity concentration measurements as a function of the radionuclides used for alpha counting efficiency calibration. ......................................................................................... 44
Figure 30. Sorted results for JRC-GAB1 PT reference material gross beta activity concentration measurements as a function of the radionuclides used for alpha counting efficiency calibration. ......................................................................................... 45
Figure 31. Sorted results for JRC-GAB2 PT reference material gross beta activity concentration measurements as a function of the radionuclides used for alpha counting efficiency calibration. ......................................................................................... 46
Figure 32. Sorted results for JRC-GAB1 PT reference material gross alpha and beta activity concentration measurements as a function of time delay between sample preparation and measurement. .................................................... 47
Figure 33. Sorted results for JRC-GAB2 PT reference material gross alpha and beta activity concentration
measurements as a function of time delay between sample preparation and measurement. .................................................... 48
Figure 34. PomPlot of the JRC-GAB1 PT reference material gross alpha activity data. ................................................................. 49
Figure 35. PomPlot of the JRC-GAB1 PT reference material ISO 11704:2017 gross alpha activity data sorted on the basis of accreditation. .................................................................................................................................................................................................................. 49
Figure 36. PomPlot of the JRC-GAB1 PT reference material gross beta activity data non-sorted. ......................................... 50
Figure 37. PomPlot of the JRC-GAB1 PT reference material ISO 11704:2017 gross beta activity data sorted on the basis of accreditation. .................................................................................................................................................................................................................. 50
Figure 38. Interpretation of a PomPlot. ....................................................................................................................................................................... 158
72
List of tables
Table 1. Timeline of the REM2019 PT exercise............................................................................................................................................................. 8
Table 2. Sources and parameters used for establishing requirements for the REM2019 PT water selection. .................... 9
Table 3. The radionuclide composition and total dissolved solid contents of the REM2019 PT reference materials (uncertainties at k=1). .................................................................................................................................................................................................................. 13
Table 4. The chemical composition and concentration of JRC-GAB2 PT reference material from gravimetric weighing.
The relative standard uncertainty on the chemical concentration was approximately 1.0%. ....................................................... 13
Table 5. Massic activities of 40K from underground gamma-ray spectrometry. ................................................................................... 15
Table 6. Summary of the radionuclide-specific and gross activity measurement results for JRC-GAB1 PT reference material. The results are presented as activity concentrations [mBq/L], uncertainties are expanded uncertainties (k = 2). .............................................................................................................................................................................................................................................................. 16
Table 7. Summary of the radionuclide-specific and gross activity measurement results for JRC-GAB2 PT reference material. The results are presented as activity concentrations [mBq/L], uncertainties are expanded uncertainties (k = 2). .............................................................................................................................................................................................................................................................. 17
Table 8. Parameters/analytes checked during the homogeneity and stability studies. ................................................................... 18
Table 9. The reference gross alpha and beta activity concentration values (𝑥PT) of the REM 2019 PT reference
materials and each combined uncertainty 𝑢𝑥PT and the standard deviation for proficiency assessment (𝜎PT). .......... 22
Table 10. Summary of the reference values and their uncertainty components (in brackets from alpha spectrometry). ................................................................................................................................................................................................................................... 22
Table 11. Ratio of the reported maximum to minimum gross activity concentrations. (Not including results reported as detection limits) ......................................................................................................................................................................................................................... 29
Table 12. Number of laboratories with a certain number of parameters with acceptable results. The values in parentheses are percentage values of the total number of submitted results. ..................................................................................... 30
Table 13. Indicative values of the total dissolved solid (TDS) content of the REM2019 PT samples. ................................... 30
Table 14. Summary on REM2019 PT and REM2012 ILC. .................................................................................................................................... 51
Table 15. REM2019 PT and REM2012 ILC satisfactory results based on the percentage difference (D%) scores. ...... 51
Table 16. Limit of detection of gross alpha/beta activity concentrations reported by the participant laboratories
in mBq L-1 ............................................................................................................................................................................................................................................. 54
Table 17. Best performing laboratories in the REM2012ILC and REM2019 PT joint evaluation on the basis of
percentage differences and zeta scores. ......................................................................................................................................................................... 60
Table 18. Information on the best performing laboratories and their methods. ................................................................................. 61
Table 19. Information on the best performing laboratories and their methods from the REM2012 ILC and REM2019 PT joint evaluation. ......................................................................................................................................................................................................................... 62
Table 20. Summary of the “Best practices” parameters. .................................................................................................................................... 64
Table 21. Participants' results of gross alpha activity concentration measurements on the JRC-GAB1 sample.
Reported activity concentration values 𝑥𝑖 and combined standard uncertainties 𝑢𝑥𝑖 are expressed in mBq/L. ............ 126
Table 22. Participants' results of gross beta activity concentration measurements on the JRC-GAB1 sample.
Reported activity concentration values 𝑥𝑖 and combined standard uncertainties 𝑢𝑥𝑖 are expressed in mBq/L. ............ 134
Table 23. Participants' results of gross alpha activity concentration measurements on the JRC-GAB2 sample.
Reported activity concentration values 𝑥𝑖 and combined standard uncertainties 𝑢𝑥𝑖 are expressed in mBq/L. ............ 141
Table 24. Participants' results of gross beta activity concentration measurements on the JRC-GAB2 sample.
Reported activity concentration values 𝑥𝑖 and combined standard uncertainties 𝑢𝑥𝑖 are expressed in mBq/L. ............ 149

73
Annexes
Annex 1. Nomination request, e-mail, invitation letter

74

75
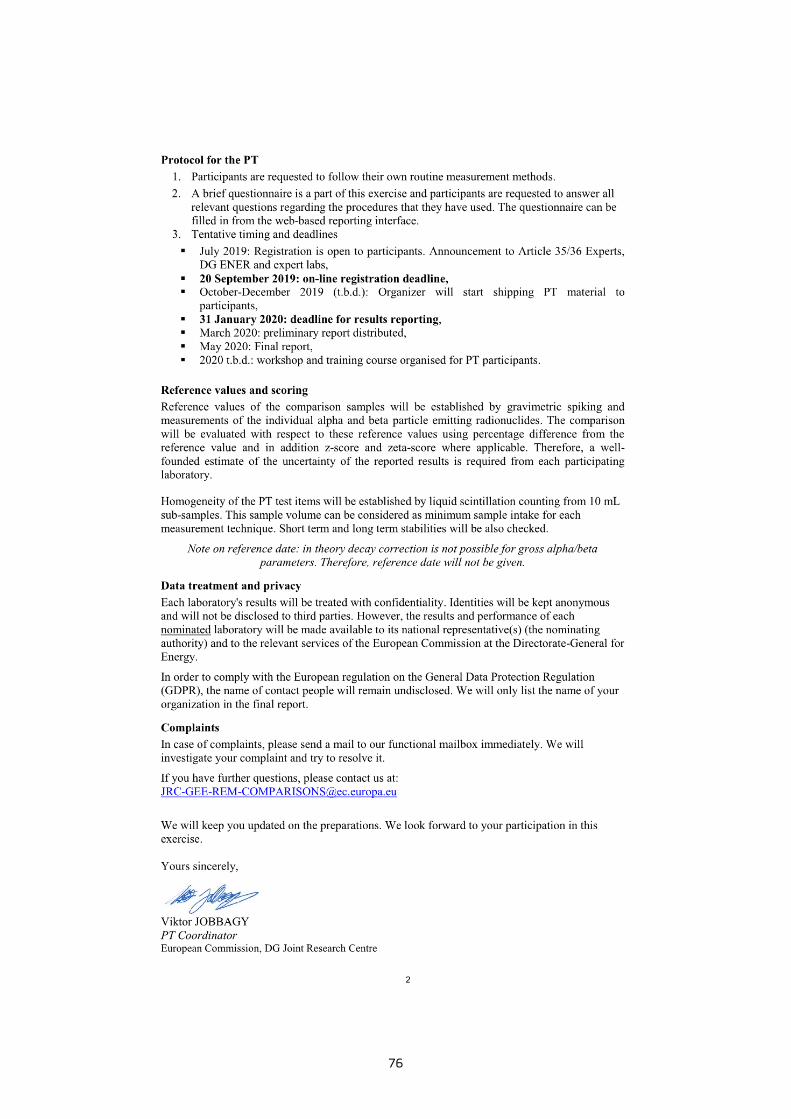
76

77
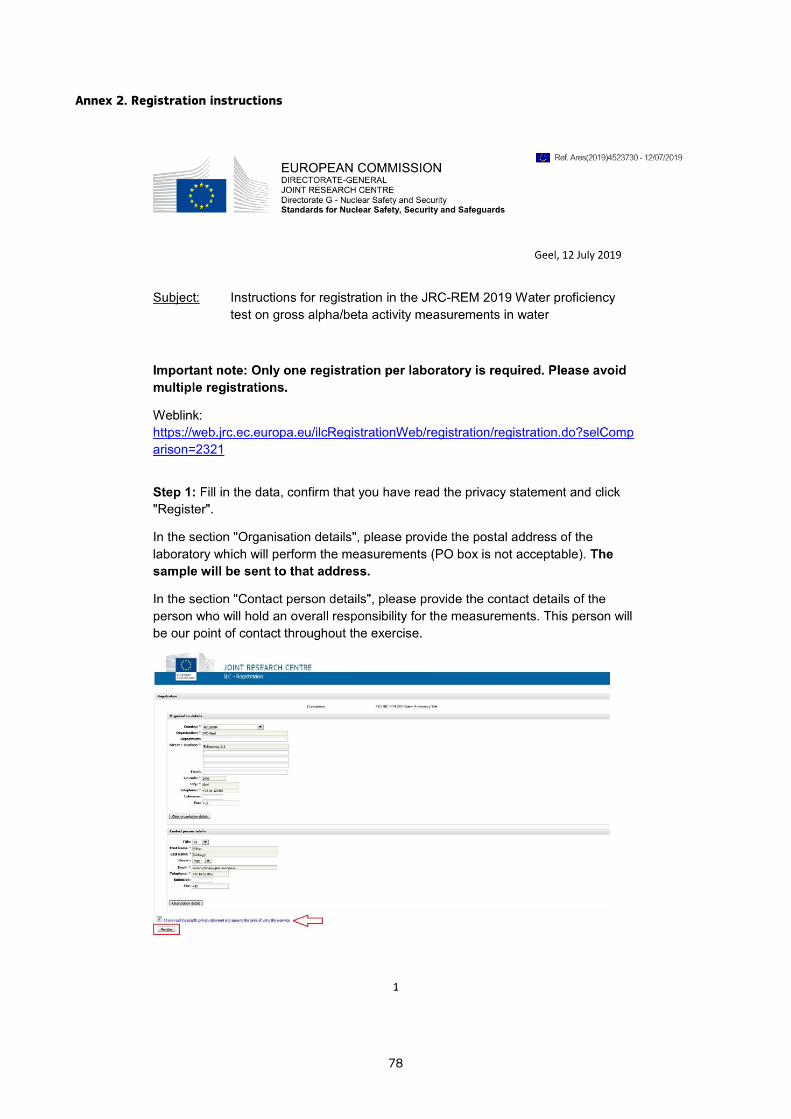
78
Annex 2. Registration instructions

79
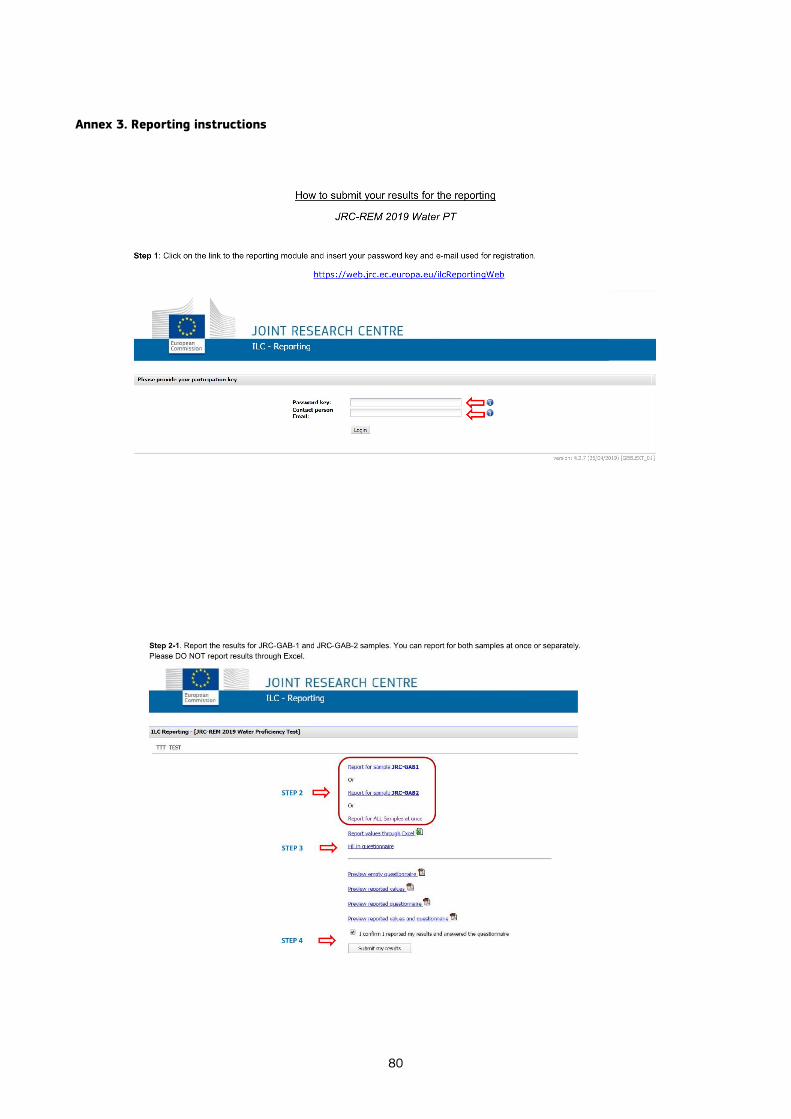
80
Annex 3. Reporting instructions
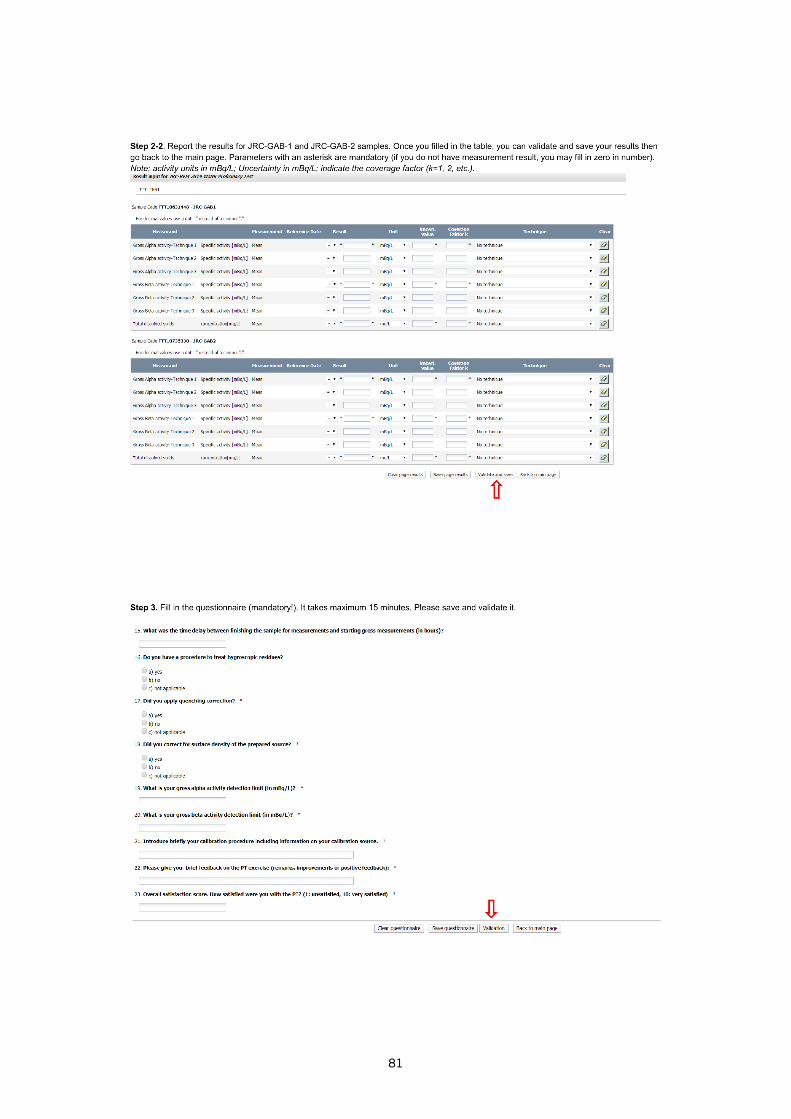
81
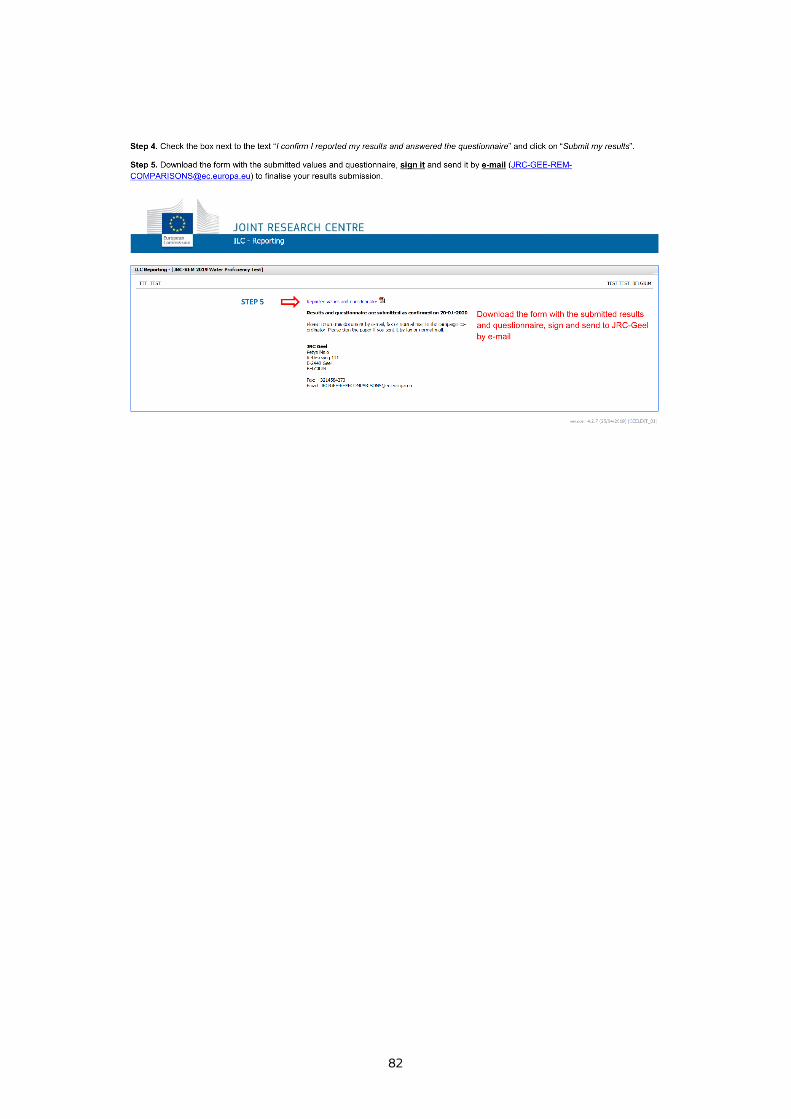
82
83
Annex 4. Accompanying letter
84

85
86

87

88
89
Annex 5. Sample receipt form
90
Annex 6. List of participating laboratories
ALBANIA
Institute of Applied Nuclear Physics, Tirana University
Radiometry & Radiochemistry
Th. Filipeu, Qesarak
1001 Tirana
ALGERIA
Centre de Recherche Nucléaire d'Alger
Physique radiologique
02, Bd Frantz fanon
399 Alger R., Alger
AUSTRIA
Austrian Agency for Health and Food Safety
Radiation Protection and Radiochemistry
Spargelfeldstrasse 191
A-1220 Vienna
BELGIUM
IRE (Institute for radioelements)
BUS
Avenue de l'éspérance 1
6220 Fleurus
BELGIUM
VIVAQUA
VIVAQUA LABORATOIRE TAILFER
Rue des Rochers de Frêne
5170 Lustin
BOSNIA - HERZEGOVINA
Public Health Institute
Radiation protection center
Jovana Ducica 1
78000 Banja Luka

91
BOSNIA - HERZEGOVINA
Institute for Public Health of FB&H
Radiation protection centre
Marsala Tita 9
71000 Sarajevo
BULGARIA
Regional Health Inspectorate
Radiation Control
Perushtitsa 1
4002 Plovdiv
BULGARIA
National Center of Radiobiology and Radiation Protection
Public Exposure Monitoring Lab
3, Georgi Sofiiski Blvd.
1606 Sofia
BULGARIA
Executive Environment Agency
Lab for Radiation Measurements
136, Tzar Boris III, blvd.
1618 Sofia
BULGARIA
Regional health inspectorate of Burgas
Control of radiation department
Aleksandrovska str. 120
8000 Burgas
CROATIA
Ruđer Bošković Institute
Laboratory for radioecology
Bijenička cesta 54
10000 Zagreb
CYPRUS
State General Laboratory
Kimonos,44
1451 Nicosia
92
CZECH REPUBLIC
Water Research Institute T. G. Masaryka, Public Research Institutions
Departement of Radioecology
Podbabska 30/2582
160 00 Prague 6
ESTONIA
Environmental Board
Radiation Safety Department
Kopli 76
10416 Tallinn
FINLAND
Radiation and Nuclear Safety Authority
Laippatie 4, P.O.Box 14
00881 Helsinki
FRANCE
EDF CNPE GOLFECH
BP 24
82400 Valence D'Agen
FRANCE
ORANO MINING - CIME/SAN
Haute Vienne
2 route de Lavaugrasse
87250 Bessines/Gartempe
FRANCE
Subatech/SMART
4 rue Alfred KASTLER
44307 Nantes
FRANCE
CNPE CHINON
37, Laboratoire Environnement
BP 80
37420 Avoine

93
FRANCE
EICHROM EUROFINS RADIOACTIVITE
Campus Ker Lann
rue Maryse Bastié
Parc de Lormandière, Bât. C
35170 Bruz
FRANCE
Orano Cycle
La Hague
50440 Beaumont Hague
FRANCE
EDF
Direction Industrielle
Bat. Pierre Gilles de Gennes
CNPE de CHINON
37420 Avoine
FRANCE
ANDRA
DOI/CA/LAC
CSA, BP 7
10200 Soulaines Dhuys
FRANCE
EDF CNPE de Flamanville
Magasin relais - BP4
50340 Les Pieux
FRANCE
CEA
DEN/MAR/DUSP/SPR/LMAR Centre de Marcoule
Bâtiment 40 - BP 17171
30207 Bagnols-sur-ceze
FRANCE
PearL
20 Rue Atlantis
87068 Limoges

94
FRANCE
IRSN
SAME
31 rue de l'Ecluse
78116 Le Vesinet
FRANCE
Marine Nationale Brest – Lasem
15 bis Avenue Ecole Navale
29430 Brest
GERMANY
Bundesamt für Strahlenschutz
Strahlenschutz und Umwelt
Koepenicker Allee 120-130
10318 Berlin
GERMANY
Karlsruhe Institute of Technology Safety and Environment (SUM)
Hermann-von-Helmholtz-Platz 1
76344 Eggenstein-Leopoldsh
GERMANY
Federal Institute of Hydrology
G4
Am Mainzer Tor 1
56068 Koblenz
GREECE
Greek Atomic Energy Commission
Department of Environmental Ra
P. Grigoriou & Neapololeos
15310 Agia Paraskevi
GREECE
Athens Analysis Laboratories
Alikarnassou 31
14231 Nea Ionia Athens
95
GREECE
Agrolab Rds
Environmental Lab
Industrial Area Thessaloniki
Sindos, Po Box 48
57022 Thessaloniki
HUNGARY
RadiÖko Kft.
Wartha Vince 1/2
8200 Veszprém
HUNGARY
National Food Chain Safety Office
Food Chain Safety Laboratory Directorate
Radioanalytical Reference Lab.
13 – 15 Fogoly Street
1182 Budapest
HUNGARY
Paks NPP
Enviromentalcontrol Laboratory
Kurcsatov street 1/D.
7030 Paks
HUNGARY
MECSEKÉRC Zrt
Radiometriai laboratórium
Akna utca 2.
7673 Kővágószőlős
HUNGARY
National Public Health Center
Radiobiology and Radiohygiene
Anna utca 5.
1221 Budapest

96
HUNGARY
Baranya County Government Office
Laboratory Department
Szentlőrinci Street 4/1.
7634 Pécs
HUNGARY
MVMV PA Zrt.
Environmental Protection
Pf. 71; Hrsz.:8803/17
7031 Paks
IRELAND
EPA
ORM
Block 3, Clonskeagh Square,
Clonskeagh Road
D14 H424 Dublin 14
ITALY
ENEA
Radiation Protection Institute
Strada per Crescentino, 41
13040 Saluggia (VC)
ITALY
Agenzia Regionale per la Protezione dell'Ambiente della Sardegna – ARPAS
DTS Servizio Agenti Fisici
Viale F. Ciusa 6
09131 Cagliari
ITALY
ARPACAL
Reggio Calabria
Via Troncovito snc
89135 Reggio Calabria

97
ITALY
ARPA Lazio
Sede di Viterbo
Via Montezebio 17
01100 Viterbo
ITALY
ARPA LOMBARDIA
CRR Milano
Via Filippo Juvara 22
20129 Milano
ITALY
ARPA Valle d'Aosta
Environmental Radioactivity
Loc. La Maladière rue de la Maladière, 48
11020 Saint-Christophe
ITALY
ARPA Friuli Venezia Giulia
SOS CRR Via Colugna 42
33100 Udine
ITALY
A.R.P.A.C. (Agenzia Regionale per la Protezione Ambientale della Campania)
Salerno (C.R.R.)
via Lanzalone 54/56
84126 Salerno
ITALY
Sogin SpA
Via Fermi, 5/A fraz. Zerbio
29012 Caorso
ITALY
ARPA Veneto
U.O.p Anal.Spec.Lab.Ovest CRR
Via Dominutti 8
37135 Verona
98
ITALY
ISIN- Italian Inspectorate for Nuclear Safety and Radiation Protection
Radiometric Laboratories
via di Castel Romano 100
00128 Rome
ITALY
ARPA Piemonte
Radiation
Via Jervis, 30
10015 Ivrea (TO)
ITALY
ARPA Marche
Dipartimento prov.le di Ancona
U.O. Radioattività Ambientale
via Colombo, 106
60127 Ancona
ITALY
Environmental Protection Agency Tuscany Region
UO Radioattività e Amianto
via Ponte alle Mosse 211
50144 Firenze
ITALY
Arpa Piemonte (Agenzia Regionale per la Protezione Ambientale del Piemonte)
Ionizzanti siti nucleari
via Trino, 89
13100 Vercelli
ITALY
Agenzia provinciale per l'ambiente e la tutela del clima
Lab analisi aria e radioprotez
Via Amba Alagi, 5
39100 Bolzano

99
ITALY
ARPA SICILIA
S.T. di Palermo
via Nairobi, 4
90129 Palermo
ITALY
ARPA Umbria
Servizio Radiazioni Ionizzanti
Via Pievaiola 207 B-3
San Sisto
06132 Perugia
ITALY
ARPAE Emilia Romagna
CTR Radioattività ambientale
Via XXI Aprile, 48
29121 Piacenza
ITALY
Kaos Coop
Via Montebello 13
44121 Ferrara
ITALY
ENEA
Radioprotection Institute
Via Anguillarese 301
00123 Rome
ITALY
Protex Italia Srl
Via Cartesio 30
47122 Forlì
ITALY
Agenzia Regionale per la Protezione dell'Ambiente della Basilicata (ARPAB)
Centro Regionale Radioattività
Via dei Mestieri 43
75100 Matera
100
LATVIA
Latvian Environment, Geology and Meteorology Centre
Laboratory
Maskavas Street 165
1019 Riga
LITHUANIA
Radiation Protection Centre
Expertise and Exposure Monitor
Kalvariju 153
08352 Vilnius
LUXEMBOURG
Ministère de la Santé - Direction de la Santé
Radioprotection
Villa Louvigny, Allée Marconi
2120 Luxembourg
MONTENEGRO
LLC Center for Ecotoxicological Research Podgorica
Radionuclide Analytics Unit
Bulevar Šarla de Gola 2
81000 Podgorica
NETHERLANDS
RIVM
Antonie van Leeuwenhoeklaan 9
3721 MA Bilthoven
NORTH MACEDONIA
Public Health Institute
Radioecology
50 Divizija No. 6
1000 Skopje
POLAND
Central Mining Institute
Silesian Centre for Envi. Radi
plac Gwarkow 1
101
40-166 Katowice
POLAND
Central Laboratory for Radiological Protection
Departmen of Radiation Hygien
Konwaliowa 7
03-194 Warsaw
POLAND
National Centre for Nuclear Research
LPD
A. Sołtana 7
05-400 Otwock
POLAND
Technical University of Lodz
Applied Radiation Chemistry
Wróblewskiego 15
90-924 Łódź
POLAND
National Institute of Public Health – National Institute of Hygiene (NIPH – NIH)
Radiation Hygiene& Radiobioloy
24 Chocimska street
00-791 Warsaw
PORTUGAL
Instituto Superior Técnico/Laboratório de Proteção e Segurança Radiológica
Estrada Nacional 10 (km 139,7)
2695-066 Bobadela LRS
ROMANIA
SNN-CERNAVODA NPP
Environmental Laboratory
Cazarmii 6a
905200 Cernavoda

102
ROMANIA
Directia de Sanatate Publica a Judetului Cluj
Laborator Igiena Radiatiilor
Nicolae Balcescu, 16
400160 Cluj Napoca
ROMANIA
Bucharest Public Health Authority
Hygiene Radiation Laboratory
Reconstrucției Street nr.6,
sector 3 Bucharest
031 726 Bucharest
ROMANIA
Direcția de Sănătate Publică Bihor
Libertății Nr.34
410042 Oradea
ROMANIA
Institute for Nuclear Research – Pitesti
RadiationProtection Laboratory
Campului str., No. 1
115400 Mioveni
ROMANIA
Regional Center of Public Health Cluj of National Institute of Public Health
Radiation Hygiene Laboratory
Louis Pasteur 6
400349 Cluj Napoca
ROMANIA
Departament of Public Health Iasi
Radiation Hygiene Laboratory
V. Conta, 2-4
700117 Iasi
ROMANIA
Directia de Sanatate Publica Judeteana Suceava
Laborator Igiena Radiatiilor
Str. Scurta Nr. 1A
720223 Suceava

103
ROMANIA
Directia de Sanatate Publica Caras-Severin
Laboratorul de Radiatii
str. Spitalului nr.36
320076 Resita
ROMANIA
Public Health District Authority Arges
Radiation Hygiene Laborator
Exercitiu Nr 39 Bis
110438 Pitesti
ROMANIA
Directia de Sanatate Publica a Judetului Sibiu
LIRI
Gh. Baritiu, Nr.3
550178 Sibiu
ROMANIA
Directorate Public Health Maramures
Laboratory of Radiation Health
Victiriei 132, Baia Mare, Maramures
430076 Baia Mare
ROMANIA
Public Health Authority - Dolj county
Laboratory of Ionising Radiati
Constantin Lecca street, no 2
200143 Craiova
ROMANIA
National Institute of RD for Physics and Nuclear Engineering - "Horia Hulubei"
Life and Environmental Physics
30 Reactorului street, Magurele, jud. Ilfov,
077125 Magurele
104
ROMANIA
Directia de Sanatate Publica Mures
Laborator Igiena Radiatiilor
Gh. Doja, nr. 34
540342 Tg.-Mures
ROMANIA
Directia de Sanatate Publica Prahova
Laborator Igiena Radiatiilor
Transilvaniei, 2
100179 Ploiesti
ROMANIA
National Institute of Public Health
Radiation Hygiene Laboratory
Street Dr. Leonte Anastasievici no. 1-3, sector 5
050463 Bucharest
SERBIA
Serbian Institute of Occupational Health "Dr Dragomir Karajovic"
Radioecology Department
Deligradska 29
11000 Belgrade
SERBIA
Institute for Nuclear Sciences Vinča
Radiation and Environmental Pr
Mike Petrovića Alasa 12-14
11351 Belgrade
SERBIA
Public Company "Nuclear Facilities of Serbia"
Mike Petrovića Alasa Street, 12-14
11351 Vinča, Belgrade
SERBIA
University of Novi Sad
Faculty of Sciences, Department of Physics
Trg Dositeja Obradovica 4
21000 Novi Sad

105
SLOVAKIA
Slovenské elektrárne, a. s.
NPP Mochovce
Komenského 6
Environmental Radiation Monitoring Laboratory
93401 Levice
SLOVAKIA
Regional Public Health Authority in Banska Bystrica
Radiation Protection
Cesta k nemocnici 1
975 56 Banska Bystrica
SLOVAKIA
Public Health Authority of the Slovak Republic
Trnavská cesta 52
82102 Bratislava
SLOVAKIA
University Comenius in Bratislava
Faculty of Natural Sciences, Nuclear Chemistry
Ilkovičova 6, Mlynská dolina
84215 Bratislava
SLOVAKIA
Slovenské elektrárne a.s.
Laboratória radičnej kontroly
Okružná 14
91701 Trnava
SLOVAKIA
Regional Public Health Organisation
Radiation protection
Ipeľská 1
04001 Košice
SLOVENIA
ZVD d.o.o.
Chengdujska cesta 25
1260 Ljubljana

106
SLOVENIA
Jozef Stefan Institute
F2 - Low/Medium Energy Physics
Jamova cesta 39
1000 Ljubljana
SPAIN
University of Huelva
Integrated Sciences
Faculty Experimental Sciences
Campus El Carmen s/n
21007 Huelva
SPAIN
ENUSA Industrias Avanzadas S.A., S.M.E (Radiological Protection and Environment)
Environmental Laboratory Km7
Ciudad Rodrigo- Lumbrales Road
37592 Saelices el Chico
SPAIN
Universitat Politècnica de Catalunya
Institut Tècniques Energètique
Edifici Etseib, Campus Sud, Planta 0, Pavelló C
Diagonal 647
08028 Barcelona
SPAIN
Universidad de Santiago de Compostela
Fisica de Particulas
C\ Xoaquin Diaz de Rabago, s/n, Edif. Monte da Condesa
Campus Vida, Laboratorio LAR
15782 Santiago de Comp
SPAIN
LaRUC (University of Cantabria)
Faculty of Medicine
Cardenal Herrera Oria S/N
39011 Santander
107
SPAIN
Medidas Ambientales, S.l.
Laboratory
Barrio Villacomparada s/n
09500 Medina de Pomar
SPAIN
University of Leon
Quimica Y Fisica Aplicadas
Escuela de Ingenierias Industr
Campus De Vegazana S/N
24007 Leon
SPAIN
University of the Balearic Islands
Environmental Radioactivity La
Cra. Valldemossa km 7'5, Ed. Mateu Orfila
07122 Palma De Mallorca
SPAIN
University of Granada
Inorganic Chemistry, Radiochemistry Environmental Laboratory
Faculty of Sciences
Av. Fuentenueva, s/n
18077 Granada
SPAIN
CIEMAT
Medio Ambiente
Avenida de la Complutense 40, Ed. 70. P1. D11
28020 Madrid
SPAIN
University of Malaga
Central Research Facilities
Universidad de Málaga, SCAI
Bulevar Louis Pasteur, 33
29071 Malaga

108
SPAIN
University of Extremadura
LARUEX, Applied Physcis
Faculty of Veterinary
Avda. Universidad, s/n
10003 Cáceres
SPAIN
GEOTECNIA Y CIMIENTOS S.A. (GEOCISA)
Area Nuclear
c/ Los Llanos de Jerez 10-12
28823 Coslada (Madrid)
SPAIN
Universidad del Pais Vasco
Escuela de Ingenieria de Bilbao; Dpt Ing Nuclear y Mec Fl
Lab Medidas Baja Actividad
Pz Ingeniero Torres Quevedo, 1
48013 Bilbao
SPAIN
Universidad de La Laguna
Laboratorio de Física Médica
Facultad de Medicina
Apartado 456
38200 La Laguna
SPAIN
University of Extremadura
Physics
Elvas Av. w/n
06006 Badajoz
SPAIN
University of Sevilla
Applied Physics II
Escuela Superior Arquitectura
Avda. Reina Mercedes, 2
41012 Sevilla

109
SPAIN
University of A Coruña
Avenida 19 de febrero S/N
Ferrol, A Coruña
15405 Ferrol
SPAIN
Universitat Politecnica De Valencia
Laboratorio de Radiactividad Ambiental
Camino De Vera, S/N
46022 Valencia
SPAIN
University of Zaragoza
Faculty of Sciences, Theoretical Physics, Nuclear A
Pedro Cerbuna 12
50009 Zaragoza
SPAIN
ENUSA Industrias Avanzadas SA SME
Protección Radiológica Juzbado
ctra. Salamanca-Juzbado km.26
37115 Juzbado
SPAIN
CEDEX
Área Aplicaciones Isotópicas
Alfonso XII, 3-5 (Edif. CETA)
28014 Madrid
SPAIN
Universidad de Salamanca
Física Fundamental
Calle Espejo Nº 2, Edificio I+D+i
37008 Salamanca

110
SPAIN
Universidad de Valencia
Laboratorio de Radiactividad Ambiental
C/ Dr. Moliner, 50 Edificio de Investigación
Sótano -2
46100 Burjassot
SPAIN
UPM-E.T.S.I Caminos, Canales y Puertos
Laboratorio Ingenieria Nuclear
Profesor Aranguren 3
28040 Madrid
SPAIN
Labs & Technological Services AGQ SL
Radioactivity Laboratory
Ctra. A-8013 Km. 20.8
41014 Burguillos
SPAIN
Universitat de Barcelona
Lab. de Radiologia Ambiental
Martí I Franqués 1-11, 3ª Planta
08023 Barcelona
SPAIN
Instituto de Salud Carlos III
Radioprotección (CNSA)
Ctra. Majadahonda Pozuelo km 2
28220 Majadahonda (Madrid)
SPAIN
University of Oviedo
Lab. Radiactividad Ambiental
c/ Independencia, 13
33004 Oviedo

111
SWITZERLAND
Spiez Laboratory
Nuclear Chemistry
Austrasse 1
3700 Spiez
TURKEY
Turkish Atomic Energy Authority
Radioactivity Department
Sarayköy Nükleer Araştırma Ve
65100 Kazan, Ankara
UKRAINE
The Marzeev Institute of Public Health
Radiation Monitoring lab
Popudrenko str., 50
02094 Kyiv
UKRAINE
UHMI
Environmental Rad. Monitoring
av. Nauki, 37
03028 Kyiv
UK
Public Health England
CRCE Glasgow
155 Hardgate Road
G51 4LS Glasgow
UK
South East Water Laboratory
3 Columbus Drive
Southwood Business Park
GU14 0NZ Farnborough
UK
SOCOTEC UK Limited
Nuclear Chemistry, Unit 12 Moorbrook
Southmead Industrial Park
OX11 7HP Didcot

112
UK
South West Water Ltd
Radiochemistry
Bridge Road, Countess Wear
EX2 7AA Exeter, Devon
UK
Thames Water
Laboratory – metals
Thames Water Spencer House lab
3 Manor Park, Manor farm Rd
RG2 0JN Reading

113
Annex 7. Questionnaire
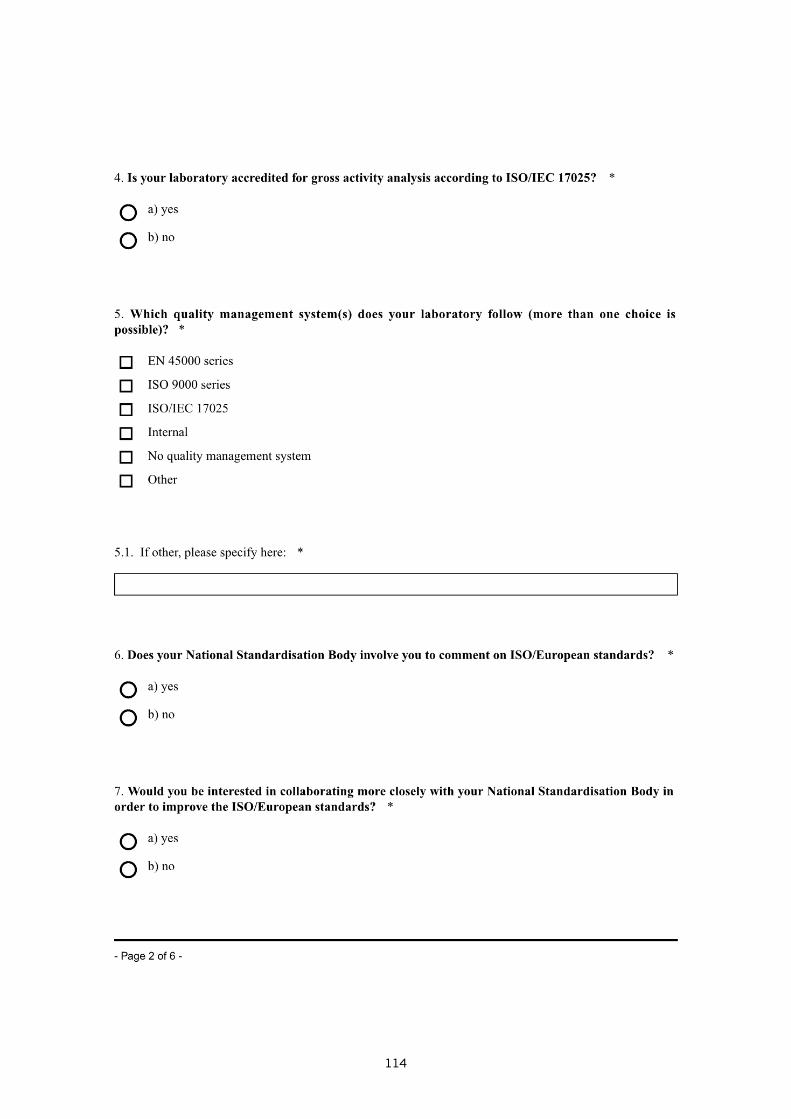
114

115
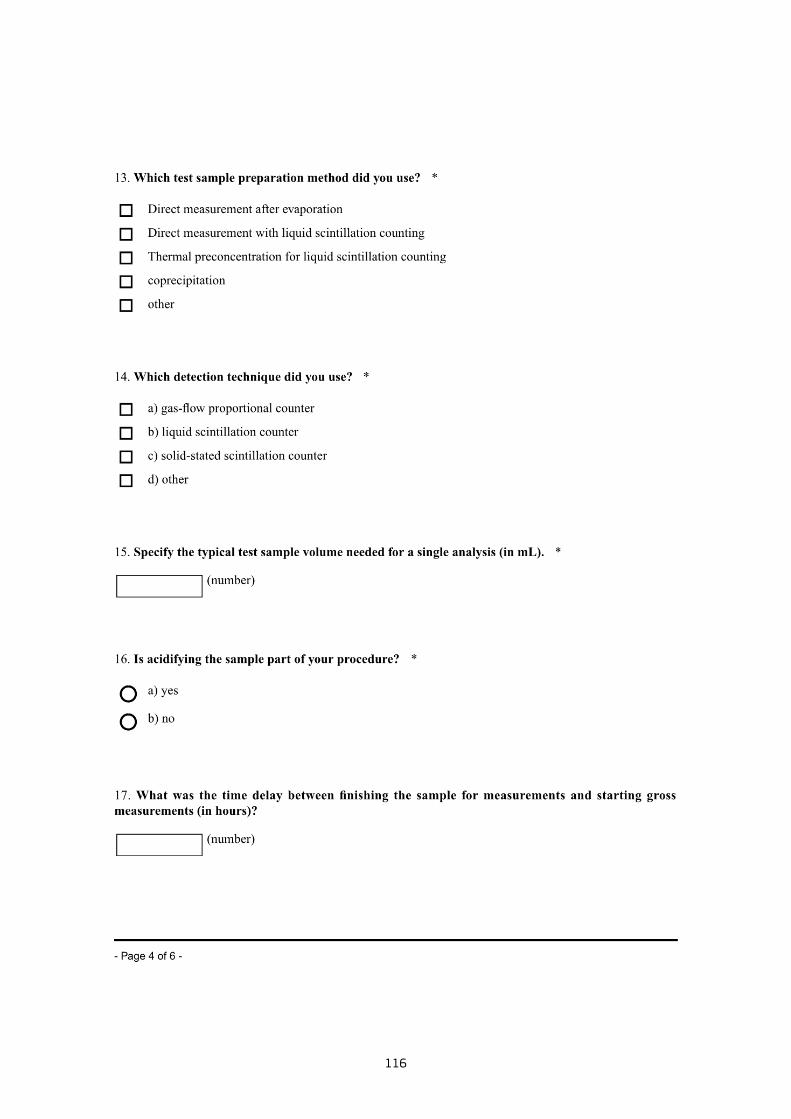
116

117
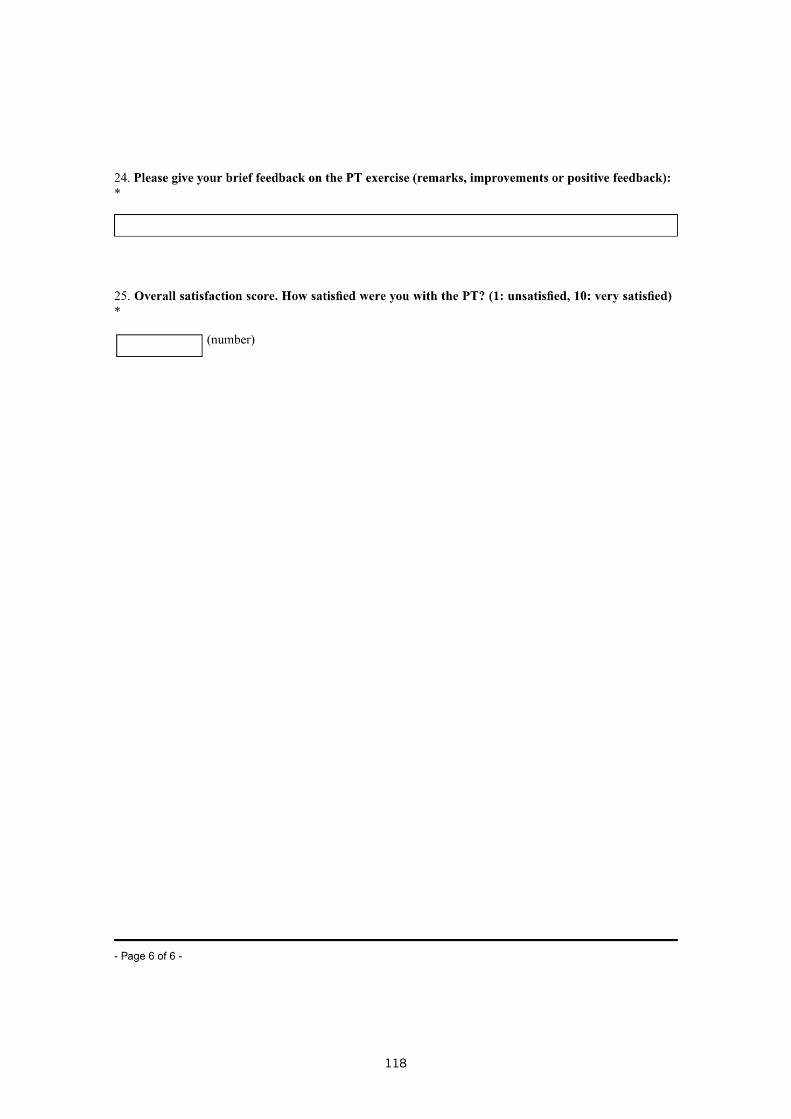
118
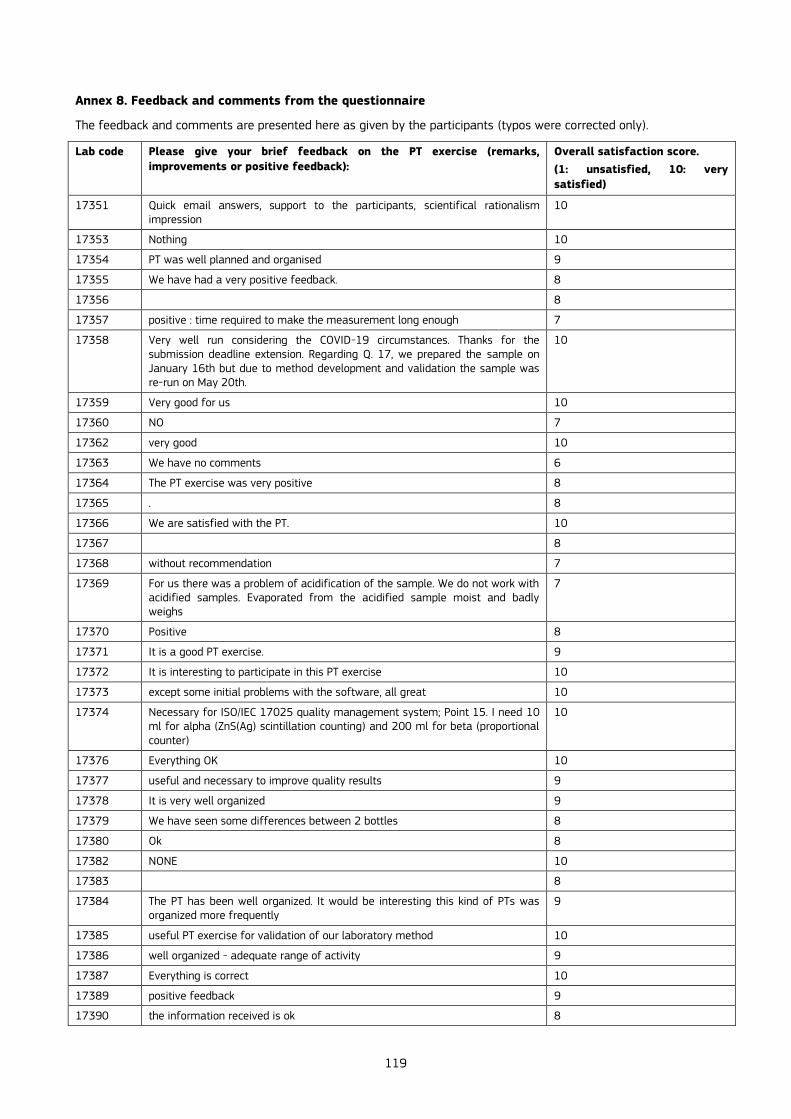
119
Annex 8. Feedback and comments from the questionnaire
The feedback and comments are presented here as given by the participants (typos were corrected only).
Lab code Please give your brief feedback on the PT exercise (remarks,
improvements or positive feedback):
Overall satisfaction score.
(1: unsatisfied, 10: very
satisfied)
17351 Quick email answers, support to the participants, scientifical rationalism impression
10
17353 Nothing 10
17354 PT was well planned and organised 9
17355 We have had a very positive feedback. 8
17356 8
17357 positive : time required to make the measurement long enough 7
17358 Very well run considering the COVID-19 circumstances. Thanks for the submission deadline extension. Regarding Q. 17, we prepared the sample on January 16th but due to method development and validation the sample was re-run on May 20th.
10
17359 Very good for us 10
17360 NO 7
17362 very good 10
17363 We have no comments 6
17364 The PT exercise was very positive 8
17365 . 8
17366 We are satisfied with the PT. 10
17367 8
17368 without recommendation 7
17369 For us there was a problem of acidification of the sample. We do not work with acidified samples. Evaporated from the acidified sample moist and badly weighs
7
17370 Positive 8
17371 It is a good PT exercise. 9
17372 It is interesting to participate in this PT exercise 10
17373 except some initial problems with the software, all great 10
17374 Necessary for ISO/IEC 17025 quality management system; Point 15. I need 10 ml for alpha (ZnS(Ag) scintillation counting) and 200 ml for beta (proportional counter)
10
17376 Everything OK 10
17377 useful and necessary to improve quality results 9
17378 It is very well organized 9
17379 We have seen some differences between 2 bottles 8
17380 Ok 8
17382 NONE 10
17383 8
17384 The PT has been well organized. It would be interesting this kind of PTs was organized more frequently
9
17385 useful PT exercise for validation of our laboratory method 10
17386 well organized - adequate range of activity 9
17387 Everything is correct 10
17389 positive feedback 9
17390 the information received is ok 8
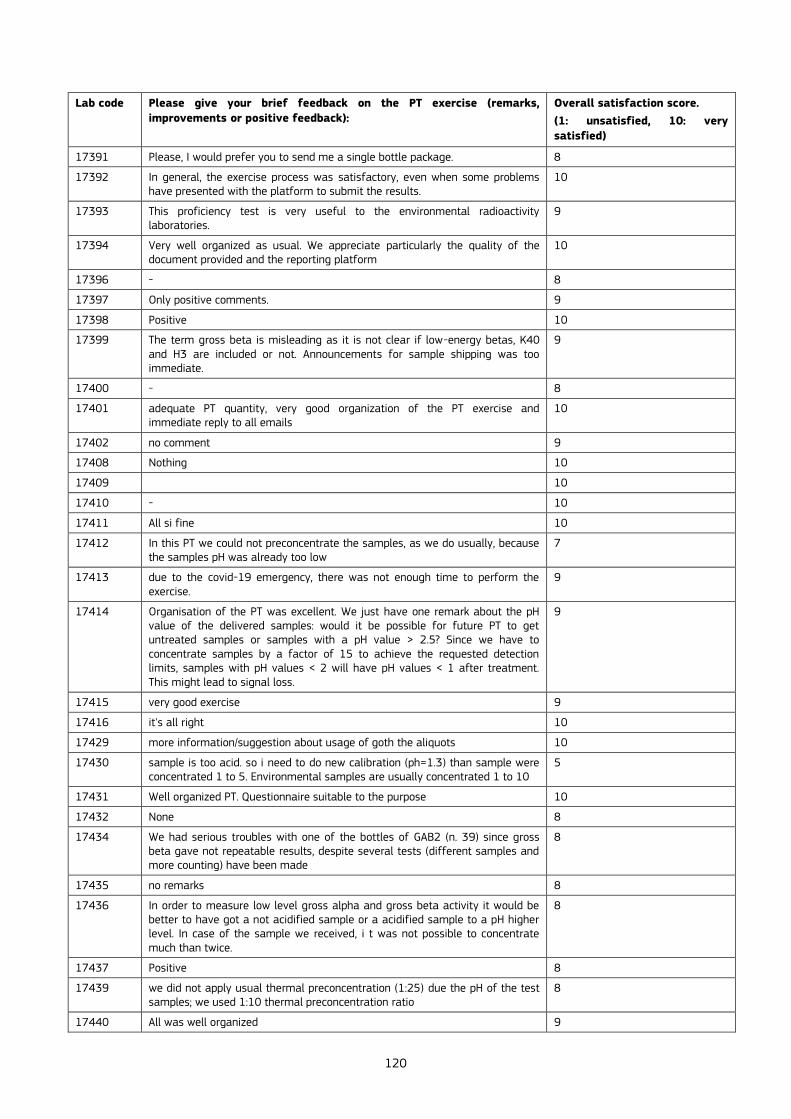
120
Lab code Please give your brief feedback on the PT exercise (remarks,
improvements or positive feedback):
Overall satisfaction score.
(1: unsatisfied, 10: very
satisfied)
17391 Please, I would prefer you to send me a single bottle package. 8
17392 In general, the exercise process was satisfactory, even when some problems have presented with the platform to submit the results.
10
17393 This proficiency test is very useful to the environmental radioactivity laboratories.
9
17394 Very well organized as usual. We appreciate particularly the quality of the document provided and the reporting platform
10
17396 - 8
17397 Only positive comments. 9
17398 Positive 10
17399 The term gross beta is misleading as it is not clear if low-energy betas, K40 and H3 are included or not. Announcements for sample shipping was too immediate.
9
17400 - 8
17401 adequate PT quantity, very good organization of the PT exercise and immediate reply to all emails
10
17402 no comment 9
17408 Nothing 10
17409 10
17410 - 10
17411 All si fine 10
17412 In this PT we could not preconcentrate the samples, as we do usually, because the samples pH was already too low
7
17413 due to the covid-19 emergency, there was not enough time to perform the exercise.
9
17414 Organisation of the PT was excellent. We just have one remark about the pH value of the delivered samples: would it be possible for future PT to get untreated samples or samples with a pH value > 2.5? Since we have to concentrate samples by a factor of 15 to achieve the requested detection limits, samples with pH values < 2 will have pH values < 1 after treatment. This might lead to signal loss.
9
17415 very good exercise 9
17416 it's all right 10
17429 more information/suggestion about usage of goth the aliquots 10
17430 sample is too acid. so i need to do new calibration (ph=1.3) than sample were concentrated 1 to 5. Environmental samples are usually concentrated 1 to 10
5
17431 Well organized PT. Questionnaire suitable to the purpose 10
17432 None 8
17434 We had serious troubles with one of the bottles of GAB2 (n. 39) since gross beta gave not repeatable results, despite several tests (different samples and more counting) have been made
8
17435 no remarks 8
17436 In order to measure low level gross alpha and gross beta activity it would be better to have got a not acidified sample or a acidified sample to a pH higher level. In case of the sample we received, i t was not possible to concentrate much than twice.
8
17437 Positive 8
17439 we did not apply usual thermal preconcentration (1:25) due the pH of the test samples; we used 1:10 thermal preconcentration ratio
8
17440 All was well organized 9
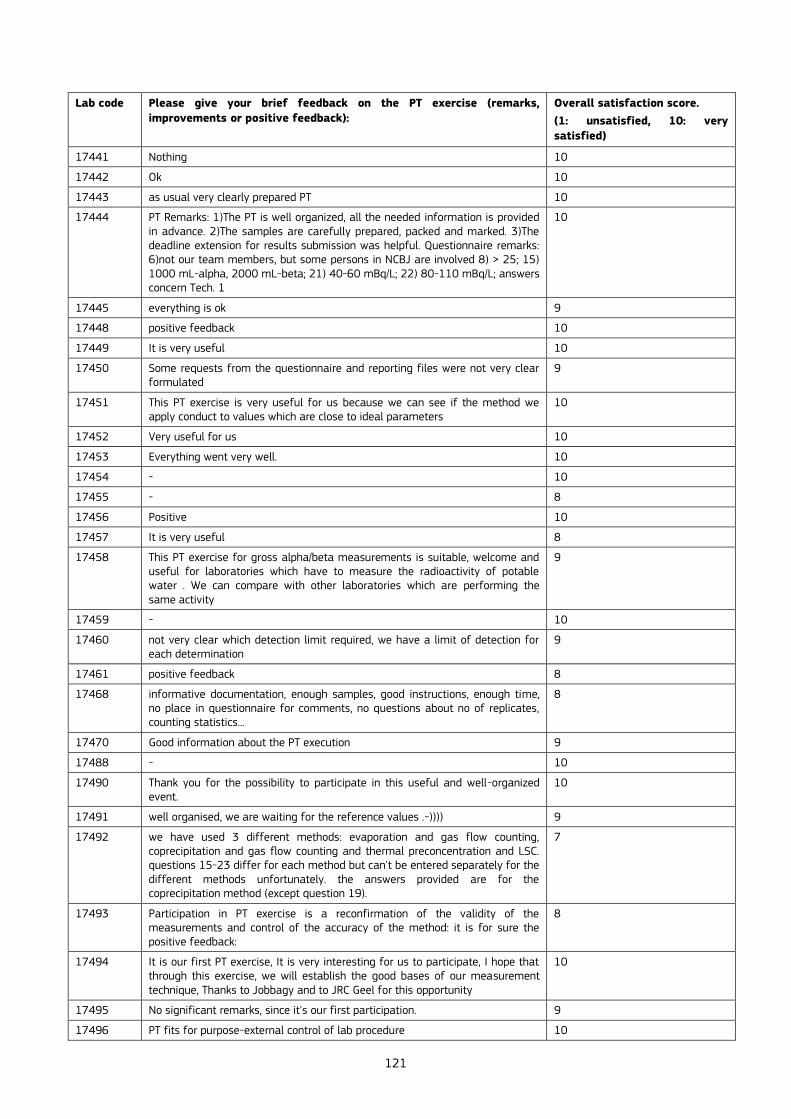
121
Lab code Please give your brief feedback on the PT exercise (remarks,
improvements or positive feedback):
Overall satisfaction score.
(1: unsatisfied, 10: very
satisfied)
17441 Nothing 10
17442 Ok 10
17443 as usual very clearly prepared PT 10
17444 PT Remarks: 1)The PT is well organized, all the needed information is provided in advance. 2)The samples are carefully prepared, packed and marked. 3)The deadline extension for results submission was helpful. Questionnaire remarks: 6)not our team members, but some persons in NCBJ are involved 8) > 25; 15) 1000 mL-alpha, 2000 mL-beta; 21) 40-60 mBq/L; 22) 80-110 mBq/L; answers concern Tech. 1
10
17445 everything is ok 9
17448 positive feedback 10
17449 It is very useful 10
17450 Some requests from the questionnaire and reporting files were not very clear formulated
9
17451 This PT exercise is very useful for us because we can see if the method we apply conduct to values which are close to ideal parameters
10
17452 Very useful for us 10
17453 Everything went very well. 10
17454 - 10
17455 - 8
17456 Positive 10
17457 It is very useful 8
17458 This PT exercise for gross alpha/beta measurements is suitable, welcome and useful for laboratories which have to measure the radioactivity of potable water . We can compare with other laboratories which are performing the same activity
9
17459 - 10
17460 not very clear which detection limit required, we have a limit of detection for each determination
9
17461 positive feedback 8
17468 informative documentation, enough samples, good instructions, enough time, no place in questionnaire for comments, no questions about no of replicates, counting statistics...
8
17470 Good information about the PT execution 9
17488 - 10
17490 Thank you for the possibility to participate in this useful and well-organized event.
10
17491 well organised, we are waiting for the reference values .-)))) 9
17492 we have used 3 different methods: evaporation and gas flow counting, coprecipitation and gas flow counting and thermal preconcentration and LSC. questions 15-23 differ for each method but can't be entered separately for the different methods unfortunately. the answers provided are for the coprecipitation method (except question 19).
7
17493 Participation in PT exercise is a reconfirmation of the validity of the measurements and control of the accuracy of the method: it is for sure the positive feedback:
8
17494 It is our first PT exercise, It is very interesting for us to participate, I hope that through this exercise, we will establish the good bases of our measurement technique, Thanks to Jobbagy and to JRC Geel for this opportunity
10
17495 No significant remarks, since it's our first participation. 9
17496 PT fits for purpose-external control of lab procedure 10

122
Lab code Please give your brief feedback on the PT exercise (remarks,
improvements or positive feedback):
Overall satisfaction score.
(1: unsatisfied, 10: very
satisfied)
17497 The concentration of the samples GAB1 and GAB2 is not typical for drinking water.
7
17498 the acidity of the sample GAB 2 is too important and we have problem with our capsule (are
5
17500 timetable was arranged due to Covid19, thanks a lot for that flexibility 10
17501 / 8
17503 unusual salinity of gab1 8
17504 Difficult 8
17505 Very good 9
17506 no particular remarks, satisfactory delivery and packaging, sufficient sample quantity for testing
10
17507 The high acidification required several preparations in order to obtain a uniform deposit and in accordance with our practices.
7
17510 Highly acidic samples especially GAB 2 not representative of the water analyzed routinely.
7
17511 - 8
17512 The PT is well organised, the samples arrived on time, their activities are in the range of those found in our routine samples. The complete feedback will be given after the PT is finished.
10
17513 up to now we are quite satisfied with the PT, we had no problems, information was clear and samples arrived
8
17514 . 9
17515 This PT was useful for our laboratory, because we can get experience how to measure gross alpha/beta from relatively small amount of water sample.
10
17516 I am very satisfied 10
17517 It was well organised and could follow the communication easily 7
17519 Good PT, too much sample quantity: according to us 2 L (1 L for GAB 1, 1 L for GAB2) were sufficient for analyses. This produces us some difficulties for waste disposal.
8
17520 good excercise to improve our techniques and measurements 10
17521 The samples are to much acidificated and so the thermal preconcentration is not completely possible, and so could be a problem in the correct alpha/beta separation. Is important in my opinion that insert in the technical data about measurements thet the candidate indicate the ROI windows and the Radionuclides used for efficiency and type of circuit separation (PSA or PLI)
9
17522 The samples are to much acidificated and so the thermal preconcentration is not completely possible, and so could be a problem in the correct alpha/beta separation
10
17523 great communication 9
17524 Everything was perfect. 10
17525 improvements 8
17526 The PT exercise is useful to check our gross alpha/beta measurement capabilities for low radioactivity levels
10
17527 10
17528 Residue from sample JRC-GAB2 has an elastic consistency, difficult to spread in the counting tray
9
17529 Very satisfied 10
17531 We appreciate the opportunity to participate in this PT exercise in order to monitor the validity of our results and possibly improve our gross activity analysis.
10
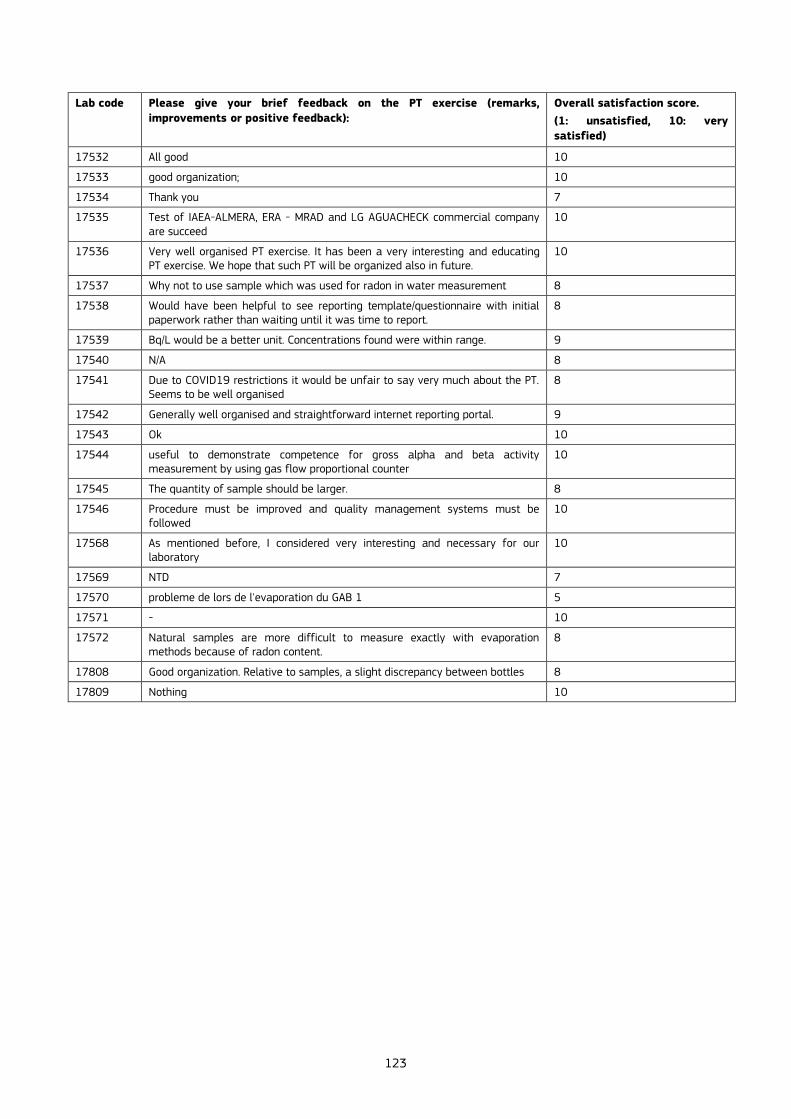
123
Lab code Please give your brief feedback on the PT exercise (remarks,
improvements or positive feedback):
Overall satisfaction score.
(1: unsatisfied, 10: very
satisfied)
17532 All good 10
17533 good organization; 10
17534 Thank you 7
17535 Test of IAEA-ALMERA, ERA - MRAD and LG AGUACHECK commercial company are succeed
10
17536 Very well organised PT exercise. It has been a very interesting and educating PT exercise. We hope that such PT will be organized also in future.
10
17537 Why not to use sample which was used for radon in water measurement 8
17538 Would have been helpful to see reporting template/questionnaire with initial paperwork rather than waiting until it was time to report.
8
17539 Bq/L would be a better unit. Concentrations found were within range. 9
17540 N/A 8
17541 Due to COVID19 restrictions it would be unfair to say very much about the PT. Seems to be well organised
8
17542 Generally well organised and straightforward internet reporting portal. 9
17543 Ok 10
17544 useful to demonstrate competence for gross alpha and beta activity measurement by using gas flow proportional counter
10
17545 The quantity of sample should be larger. 8
17546 Procedure must be improved and quality management systems must be followed
10
17568 As mentioned before, I considered very interesting and necessary for our laboratory
10
17569 NTD 7
17570 probleme de lors de l'evaporation du GAB 1 5
17571 - 10
17572 Natural samples are more difficult to measure exactly with evaporation methods because of radon content.
8
17808 Good organization. Relative to samples, a slight discrepancy between bottles 8
17809 Nothing 10

124
Annex 9. Communication on preliminary results (e-mails)
Participants were informed about their performance scores by sending a preliminary report via emails. It has to be noted that the initial preliminary report had to be recalled and new version was issued since the measurement units were not correct. The e-mail history is presented below in reverse chronological order.
----------------------------------------------------------------------------------------------------------------------------------
From: JRC GEE REM COMPARISONS <[email protected]> Sent: Thursday, September 3, 2020 5:26 PM Cc: HULT Mikael (JRC-GEEL) <[email protected]>; MALO Petya (JRC-GEEL) <[email protected]>; JOBBAGY Viktor (JRC-GEEL) <[email protected]> Subject: AMENDED Preliminary report of REM 2019 PT on gross activity measurements in water_Ares(2020)4588612 Importance: High
Dear REM2019 participants,
First of all, we would like to thank the participants for noticing errors in the preliminary report. It was also one of the the main objectives with the preliminary report to give participants possibility to point to our errors so we encourage you to review the document.
Hereby we are sending the amended version of the REM2019 preliminary report. Please use this version Ares(2020)4588612 and DELETE the report from yesterday (2 September 2020).
Please note that the measurement units were corrected from Bq/L to mBq/L and Table 1 caption was also modified. If you have correction requests, they will be considered for the final report except what concerns the reported results. We draw your attention again that changing reported results is not possible any more. Furthermore, we would like to give extra information on the total dissolved solid content in the REM2019_TDF file as some of you already requested it. It is not in the preliminary report but we will include it in the final report of course. Thank you for your cooperation and patience. Your contribution helps to improve our PT service. Best regards, Viktor Jobbagy PT coordinator
From: JRC GEE REM COMPARISONS Sent: 03 September 2020 09:45:48 Cc: HULT Mikael (JRC-GEEL); MALO Petya (JRC-GEEL); JOBBAGY Viktor (JRC-GEEL) Subject: RECALLILNG: Preliminary report of REM 2019 PT on gross activity measurements in water_Ares(2020)4562657
Dear REM2019 participants, We would like to recall the report we sent yesterday due to some errors with the measuerement units (they should be mBq/L correctly in Tables and Figures). Therefore, please delete it and do not use it further. However, the shape of S-plots and the numerical values of the scores are unaffected. A new amanded version will be issued today. We apologise for the mistakes and the inconvenience it may cause. Thank you for your patience until then. kind regards, Viktor Jobbagy
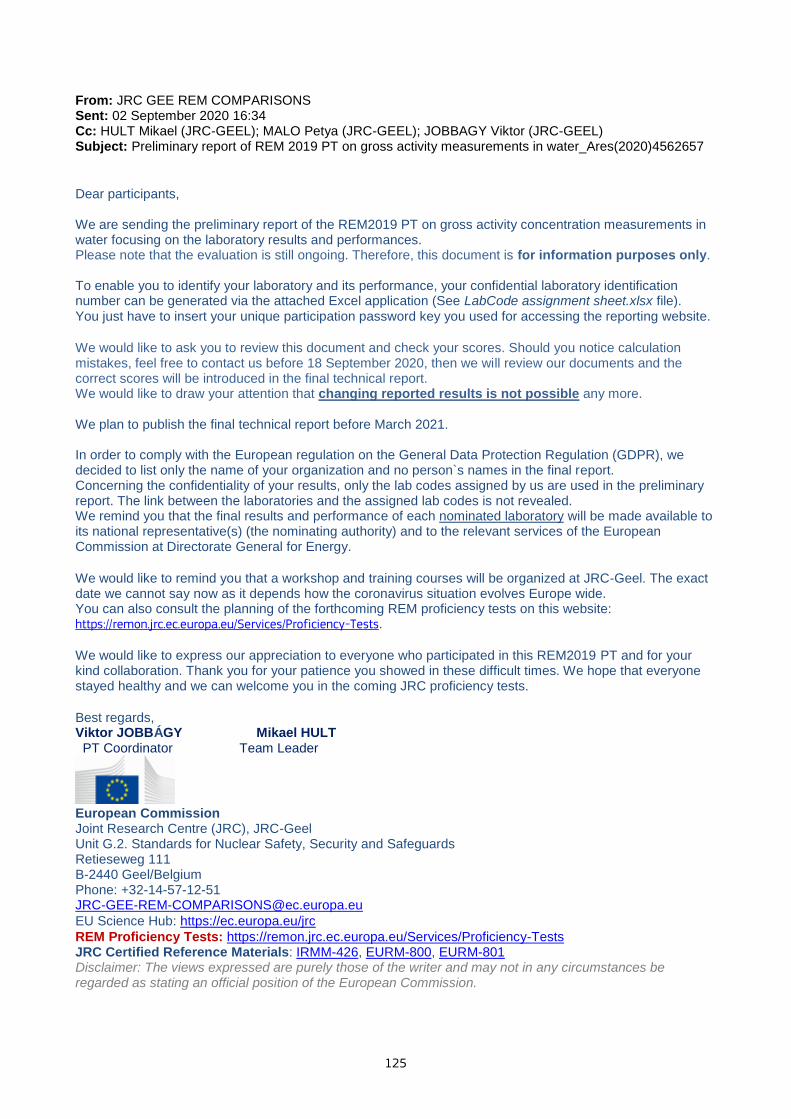
125
From: JRC GEE REM COMPARISONS Sent: 02 September 2020 16:34 Cc: HULT Mikael (JRC-GEEL); MALO Petya (JRC-GEEL); JOBBAGY Viktor (JRC-GEEL) Subject: Preliminary report of REM 2019 PT on gross activity measurements in water_Ares(2020)4562657
Dear participants, We are sending the preliminary report of the REM2019 PT on gross activity concentration measurements in water focusing on the laboratory results and performances. Please note that the evaluation is still ongoing. Therefore, this document is for information purposes only. To enable you to identify your laboratory and its performance, your confidential laboratory identification number can be generated via the attached Excel application (See LabCode assignment sheet.xlsx file). You just have to insert your unique participation password key you used for accessing the reporting website. We would like to ask you to review this document and check your scores. Should you notice calculation mistakes, feel free to contact us before 18 September 2020, then we will review our documents and the correct scores will be introduced in the final technical report. We would like to draw your attention that changing reported results is not possible any more. We plan to publish the final technical report before March 2021. In order to comply with the European regulation on the General Data Protection Regulation (GDPR), we decided to list only the name of your organization and no person`s names in the final report. Concerning the confidentiality of your results, only the lab codes assigned by us are used in the preliminary report. The link between the laboratories and the assigned lab codes is not revealed. We remind you that the final results and performance of each nominated laboratory will be made available to its national representative(s) (the nominating authority) and to the relevant services of the European Commission at Directorate General for Energy. We would like to remind you that a workshop and training courses will be organized at JRC-Geel. The exact date we cannot say now as it depends how the coronavirus situation evolves Europe wide. You can also consult the planning of the forthcoming REM proficiency tests on this website: https://remon.jrc.ec.europa.eu/Services/Proficiency-Tests. We would like to express our appreciation to everyone who participated in this REM2019 PT and for your kind collaboration. Thank you for your patience you showed in these difficult times. We hope that everyone stayed healthy and we can welcome you in the coming JRC proficiency tests. Best regards, Viktor JOBBÁGY Mikael HULT PT Coordinator Team Leader
European Commission Joint Research Centre (JRC), JRC-Geel Unit G.2. Standards for Nuclear Safety, Security and Safeguards Retieseweg 111 B-2440 Geel/Belgium Phone: +32-14-57-12-51 [email protected]
EU Science Hub: https://ec.europa.eu/jrc
REM Proficiency Tests: https://remon.jrc.ec.europa.eu/Services/Proficiency-Tests JRC Certified Reference Materials: IRMM-426, EURM-800, EURM-801 Disclaimer: The views expressed are purely those of the writer and may not in any circumstances be regarded as stating an official position of the European Commission.
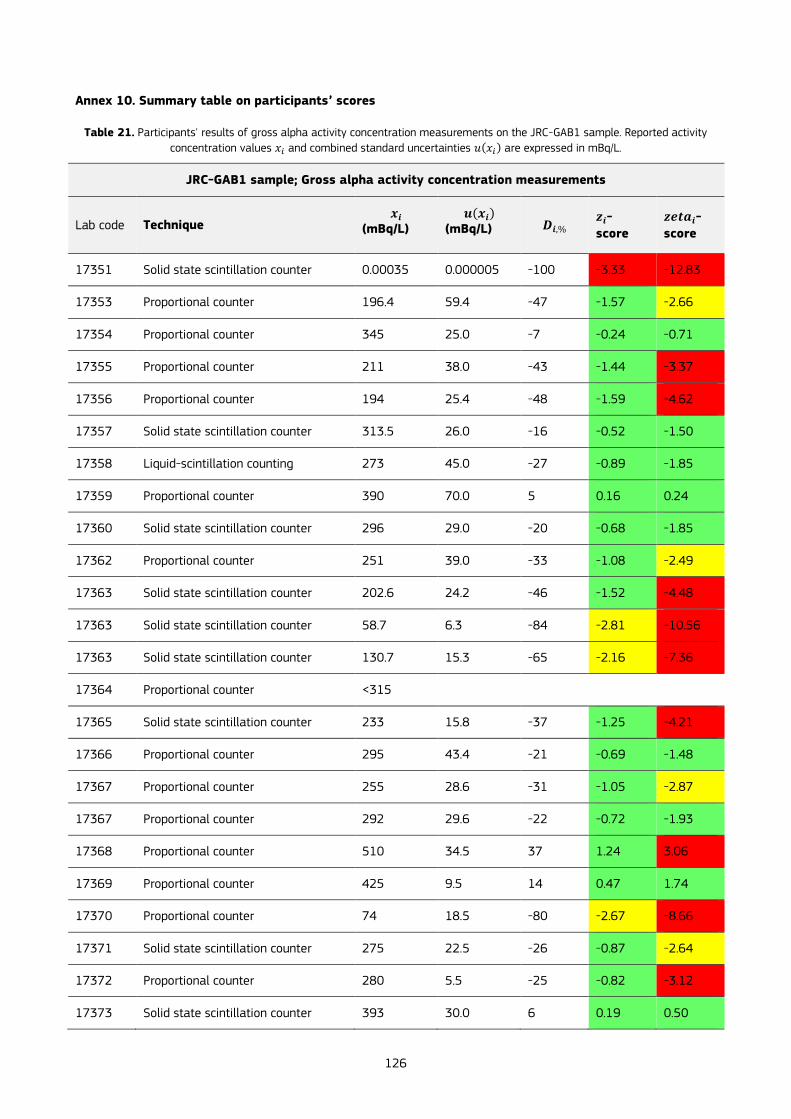
126
Annex 10. Summary table on participants’ scores
Table 21. Participants' results of gross alpha activity concentration measurements on the JRC-GAB1 sample. Reported activity
concentration values 𝑥𝑖 and combined standard uncertainties 𝑢(𝑥𝑖) are expressed in mBq/L.
JRC-GAB1 sample; Gross alpha activity concentration measurements
Lab code Technique 𝒙𝒊
(mBq/L) 𝒖(𝒙𝒊)
(mBq/L) 𝑫𝒊,% 𝒛𝒊-
score
𝒛𝒆𝒕𝒂𝒊-
score
17351 Solid state scintillation counter 0.00035 0.000005 -100 -3.33 -12.83
17353 Proportional counter 196.4 59.4 -47 -1.57 -2.66
17354 Proportional counter 345 25.0 -7 -0.24 -0.71
17355 Proportional counter 211 38.0 -43 -1.44 -3.37
17356 Proportional counter 194 25.4 -48 -1.59 -4.62
17357 Solid state scintillation counter 313.5 26.0 -16 -0.52 -1.50
17358 Liquid-scintillation counting 273 45.0 -27 -0.89 -1.85
17359 Proportional counter 390 70.0 5 0.16 0.24
17360 Solid state scintillation counter 296 29.0 -20 -0.68 -1.85
17362 Proportional counter 251 39.0 -33 -1.08 -2.49
17363 Solid state scintillation counter 202.6 24.2 -46 -1.52 -4.48
17363 Solid state scintillation counter 58.7 6.3 -84 -2.81 -10.56
17363 Solid state scintillation counter 130.7 15.3 -65 -2.16 -7.36
17364 Proportional counter <315
17365 Solid state scintillation counter 233 15.8 -37 -1.25 -4.21
17366 Proportional counter 295 43.4 -21 -0.69 -1.48
17367 Proportional counter 255 28.6 -31 -1.05 -2.87
17367 Proportional counter 292 29.6 -22 -0.72 -1.93
17368 Proportional counter 510 34.5 37 1.24 3.06
17369 Proportional counter 425 9.5 14 0.47 1.74
17370 Proportional counter 74 18.5 -80 -2.67 -8.66
17371 Solid state scintillation counter 275 22.5 -26 -0.87 -2.64
17372 Proportional counter 280 5.5 -25 -0.82 -3.12
17373 Solid state scintillation counter 393 30.0 6 0.19 0.50
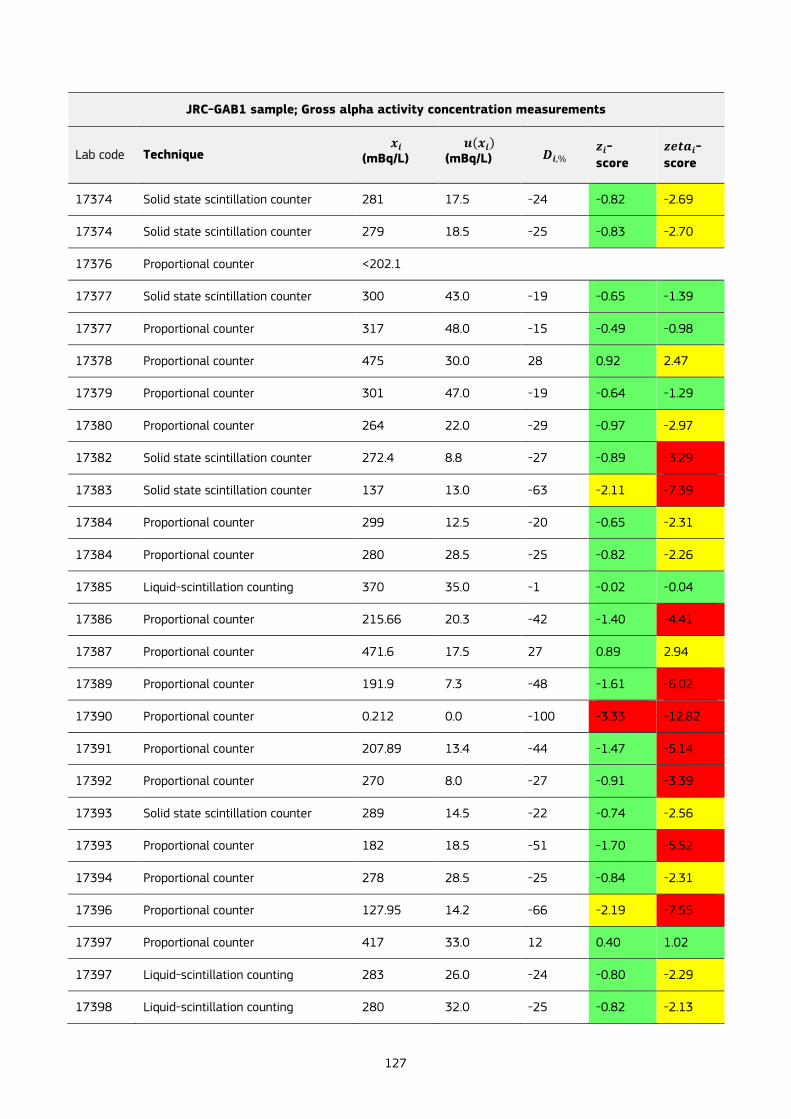
127
JRC-GAB1 sample; Gross alpha activity concentration measurements
Lab code Technique 𝒙𝒊
(mBq/L) 𝒖(𝒙𝒊)
(mBq/L) 𝑫𝒊,% 𝒛𝒊-
score
𝒛𝒆𝒕𝒂𝒊-
score
17374 Solid state scintillation counter 281 17.5 -24 -0.82 -2.69
17374 Solid state scintillation counter 279 18.5 -25 -0.83 -2.70
17376 Proportional counter <202.1
17377 Solid state scintillation counter 300 43.0 -19 -0.65 -1.39
17377 Proportional counter 317 48.0 -15 -0.49 -0.98
17378 Proportional counter 475 30.0 28 0.92 2.47
17379 Proportional counter 301 47.0 -19 -0.64 -1.29
17380 Proportional counter 264 22.0 -29 -0.97 -2.97
17382 Solid state scintillation counter 272.4 8.8 -27 -0.89 -3.29
17383 Solid state scintillation counter 137 13.0 -63 -2.11 -7.39
17384 Proportional counter 299 12.5 -20 -0.65 -2.31
17384 Proportional counter 280 28.5 -25 -0.82 -2.26
17385 Liquid-scintillation counting 370 35.0 -1 -0.02 -0.04
17386 Proportional counter 215.66 20.3 -42 -1.40 -4.41
17387 Proportional counter 471.6 17.5 27 0.89 2.94
17389 Proportional counter 191.9 7.3 -48 -1.61 -6.02
17390 Proportional counter 0.212 0.0 -100 -3.33 -12.82
17391 Proportional counter 207.89 13.4 -44 -1.47 -5.14
17392 Proportional counter 270 8.0 -27 -0.91 -3.39
17393 Solid state scintillation counter 289 14.5 -22 -0.74 -2.56
17393 Proportional counter 182 18.5 -51 -1.70 -5.52
17394 Proportional counter 278 28.5 -25 -0.84 -2.31
17396 Proportional counter 127.95 14.2 -66 -2.19 -7.55
17397 Proportional counter 417 33.0 12 0.40 1.02
17397 Liquid-scintillation counting 283 26.0 -24 -0.80 -2.29
17398 Liquid-scintillation counting 280 32.0 -25 -0.82 -2.13
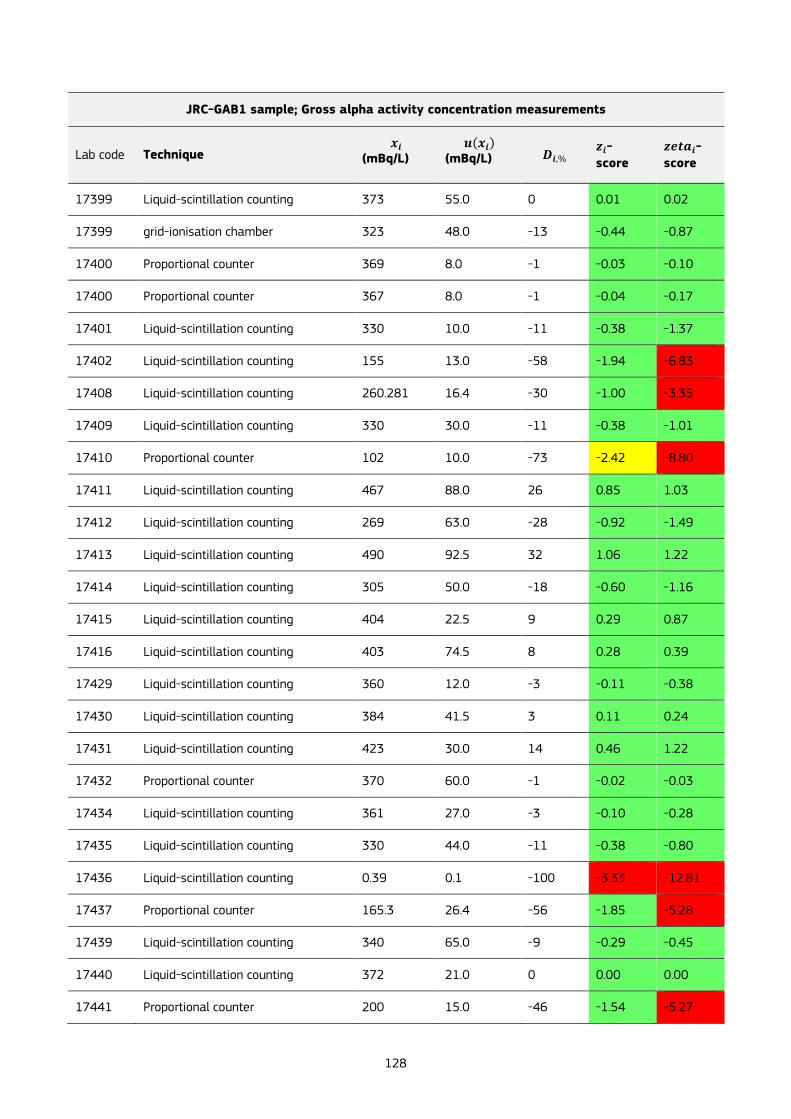
128
JRC-GAB1 sample; Gross alpha activity concentration measurements
Lab code Technique 𝒙𝒊
(mBq/L) 𝒖(𝒙𝒊)
(mBq/L) 𝑫𝒊,% 𝒛𝒊-
score
𝒛𝒆𝒕𝒂𝒊-
score
17399 Liquid-scintillation counting 373 55.0 0 0.01 0.02
17399 grid-ionisation chamber 323 48.0 -13 -0.44 -0.87
17400 Proportional counter 369 8.0 -1 -0.03 -0.10
17400 Proportional counter 367 8.0 -1 -0.04 -0.17
17401 Liquid-scintillation counting 330 10.0 -11 -0.38 -1.37
17402 Liquid-scintillation counting 155 13.0 -58 -1.94 -6.83
17408 Liquid-scintillation counting 260.281 16.4 -30 -1.00 -3.35
17409 Liquid-scintillation counting 330 30.0 -11 -0.38 -1.01
17410 Proportional counter 102 10.0 -73 -2.42 -8.80
17411 Liquid-scintillation counting 467 88.0 26 0.85 1.03
17412 Liquid-scintillation counting 269 63.0 -28 -0.92 -1.49
17413 Liquid-scintillation counting 490 92.5 32 1.06 1.22
17414 Liquid-scintillation counting 305 50.0 -18 -0.60 -1.16
17415 Liquid-scintillation counting 404 22.5 9 0.29 0.87
17416 Liquid-scintillation counting 403 74.5 8 0.28 0.39
17429 Liquid-scintillation counting 360 12.0 -3 -0.11 -0.38
17430 Liquid-scintillation counting 384 41.5 3 0.11 0.24
17431 Liquid-scintillation counting 423 30.0 14 0.46 1.22
17432 Proportional counter 370 60.0 -1 -0.02 -0.03
17434 Liquid-scintillation counting 361 27.0 -3 -0.10 -0.28
17435 Liquid-scintillation counting 330 44.0 -11 -0.38 -0.80
17436 Liquid-scintillation counting 0.39 0.1 -100 -3.33 -12.81
17437 Proportional counter 165.3 26.4 -56 -1.85 -5.28
17439 Liquid-scintillation counting 340 65.0 -9 -0.29 -0.45
17440 Liquid-scintillation counting 372 21.0 0 0.00 0.00
17441 Proportional counter 200 15.0 -46 -1.54 -5.27
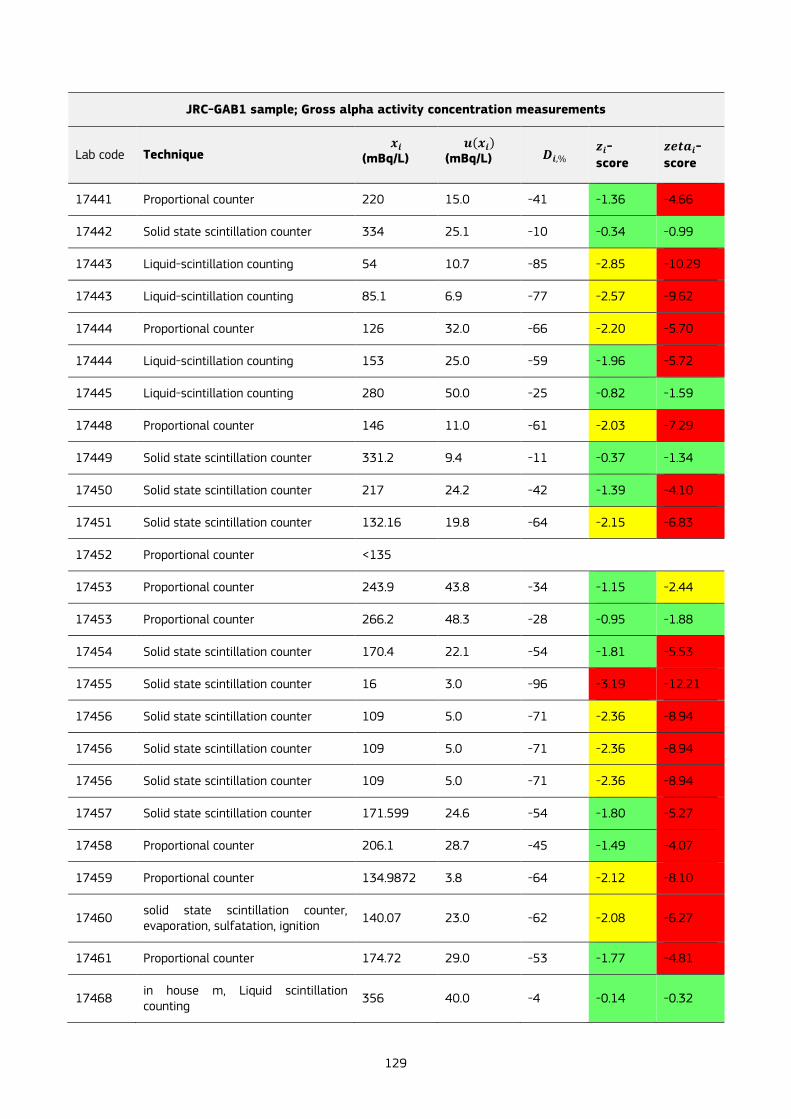
129
JRC-GAB1 sample; Gross alpha activity concentration measurements
Lab code Technique 𝒙𝒊
(mBq/L) 𝒖(𝒙𝒊)
(mBq/L) 𝑫𝒊,% 𝒛𝒊-
score
𝒛𝒆𝒕𝒂𝒊-
score
17441 Proportional counter 220 15.0 -41 -1.36 -4.66
17442 Solid state scintillation counter 334 25.1 -10 -0.34 -0.99
17443 Liquid-scintillation counting 54 10.7 -85 -2.85 -10.29
17443 Liquid-scintillation counting 85.1 6.9 -77 -2.57 -9.62
17444 Proportional counter 126 32.0 -66 -2.20 -5.70
17444 Liquid-scintillation counting 153 25.0 -59 -1.96 -5.72
17445 Liquid-scintillation counting 280 50.0 -25 -0.82 -1.59
17448 Proportional counter 146 11.0 -61 -2.03 -7.29
17449 Solid state scintillation counter 331.2 9.4 -11 -0.37 -1.34
17450 Solid state scintillation counter 217 24.2 -42 -1.39 -4.10
17451 Solid state scintillation counter 132.16 19.8 -64 -2.15 -6.83
17452 Proportional counter <135
17453 Proportional counter 243.9 43.8 -34 -1.15 -2.44
17453 Proportional counter 266.2 48.3 -28 -0.95 -1.88
17454 Solid state scintillation counter 170.4 22.1 -54 -1.81 -5.53
17455 Solid state scintillation counter 16 3.0 -96 -3.19 -12.21
17456 Solid state scintillation counter 109 5.0 -71 -2.36 -8.94
17456 Solid state scintillation counter 109 5.0 -71 -2.36 -8.94
17456 Solid state scintillation counter 109 5.0 -71 -2.36 -8.94
17457 Solid state scintillation counter 171.599 24.6 -54 -1.80 -5.27
17458 Proportional counter 206.1 28.7 -45 -1.49 -4.07
17459 Proportional counter 134.9872 3.8 -64 -2.12 -8.10
17460 solid state scintillation counter, evaporation, sulfatation, ignition
140.07 23.0 -62 -2.08 -6.27
17461 Proportional counter 174.72 29.0 -53 -1.77 -4.81
17468 in house m, Liquid scintillation counting
356 40.0 -4 -0.14 -0.32
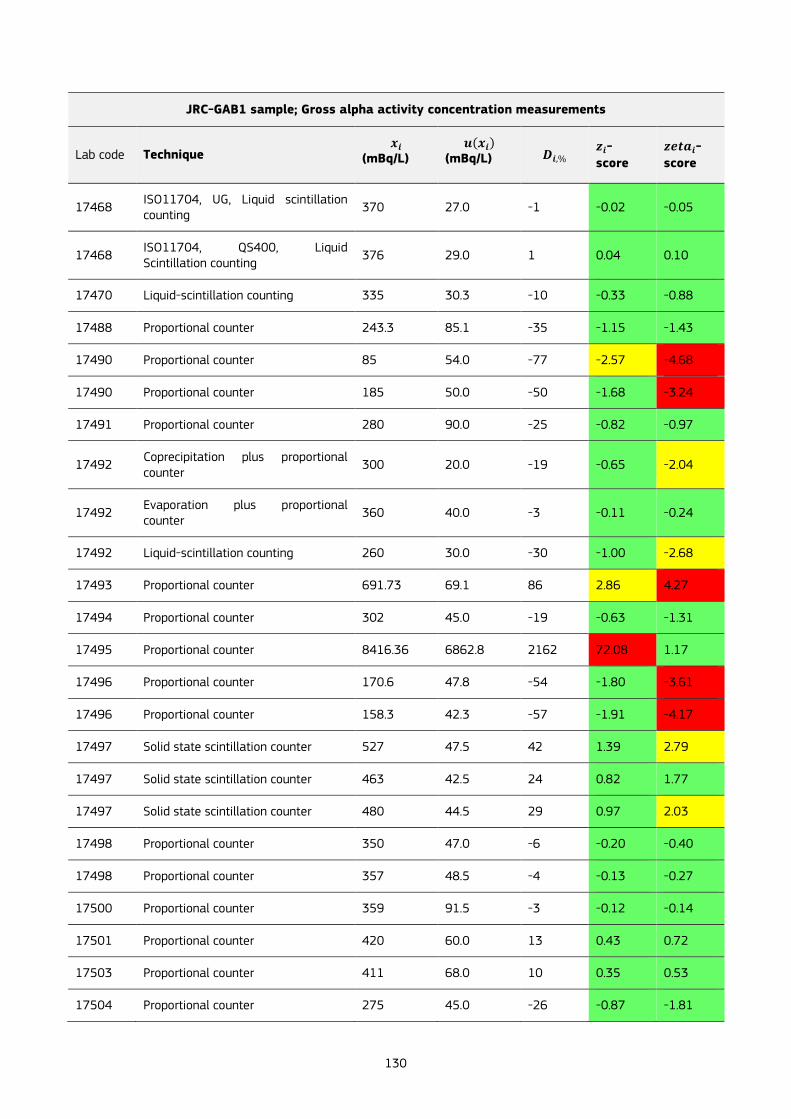
130
JRC-GAB1 sample; Gross alpha activity concentration measurements
Lab code Technique 𝒙𝒊
(mBq/L) 𝒖(𝒙𝒊)
(mBq/L) 𝑫𝒊,% 𝒛𝒊-
score
𝒛𝒆𝒕𝒂𝒊-
score
17468 ISO11704, UG, Liquid scintillation counting
370 27.0 -1 -0.02 -0.05
17468 ISO11704, QS400, Liquid Scintillation counting
376 29.0 1 0.04 0.10
17470 Liquid-scintillation counting 335 30.3 -10 -0.33 -0.88
17488 Proportional counter 243.3 85.1 -35 -1.15 -1.43
17490 Proportional counter 85 54.0 -77 -2.57 -4.68
17490 Proportional counter 185 50.0 -50 -1.68 -3.24
17491 Proportional counter 280 90.0 -25 -0.82 -0.97
17492 Coprecipitation plus proportional counter
300 20.0 -19 -0.65 -2.04
17492 Evaporation plus proportional counter
360 40.0 -3 -0.11 -0.24
17492 Liquid-scintillation counting 260 30.0 -30 -1.00 -2.68
17493 Proportional counter 691.73 69.1 86 2.86 4.27
17494 Proportional counter 302 45.0 -19 -0.63 -1.31
17495 Proportional counter 8416.36 6862.8 2162 72.08 1.17
17496 Proportional counter 170.6 47.8 -54 -1.80 -3.61
17496 Proportional counter 158.3 42.3 -57 -1.91 -4.17
17497 Solid state scintillation counter 527 47.5 42 1.39 2.79
17497 Solid state scintillation counter 463 42.5 24 0.82 1.77
17497 Solid state scintillation counter 480 44.5 29 0.97 2.03
17498 Proportional counter 350 47.0 -6 -0.20 -0.40
17498 Proportional counter 357 48.5 -4 -0.13 -0.27
17500 Proportional counter 359 91.5 -3 -0.12 -0.14
17501 Proportional counter 420 60.0 13 0.43 0.72
17503 Proportional counter 411 68.0 10 0.35 0.53
17504 Proportional counter 275 45.0 -26 -0.87 -1.81
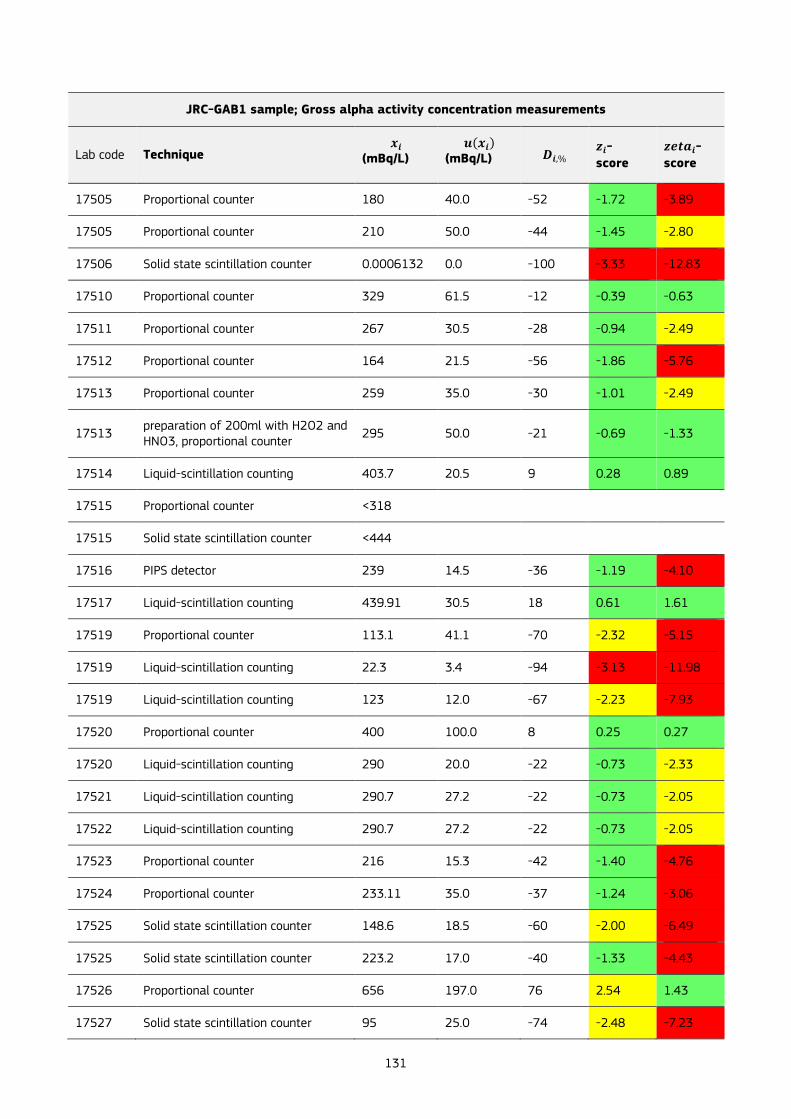
131
JRC-GAB1 sample; Gross alpha activity concentration measurements
Lab code Technique 𝒙𝒊
(mBq/L) 𝒖(𝒙𝒊)
(mBq/L) 𝑫𝒊,% 𝒛𝒊-
score
𝒛𝒆𝒕𝒂𝒊-
score
17505 Proportional counter 180 40.0 -52 -1.72 -3.89
17505 Proportional counter 210 50.0 -44 -1.45 -2.80
17506 Solid state scintillation counter 0.0006132 0.0 -100 -3.33 -12.83
17510 Proportional counter 329 61.5 -12 -0.39 -0.63
17511 Proportional counter 267 30.5 -28 -0.94 -2.49
17512 Proportional counter 164 21.5 -56 -1.86 -5.76
17513 Proportional counter 259 35.0 -30 -1.01 -2.49
17513 preparation of 200ml with H2O2 and HNO3, proportional counter
295 50.0 -21 -0.69 -1.33
17514 Liquid-scintillation counting 403.7 20.5 9 0.28 0.89
17515 Proportional counter <318
17515 Solid state scintillation counter <444
17516 PIPS detector 239 14.5 -36 -1.19 -4.10
17517 Liquid-scintillation counting 439.91 30.5 18 0.61 1.61
17519 Proportional counter 113.1 41.1 -70 -2.32 -5.15
17519 Liquid-scintillation counting 22.3 3.4 -94 -3.13 -11.98
17519 Liquid-scintillation counting 123 12.0 -67 -2.23 -7.93
17520 Proportional counter 400 100.0 8 0.25 0.27
17520 Liquid-scintillation counting 290 20.0 -22 -0.73 -2.33
17521 Liquid-scintillation counting 290.7 27.2 -22 -0.73 -2.05
17522 Liquid-scintillation counting 290.7 27.2 -22 -0.73 -2.05
17523 Proportional counter 216 15.3 -42 -1.40 -4.76
17524 Proportional counter 233.11 35.0 -37 -1.24 -3.06
17525 Solid state scintillation counter 148.6 18.5 -60 -2.00 -6.49
17525 Solid state scintillation counter 223.2 17.0 -40 -1.33 -4.43
17526 Proportional counter 656 197.0 76 2.54 1.43
17527 Solid state scintillation counter 95 25.0 -74 -2.48 -7.23

132
JRC-GAB1 sample; Gross alpha activity concentration measurements
Lab code Technique 𝒙𝒊
(mBq/L) 𝒖(𝒙𝒊)
(mBq/L) 𝑫𝒊,% 𝒛𝒊-
score
𝒛𝒆𝒕𝒂𝒊-
score
17527 Solid state scintillation counter <100
17528 Proportional counter 7.02 0.9 -98 -3.27 -12.58
17529 Liquid-scintillation counting 372 11.0 0 0.00 0.00
17531 Proportional counter 54 23.0 -85 -2.85 -8.59
17532 Proportional counter <100
17533 Proportional counter 128.6 20.3 -65 -2.18 -6.88
17534 Liquid-scintillation counting 320 100.0 -14 -0.47 -0.50
17535 Proportional counter 340 35.0 -9 -0.29 -0.70
17536 Liquid-scintillation counting 1000 250.0 169 5.63 2.50
17537 Liquid-scintillation counting 358 32.0 -4 -0.13 -0.32
17537 Liquid-scintillation counting 382 33.0 3 0.09 0.23
17538 Proportional counter 216.6 15.2 -42 -1.39 -4.74
17539 Gas proportional counting 129.5 18.0 -65 -2.17 -7.10
17540 Proportional counter 222 21.2 -40 -1.34 -4.18
17540 Proportional counter 308.1 29.4 -17 -0.57 -1.55
17541 Solid state scintillation counter 169 26.0 -55 -1.82 -5.21
17541 Proportional counter 195 29.0 -48 -1.59 -4.32
17542 Proportional counter Ref: Pu-242 336 43.5 -10 -0.32 -0.69
17542 Proportional counter Ref: Am-241 254 32.5 -32 -1.06 -2.71
17543 Liquid-scintillation counting 363 27.0 -2 -0.08 -0.23
17544 Proportional counter 324 35.0 -13 -0.43 -1.06
17545 Proportional counter 220 20.0 -41 -1.36 -4.31
17546 Proportional counter 313 24.0 -16 -0.53 -1.57
17568 Solid state scintillation counter 336 46.0 -10 -0.32 -0.66
17572 Method for total U & TRU from high salinity solutions, separation with DGA resign, measured in PIPS det.
90 10.0 -76 -2.53 -9.19

133
JRC-GAB1 sample; Gross alpha activity concentration measurements
Lab code Technique 𝒙𝒊
(mBq/L) 𝒖(𝒙𝒊)
(mBq/L) 𝑫𝒊,% 𝒛𝒊-
score
𝒛𝒆𝒕𝒂𝒊-
score
17572 Evaporation and PIPS 191 27.0 -49 -1.62 -4.57
17572 LB4200 proportional counter V=50ml
160 54.0 -57 -1.90 -3.46
17808 Proportional counter 252 31.4 -32 -1.08 -2.81
17809 Proportional counter 64.8 87.3 -83 -2.75 -3.34

134
Table 22. Participants' results of gross beta activity concentration measurements on the JRC-GAB1 sample. Reported activity
concentration values 𝑥𝑖 and combined standard uncertainties 𝑢(𝑥𝑖) are expressed in mBq/L.
JRC-GAB1 sample; Gross beta activity concentration measurements
Lab
code Technique
𝒙𝒊 (mBq/L)
𝒖(𝒙𝒊) (mBq/L) 𝑫𝒊,%
𝒛𝒊-
score
𝒛𝒆𝒕𝒂𝒊-
score
17351 Proportional counter <0.00036
17353 Proportional counter 238.7 58.1 -28 -0.94 -1.47
17354 Proportional counter 425 37.0 28 0.92 2.01
17355 Proportional counter 566 49.5 70 2.33 4.13
17356 Proportional counter 286.5 28.8 -14 -0.47 -1.18
17357 Proportional counter 416.5 58.5 25 0.84 1.30
17358 Liquid-scintillation counting 513 104.0 54 1.80 1.68
17359 Proportional counter 450 50.0 35 1.17 2.06
17360 Solid state scintillation counter 458 45.0 38 1.25 2.38
17362 Proportional counter 266 20.0 -20 -0.67 -1.99
17363 Solid state scintillation counter 848.5 13.3 155 5.16 17.14
17363 Solid state scintillation counter 741.3 11.6 123 4.09 13.89
17363 Solid state scintillation counter 794.9 12.5 139 4.62 15.54
17364 Proportional counter 342 21.2 3 0.09 0.26
17365 Proportional counter 301 11.0 -10 -0.32 -1.10
17365 Proportional counter 278 10.0 -17 -0.55 -1.91
17366 Proportional counter 307 27.6 -8 -0.26 -0.67
17367 Proportional counter 312 15.8 -6 -0.21 -0.67
17367 Proportional counter 365 16.8 10 0.32 1.01
17368 Proportional counter 427 19.0 28 0.94 2.85
17369 Proportional counter 458 8.5 38 1.25 4.42
17370 Proportional counter 350 85.0 5 0.17 0.19
17371 Proportional counter 290 17.0 -13 -0.43 -1.35
17372 Proportional counter 269 30.5 -19 -0.64 -1.57
17373 Proportional counter 324 22.0 -3 -0.09 -0.26
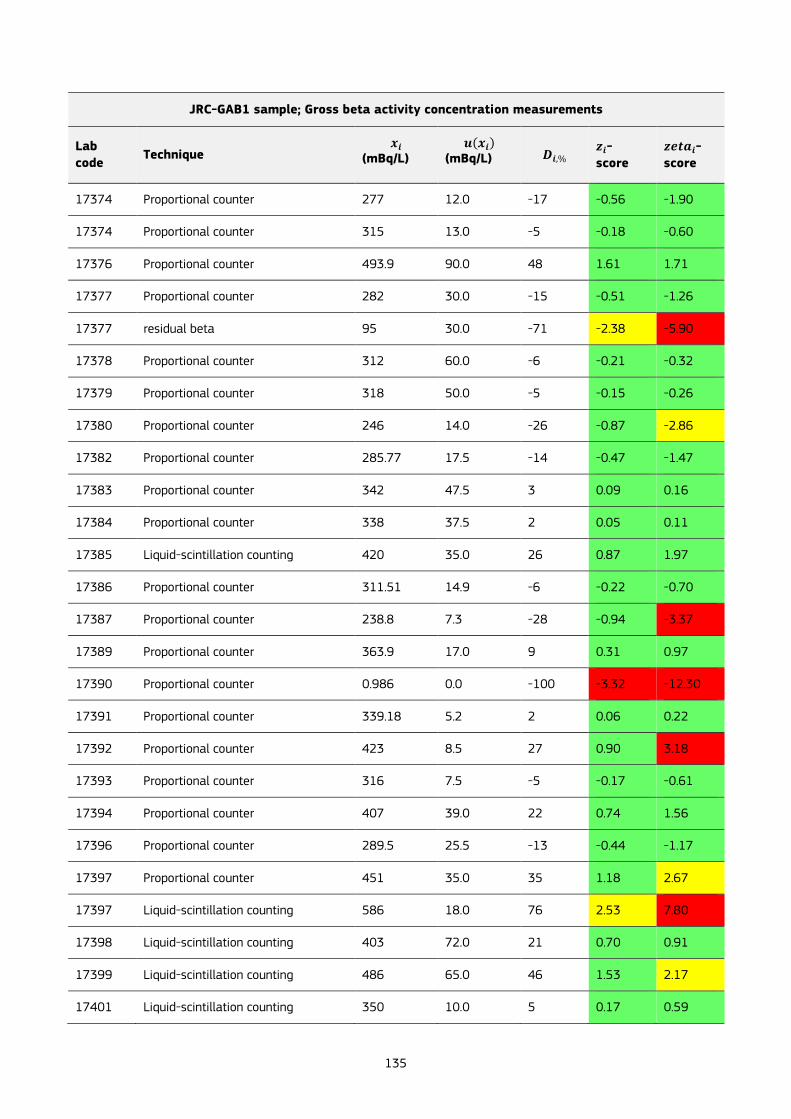
135
JRC-GAB1 sample; Gross beta activity concentration measurements
Lab
code Technique
𝒙𝒊 (mBq/L)
𝒖(𝒙𝒊) (mBq/L) 𝑫𝒊,%
𝒛𝒊-
score
𝒛𝒆𝒕𝒂𝒊-
score
17374 Proportional counter 277 12.0 -17 -0.56 -1.90
17374 Proportional counter 315 13.0 -5 -0.18 -0.60
17376 Proportional counter 493.9 90.0 48 1.61 1.71
17377 Proportional counter 282 30.0 -15 -0.51 -1.26
17377 residual beta 95 30.0 -71 -2.38 -5.90
17378 Proportional counter 312 60.0 -6 -0.21 -0.32
17379 Proportional counter 318 50.0 -5 -0.15 -0.26
17380 Proportional counter 246 14.0 -26 -0.87 -2.86
17382 Proportional counter 285.77 17.5 -14 -0.47 -1.47
17383 Proportional counter 342 47.5 3 0.09 0.16
17384 Proportional counter 338 37.5 2 0.05 0.11
17385 Liquid-scintillation counting 420 35.0 26 0.87 1.97
17386 Proportional counter 311.51 14.9 -6 -0.22 -0.70
17387 Proportional counter 238.8 7.3 -28 -0.94 -3.37
17389 Proportional counter 363.9 17.0 9 0.31 0.97
17390 Proportional counter 0.986 0.0 -100 -3.32 -12.30
17391 Proportional counter 339.18 5.2 2 0.06 0.22
17392 Proportional counter 423 8.5 27 0.90 3.18
17393 Proportional counter 316 7.5 -5 -0.17 -0.61
17394 Proportional counter 407 39.0 22 0.74 1.56
17396 Proportional counter 289.5 25.5 -13 -0.44 -1.17
17397 Proportional counter 451 35.0 35 1.18 2.67
17397 Liquid-scintillation counting 586 18.0 76 2.53 7.80
17398 Liquid-scintillation counting 403 72.0 21 0.70 0.91
17399 Liquid-scintillation counting 486 65.0 46 1.53 2.17
17401 Liquid-scintillation counting 350 10.0 5 0.17 0.59
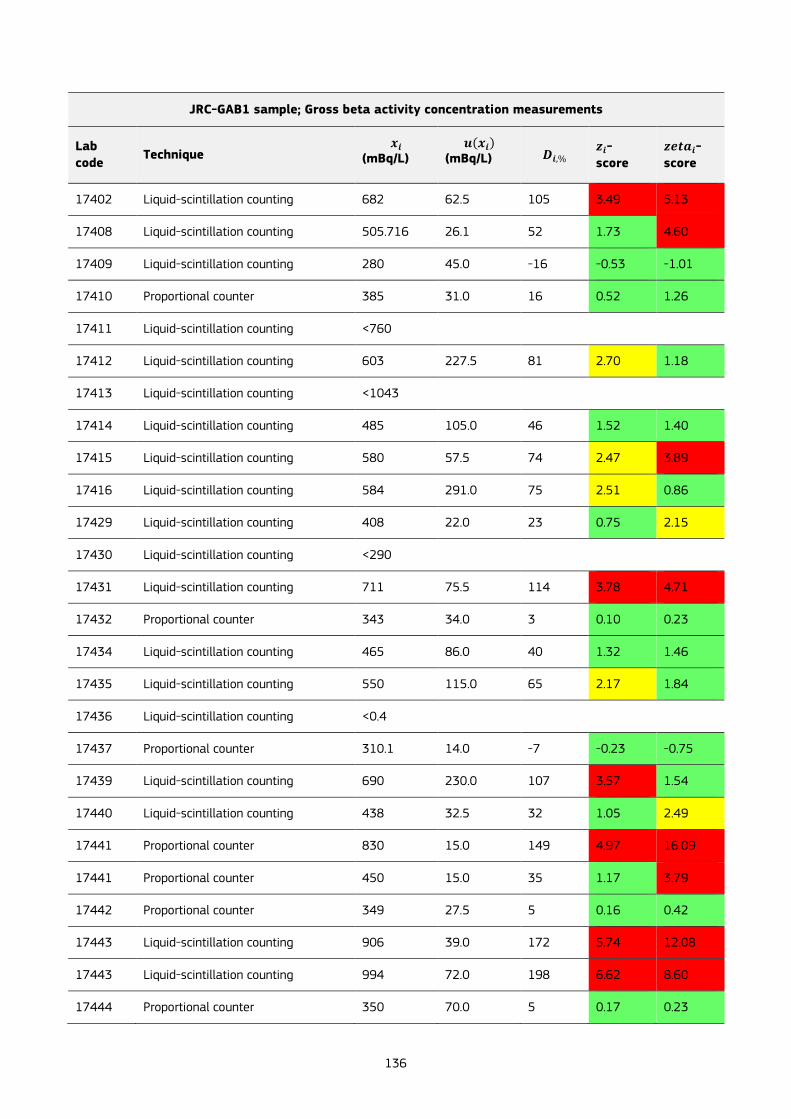
136
JRC-GAB1 sample; Gross beta activity concentration measurements
Lab
code Technique
𝒙𝒊 (mBq/L)
𝒖(𝒙𝒊) (mBq/L) 𝑫𝒊,%
𝒛𝒊-
score
𝒛𝒆𝒕𝒂𝒊-
score
17402 Liquid-scintillation counting 682 62.5 105 3.49 5.13
17408 Liquid-scintillation counting 505.716 26.1 52 1.73 4.60
17409 Liquid-scintillation counting 280 45.0 -16 -0.53 -1.01
17410 Proportional counter 385 31.0 16 0.52 1.26
17411 Liquid-scintillation counting <760
17412 Liquid-scintillation counting 603 227.5 81 2.70 1.18
17413 Liquid-scintillation counting <1043
17414 Liquid-scintillation counting 485 105.0 46 1.52 1.40
17415 Liquid-scintillation counting 580 57.5 74 2.47 3.89
17416 Liquid-scintillation counting 584 291.0 75 2.51 0.86
17429 Liquid-scintillation counting 408 22.0 23 0.75 2.15
17430 Liquid-scintillation counting <290
17431 Liquid-scintillation counting 711 75.5 114 3.78 4.71
17432 Proportional counter 343 34.0 3 0.10 0.23
17434 Liquid-scintillation counting 465 86.0 40 1.32 1.46
17435 Liquid-scintillation counting 550 115.0 65 2.17 1.84
17436 Liquid-scintillation counting <0.4
17437 Proportional counter 310.1 14.0 -7 -0.23 -0.75
17439 Liquid-scintillation counting 690 230.0 107 3.57 1.54
17440 Liquid-scintillation counting 438 32.5 32 1.05 2.49
17441 Proportional counter 830 15.0 149 4.97 16.09
17441 Proportional counter 450 15.0 35 1.17 3.79
17442 Proportional counter 349 27.5 5 0.16 0.42
17443 Liquid-scintillation counting 906 39.0 172 5.74 12.08
17443 Liquid-scintillation counting 994 72.0 198 6.62 8.60
17444 Proportional counter 350 70.0 5 0.17 0.23

137
JRC-GAB1 sample; Gross beta activity concentration measurements
Lab
code Technique
𝒙𝒊 (mBq/L)
𝒖(𝒙𝒊) (mBq/L) 𝑫𝒊,%
𝒛𝒊-
score
𝒛𝒆𝒕𝒂𝒊-
score
17444 Liquid-scintillation counting 630 55.0 89 2.97 4.85
17445 Liquid-scintillation counting 550 110.0 65 2.17 1.92
17448 Proportional counter 274 20.6 -18 -0.59 -1.74
17449 Solid state scintillation counter 292.4 8.8 -12 -0.41 -1.43
17450 Solid state scintillation counter 269 53.0 -19 -0.64 -1.08
17451 Solid state scintillation counter 179.67 47.0 -46 -1.53 -2.83
17452 Proportional counter <455
17453 Proportional counter 315.6 38.4 -5 -0.17 -0.37
17453 Proportional counter 243.5 36.2 -27 -0.90 -1.98
17454 Solid state scintillation counter 269.7 38.0 -19 -0.63 -1.36
17455 Solid state scintillation counter 195.2 22.5 -41 -1.38 -3.92
17456 Solid state scintillation counter 420 31.5 26 0.87 2.10
17456 Solid state scintillation counter 420 31.5 26 0.87 2.10
17456 Solid state scintillation counter 420 31.5 26 0.87 2.10
17457 Solid state scintillation counter 268.549 33.6 -19 -0.65 -1.49
17458 Proportional counter 345.5 11.6 4 0.13 0.43
17459 Proportional counter 315.0164 14.1 -5 -0.18 -0.59
17460 solid state scintillation counter, evaporation, sulfatation, ignition
315.16 58.3 -5 -0.18 -0.28
17461 Proportional counter 267.25 40.4 -20 -0.66 -1.35
17468 in house method, Liquid scintillation counting
431 64.0 29 0.98 1.41
17468 ISO11704, UG, Liquid scintillation counting
448 33.0 35 1.15 2.70
17468 ISO11704, QS400, Liquid Scintillation counting
537 91.0 61 2.04 2.15
17470 Liquid-scintillation counting 473 43.0 42 1.40 2.76
17488 Proportional counter 336.7 61.4 1 0.04 0.06
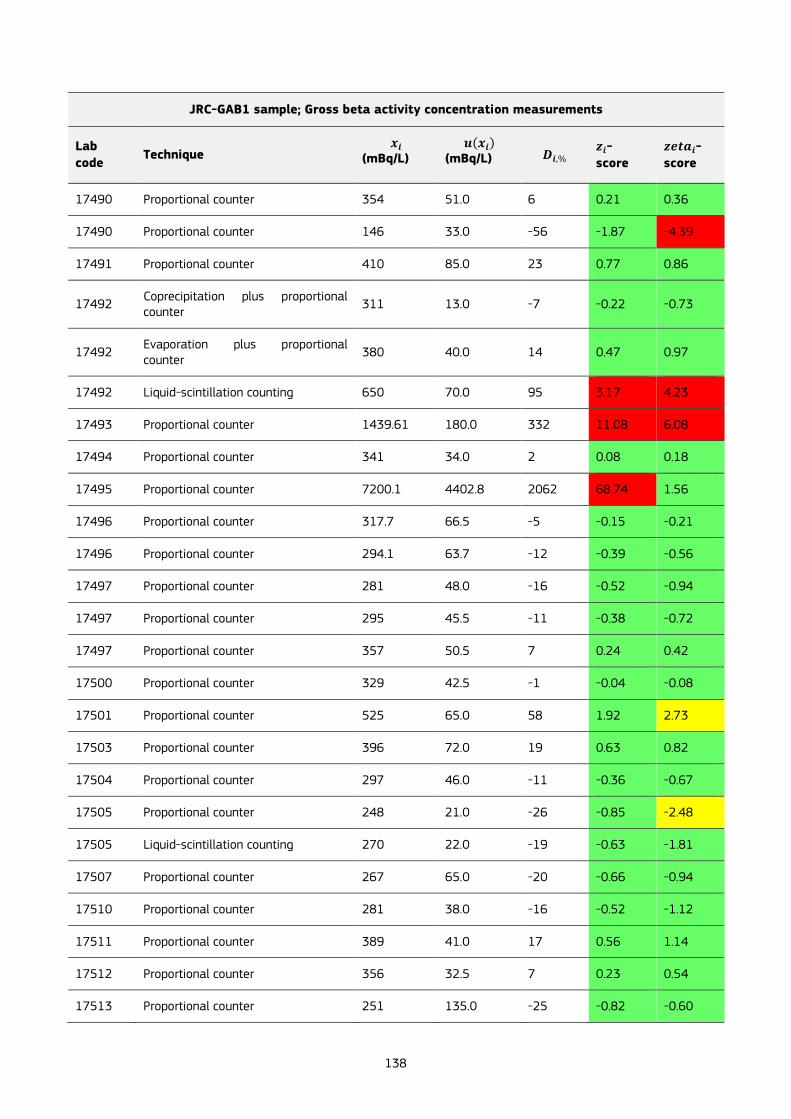
138
JRC-GAB1 sample; Gross beta activity concentration measurements
Lab
code Technique
𝒙𝒊 (mBq/L)
𝒖(𝒙𝒊) (mBq/L) 𝑫𝒊,%
𝒛𝒊-
score
𝒛𝒆𝒕𝒂𝒊-
score
17490 Proportional counter 354 51.0 6 0.21 0.36
17490 Proportional counter 146 33.0 -56 -1.87 -4.39
17491 Proportional counter 410 85.0 23 0.77 0.86
17492 Coprecipitation plus proportional counter
311 13.0 -7 -0.22 -0.73
17492 Evaporation plus proportional counter
380 40.0 14 0.47 0.97
17492 Liquid-scintillation counting 650 70.0 95 3.17 4.23
17493 Proportional counter 1439.61 180.0 332 11.08 6.08
17494 Proportional counter 341 34.0 2 0.08 0.18
17495 Proportional counter 7200.1 4402.8 2062 68.74 1.56
17496 Proportional counter 317.7 66.5 -5 -0.15 -0.21
17496 Proportional counter 294.1 63.7 -12 -0.39 -0.56
17497 Proportional counter 281 48.0 -16 -0.52 -0.94
17497 Proportional counter 295 45.5 -11 -0.38 -0.72
17497 Proportional counter 357 50.5 7 0.24 0.42
17500 Proportional counter 329 42.5 -1 -0.04 -0.08
17501 Proportional counter 525 65.0 58 1.92 2.73
17503 Proportional counter 396 72.0 19 0.63 0.82
17504 Proportional counter 297 46.0 -11 -0.36 -0.67
17505 Proportional counter 248 21.0 -26 -0.85 -2.48
17505 Liquid-scintillation counting 270 22.0 -19 -0.63 -1.81
17507 Proportional counter 267 65.0 -20 -0.66 -0.94
17510 Proportional counter 281 38.0 -16 -0.52 -1.12
17511 Proportional counter 389 41.0 17 0.56 1.14
17512 Proportional counter 356 32.5 7 0.23 0.54
17513 Proportional counter 251 135.0 -25 -0.82 -0.60
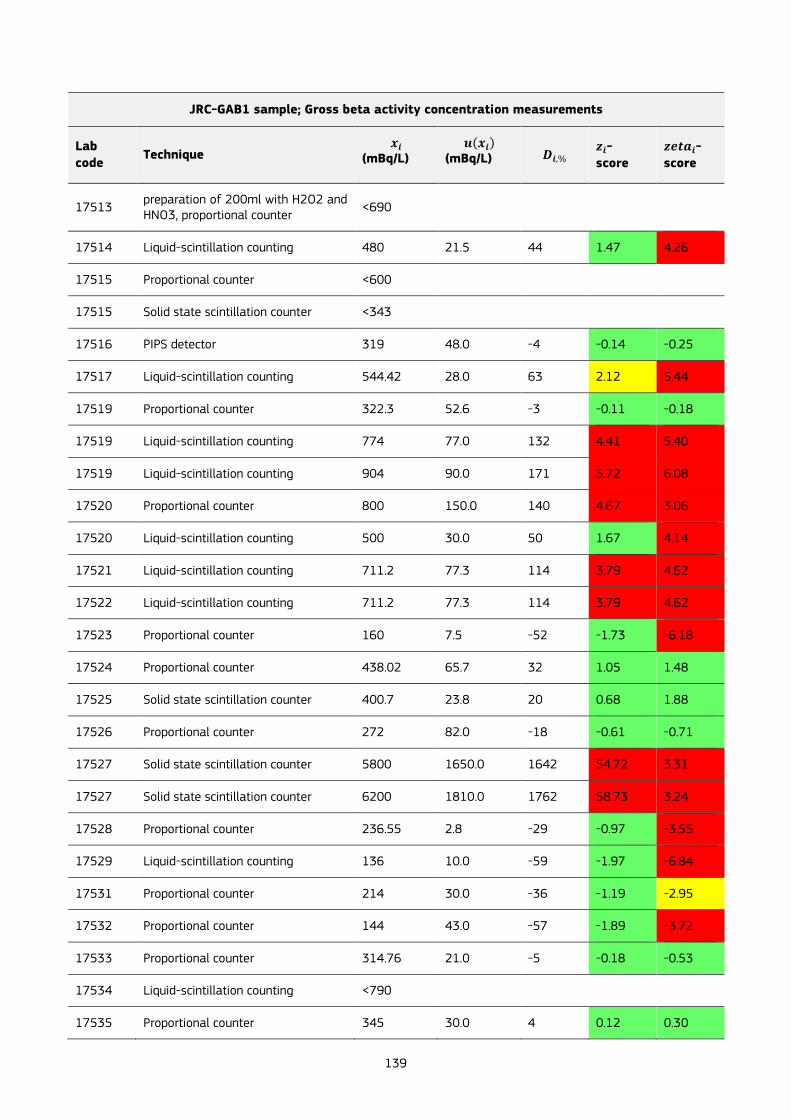
139
JRC-GAB1 sample; Gross beta activity concentration measurements
Lab
code Technique
𝒙𝒊 (mBq/L)
𝒖(𝒙𝒊) (mBq/L) 𝑫𝒊,%
𝒛𝒊-
score
𝒛𝒆𝒕𝒂𝒊-
score
17513 preparation of 200ml with H2O2 and HNO3, proportional counter
<690
17514 Liquid-scintillation counting 480 21.5 44 1.47 4.26
17515 Proportional counter <600
17515 Solid state scintillation counter <343
17516 PIPS detector 319 48.0 -4 -0.14 -0.25
17517 Liquid-scintillation counting 544.42 28.0 63 2.12 5.44
17519 Proportional counter 322.3 52.6 -3 -0.11 -0.18
17519 Liquid-scintillation counting 774 77.0 132 4.41 5.40
17519 Liquid-scintillation counting 904 90.0 171 5.72 6.08
17520 Proportional counter 800 150.0 140 4.67 3.06
17520 Liquid-scintillation counting 500 30.0 50 1.67 4.14
17521 Liquid-scintillation counting 711.2 77.3 114 3.79 4.62
17522 Liquid-scintillation counting 711.2 77.3 114 3.79 4.62
17523 Proportional counter 160 7.5 -52 -1.73 -6.18
17524 Proportional counter 438.02 65.7 32 1.05 1.48
17525 Solid state scintillation counter 400.7 23.8 20 0.68 1.88
17526 Proportional counter 272 82.0 -18 -0.61 -0.71
17527 Solid state scintillation counter 5800 1650.0 1642 54.72 3.31
17527 Solid state scintillation counter 6200 1810.0 1762 58.73 3.24
17528 Proportional counter 236.55 2.8 -29 -0.97 -3.55
17529 Liquid-scintillation counting 136 10.0 -59 -1.97 -6.84
17531 Proportional counter 214 30.0 -36 -1.19 -2.95
17532 Proportional counter 144 43.0 -57 -1.89 -3.72
17533 Proportional counter 314.76 21.0 -5 -0.18 -0.53
17534 Liquid-scintillation counting <790
17535 Proportional counter 345 30.0 4 0.12 0.30
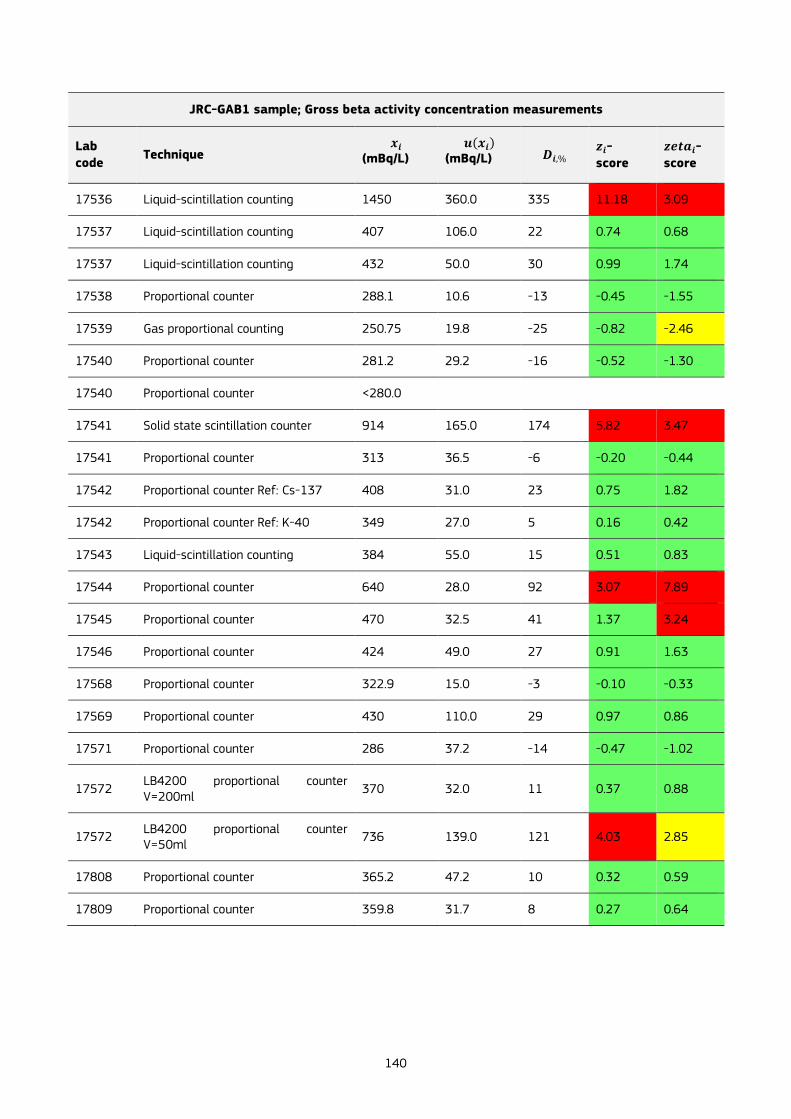
140
JRC-GAB1 sample; Gross beta activity concentration measurements
Lab
code Technique
𝒙𝒊 (mBq/L)
𝒖(𝒙𝒊) (mBq/L) 𝑫𝒊,%
𝒛𝒊-
score
𝒛𝒆𝒕𝒂𝒊-
score
17536 Liquid-scintillation counting 1450 360.0 335 11.18 3.09
17537 Liquid-scintillation counting 407 106.0 22 0.74 0.68
17537 Liquid-scintillation counting 432 50.0 30 0.99 1.74
17538 Proportional counter 288.1 10.6 -13 -0.45 -1.55
17539 Gas proportional counting 250.75 19.8 -25 -0.82 -2.46
17540 Proportional counter 281.2 29.2 -16 -0.52 -1.30
17540 Proportional counter <280.0
17541 Solid state scintillation counter 914 165.0 174 5.82 3.47
17541 Proportional counter 313 36.5 -6 -0.20 -0.44
17542 Proportional counter Ref: Cs-137 408 31.0 23 0.75 1.82
17542 Proportional counter Ref: K-40 349 27.0 5 0.16 0.42
17543 Liquid-scintillation counting 384 55.0 15 0.51 0.83
17544 Proportional counter 640 28.0 92 3.07 7.89
17545 Proportional counter 470 32.5 41 1.37 3.24
17546 Proportional counter 424 49.0 27 0.91 1.63
17568 Proportional counter 322.9 15.0 -3 -0.10 -0.33
17569 Proportional counter 430 110.0 29 0.97 0.86
17571 Proportional counter 286 37.2 -14 -0.47 -1.02
17572 LB4200 proportional counter V=200ml
370 32.0 11 0.37 0.88
17572 LB4200 proportional counter V=50ml
736 139.0 121 4.03 2.85
17808 Proportional counter 365.2 47.2 10 0.32 0.59
17809 Proportional counter 359.8 31.7 8 0.27 0.64
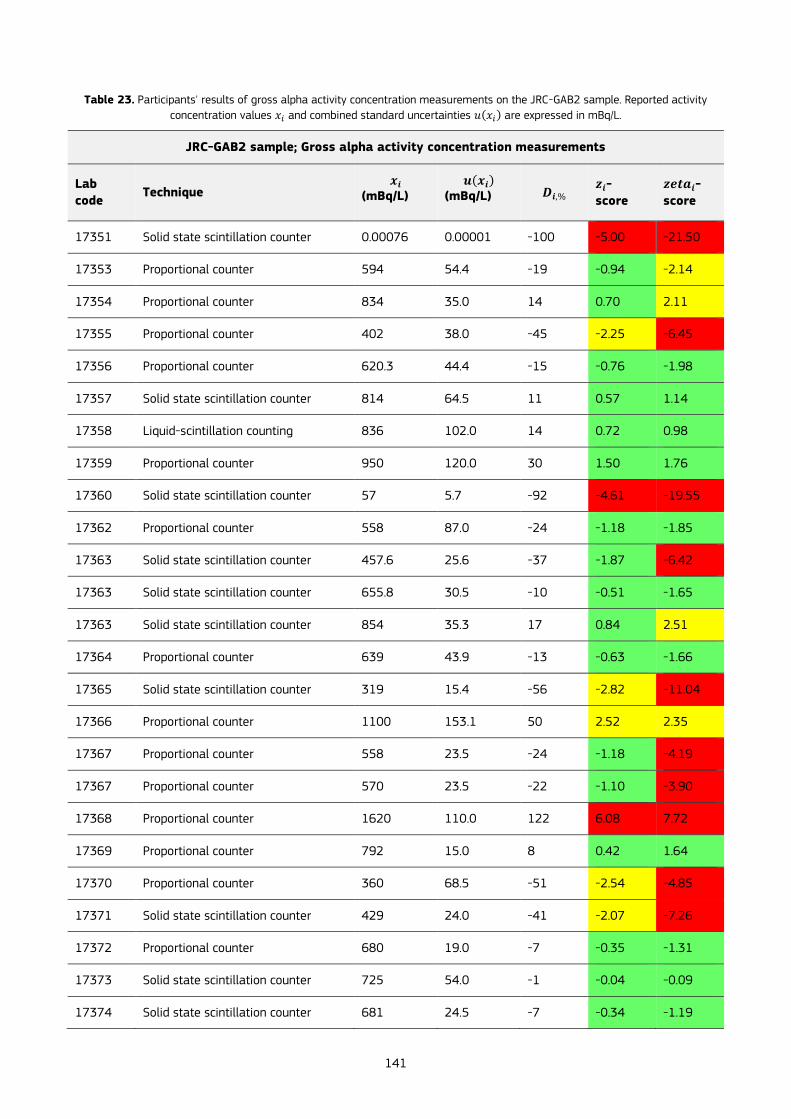
141
Table 23. Participants' results of gross alpha activity concentration measurements on the JRC-GAB2 sample. Reported activity
concentration values 𝑥𝑖 and combined standard uncertainties 𝑢(𝑥𝑖) are expressed in mBq/L.
JRC-GAB2 sample; Gross alpha activity concentration measurements
Lab
code Technique
𝒙𝒊 (mBq/L)
𝒖(𝒙𝒊) (mBq/L) 𝑫𝒊,%
𝒛𝒊-
score
𝒛𝒆𝒕𝒂𝒊-
score
17351 Solid state scintillation counter 0.00076 0.00001 -100 -5.00 -21.50
17353 Proportional counter 594 54.4 -19 -0.94 -2.14
17354 Proportional counter 834 35.0 14 0.70 2.11
17355 Proportional counter 402 38.0 -45 -2.25 -6.45
17356 Proportional counter 620.3 44.4 -15 -0.76 -1.98
17357 Solid state scintillation counter 814 64.5 11 0.57 1.14
17358 Liquid-scintillation counting 836 102.0 14 0.72 0.98
17359 Proportional counter 950 120.0 30 1.50 1.76
17360 Solid state scintillation counter 57 5.7 -92 -4.61 -19.55
17362 Proportional counter 558 87.0 -24 -1.18 -1.85
17363 Solid state scintillation counter 457.6 25.6 -37 -1.87 -6.42
17363 Solid state scintillation counter 655.8 30.5 -10 -0.51 -1.65
17363 Solid state scintillation counter 854 35.3 17 0.84 2.51
17364 Proportional counter 639 43.9 -13 -0.63 -1.66
17365 Solid state scintillation counter 319 15.4 -56 -2.82 -11.04
17366 Proportional counter 1100 153.1 50 2.52 2.35
17367 Proportional counter 558 23.5 -24 -1.18 -4.19
17367 Proportional counter 570 23.5 -22 -1.10 -3.90
17368 Proportional counter 1620 110.0 122 6.08 7.72
17369 Proportional counter 792 15.0 8 0.42 1.64
17370 Proportional counter 360 68.5 -51 -2.54 -4.85
17371 Solid state scintillation counter 429 24.0 -41 -2.07 -7.26
17372 Proportional counter 680 19.0 -7 -0.35 -1.31
17373 Solid state scintillation counter 725 54.0 -1 -0.04 -0.09
17374 Solid state scintillation counter 681 24.5 -7 -0.34 -1.19
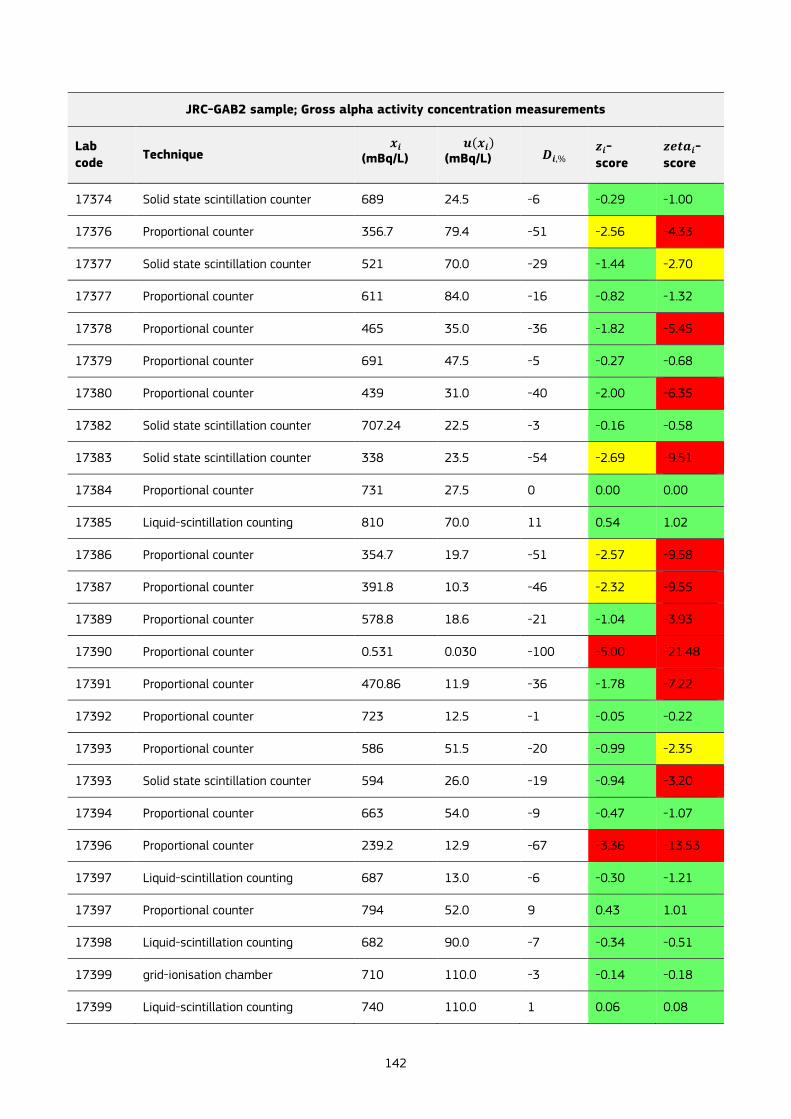
142
JRC-GAB2 sample; Gross alpha activity concentration measurements
Lab
code Technique
𝒙𝒊 (mBq/L)
𝒖(𝒙𝒊) (mBq/L) 𝑫𝒊,%
𝒛𝒊-
score
𝒛𝒆𝒕𝒂𝒊-
score
17374 Solid state scintillation counter 689 24.5 -6 -0.29 -1.00
17376 Proportional counter 356.7 79.4 -51 -2.56 -4.33
17377 Solid state scintillation counter 521 70.0 -29 -1.44 -2.70
17377 Proportional counter 611 84.0 -16 -0.82 -1.32
17378 Proportional counter 465 35.0 -36 -1.82 -5.45
17379 Proportional counter 691 47.5 -5 -0.27 -0.68
17380 Proportional counter 439 31.0 -40 -2.00 -6.35
17382 Solid state scintillation counter 707.24 22.5 -3 -0.16 -0.58
17383 Solid state scintillation counter 338 23.5 -54 -2.69 -9.51
17384 Proportional counter 731 27.5 0 0.00 0.00
17385 Liquid-scintillation counting 810 70.0 11 0.54 1.02
17386 Proportional counter 354.7 19.7 -51 -2.57 -9.58
17387 Proportional counter 391.8 10.3 -46 -2.32 -9.55
17389 Proportional counter 578.8 18.6 -21 -1.04 -3.93
17390 Proportional counter 0.531 0.030 -100 -5.00 -21.48
17391 Proportional counter 470.86 11.9 -36 -1.78 -7.22
17392 Proportional counter 723 12.5 -1 -0.05 -0.22
17393 Proportional counter 586 51.5 -20 -0.99 -2.35
17393 Solid state scintillation counter 594 26.0 -19 -0.94 -3.20
17394 Proportional counter 663 54.0 -9 -0.47 -1.07
17396 Proportional counter 239.2 12.9 -67 -3.36 -13.53
17397 Liquid-scintillation counting 687 13.0 -6 -0.30 -1.21
17397 Proportional counter 794 52.0 9 0.43 1.01
17398 Liquid-scintillation counting 682 90.0 -7 -0.34 -0.51
17399 grid-ionisation chamber 710 110.0 -3 -0.14 -0.18
17399 Liquid-scintillation counting 740 110.0 1 0.06 0.08
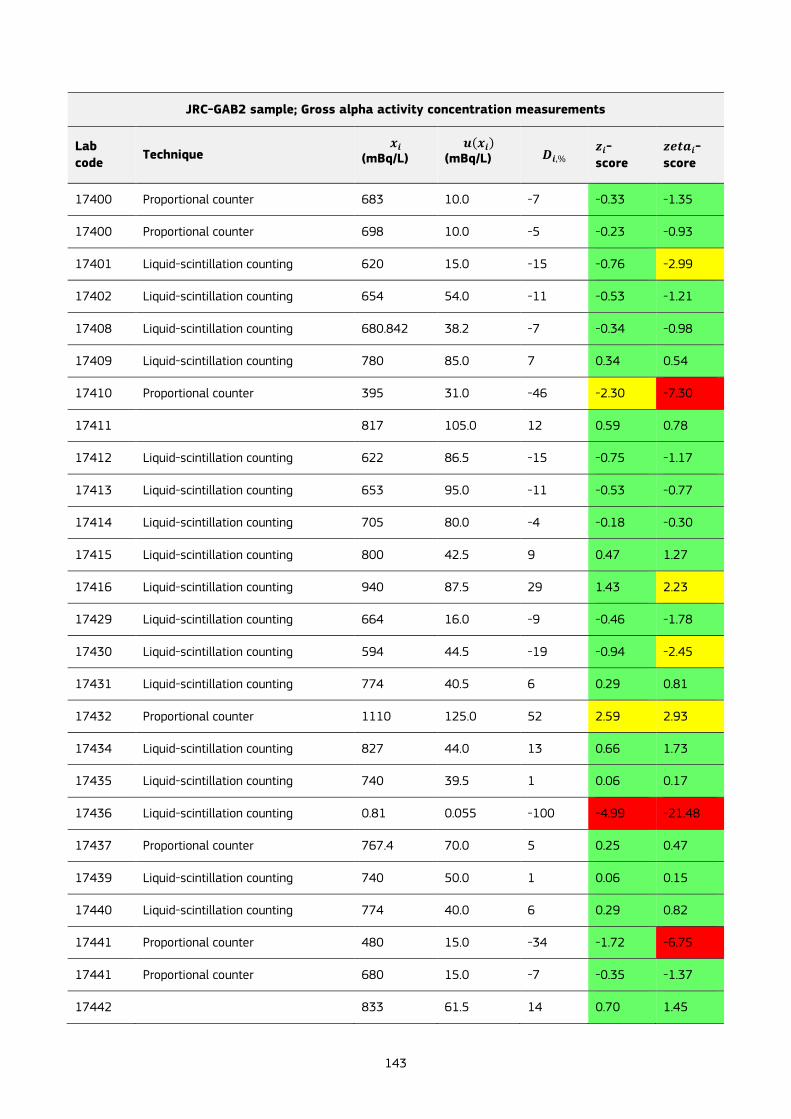
143
JRC-GAB2 sample; Gross alpha activity concentration measurements
Lab
code Technique
𝒙𝒊 (mBq/L)
𝒖(𝒙𝒊) (mBq/L) 𝑫𝒊,%
𝒛𝒊-
score
𝒛𝒆𝒕𝒂𝒊-
score
17400 Proportional counter 683 10.0 -7 -0.33 -1.35
17400 Proportional counter 698 10.0 -5 -0.23 -0.93
17401 Liquid-scintillation counting 620 15.0 -15 -0.76 -2.99
17402 Liquid-scintillation counting 654 54.0 -11 -0.53 -1.21
17408 Liquid-scintillation counting 680.842 38.2 -7 -0.34 -0.98
17409 Liquid-scintillation counting 780 85.0 7 0.34 0.54
17410 Proportional counter 395 31.0 -46 -2.30 -7.30
17411
817 105.0 12 0.59 0.78
17412 Liquid-scintillation counting 622 86.5 -15 -0.75 -1.17
17413 Liquid-scintillation counting 653 95.0 -11 -0.53 -0.77
17414 Liquid-scintillation counting 705 80.0 -4 -0.18 -0.30
17415 Liquid-scintillation counting 800 42.5 9 0.47 1.27
17416 Liquid-scintillation counting 940 87.5 29 1.43 2.23
17429 Liquid-scintillation counting 664 16.0 -9 -0.46 -1.78
17430 Liquid-scintillation counting 594 44.5 -19 -0.94 -2.45
17431 Liquid-scintillation counting 774 40.5 6 0.29 0.81
17432 Proportional counter 1110 125.0 52 2.59 2.93
17434 Liquid-scintillation counting 827 44.0 13 0.66 1.73
17435 Liquid-scintillation counting 740 39.5 1 0.06 0.17
17436 Liquid-scintillation counting 0.81 0.055 -100 -4.99 -21.48
17437 Proportional counter 767.4 70.0 5 0.25 0.47
17439 Liquid-scintillation counting 740 50.0 1 0.06 0.15
17440 Liquid-scintillation counting 774 40.0 6 0.29 0.82
17441 Proportional counter 480 15.0 -34 -1.72 -6.75
17441 Proportional counter 680 15.0 -7 -0.35 -1.37
17442
833 61.5 14 0.70 1.45

144
JRC-GAB2 sample; Gross alpha activity concentration measurements
Lab
code Technique
𝒙𝒊 (mBq/L)
𝒖(𝒙𝒊) (mBq/L) 𝑫𝒊,%
𝒛𝒊-
score
𝒛𝒆𝒕𝒂𝒊-
score
17443 Liquid-scintillation counting 487 38.0 -33 -1.67 -4.79
17443 Liquid-scintillation counting 554 44.0 -24 -1.21 -3.18
17444 Proportional counter 231 32.0 -68 -3.42 -10.71
17444 Liquid-scintillation counting 650 70.0 -11 -0.55 -1.04
17445 Liquid-scintillation counting 820 120.0 12 0.61 0.71
17448 Proportional counter 670 50.3 -8 -0.42 -1.01
17449 Solid state scintillation counter 87.69 2.5 -88 -4.40 -18.87
17450 Solid state scintillation counter 777 19.3 6 0.31 1.18
17451 Solid state scintillation counter 363.77 12.9 -50 -2.51 -10.10
17452 Proportional counter 337.74 40.3 -54 -2.69 -7.46
17453 Proportional counter 560.1 53.6 -23 -1.17 -2.69
17453
887.6 86.8 21 1.07 1.68
17454 Solid state scintillation counter 572.9 42.3 -22 -1.08 -2.91
17455 Solid state scintillation counter 21.9 4.175 -97 -4.85 -20.70
17456 Solid state scintillation counter 146 3.5 -80 -4.00 -17.12
17456 Solid state scintillation counter 146 3.5 -80 -4.00 -17.12
17456 Solid state scintillation counter 146 3.5 -80 -4.00 -17.12
17457 Solid state scintillation counter 670.71 42.4 -8 -0.41 -1.11
17458 Proportional counter 675.3 16.4 -8 -0.38 -1.48
17459 Proportional counter 348.0516 10.2 -52 -2.62 -10.78
17460 solid state scintillation counter, evaporation, sulfatation, ignition
635.04 31.7 -13 -0.66 -2.06
17461 Proportional counter 637.75 39.3 -13 -0.64 -1.80
17468 ISO11704, UG, Liquid scintillation counting
725 37.0 -1 -0.04 -0.12
17468 ISO11704, QS400, Liquid Scintillation counting
752 54.0 3 0.14 0.33
17468 in house m, Liquid scintillation 769 38.0 5 0.26 0.75
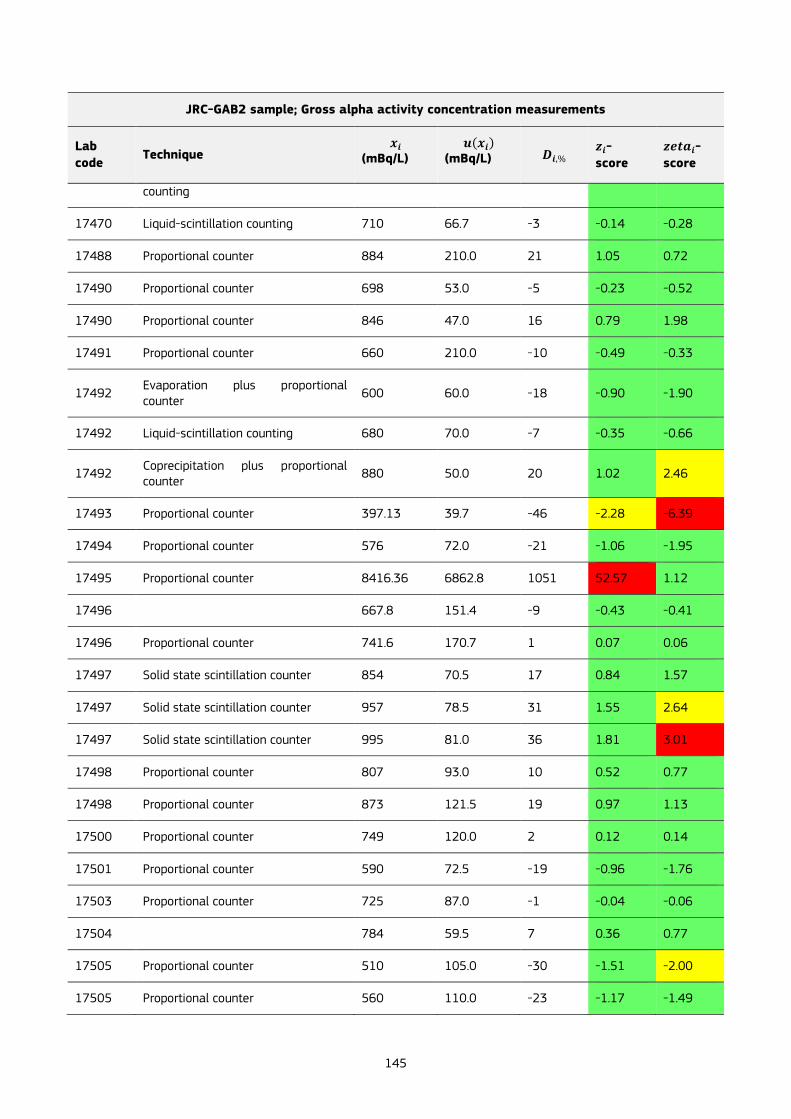
145
JRC-GAB2 sample; Gross alpha activity concentration measurements
Lab
code Technique
𝒙𝒊 (mBq/L)
𝒖(𝒙𝒊) (mBq/L) 𝑫𝒊,%
𝒛𝒊-
score
𝒛𝒆𝒕𝒂𝒊-
score
counting
17470 Liquid-scintillation counting 710 66.7 -3 -0.14 -0.28
17488 Proportional counter 884 210.0 21 1.05 0.72
17490 Proportional counter 698 53.0 -5 -0.23 -0.52
17490 Proportional counter 846 47.0 16 0.79 1.98
17491 Proportional counter 660 210.0 -10 -0.49 -0.33
17492 Evaporation plus proportional counter
600 60.0 -18 -0.90 -1.90
17492 Liquid-scintillation counting 680 70.0 -7 -0.35 -0.66
17492 Coprecipitation plus proportional counter
880 50.0 20 1.02 2.46
17493 Proportional counter 397.13 39.7 -46 -2.28 -6.39
17494 Proportional counter 576 72.0 -21 -1.06 -1.95
17495 Proportional counter 8416.36 6862.8 1051 52.57 1.12
17496
667.8 151.4 -9 -0.43 -0.41
17496 Proportional counter 741.6 170.7 1 0.07 0.06
17497 Solid state scintillation counter 854 70.5 17 0.84 1.57
17497 Solid state scintillation counter 957 78.5 31 1.55 2.64
17497 Solid state scintillation counter 995 81.0 36 1.81 3.01
17498 Proportional counter 807 93.0 10 0.52 0.77
17498 Proportional counter 873 121.5 19 0.97 1.13
17500 Proportional counter 749 120.0 2 0.12 0.14
17501 Proportional counter 590 72.5 -19 -0.96 -1.76
17503 Proportional counter 725 87.0 -1 -0.04 -0.06
17504
784 59.5 7 0.36 0.77
17505 Proportional counter 510 105.0 -30 -1.51 -2.00
17505 Proportional counter 560 110.0 -23 -1.17 -1.49

146
JRC-GAB2 sample; Gross alpha activity concentration measurements
Lab
code Technique
𝒙𝒊 (mBq/L)
𝒖(𝒙𝒊) (mBq/L) 𝑫𝒊,%
𝒛𝒊-
score
𝒛𝒆𝒕𝒂𝒊-
score
17506 Solid state scintillation counter 0.000186 0.0000397 -100 -5.00 -21.50
17510 Proportional counter 747 104.5 2 0.11 0.15
17511 Proportional counter 510 53.5 -30 -1.51 -3.49
17512 Proportional counter 443 58.5 -39 -1.97 -4.26
17513 Proportional counter 706 86.0 -3 -0.17 -0.27
17513 preparation of 200ml with H2O2 and HNO3, proportional counter
792 106.0 8 0.42 0.55
17514 Liquid-scintillation counting 760 30.0 4 0.20 0.64
17515 Proportional counter 856 138.0 17 0.85 0.88
17515 Solid state scintillation counter 1247 194.0 71 3.53 2.62
17516 PIPS detector 650 39.0 -11 -0.55 -1.57
17517 Liquid-scintillation counting 1449.516 64.6 98 4.91 9.84
17519 Liquid-scintillation counting 183 18.0 -75 -3.75 -14.24
17519 Liquid-scintillation counting 317 32.0 -57 -2.83 -8.87
17519 Proportional counter 541.3 93.2 -26 -1.30 -1.91
17520 Proportional counter 600 150.0 -18 -0.90 -0.85
17520 Liquid-scintillation counting 700 40.0 -4 -0.21 -0.59
17521 Liquid-scintillation counting 740.2 37.1 1 0.06 0.18
17522 Liquid-scintillation counting 677.7 33.6 -7 -0.36 -1.12
17523 Proportional counter 412 16.6 -44 -2.18 -8.43
17524 Proportional counter 839.51 125.9 15 0.74 0.83
17525 Solid state scintillation counter 520.4 50.7 -29 -1.44 -3.45
17525 Solid state scintillation counter 788.1 37.5 8 0.39 1.13
17526 Proportional counter 2207 552.0 202 10.10 2.67
17527 Solid state scintillation counter 570 160.0 -22 -1.10 -0.98
17527 Solid state scintillation counter 815 250.0 11 0.57 0.33
17528 Proportional counter 110 2.6 -85 -4.25 -18.21
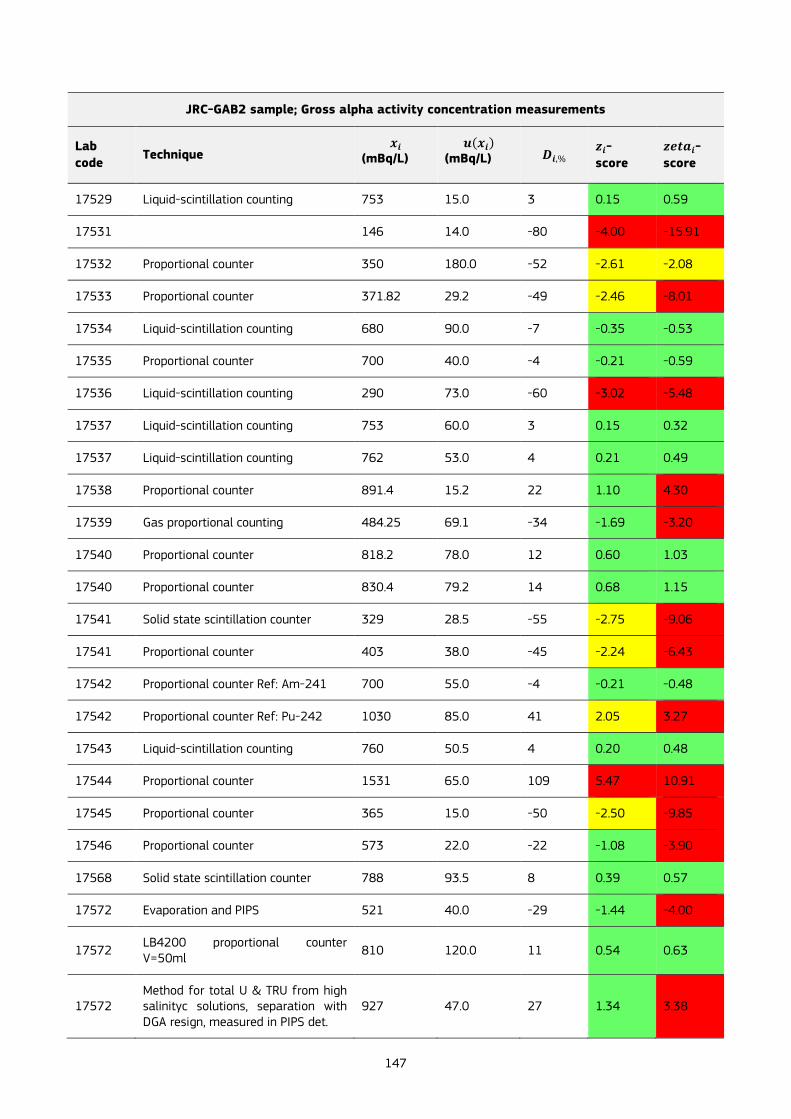
147
JRC-GAB2 sample; Gross alpha activity concentration measurements
Lab
code Technique
𝒙𝒊 (mBq/L)
𝒖(𝒙𝒊) (mBq/L) 𝑫𝒊,%
𝒛𝒊-
score
𝒛𝒆𝒕𝒂𝒊-
score
17529 Liquid-scintillation counting 753 15.0 3 0.15 0.59
17531
146 14.0 -80 -4.00 -15.91
17532 Proportional counter 350 180.0 -52 -2.61 -2.08
17533 Proportional counter 371.82 29.2 -49 -2.46 -8.01
17534 Liquid-scintillation counting 680 90.0 -7 -0.35 -0.53
17535 Proportional counter 700 40.0 -4 -0.21 -0.59
17536 Liquid-scintillation counting 290 73.0 -60 -3.02 -5.48
17537 Liquid-scintillation counting 753 60.0 3 0.15 0.32
17537 Liquid-scintillation counting 762 53.0 4 0.21 0.49
17538 Proportional counter 891.4 15.2 22 1.10 4.30
17539 Gas proportional counting 484.25 69.1 -34 -1.69 -3.20
17540 Proportional counter 818.2 78.0 12 0.60 1.03
17540 Proportional counter 830.4 79.2 14 0.68 1.15
17541 Solid state scintillation counter 329 28.5 -55 -2.75 -9.06
17541 Proportional counter 403 38.0 -45 -2.24 -6.43
17542 Proportional counter Ref: Am-241 700 55.0 -4 -0.21 -0.48
17542 Proportional counter Ref: Pu-242 1030 85.0 41 2.05 3.27
17543 Liquid-scintillation counting 760 50.5 4 0.20 0.48
17544 Proportional counter 1531 65.0 109 5.47 10.91
17545 Proportional counter 365 15.0 -50 -2.50 -9.85
17546 Proportional counter 573 22.0 -22 -1.08 -3.90
17568 Solid state scintillation counter 788 93.5 8 0.39 0.57
17572 Evaporation and PIPS 521 40.0 -29 -1.44 -4.00
17572 LB4200 proportional counter V=50ml
810 120.0 11 0.54 0.63
17572 Method for total U & TRU from high salinityc solutions, separation with DGA resign, measured in PIPS det.
927 47.0 27 1.34 3.38

148
JRC-GAB2 sample; Gross alpha activity concentration measurements
Lab
code Technique
𝒙𝒊 (mBq/L)
𝒖(𝒙𝒊) (mBq/L) 𝑫𝒊,%
𝒛𝒊-
score
𝒛𝒆𝒕𝒂𝒊-
score
17808 Proportional counter 543.8 19.8 -26 -1.28 -4.76
17809 Proportional counter 505.5 35.4 -31 -1.54 -4.60

149
Table 24. Participants' results of gross beta activity concentration measurements on the JRC-GAB2 sample. Reported
activity concentration values 𝑥𝑖 and combined standard uncertainties 𝑢(𝑥𝑖) are expressed in mBq/L.
JRC-GAB2 sample; Gross beta activity concentration measurements
Lab
code Technique
𝒙𝒊 (mBq/L)
𝒖(𝒙𝒊) (mBq/L) 𝑫𝒊,%
𝒛𝒊-
score
𝒛𝒆𝒕𝒂𝒊-
score
17351 Proportional counter 0.00141 0.00002 -100 -5.00 -30.38
17353 Proportional counter 1151.1 66.1 -29 -1.43 -5.42
17354 Proportional counter 1757 54.0 9 0.46 1.94
17355 Proportional counter 2124 119.0 32 1.60 3.95
17356 Proportional counter 1247.3 50.7 -23 -1.13 -4.95
17357 Proportional counter 1560 176.0 -3 -0.16 -0.27
17358 Liquid-scintillation counting 1592 222.0 -1 -0.06 -0.08
17359 Proportional counter 1640 120.0 2 0.09 0.23
17360 Solid state scintillation counter 820 82.0 -49 -2.45 -8.09
17362 Proportional counter 1245 94.0 -23 -1.13 -3.38
17363 Solid state scintillation counter 924.4 14.5 -43 -2.13 -12.48
17363 Solid state scintillation counter 1074.2 16.4 -33 -1.66 -9.66
17363 Solid state scintillation counter 1223.9 18.3 -24 -1.20 -6.89
17364 Proportional counter 1310 30.4 -19 -0.93 -4.91
17365 Proportional counter 1221 19.0 -24 -1.21 -6.91
17365 Proportional counter 1286 20.0 -20 -1.01 -5.72
17366 Proportional counter 1200 102.0 -25 -1.27 -3.57
17367 Proportional counter 1119 21.9 -30 -1.52 -8.56
17367 Proportional counter 1199 23.5 -26 -1.28 -7.09
17368 Proportional counter 1210 55.0 -25 -1.24 -5.24
17369 Proportional counter 1360 25.0 -16 -0.78 -4.27
17370 Proportional counter 2000 268.0 24 1.21 1.43
17371 Proportional counter 1148 56.5 -29 -1.43 -5.96
17372 Proportional counter 1273 46.0 -21 -1.05 -4.80
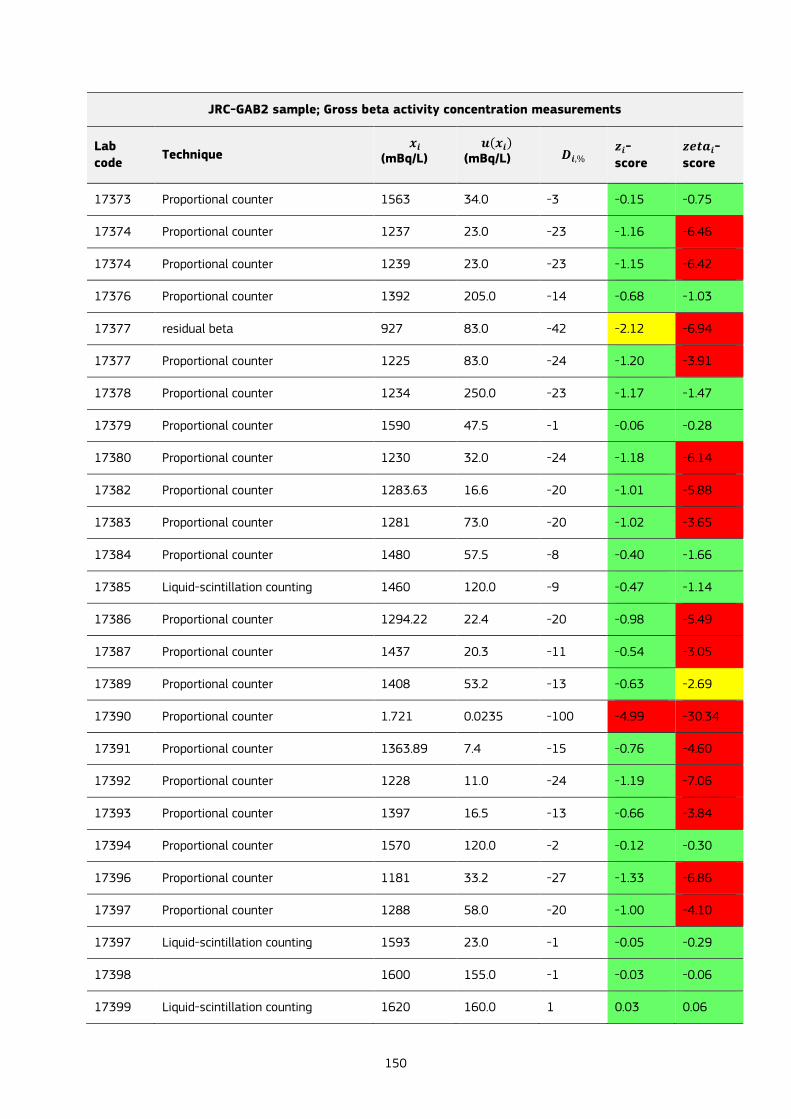
150
JRC-GAB2 sample; Gross beta activity concentration measurements
Lab
code Technique
𝒙𝒊 (mBq/L)
𝒖(𝒙𝒊) (mBq/L) 𝑫𝒊,%
𝒛𝒊-
score
𝒛𝒆𝒕𝒂𝒊-
score
17373 Proportional counter 1563 34.0 -3 -0.15 -0.75
17374 Proportional counter 1237 23.0 -23 -1.16 -6.46
17374 Proportional counter 1239 23.0 -23 -1.15 -6.42
17376 Proportional counter 1392 205.0 -14 -0.68 -1.03
17377 residual beta 927 83.0 -42 -2.12 -6.94
17377 Proportional counter 1225 83.0 -24 -1.20 -3.91
17378 Proportional counter 1234 250.0 -23 -1.17 -1.47
17379 Proportional counter 1590 47.5 -1 -0.06 -0.28
17380 Proportional counter 1230 32.0 -24 -1.18 -6.14
17382 Proportional counter 1283.63 16.6 -20 -1.01 -5.88
17383 Proportional counter 1281 73.0 -20 -1.02 -3.65
17384 Proportional counter 1480 57.5 -8 -0.40 -1.66
17385 Liquid-scintillation counting 1460 120.0 -9 -0.47 -1.14
17386 Proportional counter 1294.22 22.4 -20 -0.98 -5.49
17387 Proportional counter 1437 20.3 -11 -0.54 -3.05
17389 Proportional counter 1408 53.2 -13 -0.63 -2.69
17390 Proportional counter 1.721 0.0235 -100 -4.99 -30.34
17391 Proportional counter 1363.89 7.4 -15 -0.76 -4.60
17392 Proportional counter 1228 11.0 -24 -1.19 -7.06
17393 Proportional counter 1397 16.5 -13 -0.66 -3.84
17394 Proportional counter 1570 120.0 -2 -0.12 -0.30
17396 Proportional counter 1181 33.2 -27 -1.33 -6.86
17397 Proportional counter 1288 58.0 -20 -1.00 -4.10
17397 Liquid-scintillation counting 1593 23.0 -1 -0.05 -0.29
17398
1600 155.0 -1 -0.03 -0.06
17399 Liquid-scintillation counting 1620 160.0 1 0.03 0.06

151
JRC-GAB2 sample; Gross beta activity concentration measurements
Lab
code Technique
𝒙𝒊 (mBq/L)
𝒖(𝒙𝒊) (mBq/L) 𝑫𝒊,%
𝒛𝒊-
score
𝒛𝒆𝒕𝒂𝒊-
score
17401 Liquid-scintillation counting 1290 23.0 -20 -0.99 -5.54
17402 Liquid-scintillation counting 1858 168.0 15 0.77 1.41
17408 Liquid-scintillation counting 1459.318 74.8 -9 -0.47 -1.64
17409 Liquid-scintillation counting 1490 125.0 -7 -0.37 -0.88
17410 Proportional counter 1583 126.0 -2 -0.08 -0.20
17411
1312 350.0 -19 -0.93 -0.84
17412 Liquid-scintillation counting 1850 278.5 15 0.75 0.85
17413 Liquid-scintillation counting 1608 309.5 0 -0.01 -0.01
17414 Liquid-scintillation counting 1690 290.0 5 0.25 0.27
17415 Liquid-scintillation counting 1470 98.0 -9 -0.43 -1.26
17416 Liquid-scintillation counting 1605 298.5 0 -0.02 -0.02
17429 Liquid-scintillation counting 1493 30.0 -7 -0.36 -1.92
17430 Liquid-scintillation counting 930 115.0 -42 -2.11 -5.37
17431 Liquid-scintillation counting 1522 114.0 -5 -0.27 -0.70
17432 Proportional counter 1600 90.0 -1 -0.03 -0.10
17434 Liquid-scintillation counting 1560 117.0 -3 -0.16 -0.39
17435 Liquid-scintillation counting 1466 31.5 -9 -0.45 -2.34
17436 Liquid-scintillation counting 1.2 0.2000 -100 -5.00 -30.35
17437 Proportional counter 1181 51.5 -27 -1.33 -5.81
17439 Liquid-scintillation counting 1700 365.0 6 0.28 0.24
17440 Liquid-scintillation counting 1522 55.0 -5 -0.27 -1.15
17441 Proportional counter 1520 10.0 -6 -0.28 -1.67
17441 Proportional counter 1770 10.0 10 0.50 2.97
17442 Proportional counter 975 55.0 -39 -1.97 -8.31
17443 Liquid-scintillation counting 1941 84.0 21 1.03 3.33
17443 Liquid-scintillation counting 2084 76.0 29 1.47 5.12

152
JRC-GAB2 sample; Gross beta activity concentration measurements
Lab
code Technique
𝒙𝒊 (mBq/L)
𝒖(𝒙𝒊) (mBq/L) 𝑫𝒊,%
𝒛𝒊-
score
𝒛𝒆𝒕𝒂𝒊-
score
17444 Proportional counter 1360 100.0 -16 -0.78 -2.21
17444 Liquid-scintillation counting 1650 130.0 2 0.12 0.28
17445 Liquid-scintillation counting 1670 260.0 4 0.19 0.23
17448 Proportional counter 1214 91.1 -25 -1.23 -3.76
17449 Solid state scintillation counter 1246.4 3.5 -23 -1.13 -6.85
17450 Solid state scintillation counter 1206 19.0 -25 -1.25 -7.18
17451 Solid state scintillation counter 1243.92 18.3 -23 -1.14 -6.53
17452 Proportional counter 1270.8 90.7 -21 -1.05 -3.23
17453 Proportional counter 1207.9 165.3 -25 -1.25 -2.32
17453 Proportional counter 1282.5 70.5 -20 -1.02 -3.71
17454 Solid state scintillation counter 1198.9 65.4 -26 -1.28 -4.89
17455 Solid state scintillation counter 920.2 30.2 -43 -2.14 -11.31
17456 Solid state scintillation counter 125.8 17.0 -92 -4.61 -26.67
17456 Solid state scintillation counter 125.8 17.0 -92 -4.61 -26.67
17456 Solid state scintillation counter 125.8 17.0 -92 -4.61 -26.67
17457 Solid state scintillation counter 1215.498 71.9 -25 -1.23 -4.42
17458 Proportional counter 1299.5 8.7 -19 -0.96 -5.78
17459 Proportional counter 1181.668 49.4 -27 -1.33 -5.91
17460 solid state scintillation counter, evaporation, sulfatation, ignition
1175.83 25.7 -27 -1.35 -7.37
17461 Proportional counter 1175.45 61.4 -27 -1.35 -5.36
17468 in house m, Liquid scintillation counting
1560 120.0 -3 -0.16 -0.38
17468 ISO11704, UG, Liquid scintillation counting
1563 87.0 -3 -0.15 -0.46
17468 ISO11704, QS400, Liquid Scintillation counting
1749 141.0 9 0.43 0.92
17470 Liquid-scintillation counting 1510 139.4 -6 -0.31 -0.67
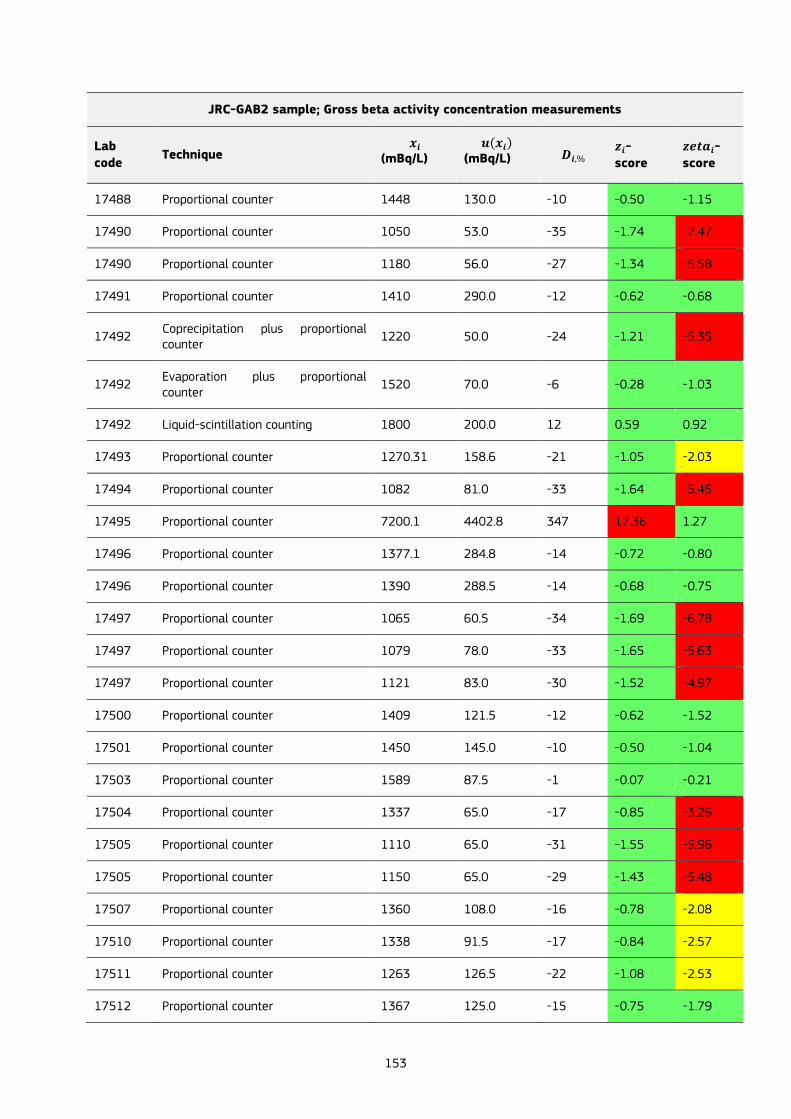
153
JRC-GAB2 sample; Gross beta activity concentration measurements
Lab
code Technique
𝒙𝒊 (mBq/L)
𝒖(𝒙𝒊) (mBq/L) 𝑫𝒊,%
𝒛𝒊-
score
𝒛𝒆𝒕𝒂𝒊-
score
17488 Proportional counter 1448 130.0 -10 -0.50 -1.15
17490 Proportional counter 1050 53.0 -35 -1.74 -7.47
17490 Proportional counter 1180 56.0 -27 -1.34 -5.58
17491 Proportional counter 1410 290.0 -12 -0.62 -0.68
17492 Coprecipitation plus proportional counter
1220 50.0 -24 -1.21 -5.35
17492 Evaporation plus proportional counter
1520 70.0 -6 -0.28 -1.03
17492 Liquid-scintillation counting 1800 200.0 12 0.59 0.92
17493 Proportional counter 1270.31 158.6 -21 -1.05 -2.03
17494 Proportional counter 1082 81.0 -33 -1.64 -5.45
17495 Proportional counter 7200.1 4402.8 347 17.36 1.27
17496 Proportional counter 1377.1 284.8 -14 -0.72 -0.80
17496 Proportional counter 1390 288.5 -14 -0.68 -0.75
17497 Proportional counter 1065 60.5 -34 -1.69 -6.78
17497 Proportional counter 1079 78.0 -33 -1.65 -5.63
17497 Proportional counter 1121 83.0 -30 -1.52 -4.97
17500 Proportional counter 1409 121.5 -12 -0.62 -1.52
17501 Proportional counter 1450 145.0 -10 -0.50 -1.04
17503 Proportional counter 1589 87.5 -1 -0.07 -0.21
17504 Proportional counter 1337 65.0 -17 -0.85 -3.26
17505 Proportional counter 1110 65.0 -31 -1.55 -5.96
17505 Proportional counter 1150 65.0 -29 -1.43 -5.48
17507 Proportional counter 1360 108.0 -16 -0.78 -2.08
17510 Proportional counter 1338 91.5 -17 -0.84 -2.57
17511 Proportional counter 1263 126.5 -22 -1.08 -2.53
17512 Proportional counter 1367 125.0 -15 -0.75 -1.79
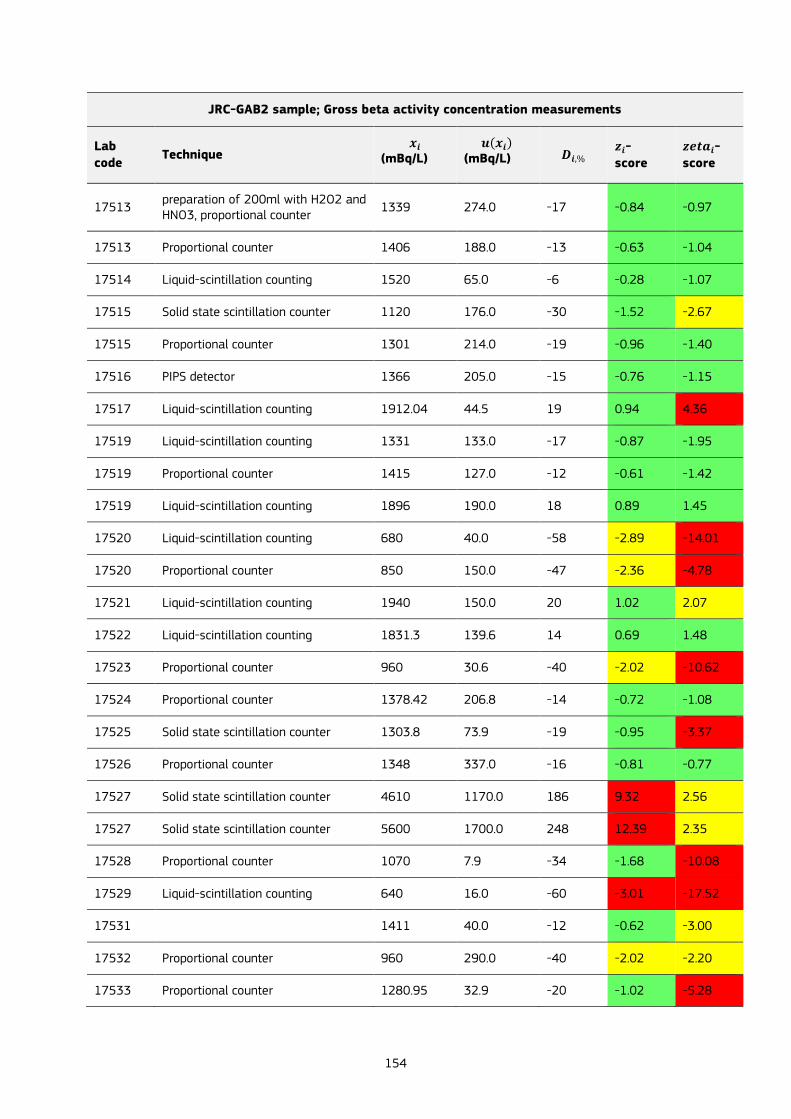
154
JRC-GAB2 sample; Gross beta activity concentration measurements
Lab
code Technique
𝒙𝒊 (mBq/L)
𝒖(𝒙𝒊) (mBq/L) 𝑫𝒊,%
𝒛𝒊-
score
𝒛𝒆𝒕𝒂𝒊-
score
17513 preparation of 200ml with H2O2 and HNO3, proportional counter
1339 274.0 -17 -0.84 -0.97
17513 Proportional counter 1406 188.0 -13 -0.63 -1.04
17514 Liquid-scintillation counting 1520 65.0 -6 -0.28 -1.07
17515 Solid state scintillation counter 1120 176.0 -30 -1.52 -2.67
17515 Proportional counter 1301 214.0 -19 -0.96 -1.40
17516 PIPS detector 1366 205.0 -15 -0.76 -1.15
17517 Liquid-scintillation counting 1912.04 44.5 19 0.94 4.36
17519 Liquid-scintillation counting 1331 133.0 -17 -0.87 -1.95
17519 Proportional counter 1415 127.0 -12 -0.61 -1.42
17519 Liquid-scintillation counting 1896 190.0 18 0.89 1.45
17520 Liquid-scintillation counting 680 40.0 -58 -2.89 -14.01
17520 Proportional counter 850 150.0 -47 -2.36 -4.78
17521 Liquid-scintillation counting 1940 150.0 20 1.02 2.07
17522 Liquid-scintillation counting 1831.3 139.6 14 0.69 1.48
17523 Proportional counter 960 30.6 -40 -2.02 -10.62
17524 Proportional counter 1378.42 206.8 -14 -0.72 -1.08
17525 Solid state scintillation counter 1303.8 73.9 -19 -0.95 -3.37
17526 Proportional counter 1348 337.0 -16 -0.81 -0.77
17527 Solid state scintillation counter 4610 1170.0 186 9.32 2.56
17527 Solid state scintillation counter 5600 1700.0 248 12.39 2.35
17528 Proportional counter 1070 7.9 -34 -1.68 -10.08
17529 Liquid-scintillation counting 640 16.0 -60 -3.01 -17.52
17531
1411 40.0 -12 -0.62 -3.00
17532 Proportional counter 960 290.0 -40 -2.02 -2.20
17533 Proportional counter 1280.95 32.9 -20 -1.02 -5.28
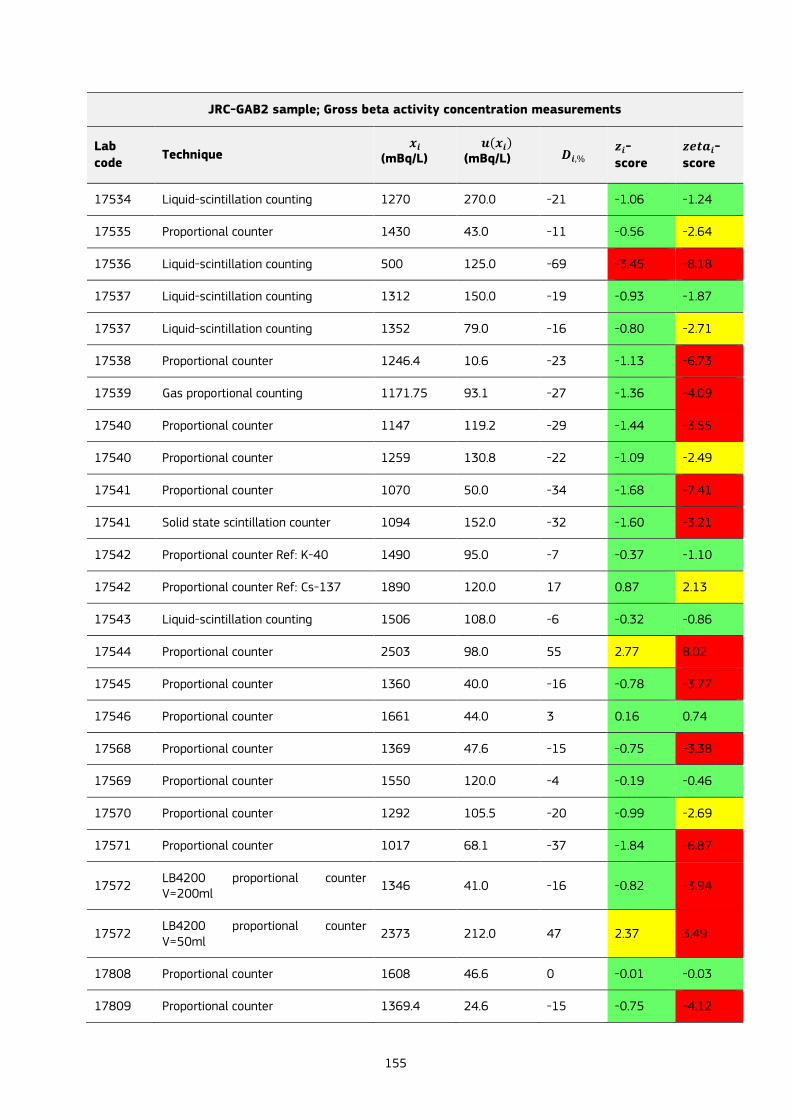
155
JRC-GAB2 sample; Gross beta activity concentration measurements
Lab
code Technique
𝒙𝒊 (mBq/L)
𝒖(𝒙𝒊) (mBq/L) 𝑫𝒊,%
𝒛𝒊-
score
𝒛𝒆𝒕𝒂𝒊-
score
17534 Liquid-scintillation counting 1270 270.0 -21 -1.06 -1.24
17535 Proportional counter 1430 43.0 -11 -0.56 -2.64
17536 Liquid-scintillation counting 500 125.0 -69 -3.45 -8.18
17537 Liquid-scintillation counting 1312 150.0 -19 -0.93 -1.87
17537 Liquid-scintillation counting 1352 79.0 -16 -0.80 -2.71
17538 Proportional counter 1246.4 10.6 -23 -1.13 -6.73
17539 Gas proportional counting 1171.75 93.1 -27 -1.36 -4.09
17540 Proportional counter 1147 119.2 -29 -1.44 -3.55
17540 Proportional counter 1259 130.8 -22 -1.09 -2.49
17541 Proportional counter 1070 50.0 -34 -1.68 -7.41
17541 Solid state scintillation counter 1094 152.0 -32 -1.60 -3.21
17542 Proportional counter Ref: K-40 1490 95.0 -7 -0.37 -1.10
17542 Proportional counter Ref: Cs-137 1890 120.0 17 0.87 2.13
17543 Liquid-scintillation counting 1506 108.0 -6 -0.32 -0.86
17544 Proportional counter 2503 98.0 55 2.77 8.02
17545 Proportional counter 1360 40.0 -16 -0.78 -3.77
17546 Proportional counter 1661 44.0 3 0.16 0.74
17568 Proportional counter 1369 47.6 -15 -0.75 -3.38
17569 Proportional counter 1550 120.0 -4 -0.19 -0.46
17570 Proportional counter 1292 105.5 -20 -0.99 -2.69
17571 Proportional counter 1017 68.1 -37 -1.84 -6.87
17572 LB4200 proportional counter V=200ml
1346 41.0 -16 -0.82 -3.94
17572 LB4200 proportional counter V=50ml
2373 212.0 47 2.37 3.49
17808 Proportional counter 1608 46.6 0 -0.01 -0.03
17809 Proportional counter 1369.4 24.6 -15 -0.75 -4.12

156
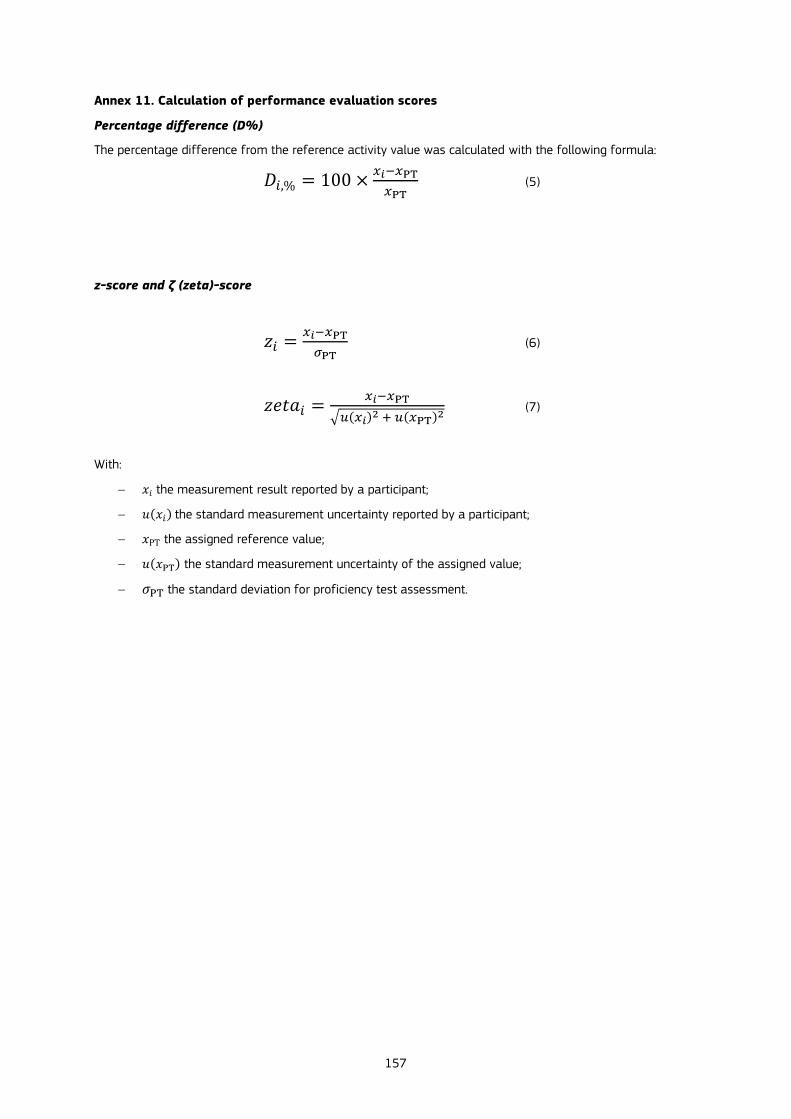
157
Annex 11. Calculation of performance evaluation scores
Percentage difference (D%)
The percentage difference from the reference activity value was calculated with the following formula:
𝐷𝑖,% = 100 ×𝑥𝑖−𝑥PT
𝑥PT (5)
z-score and ζ (zeta)-score
𝑧𝑖 =𝑥𝑖−𝑥PT
𝜎PT (6)
𝑧𝑒𝑡𝑎𝑖 =𝑥𝑖−𝑥PT
√𝑢(𝑥𝑖)2 + 𝑢(𝑥PT)
2 (7)
With:
𝑥𝑖 the measurement result reported by a participant;
𝑢(𝑥𝑖) the standard measurement uncertainty reported by a participant;
𝑥PT the assigned reference value;
𝑢(𝑥PT) the standard measurement uncertainty of the assigned value;
𝜎PT the standard deviation for proficiency test assessment.
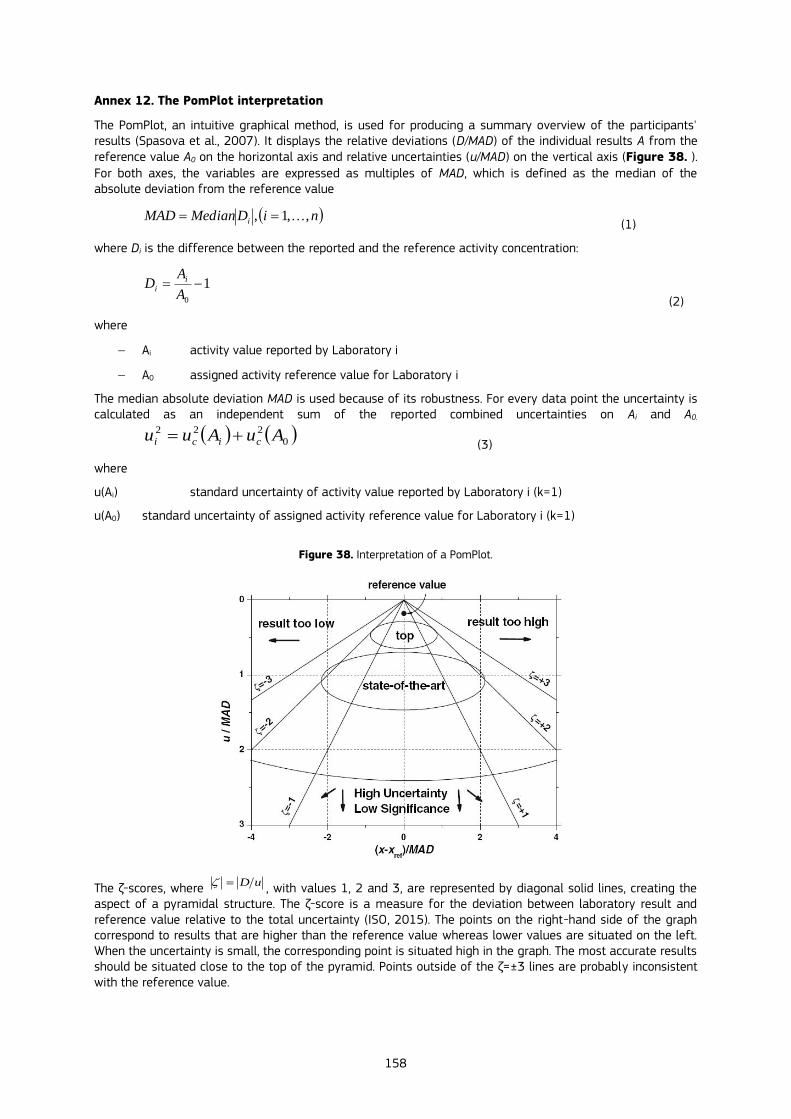
158
Annex 12. The PomPlot interpretation
The PomPlot, an intuitive graphical method, is used for producing a summary overview of the participants' results (Spasova et al., 2007). It displays the relative deviations (D/MAD) of the individual results A from the reference value A0 on the horizontal axis and relative uncertainties (u/MAD) on the vertical axis (Figure 38. ). For both axes, the variables are expressed as multiples of MAD, which is defined as the median of the absolute deviation from the reference value
(1)
where Di is the difference between the reported and the reference activity concentration:
(2)
where
Ai activity value reported by Laboratory i
A0 assigned activity reference value for Laboratory i
The median absolute deviation MAD is used because of its robustness. For every data point the uncertainty is calculated as an independent sum of the reported combined uncertainties on Ai and A0.
(3)
where
u(Ai) standard uncertainty of activity value reported by Laboratory i (k=1)
u(A0) standard uncertainty of assigned activity reference value for Laboratory i (k=1)
Figure 38. Interpretation of a PomPlot.
The ζ-scores, where uD , with values 1, 2 and 3, are represented by diagonal solid lines, creating the aspect of a pyramidal structure. The ζ-score is a measure for the deviation between laboratory result and reference value relative to the total uncertainty (ISO, 2015). The points on the right-hand side of the graph correspond to results that are higher than the reference value whereas lower values are situated on the left. When the uncertainty is small, the corresponding point is situated high in the graph. The most accurate results should be situated close to the top of the pyramid. Points outside of the ζ=±3 lines are probably inconsistent with the reference value.
niDMedianMAD i ,,1,
10
A
AD i
i
0
222 AuAuu cici

GETTING IN TOUCH WITH THE EU
In person
All over the European Union there are hundreds of Europe Direct information centres. You can find the address of the centre nearest you at: https://europa.eu/european-union/contact_en
On the phone or by email
Europe Direct is a service that answers your questions about the European Union. You can contact this service:
- by freephone: 00 800 6 7 8 9 10 11 (certain operators may charge for these calls),
- at the following standard number: +32 22999696, or
- by electronic mail via: https://europa.eu/european-union/contact_en
FINDING INFORMATION ABOUT THE EU
Online
Information about the European Union in all the official languages of the EU is available on the Europa website at: https://europa.eu/european-union/index_en
EU publications
You can download or order free and priced EU publications from EU Bookshop at: https://publications.europa.eu/en/publications. Multiple copies of free publications may be obtained by contacting Europe Direct or your local information centre (see https://europa.eu/european-union/contact_en).

KJ-N
A-3
08
22
-EN-N
doi:10.2760/069173
ISBN 978-92-76-41388-2