relating laboratory and outdoor exposures of acrylic melamine coatings
TRANSCRIPT

Relating laboratory and outdoor exposures of acrylic melaminecoatings
I. Cumulative damage model and laboratory exposure apparatus
Jonathan W. Martin*, Tinh Nguyen, Eric Byrd, Brian Dickens, Ned Embree
National Institute of Standards and Technology, Gaithersburg, MD 20899, USA
Received 6 July 2001; received in revised form 6 August 2001; accepted 9 August 2001
Abstract
A cumulative damage model and a laboratory apparatus are described for linking field and laboratory photodegradation resultsand for predicting the service life of polymeric materials exposed in the laboratory and field. The apparatus was designed to inde-pendently and precisely monitor and control in both space and time the three primary weathering factors causing polymeric mate-
rials to degrade when exposed in the field. These factors include temperature, relative humidity, and spectral ultraviolet radiation. Amodel acrylic melamine coating was exposed in the laboratory apparatus to each of 12 different spectral wavebands and four tem-perature and four relative humidity environments. The spectral dosage and material damage were measured for each exposure
treatment and this data input into the cumulative damage model from which estimates of the spectral quantum yield were made.Variables affecting the accuracy of the measurements are discussed. # 2001 Published by Elsevier Science Ltd.
Keywords: Polymer coating; Cumulative damage model; Degradation; Environmental chamber; Exposure; Photodegradation; Quantitative; UV
1. Introduction
The ability to relate the service life performance of amaterial, component or system exposed in the labora-tory and the field is a universal need. If such a linkagecan be made, then it should be possible to greatly reducethe time to market for new products by substitutingshort-term laboratory exposure results for results fromlong-term field exposures. The ability to link field andlaboratory exposure data is particularly important inphotodegradation studies [1]. For example, in weath-ering research, field and laboratory exposure resultsmust be related to ensure that a polymeric system satis-fies minimum service life specifications and to assign anappropriate warranty time to a product. Likewise, in thebiological community, field and laboratory results needto be linked to develop policies to minimize the inci-dence of melanoma and non-melanoma cancers inhumans.
Efforts to relate field and laboratory exposure resultsfor polymeric materials have been on going for at least100 years [1]. This effort is complicated by many factors,including the lack of reproducibility and repeatability offield exposure results [2]. The lack of reproducibility andrepeatability of field exposure results is not surprisingbecause the elements of the weather are known not tocycle over any time scale and they often exhibit a non-zero trend in their intensities over time [3,4].Although the weather never duplicates itself, linkage
between field and laboratory experiments can still beconstructed if the data collected from the field can bemade comparable to the data obtained in the labora-tory. Assuming that the data can be made comparable,then it should be possible to mathematically link fieldand laboratory exposure results through an appropriatechemical/physical model that accounts for the accumu-lation of field-exposed damage over time. Such modelsare called cumulative damage models. In the case of theweather, the elements of the weather cannot be con-trolled, but they can be monitored and characterized inthe same manner that these elements are monitored andcharacterized in the laboratory. In this way, field andlaboratory exposure environmental data can be made
0141-3910/01/$ - see front matter # 2001 Published by Elsevier Science Ltd.
PI I : S0141-3910(01 )00218-X
Polymer Degradation and Stability 75 (2002) 193–210
www.elsevier.com/locate/polydegstab
* Corresponding author. Tel.: +1-301-975-6707; fax: +1-301-990-
6891.
E-mail address: [email protected] (J.W. Martin).

comparable. Comparability of field and laboratoryexposure data can then be easily extended to the char-acterization of the initial and degraded properties of theexposed materials and in the way that field and labora-tory exposure data are analyzed, stored, retrieved, and,at some future date, reanalyzed.A methodology for linking field and laboratory
experiments including experimental protocols, dataanalysis techniques, storage, retrieval and reanalysis ofthe collected data has been formalized in the electronics,aerospace, medical, and nuclear industries for over 50years. This methodology is called reliability theory andlife testing analyses [5,6]. In this methodology, fieldexposure experiments are viewed as being just anotherlaboratory experiment, albeit one in which the exposureconditions cannot be controlled. Laboratory experi-ments are not designed to simulate the outdoors but areinstead systematically designed, using standard experi-mental design techniques, to cover the range of exposureconditions that a polymeric product will be exposed to inservice. Finally, the linkage between field and laboratoryexposure is made through a cumulative damage modelas opposed to using correlative techniques.The cumulative damage model selected for linking the
photodegradation response of polymeric materialsexposed in the field and laboratory has gained wide-spread acceptance in medical and biological studiessince the mid-1900s [7,8]. To date, this model, called thetotal effective dosage model, has had only limitedapplication in the materials community. The model hasa firm basis in the principles of photochemistry, includingthe Lambert–Beer law, the photochemical law, the reci-procity law and the spectral-independence-of-damageassumption, often called the law of additivity [9]. The totaleffective dosage model differs from generally acceptedfield exposure metrics such as total exposure time [10],total solar irradiance [11] and total-UV irradiance [12–14] in that absorbed spectral radiation is weighted as toits photolytic effectiveness. This weight is, of course, thespectral quantum yield. For most polymeric materials,quanta having a wavelength closer to 290 nm tend tohave a higher photolytic efficiency than do quanta hav-ing a longer wavelength. Broadband exposure metricslike total solar irradiance and total-UV irradianceassume that quantum efficiency for all incident wave-lengths have the same quantum efficiency. This mayexplain why these metrics have not been successful inlinking field and laboratory experimental results [14].The proposed reliability-based service life prediction
methodology is a predictive methodology, as opposedto a correlative methodology. As such, the reliability-based methodology requires that all systematic andexperimental errors be minimized. In our application,this implies that the weathering stresses must be con-trolled or monitored within very tight experimentallimits so that any variability in the degradation response
of a material is attributable to variations in the materialand not in the exposure conditions. To achieve this objec-tive, a laboratory apparatus has been designed and builtthat is capable of minimizing systematic errors introducedduring the exposure of the specimens. This apparatus isdescribed and its use in generating data for demonstratingthe cumulative damage model are presented.
2. Total effective dosage model
The dosage, defined as the number of photolyticallyeffective photons absorbed by a material, is given by
DdosageðtÞ ¼
ðt0
ðlmax
lmin
Eo l; tð Þ 1� 10Aðl;tÞ� �
dl dt ð1Þ
where
lmin and lmax = minimum and maximumphotolytically effectivewavelengths (units: nm),
A(l,t) = absorbance of the sampleat specified UV-visible wavelengthand at time t, (units: dimensionless),
Eo(l,t) = incident spectral UV-visibleradiation dose to which apolymeric material is exposedto at time t (units: J cm�2),
t = elapsed time (units: s).
The total effective dosage, Dtotal, is the total numberof absorbed photons that contribute to the photo-degradation of a material during an exposure period. Ithas the form
Dtotal tð Þ ¼
ðt0
ðlmax
lmin
Eo l ; tð Þ 1� 10�A l;tð Þ� �
� lð Þ dl dt ð2Þ
where
Dtotal(t) = total effective dosage (units: J) and� (l) = spectral quantum yield, the damage at
wavelength l relative to a referencewavelength (dimensionless),
Photolytic damage to a polymeric material has beenempirically related to dosage by a damage function.Commonly published damage functions include a linearresponse
� ¼ aDtotal
a power law response
� ¼ aðDtotalÞb
and an exponential response
194 J.W. Martin et al. / Polymer Degradation and Stability 75 (2002) 193–210

� ¼ a expðb DtotalÞ
where a and b are empirical constants and wheredamage is any quantitative, critical material perfor-mance characteristic.Once the spectral quantum yield has been estimated,
then this value can be substituted back into Eq. (2) andsolved for total effective dosage, Dtotal(l). In Eq. (1) and(2), the incident spectral UV-visible radiation dose canbe either constant (as, for example, in a laboratoryexposure environment) or it can be a time series (as, forexample, in a field exposure environment). Changes inthe spectral absorbance, (1–10�A(l,t)), and the spectralquantum yield, �(l,t), over time may depend on bothtemperature and moisture content of the sample as wellas the spectral ultraviolet dosage. The nature of thesedependencies will be explored in future publications.
3. Experiment
3.1. Materials
3.1.1. CoatingBauer and Gerlock [15,16] have extensively studied
the photochemistry of the model acrylic melaminecoating used in this study. The coating was made from amixture of a hydroxy-terminated acrylic polymer and apartially-alkylated melamine crosslinking agent in amass ratio of 70:30. The acrylic polymer contained 68%by mass fraction normal butylmethacrylate, 30%hydroxy ethylacrylate, and 2% acrylic acid. It was sup-plied as a mixture containing 70.2% by mass fractionacrylic polymer and 29.8% 2-heptanone. The cross-linking agent used was Cytex Industries Cymel 3251,which is a mixture containing 69% by mass fractionmelamine formaldehyde resin and 31% isobutanol sol-vent. Based on Fourier transform infrared (FTIR) evi-dence, the proposed structure of the cured coating ispresented in Fig. 1. The glass transition temperature ofthe cured coating as determined by differential scanningcalorimetry was 45�2 �C.
3.1.2. SubstratesThe acrylic melamine coating was spin-coated onto
one of three substrates: calcium fluoride, silicon, andquartz. Calcium fluoride (CaF2) disks, having a dia-meter of 100 mm and a thickness of 9 mm, were selectedfor the laboratory substrates. CaF2 is transparent in thewavelength from 0.13 to 11.5 mm and has excellentmoisture and heat resistance properties [17]. For thefield exposure experiments, silicon and quartz substrateswere selected due to the high cost of the CaF2 disks.Silicon is transparent in the 1.2 to 15 mm wavelengthsand is a suitable substrate for studying photodegrada-tion via FTIR analysis in the transmission mode.
Quartz is transparent from 0.12 to 4.5 mm and, there-fore, it is a suitable substrate for studying changes inspectral UV-absorbance.
3.1.3. Specimen preparationSolutions of acrylic polymer and melamine cross-
linking agent were mixed at the manufacturer’s suggestedratio, degassed, spread onto the substrates, and spin castat 2000 rpm for 30 s. The coatings were then cured at130 �C for 20 min. This schedule completely cured thecoatings as verified by Fourier transform infrared (FTIR)spectroscopy. Cured coating film thickness was 10.0�1.2mm as estimated by a prism coupling technique.
3.2. Apparatus
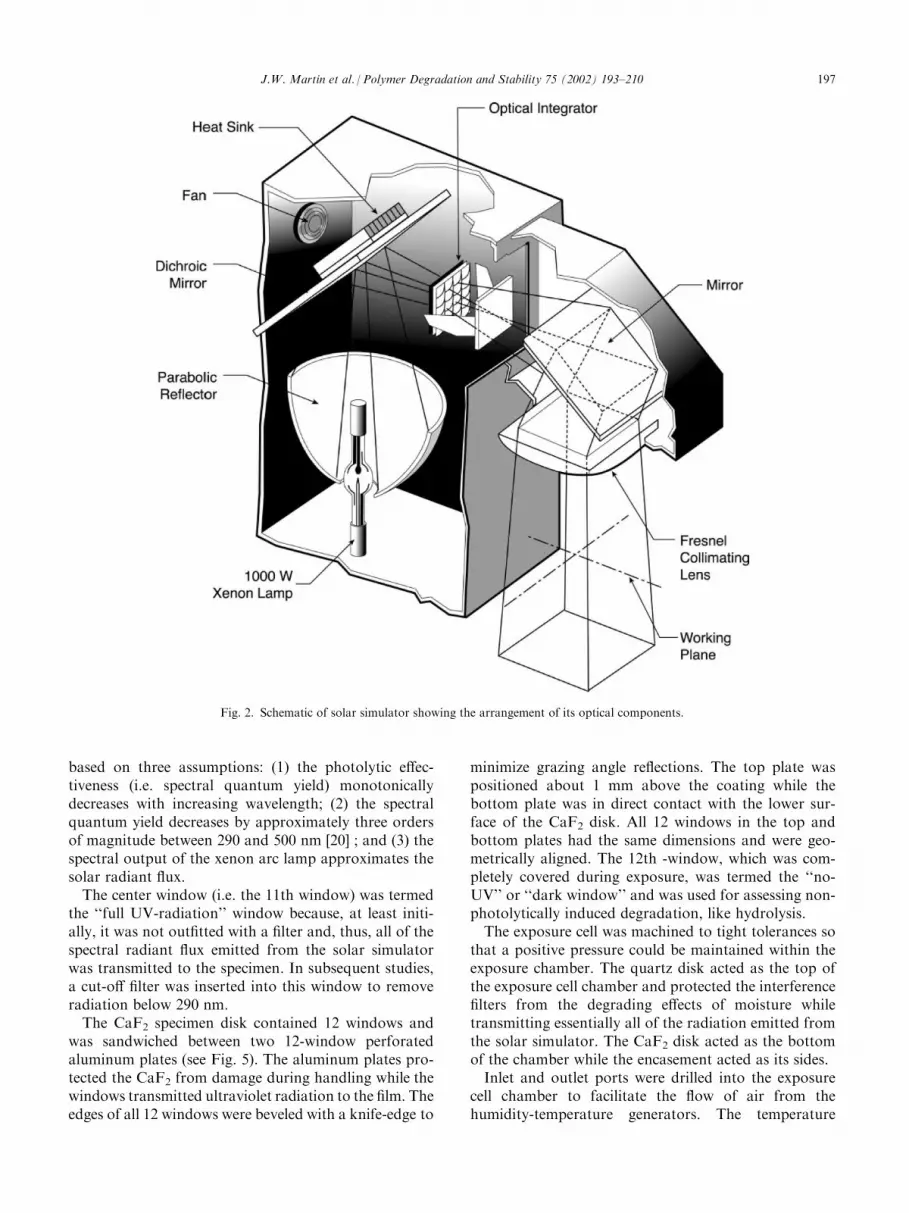
3.2.1. Solar simulatorsTwo Oriel Instruments solar simulators1 were used in
this study. A schematic of the simulator is shown inFig. 2. Each solar simulator’s optical system is com-prised of a 1000 W xenon arc lamp, a parabolic mirror,a dichroic mirror, an optical integrator, a cold mirror, a36 cm diameter Fresnel collimating lens, and a lightintensity controller (not shown).Radiation emitted from the xenon arc lamp is reflected
off the parabolic and dichroic mirrors and is projectedthrough the optical integrator. The dichroic mirrorremoves most of the visible and infrared portions of thexenon arc spectrum. Visible and infrared radiation istransmitted through the dichroic mirror and is absorbedby a heat sink. The ultraviolet portion of the xenon arcspectrum remains intact and is reflected off the dichroicmirror and projected through the optical integrator. Theoptical integrator homogenizes the beam while the Fres-nel lens collimates the beam. For our setup, the irra-diance-induced temperature change of the specimens wasless than 2 �C above the ambient room temperature.Each simulator was equipped with a light intensity
controller that regulates the electrical current densitysupplied by the power supply to the xenon arc lamp. Afiber optic cable leading to the light intensity controlleris positioned into the path of the collimated xenon arcbeam to monitor its radiant flux. Whenever the radiantflux falls outside the controller setpoint values (as wouldoccur when the lamp ages or line voltage variations), theelectrical current density is adjusted until the radiantflux again falls within the setpoint values. Regulation ofthe light source intensity was continuously and auto-matically performed throughout the experiment.
1 Certain commercial instruments and materials are identified in
this paper to adequately describe the experimental procedure. In no
case does such identification imply recommendation or endorsement
by the National Institute of Standards and Technology nor does it
imply that the instrument or materials are necessarily the best avail-
able for the purpose.
J.W. Martin et al. / Polymer Degradation and Stability 75 (2002) 193–210 195

3.3. Exposure cells
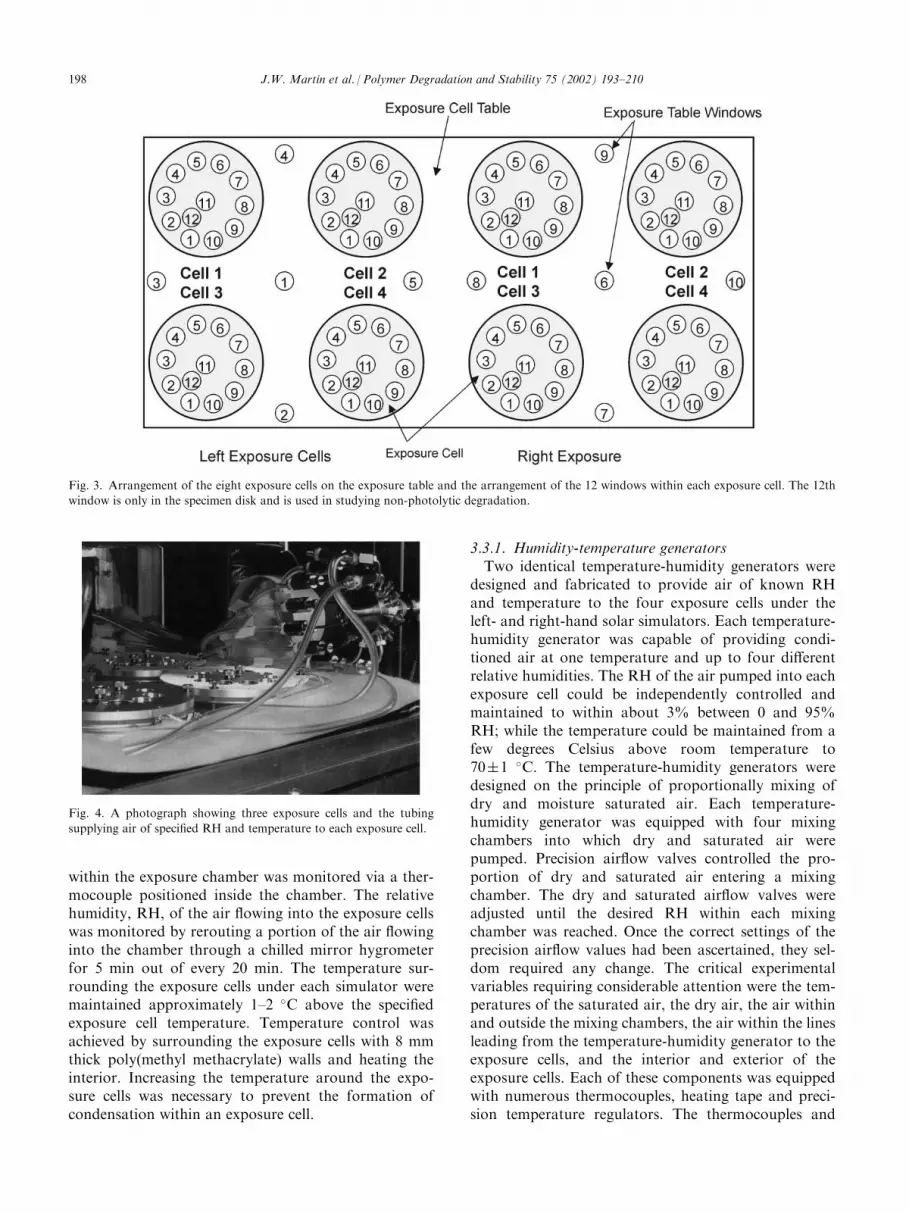
The laboratory exposure cells were designed tosimultaneously expose different sections of the same filmto 12 well-defined, spectral radiation bandwidths. Acomplete description of the exposure cell and thearrangement of exposure cells under the two solarsimulators have been presented in Ref. [18]. This sectionbriefly describes the design of an exposure cell and theirarrangement.The exposure cells were arranged as shown in Fig. 3.
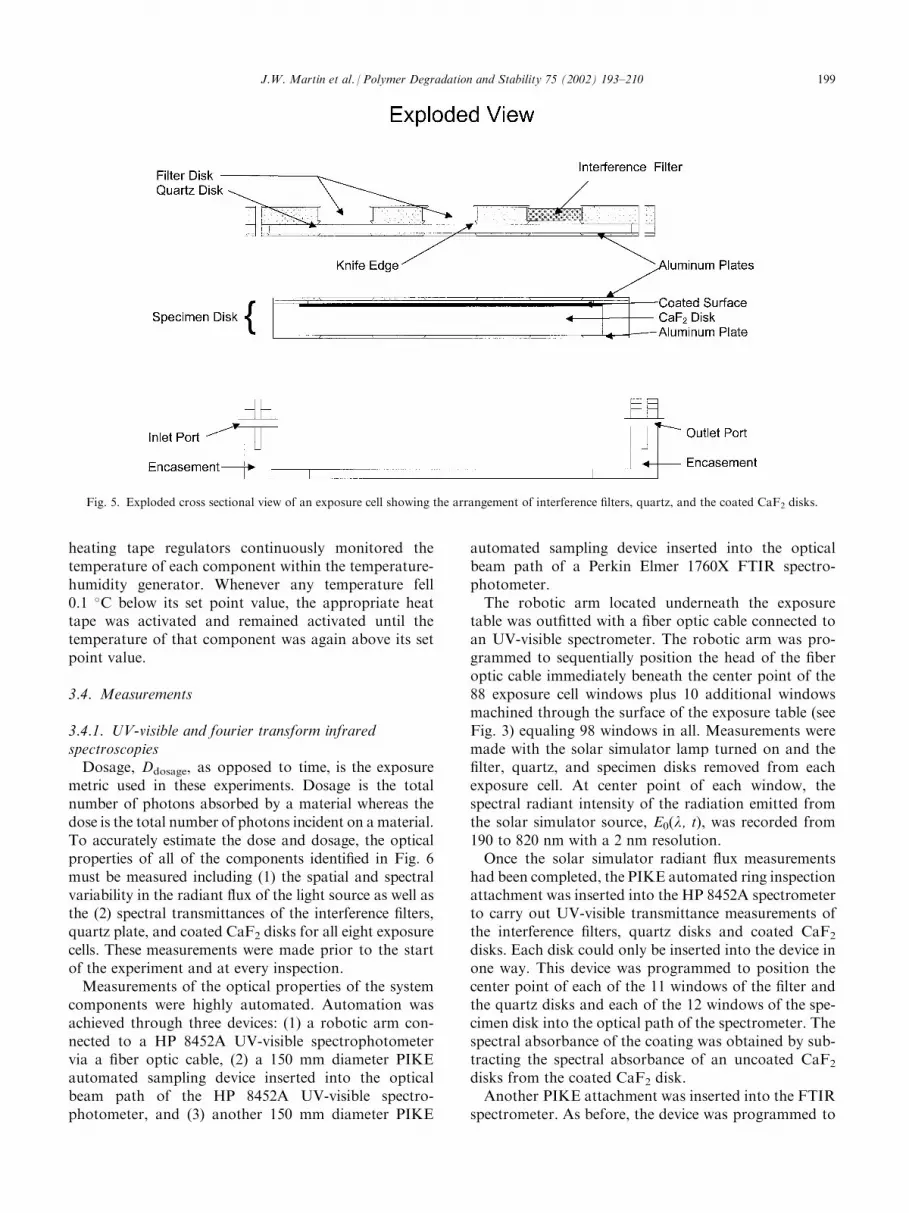
Exposure cells 1–4 were irradiated under the left-handsolar simulator while exposure cells 5–8 were irradiatedunder the right-hand simulator. A photograph of thisarrangement is presented in Fig. 4. In Fig. 4, three of thefour exposure cells positioned under one solar simulatorare shown. A cross-sectional view of an exposure cell isshown in Fig. 5. Each exposure cell had a layered con-struction that included a filter disk, a quartz disk, aCaF2 specimen disk and an encasement to hold thedisks. This layered construction facilitated the assemblyand disassembly of the exposure cell and, through theuse of pins, ensured that all of the disks could only beassembled in one way. The exposure cell encasementwas mechanically attached to the exposure cell table sothat the orientation of the each exposure cell (and thusthe exposure cell windows) remained in the same posi-tion throughout the experiment.
The filter disk contained 11 windows—10 on the diskperimeter and the eleventh in its center (the 12th win-dow is completely covered as shown in Fig. 3). Eachwindow was 16 mm in diameter. A slot was machinedinto the top of each window to support an interferencefilter and the bottom was beveled with a knife-edge tominimize grazing angle reflections from the interiorsides of the window.Each of the 10-perimeter windows was outfitted with
a narrow bandwidth interference filter covering a dif-ferent segment of the xenon arc radiant spectrum from290 to 550 nm. Nominally identical sets of interferencefilters were used in each of the eight-exposure cells. Thefirst eight interference filters had full-width-half-max-imum (FWHM) values between 2 and 10 nm and cov-ered the range between 290 and 340 nm. The nominalcenter wavelengths for these filters were 290, 294, 300,306, 312, 318, 326, and 336 nm. The two remaining filtershad FWHM values greater than 10 nm and had centerwavelengths of 354 and 450 nm. Averages and standarddeviations for the center wavelengths and FWHM valuesfor the ten filters are tabulated in Ref. [18]. The 290-nmcenter wavelength interference filter was selectedbecause 290 nm is the lowest radiation reaching theEarth’s surface [19]. These filter wavelengths were selectedto cover the range of suspected photolytic activity. TheFWHM for each filter was selected in an effort to degradethe coating at the same rate. This selection process was
Fig. 1. Postulated chemical structure of the cured partially-methylated melamine acrylic coating used in this study.
196 J.W. Martin et al. / Polymer Degradation and Stability 75 (2002) 193–210
based on three assumptions: (1) the photolytic effec-tiveness (i.e. spectral quantum yield) monotonicallydecreases with increasing wavelength; (2) the spectralquantum yield decreases by approximately three ordersof magnitude between 290 and 500 nm [20] ; and (3) thespectral output of the xenon arc lamp approximates thesolar radiant flux.The center window (i.e. the 11th window) was termed
the ‘‘full UV-radiation’’ window because, at least initi-ally, it was not outfitted with a filter and, thus, all of thespectral radiant flux emitted from the solar simulatorwas transmitted to the specimen. In subsequent studies,a cut-off filter was inserted into this window to removeradiation below 290 nm.The CaF2 specimen disk contained 12 windows and
was sandwiched between two 12-window perforatedaluminum plates (see Fig. 5). The aluminum plates pro-tected the CaF2 from damage during handling while thewindows transmitted ultraviolet radiation to the film. Theedges of all 12 windows were beveled with a knife-edge to
minimize grazing angle reflections. The top plate waspositioned about 1 mm above the coating while thebottom plate was in direct contact with the lower sur-face of the CaF2 disk. All 12 windows in the top andbottom plates had the same dimensions and were geo-metrically aligned. The 12th -window, which was com-pletely covered during exposure, was termed the ‘‘no-UV’’ or ‘‘dark window’’ and was used for assessing non-photolytically induced degradation, like hydrolysis.The exposure cell was machined to tight tolerances so
that a positive pressure could be maintained within theexposure chamber. The quartz disk acted as the top ofthe exposure cell chamber and protected the interferencefilters from the degrading effects of moisture whiletransmitting essentially all of the radiation emitted fromthe solar simulator. The CaF2 disk acted as the bottomof the chamber while the encasement acted as its sides.Inlet and outlet ports were drilled into the exposure
cell chamber to facilitate the flow of air from thehumidity-temperature generators. The temperature
Fig. 2. Schematic of solar simulator showing the arrangement of its optical components.
J.W. Martin et al. / Polymer Degradation and Stability 75 (2002) 193–210 197
within the exposure chamber was monitored via a ther-mocouple positioned inside the chamber. The relativehumidity, RH, of the air flowing into the exposure cellswas monitored by rerouting a portion of the air flowinginto the chamber through a chilled mirror hygrometerfor 5 min out of every 20 min. The temperature sur-rounding the exposure cells under each simulator weremaintained approximately 1–2 �C above the specifiedexposure cell temperature. Temperature control wasachieved by surrounding the exposure cells with 8 mmthick poly(methyl methacrylate) walls and heating theinterior. Increasing the temperature around the expo-sure cells was necessary to prevent the formation ofcondensation within an exposure cell.
3.3.1. Humidity-temperature generatorsTwo identical temperature-humidity generators were
designed and fabricated to provide air of known RHand temperature to the four exposure cells under theleft- and right-hand solar simulators. Each temperature-humidity generator was capable of providing condi-tioned air at one temperature and up to four differentrelative humidities. The RH of the air pumped into eachexposure cell could be independently controlled andmaintained to within about 3% between 0 and 95%RH; while the temperature could be maintained from afew degrees Celsius above room temperature to70�1 �C. The temperature-humidity generators weredesigned on the principle of proportionally mixing ofdry and moisture saturated air. Each temperature-humidity generator was equipped with four mixingchambers into which dry and saturated air werepumped. Precision airflow valves controlled the pro-portion of dry and saturated air entering a mixingchamber. The dry and saturated airflow valves wereadjusted until the desired RH within each mixingchamber was reached. Once the correct settings of theprecision airflow values had been ascertained, they sel-dom required any change. The critical experimentalvariables requiring considerable attention were the tem-peratures of the saturated air, the dry air, the air withinand outside the mixing chambers, the air within the linesleading from the temperature-humidity generator to theexposure cells, and the interior and exterior of theexposure cells. Each of these components was equippedwith numerous thermocouples, heating tape and preci-sion temperature regulators. The thermocouples and
Fig. 3. Arrangement of the eight exposure cells on the exposure table and the arrangement of the 12 windows within each exposure cell. The 12th
window is only in the specimen disk and is used in studying non-photolytic degradation.
Fig. 4. A photograph showing three exposure cells and the tubing
supplying air of specified RH and temperature to each exposure cell.
198 J.W. Martin et al. / Polymer Degradation and Stability 75 (2002) 193–210
heating tape regulators continuously monitored thetemperature of each component within the temperature-humidity generator. Whenever any temperature fell0.1 �C below its set point value, the appropriate heattape was activated and remained activated until thetemperature of that component was again above its setpoint value.
3.4. Measurements
3.4.1. UV-visible and fourier transform infraredspectroscopiesDosage, Ddosage, as opposed to time, is the exposure
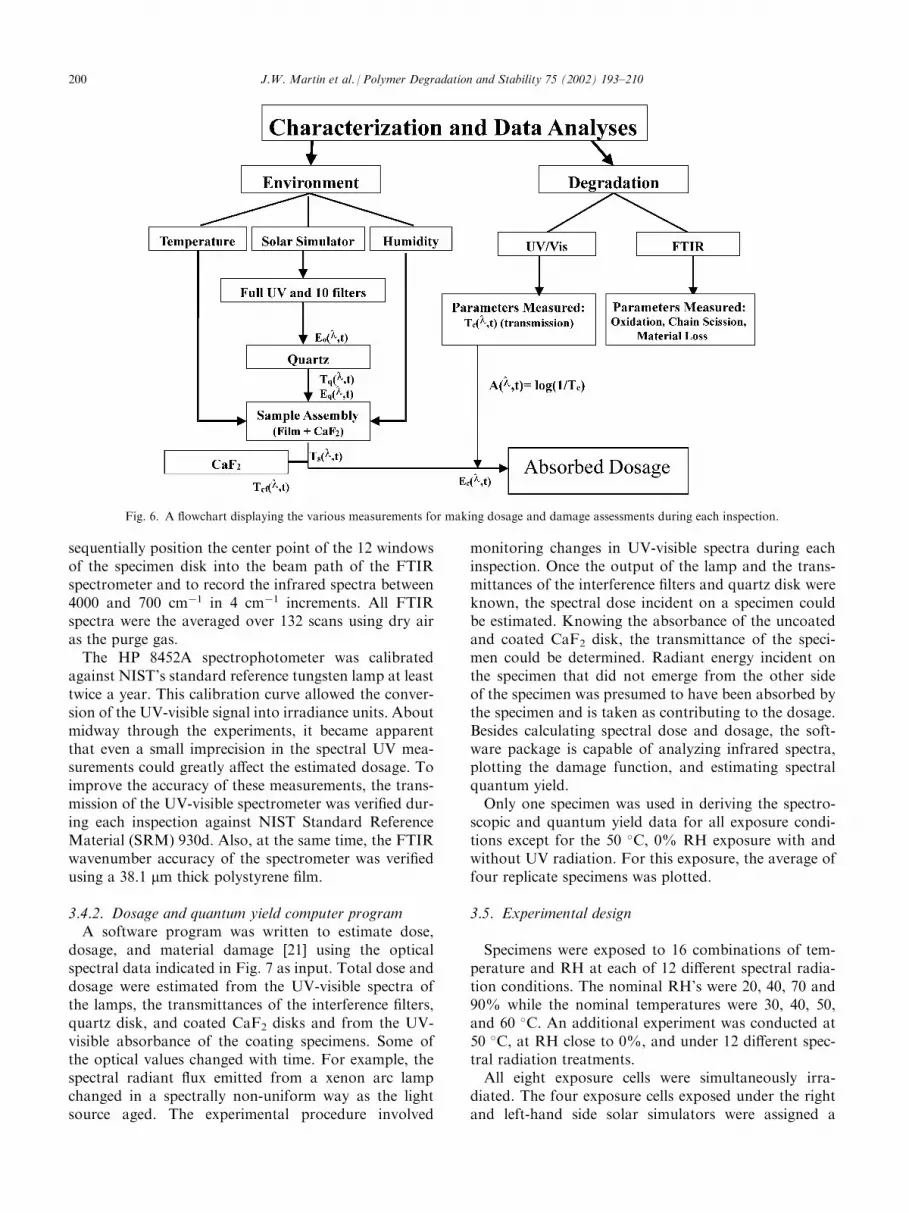
metric used in these experiments. Dosage is the totalnumber of photons absorbed by a material whereas thedose is the total number of photons incident on a material.To accurately estimate the dose and dosage, the opticalproperties of all of the components identified in Fig. 6must be measured including (1) the spatial and spectralvariability in the radiant flux of the light source as well asthe (2) spectral transmittances of the interference filters,quartz plate, and coated CaF2 disks for all eight exposurecells. These measurements were made prior to the startof the experiment and at every inspection.Measurements of the optical properties of the system
components were highly automated. Automation wasachieved through three devices: (1) a robotic arm con-nected to a HP 8452A UV-visible spectrophotometervia a fiber optic cable, (2) a 150 mm diameter PIKEautomated sampling device inserted into the opticalbeam path of the HP 8452A UV-visible spectro-photometer, and (3) another 150 mm diameter PIKE
automated sampling device inserted into the opticalbeam path of a Perkin Elmer 1760X FTIR spectro-photometer.The robotic arm located underneath the exposure
table was outfitted with a fiber optic cable connected toan UV-visible spectrometer. The robotic arm was pro-grammed to sequentially position the head of the fiberoptic cable immediately beneath the center point of the88 exposure cell windows plus 10 additional windowsmachined through the surface of the exposure table (seeFig. 3) equaling 98 windows in all. Measurements weremade with the solar simulator lamp turned on and thefilter, quartz, and specimen disks removed from eachexposure cell. At center point of each window, thespectral radiant intensity of the radiation emitted fromthe solar simulator source, E0(l, t), was recorded from190 to 820 nm with a 2 nm resolution.Once the solar simulator radiant flux measurements
had been completed, the PIKE automated ring inspectionattachment was inserted into the HP 8452A spectrometerto carry out UV-visible transmittance measurements ofthe interference filters, quartz disks and coated CaF2disks. Each disk could only be inserted into the device inone way. This device was programmed to position thecenter point of each of the 11 windows of the filter andthe quartz disks and each of the 12 windows of the spe-cimen disk into the optical path of the spectrometer. Thespectral absorbance of the coating was obtained by sub-tracting the spectral absorbance of an uncoated CaF2disks from the coated CaF2 disk.Another PIKE attachment was inserted into the FTIR
spectrometer. As before, the device was programmed to
Fig. 5. Exploded cross sectional view of an exposure cell showing the arrangement of interference filters, quartz, and the coated CaF2 disks.
J.W. Martin et al. / Polymer Degradation and Stability 75 (2002) 193–210 199
sequentially position the center point of the 12 windowsof the specimen disk into the beam path of the FTIRspectrometer and to record the infrared spectra between4000 and 700 cm�1 in 4 cm�1 increments. All FTIRspectra were the averaged over 132 scans using dry airas the purge gas.The HP 8452A spectrophotometer was calibrated
against NIST’s standard reference tungsten lamp at leasttwice a year. This calibration curve allowed the conver-sion of the UV-visible signal into irradiance units. Aboutmidway through the experiments, it became apparentthat even a small imprecision in the spectral UV mea-surements could greatly affect the estimated dosage. Toimprove the accuracy of these measurements, the trans-mission of the UV-visible spectrometer was verified dur-ing each inspection against NIST Standard ReferenceMaterial (SRM) 930d. Also, at the same time, the FTIRwavenumber accuracy of the spectrometer was verifiedusing a 38.1 mm thick polystyrene film.
3.4.2. Dosage and quantum yield computer programA software program was written to estimate dose,
dosage, and material damage [21] using the opticalspectral data indicated in Fig. 7 as input. Total dose anddosage were estimated from the UV-visible spectra ofthe lamps, the transmittances of the interference filters,quartz disk, and coated CaF2 disks and from the UV-visible absorbance of the coating specimens. Some ofthe optical values changed with time. For example, thespectral radiant flux emitted from a xenon arc lampchanged in a spectrally non-uniform way as the lightsource aged. The experimental procedure involved
monitoring changes in UV-visible spectra during eachinspection. Once the output of the lamp and the trans-mittances of the interference filters and quartz disk wereknown, the spectral dose incident on a specimen couldbe estimated. Knowing the absorbance of the uncoatedand coated CaF2 disk, the transmittance of the speci-men could be determined. Radiant energy incident onthe specimen that did not emerge from the other sideof the specimen was presumed to have been absorbed bythe specimen and is taken as contributing to the dosage.Besides calculating spectral dose and dosage, the soft-ware package is capable of analyzing infrared spectra,plotting the damage function, and estimating spectralquantum yield.Only one specimen was used in deriving the spectro-
scopic and quantum yield data for all exposure condi-tions except for the 50 �C, 0% RH exposure with andwithout UV radiation. For this exposure, the average offour replicate specimens was plotted.
3.5. Experimental design
Specimens were exposed to 16 combinations of tem-perature and RH at each of 12 different spectral radia-tion conditions. The nominal RH’s were 20, 40, 70 and90% while the nominal temperatures were 30, 40, 50,and 60 �C. An additional experiment was conducted at50 �C, at RH close to 0%, and under 12 different spec-tral radiation treatments.All eight exposure cells were simultaneously irra-
diated. The four exposure cells exposed under the rightand left-hand side solar simulators were assigned a
Fig. 6. A flowchart displaying the various measurements for making dosage and damage assessments during each inspection.
200 J.W. Martin et al. / Polymer Degradation and Stability 75 (2002) 193–210

different temperature. The two exposure temperaturesusually differed by 10 �C.
4. Results and discussion
4.1. Environmental characterization
4.1.1. Spatial uniformity, collimation and temporalstability of UV-visible light sourceMeasurements of spatial uniformity, collimation, and
temporal stability of the UV-visible light source havebeen graphically and tabularly presented in Ref. [18]. Ingeneral, the spectral radiant flux differed from one solarsimulator to another and differed from one lamp toanother. Moreover, the spatial variation in the radiantflux over the working plane of both simulators was high.The radiant flux at 380 nm of the right and left solar
simulator are displayed in Fig. 7a and b, respectively,
over the working plane of these devices. The mean andstandard deviation values for radiant fluxes at 380 nmfor the two solar simulators were 0.19�0.026 W/m2 and0.13�0.014 W/m2, respectively. The radiant flux fromthe right solar simulator was always 50% greater thanthe left simulator; even though the same type of lampwas used in both simulators. The spatial irradiance pat-tern differed from simulator to simulator and from lampto lamp within the same simulator. This high spatialvariability in the irradiance pattern necessitates a largenumber of measurements to characterize the spatialvariation. These measurements were made using therobotic arm positioned underneath the exposure celltable.The spectral radiant flux of the xenon arc light sour-
ces also changed with time. These changes differ fromone wavelength to another. For example, after 1500 h oflamp operation, the spectral radiant flux decreased withrespect to initial values at 290, 326 and 450 nm by 25,50, and 38%, respectively. These changes demonstratethe need for frequent spectral monitoring of the spectralradiant flux of the light source.Beam collimation and scattering of the radiation were
measured in both solar simulators. The degree of colli-mation was ascertained by measuring the radiant flux atthe center points of several randomly selected windows.Measurements started at a point immediately below theexposure cell window and, then, at 10 mm incrementsbelow this point until the sensor was 100 mm verticallybeneath its initial position. Measurements were made withthe fiber optic positioned at the end of the robotic arm andconnected to the UV-visible spectrometer. Radiant fluxmeasurements were plotted against vertical distance andregression analysis was performed. The slope of theregression curve was not significantly different from zerosuggesting that the radiant output from each solar simu-lator was highly collimated. The absence of stray lightincident on the covered 12th window was verified bypositioning the fiber optic probe immediately beneaththis window. No UV-visible radiation was detected.
4.1.2. Temporal stability of interference filters, quartzdisk and calcium fluoride diskThe CaF2 did not exhibit any transmittance loss. The
interference filters were photolytically and thermallystable except for the 450-nm filter. The transmittance lossfor this filter ranged from 2 to 7%. The quartz platesshowed a small transmission change over the course ofexposure. All of these changes were accounted for in thesoftware program used in calculating dose and dosage.
4.1.3. Temporal control of temperature and relativehumidity within the exposure cellsBoth temperatures and relative humidities were well
controlled. The standard deviations of the four RHlevels studied (20, 40, 70 and 90%) ranged between 3
Fig. 7. Examples of results on spatial uniformity of UV light source;
(a) right solar simulator, and (b) left solar simulator.
J.W. Martin et al. / Polymer Degradation and Stability 75 (2002) 193–210 201

and 6.8% and the standard deviations of the four tem-peratures (30, 40, 50, and 60 �C) ranged between 0.4 and1 � C [18]. With further refinement of the temperature-humidity generators, RH was controllable to within �
2% near the end of the experiment.
4.2. Coating degradation
4.2.1. UV-visible spectroscopy analysisUV-visible spectra of the initial acrylic resin, the mel-
amine crosslinking agent, and the cured acrylic-mela-mine coating are displayed in Fig. 8. The cured coatingand its components absorb strongly at wavelengthsbelow 265 nm. In addition, the spectrum of the neatacrylic resin has a shoulder around 280 nm, but thisabsorption disappeared when the coating was cured.There is no evidence of appreciable absorbance atwavelengths above 280 nm in the cured coating. How-ever, Costa et al. [22] reported a weak absorption near300 nm in the melamine molecules, and Bauer [23] sug-gested that this absorption might contribute to thephoto-enhanced hydrolysis of acrylic-melamine coatingsexposed to UV radiation and moisture.
4.2.2. Fourier transform infrared spectroscopy analysisCuring of the coating was monitored by FTIR spec-
troscopy in the transmission mode. During curing, theintensity of a number of bands decreased, includingthose in the 3600 to 3100 cm�1 region and those at 1555,1085, and 910 cm�1. However, the intensity of the bandsat 1730, 1170 and 815 cm�1 remained essentially con-stant. The coating was considered to be fully cured after20 min at 130 �C since the FTIR intensity of the bandsat 910, 2825 and 3530 cm�1 did not change at longercure times at this temperature.Damage was recorded by FTIR spectroscopy in the
transmission mode. This measurement averages degra-dation through the coating thickness. Several examples
of FTIR results on coating degradation are given in thissection to demonstrate the approach for calculating thespectral quantum yield. The detailed effects of exposureconditions (humidity, temperature, and UV-visiblewavelength range) on coating degradation and quantumyield will be treated in separate publications.Fig. 9 presents FTIR spectra of (a) the unaged acrylic-
melamine coated CaF2, (b) the same coating after it hadbeen aged for 2040 h under full UV at 50 �C and closeto 0% RH, and (c) the difference between the aged andunaged samples. Intensive FTIR analyses of the acrylicresin and melamine crosslinking agent before mixing,the melamine model compounds, FTIR in-situ studiesduring curing, and the available literature [23–26] pro-vide the following spectral information. The majorFTIR bands of interest in a cured, unaged coating arethe absorptions at 3530 cm�1 (the OH group of theacrylic resin), near 3380 cm�1 (the OH and NH groupsof the melamine resin), and at 1085 and 1015 cm�1 (theC–O of the OCH2- groups). The band at 1730 cm
�1 isdue to the C¼O of the acrylic ester group. The bandnear 1555 cm�1 has been assigned recently by Larkin etal. [24] to three different groups: the triazine ring, CNstretch, and the CH2 band. Two important chemicalspecies, not visible in Fig. 9a but frequently used forcuring and degradation analyses of melamine-basedcoatings [23,25,26], are the bands at 910 cm�1 (OCH3)and at 815 cm�1 (the triazine ring out-of-plane defor-mation).From Fig. 9a, the cured film still contained a sub-
stantial amount of unreacted OH groups of the acrylicresin (3530 cm�1 band), unreacted methylol (3380 cm�1)or imino (3380 cm�1), and OCH3 groups (2825 cm
�1
and 910 cm�1) of the melamine crosslinking agent. Thepresence of these groups in the cured films greatlyaffects both the photolysis and hydrolysis of acrylicmelamine coatings.It is noted that, because the coating films used in this
study were relatively thick (approximately 10�1.2 mm),the FTIR intensity is high (e.g. Fig. 9a). However, ouranalysis of films of different thicknesses from 0.1 mm to10 mm applied to both the silicon and CaF2 substratesshowed that, except for the 1730 cm�1 band, little devia-tion from Beer’s absorption law was observed. Further,the use of thick films did not affect our ability to quanti-tatively monitor degradation because it allowed us todetect and follow subtle changes in weakly-absorbing IRbands and the appearance of new species that were pro-duced during exposure. This kind of information isimportant for understanding the degradation processesand for developing better models for predicting the ser-vice life of polymer coatings.In the difference spectrum in Fig. 9c, decreases in
intensity occurred in the 2750–3050 cm�1 and 1600–1000 cm�1 regions and increases in intensity occurred at1760, 1670, 1630, and 1420 cm�1 band and in the 3100–
Fig. 8. UV-vis spectra of neat melamine resin, neat acrylic resin, and
cured acrylic-melamine coating.
202 J.W. Martin et al. / Polymer Degradation and Stability 75 (2002) 193–210

3400 cm�1 region. Analysis of amide model compounds,D2O vapor treatment of amide compounds, and D2Otreatment of the UV-degraded specimens, all suggest thatthe band at 1670 cm�1 is due to the C¼O of an amide andthat the band at 1630 cm�1 is due to the NH of primaryamine or primary amide. These assignments are con-sistent with Lemaire’s scheme of photodegradation foracrylic melamine coatings [27] and with Colthup’s et al.[28] assignments of primary amines and primary amides.A typical example of the wavelength-specific effect of
UV-visible radiation (as defined by the center wave-length of each interference filter) on the degradation of
an acrylic melamine coating is shown in the FTIRspectra in Fig. 10. The FTIR spectra displayed are forspecimens that have been exposed for over 2000 h at50 �C and close to 0% RH exposed to full UV radiationand under the 318 nm interference filter. The photo-degradation response for the other nine interference fil-ters are similar to the 318 nm interference filter. Inaddition, the coating also underwent changes in theabsence of light and in very dry conditions (close to 0%RH), as evidenced by decreases in the FTIR intensitiesin various bands in the 3000–2850 cm�1 and 1000–1600cm�1 regions.
Fig. 9. FTIR spectra of acrylic melamine coating (a) unaged, (b) after exposure for 2040 h in full UV, 50 oC and close to 0% RH, and (c) difference
spectrum (b minus a).
J.W. Martin et al. / Polymer Degradation and Stability 75 (2002) 193–210 203

Changes in the coatings under very dry and no UVlight conditions are believed to be due to hydrolysisreactions. Water molecules required for these reactionsare believed to be the product from a number of che-mical reactions that might take place during curing orpost curing. These reactions include the self-condensa-tion of the melamine methylol group (–CH2OH), thereaction of the methylol group with the imino (NH)group, and reaction of the methylol with OH group ofthe polymers [26]. Since partially alkoxylated melamine-acrylic coatings are highly sensitive to hydrolysis [29],the effects of moisture on photodegradation of thiscoating must be quantitatively determined. Even forsamples exposed to dry conditions (e.g. Fig. 10), hydro-lysis results from post curing reactions as a type ofequilibration of the coatings and should not be ignored.For samples exposed to UV under different RH levels,hydrolysis due to both post curing and humidity mustbe accounted for. This can be accomplished by measur-ing the degradation of specimens protected from lightand subjected to dry and humid conditions.In this study, we used the amide C¼O band at 1670
cm�1 and the C–O band at 1085 cm�1 to follow theoxidation and crosslink chain scission, respectively.Bauer and coworkers have utilized the integrated area inthe 1550–1750 cm�1 region [15], or the intensity of the1630 cm�1 band [16], to follow the photo-oxidation ofacrylic melamine coatings exposed to UV. Further, theyused the band at 915 cm�1 (due to the C–O of OCH3) tomeasure the crosslink chain scission, and indicated thatcrosslink chain scission of this coating can be observedat the ether C–O bands at 915, 1015, or 1100 cm�1.Fig. 11 depicts an autocorrelation chart of IR absor-
bance using 1085 cm�1 as the reference band. Such aplot is useful in discovering the correlation of changes ofa number of functional groups in the infrared region
with the reference band. A correlation coefficient of oneindicates that a band is changing in the same directionas the reference band; a correlation of zero indicatesthat changes at a specific band have no relationship tochanges at the reference band; while a correlation coef-ficient of �1 indicates that changes at a band are inver-sely related to the reference band. In particular, thetrends for 1015, 1085 and 1495 cm�1 bands (in Fig. 10)are very well correlated so that only one of these absor-bances needs to be followed.Fig. 12a and b show FTIR intensity changes of the
1670 cm�1 (oxidation) and 1085 cm�1 (crosslink chainscission) bands, respectively, as a function of time underdifferent UV-visible conditions. The coefficients of var-iation for the results shown in these figures were < 7%.The autocorrelation plot (Fig. 11) shows that theseabsorbances are negatively correlated. That is, the 1085cm�1 band decreased in intensity during exposure whilethe 1670 cm�1 band increased. The changes in these bandintensities were due to photolysis because post-curingeffects have been removed. The photolysis of this coatingunder all the ten filters was relatively small, as evidencedby the small changes in the IR intensity even after over2000 h exposure. Among the filters, the photodegrada-tion appeared to be more severe at the 326 nm than forany other filters. Degradation of the coating under the294, 300 and 306 filters was all similar and was not assevere as under the 326 nm filter.
4.3. Dosage and quantum yield
Fig. 13a and b displays oxidation and crosslink chainscission, respectively, as a function of dosage for speci-mens exposed to full UV and the ten filters at 50 �C andclose to 0% RH. The dosage, i.e. the actual amount ofradiation absorbed by the coating, was calculatedaccounting for the contribution from all of the variablesshown in the scheme presented in Fig. 6. Among the
Fig. 10. FTIR difference spectra for coatings exposed for 2040 h to
different UV conditions at 50 �C and close to 0% RH.
Fig. 11. Autocorrelation plot showing the correlation between the
1085 cm�1 reference wavenumber and other wavenumbers in the
infrared region.
204 J.W. Martin et al. / Polymer Degradation and Stability 75 (2002) 193–210

filters, specimens exposed under 294, 300, and 306 nmfilters were least affected while specimens exposed underthe 326 nm filter were most affected, despite the fact thatthe highest dosage was recorded at the 354 nm filter.
The quantum yield is taken as the initial slope of thedamage/ dosage curve. The damage is expressed in IRabsorbance units, which are proportional to the con-centrations of the degraded species; and the dosage is
Fig. 12. FTIR intensity changes of the bands at 1670 cm�1 (a) and at 1085 cm�1 (b) versus exposure time for 10 interference filters and full UV.
Exposure conditions were 50 oC and close to 0% RH.
J.W. Martin et al. / Polymer Degradation and Stability 75 (2002) 193–210 205

expressed in Joules. The use of this initial slope avoidscomplications from multiple degradation processes andfrom potential shielding of the coating material bydegradation products absorbing radiation. In this
paper, the quantum yield was obtained from the slopeof the curve extending from 0 to 10% of the totaldosage. The slope was determined using a fourth-orderpolynomial function fitted to the damage versus dosage
Fig. 13. Oxidation (a) and crosslink chain scission (b) as a function of dosage for an acrylic melamine coating exposed to 50 �C and close to 0% RH
to full UV and under the 10 interference filters.
206 J.W. Martin et al. / Polymer Degradation and Stability 75 (2002) 193–210

data. One example of such fitting is shown in Fig. 14 forthe 1085 and 1670 cm�1 bands, where the symbols arethe experimental data and the solid lines are the fittedcurves. The initial part of the damage versus dosagecurves at 1085 cm�1 exhibits considerable scatter due toimprecision in the measurements of very small changesat early exposures. Nevertheless, the polynomial func-tion appears to fit most of the data well. Differentiatingthe polynomial gives the quantum yield at a givendosage. Since the damage/dosage relationship is notlinear, the damage/dosage slope falls off with dosage,presumably due to increasing shielding of the coating bydegradation products and to the consumption of weaklinks in the material.Fig. 15 presents typical apparent spectral quantum
yield curves for the oxidation and crosslink chain scis-sion of coatings exposed at 50 �C and close to 0% RHunder full UV and the ten interference filters. Theapparent quantum yield at 290 nm for oxidation was thehighest. In general, the quantum yields in all UV expo-sure conditions for this coating were small, as is typicalfor solid state reactions of polymers. Gupta et al. [30]have reported quantum yield values in the range of(0.003-0.007) � 0.002 for the photoFries rearrangementin polycarbonates exposed to 300–400 nm wavelengthradiation at temperatures 26 and 55 �C and at RH 0%and 100%; whereas the quantum yield of the same
material irradiated in solution has been reported to be0.18 [31]. Dan and Guillet [32] observed that quantumyield of the crosslink chain scission in glassy polymersincreases rapidly to the value obtained for the samepolymer in solution as the temperature is increased toabove the glass transition temperature. It should benoted that the quantum yield values obtained from thisstudy are in absorbance units per Joule, while thosefrom the literature are often expressed in number ofmolecules undergoing scission or oxidation. The resultsof this study, therefore, can not be compared directlywith published values. Efforts are underway, however,to measure the infrared absorption coefficients of thechemical species of interest. This information will per-mit the conversion of absorbance units to moles ormolecules and, hence, permit comparisons to be made.
4.4. Variables affecting total absorbed dosage andquantum yield calculations
Quantum yield is determined from the slope of thedamage/dosage curve. In our study, damage was mea-sured by FTIR spectroscopy. On the other hand, thedosage is calculated from the following measurements:(1) absorbance of UV-visible radiation in the coatings,
Fig. 14. Experimental and fitting FTIR degradation data as a func-
tion of dosage for (a)0 1670 cm�1 and (b) 1085 cm�1 bands. The initial
slopes of these curves are used for obtaining the quantum yield.
Fig. 15. Quantum yields of the oxidation (a) and crosslink chain scis-
sion (b) of an acrylic melamine coating exposed to 50 �C and close to
0% RH for full UV and 10 different interference filters.
J.W. Martin et al. / Polymer Degradation and Stability 75 (2002) 193–210 207

(2) changes in the specimen absorbance with exposureconditions, (3) intensity and distribution of the UV-visible source, and (4) transmittance of the filters, quartzwindow, and CaF2 substrate. The following factorsinfluence the damage/dosage relationship.
4.4.1. Effect of exposure on UV-visible absorption of thecoatingsThe UV-visible absorption spectra of the coatings
changed with time under all exposure conditions,including no-UV. These changes were probably due tothe formation of coating degradation products. It is notknown, at this time, whether these degradation productsshield the parent compounds from photolytic degrada-tion. Examples of changes in UV absorption withexposure time are displayed in Fig. 16 for specimensexposed under the 290 nm filter and no-UV at 50 �Cand close to 0% RH. Fig. 16b represents hydrolysis inthe dark, while Fig. 16a includes both the dark hydro-lysis and the photolysis under dry conditions. The dif-ference of these two figures provides the net effect due tophotolysis only, which is substantial as shown in
Fig. 16c. Before dosage (for the photolysis) is calcu-lated, these changes must be accounted for. The influ-ence of photodegradation products on dosage is given inFig. 17 for several filters. Fig. 17a displays the resultsfor the case when the effect of degradation products istaken into account and Fig. 17b when it is not; that is,using UV-visible absorption data of the unaged coat-ings. In general, the latter case necessarily results in alower estimate of dosage than the former.
4.4.2. Errors in FTIR and UV-visible spectroscopicmeasurementsIn many commercial coatings, dark reactions may
proceed under ‘‘normal’’ outdoor exposure conditionsto a much greater extent than do photolytically sensitivereactions. Subtracting two spectra (one containing theeffect of hydrolysis from one containing the effects ofhydrolysis and photolysis) essentially multiplies thespectral noise by
p2, other factors being equal. To
reduce background noise after hydrolysis reactions hasbeen subtracted, (1) the FTIR andUV-visible spectra mustbe accurately measured, (2) the specimens must be exposedto sufficient degrading radiation to ensure that the amountof degradation is greater than the background noise, (3)
Fig. 16. Effect of exposure time and exposure conditions on UV-visi-
ble absorption spectra of acrylic melamine coating: (a) 290 nm filter,
60 �C/42% RH, (b) no UV, 60 �C/42% RH, and (c) difference spectra
(b minus a) revealing the effect of photolysis.
Fig. 17. Effect of degradation products on calculated dosage for sev-
eral interference filters: (a) dosage using UV-visible absorption change
with exposure, and (b) dosage assuming no change in UV-visible
absorption due to exposure.
208 J.W. Martin et al. / Polymer Degradation and Stability 75 (2002) 193–210

baselines must be properly corrected before subtractingspectra, and (4) ablation must be treated correctly sothat samples of differing thicknesses can be compared.Many of these problems had been resolved before the
first set of data on coating degradation was collected,but some were not encountered until the analysis of thedata was in progress. Analysis of the first set of datashowed a need for better calibration of the UV-visibleand IR spectrometers. During the collection of a secondset of data, now underway, we have routinely re-cali-brated our UV-spectrophotometer using NIST’s stan-dard UV-visible spectrometer transmittance densityfilters (NIST Standard Reference Material SRM 930d)and of polystyrene films to monitor the performance ofthe FTIR spectrometer before taking the spectra of anysamples.
5. Conclusions
In this paper, a total effective dosage model was pre-sented for linking field and laboratory photodegrada-tion results for polymeric materials. Also presented werean experimental apparatus and the experimental proto-cols for estimating the model coefficients. The totaleffective dosage models has a firm basis in the principlesof photochemistry and has had extensive application inthe biological community. The primary inputs into themodel are dose, dosage and material damage. Given thisinput, the spectral quantum yield and the total effectivedosage for a study material can be estimated.The exposure apparatus was built so that the primary
exposure factors could be independently and accuratelycontrolled and monitored within very tight bounds overboth time and space. These factors included spectral UVradiation, temperature, and RH. Collimated UV radiationwas produced by two 1000 W xenon arc solar simulators.Narrow band interference filters were used to segment thexenon arc spectrum into narrow bandwidths. Spectral UV-visible spectroscopy was employed in making spectral doseand dosage measurements. Damage to the coating wasmeasured using Fourier transform infrared spectroscopy.Damage to the coating was attributed to hydrolysis, pho-tolysis, and moisture-enhanced photolysis.Experiments were conducted on the model coating to
cover a wide range of temperature and RH exposureconditions. A full 4�4�12 factorial experiment was con-ducted at four temperatures (30, 40, 50 and 60 �C), fourrelative humidities (20, 40, 70, and 90%) and 12 spectralwavebands. An additional experiment was conducted at50 C and 0% RH at all 12 spectral wavelengths.It was quickly determined that estimates of the total
effective dosage and spectral quantum yield were sensi-tive to a number of experimental variables including theinitial UV-visible absorbance of the coatings, formationof coating degradation products, and UV-visible and
FTIR measurement errors. The spectral data was inputinto a computer program to estimate the dosage, thespectral quantum yield, and the total effective dosage.This program provided near real-time updating of thetotal effective dosage model parameters using inputfrom the current inspection period and historical datastored in the computer from previous inspections.It was concluded from this study that the total effec-
tive dosage model appears to be a good model for link-ing field and laboratory exposure results. The exposureapparatus built for this experiment appears to greatlyreduced temporal and spatial variations in the intensityof the three primary weathering factors—spectral ultra-violet radiation, temperature and relative humidity. Itwas also shown that the experimental protocol formeasuring or estimating the parameters of the totaleffective dosage model could be automated and that theoutcome of these experiments for the study acrylic mel-amine coating are consistent with published results.
Acknowledgements
The research reported here is supported by a govern-ment/industry/university consortium on Service LifePrediction at NIST. Companies involved in thisconsortium include AKZO Nobel, ATOFINA, AtlasElectric Devices Inc., Dow Chemical, Dupont Auto-motives, Duron Inc., Eastman Chemicals, MillenniumInorganic Chemicals, PPG, and Sherwin Williams Co.The Federal Highway Administration and Air ForceResearch Laboratory provided additional funds for thisresearch.
References
[1] Martin JW, Saunders SC, Floyd FL, Wineburg JP. Methodolo-
gies for predicting the service life of coatings. Federation Series
on Coatings Technology. PA: Federation of Societies for Coat-
ings Technology, 1996.
[2] Martin JW. In: Ryntz R, editor. Plastics and coatings. Munich:
Carl Hansser GmbH & Co, 2001. p 23.
[3] Karl TR. Natural climate viability on decade-to-century time
scales. Washington, DC: National Academy Press, 1995.
[4] Burroughs WJ. Weathering cycles real or imaginary. New York:
Cambridge University Press, 1992.
[5] Meeker WQ, Escobar LA. Statistical methods for reliability ana-
lysis. New York: Wiley, 1998.
[6] Elandt-Johnson RC, Johnson NL. Survival models and data
analysis. New York: Wiley Classics Library, 1980.
[7] Norins AL. In: Urbach F, editor. The biological effects of ultra-
violet radiation. New York: Pergamon Press, 1969. p. 605.
[8] Setlow R. Adv Biol Med Physiol 1957;5:37.
[9] Sayre RM, Olson RL, Everett MA. J Investigative Dermatology
1966;46:240.
[01] Clapson WJ, Schaeffer JA. J Ind Chem Eng 1934;26:956.
[11] Melchore JA. Industrial and Engineering Chemistry, Product
Research and Development 1962;1:232.
J.W. Martin et al. / Polymer Degradation and Stability 75 (2002) 193–210 209

[12] Zerlaut GA, Rupp MW, Anderson TE. Proc SAE International
Congress, Paper 850378, Detroit, Febuary 1985.
[13] Zerlaut GZ, Ellinger ML. J Oil Colour Chem Ass 1981;64:387.
[14] Zerlaut GA. In: Ketola WD, Grossman D, editors. Accelerated
and outdoor durability testing of organic materials, ASTM STP
1202. Philadelphia, PA: American Society for Testing and Mate-
rials, 1993. p. 1.
[15] Bauer DR. Prog Org Coat 1986;14:218.
[16] Bauer DR, Gerlock JL, Mielewski DF. Polym Degrad Stab 1992;
36:9.
[17] Rancourt JD. Optical thin films, user’s handbook. New York:
McGraw-Hill, 1987.
[18] Martin JW, Byrd E, Embree E, Nguyen T. A collimated, spectral
ultraviolet radiation, temperature, and relative humidity con-
trolled exposure chamber. National Institute of Standards and
Technology Internal Report, in review.
[19] Klein K, Goldberg B. Proc Int Solar Energy Soc Conference
1978;1:400.
[20] Kampf G, Sommer K, Zirngiebl E. Prog Org Coat 1991;
19:69.
[21] Dickens B, Byrd E. Guide to using program to estimate UV
dosage and damage. National Institute of Standards and Tech-
nology Technical Note, in review.
[22] Costa GW, Hirt RC, Smalley DL. J Chem Phys 1950;18:434.
[23] Bauer DR and Briggs LM. In: Labana SS, Dickie RA, editors.
Characterization of highly crosslinked polymers, ACS Sympo-
sium Series 243. Washington, DC: American Chemical Society,
1983. p. 271.
[24] Larkin PJ, Makowski MP, Colthup NB. J Anal Chem Vibr
Spectr 1998;17:53.
[25] English AD, Spinelli HJ. In: Labana SS, Dickie RA, editors.
Characterization of highly crosslinked polymers, ACS Sympo-
sium Series 243. Washington, DC: American Chemical Society,
1984. p. 257.
[26] Bauer DR, Dickie RA. J Appl Polym Sci 1980;18:2014.
[27] Lemaire J, Siampiringue N. In: Martin J, Floyd L, Bauer D,
editors. Service life prediction of coatings and materials, ACS
Symposium Series 722. Washington, DC: American Chemical
Society, 1998. p. 246.
[28] Colthup NB, Daly LH, Wiberley SE. Introduction to infrared
and raman spectroscopy, 3rd ed. New York: Academic Press,
1990.
[29] Bauer DR. J Appl Polym Sci 1982;27:3651.
[30] Gupta A, Rembaum A, Moacanin J. Macromolecules 1978;
11:1285.
[31] Gupta A, Liang AR, Moacanin J, Goldbeck R, Kliger D. Mac-
romolecules 1980;13:262.
[32] Dan E, Guillet JE. Macromolecules 1973;6:230.
210 J.W. Martin et al. / Polymer Degradation and Stability 75 (2002) 193–210