registration document 2009 - totalenergies
TRANSCRIPT
Financial Report included
Registration Document 2009
ContentsChapters 3 (Management Report), 9 (Appendix 1, Consolidated Financial Statements) and 11 (Appendix 3, TOTAL S.A.) were established by theBoard of Directors on February 10, 2010, and have not been updated with subsequent events.
1KEY FIGURESOperating and market dataSelected financial information
p. 1p. 1p. 2
2BUSINESS OVERVIEWHistory and strategy of TOTALUpstreamDownstreamChemicalsInvestmentsOrganizational structureProperty, plant and equipmentOrganization chart
p. 7p. 8p. 9
p. 38p. 46p. 51p. 52p. 53p. 54
3MANAGEMENT REPORTSummary of results and financial positionLiquidity and capital resourcesResearch and developmentTrends and outlook
p. 57p. 58p. 64p. 66p. 68
4RISK FACTORSMarket risksIndustrial and environmental risksOther risksInsurance and risk management
p. 69p. 70p. 79p. 81p. 86
5CORPORATE GOVERNANCEReport of the Chairman of the Board ofDirectors (Article L. 225-37 of the FrenchCommercial Code)Statutory auditor’s report (Article L. 225-235 of the French Commercial code)ManagementStatutory auditorsCompensation of the board of directorsand executive officersEmployees, share ownership
p. 87
p. 88
p. 106p. 108p. 109
p. 110p. 128
6TOTAL AND ITSSHAREHOLDERSListing detailsDividendsShare buybacksShareholdersInformation for overseas shareholdersCommunication with shareholders
p. 133p. 134p. 139p. 141p. 146p. 151p. 153
7FINANCIAL INFORMATIONHistorical financial informationAudit of the historical financial informationAdditional informationDividend policyLegal and arbitration proceedingsSignificant changes
p. 157p. 158p. 158p. 159p. 159p. 159p. 164
8GENERAL INFORMATIONShare capitalArticles of incorporation and by-laws; otherinformationOther mattersDocuments on displayInformation on holdings
p. 165p. 166
p. 171p. 174p. 175p. 176
9APPENDIX 1 – CONSOLIDATEDFINANCIAL STATEMENTSStatutory auditors’ report on theconsolidated financial statementsConsolidated statement of incomeConsolidated balance sheetConsolidated statement of cash flowConsolidated statement of changes inshareholders’ equityConsolidated statement of comprehensiveincomeNotes to the consolidated financialstatements
p. 179
p. 180p. 182p. 183p. 184
p. 185
p. 186
p. 187
10APPENDIX 2 – SUPPLEMENTALOIL AND GAS INFORMATION(UNAUDITED)Oil and gas information pursuant to FASBAccounting Standards Codification 932Other information
p. 263
p. 264p. 280
11APPENDIX 3 – TOTAL S.A.Statutory auditors’ report on regulatedagreements and commitmentsStatutory auditors’ report on the annualfinancial statementsFinancial statements of TOTAL S.A. asparent companyNotes to financial statementsOther financial information concerning theparent companySocial and environmental informationConsolidated financial information for thelast five years
p. 281
p. 282
p. 284
p. 286p. 290
p. 304p. 309
p. 314
GLOSSARY
EUROPEAN CROSS-REFERENCE LIST
p. 315
p. 318
REGISTRATION DOCUMENT 2009
“I certify, after having taken all reasonable measures to this effect, that, to the best of my knowledge, the information contained in thisRegistration Document (Document de référence) is accurate and does not omit any material fact.
I certify, to the best of my knowledge, that the statutory and consolidated financial statements of TOTAL S.A. have been prepared inaccordance with applicable accounting standards and give a fair view of the assets, liabilities, financial position and results of the Companyand of all the entities taken as a whole included in the consolidation, and that the Management Report (Rapport de gestion) of the Board ofDirectors included on pages 57 through 68 of this Registration Document presents a fair view of the development and performance of thebusiness and financial position of the Company and of all the entities taken as a whole included in the consolidation, as well as a description ofthe main risks and uncertainties they are exposed to.
I have received a letter from the statutory auditors confirming that they have completed the work they undertook to audit the informationrelated to the financial situation and the financial statements included in this Registration Document, as well as a review of this document in itsentirety.
The statutory auditors have issued reports on the historical financial information contained in this Registration Document, included on pages180 and 284 of this document.”
Christophe de MargerieChief Executive Officer
The French language version of this Registration Document (Document de référence) was filed with the French Financial MarketsAuthority (Autorité des marchés financiers) on April 1, 2010 pursuant to Article 212-13 of the general regulations of the FrenchFinancial Markets Authority. It may be used in connection with a financial operation if supplemented by a prospectus for theoperation and a summary, each of which will have received the visa of the Financial Markets Authority.
In accordance with paragraphs VI and VIII of aforesaid Article 212-13, the French language version of this Registration Documentincorporates the Annual Financial Report referred to in paragraph I of Article L. 451-1-2 of the French Monetary and Financial Code
/ iTOTAL

Abbreviations
b: barrelcf: cubic feet/d: per day/y: per year€ : euro$ and/or dollar: U.S. dollart: metric tonboe: barrel of oil equivalentkboe/d: thousand boe/dkb/d: thousand b/dBtu: British thermal unitM: millionB: billionMW: megawattMWp: megawatt peakTWh: terawatt hourERMI: European Refining Margin Indicator. Refining margin indicator
after variable costs for a theoretical complex refinery locatedaround Rotterdam in Norther Europe that processes a mix ofcrude oil and other inputs commonly supplied to this region toproduce and market the main refined products at prevailingprices in this region.
IFRS: International Financial Reporting StandardsAPI: American Petroleum InstituteLNG: liquefied natural gas
LPG: liquefied petroleum gasROE: Return on EquityROACE: Return on Average Capital Employed
Conversion table
1 boe = 1 barrel of crude oil = approx. 5,490 cf of gas*1 b/d = approx. 50 t/y1 t = approx. 7.5 b (for a gravity of 37° API)1 Bm3/y = approx. 0.1 Bcf/d1 m3 = approx. 35.3 cf1 t of LNG = approx. 48 kcf of gas1 Mt/y of LNG = approx. 131 Mcf/d
* This ratio is based on the actual average equivalent energy content of TOTAL’snatural gas reserves and is subject to change.
Definitions
The terms “TOTAL” and “Group” as used in this Registration Document refer toTOTAL S.A. collectively with all of its direct and indirect consolidatedsubsidiaries located in, or outside of, France.
The terms “Company” and “issuer” as used in this Registration Document referonly to TOTAL S.A., the parent company of the Group.
© TOTAL S.A. April 2010.
TOTAL - Registration Document 2009
1KEY FIGURES
� Operating and market data
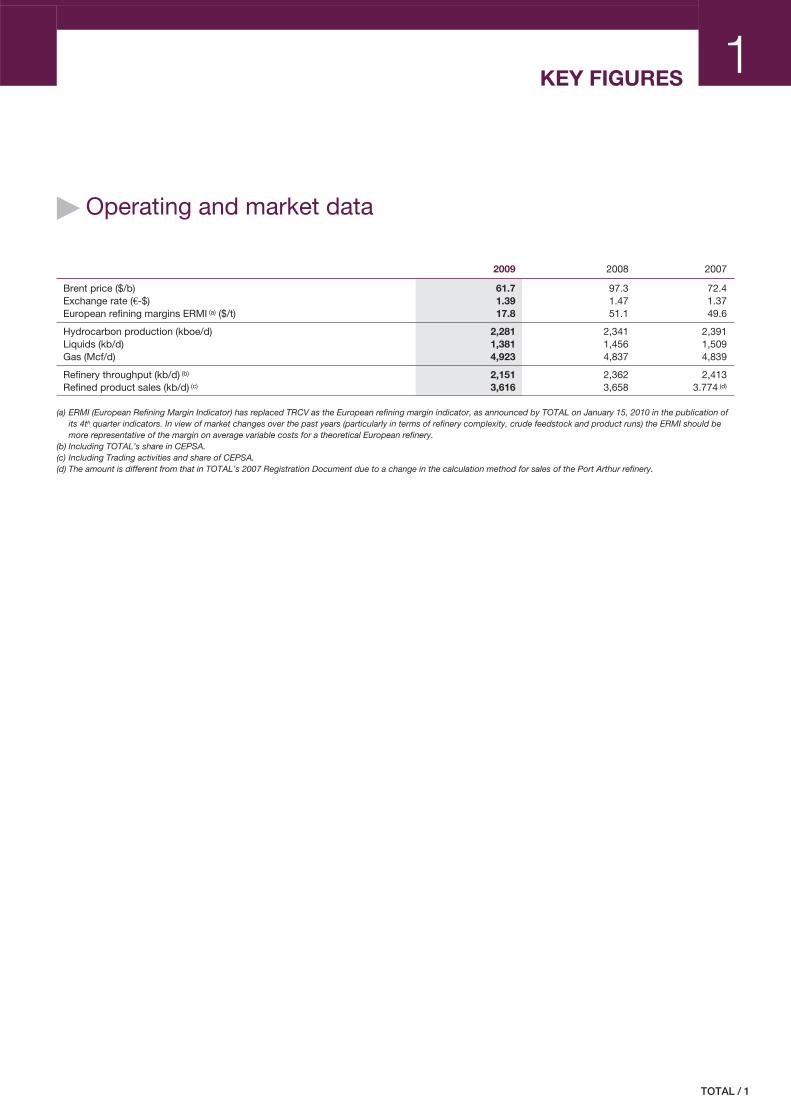
2009 2008 2007
Brent price ($/b) 61.7 97.3 72.4Exchange rate (€-$) 1.39 1.47 1.37European refining margins ERMI (a) ($/t) 17.8 51.1 49.6
Hydrocarbon production (kboe/d) 2,281 2,341 2,391Liquids (kb/d) 1,381 1,456 1,509Gas (Mcf/d) 4,923 4,837 4,839
Refinery throughput (kb/d) (b) 2,151 2,362 2,413Refined product sales (kb/d) (c) 3,616 3,658 3.774 (d)
(a) ERMI (European Refining Margin Indicator) has replaced TRCV as the European refining margin indicator, as announced by TOTAL on January 15, 2010 in the publication ofits 4th quarter indicators. In view of market changes over the past years (particularly in terms of refinery complexity, crude feedstock and product runs) the ERMI should bemore representative of the margin on average variable costs for a theoretical European refinery.
(b) Including TOTAL’s share in CEPSA.(c) Including Trading activities and share of CEPSA.(d) The amount is different from that in TOTAL’s 2007 Registration Document due to a change in the calculation method for sales of the Port Arthur refinery.
/ 1TOTAL
Selected financial informationKEY FIGURES1
� Selected financial information
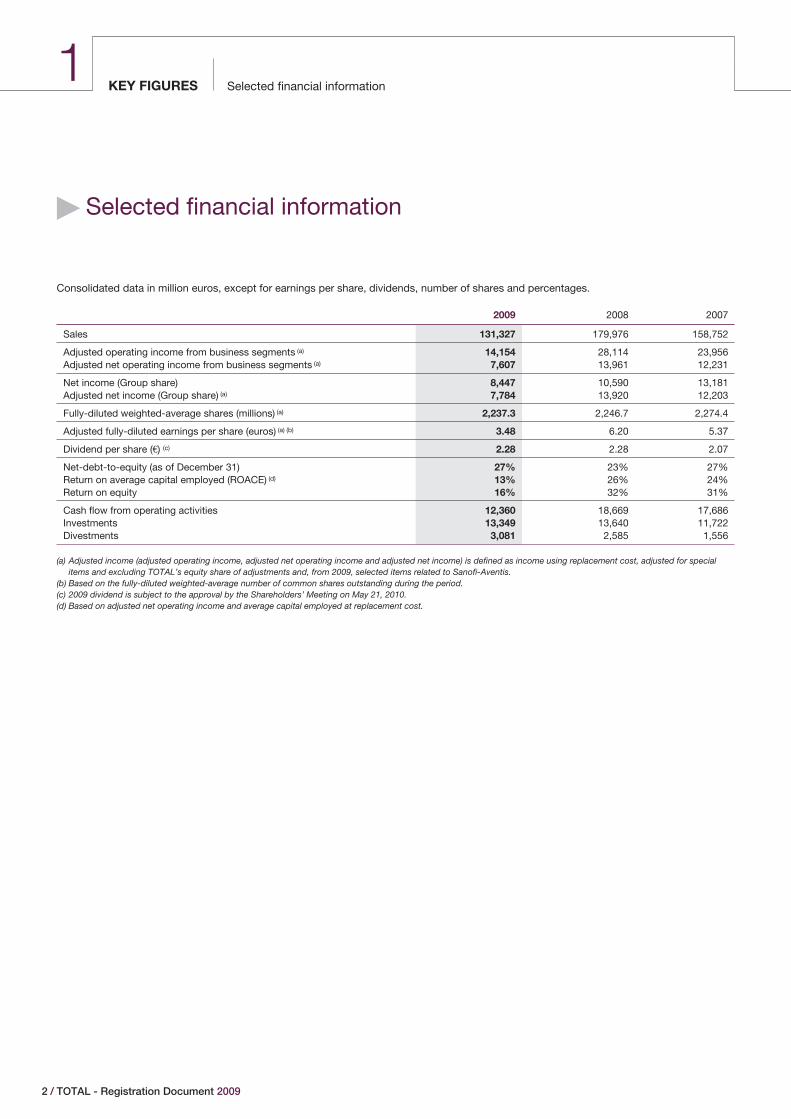
Consolidated data in million euros, except for earnings per share, dividends, number of shares and percentages.
2009 2008 2007
Sales 131,327 179,976 158,752
Adjusted operating income from business segments (a) 14,154 28,114 23,956Adjusted net operating income from business segments (a) 7,607 13,961 12,231
Net income (Group share) 8,447 10,590 13,181Adjusted net income (Group share) (a) 7,784 13,920 12,203
Fully-diluted weighted-average shares (millions) (a) 2,237.3 2,246.7 2,274.4
Adjusted fully-diluted earnings per share (euros) (a) (b) 3.48 6.20 5.37
Dividend per share (€) (c) 2.28 2.28 2.07
Net-debt-to-equity (as of December 31) 27% 23% 27%Return on average capital employed (ROACE) (d) 13% 26% 24%Return on equity 16% 32% 31%
Cash flow from operating activities 12,360 18,669 17,686InvestmentsDivestments
13,3493,081
13,6402,585
11,7221,556
(a) Adjusted income (adjusted operating income, adjusted net operating income and adjusted net income) is defined as income using replacement cost, adjusted for specialitems and excluding TOTAL’s equity share of adjustments and, from 2009, selected items related to Sanofi-Aventis.
(b) Based on the fully-diluted weighted-average number of common shares outstanding during the period.(c) 2009 dividend is subject to the approval by the Shareholders’ Meeting on May 21, 2010.(d) Based on adjusted net operating income and average capital employed at replacement cost.
2 / TOTAL - Registration Document 2009
1 2 3 4 5 6 7 8 9 10 11
Selected financial information KEY FIGURES
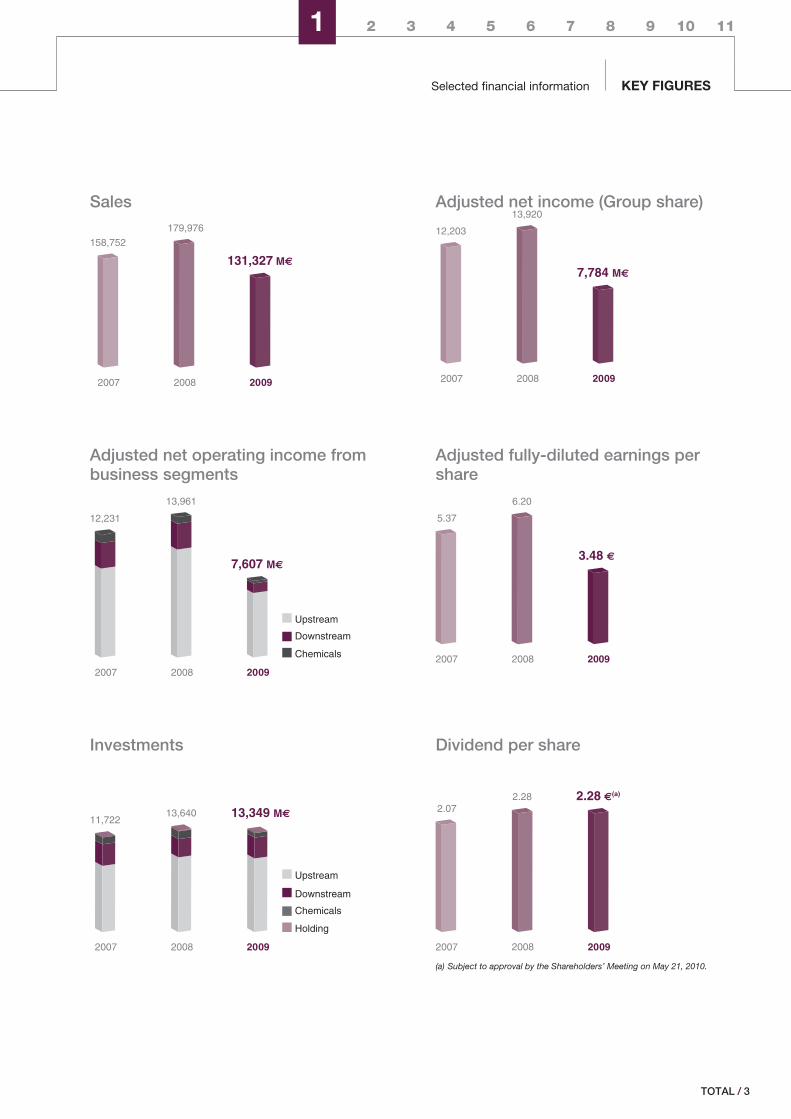
Sales Adjusted net income (Group share)
158,752
2007 2008 2009
179,976
131,327 M€
12,203
2007 2008 2009
13,920
7,784 M€
Adjusted net operating income frombusiness segments
Adjusted fully-diluted earnings pershare
7,607 M€
12,231
2007 2008 2009
13,961
Chemicals
Downstream
Upstream
5.37
2007 2008 2009
6.20
3.48 €
Investments Dividend per share
13,349 M€11,722
2007 2008 2009
13,640
Holding
Chemicals
Downstream
Upstream
20092007
2.072.28 €(a)
2008
2.28
(a) Subject to approval by the Shareholders’ Meeting on May 21, 2010.
/ 3TOTAL
Selected financial informationKEY FIGURES1
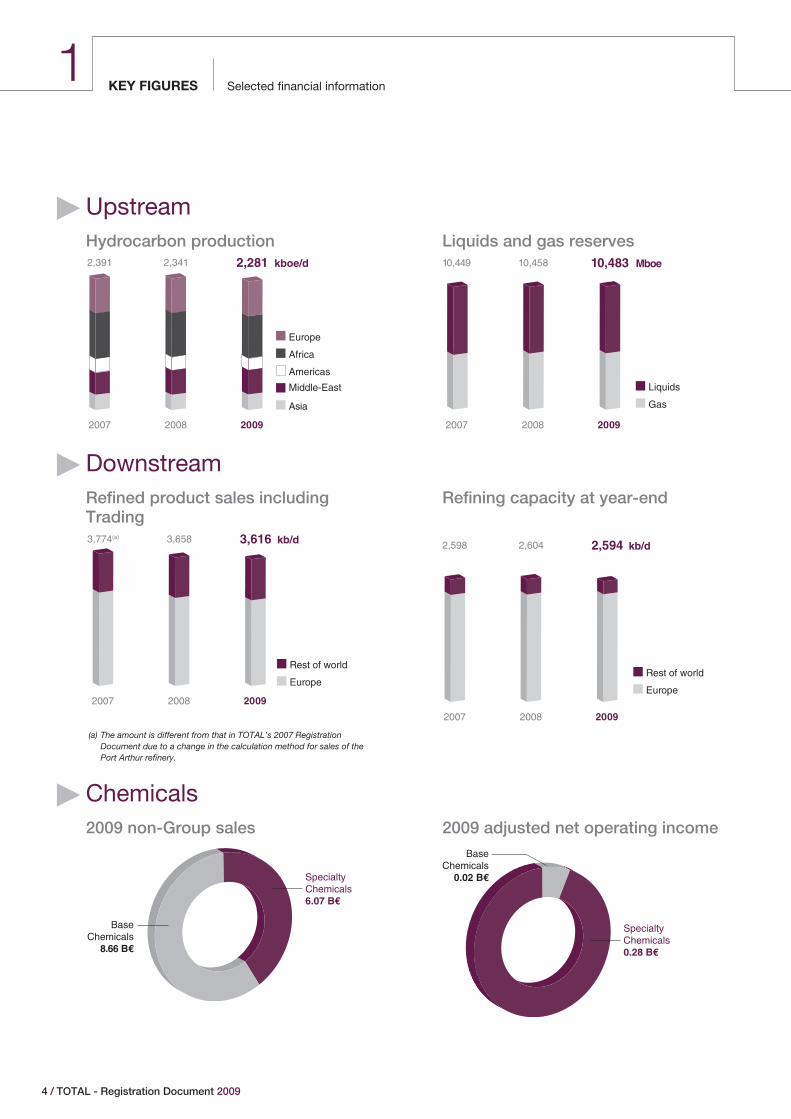
� UpstreamHydrocarbon production Liquids and gas reserves2,391
2007 2008 2009
2,341 2,281 kboe/d
Europe
Africa
Americas
Middle-East
Asia
10,449
2007 2008 2009
10,458 10,483 Mboe
Liquids
Gas
� DownstreamRefined product sales includingTrading
Refining capacity at year-end
3,774(a) 3,658 3,616 kb/d
2007 2008 2009
Rest of world
Europe
2,598
2007 2008 2009
2,604 2,594 kb/d
Rest of world
Europe
(a) The amount is different from that in TOTAL’s 2007 RegistrationDocument due to a change in the calculation method for sales of thePort Arthur refinery.
� Chemicals2009 non-Group sales 2009 adjusted net operating income
BaseChemicals
8.66 B€
SpecialtyChemicals6.07 B€
BaseChemicals
0.02 B€
SpecialtyChemicals0.28 B€
4 / TOTAL - Registration Document 2009
1 2 3 4 5 6 7 8 9 10 11
Selected financial information KEY FIGURES
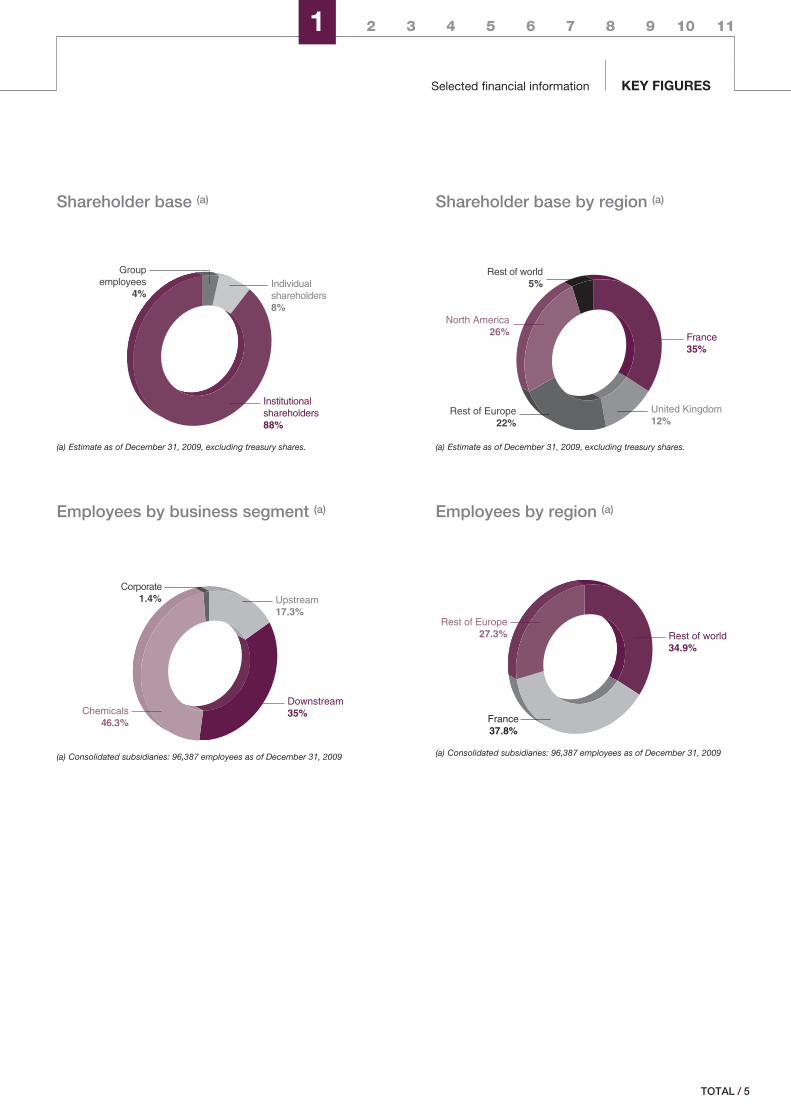
Shareholder base (a) Shareholder base by region (a)
Groupemployees
4%Individualshareholders8%
Institutionalshareholders88%
(a) Estimate as of December 31, 2009, excluding treasury shares.
Rest of Europe22%
Rest of world5%
France35%
United Kingdom12%
North America26%
(a) Estimate as of December 31, 2009, excluding treasury shares.
Employees by business segment (a) Employees by region (a)
Upstream17.3%
Downstream35%Chemicals
46.3%
Corporate1.4%
(a) Consolidated subsidiaries: 96,387 employees as of December 31, 2009
France37.8%
Rest of Europe27.3% Rest of world
34.9%
(a) Consolidated subsidiaries: 96,387 employees as of December 31, 2009
/ 5TOTAL
KEY FIGURES1
6 / TOTAL - Registration Document 2009
2BUSINESS OVERVIEW
HISTORY AND STRATEGY OF TOTAL p. 8
History and development p. 8Strategy p. 8
UPSTREAM p. 9Exploration & Production p. 11Exploration and development p. 11Reserves p. 11Proved reserves p. 11Sensitivity to oil and gas prices p. 12Production p. 12Production by geographic area p. 13Presentation of production activities by geographic area p. 14Africa p. 18North America p. 20South America p. 21Asia-Pacific p. 22Commonwealth of Independent States (CIS) p. 24Europe p. 25Middle East p. 27Oil and gas acreage p. 29Number of productive wells p. 29Number of net oil and gas wells drilled annually p. 30Drilling and production activities in progress p. 30Interests in pipelines p. 31Gas & Power p. 32Natural Gas p. 32Liquefied Natural Gas p. 33Liquefied Petroleum Gas p. 35Electricity and Cogeneration p. 35Renewable Energy p. 36Coal p. 37DME (Di-Methyl Ether) p. 37
DOWNSTREAM p. 38Refining & Marketing p. 39Refining p. 39Marketing p. 41
Trading & Shipping p. 44Trading p. 44Shipping p. 45
CHEMICALS p. 46Base Chemicals p. 47Petrochemicals p. 47Fertilizers p. 49
Specialty Chemicals p. 49Rubber processing p. 50Consumer products p. 50Resins p. 50Adhesives p. 50Electroplating p. 50
INVESTMENTS p. 51Principal investments made over the 2007-2009 period p. 51Principal investments anticipated p. 51
ORGANIZATIONAL STRUCTURE p. 52Position of the Company within the Group p. 52Principal subsidiaries p. 52
PROPERTY, PLANT AND EQUIPMENT p. 53
ORGANIZATION CHART AS OF JANUARY 1, 2010 p. 54
/ 7TOTAL
History and strategy of TOTALBUSINESS OVERVIEW2
1. Based on market capitalization (in dollars) as of December 31, 2009.
� History and strategy of TOTAL
� History and development
TOTAL S.A., a French société anonyme (limited company)incorporated in France on March 28, 1924, together with itssubsidiaries and affiliates, is the fifth largest publicly-tradedintegrated international oil and gas company in the world 1.
With operations in more than 130 countries, TOTAL engages in allaspects of the petroleum industry, including Upstream operations(oil and gas exploration, development and production, LNG) andDownstream operations (refining, marketing and the trading andshipping of crude oil and petroleum products).
TOTAL also produces base chemicals (petrochemicals andfertilizers) and specialty chemicals, mainly for the industrial market.In addition, TOTAL has interests in the coal mining and powergeneration sectors, as well as a financial interest in Sanofi-Aventis.
TOTAL began its Upstream operations in the Middle East in 1924.Since that time, the Company has grown and expanded itsoperations worldwide. In early 1999, the Company acquired controlof PetroFina S.A. and in early 2000, the Company acquired controlof Elf Aquitaine S.A. (hereafter referred to as “Elf Aquitaine” or “Elf”).
The Company’s corporate name is TOTAL S.A.
The Company’s registered office is 2 place Jean Millier,La Défense 6, 92400 Courbevoie, France.
The telephone number is +33 1 47 44 45 46 and the websiteaddress is www.total.com.
TOTAL S.A. is registered in France at the Nanterre Trade Registerunder the registration number 542 051 180.
� Strategy
TOTAL’s strategy, the implementation of which is based on a modelfor sustainable growth combining the acceptability of operationswith a sustained, profitable investment program, aims at:
o expanding hydrocarbon exploration and production activitiesthroughout the world, and strengthening its position as one of theglobal leaders in the natural gas and LNG markets;
o progressively expanding TOTAL’s energy offerings anddeveloping complementary next generation energy activities(solar, biomass, nuclear);
o adapting its refining system to market changes and, in themarketing business, consolidating its position in Europe, whilepursuing its targeted developments in Africa and the Asia-Pacificregion;
o developing its chemicals activities, particularly in Asia and theMiddle East, while improving the competitiveness of itsoperations in mature areas; and
o pursuing active research and development to develop “clean”sources of energy, contributing to the moderation of the demandfor energy, and combatting climate change.
8 / TOTAL - Registration Document 2009
1 2 3 4 5 6 7 8 9 10 11
Upstream BUSINESS OVERVIEW
� Upstream
TOTAL’s Upstream segment includes the Exploration &Production and Gas & Power divisions.
The Group has exploration and production activities in more thanforty countries of hydrocarbons and produces oil or gas in thirtycountries.
2.28 Mboe/d produced in 2009
10.5 Bboe of proved reserves as of December 31, 2009 1
€9.9 billion invested in 2009
16,628 employees
Upstream segment financial data
(M€) 2009 2008 2007
Non-Group sales 16,072 24,256 19,706Adjusted operating income 12,879 23,639 19,514Adjusted net operating income 6,382 10,724 8,849
Over the full year 2009, adjusted net operating income for theUpstream segment was €6,382 million compared to €10,724 millionin 2008, a decrease of 40%. Expressed in dollars, adjusted netoperating income for the Upstream segment was $8.9 billion, a44% decrease compared to 2008, essentially due to lowerhydrocarbon prices.
Technical costs for consolidated subsidiaries, in accordance withASC 932 2 (previously FAS69) were $15.4/boe in 2009, stablecompared to 2008, with a decrease of 8% in operating expensesper barrel offsetting an increase in depreciation, depletion andamortization (DD&A) charges related notably to the start-up of newprojects.
The return on average capital employed (ROACE 3) for the Upstreamsegment was 18% in 2009 compared to 36% in 2008.
Average gas and liquids price (a) 2009 2008 2007
Average liquids price ($/b) 58.1 91.1 68.9Average gas price ($/Mbtu) 5.17 7.38 5.40
(a) Consolidated subsidiaries, excluding fixed margin and buyback contracts.
TOTAL’s average liquids price decreased by 36% in 2009compared to 2008. TOTAL’s average gas price decreased by 30%.
Production
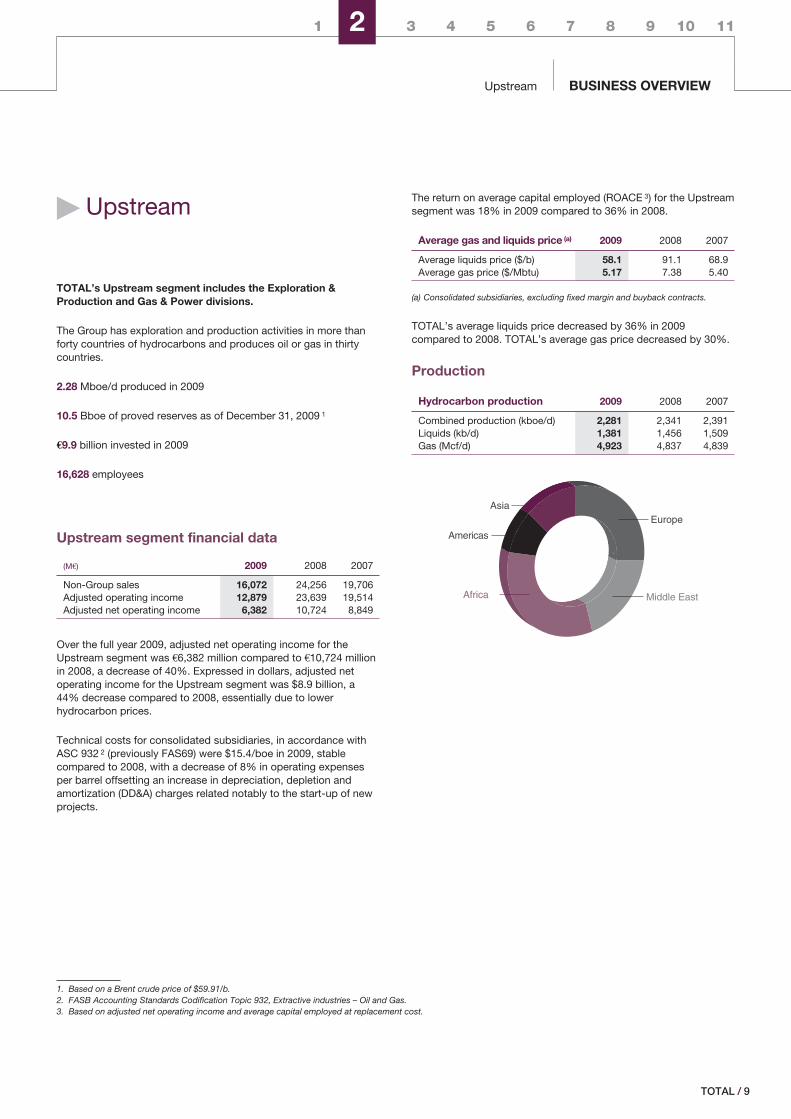
Hydrocarbon production 2009 2008 2007
Combined production (kboe/d) 2,281 2,341 2,391Liquids (kb/d) 1,381 1,456 1,509Gas (Mcf/d) 4,923 4,837 4,839
EuropeAsia
Americas
Middle EastAfrica
1. Based on a Brent crude price of $59.91/b.2. FASB Accounting Standards Codification Topic 932, Extractive industries – Oil and Gas.3. Based on adjusted net operating income and average capital employed at replacement cost.
/ 9TOTAL
UpstreamBUSINESS OVERVIEW2
For the full year 2009, hydrocarbon production was 2,281 kboe/d, adecrease of 2.6% compared to 2008, mainly as a result of:
o +2% for ramp-ups and start-ups of new fields net of the normaldecline;
o +1.5% for the price effect 1;
o -3% for OPEC reductions and lower gas demand;
o -1% for disruptions in Nigeria related to security issues; and
o -2% for changes in the portfolio, essentially in Venezuela andLibya.
Excluding the impact of OPEC reductions, production was stablecompared to 2008.
Reserves
As of December 31, 2009 2008 2007
Hydrocarbon reserves (Mboe) 10,483 10,458 10,449Liquids (Mb) 5,689 5,695 5,778Gas (Bcf) 26,318 26,218 25,730
EuropeAsia
Americas
Middle East
Africa
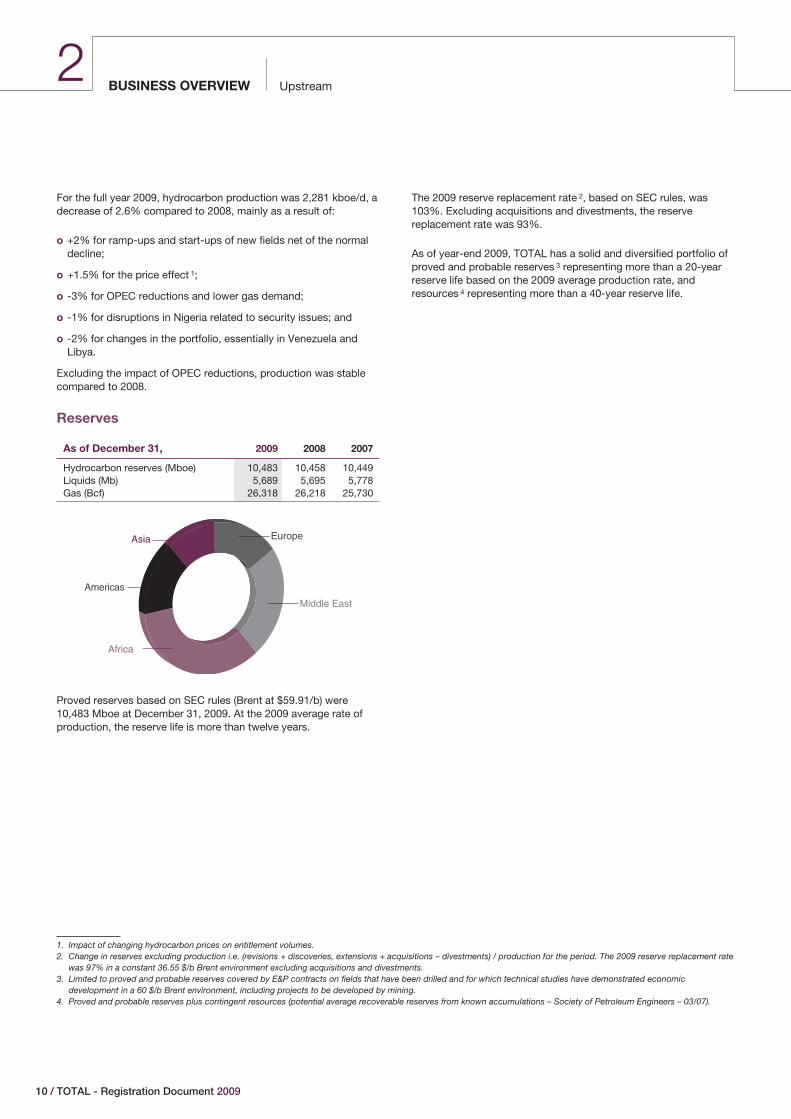
Proved reserves based on SEC rules (Brent at $59.91/b) were10,483 Mboe at December 31, 2009. At the 2009 average rate ofproduction, the reserve life is more than twelve years.
The 2009 reserve replacement rate 2, based on SEC rules, was103%. Excluding acquisitions and divestments, the reservereplacement rate was 93%.
As of year-end 2009, TOTAL has a solid and diversified portfolio ofproved and probable reserves 3 representing more than a 20-yearreserve life based on the 2009 average production rate, andresources 4 representing more than a 40-year reserve life.
1. Impact of changing hydrocarbon prices on entitlement volumes.2. Change in reserves excluding production i.e. (revisions + discoveries, extensions + acquisitions – divestments) / production for the period. The 2009 reserve replacement rate
was 97% in a constant 36.55 $/b Brent environment excluding acquisitions and divestments.3. Limited to proved and probable reserves covered by E&P contracts on fields that have been drilled and for which technical studies have demonstrated economic
development in a 60 $/b Brent environment, including projects to be developed by mining.4. Proved and probable reserves plus contingent resources (potential average recoverable reserves from known accumulations – Society of Petroleum Engineers – 03/07).
10 / TOTAL - Registration Document 2009
1 2 3 4 5 6 7 8 9 10 11
Upstream BUSINESS OVERVIEW
� Exploration & Production
‹ Exploration and development
TOTAL’s Upstream segment aims at continuing to combine long-term growth and profitability at the levels of the best in the industry.
TOTAL evaluates exploration opportunities based on a variety ofgeological, technical, political and economic factors (includingtaxes and license terms), and on projected oil and gas prices.Discoveries and extensions of existing fields accounted forapproximately 42% of the 2,419 Mboe added to the Upstreamsegment’s proved reserves during the three-year period endedDecember 31, 2009 (before deducting production and sales ofreserves in place and adding any acquisitions of reserves in placeduring this period). The remaining 58% comes from revisions ofprevious estimates.
In 2009, the exploration investments of consolidated subsidiariesamounted to €1,486 million (including unproved propertyacquisition costs). The main exploration investments were made inthe United States, Angola, the United Kingdom, Norway, Libya,Nigeria and the Republic of the Congo. In 2008, explorationinvestments of consolidated subsidiaries amounted to€1,243 million (including unproved property acquisition costs)notably in Angola, Nigeria, Norway, the United Kingdom, Australia,the United States, Libya, Brunei, Gabon, Cameroon, Indonesia,China, the Republic of the Congo and Canada. In 2007, explorationinvestments of consolidated subsidiaries amounted to€1,233 million (including unproved property acquisition costs),notably in Nigeria, Angola, the United Kingdom, Norway, Libya, theRepublic of the Congo, Australia, Venezuela, China, Indonesia,Canada, Brunei, Algeria, the United States, Mauritania, Yemen,Kazakhstan, Brazil, Azerbaijan and Thailand.
The Group’s consolidated Exploration & Production subsidiaries’development expenditures amounted to nearly €8 billion in 2009,primarily in Angola, Nigeria, Norway, Kazakhstan, Indonesia, theRepublic of the Congo, the United Kingdom, the United States,Gabon, Canada, Thailand, Russia and Qatar. In 2008, developmentexpenditures amounted to €7 billion, predominantly in Angola,Nigeria, Norway, Kazakhstan, Indonesia, the Republic of the Congo,the United Kingdom, Gabon, Canada, the United States, and Qatar.Development expenditures for 2007 amounted to €7 billion andwere carried out principally in Angola, Norway, Nigeria, Kazakhstan,the Republic of the Congo, the United Kingdom, Indonesia, Gabon,Canada, Qatar, Venezuela and the United States.
‹ Reserves
The definitions used for proved, proved developed and provedundeveloped oil and gas reserves are in accordance with the UnitedStates Securities & Exchange Commission (SEC) Rule 4-10 ofRegulation S-X as amended by the SEC Modernization of Oil andGas Reporting release issued on December 31, 2008. Provedreserves are estimated using geological and engineering data to
determine with reasonable certainty whether the crude oil or naturalgas in known reservoirs is recoverable under existing regulatory,economic and operating conditions.
TOTAL’s oil and gas reserves are consolidated annually, taking intoaccount, among other factors, levels of production, fieldreassessment, additional reserves from discoveries andacquisitions, disposal of reserves and other economic factors.Unless otherwise indicated, any reference to TOTAL’s provedreserves, proved developed reserves, proved undeveloped reservesand production reflects the Group’s entire share of such reserves orsuch production. TOTAL’s worldwide proved reserves include theproved reserves of its consolidated subsidiaries as well as itsproportionate share of the proved reserves of equity affiliates and oftwo companies accounted for under the cost method. For furtherinformation concerning changes in TOTAL’s proved reserves for theyears ended December 31, 2009, 2008 and 2007, see“Supplemental Oil and Gas Information (Unaudited)”.
The reserves estimation process involves making subjectivejudgments. Consequently, estimates of reserves are not exactmeasurements and are subject to revision under well-establishedcontrol procedures.
The reserves estimation process requires among others internalpeer reviews of technical evaluations to ensure that the SECdefinitions and guidance are followed; and that management makesignificant funding commitments towards the development of thereserves prior to booking (see “Supplemental Oil and GasInformation (Unaudited)” for more details on the preparation ofreserves estimates).
‹ Proved reserves
In accordance with the amended Rule 4-10 of Regulation S-X,proved reserves for the year ended December 31, 2009, arecalculated using a 12-month average price determined as theunweighted arithmetic average of the first-day-of-the-month pricefor each month of the relevant year unless prices are defined bycontractual arrangements, excluding escalations based upon futureconditions. The reference price for 2009 was $59.91/b for Brentcrude. The proved reserves for the years ended December 31, 2008and 2007, were calculated using December 31 prices.
As of December 31, 2009, TOTAL’s combined proved reserves ofoil and gas were 10,483 Mboe (56% of which were proveddeveloped reserves). Liquids (crude oil, natural gas liquids andbitumen) represented approximately 54% of these reserves andnatural gas the remaining 46%. These reserves were located inEurope (mainly in Norway and the United Kingdom), in Africa(mainly in Angola, Gabon, Libya, Nigeria and the Republic of theCongo), in the Americas (mainly in Canada, the United States,Argentina, and Venezuela), in the Middle East (mainly in Oman,Qatar, the United Arab Emirates, and Yemen), and in Asia (mainly inIndonesia and Kazakhstan).
As of December 31, 2008, TOTAL’s combined proved reserves ofoil and gas were 10,458 Mboe (50% of which were proveddeveloped reserves). Liquids represented approximately 54% ofthese reserves and natural gas the remaining 46%. These reserves
/ 11TOTAL
UpstreamBUSINESS OVERVIEW2
were located in Europe (mainly in Norway and the United Kingdom),in Africa (mainly in Algeria, Angola, Gabon, Libya, Nigeria and theRepublic of the Congo), in the Americas (mainly in Canada, Bolivia,Argentina, and Venezuela), in the Middle East (mainly in Oman,Qatar, the United Arab Emirates, and Yemen), and in Asia (mainly inIndonesia and Kazakhstan).
As of December 31, 2007, TOTAL’s combined proved reserves ofoil and gas were 10,449 Mboe (52% of which were proveddeveloped reserves). Liquids represented approximately 55% ofthese reserves and natural gas the remaining 45%. These reserveswere located in Europe (mainly in Norway and the United Kingdom),in Africa (mainly in Angola, Gabon, Libya, Nigeria and the Republicof the Congo), in the Americas (mainly in Canada, Argentina, andVenezuela), in the Middle East (mainly in Oman, Qatar, the UnitedArab Emirates, and Yemen), and in Asia (mainly in Indonesia andKazakhstan).
‹ Sensitivity to oil and gas prices
Changes in the price used as a reference for the proved reservesestimation result in non-proportionate inverse changes in provedreserves associated with production sharing and buybackagreements (which represent approximately 32% of TOTAL’sreserves as of December 31, 2009). Under such contracts, TOTALis entitled to a portion of the production, the sale of which is meantto cover expenses incurred by the Group. As oil prices increase,fewer barrels are necessary to cover the same amount of expenses.Moreover, the number of barrels retrievable under these contractsmay vary according to criteria such as cumulative production, therate of return on investment or the income-cumulative expensesratio. This decrease is partly offset by an extension of the durationover which fields can be produced economically. However, theincrease in reserves due to extended field life resulting from higherprices is generally less than the decrease in reserves underproduction sharing or buyback agreements due to such higherprices. As a result, higher prices lead to a decrease in TOTAL’sreserves.
‹ Production
For the full year 2009, average daily oil and gas production was2,281 kboe/d compared to 2,341 kboe/d in 2008.
Liquids accounted for approximately 61% and natural gasaccounted for approximately 39% of TOTAL’s combined liquidsand natural gas production in 2009.
The table on the next page sets forth by geographic area TOTAL’saverage daily production of liquids and natural gas for each of thelast three years.
Consistent with industry practice, TOTAL often holds a percentageinterest in its fields rather than a 100% interest, with the balancebeing held by joint venture partners (which may include otherinternational oil companies, state-owned oil companies orgovernment entities). TOTAL frequently acts as operator (the partyresponsible for technical production) on acreage in which it holdsan interest. See the table “Presentation of production activities bygeographic area” on the following pages for a description ofTOTAL’s producing assets.
As in 2008 and 2007, substantially all of the liquids production fromTOTAL’s Upstream segment in 2009 was marketed by theTrading & Shipping division of TOTAL’s Downstream segment. Seetable “Supply and sales of crude oil” on page 44 of this RegistrationDocument.
The majority of TOTAL’s natural gas production is sold under long-term contracts. However, its North American production, and tosome extent its production from the United Kingdom, Norway andArgentina, is sold on the spot market. The long-term contractsunder which TOTAL sells its natural gas usually provide for a pricerelated to, among other factors, average crude oil and otherpetroleum product prices, as well as, in some cases, acost-of-living index. Though the price of natural gas tends tofluctuate in line with crude oil prices, a slight delay may occurbefore changes in crude oil prices are reflected in long-term naturalgas prices. Due to the interaction between the contract price ofnatural gas and crude oil prices, contract prices are not usuallyaffected by short-term market fluctuations in the spot price ofnatural gas. Some of these long term contracts, notably inIndonesia, Qatar, Nigeria and Norway, also specify the delivery offixed and determinable quantities of natural gas. The Group expectsto satisfy most of these obligations through the production of itsproved developed reserves. In addition, the Group may purchasequantities on the spot market or use its undeveloped reserves tofulfill such commitments. See Chapter 10, “Supplemental Oil andGas Information (Unaudited)” of this Registration Document.
12 / TOTAL - Registration Document 2009
1 2 3 4 5 6 7 8 9 10 11
Upstream BUSINESS OVERVIEW
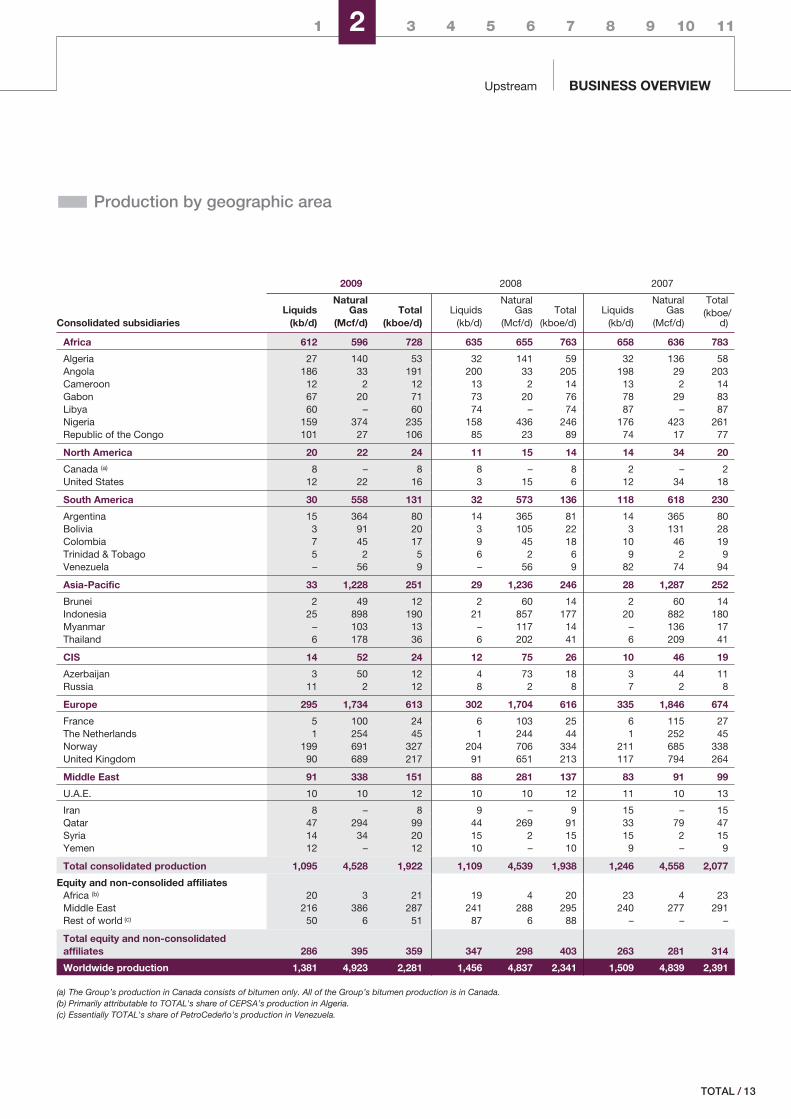
� Production by geographic area
2009 2008 2007
Consolidated subsidiariesLiquids
(kb/d)
NaturalGas
(Mcf/d)Total
(kboe/d)Liquids
(kb/d)
NaturalGas
(Mcf/d)Total
(kboe/d)Liquids
(kb/d)
NaturalGas
(Mcf/d)
Total(kboe/
d)
Africa 612 596 728 635 655 763 658 636 783
Algeria 27 140 53 32 141 59 32 136 58Angola 186 33 191 200 33 205 198 29 203Cameroon 12 2 12 13 2 14 13 2 14Gabon 67 20 71 73 20 76 78 29 83Libya 60 – 60 74 – 74 87 – 87Nigeria 159 374 235 158 436 246 176 423 261Republic of the Congo 101 27 106 85 23 89 74 17 77
North America 20 22 24 11 15 14 14 34 20
Canada (a) 8 – 8 8 – 8 2 – 2United States 12 22 16 3 15 6 12 34 18
South America 30 558 131 32 573 136 118 618 230
Argentina 15 364 80 14 365 81 14 365 80Bolivia 3 91 20 3 105 22 3 131 28Colombia 7 45 17 9 45 18 10 46 19Trinidad & Tobago 5 2 5 6 2 6 9 2 9Venezuela – 56 9 – 56 9 82 74 94
Asia-Pacific 33 1,228 251 29 1,236 246 28 1,287 252
Brunei 2 49 12 2 60 14 2 60 14Indonesia 25 898 190 21 857 177 20 882 180Myanmar – 103 13 – 117 14 – 136 17Thailand 6 178 36 6 202 41 6 209 41
CIS 14 52 24 12 75 26 10 46 19
Azerbaijan 3 50 12 4 73 18 3 44 11Russia 11 2 12 8 2 8 7 2 8
Europe 295 1,734 613 302 1,704 616 335 1,846 674
France 5 100 24 6 103 25 6 115 27The Netherlands 1 254 45 1 244 44 1 252 45Norway 199 691 327 204 706 334 211 685 338United Kingdom 90 689 217 91 651 213 117 794 264
Middle East 91 338 151 88 281 137 83 91 99
U.A.E. 10 10 12 10 10 12 11 10 13
Iran 8 – 8 9 – 9 15 – 15Qatar 47 294 99 44 269 91 33 79 47Syria 14 34 20 15 2 15 15 2 15Yemen 12 – 12 10 – 10 9 – 9
Total consolidated production 1,095 4,528 1,922 1,109 4,539 1,938 1,246 4,558 2,077
Equity and non-consolided affiliatesAfrica (b) 20 3 21 19 4 20 23 4 23Middle East 216 386 287 241 288 295 240 277 291Rest of world (c) 50 6 51 87 6 88 – – –
Total equity and non-consolidatedaffiliates 286 395 359 347 298 403 263 281 314
Worldwide production 1,381 4,923 2,281 1,456 4,837 2,341 1,509 4,839 2,391
(a) The Group’s production in Canada consists of bitumen only. All of the Group’s bitumen production is in Canada.(b) Primarily attributable to TOTAL's share of CEPSA’s production in Algeria.(c) Essentially TOTAL's share of PetroCedeño's production in Venezuela.
/ 13TOTAL
UpstreamBUSINESS OVERVIEW2
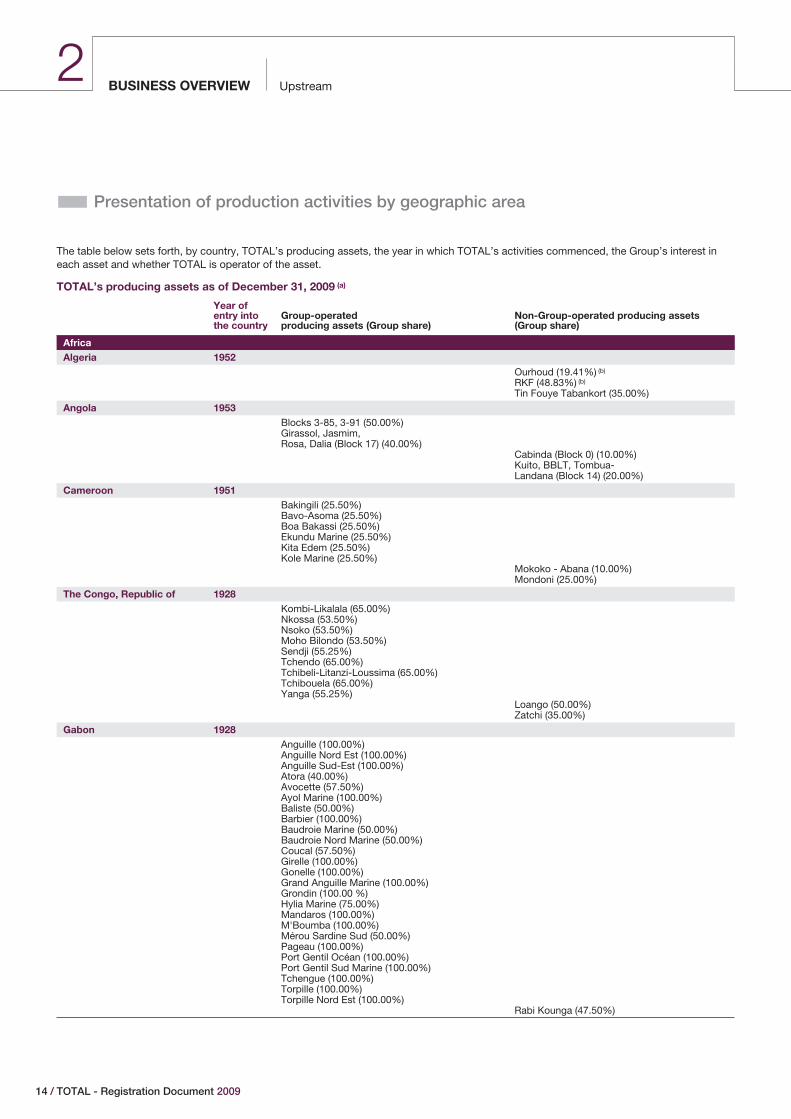
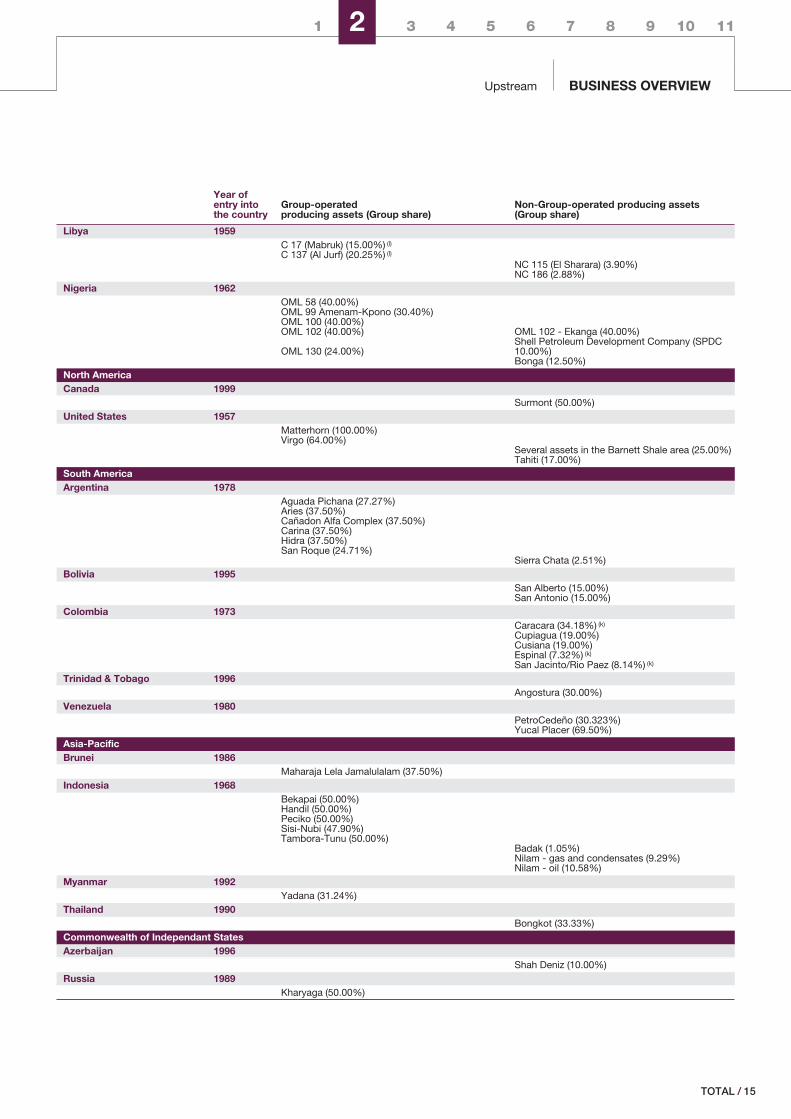
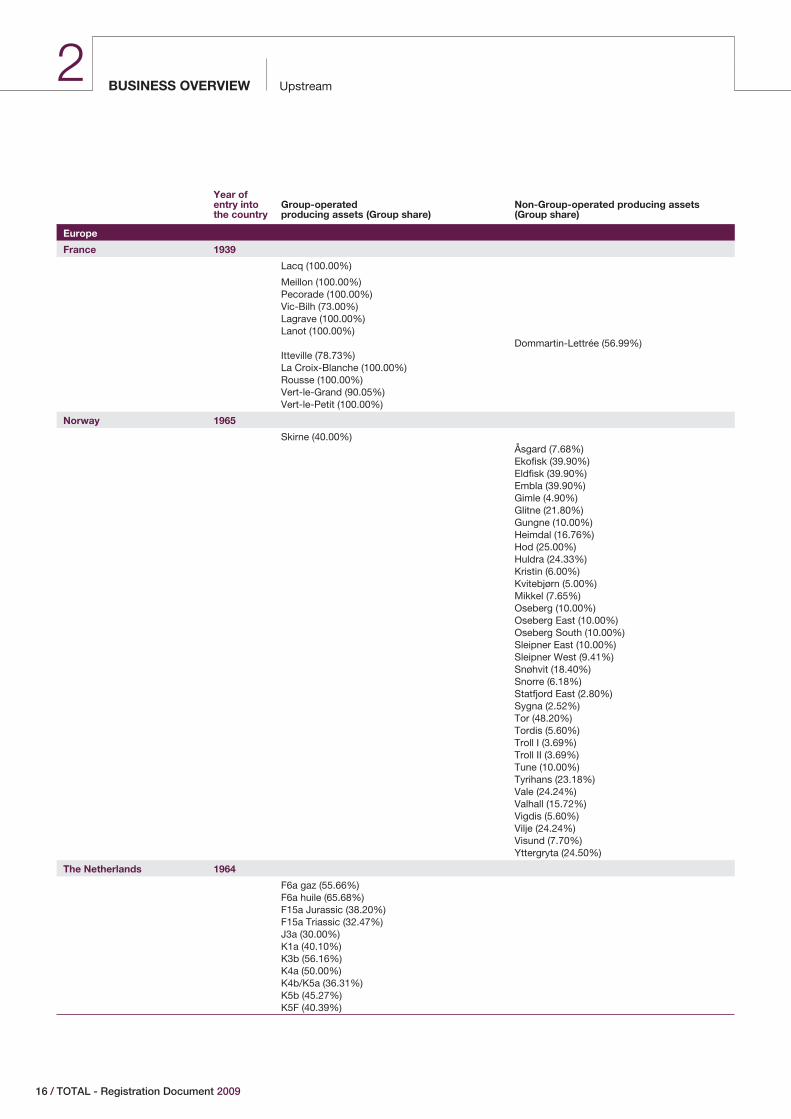
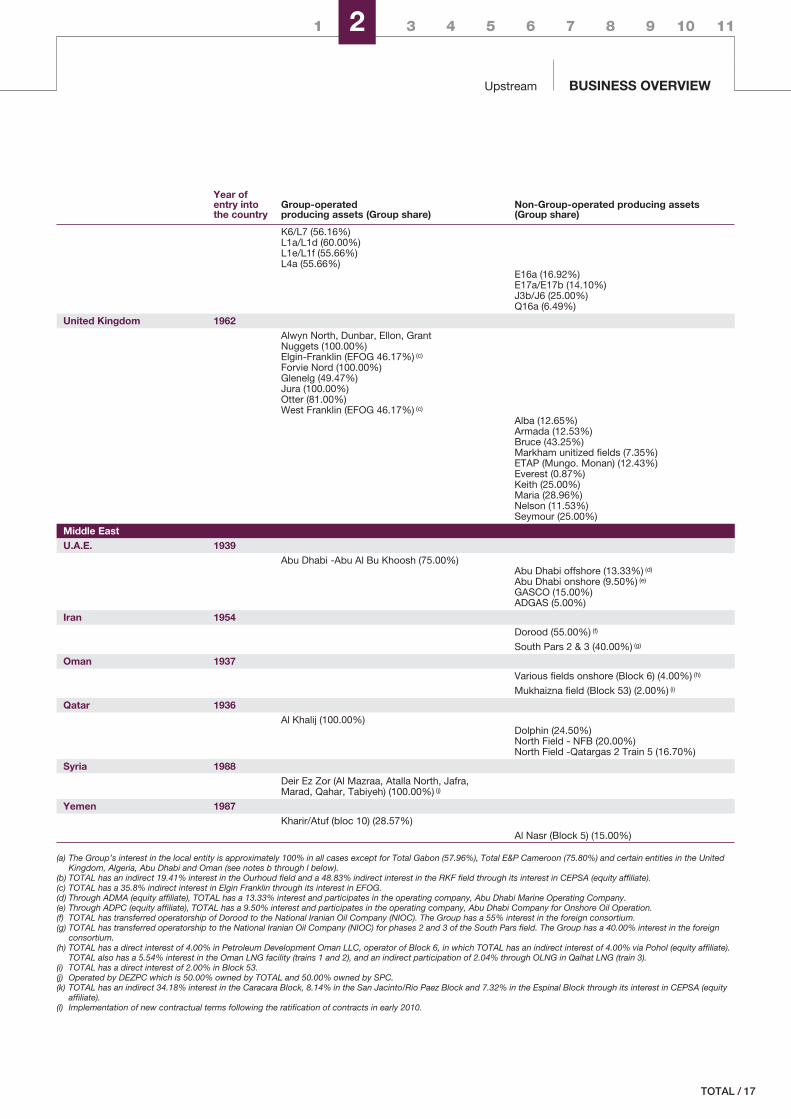
� Presentation of production activities by geographic area
The table below sets forth, by country, TOTAL’s producing assets, the year in which TOTAL’s activities commenced, the Group’s interest ineach asset and whether TOTAL is operator of the asset.
TOTAL’s producing assets as of December 31, 2009 (a)
Year ofentry intothe country
Group-operatedproducing assets (Group share)
Non-Group-operated producing assets(Group share)
AfricaAlgeria 1952
Ourhoud (19.41%) (b)
RKF (48.83%) (b)
Tin Fouye Tabankort (35.00%)
Angola 1953Blocks 3-85, 3-91 (50.00%)Girassol, Jasmim,Rosa, Dalia (Block 17) (40.00%)
Cabinda (Block 0) (10.00%)Kuito, BBLT, Tombua-Landana (Block 14) (20.00%)
Cameroon 1951Bakingili (25.50%)Bavo-Asoma (25.50%)Boa Bakassi (25.50%)Ekundu Marine (25.50%)Kita Edem (25.50%)Kole Marine (25.50%)
Mokoko - Abana (10.00%)Mondoni (25.00%)
The Congo, Republic of 1928Kombi-Likalala (65.00%)Nkossa (53.50%)Nsoko (53.50%)Moho Bilondo (53.50%)Sendji (55.25%)Tchendo (65.00%)Tchibeli-Litanzi-Loussima (65.00%)Tchibouela (65.00%)Yanga (55.25%)
Loango (50.00%)Zatchi (35.00%)
Gabon 1928Anguille (100.00%)Anguille Nord Est (100.00%)Anguille Sud-Est (100.00%)Atora (40.00%)Avocette (57.50%)Ayol Marine (100.00%)Baliste (50.00%)Barbier (100.00%)Baudroie Marine (50.00%)Baudroie Nord Marine (50.00%)Coucal (57.50%)Girelle (100.00%)Gonelle (100.00%)Grand Anguille Marine (100.00%)Grondin (100.00 %)Hylia Marine (75.00%)Mandaros (100.00%)M'Boumba (100.00%)Mérou Sardine Sud (50.00%)Pageau (100.00%)Port Gentil Océan (100.00%)Port Gentil Sud Marine (100.00%)Tchengue (100.00%)Torpille (100.00%)Torpille Nord Est (100.00%)
Rabi Kounga (47.50%)
14 / TOTAL - Registration Document 2009
1 2 3 4 5 6 7 8 9 10 11
Upstream BUSINESS OVERVIEW
Year ofentry intothe country
Group-operatedproducing assets (Group share)
Non-Group-operated producing assets(Group share)
Libya 1959C 17 (Mabruk) (15.00%) (l)
C 137 (Al Jurf) (20.25%) (l)
NC 115 (El Sharara) (3.90%)NC 186 (2.88%)
Nigeria 1962OML 58 (40.00%)OML 99 Amenam-Kpono (30.40%)OML 100 (40.00%)OML 102 (40.00%) OML 102 - Ekanga (40.00%)
OML 130 (24.00%)Shell Petroleum Development Company (SPDC10.00%)Bonga (12.50%)
North AmericaCanada 1999
Surmont (50.00%)United States 1957
Matterhorn (100.00%)Virgo (64.00%)
Several assets in the Barnett Shale area (25.00%)Tahiti (17.00%)
South AmericaArgentina 1978
Aguada Pichana (27.27%)Aries (37.50%)Cañadon Alfa Complex (37.50%)Carina (37.50%)Hidra (37.50%)San Roque (24.71%)
Sierra Chata (2.51%)Bolivia 1995
San Alberto (15.00%)San Antonio (15.00%)
Colombia 1973Caracara (34.18%) (k)
Cupiagua (19.00%)Cusiana (19.00%)Espinal (7.32%) (k)
San Jacinto/Rio Paez (8.14%) (k)
Trinidad & Tobago 1996Angostura (30.00%)
Venezuela 1980PetroCedeño (30.323%)Yucal Placer (69.50%)
Asia-PacificBrunei 1986
Maharaja Lela Jamalulalam (37.50%)Indonesia 1968
Bekapai (50.00%)Handil (50.00%)Peciko (50.00%)Sisi-Nubi (47.90%)Tambora-Tunu (50.00%)
Badak (1.05%)Nilam - gas and condensates (9.29%)Nilam - oil (10.58%)
Myanmar 1992Yadana (31.24%)
Thailand 1990Bongkot (33.33%)
Commonwealth of Independant StatesAzerbaijan 1996
Shah Deniz (10.00%)Russia 1989
Kharyaga (50.00%)
/ 15TOTAL
UpstreamBUSINESS OVERVIEW2
Year ofentry intothe country
Group-operatedproducing assets (Group share)
Non-Group-operated producing assets(Group share)
Europe
France 1939
Lacq (100.00%)
Meillon (100.00%)Pecorade (100.00%)Vic-Bilh (73.00%)Lagrave (100.00%)Lanot (100.00%)
Dommartin-Lettrée (56.99%)Itteville (78.73%)La Croix-Blanche (100.00%)Rousse (100.00%)Vert-le-Grand (90.05%)Vert-le-Petit (100.00%)
Norway 1965
Skirne (40.00%)Åsgard (7.68%)Ekofisk (39.90%)Eldfisk (39.90%)Embla (39.90%)Gimle (4.90%)Glitne (21.80%)Gungne (10.00%)Heimdal (16.76%)Hod (25.00%)Huldra (24.33%)Kristin (6.00%)Kvitebjørn (5.00%)Mikkel (7.65%)Oseberg (10.00%)Oseberg East (10.00%)Oseberg South (10.00%)Sleipner East (10.00%)Sleipner West (9.41%)Snøhvit (18.40%)Snorre (6.18%)Statfjord East (2.80%)Sygna (2.52%)Tor (48.20%)Tordis (5.60%)Troll I (3.69%)Troll II (3.69%)Tune (10.00%)Tyrihans (23.18%)Vale (24.24%)Valhall (15.72%)Vigdis (5.60%)Vilje (24.24%)Visund (7.70%)Yttergryta (24.50%)
The Netherlands 1964
F6a gaz (55.66%)F6a huile (65.68%)F15a Jurassic (38.20%)F15a Triassic (32.47%)J3a (30.00%)K1a (40.10%)K3b (56.16%)K4a (50.00%)K4b/K5a (36.31%)K5b (45.27%)K5F (40.39%)
16 / TOTAL - Registration Document 2009
1 2 3 4 5 6 7 8 9 10 11
Upstream BUSINESS OVERVIEW
Year ofentry intothe country
Group-operatedproducing assets (Group share)
Non-Group-operated producing assets(Group share)
K6/L7 (56.16%)L1a/L1d (60.00%)L1e/L1f (55.66%)L4a (55.66%)
E16a (16.92%)E17a/E17b (14.10%)J3b/J6 (25.00%)Q16a (6.49%)
United Kingdom 1962Alwyn North, Dunbar, Ellon, GrantNuggets (100.00%)Elgin-Franklin (EFOG 46.17%) (c)
Forvie Nord (100.00%)Glenelg (49.47%)Jura (100.00%)Otter (81.00%)West Franklin (EFOG 46.17%) (c)
Alba (12.65%)Armada (12.53%)Bruce (43.25%)Markham unitized fields (7.35%)ETAP (Mungo. Monan) (12.43%)Everest (0.87%)Keith (25.00%)Maria (28.96%)Nelson (11.53%)Seymour (25.00%)
Middle EastU.A.E. 1939
Abu Dhabi -Abu Al Bu Khoosh (75.00%)Abu Dhabi offshore (13.33%) (d)
Abu Dhabi onshore (9.50%) (e)
GASCO (15.00%)ADGAS (5.00%)
Iran 1954Dorood (55.00%) (f)
South Pars 2 & 3 (40.00%) (g)
Oman 1937Various fields onshore (Block 6) (4.00%) (h)
Mukhaizna field (Block 53) (2.00%) (i)
Qatar 1936Al Khalij (100.00%)
Dolphin (24.50%)North Field - NFB (20.00%)North Field -Qatargas 2 Train 5 (16.70%)
Syria 1988Deir Ez Zor (Al Mazraa, Atalla North, Jafra,Marad, Qahar, Tabiyeh) (100.00%) (j)
Yemen 1987Kharir/Atuf (bloc 10) (28.57%)
Al Nasr (Block 5) (15.00%)
(a) The Group’s interest in the local entity is approximately 100% in all cases except for Total Gabon (57.96%), Total E&P Cameroon (75.80%) and certain entities in the UnitedKingdom, Algeria, Abu Dhabi and Oman (see notes b through l below).
(b) TOTAL has an indirect 19.41% interest in the Ourhoud field and a 48.83% indirect interest in the RKF field through its interest in CEPSA (equity affiliate).(c) TOTAL has a 35.8% indirect interest in Elgin Franklin through its interest in EFOG.(d) Through ADMA (equity affiliate), TOTAL has a 13.33% interest and participates in the operating company, Abu Dhabi Marine Operating Company.(e) Through ADPC (equity affiliate), TOTAL has a 9.50% interest and participates in the operating company, Abu Dhabi Company for Onshore Oil Operation.(f) TOTAL has transferred operatorship of Dorood to the National Iranian Oil Company (NIOC). The Group has a 55% interest in the foreign consortium.(g) TOTAL has transferred operatorship to the National Iranian Oil Company (NIOC) for phases 2 and 3 of the South Pars field. The Group has a 40.00% interest in the foreign
consortium.(h) TOTAL has a direct interest of 4.00% in Petroleum Development Oman LLC, operator of Block 6, in which TOTAL has an indirect interest of 4.00% via Pohol (equity affiliate).
TOTAL also has a 5.54% interest in the Oman LNG facility (trains 1 and 2), and an indirect participation of 2.04% through OLNG in Qalhat LNG (train 3).(i) TOTAL has a direct interest of 2.00% in Block 53.(j) Operated by DEZPC which is 50.00% owned by TOTAL and 50.00% owned by SPC.(k) TOTAL has an indirect 34.18% interest in the Caracara Block, 8.14% in the San Jacinto/Rio Paez Block and 7.32% in the Espinal Block through its interest in CEPSA (equity
affiliate).(l) Implementation of new contractual terms following the ratification of contracts in early 2010.
/ 17TOTAL
UpstreamBUSINESS OVERVIEW2
‹ Africa
In 2009, TOTAL’s production in Africa (including productionfrom equity affiliates and non-consolidated subsidiaries) was749 kboe/d, representing 33% of the Group’s overallproduction, compared to 783 kboe/d in 2008 and 806 kboe/d in2007.
In Algeria, TOTAL’s production was 74 kboe/d in 2009, down from79 kboe/d in 2008 and 2007, notably due to the termination of theHamra contract in October 2009. In addition to Hamra, the Group’s2009 production came from its direct interests in the TFT field (TinFouyé Tabenkort, 35%) and from its 48.83% interest in CEPSA, apartner of Sonatrach (the Algerian national oil and gas company) onthe Ourhoud and Rhourde El Krouf fields. TOTAL also holds a 37.75%direct interest in the Timimoun gas project, alongside Sonatrach(51%) and CEPSA (11.25%). In December 2009, TOTAL won the callfor tenders related to the acquisition of a 47% interest in the Ahnetlicense. The agreement provides for a development plan that isexpected to be submitted to the authorities before mid-2011, withstart-up of production scheduled for 2015 and an expected plateauproduction of at least 400 Mcf/d (4 Bm3/y).
o On the TFT field, the completion of the compression project isexpected to maintain plateau production at nearly 180 kboe/d.
o The approval of the Timimoun project by the ALNAFT NationalAgency allowed TOTAL and its partners to launch the basicengineering studies phase in early 2010 for a start-up of productionexpected in late 2013. Commercial production for the natural gasfrom Timimoun is expected to reach nearly 160 Mcf/d (1.6 Bm3/y) atplateau.
In Angola, TOTAL produced 191 kboe/d in 2009, compared to205 kboe/d in 2008 and 2007. Production comes mainly from Blocks17, 0 and 14. From 2007 to 2009, several discoveries were made,notably on Blocks 14, 31, 32, 15/06 and 17/06.
o Deep-offshore Block 17 (40%, operator) is TOTAL’s principalasset in Angola. It is composed of four major poles: Girassol,Dalia, Pazflor and CLOV (based on the Cravo, Lirio, Orquidea andVioleta discoveries).
On the Girassol pole, production from the Girassol, Jasmim andRosa fields averaged more than 220 kb/d (in 100%) in 2009. TheRosa field, which began production in June 2007, makes asubstantial contribution to the Girassol FPSO (Floating Production,Storage and Offloading facility).
On the second pole, the Dalia field, which began production inDecember 2006, reached its plateau production of 240 kb/dduring the second quarter of 2007. This development, launchedin 2003, is based on a system of sub-sea wells connected to anFPSO.
Production from the third pole, Pazflor, comprised of thePerpetua, Zinia, Hortensia and Acacia fields, is scheduled tobegin in 2011. This development, under construction since itsapproval in late 2007, calls for the installation of an FPSO with aproduction capacity of up to 220 kb/d.
On CLOV, the fourth pole, basic engineering studies werelaunched in 2008 for the development of the Cravo, Lirio,Orquidea and Violeta fields. This development is expected to leadto the installation of a fourth FPSO with a production capacity of160 kb/d. The final investment decision is expected in 2010.
o On Block 14 (20%), production on the Tombua-Landana fieldstarted in August 2009 and adds to production from theBenguela-Belize-Lobito-Tomboco (BBLT) and Kuito fields.
o On the ultra-deep offshore Block 32 (30%, operator), the twelvediscoveries made between 2003 and 2007 confirmed the oilpotential of the block. Appraisal is continuing and pre-development studies for a first production zone in the central/southeastern portion of the block are underway.
In 2008, leasehold rights for the Calulu zone on Block 33 wereextended for five years. TOTAL became the operator of this block in2008 with a 55% interest. In 2007, TOTAL acquired interests onBlocks 17/06 (30%, operator) and 15/06 (15%).
In addition, construction is underway for the Angola LNG project(13.6%), which involves a liquefaction plant near Soyo designed tobring the country’s natural gas reserves to market, in particular theassociated gas from the fields on Blocks 0, 14, 15, 17 and 18. Thisproject was approved by the government of Angola and theproject’s partners in December 2007 and production is expected tobegin in 2012.
In Cameroon, TOTAL has been producing since 1977 and itoperated production in 2009 of approximately 50 kboe/d,representing nearly 65% of the country’s overall production 1. TheGroup’s share of production in 2009 amounted to 12 kboe/d,compared to 14 kboe/d in 2008 and 2007.
The exclusive authorization to operate the Dissoni field (37.5%,operator) was granted by the Cameroonian authorities in November2008, with production scheduled to start in 2012. Plateauproduction for this field is expected to reach nearly 15 kb/d (in100%). On this permit, the discovery made in 2008 in the deltaichorizons during the drilling of the Njonji exploration well is expectedto be assessed with an appraisal well in 2010.
In addition, TOTAL was awarded in July 2009 a new explorationblock, Lungahe (100%), located near its operated concessions andpermits.
In Egypt, TOTAL was awarded in May 2009 a 90% interest in Block4 (El Burullus offshore East) on which TOTAL is expected to be theoperator pursuant to the approval by the relevant authorities. Thispermit, located in the Nile Basin where a number of natural gasdiscoveries have already been made, covers an initial 4-yearexploration period and provides for the commitment to conduct 3Dseismic work and to drill exploration wells.
In Gabon, the Group’s share of production was 71 kboe/d in 2009,compared to 76 kboe/d in 2008 and 83 kboe/d in 2007, due to thenatural decline of mature fields. Total Gabon 2 is one of the Group’soldest subsidiaries in sub-Saharan Africa. In 2007, the Convention
1. Source: TEP Cameroun and Société Nationale des Hydrocarbures du Cameroun.2. Total Gabon is a Gabonese company whose shares are listed on Euronext Paris. TOTAL holds 58%, the Republic of Gabon 25% and the public float is 17%.
18 / TOTAL - Registration Document 2009
1 2 3 4 5 6 7 8 9 10 11
Upstream BUSINESS OVERVIEW
d’Etablissement between Total Gabon and the government ofGabon was renewed for a 25-year period. This contractual schemepromotes exploration and development projects.
o On the Anguille field, the reservoir studies begun in 2009 basedon the results of the first thirteen Phase 1 wells indicate that theoriginal production estimates will have to be revised downward.The project was first revised in early 2009 to capitalize on loweroil service costs. It now calls for a more sequential approach overa longer period. The development plan and sizing of the newfacilities have been reviewed accordingly.
o On the deep-offshore Diaba permit (Total Gabon 63.75%,operator), following the 2D seismic acquisition campaign that wasshot in 2008 and 2009, 3D seismic acquisition work started inDecember 2009.
In Libya, the Group’s share of production amounted to 60 kb/d in2009, down from 74 kb/d in 2008 and 87 kb/d in 2007. This declineis primarily due to the implementation of OPEC quotas and newcontractual provisions for Blocks NC 115 (30%) 1 and NC 186(24%) 1, on which TOTAL is a partner.
o On the Mabruk field (Block C 17, 75% 1, operator), plateauproduction of 19 kb/d was maintained in 2009. In addition, thedevelopment plan for the Dahra and Garian structures wasapproved by the National Oil Corporation (NOC) in mid-2009.
o On Block C 137 (75% 1, operator), production on the Al Jurf fieldresumed in late December 2008, following the temporary shutdownof production due to difficulties encountered in April 2008 duringdrilling operations. Production was 31 kboe/d in 2009. In addition,a project to reinject associated gas was launched in May 2009.
o TOTAL and NOC signed a Memorandum of Understanding inFebruary 2009 to convert the existing contracts for Blocks C 137and C 17 into exploration and production sharing agreements(EPSA IV) and extend them until 2032. Commitments to drilladditional exploration wells were made within this framework.The EPSA IV contracts, signed in May 2009, were ratified by theLibyan government in early 2010.
o On Blocks NC 115 and NC 186, a nearly 5,000 km2 seismiccampaign started in December 2009.
o On the Murzuk Basin, a development plan was submitted to theauthorities in 2009 following a successful appraisal well drilled onthe discovery made in 2006 on a portion of Block NC 191(100% 1, operator).
o On the Cyrenaic Basin, drilling of an exploration well started inFebruary 2010 on Block 42 2/4 (60% 1, operator).
In Madagascar, TOTAL acquired a 60% interest in, and theoperatorship of, the Bemolanga permit in September 2008.
Bemolanga contains oil sands accumulations. A first appraisalphase was launched to confirm the bitumen resources needed for amining development. Drilling operations started in July 2009 andare expected to take place in 2010 during the dry season (April toNovember).
In Mauritania, TOTAL is active in exploration on the Ta7 and Ta8permits (60%, operator), located in the Taoudenni Basin, alongsideSonatrach (20%) and Qatar Petroleum International (20%), Qatar’sstate-owned company. Drilling of an exploration well on the Ta8permit started in October 2009.
In Nigeria, the Group’s production amounted to 235 kboe/d in2009, compared to 246 kboe/d in 2008 and 261 kboe/d in 2007.TOTAL has been present in Nigeria since 1962. It operates sevenproduction permits (OML) out of the forty-seven in which it holds aninterest, and two exploration permits (OPL) out of the eight in whichit holds an interest. The Group is also active in LNG through NigeriaLNG and the Brass LNG project.
o TOTAL holds a 15% interest in the Nigeria LNG Ltd gasliquefaction plant located in Bonny Island. The plant’s overallcapacity has increased to 22 Mt/y of LNG since thecommissioning of the sixth liquefaction train in late 2007. In 2009,security issues in the Niger Delta impacted certain suppliers’ gasproduction, restricting the plant’s supply and reducing LNGproduction.
In addition, preliminary work continued in 2009 prior to launchingthe Brass LNG project (17%), which calls for the construction oftwo 5 Mt/y trains. The first phase of site preparation work wascompleted in 2009.
o TOTAL strengthened its ability to supply gas to the LNG projectsin which it has interests and to meet the growing domesticdemand in gas:
- On the OML 136 permit (40%), following the appraisal workconducted in 2008 on the Amatu field, the Group successfullyappraised the Temi Agge field in 2009, confirming thepossibility of a future development pole on this permit.
- As part of its joint venture with the Nigerian National PetroleumCorporation (NNPC), TOTAL launched a project to eventuallyincrease the production capacity of the OML 58 permit (40%,operator) to 550 Mcf/d of gas. A second phase of this project,currently being assessed, is expected to allow thedevelopment of other reserves through these facilities.
- On the OML 112/117 permits (40%), TOTAL continued in 2009development studies for the Ima gas field.
o On the OML 102 permit (40%, operator), TOTAL continued in2009 to develop the Ofon II project. The final investment decisionin expected in 2010. The Group is also planning the appraisal ofthe Etisong pole in 2010, located 15 km from the Ofon field,which is currently in production.
1. Participation in the foreign consortium.
/ 19TOTAL
UpstreamBUSINESS OVERVIEW2
o On the OML 130 permit (24%, operator), production started inMarch 2009 on the Akpo field whose plateau production is225 kboe/d (in 100%). The Group is actively developing the Eginafield, for which a development plan was approved by the Nigerianauthorities. In 2009, TOTAL conducted in Nigeria basicengineering studies on this field.
o On the OML 138 permit (20%, operator), TOTAL continued todevelop the Usan project (180 kb/d in 100%) in 2009, in particularwith the start-up of drilling operations for production wells andthe launch of the new FPSO hull in November 2009. Firstproduction is expected in 2012.
TOTAL also strengthened its position in the deep offshore bylaunching in 2009 the development of the Bonga Northwest projecton OML 118 (12.5%). In 2009, the Group actively pursued itsexploration program with the discovery made on the Owowo Southprospect on OPL 223 (18%, operator).
Security issues in the Niger Delta region continued to impact theproduction of the Shell Petroleum Development Company (SPDC)joint venture, in which TOTAL owns 10%. Repair work on facilitiesin the western zone of the Niger Delta region continued in 2009,allowing production to partially resume, in particular on the EAoffshore field (10%), where production resumed in the second halfof 2009. In addition, SPDC’s 2009 gas and condensates productionwas affected notably by the shutdown of the Soku treatment plant,which had to be repaired after vandalism on the export pipelines inlate 2008.
In the Republic of the Congo, the Group’s share of production was106 kboe/d in 2009, compared to 89 kboe/d in 2008 and 77 kboe/din 2007.
o Production began on the Moho Bilondo field (53.5%, operator) inApril 2008, where the drilling of development wells is continuing.Current production (in 100%) of approximately 80 kboe/d isexpected to reach 90 kboe/d at plateau during 2010. The MohoNorth Marine 3 appraisal well, drilled in late 2008 after twodiscoveries made in 2007 (Moho North Marine 1 and 2), confirmedthe potential of this permit. In the same area, the Moho NorthMarine 4 well discovered resources in the Albian zones in 2009.
o Development of Libondo (65%, operator), approved in October2008, is continuing. Commissioning is expected in 2011. Thisfield is located on the Kombi-Likalala-Libondo operating field, 50km off the coast in water depths of 114 meters. Anticipatedplateau production is 8 kb/d (in 100%). A substantial portion ofthe equipment is produced locally in Pointe-Noire through theredevelopment of a construction site that had been idle forseveral years.
In Sudan, the Group holds interests in an exploration permit in thesouthern part of the country, although no activity is currentlyunderway in this country. For additional information on TOTAL’soperations in Sudan, see Chapter 4 (Risk Factors).
‹ North America
In 2009, TOTAL’s production in North America was 24 kboe/d,representing 1% of the Group’s overall production, comparedto 14 kboe/d in 2008 and 20 kboe/d in 2007.
In Canada, the Group is involved in oil sands projects in Athabasca,Alberta, through its interests in the Surmont (50%), Joslyn (75%,operator) and Northern Lights (50%, operator) permits. Since theend of 2004, the Group has also acquired 100% of several permits(Oil Sands Leases) through several auction sales, notably theGriffon permit, where interpretation of the 2008/2009 winterappraisal campaign is underway. The Group’s 2009 productionamounted to 8 kb/d, stable compared to 2008.
o On the Surmont permit, construction of the first phase ofindustrial development (Surmont Phase 1A) ended in June 2007with the gradual start-up of the steam injection for the firsteighteen well pairs. The first well pairs tested SAGD (SteamAssisted Gravity Drainage) production in October 2007, andcommercial production started in November 2007.
Construction work for Phases 1B and 1C was conducted to addthe sixteen well pairs needed to reach a production levelestimated at 22 kb/d. The well pairs of Phase 1B graduallystarted production in 2009.
In early 2010, the partners of the project decided to launch theconstruction of the second phase of industrial development.Start-up of production from Surmont Phase 2 is scheduled in2015 and overall production capacity from Surmont (Phases 1and 2) is expected to increase to 110 kb/d (in 100%).
o The Joslyn permit, located approximately 140 km north ofSurmont, is expected to be developed through mining techniquesin two development phases of 100 kb/d of bitumen each.
In 2009, the pre-project for the first development phase (JoslynNorth Mine) was completely reviewed, notably to meet therequirements of the February 2009 new regulation related totailings management. The review was completed in February2010, concurrent with the filing of an updated administrative filewith the authorities. Continuation of preparation for the firstphase was approved in early March 2010, together with thelaunch of basic engineering studies. Development of the projectis expected to be approved in the following years for a start-up in2017. However, this schedule is subject to the ERCB (EnergyResources Conservation Board) administrative approval process.
In addition, a small SAGD production unit that started productionin 2006, but did not reach the expected 10 kb/d plateauproduction because of constraints on the steam injectionpressure, has been suspended since March 2009. The future ofthe facility (mothballing or complete removal) has been subject tothe request for authorization filed with ERCB in early 2010. Thecorresponding reserves were debooked as ofDecember 31, 2008.
20 / TOTAL - Registration Document 2009
1 2 3 4 5 6 7 8 9 10 11
Upstream BUSINESS OVERVIEW
1. Source: Argentinean Ministry of Federal Planning, Public Investment and Services – Energy Secretary.
o In 2006, TOTAL conducted studies leading to the decision tolocate a delayed coker technology upgrader with a capacity ofapproximately 230 kb/d in Edmonton (Alberta). This upgrader isexpected to be built in two phases to match the anticipatedincrease in bitumen production on the Joslyn permit. Pursuant toa public announcement in May 2007 and the ERCB filing inDecember 2007, the project is now subject to a public hearingexpected in late May 2010. Basic engineering studies, launchedin May 2008, ended in late 2009. This was the last step beforeconstruction work is launched. However, the final decision tolaunch the project can only be made after the approval by theadministrative authorities and start-up should coincide withstart-up of Joslyn North Mine.
o In August 2008, the Group closed the acquisition of Synenco,whose two principal assets are a 60% interest in the NorthernLights project and 100% of the adjacent McClelland permit. Inearly 2009, the Group sold a 10% share in the Northern Lightsproject and a 50% share in the McClelland permit to Sinopec, theother partner in the project, reducing its interest in each of theassets to 50%. The Northern Lights project, locatedapproximately 50 km north of Joslyn, is expected to bedeveloped through mining techniques.
In the United States, the Group’s 2009 production amounted to16 kboe/d, compared to 6 kboe/d in 2008 and 18 kboe/d in 2007.
o In the Gulf of Mexico:
- The deep-offshore Tahiti oil field (17%) started producing inMay 2009 and rapidly reached plateau production of 135 kb/d.
- In September 2007, the Group committed to developing thefirst phase of the deep-offshore Chinook project (33.33%), witha production test scheduled in 2010.
- TOTAL acquired six exploration blocks in March 2009.
- In April 2009, TOTAL and Cobalt signed an agreement tomerge both companies’ deep-offshore acreage, with Cobaltholding a 60% interest and TOTAL the remaining 40%. As partof this agreement, Cobalt is operating the exploration part andTOTAL is providing the drilling rig for the first five explorationwells. In addition, engineers from TOTAL are assigned to theexploration team set up by Cobalt in Houston.
- TOTAL operates production on the Matterhorn and Virgo fields.
o In Alaska, TOTAL acquired a 30% interest in several onshoreexploration blocks, referred to as White Hills, in 2008. Most ofthese blocks were relinquished in mid-2009 followingdisappointing results. In 2007, the Group also acquired thirty-twooffshore exploration blocks in the Beaufort Sea.
o In late 2009, TOTAL signed a joint venture agreement withChesapeake, effective retrospectively since October 1, 2009. Aspart of this joint venture, TOTAL holds 25% of Chesapeake’snon-conventional gas portfolio in the Barnett Shale area in Texaswhich produce approximately 700 Mcf/d.
o In January 2009, the Group finalized the acquisition of a 50%interest in American Shale Oil LLC in order to study thetechnology to develop oil shales in Colorado.
In Mexico, TOTAL is conducting various studies in cooperation withstate-owned PEMEX under a technical cooperation agreementsigned in 2003 and renewed in early 2010.
‹ South America
In 2009, TOTAL’s production in South America (includingproduction of equity affiliates and non-consolidatedsubsidiaries) was 182 kboe/d, representing 8% of the Group’soverall production, compared to 224 kboe/d in 2008 and230 kboe/d in 2007.
In Argentina, TOTAL has been present since 1978 and operates27% of the country’s gas production 1. The Group’s production was80 kboe/d in 2009, compared to 81 kboe/d in 2008 and 80 kboe/din 2007.
o In the Neuquen Basin, the connection of satellite discoveries andan increase in compression capacity allowed the extension of theSan Roque (24.7%, operator) and Aguada Pichana (27.3%,operator) fields’ plateau production.
The low-pressure compression project on the Aguada Pichanafield was brought on-line in August 2007. Development of theAguada Pichana North discovery is underway. The seconddevelopment phase was brought on-line between September andNovember 2009 with five producing wells. It supplements the firstphase that started in December 2007. Twenty-two wells weredrilled in 2009 on the principal portion of the field.
In February 2009, TOTAL and the Argentinean authorities signedan agreement extending the Aguada Pichana and San Roqueconcessions for ten years (from 2017 to 2027). As part of thisagreement, a 3D seismic survey was shot in late 2009 in the LasCarceles canyons area to allow exploration to continue onAguada Pichana, on the western portion of the area that isalready developed.
o In Tierra del Fuego, the Group operates notably the offshoreCarina and Aries fields (37.5%), which started up in 2005 and2006, respectively. A fourth medium-pressure compressor wasinstalled in July 2007 to debottleneck the facilities and increasethe gas production capacity from approximately 424 Mcf/d to530 Mcf/d (12 Mm3/d to 15 Mm3/d) on this zone. The Tierra delFuego gas export pipeline does not currently have the capacity totransport all of the gas that could be produced with thisdevelopment. Work to increase the capacity of the pipeline hasbeen ongoing since 2008.
In late 2009, a decision was made to launch the development ofthe offshore Vega Pleyade field and to extend low-pressurecompression with an objective to start up production in late 2014.
In Bolivia, the Group’s production, primarily gas, amounted to20 kboe/d in 2009, compared to 22 kboe/d in 2008 and 28 kboe/din 2007. TOTAL holds interests in six permits: two producingpermits, San Alberto and San Antonio (15%); and four permits inthe exploration or appraisal phase, Blocks XX West (75%, operator),Aquio and Ipati (80%, operator) and Rio Hondo (50%). The declinein 2009 production is primarily due to decreasing gas demand fromBrazil, which is San Alberto's and San Antonio's major exportmarket.
/ 21TOTAL
UpstreamBUSINESS OVERVIEW2
o Regarding the Itau discovery, located on Block XX West, TOTALfiled in August 2009 a declaration of commerciality with theBolivian authorities. Development of this field is proceeding andstart-up is expected in the second half of 2010. Production fromItau will be routed to the existing facilities of the neighboring SanAlberto field.
o In 2004, TOTAL discovered the Incahuasi gas field on the IpatiBlock. Following the interpretation of the 3D seismic acquisitionconducted in 2008, an appraisal well is ongoing on the adjacentAquio Block to confirm the extension of the discovery to thenorth.
In September 2008, TOTAL entered into a cooperation agreementwith Gazprom and Yacimientos Petrolíferos Fiscales Bolivianos toexplore the Azero Block within the framework of a joint venturecompany. TOTAL and Gazprom will be partners with equal interestsin this joint venture company.
In Brazil, TOTAL holds interests in Block BC-2 (41.2%) and BlockBM-C-14 (50%) located in the Campos Basin.
o The partners on Block BC-2 drilled an appraisal well early in 2007and filed a Declaration of Commercial Discovery with the AgênciaNational do Petroléo (ANP/National Oil Agency) in late August2007. Following seismic reprocessing, a pre-salt prospect wasfound under the Xerelete (formerly Curió) discovery made in 2001in water depths of 2,400 m. An appraisal well is expected to bedrilled in 2011.
o The southern extremity of Xerelete is located on the adjacentBM-C-14 Block. In 2009, partners on both blocks finalized aunitization agreement for the field that has been submitted toANP for approval.
In Colombia, TOTAL has been present since 1973 with productionof 23 kboe/d in 2009, similar to 2008, compared to 19 kboe/d in2007. TOTAL holds a 19% interest in the onshore Cupiaga andCusiana fields, located at the base of the Andes, and a 50% interestin the Niscota exploration permit located 300 km northeast ofBogota. TOTAL is also active through its interest in CEPSA, whichhas operated the Caracara Block since 2008.
o On Cusiaga, as part of two expansion projects, construction ofthe facilities started in July 2009 to increase gas productioncapacity from 180 Mcf/d currently to 250 Mcf/d and beginrecovering 6 kb/d of LPG. First production of additional gas andLPG is expected in the second half of 2010 and in 2011,respectively.
o On Niscota, drilling of the Huron-1 well led to the discovery in2009 of a gas and condensate field. Appraisal of the Huron-1structure is ongoing with the launch of a 3D seismic campaign todefine the size of the discovery and to plan for future appraisalwells.
In French Guiana, TOTAL acquired a 25% interest in the GuyaneMaritime permit in December 2009. The acquisition is subject toapproval by the French authorities. The permit, located about150 km off the coast, covers an area of approximately 32,000 km2
in water depths ranging from 2,000 to 3,000 meters. A 3D seismicacquisition program is already underway on this permit.
In Trinidad & Tobago, TOTAL has been present since 1996 withproduction of 5 kb/d in 2009, compared to 6 kb/d in 2008 and9 kb/d in 2007. TOTAL holds a 30% interest in the offshoreAngostura field located on Block 2C. A second phase intended todevelop gas reserves is underway, with first production expected in2011.
In Venezuela, TOTAL has been present since 1980 and is one ofthe main partners of state-owned PDVSA (Petróleos de VenezuelaS.A.). The Group’s 2009 production amounted to 54 kboe/d,compared to 92 kboe/d in 2008 and 94 kboe/d in 2007. TOTALholds interests in PetroCedeño (30.323%), Yucal Placer(69.5%) and in the offshore exploration Block 4, located in thePlataforma Deltana (49%).
o Pursuant to the decision by the Venezuelan authorities toterminate all operating contracts signed in the 1990s, TOTALsigned heads of agreement in June 2007 with PDVSA, with theapproval of the Ministry of Energy and Oil, providing for thetransformation of the Sincor association into a mixed public/private company, PetroCedeño, and the transfer of operations tothis mixed company. Under this agreement, TOTAL’s interest inthe project decreased from 47% to 30.323% and PDVSA’sinterest increased to 60%. Conditions for this transformationwere approved by the Venezuelan National Assembly in October2007 and the transformation was finalized in February 2008.
PDVSA agreed to compensate TOTAL for the reduction of itsinterest in Sincor by assuming $326 million of debt and bypaying, mostly in crude oil, $834 million. The compensationprocess was completed in 2009.
o On Block 4, the exploration campaign, which involved threewells, was completed in October 2007. In October 2008, theMinistry of Energy and Oil agreed to let the joint venture retain theCocuina discovery zone (lots B and F) and relinquish the rest ofthe block.
o In early 2008, TOTAL signed two agreements for joint studieswith PDVSA on the Junin 10 Block, in the Orinoco Belt.
‹ Asia-Pacific
In 2009, TOTAL’s production in the Asia-Pacific region was251 kboe/d, representing 11% of the Group’s overallproduction, compared to 246 kboe/d in 2008 and 252 kboe/d in2007.
In Australia, where TOTAL has held leasehold rights since 2005,the Group owns twelve offshore permits, including four that itoperates, off the northwest coast in the Browse, Vulcan, Bonaparteand Carnavon Basins.
o In the Browse Basin, preparation of the Ichthys gas andcondensates field development, located on the WA-285P permit(24%), is ongoing. FEED (Front End Engineering and Design)studies were launched in 2009 for a floating platform designed forgas production, treatment and export, an FPSO to stabilize andexport condensates, a nearly 900 km gas pipeline and aliquefaction plant located in Darwin.
Production capacity is expected to be 8.4 Mt/y of LNG, 1.6 Mt/yof LPG and 100 kb/d of condensates. The field is expected tocome onstream in the second half of the decade.
22 / TOTAL - Registration Document 2009
1 2 3 4 5 6 7 8 9 10 11
Upstream BUSINESS OVERVIEW
o Major seismic acquisition activity occurred in 2008 on the fourpermits operated by TOTAL, followed by the interpretation ofdata in 2009. A drilling campaign is expected to be carried out in2010 and 2011.
o In 2009, TOTAL disposed of a 20% interest in the WA-269Ppermit (Carnavon Basin) and relinquished the adjacent WA-370Ppermit.
In Bangladesh, TOTAL operated two exploration blocks, Blocks 17and 18, acquired in 2007. In 2008, a 3D seismic campaign wasconducted on these blocks located off the southeastern coast.Following the seismic interpretation, the decision to relinquish theblocks was made in February 2009. The branch was closed inOctober 2009.
In Brunei, where TOTAL has been present since 1986, the Groupoperates the offshore Maharaja Lela Jamalulalam field located onBlock B (37.5%). The Group’s production was 12 kboe/d in 2009,compared to 14 kboe/d in 2008 and 2007. The gas produced at thisfield is delivered to the Brunei LNG liquefaction plant.
On Block B, a new drilling campaign started in July 2009.Exploration operations on deep-offshore Block J (60%, operator)have been suspended since May 2003 due to a border disputebetween Brunei and Malaysia.
In China, the Group is present on the South Sulige block, located inthe Ordos Basin, in the Inner Mongolia province. Appraisal workwas conducted on this block between 2006 and 2008, in particularseismic acquisition, the drilling of four new wells and tests onexisting wells. Development studies were carried out in 2008 andwere continued in 2009 in order to define a development plan withthe China National Petroleum Corporation (CNPC). The jointdevelopment plan was submitted to the CNPC in January 2010.
In Indonesia, TOTAL has been present since 1968 with productionof 190 kboe/d in 2009, compared to 177 kboe/d in 2008 and180 kboe/d in 2007.
TOTAL’s operations are primarily concentrated on the Mahakampermit (50%, operator), which covers several fields, includingPeciko and Tunu, the largest gas fields in the East Kalimantan area.TOTAL also holds an interest in the Sisi-Nubi field (47.9%,operator). TOTAL delivers most of its natural gas production to theBontang LNG plant operated by the Indonesian company PTBadak. The overall capacity of the eight liquefaction trains atBontang LNG is 22 Mt/y.
In 2009, gas production operated by TOTAL amounted to 2,561Mcf/d. The gas operated and delivered by TOTAL to Bontang LNGaccounted for 80% of its supply. In addition to gas production,operated condensates and oil production from the Handil andBekapai fields amounted to 53 kb/d and 26 kb/d, respectively.
o On the Mahakam permit:
- Drilling of additional wells on the Tunu field continued in 2009as part of the twelfth and thirteenth development phases.A new seismic campaign to improve imaging on the shallowreservoirs and to identify the optimal location for additional
wells was ongoing at year-end 2009. Gas production on Tunuwas 1,269 Mcf/d in 2009. The eleventh development phase,launched in 2005, was completed in late 2009 with thecommissioning of onshore low-pressure compression units.
- On Peciko, following the start-up of a new platform (Phase 5) inlate 2008, a new phase of drilling operations (Phase 7) startedin 2009 and is expected to continue in 2010. New low-pressurecompression capacities (Phase 6) are expected to becommissioned in 2010. Gas production on Peciko was737 Mcf/d in 2009.
- On the East Bekapai exploration well, the oil discovery made in2008 led to the launch of a development study, which iscurrently underway.
- The development of South Mahakam with the Stupa, WestStupa and East Mandu discoveries was launched in early 2008,with production scheduled to begin in 2012.
o In 2008, a seismic campaign was conducted on the SoutheastMahakam exploration block (50%, operator), located in theMahakam Delta. Drilling of a first exploration well is expected in2010. TOTAL was awarded this block in early 2007.
o On the Sisi-Nubi field, which began production in November2007, drilling operations continue and gas production reached396 Mcf/d in 2009. The gas from Sisi-Nubi is produced throughTunu’s processing facilities.
In February 2009, the Group signed, alongside its partner Inpex andthe state-owned company Pertamina, heads of agreement with aconsortium of LNG buyers in Japan, setting out the principal termsfor an extension of the 1973 and 1981 LNG sales contracts. As partof this agreement, a total of 25 Mt of LNG is expected to bedelivered to Japan between 2011 and 2020 from the Bontang LNGPlant. The gas supplied will come from the Mahakam permit.
In Malaysia, TOTAL signed a production sharing contract in May2008 with state-owned Petronas for the offshore exploration BlocksPM303 and PM324 (70%, operator). An operating structure wascreated in 2008 in Kuala Lumpur.
In 2009, a 3D seismic acquisition covering 1,650 km2 was shot onBlock PM303. Processing agreements for this seismic acquisitionand reprocessing agreements for other seismic data available onBlock PM324 were signed in July 2009, totaling an area of2,600 km2 for both blocks. Drilling in high pressure/hightemperature conditions is expected to be carried out in 2011.
The offshore SKF Block (42.5%) was relinquished in 2009.
In Myanmar, TOTAL operates the Yadana field (31.2%). Located onoffshore Blocks M5 and M6, this field produces gas that is deliveredmainly to PTT (the Thai state-owned company) to be used in Thaipower plants. In 2009, the Group’s production was 13 kboe/d,compared to 14 kboe/d in 2008 and 17 kboe/d in 2007.
In Thailand, the Group’s production was 36 kboe/d in 2009,compared to 41 kboe/d in 2008 and 2007. The Group’s main assetis the Bongkot gas and condensates field (33.3%). In late 2007, theThai authorities agreed to extend the end of the concession periodof the field by ten years, from 2013 to 2023. PTT purchases all of
/ 23TOTAL
UpstreamBUSINESS OVERVIEW2
the natural gas and condensates production. Gas demand, whichdecreased at the beginning of 2009, recovered by year-end to the2008 level.
o The northern portion of the Bongkot field is being developed inseveral phases:
- Production from the 3F development phase (three productionplatforms) started in July 2008.
- Production from the 3G development phase (two platforms),launched following gas discoveries made in 2007, started inAugust 2009.
- The 3H development phase (three platforms) was launched inJuly 2008 following gas discoveries made in the first half of2008. Commissioning is expected in 2010.
Additional compression facilities were installed on four platformsto increase gas production.
o The southern portion of this field (Great Bongkot South) is alsobeing developed in several phases. This development is designedto include a processing platform, a residential platform andthirteen production platforms. In September 2009, the partnersformalized a gas sales contract with PTT. Construction of thefacilities started in 2009 and first production is expected in 2012.
To prepare for the next development phases of this large field, threeexploration wells were drilled in 2009 in the northern portion andanother well in the southern portion. Interpretation of the results isunderway.
In Vietnam, TOTAL holds a 35% interest in the production sharingcontract for the offshore 15-1/05 exploration block following anagreement signed in October 2007 with PetroVietnam. A 3D seismicacquisition covering 1,600 km2 was shot in the summer of 2008 onthis block. A first oil discovery was made in November 2009 on thesouthern portion of the Block.
In March 2009, TOTAL and PetroVietnam signed a productionsharing contract for Blocks DBSCL-02 and DBSCL-03. Located inthe Mekong Delta region, these onshore blocks are held by TOTAL(75%, operator) and PetroVietnam (25%). A first 2D seismicacquisition campaign was shot in November 2009.
‹ Commonwealth of Independent States (CIS)
In 2009, TOTAL’s production in CIS was 24 kboe/d,representing 1% of the Group’s overall production, comparedto 26 kboe/d in 2008 and 19 kboe/d in 2007.
In Azerbaijan, TOTAL has been present since 1996 with productionin 2009 of 12 kboe/d, compared to 18 kboe/d in 2008 and11 kboe/d in 2007. The Group’s production is focused on the ShahDeniz field (10%). TOTAL holds a 10% interest in South CaucasusPipeline Company, owner of the SCP (South Caucasus Pipeline)gas pipeline that transports the gas produced in Shah Deniz to the
Turkish and Georgian markets. TOTAL also holds a 5% interest inthe BTC (Bakou-Tbilissi-Ceyhan) oil pipeline, owned by BTC Co.,which connects Baku and the Mediterranean Sea.
o Gas deliveries to Turkey and Georgia from the Shah Deniz fieldcontinued throughout 2009, at a lower pace for Turkey due toweaker demand. Also, during the spring and summer of 2009,SOCAR, the Azerbaijan state-owned company, did not take thegas quantities set in the agreement, but SOCAR made thepayments provided for by the take-or-pay agreement.
Development studies and business negotiations for the sale ofadditional gas needed to launch a second development phase inShah Deniz continued in 2009.
o On the BTC oil pipeline, notably used to transport thecondensates produced at Shah Deniz, equipment was installed in2009 to inject chemicals to reduce head losses. They areexpected to increase the oil pipeline capacity from 1Mb/d to1.2 Mb/d.
In 2009, TOTAL and SOCAR signed an exploration, developmentand production sharing contract for a permit located on theoffshore Absheron block. TOTAL (40%) will be the operator duringthe exploration phase and a joint operating company will conductoperation during the development phase. Drilling of an explorationwell is expected to start in 2010.
In Kazakhstan, TOTAL has been present since 1992 through theinterest it holds in the North Caspian Sea permit, which includesnotably the Kashagan field. The size of this field may eventuallyallow production to reach nearly 1,500 kb/d (in 100%). This projectis expected to be developed in several phases.
On Kashagan, the development plan for the first phase (300 kb/d)was approved in February 2004 by the Kazakh authorities, allowingwork to begin on the field. Drilling of development wells, whichbegan in 2004, continued in 2009 and production is expected tobegin in late 2012.
The agreements signed in October 2008 by members of the NorthCaspian Sea Production Sharing Agreement (NCSPSA) consortiumand the Kazakh authorities ended the disagreement that began inAugust 2007. The implementation of these agreements led to areduction of TOTAL’s share in NCSPSA from 18.52% to 16.81%.The operating structure was reconfigured and the North CaspianOperating Company (NCOC), a joint operating company, wasentrusted with the operatorship. NCOC started operating the field inJanuary 2009. NCOC supervises and coordinates NCSPSA’soperations and is directly responsible for the schedule, reservoirmodeling, conceptual development studies and relations with theKazakh authorities. NCOC uses TOTAL’s management system andthe company’s chief executive officer is also an executive fromTOTAL.
In Russia, where TOTAL has been present since 1989, productionfrom the Kharyaga field (40%, operator) rose to 12 kboe/d in 2009from 8 kboe/d in 2008 and 2007. TOTAL strengthened its positionsin the country through its partnerships with Gazprom and Novatek.
o In July 2007, TOTAL and Gazprom signed an agreement for thefirst phase of development on the giant Shtokman gas and
24 / TOTAL - Registration Document 2009
1 2 3 4 5 6 7 8 9 10 11
Upstream BUSINESS OVERVIEW
condensates field, located in the Barents Sea. ShtokmanDevelopment AG (TOTAL, 25%) was created in February 2008 todesign, build, finance and operate the first development phasewith an expected overall production capacity of 23.7 Bm3/y.Engineering studies are underway with an investment decisionexpected in March 2011 for the part of the project that will allowthe export of 23.7 Bm3/y of gas by pipeline to the Gazpromnetwork (offshore development, gas pipeline and onshore gasand condensates processing facilities – Teriberka site). Theinvestment decision is expected before the end of 2011 for theLNG part of the project that will allow the export of 7.5 Mt/y ofLNG from a new harbor located in Teriberka, representingapproximately half of the gas produced by the first developmentphase.
o In December 2009, TOTAL finalized the acquisition from Novatekof a 49% interest in Terneftegas, which holds a development andproduction license on the onshore Termokarstovoye field.Appraisal work is expected to be carried out in 2010 and 2011 onthis gas and condensates field located in the Yamalo-Nenetsregion.
o On the Kharyaga field, work related to the development plan ofPhase 3, approved in December 2007, is ongoing. Thisdevelopment plan is intended to maintain plateau production atthe 30 kboe/d (in 100%) level reached in late 2009. In December2009, TOTAL signed an agreement to sell a 10% interest inKharyaga to state-owned Zarubezhneft. Following thisdivestment, effective as of January 1, 2010, TOTAL holds a 40%interest in this field.
o In October 2009, TOTAL signed an agreement establishing theprinciples of a partnership with KazMunaiGas (KMG) for thedevelopment of the Khvalynskoye gas and condensates field,located offshore in the Caspian Sea (under Russian jurisdiction)on the border between Kazakhstan and Russia. Gas production isexpected to be transported to Russia. Pursuant to thisagreement, TOTAL is planning to acquire a 17% interest onKMG's share.
‹ Europe
In 2009, TOTAL’s production in Europe was 613 kboe/d,representing 27% of the Group’s overall production, comparedto 616 kboe/d in 2008 and 674 kboe/d in 2007.
In France, the Group’s production was 24 kboe/d in 2009, downfrom 25 kboe/d in 2008 and 27 kboe/d in 2007. The Group hasoperated fields in this country since 1939, notably the Lacq(100%) and Meillon (100%) gas fields, located in the southwest ofthe country.
On the Lacq field, operated since 1957, a carbon capture andstorage pilot was commissioned in January 2010. In connectionwith this project, a boiler has been modified to operate in anoxy-fuel combustion environment and the carbon dioxide emitted iscaptured and re-injected in the depleted Rousse field. As part ofTOTAL’s sustainable development policy, this project will allow theGroup to assess one of the technological possibilities for reducingcarbon dioxide emissions.
In Italy, the Tempa Rossa field (50%, operator), discovered in 1989and located on the unitized Gorgoglione concession (Basilicateregion), is one of TOTAL’s principal assets in the country.
Site preparation work started in August 2008, but the proceedingsinitiated by the Prosecutor of the Potenza Court against Total Italialed to a freeze in the preparation work. New calls for tenders havebeen launched related to certain contracts that had been cancelled.Preparation work related to the drilling of an appraisal well startedin December 2009. The partners on Tempa Rossa are expected tomake the final investment decision for the project in 2011.
In addition, the extension plan for the Tarente refinery exportsystem, needed for the development of the Tempa Rossa field, isexpected to be submitted to the Italian authorities in 2010 for anapproval expected in 2011. Start-up of production is currentlyexpected in 2014 with a plateau production of 50 kb/d.
In Norway, where the Group has been present since the late 1960s,TOTAL holds interests in seventy-seven production permits on theNorwegian continental shelf, including fourteen that it operates.Norway is the largest single-country contributor to the Group’sproduction, with volumes of 327 kboe/d in 2009, compared to334 kboe/d in 2008 and 338 kboe/d in 2007.
o In the Norwegian North Sea, production was 256 kboe/d in 2009.The most substantial contribution to production, for the most partnon-operated, comes from the Ekofisk Area located in thesouthern region. This region also includes the Greater Hild area(Hild East, Central and West) located in the north.
- In the Ekofisk area, a major work program continued in 2009 onthe Ekofisk (39.9%) and Eldfisk (39.9%) fields to increaseproduction, oil recovery and the life span of existing facilities. Asystem of permanent seismic pick-ups will be set up in order tooptimize future wells.
- On Hild East, located in the PL 040 / 043 (49%, operator)permits, drilling of an appraisal/pre-development well started inSeptember 2009. Results are expected to define the basis ofthe development plan. Six exploration and appraisal wells hadalready confirmed the potential of the Greater Hild area.
- On Frigg, dismantling of the offshore facilities was completedin 2009, on schedule.
o In the Norwegian Sea, the Haltenbanken area includes theTyrihans (23.2%), Mikkel (7.7%) and Kristin (6%) fields as well asthe Åsgard (7.7%) field and its satellites Yttergryta (24.5%) andMorvin (6%). In 2009, the Group’s production in theHaltenbanken area was 56 kboe/d.
- Tyrihans came onstream in July 2009, as planned, andYttergryta started in January 2009. Morvin is expected to startup production in 2010.
- On the undeveloped Victoria discovery (PL211), operated byTOTAL (40%), the 6506/9-1 appraisal well confirmed thepresence of gas, but revealed a structure more complex thanexpected.
o In the Barents Sea, LNG production on Snøhvit (18.4%) startedup in 2007. This project includes both the development of thenatural gas field and the construction of the associated
/ 25TOTAL
UpstreamBUSINESS OVERVIEW2
liquefaction facilities. Due to design problem, the plantexperienced performance and reliability concerns during thestart-up phase. A number of turnarounds were scheduled to fixthe issue. Excluding turnarounds, production levels close to theplant's production capacity (4.2 Mt/y for LNG production) wereachieved in 2009.
Between 2007 and 2009, exploration and appraisal work occurredon various permits, including the drilling of a successful appraisalwell on the Onyx SW discovery (PL 255, 20%), in the Haltenbankenarea. In the Norwegian North Sea, the oil discovery on Dagny(PL 048, 21.8%) and the Pan/Pandora (PL 120, 11%) discovery,made in 2008, substantially increased the potential of the Sleipnerand Visund areas, respectively. A number of discoveries were alsomade in 2009, in particular on Beta Vest (PL 046, 10%) nearSleipner, Katla (PL 104, 10%), located south of Oseberg, and VigdisNorth East (PL 089, 5.6%), located south of Snorre. In the BarentsSea, during the twentieth licensing round, TOTAL was awarded anew exploration permit: PL 535 (40%). On this permit, a 3D seismicacquisition was completed in 2009 and drilling is expected to beginin 2011.
In the Netherlands, TOTAL has been active in natural gasexploration and production since 1964 and currently holds twenty-four offshore production permits, including twenty that it operates,and an offshore exploration permit, E17c (16.92%), awarded inFebruary 2008. The Group’s 2009 production amounted to45 kboe/d, compared to 44 kboe/d in 2008 and 45 kboe/d in 2007.The acquisition of Goal Petroleum (Netherlands) B.V. in August2008 is expected to increase the Group’s production by 8 kboe/dby 2011.
o On the K5F field (40.39%, operator), production began inSeptember 2008. This project is comprised of two sub-sea wellsconnected to the existing production and transport facilities. K5Fis the first project in the world to use only electrically drivensub-sea wellheads and systems. This advance in sub-seatechnologies is expected to increase the reliability of systems andimprove environmental performance.
o The development of the K5CU project (49%, operator) waslaunched in 2009 and production is expected to start in 2011.This development includes four wells supported by a newplatform connected to the K5A platform by a 15 km gas pipeline.
In the United Kingdom, TOTAL has been present since 1962 withproduction in 2009 of 217 kboe/d, compared to 213 kboe/d in 2008and 264 kboe/d in 2007. The United Kingdom accounts for nearly10% of the Group’s overall production. 85% of this productioncomes from operated fields located in two major zones: the Alwynzone in the northern North Sea, and the Elgin/Franklin zone in theCentral Graben.
o On the Alwyn zone, wells drilled on the Alwyn North field(100%) discovered new reserves that came onstream in 2007 and2009. In addition, the start-up of production from satellites or newreservoir compartments allowed the potential for production toremain at a level near the processing and compressing capacitiesof the Alwyn platform (530 Mcf/d of gas increased to 575 Mcf/dsince the summer 2008 planned shutdown for maintenance).
The Jura field (100%), discovered in late 2006, started productionin May 2008 through two sub-sea wells connected to the pipelinelinking Forvie North and Alwyn. The production capacity of thisfield is 50 kboe/d (gas and condensates).
Development studies are nearing completion for Islay (100%), asecond gas and condensates discovery made in 2008 andlocated in a faulted panel immediately east of Jura.
In late 2008, TOTAL increased its interest in the Otter field from54.3% to 81%.
o The development of the Elgin (35.8%) and Franklin fields (35.8%),in production since 2001, made a substantial contribution to theGroup’s operations in the United Kingdom. This projectconstituted a technical milestone, combining the development ofone of the deepest reservoirs in the North Sea (5,500 m) withtemperature and pressure conditions among the highest in theworld (190°C and 1,100 bars).
On the Elgin field, the infill well drilled between November 2008and September 2009 started production in October 2009 at a rateof 18 kboe/d. Drilling of a second infill well is ongoing. A similarwell was completed on the Franklin field in 2007. Drilling of sucha well in a high pressure/high temperature depleted field is amajor technical milestone.
Glenelg (49.5%) and West Franklin (35.8%), operated satellites ofthe Elgin and Franklin fields, respectively, started production inMarch 2006 and September 2007, respectively. Studies areunderway for an additional development of West Franklin from anew platform. Anticipated production for this field over its life isestimated to total approximately 200 Mboe (in 100%).
As part of an agreement signed in 2005, TOTAL acquired a 25%interest in two blocks located near Elgin and Franklin by drilling asuccessful appraisal well on the Kessog structure. This interestwas increased to 50% in 2009 following the completion of a long-duration test whose results are under study.
o In the West of Shetland area, TOTAL increased its interest to80% in the Tormore and Laggan fields in early 2010. In late 2009,TOTAL acquired a 43.75% interest (and operatorship) in the P967permit located north of Laggan-Tormore. This permit includes theTobermory gas discovery.
A successful exploration well was drilled in 2007 on the Tormoreprospect, located 15 km southwest of the Laggan field.Development studies allowed the Group and its partners to selecta joint development plan for both fields using sub-sea productionfacilities and off-gas treatment (gas and condensates) at a plantlocated near the Sullom Voe terminal in the Shetland Islands. Thegas would be exported to the Saint-Fergus terminal through anew pipeline connected to the Frigg pipeline (FUKA). The finalinvestment decision for the project has been made in March 2010and production is scheduled to start in 2014 with an expectedcapacity of 90 kboe/d.
TOTAL holds interests in ten assets operated by third parties, themost important in terms of reserves being the Bruce (43.25%) andAlba (12.65%) fields.
26 / TOTAL - Registration Document 2009
1 2 3 4 5 6 7 8 9 10 11
Upstream BUSINESS OVERVIEW
‹ Middle East
In 2009, TOTAL’s production in the Middle East (includingproduction of equity affiliates and non-consolidatedsubsidiaries) was 438 kboe/d, representing 19% of the Group’soverall production, compared to 432 kboe/d in 2008 and390 kboe/d in 2007.
In the United Arab Emirates, where TOTAL has been present since1939, the Group’s production in 2009 was 214 kboe/d, comparedto 243 kboe/d in 2008 and 242 kboe/d in 2007. The decline in 2009is primarily due to the implementation of OPEC quotas.
In Abu Dhabi, TOTAL holds interests in the Abu Al Bu Khoosh field(75%, operator), in the Abu Dhabi Company for Onshore OilOperations (ADCO, 9.5%), which operates the five major onshorefields in Abu Dhabi, and in Abu Dhabi Marine (ADMA, 13.3%), whichoperates two offshore fields. TOTAL also has interests in Abu DhabiGas Industries (GASCO, 15%), which produces LPG andcondensates from the associated gas produced by ADCO, and inAbu Dhabi Gas Liquefaction Company (ADGAS, 5%), whichproduces LNG, LPG and condensates.
In early 2009, TOTAL signed agreements for a 20-year extension of itsparticipation in the GASCO joint venture starting on October 1, 2008.
The Group also holds a 33.3% interest in Ruwais Fertilizer Industries(FERTIL), which produces urea. In 2005, FERTIL’s corporate life wasextended for an additional 25-year period. FERTIL 2, a new project,was launched in 2009 to build a new granulated urea unit with acapacity of 3,500 t/d (1.2 Mt/y). This project will allow FERTIL tomore than double production and reach nearly 2 Mt/y.
In Iraq, TOTAL participated in 2009 in both calls for tenderslaunched by the Iraqi Ministry of Oil. The CNPC-led consortium thatincludes TOTAL (25%) was awarded the development andproduction contract for the Halfaya field during the second call fortenders that was held in December 2009. This field is located in theprovince of Missan, north of Basra. In addition, the Groupcontinued its major training program for Iraqi engineers. As a result,a training framework agreement was signed in December 2009 byTOTAL and the Iraqi Ministry of Oil.
In Iran, the Group’s production, in the form of buy-backagreements, amounted to 8 kb/d in 2009, compared to 9 kb/d in2008 and 15 kb/d in 2007. For additional information on TOTAL’soperations in Iran, see Chapter 4 (Risk Factors).
In Oman, the Group’s production in 2009 was 34 kboe/d, stablecompared to 2008 and 2007. The Group produces oil mainly onBlocks 6 and 53 as well as liquefied natural gas through its interestsin the Oman LNG (5.54%)/Qalhat LNG (2.04%) 1 liquefaction plant,which has a capacity of 10.5 Mt/y.
In Qatar, TOTAL has been present since 1936 and holds interestsin the Al Khalij field (100%), the NFB Block (20%) in the North Field,the Qatargas 1 liquefaction plant (10%), the Dolphin project(24.5%) and train 5 of Qatargas 2 (16.7%). The Group’s productionwas 141 kboe/d in 2009, compared to 121 kboe/d in 2008 and74 kboe/d in 2007. Production substantially increased with thestart-ups of Qatargas 2 and Dolphin.
o Production from Dolphin started during the summer of 2007 andreached its full capacity in the first quarter of 2008. The contract,signed in December 2001 with state-owned Qatar Petroleum,provides for the sale of 2,000 Mcf/d of gas from the North Fieldfor a 25-year period. The gas is processed in the Dolphin plant inRas Lafan and exported to the United Arab Emirates through a360 km gas pipeline.
o Production from train 5 of Qatargas 2, which started inSeptember 2009, reached its full capacity (7.8 Mt/y) in late 2009.TOTAL has owned an interest in this train since December 2006.In addition, TOTAL began to off-take part of the LNG produced incompliance with the contracts signed in July 2006, which providefor the purchase of 5.2 Mt/y of LNG from Qatargas 2 by theGroup.
The Group also holds a 10% interest in Laffan Refinery, a 146 kb/dcondensate splitter that started up in September 2009.
In Syria, TOTAL is present on the Deir Ez Zor permit (100%,operated by DEZPC of which 50% is owned by TOTAL) andthrough the Tabiyeh contract that became effective in October2009. For both assets, the Group’s production was nearly20 kboe/d in 2009, compared to 15 kboe/d in 2008 and 2007.
Three new agreements were approved:
o in November 2008, the 10-year extension of the Deir Ez Zorpermit to 2021;
o in October 2009, the Tabiyeh agreement, which primarilyprovides for an increase in the production from the gas andcondensates Tabiyeh field; and
o in July 2009, the Cooperation Framework Agreement, whichprovides for the development of oil projects in partnership withthe Syrian company General Petroleum Corporation.
For additional information on TOTAL’s operations in Syria, seeChapter 4 (Risk Factors).
In Yemen, TOTAL has been present since 1987 with production in2009 of 21 kboe/d, compared to 10 kboe/d in 2008 and 9 kboe/d in2007. TOTAL has interests in the country’s two oil basins, as theoperator on Block 10 (Masila Basin, East Shabwa permit, 28.57%)and as a partner on Block 5 (Marib Basin, Jannah permit, 15%).TOTAL also has an interest in the Yemen LNG project (39.62%).
/ 27TOTAL
1. Indirect interest through the 36.8% share of Qalhat LNG owned by Oman LNG.
UpstreamBUSINESS OVERVIEW2
The Yemen LNG liquefaction plant started up in October 2009. Aspart of this project, the liquefaction plant built in Balhaf on thesouthern coast of Yemen is supplied with gas produced on Block18, located near Marib in the center of the country, through a320 km pipeline. Production from the plant started with thecommissioning of the first liquefaction train. Construction of thesecond train is nearing completion for a start-up by the summer of2010. Overall production capacity from both trains is expected toreach 6.7 Mt/y of LNG.
In 2008, TOTAL strengthened its position in onshore explorationthrough the acquisition of a 30.9% interest in Block 70 following thepurchase of a 40% share in Blocks 69 and 71 in 2007. Appraisal ofa gas discovery on Block 71 is underway. The first well drilled onBlock 70 discovered positive oil shows. The potential of thisdiscovery has yet to be assessed.
28 / TOTAL - Registration Document 2009
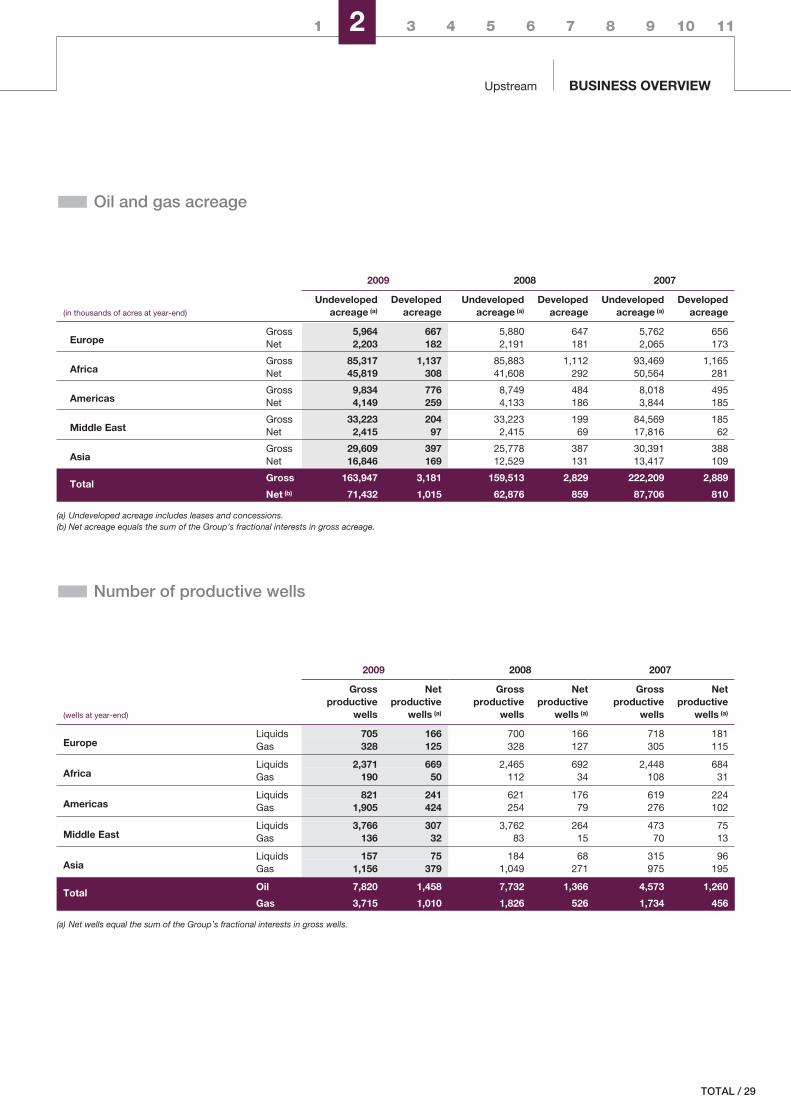
1 2 3 4 5 6 7 8 9 10 11
Upstream BUSINESS OVERVIEW
� Oil and gas acreage
2009 2008 2007
(in thousands of acres at year-end)
Undevelopedacreage (a)
Developedacreage
Undevelopedacreage (a)
Developedacreage
Undevelopedacreage (a)
Developedacreage
EuropeGross 5,964 667 5,880 647 5,762 656Net 2,203 182 2,191 181 2,065 173
AfricaGross 85,317 1,137 85,883 1,112 93,469 1,165Net 45,819 308 41,608 292 50,564 281
AmericasGross 9,834 776 8,749 484 8,018 495Net 4,149 259 4,133 186 3,844 185
Middle EastGross 33,223 204 33,223 199 84,569 185Net 2,415 97 2,415 69 17,816 62
AsiaGross 29,609 397 25,778 387 30,391 388Net 16,846 169 12,529 131 13,417 109
TotalGross 163,947 3,181 159,513 2,829 222,209 2,889
Net (b) 71,432 1,015 62,876 859 87,706 810
(a) Undeveloped acreage includes leases and concessions.(b) Net acreage equals the sum of the Group’s fractional interests in gross acreage.
� Number of productive wells
2009 2008 2007
(wells at year-end)
Grossproductive
wells
Netproductive
wells (a)
Grossproductive
wells
Netproductive
wells (a)
Grossproductive
wells
Netproductive
wells (a)
EuropeLiquids 705 166 700 166 718 181Gas 328 125 328 127 305 115
AfricaLiquids 2,371 669 2,465 692 2,448 684Gas 190 50 112 34 108 31
AmericasLiquids 821 241 621 176 619 224Gas 1,905 424 254 79 276 102
Middle EastLiquids 3,766 307 3,762 264 473 75Gas 136 32 83 15 70 13
AsiaLiquids 157 75 184 68 315 96Gas 1,156 379 1,049 271 975 195
TotalOil 7,820 1,458 7,732 1,366 4,573 1,260
Gas 3,715 1,010 1,826 526 1,734 456
(a) Net wells equal the sum of the Group’s fractional interests in gross wells.
/ 29TOTAL
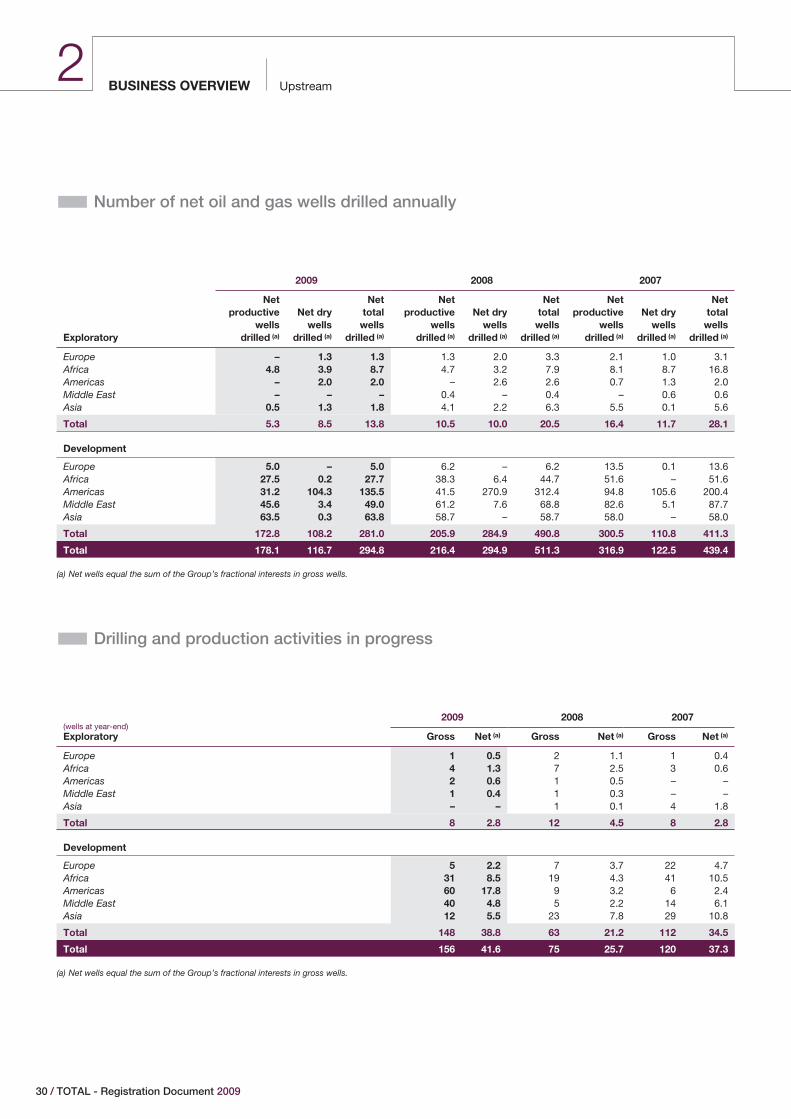
UpstreamBUSINESS OVERVIEW2
� Number of net oil and gas wells drilled annually
2009 2008 2007
Exploratory
Netproductive
wellsdrilled (a)
Net drywells
drilled (a)
Nettotal
wellsdrilled (a)
Netproductive
wellsdrilled (a)
Net drywells
drilled (a)
Nettotal
wellsdrilled (a)
Netproductive
wellsdrilled (a)
Net drywells
drilled (a)
Nettotal
wellsdrilled (a)
Europe – 1.3 1.3 1.3 2.0 3.3 2.1 1.0 3.1Africa 4.8 3.9 8.7 4.7 3.2 7.9 8.1 8.7 16.8Americas – 2.0 2.0 – 2.6 2.6 0.7 1.3 2.0Middle East – – – 0.4 – 0.4 – 0.6 0.6Asia 0.5 1.3 1.8 4.1 2.2 6.3 5.5 0.1 5.6
Total 5.3 8.5 13.8 10.5 10.0 20.5 16.4 11.7 28.1
Development
Europe 5.0 – 5.0 6.2 – 6.2 13.5 0.1 13.6Africa 27.5 0.2 27.7 38.3 6.4 44.7 51.6 – 51.6Americas 31.2 104.3 135.5 41.5 270.9 312.4 94.8 105.6 200.4Middle East 45.6 3.4 49.0 61.2 7.6 68.8 82.6 5.1 87.7Asia 63.5 0.3 63.8 58.7 – 58.7 58.0 – 58.0
Total 172.8 108.2 281.0 205.9 284.9 490.8 300.5 110.8 411.3
Total 178.1 116.7 294.8 216.4 294.9 511.3 316.9 122.5 439.4
(a) Net wells equal the sum of the Group’s fractional interests in gross wells.
� Drilling and production activities in progress
(wells at year-end)Exploratory
2009 2008 2007
Gross Net (a) Gross Net (a) Gross Net (a)
Europe 1 0.5 2 1.1 1 0.4Africa 4 1.3 7 2.5 3 0.6Americas 2 0.6 1 0.5 – –Middle East 1 0.4 1 0.3 – –Asia – – 1 0.1 4 1.8
Total 8 2.8 12 4.5 8 2.8
Development
Europe 5 2.2 7 3.7 22 4.7Africa 31 8.5 19 4.3 41 10.5Americas 60 17.8 9 3.2 6 2.4Middle East 40 4.8 5 2.2 14 6.1Asia 12 5.5 23 7.8 29 10.8
Total 148 38.8 63 21.2 112 34.5
Total 156 41.6 75 25.7 120 37.3
(a) Net wells equal the sum of the Group’s fractional interests in gross wells.
30 / TOTAL - Registration Document 2009
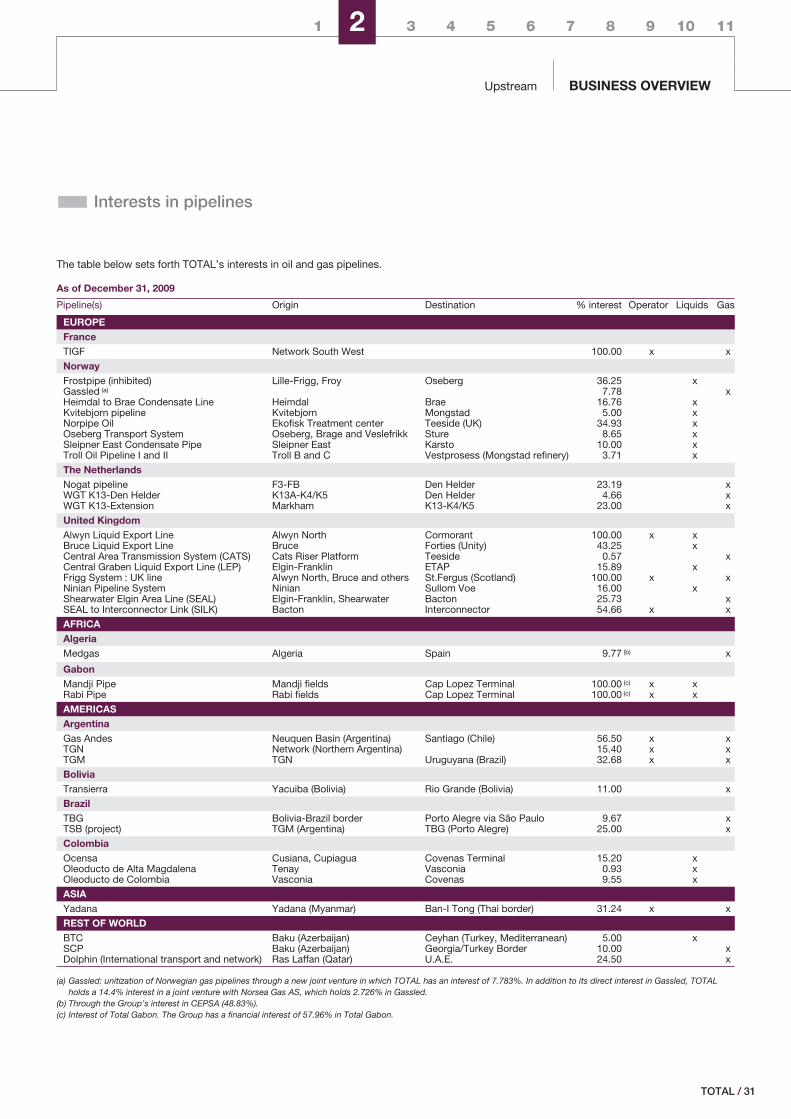
1 2 3 4 5 6 7 8 9 10 11
Upstream BUSINESS OVERVIEW
� Interests in pipelines
The table below sets forth TOTAL’s interests in oil and gas pipelines.
As of December 31, 2009
Pipeline(s) Origin Destination % interest Operator Liquids Gas
EUROPEFranceTIGF Network South West 100.00 x x
NorwayFrostpipe (inhibited) Lille-Frigg, Froy Oseberg 36.25 xGassled (a) 7.78 xHeimdal to Brae Condensate Line Heimdal Brae 16.76 xKvitebjorn pipeline Kvitebjorn Mongstad 5.00 xNorpipe Oil Ekofisk Treatment center Teeside (UK) 34.93 xOseberg Transport System Oseberg, Brage and Veslefrikk Sture 8.65 xSleipner East Condensate Pipe Sleipner East Karsto 10.00 xTroll Oil Pipeline I and II Troll B and C Vestprosess (Mongstad refinery) 3.71 x
The NetherlandsNogat pipeline F3-FB Den Helder 23.19 xWGT K13-Den Helder K13A-K4/K5 Den Helder 4.66 xWGT K13-Extension Markham K13-K4/K5 23.00 x
United KingdomAlwyn Liquid Export Line Alwyn North Cormorant 100.00 x xBruce Liquid Export Line Bruce Forties (Unity) 43.25 xCentral Area Transmission System (CATS) Cats Riser Platform Teeside 0.57 xCentral Graben Liquid Export Line (LEP) Elgin-Franklin ETAP 15.89 xFrigg System : UK line Alwyn North, Bruce and others St.Fergus (Scotland) 100.00 x xNinian Pipeline System Ninian Sullom Voe 16.00 xShearwater Elgin Area Line (SEAL) Elgin-Franklin, Shearwater Bacton 25.73 xSEAL to Interconnector Link (SILK) Bacton Interconnector 54.66 x x
AFRICAAlgeriaMedgas Algeria Spain 9.77 (b) x
GabonMandji Pipe Mandji fields Cap Lopez Terminal 100.00 (c) x xRabi Pipe Rabi fields Cap Lopez Terminal 100.00 (c) x x
AMERICASArgentinaGas Andes Neuquen Basin (Argentina) Santiago (Chile) 56.50 x xTGN Network (Northern Argentina) 15.40 x xTGM TGN Uruguyana (Brazil) 32.68 x x
BoliviaTransierra Yacuiba (Bolivia) Rio Grande (Bolivia) 11.00 x
BrazilTBG Bolivia-Brazil border Porto Alegre via São Paulo 9.67 xTSB (project) TGM (Argentina) TBG (Porto Alegre) 25.00 x
ColombiaOcensa Cusiana, Cupiagua Covenas Terminal 15.20 xOleoducto de Alta Magdalena Tenay Vasconia 0.93 xOleoducto de Colombia Vasconia Covenas 9.55 x
ASIAYadana Yadana (Myanmar) Ban-I Tong (Thai border) 31.24 x x
REST OF WORLDBTC Baku (Azerbaijan) Ceyhan (Turkey, Mediterranean) 5.00 xSCP Baku (Azerbaijan) Georgia/Turkey Border 10.00 xDolphin (International transport and network) Ras Laffan (Qatar) U.A.E. 24.50 x
(a) Gassled: unitization of Norwegian gas pipelines through a new joint venture in which TOTAL has an interest of 7.783%. In addition to its direct interest in Gassled, TOTALholds a 14.4% interest in a joint venture with Norsea Gas AS, which holds 2.726% in Gassled.
(b) Through the Group’s interest in CEPSA (48.83%).(c) Interest of Total Gabon. The Group has a financial interest of 57.96% in Total Gabon.
/ 31TOTAL
UpstreamBUSINESS OVERVIEW2
� Gas & Power
The Gas & Power division is mainly focused on the optimization ofthe Group’s gas resources through marketing, trading, transport ofnatural gas and liquefied natural gas (LNG), LNG re-gasification andnatural gas storage.
The division also contributes to the development of Group’soperations in the areas of liquefied petroleum gas (LPG) shippingand trading; power generation from gas-fired power plants orrenewable energies; solar power systems and technology (notablythrough its subsidiaries Tenesol and Photovoltech); coalproduction, trading and marketing.
The Gas & Power division also conducts research and developmentrelated to new energies that will be increasingly necessary tocomplement hydrocarbons, in particular solar and biomass.
Finally, this division prepares and implements the Group’s strategyin the nuclear energy sector.
‹ Natural Gas
In 2009, TOTAL continued to pursue its strategy of developing itsoperations downstream from natural gas production in order tooptimize access for the Group’s current and future gas productionand reserves to traditional markets (with long-term contractsbetween producers and integrated gas companies) and to marketsopen to international competition (including short-term contractsand spot sales).
The long-term contracts under which TOTAL sells its natural gasproduction usually provide for a price related to, among otherfactors, average crude oil and other petroleum product prices, aswell as, in some cases, a cost-of-living index. In most cases, priceformulas entail a time lag or an adjustment over time that reflectschanges in oil price indexes.
In the context of deregulated natural gas markets, which allowcustomers to more freely access suppliers, in turn leading to newmarketing schemes that are more flexible than traditional long-termcontracts, TOTAL is developing trading, marketing and logisticsbusinesses to offer its natural gas production directly to customers,primarily in the industrial and commercial markets.
� Europe
TOTAL has been active in the downstream sector of the gas valuechain in Europe for more than sixty years to maximize the value ofits gas reserves.
In France, the Group’s transport and storage businesses locatedin the southwest of the country are grouped under TIGF, a wholly-owned subsidiary of the Group. This subsidiary operates a
regulated transport network of 5,000 km of gas pipelines and, undera negotiated scheme, two storage units with 87 Bcf (2.5 Bm3) ofusable capacity, representing approximately 20% of the natural gasstorage capacity in France 1.
Highlights of 2009 included:
o The inauguration in October of the Artère de Guyenne gaspipeline. This pipeline (70 km long and 900 mm in diameter)connects Captieux and Mouliets-et-Villemartin to facilitate thetransport of gas, notably from the Fos Cavaou LNG terminal, tonorthern France.
o The launch of an open season, involving four French and Spanishtransportation operators, including TIGF, to develop Franco-Spanish interconnections. This open season allowed the long-term allocation of 80% of gas transport capacities betweenFrance and Spain in both directions. These allocations arescheduled to be in effect by 2013 with the development of twonew projects: the Artère du Béarn and phase B of the Artère deGuyenne gas pipelines.
o The increase by 3.5 Bcf (100 Mm3) of the storage capacity atLussagnet in April, in compliance with the authorization providedby the decree published on April 9, 2008.
o The acquisition of a 26.2% interest (through its interest inGéosud) in Géométhane, an Economic Interest Grouping thatowns natural gas storage in a salt cavern with a capacity of 10.5Bcf (0.3 Bm3), located in Manosque, in the southeast of France. Aproject to increase the storage capacity by 7 Bcf (0.2 Bm3) isunder study for a commissioning scheduled in 2016.
In addition, the European Union adopted, on July 13, 2009, theThird Energy Package, which includes two directives and threeregulations related to the natural gas and electricity markets.TOTAL will assess the potential impact on its gas and electricitytransport, storage and supply operations as soon as the legislationis transposed into French law.
Regarding its marketing business, TOTAL is mainly developing onthree major European markets.
In France, TOTAL operates through its marketing subsidiary TotalÉnergie Gaz (TEGAZ) which sold 208 Bcf of natural gas (5.9 Bm3) in2009, compared to 229 Bcf (6.5 Bm3) in 2008 and 245 Bcf(7 Bm3) in 2007. Despite a sharp decline in demand due to theeconomic crisis, TEGAZ posted a strong increase in sales toindustrial and commercial customers, which are the subsidiary’smain market segments.
32 / TOTAL - Registration Document 2009
1. GIE data (Gaz Infrastructures Europe), June 2009.
1 2 3 4 5 6 7 8 9 10 11
Upstream BUSINESS OVERVIEW
In Spain, Cepsa Gas Comercializadora markets gas in the industrialand commercial sectors. This company is held by TOTAL (35%),CEPSA (35%) and the Algerian national oil company, Sonatrach(30%). In 2009, Cepsa Gas Comercializadora sold approximately70 Bcf (2 Bm3) of natural gas to industrial and commercialcustomers, similar to 2008, compared to 59 Bcf (1.7 Bm3) in 2007.
In the United Kingdom, TOTAL’s subsidiary Total Gas & Power Ltdmarkets gas and power to the industrial and commercial markets.The subsidiary is also active in gas, electricity and LNG tradingworldwide. In 2009, 130 Bcf (3.7 Bm3) of natural gas was sold toindustrial and commercial customers, compared to 134 Bcf(3.8 Bm3) in 2008 and 124 Bcf (3.5 Bm3) in 2007. Electricity salesamounted to 4.1 TWh in 2009, compared to 4.6 TWh in 2008 and3.6 TWh in 2007. In 2007, TOTAL disposed of its 10% interest inInterconnector UK Ltd, a gas pipeline connecting Bacton in theUnited Kingdom to Zeebrugge in Belgium. This disposal did notaffect TOTAL’s rights to transport gas through the pipeline.
� The Americas
In the United States, the Group’s subsidiary Total Gas & PowerNorth America Inc. marketed 1,586 Bcf (45 Bm3) of natural gas in2009, compared to approximately 1,652 Bcf (46.9 Bm3) in 2008 and1,606 Bcf (45.5 Bm3) in 2007, supplied by its own production andexternal sources.
In Mexico, Gas del Litoral, a company in which TOTAL holds a 25%interest, sold approximately 173 Bcf (4.9 Bm3) of natural gas in2009, its third full year of activity, similar to 2008, compared to 95Bcf (2.7 Bm3) in 2007.
In South America, TOTAL owns interests in several natural gastransport companies in Argentina, Chile and Brazil, including thefollowing:
o a 15.4% interest in Transportadora de Gas del Norte (TGN),which operates a gas transport network covering the northernhalf of Argentina;
o a 56.5% interest in the companies that own the GasAndespipeline, which connects the TGN network to the Santiago delChile region; and
o a 9.7% interest in Transportadora Gasoducto Bolivia – Brasil(TBG), whose gas pipeline supplies southern Brazil from theBolivian border.
These assets represent a total integrated network of approximately9,500 km of pipelines serving the Argentine, Chilean and Brazilianmarkets from gas-producing basins in Bolivia and Argentina, wherethe Group has natural gas reserves.
The actions taken by the Argentine government after the 2001economic crisis and the subsequent energy crisis, marked in 2007by a severe gas shortage during the southern winter, put TOTAL’sArgentine subsidiaries in difficult financial and operationalsituations, even after taking into account the restructuring of TGN’s
debt, which was completed in 2006. The sale of the Group’sArgentine power generation assets was completed in 2007 andprocedures to protect TOTAL’s investments, initiated in 2002 withthe International Center for Settlement of Investment Disputes(ISCID), are ongoing.
During 2008 and 2009, gas production in Argentina decreasedsubstantially, reducing the export of gas to Chile and promptingcommercial discussions between GasAndes and its shippers abouttransportation contracts and their commitments.
Due to the deterioration of TGN’s financial situation as a result ofthe freeze of domestic tariffs and the restrictions on exports, TGNapplied for a suspension of payments in December 2008, andlaunched a new process to restructure its debt. These decisions ledthe Argentinean authorities to set up a formal monitoring of TGN'smanagement.
� Asia
TOTAL markets natural gas transported through pipelines inIndonesia, Thailand and Myanmar, and, in the form of LNG, toJapan, South Korea, China, Taiwan and India. The Group is alsodeveloping its re-gasified LNG marketing business in new emergingmarkets.
In India, Hazira LNG Private Limited, a company in which TOTALholds a 26% interest, sold approximately 74 Bcf (2.1 Bm3) of naturalgas in 2009, its fourth full year in operation, compared to 87 Bcf(2.5 Bm3) in 2008 and 76 Bcf (2.2 Bm3) in 2007.
‹ Liquefied Natural Gas
In the LNG chain, the Gas & Power division is responsible foroperations downstream from liquefaction plants 1, includingpurchase, shipping, re-gasification, storage and marketing.
Through its subsidiaries Total Gas & Power Ltd and Total Gas &Power North America Inc., TOTAL has entered into agreements toobtain long-term access to LNG re-gasification capacity on thethree continents that are the largest consumers of natural gas:North America (the United States and Mexico), Europe (France andthe United Kingdom) and Asia (India). This diversified marketpresence allows the Group to access new liquefaction projects bybecoming a long-term buyer of a portion of the LNG produced atthe plants, thereby consolidating its LNG supply portfolio.
� Europe
In France, TOTAL acquired in June 2006 an interest in Société duTerminal Méthanier de Fos Cavaou (STMFC). This terminal isexpected to have a re-gasification capacity of 291 Bcf/y
/ 33
1. The Exploration & Production division is in charge of the Group’s natural gas liquefaction operations.
TOTAL
UpstreamBUSINESS OVERVIEW2
(8.25 Bm3/y), of which 79 Bcf/y (2.25 Bm3/y) has been reserved byTOTAL. The Group’s interest in STMFC’s share capital decreasedto 28.8% from 30.3% in late 2009 pursuant to the provisions of theshareholders’ agreement, without impacting the re-gasificationvolumes reserved by TOTAL. In October 2009, the terminal wasauthorized by the prefectorial authorities to conduct commissioningtests and operate at reduced capacity. Commercial start-up isexpected in the second quarter of 2010.
In addition, TOTAL and EDF signed in March 2010 a letter of intentwhereby TOTAL will reserve re-gasification capacity in the plannedDunkirk LNG terminal being developed by Dunkerque LNG, awholly-owned EDF subsidiary, and will also acquire an interest inthis company.
In the United Kingdom, TOTAL acquired in December 2006 an8.35% interest in the South Hook LNG re-gasification terminalproject in connection with its entry in the Qatargas 2 project.Phase 1 (371 Bcf/y representing 10.5 Bm3/y) of the terminal wascommissioned in October 2009 and Phase 2, expected to comeonstream in the first half of 2010, is expected to increase the overallcapacity of the terminal to 742 Bcf/y (21 Bm3/y).
In Norway, as part of the Snøhvit project, in which TOTAL holds an18.4% interest and where the first deliveries started in October 2007,the Group signed in November 2004 a purchase agreement for35 Bcf/y (1 Bm3/y) of natural gas primarily intended for NorthAmerica and Europe. To transport this LNG, TOTAL also charters theArctic Lady, a 145,000 m3 LNG tanker that was delivered in April2006.
In Croatia, TOTAL owns an interest in Adria LNG, a company incharge of studying the construction of an LNG re-gasification terminalon Krk island, on the northern Adriatic coast. In December 2009,TOTAL’s interest increased from 25.58% to 27.36% pursuant to thewithdrawal of a partner from the project. This terminal is expected tohave an initial re-gasification capacity of 353 Bcf/y (10 Bm3/y), whichcould be subsequently increased to 494 Bcf/y (14 Bm3/y).
In addition, TOTAL holds a 30% interest in Gaztransport &Technigaz (GTT), which focuses mainly on the design andengineering of membrane cryogenic tanks for LNG tankers. Atyear-end 2009, 225 active LNG tankers were equipped withmembrane tanks built under GTT licenses out of a world tonnageestimated at 344 LNG tankers. 1
� North America
In Mexico, the Altamira re-gasification terminal, in which TOTALholds a 25% interest, has been operating since the summer of2006. This terminal, located on the east coast of Mexico, has are-gasification capacity of 236 Bcf/y (6.7 Bm3/y). This capacity hasbeen entirely reserved by Gas del Litoral, in which TOTAL has a25% interest. The terminal received forty cargos in 2009, comparedto forty-two in 2008 and thirty-three in 2007. In November 2009,Altamira received its first Q-Flex vessel from Qatar.
In the United States, the Sabine Pass terminal in Louisiana wasinaugurated in April 2008. TOTAL has reserved re-gasificationcapacity of approximately 10 Bm3/y (1 Bcf/d) at this terminal for a
renewable 20-year period starting in April 2009, concurrent with thedelivery of the Group's first LNG cargo. As part of this agreement,TOTAL plans to supply the Sabine Pass terminal though its LNGpurchase contracts associated with its various production projects,notably in the Middle East, Norway and Western Africa.
� Asia
In India, the Hazira re-gasification terminal (TOTAL 26%), located onthe west coast in the Gujarat state, was inaugurated in April 2005with an initial re-gasification capacity of approximately 120 Bcf/y(3.4 Bm3/y). Its capacity reached 177 Bcf/y (5 Bm3/y) afterde-bottlenecking operations conducted in 2008. Hazira is amerchant terminal with operations that include LNG re-gasificationand natural gas marketing. TOTAL has agreed to provide up to 26%of the LNG for the Hazira terminal. Due to market conditions in 2009,Hazira was operated on the basis of short-term contracts, both forthe sale of gas on the Indian market and the purchase of LNG frominternational markets. Twenty-seven cargos were delivered in 2009,compared to thirty in 2008 and twenty-eight in 2007.
In China, TOTAL signed in December 2008 an LNG sale agreementwith CNOOC (China National Offshore Oil Company). As part of thisagreement, TOTAL is expected to supply CNOOC with up to 1 Mt/yof LNG starting in 2010. The gas supplied will come from theGroup’s global LNG resources.
� Middle East
In Qatar, TOTAL signed purchase agreements in July 2006 for up to5.2 Mt/y of LNG from the second train of Qatargas 2 over a 25-yearperiod. This LNG is expected to be marketed principally in France,the United Kingdom and North America. The Group’s acquisition ofa 16.7% interest in the second train of Qatargas 2 was concluded inDecember 2006. LNG production from this train started inSeptember 2009.
In Yemen, TOTAL signed in July 2005 an agreement with YemenLNG Ltd (TOTAL, 39.62%) to purchase 2 Mt/y of LNG over a20-year period, beginning in 2009, to be delivered to the UnitedStates. LNG production from the first train of Yemen LNG started inOctober 2009. Construction of the second train is nearingcompletion for a start-up by the summer of 2010.
� Africa
In Angola, TOTAL is involved in the construction of the Angola LNGplant (13.6%), comprised of a 5.2 Mt/y train, which is expected tostart up in 2012. As part of this project, TOTAL signed a re-gasifiednatural gas purchase agreement in December 2007 for 13.6% ofthe quantities to be delivered to the Gulf LNG Clean Energy terminalin Mississippi in the United States.
In Nigeria, as part of the expansions of the Nigeria LNG (NLNG)plant, in which the Group holds a 15% interest, TOTAL signed anLNG purchase agreement for an initial 0.23 Mt/y over a 20-yearperiod, to which an additional 0.9 Mt/y was added when the sixthtrain came onstream.
34 / TOTAL - Registration Document 2009
1. Gaztransport & Technigaz data.
1 2 3 4 5 6 7 8 9 10 11
Upstream BUSINESS OVERVIEW
As part of the project to build an additional LNG train (train 7) with acapacity of approximately 8.5 Mt/y, TOTAL signed a purchaseagreement in February 2007 for 1.375 Mt/y of LNG over a 20-yearperiod. This agreement is subject to NLNG’s final investmentdecision for this new train.
TOTAL also acquired a 17% interest in the Brass LNG project inJuly 2006. This liquefaction project calls for the construction of twoliquefaction trains, each with a capacity of 5 Mt/y. In conjunctionwith this acquisition, TOTAL signed a preliminary agreement withBrass LNG Ltd setting forth the principal terms of an agreement topurchase approximately one-sixth of the plant’s capacity over a20-year period. This LNG would be delivered primarily to NorthAmerica and Western Europe. The purchase agreement is subjectto final investment decision for the Brass LNG project.
� Trading
TOTAL, through its subsidiary Total Gas & Power Ltd, hasconducted trading activities primarily for spot LNG between 2001and 2006. In 2007, this subsidiary began receiving cargos under itslong-term supply contracts with Nigeria and Norway. Since 2009,the new purchase agreements for LNG from Qatargas 2 and YemenLNG have allowed a substantial development of the Group’soperations in LNG marketing. This mix of spot and long term LNGpurchases allows TOTAL to supply its main customers around theworld with gas, while retaining a certain degree of flexibility to reactto market opportunities or unexpected fluctuations in supply anddemand.
In 2009, Total Gas & Power Ltd purchased twenty-three contractualcargos and twelve spot cargos from Norway, Nigeria, EquatorialGuinea, Indonesia, Trinidad & Tobago, Qatar and Yemen.
‹ Liquefied Petroleum Gas
In 2009, TOTAL traded and sold nearly 4.4 Mt of LPG (butane andpropane) worldwide (compared to 5.2 Mt in 2008 and 2007),including 0.9 Mt in the Middle East and Asia, approximately 0.6 Mtin Europe on small coastal trading vessels and approximately2.8 Mt on large vessels in the Atlantic and Mediterranean regions.Approximately 40% of these quantities come from fields orrefineries operated by the Group. LPG trading involved the use offour time-charters and approximately sixty spot charters.
Since January 2008, SALPG (South Asian LPG Limited, a companyin which TOTAL holds a 50% interest, in partnership with HindustanPetroleum Company Ltd) has operated the underground import andstorage LPG terminal located in Visakhapatnam, on the east coastof India in the state of Andhra Pradesh. This terminal, the first of itskind in India, has a storage capacity of 60 kt. In 2009, the cavernreceived 606 kt of LPG, compared to 535 kt in 2008.
‹ Electricity and Cogeneration
As a refiner and petrochemical producer, TOTAL has interests inseveral cogeneration facilities. Cogeneration is a process wherebythe steam produced to turn turbines to generate electricity is thencaptured and used for industrial purposes. TOTAL also participatesin another type of cogeneration, which combines power generationwith water desalination and gas-fired electricity generation, as partof its strategy of pursuing opportunities throughout the gas valuechain. As part of its diversification strategy for new energies, theGroup is also involved in projects to generate electricity from solaror nuclear sources.
In Abu Dhabi, the Taweelah A1 cogeneration plant, in operationsince May 2003, combines power generation and waterdesalination. It is owned and operated by Gulf Total TractebelPower Cy, in which TOTAL has a 20% interest. The Taweelah A1plant currently has a net capacity of 1,600 MW (following thestart-up of the 250 MW expansion in July 2009) and waterdesalination capacity of 385,000 m3 per day.
In addition, TOTAL, in partnership with the Spanish companyAbengoa Solar, participated in a bidding process launched by AbuDhabi Future Energy Company (ADFEC) in early 2008 as part of theMASDAR initiative to support new energies. This call for tendersconcerns the construction of a 110 MW concentrated solar powerplant.
TOTAL, together with GDF Suez, EDF and Areva, acknowledgedENEC's (Emirates Nuclear Energy Corporation) decision,announced in December 2009, to deny the bid they made as part ofthe call for tenders launched for the supply of nuclear power plants.The Group pursues its objective to eventually become a recognizednuclear operator.
In France, TOTAL has an 8.33% interest in the project to build andoperate the second French EPR in Penly, in the northwest of thecountry, in partnership with GDF Suez and EDF.
In Thailand, TOTAL owns 28% of Eastern Power and ElectricCompany Ltd (EPEC), which has operated the combined-cyclegas-fired power plant of Bang Bo, with a capacity of 350 MW, sinceMarch 2003.
/ 35TOTAL
UpstreamBUSINESS OVERVIEW2
In Nigeria, TOTAL and its partner, the state-owned NNPC (NigerianNational Petroleum Corporation), own interests in two projects tobuild gas-fired power plants that are part of the government’sobjectives to develop power generation and increase the share ofnatural gas production for domestic use:
o The Afam VI project, part of the SPDC (Shell PetroleumDevelopment Company) joint venture in which TOTAL holds a10% interest, which concerns the development of a 630 MWcombined-cycle power plant with a start-up of commercialoperations scheduled for the second half of 2010.
o The development of a new 400 MW combined-cycle power plantnear the city of Obite (Niger Delta) in connection with the OML 58gas project, part of the joint venture between NNPC and TOTAL(40%, operator). Commissioning is scheduled in early 2013. Thecombined-cycle power plant will be connected to the existingpower grid through a 108 km high-voltage transmission line.
‹ Renewable Energy
As part of its strategy to develop energy resources to complementoil and gas, the Gas & Power division continued in 2009 tostrengthen its positions in renewable energies, with a particularfocus on solar-photovoltaic power where the Group has beenpresent since 1983.
� Solar-photovoltaic power
In the photovoltaic sector based on crystalline silicon technology,TOTAL is involved in the development of the photovoltaic cellsproduction business as well as in the production and marketing ofsolar modules and systems. The Group, through severalpartnerships, is pursuing its R&D program for this technology andhas also committed to developing new innovative solartechnologies. Furthermore, TOTAL conducts projects to displaysolar application solutions at some Group sites, both foreducational purposes in France and as part of decentralized ruralelectrification projects in other countries.
TOTAL is a shareholder in Photovoltech, a company specialized inmanufacturing high-efficiency photovoltaic cells. The Group nowholds 50% of Photovoltech’s share capital, alongside GDF Suez,pursuant to the buyout in September 2009 by both companies of the4.4% interest held by IMEC (Interuniversity MicroElectronics Centre).In 2009, Photovoltech pursued its project to increase the overallproduction capacity of its Tirlemont plant (Tienen, Belgium) from80 Mwp/y in 2009 to 155 MWp/y in late 2010. In a challenging marketand given the sharp decrease in the price of cells, Photovoltech’s2009 sales were €80 million, compared to €106 million in 2008 and€73 million in 2007.
TOTAL also plans to build an industrial photovoltaic plant in theCarling region in eastern France in partnership with GDF Suez.
TOTAL holds a 50% interest in Tenesol, in partnership with EDF.Tenesol, whose headquarters are located in Lyon (France), designs,manufactures, markets and operates solar-photovoltaic powersystems. Its principal markets are for network connections inFrance, in the French Overseas Territories and in Europe. Tenesol is
also active in certain professional applications (telecommunications,oil & gas sites, etc.). Tenesol owns two solar panel manufacturingplants: Tenesol Manufacturing in South Africa, with productioncapacity of 60 MWp/y; and Tenesol Technologies in the Toulouseregion of France, with production capacity of 50 MWp/y. In 2009,despite strong pressure on the price of modules, Tenesol’sconsolidated sales increased by nearly 30% to €249 million(compared to nearly €193 million in 2008 and €133 million in 2007),representing a marketed production of 85 MWp.
Regarding R&D, TOTAL, GDF Suez and Photovoltech confirmedtheir cooperation with IMEC by signing an agreement in September2009 as part of the IIAP (IMEC Industrial Affiliation Program), amulti-partner program on crystalline silicon solar cells. Theobjective of the IIAP is to sharply reduce the use of silicon whileincreasing the efficiency of cells in order to substantially lower thecost for solar energy.
In September 2009, the Group also partnered with LPICM(Laboratoire de Physique des Interfaces et des Couches Minces), aresearch unit comprised of the French National Center for ScientificResearch (CNRS) and France’s Ecole Polytechnique engineeringschool to set up a joint research team – Nano PV – in the Saclay areanear Paris focusing on thin-film technologies and silicon-based nano-materials. TOTAL committed €8 million for the first 4-year phase.
In December 2008, TOTAL acquired an interest in a U.S. start-upcompany, Konarka, which specializes in the development oforganic solar technologies. In 2009, Konarka implemented newresearch projects in cooperation with the Gas & Power division andother Group Chemicals subsidiaries to develop solar film on a largescale. The Group is confident in the potential of this promisingtechnology and decided to increase its interest in Konarka to nearly25% of the share capital in early 2010.
Total Énergie Solaire, the subsidiary created in July 2008 as partof the Group’s contribution to the “Grenelle de l’environnement”, aprogram launched by the French government, started operating in2009 with the installation of solar panels at two Group’s sites in Pauand Lacq (France). A total of five educational projects are expectedto be completed in late 2010 to display different photovoltaicapplications at the Group’s sites, with an overall installed capacityof between 2 MWp and 3 MWp and an investment of €15 million.
Furthermore, TOTAL conducts decentralized rural electrificationoperations by responding to calls for tenders from authorities inseveral countries, notably in South Africa where KES (KwazuluEnergy Services Company), in which TOTAL holds a 35% interest,intends to equip 30,000 isolated homes. New projects are understudy related to Africa, Asia and the Middle East.
In addition, Temasol, a wholly-owned subsidiary of Tenesol sincethe transfer in 2008 of the respective shares of Total Maroc and EDFEDEV, is involved in decentralized rural electrification projects inMorocco. Since its creation in 2001, approximately 25,500households have been equipped and are now operated by Temasol.
36 / TOTAL - Registration Document 2009
1 2 3 4 5 6 7 8 9 10 11
Upstream BUSINESS OVERVIEW
� Solar power storage
In November 2009, TOTAL announced the signature of a researchagreement with the Massachussetts Institute of Technology (MIT) todevelop new stationary batteries that are designed to enable thestorage of solar power. This $4 million agreement over five years ispart of the MIT Energy Initiative, which TOTAL joined as a memberin November 2008.
� Wind power
TOTAL operates a 12 MW wind farm in Mardyck (near its Flanderssite, located in Dunkirk, France).
� Marine energy
In marine energy, TOTAL acquired a 10% interest in a pilot projectlocated offshore Santona, on the northern coast of Spain, in June2005. The construction of a first buoy, with a capacity of 40 kW,was completed and the buoy was launched in September 2008.This project is intended to assess the technical and economicpotential of this technology.
With respect to tidal current energy, TOTAL held as of the end of2007 a 24.9% interest in Scotrenewables Marine Power, located inthe Orkney Islands in Scotland. Agreements bringing new partnersinto the company’s share capital were signed in January 2008. As aresult, the Group’s participation was diluted to 16%.Scotrenewables Marine Power is developing tidal current energyconverter technology. A 1/5 scale model was successfully testedoffshore in 2009. Construction of a full-scale prototype is scheduledfor 2010.
‹ Coal
For nearly thirty years, TOTAL has exported steam coal from SouthAfrica, primarily to Europe and Asia. The Group also trades steamcoal through its subsidiaries Total Gas & Power Ltd and TotalEnergy Resources (Pacific Basin). In addition, TOTAL markets coalto French customers through its subsidiary CDF Énergie.
With the start-up of production on the Tumelo mine in January2009, the subsidiary Total Coal South Africa (TCSA) owns andoperates four mines in South Africa. A fifth mine is underdevelopment in Dorstfontein with a start-up expected in late 2011.The Group is also looking into several other mining developmentprojects.
South African coal, produced by TCSA or bought from third-party’smines, is exported through the port of Richard’s Bay in whichTOTAL has a 5.36% interest. In 2008, TOTAL and its partnerMmakau Mining acquired an additional 1 Mt/y of harbor handlingrights through the interests they hold in the fifth phase of the port’sdevelopment.
TOTAL sold approximately 7.3 Mt of coal worldwide in 2009(compared to 8.4 Mt in 2008 and 10 Mt in 2007), mainly intended forpower generation, of which 3.6 Mt was South African coal. Half ofthis volume was sold in Europe and the other half in Asia. On theSouth African domestic market, sales amounted to 0.3 Mt in 2009,primarily destined for the industrial and metallurgic sectors.
‹ DME (Di-Methyl Ether)
In Japan, TOTAL is involved with eight Japanese companies in aprogram intended to heighten consumer awareness regarding thisnew generation fuel. The 80 kt/y DME production plant, located inNiigata (Honshu Island, Japan), started up in January 2009 (TOTAL,10%).
As part of the consortium led by Volvo, TOTAL is involved in the“bio-DME” European project, which is intended to test the wholeDME chain, from its production from black liquor, a paper pulpresidue, to its use by a fleet of trucks in four Swedish cities. Thisproject, which includes the construction of a pilot in Pitea (Sweden),started in September 2009 and is expected to end in 2012. It ispartly funded by the Swedish Energy Agency and the EU SeventhFramework Program.
In addition, the international working group established as part ofthe ISO standardization process for DME pursued its activities in2009. For two years as from January 1, 2009, TOTAL will also chairthe IDA (International DME Association).
/ 37TOTAL
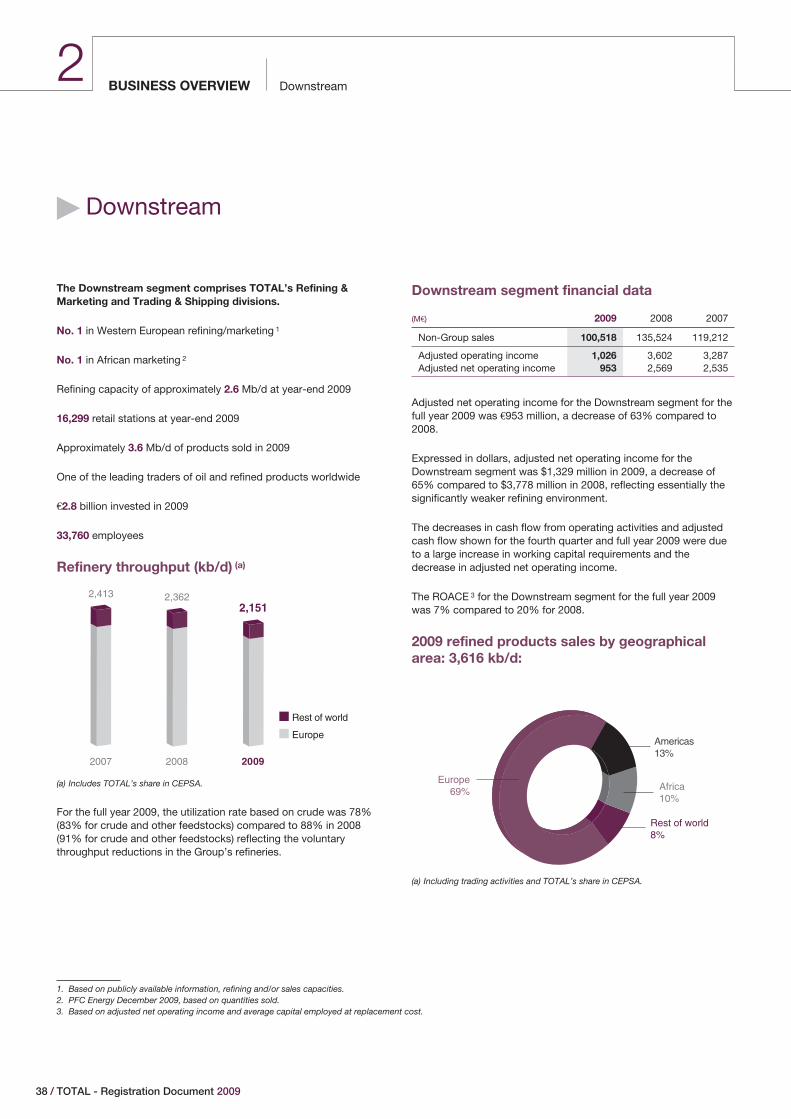
DownstreamBUSINESS OVERVIEW2
� Downstream
The Downstream segment comprises TOTAL’s Refining &Marketing and Trading & Shipping divisions.
No. 1 in Western European refining/marketing 1
No. 1 in African marketing 2
Refining capacity of approximately 2.6 Mb/d at year-end 2009
16,299 retail stations at year-end 2009
Approximately 3.6 Mb/d of products sold in 2009
One of the leading traders of oil and refined products worldwide
€2.8 billion invested in 2009
33,760 employees
Refinery throughput (kb/d) (a)
2,413
2007 2008 2009
2,3622,151
Rest of world
Europe
(a) Includes TOTAL’s share in CEPSA.
For the full year 2009, the utilization rate based on crude was 78%(83% for crude and other feedstocks) compared to 88% in 2008(91% for crude and other feedstocks) reflecting the voluntarythroughput reductions in the Group’s refineries.
Downstream segment financial data
(M€) 2009 2008 2007
Non-Group sales 100,518 135,524 119,212
Adjusted operating income 1,026 3,602 3,287Adjusted net operating income 953 2,569 2,535
Adjusted net operating income for the Downstream segment for thefull year 2009 was €953 million, a decrease of 63% compared to2008.
Expressed in dollars, adjusted net operating income for theDownstream segment was $1,329 million in 2009, a decrease of65% compared to $3,778 million in 2008, reflecting essentially thesignificantly weaker refining environment.
The decreases in cash flow from operating activities and adjustedcash flow shown for the fourth quarter and full year 2009 were dueto a large increase in working capital requirements and thedecrease in adjusted net operating income.
The ROACE 3 for the Downstream segment for the full year 2009was 7% compared to 20% for 2008.
2009 refined products sales by geographicalarea: 3,616 kb/d:
Americas13%
Africa10%
Rest of world8%
Europe69%
(a) Including trading activities and TOTAL’s share in CEPSA.
1. Based on publicly available information, refining and/or sales capacities.2. PFC Energy December 2009, based on quantities sold.3. Based on adjusted net operating income and average capital employed at replacement cost.
38 / TOTAL - Registration Document 2009
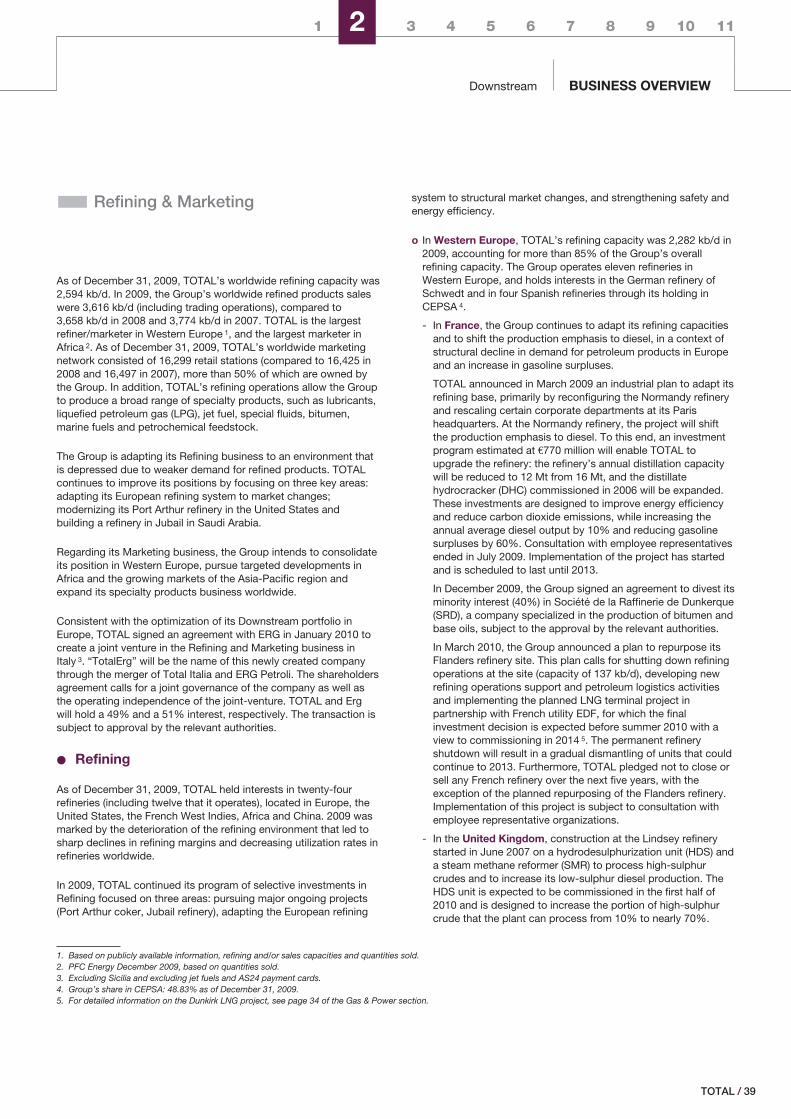
1 2 3 4 5 6 7 8 9 10 11
Downstream BUSINESS OVERVIEW
� Refining & Marketing
As of December 31, 2009, TOTAL’s worldwide refining capacity was2,594 kb/d. In 2009, the Group’s worldwide refined products saleswere 3,616 kb/d (including trading operations), compared to3,658 kb/d in 2008 and 3,774 kb/d in 2007. TOTAL is the largestrefiner/marketer in Western Europe 1, and the largest marketer inAfrica 2. As of December 31, 2009, TOTAL’s worldwide marketingnetwork consisted of 16,299 retail stations (compared to 16,425 in2008 and 16,497 in 2007), more than 50% of which are owned bythe Group. In addition, TOTAL’s refining operations allow the Groupto produce a broad range of specialty products, such as lubricants,liquefied petroleum gas (LPG), jet fuel, special fluids, bitumen,marine fuels and petrochemical feedstock.
The Group is adapting its Refining business to an environment thatis depressed due to weaker demand for refined products. TOTALcontinues to improve its positions by focusing on three key areas:adapting its European refining system to market changes;modernizing its Port Arthur refinery in the United States andbuilding a refinery in Jubail in Saudi Arabia.
Regarding its Marketing business, the Group intends to consolidateits position in Western Europe, pursue targeted developments inAfrica and the growing markets of the Asia-Pacific region andexpand its specialty products business worldwide.
Consistent with the optimization of its Downstream portfolio inEurope, TOTAL signed an agreement with ERG in January 2010 tocreate a joint venture in the Refining and Marketing business inItaly 3. “TotalErg” will be the name of this newly created companythrough the merger of Total Italia and ERG Petroli. The shareholdersagreement calls for a joint governance of the company as well asthe operating independence of the joint-venture. TOTAL and Ergwill hold a 49% and a 51% interest, respectively. The transaction issubject to approval by the relevant authorities.
‹ Refining
As of December 31, 2009, TOTAL held interests in twenty-fourrefineries (including twelve that it operates), located in Europe, theUnited States, the French West Indies, Africa and China. 2009 wasmarked by the deterioration of the refining environment that led tosharp declines in refining margins and decreasing utilization rates inrefineries worldwide.
In 2009, TOTAL continued its program of selective investments inRefining focused on three areas: pursuing major ongoing projects(Port Arthur coker, Jubail refinery), adapting the European refining
system to structural market changes, and strengthening safety andenergy efficiency.
o In Western Europe, TOTAL’s refining capacity was 2,282 kb/d in2009, accounting for more than 85% of the Group’s overallrefining capacity. The Group operates eleven refineries inWestern Europe, and holds interests in the German refinery ofSchwedt and in four Spanish refineries through its holding inCEPSA 4.
- In France, the Group continues to adapt its refining capacitiesand to shift the production emphasis to diesel, in a context ofstructural decline in demand for petroleum products in Europeand an increase in gasoline surpluses.
TOTAL announced in March 2009 an industrial plan to adapt itsrefining base, primarily by reconfiguring the Normandy refineryand rescaling certain corporate departments at its Parisheadquarters. At the Normandy refinery, the project will shiftthe production emphasis to diesel. To this end, an investmentprogram estimated at €770 million will enable TOTAL toupgrade the refinery: the refinery’s annual distillation capacitywill be reduced to 12 Mt from 16 Mt, and the distillatehydrocracker (DHC) commissioned in 2006 will be expanded.These investments are designed to improve energy efficiencyand reduce carbon dioxide emissions, while increasing theannual average diesel output by 10% and reducing gasolinesurpluses by 60%. Consultation with employee representativesended in July 2009. Implementation of the project has startedand is scheduled to last until 2013.
In December 2009, the Group signed an agreement to divest itsminority interest (40%) in Société de la Raffinerie de Dunkerque(SRD), a company specialized in the production of bitumen andbase oils, subject to the approval by the relevant authorities.
In March 2010, the Group announced a plan to repurpose itsFlanders refinery site. This plan calls for shutting down refiningoperations at the site (capacity of 137 kb/d), developing newrefining operations support and petroleum logistics activitiesand implementing the planned LNG terminal project inpartnership with French utility EDF, for which the finalinvestment decision is expected before summer 2010 with aview to commissioning in 2014 5. The permanent refineryshutdown will result in a gradual dismantling of units that couldcontinue to 2013. Furthermore, TOTAL pledged not to close orsell any French refinery over the next five years, with theexception of the planned repurposing of the Flanders refinery.Implementation of this project is subject to consultation withemployee representative organizations.
- In the United Kingdom, construction at the Lindsey refinerystarted in June 2007 on a hydrodesulphurization unit (HDS) anda steam methane reformer (SMR) to process high-sulphurcrudes and to increase its low-sulphur diesel production. TheHDS unit is expected to be commissioned in the first half of2010 and is designed to increase the portion of high-sulphurcrude that the plant can process from 10% to nearly 70%.
1. Based on publicly available information, refining and/or sales capacities and quantities sold.2. PFC Energy December 2009, based on quantities sold.3. Excluding Sicilia and excluding jet fuels and AS24 payment cards.4. Group’s share in CEPSA: 48.83% as of December 31, 2009.5. For detailed information on the Dunkirk LNG project, see page 34 of the Gas & Power section.
/ 39TOTAL
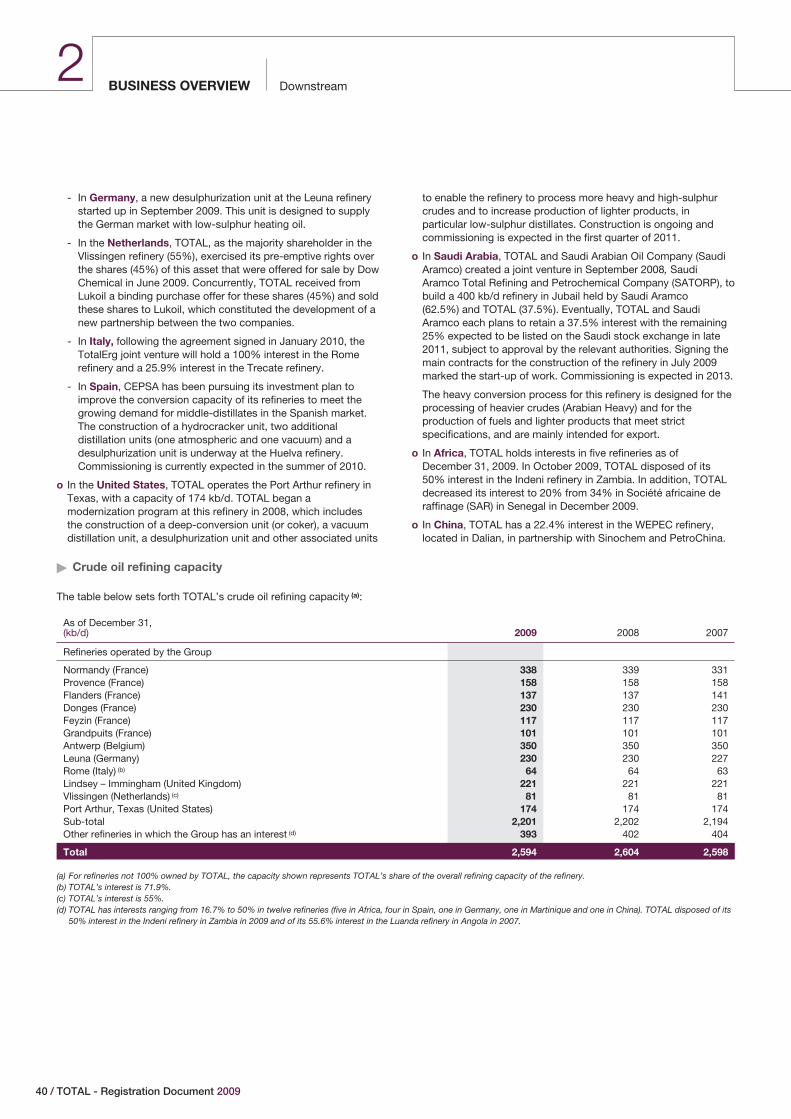
DownstreamBUSINESS OVERVIEW2
- In Germany, a new desulphurization unit at the Leuna refinerystarted up in September 2009. This unit is designed to supplythe German market with low-sulphur heating oil.
- In the Netherlands, TOTAL, as the majority shareholder in theVlissingen refinery (55%), exercised its pre-emptive rights overthe shares (45%) of this asset that were offered for sale by DowChemical in June 2009. Concurrently, TOTAL received fromLukoil a binding purchase offer for these shares (45%) and soldthese shares to Lukoil, which constituted the development of anew partnership between the two companies.
- In Italy, following the agreement signed in January 2010, theTotalErg joint venture will hold a 100% interest in the Romerefinery and a 25.9% interest in the Trecate refinery.
- In Spain, CEPSA has been pursuing its investment plan toimprove the conversion capacity of its refineries to meet thegrowing demand for middle-distillates in the Spanish market.The construction of a hydrocracker unit, two additionaldistillation units (one atmospheric and one vacuum) and adesulphurization unit is underway at the Huelva refinery.Commissioning is currently expected in the summer of 2010.
o In the United States, TOTAL operates the Port Arthur refinery inTexas, with a capacity of 174 kb/d. TOTAL began amodernization program at this refinery in 2008, which includesthe construction of a deep-conversion unit (or coker), a vacuumdistillation unit, a desulphurization unit and other associated units
to enable the refinery to process more heavy and high-sulphurcrudes and to increase production of lighter products, inparticular low-sulphur distillates. Construction is ongoing andcommissioning is expected in the first quarter of 2011.
o In Saudi Arabia, TOTAL and Saudi Arabian Oil Company (SaudiAramco) created a joint venture in September 2008, SaudiAramco Total Refining and Petrochemical Company (SATORP), tobuild a 400 kb/d refinery in Jubail held by Saudi Aramco(62.5%) and TOTAL (37.5%). Eventually, TOTAL and SaudiAramco each plans to retain a 37.5% interest with the remaining25% expected to be listed on the Saudi stock exchange in late2011, subject to approval by the relevant authorities. Signing themain contracts for the construction of the refinery in July 2009marked the start-up of work. Commissioning is expected in 2013.
The heavy conversion process for this refinery is designed for theprocessing of heavier crudes (Arabian Heavy) and for theproduction of fuels and lighter products that meet strictspecifications, and are mainly intended for export.
o In Africa, TOTAL holds interests in five refineries as ofDecember 31, 2009. In October 2009, TOTAL disposed of its50% interest in the Indeni refinery in Zambia. In addition, TOTALdecreased its interest to 20% from 34% in Société africaine deraffinage (SAR) in Senegal in December 2009.
o In China, TOTAL has a 22.4% interest in the WEPEC refinery,located in Dalian, in partnership with Sinochem and PetroChina.
� Crude oil refining capacity
The table below sets forth TOTAL’s crude oil refining capacity (a):
As of December 31,(kb/d) 2009 2008 2007
Refineries operated by the Group
Normandy (France) 338 339 331Provence (France) 158 158 158Flanders (France) 137 137 141Donges (France) 230 230 230Feyzin (France) 117 117 117Grandpuits (France) 101 101 101Antwerp (Belgium) 350 350 350Leuna (Germany) 230 230 227Rome (Italy) (b) 64 64 63Lindsey – Immingham (United Kingdom) 221 221 221Vlissingen (Netherlands) (c) 81 81 81Port Arthur, Texas (United States) 174 174 174Sub-total 2,201 2,202 2,194Other refineries in which the Group has an interest (d) 393 402 404
Total 2,594 2,604 2,598
(a) For refineries not 100% owned by TOTAL, the capacity shown represents TOTAL’s share of the overall refining capacity of the refinery.(b) TOTAL’s interest is 71.9%.(c) TOTAL’s interest is 55%.(d) TOTAL has interests ranging from 16.7% to 50% in twelve refineries (five in Africa, four in Spain, one in Germany, one in Martinique and one in China). TOTAL disposed of its
50% interest in the Indeni refinery in Zambia in 2009 and of its 55.6% interest in the Luanda refinery in Angola in 2007.
40 / TOTAL - Registration Document 2009
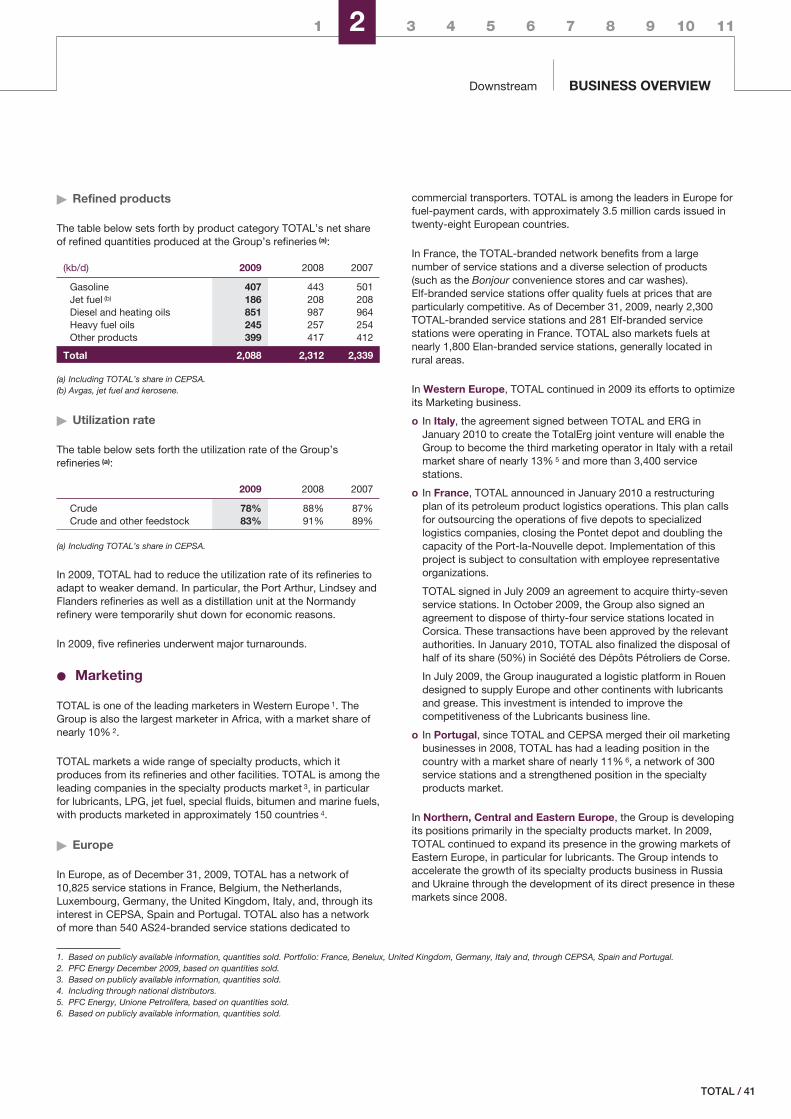
1 2 3 4 5 6 7 8 9 10 11
Downstream BUSINESS OVERVIEW
� Refined products
The table below sets forth by product category TOTAL’s net shareof refined quantities produced at the Group’s refineries (a):
(kb/d) 2009 2008 2007
Gasoline 407 443 501Jet fuel (b) 186 208 208Diesel and heating oils 851 987 964Heavy fuel oils 245 257 254Other products 399 417 412
Total 2,088 2,312 2,339
(a) Including TOTAL’s share in CEPSA.(b) Avgas, jet fuel and kerosene.
� Utilization rate
The table below sets forth the utilization rate of the Group’srefineries (a):
2009 2008 2007
Crude 78% 88% 87%Crude and other feedstock 83% 91% 89%
(a) Including TOTAL’s share in CEPSA.
In 2009, TOTAL had to reduce the utilization rate of its refineries toadapt to weaker demand. In particular, the Port Arthur, Lindsey andFlanders refineries as well as a distillation unit at the Normandyrefinery were temporarily shut down for economic reasons.
In 2009, five refineries underwent major turnarounds.
‹ Marketing
TOTAL is one of the leading marketers in Western Europe 1. TheGroup is also the largest marketer in Africa, with a market share ofnearly 10% 2.
TOTAL markets a wide range of specialty products, which itproduces from its refineries and other facilities. TOTAL is among theleading companies in the specialty products market 3, in particularfor lubricants, LPG, jet fuel, special fluids, bitumen and marine fuels,with products marketed in approximately 150 countries 4.
� Europe
In Europe, as of December 31, 2009, TOTAL has a network of10,825 service stations in France, Belgium, the Netherlands,Luxembourg, Germany, the United Kingdom, Italy, and, through itsinterest in CEPSA, Spain and Portugal. TOTAL also has a networkof more than 540 AS24-branded service stations dedicated to
commercial transporters. TOTAL is among the leaders in Europe forfuel-payment cards, with approximately 3.5 million cards issued intwenty-eight European countries.
In France, the TOTAL-branded network benefits from a largenumber of service stations and a diverse selection of products(such as the Bonjour convenience stores and car washes).Elf-branded service stations offer quality fuels at prices that areparticularly competitive. As of December 31, 2009, nearly 2,300TOTAL-branded service stations and 281 Elf-branded servicestations were operating in France. TOTAL also markets fuels atnearly 1,800 Elan-branded service stations, generally located inrural areas.
In Western Europe, TOTAL continued in 2009 its efforts to optimizeits Marketing business.
o In Italy, the agreement signed between TOTAL and ERG inJanuary 2010 to create the TotalErg joint venture will enable theGroup to become the third marketing operator in Italy with a retailmarket share of nearly 13% 5 and more than 3,400 servicestations.
o In France, TOTAL announced in January 2010 a restructuringplan of its petroleum product logistics operations. This plan callsfor outsourcing the operations of five depots to specializedlogistics companies, closing the Pontet depot and doubling thecapacity of the Port-la-Nouvelle depot. Implementation of thisproject is subject to consultation with employee representativeorganizations.
TOTAL signed in July 2009 an agreement to acquire thirty-sevenservice stations. In October 2009, the Group also signed anagreement to dispose of thirty-four service stations located inCorsica. These transactions have been approved by the relevantauthorities. In January 2010, TOTAL also finalized the disposal ofhalf of its share (50%) in Société des Dépôts Pétroliers de Corse.
In July 2009, the Group inaugurated a logistic platform in Rouendesigned to supply Europe and other continents with lubricantsand grease. This investment is intended to improve thecompetitiveness of the Lubricants business line.
o In Portugal, since TOTAL and CEPSA merged their oil marketingbusinesses in 2008, TOTAL has had a leading position in thecountry with a market share of nearly 11% 6, a network of 300service stations and a strengthened position in the specialtyproducts market.
In Northern, Central and Eastern Europe, the Group is developingits positions primarily in the specialty products market. In 2009,TOTAL continued to expand its presence in the growing markets ofEastern Europe, in particular for lubricants. The Group intends toaccelerate the growth of its specialty products business in Russiaand Ukraine through the development of its direct presence in thesemarkets since 2008.
1. Based on publicly available information, quantities sold. Portfolio: France, Benelux, United Kingdom, Germany, Italy and, through CEPSA, Spain and Portugal.2. PFC Energy December 2009, based on quantities sold.3. Based on publicly available information, quantities sold.4. Including through national distributors.5. PFC Energy, Unione Petrolifera, based on quantities sold.6. Based on publicly available information, quantities sold.
/ 41TOTAL
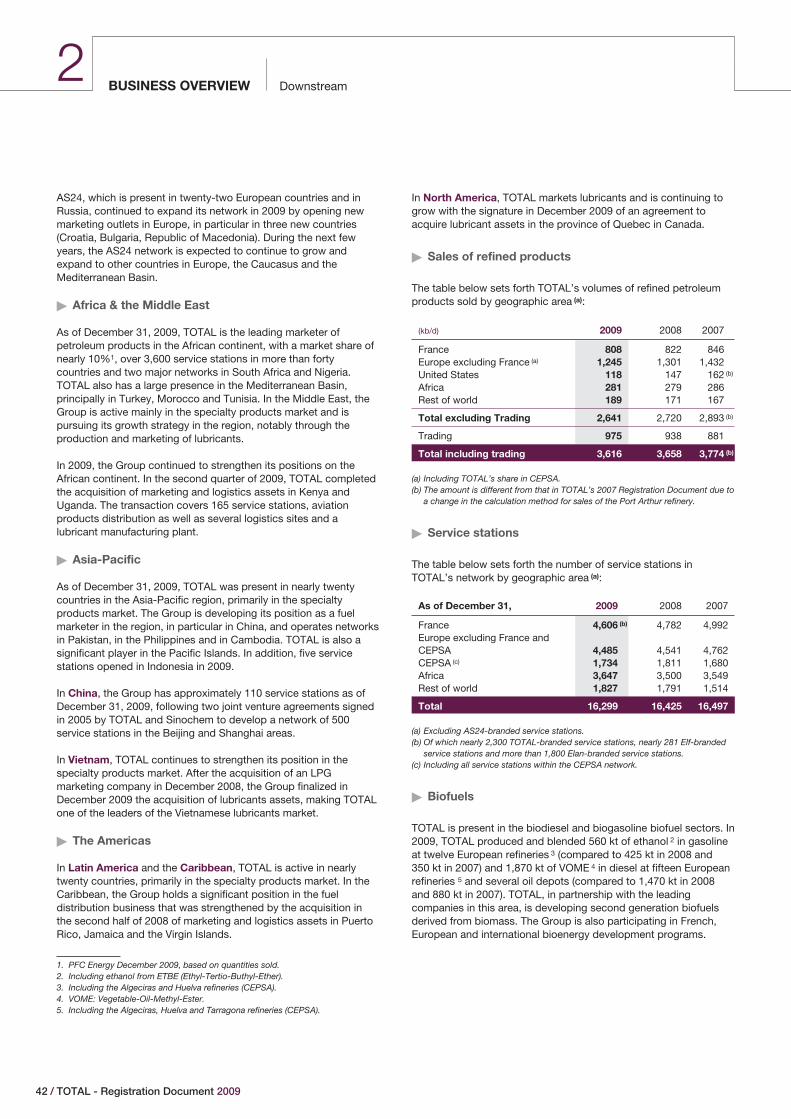
DownstreamBUSINESS OVERVIEW2
AS24, which is present in twenty-two European countries and inRussia, continued to expand its network in 2009 by opening newmarketing outlets in Europe, in particular in three new countries(Croatia, Bulgaria, Republic of Macedonia). During the next fewyears, the AS24 network is expected to continue to grow andexpand to other countries in Europe, the Caucasus and theMediterranean Basin.
� Africa & the Middle East
As of December 31, 2009, TOTAL is the leading marketer ofpetroleum products in the African continent, with a market share ofnearly 10%1, over 3,600 service stations in more than fortycountries and two major networks in South Africa and Nigeria.TOTAL also has a large presence in the Mediterranean Basin,principally in Turkey, Morocco and Tunisia. In the Middle East, theGroup is active mainly in the specialty products market and ispursuing its growth strategy in the region, notably through theproduction and marketing of lubricants.
In 2009, the Group continued to strengthen its positions on theAfrican continent. In the second quarter of 2009, TOTAL completedthe acquisition of marketing and logistics assets in Kenya andUganda. The transaction covers 165 service stations, aviationproducts distribution as well as several logistics sites and alubricant manufacturing plant.
� Asia-Pacific
As of December 31, 2009, TOTAL was present in nearly twentycountries in the Asia-Pacific region, primarily in the specialtyproducts market. The Group is developing its position as a fuelmarketer in the region, in particular in China, and operates networksin Pakistan, in the Philippines and in Cambodia. TOTAL is also asignificant player in the Pacific Islands. In addition, five servicestations opened in Indonesia in 2009.
In China, the Group has approximately 110 service stations as ofDecember 31, 2009, following two joint venture agreements signedin 2005 by TOTAL and Sinochem to develop a network of 500service stations in the Beijing and Shanghai areas.
In Vietnam, TOTAL continues to strengthen its position in thespecialty products market. After the acquisition of an LPGmarketing company in December 2008, the Group finalized inDecember 2009 the acquisition of lubricants assets, making TOTALone of the leaders of the Vietnamese lubricants market.
� The Americas
In Latin America and the Caribbean, TOTAL is active in nearlytwenty countries, primarily in the specialty products market. In theCaribbean, the Group holds a significant position in the fueldistribution business that was strengthened by the acquisition inthe second half of 2008 of marketing and logistics assets in PuertoRico, Jamaica and the Virgin Islands.
In North America, TOTAL markets lubricants and is continuing togrow with the signature in December 2009 of an agreement toacquire lubricant assets in the province of Quebec in Canada.
� Sales of refined products
The table below sets forth TOTAL’s volumes of refined petroleumproducts sold by geographic area (a):
(kb/d) 2009 2008 2007
France 808 822 846Europe excluding France (a) 1,245 1,301 1,432United States 118 147 162 (b)
Africa 281 279 286Rest of world 189 171 167
Total excluding Trading 2,641 2,720 2,893 (b)
Trading 975 938 881
Total including trading 3,616 3,658 3,774 (b)
(a) Including TOTAL’s share in CEPSA.(b) The amount is different from that in TOTAL’s 2007 Registration Document due to
a change in the calculation method for sales of the Port Arthur refinery.
� Service stations
The table below sets forth the number of service stations inTOTAL’s network by geographic area (a):
As of December 31, 2009 2008 2007
France 4,606 (b) 4,782 4,992Europe excluding France andCEPSA 4,485 4,541 4,762CEPSA (c) 1,734 1,811 1,680Africa 3,647 3,500 3,549Rest of world 1,827 1,791 1,514
Total 16,299 16,425 16,497
(a) Excluding AS24-branded service stations.(b) Of which nearly 2,300 TOTAL-branded service stations, nearly 281 Elf-branded
service stations and more than 1,800 Elan-branded service stations.(c) Including all service stations within the CEPSA network.
� Biofuels
TOTAL is present in the biodiesel and biogasoline biofuel sectors. In2009, TOTAL produced and blended 560 kt of ethanol 2 in gasolineat twelve European refineries 3 (compared to 425 kt in 2008 and350 kt in 2007) and 1,870 kt of VOME 4 in diesel at fifteen Europeanrefineries 5 and several oil depots (compared to 1,470 kt in 2008and 880 kt in 2007). TOTAL, in partnership with the leadingcompanies in this area, is developing second generation biofuelsderived from biomass. The Group is also participating in French,European and international bioenergy development programs.
1. PFC Energy December 2009, based on quantities sold.2. Including ethanol from ETBE (Ethyl-Tertio-Buthyl-Ether).3. Including the Algeciras and Huelva refineries (CEPSA).4. VOME: Vegetable-Oil-Methyl-Ester.5. Including the Algeciras, Huelva and Tarragona refineries (CEPSA).
42 / TOTAL - Registration Document 2009
1 2 3 4 5 6 7 8 9 10 11
Downstream BUSINESS OVERVIEW
In this framework, the Group announced in 2009 that it wouldparticipate in the BioTfueL research project intended to develop atechnology to transform biomass into biodiesel.
In April 2009, the Group announced that it had acquired an interestin Gevo, a U.S. company developing a portfolio of bioproductsintended for the transportation fuel and chemicals markets. Gevo isdeveloping an innovative technology to convert sugars derived frombiomass into higher alcohols and hydrocarbons.
The Group is also involved in Futurol, an R&D project for cellulosicbioethanol, which intends to develop and promote on an industrialscale a production process for bioethanol by fermentation oflignocellulosic biomass.
� Hydrogen and electric mobility
For several years, TOTAL has been involved in research and testingprograms for fuel cell and hydrogen fuel technologies. The Group isa founding member of the industrial group created in 2007 toparticipate in the European Joint Technology Initiative to promotethe development of hydrogen technology.
In 2009, as part of the Clean Energy Partnership project, TOTALbuilt a new prototype hydrogen fueling station in Germany. Threeother service stations of the Group are marketing hydrogen inGermany and Belgium.
In Germany, the Group is also involved in a demonstration projectfor marketing electricity at four TOTAL-branded service stations inBerlin, in partnership with the utility company Vattenfall.
/ 43TOTAL
DownstreamBUSINESS OVERVIEW2
� Trading & Shipping
The Trading & Shipping division:
o sells and markets the Group’s crude oil production;
o provides a supply of crude oil for the Group’s refineries;
o imports and exports the appropriate petroleum products for theGroup’s refineries to be able to adjust their production to theneeds of local markets;
o charters appropriate ships for these activities; and
o undertakes trading on various derivatives markets.
Although the Trading & Shipping division’s main focus is serving theGroup, its know-how and expertise also allow this division toextend its scope of operations beyond meeting the strict needs ofthe Group.
Trading & Shipping’s worldwide activities are conducted throughvarious wholly-owned subsidiaries, including TOTSA Total OilTrading S.A., Total International Ltd, Socap International Ltd,Atlantic Trading & Marketing Inc., Total Trading Asia Pte, TotalTrading and Marketing Canada L.P. and Chartering & ShippingServices S.A.
‹ Trading
TOTAL is one of the world’s largest traders of crude oil and refinedproducts on the basis of volumes traded. The table below sets forthselected information with respect to TOTAL’s worldwide sales andsource of supply of crude oil for each of the last three years.
Supply and sales of crude oil
For the year ended December 31,(kb/d, except %) 2009 2008 2007
Sales of crude oil 3,679 3,839 4,194Sales to Group Refining & Marketing division (a) 1,771 1,995 2,042Share of sales to external customers 1,908 1,844 2,152
Sales to external customers/total sales 52% 48% 51%
Supply of crude oil 3,679 3,839 4,194Share of production sold (b) (c) 1,310 1,365 1,502Purchased from external suppliers 2,370 2,474 2,692
Production sold/total supply 36% 36% 36%
(a) Excluding share of CEPSA.(b) Including condensates and natural gas liquids.(c) Including TOTAL’S proportionate share of joint ventures production.
The Trading division operates extensively on physical andderivatives markets, both organized and over the counter. Inconnection with its trading business, TOTAL, like most other oilcompanies, uses derivative energy instruments (futures, forwards,swaps, options) to adjust its exposure to fluctuations in the price ofcrude oil and refined products. These transactions are entered intowith various counterparties.
For additional information concerning Trading & Shipping’sderivatives, see Notes 30 (Financial instruments related tocommodity contracts) and 31 (Market risks) to the ConsolidatedFinancial Statements).
All of TOTAL’s trading operations are subject to strict internalcontrols and trading limits.
Throughout 2009, the Trading division maintained a level of activitysimilar to the levels attained in 2008 and 2007, trading physicalvolumes of crude oil and refined products amounting to an averageof approximately 5 Mb/d.
44 / TOTAL - Registration Document 2009
1 2 3 4 5 6 7 8 9 10 11
Downstream BUSINESS OVERVIEW
In 2009, the main market benchmarks were characterized by a strong contango1:
2009 2008 2007 min 2009 max 2009
Brent ICE – 1st Line (a) ($/b) 62.73 98.52 72.67 39.6 (Feb. 11) 79.7 (Oct. 14)
Brent ICE – 12th Line (b) ($/b) 70.43 102.19 73.24 48.3 (Feb. 11) 86.4 (Nov. 24)
Contango time structure (12th-1st) ($/b) 7.70 3.59 0.57 3.8 (Aug. 07) 15.2 (Jan. 02)
Gasoil ICE – 1st Line (c) ($ /t) 522.20 920.65 637.84 361.3 (Feb. 24) 653.8 (Oct. 15)
VLCC Ras Tanura Chiba – BITR (c) ($ /t) 10.43 24.09 13.93 6.3 (May 05) 17.9 (Jan. 08)
(a) 1st line: Quotation for ICE Futures for delivery during the month M+1.(b) 12th Line: Quotation for ICE Futures for delivery during the month M+12.(c) VLCC: Very Large Crude Carrier. BITR: Baltic International Tanker Routes.
Highlights of 2009 included a significant oversupply of crude oil andpetroleum products compared to demand. Demand recoveredslightly in the second half of the year.
The oversupply led to increased inventory levels. This trend wasexacerbated by the steepening of the contango structure for futureoil prices. In early 2009, the contango reached its maximum for theyear (15.2 $/b) and then decreased but remained high enough tofinance oil storage in onshore tanks and, once saturated, in offshoreoil tankers (floating storage).
‹ Shipping
The Group’s Shipping division arranges the transportation of crudeoil and refined products necessary for the Group’s activities. TheShipping division provides a wide range of shipping servicesrequired by the Group to develop its activities and maintains arigorous safety policy. Like a certain number of other oil companiesand shipowners, the Group uses freight rate derivative contracts inits shipping activity to adjust its exposure to freight ratefluctuations.
In 2009, the Shipping division chartered approximately 3,000voyages to transport approximately 123 Mt. At year-end 2009, theGroup employed a fleet of fifty-five vessels chartered under long-
term or medium-term agreements (including four LPG carriers andno single-hulled vessels). The fleet has an average age ofapproximately four years.
In 2009, the oil freight market was adversely affected by thecombination of two factors:
o A strong increase of more than 10% in the tonnage of the globalsupply of tankers of over 10,000 deadweight tons, mainly due tothe delivery of numerous new vessels in every segment and fewdisposals of vessels.
o A decline in demand for transport due to the 1.6% decrease inthe average demand for oil in 2009. This global decrease,primarily due to the worldwide recession, led to a reduction inOPEC’s production in late 2008. As a result, crude transportdropped, especially on long-haul VLCC routes from the PersianGulf.
Freight rates decreased throughout 2009 and, starting in thesecond quarter, reached levels that barely covered the vessels'operating costs. Within a few months, the market turned fromhistorically high levels in 2008 to record low levels in 2009. Theweak freight rates and pricing structure for the crude oil marketfollowed by the petroleum products market led to using vessels asfloating storage.
1. Contango is defined as a market situation in which the price of a good in the future is higher than its prompt price in the spot market.
/ 45TOTAL
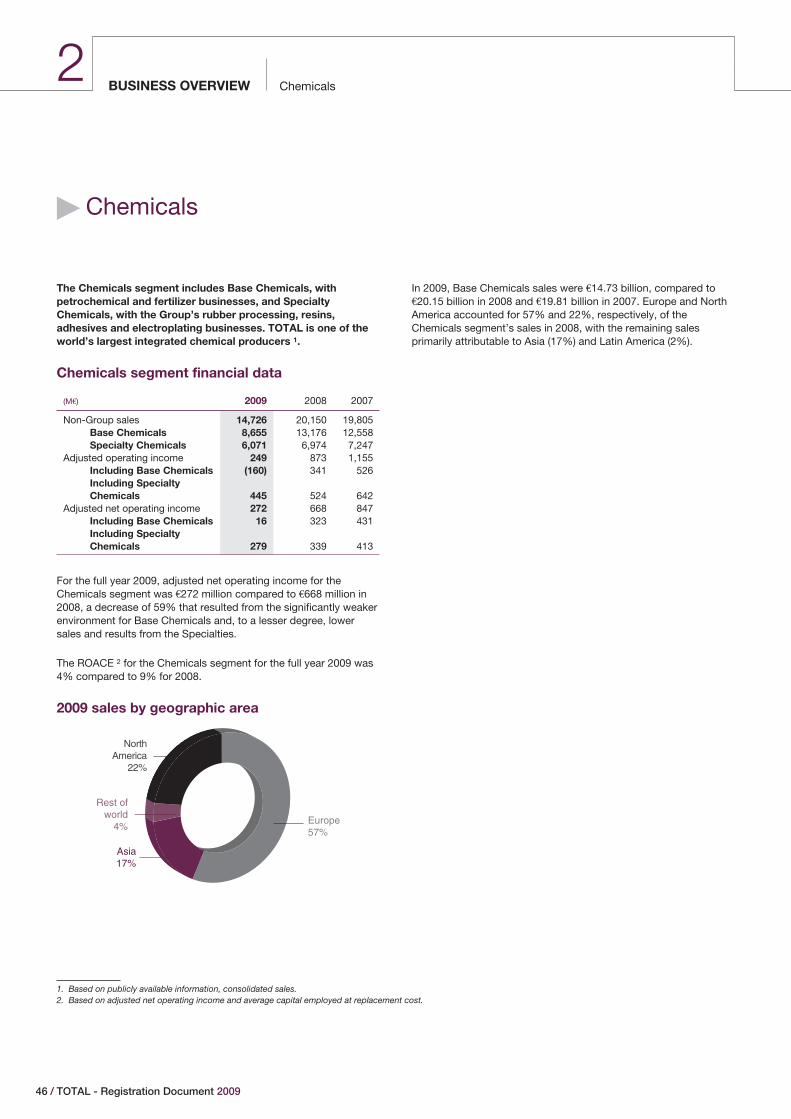
ChemicalsBUSINESS OVERVIEW2
� Chemicals
The Chemicals segment includes Base Chemicals, withpetrochemical and fertilizer businesses, and SpecialtyChemicals, with the Group’s rubber processing, resins,adhesives and electroplating businesses. TOTAL is one of theworld’s largest integrated chemical producers 1.
Chemicals segment financial data
(M€) 2009 2008 2007
Non-Group sales 14,726 20,150 19,805Base Chemicals 8,655 13,176 12,558Specialty Chemicals 6,071 6,974 7,247
Adjusted operating income 249 873 1,155Including Base Chemicals (160) 341 526Including SpecialtyChemicals 445 524 642
Adjusted net operating income 272 668 847Including Base Chemicals 16 323 431Including SpecialtyChemicals 279 339 413
For the full year 2009, adjusted net operating income for theChemicals segment was €272 million compared to €668 million in2008, a decrease of 59% that resulted from the significantly weakerenvironment for Base Chemicals and, to a lesser degree, lowersales and results from the Specialties.
The ROACE 2 for the Chemicals segment for the full year 2009 was4% compared to 9% for 2008.
2009 sales by geographic area
Rest ofworld
4%
NorthAmerica
22%
Europe57%
Asia17%
In 2009, Base Chemicals sales were €14.73 billion, compared to€20.15 billion in 2008 and €19.81 billion in 2007. Europe and NorthAmerica accounted for 57% and 22%, respectively, of theChemicals segment’s sales in 2008, with the remaining salesprimarily attributable to Asia (17%) and Latin America (2%).
1. Based on publicly available information, consolidated sales.2. Based on adjusted net operating income and average capital employed at replacement cost.
46 / TOTAL - Registration Document 2009
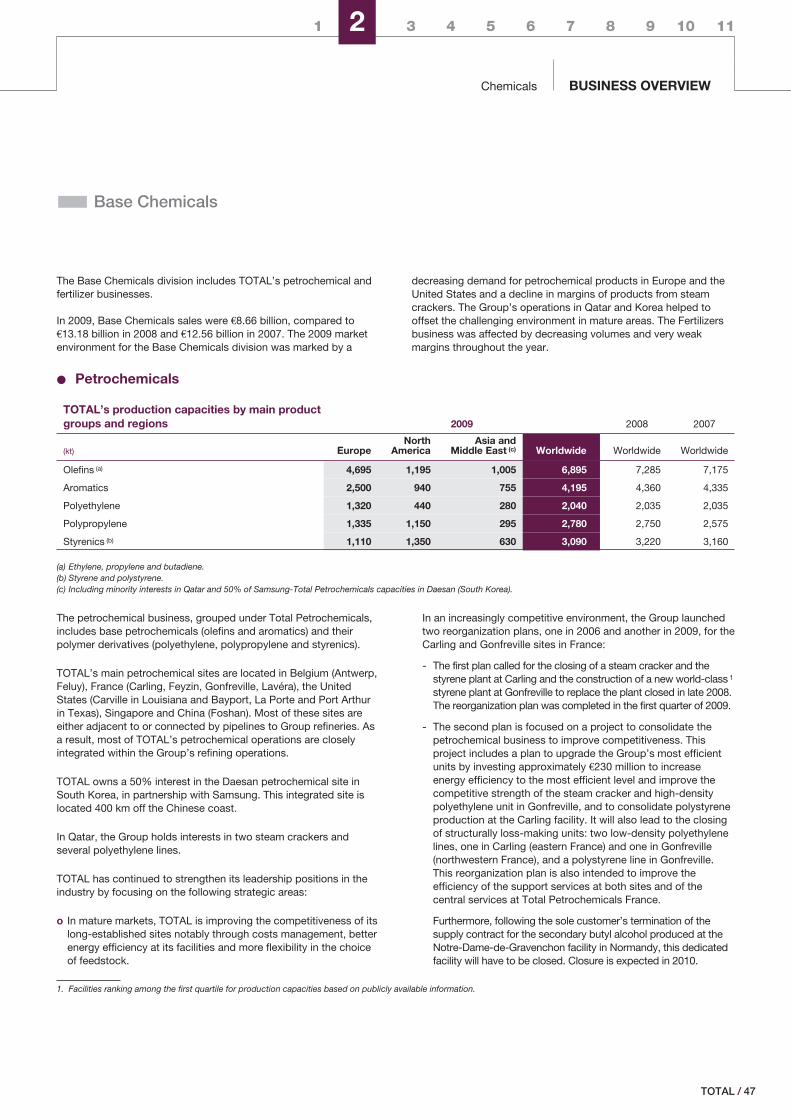
1 2 3 4 5 6 7 8 9 10 11
Chemicals BUSINESS OVERVIEW
� Base Chemicals
The Base Chemicals division includes TOTAL’s petrochemical andfertilizer businesses.
In 2009, Base Chemicals sales were €8.66 billion, compared to€13.18 billion in 2008 and €12.56 billion in 2007. The 2009 marketenvironment for the Base Chemicals division was marked by a
decreasing demand for petrochemical products in Europe and theUnited States and a decline in margins of products from steamcrackers. The Group’s operations in Qatar and Korea helped tooffset the challenging environment in mature areas. The Fertilizersbusiness was affected by decreasing volumes and very weakmargins throughout the year.
‹ Petrochemicals
TOTAL’s production capacities by main productgroups and regions 2009 2008 2007
(kt) EuropeNorth
AmericaAsia and
Middle East (c) Worldwide Worldwide Worldwide
Olefins (a) 4,695 1,195 1,005 6,895 7,285 7,175
Aromatics 2,500 940 755 4,195 4,360 4,335
Polyethylene 1,320 440 280 2,040 2,035 2,035
Polypropylene 1,335 1,150 295 2,780 2,750 2,575
Styrenics (b) 1,110 1,350 630 3,090 3,220 3,160
(a) Ethylene, propylene and butadiene.(b) Styrene and polystyrene.(c) Including minority interests in Qatar and 50% of Samsung-Total Petrochemicals capacities in Daesan (South Korea).
The petrochemical business, grouped under Total Petrochemicals,includes base petrochemicals (olefins and aromatics) and theirpolymer derivatives (polyethylene, polypropylene and styrenics).
TOTAL’s main petrochemical sites are located in Belgium (Antwerp,Feluy), France (Carling, Feyzin, Gonfreville, Lavéra), the UnitedStates (Carville in Louisiana and Bayport, La Porte and Port Arthurin Texas), Singapore and China (Foshan). Most of these sites areeither adjacent to or connected by pipelines to Group refineries. Asa result, most of TOTAL’s petrochemical operations are closelyintegrated within the Group’s refining operations.
TOTAL owns a 50% interest in the Daesan petrochemical site inSouth Korea, in partnership with Samsung. This integrated site islocated 400 km off the Chinese coast.
In Qatar, the Group holds interests in two steam crackers andseveral polyethylene lines.
TOTAL has continued to strengthen its leadership positions in theindustry by focusing on the following strategic areas:
o In mature markets, TOTAL is improving the competitiveness of itslong-established sites notably through costs management, betterenergy efficiency at its facilities and more flexibility in the choiceof feedstock.
In an increasingly competitive environment, the Group launchedtwo reorganization plans, one in 2006 and another in 2009, for theCarling and Gonfreville sites in France:
- The first plan called for the closing of a steam cracker and thestyrene plant at Carling and the construction of a new world-class 1
styrene plant at Gonfreville to replace the plant closed in late 2008.The reorganization plan was completed in the first quarter of 2009.
- The second plan is focused on a project to consolidate thepetrochemical business to improve competitiveness. Thisproject includes a plan to upgrade the Group’s most efficientunits by investing approximately €230 million to increaseenergy efficiency to the most efficient level and improve thecompetitive strength of the steam cracker and high-densitypolyethylene unit in Gonfreville, and to consolidate polystyreneproduction at the Carling facility. It will also lead to the closingof structurally loss-making units: two low-density polyethylenelines, one in Carling (eastern France) and one in Gonfreville(northwestern France), and a polystyrene line in Gonfreville.This reorganization plan is also intended to improve theefficiency of the support services at both sites and of thecentral services at Total Petrochemicals France.
Furthermore, following the sole customer’s termination of thesupply contract for the secondary butyl alcohol produced at theNotre-Dame-de-Gravenchon facility in Normandy, this dedicatedfacility will have to be closed. Closure is expected in 2010.
1. Facilities ranking among the first quartile for production capacities based on publicly available information.
/ 47TOTAL
ChemicalsBUSINESS OVERVIEW2
o TOTAL is continuing to expand in growth areas.
In Asia, the joint venture Samsung-Total Petrochemicals Co. Ltdinaugurated in September 2009 a polypropylene compoundingplant located in Dongguang, China, and continues to optimizeoperations with the construction of a jet fuel production plant todevelop co-products and a butane storage tank. This storagetank is intended to increase flexibility for the steam crackerfeedstocks. In 2008, the joint venture completed the firstmodernization phase of the Daesan site in South Korea. Thismajor development increased the site’s initial production capacityby nearly one-third through the expansion of the steam crackingand styrene units, the construction of a new polypropylene line in2007 and the start-up of a new metathesis 1 plant in 2008.
In the Middle East, construction of a 700 kt/y paraxylene unit atthe Jubail refinery in Saudi Arabia was approved in May 2008 byTOTAL and Saudi Aramco. This world-class unit 2 is intended tosupply the Asian market. Start-up is scheduled for 2013.
o TOTAL is developing sites in countries with favorable access toraw materials.
In Qatar, through its interest in Qatofin and Qacpo, TOTAL holdsa 49% interest in a Qatofin-operated world-class 2 linearlow-density polyethylene plant with a capacity of 450 kt/y inMesaieed, which started production in August 2009, as well as a22% interest in an ethane-based steam cracker in Ras Laffandesigned for processing 1.3 Mt/y of ethylene. The steam crackerstarted in March 2010.
In addition, construction of a 300 kt/y low-density polyethyleneline is expected at Qapco, in which TOTAL holds a 20% interest,with commissioning scheduled in 2012.
Pursuant to the contract signed in July 2007, TOTAL is continuingdiscussions with Sonatrach, the Algerian national oil company,related to the construction a petrochemical site in Arzew (Algeria).The contemplated project includes an ethane-based steamcracker with production capacity of 1.1 Mt/y, two polyethyleneunits and a monoethylene glycol production unit. This world-classproject 3 would benefit from access to a particularly competitivefeedstock and would be ideally located to supply Europe, theAmericas and Asia.
In addition, TOTAL inaugurated in October 2008 a pilot MTOplant (Methanol to Olefins) at its Feluy site (Belgium). This project,one of the Group’s most important research projects, is intendedto assess, on a semi-industrial scale, the technical andeconomical feasibility of producing olefins from methanol derivedfrom natural gas, coal and biomass, and to consider newmethods to produce polyolefins.
In 2009, the Chemicals segment continued to improve its safetyperformance by focusing on on-the-job safety, safety managementsystems and major risk prevention. However, in the second half of2009, the Chemicals segment faced four serious accidents. As aresult, TOTAL launched a general review of thirteen French sitespresenting technological risks, including two petrochemical sites(Gonfreville and Carling) and three sites from its Fertilizers business(Mazingarbe, Grandpuits and Grand Quevilly). The Group isconcerned by these events, especially since safety results were
steadily improving on the whole and work accident indicators werehalved between 2005 and 2009.
� Base petrochemicals
Base petrochemicals include olefins and aromatics produced bysteam cracking petroleum cuts, mainly naphtha, as well aspropylene and aromatics manufactured in the Group’s refineries.The economic environment for this business is strongly influencedby supply and demand and by changes in the price of naphtha, theprincipal raw material used.
2009 was marked by a deterioration of margins due to a continuousincrease in feedstock prices and the decline in demand for olefinsand aromatics in Europe and the United States. The estimatedutilization rate of steam crackers 3 in the industry worldwidedecreased from 91% in 2005-2007 to 86% in 2008 and 85% in2009 due to the commissioning of new capacities in the MiddleEast and the decrease in global demand.
� Polyethylene
Polyethylene is a plastic produced by the polymerization of ethylenemanufactured in the Group’s steam crackers. It is primarily intendedfor the packaging, automotive, food, cable and pipe markets.Margins are strongly influenced by the level of demand and bycompetition from expanding production in the Middle East, whichbenefits from favorable access to the raw material, ethane, toproduce ethylene.
In 2009, demand growth was weak, estimated at +0.8% worldwide,with strong differences depending on regions: falling demand inmature zones (Europe and the United States) and strong growth inChina (more than 25%), driven by a domestic demand satisfied bythe significant increase in importations.
TOTAL’s polyethylene sales volume dropped by 4% in 2009compared to 2008 and margins remained weak in Europe. In theUnited States, margins maintained at a higher level mainly due tothe competitive price of ethane-based ethylene. In Europe, thepressure on margins is expected to persist with the start-up of newethane-based units in the Middle East, which began in late 2009,and in Asia.
In this context, TOTAL intends to focus on lowering the break-evenpoint in its plants in Europe and strengthening its efforts to betterdifferentiate its range of products.
� Polypropylene
Polypropylene is a plastic produced by the polymerization ofpropylene manufactured in the Group’s steam crackers andrefineries. It is primarily intended for the automotive, packaging,household, appliances, fabrics and health care markets. Marginsare mainly influenced by the level of demand and the availabilityand price of propylene.
1. Conversion of ethylene and butene into propylene.2. Facilities ranking among the first quartile for production capacities based on publicly available information.3. Based on publicly available information.
48 / TOTAL - Registration Document 2009
1 2 3 4 5 6 7 8 9 10 11
Chemicals BUSINESS OVERVIEW
Highlights of 2009 included the slight recovery in the globalmarketplace, estimated at +1.8%, that was driven, likepolyethylene, by increasing Chinese domestic demand.
Compared to 2008, TOTAL’s sales volumes increased by 6% dueto positive contributions from every region. To face the increasingcompetition from new plants in the Middle East, TOTAL owns plantswith industrial performance, both in Europe and the United States,which place the Group among the industry’s leaders.
� Styrenics
This line of business includes the production of styrene andpolystyrene. Most of the styrene manufactured by the Group isused to produce polystyrene, a plastic principally used in foodpackaging, insulation, refrigeration, domestic appliances andelectronic devices. Margins are strongly influenced by the level ofpolystyrene demand and the price of benzene, which ispolystyrene’s principal raw material.
In 2009, the global styrene market decreased by 3%. The globalpolystyrene market decreased by approximately 4% due to theweakness of the construction, refrigeration and television marketsin mature zones. Nonetheless, 2009 was also marked by therecovery of growth in China, exceeding 10%, due to programsimplemented to stimulate domestic demand.
In 2009, TOTAL’s polystyrene sales volumes increased by 1%,driven by an increase in sales in Asia (+13%).
‹ Fertilizers
Through its subsidiary GPN, TOTAL manufactures and marketsnitrogen fertilizers made from natural gas. Margins are stronglyinfluenced by the price of natural gas.
After a record high in 2008, the European fertilizers marketdecreased by more than 10% in 2009 and returned to the levelsrecorded in 2005-2006. Following the collapse of urea prices in late2008, prices of nitrogen products decreased sharply in early 2009,leading to a drop in margins.
The Fertilizers business continued its major restructuring planinitiated in 2006:
o In France, GPN ceased production of complex fertilizers that aremade from nitrogen, phosphorus and potassium products, due tothe declining market for these products, and closed its plants inBordeaux, Basse Indre and Granville. In addition, TOTAL sold itsDutch affiliate, Zuid Chemie, to Engrais Rosier, in which theGroup holds a 57% share, to create a more competitive player inthe Benelux market.
o The core activity of the Fertilizers business, which is theproduction of nitrogen fertilizers, was strengthened through amajor investment in the construction of a competitive nitric acidplant in Rouen, which started up in the second half of 2009, and aurea plant in Grandpuits, which is expected to start up in thesecond quarter of 2010. This additional urea production isexpected to position GPN in the growing markets of productsthat contribute to reducing nitrogen oxide emissions 1: DENOX®
for industrial applications and Adblue® for transportationapplications.
o In France, the Oissel site and three obsolete nitric acid units inRouen and Mazingarbe were closed in 2009.
o The Group is considering the sale of its mine and quarriesbusiness at Mazingarbe. Sale of this business has beensubmitted to prior consultation with employee representativeorganizations and to the approval by the relevant authorities.
This plan is expected to improve the competitiveness of GPN byregrouping its operations at two sites which feature productioncapacity greater than the European average.
� Specialty Chemicals
TOTAL’s Specialty Chemicals division includes the rubberprocessing (Hutchinson), consumer products (Mapa® andSpontex®), resins (Cray Valley, Sartomer and Cook Composites &Polymers), adhesives (Bostik) and electroplating (Atotech)businesses. The division serves consumer and industrial marketsfor which customer-oriented marketing and service as well asinnovation are key drivers. The Group markets specialty products inmore than fifty-five countries. Its strategy is to pursue itsinternational expansion by combining internal growth and targeted
acquisitions while concentrating on growing markets and focusingon the marketing of new products with high added value.
In 2009, Specialty Chemicals faced a difficult environment due tothe global economic slowdown, especially in the first half of theyear. In this adverse environment, Specialty Chemicals salesdecreased by 13% compared to 2008. Results substantiallyincreased in the second half of 2009 compared to the same periodin 2008, due to improving margins and cost reduction programs.
1. Nitrogen oxide emissions are harmful to the environment and subject to regulation.
/ 49TOTAL
ChemicalsBUSINESS OVERVIEW2
‹ Rubber processing
Hutchinson manufactures and markets products derived fromrubber processing that are principally intended for the automotive,aerospace and defense industries.
Hutchinson, among the industry’s leaders 1, provides its customerswith innovative solutions in the areas of fluid transfer, water andairtightness, transmission, mobility and vibration, as well as soundand thermal insulation.
Hutchinson’s 2009 sales decreased by 11% in an unevenenvironment depending on the lines of business. Automotiveproducts sales decreased substantially compared to 2008 in achallenging market environment, especially in the first half of theyear, both in North America and in Europe. In other industrialmarkets, sales increased slightly in 2009 compared to 2008 due tosustained demand from the defense, aerospace and railwayindustries.
To strengthen its position in the aerospace industry, Hutchinsonacquired Strativer in late 2008, a company that specializes in theexpanding composite materials industry.
Throughout 2009, Hutchinson continued to develop in expandingmarkets, primarily Eastern Europe, South America and China,relying notably on the sites opened in 2006 in Brasov (Romania),Lodz (Poland) and Suzhou (China) and in 2009 in Sousse (Tunisia).
‹ Consumer products
The Consumer products business is organized into baby careproducts (Nuk® and Tigex®) and household specialties (Mapa® andSpontex®). The baby care products sector strengthened in 2009with the acquisition of Gerber in late 2008. As a result, salesincreased by 11% in 2009 compared to 2008. These marketsdepend heavily on the level of household consumption and due tothe economic slowdown, like-for-like consumption was lower onboth markets. Thanks to brand recognition, the Consumer productsbusiness is expected to continue to grow in Europe, the UnitedStates and emerging countries.
In early 2010, TOTAL launched a process to sell its Consumerproducts business. Sale of this business has been submitted toprior consultation with employee representative organizations andto the approval by the relevant authorities.
‹ Resins
TOTAL produces and markets resins for adhesives, inks, paints,coatings and composite materials through three subsidiaries: CrayValley, Sartomer, and Cook Composites & Polymers.
In 2009, sales decreased by 22%, reflecting the ongoing economicslowdown in the United States, which is the main market segmentfor the Resins business, and decreasing volumes in Europe.
In this environment, all the subsidiaries accelerated their programsto reduce fixed costs in Europe and the United States. In addition,they continued to refocus on their most profitable lines of businessthrough a selective investment policy targeting in particular themost dynamic geographical areas. For instance, Sartomercontinued to expand in China from its Nansha plant that started upin April 2008.
‹ Adhesives
Bostik is one of the world leaders in its sector, based on sales 1,with leading positions in the industrial, hygiene, construction andconsumer and commercial distribution markets.
In 2009, Bostik’s sales decreased by 8% compared to 2008. Thesecomparatively positive results in an adverse economy confirmBostik’s strategy of strengthening its position in the industrialmarket, which has been less affected than the constructionindustry, and continuing its development in growing markets,especially in the Asia-Pacific region.
For instance, new production units were commissioned in China(Zhuhai) and Australia (Sydney). In September 2009, Bostiklaunched the construction of a plant in Changshu (China) that isexpected to eventually become the company’s largest plant.
Furthermore, Bostik is actively pursuing its program for innovationand is focusing notably on new products and applicationscontributing to sustainable development.
‹ Electroplating
Atotech, which encompasses TOTAL’s electroplating business, isthe second largest company in this sector based on worldwidesales 2. It is active in both the electronics (printed circuits,semiconductors) and general metal finishing markets (automotive,sanitary goods, furnishing).
The electroplating business was impacted by the global economicslowdown that affected the automotive and the electronicsindustries. Sales decreased by 20% in 2009 compared to 2008.
In this context of economic slowdown, Atotech successfullypursued its strategy designed to better differentiate its productsthrough comprehensive service provided to its customers in termsof equipment, processes, design, chemical products and throughthe development of green, innovative technologies to reduce theenvironmental footprint. This strategy relies on global coverageprovided by its technical centers located near customers. Finally,Atotech intends to continue to develop in Asia, which representsmore than 50% of its global sales.
1. Based on publicly available information, consolidated sales.2. Based on publicly available information.
50 / TOTAL - Registration Document 2009
1 2 3 4 5 6 7 8 9 10 11
Investments BUSINESS OVERVIEW
� Investments
� Principal investments made over the2007-2009 period
(en millions d’euros) 2009 2008 2007
Upstream 9,855 10,017 8,882Downstream 2,771 2,418 1,875Chemicals 631 1,074 911Corporate 92 131 54
Total 13,349 13,640 11,722
Most of the investments made by TOTAL are comprised ofadditions to property, plant and equipment and intangible assets
Investments, including net investment in equity affiliates and nonconsolidated subsidiaries and acquisitions, amounted to$18.1 billion in 2009, compared to $18.3 billion in 2008.
In the Upstream segment, capital expenditures are mainly intendedto develop new hydrocarbon production facilities, explorationactivities and acquisitions of new permits. In 2009, developmentexpenditures were devoted primarily to the following projects:Kashagan in Kazakhstan; Pazflor, Angola LNG and TombuaLandana in Angola; Akpo, Usan and Ofon II in Nigeria; Ekofisk inNorway; the Mahakam zone in Indonesia; the Alwyn zone in theUnited Kingdom; Moho Bilondo in the Republic of the Congo andAnguille in Gabon.
In the Downstream segment, capital expenditures are split betweenrefining and marketing activities (notably for the retail network).Refining investments (approximately $2.6 billion in 2009) are dividedbetween maintenance of the facilities (included major turnaroundsamounting to $0.5 billion in 2009, similar to 2008) and projects toincrease the production of light products, add desulphurizationcapacities, adapt the system to new specifications and improve theplants energy efficiency. Highlights of 2009 included the ongoingconstruction of a deep conversion unit at the Port Arthur refinery inthe United States.
In the Chemicals segment, capital expenditures for 2009 wereapproximately 65% for Base Chemicals and 35% for Specialties.
� Principal investments anticipated
For the year 2010, TOTAL announced an investment budget 1 ofapproximately $18 billion (excluding acquisitions) of whichapproximately 80% are devoted to the Upstream segment.
Capital expenditures in the Upstream segment are expected to beprincipally dedicated to major development projects, includingKashagan in Kazakhstan ; Pazflor and Angola LNG in Angola; Usan,Ofon II and OML 58 in Nigeria; the Ekofisk area in Norway and theMahakam area in Indonesia. In the Downstream segment,investments are expected for, among others, the development ofprojects intended to increase the conversion and desulphurizationcapacities, notably through the modernization program of the PortArthur refinery in the United States.
Beyond 2010, TOTAL plans to pursue a sustained investment effortto supply the growth of its activities, prioritizing the Upstreamsegment.
TOTAL self-finances most of its capital expenditures from cash flowfrom operations (see the Consolidated Statement of Cash Flow ofthe Consolidated Financial Statements, which are essentiallyincreased by accessing the bond market on a regular basis, whenconditions in the financial markets are favorable (see Note 23 to theConsolidated Financial Statements). However, capital expendituresfor joint ventures between TOTAL and external partners may befunded through project financing.
As part of certain project financing arrangements, TOTAL S.A. hasprovided guarantees. These guarantees, as well as otherinformation on off-balance sheet commitments for the Group,appear in Note 23 to the Consolidated Financial Statements TheGroup does not currently consider that these guaranties, or anyother off-balance sheet arrangements of TOTAL S.A. or of any otherGroup company, currently have or are reasonably likely to have inthe future a material impact on the Group’s financial condition,changes in revenues or expenses liquidity, capital expenditure orcapital resources.
1. Including net investments in equity affiliates and non-consolidated companies, excluding acquisitions and divestments, based on €1 = $1.40 for 2010.
/ 51TOTAL
Organizational structureBUSINESS OVERVIEW2
� Organizational structure
� Position of the Company within theGroup
TOTAL S.A. is the parent company of the Group. As ofDecember 31, 2009, there were 712 consolidated subsidiaries ofwhich 617 were fully consolidated, 12 were proportionatelyconsolidated, and 83 were accounted for under the equity method.
The decision of the principal subsidiaries of TOTAL S.A. to declaredividends is made by their respective shareholders’ meetings andremain subject to the provisions of local laws and regulationsapplicable to them. As of December 31, 2009, there is no restrictionunder those provisions that would materially restrict the distributionto TOTAL S.A. of the dividends declared by those subsidiaries.
The Group’s businesses are organized as indicated on the chart onpages 54 and 55 of this Registration Document. The operatingsegments of the Group are assisted by centralized corporatefunctions (Finance, Legal, Ethics, Insurance, Strategy & BusinessIntelligence, Human Resources and Communications) which arealso represented in the chart mentioned above and which are partof the parent company, TOTAL S.A.
� Principal subsidiaries
A list of the principal subsidiaries of the Company is detailed inNote 35 to the Consolidated Financial Statements.
52 / TOTAL - Registration Document 2009
1 2 3 4 5 6 7 8 9 10 11
Property, plant and equipment BUSINESS OVERVIEW
� Property, plant and equipment
TOTAL has freehold and leasehold interests in over 130 countriesthroughout the world. The principal activities based at these sites,fields and other industrial, commercial or administrative propertiesare described in this chapter for each of the business segments(Upstream, Downstream, Chemicals).
A summary of the fixed assets and their financial impact on theGroup (depreciation and impairment) is included in Note 11 to theConsolidated Financial Statements.
Information about the Company’s environmental policy, notably thatfor the Group’s industrial sites, is presented on pages 312 and 313of this Registration Document.
/ 53TOTAL
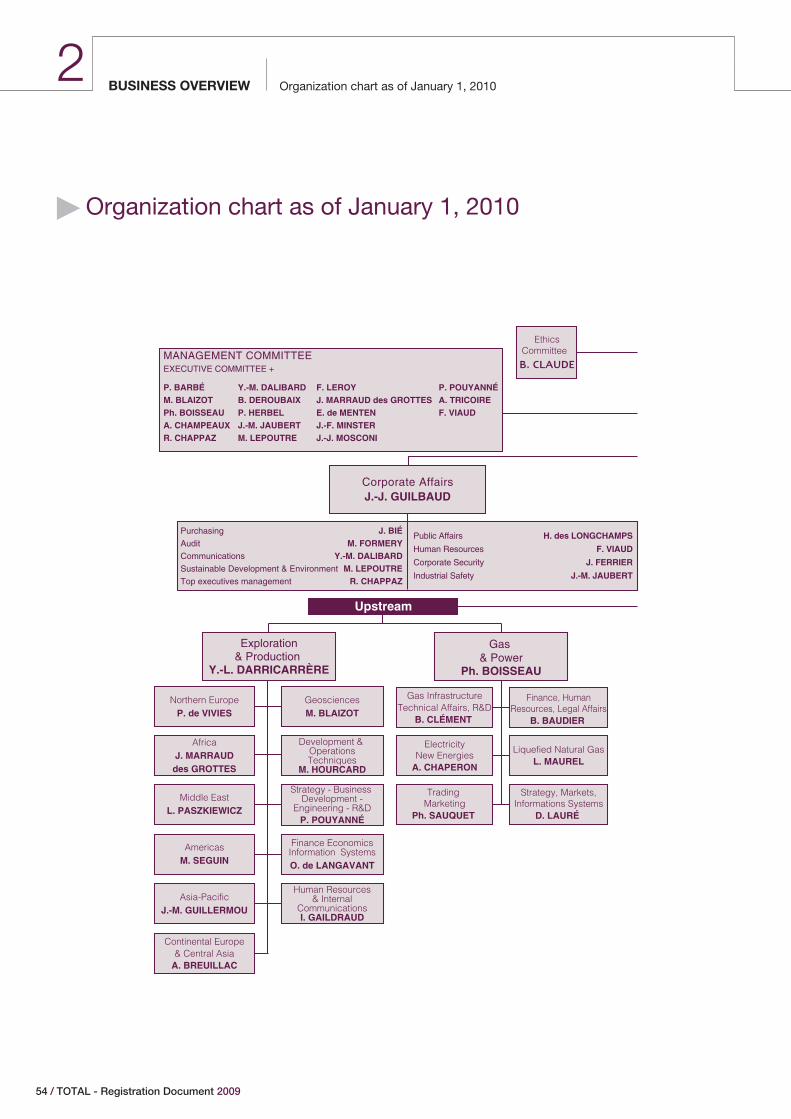
Organization chart as of January 1, 2010BUSINESS OVERVIEW2
� Organization chart as of January 1, 2010
Human Resources& Internal
CommunicationsI. GAILDRAUD
Development & OperationsTechniques
M. HOURCARD
Strategy - Business Development -
Engineering - R&DP. POUYANNÉ
Finance EconomicsInformation SystemsO. de LANGAVANT
Asia-PacificJ.-M. GUILLERMOU
Continental Europe& Central Asia
A. BREUILLAC
AmericasM. SEGUIN
Middle EastL. PASZKIEWICZ
AfricaJ. MARRAUD
des GROTTES
Northern EuropeP. de VIVIES
GeosciencesM. BLAIZOT
Exploration& Production
Y.-L. DARRICARRÈRE
EthicsCommittee
B. CLAUDE
Purchasing J. BIÉAudit M. FORMERYCommunications Y.-M. DALIBARDSustainable Development & Environment M. LEPOUTRETop executives management R. CHAPPAZ
Gas & Power
Ph. BOISSEAU
Liquefied Natural GasL. MAUREL
Gas InfrastructureTechnical Affairs, R&D
B. CLÉMENT
ElectricityNew Energies
A. CHAPERON
Trading Marketing
Ph. SAUQUET
Finance, HumanResources, Legal Affairs
B. BAUDIER
Strategy, Markets,Informations Systems
D. LAURÉ
Corporate AffairsJ.-J. GUILBAUD
Public Affairs H. des LONGCHAMPS
Human Resources F. VIAUD
Corporate Security J. FERRIER
Industrial Safety J.-M. JAUBERT
MANAGEMENT COMMITTEEEXECUTIVE COMMITTEE +
P. BARBÉ Y.-M. DALIBARD F. LEROY P. POUYANNÉM. BLAIZOT B. DEROUBAIX J. MARRAUD des GROTTES A. TRICOIRE Ph. BOISSEAU P. HERBEL E. de MENTEN F. VIAUDA. CHAMPEAUX J.-M. JAUBERT J.-F. MINSTERR. CHAPPAZ M. LEPOUTRE J.-J. MOSCONI
Upstream
54 / TOTAL - Registration Document 2009
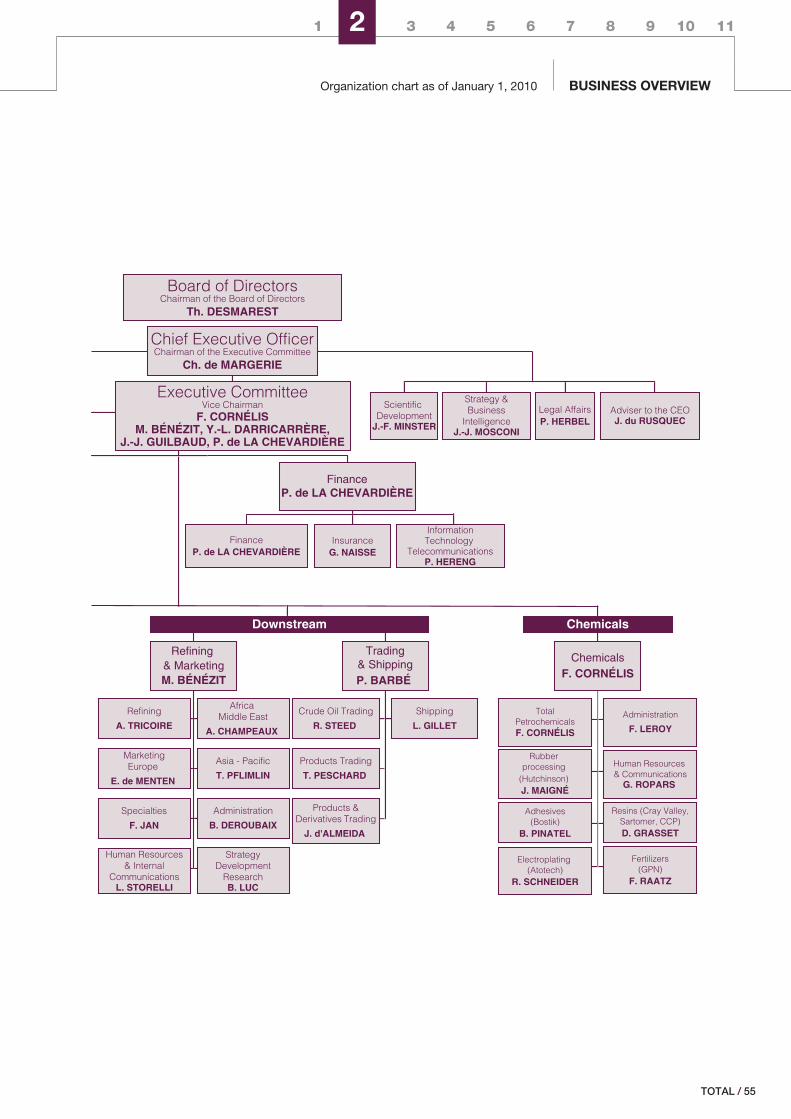
1 2 3 4 5 6 7 8 9 10 11
Organization chart as of January 1, 2010 BUSINESS OVERVIEW
FinanceP. de LA CHEVARDIÈRE
InsuranceG. NAISSE
InformationTechnology
TelecommunicationsP. HERENG
FinanceP. de LA CHEVARDIÈRE
Chief Executive OfficerChairman of the Executive Committee
Ch. de MARGERIE
Board of DirectorsChairman of the Board of Directors
Th. DESMAREST
Human Resources& Internal
CommunicationsL. STORELLI
Refining
A. TRICOIRE
Specialties
F. JAN
MarketingEurope
E. de MENTEN
StrategyDevelopment
ResearchB. LUC
Administration
B. DEROUBAIX
Asia - Pacific
T. PFLIMLIN
Africa Middle East
A. CHAMPEAUX
Products &Derivatives Trading
J. d'ALMEIDA
Crude Oil Trading
R. STEED
Products Trading
T. PESCHARD
Shipping
L. GILLET
Adhesives(Bostik)
B. PINATEL
Rubber processing
(Hutchinson) J. MAIGNÉ
TotalPetrochemicalsF. CORNÉLIS
Electroplating (Atotech)
R. SCHNEIDER
Administration
F. LEROY
Human Resources & Communications
G. ROPARS
Resins (Cray Valley,Sartomer, CCP)D. GRASSET
Legal AffairsP. HERBEL
Adviser to the CEOJ. du RUSQUEC
Strategy &Business
IntelligenceJ.-J. MOSCONI
Scientific Development
J.-F. MINSTER
Executive CommitteeVice Chairman
F. CORNÉLISM. BÉNÉZIT, Y.-L. DARRICARRÈRE,
J.-J. GUILBAUD, P. de LA CHEVARDIÈRE
Trading& ShippingP. BARBÉ
Refining & MarketingM. BÉNÉZIT
ChemicalsF. CORNÉLIS
Fertilizers(GPN)
F. RAATZ
Downstream Chemicals
/ 55TOTAL
BUSINESS OVERVIEW2
56 / TOTAL - Registration Document 2009
3MANAGEMENT REPORT
Chapter 3 (Management Report) was set by the Board of Directors on February 10, 2010, and has not been updated withsubsequent events.
SUMMARY OF RESULTS AND FINANCIAL POSITION p. 58
Overview of the 2009 fiscal year for TOTAL S.A. p. 58
2009 results p. 59
Upstream results p. 61
Downstream results p. 62
Chemicals results p. 62
TOTAL S.A. 2009 results and proposed dividend p. 63
Liquidity and capital resources p. 64
Long-term and short-term capital p. 64
Cash flow p. 64
Borrowing requirements and funding structure p. 65
External financing available p. 65
Anticipated sources of financing p. 65
Research and development p. 66
Exploration & Production p. 66
Gas & Power p. 66
Refining & Marketing p. 67
Petrochemicals p. 67
Specialty Chemicals p. 67
Environment p. 67
R&D organization p. 67
Trends and outlook p. 68
Outlook p. 68
Risks and uncertainties p. 68
2010 sensitivities to market environment p. 68
/ 57TOTAL
Summary of results and financial positionMANAGEMENT REPORT3
� Summary of results and financial position
� Overview of the 2009 fiscal year forTOTAL S.A.
The 2009 oil and gas market environment was marked by a sharpdecline in the demand for oil, natural gas and refined products.Crude oil prices, nonetheless, rebounded during the year toaverage $61.7/b thanks to the support from OPEC reductions andthe anticipation by the market of an economic recovery. In contrast,natural gas spot prices remained depressed and refining marginsfell to historically low levels, under pressure from significantovercapacity. In Chemicals, despite strong demand for polymers inChina, the environment was hurt by low margins and a sharp dropin demand in OECD markets.
In this context, TOTAL’s 2009 adjusted net income was $10.9 billion,a decrease of 47% compared to 2008. The Group’s results for theyear were among the most resilient of the major oil companies. In thefourth quarter, thanks to a 6% increase in Upstream production,higher oil prices and Downstream results that remained slightlypositive despite very weak refining margins, adjusted net incomerose to $3.1 billion, an increase of 15% compared to the thirdquarter.
With its strong balance sheet and financial flexibility, TOTAL hasbeen able to continue its investment program and dividend policy in2009, while keeping its net-debt-to-equity ratio, in line with itsobjectives, at 27% at the end of December 2009.
In the Upstream, in 2009 five major projects started production inNigeria, the Gulf of Mexico, Angola, Qatar and Yemen. The Groupalso approved the investment to launch the Surmont Phase IIproject in Canada, and, to further strengthen its portfolio, enteredinto a number of joint ventures, notably with Chesapeake andCobalt in the United States, Novatek in Russia, and Sonatrach inAlgeria. These additions were made within the framework of thecompany’s strict financial criteria. In addition, cost reduction planslaunched in late 2008 led to an 8% reduction in operating costs andallowed the company to maintain its technical costs at $15.4/boe,the same level as in 2008.
The Downstream and Chemicals segments continued to implementplans to adapt to the particularly difficult conditions they faced in2009 that included reducing capacity to restore profitability to theseactivities in an environment undergoing profound transformation.The measures taken in the modernization of the refining andpetrochemicals site at Normandy demonstrate the Group’s will tobe socially responsible as it adapts its industrial operations tostructural changes in the market.
In addition, outlays for research and development rose to€650 million in 2009, an increase of 6% compared to 2008. Inparticular, this allowed the Group to start up this year the pilotproject for CO2 capture and storage at Lacq, which illustrates itscommitment to the fight against global climate change.
In reaffirming the priority of safety and the environment and bybuilding on its investment discipline, its high-quality portfolio and itsrecognized expertise, TOTAL is confident in its ability to pursue itsstrategy of profitable and responsible growth to create value for allof its stakeholders.
58 / TOTAL - Registration Document 2009
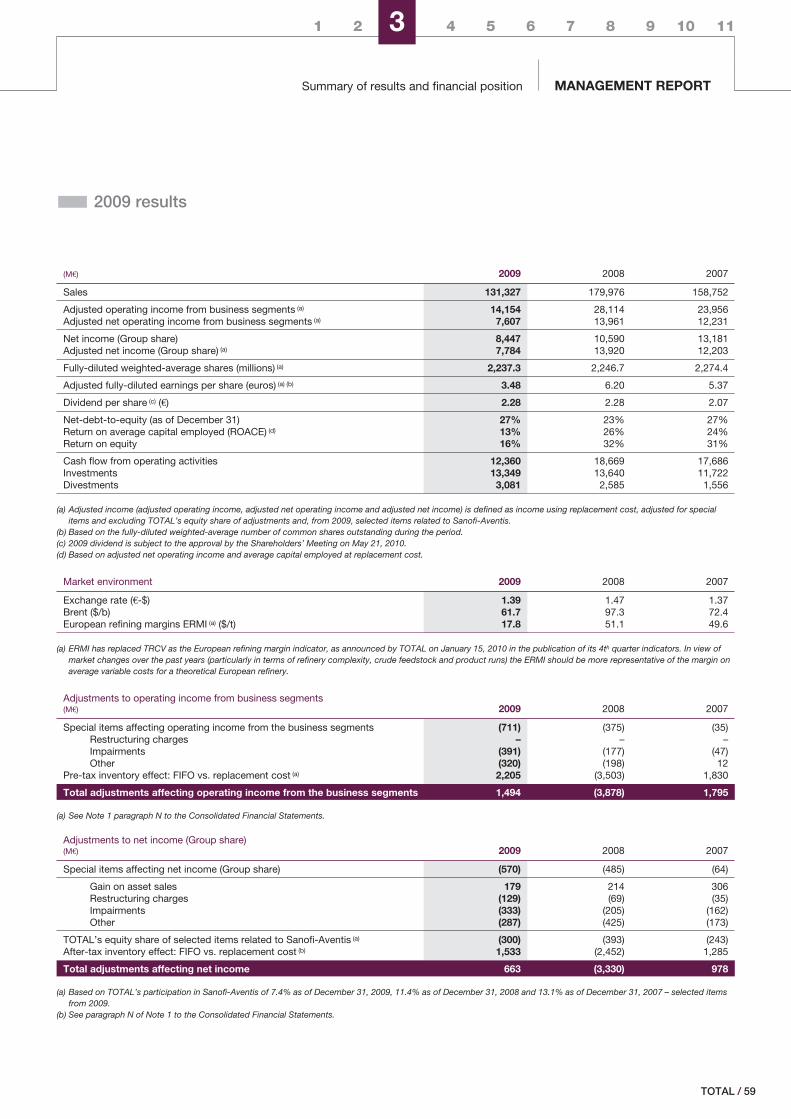
1 2 3 4 5 6 7 8 9 10 11
Summary of results and financial position MANAGEMENT REPORT
� 2009 results
(M€) 2009 2008 2007
Sales 131,327 179,976 158,752
Adjusted operating income from business segments (a) 14,154 28,114 23,956Adjusted net operating income from business segments (a) 7,607 13,961 12,231
Net income (Group share) 8,447 10,590 13,181Adjusted net income (Group share) (a) 7,784 13,920 12,203
Fully-diluted weighted-average shares (millions) (a) 2,237.3 2,246.7 2,274.4
Adjusted fully-diluted earnings per share (euros) (a) (b) 3.48 6.20 5.37
Dividend per share (c) (€) 2.28 2.28 2.07
Net-debt-to-equity (as of December 31) 27% 23% 27%Return on average capital employed (ROACE) (d) 13% 26% 24%Return on equity 16% 32% 31%
Cash flow from operating activities 12,360 18,669 17,686Investments 13,349 13,640 11,722Divestments 3,081 2,585 1,556
(a) Adjusted income (adjusted operating income, adjusted net operating income and adjusted net income) is defined as income using replacement cost, adjusted for specialitems and excluding TOTAL’s equity share of adjustments and, from 2009, selected items related to Sanofi-Aventis.
(b) Based on the fully-diluted weighted-average number of common shares outstanding during the period.(c) 2009 dividend is subject to the approval by the Shareholders’ Meeting on May 21, 2010.(d) Based on adjusted net operating income and average capital employed at replacement cost.
Market environment 2009 2008 2007
Exchange rate (€-$) 1.39 1.47 1.37Brent ($/b) 61.7 97.3 72.4European refining margins ERMI (a) ($/t) 17.8 51.1 49.6
(a) ERMI has replaced TRCV as the European refining margin indicator, as announced by TOTAL on January 15, 2010 in the publication of its 4th quarter indicators. In view ofmarket changes over the past years (particularly in terms of refinery complexity, crude feedstock and product runs) the ERMI should be more representative of the margin onaverage variable costs for a theoretical European refinery.
Adjustments to operating income from business segments(M€) 2009 2008 2007
Special items affecting operating income from the business segments (711) (375) (35)Restructuring charges – – –Impairments (391) (177) (47)Other (320) (198) 12
Pre-tax inventory effect: FIFO vs. replacement cost (a) 2,205 (3,503) 1,830
Total adjustments affecting operating income from the business segments 1,494 (3,878) 1,795
(a) See Note 1 paragraph N to the Consolidated Financial Statements.
Adjustments to net income (Group share)(M€) 2009 2008 2007
Special items affecting net income (Group share) (570) (485) (64)
Gain on asset sales 179 214 306Restructuring charges (129) (69) (35)Impairments (333) (205) (162)Other (287) (425) (173)
TOTAL’s equity share of selected items related to Sanofi-Aventis (a) (300) (393) (243)After-tax inventory effect: FIFO vs. replacement cost (b) 1,533 (2,452) 1,285
Total adjustments affecting net income 663 (3,330) 978
(a) Based on TOTAL’s participation in Sanofi-Aventis of 7.4% as of December 31, 2009, 11.4% as of December 31, 2008 and 13.1% as of December 31, 2007 – selected itemsfrom 2009.
(b) See paragraph N of Note 1 to the Consolidated Financial Statements.
/ 59TOTAL
Summary of results and financial positionMANAGEMENT REPORT3
‹ Sales
Consolidated sales decreased by 27% to €131,327 million in 2009from €179,976 million in 2008.
‹ Operating income
Using Total’s market indicators and comparing 2009 to 2008, theenvironment was marked by a 36% decrease in the averagerealized liquids price and a 30% decrease in the average realizednatural gas price. The ERMI refining margin indicator for Europe fellby 65% to $17.8/t. The Chemicals environment was marked by adrop in demand for polymers and specialty chemicals.
The euro-dollar exchange rate was $1.39/€ in 2009 compared to$1.47/€ in 2008.
In this context, the adjusted operating income from the businesssegments was €14,154 million, a decrease of 50% compared to2008 1. Expressed in dollars, adjusted operating income from thebusiness segments was $19.7 billion, a decrease of 52% comparedto 2008.
The effective tax rate 2 for the business segments was 55%compared to 56% in 2008.
Adjusted net operating income from the business segments was€7,607 million compared to €13,961 million in 2008, a decrease of46%. The smaller decrease, relative to the one in adjustedoperating income, is essentially due to the more limited decrease inthe contribution from equity affiliates.
Expressed in dollars, adjusted net operating income from thebusiness segments fell by 48%.
‹ Net income Group share
Adjusted net income decreased by 44% to €7,784 million in 2009from €13,920 million in 2008. It excludes the after-tax inventoryeffect, special items, and the Group’s equity share of adjustmentsand selected items related to Sanofi-Aventis.
The after-tax inventory effect had a positive impact on net incomeof €1,533 million in 2009 compared to a negative impact of€2,452 million in 2008;
The Group’s share of adjustments and selected items related toSanofi-Aventis had a negative impact on net income of €300 millionin 2009 and a negative impact on net income of €393 million in2008;
Other special items had a negative impact on net income of€570 million in 2009 compared to a negative impact of €485 millionin 2008.
Reported net income (Group share) was €8,447 million compared to€10,590 million in 2008.
The effective tax rate for the Group was 55% in 2009 compared to56% in 2008.
The Group did not buy back shares in 2009. On December 31,2009, there were 2,243.7 million fully-diluted shares compared to2,235.3 million fully-diluted shares on December 31, 2008.
Adjusted fully-diluted earnings per share, based on 2,237.3 millionweighted-average shares was €3.48 compared to €6.20 in 2008, adecrease of 44%.
Expressed in dollars, the adjusted fully-diluted earnings per sharewas $4.85 compared to $9.11 in 2008, a decrease of 47%.
‹ Investments – divestments
Investments excluding acquisitions and including net investments inequity affiliates and non-consolidated companies were €12.3 billion($17.1 billion) in 2009 compared to €11.4 billion ($16.8 billion) in2008.
Acquisitions were €743 million in 2009.
Asset sales in 2009 were €2,663 million, consisting essentially ofSanofi-Aventis shares.
Net investments 3 were €10.3 billion in 2009 compared to€11.1 billion in 2008. Expressed in dollars, net investments in 2009were $14.3 billion, a decrease of 12% compared to the $16.3 billionof net investments in 2008.
‹ Profitability
The ROACE for the full year 2009 was 13% for the Group and 13%for the business segments compared to 26% and 28%,respectively, for the full year 2008.
Return on equity was 16% in 2009 compared to 32% in 2008.
1. Special items affecting operating income from the business segments had a negative impact of €711 million in 2009 and a negative impact of €375 million in 2008.2. Defined as: (tax on adjusted net operating income) / (adjusted net operating income – income from equity affiliates, dividends received from investments and impairments of
acquisition goodwill + tax on adjusted net operating income).3. Net investments = investments including acquisitions and net investments in equity affiliates and non-consolidated companies – asset sales + net financing for employees
related to stock purchase plans.
60 / TOTAL - Registration Document 2009
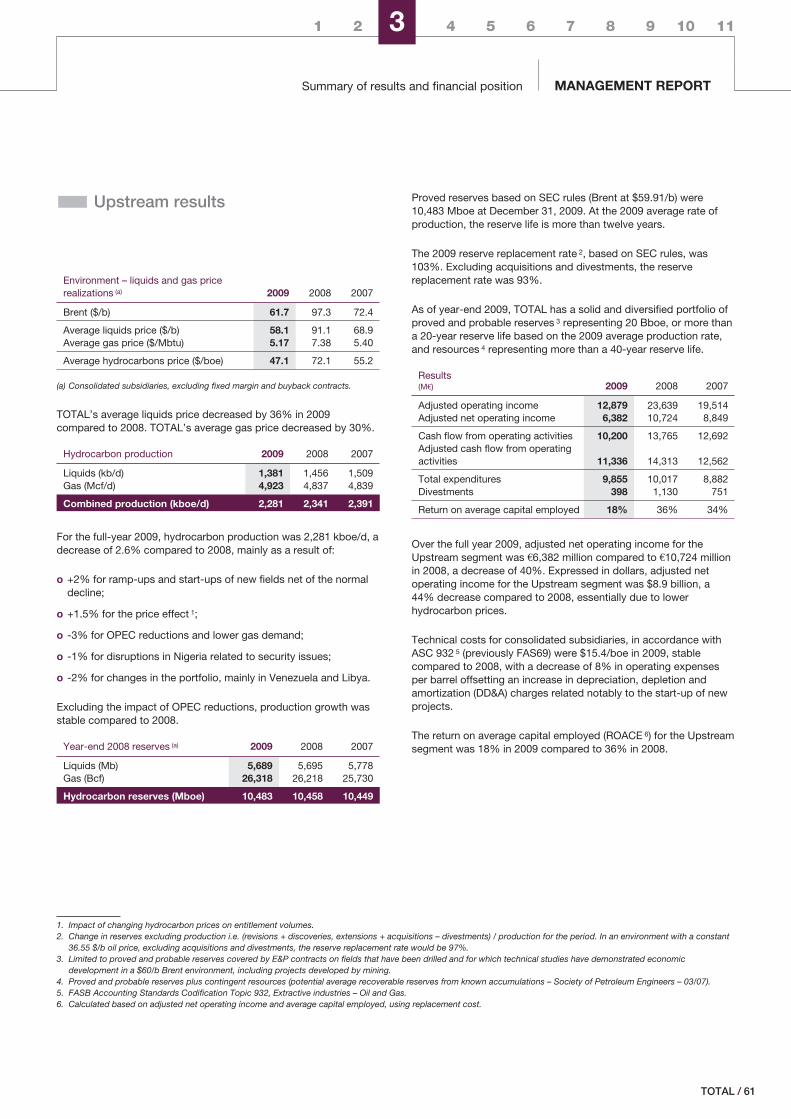
1 2 3 4 5 6 7 8 9 10 11
Summary of results and financial position MANAGEMENT REPORT
� Upstream results
Environment – liquids and gas pricerealizations (a) 2009 2008 2007
Brent ($/b) 61.7 97.3 72.4
Average liquids price ($/b) 58.1 91.1 68.9Average gas price ($/Mbtu) 5.17 7.38 5.40
Average hydrocarbons price ($/boe) 47.1 72.1 55.2
(a) Consolidated subsidiaries, excluding fixed margin and buyback contracts.
TOTAL’s average liquids price decreased by 36% in 2009compared to 2008. TOTAL’s average gas price decreased by 30%.
Hydrocarbon production 2009 2008 2007
Liquids (kb/d) 1,381 1,456 1,509Gas (Mcf/d) 4,923 4,837 4,839
Combined production (kboe/d) 2,281 2,341 2,391
For the full-year 2009, hydrocarbon production was 2,281 kboe/d, adecrease of 2.6% compared to 2008, mainly as a result of:
o +2% for ramp-ups and start-ups of new fields net of the normaldecline;
o +1.5% for the price effect 1;
o -3% for OPEC reductions and lower gas demand;
o -1% for disruptions in Nigeria related to security issues;
o -2% for changes in the portfolio, mainly in Venezuela and Libya.
Excluding the impact of OPEC reductions, production growth wasstable compared to 2008.
Year-end 2008 reserves (a) 2009 2008 2007
Liquids (Mb) 5,689 5,695 5,778Gas (Bcf) 26,318 26,218 25,730
Hydrocarbon reserves (Mboe) 10,483 10,458 10,449
Proved reserves based on SEC rules (Brent at $59.91/b) were10,483 Mboe at December 31, 2009. At the 2009 average rate ofproduction, the reserve life is more than twelve years.
The 2009 reserve replacement rate 2, based on SEC rules, was103%. Excluding acquisitions and divestments, the reservereplacement rate was 93%.
As of year-end 2009, TOTAL has a solid and diversified portfolio ofproved and probable reserves 3 representing 20 Bboe, or more thana 20-year reserve life based on the 2009 average production rate,and resources 4 representing more than a 40-year reserve life.
Results(M€) 2009 2008 2007
Adjusted operating income 12,879 23,639 19,514Adjusted net operating income 6,382 10,724 8,849
Cash flow from operating activities 10,200 13,765 12,692Adjusted cash flow from operatingactivities 11,336 14,313 12,562
Total expenditures 9,855 10,017 8,882Divestments 398 1,130 751
Return on average capital employed 18% 36% 34%
Over the full year 2009, adjusted net operating income for theUpstream segment was €6,382 million compared to €10,724 millionin 2008, a decrease of 40%. Expressed in dollars, adjusted netoperating income for the Upstream segment was $8.9 billion, a44% decrease compared to 2008, essentially due to lowerhydrocarbon prices.
Technical costs for consolidated subsidiaries, in accordance withASC 932 5 (previously FAS69) were $15.4/boe in 2009, stablecompared to 2008, with a decrease of 8% in operating expensesper barrel offsetting an increase in depreciation, depletion andamortization (DD&A) charges related notably to the start-up of newprojects.
The return on average capital employed (ROACE 6) for the Upstreamsegment was 18% in 2009 compared to 36% in 2008.
1. Impact of changing hydrocarbon prices on entitlement volumes.2. Change in reserves excluding production i.e. (revisions + discoveries, extensions + acquisitions – divestments) / production for the period. In an environment with a constant
36.55 $/b oil price, excluding acquisitions and divestments, the reserve replacement rate would be 97%.3. Limited to proved and probable reserves covered by E&P contracts on fields that have been drilled and for which technical studies have demonstrated economic
development in a $60/b Brent environment, including projects developed by mining.4. Proved and probable reserves plus contingent resources (potential average recoverable reserves from known accumulations – Society of Petroleum Engineers – 03/07).5. FASB Accounting Standards Codification Topic 932, Extractive industries – Oil and Gas.6. Calculated based on adjusted net operating income and average capital employed, using replacement cost.
/ 61TOTAL
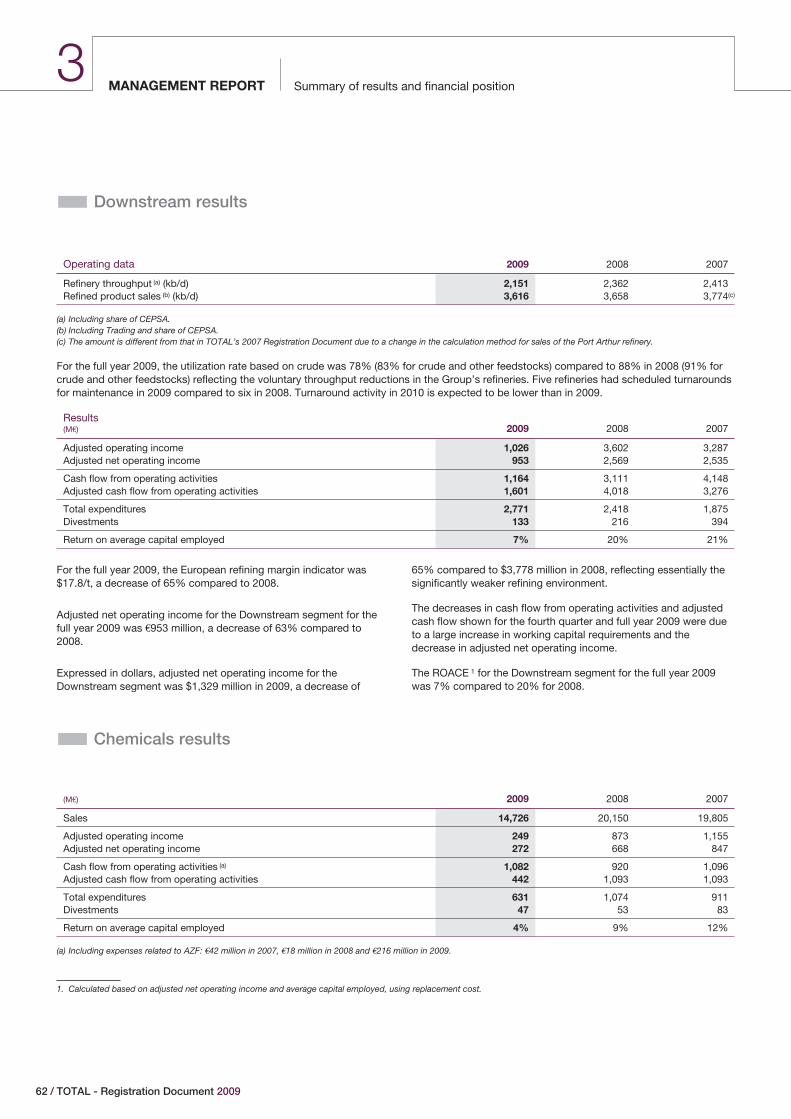
Summary of results and financial positionMANAGEMENT REPORT3
� Downstream results
Operating data 2009 2008 2007
Refinery throughput (a) (kb/d) 2,151 2,362 2,413Refined product sales (b) (kb/d) 3,616 3,658 3,774(c)
(a) Including share of CEPSA.(b) Including Trading and share of CEPSA.(c) The amount is different from that in TOTAL’s 2007 Registration Document due to a change in the calculation method for sales of the Port Arthur refinery.
For the full year 2009, the utilization rate based on crude was 78% (83% for crude and other feedstocks) compared to 88% in 2008 (91% forcrude and other feedstocks) reflecting the voluntary throughput reductions in the Group’s refineries. Five refineries had scheduled turnaroundsfor maintenance in 2009 compared to six in 2008. Turnaround activity in 2010 is expected to be lower than in 2009.
Results(M€) 2009 2008 2007
Adjusted operating income 1,026 3,602 3,287Adjusted net operating income 953 2,569 2,535
Cash flow from operating activities 1,164 3,111 4,148Adjusted cash flow from operating activities 1,601 4,018 3,276
Total expenditures 2,771 2,418 1,875Divestments 133 216 394
Return on average capital employed 7% 20% 21%
For the full year 2009, the European refining margin indicator was$17.8/t, a decrease of 65% compared to 2008.
Adjusted net operating income for the Downstream segment for thefull year 2009 was €953 million, a decrease of 63% compared to2008.
Expressed in dollars, adjusted net operating income for theDownstream segment was $1,329 million in 2009, a decrease of
65% compared to $3,778 million in 2008, reflecting essentially thesignificantly weaker refining environment.
The decreases in cash flow from operating activities and adjustedcash flow shown for the fourth quarter and full year 2009 were dueto a large increase in working capital requirements and thedecrease in adjusted net operating income.
The ROACE 1 for the Downstream segment for the full year 2009was 7% compared to 20% for 2008.
� Chemicals results
(M€) 2009 2008 2007
Sales 14,726 20,150 19,805
Adjusted operating income 249 873 1,155Adjusted net operating income 272 668 847
Cash flow from operating activities (a) 1,082 920 1,096Adjusted cash flow from operating activities 442 1,093 1,093
Total expenditures 631 1,074 911Divestments 47 53 83
Return on average capital employed 4% 9% 12%
(a) Including expenses related to AZF: €42 million in 2007, €18 million in 2008 and €216 million in 2009.
1. Calculated based on adjusted net operating income and average capital employed, using replacement cost.
62 / TOTAL - Registration Document 2009
1 2 3 4 5 6 7 8 9 10 11
Summary of results and financial position MANAGEMENT REPORT
For the full year 2009, adjusted net operating income for theChemicals segment was €272 million compared to €668 million in2008, a decrease of 59% that resulted from the significantly weakerenvironment for Base chemicals and, to a lesser degree, lowersales and results from the Specialties.
The ROACE 1 for the Chemicals segment for the full year 2009 was4% compared to 9% for 2008.
� TOTAL S.A. 2009 results andproposed dividend
Net income for TOTAL S.A., the parent company, was€5,634 million in 2009 compared to €6,008 million in 2008. Afterclosing the accounts, the Board of Directors decided to propose atthe May 21, 2010 Annual Shareholders Meeting a dividend of€2.28 per share for 2009, stable in euros compared to the previousyear.
Based on 2009 adjusted net income, TOTAL’s pay-out ratio wouldbe 66%.
Taking into account the interim dividend of €1.14 per share paid onNovember 18, 2009, the remaining €1.14 per share would be paidon June 1, 2010 2.
1. Calculated based on adjusted net operating income and average capital employed, using replacement cost.2. The ex-dividend date for the remainder of the 2009 dividend would be May 27, 2010.
/ 63TOTAL
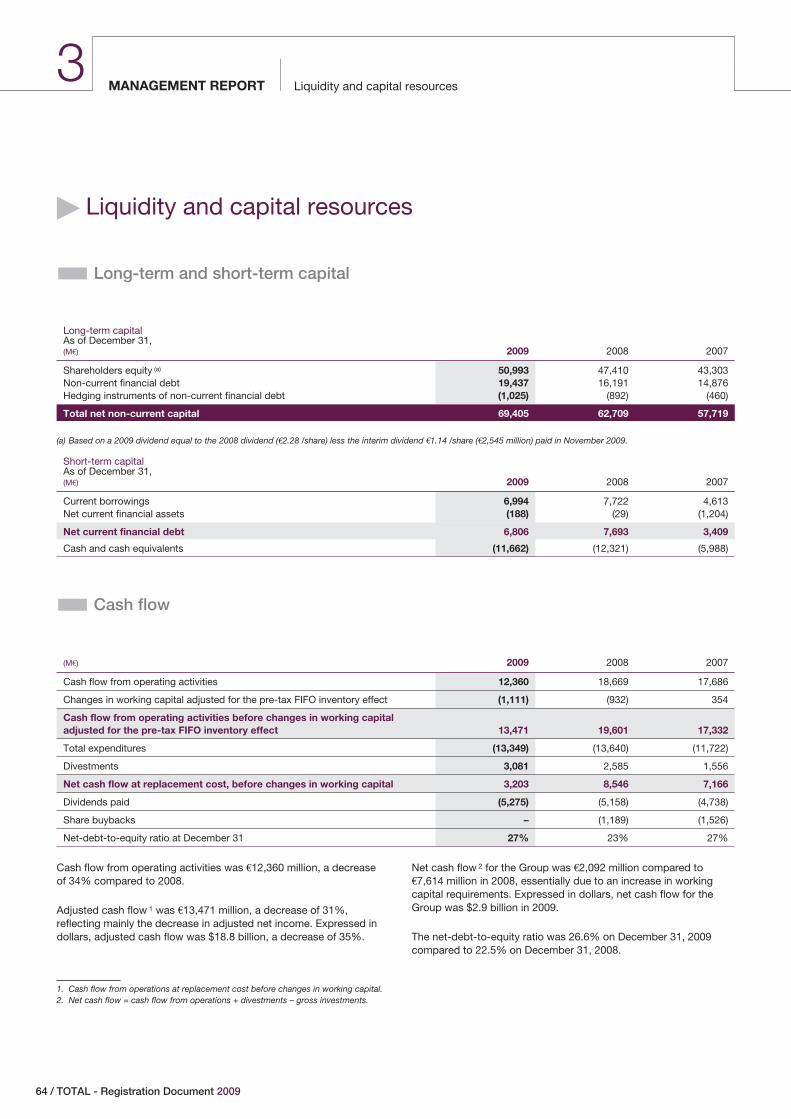
Liquidity and capital resourcesMANAGEMENT REPORT3
� Liquidity and capital resources
� Long-term and short-term capital
Long-term capitalAs of December 31,(M€) 2009 2008 2007
Shareholders equity (a) 50,993 47,410 43,303Non-current financial debt 19,437 16,191 14,876Hedging instruments of non-current financial debt (1,025) (892) (460)
Total net non-current capital 69,405 62,709 57,719
(a) Based on a 2009 dividend equal to the 2008 dividend (€2.28 /share) less the interim dividend €1.14 /share (€2,545 million) paid in November 2009.
Short-term capitalAs of December 31,(M€) 2009 2008 2007
Current borrowings 6,994 7,722 4,613Net current financial assets (188) (29) (1,204)
Net current financial debt 6,806 7,693 3,409
Cash and cash equivalents (11,662) (12,321) (5,988)
� Cash flow
(M€) 2009 2008 2007
Cash flow from operating activities 12,360 18,669 17,686
Changes in working capital adjusted for the pre-tax FIFO inventory effect (1,111) (932) 354
Cash flow from operating activities before changes in working capitaladjusted for the pre-tax FIFO inventory effect 13,471 19,601 17,332
Total expenditures (13,349) (13,640) (11,722)
Divestments 3,081 2,585 1,556
Net cash flow at replacement cost, before changes in working capital 3,203 8,546 7,166
Dividends paid (5,275) (5,158) (4,738)
Share buybacks – (1,189) (1,526)
Net-debt-to-equity ratio at December 31 27% 23% 27%
Cash flow from operating activities was €12,360 million, a decreaseof 34% compared to 2008.
Adjusted cash flow 1 was €13,471 million, a decrease of 31%,reflecting mainly the decrease in adjusted net income. Expressed indollars, adjusted cash flow was $18.8 billion, a decrease of 35%.
Net cash flow 2 for the Group was €2,092 million compared to€7,614 million in 2008, essentially due to an increase in workingcapital requirements. Expressed in dollars, net cash flow for theGroup was $2.9 billion in 2009.
The net-debt-to-equity ratio was 26.6% on December 31, 2009compared to 22.5% on December 31, 2008.
1. Cash flow from operations at replacement cost before changes in working capital.2. Net cash flow = cash flow from operations + divestments – gross investments.
64 / TOTAL - Registration Document 2009
Liquidity and capital resources MANAGEMENT REPORT
1 2 3 4 5 6 7 8 9 10 11
� Borrowing requirements and fundingstructure
The Group’s policy consists of incurring non-current debt primarilyat a floating rate, or, if the opportunity arises at the time of anissuance, at a fixed rate. Debt is incurred in dollars or in eurosaccording to general corporate needs. Long-term interest rate andcurrency swaps may be used to hedge bonds at their issuance inorder to create a variable or fixed rate synthetic debt. In order topartially modify the interest rate structure of the long-term debt,TOTAL may also enter into long-term interest rate swaps.
The non-current debt is generally raised by the TreasuryDepartment, either directly in dollars or in euros, or in currenciesexchanged for dollars or euros, based on the Group’s generalneeds, through swaps.
The Group has established standards for market transactions underwhich bank counterparties must be approved in advance, based onan assessment of the counterparty’s financial soundness (multi-criteria analysis including a review of market prices and of theCredit Default Swap (CDS), its ratings with Standard & Poor’s andMoody’s, which must be of high quality and its overall financialcondition).
An overall authorized credit limit is defined for each bank and isalloted among the subsidiaries and the Group’s central treasuryentities according to their needs.
To reduce the market values risk on its commitments, in particularfor swaps set as part of bonds issuance, the Group also developeda system of margin call that is gradually implemented withsignificant counterparties.
� External financing available
The total amount, as of December 31, 2009, of the principalconfirmed lines of credit granted by international banks to Groupcompanies, including TOTAL S.A., was $10,084 million (comparedto $9,621 as of December 31, 2008), of which $10,051 million wasunused (compared to $9,380 million December 31, 2008).
TOTAL S.A. has confirmed lines of credit granted by internationalbanks that allow the Company to fund a significant cash reserve. Asof December 31, 2009, these lines of credit amounted to $9,322million (compared to $8,966 million as of December 31, 2008), ofwhich $9,289 million were unused (compared to €8,725 million as ofDecember 31, 2008).
The contracts for the lines of credit granted to TOTAL S.A. containno provisions that tie the terms and conditions of the loan to theCompany’s financial ratios, to its financial ratings from specializedagencies, or to the occurrence of events that could have a materialnegative impact on its financial position.
The lines of credit granted to Group companies other than TOTALS.A. are not intended to finance the Group’s general needs; they areintended to finance either the general needs of the borrowingsubsidiary or a specific project.
As of December 31, 2009, there was no restriction on the use of thecapital received by the Group’s companies (including TOTAL S.A.)which could have a direct or indirect material impact on the Group’soperations.
� Anticipated sources of financing
In 2009, investments, working capital and dividend payments werefinanced essentially by the cash flow generated from operatingactivities and by asset disposals and net borrowings.
For the coming years and based on the current financingconditions, the Company intends to maintain this method offinancing its investments and activities.
/ 65TOTAL
Research and developmentMANAGEMENT REPORT3
� Research and development
In 2009, Research & Development (R&D) expenses amounted to€650 million, compared to €612 million in 2008 and €594 million in2007 1. The process initiated in 2004 to increase R&D budgetscontinued in 2009. In addition, the Group implemented in 2009 afinancial device to contribute to the development of start-ups thatspecialize in the development of innovative technologies in the fieldof energy.
In 2009, 4,016 employees were dedicated to R&D, compared to4,285 in 2008 and 4,216 in 2007.
There are six major R&D areas at TOTAL:
o developing knowledge, tools and technological mastery todiscover and operate technologically complex oil and gasresources to meet global demand for energy;
o developing and industrializing solar, biomass and carbon captureand storage technologies to contribute to the evolution of theglobal energy mix;
o understanding and measuring the impacts of the Group’soperations and products on ecosystems (water, soil, air,biodiversity) to strengthen environmental safety, as part of theregulation in place, and reduce their environmental footprint toachieve sustainability in the Group’s operations;
o developing practical, innovative and competitive materials thatmeet the market’s specific needs; contribute to the emergence ofnew features and systems; enable current materials to bereplaced by materials achieving higher performance; address thechallenges of improved energy efficiency, lower environmentalimpact and toxicity and achieve better management of productlife cycle;
o developing, industrializing and improving conversion processesof oil, coal and biomass resources to adapt to changes inresources and markets, improve reliability and safety, achievebetter energy efficiency, reduce the environmental footprint andmaintain economic margins on the long term;
o mastering and using innovative technologies such asbiotechnologies, nanotechnologies, high-performancecomputing, information and communications technologies andnew analytic techniques.
These issues are addressed synergistically within a portfolio ofprojects. Different aspects may be looked at independently bydifferent divisions.
� Exploration & Production
In addition to continuously optimizing the development of offshoreprojects and gas resources, TOTAL continues to improve itscomputing, exploration, seismic acquisition and processing tools aswell as those for the initial appraisal of reservoirs and simulation offield evolution during operations, especially for tight sand, verydeep and carbonated reservoirs.
Enhancing oil recovery from operated reservoirs and recovery of heavyoil and bitumen with lesser environmental impacts are also subjectsinvolving major research. In particular, a new major project to developtechnology for the development of oil shale was launched in 2008.
In addition, the carbon dioxide capture and storage project in theRousse depleted field in Lacq (southwestern France) continues, inline with schedule. The first injections took place in early 2010.
Water management is also the subject of increased R&D activities.
� Gas & Power
R&D mainly involves energy conversion related to:
o new technical features for terminals regarding LNG (liquefiednatural gas);
o the emergence of DME (DiMethyl Ether) through the Group’sinvolvement in a testing program for this fuel;
o CTL (Coal to Liquids) projects to convert coal into liquidhydrocarbons, with carbon dioxide capture as part of this process.
R&D efforts were sustained in new energies, in particular in thedevelopment of new generation photovoltaic cells as part of severalpartnerships with recognized research institutes.
Energy production from biomass is also a major R&D challenge inthe development of new energies. The Group is involved in aprogram to develop a production process from biomass and inbiotechnologies studies related to biomass processing.
1. Including, starting in 2009, expenses for Exploration & Production pilot facilities.
66 / TOTAL - Registration Document 2009
1 2 3 4 5 6 7 8 9 10 11
Research and development MANAGEMENT REPORT
R&D partnerships in tidal current energy, thermal energy and marinepower also contribute to the Group’s better understanding of thetechnological challenges in these fields.
� Refining & Marketing
In Refining & Marketing, TOTAL is preparing for the emergence oftomorrow’s resources, including non-conventional oil and biomass,and develops products that meet the market needs, such as higher-performance and energy-saving fuels, additives and lubricants.
The Refining & Marketing Division develops processes andcatalysts and studies the operation of its industrial sites to improveproduction and adapt to the fuel market. The division develops newproducts (fuels, heating fuels, lubricants, etc.) that are adapted tonew engines and more environmentally-friendly as well astechnologies to measure and reduce industrial emissions in theenvironment.
Several R&D projects in the field of second-generation biofuelproduction were also launched as part of partnerships withacademic, industrial and economic players in order to developenzymatic and thermo-chemical conversion of biomass.
� Petrochemicals
In Petrochemicals, R&D is focused on the use of alternativeresources to naphtha and ethane, such as methanol from coal, gasand renewable feedstock.
The development of new grades of polymers is also a significantR&D activity and the Group is involved in the development ofbiodegradable polymers such as polylactic acid (PLA) as part of ajoint venture with the company Galactic.
R&D efforts also involve research on catalysts and processes andinclude new pilot programs for development, such as the industrialpilot program to convert methanol into olefins combined with apolymerization pilot, which allows the gradual optimization of theprocess at the Feluy site in Belgium.
� Specialty Chemicals
In the Chemicals segment, R&D has strategic importance for thespecialty chemicals products. It is closely linked to the needs ofsubsidiaries.
Atotech is one of the world leaders for integrated productionsystems (chemicals, equipment, know-how and service) forindustrial surface finishing and the manufacturing of integratedcircuits. Given the environmental challenges related toelectroplating, nearly one third of Atotech’s R&D projects areintended to develop cleaner technologies and create conditions forthe sustainable development of these industries.
Innovation at Hutchinson is focused on the development ofthermoplastic elastomers, clean production technologies andenergy-efficient systems for large industrial clients.
Bostik and Cray Valley-Sartomer are seeking to develop products(glues and resins) that are adapted to new markets and offer newfeatures stemming from clean production technologies, includingbiomass resources.
� Environment
Environmental issues are important throughout the Group and takeninto account in all R&D projects. Environmental challenges include:
o detection and reduction of emissions into the air;
o prevention of soil and water contamination by focusing R&Dactivity on the most significant environmental risks at the Group’ssites or projects, notably by reducing the use of water fromnatural environments and by lowering emissions;
o changes in the Group’s different products and management oftheir life cycle, in compliance with the REACH Directive;
o reduction of greenhouse gases through the improvement ofenergy efficiency and carbon dioxide capture and storage.
� R&D organization
The Group intends to increase R&D at all the business units throughcross-functional themes and technologies. Attention is paid tosynergies of R&D efforts between business units.
The Group has twenty-two R&D sites worldwide and has developedapproximately 600 partnerships with other industrial groups,academic or special research institutes. TOTAL also has apermanently renewed network of scientific advisors worldwide thatmonitor and advise on matters of interest to the Group’s R&Dactivities. Long-term partnerships with universities and academiclaboratories, deemed strategic in Europe, the United States, Japanand China, as well as innovating small businesses are part of theGroup’s approach.
Each business unit is developing an active intellectual propertyactivity, aimed at protecting its developments, allowing its activitywithout constraints as well as facilitating its partnerships. In 2009,close to 250 new patents applications were issued by the Group.
/ 67TOTAL
Trends and outlookMANAGEMENT REPORT3
� Trends and outlook
� Outlook
In the Upstream, 2010 production is expected to increase thanks tothe ramp-up on projects started up in 2009. TOTAL will continue tobuild on its large and diversified portfolio, its recognized expertisein project management and cost control. Following the launch ofthe Surmont Phase II project announced in January 2010, TOTALexpects to launch several other major projects, including CLOV inAngola, Laggan/Tormore in the United Kingdom, and Ofon II andEgina in Nigeria.
In the Downstream and Chemicals, the Group plans to continue toadapt its activities in mature areas and reinforce its portfolio ingrowing markets, notably with the construction of the Jubail refineryand the benefit from the start-up of a new ethane cracker in Qatar.
The Group is continuing to pursue its growth policy in 2010 with aninvestment budget of $18 billion 1, stable compared to the 2009budget; 80% of the investments will be dedicated to the Upstream.In addition, TOTAL intends to divest non-strategic assets, inparticular through the progressive sale of its shares in Sanofi-Aventis and a project to sell Mapa-Spontex, a subsidiary in itsSpecialty chemicals sector. Based on this, the Group maintains itsnet-debt-to-equity ratio objective of around 25-to-30%. TOTAL isconfident in its ability to maintain its dividend policy.
Since the beginning of the first quarter 2010, the price of Brent hastraded between $70/b and $80/b and natural gas prices haverecovered somewhat. The environment for refining andpetrochemicals remains difficult.
� Risks and uncertainties
Due to the nature of its business, the Company is subject to marketrisks (in both the oil and financial markets), industrial andenvironmental risks related to their operations, and to geopoliticalrisks stemming from the global presence of most of its activities.
In addition, risks related to cash management activities and tointerest rate and foreign exchange rate financial instruments aremanaged according to strict rules set by the Company’smanagement, which also oversees the centralization of liquiditypositions and the management of financial instruments.
Detailed information is given in the Risk Factors section (Chapter 4),of this Registration Document, which also includes informationreferred to in Article L. 225-102-1 of the French Commercial Coderelated to TOTAL S.A.’s environmental and social report (Chapter11, Appendix 3, TOTAL S.A., Social and environmental information).
� 2010 sensitivities to market environment (a)
Market environment Scenario Change
Estimated impact onadjusted operating
income
Estimated impact onadjusted net
operating income
€-$ 1.40 $/€ +0.10 $/€ -1.1 B€ -0.6 B€
Brent 60 $/b +1 $/b +0.25 B€/+ 0.35 B$ +0.11 B€/+ 0.15 B$
European refining margins (ERMI (b)) 15 $/t +1 $/t +0.07 B€/+ 0.10 B$ +0.05 B€/+ 0.07 B$
(a) Sensitivities revised once per year upon publication of the previous year’s fourth quarter results. The impact of the $/€ sensitivity on adjusted operating income and adjustednet operating income attributable to the Upstream segment are approximately 80% and 75% respectively, and the remaining impact of the $/€ sensitivity is essentially in theDownstream segment.
1. Including net investments in equity affiliates and non-consolidated companies, excluding acquisitions, based on €1=$1.40 for 2010.
68 / TOTAL - Registration Document 2009
4RISK FACTORS
MARKET RISKS p. 70
Sensitivity to market environment p. 70
Oil and gas market related risks p. 70
Financial markets related risks p. 71
Counterparty risk p. 72
Currency exposure p. 72
Short-term interest rate exposure and cash p. 72
Interest rate risk on non-current debt p. 72
Sensitivity analysis on interest rate and foreign exchange risk p. 73
Stock market risk p. 75
Liquidity risk p. 75
Credit risk p. 76
INDUSTRIAL AND ENVIRONMENTAL RISKS p. 79
Types of risk p. 79
Risk evaluation p. 79
Risk management p. 80
Asbestos p. 80
OTHER RISKS p. 81
Risks related to oil and gas exploration and production p. 81
Risks related to economic or political factors p. 81
Legal aspects of exploration and production activities p. 82
Legal aspects of the Group’s other businesses p. 82
Business activities in Cuba, Iran, Sudan and Syria p. 83
Nigeria p. 85
Risks related to competition p. 85
Legal and arbitration proceedings p. 85
INSURANCE AND RISK MANAGEMENT p. 86
Organization p. 86
Risk and insurance management policy p. 86
Insurance policy p. 86
/ 69TOTAL
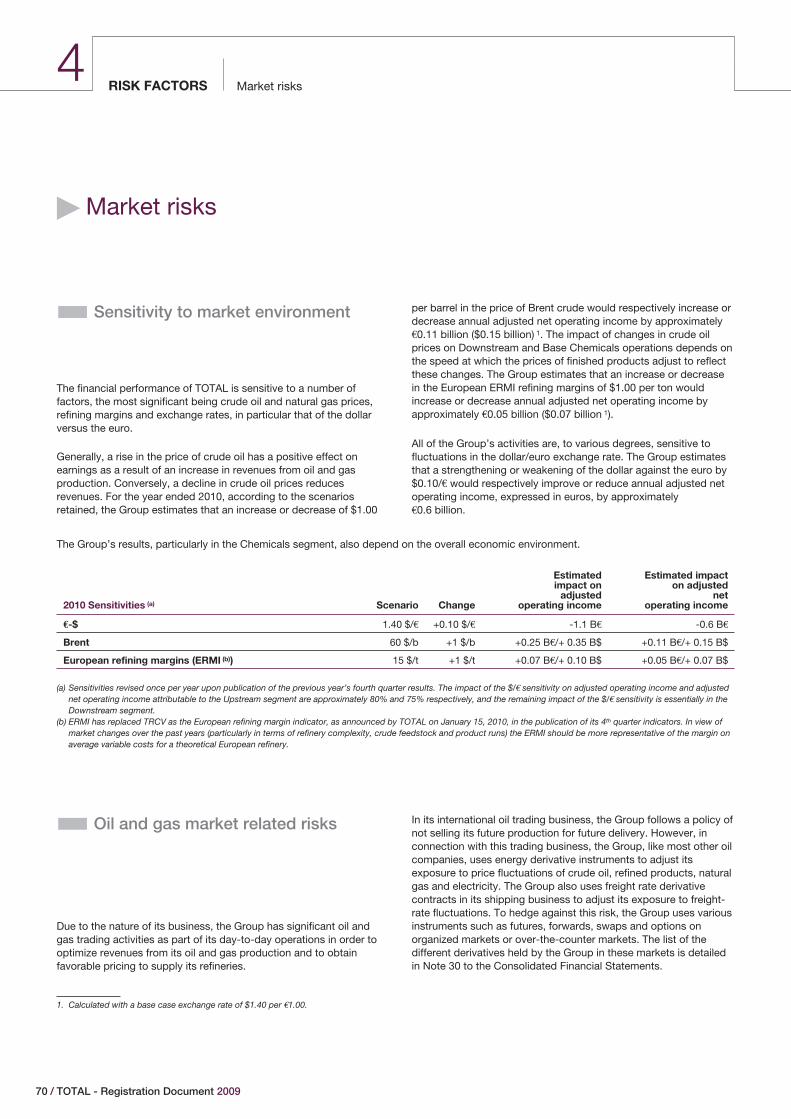
Market risksRISK FACTORS4
� Market risks
� Sensitivity to market environment
The financial performance of TOTAL is sensitive to a number offactors, the most significant being crude oil and natural gas prices,refining margins and exchange rates, in particular that of the dollarversus the euro.
Generally, a rise in the price of crude oil has a positive effect onearnings as a result of an increase in revenues from oil and gasproduction. Conversely, a decline in crude oil prices reducesrevenues. For the year ended 2010, according to the scenariosretained, the Group estimates that an increase or decrease of $1.00
per barrel in the price of Brent crude would respectively increase ordecrease annual adjusted net operating income by approximately€0.11 billion ($0.15 billion) 1. The impact of changes in crude oilprices on Downstream and Base Chemicals operations depends onthe speed at which the prices of finished products adjust to reflectthese changes. The Group estimates that an increase or decreasein the European ERMI refining margins of $1.00 per ton wouldincrease or decrease annual adjusted net operating income byapproximately €0.05 billion ($0.07 billion 1).
All of the Group’s activities are, to various degrees, sensitive tofluctuations in the dollar/euro exchange rate. The Group estimatesthat a strengthening or weakening of the dollar against the euro by$0.10/€ would respectively improve or reduce annual adjusted netoperating income, expressed in euros, by approximately€0.6 billion.
The Group’s results, particularly in the Chemicals segment, also depend on the overall economic environment.
2010 Sensitivities (a) Scenario Change
Estimatedimpact on
adjustedoperating income
Estimated impacton adjusted
netoperating income
€-$ 1.40 $/€ +0.10 $/€ -1.1 B€ -0.6 B€
Brent 60 $/b +1 $/b +0.25 B€/+ 0.35 B$ +0.11 B€/+ 0.15 B$
European refining margins (ERMI (b)) 15 $/t +1 $/t +0.07 B€/+ 0.10 B$ +0.05 B€/+ 0.07 B$
(a) Sensitivities revised once per year upon publication of the previous year’s fourth quarter results. The impact of the $/€ sensitivity on adjusted operating income and adjustednet operating income attributable to the Upstream segment are approximately 80% and 75% respectively, and the remaining impact of the $/€ sensitivity is essentially in theDownstream segment.
(b) ERMI has replaced TRCV as the European refining margin indicator, as announced by TOTAL on January 15, 2010, in the publication of its 4th quarter indicators. In view ofmarket changes over the past years (particularly in terms of refinery complexity, crude feedstock and product runs) the ERMI should be more representative of the margin onaverage variable costs for a theoretical European refinery.
� Oil and gas market related risks
Due to the nature of its business, the Group has significant oil andgas trading activities as part of its day-to-day operations in order tooptimize revenues from its oil and gas production and to obtainfavorable pricing to supply its refineries.
In its international oil trading business, the Group follows a policy ofnot selling its future production for future delivery. However, inconnection with this trading business, the Group, like most other oilcompanies, uses energy derivative instruments to adjust itsexposure to price fluctuations of crude oil, refined products, naturalgas and electricity. The Group also uses freight rate derivativecontracts in its shipping business to adjust its exposure to freight-rate fluctuations. To hedge against this risk, the Group uses variousinstruments such as futures, forwards, swaps and options onorganized markets or over-the-counter markets. The list of thedifferent derivatives held by the Group in these markets is detailedin Note 30 to the Consolidated Financial Statements.
70 / TOTAL - Registration Document 2009
1. Calculated with a base case exchange rate of $1.40 per €1.00.
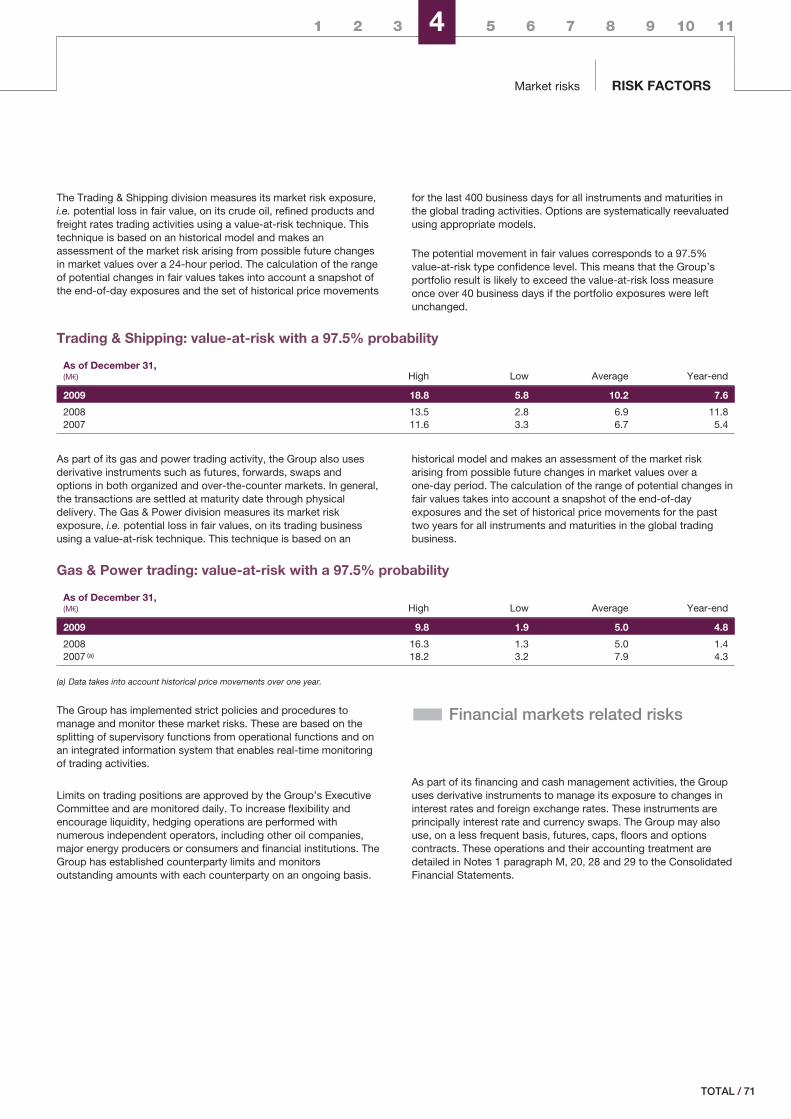
1 2 3 4 5 6 7 8 9 10 11
Market risks RISK FACTORS
The Trading & Shipping division measures its market risk exposure,i.e. potential loss in fair value, on its crude oil, refined products andfreight rates trading activities using a value-at-risk technique. Thistechnique is based on an historical model and makes anassessment of the market risk arising from possible future changesin market values over a 24-hour period. The calculation of the rangeof potential changes in fair values takes into account a snapshot ofthe end-of-day exposures and the set of historical price movements
for the last 400 business days for all instruments and maturities inthe global trading activities. Options are systematically reevaluatedusing appropriate models.
The potential movement in fair values corresponds to a 97.5%value-at-risk type confidence level. This means that the Group’sportfolio result is likely to exceed the value-at-risk loss measureonce over 40 business days if the portfolio exposures were leftunchanged.
Trading & Shipping: value-at-risk with a 97.5% probability
As of December 31,(M€) High Low Average Year-end
2009 18.8 5.8 10.2 7.6
2008 13.5 2.8 6.9 11.82007 11.6 3.3 6.7 5.4
As part of its gas and power trading activity, the Group also usesderivative instruments such as futures, forwards, swaps andoptions in both organized and over-the-counter markets. In general,the transactions are settled at maturity date through physicaldelivery. The Gas & Power division measures its market riskexposure, i.e. potential loss in fair values, on its trading businessusing a value-at-risk technique. This technique is based on an
historical model and makes an assessment of the market riskarising from possible future changes in market values over aone-day period. The calculation of the range of potential changes infair values takes into account a snapshot of the end-of-dayexposures and the set of historical price movements for the pasttwo years for all instruments and maturities in the global tradingbusiness.
Gas & Power trading: value-at-risk with a 97.5% probability
As of December 31,(M€) High Low Average Year-end
2009 9.8 1.9 5.0 4.8
2008 16.3 1.3 5.0 1.42007 (a) 18.2 3.2 7.9 4.3
(a) Data takes into account historical price movements over one year.
The Group has implemented strict policies and procedures tomanage and monitor these market risks. These are based on thesplitting of supervisory functions from operational functions and onan integrated information system that enables real-time monitoringof trading activities.
Limits on trading positions are approved by the Group’s ExecutiveCommittee and are monitored daily. To increase flexibility andencourage liquidity, hedging operations are performed withnumerous independent operators, including other oil companies,major energy producers or consumers and financial institutions. TheGroup has established counterparty limits and monitorsoutstanding amounts with each counterparty on an ongoing basis.
� Financial markets related risks
As part of its financing and cash management activities, the Groupuses derivative instruments to manage its exposure to changes ininterest rates and foreign exchange rates. These instruments areprincipally interest rate and currency swaps. The Group may alsouse, on a less frequent basis, futures, caps, floors and optionscontracts. These operations and their accounting treatment aredetailed in Notes 1 paragraph M, 20, 28 and 29 to the ConsolidatedFinancial Statements.
/ 71TOTAL
Market risksRISK FACTORS4
Risks relative to cash management operations and to interest rateand foreign exchange financial instruments are managed accordingto rules set by the Group’s senior management, which provide forpooling of available cash balances, open positions andmanagement of the financial instruments by the TreasuryDepartment. Excess cash of the Group is deposited mainly ingovernment institutions or deposit banks through deposits, reverserepurchase agreements and purchase of commercial paper.Liquidity positions and the management of financial instruments arecentralized by the Treasury Department, where they are managedby a team specialized in foreign exchange and interest rate markettransactions.
The Cash Monitoring-Management Unit within the TreasuryDepartment monitors limits and positions per bank on a daily basisand reports results. This unit also prepares marked-to-marketvaluations and, when necessary, performs sensitivity analysis.
� Counterparty risk
The Group has established standards for market transactions underwhich bank counterparties must be approved in advance, based onan assessment of the counterparty’s financial soundness (multi-criteria analysis including notably a review of market prices and ofthe Credit Default Swap (CDS), its ratings with Standard & Poor’sand Moody’s, which must be of high quality and its overall financialcondition).
An overall authorized credit limit is set for each bank and is allotedamong the subsidiaries and the Group’s central treasury entitiesaccording to their needs.
To reduce the market values risk on its commitments, in particularfor swaps set as part of bonds issuance, the Treasury Departmentalso developed a system of margin call that is graduallyimplemented with significant counterparties.
� Currency exposure
The Group seeks to minimize the currency exposure of each entityto its functional currency (primarily the euro, the dollar, the poundsterling and the Norwegian krone).
For currency exposure generated by commercial activity, thehedging of revenues and costs in foreign currencies is typicallyperformed using currency operations on the spot market and, insome cases, on the forward market. The Group rarely hedges futurecash flows, although it may use options to do so.
With respect to currency exposure linked to non-current assetsbooked in a currency other than the euro, the Group has a policy ofreducing the related currency exposure by financing these assets inthe same currency.
Net short-term currency exposure is periodically monitored againstlimits set by the Group’s senior management.
The non-current debt described in Note 20 to the ConsolidatedFinancial Statements is generally raised by the corporate treasuryentities either directly in dollars or euros, or in other currencieswhich are then exchanged for dollars or euros through swap issuesto appropriately match general corporate needs. The proceeds fromthese debt issuances are loaned to affiliates whose accounts arekept in dollars or in euros. Thus, the net sensitivity of thesepositions to currency exposure is not significant.
The Group’s short-term currency swaps, the notional value of whichappears in Note 29 to the Consolidated Financial Statements, areused to attempt to optimize the centralized cash management ofthe Group. Thus, the sensitivity to currency fluctuations which maybe induced is likewise considered negligible.
� Short-term interest rate exposureand cash
Cash balances, which are primarily composed of euros and dollars,are managed according to the guidelines established by theGroup’s senior management (maintain an adequate level of liquidity,optimize revenue from investments considering existing interestrate yield curves, and minimize the cost of borrowing) over a lessthan 12-month horizon and on the basis of a daily interest ratebenchmark, primarily through short-term interest rate swaps andshort-term currency swaps, without modifying currency exposure.
� Interest rate risk on non-current debt
The Group’s policy consists of incurring non-current debt primarilyat a floating rate, or, if the opportunity arises at the time of anissuance, at a fixed rate. Debt is incurred in dollars or in eurosaccording to general corporate needs. Long-term interest rate andcurrency swaps may be used to hedge bonds at their issuance inorder to create a variable or fixed-rate synthetic debt. In order topartially modify the interest rate structure of the long-term debt,TOTAL may also enter into long-term interest rate swaps.
72 / TOTAL - Registration Document 2009
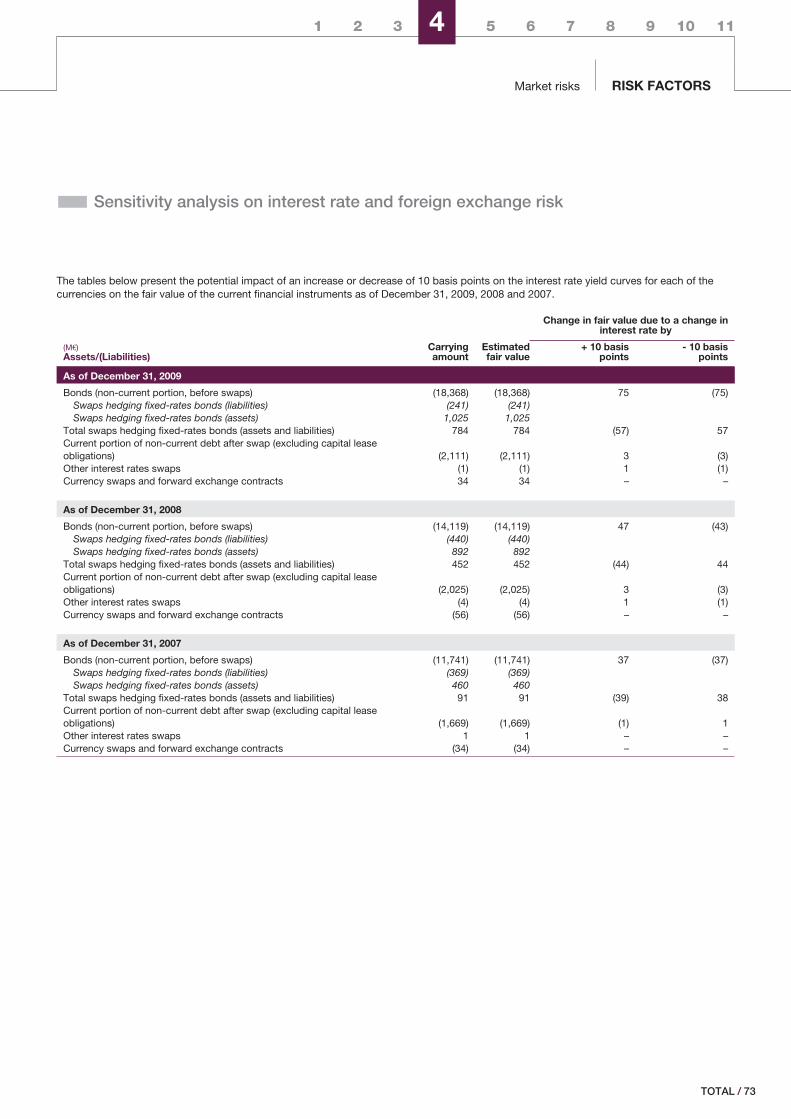
1 2 3 4 5 6 7 8 9 10 11
Market risks RISK FACTORS
� Sensitivity analysis on interest rate and foreign exchange risk
The tables below present the potential impact of an increase or decrease of 10 basis points on the interest rate yield curves for each of thecurrencies on the fair value of the current financial instruments as of December 31, 2009, 2008 and 2007.
(M€)Assets/(Liabilities)
Change in fair value due to a change ininterest rate by
Carryingamount
Estimatedfair value
+ 10 basispoints
- 10 basispoints
As of December 31, 2009
Bonds (non-current portion, before swaps) (18,368) (18,368) 75 (75)Swaps hedging fixed-rates bonds (liabilities) (241) (241)Swaps hedging fixed-rates bonds (assets) 1,025 1,025
Total swaps hedging fixed-rates bonds (assets and liabilities) 784 784 (57) 57Current portion of non-current debt after swap (excluding capital leaseobligations) (2,111) (2,111) 3 (3)Other interest rates swaps (1) (1) 1 (1)Currency swaps and forward exchange contracts 34 34 – –
As of December 31, 2008
Bonds (non-current portion, before swaps) (14,119) (14,119) 47 (43)Swaps hedging fixed-rates bonds (liabilities) (440) (440)Swaps hedging fixed-rates bonds (assets) 892 892
Total swaps hedging fixed-rates bonds (assets and liabilities) 452 452 (44) 44Current portion of non-current debt after swap (excluding capital leaseobligations) (2,025) (2,025) 3 (3)Other interest rates swaps (4) (4) 1 (1)Currency swaps and forward exchange contracts (56) (56) – –
As of December 31, 2007
Bonds (non-current portion, before swaps) (11,741) (11,741) 37 (37)Swaps hedging fixed-rates bonds (liabilities) (369) (369)Swaps hedging fixed-rates bonds (assets) 460 460
Total swaps hedging fixed-rates bonds (assets and liabilities) 91 91 (39) 38Current portion of non-current debt after swap (excluding capital leaseobligations) (1,669) (1,669) (1) 1Other interest rates swaps 1 1 – –Currency swaps and forward exchange contracts (34) (34) – –
/ 73TOTAL
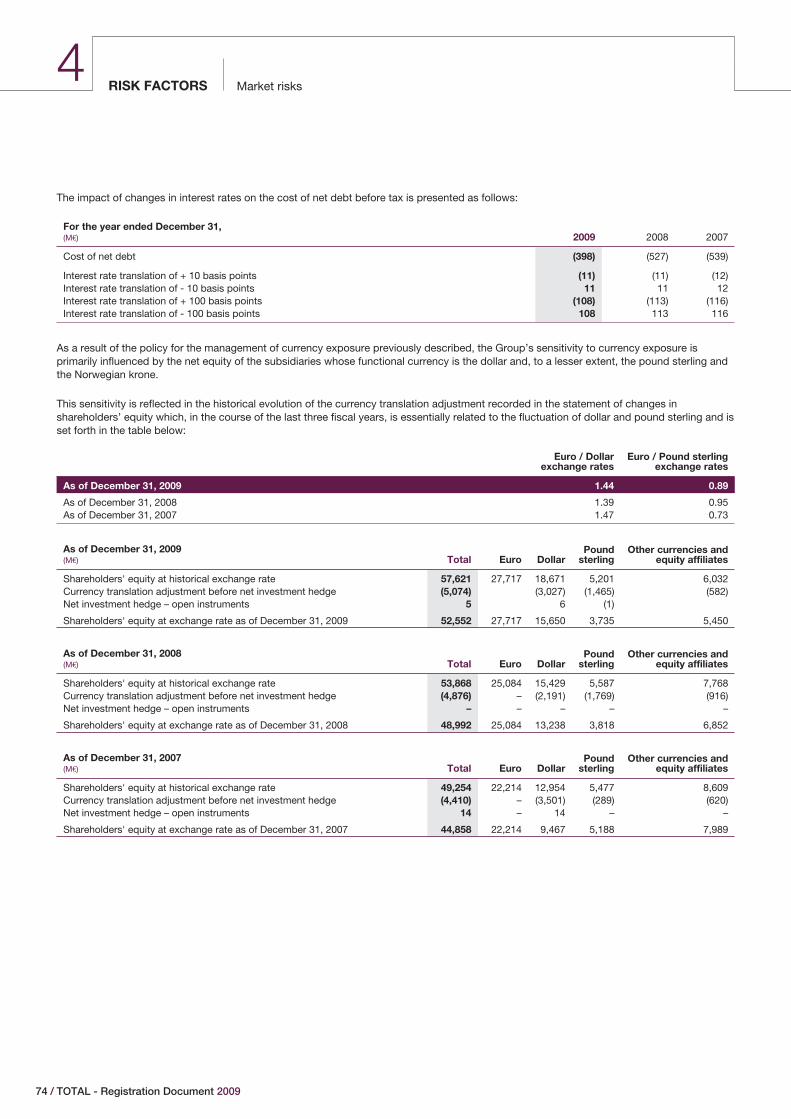
Market risksRISK FACTORS4
The impact of changes in interest rates on the cost of net debt before tax is presented as follows:
For the year ended December 31,(M€) 2009 2008 2007
Cost of net debt (398) (527) (539)
Interest rate translation of + 10 basis points (11) (11) (12)Interest rate translation of - 10 basis points 11 11 12Interest rate translation of + 100 basis points (108) (113) (116)Interest rate translation of - 100 basis points 108 113 116
As a result of the policy for the management of currency exposure previously described, the Group’s sensitivity to currency exposure isprimarily influenced by the net equity of the subsidiaries whose functional currency is the dollar and, to a lesser extent, the pound sterling andthe Norwegian krone.
This sensitivity is reflected in the historical evolution of the currency translation adjustment recorded in the statement of changes inshareholders’ equity which, in the course of the last three fiscal years, is essentially related to the fluctuation of dollar and pound sterling and isset forth in the table below:
Euro / Dollarexchange rates
Euro / Pound sterlingexchange rates
As of December 31, 2009 1.44 0.89
As of December 31, 2008 1.39 0.95As of December 31, 2007 1.47 0.73
As of December 31, 2009(M€) Total Euro Dollar
Poundsterling
Other currencies andequity affiliates
Shareholders' equity at historical exchange rate 57,621 27,717 18,671 5,201 6,032Currency translation adjustment before net investment hedge (5,074) (3,027) (1,465) (582)Net investment hedge – open instruments 5 6 (1)
Shareholders' equity at exchange rate as of December 31, 2009 52,552 27,717 15,650 3,735 5,450
As of December 31, 2008(M€) Total Euro Dollar
Poundsterling
Other currencies andequity affiliates
Shareholders' equity at historical exchange rate 53,868 25,084 15,429 5,587 7,768Currency translation adjustment before net investment hedge (4,876) – (2,191) (1,769) (916)Net investment hedge – open instruments – – – – –
Shareholders' equity at exchange rate as of December 31, 2008 48,992 25,084 13,238 3,818 6,852
As of December 31, 2007(M€) Total Euro Dollar
Poundsterling
Other currencies andequity affiliates
Shareholders' equity at historical exchange rate 49,254 22,214 12,954 5,477 8,609Currency translation adjustment before net investment hedge (4,410) – (3,501) (289) (620)Net investment hedge – open instruments 14 – 14 – –
Shareholders' equity at exchange rate as of December 31, 2007 44,858 22,214 9,467 5,188 7,989
74 / TOTAL - Registration Document 2009
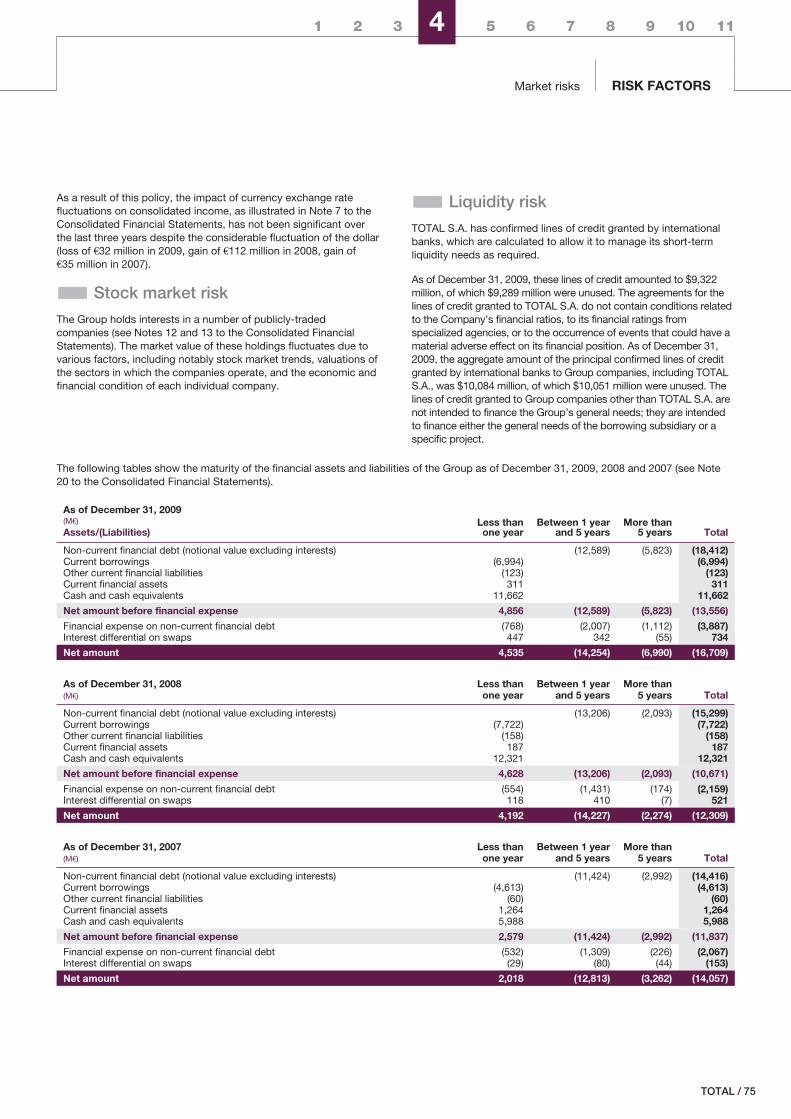
1 2 3 4 5 6 7 8 9 10 11
Market risks RISK FACTORS
As a result of this policy, the impact of currency exchange ratefluctuations on consolidated income, as illustrated in Note 7 to theConsolidated Financial Statements, has not been significant overthe last three years despite the considerable fluctuation of the dollar(loss of €32 million in 2009, gain of €112 million in 2008, gain of€35 million in 2007).
� Stock market risk
The Group holds interests in a number of publicly-tradedcompanies (see Notes 12 and 13 to the Consolidated FinancialStatements). The market value of these holdings fluctuates due tovarious factors, including notably stock market trends, valuations ofthe sectors in which the companies operate, and the economic andfinancial condition of each individual company.
� Liquidity risk
TOTAL S.A. has confirmed lines of credit granted by internationalbanks, which are calculated to allow it to manage its short-termliquidity needs as required.
As of December 31, 2009, these lines of credit amounted to $9,322million, of which $9,289 million were unused. The agreements for thelines of credit granted to TOTAL S.A. do not contain conditions relatedto the Company’s financial ratios, to its financial ratings fromspecialized agencies, or to the occurrence of events that could have amaterial adverse effect on its financial position. As of December 31,2009, the aggregate amount of the principal confirmed lines of creditgranted by international banks to Group companies, including TOTALS.A., was $10,084 million, of which $10,051 million were unused. Thelines of credit granted to Group companies other than TOTAL S.A. arenot intended to finance the Group’s general needs; they are intendedto finance either the general needs of the borrowing subsidiary or aspecific project.
The following tables show the maturity of the financial assets and liabilities of the Group as of December 31, 2009, 2008 and 2007 (see Note20 to the Consolidated Financial Statements).
As of December 31, 2009(M€)
Assets/(Liabilities)Less thanone year
Between 1 yearand 5 years
More than5 years Total
Non-current financial debt (notional value excluding interests) (12,589) (5,823) (18,412)Current borrowings (6,994) (6,994)Other current financial liabilities (123) (123)Current financial assets 311 311Cash and cash equivalents 11,662 11,662
Net amount before financial expense 4,856 (12,589) (5,823) (13,556)
Financial expense on non-current financial debt (768) (2,007) (1,112) (3,887)Interest differential on swaps 447 342 (55) 734
Net amount 4,535 (14,254) (6,990) (16,709)
As of December 31, 2008(M€)
Less thanone year
Between 1 yearand 5 years
More than5 years Total
Non-current financial debt (notional value excluding interests) (13,206) (2,093) (15,299)Current borrowings (7,722) (7,722)Other current financial liabilities (158) (158)Current financial assets 187 187Cash and cash equivalents 12,321 12,321
Net amount before financial expense 4,628 (13,206) (2,093) (10,671)
Financial expense on non-current financial debt (554) (1,431) (174) (2,159)Interest differential on swaps 118 410 (7) 521
Net amount 4,192 (14,227) (2,274) (12,309)
As of December 31, 2007(M€)
Less thanone year
Between 1 yearand 5 years
More than5 years Total
Non-current financial debt (notional value excluding interests) (11,424) (2,992) (14,416)Current borrowings (4,613) (4,613)Other current financial liabilities (60) (60)Current financial assets 1,264 1,264Cash and cash equivalents 5,988 5,988
Net amount before financial expense 2,579 (11,424) (2,992) (11,837)
Financial expense on non-current financial debt (532) (1,309) (226) (2,067)Interest differential on swaps (29) (80) (44) (153)
Net amount 2,018 (12,813) (3,262) (14,057)
/ 75TOTAL
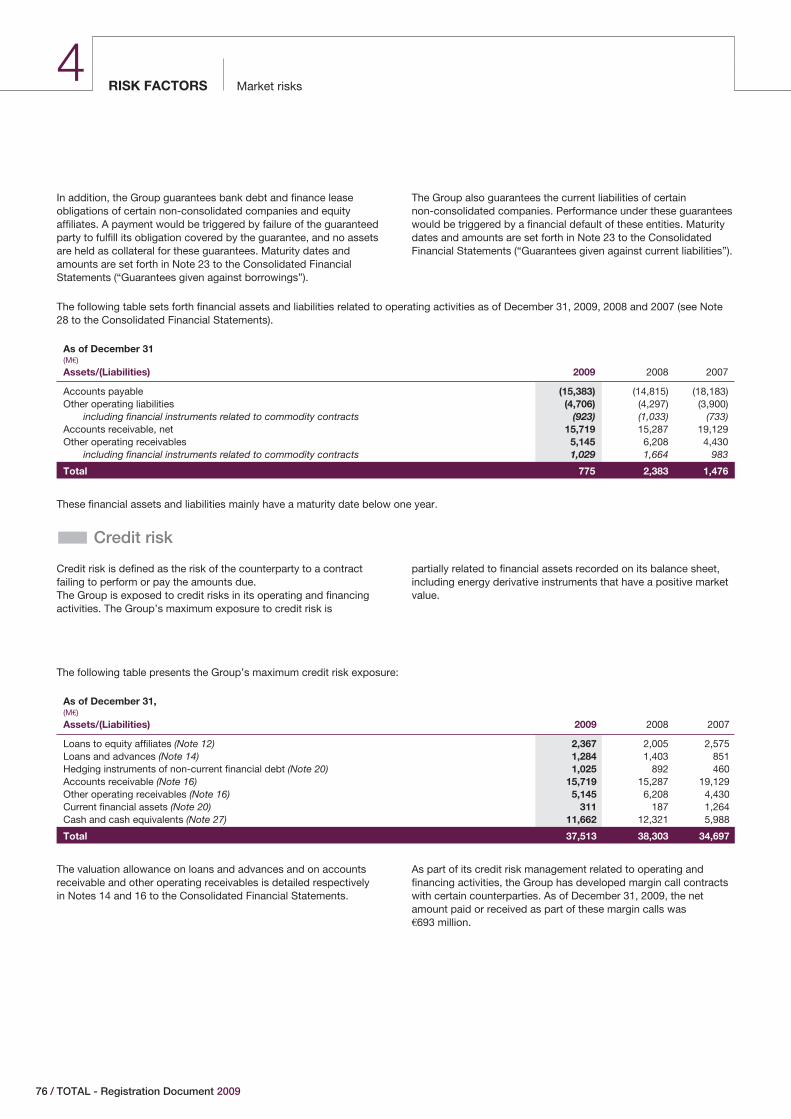
Market risksRISK FACTORS4
In addition, the Group guarantees bank debt and finance leaseobligations of certain non-consolidated companies and equityaffiliates. A payment would be triggered by failure of the guaranteedparty to fulfill its obligation covered by the guarantee, and no assetsare held as collateral for these guarantees. Maturity dates andamounts are set forth in Note 23 to the Consolidated FinancialStatements (“Guarantees given against borrowings”).
The Group also guarantees the current liabilities of certainnon-consolidated companies. Performance under these guaranteeswould be triggered by a financial default of these entities. Maturitydates and amounts are set forth in Note 23 to the ConsolidatedFinancial Statements (“Guarantees given against current liabilities”).
The following table sets forth financial assets and liabilities related to operating activities as of December 31, 2009, 2008 and 2007 (see Note28 to the Consolidated Financial Statements).
As of December 31(M€)
Assets/(Liabilities) 2009 2008 2007
Accounts payable (15,383) (14,815) (18,183)Other operating liabilities (4,706) (4,297) (3,900)
including financial instruments related to commodity contracts (923) (1,033) (733)Accounts receivable, net 15,719 15,287 19,129Other operating receivables 5,145 6,208 4,430
including financial instruments related to commodity contracts 1,029 1,664 983
Total 775 2,383 1,476
These financial assets and liabilities mainly have a maturity date below one year.
� Credit risk
Credit risk is defined as the risk of the counterparty to a contractfailing to perform or pay the amounts due.The Group is exposed to credit risks in its operating and financingactivities. The Group’s maximum exposure to credit risk is
partially related to financial assets recorded on its balance sheet,including energy derivative instruments that have a positive marketvalue.
The following table presents the Group’s maximum credit risk exposure:
As of December 31,(M€)
Assets/(Liabilities) 2009 2008 2007
Loans to equity affiliates (Note 12) 2,367 2,005 2,575Loans and advances (Note 14) 1,284 1,403 851Hedging instruments of non-current financial debt (Note 20) 1,025 892 460Accounts receivable (Note 16) 15,719 15,287 19,129Other operating receivables (Note 16) 5,145 6,208 4,430Current financial assets (Note 20) 311 187 1,264Cash and cash equivalents (Note 27) 11,662 12,321 5,988
Total 37,513 38,303 34,697
The valuation allowance on loans and advances and on accountsreceivable and other operating receivables is detailed respectivelyin Notes 14 and 16 to the Consolidated Financial Statements.
As part of its credit risk management related to operating andfinancing activities, the Group has developed margin call contractswith certain counterparties. As of December 31, 2009, the netamount paid or received as part of these margin calls was€693 million.
76 / TOTAL - Registration Document 2009
1 2 3 4 5 6 7 8 9 10 11
Market risks RISK FACTORS
Credit risk is managed by the Group’s business segments asfollows:
‹ Upstream segment
� Exploration & Production
Risks arising under contracts with government authorities or otheroil companies or under long-term supply contracts necessary forthe development of projects are evaluated during the projectapproval process. The long-term aspect of these contracts and thehigh-quality of the other parties lead to a low level of credit risk.
Risks related to commercial operations, other than those describedabove (which are, in practice, directly monitored by subsidiaries),are subject to procedures for establishing and reviewing credit.
Customer receivables are subject to provisions on a case-by-casebasis, based on prior history and management’s assessment of thefacts and circumstances.
� Gas & Power
The Gas & Power division deals with counterparties in the energy,industrial and financial sectors throughout the world, primarily inEurope and North America. Financial institutions providing creditrisk coverage are highly rated international bank and insurancegroups.
Potential counterparties are subject to credit assessment andapproval before concluding transactions and are thereafter subjectto regular review, including re-appraisal and approval of the limitspreviously granted.
The creditworthiness of counterparties is assessed based on ananalysis of quantitative and qualitative data regarding financialstanding and business risks, together with the review of anyrelevant third-party and market information, such as data publishedby rating agencies. On this basis, credit limits are defined for eachpotential counterparty and, where appropriate, transactions aresubject to specific authorizations.
Credit exposure, which is essentially an economic exposure or anexpected future physical exposure, is permanently monitored andsubject to sensitivity measures.
Credit risk is mitigated by the systematic use of industry standardcontractual frameworks that permit netting, enable requiring addedsecurity in case of adverse change in the counterparty risk, andallow for termination of the contract upon occurrence of certainevents of default.
‹ Downstream segment
� Refining & Marketing
Internal procedures for the Refining & Marketing division includerules on credit risk that describe the basis of internal control in thisdomain, including the separation of authority between commercialand financial teams. Credit policies are defined at the local level,complemented by the implementation of procedures to monitorcustomer risk (credit committees at the subsidiary level, thecreation of credit limits for corporate customers, portfolioguarantees, etc.).
Each entity also implements monitoring of its outstandingreceivables. Risks related to credit may be mitigated or limited byrequiring security or guarantees.
Bad debts are provisioned on a case-by-case basis at a ratedetermined by management based on an assessment of the factsand circumstances.
� Trading & Shipping
Trading & Shipping deals with commercial counterparties andfinancial institutions located throughout the world. Counterpartiesto physical and derivative transactions are primarily entities involvedin the oil and gas industry or in the trading of energy commodities,or financial institutions. Credit risk coverage is concluded withfinancial institutions, international banks and insurance groupsselected in accordance with strict criteria.
The Trading & Shipping division has a strict policy of internaldelegation of authority governing establishment of country andcounterparty credit limits and approval of specific transactions.Credit exposures contracted under these limits and approvals aremonitored on a daily basis.
Potential counterparties are subject to credit assessment andapproval prior to any transaction being concluded and all activecounterparties are subject to regular reviews, including re-appraisaland approval of granted limits. The creditworthiness ofcounterparties is assessed based on an analysis of quantitative andqualitative data regarding financial standing and business risks,together with the review of any relevant third-party and marketinformation, such as ratings published by Standard & Poor’s,Moody’s Investors Service and other agencies.
Contractual arrangements are structured so as to maximize the riskmitigation benefits of netting between transactions whereverpossible and additional protective terms providing for the provisionof security in the event of financial deterioration and the terminationof transactions on the occurrence of defined default events areused to the greatest permitted extent.
/ 77TOTAL
Market risksRISK FACTORS4
Credit risks in excess of approved levels are secured by means ofletters of credit and other guarantees, cash deposits and insurancearrangements. In respect of derivative transactions, risks aresecured by margin call contracts wherever possible.
‹ Chemicals segment
Credit risk in the Chemicals segment is primarily related tocommercial receivables. Each division implements procedures formanaging and provisioning credit risk that differ based on the sizeof the subsidiary and the market in which it operates. The principalelements of these procedures are:
o implementation of credit limits with different authorizationprocedures for possible credit overruns;
o use of insurance policies or specific guarantees (letters of credit);
o regular monitoring and assessment of overdue accounts (agingbalance), including collection procedures; and
o provisioning of bad debts on a customer-by-customer basis,according to payment delays and local payment practices.
78 / TOTAL - Registration Document 2009
1 2 3 4 5 6 7 8 9 10 11
Industrial and environmental risks RISK FACTORS
� Industrial and environmental risks
� Types of risks
TOTAL’s activities involve certain industrial and environmental riskswhich are inherent in the production of products that are flammable,explosive or toxic. Its activities are therefore subject to governmentregulations concerning environmental protection and industrialsafety in most countries. More specifically, in Europe, TOTALoperates industrial sites that meet the criteria of the EuropeanUnion Seveso II directive for classification as high-risk sites. Someof TOTAL’s operated sites in the United States are subject to theOccupational Safety and Health Administration (“OHSA”) ProcessSafety Management of Highly Hazardous Materials, as well as otherOSHA regulations.
The broad scope of TOTAL’s activities, which include drilling, oiland gas production, on-site processing, transportation, refining andpetrochemical activities, storage and distribution of petroleumproducts, and production of base chemical and specialty products,involve a wide range of operational risks. Among these risks arethose of explosion, fire or leakage of toxic products. In thetransportation area, the type of risk depends not only on thehazardous nature of the products transported, but also on thetransportation methods used (mainly pipelines, maritime, river-maritime, rail, road), the volumes involved, and the sensitivity of theregions through which the transport passes (population density,environmental considerations).
Most of these activities also involve environmental risks related toemissions into the air, water or soil and the creation of waste, andalso require environmental site remediation and closure anddecommissioning after production is discontinued.
Certain branches or activities face specific risks. In Exploration &Production, there are risks related to the physical characteristics ofan oil or gas field. These include eruptions of crude oil or of naturalgas, discovery of hydrocarbon pockets with abnormal pressure,crumbling of well openings, leaks generating toxic risks and risks offire or explosion. All these events could possibly cause injury oreven death, damage or even destroy crude oil or natural gas wellsas well as related equipment and other property, lead to adisruption of activity or cause environmental damage. In addition,since exploration and production activities may take place on sitesthat are ecologically sensitive (tropical forest, marine environment,etc.), each site requires a risk-based approach to avoid or minimizethe impact on human health, the related ecosystem andbiodiversity.
TOTAL’s activities in the Chemicals segment and the Refining &Marketing division may also have health, safety and environmentalrisks related to the overall life cycle of the products manufactured,
as well as raw materials used in the manufacturing process, such ascatalysts, additives and monomer feedstocks. These risks can arisefrom the intrinsic characteristics of the products involved, whichmay, for example, be flammable, toxic, or result in long-termenvironmental impacts such as greenhouse gas emissions. Risk offacility contamination and off-site impacts may also arise fromemissions and discharges resulting from processing or refining, andfrom recycling or disposing of materials and wastes at the end oftheir useful life.
� Risk evaluation
Prior to developing their activities and ongoing during theiroperation, business units evaluate the related industrial andenvironmental risks, taking into account regulatory requirements inthe countries where these activities are located as well asrecognized and generally accepted good engineering practices.
On sites with significant technological risks, Process HazardAnalyses are performed on all new processes and on existingprocesses where significant changes are proposed. These analysesare generally re-evaluated every five years. To ensure risks areappropriately analyzed and monitored, TOTAL has developed aGroup-wide risk management approach, which is beingimplemented progressively throughout the sites it operates. On thebasis of these analyses, relevant sites are finalizing safetymanagement plans and emergency plans in the event of accidents.In the United States, TOTAL is implementing a Process SafetyManagement Improvement Plan (PSMIP).
In France, all the sites that meet the criteria of the European UnionSeveso II directive are developing Risk Management Plans pursuantto the French law of July 30, 2003. Each of these plans willintroduce various urban planning measures to reduce risks to urbanenvironments surrounding industrial sites that are considered ashigh risk according to the Seveso II directive criteria. Frenchadministrative authorities are preparing such plans while taking intoaccount input from site operators and neighboring residents.
Similarly, environmental impact studies are carried out prior to anyindustrial development through a thorough initial site analysis,taking into account any special sensitivity as well as developingplans to prevent and reduce the impact of accidents. These studiesalso take into account the health impact of such operations on thelocal population, based on a shared methodology. In countrieswhere prior administrative authorization and supervision is required,projects are not undertaken without the authorization of the relevantauthorities and are developed according to the studies theauthorities are provided with.
/ 79TOTAL
Industrial and environmental risksRISK FACTORS4
For new products, risk characterizations and evaluations are carriedout. Furthermore, life cycle analyses for related risks are performedon certain products to study all the stages of a product’s life cyclefrom its conception until the end of its useful life.
TOTAL’s entities actively monitor regulatory developments tocomply with local and international rules and standards for theevaluation and management of industrial and environmental risks.In case of operations being stopped, the Group’s environmentalcontingencies and asset retirement obligations are addressed in“Asset retirement obligation” and “Provisions for environmentalcontingencies” in Note 19 to the Consolidated FinancialStatements. Future expenses related to asset retirement obligationsare accounted for in accordance with the principles described inparagraph Q of Note 1 to the Consolidated Financial Statements.
� Risk management
Risk management control measures involve equipment design, thereinforcement of safety devices, the design of structures to be builtand the protection against the consequences of environmentalevents.
TOTAL seeks to minimize industrial and environmental risksinherent to its operations and, to this end, has developed efficientorganizations as well as quality, safety and environmentalmanagement systems. The Group is also targeting the certificationfor or assessment of its management systems (includingInternational Safety Rating System, ISO 14001, EuropeanManagement and Audit Scheme) and conducts thoroughinspections and audits, trains appropriate personnel, heightensawareness of all the parties involved and implements an activeinvestment policy.
More specifically, following up on the Group’s 2002-2005 plan, anaction plan was defined by the Group for the 2006-2009 period thatfocused on two initiatives for improvement: reducing the frequencyand severity of on-the-job accidents and strengthening themanagement of technological risks. The results related to reducingon-the-job accidents are in line with the goals set by the plan, witha significant decrease in the rate of accidents (with or without time-lost) per million hours worked by more than 75% between the endof 2001 and the end of 2009. In terms of technological risks, thisplan’s initiatives include specific organization and behavioral plansas well as plans to minimize risks at the source and to increasesafety for people and for equipment use.
Several environmental action plans have been implemented fordifferent activities of the Group covering periods up to 2012. Theseplans are designed to improve environmental performance,particularly regarding the use of natural resources, air and water
pollution, waste production and treatment, and sitedecontamination. They also contain quantified objectives to reduce,most notably, greenhouse gas emissions, water pollution as well assulphur dioxide emissions and to improve energy efficiency.
As part of its efforts to combat climate change and reducegreenhouse gases, the Group committed to reducing gas flaring atits Exploration & Production sites by 2014 to 50% of the 2005 level.By the end of 2012, the Group intends to obtain ISO 14001certification for all of its sites that it considers particularly importantto the environment according to criteria updated in 2009. As oftoday, 89% of such sites are ISO 14001-certified, representingmore than 280 of the Group’s sites worldwide. These activities aremonitored through periodic and coordinated reporting by all Groupentities.
More detailed information on TOTAL’s actions regarding safety andenvironmental concerns is provided in the separate report entitledEnvironment and Society published by the Group since 2003.
The Group believes that, according to its current estimates,contingencies or liabilities related to health, safety andenvironmental concerns would not have a material impact on itsconsolidated financial situation, its cash flow or its income. Due tothe nature of such concerns, however, it is impossible to predictwhether additional future commitments or liabilities could have amaterial adverse effect on the Group’s activities.
� Asbestos
Like many other industrial groups, TOTAL is affected by reports ofoccupational diseases caused by asbestos exposure. Thecircumstances described in these reports generally concernactivities prior to the beginning of the 1980s, long before theadoption of more comprehensive bans on the new installation ofasbestos-containing products in most of the countries where theGroup operates (January 1, 1997, in France). The Group’s variousbusinesses are not particularly likely to lead to significant exposureto asbestos-related risks, since this material was generally not usedin manufacturing processes, except in limited cases. The mainpotential sources of exposure are related to the use of certaininsulating components in industrial equipment. These componentsare being gradually eliminated from the Group’s equipment throughasbestos-elimination plans that have been underway for severalyears. However, considering the long period of time that mayelapse before the harmful results of exposure to asbestos arise (upto 40 years), TOTAL anticipates that other reports may be filed inthe years to come. Asbestos-related issues have been subject toclose monitoring in all the Group’s business units. As ofDecember 31, 2009, the Group estimates that the ultimate cost ofall asbestos-related claims paid or pending is not likely to have amaterial effect on the financial situation of the Group.
80 / TOTAL - Registration Document 2009
1 2 3 4 5 6 7 8 9 10 11
Other risks RISK FACTORS
� Other risks
� Risks related to oil and gasexploration and production
Oil and gas exploration and production require high levels ofinvestment and are associated with particular risks andopportunities. These activities are subject to risks relatedspecifically to the difficulties of exploring underground, to thecharacteristics of hydrocarbons and to the physical characteristicsof an oil or gas field. Of risks related to oil and gas exploration,geologic risks are the most important. For example, exploratorywells may not result in the discovery of hydrocarbons, or may resultin amounts that would be insufficient to allow for economicdevelopment. Even if an economic analysis of estimatedhydrocarbon reserves justifies the development of a discovery, thereserves can prove lower than the estimates during the productionprocess, thus adversely affecting the economic development.
Almost all the exploration and production operations of TOTAL areaccompanied by a high level of risk of loss of the invested capitaldue to the risks related to economic or political factors detailedhereafter. It is impossible to guarantee that new resources of crudeoil or of natural gas will be discovered in sufficient amounts toreplace the reserves currently being developed, produced and soldto enable TOTAL to recover the capital it has invested.
The development of oil and gas fields, the construction of facilitiesand the drilling of production or injection wells require advancedtechnology in order to extract and exploit fossil fuels with complexproperties over several decades. The deployment of this technologyin such a difficult environment makes cost projections uncertain.TOTAL’s operations can be limited, delayed or cancelled as a resultof numerous factors, such as administrative delays, particularly interms of the host states’ approval processes for developmentprojects, shortages, late delivery of equipment and weatherconditions, including the risk of hurricanes in the Gulf of Mexico.Some of these risks may also affect TOTAL’s projects and facilitiesfurther down the oil and gas chain.
� Risks related to economic or politicalfactors
The oil sector is subject to domestic regulations and theintervention of governments or state-owned companies in suchareas as:
o the award of exploration and production interests;
o authorizations by governments or by a state-controlled partner,especially for development projects, annual programs or theselection of contractors or suppliers;
o the imposition of specific drilling obligations;
o environmental protection controls;
o control over the development and abandonment of a fieldcausing restrictions on production;
o calculating the costs that may be recovered from the relevantauthority and what expenditures are deductible from taxes; and
o possible, though exceptional, nationalization, expropriation orreconsideration of contractual rights.
The oil industry is also subject to the payment of royalties andtaxes, which may be high compared with those imposed withrespect to other commercial activities and which may be subject tomaterial modifications by the governments of certain countries.
Substantial portions of TOTAL’s oil and gas reserves are located incertain countries which may be considered as politically andeconomically unstable. These reserves and the related operationsare subject to certain additional risks, including:
o the establishment of production and export quotas;
o the compulsory renegotiation of contracts;
o the expropriation or nationalization of assets;
o risks relating to changes of local governments or resultingchanges in business customs and practices;
o payment delays;
o currency exchange restrictions;
o depreciation of assets due to the devaluation of local currenciesor other measures taken by governments that might have asignificant impact on the value of activities; and
o losses and impairment of operations due to armed conflicts, civilunrest or the actions of terrorist groups.
TOTAL, like other major international oil companies, has ageographically diverse portfolio of reserves and operational sites,which allows it to conduct its business and financial affairs so as toreduce its exposure to such political and economic risks. However,there can be no assurance that such events will not adversely affectthe Group.
/ 81TOTAL
Other risksRISK FACTORS4
� Legal aspects of exploration andproduction activities
TOTAL’s exploration and production activities are conducted inmany different countries and are therefore subject to an extremelybroad range of regulations. These cover virtually all aspects ofexploration and production activities, including matters such asleasehold rights, production rates, royalties, environmentalprotection, exports, taxes and foreign exchange rates. The terms ofthe concessions, licenses, permits and contracts governing theGroup’s ownership of oil and gas interests vary from country tocountry. These concessions, licenses, permits and contracts aregenerally granted by or entered into with a government entity or astate-owned company and are sometimes entered into with privateowners. These arrangements usually take the form of concessionsor production sharing agreements.
The oil concession agreement remains the traditional model foragreements entered into with States: the oil company owns theassets and the facilities and is entitled to the entire production. Inexchange, the operating risks, costs and investments are the oilcompany’s responsibility and it agrees to remit to the relevantState, usually the owner of the subsoil resources, a production-based royalty, income tax, and possibly other taxes that may applyunder local tax legislation.
The production sharing contract (PSC) involves a more complexlegal framework than the concession agreement: it defines theterms and conditions of production sharing and sets the rulesgoverning the cooperation between the company or consortium inpossession of the license and the host State, which is generallyrepresented by a state-owned company. The latter can thus beinvolved in operating decisions, cost accounting and productionallocation.
The consortium agrees to undertake and finance all exploration,development and production activities at its own risk. In exchange,it is entitled to a portion of the production, known as “cost oil”, thesale of which should cover all of these expenses (investments andoperating costs). The balance of production, known as “profit oil”, isthen shared in varying proportions, between the company orconsortium, on the one hand, and with the State or the state-ownedcompany, on the other hand.
In some instances, concession agreements and PSCs coexist,sometimes in the same country. Even though other contractualstructures still exist, TOTAL’s license portfolio is comprised mainlyof concession agreements. In all countries, the authorities of thehost State, often assisted by international accounting firms, performjoint venture and PSC cost audits and ensure the observance ofcontractual obligations.
In some countries, TOTAL has also signed contracts called“contracts for risk services”, which are similar to production sharingcontracts, with the main difference being that the repayment ofexpenses and the compensation for services are established on amonetary basis. Current contracts for risk services are backed by acompensation agreement (buyback), which allows TOTAL to receivepart of the production equal to the cash value of its expenses andcompensation.
Hydrocarbon exploration and production activities are subject topublic authorizations (permits), which can be different for each ofthese activities. These permits are granted for limited periods oftime and include an obligation to return a large portion, in case offailure the entire portion, of the permit area at the end of theexploration period.
TOTAL is required to pay income tax on income generated from itsproduction and sales activities under its concessions or licenses. Inaddition, depending on the country, TOTAL’s production and saleactivities may be subject to a range of other taxes, fees andwithholdings, including special petroleum taxes and fees. The taxesimposed on oil and gas production and sale activities may besubstantially higher than those imposed on other businesses.
The legal framework of TOTAL’s exploration and productionactivities, established through concessions, licenses, permits andcontracts granted by or entered into with a government entity, astate-owned company or, sometimes, private owners, is subject tocertain risks which in certain cases can diminish or challenge theprotections offered by this legal framework.
� Legal aspects of the Group’s otherbusinesses
The Group’s other businesses (Gas & Power, Downstream andChemicals) are also subject to a wide range of regulation.
In European countries and in the United States, sites and productsare subject to environmental (water, air, soil, noise, natureprotection, waste management, impact studies, etc.), health(on-the-job safety, chemical product risks) and safety (safety ofpersonnel and residents, major risk facilities) regulations. Productquality and consumer protection are also subject to regulations.Within the European Union, EU regulations must be transposed intomember states’ national laws or directly enforced. In such memberstates, EU legislation and regulations may be in addition to nationaland local government regulations. However, for the EuropeanUnion, licenses are delivered by local administrations to industrialactors based on national and EU law. In the United States, federalregulations may supplement the regulations of each state, as in theEuropean Union.
In other countries where the Group operates, legislation is ofteninspired by European and U.S. rules. These countries may morefully develop certain aspects of regulation, for example protectingwater, health and nature.
Irrespective of the particular country in which the Group operates,TOTAL has developed standards based on best practices existingin countries with more developed regulation and progressivelyimplements policies to improve these standards.
Such standards include obligations related to strategic oil reservesand shipping (whether as the owner of the transport or thecharterer) and others related to classified facilities. Requirementsfor strategic oil reserves also exist in other European countries andin the United States.
82 / TOTAL - Registration Document 2009
1 2 3 4 5 6 7 8 9 10 11
Other risks RISK FACTORS
� Business activities in Cuba, Iran,Sudan and Syria
The U.S. Department of State has identified Cuba, Iran, Sudan andSyria as state sponsors of terrorism. Provided in this section iscertain information relating to TOTAL’s activities in thesejurisdictions.
‹ U.S. and other legal restrictions
In 1996, the United States adopted legislation implementingsanctions against non-U.S. companies doing business in Iran andLibya (the Iran and Libya Sanction Act, referred to as “ILSA”), whichin 2006 was amended to concern only business in Iran (thenrenamed the Iran Sanctions Act, referred to as “ISA”). The ISA is setto expire in December 2011. Pursuant to this statute, the Presidentof the United States is authorized to initiate an investigation into theactivities of non-U.S. companies in Iran and the possible impositionof sanctions (from a list that includes denial of financing by the U.S.Export-Import Bank, limitations on the amount of loans or creditsavailable from U.S. financial institutions and prohibition of U.S.federal procurements from sanctioned persons) against personsfound, in particular, to have knowingly made investments of$20 million or more in any 12-month period in the petroleum sectorin Iran. In May 1998, the U.S. government waived the application ofsanctions for TOTAL’s investment in the South Pars gas field. Thiswaiver, which has not been modified since it was granted, does notaddress TOTAL’s other activities in Iran, although TOTAL has notbeen notified of any related sanctions.
In November 1996, the Council of the European Union adoptedregulations which prohibit TOTAL from complying with anyrequirement or prohibition based on or resulting directly or indirectlyfrom certain enumerated legislation, including the ILSA (now ISA). Italso prohibits TOTAL from having its waiver for South Parsextended to other activities.
In each of the years since the passage of the ILSA and until 2007,TOTAL made investments in Iran in excess of $20 million (excludingthe investments made as part of the development of South Pars).Since 2008, TOTAL’s position has consisted essentially in beingreimbursed for its past investments as part of buyback contractssigned between 1995 and 1999 with respect to permits on whichthe Group is no longer the operator. In 2009, TOTAL’s production inIran represented approximately 0.4% of the Group’s worldwideproduction. TOTAL does not believe that its operations in Iran havea material impact on the Group’s results.
In the future, TOTAL may decide to invest amounts in excess of$20 million per year in Iran. To our knowledge, sanctions under theISA have not been imposed on any non-U.S. oil and gas companywhich has investments in Iran. However, TOTAL cannot predictwhether the U.S. government will take any action under the ISA withrespect to its previous or possible future activities in Iran. It is
possible, however, that the United States may determine that theseor other activities constitute activity prohibited by the ISA and willsubject TOTAL to sanctions. TOTAL does not believe thatenforcement of the ISA against TOTAL, including the imposition ofthe maximum sanctions under the current version of the ISA, wouldhave a material adverse effect on its results of operations orfinancial condition, although it could result in reputational harm.
However, the U.S. House of Representatives and the Senate haverecently passed bills which, if adopted, would expand the scope ofthe ISA and could restrict the President’s ability to grant waivers.The proposed legislation would, among other things, requireimposition of specific sanctions against companies that supplyrefined petroleum products to Iran, contribute to Iran’s ability tomaintain or expand domestic production or engage in certainrelated conduct. The sanctions to be imposed against violatingfirms would generally prohibit transactions in foreign exchange bythe sanctioned company, prohibit any transfers of credit orpayments between, by, through or to any financial institution to theextent that such transfers or payments involve any interest of thesanctioned company, and require blocking of any property of thesanctioned company that is subject to the jurisdiction of the UnitedStates. The bills would also generally forbid federal procurementsfrom and assistance to non-U.S. companies that engage insanctions-triggering actions.
TOTAL is closely monitoring legislative and other developments inthe United States in order to determine whether its limited activitiesin Iran could subject it to application of either current or any futureISA sanctions. In the event the proposed legislation were adoptedin its current form, such new legislation could potentially have amaterial adverse effect on TOTAL.
France and the European Union have adopted measures, based onUnited Nations Security Council resolutions, which restrict themovement of certain individuals and goods to or from Iran as wellas certain financial transactions with Iran, in each case when suchindividuals, goods or transactions are related to nuclearproliferation and weapons activities or likely to contribute to theirdevelopment. As currently applicable, the Group believes that thesemeasures are not applicable to its activities and projects in thiscountry.
The United States also imposes sanctions based on the UnitedNations Security Council resolutions described above, as well asbroad and comprehensive economic sanctions, which areadministrated by the U.S. Treasury Department’s Office of ForeignAssets Control (referred to as “OFAC”). These OFAC sanctionsgenerally apply to U.S. persons and activities taking place in theUnited States or that are otherwise subject to U.S. jurisdiction.Sanctions administered by OFAC target Cuba, Iran, Myanmar(Burma), Sudan and Syria. TOTAL does not believe that thesesanctions are applicable to any of its activities in these countries.
In addition, many U.S. states have adopted legislation requiringstate pension funds to divest themselves of investments in anycompany with active business operations in Iran or Sudan.Recently, there have been similar initiatives by state insuranceregulators relating to investments by insurance companies incompanies doing business with the Iranian oil and gas, nuclear and
/ 83TOTAL
Other risksRISK FACTORS4
defense sectors. TOTAL has no business operations in Sudan and,to date, has not made any significant investments or industrialinvestments there. The Genocide Intervention Network (formerlyknown as Sudan Divestment Task Force) report states that TOTALshould be regarded as “inactive” in Sudan by the U.S. states thathave adopted such divestment legislation. On December 31, 2007,the U.S. Congress adopted the Sudan Accountability andDivestment Act, which supports these state legislative initiatives.Similar legislation is pending in the U.S. Congress that supportsstate legislative initiatives regarding Iran. If TOTAL’s operations inIran or Sudan were determined to fall within the prohibited scope ofthese laws, and TOTAL were to not qualify for any availableexemptions, certain U.S. state pension funds holding interests inTOTAL may be required to sell their interests. If significant, salesresulting from such laws and/or regulatory initiatives could have anadverse effect on TOTAL’s share price.
‹ Activities in Cuba, Iran, Sudan and Syria
Provided below is certain information on TOTAL’s activities in Cuba,Iran, Sudan and Syria.
� Cuba
In 2009, TOTAL had limited marketing activities for the sale ofspecialty products to non-state entities in Cuba and paid taxes onsuch activities. In addition, TOTAL’s Trading & Shipping divisionpurchased hydrocarbons pursuant to spot contracts from a state-controlled entity for approximately €18 million.
� Iran
TOTAL’s Exploration & Production division has been active in Iranthrough buyback contracts. Under such contracts, the contractor isresponsible for and finances development operations. Oncedevelopment is completed, operations are handed over to thenational oil company, which then operates the field. The contractorreceives payments in cash or in kind to recover its expenditures aswell as a remuneration based on the field’s performance.Furthermore, upon the national oil company’s request, a technicalservices agreement may be implemented in conjunction with abuyback contract to provide qualified personnel and services untilfull repayment of all amounts due to the contractor.
To date, TOTAL has entered into such buyback contracts withrespect to the development of four fields: Sirri, South Pars 2 & 3,Balal and Dorood. For all of these contracts, developmentoperations have been completed and TOTAL retains no operationalresponsibilities. In addition, a technical services agreement existswith respect to the Dorood field. As TOTAL is no longer involved inthe operation of these fields, TOTAL has no information on theproduction from these fields. Some payments are yet to bereimbursed to TOTAL with respect to South Pars 2 & 3, Balal andDorood. In 2009, TOTAL’s production in Iran, corresponding tosuch payments in kind, was approximately 8 kboe/d.
No royalties or fees are paid by the Group in connection with thesebuyback and service contracts. In 2009, TOTAL made non-materialpayments to the Iranian administration with respect to certain taxesand social security.
With respect to TOTAL’s Refining & Marketing division’s activities inIran, Beh Total, a company held 50/50 by Behran Oil and TotalOutre-Mer, a subsidiary of the Group, produces and markets smallquantities of lubricants for sale to domestic consumers in Iran. In2009, revenue generated from Beh Total’s activities was€27.4 million and cash flow was €5.6 million. Beh Total paid€605,000 in taxes. TOTAL does not own or operate any refineries orchemicals plants in Iran.
In 2009, TOTAL’s Trading & Shipping division purchased in Iranpursuant to a mix of spot and term contracts approximatelyfifty eight million barrels of hydrocarbons from state-controlledentities for approximately €2.6 billion, and paid to a state-ownedentity approximately €24 million pursuant to shipping contracts.
� Sudan
TOTAL holds an interest in Block B in Southern Sudan through a1980 Exploration and Production Sharing Agreement (EPSA).Operations were voluntarily suspended in 1985 because ofescalating security concerns, but the company maintained itsexploration rights. The Group’s initial interest was 32.5%. Despitethe withdrawal of a partner, TOTAL does not intend to increase itsinterest above its initial level. Consequently, the Group has enteredinto negotiations with new partners to transfer the former partner’sinterests for which the Group financially carries a share.
The EPSA was revised, effective December 21, 2004, to providethat the parties (the Government of Sudan and the consortiumpartners) would mutually agree upon a resumption date when thepetroleum operations could be safely undertaken in the contractarea. Such resumption date would mark the starting point of theGroup’s work obligations as foreseen in the contract. A jointdecision on the resumption date has not yet been taken.
Pursuant to the EPSA in 2009, TOTAL paid to the Government ofSudan an annual surface rental fee of approximately $200,000 anddisbursed nearly $3 million as scholarship bonus, socialdevelopment contribution and contribution to the construction ofsocial infrastructures, schools and water wells along with non-governmental organizations and other stakeholders involved inSouthern Sudan.
If TOTAL were to resume its activities in Southern Sudan, it woulddo so in compliance with applicable national, European andinternational laws and regulations, as well as with the Group’s Codeof Conduct and Ethics Charter. Within its scope of operations andauthority, the Group is committed to upholding human rights andfundamental freedoms, including social, economic and culturalrights, and the rights and interests of local residents and minorities.In particular, the Group is studying the situation with non-governmental organizations (NGOs) and stakeholders involved inSouthern Sudan and conducting socio-economic programsadapted to the needs of the local population.
84 / TOTAL - Registration Document 2009
1 2 3 4 5 6 7 8 9 10 11
Other risks RISK FACTORS
� Syria
In Syria, in 2009, TOTAL had two contracts relating to oil and gasExploration & Production activities: a Production SharingAgreement entered into in 1988 (“PSA 1988”) for an initial period oftwenty years and renewed at the end of 2008 for an additional10-year period, and the Tabiyeh Gas Project risked ServiceContract (the “Tabiyeh contract”) effective from the end of October2009. TOTAL owns 100% of the rights and obligations under PSA1988, and is operating on various oil fields in the Deir Ez Zor areathrough a dedicated non-profit operating company owned equallyby the Group and the state-owned Syrian Petroleum Company(“SPC”).
The main terms of PSA 1988 are similar to those normally used inthe oil and gas industry. The Group’s revenues derived from PSA1988 are made up of a combination of “cost oil” and “profit oil”.“Cost oil” represents the reimbursement of operating and capitalexpenditures and is accounted for in accordance with normalindustry practices. The Group’s share of “profit oil” depends on thetotal annual production level. TOTAL receives its revenues in cashpayments made by SPC. TOTAL pays to the state-owned Syriancompany SCOT a transportation fee equal to $2/bl for the oilproduced in the area, as well as non-material payments to theSyrian government related to PSA 1988 for such items aswithholding taxes and Syrian social security.
The Tabiyeh contract may be considered as an addition to PSA1988 as production, costs and revenues for the oil and part of thecondensates coming from the Tabiyeh field are governed by thecontractual terms of PSA 1988. This project is designed to enhanceliquids and gas output from the Tabiyeh field through the drilling of“commingled” wells and through process modifications in Deir EzZor Gas Plant operated by the Syrian Gas Company. TOTAL isfinancing and implementing the Tabiyeh Gas Project and operatesthe Tabiyeh field.
For 2009, technical production for PSA 1988 (for full year 2009) andthe Tabiyeh contract (since October 2009, the effective date of thecontract) taken together amounted to 36 kboe/d of which 20 kboe/dwere accounted for as the Group’s share of production. Theamount identified as technical production under the agreements,minus the amount accounted for as the Group’s share ofproduction, does not constitute the total economic benefit accruingto Syria under the terms of the agreements since Syria retains amargin on a portion of the Group’s production and receives certainproduction taxes.
In 2009, TOTAL’s Trading & Shipping division purchased in Syriapursuant to a mix of spot and term contracts nearly twelve millionbarrels of hydrocarbons from state-controlled entities forapproximately €472 million.
� Nigeria
Security issues in the Niger Delta region continued to impact theproduction of the Shell Petroleum Development Company (SPDC)joint venture, in which TOTAL owns 10%. Repair work on facilitiesin the western zone of the Niger Delta region continued in 2009,allowing production to partially resume, in particular on the EAoffshore field (10%), where production resumed in the second halfof 2009. In addition, SPDC’s 2009 gas and condensates productionwas affected notably by the shutdown of the Soku treatment plant,which had to be repaired after vandalism on the export pipelines inlate 2008.
� Risks related to competition
The Group is subject to intense competition within the oil sectorand between the oil sector and other sectors aiming to fulfill theenergy needs of the industry and of individuals. TOTAL is subject tocompetition from other oil companies in the acquisition of assetsand licenses for the exploration and production of oil and naturalgas. Competition is particularly strong with respect to theacquisition of resources of oil and natural gas. Competition is alsointense in the sale of manufactured products based on crude andrefined oil.
In this regard, the major international oil companies in competitionwith TOTAL are ExxonMobil, Royal Dutch Shell, Chevron and BP.As of December 31, 2009, TOTAL ranked fifth among thesecompanies in terms of market capitalization 1.
� Legal and arbitration proceedings
The main legal proceedings in which the Group is involved aredescribed in Chapter 7 (Financial information) of this RegistrationDocument.
1. Source: Reuters.
/ 85TOTAL
Insurance and risk managementRISK FACTORS4
� Insurance and risk management
� Organization
TOTAL has its own insurance and reinsurance company, OmniumInsurance and Reinsurance Company (OIRC). OIRC is integratedinto the Group’s insurance management and is used as acentralized global operations tool for covering the Group’s risks. Itallows the Group to implement its worldwide insurance program incompliance with the various regulatory environments in thecountries where the Group operates.
Some countries require the purchase of insurance from a localinsurance company. If the local insurer accepts to cover thesubsidiary of the Group in compliance with its worldwide insuranceprogram, OIRC requests a retrocession of the covered risks fromthe local insurer. As a result, OIRC negotiates reinsurance contractswith the subsidiaries’ local insurance companies, which transfermost of the risk to OIRC. When a local insurer covers the risks at alower level than that defined by the Group, OIRC providesadditional coverage so as to standardize coverage throughout theGroup.
At the same time, OIRC negotiates a reinsurance program at theGroup level with mutual insurance companies for the oil industryand commercial reinsurers. OIRC enables the Group to bettermanage changes in prices in the insurance market by taking on agreater or lesser amount of risk corresponding to the price trends inthe insurance market.
In 2009, the net amount of risk retained by OIRC after reinsurancewas at a maximum of €55 million per property/business interruptioninsurance claim and €50 million per third-party liability insuranceclaim.
� Risk and insurance managementpolicy
In this context, the Group risk and insurance management policy isto work with the relevant internal department of each subsidiary to:
o define scenarios of major disaster risks (estimated maximumloss);
o assess the potential financial impact on the Group in case thesecatastrophic events should occur;
o help in implementing measures to limit the probability that acatastrophic event occurs and the extent of such events; and
o manage the level of risk from such events to be either coveredinternally by the Group or to be transferred to the insurancemarket.
� Insurance policy
The Group has worldwide third-party liability and propertyinsurance coverage for all its subsidiaries. These programs arecontracted with first-class insurers (or reinsurers and mutualinsurance companies of the oil industry through OIRC).
The amounts insured depend on the financial risks defined in thedisaster scenarios and the coverage terms offered by the market(available capacities and price conditions).
More specifically, for:
o Third-party liability insurance: since the maximum financial riskcannot be evaluated by a systematic approach, the amountsinsured are based on market conditions and industry practice, inparticular, the oil industry. The insurance cap in 2009 for generaland product liability was $800 million.
o Property damage and business disruption: the amounts insuredby sector and by site are based on estimated costs andreconstruction scenarios under the estimated maximum lossscenarios and on insurance market conditions. The Groupsubscribed for business disruption coverage in 2009 for its mainrefining and petrochemical sites.
For example, for the highest estimated risks of the Group (floatingproduction, storage and offloading units (FPSO) in Angola and mainEuropean refineries), the limit of indemnity was close to $1.5 billionin 2009.
Deductibles for property damages fluctuate between €0.1 millionand €10 million depending on the level of risk, and are borne by thesubsidiary. For business interruption, they represent sixty days.
Other insurance contracts are bought by the Group in addition toproperty damage and third-party liability coverage, mainly for carfleets, credit insurance and employee benefits. These risks areentirely underwritten by outside insurance companies.
The above-described policy is given as an example of past practiceover a certain period of time and cannot be considered asrepresentative of future conditions. The Group’s insurance policymay be changed at any time depending on the market conditions,specific circumstances and on management’s assessment of therisks incurred and the adequacy of their coverage. The Groupcannot guarantee that it will not suffer any uninsured loss.
86 / TOTAL - Registration Document 2009
5CORPORATE GOVERNANCE
REPORT OF THE CHAIRMAN OF THE BOARD OF DIRECTORS(Article L. 225-37 of the French Commercial Code) p. 88
Composition of the Board of Directors p. 88
Other disclosures p. 95
Corporate governance code p. 95
Rules of procedure of the Board of Directors p. 95
Committees of the Board of Directors p. 97
2009 Activity of the Board of Directors and its Committees p. 99
Board of Directors practices p. 101
Director independence p. 101
Internal control and risk management p. 101
Particular conditions regarding participation at Shareholder’s Meeting p. 104
Information mentioned in Article L. 225-100-3 of the French Commercial Code p. 104
Policy for determining the compensation and other benefits of the Chairman and of the Chief ExecutiveOfficer p. 104
STATUTORY AUDITORS’ REPORT (Article L. 225-235 of the French Commercial Code) p. 106
MANAGEMENT p. 108
General Management p. 108
The Executive Committee p. 108
The Management Committee p. 108
STATUTORY AUDITORS p. 109
Statutory auditors p. 109
Alternate auditors p. 109
Auditor’s term of office p. 109
Fees received by the statutory auditors (including members of their network) p. 109
COMPENSATION OF THE BOARD OF DIRECTORS AND EXECUTIVE OFFICERS p. 110
Board Compensation p. 110
Directors attendance at the Board and Committees meetings in 2009 p. 110
Compensation of the Chairman p. 111
Compensation of the Chief Executive Officer p. 111
Executive Officer compensation p. 111
Pensions and other commitments (Article L. 225-102-1, paragraph 3, of the French Commercial Code) p. 112
Stock options and restricted share grants policy p. 113
Summary table for the Chairman and the Chief Executive Officer p. 115
TOTAL stock options plans p. 118
TOTAL stock options as of December 31, 2009 p. 119
TOTAL restricted share grants p. 124
Restricted share plans as of December 31, 2009 p. 125
Elf Aquitaine share subscription options p. 127
EMPLOYEES, SHARE OWNERSHIP p. 128
Employees p. 128
Arrangements for involving employees in the Company’s share capital p. 128
Shares held by Directors and Executive Officers p. 129
/ 87TOTAL
Report of the Chairman of the Board of Directors(Article L. 225-37 of the French Commercial Code)CORPORATE GOVERNANCE
5
� Report of the Chairman of the Board of Directors(Article L. 225-37 of the French Commercial Code)
Pursuant to Article L. 225-37 of the French Commercial Code, thefollowing report presents information for the year 2009 related tothe composition and practices of the Board of Directors, internalcontrol procedures and risk management implemented by theCompany and, eventually, any limits set by the Board of Directorsconcerning the powers of the Chief Executive Officer. This reportsets forth the provisions of the by-laws applicable to participation atShareholders’ Meetings as well as the principles and rules appliedto determine the compensation and other benefits of the directors.
� Composition of the Board ofDirectors
Directors are appointed by the shareholders for a 3-year term(Article 11 of the Company’s by-laws).
In case of the resignation or death of a director between twoShareholders’ Meetings, the Board may temporarily appoint areplacement director. This appointment must be ratified by the nextShareholders’ Meeting. The terms of office of the members of theBoard are staggered to more evenly space the renewal ofappointments.
The Board of Directors appoints the Chairman of the Board ofDirectors from among its members. The Board of Directors alsoappoints the Chief Executive Officer who may or may not be amember of the Board.
As of December 31, 2009, the Board of Directors has fifteenmembers. Of these, one director has been elected by theshareholders to represent employee shareholders.
The following individuals were members of the Board of Directors ofTOTAL S.A. (information as of December 31, 2009 1):
Thierry Desmarest
64 years old
A graduate of the École Polytechnique and a Mining Engineer,Mr. Desmarest served as Director of Mines and Geology in NewCaledonia, then as technical advisor on the staffs of the Minister ofIndustry and the Minister of Economy. He joined TOTAL in 1981,where he held various management positions, then served asPresident of Exploration & Production until 1995. He served as
Chairman and Chief Executive Officer of TOTAL from May 1995until February 2007, and continues to serve as Chairman of theBoard of TOTAL.
Director of TOTAL S.A. since 1995 and until 2010 (last renewal:May 11, 2007).
Holds 380,576 shares.
Current directorships
o Chairman of TOTAL S.A. *
o Director of Sanofi-Aventis *
o Director of Air Liquide *
o Director of Renault SA *
o Director of Renault SAS
o Director of Bombardier Inc. * (Canada)
Directorships that expired in the previous five years
o Member of the Supervisory Board of Areva * until March 4, 2010
o Chief Executive Officer of TOTAL S.A. * until 2007
o Chairman and Chief Executive Officer of Elf Aquitaine * until 2007
Christophe de Margerie
58 years old
Mr. de Margerie joined the Group after graduating from the ÉcoleSupérieure de Commerce in Paris in 1974. He served in severalpositions in the Group’s Finance Department and Exploration &Production division. He became president of Total Middle East in1995 before joining the Group’s executive committee as thePresident of the Exploration & Production division in May 1999. Hethen became Senior Executive Vice President of Exploration &Production of the new TotalFinaElf group in 2000. In January 2002he became President of the Exploration & Production division ofTOTAL. He was appointed a member of the Board of Directors bythe Shareholders’ Meeting held on May 12, 2006 and became ChiefExecutive Officer of TOTAL on February 14, 2007.
Director of TOTAL S.A. since 2006 and until 2012 (last renewal:May 15, 2009).
Holds 85,230 TOTAL shares and 43,714 shares of the TOTALACTIONNARIAT FRANCE collective investment fund.
1. Including information pursuant to paragraph 4 of Article L. 225-102-1 of the French Commercial Code or under Item 14.1 of Annex I of EC Regulation no 809/2004 ofApril 29, 2004.
* Company names marked with an asterisk are publicly-listed companies.
88 / TOTAL - Registration Document 2009
Report of the Chairman of the Board of Directors(Article L. 225-37 of the French Commercial Code) CORPORATE GOVERNANCE
1 2 3 4 5 6 7 8 9 10 11
Current directorships
o Chief Executive Officer and Director of TOTAL S.A. *
o Chairman and Chief Executive Officer of Elf Aquitaine *
o Chairman of Total E&P Indonésie
o Director of Shtokman Development AG (Switzerland)
o Member of the Supervisory Board of Vivendi *
o Manager of CDM Patrimonial SARL
Directorships that expired in the previous five years
o Director of Total E&P Russia until 2008
o Director of Total Exploration and Production Azerbaijan until 2008
o Director of Total E&P Kazakhstan until 2008
o Director of Total Profils Pétroliers until 2008
o Director of Abu Dhabi Petroleum Company Ltd (ADPC) until 2008
o Director of Abu Dhabi Marine Areas Ltd (ADMA) until 2008
o Director of Iraq Petroleum Company Ltd (IPC) until 2008
o Permanent representative of TOTAL S.A. on the Board of TotalAbu al Bukhoosh until 2008
o Director of Total E&P Norge A.S. until 2007
o Director of Total Upstream UK Ltd until 2007
o Director of Innovarex until 2006
o Director of Total E&P Myanmar until 2005
o Member of the Supervisory Board of Taittinger until 2005
Patrick Artus
58 years old
A graduate from the École Polytechnique, the École Nationale de laStatistique et de l’Administration de l’Économie (ENSEA) and theInstitut d’Études Politiques de Paris, Mr. Artus began his career atthe INSEE (French National Institute for Statistics and EconomicStudies) where his work included economic forecasting andmodelling. He then worked at the Economics Department of theOECD (1980), later becoming the Head of Research at the ENSAEfrom 1982 to 1985. He was scientific adviser at the researchdepartment of the Banque de France, before joining the NatixisGroup as the head of the research department. He is a professor atthe École Polytechnique and associate professor at the Universityof Paris I, Sorbonne. He is also a member of the council ofeconomic advisors to the French Prime Minister and of the FrenchNational Economic Commission. He has authored many articlesand books.
Director of TOTAL S.A. since May 5, 2009 and until 2012.
Holds 1,000 shares.
Current directorships
o Director of TOTAL S.A. *
o Director of IPSOS
* Company names marked with an asterisk are publicly-listed companies.
Directorships that expired in the previous five years
None.
Patricia Barbizet
54 years old
A graduate of the École Supérieure de Commerce of Paris in 1976,Mrs. Barbizet started her career in the Renault Group as theTreasurer of Renault Véhicules Industriels and Chief FinancialOfficer of Renault Crédit International. She joined the Pinault groupin 1989 as the Chief Financial Officer and then served as the ChiefExecutive Officer of Financière Pinault until 2009. Since 1992, shehas been the Director and Chief Executive Officer of Artémis. Since2005, she has been the Vice Chairman of the PPR Board ofDirectors and Chairman of Christie’s.
Director of TOTAL S.A. since May 18, 2008 and until 2011.
Holds 1,000 shares.
Current directorships
o Director of TOTAL S.A. *
o Vice Chairman of PPR * Board of Directors
o Chief Executive Officer and Director of Artémis
o Acting Managing Director of Palazzo Grazzi
o Chairman of Christie’s International Plc
o Director of Société Nouvelle du Théâtre Marigny
o Permanent representative of Artémis at the Board of Directors ofAgefi
o Permanent representative of Artémis at the Board of Directors ofSebdo le Point
o Member of the Supervisory Board of Financière Pinault
o Director of Tawa Plc *
o Director of Fnac
o Member of the Supervisory Board of Gucci Group N.V.
o Member of the Supervisory Board of Yves Saint Laurent
o Director of Air France-KLM *
o Director of Bouygues *
o Director of TF1 *
o Director of the Fonds stratégique d’investissement (Frenchgovernment sovereign fund)
o Member of the Management Board of Château Latour
Directorships that expired in the previous five years
o Chief Executive Officer of Financière Pinault until 2009
o Director of Piasa until 2008
o Director of AFIPA until 2006
/ 89TOTAL
Report of the Chairman of the Board of Directors(Article L. 225-37 of the French Commercial Code)CORPORATE GOVERNANCE
5
o President of the Supervisory Board of PPR * until 2005
o Chairman of the Board of Directors of Société Nouvelle duThéâtre Marigny until 2005
o Permanent representative of Artémis at the Board of Directors ofBouygues * until 2005
Daniel Boeuf
61 years old
A graduate of the École Supérieure des Sciences Économiques etCommerciales (ESSEC), Mr. Boeuf joined the Group in October1973 and served in several sales positions before holding variousoperational positions in Refining & Marketing entities, until, in hislast operational position, he was responsible for training and skillsmanagement in specialties within the Refining & Marketing division.An elected member of the Supervisory Board of the TOTALACTIONNARIAT FRANCE collective investment fund from 1999 to2009, he served as the Chairman of its Supervisory Board from2003 to 2006.
Director of TOTAL S.A. since 2004 (last renewal: May 11, 2007; endof office: December 31, 2009, pursuant to Article 11 of theCompany’s by-laws).
Holds 4,396 TOTAL shares and 4,394 shares of the TOTALACTIONNARIAT FRANCE collective investment fund.
Current directorships
o Director of TOTAL S.A. * representing employee shareholdersuntil December 31, 2009.
Directorships that expired in the previous five years
o Elected member, representing holders, of the Supervisory Boardof the TOTAL ACTIONNARIAT FRANCE collective investmentfund until 2009
o Chairman of the Supervisory Board of the TOTALACTIONNARIAT FRANCE collective investment fund until 2006
Daniel Bouton
59 years old
Inspector General of Finance, Mr. Bouton has held various positionswithin the French Ministry of Economy. He served as BudgetDirector at the Ministry of Finance from 1988 to 1990. He joinedSociété Générale in 1991, where he was appointed Chief ExecutiveOfficer in 1993, then Chairman and Chief Executive Officer inNovember 1997. He has been serving as the Chairman of theSociété Générale group since May 12, 2008, and has been thehonorary President since May 6, 2009.
Director of TOTAL S.A. since 1997 and until 2012 (last renewal:May 15, 2009).
Holds 3,200 shares.
Current directorships
o Director of TOTAL S.A. *
o Director of Veolia Environnement *
Directorships that expired in the previous five years
o Chairman and Chief Executive Officer of Société Générale * until2008 and Chairman of the Board of Directors until 2009.
o Director of Schneider Electric S.A. * until 2006
Bertrand Collomb
67 years old
A graduate of the École Polytechnique and a Mining Engineer,Mr. Collomb held a number of positions within the Ministry ofIndustry and other staff positions from 1966 to 1975. He joined theLafarge group in 1975, where he served in various managementpositions. He served as Chairman and Chief Executive Officer ofLafarge from 1989 to 2003, then as Chairman of the Lafarge Boardof Directors from 2003 to 2007 and has been the honoraryPresident since 2007.
He is also President of the Institut des Hautes Études pour laScience et la Technologie (IHEST) and the Institut Français desRelations Internationales (IFRI).
Director of TOTAL S.A. since 2000 and until 2012 (last renewal:May 15, 2009).
Holds 4,712 shares.
Current directorships
o Director of TOTAL S.A. *
o Director of Lafarge *
o Director of DuPont * (United States)
o Director of Atco * (Canada)
Directorships that expired in the previous five years
o Chairman of the Board of Directors of Lafarge * until 2007
o Director of Lafarge North America until 2006
o Director of Unilever * (the Netherlands) until 2006
o Director of Vivendi Universal * until 2005
Paul Desmarais Jr.
55 years old
A graduate of McGill University in Montreal and INSEAD inFontainebleau, Mr. Desmarais was elected Vice Chairman(1984) then Chairman of the Board (1990) of Corporation FinancièrePower, a company he helped to found. Since 1996, he has servedas Chairman of the Board and Co-Chief Executive Officer of PowerCorporation of Canada.
* Company names marked with an asterisk are publicly-listed companies.
90 / TOTAL - Registration Document 2009
Report of the Chairman of the Board of Directors(Article L. 225-37 of the French Commercial Code) CORPORATE GOVERNANCE
1 2 3 4 5 6 7 8 9 10 11
Director of TOTAL S.A. since 2002 and until 2011 (last renewal:May 16, 2008).
Holds 2,000 ADRs (corresponding to 2,000 shares).
Current directorships
o Director of TOTAL S.A. *
o Chairman of the Board, Co-Chief Executive Officer and Memberof the Executive Committee of Power Corporation of Canada *
o Member of the Board, Co-Chief Executive Officer and Chairmanof the Executive Committee of Corporation Financière Power *(Canada)
o Vice Chairman of the Board of Directors and Acting ManagingDirector of Pargesa Holding S.A. * (Switzerland)
o Member of the Board of Directors and Executive Committee of LaGreat-West Compagnie d’assurance-vie (Canada)
o Member of the Board of Directors and Executive Committee ofGreat-West Life & Annuity Insurance Company (United States)
o Member of the Board of Directors and Executive Committee ofGreat-West Lifeco Inc. * (Canada)
o Member of the Board of Directors of Great West Financial(Canada) Inc. (Canada)
o Member of the Board of Directors and Executive Committee ofGroupe Bruxelles Lambert S.A. * (Belgium)
o Member of the Board of Directors and Executive Committee ofGroupe Investors Inc. (Canada)
o Member of the Board of Directors and Executive Committee ofLondon Insurance Group Inc. (Canada)
o Member of the Board of Directors and Executive Committee ofLondon Life, Compagnie d’assurance-vie (Canada)
o Member of the Board and Executive Committee of MackenzieInc.
o Deputy Chairman of the Board of La Presse Ltée (Canada)
o Deputy Chairman of the Board of Gesca Ltée (Canada)
o Director of GDF Suez * (France)
o Director of Lafarge *
o Director of The Canada Life Assurance Company (Canada)
o Director of Canada Life Financial Corporation (Canada)
o Director of IGM Financial Inc. * (Canada)
o Chairman of the Board of 152245 Canada Inc, 171263 CanadaInc. (Canada)
o Deputy Chairman of the Board of 3819787 Canada Inc. (Canada)
o Director of GWL&A Financial Inc. (USA)
o Director of Great West Financial (Nova Scotia) Co.
o Director of First Great-West Life & Annuity Insurance Company
o Director of Power Communications Inc.
o Vice Chairman of the Board of Power Corporation International
o Director of Putman Investments LLC
* Company names marked with an asterisk are publicly-listed companies.
o Member of the Supervisory Boards of Power Financial EuropeB.V. and of Parjointco N.V.
o Director of Canada Life Capital Corporation Inc. (Canada)
o Director of The Canada Life Insurance Company (Canada)
o Director of Crown Life Insurance Company (Canada)
Directorships that expired in the previous five years
o Member of the Board of Les Journaux Trans-Canada (1996) Inc.(Canada) until 2009
o Vice Chairman of the Board of Directors and member of theStrategic Committee of Imerys * (France) until 2008
o Director of GWL Properties until 2007
Bertrand Jacquillat
65 years old
A graduate of École des Hautes Études Commerciales (HEC),Institut d’Études Politiques de Paris and Harvard Business School,Mr. Jacquillat holds a PhD in management. He has been auniversity professor (in both France and the United States) since1969, and is a professor at the Institut d’Études Politiques in Paris,Vice President of the Cercle des Économistes and member of theEconomic Analysis Board to the Prime Minister. He is the foundingchairman of Associés en Finance.
Director of TOTAL S.A. since 1996 and until 2011 (last renewal:May 16, 2008).
Holds 3,600 shares.
Current directorships
o Director of TOTAL S.A. *
o Chairman and Chief Executive Officer of Associés en Finance
o Member of the Supervisory Board of Klépierre *
o Member of the Supervisory Board of Presses Universitaires deFrance (PUF)
Directorships that expired in the previous five years
None.
Antoine Jeancourt-Galignani
72 years old
Inspector of Finance, Mr. Jeancourt-Galignani held variouspositions within the Ministry of Finance before serving as DeputyManaging Director of Crédit Agricole from 1973 to 1979. Hebecame Chief Executive Officer of Indosuez bank in 1979 beforeserving as its Chairman from 1988 to 1994. He then served asChairman of Assurances Générales de France (AGF) from 1994 to2001, before serving as Chairman of Gecina from 2001 to 2005,where he served as a director until 2009.
/ 91TOTAL
Report of the Chairman of the Board of Directors(Article L. 225-37 of the French Commercial Code)CORPORATE GOVERNANCE
5
Director of TOTAL S.A. since 1994 (last renewal: May 12, 2006; endof office: May 15, 2009).
Current directorships
o Chairman of the Supervisory Board of Euro Disney SCA *
o Director of Kaufman & Broad S.A. *
o Member of the Supervisory Board of Oddo et Cie
Directorships that expired in the previous five years
o Director of TOTAL S.A. * until May 2009
o Director of Gecina * until June 2009
o Director of Société Générale * until 2008
o Member of the Supervisory Board of Hypo Real Estate Holding *(Germany) until 2008
o Chairman of the Board of Groupe SNA (Lebanon) until 2007 andDirector until 2008
o Director of Société des Immeubles de France * until 2007
o Director of Assurances Générales de France * until 2007
o Member of the Supervisory Board of Jetix Europe N.V. * until2005
o Chairman of the Board of Directors of Gecina * until 2005
Anne Lauvergeon
50 years old
Chief Mining Engineer and a graduate of the École NormaleSupérieure with a doctorate in physical sciences, Mrs. Lauvergeonheld various positions in industry before becoming Deputy Chief ofStaff in the Office of the President of the Republic in 1990. Shejoined Lazard Frères et Cie as Managing Partner in 1995. From1997 to 1999 she was Executive Vice President and member of theExecutive Committee of Alcatel, in charge of industrial partnerships.
Mrs. Anne Lauvergeon has served as Chairman of the ManagementBoard of AREVA since July 2001 and Chairman and Chief ExecutiveOfficer of Areva NC (formerly Cogema) since June 1999.
Director of TOTAL S.A. since 2000 and until 2012 (last renewal:May 15, 2009).
Holds 2,000 shares.
Current directorships
o Director of TOTAL S.A. *
o Chairperson of the Management Board of Areva *
o Chairperson and CEO of Areva NC
o Director of GDF Suez *
o Director of Vodafone Group Plc *
Directorships that expired in the previous five years
o Vice President and Member of the Supervisory Board of Safran *until February 2009
o Director of FCI until 2005
Lord Levene of Portsoken
68 years old
Lord Levene served in various positions within the Ministry ofDefense, the office of the Secretary of State for the Environment,the office of the Prime Minister and the Ministry of Trade in theUnited Kingdom from 1984 to 1995. He then served as senioradviser at Morgan Stanley from 1996 to 1998 before becoming theChairman of Bankers Trust International from 1998 to 2002. He wasLord Mayor of London from 1998 to 1999. He is currently Chairmanof Lloyd’s.
Director of TOTAL S.A. since 2005 and until 2011 (last renewal:May 16, 2008).
Holds 2,000 shares.
Current directorships
o Director of TOTAL S.A. *
o Chairman of Lloyd’s
o Chairman of International Financial Services
o Chairman of General Dynamics UK Ltd
o Director of Haymarket Group Ltd
o Director of China Construction Bank *
Directorships that expired in the previous five years
o Member of the Supervisory Board of Deutsche Börse* until 2005
Claude Mandil
67 years old
A graduate of the École Polytechnique and a General MiningEngineer, Mr. Mandil served as a Mining Engineer in the Lorraineand Bretagne provinces. He then served as a Project Manager atthe Délégation de l’Aménagement du Territoire et de l’ActionRégionale (City and Department planning/DATAR) and as theInterdepartmental Head of Industry and Research and regionaldelegate of ANVAR. From 1981 to 1982, he served as the technicaladvisor on the staff of the Prime Minister, in charge of the industry,energy and research sectors. He was appointed Chief ExecutiveOfficer, then Chairman and Chief Executive Officer of the Institut deDéveloppement Industriel (Industry Development Institute) until1988. He was Chief Executive Officer of Bureau de RecherchesGéologiques et Minières (BRGM) from 1988 to 1990. From 1990 to1998, Mr. Mandil was Chief Executive Officer for Energy andCommodities at the French Industry Ministry and the firstrepresentative for France at the Management Board of the EnergyInternational Agency (EIA) Executive Committee. He served as theChairman of the EIA in 1997 and 1998. In 1998, he was appointedDeputy Chief Executive Officer of Gaz de France and, in April 2000,Chairman of the Institut Français du Pétrole (French Institute of Oil).From 2003 to 2007, he was the Executive Director of the EIA.
* Company names marked with an asterisk are publicly-listed companies.
92 / TOTAL - Registration Document 2009
Report of the Chairman of the Board of Directors(Article L. 225-37 of the French Commercial Code) CORPORATE GOVERNANCE
1 2 3 4 5 6 7 8 9 10 11
Director of TOTAL S.A. since May 16, 2008 and until 2011.
Holds 1,000 shares.
Current directorships
o Director of TOTAL S.A. *
o Director of Institut Veolia Environnement
Directorships that expired in the previous five years
o Director of GDF Suez * from July to December 2008
Michel Pébereau
67 years old
Honorary Inspector General of Finance, Mr. Pébereau held variouspositions in the Ministry of Economy and Finance, before serving,from 1982 to 1993, as Chief Executive Officer and then asChairman and CEO of Crédit Commercial de France (CCF). He wasChairman and Chief Executive Officer of BNP then BNP Paribasfrom 1993 to 2003, and is currently Chairman of the Board of BNPParibas. He has also been the Chairman of European FinancialRound Table (EFRT) since 2009.
Director of TOTAL S.A. since 2000 and until 2012 (last renewal:May 15, 2009).
Holds 2,356 shares.
Current directorships
o Director of TOTAL S.A. *
o Chairman of the Board of Directors of BNP Paribas*
o Director of Lafarge *
o Director of Saint-Gobain *
o Member of the Supervisory Board of AXA *
o Director of EADS N.V. *
o Director of Pargesa Holding S.A. * (Switzerland)
o Director of BNP Paribas Suisse
o Member of the Supervisory Board of Banque marocaine pour leCommerce et l’Industrie *
o Non-voting member (Censeur) of the Supervisory Board ofGaleries Lafayette
Directorships that expired in the previous five years
o Chairman of la Fédération Bancaire Européenne until 2008
o Director of BNP Paribas UK Holdings Ltd until 2005
Thierry de Rudder
60 years old
A graduate of the Université de Genève in mathematics, theUniversité Libre de Bruxelles and Wharton (MBA), Mr. de Rudderserved in various positions at Citibank from 1975 to 1986 beforejoining Groupe Bruxelles Lambert, where he was appointed ActingManaging Director.
Director of TOTAL S.A. since 1999 and until 2010 (last renewal:May 11, 2007).
Holds 3,956 shares.
Current directorships
o Director of TOTAL S.A. *
o Director of Imerys *
o Director of GDF Suez *
o Director of Lafarge *
o Director of Compagnie Nationale à Portefeuille *
o Director of Suez-Tractebel
o Acting Managing Director of Groupe Bruxelles Lambert *
o Director of Brussels Securities (Belgium)
o Director of GBL Treasury Center ** (Belgium)
o Director of GBL Participations ** (Belgium)
o Director of Sagerpar ** (Belgium)
o Director of GBL Energy Sarl ** (Luxembourg)
o Director of GBL Verwaltung Sarl ** (Luxembourg)
o Director of GBL Verwaltung GmbH ** (Germany)
Directorships that expired in the previous five years
o Director of GBL Finance SA ** (Luxembourg) until April 2009
o Directeur of Immobilière Rue de Namur ** (Luxembourg) until2007
o Director of SI Finance until 2005
Serge Tchuruk
72 years old
A graduate of the École Polytechnique and an Ingénieur del’armement, Mr. Tchuruk held various management positions withMobil Corporation, then with Rhône-Poulenc, where he was namedChief Executive Officer in 1983. He served as Chairman and CEO ofCDF-Chimie/Orkem from 1986 to 1990, then as Chairman and CEOof TOTAL from 1990 to 1995. In 1995, he became Chairman andChief Executive Officer of Alcatel. From 2006 to 2008, he wasappointed Chairman of the Board of Alcatel-Lucent.
Director of TOTAL S.A. since 1989 and until 2010 (last renewal:May 11, 2007).
Holds 61,060 shares.
Current directorships
o Director of TOTAL S.A. *
* Company names marked with an asterisk are publicly-listed companies.** A Groupe Bruxelles Lambert (GBL) 100%-owned subsidiary.
/ 93TOTAL
Report of the Chairman of the Board of Directors(Article L. 225-37 of the French Commercial Code)CORPORATE GOVERNANCE
5
o Director of Weather Investment SPA
Directorships that expired in the previous five years
o Director of Thalès * until 2009
o Chairman of the Board of Directors of Alcatel-Lucent * until 2008
o Member of the Supervisory Board of Alcatel Deutschland GmbHuntil 2008
o Member of the Board of Directors of the École Polytechniqueuntil 2008
o Chairman of the Board of Directors of Alcatel USA HoldingsCorp. until 2006
o Director of the Institut Pasteur until 2005
Pierre Vaillaud
74 years old
A graduate of the École Polytechnique, a Mining Engineer and agraduate of the École Nationale Supérieure du Pétrole et desMoteurs, Mr. Vaillaud worked as an engineer with Technip andAtochem before joining TOTAL. He served as Chief ExecutiveOfficer of TOTAL from 1989 to 1992, before becoming Chairmanand Chief Executive Officer of Technip from 1992 to 1999, and ofElf Aquitaine from 1999 to 2000.
Director of TOTAL S.A. since 2000 (last renewal: May 12, 2006; endof office: May 15, 2009).
Current directorships
o Member of the Supervisory Board of Oddo et Cie
Directorships that expired in the previous five years
o Director of TOTAL S.A. * until May 2009
o Director of Technip * until 2007
o Member of the Supervisory Board of Cegelec until 2006
* Company names marked with an asterisk are publicly-listed companies.
94 / TOTAL - Registration Document 2009
1 2 3 4 5 6 7 8 9 10 11
Report of the Chairman of the Board of Directors(Article L. 225-37 of the French Commercial Code) CORPORATE GOVERNANCE
� Other disclosures
At its meeting on September 15, 2009, the Board of Directorsappointed Charles Paris de Bollardière Secretary of the Board.He succeeds Thierry Reveau de Cyrières.
The current members of the Board of Directors of the Companyhave informed the Company that they have not been convicted,have not been associated with a bankruptcy, receivership orliquidation, and have not been incriminated or publicly sanctionedor disqualified, as stipulated in item 14.1 of Annex I of ECRegulation 809/2004 of April 29, 2004.
� Corporate governance code
For several years, TOTAL has been actively examining corporategovernance matters. At its meeting on November 4, 2008, theBoard of Directors confirmed its decision to use the CorporateGovernance Code for Listed Companies published in 2008 by theprincipal French business confederations, the Association Françaisedes Entreprises Privées (AFEP) and the Mouvement des Entreprisesde France (MEDEF) (“AFEP-MEDEF Code”) as its reference forcorporate governance matters.
The AFEP-MEDEF Code is available on the MEDEF website(www.medef.fr).
The Company’s corporate governance practices differ from therecommendations contained in the AFEP-MEDEF Code on thefollowing limited matters:
o The AFEP-MEDEF Code recommends that a director no longerbe considered as independent upon the expiry of the term ofoffice during which the length of his service on the board reachestwelve years. The Board has not followed this recommendation inregards to one of its members considering the long-term natureof its investments and operation as well as the experience andauthority of which this director is in possession, which reinforcehis independence and contribute to the Board’s work.
o The Chairman of the Board of Directors chairs the Nominating &Governance Committee of the Board. The Board of Directors andthis Committee consider that the participation of the Chairman onthe Nominating & Governance Committee enables the Committeeto benefit from his experience and his knowledge of theCompany’s activities, environment and executive teams, which isparticularly useful to inform the Committee’s deliberationsconcerning the appointment of executives and directors. The factthat the Chairman of the Board, who does not exercise executiveduties, chairs the committee permits close collaboration betweenthe Board and the Committee, the latter being responsible for thereview of the Board’s workings and corporate governancematters. This committee is comprised of a majority ofindependent directors and the Chairman and the Chief ExecutiveOfficer do not attend deliberations concerning their own situation.
Pursuant to the AFEP-MEDEF Code, on February 11, 2009, theBoard of Directors noted that, effective from the same day, theemployment contracts of its Chairman and its Chief ExecutiveOfficer had been terminated.
Since 2004, the Board of Directors has had a financial code ofethics that, in the overall context of the Group’s Code of Conduct,sets forth specific rules for its Chairman, Chief Executive Officer,Chief Financial Officer, Chief Accounting Officer and the financialand accounting officers for its principal activities. The Board hasmade the Audit Committee responsible for implementing andensuring compliance with this code.
In 2005, the Board approved the procedure for alerting the AuditCommittee of complaints or concerns regarding accounting,internal accounting controls or auditing matters.
� Rules of procedure of the Board ofDirectors
At its meeting on February 13, 2007, the Board of Directorsadopted rules of procedure to replace the Directors’ Charter and totake into account the separation of the positions of Chairman of theBoard and Chief Executive Officer implemented at the samemeeting.
The Board’s rules of procedure specify the obligations of eachdirector and set forth the mission and working procedures of theBoard of Directors. They also define the respective responsibilitiesand authority of the Chairman and of the Chief Executive Officer. Itis reviewed on a regular basis to match the changes in rules andpractices related to governance.
The principal matters covered by the rules of procedure aresummarized below. An unabridged version of these rules andprocedures is available on the Company’s website.
Each director undertakes to maintain the independence of hisanalysis, judgment, decision-making and actions as well as not tobe unduly influenced. When a director participates in and votes atBoard meetings, he is required to represent the interest of theshareholders and the Company as a whole. Directors must activelyparticipate in the affairs of the Board, specifically on the basis ofinformation communicated to them by the Company.
Directors undertake to devote the amount of time required toconsider the information they are given and otherwise prepare formeetings of the Board and of the committees on which they sit.Directors may request any additional information that they feel isnecessary or useful from the Chairman or the Chief ExecutiveOfficer. A director, if he considers it necessary, may request training
/ 95TOTAL
Report of the Chairman of the Board of Directors(Article L. 225-37 of the French Commercial Code)CORPORATE GOVERNANCE
5
on the Company’s specificities, businesses and activities. Directorsparticipate in all Board meetings and all committees orShareholders’ Meetings, unless they have previously contacted theChairman to inform him of scheduling conflicts.
Each director must inform the Board of conflicts of interest that mayarise, including the nature and terms of any proposed transactionsthat could give rise to such situations. If he is opposed to a projectbrought before the Board, he is required to clearly express hisopposition. He is required to own at least 1,000 company shares inregistered form (with the exception of the director representingemployee shareholders, for whom the requirements are moreflexible) and comply strictly with provisions regarding the use ofmaterial non-public information. The requirement to hold aminimum of 1,000 company shares while in office is accepted byeach director as a restriction on his ability to freely dispose of theseshares.
In addition to stipulating that any shares and ADRs of TOTAL S.A.and its publicly traded subsidiaries held by directors are to be heldin registered form, the rules of procedure prohibit buying on marginor short selling those same securities. They also prohibit tradingshares of TOTAL S.A. on the dates of the Company’s periodicearnings announcements, as well as the 15 calendar dayspreceding such dates.
The Board of Directors’ mission is to determine the strategicdirection of the Group and supervise the implementation of thisvision.
With the exception of the powers and authority expressly reservedfor shareholders and within the limits of the Company’s legalpurpose, the Board may address any issue related to the operationof the Company and take any decision concerning the mattersfalling within its purview.
Within this framework, the Board’s duties and responsibilitiesinclude, but are not limited to, the following:
o appointing the Chairman and the Chief Executive Officer andsupervising the handling of their responsibilities;
o defining the Company’s strategic orientation and, more generally,that of the Group;
o approving investments or divestments under study by the Groupthat concern amounts greater than 3% of shareholders’ equity,whether or not the project is part of the announced strategy;
o reviewing information on significant events related to theCompany’s affairs, in particular for investments or divestmentsthat are greater than 1% of shareholders’ equity;
o monitoring the quality of information supplied to shareholdersand the financial markets through the financial statements that itapproves and the annual reports, or when major transactions areconducted;
o convening and setting the agenda for Shareholders’ Meetings;
o preparing, for each year, a list of the directors it deems to beindependent under generally recognized corporate governancecriteria, in particular those defined in the AFEP-MEDEF Code;and
o conducting audits and investigations as it may deem appropriate.
The Board, with the assistance of its specialized committees whereappropriate, ensures that:
o authority within the Company has been properly delegated beforeit is exercised, and that the various entities of the Companyrespect the authority, duties and responsibilities they have beengiven;
o no individual is authorized to contract on behalf of the Companyor to commit to pay, or to make payments, on behalf of theCompany, without proper supervision and control;
o the internal control function operates properly and that thestatutory auditors are able to conduct their audits underappropriate circumstances; and
o the committees it has created duly perform their responsibilities.
The Board of Directors is regularly informed, through the AuditCommittee, of the Group’s financial position, cash position andobligations.
Board of Directors’ activity: The Board of Directors meets at leastfour times a year and as often as circumstances may require.
Directors are generally given written notice eight days prior toBoard meetings. Documents to be considered for decisions to bemade at Board meetings are, when possible, sent with the notice ofmeetings, or otherwise delivered to the directors. The minutes ofthe previous meeting are expressly approved at each Boardmeeting.
Directors may participate in meetings either by being present, bybeing represented by another director or via video conference (incompliance with the technical requirements set by applicableregulations).
The Board may establish specialized committees, whetherpermanent or ad hoc, as required by applicable legislation or as itmay deem appropriate. The Board allocates directors’ fees and mayallocate additional directors’ fees to directors who participate inspecialized committees, within the total amount established by theshareholders. The Chairman and the Chief Executive Officer are notawarded directors’ fees for their work on the Board andCommittees.
The Board of Directors, based on the recommendation of itsChairman, appoints a Secretary. Every member of the Board ofDirectors can refer to the Secretary and benefit from his assistance.The Secretary is responsible for the working procedures of theBoard of Directors. The Board shall review such proceduresperiodically.
The Board conducts, at regular intervals not to exceed three years,an assessment of its practices. It also conducts an annualdiscussion of its methods.
Responsibility and authority of the Chairman: The Chairmanrepresents the Board, and, except under exceptional circumstances,is the sole member authorized to act and speak on behalf of the
96 / TOTAL - Registration Document 2009
Report of the Chairman of the Board of Directors(Article L. 225-37 of the French Commercial Code) CORPORATE GOVERNANCE
1 2 3 4 5 6 7 8 9 10 11
Board. He is responsible for organizing and presiding over theBoard’s activities and monitors corporate bodies to ensure thatthey are functioning effectively and respecting corporategovernance principles. He is responsible, with the Group’smanagement, for maintaining relations between the Board and theCompany’s shareholders. He monitors the quality of the informationdisclosed by the Company. In close cooperation with the Group’smanagement, he may represent the Group in high level discussionswith government authorities and the Group’s important partners, onboth a national and international level. He is regularly informed bythe Chief Executive Officer of events and situations that areimportant for the Group and may request that the Chief ExecutiveOfficer provide any useful information for the Board or itscommittees. He may also work with the statutory auditors toprepare matters before the Board or the Audit Committee.
Authority of the Chief Executive Officer: The Chief ExecutiveOfficer is responsible for the general management of the Company.He chairs the Group’s Executive Committee and ManagementCommittee. Subject to the Company’s corporate governance rules(see above: “the Board of Directors’ mission”), he has the full extentof authority to act on behalf of the Company in all instances, withthe exception of actions that are, by law, reserved to the Board ofDirectors or to Shareholders’ meetings. He is responsible forperiodic reporting of the Group’s results and outlook toshareholders and the financial community. He reports on significantGroup activities to the Board.
� Committees of the Board ofDirectors
‹ Audit Committee
The Audit Committee’s role is to assist the Board of Directors inensuring effective internal control and oversight over financialreporting to shareholders and the financial markets.
The Audit Committee’s duties include:
o recommending the appointment of statutory auditors and theircompensation, ensuring their independence and monitoring theirwork;
o establishing the rules for the use of statutory auditors fornon-audit services and verifying their implementation;
o supervising the audit by the statutory auditors of the Company’sfinancial statements and consolidated financial statements;
o examining the accounting policies used to prepare the financialstatements, examining the parent company’s annual financialstatements and the consolidated annual, semi-annual, andquarterly financial statements prior to their examination by theBoard, after regularly monitoring the financial situation, cashposition and obligations of the Company;
o supervising the implementation of internal control and riskmanagement procedures and their effective application, with theassistance of the internal audit department;
o supervising procedures for preparing financial information;
o monitoring the implementation and activities of the disclosurecommittee, including reviewing the conclusions of thiscommittee;
o reviewing the annual work program of internal and externalauditors;
o receiving information periodically on completed audits andexamining annual internal audit reports and other reports(statutory auditors, annual reports, etc.);
o reviewing the choice of appropriate accounting principles andmethods;
o reviewing the Group’s policy for the use of derivative instruments;
o reviewing, if requested by the Board, major transactionscontemplated by the Group;
o reviewing significant litigation annually;
o implementing, and monitoring compliance with, the financial codeof ethics;
o proposing to the Board, for implementation, a procedure forcomplaints or concerns of employees, shareholders and others,related to accounting, internal accounting controls or auditingmatters, and monitoring the implementation of this procedure;and
o reviewing the procedure for booking the Group’s provedreserves.
� Audit Committee membership and practices
The Committee is made up of at least three directors designated bythe Board of Directors. Members must be independent directors.
In selecting the members of the Committee, the Board paysparticular attention to their independence and their financial andaccounting qualifications. Members of the Committee may not beexecutive officers of the Company or one of its subsidiaries, norown more than 10% of the Company’s shares, whether directly orindirectly, individually or acting together with another party.
Members of the Audit Committee may not receive from theCompany and its subsidiaries, whether directly or indirectly, anycompensation other than:
o directors’ fees paid for their services as directors or as membersof the Audit Committee or, if applicable, another committee of theBoard; and
o compensation and pension benefits related to prior employmentby the Company, or another Group company, which are notdependent upon future work or activities.
The Committee appoints its own Chairman. The Chairman appointsthe Committee secretary who may be the Chief Financial Officer.The Committee meets at least four times a year to examine theconsolidated annual and quarterly financial statements.
The Audit Committee may meet with the Chairman of the Board, theChief Executive Officer, and, if applicable, any acting ManagingDirector of the Company and perform inspections and consult withmanagers of operating or non-operating departments, as may beuseful in performing its duties.
/ 97TOTAL
Report of the Chairman of the Board of Directors(Article L. 225-37 of the French Commercial Code)CORPORATE GOVERNANCE
5
The Committee consults with the statutory auditors and examinestheir work, and may do so without management being present. If itdeems it necessary to accomplish its duties, the Committee mayrequest from the Board the resources to engage externalconsultants.
The Committee submits written reports to the Board of Directorsregarding its work.
In 2009, the Committee’s members were Mrs. Patricia Barbizet andMessrs. Bertrand Jacquillat and Thierry de Rudder as well as, untilMay 15, 2009, Mr. Antoine Jeancourt-Galignani. All of the membersof the Committee are independent directors and have recognizedexperience in the financial and accounting fields, as illustrated intheir summary biographies (see pages 89 to 93 of this RegistrationDocument).
The Committee was chaired by Mr. Antoine Jeancourt-Galignani,who was determined to be the Audit Committee financial expert bythe Board at its meeting on September 5, 2006. Mrs. PatriciaBarbizet was appointed by the Committee at its meeting onJuly 28, 2009, to succeed Mr. Antoine Jeancourt-Galignani for theCommittee chairmanship. The Board of Directors, at its meeting onJuly 30, 2009, decided to appoint Mr. Bertrand Jacquillat to serveas the Audit Committee financial expert based on arecommendation by the Audit Committee.
‹ Compensation Committee
In February 2007, the Compensation Committee was separatedfrom the then existing Nominating & Compensation Committee. Theprincipal objectives of the Compensation Committee are to:
o examine the executive compensation policies implemented bythe Group and the compensation of members of the ExecutiveCommittee; and
o evaluate the performance and recommend the compensation ofthe Chairman of the Board and of the Chief Executive Officer.
Its duties include the following:
o examining the criteria and objectives proposed by managementfor executive compensation and advising on this subject;
o presenting recommendations and proposals to the Boardconcerning;
- compensation, pension and insurance plans, in-kind benefitsand other compensation, including severance benefits, for theChairman and the Chief Executive Officer of the Company, and
- awards of stock options and restricted share grants to theChairman and the Chief Executive Officer; and
o examining stock option plans, restricted share grants, equity-based plans and pension and insurance plans.
� Compensation Committee membership and practices
The Committee is made up of at least three directors designated bythe Board of Directors.
A majority of the members must be independent directors.Members of the Compensation Committee may not receive fromthe Company and its subsidiaries, either directly or indirectly, anycompensation other than:
o directors’ fees paid for their services as directors or as membersof the committee, or, if applicable, as members of anothercommittee of the Company’s Board; and
o compensation and pension benefits related to prior employmentby the Company which are not dependant upon future work oractivities.
The Committee appoints its chairman and its secretary. Thesecretary is a Company senior executive.
The Committee meets at least twice a year.
The Committee invites the Chairman and the Chief ExecutiveOfficer of the Company to present their recommendations.
Neither the Chairman nor the Chief Executive Officer may bepresent during deliberations regarding his own situation.
While maintaining the appropriate level of confidentiality for itsdiscussions, the Committee may request that the Chief ExecutiveOfficer provide it with the assistance of any senior executive of theCompany whose skills and qualifications could facilitate thehandling of an agenda item.
If it deems it necessary to accomplish its duties, the Committeemay request from the Board the resources to engage externalconsultants.
The Committee reports on its activities to the Board of Directors.
In 2009, the Committee’s members were Messrs. BertrandCollomb, Michel Pébereau and Serge Tchuruk, each anindependent director.
Mr. Michel Pébereau chairs the Committee.
‹ Nominating & Governance Committee
In February 2007, the Nominating & Governance Committee wasseparated from the then existing Nominating & CompensationCommittee. The principal objectives of the Nominating &Governance Committee are to:
o recommend to the Board of Directors the persons that arequalified to be appointed as directors, Chairman or ChiefExecutive Officer;
o prepare the Company’s corporate governance rules andsupervise their implementation; and
o examine any questions referred to it by the Board or theChairman of the Board, in particular questions related to ethics.
Its duties include the following:
o presenting recommendations to the Board for its membershipand the membership of its committees;
98 / TOTAL - Registration Document 2009
Report of the Chairman of the Board of Directors(Article L. 225-37 of the French Commercial Code) CORPORATE GOVERNANCE
1 2 3 4 5 6 7 8 9 10 11
o proposing annually to the Board the list of directors who may beconsidered as “independent directors” of the Company;
o assisting the Board in the selection and evaluation of theChairman of the Board and the Chief Executive Officer andexamining the preparation of their possible successors, incooperation with the Compensation Committee;
o preparing a list of individuals who might be considered forelection as Directors and those who might be named to serve onBoard committees;
o proposing methods for the Board to evaluate its performance;
o proposing the procedure for allocating directors’ fees;
o developing and recommending to the Board the corporategovernance principles applicable to the Company; and
o examining ethical issues at the request of the Board or itsChairman.
� Nominating & Governance Committee membershipand practices
The Committee is made up of at least three directors designated bythe Board of Directors.
A majority of the members must be independent directors.
Members of the Nominating & Governance Committee, other thanthe Chairman of the Board and the Chief Executive Officer, may notreceive from the Company and its subsidiaries any compensationother than:
o directors’ fees paid for their services as directors or as membersof the committee, or, if applicable, as members of anothercommittee of the Company’s Board; and
o compensation and pension benefits related to prior employmentby the Company which are not dependant upon future work oractivities.
The Committee appoints its chairman and its secretary. Thesecretary is a Company senior executive.
The Committee meets at least twice a year.
The Committee may invite the Chairman of the Board or the ChiefExecutive Officer of the Company, as applicable, to presentrecommendations.
Neither the Chairman nor the Chief Executive Officer may bepresent during deliberations regarding his own situation.
While maintaining the appropriate level of confidentiality for itsdiscussions, the Committee may request that the Chief ExecutiveOfficer provide it with the assistance of any senior executive of theCompany whose skills and qualifications could facilitate thehandling of an agenda item.
If it deems it necessary to accomplish its duties, the Committeemay request from the Board the resources to engage externalconsultants.
The Committee reports on its activities to the Board of Directors.
In 2009, the Committee’s members were Messrs. BertrandCollomb, Thierry Desmarest, Michel Pébereau and Serge Tchuruk.Each, with the exception of the Chairman of the Board, is anindependent director.
Mr. Thierry Desmarest chairs the Committee.
� 2009 Activity of the Board ofDirectors and its Committees
The Board held eight meetings in 2009, with an average attendanceof 88.7%.
The Audit Committee held six meetings in 2009, with 100%attendance.
The Compensation Committee met twice, with 100% attendance.
The Nominating & Governance Committee met twice, with 100%attendance.
A table summarizing individual attendance at the Board of Directorsand Committees meetings is provided on page 110 of thisRegistration Document.
The meetings of the Board of Directors included, but were notlimited to, a review of the following subjects:
January 13
o strategic outlook for the Chemicals segment;
o 2009 Budget;
o Group insurance policy; and
o summary of the Ethics Committee activities.
February 11
o 2008 accounts (consolidated financial statements, parentcompany accounts);
o debate on Board of Directors practices;
o proposition to change the by-laws regarding the age limit of theChairman of the Board;
o change in the rules and procedures of the Board of Directors, theAudit Committee and the Nominating & Governance Committee;
o assessment of the independence of the Directors;
o proposal to renew directorships and appoint a new director;
o policy for determining the compensation and other advantages ofthe Chairman and of the Chief Executive Officer;
o compensation of the Chairman and of the Chief Executive Officerand other related commitments;
o convocation of the Shareholders’ Meeting and approval of thedocuments related to this meeting;
/ 99TOTAL
Report of the Chairman of the Board of Directors(Article L. 225-37 of the French Commercial Code)CORPORATE GOVERNANCE
5
o Group financial policy;
o project to invest in deep offshore in Nigeria (Egina project); and
o project to launch a public tender offer for UTS EnergyCorporation (Canada).
March 31
o review of requests to include new resolution projects on theShareholders’ Meeting agenda.
May 5
o strategic outlook for the Gas & Power division;
o earnings for the first quarter of 2009; and
o preparation and arrangements for the Shareholders’ Meeting.
May 15
o appointment of the Chief Executive Officer and confirmation ofthe conditions for its compensation; and
o renewal of the appointments of the members of the Committeesof the Board of Directors.
July 30
o strategic outlook for the Refining & Marketing division;
o earnings for the second quarter of 2009 and the first half of 2009;
o cancellation of Company shares and corresponding reduction ofshare capital;
o payment of an interim dividend; and
o presentation of the participation in the call for tenders launchedby the Abu Dhabi Emirate to build and operate a nuclear powerplant in partnership with GDF Suez and Areva.
September 15
o strategic outlook for the Exploration & Production division;
o financial communication for mid-2009;
o award of share subscription options and restricted share grants;and
o announcement by the Nominating & Governance Committee ofthe Board’s self-evaluation for its activities during the fourthquarter of 2009.
November 3
o Group strategy and 5-year plan; and
o results for the third quarter of 2009.
� Audit Committee activity
In 2009, the members of the Audit Committee reviewed thefollowing matters:
o At its meeting on February 9, the Committee reviewed theaccounts for the fourth quarter of 2008 as well as the annualconsolidated statements report for the Group and the statutoryaccounts of TOTAL S.A., the parent company, for 2008. TheHead of Internal Audit presented the conclusions of the audits
conducted in 2008 and the audit plan scheduled for 2009, as wellas the 2009 work program for internal control over financialreporting in compliance with the Sarbanes-Oxley Act. TheCommittee also reviewed the draft of the Chairman’s report oninternal control procedures
o At its meeting on April 20, the Committee reviewed the conditionsfor the use of derivatives in crude oil and petroleum productstrading activities. The Committee also reviewed the proceduresfor evaluating oil and gas reserves. It acknowledged theapproach of the Refining & Marketing division to strengthen itsrisk assessment and management device, in particular bymapping the major risks faced by the division and business units.Finally, the Committee also reviewed the update of the financialcode of ethics.
o The Committee met on April 30, to review the consolidatedfinancial statements for the first quarter of 2009. The Committeealso approved the launch of a call for tenders to select the twostatutory auditors whose appointment will be submitted to theShareholders’ Meeting on May 2010, the term of office of thecurrent statutory auditors expiring at that date.
o At its meeting on July 28, the Committee appointed its chairmanand proposed the appointment of a financial expert within theCommittee. It reviewed the financial statements for the secondquarter and first half of 2009.
o On October 15, the Committee met to acknowledge the statutoryauditors’ specific focus with regard to the audit of the 2009financial statements. The Committee reviewed the Group’ssignificant litigation. It also studied the mapping of thePetrochemicals business risks. The investment decision-makingprocess and the procedure to prepare financial statements andconsolidated information were submitted to the Committee.
o On October 30, the Committee reviewed the financial statementsfor the third quarter of 2009 and the budget for the fees of thestatutory auditors. The members of the Committee met with thestatutory auditors without management being present. TheCommittee was informed of the Group’s policy for the use ofderivative instruments.
The statutory auditors attended all the Audit Committee meetings in2009, except for the review of their compensation and thepreparation of the call for tenders related to their appointment. Ateach presentation of the quarterly consolidated financialstatements, the statutory auditors reported on their work andpresented their conclusions.
The Committee periodically monitored the financial situation, cashflow, risks and significant off-balance sheet commitments of theCompany, as well as internal audit activity.
The chairman of the Committee reported to the Board of Directorson the Committee’s activities.
� Compensation Committee activity
At its meeting on February 5, 2009, the Committee acknowledgedthe Chairman and the Chief Executive Officer’s request to terminatetheir employment contract. The Committee prepared its proposal tobe made to the Board for the rules and principles to determinecompensation and other benefits to be awarded to the Chairman
100 / TOTAL - Registration Document 2009
Report of the Chairman of the Board of Directors(Article L. 225-37 of the French Commercial Code) CORPORATE GOVERNANCE
1 2 3 4 5 6 7 8 9 10 11
and to the Chief Executive Officer as well as the terms that apply incase they are removed from or not renewed in office.
The Committee reviewed the 2009 compensation policy for theChairman and the Chief Executive Officer and made a proposal forthe compensation of the Chairman and Chief Executive Officer, aswell as restrictions on share transfers by these individuals. TheCommittee also examined the compensation of the members of theExecutive Committee and reviewed information related to thecompensation of the Company’s management bodies and to theCompany’s pension and insurance plans, in preparation for thedisclosure of this information in the Company’s annual reports for2008.
At its meeting on September 2, 2009, the Committee reviewed theshare subscription option and restricted share grant plans.
� Nominating & Governance Committee activity
At its meeting on February 5, 2009, the Committee discussed thecomposition of the Board, in particular in relation to variouscommonly used independence criteria. The Committee proposed tothe Board of Directors the list of directors to be recommended forappointment by the 2009 Shareholders’ Meeting, which includedthe recommendation of a new independent director. The Committeeproposed to the Board of Directors a resolution to change theby-laws regarding the age limit of the Chairman of the Board to besubmitted to the Shareholders’ Meeting in order to have moreflexibility depending on circumstances.
At its meeting on September 2, 2009, the Committee discussed thechanges in the composition of the Board of Directors to beanticipated in 2010 in order to strengthen the diversity of the Boardand the share of independent directors.
The Committee evaluated the independence of the directors andmade a list of independent directors as of December 31, 2009.
It also reviewed the working procedures of the Board of Directorsand proposed to the Board that it carries out a self-evaluation, withthe assistance of a consulting agency.
� Board of Directors practices
At its meeting on February 10, 2010, the Board of Directorsdiscussed the results of its self-evaluation carried out with theassistance of a consulting agency, which demonstrated that theBoard’s working procedures and the quality of the informationprovided met the Directors’s expectations.
Pursuant to the recommendation of the Nominating & GovernanceCommittee, at its meeting on February 10, 2010, the Boardapproved the suggestions for improvement that were proposed,which were mainly related to the organization of a day for strategicthinking.
� Director independence
At its meeting on February 10, 2010, the Board of Directors, actingon a proposal from the Nominating & Governance Committee,reviewed the independence of the Company’s directors as ofDecember 31, 2009. Also based on the Committee’s proposal, theBoard considered that, pursuant to the AFEP-MEDEF Code, adirector is independent when “he or she has no relationship, of anynature, with the company, its group, or the management of either,that may compromise the exercise of his or her freedom ofjudgement”.
Mrs. Barbizet, Messrs. Artus, Bouton, Collomb, Desmarais,Jacquillat, Mandil, Pébereau, de Rudder, Tchuruk and Lord Leveneof Portsoken were deemed to be independent directors.
These directors meet the criteria set forth in the AFEP-MEDEFCode, with the exception of one individual who has been a directorfor longer than twelve years. For a company that has long-terminvestments and activities, a longer term of office gives experienceand authority, and thereby reinforces the independence ofdirectors. The Board concluded that Mr. Tchuruk, the only directorconcerned by this criterion, should be considered as independent.
Concerning “material” relationships, as a client, supplier,investment or finance banker, between a director and theCompany, the Board deemed that the level of activity betweenGroup companies and the bank at which one of its Directors is anofficer, which is less than 0.1% of its net banking income and lessthan 5% of the Group’s overall assets, represents neither a materialportion of the overall activity of such bank nor a material portion ofthe Group’s external financing. The Board concluded thatMr. Pébereau should be considered as independent.
73% of the directors are independent.
The Board also noted the absence of potential conflicts of interestsbetween the Company and its directors.
� Internal control and riskmanagement
The internal control framework adopted by TOTAL is that of theCommittee of Sponsoring Organizations of the TreadwayCommission (COSO). In this framework, internal control is aprocess intended to provide reasonable assurance that thefollowing will be achieved: effective and efficient operationalcontrol, accurate reporting of financial information, and compliancewith applicable laws and regulations. As for any system for internalcontrol, there can be no guarantee that all risks are completelyeliminated.
/ 101TOTAL
Report of the Chairman of the Board of Directors(Article L. 225-37 of the French Commercial Code)CORPORATE GOVERNANCE
5
As a result, the Group’s internal control procedures are based onthe COSO framework: design and implementation of internalcontrols, risk evaluation process, internal control operation,documentation and reporting internal controls, and supervision ofthe internal control system.
‹ Organization and principles of internalcontrol
The Group’s internal control procedures are designed around anoperating environment with three levels: Group, business segmentsand profit centers. Each level is directly involved in the design andimplementation of internal controls, as determined by the level ofcentralization desired by the Group’s management.
At each of the three levels, internal control procedures are designedto include specific organizational procedures, delegation ofauthority and employee training and education that conform to theGroup’s overall framework.
The principal themes of human resources policy are coordinated atthe Group’s Human Resources Department. Human resources aregenerally managed on a decentralized basis at profit centers.
The design of internal control procedures is based on key valuesthat are deeply rooted in the Group’s control environment, includingthe integrity, ethical conduct and professional competence of itsemployees.
The Group’s values and principles of conduct are formalized anddistributed to employees throughout the Group in the Group’s codeof conduct and ethics charter. The Group’s code of financial ethicsis distributed to financial managers at the corporate and operatinglevels. They are also implemented in codes, procedures andpractical guides governing certain important procedures at theoperating level. These codes explain the Group’s values anddescribe its principles for behavior and conduct with regard toemployees, shareholders, clients, suppliers and competitors. Theymention principles for individual behavior that all employees areexpected to respect and the conduct that is expected in countrieswhere the Group is present.
The Group’s senior management receives regular training on thecontent and the importance of proper conduct, which isdocumented in the code of conduct and available on the Group’swebsite. Each year, the chief executive and financial officers ofprofit centers or subsidiaries provide internal writtenrepresentations to the Chief Financial Officer that they havecomplied with internal control procedures and that the financialreporting under their responsibility is accurate.
The Group’s Ethics Committee has implemented a program toprevent insider trading. This program alerts employees to theirstatus as permanent or temporary insiders and warns them thatthey are prohibited from trading Group securities during certainperiods.
These control principles are part of the corporate governanceframework described above. The Audit Committee is responsiblefor monitoring the efficiency of internal controls systems and risk
management with the assistance of the Internal Audit Departmentand the teams in charge of internal control at the operating level.These rules are designed to allow the Board of Directors to ensurethat internal control is effective and that accurate information isdisclosed to shareholders and financial markets.
‹ Risk evaluation
The Executive Committee, with the assistance of the RiskCommittee, the Budget Management Department and the InternalAudit Department, is responsible for compiling and analyzing theinternal and external risks that could have an impact on the Group’sperformance. This approach is part of a continual process withinthe relevant entities and divisions.
The principal risks monitored at Group level are: sensitivity to the oilmarket environment (oil prices and refining, marketing andpetrochemical margins); exposure to oil and gas trading risks;financial markets risks (foreign exchange risk, particularly related tothe dollar, and interest rate); political and legal risks related to theoperating and contractual environment of the exploration andproduction activities; and industrial and environmental risks relatedto the sectors in which the Group is active.
As regards risks related to the trading of oil and financialinstruments, the relevant departments whose activity is restricted tolimits defined by the Executive Committee, assess on a daily basistheir position and exposition and analyze their market risks using,notably, a value-at-risk technique.
As regards counterparty risks, credit limits and processes toanalyze the credit risk are determined at the level of each line ofbusiness and updated on a regular basis.
The broad range of activities and countries in which the Groupoperates requires analysis on a local level, by business segment, ofthe associated legal, contractual and political risks. Complianceprograms with regards to competition law matters are implementedby the Group to ensure compliance with applicable legislation.
Business units are responsible for the evaluation of their industrialand environmental risks and for the implementation of theregulatory requirements of the countries where these activities arelocated as well as any directive or recommendation in this fielddefined at the Group or division level. TOTAL’s entities are alsoresponsible for actively monitoring developments and complyingwith local and international rules and standards for the evaluationand management of industrial and environmental risks. Riskevaluations lead to the establishment of management measuresthat are designed to prevent and decrease environmental impacts,to minimize the risks of accidents and to limit their consequences.
The “Risk Factors” section (Chapter 4) of this RegistrationDocument contains a formal and extensive description of theprincipal risks faced by the Group and how the Group managesthese risks.
‹ Internal control operations
Internal control procedures, particularly financial reporting systems,are designed to take into account the specific nature of these risksand the degree to which operational control is delegated to thebusiness segments and profit centers.
102 / TOTAL - Registration Document 2009
Report of the Chairman of the Board of Directors(Article L. 225-37 of the French Commercial Code) CORPORATE GOVERNANCE
1 2 3 4 5 6 7 8 9 10 11
Management exercises operational control over the Group’sactivities through the Executive Committee’s approval ofinvestments and commitments for projects, based on definedthresholds. These projects are subject to prior vetting by the RiskCommittee, whose report is presented to the Executive Committee.
Control is primarily based on a strategic plan which is reviewedannually, an annual budget, monthly management financial reportswith in-depth analysis of differences between actual and budgetedexpenditures, and a quarterly reconciliation between consolidatedfinancial statements and management reports. These proceduresare supervised at the Finance Department by the Budget-Management Accounting and the Accounting Departments, and areconducted according to accepted financial reporting methods thatconform to the accounting standards used to publish the Group’saccounts. The financial measures and accounting methods usedallow the accurate measure of risks and return on average capitalemployed (ROACE).
The Group’s Accounting Department centralizes the interpretationand application of accounting standards applicable to the Group’sconsolidated accounts and transmits these standards throughformal procedures and a financial reporting manual. ThisDepartment monitors the effective implementation of standardsthroughout the Group through periodic, formal communication withmanagement at the operating level. This Department alsoperiodically reports any exceptions to the Chief Financial Officer.
The Treasury Department monitors and manages the risks relatedto cash management operations as well as to interest rate relatedand foreign exchange related financial instruments in accordancewith specific rules defined by the Group’s management. Cash andcash equivalents, financial positions and financial instruments arecentralized by the Treasury Department.
Oil and gas reserves are reviewed by a committee of experts (theReserves Committee), approved by the senior management of theExploration & Production division and then confirmed by theGroup’s management.
The Disclosure Committee, whose members are the managers ofthe principal non-operating departments in the Group, establishesand maintains procedures designed to ensure the quality andaccuracy of external communications intended for the public andfinancial markets.
At the profit center and subsidiary level, daily control operations areorganized around the principal operational processes: explorationand reserves, purchasing, capital expenditures, production, sales,oil and gas trading, inventories, human resources, financing andcash management.
The Group has implemented a wide range of procedures andprograms that help to prevent, detect and limit different types offraud. This effort is supported by the principles and conductdescribed in the Group’s code of conduct and in procedures andcodes issued at the operating level. The Group has alsoimplemented an ethics alert system for employees and third partiesto report circumstances that might amount to fraud or otherviolations related to accounting and internal control.
The Information Technology Department has developed anddistributed rules for governance and security that describe therecommended infrastructure, organization and procedures tomaintain information systems that are adapted to the needs of theGroup and to limit information security risks. These rules areimplemented throughout the Group under the responsibility of thevarious operating divisions.
Internal control procedures intended to prevent industrial orenvironmental risks are implemented at the profit centers. Externalcertification or third-party audits are conducted for some of themanagement systems related to this type of risk. More detailedinformation on TOTAL’s actions regarding safety and environmentalconcerns is provided in the separate report entitled Environmentand Society.
‹ Documentation and communication ofinternal control procedures
Internal control procedures are defined at each of the threeoperating levels: general rules at the Group level; sector specificprocedures at the business segment level; and more specificprocedures at the profit center and subsidiary level. Theseprocedures are circulated in memorandum, and are also availableon the intranet sites of the Group and, where applicable, those ofthe business segments.
The principal procedures regarding financial controls established atthe Group level cover acquisitions and disposals, capitalexpenditures, financing and cash management, budgetmanagement and financial reporting. Disclosure controls andprocedures for financial information are in place. At the operatinglevel, procedures, directives or recommendations cover mainlysafety and security (both industrial and information technology),health, environment and sustainable development
The procedures for the business segments primarily concernmanagement supervision specific to each sector. At the profitcenter and subsidiary level, the principles of the Group’s overallframework are implemented through the creation of specificprocedures adapted to the size and context of operations.
‹ Internal control supervision
The holding company, each business segment and the profitcenters and subsidiaries are responsible together for supervisinginternal control by monitoring the elements assigned to each ofthem.
Internal control audits are primarily conducted by the Group AuditDepartment, which reports to the Executive Committee through theChief Administrative Officer. Internal audits are planned annually.The reports from these audits are periodically summarized andpresented to the Audit Committee and, thereby, to the Board ofDirectors.
In 2009, the Group Audit Department employed seventy-fiveprofessionals and conducted nearly 200 audits. The Vice Presidentof Group Internal Audit Department attended all the meetings heldby the Audit Committee and presented internal audit activity on aquarterly basis.
/ 103TOTAL
Report of the Chairman of the Board of Directors(Article L. 225-37 of the French Commercial Code)CORPORATE GOVERNANCE
5
The Group’s management is responsible for implementing andevaluating internal control over financial reporting. In this context,the Group conducted in 2008 an evaluation of the quality ofexecution of the Group’s internal control procedures, based on theCOSO framework, covering the principal entities of the Group. TheGroup, with the assistance of its principal entities and the GroupAudit Department as coordinated by the officer in charge of internalcontrol compliance with regulations related to financial information,also examined and evaluated in 2009 the design and effectivenessof the key operational, information systems and financial controlsrelated to internal control over financial reporting pursuant tosection 404 of the Sarbanes-Oxley Act. Based on this internalevaluation, the Group’s management concluded that internalcontrol over financial reporting was effective.
The statutory auditors perform those verifications of internal controlthat they deem necessary as part of the mission to certify theGroup’s accounts and present their observations to the AuditCommittee.
For the year 2009, the statutory auditors evaluated theimplementation of the Group’s internal control framework and thedesign and execution at its principal entities of the Group’s keyinternal controls over financial reporting. Based on the workperformed, the statutory auditors declared that they had nocomments on the information and conclusions related to thissubject presented in this report.
� Particular conditions regardingparticipation at Shareholders’Meeting
Shareholders’ Meetings are convened and deliberate under theconditions provided for by law. However, pursuant to Article 18 ofthe Company’s by-laws, double voting rights are granted to allregistered shares held continuously in the name of the sameshareholder for at least two years. Article 18 of the Company’sby-laws also provides that at Shareholders’ Meetings, noshareholder may cast, by himself or through his agent, on the basisof the single voting rights attached to the shares he holds directly orindirectly and the shares for which he holds powers, more than10% of the total number of voting rights attached to the Company’sshares. However, if a shareholder holds double voting rights, thislimit may be greater than 10%, but shall not exceed 20%.
For more detailed information on these conditions, see Chapter 8(General Information – Shareholders’ Meetings) of this RegistrationDocument.
� Information mentioned in ArticleL. 225-100-3 of the FrenchCommercial Code
This information is provided in Chapter 8 (General information –Agreements mentioned in Article L. 225-100-3 of the FrenchCommercial Code) of this Registration Document.
� Policy for determining thecompensation and other benefits ofthe Chairman and of the ChiefExecutive Officer
Based on a proposal by the Compensation Committee, the Boardadopted the following policy for determining the compensation andother benefits of the Chairman and of the Chief Executive Officer:
o Compensation and benefits for the Chairman and the ChiefExecutive Officer are set by the Board of Directors afterconsidering proposals from the Compensation Committee. Suchcompensation shall be reasonable and fair, in a context thatvalues both teamwork and motivation within the Company.
Compensation for the Chairman and the Chief Executive Officeris related to market practice, work performed, results achievedand responsibilities held.
o Compensation for the Chairman and the Chief Executive Officerincludes both a fixed portion and a variable portion, each ofwhich is reviewed annually.
o The amount of variable compensation may not exceed a statedpercentage of fixed compensation. Variable compensation isdetermined based on pre-defined quantitative and qualitativecriteria. Quantitative criteria are limited in number, objective,measurable and adapted to the Group’s strategy.
Variable compensation is designed to reward short-termperformance and progress towards medium-term objectives. Thequalitative criteria for variable compensation are designed toallow exceptional circumstances to be taken into account, whenappropriate.
o The Group does not have any specific pension plan for theChairman and the Chief Executive Officer. They are eligible forretirement benefits and pensions available to other employees ofthe Group under conditions determined by the Board.
o Stock options are designed to align the long-term interests of theChairman and the Chief Executive Officer with those of theshareholders.
Awards of stock options are considered in light of the amount ofthe total compensation paid to the Chairman and the ChiefExecutive Officer. The exercise of stock options to which theChairman and the Chief Executive Officer are entitled is subjectto a performance condition.
The exercise price for stock options awarded is not discountedcompared to the market price, at the time of the grant, for theunderlying share.
Stock options are awarded at regular intervals to prevent anyopportunistic behavior.
104 / TOTAL - Registration Document 2009
Report of the Chairman of the Board of Directors(Article L. 225-37 of the French Commercial Code) CORPORATE GOVERNANCE
1 2 3 4 5 6 7 8 9 10 11
The Board has put in place restrictions on the transfer of aportion of shares issued upon the exercise of options.
o After three years in office, the Chairman and Chief ExecutiveOfficer are required to hold at least the number of Companyshares set by the Board.
o The Chairman and Chief Executive Officer do not receiverestricted share grants.
This report, which has been prepared with the assistance of therelevant corporate departments of the Company, has beenapproved by the Board of Directors at its meeting onFebruary 10, 2010, after the Board’s Committees reviewed thesections relevant to their respective duties.
Thierry Desmarest
Chairman of the Board of Directors
/ 105TOTAL
Statutory auditors’ report(Article L. 225-235 of the French Commercial Code)CORPORATE GOVERNANCE
5
� Statutory auditors’ report(Article L. 225-235 of the French Commercial Code)
This is a free translation into English of a report issued in French and is provided solely for the convenience of English-speaking readers. Thisreport should be read in conjunction and construed in accordance with French law and the relevant professional auditing standards applicablein France.
Statutory Auditors’ report, prepared in accordance with Article L. 225-235 of the French Commercial Law (“Code de commerce”), on the reportprepared by the Chairman of the Board of Directors of the Company TOTAL S.A.
Year ended December 31, 2009
To the Shareholders,
In our capacity as Statutory Auditors of TOTAL S.A., and in accordance with Article L. 225-235 of the French Commercial Law (“Code decommerce”), we hereby report on the report prepared by the Chairman of your company in accordance with Article L. 225-37 of the FrenchCommercial Law for the year ended 31 December 2009.
It is the Chairman’s responsibility to prepare, and submit to the Board of Directors for approval, a report on the internal control and riskmanagement procedures implemented by the company and containing the other disclosures required by Article L. 225-37 of the FrenchCommercial Law (“Code de Commerce”) relating especially to corporate governance.
It is our responsibility to:
o report to you on the information contained in the Chairman’s report in respect of the internal control procedures relating to the preparationand processing of the accounting and financial information, and
o attest that this report contains the other disclosures required by Article L. 225-37 of the French Commercial Law (“Code de commerce”), itbeing specified that we are not responsible for verifying the fairness of these other disclosures.
We conducted our work in accordance with professional standards applicable in France.
Information on the internal control procedures relating to the preparation andprocessing of accounting and financial information
These standards require that we perform the necessary procedures to assess the fairness of the information provided in the Chairman’s reportin respect of the internal control procedures relating to the preparation and processing of the accounting and financial information. Theseprocedures consisted mainly in:
o obtaining an understanding of the internal control procedures relating to the preparation and processing of the accounting and financialinformation on which the information presented in the Chairman’s report is based and of the existing documentation;
o obtaining an understanding of the work involved in the preparation of this information and of the existing documentation;
o obtaining an understanding of the evaluation process in place and assessing the quality and appropriateness of its documentation withrespect to the information on the evaluation of internal control procedures;
o determining if any significant weaknesses in the internal control procedures relating to the preparation and processing of the accounting andfinancial information that we would have noted in the course of our engagement are properly disclosed in the Chairman’s report.
On the basis of our work, we have nothing to report on the information in respect of the company’s internal control procedures relating to thepreparation and processing of accounting and financial information contained in the report prepared by the Chairman of the Board inaccordance with Article L. 225-37 of the French Commercial Law (“Code de Commerce”).
106 / TOTAL - Registration Document 2009
1 2 3 4 5 6 7 8 9 10 11
Statutory auditors’ report(Article L. 225-235 of the French Commercial Code) CORPORATE GOVERNANCE
Other information
We hereby attest that the Chairman’s report includes the other disclosures required by Article L. 225-37 of the French Commercial Law (“Codede commerce”).
Paris La Défense, March 31, 2010
The Statutory Auditors
French original signed by
KPMG Audit ERNST & YOUNG AUDITA department of KPMG S.A
Jay Nirsimloo Pascal Macioce
/ 107TOTAL
ManagementCORPORATE GOVERNANCE5
� Management
� General Management
At its meeting on February 13, 2007, the Board of Directors, basedon the recommendation of the Nominating & CompensationCommittee, resolved to have separate individuals serve in thepositions of Chairman of the Board and of Chief Executive Officer ofthe Company to ensure continuity during changes to the Group’smanagement.
The management form selected shall remain in effect until adecision to the contrary is made by the Board of Directors.
� The Executive Committee
The Executive Committee, under the responsibility of the ChiefExecutive Officer, is the primary decision-making body of theGroup. It implements the strategy formulated by the Board ofDirectors and authorizes related investments, subject to theapproval by the Board of Directors for investments exceeding 3%of the Group’s equity.
The following individuals were members of the ExecutiveCommittee as of December 31, 2009:
o Christophe de Margerie, Chairman of the Executive Committee(Chief Executive Officer);
o François Cornélis, Vice Chairman of the Executive Committee(President of the Chemicals segment);
o Michel Bénézit (President of the Refining & Marketing division);
o Yves-Louis Darricarrère (President of the Exploration &Production division);
o Jean-Jacques Guilbaud (Chief Administrative Officer); and
o Patrick de La Chevardière (Chief Financial Officer).
� The Management Committee
The Group Management Committee facilitates coordination amongthe divisions and monitors the operating results and activity reportsof these divisions.
In addition to the members of the Executive Committee, thefollowing eighteen individuals from various non-operatingdepartments and operating divisions served as members of theManagement Committee as of December 31, 2009:
Corporate
René Chappaz, Yves-Marie Dalibard, Peter Herbel, Jean-MarcJaubert, Manoelle Lepoutre, Jean-François Minster, Jean-JacquesMosconi, François Viaud.
Upstream
Marc Blaizot, Philippe Boisseau, Jacques Marraud des Grottes,Patrick Pouyanné.
Downstream
Pierre Barbé, Alain Champeaux, Eric de Menten, BertrandDeroubaix, André Tricoire.
Chemicals
Françoise Leroy.
108 / TOTAL - Registration Document 2009
1 2 3 4 5 6 7 8 9 10 11
Statutory auditors CORPORATE GOVERNANCE
� Statutory auditors
� Statutory auditors
Ernst & Young Audit
41, rue Ybry, 92576 Neuilly-sur-Seine Cedex
Appointed on May 14, 2004 for a 6-year term
P. Macioce
KPMG Audit
A department of KPMG S.A.
1, cours Valmy, 92923 Paris-La Défense
Appointed on May 13, 1998 for a 6-year term
Appointment renewed on May 14, 2004, for an additional 6-yearterm.
J. Nirsimloo
� Alternate auditors
Jean-Luc Decornoy
2 bis, rue de Villiers, 92300 Levallois-Perret
Appointed on May 14, 2004 for a 6-year term
Pierre Jouanne
41, rue Ybry, 92576 Neuilly-sur-Seine Cedex
Appointed on May 14, 2004 for a 6-year term
� Auditor’s term of office
French law provides that the statutory and alternate auditors are appointed for renewable 6-year terms. The terms of office of the statutoryauditors and of the alternate auditors expire at the conclusion of the Shareholders’ Meeting of May 21, 2010.
The renewal of the statutory auditors’ term of office as well as the appointment of alternate auditors will be proposed to this Shareholders’Meeting.
� Fees received by the statutory auditors (including members of their network)
Ernst & Young Audit KPMG Audit
Amount(excluding VAT) %
Amount(excluding VAT) %
(M€) 2009 2008 2009 2008 2009 2008 2009 2008
Audito Audit and certification of the parent company and consolidated
accountsTOTAL S.A.Consolidated subsidiaries
3.314.4
3.314.4
16.572.0
16.170.2
3.512.5
3.512.4
17.161.3
16.959.9
o Other work and services directly related to the responsibilities ofstatutory auditors
TOTAL S.A.Consolidated subsidiaries
0.20.6
0.20.8
1.03.0
1.03.9
1.01.9
1.22.2
4.99.3
5.810.6
Sub-total 18.5 18.7 92.5 91.2 18.9 19.3 92.6 93.2
Other services provided by the network to consolidated subsidiarieso Legal, tax, corporateo Other
1.40.1
1.80.0
7.00.5
8.80.0
1.20.3
1.20.2
5.91.5
5.81.0
Sub-total 1.5 1.8 7.5 8.8 1.5 1.4 7.4 6.8
Total 20.0 20.5 100 100 20.4 20.7 100 100
/ 109TOTAL
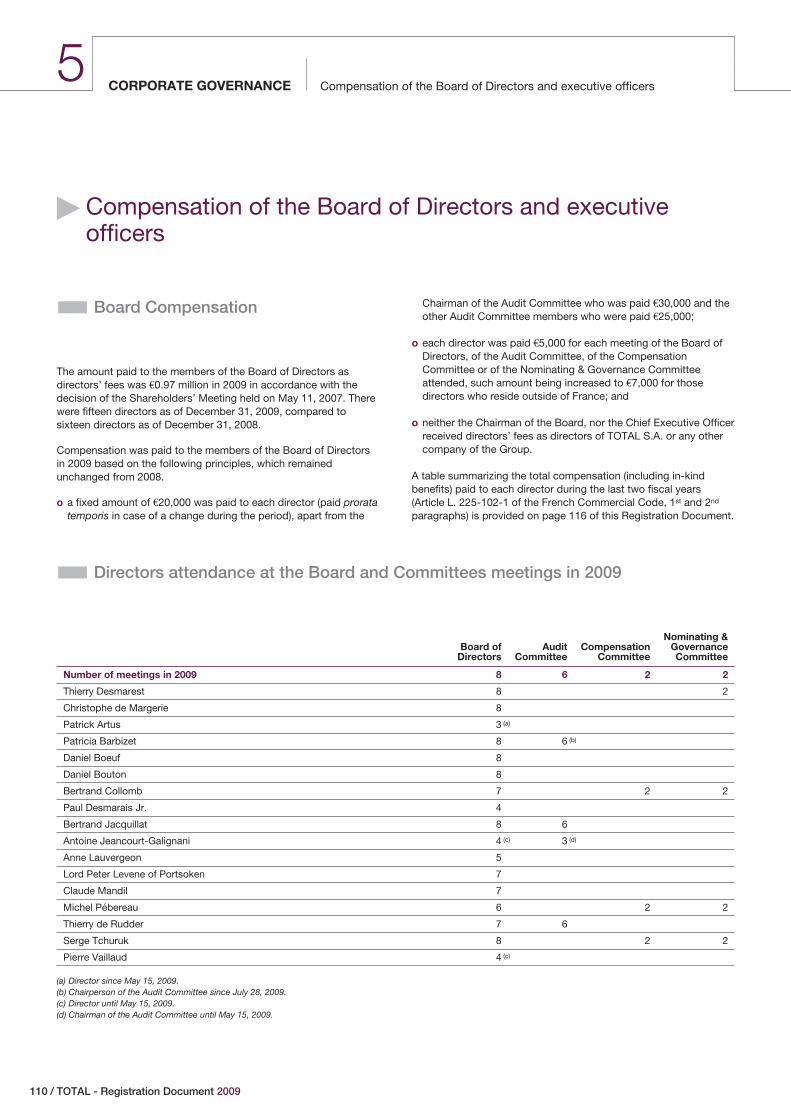
Compensation of the Board of Directors and executive officersCORPORATE GOVERNANCE5
� Compensation of the Board of Directors and executiveofficers
� Board Compensation
The amount paid to the members of the Board of Directors asdirectors’ fees was €0.97 million in 2009 in accordance with thedecision of the Shareholders’ Meeting held on May 11, 2007. Therewere fifteen directors as of December 31, 2009, compared tosixteen directors as of December 31, 2008.
Compensation was paid to the members of the Board of Directorsin 2009 based on the following principles, which remainedunchanged from 2008.
o a fixed amount of €20,000 was paid to each director (paid proratatemporis in case of a change during the period), apart from the
Chairman of the Audit Committee who was paid €30,000 and theother Audit Committee members who were paid €25,000;
o each director was paid €5,000 for each meeting of the Board ofDirectors, of the Audit Committee, of the CompensationCommittee or of the Nominating & Governance Committeeattended, such amount being increased to €7,000 for thosedirectors who reside outside of France; and
o neither the Chairman of the Board, nor the Chief Executive Officerreceived directors’ fees as directors of TOTAL S.A. or any othercompany of the Group.
A table summarizing the total compensation (including in-kindbenefits) paid to each director during the last two fiscal years(Article L. 225-102-1 of the French Commercial Code, 1st and 2nd
paragraphs) is provided on page 116 of this Registration Document.
� Directors attendance at the Board and Committees meetings in 2009
Board ofDirectors
AuditCommittee
CompensationCommittee
Nominating &GovernanceCommittee
Number of meetings in 2009 8 6 2 2
Thierry Desmarest 8 2
Christophe de Margerie 8
Patrick Artus 3 (a)
Patricia Barbizet 8 6 (b)
Daniel Boeuf 8
Daniel Bouton 8
Bertrand Collomb 7 2 2
Paul Desmarais Jr. 4
Bertrand Jacquillat 8 6
Antoine Jeancourt-Galignani 4 (c) 3 (d)
Anne Lauvergeon 5
Lord Peter Levene of Portsoken 7
Claude Mandil 7
Michel Pébereau 6 2 2
Thierry de Rudder 7 6
Serge Tchuruk 8 2 2
Pierre Vaillaud 4 (c)
(a) Director since May 15, 2009.(b) Chairperson of the Audit Committee since July 28, 2009.(c) Director until May 15, 2009.(d) Chairman of the Audit Committee until May 15, 2009.
110 / TOTAL - Registration Document 2009
Compensation of the Board of Directors and executive officers CORPORATE GOVERNANCE
1 2 3 4 5 6 7 8 9 10 11
� Compensation of the Chairman
(See summary tables on pages 115 to 117 of this RegistrationDocument)
The total gross compensation paid to Mr. Desmarest for fiscal 2009was set by the Board of Directors, based upon the proposal of theCompensation Committee. This compensation is composed of afixed base salary of €1,100,000 and a variable portion.
The variable portion is calculated by taking into account theGroup’s return on equity, the Group’s earnings compared to thoseof other major international oil companies, as well as theChairman’s personal contribution to the Group’s strategy, corporategovernance and performance. The variable portion can reach amaximum amount of 100% of the fixed base salary. The objectivesrelated to personal contribution were considered to be mostlyfulfilled, and taking into account the comparison of TOTAL’searnings with the major international oil companies that are itscompetitors, the variable portion paid to the Chairman in 2010 forhis contribution in 2009 amounted to €871,852.
The total gross compensation paid to the Chairman for fiscal year2009 amounted to €1,971,852.
Mr. Thierry Desmarest’s total gross compensation for fiscal 2008,as Chairman of the Board of Directors, amounted to €2,069,430,composed of a fixed base salary of €1,100,000 and a variableportion of €969,430 paid in 2009.
Mr. Desmarest does not receive any in-kind benefits.
� Compensation of the Chief ExecutiveOfficer
(See summary tables on pages 115 to 117 of this RegistrationDocument)
The total gross compensation paid to Mr. de Margerie for fiscal2009 was set by the Board of Directors, based upon the proposal ofthe Compensation Committee. This compensation is composed ofa fixed base salary of €1,310,000 and a variable portion.
The variable portion is calculated by taking into account theGroup’s return on equity, the Group’s earnings compared to thoseof other major international oil companies, as well as the ChiefExecutive Officer’s personal contribution to the Group’s strategy,evaluated on the basis of objective operational criteria related to the
* Member of the Executive Committee
Group’s business segments. The variable portion can reach amaximum amount of 140% of the fixed base salary, which may beincreased up to 165% for exceptional performance. The objectivesrelated to personal contribution were considered to be mostlyfulfilled, and taking into account the comparison of TOTAL’searnings with the major international oil companies that are itscompetitors, the variable portion paid to the Chief Executive Officerin 2010 for his contribution in 2009 amounted to €1,356,991.
The total gross compensation paid to the Chief Executive Officer forfiscal year 2009 amounted to €2,666,991.
Mr. Christophe de Margerie’s total gross compensation for fiscal2008 amounted to €2,802,875, composed of a fixed-base salary of€1,250,000 and a variable portion of €1,552,875 paid in 2009.
Mr. Christophe de Margerie has the use of a company car.
� Executive Officer compensation
In 2009, the aggregate amount paid directly or indirectly by theFrench and foreign affiliates of the Company as compensation tothe executive officers of TOTAL in office as of December 31, 2009(members of the Management Committee and the Treasurer,twenty-five individuals) as a group was €17.1 million, including€8 million paid to the six members of the Executive Committee.Variable compensation accounted for 44.5% of the aggregateamount of €17.1 million paid to executive officers.
The following individuals were executive officers of the Group as ofDecember 31, 2009 (twenty-five individuals compared totwenty-eight individuals as of December 31, 2008):
Management Committee
Christophe de Margerie * Bertrand DeroubaixFrançois Cornélis * Peter HerbelMichel Bénézit * Jean-Marc JaubertYves-Louis Darricarrère * Manoelle LepoutreJean-Jacques Guilbaud * Françoise LeroyPatrick de La Chevardière * Jacques Marraud des GrottesPierre Barbé Éric de MentenMarc Blaizot Jean-François MinsterPhilippe Boisseau Jean-Jacques MosconiAlain Champeaux Patrick PouyannéRené Chappaz André TricoireYves-Marie Dalibard François Viaud
Treasurer
Jérôme Schmitt
/ 111TOTAL
Compensation of the Board of Directors and executive officersCORPORATE GOVERNANCE5
� Pension and other commitments(Article L. 225-102-1, paragraph 3, ofthe French Commercial Code)
1) The Chairman and the Chief Executive Officer, pursuant toapplicable law, are eligible for the French social security benefits,ARRCO (French Association for Complementary PensionSchemes) and AGIRC (French executive pension schemefederation) complementary pensions, RECOSUP (FrenchCollective Supplementary Pension Scheme) defined benefitpension plan, and the supplementary pension plan created by theCompany. This supplementary pension plan, which is not limitedto the Chairman and the Chief Executive Officer, is detailedbelow.
2) The Chairman and the Chief Executive Officer are eligible for asupplementary pension plan open to all employees of the Groupwhose annual compensation is greater than the annual Frenchsocial security threshold multiplied by eight.
This supplementary pension plan is financed and managed byTOTAL S.A. to award a pension that is based on the period ofemployment (up to a limit of twenty years) and the portion ofannual gross compensation (including fixed and variable portions)that exceeds by at least eight times the annual French socialsecurity threshold. This pension is indexed to the ARRCO index.
As of December 31, 2009, the Group’s supplementary pensionobligations related to the Chairman are the equivalent of anannual pension of 26.3% of the Chairman’s 2009 compensation.
For the Chief Executive Officer, the Group’s pension obligationsare, as of December 31, 2009, the equivalent of an annualpension of 18.8% of his 2009 compensation.
3) The Company also funds a life insurance policy which guaranteesa payment, upon death, equal to two years’ compensation (bothfixed and variable), increased to three years upon accidentaldeath, as well as, in case of disability, a payment proportional tothe degree of disability.
4) The Chairman and the Chief Executive Officer are also entitled toretirement benefits equal to those available to eligible membersof the Group under the French National Collective BargainingAgreement for the Petroleum. This benefit amounts to 25% of theannual compensation (including fixed and variable portions) of the12-month period preceding the retirement of the Chairman andthe Chief Executive Officer.
5) If the Chairman or the Chief Executive Officer’s employment isterminated or his term of office is not renewed by the Company,he is eligible for severance benefits equal to two times his grossannual compensation. The calculation will be based on the grosscompensation (including both fixed and variable) paid in the12-month period preceding the termination or the non-renewal ofhis term of office.
The severance benefits to be paid upon a change of control or achange of strategy of the Company are cancelled in the case ofgross negligence or wilful misconduct or if the Chairman or theChief Executive Officer leaves the Company of his own volition,accepts new responsibilities within the Group, or may claim fullretirement benefits within a short time period.
Since Mr. Desmarest is eligible to claim his full retirementbenefits, these provisions are only relevant to Mr. de Margerie.
6) The commitments related to the supplementary pension plan,retirement benefits and severance benefits upon termination ofemployment or term of office are subject to the procedure forregulated agreements set forth in article L. 225-38 of the FrenchCommercial Code.
7) Pursuant to the provisions of the French law of August 21, 2007,which modifies article L. 225-42-1 of the French CommercialCode, the commitments described in items 4) and 5) above aresubject to performance conditions.
These performance conditions are deemed to be met if at leasttwo of the three following criteria are satisfied:
o the average ROE (Return On Equity) over the three yearsimmediately preceding the year in which the officer retires is atleast 12%;
o the average ROACE (Return On Average Capital Employed) overthe three years immediately preceding the year in which theofficer retires is at least 10%;
o The Company’s oil and gas production growth over the threeyears immediately preceding the year in which the officer retiresis greater than or equal to the average production growth ofExxonMobil, Shell, BP and Chevron.
8) In addition, the Company has the following pensioncommitments, (described in paragraph 2, above) as definedunder French law, to Messrs. Tchuruk and Vaillaud:
o The Company has funded an annual supplementary pension forMr. Tchuruk related to his previous employment by the Group ofapproximately €74,379 (December 31, 2009 value) indexed to theARRCO index.
o The Company has funded supplementary pension for Mr. Vaillaudrelated to his previous employment by the Group ofapproximately €53,431 indexed to the ARRCO index.
9) At year end 2009, the total amount of the Group’s pensioncommitments related to the directors of the Group is equal to€28.1 million.
112 / TOTAL - Registration Document 2009
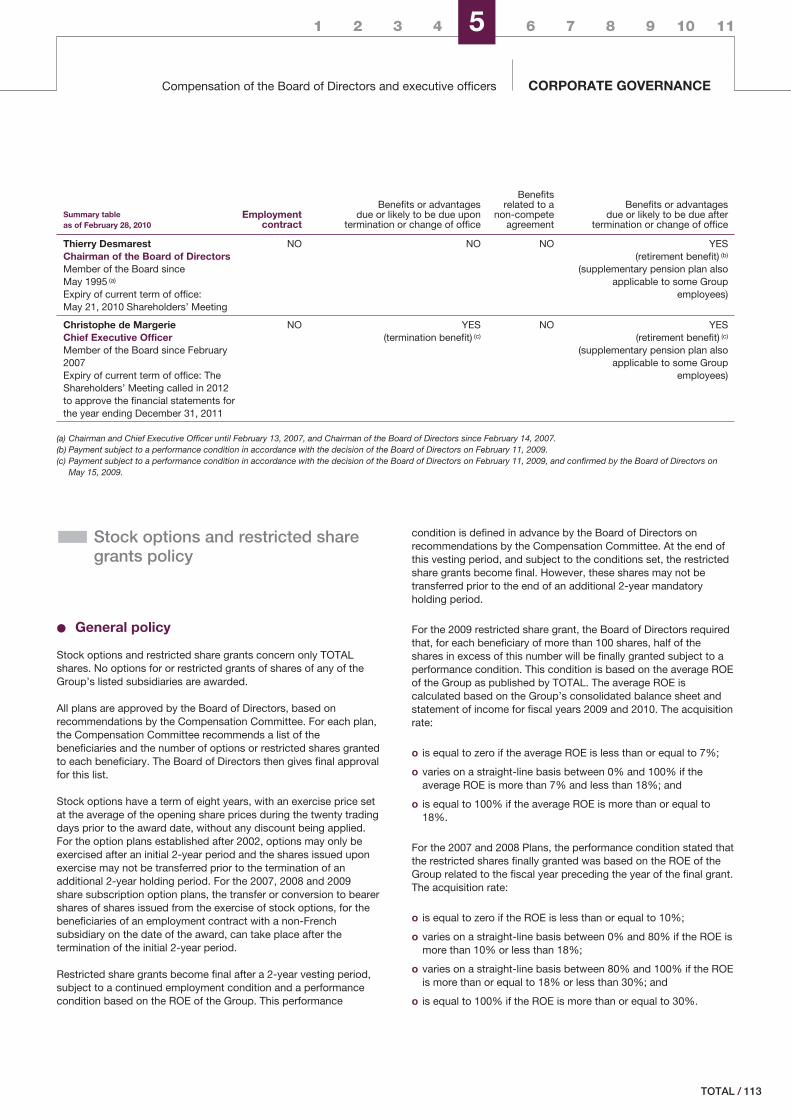
1 2 3 4 5 6 7 8 9 10 11
Compensation of the Board of Directors and executive officers CORPORATE GOVERNANCE
Summary tableas of February 28, 2010
Employmentcontract
Benefits or advantagesdue or likely to be due upon
termination or change of office
Benefitsrelated to a
non-competeagreement
Benefits or advantagesdue or likely to be due after
termination or change of office
Thierry DesmarestChairman of the Board of DirectorsMember of the Board sinceMay 1995 (a)
Expiry of current term of office:May 21, 2010 Shareholders’ Meeting
NO NO NO YES(retirement benefit) (b)
(supplementary pension plan alsoapplicable to some Group
employees)
Christophe de MargerieChief Executive OfficerMember of the Board since February2007Expiry of current term of office: TheShareholders’ Meeting called in 2012to approve the financial statements forthe year ending December 31, 2011
NO YES(termination benefit) (c)
NO YES(retirement benefit) (c)
(supplementary pension plan alsoapplicable to some Group
employees)
(a) Chairman and Chief Executive Officer until February 13, 2007, and Chairman of the Board of Directors since February 14, 2007.(b) Payment subject to a performance condition in accordance with the decision of the Board of Directors on February 11, 2009.(c) Payment subject to a performance condition in accordance with the decision of the Board of Directors on February 11, 2009, and confirmed by the Board of Directors on
May 15, 2009.
� Stock options and restricted sharegrants policy
‹ General policy
Stock options and restricted share grants concern only TOTALshares. No options for or restricted grants of shares of any of theGroup’s listed subsidiaries are awarded.
All plans are approved by the Board of Directors, based onrecommendations by the Compensation Committee. For each plan,the Compensation Committee recommends a list of thebeneficiaries and the number of options or restricted shares grantedto each beneficiary. The Board of Directors then gives final approvalfor this list.
Stock options have a term of eight years, with an exercise price setat the average of the opening share prices during the twenty tradingdays prior to the award date, without any discount being applied.For the option plans established after 2002, options may only beexercised after an initial 2-year period and the shares issued uponexercise may not be transferred prior to the termination of anadditional 2-year holding period. For the 2007, 2008 and 2009share subscription option plans, the transfer or conversion to bearershares of shares issued from the exercise of stock options, for thebeneficiaries of an employment contract with a non-Frenchsubsidiary on the date of the award, can take place after thetermination of the initial 2-year period.
Restricted share grants become final after a 2-year vesting period,subject to a continued employment condition and a performancecondition based on the ROE of the Group. This performance
condition is defined in advance by the Board of Directors onrecommendations by the Compensation Committee. At the end ofthis vesting period, and subject to the conditions set, the restrictedshare grants become final. However, these shares may not betransferred prior to the end of an additional 2-year mandatoryholding period.
For the 2009 restricted share grant, the Board of Directors requiredthat, for each beneficiary of more than 100 shares, half of theshares in excess of this number will be finally granted subject to aperformance condition. This condition is based on the average ROEof the Group as published by TOTAL. The average ROE iscalculated based on the Group’s consolidated balance sheet andstatement of income for fiscal years 2009 and 2010. The acquisitionrate:
o is equal to zero if the average ROE is less than or equal to 7%;
o varies on a straight-line basis between 0% and 100% if theaverage ROE is more than 7% and less than 18%; and
o is equal to 100% if the average ROE is more than or equal to18%.
For the 2007 and 2008 Plans, the performance condition stated thatthe restricted shares finally granted was based on the ROE of theGroup related to the fiscal year preceding the year of the final grant.The acquisition rate:
o is equal to zero if the ROE is less than or equal to 10%;
o varies on a straight-line basis between 0% and 80% if the ROE ismore than 10% or less than 18%;
o varies on a straight-line basis between 80% and 100% if the ROEis more than or equal to 18% or less than 30%; and
o is equal to 100% if the ROE is more than or equal to 30%.
/ 113TOTAL
Compensation of the Board of Directors and executive officersCORPORATE GOVERNANCE5
The grant of these options or restricted shares is used tocomplement, based upon individual performance assessments atthe time of each plan, the Group-wide policy of developingemployee shareholding (including savings plans, and capitalincreases reserved for employees) which allows employees to bemore closely associated with the financial and share priceperformance of TOTAL (see pages 128 and 131 of this RegistrationDocument).
‹ Grants to the Chairman, the Chief ExecutiveOfficer and executive officers
Pursuant to the provisions of French law No. 2006-1770 ofDecember 30, 2006, the Board of Directors decided that, for the2007, 2008 and 2009 share subscription option plans, the Chairmanof the Board and the Chief Executive Officer will have to hold anumber of TOTAL shares representing 50% of the capital gains, netof tax and related contributions, resulting from the exercise of stockoptions under these plans. Once the Chairman and the ChiefExecutive Officer hold a number of shares (including shares orinterests in collective investment funds invested in Companysecurities) corresponding to more than five times their current grossannual fixed salary, this holding requirement will be reduced to10%. If in the future this ratio is no longer met, the previous 50%holding requirement will once again apply.
The Chairman of the Board of Directors was not granted any sharesubscription options under the 2008 and 2009 plans.
In addition, the Chairman of the Board of Directors and the ChiefExecutive Officer were not granted any restricted shares under the2006, 2007, 2008 and 2009 plans.
As part of the 2009 share subscription option plan, the Board ofDirectors required that, for the Chief Executive Officer, the numberof share subscription options finally granted will be subject to twoperformance conditions:
o For 50% of the share subscription options granted, the firstperformance condition states that the number of options finallygranted is based on the average ROE of the Group as publishedby TOTAL. The average ROE is calculated based on the Group’sconsolidated balance sheet and statement of income for fiscalyears 2009 and 2010. The acquisition rate is equal to zero if theaverage ROE is less than or equal to 7%, varies on a straight-linebasis between 0% and 100% if the average ROE is more than7% and less than
18%; and is equal to 100% if the average ROE is more than orequal to 18%.
o For 50% of the share subscription options granted, the secondperformance condition states that the number of options finallygranted is related to the average ROACE of the Group aspublished by TOTAL. The average ROACE is calculated based onthe Group’s consolidated balance sheet and statement of incomefor fiscal years 2009 and 2010. The acquisition rate is equal tozero if the average ROACE is less than or equal to 6%, varies ona straight-line basis between 0% and 100% if the averageROACE is more than 6% and less than 15%, and is equal to100% if the average ROACE is more than or equal to 15%.
In addition, as part of the 2009 share subscription option plan, theBoard of Directors required that for each beneficiary other than theCEO of more than 25,000 options, one third of the options grantedin excess of this number will be finally granted subject to aperformance condition. This condition is based on the average ROEof the Group as published by TOTAL. The average ROE iscalculated based on the Group’s consolidated balance sheet andstatement of income for fiscal years 2009 and 2010. The acquisitionrate:
o is equal to zero if the average ROE is less than or equal to 7%;
o varies on a straight-line basis between 0% and 100% if theaverage ROE is more than 7% and less than 18%; and
o is equal to 100% if the average ROE is more than or equal to18%.
As part of the 2007 and 2008 share subscription option plans, theBoard required that, for each beneficiary of more than 25,000options, one third of the options granted in excess of this numberbe subject to a performance condition. This performance conditionstates that the final acquisition rate is based on the ROE of theGroup. The ROE is calculated based on the consolidated accountspublished by TOTAL and related to the fiscal year preceding thefinal grant. The acquisition rate:
o is equal to zero if the ROE is less than or equal to 10%;
o varies on a straight-line basis between 0% and 80% if the ROE ismore than 10% or less than 18%;
o varies on a straight-line basis between 80% and 100% if the ROEis more than or equal to 18% or less than 30%; and
o is equal to 100% if the ROE is more than or equal to 30%.
114 / TOTAL - Registration Document 2009
1 2 3 4 5 6 7 8 9 10 11
Compensation of the Board of Directors and executive officers CORPORATE GOVERNANCE
� Summary table for the Chairman and the Chief Executive Officer(AFEP-MEDEF Code for corporate governance of listed companies)
‹ Summary of compensation, stock options and restricted shares granted to the Chairman and theChief Executive Officer
For the year ended December 31,(€) 2009 2008
Thierry DesmarestChairman of the Board of DirectorsCompensation (a) 1,971,852 2,069,430Value of options granted (b) – –Value of restricted shares granted (c) – –
Total 1,971,852 2,069,430
Christophe de MargerieChief Executive OfficerCompensation (a) 2,673,771 2,808,395Value of options granted (d) 1,676,000 998,000Value of restricted shares granted (c) – –
Total 4,349,771 3,806,395
(a) Compensation detailed in the following table.(b) The Chairman of the Board was not granted any share subscription options as part of the 2008 and 2009 plans.(c) The Chairman and Chief Executive Officer were not granted any restricted shares as part of the 2008 and 2009 plans.(d) Options granted in 2009 are detailed on page 116 of this Registration Document. The value of options granted was calculated on the day they were granted using the Black-
Scholes model based on the assumptions used for the consolidated accounts (see Note 25 to the Consolidated Financial Statement).
‹ Compensation of the Chairman and the Chief Executive Officer
For the year ended 2009 For the year ended 2008
(€) Amount due for 2009 Amount paid in 2009 (a)Amount due for
2008 Amount paid in 2008 (a)
Thierry DesmarestChairman of the Board of DirectorsFixed compensation 1,100,000 1,100,000 1,100,000 1,100,000Variable compensation (b) 871,852 969,430 969,430 1,112,199Extraordinary compensation – – – –Directors’ fees – – – –In-kind benefits – – – –
Total 1,971,852 2,069,430 2,069,430 2,212,199
Christophe de MargerieChief Executive OfficerFixed compensation 1,310,000 1,310,000 1,250,000 1,250,000Variable compensation (c) 1,356,991 1,552,875 1,552,875 1,496,335Extraordinary compensation – – – –Directors’ fees – – – –In-kind benefits (d) 6,780 6,780 5,520 5,520
Total 2,673,771 2,869,655 2,808,395 2,751,855
(a) Variable portion paid for prior fiscal year.(b) The variable portion for the Chairman is calculated by taking into account the Group’s return on equity during the relevant fiscal year, the Group’s earnings compared to
those of other major international oil companies, as well as the Chairman’s personal contribution to the Group strategy, corporate governance and performance. The variableportion can reach a maximum amount of 100% of the fixed base salary. The objectives related to personal contribution were considered to be mostly met in 2009.
(c) The variable portion for the Chief Executive Officer is calculated by taking into account the Group’s return on equity during the relevant fiscal year, the Group’s earningscompared to those of other major international oil companies as well as the Chief Executive Officer’s personal contribution based on operational target criteria. The variableportion can reach a maximum amount of 140% of the fixed base salary, which may be increased up to 165% for exceptional performance. The objectives related to personalcontribution were considered to be mostly met in 2009.
(d) Mr. de Margerie has the use of a company car.
/ 115TOTAL
Compensation of the Board of Directors and executive officersCORPORATE GOVERNANCE5
‹ Directors’ fees and other compensation received by directors
Total compensation (including in-kind benefits) paid to each director in the year indicated (Article L. 225-102-1 of the French CommercialCode, 1st and 2nd paragraphs)
(€) 2009 2008
Thierry Desmarest (a) (a)
Christophe de Margerie (a) (a)
Patrick Artus 27,656 (b) –Patricia Barbizet 94,192 (c) 39,651 (d)
Daniel Boeuf 272,143 (e) 173,910 (e)
Daniel Bouton 60,000 40,000Bertrand Collomb 75,000 55,000Paul Desmarais Jr. 48,000 48,000Bertrand Jacquillat 95,000 90,000Antoine Jeancourt-Galignani 46,013 (f) (g) 95,000Anne Lauvergeon 45,000 45,000Peter Levene of Portsoken 69,000 41,000Claude Mandil 55,000 27,568 (d)
Michel Pébereau 70,000 70,000Thierry de Rudder 116,000 116,000Serge Tchuruk 154,379 (h) 143,427 (h)
Pierre Vaillaud 80,773 (f) (i) 186,873 (i)
(a) For the Chairman of the Board of Directors and the Chief Executive Officer, see summary tables of compensation provided on pages 115 to 117 of this RegistrationDocument. Thierry Desmarest and Christophe de Margerie received no directors’ fees for their service on the Company’s Board of Directors.
(b) Appointed as a director on May 15, 2009.(c) Chairperson of the Audit Committee since July 28, 2009.(d) Appointed as a director on May 16, 2008.(a) Including the compensation received from Total Raffinage Marketing (a subsidiary of TOTAL S.A.), representing €123,910.48 in 2008 and €212,143 in 2009.(f) Director until May 15, 2009.(g) Chairman of the Audit Committee until May 15, 2009.(h) Including pension payments related to previous employment by the Group, which amounted to €73,427 in 2008 and €74,379 in 2009.(i) Including pension payments related to previous employment by the Group, which amounted to €141,873 in 2008 and €53,431 in 2009.
Over the past two years, the directors currently in office have not received any compensation or in-kind benefits from companies controlled byTOTAL S.A., except for Mr. Daniel Boeuf, who is an employee of Total Raffinage Marketing. The compensation indicated in the table above(except for that of the Chairman, the Chief Executive Officer and Messrs. Boeuf, Tchuruk and Vaillaud) consists solely of directors’ fees (grossamount) paid during the relevant period. None of the Directors of TOTAL S.A. have service contracts which provide for benefits upontermination of employment.
‹ Stock options granted in 2009 to the Chairman and the Chief Executive Officer
Date of planType ofoptions
Value ofoptions (€) (a)
Number ofoptionsgranted
during fiscalyear (b)
Exerciseprice (€)
Exerciseperiod
Thierry DesmarestChairman of the Board of Directors
2009 Plan09/15/2009
Subscriptionoptions
– – – –
Total – –
Christophe de MargerieChief Executive Officer
2009 Plan09/15/2009
Subscriptionoptions
1,676,000 200,000 39.90 09/16/201109/15/2017
Total 1,676,000 200,000
Detailed stock option plans for the Chairman and the Chief Executive Officer are provided on pages 121 and 122 of this RegistrationDocument.
(a) The value of options granted was calculated on the day they were granted using the Black-Scholes model based on the assumptions used for the consolidated accounts (seeNote 25 to the Consolidated Financial Statement).
(b) As part of the share subscription option plan awarded on September 15, 2009, the Board of Directors required that, for the Chief Executive Officer, the number of sharesubscription options finally granted after a 2-year vesting period will be subject to performance conditions (see page 114 of this Registration Document).
116 / TOTAL - Registration Document 2009
1 2 3 4 5 6 7 8 9 10 11
Compensation of the Board of Directors and executive officers CORPORATE GOVERNANCE
‹ Stock options exercised in 2009 by the Chairman and the Chief Executive Officer
Detailed stock option plans for the Chairman and the Chief Executive Officer are provided on pages 121 and 122 of this RegistrationDocument.
Date of plan
Number of optionsexercised during
fiscal year Exercise price (€)
Thierry DesmarestChairman of the Board of Directors
2002 Plan07/09/2002
45,000 39.03
Total 45,000
Christophe de Margerie – – –Chief Executive Officer – – –
Total –
‹ Restricted share grants awarded in 2009 to the Chairman, the Chief Executive Officer or anydirector (conditional award)
Date of plan
Numberof shares
grantedduring fiscal
year
Value ofshares
granted (€)Acquisition
dateAvailability
datePerformance
condition
Thierry DesmarestChairman of the Board of Directors
2009 Plan09/15/2009
– – – – –
Christophe de MargerieChief Executive Officer
2009 Plan09/15/2009
– – – – –
Daniel BoeufDirector representing the employee shareholders
2009 Plan09/15/2009
– – – – –
Total – –
‹ Restricted shares finally granted in 2009 to the Chairman, the Chief Executive Officer or anydirector
Date of plan
Number of sharesfinally granted
during fiscal year (a)
Acquisitioncondition
Thierry DesmarestChairman of the Board of Directors
2007 Plan07/17/2007
– –
Christophe de MargerieChief Executive Officer
2007 Plan07/17/2007
– –
Daniel BoeufDirector representing the employee shareholders
2007 Plan07/17/2007
432 (b)
Total 432
(a) Shares finally granted to the beneficiaries after a 2-year vesting period, i.e. on July 18, 2009.(b) The acquisition rate, connected to the performance condition, was 100% (see page 125 of this Registration Document). Moreover, the transfer of the restricted shares finally
granted will only be permitted after the end of a 2-year mandatory holding period, i.e. from July 18, 2011.
/ 117TOTAL
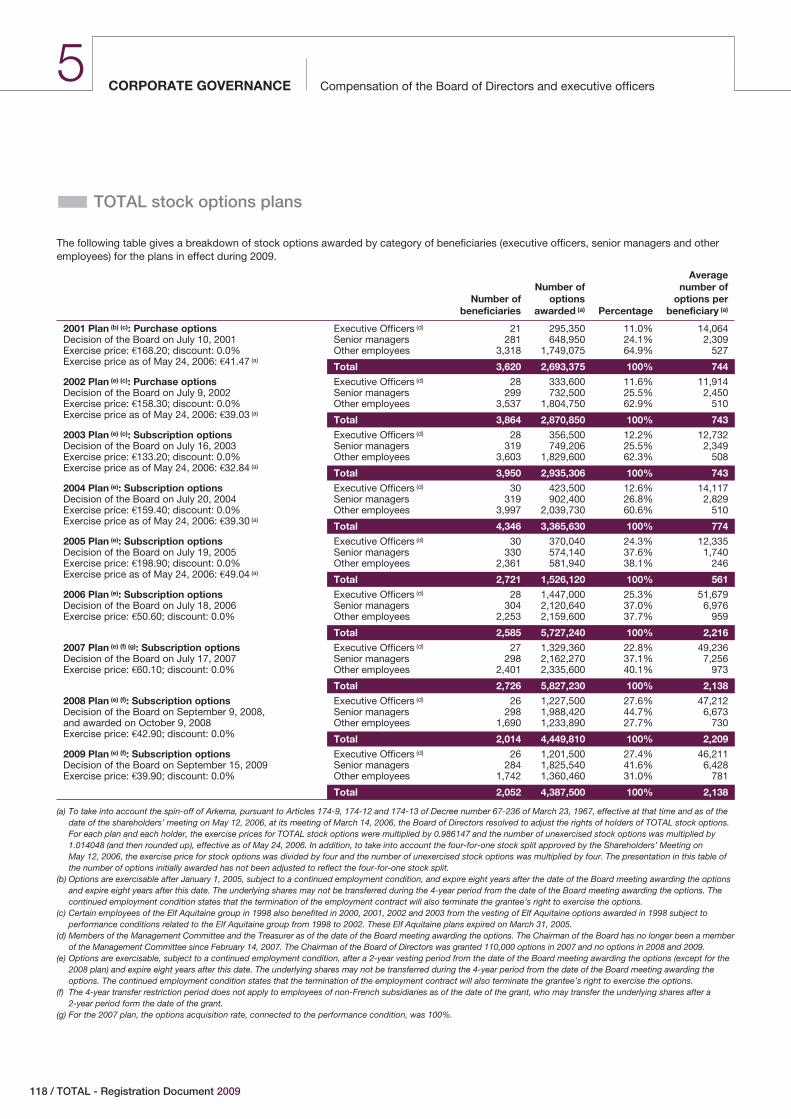
Compensation of the Board of Directors and executive officersCORPORATE GOVERNANCE5
� TOTAL stock options plans
The following table gives a breakdown of stock options awarded by category of beneficiaries (executive officers, senior managers and otheremployees) for the plans in effect during 2009.
Number ofbeneficiaries
Number ofoptions
awarded (a) Percentage
Averagenumber of
options perbeneficiary (a)
2001 Plan (b) (c): Purchase optionsDecision of the Board on July 10, 2001Exercise price: €168.20; discount: 0.0%Exercise price as of May 24, 2006: €41.47 (a)
Executive Officers (d) 21 295,350 11.0% 14,064Senior managers 281 648,950 24.1% 2,309Other employees 3,318 1,749,075 64.9% 527
Total 3,620 2,693,375 100% 744
2002 Plan (e) (c): Purchase optionsDecision of the Board on July 9, 2002Exercise price: €158.30; discount: 0.0%Exercise price as of May 24, 2006: €39.03 (a)
Executive Officers (d) 28 333,600 11.6% 11,914Senior managers 299 732,500 25.5% 2,450Other employees 3,537 1,804,750 62.9% 510
Total 3,864 2,870,850 100% 743
2003 Plan (e) (c): Subscription optionsDecision of the Board on July 16, 2003Exercise price: €133.20; discount: 0.0%Exercise price as of May 24, 2006: €32.84 (a)
Executive Officers (d) 28 356,500 12.2% 12,732Senior managers 319 749,206 25.5% 2,349Other employees 3,603 1,829,600 62.3% 508
Total 3,950 2,935,306 100% 743
2004 Plan (e): Subscription optionsDecision of the Board on July 20, 2004Exercise price: €159.40; discount: 0.0%Exercise price as of May 24, 2006: €39.30 (a)
Executive Officers (d) 30 423,500 12.6% 14,117Senior managers 319 902,400 26.8% 2,829Other employees 3,997 2,039,730 60.6% 510
Total 4,346 3,365,630 100% 774
2005 Plan (e): Subscription optionsDecision of the Board on July 19, 2005Exercise price: €198.90; discount: 0.0%Exercise price as of May 24, 2006: €49.04 (a)
Executive Officers (d) 30 370,040 24.3% 12,335Senior managers 330 574,140 37.6% 1,740Other employees 2,361 581,940 38.1% 246
Total 2,721 1,526,120 100% 561
2006 Plan (e): Subscription optionsDecision of the Board on July 18, 2006Exercise price: €50.60; discount: 0.0%
Executive Officers (d) 28 1,447,000 25.3% 51,679Senior managers 304 2,120,640 37.0% 6,976Other employees 2,253 2,159,600 37.7% 959
Total 2,585 5,727,240 100% 2,216
2007 Plan (e) (f) (g): Subscription optionsDecision of the Board on July 17, 2007Exercise price: €60.10; discount: 0.0%
Executive Officers (d) 27 1,329,360 22.8% 49,236Senior managers 298 2,162,270 37.1% 7,256Other employees 2,401 2,335,600 40.1% 973
Total 2,726 5,827,230 100% 2,138
2008 Plan (e) (f): Subscription optionsDecision of the Board on September 9, 2008,and awarded on October 9, 2008Exercise price: €42.90; discount: 0.0%
Executive Officers (d) 26 1,227,500 27.6% 47,212Senior managers 298 1,988,420 44.7% 6,673Other employees 1,690 1,233,890 27.7% 730
Total 2,014 4,449,810 100% 2,209
2009 Plan (e) (f): Subscription optionsDecision of the Board on September 15, 2009Exercise price: €39.90; discount: 0.0%
Executive Officers (d) 26 1,201,500 27.4% 46,211Senior managers 284 1,825,540 41.6% 6,428Other employees 1,742 1,360,460 31.0% 781
Total 2,052 4,387,500 100% 2,138
(a) To take into account the spin-off of Arkema, pursuant to Articles 174-9, 174-12 and 174-13 of Decree number 67-236 of March 23, 1967, effective at that time and as of thedate of the shareholders’ meeting on May 12, 2006, at its meeting of March 14, 2006, the Board of Directors resolved to adjust the rights of holders of TOTAL stock options.For each plan and each holder, the exercise prices for TOTAL stock options were multiplied by 0.986147 and the number of unexercised stock options was multiplied by1.014048 (and then rounded up), effective as of May 24, 2006. In addition, to take into account the four-for-one stock split approved by the Shareholders’ Meeting onMay 12, 2006, the exercise price for stock options was divided by four and the number of unexercised stock options was multiplied by four. The presentation in this table ofthe number of options initially awarded has not been adjusted to reflect the four-for-one stock split.
(b) Options are exercisable after January 1, 2005, subject to a continued employment condition, and expire eight years after the date of the Board meeting awarding the optionsand expire eight years after this date. The underlying shares may not be transferred during the 4-year period from the date of the Board meeting awarding the options. Thecontinued employment condition states that the termination of the employment contract will also terminate the grantee’s right to exercise the options.
(c) Certain employees of the Elf Aquitaine group in 1998 also benefited in 2000, 2001, 2002 and 2003 from the vesting of Elf Aquitaine options awarded in 1998 subject toperformance conditions related to the Elf Aquitaine group from 1998 to 2002. These Elf Aquitaine plans expired on March 31, 2005.
(d) Members of the Management Committee and the Treasurer as of the date of the Board meeting awarding the options. The Chairman of the Board has no longer been a memberof the Management Committee since February 14, 2007. The Chairman of the Board of Directors was granted 110,000 options in 2007 and no options in 2008 and 2009.
(e) Options are exercisable, subject to a continued employment condition, after a 2-year vesting period from the date of the Board meeting awarding the options (except for the2008 plan) and expire eight years after this date. The underlying shares may not be transferred during the 4-year period from the date of the Board meeting awarding theoptions. The continued employment condition states that the termination of the employment contract will also terminate the grantee’s right to exercise the options.
(f) The 4-year transfer restriction period does not apply to employees of non-French subsidiaries as of the date of the grant, who may transfer the underlying shares after a2-year period form the date of the grant.
(g) For the 2007 plan, the options acquisition rate, connected to the performance condition, was 100%.
118 / TOTAL - Registration Document 2009
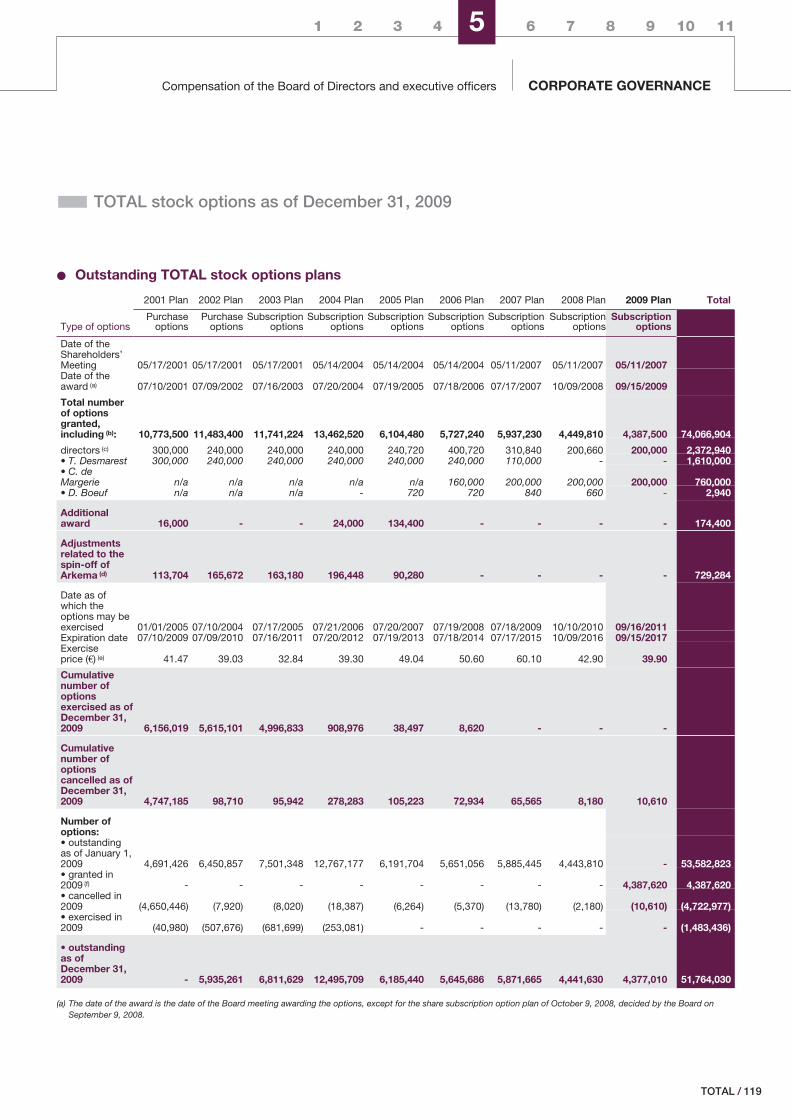
1 2 3 4 5 6 7 8 9 10 11
Compensation of the Board of Directors and executive officers CORPORATE GOVERNANCE
� TOTAL stock options as of December 31, 2009
‹ Outstanding TOTAL stock options plans
2001 Plan 2002 Plan 2003 Plan 2004 Plan 2005 Plan 2006 Plan 2007 Plan 2008 Plan 2009 Plan Total
Type of optionsPurchase
optionsPurchase
optionsSubscription
optionsSubscription
optionsSubscription
optionsSubscription
optionsSubscription
optionsSubscription
optionsSubscription
options
Date of theShareholders’Meeting 05/17/2001 05/17/2001 05/17/2001 05/14/2004 05/14/2004 05/14/2004 05/11/2007 05/11/2007 05/11/2007Date of theaward (a) 07/10/2001 07/09/2002 07/16/2003 07/20/2004 07/19/2005 07/18/2006 07/17/2007 10/09/2008 09/15/2009
Total numberof optionsgranted,including (b): 10,773,500 11,483,400 11,741,224 13,462,520 6,104,480 5,727,240 5,937,230 4,449,810 4,387,500 74,066,904
directors (c) 300,000 240,000 240,000 240,000 240,720 400,720 310,840 200,660 200,000 2,372,940• T. Desmarest 300,000 240,000 240,000 240,000 240,000 240,000 110,000 - - 1,610,000• C. deMargerie n/a n/a n/a n/a n/a 160,000 200,000 200,000 200,000 760,000• D. Boeuf n/a n/a n/a - 720 720 840 660 - 2,940
Additionalaward 16,000 - - 24,000 134,400 - - - - 174,400
Adjustmentsrelated to thespin-off ofArkema (d) 113,704 165,672 163,180 196,448 90,280 - - - - 729,284
Date as ofwhich theoptions may beexercised 01/01/2005 07/10/2004 07/17/2005 07/21/2006 07/20/2007 07/19/2008 07/18/2009 10/10/2010 09/16/2011Expiration date 07/10/2009 07/09/2010 07/16/2011 07/20/2012 07/19/2013 07/18/2014 07/17/2015 10/09/2016 09/15/2017Exerciseprice (€) (e) 41.47 39.03 32.84 39.30 49.04 50.60 60.10 42.90 39.90
Cumulativenumber ofoptionsexercised as ofDecember 31,2009 6,156,019 5,615,101 4,996,833 908,976 38,497 8,620 - - -
Cumulativenumber ofoptionscancelled as ofDecember 31,2009 4,747,185 98,710 95,942 278,283 105,223 72,934 65,565 8,180 10,610
Number ofoptions:• outstandingas of January 1,2009 4,691,426 6,450,857 7,501,348 12,767,177 6,191,704 5,651,056 5,885,445 4,443,810 - 53,582,823• granted in2009 (f) - - - - - - - - 4,387,620 4,387,620• cancelled in2009 (4,650,446) (7,920) (8,020) (18,387) (6,264) (5,370) (13,780) (2,180) (10,610) (4,722,977)• exercised in2009 (40,980) (507,676) (681,699) (253,081) - - - - - (1,483,436)
• outstandingas ofDecember 31,2009 - 5,935,261 6,811,629 12,495,709 6,185,440 5,645,686 5,871,665 4,441,630 4,377,010 51,764,030
(a) The date of the award is the date of the Board meeting awarding the options, except for the share subscription option plan of October 9, 2008, decided by the Board onSeptember 9, 2008.
/ 119TOTAL
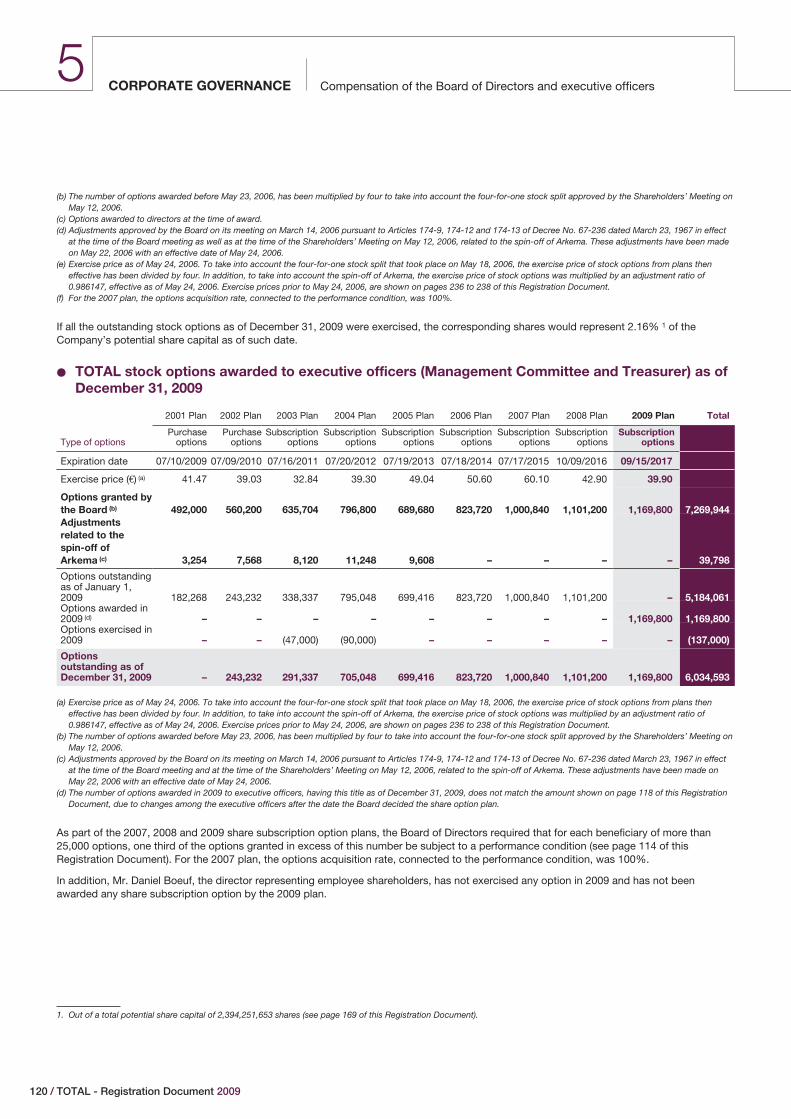
Compensation of the Board of Directors and executive officersCORPORATE GOVERNANCE5
(b) The number of options awarded before May 23, 2006, has been multiplied by four to take into account the four-for-one stock split approved by the Shareholders’ Meeting onMay 12, 2006.
(c) Options awarded to directors at the time of award.(d) Adjustments approved by the Board on its meeting on March 14, 2006 pursuant to Articles 174-9, 174-12 and 174-13 of Decree No. 67-236 dated March 23, 1967 in effect
at the time of the Board meeting as well as at the time of the Shareholders’ Meeting on May 12, 2006, related to the spin-off of Arkema. These adjustments have been madeon May 22, 2006 with an effective date of May 24, 2006.
(e) Exercise price as of May 24, 2006. To take into account the four-for-one stock split that took place on May 18, 2006, the exercise price of stock options from plans theneffective has been divided by four. In addition, to take into account the spin-off of Arkema, the exercise price of stock options was multiplied by an adjustment ratio of0.986147, effective as of May 24, 2006. Exercise prices prior to May 24, 2006, are shown on pages 236 to 238 of this Registration Document.
(f) For the 2007 plan, the options acquisition rate, connected to the performance condition, was 100%.
If all the outstanding stock options as of December 31, 2009 were exercised, the corresponding shares would represent 2.16% 1 of theCompany’s potential share capital as of such date.
‹ TOTAL stock options awarded to executive officers (Management Committee and Treasurer) as ofDecember 31, 2009
2001 Plan 2002 Plan 2003 Plan 2004 Plan 2005 Plan 2006 Plan 2007 Plan 2008 Plan 2009 Plan Total
Type of optionsPurchase
optionsPurchase
optionsSubscription
optionsSubscription
optionsSubscription
optionsSubscription
optionsSubscription
optionsSubscription
optionsSubscription
options
Expiration date 07/10/2009 07/09/2010 07/16/2011 07/20/2012 07/19/2013 07/18/2014 07/17/2015 10/09/2016 09/15/2017
Exercise price (€) (a) 41.47 39.03 32.84 39.30 49.04 50.60 60.10 42.90 39.90
Options granted bythe Board (b) 492,000 560,200 635,704 796,800 689,680 823,720 1,000,840 1,101,200 1,169,800 7,269,944Adjustmentsrelated to thespin-off ofArkema (c) 3,254 7,568 8,120 11,248 9,608 – – – – 39,798
Options outstandingas of January 1,2009 182,268 243,232 338,337 795,048 699,416 823,720 1,000,840 1,101,200 – 5,184,061Options awarded in2009 (d) – – – – – – – – 1,169,800 1,169,800Options exercised in2009 – – (47,000) (90,000) – – – – – (137,000)
Optionsoutstanding as ofDecember 31, 2009 – 243,232 291,337 705,048 699,416 823,720 1,000,840 1,101,200 1,169,800 6,034,593
(a) Exercise price as of May 24, 2006. To take into account the four-for-one stock split that took place on May 18, 2006, the exercise price of stock options from plans theneffective has been divided by four. In addition, to take into account the spin-off of Arkema, the exercise price of stock options was multiplied by an adjustment ratio of0.986147, effective as of May 24, 2006. Exercise prices prior to May 24, 2006, are shown on pages 236 to 238 of this Registration Document.
(b) The number of options awarded before May 23, 2006, has been multiplied by four to take into account the four-for-one stock split approved by the Shareholders’ Meeting onMay 12, 2006.
(c) Adjustments approved by the Board on its meeting on March 14, 2006 pursuant to Articles 174-9, 174-12 and 174-13 of Decree No. 67-236 dated March 23, 1967 in effectat the time of the Board meeting and at the time of the Shareholders’ Meeting on May 12, 2006, related to the spin-off of Arkema. These adjustments have been made onMay 22, 2006 with an effective date of May 24, 2006.
(d) The number of options awarded in 2009 to executive officers, having this title as of December 31, 2009, does not match the amount shown on page 118 of this RegistrationDocument, due to changes among the executive officers after the date the Board decided the share option plan.
As part of the 2007, 2008 and 2009 share subscription option plans, the Board of Directors required that for each beneficiary of more than25,000 options, one third of the options granted in excess of this number be subject to a performance condition (see page 114 of thisRegistration Document). For the 2007 plan, the options acquisition rate, connected to the performance condition, was 100%.
In addition, Mr. Daniel Boeuf, the director representing employee shareholders, has not exercised any option in 2009 and has not beenawarded any share subscription option by the 2009 plan.
1. Out of a total potential share capital of 2,394,251,653 shares (see page 169 of this Registration Document).
120 / TOTAL - Registration Document 2009
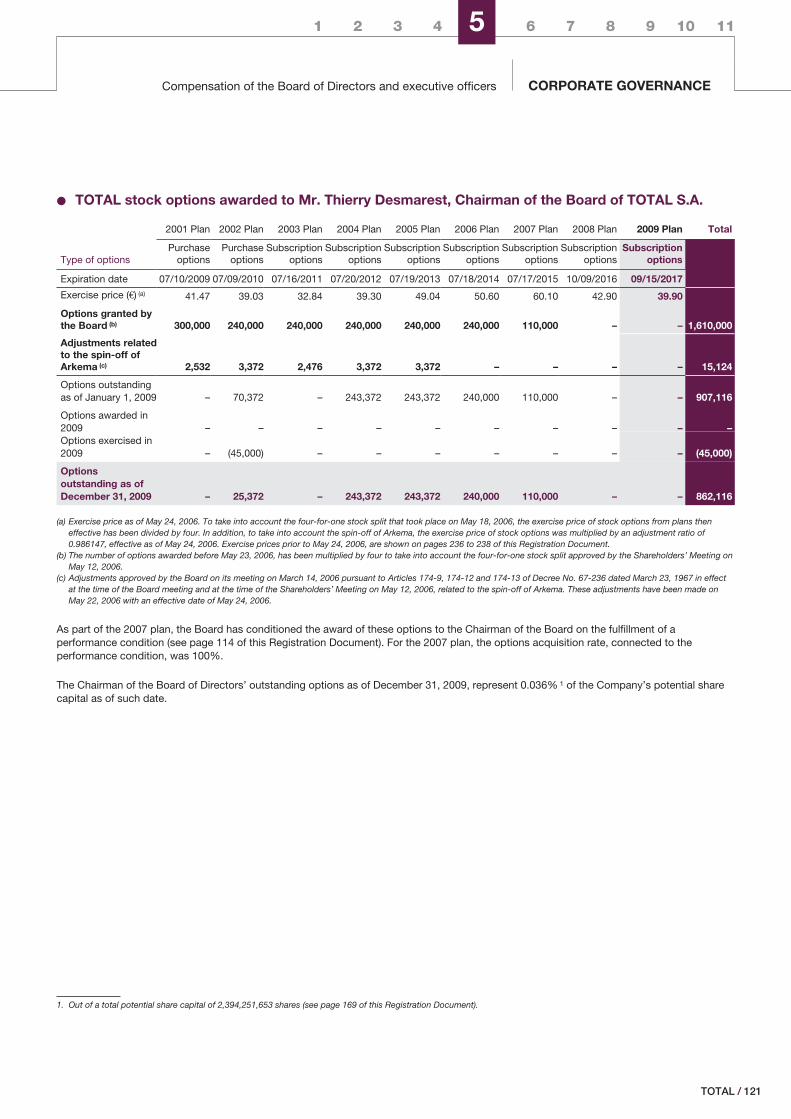
1 2 3 4 5 6 7 8 9 10 11
Compensation of the Board of Directors and executive officers CORPORATE GOVERNANCE
‹ TOTAL stock options awarded to Mr. Thierry Desmarest, Chairman of the Board of TOTAL S.A.
2001 Plan 2002 Plan 2003 Plan 2004 Plan 2005 Plan 2006 Plan 2007 Plan 2008 Plan 2009 Plan Total
Type of optionsPurchase
optionsPurchase
optionsSubscription
optionsSubscription
optionsSubscription
optionsSubscription
optionsSubscription
optionsSubscription
optionsSubscription
options
Expiration date 07/10/2009 07/09/2010 07/16/2011 07/20/2012 07/19/2013 07/18/2014 07/17/2015 10/09/2016 09/15/2017
Exercise price (€) (a) 41.47 39.03 32.84 39.30 49.04 50.60 60.10 42.90 39.90
Options granted bythe Board (b) 300,000 240,000 240,000 240,000 240,000 240,000 110,000 – – 1,610,000
Adjustments relatedto the spin-off ofArkema (c) 2,532 3,372 2,476 3,372 3,372 – – – – 15,124
Options outstandingas of January 1, 2009 – 70,372 – 243,372 243,372 240,000 110,000 – – 907,116
Options awarded in2009 – – – – – – – – – –Options exercised in2009 – (45,000) – – – – – – – (45,000)
Optionsoutstanding as ofDecember 31, 2009 – 25,372 – 243,372 243,372 240,000 110,000 – – 862,116
(a) Exercise price as of May 24, 2006. To take into account the four-for-one stock split that took place on May 18, 2006, the exercise price of stock options from plans theneffective has been divided by four. In addition, to take into account the spin-off of Arkema, the exercise price of stock options was multiplied by an adjustment ratio of0.986147, effective as of May 24, 2006. Exercise prices prior to May 24, 2006, are shown on pages 236 to 238 of this Registration Document.
(b) The number of options awarded before May 23, 2006, has been multiplied by four to take into account the four-for-one stock split approved by the Shareholders’ Meeting onMay 12, 2006.
(c) Adjustments approved by the Board on its meeting on March 14, 2006 pursuant to Articles 174-9, 174-12 and 174-13 of Decree No. 67-236 dated March 23, 1967 in effectat the time of the Board meeting and at the time of the Shareholders’ Meeting on May 12, 2006, related to the spin-off of Arkema. These adjustments have been made onMay 22, 2006 with an effective date of May 24, 2006.
As part of the 2007 plan, the Board has conditioned the award of these options to the Chairman of the Board on the fulfillment of aperformance condition (see page 114 of this Registration Document). For the 2007 plan, the options acquisition rate, connected to theperformance condition, was 100%.
The Chairman of the Board of Directors’ outstanding options as of December 31, 2009, represent 0.036% 1 of the Company’s potential sharecapital as of such date.
1. Out of a total potential share capital of 2,394,251,653 shares (see page 169 of this Registration Document).
/ 121TOTAL
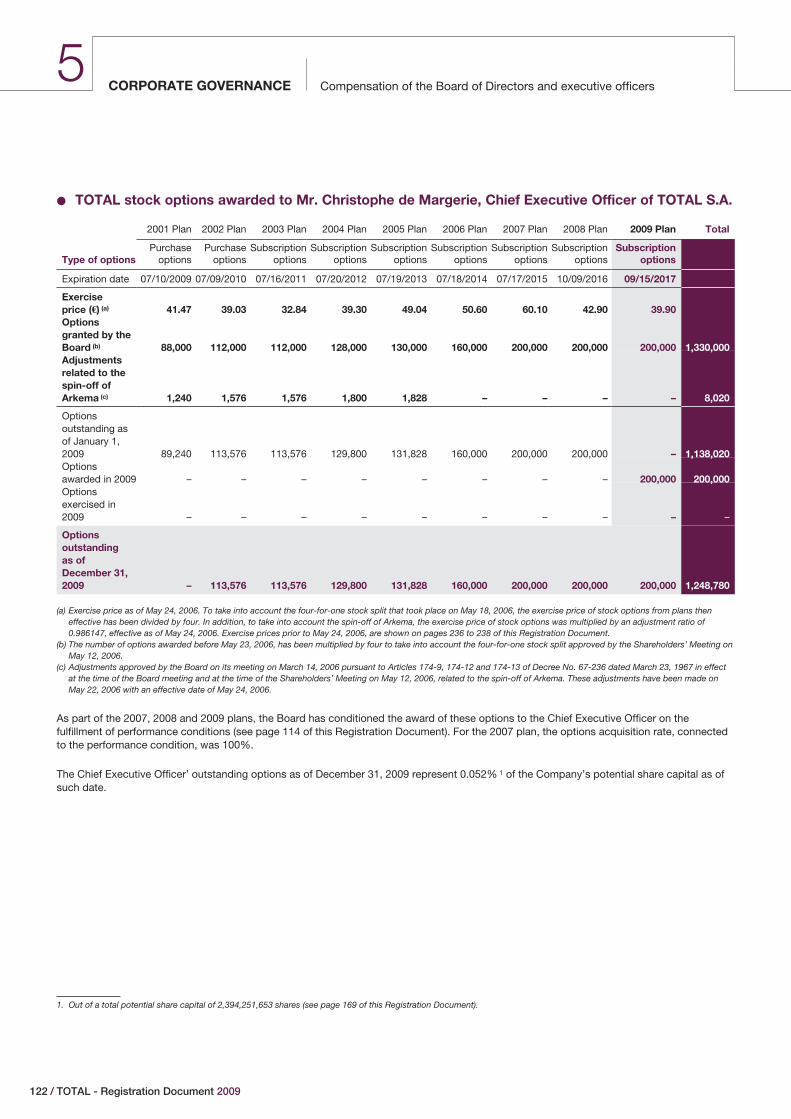
Compensation of the Board of Directors and executive officersCORPORATE GOVERNANCE5
‹ TOTAL stock options awarded to Mr. Christophe de Margerie, Chief Executive Officer of TOTAL S.A.
2001 Plan 2002 Plan 2003 Plan 2004 Plan 2005 Plan 2006 Plan 2007 Plan 2008 Plan 2009 Plan Total
Type of optionsPurchase
optionsPurchase
optionsSubscription
optionsSubscription
optionsSubscription
optionsSubscription
optionsSubscription
optionsSubscription
optionsSubscription
options
Expiration date 07/10/2009 07/09/2010 07/16/2011 07/20/2012 07/19/2013 07/18/2014 07/17/2015 10/09/2016 09/15/2017
Exerciseprice (€) (a) 41.47 39.03 32.84 39.30 49.04 50.60 60.10 42.90 39.90Optionsgranted by theBoard (b) 88,000 112,000 112,000 128,000 130,000 160,000 200,000 200,000 200,000 1,330,000Adjustmentsrelated to thespin-off ofArkema (c) 1,240 1,576 1,576 1,800 1,828 – – – – 8,020
Optionsoutstanding asof January 1,2009 89,240 113,576 113,576 129,800 131,828 160,000 200,000 200,000 – 1,138,020Optionsawarded in 2009 – – – – – – – – 200,000 200,000Optionsexercised in2009 – – – – – – – – – –
Optionsoutstandingas ofDecember 31,2009 – 113,576 113,576 129,800 131,828 160,000 200,000 200,000 200,000 1,248,780
(a) Exercise price as of May 24, 2006. To take into account the four-for-one stock split that took place on May 18, 2006, the exercise price of stock options from plans theneffective has been divided by four. In addition, to take into account the spin-off of Arkema, the exercise price of stock options was multiplied by an adjustment ratio of0.986147, effective as of May 24, 2006. Exercise prices prior to May 24, 2006, are shown on pages 236 to 238 of this Registration Document.
(b) The number of options awarded before May 23, 2006, has been multiplied by four to take into account the four-for-one stock split approved by the Shareholders’ Meeting onMay 12, 2006.
(c) Adjustments approved by the Board on its meeting on March 14, 2006 pursuant to Articles 174-9, 174-12 and 174-13 of Decree No. 67-236 dated March 23, 1967 in effectat the time of the Board meeting and at the time of the Shareholders’ Meeting on May 12, 2006, related to the spin-off of Arkema. These adjustments have been made onMay 22, 2006 with an effective date of May 24, 2006.
As part of the 2007, 2008 and 2009 plans, the Board has conditioned the award of these options to the Chief Executive Officer on thefulfillment of performance conditions (see page 114 of this Registration Document). For the 2007 plan, the options acquisition rate, connectedto the performance condition, was 100%.
The Chief Executive Officer’ outstanding options as of December 31, 2009 represent 0.052% 1 of the Company’s potential share capital as ofsuch date.
1. Out of a total potential share capital of 2,394,251,653 shares (see page 169 of this Registration Document).
122 / TOTAL - Registration Document 2009
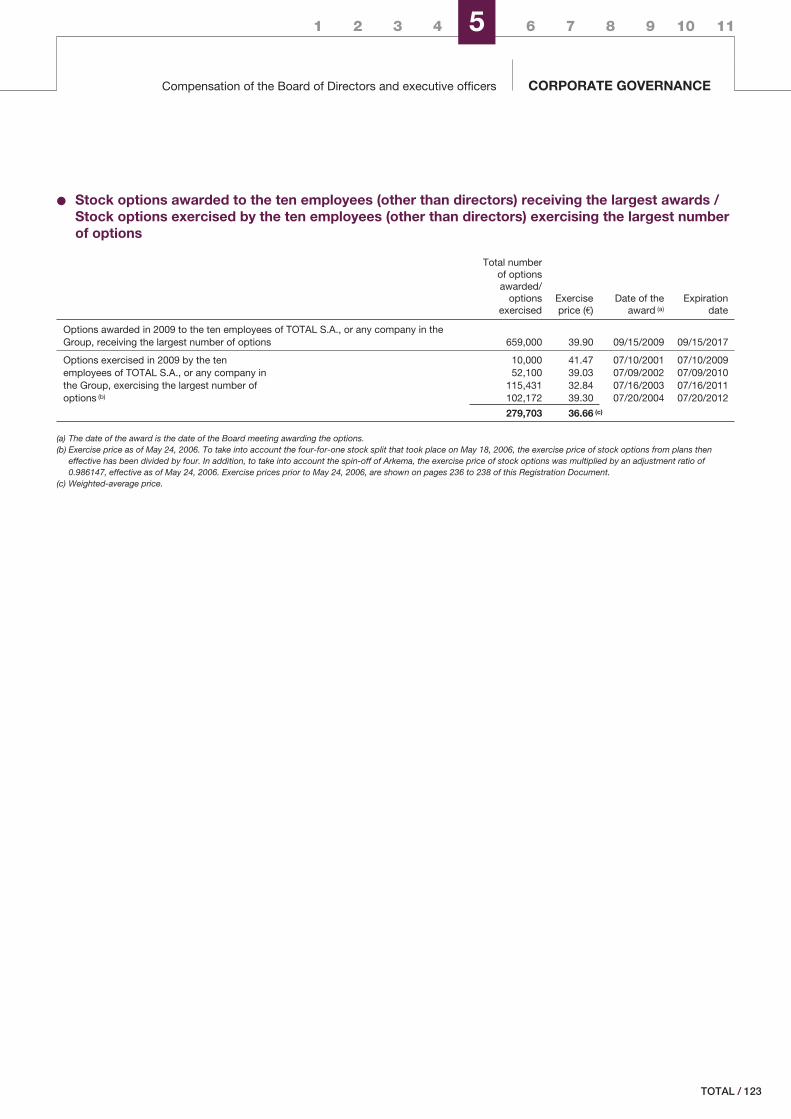
1 2 3 4 5 6 7 8 9 10 11
Compensation of the Board of Directors and executive officers CORPORATE GOVERNANCE
‹ Stock options awarded to the ten employees (other than directors) receiving the largest awards /Stock options exercised by the ten employees (other than directors) exercising the largest numberof options
Total numberof optionsawarded/
optionsexercised
Exerciseprice (€)
Date of theaward (a)
Expirationdate
Options awarded in 2009 to the ten employees of TOTAL S.A., or any company in theGroup, receiving the largest number of options 659,000 39.90 09/15/2009 09/15/2017
Options exercised in 2009 by the ten 10,000 41.47 07/10/2001 07/10/2009employees of TOTAL S.A., or any company in 52,100 39.03 07/09/2002 07/09/2010the Group, exercising the largest number of 115,431 32.84 07/16/2003 07/16/2011options (b) 102,172 39.30 07/20/2004 07/20/2012
279,703 36.66 (c)
(a) The date of the award is the date of the Board meeting awarding the options.(b) Exercise price as of May 24, 2006. To take into account the four-for-one stock split that took place on May 18, 2006, the exercise price of stock options from plans then
effective has been divided by four. In addition, to take into account the spin-off of Arkema, the exercise price of stock options was multiplied by an adjustment ratio of0.986147, effective as of May 24, 2006. Exercise prices prior to May 24, 2006, are shown on pages 236 to 238 of this Registration Document.
(c) Weighted-average price.
/ 123TOTAL
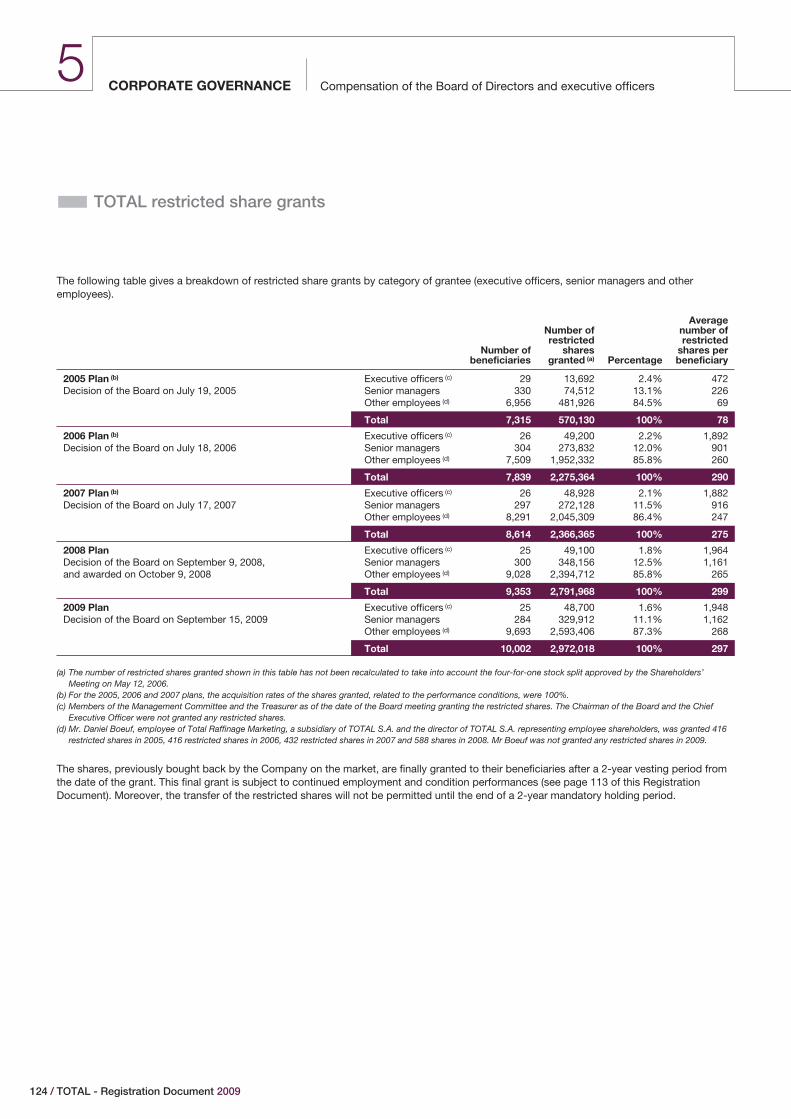
Compensation of the Board of Directors and executive officersCORPORATE GOVERNANCE5
� TOTAL restricted share grants
The following table gives a breakdown of restricted share grants by category of grantee (executive officers, senior managers and otheremployees).
Number ofbeneficiaries
Number ofrestricted
sharesgranted (a) Percentage
Averagenumber ofrestricted
shares perbeneficiary
2005 Plan (b)
Decision of the Board on July 19, 2005Executive officers (c) 29 13,692 2.4% 472Senior managers 330 74,512 13.1% 226Other employees (d) 6,956 481,926 84.5% 69
Total 7,315 570,130 100% 78
2006 Plan (b)
Decision of the Board on July 18, 2006Executive officers (c) 26 49,200 2.2% 1,892Senior managers 304 273,832 12.0% 901Other employees (d) 7,509 1,952,332 85.8% 260
Total 7,839 2,275,364 100% 290
2007 Plan (b)
Decision of the Board on July 17, 2007Executive officers (c) 26 48,928 2.1% 1,882Senior managers 297 272,128 11.5% 916Other employees (d) 8,291 2,045,309 86.4% 247
Total 8,614 2,366,365 100% 275
2008 PlanDecision of the Board on September 9, 2008,and awarded on October 9, 2008
Executive officers (c) 25 49,100 1.8% 1,964Senior managers 300 348,156 12.5% 1,161Other employees (d) 9,028 2,394,712 85.8% 265
Total 9,353 2,791,968 100% 299
2009 PlanDecision of the Board on September 15, 2009
Executive officers (c) 25 48,700 1.6% 1,948Senior managers 284 329,912 11.1% 1,162Other employees (d) 9,693 2,593,406 87.3% 268
Total 10,002 2,972,018 100% 297
(a) The number of restricted shares granted shown in this table has not been recalculated to take into account the four-for-one stock split approved by the Shareholders’Meeting on May 12, 2006.
(b) For the 2005, 2006 and 2007 plans, the acquisition rates of the shares granted, related to the performance conditions, were 100%.(c) Members of the Management Committee and the Treasurer as of the date of the Board meeting granting the restricted shares. The Chairman of the Board and the Chief
Executive Officer were not granted any restricted shares.(d) Mr. Daniel Boeuf, employee of Total Raffinage Marketing, a subsidiary of TOTAL S.A. and the director of TOTAL S.A. representing employee shareholders, was granted 416
restricted shares in 2005, 416 restricted shares in 2006, 432 restricted shares in 2007 and 588 shares in 2008. Mr Boeuf was not granted any restricted shares in 2009.
The shares, previously bought back by the Company on the market, are finally granted to their beneficiaries after a 2-year vesting period fromthe date of the grant. This final grant is subject to continued employment and condition performances (see page 113 of this RegistrationDocument). Moreover, the transfer of the restricted shares will not be permitted until the end of a 2-year mandatory holding period.
124 / TOTAL - Registration Document 2009
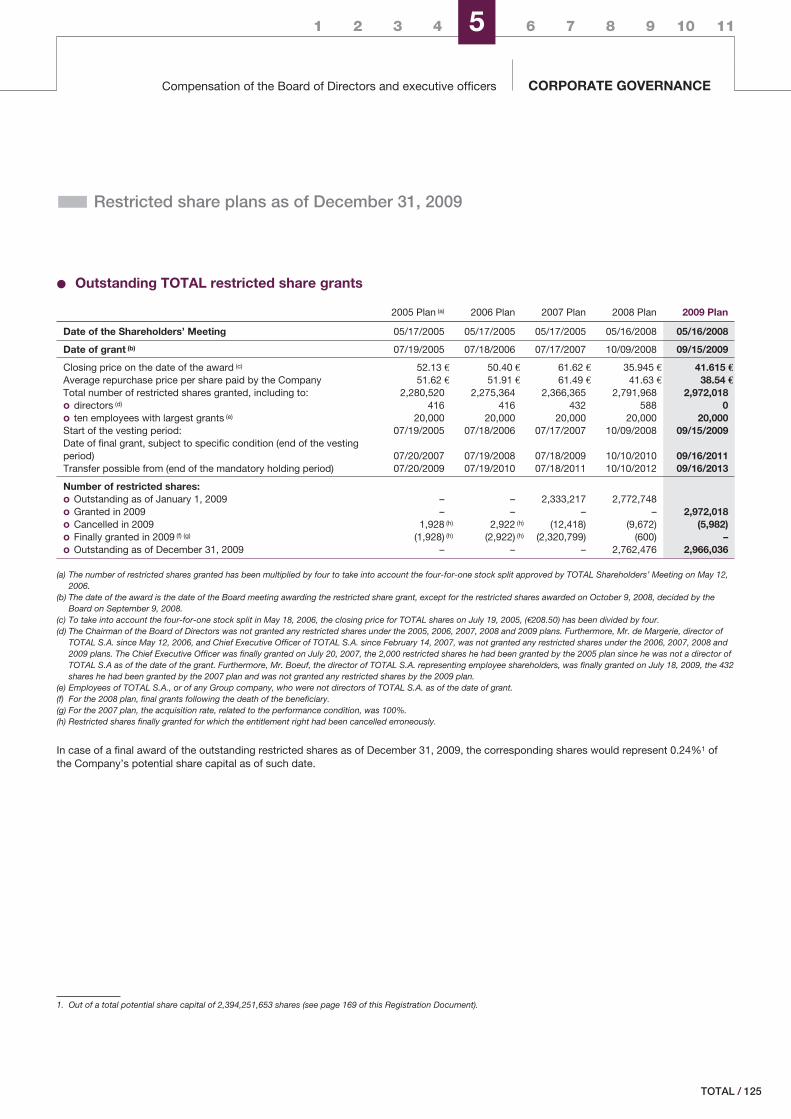
1 2 3 4 5 6 7 8 9 10 11
Compensation of the Board of Directors and executive officers CORPORATE GOVERNANCE
� Restricted share plans as of December 31, 2009
‹ Outstanding TOTAL restricted share grants
2005 Plan (a) 2006 Plan 2007 Plan 2008 Plan 2009 Plan
Date of the Shareholders’ Meeting 05/17/2005 05/17/2005 05/17/2005 05/16/2008 05/16/2008
Date of grant (b) 07/19/2005 07/18/2006 07/17/2007 10/09/2008 09/15/2009
Closing price on the date of the award (c) 52.13 € 50.40 € 61.62 € 35.945 € 41.615 €
Average repurchase price per share paid by the Company 51.62 € 51.91 € 61.49 € 41.63 € 38.54 €
Total number of restricted shares granted, including to: 2,280,520 2,275,364 2,366,365 2,791,968 2,972,018o directors (d) 416 416 432 588 0o ten employees with largest grants (e) 20,000 20,000 20,000 20,000 20,000Start of the vesting period: 07/19/2005 07/18/2006 07/17/2007 10/09/2008 09/15/2009Date of final grant, subject to specific condition (end of the vestingperiod) 07/20/2007 07/19/2008 07/18/2009 10/10/2010 09/16/2011Transfer possible from (end of the mandatory holding period) 07/20/2009 07/19/2010 07/18/2011 10/10/2012 09/16/2013
Number of restricted shares:o Outstanding as of January 1, 2009 – – 2,333,217 2,772,748o Granted in 2009 – – – – 2,972,018o Cancelled in 2009 1,928 (h) 2,922 (h) (12,418) (9,672) (5,982)o Finally granted in 2009 (f) (g) (1,928) (h) (2,922) (h) (2,320,799) (600) –o Outstanding as of December 31, 2009 – – – 2,762,476 2,966,036
(a) The number of restricted shares granted has been multiplied by four to take into account the four-for-one stock split approved by TOTAL Shareholders’ Meeting on May 12,2006.
(b) The date of the award is the date of the Board meeting awarding the restricted share grant, except for the restricted shares awarded on October 9, 2008, decided by theBoard on September 9, 2008.
(c) To take into account the four-for-one stock split in May 18, 2006, the closing price for TOTAL shares on July 19, 2005, (€208.50) has been divided by four.(d) The Chairman of the Board of Directors was not granted any restricted shares under the 2005, 2006, 2007, 2008 and 2009 plans. Furthermore, Mr. de Margerie, director of
TOTAL S.A. since May 12, 2006, and Chief Executive Officer of TOTAL S.A. since February 14, 2007, was not granted any restricted shares under the 2006, 2007, 2008 and2009 plans. The Chief Executive Officer was finally granted on July 20, 2007, the 2,000 restricted shares he had been granted by the 2005 plan since he was not a director ofTOTAL S.A as of the date of the grant. Furthermore, Mr. Boeuf, the director of TOTAL S.A. representing employee shareholders, was finally granted on July 18, 2009, the 432shares he had been granted by the 2007 plan and was not granted any restricted shares by the 2009 plan.
(e) Employees of TOTAL S.A., or of any Group company, who were not directors of TOTAL S.A. as of the date of grant.(f) For the 2008 plan, final grants following the death of the beneficiary.(g) For the 2007 plan, the acquisition rate, related to the performance condition, was 100%.(h) Restricted shares finally granted for which the entitlement right had been cancelled erroneously.
In case of a final award of the outstanding restricted shares as of December 31, 2009, the corresponding shares would represent 0.24%1 ofthe Company’s potential share capital as of such date.
1. Out of a total potential share capital of 2,394,251,653 shares (see page 169 of this Registration Document).
/ 125TOTAL
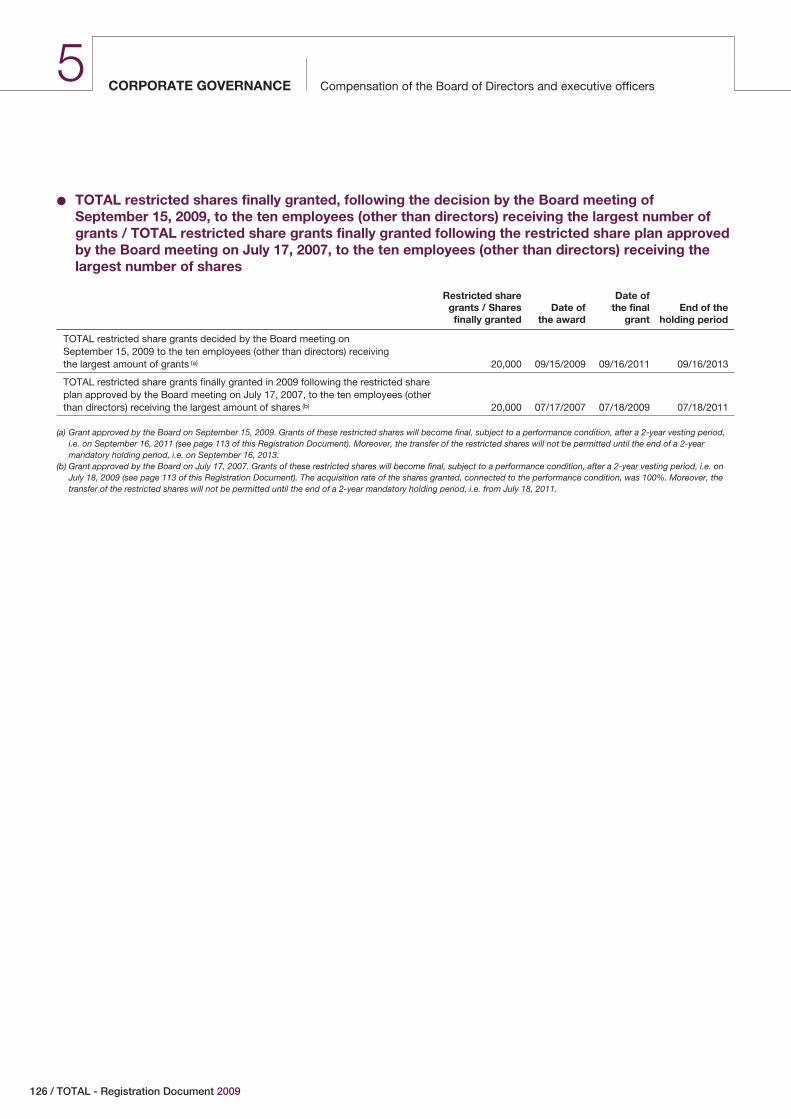
Compensation of the Board of Directors and executive officersCORPORATE GOVERNANCE5
‹ TOTAL restricted shares finally granted, following the decision by the Board meeting ofSeptember 15, 2009, to the ten employees (other than directors) receiving the largest number ofgrants / TOTAL restricted share grants finally granted following the restricted share plan approvedby the Board meeting on July 17, 2007, to the ten employees (other than directors) receiving thelargest number of shares
Restricted sharegrants / Sharesfinally granted
Date ofthe award
Date ofthe final
grantEnd of the
holding period
TOTAL restricted share grants decided by the Board meeting onSeptember 15, 2009 to the ten employees (other than directors) receivingthe largest amount of grants (a) 20,000 09/15/2009 09/16/2011 09/16/2013
TOTAL restricted share grants finally granted in 2009 following the restricted shareplan approved by the Board meeting on July 17, 2007, to the ten employees (otherthan directors) receiving the largest amount of shares (b) 20,000 07/17/2007 07/18/2009 07/18/2011
(a) Grant approved by the Board on September 15, 2009. Grants of these restricted shares will become final, subject to a performance condition, after a 2-year vesting period,i.e. on September 16, 2011 (see page 113 of this Registration Document). Moreover, the transfer of the restricted shares will not be permitted until the end of a 2-yearmandatory holding period, i.e. on September 16, 2013.
(b) Grant approved by the Board on July 17, 2007. Grants of these restricted shares will become final, subject to a performance condition, after a 2-year vesting period, i.e. onJuly 18, 2009 (see page 113 of this Registration Document). The acquisition rate of the shares granted, connected to the performance condition, was 100%. Moreover, thetransfer of the restricted shares will not be permitted until the end of a 2-year mandatory holding period, i.e. from July 18, 2011.
126 / TOTAL - Registration Document 2009
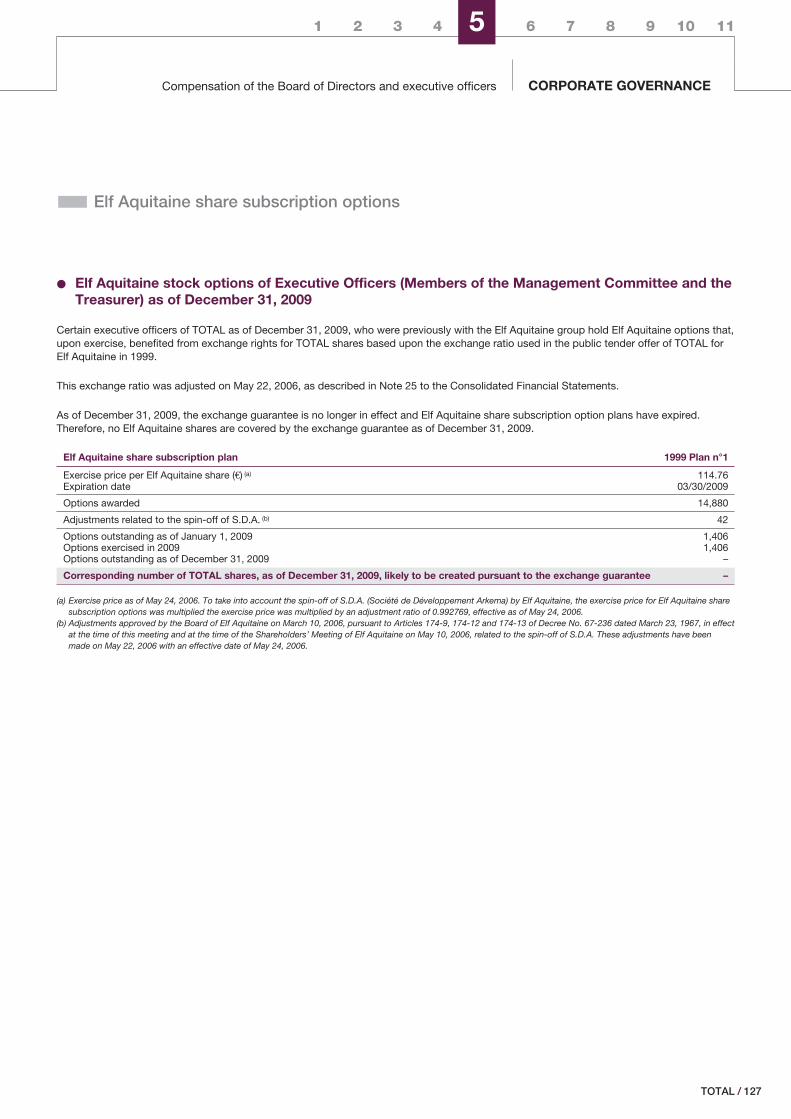
1 2 3 4 5 6 7 8 9 10 11
Compensation of the Board of Directors and executive officers CORPORATE GOVERNANCE
� Elf Aquitaine share subscription options
‹ Elf Aquitaine stock options of Executive Officers (Members of the Management Committee and theTreasurer) as of December 31, 2009
Certain executive officers of TOTAL as of December 31, 2009, who were previously with the Elf Aquitaine group hold Elf Aquitaine options that,upon exercise, benefited from exchange rights for TOTAL shares based upon the exchange ratio used in the public tender offer of TOTAL forElf Aquitaine in 1999.
This exchange ratio was adjusted on May 22, 2006, as described in Note 25 to the Consolidated Financial Statements.
As of December 31, 2009, the exchange guarantee is no longer in effect and Elf Aquitaine share subscription option plans have expired.Therefore, no Elf Aquitaine shares are covered by the exchange guarantee as of December 31, 2009.
Elf Aquitaine share subscription plan 1999 Plan n°1
Exercise price per Elf Aquitaine share (€) (a) 114.76Expiration date 03/30/2009
Options awarded 14,880
Adjustments related to the spin-off of S.D.A. (b) 42
Options outstanding as of January 1, 2009 1,406Options exercised in 2009 1,406Options outstanding as of December 31, 2009 –
Corresponding number of TOTAL shares, as of December 31, 2009, likely to be created pursuant to the exchange guarantee –
(a) Exercise price as of May 24, 2006. To take into account the spin-off of S.D.A. (Société de Développement Arkema) by Elf Aquitaine, the exercise price for Elf Aquitaine sharesubscription options was multiplied the exercise price was multiplied by an adjustment ratio of 0.992769, effective as of May 24, 2006.
(b) Adjustments approved by the Board of Elf Aquitaine on March 10, 2006, pursuant to Articles 174-9, 174-12 and 174-13 of Decree No. 67-236 dated March 23, 1967, in effectat the time of this meeting and at the time of the Shareholders’ Meeting of Elf Aquitaine on May 10, 2006, related to the spin-off of S.D.A. These adjustments have beenmade on May 22, 2006 with an effective date of May 24, 2006.
/ 127TOTAL
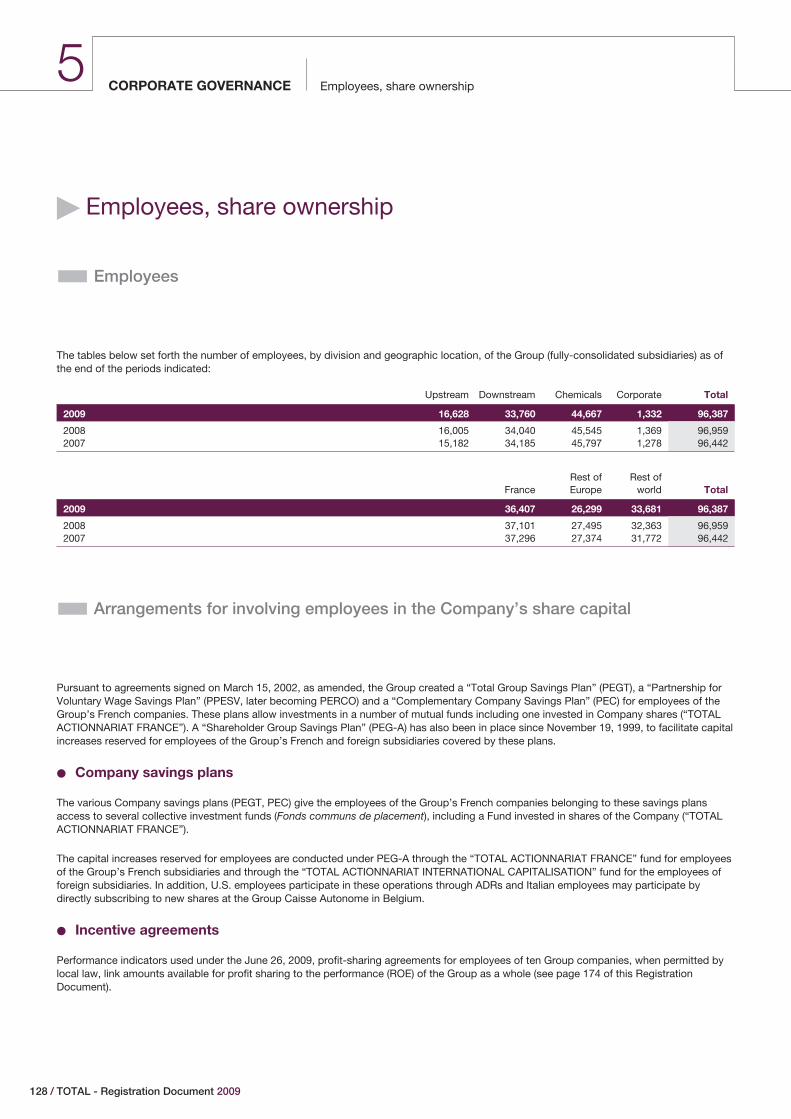
Employees, share ownershipCORPORATE GOVERNANCE5
� Employees, share ownership
� Employees
The tables below set forth the number of employees, by division and geographic location, of the Group (fully-consolidated subsidiaries) as ofthe end of the periods indicated:
Upstream Downstream Chemicals Corporate Total
2009 16,628 33,760 44,667 1,332 96,387
2008 16,005 34,040 45,545 1,369 96,9592007 15,182 34,185 45,797 1,278 96,442
FranceRest ofEurope
Rest ofworld Total
2009 36,407 26,299 33,681 96,387
2008 37,101 27,495 32,363 96,9592007 37,296 27,374 31,772 96,442
� Arrangements for involving employees in the Company’s share capital
Pursuant to agreements signed on March 15, 2002, as amended, the Group created a “Total Group Savings Plan” (PEGT), a “Partnership forVoluntary Wage Savings Plan” (PPESV, later becoming PERCO) and a “Complementary Company Savings Plan” (PEC) for employees of theGroup’s French companies. These plans allow investments in a number of mutual funds including one invested in Company shares (“TOTALACTIONNARIAT FRANCE”). A “Shareholder Group Savings Plan” (PEG-A) has also been in place since November 19, 1999, to facilitate capitalincreases reserved for employees of the Group’s French and foreign subsidiaries covered by these plans.
‹ Company savings plans
The various Company savings plans (PEGT, PEC) give the employees of the Group’s French companies belonging to these savings plansaccess to several collective investment funds (Fonds communs de placement), including a Fund invested in shares of the Company (“TOTALACTIONNARIAT FRANCE”).
The capital increases reserved for employees are conducted under PEG-A through the “TOTAL ACTIONNARIAT FRANCE” fund for employeesof the Group’s French subsidiaries and through the “TOTAL ACTIONNARIAT INTERNATIONAL CAPITALISATION” fund for the employees offoreign subsidiaries. In addition, U.S. employees participate in these operations through ADRs and Italian employees may participate bydirectly subscribing to new shares at the Group Caisse Autonome in Belgium.
‹ Incentive agreements
Performance indicators used under the June 26, 2009, profit-sharing agreements for employees of ten Group companies, when permitted bylocal law, link amounts available for profit sharing to the performance (ROE) of the Group as a whole (see page 174 of this RegistrationDocument).
128 / TOTAL - Registration Document 2009
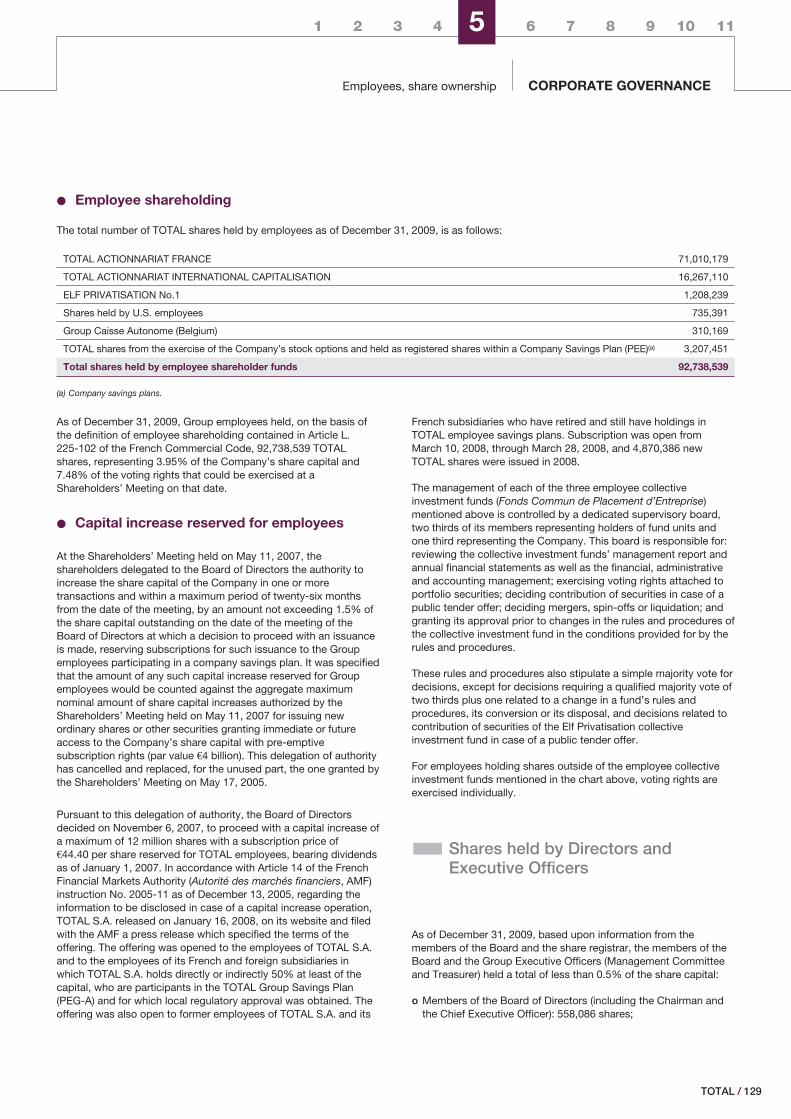
1 2 3 4 5 6 7 8 9 10 11
Employees, share ownership CORPORATE GOVERNANCE
‹ Employee shareholding
The total number of TOTAL shares held by employees as of December 31, 2009, is as follows:
TOTAL ACTIONNARIAT FRANCE 71,010,179
TOTAL ACTIONNARIAT INTERNATIONAL CAPITALISATION 16,267,110
ELF PRIVATISATION No.1 1,208,239
Shares held by U.S. employees 735,391
Group Caisse Autonome (Belgium) 310,169
TOTAL shares from the exercise of the Company’s stock options and held as registered shares within a Company Savings Plan (PEE)(a) 3,207,451
Total shares held by employee shareholder funds 92,738,539
(a) Company savings plans.
As of December 31, 2009, Group employees held, on the basis ofthe definition of employee shareholding contained in Article L.225-102 of the French Commercial Code, 92,738,539 TOTALshares, representing 3.95% of the Company’s share capital and7.48% of the voting rights that could be exercised at aShareholders’ Meeting on that date.
‹ Capital increase reserved for employees
At the Shareholders’ Meeting held on May 11, 2007, theshareholders delegated to the Board of Directors the authority toincrease the share capital of the Company in one or moretransactions and within a maximum period of twenty-six monthsfrom the date of the meeting, by an amount not exceeding 1.5% ofthe share capital outstanding on the date of the meeting of theBoard of Directors at which a decision to proceed with an issuanceis made, reserving subscriptions for such issuance to the Groupemployees participating in a company savings plan. It was specifiedthat the amount of any such capital increase reserved for Groupemployees would be counted against the aggregate maximumnominal amount of share capital increases authorized by theShareholders’ Meeting held on May 11, 2007 for issuing newordinary shares or other securities granting immediate or futureaccess to the Company’s share capital with pre-emptivesubscription rights (par value €4 billion). This delegation of authorityhas cancelled and replaced, for the unused part, the one granted bythe Shareholders’ Meeting on May 17, 2005.
Pursuant to this delegation of authority, the Board of Directorsdecided on November 6, 2007, to proceed with a capital increase ofa maximum of 12 million shares with a subscription price of€44.40 per share reserved for TOTAL employees, bearing dividendsas of January 1, 2007. In accordance with Article 14 of the FrenchFinancial Markets Authority (Autorité des marchés financiers, AMF)instruction No. 2005-11 as of December 13, 2005, regarding theinformation to be disclosed in case of a capital increase operation,TOTAL S.A. released on January 16, 2008, on its website and filedwith the AMF a press release which specified the terms of theoffering. The offering was opened to the employees of TOTAL S.A.and to the employees of its French and foreign subsidiaries inwhich TOTAL S.A. holds directly or indirectly 50% at least of thecapital, who are participants in the TOTAL Group Savings Plan(PEG-A) and for which local regulatory approval was obtained. Theoffering was also open to former employees of TOTAL S.A. and its
French subsidiaries who have retired and still have holdings inTOTAL employee savings plans. Subscription was open fromMarch 10, 2008, through March 28, 2008, and 4,870,386 newTOTAL shares were issued in 2008.
The management of each of the three employee collectiveinvestment funds (Fonds Commun de Placement d’Entreprise)mentioned above is controlled by a dedicated supervisory board,two thirds of its members representing holders of fund units andone third representing the Company. This board is responsible for:reviewing the collective investment funds’ management report andannual financial statements as well as the financial, administrativeand accounting management; exercising voting rights attached toportfolio securities; deciding contribution of securities in case of apublic tender offer; deciding mergers, spin-offs or liquidation; andgranting its approval prior to changes in the rules and procedures ofthe collective investment fund in the conditions provided for by therules and procedures.
These rules and procedures also stipulate a simple majority vote fordecisions, except for decisions requiring a qualified majority vote oftwo thirds plus one related to a change in a fund’s rules andprocedures, its conversion or its disposal, and decisions related tocontribution of securities of the Elf Privatisation collectiveinvestment fund in case of a public tender offer.
For employees holding shares outside of the employee collectiveinvestment funds mentioned in the chart above, voting rights areexercised individually.
� Shares held by Directors andExecutive Officers
As of December 31, 2009, based upon information from themembers of the Board and the share registrar, the members of theBoard and the Group Executive Officers (Management Committeeand Treasurer) held a total of less than 0.5% of the share capital:
o Members of the Board of Directors (including the Chairman andthe Chief Executive Officer): 558,086 shares;
/ 129TOTAL
Employees, share ownershipCORPORATE GOVERNANCE5
o Chairman of the Board of Directors: 380,576 shares;
o Chief Executive Officer: 85,230 shares and 43,714 shares of theTOTAL ACTIONNARIAT FRANCE collective investment plan;
o Management Committee (including the Chief Executive Officer)and Treasurer: 542,935 shares.
By decision of the Board of Directors:
o The Chairman and Chief Executive Officer are required to hold anumber of shares of the Company equal in value to two years ofthe fixed portion of their annual compensation.
o Members of the Executive Committee are required to hold anumber of shares of the Company equal in value to two years ofthe fixed portion of their annual compensation. These shareshave to be acquired within three years from the appointment tothe Executive Committee.
The number of TOTAL shares to be considered includes:
o directly held shares, whether or not they are subject to transferrestrictions; and
o shares in collective investment funds (FCPE) invested in TOTALshares.
130 / TOTAL - Registration Document 2009
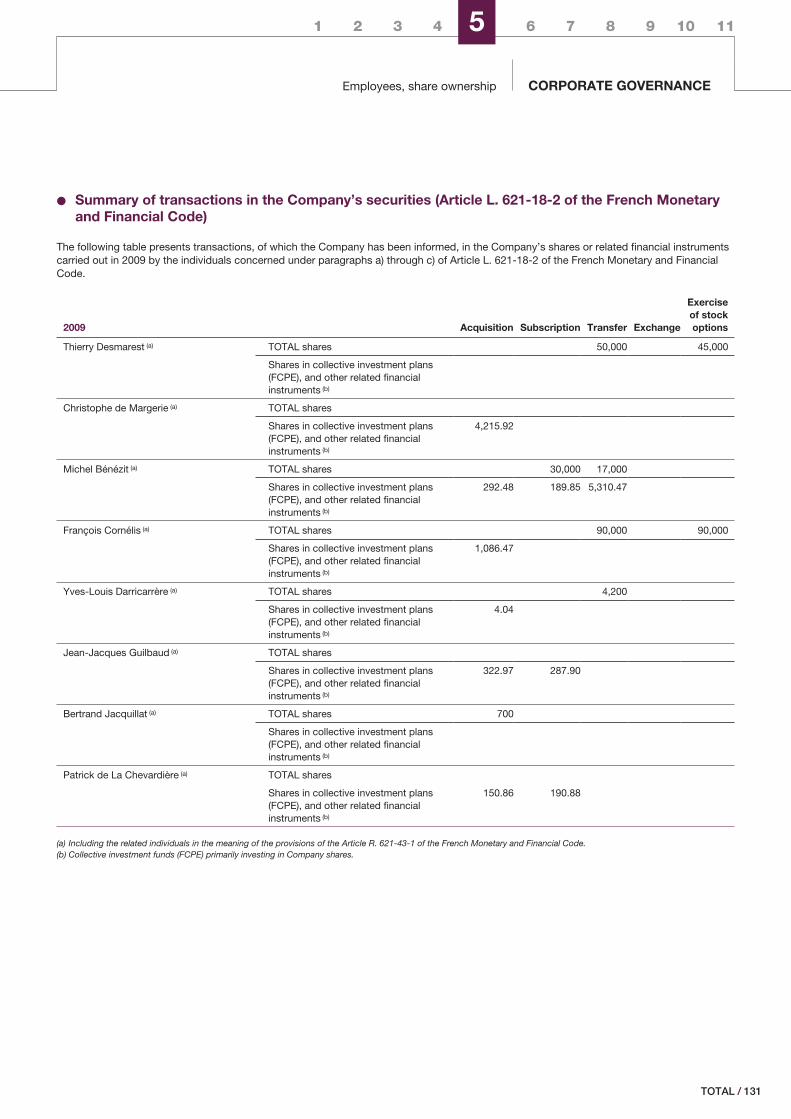
1 2 3 4 5 6 7 8 9 10 11
Employees, share ownership CORPORATE GOVERNANCE
‹ Summary of transactions in the Company’s securities (Article L. 621-18-2 of the French Monetaryand Financial Code)
The following table presents transactions, of which the Company has been informed, in the Company’s shares or related financial instrumentscarried out in 2009 by the individuals concerned under paragraphs a) through c) of Article L. 621-18-2 of the French Monetary and FinancialCode.
2009 Acquisition Subscription Transfer Exchange
Exerciseof stockoptions
Thierry Desmarest (a) TOTAL shares 50,000 45,000
Shares in collective investment plans(FCPE), and other related financialinstruments (b)
Christophe de Margerie (a) TOTAL shares
Shares in collective investment plans(FCPE), and other related financialinstruments (b)
4,215.92
Michel Bénézit (a) TOTAL shares 30,000 17,000
Shares in collective investment plans(FCPE), and other related financialinstruments (b)
292.48 189.85 5,310.47
François Cornélis (a) TOTAL shares 90,000 90,000
Shares in collective investment plans(FCPE), and other related financialinstruments (b)
1,086.47
Yves-Louis Darricarrère (a) TOTAL shares 4,200
Shares in collective investment plans(FCPE), and other related financialinstruments (b)
4.04
Jean-Jacques Guilbaud (a) TOTAL shares
Shares in collective investment plans(FCPE), and other related financialinstruments (b)
322.97 287.90
Bertrand Jacquillat (a) TOTAL shares 700
Shares in collective investment plans(FCPE), and other related financialinstruments (b)
Patrick de La Chevardière (a) TOTAL shares
Shares in collective investment plans(FCPE), and other related financialinstruments (b)
150.86 190.88
(a) Including the related individuals in the meaning of the provisions of the Article R. 621-43-1 of the French Monetary and Financial Code.(b) Collective investment funds (FCPE) primarily investing in Company shares.
/ 131TOTAL
CORPORATE GOVERNANCE5
132 / TOTAL - Registration Document 2009
6TOTAL AND ITS SHAREHOLDERS
LISTING DETAILS p. 134
Listing p. 134
Share performance p. 135
DIVIDEND p. 139
Dividend policy p. 139
Dividend payment p. 139
Coupons p. 140
SHARE BUYBACKS p. 141
Share buybacks and cancellations in 2009 p. 141
Board’s report on share buybacks p. 142
2010-2011 share buyback program p. 143
SHAREHOLDERS p. 146
Relationship between TOTAL and the French State p. 146
Merger of TOTAL with PetroFina in 1999 p. 146
Merger of TotalFina with Elf Aquitaine p. 146
Principal shareholders p. 147
Treasury shares p. 148
Shares held by members of the administrative and management bodies p. 149
Employee shareholding p. 149
Shareholding structure p. 149
Regulated agreements and related party transactions p. 150
INFORMATION FOR OVERSEAS SHAREHOLDERS p. 151
United States holders of ADRs p. 151
Non-resident shareholders (other than U.S. Shareholders) p. 151
Dividends p. 151
COMMUNICATION WITH SHAREHOLDERS p. 153
Communication policy p. 153
Relationships with institutional investors and financial analysts p. 153
An ISO 9001-certified Individual Shareholders Department since 2007 p. 153
Registered shareholding p. 154
Individual Shareholders Department Contacts p. 155
2010 Schedule p. 156
2011 Schedule p. 156
Investor Relations contacts p. 156
/ 133TOTAL
Listing detailsTOTAL AND ITS SHAREHOLDERS6
� Listing details
� Listing
‹ Exchanges
Paris, Brussels, London and New York
‹ Codes
ISIN FR0000120271
Reuters TOTF.PA
Bloomberg FP FP
Datastream F:TAL
Mnémo FP
‹ Included in the following stock indexes:
CAC 40, DJ Euro Stoxx 50, DJ Stoxx 50, DJ Global Titans
‹ Included in the following sustainabledevelopment and governance indexes
DJSI World, DJ STOXX SI, FTSE4Good, ASPI
‹ Weight in indexes as of December 31, 2009
CAC 40 13.3% 1st place
DJ EURO STOXX 50 6.1% 1st place
DJ STOXX 50 3.8% 4th place
DJ GLOBAL TITANS 2.3% 16th place
‹ Largest market capitalization on EuronextParis and in the euro zone as ofDecember 31, 2009
Largest companies by market capitalization in the euro zone (a)
As of December 31, 2009(B€)
TOTAL 105,7
Santander 95,0
Telefónica 89,1
EDF 76,8
Sanofi 72,5
(a) Bloomberg for companies other than TOTAL.
‹ Market capitalization as ofDecember 31, 2009 1
€105.7 billion 2
$150.4 billion 3
‹ Percentage of free float
90% 4
‹ Par value
€2.50
‹ Credit ratings as of December 31, 2009(long term/outlook/short term)
Standard & Poor’s: AA/Negative/A-1+
Moody’s: Aa1/Stable/P-1
DBRS: AA/Stable/R-1(middle)
On September 3, 2009, Standard & Poor’s announced the revisionof its outlook to “negative” for the Group’s long-term rating.
1. Shares outstanding as of December 31, 2009: 2,348,422,884.2. TOTAL share closing price in Paris as of December 31, 2009: €45.005.3. TOTAL ADR closing price in New York as of December 31, 2009: $64.044. Euronext Paris revized the floating rate of the TOTAL share from 100% to 90% on September 18, 2009. Since September 18, 2009, the calculation of the free float has
excluded interests greater than 5% of the total voting rights of the issuer, except if these interests are held by a collective investment scheme, a pension fund or mutualfunds. In addition, certain insider holdings, government holding and holdings of the company itself (including subsidiaries) will no longer be considered free float, irrespectiveof the size. This rule is applied to all Euronext Paris indexes weighted by the percentage of free float.
134 / TOTAL - Registration Document 2009
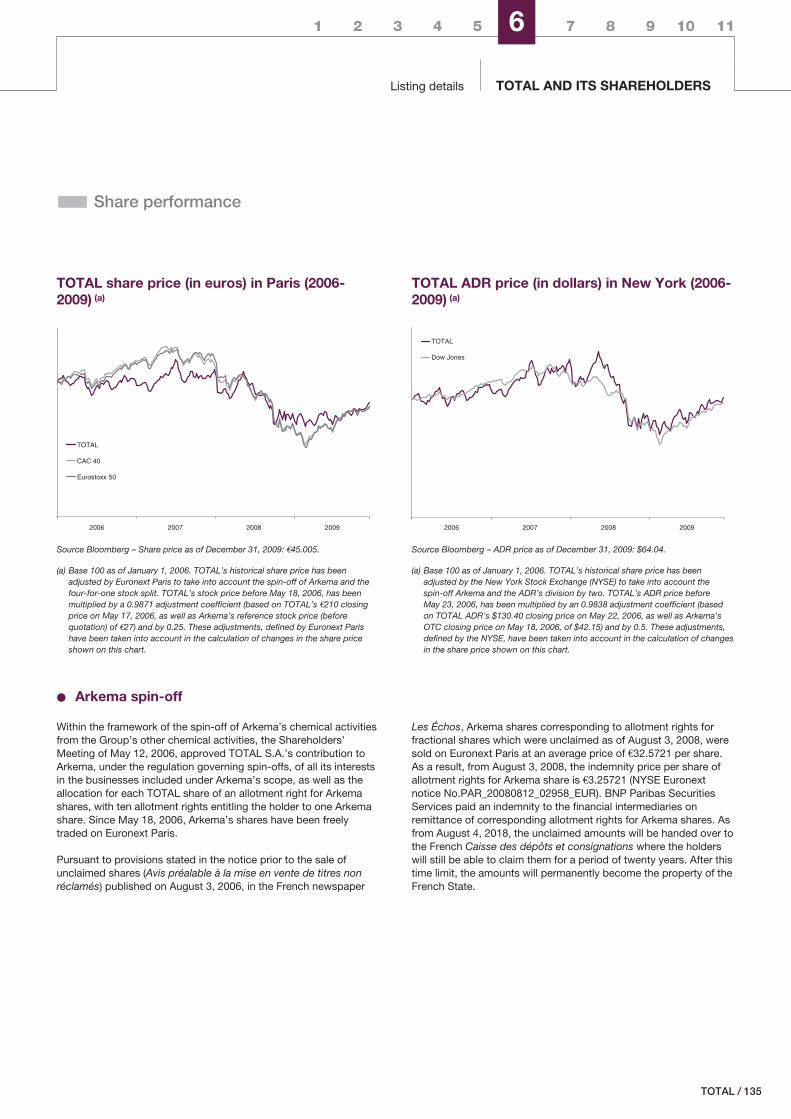
1 2 3 4 5 6 7 8 9 10 11
Listing details TOTAL AND ITS SHAREHOLDERS
� Share performance
TOTAL share price (in euros) in Paris (2006-2009) (a)
2006 2007 2008 2009
TOTAL
CAC 40
Eurostoxx 50
Source Bloomberg – Share price as of December 31, 2009: €45.005.
(a) Base 100 as of January 1, 2006. TOTAL’s historical share price has beenadjusted by Euronext Paris to take into account the spin-off of Arkema and thefour-for-one stock split. TOTAL’s stock price before May 18, 2006, has beenmultiplied by a 0.9871 adjustment coefficient (based on TOTAL’s €210 closingprice on May 17, 2006, as well as Arkema’s reference stock price (beforequotation) of €27) and by 0.25. These adjustments, defined by Euronext Parishave been taken into account in the calculation of changes in the share priceshown on this chart.
TOTAL ADR price (in dollars) in New York (2006-2009) (a)
2006 2007 2008 2009
TOTAL
Dow Jones
Source Bloomberg – ADR price as of December 31, 2009: $64.04.
(a) Base 100 as of January 1, 2006. TOTAL’s historical share price has beenadjusted by the New York Stock Exchange (NYSE) to take into account thespin-off Arkema and the ADR’s division by two. TOTAL’s ADR price beforeMay 23, 2006, has been multiplied by an 0.9838 adjustment coefficient (basedon TOTAL ADR’s $130.40 closing price on May 22, 2006, as well as Arkema’sOTC closing price on May 18, 2006, of $42.15) and by 0.5. These adjustments,defined by the NYSE, have been taken into account in the calculation of changesin the share price shown on this chart.
‹ Arkema spin-off
Within the framework of the spin-off of Arkema’s chemical activitiesfrom the Group’s other chemical activities, the Shareholders’Meeting of May 12, 2006, approved TOTAL S.A.’s contribution toArkema, under the regulation governing spin-offs, of all its interestsin the businesses included under Arkema’s scope, as well as theallocation for each TOTAL share of an allotment right for Arkemashares, with ten allotment rights entitling the holder to one Arkemashare. Since May 18, 2006, Arkema’s shares have been freelytraded on Euronext Paris.
Pursuant to provisions stated in the notice prior to the sale ofunclaimed shares (Avis préalable à la mise en vente de titres nonréclamés) published on August 3, 2006, in the French newspaper
Les Échos, Arkema shares corresponding to allotment rights forfractional shares which were unclaimed as of August 3, 2008, weresold on Euronext Paris at an average price of €32.5721 per share.As a result, from August 3, 2008, the indemnity price per share ofallotment rights for Arkema share is €3.25721 (NYSE Euronextnotice No.PAR_20080812_02958_EUR). BNP Paribas SecuritiesServices paid an indemnity to the financial intermediaries onremittance of corresponding allotment rights for Arkema shares. Asfrom August 4, 2018, the unclaimed amounts will be handed over tothe French Caisse des dépôts et consignations where the holderswill still be able to claim them for a period of twenty years. After thistime limit, the amounts will permanently become the property of theFrench State.
/ 135TOTAL
Listing detailsTOTAL AND ITS SHAREHOLDERS6
‹ Change in share prices in Europe comparedto major European oil companies betweenJanuary 1, 2009 and December 31, 2009(closing price in local currency)
TOTAL (euro) +15.7%
BP (pound sterling) +14.1%
Royal Dutch Shell A (euro) +12.5%
Royal Dutch Shell B (pound sterling) +5.0%
ENI (euro) +6.3%
Source: Bloomberg
‹ Change in share prices in the United States(ADR quotes in dollars for Europeancompanies) compared to major internationaloil companies between January 1, 2009 andDecember 31, 2009 (closing price in dollars)
TOTAL +15.8%
ExxonMobil -14.6%
BP +24.0%
Royal Dutch Shell A +13.5%
Royal Dutch Shell B +13.0%
Chevron +4.1%
ENI +5.8%
ConocoPhillips -1.4%
Source: Bloomberg
‹ Appreciation of a portfolio invested in TOTAL shares
Net yield of 7.0% per year over ten years (excluding tax credit).
‹ Multiplication of the initial investment by two over ten years
For every €1,000 invested in TOTAL shares as of December 31, in year N, by an individual residing in France, assuming that the net dividends(excluding the tax credit) are reinvested in TOTAL shares, and excluding tax and social withholding.
Average annual total return (a)
Total investment at year ended 2009would be:
Investment date TOTAL CAC 40 (b) TOTAL CAC 40
1 year January 1, 2009 +21.8% +27.6% 1,218 1,2765 years January 1, 2005 +7.2% +3.9% 1,416 1,21110 years January 1, 2000 +7.0% -1.6% 1,967 85115 years January 1, 1995 +13.7% +7.5% 6,861 2,959
(a) TOTAL’s share prices, used for the calculation of the total return (including dividends and appreciation), take into account the adjustment made by Euronext Paris exArkema’s share allocation rights.
(b) CAC 40 quotes taken into account to calculate the total return (including dividends and appreciation) include all dividends distributed by the companies that are in the index.
136 / TOTAL - Registration Document 2009
1 2 3 4 5 6 7 8 9 10 11
Listing details TOTAL AND ITS SHAREHOLDERS
‹ Information summary
Information in this table prior to May 18, 2006, has been adjusted to take into account the four-for-one stock split. Trading prices anddividends have been divided by four and trading volumes in Paris have been multiplied by four.
Share price(€) 2009 2008 2007 2006 2005
Highest (during regular trading session) 45.785 59.50 63.40 58.15 57.28Adjusted highest (a) (during regular trading session) – – – 57.40 56.54
Lowest (during regular trading session) 34.25 31.52 48.33 46.52 39.50Adjusted lowest (a) (during regular trading session) – – – – 38.99
End of the year (close) 45.005 38.91 56.83 54.65 53.05Adjusted end of the year (a) (close) – – – – 52.37
Average of the last 30 trading sessions of the year (close) 43.194 39.58 55.31 54.30 54.11
Trading volume (average per session)
Euronext Paris 7,014,959 11,005,751 10,568,310 10,677,157 10,838,962New York Stock Exchange (b) (number of ADRs) 2,396,192 2,911,002 1,882,072 1,500,331 1,716,466
Dividend (c) 2.28 2.28 2.07 1.87 1.62
(a) Adjusted market price of the spin-off of Arkema.(b) Pursuant to the four-for-one stock split approved by the Shareholders’ Meeting on May 12, 2006, and effective on May 18, 2006, and pursuant to the change in the ADR
ratio, effective on May 23, 2006, one ADR corresponding to one TOTAL share. Trading volumes in New York before May 23, 2006, have been multiplied by two.(c) 2009 dividend is subject to the approval by the Shareholders’ Meeting on May 21, 2010. This amount includes the 2009 interim dividend of €1.14 per share paid on
November 18, 2009, and is eligible for the 40% rebate applying to individuals residing in France for tax purposes provided for by Article 158 of the French General Tax Code.
‹ TOTAL share price over the past 18 months (Euronext Paris) (a)
Average dailyvolume
Highestprice quoted
(€)
Lowestprice quoted
(€)
September 2008 12,523,975 49.17 40.50October 2008 19,433,641 43.90 31.52November 2008 11,883,725 44.55 36.115December 2008 9,319,764 42.00 35.44January 2009 8,277,843 42.465 34.35February 2009 8,120,267 42.185 36.64March 2009 9,069,449 39.42 34.25April 2009 8,163,626 39.04 34.72May 2009 7,026,974 41.97 38.30June 2008 6,031,235 42.455 37.20July 2009 5,956,920 40.89 35.75August 2009 5,978,302 40.64 36.965September 2009 7,537,239 42.45 38.91October 2009 7,312,637 43.11 39.005November 2009 5,908,294 43.495 40.50December 2009 5,010,797 45.785 41.50January 2010 6,089,982 46.735 41.215February 2010 7,098,526 43.165 40.05Maximum for the period 49.17Minimum for the period 31.52
(a) Source: Euronext Paris.
/ 137TOTAL
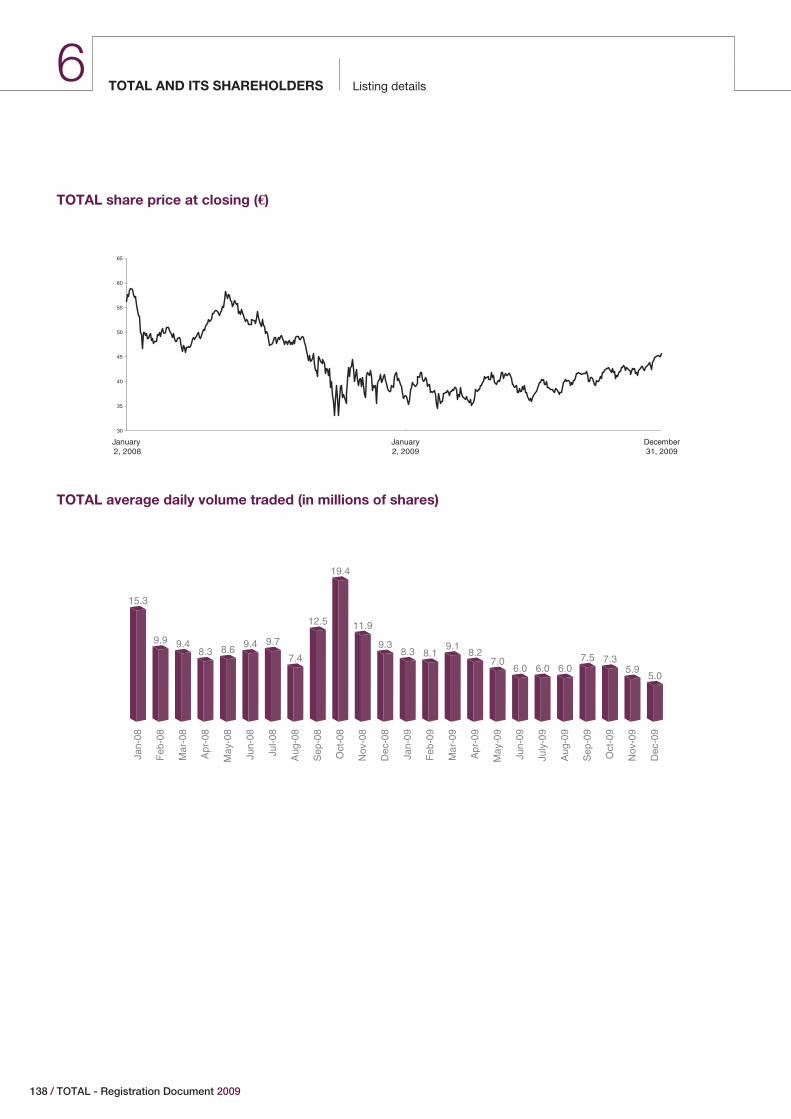
Listing detailsTOTAL AND ITS SHAREHOLDERS6
TOTAL share price at closing (€)
30
35
40
45
50
55
60
65
January 2, 2008
January2, 2009
December31, 2009
TOTAL average daily volume traded (in millions of shares)
15.3
9.9 9.48.3 8.6 9.4 9.7
7.4
12.5
19.4
11.9
9.38.3 8.1
9.18.2
7.06.0 6.0 6.0
7.5 7.35.9
5.0
Jan-
08
Feb
-08
Mar
-08
Apr
-08
May
-08
Jun-
08
Jul-0
8
Aug
-08
Sep
-08
Oct
-08
Nov
-08
Dec
-08
Jan-
09
Feb
-09
Mar
-09
Apr
-09
May
-09
Jun-
09
July
-09
Aug
-09
Sep
-09
Oct
-09
Nov
-09
Dec
-09
138 / TOTAL - Registration Document 2009
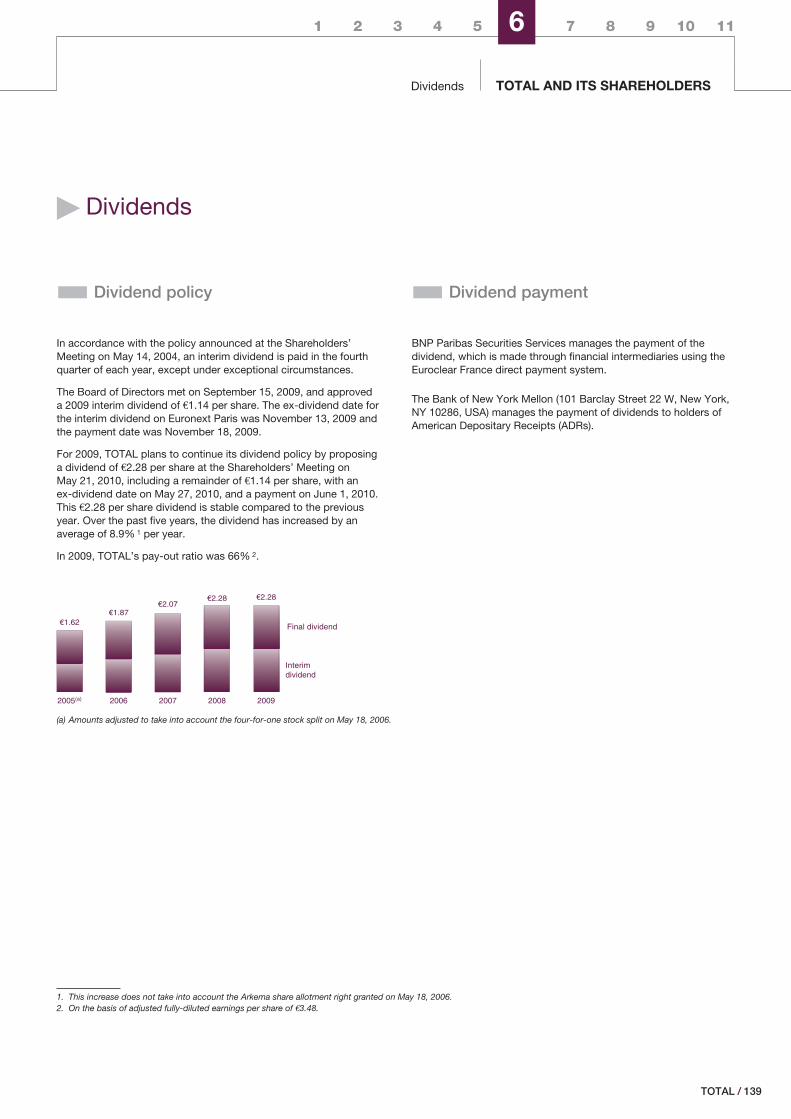
1 2 3 4 5 6 7 8 9 10 11
Dividends TOTAL AND ITS SHAREHOLDERS
� Dividends
� Dividend policy
In accordance with the policy announced at the Shareholders’Meeting on May 14, 2004, an interim dividend is paid in the fourthquarter of each year, except under exceptional circumstances.
The Board of Directors met on September 15, 2009, and approveda 2009 interim dividend of €1.14 per share. The ex-dividend date forthe interim dividend on Euronext Paris was November 13, 2009 andthe payment date was November 18, 2009.
For 2009, TOTAL plans to continue its dividend policy by proposinga dividend of €2.28 per share at the Shareholders’ Meeting onMay 21, 2010, including a remainder of €1.14 per share, with anex-dividend date on May 27, 2010, and a payment on June 1, 2010.This €2.28 per share dividend is stable compared to the previousyear. Over the past five years, the dividend has increased by anaverage of 8.9% 1 per year.
In 2009, TOTAL’s pay-out ratio was 66% 2.
� Dividend payment
BNP Paribas Securities Services manages the payment of thedividend, which is made through financial intermediaries using theEuroclear France direct payment system.
The Bank of New York Mellon (101 Barclay Street 22 W, New York,NY 10286, USA) manages the payment of dividends to holders ofAmerican Depositary Receipts (ADRs).
(a) Amounts adjusted to take into account the four-for-one stock split on May 18, 2006.
1. This increase does not take into account the Arkema share allotment right granted on May 18, 2006.2. On the basis of adjusted fully-diluted earnings per share of €3.48.
/ 139TOTAL
DividendsTOTAL AND ITS SHAREHOLDERS6
‹ Dividend payment on Stock Certificates
TOTAL issued Stock Certificates (certificats représentatifs d’actions, “CRs”) as part of the public exchange offer for PetroFina shares. The CRis a stock certificate provided for by French Law, issued by Euroclear France, intended to circulate exclusively outside of France, and whichmay not be held by French residents. The CR is issued as a physical certificate that is registered in a custody account, and has thecharacteristics of a bearer security. The CR is freely convertible from a physical certificate into a security registered on a custody account andconversely. However, pursuant to the Belgian law of December 14, 2005 on the dematerialization of securities in Belgium, CRs may only bedelivered in the form of a dematerialized certificate once this law became effective on January 1, 2008. New CRs were issued followingTOTAL’s four-for-one stock split in 2006. ING Belgique is the bank handling the payment of any coupon detached from any outstanding CR.
No fees are applicable to the payment of coupons detached from CRs, except for any income or withholding taxes; the payment may bereceived at the teller windows of the following institutions:
ING Belgique Avenue Marnix 24, 1000 Brussels, Belgium
BNP Paribas Fortis Montagne du Parc 3, 1000 Brussels, Belgium
KBC BANK N.V. Avenue du Port 2, 1080 Brussels, Belgium
‹ Strips-VVPR TOTAL
Strips-VVPR are securities that allow a shareholder resident in Belgium to reduce the Belgian withholding tax applicable to securities incomeon the dividend paid by TOTAL from 25% to 15%. These Strips-VVPR are traded separately from TOTAL shares and are listed on the semi-official market (marché semi-continu) of the Brussels stock exchange. According to the Belgian law of December 14, 2005, on thedematerialization of securities in Belgium, the Strips VVPR may only be delivered in the form of a dematerialized certificate after this lawbecame effective on January 1, 2008.
Strips-VVPR grant rights only if accompanied by TOTAL shares. There were 227,734,056 strips-VVPR TOTAL outstanding as of December 31,2009.
� Coupons
For the year endedDecember 31,
Ex-dividenddate
Paymentdate
Expirationdate Type
Net amount(€)
Net amount (a)
(€)
2003 05/24/2004 05/24/2004 05/24/2009 Dividends 4.70 1.18
2004 11/24/2004 11/24/2004 11/24/2009 Interim dividend 2.40 0.6005/24/2005 05/24/2005 05/24/2010 Final dividend 3.00 0.75
2005 11/24/2005 11/24/2005 11/24/2010 Interim dividend 3.00 0.7505/18/2006 05/18/2006 05/18/2011 Final dividend 3.48 0.87
2006 11/17/2006 11/17/2006 11/17/2011 Interim dividend 0.87 0.8705/18/2007 05/18/2007 05/18/2012 Final dividend 1.00 1.00
2007 11/16/2007 11/16/2007 11/16/2012 Interim dividend 1.00 1.0005/20/2008 05/23/2008 05/23/2013 Final dividend 1.07 1.07
2008 11/14/2008 11/19/2008 11/19/2013 Interim dividend 1.14 1.1405/19/2009 05/22/2009 05/22/2014 Final dividend 1.14 1.14
2009 (b) 11/13/2009 11/18/2009 11/18/2014 Interim dividend 1.14 1.14
05/27/2010 06/01/2010 06/01/2015 Final dividend 1.14 1.14
(a) Net amounts adjusted to take into account the four-for-one stock split on May 18, 2006.(b) A resolution will be submitted to the Shareholders’ Meeting on May 21, 2010, to pay a cash dividend of €2.28 per share for fiscal year 2009. Taking into account the interim
dividend of €1.14 per share with an ex-dividend date of November 13, 2009, and payment date of November 18, 2009, the final dividend would be €1.14 per share with anex-dividend date of May 27, 2010 and payment date of June 1, 2010.
140 / TOTAL - Registration Document 2009
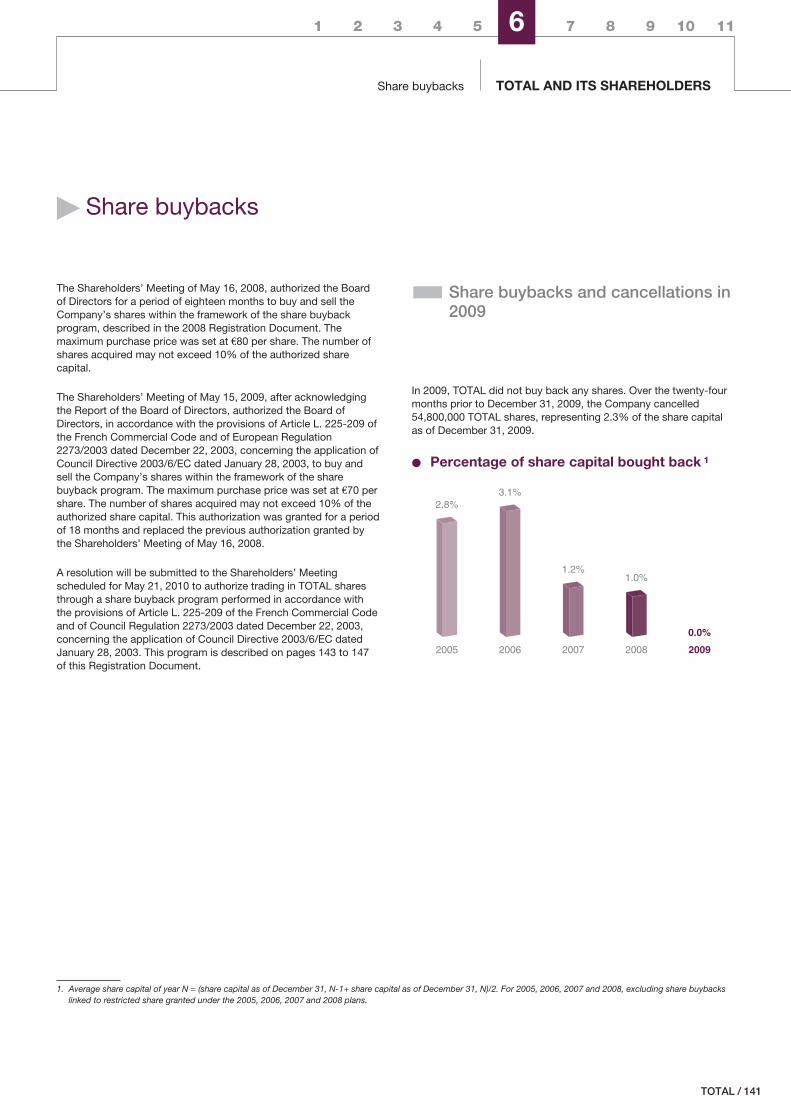
1 2 3 4 5 6 7 8 9 10 11
Share buybacks TOTAL AND ITS SHAREHOLDERS
� Share buybacks
The Shareholders’ Meeting of May 16, 2008, authorized the Boardof Directors for a period of eighteen months to buy and sell theCompany’s shares within the framework of the share buybackprogram, described in the 2008 Registration Document. Themaximum purchase price was set at €80 per share. The number ofshares acquired may not exceed 10% of the authorized sharecapital.
The Shareholders’ Meeting of May 15, 2009, after acknowledgingthe Report of the Board of Directors, authorized the Board ofDirectors, in accordance with the provisions of Article L. 225-209 ofthe French Commercial Code and of European Regulation2273/2003 dated December 22, 2003, concerning the application ofCouncil Directive 2003/6/EC dated January 28, 2003, to buy andsell the Company’s shares within the framework of the sharebuyback program. The maximum purchase price was set at €70 pershare. The number of shares acquired may not exceed 10% of theauthorized share capital. This authorization was granted for a periodof 18 months and replaced the previous authorization granted bythe Shareholders’ Meeting of May 16, 2008.
A resolution will be submitted to the Shareholders’ Meetingscheduled for May 21, 2010 to authorize trading in TOTAL sharesthrough a share buyback program performed in accordance withthe provisions of Article L. 225-209 of the French Commercial Codeand of Council Regulation 2273/2003 dated December 22, 2003,concerning the application of Council Directive 2003/6/EC datedJanuary 28, 2003. This program is described on pages 143 to 147of this Registration Document.
� Share buybacks and cancellations in2009
In 2009, TOTAL did not buy back any shares. Over the twenty-fourmonths prior to December 31, 2009, the Company cancelled54,800,000 TOTAL shares, representing 2.3% of the share capitalas of December 31, 2009.
‹ Percentage of share capital bought back 1
2005 2006 2007 2008 2009
2.8%3.1%
1.2%1.0%
0.0%
1. Average share capital of year N = (share capital as of December 31, N-1+ share capital as of December 31, N)/2. For 2005, 2006, 2007 and 2008, excluding share buybackslinked to restricted share granted under the 2005, 2006, 2007 and 2008 plans.
/ 141TOTAL
Share buybacksTOTAL AND ITS SHAREHOLDERS6
� Board’s report on share buybacks
‹ Share buybacks during 2009
In 2009, TOTAL did not buy back any shares.
‹ Shares held in the name of the Company andits subsidiaries as of December 31, 2009.
As of December 31, 2009, the Company held directly 15,075,922TOTAL shares, representing 0.64% of TOTAL’s share capital. Bylaw, the voting rights and dividend rights of these shares aresuspended.
After taking into account the shares held by Group subsidiaries thatare entitled to a dividend but deprived of voting rights, the totalnumber of TOTAL shares held by the Group as of December 31,2009, was 115,407,190, representing 4.91% of TOTAL’s sharecapital comprised, on the one hand, of 15,075,922 treasury shares,6,017,499 shares held to cover call options, 5,799,400 shares tocover restricted share grants, 3,259,023 shares to cover new sharepurchase option plans or restricted share grants and, on the otherhand, of 100,331,268 shares held by subsidiaries.
For shares bought back to be allocated to Company or Groupemployees as part of one of the provisions referred to in Article 3 ofEC Regulation No.2273/2003 of December 22, 2003, note thatwhen such shares are held to cover call options that have expiredor restricted share grants that have not been awarded at the end ofthe vesting period, they will be allocated to new TOTAL sharepurchase options plans or restricted share grants that could beapproved by the Board of Directors.
‹ Sale of shares during 2009
548,656 TOTAL shares were sold in 2009 at an average price of€39.21 per share through the exercise of TOTAL share purchaseoptions granted under share purchase option plans approved bythe Board of Directors on July 10, 2001 and July 9, 2002.
In addition, 2,326,249 TOTAL shares were sold in 2009 pursuant tothe shares finally granted under the restricted share grantsapproved by the Board of Directors on July 19, 2005,July 18, 2006, July 17, 2007 and September 9, 2008.
‹ Cancellation of Company shares during 2008,2009 and 2010
Pursuant to the authorization granted by the Shareholders’ Meetingon May 11, 2007, to reduce the share capital by up to 10% by
cancelling shares held by the Company during a 24-month period,the Board of Directors decided to cancel 30,000,000 shares onJuly 31, 2008, and 24,800,000 shares on July 30, 2009. Theseshares were accounted for as long-term securities in the parentcompany’s financial statements. This authorization will no longer bevalid from the date of the Shareholders’ Meeting to approve thefinancial statements for the year ending December 31, 2011.
Based on 2,348,422,884 shares outstanding as ofDecember 31, 2009, and given the cancellations carried outsuccessively on July 31, 2008 (30,000,000 shares) andJuly 30, 2009 (24,800,000 shares), the Company may cancel amaximum of 180,042,288 shares up to and including July 31, 2010,before reaching the cancellation threshold of 10% of share capitalcancelled during a 24-month period.
‹ Reallocation for other approved purposesduring fiscal year 2009
Shares purchased by the Company under the authorization grantedby the Shareholders’ Meeting of May 16, 2008, or under previousauthorizations, were not reallocated in 2009 to purposes other thanthose initially specified at the time of purchase.
‹ Conditions for the buyback and use ofderivative products
Between January 1, 2009 and February 28, 2010, the Company didnot use any derivative products on the financial markets as part ofthe share buyback programs successively authorized by theShareholders’ Meetings on May 16, 2008 and May 15, 2009.
‹ Treasury shares
As of February 28, 2010, the Company held 14,710,872 TOTALtreasury shares, representing 0.63% of TOTAL’s share capital. Bylaw, the voting rights and dividend rights of these shares aresuspended.
After taking into account the shares held by Group subsidiaries thatare entitled to a dividend but deprived of voting rights, the totalnumber of TOTAL shares held by the Group as of February 28,2010 was 115,042,140, representing 4.90% of TOTAL’s sharecapital comprised, on the one hand, of 14,710,872 treasury shares,including 5,653,571 shares held to cover call options, 5,799,120shares to cover restricted share grants, 3,258,181 shares to covernew share purchase option plans or restricted share grants and, onthe other hand, of 100,331,268 shares held by subsidiaries.
142 / TOTAL - Registration Document 2009
1 2 3 4 5 6 7 8 9 10 11
Share buybacks TOTAL AND ITS SHAREHOLDERS
Summary table of transactions completed by the Company involving its own shares from March 1, 2009 to February 28, 2010 (a)
Gross cumulated flows Open positions as of February 28, 2010
Purchases Sales (b) Open buy positions Open sell positions
Bought callsForward
buys Sold calls Forward sellsNumber of shares – 904,370Average maximum maturity date – – – –Average transaction price (€) – 39.14 – – – –Average exercise price – – – – – –Amounts (M€) – 35.4 – – – –
(a) In compliance with the applicable regulations as of February 28, 2010, the period indicated commenced the day after the date used as a reference for the publication ofinformation regarding the previous program (Registration Document 2008).
(b) Shares disposed of pursuant to the exercise of TOTAL share purchase options as part of the share purchase option plans decided by the Board of Directors on July 10, 2001and July 9, 2002.
In addition, 2,324,329 TOTAL shares were sold between March 1, 2009 and February 28, 2010, pursuant to the shares finally granted underthe restricted share grants approved by the Board of Directors on July 19, 2005, July 18, 2006, July 17, 2007 and September 9, 2008.
Treasury shares
As of February 28, 2010
Percentage of share capital held by TOTAL S.A. 0.63%
Number of shares held in portfolio (a) 14,710,872Book value of the portfolio (at purchase price) (M€) 581Market value of the portfolio (M€) (b) 603
Percentage of capital held by the entire Group (c) 4.90%
Number of shares held in portfolio 115,042,140Book value of the portfolio (at purchase price) (M€) 3,608Market value of the portfolio (M€) (b) 4,714
(a) TOTAL S.A. has not bought back any shares during the 3 business days preceding February 28, 2010. As a result, TOTAL S.A. owns all the shares held in portfolio as of thisdate.
(b) On the basis of a closing price of €40.98 per share as of February 26, 2010.(c) TOTAL S.A., Total Nucléaire, Financière Valorgest, Sogapar and Fingestval.
� 2010-2011 share buyback program
Description of the share buyback program under Article 241-1and following of the French Financial Markets Authority(Autorité des marchés financiers) General Regulation
‹ Objectives of the share buyback program
o Reduce the Company’s capital through the cancellation ofshares;
o Honor the Company’s obligations related to securities convertibleor exchangeable into Company shares; and
o Honor the Company’s obligations related to stock optionprograms or other share grants to employees of the Company orGroup Companies.
‹ Legal framework
Implementation of the share buyback program, which falls withinthe legal framework created by French Law No. 98-546 ofJuly 2, 1998, containing various economic and financial provisionsand within the framework of the provisions of European RegulationNo. 2273/2003 of December 22, 2003, on the conditions for theapplication of Council Directive No. 2003/6/EC of January 28, 2003,is subject to approval by TOTAL S.A.’s Shareholders’ Meeting ofMay 21, 2010, through the sixth resolution, which reads as follows:
“Ruling under conditions for quorum and majority required forordinary general meetings and upon presentation of the report bythe Board of Directors, and certain information appearing in thedescription of the program prepared in accordance withArticles 241-1 and thereafter of the General Regulation (règlementgénéral) of the French Financial Markets Authority (Autorité desmarchés financiers) and in accordance with the provisions of ArticleL. 225-209 of the French Commercial Code and of CouncilRegulation No. 2273/2003 dated December 22, 2003, concerningthe application of Council Directive No. 2003/6/CE dated
/ 143TOTAL
Share buybacksTOTAL AND ITS SHAREHOLDERS6
January 28, 2003, the shareholders hereby authorize the Board ofDirectors to buy or sell shares within the framework of a sharebuyback program.
The purchase of such shares may be transacted by any means onthe market or over the counter, including the purchase of blocks ofshares under the conditions authorized by the competent marketauthorities. Within this framework, this includes using any financialderivative instrument traded on a regulated market or over thecounter and implementing option strategies.
These transactions may be carried out at any time, except anypublic offering periods applying to the Company’s share capital, inaccordance with the applicable rules and regulations.
The maximum purchase price is set at €70 per share.
In case of a capital increase by incorporation of reserves andrestricted share grants, and in the case of a stock-split or a reverse-stock-split, this maximum price shall be adjusted by applying theratio of the number of shares outstanding before the transaction tothe number of shares outstanding after the transaction.
Pursuant to Article L. 225-209 of the French Commercial Code, themaximum number of shares that may be bought back under thisauthorization may not exceed 10% of the total number of sharesoutstanding, as this number may be adjusted from time to time as aresult of transactions after the date of the present meeting, andunder no circumstances may the Company hold, either directly orindirectly through indirect subsidiaries, more than 10% of its sharecapital.
As of December 31, 2009, of the 2,348,422,884 shares outstandingat this date, the Company held 15,075,922 shares directly and100,331,268 shares indirectly through its subsidiaries, for a total of115,407,190 shares. Under these circumstances, the maximumnumber of shares that the Company could buy back is 119,435,098shares, and the maximum amount that the Company may spend toacquire such shares is €8,360,456,860.
The purpose of this share buyback program is to reduce thenumber of shares outstanding or to allow the Company to fulfill itsengagements in connection with:
o Convertible or exchangeable securities that may give holdersrights to receive shares upon conversion or exchange; and
o Share purchase option plans, employee shareholding plans,company savings plans, or other share allocation programs formanagement or employees of the Company or of Groupcompanies (in particular as part of restricted share grants).
According to the intended purpose, the treasury shares that areacquired by the Company through this program may be:
o Cancelled up to the maximum legal limit of 10 % of the totalnumber of shares outstanding on the date of the operation duringeach 24-month period;
o Granted to the employees of the Group and to the managementof the Company or of other companies in the Group;
o Delivered to the holders of Company’s share subscription optionshaving exercised such options;
o Sold to employees, either directly or through the intermediary ofCompany savings plans; or
o Delivered to the holders of securities that grant such rights toreceive such shares, either through redemption, conversion,exchange, presentation of a warrant or in any other manner.
This program may also be used by the Company to trade in its ownshares, either on or off the market, for any other purpose that isauthorized or any permitted market practice, or any other purposethat may be authorized or any other market practice that may bepermitted under the applicable law or regulation. In case oftransactions other than the mentioned intended purpose, theCompany will inform its shareholders in a press release.
While they are held by the Company, such shares will be deprivedof voting rights and dividend rights.
This authorization is granted for a period of eighteen months fromthe date of this meeting or until the date such authorization isrenewed at a Shareholders’ Meeting prior to the expiration of such18-month period.
The Board of Directors is hereby granted full authority, with the rightto delegate such authority, to undertake all actions necessary ordesirable to carry out the program or programs authorized by thisresolution. This resolution cancels and replaces up to unusedportion of the previous authorization granted by the seventhresolution of the Shareholders’ Meeting held on May 15, 2009.”
The Shareholders’ Meeting of May 11, 2007, had also authorizedthe Board of Directors to reduce the capital by cancellation ofshares up to a maximum of 10% of the share capital over a periodof twenty-four months in accordance with the following resolution:
“Upon presentation of the report of the Board of Directors and theauditors’ special report, and ruling under conditions for quorum andmajority required for extraordinary general meetings, theshareholders hereby authorize the Board of Directors, inaccordance with Article L. 225-209 of the French CommercialCode, to reduce the company’s capital on one or more occasionsby cancelling shares that the Company holds or that it could holdas a result of purchases made in connection with this same article.The shareholders hereby grant all powers to the Board of Directors,with the option to sub-delegate such powers under conditionsprovided for by law, to carry out such capital reduction orreductions based on its decisions alone, in 24-month periods andwithin the limit of 10% of the total number of shares outstanding asof the transaction date, to decide on the amount, and to apply thedifference between the buyback value of the securities and their parvalue against any reserves or premiums, to amend the by-lawsaccordingly, and to complete all necessary formalities relatedthereto. This authorization shall cancel and replace any unusedamounts otherwise available under the authorization granted by thethirteenth resolution of the Shareholders’ Meeting of May 7, 2002,and shall expire at the conclusion of the Shareholders’ Meetingcalled to approve the financial statements for the fiscal year endingDecember 31, 2011.”
144 / TOTAL - Registration Document 2009
1 2 3 4 5 6 7 8 9 10 11
Share buybacks TOTAL AND ITS SHAREHOLDERS
‹ Conditions
� Maximum share capital to be purchased andmaximum funds allocated to the transaction
The maximum number of shares that may be purchased under theauthorization proposed to the Shareholders’ Meeting of May 21,2010, may not exceed 10% of the total number of sharesoutstanding, with this limit applying to an amount of the Company’sshare capital that will be adjusted, if necessary, to includetransactions affecting the share capital subsequent to this meeting;purchases made by the Company cannot in any case result in theCompany holding more than 10% of the share capital, eitherdirectly or indirectly through subsidiaries.
Before any share cancellation under the authorization given by theShareholders’ Meeting of May 11, 2007, based on the number ofshares outstanding as of December 31, 2009 (2,348,422,884shares), and given the 115,042,140 shares held by the Group onFebruary 28, 2010, representing 4.90% of the share capital, themaximum number of shares that may be purchased would be119,800,148 shares representing a theoretical maximum investmentof €8,386,010,360 based on the maximum purchase price of €70.
� Conditions for buybacks
Such shares may be bought back by any means on the market orover the counter, including the purchase of blocks of shares under
the conditions authorized by the competent market authorities.Within this framework, this includes using any financial derivativeinstrument traded on a regulated market or over the counter andimplementing option strategies, with the Company takingmeasures, however, to avoid increasing the volatility of its stock.The portion of the program realized through the purchase of blocksof shares will not be subject to quota allocation, up to the limit setby this resolution. These shares may be bought back at any time inaccordance with current regulation, except any public offeringperiods applying to the Company’s share capital.
� Duration and schedule of the share buyback program
In accordance with the sixth resolution, which will be subject toapproval of the Shareholders’ Meeting of May 21, 2010, the sharebuyback program may be implemented over an 18-month periodfollowing the date of this meeting, expiring therefore onNovember 21, 2011.
� Transactions carried out under the previous program
Transactions carried out under the previous program are listed inthe special report of the Board of Directors on share buybacks (seepages 142 and 143 of this Registration Document).
/ 145TOTAL
ShareholdersTOTAL AND ITS SHAREHOLDERS6
� Shareholders
� Relationship between TOTAL andthe French State
Since the decree of December 13, 1993, providing for a unique ElfAquitaine share to the French State was repealed on October 3,2002, no agreement governing shareholding relationships betweenTOTAL (or its subsidiary Elf Aquitaine) and the French State hasbeen implemented.
� Merger of Total with PetroFina in1999
In December, 1998, Total 1 signed an in-kind contributionagreement with Electrafina, Investor, Tractebel, Electrabel and AG1824 (the Contributors), under which the Contributors exchangedtheir PetroFina shares. Total then launched in 1999 a publicexchange offer for the remaining PetroFina shares not in itspossession, at the same parity of exchange as the previous one.Following this public offer, Total held 98.8% of Petrofina’s sharecapital.
In October 2000, TotalFinaElf launched, at the same parity ofexchange as the previous one, a complementary public exchangeoffer for the PetroFina shares not yet held by the Company. As ofDecember 31, 2000, TotalFinaElf held 99.6% of PetroFina’s sharecapital. Then in April 2001, the Extraordinary Shareholders’ Meetingof Total Chimie approved TotalFinaElf’s contribution to Total Chimie(a 100% subsidiary of TOTAL S.A.) of the entire interest held by theCompany in PetroFina. Finally in September, 2001, the Board ofDirectors of Total Chimie decided to launch a squeeze-outprocedure for the 90,129 PetroFina shares not yet held. Since theend of the squeeze-out, all shares of PetroFina have been held byTotal Chimie.
On December 22, 2006, the Court of Appeal of Brussels rendered adecision in which it put an end to the escrow ordered by theCommercial Court of Brussels dated April 15, 2002, following amotion for a summary hearing filed by minority PetroFina
shareholders holding 4,938 shares. In May 2003, the same group offormer minority PetroFina shareholders brought a complaint againstTotal Chimie and PetroFina before the Commercial Court ofBrussels contesting, in particular, the price offered by Total Chimiein the squeeze-out procedure and the terms of PetroFina’s sale ofthe assets of Fina Exploration Norway (FEN SA) to Total Norge ASin December 2000. In June 2006, the same group of shareholdersbrought a complaint against TOTAL S.A. On May 31, 2007 andFebruary 8, 2008, the Commercial Court of Brussels renderedpreliminary rulings in which it appointed an expert to examine thevaluation of PetroFina’s assets in Angola and Norway with regard tothe squeeze-out procedure launched by Total Chimie. On April 16,2008, Total Chimie, PetroFina and TOTAL S.A. appealed thedecisions rendered by the Commercial Court of Brussels. The legalproceeding is currently pending before the Court of Appeals ofBrussels. Following the withdrawal of several minority shareholders,the plaintiffs account for less than 2,500 securities as of today.
� Merger of TotalFina with ElfAquitaine
In 1999, the Boards of Directors of TotalFina and Elf Aquitainerecommended to their shareholders that the two companies mergethrough a public exchange offer. TotalFina acquired 254,345,078shares of Elf Aquitaine in exchange for 371,735,114 new TotalFinashares. In 2000, the Board of Directors launched an offer for theremaining Elf Aquitaine shares not yet held by the Company. Uponcompletion of this offer, TotalFinaElf acquired 10,828,326 shares ofElf Aquitaine in exchange for 14,437,768 new TotalFinaElf shares.
Elf Aquitaine shares are traded in the delisted shares section of theregulated markets (compartiment des valeurs radiées des marchésréglementés of Euronext Paris) and may be traded at a price fixeddaily at 3:00 p.m. (Paris time).
As of December 31, 2009, TOTAL S.A. held, directly and indirectly,279,875,134 shares of Elf Aquitaine, taking into account the10,635,844 Elf Aquitaine treasury shares held by Elf Aquitaine. Thisrepresented 99.48% of Elf Aquitaine’s share capital (281,343,859shares) and 538,308,099 voting rights, or 99.72% of the539,811,865 voting rights exercisable at Shareholders Meetings.
1. The name “Total” was changed to “TotalFina S.A.” on June, 14 1999. The name “TotalFina S.A” was then changed to “TotalFinaElf S.A” by the Shareholders’ Meeting ofMarch 22, 2000. It was then changed to “TOTAL S.A.” by the Shareholders’ Meeting of May 6, 2003.
146 / TOTAL - Registration Document 2009
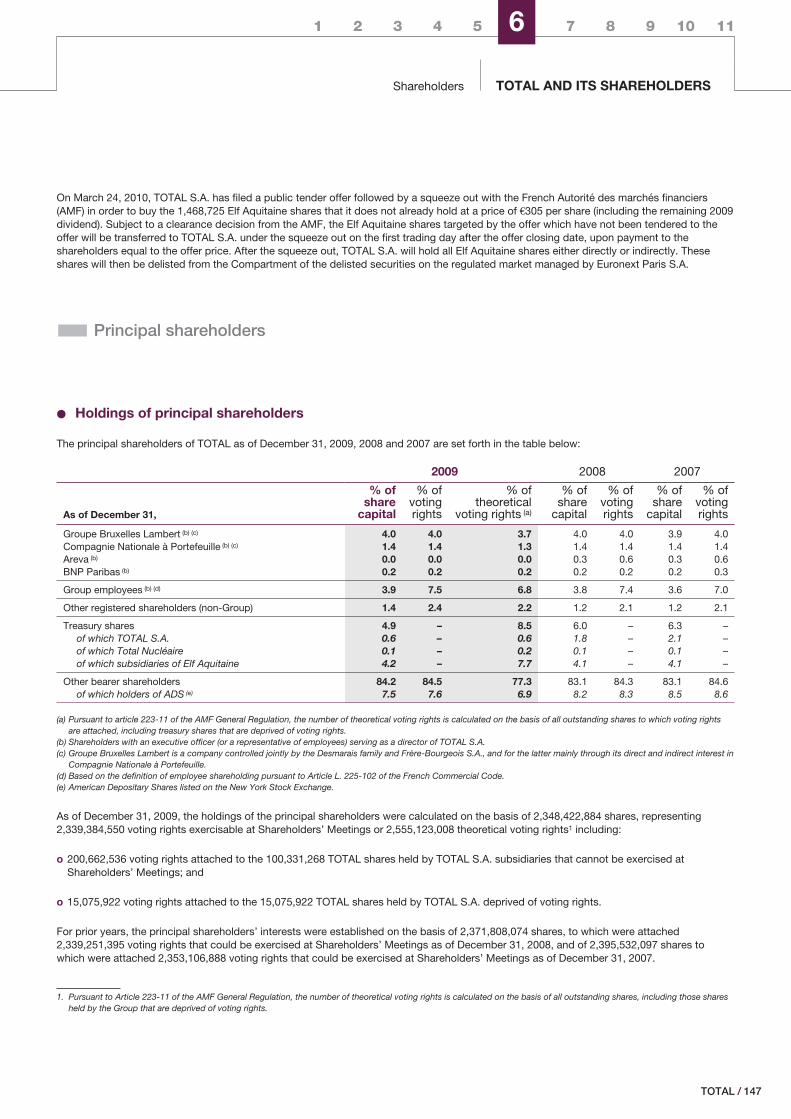
1 2 3 4 5 6 7 8 9 10 11
Shareholders TOTAL AND ITS SHAREHOLDERS
On March 24, 2010, TOTAL S.A. has filed a public tender offer followed by a squeeze out with the French Autorité des marchés financiers(AMF) in order to buy the 1,468,725 Elf Aquitaine shares that it does not already hold at a price of €305 per share (including the remaining 2009dividend). Subject to a clearance decision from the AMF, the Elf Aquitaine shares targeted by the offer which have not been tendered to theoffer will be transferred to TOTAL S.A. under the squeeze out on the first trading day after the offer closing date, upon payment to theshareholders equal to the offer price. After the squeeze out, TOTAL S.A. will hold all Elf Aquitaine shares either directly or indirectly. Theseshares will then be delisted from the Compartment of the delisted securities on the regulated market managed by Euronext Paris S.A.
� Principal shareholders
‹ Holdings of principal shareholders
The principal shareholders of TOTAL as of December 31, 2009, 2008 and 2007 are set forth in the table below:
2009 2008 2007
As of December 31,
% ofshare
capital
% ofvotingrights
% oftheoretical
voting rights (a)
% ofshare
capital
% ofvotingrights
% ofshare
capital
% ofvotingrights
Groupe Bruxelles Lambert (b) (c) 4.0 4.0 3.7 4.0 4.0 3.9 4.0Compagnie Nationale à Portefeuille (b) (c) 1.4 1.4 1.3 1.4 1.4 1.4 1.4Areva (b) 0.0 0.0 0.0 0.3 0.6 0.3 0.6BNP Paribas (b) 0.2 0.2 0.2 0.2 0.2 0.2 0.3
Group employees (b) (d) 3.9 7.5 6.8 3.8 7.4 3.6 7.0
Other registered shareholders (non-Group) 1.4 2.4 2.2 1.2 2.1 1.2 2.1
Treasury shares 4.9 – 8.5 6.0 – 6.3 –of which TOTAL S.A. 0.6 – 0.6 1.8 – 2.1 –of which Total Nucléaire 0.1 – 0.2 0.1 – 0.1 –of which subsidiaries of Elf Aquitaine 4.2 – 7.7 4.1 – 4.1 –
Other bearer shareholders 84.2 84.5 77.3 83.1 84.3 83.1 84.6of which holders of ADS (e) 7.5 7.6 6.9 8.2 8.3 8.5 8.6
(a) Pursuant to article 223-11 of the AMF General Regulation, the number of theoretical voting rights is calculated on the basis of all outstanding shares to which voting rightsare attached, including treasury shares that are deprived of voting rights.
(b) Shareholders with an executive officer (or a representative of employees) serving as a director of TOTAL S.A.(c) Groupe Bruxelles Lambert is a company controlled jointly by the Desmarais family and Frère-Bourgeois S.A., and for the latter mainly through its direct and indirect interest in
Compagnie Nationale à Portefeuille.(d) Based on the definition of employee shareholding pursuant to Article L. 225-102 of the French Commercial Code.(e) American Depositary Shares listed on the New York Stock Exchange.
As of December 31, 2009, the holdings of the principal shareholders were calculated on the basis of 2,348,422,884 shares, representing2,339,384,550 voting rights exercisable at Shareholders’ Meetings or 2,555,123,008 theoretical voting rights1 including:
o 200,662,536 voting rights attached to the 100,331,268 TOTAL shares held by TOTAL S.A. subsidiaries that cannot be exercised atShareholders’ Meetings; and
o 15,075,922 voting rights attached to the 15,075,922 TOTAL shares held by TOTAL S.A. deprived of voting rights.
For prior years, the principal shareholders’ interests were established on the basis of 2,371,808,074 shares, to which were attached2,339,251,395 voting rights that could be exercised at Shareholders’ Meetings as of December 31, 2008, and of 2,395,532,097 shares towhich were attached 2,353,106,888 voting rights that could be exercised at Shareholders’ Meetings as of December 31, 2007.
1. Pursuant to Article 223-11 of the AMF General Regulation, the number of theoretical voting rights is calculated on the basis of all outstanding shares, including those sharesheld by the Group that are deprived of voting rights.
/ 147TOTAL
ShareholdersTOTAL AND ITS SHAREHOLDERS6
‹ Identification of the holders of bearer shares
In accordance with Article 9 of its by-laws, the Company isauthorized, to the extent permitted under applicable law, to identifythe holders of securities that grant immediate or future voting rightsat the Company’s Shareholders’ Meetings.
‹ Legal thresholds
In addition to the legal obligation to inform the Company and theFrench Financial Markets Authority (Autorité des marchés financiers)within four business days when thresholds representing 5%, 10%,15%, 20%, 25%, 33 1⁄3%, 50%, 66 2⁄3%, 90% or 95% of the sharecapital or voting rights 1 are crossed (Article L. 233-7 of the FrenchCommercial Code), any individual or entity who directly or indirectlyacquires a percentage of the share capital, voting rights or rightsgiving future access to the share capital of the Company which isequal to or greater than 1%, or a multiple of this percentage, isrequired to notify the Company within fifteen days by registeredmail with return receipt requested, and declare the number ofsecurities held.
In case the shares above these thresholds are not declared, anyshares held in excess of the threshold and undeclared may bedeprived of voting rights at future Shareholders’ Meetings if, at thatmeeting, the failure to make a declaration is acknowledged and ifone or more shareholders holding collectively at least 3% of theCompany’s share capital or voting rights so request at that meeting.
All individuals and entities are also required to notify the Companyin due form and within the time limits stated above when their director indirect holdings fall below each of the aforementionedthresholds.
‹ Holdings above the legal thresholds
In accordance with Article L. 233-13 of the French CommercialCode, only one shareholder, Compagnie Nationale à Portefeuille(CNP) and Groupe Bruxelles Lambert (GBL), acting together, holds5% or more of TOTAL’s share capital at year-end 2009 2.
In addition, two known shareholders held 5% or more of the votingrights exercisable at TOTAL Shareholders’ Meetings at year-end2009:
o CNP jointly with GBL.
In the AMF notice No. 209C1156 dated September 2, 2009, CNPand GBL acting together declared that they held more than thethreshold of 5% of the voting rights of TOTAL as ofAugust 25, 2009, and held 127,149,464 TOTAL sharesrepresenting 127,745,604 voting rights, i.e. 5.42% of the sharecapital and 5.0009% of the theoretical voting rights 1 (on the basis
of a share capital of a share capital of 2,347,601,812 sharesrepresenting 2,554,431,468 voting rights). To the Company’sknowledge, CNP, jointly with GBL, held, as of December 31,2009, 5.41% of the share capital representing 5.46% of thevoting rights exercisable at Shareholders’ Meetings and 5% ofthe theoretical voting rights 1.
o The collective investment fund (Fonds commun de placement)“TOTAL ACTIONNARIAT FRANCE”.
To the Company’s knowledge, the collective investment fund(fonds commun de placement) “TOTAL ACTIONNARIAT FRANCE”held, as of December 31, 2009, 3.02% of the share capitalrepresenting 5.76% of the voting rights exercisable at aShareholders’ Meeting and 5.28% of the theoretical voting rights 1.
‹ Shareholders’ agreements
TOTAL is not aware of any agreements among its shareholders.
� Treasury shares
As of December 31, 2009, the Company held 115,407,190 TOTALshares either directly or through its indirect subsidiaries, whichrepresented 4.91% of the share capital, as of this date. By law,these shares are also deprived of voting rights.
For further information, see Chapter 8 (General Information–Treasury shares) of this Registration Document.
‹ TOTAL shares held directly by the Company(treasury shares)
The Company held 15,075,922 treasury shares as ofDecember 31, 2009, representing 0.64% of the share capital as ofthat date.
‹ TOTAL shares held by Group companies
As of December 31, 2009, Total Nucléaire, a Group companywholly-owned indirectly by TOTAL held 2,023,672 TOTAL shares.As of December 31, 2009, Financière Valorgest, Sogapar andFingestval, indirect subsidiaries of Elf Aquitaine, held respectively22,203,704, 4,104,000 and 71,999,892 TOTAL shares, representinga total of 98,307,596 TOTAL shares. As of December 31, 2009, theCompany held through its indirect subsidiaries 4.27% of the sharecapital.
148 / TOTAL - Registration Document 2009
1. Pursuant to Article 223-11 of the AMF General Regulation, the number of theoretical voting rights is calculated on the basis of all outstanding shares, including those sharesheld by the Group that are deprived of voting rights.
2. AMF notice No. 209C1156 dated September 2, 2009.
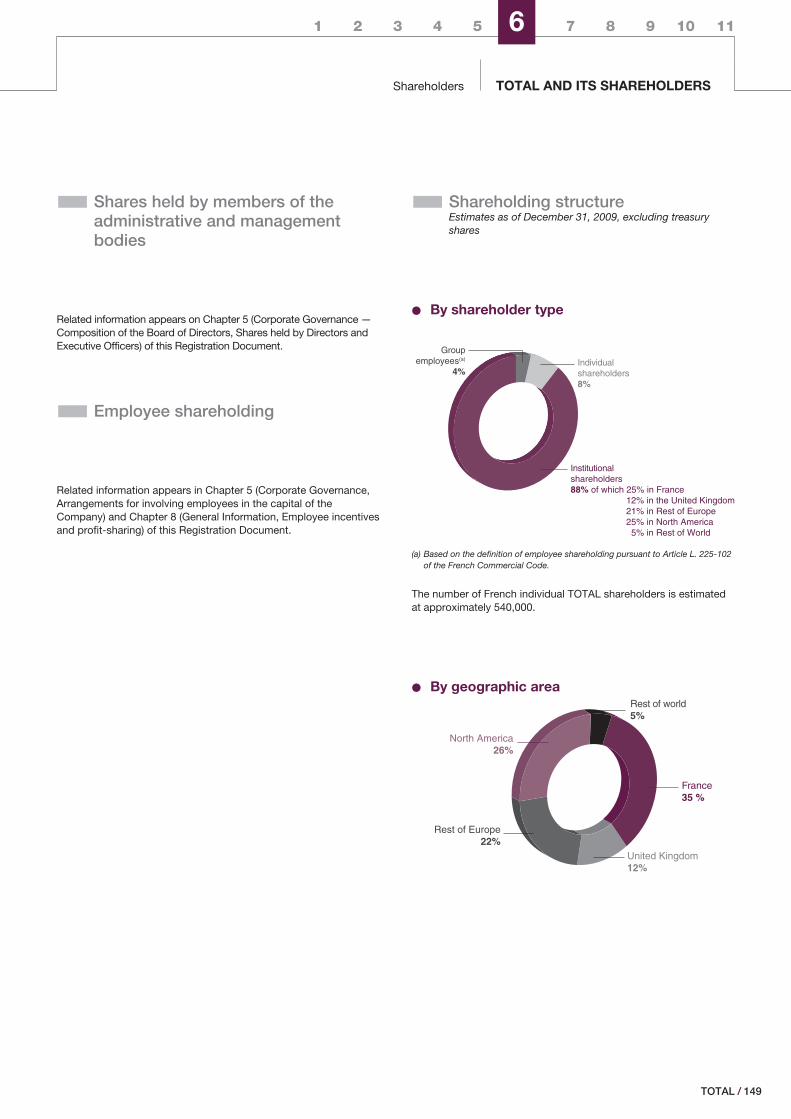
1 2 3 4 5 6 7 8 9 10 11
Shareholders TOTAL AND ITS SHAREHOLDERS
� Shares held by members of theadministrative and managementbodies
Related information appears on Chapter 5 (Corporate Governance —Composition of the Board of Directors, Shares held by Directors andExecutive Officers) of this Registration Document.
� Employee shareholding
Related information appears in Chapter 5 (Corporate Governance,Arrangements for involving employees in the capital of theCompany) and Chapter 8 (General Information, Employee incentivesand profit-sharing) of this Registration Document.
� Shareholding structureEstimates as of December 31, 2009, excluding treasuryshares
‹ By shareholder type
Groupemployees(a)
4%Individualshareholders8%
Institutionalshareholders88% of which 25% in France 12% in the United Kingdom 21% in Rest of Europe 25% in North America 5% in Rest of World
(a) Based on the definition of employee shareholding pursuant to Article L. 225-102of the French Commercial Code.
The number of French individual TOTAL shareholders is estimatedat approximately 540,000.
‹ By geographic area
Rest of Europe22%
Rest of world5%
France35 %
United Kingdom12%
North America26%
/ 149TOTAL
ShareholdersTOTAL AND ITS SHAREHOLDERS6
� Regulated agreements and relatedparty transactions
‹ Regulated agreements and undertakings
The special report of the statutory auditors of TOTAL S.A. onregulated agreements and undertakings in accordance with ArticleL. 225-38 of the French Commercial Code for fiscal year 2009appears in Appendix 3, page 282 of this Registration Document.
The list and purpose of the other regulating to agreements relatedto current operations entered into under normal terms andconditions and covered by Articles L. 225-39 and L. 225-115 of theFrench Commercial Code, provided to the shareholders at theCompany’s corporate offices, contains no agreement likely to havea significant impact on the Company’s financial situation.
No agreement links the Company to a shareholder holding afraction greater than 10% of the Company’s voting rights.
‹ Related party transactions
Details of transactions with related entities as required by theregulations adopted under EC regulation No. 1606/2002, enteredinto by the Group Companies during fiscal years 2007, 2008 or2009, appear in Note 24 to the Consolidated Financial Statementsof this Registration Document.
These transactions primarily concern equity affiliates andnon-consolidated companies in which TOTAL exercises significantinfluence.
150 / TOTAL - Registration Document 2009
1 2 3 4 5 6 7 8 9 10 11
Information for overseas shareholders TOTAL AND ITS SHAREHOLDERS
� Information for overseas shareholders
� United States holders of ADRs
Information intended for U.S. holders of TOTAL’s AmericanDepositary Shares (ADSs), represented by American DepositaryReceipts (ADRs), is provided in the Form 20-F filed by TOTAL S.A.with the United States Securities and Exchange Commission for theyear ended December 31, 2009.
� Non-resident shareholders (otherthan U.S. Shareholders)
In addition to Euronext Paris, TOTAL’s shares have been listed onthe London Stock Exchange since 1973 and on the Brussels stockexchange since 1999.
� Dividends
Dividends paid to non-French resident shareholders are generallysubject to French withholding tax at a rate of 25%.
Effective January 2008, the 25% withholding tax rate was reducedto 18% for dividends distributed to individuals who are residents,for tax purposes, within the European Union, in Iceland or inNorway.
In accordance with the French Finance Law for 2009 (Loi deFinances rectificative pour 2009), dated December 30, 2009,dividends paid to not-for-profit organizations that are residents ofthe European Union, Iceland or Norway are subject to the Frenchwithholding tax rate of 15%. Administrative guidelines setting forththe conditions under which this 15% withholding tax rate will beapplied have not yet been released.
In accordance with the above-mentioned French Finance Law thewithholding tax rate on dividends will be 50% effective March 1, 2010,should the dividends be distributed to so-called “Non-CooperativeCountries and Territories” (“NCCTs”), regardless of the beneficiary's taxresidence.
Pursuant to French law, a country or territory is described asnon-cooperative should the following cumulative conditions besatisfied: (1) it is not a member of the European Union; and (2) it hasnot concluded with France and with at least twelve other countriesor territories a convention on administrative assistance for theexchange of any information necessary for the application of taxlegislation of the relevant parties.Countries or territories that have signed such a convention withFrance prior to January 1, 2010, will not be registered on the NCCTlist, even if the convention has not entered into force as of that date(conversely, such countries or territories will be registered on theNCCT list if the convention has not entered into force by January 1,2011). A list of NCCTs will be established annually and updated bythe French tax authorities. The procedure for application of this newtax provision has not yet been released by the French taxauthorities.
According to many tax treaties signed between France and othercountries (“Tax Treaties”), the rate of French withholding tax isreduced in the case of dividends paid to a beneficial owner of thedividend that is a resident of one of these countries as defined bythe Tax Treaties, provided that certain requirements are satisfied(“Eligible Holder”).
Countries with which France has signed a Tax Treaty providing for areduction of the French withholding tax rate on dividends to 15%include Austria, Belgium, Canada, Germany, Ireland, Italy, Japan,Luxembourg, Norway, the Netherlands, Singapore, South Africa,Spain, Switzerland, and the United Kingdom (this is not anexhaustive list).
Administrative guidelines issued by the French Tax Authorities setforth the conditions under which the reduced French withholdingtax rate of 15% may be available. The immediate application of thereduced 15% rate is available only to Eligible Holders who maybenefit from the so-called “simplified procedure” and are residentsof a country with which France has concluded a Tax Treaty thatprovides for a reduction of the withholding tax.
Under the “simplified procedure”, such Eligible Holders may claimthe instant application of the reduced 15% withholding tax on thedividends to be received by them, provided that:
o They provide the financial institution managing their securitieswith a certificate of residence conforming to the model attachedto the Administrative Guidelines. The instant application of the15% withholding tax rate will be available only if the certificate ofresidence is sent to the financial institution managing theirsecurities before the dividend payment date. Furthermore, eachfinancial institution managing the eligible Holders’ securities mustalso send to the French paying agent the figure of the totalamount of dividends eligible for the reduced withholding tax ratebefore the dividend payment date.
o The foreign financial institution managing such Eligible Holder’ssecurities provides the French paying agent with a list of the
/ 151TOTAL
Information for overseas shareholdersTOTAL AND ITS SHAREHOLDERS6
Eligible Holders and other information set forth in theAdministrative Guidelines. These documents must be sent assoon as possible, in all cases before the end of the third monthcomputed as from the end of the month of the dividend paymentdate.
Where the foreign Eligible Holder’s identity and tax residence areknown by the French paying agent, the latter may release suchforeign Eligible Holder from providing the financial institutionmanaging its securities with the above-mentioned certificate ofresidence, and apply the 15% withholding tax rate to dividends itpays to such foreign Eligible Holder.
For an Eligible Holder that is not entitled to the so-called “simplifiedprocedure”, the 25% French withholding tax will be levied at thetime the dividends are paid. Such Eligible Holder may, however, beentitled to a refund of the withholding tax in excess of the 15% rateunder the standard procedure, as opposed to the “simplifiedprocedure”, provided that the Eligible Holder provides the Frenchpaying agent with an application for refund on a specific formbefore December 31 of the second year following the date ofpayment of the withholding tax at the 25% rate. Any Frenchwithholding tax refund is generally expected to be paid within12 months from the filing of the abovementioned form. However, itwill not be paid before January 15 of the year following the year inwhich the dividend was paid. The “simplified procedure” is notapplicable to Swiss corporate holders and Singapore residentholders.
Copies of the French forms mentioned above are, in principle,available from the French non-resident tax office, at the followingaddress:
Recette des impôts des non résidents, 10, rue du Centre, 93463Noisy le Grand, France.
According to certain Tax Treaties, certain Eligible Holders wereentitled to receive a French tax credit (the so-called avoir fiscal).However, the avoir fiscal was abolished, effective January 1, 2005.
The avoir fiscal was replaced, for French resident shareholders whoare individuals, by a tax credit equal to 50% of the amountdistributed, but with an overall annual cap of €230 or, as the casemaybe, €115 depending on the marital status of the individualholder.
Non-resident individual taxpayers entitled to the previous avoirfiscal under certain Tax Treaties are also entitled to this tax creditlimited to €230 or €115 depending on the marital status of theindividual holder, possibly reduced by the French withholding tax.Please note that the French tax authorities do not provide for theprocedure of refund of such credit yet.
The foreign taxation of dividends varies from one country to anotheraccording to their respective tax legislation.
In most countries, the gross amount of dividend, if any, and therefund up to €230 or €115 is generally included in the recipient’staxable income. Subject to certain conditions and limitations,French withholding taxes on dividends will be eligible for creditagainst the holder’s income tax liability.
However, there are certain exceptions. For instance, in Belgium, aso-called précompte mobilier of 15% is applicable to the netdividends received by individual shareholders.
Because the foregoing is a general summary, holders are advised toconsult their own tax advisors in order to determine the effect of theTax Treaties and the applicable procedures as well as their incometax and more generally the tax consequences of the ownership ofshares applicable in their particular tax situations.
152 / TOTAL - Registration Document 2009
1 2 3 4 5 6 7 8 9 10 11
Communication with shareholders TOTAL AND ITS SHAREHOLDERS
� Communication with shareholders
� Communication policy
In addition to its Registration Document filed each year with theFrench Financial Markets Authority (Autorité des marchés financiers)the Group provides information regularly on its operations onreports and newsletters as well as its website www.total.com andthrough press releases for significant news. The Group’spresentations on its results and outlook are also available on itswebsite.
Since its shares are traded in the United States, the Company alsofiles an annual report on Form 20-F, in English, with the UnitedStates Securities and Exchange Commission (SEC) (see page 174).
The Group holds regular information sessions and participates inconferences for shareholders and financial analysts, both in Franceand abroad.
In 2009, TOTAL was awarded several prizes by the InstitutionalInvestor Research Group, the Investor Relations Global Rankingand the Thomson Extel Survey, including a prize for the best Headof Investors Relations and the second best Investor RelationsDepartment among listed oil companies for the quality of itsfinancial communication policy.
� Relationships with institutionalinvestors and financial analysts
Members of the Group’s management regularly meet with portfoliomanagers and financial analysts in the leading financial centersthroughout the world (Europe, North America, Asia and the MiddleEast).
The first series of meetings are held annually in the first quarter,after publication of the results for the prior fiscal year. The secondset of meetings takes place in the third quarter of the year. Materialfrom those meetings is available on the Group’s website(www.total.com, heading Investors/Presentations).
As in previous years, three phone conferences were led by theGroup’s Chief Financial Officer in 2009 to discuss results for thefirst, second and third quarters of the year. These conferences areavailable on the Group’s website (www.total.com, headingInvestors/Results).
In 2009 about 600 meetings bringing together institutional investorsand analysts were organized by the Group.
The Group maintains an active dialogue with shareholders onissues related to Corporate and Social Responsibility (CSR)through:
o The publication of an annual report: Environment and Society.
o Individual and group meetings with shareholders are organized inEurope and in the United States. In November 2009, TOTALmade its first full-day CSR (Corporate Social Responsibility)presentation in London to the financial community, with severalGroup senior executives speaking, including the Chief ExecutiveOfficer. The agenda of the day focused on the sustainablesatisfaction of the energy needs of today and tomorrow and theacceptability of TOTAL though its commitment as a responsiblelocal actor. Topics such as TOTAL’s safety policy, climatechange, development of new energies, transparency for oil andgas revenues, operational implementation of the Group’senvironmental and social responsibility in challengingenvironments, such as Nigeria, Myanmar and Canada, were alsoaddressed.
o The Investor Relations Department is available to investors andprovides responses to their questions about the Group’s socialand environmental responsibilities (ethics, governance, safety,health and environmental protection, contribution to thedevelopment of local communities, future energies, measures tocombat climate change).
� An ISO 9001-certified IndividualShareholders Department since 2007
TOTAL’s Individual Shareholder Relations Department is the firstISO 9001 version 2000 certified-shareholder service for itscommunication policy with individual shareholders. Thiscertification was issued by AFNOR following a thorough audit of thevarious processes implemented in terms of communication withindividual shareholders.
To achieve this goal, TOTAL optimized its communication tools byimplementing a Customer Relationship Management (CRM)software designed for increasing its personal interactions with everyindividual shareholder through a contact log.
Since then, two follow-up audits, one conducted on October 7,2008, and another on October 22, 2009, confirmed the certification.In particular, the second audit allowed TOTAL to gain the 2008version of this certification.
/ 153TOTAL
Communication with shareholdersTOTAL AND ITS SHAREHOLDERS6
This certification demonstrates TOTAL’s commitment to providingshareholders with high-quality financial information over the longterm. As a result, TOTAL was awarded the 2007 “Fils d’Or” prize,organized by La Vie Financière and Synerfil for the best IndividualShareholders Department of the CAC 40 index. As the 2007 prize-winner, TOTAL chaired the 2008 Fils d’Or Board. Given the closureof the Vie Financière newspaper, this prize was not awarded in2009.
As part of this quality assurance certification, a satisfaction formhas been available on the Group’s website since 2008 in order toimprove feedback from shareholders (www.total.com, IndividualShareholders/ Individual Shareholders Relations). In addition, phonesurveys were conducted in 2008 and 2009 to poll the shareholders’opinion on the Shareholders’ Newsletter as well as the efficiency ofthe services provided by the Shareholders’ Circle and itscommunication policy. These surveys were intended to ensure thatthe services provided met the shareholders’ expectations.
In 2009, TOTAL also continued to organize meetings andinformation sessions with individual shareholders as part of differentevents:
o The Shareholders’ Meeting, held on May 15, 2009, gathered morethan 3,500 shareholders at the Paris Convention Center. As foreach year, this meeting was broadcast live and was lateravailable on the Group’s website. Notice of the meeting is sent toall holders of 250 or more bearer shares and to all registeredshareholders.
o During the Actionaria Trade Show that was held at theConvention Center in Paris in November 2009, TOTAL welcomedvisitors to a new booth dedicated to the Pazflor project andproposed seven short seminars on the alliance of deepwaterexperience with technological boldness, with the projectcommunication managers attending. In 2010, TOTAL is planningto organize a meeting led by the Group CEO at the ParisConvention Center.
The five meetings with individual shareholders organized in 2009 inMarseille, Geneva, Rennes, Toulouse and Brussels gathered over1,600 people. In 2010, TOTAL is planning to organize the nextmeetings in Clermont-Ferrand, La Rochelle, Lille,Mandelieu-La-Napoule and Orléans.
o The new Consultative Shareholders Committee, comprised oftwelve members, held four meetings:
- in March, on the occasion of the transfer of powers during ameeting held with the former Consultative ShareholdersCommittee, with Christophe de Margerie attending;
- in May, following the Shareholders' Meeting;
- in October, at the Exploration & Production Scientific andTechnical Center in Pau, France; and
- in December, with the Group Chief Financial Officer, at LaDéfense.
During these meetings, the Consultative Shareholders Committeegives its opinion on various components of the communicationsdirected towards individual shareholders, including theShareholders’ Newsletter and the program of the Shareholders’Circle.
As a result, in 2009, the Consultative Shareholders Committeebrought its contribution to different projects concerning individualshareholders, such as the efficiency of the services provided by theShareholders’ Circle as well as its communication policy and theactions to take to improve them. Regarding the Shareholders’Meeting, the Consultative Shareholders Committee also addressedthe format of the notice of the Shareholders’ Meeting and gave itsfeedback on the arrangements for this meeting.
o The Shareholders’ Circle, open to shareholders holding at leastthirty bearer shares or one registered share, organized close tothirty events in 2009, gathering over 2,200 shareholder-membersof the Circle. They visited industrial facilities, sites supported bythe Total Foundation and attended seminars dedicated to betterunderstanding the Group’s different businesses and expertise.Finally, they attended cultural events within the framework of theTotal Foundation sponsorship policy.
In this context, more than 11,000 individual shareholders met withGroup representatives in 2009.
� Registered shareholding
TOTAL shares, which are generally bearer instruments, can beregistered. In this case shareholders are identified by TOTAL S.A.,in its capacity as the issuer, or by its agent, BNP Paribas SecuritiesServices, which is responsible for the registration of shareholders.
� Registration
There are two forms of registration:
o administered registered shares: shares are registered with TOTALthrough BNP Paribas Securities Services, but the holder’sfinancial intermediary continues to administer them with regardsto sales, purchases, coupons, shareholders’ meeting notices, etc.
o pure registered shares: TOTAL holds and directly administersshares on behalf of the holder through BNP Paribas SecuritiesServices, which administers sales, purchases, coupons,shareholders’ meeting notices, etc., so that the shareholder doesnot need to appoint a financial intermediary. This form ofregistration is not easily compatible with the registration of sharesin a French share savings plan (PEA) given the administrativeprocedures in place.
� Main advantages of administered registered shares
The advantages of administered registered shares include:
o double voting rights if the shares are held continuously for twosuccessive years (page 172 of this Registration Document);
o a dedicated number for all contacts with BNP Paribas SecuritiesServices (a toll-free call within France from a landline):0 800 11 7000 or +33 1 40 14 80 61 (from abroad); from Mondayto Friday (working days), 8:45 am – 6:00 pm (Paris time)(fax +33 1 55 77 34 17);
154 / TOTAL - Registration Document 2009
1 2 3 4 5 6 7 8 9 10 11
Communication with shareholders TOTAL AND ITS SHAREHOLDERS
o complete information about TOTAL: the shareholder receives, athome, all information published by the Group for its shareholders;and
o the ability to join the TOTAL Shareholders’ Circle by holding oneshare or more.
� Main advantages of pure registered shares
The advantages of pure registered shares, in addition to those ofadministered registered shares, include:
o no custodial fees;
o easier placement of market orders 1 (phone, mail, fax, internet);
o brokerage fees of 0.20% (before tax) based on the amount of thetransaction, with no minimum charge and up to €1,000 pertransaction; and
o possibility to check share holdings on the Internet.
To convert TOTAL shares into pure registered shares, shareholdersare required to fill out a form, which can be obtained upon requestfrom the Individual Shareholder Relations Department, and send itto his/her financial intermediary. Once BNP Paribas SecuritiesServices receives the shares, a certificate of account registration issent and the following are requested:
o a bank account number (or a postal account or savings accountnumber) for payment of dividends; and
o a market service agreement to facilitate trading TOTAL shares onthe stock exchange.
� Individual Shareholders DepartmentContacts
For any information regarding the conversion of bearer to registeredshares, membership in the Shareholders’ Circle or any other generalinformation, individual shareholders may contact:
TOTAL S.A.Individual Shareholder Relations Department2, place Jean Millier – La Défense 692078 Paris La Défense CedexFrance
Phone: From France: 0 800 039 039(toll-free number from a landline in France)From abroad: + 33 1 47 44 24 02From Monday to Friday, 9:00 am - 12:30 pm and1:30 pm - 5:30 pm (Paris time)
Fax: From France: 01 47 44 20 14From abroad: + 33 1 47 44 20 14
E-mail From the contact form available at www.total.com,heading Individual Shareholders
Contacts Jean-Marie Rossini (Head of Individual ShareholdersRelations Department)Claire Nabet (Individual Shareholders RelationsManager)
1. Subject to having entered into a brokerage services contract, which is free of charge.
/ 155TOTAL
Communication with shareholdersTOTAL AND ITS SHAREHOLDERS6
� 2010 Schedule
February 11 Results for the fourth quarter of and full year 2009
April 30 Results for the first quarter of 2010
May 21 2010 Shareholders’ Meeting in Paris (Paris Convention Center)
May 27 Ex-dividend date for the 2009 final dividend 1
June 1 Payment date for the 2009 final cash dividend 1
June 7 Meeting with individual shareholders in Clermont-Ferrand (France)
June 17 Meeting with individual shareholders in La Rochelle (France)
July 30 Results for the second quarter and the first half of 2010
September 15 Performance and mid-2010 outlook in London
October 14 Meeting with individual shareholders in Lille (France)
October 21 Meeting with individual shareholders in Mandelieu-La-Napoule (France)
October 29 Results for the third quarter of 2010
November 19-20 Actionaria Trade Show (Paris Convention Center)
December 7 Meeting with individual shareholders in Orléans (France)
� 2011 Schedule
May 13 Shareholders’ Meeting in Paris (Paris Convention Center)
� Investor Relations contacts
Paris: Bertrand de La NoueVice President Investor RelationsTOTAL S.A.2, place Jean Millier – La Défense 692078 Paris La Défense CedexFrancePhone: 01 47 44 58 53 or +33 1 47 44 58 53Fax: 01 47 44 58 24 or +33 1 47 44 58 24E-mail: [email protected]
North America: Robert HammondDirector Investor Relations North AmericaTOTAL American Services Inc.1201 Louisiana Street, Suite 1800Houston, TX 77002United StatesPhone: +1 713 483 5070Fax: +1 713 483 5629E-mail: [email protected]
1. Subject to the approval of the Shareholders’ Meeting of May 21, 2010.
156 / TOTAL - Registration Document 2009
7FINANCIAL INFORMATION
HISTORICAL FINANCIAL INFORMATION p. 158
2009, 2008 and 2007 consolidated financial statements p. 158
Financial information concerning TOTAL S.A. p. 158
AUDIT OF THE HISTORICAL FINANCIAL INFORMATION p. 158
ADDITIONAL INFORMATION p. 159
DIVIDEND POLICY p. 159
LEGAL AND ARBITRATION PROCEEDINGS p. 159
Grande Paroisse p. 159
Antitrust investigations p. 160
Sinking of the Erika p. 161
Buncefield p. 161
Myanmar p. 162
South Africa p. 162
Iran p. 162
Italy p. 163
Oil-for-Food Program p. 163
Blue Rapid and the Russian Olympic Committee p. 163
SIGNIFICANT CHANGES p. 164
/ 157TOTAL
Historical financial informationFINANCIAL INFORMATION7
� Historical financial information
� 2009, 2008 and 2007 consolidatedfinancial statements
The consolidated financial statements of TOTAL S.A. and itssubsidiaries (the Group) for the years endedDecember 31, 2009, December 31, 2008 and December 31, 2007,were prepared in accordance with International Financial ReportingStandards (IFRS) as issued by the IASB (International AccountingStandards Board) and as adopted by the European Union as ofDecember 31, 2009.
They appear in Appendix 1 to this Registration Document:
o Consolidated Statement of Income page 182
o Consolidated Balance Sheet page 183
o Consolidated Statement of Cash Flows page 184
o Consolidated Statement of Changes in Shareholders’Equity page 185
o Consolidated Statement of Comprehensive Income page 186
o Notes to the Consolidated Financial Statements page 187
� Financial information concerningTOTAL S.A.
The statutory accounts of TOTAL S.A., the parent company of theGroup, for the years ended December 31, 2009, December 31, 2008and December 31, 2007, were prepared in accordance with Frenchaccounting standards as applicable on December 31, 2009.
They appear in Appendix 3 to this Registration Document:
o Statement of Income page 286
o Balance Sheet page 287
o Statement of Cash Flow page 288
o Statement of Changes in Shareholders’ Equity page 289
o Notes to the Financial Statements page 290
� Audit of the historical financial information
The consolidated financial statements for the fiscal year 2009 whichappear in Appendix 1 to this Registration Document were certifiedby the Company’s auditors. A free translation of the auditors’ reporton these consolidated financial statements is provided in Appendix1 (page 180).
The consolidated financial statements for fiscal years 2008 and2007 appearing in Appendix 1 to this Registration Document werealso certified by the Company’s auditors. The auditors’ report onthe Consolidated Financial Statements for fiscal year 2008 isreproduced on page 176 of the French version of the RegistrationDocument for fiscal year 2008 which was filed with the FrenchFinancial Markets Authority (Autorité des marchés financiers) onApril 3, 2009 (and a free translation is reproduced on page 174 ofthe English version of such Registration Document). The auditors’report on the Consolidated Financial Statements for fiscal year2007 is reproduced on page 160 of the French version of theRegistration Document for fiscal year 2007 which was filed with theFrench Financial Markets Authority (Autorité des marchés financiers)on April 2, 2008 (and a free translation is reproduced on page 154of the English version of such Registration Document). Pursuant toArticle 28 of EC Regulation No 809/2004, these two reports areincorporated by reference in this Registration Document.
TOTAL’s statutory accounts for the fiscal year 2009 (under Frenchaccounting standards) which appear in Appendix 3 to thisRegistration Document were also certified by the Company’sauditors. A free translation of the auditors’ report on the 2009statutory accounts is reproduced in Appendix 3 (page 284).
TOTAL’s statutory accounts for fiscal years 2008 and 2007appearing in Appendix 3 to this Registration Document were alsocertified by the Company’s auditors. The auditors’ report on thestatutory accounts for fiscal year 2008 is reproduced on page 278of the French version of the Registration Document for fiscal year2008 which was filed with the French Autorité des marchésfinanciers on April 3, 2009 (and a free translation is reproduced onpage 272 of the English version of such Registration Document).The auditors’ report on the statutory accounts for fiscal year 2007 isreproduced on page 254 of the French version of the RegistrationDocument for fiscal year 2007 which was filed with the FrenchAutorité des marchés financiers on April 2, 2008 (and a freetranslation is reproduced on page 246 of the English version ofsuch Registration Document). Pursuant to Article 28 of ECRegulation No 809/2004, these two reports are incorporated byreference in this Registration Document.
158 / TOTAL - Registration Document 2009
1 2 3 4 5 6 7 8 9 10 11
Additional information FINANCIAL INFORMATION
� Additional information
Financial information other than that contained in Appendix 1 or 3of this Registration Document, in particular ratios, statistical data orother calculated data, which are used to describe the Group or itsbusiness performance, is not extracted from the audited financialstatements of the issuer. Except where otherwise stated, these dataare based on internal Company data.
In particular, the supplemental oil and gas information provided inAppendix 2 to this Registration Document is not extracted from theaudited financial statements of the issuer and was not audited bythe Company’s statutory auditors. This supplemental information
was prepared by the Company based on information available to it,using its own calculations or estimates and taking into account theU.S. standards to which the Company is subject for this kind ofinformation as a result of the listing of its shares (in the form ofADRs) on the New York Stock Exchange.
This Registration Document does not include profit forecasts orestimates, under the meaning given to such terms by RegulationEC No. 809/2004 dated April 29, 2004, for the period afterDecember 31, 2009.
� Dividend policy
The Company’s dividend policy is described in Chapter 6 (TOTAL and its shareholders) of this Registration Document.
� Legal and arbitration proceedings
The main legal proceedings in which the Group is involved aredescribed below.
The Company is not aware of any administrative, legal or arbitrationdisputes which have recently had or could have a material impact onits financial situation or its profitability or on those of the Group as awhole. According to the information available to the Company to date,there are no administrative, legal or arbitration proceedings pending orthreatened that could have a material impact on its financial situationor its profitability or on those of the Group as a whole.
� Grande Paroisse
An explosion occurred at the Grande Paroisse industrial site in thecity of Toulouse in France on September 21, 2001. GrandeParoisse, a former subsidiary of Atofina which became a subsidiaryof Elf Aquitaine Fertilisants on December 31, 2004, as part of thereorganization of the Chemicals segment, was principally engagedin the production and sale of agricultural fertilizers. The explosion,which involved a stockpile of ammonium nitrate pellets, destroyed aportion of the site and caused the death of thirty-one people,including twenty-one workers at the site, and injured many others.The explosion also caused significant damage to certain property inpart of the city of Toulouse.
This plant has been closed and individual assistance packageshave been provided for employees. The site has been rehabilitated.
On December 14, 2006, Grande Paroisse signed, under thesupervision of the city of Toulouse, the deed whereby it donated theformer site of the AZF plant to the greater agglomeration ofToulouse (CAGT) and the Caisse des dépôts et consignations andits subsidiary ICADE. Under this deed, TOTAL S.A. guaranteed thesite restoration obligations of Grande Paroisse and granted a€10 million endowment to the InNaBioSanté research foundation aspart of the setting up of a cancer research center at the site by thecity of Toulouse.
Regarding the cause of the explosion, the hypothesis that theexplosion was caused by Grande Paroisse through the accidentalmixing of hundreds of kilos of a chlorine compound at a storage sitefor ammonium nitrate was discredited over the course of theinvestigation. As a result, proceedings against ten of the elevenGrande Paroisse employees charged during the criminalinvestigation conducted by the Toulouse Regional Court (Tribunalde grande instance) were dismissed and this dismissal was upheldby the Court of Appeal of Toulouse. Nevertheless, the final experts’report filed on May 11, 2006 continued to focus on the hypothesisof a chemical accident, although this hypothesis was not confirmedduring the attempt to reconstruct the accident at the site. Afterhaving articulated several hypotheses, the experts no longermaintain that the accident was caused by pouring a large quantityof a chlorine compound over ammonium nitrate. Instead, theexperts have retained a scenario where a container of chlorine
/ 159TOTAL
Legal and arbitration proceedingsFINANCIAL INFORMATION7
compound sweepings was poured between a layer of wetammonium nitrate covering the floor and a quantity of dryagricultural nitrate at a location not far from the principal storagesite. This is claimed to have caused an explosion which then spreadinto the main storage site. Grande Paroisse was investigated basedon this new hypothesis in 2006. Grande Paroisse is contesting thisexplanation, which it believes to be based on elements that are notfactually accurate.
The Court of Appeal of Toulouse denied all the requests foradditional investigations that were submitted by Grande Paroisse,the former site manager and various plaintiffs after the end of thecriminal investigation procedure. On July 9, 2007, the investigatingjudge brought charges against Grande Paroisse and the formerplant manager before the criminal chamber of the Court of Appealof Toulouse. In late 2008, TOTAL S.A. and Mr. Thierry Desmarestwere summoned to appear in court pursuant to a request by avictims association. The trial for this case began on February 23,2009, and lasted approximately four months.
On November 19, 2009, the Toulouse Criminal Court acquitted boththe former Plant Manager and Grande Paroisse due to the lack ofreliable evidence for the explosion. The Court also ruled that thesummonses against TOTAL S.A. and Thierry Desmarest, Chairmanand CEO at the time of the disaster, were inadmissible.
Due to the presumption of civil liability that applied to GrandeParoisse, the Court declared Grande Paroisse civilly liable for thedamages caused by the explosion to the victims in its capacity ascustodian and operator of the plant.
The Prosecutor’s office, together with certain third parties, hasappealed the Toulouse Criminal Court verdict. In order to preserveits rights, Grande Paroisse lodged a cross-appeal with respect tocivil charges.
The appeal proceedings are expected to be ruled by the Court ofAppeal of Toulouse during the first half of 2011.
A compensation mechanism for victims was set up immediatelyfollowing the explosion and €2.29 billion in settlement were paid forthe compensation of all claims and related expenses amounts. Asof December 31, 2009, a €40 million reserve is recorded in theGroup’s Consolidated Balance Sheet.
� Antitrust investigations
o Following investigations into certain commercial practices in thechemicals industry in the United States, some subsidiaries of theArkema 1 group are involved in several criminal investigations,today closed, and civil liability lawsuits for violations of antitrustlaws in the United States. TOTAL S.A. has been named in certainof these suits as the parent company.
In Europe, the European Commission commenced investigationsin 2000, 2003 and 2004 into alleged anti-competitive practicesinvolving certain products sold by Arkema. In January 2005,under one of these investigations, the European Commissionfined Arkema €13.5 million and jointly fined Arkema and ElfAquitaine €45 million. On September 30, 2009, the Court of FirstInstance of the European Union denied the appeal from Arkemaand Elf Aquitaine. An appeal has been filed to the Court of Justiceof the European Communities in the allotted time.
The Commission notified Arkema, TOTAL S.A. and Elf Aquitaineof complaints concerning two other product lines in January andAugust 2005, respectively. Arkema has cooperated with theauthorities in these procedures and investigations. In May 2006,the European Commission fined Arkema €78.7 million and€219.1 million as a result of, respectively, each of these twoproceedings. Elf Aquitaine was held jointly and severally liable for,respectively, €65.1 million and €181.35 million of these fines whileTOTAL S.A. was held jointly and severally liable, respectively, for€42 million and €140.4 million. TOTAL S.A., Arkema and ElfAquitaine have appealed these decisions to the Court of FirstInstance of the European Union.
Arkema and Elf Aquitaine received a statement of objections fromthe European Commission in August 2007 concerning allegedanti-competitive practices related to another line of chemicalproducts. As a result, Arkema and Elf Aquitaine have been jointlyand severally fined in an amount of €22.7 million and individuallyin an amount of €20.43 million for Arkema and €15.89 million forElf Aquitaine. The companies concerned have appealed thisdecision to the relevant European court.
Arkema and Elf Aquitaine received a statement of objections fromthe European Commission in March 2009 concerning allegedanti-competitive practices related to another line of chemicalproducts. The decision was rendered by the EuropeanCommission in November 2009. Arkema and Elf Aquitaine werejointly and severally fined in an amount of €11 million andindividually in an amount of €9.92 million for Arkema and€7.71 million for Elf Aquitaine. The companies concerned willappeal this decision to the relevant European court.
No facts have been alleged that would implicate TOTAL S.A. orElf Aquitaine in the practices questioned in these proceedings,and the fines received are based solely on their status as parentcompanies.
Arkema began implementing compliance procedures in 2001 thatare designed to prevent its employees from violating antitrustprovisions. However, it is not possible to exclude the possibilitythat the relevant authorities could commence additionalproceedings involving Arkema, as well as TOTAL S.A. and ElfAquitaine.
o As part of the agreement relating to the spin-off of Arkema,TOTAL S.A. or certain other Group companies agreed to grantArkema guarantees for certain risks related to antitrustproceedings arising from events prior to the spin-off.
1. Arkema is used in this section to designate those companies of the Arkema group whose ultimate parent company is Arkema S.A. Arkema became an independent companyafter being spun-off from TOTAL S.A. in May 2006.
160 / TOTAL - Registration Document 2009
1 2 3 4 5 6 7 8 9 10 11
Legal and arbitration proceedings FINANCIAL INFORMATION
These guarantees cover, for a period of ten years that began in2006, 90% of amounts paid by Arkema related to (i) finesimposed by European authorities or European member-states forcompetition law violations, (ii) fines imposed by U.S. courts orantitrust authorities for federal antitrust violations or violations ofthe competition laws of U.S. states, (iii) damages awarded in civilproceedings related to the government proceedings mentionedabove, and (iv) certain costs related to these proceedings.
The guarantee covering the risks related to anti-competitionviolations in Europe applies to amounts above a €176.5 millionthreshold.
If one or more individuals or legal entities, acting alone ortogether, directly or indirectly holds more than one-third of thevoting rights of Arkema, or if Arkema transfers more than 50% ofits assets (as calculated under the enterprise valuation method,as of the date of the transfer) to a third party or parties actingtogether, irrespective of the type or number of transfers, theseguarantees will become void.
On the other hand, the agreements provide that Arkema willindemnify TOTAL S.A. or any Group company for 10% of anyamount that TOTAL S.A. or any Group company are required topay under any of the proceedings covered by these guarantees.
o The Group has recorded provisions amounting to €43 million inits consolidated financial statements as of December 31, 2009 tocover the risks mentioned above.
o Moreover, as a result of investigations started by the EuropeanCommission in October 2002 concerning certain Refining &Marketing subsidiaries of the Group, Total Nederland N.V. andTOTAL S.A. received a statement of objections in October 2004.These proceedings resulted, in September 2006, in TotalNederland N.V. being fined €20.25 million and in TOTAL S.A. asits parent company being held jointly responsible for €13.5 millionof this amount, although no facts implicating TOTAL S.A. in thepractices under investigation were alleged. TOTAL S.A. and TotalNederland N.V. have appealed this decision to the Court of FirstInstance of the European Union.
In addition, in May 2007, Total France (new corporate name: TotalRaffinage & Marketing) and TOTAL S.A. received a statement ofobjections regarding alleged antitrust practices concerninganother product line of the Refining & Marketing division. Theseproceedings resulted, in October 2008, in Total France beingfined €128.2 million and in TOTAL S.A., as its parent company,being held jointly responsible although no facts implicatingTOTAL S.A. in the practices under investigation were alleged.TOTAL S.A. and Total Raffinage & Marketing have appealed thisdecision to the Court of First Instance of the European Union.
Furthermore, in July 2009, the French antitrust Authority sent toTotalGaz and Total Raffinage Marketing a statement of objectionsregarding alleged antitrust practices concerning another productline of the Refining & Marketing division.
o Given the discretionary powers granted to the EuropeanCommission for determining fines relating to antitrust regulations,it is not currently possible to determine with certainty theoutcome of these investigations and proceedings. TOTAL S.A.and Elf Aquitaine are contesting their liability and the method ofdetermining these fines. Although it is not possible to predict theultimate outcome of these proceedings, the Group believes thatthey will not have a material adverse effect on its financialsituation or consolidated results.
� Sinking of the Erika
Following the sinking in December 1999 of the Erika, a tanker thatwas transporting products belonging to one of the Groupcompanies, the Tribunal de grande instance of Paris convictedTOTAL S.A. of marine pollution pursuant to a judgment issued onJanuary 16, 2008, finding that TOTAL S.A. was negligent in itsvetting procedure for vessel selection. TOTAL S.A. was fined€375,000. The court also ordered compensation to be paid to thevictims of pollution from the Erika up to an aggregate amount of€192 million, declaring TOTAL S.A. jointly and severally liable forsuch payments together with the Erika’s inspection andclassification firm, the Erika’s owner and the Erika’s manager.
TOTAL believes that the finding of negligence and the relatedconviction for marine pollution are without substance as a matter offact and as a matter of law. TOTAL also considers that this verdict iscontrary to the intended aim of enhancing maritime transport safety.
TOTAL has appealed the verdict of January 16, 2008. In themeantime, it has nevertheless proposed to pay third parties who sorequest definitive compensation as determined by the court. As oftoday, forty-one third parties have been compensated for anaggregate amount of €171.5 million.
The appeal proceedings were heard by the Court of Appeal of Parisin late 2009.
By decision dated March 30, 2010, the Court of Appeal upheld thelower court judgment pursuant to which TOTAL S.A. was convictedof marine pollution and fined the Company €375,000. TOTAL S.A. isconsidering the possibility of filing an appeal in the French SupremeCourt (Cour de cassation) in this respect.
On the other hand, the Court of Appeal ruled that TOTAL S.A. bearsno civil liability according to the applicable internationalconventions.
TOTAL S.A. considers, according to the information currentlyavailable to it, that this case should have no significant impact onthe Group’s financial situation or consolidated results.
� Buncefield
On December 11, 2005, several explosions, followed by a majorfire, occurred at an oil storage depot at Buncefield, north ofLondon. This depot is operated by Hertfordshire Oil Storage Limited(HOSL), a company in which TOTAL’s UK subsidiary holds 60%and another oil group holds 40%.
The explosion caused minor injuries to a number of people andcaused property damage to the depot and the buildings and homeslocated nearby. The official Independent Investigation Board hasindicated that the explosion was caused by the overflow of a tankat the depot. The Board’s final report was released onDecember 11, 2008. The civil procedure for claims, which have notyet been settled, took place between October and December 2008.The Court’s decision of March 20, 2009, declared TOTAL’s UKsubsidiary liable for the accident and solely liable for indemnifyingthe victims. The subsidiary appealed the decision. The appealhearings were held in January 2010. The Court of Appeals, by adecision handed down on March 4, 2010, confirmed the priorjudgment. TOTAL’s UK subsidiary is looking into the possibility tofile an appeal before the Supreme Court with respect to both theextent and sharing of the liabilities incurred.
/ 161TOTAL
Legal and arbitration proceedingsFINANCIAL INFORMATION7
The provision for the civil liability that appears in the Group’sconsolidated financial statements as of December 31, 2009, standsat €295 million after taking into account payments previously made.
The Group carries insurance for damage to its interests in thesefacilities, business interruption and civil liability claims from thirdparties. The residual amount to be received from insurers amountsto € 211 million as of December 31, 2009.
The Group believes that, based on the information currentlyavailable, on a reasonable estimate of its financial liability and onprovisions recognized, this accident should not have a significantimpact on the Group’s financial situation or consolidated results.
On December 1, 2008, the Health and Safety Executive (HSE) andthe Environment Agency (EA) issued a Notice of prosecution againstfive companies, including TOTAL’s UK subsidiary. In November2009, TOTAL’s UK subsidiary pleaded guilty to the charges broughtby the prosecution and intends to raise a number of elementexpected to mitigate the impact of the charges brought against it.
� Myanmar
Under the Belgian “universal jurisdiction” laws of June 16, 1993 andFebruary 10, 1999, a complaint was filed in Belgium onApril 25, 2002, against the Company, its Chairman and the formerpresident of its subsidiary in Myanmar. These laws were repealedby the Belgian law of August 5, 2003 on “serious violations ofinternational human rights”, which also provided a procedure forterminating certain proceedings that were underway. In thisframework, the Belgian Cour de cassation terminated theproceedings against TOTAL in a decision dated June 29, 2005. Theplaintiffs’ request to withdraw this decision was rejected by theCour de cassation on March 28, 2007.
Despite this decision, the Belgian Ministry of Justice asked theBelgian federal prosecutor to request that the investigating judgereopen the case. The Belgian federal prosecutor decided to submitthe admissibility of this request to the Court of Appeal of Brussels.In its decision of March 5, 2008, the Court of Appeal confirmed thetermination of the proceedings against TOTAL, its Chairman andthe former president of its subsidiary, based on the principle of resjudicata applying to the Cour de cassation’s decision ofJune 29, 2005. The plaintiffs appealed the decision ofMarch 5, 2008. On October 29, 2008, the Cour de cassationrejected the plaintiffs’ appeal, thus ending definitively theproceedings.
TOTAL has always maintained that the accusations made againstthe Company and its management arising out of the activities of itssubsidiary in Myanmar were without substance as a matter of factand as a matter of law.
� South Africa
In a threatened class action proceeding in the United States,TOTAL, together with approximately 100 other multinationalcompanies, is the subject of accusations by certain South Africancitizens who alleged that their human rights were violated duringthe era of apartheid by the army, the police or militias, and whoconsider that these companies were accomplices in the actions bythe South African authorities at the time.
The claims against the companies named in the class action, whichwere not officially brought against TOTAL, were dismissed by afederal judge in New York. The plaintiffs appealed this dismissaland, after a procedural hearing on November 3, 2008, decided toremove TOTAL from the list of companies against which it wasbringing claims.
� Iran
In 2003, the United States Securities and Exchange Commission(SEC) issued a non-public formal order directing a privateinvestigation in the matter of certain oil companies (including,among others, TOTAL), in connection with the pursuit of business inIran. In 2006, a judicial inquiry related to TOTAL was initiated inFrance. In 2007, the Company’s Chief Executive Officer was placedunder formal investigation in relation to this inquiry, as the formerPresident of the Middle East department of the Group’sExploration & Production division.
The inquiry concerns an agreement concluded by the Group thatrelates to the South Pars gas field and allegations that certainpayments were made under this agreement to Iranian officials inconnection with contracts entered into between the Group and theNational Iranian Oil Company (NIOC). The Company has not beennotified of any significant developments in the proceedings sincethe formal investigation was launched. The Company believes thatthe negotiation and execution of the agreement did not violate anyapplicable laws or applicable international conventions. However,the Company cannot exclude the possibility that additionalprocedures may be initiated with respect to this matter.
162 / TOTAL - Registration Document 2009
1 2 3 4 5 6 7 8 9 10 11
Legal and arbitration proceedings FINANCIAL INFORMATION
� Italy
As part of an investigation led by the Prosecutor of the Republic ofthe Potenza court, Total Italia is the subject of an investigationrelated to certain calls for tenders that it made for the preparationand development of an oil field. On February 16, 2009, as apreliminary measure before the proceedings go before the court,the preliminary investigation judge of Potenza served notice to TotalItalia of a decision that would suspend the concession for this fieldfor one year. Total Italia has appealed the decision by thepreliminary investigation judge before the Court of Appeal ofPotenza. In a decision handed down on April 8, 2009, the Courtreversed the suspension of the concession and appointed for oneyear, i.e. until February 16, 2010, a judicial administrator tosupervise the operations related to the development of theconcession, allowing the Tempa Rossa project to continue.
In January 2010, the Prosecutor of the Potenza Court filed for anotice to close the criminal investigation.
Since in January 1, 2010, Total Italia’s exploration and productionoperations have been transferred to Total E&P Italia.
� Oil-for-Food Program
Several countries have commenced investigations concerningpossible violations related to the United Nations (UN) “Oil-for-Food”program in Iraq.
Pursuant to a French criminal investigation, certain current orformer Group employees were placed under formal criminalinvestigation for possible charges as accessories to themisappropriation of corporate assets and as accessories to thecorruption of foreign public agents. The Chief Executive Officer ofthe Company, formerly president of the Group’s Exploration &Production division, was also placed under formal investigation inOctober 2006. In 2007, the criminal investigation was closed andthe case was transferred to the Prosecutor’s office. In 2009, theProsecutor’s office recommended dismissing the case for all theGroup’s current and former employees and for the Chief ExecutiveOfficer.
In early 2010, despite the advice of the Prosecutor’s office, a newinvestigating judge decided to place TOTAL S.A. under formalinvestigation on bribery charges as well as complicity and influencepeddling. This formal investigation has been pronounced eightyears after the beginning of the investigation without any newevidence being added to the affair.
The Company believes that its activities related to the “Oil-for-Food” program have been in compliance with this program, asorganized by the UN in 1996. The Volker report released by theindependent investigating committee set up by the UN haddiscarded any bribery grievance within the framework of the “Oil-For-Food” program.
� Blue Rapid and the Russian OlympicCommittee
Blue Rapid, a Panamanian company, and the Russian OlympicCommittee filed a claim for damages with the Paris CommercialCourt against Elf Aquitaine concerning its withdrawal from anexploration and production project in Russia that was negotiated inthe early 1990s.
Elf Aquitaine believes this claim to be unfounded.
On January 12, 2009, the Commercial Court of Paris rejected BlueRapid’s claim and found that the Russian Olympic Committee didnot have standing in the matter. This decision has been appealed.
/ 163TOTAL
Significant changesFINANCIAL INFORMATION7
� Significant changes
Except for the recent events mentioned in the Management Reportof the Board of Directors (Chapter 3, Management report) or in thebusiness overview (Chapter 2, Business overview), no significantchanges in the Group’s financial or commercial position haveoccurred since December 31, 2009, the end of the last fiscal yearfor which audited financial statements have been published by theCompany.
164 / TOTAL - Registration Document 2009
8GENERAL INFORMATION
SHARE CAPITAL p. 166
Share capital as of December 31, 2009 p. 166
Features of the shares p. 166
Authorized share capital not issued as of December 31, 2009 p. 166
Potential share capital as of December 31, 2009 p. 169
Treasury shares p. 169
Share capital history p. 169
ARTICLES OF INCORPORATION AND BY-LAWS; OTHER INFORMATION p. 171
General information concerning the Company p. 171
Company’s purpose p. 171
Provisions of the by-laws governing the administration and management bodies p. 171
Rights, privileges and restrictions attached to the shares p. 172
Amending shareholders’ rights p. 173
Shareholders’ meetings p. 173
Thresholds to be declared according to the by-laws p. 173
Changes in the share capital p. 173
OTHER MATTERS p. 174
Employee incentives and profit-sharing p. 174
Pension savings plan p. 174
Agreements mentioned in Article L. 225-100-3 of the French Commercial Code p. 174
Filing of Form 20-F with the United States Securities and Exchange Commission p. 174
DOCUMENTS ON DISPLAY p. 175
INFORMATION ON HOLDINGS p. 176
General information p. 176
TOTAL’s interest in Sanofi-Aventis p. 176
TOTAL’s interest in CEPSA p. 176
TOTAL’s interest in Arkema p. 177
/ 165TOTAL
Share capitalGENERAL INFORMATION8
� Share capital
� Share capital as of December 31,2009
€5,871,057,210, consisting of 2,348,422,884 fully paid shares.
� Features of the shares
There is only one class of shares, par value €2.50. A double votingright is granted to every shareholder, under certain conditions (seepage 172 of this Registration Document). The shares are in beareror registered form at the shareholder’s discretion. The shares are inbook-entry form and registered in a security account.
� Authorized share capital not issuedas of December 31, 2009
A table summarizing the currently valid delegations to increaseshare capital which have been granted by the Shareholders’Meeting to the Board of Directors, and the uses made of thosedelegations of authority in fiscal year 2009, is provided on page 168of this Registration Document.
‹ Thirteenth resolution of the Shareholders’Meeting held on May 16, 2008
Delegation of authority granted by the Shareholders’ Meeting to theBoard of Directors to increase the share capital by issuing commonshares or other securities granting immediate or future rights to theCompany’s share capital, maintaining shareholders’ pre-emptivesubscription rights up to a maximum nominal amount of €2.5 billion(delegation of authority valid for twenty-six months).
‹ Fourteenth resolution of the Shareholders’Meeting held on May 16, 2008
Delegation of authority granted by the Shareholders’ Meeting to theBoard of Directors to increase the share capital by issuing commonshares or other securities granting immediate or future rights to theCompany’s share capital, deleting shareholders’ pre-emptivesubscription rights, including the compensation comprised of
securities as part of a public exchange offer, provided that theymeet the requirements of Article L. 225-148 of the FrenchCommercial Code. This resolution grants the Board of Directors theability to anticipate a priority period for shareholders to subscribe tothese securities pursuant to the provisions of Article L. 225-135 ofthe French Commercial Code. The total amount of the capitalincreases without pre-emptive subscription rights likely to occurimmediately or in the future cannot exceed the nominal amount of€875 million, i.e. 350 million shares, par value €2.50 (delegation ofauthority valid for twenty-six months). The nominal amount of thecapital increases is counted against the maximum aggregatenominal amount of €2.5 billion authorized by the thirteenthresolution of the Shareholders’ Meeting held on May 16, 2008.
Furthermore, the maximum nominal amount of the debt securitiesgranting rights to the Company’s share capital which are likely to beissued pursuant to the above mentioned delegations of authoritymay not exceed €10 billion, or their exchange value, on the date ofthe issue.
‹ Fifteenth resolution of the Shareholders’Meeting held on May 16, 2008
Delegation of authority granted by the Shareholders’ Meeting to theBoard of Directors to increase the share capital by issuing newordinary shares or other securities granting immediate or futurerights to the Company’s share capital with pre-emptive subscriptionrights through in-kind compensation granted to the Company, byan amount not exceeding 10% of the share capital outstanding atthe date of the Shareholders’ Meeting on May 16, 2008 (delegationof authority valid for twenty-six months). The nominal amount of thecapital increases is counted against the maximum aggregatenominal amount of €875 million authorized by the fourteenthresolution of the Shareholders’ Meeting held on May 16, 2008.
‹ Sixteenth resolution of the Shareholders’Meeting held on May 16, 2008
Delegation of authority to the Board of Directors to complete capitalincreases reserved for employees participating in the CompanySavings Plan (Plan d’épargne d’entreprise), up to a maximumamount equal to 1.5% of the outstanding share capital on the dateof the decision of the Board of Directors to proceed with the issue(delegation of authority valid for twenty-six months). It is beingspecified that the amount of the capital increase is counted againstthe maximum aggregate nominal amount of €2.5 billion authorizedby the thirteenth resolution of the Shareholders’ Meeting held onMay 16, 2008.
As the Board of Directors did not use the delegations of authoritygranted by the thirteenth, fourteenth, fifteenth and sixteenthresolutions, the authorized share capital not issued was €2.5 billion(i.e. 1,000 million shares) as of December 31, 2009.
166 / TOTAL - Registration Document 2009
1 2 3 4 5 6 7 8 9 10 11
Share capital GENERAL INFORMATION
‹ Seventeenth resolution of the Shareholders’Meeting held on May 16, 2008
Authority to grant restricted outstanding or new TOTAL shares toemployees of the Group and to executives and officers, up to amaximum of 0.8% of the share capital outstanding on the date ofthe meeting of the Board of Directors that approves the restrictedshare grants (authorization valid for thirty-eight months).
Pursuant to this authorization, 2,800,000 outstanding TOTAL shareswere granted in October 9, 2008 by decision of the Board ofDirectors at its meeting on September 9, 2008 and 3,000,000outstanding TOTAL shares were granted by decision of the Boardof Directors at its meeting on September 15, 2009. As ofDecember 31, 2009, 12,987,383 shares could still be grantedpursuant to this authorization.
‹ Sixteenth resolution of the Shareholders’Meeting held on May 11, 2007
Authority to grant stock options reserved for TOTAL employees andto executive and officers up to a maximum of 1.5% of the sharecapital outstanding on the date of the meeting of the Board ofDirectors that approves the stock option grant (authorization validfor thirty-eight months).
Pursuant to this authorization, the Board of Directors granted6,082,640 and 4,600,000 and 4,600,000 share subscription optionsat its meetings on July 17, 2007, on September 9, 2008 and onSeptember 15, 2009. Therefore, as of December 31, 2009,19,943,703 shares could still be issued pursuant to thisauthorization.
‹ Seventeenth resolution of the Shareholders’Meeting held on May 11, 2007
Authority to cancel shares up to a maximum of 10% of the sharecapital of the Company existing as of the date of the operationwithin a 24-month period. This authorization is effective until theShareholders’ Meeting called to approve the financial statementsfor the year ending December 31, 2011. Pursuant to thisauthorization, on July 30, 2009 the Board of Directors decided tocancel 24,800,000 shares acquired in 2008 and accounted for aslong-term securities in the parent company’s financial statements.
Thus, as of December 31, 2009, taking into account thecancellation of 30,000,000 shares on July 31, 2008, pursuant to theauthorization granted by the Shareholder’s Meeting on May 11,2007, 180,042,288 shares could still be cancelled under theseauthorizations up to and including July 31, 2010, before reachingthe cancellation threshold of 10% of the share capital cancelledduring a 24-month period.
/ 167TOTAL
Share capitalGENERAL INFORMATION8
Summary table of valid delegations and authorizations to increase the share capital granted to theBoard of Directors as of December 31, 2009 (Article L. 225-100 of the French Commercial Code)
Type
Par value limit, or maximum number of sharesexpressed as % of share capital (par value, number ofshares or % of share capital)
Use in 2009,par value,or numberof shares
Availablebalance as of12/31/09, parvalue, or numberof shares
Date ofdelegation ofauthority orauthorization
Term ofauthorizationgranted tothe Board ofDirectors
Total cap onissues ofsecuritiesgrantingimmediate orfuture rightsto sharecapital
Debtsecuritiesrepresentingrights tocapital
10 B€ of securities
– 10 B€
ESM (a) ofMay 16, 2008(13th and 14th
resolutions) 26 months
2.5 B€, i.e. a maximum of 1,000 million shares issuedwith a pre-emptive subscription right, of which
– 2.5 G€
ESM (a) ofMay 16, 2008
(13th resolution) 26 months
Nominalshare capital
1/ a specific sub-cap of 875M€, i.e. a maximum of 350million shares for issuances without pre-emptivesubscription rights, including the compensationcomprised of securities as part of a public exchangeoffer, provided that they meet the requirements of ArticleL.225-148 of the French Commercial Code. – 875 M€
ESM (a) ofMay 16, 2008
(14th resolution) 26 months
a sub-cap of 10% of the share capital on the date of theShareholders’ Meeting on May 16, 2008 (b) (600.1 M€)through in-kind contributions when provisions of ArticleL.225-148 of the French Commercial Code are notapplicable – 600.1 M€
ESM (a) ofMay 16, 2008
(15th resolution) 26 months
2/ a specific sub-cap of 1.5% of the share capital on thedate of Board decision (c), for capital increases reservedfor employees participating in Company Savings Plan –
35.2 millionshares (d)
ESM (a) ofMay 16, 2008
(16th resolution) 26 months
Stockoptions
1.5% of share capital (c) on the date of Board decision togrant options 4.6 million
shares (e)19.9 million
shares (e)
ESM (a) ofMay 11, 2007
(16th resolution) 38 months
Restrictedsharesgranted toGroupemployeesand toexecutivesand officers
0.8% of share capital (c) on the date of Board decision togrant options
3.0 millionshares (f)
13.0 millionshares (f)
ESM (a) ofMay 16, 2008
(17th resolution) 38 months
(a) ESM = Extraordinary Shareholders’ Meeting.(b) Share capital as of May 16, 2008: 2,400,402,483 shares.(c) Share capital as of December 31, 2009: 2,348,422,884 shares.(d) The number of shares authorized under the 16th Resolution of the May 16, 2008 ESM may not exceed 1.5% of the share capital on the date on which the capital increase is
decided by the Board of Directors. As the Board of Directors decided not to use the delegation of authority, the balance available under this authorization was 35,226,343new shares as of December 31, 2009, which represents 1.5% of the 2,348,422,884 outstanding shares at year-end.
(e) The number of stock options authorized under the 16th Resolution of the May 11, 2007 ESM may not exceed 1.5% of the share capital on the date the options are granted bythe Board of Directors. As the Board of Directors granted 6,082,640 TOTAL share subscription options on July 17, 2007, 4,600,000 TOTAL share subscription options onOctober 9, 2008, for the plan that it awarded at its meeting on September 9, 2008, and 4,600,000 TOTAL share subscription options on September 15, 2009, the number ofoptions that may still be granted as of December 31, 2009 was 19,943,703, which represents 1.5% of the 2,348,422,884 outstanding shares at year-end, minus 15,282,640options already granted and representing the same number of shares.
(f) The number of outstanding shares that may be awarded as restricted share grants under the 17th Resolution of the May 16, 2008 ESM may not exceed 0.8% of the sharecapital on the date the restricted shares are granted by the Board of Directors. As the Board of Directors granted 2,800,000 outstanding TOTAL shares on October 9, 2008,for the plan that it awarded at its meeting on September 9, 2008, and 3,000,000 outstanding TOTAL shares on September 15, 2009, the number of shares that may still begranted as of December 31, 2009, is 12,987,383 shares, which represents 0.8% of the outstanding 2,348,422,884 shares at year-end, minus the 5,800,000 shares alreadygranted.
168 / TOTAL - Registration Document 2009
1 2 3 4 5 6 7 8 9 10 11
Share capital GENERAL INFORMATION
� Potential share capital as ofDecember 31, 2009
Securities granting rights to TOTAL shares, through exercise orredemption, are TOTAL share subscription options, such optionsamounting to 45,828,769 as of December 31, 2009, divided into6,811,629 options1 for the plan awarded by the Board of Directorsat its meeting on July 16, 2003, 12,495,709 options 1 for the planawarded by the Board of Directors at its meeting on July 20, 2004,6,185,440 options1 for the plan awarded by the Board of Directorsat its meeting on July 19, 2005, 5,645,686 options for the planawarded by the Board of Directors at its meeting on July 18, 2006,and 5,871,665 options for the plan awarded by the Board ofDirectors at its meeting on July 17, 2007, 4,441,630 options for theOctober 9, 2008 plan awarded by the Board of Directors at its
meeting on September 9, 2008, and 4,377,010 options for the planawarded by the Board of Directors at its meeting on September 15,2009.
Due to the expiration in 2009 of the last share subscription optionplans for Elf Aquitaine shares (on March 30 and September 12,2009) and due to the expiration of the exchange guarantee (underthe guarantee given by the Company in the information noticepertaining to the counter-offer of September 22, 1999) for TOTALshares, no outstanding Elf Aquitaine benefited from exchange rightsfor TOTAL shares as of December 31, 2009.
The potential share capital (existing share capital plus securitiesgranting rights to TOTAL shares, through exercise or redemption)represented 101.95% of the share capital as of December 31, 2009,on the basis of 2,348,422,884 TOTAL shares constituting the sharecapital as of December 31, 2009, and of 45,828,769 TOTAL sharesthat could be issued upon the exercise of TOTAL options.
� Treasury shares
December 31, 2009
Percentage of share capital held by TOTAL S.A. 0.64%
Number of shares held in portfolio 15,075,922Book value of the portfolio (at purchase price) (M€) 595Market value of portfolio (M€) (a) 678
Percentage of capital held by the entire Group (b) 4.91%
Number of shares held in portfolio 115,407,190Book value of the portfolio (at purchase price) (M€) 3,622Market value of portfolio (M€) (a) 5,194
(a) On the basis of a market price of €45.005 per share as of December 31, 2009.(b) TOTAL S.A., Total Nucléaire, Financière Valorgest, Sogapar and Fingestval.
� Share capital history
(Since January 1, 2007)
‹ For the year ended 2007
January 10, 2007 Reduction of the share capital from €6,064,419,882.50 to €5,981,907,382.50, through the cancellation of 33,005,000treasury shares, par value €2.50 per share.
January 10, 2008 Certification of the issue of 2,769,144 new shares, par value €2.50 per share, between January 1 and December 31, 2007,raising the share capital by a total of €6,922,860 from €5,981,907,382.50 to €5,988,830,242.50 (of which 2,453,832 newshares issued through the exercise of the Company’s stock options and 315,312 new shares through the exchange of52,552 shares of Elf Aquitaine stock resulting from the exercise of Elf Aquitaine stock options and eligible for a guaranteedexchange for TOTAL shares).
1. After considering the May 22, 2006 adjustments of the price and the number of share options, in accordance with the legal provisions in force at that date and followingdecisions of the Shareholders’ Meeting held on May 12, 2006, pertaining to the four-for-one stock split of TOTAL and the spin-off of Arkema.
/ 169TOTAL
Share capitalGENERAL INFORMATION8
‹ For the year ended 2008
April 25, 2008 Certification of the subscription to 4,870,386 new shares, par value €2.50 per share, as part of the capital increasereserved for Group employees approved by the Board of Directors on November 6, 2007, raising the share capital by€12,175,965, from €5,988,830,242.50 to €6,001,006,207.50.
July 31, 2008 Reduction of the share capital from €6,001,006,207.50 to €5,926,006,207.50, through the cancellation of 30,000,000treasury shares, par value €2.50 per share.
January 13, 2009 Certification of the issue of 1,405,591 new shares, par value €2.50 per share, between January 1 and December 31, 2008,raising the share capital by a total of €3,513,977.50 from €5,926,006,207.50 to €5,929,520,185 (of which 1,178,167 newshares issued through the exercise of the Company’s stock options and 227,424 new shares through the exchange of37,904 shares of Elf Aquitaine stock resulting from the exercise of Elf Aquitaine stock options and eligible for a guaranteedexchange for TOTAL shares).
‹ For the year ended 2009
July 30, 2009 Reduction of the share capital from €5,929,520,185 to €5,867,520,185, through the cancellation of 24,800,000 treasuryshares, par value €2.50 per share.
January 12, 2010 Certification of the issue of 1,414,810 new shares, par value €2.50 per share, between January 1 and December 31, 2009,raising the share capital by a total of €3,537,025 from €5,867,520,185 to €5,871,057,210 (of which 934,780 new sharesissued through the exercise of the Company’s stock options and 480,030 new shares through the exchange of 80,005shares of Elf Aquitaine stock resulting from the exercise of Elf Aquitaine stock options and eligible for a guaranteedexchange for TOTAL shares).
170 / TOTAL - Registration Document 2009
1 2 3 4 5 6 7 8 9 10 11
Articles of incorporation and by-laws; other information GENERAL INFORMATION
� Articles of incorporation and by-laws; other information
� General information concerning theCompany
‹ Name
TOTAL S.A.
‹ Corporate offices
2, place Jean Millier, La Défense 6, 92400 Courbevoie (France)
‹ Legal form and nationality
A French société anonyme (limited liability company)
‹ Trade Registry
542 051 180 RCS Nanterre
‹ EC Registration Number
FR 59 542 051 180
‹ Charter and by-laws
On file with Maîtres Gildas Le Gonidec de Kerhalic and FrédéricLucet, Notaries in Paris
‹ APE Code (NAF)
111Z until January 7, 2008
741J from January 8, 2008
‹ Term
99 years from March 22, 2000, to expire on March 22, 2099, unlessdissolved prior to this date or extended
‹ Fiscal year
From January 1 to December 31 of each year
� Company’s purpose
The direct and indirect purpose of the Company is to search for andextract mining deposits in all countries, particularly hydrocarbons inall forms, and to perform industrial refining, processing and tradingin said materials as well as their derivatives and by-products, aswell as all activities relating to production and distribution of allforms of energy, as well as the chemicals sector in all of its formsand to the rubber and health sectors. The complete details of theCompany’s corporate purpose are set forth in Article, 3 of theby-laws.
� Provisions of the by-laws governingthe administration and managementbodies
‹ Election of directors and term of office
Directors are elected by the Shareholders’ Meeting for a 3-yearterm up to a maximum number of directors authorized by law(currently 18), subject to the legal provisions that allow the term tobe extended until the next Shareholders’ Meeting called to approvethe financial statements for the previous fiscal year.
In addition, one director representing the employee shareholders isalso elected by the Shareholders’ Meeting for a 3-year term from alist of at least two candidates pre-selected by the employeeshareholders under the conditions provided for by the laws,regulations and by-laws in force. However, his term shall expireautomatically once this Director is no longer an employee or ashareholder. The Board of Directors may meet and conduct validdeliberations until the date his replacement is named.
‹ Age limit of directors
On the closing date of each fiscal year, the number of individualdirectors over the age of 70 may not be greater than one third of thedirectors in office. If this percentage is exceeded, the oldest Boardmember is automatically considered to have resigned.
The director permanent representative of a legal entity must beunder 70 years old.
/ 171TOTAL
Articles of incorporation and by-laws; other informationGENERAL INFORMATION8
‹ Age limit of Chairman and Chief ExecutiveOfficer
Currently, the duties of the Chairman of the Board and of the ChiefExecutive Officer automatically cease on their 65th birthday at thelatest.
The Shareholders’ Meeting of May 15, 2009, approved anamendment of the by-laws pertaining to the rules relating to thenomination of the Chairman. The amendment allows the Board, asan exception to the applicable 65-year age limit, to appoint asChairman of the Board for a period of up to two years a directorwho is more than 65 years old but less than 70 years old.
‹ Minimum interest in the Company held bydirectors
Each director (other than the director representing the employeeshareholders) must own at least 1,000 shares of stock during histerm of office. If he ceases to own the required number of shares,he may, however, adjust his position subject to the conditions setby law. The director representing employee shareholders must hold,during his term of office, either individually or through a CompanySavings Plan (Fonds Commun de Placement d’Entreprise – FCPE)governed by Article L. 214-40 of the French Monetary and FinanceCode, at least one share or a number of units in said fundequivalent to at least one share.
‹ Majority rules for Board meetings
Decisions are adopted by a majority vote of the Directors present orrepresented. In the event of a tie vote, the Chairman shall cast thedeciding vote.
‹ Rules of procedure of the Board andCommittees of the Board of Directors
See Chapter 5 (Corporate Governance – Report of the Chairman ofthe Board of Directors) of this Registration Document.
‹ Form of Management
The Management of the Company is assumed either by theChairman of the Board of Directors (who then holds the title of theChairman and Chief Executive Officer), or by another personappointed by the Board of Directors with the title of Chief ExecutiveOfficer. It is the responsibility of the Board of Directors to choosebetween these two forms of management under the majority rulesdescribed above.
On February 13, 2007, the Board resolved to have separateindividuals serve in the positions of Chairman of the Board and ofChief Executive Officer of the Company.
The management form selected shall remain in effect until adecision to the contrary is made by the Board of Directors.
� Rights, privileges and restrictionsattached to the shares
In addition to the right to vote, each share entitles the holder to aportion of the corporate assets, distributions of profits andliquidation dividend which is proportional to the number of sharesissued, subject to the laws and regulations in force and the by-laws.
With the exception of the double voting right, no privilege isattached to a specific class of shares or to a specific class ofshareholders.
‹ Double voting rights
Double voting rights, in relation to the portion of share capital theyrepresent, are granted to all fully paid-up registered shares heldcontinuously in the name of the same shareholder for at least twoyears 1, and to additional registered shares allotted to a shareholderin connection with a capital increase by capitalization of reserves,profits or premiums on the basis of the existing shares which entitlethe shareholder to a double voting right.
‹ Limitation of voting rights
Article 18 of the Company’s by-laws provides that at Shareholders’Meetings, no shareholder may cast, by himself or through his agent,on the basis of the single voting rights attached to the shares heholds directly or indirectly and the shares for which he holdspowers, more than 10% of the total number of voting rightsattached to the Company’s shares. However, if a shareholder holdsdouble voting rights, this limit may be greater than 10%, but shallnot exceed 20%.
Moreover, Article 18 of the Company’s by-laws also provides thatthe limitation on voting rights no longer applies, absent any decisionof the Shareholders’ Meeting, if an individual or a legal entity actingsolely or together with one or more individuals or entities acquiresat least two third of the Company shares following a public tenderoffer for all the Company’s shares. In that case, the Board ofDirectors acknowledges that the limitation no longer applies andcarries out the necessary procedure to modify the company’sby-laws accordingly.
Once acknowledged, the fact that the limitation no longer applies isfinal and applies to all Shareholders’ Meetings following the publictender offer under which the acquisition of at least two third of theoverall number of shares of the Company was made possible, andnot solely to the first meeting following that public tender offer.
Because of the fact that in such circumstances the limitation nolonger applies, such limitation on voting rights cannot prevent ordelay any takeover of the Company, except in case of a publictender offer where the bidder does not acquire at least two third ofthe Company’s shares.
1. This term is not interrupted and the right acquired is retained in case of a conversion of bearer to bearer pursuant to intestate or testamentary succession, share of communityproperty between spouses or donation to the spouse or relatives entitled to inherit (Article 18 § 6 of by-laws).
172 / TOTAL - Registration Document 2009
1 2 3 4 5 6 7 8 9 10 11
Articles of incorporation and by-laws; other information GENERAL INFORMATION
‹ Fractional rights
Whenever it is necessary to own several shares in order to exercisea right, a number of shares less than the number required does notgive the owners any right with respect to the Company; in suchcase, the shareholders are responsible for aggregating the requirednumber of shares.
‹ Statutory allocation of profits
The net profit for the period is equal to the net income minusgeneral expenses and other personnel expenses, all amortizationand depreciation of the assets, and all provisions for commercialand industrial contingencies.
From this profit, minus prior losses, if any, the following items arededucted in the order indicated:
1) 5% to constitute the legal reserve fund, until said fund reaches10% of the share capital;
2) the amounts set by the Shareholders’ Meeting to fund reservesfor which it determines the allocation or use; and
3) the amounts that the Shareholders’ Meeting decides to retain.
The remainder is paid to the shareholders as dividends.
The Board of Directors may pay interim dividends.
The Shareholders’ Meeting held to approve the financial statementsfor the fiscal year may decide to grant shareholders an option, forall or part of the dividend or interim dividends, between payment ofthe dividend in cash or in shares.
The Shareholders’ Meeting may decide at any time, but only on thebasis of a proposal by the Board of Directors, to make a full orpartial distribution of the amounts in the reserve accounts, either incash or in Company shares.
Dividends which have not been claimed at the end of a 5-yearperiod are forfeited to the French government.
� Amending shareholders’ rights
Any amendment to the by-laws must be approved or authorized bythe Shareholders’ Meeting voting with the quorum and majorityrequired by the laws and regulations governing ExtraordinaryShareholders’ Meetings.
� Shareholders’ meetings
‹ Notice of meetings
Shareholders’ Meetings are convened and conducted under theconditions provided for by law.
‹ Admission to meetings
Participation in any form in Shareholders’ Meetings is subject toregistration or record of participating shares. Shares must either beheld in the registered account maintained by the Company (or itssecurities agent) or recorded in bearer form in a securities accountmaintained by a financial intermediary. Proof of this registration orrecord is obtained under a certificate of participation (attestation departicipation) delivered to the shareholder. This registration orrecording of the shares must be effective no later than a “recorddate” at 0:00 a.m. (Paris time) three business days before the dateof the Shareholders’ Meeting. If, after having received such acertificate, shares are sold or transferred prior to this record date,the certificate of participation will be cancelled and the votes sentby mail or proxies granted to the Company for such shares will becancelled accordingly. If shares are sold or transferred after thisrecord date, the certificate of participation will remain valid andvotes cast or proxies granted will be taken into account.
� Thresholds to be declared accordingto the by-laws
Any individual or entity who directly or indirectly acquires apercentage of the share capital, voting rights or securities givingfuture access to the share capital of the Company which is equal toor greater than 1%, or a multiple of this percentage, is required tonotify the Company within fifteen days by registered mail with returnreceipt requested, and declare the number of securities held. Theyare also required to notify the Company in due form and within thetime limits stated for the aforementioned thresholds when theirdirect or indirect holdings fall below each of the aforementionedthresholds.
� Changes in the share capital
The Company’s share capital may be modified only under theconditions stipulated by the legal and regulatory provisions in force.The provisions of the by-laws, charter, or internal regulations shallnot prevail over the law governing changes in the Company’s sharecapital.
/ 173TOTAL
Other mattersGENERAL INFORMATION8
� Other matters
� Employee incentives and profit-sharing
On June 26, 2009, a new incentive agreement and a profit-sharingagreement was signed for 2009, 2010 and 2011, concerning TOTALS.A., CDF Énergie, Elf Exploration Production, Total ExplorationProduction France, Total Fluides, Total Additifs et CarburantsSpéciaux, TIGF, Total Raffinage Marketing, Total Lubrifiants andTotalgaz. The amount of the special profit-sharing and incentivereserve to be distributed by all of the companies that signed theGroup agreements for fiscal year 2009 would total €106 million.
Company savings plans give employees of the Group’s companiescovered by these plans the ability to make discretionarycontributions (which the Company may, under certain conditions,supplement) to the plans invested in the shares of the Company(see Chapter 5 – Corporate Governance, Employees, shareownership) of this Registration Document.
The Group made gross additional contributions to various savingsplans that totaled €53.6 million in 2009.
� Pension savings plan
Pursuant to French law 2003-775 of August 21, 2003, reformingpensions, an agreement was signed with the unions onSeptember 29, 2004, to set up, as of January 1, 2005, a CollectiveRetirement Savings Plan (PERCO) replacing the VoluntaryPartnerships Plan for Employee Savings (PPESV) created in theagreement of March 15, 2002. An amendment to this agreementsigned on December 20, 2005, allows for an increase in France ofthe employee and Company contributions and for contribution ofbonuses and/or profit-sharing.
� Agreements mentioned in ArticleL. 225-100-3 of the FrenchCommercial Code
There are no agreements mentioned in paragraph 9 or 10 ofArticle L. 225-100-3 of the French Commercial Code.
� Filing of Form 20-F with the UnitedStates Securities and ExchangeCommission
In order to meet its obligations related to the listing of its shares inthe United States, the Company files, along with this RegistrationDocument, an annual report on Form 20-F, in English, with the SEC.
Pursuant to the requirements introduced by Section 302 of theSarbanes-Oxley Act of July 30, 2002, the Chief Executive Officerand the Chief Financial Officer of the Company have conducted,with the assistance of Management, an evaluation of theeffectiveness of the disclosure controls and procedures as definedby U.S. regulations, over the period covered by the Form 20-F. For2009, the Chief Executive Officer and the Chief Financial Officerconcluded that the disclosure controls and procedures wereeffective.
174 / TOTAL - Registration Document 2009
1 2 3 4 5 6 7 8 9 10 11
Documents on display GENERAL INFORMATION
� Documents on display
Documents and information concerning TOTAL S.A., including itscharter, by-laws and the Company’s statutory and consolidatedfinancial statements for the year ended December 31, 2009, or forprevious fiscal years may be consulted at the Company’s corporateoffices pursuant to the legal and regulatory provisions in force.
In addition, financial information for direct or indirect subsidiaries ofthe Company for the years ended December 31, 2008 andDecember 31, 2009 may be consulted at the headquarters of thesubsidiary, under the applicable legal and regulatory conditions.
TOTAL’s Registration Documents filed with the French FinancialMarkets Authority (Autorité des marchés financiers) for each of thepast five fiscal years, the first half financial statements, the first halfGroup presentations of its results and outlook, as well as thequarterly financial reports, are available on the Company’s website(www.total.com, Investor/Regulated Information in France).Furthermore, the annual summary for information publicly disclosedby TOTAL S.A., as provided for by Article L. 451-1-1 of the FrenchFinancial and Monetary Code, are also available on the Company’swebsite (www.total.com, heading Investor/Publications).
/ 175TOTAL
Information on holdingsGENERAL INFORMATION8
� Information on holdings
� General information
As of December 31, 2009:
o 617 subsidiaries were fully consolidated, 12 were proportionatelyconsolidated and 83 were accounted for using the equitymethod;
o TOTAL S.A.’s scope of consolidation includes all companies inwhich the Company holds a direct or indirect interest, the bookvalue of which on that date is at least equal to 10% of the amountof TOTAL S.A.’s equity or of the consolidated net assets of theGroup, or which has generated at least 10% of the TOTAL S.A.’snet income or of the Group’s consolidated net income during thelast year.
A list of the principal companies consolidated by TOTAL S.A. isprovided in a summary table in Note 35 to the consolidatedfinancial statements of this Registration Document.
� TOTAL’s interest in Sanofi-Aventis
Following an amendment, signed in November 2003, to theshareholders’ agreement concluded in 1999 between TOTAL andL’Oréal, both companies declared that they were not actingtogether regarding Sanofi-Aventis as of December 2004, thetermination date of the agreement. However, each one of thecompanies had committed itself for a period of three years, startingfrom the date of termination of the agreement, to inform the othercompany of any intention to sell more than 1% of Sanofi-Aventis’share capital. The notification was to be sent at least two monthsprior to the disposal date. Consequently, this obligation of priornotification agreed between the parties expired in December 2007.
In 2009, TOTAL’s interest in Sanofi-Aventis, held indirectly throughits 99.5% subsidiary Elf Aquitaine, decreased from 11.29% of theshare capital and 18.16% of the voting rights (or 148,559,513shares 1 for 290,052,340 voting rights) as of December 31, 2008 2, to7.33% of the share capital and 12.29% of the voting rights (or96,692,473 shares for 190,899,986 voting rights) as ofDecember 31, 2009 3.
On June 10, 2009, TOTAL declared in the AMF noticeNo. 209C0835, that its interest in Sanofi-Aventis share capitalindirectly fell below the 10% threshold pursuant to the disposal ofSanofi-Aventis shares on the market and that the Group held 9.99%of the share capital and 16.23% of voting rights of the company.
On September 2, 2009, TOTAL declared in the AMF noticeNo. 209C1154, that its voting rights in Sanofi-Aventis indirectly fellbelow the 15% threshold on August 28, 2009, pursuant to theconversion of Sanofi-Aventis shares to bearer shares, which led toa decrease in the Group’s voting rights and to the disposal ofSanofi-Aventis shares on the market, such that the Group held9.09% of the share capital and 14.58% of the voting rights of thecompany.
Over the years 2007 and 2008, TOTAL’s interest in Sanofi-Aventissuccessively changed from 13.13% of the outstanding shares and19.21% of the voting rights to 12.70% of the outstanding sharesand 19.11% of the voting rights, and then from 12.70% of theoutstanding shares and 19.11% of the voting rights to 11.29% ofthe outstanding shares and 18.16% of the voting rights.
The gradual selling of the Sanofi-Aventis shares, over the short ormedium term, gives the Group a certain amount of financialflexibility to adapt its financial resources to its growth and dividendpolicies.
For a description of Sanofi-Aventis, please consult the publicationsissued by that company.
� TOTAL’s interest in CEPSA
TOTAL has been a shareholder of the Spanish oil and gas companyCEPSA since 1990. As of December 31, 2009, CEPSA’s singlemajority shareholder is International Petroleum InvestmentCompany pursuant to the disposal in 2009 of Santander CentralHispano S.A. (SCH)’s and Unión Fenosa’s interest in CEPSA toInternational Petroleum Investment Company.
As of December 31, 2009, TOTAL held (through its indirectly-ownedsubsidiary Odivial) 130,668,240 CEPSA shares out of a total of267,574,941 outstanding shares, representing 48.83% of CEPSA’sshare capital and voting rights.
1. This number takes into account the 500 shares lent to directors representing TOTAL at the Board of directors of Sanofi-Aventis.2. On the basis of 1,315,525,463 Sanofi-Aventis shares to which are attached 1,597,584,326 voting rights as of December 31, 2008.3. On the basis of 1,318,479,052 Sanofi-Aventis shares to which are attached 1,553,331,156 voting rights as of December 31, 2009.
176 / TOTAL - Registration Document 2009
1 2 3 4 5 6 7 8 9 10 11
Information on holdings GENERAL INFORMATION
� TOTAL’s interest in Arkema
Given the expiration, in May 2009, of the mandatory holding periodfor Arkema shares and the non-strategic character of the Group’sinterest in Arkema’s share capital, TOTAL decided in the fourthquarter of 2009 to gradually divest its interest in Arkema’s sharecapital.
As of December 31, 2009, TOTAL held, through its indirectsubsidiaries Fingestval and Financière Valorgest, 2,352,493 sharesand 4,152,490 voting rights, representing 3.89% of the outstandingshares and 6.42% of the voting rights.
On March 17, 2010, TOTAL declared in the AMF noticeNo. 210C0255, that its voting rights in Arkema indirectly fell belowthe 5% threshold on March 12, 2010, pursuant to the loss of doublevoting rights following the conversion of Arkema shares to bearershares and to the disposal of Arkema shares on the market, suchthat the Group held 2.66% of the share capital and 3.97% of thevoting rights of the company.
/ 177TOTAL
GENERAL INFORMATION8
178 / TOTAL - Registration Document 2009
9APPENDIX 1CONSOLIDATED FINANCIAL STATEMENTS
Chapter 9 (Appendix 1, Consolidated Financial Statements) was set by the Board of Directors on February 10, 2010, andhas not been updated with subsequent events.
STATUTORY AUDITORS’ REPORT ON THE CONSOLIDATED FINANCIAL STATEMENTS p. 180
CONSOLIDATED STATEMENT OF INCOME p. 182
CONSOLIDATED BALANCE SHEET p. 183
CONSOLIDATED STATEMENT OF CASH FLOW p. 184
CONSOLIDATED STATEMENT OF CHANGES IN SHAREHOLDERS’ EQUITY p. 185
CONSOLIDATED STATEMENT OF COMPREHENSIVE INCOME p. 186
NOTES TO THE CONSOLIDATED FINANCIAL STATEMENTS p. 187
Introduction p. 187
1 - Accounting policies p. 187
2 - Main indicators – information by business segment p. 195
3 - Changes in the Group structure, main acquisitions and divestments p. 196
4 - Business segment information p. 196
5 - Information by geographical area p. 206
6 - Operating expenses p. 206
7 - Other income and other expense p. 207
8 - Other financial income and expense p. 207
9 - Income taxes p. 207
10 - Intangible assets p. 210
11 - Property, plant and equipment p. 211
12 - Equity affiliates: investments and loans p. 213
13 - Other investments p. 215
14 - Other non-current assets p. 216
15 - Inventories p. 216
16 - Accounts receivable and other current assets p. 217
17 - Shareholders’ equity p. 218
18 - Employee benefits obligations p. 221
19 - Provisions and other non-current liabilities p. 224
20 - Financial debt and related financial instruments p. 226
21 - Other creditors and accrued liabilities p. 231
22 - Lease contracts p. 232
23 - Commitments and contingencies p. 233
24 - Related parties p. 235
25 - Share-based payments p. 236
26 - Payroll and staff p. 241
27 - Statement of cash flows p. 241
28 - Financial assets and liabilities analysis per instruments class and strategy p. 243
29 - Fair value of financial instruments (excluding commodity contracts) p. 245
30 - Financial instruments related to commodity contracts p. 249
31 - Market risks p. 251
32 - Other risks and contingent liabilities p. 257
33 - Other information p. 259
34 - Post-closing events p. 259
35 - Consolidation Scope p. 260
/ 179TOTAL
APPENDIX 1 Statutory auditors’ report on the ConsolidatedFinancial StatementsCONSOLIDATED FINANCIAL STATEMENTS
9
� Statutory auditors’ report on the Consolidated FinancialStatements
This is a free translation into English of the statutory auditors’ report on the consolidated financial statements issued in French and it is providedsolely for the convenience of English-speaking users.
The statutory auditors’ report includes information specifically required by French law in such reports, whether modified or not. This informationis presented below the audit opinion on the consolidated financial statements and includes an explanatory paragraph discussing the auditors’assessments of certain significant accounting and auditing matters. These assessments were considered for the purpose of issuing an auditopinion on the consolidated financial statements taken as a whole and not to provide separate assurance on individual account balances,transactions, or disclosures.
This report also includes information relating to the specific verification of information given in the Group’s management report.
This report should be read in conjunction with, and construed in accordance with, French law and professional auditing standards applicable inFrance.
Year ended December 31, 2009
To the Shareholders,
In compliance with the assignment entrusted to us by your General Shareholder’s Annual Meeting, we hereby report to you, for the year ended31 December 2009, on:
o the audit of the accompanying consolidated financial statements of TOTAL S.A.;o the justification of our assessments;o the specific verification required by law.
These consolidated financial statements have been approved by the Board of Directors. Our role is to express an opinion on theseconsolidated financial statements based on our audit.
I. Opinion on the consolidated financial statementsWe conducted our audit in accordance with professional standards applicable in France; those standards require that we plan and perform theaudit to obtain reasonable assurance about whether the consolidated financial statements are free of material misstatement. An audit involvesperforming procedures, using sampling techniques or other methods of selection, to obtain audit evidence about the amounts and disclosuresin the consolidated financial statements. An audit also includes evaluating the appropriateness of accounting policies used and thereasonableness of accounting estimates made, as well as the overall presentation of the consolidated financial statements. We believe that theaudit evidence we have obtained is sufficient and appropriate to provide a basis for our audit opinion.
In our opinion, the consolidated financial statements give a true and fair view of the assets and liabilities and of the financial position of theGroup as at 31 December 2009 and of the results of its operations for the year then ended in accordance with International Financial ReportingStandards as adopted by the European Union.
Without qualifying our opinion, we draw your attention to the matter set out in the Note “Introduction” to the consolidated financial statementsregarding application of the new definition and the new rules of estimates for Oil & Gas reserves.
II. Justification of our assessmentsIn accordance with the requirements of article L. 823-9 of French commercial Code (Code de commerce) relating to the justification of ourassessments, we bring to your attention the following matters:
As stated in the Note “Introduction” to the consolidated financial statements, some accounting principles applied by TOTAL S.A. involve asignificant amount of assumptions and estimates principally related to the application of the successful efforts method for the oil and gasactivities, the depreciation of long-lived assets, the provisions for dismantlement, removal and environmental costs, the valuation of retirementobligations and the determination of the current and deferred taxation. Detailed information relating to the application of these accountingprinciples is given in the notes to the consolidated financial statements.
Our procedures relating to the material assumptions and estimates made by the management and which can result from the application ofthese accounting principles enabled us to assess their reasonableness.
These assessments were made as part of our audit of the consolidated financial statements taken as a whole and, therefore, served in formingour audit opinion expressed in the first part of this report.
180 / TOTAL - Registration Document 2009
1 2 3 4 5 6 7 8 9 10 11
Statutory auditors’ report on the ConsolidatedFinancial Statements
APPENDIX 1CONSOLIDATED FINANCIAL STATEMENTS
III. Specific verification
As required by law we have also verified, in accordance with professional standards applicable in France, the information relative to the Group,given in the parent company’s management report.
We have no matters to report regarding its fair presentation and its consistency with the consolidated financial statements.
Paris-La Défense, March 8, 2010
The Statutory Auditors
French original signed by
KPMG Audit ERNST & YOUNG AuditA division of KPMG S.A.
Jay Nirsimloo Pascal Macioce
/ 181TOTAL
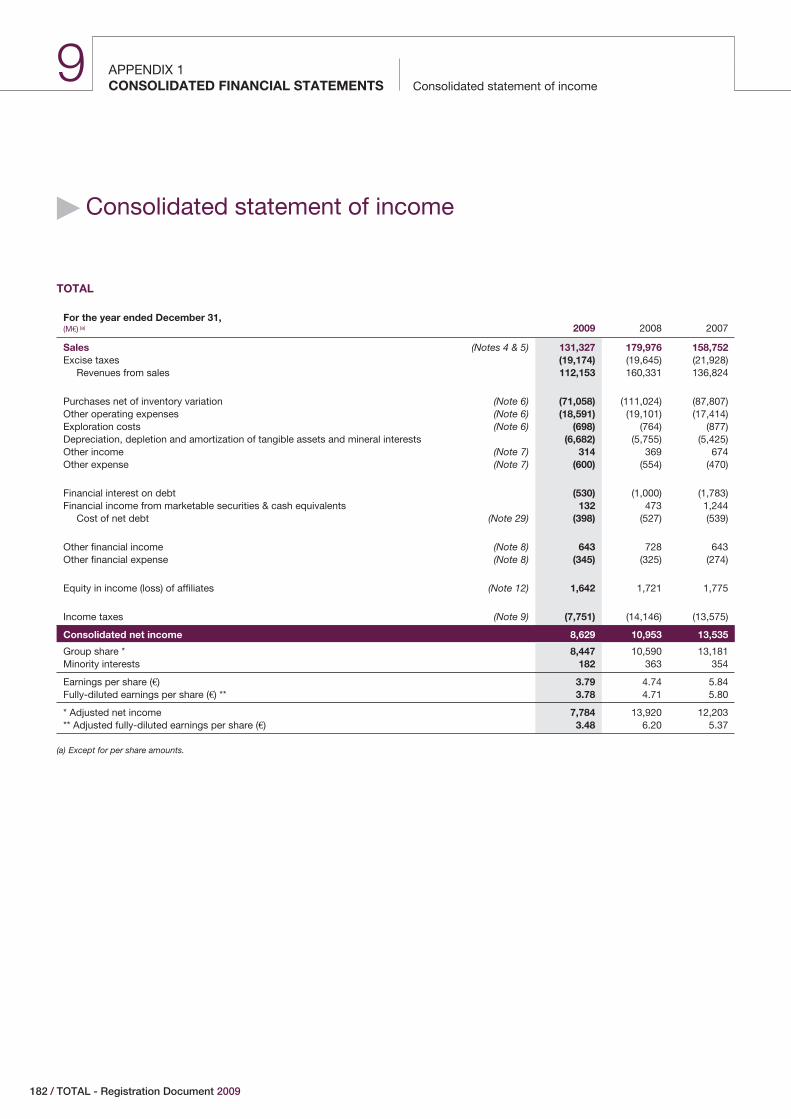
APPENDIX 1Consolidated statement of incomeCONSOLIDATED FINANCIAL STATEMENTS
9
� Consolidated statement of income
TOTAL
For the year ended December 31,(M€) (a) 2009 2008 2007
Sales (Notes 4 & 5) 131,327 179,976 158,752Excise taxes (19,174) (19,645) (21,928)
Revenues from sales 112,153 160,331 136,824
Purchases net of inventory variation (Note 6) (71,058) (111,024) (87,807)Other operating expenses (Note 6) (18,591) (19,101) (17,414)Exploration costs (Note 6) (698) (764) (877)Depreciation, depletion and amortization of tangible assets and mineral interests (6,682) (5,755) (5,425)Other income (Note 7) 314 369 674Other expense (Note 7) (600) (554) (470)
Financial interest on debt (530) (1,000) (1,783)Financial income from marketable securities & cash equivalents 132 473 1,244
Cost of net debt (Note 29) (398) (527) (539)
Other financial income (Note 8) 643 728 643Other financial expense (Note 8) (345) (325) (274)
Equity in income (loss) of affiliates (Note 12) 1,642 1,721 1,775
Income taxes (Note 9) (7,751) (14,146) (13,575)
Consolidated net income 8,629 10,953 13,535
Group share * 8,447 10,590 13,181Minority interests 182 363 354
Earnings per share (€) 3.79 4.74 5.84Fully-diluted earnings per share (€) ** 3.78 4.71 5.80
* Adjusted net income 7,784 13,920 12,203** Adjusted fully-diluted earnings per share (€) 3.48 6.20 5.37
(a) Except for per share amounts.
182 / TOTAL - Registration Document 2009
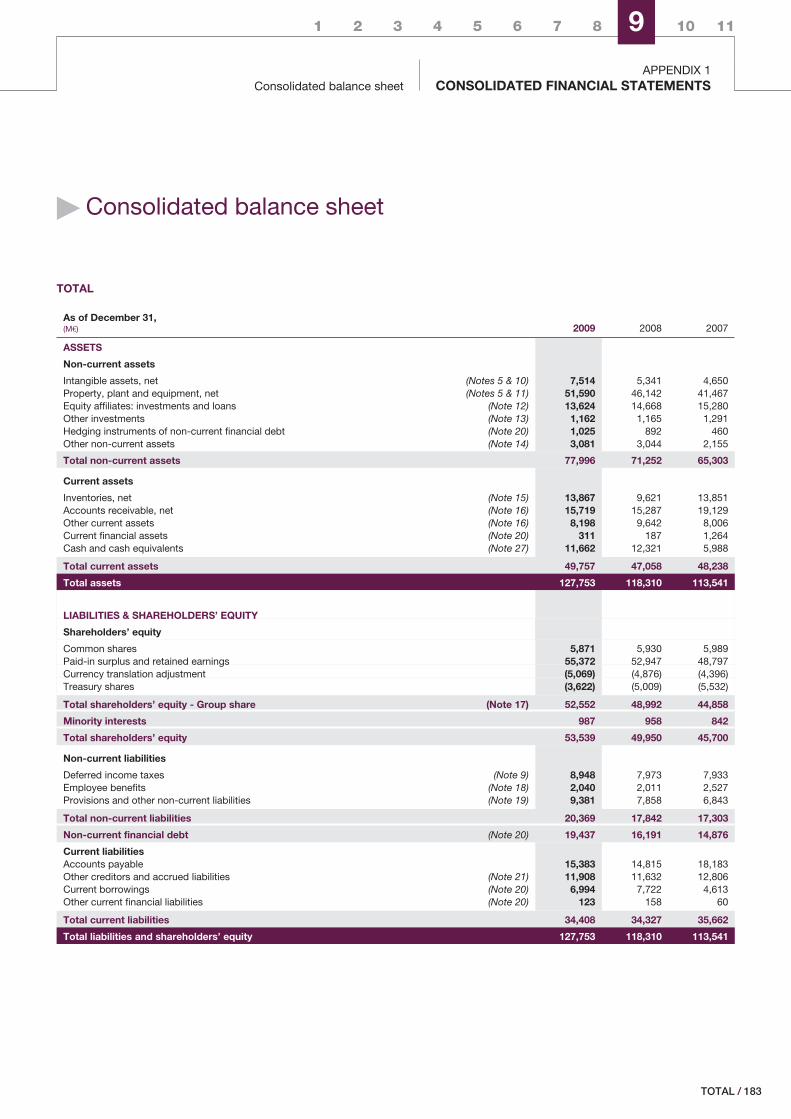
1 2 3 4 5 6 7 8 9 10 11
Consolidated balance sheetAPPENDIX 1
CONSOLIDATED FINANCIAL STATEMENTS
� Consolidated balance sheet
TOTAL
As of December 31,(M€) 2009 2008 2007
ASSETS
Non-current assets
Intangible assets, net (Notes 5 & 10) 7,514 5,341 4,650Property, plant and equipment, net (Notes 5 & 11) 51,590 46,142 41,467Equity affiliates: investments and loans (Note 12) 13,624 14,668 15,280Other investments (Note 13) 1,162 1,165 1,291Hedging instruments of non-current financial debt (Note 20) 1,025 892 460Other non-current assets (Note 14) 3,081 3,044 2,155
Total non-current assets 77,996 71,252 65,303
Current assets
Inventories, net (Note 15) 13,867 9,621 13,851Accounts receivable, net (Note 16) 15,719 15,287 19,129Other current assets (Note 16) 8,198 9,642 8,006Current financial assets (Note 20) 311 187 1,264Cash and cash equivalents (Note 27) 11,662 12,321 5,988
Total current assets 49,757 47,058 48,238
Total assets 127,753 118,310 113,541
LIABILITIES & SHAREHOLDERS’ EQUITY
Shareholders’ equity
Common shares 5,871 5,930 5,989Paid-in surplus and retained earnings 55,372 52,947 48,797Currency translation adjustment (5,069) (4,876) (4,396)Treasury shares (3,622) (5,009) (5,532)
Total shareholders’ equity - Group share (Note 17) 52,552 48,992 44,858
Minority interests 987 958 842
Total shareholders’ equity 53,539 49,950 45,700
Non-current liabilities
Deferred income taxes (Note 9) 8,948 7,973 7,933Employee benefits (Note 18) 2,040 2,011 2,527Provisions and other non-current liabilities (Note 19) 9,381 7,858 6,843
Total non-current liabilities 20,369 17,842 17,303
Non-current financial debt (Note 20) 19,437 16,191 14,876
Current liabilitiesAccounts payable 15,383 14,815 18,183Other creditors and accrued liabilities (Note 21) 11,908 11,632 12,806Current borrowings (Note 20) 6,994 7,722 4,613Other current financial liabilities (Note 20) 123 158 60
Total current liabilities 34,408 34,327 35,662
Total liabilities and shareholders’ equity 127,753 118,310 113,541
/ 183TOTAL
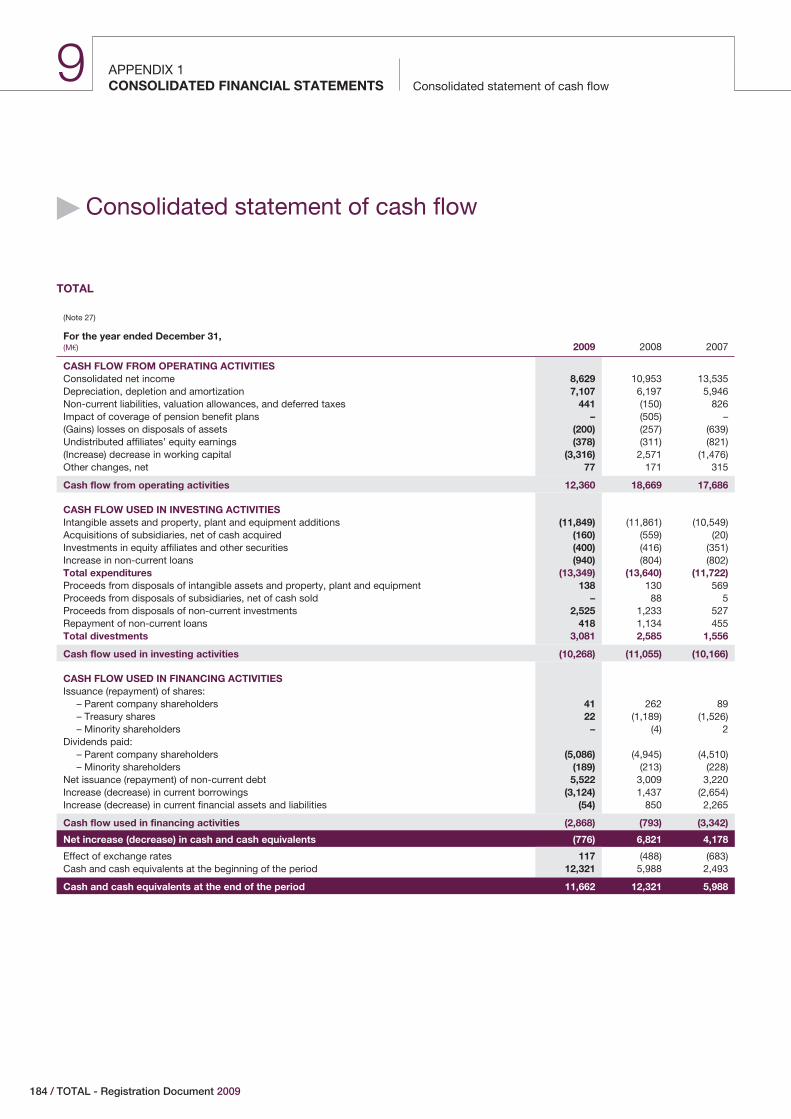
APPENDIX 1Consolidated statement of cash flowCONSOLIDATED FINANCIAL STATEMENTS
9
� Consolidated statement of cash flow
TOTAL
(Note 27)
For the year ended December 31,(M€) 2009 2008 2007
CASH FLOW FROM OPERATING ACTIVITIESConsolidated net income 8,629 10,953 13,535Depreciation, depletion and amortization 7,107 6,197 5,946Non-current liabilities, valuation allowances, and deferred taxes 441 (150) 826Impact of coverage of pension benefit plans – (505) –(Gains) losses on disposals of assets (200) (257) (639)Undistributed affiliates’ equity earnings (378) (311) (821)(Increase) decrease in working capital (3,316) 2,571 (1,476)Other changes, net 77 171 315
Cash flow from operating activities 12,360 18,669 17,686
CASH FLOW USED IN INVESTING ACTIVITIESIntangible assets and property, plant and equipment additions (11,849) (11,861) (10,549)Acquisitions of subsidiaries, net of cash acquired (160) (559) (20)Investments in equity affiliates and other securities (400) (416) (351)Increase in non-current loans (940) (804) (802)Total expenditures (13,349) (13,640) (11,722)Proceeds from disposals of intangible assets and property, plant and equipment 138 130 569Proceeds from disposals of subsidiaries, net of cash sold – 88 5Proceeds from disposals of non-current investments 2,525 1,233 527Repayment of non-current loans 418 1,134 455Total divestments 3,081 2,585 1,556
Cash flow used in investing activities (10,268) (11,055) (10,166)
CASH FLOW USED IN FINANCING ACTIVITIESIssuance (repayment) of shares:
– Parent company shareholders 41 262 89– Treasury shares 22 (1,189) (1,526)– Minority shareholders – (4) 2
Dividends paid:– Parent company shareholders (5,086) (4,945) (4,510)– Minority shareholders (189) (213) (228)
Net issuance (repayment) of non-current debt 5,522 3,009 3,220Increase (decrease) in current borrowings (3,124) 1,437 (2,654)Increase (decrease) in current financial assets and liabilities (54) 850 2,265
Cash flow used in financing activities (2,868) (793) (3,342)
Net increase (decrease) in cash and cash equivalents (776) 6,821 4,178
Effect of exchange rates 117 (488) (683)Cash and cash equivalents at the beginning of the period 12,321 5,988 2,493
Cash and cash equivalents at the end of the period 11,662 12,321 5,988
184 / TOTAL - Registration Document 2009
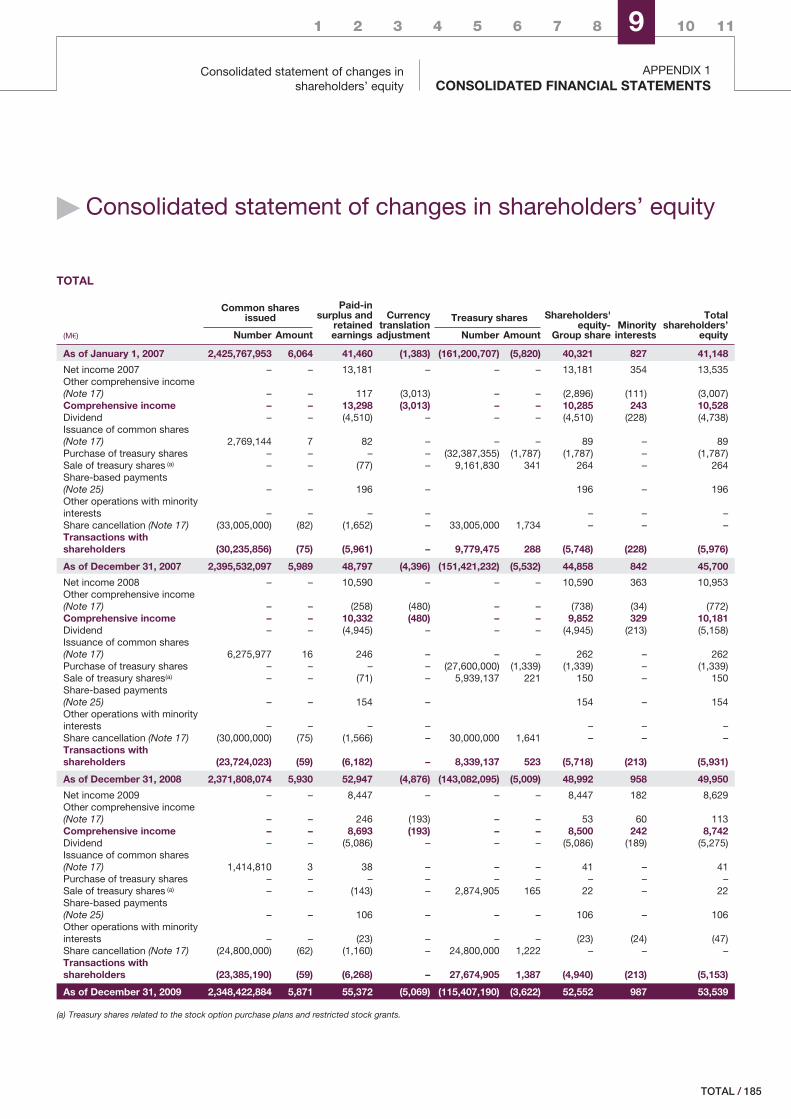
1 2 3 4 5 6 7 8 9 10 11
Consolidated statement of changes inshareholders’ equity
APPENDIX 1CONSOLIDATED FINANCIAL STATEMENTS
� Consolidated statement of changes in shareholders’ equity
TOTAL
Common sharesissued
Paid-insurplus and
retainedearnings
Currencytranslation
adjustment
Treasury shares Shareholders'equity-
Group shareMinority
interests
Totalshareholders’
equity(M€) Number Amount Number Amount
As of January 1, 2007 2,425,767,953 6,064 41,460 (1,383) (161,200,707) (5,820) 40,321 827 41,148
Net income 2007 – – 13,181 – – – 13,181 354 13,535Other comprehensive income(Note 17) – – 117 (3,013) – – (2,896) (111) (3,007)Comprehensive income – – 13,298 (3,013) – – 10,285 243 10,528Dividend – – (4,510) – – – (4,510) (228) (4,738)Issuance of common shares(Note 17) 2,769,144 7 82 – – – 89 – 89Purchase of treasury shares – – – – (32,387,355) (1,787) (1,787) – (1,787)Sale of treasury shares (a) – – (77) – 9,161,830 341 264 – 264Share-based payments(Note 25) – – 196 – 196 – 196Other operations with minorityinterests – – – – – – –Share cancellation (Note 17) (33,005,000) (82) (1,652) – 33,005,000 1,734 – – –Transactions withshareholders (30,235,856) (75) (5,961) – 9,779,475 288 (5,748) (228) (5,976)
As of December 31, 2007 2,395,532,097 5,989 48,797 (4,396) (151,421,232) (5,532) 44,858 842 45,700
Net income 2008 – – 10,590 – – – 10,590 363 10,953Other comprehensive income(Note 17) – – (258) (480) – – (738) (34) (772)Comprehensive income – – 10,332 (480) – – 9,852 329 10,181Dividend – – (4,945) – – – (4,945) (213) (5,158)Issuance of common shares(Note 17) 6,275,977 16 246 – – – 262 – 262Purchase of treasury shares – – – – (27,600,000) (1,339) (1,339) – (1,339)Sale of treasury shares(a) – – (71) – 5,939,137 221 150 – 150Share-based payments(Note 25) – – 154 – 154 – 154Other operations with minorityinterests – – – – – – –Share cancellation (Note 17) (30,000,000) (75) (1,566) – 30,000,000 1,641 – – –Transactions withshareholders (23,724,023) (59) (6,182) – 8,339,137 523 (5,718) (213) (5,931)
As of December 31, 2008 2,371,808,074 5,930 52,947 (4,876) (143,082,095) (5,009) 48,992 958 49,950
Net income 2009 – – 8,447 – – – 8,447 182 8,629Other comprehensive income(Note 17) – – 246 (193) – – 53 60 113Comprehensive income – – 8,693 (193) – – 8,500 242 8,742Dividend – – (5,086) – – – (5,086) (189) (5,275)Issuance of common shares(Note 17) 1,414,810 3 38 – – – 41 – 41Purchase of treasury shares – – – – – – – – –Sale of treasury shares (a) – – (143) – 2,874,905 165 22 – 22Share-based payments(Note 25) – – 106 – – – 106 – 106Other operations with minorityinterests – – (23) – – – (23) (24) (47)Share cancellation (Note 17) (24,800,000) (62) (1,160) – 24,800,000 1,222 – – –Transactions withshareholders (23,385,190) (59) (6,268) – 27,674,905 1,387 (4,940) (213) (5,153)
As of December 31, 2009 2,348,422,884 5,871 55,372 (5,069) (115,407,190) (3,622) 52,552 987 53,539
(a) Treasury shares related to the stock option purchase plans and restricted stock grants.
/ 185TOTAL
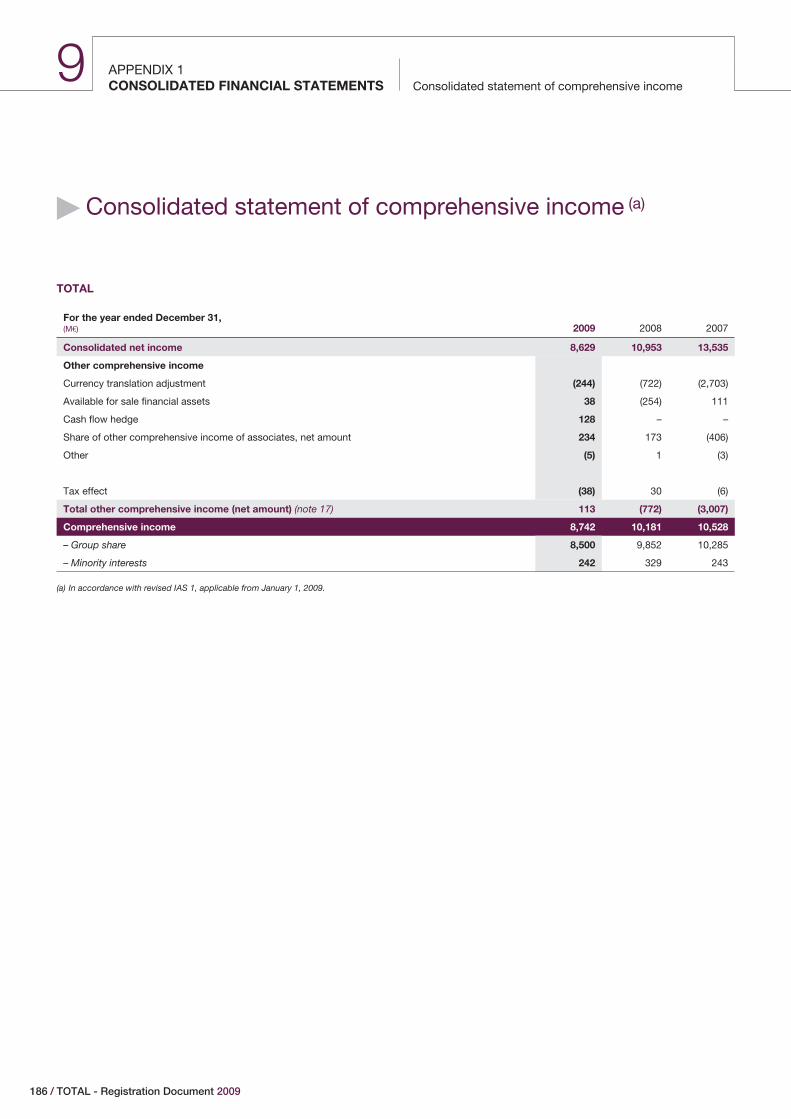
APPENDIX 1Consolidated statement of comprehensive incomeCONSOLIDATED FINANCIAL STATEMENTS
9
� Consolidated statement of comprehensive income (a)
TOTAL
For the year ended December 31,(M€) 2009 2008 2007
Consolidated net income 8,629 10,953 13,535
Other comprehensive income
Currency translation adjustment (244) (722) (2,703)
Available for sale financial assets 38 (254) 111
Cash flow hedge 128 – –
Share of other comprehensive income of associates, net amount 234 173 (406)
Other (5) 1 (3)
Tax effect (38) 30 (6)
Total other comprehensive income (net amount) (note 17) 113 (772) (3,007)
Comprehensive income 8,742 10,181 10,528
– Group share 8,500 9,852 10,285
– Minority interests 242 329 243
(a) In accordance with revised IAS 1, applicable from January 1, 2009.
186 / TOTAL - Registration Document 2009
1 2 3 4 5 6 7 8 9 10 11
Notes to the Consolidated Financial StatementsAPPENDIX 1
CONSOLIDATED FINANCIAL STATEMENTS
� Notes to the Consolidated Financial Statements
On February 10, 2010, the Board of Directors established andauthorized the publication of the Consolidated Financial Statementsof TOTAL S.A. for the year ended December 31, 2009, which will besubmitted for approval to the shareholders’ meeting to be held onMay 21, 2010.
Introduction
The Consolidated Financial Statements of TOTAL S.A. and itssubsidiaries (the Group) have been prepared on the basis of IFRS(International Financial Reporting Standards) as adopted by theEuropean Union and IFRS as issued by the IASB (InternationalAccounting Standard Board) as of December 31, 2009.
The accounting principles applied in the Consolidated FinancialStatements as of December 31, 2009 were the same as those thatwere used as of December 31, 2008 except for amendments andinterpretations of IFRS which were mandatory for the periodsbeginning after January 1, 2009 (and not early adopted). Theiradoption has no impact on the Consolidated Financial Statementsas of December 31, 2009.
Among these new standards or interpretations, it should be notedthat the revised version of IAS 1 “Presentation of financialstatements”, effective for annual periods beginning on or afterJanuary 1, 2009, resulted in the following:
o presentation of the consolidated statement of comprehensiveincome; and
o information on other comprehensive income presented in Note 17to the Consolidated Financial Statements.
In addition, the IASB issued in 2009 amendments to standard IFRS7 “Financial instruments: disclosures” which introduce newdisclosure requirements, effective for annual periods beginning onor after January 1, 2009. In particular, financial instruments shall bepresented according to the fair value measurement method used(three-level hierarchy described in Note 1 M(v) to the ConsolidatedFinancial Statements).
Lastly, the Group has applied the new definitions and the newmethod of estimating oil & gas reserves resulting from U.S.Accounting Standards Update No. 2010-03, “Oil and Gas ReserveEstimation and Disclosures”, effective for annual reporting periodsended on or after December 31, 2009. The adoption of these newrules had no significant impact on oil & gas reserve estimates andno significant impact on the Consolidated Financial Statements.
The preparation of financial statements in accordance with IFRSrequires the management to make estimates and assumptions thataffect the reported amounts of assets, liabilities and contingentliabilities at the date of preparation of the financial statements and
reported income and expenses for the period. The managementreviews these estimates and assumptions on an ongoing basis, byreference to past experience and various other factors consideredas reasonable which form the basis for assessing the carryingamount of assets and liabilities. Actual results may differsignificantly from these estimates, if different assumptions orcircumstances apply. These judgments and estimates relateprincipally to the application of the successful efforts method forthe oil and gas accounting, the valuation of long-lived assets, theprovisions for asset retirement obligations and environmentalremediation, the pensions and post-retirements benefits and theincome tax computation.
Furthermore, where the accounting treatment of a specifictransaction is not addressed by any accounting standard orinterpretation, the management applies its judgment to define andapply accounting policies that will lead to relevant and reliableinformation, so that the financial statements:
o give a true and fair view of the Group’s financial position, financialperformance and cash flows;
o reflect the substance of transactions;
o are neutral;
o are prepared on a prudent basis; and
o are complete in all material aspects.
1) Accounting policies
Pursuant to the accrual basis of accounting followed by the Group,the financial statements reflect the effects of transactions and otherevents when they occur. Assets and liabilities such as property,plant and equipment and intangible assets are usually measured atamortized cost. Financial assets and liabilities are usually measuredat fair value.
Accounting policies used by the Group are described below:
A) Principles of consolidation
Subsidiaries that are directly controlled by the parent company orindirectly controlled by other consolidated subsidiaries are fullyconsolidated.
Investments in jointly-controlled entities are proportionatelyconsolidated.
Investments in associates, in which the Group has significantinfluence, are accounted for by the equity method. Significantinfluence is presumed when the Group holds, directly or indirectly(e.g. through subsidiaries), 20% or more of the voting rights.
/ 187TOTAL
APPENDIX 1Notes to the Consolidated Financial StatementsCONSOLIDATED FINANCIAL STATEMENTS
9
Companies in which ownership interest is less than 20%, but overwhich the Company is deemed to exercise significant influence, arealso accounted for by the equity method.
All significant intercompany balances, transactions and incomehave been eliminated.
B) Business combinations
Business combinations are accounted for using the purchasemethod. This method implies the recognition of the assets, liabilitiesand contingent liabilities of the companies acquired by the Group attheir fair value.
The difference between the acquisition cost of the shares and fairvalue of the acquired share of the assets, liabilities and contingentliabilities identified on the acquisition date is recorded as goodwill.
If the cost of an acquisition is less than the fair value of net assetsof the subsidiary acquired, an additional analysis is performed onthe identification and valuation of the identifiable elements of theassets and liabilities. Any residual negative goodwill is recorded asincome.
The analysis of goodwill is finalized within one year from theacquisition date.
C) Foreign currency translation
The financial statements of subsidiaries are prepared in thecurrency that most clearly reflects their business environment. Thisis referred to as their functional currency.
(i) Monetary transactions
Transactions denominated in foreign currencies are translated atthe exchange rate on the transaction date. At each balance sheetdate, monetary assets and liabilities are translated at the closingrate and the resulting exchange differences are recognized in“Other income” or “Other expenses”.
(ii) Translation of financial statements denominated in foreigncurrencies
Assets and liabilities of foreign entities are translated into euros onthe basis of the exchange rates at the end of the period. Theincome and cash flow statements are translated using the averageexchange rates for the period. Foreign exchange differencesresulting from such translations are either recorded in shareholders’equity under “Currency translation adjustments” (for the Groupshare) or under “Minority interests” (for the minority share) asdeemed appropriate.
D) Sales and revenues from sales
Revenues from sales are recognized when the significant risks andrewards of ownership have been passed to the buyer and theamount can be reasonably measured. Sales figures include excisetaxes collected by the Group within the course of its oil distributionoperations. Excise taxes are deducted from sales in order to obtainthe “Revenues from sales” indicator.
Revenues from sales of crude oil, natural gas and coal are recordedupon transfer of title, according to the terms of the sales contracts.
Revenues from the production of crude oil and natural gasproperties, in which the Group has an interest with other producers,are recognized based on actual volumes sold during the period.Any difference between volumes sold and entitlement volumes,based on the Group net working interest, are recognized as “Crudeoil and natural gas inventories” or “Accounts receivable, net” or“Accounts payable”, as appropriate.
Revenues from gas transport are recognized when services arerendered. These revenues are based on the quantities transportedand measured according to procedures defined in each servicecontract.
Revenues from sales of electricity are recorded upon transfer oftitle, according to the terms of the related contracts.
Revenues from services are recognized when the services havebeen rendered.
Shipping revenues and expenses from time-charter activities arerecognized on a pro rata basis over a period that commences uponthe unloading of the previous voyage and terminates upon theunloading of the current voyage. Shipping revenue recognitionstarts only when a charter has been agreed to by both the Groupand the customer.
Oil and gas sales are inclusive of quantities delivered that representproduction royalties and taxes, when paid in cash, and outside theUnited States and Canada.
Certain transactions within the trading activities (contracts involvingquantities that are purchased to third parties then resold to thirdparties) are shown at their net value in sales.
Exchanges of crude oil and petroleum products within normaltrading activities do not generate any income and therefore theseflows are shown at their net value in both the statement of incomeand the balance sheet.
E) Share-based payments
The Group may grant employees stock options, create employeeshare purchase plans and offer its employees the opportunity tosubscribe to reserved capital increases. These employee benefitsare recognized as expenses with a corresponding credit toshareholders’ equity.
The expense is equal to the fair value of the instruments granted.The fair value of the options is calculated using the Black-Scholesmodel at the grant date. The expense is recognized on a straight-line basis between the grant date and vesting date.
188 / TOTAL - Registration Document 2009
1 2 3 4 5 6 7 8 9 10 11
Notes to the Consolidated Financial StatementsAPPENDIX 1
CONSOLIDATED FINANCIAL STATEMENTS
For restricted share plans, the expense is calculated using themarket price at the grant date after deducting the expecteddistribution rate during the vesting period.
The cost of employee-reserved capital increases is immediatelyexpensed. A discount reduces the expense in order to account forthe nontransferability of the shares awarded to the employees overa period of five years.
F) Income taxes
Income taxes disclosed in the statement of income include thecurrent tax expenses and the deferred tax expenses.
The Group uses the liability method whereby deferred income taxesare recorded based on the temporary differences between thecarrying amounts of assets and liabilities recorded in the balancesheet and their tax bases, and on carry-forwards of unused taxlosses and tax credits.
Deferred tax assets and liabilities are measured using the tax ratesthat have been enacted or substantially enacted at the balancesheet date. The tax rates used depend on the timing of reversals oftemporary differences, tax losses and other tax credits. The effectof a change in tax rate is recognized either in the ConsolidatedStatement of Income or in shareholders’ equity depending on theitem it relates to.
Deferred tax assets are recognized when future recovery isprobable.
Asset retirement obligations and finance leases give rise to therecognition of assets and liabilities for accounting purposes asdescribed in paragraph K “Leases” and paragraph Q “Assetretirement obligations” of this Note. Deferred income taxes resultingfrom temporary differences between the carrying amounts and taxbases of such assets and liabilities are recognized.
Deferred tax liabilities resulting from temporary differences betweenthe carrying amounts of equity-method investments and their taxbases are recognized. The deferred tax calculation is based on theexpected future tax effect (dividend distribution rate or tax rate onthe gain or loss upon disposal of these investments).
Taxes paid on the Upstream production are included in operatingexpenses, including those related to historical concessions held bythe Group in the Middle East producing countries.
G) Earnings per share
Earnings per share is calculated by dividing net income (Groupshare) by the weighted-average number of common sharesoutstanding during the period.
Diluted earnings per share is calculated by dividing net income(Group share) by the fully-diluted weighted-average number ofcommon shares outstanding during the period. Treasury sharesheld by the parent company, TOTAL S.A., and TOTAL shares heldby the Group subsidiaries are deducted from consolidatedshareholders’ equity. These shares are not considered outstanding
for purposes of this calculation which also takes into account thedilutive effect of stock options, restricted share grants and capitalincreases with a subscription period closing after the end of thefiscal year.
The weighted-average number of fully-diluted shares is calculatedin accordance with the treasury stock method provided for by IAS33. The proceeds, which would be recovered in the event of anexercise of rights related to dilutive instruments, are presumed tobe a share buyback at the average market price over the period.The number of shares thereby obtained leads to a reduction in thetotal number of shares that would result from the exercise of rights.
H) Oil and gas exploration and producingproperties
The Group applies IFRS 6 “Exploration for and Evaluation of MineralResources”. Oil and gas exploration and production properties andassets are accounted for in accordance with the successful effortsmethod.
(i) Exploration costs
Geological and geophysical costs, including seismic surveys forexploration purposes are expensed as incurred.
Mineral interests are capitalized as intangible assets when acquired.These acquired interests are tested for impairment on a regularbasis, property-by-property, based on the results of the exploratoryactivity and the management’s evaluation.
In the event of a discovery, the unproved mineral interests aretransferred to proved mineral interests at their net book value assoon as proved reserves are booked.
Exploratory wells are tested for impairment on a well-by-well basisand accounted for as follows:
o Costs of exploratory wells which result in proved reserves arecapitalized and then depreciated using the unit-of-productionmethod based on proved developed reserves;
o Costs of dry exploratory wells and wells that have not foundproved reserves are charged to expense;
o Costs of exploratory wells are temporarily capitalized until adetermination is made as to whether the well has found provedreserves if both of the following conditions are met:
- The well has found a sufficient quantity of reserves to justify itscompletion as a producing well, if appropriate, assuming thatthe required capital expenditures are made;
- The Group is making sufficient progress assessing the reservesand the economic and operating viability of the project. Thisprogress is evaluated on the basis of indicators such aswhether additional exploratory works are under way or firmlyplanned (wells, seismic or significant studies), whether costsare being incurred for development studies and whether theGroup is waiting for governmental or other third-partyauthorization of a proposed project, or availability of capacityon an existing transport or processing facility.
/ 189TOTAL
APPENDIX 1Notes to the Consolidated Financial StatementsCONSOLIDATED FINANCIAL STATEMENTS
9
Costs of exploratory wells not meeting these conditions arecharged to expense.
(ii) Oil and Gas producing assets
Development costs incurred for the drilling of development wellsand for the construction of production facilities are capitalized,together with borrowing costs incurred during the period ofconstruction and the present value of estimated costs of assetretirement obligations. The depletion rate is usually equal to theratio of oil and gas production for the period to proved developedreserves (unit-of-production method).
With respect to production sharing contracts, this computation isbased on the portion of production and reserves assigned to theGroup taking into account estimates based on the contractualclauses regarding the reimbursement of exploration anddevelopment costs (cost oil) as well as the sharing of hydrocarbonrights (profit oil).
Transportation assets are depreciated using the unit-of-productionmethod based on throughput or by using the straight-line methodwhichever best reflects the economic life of the asset.
Proved mineral interests are depreciated using theunit-of-production method based on proved reserves.
I) Goodwill and other intangible assets
Other intangible assets include goodwill, patents, trademarks, andlease rights.
Intangible assets are carried at cost, after deducting anyaccumulated depreciation and accumulated impairment losses.
Goodwill in a consolidated subsidiary is calculated as the excess ofthe cost of shares, including transaction expenses, over the fairvalue of the Group’s share of the net assets at the acquisition date.Goodwill is not amortized but is tested for impairment annually oras soon as there is any indication of impairment (see Note 1paragraph L to the Consolidated Financial Statements “Impairmentof long-lived assets”).
In equity affiliates, goodwill is included in the investment bookvalue.
Other intangible assets (except goodwill) have a finite useful life andare amortized on a straight-line basis over 10 to 40 yearsdepending on the useful life of the assets.
Research and development:
Research costs are charged to expense as incurred.
Development expenses are capitalized when the following can bedemonstrated:
o the technical feasibility of the project and the availability of theadequate resources for the completion of the intangible asset;
o the ability of the asset to generate probable future economicbenefits;
o the ability to measure reliably the expenditures attributable to theasset; and
o the feasibility and intention of the Group to complete theintangible asset and use or sell it.
Advertising costs are charged to expense as incurred.
J) Other property, plant and equipment
Other property, plant and equipment are carried at cost, afterdeducting any accumulated depreciation and accumulatedimpairment losses. This cost includes borrowing costs directlyattributable to the acquisition or production of a qualifying assetincurred until assets are placed in service. Borrowing costs arecapitalized as follows:
o if the project benefits from a specific funding, the capitalization ofborrowing costs is based on the borrowing rate;
o if the project is financed by all the Group’s debt, the capitalizationof borrowing costs is based on the weighted average borrowingcost for the period.
Routine maintenance and repairs are charged to expense asincurred. The costs of major turnarounds of refineries and largepetrochemical units are capitalized as incurred and depreciatedover the period of time between two consecutive majorturnarounds.
Other property, plant and equipment are depreciated using thestraight-line method over their useful lives, which are as follows:
o Furniture, office equipment, machinery and tools 3 – 12 years
o Transportation equipments 5 – 20 years
o Storage tanks and related equipment 10 – 15 years
o Specialized complex installations and pipelines 10 – 30 years
o Buildings 10 – 50 years
K) Leases
A finance lease transfers substantially all the risks and rewardsincidental to ownership from the lessor to the lessee. Thesecontracts are capitalized as assets at fair value or, if lower, at thepresent value of the minimum lease payments according to thecontract. A corresponding financial debt is recognized as a financialliability. These assets are depreciated over the correspondinguseful life used by the Group.
Leases that are not finance leases as defined above are recordedas operating leases.
Certain arrangements do not take the legal form of a lease butconvey the right to use an asset or a group of assets in return forfixed payments. Such arrangements are accounted for as leasesand are analyzed to determine whether they should be classified asoperating leases or as finance leases.
190 / TOTAL - Registration Document 2009
1 2 3 4 5 6 7 8 9 10 11
Notes to the Consolidated Financial StatementsAPPENDIX 1
CONSOLIDATED FINANCIAL STATEMENTS
L) Impairment of long-lived assets
The recoverable amounts of intangible assets and property, plantand equipment are tested for impairment as soon as any indicationof impairment exists. This test is performed at least annually forgoodwill.
The recoverable amount is the higher of the fair value (less costs tosell) or its value in use.
Assets are grouped into cash-generating units (or CGUs) andtested. A cash-generating unit is a homogeneous group of assetsthat generates cash inflows that are largely independent of the cashinflows from other groups of assets.
The value in use of a CGU is determined by reference to thediscounted expected future cash flows, based upon themanagement’s expectation of future economic and operatingconditions. If this value is less than the carrying amount, animpairment loss on property, plant and equipment and mineralinterests, or on other intangible assets, is recognized either in“Depreciation, depletion and amortization of property, plant andequipment and mineral interests” or in “Other expense”,respectively. This impairment loss is first allocated to reduce thecarrying amount of any goodwill.
Impairment losses recognized in prior periods can be reversed upto the original carrying amount, had the impairment loss not beenrecognized. Impairment losses recognized for goodwill cannot bereversed.
M) Financial assets and liabilities
Financial assets and liabilities are financial loans and receivables,investments in non-consolidated companies, publicly traded equitysecurities, derivatives instruments and current and non-currentfinancial liabilities.
The accounting treatment of these financial assets and liabilities isas follows:
(i) Loans and receivables
Financial loans and receivables are recognized at amortized cost.They are tested for impairment, by comparing the carrying amountof the assets to estimates of the discounted future recoverable cashflows. These tests are conducted as soon as there is any evidencethat their fair value is less than their carrying amount, and at leastannually. Any impairment loss is recorded in the statement ofincome.
(ii) Investments in non-consolidated companies and publiclytraded equity securities
These assets are classified as financial assets available for sale andtherefore measured at their fair value. For listed securities, this fairvalue is equal to the market price. For unlisted securities, if the fairvalue is not reliably determinable, securities are recorded at theirhistorical value. Changes in fair value are recorded in shareholders’equity. If there is any evidence of a significant or long-lasting loss,an impairment loss is recorded in the Consolidated Statement ofIncome. This impairment is reversed in the statement of incomeonly when the securities are sold.
These investments are presented in the section “Other investments”of the balance sheet.
(iii) Derivative instruments
The Group uses derivative instruments to manage its exposure torisks of changes in interest rates, foreign exchange rates andcommodity prices. Changes in fair value of derivative instrumentsare recognized in the statement of income or in shareholders’ equityand are recognized in the balance sheet in the accountscorresponding to their nature, according to the risk managementstrategy described in Note 31 to the Consolidated FinancialStatements. The derivative instruments used by the Group are thefollowing:
o Cash management
Financial instruments used for cash management purposes arepart of a hedging strategy of currency and interest rate riskswithin global limits set by the Group and are considered to beused for transactions (held for trading). Changes in fair value aresystematically recorded in the statement of income. The balancesheet value of those instruments is included in “Current financialassets” or “Other current financial liabilities”.
o Long-term financing
When an external long-term financing is set up, specifically tofinance subsidiaries, and when this financing involves currencyand interest rate derivatives, these instruments are qualified as:
1) Fair value hedge of the interest rate risk on the external debtand of the currency risk of the loans to subsidiaries. Changes infair value of derivatives are recognized in the statement ofincome as are changes in fair value of financial debts and loansto subsidiaries.
The fair value of those hedging instruments of long-termfinancing is included in the assets under “Hedging instrumentson non-current financial debt” or in the liabilities under “Non-current financial debt “for the non-current portion. The currentportion (less than one year) is accounted for in “Currentfinancial assets” or “Other current financial liabilities”.
In case of the anticipated termination of derivative instrumentsaccounted for as fair value hedges, the amount paid orreceived is recognized in the statement of income and:
- If this termination is due to an early cancellation of thehedged items, the adjustment previously recorded asrevaluation of those hedged items is also recognized in thestatement of income;
- If the hedged items remain in the balance sheet, theadjustment previously recorded as a revaluation of thosehedged items is spread over the remaining life of thoseitems.
2) Cash flow hedge of the currency risk of the external debt.Changes in fair value are recorded in equity for the effectiveportion of the hedging and in the statement of income for theineffective portion of the hedging. Amounts recorded in equityare transferred to the income statement when the hedgedtransaction affects profit or loss.
/ 191TOTAL
APPENDIX 1Notes to the Consolidated Financial StatementsCONSOLIDATED FINANCIAL STATEMENTS
9
The fair value of those hedging instruments of long-termfinancing is included in the assets under “Hedging instrumentson non-current financial debt” or in the liabilities under “Non-current financial debt“ for the non-current portion. The currentportion (less than one year) is accounted for in “Currentfinancial assets” or “Other current financial liabilities”.
If the hedging instrument expires, is sold or terminated byanticipation, gains or losses previously recognized in equityremain in equity. Amounts are recycled in the incomestatement when the hedged transaction affects profit or loss.
o Foreign subsidiaries’ equity hedge
Certain financial instruments hedge against risks related to theequity of foreign subsidiaries whose functional currency is not theeuro (mainly the dollar). These instruments qualify as “netinvestment hedges”. Changes in fair value are recorded inshareholders’ equity.
The fair value of these instruments is recorded under “Currentfinancial assets” or ”Other current financial liabilities”.
o Financial instruments related to commodity contracts
Financial instruments related to commodity contracts, includingcrude oil, petroleum products, gas and power purchasing/sellingcontracts related to the trading activities, together with thecommodity contract derivative instruments such as energycontracts and forward freight agreements, are used to adjust theGroup's exposure to price fluctuations within global trading limits.These instruments are considered, according to the industrypractice, as held for trading. Changes in fair value are recorded inthe statement of income. The fair value of these instruments isrecorded in “Other current assets” or “Other creditors andaccrued liabilities” depending on whether they are assets orliabilities.
Detailed information about derivatives positions is disclosed inNotes 20, 28, 29, 30 and 31 to the Consolidated FinancialStatements.
(iv) Current and non-current financial liabilities
Current and non-current financial liabilities (excluding derivatives)are recognized at amortized cost, except those for which a hedgeaccounting can be applied as described in the previous paragraph.
(v) Fair value of financial instruments
Fair values are estimated for the majority of the Group’s financialinstruments, with the exception of publicly traded equity securitiesand marketable securities for which the market price is used.
Estimated fair values, which are based on principles such asdiscounting future cash flows to present value, must be weightedby the fact that the value of a financial instrument at a given timemay be influenced by the market environment (liquidity especially),and also the fact that subsequent changes in interest rates andexchange rates are not taken into account.
As a consequence, the use of different estimates, methodologiesand assumptions could have a material effect on the estimated fairvalue amounts.
The methods used are as follows:
o Financial debts, swaps
The market value of swaps and of bonds that are hedged bythose swaps, have been determined on an individual basis bydiscounting future cash flows with the zero coupon interest ratecurves existing at year-end.
o Financial instruments related to commodity contracts
The valuation methodology is to mark to market all openpositions for both physical and derivative transactions. Thevaluations are determined on a daily basis using observablemarket data based on organized and over the counter (OTC)markets. In particular cases when market data are not directlyavailable, the valuations are derived from observable data suchas arbitrages, freight or spreads and market corroboration. Forvaluation of risks which are the result of a calculation, such asoptions for example, commonly known models are used tocompute the fair value.
o Other financial instruments
The fair value of the interest rate swaps and of FRA (ForwardRate Agreement) are calculated by discounting future cash flowson the basis of zero coupon interest rate curves existing atyear-end after adjustment for interest accrued but unpaid.
Forward exchange contracts and currency swaps are valued onthe basis of a comparison of the negociated forward rates withthe rates in effect on the financial markets at year-end for similarmaturities.
Exchange options are valued based on the Garman-Kohlhagenmodel including market quotations at year-end.
o Fair value hierarchy
IFRS 7 “Financial instruments: disclosures”, amended in 2009,introduces a fair value hierarchy for financial instruments andproposes the following three-level classification :
- level 1: quotations for assets and liabilities (identical to theones that are being valued) obtained at the valuation date onan active market to which the entity has access;
- level 2: the entry data are observable data but do notcorrespond to quotations for identical assets or liabilities;
- level 3: the entry data are not observable data. For example:these data come from extrapolation. This level applies whenthere is no market or observable data and the company has touse its own hypotheses to estimate the data that other marketplayers would have used to determine the fair value of theasset.
Fair value hierarchy is disclosed in Notes 29 and 30 to theConsolidated Financial Statements.
192 / TOTAL - Registration Document 2009
1 2 3 4 5 6 7 8 9 10 11
Notes to the Consolidated Financial StatementsAPPENDIX 1
CONSOLIDATED FINANCIAL STATEMENTS
N) Inventories
Inventories are measured in the Consolidated Financial Statementsat the lower of historical cost or market value. Costs for petroleumand petrochemical products are determined according to the FIFO(First-In, First-Out) method and other inventories are measuredusing the weighted-average cost method.
‹ Downstream (Refining – Marketing)
Petroleum product inventories are mainly comprised of crude oiland refined products. Refined products principally consist ofgasoline, kerosene, diesel, fuel oil and heating oil produced by theGroup's refineries. The turnover of petroleum products does notexceed two months on average.
Crude oil costs include raw material and receiving costs. Refiningcosts principally include the crude oil costs, production costs(energy, labor, depreciation of producing assets) and allocation ofproduction overhead (taxes, maintenance, insurance, etc.). Start-upcosts and general administrative costs are excluded from the costprice of refined products.
‹ Chemicals
Costs of chemical products inventories consist of raw materialcosts, direct labor costs and an allocation of production overhead.Start-up costs and general administrative costs are excluded fromthe cost of inventories of chemicals products.
O) Treasury shares
Treasury shares of the parent company held by its subsidiaries oritself are deducted from consolidated shareholders' equity. Gains orlosses on sales of treasury shares are excluded from thedetermination of net income and are recognized in shareholders’equity.
P) Provisions and other non-current liabilities
Provisions and non-current liabilities are comprised of liabilities forwhich the amount and the timing are uncertain. They arise fromenvironmental risks, legal and tax risks, litigation and other risks.
A provision is recognized when the Group has a present obligation(legal or constructive) as a result of a past event for which it isprobable that an outflow of resources will be required and when areliable estimate can be made regarding the amount of theobligation. The amount of the liability corresponds to the bestpossible estimate.
Q) Asset retirement obligations
Asset retirement obligations, which result from a legal orconstructive obligation, are recognized based on a reasonableestimate in the period in which the obligation arises.
The associated asset retirement costs are capitalized as part of thecarrying amount of the underlying asset and depreciated over theuseful life of this asset.
An entity is required to measure changes in the liability for an assetretirement obligation due to the passage of time (accretion) byapplying a risk-free discount rate to the amount of the liability. Theincrease of the provision due to the passage of time is recognizedas “Other financial expense”.
R) Employee benefits
In accordance with the laws and practices of each country, theGroup participates in employee benefit plans offering retirement,death and disability, healthcare and special termination benefits.These plans provide benefits based on various factors such aslength of service, salaries, and contributions made to thegovernmental bodies responsible for the payment of benefits.
These plans can be either defined contribution or defined benefitpension plans and may be entirely or partially funded withinvestments made in various non-Group instruments such asmutual funds, insurance contracts, and other instruments.
For defined contribution plans, expenses correspond to thecontributions paid.
Defined benefit obligations are determined according to theProjected Unit Method. Actuarial gains and losses may arise fromdifferences between actuarial valuation and projected commitments(depending on new calculations or assumptions) and betweenprojected and actual return of plan assets.
The Group applies the corridor method to amortize its actuarialgains and losses. This method amortizes the net cumulativeactuarial gains and losses that exceed 10% of the greater of thepresent value of the defined benefit obligation and the fair value ofplan assets, over the average expected remaining working lives ofthe employees participating in the plan.
In case of a change in or creation of a plan, the vested portion ofthe cost of past services is recorded immediately in the statementof income, and the unvested past service cost is amortized over thevesting period.
The net periodic pension cost is recognized under “Other operatingexpenses”.
S) Consolidated Statement of Cash Flows
The Consolidated Statement of Cash Flows prepared in foreigncurrencies has been translated into euros using the exchange rateon the transaction date or the average exchange rate for the period.Currency translation differences arising from the translation ofmonetary assets and liabilities denominated in foreign currency intoeuros using the closing exchange rates are shown in theConsolidated Statement of Cash Flows under “Effect of exchangerates”. Therefore, the Consolidated Statement of Cash Flows willnot agree with the figures derived from the Consolidated BalanceSheet.
/ 193TOTAL
APPENDIX 1Notes to the Consolidated Financial StatementsCONSOLIDATED FINANCIAL STATEMENTS
9
‹ Cash and cash equivalents
Cash and cash equivalents are comprised of cash on hand andhighly liquid short-term investments that are easily convertible intoknown amounts of cash and are subject to insignificant risks ofchanges in value.
Investments with maturity greater than three months and less thantwelve months are shown under “Current financial assets”.
Changes in current financial assets and liabilities are included in thefinancing activities section of the Consolidated Statement of CashFlows.
‹ Non-current financial debt
Changes in non-current financial debt have been presented as thenet variation to reflect significant changes mainly related torevolving credit agreements.
T) Carbon dioxide emission rights
In the absence of a current IFRS standard or interpretation onaccounting for emission rights of carbon dioxide, the followingprinciples have been applied:
o emission rights granted free of charge are accounted for at zerocarrying amount;
o liabilities resulting from potential differences between availablequotas and quotas to be delivered at the end of the complianceperiod are accounted for as liabilities and measured at fair marketvalue;
o spot market transactions are recognized in income at cost; and
o forward transactions are recognized at their fair market value onthe face of the balance sheet. Changes in the fair value of suchforward transactions are recognized in income.
U) Non-current assets held for sale anddiscontinued operations
Pursuant to IFRS 5 “Non-current assets held for sale anddiscontinued operations”, assets and liabilities of affiliates that areheld for sale are presented separately on the face of the balancesheet.
Net income from discontinued operations is presented separatelyon the face of the statement of income. Therefore, the notes to theConsolidated Financial Statements related to the statement ofincome only refer to continuing operations.
A discontinued operation is a component of the Group for whichcash flows are independent. It represents a major line of businessor geographical area of operations which has been disposed of or iscurrently being held for sale.
V) Alternative IFRS methods
For measuring and recognizing assets and liabilities, the followingchoices among alternative methods allowable under IFRS havebeen made:
o property, plant and equipment, and intangible assets aremeasured using historical cost model instead of revaluationmodel;
o actuarial gains and losses on pension and other post-employment benefit obligations are recognized according to thecorridor method (see Note 1 paragraph R to the ConsolidatedFinancial Statements);
o jointly-controlled entities are consolidated using theproportionate method, as provided for in IAS 31 “Interests in jointventures”.
W) New accounting principles not yet in effect
The standards or interpretations published respectively by theInternational Accounting Standards Board (IASB) and theInternational Financial Reporting Interpretations Committee (IFRIC)which were not yet in effect at December 31, 2009, were as follows:
‹ Revised IFRS 3 “Business Combinations” andIAS 27 “Consolidated and Separate FinancialStatements”
In January 2008, the IASB issued revised versions of IFRS 3“Business Combinations” and IAS 27 “Consolidated and SeparateFinancial Statements”. These revised standards introduce newprovisions regarding the accounting for business combinations.They are effective as of the first annual period starting afterJuly 1, 2009 (i.e. as of January 1, 2010 for the Group). Theirapplication is prospective.
‹ IFRS 9 “Financial Instruments”
In November 2009, the IASB issued standard IFRS 9 “FinancialInstruments” that introduces new requirements for the classificationand measurement of financial assets. This standard shall becompleted in 2010 with requirements regarding classification andmeasurement of liabilities, derecognition of financial instruments,impairment and hedge accounting. Under standard IFRS 9, financialassets are measured either at fair value through profit or loss or atamortised cost if certain conditions are met. The standard isapplicable for annual periods starting on or after January 1, 2013.The application of the standard as published in 2009 should nothave any material effect on the Group’s consolidated balancesheet, statement of income and shareholder’s equity.
‹ Revised IAS 24 “Related Party Disclosures”
In November 2009, the IASB issued revised standard IAS 24“Related Party Disclosures” that clarifies the definition of a relatedparty and reduces the disclosure requirements for entitiescontrolled by a government. The standard is applicable for annualperiods starting on or after January 1, 2011. The application of thisstandard should not have any material impact on informationpresented in the notes to the Consolidated Financial Statements.
194 / TOTAL - Registration Document 2009
1 2 3 4 5 6 7 8 9 10 11
Notes to the Consolidated Financial StatementsAPPENDIX 1
CONSOLIDATED FINANCIAL STATEMENTS
‹ IFRIC 17 “Distributions of Non-cash Assets toOwners”
In November 2008, the IFRIC issued interpretation IFRIC 17“Distributions of Non-cash Assets to Owners”. The interpretationaddresses the accounting of non-cash assets distributed amongtwo entities which are not jointly-controlled. It provides that thedividend payable should be measured at the fair value of the netassets to be distributed and that any difference with the carryingamount of the net assets distributed should be recognised in profitor loss. The interpretation is effective for annual periods starting onor after July 1, 2009 (i.e. starting January 1, 2010 for the Group).The application of IFRIC 17 should not have any material effect onthe Group’s consolidated balance sheet, statement of income andshareholder’s equity.
‹ IFRIC 19 “Extinguishing Financial Liabilitieswith Equity Instruments”
In November 2009, the IFRIC issued interpretation IFRIC 19“Extinguishing Financial Liabilities with Equity Instruments”. Theinterpretation deals with accounting for debt to equity swaps. Itclarifies that equity instruments issued are measured at fair valueand that any difference with the carrying amount of the liability isrecognised in profit or loss. The interpretation is effective for annualperiods starting on or after July 1, 2010 (i.e. starting January 1,2011 for the Group). The application of IFRIC 19 should not haveany material effect on the Group’s consolidated balance sheet,statement of income and shareholder’s equity.
2) Main indicators – information bybusiness segment
Performance indicators excluding the adjustment items, such asadjusted operating income, adjusted net operating income, andadjusted net income are meant to facilitate the analysis of thefinancial performance and the comparison of income betweenperiods.
Adjustment items
The detail of these adjustment items is presented in Note 4 to theConsolidated Financial Statements.
Adjustment items include:
(i) Special items
Due to their unusual nature or particular significance, certaintransactions qualified as “special items” are excluded from thebusiness segment figures. In general, special items relate totransactions that are significant, infrequent or unusual. However, incertain instances, transactions such as restructuring costs or assetsdisposals, which are not considered to be representative of thenormal course of business, may be qualified as special itemsalthough they may have occurred within prior years or are likely tooccur again within the coming years.
(ii) The inventory valuation effect
The adjusted results of the Downstream and Chemicals segmentsare presented according to the replacement cost method. Thismethod is used to assess the segments’ performance and facilitatethe comparability of the segments’ performance with those of itscompetitors.
In the replacement cost method, which approximates the LIFO(Last-In, First-Out) method, the variation of inventory values in thestatement of income is determined by the average prices of theperiod rather than the historical value. The inventory valuation effectis the difference between the results according to the FIFO (First-In,First-Out) and the replacement cost.
(iii) TOTAL’s equity share of adjustments and selected itemsrelated to Sanofi-Aventis
Main indicators
(i) Operating income (measure used to evaluate operatingperformance)
Revenue from sales after deducting cost of goods sold andinventory variations, other operating expenses, explorationexpenses and depreciation, depletion, and amortization.
Operating income excludes the amortization of intangible assetsother than mineral interests, currency translation adjustments andgains or losses on the disposal of assets.
(ii) Net operating income (measure used to evaluate the returnon capital employed)
Operating income after taking into account the amortization ofintangible assets other than mineral interests, currency translationadjustments, gains or losses on the disposal of assets, as well as allother income and expenses related to capital employed (dividendsfrom non-consolidated companies, equity in income of affiliates,capitalized interest expenses), and after income taxes applicable tothe above.
The only income and expense not included in net operating incomebut included in net income are interest expenses related to netfinancial debt, after applicable income taxes (net cost of net debt)and minority interests.
(iii) Adjusted income
Operating income, net operating income, or net income excludingthe effect of adjustment items described above.
(iv) Capital employed
Non-current assets and working capital, at replacement cost, net ofdeferred income taxes and non-current liabilities.
(v) ROACE (Return on Average Capital Employed)
Ratio of adjusted net operating income to average capital employedbetween the beginning and the end of the period.
/ 195TOTAL
APPENDIX 1Notes to the Consolidated Financial StatementsCONSOLIDATED FINANCIAL STATEMENTS
9
(vi) Net debt
Non-current debt, including current portion, current borrowings,other current financial liabilities less cash and cash equivalents andother current financial assets.
3) Changes in the Group structure, mainacquisitions and divestments
2009
o In December 2009, TOTAL signed an agreement withChesapeake Energy Corporation whereby Total acquired a 25%share in Chesapeake’s Barnett shale gas portfolio located in theUnited States (State of Texas). The acquisition cost of theseassets amounted to €1,562 million and it represents the value ofmineral interests that have been recognized as intangible assetson the face of the Consolidated Balance Sheet for €1,449 millionand the value of tangible assets that have been recognized on theface of the Consolidated Balance Sheet for €113 million. As nocash payment has occurred in 2009, a corresponding debt hasbeen recognized in the sections “Provisions and othernon-current liabilities” and “Other creditors and accruedliabilities” for €818 million and €744 million respectively.
o During 2009, TOTAL progressively sold 3.99% of Sanofi-Aventis’share capital, thus reducing its interest to 7.39%. Sanofi-Aventisis accounted for by the equity method in TOTAL’s ConsolidatedFinancial Statements.
2008
o Pursuant to the tender offer described in the prospectus onMay 13, 2008 and renewed by the notices on June 19, July 4 andJuly 16, 2008, TOTAL acquired 100% of Synenco Energy Inc’sClass A ordinary shares. Synenco’s main asset is a 60% interestin the Northern Lights project in the Athabasca region of theCanadian province of Alberta.
The acquisition cost, net of cash acquired (€161 million) for allshares amounted to €352 million. This cost essentiallyrepresented the value of the company’s mineral interests thathave been recognized as intangible assets on the face of theConsolidated Balance Sheet for €221 million.
Synenco Energy Inc. is fully consolidated in TOTAL’sConsolidated Financial Statements. Its contribution to theconsolidated net income for fiscal year 2008 was not material.
o In August 2008, TOTAL acquired the Dutch company GoalPetroleum BV. The acquisition cost amounted to €349 million.This cost essentially represented the value of the company’smineral interests that have been recognized as intangible assetson the face of the Consolidated Balance Sheet for €292 million.
Goal Petroleum BV is fully consolidated in TOTAL’s ConsolidatedFinancial Statements. Its contribution to the consolidated netincome for fiscal year 2008 was not material.
o Pursuant to the agreements signed between the partners inNovember 2008, the Group’s participation in the Kashagan fielddecreased from 18.52% to 16.81%.
o During 2008, TOTAL progressively sold 1.68% of Sanofi-Aventis’share capital, thus reducing its interest to 11.38%. Sanofi-Aventisis accounted for by the equity method in TOTAL’s ConsolidatedFinancial Statements.
2007
o Pursuant to the agreements signed in 2007, the Group’sparticipation in Sincor project in Venezuela decreased from 47%to 30.323%.
o In December 2007, TOTAL completed the sale of its 70% interestin the Milford Haven Refinery in Wales (UK) to its partner MurcoPetroleum Company. This operation will allow TOTAL toconcentrate its UK refining operations at the wholly-ownedLindsey Oil Refinery.
o During the fourth quarter 2007, TOTAL progressively sold 0.4% ofSanofi-Aventis’ share capital, thus reducing its interest to13.06%. Sanofi-Aventis is accounted for by the equity method inTOTAL’s Consolidated Financial Statements.
4) Business segment information
Financial information by business segment is reported inaccordance with the internal reporting system and shows internalsegment information that is used to manage and measure theperformance of TOTAL. The Group's activities are conductedthrough three business segments: Upstream, Downstream andChemicals.
o the Upstream segment includes the activities of the Exploration &Production division and the Gas & Power division;
o the Downstream segment includes activities of the Refining &Marketing division and the Trading & Shipping division; and
o the Chemicals segment includes Base Chemicals andSpecialties.
The Corporate segment includes the operating and financialactivities of the holding companies (including the investment inSanofi-Aventis).
The operational profit and assets are broken down by businesssegment prior to the consolidation and inter-segment adjustments.
Sales prices between business segments approximate marketprices.
196 / TOTAL - Registration Document 2009
1 2 3 4 5 6 7 8 9 10 11
Notes to the Consolidated Financial StatementsAPPENDIX 1
CONSOLIDATED FINANCIAL STATEMENTS
A) Information by business segment
For the year ended December 31, 2009(M€) Upstream Downstream Chemicals Corporate Intercompany Total
Non-Group sales 16,072 100,518 14,726 11 – 131,327Intersegment sales 15,958 3,786 735 156 (20,635) –Excise taxes – (19,174) – – (19,174)Revenues from sales 32,030 85,130 15,461 167 (20,635) 112,153
Operating expenses (14,752) (81,281) (14,293) (656) 20,635 (90,347)Depreciation, depletion and amortization of tangible assets andmineral interests (4,420) (1,612) (615) (35) – (6,682)Operating income 12,858 2,237 553 (524) – 15,124
Equity in income (loss) of affiliates and other items 846 169 (58) 697 – 1,654Tax on net operating income (7,486) (633) (92) 326 – (7,885)
Net operating income 6,218 1,773 403 499 – 8,893
Net cost of net debt (264)Minority interests (182)
Net income 8,447
For the year ended December 31, 2009 (adjustments (a))(M€) Upstream Downstream Chemicals Corporate Intercompany Total
Non-Group salesIntersegment salesExcise taxesRevenues from sales
Operating expenses (17) 1,558 344 – 1,885Depreciation, depletion and amortization of tangible assets andmineral interests (4) (347) (40) – (391)Operating income (b) (21) 1,211 304 – 1,494
Equity in income (loss) of affiliates and other items (c) (160) 22 (123) (117) (378)Tax on net operating income 17 (413) (50) (3) (449)
Net operating income (b) (164) 820 131 (120) 667
Net cost of net debt –Minority interests (4)
Net income 663
(a) Adjustments include special items, inventory valuation effect and equity share of adjustments and selected items related to Sanofi-Aventis.
(b) Of which inventory valuation effect Upstream Downstream Chemicals Corporate
on operating income – 1,816 389 –on net operating income – 1,285 254 –
(c) Of which equity share of adjustments and selected items related toSanofi-Aventis – – – (300)
/ 197TOTAL
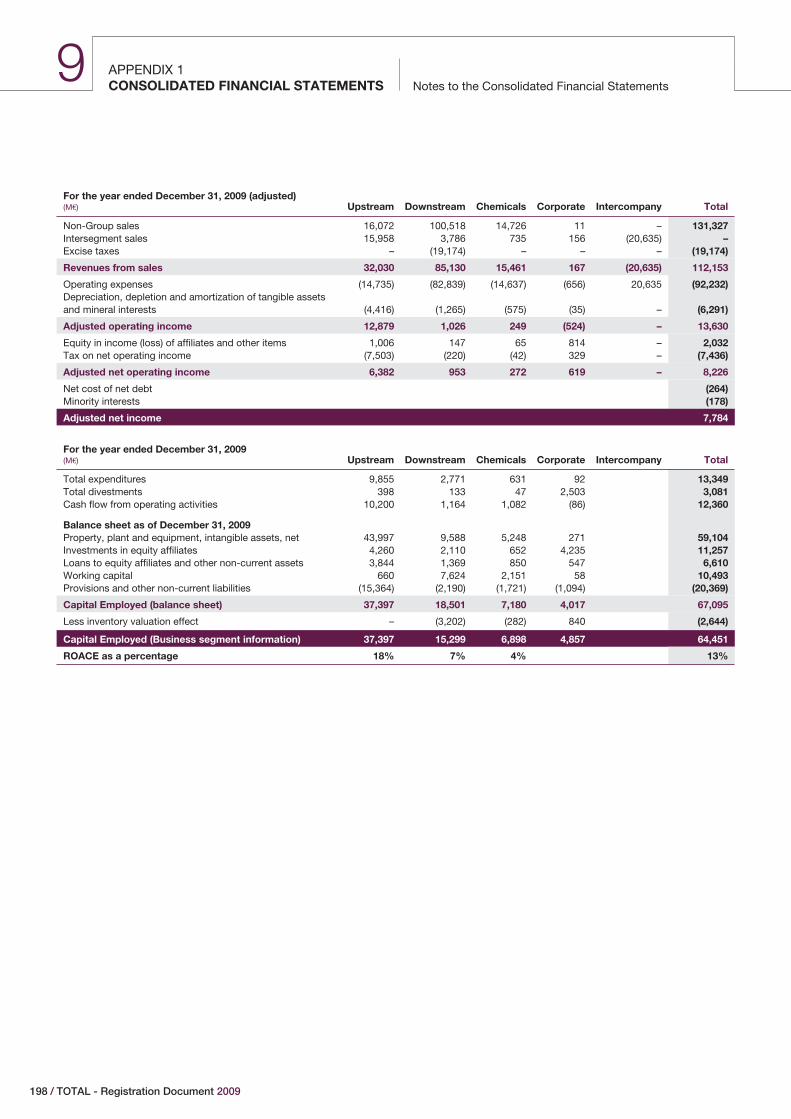
APPENDIX 1Notes to the Consolidated Financial StatementsCONSOLIDATED FINANCIAL STATEMENTS
9
For the year ended December 31, 2009 (adjusted)(M€) Upstream Downstream Chemicals Corporate Intercompany Total
Non-Group sales 16,072 100,518 14,726 11 – 131,327Intersegment sales 15,958 3,786 735 156 (20,635) –Excise taxes – (19,174) – – – (19,174)
Revenues from sales 32,030 85,130 15,461 167 (20,635) 112,153
Operating expenses (14,735) (82,839) (14,637) (656) 20,635 (92,232)Depreciation, depletion and amortization of tangible assetsand mineral interests (4,416) (1,265) (575) (35) – (6,291)
Adjusted operating income 12,879 1,026 249 (524) – 13,630
Equity in income (loss) of affiliates and other items 1,006 147 65 814 – 2,032Tax on net operating income (7,503) (220) (42) 329 – (7,436)
Adjusted net operating income 6,382 953 272 619 – 8,226
Net cost of net debt (264)Minority interests (178)
Adjusted net income 7,784
For the year ended December 31, 2009(M€) Upstream Downstream Chemicals Corporate Intercompany Total
Total expenditures 9,855 2,771 631 92 13,349Total divestments 398 133 47 2,503 3,081Cash flow from operating activities 10,200 1,164 1,082 (86) 12,360
Balance sheet as of December 31, 2009Property, plant and equipment, intangible assets, net 43,997 9,588 5,248 271 59,104Investments in equity affiliates 4,260 2,110 652 4,235 11,257Loans to equity affiliates and other non-current assets 3,844 1,369 850 547 6,610Working capital 660 7,624 2,151 58 10,493Provisions and other non-current liabilities (15,364) (2,190) (1,721) (1,094) (20,369)
Capital Employed (balance sheet) 37,397 18,501 7,180 4,017 67,095
Less inventory valuation effect – (3,202) (282) 840 (2,644)
Capital Employed (Business segment information) 37,397 15,299 6,898 4,857 64,451
ROACE as a percentage 18% 7% 4% 13%
198 / TOTAL - Registration Document 2009
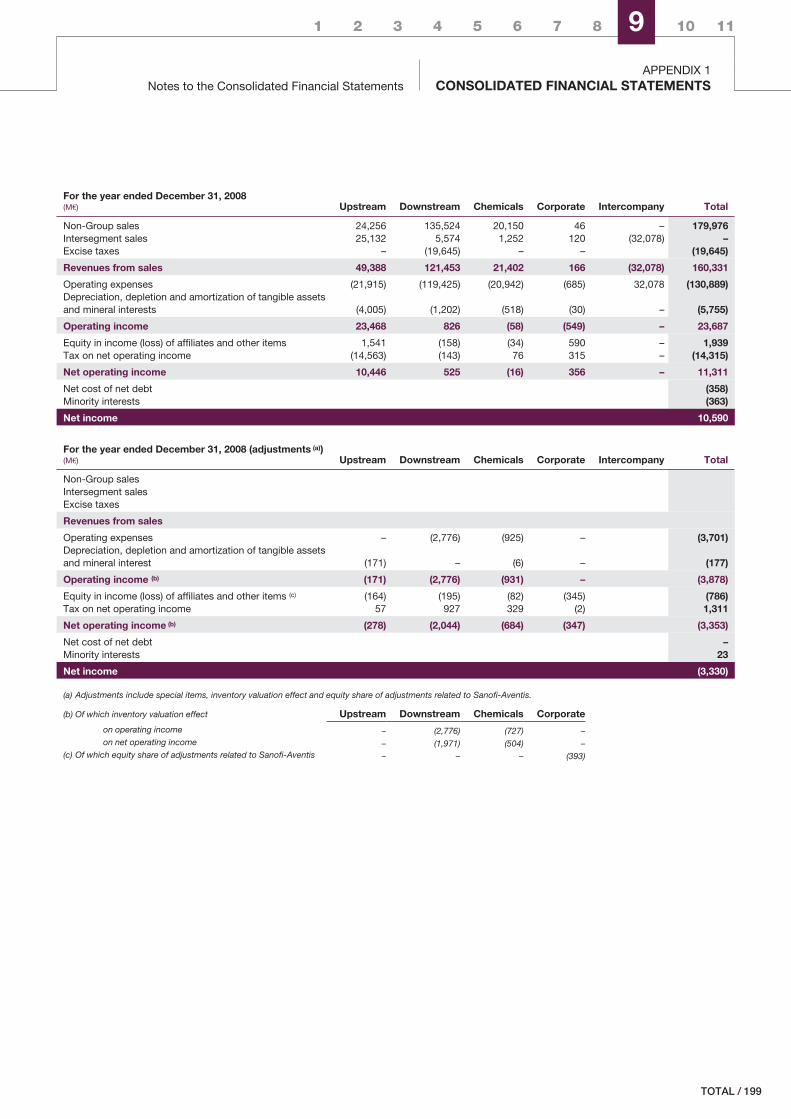
1 2 3 4 5 6 7 8 9 10 11
Notes to the Consolidated Financial StatementsAPPENDIX 1
CONSOLIDATED FINANCIAL STATEMENTS
For the year ended December 31, 2008(M€) Upstream Downstream Chemicals Corporate Intercompany Total
Non-Group sales 24,256 135,524 20,150 46 – 179,976Intersegment sales 25,132 5,574 1,252 120 (32,078) –Excise taxes – (19,645) – – (19,645)
Revenues from sales 49,388 121,453 21,402 166 (32,078) 160,331
Operating expenses (21,915) (119,425) (20,942) (685) 32,078 (130,889)Depreciation, depletion and amortization of tangible assetsand mineral interests (4,005) (1,202) (518) (30) – (5,755)
Operating income 23,468 826 (58) (549) – 23,687
Equity in income (loss) of affiliates and other items 1,541 (158) (34) 590 – 1,939Tax on net operating income (14,563) (143) 76 315 – (14,315)
Net operating income 10,446 525 (16) 356 – 11,311
Net cost of net debt (358)Minority interests (363)
Net income 10,590
For the year ended December 31, 2008 (adjustments (a))(M€) Upstream Downstream Chemicals Corporate Intercompany Total
Non-Group salesIntersegment salesExcise taxes
Revenues from sales
Operating expenses – (2,776) (925) – (3,701)Depreciation, depletion and amortization of tangible assetsand mineral interest (171) – (6) – (177)
Operating income (b) (171) (2,776) (931) – (3,878)
Equity in income (loss) of affiliates and other items (c) (164) (195) (82) (345) (786)Tax on net operating income 57 927 329 (2) 1,311
Net operating income (b) (278) (2,044) (684) (347) (3,353)
Net cost of net debt –Minority interests 23
Net income (3,330)
(a) Adjustments include special items, inventory valuation effect and equity share of adjustments related to Sanofi-Aventis.
(b) Of which inventory valuation effect Upstream Downstream Chemicals Corporate
on operating income – (2,776) (727) –on net operating income – (1,971) (504) –
(c) Of which equity share of adjustments related to Sanofi-Aventis – – – (393)
/ 199TOTAL
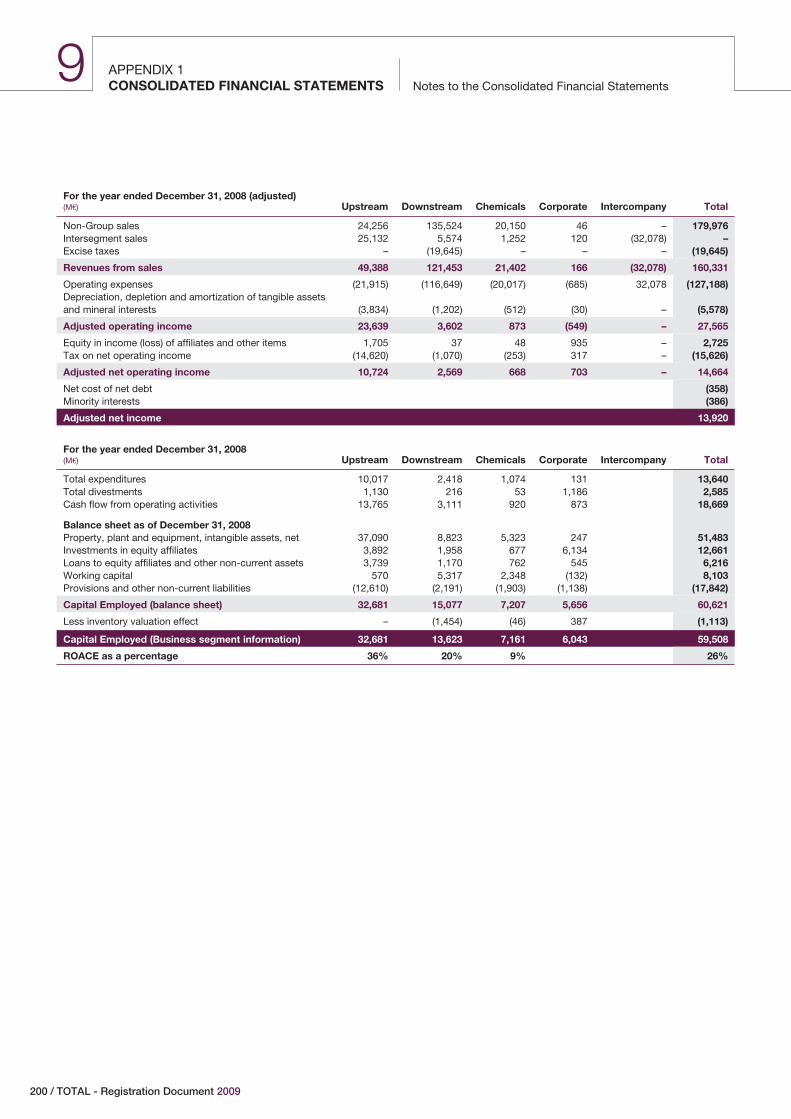
APPENDIX 1Notes to the Consolidated Financial StatementsCONSOLIDATED FINANCIAL STATEMENTS
9
For the year ended December 31, 2008 (adjusted)(M€) Upstream Downstream Chemicals Corporate Intercompany Total
Non-Group sales 24,256 135,524 20,150 46 – 179,976Intersegment sales 25,132 5,574 1,252 120 (32,078) –Excise taxes – (19,645) – – – (19,645)
Revenues from sales 49,388 121,453 21,402 166 (32,078) 160,331
Operating expenses (21,915) (116,649) (20,017) (685) 32,078 (127,188)Depreciation, depletion and amortization of tangible assetsand mineral interests (3,834) (1,202) (512) (30) – (5,578)
Adjusted operating income 23,639 3,602 873 (549) – 27,565
Equity in income (loss) of affiliates and other items 1,705 37 48 935 – 2,725Tax on net operating income (14,620) (1,070) (253) 317 – (15,626)
Adjusted net operating income 10,724 2,569 668 703 – 14,664
Net cost of net debt (358)Minority interests (386)
Adjusted net income 13,920
For the year ended December 31, 2008(M€) Upstream Downstream Chemicals Corporate Intercompany Total
Total expenditures 10,017 2,418 1,074 131 13,640Total divestments 1,130 216 53 1,186 2,585Cash flow from operating activities 13,765 3,111 920 873 18,669
Balance sheet as of December 31, 2008Property, plant and equipment, intangible assets, net 37,090 8,823 5,323 247 51,483Investments in equity affiliates 3,892 1,958 677 6,134 12,661Loans to equity affiliates and other non-current assets 3,739 1,170 762 545 6,216Working capital 570 5,317 2,348 (132) 8,103Provisions and other non-current liabilities (12,610) (2,191) (1,903) (1,138) (17,842)
Capital Employed (balance sheet) 32,681 15,077 7,207 5,656 60,621
Less inventory valuation effect – (1,454) (46) 387 (1,113)
Capital Employed (Business segment information) 32,681 13,623 7,161 6,043 59,508
ROACE as a percentage 36% 20% 9% 26%
200 / TOTAL - Registration Document 2009
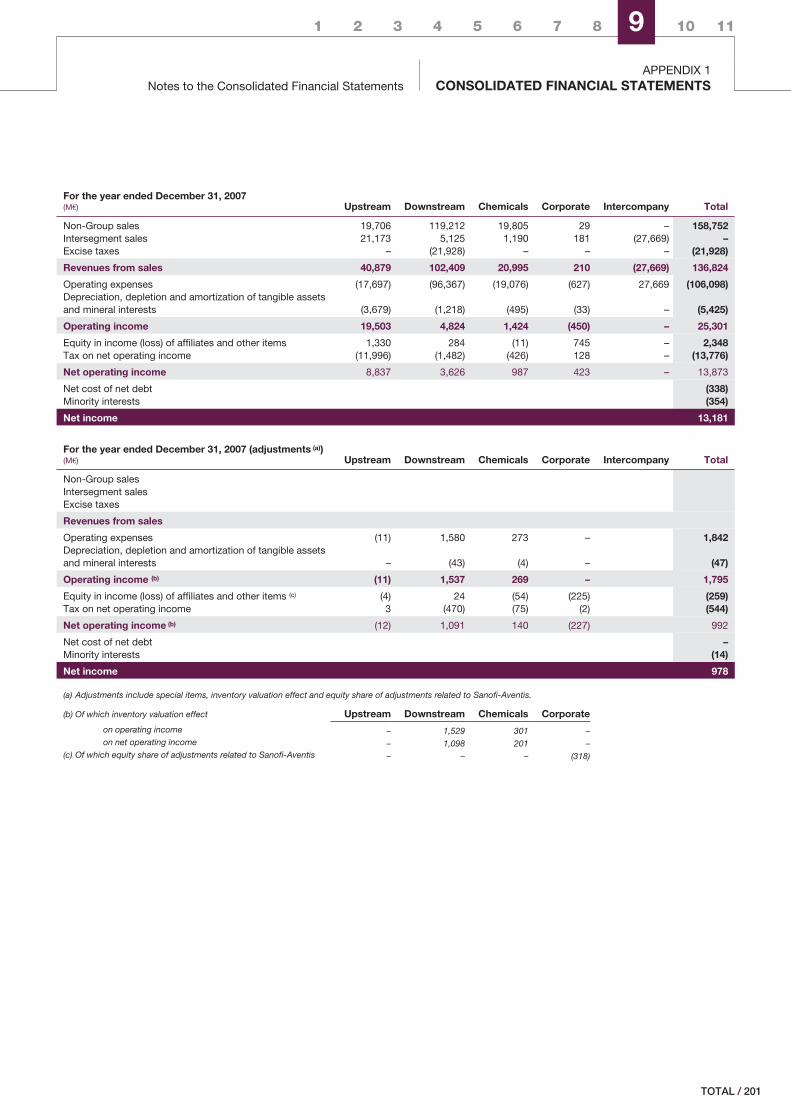
1 2 3 4 5 6 7 8 9 10 11
Notes to the Consolidated Financial StatementsAPPENDIX 1
CONSOLIDATED FINANCIAL STATEMENTS
For the year ended December 31, 2007(M€) Upstream Downstream Chemicals Corporate Intercompany Total
Non-Group sales 19,706 119,212 19,805 29 – 158,752Intersegment sales 21,173 5,125 1,190 181 (27,669) –Excise taxes – (21,928) – – – (21,928)
Revenues from sales 40,879 102,409 20,995 210 (27,669) 136,824
Operating expenses (17,697) (96,367) (19,076) (627) 27,669 (106,098)Depreciation, depletion and amortization of tangible assetsand mineral interests (3,679) (1,218) (495) (33) – (5,425)
Operating income 19,503 4,824 1,424 (450) – 25,301
Equity in income (loss) of affiliates and other items 1,330 284 (11) 745 – 2,348Tax on net operating income (11,996) (1,482) (426) 128 – (13,776)
Net operating income 8,837 3,626 987 423 – 13,873
Net cost of net debt (338)Minority interests (354)
Net income 13,181
For the year ended December 31, 2007 (adjustments (a))(M€) Upstream Downstream Chemicals Corporate Intercompany Total
Non-Group salesIntersegment salesExcise taxes
Revenues from sales
Operating expenses (11) 1,580 273 – 1,842Depreciation, depletion and amortization of tangible assetsand mineral interests – (43) (4) – (47)
Operating income (b) (11) 1,537 269 – 1,795
Equity in income (loss) of affiliates and other items (c) (4) 24 (54) (225) (259)Tax on net operating income 3 (470) (75) (2) (544)
Net operating income (b) (12) 1,091 140 (227) 992
Net cost of net debt –Minority interests (14)
Net income 978
(a) Adjustments include special items, inventory valuation effect and equity share of adjustments related to Sanofi-Aventis.
(b) Of which inventory valuation effect Upstream Downstream Chemicals Corporate
on operating income – 1,529 301 –on net operating income – 1,098 201 –
(c) Of which equity share of adjustments related to Sanofi-Aventis – – – (318)
/ 201TOTAL
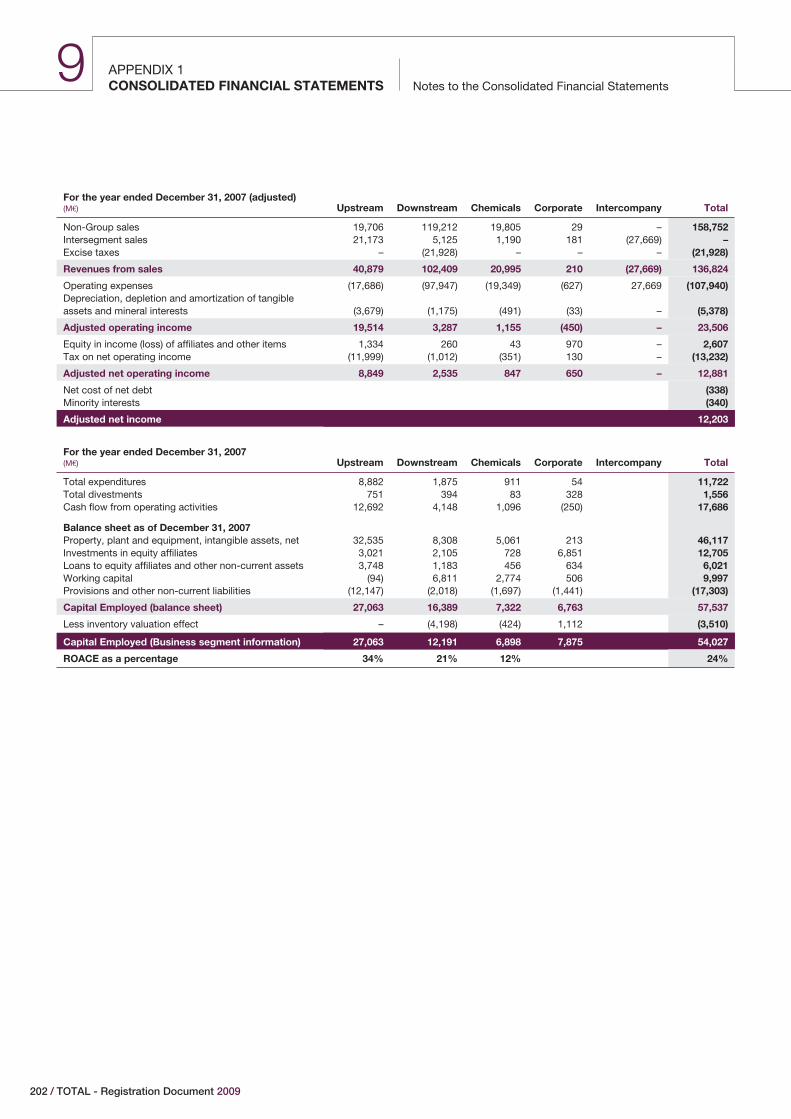
APPENDIX 1Notes to the Consolidated Financial StatementsCONSOLIDATED FINANCIAL STATEMENTS
9
For the year ended December 31, 2007 (adjusted)(M€) Upstream Downstream Chemicals Corporate Intercompany Total
Non-Group sales 19,706 119,212 19,805 29 – 158,752Intersegment sales 21,173 5,125 1,190 181 (27,669) –Excise taxes – (21,928) – – – (21,928)
Revenues from sales 40,879 102,409 20,995 210 (27,669) 136,824
Operating expenses (17,686) (97,947) (19,349) (627) 27,669 (107,940)Depreciation, depletion and amortization of tangibleassets and mineral interests (3,679) (1,175) (491) (33) – (5,378)
Adjusted operating income 19,514 3,287 1,155 (450) – 23,506
Equity in income (loss) of affiliates and other items 1,334 260 43 970 – 2,607Tax on net operating income (11,999) (1,012) (351) 130 – (13,232)
Adjusted net operating income 8,849 2,535 847 650 – 12,881
Net cost of net debt (338)Minority interests (340)
Adjusted net income 12,203
For the year ended December 31, 2007(M€) Upstream Downstream Chemicals Corporate Intercompany Total
Total expenditures 8,882 1,875 911 54 11,722Total divestments 751 394 83 328 1,556Cash flow from operating activities 12,692 4,148 1,096 (250) 17,686
Balance sheet as of December 31, 2007Property, plant and equipment, intangible assets, net 32,535 8,308 5,061 213 46,117Investments in equity affiliates 3,021 2,105 728 6,851 12,705Loans to equity affiliates and other non-current assets 3,748 1,183 456 634 6,021Working capital (94) 6,811 2,774 506 9,997Provisions and other non-current liabilities (12,147) (2,018) (1,697) (1,441) (17,303)
Capital Employed (balance sheet) 27,063 16,389 7,322 6,763 57,537
Less inventory valuation effect – (4,198) (424) 1,112 (3,510)
Capital Employed (Business segment information) 27,063 12,191 6,898 7,875 54,027
ROACE as a percentage 34% 21% 12% 24%
202 / TOTAL - Registration Document 2009
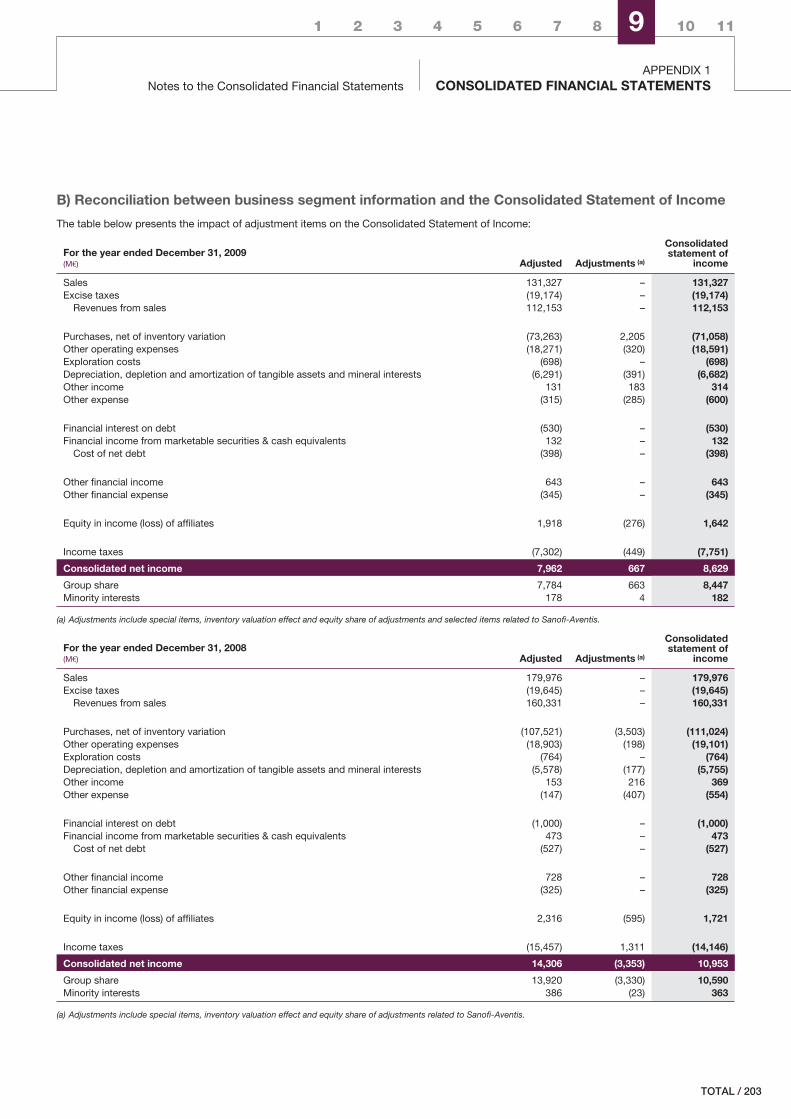
1 2 3 4 5 6 7 8 9 10 11
Notes to the Consolidated Financial StatementsAPPENDIX 1
CONSOLIDATED FINANCIAL STATEMENTS
B) Reconciliation between business segment information and the Consolidated Statement of Income
The table below presents the impact of adjustment items on the Consolidated Statement of Income:
For the year ended December 31, 2009(M€) Adjusted Adjustments (a)
Consolidatedstatement of
income
Sales 131,327 – 131,327Excise taxes (19,174) – (19,174)
Revenues from sales 112,153 – 112,153
Purchases, net of inventory variation (73,263) 2,205 (71,058)Other operating expenses (18,271) (320) (18,591)Exploration costs (698) – (698)Depreciation, depletion and amortization of tangible assets and mineral interests (6,291) (391) (6,682)Other income 131 183 314Other expense (315) (285) (600)
Financial interest on debt (530) – (530)Financial income from marketable securities & cash equivalents 132 – 132
Cost of net debt (398) – (398)
Other financial income 643 – 643Other financial expense (345) – (345)
Equity in income (loss) of affiliates 1,918 (276) 1,642
Income taxes (7,302) (449) (7,751)
Consolidated net income 7,962 667 8,629
Group share 7,784 663 8,447Minority interests 178 4 182
(a) Adjustments include special items, inventory valuation effect and equity share of adjustments and selected items related to Sanofi-Aventis.
For the year ended December 31, 2008(M€) Adjusted Adjustments (a)
Consolidatedstatement of
income
Sales 179,976 – 179,976Excise taxes (19,645) – (19,645)
Revenues from sales 160,331 – 160,331
Purchases, net of inventory variation (107,521) (3,503) (111,024)Other operating expenses (18,903) (198) (19,101)Exploration costs (764) – (764)Depreciation, depletion and amortization of tangible assets and mineral interests (5,578) (177) (5,755)Other income 153 216 369Other expense (147) (407) (554)
Financial interest on debt (1,000) – (1,000)Financial income from marketable securities & cash equivalents 473 – 473
Cost of net debt (527) – (527)
Other financial income 728 – 728Other financial expense (325) – (325)
Equity in income (loss) of affiliates 2,316 (595) 1,721
Income taxes (15,457) 1,311 (14,146)
Consolidated net income 14,306 (3,353) 10,953
Group share 13,920 (3,330) 10,590Minority interests 386 (23) 363
(a) Adjustments include special items, inventory valuation effect and equity share of adjustments related to Sanofi-Aventis.
/ 203TOTAL
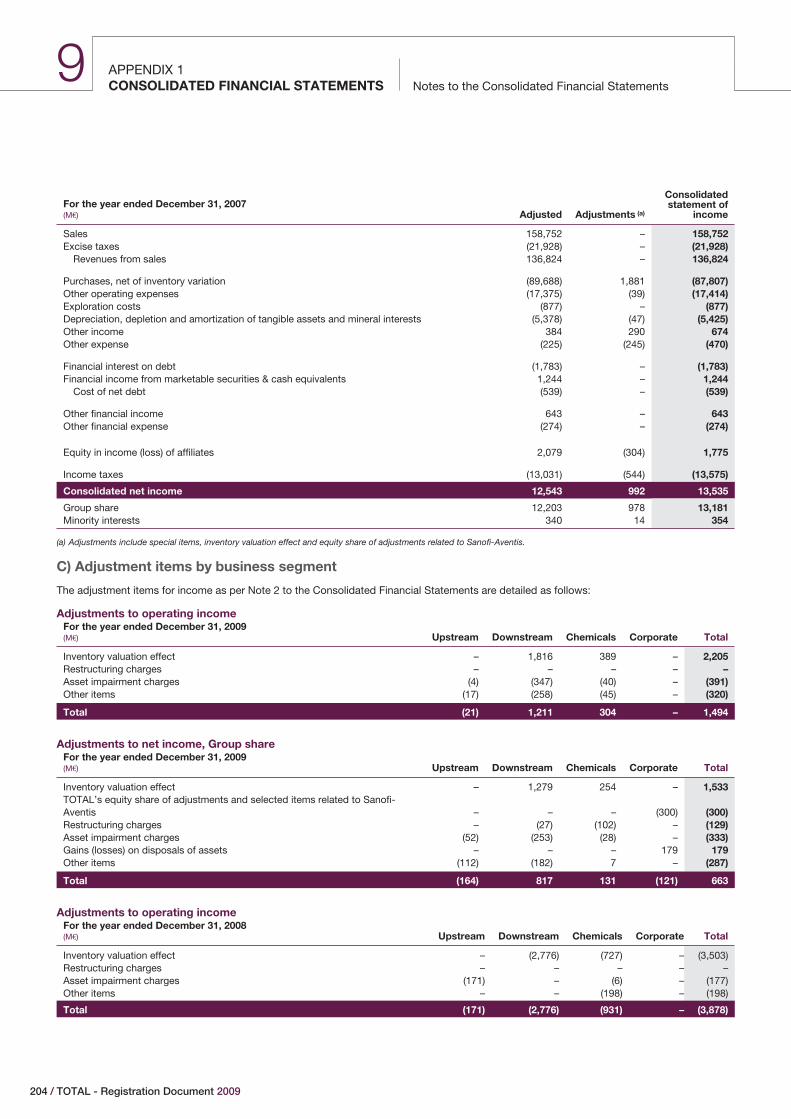
APPENDIX 1Notes to the Consolidated Financial StatementsCONSOLIDATED FINANCIAL STATEMENTS
9
For the year ended December 31, 2007(M€) Adjusted Adjustments (a)
Consolidatedstatement of
income
Sales 158,752 – 158,752Excise taxes (21,928) – (21,928)
Revenues from sales 136,824 – 136,824
Purchases, net of inventory variation (89,688) 1,881 (87,807)Other operating expenses (17,375) (39) (17,414)Exploration costs (877) – (877)Depreciation, depletion and amortization of tangible assets and mineral interests (5,378) (47) (5,425)Other income 384 290 674Other expense (225) (245) (470)
Financial interest on debt (1,783) – (1,783)Financial income from marketable securities & cash equivalents 1,244 – 1,244
Cost of net debt (539) – (539)
Other financial income 643 – 643Other financial expense (274) – (274)
Equity in income (loss) of affiliates 2,079 (304) 1,775
Income taxes (13,031) (544) (13,575)
Consolidated net income 12,543 992 13,535
Group share 12,203 978 13,181Minority interests 340 14 354
(a) Adjustments include special items, inventory valuation effect and equity share of adjustments related to Sanofi-Aventis.
C) Adjustment items by business segment
The adjustment items for income as per Note 2 to the Consolidated Financial Statements are detailed as follows:
Adjustments to operating incomeFor the year ended December 31, 2009(M€) Upstream Downstream Chemicals Corporate Total
Inventory valuation effect – 1,816 389 – 2,205Restructuring charges – – – – –Asset impairment charges (4) (347) (40) – (391)Other items (17) (258) (45) – (320)
Total (21) 1,211 304 – 1,494
Adjustments to net income, Group shareFor the year ended December 31, 2009(M€) Upstream Downstream Chemicals Corporate Total
Inventory valuation effect – 1,279 254 – 1,533TOTAL’s equity share of adjustments and selected items related to Sanofi-Aventis – – – (300) (300)Restructuring charges – (27) (102) – (129)Asset impairment charges (52) (253) (28) – (333)Gains (losses) on disposals of assets – – – 179 179Other items (112) (182) 7 – (287)
Total (164) 817 131 (121) 663
Adjustments to operating incomeFor the year ended December 31, 2008(M€) Upstream Downstream Chemicals Corporate Total
Inventory valuation effect – (2,776) (727) – (3,503)Restructuring charges – – – – –Asset impairment charges (171) – (6) – (177)Other items – – (198) – (198)
Total (171) (2,776) (931) – (3,878)
204 / TOTAL - Registration Document 2009
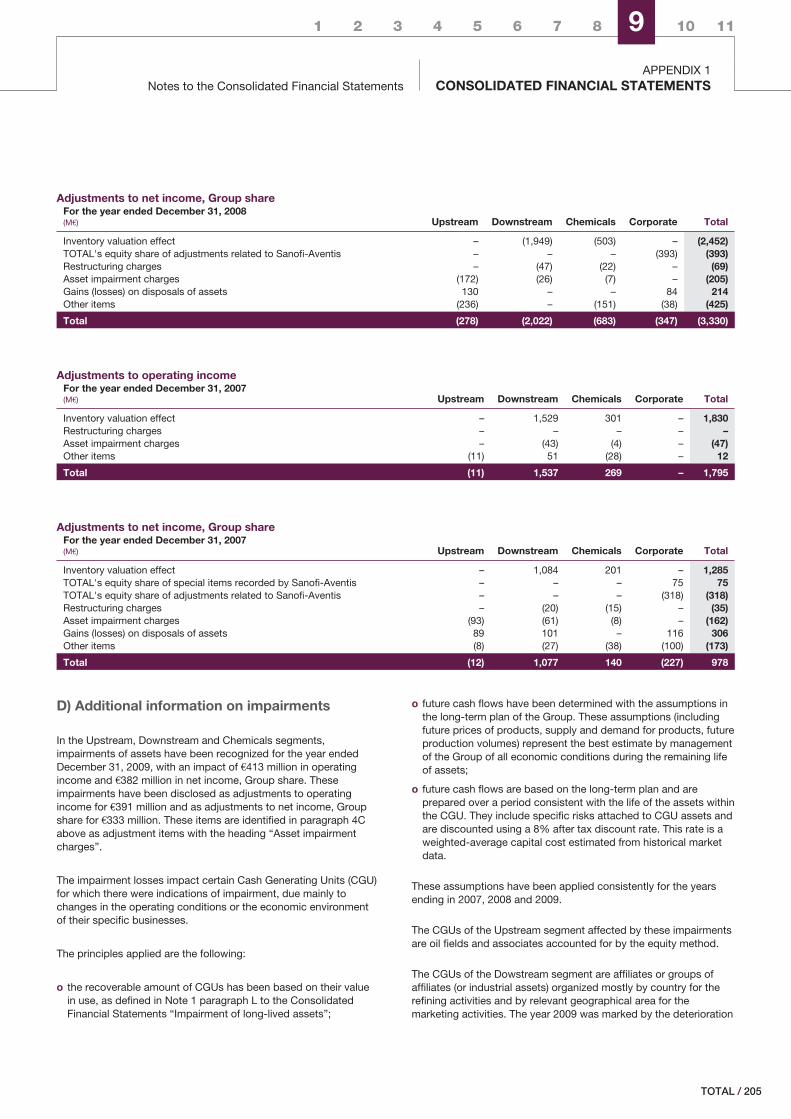
1 2 3 4 5 6 7 8 9 10 11
Notes to the Consolidated Financial StatementsAPPENDIX 1
CONSOLIDATED FINANCIAL STATEMENTS
Adjustments to net income, Group shareFor the year ended December 31, 2008(M€) Upstream Downstream Chemicals Corporate Total
Inventory valuation effect – (1,949) (503) – (2,452)TOTAL's equity share of adjustments related to Sanofi-Aventis – – – (393) (393)Restructuring charges – (47) (22) – (69)Asset impairment charges (172) (26) (7) – (205)Gains (losses) on disposals of assets 130 – – 84 214Other items (236) – (151) (38) (425)
Total (278) (2,022) (683) (347) (3,330)
Adjustments to operating incomeFor the year ended December 31, 2007(M€) Upstream Downstream Chemicals Corporate Total
Inventory valuation effect – 1,529 301 – 1,830Restructuring charges – – – – –Asset impairment charges – (43) (4) – (47)Other items (11) 51 (28) – 12
Total (11) 1,537 269 – 1,795
Adjustments to net income, Group shareFor the year ended December 31, 2007(M€) Upstream Downstream Chemicals Corporate Total
Inventory valuation effect – 1,084 201 – 1,285TOTAL's equity share of special items recorded by Sanofi-Aventis – – – 75 75TOTAL's equity share of adjustments related to Sanofi-Aventis – – – (318) (318)Restructuring charges – (20) (15) – (35)Asset impairment charges (93) (61) (8) – (162)Gains (losses) on disposals of assets 89 101 – 116 306Other items (8) (27) (38) (100) (173)
Total (12) 1,077 140 (227) 978
D) Additional information on impairments
In the Upstream, Downstream and Chemicals segments,impairments of assets have been recognized for the year endedDecember 31, 2009, with an impact of €413 million in operatingincome and €382 million in net income, Group share. Theseimpairments have been disclosed as adjustments to operatingincome for €391 million and as adjustments to net income, Groupshare for €333 million. These items are identified in paragraph 4Cabove as adjustment items with the heading “Asset impairmentcharges”.
The impairment losses impact certain Cash Generating Units (CGU)for which there were indications of impairment, due mainly tochanges in the operating conditions or the economic environmentof their specific businesses.
The principles applied are the following:
o the recoverable amount of CGUs has been based on their valuein use, as defined in Note 1 paragraph L to the ConsolidatedFinancial Statements “Impairment of long-lived assets”;
o future cash flows have been determined with the assumptions inthe long-term plan of the Group. These assumptions (includingfuture prices of products, supply and demand for products, futureproduction volumes) represent the best estimate by managementof the Group of all economic conditions during the remaining lifeof assets;
o future cash flows are based on the long-term plan and areprepared over a period consistent with the life of the assets withinthe CGU. They include specific risks attached to CGU assets andare discounted using a 8% after tax discount rate. This rate is aweighted-average capital cost estimated from historical marketdata.
These assumptions have been applied consistently for the yearsending in 2007, 2008 and 2009.
The CGUs of the Upstream segment affected by these impairmentsare oil fields and associates accounted for by the equity method.
The CGUs of the Dowstream segment are affiliates or groups ofaffiliates (or industrial assets) organized mostly by country for therefining activities and by relevant geographical area for themarketing activities. The year 2009 was marked by the deterioration
/ 205TOTAL
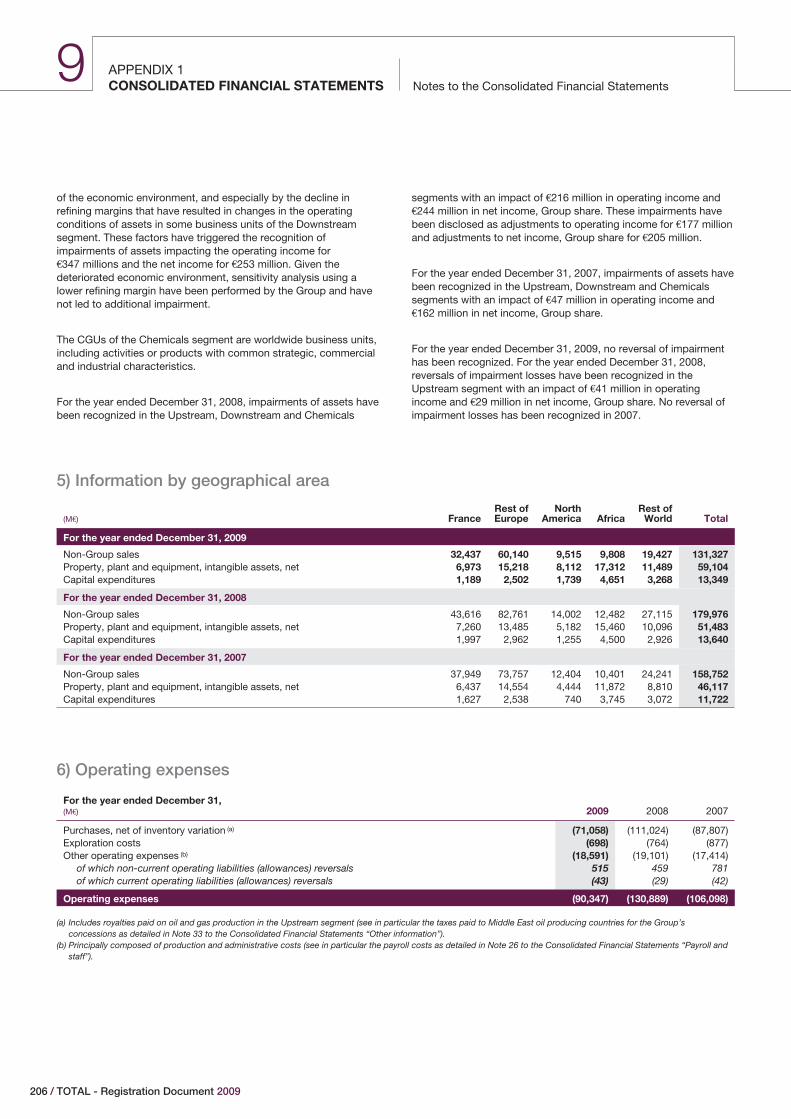
APPENDIX 1Notes to the Consolidated Financial StatementsCONSOLIDATED FINANCIAL STATEMENTS
9
of the economic environment, and especially by the decline inrefining margins that have resulted in changes in the operatingconditions of assets in some business units of the Downstreamsegment. These factors have triggered the recognition ofimpairments of assets impacting the operating income for€347 millions and the net income for €253 million. Given thedeteriorated economic environment, sensitivity analysis using alower refining margin have been performed by the Group and havenot led to additional impairment.
The CGUs of the Chemicals segment are worldwide business units,including activities or products with common strategic, commercialand industrial characteristics.
For the year ended December 31, 2008, impairments of assets havebeen recognized in the Upstream, Downstream and Chemicals
segments with an impact of €216 million in operating income and€244 million in net income, Group share. These impairments havebeen disclosed as adjustments to operating income for €177 millionand adjustments to net income, Group share for €205 million.
For the year ended December 31, 2007, impairments of assets havebeen recognized in the Upstream, Downstream and Chemicalssegments with an impact of €47 million in operating income and€162 million in net income, Group share.
For the year ended December 31, 2009, no reversal of impairmenthas been recognized. For the year ended December 31, 2008,reversals of impairment losses have been recognized in theUpstream segment with an impact of €41 million in operatingincome and €29 million in net income, Group share. No reversal ofimpairment losses has been recognized in 2007.
5) Information by geographical area
(M€) FranceRest ofEurope
NorthAmerica Africa
Rest ofWorld Total
For the year ended December 31, 2009
Non-Group sales 32,437 60,140 9,515 9,808 19,427 131,327Property, plant and equipment, intangible assets, net 6,973 15,218 8,112 17,312 11,489 59,104Capital expenditures 1,189 2,502 1,739 4,651 3,268 13,349
For the year ended December 31, 2008
Non-Group sales 43,616 82,761 14,002 12,482 27,115 179,976Property, plant and equipment, intangible assets, net 7,260 13,485 5,182 15,460 10,096 51,483Capital expenditures 1,997 2,962 1,255 4,500 2,926 13,640
For the year ended December 31, 2007
Non-Group sales 37,949 73,757 12,404 10,401 24,241 158,752Property, plant and equipment, intangible assets, net 6,437 14,554 4,444 11,872 8,810 46,117Capital expenditures 1,627 2,538 740 3,745 3,072 11,722
6) Operating expenses
For the year ended December 31,(M€) 2009 2008 2007
Purchases, net of inventory variation (a) (71,058) (111,024) (87,807)Exploration costs (698) (764) (877)Other operating expenses (b) (18,591) (19,101) (17,414)
of which non-current operating liabilities (allowances) reversals 515 459 781of which current operating liabilities (allowances) reversals (43) (29) (42)
Operating expenses (90,347) (130,889) (106,098)
(a) Includes royalties paid on oil and gas production in the Upstream segment (see in particular the taxes paid to Middle East oil producing countries for the Group’sconcessions as detailed in Note 33 to the Consolidated Financial Statements “Other information”).
(b) Principally composed of production and administrative costs (see in particular the payroll costs as detailed in Note 26 to the Consolidated Financial Statements “Payroll andstaff”).
206 / TOTAL - Registration Document 2009
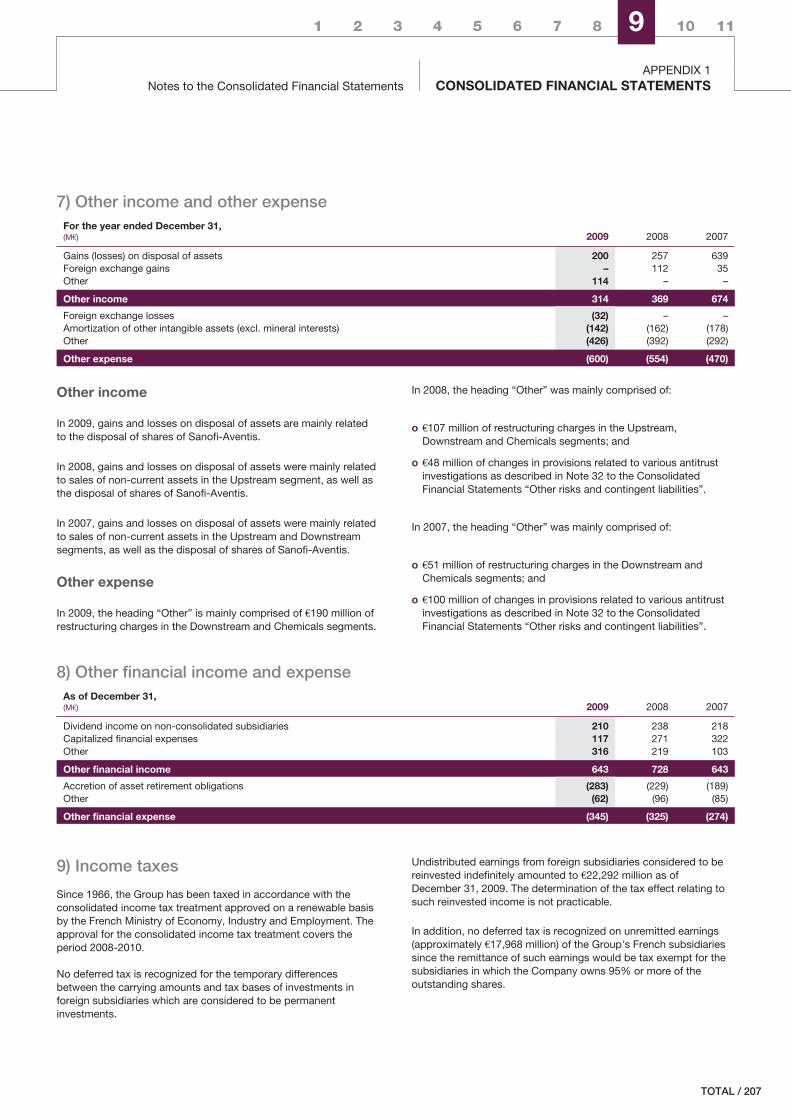
1 2 3 4 5 6 7 8 9 10 11
Notes to the Consolidated Financial StatementsAPPENDIX 1
CONSOLIDATED FINANCIAL STATEMENTS
7) Other income and other expenseFor the year ended December 31,(M€) 2009 2008 2007
Gains (losses) on disposal of assets 200 257 639Foreign exchange gains – 112 35Other 114 – –
Other income 314 369 674
Foreign exchange losses (32) – –Amortization of other intangible assets (excl. mineral interests) (142) (162) (178)Other (426) (392) (292)
Other expense (600) (554) (470)
Other income
In 2009, gains and losses on disposal of assets are mainly relatedto the disposal of shares of Sanofi-Aventis.
In 2008, gains and losses on disposal of assets were mainly relatedto sales of non-current assets in the Upstream segment, as well asthe disposal of shares of Sanofi-Aventis.
In 2007, gains and losses on disposal of assets were mainly relatedto sales of non-current assets in the Upstream and Downstreamsegments, as well as the disposal of shares of Sanofi-Aventis.
Other expense
In 2009, the heading “Other” is mainly comprised of €190 million ofrestructuring charges in the Downstream and Chemicals segments.
In 2008, the heading “Other” was mainly comprised of:
o €107 million of restructuring charges in the Upstream,Downstream and Chemicals segments; and
o €48 million of changes in provisions related to various antitrustinvestigations as described in Note 32 to the ConsolidatedFinancial Statements “Other risks and contingent liabilities”.
In 2007, the heading “Other” was mainly comprised of:
o €51 million of restructuring charges in the Downstream andChemicals segments; and
o €100 million of changes in provisions related to various antitrustinvestigations as described in Note 32 to the ConsolidatedFinancial Statements “Other risks and contingent liabilities”.
8) Other financial income and expenseAs of December 31,(M€) 2009 2008 2007
Dividend income on non-consolidated subsidiaries 210 238 218Capitalized financial expenses 117 271 322Other 316 219 103
Other financial income 643 728 643
Accretion of asset retirement obligations (283) (229) (189)Other (62) (96) (85)
Other financial expense (345) (325) (274)
9) Income taxes
Since 1966, the Group has been taxed in accordance with theconsolidated income tax treatment approved on a renewable basisby the French Ministry of Economy, Industry and Employment. Theapproval for the consolidated income tax treatment covers theperiod 2008-2010.
No deferred tax is recognized for the temporary differencesbetween the carrying amounts and tax bases of investments inforeign subsidiaries which are considered to be permanentinvestments.
Undistributed earnings from foreign subsidiaries considered to bereinvested indefinitely amounted to €22,292 million as ofDecember 31, 2009. The determination of the tax effect relating tosuch reinvested income is not practicable.
In addition, no deferred tax is recognized on unremitted earnings(approximately €17,968 million) of the Group's French subsidiariessince the remittance of such earnings would be tax exempt for thesubsidiaries in which the Company owns 95% or more of theoutstanding shares.
/ 207TOTAL
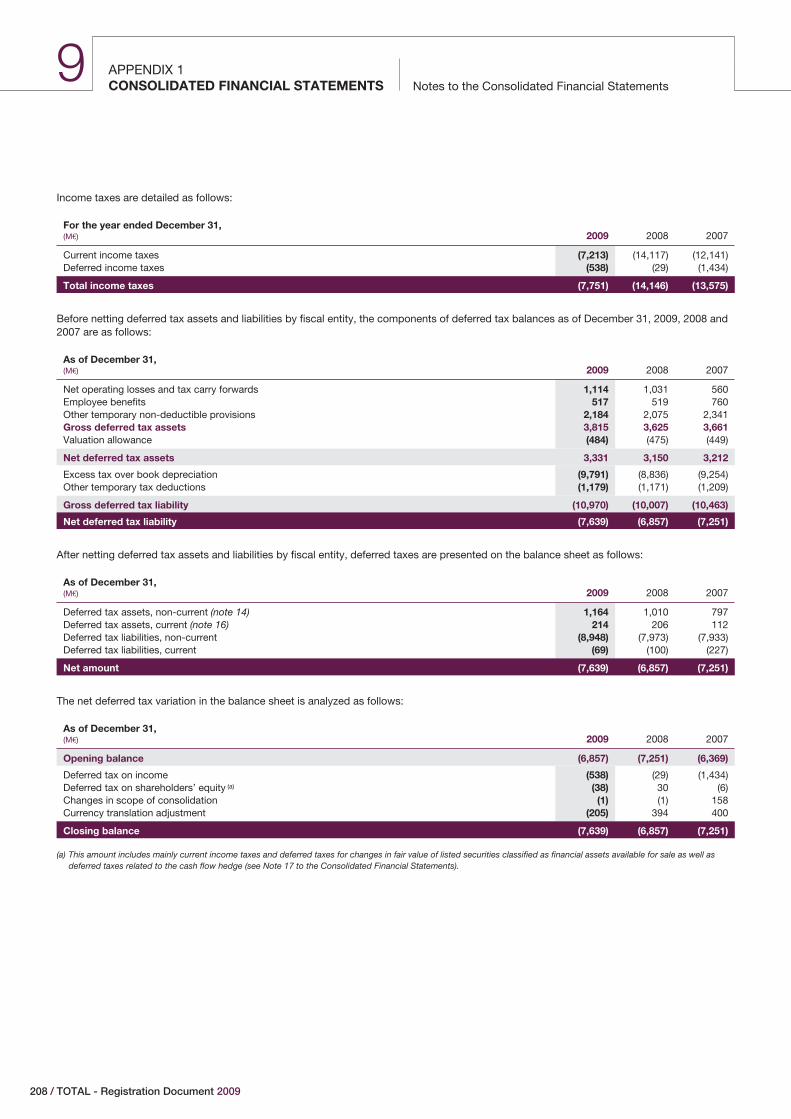
APPENDIX 1Notes to the Consolidated Financial StatementsCONSOLIDATED FINANCIAL STATEMENTS
9
Income taxes are detailed as follows:
For the year ended December 31,(M€) 2009 2008 2007
Current income taxes (7,213) (14,117) (12,141)Deferred income taxes (538) (29) (1,434)
Total income taxes (7,751) (14,146) (13,575)
Before netting deferred tax assets and liabilities by fiscal entity, the components of deferred tax balances as of December 31, 2009, 2008 and2007 are as follows:
As of December 31,(M€) 2009 2008 2007
Net operating losses and tax carry forwards 1,114 1,031 560Employee benefits 517 519 760Other temporary non-deductible provisions 2,184 2,075 2,341Gross deferred tax assets 3,815 3,625 3,661Valuation allowance (484) (475) (449)
Net deferred tax assets 3,331 3,150 3,212
Excess tax over book depreciation (9,791) (8,836) (9,254)Other temporary tax deductions (1,179) (1,171) (1,209)
Gross deferred tax liability (10,970) (10,007) (10,463)
Net deferred tax liability (7,639) (6,857) (7,251)
After netting deferred tax assets and liabilities by fiscal entity, deferred taxes are presented on the balance sheet as follows:
As of December 31,(M€) 2009 2008 2007
Deferred tax assets, non-current (note 14) 1,164 1,010 797Deferred tax assets, current (note 16) 214 206 112Deferred tax liabilities, non-current (8,948) (7,973) (7,933)Deferred tax liabilities, current (69) (100) (227)
Net amount (7,639) (6,857) (7,251)
The net deferred tax variation in the balance sheet is analyzed as follows:
As of December 31,(M€) 2009 2008 2007
Opening balance (6,857) (7,251) (6,369)
Deferred tax on income (538) (29) (1,434)Deferred tax on shareholders’ equity (a) (38) 30 (6)Changes in scope of consolidation (1) (1) 158Currency translation adjustment (205) 394 400
Closing balance (7,639) (6,857) (7,251)
(a) This amount includes mainly current income taxes and deferred taxes for changes in fair value of listed securities classified as financial assets available for sale as well asdeferred taxes related to the cash flow hedge (see Note 17 to the Consolidated Financial Statements).
208 / TOTAL - Registration Document 2009
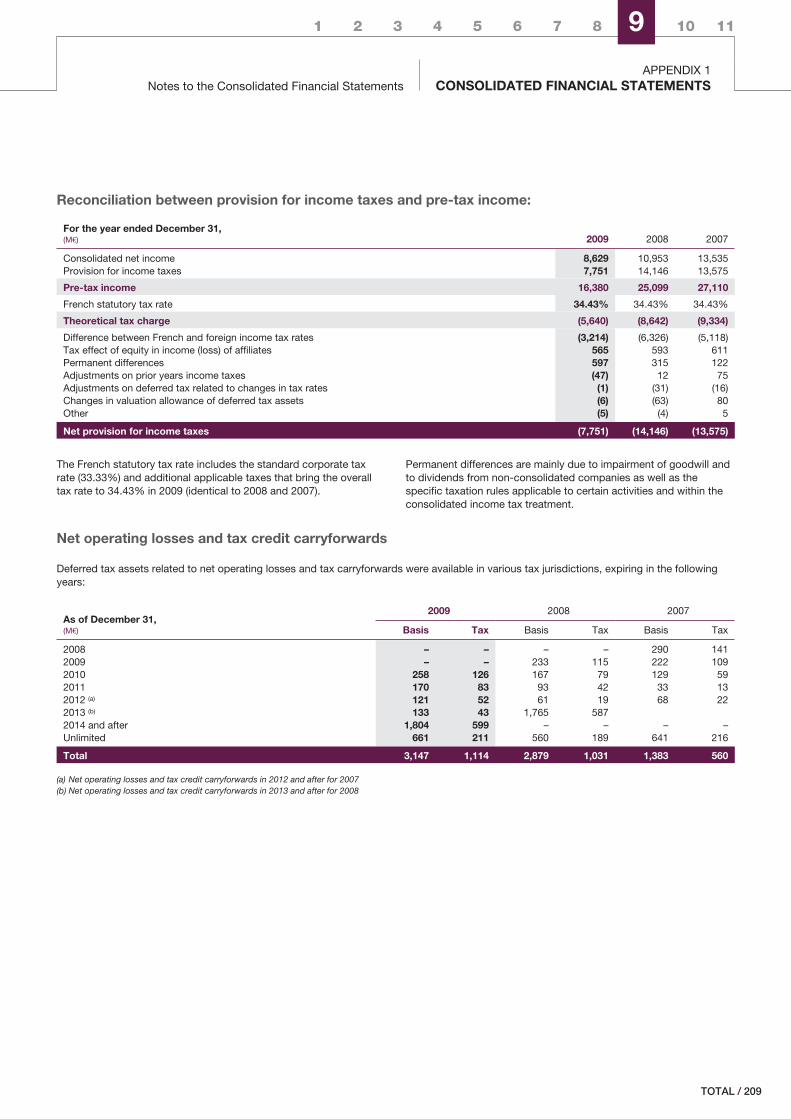
1 2 3 4 5 6 7 8 9 10 11
Notes to the Consolidated Financial StatementsAPPENDIX 1
CONSOLIDATED FINANCIAL STATEMENTS
Reconciliation between provision for income taxes and pre-tax income:
For the year ended December 31,(M€) 2009 2008 2007
Consolidated net income 8,629 10,953 13,535Provision for income taxes 7,751 14,146 13,575
Pre-tax income 16,380 25,099 27,110
French statutory tax rate 34.43% 34.43% 34.43%
Theoretical tax charge (5,640) (8,642) (9,334)
Difference between French and foreign income tax rates (3,214) (6,326) (5,118)Tax effect of equity in income (loss) of affiliates 565 593 611Permanent differences 597 315 122Adjustments on prior years income taxes (47) 12 75Adjustments on deferred tax related to changes in tax rates (1) (31) (16)Changes in valuation allowance of deferred tax assets (6) (63) 80Other (5) (4) 5
Net provision for income taxes (7,751) (14,146) (13,575)
The French statutory tax rate includes the standard corporate taxrate (33.33%) and additional applicable taxes that bring the overalltax rate to 34.43% in 2009 (identical to 2008 and 2007).
Permanent differences are mainly due to impairment of goodwill andto dividends from non-consolidated companies as well as thespecific taxation rules applicable to certain activities and within theconsolidated income tax treatment.
Net operating losses and tax credit carryforwards
Deferred tax assets related to net operating losses and tax carryforwards were available in various tax jurisdictions, expiring in the followingyears:
As of December 31,(M€)
2009 2008 2007
Basis Tax Basis Tax Basis Tax
2008 – – – – 290 1412009 – – 233 115 222 1092010 258 126 167 79 129 592011 170 83 93 42 33 132012 (a) 121 52 61 19 68 222013 (b) 133 43 1,765 5872014 and after 1,804 599 – – – –Unlimited 661 211 560 189 641 216
Total 3,147 1,114 2,879 1,031 1,383 560
(a) Net operating losses and tax credit carryforwards in 2012 and after for 2007(b) Net operating losses and tax credit carryforwards in 2013 and after for 2008
/ 209TOTAL
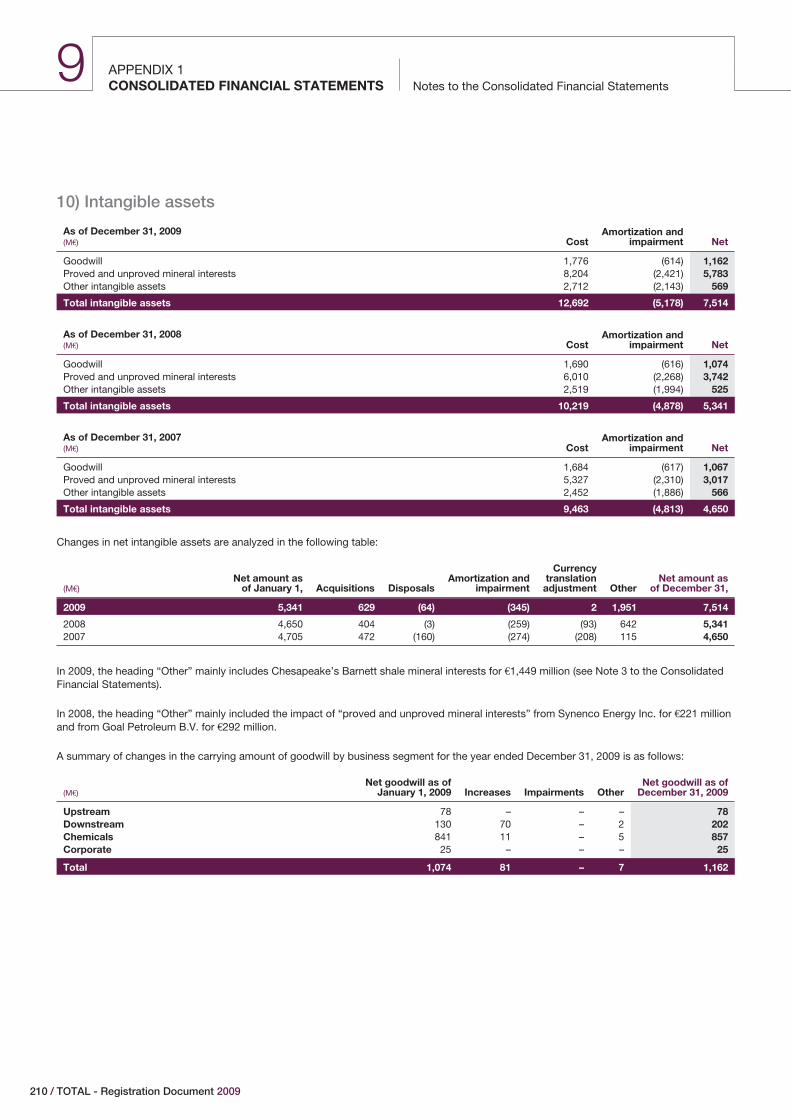
APPENDIX 1Notes to the Consolidated Financial StatementsCONSOLIDATED FINANCIAL STATEMENTS
9
10) Intangible assets
As of December 31, 2009(M€) Cost
Amortization andimpairment Net
Goodwill 1,776 (614) 1,162Proved and unproved mineral interests 8,204 (2,421) 5,783Other intangible assets 2,712 (2,143) 569
Total intangible assets 12,692 (5,178) 7,514
As of December 31, 2008(M€) Cost
Amortization andimpairment Net
Goodwill 1,690 (616) 1,074Proved and unproved mineral interests 6,010 (2,268) 3,742Other intangible assets 2,519 (1,994) 525
Total intangible assets 10,219 (4,878) 5,341
As of December 31, 2007(M€) Cost
Amortization andimpairment Net
Goodwill 1,684 (617) 1,067Proved and unproved mineral interests 5,327 (2,310) 3,017Other intangible assets 2,452 (1,886) 566
Total intangible assets 9,463 (4,813) 4,650
Changes in net intangible assets are analyzed in the following table:
(M€)Net amount as
of January 1, Acquisitions DisposalsAmortization and
impairment
Currencytranslation
adjustment OtherNet amount as
of December 31,
2009 5,341 629 (64) (345) 2 1,951 7,514
2008 4,650 404 (3) (259) (93) 642 5,3412007 4,705 472 (160) (274) (208) 115 4,650
In 2009, the heading “Other” mainly includes Chesapeake’s Barnett shale mineral interests for €1,449 million (see Note 3 to the ConsolidatedFinancial Statements).
In 2008, the heading “Other” mainly included the impact of “proved and unproved mineral interests” from Synenco Energy Inc. for €221 millionand from Goal Petroleum B.V. for €292 million.
A summary of changes in the carrying amount of goodwill by business segment for the year ended December 31, 2009 is as follows:
(M€)Net goodwill as of
January 1, 2009 Increases Impairments OtherNet goodwill as of
December 31, 2009
Upstream 78 – – – 78Downstream 130 70 – 2 202Chemicals 841 11 – 5 857Corporate 25 – – – 25
Total 1,074 81 – 7 1,162
210 / TOTAL - Registration Document 2009
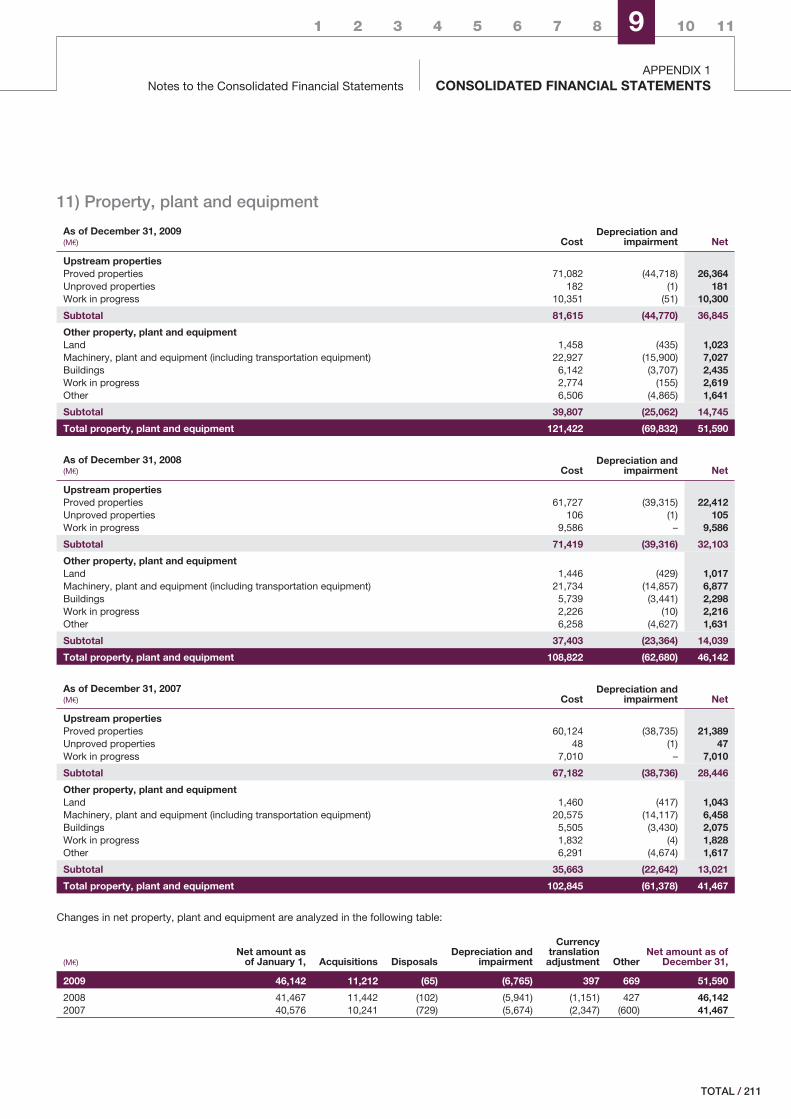
1 2 3 4 5 6 7 8 9 10 11
Notes to the Consolidated Financial StatementsAPPENDIX 1
CONSOLIDATED FINANCIAL STATEMENTS
11) Property, plant and equipment
As of December 31, 2009(M€) Cost
Depreciation andimpairment Net
Upstream propertiesProved properties 71,082 (44,718) 26,364Unproved properties 182 (1) 181Work in progress 10,351 (51) 10,300
Subtotal 81,615 (44,770) 36,845
Other property, plant and equipmentLand 1,458 (435) 1,023Machinery, plant and equipment (including transportation equipment) 22,927 (15,900) 7,027Buildings 6,142 (3,707) 2,435Work in progress 2,774 (155) 2,619Other 6,506 (4,865) 1,641
Subtotal 39,807 (25,062) 14,745
Total property, plant and equipment 121,422 (69,832) 51,590
As of December 31, 2008(M€) Cost
Depreciation andimpairment Net
Upstream propertiesProved properties 61,727 (39,315) 22,412Unproved properties 106 (1) 105Work in progress 9,586 – 9,586
Subtotal 71,419 (39,316) 32,103
Other property, plant and equipmentLand 1,446 (429) 1,017Machinery, plant and equipment (including transportation equipment) 21,734 (14,857) 6,877Buildings 5,739 (3,441) 2,298Work in progress 2,226 (10) 2,216Other 6,258 (4,627) 1,631
Subtotal 37,403 (23,364) 14,039
Total property, plant and equipment 108,822 (62,680) 46,142
As of December 31, 2007(M€) Cost
Depreciation andimpairment Net
Upstream propertiesProved properties 60,124 (38,735) 21,389Unproved properties 48 (1) 47Work in progress 7,010 – 7,010
Subtotal 67,182 (38,736) 28,446
Other property, plant and equipmentLand 1,460 (417) 1,043Machinery, plant and equipment (including transportation equipment) 20,575 (14,117) 6,458Buildings 5,505 (3,430) 2,075Work in progress 1,832 (4) 1,828Other 6,291 (4,674) 1,617
Subtotal 35,663 (22,642) 13,021
Total property, plant and equipment 102,845 (61,378) 41,467
Changes in net property, plant and equipment are analyzed in the following table:
(M€)Net amount as
of January 1, Acquisitions DisposalsDepreciation and
impairment
Currencytranslation
adjustment OtherNet amount as of
December 31,
2009 46,142 11,212 (65) (6,765) 397 669 51,590
2008 41,467 11,442 (102) (5,941) (1,151) 427 46,1422007 40,576 10,241 (729) (5,674) (2,347) (600) 41,467
/ 211TOTAL
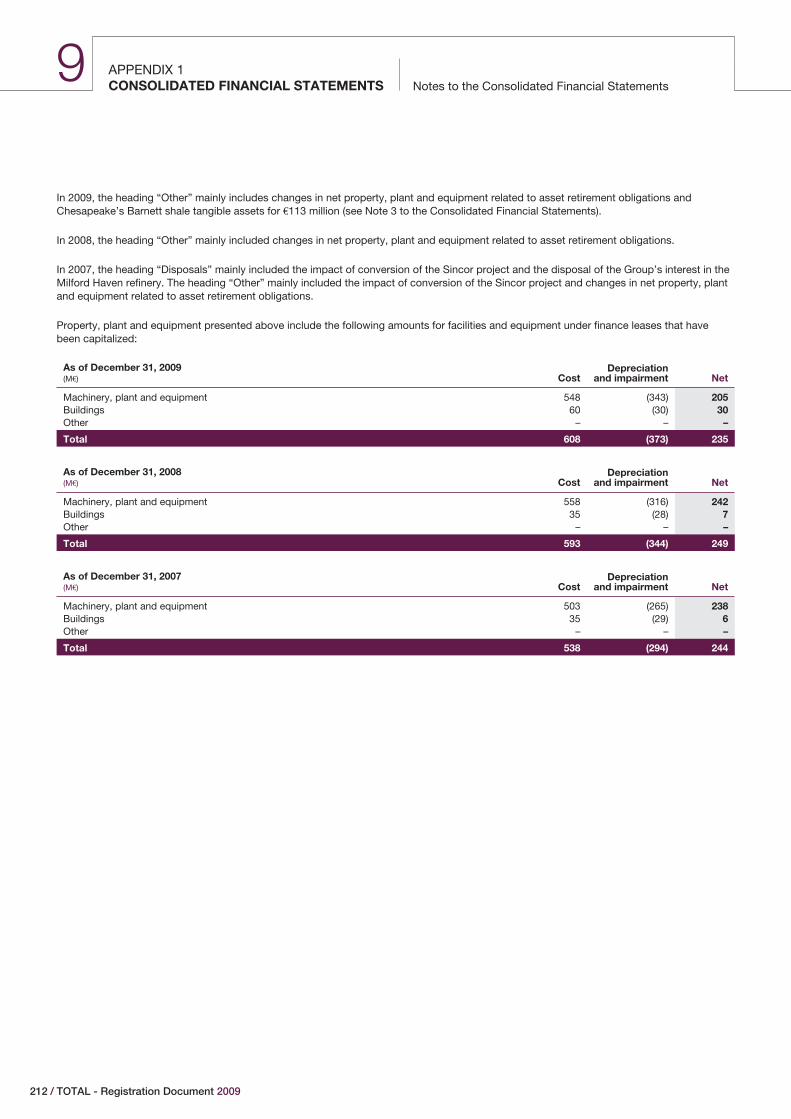
APPENDIX 1Notes to the Consolidated Financial StatementsCONSOLIDATED FINANCIAL STATEMENTS
9
In 2009, the heading “Other” mainly includes changes in net property, plant and equipment related to asset retirement obligations andChesapeake’s Barnett shale tangible assets for €113 million (see Note 3 to the Consolidated Financial Statements).
In 2008, the heading “Other” mainly included changes in net property, plant and equipment related to asset retirement obligations.
In 2007, the heading “Disposals” mainly included the impact of conversion of the Sincor project and the disposal of the Group’s interest in theMilford Haven refinery. The heading “Other” mainly included the impact of conversion of the Sincor project and changes in net property, plantand equipment related to asset retirement obligations.
Property, plant and equipment presented above include the following amounts for facilities and equipment under finance leases that havebeen capitalized:
As of December 31, 2009(M€) Cost
Depreciationand impairment Net
Machinery, plant and equipment 548 (343) 205Buildings 60 (30) 30Other – – –
Total 608 (373) 235
As of December 31, 2008(M€) Cost
Depreciationand impairment Net
Machinery, plant and equipment 558 (316) 242Buildings 35 (28) 7Other – – –
Total 593 (344) 249
As of December 31, 2007(M€) Cost
Depreciationand impairment Net
Machinery, plant and equipment 503 (265) 238Buildings 35 (29) 6Other – – –
Total 538 (294) 244
212 / TOTAL - Registration Document 2009
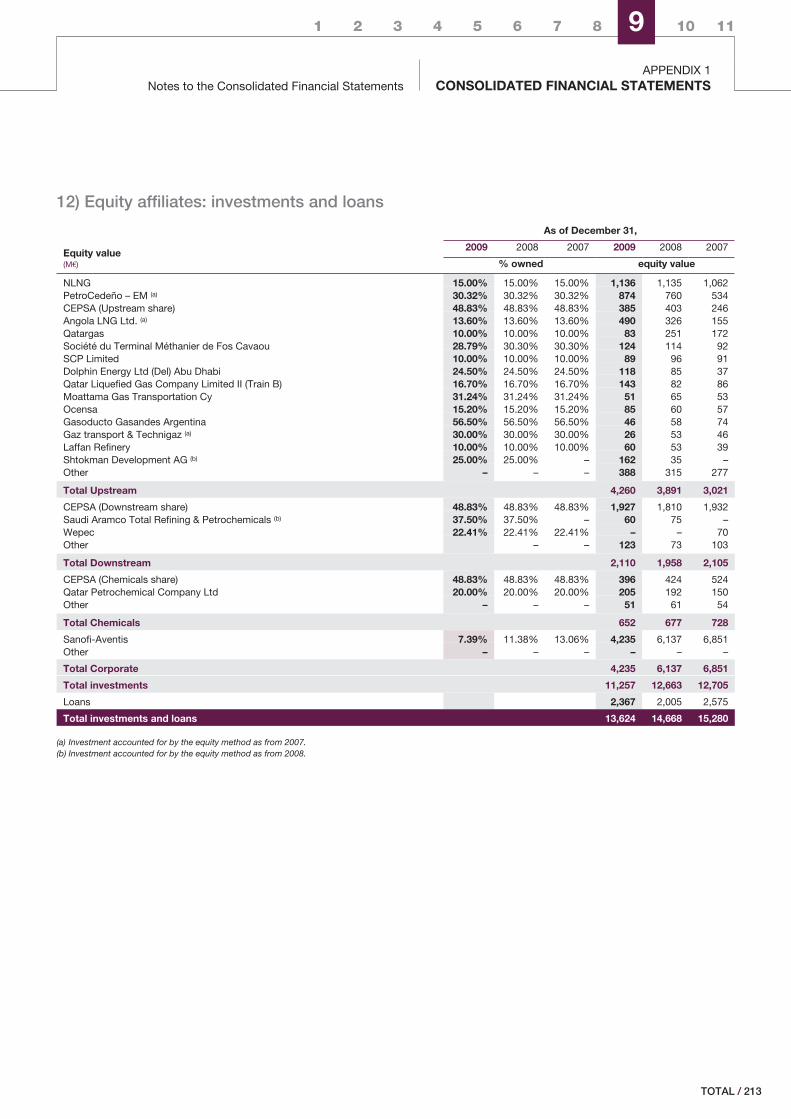
1 2 3 4 5 6 7 8 9 10 11
Notes to the Consolidated Financial StatementsAPPENDIX 1
CONSOLIDATED FINANCIAL STATEMENTS
12) Equity affiliates: investments and loans
As of December 31,
Equity value(M€)
2009 2008 2007 2009 2008 2007
% owned equity value
NLNG 15.00% 15.00% 15.00% 1,136 1,135 1,062PetroCedeño – EM (a) 30.32% 30.32% 30.32% 874 760 534CEPSA (Upstream share) 48.83% 48.83% 48.83% 385 403 246Angola LNG Ltd. (a) 13.60% 13.60% 13.60% 490 326 155Qatargas 10.00% 10.00% 10.00% 83 251 172Société du Terminal Méthanier de Fos Cavaou 28.79% 30.30% 30.30% 124 114 92SCP Limited 10.00% 10.00% 10.00% 89 96 91Dolphin Energy Ltd (Del) Abu Dhabi 24.50% 24.50% 24.50% 118 85 37Qatar Liquefied Gas Company Limited II (Train B) 16.70% 16.70% 16.70% 143 82 86Moattama Gas Transportation Cy 31.24% 31.24% 31.24% 51 65 53Ocensa 15.20% 15.20% 15.20% 85 60 57Gasoducto Gasandes Argentina 56.50% 56.50% 56.50% 46 58 74Gaz transport & Technigaz (a) 30.00% 30.00% 30.00% 26 53 46Laffan Refinery 10.00% 10.00% 10.00% 60 53 39Shtokman Development AG (b) 25.00% 25.00% – 162 35 –Other – – – 388 315 277
Total Upstream 4,260 3,891 3,021
CEPSA (Downstream share) 48.83% 48.83% 48.83% 1,927 1,810 1,932Saudi Aramco Total Refining & Petrochemicals (b) 37.50% 37.50% – 60 75 –Wepec 22.41% 22.41% 22.41% – – 70Other – – 123 73 103
Total Downstream 2,110 1,958 2,105
CEPSA (Chemicals share) 48.83% 48.83% 48.83% 396 424 524Qatar Petrochemical Company Ltd 20.00% 20.00% 20.00% 205 192 150Other – – – 51 61 54
Total Chemicals 652 677 728
Sanofi-Aventis 7.39% 11.38% 13.06% 4,235 6,137 6,851Other – – – – – –
Total Corporate 4,235 6,137 6,851
Total investments 11,257 12,663 12,705
Loans 2,367 2,005 2,575
Total investments and loans 13,624 14,668 15,280
(a) Investment accounted for by the equity method as from 2007.(b) Investment accounted for by the equity method as from 2008.
/ 213TOTAL
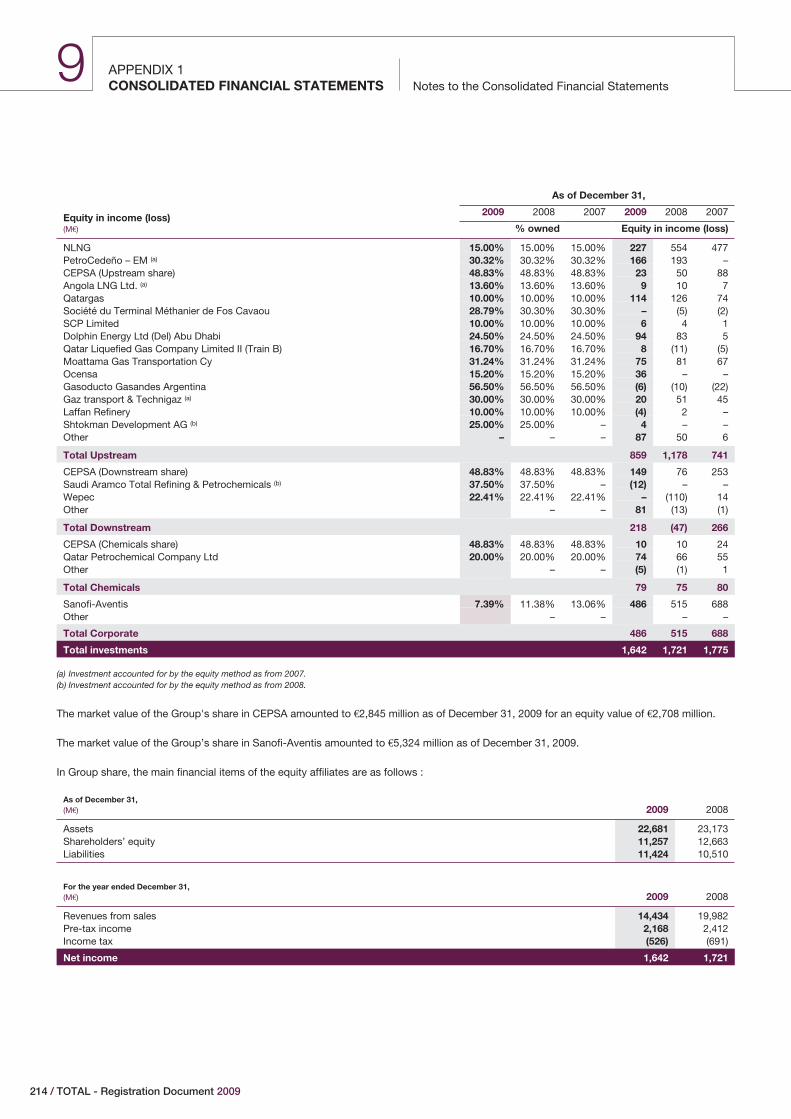
APPENDIX 1Notes to the Consolidated Financial StatementsCONSOLIDATED FINANCIAL STATEMENTS
9
As of December 31,
Equity in income (loss)(M€)
2009 2008 2007 2009 2008 2007
% owned Equity in income (loss)
NLNG 15.00% 15.00% 15.00% 227 554 477PetroCedeño – EM (a) 30.32% 30.32% 30.32% 166 193 –CEPSA (Upstream share) 48.83% 48.83% 48.83% 23 50 88Angola LNG Ltd. (a) 13.60% 13.60% 13.60% 9 10 7Qatargas 10.00% 10.00% 10.00% 114 126 74Société du Terminal Méthanier de Fos Cavaou 28.79% 30.30% 30.30% – (5) (2)SCP Limited 10.00% 10.00% 10.00% 6 4 1Dolphin Energy Ltd (Del) Abu Dhabi 24.50% 24.50% 24.50% 94 83 5Qatar Liquefied Gas Company Limited II (Train B) 16.70% 16.70% 16.70% 8 (11) (5)Moattama Gas Transportation Cy 31.24% 31.24% 31.24% 75 81 67Ocensa 15.20% 15.20% 15.20% 36 – –Gasoducto Gasandes Argentina 56.50% 56.50% 56.50% (6) (10) (22)Gaz transport & Technigaz (a) 30.00% 30.00% 30.00% 20 51 45Laffan Refinery 10.00% 10.00% 10.00% (4) 2 –Shtokman Development AG (b) 25.00% 25.00% – 4 – –Other – – – 87 50 6
Total Upstream 859 1,178 741
CEPSA (Downstream share) 48.83% 48.83% 48.83% 149 76 253Saudi Aramco Total Refining & Petrochemicals (b) 37.50% 37.50% – (12) – –Wepec 22.41% 22.41% 22.41% – (110) 14Other – – 81 (13) (1)
Total Downstream 218 (47) 266
CEPSA (Chemicals share) 48.83% 48.83% 48.83% 10 10 24Qatar Petrochemical Company Ltd 20.00% 20.00% 20.00% 74 66 55Other – – (5) (1) 1
Total Chemicals 79 75 80
Sanofi-Aventis 7.39% 11.38% 13.06% 486 515 688Other – – – –
Total Corporate 486 515 688
Total investments 1,642 1,721 1,775
(a) Investment accounted for by the equity method as from 2007.(b) Investment accounted for by the equity method as from 2008.
The market value of the Group's share in CEPSA amounted to €2,845 million as of December 31, 2009 for an equity value of €2,708 million.
The market value of the Group’s share in Sanofi-Aventis amounted to €5,324 million as of December 31, 2009.
In Group share, the main financial items of the equity affiliates are as follows :
As of December 31,(M€) 2009 2008
Assets 22,681 23,173Shareholders’ equity 11,257 12,663Liabilities 11,424 10,510
For the year ended December 31,(M€) 2009 2008
Revenues from sales 14,434 19,982Pre-tax income 2,168 2,412Income tax (526) (691)
Net income 1,642 1,721
214 / TOTAL - Registration Document 2009
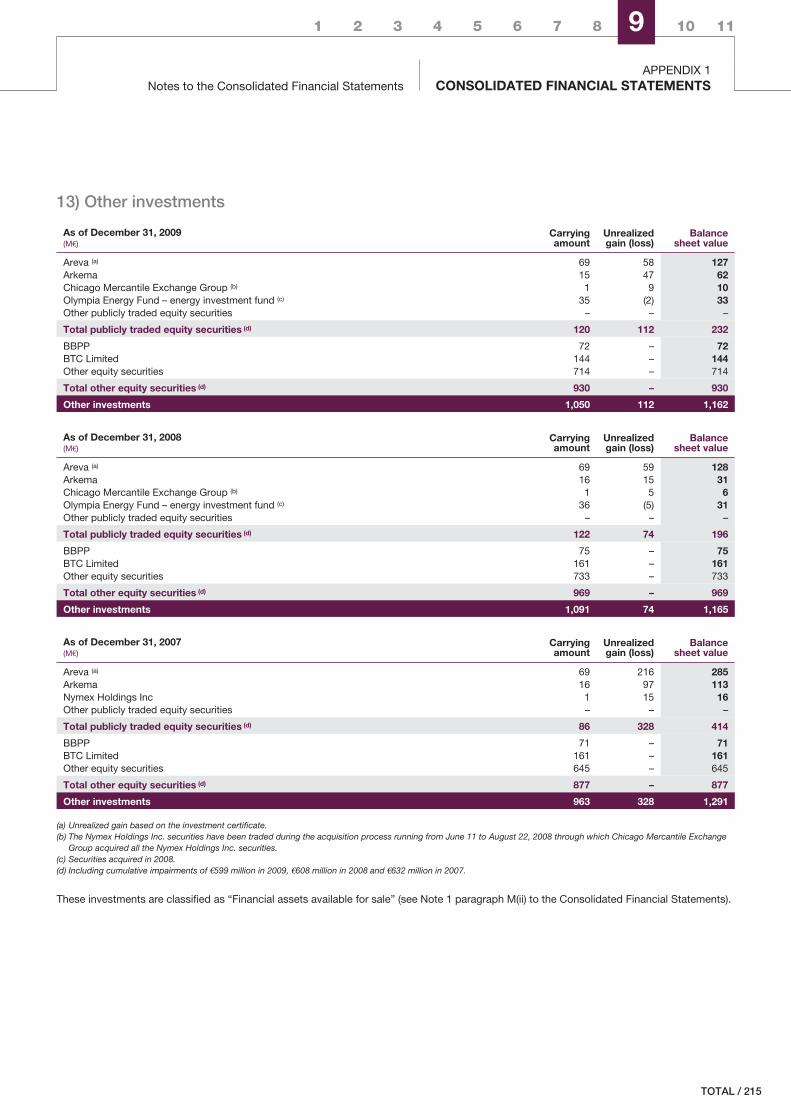
1 2 3 4 5 6 7 8 9 10 11
Notes to the Consolidated Financial StatementsAPPENDIX 1
CONSOLIDATED FINANCIAL STATEMENTS
13) Other investments
As of December 31, 2009(M€)
Carryingamount
Unrealizedgain (loss)
Balancesheet value
Areva (a) 69 58 127Arkema 15 47 62Chicago Mercantile Exchange Group (b) 1 9 10Olympia Energy Fund – energy investment fund (c) 35 (2) 33Other publicly traded equity securities – – –
Total publicly traded equity securities (d) 120 112 232
BBPP 72 – 72BTC Limited 144 – 144Other equity securities 714 – 714
Total other equity securities (d) 930 – 930
Other investments 1,050 112 1,162
As of December 31, 2008(M€)
Carryingamount
Unrealizedgain (loss)
Balancesheet value
Areva (a) 69 59 128Arkema 16 15 31Chicago Mercantile Exchange Group (b) 1 5 6Olympia Energy Fund – energy investment fund (c) 36 (5) 31Other publicly traded equity securities – – –
Total publicly traded equity securities (d) 122 74 196
BBPP 75 – 75BTC Limited 161 – 161Other equity securities 733 – 733
Total other equity securities (d) 969 – 969
Other investments 1,091 74 1,165
As of December 31, 2007(M€)
Carryingamount
Unrealizedgain (loss)
Balancesheet value
Areva (a) 69 216 285Arkema 16 97 113Nymex Holdings Inc 1 15 16Other publicly traded equity securities – – –
Total publicly traded equity securities (d) 86 328 414
BBPP 71 – 71BTC Limited 161 – 161Other equity securities 645 – 645
Total other equity securities (d) 877 – 877
Other investments 963 328 1,291
(a) Unrealized gain based on the investment certificate.(b) The Nymex Holdings Inc. securities have been traded during the acquisition process running from June 11 to August 22, 2008 through which Chicago Mercantile Exchange
Group acquired all the Nymex Holdings Inc. securities.(c) Securities acquired in 2008.(d) Including cumulative impairments of €599 million in 2009, €608 million in 2008 and €632 million in 2007.
These investments are classified as “Financial assets available for sale” (see Note 1 paragraph M(ii) to the Consolidated Financial Statements).
/ 215TOTAL
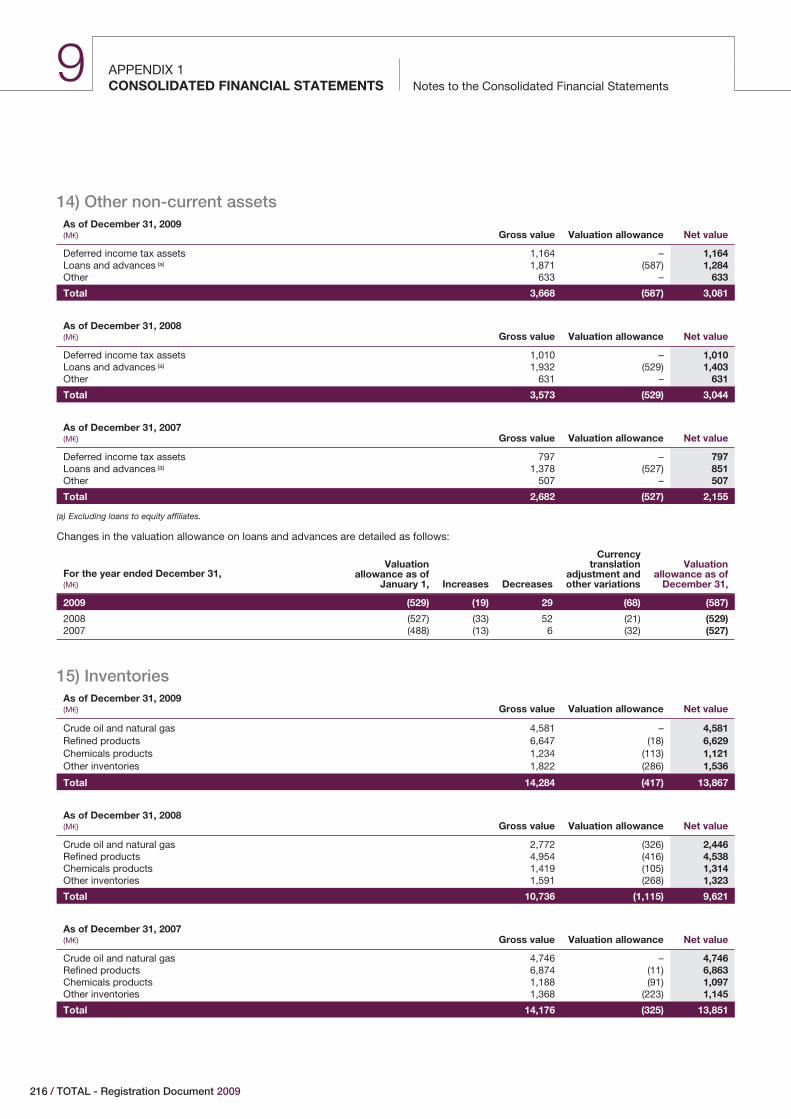
APPENDIX 1Notes to the Consolidated Financial StatementsCONSOLIDATED FINANCIAL STATEMENTS
9
14) Other non-current assetsAs of December 31, 2009(M€) Gross value Valuation allowance Net value
Deferred income tax assets 1,164 – 1,164Loans and advances (a) 1,871 (587) 1,284Other 633 – 633
Total 3,668 (587) 3,081
As of December 31, 2008(M€) Gross value Valuation allowance Net value
Deferred income tax assets 1,010 – 1,010Loans and advances (a) 1,932 (529) 1,403Other 631 – 631
Total 3,573 (529) 3,044
As of December 31, 2007(M€) Gross value Valuation allowance Net value
Deferred income tax assets 797 – 797Loans and advances (a) 1,378 (527) 851Other 507 – 507
Total 2,682 (527) 2,155
(a) Excluding loans to equity affiliates.
Changes in the valuation allowance on loans and advances are detailed as follows:
For the year ended December 31,(M€)
Valuationallowance as of
January 1, Increases Decreases
Currencytranslation
adjustment andother variations
Valuationallowance as of
December 31,
2009 (529) (19) 29 (68) (587)
2008 (527) (33) 52 (21) (529)2007 (488) (13) 6 (32) (527)
15) InventoriesAs of December 31, 2009(M€) Gross value Valuation allowance Net value
Crude oil and natural gas 4,581 – 4,581Refined products 6,647 (18) 6,629Chemicals products 1,234 (113) 1,121Other inventories 1,822 (286) 1,536
Total 14,284 (417) 13,867
As of December 31, 2008(M€) Gross value Valuation allowance Net value
Crude oil and natural gas 2,772 (326) 2,446Refined products 4,954 (416) 4,538Chemicals products 1,419 (105) 1,314Other inventories 1,591 (268) 1,323
Total 10,736 (1,115) 9,621
As of December 31, 2007(M€) Gross value Valuation allowance Net value
Crude oil and natural gas 4,746 – 4,746Refined products 6,874 (11) 6,863Chemicals products 1,188 (91) 1,097Other inventories 1,368 (223) 1,145
Total 14,176 (325) 13,851
216 / TOTAL - Registration Document 2009
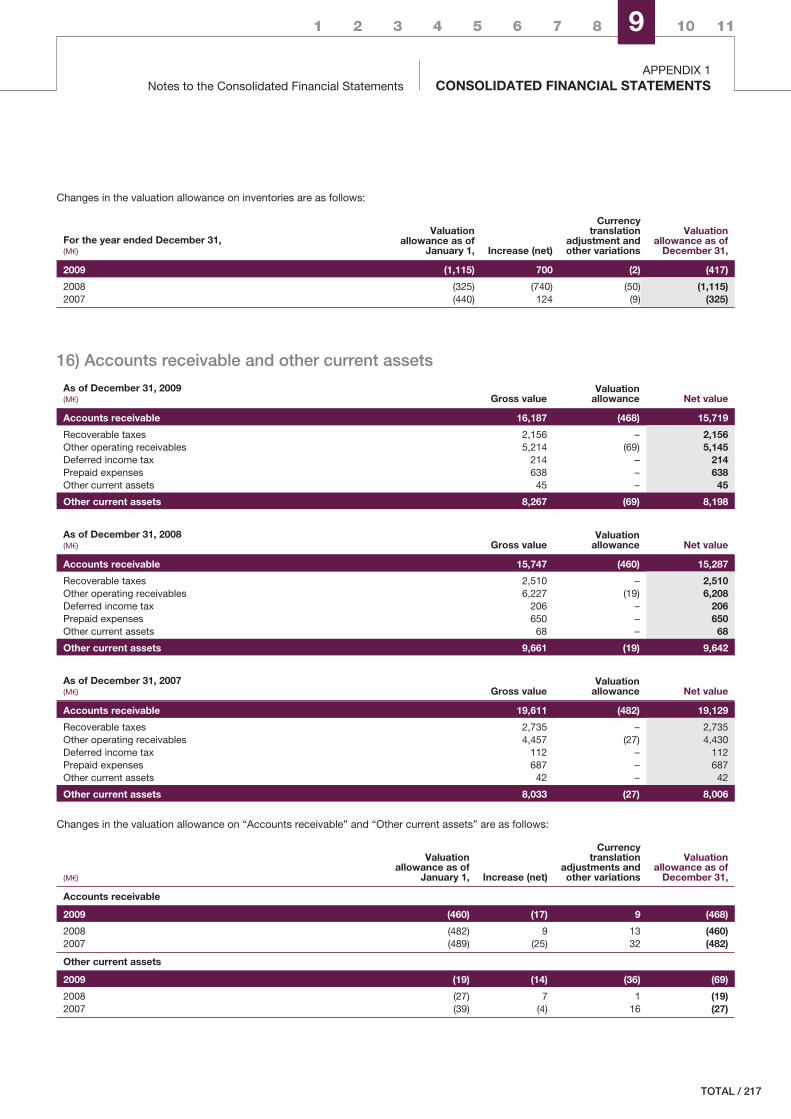
1 2 3 4 5 6 7 8 9 10 11
Notes to the Consolidated Financial StatementsAPPENDIX 1
CONSOLIDATED FINANCIAL STATEMENTS
Changes in the valuation allowance on inventories are as follows:
For the year ended December 31,(M€)
Valuationallowance as of
January 1, Increase (net)
Currencytranslation
adjustment andother variations
Valuationallowance as of
December 31,
2009 (1,115) 700 (2) (417)
2008 (325) (740) (50) (1,115)2007 (440) 124 (9) (325)
16) Accounts receivable and other current assets
As of December 31, 2009(M€) Gross value
Valuationallowance Net value
Accounts receivable 16,187 (468) 15,719
Recoverable taxes 2,156 – 2,156Other operating receivables 5,214 (69) 5,145Deferred income tax 214 – 214Prepaid expenses 638 – 638Other current assets 45 – 45
Other current assets 8,267 (69) 8,198
As of December 31, 2008(M€) Gross value
Valuationallowance Net value
Accounts receivable 15,747 (460) 15,287
Recoverable taxes 2,510 – 2,510Other operating receivables 6,227 (19) 6,208Deferred income tax 206 – 206Prepaid expenses 650 – 650Other current assets 68 – 68
Other current assets 9,661 (19) 9,642
As of December 31, 2007(M€) Gross value
Valuationallowance Net value
Accounts receivable 19,611 (482) 19,129
Recoverable taxes 2,735 – 2,735Other operating receivables 4,457 (27) 4,430Deferred income tax 112 – 112Prepaid expenses 687 – 687Other current assets 42 – 42
Other current assets 8,033 (27) 8,006
Changes in the valuation allowance on “Accounts receivable” and “Other current assets” are as follows:
(M€)
Valuationallowance as of
January 1, Increase (net)
Currencytranslation
adjustments andother variations
Valuationallowance as of
December 31,
Accounts receivable
2009 (460) (17) 9 (468)
2008 (482) 9 13 (460)2007 (489) (25) 32 (482)
Other current assets
2009 (19) (14) (36) (69)
2008 (27) 7 1 (19)2007 (39) (4) 16 (27)
/ 217TOTAL
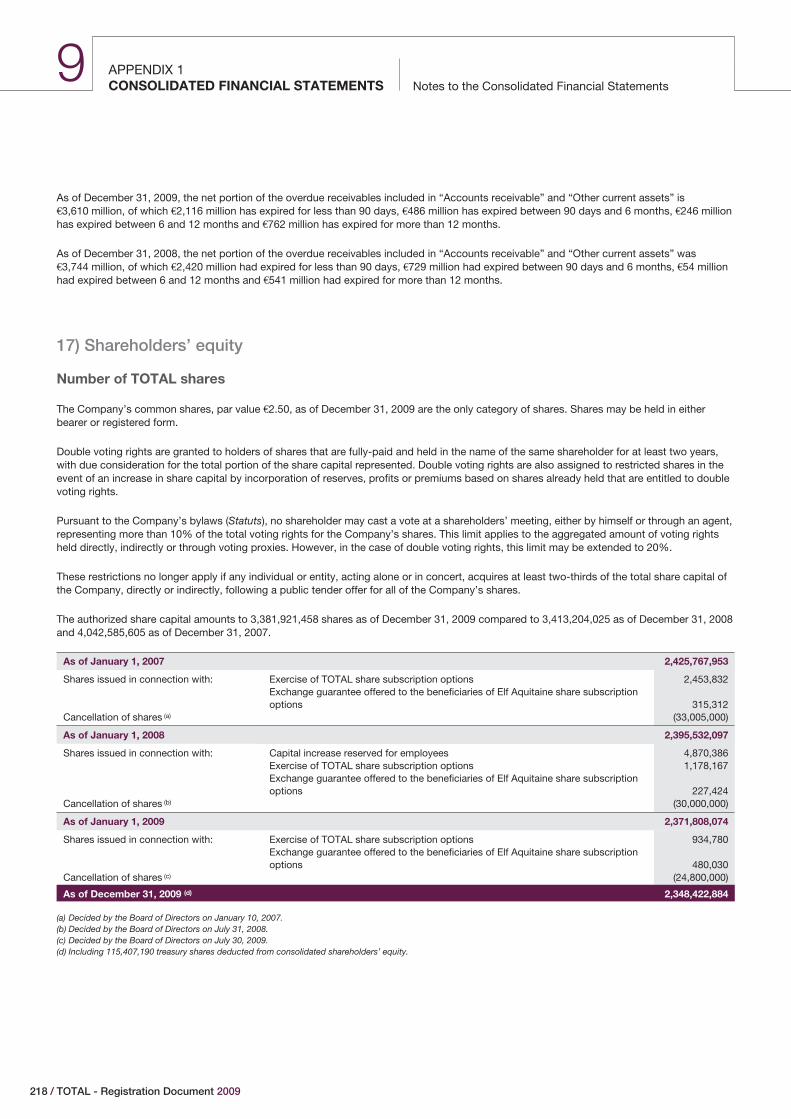
APPENDIX 1Notes to the Consolidated Financial StatementsCONSOLIDATED FINANCIAL STATEMENTS
9
As of December 31, 2009, the net portion of the overdue receivables included in “Accounts receivable” and “Other current assets” is€3,610 million, of which €2,116 million has expired for less than 90 days, €486 million has expired between 90 days and 6 months, €246 millionhas expired between 6 and 12 months and €762 million has expired for more than 12 months.
As of December 31, 2008, the net portion of the overdue receivables included in “Accounts receivable” and “Other current assets” was€3,744 million, of which €2,420 million had expired for less than 90 days, €729 million had expired between 90 days and 6 months, €54 millionhad expired between 6 and 12 months and €541 million had expired for more than 12 months.
17) Shareholders’ equity
Number of TOTAL shares
The Company’s common shares, par value €2.50, as of December 31, 2009 are the only category of shares. Shares may be held in eitherbearer or registered form.
Double voting rights are granted to holders of shares that are fully-paid and held in the name of the same shareholder for at least two years,with due consideration for the total portion of the share capital represented. Double voting rights are also assigned to restricted shares in theevent of an increase in share capital by incorporation of reserves, profits or premiums based on shares already held that are entitled to doublevoting rights.
Pursuant to the Company’s bylaws (Statuts), no shareholder may cast a vote at a shareholders’ meeting, either by himself or through an agent,representing more than 10% of the total voting rights for the Company’s shares. This limit applies to the aggregated amount of voting rightsheld directly, indirectly or through voting proxies. However, in the case of double voting rights, this limit may be extended to 20%.
These restrictions no longer apply if any individual or entity, acting alone or in concert, acquires at least two-thirds of the total share capital ofthe Company, directly or indirectly, following a public tender offer for all of the Company’s shares.
The authorized share capital amounts to 3,381,921,458 shares as of December 31, 2009 compared to 3,413,204,025 as of December 31, 2008and 4,042,585,605 as of December 31, 2007.
As of January 1, 2007 2,425,767,953
Shares issued in connection with: Exercise of TOTAL share subscription options 2,453,832Exchange guarantee offered to the beneficiaries of Elf Aquitaine share subscriptionoptions 315,312
Cancellation of shares (a) (33,005,000)
As of January 1, 2008 2,395,532,097
Shares issued in connection with: Capital increase reserved for employees 4,870,386Exercise of TOTAL share subscription options 1,178,167Exchange guarantee offered to the beneficiaries of Elf Aquitaine share subscriptionoptions 227,424
Cancellation of shares (b) (30,000,000)
As of January 1, 2009 2,371,808,074
Shares issued in connection with: Exercise of TOTAL share subscription options 934,780Exchange guarantee offered to the beneficiaries of Elf Aquitaine share subscriptionoptions 480,030
Cancellation of shares (c) (24,800,000)
As of December 31, 2009 (d) 2,348,422,884
(a) Decided by the Board of Directors on January 10, 2007.(b) Decided by the Board of Directors on July 31, 2008.(c) Decided by the Board of Directors on July 30, 2009.(d) Including 115,407,190 treasury shares deducted from consolidated shareholders’ equity.
218 / TOTAL - Registration Document 2009
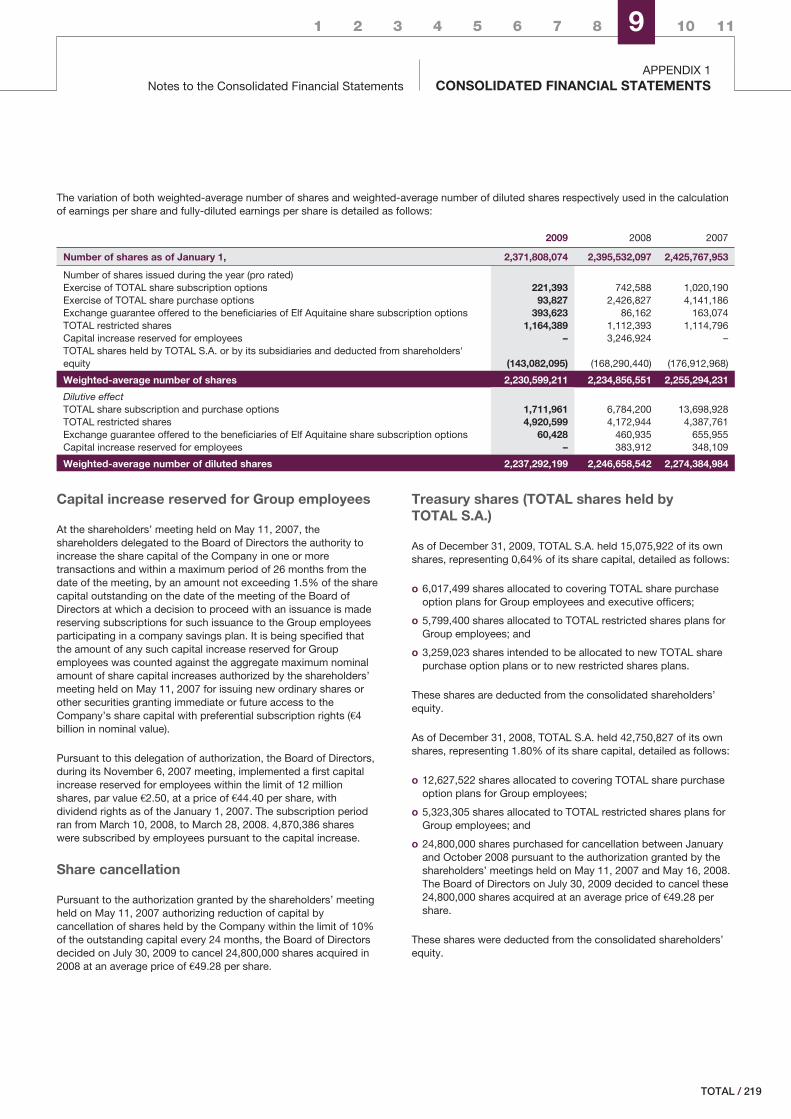
1 2 3 4 5 6 7 8 9 10 11
Notes to the Consolidated Financial StatementsAPPENDIX 1
CONSOLIDATED FINANCIAL STATEMENTS
The variation of both weighted-average number of shares and weighted-average number of diluted shares respectively used in the calculationof earnings per share and fully-diluted earnings per share is detailed as follows:
2009 2008 2007
Number of shares as of January 1, 2,371,808,074 2,395,532,097 2,425,767,953
Number of shares issued during the year (pro rated)Exercise of TOTAL share subscription options 221,393 742,588 1,020,190Exercise of TOTAL share purchase options 93,827 2,426,827 4,141,186Exchange guarantee offered to the beneficiaries of Elf Aquitaine share subscription options 393,623 86,162 163,074TOTAL restricted shares 1,164,389 1,112,393 1,114,796Capital increase reserved for employees – 3,246,924 –TOTAL shares held by TOTAL S.A. or by its subsidiaries and deducted from shareholders'equity (143,082,095) (168,290,440) (176,912,968)
Weighted-average number of shares 2,230,599,211 2,234,856,551 2,255,294,231
Dilutive effectTOTAL share subscription and purchase options 1,711,961 6,784,200 13,698,928TOTAL restricted shares 4,920,599 4,172,944 4,387,761Exchange guarantee offered to the beneficiaries of Elf Aquitaine share subscription options 60,428 460,935 655,955Capital increase reserved for employees – 383,912 348,109
Weighted-average number of diluted shares 2,237,292,199 2,246,658,542 2,274,384,984
Capital increase reserved for Group employees
At the shareholders’ meeting held on May 11, 2007, theshareholders delegated to the Board of Directors the authority toincrease the share capital of the Company in one or moretransactions and within a maximum period of 26 months from thedate of the meeting, by an amount not exceeding 1.5% of the sharecapital outstanding on the date of the meeting of the Board ofDirectors at which a decision to proceed with an issuance is madereserving subscriptions for such issuance to the Group employeesparticipating in a company savings plan. It is being specified thatthe amount of any such capital increase reserved for Groupemployees was counted against the aggregate maximum nominalamount of share capital increases authorized by the shareholders’meeting held on May 11, 2007 for issuing new ordinary shares orother securities granting immediate or future access to theCompany’s share capital with preferential subscription rights (€4billion in nominal value).
Pursuant to this delegation of authorization, the Board of Directors,during its November 6, 2007 meeting, implemented a first capitalincrease reserved for employees within the limit of 12 millionshares, par value €2.50, at a price of €44.40 per share, withdividend rights as of the January 1, 2007. The subscription periodran from March 10, 2008, to March 28, 2008. 4,870,386 shareswere subscribed by employees pursuant to the capital increase.
Share cancellation
Pursuant to the authorization granted by the shareholders’ meetingheld on May 11, 2007 authorizing reduction of capital bycancellation of shares held by the Company within the limit of 10%of the outstanding capital every 24 months, the Board of Directorsdecided on July 30, 2009 to cancel 24,800,000 shares acquired in2008 at an average price of €49.28 per share.
Treasury shares (TOTAL shares held byTOTAL S.A.)
As of December 31, 2009, TOTAL S.A. held 15,075,922 of its ownshares, representing 0,64% of its share capital, detailed as follows:
o 6,017,499 shares allocated to covering TOTAL share purchaseoption plans for Group employees and executive officers;
o 5,799,400 shares allocated to TOTAL restricted shares plans forGroup employees; and
o 3,259,023 shares intended to be allocated to new TOTAL sharepurchase option plans or to new restricted shares plans.
These shares are deducted from the consolidated shareholders’equity.
As of December 31, 2008, TOTAL S.A. held 42,750,827 of its ownshares, representing 1.80% of its share capital, detailed as follows:
o 12,627,522 shares allocated to covering TOTAL share purchaseoption plans for Group employees;
o 5,323,305 shares allocated to TOTAL restricted shares plans forGroup employees; and
o 24,800,000 shares purchased for cancellation between Januaryand October 2008 pursuant to the authorization granted by theshareholders’ meetings held on May 11, 2007 and May 16, 2008.The Board of Directors on July 30, 2009 decided to cancel these24,800,000 shares acquired at an average price of €49.28 pershare.
These shares were deducted from the consolidated shareholders’equity.
/ 219TOTAL
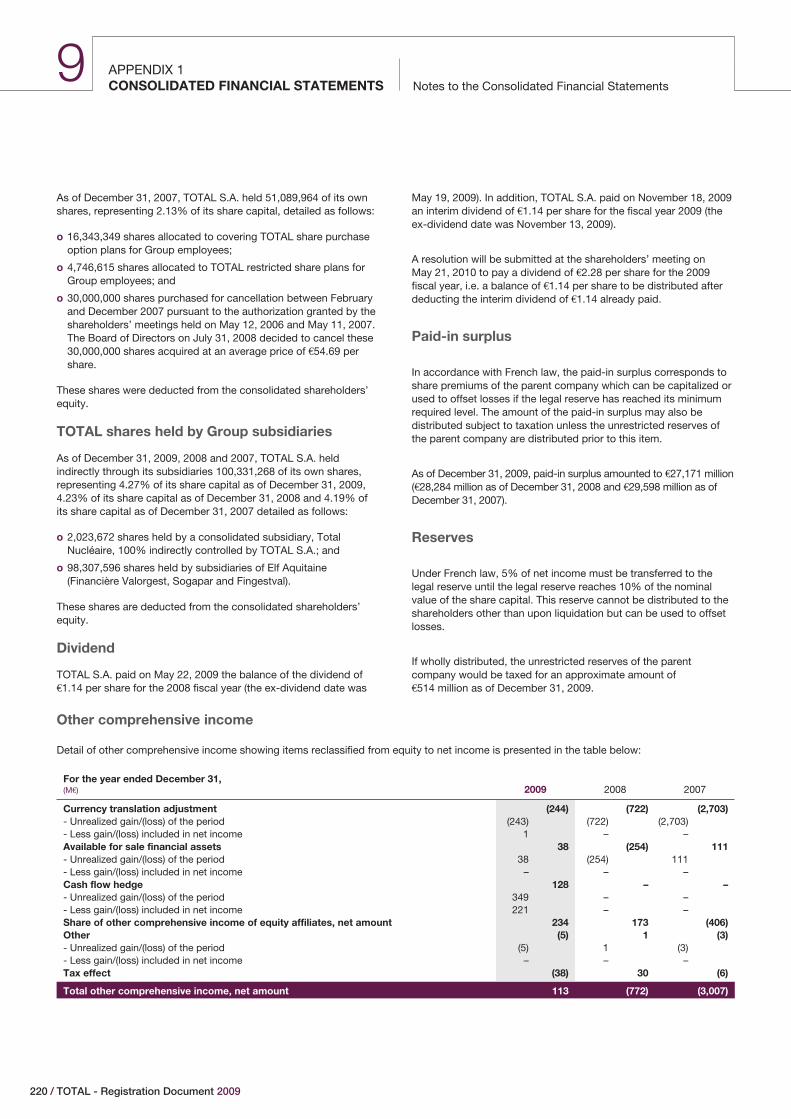
APPENDIX 1Notes to the Consolidated Financial StatementsCONSOLIDATED FINANCIAL STATEMENTS
9
As of December 31, 2007, TOTAL S.A. held 51,089,964 of its ownshares, representing 2.13% of its share capital, detailed as follows:
o 16,343,349 shares allocated to covering TOTAL share purchaseoption plans for Group employees;
o 4,746,615 shares allocated to TOTAL restricted share plans forGroup employees; and
o 30,000,000 shares purchased for cancellation between Februaryand December 2007 pursuant to the authorization granted by theshareholders’ meetings held on May 12, 2006 and May 11, 2007.The Board of Directors on July 31, 2008 decided to cancel these30,000,000 shares acquired at an average price of €54.69 pershare.
These shares were deducted from the consolidated shareholders’equity.
TOTAL shares held by Group subsidiaries
As of December 31, 2009, 2008 and 2007, TOTAL S.A. heldindirectly through its subsidiaries 100,331,268 of its own shares,representing 4.27% of its share capital as of December 31, 2009,4.23% of its share capital as of December 31, 2008 and 4.19% ofits share capital as of December 31, 2007 detailed as follows:
o 2,023,672 shares held by a consolidated subsidiary, TotalNucléaire, 100% indirectly controlled by TOTAL S.A.; and
o 98,307,596 shares held by subsidiaries of Elf Aquitaine(Financière Valorgest, Sogapar and Fingestval).
These shares are deducted from the consolidated shareholders’equity.
Dividend
TOTAL S.A. paid on May 22, 2009 the balance of the dividend of€1.14 per share for the 2008 fiscal year (the ex-dividend date was
May 19, 2009). In addition, TOTAL S.A. paid on November 18, 2009an interim dividend of €1.14 per share for the fiscal year 2009 (theex-dividend date was November 13, 2009).
A resolution will be submitted at the shareholders’ meeting onMay 21, 2010 to pay a dividend of €2.28 per share for the 2009fiscal year, i.e. a balance of €1.14 per share to be distributed afterdeducting the interim dividend of €1.14 already paid.
Paid-in surplus
In accordance with French law, the paid-in surplus corresponds toshare premiums of the parent company which can be capitalized orused to offset losses if the legal reserve has reached its minimumrequired level. The amount of the paid-in surplus may also bedistributed subject to taxation unless the unrestricted reserves ofthe parent company are distributed prior to this item.
As of December 31, 2009, paid-in surplus amounted to €27,171 million(€28,284 million as of December 31, 2008 and €29,598 million as ofDecember 31, 2007).
Reserves
Under French law, 5% of net income must be transferred to thelegal reserve until the legal reserve reaches 10% of the nominalvalue of the share capital. This reserve cannot be distributed to theshareholders other than upon liquidation but can be used to offsetlosses.
If wholly distributed, the unrestricted reserves of the parentcompany would be taxed for an approximate amount of€514 million as of December 31, 2009.
Other comprehensive income
Detail of other comprehensive income showing items reclassified from equity to net income is presented in the table below:
For the year ended December 31,(M€) 2009 2008 2007
Currency translation adjustment (244) (722) (2,703)- Unrealized gain/(loss) of the period (243) (722) (2,703)- Less gain/(loss) included in net income 1 – –Available for sale financial assets 38 (254) 111- Unrealized gain/(loss) of the period 38 (254) 111- Less gain/(loss) included in net income – – –Cash flow hedge 128 – –- Unrealized gain/(loss) of the period 349 – –- Less gain/(loss) included in net income 221 – –Share of other comprehensive income of equity affiliates, net amount 234 173 (406)Other (5) 1 (3)- Unrealized gain/(loss) of the period (5) 1 (3)- Less gain/(loss) included in net income – – –Tax effect (38) 30 (6)
Total other comprehensive income, net amount 113 (772) (3,007)
220 / TOTAL - Registration Document 2009
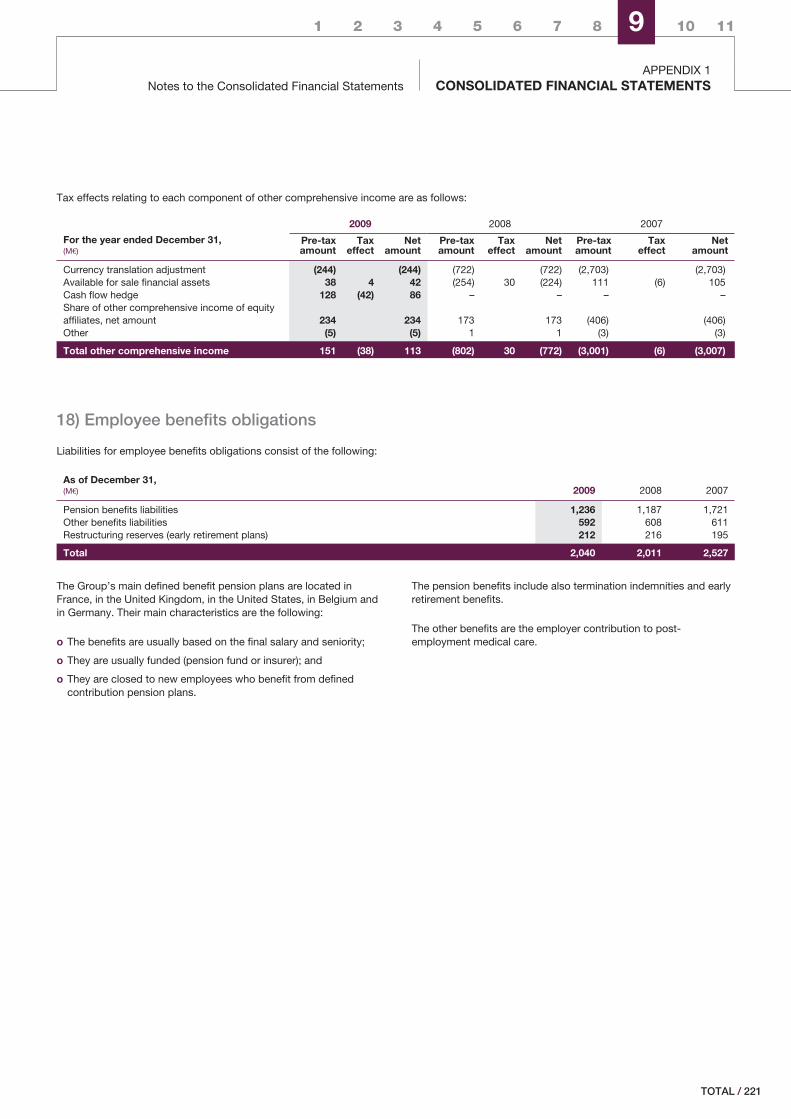
1 2 3 4 5 6 7 8 9 10 11
Notes to the Consolidated Financial StatementsAPPENDIX 1
CONSOLIDATED FINANCIAL STATEMENTS
Tax effects relating to each component of other comprehensive income are as follows:
For the year ended December 31,(M€)
2009 2008 2007
Pre-taxamount
Taxeffect
Netamount
Pre-taxamount
Taxeffect
Netamount
Pre-taxamount
Taxeffect
Netamount
Currency translation adjustment (244) (244) (722) (722) (2,703) (2,703)Available for sale financial assets 38 4 42 (254) 30 (224) 111 (6) 105Cash flow hedge 128 (42) 86 – – – –Share of other comprehensive income of equityaffiliates, net amount 234 234 173 173 (406) (406)Other (5) (5) 1 1 (3) (3)
Total other comprehensive income 151 (38) 113 (802) 30 (772) (3,001) (6) (3,007)
18) Employee benefits obligations
Liabilities for employee benefits obligations consist of the following:
As of December 31,(M€) 2009 2008 2007
Pension benefits liabilities 1,236 1,187 1,721Other benefits liabilities 592 608 611Restructuring reserves (early retirement plans) 212 216 195
Total 2,040 2,011 2,527
The Group’s main defined benefit pension plans are located inFrance, in the United Kingdom, in the United States, in Belgium andin Germany. Their main characteristics are the following:
o The benefits are usually based on the final salary and seniority;
o They are usually funded (pension fund or insurer); and
o They are closed to new employees who benefit from definedcontribution pension plans.
The pension benefits include also termination indemnities and earlyretirement benefits.
The other benefits are the employer contribution to post-employment medical care.
/ 221TOTAL
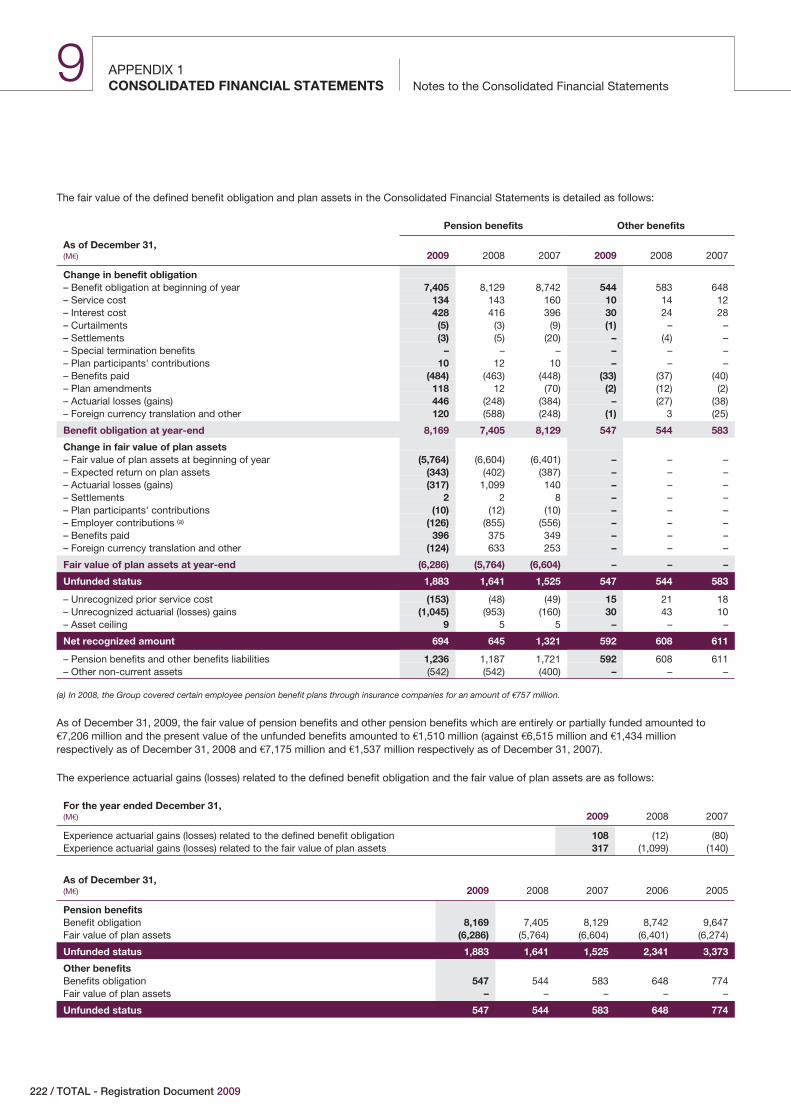
APPENDIX 1Notes to the Consolidated Financial StatementsCONSOLIDATED FINANCIAL STATEMENTS
9
The fair value of the defined benefit obligation and plan assets in the Consolidated Financial Statements is detailed as follows:
Pension benefits Other benefits
As of December 31,(M€) 2009 2008 2007 2009 2008 2007
Change in benefit obligation– Benefit obligation at beginning of year 7,405 8,129 8,742 544 583 648– Service cost 134 143 160 10 14 12– Interest cost 428 416 396 30 24 28– Curtailments (5) (3) (9) (1) – –– Settlements (3) (5) (20) – (4) –– Special termination benefits – – – – – –– Plan participants' contributions 10 12 10 – – –– Benefits paid (484) (463) (448) (33) (37) (40)– Plan amendments 118 12 (70) (2) (12) (2)– Actuarial losses (gains) 446 (248) (384) – (27) (38)– Foreign currency translation and other 120 (588) (248) (1) 3 (25)
Benefit obligation at year-end 8,169 7,405 8,129 547 544 583
Change in fair value of plan assets– Fair value of plan assets at beginning of year (5,764) (6,604) (6,401) – – –– Expected return on plan assets (343) (402) (387) – – –– Actuarial losses (gains) (317) 1,099 140 – – –– Settlements 2 2 8 – – –– Plan participants' contributions (10) (12) (10) – – –– Employer contributions (a) (126) (855) (556) – – –– Benefits paid 396 375 349 – – –– Foreign currency translation and other (124) 633 253 – – –
Fair value of plan assets at year-end (6,286) (5,764) (6,604) – – –
Unfunded status 1,883 1,641 1,525 547 544 583
– Unrecognized prior service cost (153) (48) (49) 15 21 18– Unrecognized actuarial (losses) gains (1,045) (953) (160) 30 43 10– Asset ceiling 9 5 5 – – –
Net recognized amount 694 645 1,321 592 608 611
– Pension benefits and other benefits liabilities 1,236 1,187 1,721 592 608 611– Other non-current assets (542) (542) (400) – – –
(a) In 2008, the Group covered certain employee pension benefit plans through insurance companies for an amount of €757 million.
As of December 31, 2009, the fair value of pension benefits and other pension benefits which are entirely or partially funded amounted to€7,206 million and the present value of the unfunded benefits amounted to €1,510 million (against €6,515 million and €1,434 millionrespectively as of December 31, 2008 and €7,175 million and €1,537 million respectively as of December 31, 2007).
The experience actuarial gains (losses) related to the defined benefit obligation and the fair value of plan assets are as follows:
For the year ended December 31,(M€) 2009 2008 2007
Experience actuarial gains (losses) related to the defined benefit obligation 108 (12) (80)Experience actuarial gains (losses) related to the fair value of plan assets 317 (1,099) (140)
As of December 31,(M€) 2009 2008 2007 2006 2005
Pension benefitsBenefit obligation 8,169 7,405 8,129 8,742 9,647Fair value of plan assets (6,286) (5,764) (6,604) (6,401) (6,274)
Unfunded status 1,883 1,641 1,525 2,341 3,373
Other benefitsBenefits obligation 547 544 583 648 774Fair value of plan assets – – – – –
Unfunded status 547 544 583 648 774
222 / TOTAL - Registration Document 2009
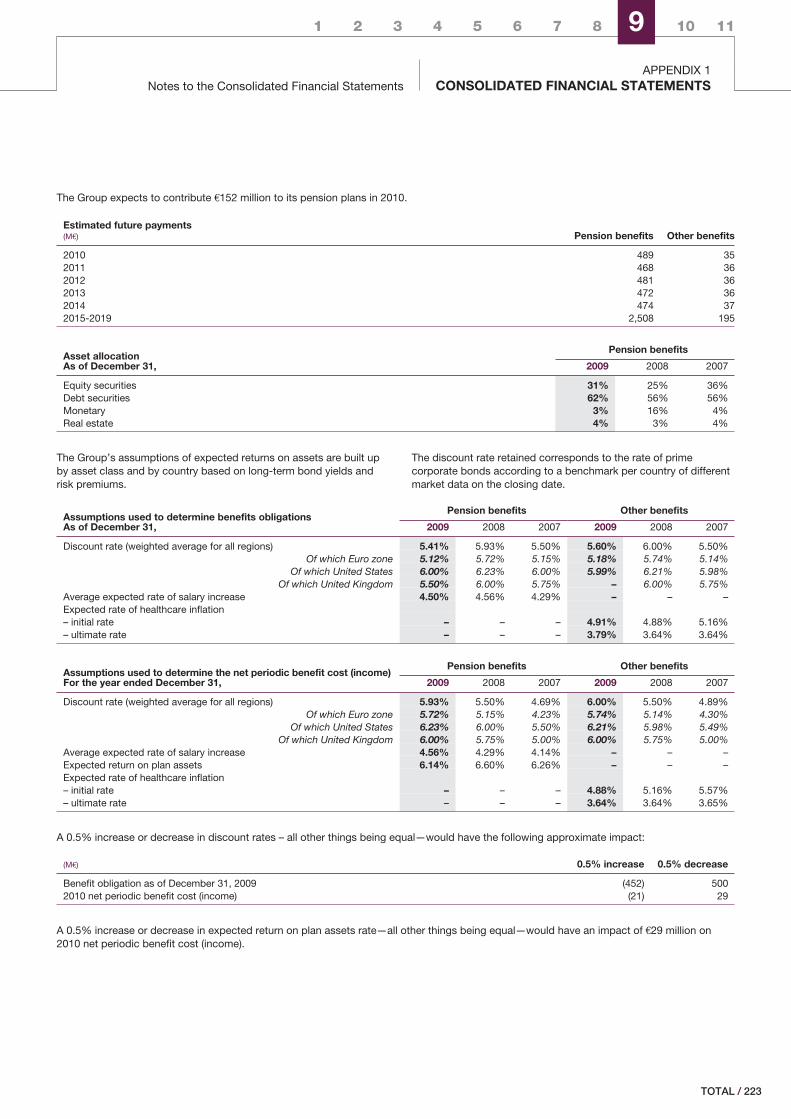
1 2 3 4 5 6 7 8 9 10 11
Notes to the Consolidated Financial StatementsAPPENDIX 1
CONSOLIDATED FINANCIAL STATEMENTS
The Group expects to contribute €152 million to its pension plans in 2010.
Estimated future payments(M€) Pension benefits Other benefits
2010 489 352011 468 362012 481 362013 472 362014 474 372015-2019 2,508 195
Asset allocationAs of December 31,
Pension benefits
2009 2008 2007
Equity securities 31% 25% 36%Debt securities 62% 56% 56%Monetary 3% 16% 4%Real estate 4% 3% 4%
The Group’s assumptions of expected returns on assets are built upby asset class and by country based on long-term bond yields andrisk premiums.
The discount rate retained corresponds to the rate of primecorporate bonds according to a benchmark per country of differentmarket data on the closing date.
Assumptions used to determine benefits obligationsAs of December 31,
Pension benefits Other benefits
2009 2008 2007 2009 2008 2007
Discount rate (weighted average for all regions) 5.41% 5.93% 5.50% 5.60% 6.00% 5.50%Of which Euro zone 5.12% 5.72% 5.15% 5.18% 5.74% 5.14%
Of which United States 6.00% 6.23% 6.00% 5.99% 6.21% 5.98%Of which United Kingdom 5.50% 6.00% 5.75% – 6.00% 5.75%
Average expected rate of salary increase 4.50% 4.56% 4.29% – – –Expected rate of healthcare inflation– initial rate – – – 4.91% 4.88% 5.16%– ultimate rate – – – 3.79% 3.64% 3.64%
Assumptions used to determine the net periodic benefit cost (income)For the year ended December 31,
Pension benefits Other benefits
2009 2008 2007 2009 2008 2007
Discount rate (weighted average for all regions) 5.93% 5.50% 4.69% 6.00% 5.50% 4.89%Of which Euro zone 5.72% 5.15% 4.23% 5.74% 5.14% 4.30%
Of which United States 6.23% 6.00% 5.50% 6.21% 5.98% 5.49%Of which United Kingdom 6.00% 5.75% 5.00% 6.00% 5.75% 5.00%
Average expected rate of salary increase 4.56% 4.29% 4.14% – – –Expected return on plan assets 6.14% 6.60% 6.26% – – –Expected rate of healthcare inflation– initial rate – – – 4.88% 5.16% 5.57%– ultimate rate – – – 3.64% 3.64% 3.65%
A 0.5% increase or decrease in discount rates – all other things being equal—would have the following approximate impact:
(M€) 0.5% increase 0.5% decrease
Benefit obligation as of December 31, 2009 (452) 5002010 net periodic benefit cost (income) (21) 29
A 0.5% increase or decrease in expected return on plan assets rate—all other things being equal—would have an impact of €29 million on2010 net periodic benefit cost (income).
/ 223TOTAL
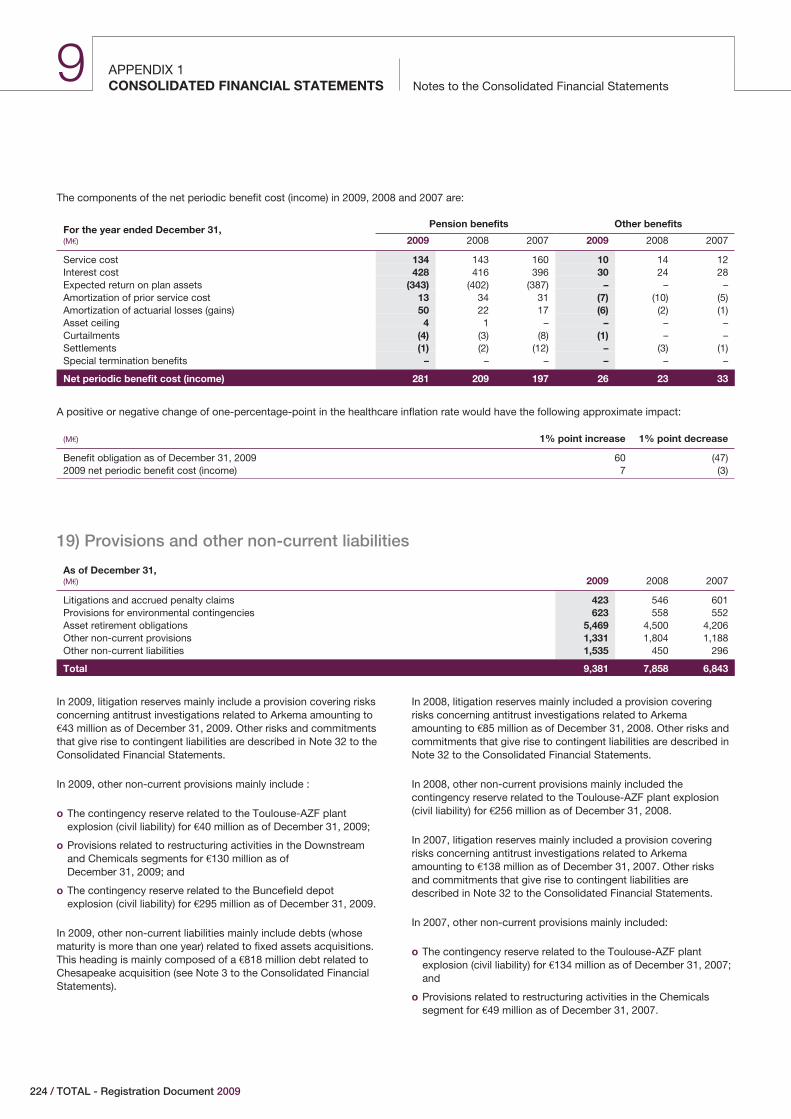
APPENDIX 1Notes to the Consolidated Financial StatementsCONSOLIDATED FINANCIAL STATEMENTS
9
The components of the net periodic benefit cost (income) in 2009, 2008 and 2007 are:
For the year ended December 31,(M€)
Pension benefits Other benefits
2009 2008 2007 2009 2008 2007
Service cost 134 143 160 10 14 12Interest cost 428 416 396 30 24 28Expected return on plan assets (343) (402) (387) – – –Amortization of prior service cost 13 34 31 (7) (10) (5)Amortization of actuarial losses (gains) 50 22 17 (6) (2) (1)Asset ceiling 4 1 – – – –Curtailments (4) (3) (8) (1) – –Settlements (1) (2) (12) – (3) (1)Special termination benefits – – – – – –
Net periodic benefit cost (income) 281 209 197 26 23 33
A positive or negative change of one-percentage-point in the healthcare inflation rate would have the following approximate impact:
(M€) 1% point increase 1% point decrease
Benefit obligation as of December 31, 2009 60 (47)2009 net periodic benefit cost (income) 7 (3)
19) Provisions and other non-current liabilities
As of December 31,(M€) 2009 2008 2007
Litigations and accrued penalty claims 423 546 601Provisions for environmental contingencies 623 558 552Asset retirement obligations 5,469 4,500 4,206Other non-current provisions 1,331 1,804 1,188Other non-current liabilities 1,535 450 296
Total 9,381 7,858 6,843
In 2009, litigation reserves mainly include a provision covering risksconcerning antitrust investigations related to Arkema amounting to€43 million as of December 31, 2009. Other risks and commitmentsthat give rise to contingent liabilities are described in Note 32 to theConsolidated Financial Statements.
In 2009, other non-current provisions mainly include :
o The contingency reserve related to the Toulouse-AZF plantexplosion (civil liability) for €40 million as of December 31, 2009;
o Provisions related to restructuring activities in the Downstreamand Chemicals segments for €130 million as ofDecember 31, 2009; and
o The contingency reserve related to the Buncefield depotexplosion (civil liability) for €295 million as of December 31, 2009.
In 2009, other non-current liabilities mainly include debts (whosematurity is more than one year) related to fixed assets acquisitions.This heading is mainly composed of a €818 million debt related toChesapeake acquisition (see Note 3 to the Consolidated FinancialStatements).
In 2008, litigation reserves mainly included a provision coveringrisks concerning antitrust investigations related to Arkemaamounting to €85 million as of December 31, 2008. Other risks andcommitments that give rise to contingent liabilities are described inNote 32 to the Consolidated Financial Statements.
In 2008, other non-current provisions mainly included thecontingency reserve related to the Toulouse-AZF plant explosion(civil liability) for €256 million as of December 31, 2008.
In 2007, litigation reserves mainly included a provision coveringrisks concerning antitrust investigations related to Arkemaamounting to €138 million as of December 31, 2007. Other risksand commitments that give rise to contingent liabilities aredescribed in Note 32 to the Consolidated Financial Statements.
In 2007, other non-current provisions mainly included:
o The contingency reserve related to the Toulouse-AZF plantexplosion (civil liability) for €134 million as of December 31, 2007;and
o Provisions related to restructuring activities in the Chemicalssegment for €49 million as of December 31, 2007.
224 / TOTAL - Registration Document 2009
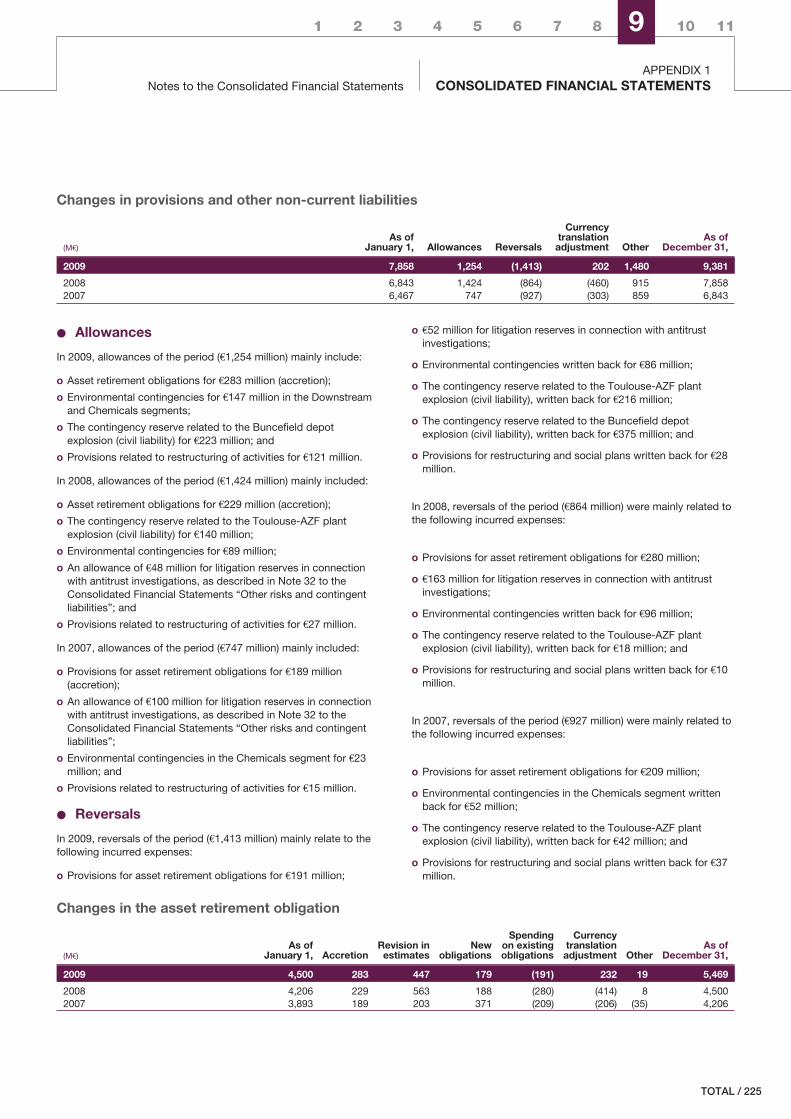
1 2 3 4 5 6 7 8 9 10 11
Notes to the Consolidated Financial StatementsAPPENDIX 1
CONSOLIDATED FINANCIAL STATEMENTS
Changes in provisions and other non-current liabilities
(M€)As of
January 1, Allowances Reversals
Currencytranslation
adjustment OtherAs of
December 31,
2009 7,858 1,254 (1,413) 202 1,480 9,381
2008 6,843 1,424 (864) (460) 915 7,8582007 6,467 747 (927) (303) 859 6,843
‹ Allowances
In 2009, allowances of the period (€1,254 million) mainly include:
o Asset retirement obligations for €283 million (accretion);
o Environmental contingencies for €147 million in the Downstreamand Chemicals segments;
o The contingency reserve related to the Buncefield depotexplosion (civil liability) for €223 million; and
o Provisions related to restructuring of activities for €121 million.
In 2008, allowances of the period (€1,424 million) mainly included:
o Asset retirement obligations for €229 million (accretion);
o The contingency reserve related to the Toulouse-AZF plantexplosion (civil liability) for €140 million;
o Environmental contingencies for €89 million;
o An allowance of €48 million for litigation reserves in connectionwith antitrust investigations, as described in Note 32 to theConsolidated Financial Statements “Other risks and contingentliabilities”; and
o Provisions related to restructuring of activities for €27 million.
In 2007, allowances of the period (€747 million) mainly included:
o Provisions for asset retirement obligations for €189 million(accretion);
o An allowance of €100 million for litigation reserves in connectionwith antitrust investigations, as described in Note 32 to theConsolidated Financial Statements “Other risks and contingentliabilities”;
o Environmental contingencies in the Chemicals segment for €23million; and
o Provisions related to restructuring of activities for €15 million.
‹ Reversals
In 2009, reversals of the period (€1,413 million) mainly relate to thefollowing incurred expenses:
o Provisions for asset retirement obligations for €191 million;
o €52 million for litigation reserves in connection with antitrustinvestigations;
o Environmental contingencies written back for €86 million;
o The contingency reserve related to the Toulouse-AZF plantexplosion (civil liability), written back for €216 million;
o The contingency reserve related to the Buncefield depotexplosion (civil liability), written back for €375 million; and
o Provisions for restructuring and social plans written back for €28million.
In 2008, reversals of the period (€864 million) were mainly related tothe following incurred expenses:
o Provisions for asset retirement obligations for €280 million;
o €163 million for litigation reserves in connection with antitrustinvestigations;
o Environmental contingencies written back for €96 million;
o The contingency reserve related to the Toulouse-AZF plantexplosion (civil liability), written back for €18 million; and
o Provisions for restructuring and social plans written back for €10million.
In 2007, reversals of the period (€927 million) were mainly related tothe following incurred expenses:
o Provisions for asset retirement obligations for €209 million;
o Environmental contingencies in the Chemicals segment writtenback for €52 million;
o The contingency reserve related to the Toulouse-AZF plantexplosion (civil liability), written back for €42 million; and
o Provisions for restructuring and social plans written back for €37million.
Changes in the asset retirement obligation
(M€)As of
January 1, AccretionRevision inestimates
Newobligations
Spendingon existingobligations
Currencytranslation
adjustment OtherAs of
December 31,
2009 4,500 283 447 179 (191) 232 19 5,469
2008 4,206 229 563 188 (280) (414) 8 4,5002007 3,893 189 203 371 (209) (206) (35) 4,206
/ 225TOTAL
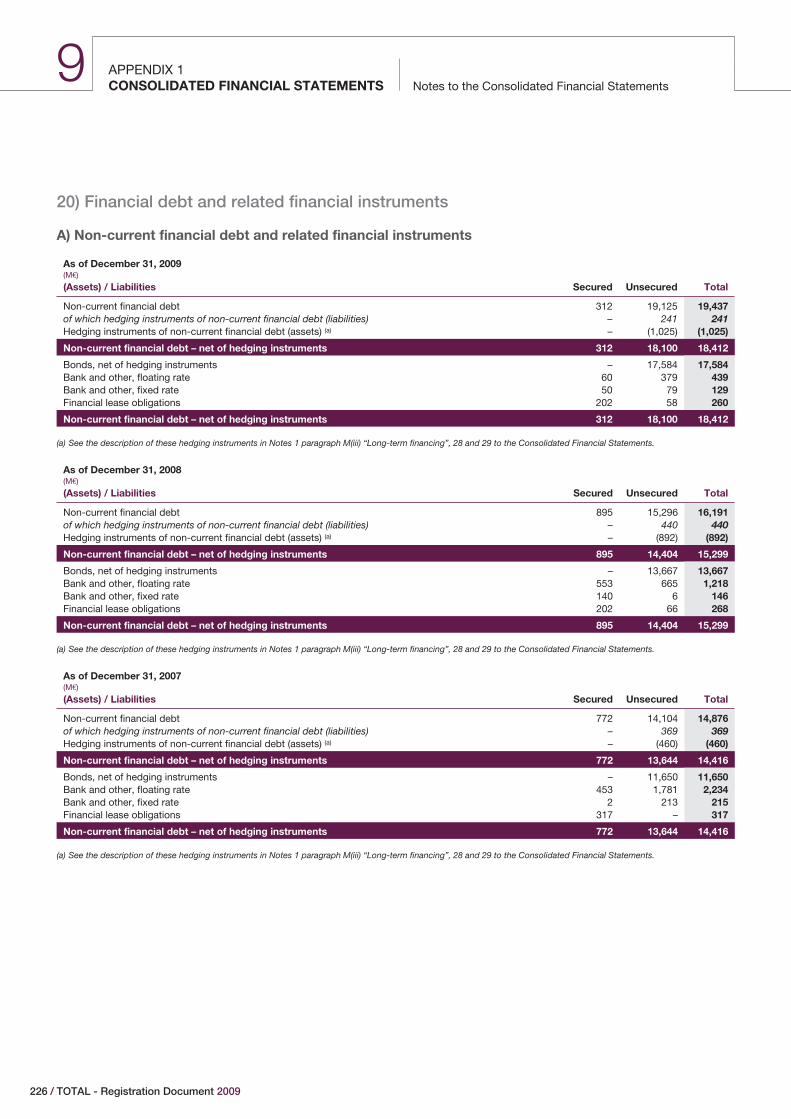
APPENDIX 1Notes to the Consolidated Financial StatementsCONSOLIDATED FINANCIAL STATEMENTS
9
20) Financial debt and related financial instruments
A) Non-current financial debt and related financial instruments
As of December 31, 2009(M€)
(Assets) / Liabilities Secured Unsecured Total
Non-current financial debt 312 19,125 19,437of which hedging instruments of non-current financial debt (liabilities) – 241 241Hedging instruments of non-current financial debt (assets) (a) – (1,025) (1,025)
Non-current financial debt – net of hedging instruments 312 18,100 18,412
Bonds, net of hedging instruments – 17,584 17,584Bank and other, floating rate 60 379 439Bank and other, fixed rate 50 79 129Financial lease obligations 202 58 260
Non-current financial debt – net of hedging instruments 312 18,100 18,412
(a) See the description of these hedging instruments in Notes 1 paragraph M(iii) “Long-term financing”, 28 and 29 to the Consolidated Financial Statements.
As of December 31, 2008(M€)
(Assets) / Liabilities Secured Unsecured Total
Non-current financial debt 895 15,296 16,191of which hedging instruments of non-current financial debt (liabilities) – 440 440Hedging instruments of non-current financial debt (assets) (a) – (892) (892)
Non-current financial debt – net of hedging instruments 895 14,404 15,299
Bonds, net of hedging instruments – 13,667 13,667Bank and other, floating rate 553 665 1,218Bank and other, fixed rate 140 6 146Financial lease obligations 202 66 268
Non-current financial debt – net of hedging instruments 895 14,404 15,299
(a) See the description of these hedging instruments in Notes 1 paragraph M(iii) “Long-term financing”, 28 and 29 to the Consolidated Financial Statements.
As of December 31, 2007(M€)
(Assets) / Liabilities Secured Unsecured Total
Non-current financial debt 772 14,104 14,876of which hedging instruments of non-current financial debt (liabilities) – 369 369Hedging instruments of non-current financial debt (assets) (a) – (460) (460)
Non-current financial debt – net of hedging instruments 772 13,644 14,416
Bonds, net of hedging instruments – 11,650 11,650Bank and other, floating rate 453 1,781 2,234Bank and other, fixed rate 2 213 215Financial lease obligations 317 – 317
Non-current financial debt – net of hedging instruments 772 13,644 14,416
(a) See the description of these hedging instruments in Notes 1 paragraph M(iii) “Long-term financing”, 28 and 29 to the Consolidated Financial Statements.
226 / TOTAL - Registration Document 2009
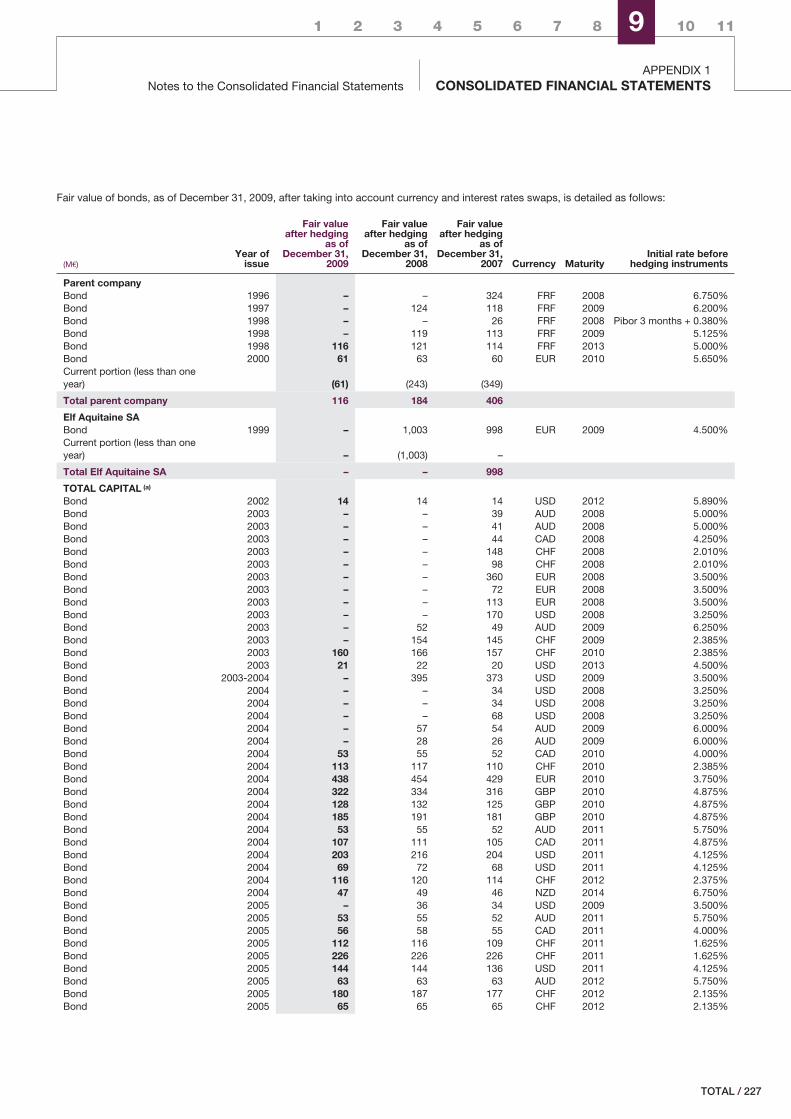
1 2 3 4 5 6 7 8 9 10 11
Notes to the Consolidated Financial StatementsAPPENDIX 1
CONSOLIDATED FINANCIAL STATEMENTS
Fair value of bonds, as of December 31, 2009, after taking into account currency and interest rates swaps, is detailed as follows:
(M€)Year of
issue
Fair valueafter hedging
as ofDecember 31,
2009
Fair valueafter hedging
as ofDecember 31,
2008
Fair valueafter hedging
as ofDecember 31,
2007 Currency MaturityInitial rate before
hedging instruments
Parent companyBond 1996 – – 324 FRF 2008 6.750%Bond 1997 – 124 118 FRF 2009 6.200%Bond 1998 – – 26 FRF 2008 Pibor 3 months + 0.380%Bond 1998 – 119 113 FRF 2009 5.125%Bond 1998 116 121 114 FRF 2013 5.000%Bond 2000 61 63 60 EUR 2010 5.650%Current portion (less than oneyear) (61) (243) (349)
Total parent company 116 184 406
Elf Aquitaine SABond 1999 – 1,003 998 EUR 2009 4.500%Current portion (less than oneyear) – (1,003) –
Total Elf Aquitaine SA – – 998
TOTAL CAPITAL (a)
Bond 2002 14 14 14 USD 2012 5.890%Bond 2003 – – 39 AUD 2008 5.000%Bond 2003 – – 41 AUD 2008 5.000%Bond 2003 – – 44 CAD 2008 4.250%Bond 2003 – – 148 CHF 2008 2.010%Bond 2003 – – 98 CHF 2008 2.010%Bond 2003 – – 360 EUR 2008 3.500%Bond 2003 – – 72 EUR 2008 3.500%Bond 2003 – – 113 EUR 2008 3.500%Bond 2003 – – 170 USD 2008 3.250%Bond 2003 – 52 49 AUD 2009 6.250%Bond 2003 – 154 145 CHF 2009 2.385%Bond 2003 160 166 157 CHF 2010 2.385%Bond 2003 21 22 20 USD 2013 4.500%Bond 2003-2004 – 395 373 USD 2009 3.500%Bond 2004 – – 34 USD 2008 3.250%Bond 2004 – – 34 USD 2008 3.250%Bond 2004 – – 68 USD 2008 3.250%Bond 2004 – 57 54 AUD 2009 6.000%Bond 2004 – 28 26 AUD 2009 6.000%Bond 2004 53 55 52 CAD 2010 4.000%Bond 2004 113 117 110 CHF 2010 2.385%Bond 2004 438 454 429 EUR 2010 3.750%Bond 2004 322 334 316 GBP 2010 4.875%Bond 2004 128 132 125 GBP 2010 4.875%Bond 2004 185 191 181 GBP 2010 4.875%Bond 2004 53 55 52 AUD 2011 5.750%Bond 2004 107 111 105 CAD 2011 4.875%Bond 2004 203 216 204 USD 2011 4.125%Bond 2004 69 72 68 USD 2011 4.125%Bond 2004 116 120 114 CHF 2012 2.375%Bond 2004 47 49 46 NZD 2014 6.750%Bond 2005 – 36 34 USD 2009 3.500%Bond 2005 53 55 52 AUD 2011 5.750%Bond 2005 56 58 55 CAD 2011 4.000%Bond 2005 112 116 109 CHF 2011 1.625%Bond 2005 226 226 226 CHF 2011 1.625%Bond 2005 144 144 136 USD 2011 4.125%Bond 2005 63 63 63 AUD 2012 5.750%Bond 2005 180 187 177 CHF 2012 2.135%Bond 2005 65 65 65 CHF 2012 2.135%
/ 227TOTAL
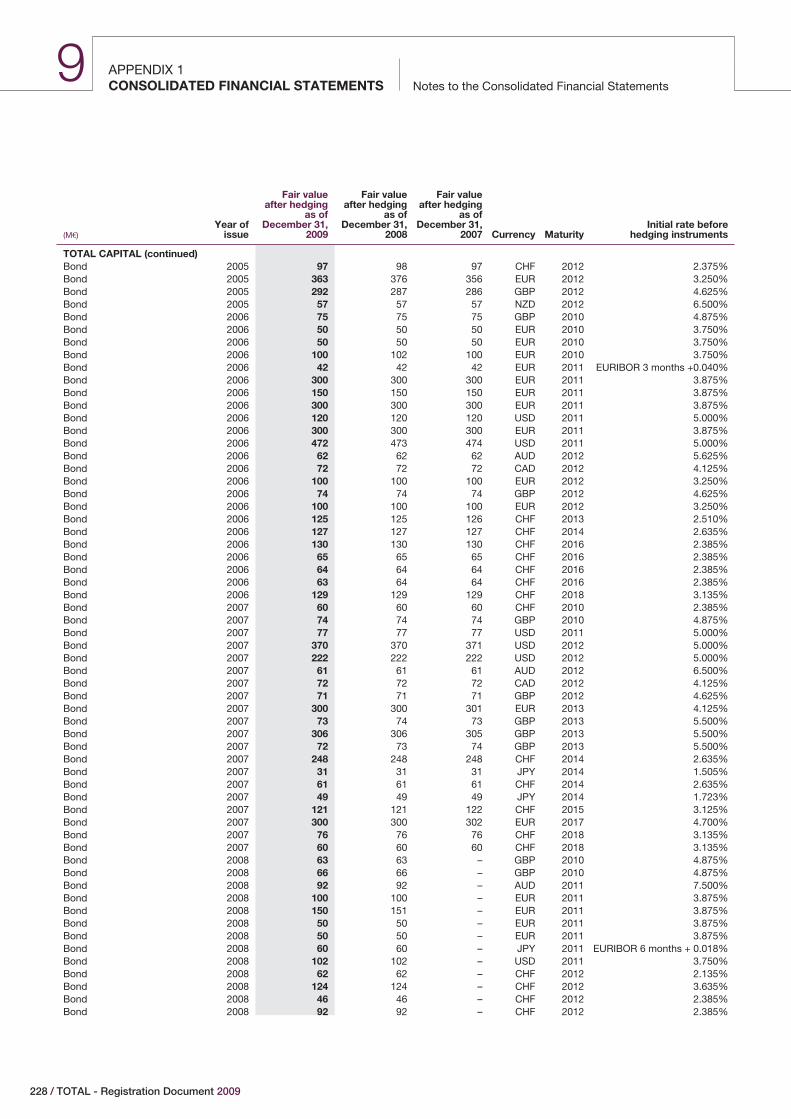
APPENDIX 1Notes to the Consolidated Financial StatementsCONSOLIDATED FINANCIAL STATEMENTS
9
(M€)Year of
issue
Fair valueafter hedging
as ofDecember 31,
2009
Fair valueafter hedging
as ofDecember 31,
2008
Fair valueafter hedging
as ofDecember 31,
2007 Currency MaturityInitial rate before
hedging instruments
TOTAL CAPITAL (continued)Bond 2005 97 98 97 CHF 2012 2.375%Bond 2005 363 376 356 EUR 2012 3.250%Bond 2005 292 287 286 GBP 2012 4.625%Bond 2005 57 57 57 NZD 2012 6.500%Bond 2006 75 75 75 GBP 2010 4.875%Bond 2006 50 50 50 EUR 2010 3.750%Bond 2006 50 50 50 EUR 2010 3.750%Bond 2006 100 102 100 EUR 2010 3.750%Bond 2006 42 42 42 EUR 2011 EURIBOR 3 months +0.040%Bond 2006 300 300 300 EUR 2011 3.875%Bond 2006 150 150 150 EUR 2011 3.875%Bond 2006 300 300 300 EUR 2011 3.875%Bond 2006 120 120 120 USD 2011 5.000%Bond 2006 300 300 300 EUR 2011 3.875%Bond 2006 472 473 474 USD 2011 5.000%Bond 2006 62 62 62 AUD 2012 5.625%Bond 2006 72 72 72 CAD 2012 4.125%Bond 2006 100 100 100 EUR 2012 3.250%Bond 2006 74 74 74 GBP 2012 4.625%Bond 2006 100 100 100 EUR 2012 3.250%Bond 2006 125 125 126 CHF 2013 2.510%Bond 2006 127 127 127 CHF 2014 2.635%Bond 2006 130 130 130 CHF 2016 2.385%Bond 2006 65 65 65 CHF 2016 2.385%Bond 2006 64 64 64 CHF 2016 2.385%Bond 2006 63 64 64 CHF 2016 2.385%Bond 2006 129 129 129 CHF 2018 3.135%Bond 2007 60 60 60 CHF 2010 2.385%Bond 2007 74 74 74 GBP 2010 4.875%Bond 2007 77 77 77 USD 2011 5.000%Bond 2007 370 370 371 USD 2012 5.000%Bond 2007 222 222 222 USD 2012 5.000%Bond 2007 61 61 61 AUD 2012 6.500%Bond 2007 72 72 72 CAD 2012 4.125%Bond 2007 71 71 71 GBP 2012 4.625%Bond 2007 300 300 301 EUR 2013 4.125%Bond 2007 73 74 73 GBP 2013 5.500%Bond 2007 306 306 305 GBP 2013 5.500%Bond 2007 72 73 74 GBP 2013 5.500%Bond 2007 248 248 248 CHF 2014 2.635%Bond 2007 31 31 31 JPY 2014 1.505%Bond 2007 61 61 61 CHF 2014 2.635%Bond 2007 49 49 49 JPY 2014 1.723%Bond 2007 121 121 122 CHF 2015 3.125%Bond 2007 300 300 302 EUR 2017 4.700%Bond 2007 76 76 76 CHF 2018 3.135%Bond 2007 60 60 60 CHF 2018 3.135%Bond 2008 63 63 – GBP 2010 4.875%Bond 2008 66 66 – GBP 2010 4.875%Bond 2008 92 92 – AUD 2011 7.500%Bond 2008 100 100 – EUR 2011 3.875%Bond 2008 150 151 – EUR 2011 3.875%Bond 2008 50 50 – EUR 2011 3.875%Bond 2008 50 50 – EUR 2011 3.875%Bond 2008 60 60 – JPY 2011 EURIBOR 6 months + 0.018%Bond 2008 102 102 – USD 2011 3.750%Bond 2008 62 62 – CHF 2012 2.135%Bond 2008 124 124 – CHF 2012 3.635%Bond 2008 46 46 – CHF 2012 2.385%Bond 2008 92 92 – CHF 2012 2.385%
228 / TOTAL - Registration Document 2009
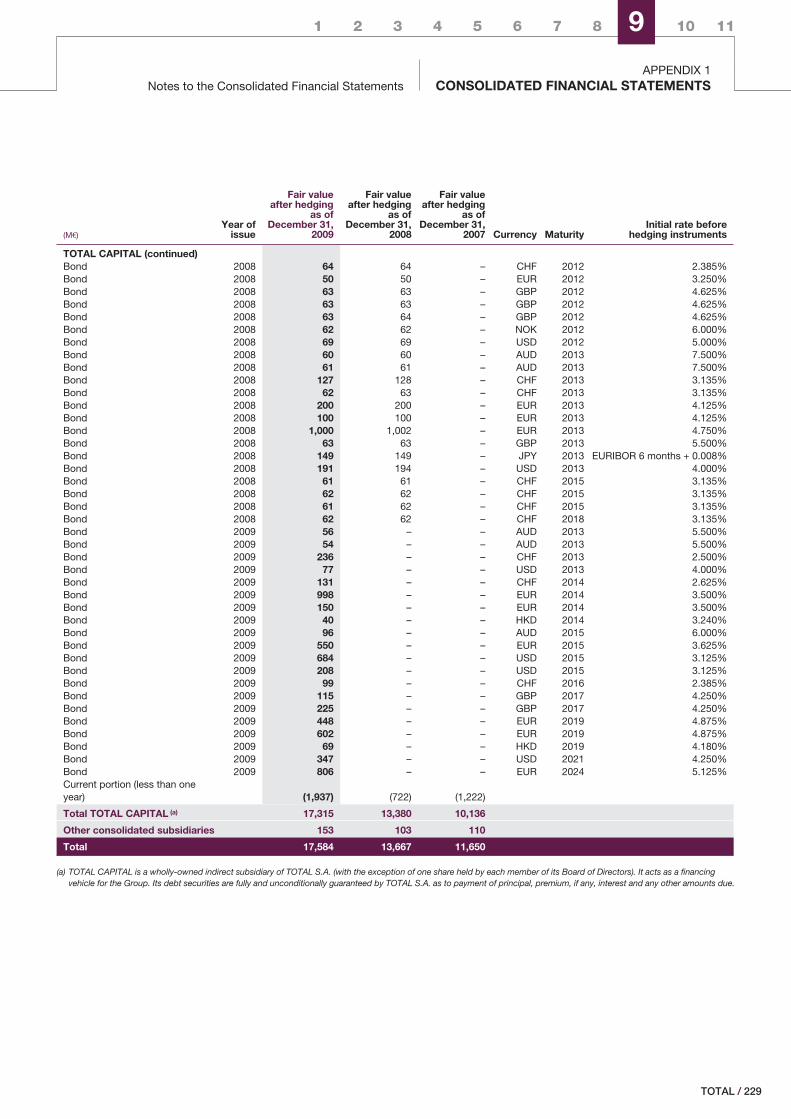
1 2 3 4 5 6 7 8 9 10 11
Notes to the Consolidated Financial StatementsAPPENDIX 1
CONSOLIDATED FINANCIAL STATEMENTS
(M€)Year of
issue
Fair valueafter hedging
as ofDecember 31,
2009
Fair valueafter hedging
as ofDecember 31,
2008
Fair valueafter hedging
as ofDecember 31,
2007 Currency MaturityInitial rate before
hedging instruments
TOTAL CAPITAL (continued)Bond 2008 64 64 – CHF 2012 2.385%Bond 2008 50 50 – EUR 2012 3.250%Bond 2008 63 63 – GBP 2012 4.625%Bond 2008 63 63 – GBP 2012 4.625%Bond 2008 63 64 – GBP 2012 4.625%Bond 2008 62 62 – NOK 2012 6.000%Bond 2008 69 69 – USD 2012 5.000%Bond 2008 60 60 – AUD 2013 7.500%Bond 2008 61 61 – AUD 2013 7.500%Bond 2008 127 128 – CHF 2013 3.135%Bond 2008 62 63 – CHF 2013 3.135%Bond 2008 200 200 – EUR 2013 4.125%Bond 2008 100 100 – EUR 2013 4.125%Bond 2008 1,000 1,002 – EUR 2013 4.750%Bond 2008 63 63 – GBP 2013 5.500%Bond 2008 149 149 – JPY 2013 EURIBOR 6 months + 0.008%Bond 2008 191 194 – USD 2013 4.000%Bond 2008 61 61 – CHF 2015 3.135%Bond 2008 62 62 – CHF 2015 3.135%Bond 2008 61 62 – CHF 2015 3.135%Bond 2008 62 62 – CHF 2018 3.135%Bond 2009 56 – – AUD 2013 5.500%Bond 2009 54 – – AUD 2013 5.500%Bond 2009 236 – – CHF 2013 2.500%Bond 2009 77 – – USD 2013 4.000%Bond 2009 131 – – CHF 2014 2.625%Bond 2009 998 – – EUR 2014 3.500%Bond 2009 150 – – EUR 2014 3.500%Bond 2009 40 – – HKD 2014 3.240%Bond 2009 96 – – AUD 2015 6.000%Bond 2009 550 – – EUR 2015 3.625%Bond 2009 684 – – USD 2015 3.125%Bond 2009 208 – – USD 2015 3.125%Bond 2009 99 – – CHF 2016 2.385%Bond 2009 115 – – GBP 2017 4.250%Bond 2009 225 – – GBP 2017 4.250%Bond 2009 448 – – EUR 2019 4.875%Bond 2009 602 – – EUR 2019 4.875%Bond 2009 69 – – HKD 2019 4.180%Bond 2009 347 – – USD 2021 4.250%Bond 2009 806 – – EUR 2024 5.125%Current portion (less than oneyear) (1,937) (722) (1,222)
Total TOTAL CAPITAL (a) 17,315 13,380 10,136
Other consolidated subsidiaries 153 103 110
Total 17,584 13,667 11,650
(a) TOTAL CAPITAL is a wholly-owned indirect subsidiary of TOTAL S.A. (with the exception of one share held by each member of its Board of Directors). It acts as a financingvehicle for the Group. Its debt securities are fully and unconditionally guaranteed by TOTAL S.A. as to payment of principal, premium, if any, interest and any other amounts due.
/ 229TOTAL
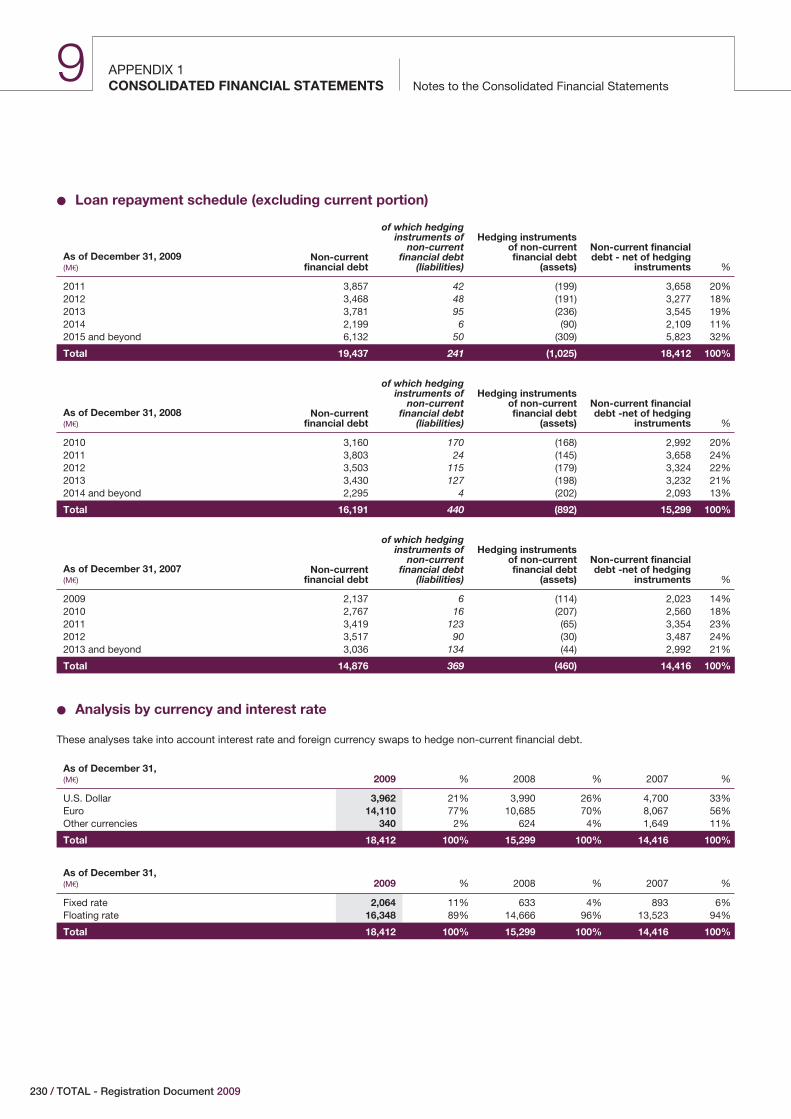
APPENDIX 1Notes to the Consolidated Financial StatementsCONSOLIDATED FINANCIAL STATEMENTS
9
‹ Loan repayment schedule (excluding current portion)
As of December 31, 2009(M€)
Non-currentfinancial debt
of which hedginginstruments of
non-currentfinancial debt
(liabilities)
Hedging instrumentsof non-currentfinancial debt
(assets)
Non-current financialdebt - net of hedging
instruments %
2011 3,857 42 (199) 3,658 20%2012 3,468 48 (191) 3,277 18%2013 3,781 95 (236) 3,545 19%2014 2,199 6 (90) 2,109 11%2015 and beyond 6,132 50 (309) 5,823 32%
Total 19,437 241 (1,025) 18,412 100%
As of December 31, 2008(M€)
Non-currentfinancial debt
of which hedginginstruments of
non-currentfinancial debt
(liabilities)
Hedging instrumentsof non-currentfinancial debt
(assets)
Non-current financialdebt -net of hedging
instruments %
2010 3,160 170 (168) 2,992 20%2011 3,803 24 (145) 3,658 24%2012 3,503 115 (179) 3,324 22%2013 3,430 127 (198) 3,232 21%2014 and beyond 2,295 4 (202) 2,093 13%
Total 16,191 440 (892) 15,299 100%
As of December 31, 2007(M€)
Non-currentfinancial debt
of which hedginginstruments of
non-currentfinancial debt
(liabilities)
Hedging instrumentsof non-currentfinancial debt
(assets)
Non-current financialdebt -net of hedging
instruments %
2009 2,137 6 (114) 2,023 14%2010 2,767 16 (207) 2,560 18%2011 3,419 123 (65) 3,354 23%2012 3,517 90 (30) 3,487 24%2013 and beyond 3,036 134 (44) 2,992 21%
Total 14,876 369 (460) 14,416 100%
‹ Analysis by currency and interest rate
These analyses take into account interest rate and foreign currency swaps to hedge non-current financial debt.
As of December 31,(M€) 2009 % 2008 % 2007 %
U.S. Dollar 3,962 21% 3,990 26% 4,700 33%Euro 14,110 77% 10,685 70% 8,067 56%Other currencies 340 2% 624 4% 1,649 11%
Total 18,412 100% 15,299 100% 14,416 100%
As of December 31,(M€) 2009 % 2008 % 2007 %
Fixed rate 2,064 11% 633 4% 893 6%Floating rate 16,348 89% 14,666 96% 13,523 94%
Total 18,412 100% 15,299 100% 14,416 100%
230 / TOTAL - Registration Document 2009
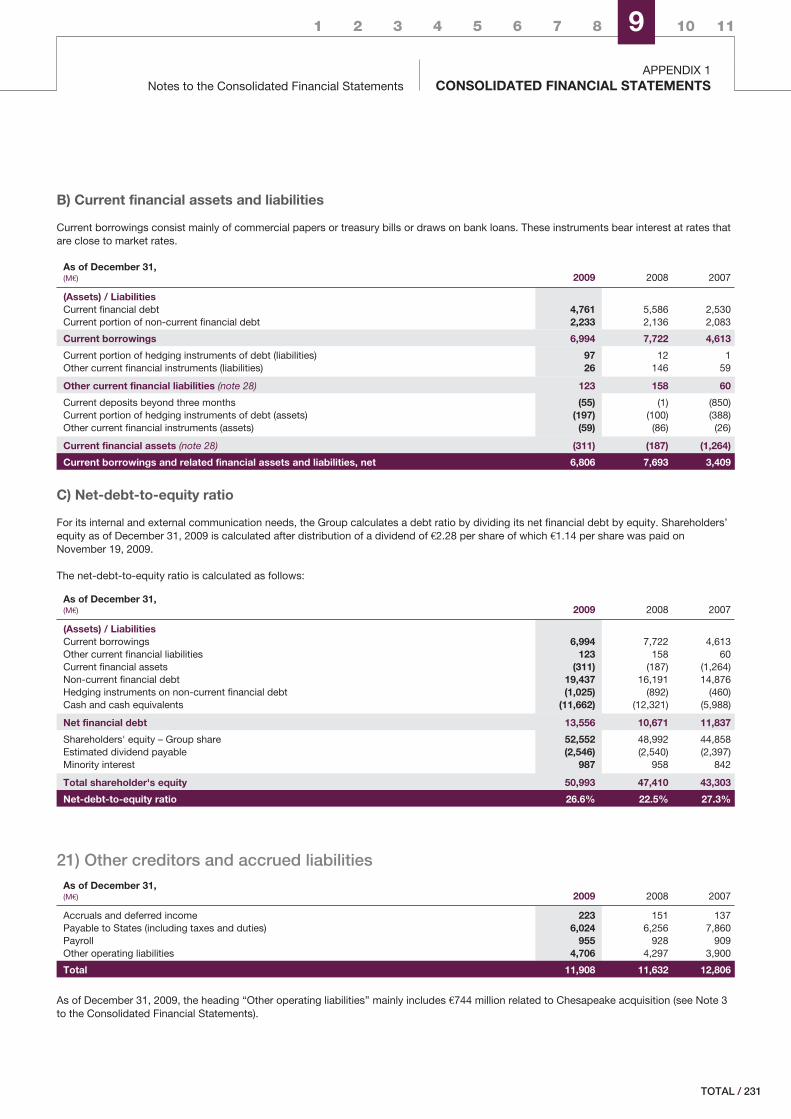
1 2 3 4 5 6 7 8 9 10 11
Notes to the Consolidated Financial StatementsAPPENDIX 1
CONSOLIDATED FINANCIAL STATEMENTS
B) Current financial assets and liabilities
Current borrowings consist mainly of commercial papers or treasury bills or draws on bank loans. These instruments bear interest at rates thatare close to market rates.
As of December 31,(M€) 2009 2008 2007
(Assets) / LiabilitiesCurrent financial debt 4,761 5,586 2,530Current portion of non-current financial debt 2,233 2,136 2,083
Current borrowings 6,994 7,722 4,613
Current portion of hedging instruments of debt (liabilities) 97 12 1Other current financial instruments (liabilities) 26 146 59
Other current financial liabilities (note 28) 123 158 60
Current deposits beyond three months (55) (1) (850)Current portion of hedging instruments of debt (assets) (197) (100) (388)Other current financial instruments (assets) (59) (86) (26)
Current financial assets (note 28) (311) (187) (1,264)
Current borrowings and related financial assets and liabilities, net 6,806 7,693 3,409
C) Net-debt-to-equity ratio
For its internal and external communication needs, the Group calculates a debt ratio by dividing its net financial debt by equity. Shareholders’equity as of December 31, 2009 is calculated after distribution of a dividend of €2.28 per share of which €1.14 per share was paid onNovember 19, 2009.
The net-debt-to-equity ratio is calculated as follows:
As of December 31,(M€) 2009 2008 2007
(Assets) / LiabilitiesCurrent borrowings 6,994 7,722 4,613Other current financial liabilities 123 158 60Current financial assets (311) (187) (1,264)Non-current financial debt 19,437 16,191 14,876Hedging instruments on non-current financial debt (1,025) (892) (460)Cash and cash equivalents (11,662) (12,321) (5,988)
Net financial debt 13,556 10,671 11,837
Shareholders' equity – Group share 52,552 48,992 44,858Estimated dividend payable (2,546) (2,540) (2,397)Minority interest 987 958 842
Total shareholder's equity 50,993 47,410 43,303
Net-debt-to-equity ratio 26.6% 22.5% 27.3%
21) Other creditors and accrued liabilitiesAs of December 31,(M€) 2009 2008 2007
Accruals and deferred income 223 151 137Payable to States (including taxes and duties) 6,024 6,256 7,860Payroll 955 928 909Other operating liabilities 4,706 4,297 3,900
Total 11,908 11,632 12,806
As of December 31, 2009, the heading “Other operating liabilities” mainly includes €744 million related to Chesapeake acquisition (see Note 3to the Consolidated Financial Statements).
/ 231TOTAL
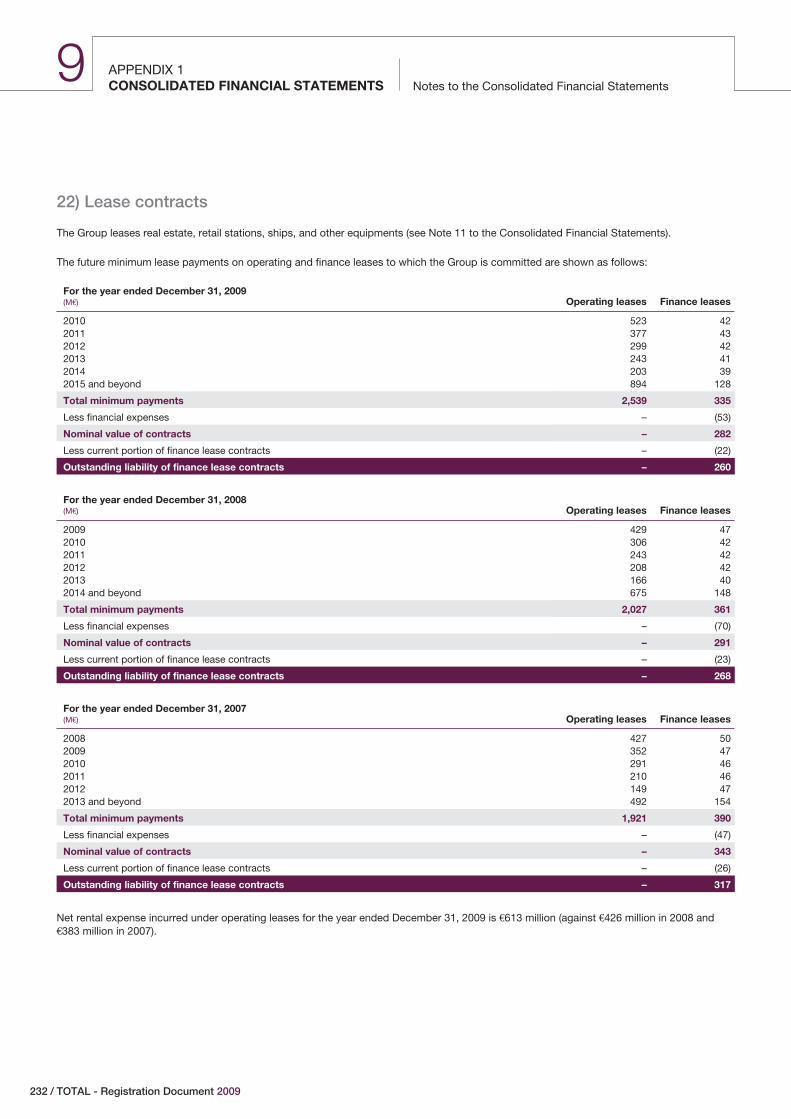
APPENDIX 1Notes to the Consolidated Financial StatementsCONSOLIDATED FINANCIAL STATEMENTS
9
22) Lease contracts
The Group leases real estate, retail stations, ships, and other equipments (see Note 11 to the Consolidated Financial Statements).
The future minimum lease payments on operating and finance leases to which the Group is committed are shown as follows:
For the year ended December 31, 2009(M€) Operating leases Finance leases
2010 523 422011 377 432012 299 422013 243 412014 203 392015 and beyond 894 128
Total minimum payments 2,539 335
Less financial expenses – (53)
Nominal value of contracts – 282
Less current portion of finance lease contracts – (22)
Outstanding liability of finance lease contracts – 260
For the year ended December 31, 2008(M€) Operating leases Finance leases
2009 429 472010 306 422011 243 422012 208 422013 166 402014 and beyond 675 148
Total minimum payments 2,027 361
Less financial expenses – (70)
Nominal value of contracts – 291
Less current portion of finance lease contracts – (23)
Outstanding liability of finance lease contracts – 268
For the year ended December 31, 2007(M€) Operating leases Finance leases
2008 427 502009 352 472010 291 462011 210 462012 149 472013 and beyond 492 154
Total minimum payments 1,921 390
Less financial expenses – (47)
Nominal value of contracts – 343
Less current portion of finance lease contracts – (26)
Outstanding liability of finance lease contracts – 317
Net rental expense incurred under operating leases for the year ended December 31, 2009 is €613 million (against €426 million in 2008 and€383 million in 2007).
232 / TOTAL - Registration Document 2009
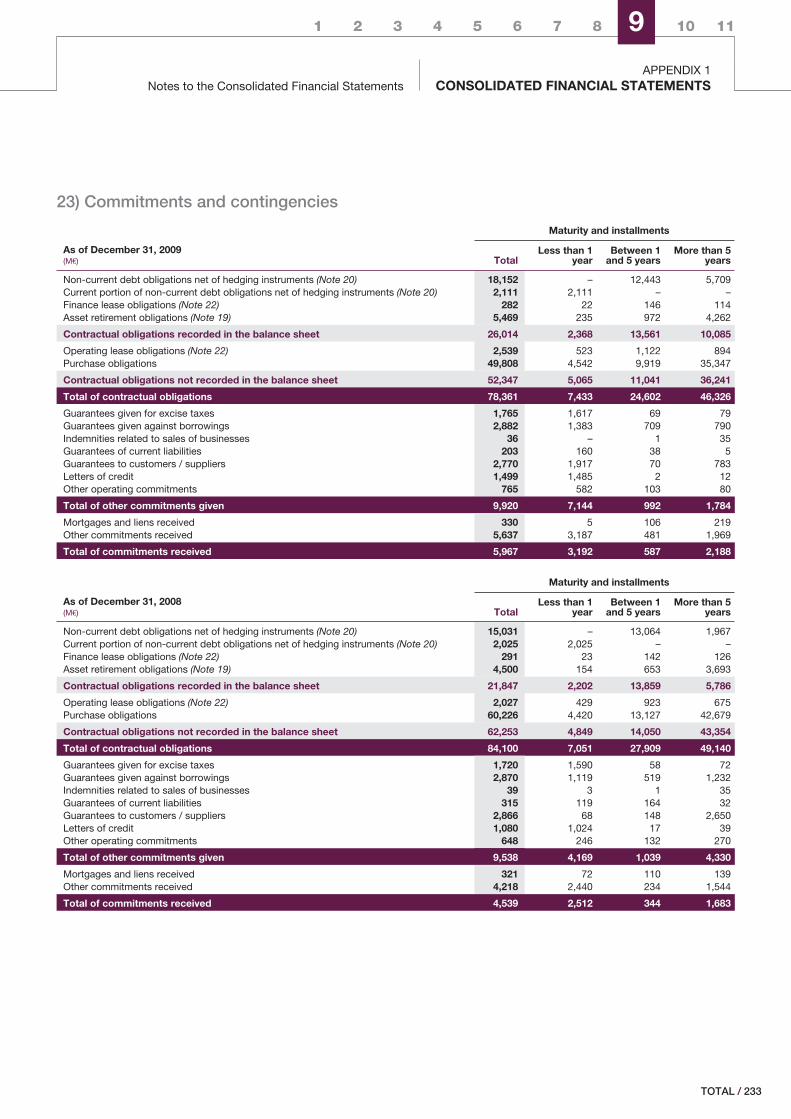
1 2 3 4 5 6 7 8 9 10 11
Notes to the Consolidated Financial StatementsAPPENDIX 1
CONSOLIDATED FINANCIAL STATEMENTS
23) Commitments and contingencies
Maturity and installments
As of December 31, 2009(M€) Total
Less than 1year
Between 1and 5 years
More than 5years
Non-current debt obligations net of hedging instruments (Note 20) 18,152 – 12,443 5,709Current portion of non-current debt obligations net of hedging instruments (Note 20) 2,111 2,111 – –Finance lease obligations (Note 22) 282 22 146 114Asset retirement obligations (Note 19) 5,469 235 972 4,262
Contractual obligations recorded in the balance sheet 26,014 2,368 13,561 10,085
Operating lease obligations (Note 22) 2,539 523 1,122 894Purchase obligations 49,808 4,542 9,919 35,347
Contractual obligations not recorded in the balance sheet 52,347 5,065 11,041 36,241
Total of contractual obligations 78,361 7,433 24,602 46,326
Guarantees given for excise taxes 1,765 1,617 69 79Guarantees given against borrowings 2,882 1,383 709 790Indemnities related to sales of businesses 36 – 1 35Guarantees of current liabilities 203 160 38 5Guarantees to customers / suppliers 2,770 1,917 70 783Letters of credit 1,499 1,485 2 12Other operating commitments 765 582 103 80
Total of other commitments given 9,920 7,144 992 1,784
Mortgages and liens received 330 5 106 219Other commitments received 5,637 3,187 481 1,969
Total of commitments received 5,967 3,192 587 2,188
Maturity and installments
As of December 31, 2008(M€) Total
Less than 1year
Between 1and 5 years
More than 5years
Non-current debt obligations net of hedging instruments (Note 20) 15,031 – 13,064 1,967Current portion of non-current debt obligations net of hedging instruments (Note 20) 2,025 2,025 – –Finance lease obligations (Note 22) 291 23 142 126Asset retirement obligations (Note 19) 4,500 154 653 3,693
Contractual obligations recorded in the balance sheet 21,847 2,202 13,859 5,786
Operating lease obligations (Note 22) 2,027 429 923 675Purchase obligations 60,226 4,420 13,127 42,679
Contractual obligations not recorded in the balance sheet 62,253 4,849 14,050 43,354
Total of contractual obligations 84,100 7,051 27,909 49,140
Guarantees given for excise taxes 1,720 1,590 58 72Guarantees given against borrowings 2,870 1,119 519 1,232Indemnities related to sales of businesses 39 3 1 35Guarantees of current liabilities 315 119 164 32Guarantees to customers / suppliers 2,866 68 148 2,650Letters of credit 1,080 1,024 17 39Other operating commitments 648 246 132 270
Total of other commitments given 9,538 4,169 1,039 4,330
Mortgages and liens received 321 72 110 139Other commitments received 4,218 2,440 234 1,544
Total of commitments received 4,539 2,512 344 1,683
/ 233TOTAL
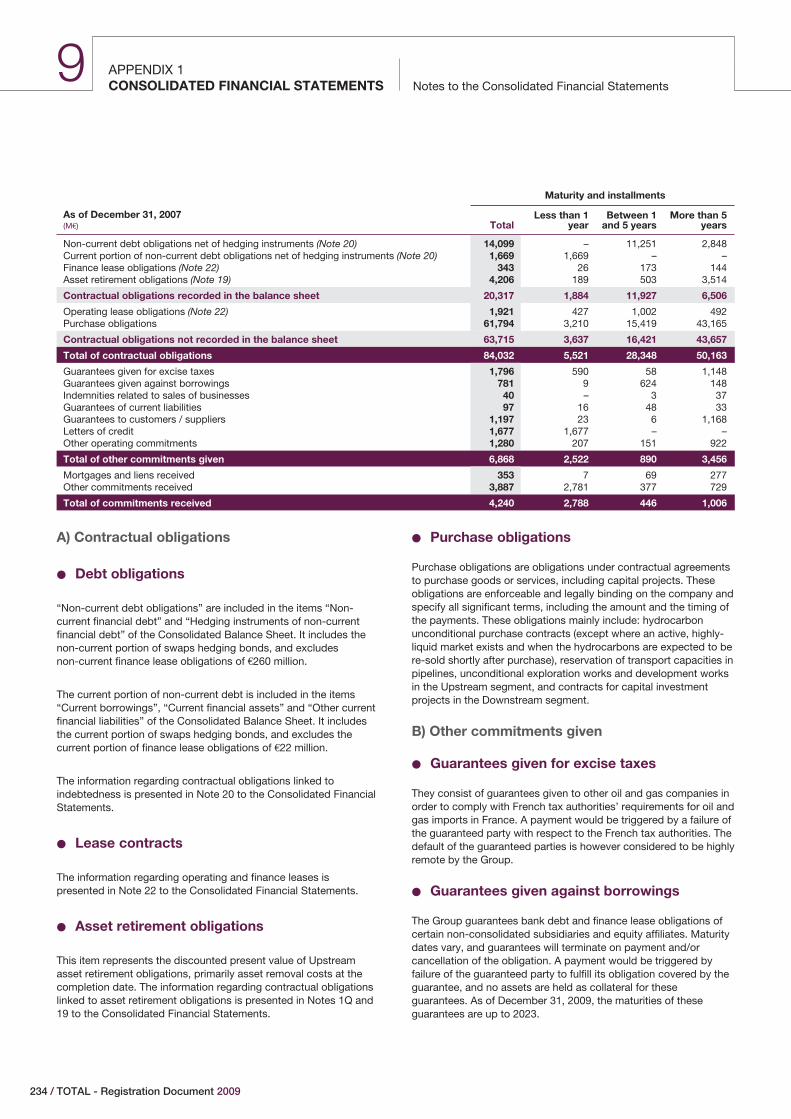
APPENDIX 1Notes to the Consolidated Financial StatementsCONSOLIDATED FINANCIAL STATEMENTS
9
Maturity and installments
As of December 31, 2007(M€) Total
Less than 1year
Between 1and 5 years
More than 5years
Non-current debt obligations net of hedging instruments (Note 20) 14,099 – 11,251 2,848Current portion of non-current debt obligations net of hedging instruments (Note 20) 1,669 1,669 – –Finance lease obligations (Note 22) 343 26 173 144Asset retirement obligations (Note 19) 4,206 189 503 3,514
Contractual obligations recorded in the balance sheet 20,317 1,884 11,927 6,506
Operating lease obligations (Note 22) 1,921 427 1,002 492Purchase obligations 61,794 3,210 15,419 43,165
Contractual obligations not recorded in the balance sheet 63,715 3,637 16,421 43,657
Total of contractual obligations 84,032 5,521 28,348 50,163
Guarantees given for excise taxes 1,796 590 58 1,148Guarantees given against borrowings 781 9 624 148Indemnities related to sales of businesses 40 – 3 37Guarantees of current liabilities 97 16 48 33Guarantees to customers / suppliers 1,197 23 6 1,168Letters of credit 1,677 1,677 – –Other operating commitments 1,280 207 151 922
Total of other commitments given 6,868 2,522 890 3,456
Mortgages and liens received 353 7 69 277Other commitments received 3,887 2,781 377 729
Total of commitments received 4,240 2,788 446 1,006
A) Contractual obligations
‹ Debt obligations
“Non-current debt obligations” are included in the items “Non-current financial debt” and “Hedging instruments of non-currentfinancial debt” of the Consolidated Balance Sheet. It includes thenon-current portion of swaps hedging bonds, and excludesnon-current finance lease obligations of €260 million.
The current portion of non-current debt is included in the items“Current borrowings”, “Current financial assets” and “Other currentfinancial liabilities” of the Consolidated Balance Sheet. It includesthe current portion of swaps hedging bonds, and excludes thecurrent portion of finance lease obligations of €22 million.
The information regarding contractual obligations linked toindebtedness is presented in Note 20 to the Consolidated FinancialStatements.
‹ Lease contracts
The information regarding operating and finance leases ispresented in Note 22 to the Consolidated Financial Statements.
‹ Asset retirement obligations
This item represents the discounted present value of Upstreamasset retirement obligations, primarily asset removal costs at thecompletion date. The information regarding contractual obligationslinked to asset retirement obligations is presented in Notes 1Q and19 to the Consolidated Financial Statements.
‹ Purchase obligations
Purchase obligations are obligations under contractual agreementsto purchase goods or services, including capital projects. Theseobligations are enforceable and legally binding on the company andspecify all significant terms, including the amount and the timing ofthe payments. These obligations mainly include: hydrocarbonunconditional purchase contracts (except where an active, highly-liquid market exists and when the hydrocarbons are expected to bere-sold shortly after purchase), reservation of transport capacities inpipelines, unconditional exploration works and development worksin the Upstream segment, and contracts for capital investmentprojects in the Downstream segment.
B) Other commitments given
‹ Guarantees given for excise taxes
They consist of guarantees given to other oil and gas companies inorder to comply with French tax authorities’ requirements for oil andgas imports in France. A payment would be triggered by a failure ofthe guaranteed party with respect to the French tax authorities. Thedefault of the guaranteed parties is however considered to be highlyremote by the Group.
‹ Guarantees given against borrowings
The Group guarantees bank debt and finance lease obligations ofcertain non-consolidated subsidiaries and equity affiliates. Maturitydates vary, and guarantees will terminate on payment and/orcancellation of the obligation. A payment would be triggered byfailure of the guaranteed party to fulfill its obligation covered by theguarantee, and no assets are held as collateral for theseguarantees. As of December 31, 2009, the maturities of theseguarantees are up to 2023.
234 / TOTAL - Registration Document 2009
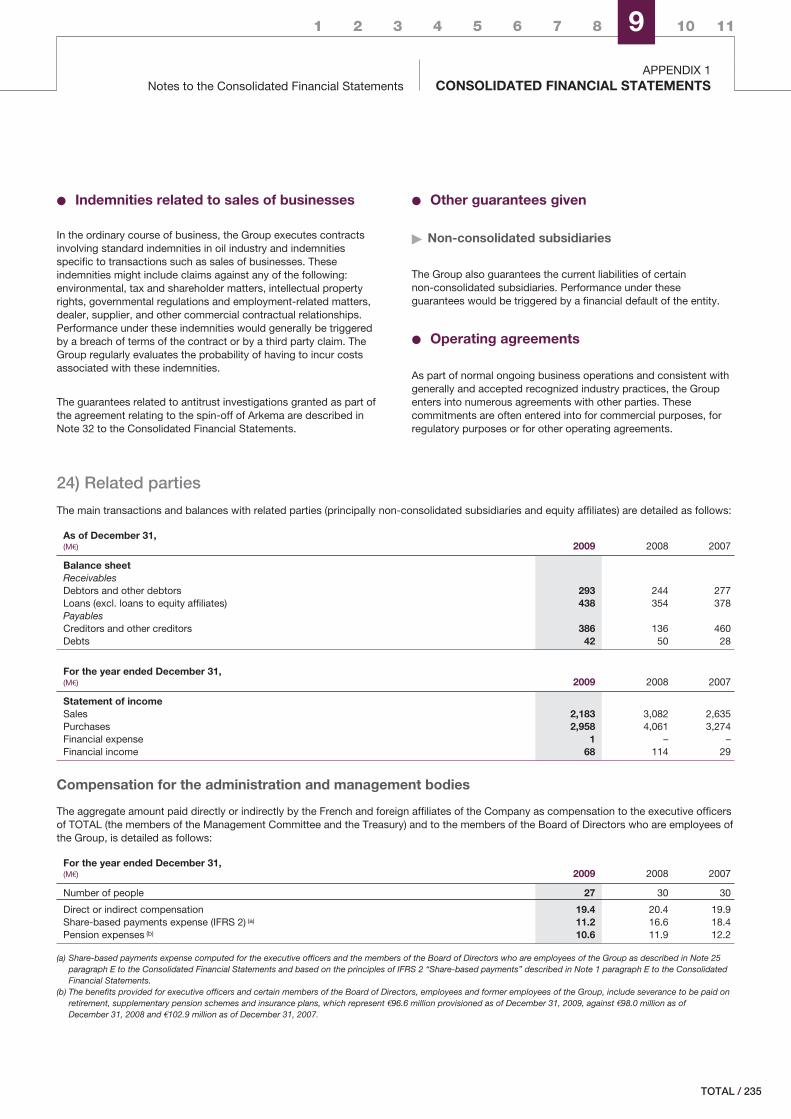
1 2 3 4 5 6 7 8 9 10 11
Notes to the Consolidated Financial StatementsAPPENDIX 1
CONSOLIDATED FINANCIAL STATEMENTS
‹ Indemnities related to sales of businesses
In the ordinary course of business, the Group executes contractsinvolving standard indemnities in oil industry and indemnitiesspecific to transactions such as sales of businesses. Theseindemnities might include claims against any of the following:environmental, tax and shareholder matters, intellectual propertyrights, governmental regulations and employment-related matters,dealer, supplier, and other commercial contractual relationships.Performance under these indemnities would generally be triggeredby a breach of terms of the contract or by a third party claim. TheGroup regularly evaluates the probability of having to incur costsassociated with these indemnities.
The guarantees related to antitrust investigations granted as part ofthe agreement relating to the spin-off of Arkema are described inNote 32 to the Consolidated Financial Statements.
‹ Other guarantees given
� Non-consolidated subsidiaries
The Group also guarantees the current liabilities of certainnon-consolidated subsidiaries. Performance under theseguarantees would be triggered by a financial default of the entity.
‹ Operating agreements
As part of normal ongoing business operations and consistent withgenerally and accepted recognized industry practices, the Groupenters into numerous agreements with other parties. Thesecommitments are often entered into for commercial purposes, forregulatory purposes or for other operating agreements.
24) Related parties
The main transactions and balances with related parties (principally non-consolidated subsidiaries and equity affiliates) are detailed as follows:
As of December 31,(M€) 2009 2008 2007
Balance sheetReceivablesDebtors and other debtors 293 244 277Loans (excl. loans to equity affiliates) 438 354 378PayablesCreditors and other creditors 386 136 460Debts 42 50 28
For the year ended December 31,(M€) 2009 2008 2007
Statement of incomeSales 2,183 3,082 2,635Purchases 2,958 4,061 3,274Financial expense 1 – –Financial income 68 114 29
Compensation for the administration and management bodies
The aggregate amount paid directly or indirectly by the French and foreign affiliates of the Company as compensation to the executive officersof TOTAL (the members of the Management Committee and the Treasury) and to the members of the Board of Directors who are employees ofthe Group, is detailed as follows:
For the year ended December 31,(M€) 2009 2008 2007
Number of people 27 30 30
Direct or indirect compensation 19.4 20.4 19.9Share-based payments expense (IFRS 2) (a) 11.2 16.6 18.4Pension expenses (b) 10.6 11.9 12.2
(a) Share-based payments expense computed for the executive officers and the members of the Board of Directors who are employees of the Group as described in Note 25paragraph E to the Consolidated Financial Statements and based on the principles of IFRS 2 “Share-based payments” described in Note 1 paragraph E to the ConsolidatedFinancial Statements.
(b) The benefits provided for executive officers and certain members of the Board of Directors, employees and former employees of the Group, include severance to be paid onretirement, supplementary pension schemes and insurance plans, which represent €96.6 million provisioned as of December 31, 2009, against €98.0 million as ofDecember 31, 2008 and €102.9 million as of December 31, 2007.
/ 235TOTAL
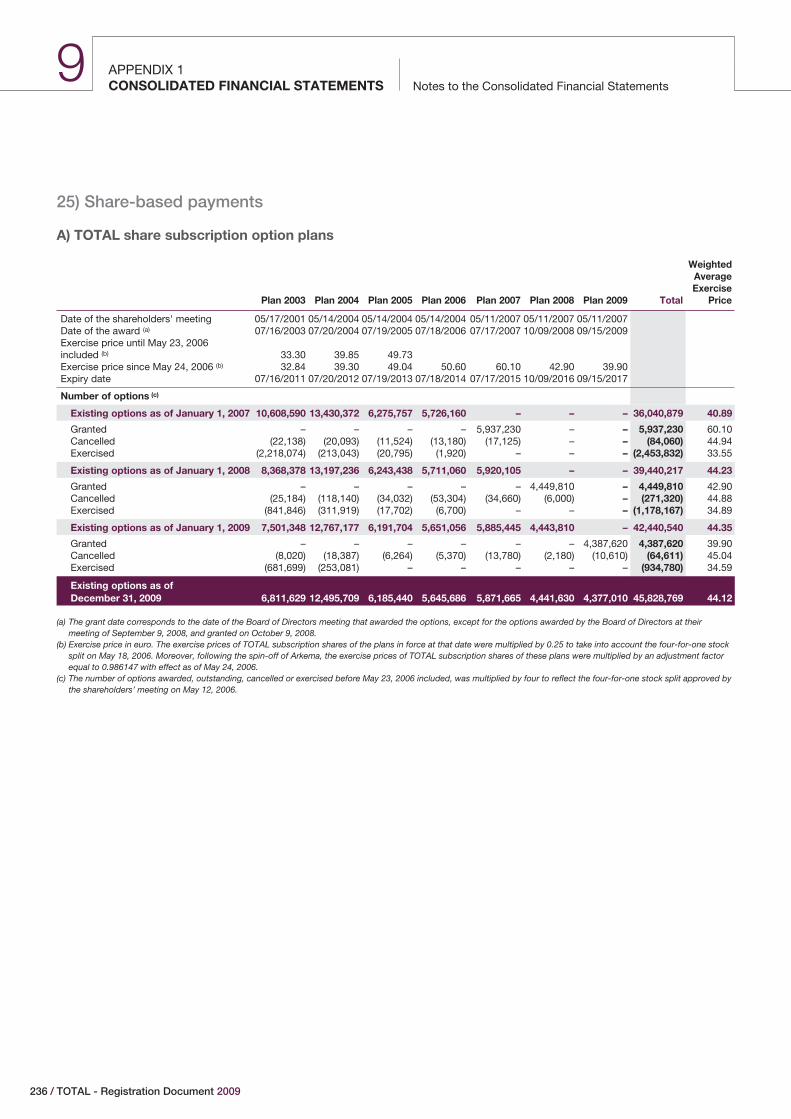
APPENDIX 1Notes to the Consolidated Financial StatementsCONSOLIDATED FINANCIAL STATEMENTS
9
25) Share-based payments
A) TOTAL share subscription option plans
Plan 2003 Plan 2004 Plan 2005 Plan 2006 Plan 2007 Plan 2008 Plan 2009 Total
WeightedAverageExercise
Price
Date of the shareholders' meeting 05/17/2001 05/14/2004 05/14/2004 05/14/2004 05/11/2007 05/11/2007 05/11/2007Date of the award (a) 07/16/2003 07/20/2004 07/19/2005 07/18/2006 07/17/2007 10/09/2008 09/15/2009Exercise price until May 23, 2006included (b) 33.30 39.85 49.73Exercise price since May 24, 2006 (b) 32.84 39.30 49.04 50.60 60.10 42.90 39.90Expiry date 07/16/2011 07/20/2012 07/19/2013 07/18/2014 07/17/2015 10/09/2016 09/15/2017
Number of options (c)
Existing options as of January 1, 2007 10,608,590 13,430,372 6,275,757 5,726,160 – – – 36,040,879 40.89
Granted – – – – 5,937,230 – – 5,937,230 60.10Cancelled (22,138) (20,093) (11,524) (13,180) (17,125) – – (84,060) 44.94Exercised (2,218,074) (213,043) (20,795) (1,920) – – – (2,453,832) 33.55
Existing options as of January 1, 2008 8,368,378 13,197,236 6,243,438 5,711,060 5,920,105 – – 39,440,217 44.23
Granted – – – – – 4,449,810 – 4,449,810 42.90Cancelled (25,184) (118,140) (34,032) (53,304) (34,660) (6,000) – (271,320) 44.88Exercised (841,846) (311,919) (17,702) (6,700) – – – (1,178,167) 34.89
Existing options as of January 1, 2009 7,501,348 12,767,177 6,191,704 5,651,056 5,885,445 4,443,810 – 42,440,540 44.35
Granted – – – – – – 4,387,620 4,387,620 39.90Cancelled (8,020) (18,387) (6,264) (5,370) (13,780) (2,180) (10,610) (64,611) 45.04Exercised (681,699) (253,081) – – – – – (934,780) 34.59
Existing options as ofDecember 31, 2009 6,811,629 12,495,709 6,185,440 5,645,686 5,871,665 4,441,630 4,377,010 45,828,769 44.12
(a) The grant date corresponds to the date of the Board of Directors meeting that awarded the options, except for the options awarded by the Board of Directors at theirmeeting of September 9, 2008, and granted on October 9, 2008.
(b) Exercise price in euro. The exercise prices of TOTAL subscription shares of the plans in force at that date were multiplied by 0.25 to take into account the four-for-one stocksplit on May 18, 2006. Moreover, following the spin-off of Arkema, the exercise prices of TOTAL subscription shares of these plans were multiplied by an adjustment factorequal to 0.986147 with effect as of May 24, 2006.
(c) The number of options awarded, outstanding, cancelled or exercised before May 23, 2006 included, was multiplied by four to reflect the four-for-one stock split approved bythe shareholders’ meeting on May 12, 2006.
236 / TOTAL - Registration Document 2009
1 2 3 4 5 6 7 8 9 10 11
Notes to the Consolidated Financial StatementsAPPENDIX 1
CONSOLIDATED FINANCIAL STATEMENTS
The options, subject to a continued employment condition, areexercisable only after a 2-year period from the date of the Boardmeeting awarding the options and must be exercised within eightyears from this date. Underlying shares may not be sold for fouryears from the date of grant. For the options of the 2007, 2008 and2009 Plans, beneficiaries working for a non-French subsidiary as ofthe grant date are authorized to transfer the shares issued uponexercise of options starting after a 2-year period from the grantdate.
The continued employment condition states that the termination ofthe employment contract will result in the employee losing the rightto exercise the options.
For the 2009 Plan, the Board of Directors decided that for eachbeneficiary other than the CEO of more than 25,000 stock options,one third of the options in excess of this number finally awardedfollowing the 2-year vesting period will be subject to a performancecondition. This condition is based on the average of the Return OnEquity (ROE) of the Group. The average ROE is calculated based onthe consolidated accounts published by TOTAL for fiscal years2009 and 2010. The acquisition rate:
o is equal to zero if the average ROE is less than or equal to 7%;
o varies on straight-line basis between 0% and 100% if the averageROE is greater than 7% and less than 18%; and
o is equal to 100% if the average ROE is greater than or equal to18%.
Furthermore, the Board of Directors decided that the number ofoptions awarded to the CEO is subject to two performanceconditions:
o For 50% of the options granted, the performance condition statesthat the number of options finally granted is based on the averageROE of the Group. The average ROE is calculated based on the
consolidated accounts published by TOTAL for fiscal years 2009and 2010. The acquisition rates equal to zero if the average ROEis less than or equal to 7%; varies on a straight-line basisbetween 0% and 100% if the average ROE is greater than 7%and less than 18%; and is equal to 100% if the average ROE isgreater than or equal to 18%.
o For the other 50% of the options granted, the performancecondition states that the number of options finally granted isbased on the average of the Return On Average Capital Employed(ROACE) of the Group. The average ROACE is calculated basedon the consolidated accounts published by TOTAL for fiscal years2009 and 2010. The acquisition rate is equal to zero if the averageROACE is less than or equal to 6%; varies on a straight-line basisbetween 0% and 100% if the average ROACE is greater than 6%and less than 15%; and is equal to 100% if the average ROACE isgreater than or equal to 15%.
For the 2007 and 2008 Plans, the Board of Directors decided thatfor each beneficiary of more than 25,000 stock options, one third ofthe options in excess of this number finally awarded following the2-year vesting period will be subject to a performance condition.This condition states that the number of subscription options finallygranted is based on the ROE of the Group. The ROE is calculatedbased on the consolidated accounts published by TOTAL for thefiscal year preceding the final grant. The acquisition rate:
o is equal to zero if the ROE is less than or equal to 10%;
o varies on a straight-line basis between 0% and 80% if the ROE isgreater than 10% and less than 18%;
o varies on a straight-line basis between 80% and 100% if the ROEis greater than or equal to 18% and less than 30%; and
o is equal to 100% if the ROE is greater than or equal to 30%.
For the 2007 Plan, the acquisition rate of the options, linked to theperformance condition, amounted to 100%.
/ 237TOTAL
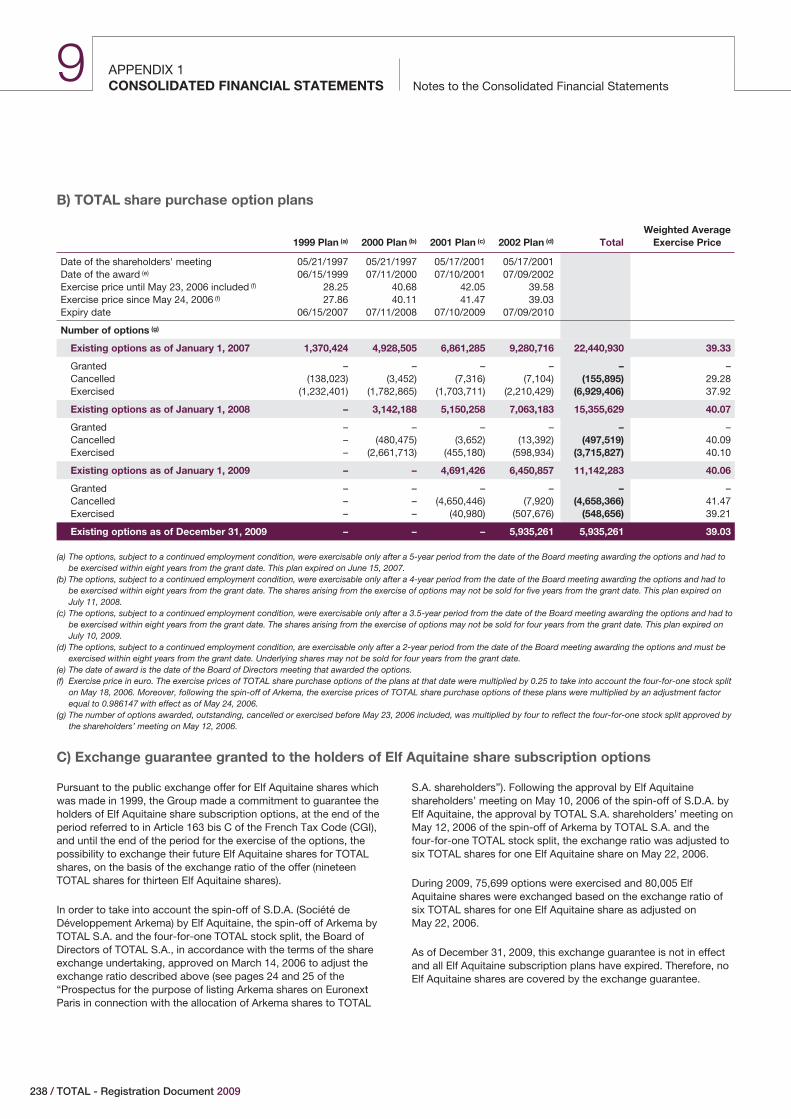
APPENDIX 1Notes to the Consolidated Financial StatementsCONSOLIDATED FINANCIAL STATEMENTS
9
B) TOTAL share purchase option plans
1999 Plan (a) 2000 Plan (b) 2001 Plan (c) 2002 Plan (d) TotalWeighted Average
Exercise Price
Date of the shareholders' meeting 05/21/1997 05/21/1997 05/17/2001 05/17/2001Date of the award (e) 06/15/1999 07/11/2000 07/10/2001 07/09/2002Exercise price until May 23, 2006 included (f) 28.25 40.68 42.05 39.58Exercise price since May 24, 2006 (f) 27.86 40.11 41.47 39.03Expiry date 06/15/2007 07/11/2008 07/10/2009 07/09/2010
Number of options (g)
Existing options as of January 1, 2007 1,370,424 4,928,505 6,861,285 9,280,716 22,440,930 39.33
Granted – – – – – –Cancelled (138,023) (3,452) (7,316) (7,104) (155,895) 29.28Exercised (1,232,401) (1,782,865) (1,703,711) (2,210,429) (6,929,406) 37.92
Existing options as of January 1, 2008 – 3,142,188 5,150,258 7,063,183 15,355,629 40.07
Granted – – – – – –Cancelled – (480,475) (3,652) (13,392) (497,519) 40.09Exercised – (2,661,713) (455,180) (598,934) (3,715,827) 40.10
Existing options as of January 1, 2009 – – 4,691,426 6,450,857 11,142,283 40.06
Granted – – – – – –Cancelled – – (4,650,446) (7,920) (4,658,366) 41.47Exercised – – (40,980) (507,676) (548,656) 39.21
Existing options as of December 31, 2009 – – – 5,935,261 5,935,261 39.03
(a) The options, subject to a continued employment condition, were exercisable only after a 5-year period from the date of the Board meeting awarding the options and had tobe exercised within eight years from the grant date. This plan expired on June 15, 2007.
(b) The options, subject to a continued employment condition, were exercisable only after a 4-year period from the date of the Board meeting awarding the options and had tobe exercised within eight years from the grant date. The shares arising from the exercise of options may not be sold for five years from the grant date. This plan expired onJuly 11, 2008.
(c) The options, subject to a continued employment condition, were exercisable only after a 3.5-year period from the date of the Board meeting awarding the options and had tobe exercised within eight years from the grant date. The shares arising from the exercise of options may not be sold for four years from the grant date. This plan expired onJuly 10, 2009.
(d) The options, subject to a continued employment condition, are exercisable only after a 2-year period from the date of the Board meeting awarding the options and must beexercised within eight years from the grant date. Underlying shares may not be sold for four years from the grant date.
(e) The date of award is the date of the Board of Directors meeting that awarded the options.(f) Exercise price in euro. The exercise prices of TOTAL share purchase options of the plans at that date were multiplied by 0.25 to take into account the four-for-one stock split
on May 18, 2006. Moreover, following the spin-off of Arkema, the exercise prices of TOTAL share purchase options of these plans were multiplied by an adjustment factorequal to 0.986147 with effect as of May 24, 2006.
(g) The number of options awarded, outstanding, cancelled or exercised before May 23, 2006 included, was multiplied by four to reflect the four-for-one stock split approved bythe shareholders’ meeting on May 12, 2006.
C) Exchange guarantee granted to the holders of Elf Aquitaine share subscription options
Pursuant to the public exchange offer for Elf Aquitaine shares whichwas made in 1999, the Group made a commitment to guarantee theholders of Elf Aquitaine share subscription options, at the end of theperiod referred to in Article 163 bis C of the French Tax Code (CGI),and until the end of the period for the exercise of the options, thepossibility to exchange their future Elf Aquitaine shares for TOTALshares, on the basis of the exchange ratio of the offer (nineteenTOTAL shares for thirteen Elf Aquitaine shares).
In order to take into account the spin-off of S.D.A. (Société deDéveloppement Arkema) by Elf Aquitaine, the spin-off of Arkema byTOTAL S.A. and the four-for-one TOTAL stock split, the Board ofDirectors of TOTAL S.A., in accordance with the terms of the shareexchange undertaking, approved on March 14, 2006 to adjust theexchange ratio described above (see pages 24 and 25 of the“Prospectus for the purpose of listing Arkema shares on EuronextParis in connection with the allocation of Arkema shares to TOTAL
S.A. shareholders”). Following the approval by Elf Aquitaineshareholders’ meeting on May 10, 2006 of the spin-off of S.D.A. byElf Aquitaine, the approval by TOTAL S.A. shareholders’ meeting onMay 12, 2006 of the spin-off of Arkema by TOTAL S.A. and thefour-for-one TOTAL stock split, the exchange ratio was adjusted tosix TOTAL shares for one Elf Aquitaine share on May 22, 2006.
During 2009, 75,699 options were exercised and 80,005 ElfAquitaine shares were exchanged based on the exchange ratio ofsix TOTAL shares for one Elf Aquitaine share as adjusted onMay 22, 2006.
As of December 31, 2009, this exchange guarantee is not in effectand all Elf Aquitaine subscription plans have expired. Therefore, noElf Aquitaine shares are covered by the exchange guarantee.
238 / TOTAL - Registration Document 2009
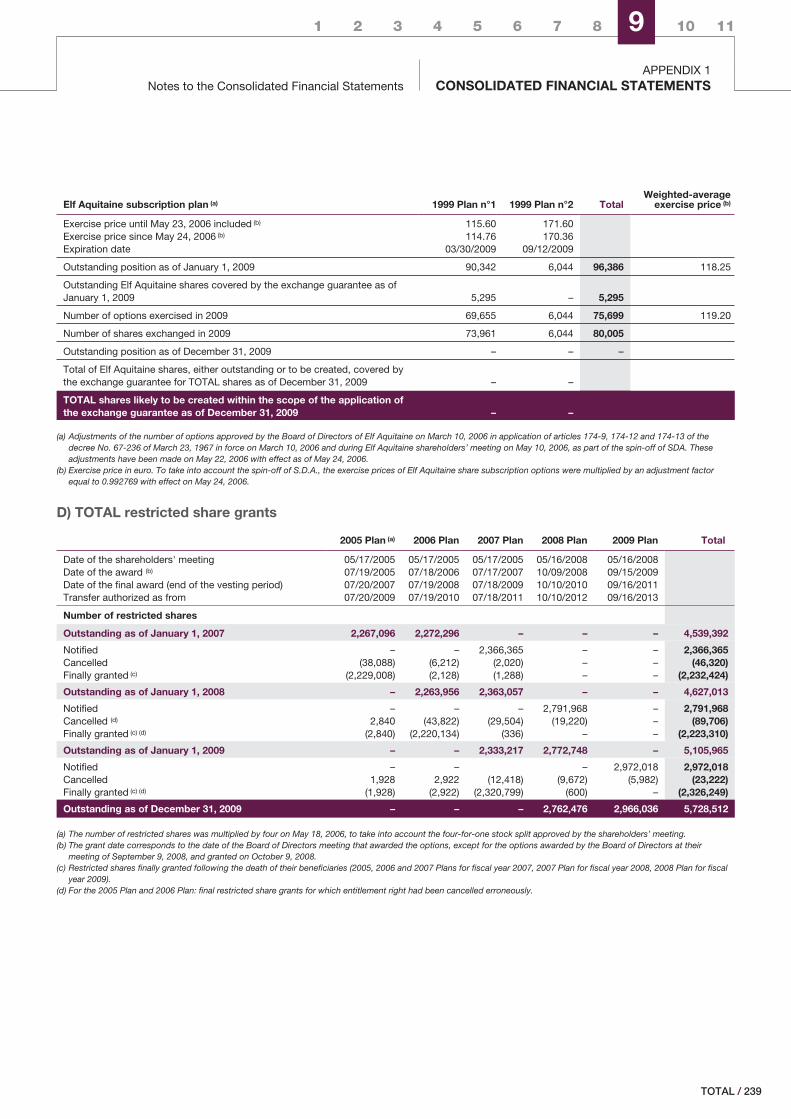
1 2 3 4 5 6 7 8 9 10 11
Notes to the Consolidated Financial StatementsAPPENDIX 1
CONSOLIDATED FINANCIAL STATEMENTS
Elf Aquitaine subscription plan (a) 1999 Plan n°1 1999 Plan n°2 TotalWeighted-average
exercise price (b)
Exercise price until May 23, 2006 included (b) 115.60 171.60Exercise price since May 24, 2006 (b) 114.76 170.36Expiration date 03/30/2009 09/12/2009
Outstanding position as of January 1, 2009 90,342 6,044 96,386 118.25
Outstanding Elf Aquitaine shares covered by the exchange guarantee as ofJanuary 1, 2009 5,295 – 5,295
Number of options exercised in 2009 69,655 6,044 75,699 119.20
Number of shares exchanged in 2009 73,961 6,044 80,005
Outstanding position as of December 31, 2009 – – –
Total of Elf Aquitaine shares, either outstanding or to be created, covered bythe exchange guarantee for TOTAL shares as of December 31, 2009 – –
TOTAL shares likely to be created within the scope of the application ofthe exchange guarantee as of December 31, 2009 – –
(a) Adjustments of the number of options approved by the Board of Directors of Elf Aquitaine on March 10, 2006 in application of articles 174-9, 174-12 and 174-13 of thedecree No. 67-236 of March 23, 1967 in force on March 10, 2006 and during Elf Aquitaine shareholders’ meeting on May 10, 2006, as part of the spin-off of SDA. Theseadjustments have been made on May 22, 2006 with effect as of May 24, 2006.
(b) Exercise price in euro. To take into account the spin-off of S.D.A., the exercise prices of Elf Aquitaine share subscription options were multiplied by an adjustment factorequal to 0.992769 with effect on May 24, 2006.
D) TOTAL restricted share grants
2005 Plan (a) 2006 Plan 2007 Plan 2008 Plan 2009 Plan Total
Date of the shareholders' meeting 05/17/2005 05/17/2005 05/17/2005 05/16/2008 05/16/2008Date of the award (b) 07/19/2005 07/18/2006 07/17/2007 10/09/2008 09/15/2009Date of the final award (end of the vesting period) 07/20/2007 07/19/2008 07/18/2009 10/10/2010 09/16/2011Transfer authorized as from 07/20/2009 07/19/2010 07/18/2011 10/10/2012 09/16/2013
Number of restricted shares
Outstanding as of January 1, 2007 2,267,096 2,272,296 – – – 4,539,392
Notified – – 2,366,365 – – 2,366,365Cancelled (38,088) (6,212) (2,020) – – (46,320)Finally granted (c) (2,229,008) (2,128) (1,288) – – (2,232,424)
Outstanding as of January 1, 2008 – 2,263,956 2,363,057 – – 4,627,013
Notified – – – 2,791,968 – 2,791,968Cancelled (d) 2,840 (43,822) (29,504) (19,220) – (89,706)Finally granted (c) (d) (2,840) (2,220,134) (336) – – (2,223,310)
Outstanding as of January 1, 2009 – – 2,333,217 2,772,748 – 5,105,965
Notified – – – 2,972,018 2,972,018Cancelled 1,928 2,922 (12,418) (9,672) (5,982) (23,222)Finally granted (c) (d) (1,928) (2,922) (2,320,799) (600) – (2,326,249)
Outstanding as of December 31, 2009 – – – 2,762,476 2,966,036 5,728,512
(a) The number of restricted shares was multiplied by four on May 18, 2006, to take into account the four-for-one stock split approved by the shareholders’ meeting.(b) The grant date corresponds to the date of the Board of Directors meeting that awarded the options, except for the options awarded by the Board of Directors at their
meeting of September 9, 2008, and granted on October 9, 2008.(c) Restricted shares finally granted following the death of their beneficiaries (2005, 2006 and 2007 Plans for fiscal year 2007, 2007 Plan for fiscal year 2008, 2008 Plan for fiscal
year 2009).(d) For the 2005 Plan and 2006 Plan: final restricted share grants for which entitlement right had been cancelled erroneously.
/ 239TOTAL
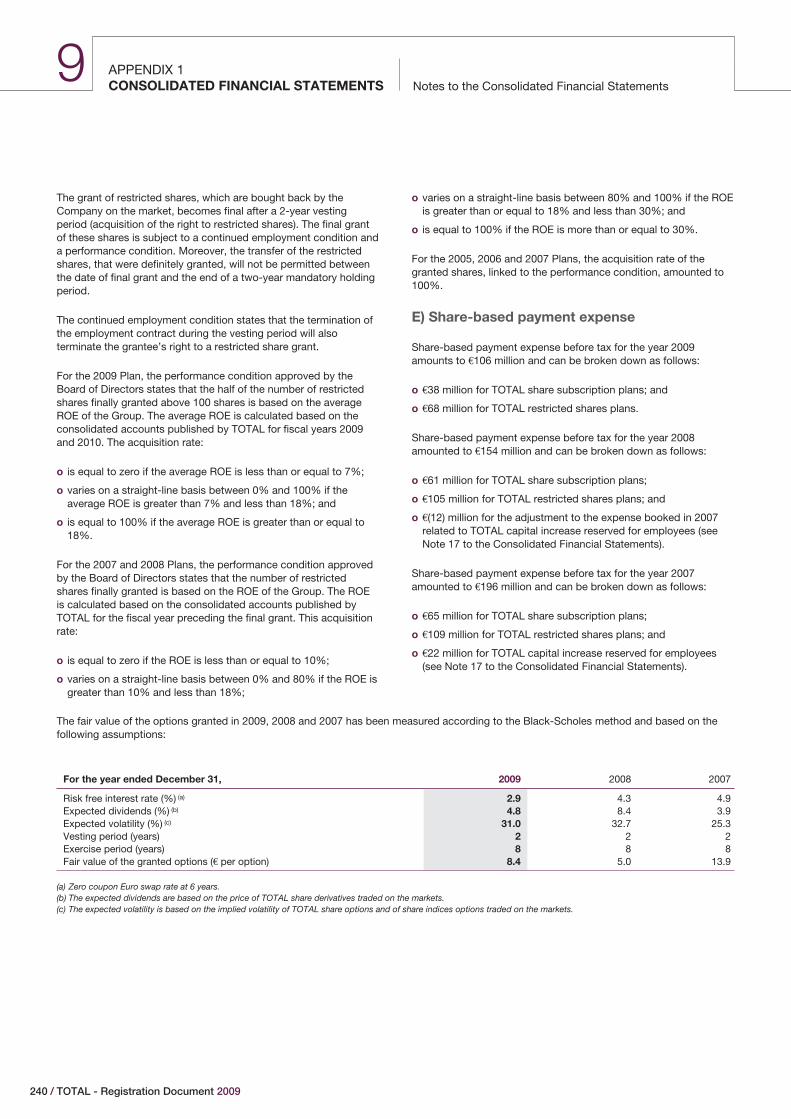
APPENDIX 1Notes to the Consolidated Financial StatementsCONSOLIDATED FINANCIAL STATEMENTS
9
The grant of restricted shares, which are bought back by theCompany on the market, becomes final after a 2-year vestingperiod (acquisition of the right to restricted shares). The final grantof these shares is subject to a continued employment condition anda performance condition. Moreover, the transfer of the restrictedshares, that were definitely granted, will not be permitted betweenthe date of final grant and the end of a two-year mandatory holdingperiod.
The continued employment condition states that the termination ofthe employment contract during the vesting period will alsoterminate the grantee’s right to a restricted share grant.
For the 2009 Plan, the performance condition approved by theBoard of Directors states that the half of the number of restrictedshares finally granted above 100 shares is based on the averageROE of the Group. The average ROE is calculated based on theconsolidated accounts published by TOTAL for fiscal years 2009and 2010. The acquisition rate:
o is equal to zero if the average ROE is less than or equal to 7%;
o varies on a straight-line basis between 0% and 100% if theaverage ROE is greater than 7% and less than 18%; and
o is equal to 100% if the average ROE is greater than or equal to18%.
For the 2007 and 2008 Plans, the performance condition approvedby the Board of Directors states that the number of restrictedshares finally granted is based on the ROE of the Group. The ROEis calculated based on the consolidated accounts published byTOTAL for the fiscal year preceding the final grant. This acquisitionrate:
o is equal to zero if the ROE is less than or equal to 10%;
o varies on a straight-line basis between 0% and 80% if the ROE isgreater than 10% and less than 18%;
o varies on a straight-line basis between 80% and 100% if the ROEis greater than or equal to 18% and less than 30%; and
o is equal to 100% if the ROE is more than or equal to 30%.
For the 2005, 2006 and 2007 Plans, the acquisition rate of thegranted shares, linked to the performance condition, amounted to100%.
E) Share-based payment expense
Share-based payment expense before tax for the year 2009amounts to €106 million and can be broken down as follows:
o €38 million for TOTAL share subscription plans; and
o €68 million for TOTAL restricted shares plans.
Share-based payment expense before tax for the year 2008amounted to €154 million and can be broken down as follows:
o €61 million for TOTAL share subscription plans;
o €105 million for TOTAL restricted shares plans; and
o €(12) million for the adjustment to the expense booked in 2007related to TOTAL capital increase reserved for employees (seeNote 17 to the Consolidated Financial Statements).
Share-based payment expense before tax for the year 2007amounted to €196 million and can be broken down as follows:
o €65 million for TOTAL share subscription plans;
o €109 million for TOTAL restricted shares plans; and
o €22 million for TOTAL capital increase reserved for employees(see Note 17 to the Consolidated Financial Statements).
The fair value of the options granted in 2009, 2008 and 2007 has been measured according to the Black-Scholes method and based on thefollowing assumptions:
For the year ended December 31, 2009 2008 2007
Risk free interest rate (%) (a) 2.9 4.3 4.9Expected dividends (%) (b) 4.8 8.4 3.9Expected volatility (%) (c) 31.0 32.7 25.3Vesting period (years) 2 2 2Exercise period (years) 8 8 8Fair value of the granted options (€ per option) 8.4 5.0 13.9
(a) Zero coupon Euro swap rate at 6 years.(b) The expected dividends are based on the price of TOTAL share derivatives traded on the markets.(c) The expected volatility is based on the implied volatility of TOTAL share options and of share indices options traded on the markets.
240 / TOTAL - Registration Document 2009
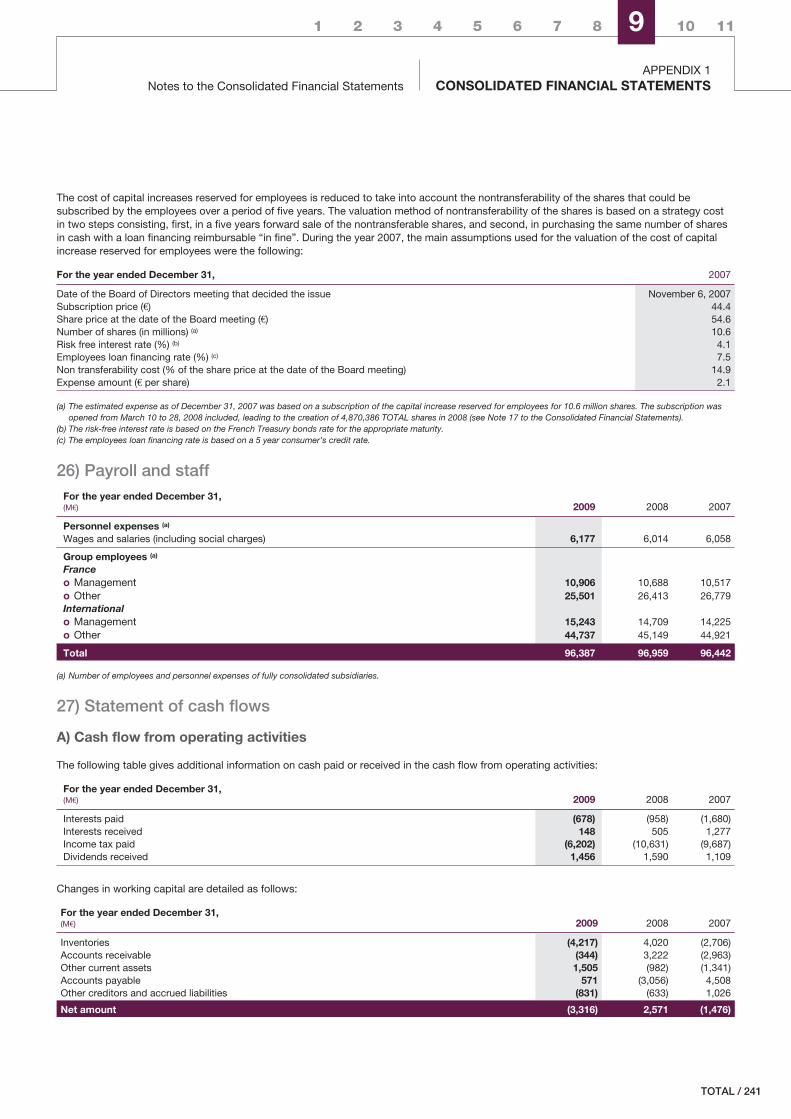
1 2 3 4 5 6 7 8 9 10 11
Notes to the Consolidated Financial StatementsAPPENDIX 1
CONSOLIDATED FINANCIAL STATEMENTS
The cost of capital increases reserved for employees is reduced to take into account the nontransferability of the shares that could besubscribed by the employees over a period of five years. The valuation method of nontransferability of the shares is based on a strategy costin two steps consisting, first, in a five years forward sale of the nontransferable shares, and second, in purchasing the same number of sharesin cash with a loan financing reimbursable “in fine”. During the year 2007, the main assumptions used for the valuation of the cost of capitalincrease reserved for employees were the following:
For the year ended December 31, 2007
Date of the Board of Directors meeting that decided the issue November 6, 2007Subscription price (€) 44.4Share price at the date of the Board meeting (€) 54.6Number of shares (in millions) (a) 10.6Risk free interest rate (%) (b) 4.1Employees loan financing rate (%) (c) 7.5Non transferability cost (% of the share price at the date of the Board meeting) 14.9Expense amount (€ per share) 2.1
(a) The estimated expense as of December 31, 2007 was based on a subscription of the capital increase reserved for employees for 10.6 million shares. The subscription wasopened from March 10 to 28, 2008 included, leading to the creation of 4,870,386 TOTAL shares in 2008 (see Note 17 to the Consolidated Financial Statements).
(b) The risk-free interest rate is based on the French Treasury bonds rate for the appropriate maturity.(c) The employees loan financing rate is based on a 5 year consumer’s credit rate.
26) Payroll and staffFor the year ended December 31,(M€) 2009 2008 2007
Personnel expenses (a)
Wages and salaries (including social charges) 6,177 6,014 6,058
Group employees (a)
Franceo Management 10,906 10,688 10,517o Other 25,501 26,413 26,779Internationalo Management 15,243 14,709 14,225o Other 44,737 45,149 44,921
Total 96,387 96,959 96,442
(a) Number of employees and personnel expenses of fully consolidated subsidiaries.
27) Statement of cash flows
A) Cash flow from operating activities
The following table gives additional information on cash paid or received in the cash flow from operating activities:
For the year ended December 31,(M€) 2009 2008 2007
Interests paid (678) (958) (1,680)Interests received 148 505 1,277Income tax paid (6,202) (10,631) (9,687)Dividends received 1,456 1,590 1,109
Changes in working capital are detailed as follows:
For the year ended December 31,(M€) 2009 2008 2007
Inventories (4,217) 4,020 (2,706)Accounts receivable (344) 3,222 (2,963)Other current assets 1,505 (982) (1,341)Accounts payable 571 (3,056) 4,508Other creditors and accrued liabilities (831) (633) 1,026
Net amount (3,316) 2,571 (1,476)
/ 241TOTAL
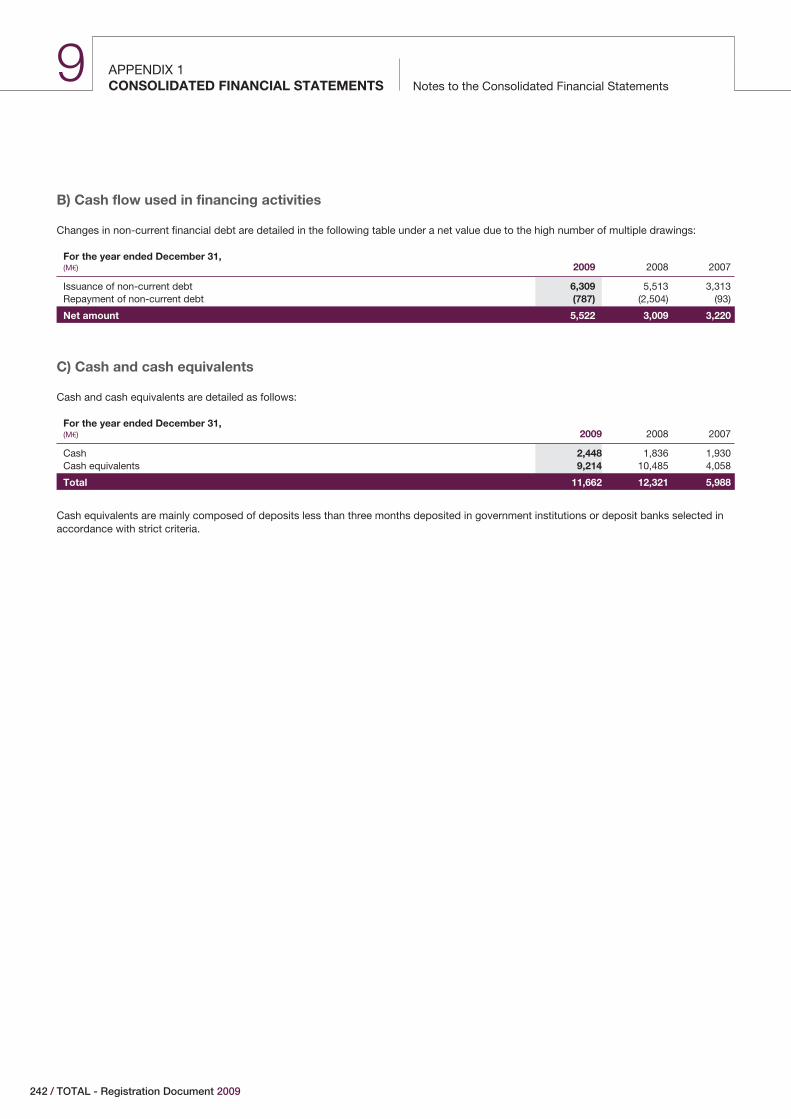
APPENDIX 1Notes to the Consolidated Financial StatementsCONSOLIDATED FINANCIAL STATEMENTS
9
B) Cash flow used in financing activities
Changes in non-current financial debt are detailed in the following table under a net value due to the high number of multiple drawings:
For the year ended December 31,(M€) 2009 2008 2007
Issuance of non-current debt 6,309 5,513 3,313Repayment of non-current debt (787) (2,504) (93)
Net amount 5,522 3,009 3,220
C) Cash and cash equivalents
Cash and cash equivalents are detailed as follows:
For the year ended December 31,(M€) 2009 2008 2007
Cash 2,448 1,836 1,930Cash equivalents 9,214 10,485 4,058
Total 11,662 12,321 5,988
Cash equivalents are mainly composed of deposits less than three months deposited in government institutions or deposit banks selected inaccordance with strict criteria.
242 / TOTAL - Registration Document 2009
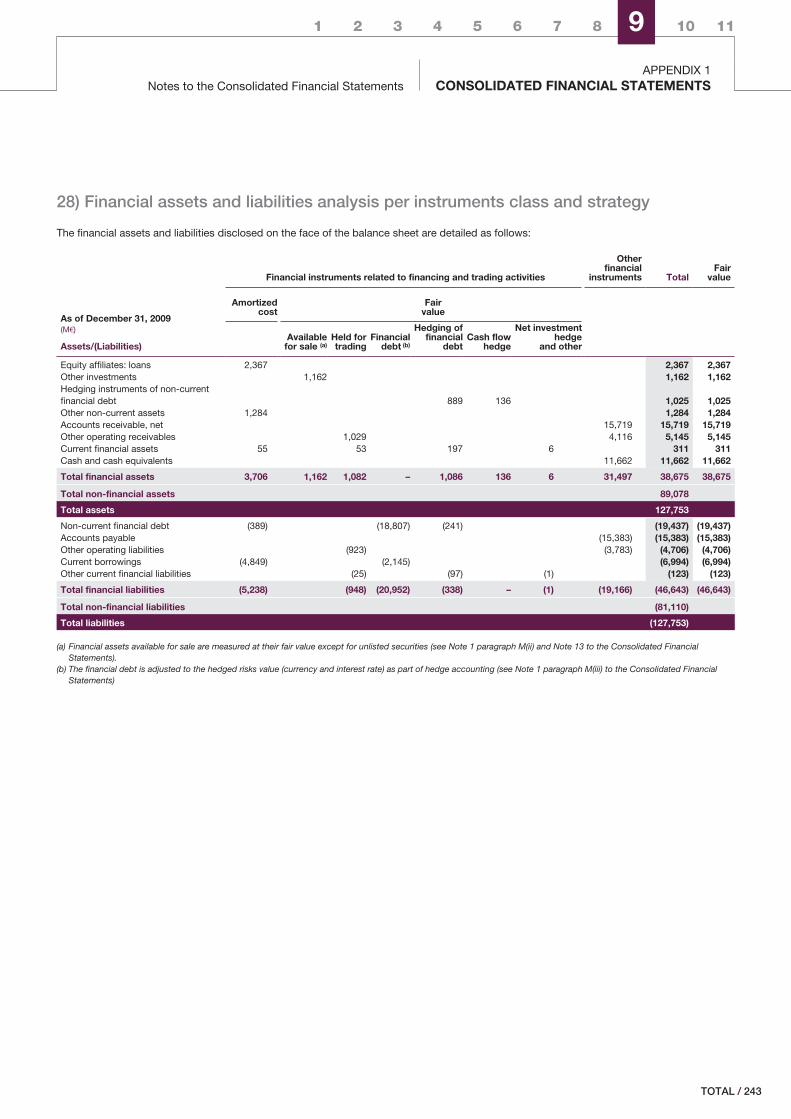
1 2 3 4 5 6 7 8 9 10 11
Notes to the Consolidated Financial StatementsAPPENDIX 1
CONSOLIDATED FINANCIAL STATEMENTS
28) Financial assets and liabilities analysis per instruments class and strategy
The financial assets and liabilities disclosed on the face of the balance sheet are detailed as follows:
As of December 31, 2009(M€)
Assets/(Liabilities)
Financial instruments related to financing and trading activities
Otherfinancial
instruments TotalFair
value
Amortizedcost
Fairvalue
Availablefor sale (a)
Held fortrading
Financialdebt (b)
Hedging offinancial
debtCash flow
hedge
Net investmenthedge
and other
Equity affiliates: loans 2,367 2,367 2,367Other investments 1,162 1,162 1,162Hedging instruments of non-currentfinancial debt 889 136 1,025 1,025Other non-current assets 1,284 1,284 1,284Accounts receivable, net 15,719 15,719 15,719Other operating receivables 1,029 4,116 5,145 5,145Current financial assets 55 53 197 6 311 311Cash and cash equivalents 11,662 11,662 11,662
Total financial assets 3,706 1,162 1,082 – 1,086 136 6 31,497 38,675 38,675
Total non-financial assets 89,078
Total assets 127,753
Non-current financial debt (389) (18,807) (241) (19,437) (19,437)Accounts payable (15,383) (15,383) (15,383)Other operating liabilities (923) (3,783) (4,706) (4,706)Current borrowings (4,849) (2,145) (6,994) (6,994)Other current financial liabilities (25) (97) (1) (123) (123)
Total financial liabilities (5,238) (948) (20,952) (338) – (1) (19,166) (46,643) (46,643)
Total non-financial liabilities (81,110)
Total liabilities (127,753)
(a) Financial assets available for sale are measured at their fair value except for unlisted securities (see Note 1 paragraph M(ii) and Note 13 to the Consolidated FinancialStatements).
(b) The financial debt is adjusted to the hedged risks value (currency and interest rate) as part of hedge accounting (see Note 1 paragraph M(iii) to the Consolidated FinancialStatements)
/ 243TOTAL
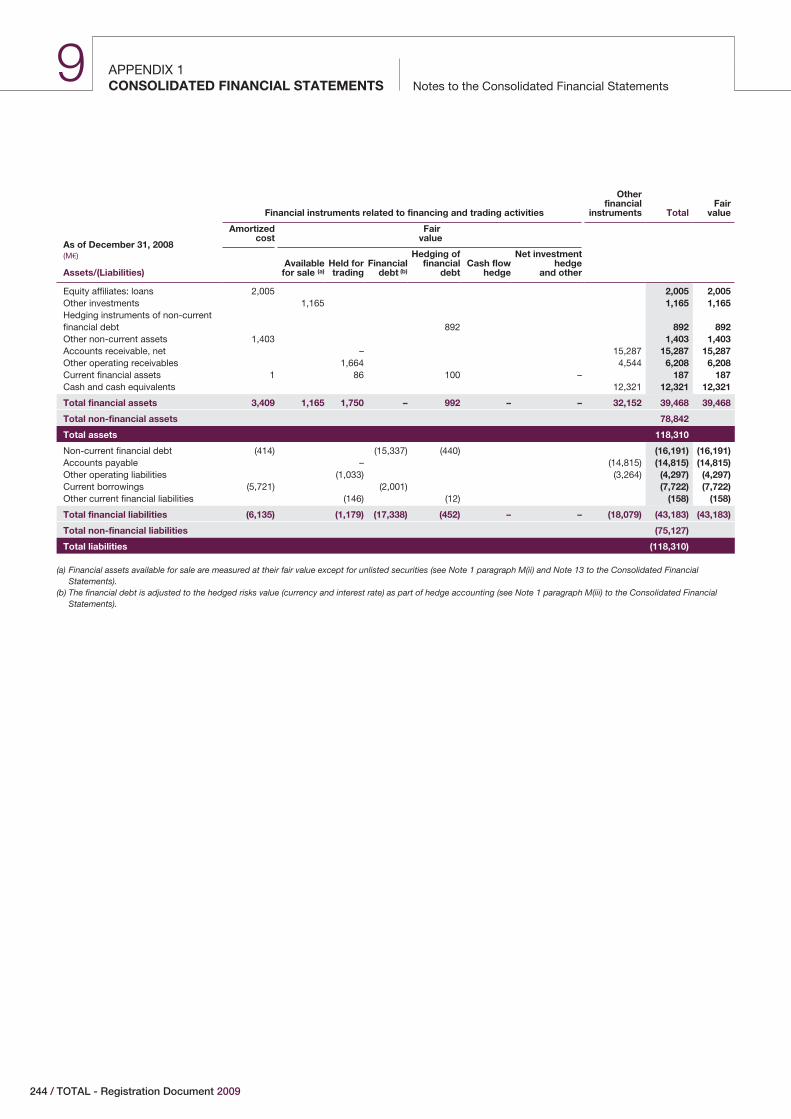
APPENDIX 1Notes to the Consolidated Financial StatementsCONSOLIDATED FINANCIAL STATEMENTS
9
As of December 31, 2008(M€)
Assets/(Liabilities)
Financial instruments related to financing and trading activities
Otherfinancial
instruments TotalFair
value
Amortizedcost
Fairvalue
Availablefor sale (a)
Held fortrading
Financialdebt (b)
Hedging offinancial
debtCash flow
hedge
Net investmenthedge
and other
Equity affiliates: loans 2,005 2,005 2,005Other investments 1,165 1,165 1,165Hedging instruments of non-currentfinancial debt 892 892 892Other non-current assets 1,403 1,403 1,403Accounts receivable, net – 15,287 15,287 15,287Other operating receivables 1,664 4,544 6,208 6,208Current financial assets 1 86 100 – 187 187Cash and cash equivalents 12,321 12,321 12,321
Total financial assets 3,409 1,165 1,750 – 992 – – 32,152 39,468 39,468
Total non-financial assets 78,842
Total assets 118,310
Non-current financial debt (414) (15,337) (440) (16,191) (16,191)Accounts payable – (14,815) (14,815) (14,815)Other operating liabilities (1,033) (3,264) (4,297) (4,297)Current borrowings (5,721) (2,001) (7,722) (7,722)Other current financial liabilities (146) (12) (158) (158)
Total financial liabilities (6,135) (1,179) (17,338) (452) – – (18,079) (43,183) (43,183)
Total non-financial liabilities (75,127)
Total liabilities (118,310)
(a) Financial assets available for sale are measured at their fair value except for unlisted securities (see Note 1 paragraph M(ii) and Note 13 to the Consolidated FinancialStatements).
(b) The financial debt is adjusted to the hedged risks value (currency and interest rate) as part of hedge accounting (see Note 1 paragraph M(iii) to the Consolidated FinancialStatements).
244 / TOTAL - Registration Document 2009
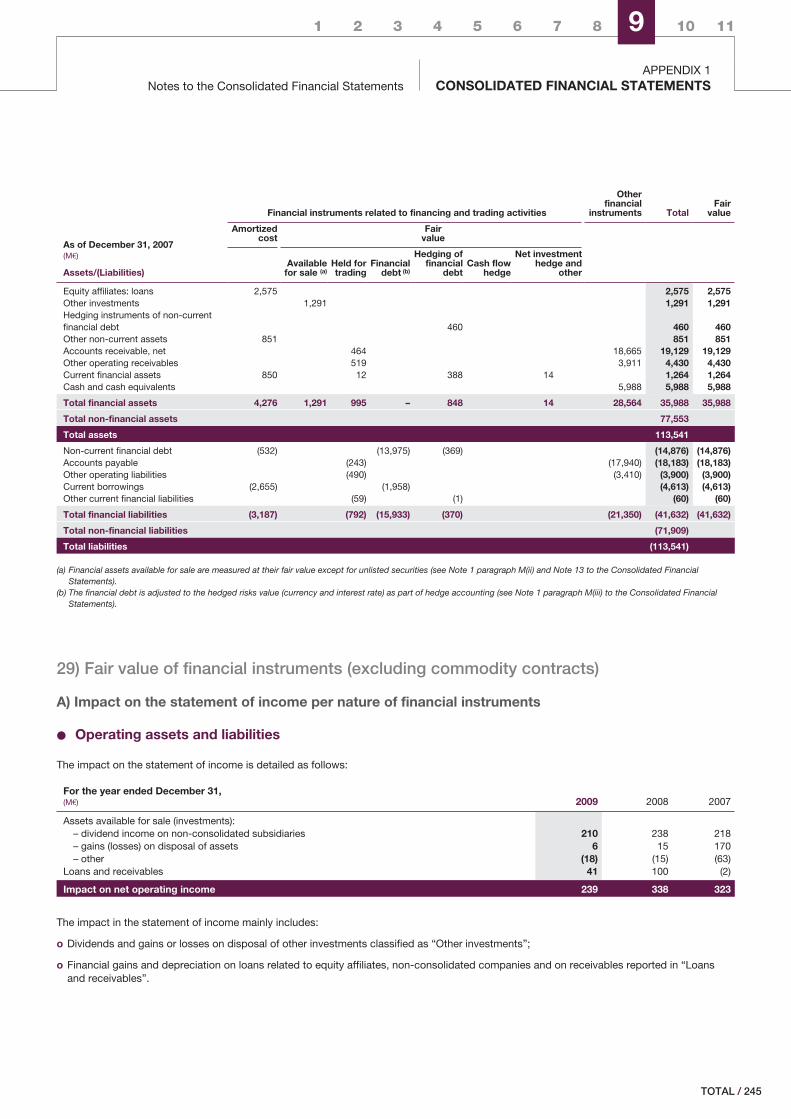
1 2 3 4 5 6 7 8 9 10 11
Notes to the Consolidated Financial StatementsAPPENDIX 1
CONSOLIDATED FINANCIAL STATEMENTS
As of December 31, 2007(M€)
Assets/(Liabilities)
Financial instruments related to financing and trading activities
Otherfinancial
instruments TotalFair
value
Amortizedcost
Fairvalue
Availablefor sale (a)
Held fortrading
Financialdebt (b)
Hedging offinancial
debtCash flow
hedge
Net investmenthedge and
other
Equity affiliates: loans 2,575 2,575 2,575Other investments 1,291 1,291 1,291Hedging instruments of non-currentfinancial debt 460 460 460Other non-current assets 851 851 851Accounts receivable, net 464 18,665 19,129 19,129Other operating receivables 519 3,911 4,430 4,430Current financial assets 850 12 388 14 1,264 1,264Cash and cash equivalents 5,988 5,988 5,988
Total financial assets 4,276 1,291 995 – 848 14 28,564 35,988 35,988
Total non-financial assets 77,553
Total assets 113,541
Non-current financial debt (532) (13,975) (369) (14,876) (14,876)Accounts payable (243) (17,940) (18,183) (18,183)Other operating liabilities (490) (3,410) (3,900) (3,900)Current borrowings (2,655) (1,958) (4,613) (4,613)Other current financial liabilities (59) (1) (60) (60)
Total financial liabilities (3,187) (792) (15,933) (370) (21,350) (41,632) (41,632)
Total non-financial liabilities (71,909)
Total liabilities (113,541)
(a) Financial assets available for sale are measured at their fair value except for unlisted securities (see Note 1 paragraph M(ii) and Note 13 to the Consolidated FinancialStatements).
(b) The financial debt is adjusted to the hedged risks value (currency and interest rate) as part of hedge accounting (see Note 1 paragraph M(iii) to the Consolidated FinancialStatements).
29) Fair value of financial instruments (excluding commodity contracts)
A) Impact on the statement of income per nature of financial instruments
‹ Operating assets and liabilities
The impact on the statement of income is detailed as follows:
For the year ended December 31,(M€) 2009 2008 2007
Assets available for sale (investments):– dividend income on non-consolidated subsidiaries 210 238 218– gains (losses) on disposal of assets 6 15 170– other (18) (15) (63)
Loans and receivables 41 100 (2)
Impact on net operating income 239 338 323
The impact in the statement of income mainly includes:
o Dividends and gains or losses on disposal of other investments classified as “Other investments”;
o Financial gains and depreciation on loans related to equity affiliates, non-consolidated companies and on receivables reported in “Loansand receivables”.
/ 245TOTAL
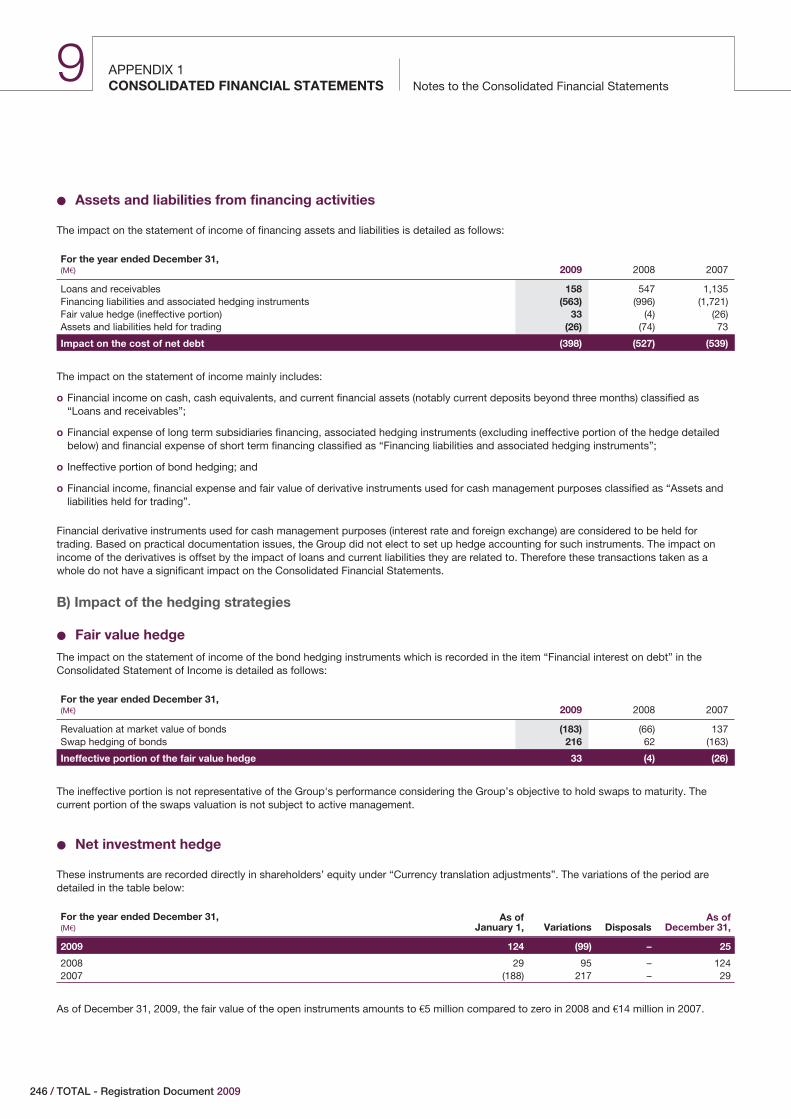
APPENDIX 1Notes to the Consolidated Financial StatementsCONSOLIDATED FINANCIAL STATEMENTS
9
‹ Assets and liabilities from financing activities
The impact on the statement of income of financing assets and liabilities is detailed as follows:
For the year ended December 31,(M€) 2009 2008 2007
Loans and receivables 158 547 1,135Financing liabilities and associated hedging instruments (563) (996) (1,721)Fair value hedge (ineffective portion) 33 (4) (26)Assets and liabilities held for trading (26) (74) 73
Impact on the cost of net debt (398) (527) (539)
The impact on the statement of income mainly includes:
o Financial income on cash, cash equivalents, and current financial assets (notably current deposits beyond three months) classified as“Loans and receivables”;
o Financial expense of long term subsidiaries financing, associated hedging instruments (excluding ineffective portion of the hedge detailedbelow) and financial expense of short term financing classified as “Financing liabilities and associated hedging instruments”;
o Ineffective portion of bond hedging; and
o Financial income, financial expense and fair value of derivative instruments used for cash management purposes classified as “Assets andliabilities held for trading”.
Financial derivative instruments used for cash management purposes (interest rate and foreign exchange) are considered to be held fortrading. Based on practical documentation issues, the Group did not elect to set up hedge accounting for such instruments. The impact onincome of the derivatives is offset by the impact of loans and current liabilities they are related to. Therefore these transactions taken as awhole do not have a significant impact on the Consolidated Financial Statements.
B) Impact of the hedging strategies
‹ Fair value hedge
The impact on the statement of income of the bond hedging instruments which is recorded in the item “Financial interest on debt” in theConsolidated Statement of Income is detailed as follows:
For the year ended December 31,(M€) 2009 2008 2007
Revaluation at market value of bonds (183) (66) 137Swap hedging of bonds 216 62 (163)
Ineffective portion of the fair value hedge 33 (4) (26)
The ineffective portion is not representative of the Group's performance considering the Group’s objective to hold swaps to maturity. Thecurrent portion of the swaps valuation is not subject to active management.
‹ Net investment hedge
These instruments are recorded directly in shareholders’ equity under “Currency translation adjustments”. The variations of the period aredetailed in the table below:
For the year ended December 31,(M€)
As ofJanuary 1, Variations Disposals
As ofDecember 31,
2009 124 (99) – 25
2008 29 95 – 1242007 (188) 217 – 29
As of December 31, 2009, the fair value of the open instruments amounts to €5 million compared to zero in 2008 and €14 million in 2007.
246 / TOTAL - Registration Document 2009
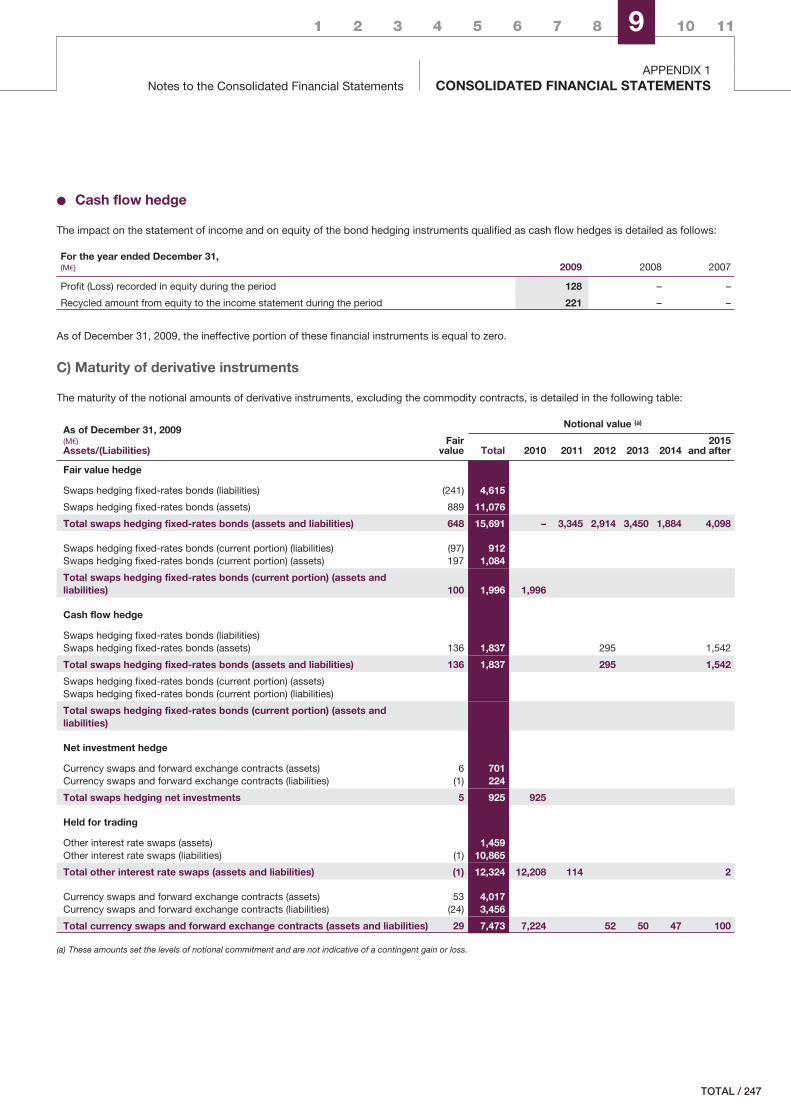
1 2 3 4 5 6 7 8 9 10 11
Notes to the Consolidated Financial StatementsAPPENDIX 1
CONSOLIDATED FINANCIAL STATEMENTS
‹ Cash flow hedge
The impact on the statement of income and on equity of the bond hedging instruments qualified as cash flow hedges is detailed as follows:
For the year ended December 31,(M€) 2009 2008 2007
Profit (Loss) recorded in equity during the period 128 – –
Recycled amount from equity to the income statement during the period 221 – –
As of December 31, 2009, the ineffective portion of these financial instruments is equal to zero.
C) Maturity of derivative instruments
The maturity of the notional amounts of derivative instruments, excluding the commodity contracts, is detailed in the following table:
As of December 31, 2009(M€)Assets/(Liabilities)
Notional value (a)
Fairvalue Total 2010 2011 2012 2013 2014
2015and after
Fair value hedge
Swaps hedging fixed-rates bonds (liabilities) (241) 4,615
Swaps hedging fixed-rates bonds (assets) 889 11,076
Total swaps hedging fixed-rates bonds (assets and liabilities) 648 15,691 – 3,345 2,914 3,450 1,884 4,098
Swaps hedging fixed-rates bonds (current portion) (liabilities) (97) 912Swaps hedging fixed-rates bonds (current portion) (assets) 197 1,084
Total swaps hedging fixed-rates bonds (current portion) (assets andliabilities) 100 1,996 1,996
Cash flow hedge
Swaps hedging fixed-rates bonds (liabilities)Swaps hedging fixed-rates bonds (assets) 136 1,837 295 1,542
Total swaps hedging fixed-rates bonds (assets and liabilities) 136 1,837 295 1,542
Swaps hedging fixed-rates bonds (current portion) (assets)Swaps hedging fixed-rates bonds (current portion) (liabilities)
Total swaps hedging fixed-rates bonds (current portion) (assets andliabilities)
Net investment hedge
Currency swaps and forward exchange contracts (assets) 6 701Currency swaps and forward exchange contracts (liabilities) (1) 224
Total swaps hedging net investments 5 925 925
Held for trading
Other interest rate swaps (assets) 1,459Other interest rate swaps (liabilities) (1) 10,865
Total other interest rate swaps (assets and liabilities) (1) 12,324 12,208 114 2
Currency swaps and forward exchange contracts (assets) 53 4,017Currency swaps and forward exchange contracts (liabilities) (24) 3,456
Total currency swaps and forward exchange contracts (assets and liabilities) 29 7,473 7,224 52 50 47 100
(a) These amounts set the levels of notional commitment and are not indicative of a contingent gain or loss.
/ 247TOTAL
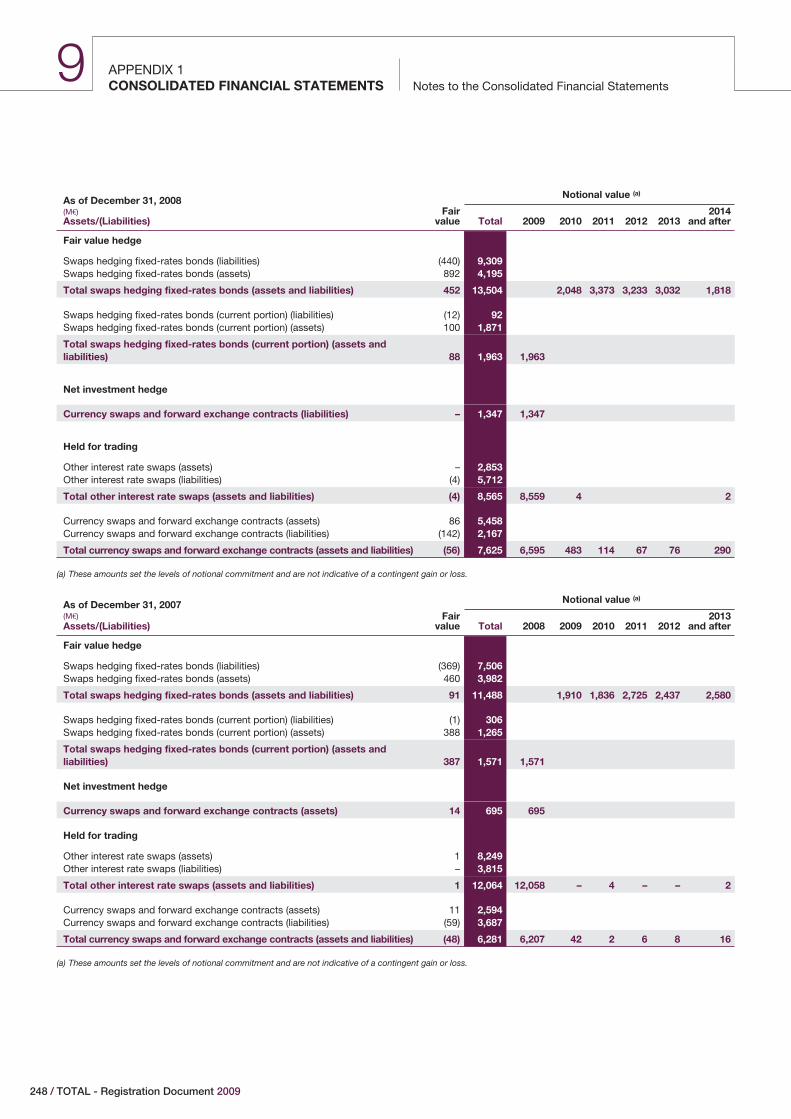
APPENDIX 1Notes to the Consolidated Financial StatementsCONSOLIDATED FINANCIAL STATEMENTS
9
As of December 31, 2008(M€)Assets/(Liabilities)
Notional value (a)
Fairvalue Total 2009 2010 2011 2012 2013
2014and after
Fair value hedge
Swaps hedging fixed-rates bonds (liabilities) (440) 9,309Swaps hedging fixed-rates bonds (assets) 892 4,195
Total swaps hedging fixed-rates bonds (assets and liabilities) 452 13,504 2,048 3,373 3,233 3,032 1,818
Swaps hedging fixed-rates bonds (current portion) (liabilities) (12) 92Swaps hedging fixed-rates bonds (current portion) (assets) 100 1,871
Total swaps hedging fixed-rates bonds (current portion) (assets andliabilities) 88 1,963 1,963
Net investment hedge
Currency swaps and forward exchange contracts (liabilities) – 1,347 1,347
Held for trading
Other interest rate swaps (assets) – 2,853Other interest rate swaps (liabilities) (4) 5,712
Total other interest rate swaps (assets and liabilities) (4) 8,565 8,559 4 2
Currency swaps and forward exchange contracts (assets) 86 5,458Currency swaps and forward exchange contracts (liabilities) (142) 2,167
Total currency swaps and forward exchange contracts (assets and liabilities) (56) 7,625 6,595 483 114 67 76 290
(a) These amounts set the levels of notional commitment and are not indicative of a contingent gain or loss.
As of December 31, 2007(M€)Assets/(Liabilities)
Notional value (a)
Fairvalue Total 2008 2009 2010 2011 2012
2013and after
Fair value hedge
Swaps hedging fixed-rates bonds (liabilities) (369) 7,506Swaps hedging fixed-rates bonds (assets) 460 3,982
Total swaps hedging fixed-rates bonds (assets and liabilities) 91 11,488 1,910 1,836 2,725 2,437 2,580
Swaps hedging fixed-rates bonds (current portion) (liabilities) (1) 306Swaps hedging fixed-rates bonds (current portion) (assets) 388 1,265
Total swaps hedging fixed-rates bonds (current portion) (assets andliabilities) 387 1,571 1,571
Net investment hedge
Currency swaps and forward exchange contracts (assets) 14 695 695
Held for trading
Other interest rate swaps (assets) 1 8,249Other interest rate swaps (liabilities) – 3,815
Total other interest rate swaps (assets and liabilities) 1 12,064 12,058 – 4 – – 2
Currency swaps and forward exchange contracts (assets) 11 2,594Currency swaps and forward exchange contracts (liabilities) (59) 3,687
Total currency swaps and forward exchange contracts (assets and liabilities) (48) 6,281 6,207 42 2 6 8 16
(a) These amounts set the levels of notional commitment and are not indicative of a contingent gain or loss.
248 / TOTAL - Registration Document 2009
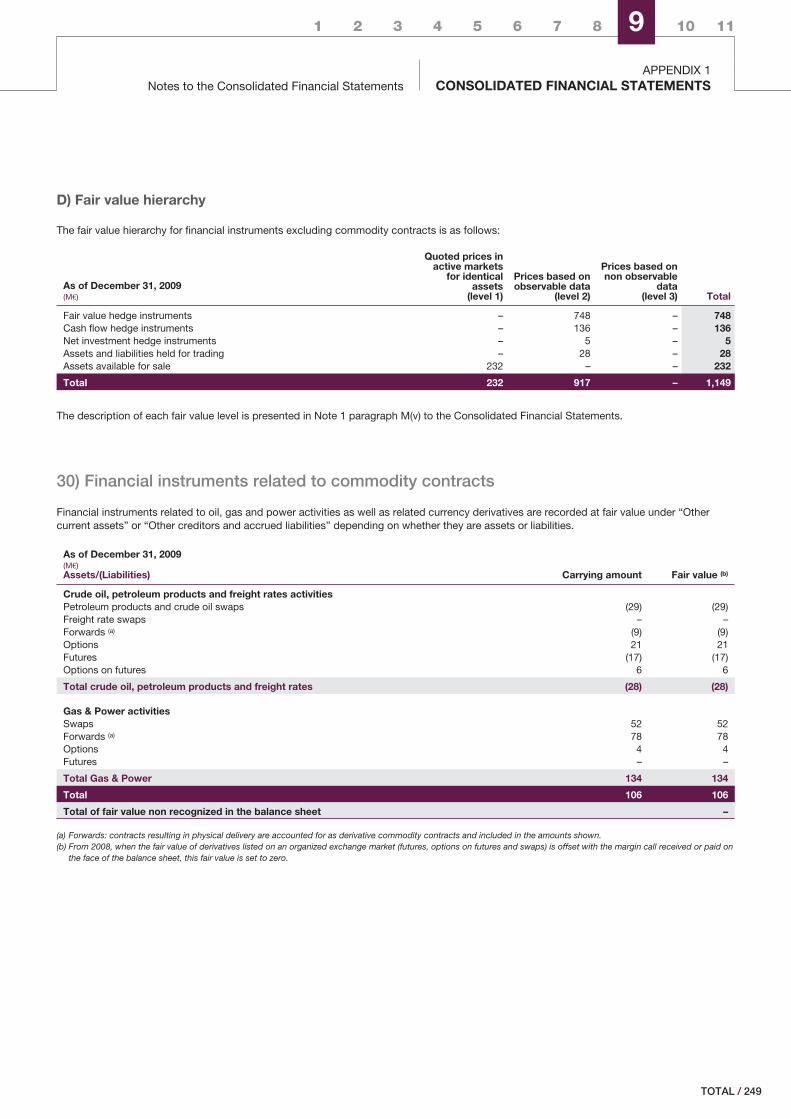
1 2 3 4 5 6 7 8 9 10 11
Notes to the Consolidated Financial StatementsAPPENDIX 1
CONSOLIDATED FINANCIAL STATEMENTS
D) Fair value hierarchy
The fair value hierarchy for financial instruments excluding commodity contracts is as follows:
As of December 31, 2009(M€)
Quoted prices inactive markets
for identicalassets
(level 1)
Prices based onobservable data
(level 2)
Prices based onnon observable
data(level 3) Total
Fair value hedge instruments – 748 – 748Cash flow hedge instruments – 136 – 136Net investment hedge instruments – 5 – 5Assets and liabilities held for trading – 28 – 28Assets available for sale 232 – – 232
Total 232 917 – 1,149
The description of each fair value level is presented in Note 1 paragraph M(v) to the Consolidated Financial Statements.
30) Financial instruments related to commodity contracts
Financial instruments related to oil, gas and power activities as well as related currency derivatives are recorded at fair value under “Othercurrent assets” or “Other creditors and accrued liabilities” depending on whether they are assets or liabilities.
As of December 31, 2009(M€)Assets/(Liabilities) Carrying amount Fair value (b)
Crude oil, petroleum products and freight rates activitiesPetroleum products and crude oil swaps (29) (29)Freight rate swaps – –Forwards (a) (9) (9)Options 21 21Futures (17) (17)Options on futures 6 6
Total crude oil, petroleum products and freight rates (28) (28)
Gas & Power activitiesSwaps 52 52Forwards (a) 78 78Options 4 4Futures – –
Total Gas & Power 134 134
Total 106 106
Total of fair value non recognized in the balance sheet –
(a) Forwards: contracts resulting in physical delivery are accounted for as derivative commodity contracts and included in the amounts shown.(b) From 2008, when the fair value of derivatives listed on an organized exchange market (futures, options on futures and swaps) is offset with the margin call received or paid on
the face of the balance sheet, this fair value is set to zero.
/ 249TOTAL
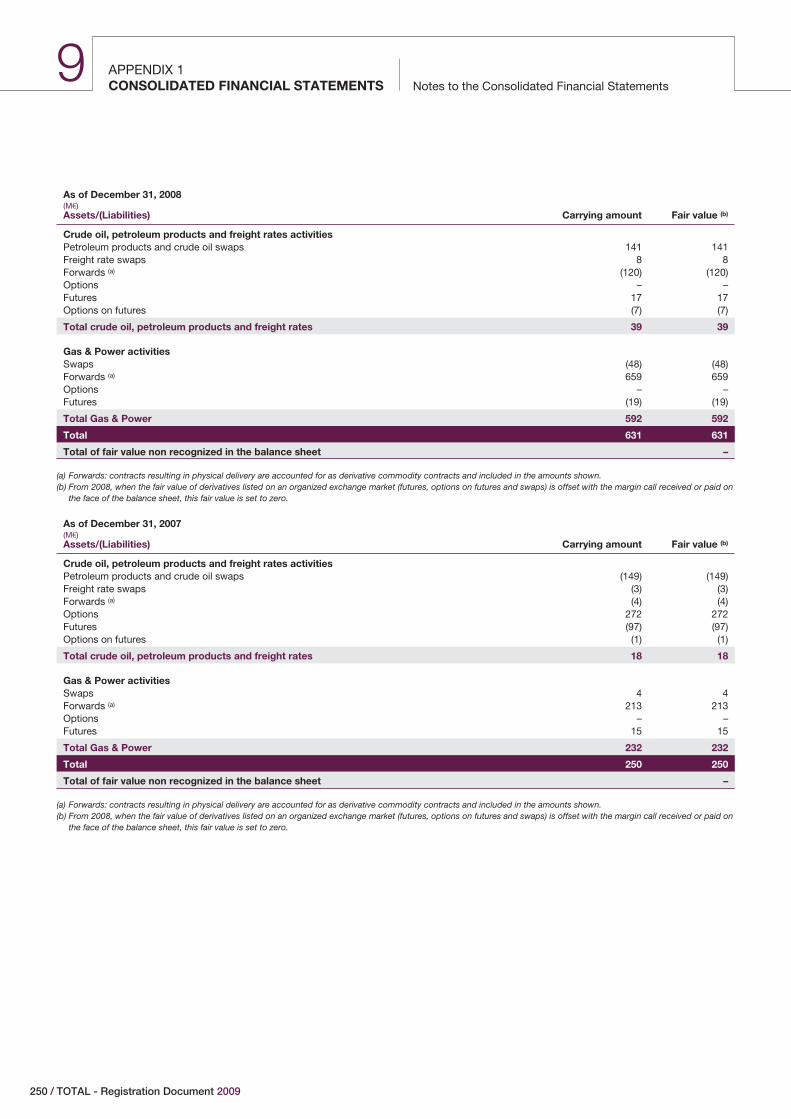
APPENDIX 1Notes to the Consolidated Financial StatementsCONSOLIDATED FINANCIAL STATEMENTS
9
As of December 31, 2008(M€)Assets/(Liabilities) Carrying amount Fair value (b)
Crude oil, petroleum products and freight rates activitiesPetroleum products and crude oil swaps 141 141Freight rate swaps 8 8Forwards (a) (120) (120)Options – –Futures 17 17Options on futures (7) (7)
Total crude oil, petroleum products and freight rates 39 39
Gas & Power activitiesSwaps (48) (48)Forwards (a) 659 659Options – –Futures (19) (19)
Total Gas & Power 592 592
Total 631 631
Total of fair value non recognized in the balance sheet –
(a) Forwards: contracts resulting in physical delivery are accounted for as derivative commodity contracts and included in the amounts shown.(b) From 2008, when the fair value of derivatives listed on an organized exchange market (futures, options on futures and swaps) is offset with the margin call received or paid on
the face of the balance sheet, this fair value is set to zero.
As of December 31, 2007(M€)Assets/(Liabilities) Carrying amount Fair value (b)
Crude oil, petroleum products and freight rates activitiesPetroleum products and crude oil swaps (149) (149)Freight rate swaps (3) (3)Forwards (a) (4) (4)Options 272 272Futures (97) (97)Options on futures (1) (1)
Total crude oil, petroleum products and freight rates 18 18
Gas & Power activitiesSwaps 4 4Forwards (a) 213 213Options – –Futures 15 15
Total Gas & Power 232 232
Total 250 250
Total of fair value non recognized in the balance sheet –
(a) Forwards: contracts resulting in physical delivery are accounted for as derivative commodity contracts and included in the amounts shown.(b) From 2008, when the fair value of derivatives listed on an organized exchange market (futures, options on futures and swaps) is offset with the margin call received or paid on
the face of the balance sheet, this fair value is set to zero.
250 / TOTAL - Registration Document 2009
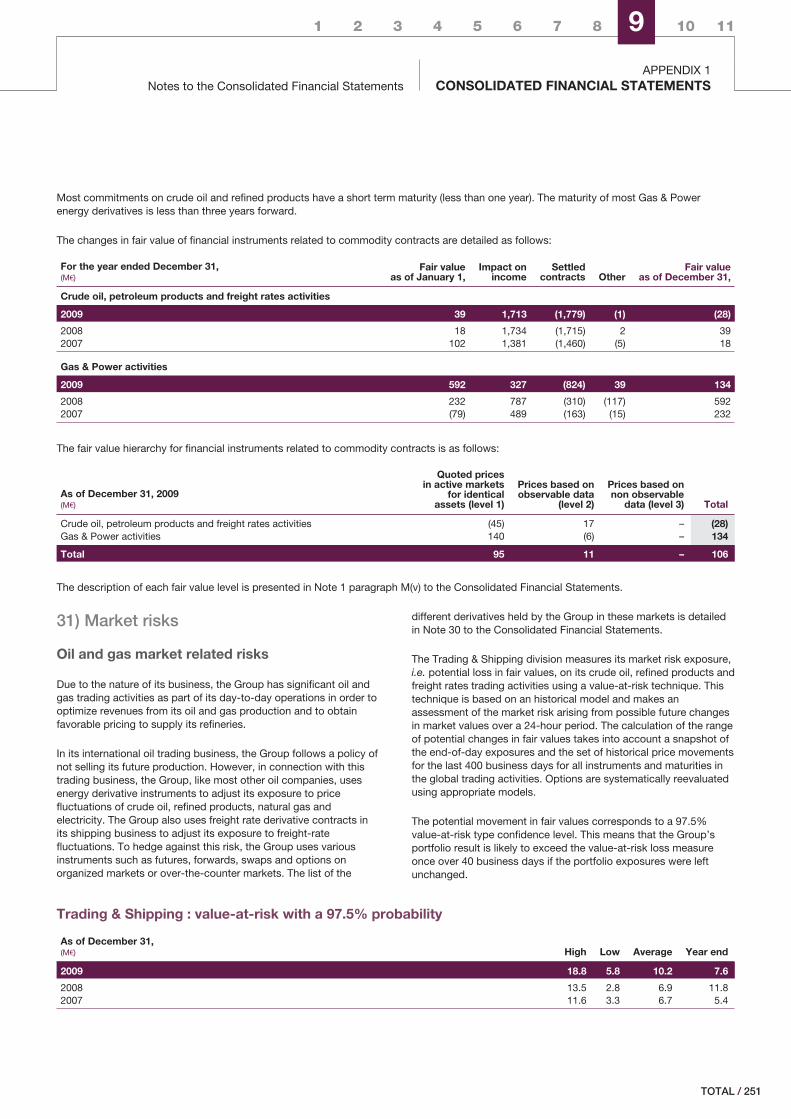
1 2 3 4 5 6 7 8 9 10 11
Notes to the Consolidated Financial StatementsAPPENDIX 1
CONSOLIDATED FINANCIAL STATEMENTS
Most commitments on crude oil and refined products have a short term maturity (less than one year). The maturity of most Gas & Powerenergy derivatives is less than three years forward.
The changes in fair value of financial instruments related to commodity contracts are detailed as follows:
For the year ended December 31,(M€)
Fair valueas of January 1,
Impact onincome
Settledcontracts Other
Fair valueas of December 31,
Crude oil, petroleum products and freight rates activities
2009 39 1,713 (1,779) (1) (28)
2008 18 1,734 (1,715) 2 392007 102 1,381 (1,460) (5) 18
Gas & Power activities
2009 592 327 (824) 39 134
2008 232 787 (310) (117) 5922007 (79) 489 (163) (15) 232
The fair value hierarchy for financial instruments related to commodity contracts is as follows:
As of December 31, 2009(M€)
Quoted pricesin active markets
for identicalassets (level 1)
Prices based onobservable data
(level 2)
Prices based onnon observable
data (level 3) Total
Crude oil, petroleum products and freight rates activities (45) 17 – (28)Gas & Power activities 140 (6) – 134
Total 95 11 – 106
The description of each fair value level is presented in Note 1 paragraph M(v) to the Consolidated Financial Statements.
31) Market risks
Oil and gas market related risks
Due to the nature of its business, the Group has significant oil andgas trading activities as part of its day-to-day operations in order tooptimize revenues from its oil and gas production and to obtainfavorable pricing to supply its refineries.
In its international oil trading business, the Group follows a policy ofnot selling its future production. However, in connection with thistrading business, the Group, like most other oil companies, usesenergy derivative instruments to adjust its exposure to pricefluctuations of crude oil, refined products, natural gas andelectricity. The Group also uses freight rate derivative contracts inits shipping business to adjust its exposure to freight-ratefluctuations. To hedge against this risk, the Group uses variousinstruments such as futures, forwards, swaps and options onorganized markets or over-the-counter markets. The list of the
different derivatives held by the Group in these markets is detailedin Note 30 to the Consolidated Financial Statements.
The Trading & Shipping division measures its market risk exposure,i.e. potential loss in fair values, on its crude oil, refined products andfreight rates trading activities using a value-at-risk technique. Thistechnique is based on an historical model and makes anassessment of the market risk arising from possible future changesin market values over a 24-hour period. The calculation of the rangeof potential changes in fair values takes into account a snapshot ofthe end-of-day exposures and the set of historical price movementsfor the last 400 business days for all instruments and maturities inthe global trading activities. Options are systematically reevaluatedusing appropriate models.
The potential movement in fair values corresponds to a 97.5%value-at-risk type confidence level. This means that the Group’sportfolio result is likely to exceed the value-at-risk loss measureonce over 40 business days if the portfolio exposures were leftunchanged.
Trading & Shipping : value-at-risk with a 97.5% probability
As of December 31,(M€) High Low Average Year end
2009 18.8 5.8 10.2 7.6
2008 13.5 2.8 6.9 11.82007 11.6 3.3 6.7 5.4
/ 251TOTAL
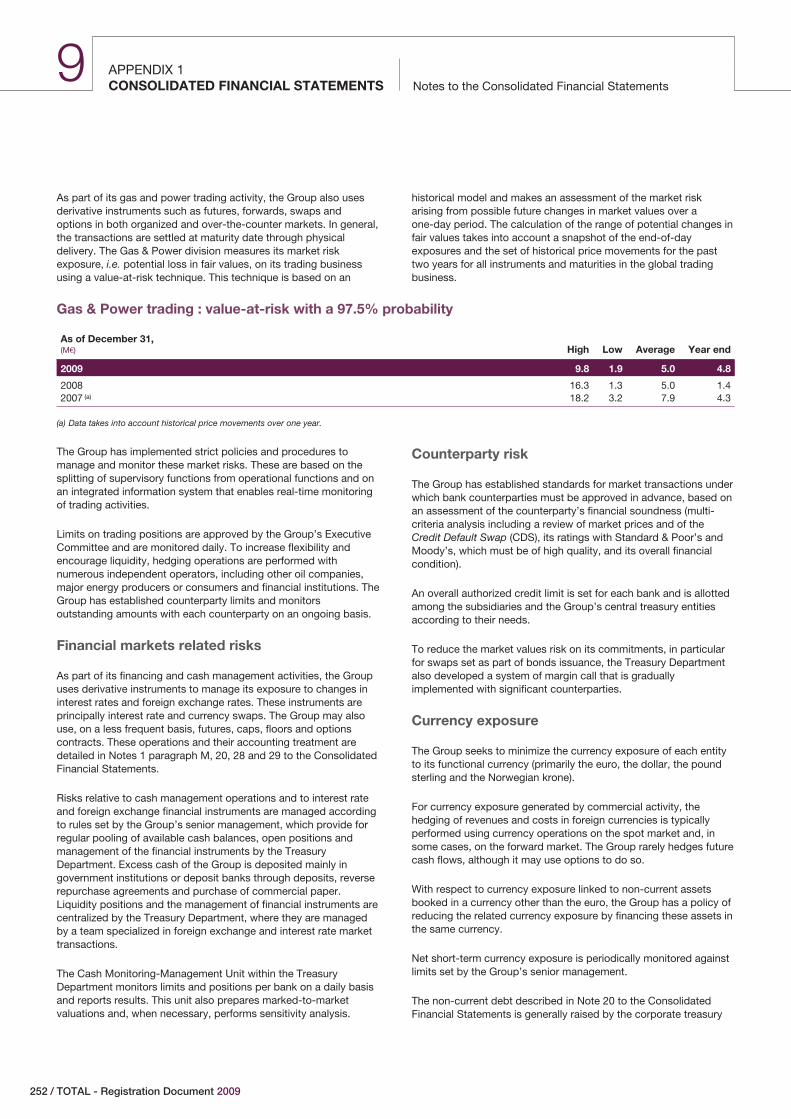
APPENDIX 1Notes to the Consolidated Financial StatementsCONSOLIDATED FINANCIAL STATEMENTS
9
As part of its gas and power trading activity, the Group also usesderivative instruments such as futures, forwards, swaps andoptions in both organized and over-the-counter markets. In general,the transactions are settled at maturity date through physicaldelivery. The Gas & Power division measures its market riskexposure, i.e. potential loss in fair values, on its trading businessusing a value-at-risk technique. This technique is based on an
historical model and makes an assessment of the market riskarising from possible future changes in market values over aone-day period. The calculation of the range of potential changes infair values takes into account a snapshot of the end-of-dayexposures and the set of historical price movements for the pasttwo years for all instruments and maturities in the global tradingbusiness.
Gas & Power trading : value-at-risk with a 97.5% probability
As of December 31,(M€) High Low Average Year end
2009 9.8 1.9 5.0 4.8
2008 16.3 1.3 5.0 1.42007 (a) 18.2 3.2 7.9 4.3
(a) Data takes into account historical price movements over one year.
The Group has implemented strict policies and procedures tomanage and monitor these market risks. These are based on thesplitting of supervisory functions from operational functions and onan integrated information system that enables real-time monitoringof trading activities.
Limits on trading positions are approved by the Group’s ExecutiveCommittee and are monitored daily. To increase flexibility andencourage liquidity, hedging operations are performed withnumerous independent operators, including other oil companies,major energy producers or consumers and financial institutions. TheGroup has established counterparty limits and monitorsoutstanding amounts with each counterparty on an ongoing basis.
Financial markets related risks
As part of its financing and cash management activities, the Groupuses derivative instruments to manage its exposure to changes ininterest rates and foreign exchange rates. These instruments areprincipally interest rate and currency swaps. The Group may alsouse, on a less frequent basis, futures, caps, floors and optionscontracts. These operations and their accounting treatment aredetailed in Notes 1 paragraph M, 20, 28 and 29 to the ConsolidatedFinancial Statements.
Risks relative to cash management operations and to interest rateand foreign exchange financial instruments are managed accordingto rules set by the Group’s senior management, which provide forregular pooling of available cash balances, open positions andmanagement of the financial instruments by the TreasuryDepartment. Excess cash of the Group is deposited mainly ingovernment institutions or deposit banks through deposits, reverserepurchase agreements and purchase of commercial paper.Liquidity positions and the management of financial instruments arecentralized by the Treasury Department, where they are managedby a team specialized in foreign exchange and interest rate markettransactions.
The Cash Monitoring-Management Unit within the TreasuryDepartment monitors limits and positions per bank on a daily basisand reports results. This unit also prepares marked-to-marketvaluations and, when necessary, performs sensitivity analysis.
Counterparty risk
The Group has established standards for market transactions underwhich bank counterparties must be approved in advance, based onan assessment of the counterparty’s financial soundness (multi-criteria analysis including a review of market prices and of theCredit Default Swap (CDS), its ratings with Standard & Poor’s andMoody’s, which must be of high quality, and its overall financialcondition).
An overall authorized credit limit is set for each bank and is allottedamong the subsidiaries and the Group’s central treasury entitiesaccording to their needs.
To reduce the market values risk on its commitments, in particularfor swaps set as part of bonds issuance, the Treasury Departmentalso developed a system of margin call that is graduallyimplemented with significant counterparties.
Currency exposure
The Group seeks to minimize the currency exposure of each entityto its functional currency (primarily the euro, the dollar, the poundsterling and the Norwegian krone).
For currency exposure generated by commercial activity, thehedging of revenues and costs in foreign currencies is typicallyperformed using currency operations on the spot market and, insome cases, on the forward market. The Group rarely hedges futurecash flows, although it may use options to do so.
With respect to currency exposure linked to non-current assetsbooked in a currency other than the euro, the Group has a policy ofreducing the related currency exposure by financing these assets inthe same currency.
Net short-term currency exposure is periodically monitored againstlimits set by the Group’s senior management.
The non-current debt described in Note 20 to the ConsolidatedFinancial Statements is generally raised by the corporate treasury
252 / TOTAL - Registration Document 2009
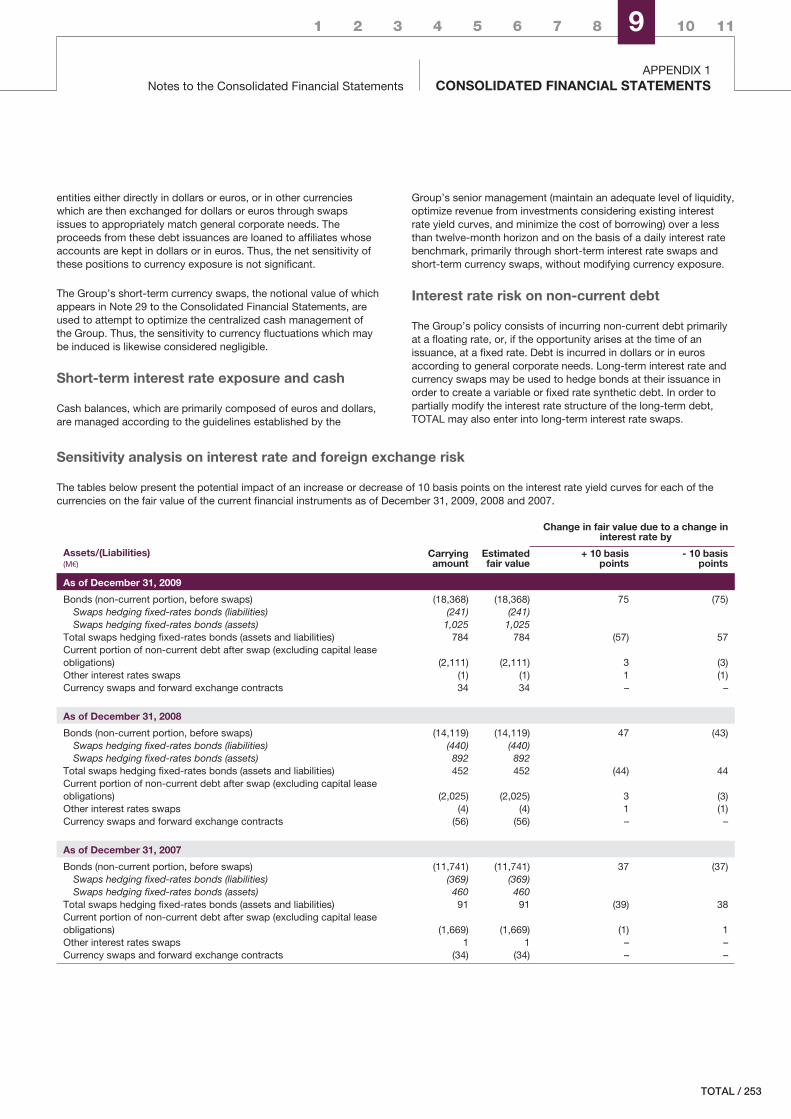
1 2 3 4 5 6 7 8 9 10 11
Notes to the Consolidated Financial StatementsAPPENDIX 1
CONSOLIDATED FINANCIAL STATEMENTS
entities either directly in dollars or euros, or in other currencieswhich are then exchanged for dollars or euros through swapsissues to appropriately match general corporate needs. Theproceeds from these debt issuances are loaned to affiliates whoseaccounts are kept in dollars or in euros. Thus, the net sensitivity ofthese positions to currency exposure is not significant.
The Group’s short-term currency swaps, the notional value of whichappears in Note 29 to the Consolidated Financial Statements, areused to attempt to optimize the centralized cash management ofthe Group. Thus, the sensitivity to currency fluctuations which maybe induced is likewise considered negligible.
Short-term interest rate exposure and cash
Cash balances, which are primarily composed of euros and dollars,are managed according to the guidelines established by the
Group’s senior management (maintain an adequate level of liquidity,optimize revenue from investments considering existing interestrate yield curves, and minimize the cost of borrowing) over a lessthan twelve-month horizon and on the basis of a daily interest ratebenchmark, primarily through short-term interest rate swaps andshort-term currency swaps, without modifying currency exposure.
Interest rate risk on non-current debt
The Group’s policy consists of incurring non-current debt primarilyat a floating rate, or, if the opportunity arises at the time of anissuance, at a fixed rate. Debt is incurred in dollars or in eurosaccording to general corporate needs. Long-term interest rate andcurrency swaps may be used to hedge bonds at their issuance inorder to create a variable or fixed rate synthetic debt. In order topartially modify the interest rate structure of the long-term debt,TOTAL may also enter into long-term interest rate swaps.
Sensitivity analysis on interest rate and foreign exchange risk
The tables below present the potential impact of an increase or decrease of 10 basis points on the interest rate yield curves for each of thecurrencies on the fair value of the current financial instruments as of December 31, 2009, 2008 and 2007.
Assets/(Liabilities)(M€)
Change in fair value due to a change ininterest rate by
Carryingamount
Estimatedfair value
+ 10 basispoints
- 10 basispoints
As of December 31, 2009
Bonds (non-current portion, before swaps) (18,368) (18,368) 75 (75)Swaps hedging fixed-rates bonds (liabilities) (241) (241)Swaps hedging fixed-rates bonds (assets) 1,025 1,025
Total swaps hedging fixed-rates bonds (assets and liabilities) 784 784 (57) 57Current portion of non-current debt after swap (excluding capital leaseobligations) (2,111) (2,111) 3 (3)Other interest rates swaps (1) (1) 1 (1)Currency swaps and forward exchange contracts 34 34 – –
As of December 31, 2008
Bonds (non-current portion, before swaps) (14,119) (14,119) 47 (43)Swaps hedging fixed-rates bonds (liabilities) (440) (440)Swaps hedging fixed-rates bonds (assets) 892 892
Total swaps hedging fixed-rates bonds (assets and liabilities) 452 452 (44) 44Current portion of non-current debt after swap (excluding capital leaseobligations) (2,025) (2,025) 3 (3)Other interest rates swaps (4) (4) 1 (1)Currency swaps and forward exchange contracts (56) (56) – –
As of December 31, 2007
Bonds (non-current portion, before swaps) (11,741) (11,741) 37 (37)Swaps hedging fixed-rates bonds (liabilities) (369) (369)Swaps hedging fixed-rates bonds (assets) 460 460
Total swaps hedging fixed-rates bonds (assets and liabilities) 91 91 (39) 38Current portion of non-current debt after swap (excluding capital leaseobligations) (1,669) (1,669) (1) 1Other interest rates swaps 1 1 – –Currency swaps and forward exchange contracts (34) (34) – –
/ 253TOTAL
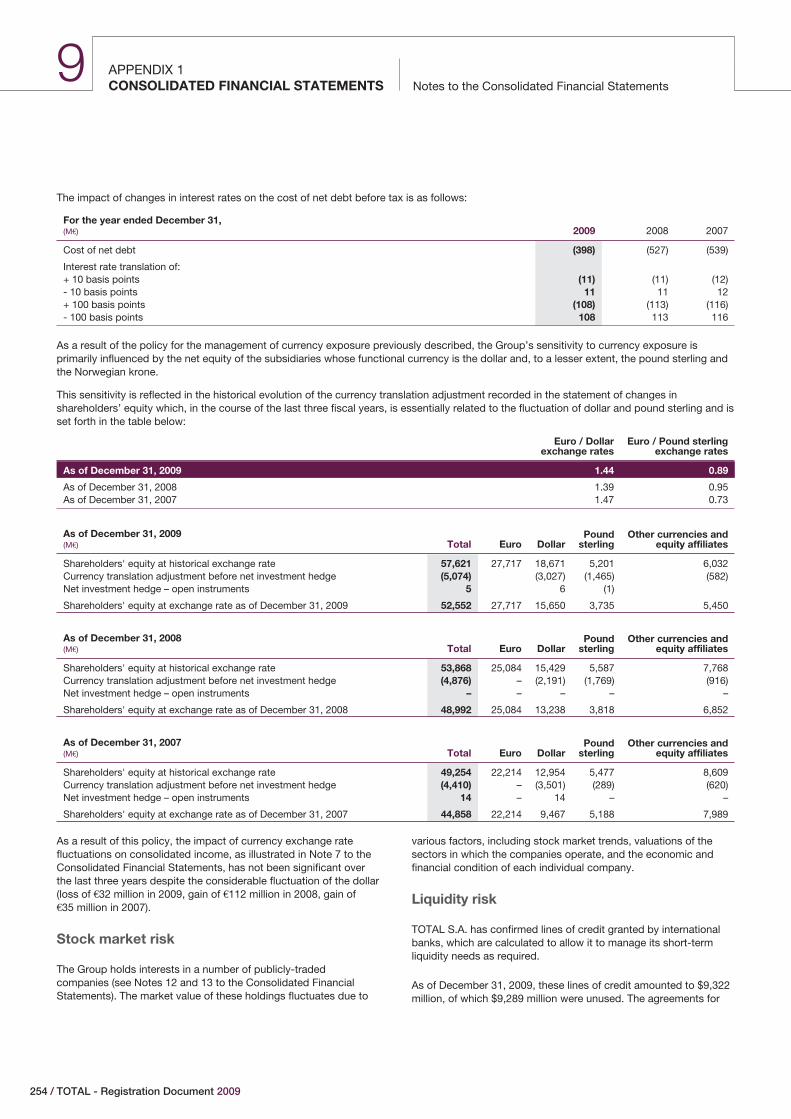
APPENDIX 1Notes to the Consolidated Financial StatementsCONSOLIDATED FINANCIAL STATEMENTS
9
The impact of changes in interest rates on the cost of net debt before tax is as follows:
For the year ended December 31,(M€) 2009 2008 2007
Cost of net debt (398) (527) (539)
Interest rate translation of:+ 10 basis points (11) (11) (12)- 10 basis points 11 11 12+ 100 basis points (108) (113) (116)- 100 basis points 108 113 116
As a result of the policy for the management of currency exposure previously described, the Group’s sensitivity to currency exposure isprimarily influenced by the net equity of the subsidiaries whose functional currency is the dollar and, to a lesser extent, the pound sterling andthe Norwegian krone.
This sensitivity is reflected in the historical evolution of the currency translation adjustment recorded in the statement of changes inshareholders’ equity which, in the course of the last three fiscal years, is essentially related to the fluctuation of dollar and pound sterling and isset forth in the table below:
Euro / Dollarexchange rates
Euro / Pound sterlingexchange rates
As of December 31, 2009 1.44 0.89
As of December 31, 2008 1.39 0.95As of December 31, 2007 1.47 0.73
As of December 31, 2009(M€) Total Euro Dollar
Poundsterling
Other currencies andequity affiliates
Shareholders' equity at historical exchange rate 57,621 27,717 18,671 5,201 6,032Currency translation adjustment before net investment hedge (5,074) (3,027) (1,465) (582)Net investment hedge – open instruments 5 6 (1)
Shareholders' equity at exchange rate as of December 31, 2009 52,552 27,717 15,650 3,735 5,450
As of December 31, 2008(M€) Total Euro Dollar
Poundsterling
Other currencies andequity affiliates
Shareholders' equity at historical exchange rate 53,868 25,084 15,429 5,587 7,768Currency translation adjustment before net investment hedge (4,876) – (2,191) (1,769) (916)Net investment hedge – open instruments – – – – –
Shareholders' equity at exchange rate as of December 31, 2008 48,992 25,084 13,238 3,818 6,852
As of December 31, 2007(M€) Total Euro Dollar
Poundsterling
Other currencies andequity affiliates
Shareholders' equity at historical exchange rate 49,254 22,214 12,954 5,477 8,609Currency translation adjustment before net investment hedge (4,410) – (3,501) (289) (620)Net investment hedge – open instruments 14 – 14 – –
Shareholders' equity at exchange rate as of December 31, 2007 44,858 22,214 9,467 5,188 7,989
As a result of this policy, the impact of currency exchange ratefluctuations on consolidated income, as illustrated in Note 7 to theConsolidated Financial Statements, has not been significant overthe last three years despite the considerable fluctuation of the dollar(loss of €32 million in 2009, gain of €112 million in 2008, gain of€35 million in 2007).
Stock market risk
The Group holds interests in a number of publicly-tradedcompanies (see Notes 12 and 13 to the Consolidated FinancialStatements). The market value of these holdings fluctuates due to
various factors, including stock market trends, valuations of thesectors in which the companies operate, and the economic andfinancial condition of each individual company.
Liquidity risk
TOTAL S.A. has confirmed lines of credit granted by internationalbanks, which are calculated to allow it to manage its short-termliquidity needs as required.
As of December 31, 2009, these lines of credit amounted to $9,322million, of which $9,289 million were unused. The agreements for
254 / TOTAL - Registration Document 2009
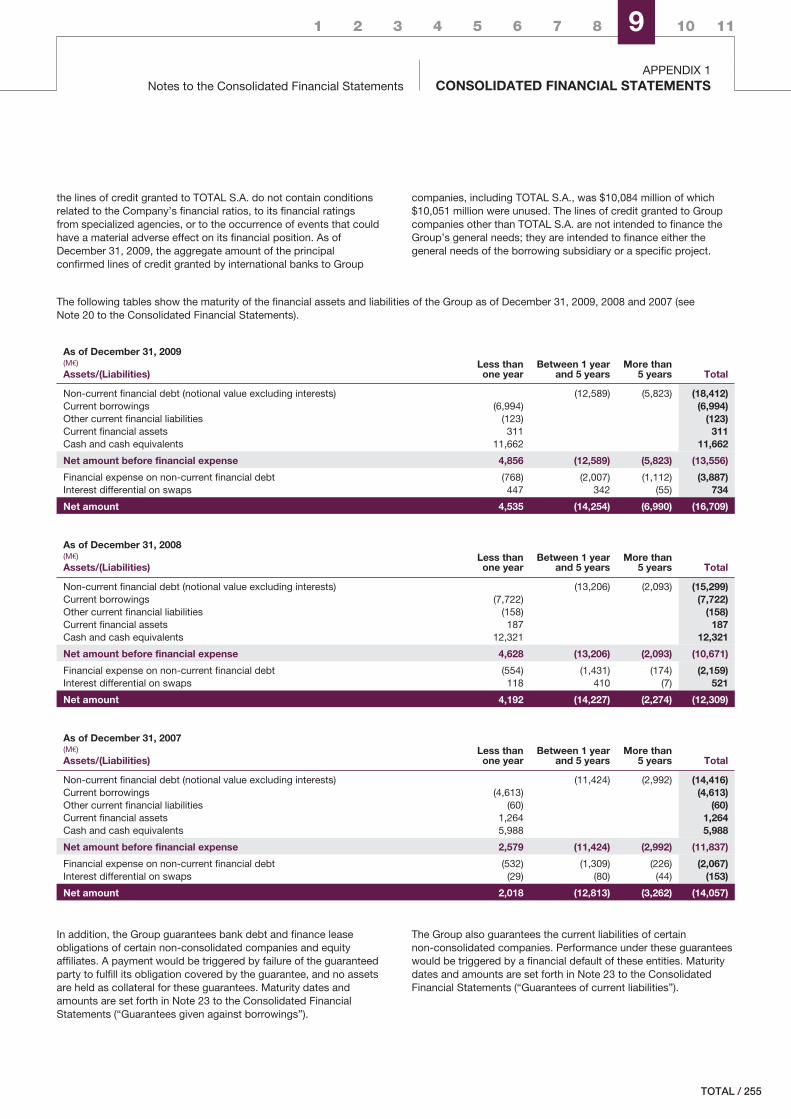
1 2 3 4 5 6 7 8 9 10 11
Notes to the Consolidated Financial StatementsAPPENDIX 1
CONSOLIDATED FINANCIAL STATEMENTS
the lines of credit granted to TOTAL S.A. do not contain conditionsrelated to the Company’s financial ratios, to its financial ratingsfrom specialized agencies, or to the occurrence of events that couldhave a material adverse effect on its financial position. As ofDecember 31, 2009, the aggregate amount of the principalconfirmed lines of credit granted by international banks to Group
companies, including TOTAL S.A., was $10,084 million of which$10,051 million were unused. The lines of credit granted to Groupcompanies other than TOTAL S.A. are not intended to finance theGroup’s general needs; they are intended to finance either thegeneral needs of the borrowing subsidiary or a specific project.
The following tables show the maturity of the financial assets and liabilities of the Group as of December 31, 2009, 2008 and 2007 (seeNote 20 to the Consolidated Financial Statements).
As of December 31, 2009(M€)
Assets/(Liabilities)Less thanone year
Between 1 yearand 5 years
More than5 years Total
Non-current financial debt (notional value excluding interests) (12,589) (5,823) (18,412)Current borrowings (6,994) (6,994)Other current financial liabilities (123) (123)Current financial assets 311 311Cash and cash equivalents 11,662 11,662
Net amount before financial expense 4,856 (12,589) (5,823) (13,556)
Financial expense on non-current financial debt (768) (2,007) (1,112) (3,887)Interest differential on swaps 447 342 (55) 734
Net amount 4,535 (14,254) (6,990) (16,709)
As of December 31, 2008(M€)
Assets/(Liabilities)Less thanone year
Between 1 yearand 5 years
More than5 years Total
Non-current financial debt (notional value excluding interests) (13,206) (2,093) (15,299)Current borrowings (7,722) (7,722)Other current financial liabilities (158) (158)Current financial assets 187 187Cash and cash equivalents 12,321 12,321
Net amount before financial expense 4,628 (13,206) (2,093) (10,671)
Financial expense on non-current financial debt (554) (1,431) (174) (2,159)Interest differential on swaps 118 410 (7) 521
Net amount 4,192 (14,227) (2,274) (12,309)
As of December 31, 2007(M€)
Assets/(Liabilities)Less thanone year
Between 1 yearand 5 years
More than5 years Total
Non-current financial debt (notional value excluding interests) (11,424) (2,992) (14,416)Current borrowings (4,613) (4,613)Other current financial liabilities (60) (60)Current financial assets 1,264 1,264Cash and cash equivalents 5,988 5,988
Net amount before financial expense 2,579 (11,424) (2,992) (11,837)
Financial expense on non-current financial debt (532) (1,309) (226) (2,067)Interest differential on swaps (29) (80) (44) (153)
Net amount 2,018 (12,813) (3,262) (14,057)
In addition, the Group guarantees bank debt and finance leaseobligations of certain non-consolidated companies and equityaffiliates. A payment would be triggered by failure of the guaranteedparty to fulfill its obligation covered by the guarantee, and no assetsare held as collateral for these guarantees. Maturity dates andamounts are set forth in Note 23 to the Consolidated FinancialStatements (“Guarantees given against borrowings”).
The Group also guarantees the current liabilities of certainnon-consolidated companies. Performance under these guaranteeswould be triggered by a financial default of these entities. Maturitydates and amounts are set forth in Note 23 to the ConsolidatedFinancial Statements (“Guarantees of current liabilities”).
/ 255TOTAL
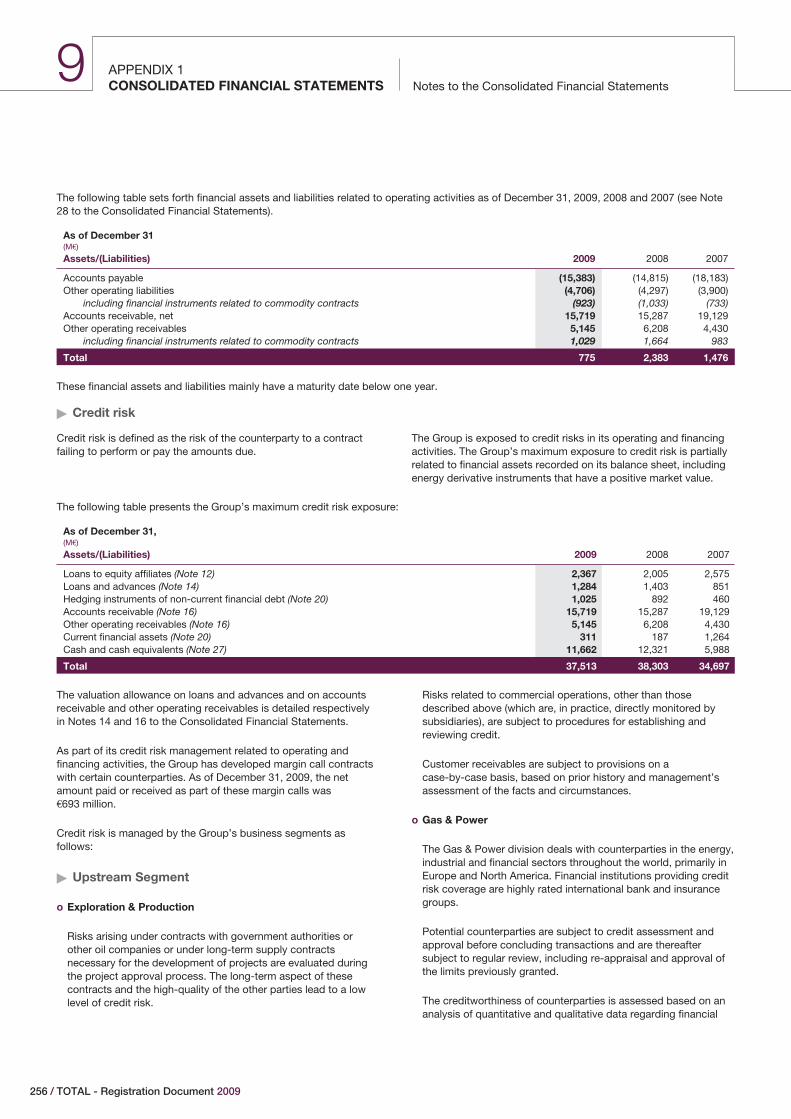
APPENDIX 1Notes to the Consolidated Financial StatementsCONSOLIDATED FINANCIAL STATEMENTS
9
The following table sets forth financial assets and liabilities related to operating activities as of December 31, 2009, 2008 and 2007 (see Note28 to the Consolidated Financial Statements).
As of December 31(M€)
Assets/(Liabilities) 2009 2008 2007
Accounts payable (15,383) (14,815) (18,183)Other operating liabilities (4,706) (4,297) (3,900)
including financial instruments related to commodity contracts (923) (1,033) (733)Accounts receivable, net 15,719 15,287 19,129Other operating receivables 5,145 6,208 4,430
including financial instruments related to commodity contracts 1,029 1,664 983
Total 775 2,383 1,476
These financial assets and liabilities mainly have a maturity date below one year.
� Credit risk
Credit risk is defined as the risk of the counterparty to a contractfailing to perform or pay the amounts due.
The Group is exposed to credit risks in its operating and financingactivities. The Group’s maximum exposure to credit risk is partiallyrelated to financial assets recorded on its balance sheet, includingenergy derivative instruments that have a positive market value.
The following table presents the Group’s maximum credit risk exposure:
As of December 31,(M€)
Assets/(Liabilities) 2009 2008 2007
Loans to equity affiliates (Note 12) 2,367 2,005 2,575Loans and advances (Note 14) 1,284 1,403 851Hedging instruments of non-current financial debt (Note 20) 1,025 892 460Accounts receivable (Note 16) 15,719 15,287 19,129Other operating receivables (Note 16) 5,145 6,208 4,430Current financial assets (Note 20) 311 187 1,264Cash and cash equivalents (Note 27) 11,662 12,321 5,988
Total 37,513 38,303 34,697
The valuation allowance on loans and advances and on accountsreceivable and other operating receivables is detailed respectivelyin Notes 14 and 16 to the Consolidated Financial Statements.
As part of its credit risk management related to operating andfinancing activities, the Group has developed margin call contractswith certain counterparties. As of December 31, 2009, the netamount paid or received as part of these margin calls was€693 million.
Credit risk is managed by the Group’s business segments asfollows:
� Upstream Segment
o Exploration & Production
Risks arising under contracts with government authorities orother oil companies or under long-term supply contractsnecessary for the development of projects are evaluated duringthe project approval process. The long-term aspect of thesecontracts and the high-quality of the other parties lead to a lowlevel of credit risk.
Risks related to commercial operations, other than thosedescribed above (which are, in practice, directly monitored bysubsidiaries), are subject to procedures for establishing andreviewing credit.
Customer receivables are subject to provisions on acase-by-case basis, based on prior history and management’sassessment of the facts and circumstances.
o Gas & Power
The Gas & Power division deals with counterparties in the energy,industrial and financial sectors throughout the world, primarily inEurope and North America. Financial institutions providing creditrisk coverage are highly rated international bank and insurancegroups.
Potential counterparties are subject to credit assessment andapproval before concluding transactions and are thereaftersubject to regular review, including re-appraisal and approval ofthe limits previously granted.
The creditworthiness of counterparties is assessed based on ananalysis of quantitative and qualitative data regarding financial
256 / TOTAL - Registration Document 2009
1 2 3 4 5 6 7 8 9 10 11
Notes to the Consolidated Financial StatementsAPPENDIX 1
CONSOLIDATED FINANCIAL STATEMENTS
standing and business risks, together with the review of anyrelevant third party and market information, such as datapublished by rating agencies. On this basis, credit limits aredefined for each potential counterparty and, where appropriate,transactions are subject to specific authorizations.
Credit exposure, which is essentially an economic exposure or anexpected future physical exposure, is permanently monitored andsubject to sensitivity measures.
Credit risk is mitigated by the systematic use of industry standardcontractual frameworks that permit netting, enable requiringadded security in case of adverse change in the counterpartyrisk, and allow for termination of the contract upon occurrence ofcertain events of default.
� Downstream Segment
o Refining & Marketing
Internal procedures for the Refining & Marketing division includerules on credit risk that describe the basis of internal control inthis domain, including the separation of authority betweencommercial and financial operations. Credit policies are definedat the local level, complemented by the implementation ofprocedures to monitor customer risk (credit committees at thesubsidiary level, the creation of credit limits for corporatecustomers, portfolio guarantees, etc.).
Each entity also implements monitoring of its outstandingreceivables. Risks related to credit may be mitigated or limited byrequiring security or guarantees.
Bad debts are provisioned on a case-by-case basis at a ratedetermined by management based on an assessment of the factsand circumstances.
o Trading & Shipping
Trading & Shipping deals with commercial counterparties andfinancial institutions located throughout the world. Counterpartiesto physical and derivative transactions are primarily entitiesinvolved in the oil and gas industry or in the trading of energycommodities, or financial institutions. Credit risk coverage isconcluded with financial institutions, international banks andinsurance groups selected in accordance with strict criteria.
The Trading & Shipping division has a strict policy of internaldelegation of authority governing establishment of country andcounterparty credit limits and approval of specific transactions.Credit exposures contracted under these limits and approvals aremonitored on a daily basis.
Potential counterparties are subject to credit assessment andapproval prior to any transaction being concluded and all activecounterparties are subject to regular reviews, includingre-appraisal and approval of granted limits. The creditworthinessof counterparties is assessed based on an analysis of quantitativeand qualitative data regarding financial standing and businessrisks, together with the review of any relevant third party and
market information, such as ratings published by Standard &Poor’s, Moody’s Investors Service and other agencies.
Contractual arrangements are structured so as to maximize therisk mitigation benefits of netting between transactions whereverpossible and additional protective terms providing for theprovision of security in the event of financial deterioration and thetermination of transactions on the occurrence of defined defaultevents are used to the greatest permitted extent.
Credit risks in excess of approved levels are secured by means ofletters of credit and other guarantees, cash deposits andinsurance arrangements. In respect of derivative transactions,risks are secured by margin call contracts wherever possible.
� Chemicals Segment
Credit risk in the Chemicals segment is primarily related tocommercial receivables. Each division implements procedures formanaging and provisioning credit risk that differ based on the sizeof the subsidiary and the market in which it operates. The principalelements of these procedures are:
- implementation of credit limits with different authorizationprocedures for possible credit overruns;
- use of insurance policies or specific guarantees (letters of credit);
- regular monitoring and assessment of overdue accounts (agingbalance), including collection procedures; and
- provisioning of bad debts on a customer-by-customer basis,according to payment delays and local payment practices.
32) Other risks and contingent liabilitiesTOTAL is not currently aware of any event, litigation, risks orcontingent liabilities that could have a material impact on the assetsand liabilities, results, financial position or operations of the Group.
Antitrust investigations
1) Following investigations into certain commercial practices inthe chemicals industry in the United States, some subsidiariesof the Arkema 1 group have been involved in criminalinvestigations, closed as of today, and civil liability lawsuits inthe United States for violations of antitrust laws. TOTAL S.A.has been named in certain of these suits as the parentcompany.
In Europe, the European Commission commencedinvestigations in 2000, 2003 and 2004 into alleged anti-competitive practices involving certain products sold byArkema. In January 2005, under one of these investigations,the European Commission fined Arkema €13.5 million andjointly fined Arkema and Elf Aquitaine €45 million. The appealfrom Arkema and Elf Aquitaine before the Court of FirstInstance of the European Union has been rejected onSeptember 30, 2009. A recourse before the Court of Justice ofthe European Communities has been filed.
1. Arkema is used in this section to designate those companies of the Arkema group whose ultimate parent company is Arkema S.A. Arkema became an independent companyafter being spun-off from TOTAL S.A. in May 2006.
/ 257TOTAL
APPENDIX 1Notes to the Consolidated Financial StatementsCONSOLIDATED FINANCIAL STATEMENTS
9
The Commission notified Arkema, TOTAL S.A. and ElfAquitaine of complaints concerning two other product lines inJanuary and August 2005, respectively. Arkema hascooperated with the authorities in these procedures andinvestigations. In May 2006, the European Commission finedArkema €78.7 million and €219.1 million, as a result of,respectively, each of these two proceedings. Elf Aquitaine washeld jointly and severally liable for, respectively, €65.1 millionand €181.35 million of these fines while TOTAL S.A. was heldjointly and severally liable, respectively, for €42 million and€140.4 million. TOTAL S.A., Arkema and Elf Aquitaine haveappealed these decisions to the Court of First Instance of theEuropean Union.
Arkema and Elf Aquitaine received a statement of objectionsfrom the European Commission in August 2007 concerningalleged anti-competitive practices related to another line ofchemical products. As a result, in June 2008, Arkema andElf Aquitaine have been jointly and severally fined in an amountof €22.7 million and individually in an amount of €20.43 millionfor Arkema and €15.89 million for Elf Aquitaine. The companiesconcerned appealed this decision to the relevant Europeancourt.
Arkema and Elf Aquitaine received a statement of objectionsfrom the European Commission in March 2009 concerningalleged anti-competitive practices related to another line ofchemical products. The decision has been rendered by theCommission in November 2009. The companies have beenjointly and severally fined in an amount of €11 million andindividually in an amount of €9.92 million for Arkema and€7.71 million for Elf Aquitaine. The concerned companies willappeal this decision to the relevant European court.
No facts have been alleged that would implicate TOTAL S.A.or Elf Aquitaine in the practices questioned in theseproceedings, and the fines received are based solely on theirstatus as parent companies.
Arkema began implementing compliance procedures in 2001that are designed to prevent its employees from violatingantitrust provisions. However, it is not possible to exclude thepossibility that the relevant authorities could commenceadditional proceedings involving Arkema, as well asTOTAL S.A. and Elf Aquitaine.
2) As part of the agreement relating to the spin-off of Arkema,TOTAL S.A. or certain other Group companies agreed to grantArkema guarantees for certain risks related to antitrustproceedings arising from events prior to the spin-off.
These guarantees cover, for a period of ten years that began in2006, 90% of amounts paid by Arkema related to (i) finesimposed by European authorities or European member-statesfor competition law violations, (ii) fines imposed by U.S. courtsor antitrust authorities for federal antitrust violations orviolations of the competition laws of U.S. states, (iii) damagesawarded in civil proceedings related to the governmentproceedings mentioned above, and (iv) certain costs related tothese proceedings.
The guarantee covering the risks related to anticompetitionviolations in Europe applies to amounts above a €176.5 millionthreshold.
If one or more individuals or legal entities, acting alone ortogether, directly or indirectly holds more than one-third of the
voting rights of Arkema, or if Arkema transfers more than 50%of its assets (as calculated under the enterprise valuationmethod, as of the date of the transfer) to a third party orparties acting together, irrespective of the type or number oftransfers, these guarantees will become void.
On the other hand, the agreements provide that Arkema willindemnify TOTAL S.A. or any Group company for 10% of anyamount that TOTAL S.A. or any Group company are requiredto pay under any of the proceedings covered by theseguarantees.
3) The Group has recorded provisions amounting to €43 million inits consolidated financial statements as of December 31, 2009to cover the risks mentioned above.
4) Moreover, as a result of investigations started by the EuropeanCommission in October 2002 concerning certain Refining &Marketing subsidiaries of the Group, Total Nederland N.V. andTOTAL S.A. received a statement of objections in October2004. These proceedings resulted, in September 2006, in TotalNederland N.V. being fined €20.25 million and in TOTAL S.A.as its parent company being held jointly responsible for€13.5 million of this amount, although no facts implicatingTOTAL S.A. in the practices under investigation were alleged.TOTAL S.A. and Total Nederland N.V. have appealed thisdecision to the Court of First Instance of the European Union.
In addition, in May 2007, Total France and TOTAL S.A.received a statement of objections regarding alleged antitrustpractices concerning another product line of the Refining &Marketing division. These proceedings resulted, inOctober 2008, in Total France being fined €128.2 million and inTOTAL S.A., as its parent company, being held jointlyresponsible although no facts implicating TOTAL S.A. in thepractices under investigation were alleged. TOTAL S.A. andTotal Raffinage Marketing (the new corporate name of TotalFrance) have appealed this decision to the Court of FirstInstance of the European Union.
Furthermore, in July 2009, the French antitrust Authority sentto TotalGaz and Total Raffinage Marketing a statement ofobjections regarding alleged antitrust practices concerninganother product line of the Refining & Marketing division.
5) Given the discretionary powers granted to antitrust Authoritiesfor determining fines, it is not currently possible to determinewith certainty the ultimate outcome of these investigations andproceedings. TOTAL S.A. and Elf Aquitaine are contesting theirliability and the method of determining these fines. Although itis not possible to predict the outcome of these proceedings,the Group believes that they will not have a material adverseeffect on its financial condition or results.
Buncefield
On December 11, 2005, several explosions, followed by a majorfire, occurred at an oil storage depot at Buncefield, north ofLondon. This depot is operated by Hertfordshire Oil Storage Limited(HOSL), a company in which the British subsidiary of TOTAL holds60% and another oil group holds 40%.
The explosion caused minor injuries to a number of people andcaused property damage to the depot and the buildings and homeslocated nearby. The official Independent Investigation Board has
258 / TOTAL - Registration Document 2009
1 2 3 4 5 6 7 8 9 10 11
Notes to the Consolidated Financial StatementsAPPENDIX 1
CONSOLIDATED FINANCIAL STATEMENTS
indicated that the explosion was caused by the overflow of a tankat the depot. The Board’s final report was released onDecember 11, 2008. The civil procedure for claims, which had notyet been settled, took place between October and December 2008.The Court’s decision of March 20, 2009, declared the Britishsubsidiary of TOTAL responsible for the accident and solely liablefor indemnifying the victims. TOTAL’s British subsidiary hasappealed this decision. The appeal trial took place in January 2010and a decision is expected during the first-half 2010.
With respect to civil liability the provision recorded in the Group’sconsolidated financial statements as of December 31, 2009amounts to € 295 million after payments already completed.
The Group carries insurance for damage to its interests in thesefacilities, business interruption and civil liability claims from thirdparties. The residual amount to be received from insurers amountsto € 211 million as of December 31, 2009.
The Group believes that, based on the information currentlyavailable, on a reasonable estimate of its liability and on provisionsrecognized, this accident should not have a significant impact onthe Group’s financial situation or consolidated results.
On December 1, 2008, the Health and Safety Executive (HSE) andthe Environment Agency (EA) issued a Notice of prosecutionagainst five companies, including the British subsidiary of TOTAL.In November 2009, the British subsidiary of TOTAL, pleaded guiltyto charges brought by the prosecution and intends to raise, into thisframework, a number of elements likely to mitigate the impact of thecharges brought against it.
Erika
Following the sinking in December 1999 of the Erika, a tanker thatwas transporting products belonging to one of the Groupcompanies, the Tribunal de grande instance of Paris convictedTOTAL S.A. of marine pollution pursuant to a judgment issued onJanuary 16, 2008, finding that TOTAL S.A. was negligent in itsvetting procedure for vessel selection. TOTAL S.A. was fined €
375,000. The court also ordered compensation to be paid to thevictims of pollution from the Erika up to an aggregate amount of€192 million, declaring TOTAL S.A. jointly and severally liable forsuch payments together with the Erika’s inspection andclassification firm, the Erika’s owner and the Erika’s manager.
TOTAL believes that the finding of negligence and the relatedconviction for marine pollution are without substance as a matter offact and as a matter of law. TOTAL also considers that this verdict iscontrary to the intended aim of enhancing maritime transport safety.
TOTAL has appealed the verdict of January 16, 2008. In themeantime, it has nevertheless proposed to pay third parties who sorequest definitive compensation as determined by the court. Todate, forty-one third parties have received compensation payments,representing an aggregate amount of €171.5 million.
The appeal was heard end of 2009 by the Court of Appeal in Paris.The decision of the Court is expected during the first-half 2010.
TOTAL S.A. believes that, based on a reasonable estimate of itsliability, the case will not have a material impact on the Group’sfinancial situation or consolidated results.
33) Other information
A) Research and development costs
Research and development costs incurred by the Group in 2009amounted to €650 million (€612 million in 2008 and €594 million in2007), corresponding to 0.5% of the sales.
The staff dedicated in 2009 to these research and developmentactivities are estimated at 4,016 people (4,285 in 2008 and 4,216 in2007).
B) Taxes paid to Middle East oil-producingcountries for the portion which TOTAL heldhistorically as concessions
Taxes paid for the portion that TOTAL held historically asconcessions (Abu Dhabi offshore and onshore, Dubai offshore,Oman and Abu Al Bu Khoosh) included in operating expensesamounted to €1,871 million in 2009 (€3,301 million in 2008 and€2,505 million in 2007).
C) Carbon dioxide emission rights
The principles governing the accounting for emission rights arepresented in Note 1 paragraph T to the Consolidated FinancialStatements.
As of December 31, 2009, the Group sites’ position for emissionrights is balanced between delivered/acquired emission rights andemissions for the year 2009.
34) Post-closing events
A) Devaluation of the Bolivar
In January 2010, the President of Venezuela announced adevaluation of the Bolivar and the establishment of a dual exchangerate. Subsidiaries of the Group in this country operate mostly in theUpstream segment and are dollar functional currency entities. Inthis context, the devaluation of the Bolivar should not have anymaterial effect on the Group’s consolidated balance sheet,statement of income and shareholders’ equity.
B) Creation of TotalErg
On January 27, 2010, TOTAL and ERG signed an agreement tocreate a joint venture in the Italian marketing and refining business.The shareholder pact calls for joint governance as well as operatingindependence for the new entity. TOTAL and ERG will hold equitystakes of, respectively, 49% and 51%. Created through the mergerof TOTAL Italia and ERG Petroli, the joint venture will be called“TotalErg” and will operate under both the TOTAL and ERG brands.TotalErg will become one of the largest marketing operators in Italy,with a retail market share of nearly 13% and over 3,400 servicestations. The joint venture will also be active in the refiningbusiness, with a total capacity of around 8% of national demand.The transaction will be submitted to competition authorities forapproval. Until then, TOTAL Italia and ERG Petroli will remain asseparate, competing entities.
/ 259TOTAL
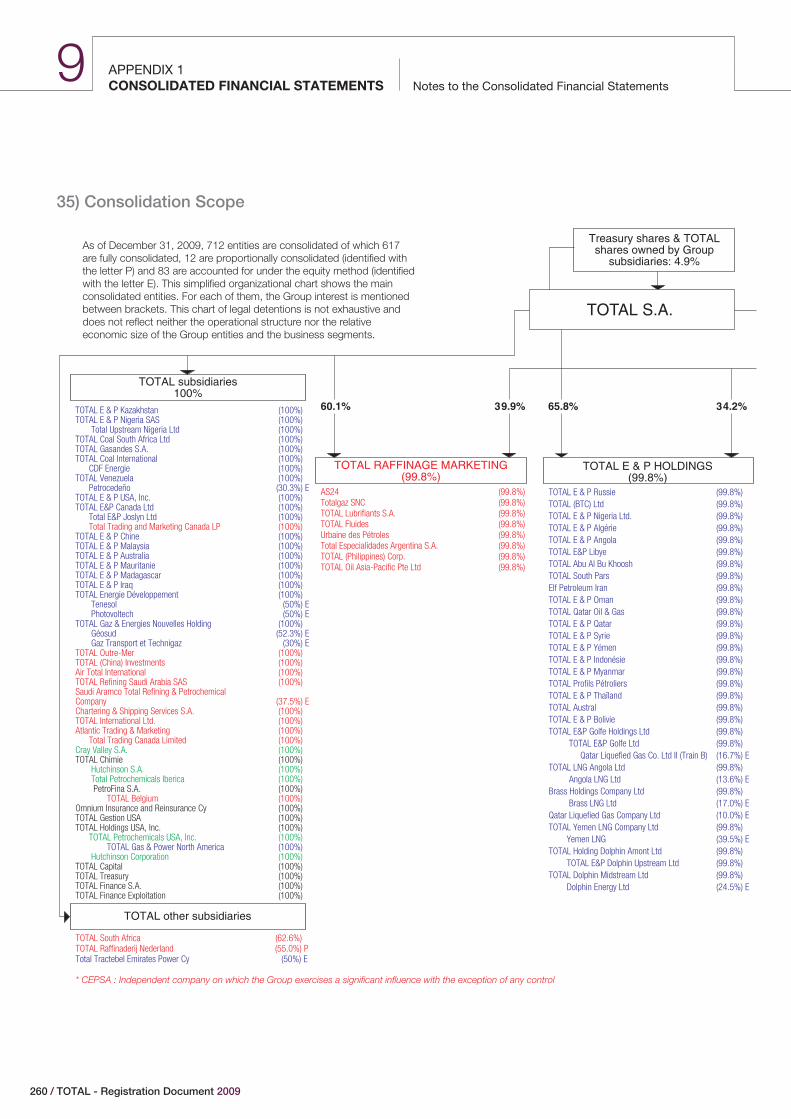
APPENDIX 1Notes to the Consolidated Financial StatementsCONSOLIDATED FINANCIAL STATEMENTS
9
35) Consolidation Scope
TOTAL South Africa (62.6%)TOTAL Raffinaderij Nederland (55.0%) PTotal Tractebel Emirates Power Cy (50%) E
* CEPSA : Independent company on which the Group exercises a significant influence with the exception of any control
60.1% 39.9%
TOTAL S.A.
65.8% 34.2%
TOTAL subsidiaries100%
TOTAL RAFFINAGE MARKETING(99.8%)
TOTAL E & P HOLDINGS(99.8%)
TOTAL E & P Kazakhstan (100%)TOTAL E & P Nigeria SAS (100%) Total Upstream Nigeria Ltd (100%)TOTAL Coal South Africa Ltd (100%)TOTAL Gasandes S.A. (100%)TOTAL Coal International (100%) CDF Energie (100%)TOTAL Venezuela (100%) Petrocedeño (30.3%) ETOTAL E & P USA, Inc. (100%)TOTAL E&P Canada Ltd (100%) Total E&P Joslyn Ltd (100%) Total Trading and Marketing Canada LP (100%)TOTAL E & P Chine (100%)TOTAL E & P Malaysia (100%)TOTAL E & P Australia (100%)TOTAL E & P Mauritanie (100%)TOTAL E & P Madagascar (100%)TOTAL E & P Iraq (100%)TOTAL Energie Développement (100%) Tenesol (50%) E Photovoltech (50%) ETOTAL Gaz & Energies Nouvelles Holding (100%) Géosud (52.3%) E Gaz Transport et Technigaz (30%) ETOTAL Outre-Mer (100%)TOTAL (China) Investments (100%)Air Total International (100%)TOTAL Refining Saudi Arabia SAS (100%)Saudi Aramco Total Refining & PetrochemicalCompany (37.5%) EChartering & Shipping Services S.A. (100%)TOTAL International Ltd. (100%)Atlantic Trading & Marketing (100%) Total Trading Canada Limited (100%)Cray Valley S.A. (100%)TOTAL Chimie (100%) Hutchinson S.A. (100%) Total Petrochemicals Iberica (100%) PetroFina S.A. (100%) TOTAL Belgium (100%)Omnium Insurance and Reinsurance Cy (100%)TOTAL Gestion USA (100%)TOTAL Holdings USA, Inc. (100%) TOTAL Petrochemicals USA, Inc. (100%) TOTAL Gas & Power North America (100%) Hutchinson Corporation (100%)TOTAL Capital (100%)TOTAL Treasury (100%)TOTAL Finance S.A. (100%)TOTAL Finance Exploitation (100%)
AS24 (99.8%)Totalgaz SNC (99.8%)TOTAL Lubrifiants S.A. (99.8%)TOTAL Fluides (99.8%)Urbaine des Pétroles (99.8%)Total Especialidades Argentina S.A. (99.8%)TOTAL (Philippines) Corp. (99.8%)TOTAL Oil Asia-Pacific Pte Ltd (99.8%)
TOTAL E & P Russie (99.8%)TOTAL (BTC) Ltd (99.8%)TOTAL E & P Nigeria Ltd. (99.8%)TOTAL E & P Algérie (99.8%)TOTAL E & P Angola (99.8%)TOTAL E&P Libye (99.8%)TOTAL Abu Al Bu Khoosh (99.8%)TOTAL South Pars (99.8%)Elf Petroleum Iran (99.8%)TOTAL E & P Oman (99.8%)TOTAL Qatar Oil & Gas (99.8%)TOTAL E & P Qatar (99.8%)TOTAL E & P Syrie (99.8%)TOTAL E & P Yémen (99.8%)TOTAL E & P Indonésie (99.8%)TOTAL E & P Myanmar (99.8%)TOTAL Profils Pétroliers (99.8%)TOTAL E & P Thaïland (99.8%)TOTAL Austral (99.8%)TOTAL E & P Bolivie (99.8%)TOTAL E&P Golfe Holdings Ltd (99.8%) TOTAL E&P Golfe Ltd (99.8%) Qatar Liquefied Gas Co. Ltd II (Train B) (16.7%) ETOTAL LNG Angola Ltd (99.8%) Angola LNG Ltd (13.6%) EBrass Holdings Company Ltd (99.8%) Brass LNG Ltd (17.0%) EQatar Liquefied Gas Company Ltd (10.0%) ETOTAL Yemen LNG Company Ltd (99.8%) Yemen LNG (39.5%) ETOTAL Holding Dolphin Amont Ltd (99.8%) TOTAL E&P Dolphin Upstream Ltd (99.8%)TOTAL Dolphin Midstream Ltd (99.8%) Dolphin Energy Ltd (24.5%) E
As of December 31, 2009, 712 entities are consolidated of which 617
are fully consolidated, 12 are proportionally consolidated (identified with
the letter P) and 83 are accounted for under the equity method (identified
with the letter E). This simplified organizational chart shows the main
consolidated entities. For each of them, the Group interest is mentioned
between brackets. This chart of legal detentions is not exhaustive and
does not reflect neither the operational structure nor the relative
economic size of the Group entities and the business segments.
Treasury shares & TOTALshares owned by Group
subsidiaries: 4.9%
TOTAL other subsidiaries
260 / TOTAL - Registration Document 2009
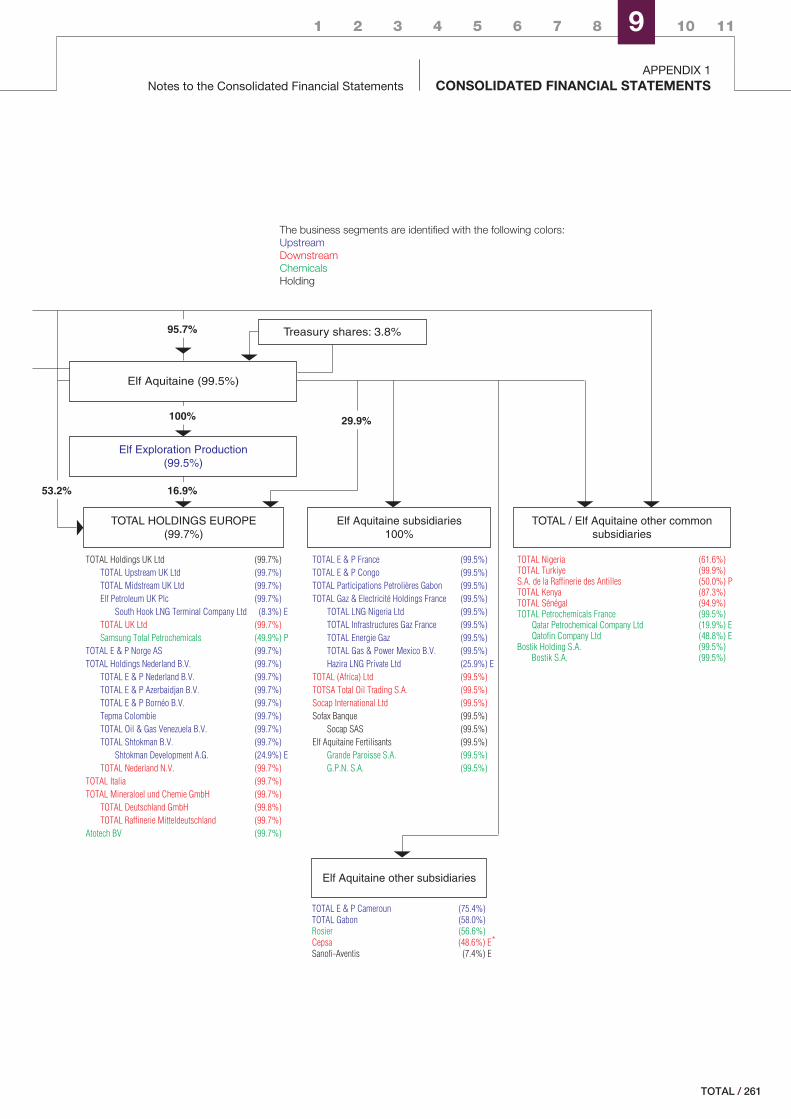
1 2 3 4 5 6 7 8 9 10 11
Notes to the Consolidated Financial StatementsAPPENDIX 1
CONSOLIDATED FINANCIAL STATEMENTS
The business segments are identified with the following colors:
Upstream
Downstream
Chemicals
Holding
TOTAL E & P Cameroun (75.4%)TOTAL Gabon (58.0%)Rosier (56.6%)Cepsa (48.6%) E*Sanofi-Aventis (7.4%) E
95.7%
29.9%
Elf Aquitaine (99.5%)
Elf Exploration Production(99.5%)
53.2% 16.9%
TOTAL / Elf Aquitaine other commonsubsidiaries
100%
TOTAL Holdings UK Ltd (99.7%) TOTAL Upstream UK Ltd (99.7%) TOTAL Midstream UK Ltd (99.7%) Elf Petroleum UK Plc (99.7%) South Hook LNG Terminal Company Ltd (8.3%) E TOTAL UK Ltd (99.7%) Samsung Total Petrochemicals (49.9%) PTOTAL E & P Norge AS (99.7%)TOTAL Holdings Nederland B.V. (99.7%) TOTAL E & P Nederland B.V. (99.7%) TOTAL E & P Azerbaidjan B.V. (99.7%) TOTAL E & P Bornéo B.V. (99.7%) Tepma Colombie (99.7%) TOTAL Oil & Gas Venezuela B.V. (99.7%) TOTAL Shtokman B.V. (99.7%) Shtokman Development A.G. (24.9%) E TOTAL Nederland N.V. (99.7%)TOTAL Italia (99.7%)TOTAL Mineraloel und Chemie GmbH (99.7%) TOTAL Deutschland GmbH (99.8%) TOTAL Raffinerie Mitteldeutschland (99.7%)Atotech BV (99.7%)
TOTAL E & P France (99.5%)TOTAL E & P Congo (99.5%)TOTAL Participations Petrolières Gabon (99.5%)TOTAL Gaz & Electricité Holdings France (99.5%) TOTAL LNG Nigeria Ltd (99.5%) TOTAL Infrastructures Gaz France (99.5%) TOTAL Energie Gaz (99.5%) TOTAL Gas & Power Mexico B.V. (99.5%) Hazira LNG Private Ltd (25.9%) ETOTAL (Africa) Ltd (99.5%)TOTSA Total Oil Trading S.A. (99.5%)Socap International Ltd (99.5%)Sofax Banque (99.5%) Socap SAS (99.5%)Elf Aquitaine Fertilisants (99.5%) Grande Paroisse S.A. (99.5%) G.P.N. S.A. (99.5%)
TOTAL Nigeria (61.6%)TOTAL Turkiye (99.9%)S.A. de la Raffinerie des Antilles (50.0%) PTOTAL Kenya (87.3%)TOTAL Sénégal (94.9%)TOTAL Petrochemicals France (99.5%) Qatar Petrochemical Company Ltd (19.9%) E Qatofin Company Ltd (48.8%) EBostik Holding S.A. (99.5%) Bostik S.A. (99.5%)
Treasury shares: 3.8%
TOTAL HOLDINGS EUROPE(99.7%)
Elf Aquitaine subsidiaries100%
Elf Aquitaine other subsidiaries
/ 261TOTAL
APPENDIX 1CONSOLIDATED FINANCIAL STATEMENTS
9
262 / TOTAL - Registration Document 2009
10APPENDIX 2SUPPLEMENTAL OIL AND GAS INFORMATION (UNAUDITED)
OIL AND GAS INFORMATION PURSUANT TO FASB ACCOUNTING STANDARDS CODIFICATION 932 p. 264
New rules p. 264
Preparation of reserves estimates p. 264
Proved developed reserves p. 265
Proved undeveloped reserves p. 265
Estimated proved reserves of oil, bitumen and gas reserves p. 265
Results of operations for oil and gas producing activities p. 273
Costs incurred in oil and gas property acquisition, exploration and development activities p. 275
Capitalized cost related to oil and gas producing activities p. 276
Standardized measure of discounted future net cash flows (excluding transportation) p. 277
Changes in the standardized measure of discounted future net cash flows p. 279
OTHER INFORMATION p. 280
Net gas production, production prices and production costs p. 280
/ 263TOTAL
APPENDIX 2SUPPLEMENTAL OIL AND GAS Oil and gas information pursuant to FASB Accounting Standards
Codification 932INFORMATION (UNAUDITED)10
� Oil and gas information pursuant to FASB AccountingStandards Codification 932
� New rules
The amendments to Securities and Exchange Commission (SEC)Rule 4-10 of Regulation S-X set forth in the “Modernization of Oiland Gas Reporting” release (SEC Release n° 33-8995) and theFinancial Accounting Standard Board (FASB) Accounting StandardsUpdate regarding Extractive Activities — Oil and Gas (ASC 932)change a number of reserves estimation and disclosurerequirements. In terms of reserves estimation, the main changesare: the use of an average price instead of a single year-end price;the use of new reliable technologies to assess proved reserves; andthe inclusion, under certain conditions, of non traditional sources asoil and gas producing activities. The revised rules form the basis ofthe 2009 year-end estimation of proved reserves and theirapplication resulted in an immaterial increase in TOTAL’s provedreserves. In particular, positive revisions were made possible in2009 on a limited number of proved properties due to theintegration of reliable technologies such as seismic and wirelinepressure data in the proved reserves evaluation workflow. Theserevisions represent less than 2% of the Group’s proved reservesportfolio. Bitumen was included in 2008 and 2007 in the crude oilreserves and is disclosed separately for 2009 pursuant to the SECrequirements, as amended.
� Preparation of reserves estimates
The estimation of reserves is an ongoing process which is donewithin affiliates by experienced geoscientists, engineers andeconomists under the supervision of each affiliate’s GeneralManagement. Persons involved in reserves evaluation are trained tofollow SEC-compliant internal guidelines and policies regardingcriteria that must be met before reserves can be considered asproved.
The technical validation process involves a Reservoir Committeethat is responsible for approving proved reserves changes above acertain threshold and technical evaluations of reserves associatedwith any investment decision that requires approval from theExploration & Production Executive Committee. The Chairman ofthe Reservoir Committee and its members are appointed by thePresident of Exploration & Production and represent expertise in
reservoir engineering, production geology, production geophysics,drilling, and pre-development projects.
An internal control process related to reserves estimation is wellestablished within TOTAL and involves the following elements:
o A central Reserve Entity whose responsibility is: to consolidate,document and archive the Group’s reserves ; to ensure coherencyof evaluations worldwide; to maintain the Corporate ReservesGuidelines Standards in line with SEC guidelines and policies; todeliver training on reserves evaluation and classification; and toconduct periodically in-depth technical review of reserves for eachaffiliate .
o An annual review of reserves conducted by an internal group ofspecialists selected for their expertise in geosciences andengineering or their knowledge of the affiliate. All members of thisgroup chaired by the Geoscience Reserve Manager andcomposed of at least three Reservoir Committee members areknowledgeable in the SEC guidelines for proved reservesevaluation. Their responsibility is to provide an independent reviewof reserves changes proposed by affiliates and ensure thatreserves are estimated using appropriate standards andprocedures.
o At the end of the annual review carried out by the GeoscienceDivision, a SEC Reserves Committee chaired by the Exploration &Production Finance Senior Vice President and comprised of theGeoscience, Strategy and Legal Senior Vice Presidents, or theirrepresentatives, as well as the Chairman of the ReservoirCommittee and the Geoscience Reserves Manager, approves theSEC reserve booking proposals as regards to criteria that are notdepending upon reservoir and geoscience techniques. The resultsof the annual review and the proposals for including revisions oradditions of SEC Proved Reserves are presented to theExploration & Production Executive Committee for approval beforefinal validation by the Group Executive Management.
The reserves evaluation and control process is audited periodicallyby the Group internal auditors who verify the effectiveness of thereserves evaluation process and control procedures.
The Geosciences Reserves Manager (GRM) is the technical personresponsible for preparing the reserves estimates for the Group. TheGRM supervises the Reserve Entity, chairs the annual review ofreserves, and is a member of the Reservoir Committee and the SECReserves Committee. The GRM has a solid background in the fieldsof reservoir engineering and geosciences, a strong experience ofreserve evaluation, audit and control processes and a goodknowledge in economics and finance.
264 / TOTAL - Registration Document 2009
1 2 3 4 5 6 7 8 9 10 11
APPENDIX 2Oil and gas information pursuant to FASB Accounting Standards
Codification 932SUPPLEMENTAL OIL AND GAS
INFORMATION (UNAUDITED)
� Proved developed reserves
At year-end 2009, proved developed reserves of oil and gas were5,835 Mboe and represented 56% of proved reserves. At the end of2008, proved developed reserves were 5,243 Mboe andrepresented 50% of proved reserves. Over the past three years, thelevel of proved developed reserves has remained above 5.2 Bboeand over 50% of proved reserves, illustrating TOTAL’s ability toconsistently transfer proved undeveloped reserves into developedstatus.
� Proved undeveloped reserves
As of December 31, 2009, TOTAL’s combined proved undevelopedreserves of oil and gas were 4,648 Mboe as compared to5,215 Mboe at the end of 2008. The reduction of provedundeveloped reserves reflects primarily the progress made inconverting proved undeveloped reserves into proved developedreserves in particular with the successful production start up oflarge projects in Nigeria, Angola, United States, Qatar and Yemen.The reduction of proved undeveloped reserves associated with thetransfer into developed reserves has been partially offset by theaddition of undeveloped reserves mainly in Canada and Argentina.
More than 60% of the proved undeveloped reserves are associatedwith producing fields and are located for the most part in Canada,Nigeria, Yemen, UAE, Venezuela and Norway. These reserves areexpected to be developed over time as part of initial fielddevelopment plans or additional development phases. The timing tobring these proved reserves into production will depend uponseveral factors including reservoir performance, surface facilities orplant capacity constraints and contractual limitations on productionlevel.
The remaining proved undeveloped reserves correspond toundeveloped fields or assets for which a development has beensanctioned or is in progress. These proved undeveloped reservesare located primarily in Kazakhstan, Angola and Nigeria. For someof the major developments we anticipate it may take more than five
years from the time of recording proved reserves to the start ofproduction due to the complexity and the size of the projects.
Development costs for the year 2009 were €8.1 billion. A large partof the investments was allocated to major development projects inKazakhstan, Angola, Nigeria, United States, Qatar and Yemen andcontributed to convert proved undeveloped reserves into proveddeveloped reserves.
Information shown in the following tables is presented inaccordance with the FASB’s ASC 932 and the requirements of theSEC Regulation S-K (Items 1200 to 1208).
The tables provided below are presented by the followinggeographic areas: Europe, Africa, the Americas, Middle East andAsia (including CIS). Certain previously reported amounts for 2008and 2007 have been reclassified to conform to the current yearpresentation.
� Estimated proved reserves of oil,bitumen and gas reserves
The following tables present, for oil, bitumen and gas reserves, anestimate of the Group’s oil and gas quantities by geographic areasas of December 31, 2009, 2008 and 2007. Quantities shownconcern proved developed and undeveloped reserves together withchanges in quantities for 2009, 2008 and 2007.
The definitions used for proved, proved developed and provedundeveloped oil and gas reserves are in accordance with therevised Rule 4-10 of SEC Regulation S-X.
All references in the following tables to reserves or production areto the Group’s entire share of such reserves or production. TOTAL’sworldwide proved reserves include the proved reserves of itsconsolidated subsidiaries as well as its proportionate share of theproved reserves of equity affiliates and of two companiesaccounted for by the cost method.
/ 265TOTAL
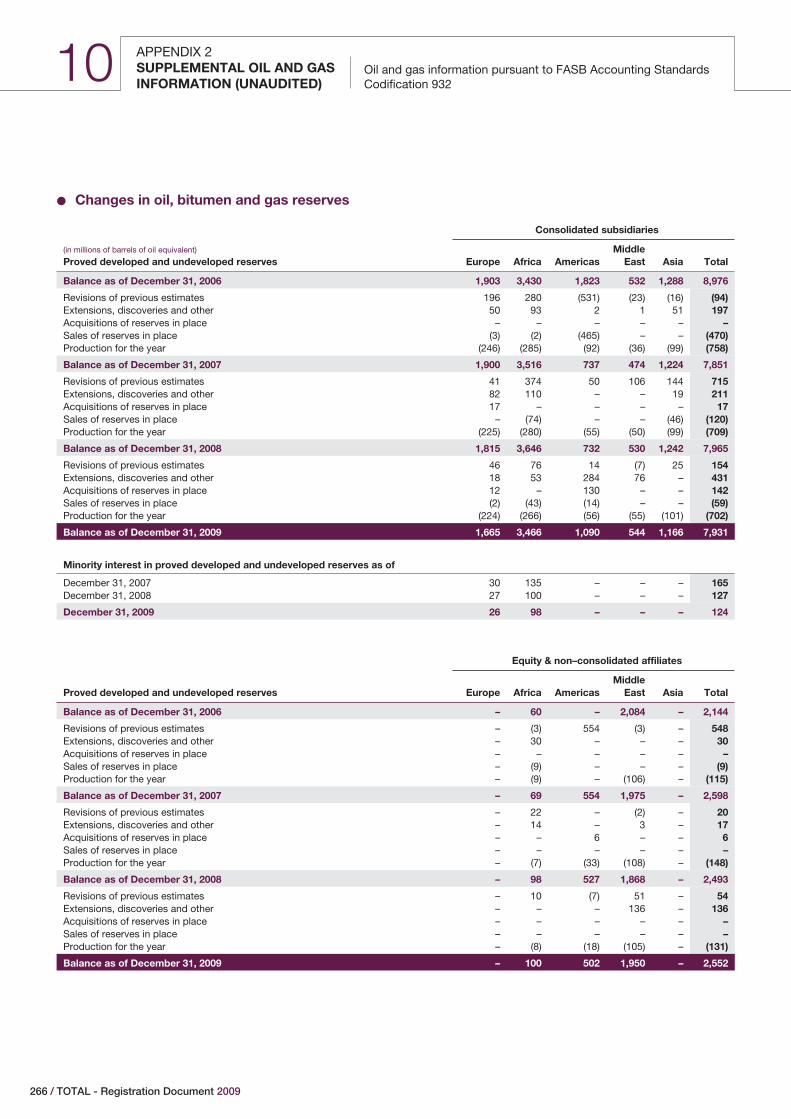
APPENDIX 2SUPPLEMENTAL OIL AND GAS Oil and gas information pursuant to FASB Accounting Standards
Codification 932INFORMATION (UNAUDITED)10
‹ Changes in oil, bitumen and gas reserves
Consolidated subsidiaries
(in millions of barrels of oil equivalent)
Proved developed and undeveloped reserves Europe Africa AmericasMiddle
East Asia Total
Balance as of December 31, 2006 1,903 3,430 1,823 532 1,288 8,976
Revisions of previous estimates 196 280 (531) (23) (16) (94)Extensions, discoveries and other 50 93 2 1 51 197Acquisitions of reserves in place – – – – – –Sales of reserves in place (3) (2) (465) – – (470)Production for the year (246) (285) (92) (36) (99) (758)
Balance as of December 31, 2007 1,900 3,516 737 474 1,224 7,851
Revisions of previous estimates 41 374 50 106 144 715Extensions, discoveries and other 82 110 – – 19 211Acquisitions of reserves in place 17 – – – – 17Sales of reserves in place – (74) – – (46) (120)Production for the year (225) (280) (55) (50) (99) (709)
Balance as of December 31, 2008 1,815 3,646 732 530 1,242 7,965
Revisions of previous estimates 46 76 14 (7) 25 154Extensions, discoveries and other 18 53 284 76 – 431Acquisitions of reserves in place 12 – 130 – – 142Sales of reserves in place (2) (43) (14) – – (59)Production for the year (224) (266) (56) (55) (101) (702)
Balance as of December 31, 2009 1,665 3,466 1,090 544 1,166 7,931
Minority interest in proved developed and undeveloped reserves as of
December 31, 2007 30 135 – – – 165December 31, 2008 27 100 – – – 127
December 31, 2009 26 98 – – – 124
Equity & non–consolidated affiliates
Proved developed and undeveloped reserves Europe Africa AmericasMiddle
East Asia Total
Balance as of December 31, 2006 – 60 – 2,084 – 2,144
Revisions of previous estimates – (3) 554 (3) – 548Extensions, discoveries and other – 30 – – – 30Acquisitions of reserves in place – – – – – –Sales of reserves in place – (9) – – – (9)Production for the year – (9) – (106) – (115)
Balance as of December 31, 2007 – 69 554 1,975 – 2,598
Revisions of previous estimates – 22 – (2) – 20Extensions, discoveries and other – 14 – 3 – 17Acquisitions of reserves in place – – 6 – – 6Sales of reserves in place – – – – – –Production for the year – (7) (33) (108) – (148)
Balance as of December 31, 2008 – 98 527 1,868 – 2,493
Revisions of previous estimates – 10 (7) 51 – 54Extensions, discoveries and other – – – 136 – 136Acquisitions of reserves in place – – – – – –Sales of reserves in place – – – – – –Production for the year – (8) (18) (105) – (131)
Balance as of December 31, 2009 – 100 502 1,950 – 2,552
266 / TOTAL - Registration Document 2009
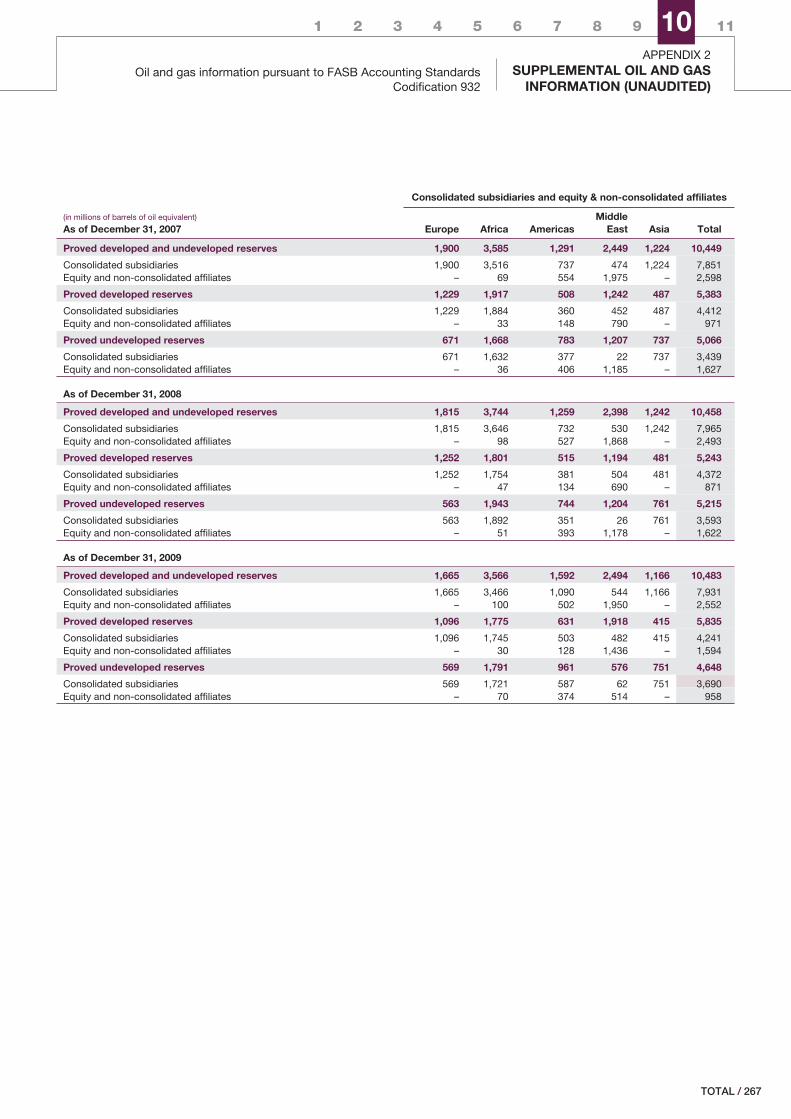
APPENDIX 2Oil and gas information pursuant to FASB Accounting Standards
Codification 932SUPPLEMENTAL OIL AND GAS
INFORMATION (UNAUDITED)
1 2 3 4 5 6 7 8 9 10 11
Consolidated subsidiaries and equity & non-consolidated affiliates
(in millions of barrels of oil equivalent)
As of December 31, 2007 Europe Africa AmericasMiddle
East Asia Total
Proved developed and undeveloped reserves 1,900 3,585 1,291 2,449 1,224 10,449
Consolidated subsidiaries 1,900 3,516 737 474 1,224 7,851Equity and non-consolidated affiliates – 69 554 1,975 – 2,598
Proved developed reserves 1,229 1,917 508 1,242 487 5,383
Consolidated subsidiaries 1,229 1,884 360 452 487 4,412Equity and non-consolidated affiliates – 33 148 790 – 971
Proved undeveloped reserves 671 1,668 783 1,207 737 5,066
Consolidated subsidiaries 671 1,632 377 22 737 3,439Equity and non-consolidated affiliates – 36 406 1,185 – 1,627
As of December 31, 2008
Proved developed and undeveloped reserves 1,815 3,744 1,259 2,398 1,242 10,458
Consolidated subsidiaries 1,815 3,646 732 530 1,242 7,965Equity and non-consolidated affiliates – 98 527 1,868 – 2,493
Proved developed reserves 1,252 1,801 515 1,194 481 5,243
Consolidated subsidiaries 1,252 1,754 381 504 481 4,372Equity and non-consolidated affiliates – 47 134 690 – 871
Proved undeveloped reserves 563 1,943 744 1,204 761 5,215
Consolidated subsidiaries 563 1,892 351 26 761 3,593Equity and non-consolidated affiliates – 51 393 1,178 – 1,622
As of December 31, 2009
Proved developed and undeveloped reserves 1,665 3,566 1,592 2,494 1,166 10,483
Consolidated subsidiaries 1,665 3,466 1,090 544 1,166 7,931Equity and non-consolidated affiliates – 100 502 1,950 – 2,552
Proved developed reserves 1,096 1,775 631 1,918 415 5,835
Consolidated subsidiaries 1,096 1,745 503 482 415 4,241Equity and non-consolidated affiliates – 30 128 1,436 – 1,594
Proved undeveloped reserves 569 1,791 961 576 751 4,648
Consolidated subsidiaries 569 1,721 587 62 751 3,690Equity and non-consolidated affiliates – 70 374 514 – 958
/ 267TOTAL
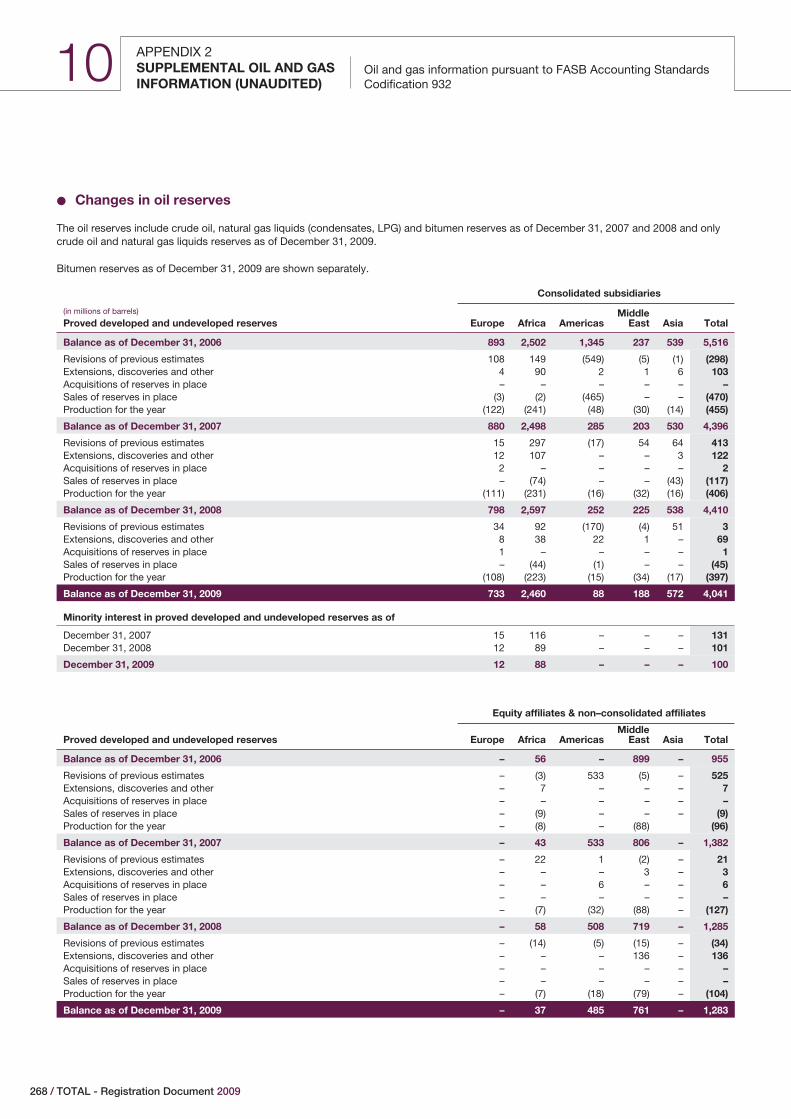
APPENDIX 2SUPPLEMENTAL OIL AND GAS Oil and gas information pursuant to FASB Accounting Standards
Codification 932INFORMATION (UNAUDITED)10
‹ Changes in oil reserves
The oil reserves include crude oil, natural gas liquids (condensates, LPG) and bitumen reserves as of December 31, 2007 and 2008 and onlycrude oil and natural gas liquids reserves as of December 31, 2009.
Bitumen reserves as of December 31, 2009 are shown separately.
Consolidated subsidiaries
(in millions of barrels)
Proved developed and undeveloped reserves Europe Africa AmericasMiddle
East Asia Total
Balance as of December 31, 2006 893 2,502 1,345 237 539 5,516
Revisions of previous estimates 108 149 (549) (5) (1) (298)Extensions, discoveries and other 4 90 2 1 6 103Acquisitions of reserves in place – – – – – –Sales of reserves in place (3) (2) (465) – – (470)Production for the year (122) (241) (48) (30) (14) (455)
Balance as of December 31, 2007 880 2,498 285 203 530 4,396
Revisions of previous estimates 15 297 (17) 54 64 413Extensions, discoveries and other 12 107 – – 3 122Acquisitions of reserves in place 2 – – – – 2Sales of reserves in place – (74) – – (43) (117)Production for the year (111) (231) (16) (32) (16) (406)
Balance as of December 31, 2008 798 2,597 252 225 538 4,410
Revisions of previous estimates 34 92 (170) (4) 51 3Extensions, discoveries and other 8 38 22 1 – 69Acquisitions of reserves in place 1 – – – – 1Sales of reserves in place – (44) (1) – – (45)Production for the year (108) (223) (15) (34) (17) (397)
Balance as of December 31, 2009 733 2,460 88 188 572 4,041
Minority interest in proved developed and undeveloped reserves as of
December 31, 2007 15 116 – – – 131December 31, 2008 12 89 – – – 101
December 31, 2009 12 88 – – – 100
Equity affiliates & non–consolidated affiliates
Proved developed and undeveloped reserves Europe Africa AmericasMiddle
East Asia Total
Balance as of December 31, 2006 – 56 – 899 – 955
Revisions of previous estimates – (3) 533 (5) – 525Extensions, discoveries and other – 7 – – – 7Acquisitions of reserves in place – – – – – –Sales of reserves in place – (9) – – – (9)Production for the year – (8) – (88) (96)
Balance as of December 31, 2007 – 43 533 806 – 1,382
Revisions of previous estimates – 22 1 (2) – 21Extensions, discoveries and other – – – 3 – 3Acquisitions of reserves in place – – 6 – – 6Sales of reserves in place – – – – – –Production for the year – (7) (32) (88) – (127)
Balance as of December 31, 2008 – 58 508 719 – 1,285
Revisions of previous estimates – (14) (5) (15) – (34)Extensions, discoveries and other – – – 136 – 136Acquisitions of reserves in place – – – – – –Sales of reserves in place – – – – – –Production for the year – (7) (18) (79) – (104)
Balance as of December 31, 2009 – 37 485 761 – 1,283
268 / TOTAL - Registration Document 2009
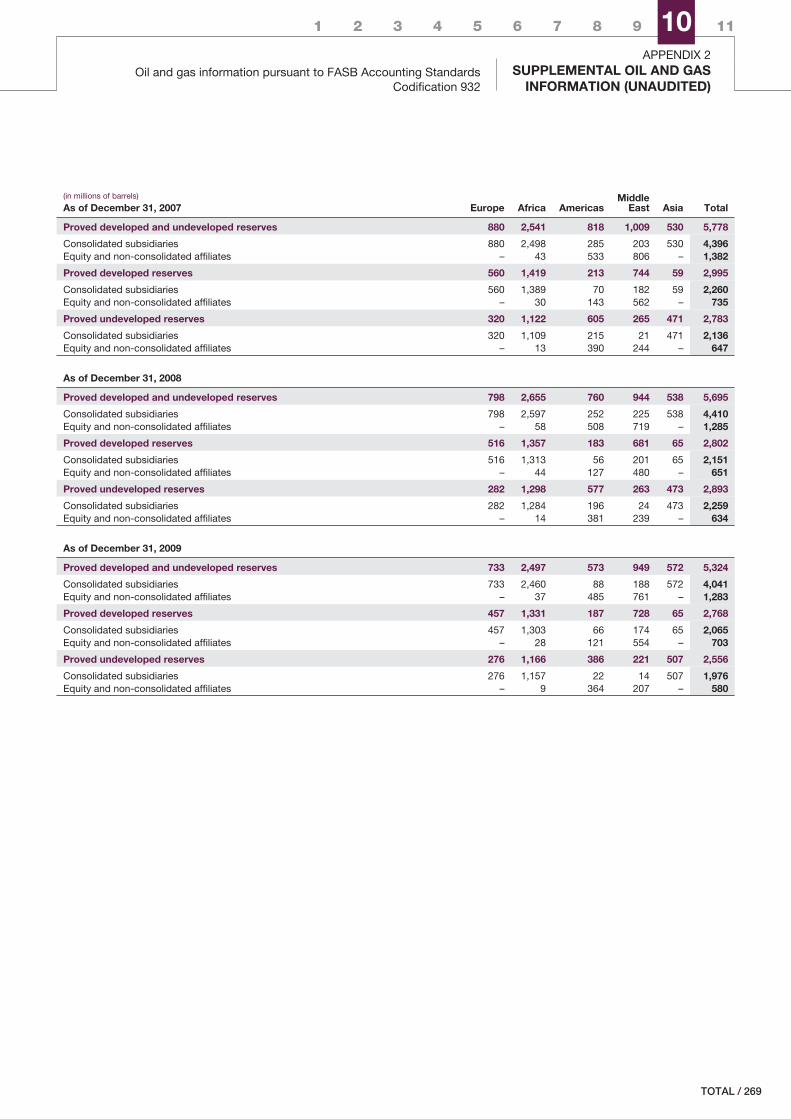
APPENDIX 2Oil and gas information pursuant to FASB Accounting Standards
Codification 932SUPPLEMENTAL OIL AND GAS
INFORMATION (UNAUDITED)
1 2 3 4 5 6 7 8 9 10 11
(in millions of barrels)
As of December 31, 2007 Europe Africa AmericasMiddle
East Asia Total
Proved developed and undeveloped reserves 880 2,541 818 1,009 530 5,778
Consolidated subsidiaries 880 2,498 285 203 530 4,396Equity and non-consolidated affiliates – 43 533 806 – 1,382
Proved developed reserves 560 1,419 213 744 59 2,995
Consolidated subsidiaries 560 1,389 70 182 59 2,260Equity and non-consolidated affiliates – 30 143 562 – 735
Proved undeveloped reserves 320 1,122 605 265 471 2,783
Consolidated subsidiaries 320 1,109 215 21 471 2,136Equity and non-consolidated affiliates – 13 390 244 – 647
As of December 31, 2008
Proved developed and undeveloped reserves 798 2,655 760 944 538 5,695
Consolidated subsidiaries 798 2,597 252 225 538 4,410Equity and non-consolidated affiliates – 58 508 719 – 1,285
Proved developed reserves 516 1,357 183 681 65 2,802
Consolidated subsidiaries 516 1,313 56 201 65 2,151Equity and non-consolidated affiliates – 44 127 480 – 651
Proved undeveloped reserves 282 1,298 577 263 473 2,893
Consolidated subsidiaries 282 1,284 196 24 473 2,259Equity and non-consolidated affiliates – 14 381 239 – 634
As of December 31, 2009
Proved developed and undeveloped reserves 733 2,497 573 949 572 5,324
Consolidated subsidiaries 733 2,460 88 188 572 4,041Equity and non-consolidated affiliates – 37 485 761 – 1,283
Proved developed reserves 457 1,331 187 728 65 2,768
Consolidated subsidiaries 457 1,303 66 174 65 2,065Equity and non-consolidated affiliates – 28 121 554 – 703
Proved undeveloped reserves 276 1,166 386 221 507 2,556
Consolidated subsidiaries 276 1,157 22 14 507 1,976Equity and non-consolidated affiliates – 9 364 207 – 580
/ 269TOTAL
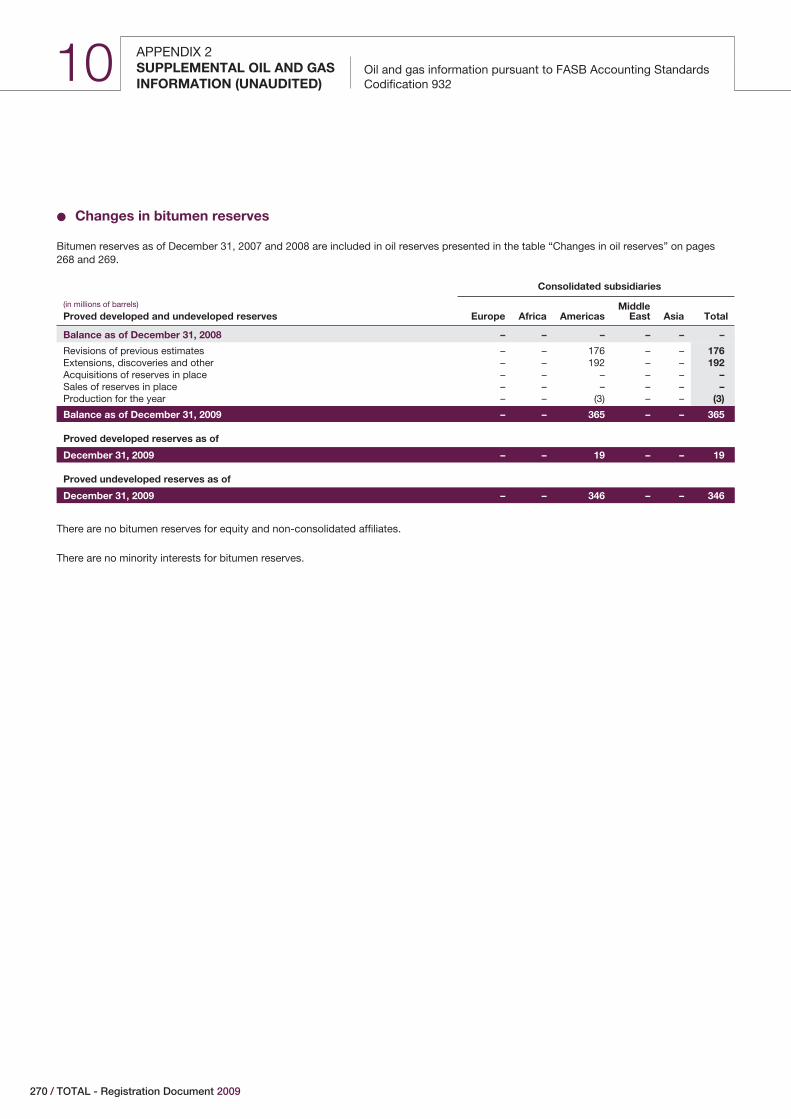
APPENDIX 2SUPPLEMENTAL OIL AND GAS Oil and gas information pursuant to FASB Accounting Standards
Codification 932INFORMATION (UNAUDITED)10
‹ Changes in bitumen reserves
Bitumen reserves as of December 31, 2007 and 2008 are included in oil reserves presented in the table “Changes in oil reserves” on pages268 and 269.
Consolidated subsidiaries
(in millions of barrels)
Proved developed and undeveloped reserves Europe Africa AmericasMiddle
East Asia Total
Balance as of December 31, 2008 – – – – – –
Revisions of previous estimates – – 176 – – 176Extensions, discoveries and other – – 192 – – 192Acquisitions of reserves in place – – – – – –Sales of reserves in place – – – – – –Production for the year – – (3) – – (3)
Balance as of December 31, 2009 – – 365 – – 365
Proved developed reserves as of
December 31, 2009 – – 19 – – 19
Proved undeveloped reserves as of
December 31, 2009 – – 346 – – 346
There are no bitumen reserves for equity and non-consolidated affiliates.
There are no minority interests for bitumen reserves.
270 / TOTAL - Registration Document 2009
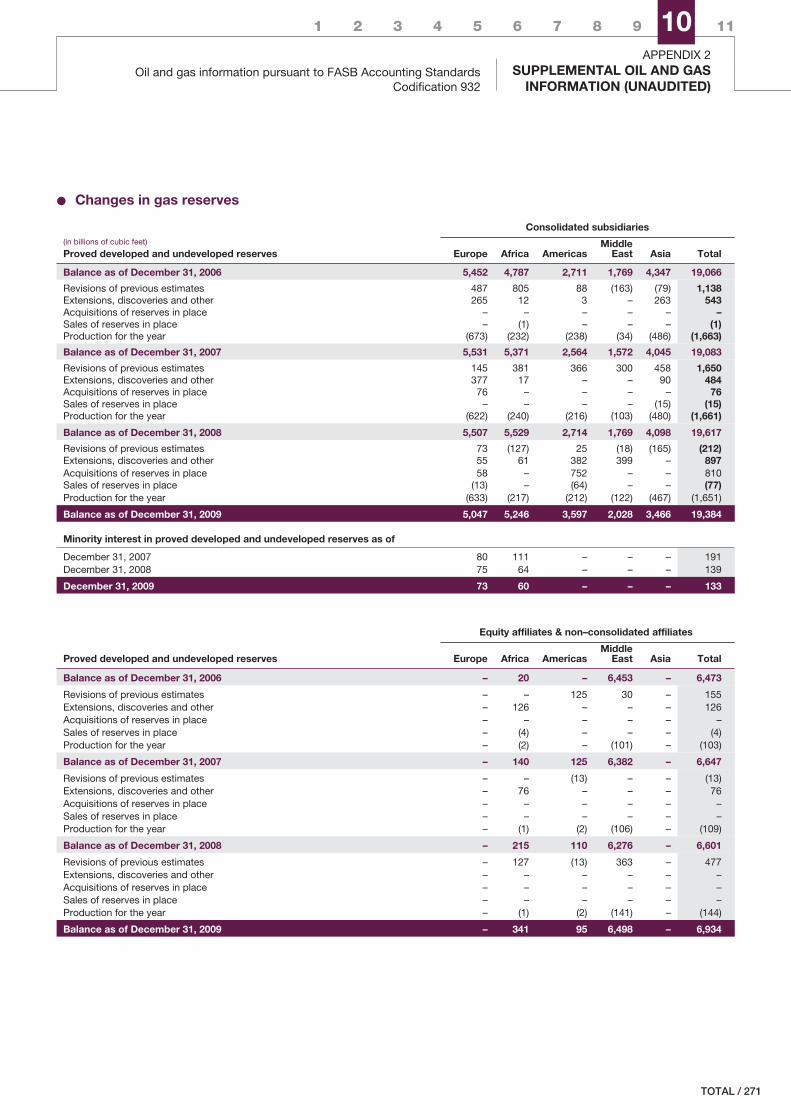
APPENDIX 2Oil and gas information pursuant to FASB Accounting Standards
Codification 932SUPPLEMENTAL OIL AND GAS
INFORMATION (UNAUDITED)
1 2 3 4 5 6 7 8 9 10 11
‹ Changes in gas reserves
(in billions of cubic feet)
Proved developed and undeveloped reserves
Consolidated subsidiaries
Europe Africa AmericasMiddle
East Asia Total
Balance as of December 31, 2006 5,452 4,787 2,711 1,769 4,347 19,066
Revisions of previous estimates 487 805 88 (163) (79) 1,138Extensions, discoveries and other 265 12 3 – 263 543Acquisitions of reserves in place – – – – – –Sales of reserves in place – (1) – – – (1)Production for the year (673) (232) (238) (34) (486) (1,663)
Balance as of December 31, 2007 5,531 5,371 2,564 1,572 4,045 19,083
Revisions of previous estimates 145 381 366 300 458 1,650Extensions, discoveries and other 377 17 – – 90 484Acquisitions of reserves in place 76 – – – – 76Sales of reserves in place – – – – (15) (15)Production for the year (622) (240) (216) (103) (480) (1,661)
Balance as of December 31, 2008 5,507 5,529 2,714 1,769 4,098 19,617
Revisions of previous estimates 73 (127) 25 (18) (165) (212)Extensions, discoveries and other 55 61 382 399 – 897Acquisitions of reserves in place 58 – 752 – – 810Sales of reserves in place (13) – (64) – – (77)Production for the year (633) (217) (212) (122) (467) (1,651)
Balance as of December 31, 2009 5,047 5,246 3,597 2,028 3,466 19,384
Minority interest in proved developed and undeveloped reserves as of
December 31, 2007 80 111 – – – 191December 31, 2008 75 64 – – – 139
December 31, 2009 73 60 – – – 133
Equity affiliates & non–consolidated affiliates
Proved developed and undeveloped reserves Europe Africa AmericasMiddle
East Asia Total
Balance as of December 31, 2006 – 20 – 6,453 – 6,473
Revisions of previous estimates – – 125 30 – 155Extensions, discoveries and other – 126 – – – 126Acquisitions of reserves in place – – – – – –Sales of reserves in place – (4) – – – (4)Production for the year – (2) – (101) – (103)
Balance as of December 31, 2007 – 140 125 6,382 – 6,647
Revisions of previous estimates – – (13) – – (13)Extensions, discoveries and other – 76 – – – 76Acquisitions of reserves in place – – – – – –Sales of reserves in place – – – – – –Production for the year – (1) (2) (106) – (109)
Balance as of December 31, 2008 – 215 110 6,276 – 6,601
Revisions of previous estimates – 127 (13) 363 – 477Extensions, discoveries and other – – – – – –Acquisitions of reserves in place – – – – – –Sales of reserves in place – – – – – –Production for the year – (1) (2) (141) – (144)
Balance as of December 31, 2009 – 341 95 6,498 – 6,934
/ 271TOTAL
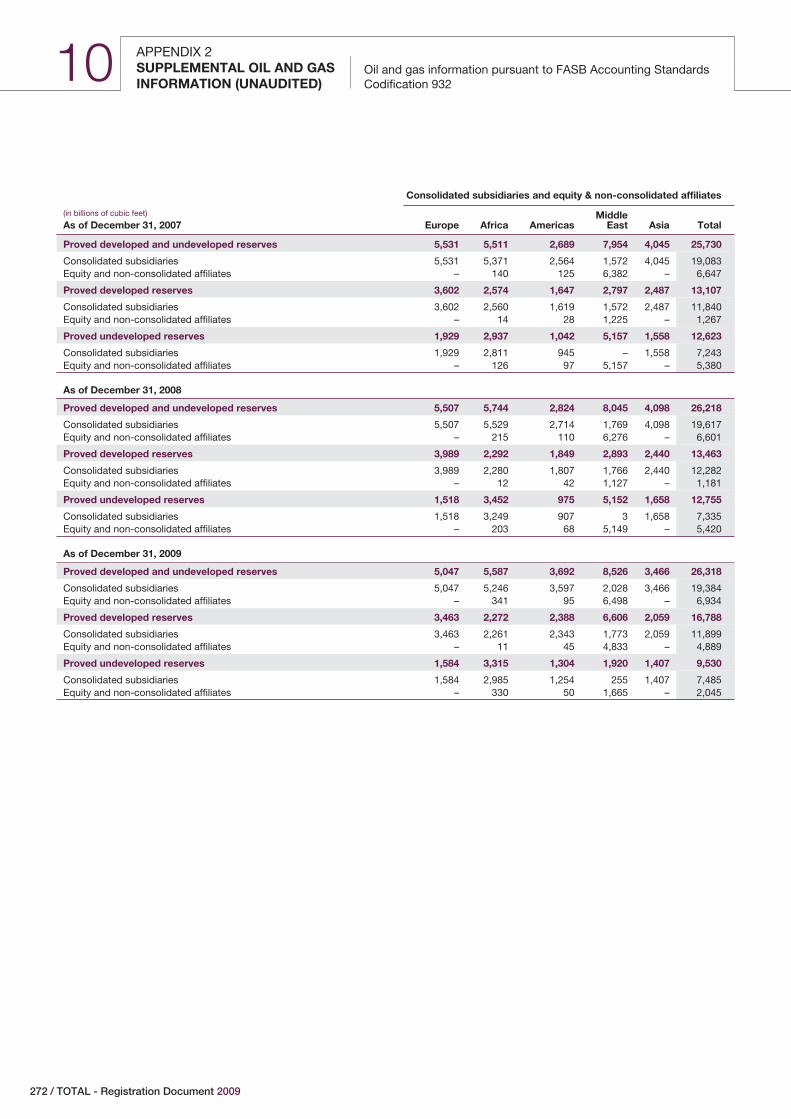
APPENDIX 2SUPPLEMENTAL OIL AND GAS Oil and gas information pursuant to FASB Accounting Standards
Codification 932INFORMATION (UNAUDITED)10
Consolidated subsidiaries and equity & non-consolidated affiliates
(in billions of cubic feet)
As of December 31, 2007 Europe Africa AmericasMiddle
East Asia Total
Proved developed and undeveloped reserves 5,531 5,511 2,689 7,954 4,045 25,730
Consolidated subsidiaries 5,531 5,371 2,564 1,572 4,045 19,083Equity and non-consolidated affiliates – 140 125 6,382 – 6,647
Proved developed reserves 3,602 2,574 1,647 2,797 2,487 13,107
Consolidated subsidiaries 3,602 2,560 1,619 1,572 2,487 11,840Equity and non-consolidated affiliates – 14 28 1,225 – 1,267
Proved undeveloped reserves 1,929 2,937 1,042 5,157 1,558 12,623
Consolidated subsidiaries 1,929 2,811 945 – 1,558 7,243Equity and non-consolidated affiliates – 126 97 5,157 – 5,380
As of December 31, 2008
Proved developed and undeveloped reserves 5,507 5,744 2,824 8,045 4,098 26,218
Consolidated subsidiaries 5,507 5,529 2,714 1,769 4,098 19,617Equity and non-consolidated affiliates – 215 110 6,276 – 6,601
Proved developed reserves 3,989 2,292 1,849 2,893 2,440 13,463
Consolidated subsidiaries 3,989 2,280 1,807 1,766 2,440 12,282Equity and non-consolidated affiliates – 12 42 1,127 – 1,181
Proved undeveloped reserves 1,518 3,452 975 5,152 1,658 12,755
Consolidated subsidiaries 1,518 3,249 907 3 1,658 7,335Equity and non-consolidated affiliates – 203 68 5,149 – 5,420
As of December 31, 2009
Proved developed and undeveloped reserves 5,047 5,587 3,692 8,526 3,466 26,318
Consolidated subsidiaries 5,047 5,246 3,597 2,028 3,466 19,384Equity and non-consolidated affiliates – 341 95 6,498 – 6,934
Proved developed reserves 3,463 2,272 2,388 6,606 2,059 16,788
Consolidated subsidiaries 3,463 2,261 2,343 1,773 2,059 11,899Equity and non-consolidated affiliates – 11 45 4,833 – 4,889
Proved undeveloped reserves 1,584 3,315 1,304 1,920 1,407 9,530
Consolidated subsidiaries 1,584 2,985 1,254 255 1,407 7,485Equity and non-consolidated affiliates – 330 50 1,665 – 2,045
272 / TOTAL - Registration Document 2009
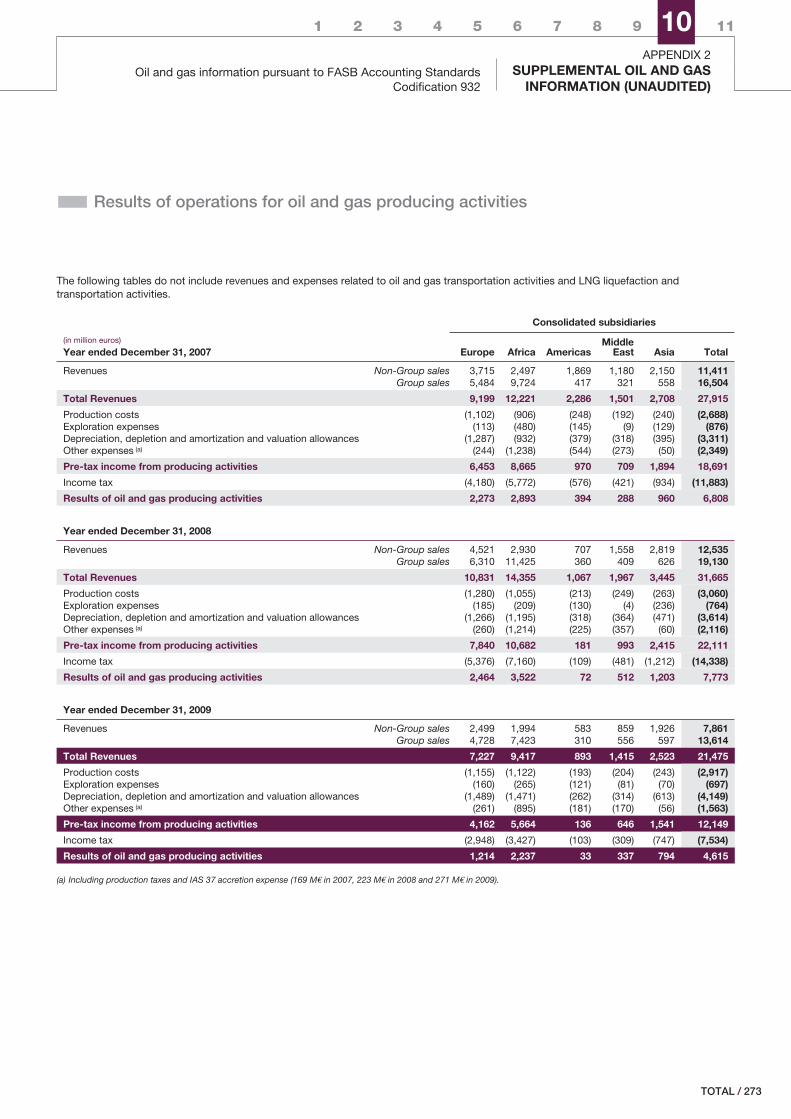
APPENDIX 2Oil and gas information pursuant to FASB Accounting Standards
Codification 932SUPPLEMENTAL OIL AND GAS
INFORMATION (UNAUDITED)
1 2 3 4 5 6 7 8 9 10 11
� Results of operations for oil and gas producing activities
The following tables do not include revenues and expenses related to oil and gas transportation activities and LNG liquefaction andtransportation activities.
Consolidated subsidiaries
(in million euros)
Year ended December 31, 2007 Europe Africa AmericasMiddle
East Asia Total
Revenues Non-Group sales 3,715 2,497 1,869 1,180 2,150 11,411Group sales 5,484 9,724 417 321 558 16,504
Total Revenues 9,199 12,221 2,286 1,501 2,708 27,915
Production costs (1,102) (906) (248) (192) (240) (2,688)Exploration expenses (113) (480) (145) (9) (129) (876)Depreciation, depletion and amortization and valuation allowances (1,287) (932) (379) (318) (395) (3,311)Other expenses (a) (244) (1,238) (544) (273) (50) (2,349)
Pre-tax income from producing activities 6,453 8,665 970 709 1,894 18,691
Income tax (4,180) (5,772) (576) (421) (934) (11,883)
Results of oil and gas producing activities 2,273 2,893 394 288 960 6,808
Year ended December 31, 2008
Revenues Non-Group sales 4,521 2,930 707 1,558 2,819 12,535Group sales 6,310 11,425 360 409 626 19,130
Total Revenues 10,831 14,355 1,067 1,967 3,445 31,665
Production costs (1,280) (1,055) (213) (249) (263) (3,060)Exploration expenses (185) (209) (130) (4) (236) (764)Depreciation, depletion and amortization and valuation allowances (1,266) (1,195) (318) (364) (471) (3,614)Other expenses (a) (260) (1,214) (225) (357) (60) (2,116)
Pre-tax income from producing activities 7,840 10,682 181 993 2,415 22,111
Income tax (5,376) (7,160) (109) (481) (1,212) (14,338)
Results of oil and gas producing activities 2,464 3,522 72 512 1,203 7,773
Year ended December 31, 2009
Revenues Non-Group sales 2,499 1,994 583 859 1,926 7,861Group sales 4,728 7,423 310 556 597 13,614
Total Revenues 7,227 9,417 893 1,415 2,523 21,475
Production costs (1,155) (1,122) (193) (204) (243) (2,917)Exploration expenses (160) (265) (121) (81) (70) (697)Depreciation, depletion and amortization and valuation allowances (1,489) (1,471) (262) (314) (613) (4,149)Other expenses (a) (261) (895) (181) (170) (56) (1,563)
Pre-tax income from producing activities 4,162 5,664 136 646 1,541 12,149
Income tax (2,948) (3,427) (103) (309) (747) (7,534)
Results of oil and gas producing activities 1,214 2,237 33 337 794 4,615
(a) Including production taxes and IAS 37 accretion expense (169 M€ in 2007, 223 M€ in 2008 and 271 M€ in 2009).
/ 273TOTAL
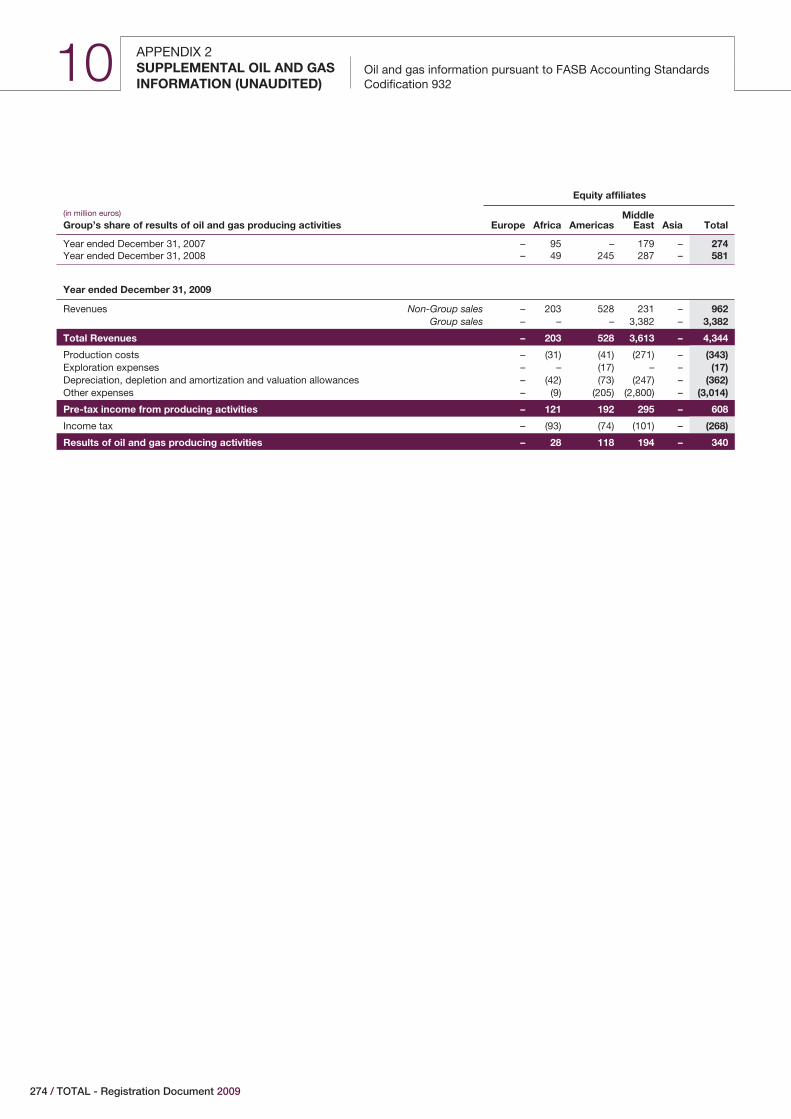
APPENDIX 2SUPPLEMENTAL OIL AND GAS Oil and gas information pursuant to FASB Accounting Standards
Codification 932INFORMATION (UNAUDITED)10
Equity affiliates
(in million euros)
Group’s share of results of oil and gas producing activities Europe Africa AmericasMiddle
East Asia Total
Year ended December 31, 2007 – 95 – 179 – 274Year ended December 31, 2008 – 49 245 287 – 581
Year ended December 31, 2009
Revenues Non-Group sales – 203 528 231 – 962Group sales – – – 3,382 – 3,382
Total Revenues – 203 528 3,613 – 4,344
Production costs – (31) (41) (271) – (343)Exploration expenses – – (17) – – (17)Depreciation, depletion and amortization and valuation allowances – (42) (73) (247) – (362)Other expenses – (9) (205) (2,800) – (3,014)
Pre-tax income from producing activities – 121 192 295 – 608
Income tax – (93) (74) (101) – (268)
Results of oil and gas producing activities – 28 118 194 – 340
274 / TOTAL - Registration Document 2009
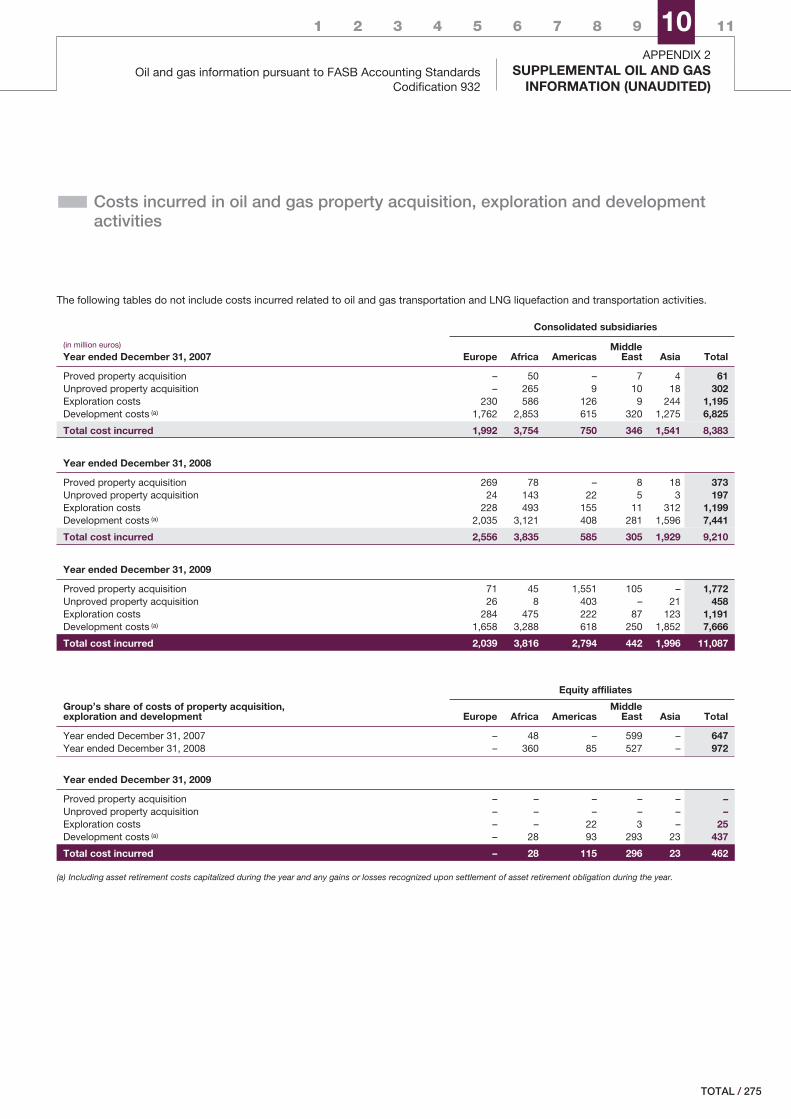
APPENDIX 2Oil and gas information pursuant to FASB Accounting Standards
Codification 932SUPPLEMENTAL OIL AND GAS
INFORMATION (UNAUDITED)
1 2 3 4 5 6 7 8 9 10 11
� Costs incurred in oil and gas property acquisition, exploration and developmentactivities
The following tables do not include costs incurred related to oil and gas transportation and LNG liquefaction and transportation activities.
Consolidated subsidiaries
(in million euros)
Year ended December 31, 2007 Europe Africa AmericasMiddle
East Asia Total
Proved property acquisition – 50 – 7 4 61Unproved property acquisition – 265 9 10 18 302Exploration costs 230 586 126 9 244 1,195Development costs (a) 1,762 2,853 615 320 1,275 6,825
Total cost incurred 1,992 3,754 750 346 1,541 8,383
Year ended December 31, 2008
Proved property acquisition 269 78 – 8 18 373Unproved property acquisition 24 143 22 5 3 197Exploration costs 228 493 155 11 312 1,199Development costs (a) 2,035 3,121 408 281 1,596 7,441
Total cost incurred 2,556 3,835 585 305 1,929 9,210
Year ended December 31, 2009
Proved property acquisition 71 45 1,551 105 – 1,772Unproved property acquisition 26 8 403 – 21 458Exploration costs 284 475 222 87 123 1,191Development costs (a) 1,658 3,288 618 250 1,852 7,666
Total cost incurred 2,039 3,816 2,794 442 1,996 11,087
Equity affiliates
Group’s share of costs of property acquisition,exploration and development Europe Africa Americas
MiddleEast Asia Total
Year ended December 31, 2007 – 48 – 599 – 647Year ended December 31, 2008 – 360 85 527 – 972
Year ended December 31, 2009
Proved property acquisition – – – – – –Unproved property acquisition – – – – – –Exploration costs – – 22 3 – 25Development costs (a) – 28 93 293 23 437
Total cost incurred – 28 115 296 23 462
(a) Including asset retirement costs capitalized during the year and any gains or losses recognized upon settlement of asset retirement obligation during the year.
/ 275TOTAL
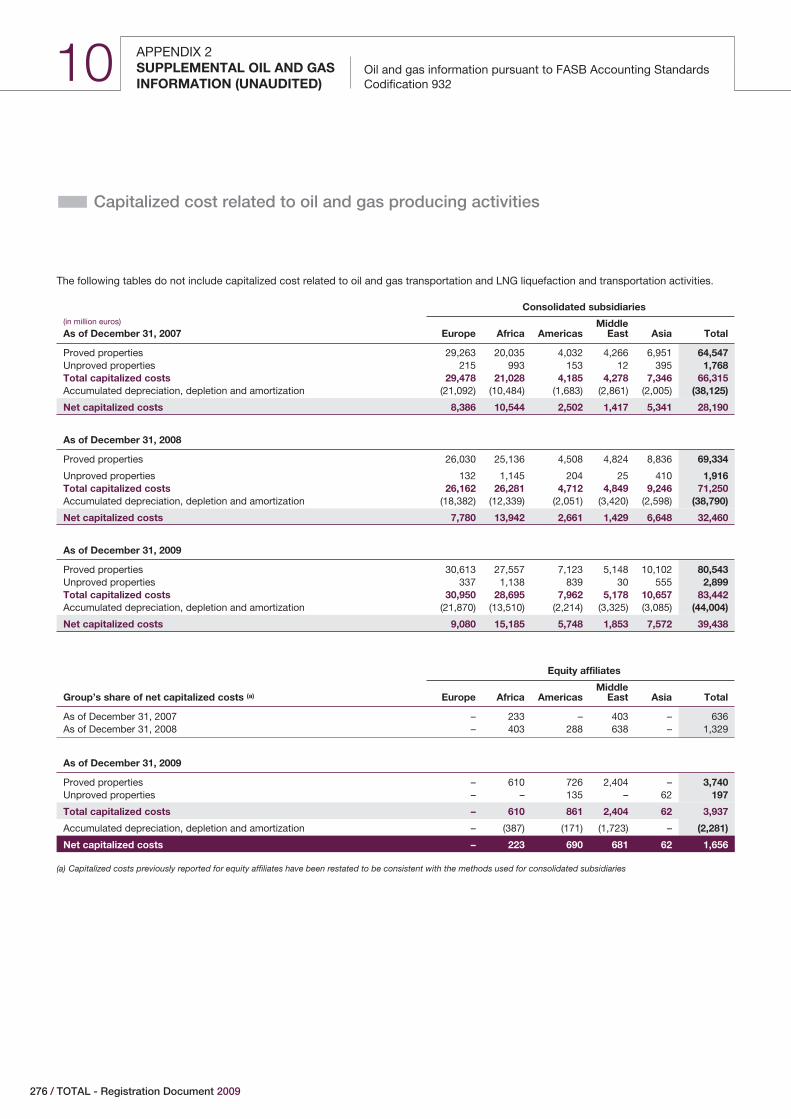
APPENDIX 2SUPPLEMENTAL OIL AND GAS Oil and gas information pursuant to FASB Accounting Standards
Codification 932INFORMATION (UNAUDITED)10
� Capitalized cost related to oil and gas producing activities
The following tables do not include capitalized cost related to oil and gas transportation and LNG liquefaction and transportation activities.
(in million euros)
As of December 31, 2007
Consolidated subsidiaries
Europe Africa AmericasMiddle
East Asia Total
Proved properties 29,263 20,035 4,032 4,266 6,951 64,547Unproved properties 215 993 153 12 395 1,768Total capitalized costs 29,478 21,028 4,185 4,278 7,346 66,315Accumulated depreciation, depletion and amortization (21,092) (10,484) (1,683) (2,861) (2,005) (38,125)
Net capitalized costs 8,386 10,544 2,502 1,417 5,341 28,190
As of December 31, 2008
Proved properties 26,030 25,136 4,508 4,824 8,836 69,334
Unproved properties 132 1,145 204 25 410 1,916Total capitalized costs 26,162 26,281 4,712 4,849 9,246 71,250Accumulated depreciation, depletion and amortization (18,382) (12,339) (2,051) (3,420) (2,598) (38,790)
Net capitalized costs 7,780 13,942 2,661 1,429 6,648 32,460
As of December 31, 2009
Proved properties 30,613 27,557 7,123 5,148 10,102 80,543Unproved properties 337 1,138 839 30 555 2,899Total capitalized costs 30,950 28,695 7,962 5,178 10,657 83,442Accumulated depreciation, depletion and amortization (21,870) (13,510) (2,214) (3,325) (3,085) (44,004)
Net capitalized costs 9,080 15,185 5,748 1,853 7,572 39,438
Equity affiliates
Group’s share of net capitalized costs (a) Europe Africa AmericasMiddle
East Asia Total
As of December 31, 2007 – 233 – 403 – 636As of December 31, 2008 – 403 288 638 – 1,329
As of December 31, 2009
Proved properties – 610 726 2,404 – 3,740Unproved properties – – 135 – 62 197
Total capitalized costs – 610 861 2,404 62 3,937
Accumulated depreciation, depletion and amortization – (387) (171) (1,723) – (2,281)
Net capitalized costs – 223 690 681 62 1,656
(a) Capitalized costs previously reported for equity affiliates have been restated to be consistent with the methods used for consolidated subsidiaries
276 / TOTAL - Registration Document 2009
APPENDIX 2Oil and gas information pursuant to FASB Accounting Standards
Codification 932SUPPLEMENTAL OIL AND GAS
INFORMATION (UNAUDITED)
1 2 3 4 5 6 7 8 9 10 11
� Standardized measure of discounted future net cash flows (excludingtransportation)
The standardized measure of discounted future net cash flowsrelating to proved oil, bitumen and gas reserve quantities wasdeveloped as follows:
o Estimates of proved reserves and the corresponding productionprofiles are based on existing technical and economic conditions;
o The estimated future cash flows are determined based on pricesused in estimating the Group’s proved oil and gas reserves;
o The future cash flows incorporate estimated production costs(including production taxes), future development costs and assetretirement costs. All cost estimates are based on year-endtechnical and economic conditions;
o Future income taxes are computed by applying the year-endstatutory tax rate to future net cash flows after consideration ofpermanent differences and future income tax credits; and
o Future net cash flows are discounted at a standard discount rateof 10 percent.
These principles applied are those required by ASC 932 and do not reflect the expectations of real revenues from these reserves, nor theirpresent value; hence, they do not constitute criteria for investment decisions. An estimate of the fair value of reserves should also take intoaccount, among other things, the recovery of reserves not presently classified as proved, anticipated future changes in prices and costs and adiscount factor more representative of the time value of money and the risks inherent in reserves estimates.
/ 277TOTAL
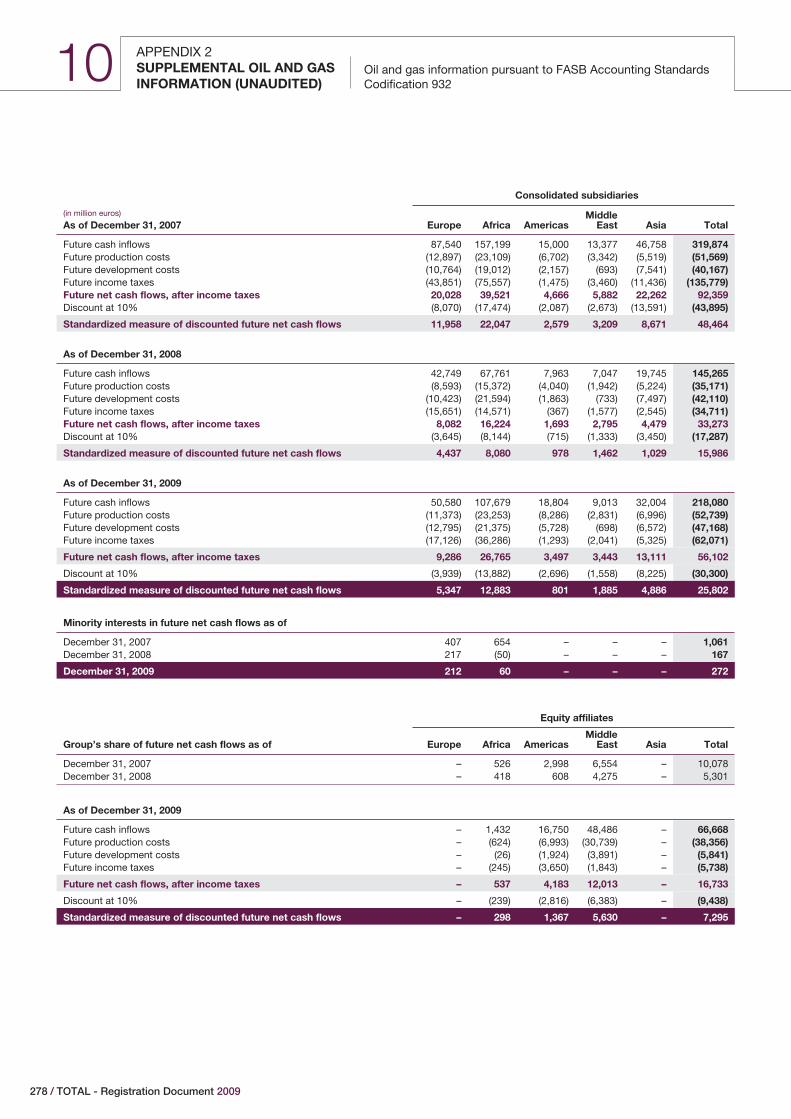
APPENDIX 2SUPPLEMENTAL OIL AND GAS Oil and gas information pursuant to FASB Accounting Standards
Codification 932INFORMATION (UNAUDITED)10
Consolidated subsidiaries
(in million euros)
As of December 31, 2007 Europe Africa AmericasMiddle
East Asia Total
Future cash inflows 87,540 157,199 15,000 13,377 46,758 319,874Future production costs (12,897) (23,109) (6,702) (3,342) (5,519) (51,569)Future development costs (10,764) (19,012) (2,157) (693) (7,541) (40,167)Future income taxes (43,851) (75,557) (1,475) (3,460) (11,436) (135,779)Future net cash flows, after income taxes 20,028 39,521 4,666 5,882 22,262 92,359Discount at 10% (8,070) (17,474) (2,087) (2,673) (13,591) (43,895)
Standardized measure of discounted future net cash flows 11,958 22,047 2,579 3,209 8,671 48,464
As of December 31, 2008
Future cash inflows 42,749 67,761 7,963 7,047 19,745 145,265Future production costs (8,593) (15,372) (4,040) (1,942) (5,224) (35,171)Future development costs (10,423) (21,594) (1,863) (733) (7,497) (42,110)Future income taxes (15,651) (14,571) (367) (1,577) (2,545) (34,711)Future net cash flows, after income taxes 8,082 16,224 1,693 2,795 4,479 33,273Discount at 10% (3,645) (8,144) (715) (1,333) (3,450) (17,287)
Standardized measure of discounted future net cash flows 4,437 8,080 978 1,462 1,029 15,986
As of December 31, 2009
Future cash inflows 50,580 107,679 18,804 9,013 32,004 218,080Future production costs (11,373) (23,253) (8,286) (2,831) (6,996) (52,739)Future development costs (12,795) (21,375) (5,728) (698) (6,572) (47,168)Future income taxes (17,126) (36,286) (1,293) (2,041) (5,325) (62,071)
Future net cash flows, after income taxes 9,286 26,765 3,497 3,443 13,111 56,102
Discount at 10% (3,939) (13,882) (2,696) (1,558) (8,225) (30,300)
Standardized measure of discounted future net cash flows 5,347 12,883 801 1,885 4,886 25,802
Minority interests in future net cash flows as of
December 31, 2007 407 654 – – – 1,061December 31, 2008 217 (50) – – – 167
December 31, 2009 212 60 – – – 272
Equity affiliates
Group’s share of future net cash flows as of Europe Africa AmericasMiddle
East Asia Total
December 31, 2007 – 526 2,998 6,554 – 10,078December 31, 2008 – 418 608 4,275 – 5,301
As of December 31, 2009
Future cash inflows – 1,432 16,750 48,486 – 66,668Future production costs – (624) (6,993) (30,739) – (38,356)Future development costs – (26) (1,924) (3,891) – (5,841)Future income taxes – (245) (3,650) (1,843) – (5,738)
Future net cash flows, after income taxes – 537 4,183 12,013 – 16,733
Discount at 10% – (239) (2,816) (6,383) – (9,438)
Standardized measure of discounted future net cash flows – 298 1,367 5,630 – 7,295
278 / TOTAL - Registration Document 2009
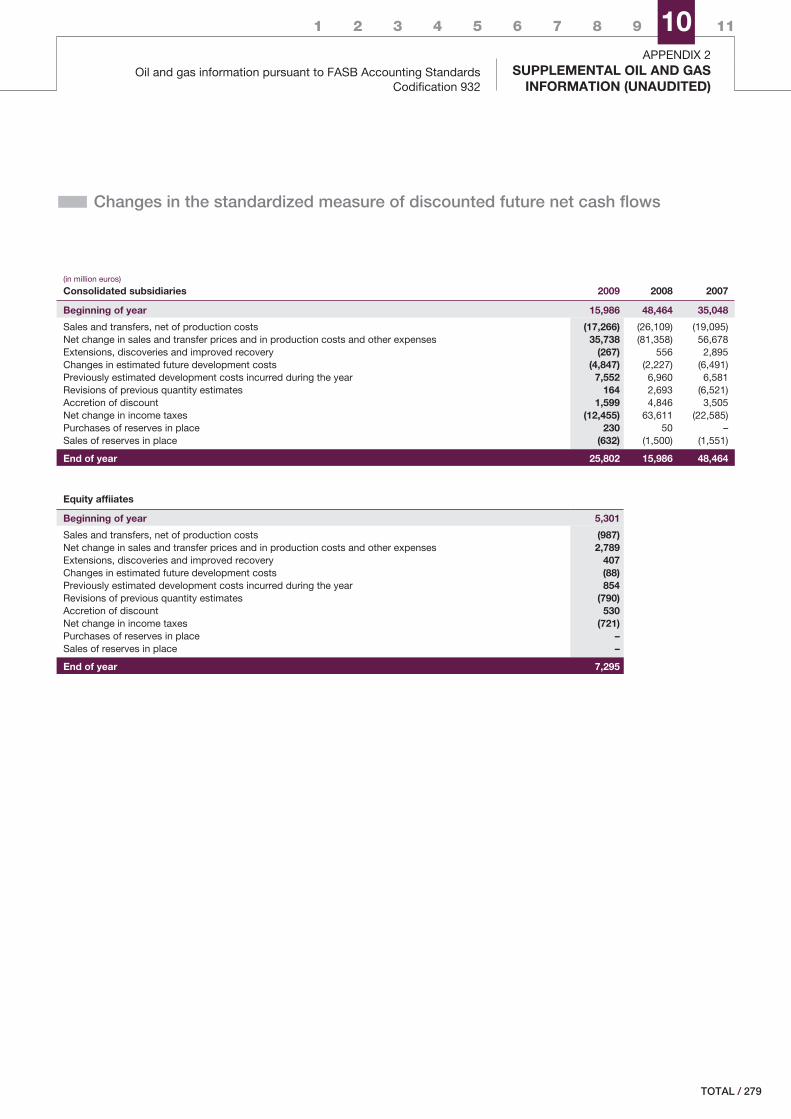
APPENDIX 2Oil and gas information pursuant to FASB Accounting Standards
Codification 932SUPPLEMENTAL OIL AND GAS
INFORMATION (UNAUDITED)
1 2 3 4 5 6 7 8 9 10 11
� Changes in the standardized measure of discounted future net cash flows
(in million euros)
Consolidated subsidiaries 2009 2008 2007
Beginning of year 15,986 48,464 35,048
Sales and transfers, net of production costs (17,266) (26,109) (19,095)Net change in sales and transfer prices and in production costs and other expenses 35,738 (81,358) 56,678Extensions, discoveries and improved recovery (267) 556 2,895Changes in estimated future development costs (4,847) (2,227) (6,491)Previously estimated development costs incurred during the year 7,552 6,960 6,581Revisions of previous quantity estimates 164 2,693 (6,521)Accretion of discount 1,599 4,846 3,505Net change in income taxes (12,455) 63,611 (22,585)Purchases of reserves in place 230 50 –Sales of reserves in place (632) (1,500) (1,551)
End of year 25,802 15,986 48,464
Equity affiiates
Beginning of year 5,301
Sales and transfers, net of production costs (987)Net change in sales and transfer prices and in production costs and other expenses 2,789Extensions, discoveries and improved recovery 407Changes in estimated future development costs (88)Previously estimated development costs incurred during the year 854Revisions of previous quantity estimates (790)Accretion of discount 530Net change in income taxes (721)Purchases of reserves in place –Sales of reserves in place –
End of year 7,295
/ 279TOTAL
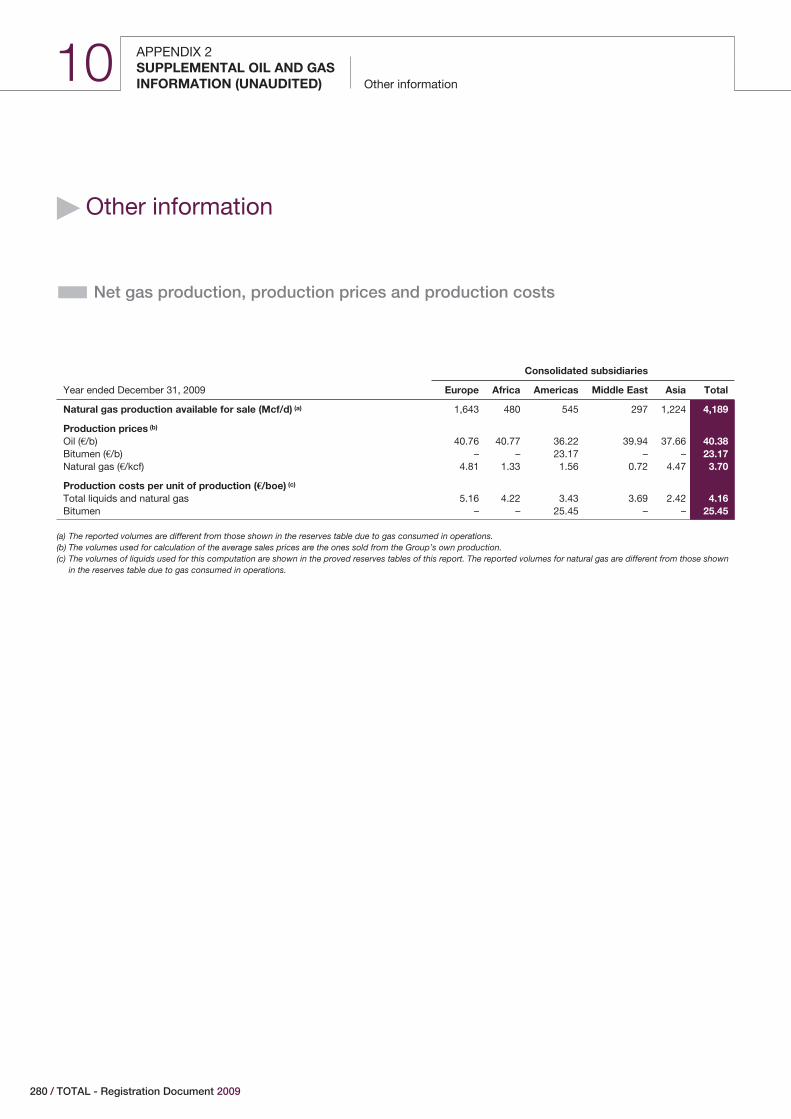
APPENDIX 2SUPPLEMENTAL OIL AND GAS
Other informationINFORMATION (UNAUDITED)10
� Other information
� Net gas production, production prices and production costs
Consolidated subsidiaries
Year ended December 31, 2009 Europe Africa Americas Middle East Asia Total
Natural gas production available for sale (Mcf/d) (a) 1,643 480 545 297 1,224 4,189
Production prices (b)
Oil (€/b) 40.76 40.77 36.22 39.94 37.66 40.38Bitumen (€/b) – – 23.17 – – 23.17Natural gas (€/kcf) 4.81 1.33 1.56 0.72 4.47 3.70
Production costs per unit of production (€/boe) (c)
Total liquids and natural gas 5.16 4.22 3.43 3.69 2.42 4.16Bitumen – – 25.45 – – 25.45
(a) The reported volumes are different from those shown in the reserves table due to gas consumed in operations.(b) The volumes used for calculation of the average sales prices are the ones sold from the Group’s own production.(c) The volumes of liquids used for this computation are shown in the proved reserves tables of this report. The reported volumes for natural gas are different from those shown
in the reserves table due to gas consumed in operations.
280 / TOTAL - Registration Document 2009
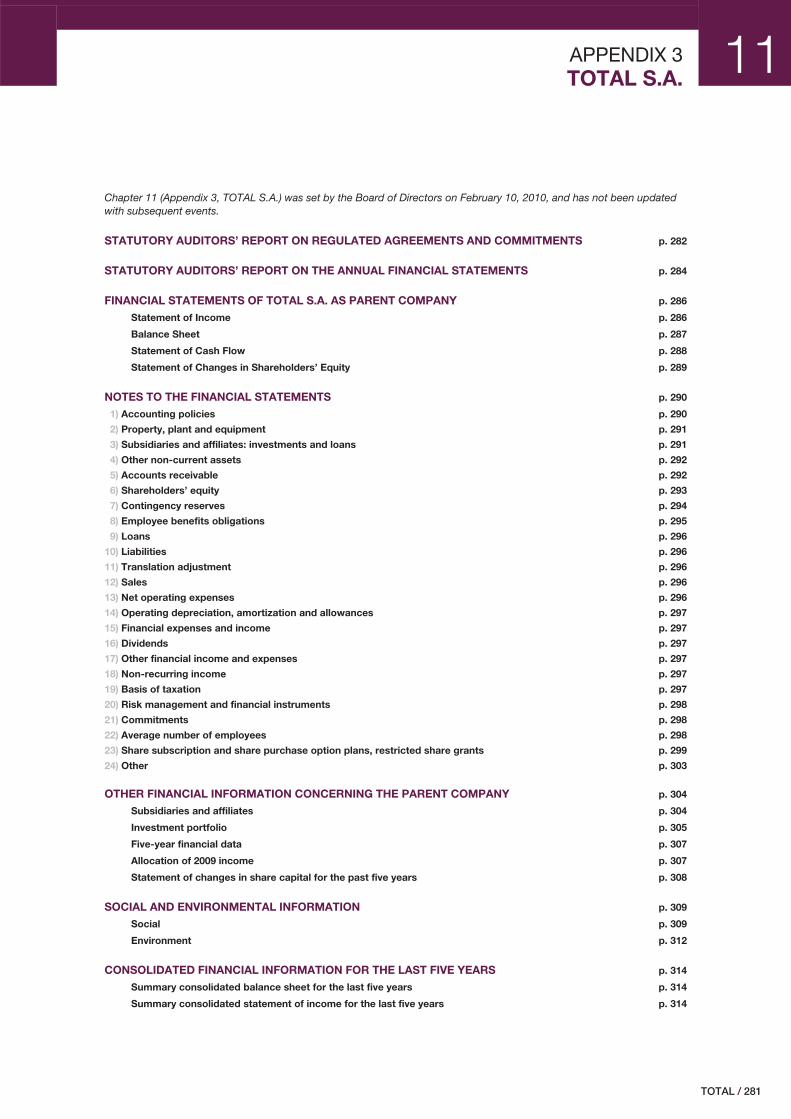
11APPENDIX 3TOTAL S.A.
Chapter 11 (Appendix 3, TOTAL S.A.) was set by the Board of Directors on February 10, 2010, and has not been updatedwith subsequent events.
STATUTORY AUDITORS’ REPORT ON REGULATED AGREEMENTS AND COMMITMENTS p. 282
STATUTORY AUDITORS’ REPORT ON THE ANNUAL FINANCIAL STATEMENTS p. 284
FINANCIAL STATEMENTS OF TOTAL S.A. AS PARENT COMPANY p. 286
Statement of Income p. 286
Balance Sheet p. 287
Statement of Cash Flow p. 288
Statement of Changes in Shareholders’ Equity p. 289
NOTES TO THE FINANCIAL STATEMENTS p. 290
1) Accounting policies p. 290
2) Property, plant and equipment p. 291
3) Subsidiaries and affiliates: investments and loans p. 291
4) Other non-current assets p. 292
5) Accounts receivable p. 292
6) Shareholders’ equity p. 293
7) Contingency reserves p. 294
8) Employee benefits obligations p. 295
9) Loans p. 296
10) Liabilities p. 296
11) Translation adjustment p. 296
12) Sales p. 296
13) Net operating expenses p. 296
14) Operating depreciation, amortization and allowances p. 297
15) Financial expenses and income p. 297
16) Dividends p. 297
17) Other financial income and expenses p. 297
18) Non-recurring income p. 297
19) Basis of taxation p. 297
20) Risk management and financial instruments p. 298
21) Commitments p. 298
22) Average number of employees p. 298
23) Share subscription and share purchase option plans, restricted share grants p. 299
24) Other p. 303
OTHER FINANCIAL INFORMATION CONCERNING THE PARENT COMPANY p. 304
Subsidiaries and affiliates p. 304
Investment portfolio p. 305
Five-year financial data p. 307
Allocation of 2009 income p. 307
Statement of changes in share capital for the past five years p. 308
SOCIAL AND ENVIRONMENTAL INFORMATION p. 309
Social p. 309
Environment p. 312
CONSOLIDATED FINANCIAL INFORMATION FOR THE LAST FIVE YEARS p. 314
Summary consolidated balance sheet for the last five years p. 314
Summary consolidated statement of income for the last five years p. 314
/ 281TOTAL
11 APPENDIX 3Statutory auditors’ report on regulated agreements and commitmentsTOTAL S.A.
� Statutory auditors’ report on regulated agreements andcommitments
This is a free translation into English of a report issued in French and is provided solely for the convenience of English-speaking readers. Thisreport should be read in conjunction and construed in accordance with French law and the relevant professional auditing standards applicablein France.
Year ended December 31, 2009
To the Shareholders,
In our capacity as statutory auditors of your Company, we hereby present to you our report on the regulated agreements and commitments.
In accordance with Article L.225-40 of the French Commercial Law (“Code de commerce”), we have been advised of agreements andcommitments referring to Article L.225-38 of the French Commercial Law (“Code de commerce”) which have been previously authorized byyour Board of Directors.
We are not required to ascertain whether any other agreements or commitments exist but to inform you, on the basis of the informationprovided to us, of the terms and conditions of those agreements and commitments indicated to us. We are not required to comment as towhether they are beneficial or appropriate. It is your responsibility, in accordance with Article R.225-31 of the French Commercial CommercialLaw, to evaluate the benefits resulting from these agreements and commitments prior to their approval.
We performed the procedures we considered necessary in accordance with professional guidance issued by the French national auditing body(“Compagnie Nationale des Commissaires aux Comptes”), relating to this engagement. Our work consisted in verifying that the informationprovided to us is in agreement with the underlying documentation from which it was extracted.
� Agreements and commitments entered into by the Company in 2009 which werealready subject to a statutory auditor’s report presented to the Shareholders’meeting held on May 15, 2009 and approved
The following agreements were allowed by the Board of Directors held on February 11, 2009 and approved by the Shareholders’ meeting heldon May 15, 2009.
a) Agreements concerning the pension plan for the Chairman and the Chief Executive Officer:
‹ Directors affected by the agreement or commitment:
Mr Thierry Desmarest, Chairman
Mr Christophe de Margerie, Chief Executive Officer
‹ Purpose of the agreement or commitment:
The Chairman and the Chief Executive Officer are entitled to a retirement benefit calculated pursuant to the same formula used for allemployees of TOTAL S.A.
‹ Terms and conditions of the agreement or commitment:
- Retirement benefit:
The Chairman and the Chief Executive Officer are also entitled to retirement benefits equal to those available to eligible members of the Groupunder the French National Collective Bargaining Agreement for the Petroleum. This benefit amounts to 25% of the annual compensation(including fixed and variable portions) of the twelve-month period preceding the retirement of the Chairman and the Chief Executive Officer.
The payment of this benefit is subject to performance conditions. These performance conditions are deemed to be met if at least two of thethree following criteria are satisfied:
- The average ROE (return on equity) over the three years immediately preceding the year in which the officer retires is at least 12%;
- The average ROACE (return on average capital employed) over the three years immediately preceding the year in which the officer retiresis at least 10%;
282 / TOTAL - Registration Document 2009
1 2 3 4 5 6 7 8 9 10 11
Statutory auditors’ report on regulated agreements and commitmentsAPPENDIX 3TOTAL S.A.
- The Company’s oil and gas production growth over the three years immediately preceding the year in which the officer retires is greaterthan or equal to the average production growth of the four following companies: ExxonMobil, Shell, BP, and Chevron.
- Supplementary pension plan:
This supplementary pension is applicable to the Chairman and the Chief Executive Officer and employees of the Group whose annualcompensation is greater than the annual social security threshold multiplied by eight. There are no French legal or collective bargainingprovisions that apply to remuneration above this social security ceiling.
This supplementary pension plan is financed and managed by TOTAL S.A. to award a pension that is based on the period of employment (upto a limit of 20 years) and the portion of annual gross compensation (including fixed and variable portions) exceeding by eight times the annualsocial security threshold. This pension is indexed to the French Association for Complementary Pensions Schemes (ARRCO) index.
As of December 31, 2009, the Group’s supplementary pension obligations related to the Chairman are the equivalent of an annual pension of26.29% of the Chairman’s 2009 compensation.
For the Chief Executive Officer, the Group’s pension obligations are, as of December 31, 2009, the equivalent of an annual pension of 18.72%of his 2009 compensation.
b) Agreement in case of termination of the Chief Executive Officer’s employment or in case his termof office is not renewed
‹ Director affected by the agreement or commitment:
Mr Christophe de Margerie, Chief Executive Officer.
‹ Purpose of the agreement or commitment:
If the Chief Executive Officer’s employment is terminated or if his term of office is not renewed, he is eligible for severance benefits.
‹ Terms and conditions of the agreement or commitment:
This severance benefit is equal to two times an individual’s annual pay.
The calculation will be based on the gross compensation (including both fixed and variable) paid in the twelve-month period preceding thetermination or the no renewal of the Chief Executive Officer’s term.
The severance benefits that may be paid upon a change of control or a change of strategy of the Company are cancelled in the case of grossnegligence or willful misconduct or if the Chief Executive Officer leaves the Company of his own volition, accepts new responsibilities withinthe Group, or may claim full retirement benefits within a short time period.
The payment of this severance benefit is subject to performance conditions. These performance conditions are deemed to be met if at leasttwo of the three following criteria are satisfied:
- The average ROE (return on equity) over the three years immediately preceding the year in which the officer retires is at least 12%;
- The average ROACE (return on average capital employed) over the three years immediately preceding the year in which the officer retiresis at least 10%;
- The Company’s oil and gas production growth over the three years immediately preceding the year in which the officer retires is greaterthan or equal to the average production growth of the four following companies: ExxonMobil, Shell, BP, and Chevron.
� Agreements and commitments entered into by the Company in 2009In accordance with Article L.225-42-1 of the French Commercial Law (“Code de commerce”), the commitments regarding the retirementbenefit, the supplementary pension plan and, under certain conditions, the severance benefit if Mr Christophe de Margerie’s contract isterminated or if his term of office is not renewed, have been confirmed by the Board of Directors held on May 15, 2009 which has renewed thecontract of Mr Christophe de Margerie as Chief Executive Officer following its renewal as Board member by the Shareholders’ meeting held onMay 15, 2009, according to the terms and conditions approved by the Board of Directors held on February 11, 2009 and described above.
Paris, La Défense March 31, 2010
The statutory auditors
French original signed by
KPMG Audit ERNST & YOUNG AUDITA department of KPMG S.A
Jay Nirsimloo Pascal Macioce
/ 283TOTAL
APPENDIX 3Statutory auditors’ report on the annual financial statementsTOTAL S.A.
11
� Statutory auditors’ report on the annual financial statements
This is a free translation into English of the statutory auditors’ report on the financial statements issued in French and it is provided solely for theconvenience of English speaking users.
The statutory auditors’ report includes information specifically required by French law in such reports, whether modified or not. This informationis presented below the audit opinion on the financial statements and includes an explanatory paragraph discussing the auditors’ assessmentsof certain significant accounting and auditing matters. These assessments were considered for the purpose of issuing an audit opinion on thefinancial statements taken as a whole and not to provide separate assurance on individual account balances, transactions, or disclosures.
This report also includes information relating to the specific verification of information given in the management report and in the documentsaddressed to shareholders.
This report should be read in conjunction with, and construed in accordance with, French law and professional auditing standards applicable inFrance.
Year ended December 31, 2009
To the Shareholders,
In compliance with the assignment entrusted to us by your Shareholder’s meeting, we hereby report to you, for the year ended December 31,2009, on:
o the audit of the accompanying annual financial statements of TOTAL S.A.;
o the justification of our assessments;
o the specific verifications and information required by law.
These financial statements have been approved by the Board of Directors. Our role is to express an opinion on these financial statementsbased on our audit.
I. Opinion on the financial statements
We conducted our audit in accordance with professional standards applicable in France; those standards require that we plan and perform theaudit to obtain reasonable assurance about whether the financial statements are free of material misstatement. An audit involves performingprocedures, using sampling techniques or other methods of selection, to obtain audit evidence about the amounts and disclosures in thefinancial statements. An audit also includes evaluating the appropriateness of accounting policies used and the reasonableness of accountingestimates made, as well as the overall presentation of the financial statements. We believe that the audit evidence we have obtained issufficient and appropriate to provide a basis for our audit opinion.
In our opinion, the financial statements give a true and fair view of the assets and liabilities and of the financial position of the Company as at31 December 2009 and of the results of its operations for the year then ended in accordance with French accounting principles.
II. Justification of our assessments
In accordance with the requirements of article L. 823-9 of the French Commercial Law (“Code de commerce”) relating to the justification of ourassessments, we bring to your attention the following matter:
We assessed the approaches used by your company to value investments in subsidiaries and affiliates as described in Note 1 to the financialstatements, based on the information available to date and performed tests to verify the application of those methods. Within the framework ofour assessments, we verified the reasonable nature of those estimates.
These assessments were made as part of our audit of the financial statements, taken as a whole, and therefore contributed to the opinion weformed which is expressed in the first part of this report.
284 / TOTAL - Registration Document 2009
1 2 3 4 5 6 7 8 9 10 11
Statutory auditors’ report on the annual financial statementsAPPENDIX 3TOTAL S.A.
III. Specific verifications and information
We have also performed, in accordance with professional standards applicable in France, the specific verifications required by French law.
We have no matters to report as to the fair presentation and the consistency with the financial statements of the information given in themanagement report of the Board of Directors, and in the documents addressed to shareholders with respect to the financial position and thefinancial statements.
Concerning the information given in accordance with the requirements of article L. 225-102-1 of the French Commercial Law (“Code decommerce”) relating to remunerations and benefits received by the directors and any other commitments made in their favour, we have verifiedits consistency with the financial statements or with the underlying information used to prepare these financial statements and, whereapplicable, with the information obtained by your company from companies controlling your company or controlled by it. Based on this work,we attest the accuracy and fair presentation of this information.
In accordance with French law, we have verified that the required information concerning the purchase of investments and controlling interestsand the identity of the shareholders and holders of the voting rights has been properly disclosed in the management report.
Paris-La Défense, March 31, 2010
The Statutory Auditors
French original signed by
KPMG Audit ERNST & YOUNG AUDITA department of KPMG S.A.
Jay Nirsimloo Pascal Macioce
/ 285TOTAL
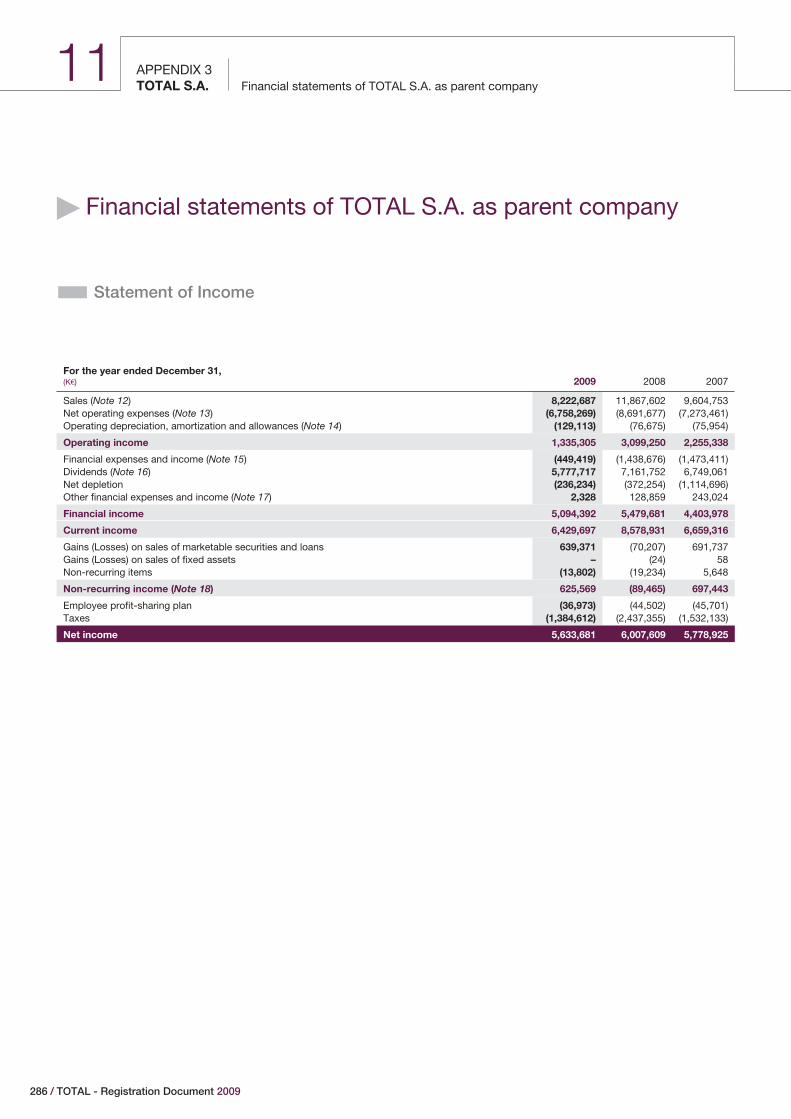
11 APPENDIX 3Financial statements of TOTAL S.A. as parent companyTOTAL S.A.
� Financial statements of TOTAL S.A. as parent company
� Statement of Income
For the year ended December 31,(K€) 2009 2008 2007
Sales (Note 12) 8,222,687 11,867,602 9,604,753Net operating expenses (Note 13) (6,758,269) (8,691,677) (7,273,461)Operating depreciation, amortization and allowances (Note 14) (129,113) (76,675) (75,954)
Operating income 1,335,305 3,099,250 2,255,338
Financial expenses and income (Note 15) (449,419) (1,438,676) (1,473,411)Dividends (Note 16) 5,777,717 7,161,752 6,749,061Net depletion (236,234) (372,254) (1,114,696)Other financial expenses and income (Note 17) 2,328 128,859 243,024
Financial income 5,094,392 5,479,681 4,403,978
Current income 6,429,697 8,578,931 6,659,316
Gains (Losses) on sales of marketable securities and loans 639,371 (70,207) 691,737Gains (Losses) on sales of fixed assets – (24) 58Non-recurring items (13,802) (19,234) 5,648
Non-recurring income (Note 18) 625,569 (89,465) 697,443
Employee profit-sharing plan (36,973) (44,502) (45,701)Taxes (1,384,612) (2,437,355) (1,532,133)
Net income 5,633,681 6,007,609 5,778,925
286 / TOTAL - Registration Document 2009
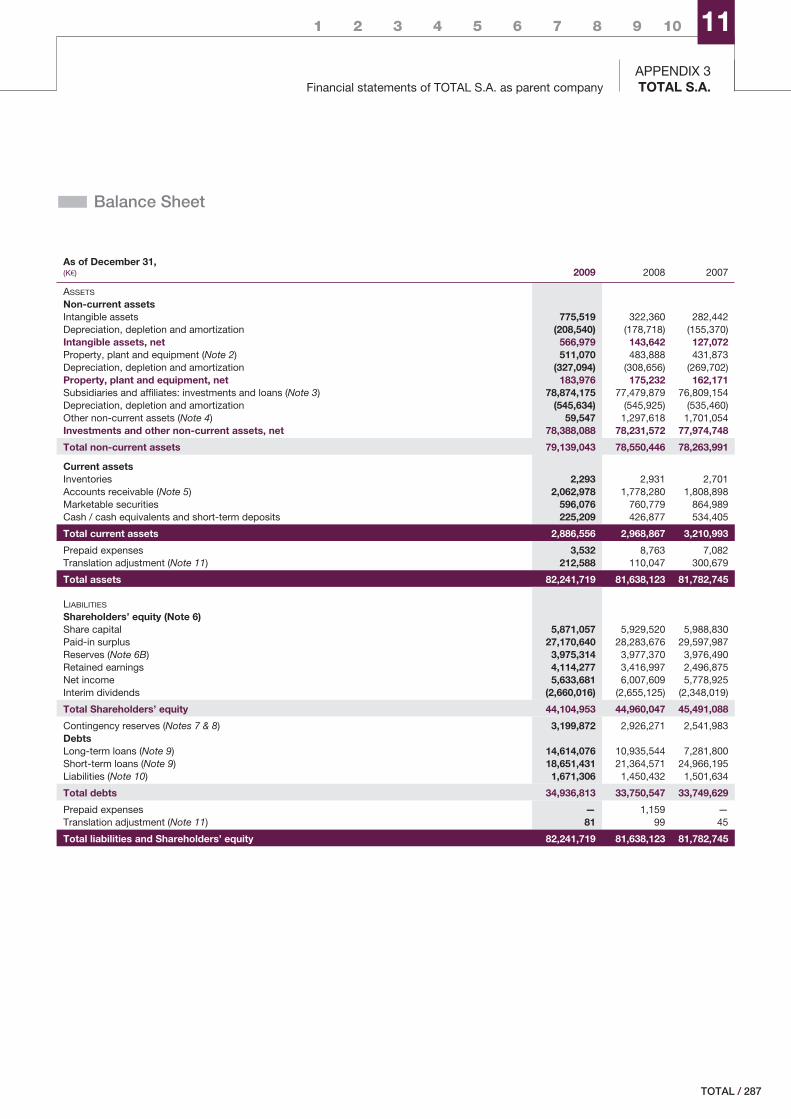
Financial statements of TOTAL S.A. as parent companyAPPENDIX 3TOTAL S.A.
1 2 3 4 5 6 7 8 9 10 11
� Balance Sheet
As of December 31,(K€) 2009 2008 2007
ASSETS
Non-current assetsIntangible assets 775,519 322,360 282,442Depreciation, depletion and amortization (208,540) (178,718) (155,370)Intangible assets, net 566,979 143,642 127,072Property, plant and equipment (Note 2) 511,070 483,888 431,873Depreciation, depletion and amortization (327,094) (308,656) (269,702)Property, plant and equipment, net 183,976 175,232 162,171Subsidiaries and affiliates: investments and loans (Note 3) 78,874,175 77,479,879 76,809,154Depreciation, depletion and amortization (545,634) (545,925) (535,460)Other non-current assets (Note 4) 59,547 1,297,618 1,701,054Investments and other non-current assets, net 78,388,088 78,231,572 77,974,748
Total non-current assets 79,139,043 78,550,446 78,263,991
Current assetsInventories 2,293 2,931 2,701Accounts receivable (Note 5) 2,062,978 1,778,280 1,808,898Marketable securities 596,076 760,779 864,989Cash / cash equivalents and short-term deposits 225,209 426,877 534,405
Total current assets 2,886,556 2,968,867 3,210,993
Prepaid expenses 3,532 8,763 7,082Translation adjustment (Note 11) 212,588 110,047 300,679
Total assets 82,241,719 81,638,123 81,782,745
LIABILITIES
Shareholders’ equity (Note 6)Share capital 5,871,057 5,929,520 5,988,830Paid-in surplus 27,170,640 28,283,676 29,597,987Reserves (Note 6B) 3,975,314 3,977,370 3,976,490Retained earnings 4,114,277 3,416,997 2,496,875Net income 5,633,681 6,007,609 5,778,925Interim dividends (2,660,016) (2,655,125) (2,348,019)
Total Shareholders’ equity 44,104,953 44,960,047 45,491,088
Contingency reserves (Notes 7 & 8) 3,199,872 2,926,271 2,541,983DebtsLong-term loans (Note 9) 14,614,076 10,935,544 7,281,800Short-term loans (Note 9) 18,651,431 21,364,571 24,966,195Liabilities (Note 10) 1,671,306 1,450,432 1,501,634
Total debts 34,936,813 33,750,547 33,749,629
Prepaid expenses — 1,159 —Translation adjustment (Note 11) 81 99 45
Total liabilities and Shareholders’ equity 82,241,719 81,638,123 81,782,745
/ 287TOTAL
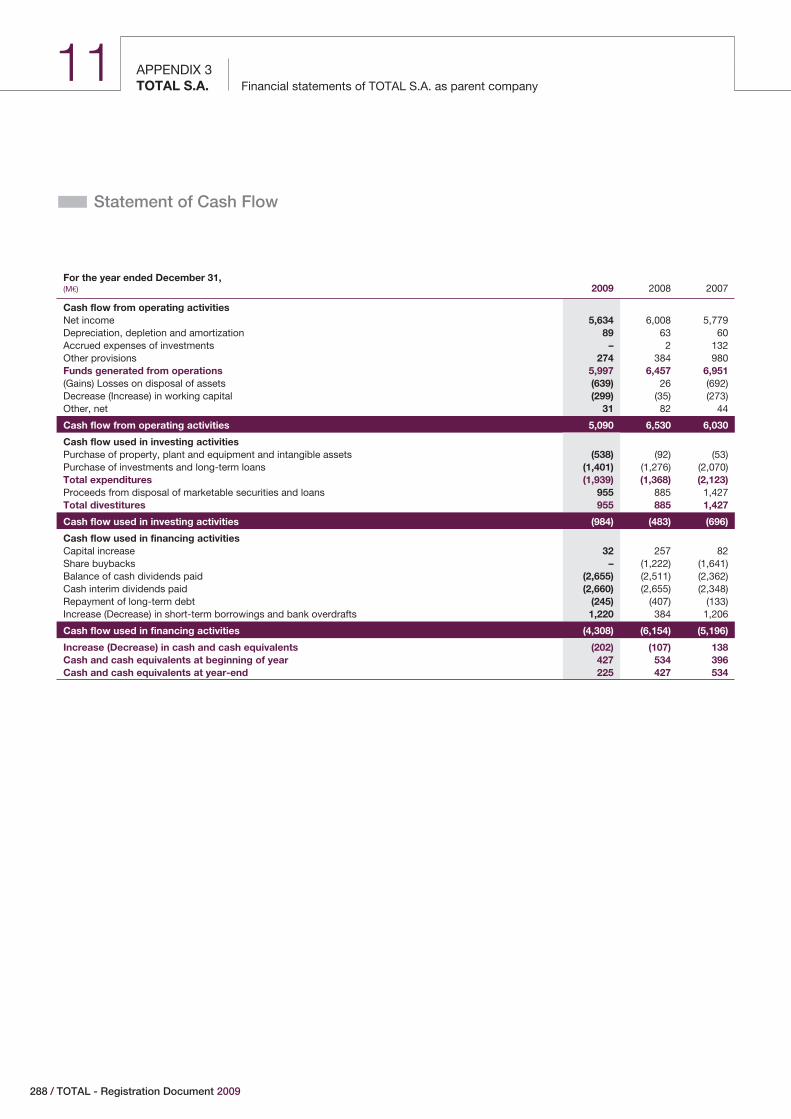
11 APPENDIX 3Financial statements of TOTAL S.A. as parent companyTOTAL S.A.
� Statement of Cash Flow
For the year ended December 31,(M€) 2009 2008 2007
Cash flow from operating activitiesNet income 5,634 6,008 5,779Depreciation, depletion and amortization 89 63 60Accrued expenses of investments – 2 132Other provisions 274 384 980Funds generated from operations 5,997 6,457 6,951(Gains) Losses on disposal of assets (639) 26 (692)Decrease (Increase) in working capital (299) (35) (273)Other, net 31 82 44
Cash flow from operating activities 5,090 6,530 6,030
Cash flow used in investing activitiesPurchase of property, plant and equipment and intangible assets (538) (92) (53)Purchase of investments and long-term loans (1,401) (1,276) (2,070)Total expenditures (1,939) (1,368) (2,123)Proceeds from disposal of marketable securities and loans 955 885 1,427Total divestitures 955 885 1,427
Cash flow used in investing activities (984) (483) (696)
Cash flow used in financing activitiesCapital increase 32 257 82Share buybacks – (1,222) (1,641)Balance of cash dividends paid (2,655) (2,511) (2,362)Cash interim dividends paid (2,660) (2,655) (2,348)Repayment of long-term debt (245) (407) (133)Increase (Decrease) in short-term borrowings and bank overdrafts 1,220 384 1,206
Cash flow used in financing activities (4,308) (6,154) (5,196)
Increase (Decrease) in cash and cash equivalents (202) (107) 138Cash and cash equivalents at beginning of year 427 534 396Cash and cash equivalents at year-end 225 427 534
288 / TOTAL - Registration Document 2009
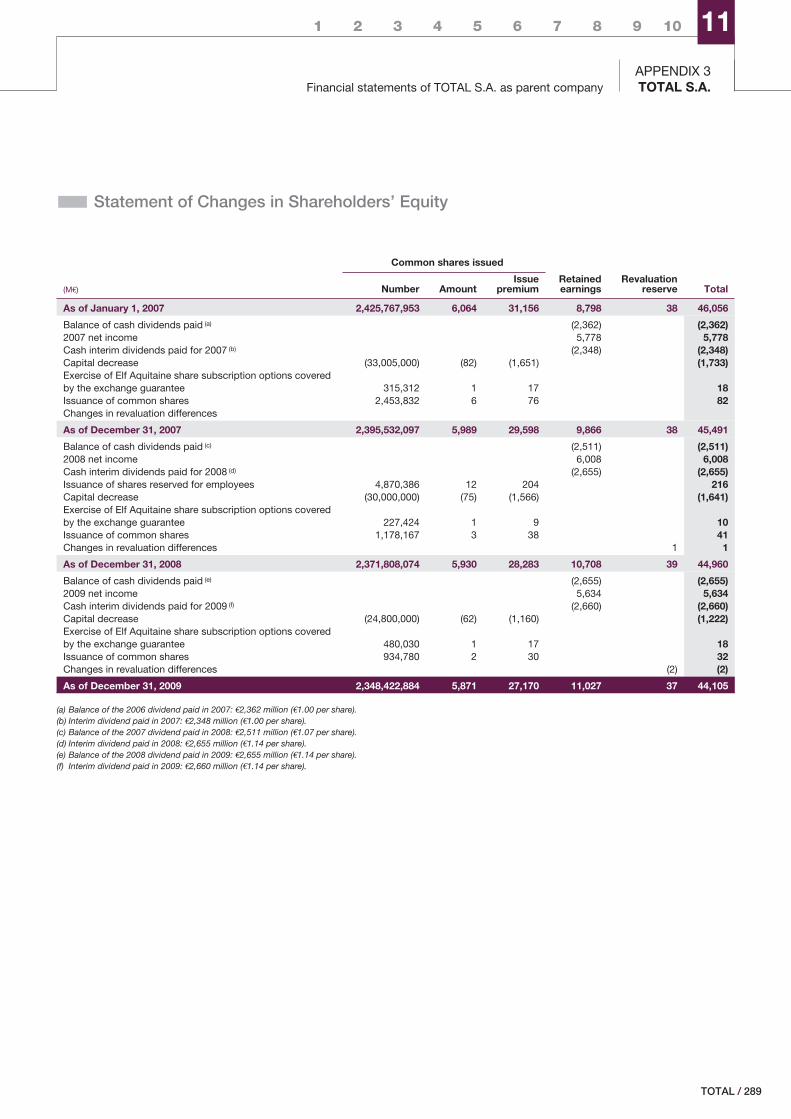
1 2 3 4 5 6 7 8 9 10 11
Financial statements of TOTAL S.A. as parent companyAPPENDIX 3TOTAL S.A.
� Statement of Changes in Shareholders’ Equity
Common shares issued
(M€) Number AmountIssue
premiumRetainedearnings
Revaluationreserve Total
As of January 1, 2007 2,425,767,953 6,064 31,156 8,798 38 46,056
Balance of cash dividends paid (a) (2,362) (2,362)2007 net income 5,778 5,778Cash interim dividends paid for 2007 (b) (2,348) (2,348)Capital decrease (33,005,000) (82) (1,651) (1,733)Exercise of Elf Aquitaine share subscription options coveredby the exchange guarantee 315,312 1 17 18Issuance of common shares 2,453,832 6 76 82Changes in revaluation differences
As of December 31, 2007 2,395,532,097 5,989 29,598 9,866 38 45,491
Balance of cash dividends paid (c) (2,511) (2,511)2008 net income 6,008 6,008Cash interim dividends paid for 2008 (d) (2,655) (2,655)Issuance of shares reserved for employees 4,870,386 12 204 216Capital decrease (30,000,000) (75) (1,566) (1,641)Exercise of Elf Aquitaine share subscription options coveredby the exchange guarantee 227,424 1 9 10Issuance of common shares 1,178,167 3 38 41Changes in revaluation differences 1 1
As of December 31, 2008 2,371,808,074 5,930 28,283 10,708 39 44,960
Balance of cash dividends paid (e) (2,655) (2,655)2009 net income 5,634 5,634Cash interim dividends paid for 2009 (f) (2,660) (2,660)Capital decrease (24,800,000) (62) (1,160) (1,222)Exercise of Elf Aquitaine share subscription options coveredby the exchange guarantee 480,030 1 17 18Issuance of common shares 934,780 2 30 32Changes in revaluation differences (2) (2)
As of December 31, 2009 2,348,422,884 5,871 27,170 11,027 37 44,105
(a) Balance of the 2006 dividend paid in 2007: €2,362 million (€1.00 per share).(b) Interim dividend paid in 2007: €2,348 million (€1.00 per share).(c) Balance of the 2007 dividend paid in 2008: €2,511 million (€1.07 per share).(d) Interim dividend paid in 2008: €2,655 million (€1.14 per share).(e) Balance of the 2008 dividend paid in 2009: €2,655 million (€1.14 per share).(f) Interim dividend paid in 2009: €2,660 million (€1.14 per share).
/ 289TOTAL
APPENDIX 3Notes to the financial statementsTOTAL S.A.
11
� Notes to the financial statements
1) Accounting policies
The 2009 financial statements have been prepared in accordancewith French Generally Accepted Accounting Principles (“FrenchGAAP”).
Property, plant and equipment
Property, plant and equipment are carried at cost with theexception of assets that were acquired before 1976 for which thebasis has been revalued pursuant to French regulations. They aredepreciated by the straight-line method over their estimated usefullife, as follows:
Buildings 20 – 30 yearsFurniture and fixtures 5 – 10 yearsTransportation equipment 2 – 5 yearsOffice equipment and furniture 5 – 10 yearsComputer equipment 3 – 5 years
Investments and loans to consolidatedsubsidiaries and equity affiliates
Investments in consolidated subsidiaries and equity affiliates areaccounted for at the acquisition cost, or the appraised value forinvestments affected by the 1976 legal revaluation.
Loans to consolidated subsidiaries and equity affiliates are stated attheir nominal value.
In the Upstream segment, in the absence of a developmentdecision, allowances are recorded against investments and loansfor an amount corresponding to the exploration costs incurred.When the existence of proved reserves is established, the value ofthe investments and loans is limited to the subsidiary expectedpay-back evaluated at year-end.
For other segments, allowances for impairment in value arecalculated by reference to the Company’s equity in the underlyingnet assets, the fair value and usefulness of the investment.
Inventories
Inventories are valued at either the historical cost or the marketvalue, whichever is lower. Cost for crude oil and refined productinventories is determined according to the First-In, First-Out (FIFO)method.
Receivables and payables
Receivables and payables are stated at nominal value. Allowancesfor doubtful debts are recorded when the actual value is inferior tothe book value.
Foreign currency transactions
Receivables and payables denominated in foreign currencies aretranslated into euros at the year-end exchange rate. Translationdifferences for non-hedged items are recorded under “Translationadjustment” on the assets or liabilities side of the balance sheet.Unrealized exchange losses are recorded as provisions.
Translation differences related to other foreign receivables andpayables are recorded in the statement of income and offset byunrealized gains or losses from off-balance sheet hedging.
Financial instruments
The Company mainly uses financial instruments for hedgingpurposes, in order to manage its exposure to changes in interestrates and foreign exchange rates.
The Company enters into interest rate and foreign currency swapagreements. The difference between interest to be paid and interestto be received or premiums and discounts on these swaps isrecognized as interest expense or interest income on a proratedbasis, over the life of the hedged item.
The Company may also use futures, caps, floors, and options.Under hedge accounting, changes in the market value of suchcontracts are recognized as interest expense or interest income inthe same period as the gains and losses on the item being hedged.For option contracts, premiums paid are amortized over theduration of the option.
A provision is recorded for any unrealized losses related tooperations that do not comply with the criteria required for hedgeaccounting.
290 / TOTAL - Registration Document 2009
1 2 3 4 5 6 7 8 9 10 11
Notes to the financial statementsAPPENDIX 3TOTAL S.A.
2) Property, plant and equipment
2009 2008
As of December 31,(M€) Cost
Depreciation,depletion andamortization Net Net
Land 34 – 34 34Buildings 92 (42) 50 54Other 385 (285) 100 87
Total (a) 511 (327) 184 175
(a) As of December 31, 2008, aggregate cost and accumulated depreciation and provision amounted respectively to €484 million and €309 million.
3) Subsidiaries and affiliates: investments and loans
A) Changes in investments and loans
2009
Increases Decreases
As of December 31,(M€)
Grossamount
atbeginning
of year MonetaryNon
monetary MonetaryNon
monetaryTranslationadjustment
Gross amount atyear-end
Investments 72,454 622 29 (52) (4) – 73,049Receivables (a) 5,026 1,172 100 (239) (130) (104) 5,825
Total 77,480 1,794 129 (291) (134) (104) 78,874
Analysis by segmentUpstream 2,406 811 12 (67) (51) – 3,111Downstream 3,327 12 99 – (81) – 3,357Chemicals 13,383 – – (18) – 1 13,366Financial activities 58,364 971 18 (206) (2) (105) 59,040
Total 77,480 1,794 129 (291) (134) (104) 78,874
(a) Changes in receivables mainly result from flows of funds with Total Finance and Total Treasury.
B) Allowances for investments and loans
2009 2008
As of December 31,(M€) Cost
Valuationallowance Net Net
Investments 73,049 (437) 72,612 72,026Receivables (a) (b) 5,825 (109) 5,716 4,908
Total (c) 78,874 (546) 78,328 76,934
Analysis by segmentUpstream 3,111 (299) 2,812 2,133Downstream 3,357 (116) 3,241 3,211Chemicals 13,366 (88) 13,278 13,279Financial activities 59,040 (43) 58,997 58,311
Total 78,874 (546) 78,328 76,934
(a) As of December 31, 2009, the gross amount included €5,240 million related to affiliates.(b) As of December 31, 2009, the net amount was split into €1,621 million due in 12 months or less and €4,095 million due in 12 months or more.(c) As of December 31, 2008, aggregate cost and valuation allowance amounted to €77,480 million and €546 million, respectively.
/ 291TOTAL
APPENDIX 3Notes to the financial statementsTOTAL S.A.
11
4) Other non-current assets
A) Changes in other non-current assets
2009
As of December 31,(M€)
Increases Decreases
Grossamount at
beginning ofyear Monetary
Nonmonetary Monetary
Nonmonetary
Translationadjustment
Grossamount at
year-end
Investment portfolio (a) 1,226 – – – (1,222) – 4Other non-current assets 57 4 – (21) – – 40Deposits and guarantees 14 2 – – – – 16
Total 1,297 6 – (21) (1,222) – 60
(a) Non-monetary decreases correspond to TOTAL shares cancelled in 2009.
B) Allowances for non-current assets
2009 2008
As of December 31,(M€) Cost
Valuationallowance Net Net
Investment portfolio 4 – 4 1,226Other non-current assets (a) 40 – 40 57Deposits and guarantees 16 – 16 14
Total (b) 60 – 60 1,297
(a) As of December 31, 2009, net amount is due in 12 months or more.(b) As of December 31, 2008, aggregate cost and net amounts were equivalent.
5) Accounts receivable
2009 2008
As of December 31,(M€) Cost
Valuationallowance Net Net
Accounts and notes receivable 945 – 945 698Other operating receivables 1,118 – 1,118 1,080
Total (a) (b) 2,063 – 2,063 1,778
(a) Including €1,073 million related to affiliates as of December 31, 2009.(b) Due in 12 months or less.
292 / TOTAL - Registration Document 2009
1 2 3 4 5 6 7 8 9 10 11
Notes to the financial statementsAPPENDIX 3TOTAL S.A.
6) Shareholders’ equity
A) Common shares
Share capital transactions are detailed as follows:
Historical data
As of January 1, 2007 2,425,767,953
Shares issued in connection with: Exercise of TOTAL share subscription options 2,453,832Exchange guarantee offered to the beneficiaries of ElfAquitaine share subscription options 315,312
Shares cancelled (a) (33,005,000)
As of January 1, 2008 2,395,532,097
Shares issued in connection with: Capital increase reserved for employees 4,870,386Exercise of TOTAL share subscription options 1,178,167Exchange guarantee offered to the beneficiaries of ElfAquitaine share subscription options 227,424
Shares cancelled (b) (30,000,000)
As of January 1, 2009 2,371,808,074
Shares issued in connection with: Exercise of TOTAL share subscription options 934,780Exchange guarantee offered to the beneficiaries of ElfAquitaine share subscription options 480,030
Shares cancelled (c) (24,800,000)
As of December 31, 2009 (d) 2,348,422,884
(a) Approved by the Board of Directors on January 10, 2007.(b) Approved by the Board of Directors on July 31, 2008.(c) Approved by the Board of Directors on July 30, 2009.(d) Including 115,407,190 treasury shares and shares held by subsidiaries deducted from consolidated shareholders’ equity.
‹ Capital increase reserved for Companyemployees
At the shareholders’ meeting held on May 11, 2007, theshareholders delegated to the Board of Directors the authority toincrease the share capital of the Company in one or moretransactions and within a maximum period of 26 months from thedate of the meeting, by an amount not exceeding 1.5% of the sharecapital outstanding on the date of the meeting of the Board ofDirectors at which a decision to proceed with an issuance is madereserving subscriptions for such issuance to the Group employeesparticipating in a company savings plan. It is being specified thatthe amount of any such capital increase reserved for Groupemployees was counted against the aggregate maximum nominalamount of share capital increases authorized by the shareholders’meeting held on May 11, 2007 for issuing new ordinary shares orother securities granting immediate or future access to theCompany’s share capital with preferential subscription rights (€4billion in nominal value).
Pursuant to this delegation of authorization, the Board of Directors,during its November 6, 2007 meeting, implemented a first capitalincrease reserved for employees within the limit of 12 millionshares, par value €2.50, at a price of €44.40 per share, withdividend rights as of the January 1, 2007. The subscription periodran from March 10, 2008, to March 28, 2008. 4,870,386 shareswere subscribed by employees pursuant to the capital increase.
‹ Share cancellation
Pursuant to the authorization granted by the shareholders’ meetingheld on May 11, 2007 authorizing reduction of capital bycancellation of shares held by the Company within the limit of 10%of the outstanding capital every 24 months, the Board of Directorsdecided on July 30, 2009 to cancel 24,800,000 shares acquired in2008 at an average price of €49.28 per share.
‹ Treasury shares (TOTAL shares held by theparent company TOTAL S.A.)
As of December 31, 2009, TOTAL S.A. held 15,075,922 of its ownshares, representing 0,64% of its share capital, detailed as follows:
o 6,017,499 shares allocated to covering TOTAL share purchaseoption plans for Group employees and executive officers;
o 5,799,400 shares allocated to TOTAL restricted shares plans forGroup employees; and
o 3,259,023 shares intended to be allocated to new TOTAL sharepurchase option plans or to new restricted shares plans.
These shares are deducted from the consolidated shareholders’equity.
/ 293TOTAL
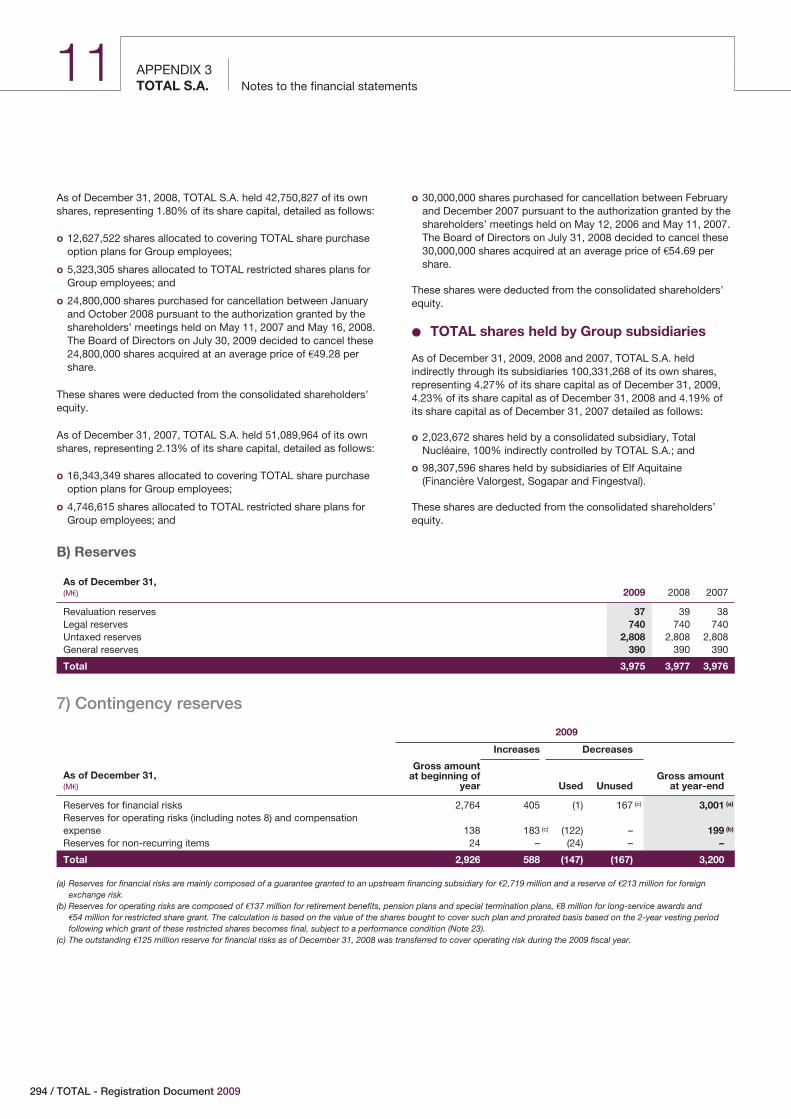
APPENDIX 3Notes to the financial statementsTOTAL S.A.
11
As of December 31, 2008, TOTAL S.A. held 42,750,827 of its ownshares, representing 1.80% of its share capital, detailed as follows:
o 12,627,522 shares allocated to covering TOTAL share purchaseoption plans for Group employees;
o 5,323,305 shares allocated to TOTAL restricted shares plans forGroup employees; and
o 24,800,000 shares purchased for cancellation between Januaryand October 2008 pursuant to the authorization granted by theshareholders’ meetings held on May 11, 2007 and May 16, 2008.The Board of Directors on July 30, 2009 decided to cancel these24,800,000 shares acquired at an average price of €49.28 pershare.
These shares were deducted from the consolidated shareholders’equity.
As of December 31, 2007, TOTAL S.A. held 51,089,964 of its ownshares, representing 2.13% of its share capital, detailed as follows:
o 16,343,349 shares allocated to covering TOTAL share purchaseoption plans for Group employees;
o 4,746,615 shares allocated to TOTAL restricted share plans forGroup employees; and
o 30,000,000 shares purchased for cancellation between Februaryand December 2007 pursuant to the authorization granted by theshareholders’ meetings held on May 12, 2006 and May 11, 2007.The Board of Directors on July 31, 2008 decided to cancel these30,000,000 shares acquired at an average price of €54.69 pershare.
These shares were deducted from the consolidated shareholders’equity.
‹ TOTAL shares held by Group subsidiaries
As of December 31, 2009, 2008 and 2007, TOTAL S.A. heldindirectly through its subsidiaries 100,331,268 of its own shares,representing 4.27% of its share capital as of December 31, 2009,4.23% of its share capital as of December 31, 2008 and 4.19% ofits share capital as of December 31, 2007 detailed as follows:
o 2,023,672 shares held by a consolidated subsidiary, TotalNucléaire, 100% indirectly controlled by TOTAL S.A.; and
o 98,307,596 shares held by subsidiaries of Elf Aquitaine(Financière Valorgest, Sogapar and Fingestval).
These shares are deducted from the consolidated shareholders’equity.
B) Reserves
As of December 31,(M€) 2009 2008 2007
Revaluation reserves 37 39 38Legal reserves 740 740 740Untaxed reserves 2,808 2,808 2,808General reserves 390 390 390
Total 3,975 3,977 3,976
7) Contingency reserves
2009
Increases Decreases
As of December 31,(M€)
Gross amountat beginning of
year Used UnusedGross amount
at year-end
Reserves for financial risks 2,764 405 (1) 167 (c) 3,001 (a)
Reserves for operating risks (including notes 8) and compensationexpense 138 183 (c) (122) – 199 (b)
Reserves for non-recurring items 24 – (24) – –
Total 2,926 588 (147) (167) 3,200
(a) Reserves for financial risks are mainly composed of a guarantee granted to an upstream financing subsidiary for €2,719 million and a reserve of €213 million for foreignexchange risk.
(b) Reserves for operating risks are composed of €137 million for retirement benefits, pension plans and special termination plans, €8 million for long-service awards and€54 million for restricted share grant. The calculation is based on the value of the shares bought to cover such plan and prorated basis based on the 2-year vesting periodfollowing which grant of these restricted shares becomes final, subject to a performance condition (Note 23).
(c) The outstanding €125 million reserve for financial risks as of December 31, 2008 was transferred to cover operating risk during the 2009 fiscal year.
294 / TOTAL - Registration Document 2009
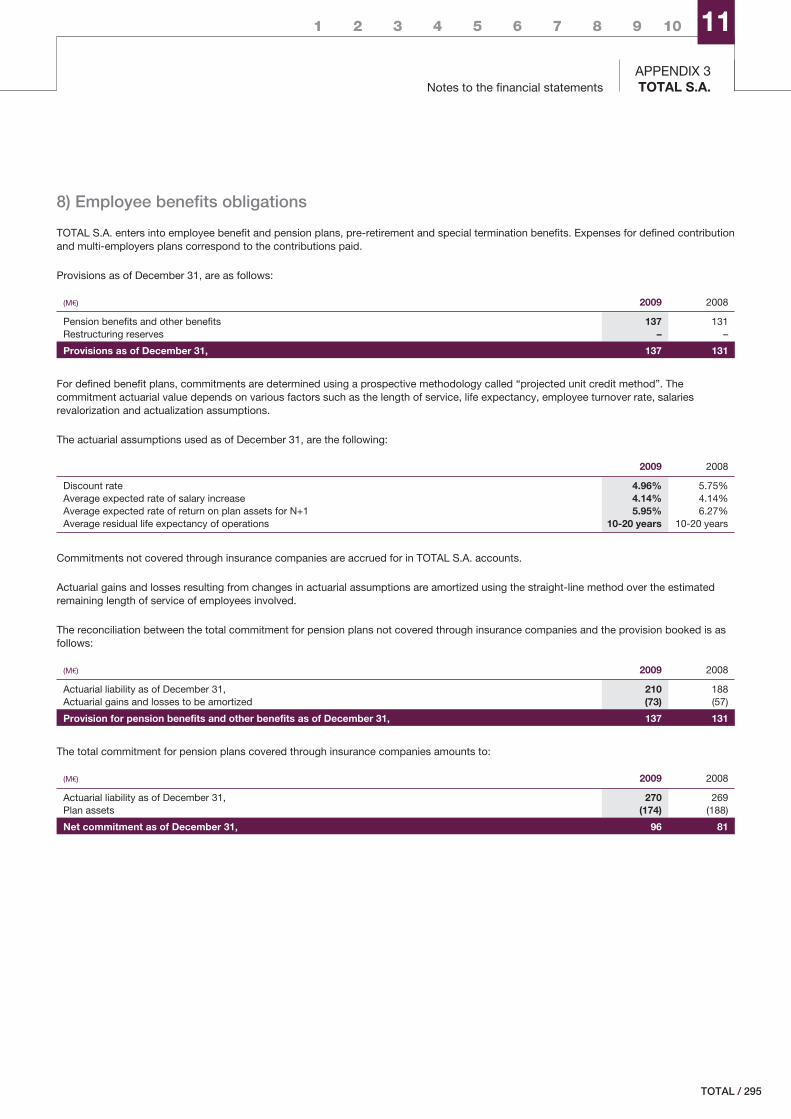
1 2 3 4 5 6 7 8 9 10 11
Notes to the financial statementsAPPENDIX 3TOTAL S.A.
8) Employee benefits obligations
TOTAL S.A. enters into employee benefit and pension plans, pre-retirement and special termination benefits. Expenses for defined contributionand multi-employers plans correspond to the contributions paid.
Provisions as of December 31, are as follows:
(M€) 2009 2008
Pension benefits and other benefits 137 131Restructuring reserves – –
Provisions as of December 31, 137 131
For defined benefit plans, commitments are determined using a prospective methodology called “projected unit credit method”. Thecommitment actuarial value depends on various factors such as the length of service, life expectancy, employee turnover rate, salariesrevalorization and actualization assumptions.
The actuarial assumptions used as of December 31, are the following:
2009 2008
Discount rate 4.96% 5.75%Average expected rate of salary increase 4.14% 4.14%Average expected rate of return on plan assets for N+1 5.95% 6.27%Average residual life expectancy of operations 10-20 years 10-20 years
Commitments not covered through insurance companies are accrued for in TOTAL S.A. accounts.
Actuarial gains and losses resulting from changes in actuarial assumptions are amortized using the straight-line method over the estimatedremaining length of service of employees involved.
The reconciliation between the total commitment for pension plans not covered through insurance companies and the provision booked is asfollows:
(M€) 2009 2008
Actuarial liability as of December 31, 210 188Actuarial gains and losses to be amortized (73) (57)
Provision for pension benefits and other benefits as of December 31, 137 131
The total commitment for pension plans covered through insurance companies amounts to:
(M€) 2009 2008
Actuarial liability as of December 31, 270 269Plan assets (174) (188)
Net commitment as of December 31, 96 81
/ 295TOTAL
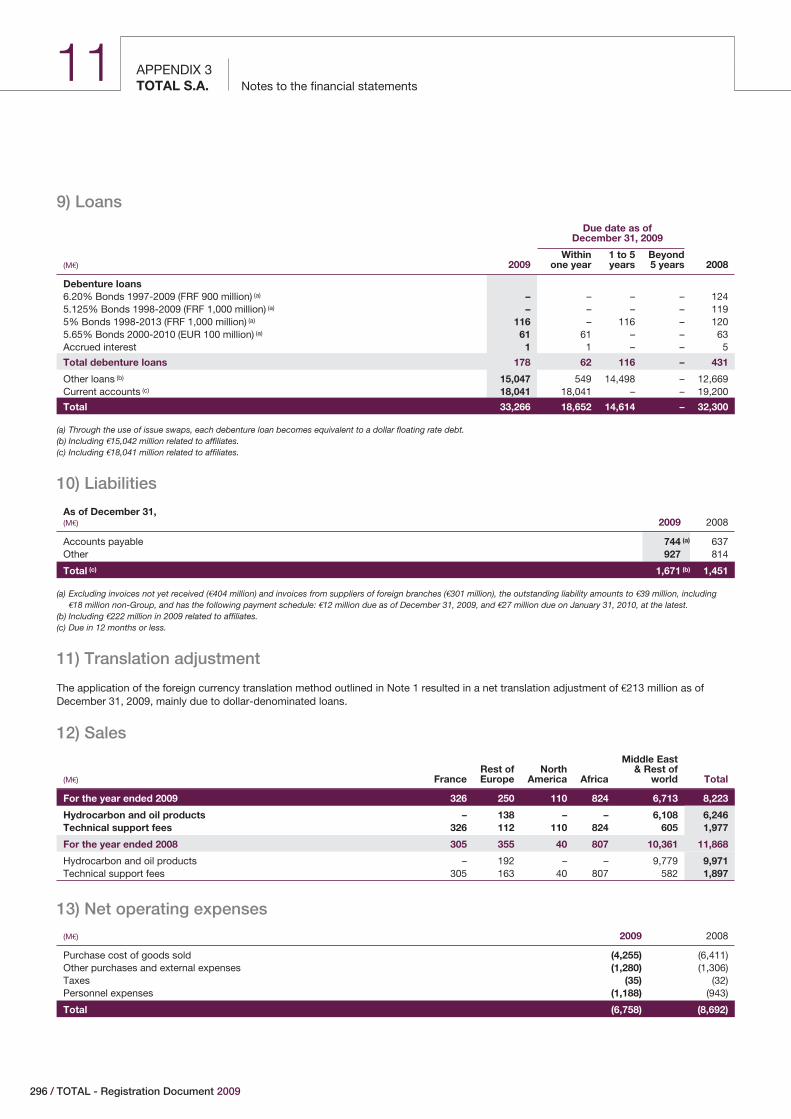
APPENDIX 3Notes to the financial statementsTOTAL S.A.
11
9) Loans
2009
Due date as ofDecember 31, 2009
(M€)Within
one year1 to 5years
Beyond5 years 2008
Debenture loans6.20% Bonds 1997-2009 (FRF 900 million) (a) – – – – 1245.125% Bonds 1998-2009 (FRF 1,000 million) (a) – – – – 1195% Bonds 1998-2013 (FRF 1,000 million) (a) 116 – 116 – 1205.65% Bonds 2000-2010 (EUR 100 million) (a) 61 61 – – 63Accrued interest 1 1 – – 5
Total debenture loans 178 62 116 – 431
Other loans (b) 15,047 549 14,498 – 12,669Current accounts (c) 18,041 18,041 – – 19,200
Total 33,266 18,652 14,614 – 32,300
(a) Through the use of issue swaps, each debenture loan becomes equivalent to a dollar floating rate debt.(b) Including €15,042 million related to affiliates.(c) Including €18,041 million related to affiliates.
10) Liabilities
As of December 31,(M€) 2009 2008
Accounts payable 744 (a) 637Other 927 814
Total (c) 1,671 (b) 1,451
(a) Excluding invoices not yet received (€404 million) and invoices from suppliers of foreign branches (€301 million), the outstanding liability amounts to €39 million, including€18 million non-Group, and has the following payment schedule: €12 million due as of December 31, 2009, and €27 million due on January 31, 2010, at the latest.
(b) Including €222 million in 2009 related to affiliates.(c) Due in 12 months or less.
11) Translation adjustment
The application of the foreign currency translation method outlined in Note 1 resulted in a net translation adjustment of €213 million as ofDecember 31, 2009, mainly due to dollar-denominated loans.
12) Sales
(M€) FranceRest ofEurope
NorthAmerica Africa
Middle East& Rest of
world Total
For the year ended 2009 326 250 110 824 6,713 8,223
Hydrocarbon and oil products – 138 – – 6,108 6,246Technical support fees 326 112 110 824 605 1,977
For the year ended 2008 305 355 40 807 10,361 11,868
Hydrocarbon and oil products – 192 – – 9,779 9,971Technical support fees 305 163 40 807 582 1,897
13) Net operating expenses
(M€) 2009 2008
Purchase cost of goods sold (4,255) (6,411)Other purchases and external expenses (1,280) (1,306)Taxes (35) (32)Personnel expenses (1,188) (943)
Total (6,758) (8,692)
296 / TOTAL - Registration Document 2009
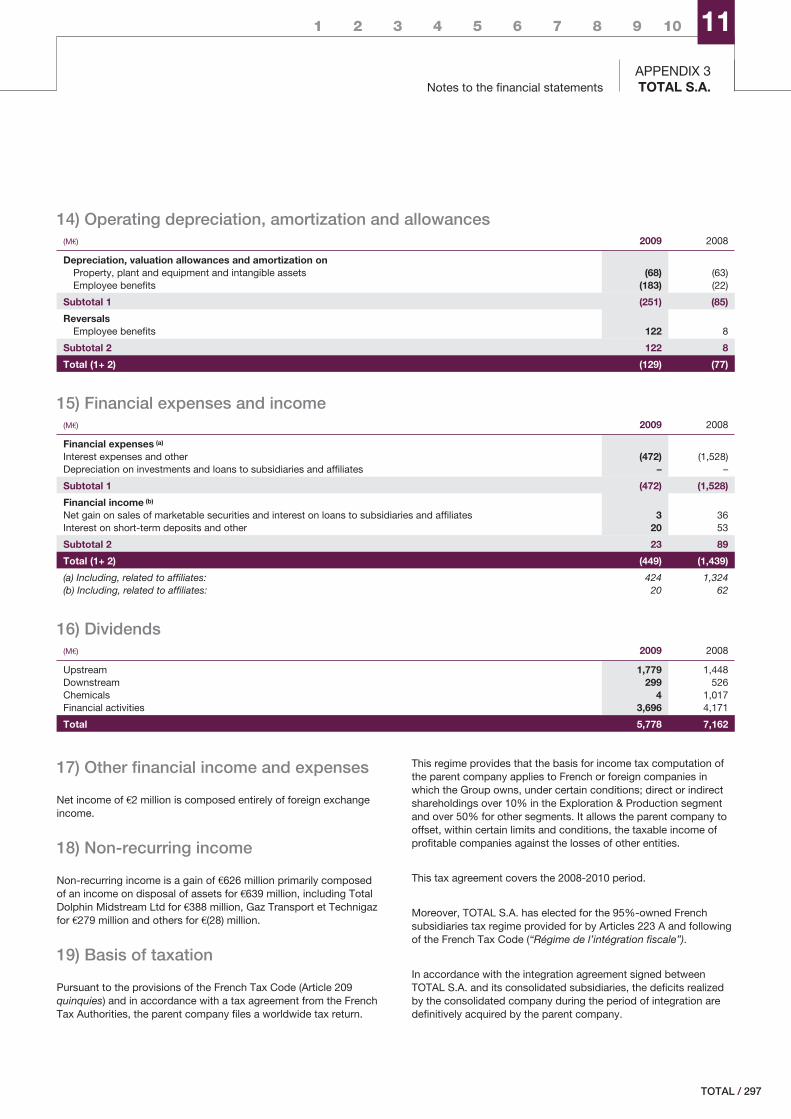
Notes to the financial statementsAPPENDIX 3TOTAL S.A.
1 2 3 4 5 6 7 8 9 10 11
14) Operating depreciation, amortization and allowances(M€) 2009 2008
Depreciation, valuation allowances and amortization onProperty, plant and equipment and intangible assets (68) (63)Employee benefits (183) (22)
Subtotal 1 (251) (85)
ReversalsEmployee benefits 122 8
Subtotal 2 122 8
Total (1+ 2) (129) (77)
15) Financial expenses and income(M€) 2009 2008
Financial expenses (a)
Interest expenses and other (472) (1,528)Depreciation on investments and loans to subsidiaries and affiliates – –
Subtotal 1 (472) (1,528)
Financial income (b)
Net gain on sales of marketable securities and interest on loans to subsidiaries and affiliates 3 36Interest on short-term deposits and other 20 53
Subtotal 2 23 89
Total (1+ 2) (449) (1,439)
(a) Including, related to affiliates: 424 1,324(b) Including, related to affiliates: 20 62
16) Dividends(M€) 2009 2008
Upstream 1,779 1,448Downstream 299 526Chemicals 4 1,017Financial activities 3,696 4,171
Total 5,778 7,162
17) Other financial income and expenses
Net income of €2 million is composed entirely of foreign exchangeincome.
18) Non-recurring income
Non-recurring income is a gain of €626 million primarily composedof an income on disposal of assets for €639 million, including TotalDolphin Midstream Ltd for €388 million, Gaz Transport et Technigazfor €279 million and others for €(28) million.
19) Basis of taxation
Pursuant to the provisions of the French Tax Code (Article 209quinquies) and in accordance with a tax agreement from the FrenchTax Authorities, the parent company files a worldwide tax return.
This regime provides that the basis for income tax computation ofthe parent company applies to French or foreign companies inwhich the Group owns, under certain conditions; direct or indirectshareholdings over 10% in the Exploration & Production segmentand over 50% for other segments. It allows the parent company tooffset, within certain limits and conditions, the taxable income ofprofitable companies against the losses of other entities.
This tax agreement covers the 2008-2010 period.
Moreover, TOTAL S.A. has elected for the 95%-owned Frenchsubsidiaries tax regime provided for by Articles 223 A and followingof the French Tax Code (“Régime de l’intégration fiscale”).
In accordance with the integration agreement signed betweenTOTAL S.A. and its consolidated subsidiaries, the deficits realizedby the consolidated company during the period of integration aredefinitively acquired by the parent company.
/ 297TOTAL
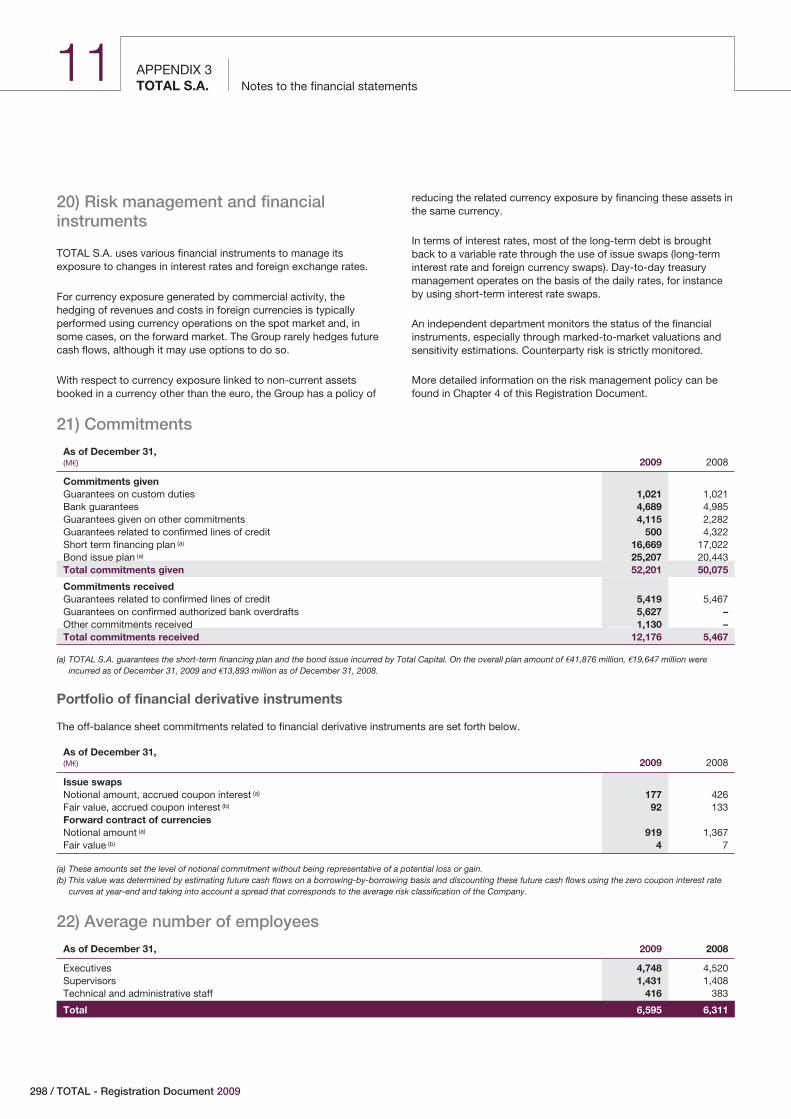
APPENDIX 3Notes to the financial statementsTOTAL S.A.
11
20) Risk management and financialinstruments
TOTAL S.A. uses various financial instruments to manage itsexposure to changes in interest rates and foreign exchange rates.
For currency exposure generated by commercial activity, thehedging of revenues and costs in foreign currencies is typicallyperformed using currency operations on the spot market and, insome cases, on the forward market. The Group rarely hedges futurecash flows, although it may use options to do so.
With respect to currency exposure linked to non-current assetsbooked in a currency other than the euro, the Group has a policy of
reducing the related currency exposure by financing these assets inthe same currency.
In terms of interest rates, most of the long-term debt is broughtback to a variable rate through the use of issue swaps (long-terminterest rate and foreign currency swaps). Day-to-day treasurymanagement operates on the basis of the daily rates, for instanceby using short-term interest rate swaps.
An independent department monitors the status of the financialinstruments, especially through marked-to-market valuations andsensitivity estimations. Counterparty risk is strictly monitored.
More detailed information on the risk management policy can befound in Chapter 4 of this Registration Document.
21) Commitments
As of December 31,(M€) 2009 2008
Commitments givenGuarantees on custom duties 1,021 1,021Bank guarantees 4,689 4,985Guarantees given on other commitments 4,115 2,282Guarantees related to confirmed lines of credit 500 4,322Short term financing plan (a) 16,669 17,022Bond issue plan (a) 25,207 20,443Total commitments given 52,201 50,075
Commitments receivedGuarantees related to confirmed lines of credit 5,419 5,467Guarantees on confirmed authorized bank overdrafts 5,627 –Other commitments received 1,130 –Total commitments received 12,176 5,467
(a) TOTAL S.A. guarantees the short-term financing plan and the bond issue incurred by Total Capital. On the overall plan amount of €41,876 million, €19,647 million wereincurred as of December 31, 2009 and €13,893 million as of December 31, 2008.
Portfolio of financial derivative instruments
The off-balance sheet commitments related to financial derivative instruments are set forth below.
As of December 31,(M€) 2009 2008
Issue swapsNotional amount, accrued coupon interest (a) 177 426Fair value, accrued coupon interest (b) 92 133Forward contract of currenciesNotional amount (a) 919 1,367Fair value (b) 4 7
(a) These amounts set the level of notional commitment without being representative of a potential loss or gain.(b) This value was determined by estimating future cash flows on a borrowing-by-borrowing basis and discounting these future cash flows using the zero coupon interest rate
curves at year-end and taking into account a spread that corresponds to the average risk classification of the Company.
22) Average number of employees
As of December 31, 2009 2008
Executives 4,748 4,520Supervisors 1,431 1,408Technical and administrative staff 416 383
Total 6,595 6,311
298 / TOTAL - Registration Document 2009
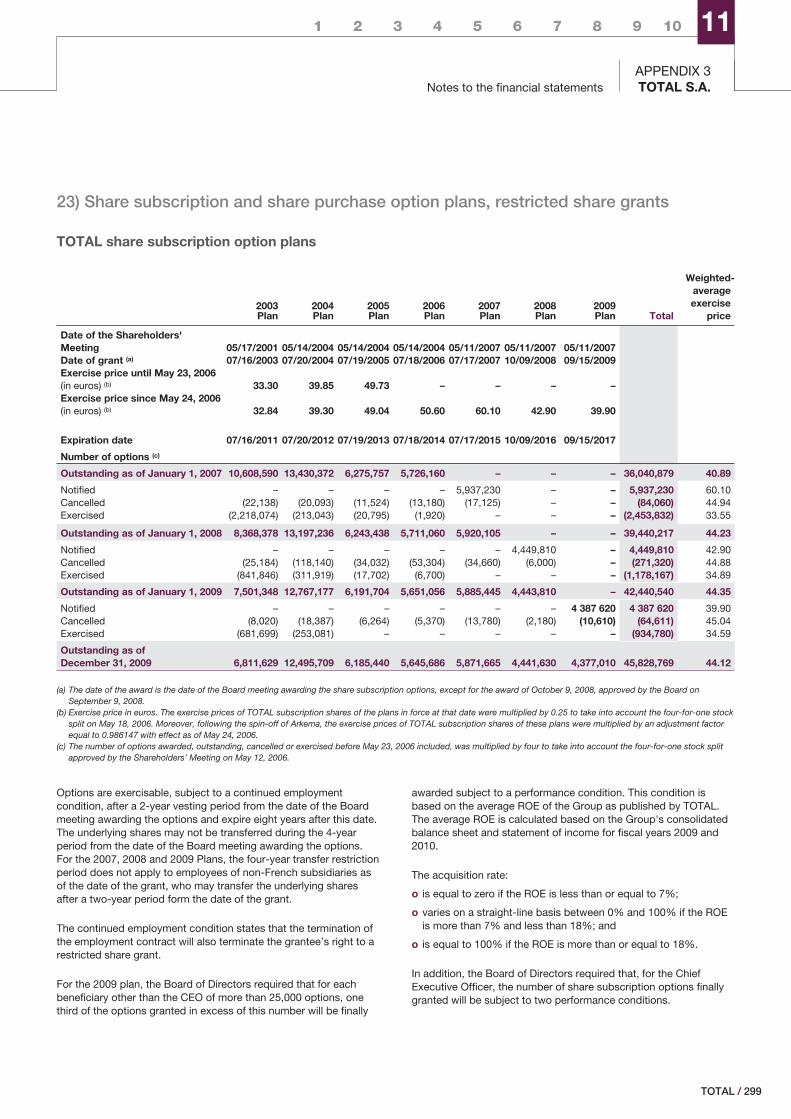
Notes to the financial statementsAPPENDIX 3TOTAL S.A.
1 2 3 4 5 6 7 8 9 10 11
23) Share subscription and share purchase option plans, restricted share grants
TOTAL share subscription option plans
2003Plan
2004Plan
2005Plan
2006Plan
2007Plan
2008Plan
2009Plan Total
Weighted-averageexercise
price
Date of the Shareholders'Meeting 05/17/2001 05/14/2004 05/14/2004 05/14/2004 05/11/2007 05/11/2007 05/11/2007Date of grant (a) 07/16/2003 07/20/2004 07/19/2005 07/18/2006 07/17/2007 10/09/2008 09/15/2009Exercise price until May 23, 2006(in euros) (b) 33.30 39.85 49.73 – – – –Exercise price since May 24, 2006(in euros) (b) 32.84 39.30 49.04 50.60 60.10 42.90 39.90
Expiration date 07/16/2011 07/20/2012 07/19/2013 07/18/2014 07/17/2015 10/09/2016 09/15/2017
Number of options (c)
Outstanding as of January 1, 2007 10,608,590 13,430,372 6,275,757 5,726,160 – – – 36,040,879 40.89
Notified – – – – 5,937,230 – – 5,937,230 60.10Cancelled (22,138) (20,093) (11,524) (13,180) (17,125) – – (84,060) 44.94Exercised (2,218,074) (213,043) (20,795) (1,920) – – – (2,453,832) 33.55
Outstanding as of January 1, 2008 8,368,378 13,197,236 6,243,438 5,711,060 5,920,105 – – 39,440,217 44.23
Notified – – – – – 4,449,810 – 4,449,810 42.90Cancelled (25,184) (118,140) (34,032) (53,304) (34,660) (6,000) – (271,320) 44.88Exercised (841,846) (311,919) (17,702) (6,700) – – – (1,178,167) 34.89
Outstanding as of January 1, 2009 7,501,348 12,767,177 6,191,704 5,651,056 5,885,445 4,443,810 – 42,440,540 44.35
Notified – – – – – – 4 387 620 4 387 620 39.90Cancelled (8,020) (18,387) (6,264) (5,370) (13,780) (2,180) (10,610) (64,611) 45.04Exercised (681,699) (253,081) – – – – – (934,780) 34.59
Outstanding as ofDecember 31, 2009 6,811,629 12,495,709 6,185,440 5,645,686 5,871,665 4,441,630 4,377,010 45,828,769 44.12
(a) The date of the award is the date of the Board meeting awarding the share subscription options, except for the award of October 9, 2008, approved by the Board onSeptember 9, 2008.
(b) Exercise price in euros. The exercise prices of TOTAL subscription shares of the plans in force at that date were multiplied by 0.25 to take into account the four-for-one stocksplit on May 18, 2006. Moreover, following the spin-off of Arkema, the exercise prices of TOTAL subscription shares of these plans were multiplied by an adjustment factorequal to 0.986147 with effect as of May 24, 2006.
(c) The number of options awarded, outstanding, cancelled or exercised before May 23, 2006 included, was multiplied by four to take into account the four-for-one stock splitapproved by the Shareholders’ Meeting on May 12, 2006.
Options are exercisable, subject to a continued employmentcondition, after a 2-year vesting period from the date of the Boardmeeting awarding the options and expire eight years after this date.The underlying shares may not be transferred during the 4-yearperiod from the date of the Board meeting awarding the options.For the 2007, 2008 and 2009 Plans, the four-year transfer restrictionperiod does not apply to employees of non-French subsidiaries asof the date of the grant, who may transfer the underlying sharesafter a two-year period form the date of the grant.
The continued employment condition states that the termination ofthe employment contract will also terminate the grantee’s right to arestricted share grant.
For the 2009 plan, the Board of Directors required that for eachbeneficiary other than the CEO of more than 25,000 options, onethird of the options granted in excess of this number will be finally
awarded subject to a performance condition. This condition isbased on the average ROE of the Group as published by TOTAL.The average ROE is calculated based on the Group's consolidatedbalance sheet and statement of income for fiscal years 2009 and2010.
The acquisition rate:
o is equal to zero if the ROE is less than or equal to 7%;
o varies on a straight-line basis between 0% and 100% if the ROEis more than 7% and less than 18%; and
o is equal to 100% if the ROE is more than or equal to 18%.
In addition, the Board of Directors required that, for the ChiefExecutive Officer, the number of share subscription options finallygranted will be subject to two performance conditions.
/ 299TOTAL
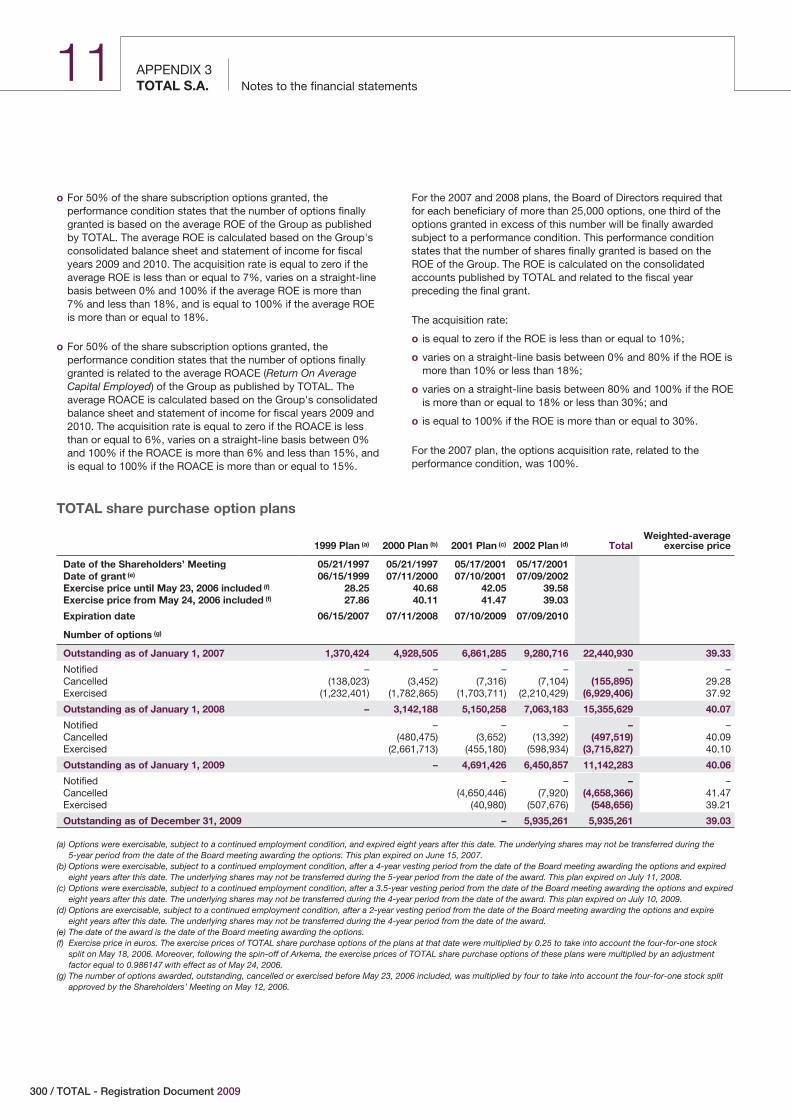
APPENDIX 3Notes to the financial statementsTOTAL S.A.
11
o For 50% of the share subscription options granted, theperformance condition states that the number of options finallygranted is based on the average ROE of the Group as publishedby TOTAL. The average ROE is calculated based on the Group'sconsolidated balance sheet and statement of income for fiscalyears 2009 and 2010. The acquisition rate is equal to zero if theaverage ROE is less than or equal to 7%, varies on a straight-linebasis between 0% and 100% if the average ROE is more than7% and less than 18%, and is equal to 100% if the average ROEis more than or equal to 18%.
o For 50% of the share subscription options granted, theperformance condition states that the number of options finallygranted is related to the average ROACE (Return On AverageCapital Employed) of the Group as published by TOTAL. Theaverage ROACE is calculated based on the Group's consolidatedbalance sheet and statement of income for fiscal years 2009 and2010. The acquisition rate is equal to zero if the ROACE is lessthan or equal to 6%, varies on a straight-line basis between 0%and 100% if the ROACE is more than 6% and less than 15%, andis equal to 100% if the ROACE is more than or equal to 15%.
For the 2007 and 2008 plans, the Board of Directors required thatfor each beneficiary of more than 25,000 options, one third of theoptions granted in excess of this number will be finally awardedsubject to a performance condition. This performance conditionstates that the number of shares finally granted is based on theROE of the Group. The ROE is calculated on the consolidatedaccounts published by TOTAL and related to the fiscal yearpreceding the final grant.
The acquisition rate:
o is equal to zero if the ROE is less than or equal to 10%;
o varies on a straight-line basis between 0% and 80% if the ROE ismore than 10% or less than 18%;
o varies on a straight-line basis between 80% and 100% if the ROEis more than or equal to 18% or less than 30%; and
o is equal to 100% if the ROE is more than or equal to 30%.
For the 2007 plan, the options acquisition rate, related to theperformance condition, was 100%.
TOTAL share purchase option plans
1999 Plan (a) 2000 Plan (b) 2001 Plan (c) 2002 Plan (d) TotalWeighted-average
exercise price
Date of the Shareholders’ Meeting 05/21/1997 05/21/1997 05/17/2001 05/17/2001Date of grant (e) 06/15/1999 07/11/2000 07/10/2001 07/09/2002Exercise price until May 23, 2006 included (f) 28.25 40.68 42.05 39.58Exercise price from May 24, 2006 included (f) 27.86 40.11 41.47 39.03
Expiration date 06/15/2007 07/11/2008 07/10/2009 07/09/2010
Number of options (g)
Outstanding as of January 1, 2007 1,370,424 4,928,505 6,861,285 9,280,716 22,440,930 39.33
Notified – – – – – –Cancelled (138,023) (3,452) (7,316) (7,104) (155,895) 29.28Exercised (1,232,401) (1,782,865) (1,703,711) (2,210,429) (6,929,406) 37.92
Outstanding as of January 1, 2008 – 3,142,188 5,150,258 7,063,183 15,355,629 40.07
Notified – – – – –Cancelled (480,475) (3,652) (13,392) (497,519) 40.09Exercised (2,661,713) (455,180) (598,934) (3,715,827) 40.10
Outstanding as of January 1, 2009 – 4,691,426 6,450,857 11,142,283 40.06
Notified – – – –Cancelled (4,650,446) (7,920) (4,658,366) 41.47Exercised (40,980) (507,676) (548,656) 39.21
Outstanding as of December 31, 2009 – 5,935,261 5,935,261 39.03
(a) Options were exercisable, subject to a continued employment condition, and expired eight years after this date. The underlying shares may not be transferred during the5-year period from the date of the Board meeting awarding the options. This plan expired on June 15, 2007.
(b) Options were exercisable, subject to a continued employment condition, after a 4-year vesting period from the date of the Board meeting awarding the options and expiredeight years after this date. The underlying shares may not be transferred during the 5-year period from the date of the award. This plan expired on July 11, 2008.
(c) Options were exercisable, subject to a continued employment condition, after a 3.5-year vesting period from the date of the Board meeting awarding the options and expiredeight years after this date. The underlying shares may not be transferred during the 4-year period from the date of the award. This plan expired on July 10, 2009.
(d) Options are exercisable, subject to a continued employment condition, after a 2-year vesting period from the date of the Board meeting awarding the options and expireeight years after this date. The underlying shares may not be transferred during the 4-year period from the date of the award.
(e) The date of the award is the date of the Board meeting awarding the options.(f) Exercise price in euros. The exercise prices of TOTAL share purchase options of the plans at that date were multiplied by 0.25 to take into account the four-for-one stock
split on May 18, 2006. Moreover, following the spin-off of Arkema, the exercise prices of TOTAL share purchase options of these plans were multiplied by an adjustmentfactor equal to 0.986147 with effect as of May 24, 2006.
(g) The number of options awarded, outstanding, cancelled or exercised before May 23, 2006 included, was multiplied by four to take into account the four-for-one stock splitapproved by the Shareholders’ Meeting on May 12, 2006.
300 / TOTAL - Registration Document 2009

1 2 3 4 5 6 7 8 9 10 11
Notes to the financial statementsAPPENDIX 3TOTAL S.A.
Exchange guarantee granted to the holders ofElf Aquitaine share subscription options
Pursuant to the public exchange offer for Elf Aquitaine shares whichwas made in 1999, the Group made a commitment to guarantee theholders of Elf Aquitaine share subscription options, at the end of theperiod referred to in Article 163 bis C of the French Tax Code (CGI),and until the end of the period for the exercise of the options, thepossibility to exchange their future Elf Aquitaine shares for TOTALshares, on the basis of the exchange ratio of the offer (nineteenTOTAL shares for thirteen Elf Aquitaine shares).
In order to take into account the spin-off of S.D.A. (Société deDéveloppement Arkema) by Elf Aquitaine, the spin-off of Arkema byTOTAL S.A. and the four-for-one TOTAL stock split, the Board ofDirectors of TOTAL S.A., in accordance with the terms of the shareexchange undertaking, approved on March 14, 2006 to adjust the
exchange ratio described above (see pages 24 and 25 of the“Prospectus for the purpose of listing Arkema shares on EuronextParis in connection with the allocation of Arkema shares toTOTAL S.A. shareholders”). Following the approval by Elf AquitaineShareholders’ Meeting on May 10, 2006 of the spin-off of S.D.A. byElf Aquitaine, the approval by TOTAL S.A. Shareholders’ Meetingon May 12, 2006 of the spin-off of Arkema by TOTAL S.A. and thefour-for-one TOTAL stock split, the exchange ratio was adjusted tosix TOTAL shares for one Elf Aquitaine share on May 22, 2006. In2009, 75,699 options were exercised and 80,005 Elf Aquitaineshares were exchanged based on the exchange ratio of six TOTALshares for one Elf Aquitaine share pursuant as adjusted onMay 22, 2006.
As of December 31, 2009, the exchange guarantee is no longer ineffect and Elf Aquitaine share subscription option plans haveexpired. Therefore, no Elf Aquitaine shares are covered by theexchange guarantee as of December 31, 2009.
Elf Aquitaine subscription plan (a) 1999 Plan n°1 1999 Plan n°2 TotalWeighted-average
exercise price (b)
Exercise price until May 23, 2006 included (b) 115.60 171.60Exercise price since May 24, 2006 (b) 114.76 170.36Expiration date 03/30/2009 09/12/2009
Outstanding options as of January 1, 2009 90,342 6,044 96,386 118.25
Outstanding Elf Aquitaine shares covered by the exchange guarantee as ofDecember 31, 2008 5,295 – 5,295
Options exercised in 2009 69,655 6,044 75,699 119.20
Shares exchanged in 2009 73,961 6,044 80,005
Outstanding options as of December 31, 2009 – – –
Outstanding Elf Aquitaine shares covered by the exchange guarantee as ofDecember 31, 2009 – – –
Total of Elf Aquitaine shares, either outstanding or to be created, coveredby the exchange guarantee for TOTAL shares as of December 31, 2009 – – –
(a) Adjustments approved by the Board of Elf Aquitaine on March 10, 2006, pursuant to Articles 174-9, 174-12 and 174-13 of Decree No. 67-236 dated March 23, 1967, in effectat the time of this meeting as well as at the time of the Shareholders’ Meeting of Elf Aquitaine on May 10, 2006, related to the spin-off of S.D.A. These adjustments have beenmade on May 22, 2006 with an effective date of May 24, 2006.
(b) Exercise price in euros. To take into account the spin-off of S.D.A., the exercise prices of Elf Aquitaine share subscription options were multiplied by an adjustment factorequal to 0.992769 with effect on May 24, 2006.
/ 301TOTAL
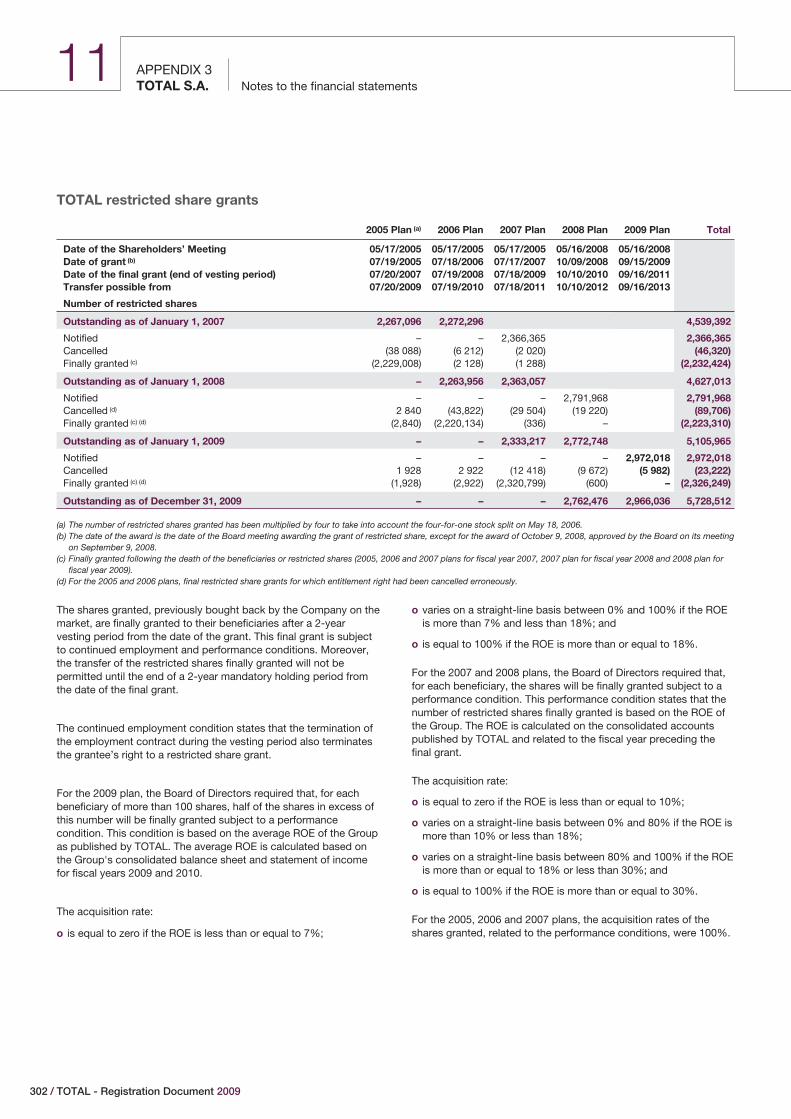
APPENDIX 3Notes to the financial statementsTOTAL S.A.
11
TOTAL restricted share grants
2005 Plan (a) 2006 Plan 2007 Plan 2008 Plan 2009 Plan Total
Date of the Shareholders’ Meeting 05/17/2005 05/17/2005 05/17/2005 05/16/2008 05/16/2008Date of grant (b) 07/19/2005 07/18/2006 07/17/2007 10/09/2008 09/15/2009Date of the final grant (end of vesting period) 07/20/2007 07/19/2008 07/18/2009 10/10/2010 09/16/2011Transfer possible from 07/20/2009 07/19/2010 07/18/2011 10/10/2012 09/16/2013
Number of restricted shares
Outstanding as of January 1, 2007 2,267,096 2,272,296 4,539,392
Notified – – 2,366,365 2,366,365Cancelled (38 088) (6 212) (2 020) (46,320)Finally granted (c) (2,229,008) (2 128) (1 288) (2,232,424)
Outstanding as of January 1, 2008 – 2,263,956 2,363,057 4,627,013
Notified – – – 2,791,968 2,791,968Cancelled (d) 2 840 (43,822) (29 504) (19 220) (89,706)Finally granted (c) (d) (2,840) (2,220,134) (336) – (2,223,310)
Outstanding as of January 1, 2009 – – 2,333,217 2,772,748 5,105,965
Notified – – – – 2,972,018 2,972,018Cancelled 1 928 2 922 (12 418) (9 672) (5 982) (23,222)Finally granted (c) (d) (1,928) (2,922) (2,320,799) (600) – (2,326,249)
Outstanding as of December 31, 2009 – – – 2,762,476 2,966,036 5,728,512
(a) The number of restricted shares granted has been multiplied by four to take into account the four-for-one stock split on May 18, 2006.(b) The date of the award is the date of the Board meeting awarding the grant of restricted share, except for the award of October 9, 2008, approved by the Board on its meeting
on September 9, 2008.(c) Finally granted following the death of the beneficiaries or restricted shares (2005, 2006 and 2007 plans for fiscal year 2007, 2007 plan for fiscal year 2008 and 2008 plan for
fiscal year 2009).(d) For the 2005 and 2006 plans, final restricted share grants for which entitlement right had been cancelled erroneously.
The shares granted, previously bought back by the Company on themarket, are finally granted to their beneficiaries after a 2-yearvesting period from the date of the grant. This final grant is subjectto continued employment and performance conditions. Moreover,the transfer of the restricted shares finally granted will not bepermitted until the end of a 2-year mandatory holding period fromthe date of the final grant.
The continued employment condition states that the termination ofthe employment contract during the vesting period also terminatesthe grantee’s right to a restricted share grant.
For the 2009 plan, the Board of Directors required that, for eachbeneficiary of more than 100 shares, half of the shares in excess ofthis number will be finally granted subject to a performancecondition. This condition is based on the average ROE of the Groupas published by TOTAL. The average ROE is calculated based onthe Group's consolidated balance sheet and statement of incomefor fiscal years 2009 and 2010.
The acquisition rate:
o is equal to zero if the ROE is less than or equal to 7%;
o varies on a straight-line basis between 0% and 100% if the ROEis more than 7% and less than 18%; and
o is equal to 100% if the ROE is more than or equal to 18%.
For the 2007 and 2008 plans, the Board of Directors required that,for each beneficiary, the shares will be finally granted subject to aperformance condition. This performance condition states that thenumber of restricted shares finally granted is based on the ROE ofthe Group. The ROE is calculated on the consolidated accountspublished by TOTAL and related to the fiscal year preceding thefinal grant.
The acquisition rate:
o is equal to zero if the ROE is less than or equal to 10%;
o varies on a straight-line basis between 0% and 80% if the ROE ismore than 10% or less than 18%;
o varies on a straight-line basis between 80% and 100% if the ROEis more than or equal to 18% or less than 30%; and
o is equal to 100% if the ROE is more than or equal to 30%.
For the 2005, 2006 and 2007 plans, the acquisition rates of theshares granted, related to the performance conditions, were 100%.
302 / TOTAL - Registration Document 2009
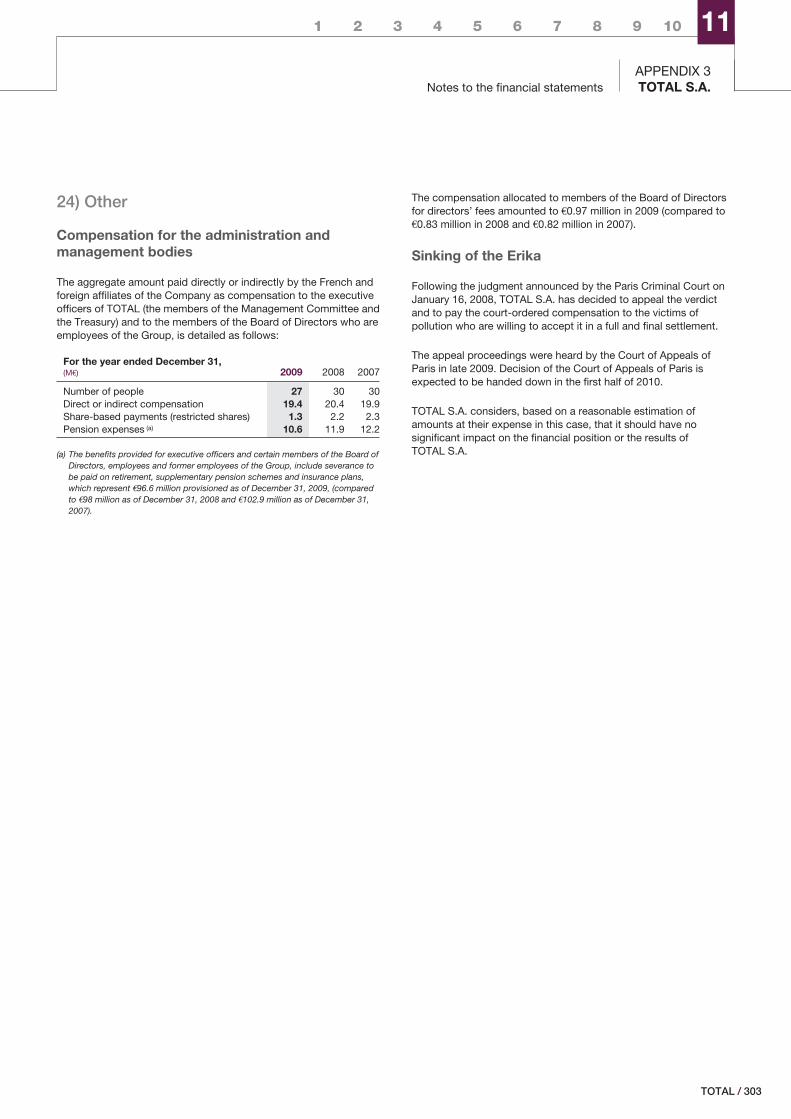
Notes to the financial statementsAPPENDIX 3TOTAL S.A.
1 2 3 4 5 6 7 8 9 10 11
24) Other
Compensation for the administration andmanagement bodies
The aggregate amount paid directly or indirectly by the French andforeign affiliates of the Company as compensation to the executiveofficers of TOTAL (the members of the Management Committee andthe Treasury) and to the members of the Board of Directors who areemployees of the Group, is detailed as follows:
For the year ended December 31,(M€) 2009 2008 2007
Number of people 27 30 30Direct or indirect compensation 19.4 20.4 19.9Share-based payments (restricted shares) 1.3 2.2 2.3Pension expenses (a) 10.6 11.9 12.2
(a) The benefits provided for executive officers and certain members of the Board ofDirectors, employees and former employees of the Group, include severance tobe paid on retirement, supplementary pension schemes and insurance plans,which represent €96.6 million provisioned as of December 31, 2009, (comparedto €98 million as of December 31, 2008 and €102.9 million as of December 31,2007).
The compensation allocated to members of the Board of Directorsfor directors’ fees amounted to €0.97 million in 2009 (compared to€0.83 million in 2008 and €0.82 million in 2007).
Sinking of the Erika
Following the judgment announced by the Paris Criminal Court onJanuary 16, 2008, TOTAL S.A. has decided to appeal the verdictand to pay the court-ordered compensation to the victims ofpollution who are willing to accept it in a full and final settlement.
The appeal proceedings were heard by the Court of Appeals ofParis in late 2009. Decision of the Court of Appeals of Paris isexpected to be handed down in the first half of 2010.
TOTAL S.A. considers, based on a reasonable estimation ofamounts at their expense in this case, that it should have nosignificant impact on the financial position or the results ofTOTAL S.A.
/ 303TOTAL
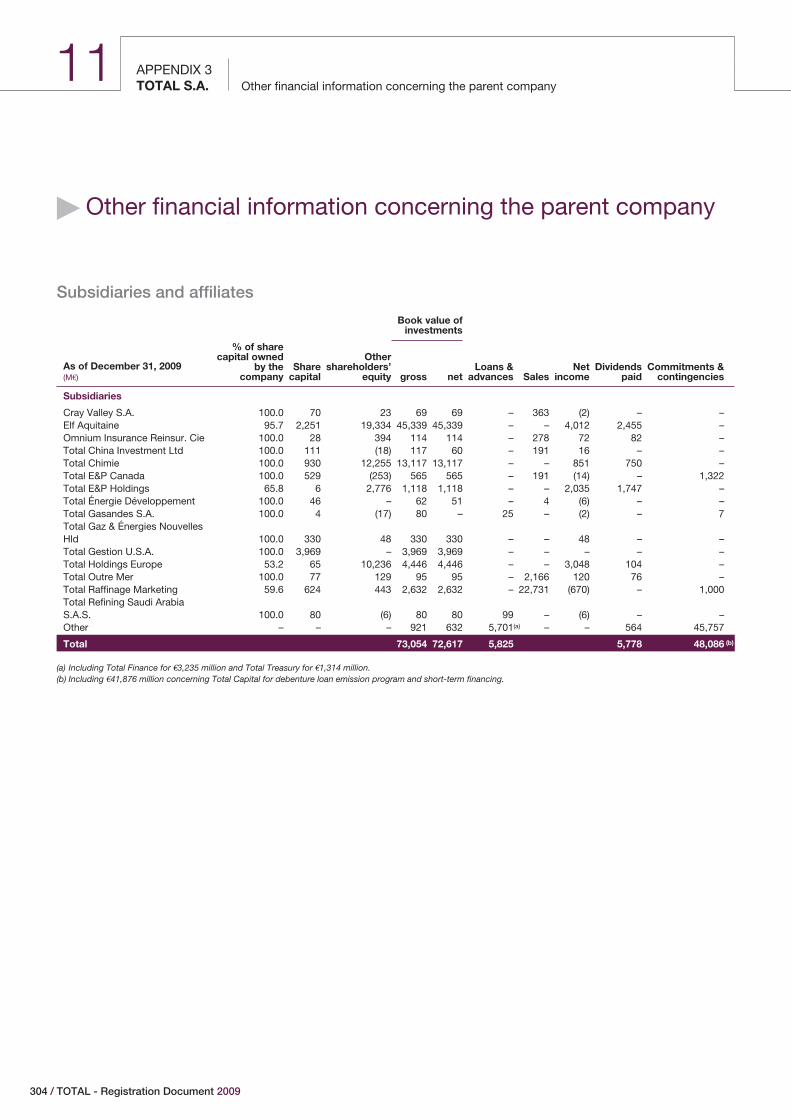
APPENDIX 3Other financial information concerning the parent companyTOTAL S.A.
11
� Other financial information concerning the parent company
Subsidiaries and affiliates
Book value ofinvestments
As of December 31, 2009(M€)
% of sharecapital owned
by thecompany
Sharecapital
Othershareholders’
equity gross netLoans &
advances SalesNet
incomeDividends
paidCommitments &
contingencies
Subsidiaries
Cray Valley S.A. 100.0 70 23 69 69 – 363 (2) – –Elf Aquitaine 95.7 2,251 19,334 45,339 45,339 – – 4,012 2,455 –Omnium Insurance Reinsur. Cie 100.0 28 394 114 114 – 278 72 82 –Total China Investment Ltd 100.0 111 (18) 117 60 – 191 16 – –Total Chimie 100.0 930 12,255 13,117 13,117 – – 851 750 –Total E&P Canada 100.0 529 (253) 565 565 – 191 (14) – 1,322Total E&P Holdings 65.8 6 2,776 1,118 1,118 – – 2,035 1,747 –Total Énergie Développement 100.0 46 – 62 51 – 4 (6) – –Total Gasandes S.A. 100.0 4 (17) 80 – 25 – (2) – 7Total Gaz & Énergies NouvellesHld 100.0 330 48 330 330 – – 48 – –Total Gestion U.S.A. 100.0 3,969 – 3,969 3,969 – – – – –Total Holdings Europe 53.2 65 10,236 4,446 4,446 – – 3,048 104 –Total Outre Mer 100.0 77 129 95 95 – 2,166 120 76 –Total Raffinage Marketing 59.6 624 443 2,632 2,632 – 22,731 (670) – 1,000Total Refining Saudi ArabiaS.A.S. 100.0 80 (6) 80 80 99 – (6) – –Other – – – 921 632 5,701(a) – – 564 45,757
Total 73,054 72,617 5,825 5,778 48,086 (b)
(a) Including Total Finance for €3,235 million and Total Treasury for €1,314 million.(b) Including €41,876 million concerning Total Capital for debenture loan emission program and short-term financing.
304 / TOTAL - Registration Document 2009
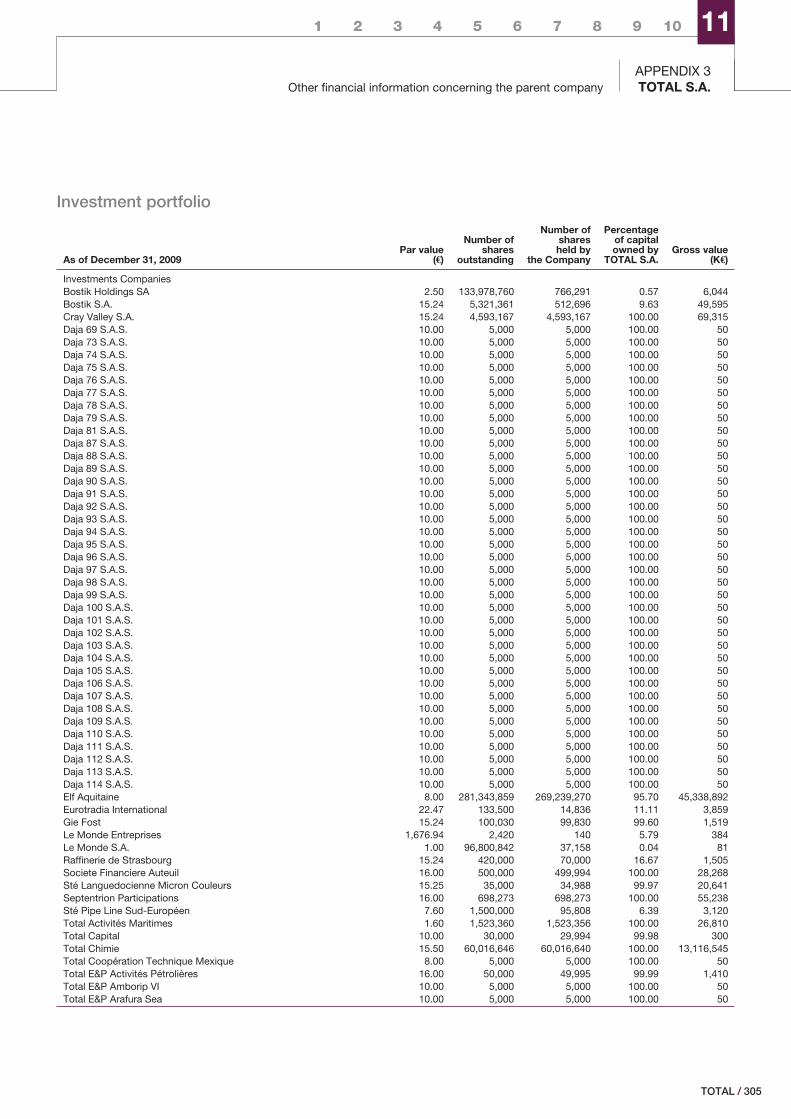
Other financial information concerning the parent companyAPPENDIX 3TOTAL S.A.
1 2 3 4 5 6 7 8 9 10 11
Investment portfolio
As of December 31, 2009Par value
(€)
Number ofshares
outstanding
Number ofsharesheld by
the Company
Percentageof capitalowned by
TOTAL S.A.Gross value
(K€)
Investments CompaniesBostik Holdings SA 2.50 133,978,760 766,291 0.57 6,044Bostik S.A. 15.24 5,321,361 512,696 9.63 49,595Cray Valley S.A. 15.24 4,593,167 4,593,167 100.00 69,315Daja 69 S.A.S. 10.00 5,000 5,000 100.00 50Daja 73 S.A.S. 10.00 5,000 5,000 100.00 50Daja 74 S.A.S. 10.00 5,000 5,000 100.00 50Daja 75 S.A.S. 10.00 5,000 5,000 100.00 50Daja 76 S.A.S. 10.00 5,000 5,000 100.00 50Daja 77 S.A.S. 10.00 5,000 5,000 100.00 50Daja 78 S.A.S. 10.00 5,000 5,000 100.00 50Daja 79 S.A.S. 10.00 5,000 5,000 100.00 50Daja 81 S.A.S. 10.00 5,000 5,000 100.00 50Daja 87 S.A.S. 10.00 5,000 5,000 100.00 50Daja 88 S.A.S. 10.00 5,000 5,000 100.00 50Daja 89 S.A.S. 10.00 5,000 5,000 100.00 50Daja 90 S.A.S. 10.00 5,000 5,000 100.00 50Daja 91 S.A.S. 10.00 5,000 5,000 100.00 50Daja 92 S.A.S. 10.00 5,000 5,000 100.00 50Daja 93 S.A.S. 10.00 5,000 5,000 100.00 50Daja 94 S.A.S. 10.00 5,000 5,000 100.00 50Daja 95 S.A.S. 10.00 5,000 5,000 100.00 50Daja 96 S.A.S. 10.00 5,000 5,000 100.00 50Daja 97 S.A.S. 10.00 5,000 5,000 100.00 50Daja 98 S.A.S. 10.00 5,000 5,000 100.00 50Daja 99 S.A.S. 10.00 5,000 5,000 100.00 50Daja 100 S.A.S. 10.00 5,000 5,000 100.00 50Daja 101 S.A.S. 10.00 5,000 5,000 100.00 50Daja 102 S.A.S. 10.00 5,000 5,000 100.00 50Daja 103 S.A.S. 10.00 5,000 5,000 100.00 50Daja 104 S.A.S. 10.00 5,000 5,000 100.00 50Daja 105 S.A.S. 10.00 5,000 5,000 100.00 50Daja 106 S.A.S. 10.00 5,000 5,000 100.00 50Daja 107 S.A.S. 10.00 5,000 5,000 100.00 50Daja 108 S.A.S. 10.00 5,000 5,000 100.00 50Daja 109 S.A.S. 10.00 5,000 5,000 100.00 50Daja 110 S.A.S. 10.00 5,000 5,000 100.00 50Daja 111 S.A.S. 10.00 5,000 5,000 100.00 50Daja 112 S.A.S. 10.00 5,000 5,000 100.00 50Daja 113 S.A.S. 10.00 5,000 5,000 100.00 50Daja 114 S.A.S. 10.00 5,000 5,000 100.00 50Elf Aquitaine 8.00 281,343,859 269,239,270 95.70 45,338,892Eurotradia International 22.47 133,500 14,836 11.11 3,859Gie Fost 15.24 100,030 99,830 99.60 1,519Le Monde Entreprises 1,676.94 2,420 140 5.79 384Le Monde S.A. 1.00 96,800,842 37,158 0.04 81Raffinerie de Strasbourg 15.24 420,000 70,000 16.67 1,505Societe Financiere Auteuil 16.00 500,000 499,994 100.00 28,268Sté Languedocienne Micron Couleurs 15.25 35,000 34,988 99.97 20,641Septentrion Participations 16.00 698,273 698,273 100.00 55,238Sté Pipe Line Sud-Européen 7.60 1,500,000 95,808 6.39 3,120Total Activités Maritimes 1.60 1,523,360 1,523,356 100.00 26,810Total Capital 10.00 30,000 29,994 99.98 300Total Chimie 15.50 60,016,646 60,016,640 100.00 13,116,545Total Coopération Technique Mexique 8.00 5,000 5,000 100.00 50Total E&P Activités Pétrolières 16.00 50,000 49,995 99.99 1,410Total E&P Amborip VI 10.00 5,000 5,000 100.00 50Total E&P Arafura Sea 10.00 5,000 5,000 100.00 50
/ 305TOTAL
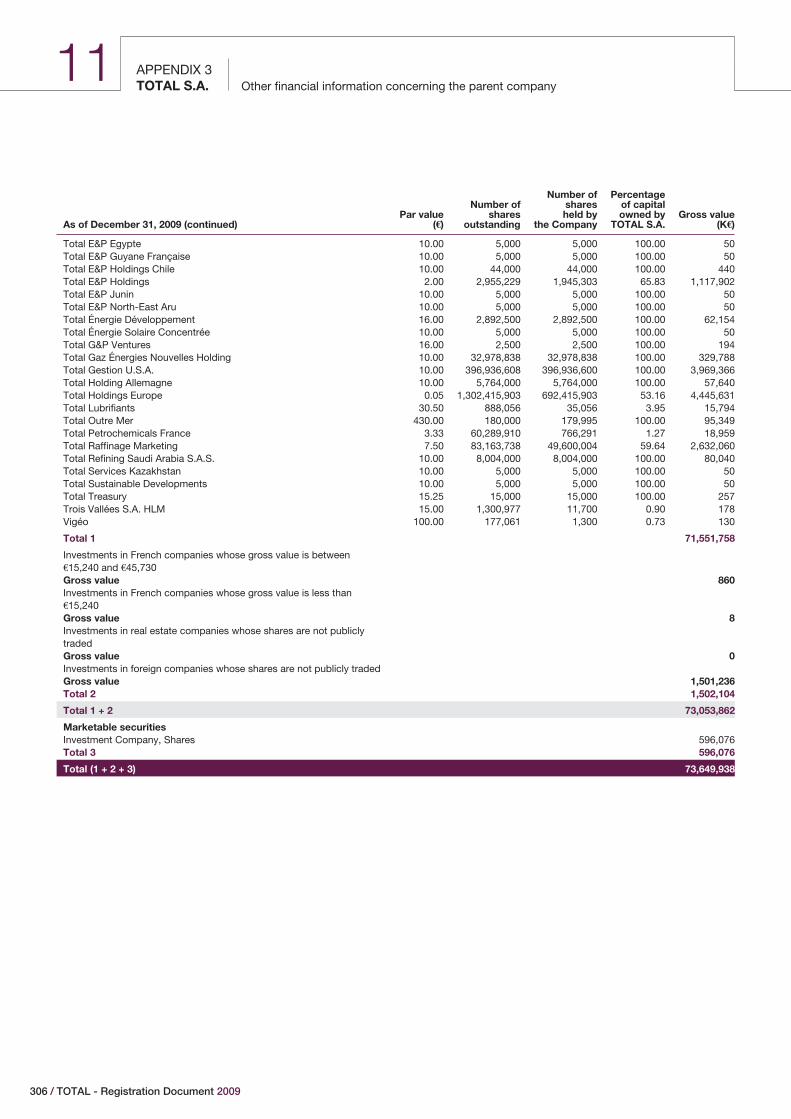
APPENDIX 3Other financial information concerning the parent companyTOTAL S.A.
11
As of December 31, 2009 (continued)Par value
(€)
Number ofshares
outstanding
Number ofsharesheld by
the Company
Percentageof capitalowned by
TOTAL S.A.Gross value
(K€)
Total E&P Egypte 10.00 5,000 5,000 100.00 50Total E&P Guyane Française 10.00 5,000 5,000 100.00 50Total E&P Holdings Chile 10.00 44,000 44,000 100.00 440Total E&P Holdings 2.00 2,955,229 1,945,303 65.83 1,117,902Total E&P Junin 10.00 5,000 5,000 100.00 50Total E&P North-East Aru 10.00 5,000 5,000 100.00 50Total Énergie Développement 16.00 2,892,500 2,892,500 100.00 62,154Total Énergie Solaire Concentrée 10.00 5,000 5,000 100.00 50Total G&P Ventures 16.00 2,500 2,500 100.00 194Total Gaz Énergies Nouvelles Holding 10.00 32,978,838 32,978,838 100.00 329,788Total Gestion U.S.A. 10.00 396,936,608 396,936,600 100.00 3,969,366Total Holding Allemagne 10.00 5,764,000 5,764,000 100.00 57,640Total Holdings Europe 0.05 1,302,415,903 692,415,903 53.16 4,445,631Total Lubrifiants 30.50 888,056 35,056 3.95 15,794Total Outre Mer 430.00 180,000 179,995 100.00 95,349Total Petrochemicals France 3.33 60,289,910 766,291 1.27 18,959Total Raffinage Marketing 7.50 83,163,738 49,600,004 59.64 2,632,060Total Refining Saudi Arabia S.A.S. 10.00 8,004,000 8,004,000 100.00 80,040Total Services Kazakhstan 10.00 5,000 5,000 100.00 50Total Sustainable Developments 10.00 5,000 5,000 100.00 50Total Treasury 15.25 15,000 15,000 100.00 257Trois Vallées S.A. HLM 15.00 1,300,977 11,700 0.90 178Vigéo 100.00 177,061 1,300 0.73 130
Total 1 71,551,758
Investments in French companies whose gross value is between€15,240 and €45,730Gross value 860Investments in French companies whose gross value is less than€15,240Gross value 8Investments in real estate companies whose shares are not publiclytradedGross value 0Investments in foreign companies whose shares are not publicly tradedGross value 1,501,236Total 2 1,502,104
Total 1 + 2 73,053,862
Marketable securitiesInvestment Company, Shares 596,076Total 3 596,076
Total (1 + 2 + 3) 73,649,938
306 / TOTAL - Registration Document 2009
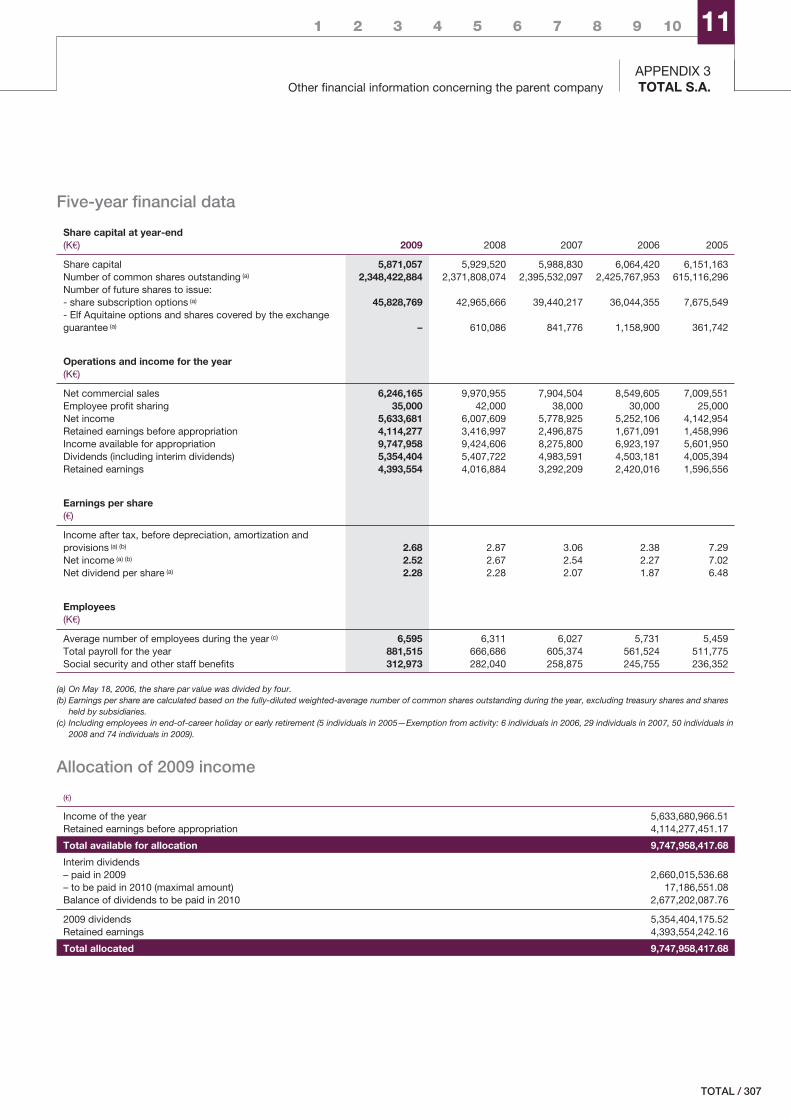
Other financial information concerning the parent companyAPPENDIX 3TOTAL S.A.
1 2 3 4 5 6 7 8 9 10 11
Five-year financial data
Share capital at year-end(K€) 2009 2008 2007 2006 2005
Share capital 5,871,057 5,929,520 5,988,830 6,064,420 6,151,163Number of common shares outstanding (a) 2,348,422,884 2,371,808,074 2,395,532,097 2,425,767,953 615,116,296Number of future shares to issue:- share subscription options (a) 45,828,769 42,965,666 39,440,217 36,044,355 7,675,549- Elf Aquitaine options and shares covered by the exchangeguarantee (a) – 610,086 841,776 1,158,900 361,742
Operations and income for the year(K€)
Net commercial sales 6,246,165 9,970,955 7,904,504 8,549,605 7,009,551Employee profit sharing 35,000 42,000 38,000 30,000 25,000Net income 5,633,681 6,007,609 5,778,925 5,252,106 4,142,954Retained earnings before appropriation 4,114,277 3,416,997 2,496,875 1,671,091 1,458,996Income available for appropriation 9,747,958 9,424,606 8,275,800 6,923,197 5,601,950Dividends (including interim dividends) 5,354,404 5,407,722 4,983,591 4,503,181 4,005,394Retained earnings 4,393,554 4,016,884 3,292,209 2,420,016 1,596,556
Earnings per share(€)
Income after tax, before depreciation, amortization andprovisions (a) (b) 2.68 2.87 3.06 2.38 7.29Net income (a) (b) 2.52 2.67 2.54 2.27 7.02Net dividend per share (a) 2.28 2.28 2.07 1.87 6.48
Employees(K€)
Average number of employees during the year (c) 6,595 6,311 6,027 5,731 5,459Total payroll for the year 881,515 666,686 605,374 561,524 511,775Social security and other staff benefits 312,973 282,040 258,875 245,755 236,352
(a) On May 18, 2006, the share par value was divided by four.(b) Earnings per share are calculated based on the fully-diluted weighted-average number of common shares outstanding during the year, excluding treasury shares and shares
held by subsidiaries.(c) Including employees in end-of-career holiday or early retirement (5 individuals in 2005—Exemption from activity: 6 individuals in 2006, 29 individuals in 2007, 50 individuals in
2008 and 74 individuals in 2009).
Allocation of 2009 income
(€)
Income of the year 5,633,680,966.51Retained earnings before appropriation 4,114,277,451.17
Total available for allocation 9,747,958,417.68
Interim dividends– paid in 2009 2,660,015,536.68– to be paid in 2010 (maximal amount) 17,186,551.08Balance of dividends to be paid in 2010 2,677,202,087.76
2009 dividends 5,354,404,175.52Retained earnings 4,393,554,242.16
Total allocated 9,747,958,417.68
/ 307TOTAL
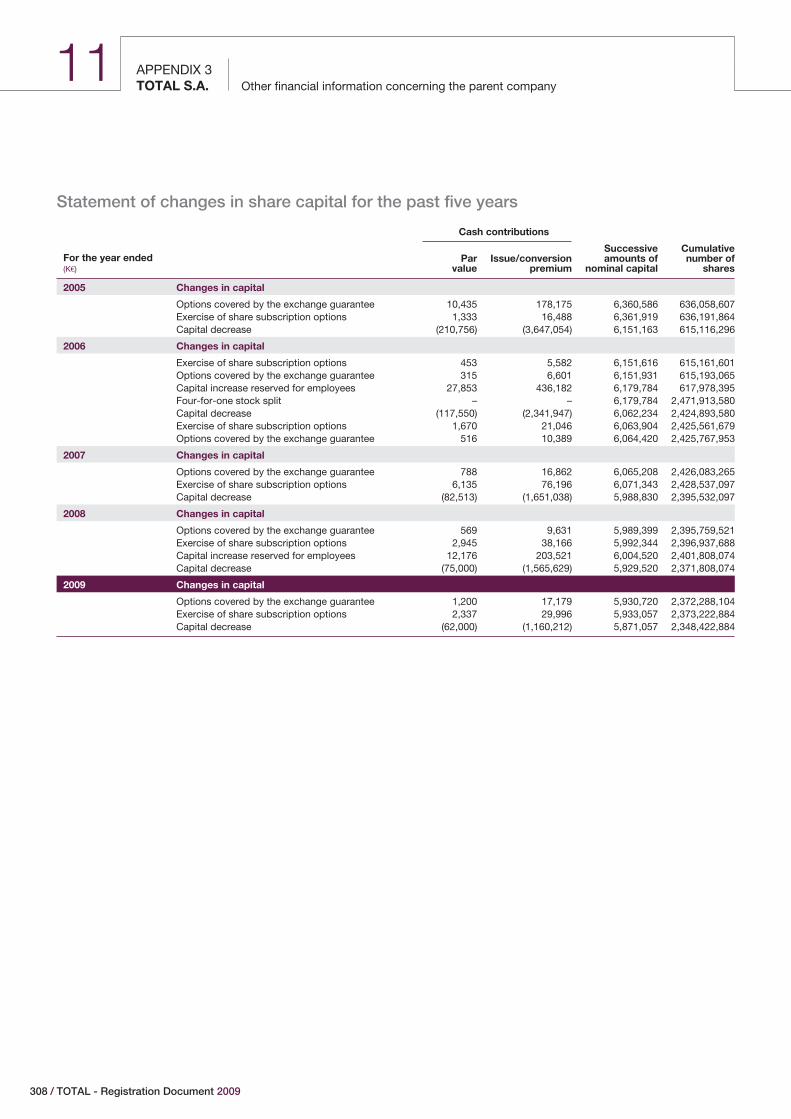
APPENDIX 3Other financial information concerning the parent companyTOTAL S.A.
11
Statement of changes in share capital for the past five years
Cash contributions
For the year ended(K€)
Parvalue
Issue/conversionpremium
Successiveamounts of
nominal capital
Cumulativenumber of
shares
2005 Changes in capital
Options covered by the exchange guarantee 10,435 178,175 6,360,586 636,058,607Exercise of share subscription options 1,333 16,488 6,361,919 636,191,864Capital decrease (210,756) (3,647,054) 6,151,163 615,116,296
2006 Changes in capital
Exercise of share subscription options 453 5,582 6,151,616 615,161,601Options covered by the exchange guarantee 315 6,601 6,151,931 615,193,065Capital increase reserved for employees 27,853 436,182 6,179,784 617,978,395Four-for-one stock split – – 6,179,784 2,471,913,580Capital decrease (117,550) (2,341,947) 6,062,234 2,424,893,580Exercise of share subscription options 1,670 21,046 6,063,904 2,425,561,679Options covered by the exchange guarantee 516 10,389 6,064,420 2,425,767,953
2007 Changes in capital
Options covered by the exchange guarantee 788 16,862 6,065,208 2,426,083,265Exercise of share subscription options 6,135 76,196 6,071,343 2,428,537,097Capital decrease (82,513) (1,651,038) 5,988,830 2,395,532,097
2008 Changes in capital
Options covered by the exchange guarantee 569 9,631 5,989,399 2,395,759,521Exercise of share subscription options 2,945 38,166 5,992,344 2,396,937,688Capital increase reserved for employees 12,176 203,521 6,004,520 2,401,808,074Capital decrease (75,000) (1,565,629) 5,929,520 2,371,808,074
2009 Changes in capital
Options covered by the exchange guarantee 1,200 17,179 5,930,720 2,372,288,104Exercise of share subscription options 2,337 29,996 5,933,057 2,373,222,884Capital decrease (62,000) (1,160,212) 5,871,057 2,348,422,884
308 / TOTAL - Registration Document 2009
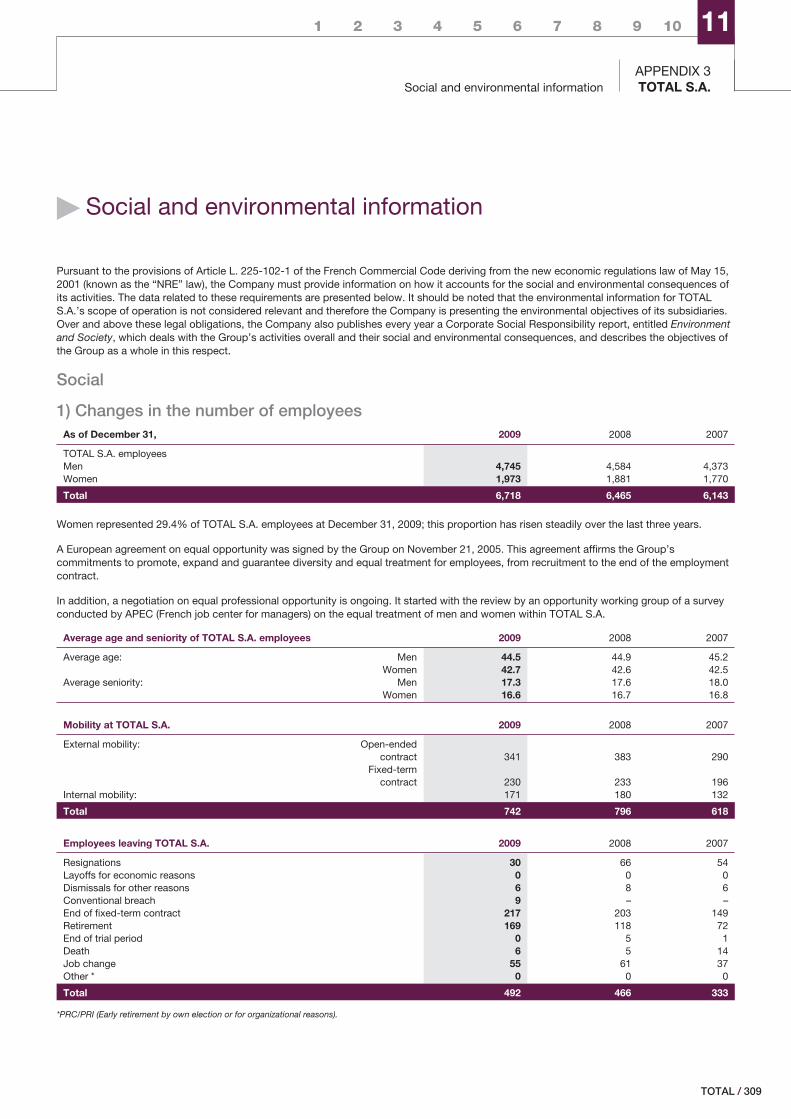
1 2 3 4 5 6 7 8 9 10 11
Social and environmental informationAPPENDIX 3TOTAL S.A.
� Social and environmental information
Pursuant to the provisions of Article L. 225-102-1 of the French Commercial Code deriving from the new economic regulations law of May 15,2001 (known as the “NRE” law), the Company must provide information on how it accounts for the social and environmental consequences ofits activities. The data related to these requirements are presented below. It should be noted that the environmental information for TOTALS.A.’s scope of operation is not considered relevant and therefore the Company is presenting the environmental objectives of its subsidiaries.Over and above these legal obligations, the Company also publishes every year a Corporate Social Responsibility report, entitled Environmentand Society, which deals with the Group’s activities overall and their social and environmental consequences, and describes the objectives ofthe Group as a whole in this respect.
Social
1) Changes in the number of employeesAs of December 31, 2009 2008 2007
TOTAL S.A. employeesMen 4,745 4,584 4,373Women 1,973 1,881 1,770
Total 6,718 6,465 6,143
Women represented 29.4% of TOTAL S.A. employees at December 31, 2009; this proportion has risen steadily over the last three years.
A European agreement on equal opportunity was signed by the Group on November 21, 2005. This agreement affirms the Group’scommitments to promote, expand and guarantee diversity and equal treatment for employees, from recruitment to the end of the employmentcontract.
In addition, a negotiation on equal professional opportunity is ongoing. It started with the review by an opportunity working group of a surveyconducted by APEC (French job center for managers) on the equal treatment of men and women within TOTAL S.A.
Average age and seniority of TOTAL S.A. employees 2009 2008 2007
Average age: Men 44.5 44.9 45.2Women 42.7 42.6 42.5
Average seniority: Men 17.3 17.6 18.0Women 16.6 16.7 16.8
Mobility at TOTAL S.A. 2009 2008 2007
External mobility: Open-endedcontract 341 383 290
Fixed-termcontract 230 233 196
Internal mobility: 171 180 132
Total 742 796 618
Employees leaving TOTAL S.A. 2009 2008 2007
Resignations 30 66 54Layoffs for economic reasons 0 0 0Dismissals for other reasons 6 8 6Conventional breach 9 – –End of fixed-term contract 217 203 149Retirement 169 118 72End of trial period 0 5 1Death 6 5 14Job change 55 61 37Other * 0 0 0
Total 492 466 333
*PRC/PRI (Early retirement by own election or for organizational reasons).
/ 309TOTAL
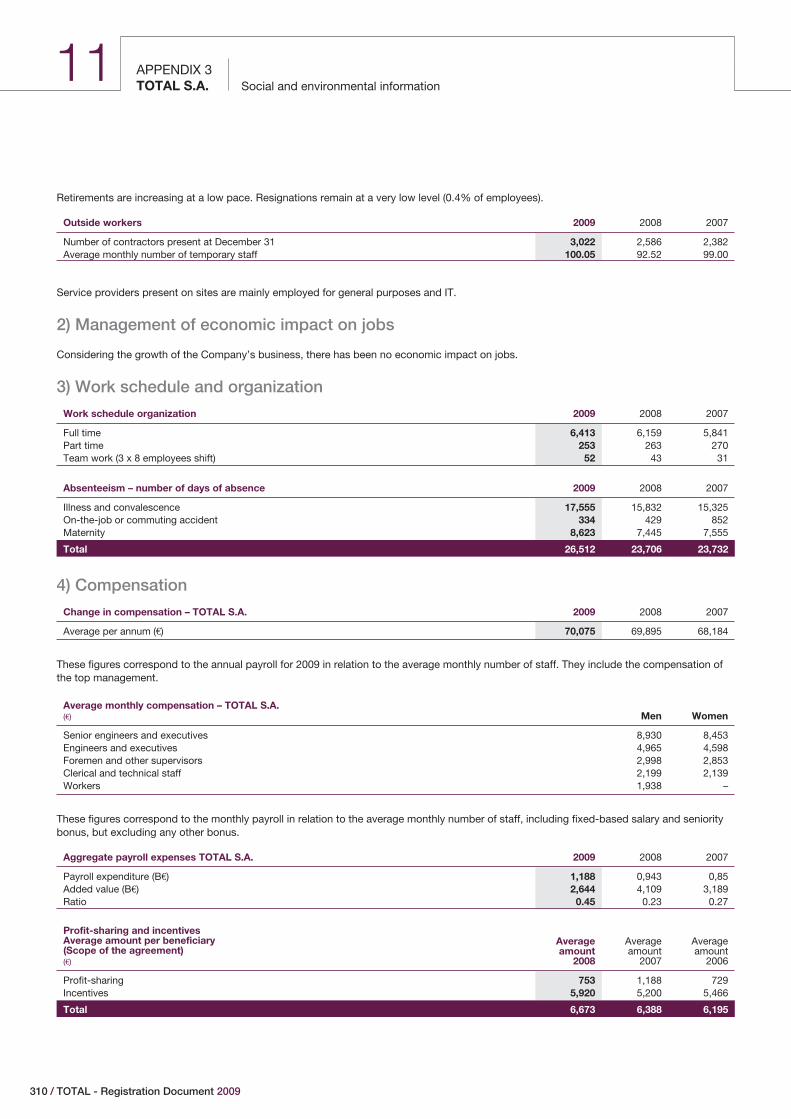
APPENDIX 3Social and environmental informationTOTAL S.A.
11
Retirements are increasing at a low pace. Resignations remain at a very low level (0.4% of employees).
Outside workers 2009 2008 2007
Number of contractors present at December 31 3,022 2,586 2,382Average monthly number of temporary staff 100.05 92.52 99.00
Service providers present on sites are mainly employed for general purposes and IT.
2) Management of economic impact on jobs
Considering the growth of the Company’s business, there has been no economic impact on jobs.
3) Work schedule and organization
Work schedule organization 2009 2008 2007
Full time 6,413 6,159 5,841Part time 253 263 270Team work (3 x 8 employees shift) 52 43 31
Absenteeism – number of days of absence 2009 2008 2007
Illness and convalescence 17,555 15,832 15,325On-the-job or commuting accident 334 429 852Maternity 8,623 7,445 7,555
Total 26,512 23,706 23,732
4) Compensation
Change in compensation – TOTAL S.A. 2009 2008 2007
Average per annum (€) 70,075 69,895 68,184
These figures correspond to the annual payroll for 2009 in relation to the average monthly number of staff. They include the compensation ofthe top management.
Average monthly compensation – TOTAL S.A.(€) Men Women
Senior engineers and executives 8,930 8,453Engineers and executives 4,965 4,598Foremen and other supervisors 2,998 2,853Clerical and technical staff 2,199 2,139Workers 1,938 –
These figures correspond to the monthly payroll in relation to the average monthly number of staff, including fixed-based salary and senioritybonus, but excluding any other bonus.
Aggregate payroll expenses TOTAL S.A. 2009 2008 2007
Payroll expenditure (B€) 1,188 0,943 0,85Added value (B€) 2,644 4,109 3,189Ratio 0.45 0.23 0.27
Profit-sharing and incentivesAverage amount per beneficiary(Scope of the agreement)(€)
Averageamount
2008
Averageamount
2007
Averageamount
2006
Profit-sharing 753 1,188 729Incentives 5,920 5,200 5,466
Total 6,673 6,388 6,195
310 / TOTAL - Registration Document 2009
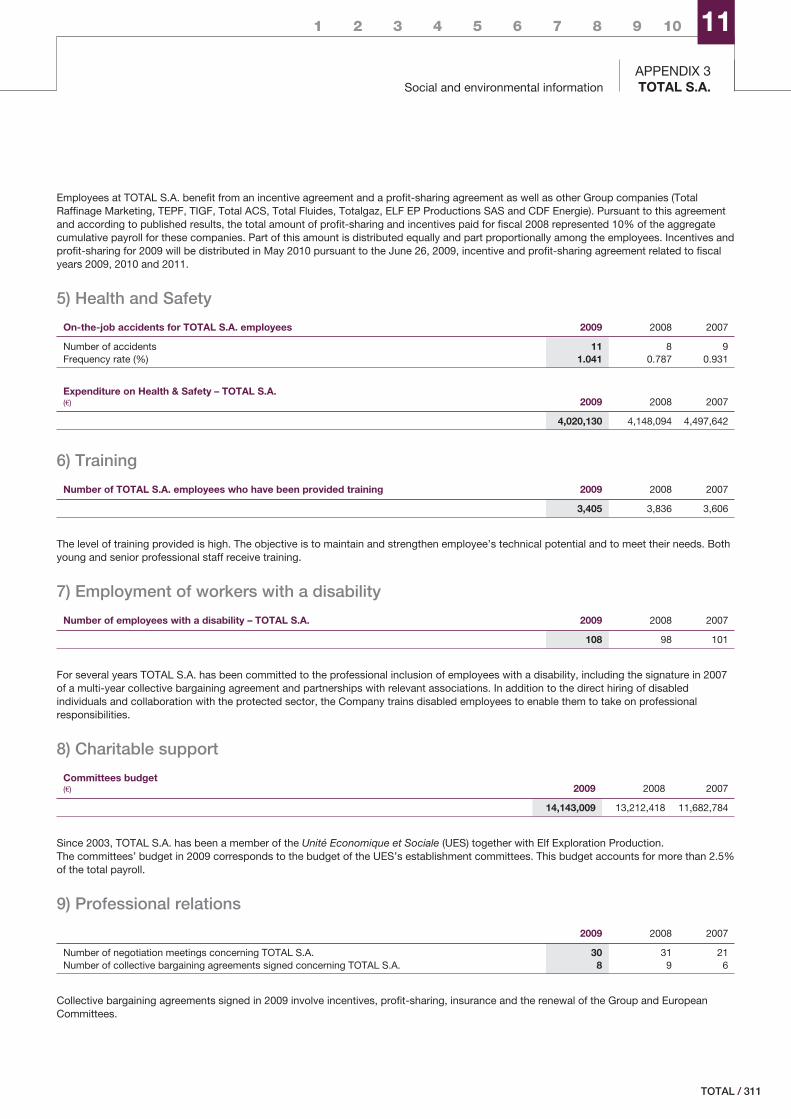
1 2 3 4 5 6 7 8 9 10 11
Social and environmental informationAPPENDIX 3TOTAL S.A.
Employees at TOTAL S.A. benefit from an incentive agreement and a profit-sharing agreement as well as other Group companies (TotalRaffinage Marketing, TEPF, TIGF, Total ACS, Total Fluides, Totalgaz, ELF EP Productions SAS and CDF Energie). Pursuant to this agreementand according to published results, the total amount of profit-sharing and incentives paid for fiscal 2008 represented 10% of the aggregatecumulative payroll for these companies. Part of this amount is distributed equally and part proportionally among the employees. Incentives andprofit-sharing for 2009 will be distributed in May 2010 pursuant to the June 26, 2009, incentive and profit-sharing agreement related to fiscalyears 2009, 2010 and 2011.
5) Health and Safety
On-the-job accidents for TOTAL S.A. employees 2009 2008 2007
Number of accidents 11 8 9Frequency rate (%) 1.041 0.787 0.931
Expenditure on Health & Safety – TOTAL S.A.(€) 2009 2008 2007
4,020,130 4,148,094 4,497,642
6) Training
Number of TOTAL S.A. employees who have been provided training 2009 2008 2007
3,405 3,836 3,606
The level of training provided is high. The objective is to maintain and strengthen employee’s technical potential and to meet their needs. Bothyoung and senior professional staff receive training.
7) Employment of workers with a disability
Number of employees with a disability – TOTAL S.A. 2009 2008 2007
108 98 101
For several years TOTAL S.A. has been committed to the professional inclusion of employees with a disability, including the signature in 2007of a multi-year collective bargaining agreement and partnerships with relevant associations. In addition to the direct hiring of disabledindividuals and collaboration with the protected sector, the Company trains disabled employees to enable them to take on professionalresponsibilities.
8) Charitable support
Committees budget(€) 2009 2008 2007
14,143,009 13,212,418 11,682,784
Since 2003, TOTAL S.A. has been a member of the Unité Economique et Sociale (UES) together with Elf Exploration Production.The committees’ budget in 2009 corresponds to the budget of the UES’s establishment committees. This budget accounts for more than 2.5%of the total payroll.
9) Professional relations
2009 2008 2007
Number of negotiation meetings concerning TOTAL S.A. 30 31 21Number of collective bargaining agreements signed concerning TOTAL S.A. 8 9 6
Collective bargaining agreements signed in 2009 involve incentives, profit-sharing, insurance and the renewal of the Group and EuropeanCommittees.
/ 311TOTAL
APPENDIX 3Social and environmental informationTOTAL S.A.
11
Environment
Pursuant to Article L. 225-102 and R. 225.105 of the FrenchCommercial Code, TOTAL S.A. supplies information on how it takesinto account the environmental consequences of its activity, notablythe environmental objectives of its subsidiaries outside France.
The following paragraphs present information on the environmentalpolicy guidance and objectives of the parent company. Moredetailed environmental information appears not to be relevant forTOTAL S.A., given, on the one hand, the type of operationsconducted by the holding company, and, on the other hand, thetype of operations conducted by the Group.
The Group has operations in more than 130 countries in a numberof areas such as the upstream and downstream oil and gasindustry, energy production and chemicals. The Group’s social andenvironmental report Environment and Society includes detailedinformation on how the Group’s business units conduct theirenvironmental policies. This report summarizes the environmentalconsequences of the Group’s operations, describes and explainstheir qualitative and quantitative impacts, details the actions taken,and addresses the Group’s environmental performance, itscommitments and achievements.
The Health, Safety and Environment (HSE) Charter constitutes anessential reference in the Group’s culture and illustrates itscommitment to the safety of operations, health of people, respectfor the environment, and quality of its products and services. The2009 HSE Charter highlights the need for sharing this cultureamong employees, industrial and commercial partners, andemphasizes behaviors such as listening of and dialogue withstakeholders. It is translated into several languages and should beimplemented by taking into account the operating context of all theGroup’s businesses.
This Charter is based on ten key principles that are detailed in aguide designed to help managers implement them into their dailybusiness activities. This guide already came with the 2003 Charter.
The ten principles fall into three broad categories: the industrialbusiness itself, employees and third parties:
o For industrial activity, no development project, expansion of anindustrial facility or new product launch can be undertaken in anycountry where a Group subsidiary operates without a priordetailed analysis of the risks concerning health, safety and theenvironment having been performed by the relevant sustainabledevelopment and environment or industrial safety department ofthe Group. Verification that these risks have been taken intoaccount and necessary prevention, correction and compensationmeasures were adopted is done at the time the project isexamined by the business units concerned. Proposals for majorinvestments, acquisitions and disposals are reviewed by theGroup’s Executive Committee, having first been presented to theGroup’s Risks Committee. This committee includes notably arepresentative of the Sustainable Development and Environmentdepartment and a representative of the Industrial Safetydepartment.
This procedure for the evaluation and prevention of risks, prior tothe commencement of any project, relies on scientific analysis ofthe substances used and produced and their effects, and onenvironmental impact studies and technological riskassessments, pursuant to the regulations in force in the countriesof operation and the industry guidelines. It is also based on healthimpact analyses and takes into account end-of-life issues forproducts and facilities.
Close attention is also paid to biological diversity, especially inareas of particular ecological sensitivity, identified with thesupport of scientific organizations. The Group’s sites in relation toecologically sensitive areas are currently being mapped as part ofa Geographical Information System project. Furthermore, a guidedesigned to help the management of industrial sites inaddressing biodiversity issues is being tested at some of theGroup’s sites, notably in France and Yemen, with the support ofthe scientific community, with feedback expected soon. Theobjective is to create biodiversity observatories near industrialsites to better understand and monitor fauna and flora.
These different aspects, with their highly scientific and technicalcomponents, are an integral part of any project’s decision-making process and rely on preliminary studies. Actions toharmonize the methodologies on which these studies rely aretaken at each business unit.
As part of this evaluation and prevention approach, projects,once they have started up, are subject to regular environmentalmonitoring and periodic audits.
In accordance with the HSE Charter, the prevention objectivesare incorporated in the various environmental action plans andcover the improvement of energy efficiency, reduction ofemissions of pollutants into the atmosphere and water, reductionof consumption of water and certain raw materials, reduction ofwaste at the sites and recovery of the waste that is produced.Each business unit sets certain targets for improving itsenvironmental performance and circulates this information at itssites, taking into account the particular features relevant to it.
Regarding greenhouse gas emissions, the implementation in2008 of the second application period of the European Unioncarbon dioxide emissions quota trading plan represents a newstep in the policy to combat global warming and represents a realtechnological challenge for the Group. The Group continues toimplement the commitment to reduce by 50% by 2014 thevolume of associated gas flared at its Exploration & Productionfacilities, using the year 2005 as a reference. In addition, TOTALhas gradually started up in 2009 a carbon dioxide capture andstorage pilot at its Lacq site in southwestern France. Theseactions to reduce greenhouse gas are detailed in the Group’ssocial and environmental report mentioned above.
The Group has also set internal goals for better management ofthe consumption of energy and raw materials. Internal documents(roadmaps and guides) describe what is at stake, proposemethodologies and action plans, and include quantified goals toreduce emissions. In particular, a guide developed in late 2008dedicated to the management of energy performance includesguidance to improve energy management by the Group’sdifferent businesses. Since 2008, the business segments haveset quantified targets to optimize their energy efficiency by 1% to2% per year depending on the business. Through the “TotalEcosolutions” program, they also provide their customers with a
312 / TOTAL - Registration Document 2009
1 2 3 4 5 6 7 8 9 10 11
Social and environmental informationAPPENDIX 3TOTAL S.A.
number of innovative products and services to improve theenvironmental and energy balance of products they use and toincrease energy efficiency when using such products.
Close attention is also paid to soil and groundwatercontamination in the context of specific risk and pollution controlassessment programs. The Sustainable Development &Environment department and the relevant department insubsidiaries worked on studies aimed at standardizing theassessment methodologies and criteria for drawing up actionplans for pollution control.
Beyond the prevention policy, the Group’s operational entities areprovided with emergency plans in the event of an accidenttogether with the means to implement them. These plans areregularly updated and verified with the relevant Environment andSafety departments, and feedbacks systematically take place.These policies for prevention and site clean-up in the event of anaccident are launched not only for industrial sites, but also for thetransport of hazardous goods, both maritime and overland,including the harmonization of methodologies and action plans.
The Group is also involved in a number of research projects inpartnership with laboratories, universities and public entities,often on an international level, notably in the areas of combatingclimate change, behavior of hydrocarbons in water andbiodiversity. Experimentation, as well as increasing and sharingof scientific and technical knowledge, contribute to improvingperformances and better integrate environmental issues inindustrial projects. These projects are covered in the Group’ssocial and environmental report.
o The principles relating to staff revolve around three ideas: allemployees have a responsibility at their level in terms of safetyand the environment, must be aware of such responsibility andmust act accordingly. Work performance is assessed by managersaccording to these and other criteria. To implement theseprinciples, TOTAL S.A.’s Environment and Safety departmentorganizes training both for management and those in charge ofhealth, safety and environment issues. Training for emergencysituations, crisis management and providing feedback harmings isalso in place. The business units also offer numerous trainingsappropriate for the various staff responsible for these functions.
o Regarding relations with third parties, the charter recommendsthat outside service providers, suppliers and other industrial andcommercial partners adhere to the Group’s Safety andEnvironment policy. It also emphasizes that the environmentalexpectations of the unions, customers, shareholders, and otherstakeholder in respect of environmental matters must beaddressed in an atmosphere of constructive dialogue andtransparency. Particular attention is paid to relations with localcommunities, and pilot programs for close interactions, dialogueand concerted plans, as illustrated in the Group’s social andenvironmental report, are conducted around certain sites. Thisapproach is intended to become more widespread depending onthe experience on the ground. Various tools provided to theGroup’s managers (Stakeholder Relationship Management, SRM,SRM+, social performance indicators) are designed to facilitate areview of social issues and to define a course of positive action atthe sites and at the subsidiaries. In particular, through itscommunity development commitment, the Group’s endeavoursto develop its business in harmony with the neighboringcommunities.
The structure of the Group’s entities ensures that they constantlyand effectively take into account the environment in all theiroperations. At the Group level, the Sustainable Development &Environment department coordinates the environmental policy andcontributes to its implementation in order to facilitate exchangesand synergies between units. The actions and policies of theSustainable Development & Environment department and theIndustrial Safety department of TOTAL S.A. are coordinated withinthe Corporate Affairs department.
The departments in charge of sustainable development, environmentand industrial safety within the business units convey to theirsubsidiaries, who in turn pass them on to their industrial sites, theprinciples for action and the short and medium-term environmentalobjectives that they have established in a concerted way.
All of the Group’s business units have implemented internalmanagement systems related to environmental, safety, quality andindustrial hygiene issues, taking into account the specificrequirements related to their location and business. This involves adetermined and concerted approach, based on know-how, workingtogether, raising the awareness of staff and delivering trainingprograms. Progress objectives are defined and action plansimplemented; the results obtained are measured usingmethodologies and indicators that are progressively developed andrefined; and feedback and associated controls in the form ofinternal audits are conducted. These management systems aresubject to periodic evaluation by internal auditors in order tocontinually optimize them.
To facilitate monitoring the achievement of environmentalobjectives, reporting processes on environmental performance andon major events are implemented within the business units, andbetween the business units and the corporate departments. Theyare gradually being harmonized within the Group.
Every year, the Group uses external auditors to verify the reliabilityof its environmental reporting procedures by examining arepresentative percentage of sites, with different sites being verifiedyear after year. The fourth audit report, which was conducted in2009 and attached to the Group’s 2008 CSR Report, focused oneight indicators: carbon dioxide, methane, nitrous oxide, hydro-fluorocarbons, sulfur dioxide, nitrogen dioxide, production ofhazardous waste and the amount of fresh water consumed at thesites (excluding cooling water). The auditors reviewed theseindicators with regard to their relevance, reliability, objectivity,understandability and comprehensiveness.
This desire to continually achieve better-integrated management ofthe environment has led the Group to work towards ISO 14001environmental certification. Because this international standard isawarded by a third party, following independent audits forcompliance that are repeated every three years, it allows forexternal recognition of environmental management systems.
By the end of 2012, the Group intends to obtain ISO 14001certification for all of its sites that it considers particularly importantto the environment. As of today, 89% of such sites are so certified.More than 280 of the Group’s sites worldwide are certifiedISO 14001.
/ 313TOTAL
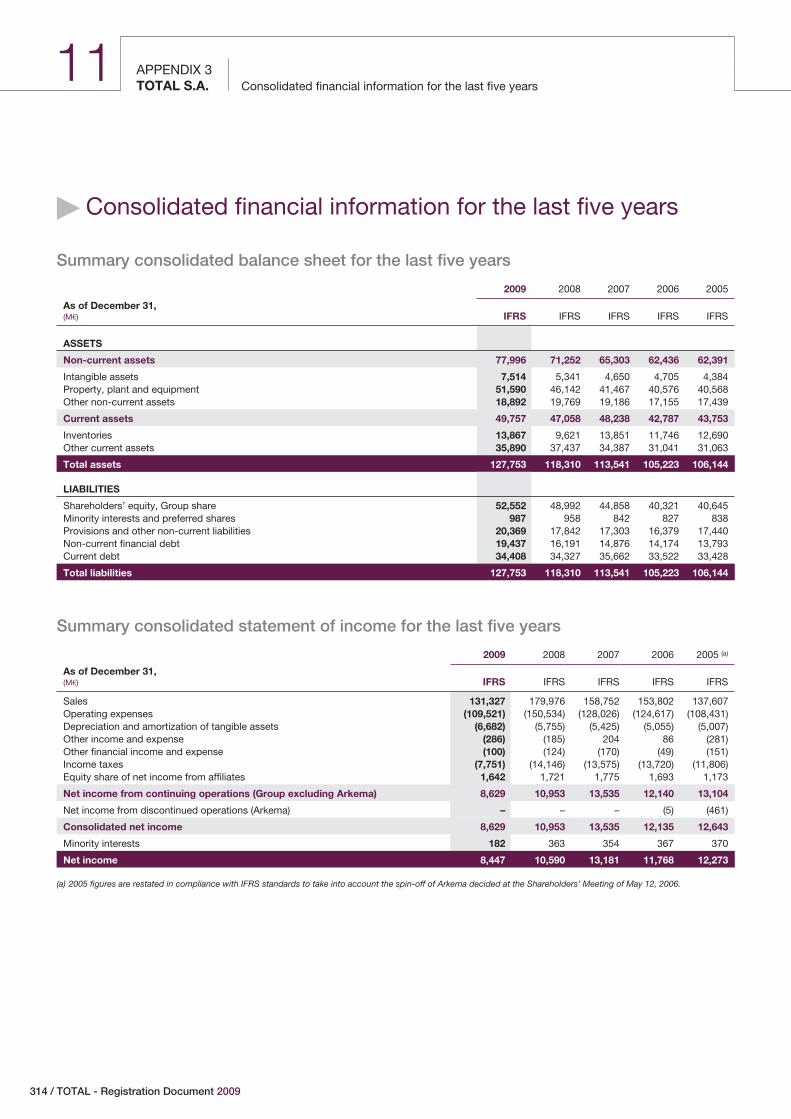
APPENDIX 3Consolidated financial information for the last five yearsTOTAL S.A.
11
� Consolidated financial information for the last five years
Summary consolidated balance sheet for the last five years
2009 2008 2007 2006 2005
As of December 31,(M€) IFRS IFRS IFRS IFRS IFRS
ASSETS
Non-current assets 77,996 71,252 65,303 62,436 62,391
Intangible assets 7,514 5,341 4,650 4,705 4,384Property, plant and equipment 51,590 46,142 41,467 40,576 40,568Other non-current assets 18,892 19,769 19,186 17,155 17,439
Current assets 49,757 47,058 48,238 42,787 43,753
Inventories 13,867 9,621 13,851 11,746 12,690Other current assets 35,890 37,437 34,387 31,041 31,063
Total assets 127,753 118,310 113,541 105,223 106,144
LIABILITIES
Shareholders’ equity, Group share 52,552 48,992 44,858 40,321 40,645Minority interests and preferred shares 987 958 842 827 838Provisions and other non-current liabilities 20,369 17,842 17,303 16,379 17,440Non-current financial debt 19,437 16,191 14,876 14,174 13,793Current debt 34,408 34,327 35,662 33,522 33,428
Total liabilities 127,753 118,310 113,541 105,223 106,144
Summary consolidated statement of income for the last five years
2009 2008 2007 2006 2005 (a)
As of December 31,(M€) IFRS IFRS IFRS IFRS IFRS
Sales 131,327 179,976 158,752 153,802 137,607Operating expenses (109,521) (150,534) (128,026) (124,617) (108,431)Depreciation and amortization of tangible assets (6,682) (5,755) (5,425) (5,055) (5,007)Other income and expense (286) (185) 204 86 (281)Other financial income and expense (100) (124) (170) (49) (151)Income taxes (7,751) (14,146) (13,575) (13,720) (11,806)Equity share of net income from affiliates 1,642 1,721 1,775 1,693 1,173
Net income from continuing operations (Group excluding Arkema) 8,629 10,953 13,535 12,140 13,104
Net income from discontinued operations (Arkema) – – – (5) (461)
Consolidated net income 8,629 10,953 13,535 12,135 12,643
Minority interests 182 363 354 367 370
Net income 8,447 10,590 13,181 11,768 12,273
(a) 2005 figures are restated in compliance with IFRS standards to take into account the spin-off of Arkema decided at the Shareholders’ Meeting of May 12, 2006.
314 / TOTAL - Registration Document 2009
� Glossary
A
API degrees
Scale established by the American Petroleum Institute (API) tomeasure oil density. A higher API-degree indicates lighter oil fromwhich a higher yield of gasoline can be refined.
Association / Joint Venture / Consortium
Group of companies not forming a new legal entity. Each memberof the joint venture holds an undivided interest in the specific areaof the contract (PSC, Concession and Buyback) and has separatetax obligations towards the host country.
Appraisal (delineation)
Work performed after a discovery, performed for the determinationof the boundaries or extent of a deposit of hydrocarbons, orassessment of its reserves and production potential.
B
Barrel
Unit of measurement of volume of crude oil equal to 42 U.S. gallonsor 158.9 liters at 60°F or 15.6°C.
Barrel of Oil Equivalent (BOE)
Conventional unit for measuring the energy released by a quantityof fuel by relating it to the energy released by the combustion of abarrel of oil.
Brent
Quality of crude (38° API) produced in the North Sea, at the Brentfields.
Buyback
Risk services agreement (the investments and risks are undertakenby the contractor) combined with an offset mechanism that allowsthe contractor to receive a portion of the production equivalent tothe monetary value (with interest) of its investments and a return onits investment.
C
Capacity of treatment (refinery throughput)
Annual capacity for the treatment of crude oil by atmosphericdistillation units at a refinery.
Catalysts
Substances that facilitate chemical reactions during the refiningprocess used in conversion units (reformer, hydrocracker, catalyticcracker) and desulfurization units. Principal catalysts are preciousmetals (platinum) or other metals such as nickel or cobalt. There aresome catalysts that regenerate themselves and others that areconsumable.
Cogeneration
Simultaneous generation of electrical and thermal energies from acombustible source (gas, fuel oil or coal).
Concession contract
Exploration and production contract under which an oil & gascompany (or group of companies) is granted, by a host country,rights to explore an area and develop and produce potentialreserves. The oil and gas company (or group of oil & gascompanies) undertakes the execution and financing (at its own risk)of all operations. In return, it is entitled to the entire production.
Condensate
Light hydrocarbon substances produced with natural gas that existin either a gaseous phase or in solution in the crude oil under theinitial pressure and temperature conditions in the reservoir, andwhich are recovered in a liquid state in separators, on-site facilitiesor gas treatment units.
Conversion
Refining operation aiming at transforming heavy products (heavyfuel oil) into lighter or less viscous ones (oils, jet fuels, etc.)
Cost oil / Cost gas
In a production sharing contract, the portion of the oil and gasproduction made available to the contractor (contractor group) andcontractually reserved for the reimbursement for exploration costs,costs of site development, exploitation, site restitution(“recoverable” costs).
Cracking / cracker
Refinery conversion operation, performed to obtain lightermolecules, by modifying the structure and the molecular mass ofthe hydrocarbons obtained in the first distillation process necessaryfor manufacturing gasoline.
D
(To) Debottleneck
Action of increasing the throughput capacity of a refinery.
/ 315TOTAL
Desulfurization
The process of eliminating or reducing sulfur from oil usuallythrough chemical reactions.
Development
Operations carried out to bring an oil or gas field on stream.
Distillates
A large range of products obtained through the atmosphericdistillation of crude oil or through vacuum distillation. Includesmedium distillate such as aviation fuel, diesel fuel and heating oil.
F
FPSO : Floating production, storage and offloading
Floating integrated offshore unit comprising the equipment used toproduce, process and store hydrocarbons and off load themdirectly to an offshore oil tanker.
H
Hydrocarbons
Molecules composed principally of carbon and hydrogen atoms.They can be solid such as asphalt, liquid such as crude oil orgaseous such as natural gas. They may also include compoundswith sulphur, nitrogen, metals, etc.
L
Liquefied Natural Gas (LNG)
Natural gas, principally methane and ethane, that has been liquefiedby cooling to -258°F (-162°C) at normal pressure in order totransport it.
Liquefied Petroleum Gas (LPG)
Light hydrocarbons (comprised principally of butane and propane)that are gaseous under normal temperature and pressureconditions and that are kept in liquid state by increasing thepressure or reducing the temperature.
M
Mineral interests
The rights to explore for and/or to produce oil and gas in a specificarea for a fixed period. Covers the concepts of “permit”, “license”,“title”, etc.
N
Natural gas
Mixture of gaseous hydrocarbons, composed mainly of methane.
O
Oil and gas exploration
All operations carried out to reveal the existence of oil and gasdeposits, to prepare for their production.
Operator
Partner of an oil and gas joint venture in charge of carrying out theoperations on a specific area on behalf of the joint venture.
Operated production
Quantity of oil and gas produced on fields operated by the Group.
P
Permit
Area contractually granted to an oil and gas company (or a jointventure) by the host country for a defined period. The permit grantsthe oil and gas company (or joint venture) exclusive rights to carryout exploration work (“exploration” permit) or to exploit a deposit(“exploitation” permit).
Production plateau
Expected average stabilized level of production for a field followingthe production build-up.
Production share (Group)
Portion of production the Group is entitled to receive as per thesharing rules defined in oil and gas exploration and productionagreements.
Production Sharing Contract (PSC)
Exploration and production contract by which a host country or,more frequently, its national company transfers to an oil & gascompany (the contractor) or a group of oil and gas companies (thecontractor group) the right to explore in a given area and, ifsuccessful, to develop and produce the reserves of the discovereddeposits. The contractor (contractor group) shall undertake theexecution and financing (as its exclusive risk) of all operations. Inreturn, it is entitled to a portion of the production, called cost oil/gas, for the recovery of the costs. The remaining production, calledprofit oil/gas, is shared between the contractor (contractor group)and the national company (and/or the host country).
316 / TOTAL - Registration Document 2009
Production site restoration
Oil companies may have to incur expenses related to theabandonment of production sites at the end of exploitation of adeposit. This definitive shutdown of the production on a field or partof sites production capacity (a well, a group of wells, etc.) generallyinvolves the dismantling of production, transport and storagefacilities and the restoration of the sites.
Profit oil / Profit gas
Under a PSC, a portion of the oil and gas production sharedbetween the host country and the contractor (contractor group), netof cost oil. The share of profit oil/gas made available to thecontractor is payment for the services, know-how provided and therisks undertaken.
R
Refinery
Plant where crude oil is separated and transformed into marketableproducts.
Reserves
Reserves are estimated remaining quantities of oil and gas andrelated substances anticipated to be economically producible, as ofa given date, by application of development projects to knownaccumulations. In Exploration & Production, Reserves areexpressed in barrels (b) for liquid hydrocarbons, cubic feet (cf) forthe gas or oil equivalent barrels (boe) for both.
Developed Reserves
Developed Oil and Gas Reserves are reserves that can be expectedto be recovered through existing wells and installations or for whichthe cost of the required equipment is relatively minor. This appliesto both proved reserves and proved plus probable reserves.
Proved reserves (1P reserves)
Estimated quantities of crude oil and natural gas that geologic andengineering data show, with reasonable certainty (90%) to berecoverable in the coming years from known reservoirs underexisting contract, economic and operating conditions:
o Developed proved reserves are those that can be recovered withexisting facilities and without significant additional investment;
o Undeveloped proved reserves are those that can be recoveredwith new investments (surface facilities, wells, etc.).
Proved and probable reserves (2P reserves)
Sum of proved reserves and probable reserves. The 2P reserves arethe median quantities of oil and gas recoverable from fields that
have been drilled, covered by E&P contracts and for whichtechnical studies have demonstrated economic development in along term Brent price environment. They also include projects to bedeveloped by mining.
Reserve life
Ratio of proved reserves at the end of the year to the productionsold during the past year.
Resources
Sum of proved and probable reserves and contingent resources(mean quantities potentially recoverable from known accumulations)(Society of Petroleum Engineers 03/07).
S
Seismic
Exploration technique of methodically sending vibration or soundwaves into the earth and recording their reflections to assess thetype, size, shape, and depth of subsurface layers.
T
Technical costs
Technical costs include the cost of producing oil and gas, thedepreciation and amortization associated with production facilitiesand the cost of exploration expensed.
U
Unitization
Creation of a new joint venture and nomination of a single operatorfor the development and the production as single asset of ahydrocarbon deposit that straddles two or more permits/licenses orcountries.
Upgrader
Refining unit where petroleum products, such as heavy oils, areupgraded through a cracking process.
W
Well
Hole drilled underground for oil exploration and operation.
/ 317TOTAL
� European cross reference list
Cross reference list of the information items set forth in Annex I of the EuropeanRegulation EC No. 809/2004 of April 29, 2004
Information required by Annex I of Regulation EC No. 809/2004 Corresponding pages ofthis Registration Document
1. PERSONS RESPONSIBLE .. .. .. .. .. .. .. .. .. .. .. .. .. .. .. .. .. .. .. .. .. .. .. .. .. .. .. .. .. .. .. .. .. .. .. .. .. .. .. .. i
2. STATUTORY AUDITORS .. .. .. .. .. .. .. .. .. .. .. .. .. .. .. .. .. .. .. .. .. .. .. .. .. .. .. .. .. .. .. .. .. .. .. .. .. .. p.109
3. SELECTED FINANCIAL INFORMATION .. .. .. .. .. .. .. .. .. .. .. .. .. .. .. .. .. .. .. .. .. .. .. .. .. .. .. .. .. .. .. .. .. p.2
4. RISK FACTORS .. .. .. .. .. .. .. .. .. .. .. .. .. .. .. .. .. .. .. .. .. .. .. .. .. .. .. .. .. .. .. .. .. .. .. .. .. .. .. .. p.69 to 86
5. INFORMATION ABOUT THE ISSUER
5.1. History and development .. .. .. .. .. .. .. .. .. .. .. .. .. .. .. .. .. .. .. .. .. .. .. .. .. .. .. .. .. .. .. .. .. .. .. .. .. .. p.8; 171
5.1.1. Legal and business name .. .. .. .. .. .. .. .. .. .. .. .. .. .. .. .. .. .. .. .. .. .. .. .. .. .. .. .. .. .. .. .. .. .. .. .. .. .. p.8; 171
5.1.2. Place of registration and registration number .. .. .. .. .. .. .. .. .. .. .. .. .. .. .. .. .. .. .. .. .. .. .. .. .. .. .. .. .. .. p.8; 171
5.1.3. Incorporation date of and issuer’s length of life .. .. .. .. .. .. .. .. .. .. .. .. .. .. .. .. .. .. .. .. .. .. .. .. .. .. .. .. .. p.8; 171
5.1.4. Domicile, legal form, applicable legislation, country of incorporation registered office’s address and telephonenumber .. .. .. .. .. .. .. .. .. .. .. .. .. .. .. .. .. .. .. .. .. .. .. .. .. .. .. .. .. .. .. .. .. .. .. .. .. .. .. .. .. .. .. .. .. p.8; 171
5.1.5. Business development’s main events .. .. .. .. .. .. .. .. .. .. .. .. .. .. .. .. .. .. .. .. .. .. .. .. .. .. .. .. .. .. .. .. p.9 to 50
5.2. Investments .. .. .. .. .. .. .. .. .. .. .. .. .. .. .. .. .. .. .. .. .. .. .. .. .. .. .. .. .. .. .. .. .. .. .. .. .. .. .. .. .. .. .. .. .. p.51
5.2.1 Main investments for the three last fiscal years .. .. .. .. .. .. .. .. .. .. .. .. .. .. .. .. .. .. .. .. .. .. .. .. .. .. .. .. .. .. .. p.51
5.2.2 Main investments in progress .. .. .. .. .. .. .. .. .. .. .. .. .. .. .. .. .. .. .. .. .. .. .. .. .. .. .. .. .. .. .. .. .. .. .. .. .. .. p.51
5.2.3 Main contemplated investments .. .. .. .. .. .. .. .. .. .. .. .. .. .. .. .. .. .. .. .. .. .. .. .. .. .. .. .. .. .. .. .. .. .. .. .. .. p.51
6. BUSINESS OVERVIEW
6.1. Main activities .. .. .. .. .. .. .. .. .. .. .. .. .. .. .. .. .. .. .. .. .. .. .. .. .. .. .. .. .. .. .. .. .. .. .. .. .. .. .. .. .. .. p.9 to 50
6.2. Main markets .. .. .. .. .. .. .. .. .. .. .. .. .. .. .. .. .. .. .. .. .. .. .. .. .. .. .. .. .. .. .. .. .. .. .. .. .. .. .. .. .. .. p.9 to 50
6.3. Exceptional factors having influenced the main activities or main markets .. .. .. .. .. .. .. .. .. .. .. .. .. .. p.9 to 50; 61 to 63
6.4. Dependency from certain contracts .. .. .. .. .. .. .. .. .. .. .. .. .. .. .. .. .. .. .. .. .. .. .. .. .. .. .. .. .. .. .. .. .. .. .. p.82
6.5. Competitive position .. .. .. .. .. .. .. .. .. .. .. .. .. .. .. .. .. .. .. .. .. .. .. .. .. .. .. .. .. .. .. .. .. .. .. .. .. .. p.8; 9; 38; 46
7. ORGANIZATIONAL STRUCTURE
7.1. Issuer’s position within the Group .. .. .. .. .. .. .. .. .. .. .. .. .. .. .. .. .. .. .. .. .. .. .. .. .. .. .. .. .. .. .. .. .. .. .. .. p.52
7.2. Main subsidiaries .. .. .. .. .. .. .. .. .. .. .. .. .. .. .. .. .. .. .. .. .. .. .. .. .. .. .. .. .. .. .. .. .. .. .. .. .. p.52; 260 and 261
8. PROPERTY, PLANTS AND EQUIPMENT
8.1. Most significant tangible fixed assets .. .. .. .. .. .. .. .. .. .. .. .. .. .. .. .. .. .. .. .. .. .. .. .. .. .. .. .. p.53; 11 to 50; 211
8.2. Environmental issues concerning the most significant tangible fixed assets .. .. .. .. .. .. .. .. .. .. .. .. .. .. p.53; 312 and 313
9. OPERATING AND FINANCIAL REVIEW
9.1. Financial Condition .. .. .. .. .. .. .. .. .. .. .. .. .. .. .. .. .. .. .. .. .. .. .. .. .. .. .. .. .. .. .. .. .. .. .. .. .. .. .. p.58 to 63
9.2. Operating Results
9.2.1. Significant factors affecting the income from operations .. .. .. .. .. .. .. .. .. .. .. .. .. .. .. .. .. .. .. .. .. .. .. p.58 to 63; 68
9.2.2. Discussion and analysis of material changes in net sales or revenues .. .. .. .. .. .. .. .. .. .. .. .. .. .. .. .. .. .. .. p.58 to 63
9.2.3. External factors that had (or could have) material impact on business operations .. .. .. .. .. .. .. .. .. .. .. .. .. p.58 to 63; 68
318 / TOTAL - Registration Document 2009
10. CAPITAL RESOURCES
10.1. Information concerning capital resources (both short and long term) .. .. .. .. .. .. .. .. .. .. .. .. .. .. .. .. .. .. .. .. .. p.64
10.2. Sources, amounts and description of cash flows .. .. .. .. .. .. .. .. .. .. .. .. .. .. .. .. .. .. .. .. .. .. .. .. .. .. .. p.64; 184
10.3. Borrowings and funding structure .. .. .. .. .. .. .. .. .. .. .. .. .. .. .. .. .. .. .. .. .. .. .. .. .. .. .. .. .. .. .. p.65; 71 to 78
10.4. Restrictions on use of capital resources, having materially impact on business operations .. .. .. .. .. .. .. .. .. .. .. .. .. .. n/a
10.5. Anticipated sources of funds for main contemplated investments, including major encumbrances on most significanttangible fixed assets .. .. .. .. .. .. .. .. .. .. .. .. .. .. .. .. .. .. .. .. .. .. .. .. .. .. .. .. .. .. .. .. .. .. .. .. .. .. .. .. .. p.65
11. RESEARCH AND DEVELOPMENT, PATENTS AND LICENCES .. .. .. .. .. .. .. .. .. .. .. .. .. .. .. .. .. .. .. p.66 and 67
12. TREND INFORMATION
12.1. Main trends in production, sales and inventory, and in costs and selling prices, since the end of the last fiscal year .. .. .. p.68
12.2. Known trends, uncertainties, demands, commitments or events that might have a material effect on prospectsfor the current fiscal year .. .. .. .. .. .. .. .. .. .. .. .. .. .. .. .. .. .. .. .. .. .. .. .. .. .. .. .. .. .. .. .. .. .. .. p.68; 70 to 78
13. PROFIT FORECASTS OR ESTIMATES .. .. .. .. .. .. .. .. .. .. .. .. .. .. .. .. .. .. .. .. .. .. .. .. .. .. .. .. .. .. .. .. .. .. n/a
14. ADMINISTRATIVE, MANAGEMENT, AND SUPERVISORY BODIES AND SENIOR MANAGEMENT
14.1. Information concerning members of the administrative and management bodies .. .. .. .. .. .. .. .. .. .. .. .. p.88 to 94; 108
14.2. Conflicts of interests, arrangement/understanding for appointments, restrictions on disposals ofequity interests held in the share capital of the issuer .. .. .. .. .. .. .. .. .. .. .. .. .. .. .. .. .. .. p.95; 101; 113; 129 and 130
15. REMUNERATION AND BENEFITS
15.1. Remuneration paid, and benefits in kind granted by the issuer rand its subsidiaries .. .. .. .. .. .. p.110 and 111; 115 and 116
15.2. Amounts set aside or accrued for pension, retirement or similar benefits .. .. .. .. .. .. .. .. .. .. .. .. .. .. p.111 to 113; 235
16. BOARD PRACTICES
16.1. Expiration date of current term of offices, and commencement date .. .. .. .. .. .. .. .. .. .. .. .. .. .. .. .. .. .. .. p.87 to 94
16.2. Contracts with the issuer or any of its subsidiaries providing for benefits upon contract’s termination .. .. .. p.116; 111 to 113
16.3. Information about the audit committee and remuneration committee of the issuer .. .. .. .. .. .. .. .. .. .. p.97 and 98; 99; 101
16.4. Compliance with the corporate governance regime applicable in France .. .. .. .. .. .. .. .. .. .. .. .. .. .. .. .. .. .. .. .. p.95
17. EMPLOYEES
17.1. Headcount at the end of the 3 last fiscal years; breakdown by geographic location and by segment ofactivities .. .. .. .. .. .. .. .. .. .. .. .. .. .. .. .. .. .. .. .. .. .. .. .. .. .. .. .. .. .. .. .. .. .. .. .. .. .. .. p.5; 128; 309 to 311
17.2. Shareholdings and stock options .. .. .. .. .. .. .. .. .. .. .. .. .. .. .. .. .. .. .. p.5; 128 to 130; 113; 118 to 120; 123 to 127
17.3. Agreements for employees’ equity stake in the capital of the issuer .. .. .. .. .. .. .. .. .. .. .. .. .. .. p.128 to 130; 113; 174
18. MAJOR SHAREHOLDERS
18.1. Shareholdings above thresholds that must be notified (known shareholdings) .. .. .. .. .. .. .. .. .. .. .. .. .. .. p.147 to 149
18.2. Major shareholders’ voting rights above their equity interest in the share capital .. .. .. .. .. .. .. .. .. .. .. .. .. .. p.147; 170
18.3. Control performed by one or several shareholders over the issuer .. .. .. .. .. .. .. .. .. .. .. .. .. .. .. .. .. .. .. .. .. .. .. .. n/a
18.4. Agreement, known to the issuer, whose performance might subsequently result in a change in control of the issuer .. .. .. .. n/a
19. RELATED PARTY TRANSACTIONS .. .. .. .. .. .. .. .. .. .. .. .. .. .. .. .. .. .. .. .. .. .. .. .. .. .. .. .. .. .. .. p.150; 235
20. FINANCIAL INFORMATION CONCERNING THE ISSUER’S ASSETS AND LIABILITIES, FINANCIAL POSITION ANDPROFITS AND LOSSES
20.1. Historical Financial Information .. .. .. .. .. .. .. .. .. .. .. .. .. .. .. .. .. .. .. .. .. .. .. .. .. .. .. .. .. .. .. .. .. .. .. .. p.158
Appendix 1 .. .. .. .. .. .. .. .. .. .. .. .. .. .. .. .. .. .. .. .. .. .. .. .. .. .. .. .. .. .. .. .. .. .. .. .. .. .. .. .. .. p.179 to 261
Appendix 3 .. .. .. .. .. .. .. .. .. .. .. .. .. .. .. .. .. .. .. .. .. .. .. .. .. .. .. .. .. .. .. .. .. .. .. .. .. .. .. p.281 to 311; 314
20.2. Pro forma financial information .. .. .. .. .. .. .. .. .. .. .. .. .. .. .. .. .. .. .. .. .. .. .. .. .. .. .. .. .. .. .. .. .. .. .. .. .. .. n/a
20.3. Consolidated financial statements .. .. .. .. .. .. .. .. .. .. .. .. .. .. .. .. .. .. .. .. .. .. .. .. .. .. (Appendix 1) (p.179 to 261)
/ 319TOTAL
20.4. Auditing of historical annual financial information
20.4.1. Auditing of historical financial information .. .. .. .. .. .. .. .. .. .. .. .. .. .. .. .. .. .. .. .. .. .. .. .. .. .. .. .. p.158; 180; 284
20.4.2. Other information contained in the registration document which has beenaudited by the auditors .. .. .. .. .. .. .. .. .. .. .. .. .. .. .. .. .. .. .. .. .. .. .. p.101 to 105; 106 and 107; 112; 282 and 283
20.4.3. Financial data contained in the registration document and not extracted from the issuer’s audited financialstatement .. .. .. .. .. .. .. .. .. .. .. .. .. .. .. .. .. .. .. .. .. .. .. .. .. .. .. .. .. .. .. .. .. .. .. .. .. .. .. p.159; 273 to 280
20.5. Age of latest audited financial information .. .. .. .. .. .. .. .. .. .. .. .. .. .. .. .. .. .. .. .. .. .. .. .. .. .. December 31, 2009
20.6. Interim and other financial information
20.6.1. Quarterly or half yearly financial information established since the date of the last audited financial statements .. .. .. .. .. .. n/a
20.6.2. interim financial information covering the first six months of the fiscal year which follows the end of the last audited fiscalyear .. .. .. .. .. .. .. .. .. .. .. .. .. .. .. .. .. .. .. .. .. .. .. .. .. .. .. .. .. .. .. .. .. .. .. .. .. .. .. .. .. .. .. .. .. .. .. .. n/a
20.7. Dividend policy .. .. .. .. .. .. .. .. .. .. .. .. .. .. .. .. .. .. .. .. .. .. .. .. .. .. .. .. .. .. .. .. .. .. .. .. .. .. .. .. p.159; 139
20.8. Legal and arbitration proceedings .. .. .. .. .. .. .. .. .. .. .. .. .. .. .. .. .. .. .. .. .. .. .. .. .. .. .. .. .. .. .. .. .. p.159; 163
20.9. Significant change in the financial or business situation .. .. .. .. .. .. .. .. .. .. .. .. .. .. .. .. .. .. .. p.164; 58 to 68; 9 to 50
21. ADDITIONAL INFORMATION
21.1. Share Capital
21.1.1. Issued and authorized share capital .. .. .. .. .. .. .. .. .. .. .. .. .. .. .. .. .. .. .. .. .. .. .. .. .. .. .. .. p.166 and 167; 293
21.1.2. Shares not representing capital .. .. .. .. .. .. .. .. .. .. .. .. .. .. .. .. .. .. .. .. .. .. .. .. .. .. .. .. .. .. .. .. .. .. .. .. .. n/a
21.1.3. Treasury shares and shares held by issuer’s subsidiaries .. .. .. .. p.141 to 145; 147 and 148; 169; 218 and 219; 293 and 294
21.1.4. Securities giving later access to the share capital of the issuer .. .. .. .. .. .. .. .. .. .. .. .. .. .. .. .. .. .. .. .. .. .. .. p.167
21.1.5. Terms of any acquisition right and/or commitment in respect of authorized but non-issued capital, or of any increase ofcapital .. .. .. .. .. .. .. .. .. .. .. .. .. .. .. .. .. .. .. .. .. .. .. .. .. .. .. .. .. .. .. .. .. .. .. .. .. .. .. .. .. .. .. .. .. .. .. n/a
21.1.6. Equity stake in any Group’s member, submitted to an option .. .. .. .. .. .. .. .. .. .. .. .. .. .. .. .. .. .. .. .. .. .. .. .. .. .. n/a
21.1.7. History of the issuer’s share capital for the 3 last fiscal years .. .. .. .. .. .. .. .. .. .. .. .. .. .. .. .. .. .. p.169 and 170; 307
21.2. Articles of Incorporation and by-laws
21.2.1. Issuer’s objects and purposes .. .. .. .. .. .. .. .. .. .. .. .. .. .. .. .. .. .. .. .. .. .. .. .. .. .. .. .. .. .. .. .. .. .. .. .. p.171
21.2.2. Provisions of by-laws concerning the members of the administrative, management and supervisorybodies .. .. .. .. .. .. .. .. .. .. .. .. .. .. .. .. .. .. .. .. .. .. .. .. .. .. .. .. .. .. .. .. .. .. .. .. .. .. p.171 to 172; 95 to 100
21.2.3. Rights, preferences and restrictions for each class of the existing shares .. .. .. .. .. .. .. .. .. .. .. .. .. .. .. .. p.172 to 173
21.2.4. Actions necessary to change the rights of shareholders .. .. .. .. .. .. .. .. .. .. .. .. .. .. .. .. .. .. .. .. .. .. .. .. .. .. p.173
21.2.5. Calling-up of shareholders’ meetings, and admittance prerequisites .. .. .. .. .. .. .. .. .. .. .. .. .. .. .. .. p.173; 154 to 155
21.2.6. Provisions of by-laws, charter or rules of the issuer that might delay, postpone or prevent a change of control of theissuer .. .. .. .. .. .. .. .. .. .. .. .. .. .. .. .. .. .. .. .. .. .. .. .. .. .. .. .. .. .. .. .. .. .. .. .. .. .. .. .. .. .. .. .. .. .. p.172
21.2.7. Threshold above which shareholdings must be disclosed by virtue of the by-laws .. .. .. .. .. .. .. .. .. .. .. .. .. .. p.173; 148
21.2.8. Conditions more stringent than legal ones regarding changes in the share capital .. .. .. .. .. .. .. .. .. .. .. .. .. .. .. .. .. n/a
22. MATERIAL CONTRACTS (other than contracts entered into in the ordinary course of business) .. .. .. .. .. .. .. .. .. n/a
23. THIRD PARTY INFORMATION, STATEMENT BY EXPERTS AND DECLARATIONS OF ANY INTEREST .. .. .. .. .. .. .. n/a
24. DOCUMENTS ON DISPLAY .. .. .. .. .. .. .. .. .. .. .. .. .. .. .. .. .. .. .. .. .. .. .. .. .. .. .. .. .. .. .. .. .. .. .. .. .. p.175
25. INFORMATION ON HOLDINGS .. .. .. .. .. .. .. .. .. .. .. .. .. .. .. .. .. .. .. .. .. p.176 and 177; 260 and 261; 304 to 306
320 / TOTAL - Registration Document 2009
TOTAL S.A.Registered Office: 2 place Jean Millier - La Défense 692400 Courbevoie - FranceShare capital: 5,871,057,210 euros542 051 180 RCS Nanterre
www.total.com TOTA
L S
.A. -
Apr
il 20
10 –
Cov
er p
hoto
s: M
arco
Duf
our
- P
eter
Liv
erm
ore
- C
laud
e P
irott
e -
Phi
lippe
Zam
ora
- D
esig
n: B
RIE
F
Standard: +33 (0)1 47 44 45 46Investor Relations: +33 (0)1 47 44 58 53North American Investor Relations: +1 (713) 483 5070