reduction of false alarm rate in automatic forest fire infrared surveillance systems
TRANSCRIPT
www.elsevier.com/locate/rse
Remote Sensing of Environment 86 (2003) 19–29
Reduction of false alarm rate in automatic forest fire infrared
surveillance systems
S. Briz1, A.J. de Castro*, J.M. Aranda, J. Melendez, F. Lopez
Departamento de Fısica, Universidad Carlos III de Madrid, Avda. Universidad 30, 28911-Leganes, Madrid, Spain
Received 31 May 2001; received in revised form 13 February 2003; accepted 17 February 2003
Abstract
One of the main problems related to infrared remote sensing of forest fires by automatic systems concerns the rejection of false alarms.
The study of the infrared spectral radiance emitted by a biomass fire has been used to define spectral algorithms that permit to separate fires
from other sources considered as false alarms. The different behaviour of the medium (3–5 Am) and thermal (8–12 Am) infrared spectral
regions has been the basis for the definition of a new ‘‘figure’’ of merit, the so-called Fire Index (FI). An experimental burn has been used to
test the ability of FI to identify clearly fires. A second algorithm based on an intraband analysis, the Mid-IR Fire Index (MFI), has been
proposed to give complementary information to FI. Evolution of FI and MFI values with distance for different IR sources has been
calculated. Finally, an experimental validation of both algorithms has been performed by using two infrared cameras working in the medium
and thermal infrared spectral windows.
D 2003 Elsevier Science Inc. All rights reserved.
Keywords: False alarm rate; Fire index; Forest fire surveillance systems
1. Introduction
Fires represent a very important threat for the European
forests, mainly in the Mediterranean area. In Spain, during
the last 5 years, an average of 105 ha per year has been
burned. It has been estimated that fire fighting and restora-
tion cost between 1000 and 5000 euro per burnt hectare. The
European Union has devoted over the last 6 years an
important effort to research projects (Fourth and Fifth
Framework programmes) that cover development of new
technologies for early fire detection, fire danger prediction,
or post-fire rehabilitation and management. Among others,
MEGAFIRES (1996–1998), AFFIRM (1996–1998),
EFAISTOS (1996–1998), FUEGO2 (1998–2001), or
RISCOFF (2000–2001) are good examples of this effort.
A forest fire is a combustion process where temperatures
usually go beyond 400 jC (charcoal undergoes glowing
combustion at around 500–600 jC; thick flames burn
around 1000 jC) and may reach values as high as 1500
0034-4257/03/$ - see front matter D 2003 Elsevier Science Inc. All rights reserv
doi:10.1016/S0034-4257(03)00064-6
* Corresponding author. Fax: +34-91-624-87-49.
E-mail address: [email protected] (A.J. de Castro).1 Present address: Departamento de Fısica, Universidad Europea de
Madrid, c/ Tajo s/n, 28670 Villaviciosa de Odon, Madrid, Spain.
jC (Robinson, 1991). According to Planck’s law, a body at
such temperature radiates mostly in the infrared spectral
region. Because of atmospheric attenuation, most IR fire
detection systems are designed to operate in one of the two
atmospheric spectral windows: 3–5 Am (MIR) and 8–12
Am (TIR). Up to now, the satellite sensor most widely used
for the detection of forest fires and/or management of
burned areas is the Advanced Very High Resolution Radio-
meter (AVHRR) aboard the NOAA satellites (Flannigan &
Vonder Haar, 1986). Channel 3 (3.55–3.93 Am) of this
instrument is widely used to monitor forest fires from space.
Casanova (2000) is an example of recent scientific work in
the field of fire management by using the AVHRR images.
Although this sensor has IR channels that can be used to
measure emission from fires, it has not been specifically
designed to monitor fires and it presents various problems:
signal saturation, false alarms, and low efficiency to detect
small burned areas. Some research programmes plan to
launch in the near future space platforms with multispectral
sensors specifically devoted to infrared remote sensing of
forest fires (among other surface hot events):
� small satellite missions like BIRD (Web1, BIR), IRSUTE
(Seguin et al., 1999), or FUEGO (Web2, FUE)� sensors aboard the ISS like FOCUS (Web3, FOC)
ed.
S. Briz et al. / Remote Sensing of Environment 86 (2003) 19–2920
In contrast with satellite sensors, most ground-based
systems for early detection have been designed to work in
the visible/near infrared spectral range. The basis of these
systems is the identification of smoke in real time by
analyzing its characteristic dynamic and stochastic features
(Kuhrt et al., 2000; Venter, 2000).
However, infrared systems are now being proposed for
automatic ground-based surveillance of forest surfaces
(Ugarte, de Castro, Briz, Aranda, & Lopez, 2000a). For
instance, BOSQUE system developed by Bazan-Faba
(Spain) or BSDS system developed by FISIA (Italy) (Ollero,
Arrue, Martinez, & Murillo, 1999) use high-resolution
infrared thermal cameras to monitor forest areas. Other IR
systems operate aboard an aircraft, like the Firefly sensor,
developed by JPL and USFS (Web4, Fir).
The main problem related to IR remote sensing of fires
by automatic systems concerns the identification of fires and
the rejection of false alarms (sunglints, industrial hotspots,
hot soil due to strong solar irradiance during summer
periods, etc.). There are different approaches in the literature
to the problem, by using spectral information (Pereira &
Setzer, 1993), spatial information (Vries & Kemp, 1994),
signal analysis, or combinations of these methods (Ollero et
al., 1999). The work developed in this paper focuses on the
spectral approach to the problem. In order to design accu-
rately these IR systems, it is very important to have a good
spectral characterization of the infrared emission due to the
fire as well as the other IR emitters that constitute the
Fig. 1. Normalized intensity of spectroscopic lines for
infrared scenario in the field of view of the sensor. In this
paper, this spectral characterization is used to define very
simple algorithms to reject emissions from sources other
than fires. These algorithms could be implemented in an
easy way in simple, rugged, and staring systems specifically
devoted to fire detection. See for instance some work of our
research group on the design of these simple systems
(Ugarte et al., 2000a, 2000b).
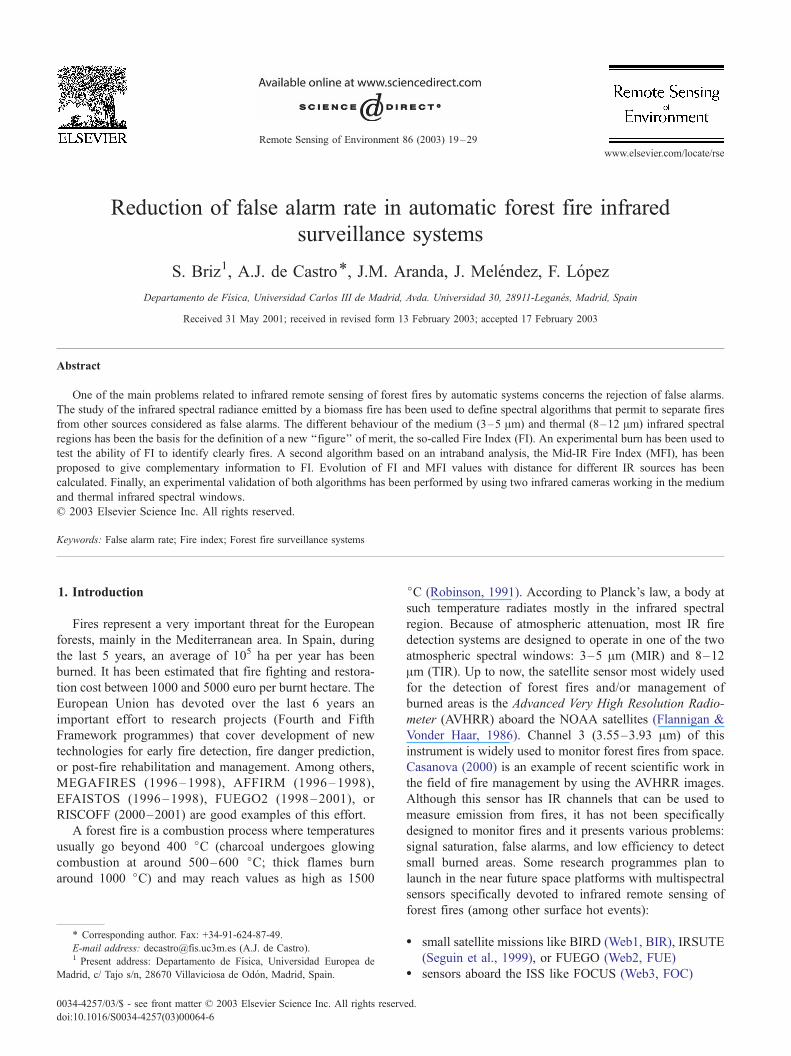
2. Infrared emission of a biomass burn
The major products of biomass combustion are CO2 and
H2O, which account for over 90% of the emitted mass. In
order to obtain information on the spectral distribution of
spectroscopic emission lines for both gases, the high-tem-
perature molecular spectroscopic database (HITEMP) has
been used (Web5, HIT). HITEMP is a compilation of the
line-by-line parameters of CO2 and H2O spectroscopic lines.
This database is the high temperature analogous of the
widely used HITRAN spectroscopic database. Fig. 1 shows
the intensity of spectroscopic lines for both gases in the two
spectral windows 2000–3330 cm� 1 (3–5 Am) and 770–
1250 cm� 1 (8–12 Am). Calculations have been performed
by using a temperature of 1000 jC. Only the most abundant
isotope has been taken into consideration. As can be seen in
the figure, CO2 is the most important emitter in the MIR
window. Most of the water lines have intensities below
CO2 and H2O obtained from HITEMP database.
S. Briz et al. / Remote Sensing of Environment 86 (2003) 19–29 21
10� 20 cm/molecule, whereas carbon dioxide presents a
strong emission band around 2300 cm� 1 with intensities
higher than 10� 19 cm/molecule. Other interesting conclu-
sion is that emission in the TIR region is clearly smaller than
in the MIR region, in particular for CO2. Therefore, the
change due to a fire in the infrared emission of a scenario
will affect mainly the MIR window.
Other sources of infrared radiation in a fire scenario are
the ‘‘solid’’ sources: burning wood, heated soil, embers, and
emitted particulates. All these emitters have a ‘‘greybody’’
behaviour emitting at all the wave numbers with temper-
atures between 230 and 730 jC (Stearns, Zahniser, Kolb, &
Sandford, 1986; Worden, Beer, & Rinsland, 1997).
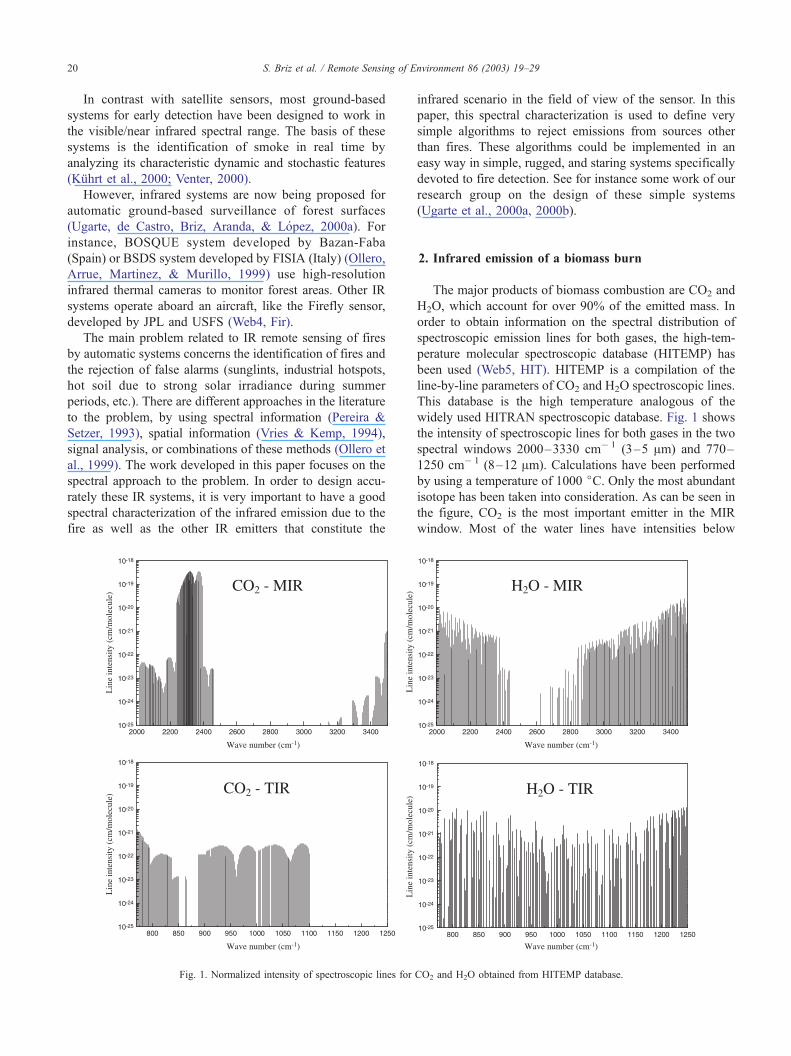
In order to measure the IR emission of a fire, exper-
imental burns have been performed at the CIFOR-INIA
facilities (Spanish Ministry of Science and Technology).
The heating area is a tunnel (8.5-m length) composed of
Fig. 2. Top: scheme of the experimental setup for controlled burns. Bottom:
eight small wagons where the forest fuel is spread. Wind
speeds between 1 and 7 m s� 1 are simulated by using a fan
located at the tunnel entrance. A Fourier transform infrared
(FTIR) spectroradiometer was located on top of the fan
structure with its line of sight pointing to the sixth wagon
with a zenith angle of h = 108 jC. With this configuration,
both the flame and the soil emission were measured by the
instrument. A scheme of the experimental setup is shown in
Fig. 2 (top). The spectroradiometer is equipped with a
mercury–cadmium–telluride (MCT) detector and measures
the spectral radiance between 600 and 4500 cm� 1 (c 2.2–
16.7 Am). This instrument has been previously calibrated to
radiometric units W/(cm2 sr cm� 1) by using a blackbody at
two known temperatures (Revercomb et al., 1988). Fig. 2
(bottom) shows a typical spectrum measured during a straw
burn compared with the one corresponding to unburned
terrain. Theoretical considerations about the expected signal
typical distribution of spectral radiance measured during a straw burn.
-0.5
0.0
0.5
1.0765
Fire
inde
x
bb 500 °C
sunglint
straw burn
S. Briz et al. / Remote Sensing of Environment 86 (2003) 19–2922
made above are clearly evidenced in the experiment. In the
MIR region, the CO2 emission band is the main feature.
This band appears like two ‘‘peaks’’ (the so-called red and
blue spikes; Wormhoudt, 1985) due to atmospheric carbon
dioxide absorption. Water emission is also present, although
its contribution to the radiance is noticeably smaller. Emis-
sion of the hot soil appears as a continuum at all the wave
numbers (a blackbody-like contribution). In contrast with
the MIR region, the TIR region shows no important gas-
related emission features.
0 100 200 300 400 500 600 700 800-1.0
Time (s)
bb 100 °Cbb 27 °C
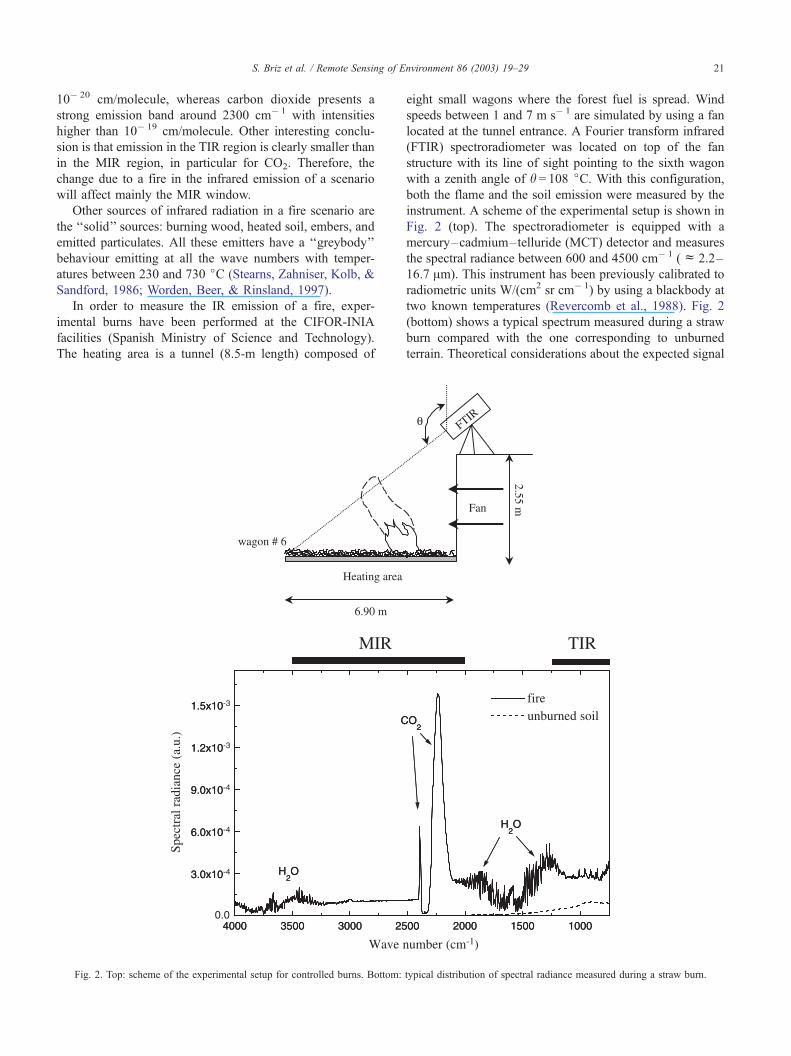
Fig. 3. Evolution of FI values during a straw burn. Horizontal dashed lines
correspond to the FI value calculated for different blackbody temperatures.
Vertical dashed lines indicate the beginning of fire in wagons #5, 6, and 7.
3. Spectral interband analysis: the fire index algorithm
The approach proposed in this paper is the definition of a
new ‘‘figure of merit’’ based on the different behaviour of
MIR and TIR spectral regions. As it has been shown above,
emission in the MIR region is strongly modified by the fire
as compared to the unburned situation. This change is
mainly due to the spectral features of CO2 emission. In
order to define the fire index, two ‘‘channels’’ will be
specified: one into the MIR spectral window, from 2000
to 2410 cm� 1 (4.15–5 Am), and another into the TIR
region, from 800 to 1100 cm� 1 (9.09–12.5 Am). The first
channel takes account of the emission of the red and blue
CO2 spikes. The figure of merit is defined by a comparison
of both channels. By analogy with the definition of the
vegetation indexes (Holben, 1986), a fire index FI is defined
as follows
FI ¼ RM � RT
RM þ RT
ð1Þ
where RM and RT are the radiances integrated in the channels
defined into the MIR and TIR regions, respectively. RM is
very sensitive to the CO2 red spike emission, whereas RTwill be much less sensitive to the emission of hot gases. This
different behaviour of RM and RT makes Eq. (1) a promising
way to identify fire events in a scene.
In order to check the behaviour of the fire index during a
fire, a straw burn has been performed in the tunnel. The
spectroradiometer was programmed to acquire radiance
spectra at each 5 s. Fig. 3 shows the evolution during this
burn of the FI values calculated from spectra measured by
the spectroradiometer. Horizontal dashed lines mark the FI
values calculated for blackbodies at different interesting
temperatures. At the beginning, unburned soil gives FI
values around � 1. When the burn begins, FI increases.
This increase is due to the smoke column produced in the
first wagons, which ascends and intercepts the field of view
(FOV) of the spectroradiometer. This smoke column con-
tains CO2 relatively cold, which increases slightly the value
of RM, whereas RT remains practically unchanged. Vertical
dashed lines in Fig. 3 indicate the beginning of fire in the
corresponding wagon (only wagons #5, 6, and 7 are
indicated for clarity purposes). When fire spreads over the
wagons, the CO2 in the smoke column that intercepts the
spectroradiometer FOV is hotter. That means a stronger red
spike in the emission, and that FI continues increasing.
Maximum values of FI (around 0.7) are reached when
wagon 6 is burning. At this moment, flames (the hottest
CO2) are inside the FOV. After this moment, the postcom-
bustion process is observed. Flames are less intense and do
not fill completely the FOV, and FI begins to decrease due
to the decrease in the red spike intensity. During this
process, short peaks appear in the FI value (for instance,
at 495 and 515 s), associated to combustions reactivated by
the wind. After t= 600 s, there are no more oscillations, as
corresponds to a situation where only the embers are
emitting infrared radiation.
It is important to compare the FI values reached by the
fire emission with those corresponding to high-temperature
blackbodies (horizontal dashed lines in Fig. 3). As can be
seen, temperatures as high as 500 jC give FI values clearly
below those corresponding to the fire in wagon 6. Sunglints
have been simulated by supposing a 5727 jC blackbody
emission, corrected by atmospheric attenuation, and
reflected by a surface with maximum reflexivity of unity.
Atmospheric transmittance has been calculated by using the
PcModWin3 code (Web6, MOD). This code is a PC version
of the well-known MODTRAN atmospheric code. FI values
associated to sunglints are around 0.35, and they are also
well separated from the fire. In conclusion, FI seems to be a
good figure of merit to discriminate high-temperature events
not associated to the fire (false alarms for an automatic
surveillance sensor system).
Efficiency of FI to identify fire events is directly asso-
ciated to the intensity of the CO2 red spike, which depends
not only on the CO2 concentration and temperature, but also
on the atmospheric absorption. That means that the spike
intensity, and in consequence, the FI value, depends on the
source-detector distance. Experimental measurements on the
tunnel involve distances around 10 m between the sixth
wagon and the spectroradiometer. This distance is appro-
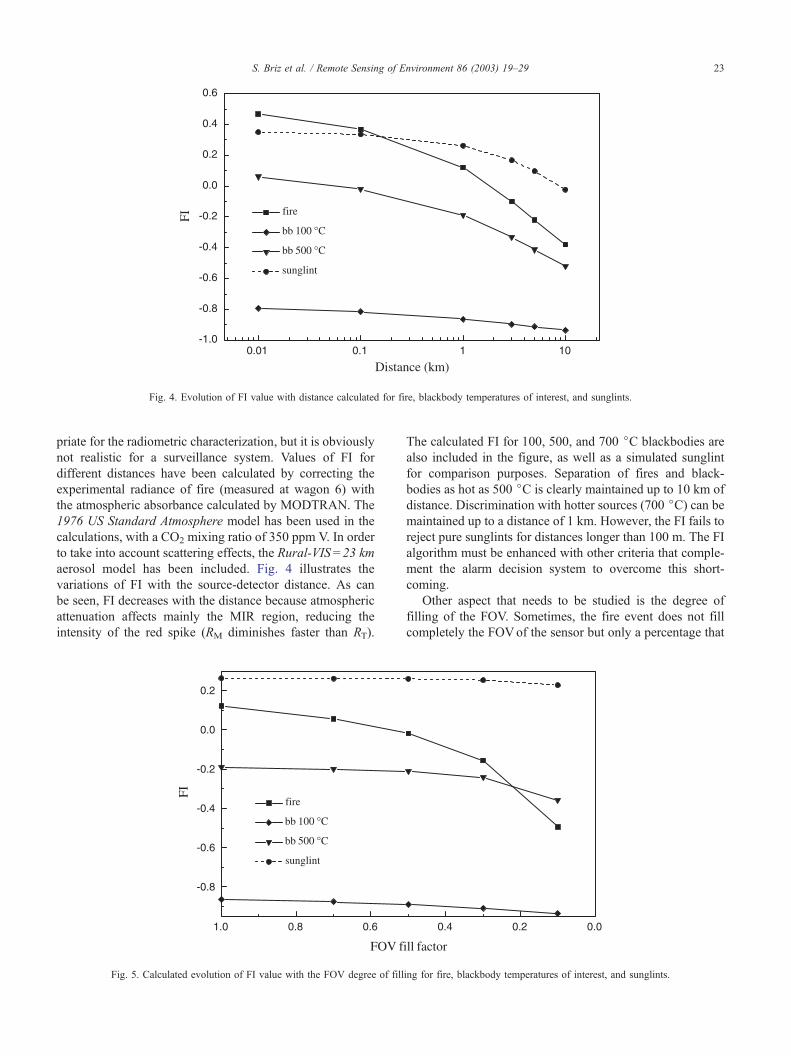
Fig. 4. Evolution of FI value with distance calculated for fire, blackbody temperatures of interest, and sunglints.
S. Briz et al. / Remote Sensing of Environment 86 (2003) 19–29 23
priate for the radiometric characterization, but it is obviously
not realistic for a surveillance system. Values of FI for
different distances have been calculated by correcting the
experimental radiance of fire (measured at wagon 6) with
the atmospheric absorbance calculated by MODTRAN. The
1976 US Standard Atmosphere model has been used in the
calculations, with a CO2 mixing ratio of 350 ppm V. In order
to take into account scattering effects, the Rural-VIS = 23 km
aerosol model has been included. Fig. 4 illustrates the
variations of FI with the source-detector distance. As can
be seen, FI decreases with the distance because atmospheric
attenuation affects mainly the MIR region, reducing the
intensity of the red spike (RM diminishes faster than RT).
Fig. 5. Calculated evolution of FI value with the FOV degree of fill
The calculated FI for 100, 500, and 700 jC blackbodies are
also included in the figure, as well as a simulated sunglint
for comparison purposes. Separation of fires and black-
bodies as hot as 500 jC is clearly maintained up to 10 km of
distance. Discrimination with hotter sources (700 jC) can bemaintained up to a distance of 1 km. However, the FI fails to
reject pure sunglints for distances longer than 100 m. The FI
algorithm must be enhanced with other criteria that comple-
ment the alarm decision system to overcome this short-
coming.
Other aspect that needs to be studied is the degree of
filling of the FOV. Sometimes, the fire event does not fill
completely the FOVof the sensor but only a percentage that
ing for fire, blackbody temperatures of interest, and sunglints.
S. Briz et al. / Remote Sensing of Environment 86 (2003) 19–2924
we will call ‘‘FOV fill factor’’. From the sensor point of
view, the observed scene will be composed of a high-
temperature event against a cold background. In Fig. 5, FI
values for different FOV fill factors have been simulated by
composing a scene with a 27 jC background and a hot
blackbody. Calculations have been performed for a distance
of 1 km. Fire is the most affected event by the variation of
the fill factor. As can be seen, fires are very well distin-
guished from blackbodies around 100 jC for any fill factor.
However, blackbodies at 500 jC are well separated only for
fill factors above 0.4. At the studied distance, sunglints have
always higher FI values than fires, and they are not
separated from fire for any value of the fill factor.
4. Spectral intraband analysis: the mid-IR fire index
algorithm
The fire index FI defined in Eq. (1) uses two channels at
the MIR and TIR spectral regions. It is also possible to
define another index using only one channel at the mid-
infrared spectral region. It can be noted from Fig. 2 that
spectral features of CO2 emission (the red and blue spikes)
are limited to a narrow window within the MIR region. This
characteristic can be used to define a new spectral index on
the same basis of Eq. (1). Two channels RM1 and RM2 are
defined: RM1 from 2100 to 2410 cm� 1 (4.15–4.76 Am) and
RM2 from 2410 to 3000 cm� 1 (3.33–4.15 Am). RM1 is the
specific region that takes into account the CO2 emission,
analogous to RM channel in Eq. (1), whereas RM2 is a wide
channel that covers the spectral window in the MIR region
that does not present emission features corresponding to the
hot gases.
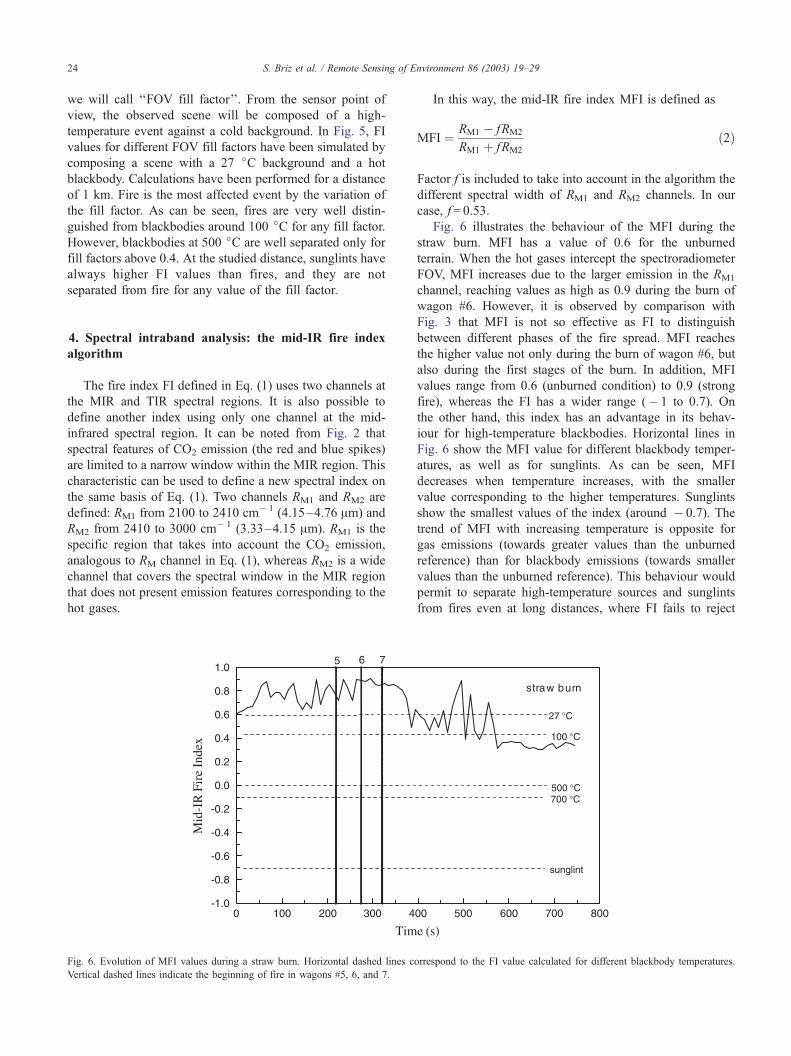
Fig. 6. Evolution of MFI values during a straw burn. Horizontal dashed lines c
Vertical dashed lines indicate the beginning of fire in wagons #5, 6, and 7.
In this way, the mid-IR fire index MFI is defined as
MFI ¼ RM1 � fRM2
RM1 þ fRM2
ð2Þ
Factor f is included to take into account in the algorithm the
different spectral width of RM1 and RM2 channels. In our
case, f = 0.53.
Fig. 6 illustrates the behaviour of the MFI during the
straw burn. MFI has a value of 0.6 for the unburned
terrain. When the hot gases intercept the spectroradiometer
FOV, MFI increases due to the larger emission in the RM1
channel, reaching values as high as 0.9 during the burn of
wagon #6. However, it is observed by comparison with
Fig. 3 that MFI is not so effective as FI to distinguish
between different phases of the fire spread. MFI reaches
the higher value not only during the burn of wagon #6, but
also during the first stages of the burn. In addition, MFI
values range from 0.6 (unburned condition) to 0.9 (strong
fire), whereas the FI has a wider range (� 1 to 0.7). On
the other hand, this index has an advantage in its behav-
iour for high-temperature blackbodies. Horizontal lines in
Fig. 6 show the MFI value for different blackbody temper-
atures, as well as for sunglints. As can be seen, MFI
decreases when temperature increases, with the smaller
value corresponding to the higher temperatures. Sunglints
show the smallest values of the index (around � 0.7). The
trend of MFI with increasing temperature is opposite for
gas emissions (towards greater values than the unburned
reference) than for blackbody emissions (towards smaller
values than the unburned reference). This behaviour would
permit to separate high-temperature sources and sunglints
from fires even at long distances, where FI fails to reject
orrespond to the FI value calculated for different blackbody temperatures.
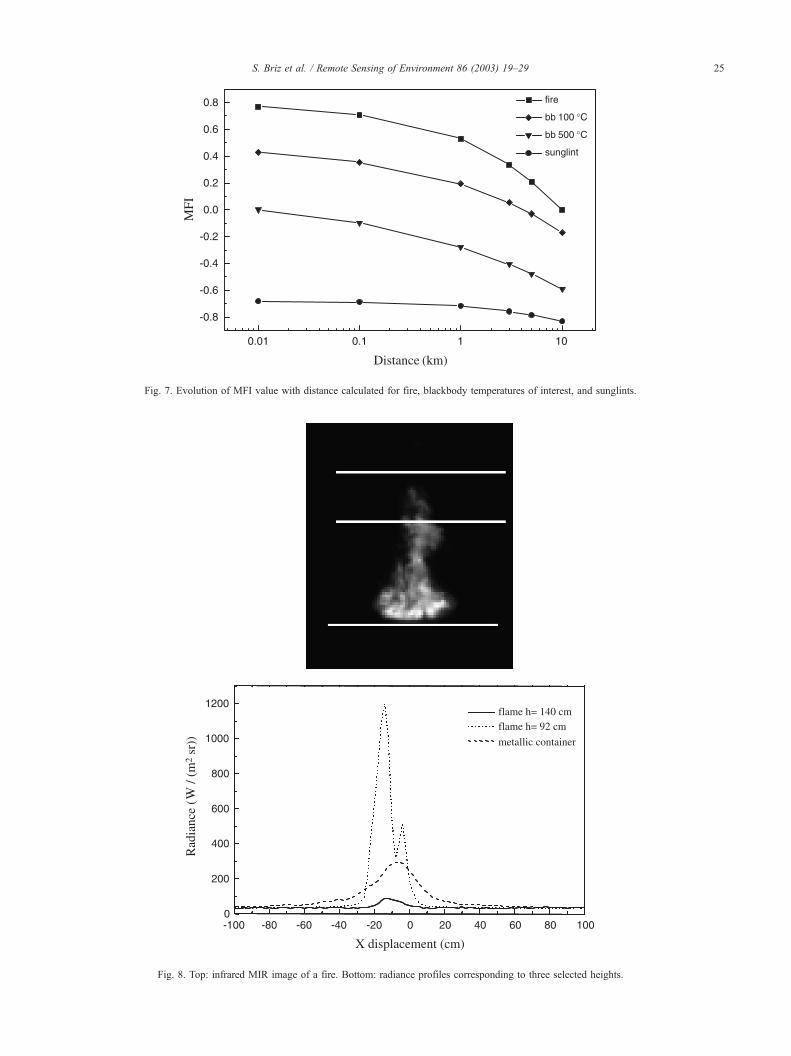
Fig. 7. Evolution of MFI value with distance calculated for fire, blackbody temperatures of interest, and sunglints.
Fig. 8. Top: infrared MIR image of a fire. Bottom: radiance profiles corresponding to three selected heights.
S. Briz et al. / Remote Sensing of Environment 86 (2003) 19–29 25
S. Briz et al. / Remote Sensing of Environment 86 (2003) 19–2926
these false alarms. Fig. 7 represents values of MFI for
different source-detector distances calculated with the same
methodology used for Fig. 5. It is very interesting to
observe that, although the MFI value decreases with the
distance, fire is well distinguished from the high-temper-
ature blackbodies. At 10 km, sunglints are still perfectly
separated from fires. However, MFI separates worse than
FI blackbodies with temperatures below 100 jC. The main
conclusion is that MFI gives complementary information
to the FI to separate false alarms from real fires. This
separation can be effective in the wide-range 100 jCsunglints.
5. Experimental validation of the algorithms
Up to this point, the discussion has been based upon
measurements performed with an FTIR spectroradiometer.
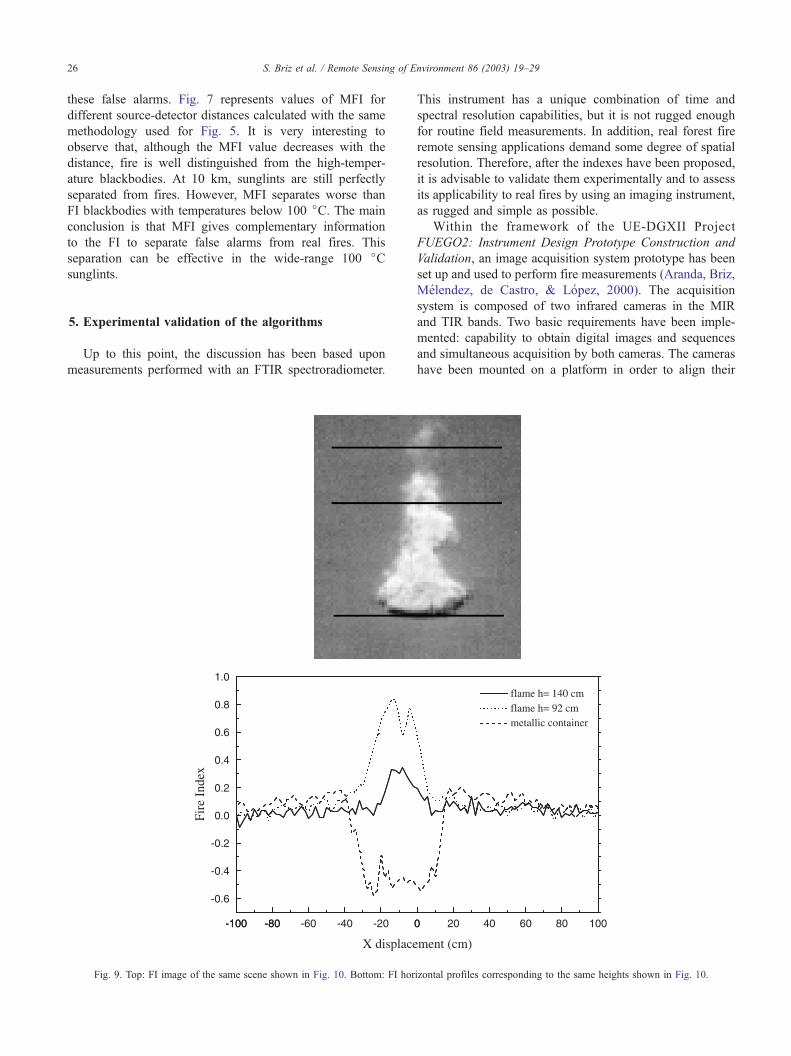
Fig. 9. Top: FI image of the same scene shown in Fig. 10. Bottom: FI hor
This instrument has a unique combination of time and
spectral resolution capabilities, but it is not rugged enough
for routine field measurements. In addition, real forest fire
remote sensing applications demand some degree of spatial
resolution. Therefore, after the indexes have been proposed,
it is advisable to validate them experimentally and to assess
its applicability to real fires by using an imaging instrument,
as rugged and simple as possible.
Within the framework of the UE-DGXII Project
FUEGO2: Instrument Design Prototype Construction and
Validation, an image acquisition system prototype has been
set up and used to perform fire measurements (Aranda, Briz,
Melendez, de Castro, & Lopez, 2000). The acquisition
system is composed of two infrared cameras in the MIR
and TIR bands. Two basic requirements have been imple-
mented: capability to obtain digital images and sequences
and simultaneous acquisition by both cameras. The cameras
have been mounted on a platform in order to align their
izontal profiles corresponding to the same heights shown in Fig. 10.
S. Briz et al. / Remote Sensing of Environment 86 (2003) 19–29 27
optical axes. A computer, provided with two digital frame
grabbers and specific software, controls the acquisition.
Both cameras have been calibrated in our laboratory against
a blackbody. By using neutral density filters and dia-
phragms, a wide temperature range of calibration (0–1000
jC) has been achieved. The simultaneous MIR and TIR
images obtained by this system can be subsequently co-
registered in order to have a correspondence between pixels
in both images.
The system described above is the ideal tool to image in
quasi-real time the FI algorithm because of the simulta-
neity in the MIR and TIR image acquisition and the co-
registration of the images. These properties are of funda-
mental importance for any algorithm to be applied to
sources like flames, which are neither stationary in time
nor homogeneous in space. A simplified version of the FI
index has been implemented because the MIR and TIR
cameras have no spectral filters to match the optimum RM
and RT spectral ranges. The full 3–5 and 8–12 Am ranges
have been used instead.
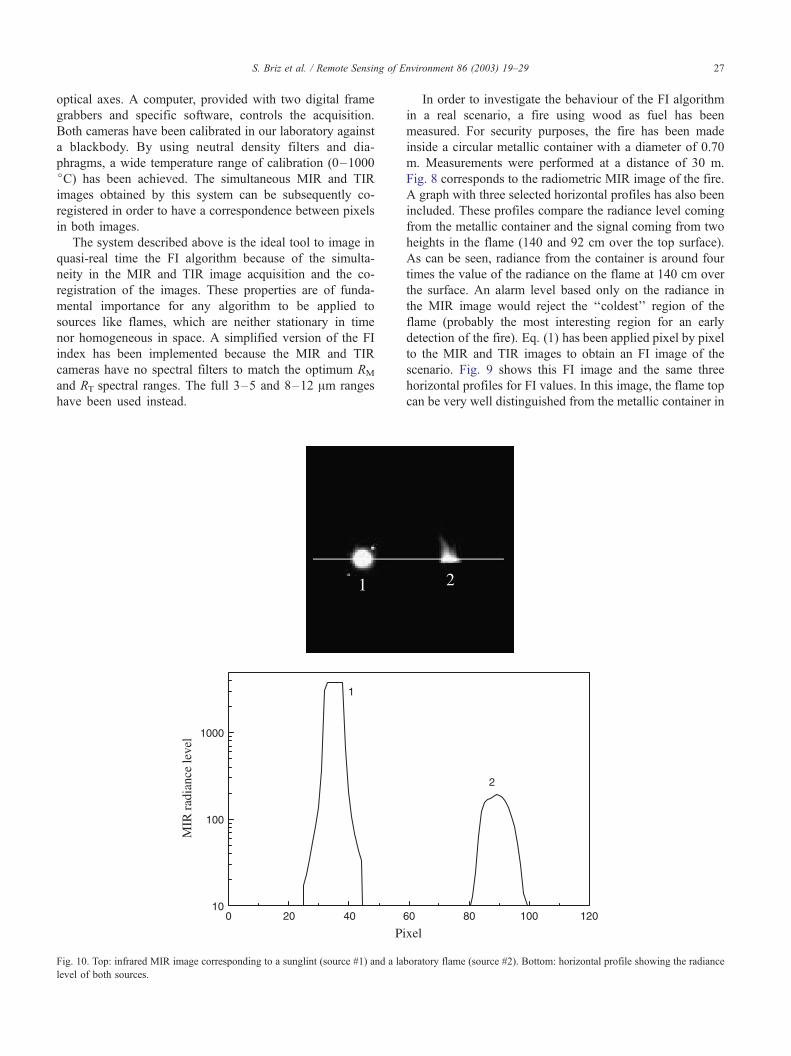
Fig. 10. Top: infrared MIR image corresponding to a sunglint (source #1) and a la
level of both sources.
In order to investigate the behaviour of the FI algorithm
in a real scenario, a fire using wood as fuel has been
measured. For security purposes, the fire has been made
inside a circular metallic container with a diameter of 0.70
m. Measurements were performed at a distance of 30 m.
Fig. 8 corresponds to the radiometric MIR image of the fire.
A graph with three selected horizontal profiles has also been
included. These profiles compare the radiance level coming
from the metallic container and the signal coming from two
heights in the flame (140 and 92 cm over the top surface).
As can be seen, radiance from the container is around four
times the value of the radiance on the flame at 140 cm over
the surface. An alarm level based only on the radiance in
the MIR image would reject the ‘‘coldest’’ region of the
flame (probably the most interesting region for an early
detection of the fire). Eq. (1) has been applied pixel by pixel
to the MIR and TIR images to obtain an FI image of the
scenario. Fig. 9 shows this FI image and the same three
horizontal profiles for FI values. In this image, the flame top
can be very well distinguished from the metallic container in
boratory flame (source #2). Bottom: horizontal profile showing the radiance
S. Briz et al. / Remote Sensing of Environment 86 (2003) 19–2928
spite of its lower radiance level. FI images demonstrate their
ability to separate flames from other sources even for very
low flame radiance levels.
As was pointed above, MFI algorithm is very interesting
because of its capability to separate very high signal levels
coming from sunglints or very hot sources from signals
coming from a fire. In order to validate the MFI algorithm,
only the MIR camera and two optical filters to define the
RM1 and RM2 channels will be needed. In order to obtain a
rugger system, some simplifications in the spectral defini-
tion of RM1 and RM2 channels have been done. The MIR
camera used in the experiment works in the 3–5 Am spectral
region when no filters are used. This whole range includes
the CO2 emission peaks and also all the contributions
coming from other sources (solid hot bodies and sunglints)
in the scenario. In this sense, the whole range from 3 to 5
Am can be used as channel RM2. In this way, we avoid the
use of one optical filter in the system. A commercial high-
pass spectral filter with a cutoff wavelength at 4.2 Am has
been used to define the RM1 channel because this filter
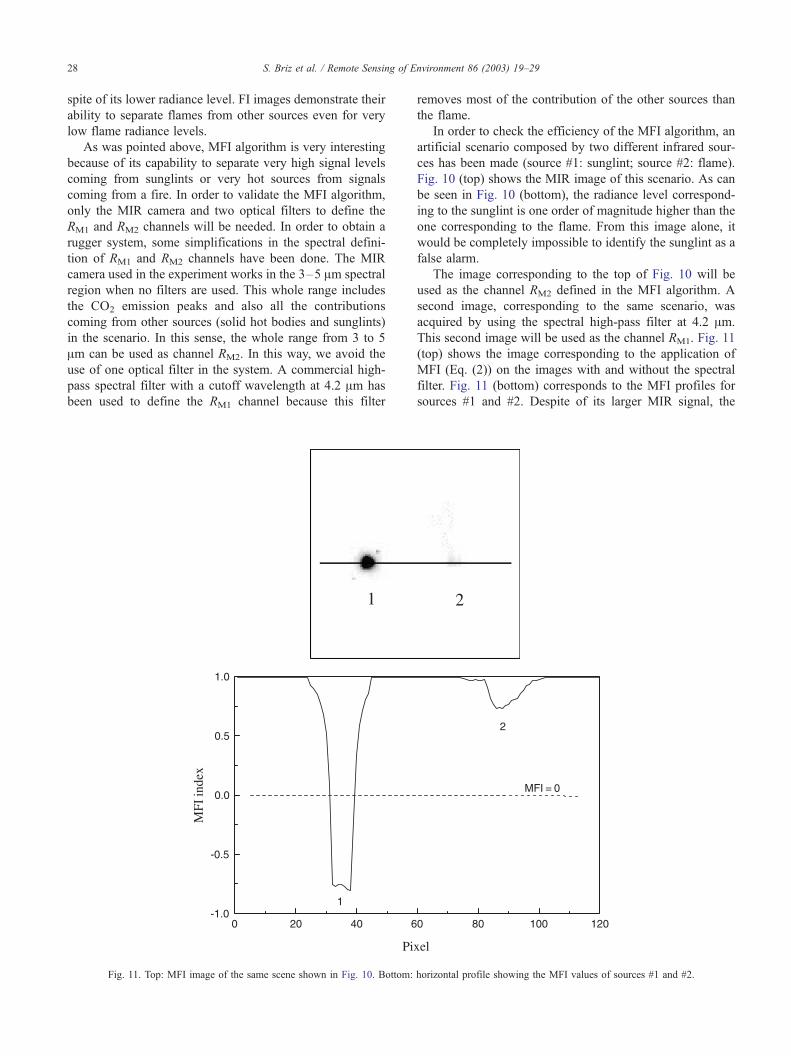
Fig. 11. Top: MFI image of the same scene shown in Fig. 10. Bottom:
removes most of the contribution of the other sources than
the flame.
In order to check the efficiency of the MFI algorithm, an
artificial scenario composed by two different infrared sour-
ces has been made (source #1: sunglint; source #2: flame).
Fig. 10 (top) shows the MIR image of this scenario. As can
be seen in Fig. 10 (bottom), the radiance level correspond-
ing to the sunglint is one order of magnitude higher than the
one corresponding to the flame. From this image alone, it
would be completely impossible to identify the sunglint as a
false alarm.
The image corresponding to the top of Fig. 10 will be
used as the channel RM2 defined in the MFI algorithm. A
second image, corresponding to the same scenario, was
acquired by using the spectral high-pass filter at 4.2 Am.
This second image will be used as the channel RM1. Fig. 11
(top) shows the image corresponding to the application of
MFI (Eq. (2)) on the images with and without the spectral
filter. Fig. 11 (bottom) corresponds to the MFI profiles for
sources #1 and #2. Despite of its larger MIR signal, the
horizontal profile showing the MFI values of sources #1 and #2.
S. Briz et al. / Remote Sensing of Environment 86 (2003) 19–29 29
sunglint is very well separated from the flame signal. MFI
value of the sunglint tends towards � 1, whereas the
corresponding value of the flame tends towards + 1, as
was pointed in Section 4. From this image, source #1 was
clearly identified as a false alarm, and source #2 was
identified as a fire. The image of Fig. 11 illustrates how
the MFI algorithm can be used to discriminate false alarms
in forest fire surveillance systems.
As was pointed out in Section 1, most future smart
surveillance systems of hot events are planned to be based
on IR sensors. As an example, the German satellite BIRD
(Web1, BIR), launched on October 2001, has channels in
the visible/near infrared, MIR, and TIR spectral bands. The
satellite constellation planned in the FUEGO project (Web2,
FUE) will also use MIR and TIR spectral bands.
The results obtained with our image acquisition system
demonstrate that fire index imaging can be implemented
by using ordinary IR cameras with only relatively minor
modifications, thereby making possible to apply bi-spec-
tral algorithms to ground- or airborne-based detection.
The results and implementation described can be of
interest to provide ‘‘ground-truth’’ validation to the satel-
lite systems.
In addition, the results described in this section, in
particular, in combination with those presented in Section
4 for the intraband analysis, provide some orientation for
the design of ground-based IR forest fire surveillance
systems.
6. Conclusions
In this paper, very simple algorithms working in the 3–5
and 8–12 Am spectral regions have been proposed to be
incorporated in an automatic smart surveillance system. A
study of the behaviour of these algorithms in reference to
the fire distance and FOV degree of filling has been
performed. The combination of inter- (MIR-TIR) and intra-
(MIR) band analysis appears to be the best solution to obtain
an effective rejection of false alarms in the system. Finally,
an infrared image acquisition system measuring in both
MIR and TIR channels has been used to prove the ability of
the FI and MFI algorithms to discriminate false alarms in the
scenario under surveillance.
Acknowledgements
The authors wish to thank C. Hernando, M. Guijarro, and
C. Dıaz (Instituto Nacional de Investigaciones Agrarias,
Spain) for the performance of the controlled burn and their
scientific comments. One of the authors (S.B.) acknowl-
edges financial support from the Spanish Ministerio de
Educacion y Cultura.
References
Aranda, J. M., Briz, S., Melendez, J., de Castro, A. J., & Lopez, F. (2000).
Flame analysis by IR thermography and IR hyperspectral imaging. In D.
Belageas, J. L. Beaudoin, G. Busse, & G. M. Carlomagno (Eds.), Pro-
ceedings of QIRT (Quantitative Infrared Thermography) ( pp. 337–342).
France: Reims.
Casanova, J. L. (Ed.) (2000). Remote sensing in the 21st century: economic
and environmental applications (pp. 319–370). Rotterdam: A.A. Bal-
kema.
Flannigan, M. D., & Vonder Haar, T. H. (1986). Forest fire monitoring
using NOAA satellite AVHRR. Canadian Journal of Forest Research,
16, 975–982.
Holben, B. N. (1986). Characteristics of maximum-value composite images
from temporal AVHRR data. International Journal of Remote Sensing,
7, 1417–1434.
Kuhrt, E., Behnke, T., Jahn, H., Hetzheim, H., Knollenberg, J., Mertens, V.,
Schlotzhauer, G., & Gotze, B. (2000). Autonomous early warning sys-
tem for forest fires tested in Brandenburg (Germany). International
Forest Fire News, 22, 84–90.
Ollero, A., Arrue, B. C., Martinez, J. R., & Murillo, J. J. (1999). Techni-
ques for reducing false alarms in infrared forest-fire automatic detection
systems. Control Engineering Practice, 7, 123–131.
Pereira, M. C., & Setzer, A. W. (1993). Spectral characteristics of defor-
estation fires in NOAA/AVHRR images. International Journal of Re-
mote Sensing, 14, 583–597.
Revercomb, H. E., Buijs, H., Howell, H. B., LaPorte, D. D., Smithand,
W. L., & Sromovsky, L. A. (1988). Radiometric calibration of IR Fourier
transform spectrometers: solution to a problem with the high-resolution
interferometer sounder. Applied Optics, 27, 3210–3218.
Robinson, J. M. (1991). Fire from space: global fire evaluation using infra-
red remote sensing. International Journal of Remote Sensing, 12, 3–24.
Seguin, B., Becker, F., Phulpin, T., Gu, X. F., Guyot, G., Kerr, Y., King, C.,
Lagouarde, J. P., Ottle, C., Stoll, M. P., Tabbagh, T., & Vidal, A. (1999).
IRSUTE: a minisatellite project for land surface heat flux estimation
from field to regional scale. Remote Sensing of Environment, 68,
357–369.
Stearns, J. R., Zahniser, M. S., Kolb, C. E., & Sandford, B. P. (1986).
Airborne infrared observations and analyses of a large forest fire. Ap-
plied Optics, 25, 2554–2562.
Ugarte, M. F., de Castro, A. J., Briz, S., Aranda, J. M., & Lopez, F. (2000a).
Optimized geometry in infrared arrays for remote sensing of forest fires.
Infrared Physics & Technology, 41, 35–39.
Ugarte, M. F., de Castro, A. J., Briz, S., Aranda, J. M., & Lopez, F.
(2000b). Automatic and autonomous infrared system for remote sensing
of forest fires. Review of Scientific Instruments, 71, 3657–3661.
Venter, J. (2000). Firehawkk electronic forest fire detection and manage-
ment system. International Forest Fire News, 23, 105–108.
Vries, J. S., & Kemp, R. A. W. (1994). Results with a multi-spectral
autonomous wildfire detection system. Proc. 2nd Conf. Forest Fire
Research Vol II, Coimbra (Portugal) ( pp. 779–791).
Web1, BIR: Website http://www.ba.dlr.de/NE-WS/projects/bird/.
Web2, FUE: Website http://www.insa.es/fuego/.
Web3, FOC: Website http://www.fuchs-gruppe.com/eo/focus/1_summary.
html.
Web4, Fir: Website http://observe.arc.nasa.gov/nasa/Tech_Twice/
Tech_twice8.html.
Web5, HIT: Website http://www.ontar.com/pub_hitran96vol3.htm.
Web6, Mod: Website http://www.ontar.com/prod_PcModWin.htm.
Worden, H., Beer, R., & Rinsland, C. P. (1997). Airborne infrared spectro-
scopy of 1994 western wildfires. Journal of Geophysical Research, 102,
1287–1299.
Wormhoudt, J. (Ed.) (1985). Infrared methods for gaseous measurements.
New York: Marcel Dekker.