recovery from transportation by road of farmed european eel (anguilla anguilla)
TRANSCRIPT
Recovery from transportation by road of farmed
European eel (Anguilla anguilla)
Jeroen G J Boerrigter1,*, Remy Manuel1,*, Ruud van den Bos1, Jonathan A C Roques1,
Tom Spanings1, Gert Flik1 & Hans W van de Vis2,†
1Radboud University Nijmegen, Nijmegen, The Netherlands2IMARES, Wageningen UR, Yerseke, The Netherlands
Correspondence: J G J Boerrigter, Radboud University Nijmegen, Heyendaalseweg 135, 6525 AJ Nijmegen, The Netherlands.
E-mail: [email protected]
*These authors contributed equally to this work.
†Wageningen Aquaculture is a consortium of IMARES (Institute for Marine Resources & Ecosystem Studies) and AFI (Aquaculture
and Fisheries Group, Wageningen University), both part of Wageningen University & Research Centre (WUR).
Abstract
The objective of this study was to assess the effects
of transportation of marketable eel (0.15 kg) in
the Netherlands with respect to welfare. Eels
(Anguilla anguilla) were obtained from a commer-
cial farm and acclimatized for 7 weeks at the labo-
ratory. Fish were transported according to regular
commercial procedures. The animals were placed
in water-filled transport tanks on the trailer. Fish
density increased from 72 kg m�3 (husbandry) to
206 kg m�3 (fasting) and was further increased to
270–290 kg m�3 during transport. Fish transport
lasted 3 h after which the eels were returned to
laboratory recirculation systems to measure
parameters indicative of stress load, i.e. mortality,
plasma cortisol, lactate and non-esterified fatty
acids (NEFA) as well as gill morphology. Samples
were taken at 0, 6, 24, 48 and 72 h after trans-
port in transported fish and non-transported coun-
terparts (controls). Transportation affected water
quality within known tolerable limits. No mortality
during or after transport was observed. After 6 h,
plasma cortisol levels had returned to baseline.
However, energy metabolism had increased sug-
gesting that transportation of eels resulted in an
increased energy demand that lasted for at least
72 h in the fasted animals. Thus, it is conceivable
that exposure to adverse conditions, prior to stun-
ning/killing, in a slaughterhouse may result in
allostatic overload in eel.
Keywords: European eel, stress, transport, wel-
fare, cortisol, Anguilla anguilla
Introduction
In aquaculture live fish are transported on farms,
between farms and from a farm to a processing
facility to slaughter or kill them. In general, trans-
portation of fish comprises the following steps (1)
fasting that may range from 24 to 168 h, depend-
ing on species and water temperature; (2) crowd-
ing, which is followed by capture; (3) loading a
transport vehicle; (4) transport while being kept in
a tank or closed bag; (5) unloading of fish and; (6)
releasing fish in a new environment or han-
dling them to commence slaughter (Dalla Villa,
Marahrens, VelardeCalvo, Di Nardo, Kleinschmidt,
Fuentes Alvarez, Truar, Di Fede, Otero & M€uller-
Graf 2009). A limited number of studies show that
transportation of live fish may induce strong stress
responses that can affect behaviour, physiology
and general health of fish over a prolonged period
thereafter (Specker & Schreck 1980; Davis &
Parker 1986; Schreck, Solazzi, Johnson & Nickelson
1989; Iversen, Finstad & Nilssen1998). Winton
(2001) described that handling and crowding,
which are part of transportation, influence suscep-
tibility of fish to disease. These studies thus show
that transportation of live fish may impair their
welfare.
To protect the welfare of animals during trans-
port, the European Council Directive 2006/88/EC
2006/88/EC (2006) was issued. Companies must
keep records of all movements of aquaculture ani-
mals and products into and out of the site or sites
and of mortality of animals during transport. The
lack of further requirements for fish in the
© 2013 John Wiley & Sons Ltd 1
Aquaculture Research, 2013, 1–13 doi:10.1111/are.12284
Directive can be traced back to the limited avail-
able body of research data on transportation of
farmed fish as indicated above. However, this lim-
ited number of studies has shown that transporta-
tion will activate the stress system in fish
comparable to what is known in farmed land-
based animals (Broom 2005; Warris 1998). This
also raises the question whether welfare of farmed
fish is affected during transport, as transport leads
to a simultaneous exposure of the animals to a
variety of stressors in a relatively short period of
time. For the interpretation of behavioural and
physiological changes as well as general changes
in health status, which result from transportation
in terms of good or poor welfare, we use the con-
cept of allostasis (Korte, Olivier & Koolhaas 2007;
Sterling & Eyer 1988). Allostasis assumes stability
through change and the capacity to adapt to a
dynamic environment. The allostasis concept holds
particular value as a model to discriminate
between stress responses which are within the lim-
its of the adaptive capacity of animals and those
which are outside these limits and thus compro-
mising animal welfare or not (Korte et al. 2007).
At present, data on the effects of transportation
on physiology in marketable European eel (Angu-
illa anguilla) are scarce. Together with African
catfish (Clarias gariepinus) and a hybrid of A. cat-
fish and Vundu catfish (Heterobranchus longifilis),
European eel comprises the majority of fish species
that are transported in the Netherlands for produc-
tion of food. Within these species, European eel
constitutes the most important one with a produc-
tion of 3200 tons (FEAP 2011) in the Netherlands
and 7000 tons in 2010 in Europe (FAO 2012).
Given the importance of European eel for Dutch
Aquaculture, we decided to expose this species to
a simulated overland transportation to assess how
this influences the physiological stress response
and how long recovery from transportation may
take. Therefore, in our study a commercial trans-
porter drove marketable eels, which were kept in
our laboratory, for 3 h (a period representative for
regular commercial practice) and then returned to
our laboratory. Upon return, the fish were sampled
for parameters indicative for activation of the
stress system (cortisol; Martinez-Porchas & Marti-
nez-Cordova 2009), changes in energy metabolism
as a consequence of fasting- and transport-related
stress (glucose, lactate, non-esterified fatty acid
(NEFA); Rosen & Spiegelman 2006), changes in
general plasma ion-levels as a consequence of
fasting- and transport-related stress (osmolality;
Kammerer, Cech & K€ultz 2010) and changes in gill
morphology and histology (e.g. migration of chlo-
ride cells towards lamellar regions; Roques, Abbink,
Geurds, van de Vis & Flik 2010) as a consequence
of fasting- and transport-related stress. One group
was sampled directly upon return (0 h), while four
other groups were sampled at 6, 24, 48 and 72 h
following transport. Controls were held under iden-
tical conditions, but were not transported and
remained at the laboratory.
Materials and methods
Fish and husbandry conditions
The experiment was conducted with a total of 1300
eels (Anguilla anguilla; mixed sexes; 149 �50 grams) grown to a normal Dutch slaughter
weight at a local eel farm under commercial farm-
ing conditions (250 kg m�3, T = 25°C). We used,
in total, 170 animals for sampling, the remainder
was sold by the farmer. Both in pre- and post-fasting
sampling, 10 animals were taken. Both transported
groups and the control group were sampled at fixed
intervals after transport/holding period i.e. at 0, 6,
24, 48 and 72 h after transport/holding period
(Fig 1). Every sample point consisted of 10 animals.
Transportation was performed in duplicate and
therefore the number of animals was finally 20 per
sample point. It should be noted that we did not
re-use the fish.
At arrival in our facilities, eels were placed at a
commercial stocking density (approximately 67
eels per aquarium) in all-glass aquaria with 140 L
water (bottom area 90 9 50 cm, height 40 cm;
distance from the water level till the glass lid was
9 cm) which were covered with a glass lid. Seven-
teen aquaria were part of two recirculation sys-
tems (total system volume: 2500 L) with biofilters.
Fish were housed at a density of 72 kg 1000 L�1,
average water temperature of T = 24 � 0.3°C, anoxygen level of at least 6 mg O2 L�1 and a
12–12 h light–dark cycle (lights on: 06:30 AM).
The stocking density is within the range of normal
production as is documented by the EFSA (2008).
Oxygen, temperature, pH, food, were all according
to commercial farming conditions. The experimen-
tal procedure (fasting, transport and post-transport
observation) was started after an acclimation per-
iod of 7 weeks. During acclimation, the fish were
manually fed twice daily (09.00 and 17.00), in
© 2013 John Wiley & Sons Ltd, Aquaculture Research, 1–132
Recovery from road transportation of eel J G J Boerrigter et al. Aquaculture Research, 2013, 1–13
total 10 g feed day�1 kg�1 eel. Commercial eel
feed was used (Skretting; composition: 47% pro-
tein, 14% fat, 7,5% ashes, 2,3% cellulose, 1%
phosphor, 5 mg kg�1 copper, vitamin E, A, D3).
Preceding transport eels were fasted for 120 h. For
marketable eels that are cultivated in recirculation
systems, this fasting period is necessary for
removal of undesirable off-flavours (EFSA 2008).
Fasting was performed according to regular com-
mercial farming conditions. After 24 h of food
deprivation, water temperature was lowered over
24 h from 24°C to 19°C according to production
practice, stocking density was increased to
206 kg 1000 L�1 by placing a vertical glass plate
in the tank that reduced the volume to 1/3.
Increasing the density during fasting by a factor of
3 is customary in eel aquaculture. When water
temperature reached 19°C, feed deprivation was
continued over the next 96 h. At this point, the
fish were ready for the actual transport.
Experimental design
European eel was transported according to general
production standards and practices used in the
Netherlands. Animals were transported for 3 h at
a stocking density of 270–290 kg 1000 L�1. Eels
from 5 aquaria were carefully netted and loaded
in a polystyrene transport tank. Subsequently, the
tank was closed by a wooden lid. This tank (bot-
tom area: 0.95 9 1.05 m, height: 1.00 m) was
filled with 150 L water from the recirculation sys-
tem that contained the eels. During transport,
water was oxygenated, via a fenestrated ring on
the bottom of the tank, using pure oxygen. Trans-
port was performed by a hauler who checked the
oxygen level in the water manually after 1.5 h of
transport, using the Hach Lange, HQ 40 multime-
ter. For approximately 50% of the Dutch haulers
this is a standard procedure during eel transport
which lasts about 1 min. The route taken was
planned beforehand using GPS and represented a
normal, average, transport route. After transport,
fish were randomly returned to the five glass
aquaria, i.e. group composition in each tank after
transport was thus different from before transport.
Transportation was repeated with eels from five
other aquaria. Before transport, water in the trans-
port tank was changed. Another five aquaria were
emptied, mixed and placed in a non-transparent
plastic 150 L tank covered with a wooden lid to
function as control. This tank was also supplied
with pure oxygen in the water, but oxygen levels
were not measured half-way the holding period as
no major changes were expected in the control
eels. After 3 h, these eels were returned to the five
Fas ng120 hours
Transfer to a tankin the lab
Transfer to a tankmounted on thetransport trailer
0 h6 h
24 h48 h72 h
Transport: 3 hourstransport, unloading andreturn to the aquaria.Repeated with secondgroup
Time points ofsampling at the lab
Control: 3 hours wai ng periodand return to the aquaria
0 h6 h
24 h48 h72 h
Basal Fas ng
Pre-transport analyses ofeels
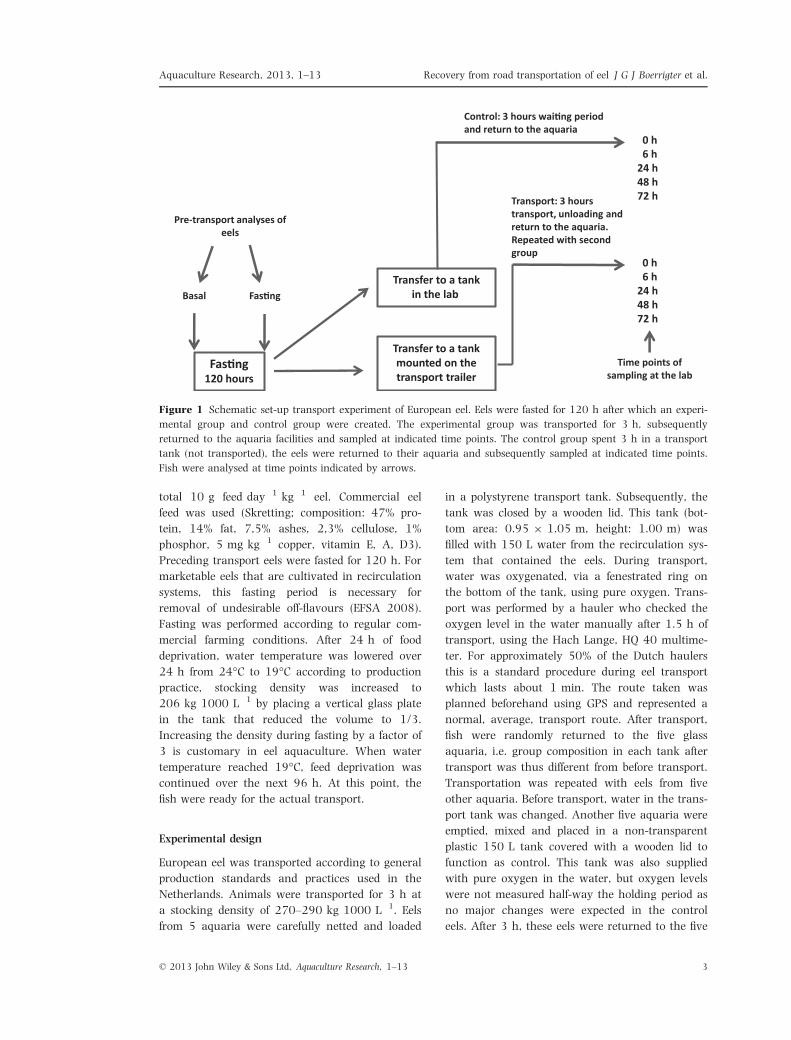
Figure 1 Schematic set-up transport experiment of European eel. Eels were fasted for 120 h after which an experi-
mental group and control group were created. The experimental group was transported for 3 h, subsequently
returned to the aquaria facilities and sampled at indicated time points. The control group spent 3 h in a transport
tank (not transported), the eels were returned to their aquaria and subsequently sampled at indicated time points.
Fish were analysed at time points indicated by arrows.
© 2013 John Wiley & Sons Ltd, Aquaculture Research, 1–13 3
Aquaculture Research, 2013, 1–13 Recovery from road transportation of eel J G J Boerrigter et al.
aquaria. Post-transport stocking density was
72 kg 1000 L�1 for all groups as the glass plates,
which had been inserted to increase densities,
were removed. The remaining two aquaria were
used to analyse basal and fasting conditions before
the transport.
Prior to the experiment, 10 fish from one aquar-
ium were taken randomly for sampling (basal;
Fig 1). Another 10 fish from one aquarium were
randomly sampled after 120 h of fasting (fasting;
Fig 1). Both transported groups and the control
group were sampled at fixed intervals after trans-
port/holding period i.e. at 0, 6, 24, 48 and 72 h
after transport/holding period (Fig 1). Fish were
not fed during the recovery period to avoid
adverse water conditions. During sampling, fish
were randomly caught and blood and gills were
taken (n = 10 per aquaria). Also, weights were
noted and water samples were analysed.
Fish euthanasia and sample collection
Randomly, fish were removed from their holding
tanks by netting and placed within a large water-
filled bucket containing 0.1% (v/v) 2-phenoxyethanol
(Sigma, St. Louis, MO, USA). Once anaesthetized
(within 1 min), fish were removed from the water
and blood was drawn after which the fish were imme-
diately killed by transecting the spinal cord right
behind the skull. Blood was drawn using heparinized
syringes and 1 mL of blood was collected in vials
(Eppendorf, 1.5 mL) and immediately put on ice.
Subsequently, the vials were centrifuged (1800 g,
4°C, 10 min) and blood plasma was separated from
blood cells and stored at �20°C until analysis.
Gill tissue was collected and put into 50 mL
Greiner tubes containing BOUIN fixative (filtrated;
saturated picric acid, saturated formaldehyde
(37%), glacial acetic acid (15:5:1 ratio)). The next
day samples were dehydrated through steps of
increasing ethanol percentages and finally embed-
ded in paraffin. We mounted 7 lm thick tissue
sections on gelatinized glass slides and dried.
In addition, we also inspected whether or not
mortality occurred in the course of the study.
Water quality
Since the water quality in the tanks in the labora-
tory was controlled with regard to temperature, pH,
ammonia levels, refreshment and oxygenation, the
number of water samples taken before and during
the experiment was reduced. In the aquaria, water
temperature was stable (19°C � 0.09). Analyses of
Total Ammonia Nitrogen (TAN, recalculated to mg
NH3�N L�1 by use of the data of Emerson, Russo,
Lund & Thurston 1975), Nitrite-N (NO2), Nitrate-N
(NO3�) levels were performed with Tetra test kits
(Tetra Werke, Melle, Germany). Temperature, pH
and oxygen concentrations were continuously
measured by Hach Lange HQ 40 multimeter.
Blood plasma analysis
Cortisol was measured as previously described by
Gorissen and colleagues (Gorissen, Bernier, Manuel,
de Gelder, Metz, Huising & Flik 2012). Briefly, 96-well
microtitre plates were coated with mouse cortisol
antibodies in a coating buffer. Plates were cleared of
coating buffer and washed with a wash buffer before
blocking possible a-specific binding sites with a block-
ing buffer. Wells were cleared of blocking buffer and
10 lL of standard or sample, together with 90 lL of
tracer, was added to the proper wells. After the incu-
bation period, wells were cleared and washed before
scintillation liquid was added. Activity within the
wells was measured using a b-counter.Glucose, NEFA and lactate were measured using
commercially available kits (Wako Diagnostics,
Richmond, VA, USA). Plasma osmolality (sample
volumes: 50 lL) was measured with a cryoscopicos-
mometer (Osmomat 030, Gonotec, Germany). De-
ionized water (0 mOsmol kg�1) and a standard
solution (300 mOsmol kg�1) were used as refer-
ence. Plasma sodium and plasma chloride were
photometric determined with the Sodium rapid
kit and Chloridliquicolor kit of Human (Human
Diagnostics, Wiesbaden, Germany).
Gill histology
After paraffin removal from the collected gill tissue
samples, sections were either placed in an alcian
blue solution to stain mucus producing cells or
placed in 2% (v/v) H2O2 to neutralize endogenous
peroxidase activity for use in immunohistochemis-
try. Subsequently, non-specific binding sites were
blocked with 2% (v/v) normal donkey serum and
the sections incubated overnight with antibodies
against Na/K-ATPase (final dilution 1:300) to stain
chloride cells. Donkey anti-rabbit was used as sec-
ondary antibody at a dilution of 1:200. Sections
were subsequently incubated with the Vectastain
ABC Kit (Vector Laboratories, Burlingame, CA,
© 2013 John Wiley & Sons Ltd, Aquaculture Research, 1–134
Recovery from road transportation of eel J G J Boerrigter et al. Aquaculture Research, 2013, 1–13
USA). Staining was performed in 0.025% (w/v) 3,3′-
diaminobenzidine (DAB) and 0.0005% (v/v) H2O2.
Statistics
Data were checked for normal distribution and statis-
tical analysis was performed in Graphpad Prism 5
(Graphpad Software, La Jolla, CA, USA) using Krus-
kal–Wallis (when not normally distributed) or a
One-Way ANOVA (when normally distributed) to test
for significance between either experimental or con-
trol groups over time; time points are independent
samples. To test for significance between an experi-
mental and control group at specific time points, a
Mann–Whitney U-test (when not normally distrib-
uted), unpaired t-test or unpaired t-test with Welch’s
correction were used (when normally distributed and
depending on sample distribution). Significance was
set at P ≤ 0.05. Data are expressed as means � 1
standard deviation (SD). For all figures: groups with
the same letters are not significantly different.
Results
Water quality
Water quality was closely monitored during the
experiment. Data are shown in Table 1; pH-values
were adjusted where necessary to represent farming
conditions (see Table 1). During fasting, the pH-
value was down-regulated, when it was higher than
7.9 using nitric acid (1:10 diluted). The pH-values
fluctuated in the course of the experiment between
6.9 and 7.4. Transport tanks were filled with water
from the recirculation system, which contained a
dissolved oxygen concentration of 5.50 and
6.36 mg L�1 at the beginning of transport. At the
end of the transport, i.e. after 3 h, oxygen concentra-
tions were between 11.96 and 10 mg L�1. After
transfer of the control group into the tank, the oxy-
gen concentration decreased to 3.0 mg L�1. During
the waiting period, the oxygen concentration started
to increase to 4.46 mg L�1 due to pure oxygen sup-
ply in the water. Water temperature fluctuated dur-
ing transport between 17°C and 21°C. In the control
group, temperature dropped from 21.4°C to 20.0°Cover 3 h. TAN was low in the aquaria throughout
the experiment i.e., between 0.21 and 1.2 mg
(NH3+NH4+)-N L�1. Before fasting, nitrite levels
varied between 0 and 1.5 mg NO2�-N L�1. After
transport, nitrite-N in the water varied between
<0.091 and 0.45 mg NO2�-N L�1. Prior to fasting,
nitrate-N levels in the water fluctuated between 5
and 57.5 mg NO3�-N L�1. Directly after transport,
nitrate levels were 2.8 mg NO3�-N L�1 in all groups.
Table 1 Water quality during transport and the recovery period following transport
pH O2 (mg L�1) Temperature (°C)
Control Batch 1 Batch 2 Control Batch 1 Batch 2 Control Batch 1 Batch 2
Post fasting 7.67 7.67 7.65 9.3 9.3 9.3 18.4 18.4 18.6
Transport tank (begin of transport) 7.67 7.43 7.62 2.95 5.5 6.36 21.4 19.5 19.3
Transport tank (after transport) 6.94 7.91 7.23 4.46 11.96 10 20 18.6 17.1
(Time after transport)
0 7.68 7.73 7.73 9.83 11.16 11.16 18.8 18.6 18.6
24 7.82 7.7 7.7 7.7 6.8 6.8 18.9 18.9 18.9
48 7.85 7.73 7.73 7.8 6.7 6.7 19.1 19 19
72 7.81 7.74 7.74 8.3 6.2 6.2 19.4 19.2 19.2
TAN (NH3+NH4+)-N mg L�1) NO2
�-N (mg L�1) NO3�-N (mg L�1)
Control Batch 1 Batch 2 Control Batch 1 Batch 2 Control Batch 1 Batch 2
Post fasting 0.2059 0.2059 0.2059
Transport tank (begin of transport) 0.2059 0.2059 0.2059
Transport tank (after transport) 0.2059 0.2059 1.2353 0.091 0.45 2.8 2.8 2.8
(Time after transport)
0 n.d. 0.2059 0.2059 n.d. n.d. 0.24
24 n.d. 0.091 0.091 0.091
48 n.d. n.d. n.d. 0.091 0.091 0.091
72 n.d. n.d. n.d. 0.091 0.091 0.091
Empty cells: not measured.
n.d., not determined.
© 2013 John Wiley & Sons Ltd, Aquaculture Research, 1–13 5
Aquaculture Research, 2013, 1–13 Recovery from road transportation of eel J G J Boerrigter et al.
Stress axis
While we sampled 10 (control) to 20 (transport,
in duplicate) animals per time point, we did not
obtain data for all animals for the following two
reasons, (1) due to haemolyses we had to discard
the sample, (2) the volumes of plasma samples
were too small to measure all parameters.
Therefore, in the bars of the figures the numbers
are lower than 10 (control) or 20 (transport
groups).
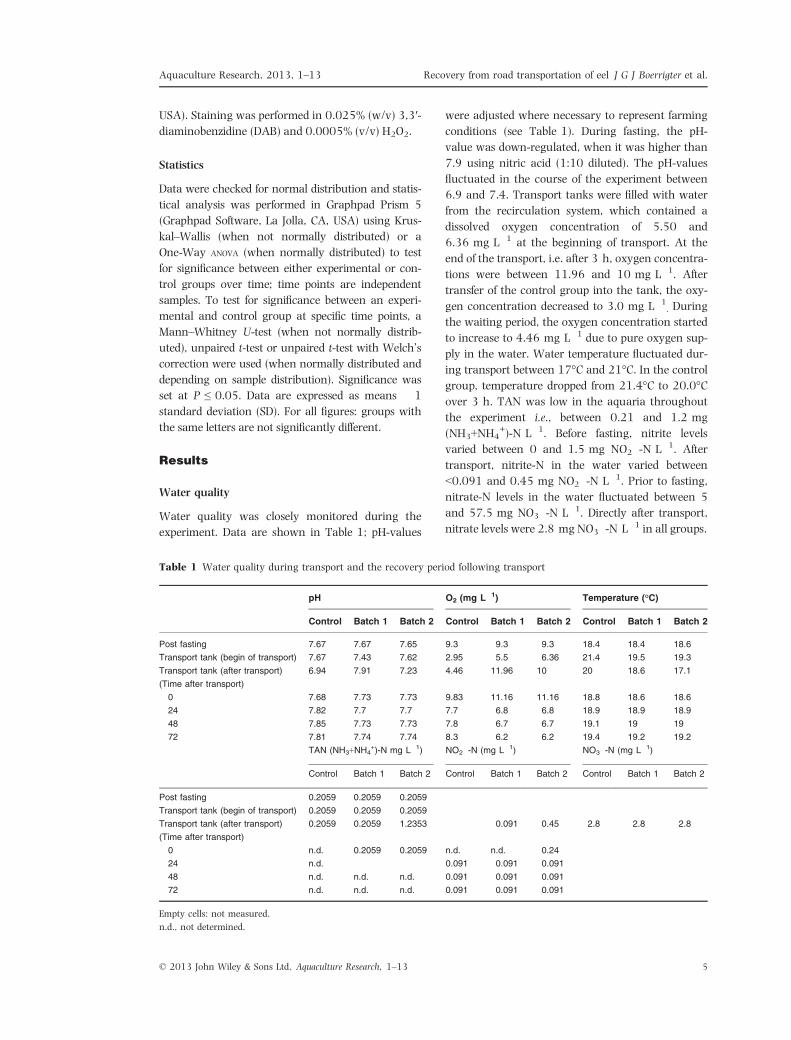
Basal plasma cortisol levels were low: 1.0 �0.6 ng mL�1. Also, values after 120 h fasting were
low: 1.6 � 1.2 ng mL�1. Transporting European
eel by a hauler led to a significant increase of
plasma cortisol levels immediately after transport
(levels at 0 h; Fig 2; 10.2 � 5.73 ng mL�1) com-
pared with basal levels. In contrast, for the control
no differences were found between levels immedi-
ately after transport (levels at 0 h; Fig 2; 4.4 �3.3 ng mL�1) and basal levels. Furthermore, blood
plasma cortisol levels in transported fish were sig-
nificantly (Mann–whitney U; P = 0.0145) higher
compared with levels in control fish, immediately
after transport (levels at 0 h; Fig 2). After 6 h,
plasma cortisol levels were not significantly differ-
ent from basal levels in the transported or control
group, neither was there a significant difference
between the transported and control group. In the
course of the recovery period (72 h in total),
plasma cortisol levels in the transported eels fluc-
tuated between 8.5 � 6.4 ng mL�1 at 6 h and
19.3 � 10.7 ng mL�1 at 24 h after transport.
Both in the transported fish and control fish, we
observed a gradual increase of plasma cortisol lev-
els compared with baseline levels as the recovery
period continued, starting at 24 h of the recovery
period and lasting up to 72 h. At 24, 48 or 72 h,
no significant differences between transported and
control fish were found. We did not observe any
mortality in the course of the experiment.
Energy metabolism
Glucose
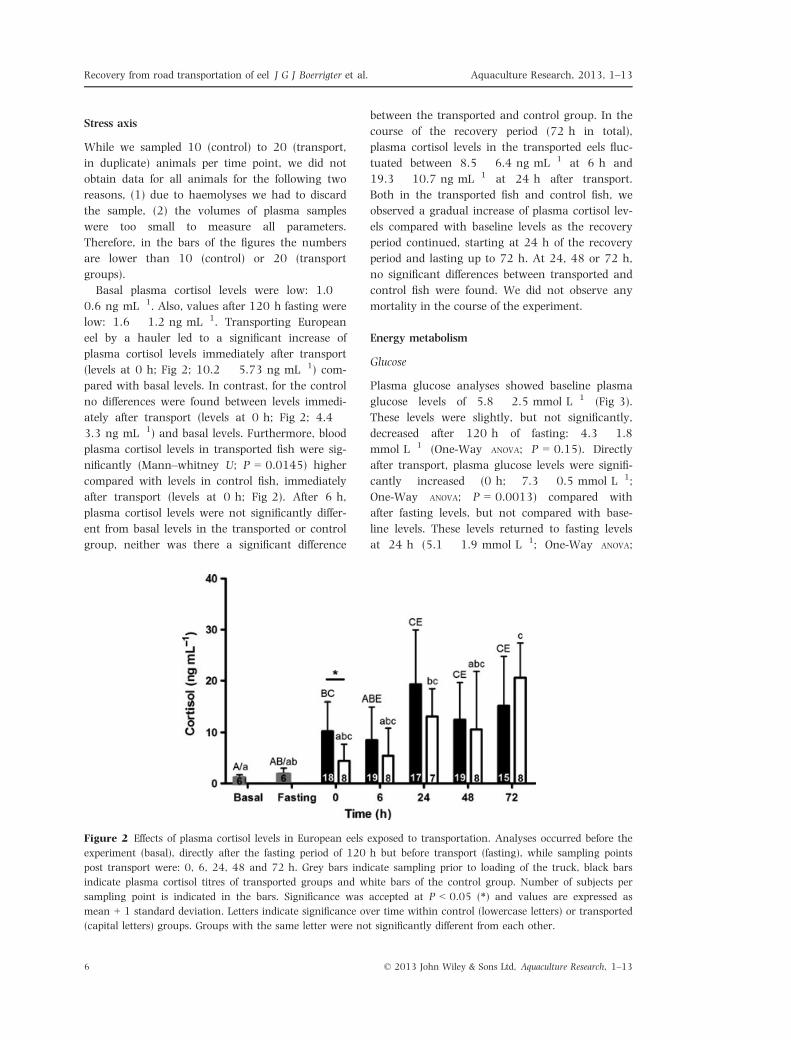
Plasma glucose analyses showed baseline plasma
glucose levels of 5.8 � 2.5 mmol L�1 (Fig 3).
These levels were slightly, but not significantly,
decreased after 120 h of fasting: 4.3 � 1.8
mmol L�1 (One-Way ANOVA; P = 0.15). Directly
after transport, plasma glucose levels were signifi-
cantly increased (0 h; 7.3 � 0.5 mmol L�1;
One-Way ANOVA; P = 0.0013) compared with
after fasting levels, but not compared with base-
line levels. These levels returned to fasting levels
at 24 h (5.1 � 1.9 mmol L�1; One-Way ANOVA;
Figure 2 Effects of plasma cortisol levels in European eels exposed to transportation. Analyses occurred before the
experiment (basal), directly after the fasting period of 120 h but before transport (fasting), while sampling points
post transport were: 0, 6, 24, 48 and 72 h. Grey bars indicate sampling prior to loading of the truck, black bars
indicate plasma cortisol titres of transported groups and white bars of the control group. Number of subjects per
sampling point is indicated in the bars. Significance was accepted at P < 0.05 (*) and values are expressed as
mean + 1 standard deviation. Letters indicate significance over time within control (lowercase letters) or transported
(capital letters) groups. Groups with the same letter were not significantly different from each other.
© 2013 John Wiley & Sons Ltd, Aquaculture Research, 1–136
Recovery from road transportation of eel J G J Boerrigter et al. Aquaculture Research, 2013, 1–13
P = 0.0008) after transport. Hereafter, they were
similar to baseline and fasting levels. In the control
group (basal, fasting), plasma glucose levels did
not change significantly after the waiting period
(0, 6, 24, 48, 72 h). After 6 h (7.2 � 0.5
mmol L�1), plasma glucose levels in the trans-
ported fish were significantly higher than in the
control fish (5.4 � 2.3 mmol L�1; unpaired t-test;
P = 0.0361).
NEFA
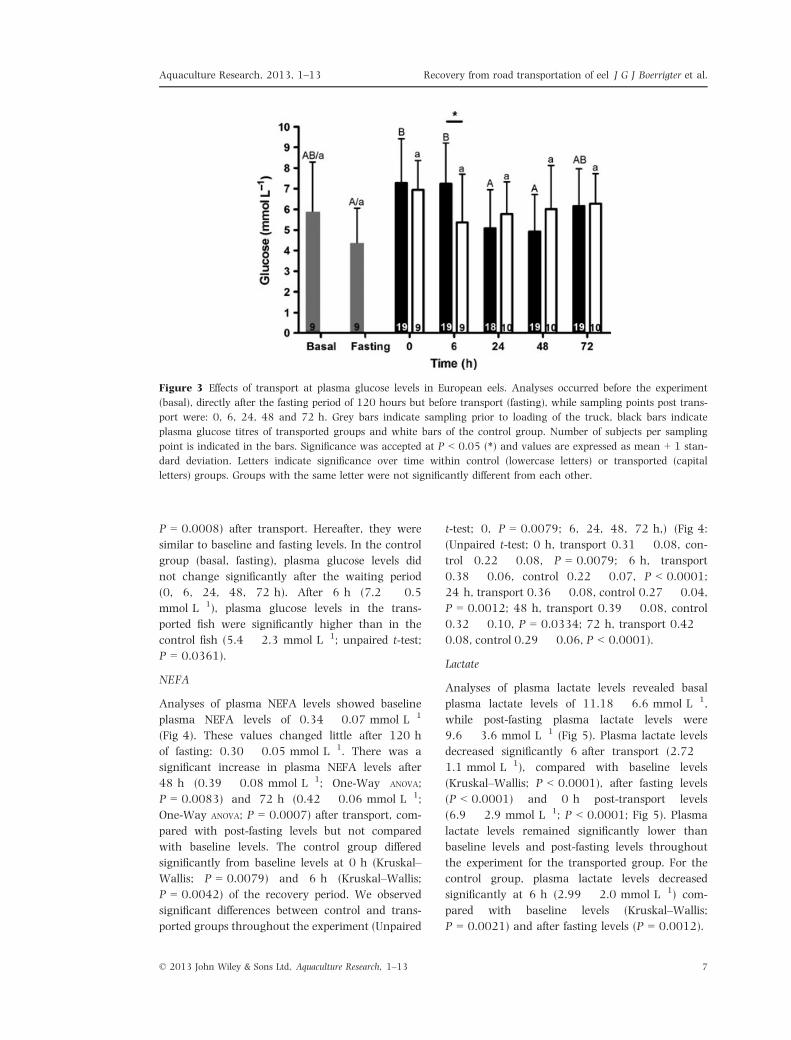
Analyses of plasma NEFA levels showed baseline
plasma NEFA levels of 0.34 � 0.07 mmol L�1
(Fig 4). These values changed little after 120 h
of fasting: 0.30 � 0.05 mmol L�1. There was a
significant increase in plasma NEFA levels after
48 h (0.39 � 0.08 mmol L�1; One-Way ANOVA;
P = 0.0083) and 72 h (0.42 � 0.06 mmol L�1;
One-Way ANOVA; P = 0.0007) after transport, com-
pared with post-fasting levels but not compared
with baseline levels. The control group differed
significantly from baseline levels at 0 h (Kruskal–
Wallis; P = 0.0079) and 6 h (Kruskal–Wallis;
P = 0.0042) of the recovery period. We observed
significant differences between control and trans-
ported groups throughout the experiment (Unpaired
t-test; 0, P = 0.0079; 6, 24, 48, 72 h,) (Fig 4:
(Unpaired t-test; 0 h, transport 0.31 � 0.08, con-
trol 0.22 � 0.08, P = 0.0079; 6 h, transport
0.38 � 0.06, control 0.22 � 0.07, P < 0.0001;
24 h, transport 0.36 � 0.08, control 0.27 � 0.04,
P = 0.0012; 48 h, transport 0.39 � 0.08, control
0.32 � 0.10, P = 0.0334; 72 h, transport 0.42 �0.08, control 0.29 � 0.06, P < 0.0001).
Lactate
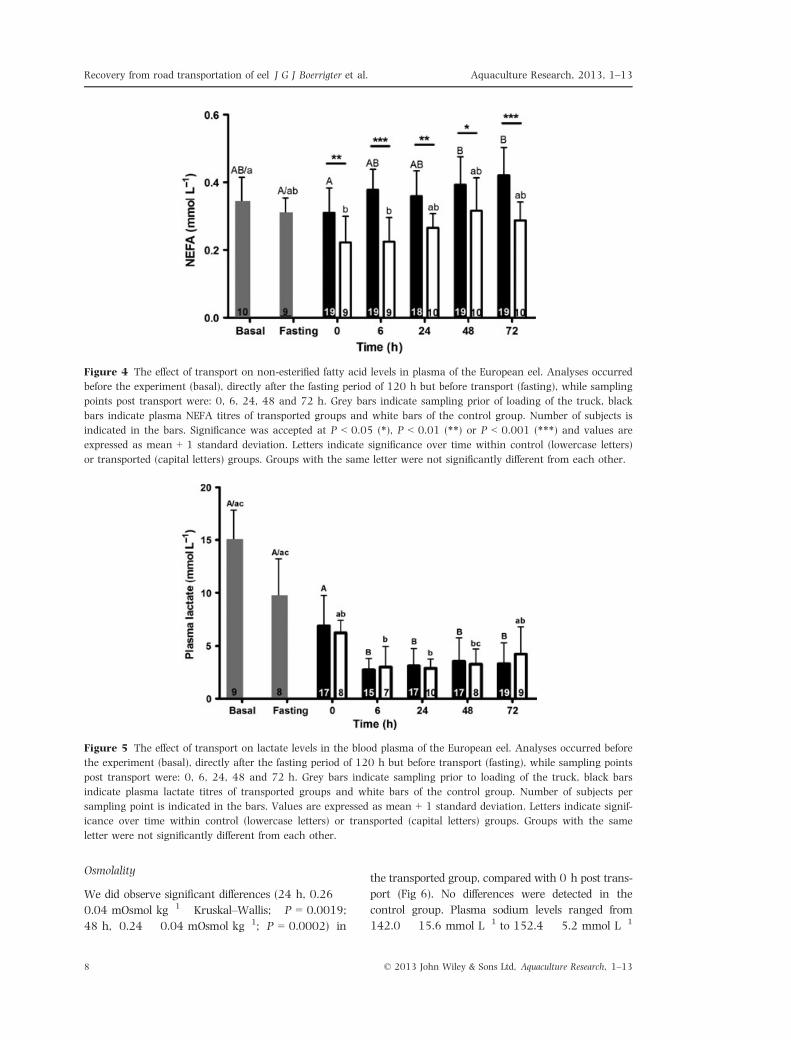
Analyses of plasma lactate levels revealed basal
plasma lactate levels of 11.18 � 6.6 mmol L�1,
while post-fasting plasma lactate levels were
9.6 � 3.6 mmol L�1 (Fig 5). Plasma lactate levels
decreased significantly 6 after transport (2.72 �1.1 mmol L�1), compared with baseline levels
(Kruskal–Wallis; P < 0.0001), after fasting levels
(P < 0.0001) and 0 h post-transport levels
(6.9 � 2.9 mmol L�1; P < 0.0001; Fig 5). Plasma
lactate levels remained significantly lower than
baseline levels and post-fasting levels throughout
the experiment for the transported group. For the
control group, plasma lactate levels decreased
significantly at 6 h (2.99 � 2.0 mmol L�1) com-
pared with baseline levels (Kruskal–Wallis;
P = 0.0021) and after fasting levels (P = 0.0012).
Figure 3 Effects of transport at plasma glucose levels in European eels. Analyses occurred before the experiment
(basal), directly after the fasting period of 120 hours but before transport (fasting), while sampling points post trans-
port were: 0, 6, 24, 48 and 72 h. Grey bars indicate sampling prior to loading of the truck, black bars indicate
plasma glucose titres of transported groups and white bars of the control group. Number of subjects per sampling
point is indicated in the bars. Significance was accepted at P < 0.05 (*) and values are expressed as mean + 1 stan-
dard deviation. Letters indicate significance over time within control (lowercase letters) or transported (capital
letters) groups. Groups with the same letter were not significantly different from each other.
© 2013 John Wiley & Sons Ltd, Aquaculture Research, 1–13 7
Aquaculture Research, 2013, 1–13 Recovery from road transportation of eel J G J Boerrigter et al.
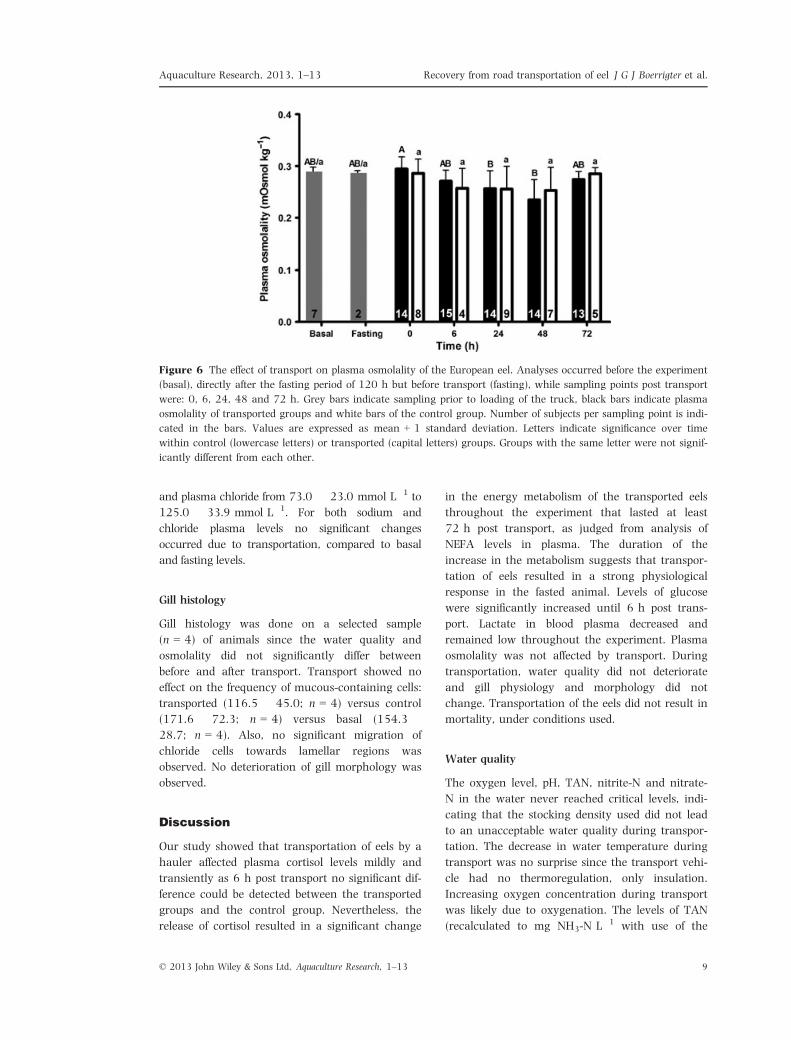
Osmolality
We did observe significant differences (24 h, 0.26 �0.04 mOsmol kg�1 Kruskal–Wallis; P = 0.0019;
48 h, 0.24 � 0.04 mOsmol kg�1; P = 0.0002) in
the transported group, compared with 0 h post trans-
port (Fig 6). No differences were detected in the
control group. Plasma sodium levels ranged from
142.0 � 15.6 mmol L�1 to 152.4 � 5.2 mmol L�1
Figure 4 The effect of transport on non-esterified fatty acid levels in plasma of the European eel. Analyses occurred
before the experiment (basal), directly after the fasting period of 120 h but before transport (fasting), while sampling
points post transport were: 0, 6, 24, 48 and 72 h. Grey bars indicate sampling prior of loading of the truck, black
bars indicate plasma NEFA titres of transported groups and white bars of the control group. Number of subjects is
indicated in the bars. Significance was accepted at P < 0.05 (*), P < 0.01 (**) or P < 0.001 (***) and values are
expressed as mean + 1 standard deviation. Letters indicate significance over time within control (lowercase letters)
or transported (capital letters) groups. Groups with the same letter were not significantly different from each other.
Figure 5 The effect of transport on lactate levels in the blood plasma of the European eel. Analyses occurred before
the experiment (basal), directly after the fasting period of 120 h but before transport (fasting), while sampling points
post transport were: 0, 6, 24, 48 and 72 h. Grey bars indicate sampling prior to loading of the truck, black bars
indicate plasma lactate titres of transported groups and white bars of the control group. Number of subjects per
sampling point is indicated in the bars. Values are expressed as mean + 1 standard deviation. Letters indicate signif-
icance over time within control (lowercase letters) or transported (capital letters) groups. Groups with the same
letter were not significantly different from each other.
© 2013 John Wiley & Sons Ltd, Aquaculture Research, 1–138
Recovery from road transportation of eel J G J Boerrigter et al. Aquaculture Research, 2013, 1–13
and plasma chloride from 73.0 � 23.0 mmol L�1 to
125.0 � 33.9 mmol L�1. For both sodium and
chloride plasma levels no significant changes
occurred due to transportation, compared to basal
and fasting levels.
Gill histology
Gill histology was done on a selected sample
(n = 4) of animals since the water quality and
osmolality did not significantly differ between
before and after transport. Transport showed no
effect on the frequency of mucous-containing cells:
transported (116.5 � 45.0; n = 4) versus control
(171.6 � 72.3; n = 4) versus basal (154.3 �28.7; n = 4). Also, no significant migration of
chloride cells towards lamellar regions was
observed. No deterioration of gill morphology was
observed.
Discussion
Our study showed that transportation of eels by a
hauler affected plasma cortisol levels mildly and
transiently as 6 h post transport no significant dif-
ference could be detected between the transported
groups and the control group. Nevertheless, the
release of cortisol resulted in a significant change
in the energy metabolism of the transported eels
throughout the experiment that lasted at least
72 h post transport, as judged from analysis of
NEFA levels in plasma. The duration of the
increase in the metabolism suggests that transpor-
tation of eels resulted in a strong physiological
response in the fasted animal. Levels of glucose
were significantly increased until 6 h post trans-
port. Lactate in blood plasma decreased and
remained low throughout the experiment. Plasma
osmolality was not affected by transport. During
transportation, water quality did not deteriorate
and gill physiology and morphology did not
change. Transportation of the eels did not result in
mortality, under conditions used.
Water quality
The oxygen level, pH, TAN, nitrite-N and nitrate-
N in the water never reached critical levels, indi-
cating that the stocking density used did not lead
to an unacceptable water quality during transpor-
tation. The decrease in water temperature during
transport was no surprise since the transport vehi-
cle had no thermoregulation, only insulation.
Increasing oxygen concentration during transport
was likely due to oxygenation. The levels of TAN
(recalculated to mg NH3-N L�1 with use of the
Figure 6 The effect of transport on plasma osmolality of the European eel. Analyses occurred before the experiment
(basal), directly after the fasting period of 120 h but before transport (fasting), while sampling points post transport
were: 0, 6, 24, 48 and 72 h. Grey bars indicate sampling prior to loading of the truck, black bars indicate plasma
osmolality of transported groups and white bars of the control group. Number of subjects per sampling point is indi-
cated in the bars. Values are expressed as mean + 1 standard deviation. Letters indicate significance over time
within control (lowercase letters) or transported (capital letters) groups. Groups with the same letter were not signif-
icantly different from each other.
© 2013 John Wiley & Sons Ltd, Aquaculture Research, 1–13 9
Aquaculture Research, 2013, 1–13 Recovery from road transportation of eel J G J Boerrigter et al.
database published by Emerson et al. 1975),
nitrite-N, nitrate-N and pH during transport of the
eels with a stocking density of 270–290 kg
1000 L�1 did not exceed threshold values for
these substances. The thresholds are 0.058 mg L�1
for NH3-N (20 mg L�1 for nitrite-N (Kamstra
& Span 1996) (Yamagata & Niwa 1979),
100 mg L�1 for nitrate-N (Kamstra & van der Heul
1998) and an acidity level above pH 5 (Kamstra &
van der Heul 1998). Analyses of the oxygen level
showed a decrease in oxygen in water (3 mg L�1)
of the control group after transfer in the new tank.
Cruz-Neto and Steffensen (1997) showed that
European eel acclimatized to 25°C decreased their
oxygen consumption when oxygen levels in the
water are below 1.9 mg L�1. The oxygen levels in
our experiment were higher, at lowest 3 mg L�1,
and were kept at a lower temperature (19°C) thanthis, and therefore we assume that the metabolism
of the eels was not detrimentally affected. Post
transport, the oxygen concentration in the water
dropped in the first 24 h. This is likely due to the
handling of the animals.
Cortisol
It appeared that plasma cortisol levels in the eels
that were transported were only mildly affected by
this process, under the conditions used. There is
on average a 6.4 fold (from 1.6 to 10.2 ng mL�1)
increase in the cortisol level, compared with the
fasted animals. A plasma level of 10.2 ng mL�1
on average is (still) low, as for other fish species
like carp or salmon, is it known that this may
reflect a normal baseline (Metz, Huising, Meek,
Taverne-Thiele, Wendelaar Bonga & Flik 2004;
Fast, Hosoya, Johnson & Afonso 2008). However,
when one notices the increased energy metabo-
lism, as shown by the NEFA data, it is likely that
we missed the window during which plasma corti-
sol levels in the eels increased to a higher value,
as Gollock, Kennedy, Quabius and Brown (2004)
showed that 4 h after exposure to a stressor
plasma cortisol returned to basal levels. We, there-
fore, assume that in our study this window
occurred during transport that lasted for 3 h.
Analysis during this period was not an option, as
this would have interrupted the experiment. In
addition, also Vijayan and Pereira (1994)
observed that in rainbow trout exposed to acute
stress the window during which plasma cortisol
increased and returned to basal levels was 6 h.
Lack of nutrition is a plausible explanation for the
steady rise in plasma cortisol which started at
24 h post transport. At the end of the experiment,
the fish have been deprived of food over 192 h
which can evoke metabolic changes directed by
cortisol. It is known that the stress axis is inter-
twined with food intake (see reviews of Bernier &
Peter 2001; Wendelaar Bonga 1997). It seems
that for a migrating fish like the European eel
analyses of only plasma cortisol is not a good bio-
marker for stress and additional measurements are
required.
Glucose
Even though cortisol reflects normal homeostatic
variation, there are enduring changes to the
metabolic system. Average glucose levels were
ranging from 4 to 7.5 mmol L�1, which is very
similar to other experiments with European eels
(Teles & Maria 2003). Glucose in the blood
increased significantly during the first 6 h after
transport compared with baseline or post-fasting
levels but returns within 24 h to basal. Hyper-
glycaemia in the first hours after transport can
indicate that the fish experience stress (Arends,
Mancera, Mu~nol, Wendelaar Bonga & Flik 1999)
and we might even have missed the highest pro-
duction within 6 h post stress (Vijayan & Pereira
1994). It has already been shown in Anguilla
japonica that injections with cortisol can increase
blood glucose (Chan & Woo 1978). Similar
effects have been shown in experiments with
Anguilla rostrata (Butler 1968). Glucose is an
important driver of metabolism and certain tis-
sues (involved during stress) may rely primarily
on glucose (for example brain, heart, blood cells,
and gills; Mommsen 1986). However, the quick
return of glucose to basal indicates that the
immediate stress response on transport is not
long lasting.
The lasting decrease in plasma lactate indicates
that transport has a more enduring effect than ini-
tially was concluded from the cortisol and plasma
glucose data. These data suggest that the fish have
the need for additional energy as lactate can be
converted to pyruvate and used in the Krebs cycle.
It is known that lactate can be used as an energy
source in tissues (involved during stress) like gills,
kidney, liver and brain (rev. Soengas, Sangio-
Alvarellos, Laiz-Carri�on & Mancera 2007; Soen-
gas, Andr�es & Strong 1998).
© 2013 John Wiley & Sons Ltd, Aquaculture Research, 1–1310
Recovery from road transportation of eel J G J Boerrigter et al. Aquaculture Research, 2013, 1–13
NEFA
There is a significant difference in plasma NEFA lev-
els between all transported and control groups. This
suggests a change in the energy metabolism, as we
also observed a descent in plasma lactate levels after
transportation. Due to this change, the eels were
able to cope with the increased energy demand,
which is probably needed to fuel cellular processes.
Plasma NEFA levels decreased in the control groups
at 0 and 6 h post transport, compared with the
baseline level. This may be caused by the drop in
temperature at the start of fasting (24 to 19°C).However in the transported groups, plasma NEFA
levels did not change compared with baseline levels.
This could be due to the additional energy needed
because of stress induced by transportation.
Osmolality
No chances in plasma osmolality and in also
plasma sodium and chloride levels were found. It
is known that stress can change the permeability
of the gill membranes (Dang, Balm, Flik, Wend-
elaar Bonga & Lock 2000), thereby potentially
influencing the osmolality of the blood. The
increase of cortisol does apparently not change gill
permeability and thereby the osmolality. This is in
accordance with the gill physiology, where no dif-
ferences were observed in the amount of mucous
cells between the groups.
Biological relevance
Elevated plasma cortisol is a primary stress
response and a strong indicator of stress in ani-
mals. Plasma cortisol levels in eel were only very
mildly affected by transport, as after a recovery
period of 6 h baseline levels were obtained. How-
ever, as shown by Gollock et al. (2004) in Euro-
pean eels cortisol is not necessarily a good readout
to address stress or welfare. The duration (72 h) of
the increased metabolism suggests that transporta-
tion of eels resulted in an increased energy
demand in the fasted animal. Following the 3 h-
transport, differences in cortisol levels were
observed between eels as indicated by the larger
SD values in Fig 2. This may suggest differences in
coping style between subjects (Koolhaas, Korte, De
Boer, Van Der Vegt, Van Reenen, Hopster, De
Jong, Ruis & Blokhuis 1999). This warrants fur-
ther studies as these differences may be associated
with differences in allostatic load (Koolhaas et al.
1999). The adverse effect of a recovery period of
more than 72 h post transport was scored as 5 on
a scale of 1 to 5 by Dalla Villa et al. (2009). Also,
it is conceivable that exposure to adverse condi-
tions, prior to stunning/killing, in a slaughter-
house may result in allostatic overload in eel. This
has been shown in a study by Bogdan and Walu-
ga (1980), who reported high mortality among
elvers especially on second day after transport,
mainly by pathogenic causes. This indicates that
transport is a potential hazard for this species, as
an allostatic overload may occur.
Conclusion
Here, we present evidence that transport of Euro-
pean eel under these conditions seems to be toler-
ated by the animals as indicated by the
physiological parameters, that we measured.
Transportation at a density of 270–290 kg
eels 1000 L�1 affected water quality within
known tolerable limits. Nevertheless, our study
indicates that the fish were affected for longer per-
iod than is revealed by the plasma cortisol titres
only, as shown by the plasma NEFA levels.
Acknowledgments
This study was sponsored by NWO (programme:
417 Value of Animal Welfare; project 418 num-
ber: 827.09.040) and Ministry of EL&I in the
Netherlands (BO project BO-12-02-002-025).
References
Arends R.J., Mancera J.M., Mu~nol J.L., Wendelaar Bonga
S.E. & Flik G. (1999) The stress response of the gilt-
head sea bream (Sparus aurata L.) to air exposure and
confinement. Journal of Endocrinology 163, 149–157.
Bernier N.J. & Peter R.E. (2001) The hypothalamic-pitui-
tary-interrenal axis and the control of food intake in
teleost fish. Comparative Biochemistry and Physiology
Part B 129, 639–644.
Bogdan E. & Waluga D. (1980) The effect of transport on
the quality of eel stocking material. Aquaculture 20,
139–146.
Broom D.M. (2005) The effects of land transport on ani-
mal welfare. Revue Scientifique et Technique de l Office
International des Epizooties 430, 683–691.
Butler D.G. (1968) Hormonal control of gluconeogenesis
in the North American eel, Anguilla rostrata. General
and Comparative Endocrinology 10, 85–91.
© 2013 John Wiley & Sons Ltd, Aquaculture Research, 1–13 11
Aquaculture Research, 2013, 1–13 Recovery from road transportation of eel J G J Boerrigter et al.
Chan D.K.O. & Woo N.Y.S. (1978) Effect of cortisol on
the metabolism of the eel, Anguilla japonica. General and
Comparative Endocrinology 35, 205–215.
Cruz-Neto A.P. & Steffensen J.F. (1997) The effects of
acute hypoxia and hypercapnia on oxygen consump-
tion of the freshwater European eels. Journal of Fish
Biology 50, 759–769.
Dalla Villa P., Marahrens M., VelardeCalvo A., Di Nardo
A., Kleinschmidt N., Fuentes Alvarez C., Truar A., Di
Fede E., Otero J.L. & M€uller-Graf C., Traw P. (2009)
Final report on Project to develop Animal Welfare Risk
Assessment Guidelines on Transport-Project developed
on the proposal CFP/EFSA/AHAW/2008/02. 127-
143 pp. Available at website: www.efsa.europa.eu/en/
supporting/doc/21e.pdf
Dang Z., Balm P.H., Flik G., Wendelaar Bonga S.E. &
Lock R.A. (2000) Cortisol increases Na+/K+-ATPase
density in plasma membranes of gill chloride cells in
the freshwater tilapia Oreochromis mossambicus. Journal
of Experimental Biology 203, 2349–2355.
Davis K.B. & Parker N.C. (1986) Plasma corticosteroid
stress response of 14 species of warm water fish to
transportation. Transactions of the American Fisheries
Society 115, 495–499.
EFSA (2008) Scientific report of EFSA on animal welfare
aspects of husbandry systems for farmed European eel
(Question No EFSA-Q-2006–149). Annex I EFSA Jour-
nal 809, 1–48.
Emerson K., Russo R.C., Lund R.E. & Thurston R.V.
(1975) Aqueous ammonia equilibrium calculations –
effect of pH and temperature. Journal of the Fisheries
Research Board of Canada 32, 2379–2383.
European Council Directive 2006/88/EC (2006)On
animal health requirements for aquaculture animals
and products thereof, and on the prevention and
control of certain diseases in aquatic animals. Official
Journal of the European Union L 328, 14–56, October
2006.
FAO (2012) http://www.fao.org/fishery/culturedspecies/
Anguilla_anguilla/en, website visited on 12 August 2012.
Fast M.D., Hosoya S., Johnson S.C. & Afonso L.O.B.
(2008) Cortisol response and immune-related effects of
Atlantic salmon (Salmo salar Linnaeus) subjected to
short-and long-term stress. Fish & Shellfish Immunology
24, 194–204.
FEAP (2011) Production report by members 2002-2010.
59 pp. Website: http://www.aquamedia.info/pdfflip/
FEAPPROD2011/ByCountries/index.html#/1, visited
12 August 2012.
Gollock M.J., Kennedy C.R., Quabius E.S. & Brown J.A.
(2004) The effect of parasitism of European eels with
the nematode, Anguillicola crassus on the impact of net-
ting and aerial exposure. Aquaculture 233, 45–54.
Gorissen M., Bernier N.J., Manuel R., de Gelder S., Metz
J.R., Huising M.O. & Flik G. (2012) Recombinant
human leptin attenuates stress axis activity in com-
mon carp (Cyprinus carpio L.). General and Comparative
Endocrinology 178, 75–81.
Iversen M., Finstad B. & Nilssen K.J. (1998) Recovery
from loading and transport stress in Atlantic salmon
(Salmo salar L.) smolts. Aquaculture 168, 387–394.
Kammerer D.B., Cech J.J. Jr & K€ultz D (2010) Rapid
changes in plasma cortisol, osmolality and respiration in
response to salinity stress in tilapia (Oreochromis mos-
sambicus). Comparative Biochemistry and Physiology Part
A: Molecular & Integrative Physiology 157, 260–265.
Kamstra A., Span J. A., et al. (1996) The acute toxicity
and sublethal effects of nitrite on growth and feed util-
isation of European eel, Anguilla anguilla (L.). Aquacul-
ture Research 27, 903–911.
Kamstra A. & van der Heul J. W. (1998) Effecten van de
pH op voederopname en voederbenutting van Europese
aal (Anguilla anguilla L.). RIVO-DLO rapport C027/98.
Koolhaas J.M., Korte S.M., De Boer S.F., Van Der Vegt
B.J., Van Reenen C.G., Hopster H., De Jong I.C., Ruis
M.A. & Blokhuis H.J. (1999) Coping styles in animals:
current status in behavior and stress-physiology.
Neuroscience and Biobehavioral Reviews 23, 925–935.
Korte S.M., Olivier B. & Koolhaas J.M. (2007) A new ani-
mal welfare concept based on allostasis. Physiology and
Behavior 92, 422–428.
Martinez-Porchas M. & Martinez-Cordova L. R. (2009)
Cortisol and glucose: reliable stress indicators of fish
stress? Pan-American Journal of Aquatic Sciences 4,
158–178.
Metz J.R., Huising M.O., Meek J., Taverne-Thiele A.J.,
Wendelaar Bonga S.E. & Flik G. (2004) Localisation,
expression and control of adrenocorticotropic hormone
in the nucleus preopticus and pituitary gland of com-
mon carp (Cyprinus carpio L.). Journal of Endocrinology
182, 23–31.
Mommsen T.P. (1986) Comparative gluconeogenesis in
hepatocytes from salmonid fishes. Canadian Journal of
Zoology 64, 1110–1117.
Roques J. A. C., Abbink W., Geurds F., van de Vis H. &
Flik G. (2010) Tailfin clipping, a painful procedure:
studies on Nile tilapia and common carp. Physiology &
Behavior 101, 533–540.
Rosen E. D. & Spiegelman B. M. (2006) Adipocytes as
regulators of energy balance and glucose homeostasis.
Nature 444, 847–853.
Schreck C.B., Solazzi M.F., Johnson S.L. & Nickelson T.E.
(1989) Transportation stress affects performance of
cohosalmon, Oncorhynchus kisutch. Aquaculture 82, 15–
20.
Soengas J.L., Andr�es M.D. & Strong E.F. (1998) Glucose,
lactate, and b-hydroxybutyrate utilization by rainbow
trout brain: changes during food deprivation. Physio-
logical Zoology 71, 285–293.
Soengas J.L., Sangio-Alvarellos S., Laiz-Carri�on R. &
Mancera J.M. (2007) Energy metabolism and osmotic
acclimation in teleost fish. In: Fish osmoregulation (ed.
© 2013 John Wiley & Sons Ltd, Aquaculture Research, 1–1312
Recovery from road transportation of eel J G J Boerrigter et al. Aquaculture Research, 2013, 1–13
by B. G. Kapoor), pp. 277–307. Science Publishers,
Enfield, NH, USA.
Specker J.L. & Schreck C.B. (1980) Stress responses to
transportation and fitness for marine survival in coho
salmon (Oncorhynchus kisutch) smolts. Canadian Journal
of Fish and Aquatic Science 37, 765–769.
Sterling P. & Eyer J. (1988) Allostasis: a new paradigm
to explain arousal pathology. In: Handbook of life stress,
cognition and health (ed. by P. Sterling, J. Eyer, S. Fisher
& J. Reason), pp. 629–649. John Wiley & Sons,
Oxford.
Teles M. & Maria V.L. (2003) Anguilla Anguilla L. Plasma
cortisol, lactate and glucose responses to abietic acid,
dehydroabietic acid and retene. Environment Interna-
tional 29, 995–1000.
Vijayan M.M & Pereira C. (1994) Hormonal stimulation
of hepatocyte metabolism in rainbow trout following
an acute handling stress. Comparative Biochemistry and
Physiology 108, 321–329.
Warris P.D. (1998) The welfare of slaughter pigs during
transport. Animal Welfare 7, 365–381.
Wendelaar Bonga S.E. (1997) Stress response in fish.
Physiological Reviews 77, 591–625.
Winton J.R. (2001). Fish health management. In: Fish
hatchery management (ed. by G.A. Wedemeyer),
pp. 559–639. American Fisheries Society, Bethesda,
MD.
Yamagata Y. & Niwa M. (1979) Toxicity of nitrite to
eels. Aquaculture (Suisan Zoshoku) 27, 5–11.
© 2013 John Wiley & Sons Ltd, Aquaculture Research, 1–13 13
Aquaculture Research, 2013, 1–13 Recovery from road transportation of eel J G J Boerrigter et al.