real estate - old dominion university
TRANSCRIPT
| https://odu.edu/business/center/evwilliams-center |
2021
E. V. WILLIAMS CENTER FOR REAL ESTATE
REAL ESTATEMARKET REVIEW & FORECAST
Hampton Roads
E. V. WILLIAMS CENTER FOR REAL ESTATEAT THE HARVEY LINDSAY SCHOOL OF REAL ESTATE
March 9, 2021
| https://odu.edu/business/center/evwilliams-center |
At Atlantic Union Bank®, we know local is better. That’s why Andy Hodge and his team of commercial bankers make fast and fair decisions locally, so you can get on with building your business.
Let’s talk.
We’re proud to be the Presenting Sponsor of the 26th Annual Hampton Roads Market Review & Forecast.
Discover the Local FinancingDifference
In Hampton Roads, please contact:Commercial Real Estate FinanceTom Dillon | 757.473.5843
Business BankingPaul Buckley | 757.473.5855
Commercial LendingJay Kenslow | 757.227.5251Mike Kos | 757.985.4791
MEMBER FDIC
AtlanticUnionBank.com
Coastal Commercial Team: Andy Hodge, Tom Dillon, Jay Kenslow, Mike Kos
150 W Brambleton AvenueNorfolk, Virginia 23510
757.222.5380 • insidebiz.com
The Hampton Roads Business Journal
MEDIA SPONSOR:
Message from the Center ................ 5
Executive Committee ....................... 7
Advisory Board ................................. 7
Members ........................................... 8
Sponsors .......................................... 11
Economic Trends ............................. 13
Office .............................................. 16
Industrial ......................................... 20
Retail ............................................... 23
Multifamily ..................................... 27
Residential ...................................... 31
https://odu.edu/business/center/evwilliams-center
CONTENTS
26th Annual Hampton Roads REAL ESTATE m a r k e t r e v i e w & f o r e c a s t


Last year as we prepared for the Hampton Roads Real Estate Market Review and Forecast, we were not aware that the local commercial real estate market’s biggest annual event would also be the last…for a while, anyway. Just a week later, we were faced with an economic shut-down. The local
community had heard of COVID-19, but few of us really understood the chaos and tragedy it would cause. As I write this, vaccinations have begun and there is light at the end of the tunnel; but the pandemic has put into perspective how important health and safety really is.
With this in mind, the E.V. Williams Center for Real Estate presses on with our mission by presenting this year’s event virtually. We could not have accomplished it without the continued support of the real estate community, especially our Directors and Speakers/Authors. We appreciate their time, dedication, and research, which continue to ensure a comprehensive examination of the market sectors.
The E.V. Williams Center for Real Estate and the Harvey Lindsay School of Real Estate rely on the contributions of the community. Our programs and events are designed to connect the academic and business communities. As partners, we strive to promote academic achievement, professional development, and personal growth by providing career information, mentoring, and networking opportunities to the students who comprise our future real estate workforce. Over the past year, students in the Harvey Lindsay School of Real Estate had the opportunity to participate in industry events, guest lectures, site visits, internships, and licensing preparation programs. These opportunities provide them with the hands-on experiences necessary to support their academic work. Thank you to everyone who enriched our students as they continue their pursuits.
This is my last Market Review as Chair of the E.V. Williams Center. When I succeeded Stephanie Sanker, I swore I would not do for it as long as she did. Stephanie, I guess I lied, but I have enjoyed every minute of it. Congratulations to incoming Chair Krista Costa, S.V.P. at Divaris Real Estate. Krista is a consummate professional, and a devoted ODU alumna. The Center is in very good hands.
We are blessed to have a strong and supportive group of local practitioners. I would like to personally thank the Harvey Lindsay family for whom ODU’s Real Estate program is named; Robert M. Stanton who endowed the Chair in Real Estate; and E.V. Williams, the Center’s namesake. I also thank our sponsors who make the Market Review possible. I am grateful to my Executive Committee, Stephanie Sanker, Tom Dillon, Jonathan Guion, and Brad Sanford. We could not accomplish our goals without the consistent support of ODU Administration especially President Broderick and Dean Tanner; as well as current and past ODU Faculty and Staff Andy Hansz, PhD, John Griffith, PhD, Bruce Rubin, PhD, Walter D’Lima, PhD, Sara Russell Riggs, Stephanie Hawthorne, and Ruth Cookson. It is because of each of you that the future is bright for real estate at ODU.
The Center is constantly looking for opportunities to offer additional educational programming and support the needs of the local industry. To learn more or to participate in upcoming events, please contact Ruth Cookson, Interim Director.
Thank you for attending the 2021 Market Review and Forecast. We appreciate your support of the E.V. Williams Center for Real Estate, and look forward to hosting you at future events
Lawrence J. Colorito, MAIChair, E.V. Williams Center for Real EstateChairman of the Board & Senior Managing Director, Valbridge Property [email protected] / (757) 550-1138
MESSAGEFROM THE CENTER
5

© 2021 Jones Lang LaSalle Brokerage, Inc. All rights reserved.
We’re here to help.At JLL, we get to know you, your plans and your ambitions so that your real estate provides more than just a short-term solution.
We look beyond the transaction to give you the full benefit of our market-leading research and strategic perspective—ensuring that your real estate decisions today meet your goals for tomorrow.
Brokerage | Consultancy | Finance | Investment Sales Project Management | Property Management
101 W. Main Street, Suite 7770 Norfolk, VA 23510 +1 757 965 3006
us.jll.com
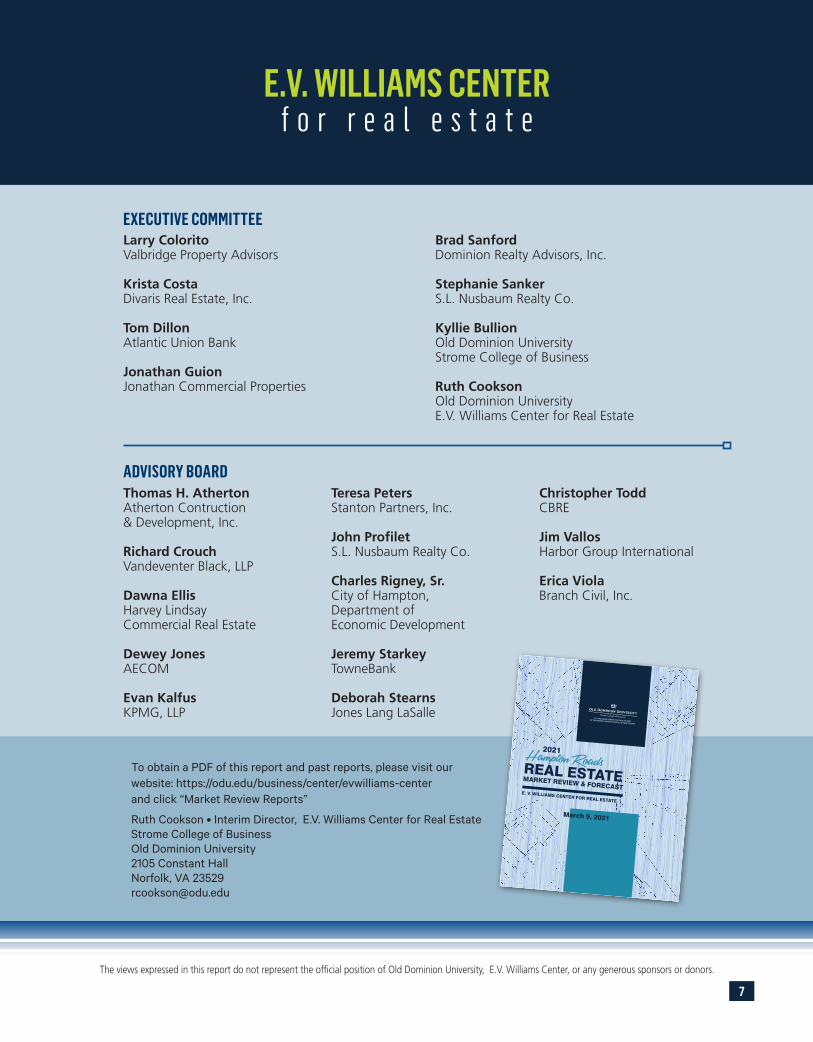
EXECUTIVE COMMITTEE
ADVISORY BOARD
Larry ColoritoValbridge Property Advisors
Krista CostaDivaris Real Estate, Inc.
Tom DillonAtlantic Union Bank
Jonathan GuionJonathan Commercial Properties
Brad SanfordDominion Realty Advisors, Inc.
Stephanie SankerS.L. Nusbaum Realty Co.
Kyllie BullionOld Dominion UniversityStrome College of Business
Ruth CooksonOld Dominion UniversityE.V. Williams Center for Real Estate
Thomas H. AthertonAtherton Contruction& Development, Inc.
Richard CrouchVandeventer Black, LLP
Dawna EllisHarvey LindsayCommercial Real Estate
Dewey JonesAECOM
Evan KalfusKPMG, LLP
Teresa PetersStanton Partners, Inc.
John ProfiletS.L. Nusbaum Realty Co.
Charles Rigney, Sr.City of Hampton,Department of Economic Development
Jeremy StarkeyTowneBank
Deborah StearnsJones Lang LaSalle
Christopher ToddCBRE
Jim VallosHarbor Group International
Erica ViolaBranch Civil, Inc.
To obtain a PDF of this report and past reports, please visit ourwebsite: https://odu.edu/business/center/evwilliams-centerand click “Market Review Reports”
Ruth Cookson • Interim Director, E.V. Williams Center for Real EstateStrome College of BusinessOld Dominion University2105 Constant HallNorfolk, VA [email protected]
E.V. WILLIAMS CENTER f o r r e a l e s t a t e
The views expressed in this report do not represent the official position of Old Dominion University, E.V. Williams Center, or any generous sponsors or donors.
| https://odu.edu/business/center/evwilliams-center |
2021
E. V. WILLIAMS CENTER FOR REAL ESTATE
REAL ESTATEMARKET REVIEW & FORECAST
Hampton Roads
E. V. WILLIAMS CENTER FOR REAL ESTATEAT THE HARVEY LINDSAY SCHOOL OF REAL ESTATE
March 9, 2021
7
E.V. WILLIAMS CENTER FOR REAL ESTATE
m e m b e r s
8
Scott AdamsColliers InternationalVirginia, LLC
Matt BaumgartenTidewater Community College
Dan BeckBeck Roofing Corporation
Lawrence ColoritoValbridge Property Advisors
Krista CostaDivaris Real Estate, Inc.
John CrouseSaunders+Crouse Architects
Kim CurtisTidewater Home Funding, LLC
Edward DentonDenton Realty Company
Thomas DillonAtlantic Union Bank
Nancy DoveDove Valuation Services, LLC
Wendy DruckerDrucker + Falk
Dawna EllisHarvey Lindsay Commercial Real Estate
Tasos GaliotosWillcox + Savage, P.C.
Libby GriebelCity of Hampton
Jonathan GuionJonathan Commercial Properties
Jan HallRRMM Design Build, LLC
Carl HardeeThe Lawson Companies
Kevin HughesSuffolk Economic Development
Michael InmanInman & Strickler, PLC
Jerry JonesAll Access Property Management
Ryan KingHarvey Lindsay Commercial Real Estate
Larry LombardiCurrituck County Economic Development
Jeremy McLendonCCP Commercial Real Estate
Janet MooreBerkshire Hathaway HomeServices Towne Realty
Robert MoorePortsmouth Economic Development
Tom O’GradyClancy & Theys Construction
Teresa Peters Stanton Partners, Inc.
E.V. WILLIAMS CENTER FOR REAL ESTATE
m e m b e r s
9
Victor PickettGrandbridge Real Estate Capital, LLC
Donna PriceCommercial Loan Services
Craig ReadRead Commercial Properties, Inc.
Brenda ReidHoward HannaReal Estate Services
Mark RichardsonTimmons Group
Stewart SacksStewart Title Guaranty Company
Bradley SanfordDominion Realty Advisors, Inc.
Stephanie SankerS.L. Nusbaum Realty Co.
Tara SaundersODU Real Estate Foundation
Keith SlattumDollar Bank, FSB Virginia Division
Robert M. StantonStanton Partners, Inc.
Jeremy StarkeyTowneBank
Deborah StearnsJLL
Bonnie StretzAtlantic Union Bank
Bob ThorntonThornton Commercial Property Services
Altay UzunMarcus & Millichap
Erica ViolaBranch Civil, Inc.
Samuel WalkerPembroke Commercial Realty
Brennen WatersHarris Property Advisors
Ami WhiteTowneBank Mortgage
Jen WilsonValbridge Property Advisors
Eva WigginsHarvey Lindsay Commercial Real Estate
Steven WrightCity of Chesapeake, Economic Development Department
Mike ZarpasS.L. Nusbaum Realty Co.
Membership as of February 10, 2021

WWW.RMRGROUP.COM
SETTING A NEW STANDARD IN REAL ESTATE EXPERTISE
SINCE 1986.
FORTUNE MAGAZINE'S 75TH FASTEST GROWING COMPANY IN 2019.
LOCAL ROOTS, GLOBAL REACHThere are many reasons to put down roots in Isle of Wight, home of the Shirley T. Holland Intermodal Park
ISLE OF WIGHT COUNTY DEPARTMENT OF ECONOMIC DEVELOPMENTP.O. BOX 80, ISLE OF WIGHT, VA 23397 | 757.356.1962 | [email protected] | INSIDETHEISLE.COM
ISLE OF WIGHTMAJOR EMPLOYERS:
Smith eld FoodsKeurig Dr PepperInternational Paper
★
• The premier, publicly-owned manufacturing, distribution & logistics park in the Hampton Roads region
• 44-acre permit-ready site under development• Able & ready labor force of 840,000+• 35 minute drive to Port of Virginia• Access to interstates 95, 85, 64, 264, & 664• Enterprise & Foreign Trade zones• Rail-served sites• All utilities including abundant public water• Proven fast-track site plan review & permitting process
10
11
THANK YOUTHANK YOU2021 SPONSORS
PRESENTING SPONSOR
EXCLUSIVE MONARCH SPONSOR
BLUE & SILVER SPONSORS
PROGRAM SPONSORS
MUNICIPAL SPONSORS MEDIA SPONSOR
SIGNATURE SPONSOR

12
Some of the hottest commercial property in Virginia is located
in North Carolina.Currituck County, North Carolina is actually part of the Hampton Roads Metropolitan Statistical Area. Expand your business here and get all the benefits of the Southeastern Virginia corridor, plus extra advantages—including the lowest tax rate of all the
Hampton Roads localities (.48 per $100 valuation), the lowest corporate tax in the U.S. (among states with a corporate tax) and workforce incentives offered only in North Carolina. It’s the best of both worlds; like being in two states at once.
www.ThinkCurrituck.com
CALL LARRY (252) 232-6015
Larry Lombardi, Director of Economic Development
115+ Communities - 500+ Team Members - 7 StatesTHEFRANKLINJOHNSTONGROUP.COM
MANAGEMENT | DEVELOPMENT
VINOD AGARWAL, Ph.D.Deputy Director, Dragas Center for Economic Analysis and PolicyStrome College of Business, Old Dominion University
ECONOMIC TRENDS
13
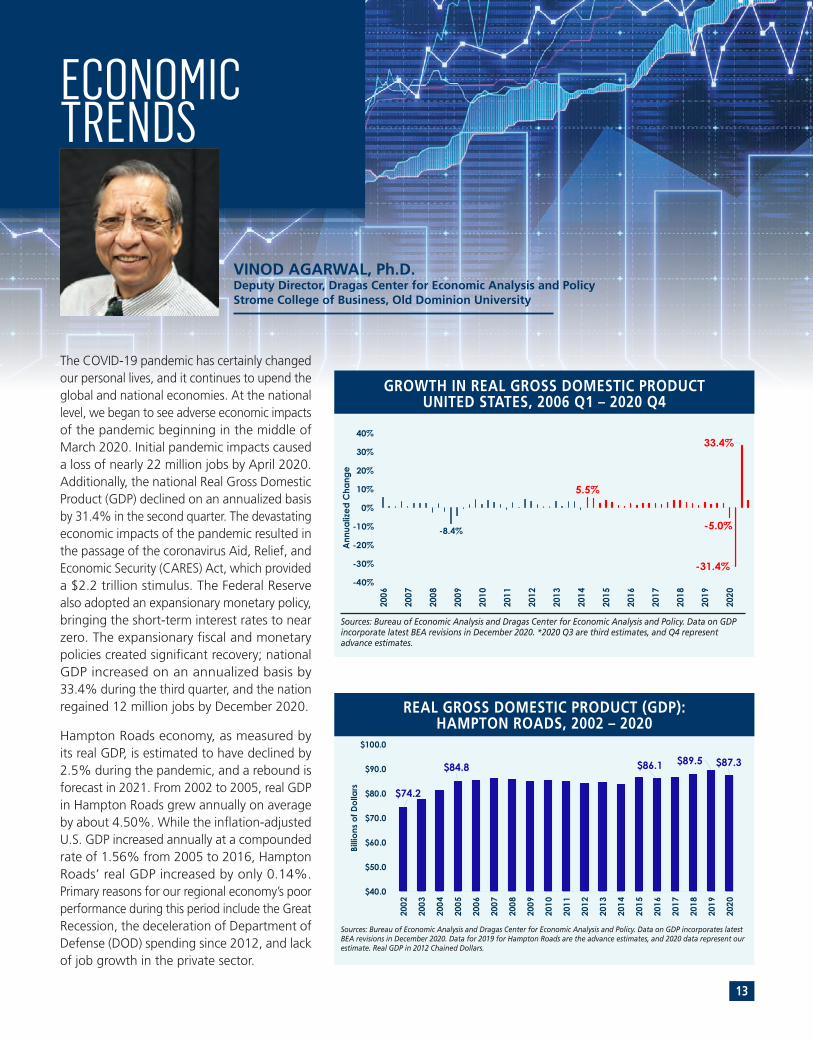
The COVID-19 pandemic has certainly changed our personal lives, and it continues to upend the global and national economies. At the national level, we began to see adverse economic impacts of the pandemic beginning in the middle of March 2020. Initial pandemic impacts caused a loss of nearly 22 million jobs by April 2020. Additionally, the national Real Gross Domestic Product (GDP) declined on an annualized basis by 31.4% in the second quarter. The devastating economic impacts of the pandemic resulted in the passage of the coronavirus Aid, Relief, and Economic Security (CARES) Act, which provided a $2.2 trillion stimulus. The Federal Reserve also adopted an expansionary monetary policy, bringing the short-term interest rates to near zero. The expansionary fiscal and monetary policies created significant recovery; national GDP increased on an annualized basis by 33.4% during the third quarter, and the nation regained 12 million jobs by December 2020.
Hampton Roads economy, as measured by its real GDP, is estimated to have declined by 2.5% during the pandemic, and a rebound is forecast in 2021. From 2002 to 2005, real GDP in Hampton Roads grew annually on average by about 4.50%. While the inflation-adjusted U.S. GDP increased annually at a compounded rate of 1.56% from 2005 to 2016, Hampton Roads’ real GDP increased by only 0.14%. Primary reasons for our regional economy’s poor performance during this period include the Great Recession, the deceleration of Department of Defense (DOD) spending since 2012, and lack of job growth in the private sector.
REAL GROSS DOMESTIC PRODUCT (GDP):HAMPTON ROADS, 2002 – 2020
Sources: Bureau of Economic Analysis and Dragas Center for Economic Analysis and Policy. Data on GDP incorporates latest BEA revisions in December 2020. Data for 2019 for Hampton Roads are the advance estimates, and 2020 data represent our estimate. Real GDP in 2012 Chained Dollars.
GROWTH IN REAL GROSS DOMESTIC PRODUCT UNITED STATES, 2006 Q1 – 2020 Q4
Sources: Bureau of Economic Analysis and Dragas Center for Economic Analysis and Policy. Data on GDP incorporate latest BEA revisions in December 2020. *2020 Q3 are third estimates, and Q4 represent advance estimates.
-8.4%
5.5%
-5.0%
-31.4%
33.4%
-40%
-30%
-20%
-10%
0%
10%
20%
30%
40%
2006
2007
2008
2009
2010
2011
2012
2013
2014
2015
2016
2017
2018
2019
2020
Annu
alize
d C
hang
e
$74.2
$84.8 $86.1 $89.5 $87.3
$40.0
$50.0
$60.0
$70.0
$80.0
$90.0
$100.0
2002
2003
2004
2005
2006
2007
2008
2009
2010
2011
2012
2013
2014
2015
2016
2017
2018
2019
2020
Billi
ons
of D
olla
rs
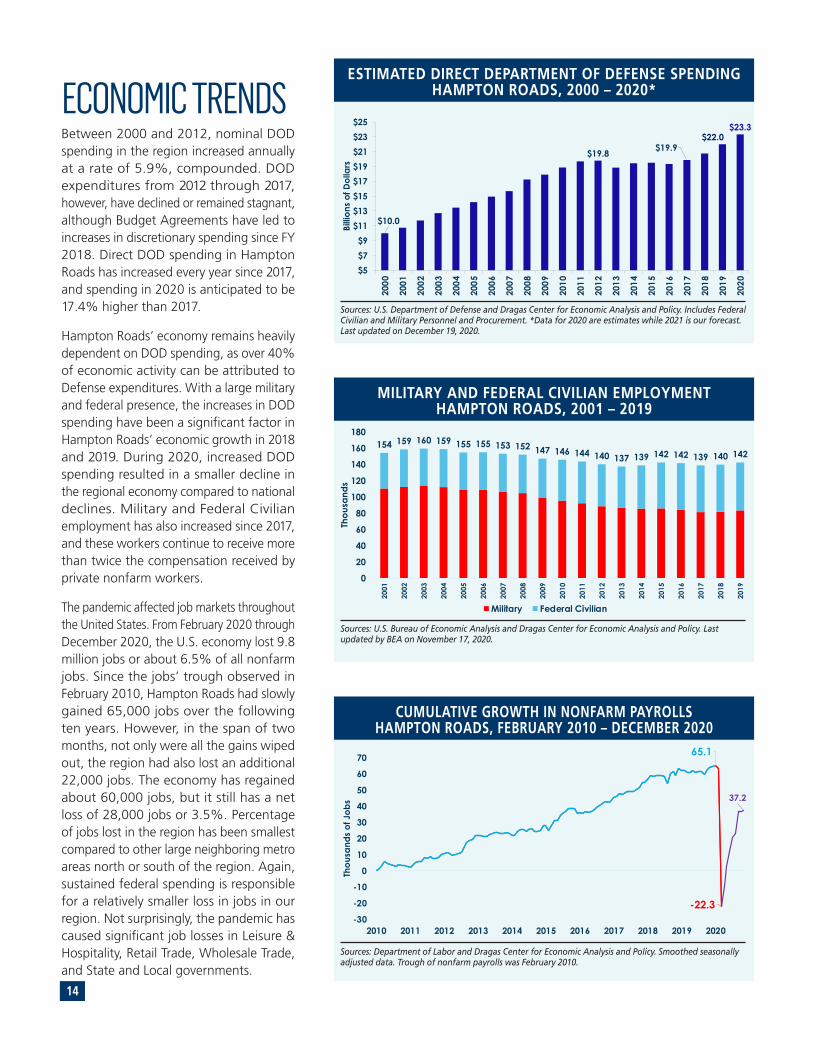
ECONOMIC TRENDSBetween 2000 and 2012, nominal DOD spending in the region increased annually at a rate of 5.9%, compounded. DOD expenditures from 2012 through 2017, however, have declined or remained stagnant, although Budget Agreements have led to increases in discretionary spending since FY 2018. Direct DOD spending in Hampton Roads has increased every year since 2017, and spending in 2020 is anticipated to be 17.4% higher than 2017.
Hampton Roads’ economy remains heavily dependent on DOD spending, as over 40% of economic activity can be attributed to Defense expenditures. With a large military and federal presence, the increases in DOD spending have been a significant factor in Hampton Roads’ economic growth in 2018 and 2019. During 2020, increased DOD spending resulted in a smaller decline in the regional economy compared to national declines. Military and Federal Civilian employment has also increased since 2017, and these workers continue to receive more than twice the compensation received by private nonfarm workers.
The pandemic affected job markets throughout the United States. From February 2020 through December 2020, the U.S. economy lost 9.8 million jobs or about 6.5% of all nonfarm jobs. Since the jobs’ trough observed in February 2010, Hampton Roads had slowly gained 65,000 jobs over the following ten years. However, in the span of two months, not only were all the gains wiped out, the region had also lost an additional 22,000 jobs. The economy has regained about 60,000 jobs, but it still has a net loss of 28,000 jobs or 3.5%. Percentage of jobs lost in the region has been smallest compared to other large neighboring metro areas north or south of the region. Again, sustained federal spending is responsible for a relatively smaller loss in jobs in our region. Not surprisingly, the pandemic has caused significant job losses in Leisure & Hospitality, Retail Trade, Wholesale Trade, and State and Local governments.
ESTIMATED DIRECT DEPARTMENT OF DEFENSE SPENDINGHAMPTON ROADS, 2000 – 2020*
Sources: U.S. Department of Defense and Dragas Center for Economic Analysis and Policy. Includes Federal Civilian and Military Personnel and Procurement. *Data for 2020 are estimates while 2021 is our forecast. Last updated on December 19, 2020.
$10.0
$19.8 $19.9$22.0
$23.3
$5$7$9
$11$13$15$17$19$21$23$25
2000
2001
2002
2003
2004
2005
2006
2007
2008
2009
2010
2011
2012
2013
2014
2015
2016
2017
2018
2019
2020
Billi
ons
of D
olla
rs
MILITARY AND FEDERAL CIVILIAN EMPLOYMENTHAMPTON ROADS, 2001 – 2019
Sources: U.S. Bureau of Economic Analysis and Dragas Center for Economic Analysis and Policy. Last updated by BEA on November 17, 2020.
CUMULATIVE GROWTH IN NONFARM PAYROLLSHAMPTON ROADS, FEBRUARY 2010 – DECEMBER 2020
Sources: Department of Labor and Dragas Center for Economic Analysis and Policy. Smoothed seasonally adjusted data. Trough of nonfarm payrolls was February 2010.
65.1
-22.3
37.2
-30
-20
-10
0
10
20
30
40
50
60
70
2010 2011 2012 2013 2014 2015 2016 2017 2018 2019 2020
Thou
sand
s of
Job
s
154 159 160 159 155 155 153 152 147 146 144 140 137 139 142 142 139 140 142
0
20
40
60
80
100
120
140
160
180
2001
2002
2003
2004
2005
2006
2007
2008
2009
2010
2011
2012
2013
2014
2015
2016
2017
2018
2019
Thou
sand
s
Military Federal Civilian
14
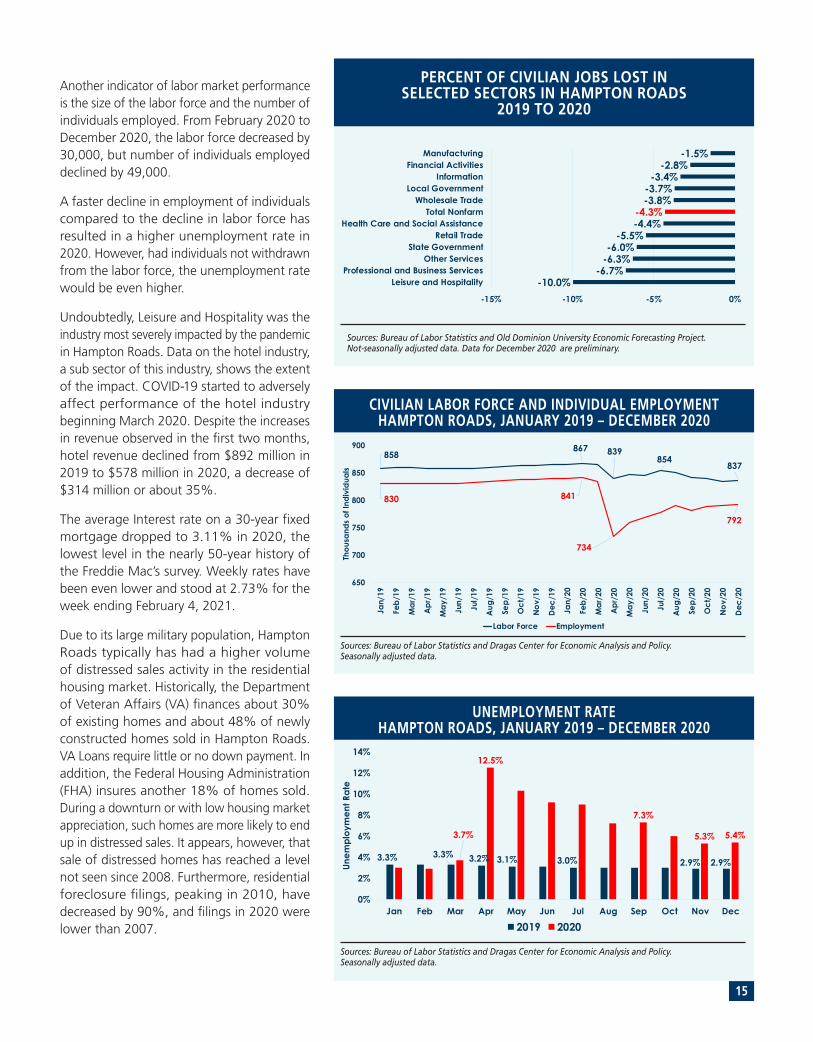
Another indicator of labor market performance is the size of the labor force and the number of individuals employed. From February 2020 to December 2020, the labor force decreased by 30,000, but number of individuals employed declined by 49,000.
A faster decline in employment of individuals compared to the decline in labor force has resulted in a higher unemployment rate in 2020. However, had individuals not withdrawn from the labor force, the unemployment rate would be even higher.
Undoubtedly, Leisure and Hospitality was the industry most severely impacted by the pandemic in Hampton Roads. Data on the hotel industry, a sub sector of this industry, shows the extent of the impact. COVID-19 started to adversely affect performance of the hotel industry beginning March 2020. Despite the increases in revenue observed in the first two months, hotel revenue declined from $892 million in 2019 to $578 million in 2020, a decrease of $314 million or about 35%.
The average Interest rate on a 30-year fixed mortgage dropped to 3.11% in 2020, the lowest level in the nearly 50-year history of the Freddie Mac’s survey. Weekly rates have been even lower and stood at 2.73% for the week ending February 4, 2021.
Due to its large military population, Hampton Roads typically has had a higher volume of distressed sales activity in the residential housing market. Historically, the Department of Veteran Affairs (VA) finances about 30% of existing homes and about 48% of newly constructed homes sold in Hampton Roads. VA Loans require little or no down payment. In addition, the Federal Housing Administration (FHA) insures another 18% of homes sold. During a downturn or with low housing market appreciation, such homes are more likely to end up in distressed sales. It appears, however, that sale of distressed homes has reached a level not seen since 2008. Furthermore, residential foreclosure filings, peaking in 2010, have decreased by 90%, and filings in 2020 were lower than 2007.
UNEMPLOYMENT RATEHAMPTON ROADS, JANUARY 2019 – DECEMBER 2020
Sources: Bureau of Labor Statistics and Dragas Center for Economic Analysis and Policy. Seasonally adjusted data.
3.3% 3.3% 3.2% 3.1% 3.0% 2.9% 2.9%
3.7%
12.5%
7.3%
5.3% 5.4%
0%
2%
4%
6%
8%
10%
12%
14%
Jan Feb Mar Apr May Jun Jul Aug Sep Oct Nov Dec
Unem
ploy
men
t Rat
e
2019 2020
CIVILIAN LABOR FORCE AND INDIVIDUAL EMPLOYMENTHAMPTON ROADS, JANUARY 2019 – DECEMBER 2020
Sources: Bureau of Labor Statistics and Dragas Center for Economic Analysis and Policy. Seasonally adjusted data.
858867 839
854837
830 841
734
792
650
700
750
800
850
900
Jan/
19
Feb/
19
Mar
/19
Apr
/19
May
/19
Jun/
19
Jul/
19
Aug
/19
Sep/
19
Oct
/19
Nov
/19
Dec
/19
Jan/
20
Feb/
20
Mar
/20
Apr
/20
May
/20
Jun/
20
Jul/
20
Aug
/20
Sep/
20
Oct
/20
Nov
/20
Dec
/20
Thou
sand
s of
Indi
vidu
als
Labor Force Employment
PERCENT OF CIVILIAN JOBS LOST INSELECTED SECTORS IN HAMPTON ROADS
2019 TO 2020
Sources: Bureau of Labor Statistics and Old Dominion University Economic Forecasting Project. Not-seasonally adjusted data. Data for December 2020 are preliminary.
-10.0%-6.7%
-6.3%-6.0%
-5.5%-4.4%-4.3%
-3.8%-3.7%
-3.4%-2.8%
-1.5%
-15% -10% -5% 0%
Leisure and HospitalityProfessional and Business Services
Other ServicesState Government
Retail TradeHealth Care and Social Assistance
Total NonfarmWholesale Trade
Local GovernmentInformation
Financial ActivitiesManufacturing
15
HAMPTON ROADS OFFICE MARKET STATISTICS
OFFICE
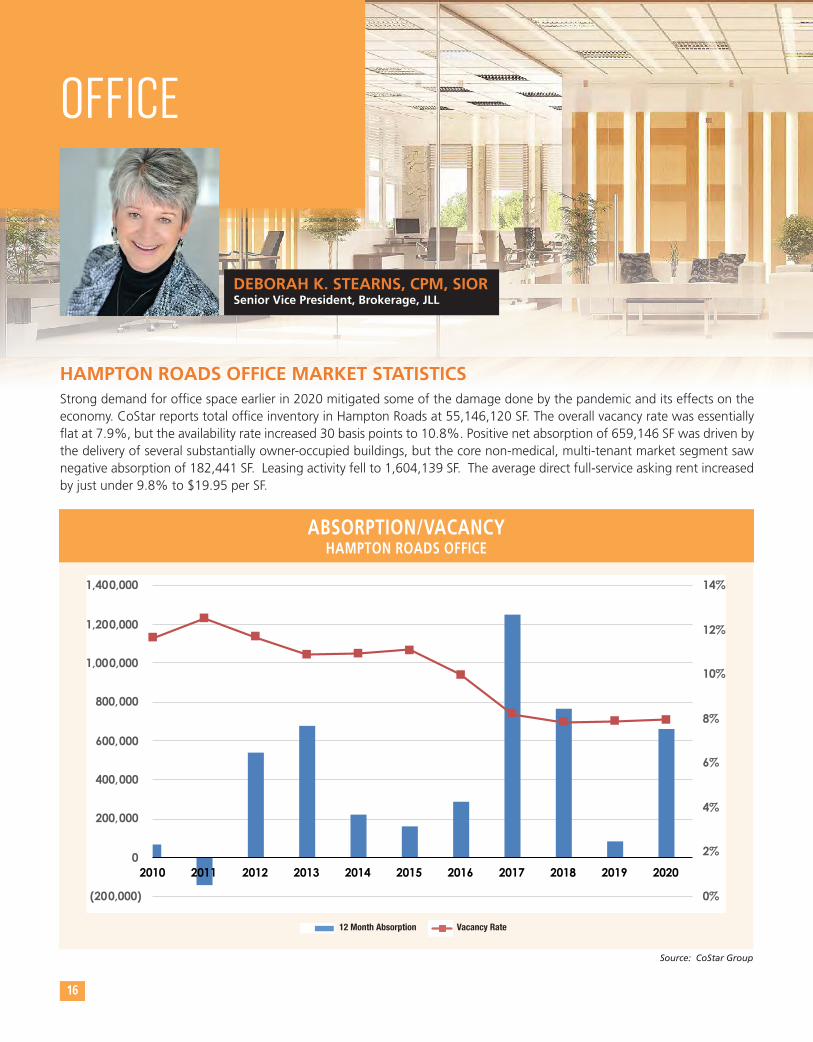
Strong demand for office space earlier in 2020 mitigated some of the damage done by the pandemic and its effects on the economy. CoStar reports total office inventory in Hampton Roads at 55,146,120 SF. The overall vacancy rate was essentially flat at 7.9%, but the availability rate increased 30 basis points to 10.8%. Positive net absorption of 659,146 SF was driven by the delivery of several substantially owner-occupied buildings, but the core non-medical, multi-tenant market segment saw negative absorption of 182,441 SF. Leasing activity fell to 1,604,139 SF. The average direct full-service asking rent increased by just under 9.8% to $19.95 per SF.
ABSORPTION/VACANCY HAMPTON ROADS OFFICE
Source: CoStar Group
16
DEBORAH K. STEARNS, CPM, SIORSenior Vice President, Brokerage, JLL
0%
2%
4%
6%
8%
10%
12%
14%
(400,000.00)
(200,000.00)
0.00
200,000.00
400,000.00
600,000.00
800,000.00
1,000,000.00
1,200,000.00
1,400,000.00
2008 2009 2010 2011 2012 2013 2014 2015 2016 2017 2018
VACANCY AND ABSORPTION Hampton Road Office
12 Month Absorption
Vacancy Rate
12 Month Absorption Vacancy Rate
0%
2%
4%
6%
8%
10%
12%
14%
(400,000.00)
(200,000.00)
0.00
200,000.00
400,000.00
600,000.00
800,000.00
1,000,000.00
1,200,000.00
1,400,000.00
2008 2009 2010 2011 2012 2013 2014 2015 2016 2017 2018
VACANCY AND ABSORPTION Hampton Road Office
12 Month Absorption
Vacancy Rate
0%
2%
4%
6%
8%
10%
12%
14%
(200,000)
0
200,000
400,000
600,000
800,000
1,000,000
1,200,000
1,400,000
2010 2011 2012 2013 2014 2015 2016 2017 2018 2019 2020
VACANCY AND ABSORPTIONHampton Road Office
12 MonthAbsorption
VacancyRate
0%
2%
4%
6%
8%
10%
12%
14%
(400,000.00)
(200,000.00)
0.00
200,000.00
400,000.00
600,000.00
800,000.00
1,000,000.00
1,200,000.00
1,400,000.00
2008 2009 2010 2011 2012 2013 2014 2015 2016 2017 2018
VACANCY AND ABSORPTION Hampton Road Office
12 Month Absorption
Vacancy Rate
12 Month Absorption Vacancy Rate
0%
2%
4%
6%
8%
10%
12%
14%
(400,000.00)
(200,000.00)
0.00
200,000.00
400,000.00
600,000.00
800,000.00
1,000,000.00
1,200,000.00
1,400,000.00
2008 2009 2010 2011 2012 2013 2014 2015 2016 2017 2018
VACANCY AND ABSORPTION Hampton Road Office
12 Month Absorption
Vacancy Rate
KEY HAMPTON ROADS TRANSACTIONS
Tenant Property Square Footage Lease TypeDate
Movement Mortgage
City of Virginia Beach
City of Virginia Beach
Orbis Education
NVR/Ryan Homes
Eplus
1434 Crossways Boulevard
2809 S. Lynnhaven Road
484 Viking Drive
6320 Center Drive
4525 South Boulevard
447 Viking Drive
Q2 2020
Q3 2020
Q4 2020
Q1 2020
Q3 2020
Q4 2020
33,016
29,000
20,437
16,000
15,968
15,257
Sublease
New
New
New
New
New
2020 TOP NEW OFFICE LEASES
Property Square Footage Sale Price Price Per SF Buyer TypeDate
310,745
206,504144,512
61,992
184,081
123,407
74,210
$30,000,000
$41,150,000$26,150,000$15,000,000
$20,000,000
$8,500,000
$8,400,000
$96.54
$199.27$180.95$241.97
$108.65
$68.88
$133.19
Owner/Occupant
InvestorInvestor (BW)Investor (BW)
Owner/Occupant
Investor
Investor
Q2 2020
Q3 2020Q3 2020Q3 2020
Q3 2020
Q2 2020
Q1 2020
2020 TOP SALES TRANSACTIONS
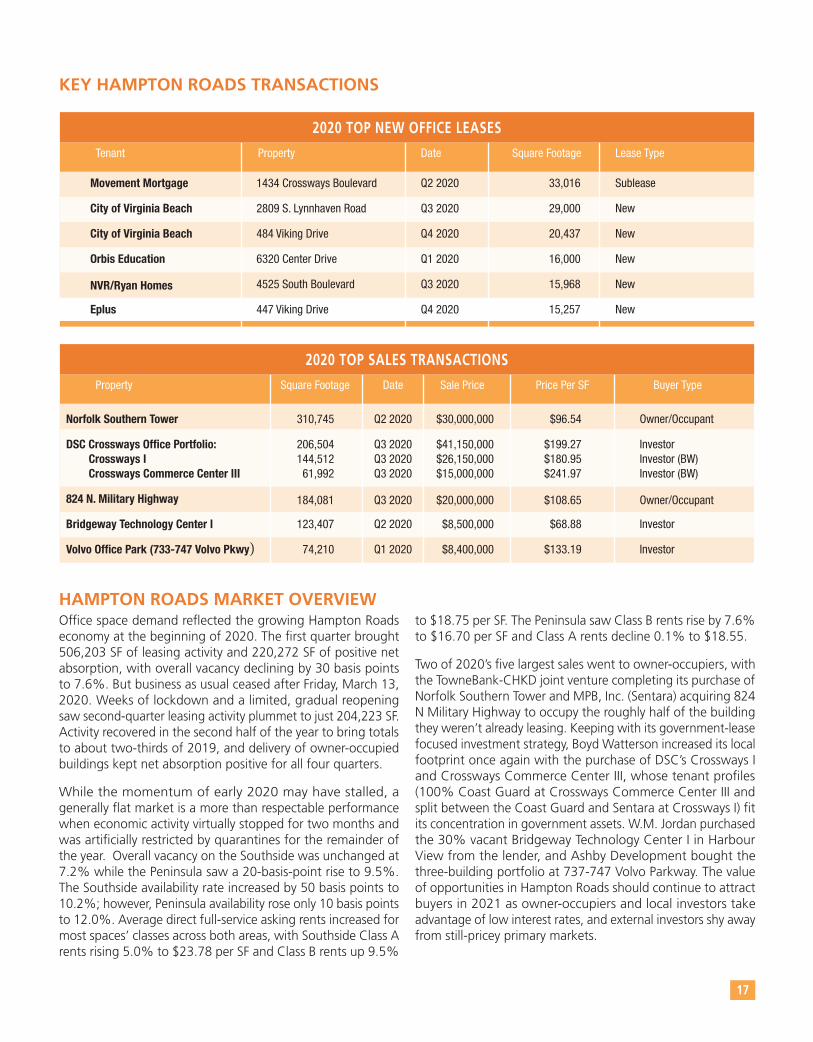
HAMPTON ROADS MARKET OVERVIEWOffice space demand reflected the growing Hampton Roads economy at the beginning of 2020. The first quarter brought 506,203 SF of leasing activity and 220,272 SF of positive net absorption, with overall vacancy declining by 30 basis points to 7.6%. But business as usual ceased after Friday, March 13, 2020. Weeks of lockdown and a limited, gradual reopening saw second-quarter leasing activity plummet to just 204,223 SF. Activity recovered in the second half of the year to bring totals to about two-thirds of 2019, and delivery of owner-occupied buildings kept net absorption positive for all four quarters.
While the momentum of early 2020 may have stalled, a generally flat market is a more than respectable performance when economic activity virtually stopped for two months and was artificially restricted by quarantines for the remainder of the year. Overall vacancy on the Southside was unchanged at 7.2% while the Peninsula saw a 20-basis-point rise to 9.5%. The Southside availability rate increased by 50 basis points to 10.2%; however, Peninsula availability rose only 10 basis points to 12.0%. Average direct full-service asking rents increased for most spaces’ classes across both areas, with Southside Class A rents rising 5.0% to $23.78 per SF and Class B rents up 9.5%
to $18.75 per SF. The Peninsula saw Class B rents rise by 7.6% to $16.70 per SF and Class A rents decline 0.1% to $18.55.
Two of 2020’s five largest sales went to owner-occupiers, with the TowneBank-CHKD joint venture completing its purchase of Norfolk Southern Tower and MPB, Inc. (Sentara) acquiring 824 N Military Highway to occupy the roughly half of the building they weren’t already leasing. Keeping with its government-lease focused investment strategy, Boyd Watterson increased its local footprint once again with the purchase of DSC’s Crossways I and Crossways Commerce Center III, whose tenant profiles (100% Coast Guard at Crossways Commerce Center III and split between the Coast Guard and Sentara at Crossways I) fit its concentration in government assets. W.M. Jordan purchased the 30% vacant Bridgeway Technology Center I in Harbour View from the lender, and Ashby Development bought the three-building portfolio at 737-747 Volvo Parkway. The value of opportunities in Hampton Roads should continue to attract buyers in 2021 as owner-occupiers and local investors take advantage of low interest rates, and external investors shy away from still-pricey primary markets.
17
Norfolk Southern Tower
DSC Crossways Office Portfolio: Crossways I Crossways Commerce Center III
824 N. Military Highway
Bridgeway Technology Center I
Volvo Office Park (733-747 Volvo Pkwy)
18
Buildings under construction were delivered, but no speculative construction broke ground. Waitzer Hall, now under construction at the corner of West Brambleton and Colley avenues, is projected to add 89,000 SF of occupied space and a 310-space parking garage to the EVMS campus in Q2 2021. Delivery of Ferguson Enterprise’s new 260,000 SF headquarters boosted Peninsula absorption, as did completion of 580 City Center Boulevard, whose owner, Orthopedic and Spine Center, occupies one of three floors. Sentara Healthcare’s Orthopedic Surgery Center and Brock Cancer Center buildings were also largely owner-occupied on delivery. And 555 Belaire Avenue, Summit Pointe’s first multi-tenant office building and the Southside’s first non-medical, Class A spec building since 2014, delivered in the fall, with one lease executed prior to year-end.
OFFICE
n WFH. The ‘work from home’ reality of 2020 is definitely an ongoing component of the work environment, with employees expecting a new ‘benefit’ of WFH 2-3 days per week. The PWC Emerging Trends in Real Estate 2021 respondents indicated 55% of the workforce would WFH post-COVID vs. 39% pre-COVID.
n Office design. Plexiglass shields are flying out of manufacturing facilities to wrap around traditional workstation designs. It does not appear that workstations are being replaced by private offices but enhanced by privacy partitions. It is, however, too soon to determine what design trends may emerge post-COVID.
n Renew in Place … also known as ‘kick the can down the road.’ Many tenants facing lease renewals in 2021 are opting to remain in place until they have a better assessment of virus containment. Expectations from agents predict downsizing on renewals in 2021 and 2022.
n Sublease Options. Hampton Roads has historically seen minimal sublease av ailability, but it is definitely on the rise, increasing over 2% in the multi-tenant market since Q1 2020. Attractive rates are offset by ‘as is’ occupancy criteria.
n Capital investment remains solid with interest rates still at extremely attractive rates. Older properties are being acquired for renovation and releasing at competitive market rates. Continuing interest from owner occupants is driven by interest rates and the ability to control the operating environment, helping employees feel safe in returning to the office.
CURRENT TRENDS
2021-2022 OFFICEOutlook
The office market for the 757 is holding its own. Market fundamentals were extremely strong on the landlord side at the beginning of 2020. There were minimal lease adjustments from landlords during the year as most office businesses remained healthy. Shifts from leased space to owned space by TowneBank and Ferguson Enterprises and corporate decisions to increase remote working or consolidate locations will drive an increase in multi-tenant vacancy in 2021 that matches the rise in 2020. Notwithstanding, rents should hold steady with concessions that had diminished returning to deal structure. Tenant requests for short-term leases and flexibility are often pushing rents up. Dire forecasts of rate reductions have not materialized. Students should be back in the classroom by the start of the school year this fall, allowing workers to return to the office. The crystal ball for 2021 has a big question mark as we begin a year with the promise of vaccine distribution, but not eradication of COVID-19, a new administration in Washington, employees who want to get back to the office, employees who want to remain at home, and office cleaning protocols that hospitals could emulate! As corporations assess shifts in the workforce, Hampton Roads offers an excellent quality of life, competitive cost of living, and increasing opportunities to lease large blocks of space at attractive rents.
From accelerating businesses to creating new jobs, Newport News bands together to ensure success in every corner of our City.
N E W P O R T N E W S V A . C O M

19
ONLINE, VIRTUAL, ANDIN-PERSON EVENTS
All About Presentation is aninternational woman and minority-owned live and virtual event strategyand management company. Since 2007, All About Presentation hasproduced over 1000 events, designed theevent experience for over 350,000 eventattendees, and managed over 75 milliondollars of event spend.
allaboutpresentation.com11 S. 12th StreetSuite 500A Richmond, VA804-381-4002
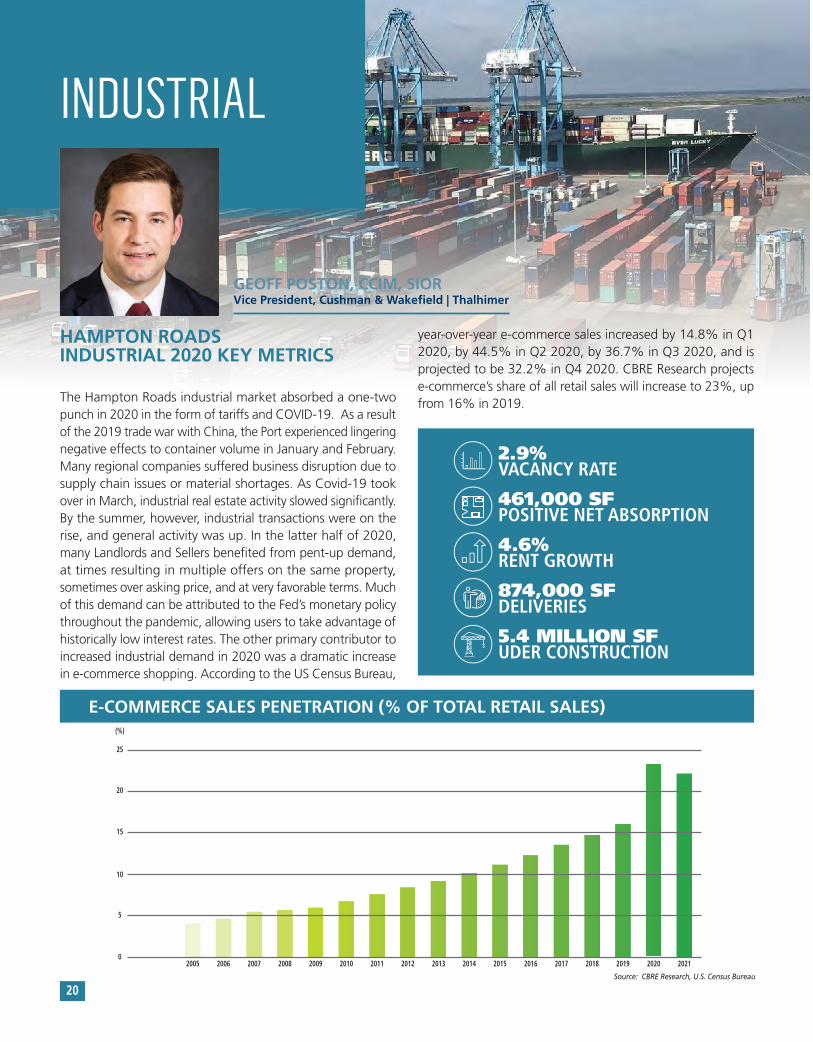
The Hampton Roads industrial market absorbed a one-two punch in 2020 in the form of tariffs and COVID-19. As a result of the 2019 trade war with China, the Port experienced lingering negative effects to container volume in January and February. Many regional companies suffered business disruption due to supply chain issues or material shortages. As Covid-19 took over in March, industrial real estate activity slowed significantly. By the summer, however, industrial transactions were on the rise, and general activity was up. In the latter half of 2020, many Landlords and Sellers benefited from pent-up demand, at times resulting in multiple offers on the same property, sometimes over asking price, and at very favorable terms. Much of this demand can be attributed to the Fed’s monetary policy throughout the pandemic, allowing users to take advantage of historically low interest rates. The other primary contributor to increased industrial demand in 2020 was a dramatic increase in e-commerce shopping. According to the US Census Bureau,
GEOFF POSTON, CCIM, SIORVice President, Cushman & Wakefield | Thalhimer
HAMPTON ROADS INDUSTRIAL 2020 KEY METRICS
INDUSTRIAL
20
year-over-year e-commerce sales increased by 14.8% in Q1 2020, by 44.5% in Q2 2020, by 36.7% in Q3 2020, and is projected to be 32.2% in Q4 2020. CBRE Research projects e-commerce’s share of all retail sales will increase to 23%, up from 16% in 2019.
E-COMMERCE SALES PENETRATION (% OF TOTAL RETAIL SALES)
Source: CBRE Research, U.S. Census Bureau
2.9% VACANCY RATE
461,000 SF POSITIVE NET ABSORPTION
4.6% RENT GROWTH
874,000 SF DELIVERIES
5.4 MILLION SF UDER CONSTRUCTION
2005 2006 2007 2008 2009 2010 2011 2012 2013 2014 2015 2016 2017 2018 2019 2020 2021 0
5
10
15
20
25
(%)
21
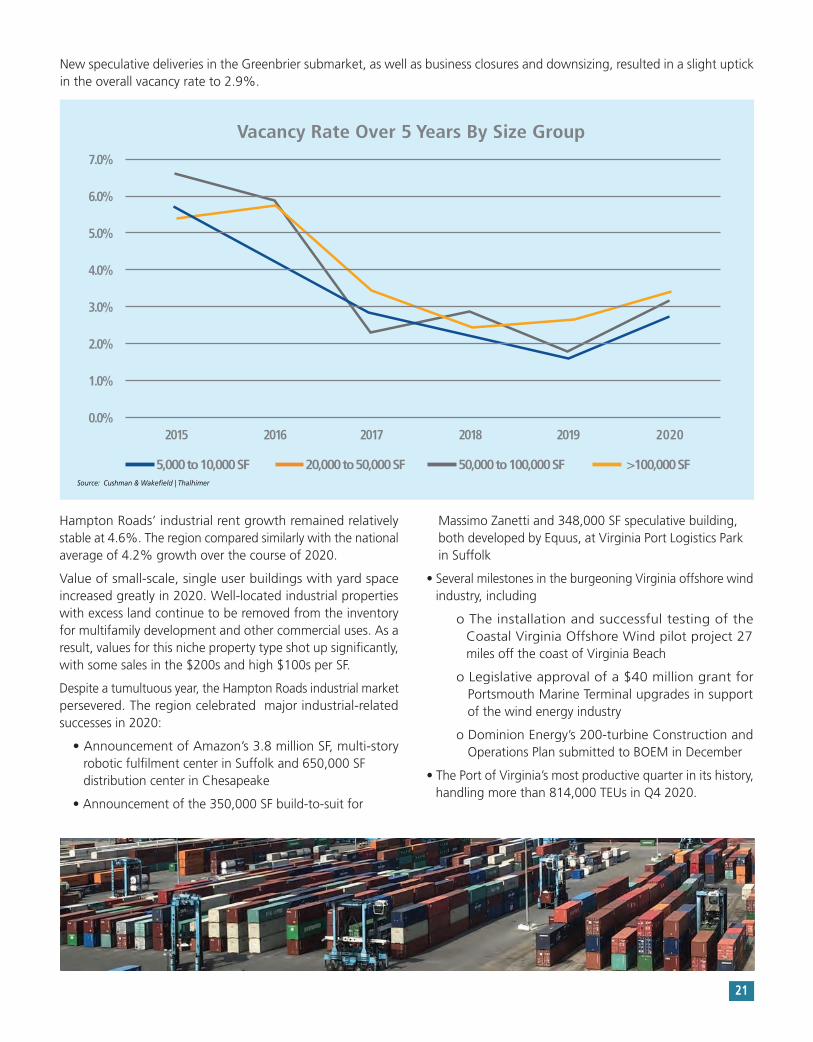
New speculative deliveries in the Greenbrier submarket, as well as business closures and downsizing, resulted in a slight uptick in the overall vacancy rate to 2.9%.
2015
5,000 to 10,000 SF 20,000 to 50,000 SF 50,000 to 100,000 SF >100,000 SF
2016 2017 2018 2019 2020
7.0%
6.0%
5.0%
4.0%
3.0%
2.0%
1.0%
0.0%
Vacancy Rate Over 5 Years By Size Group
Source: Cushman & Wakefield | Thalhimer
Hampton Roads’ industrial rent growth remained relatively stable at 4.6%. The region compared similarly with the national average of 4.2% growth over the course of 2020.
Value of small-scale, single user buildings with yard space increased greatly in 2020. Well-located industrial properties with excess land continue to be removed from the inventory for multifamily development and other commercial uses. As a result, values for this niche property type shot up significantly, with some sales in the $200s and high $100s per SF.
Despite a tumultuous year, the Hampton Roads industrial market persevered. The region celebrated major industrial-related successes in 2020:
• Announcement of Amazon’s 3.8 million SF, multi-story robotic fulfilment center in Suffolk and 650,000 SF distribution center in Chesapeake
• Announcement of the 350,000 SF build-to-suit for
Massimo Zanetti and 348,000 SF speculative building, both developed by Equus, at Virginia Port Logistics Park in Suffolk
• Several milestones in the burgeoning Virginia offshore wind industry, including
o The installation and successful testing of the Coastal Virginia Offshore Wind pilot project 27 miles off the coast of Virginia Beach
o Legislative approval of a $40 million grant for Portsmouth Marine Terminal upgrades in support of the wind energy industry
o Dominion Energy’s 200-turbine Construction and Operations Plan submitted to BOEM in December
• The Port of Virginia’s most productive quarter in its history, handling more than 814,000 TEUs in Q4 2020.
22
Tenant Property Total SF Comments
Amazon
Amazon
Massimo Zanetti Beverage USA
Amazon
Amazon
2020 Northgate Commerce ParkwaySuffolk
5945 Portsmouth BoulevardChesapeake
Enterprise DriveSuffolk
1960 Diamond Hill RoadChesapeake
1400 Sewells Point RoadNorfolk
3,800,000
650,000
350,000
200,000
166,000
INDUSTRIAL LEASE TRANSACTIONS
4-story fulfillment center, partially automated with robotic machinery. Largest distribution facility on the East Coast (source: Colliers International).
Build-to-suit at Virginia Port Logistics Park
Simultaneously leased 148,500 SF at 1910 Campostella Road for a total of 348,500 SF at the Diamond Hill Distribution Center
Infill location, excess yard for van parking
Distribution center. 1.8 miles from 3.8 million SF fulfillment center.
Property Buyer Sale Price Buyer TypeTotal SF
Prologis/Liberty Property Trust Portfolio 1537 Air Rail Avenue Virginia Beach
3000 John Deere Parkway Toano 4554 Progress Road Norfolk
6700 College Dr Suffolk
650,952
320,000
307,184
109,000
45 acres
$56,390,000
$21,750,000
$15,350,000
$ 6,450,000
$ 5,625,000
Price Per SF
$86.62
$67.97
$49.97
$58.62
$125,000/acre
Investment
Investment
Owner/Occupier
Investment
Development
Equus Capital Partners
Manchester Capital
Navien
Norfolk Co, LLC
Brookwood
INDUSTRIAL SALE TRANSACTIONS
LOOKINGFORWARD
Expect a slight decrease in local user transaction volume due to limited available inventory. Demand will remain high and functional properties will generate significant interest in short order.
Expect vacancy to hover around the three percent mark as new, speculative product comes on throughout the year and in 2022. Additional institutional multi-tenant development is just entering the pipeline — a healthy phase in the region’s real estate cycle — with anticipated delivery in 2023. The staggered timeline for new development coming online bodes well for continued demand and stable vacancy.
Expect exciting developments in wind energy with big implications for the region. Our region is well positioned to capture a
We say goodbye to the Port of Virginia’s John Reinhart, who has left our entire region in a much better place than he found it, and say hello to new CEO, Stephen Edwards. Stephen has no doubt hit the ground running on his mission to propel the Port, and the region, forward.
sizeable share of the growing wind energy industry and associated supply chain. Due to the region’s Mid-Atlantic location, deep channels, unrestricted air heights, and skilled labor force, Hampton Roads is in the driver’s seat to attract manufacturers providing jobs and further industrial demand for warehousing of related components.
Expect more Amazon deals. Other e-commerce users will follow Amazon’s lead and begin to set up major import/export facilities and smaller infill, last mile distribution depots throughout the Hampton Roads region.
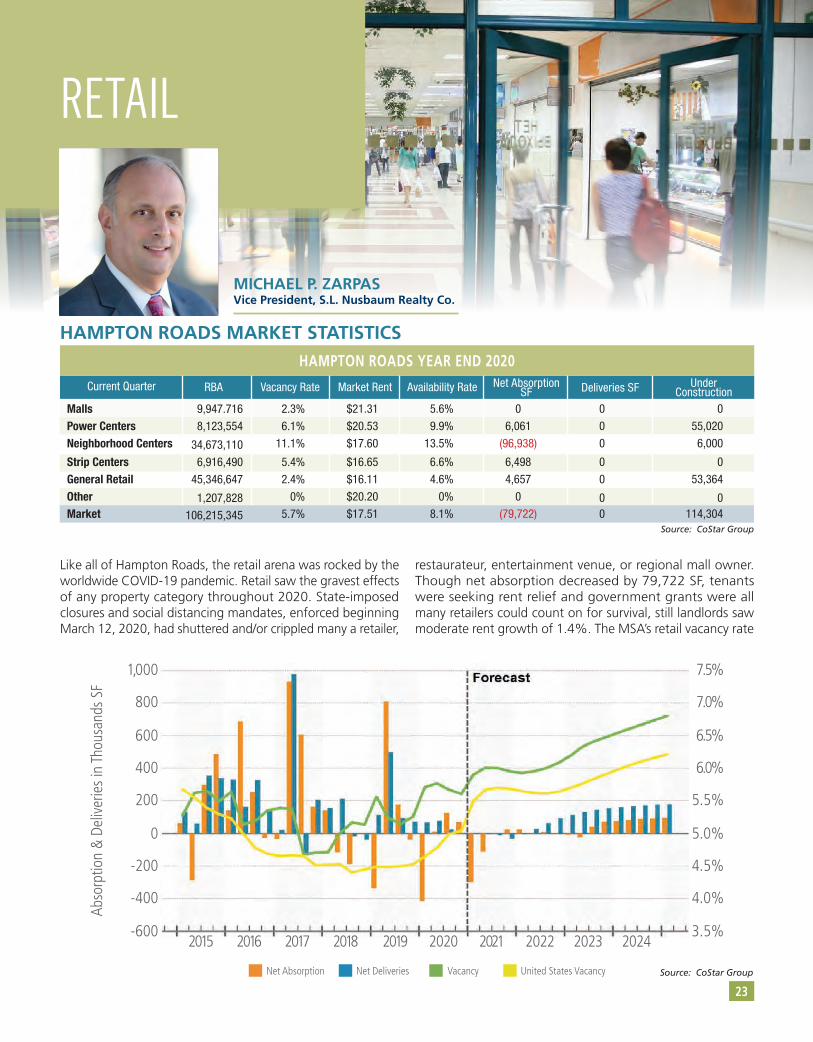
MICHAEL P. ZARPASVice President, S.L. Nusbaum Realty Co.
HAMPTON ROADS MARKET STATISTICS
RETAIL
Source: CoStar Group
23
Current Quarter RBA Vacancy Rate Availability Rate Net AbsorptionSF
UnderConstructionDeliveries SFMarket Rent
HAMPTON ROADS YEAR END 2020
MallsPower CentersNeighborhood Centers
Strip CentersGeneral RetailOtherMarket
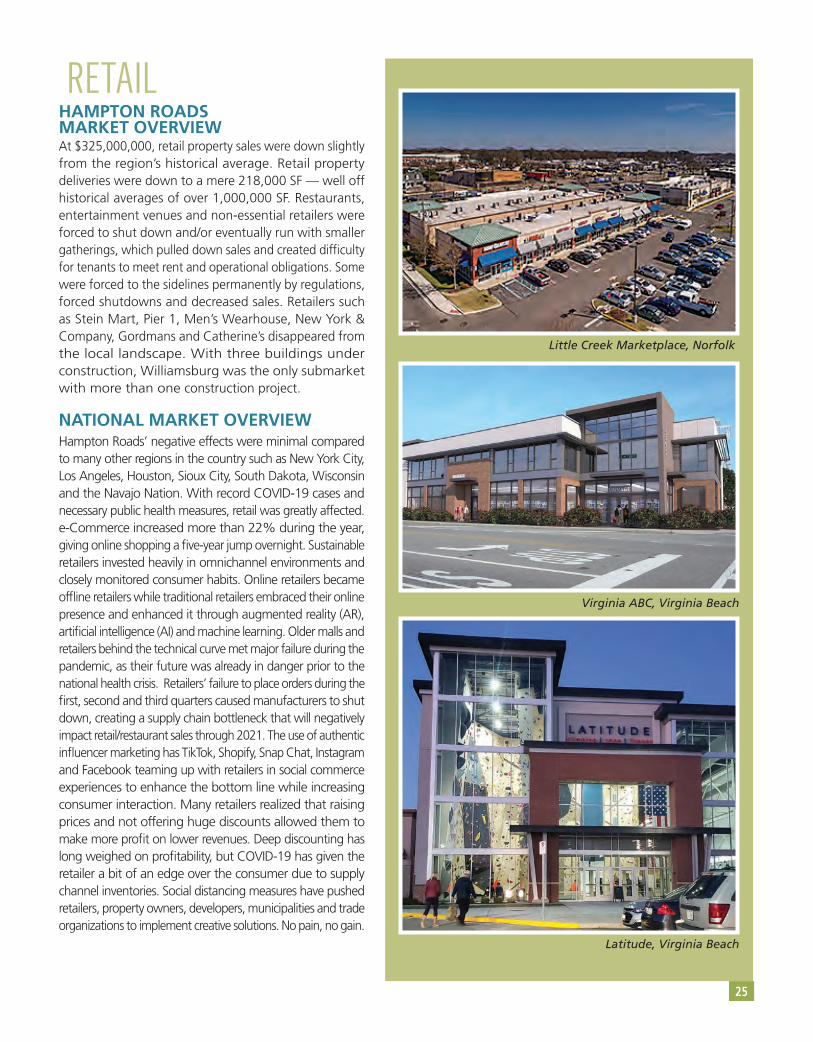
Like all of Hampton Roads, the retail arena was rocked by the worldwide COVID-19 pandemic. Retail saw the gravest effects of any property category throughout 2020. State-imposed closures and social distancing mandates, enforced beginning March 12, 2020, had shuttered and/or crippled many a retailer,
restaurateur, entertainment venue, or regional mall owner. Though net absorption decreased by 79,722 SF, tenants were seeking rent relief and government grants were all many retailers could count on for survival, still landlords saw moderate rent growth of 1.4%. The MSA’s retail vacancy rate
Source: CoStar Group
9,947.716
8,123,554
34,673,110
6,916,490
45,346,647
1,207,828
106,215,345
2.3%
6.1%
11.1%
5.4%
2.4%
0%
5.7%
$21.31
$20.53
$17.60
$16.65
$16.11
$20.20
$17.51
5.6%
9.9%
13.5%
6.6%
4.6%
0%
8.1%
0
6,061
(96,938)
6,498
4,657
0
(79,722)
0
0
0
0
0
00
0
55,020
6,000
0
53,364
0114,304
Abso
rptio
n &
Deliv
erie
s in
Thou
sand
s SF
1,000
800
600
400
200
-200
-400
-600
0
7.5%
7.0%
6.5%
6.0%
5.5%
4.5%
4.0%
3.5%
5.0%
2015 2016 2017 2018 2019 2020 2021 2022 2023 2024
Net Absorption Net Deliveries Vacancy United States Vacancy

Top 5 Retail Leases in 2020
1) 63,000 SF – East Coast Appliance, Norfolk
2) 37,942 SF – AutoZone, Norfolk
3) 33,472 SF – Kool Bins,
4) 25,132 SF – Wayne’s Home, Chesapeake
5) 18,635 SF – Caliber Collision, Williamsburg
Top 5 Retail Sales in 2020
1) $21,500,000 – Mercury Plaza, Hampton
2) $17,100,000 – Little Creek Marketplace, Norfolk
3) $13,636,972 – Gainsborough Square, Chesapeake
4) $11,000,000 – Military Circle Mall, Norfolk
5) $7,605,634 – Indian Lakes Crossing, Virginia Beach
Top 5 Retail Developments in 2020 1) 17,000 SF – Poindexter Street Shops, Chesapeake
2) 9,000 SF – Bridgeport, Suffolk
3) 8,469 SF – Great Bridge Village Shoppes, Chesapeake
4) 6,600 SF – Virginia ABC, Virginia Beach
5) 6,049 SF – Wawa, Newport News
Top Cool New Tenants Opening in 2020
1) Apex Entertainment
2) Latitude Climbing & Fitness
3) The Yard Milkshake Bar
4) Fink’s Jewelers
5) Orion’s Roof
24
increased to 5.7%, up from 5.1% in 2019. The neighborhood center category was hardest hit, with an 11.1% vacancy rate and a 13.5% availability rate. New tenant entrances, like dd’s DISCOUNTS at Todd Center in Hampton, were overshadowed by mass store closings such as Stein Mart, Gordmans, Catherine’s Plus Sizes, Justice, Men’s Wearhouse, New York & Company, Victoria’s Secret, Ruby Tuesday, Save-A-Lot, Zoe’s Kitchen, Pier 1, Allied Cash Advance, Advance America, TitleMax and IHOP.
Many local spaces were gobbled up by budding entrepreneurs loaded with government grant money, lack of employment and an eagerness to enjoy success as a contrarian in the throes of national chaos. Consumer behavior patterns were greatly changed due to COVID-19 fear, racial issues and partisan politics, which all flared up concurrently, causing major disruption in retail shopping habits.
KEY HAMPTON ROADS TRANSACTIONS
RETAIL
25
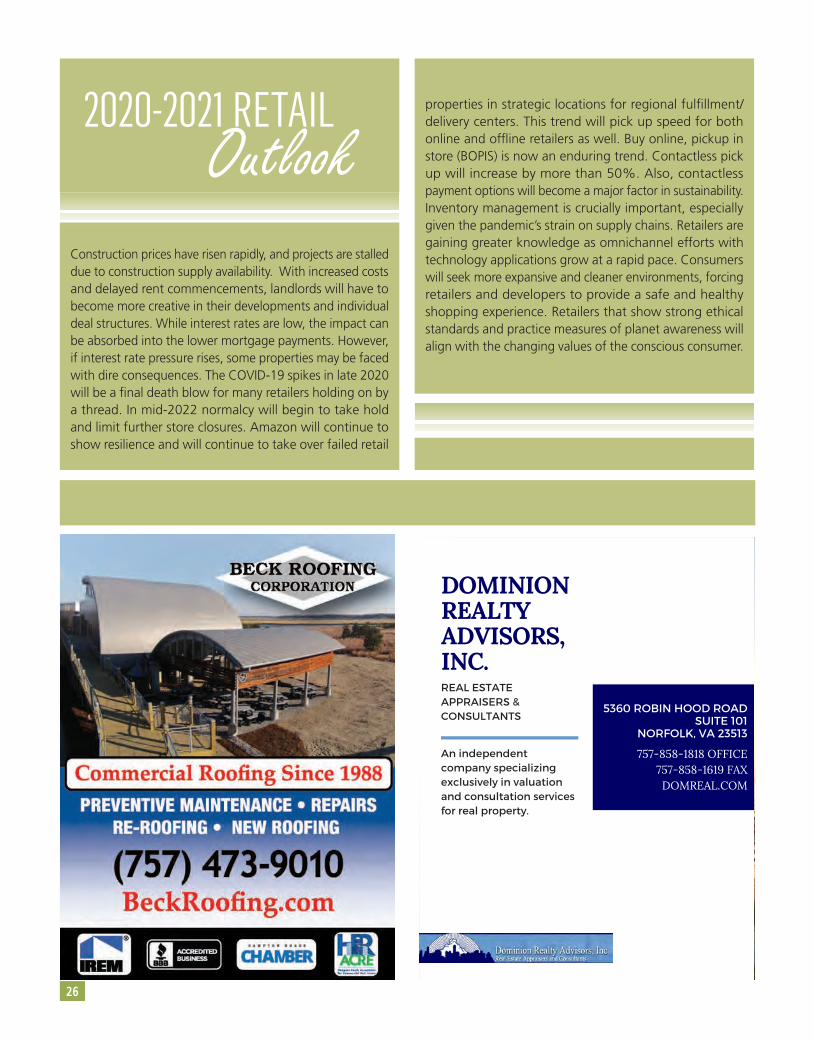
HAMPTON ROADS MARKET OVERVIEWAt $325,000,000, retail property sales were down slightly from the region’s historical average. Retail property deliveries were down to a mere 218,000 SF — well off historical averages of over 1,000,000 SF. Restaurants, entertainment venues and non-essential retailers were forced to shut down and/or eventually run with smaller gatherings, which pulled down sales and created difficulty for tenants to meet rent and operational obligations. Some were forced to the sidelines permanently by regulations, forced shutdowns and decreased sales. Retailers such as Stein Mart, Pier 1, Men’s Wearhouse, New York & Company, Gordmans and Catherine’s disappeared fromthe local landscape. With three buildings under construction, Williamsburg was the only submarket with more than one construction project.
NATIONAL MARKET OVERVIEW Hampton Roads’ negative effects were minimal compared to many other regions in the country such as New York City, Los Angeles, Houston, Sioux City, South Dakota, Wisconsin and the Navajo Nation. With record COVID-19 cases and necessary public health measures, retail was greatly affected. e-Commerce increased more than 22% during the year, giving online shopping a five-year jump overnight. Sustainable retailers invested heavily in omnichannel environments and closely monitored consumer habits. Online retailers became offline retailers while traditional retailers embraced their online presence and enhanced it through augmented reality (AR), artificial intelligence (AI) and machine learning. Older malls and retailers behind the technical curve met major failure during the pandemic, as their future was already in danger prior to the national health crisis. Retailers’ failure to place orders during the first, second and third quarters caused manufacturers to shut down, creating a supply chain bottleneck that will negatively impact retail/restaurant sales through 2021. The use of authentic influencer marketing has TikTok, Shopify, Snap Chat, Instagram and Facebook teaming up with retailers in social commerce experiences to enhance the bottom line while increasing consumer interaction. Many retailers realized that raising prices and not offering huge discounts allowed them to make more profit on lower revenues. Deep discounting has long weighed on profitability, but COVID-19 has given the retailer a bit of an edge over the consumer due to supply channel inventories. Social distancing measures have pushed retailers, property owners, developers, municipalities and trade organizations to implement creative solutions. No pain, no gain.
Little Creek Marketplace, Norfolk
Virginia ABC, Virginia Beach
Latitude, Virginia Beach
26
2020-2021 RETAILOutlook
Construction prices have risen rapidly, and projects are stalled due to construction supply availability. With increased costs and delayed rent commencements, landlords will have to become more creative in their developments and individual deal structures. While interest rates are low, the impact can be absorbed into the lower mortgage payments. However, if interest rate pressure rises, some properties may be faced with dire consequences. The COVID-19 spikes in late 2020 will be a final death blow for many retailers holding on by a thread. In mid-2022 normalcy will begin to take hold and limit further store closures. Amazon will continue to show resilience and will continue to take over failed retail
properties in strategic locations for regional fulfillment/delivery centers. This trend will pick up speed for both online and offline retailers as well. Buy online, pickup in store (BOPIS) is now an enduring trend. Contactless pick up will increase by more than 50%. Also, contactless payment options will become a major factor in sustainability. Inventory management is crucially important, especially given the pandemic’s strain on supply chains. Retailers are gaining greater knowledge as omnichannel efforts with technology applications grow at a rapid pace. Consumers will seek more expansive and cleaner environments, forcing retailers and developers to provide a safe and healthy shopping experience. Retailers that show strong ethical standards and practice measures of planet awareness will align with the changing values of the conscious consumer.
757-858-1818 OFFICE757-858-1619 FAXDOMREAL.COM
DOMINIONREALTYADVISORS,INC.
Despite the ongoing pandemic, the multifamily market in Hampton Roads was stable in 2020 and will continue to prove resilient over the next 12 months.
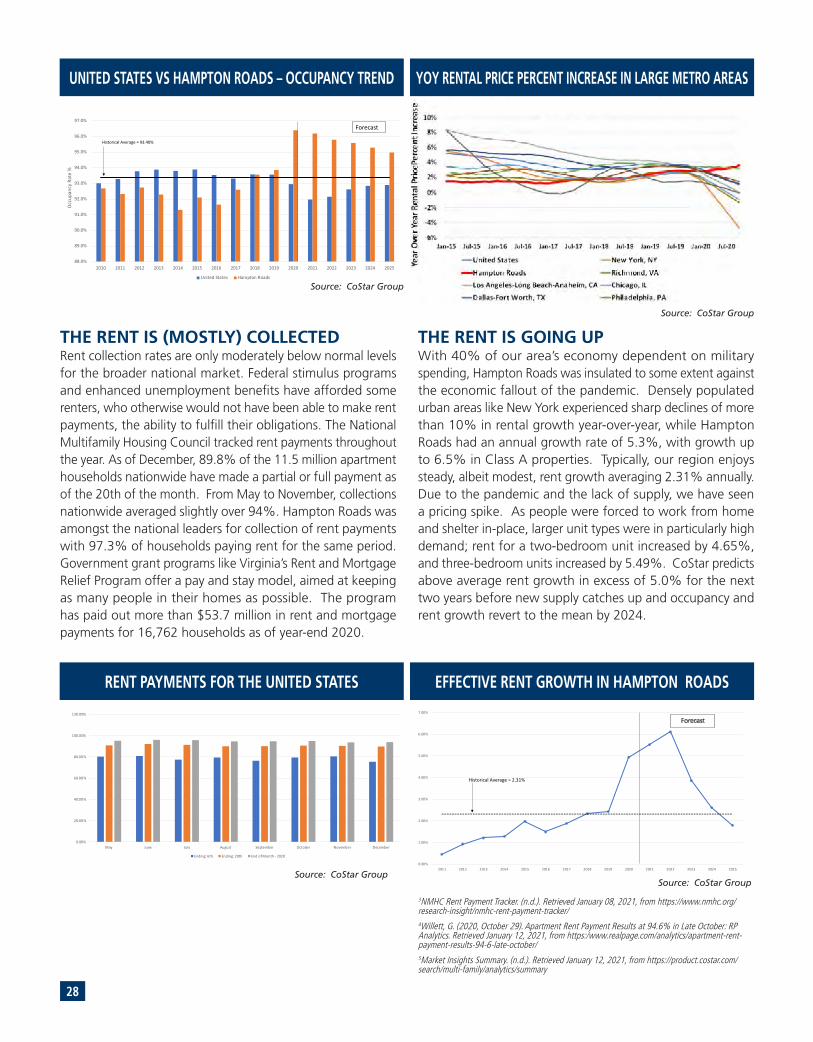
Our apartments are rented. The Hampton Roads market had approximately 115,000 apartment units as of 2020. Average occupancy of those units was 96%, outperforming every year in the last decade. Historically, occupancy in Hampton Roads lagged the national average. However, this trend reversed in 2019, and Hampton Roads is expected to continue outperforming the national average through 2025. We can attribute this to a few factors. Most notably, supply
simply has not kept up with demand, and income and job growth are very modest, but nonetheless positive. In our own portfolio, two-thirds of our Virginia communities had lower turnover in 2020 than in 2019, which we largely attribute to residents foregoing a move until the pandemic abates and labor markets restabilize. The national eviction moratorium also prevented landlords nationwide from reclaiming possession of their apartments from non-paying residents. As of this writing, the moratorium is still in place until March 31, 2021.
CHRISTEN FAATZSenior Vice President, Corporate Finance and Accounting
KEY HAMPTON ROADS MARKET STATISTICS
MULTIFAMILY
12 Mo. Delivered Units 12 Mo. Absorption Units Vacancy Rates 12 Mo. Asking Rent Growth
1,982 4,468 3.9% 5.30%
HAMPTON ROADS MARKET OVERVIEW
Current Quarter Q4 20204 & 5 Star3 Star1 & 2 Star
Market
National
26,29751,28137,161
114,739
17,445,088
Vacancy Rate4.90%3.2%3.9%
3.9%
6.80%
Asking Rent$1,445$1,142$929
$1,153
$1,371
Effective Rent$1,436$1,137$926
$1,147
$1,355
Historical Average
6.8%1,3641,452562.70%2.70%$348.3 M
When
2004 Q32020 Q42016 Q32015 Q42001 Q22001 Q32019 Q3
Trough
3.80%(3,103)570-0.10%-0.10%$14.8 M
When
2020 Q22003 Q42000 Q42019 Q42011 Q32011 Q32006 Q3
Annual Trends
Vacancy Change Absorption Units Delivered Units Demolished Units Asking Rent Growth (YOY) Effective Rent Growth (YOY) Sales Volume
12 Month
-2.20%4,2631,912465.10%5.10%$702 M
Forecast Average
4.2%1,494.001,603.00673.70%3.70%N/A
Peak
9.80%4,4473,4004676.90%6.80%$889 M
Absorption Units34679.00(27.00)
398
334,132
Under Construct Units3241,0110
1,335
559,998
Source: CoStar Group
27
Units
1Market Insights Summary. (n.d.). Retrieved January 12, 2021, from https://product.costar.com/search/multi-family/analytics/summary2Greg Willett Posted Jun 15, 1, O., 7, J., 20, F., 13, D., 14, N., & 5, N. (2020, June 15). Better-Than-Expected Local Apartment Market
Performers: RP Analytics. Retrieved January 08, 2021, from https://www.realpage.com/analytics/better-than-expected-local-apartment-market-performers-May-2020/
Delivered Units000
0
416,327
28
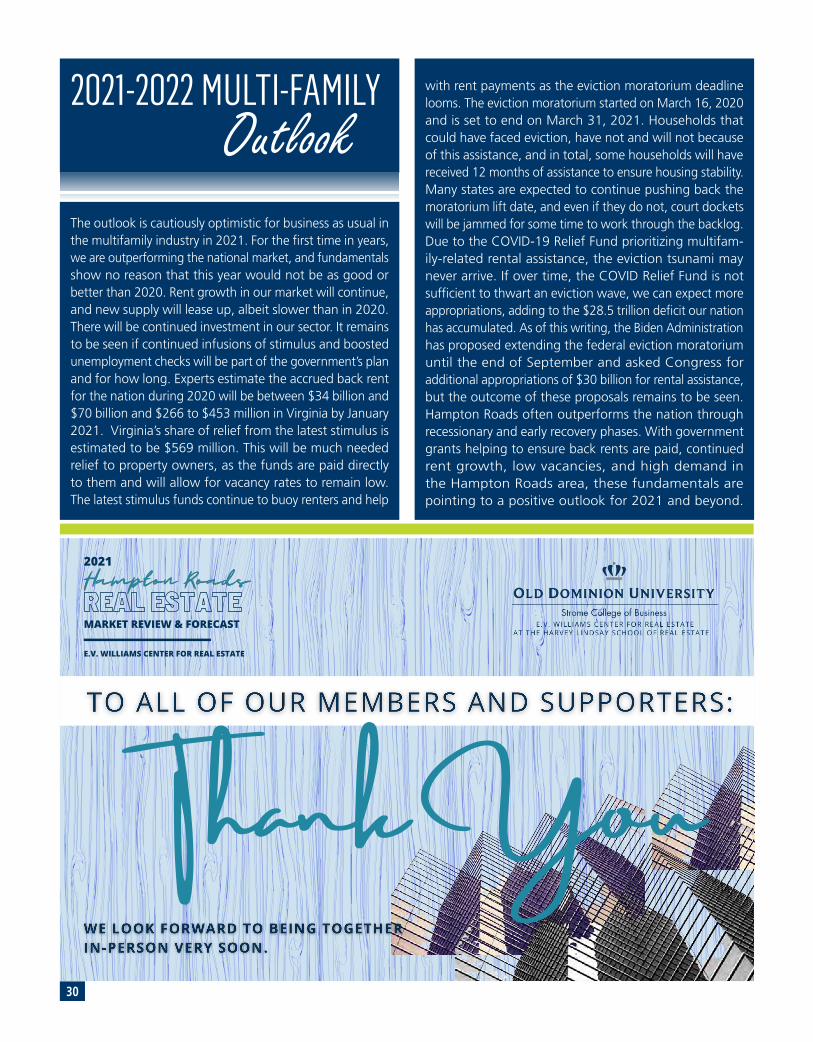
THE RENT IS (MOSTLY) COLLECTEDRent collection rates are only moderately below normal levels for the broader national market. Federal stimulus programs and enhanced unemployment benefits have afforded some renters, who otherwise would not have been able to make rent payments, the ability to fulfill their obligations. The National Multifamily Housing Council tracked rent payments throughout the year. As of December, 89.8% of the 11.5 million apartment households nationwide have made a partial or full payment as of the 20th of the month. From May to November, collections nationwide averaged slightly over 94%. Hampton Roads was amongst the national leaders for collection of rent payments with 97.3% of households paying rent for the same period. Government grant programs like Virginia’s Rent and Mortgage Relief Program offer a pay and stay model, aimed at keeping as many people in their homes as possible. The program has paid out more than $53.7 million in rent and mortgage payments for 16,762 households as of year-end 2020.
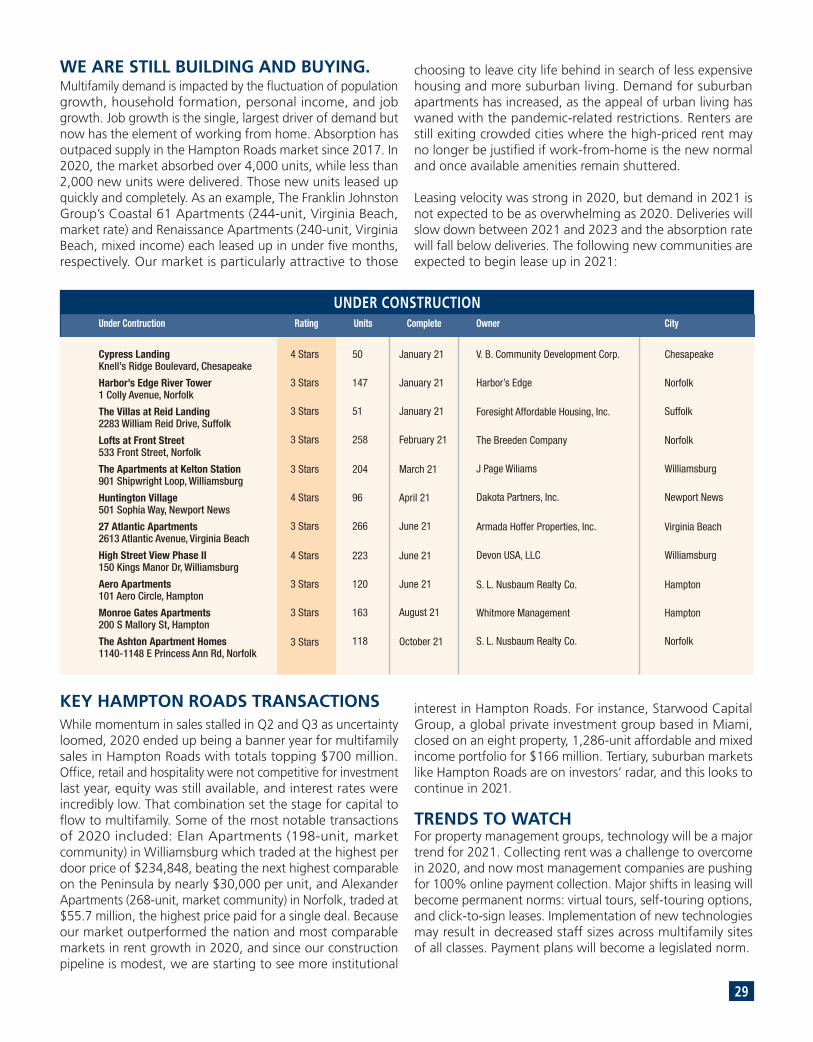
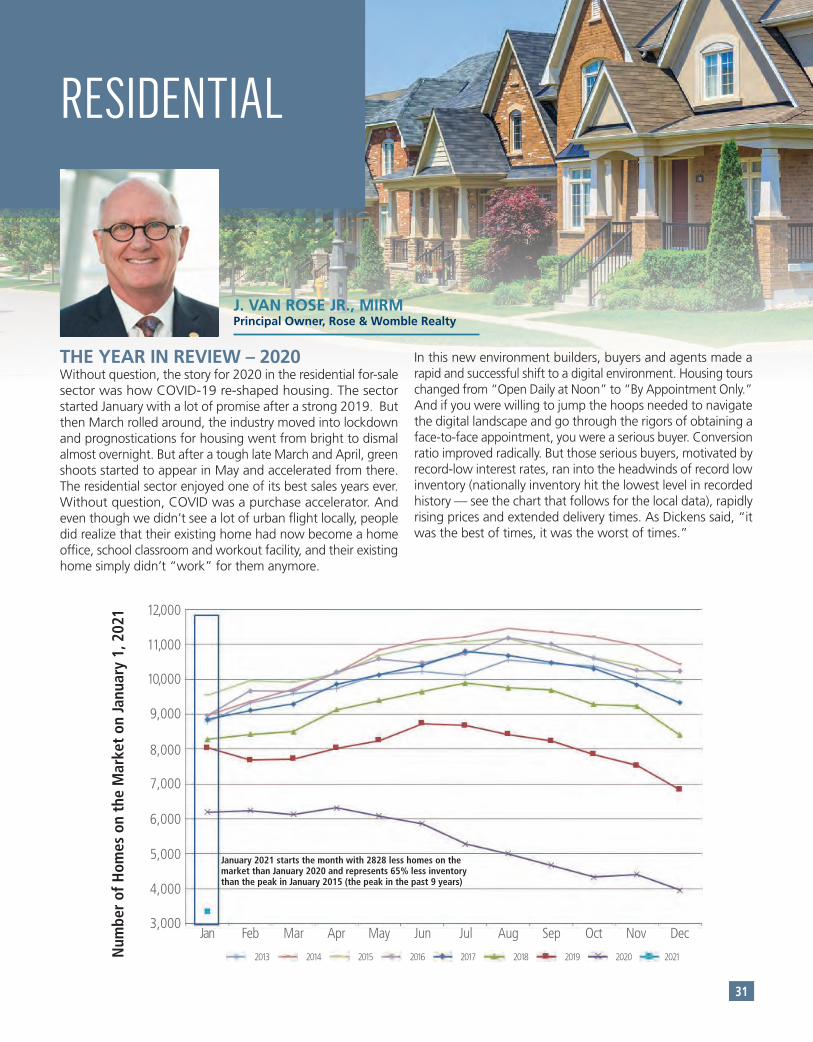
THE RENT IS GOING UPWith 40% of our area’s economy dependent on military spending, Hampton Roads was insulated to some extent against the economic fallout of the pandemic. Densely populated urban areas like New York experienced sharp declines of more than 10% in rental growth year-over-year, while Hampton Roads had an annual growth rate of 5.3%, with growth up to 6.5% in Class A properties. Typically, our region enjoys steady, albeit modest, rent growth averaging 2.31% annually. Due to the pandemic and the lack of supply, we have seen a pricing spike. As people were forced to work from home and shelter in-place, larger unit types were in particularly high demand; rent for a two-bedroom unit increased by 4.65%, and three-bedroom units increased by 5.49%. CoStar predicts above average rent growth in excess of 5.0% for the next two years before new supply catches up and occupancy and rent growth revert to the mean by 2024.
88.0%
89.0%
90.0%
91.0%
92.0%
93.0%
94.0%
95.0%
96.0%
97.0%
2010 2011 2012 2013 2014 2015 2016 2017 2018 2019 2020 2021 2022 2023 2024 2025
Occ
upan
cy R
ate
%
United States vs. Hampton Roads - Occupancy Trend
United States Hampton Roads
Historical Average = 93.40%
Forecast
UNITED STATES VS HAMPTON ROADS – OCCUPANCY TREND
Source: CoStar Group
EFFECTIVE RENT GROWTH IN HAMPTON ROADS
0.00%
1.00%
2.00%
3.00%
4.00%
5.00%
6.00%
7.00%
2011 2012 2013 2014 2015 2016 2017 2018 2019 2020 2021 2022 2023 2024 2025
Historical Average = 2.31%
Forecast
0.00%
20.00%
40.00%
60.00%
80.00%
100.00%
120.00%
May June July August September October November December
Ending: 6th Ending: 20th End of Month - 2020
RENT PAYMENTS FOR THE UNITED STATES
Source: CoStar GroupSource: CoStar Group
Source: CoStar Group
YOY RENTAL PRICE PERCENT INCREASE IN LARGE METRO AREAS
3NMHC Rent Payment Tracker. (n.d.). Retrieved January 08, 2021, from https://www.nmhc.org/research-insight/nmhc-rent-payment-tracker/4Willett, G. (2020, October 29). Apartment Rent Payment Results at 94.6% in Late October: RP Analytics. Retrieved January 12, 2021, from https:/www.realpage.com/analytics/apartment-rent-payment-results-94-6-late-october/5Market Insights Summary. (n.d.). Retrieved January 12, 2021, from https://product.costar.com/search/multi-family/analytics/summary
WE ARE STILL BUILDING AND BUYING. Multifamily demand is impacted by the fluctuation of population growth, household formation, personal income, and job growth. Job growth is the single, largest driver of demand but now has the element of working from home. Absorption has outpaced supply in the Hampton Roads market since 2017. In 2020, the market absorbed over 4,000 units, while less than 2,000 new units were delivered. Those new units leased up quickly and completely. As an example, The Franklin Johnston Group’s Coastal 61 Apartments (244-unit, Virginia Beach, market rate) and Renaissance Apartments (240-unit, Virginia Beach, mixed income) each leased up in under five months, respectively. Our market is particularly attractive to those
choosing to leave city life behind in search of less expensive housing and more suburban living. Demand for suburban apartments has increased, as the appeal of urban living has waned with the pandemic-related restrictions. Renters are still exiting crowded cities where the high-priced rent may no longer be justified if work-from-home is the new normal and once available amenities remain shuttered.
Leasing velocity was strong in 2020, but demand in 2021 is not expected to be as overwhelming as 2020. Deliveries will slow down between 2021 and 2023 and the absorption rate will fall below deliveries. The following new communities are expected to begin lease up in 2021:
KEY HAMPTON ROADS TRANSACTIONSWhile momentum in sales stalled in Q2 and Q3 as uncertainty loomed, 2020 ended up being a banner year for multifamily sales in Hampton Roads with totals topping $700 million. Office, retail and hospitality were not competitive for investment last year, equity was still available, and interest rates were incredibly low. That combination set the stage for capital to flow to multifamily. Some of the most notable transactions of 2020 included: Elan Apartments (198-unit, market community) in Williamsburg which traded at the highest per door price of $234,848, beating the next highest comparable on the Peninsula by nearly $30,000 per unit, and Alexander Apartments (268-unit, market community) in Norfolk, traded at $55.7 million, the highest price paid for a single deal. Because our market outperformed the nation and most comparable markets in rent growth in 2020, and since our construction pipeline is modest, we are starting to see more institutional
interest in Hampton Roads. For instance, Starwood Capital Group, a global private investment group based in Miami, closed on an eight property, 1,286-unit affordable and mixed income portfolio for $166 million. Tertiary, suburban markets like Hampton Roads are on investors’ radar, and this looks to continue in 2021.
TRENDS TO WATCH For property management groups, technology will be a major trend for 2021. Collecting rent was a challenge to overcome in 2020, and now most management companies are pushing for 100% online payment collection. Major shifts in leasing will become permanent norms: virtual tours, self-touring options, and click-to-sign leases. Implementation of new technologies may result in decreased staff sizes across multifamily sites of all classes. Payment plans will become a legislated norm.
29
4 Stars
3 Stars
3 Stars
3 Stars
3 Stars
4 Stars
3 Stars
4 Stars
3 Stars
3 Stars
3 Stars
50
147
51
258
204
96
266
223
120
163
118
January 21
January 21
January 21
February 21
March 21
April 21
June 21
June 21
June 21
August 21
October 21
V. B. Community Development Corp.
Harbor’s Edge
Foresight Affordable Housing, Inc.
The Breeden Company
J Page Wiliams
Dakota Partners, Inc.
Armada Hoffer Properties, Inc.
Devon USA, LLC
S. L. Nusbaum Realty Co.
Whitmore Management
S. L. Nusbaum Realty Co.
Chesapeake
Norfolk
Suffolk
Norfolk
Williamsburg
Newport News
Virginia Beach
Williamsburg
Hampton
Hampton
Norfolk
Cypress LandingKnell’s Ridge Boulevard, Chesapeake
Harbor’s Edge River Tower 1 Colly Avenue, Norfolk
The Villas at Reid Landing 2283 William Reid Drive, Suffolk
Lofts at Front Street533 Front Street, Norfolk
The Apartments at Kelton Station901 Shipwright Loop, Williamsburg
Huntington Village501 Sophia Way, Newport News
27 Atlantic Apartments2613 Atlantic Avenue, Virginia Beach
High Street View Phase II150 Kings Manor Dr, Williamsburg
Aero Apartments101 Aero Circle, Hampton
Monroe Gates Apartments200 S Mallory St, Hampton
The Ashton Apartment Homes1140-1148 E Princess Ann Rd, Norfolk
UNDER CONSTRUCTIONUnder Contruction Rating Units Complete Owner City
30
2021-2022 MULTI-FAMILYOutlook
The outlook is cautiously optimistic for business as usual in the multifamily industry in 2021. For the first time in years, we are outperforming the national market, and fundamentals show no reason that this year would not be as good or better than 2020. Rent growth in our market will continue, and new supply will lease up, albeit slower than in 2020. There will be continued investment in our sector. It remains to be seen if continued infusions of stimulus and boosted unemployment checks will be part of the government’s plan and for how long. Experts estimate the accrued back rent for the nation during 2020 will be between $34 billion and $70 billion and $266 to $453 million in Virginia by January 2021. Virginia’s share of relief from the latest stimulus is estimated to be $569 million. This will be much needed relief to property owners, as the funds are paid directly to them and will allow for vacancy rates to remain low. The latest stimulus funds continue to buoy renters and help
with rent payments as the eviction moratorium deadline looms. The eviction moratorium started on March 16, 2020 and is set to end on March 31, 2021. Households that could have faced eviction, have not and will not because of this assistance, and in total, some households will have received 12 months of assistance to ensure housing stability. Many states are expected to continue pushing back the moratorium lift date, and even if they do not, court dockets will be jammed for some time to work through the backlog. Due to the COVID-19 Relief Fund prioritizing multifam-ily-related rental assistance, the eviction tsunami may never arrive. If over time, the COVID Relief Fund is not sufficient to thwart an eviction wave, we can expect more appropriations, adding to the $28.5 trillion deficit our nation has accumulated. As of this writing, the Biden Administration has proposed extending the federal eviction moratorium until the end of September and asked Congress for additional appropriations of $30 billion for rental assistance, but the outcome of these proposals remains to be seen. Hampton Roads often outperforms the nation through recessionary and early recovery phases. With government grants helping to ensure back rents are paid, continued rent growth, low vacancies, and high demand in the Hampton Roads area, these fundamentals are pointing to a positive outlook for 2021 and beyond.
E.V. WILLIAMS CENTER FOR REAL ESTATE
REAL ESTATEREAL ESTATEHampton RoadsHampton RoadsHampton Roads2021
MARKET REVIEW & FORECAST
Thank You
31
J. VAN ROSE JR., MIRMPrincipal Owner, Rose & Womble Realty
RESIDENTIAL
THE YEAR IN REVIEW – 2020 Without question, the story for 2020 in the residential for-sale sector was how COVID-19 re-shaped housing. The sector started January with a lot of promise after a strong 2019. But then March rolled around, the industry moved into lockdown and prognostications for housing went from bright to dismal almost overnight. But after a tough late March and April, green shoots started to appear in May and accelerated from there. The residential sector enjoyed one of its best sales years ever. Without question, COVID was a purchase accelerator. And even though we didn’t see a lot of urban flight locally, people did realize that their existing home had now become a home office, school classroom and workout facility, and their existing home simply didn’t “work” for them anymore.
In this new environment builders, buyers and agents made a rapid and successful shift to a digital environment. Housing tours changed from “Open Daily at Noon” to “By Appointment Only.” And if you were willing to jump the hoops needed to navigate the digital landscape and go through the rigors of obtaining a face-to-face appointment, you were a serious buyer. Conversion ratio improved radically. But those serious buyers, motivated by record-low interest rates, ran into the headwinds of record low inventory (nationally inventory hit the lowest level in recorded history — see the chart that follows for the local data), rapidly rising prices and extended delivery times. As Dickens said, “it was the best of times, it was the worst of times.”
11,000
12,000
10,000
9,000
8,000
7,000
6,000
5,000
4,000
3,000
January 2021 starts the month with 2828 less homes on the market than January 2020 and represents 65% less inventory than the peak in January 2015 (the peak in the past 9 years)
Jan Feb Mar Apr May Jun Jul Aug Sep Oct Nov Dec
2015 2016 2017 2018 2019 2020 2021201320142013Num
ber
of H
omes
on
the
Mar
ket
on Ja
nuar
y 1,
202
1
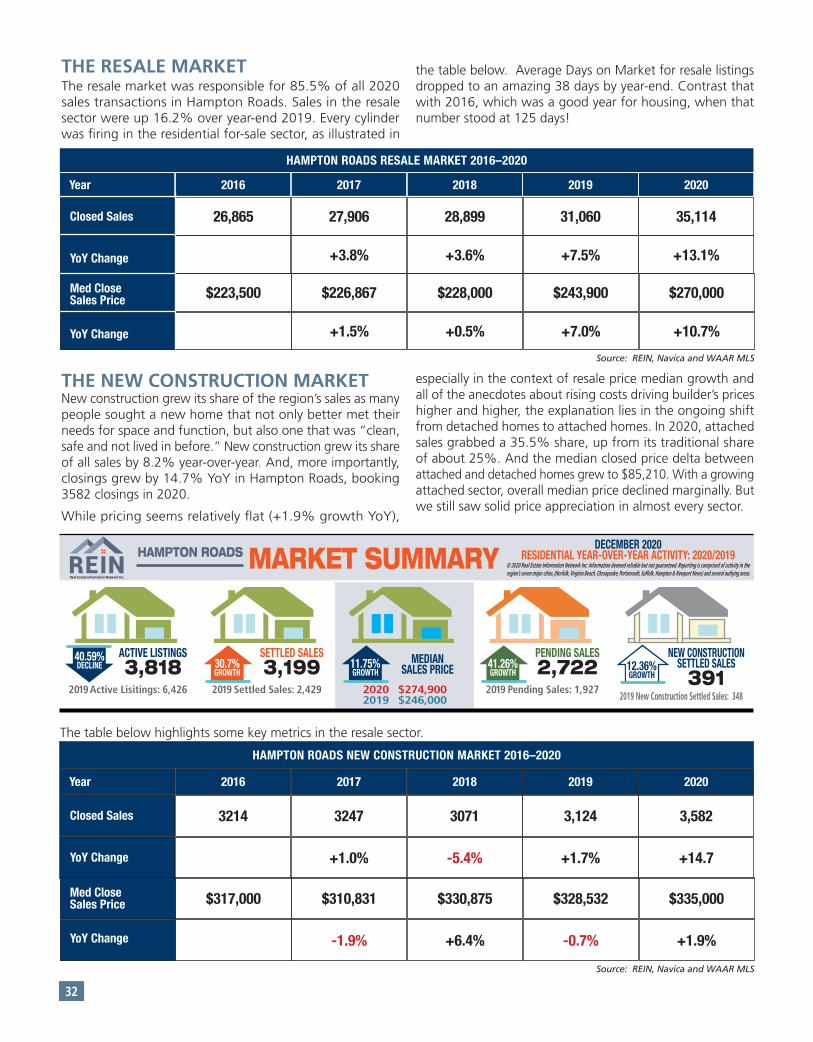
THE RESALE MARKETThe resale market was responsible for 85.5% of all 2020 sales transactions in Hampton Roads. Sales in the resale sector were up 16.2% over year-end 2019. Every cylinder was firing in the residential for-sale sector, as illustrated in
the table below. Average Days on Market for resale listings dropped to an amazing 38 days by year-end. Contrast that with 2016, which was a good year for housing, when that number stood at 125 days!
THE NEW CONSTRUCTION MARKETNew construction grew its share of the region’s sales as many people sought a new home that not only better met their needs for space and function, but also one that was “clean, safe and not lived in before.” New construction grew its share of all sales by 8.2% year-over-year. And, more importantly, closings grew by 14.7% YoY in Hampton Roads, booking 3582 closings in 2020.
While pricing seems relatively flat (+1.9% growth YoY),
especially in the context of resale price median growth and all of the anecdotes about rising costs driving builder’s prices higher and higher, the explanation lies in the ongoing shift from detached homes to attached homes. In 2020, attached sales grabbed a 35.5% share, up from its traditional share of about 25%. And the median closed price delta between attached and detached homes grew to $85,210. With a growing attached sector, overall median price declined marginally. But we still saw solid price appreciation in almost every sector.
Year 2016 2017 2018 2019 2020
HAMPTON ROADS RESALE MARKET 2016–2020
26,865 27,906 28,899 31,060 35,114
+3.8% +3.6% +7.5% +13.1%
$223,500 $226,867 $228,000 $243,900 $270,000
+1.5% +0.5% +7.0% +10.7%
Closed Sales
YoY Change
Med Close Sales Price
YoY Change
Source: REIN, Navica and WAAR MLS
Year 2016 2017 2018 2019 2020
HAMPTON ROADS NEW CONSTRUCTION MARKET 2016–2020
3214 3247 3071 3,124 3,582
+1.0% -5.4% +1.7% +14.7
$317,000 $310,831 $330,875 $328,532 $335,000
-1.9% +6.4% -0.7% +1.9%
Closed Sales
YoY Change
Med Close Sales Price
YoY Change
Source: REIN, Navica and WAAR MLS
32
The table below highlights some key metrics in the resale sector.
HAMPTON ROADS MARKET SUMMARY
40.59%DECLINE
ACTIVE LISTINGS3,818
2019 Active Lisitings: 6,426
SETTLED SALES3,199
2019 Settled Sales: 2,429
30.7%GROWTH
PENDING SALES2,722
2019 Pending Sales: 1,927
41.26%GROWTH
NEW CONSTRUCTIONSETTLED SALES391
2019 New Construction Settled Sales: 348
12.36%GROWTH
MEDIAN SALES PRICE
2020 $274,9002019 $246,000
11.75%GROWTH
DECEMBER 2020RESIDENTIAL YEAR-OVER-YEAR ACTIVITY: 2020/2019
© 2020 Real Estate Information Network Inc: Information deemed reliable but not guaranteed. Reporting is comprised of activity in the region’s seven major cities, (Norfolk, Virginia Beach, Chesapeake, Portsmouth, Suffolk, Hampton & Newport News) and several outlying areas.
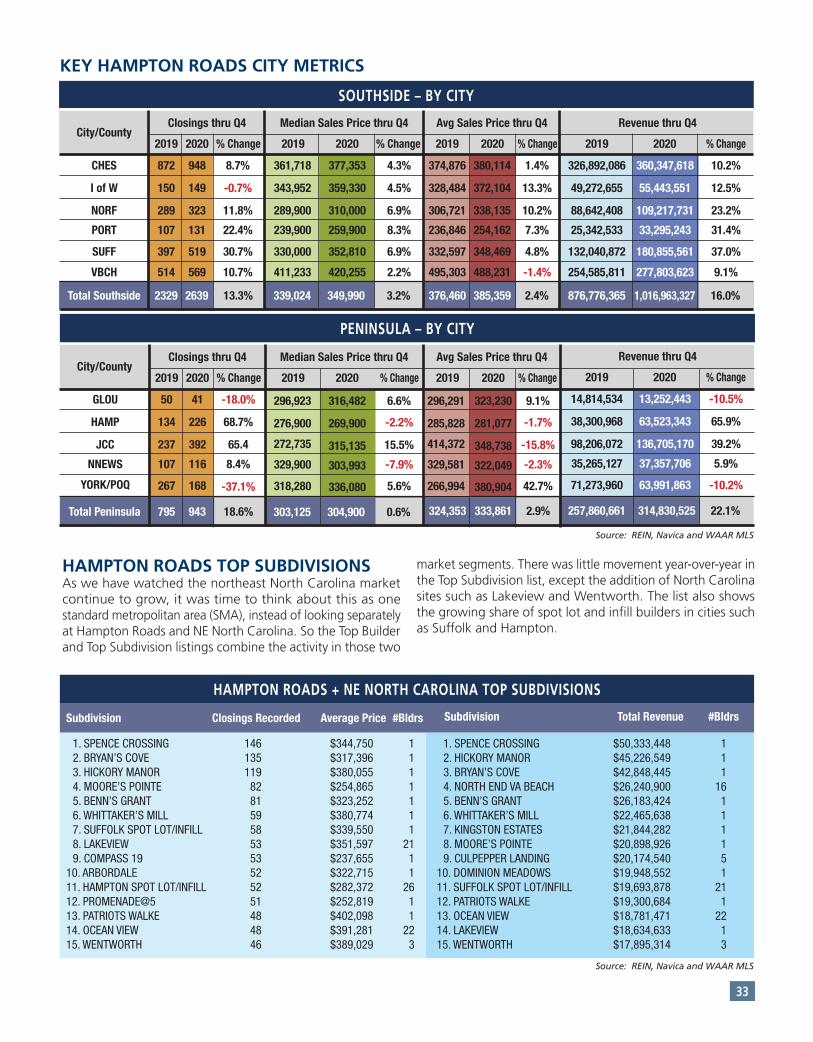
SOUTHSIDE – BY CITY
KEY HAMPTON ROADS CITY METRICS
Source: REIN, Navica and WAAR MLS
Total Southside 2329 339,024 376,460 876,776,3652639 349,990 385,359 1,016,963,32713.3% 3.2% 2.4% 16.0%
City/County
CHES
I of W
NORF
PORT
SUFF
VBCH
872
150
289
107
397
514
361,718
343,952
289,900
239,900
330,000
411,233
326,892,086
49,272,655
88,642,408
25,342,533
132,040,872
254,585,811
374,876
328,484
306,721
236,846
332,597
495,303
948
149
323
131
519
569
377,353
359,330
310,000
259,900
352,810
420,255
360,347,618
55,443,551
109,217,731
33,295,243
180,855,561
277,803,623
380,114
372,104
338,135
254,162
348,469
488,231
2019 2020 2019 2019 20192020 2020 2020
8.7%
-0.7%
11.8%
22.4%
30.7%
10.7%
4.3%
4.5%
6.9%
8.3%
6.9%
2.2%
10.2%
12.5%
23.2%
31.4%
37.0%
9.1%
1.4%
13.3%
10.2%
7.3%
4.8%
-1.4%
Closings thru Q4 Median Sales Price thru Q4 Avg Sales Price thru Q4 Revenue thru Q4
% Change
T P
PENINSULA – BY CITY
Total Peninsula 795 943 18.6%
City/County
GLOU
HAMP
JCC
NNEWS
YORK/POQ
50
134
237
107
267
41
226
392
116
168
2019 2020
Closings thru Q4
% Change
% Change % Change % Change
303,125 324,353304,900 333,8610.6% 2.9%
296,923
276,900
272,735
329,900
318,280
296,291
285,828
414,372
329,581
266,994
316,482
269,900
315,135
303,993
336,080
323,230
281,077
348,738
322,049
380,904
2019 20192020 2020
6.6%
-2.2%
15.5%
-7.9%
5.6%
9.1%
-1.7%
-15.8%
-2.3%
42.7%
Median Sales Price thru Q4 Avg Sales Price thru Q4
% Change % Change
257,860,661 314,830,525 22.1%
14,814,534
38,300,968
98,206,072
35,265,127
71,273,960
13,252,443
63,523,343
136,705,170
37,357,706
63,991,863
2019 2020
-10.5%
65.9%
39.2%
5.9%
-10.2%
Revenue thru Q4
% Change
HAMPTON ROADS TOP SUBDIVISIONSAs we have watched the northeast North Carolina market continue to grow, it was time to think about this as one standard metropolitan area (SMA), instead of looking separately at Hampton Roads and NE North Carolina. So the Top Builder and Top Subdivision listings combine the activity in those two
market segments. There was little movement year-over-year in the Top Subdivision list, except the addition of North Carolina sites such as Lakeview and Wentworth. The list also shows the growing share of spot lot and infill builders in cities such as Suffolk and Hampton.
Source: REIN, Navica and WAAR MLS
HAMPTON ROADS + NE NORTH CAROLINA TOP SUBDIVISIONS
Subdivision Closings Recorded Average Price #Bldrs Subdivision Total Revenue #Bldrs
1. SPENCE CROSSING 146 $344,750 1 2. BRYAN’S COVE 135 $317,396 1 3. HICKORY MANOR 119 $380,055 1 4. MOORE’S POINTE 82 $254,865 1 5. BENN’S GRANT 81 $323,252 1 6. WHITTAKER’S MILL 59 $380,774 1 7. SUFFOLK SPOT LOT/INFILL 58 $339,550 1 8. LAKEVIEW 53 $351,597 21 9. COMPASS 19 53 $237,655 110. ARBORDALE 52 $322,715 111. HAMPTON SPOT LOT/INFILL 52 $282,372 2612. PROMENADE@5 51 $252,819 113. PATRIOTS WALKE 48 $402,098 114. OCEAN VIEW 48 $391,281 2215. WENTWORTH 46 $389,029 3
1. SPENCE CROSSING $50,333,448 1 2. HICKORY MANOR $45,226,549 1 3. BRYAN’S COVE $42,848,445 1 4. NORTH END VA BEACH $26,240,900 16 5. BENN’S GRANT $26,183,424 1 6. WHITTAKER’S MILL $22,465,638 1 7. KINGSTON ESTATES $21,844,282 1 8. MOORE’S POINTE $20,898,926 1 9. CULPEPPER LANDING $20,174,540 510. DOMINION MEADOWS $19,948,552 111. SUFFOLK SPOT LOT/INFILL $19,693,878 2112. PATRIOTS WALKE $19,300,684 113. OCEAN VIEW $18,781,471 2214. LAKEVIEW $18,634,633 115. WENTWORTH $17,895,314 3
33
-18.0%
68.7%
65.4
8.4%
-37.1%
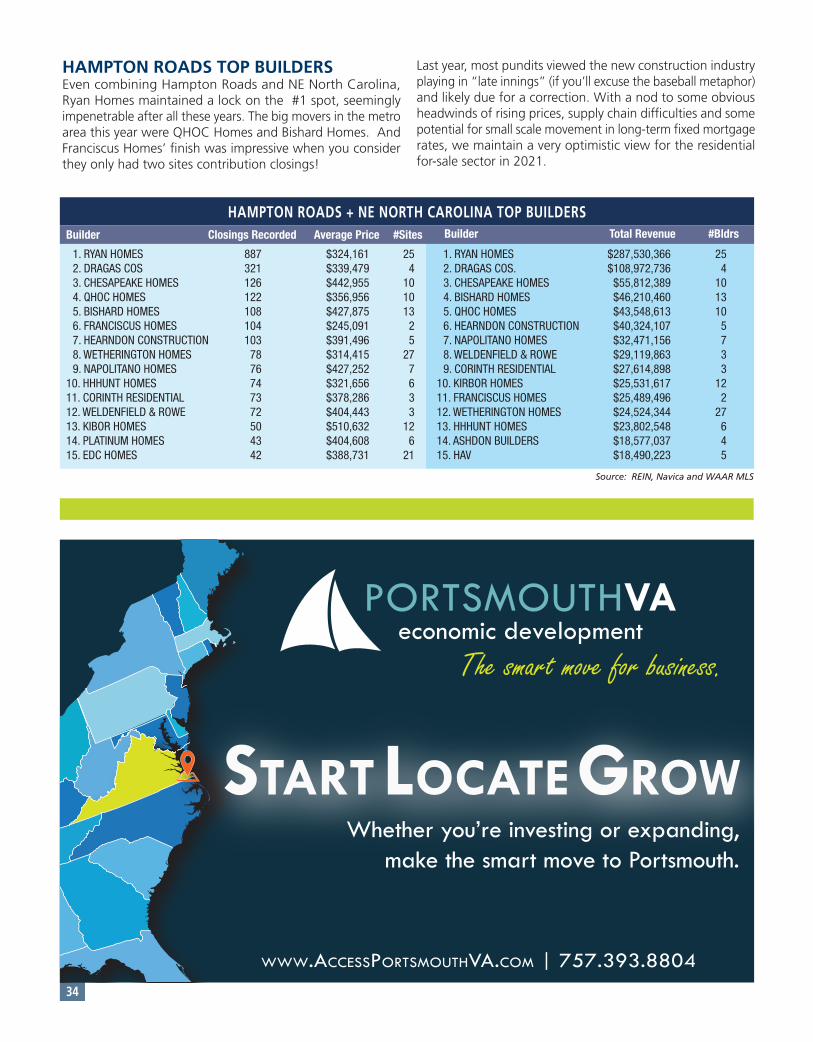
HAMPTON ROADS TOP BUILDERSEven combining Hampton Roads and NE North Carolina, Ryan Homes maintained a lock on the #1 spot, seemingly impenetrable after all these years. The big movers in the metro area this year were QHOC Homes and Bishard Homes. And Franciscus Homes’ finish was impressive when you consider they only had two sites contribution closings!
Last year, most pundits viewed the new construction industry playing in “late innings” (if you’ll excuse the baseball metaphor) and likely due for a correction. With a nod to some obvious headwinds of rising prices, supply chain difficulties and some potential for small scale movement in long-term fixed mortgage rates, we maintain a very optimistic view for the residential for-sale sector in 2021.
Source: REIN, Navica and WAAR MLS
HAMPTON ROADS + NE NORTH CAROLINA TOP BUILDERSBuilder Closings Recorded Average Price #Sites Builder Total Revenue #Bldrs
1. RYAN HOMES 887 $324,161 25 2. DRAGAS COS 321 $339,479 4 3. CHESAPEAKE HOMES 126 $442,955 10 4. QHOC HOMES 122 $356,956 10 5. BISHARD HOMES 108 $427,875 13 6. FRANCISCUS HOMES 104 $245,091 2 7. HEARNDON CONSTRUCTION 103 $391,496 5 8. WETHERINGTON HOMES 78 $314,415 27 9. NAPOLITANO HOMES 76 $427,252 710. HHHUNT HOMES 74 $321,656 611. CORINTH RESIDENTIAL 73 $378,286 312. WELDENFIELD & ROWE 72 $404,443 313. KIBOR HOMES 50 $510,632 1214. PLATINUM HOMES 43 $404,608 615. EDC HOMES 42 $388,731 21
1. RYAN HOMES $287,530,366 25 2. DRAGAS COS. $108,972,736 4 3. CHESAPEAKE HOMES $55,812,389 10 4. BISHARD HOMES $46,210,460 13 5. QHOC HOMES $43,548,613 10 6. HEARNDON CONSTRUCTION $40,324,107 5 7. NAPOLITANO HOMES $32,471,156 7 8. WELDENFIELD & ROWE $29,119,863 3 9. CORINTH RESIDENTIAL $27,614,898 310. KIRBOR HOMES $25,531,617 1211. FRANCISCUS HOMES $25,489,496 212. WETHERINGTON HOMES $24,524,344 2713. HHHUNT HOMES $23,802,548 614. ASHDON BUILDERS $18,577,037 415. HAV $18,490,223 5
34

Educators for our community,advocates of our industry.
LEASING | DEVELOPMENT | PROPERTY MANAGEMENT | SALES | FINANCIAL SERVICES
Thank you for the many years of partnership and commitment.
HEADQUARTERS: 1700 Wells Fargo Center | 440 Monticello Avenue | Norfolk, VA 23510 | 757.627.8611RICHMOND: 7200 Glen Forest Drive | Suite 300 | Richmond, VA 23235 | 804.320.7600
slnusbaum.com
| https://odu.edu/business/center/evwilliams-center |
E. V. WILLIAMS CENTER FOR REAL ESTATEAT THE HARVEY LINDSAY SCHOOL OF REAL ESTATE
STATEMENTof theE. V. WILLIAMS CENTER FOR REAL ESTATE
Mission
The E.V. WilliamsCenter for Real Estate strives to
connect those engaged or interested inreal estate and economic development to the
research, curriculum, and students at Old DominionUniversity (ODU). Through programming, research
initiatives, and publications, the Center partners with itsmembers, ODU alumni, and business leaders to educate
the community and provide ODU students withenrichment experiences that facilitate their
professional development.For membership or programming inquiries,
please contactRuth Cookson ([email protected]).
E.V. Williams Center for Real Estatehttps://odu.edu/business/center/evwilliams-center