ready. - moneycontrol
TRANSCRIPT

READY.
SeQuent Scientific Limited Annual Report 2010-11
Forward-looking StatementsThe report contains forward-looking statements that involve risks and uncertainties. When used in this discussion, the words like ‘plans’, ‘expects’, ‘anticipates’, ‘believes’, ‘intends’, ‘estimates’, or other similar expressions as they relate to Company or its business are intended to identity such forward-looking statements. Forward-looking statements are based on certain assumptions and expectations of future events. The Company’s actual results, performance or achievements could differ materially from those expressed or implied in such forward-looking statements. The Company undertakes no obligation or responsibility to publicly amend, update, modify or revise any forward-looking statements, on the basis of any new information, future event, subsequent development or otherwise.

STEADY


GROW!
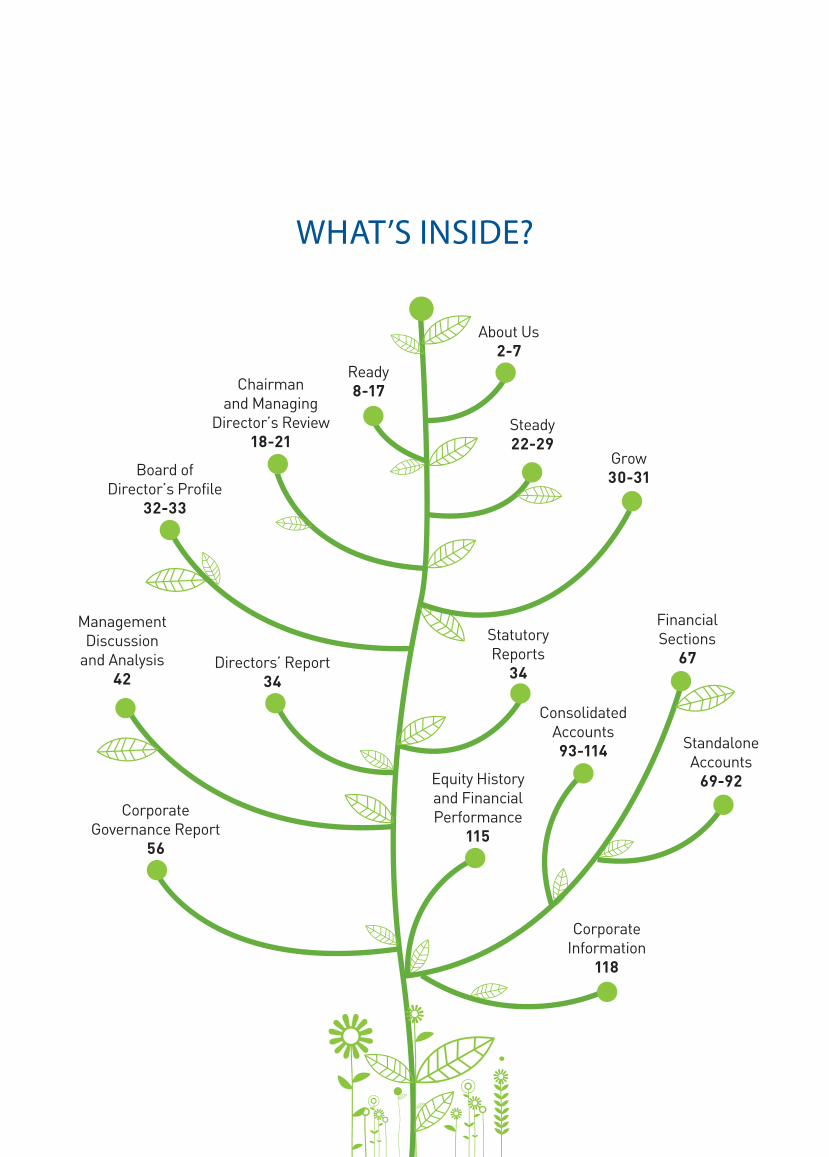
WHAT’S INSIDE?
Statutory Reports
34
Corporate Governance Report
56
Ready8-17
Grow30-31
About Us2-7
Chairman and Managing
Director’s Review18-21
Directors’ Report34
Financial Sections
67
Standalone Accounts
69-92
Consolidated Accounts93-114
Equity History and Financial Performance
115
CorporateInformation
118
ManagementDiscussion
and Analysis 42
Board of Director’s Profile
32-33
Steady 22-29

Great things are not done by impulse, but by a series of small thingsbrought together.
- JumaIkangaa (Tanzanian Marathoner)
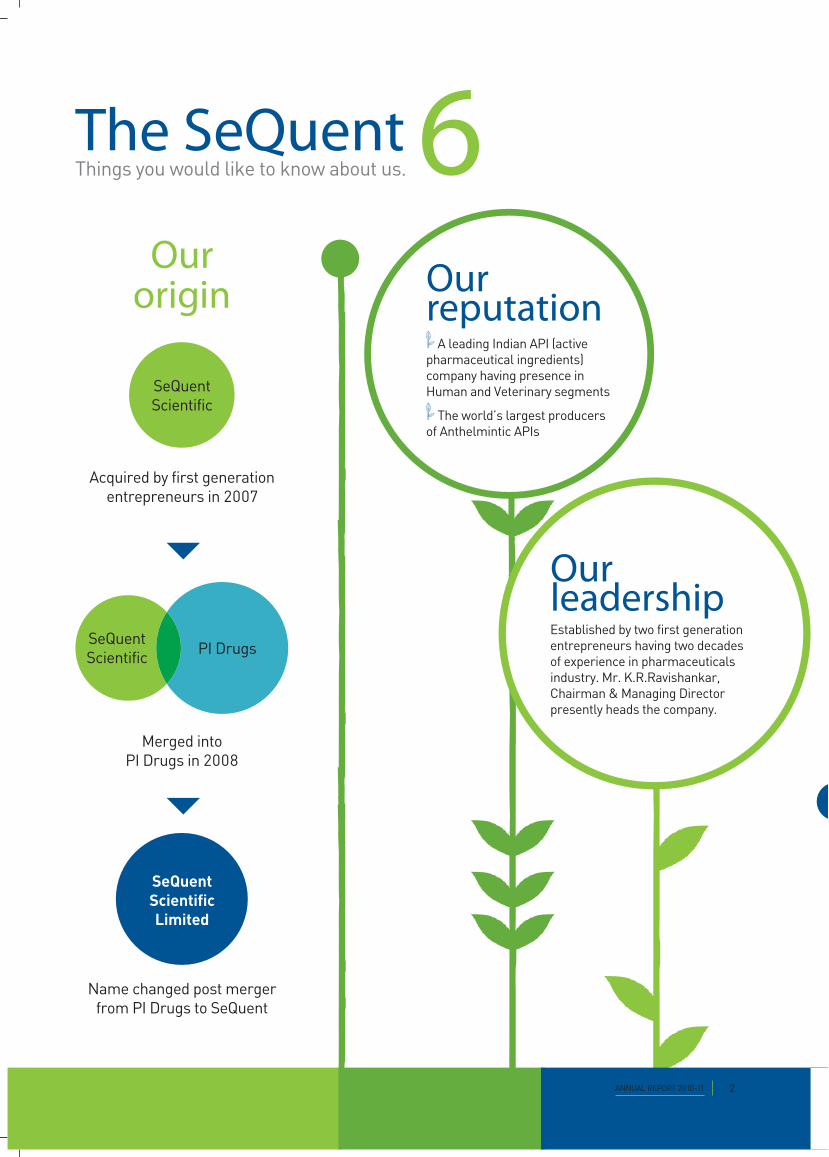
The SeQuent 6Things you would like to know about us.
Our origin
SeQuentScientific
SeQuentScientificLimited
SeQuentScientific PI Drugs
Acquired by first generation entrepreneurs in 2007
Merged into PI Drugs in 2008
Name changed post merger from PI Drugs to SeQuent
Our reputation
A leading Indian API (active pharmaceutical ingredients) company having presence in Human and Veterinary segments
The world’s largest producers of Anthelmintic APIs
Our leadershipEstablished by two first generation entrepreneurs having two decades of experience in pharmaceuticals industry. Mr. K.R.Ravishankar, Chairman & Managing Director presently heads the company.
ANNUAL REPORT 2010-11 2
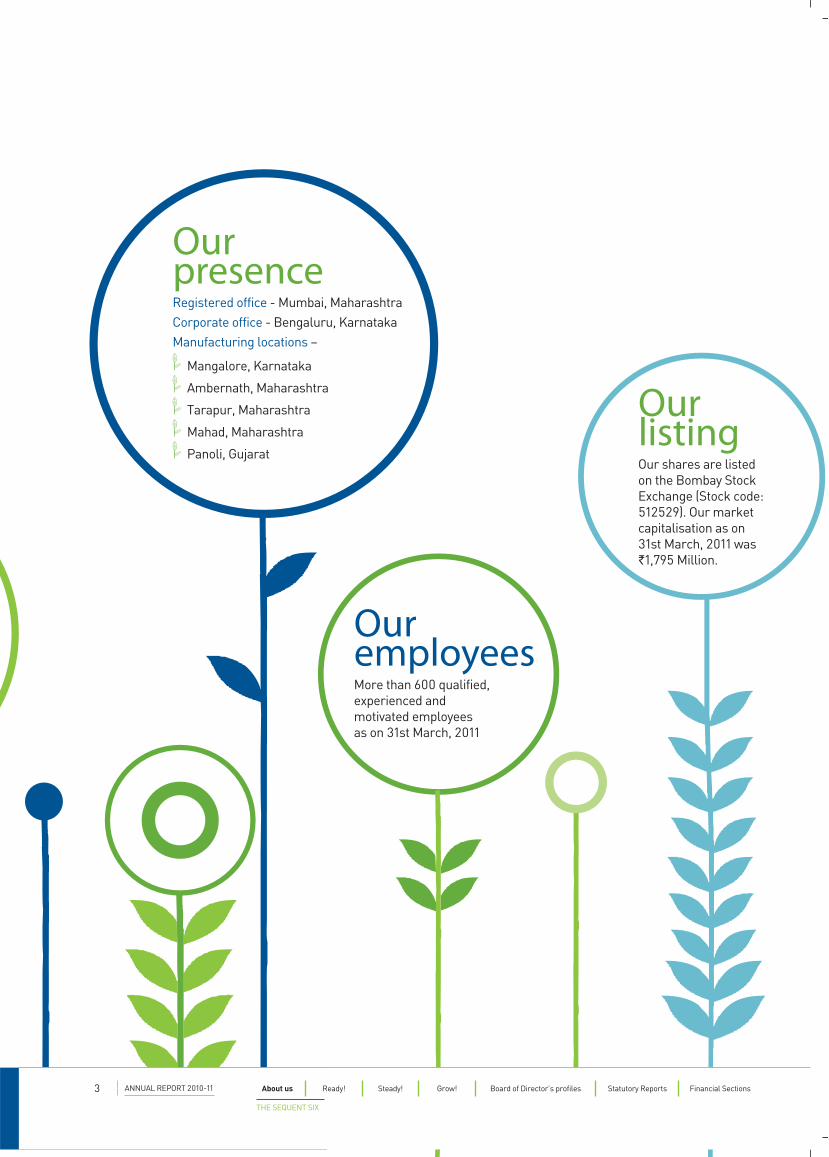
Our presenceRegistered office - Mumbai, MaharashtraCorporate office - Bengaluru, KarnatakaManufacturing locations –
Mangalore, Karnataka
Ambernath, Maharashtra
Tarapur, Maharashtra
Mahad, Maharashtra
Panoli, Gujarat
Our employeesMore than 600 qualified, experienced and motivated employees as on 31st March, 2011
Our listingOur shares are listed on the Bombay Stock Exchange (Stock code: 512529). Our market capitalisation as on 31st March, 2011 was `1,795 Million.
ANNUAL REPORT 2010-113 About us Ready! Steady! Grow! Board of Director’s profiles Statutory Reports Financial Sections
THE SEQUENT SIX
TODAY, WE STAND AT THE STARTING LINE. READY TO EMBARK ON A GROWTH PHASE. CONFIDENT OF OUR CREDENTIALS, NURTURED OVER THE YEARS.
A JOURNEY OF THOUSAND MILES BEGINS WITH A SINGLE STEP. OVER THE FIRST FOUR YEARS OF OUR OPERATIONS SINCE ACQUISITION, WE HAVE COME A LONG WAY. SIMPLY BY TAKING ONE STEP AT A TIME. ALONG THE WAY, WE MODERNISED AND DEBOTTLENECKED EXISTING CAPACITIES, CREATED NEW CLIENTS, FORAYED INTO NEW PRODUCTS, STRENGTHENED PROCESSES, IMPROVED QUALITY AND BUILT AN ORGANISATION.
Today, we stand at the starting line. Ready to embark on a growth phase. Confident of our credentials, nurtured over the years. Staring at the opportunities that our diversified business model offers in wake of growing population, longer working hours, increased per capita income and increasing healthcare spends. With the global healthcare spends expected to reach ~US$ 1,100 billion (bn) by 2015, India is expected to remain a preferred pharmerging market, both in terms of outsourcing by large global pharma companies and consumption spends.
We have consistently invested in our R&D capabilities, capacities and product pipeline. Our production facilities are audited and accredited with global certifications. We have developed requisite production flexibility by partnering with smaller convertors and manufacturers. We have established our presence in unregulated and semi-regulated markets and are now focused foraying into regulated markets.
Having built a robust platform based on learning from the past and envisioning the future growth; we stand prepared.
Ready. Steady. Grow.
ANNUAL REPORT 2010-115 About us Ready! Steady! Grow! Board of Director’s profiles Statutory Reports Financial Sections
READY! STEADY! GROW!
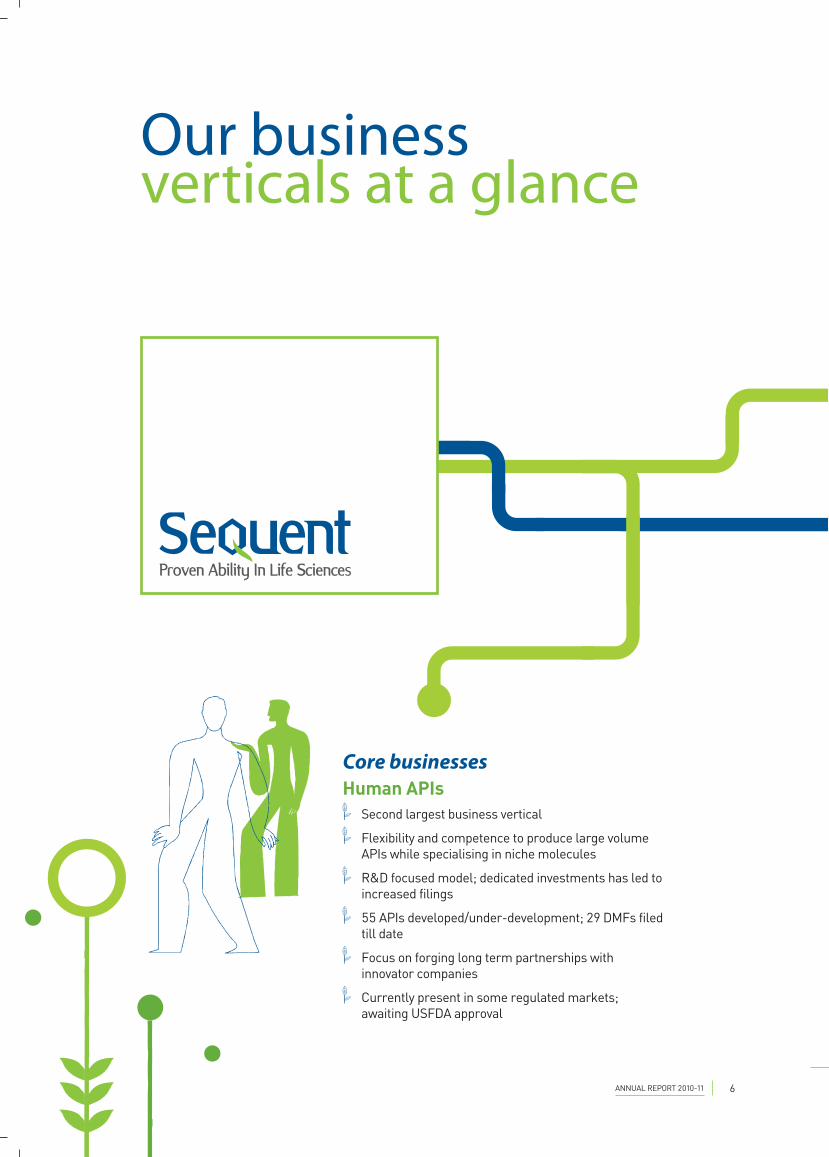
Our business verticals at a glance
Core businessesHuman APIs
Second largest business vertical
Flexibility and competence to produce large volume APIs while specialising in niche molecules
R&D focused model; dedicated investments has led to increased filings
55 APIs developed/under-development; 29 DMFs filed till date
Focus on forging long term partnerships with innovator companies
Currently present in some regulated markets; awaiting USFDA approval
ANNUAL REPORT 2010-11 6
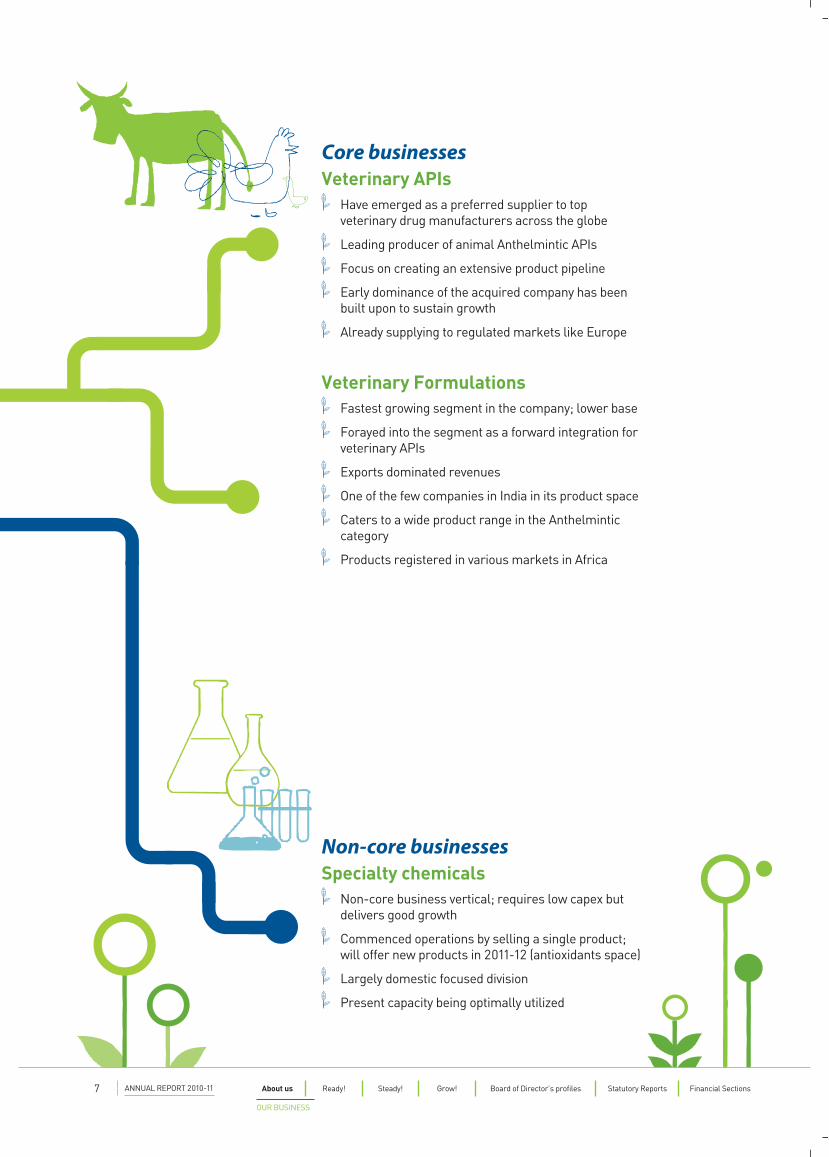
Core businessesVeterinary APIs
Have emerged as a preferred supplier to top veterinary drug manufacturers across the globe
Leading producer of animal Anthelmintic APIs
Focus on creating an extensive product pipeline
Early dominance of the acquired company has been built upon to sustain growth
Already supplying to regulated markets like Europe
Veterinary Formulations Fastest growing segment in the company; lower base
Forayed into the segment as a forward integration for veterinary APIs
Exports dominated revenues
One of the few companies in India in its product space
Caters to a wide product range in the Anthelmintic category
Products registered in various markets in Africa
Non-core businessesSpecialty chemicals
Non-core business vertical; requires low capex but delivers good growth
Commenced operations by selling a single product; will offer new products in 2011-12 (antioxidants space)
Largely domestic focused division
Present capacity being optimally utilized
ANNUAL REPORT 2010-117 About us Ready! Steady! Grow! Board of Director’s profiles Statutory Reports Financial Sections
OUR BUSINESS

READY.BEING READY IS THE FIRST STEP. BEING READY, IS ENVISIONING THE FUTURE. BEING READY, IS BELIEVING IN ONE’S ABILITIES TO CHANGE PERCEPTIONS AND MITIGATE RISKS. IN 2007, WHEN WE ACQUIRED SEQUENT SCIENTIFIC LTD, SPECIALTY CHEMICALS DOMINATED THE REVENUES AND HUMAN APIS VERTICAL WAS AT A NASCENT STAGE. WE FOCUSED ON PHARMACEUTICALS VERTICAL BEING THE CORE BUSINESS.
ANNUAL REPORT 2010-11 8
Though a deviation from our core business; we continued with Specialty chemicals, a low capital intensive and cash generating vertical,as a non-core business. Since the infrastructure for the same already existed, we chose to continue the business, only focusing on high value products.
We chose Pharmaceuticals vertical as a core business on account of our research-led pedigree. Human APIs, being a capital-intensive business, it was important for us to define our expertise and ensure phased spending. We focused on anti-infective category and at the same time initiated steps to develop a world-class research and development infrastructure. Our investments in processes, people and products enabled us to expand our clientele and also built our credentials as a research-led player in niche molecules and intermediates. However, scaling up was essential to reach the next level of growth. The challenge was to look beyond Human APIs.
In 2008 we acquired a two decade old company, PI Drugs through reverse merger. Then the erstwhile PI Drugs was renamed as Sequent Scientific. That merger provided us with established expertise in veterinary APIs and formulations. The veterinary pharmaceuticals industry is largely concentrated in Europe and United States. With increased cost of inputs, the veterinary pharma segment too would outsource its production to low cost destinations. India being in forefront of the cost-quality benefit providers, we chose to pursue this vertical. As a result of our R&D set-up, understanding of complex chemistry and uncompromising attitude towards quality, we have emerged among the fastest growing veterinary solutions providers in India.
Today, we are ready. The core business (Pharmaceuticals) contributes 86 per cent to our topline and non-core (specialty chemicals) account for the remaining 14 per cent. In the past five years, revenues from veterinary business have quadrupled and Human APIs have tripled. Veterinary segment accounts for 58 per cent and Human APIs account for 28 per cent of the total revenues.
With moderate scale set in each business vertical, backed by robust financial health, we are ready.
We chose Pharmaceuticals vertical as a core
business on account of our research-led
pedigree. Human APIs, being a capital-intensive business, it was important for us
to define our expertise and ensure phased
spending.

OUR GUIDING PRINCIPLES
Our vision
To be a reliable source in the mature generic and
niche molecule areas while building a sustainable CRAMS
resource for our customer.
Our missionTo deliver quality products competitively while adhering to high quality standards and safety of our people and our environment.
ANNUAL REPORT 2010-11 10
Our quality policySeQuent Scientific Limited is engaged in development & manufacture of pharmaceuticals and specialty chemicals. Every product manufactured in our premises shall adhere to the prescribed quality norms for the product and focused efforts shall be taken towards continual improvement of the product and processes involved. We shall achieve this by ensuring excellent Quality Standards in:
Our People - Through constant training and motivation programs to imbibe the goals and objectives of the Company in their work
Our Inputs - Through strict adherence to Quality standards prescribed for the respective inputs
Our Facilities - Through stringent in-house manufacturing & documentation standards complying to cGMP and all applicable legal and regulatory requirements
ANNUAL REPORT 2010-1111 About us Ready! Steady! Grow! Board of Director’s profiles Statutory Reports Financial Sections
OUR GUIDING PRINCIPLES
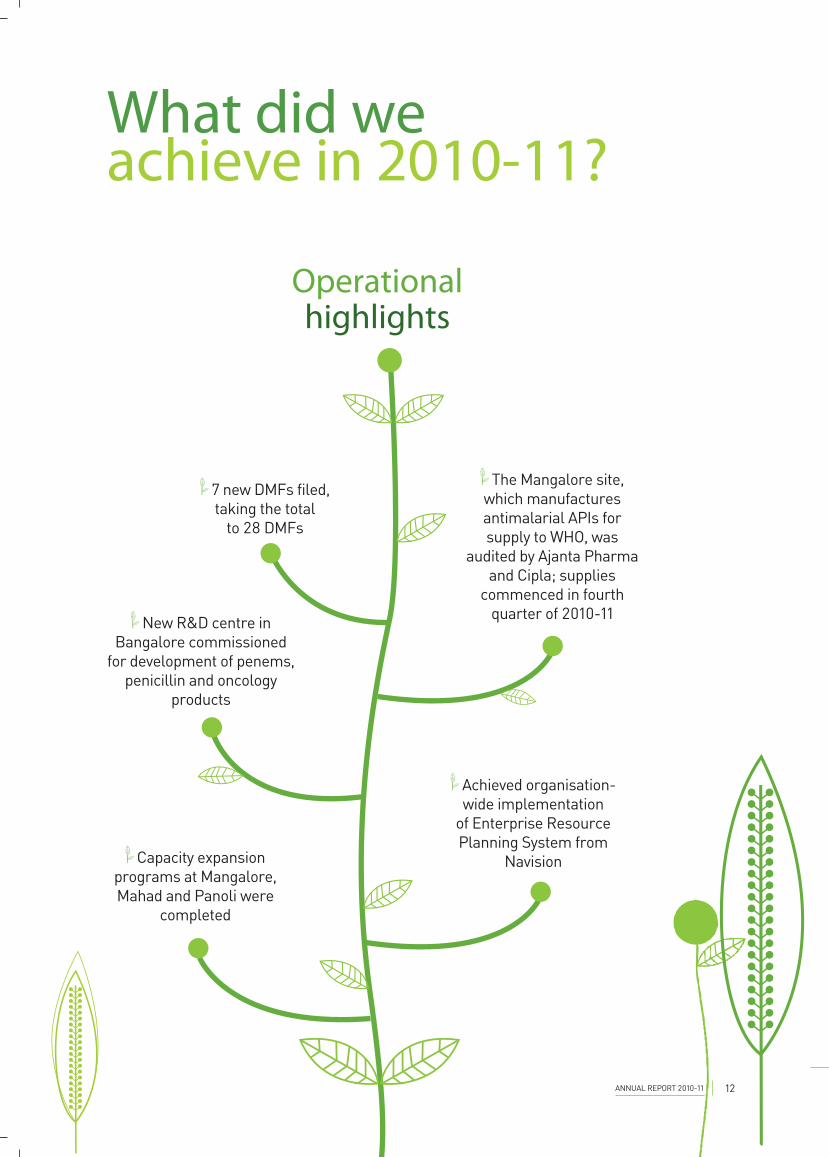
What did we achieve in 2010-11?
Operational highlights
7 new DMFs filed, taking the total
to 28 DMFs
The Mangalore site, which manufactures antimalarial APIs for supply to WHO, was
audited by Ajanta Pharma and Cipla; supplies
commenced in fourth quarter of 2010-11
New R&D centre in Bangalore commissioned
for development of penems, penicillin and oncology
products
Capacity expansion programs at Mangalore, Mahad and Panoli were
completed
Achieved organisation-wide implementation
of Enterprise Resource Planning System from
Navision
ANNUAL REPORT 2010-11 12
Awards and accolades The Mangalore R&D centre received accreditation from
DSIR
The company’s 2009-10 annual report won the Platinum
Award among Pharmaceutical Companies and was
ranked at 17th among top 50 annual reports of 2009-10
by League of American Communication Professionals
ANNUAL REPORT 2010-1113 About us Ready! Steady! Grow! Board of Director’s profiles Statutory Reports Financial Sections
WHAT DID WE ACHIEVE IN 2010-11!
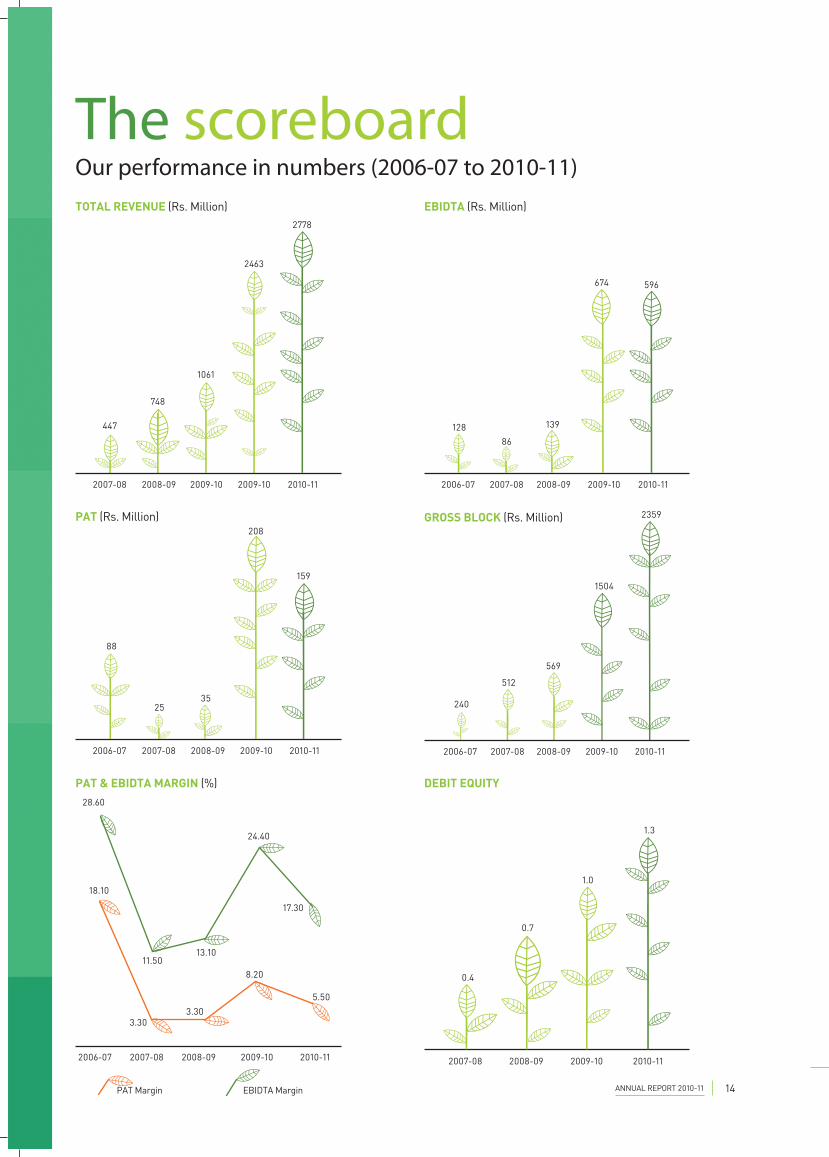
The scoreboardOur performance in numbers (2006-07 to 2010-11)TOTAL REVENUE (Rs. Million)
2778
2010-11
1061
2009-10
748
2008-09
447
2007-08
2463
2009-10
EBIDTA (Rs. Million)
2010-11
596
2009-10
674
2008-09
139
2007-08
86
2006-07
128
PAT (Rs. Million)
2008-09
35
2007-08
25
2009-10
208
2006-07
88
2010-11
159
GROSS BLOCK (Rs. Million)
2006-07 2009-10 2010-112008-092007-08
1504
2359
569
512
240
PAT & EBIDTA MARGIN (%)
2010-112009-102008-092007-082006-07
11.50
18.10
28.60
13.10
24.40
17.30
3.303.30
8.20
5.50
EBIDTA MarginPAT Margin
DEBIT EQUITY
2010-11
1.3
2009-10
1.0
2008-09
0.7
2007-08
0.4
ANNUAL REPORT 2010-11 14
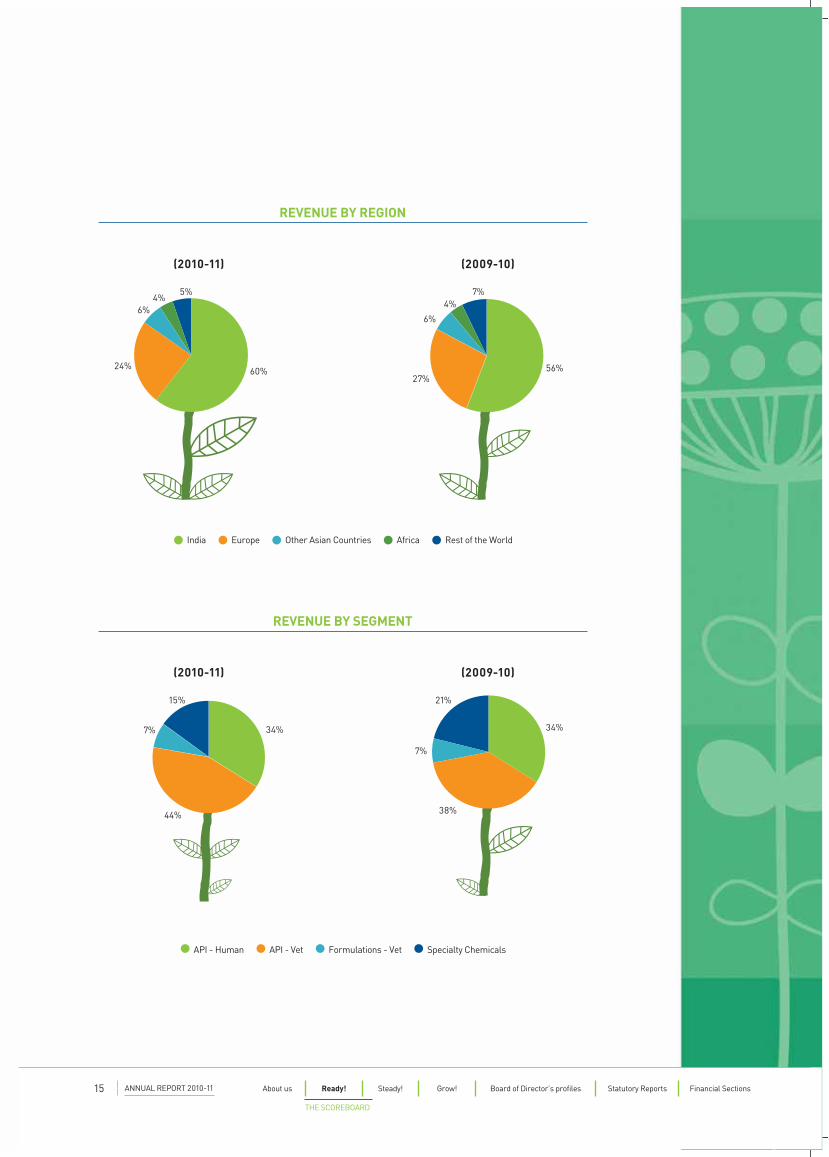
(2009-10)
56%27%
6%
4%7%
India Europe Other Asian Countries Africa Rest of the World
(2010-11)
60%24%
6%4%
5%
REVENUE BY REGION
34%
44%
7%
15%
34%
38%
21%
7%
(2009-10)
API - Human API - Vet Formulations - Vet Specialty Chemicals
(2010-11)
REVENUE BY SEGMENT
ANNUAL REPORT 2010-1115 About us Ready! Steady! Grow! Board of Director’s profiles Statutory Reports Financial Sections
THE SCOREBOARD
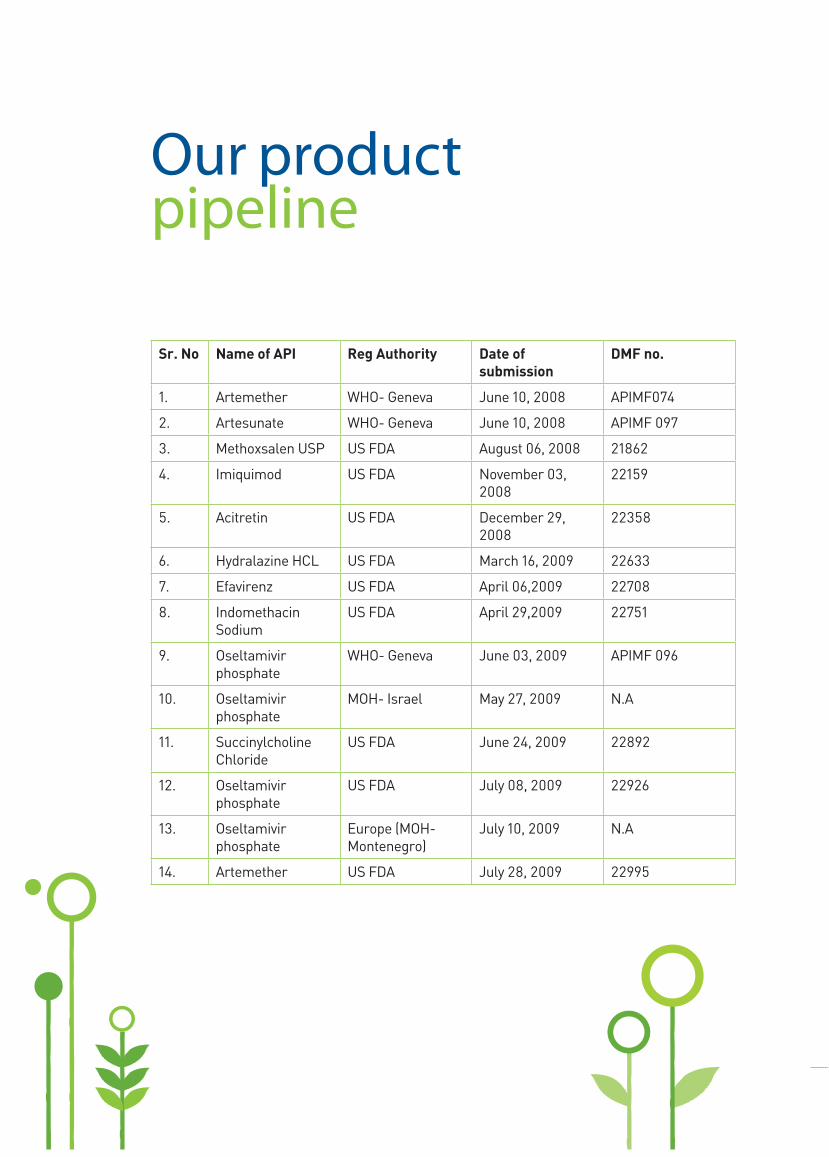
Our product pipeline
Sr. No Name of API Reg Authority Date of submission
DMF no.
1. Artemether WHO- Geneva June 10, 2008 APIMF074
2. Artesunate WHO- Geneva June 10, 2008 APIMF 097
3. Methoxsalen USP US FDA August 06, 2008 21862
4. Imiquimod US FDA November 03, 2008
22159
5. Acitretin US FDA December 29, 2008
22358
6. Hydralazine HCL US FDA March 16, 2009 22633
7. Efavirenz US FDA April 06,2009 22708
8. Indomethacin Sodium
US FDA April 29,2009 22751
9. Oseltamivir phosphate
WHO- Geneva June 03, 2009 APIMF 096
10. Oseltamivir phosphate
MOH- Israel May 27, 2009 N.A
11. Succinylcholine Chloride
US FDA June 24, 2009 22892
12. Oseltamivir phosphate
US FDA July 08, 2009 22926
13. Oseltamivir phosphate
Europe (MOH- Montenegro)
July 10, 2009 N.A
14. Artemether US FDA July 28, 2009 22995
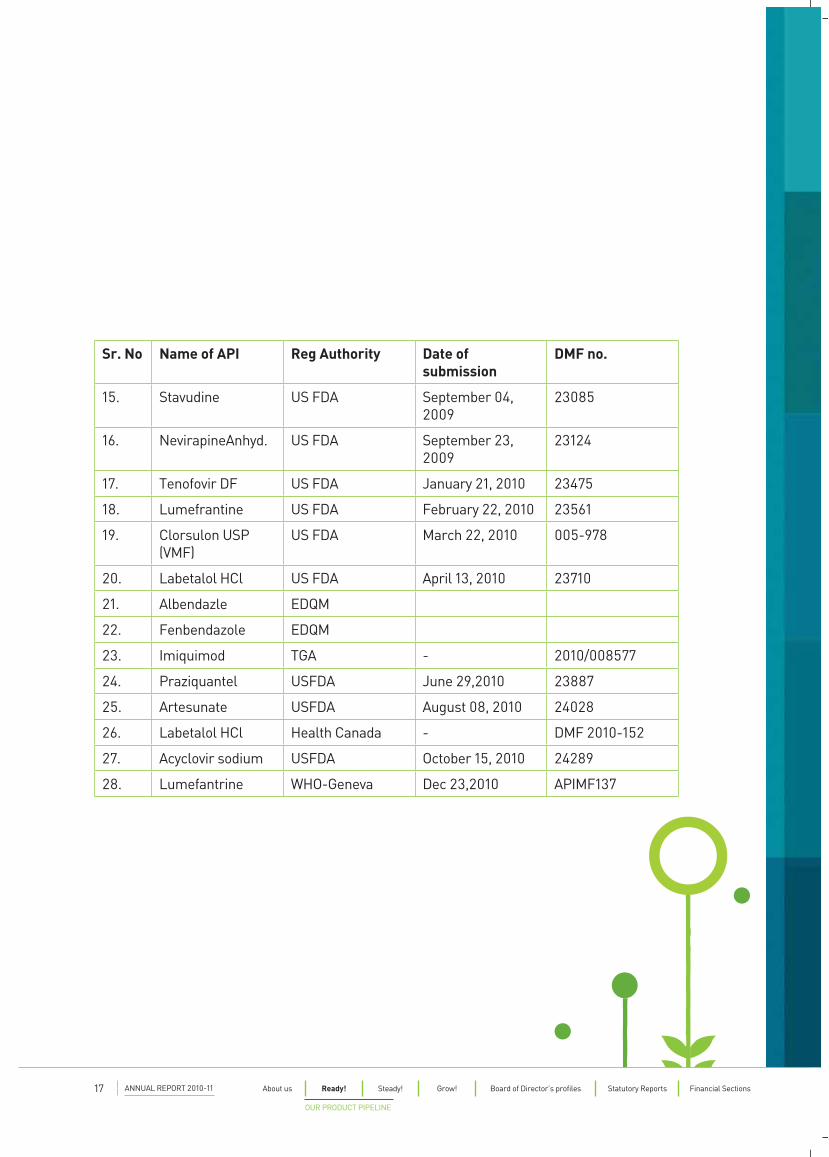
Sr. No Name of API Reg Authority Date of submission
DMF no.
15. Stavudine US FDA September 04, 2009
23085
16. NevirapineAnhyd. US FDA September 23, 2009
23124
17. Tenofovir DF US FDA January 21, 2010 23475
18. Lumefrantine US FDA February 22, 2010 23561
19. Clorsulon USP (VMF)
US FDA March 22, 2010 005-978
20. Labetalol HCl US FDA April 13, 2010 23710
21. Albendazle EDQM
22. Fenbendazole EDQM
23. Imiquimod TGA - 2010/008577
24. Praziquantel USFDA June 29,2010 23887
25. Artesunate USFDA August 08, 2010 24028
26. Labetalol HCl Health Canada - DMF 2010-152
27. Acyclovir sodium USFDA October 15, 2010 24289
28. Lumefantrine WHO-Geneva Dec 23,2010 APIMF137
ANNUAL REPORT 2010-1117 About us Ready! Steady! Grow! Board of Director’s profiles Statutory Reports Financial Sections
OUR PRODUCT PIPELINE
The pursuit towards attaining excellence is ever-demanding and never-ending.
Four years ago, when we embarked on this journey to create a leading pharma company, we opted for inorganic expansion. As a result, we acquired companies including their processes and assets. Along with this we also acquired their legacies. The challenges were aplenty – from revamping the processes, to improving the capacities, to instilling a common corporate culture. During the first four years, we focused on consolidating operations, capacities and improving efficiencies. Being in a capital-intensive industry, it was also a challenge to achieve medium term growth without compromising on long-term liquidity and leverage. The focus therefore, was upon improving the existing capacities and building a strong foundation, upon which a robust future could be crafted. In the past four years, we have not only registered a 44 per cent CAGR growth in our revenues (from `447 Million in 2006-07 to `2.78 bn in 2010-11), but also scaled up each of the product verticals (APIs, Formulations, CRAMS and Specialty Chemicals) to a respectable size.
CHAIRMAN AND MANAGING DIRECTOR’S REVIEW
KR RavishankarChairman & Managing Director
ANNUAL REPORT 2010-11 18
for development of penems, penicillin and oncology
products. Today, with two R&D centres, in Mangalore
and Bengaluru, we have further strengthened
our delivery capability for niche APIs and CRAMS.
The company has more than 55 new APIs under
development and filed a total of 29 DMFs till date.
These DMFs are expected to propel our future
growth subject to their approval in the coming years.
During the year under review, we filed 7 new DMFs.
Built capacities and consolidated operations
2010-11 also witnessed completion of our capacity
expansion programme at Mangalore, Mahad and
Panoli. All the manufacturing facilities of the
company have been audited and certified by top
global pharmaceutical companies and institutions.
All our units have the requisite competence and
infrastructure to handle a wide range of reactions in
synthetic chemistry. During the year, our Mangalore
unit was audited and approved by our esteemed
clients Ajanta Pharma and Cipla for supply of
Antimalarial products to World Health Organisation.
The regulatory delay has posed one of the major
challenges for us. Our Mangalore unit has been
awaiting USFDA inspection for more than a year now.
The impending USFDA approval will enable us foray
into the highly regulated market of USA thereby
improve our margins. Owing to regulatory delays in
land allotment, our ambitious penems project has
got delayed by 8-10 months. However, we are now
on course and expect to complete the first phase by
March 2012.
We continued to consolidate our business, by
merging our subsidiary Vedic Elements. The scheme
of amalgamation was approved by the Karnataka
Higher input costs coupled with pricing pressure
on some of our key products resulted in deflating
the margins. We responded by initiating cost-
control initiatives across our units. The focus was
on sweating-off existing capacities to ensure higher
overhead absorption. Each product and process
was clearly looked at; and for some in-licensing
arrangements were preferred, leading to lower
cost, with no compromise on quality standards.
The capacities were debottlenecked to improve
economies of scale. Efficient inventory and debtors
management led to improvement in inventory
carrying and receivables cycles. However, the impact
of our initiative hardly translated into the numbers
during 2010-11. While our revenues increased by
13 per cent to `2.78bn, our net profit declined by
23 per cent to `159Million. It is worth noting that
during 2009-10, the company derived 21 per cent of
its revenues from Oseltavimir, an API used in swine
flu drugs. Oseltavimir contributed 48 per cent to the
company’s EBIDTA. In 2010-11, there were no sales
of Oseltavimir. In absolute terms, company’s non-
Oselamivir sales increased by 43 per cent in 2010-11
and EBIDTA improved by 54 per cent, as compared to
2009-10.
Aiming for sustainable growth
In our continuous pursuit towards sustainable
growth, we have focused on creating a research-
led organisation. Our research and development
initiative has enabled us to offer customised
solutions to our clients, streamline processes,
eliminate wastages and yet initiated quality
benchmarking and improvements across our
divisions. During 2010-11, we commissioned our
second state-of-the-art R&D centre in Bengaluru
ANNUAL REPORT 2010-1119 About us Ready! Steady! Grow! Board of Director’s profiles Statutory Reports Financial Sections
CHAIRMAN AND MANAGING DIRECTOR’S REVIEW
margins by targeting niche products and new
markets including India. The CRAMS vertical would
also benefit from the improvement in R&D spending
of the global pharma companies in the wake of
patent expiries.
The future is bright.
Over the years, we have taken numerous initiatives
to build an organisational culture based on efficiency,
economy and quality. In the process we have
revitalised our capacities, identified and nurtured
core businesses, reinforced our R&D edge, set up
a reputed management team and built a robust
product pipeline. Some of these initiatives have
started bearing fruits and some of them remain at an
initial stage. However, we remain confident that the
impact of the measures taken over the years would
translate into numbers going forward. I would like to
thank each and every stakeholder of the company for
supporting us and believing in our credentials. Our
focus is unwavering. Our commitment is unfaltering.
Our future is exciting. And we are Ready.
Ravi
High Court on 7th September 2010. We also exited
few overseas markets during the year owing to lower
profitability.
We live in exciting times.
More than US$ 80bn worth of medicines are
expected to go off patent by 2012. This provides a
huge opportunity for a niche and integrated player
like us. India provides a cost-advantage and also
serves a ready market for global pharma companies.
As a growth strategy, we have initiated product
partnerships with few of our esteemed clients.
Owing to our strong R&D capability, we have already
derived 23 per cent of our total revenues during
2010-11 from these long-term product partnerships.
Going forward, we would expand our product profile.
Today, all of our businesses have earned a
respectable scale.
As a result, we continued to chalk and implement
customised strategies for each of our verticals.
Specialty chemicals business, despite being a
non-core business remains cash generating and
commands good margins. Our focus on veterinary
APIs and Formulations will enable us improve
ANNUAL REPORT 2010-1121 About us Ready! Steady! Grow! Board of Director’s profiles Statutory Reports Financial Sections
CHAIRMAN AND MANAGING DIRECTOR’S REVIEW

BEING STEADY IS NOT AN EVENT BUT A
CONTINUOUS PROCESS. BEING STEADY
IS TO REMAIN UNDETERRED IN WAKE OF
ADVERSITIES. BEING STEADY IS TO BELIEVE IN
OWN STRENGTHS AND IMPROVE UPON THEM.
IN AN EVOLVING INDUSTRIAL LANDSCAPE, THE
BUSINESS CHALLENGES ARE FREQUENT. AS A
RESULT, WE CHOSE TO REVIEW OUR BUSINESS
MODEL REGULARLY AND BUILT MECHANISMS TO
MITIGATE EVOLVING RISKS AND CHALLENGES.
STEADY
ANNUAL REPORT 2010-11 22
We identified the potential in Veterinary business, enabling us to serve a diverse range of clients globally, which in turn, diversified our revenue concentration and resulted in faster growth.Today, we are steady with a business model offering diversified business verticals- each offering varied products and solutions.
We understood the importance of having a world-class research and development infrastructure. Today, we are steady with 29 DMFs filed, a pending USFDA Approval and more than 55 APIs under development
To ensure real-time sharing of information, we have implemented an organisation-wide ERP network. This ensures that information is accessible in real time across our units and branches. Today we are steady and connected.
We partnered global players and developed requisite production flexibility to cater to diverse and complex processes at competitive costs. Today we are steady partner to our clients.
Today, we are steady.
World-class research and development
infrastructure. Today, we are steady with 29 DMFs filed, a pending USFDA Approval and
more than 55 APIs under development
ANNUAL REPORT 2010-1123 About us Ready! Steady! Grow! Board of Director’s profiles Statutory Reports Financial Sections

ANNUAL REPORT 2010-11 24
At Sequent, we inherited all of our existing facilities. Each unit attuned to produce strictly limited quality and number of products. The immediate need was to create a bigger capacity with requisite flexibility. The focus was on creating capacities that can be translated into revenues in a phased manner.
As a strategy, key units were identified and a focused drive to modernise/debottleneck capacities was carried out. The products produced at multiple locations were consolidated into one unit, resulting in better economies and higher efficiencies. The company invested 0ver `900 Million in the past four years on modernising, debottlenecking, renovating and inducting fresh capacities across its units.
At the same time, we also benchmarked our quality standards with the best industry practices and opted for compliance certifications for all our units. This enabled us to develop requisite production flexibility across our units, leading to optimum capacity utilisation.
Our uncompromising benchmarks in terms of quality and delivery schedule enabled us to consistently match our customers’ expectations. This established our flexibility and competence to produce large volume APIs while specialising in niche molecules.
Increasing capacities. Improving flexibility.
ANNUAL REPORT 2010-1125 About us Ready! Steady! Grow! Board of Director’s profiles Statutory Reports Financial Sections
INCREASING CAPACITIES

ANNUAL REPORT 2010-11 26
To emerge as a truly knowledge-driven company, it was vital for us to establish a dedicated R&D infrastructure. In 2007, we established a state of the art R&D centre at Mangalore. This centre proved to be a shot in the arm. It enabled us to becomea customised solutions provider to our clients.
Our investments in R&D also enabled us develop niche molecules and expertise in different types of chemistries. We filed 29 drug master files in the past four years and developed more than 55 APIs. Our timely investment in the product pipeline translated from our efforts in R&D. Upon approval, we expect the drug master files to drive our growth in the coming years.
During 2010-11, we commissioned a new R&D centre in Bengaluru. Situated in 8,000 sqft area, this state of the art centrewill be dedicated towardsniche R&D on Penems, Penicillin and Oncology APIs. An environment friendly, zero-discharge facility, it will act as the feeder unit to the company’s ambitious `1.5 bn API project. This centre would enable the company achieve development and stabilisation of new products and processes, which will be commercialised in the new manufacturing facility in Bengaluru.
Our in-house team of more than 50 scientists, including 8 PhDs and 35 MoS, has played a vital role in building up our R&D vertical. As on 2010-11, our total R&D spends accounted for Two per cent of our revenues.Owing to our R&D, we forayed into newer molecules, which led to filings in regulated markets. During 2010-11, we also commercialized seven new products. The R&D centre also enabled us broaden the product profile in veterinary business.
Researching possibilities. Developing potential.
ANNUAL REPORT 2010-1127 About us Ready! Steady! Grow! Board of Director’s profiles Statutory Reports Financial Sections
RESEARCHING POSSIBILITIES.

ANNUAL REPORT 2010-11 28

Having established flexible production capacity and credible research infrastructure, it was important for us to target generation of sustained revenues and higher margins. Being a reputed player, catering to global pharma companies, both in human and veterinary segments, we aimed at forging long-term product based partnerships with our clients as well as expanding into newer markets offering higher margins.
We initiated this strategy by offering one product to a large customer in 2006-07. By the end of 2010-11, we had developed four such partnerships. These partnerships not only resulted in assured revenues but also enabled us to utilise our R&D infrastructure efficiently and thereby enhance our intellectual capital. These partnerships also assured our global clients of our abilities and deliverables, resulting in new business enquiries.
In our veterinary business, we concentrated on expanding our product profile and reach our target markets of Europe and some less regulated markets. Today we are market leaders in Anthelmintics and have successfully established our credentials as a preferred supplier to global vet pharma companies. In the veterinary formulations, we focused on African markets where our products are registered.
In Human APIs, we aim to expand our geographical presence to larger markets owing to our expertise in offering quality products and economical costs. We would continue to focus on niche APIs, long-term product partnerships with innovator companies and import substitution products.
Exploring partnerships. Expanding horizons.
ANNUAL REPORT 2010-1129 About us Ready! Steady! Grow! Board of Director’s profiles Statutory Reports Financial Sections
EXPLORING PARTNERSHIPS.
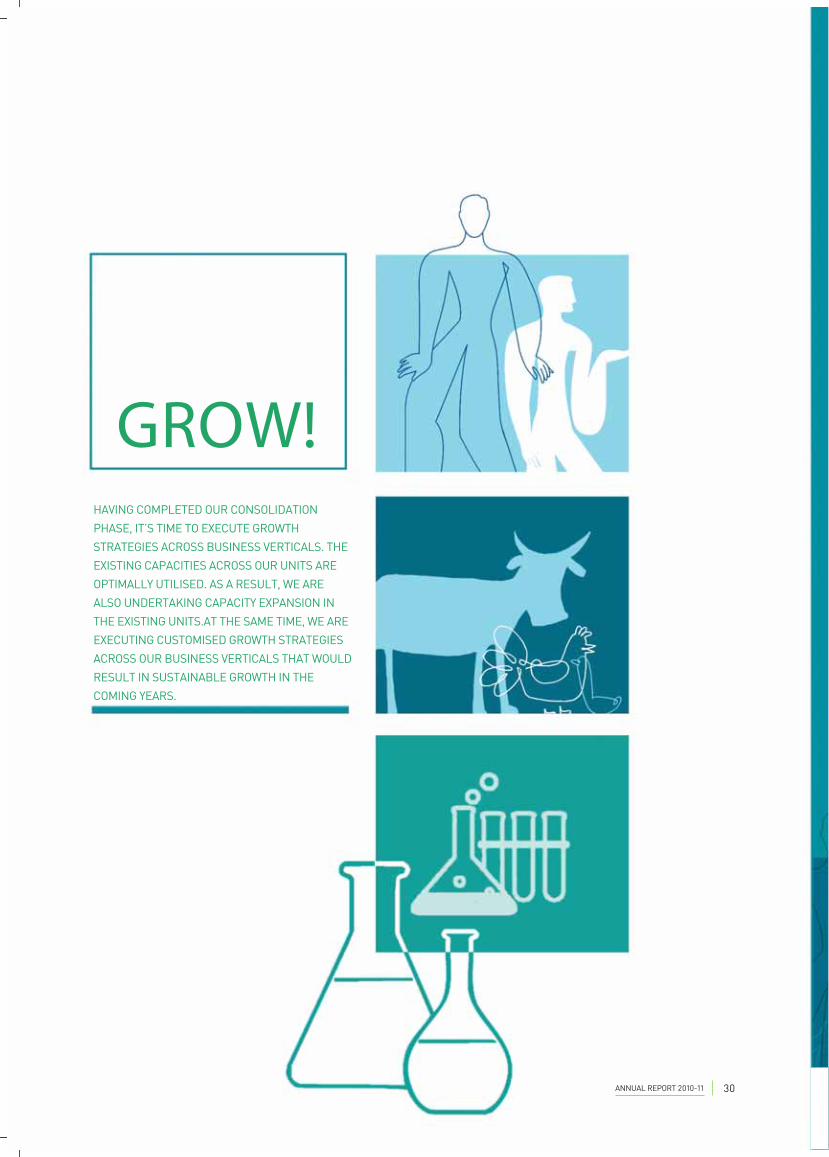
GROW!HAVING COMPLETED OUR CONSOLIDATION
PHASE, IT’S TIME TO EXECUTE GROWTH
STRATEGIES ACROSS BUSINESS VERTICALS. THE
EXISTING CAPACITIES ACROSS OUR UNITS ARE
OPTIMALLY UTILISED. AS A RESULT, WE ARE
ALSO UNDERTAKING CAPACITY EXPANSION IN
THE EXISTING UNITS.AT THE SAME TIME, WE ARE
EXECUTING CUSTOMISED GROWTH STRATEGIES
ACROSS OUR BUSINESS VERTICALS THAT WOULD
RESULT IN SUSTAINABLE GROWTH IN THE
COMING YEARS.
ANNUAL REPORT 2010-11 30
Veterinary Formulations
The Indian market for animal nutrition and health product is highly fragmented with a very large number of relatively small players. The top 10 players are estimated to control around 25 per cent of the market, and more than 350 companies accounting for the balance 75 per cent between them. At present, we command a limited presence in the veterinary formulation market. Going forward, we expect the market to offer good growth prospects.
Currently, the division is largely exports dependent, with presence and focus on unregulated markets in Africa. The new APIs, currently under development in the Vet API division, will propel the product development in formulations. We would target products going off patent and expect to tap the lesser-regulated markets like India and CIS going forward.
Specialty chemicals
Our specialty chemicals division has also benefited from the continuous thrust on R&D. 2011-12 will witness two major developments from this division. The first being the introduction of new products in the antioxidants space; and the second, being commencement of exports. Our capacities have been running at optimum utility and therefore some measures will be taken going forward to unlock additional capacities for the division.
Human APIs
Our R&D centres are already set up and the R&D teams have settled down. We have an existing product pipeline that would translate into revenues going forward. We will continue to focus on the development of niche APIs and import substitution products. Our R&D expertise and track record will also be utilised going forward to expand our CRAMS division.
Our expansion plans in therapeutic segments like Phyto-Pharmaceutical & Herbal Extract, Oncology, Penems and Penicillinswere delayed on account of regulatory delays and land acquisition. We have now started thePenems project. The first phase will be operational by March 2012. We would also expand our capacities by debottlenecking/modernising capacities in our existing units.
We would continue to forge long-term product partnerships with market leaders, since it will lead to better margins and sustained revenues. We are awaiting regulatory approvals especially UDFDA, post which we can strengthen our presence in the regulated markets.
Veterinary APIs
We have already emerged as a leading producer of animal Anthelmintic APIs. We will continue to expand our product range in this category and will also identify new product categories to focus upon in the future. Our R&D practices would play a key role in this endeavor
Currently, we supply our products to regulated markets in Europe. Going forward, we would also foray in to US market, which offers better margins and sustained demand for our products.
ANNUAL REPORT 2010-1131 About us Ready! Steady! Grow! Board of Director’s profiles Statutory Reports Financial Sections
Board of Director’s pro! les
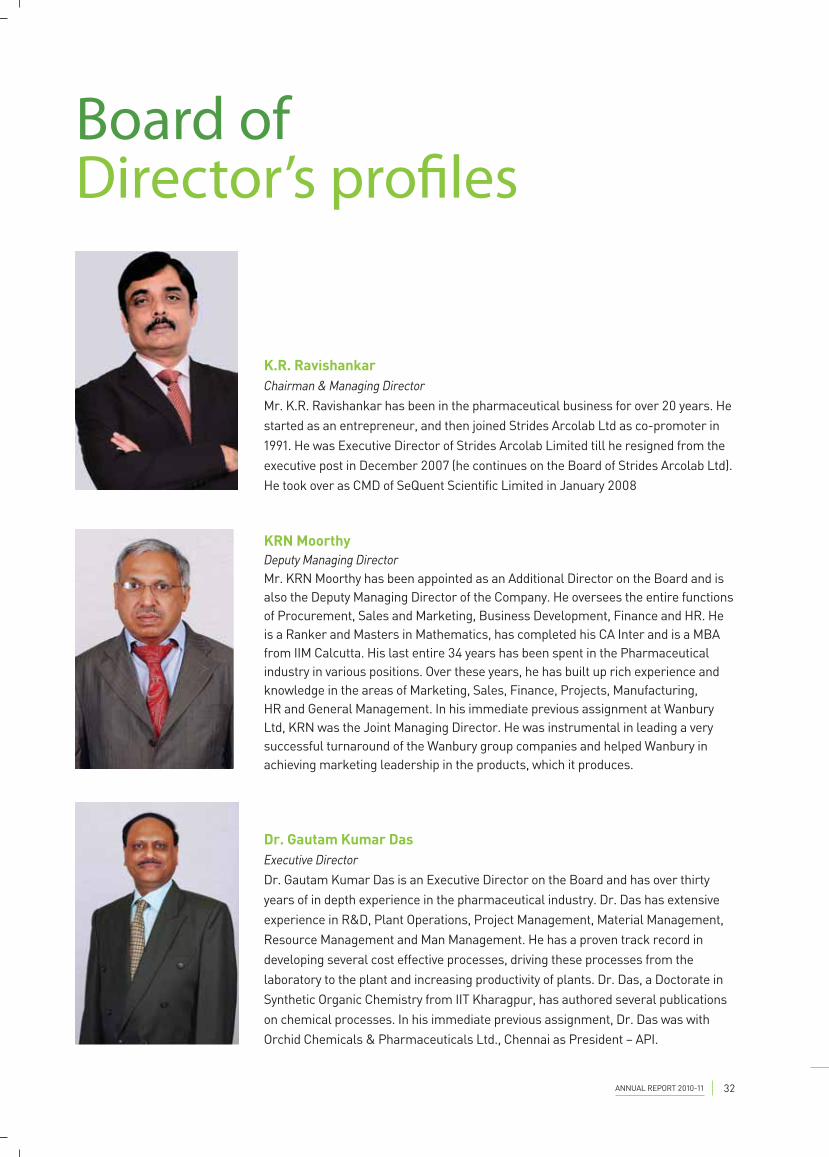
KRN MoorthyDeputy Managing DirectorMr. KRN Moorthy has been appointed as an Additional Director on the Board and is also the Deputy Managing Director of the Company. He oversees the entire functions of Procurement, Sales and Marketing, Business Development, Finance and HR. He is a Ranker and Masters in Mathematics, has completed his CA Inter and is a MBA from IIM Calcutta. His last entire 34 years has been spent in the Pharmaceutical industry in various positions. Over these years, he has built up rich experience and knowledge in the areas of Marketing, Sales, Finance, Projects, Manufacturing, HR and General Management. In his immediate previous assignment at Wanbury Ltd, KRN was the Joint Managing Director. He was instrumental in leading a very successful turnaround of the Wanbury group companies and helped Wanbury in achieving marketing leadership in the products, which it produces.
Dr. Gautam Kumar DasExecutive DirectorDr. Gautam Kumar Das is an Executive Director on the Board and has over thirty years of in depth experience in the pharmaceutical industry. Dr. Das has extensive experience in R&D, Plant Operations, Project Management, Material Management, Resource Management and Man Management. He has a proven track record in developing several cost effective processes, driving these processes from the laboratory to the plant and increasing productivity of plants. Dr. Das, a Doctorate in Synthetic Organic Chemistry from IIT Kharagpur, has authored several publications on chemical processes. In his immediate previous assignment, Dr. Das was with Orchid Chemicals & Pharmaceuticals Ltd., Chennai as President – API.
K.R. RavishankarChairman & Managing DirectorMr. K.R. Ravishankar has been in the pharmaceutical business for over 20 years. He started as an entrepreneur, and then joined Strides Arcolab Ltd as co-promoter in 1991. He was Executive Director of Strides Arcolab Limited till he resigned from the executive post in December 2007 (he continues on the Board of Strides Arcolab Ltd). He took over as CMD of SeQuent Scientific Limited in January 2008
ANNUAL REPORT 2010-11 32
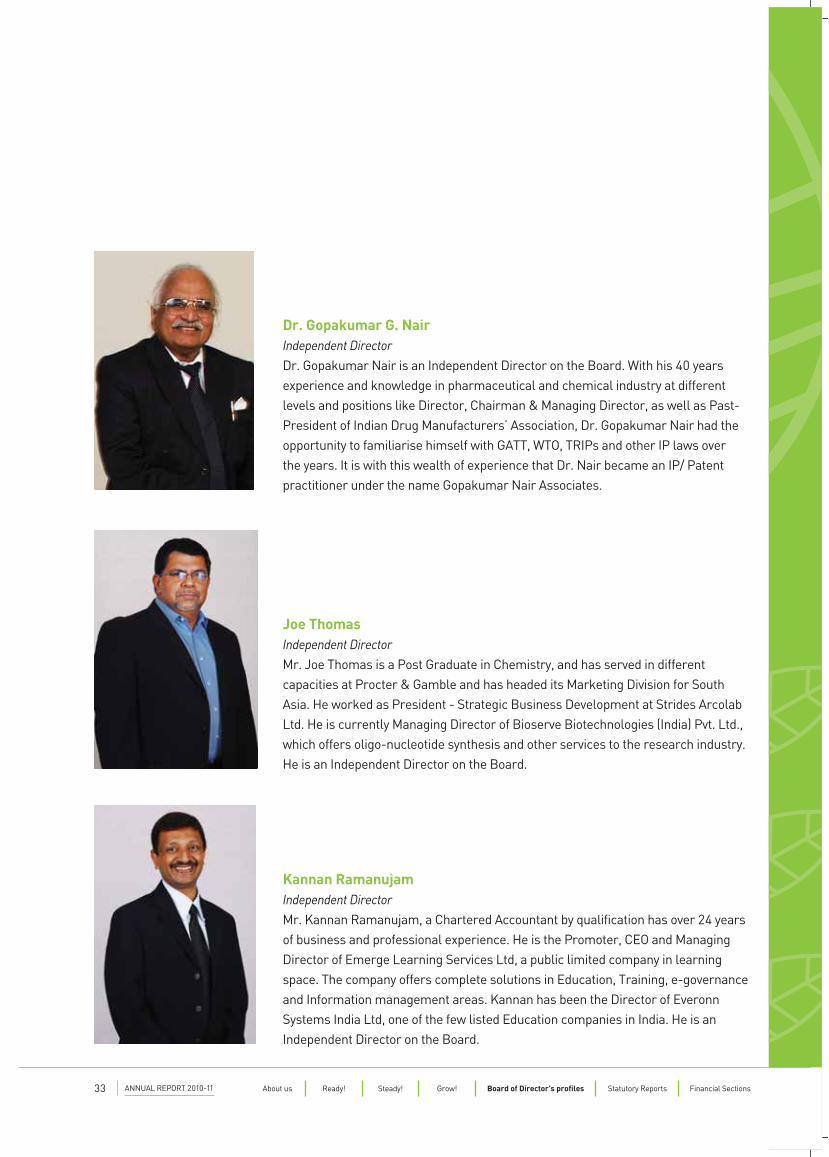
Joe ThomasIndependent DirectorMr. Joe Thomas is a Post Graduate in Chemistry, and has served in different capacities at Procter & Gamble and has headed its Marketing Division for South Asia. He worked as President - Strategic Business Development at Strides Arcolab Ltd. He is currently Managing Director of Bioserve Biotechnologies (India) Pvt. Ltd., which offers oligo-nucleotide synthesis and other services to the research industry. He is an Independent Director on the Board.
Kannan RamanujamIndependent DirectorMr. Kannan Ramanujam, a Chartered Accountant by qualification has over 24 years of business and professional experience. He is the Promoter, CEO and Managing Director of Emerge Learning Services Ltd, a public limited company in learning space. The company offers complete solutions in Education, Training, e-governance and Information management areas. Kannan has been the Director of Everonn Systems India Ltd, one of the few listed Education companies in India. He is an Independent Director on the Board.
Dr. Gopakumar G. NairIndependent DirectorDr. Gopakumar Nair is an Independent Director on the Board. With his 40 years experience and knowledge in pharmaceutical and chemical industry at different levels and positions like Director, Chairman & Managing Director, as well as Past-President of Indian Drug Manufacturers’ Association, Dr. Gopakumar Nair had the opportunity to familiarise himself with GATT, WTO, TRIPs and other IP laws over the years. It is with this wealth of experience that Dr. Nair became an IP/ Patent practitioner under the name Gopakumar Nair Associates.
ANNUAL REPORT 2010-1133 About us Ready! Steady! Grow! Board of Director’s profiles Statutory Reports Financial Sections

35
DIRECTORS’ REPORT
Dear Members,
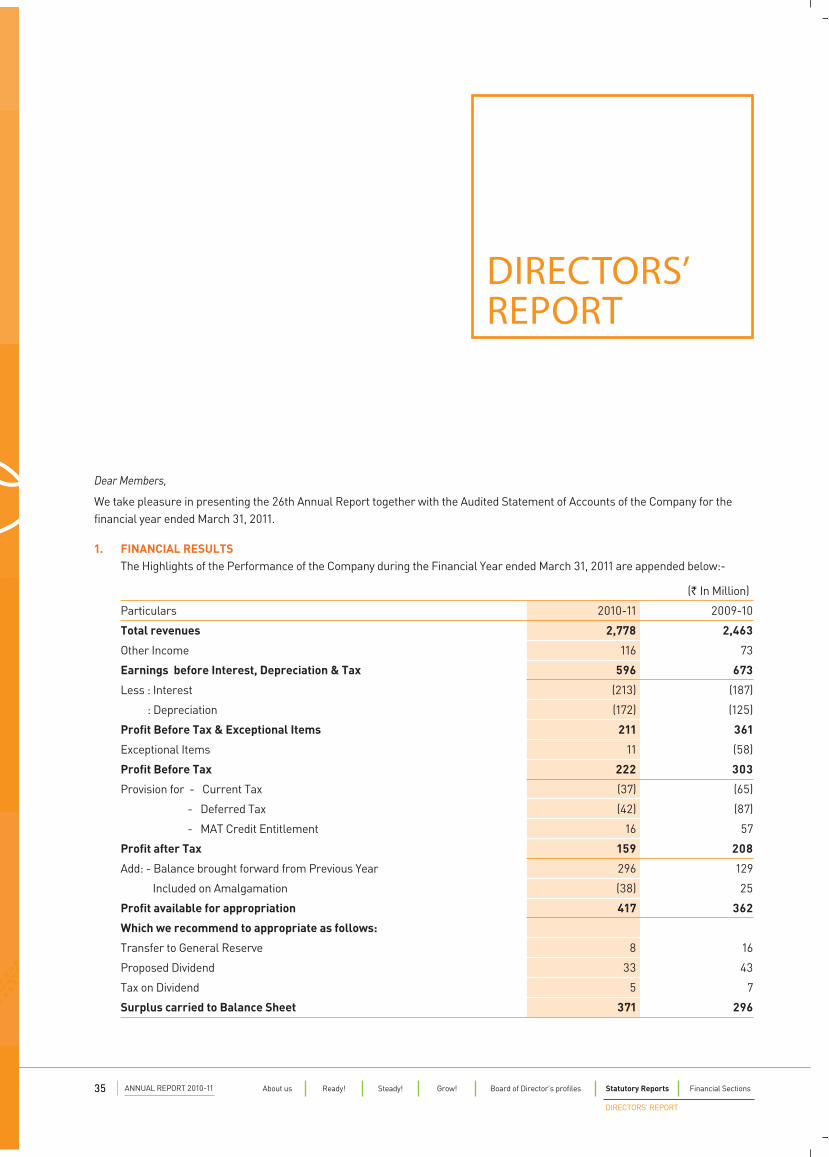
We take pleasure in presenting the 26th Annual Report together with the Audited Statement of Accounts of the Company for the financial year ended March 31, 2011.
1. FINANCIAL RESULTS The Highlights of the Performance of the Company during the Financial Year ended March 31, 2011 are appended below:-
(` In Million)
Particulars 2010-11 2009-10
Total revenues 2,778 2,463
Other Income 116 73
Earnings before Interest, Depreciation & Tax 596 673
Less : Interest (213) (187)
: Depreciation (172) (125)
Profit Before Tax & Exceptional Items 211 361
Exceptional Items 11 (58)
Profit Before Tax 222 303
Provision for - Current Tax (37) (65)
- Deferred Tax (42) (87)
- MAT Credit Entitlement 16 57
Profit after Tax 159 208
Add: - Balance brought forward from Previous Year 296 129
Included on Amalgamation (38) 25
Profit available for appropriation 417 362
Which we recommend to appropriate as follows:
Transfer to General Reserve 8 16
Proposed Dividend 33 43
Tax on Dividend 5 7
Surplus carried to Balance Sheet 371 296
ANNUAL REPORT 2010-1135 About us Ready! Steady! Grow! Board of Director’s profiles Statutory Reports Financial Sections
DIRECTORS’ REPORT
4. Sanved Research Labs Private Limited
5. Vedic Fanxipang Pharma Chemic Company Limited, Vietnam
6. Galenica B.V., Netherlands
7. Codifar N.V., Belgium
8. SeQuent Anti Biotics Private Limited
9. SeQuent Oncolytics Private Limited
10. Elysian Life Sciences Private Limited
11. Elysian Health Care Private Limited
6. MERGER OF FRAXIS LIFE SCIENCES LIMITED WITH
THE COMPANY The Company is in the process of merging Fraxis Life
Sciences Limited, a promoter group Company with that of the Company. The merger was approved by the shareholders at their meeting held on March 15, 2011 and final order from the Hon’ble High Court of Judicature at Bombay is awaited.
On approval, Company will allot 14,865,000 equity shares to the shareholders of Fraxis Life Sciences Limited and the shares held by Fraxis Life Sciences Limited in the Company will stand cancelled.
7. CONSOLIDATED ACCOUNTS In accordance with Accounting Standard 21 on
consolidated financial statements, the audited consolidated financial statements are provided in this Annual report.
In terms of the Central Government approval under Section 212(8) of the Companies Act, 1956, the audited Financial Statements of the Company’s subsidiaries have not been attached to this Report. The Financial Statements of the said subsidiaries will be kept for inspection during business hours by any investor at the registered office and at the corporate office of your Company. The Company will also make available the audited annual accounts and related information of the subsidiary companies, upon request by any investor of the Company.
8. PUBLIC DEPOSIT The Company has not accepted or renewed any public
deposits under section 58A of the Companies Act, 1956.
9. DIRECTOR Dr. Gopakumar Gopalan Nair & Dr. Gautam Kumar
Das retire by rotation at the ensuing Annual General Meeting and are proposed for re-appointment. The Board recommends their re-appointment at the ensuing Annual General Meeting.
Mr. Moorthy was appointed as a Deputy Managing Director w.e.f 8th day of September, 2010.
2. BUSINESS PERFORMANCE REVIEW On standalone basis, the company posted a 12.8%
growth in the total revenues, from `2,463.35 Million in 2009-10 to `2,777.56 Million in 2010-11. The company posted an EBIDTA of `596 Million as against `673 Million in 2009-10. On a standalone level, the Company made a PAT of `159.33 Million.
On consolidated basis, the company posted a 9.6% growth in the total revenues, from `2,844.48 Million in 2009-10 to `3,116.65 Million in 2010-11. The company posted an EBIDTA of `522 Million as against `849 Million in 2009-10. On a consolidated level, the Company made a loss of `40.24 Million.
The company caters to two major segments – Pharmaceuticals Division (consisting of API, CRAMS and Veterinary Formulations businesses) accounted for 85.6 per cent of the company’s revenues while the Specialty chemicals divisions accounted for 14.4 per cent.
During the year, the Company forayed in to four new therapeutic segments – Penems, Penicillin, Oncology and Phy to-Pharmaceutical/Herbal Extracts. The company signed a Memorandum of Understanding with Government of Karnataka to set up three new Greenfield facilities in Bangalore, for which it will invest `1500 Million.
Detailed analysis of the operational and financial performance for the year is covered under the ‘Management Discussion & Analysis’ section.
3. DIVIDEND The Board of Directors of the Company has
recommended a final dividend of `1.50 (15 per cent) per equity share for the year 2010-11. This, if approved by the shareholders, would result in a cash outflow of `32.90 Million.
4. SHARE CAPITAL Pursuant to the approval of the Scheme of
Amalgamation for merger of Vedic Elements Private Limited, which was a wholly owned subsidiary of the Company with the Company, the Authorised Share Capital of the Company enhanced by `70 Million during the year. As at March 31, 2011, the authorized capital of the Company stood at `320 Million as against `250 Million as at March 31, 2010.
There was no change in the Issued, subscribed and paid up equity capital which stood at `219.35 Million.
5. SUBSIDIARIES The Company has a total of 11 subsidiaries as at March
31, 2011. They are:
1. SeQuent Global Holdings Limited, Mauritius
2. SeQuent European Holdings Limited, Cyprus
3. SeQuent Research Limited
ANNUAL REPORT 2010-11 36
10. DIRECTOR’S RESPONSIBILITY STATEMENT Pursuant to Section 217(2AA) of the act, as amended by
the companies (amendment) Act, 2000, the Directors confirms that:
1. In the preparation of annual accounts, the applicable accounting standards have been followed along with proper explanation related to the material departures.
However, the deviation on the accounting standard has been with reference to the scheme of amalgamation sanctioned by the Hon’ble High Court of Karnataka for amalgamation of the company’s wholly owned subsidiary, Vedic Elements Private Limited (the Transferor Company) with SeQuent Scientific Limited (the Transferee Company). Refer notes to account for details on the same.
2. Appropriate Accounting Policies have been applied consistently and have made adjustments and estimates that are reasonable and prudent, so as to give a true and fair view of the state of affairs of the Company as on 31st March 2011 and profit of the Company for the year ended 31st March 2011.
3. Proper and sufficient care has been taken for the maintenance of adequate accounting records in accordance with the provisions of the Companies Act, 1956 for safeguarding the assets of the Company and for preventing and detecting fraud and other irregularities.
4. The Annual Accounts have been prepared on a going concern basis.
11. AUDITORS M/s Deloitte Haskins & Sells retire as Statutory Auditors
of the Company at the ensuing Annual General Meeting and are eligible for re-appointment.
12. CONSERVATION OF ENERGY, TECHNOLOGY
ABSORPTION AND FOREIGN EXCHANGE EARNING /
OUTGO The particulars as prescribed under Section 217 (1)(e)
of the Companies Act, 1956 read with the Companies (Disclosure of Particulars in the Report of Board of Directors) Rules, 1988 are set out in the Annexure to the Directors’ Report.
13. CORPORATE GOVERNANCE The Company has complied with all the mandatory
requirements of Corporate Governance specified by the Securities and Exchange Board of India through clause 49 of the Listing Agreement. As required by the said clause, a separate Report on Corporate Governance forms part of the Annual Report of the Company. A
certificate from the Statutory Auditors of the Company regarding compliance with the conditions of Corporate Governance also forms part of this Report.
14. MANAGEMENT DISCUSSION AND ANALYSIS Pursuant to clause 49 of the Listing Agreement entered
into with the Stock Exchanges, Management Discussion and Analysis Report forms part of this Report.
15. RESEARCH AND DEVELOPMENT A write-up on Research and Development activity forms
part of the annexure to the Directors’ Report.
16. EMPLOYEE STOCK OPTION SCHEME The Company has formulated a Employee Stock Option
Plan titled ‘SSL ESOP Scheme 2010‘ and the scheme is administered through a trust. As on date, 700,000 shares have been issued to the trust and 1,00,000 options has been granted to the Deputy Managing Director. The Company is in the process of expanding the coverage to other employees. Details of the ESOPs issued are provided in the corporate governance report.
Further, Statement giving additional information in terms of Regulation 12 of Securities and Exchange Board of India (Employee Stock Guidelines, 1999) is annexed to this Directors’ Report.
17. PARTICULARS OF EMPLOYEES U/S 217 OF THE
COMPANIES ACT OF, 1956 Any shareholder interested in obtaining a copy of the
statement of particulars of employees referred to in section 217 (2A) of the Companies Act, 1956, may write to the Company Secretary at the Registered Office of the Company.
18. APPRECIATION Your Directors would like to express their grateful
appreciation for the excellent support and co-operation received from the Financial Institutions, Banks, Government Authorities, Reserve Bank of India, Securities and Exchange Board of India, Stock Exchanges, Customers, Manufacturers, Suppliers, Directors and Shareholders during the year under review.
At this point, we would like to place on record our sincere appreciation for the total commitment, dedication, untiring efforts and hard work put in by the employees at all levels of the Company in realisation of the corporate goals in the years ahead.
For and on behalf of the Board of Directors
KR Ravishankar
Chairman & Managing Director
Place: Bangalore
Date: August 12, 2011
ANNUAL REPORT 2010-1137 About us Ready! Steady! Grow! Board of Director’s profiles Statutory Reports Financial Sections
DIRECTORS’ REPORT
ANNEXURE TO DIRECTORS’
REPORT
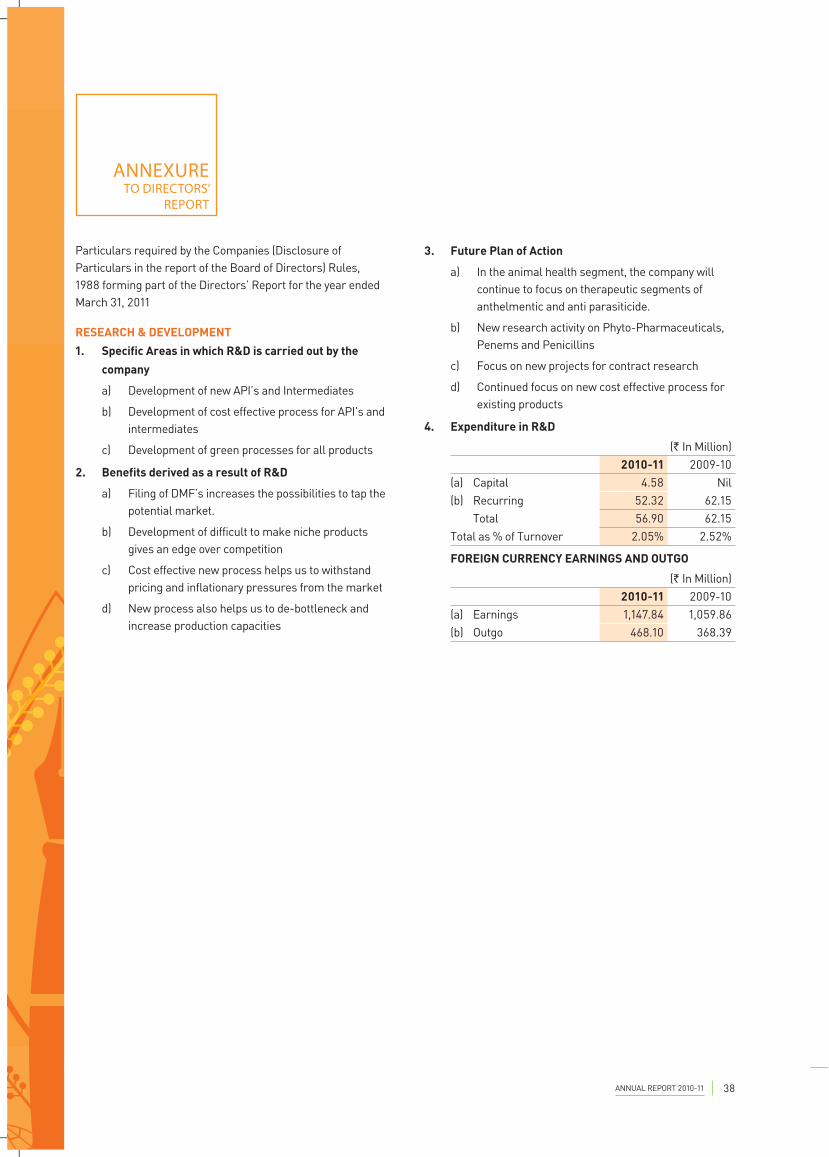
3. Future Plan of Action
a) In the animal health segment, the company will continue to focus on therapeutic segments of anthelmentic and anti parasiticide.
b) New research activity on Phyto-Pharmaceuticals, Penems and Penicillins
c) Focus on new projects for contract research
d) Continued focus on new cost effective process for existing products
4. Expenditure in R&D
(` In Million)2010-11 2009-10
(a) Capital 4.58 Nil(b) Recurring 52.32 62.15
Total 56.90 62.15Total as % of Turnover 2.05% 2.52%
FOREIGN CURRENCY EARNINGS AND OUTGO
(` In Million)2010-11 2009-10
(a) Earnings 1,147.84 1,059.86(b) Outgo 468.10 368.39
Particulars required by the Companies (Disclosure of Particulars in the report of the Board of Directors) Rules, 1988 forming part of the Directors’ Report for the year ended March 31, 2011
RESEARCH & DEVELOPMENT
1. Specific Areas in which R&D is carried out by the
company
a) Development of new API’s and Intermediates
b) Development of cost effective process for API’s and intermediates
c) Development of green processes for all products
2. Benefits derived as a result of R&D
a) Filing of DMF’s increases the possibilities to tap the potential market.
b) Development of difficult to make niche products gives an edge over competition
c) Cost effective new process helps us to withstand pricing and inflationary pressures from the market
d) New process also helps us to de-bottleneck and increase production capacities
ANNUAL REPORT 2010-11 38
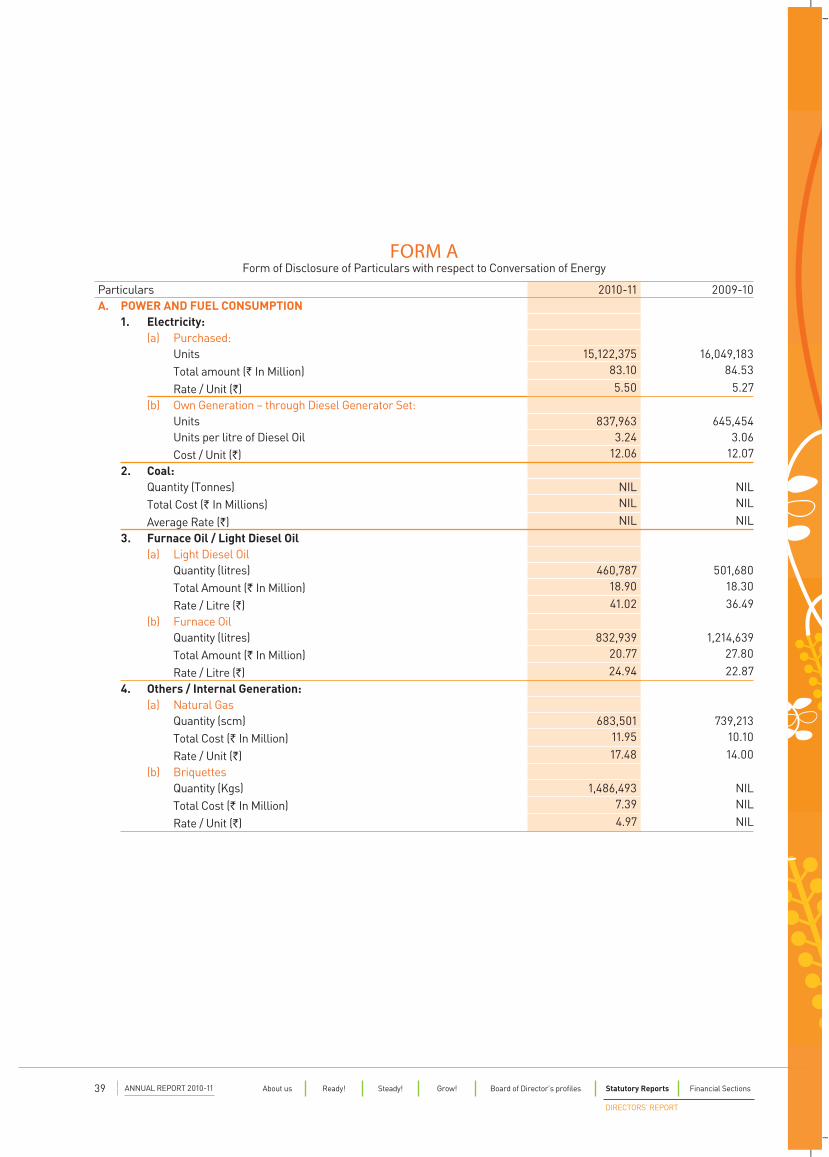
FORM AForm of Disclosure of Particulars with respect to Conversation of Energy
Particulars 2010-11 2009-10A. POWER AND FUEL CONSUMPTION
1. Electricity:(a) Purchased:
Units 15,122,375 16,049,183Total amount (` In Million) 83.10 84.53
Rate / Unit (`) 5.50 5.27(b) Own Generation – through Diesel Generator Set:
Units 837,963 645,454Units per litre of Diesel Oil 3.24 3.06Cost / Unit (`) 12.06 12.07
2. Coal:Quantity (Tonnes) NIL NILTotal Cost (` In Millions) NIL NIL
Average Rate (`) NIL NIL3. Furnace Oil / Light Diesel Oil
(a) Light Diesel OilQuantity (litres) 460,787 501,680Total Amount (` In Million) 18.90 18.30
Rate / Litre (`) 41.02 36.49(b) Furnace Oil
Quantity (litres) 832,939 1,214,639Total Amount (` In Million) 20.77 27.80
Rate / Litre (`) 24.94 22.874. Others / Internal Generation:
(a) Natural GasQuantity (scm) 683,501 739,213Total Cost (` In Million) 11.95 10.10
Rate / Unit (`) 17.48 14.00(b) Briquettes
Quantity (Kgs) 1,486,493 NILTotal Cost (` In Million) 7.39 NIL
Rate / Unit (`) 4.97 NIL
ANNUAL REPORT 2010-1139 About us Ready! Steady! Grow! Board of Director’s profiles Statutory Reports Financial Sections
DIRECTORS’ REPORT
FORM BForm of Disclosure of Particulars with respect to absorption
SeQuent Scientific Ltd. is committed to seek & implement all possible measures to minimise its environmental foot-print by following good practices and continuously reviewing / upgrading its operations to ensure Effective Energy Management which ultimately lead to lower emissions. In keeping with this commitment, a number of Energy Conservation measures have been implemented during the year across various sites which cumulatively are estimated to result in a saving of approx. 389,000 units of electrical energy annually.
MEASURES TAKEN DURING THE PERIOD FOR CONSERVATION OF ENERGY1. Rationalisation of Compressor operation for
Compressed Air & Nitrogen Plant at Panoli is expected to lead to a saving of 233,280 units of energy per year.
2. Rationalisation of Pump operation in Ejector & Chilled Water systems, again at Panoli, is estimated to save 60,000 units p. a.
3. Provision of VFDs (Variable Frequency Drives) on key equipment in Plant 3 at Mangalore have resulted in a saving of 39,000 kWH of energy annually.
4. By providing vertical barriers above false ceiling & closing the dampers of AHU ducts of corridor and lobby area in the R&D. Building at Mangalore, load on air-conditioning system has been considerably reduced resulting in an annual saving of 38,000 kWH of energy.
5. Application of a special coating internally in 5 Cooling tower pumps at Panoli to reduce friction is estimated to reduce power consumption by 17,000 units annually.
6. Our relentless focus on maintaining a high level of “Power Factor (p. f. )” in our Electrical Systems - most of the time at the level of 0.99 – at all our sites has not only resulted in substantial reduction in wastage of energy but has also earned us handsome revenue by way of “incentives” offered by distribution authorities.
7. At Mahad, all small-capacity F. O. fired boilers have been replaced by one Briquette (bio-fuel) fired boiler leading to significant reduction in our “Carbon Foot-print“.
8. Another important step taken towards Environmental protection at Mahad again is commissioning of a modern “Multiple Effect Evaporator“ system to treat the entire quantity of high COD effluent in-house and use the condensate generated thereof as make-up water in Cooling Towers thereby saving approx. 35 – 40 KL of water per day.
9. At Ambernath, water used in Water Ring Vacuum Pumps
is being reused / recycled by providing a small Cooling Tower which has resulted in a saving of approx. 30 KL of water per day.”
PLANS FOR FUTURE CONSERVATION OF ENERGY1. Recovery of Condensate & Flash Steam from blow-down
of IBR boilers at Mahad, Mangalore & Panoli.
2. Optimisation of operation of HVAC systems at all our sites to reduce energy consumption.
3. Replacement of Incandescent lamps & mercury vapour bulbs by energy efficient CFL / LED lamps / lights. This is estimated to save almost 500 units of energy per day at Mangalore alone.
4. Rationalisation of the entire Cooling Water, Chilled Water & Chilled Brine systems & piping network thereof at Mahad & Tarapur to reduce energy loss and make the operations more productive.
5. Replacement of inefficient Process Cooling Tower at Mangalore.
6. Improving the efficiency of Solvent Recovery Unit at Mahad by redesigning the Heat Exchanger system.
7. Use of Rain Water for Cooling Tower, Boiler, Flushing / Cleaning, etc. during the monsoon period (4 months, approx. ) at Mangalore. Potential saving of 7,500 KL of water annually.
8. Replacement of Starters of AHUs & Ventilation systems at Mangalore by VFDs. This may lead to an estimated saving of 120 units of energy per day.
9. Provision of Capacitor banks near load centres to reduce transmission loss within the premises at Ambernath, Mahad & Mangalore.
10. Provision of additional Capacitor banks at all our sites to attain Power Factor close to “UNITY“ as far as possible.
11. Carry out Energy Audit at Ambernath, Mahad & Tarapur.
12. Explore the possibility of replacing the existing electrically operated Process Chillers, AHU Chillers & Brine Chillers by Vapour Absorption Machines (VAM) at Mangalore. These machines operate on steam and do not require the use of non-eco-friendly refrigerants.
13. Installation of Energy Saver Transformer & Panel to reduce power consumption in lighting load at Panoli.
14. Installation of full-fledged Effluent Treatment Plants at Mahad & Panoli to treat the entire quantity of effluent in-house.
15. Explore the feasibility of converting Mahad & Panoli as “Zero Discharge“ sites.
ANNUAL REPORT 2010-11 40
ANNEXURE TO DIRECTOR’S REPORT
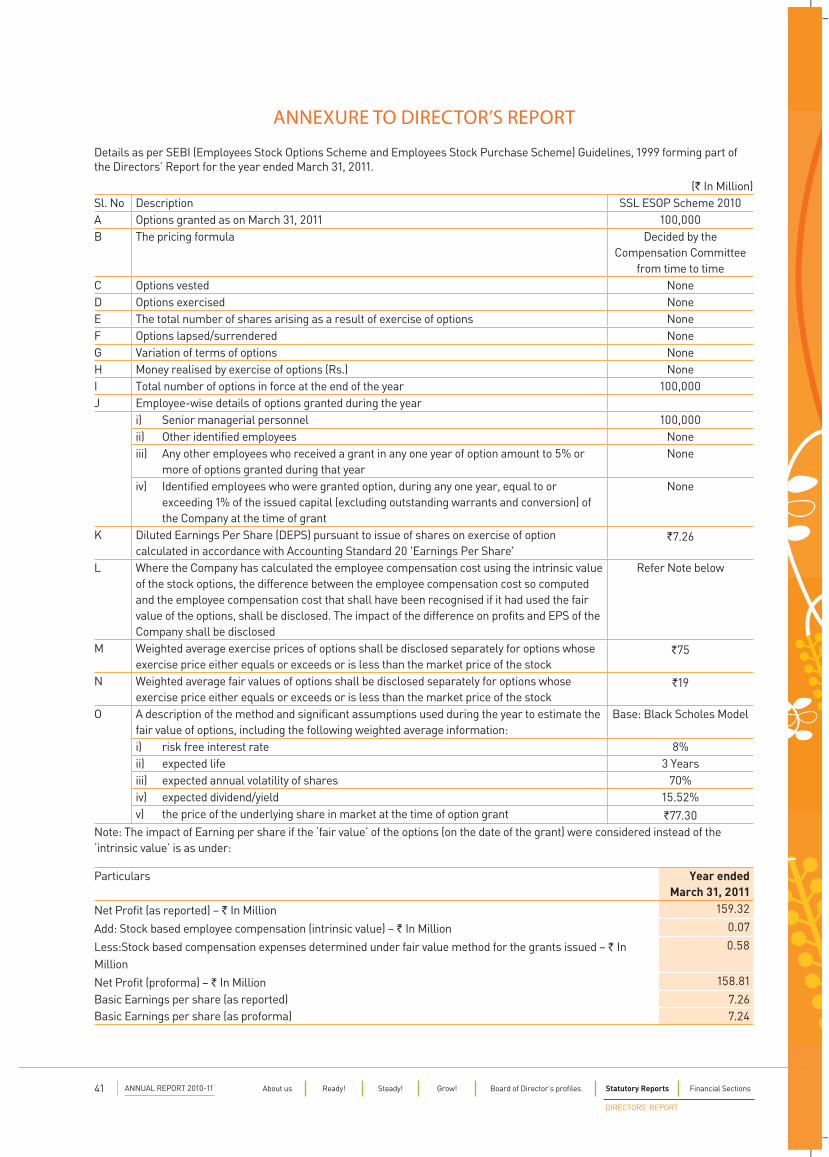
Details as per SEBI (Employees Stock Options Scheme and Employees Stock Purchase Scheme) Guidelines, 1999 forming part of the Directors’ Report for the year ended March 31, 2011.
(` In Million)Sl. No Description SSL ESOP Scheme 2010A Options granted as on March 31, 2011 100,000B The pricing formula Decided by the
Compensation Committee from time to time
C Options vested NoneD Options exercised NoneE The total number of shares arising as a result of exercise of options NoneF Options lapsed/surrendered NoneG Variation of terms of options NoneH Money realised by exercise of options (Rs.) NoneI Total number of options in force at the end of the year 100,000J Employee-wise details of options granted during the year
i) Senior managerial personnel 100,000ii) Other identified employees Noneiii) Any other employees who received a grant in any one year of option amount to 5% or
more of options granted during that yearNone
iv) Identified employees who were granted option, during any one year, equal to or exceeding 1% of the issued capital (excluding outstanding warrants and conversion) of the Company at the time of grant
None
K Diluted Earnings Per Share (DEPS) pursuant to issue of shares on exercise of option calculated in accordance with Accounting Standard 20 'Earnings Per Share'
`7.26
L Where the Company has calculated the employee compensation cost using the intrinsic value of the stock options, the difference between the employee compensation cost so computed and the employee compensation cost that shall have been recognised if it had used the fair value of the options, shall be disclosed. The impact of the difference on profits and EPS of the Company shall be disclosed
Refer Note below
M Weighted average exercise prices of options shall be disclosed separately for options whose exercise price either equals or exceeds or is less than the market price of the stock
`75
N Weighted average fair values of options shall be disclosed separately for options whose exercise price either equals or exceeds or is less than the market price of the stock
`19
O A description of the method and significant assumptions used during the year to estimate the fair value of options, including the following weighted average information:
Base: Black Scholes Model
i) risk free interest rate 8%ii) expected life 3 Yearsiii) expected annual volatility of shares 70%iv) expected dividend/yield 15.52%v) the price of the underlying share in market at the time of option grant `77.30
Note: The impact of Earning per share if the ‘fair value’ of the options (on the date of the grant) were considered instead of the ‘intrinsic value’ is as under:
Particulars Year endedMarch 31, 2011
Net Profit (as reported) – ` In Million 159.32
Add: Stock based employee compensation (intrinsic value) – ` In Million 0.07
Less:Stock based compensation expenses determined under fair value method for the grants issued – ` In Million
0.58
Net Profit (proforma) – ` In Million 158.81
Basic Earnings per share (as reported) 7.26Basic Earnings per share (as proforma) 7.24
ANNUAL REPORT 2010-1141 About us Ready! Steady! Grow! Board of Director’s profiles Statutory Reports Financial Sections
DIRECTORS’ REPORT

43
MANAGEMENT DISCUSSION & ANALYSIS
INDUSTRY OVERVIEW
Global overview
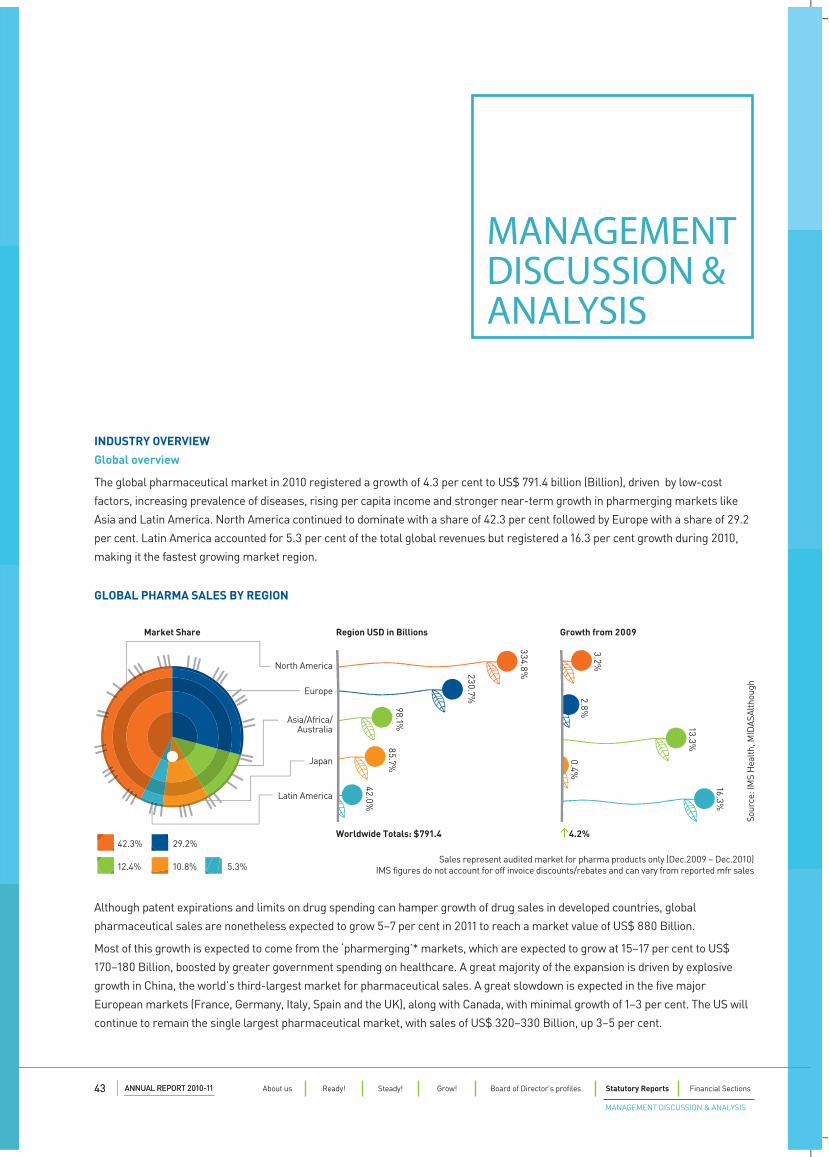
The global pharmaceutical market in 2010 registered a growth of 4.3 per cent to US$ 791.4 billion (Billion), driven by low-cost
factors, increasing prevalence of diseases, rising per capita income and stronger near-term growth in pharmerging markets like
Asia and Latin America. North America continued to dominate with a share of 42.3 per cent followed by Europe with a share of 29.2
per cent. Latin America accounted for 5.3 per cent of the total global revenues but registered a 16.3 per cent growth during 2010,
making it the fastest growing market region.
Although patent expirations and limits on drug spending can hamper growth of drug sales in developed countries, global
pharmaceutical sales are nonetheless expected to grow 5–7 per cent in 2011 to reach a market value of US$ 880 Billion.
Most of this growth is expected to come from the ‘pharmerging’* markets, which are expected to grow at 15–17 per cent to US$
170–180 Billion, boosted by greater government spending on healthcare. A great majority of the expansion is driven by explosive
growth in China, the world’s third-largest market for pharmaceutical sales. A great slowdown is expected in the five major
European markets (France, Germany, Italy, Spain and the UK), along with Canada, with minimal growth of 1–3 per cent. The US will
continue to remain the single largest pharmaceutical market, with sales of US$ 320–330 Billion, up 3–5 per cent.
Market Share Region USD in Billions
Worldwide Totals: $791.4
3.2%2.8%
13.3%
0.4%
16.3%
Growth from 2009
4.2%
North America
Asia/Africa/Australia
Europe
Japan
Latin America
334.8%230.7%
98.1%85.7%
42.0%
Sour
ce: I
MS
Hea
lth, M
IDAS
Alth
ough
Sales represent audited market for pharma products only (Dec.2009 – Dec.2010)IMS figures do not account for off invoice discounts/rebates and can vary from reported mfr sales
GLOBAL PHARMA SALES BY REGION
42.3% 29.2%
5.3%12.4% 10.8%
ANNUAL REPORT 2010-1143 About us Ready! Steady! Grow! Board of Director’s profiles Statutory Reports Financial Sections
MANAGEMENT DISCUSSION & ANALYSIS
ANNUAL REPORT 2010-11
continue to gain market share, and the incremental
prescription market share for Indian companies is 33.7 per
cent.
INDIAN OVERVIEW
India’s pharmaceutical sector can be classified into three
broad market segments namely Contract Research And
Manufacturing Services (CRAMS), Formulations, and Active
Pharmaceutical Ingredients (APIs).
The Indian pharmaceutical Industry has witnessed robust
growth, being valued at around `550 Billion in 2005 to over
`1 Trillion in 2010-11. The growth has stemmed from various
factors - knowledge, skills, low cost, improved quality and
huge demand from both domestic as well as international
markets. During 2010-11, exports accounted for nearly 42
per cent of the total industry size at `420 Billion. For the
seven-year period (2003-2010), the domestic sale has grown
at compound annual growth rate (CAGR) of 10.7 per cent,
whereas exports have grown faster at CAGR of 19.0 per cent.
(Refer Graph 3)
The Indian Pharmaceutical sector has more than 10,000
manufacturers in the country. It has expanded drastically
in the last two decades. The leading 250 pharmaceutical
companies control 70 per cent of the market with market
leader holding nearly 7.0 per cent of the market share. In the
Asia-Pacific pharmaceuticals market, India holds a share of
6.6 per cent.
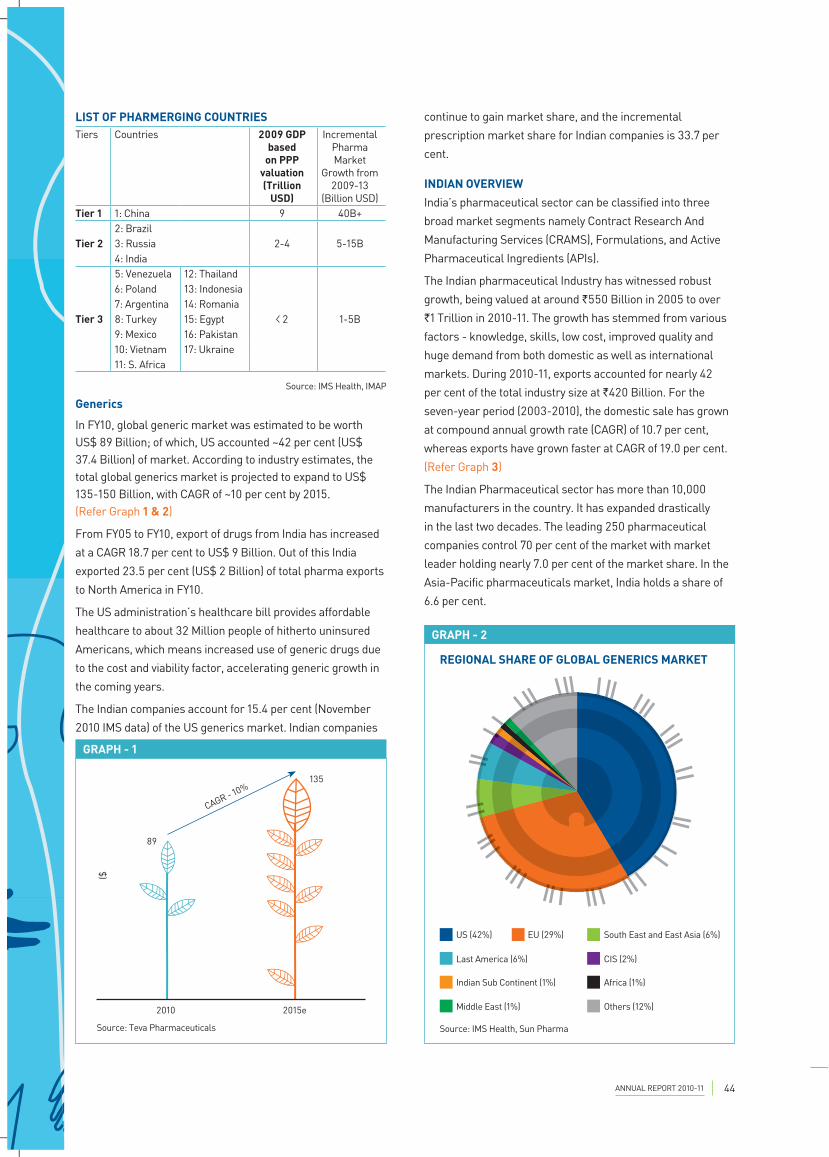
LIST OF PHARMERGING COUNTRIES Tiers Countries 2009 GDP
based on PPP
valuation (Trillion
USD)
Incremental Pharma Market
Growth from 2009-13
(Billion USD)Tier 1 1: China 9 40B+
Tier 22: Brazil
2-4 5-15B3: Russia4: India
Tier 3
5: Venezuela 12: Thailand
2 1-5B
6: Poland 13: Indonesia7: Argentina 14: Romania8: Turkey 15: Egypt9: Mexico 16: Pakistan10: Vietnam 17: Ukraine11: S. Africa
Source: IMS Health, IMAP
Generics
In FY10, global generic market was estimated to be worth US$ 89 Billion; of which, US accounted ~42 per cent (US$ 37.4 Billion) of market. According to industry estimates, the total global generics market is projected to expand to US$ 135-150 Billion, with CAGR of ~10 per cent by 2015. (Refer Graph 1 & 2)
From FY05 to FY10, export of drugs from India has increased
at a CAGR 18.7 per cent to US$ 9 Billion. Out of this India
exported 23.5 per cent (US$ 2 Billion) of total pharma exports
to North America in FY10.
The US administration’s healthcare bill provides affordable
healthcare to about 32 Million people of hitherto uninsured
Americans, which means increased use of generic drugs due
to the cost and viability factor, accelerating generic growth in
the coming years.
The Indian companies account for 15.4 per cent (November
2010 IMS data) of the US generics market. Indian companies
GRAPH - 1
CAGR - 10%
2010 2015e
Source: Teva Pharmaceuticals
89
135
($
GRAPH - 2
US (42%) EU (29%) South East and East Asia (6%)
Last America (6%) CIS (2%)
Indian Sub Continent (1%) Africa (1%)
Middle East (1%) Others (12%)
Source: IMS Health, Sun Pharma
REGIONAL SHARE OF GLOBAL GENERICS MARKET
ANNUAL REPORT 2010-11 44
The pharmaceutical industry in India meets around
70 per cent of the country’s demand for bulk drugs,
drug intermediates and 95 per cent of the demand of
pharmaceutical formulations, chemicals, tablets, capsules,
orals and injectibles. There are about 250 large units and
about 8,000 Small Scale Units, which form the core of
the pharmaceutical industry in India (including 5 Central
Public Sector Units). These units produce the complete
range of pharmaceutical formulations, i.e., medicines ready
for consumption by patients and about 350 bulk drugs, i.e.,
chemicals having therapeutic value and used for production of
pharmaceutical formulations.
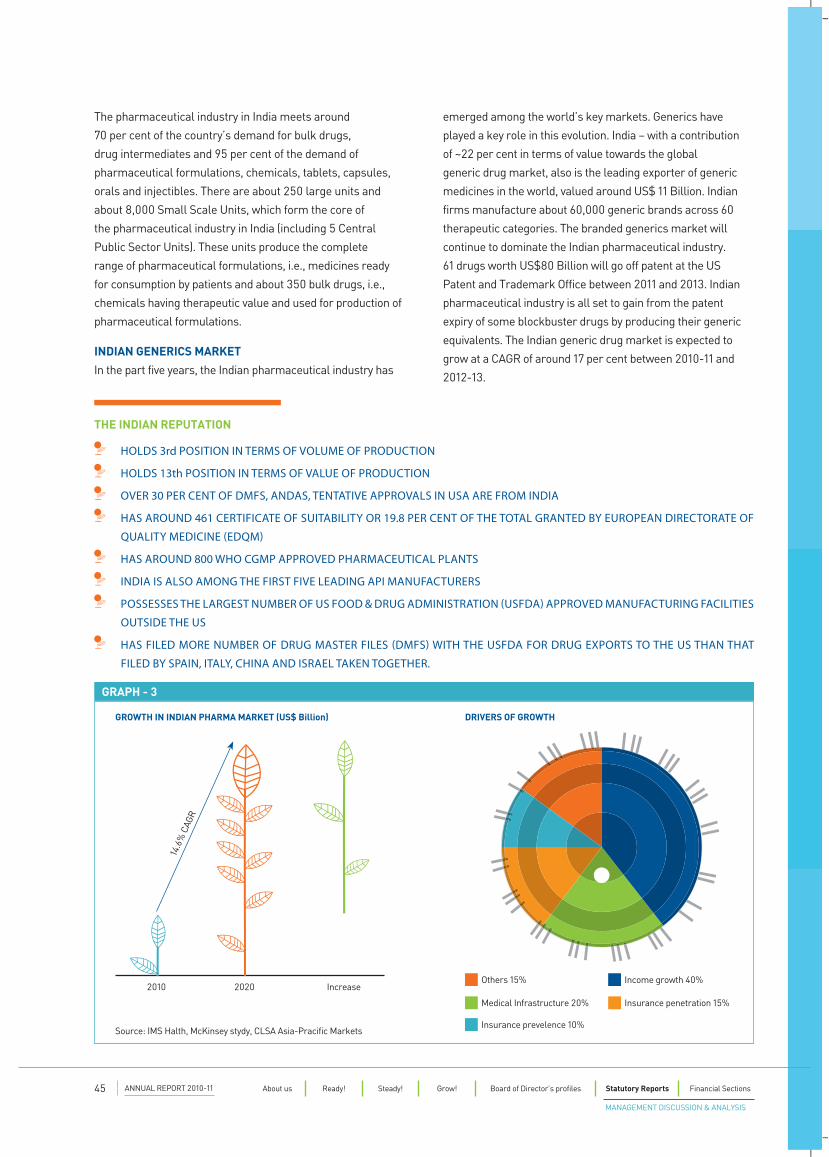
INDIAN GENERICS MARKET
In the part five years, the Indian pharmaceutical industry has
GRAPH - 3
Others 15%
Medical Infrastructure 20% Insurance penetration 15%
Insurance prevelence 10%
Income growth 40%
DRIVERS OF GROWTH
14.6
% C
AGR
Source: IMS Halth, McKinsey stydy, CLSA Asia-Pracific Markets
2010 2020 Increase
GROWTH IN INDIAN PHARMA MARKET (US$ Billion)
THE INDIAN REPUTATION
HOLDS 3rd POSITION IN TERMS OF VOLUME OF PRODUCTION
HOLDS 13th POSITION IN TERMS OF VALUE OF PRODUCTION
OVER 30 PER CENT OF DMFS, ANDAS, TENTATIVE APPROVALS IN USA ARE FROM INDIA
HAS AROUND 461 CERTIFICATE OF SUITABILITY OR 19.8 PER CENT OF THE TOTAL GRANTED BY EUROPEAN DIRECTORATE OF QUALITY MEDICINE "EDQM#
HAS AROUND 800 WHO CGMP APPROVED PHARMACEUTICAL PLANTS
INDIA IS ALSO AMONG THE FIRST FIVE LEADING API MANUFACTURERS
POSSESSES THE LARGEST NUMBER OF US FOOD & DRUG ADMINISTRATION "USFDA# APPROVED MANUFACTURING FACILITIES OUTSIDE THE US
HAS FILED MORE NUMBER OF DRUG MASTER FILES "DMFS# WITH THE USFDA FOR DRUG EXPORTS TO THE US THAN THAT FILED BY SPAIN, ITALY, CHINA AND ISRAEL TAKEN TOGETHER.
emerged among the world’s key markets. Generics have
played a key role in this evolution. India – with a contribution
of ~22 per cent in terms of value towards the global
generic drug market, also is the leading exporter of generic
medicines in the world, valued around US$ 11 Billion. Indian
firms manufacture about 60,000 generic brands across 60
therapeutic categories. The branded generics market will
continue to dominate the Indian pharmaceutical industry.
61 drugs worth US$80 Billion will go off patent at the US
Patent and Trademark Office between 2011 and 2013. Indian
pharmaceutical industry is all set to gain from the patent
expiry of some blockbuster drugs by producing their generic
equivalents. The Indian generic drug market is expected to
grow at a CAGR of around 17 per cent between 2010-11 and
2012-13.
ANNUAL REPORT 2010-1145 About us Ready! Steady! Grow! Board of Director’s profiles Statutory Reports Financial Sections
MANAGEMENT DISCUSSION & ANALYSIS
manufacturing of APIs.Contract Research predominantly
consists of drug discovery, preclinical and clinical research
and represent US$ 25 Billion opportunity globally It is
estimated that currently only ~20 per cent of global Pharma
R&D spend is being outsourced. This represents a huge
opportunity for the Indian Companies. (Refer Graph 5)
INDIAN CRAMS SECTOR (Refer Graph 6)Out of the estimated US$ 3.8 Billion market in 2010, approximately US$ 2.3 Billion pertains to contract manufacturing. Indian CRO market has witnessed huge growth in the number of players leading to higher competitive intensity.
Contract Manufacturing Outsourcing (CMO)
Approximately 60 per cent of the total US$ 2.3 Billion Indian CMO market relates to chemical synthesis followed by formulation and packaging, which constitutes about 40 per cent. The market has grown at a CAGR of 51 per cent over 2007-10 reflecting upon the strong potential it has to offer
Contract Manufacturing requires upfront investments for building up requisite facilities and is capital intensive in nature, thereby requiring long term assured supply contracts in order to recoup investments or ‘take or pay’ type of contracts
Indian players have taken in-organic route of acquisition to gain access to customers, regulated markets of America and Europe and niche technologies like sterile injectables, cytotoxics to build strong franchise for themselves
Contract Research Outsourcing (CRO)
Contract Research Organisations (CROs) provide services including drug discovery, new product development, formulation, pre-clinical trial management spanning till phase IIA
APIs
Bulk drugs are the active pharmaceutical ingredients
(APIs), which are used for the manufacture of formulations.
According to estimates, the proportion of formulations and
bulk drugs is in the ratio of 75:25. More than 85 per cent
of the formulations produced in the country are sold in the
domestic market. India is largely self-sufficient in case of
formulations, though some life saving, new-generation-
technology-barrier formulations continue to be imported.
The bulk drug industry meets the domestic requirement to an
extent of about 70 per cent. Indian companies are leveraging
their strength in organic synthesis, process engineering and
commercially viable manufacturing technologies to produce
new range of bulk drugs. It has been partially in developing
cost, partially successful in developing cost effective
technology for Drug Intermediates, although the industry
continues to depend on China and other developed countries
to an extent of 30 per cent of their requirement of Drug
Intermediates.
The generics push being witnessed by the global
pharmaceutical industry due to patent expiries as well as
Government pressure to reduce healthcare costs is aiding the
growth of the Bulk Drug exports industry in India. In addition,
price erosion of generics and decreasing R&D productivity
is causing global companies to cut costs and outsource
manufacturing of Bulk Drugs to cost effective destinations
such as India.
Lifestyle diseases – to increase in India
By 2015, the specialty and super-specialty therapies will
account for 45 per cent of the pharma market. The growing
lifestyle disorders, particularly metabolic disorders like
diabetes and obesity as well as coronary heart disease and
hypertension, cardiovascular, neuropsychiatry and oncology
drugs will gain considerable significance.
India is key market
Global pharma players continue to penetrate the burgeoning
emerging markets by acquisition of domestic generics and
manufacturing companies, which accounted for nearly 50
percent of M&A targets for deals made during 2008 to 2010 in
the emerging markets (compared to 21 percent of targets in
North America, Europe, Australia and Japan). The importance
of India as a key market as well as a preferred manufacturing
destination was cemented with global pharma companies
acquiring Indian pharma giants during 2010-11.
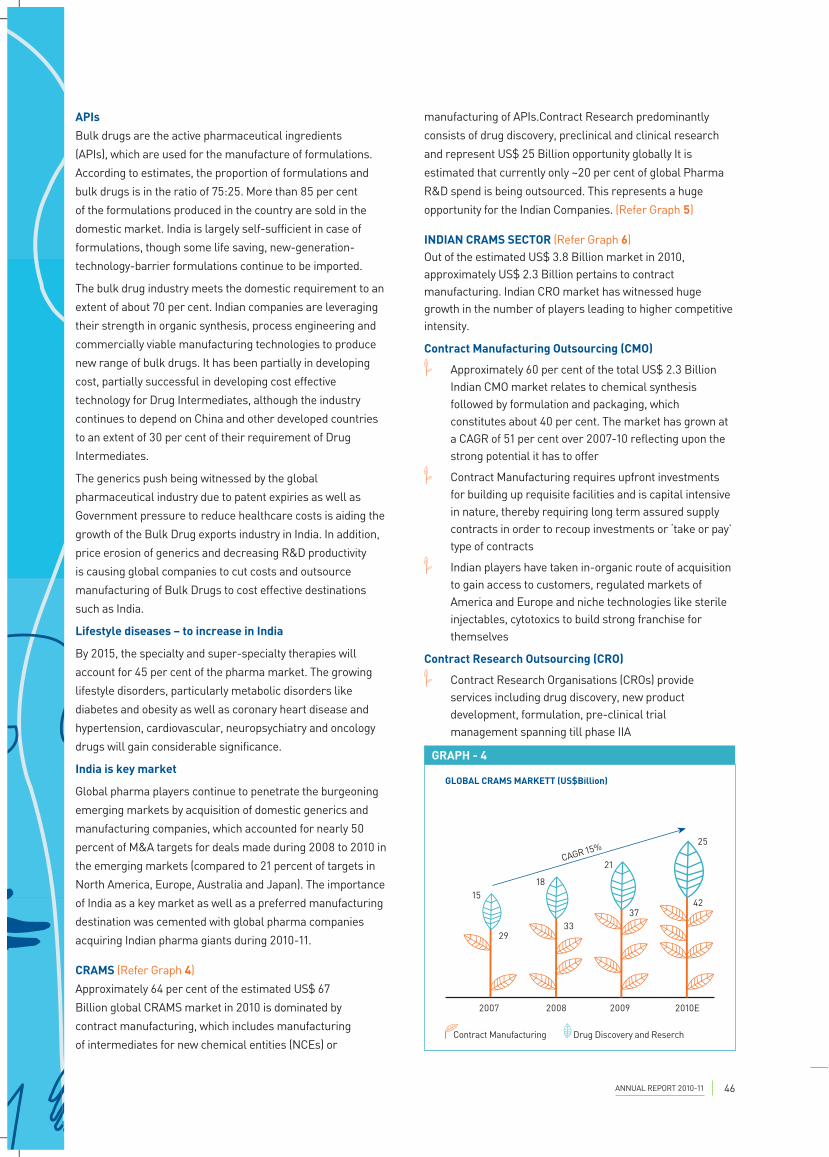
CRAMS (Refer Graph 4)
Approximately 64 per cent of the estimated US$ 67
Billion global CRAMS market in 2010 is dominated by
contract manufacturing, which includes manufacturing
of intermediates for new chemical entities (NCEs) or
GRAPH - 4
CAGR 15%
2007 2008 2009 2010E
Drug Discovery and ReserchContract Manufacturing
GLOBAL CRAMS MARKETT (US$Billion)
15
2933
18
21
25
4237
ANNUAL REPORT 2010-11 46
The global contract research market reached at US$ 25 Billion in 2010 growing at a CAGR of 19 per cent during 2007-10. The Indian contract research industry has been growing tremendously over the past few years and reached approximately US$ 1.5 Billion in 2010, a CAGR of 65 per cent from 2007-10, albeit on a small base
The Indian Pharmaceutical outsourcing providers have capabilities to provide late stage discovery (research chemistry) and drug development services.
Advantage India
High Number of USFDA and UK MHRA approved plants (200+)
Well-developed chemistry skills
Robust talent pool
Low production & R&D cost
Quality Infrastructure & established track record of IPR compliance
Sufficient product filing track record: Indian companies have been on the fore-front, both in terms of filing DMFs
and ANDA. (Refer Graph 7)
Veterinary or Animal health industry
Animal Health Industry in 2010 was valued US$ 20.1 Billion
Nominal growth = +7.8 per cent
Real growth = +4.0 per cent
In 2010, the animal healthcare industry regained its average
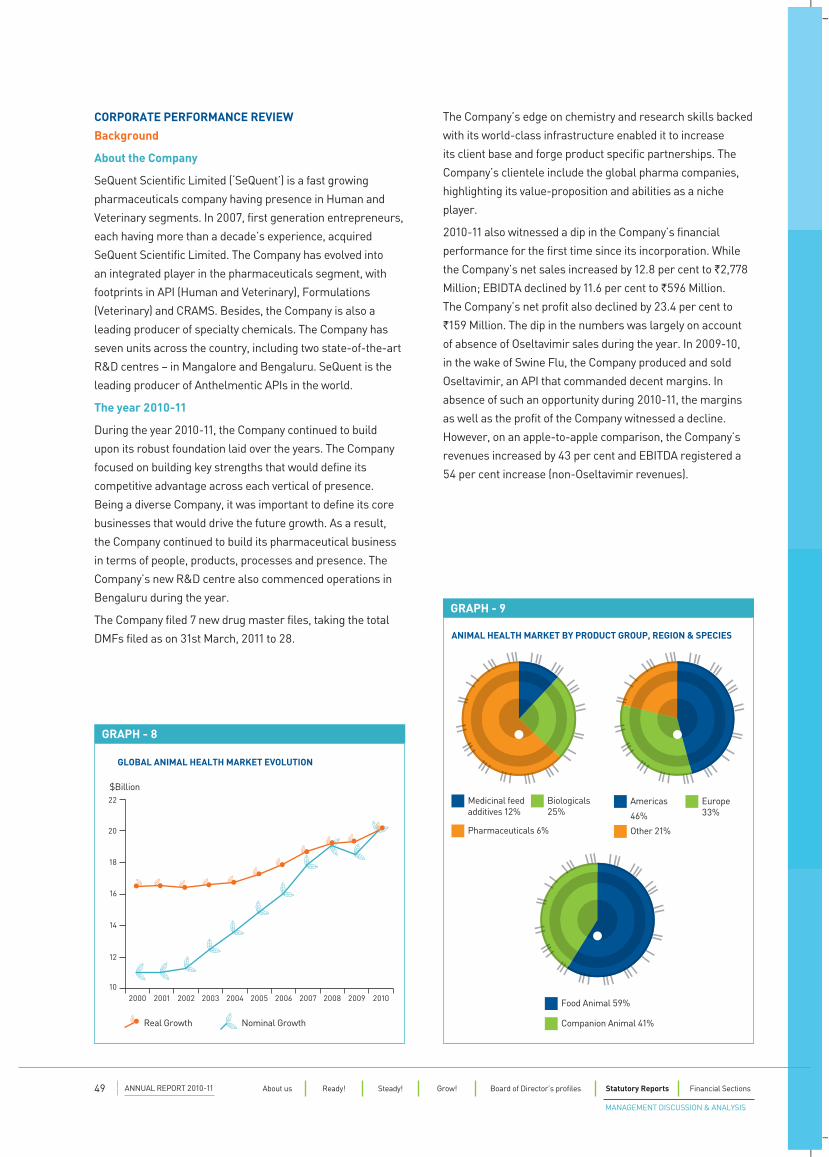
long-term trend, with growth in the mid-single digits. (Refer Graph 8 & 9)
The total spend towards healthcare of feed/production animals account for 59 per cent of the total industry size. However, the market for companion animals has been growing at a faster pace. Of the total health care spends for feed/production animal, cattle and pigs account for 75 per cent; poultry and sheep account for 25 per cent.
The Indian Animal Health market is estimated to be around US$ 400 Million, dominated by spends towards production/feed animals – mainly dairy and poultry.
Cattle (Dairy) and Poultry – the key promising Indian
segments
Dairy Segment
No.1 milk producer in the world (106 Million tonnes per year)
Meat products (Pork/Beef/Mutton) have a growth rate of 10 per cent (CII &Mckinsey)
Increasing urbanisation leading to greater consumerism (Packed milk & meat products)
All Poultry & Livestock related industries establishing base to encash from one of world largest growing economy
Poultry Segment
5th largest Egg Producer Growth rate of eggs & broilers are 16 per cent and 20 per cent respectively (CII &Mckinsey)
Productivity of hens equivalent to USA (300 - 305 eggs/year/hen)
Indian eggs cheapest in the world (75 cents/kg)
Production of egg powder for export greater than China
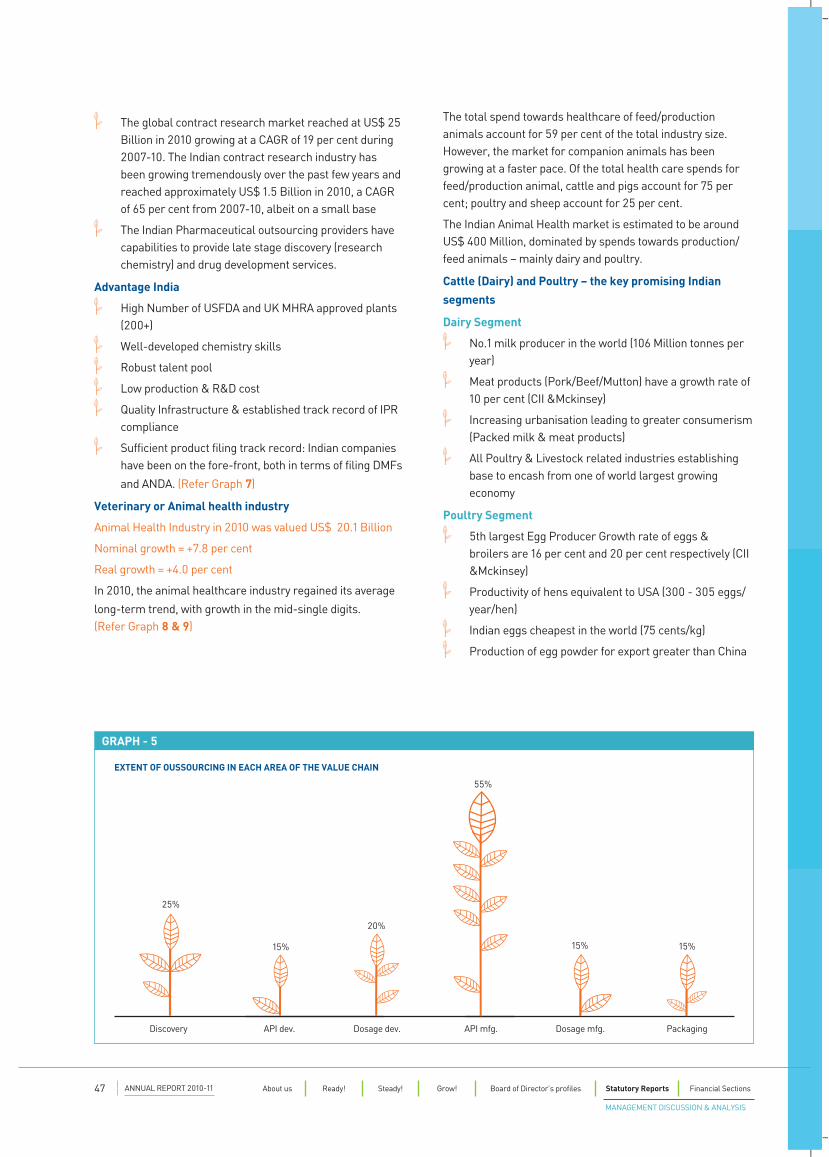
GRAPH - 5
55%
API dev. API mfg.Dosage dev.Discovery Dosage mfg. Packaging
25%
15%
20%
15% 15%
EXTENT OF OUSSOURCING IN EACH AREA OF THE VALUE CHAIN
ANNUAL REPORT 2010-1147 About us Ready! Steady! Grow! Board of Director’s profiles Statutory Reports Financial Sections
MANAGEMENT DISCUSSION & ANALYSIS
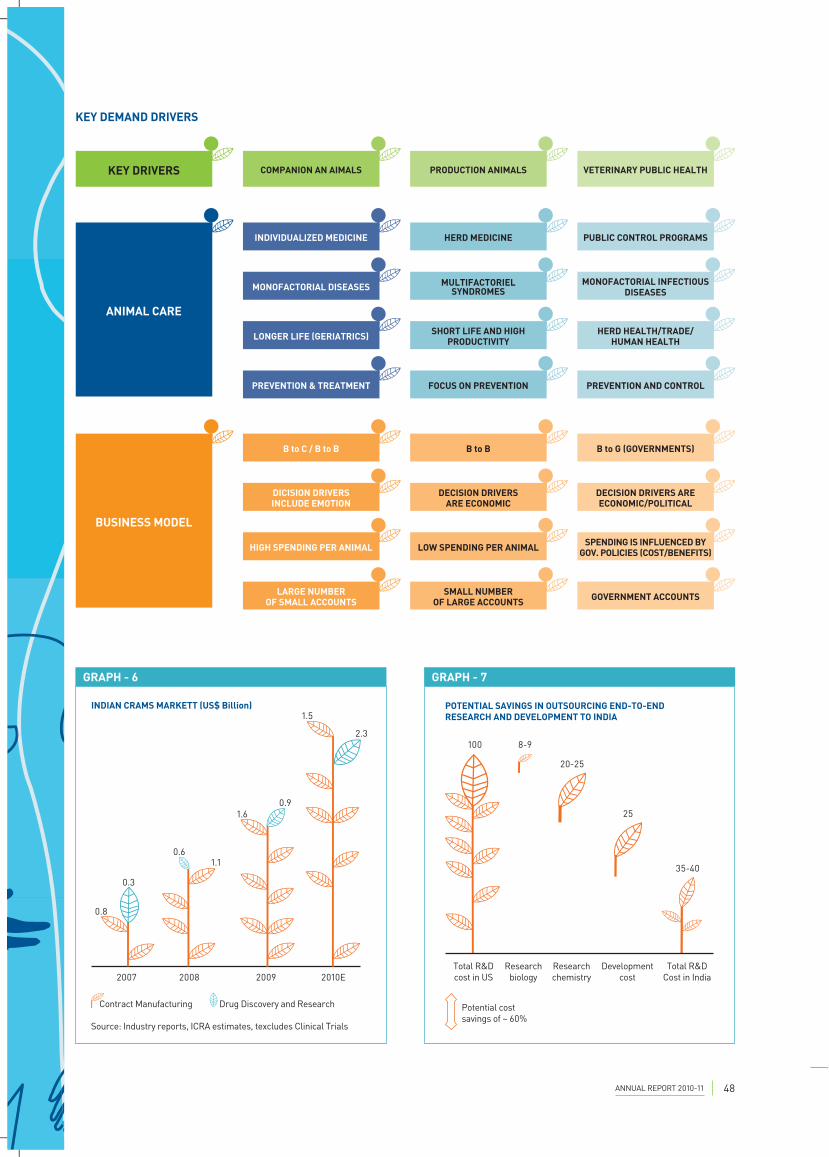
Drug Discovery and ResearchContract Manufacturing
INDIAN CRAMS MARKETT (US$ Billion)
2010E
2.3
1.5
2009
0.91.6
2008
0.61.1
2007
0.3
0.8
Source: Industry reports, ICRA estimates, texcludes Clinical Trials
GRAPH - 6
100
Total R&D cost in US
8-9
Researchbiology
20-25
Researchchemistry
25
Developmentcost
35-40
Total R&D Cost in India
POTENTIAL SAVINGS IN OUTSOURCING END-TO-END RESEARCH AND DEVELOPMENT TO INDIA
Potential cost savings of ~ 60%
GRAPH - 7
KEY DEMAND DRIVERS
ANIMAL CARE
INDIVIDUALIZED MEDICINE
MONOFACTORIAL DISEASES
LONGER LIFE (GERIATRICS)
PREVENTION & TREATMENT
HERD MEDICINE
MULTIFACTORIEL SYNDROMES
SHORT LIFE AND HIGH PRODUCTIVITY
FOCUS ON PREVENTION
PUBLIC CONTROL PROGRAMS
MONOFACTORIAL INFECTIOUS DISEASES
HERD HEALTH/TRADE/HUMAN HEALTH
PREVENTION AND CONTROL
BUSINESS MODEL
B to C / B to B
DICISION DRIVERS INCLUDE EMOTION
HIGH SPENDING PER ANIMAL
LARGE NUMBER OF SMALL ACCOUNTS
B to B
DECISION DRIVERS ARE ECONOMIC
LOW SPENDING PER ANIMAL
SMALL NUMBER OF LARGE ACCOUNTS
B to G (GOVERNMENTS)
DECISION DRIVERS ARE ECONOMIC/POLITICAL
SPENDING IS INFLUENCED BY GOV. POLICIES (COST/BENEFITS)
GOVERNMENT ACCOUNTS
KEY DRIVERS COMPANION AN AIMALS PRODUCTION ANIMALS VETERINARY PUBLIC HEALTH
ANNUAL REPORT 2010-11 48
GLOBAL ANIMAL HEALTH MARKET EVOLUTION
$Billion
2000 2001 2002 2003 2004 2005 2006 2007 2008 2009 2010
22
20
18
16
14
12
10
Nominal GrowthReal Growth
GRAPH - 8
GRAPH - 9
ANIMAL HEALTH MARKET BY PRODUCT GROUP, REGION & SPECIES
Medicinal feed additives 12%
Pharmaceuticals 6%
Biologicals 25%
Other 21%
Americas
46%
Europe 33%
Companion Animal 41%
Food Animal 59%
CORPORATE PERFORMANCE REVIEW
Background
About the Company
SeQuent Scientific Limited (‘SeQuent’) is a fast growing
pharmaceuticals company having presence in Human and
Veterinary segments. In 2007, first generation entrepreneurs,
each having more than a decade’s experience, acquired
SeQuent Scientific Limited. The Company has evolved into
an integrated player in the pharmaceuticals segment, with
footprints in API (Human and Veterinary), Formulations
(Veterinary) and CRAMS. Besides, the Company is also a
leading producer of specialty chemicals. The Company has
seven units across the country, including two state-of-the-art
R&D centres – in Mangalore and Bengaluru. SeQuent is the
leading producer of Anthelmentic APIs in the world.
The year 2010-11
During the year 2010-11, the Company continued to build
upon its robust foundation laid over the years. The Company
focused on building key strengths that would define its
competitive advantage across each vertical of presence.
Being a diverse Company, it was important to define its core
businesses that would drive the future growth. As a result,
the Company continued to build its pharmaceutical business
in terms of people, products, processes and presence. The
Company’s new R&D centre also commenced operations in
Bengaluru during the year.
The Company filed 7 new drug master files, taking the total
DMFs filed as on 31st March, 2011 to 28.
The Company’s edge on chemistry and research skills backed
with its world-class infrastructure enabled it to increase
its client base and forge product specific partnerships. The
Company’s clientele include the global pharma companies,
highlighting its value-proposition and abilities as a niche
player.
2010-11 also witnessed a dip in the Company’s financial
performance for the first time since its incorporation. While
the Company’s net sales increased by 12.8 per cent to `2,778
Million; EBIDTA declined by 11.6 per cent to `596 Million.
The Company’s net profit also declined by 23.4 per cent to
`159 Million. The dip in the numbers was largely on account
of absence of Oseltavimir sales during the year. In 2009-10,
in the wake of Swine Flu, the Company produced and sold
Oseltavimir, an API that commanded decent margins. In
absence of such an opportunity during 2010-11, the margins
as well as the profit of the Company witnessed a decline.
However, on an apple-to-apple comparison, the Company’s
revenues increased by 43 per cent and EBITDA registered a
54 per cent increase (non-Oseltavimir revenues).
ANNUAL REPORT 2010-1149 About us Ready! Steady! Grow! Board of Director’s profiles Statutory Reports Financial Sections
MANAGEMENT DISCUSSION & ANALYSIS
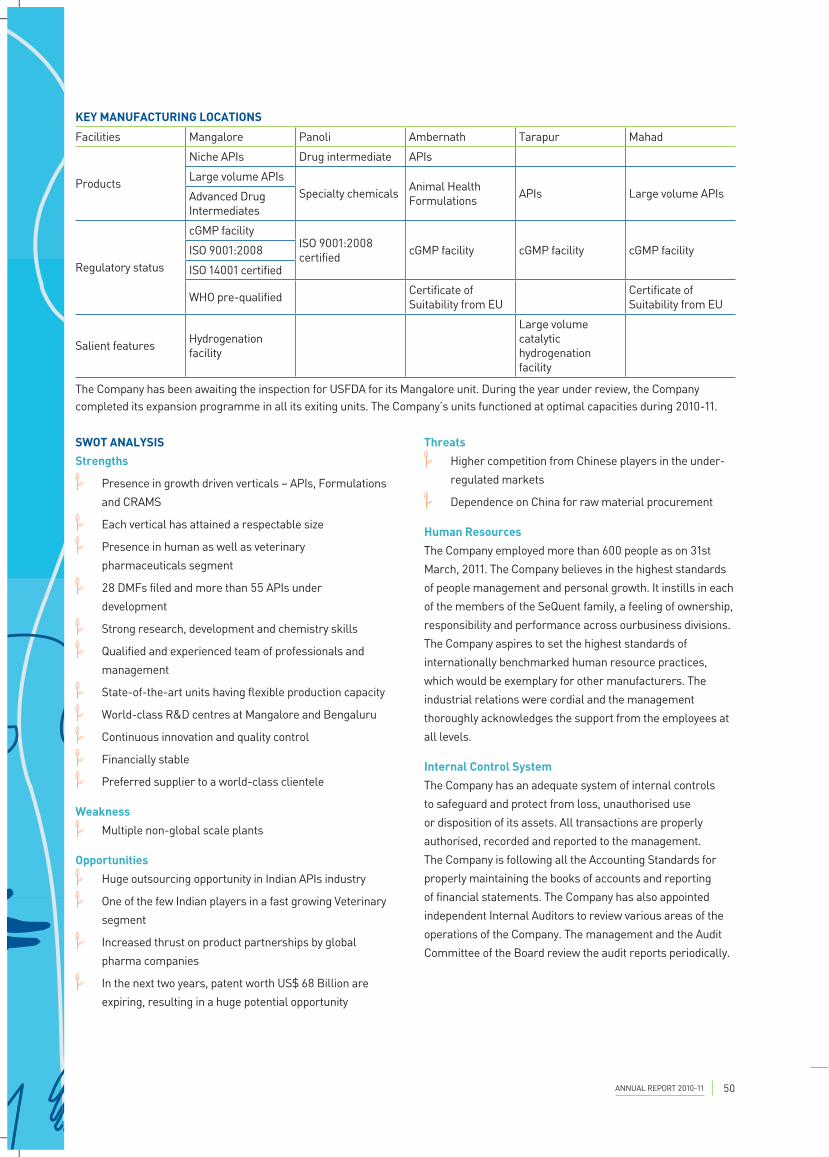
SWOT ANALYSIS
Strengths
Presence in growth driven verticals – APIs, Formulations
and CRAMS
Each vertical has attained a respectable size
Presence in human as well as veterinary
pharmaceuticals segment
28 DMFs filed and more than 55 APIs under
development
Strong research, development and chemistry skills
Qualified and experienced team of professionals and
management
State-of-the-art units having flexible production capacity
World-class R&D centres at Mangalore and Bengaluru
Continuous innovation and quality control
Financially stable
Preferred supplier to a world-class clientele
Weakness
Multiple non-global scale plants
Opportunities
Huge outsourcing opportunity in Indian APIs industry
One of the few Indian players in a fast growing Veterinary
segment
Increased thrust on product partnerships by global
pharma companies
In the next two years, patent worth US$ 68 Billion are
expiring, resulting in a huge potential opportunity
Threats
Higher competition from Chinese players in the under-
regulated markets
Dependence on China for raw material procurement
Human Resources
The Company employed more than 600 people as on 31st
March, 2011. The Company believes in the highest standards
of people management and personal growth. It instills in each
of the members of the SeQuent family, a feeling of ownership,
responsibility and performance across ourbusiness divisions.
The Company aspires to set the highest standards of
internationally benchmarked human resource practices,
which would be exemplary for other manufacturers. The
industrial relations were cordial and the management
thoroughly acknowledges the support from the employees at
all levels.
Internal Control System
The Company has an adequate system of internal controls
to safeguard and protect from loss, unauthorised use
or disposition of its assets. All transactions are properly
authorised, recorded and reported to the management.
The Company is following all the Accounting Standards for
properly maintaining the books of accounts and reporting
of financial statements. The Company has also appointed
independent Internal Auditors to review various areas of the
operations of the Company. The management and the Audit
Committee of the Board review the audit reports periodically.
KEY MANUFACTURING LOCATIONS
Facilities Mangalore Panoli Ambernath Tarapur Mahad
Products
Niche APIs Drug intermediate APIs
Large volume APIsSpecialty chemicals Animal Health
Formulations APIs Large volume APIsAdvanced Drug Intermediates
Regulatory status
cGMP facilityISO 9001:2008 certified cGMP facility cGMP facility cGMP facilityISO 9001:2008
ISO 14001 certified
WHO pre-qualified Certificate of Suitability from EU
Certificate of Suitability from EU
Salient features Hydrogenation facility
Large volume catalytic hydrogenation facility
The Company has been awaiting the inspection for USFDA for its Mangalore unit. During the year under review, the Company completed its expansion programme in all its exiting units. The Company’s units functioned at optimal capacities during 2010-11.
ANNUAL REPORT 2010-11 50
RISK MANAGEMENT
Risk category: Strategic
INVESTOR PERCEPTION RISK
What does it mean?
Since the Company has presence in diverse
businesses; it may lead to a negative perception
relating to core business focus in the minds of the
investors.
Mitigation measures
Pharmaceuticals segment is the Company’s core
business, comprising of growth-ready verticals in
Human and Veterinary segments. Each business
vertical is headed by core sector specialists and
dedicated professionals, bringing the requisite
expertise and focus. Over the years, the Company has
invested in each of its core verticals and has attained a
critical mass in each of them. The specialty chemicals
business remains to be non-core and generates
liquidity for the Company on accounts of its novel
products.
1
Risk category: Operational
ATTRITION RISK
What does it mean?
For a company whose business model is entirely
dependent on intellectual capital, any attrition at the
key levels can result in an adverse impact for the
business.
Mitigation measures
The Company follows a principle of ‘merit above
all’. Every employee sans level is appraised and
rewarded in view of their ability to add value to the
workplace. The Company ensures a progressive
career path for each of its employees. High levels
of interdepartmental and intra-departmental
transparency allow speedy resolution of the
employees’ concerns. Performance linked
remuneration coupled with ESOPs help in retaining
talent. The attrition rate in the Company is amongst
the lowest in the industry.
1
COMPETITION RISK
What does it mean?
Competition from global as well as local players can
hit the Company’s margins.
Mitigation measures
Being a relatively new player in the segments ruled
by global pharma companies, the Company has
focused on offering niche products across all its
business verticals. These products require dedicated
expertise and specialisation that the global players
are not willing to impart on account of their scale
and cost-benefit parameters. The Company’s ability
to offer products has elevated it among the favoured
producers of niche molecules and APIs in Human and
Veterinary segments. As a result, the Company has
emerged as a partner to the MNCs.
2REGULATORY RISK
What does it mean?
Getting approval on facilities and products from
various authorities is a time-taking exercise. The delay
caused can lead to loss of potential revenues in wake
of opportunity.
Mitigation measures
The Company’s Mangalore unit has been awaiting
inspection from the USFDA authorities. Of the
Company’s six manufacturing facilities, four plants are
cGMP certified and one is ISO certified, reflecting the
state-of-the-art processes and equipment. The risk
of delay in regulatory inspection is non-controllable;
however, the Company has invested in highest
standards of quality practices and control to be
confident of clearing inspections.
2
ANNUAL REPORT 2010-1151 About us Ready! Steady! Grow! Board of Director’s profiles Statutory Reports Financial Sections
MANAGEMENT DISCUSSION & ANALYSIS RISK MANAGEMENT
RISK MANAGEMENT
QUALITY RISK
What does it mean?
Any quality defect in the Company’s products can lead
to huge losses at client’s end as well as its own loss of
reputation.
Mitigation measures
The Company has a ‘zero tolerance‘ policy on quality.
Each of its units is certified by credible authorities and
has successfully passed key client audits. A dedicated
department in each unit takes care of stringent quality
control and quality assurance practices at every
product/process level.
3 ENVIRONMENT AND SAFETY RISK
What does it mean?
Non-compliance with environment protection policies
or safety related issues could dent operation and can
also impair quality standards.
Mitigation measures
The Company lays a great emphasis on the proactive
environment and health safety compliance. A
dedicated EHS Policy is formulated and strictly
adhered to protect its employees, the environment
and the public at every stage of its business activity.
Environment Management Systems are in place at
each site to continuously monitor progress in this
area.
4
ANNUAL REPORT 2010-11 52
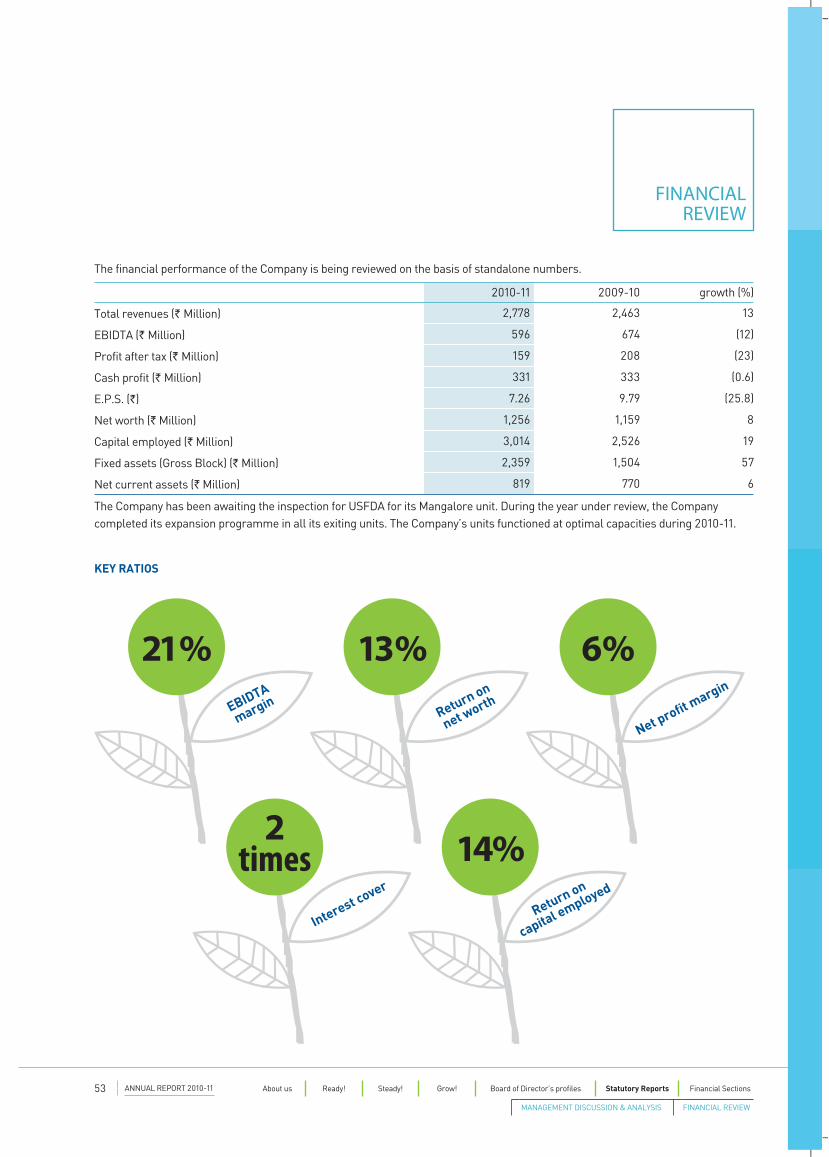
FINANCIAL REVIEW
The financial performance of the Company is being reviewed on the basis of standalone numbers.
2010-11 2009-10 growth (%)
Total revenues (` Million) 2,778 2,463 13
EBIDTA (` Million) 596 674 (12)
Profit after tax (` Million) 159 208 (23)
Cash profit (` Million) 331 333 (0.6)
E.P.S. (`) 7.26 9.79 (25.8)
Net worth (` Million) 1,256 1,159 8
Capital employed (` Million) 3,014 2,526 19
Fixed assets (Gross Block) (` Million) 2,359 1,504 57
Net current assets (` Million) 819 770 6
The Company has been awaiting the inspection for USFDA for its Mangalore unit. During the year under review, the Company completed its expansion programme in all its exiting units. The Company’s units functioned at optimal capacities during 2010-11.
21 %EBIDTA
margin
2 times
Interest cover
13 %Return on
net worth
14%Return on
capital employed
6 %
Net profit margin
KEY RATIOS
ANNUAL REPORT 2010-1153 About us Ready! Steady! Grow! Board of Director’s profiles Statutory Reports Financial Sections
MANAGEMENT DISCUSSION & ANALYSIS FINANCIAL REVIEW
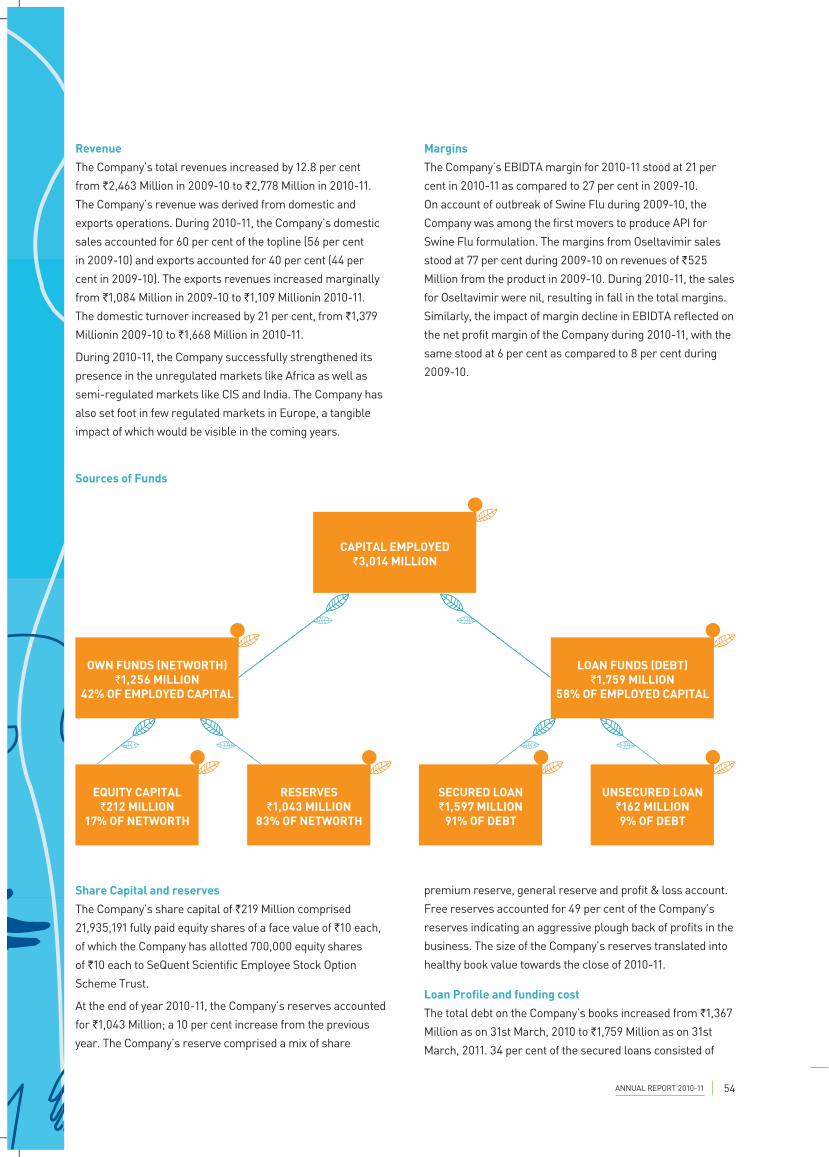
Revenue
The Company’s total revenues increased by 12.8 per cent
from `2,463 Million in 2009-10 to `2,778 Million in 2010-11.
The Company’s revenue was derived from domestic and
exports operations. During 2010-11, the Company’s domestic
sales accounted for 60 per cent of the topline (56 per cent
in 2009-10) and exports accounted for 40 per cent (44 per
cent in 2009-10). The exports revenues increased marginally
from `1,084 Million in 2009-10 to `1,109 Millionin 2010-11.
The domestic turnover increased by 21 per cent, from `1,379
Millionin 2009-10 to `1,668 Million in 2010-11.
During 2010-11, the Company successfully strengthened its
presence in the unregulated markets like Africa as well as
semi-regulated markets like CIS and India. The Company has
also set foot in few regulated markets in Europe, a tangible
impact of which would be visible in the coming years.
Share Capital and reserves
The Company’s share capital of `219 Million comprised
21,935,191 fully paid equity shares of a face value of `10 each,
of which the Company has allotted 700,000 equity shares
of `10 each to SeQuent Scientific Employee Stock Option
Scheme Trust.
At the end of year 2010-11, the Company’s reserves accounted
for `1,043 Million; a 10 per cent increase from the previous
year. The Company’s reserve comprised a mix of share
Margins
The Company’s EBIDTA margin for 2010-11 stood at 21 per
cent in 2010-11 as compared to 27 per cent in 2009-10.
On account of outbreak of Swine Flu during 2009-10, the
Company was among the first movers to produce API for
Swine Flu formulation. The margins from Oseltavimir sales
stood at 77 per cent during 2009-10 on revenues of `525
Million from the product in 2009-10. During 2010-11, the sales
for Oseltavimir were nil, resulting in fall in the total margins.
Similarly, the impact of margin decline in EBIDTA reflected on
the net profit margin of the Company during 2010-11, with the
same stood at 6 per cent as compared to 8 per cent during
2009-10.
premium reserve, general reserve and profit & loss account.
Free reserves accounted for 49 per cent of the Company’s
reserves indicating an aggressive plough back of profits in the
business. The size of the Company’s reserves translated into
healthy book value towards the close of 2010-11.
Loan Profile and funding cost
The total debt on the Company’s books increased from `1,367
Million as on 31st March, 2010 to `1,759 Million as on 31st
March, 2011. 34 per cent of the secured loans consisted of
Sources of Funds
CAPITAL EMPLOYED`3,014 MILLION
UNSECURED LOAN`162 MILLION9% OF DEBT
SECURED LOAN`1,597 MILLION
91% OF DEBT
RESERVES`1,043 MILLION
83% OF NETWORTH
EQUITY CAPITAL`212 MILLION
17% OF NETWORTH
OWN FUNDS (NETWORTH)`1,256 MILLION
42% OF EMPLOYED CAPITAL
LOAN FUNDS (DEBT)`1,759 MILLION
58% OF EMPLOYED CAPITAL
ANNUAL REPORT 2010-11 54
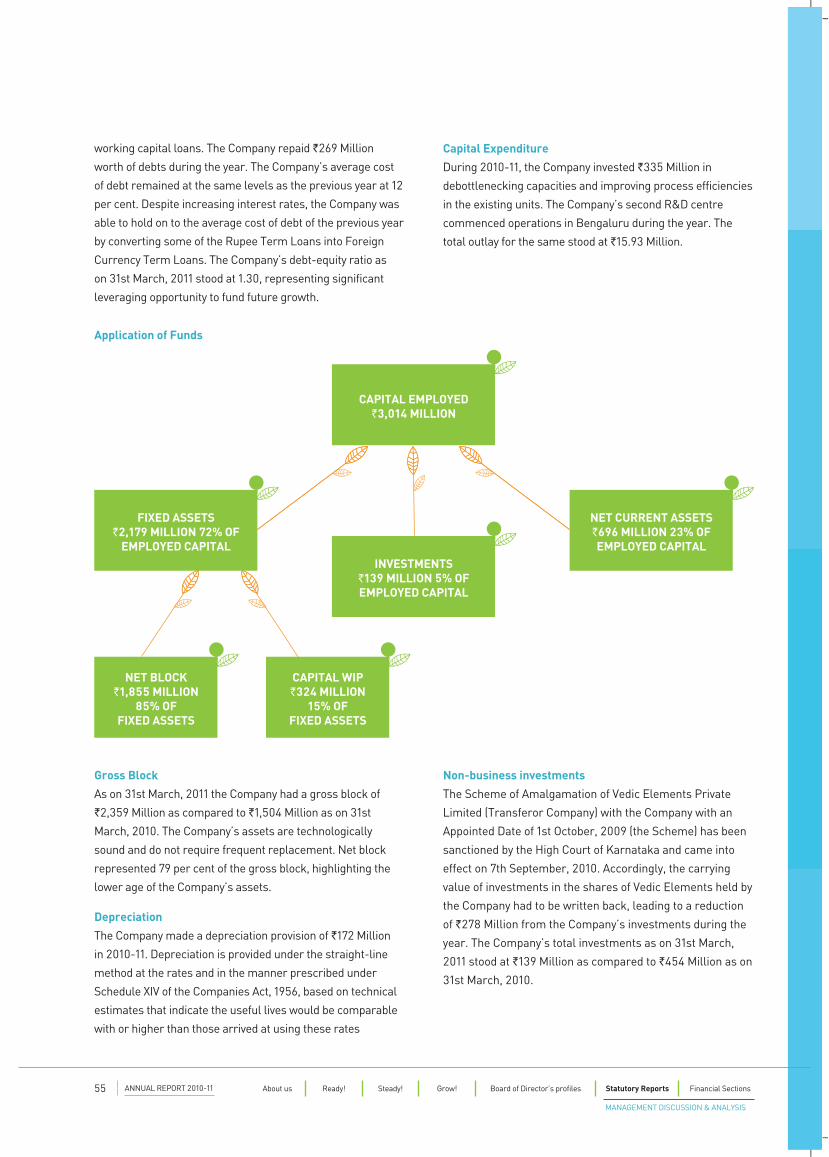
working capital loans. The Company repaid `269 Million
worth of debts during the year. The Company’s average cost
of debt remained at the same levels as the previous year at 12
per cent. Despite increasing interest rates, the Company was
able to hold on to the average cost of debt of the previous year
by converting some of the Rupee Term Loans into Foreign
Currency Term Loans. The Company’s debt-equity ratio as
on 31st March, 2011 stood at 1.30, representing significant
leveraging opportunity to fund future growth.
Gross Block
As on 31st March, 2011 the Company had a gross block of
`2,359 Million as compared to `1,504 Million as on 31st
March, 2010. The Company’s assets are technologically
sound and do not require frequent replacement. Net block
represented 79 per cent of the gross block, highlighting the
lower age of the Company’s assets.
Depreciation
The Company made a depreciation provision of `172 Million
in 2010-11. Depreciation is provided under the straight-line
method at the rates and in the manner prescribed under
Schedule XIV of the Companies Act, 1956, based on technical
estimates that indicate the useful lives would be comparable
with or higher than those arrived at using these rates
Capital Expenditure
During 2010-11, the Company invested `335 Million in
debottlenecking capacities and improving process efficiencies
in the existing units. The Company’s second R&D centre
commenced operations in Bengaluru during the year. The
total outlay for the same stood at `15.93 Million.
Non-business investments
The Scheme of Amalgamation of Vedic Elements Private
Limited (Transferor Company) with the Company with an
Appointed Date of 1st October, 2009 (the Scheme) has been
sanctioned by the High Court of Karnataka and came into
effect on 7th September, 2010. Accordingly, the carrying
value of investments in the shares of Vedic Elements held by
the Company had to be written back, leading to a reduction
of `278 Million from the Company’s investments during the
year. The Company’s total investments as on 31st March,
2011 stood at `139 Million as compared to `454 Million as on
31st March, 2010.
Application of Funds
CAPITAL EMPLOYED`3,014 MILLION
CAPITAL WIP`324 MILLION
15% OF FIXED ASSETS
NET BLOCK`1,855 MILLION
85% OF FIXED ASSETS
FIXED ASSETS`2,179 MILLION 72% OF
EMPLOYED CAPITAL
NET CURRENT ASSETS`696 MILLION 23% OF EMPLOYED CAPITAL
INVESTMENTS`139 MILLION 5% OF EMPLOYED CAPITAL
ANNUAL REPORT 2010-1155 About us Ready! Steady! Grow! Board of Director’s profiles Statutory Reports Financial Sections
MANAGEMENT DISCUSSION & ANALYSIS

The detailed report on Corporate Governance as per the format prescribed by SEBI and incorporated in Clause 49 of the Listing
Agreement is set out below:
1. COMPANY’S PHILOSOPHY ON CODE OF GOVERNANCE
Your Company believes in creating wealth for all its shareholders. In pursuit of this objective, the Policies of the Company
are designed to strengthen the ability of the Board of Directors to supervise the management and to enhance long-term
shareholder value.
All decisions are taken in the interest of the shareholders. The Board and the management are aware and conscious of
minority shareholder’s interest, and everything is done to enhance shareholders value in totality. Hence, considerable
emphasis is placed on accountability in decision-making and ethics in implementing them.
Adequate and timely information is critical to accountability. Sequent Scientific Limited believes to act in the spirit of law and
not just the letter of law. We aim at providing complete transparency in our operations.
2. BOARD OF DIRECTORS:
Composition of Board
The composition of Board of Directors of the company is an appropriate combination of Executive and Non executive Directors
with right element of independence. As on date the Board consists of Six Directors. Fifty percent of the Board consists of Non-
Executive Independent Directors.
Meetings held during the year
During the financial year ended March 31, 2011, 5 (five) board meetings were held. Dates on which the meetings were held are
May 28, 2010, August 13, 2010, October 29, 2010, February 10, 2011 and March 22, 2011.
CORPORATE GOVERNANCE REPORT
ANNUAL REPORT 2010-1157 About us Ready! Steady! Grow! Board of Director’s profiles Statutory Reports Financial Sections
CORPORATE GOVERNANCE REPORT
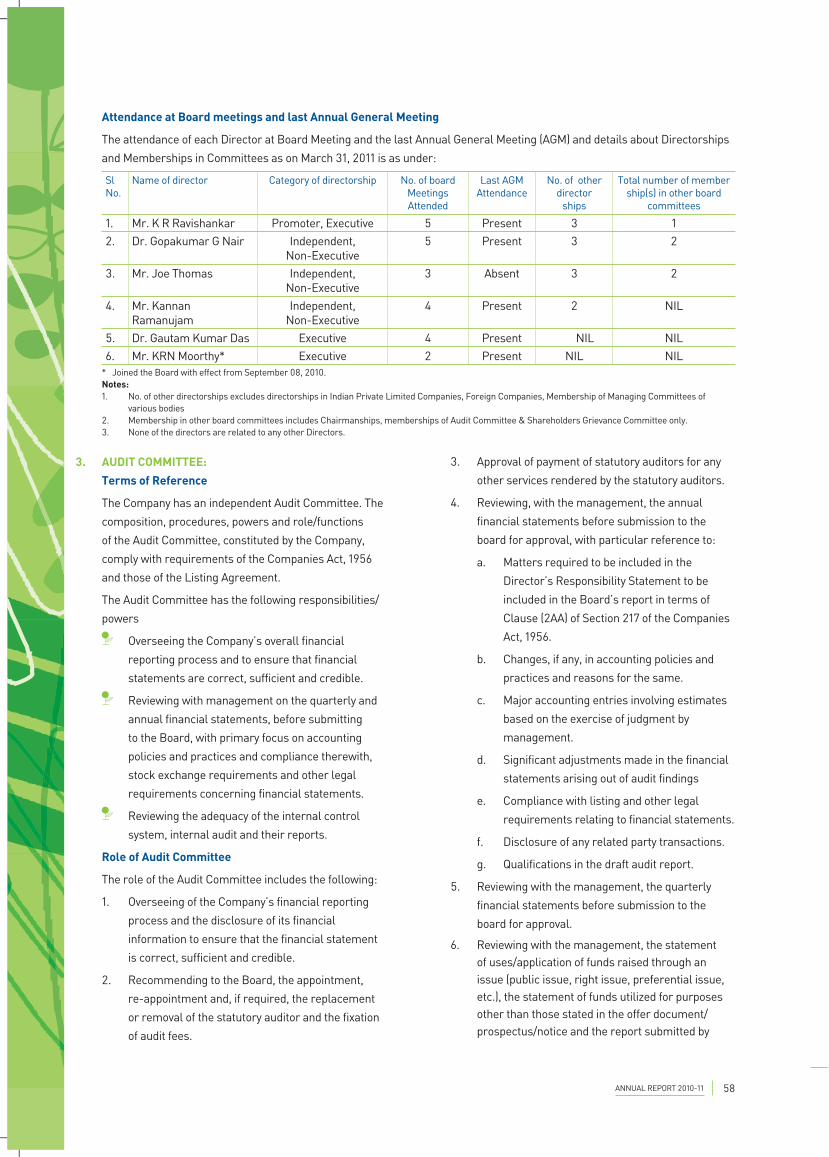
Attendance at Board meetings and last Annual General Meeting
The attendance of each Director at Board Meeting and the last Annual General Meeting (AGM) and details about Directorships
and Memberships in Committees as on March 31, 2011 is as under:
SlNo.
Name of director Category of directorship No. of board Meetings Attended
Last AGM Attendance
No. of other director
ships
Total number of member ship(s) in other board
committees
1. Mr. K R Ravishankar Promoter, Executive 5 Present 3 12. Dr. Gopakumar G Nair Independent,
Non-Executive5 Present 3 2
3. Mr. Joe Thomas Independent, Non-Executive
3 Absent 3 2
4. Mr. Kannan Ramanujam
Independent, Non-Executive
4 Present 2 NIL
5. Dr. Gautam Kumar Das Executive 4 Present NIL NIL6. Mr. KRN Moorthy* Executive 2 Present NIL NIL
* Joined the Board with effect from September 08, 2010. Notes: 1. No. of other directorships excludes directorships in Indian Private Limited Companies, Foreign Companies, Membership of Managing Committees of
various bodies 2. Membership in other board committees includes Chairmanships, memberships of Audit Committee & Shareholders Grievance Committee only. 3. None of the directors are related to any other Directors.
3. Approval of payment of statutory auditors for any
other services rendered by the statutory auditors.
4. Reviewing, with the management, the annual
financial statements before submission to the
board for approval, with particular reference to:
a. Matters required to be included in the
Director’s Responsibility Statement to be
included in the Board’s report in terms of
Clause (2AA) of Section 217 of the Companies
Act, 1956.
b. Changes, if any, in accounting policies and
practices and reasons for the same.
c. Major accounting entries involving estimates
based on the exercise of judgment by
management.
d. Significant adjustments made in the financial
statements arising out of audit findings
e. Compliance with listing and other legal
requirements relating to financial statements.
f. Disclosure of any related party transactions.
g. Qualifications in the draft audit report.
5. Reviewing with the management, the quarterly
financial statements before submission to the
board for approval.
6. Reviewing with the management, the statement of uses/application of funds raised through an issue (public issue, right issue, preferential issue, etc.), the statement of funds utilized for purposes other than those stated in the offer document/prospectus/notice and the report submitted by
3. AUDIT COMMITTEE:
Terms of Reference
The Company has an independent Audit Committee. The
composition, procedures, powers and role/functions
of the Audit Committee, constituted by the Company,
comply with requirements of the Companies Act, 1956
and those of the Listing Agreement.
The Audit Committee has the following responsibilities/
powers
Overseeing the Company’s overall financial
reporting process and to ensure that financial
statements are correct, sufficient and credible.
Reviewing with management on the quarterly and
annual financial statements, before submitting
to the Board, with primary focus on accounting
policies and practices and compliance therewith,
stock exchange requirements and other legal
requirements concerning financial statements.
Reviewing the adequacy of the internal control
system, internal audit and their reports.
Role of Audit Committee
The role of the Audit Committee includes the following:
1. Overseeing of the Company’s financial reporting
process and the disclosure of its financial
information to ensure that the financial statement
is correct, sufficient and credible.
2. Recommending to the Board, the appointment,
re-appointment and, if required, the replacement
or removal of the statutory auditor and the fixation
of audit fees.
ANNUAL REPORT 2010-11 58
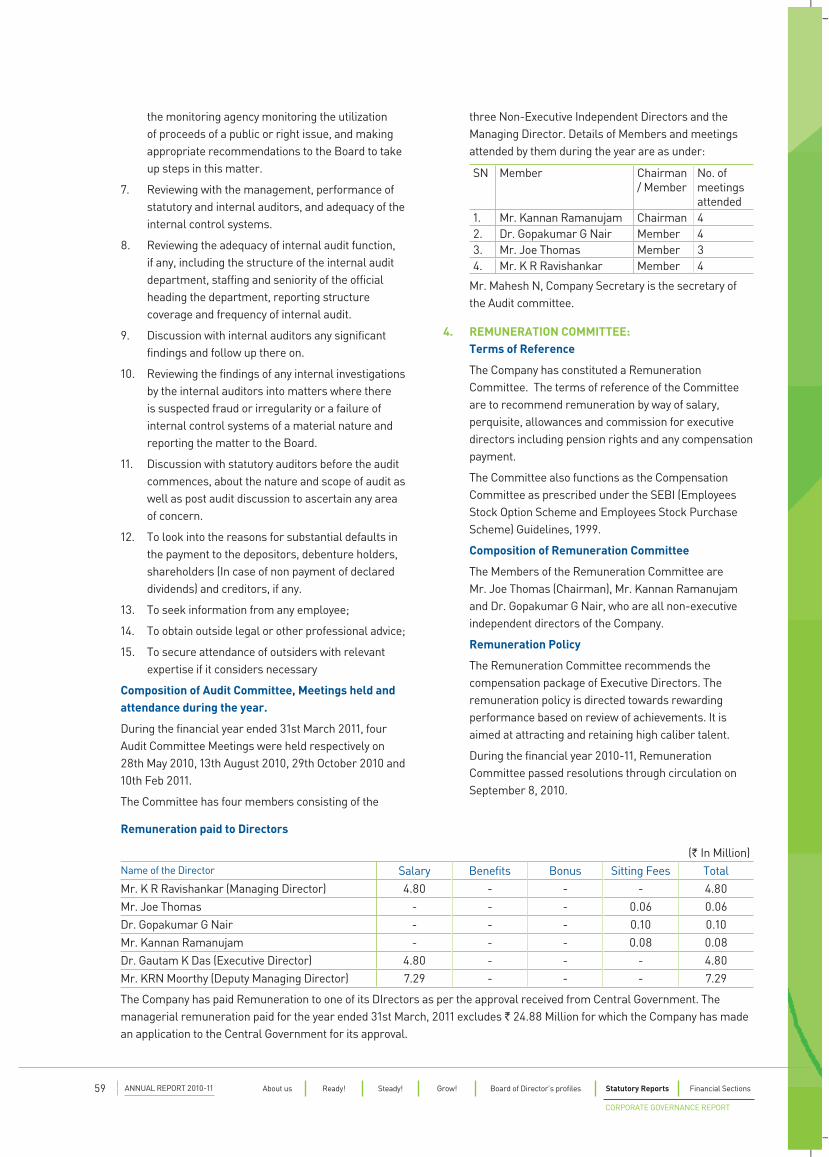
the monitoring agency monitoring the utilization of proceeds of a public or right issue, and making appropriate recommendations to the Board to take up steps in this matter.
7. Reviewing with the management, performance of statutory and internal auditors, and adequacy of the internal control systems.
8. Reviewing the adequacy of internal audit function, if any, including the structure of the internal audit department, staffing and seniority of the official heading the department, reporting structure coverage and frequency of internal audit.
9. Discussion with internal auditors any significant findings and follow up there on.
10. Reviewing the findings of any internal investigations by the internal auditors into matters where there is suspected fraud or irregularity or a failure of internal control systems of a material nature and reporting the matter to the Board.
11. Discussion with statutory auditors before the audit commences, about the nature and scope of audit as well as post audit discussion to ascertain any area of concern.
12. To look into the reasons for substantial defaults in the payment to the depositors, debenture holders, shareholders (In case of non payment of declared dividends) and creditors, if any.
13. To seek information from any employee;
14. To obtain outside legal or other professional advice;
15. To secure attendance of outsiders with relevant expertise if it considers necessary
Composition of Audit Committee, Meetings held and attendance during the year.
During the financial year ended 31st March 2011, four Audit Committee Meetings were held respectively on 28th May 2010, 13th August 2010, 29th October 2010 and 10th Feb 2011.
The Committee has four members consisting of the
three Non-Executive Independent Directors and the Managing Director. Details of Members and meetings attended by them during the year are as under:
SN Member Chairman / Member
No. of meetings attended
1. Mr. Kannan Ramanujam Chairman 42. Dr. Gopakumar G Nair Member 43. Mr. Joe Thomas Member 34. Mr. K R Ravishankar Member 4
Mr. Mahesh N, Company Secretary is the secretary of the Audit committee.
4. REMUNERATION COMMITTEE: Terms of Reference
The Company has constituted a Remuneration Committee. The terms of reference of the Committee are to recommend remuneration by way of salary, perquisite, allowances and commission for executive directors including pension rights and any compensation payment.
The Committee also functions as the Compensation Committee as prescribed under the SEBI (Employees Stock Option Scheme and Employees Stock Purchase Scheme) Guidelines, 1999.
Composition of Remuneration Committee
The Members of the Remuneration Committee are Mr. Joe Thomas (Chairman), Mr. Kannan Ramanujam and Dr. Gopakumar G Nair, who are all non-executive independent directors of the Company.
Remuneration Policy
The Remuneration Committee recommends the compensation package of Executive Directors. The remuneration policy is directed towards rewarding performance based on review of achievements. It is aimed at attracting and retaining high caliber talent.
During the financial year 2010-11, Remuneration Committee passed resolutions through circulation on September 8, 2010.
Remuneration paid to Directors
(` In Million)Name of the Director Salary Benefits Bonus Sitting Fees TotalMr. K R Ravishankar (Managing Director) 4.80 - - - 4.80Mr. Joe Thomas - - - 0.06 0.06Dr. Gopakumar G Nair - - - 0.10 0.10Mr. Kannan Ramanujam - - - 0.08 0.08Dr. Gautam K Das (Executive Director) 4.80 - - - 4.80Mr. KRN Moorthy (Deputy Managing Director) 7.29 - - - 7.29
The Company has paid Remuneration to one of its DIrectors as per the approval received from Central Government. The managerial remuneration paid for the year ended 31st March, 2011 excludes ` 24.88 Million for which the Company has made an application to the Central Government for its approval.
ANNUAL REPORT 2010-1159 About us Ready! Steady! Grow! Board of Director’s profiles Statutory Reports Financial Sections
CORPORATE GOVERNANCE REPORT
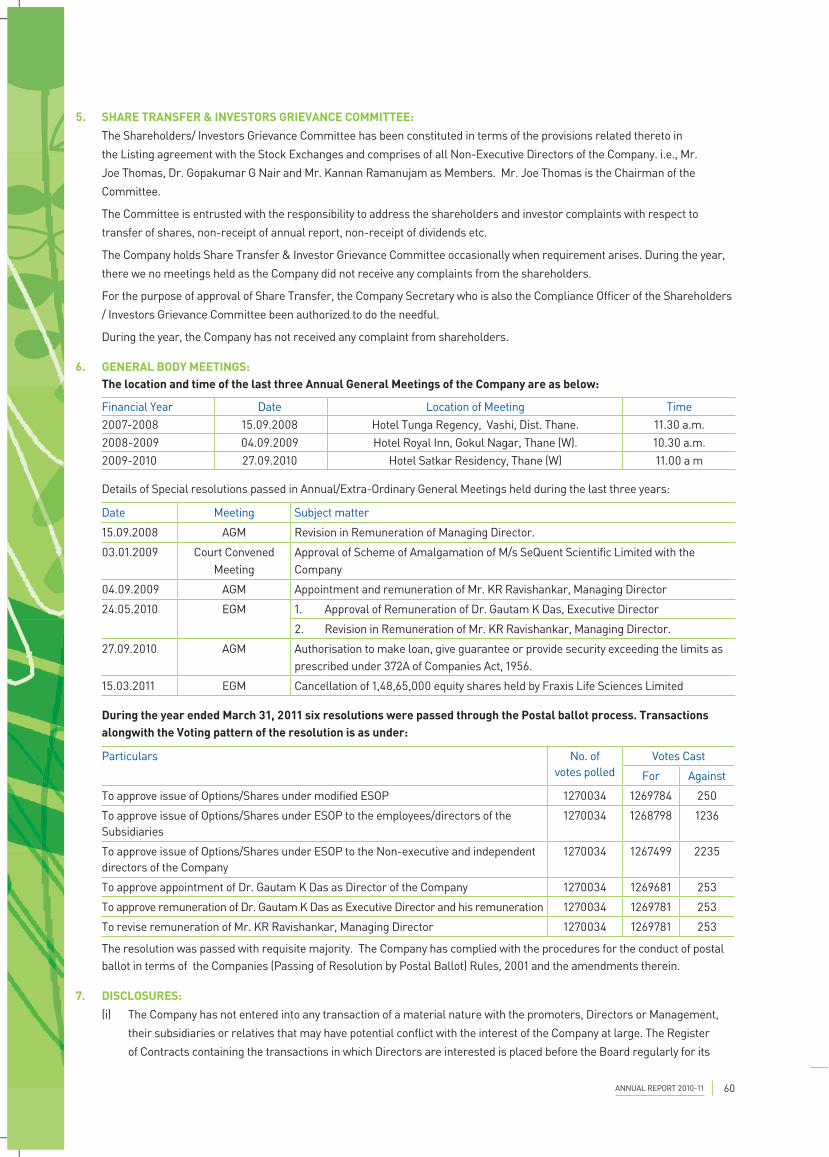
5. SHARE TRANSFER & INVESTORS GRIEVANCE COMMITTEE:
The Shareholders/ Investors Grievance Committee has been constituted in terms of the provisions related thereto in
the Listing agreement with the Stock Exchanges and comprises of all Non-Executive Directors of the Company. i.e., Mr.
Joe Thomas, Dr. Gopakumar G Nair and Mr. Kannan Ramanujam as Members. Mr. Joe Thomas is the Chairman of the
Committee.
The Committee is entrusted with the responsibility to address the shareholders and investor complaints with respect to
transfer of shares, non-receipt of annual report, non-receipt of dividends etc.
The Company holds Share Transfer & Investor Grievance Committee occasionally when requirement arises. During the year,
there we no meetings held as the Company did not receive any complaints from the shareholders.
For the purpose of approval of Share Transfer, the Company Secretary who is also the Compliance Officer of the Shareholders
/ Investors Grievance Committee been authorized to do the needful.
During the year, the Company has not received any complaint from shareholders.
6. GENERAL BODY MEETINGS: The location and time of the last three Annual General Meetings of the Company are as below:
Financial Year Date Location of Meeting Time2007-2008 15.09.2008 Hotel Tunga Regency, Vashi, Dist. Thane. 11.30 a.m.2008-2009 04.09.2009 Hotel Royal Inn, Gokul Nagar, Thane (W). 10.30 a.m.2009-2010 27.09.2010 Hotel Satkar Residency, Thane (W) 11.00 a m
Details of Special resolutions passed in Annual/Extra-Ordinary General Meetings held during the last three years:
Date Meeting Subject matter
15.09.2008 AGM Revision in Remuneration of Managing Director.
03.01.2009 Court Convened Meeting
Approval of Scheme of Amalgamation of M/s SeQuent Scientific Limited with the Company
04.09.2009 AGM Appointment and remuneration of Mr. KR Ravishankar, Managing Director
24.05.2010 EGM 1. Approval of Remuneration of Dr. Gautam K Das, Executive Director
2. Revision in Remuneration of Mr. KR Ravishankar, Managing Director.
27.09.2010 AGM Authorisation to make loan, give guarantee or provide security exceeding the limits as prescribed under 372A of Companies Act, 1956.
15.03.2011 EGM Cancellation of 1,48,65,000 equity shares held by Fraxis Life Sciences Limited
During the year ended March 31, 2011 six resolutions were passed through the Postal ballot process. Transactions alongwith the Voting pattern of the resolution is as under:
Particulars No. of votes polled
Votes Cast
For Against
To approve issue of Options/Shares under modified ESOP 1270034 1269784 250
To approve issue of Options/Shares under ESOP to the employees/directors of the Subsidiaries
1270034 1268798 1236
To approve issue of Options/Shares under ESOP to the Non-executive and independent directors of the Company
1270034 1267499 2235
To approve appointment of Dr. Gautam K Das as Director of the Company 1270034 1269681 253
To approve remuneration of Dr. Gautam K Das as Executive Director and his remuneration 1270034 1269781 253
To revise remuneration of Mr. KR Ravishankar, Managing Director 1270034 1269781 253
The resolution was passed with requisite majority. The Company has complied with the procedures for the conduct of postal ballot in terms of the Companies (Passing of Resolution by Postal Ballot) Rules, 2001 and the amendments therein.
7. DISCLOSURES:
(i) The Company has not entered into any transaction of a material nature with the promoters, Directors or Management,
their subsidiaries or relatives that may have potential conflict with the interest of the Company at large. The Register
of Contracts containing the transactions in which Directors are interested is placed before the Board regularly for its
ANNUAL REPORT 2010-11 60
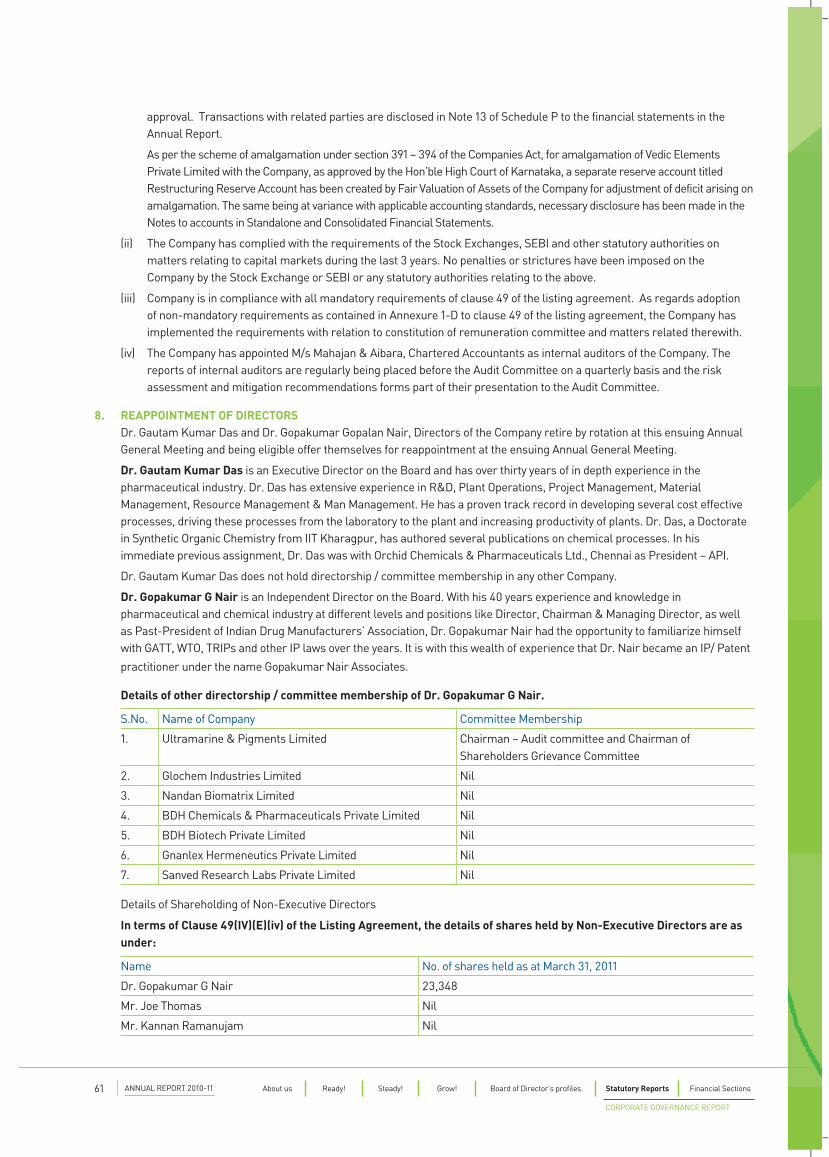
approval. Transactions with related parties are disclosed in Note 13 of Schedule P to the financial statements in the Annual Report.
As per the scheme of amalgamation under section 391 – 394 of the Companies Act, for amalgamation of Vedic Elements Private Limited with the Company, as approved by the Hon’ble High Court of Karnataka, a separate reserve account titled Restructuring Reserve Account has been created by Fair Valuation of Assets of the Company for adjustment of deficit arising on amalgamation. The same being at variance with applicable accounting standards, necessary disclosure has been made in the Notes to accounts in Standalone and Consolidated Financial Statements.
(ii) The Company has complied with the requirements of the Stock Exchanges, SEBI and other statutory authorities on matters relating to capital markets during the last 3 years. No penalties or strictures have been imposed on the Company by the Stock Exchange or SEBI or any statutory authorities relating to the above.
(iii) Company is in compliance with all mandatory requirements of clause 49 of the listing agreement. As regards adoption of non-mandatory requirements as contained in Annexure 1-D to clause 49 of the listing agreement, the Company has implemented the requirements with relation to constitution of remuneration committee and matters related therewith.
(iv) The Company has appointed M/s Mahajan & Aibara, Chartered Accountants as internal auditors of the Company. The reports of internal auditors are regularly being placed before the Audit Committee on a quarterly basis and the risk assessment and mitigation recommendations forms part of their presentation to the Audit Committee.
8. REAPPOINTMENT OF DIRECTORS Dr. Gautam Kumar Das and Dr. Gopakumar Gopalan Nair, Directors of the Company retire by rotation at this ensuing Annual
General Meeting and being eligible offer themselves for reappointment at the ensuing Annual General Meeting.
Dr. Gautam Kumar Das is an Executive Director on the Board and has over thirty years of in depth experience in the pharmaceutical industry. Dr. Das has extensive experience in R&D, Plant Operations, Project Management, Material Management, Resource Management & Man Management. He has a proven track record in developing several cost effective processes, driving these processes from the laboratory to the plant and increasing productivity of plants. Dr. Das, a Doctorate in Synthetic Organic Chemistry from IIT Kharagpur, has authored several publications on chemical processes. In his immediate previous assignment, Dr. Das was with Orchid Chemicals & Pharmaceuticals Ltd., Chennai as President – API.
Dr. Gautam Kumar Das does not hold directorship / committee membership in any other Company.
Dr. Gopakumar G Nair is an Independent Director on the Board. With his 40 years experience and knowledge in pharmaceutical and chemical industry at different levels and positions like Director, Chairman & Managing Director, as well as Past-President of Indian Drug Manufacturers’ Association, Dr. Gopakumar Nair had the opportunity to familiarize himself with GATT, WTO, TRIPs and other IP laws over the years. It is with this wealth of experience that Dr. Nair became an IP/ Patent
practitioner under the name Gopakumar Nair Associates.
Details of other directorship / committee membership of Dr. Gopakumar G Nair.
S.No. Name of Company Committee Membership
1. Ultramarine & Pigments Limited Chairman – Audit committee and Chairman of Shareholders Grievance Committee
2. Glochem Industries Limited Nil
3. Nandan Biomatrix Limited Nil
4. BDH Chemicals & Pharmaceuticals Private Limited Nil
5. BDH Biotech Private Limited Nil
6. Gnanlex Hermeneutics Private Limited Nil
7. Sanved Research Labs Private Limited Nil
Details of Shareholding of Non-Executive Directors
In terms of Clause 49(IV)(E)(iv) of the Listing Agreement, the details of shares held by Non-Executive Directors are as under:
Name No. of shares held as at March 31, 2011
Dr. Gopakumar G Nair 23,348
Mr. Joe Thomas Nil
Mr. Kannan Ramanujam Nil
ANNUAL REPORT 2010-1161 About us Ready! Steady! Grow! Board of Director’s profiles Statutory Reports Financial Sections
CORPORATE GOVERNANCE REPORT
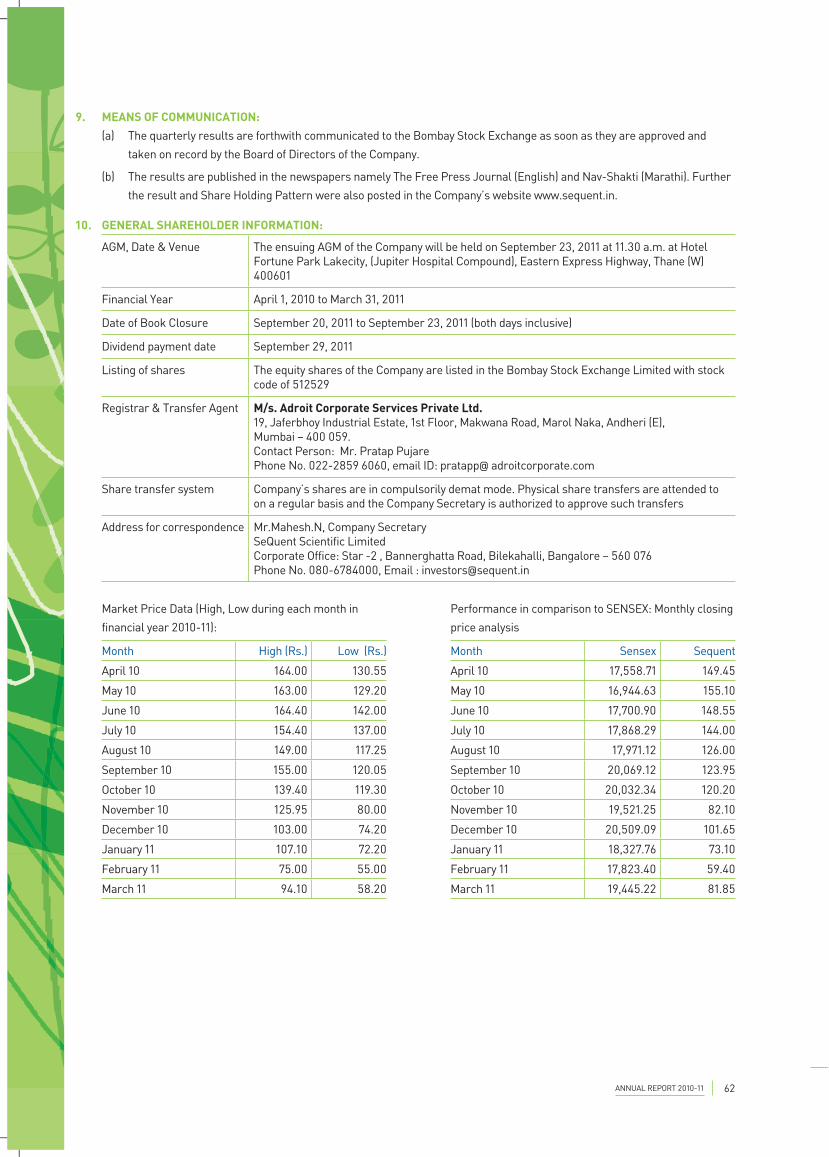
9. MEANS OF COMMUNICATION:
(a) The quarterly results are forthwith communicated to the Bombay Stock Exchange as soon as they are approved and
taken on record by the Board of Directors of the Company.
(b) The results are published in the newspapers namely The Free Press Journal (English) and Nav-Shakti (Marathi). Further
the result and Share Holding Pattern were also posted in the Company’s website www.sequent.in.
10. GENERAL SHAREHOLDER INFORMATION:
AGM, Date & Venue The ensuing AGM of the Company will be held on September 23, 2011 at 11.30 a.m. at Hotel Fortune Park Lakecity, (Jupiter Hospital Compound), Eastern Express Highway, Thane (W) 400601
Financial Year April 1, 2010 to March 31, 2011
Date of Book Closure September 20, 2011 to September 23, 2011 (both days inclusive)
Dividend payment date September 29, 2011
Listing of shares The equity shares of the Company are listed in the Bombay Stock Exchange Limited with stock code of 512529
Registrar & Transfer Agent M/s. Adroit Corporate Services Private Ltd.19, Jaferbhoy Industrial Estate, 1st Floor, Makwana Road, Marol Naka, Andheri (E), Mumbai – 400 059.Contact Person: Mr. Pratap PujarePhone No. 022-2859 6060, email ID: pratapp@ adroitcorporate.com
Share transfer system Company’s shares are in compulsorily demat mode. Physical share transfers are attended to on a regular basis and the Company Secretary is authorized to approve such transfers
Address for correspondence Mr.Mahesh.N, Company SecretarySeQuent Scientific LimitedCorporate Office: Star -2 , Bannerghatta Road, Bilekahalli, Bangalore – 560 076Phone No. 080-6784000, Email : [email protected]
Market Price Data (High, Low during each month in
financial year 2010-11):
Month High (Rs.) Low (Rs.)
April 10 164.00 130.55
May 10 163.00 129.20
June 10 164.40 142.00
July 10 154.40 137.00
August 10 149.00 117.25
September 10 155.00 120.05
October 10 139.40 119.30
November 10 125.95 80.00
December 10 103.00 74.20
January 11 107.10 72.20
February 11 75.00 55.00
March 11 94.10 58.20
Performance in comparison to SENSEX: Monthly closing
price analysis
Month Sensex Sequent
April 10 17,558.71 149.45
May 10 16,944.63 155.10
June 10 17,700.90 148.55
July 10 17,868.29 144.00
August 10 17,971.12 126.00
September 10 20,069.12 123.95
October 10 20,032.34 120.20
November 10 19,521.25 82.10
December 10 20,509.09 101.65
January 11 18,327.76 73.10
February 11 17,823.40 59.40
March 11 19,445.22 81.85
ANNUAL REPORT 2010-11 62
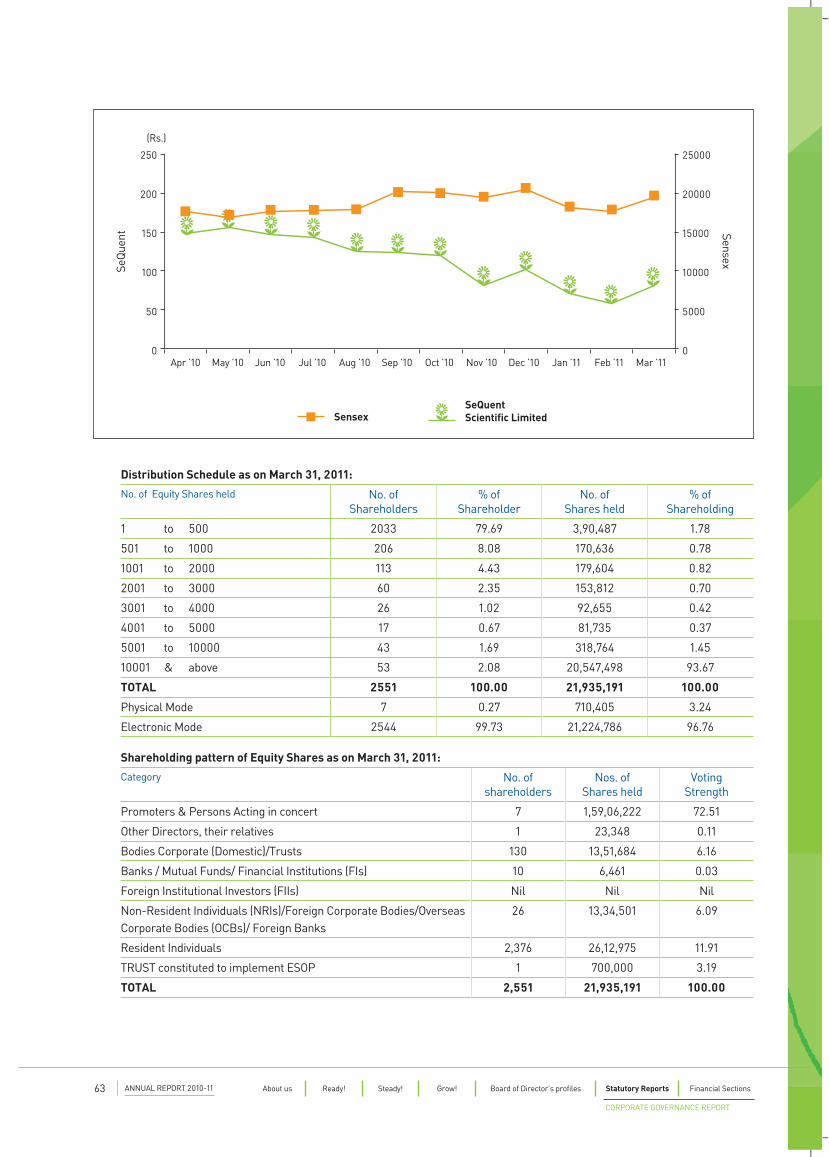
Distribution Schedule as on March 31, 2011:
No. of Equity Shares held No. of Shareholders
% of Shareholder
No. of Shares held
% of Shareholding
1 to 500 2033 79.69 3,90,487 1.78
501 to 1000 206 8.08 170,636 0.78
1001 to 2000 113 4.43 179,604 0.82
2001 to 3000 60 2.35 153,812 0.70
3001 to 4000 26 1.02 92,655 0.42
4001 to 5000 17 0.67 81,735 0.37
5001 to 10000 43 1.69 318,764 1.45
10001 & above 53 2.08 20,547,498 93.67
TOTAL 2551 100.00 21,935,191 100.00
Physical Mode 7 0.27 710,405 3.24
Electronic Mode 2544 99.73 21,224,786 96.76
Shareholding pattern of Equity Shares as on March 31, 2011:
Category No. of shareholders
Nos. of Shares held
Voting Strength
Promoters & Persons Acting in concert 7 1,59,06,222 72.51
Other Directors, their relatives 1 23,348 0.11
Bodies Corporate (Domestic)/Trusts 130 13,51,684 6.16
Banks / Mutual Funds/ Financial Institutions (FIs) 10 6,461 0.03
Foreign Institutional Investors (FIIs) Nil Nil Nil
Non-Resident Individuals (NRIs)/Foreign Corporate Bodies/Overseas Corporate Bodies (OCBs)/ Foreign Banks
26 13,34,501 6.09
Resident Individuals 2,376 26,12,975 11.91
TRUST constituted to implement ESOP 1 700,000 3.19
TOTAL 2,551 21,935,191 100.00
SensexSeQuent Scientific Limited
Apr ’10 Jun ’10 Aug ’10 Oct ’10 Dec ’10May ’10 Jul ’10 Sep ’10 Nov ’10 Jan ’11 Feb ’11 Mar ’11
250
200
25000
20000
15000
10000
5000
150
100
50
0 0
Sensex
SeQ
uent
(Rs.)
ANNUAL REPORT 2010-1163 About us Ready! Steady! Grow! Board of Director’s profiles Statutory Reports Financial Sections
CORPORATE GOVERNANCE REPORT
Dematerialization of shares and liquidity:
The Company’s shares are compulsorily traded in dematerialized form. The Company has established connectivity with both
the Depositories viz., National Securities Depository Limited (NSDL) and Central Depository Services (India) Limited (CDSL)
through the Registrars, Adroit Corporate Services Pvt Ltd. As on 31st March, 2011 96.76% of the paid-up share capital of the
Company representing 21,224,786 shares have been dematerialized.
Outstanding ADRs/GDRs/warrants/ other convertible instruments:
The Company has no outstanding ADRs / GDRs/ warrants outstanding.
ESOPs: Company has framed an Employee Stock Option plan to reward its employee. It is proposed to grant options under
the said plan through Trust that has been established by the Company for the purpose having independent directors as its
trustees. The Plan was approved by the shareholders on 28.03.2008, However Board in its meeting has modified some of the
provisions of ESOP Plan. Modified ESOP Plan was approved by the shareholders on 24.05.2010 through Postal Ballot. Under
the said plan company has allotted 700000 equity shares of Rs. 10/- each to the Trust at a price of Rs. 113/- per share.
The Company has granted 100,000 options to Mr. KRN Moorthy, Dy. Managing Director at an exercise price of Rs. 75/- per
share to be vested over a period of 3 years.
Plant Location:
1. Plot No. 7, MIDC Engineering Zone, Kalyan Badlapur Road, Ambernath
2. W-152, MIDC, Tarapur, Boisar, Dist Thane, Maharashtra.
3. B-32, G-2, G-3, MIDC, Mahad, Dist. Raigad.
4. A-68, Additional Ambernath, MIDC Indl. Area, Ambernath (East), Dist. Thane
5. Plot No. 150, 151, 136, 141 MIDC, Tarapur, Boisar, Thane
6. 120 A & B Industrial Area, Baikampady, New Mangalore
7. Plot No. 26, 26B, GIDC Industrial Estate, Panoli, Dist. Bharuch
8. A-14, MIDC, Phase I, Dombivali (E), Dist. Thane
9. Plot No. 11, KIADB Industrial Area, Centre Jigani, Anekal, Bangalore
10. Plot No. SPL 9 & 15 Kumta Industrial Area, Hegde Road, Kumta
11. CODE OF CONDUCT
The Board has prescribed Code of Conduct (“Code”) for all Board Members and Senior Management of the Company, which is
also put on the website of the Company.
` All Board Members and Senior Management personnel have confirmed compliance with the code for the year 2010 – 2011.
A declaration to this effect signed by the Mr. K.R. Ravishankar, Managing Director is reproduced below:
“I confirm that the Company has in respect of the year ended March 31, 2011, received from its Board Members as well as
Senior Management Personnel affirmation as to compliance with the Code of Conduct’.
ANNUAL REPORT 2010-11 64
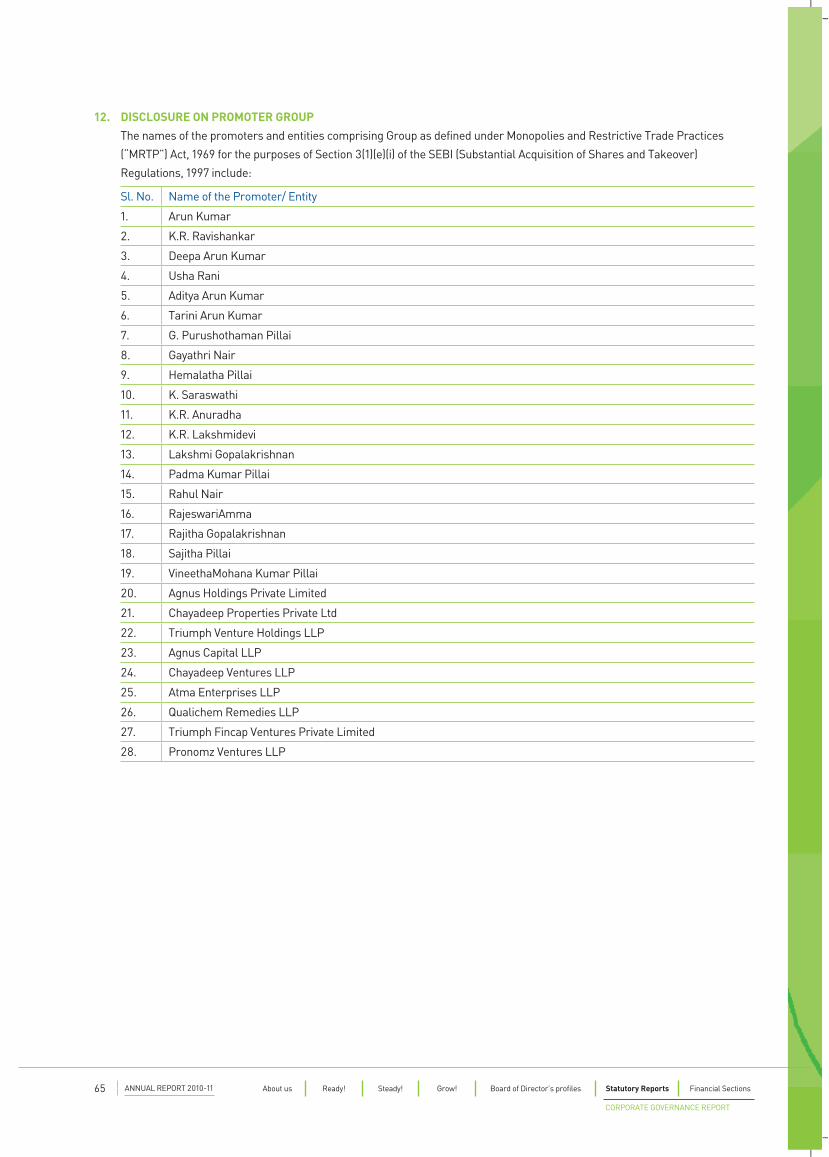
12. DISCLOSURE ON PROMOTER GROUP
The names of the promoters and entities comprising Group as defined under Monopolies and Restrictive Trade Practices
(“MRTP”) Act, 1969 for the purposes of Section 3(1)(e)(i) of the SEBI (Substantial Acquisition of Shares and Takeover)
Regulations, 1997 include:
Sl. No. Name of the Promoter/ Entity
1. Arun Kumar
2. K.R. Ravishankar
3. Deepa Arun Kumar
4. Usha Rani
5. Aditya Arun Kumar
6. Tarini Arun Kumar
7. G. Purushothaman Pillai
8. Gayathri Nair
9. Hemalatha Pillai
10. K. Saraswathi
11. K.R. Anuradha
12. K.R. Lakshmidevi
13. Lakshmi Gopalakrishnan
14. Padma Kumar Pillai
15. Rahul Nair
16. RajeswariAmma
17. Rajitha Gopalakrishnan
18. Sajitha Pillai
19. VineethaMohana Kumar Pillai
20. Agnus Holdings Private Limited
21. Chayadeep Properties Private Ltd
22. Triumph Venture Holdings LLP
23. Agnus Capital LLP
24. Chayadeep Ventures LLP
25. Atma Enterprises LLP
26. Qualichem Remedies LLP
27. Triumph Fincap Ventures Private Limited
28. Pronomz Ventures LLP
ANNUAL REPORT 2010-1165 About us Ready! Steady! Grow! Board of Director’s profiles Statutory Reports Financial Sections
CORPORATE GOVERNANCE REPORT
To the Members of SeQuent Scientific Limited
We have examined the compliance of conditions of corporate governance by SeQuent Scientific Limited (‘the Company’), for the year
ended on March 31, 2011, as stipulated in clause 49 of the Listing Agreement of the said Company with the said stock exchanges.
The compliance of conditions of Corporate Governance is the responsibility of the management. Our examination has been limited
to a review of the procedures and implementations thereof, adopted by the Company for ensuring compliance with the conditions of
Corporate Governance. It is neither an audit nor an expression of opinion of the financial statements of the Company.
In our opinion and to the best of our information and according to the explanations given to us, and the representations made by
the Directors and the management, we certify that the Company has complied with the conditions of Corporate Governance as
stipulated in clause 49 of the above-mentioned Listing Agreement.
We further state that such compliance is neither an assurance as to the future viability of the Company nor the efficiency or
effectiveness with which the management has conducted the affairs of the Company.
For DELOITTE HASKINS & SELLS
Chartered Accountants
(Registration No. 008072S)
V. SRIKUMAR
Partner
Bangalore, August 12, 2011 (Membership No.84494)
CERTIFICATE
ANNUAL REPORT 2010-11 66

FINANCIAL SECTIONS
THIS PAGE HAS BEEN INTENTIONALLY LEFT BLANK
SeQuent Scientific Limited Annual Report 2010-11
ANNUAL REPORT 2010-1169 About us Ready! Steady! Grow! Board of Director’s profiles Statutory Reports Financial Sections
Auditors’ Report
TO THE MEMBERS OF SEQUENT SCIENTIFIC LIMITED
1. We have audited the attached Balance Sheet of SEQUENT SCIENTIFIC LIMITED (“the Company”) as at March 31, 2011, the Profit and Loss Account and the Cash Flow Statement of the Company for the year ended on that date, both annexed thereto. These financial statements are the responsibility of the Company’s Management. Our responsibility is to express an opinion on these financial statements based on our audit.
2. We conducted our audit in accordance with the auditing standards generally accepted in India. Those Standards require that we plan and perform the audit to obtain reasonable assurance about whether the financial statements are free of material misstatements. An audit includes examining, on a test basis, evidence supporting the amounts and the disclosures in the financial statements. An audit also includes assessing the accounting principles used and the significant estimates made by the Management, as well as evaluating the overall financial statement presentation. We believe that our audit provides a reasonable basis for our opinion.
3. We draw attention to Note B.1 of Schedule ‘P’ regarding the accounting of Scheme of Arrangement (“the Scheme”) between the Company, and its wholly owned subsidiary Vedic Elements Private Limited under section 391 to 394 and the other provisions of the Companies Act, 1956, which has been approved by the Hon’ble High Court of Karnataka. In accordance with the Scheme the Company has fair valued some of its fixed assets and investments and the net excess of such fair values over the previously carried book values, amounting to ` 341.08 Million has been credited to ‘Restructuring Reserve’ to be utilized for set off of goodwill arising on amalgamation. The Company has also reversed the provision for decline, other than temporary, for the related investment amounting to ` 57.50 Million made in the prior year to the profit and loss statement.
As a result of the above:
(i) Insofar as the excess relates to Fixed assets, crediting such amounts to Restructuring Reserve is contrary to the requirements of Accounting Standard 10 ‘Accounting for Fixed Assets’.
(ii) Insofar as the fair valuation relates to Investments, declines, other than temporary, in the carrying value of long term investments amounting to `34.78 Million are required to be charged to the profit and loss statement in terms of Accounting Standard 13 ‘Accounting for Investments’.
(iii) Additional depreciation for the year on fair valued fixed assets amounting to `8.16 Million has been charged to the profit and loss statement instead of being adjusted against the ‘revaluation reserve’ as required under Accounting Standard 10 ‘Accounting for Fixed Assets’.
The resultant impact of the above accounting is that profit after tax for the year is higher by `84.12 Million.
4. As required by the Companies (Auditor’s Report) Order, 2003 (CARO) issued by the Central Government in terms of Section 227 (4A) of the Companies Act, 1956, we give in the Annexure a statement on the matters specified in paragraphs 4 and 5 of the said Order.
5. Further to our comments in the paragraph 3 and annexure referred to in paragraph 4 above, we report that:
(i) we have obtained all the information and explanations which to the best of our knowledge and belief were necessary for the purposes of our audit;
(ii) in our opinion, proper books of account as required by law have been kept by the Company so far as it appears from our examination of those books;
(iii) the Balance Sheet, the Profit and Loss Account and the Cash Flow Statement dealt with by this report are in agreement with the books of account;
(iv) subject to our comments in paragraph 3 above, in our opinion, the Balance Sheet, the Profit and Loss Account and the Cash Flow Statement dealt with by this report are in compliance with the Accounting Standards referred to in Section 211(3C) of the Companies Act, 1956;
(v) in our opinion and to the best of our information and according to the explanations given to us, the said accounts give the information required by the Companies Act, 1956 in the manner so required and read with our comments in paragraph 3 above, give a true and fair view in conformity with the accounting principles generally accepted in India:
(a) in the case of the Balance Sheet, of the state of affairs of the Company as at March 31, 2011;
Standalone AUDITORS’ REPORT
SeQuent Scientific Limited Annual Report 2010-11
ANNUAL REPORT 2010-11 70
Annexure to the Auditors’ Report
(b) in the case of the Profit and Loss Account, of the profit of the Company for the year ended on that date and
(c) in the case of the Cash Flow Statement, of the cash flows of the Company for the year ended on that date.
(Referred to in paragraph 4 of our report of even date)(i) Having regard to the nature of the Company’s business/
activities/result, clauses i (c), iii (d), (f) & (g), vi, viii, xii, xiii, xiv, xix and xx of paragraph 4 of CARO are not applicable to the Company.
(ii) In respect of its fixed assets:
(a) The Company has maintained proper records showing full particulars, including quantitative details and situation of the fixed assets.
(b) The fixed assets were physically verified during the year by the Management in accordance with a regular programme of verification which, in our opinion, provides for physical verification of all the fixed assets at reasonable intervals. According to the information and explanation given to us, no material discrepancies were noticed on such verification.
(iii) In respect of its inventory:
(a) As explained to us, the inventories were physically verified during the year by the Management at reasonable intervals.
(b) In our opinion and according to the information and explanation given to us, the procedures of physical verification of inventories followed by the Management were reasonable and adequate in relation to the size of the Company and the nature of its business.
(c) In our opinion and according to the information and explanations given to us, the Company has maintained proper records of its inventories and no material discrepancies were noticed on physical verification.
(iv) In respect of loans, secured or unsecured, granted by the Company to companies, firms or other parties covered in the Register under Section 301 of the Companies Act, 1956, according to the information and explanations given to us:
(a) The Company has granted loans aggregating ` 106.29 Million to 3 parties during the year. At the year-end, the outstanding balances of such loans aggregated ` 36.29 Million (number of parties 2) and the maximum amount involved during the year was ` 126.29 Million (number of parties 3).
(b) The rate of interest and other terms and conditions of such loans are, in our opinion, prima facie not prejudicial to the interests of the Company.
(c) The receipts of principal amounts and interest have been regular/as per stipulations.
(v) The Company has not taken any loans, secured or unsecured from companies, firms or other parties listed in the Register maintained under Section 301 of the Companies Act, 1956.
(vi) In our opinion and according to the information and explanations given to us, having regard to the explanations that some of the items purchased are of special nature and suitable alternative sources are not readily available for obtaining comparable quotations, there is an adequate internal control system commensurate with the size of the Company and the nature of its business with regard to purchases of inventory and fixed assets and the sale of goods and services. During the course of our audit, we have not observed any major weakness in such internal control system.
(vii) In respect of contracts or arrangements entered in the Register maintained in pursuance of Section 301 of the Companies Act, 1956, to the best of our knowledge and belief and according to the information and explanations given to us:
(a) The particulars of contracts or arrangements referred to in Section 301 that needed to be entered in the Register maintained under the said Section have been so entered.
6. On the basis of the written representations received from the Directors as on March 31, 2011 taken on record by the Board of Directors, we report that none of the Directors is disqualified as on March 31, 2011 from being appointed as a director in terms of Section 274(1)(g) of the Companies Act, 1956.
For DELOITTE HASKINS & SELLS Chartered Accountants (Registration No.008072S) V. SrikumarPlace: Bangalore Partner Date: May 27, 2011 Membership No.84494
SeQuent Scientific Limited Annual Report 2010-11
ANNUAL REPORT 2010-1171 About us Ready! Steady! Grow! Board of Director’s profiles Statutory Reports Financial Sections
(b) Where each of such transaction is in excess of ` 5 lakhs in respect of any party, the transactions have been made at prices which are prima facie reasonable having regard to the prevailing market prices at the relevant time except in respect of certain purchases for which comparable quotations are not available and in respect of which we are unable to comment.
(viii) In our opinion, the internal audit functions carried out during the year by a firm of Chartered Accountants appointed by the Management have been commensurate with the size of the Company and the nature of its business.
(ix) According to the information and explanations given to us in respect of statutory dues:
(a) The Company has generally been regular in depositing undisputed statutory dues, including Provident Fund, Investor Education and Protection Fund, Employees’ State Insurance, Income-tax, Sales Tax, Wealth Tax, Service Tax, Custom Duty, Excise Duty, Cess and any other material statutory dues applicable to it with the appropriate authorities.
(b) There were no undisputed amounts payable in respect of Income-tax, Wealth Tax, Custom Duty, Excise Duty, Cess and other material statutory dues in arrears as at March 31, 2011 for a period of more than six months from the date they became payable.
(c) Details of dues of Income-tax, Sales Tax, Wealth Tax, Service Tax, Custom Duty, Excise Duty and Cess which have not been deposited as on March 31, 2011 on account of disputes are given below:
(` In Million)
Statute Nature of Dues Forum where Dispute is pending
Period to which the amount relates
Amount involved
Maharashtra Value Added Tax Act, 2002 & Central Sales Tax Act, 1956
Value Added tax and Central Sales tax
Deputy Commissioner of Sales Tax
A.Y. 2006-2007 9.02
Karnataka Value Added Tax Value Added Tax Joint Commissioner of Commercial Taxes (Appeals)
A.Y. 2009-2010 3.31
Income-tax Act, 1961 Income-tax Commissioner Income Tax (Appeals), Mumbai
A.Y. 2007-2008 3.99
Income-tax Act, 1961 Income-tax Commissioner Income Tax (Appeals), Mumbai
A.Y. 2006-2007 1.98
(x) The Company has no accumulated losses at the end of the financial year and has not incurred cash losses in the financial year and in the immediately preceding financial year.
(xi) In our opinion and according to the information and explanations given to us, there have been delays in repayment of dues to banks during the year and the period of such delays range from 1 to 57 days with dues aggregating to `79.45 Million (including interest on delayed repayments). There was no overdue outstanding as at year end.
(xii) In our opinion and according to the information and explanations given to us, the terms and conditions of the guarantees given by the Company for loans taken by others from banks and financial institutions are not prima facie prejudicial to the interests of the Company.
(xiii) In our opinion and according to the information and explanations given to us, the term loans have been applied for the purposes for which they were obtained, other than temporary deployment pending application.
(xiv) In our opinion and according to the information and explanations given to us and on an overall examination of the Balance Sheet, we report that funds raised on short-term basis have not been used during the year for long-term investment.
(xv) The Company has not made any preferential allotment of shares to parties and companies covered in the Register maintained under section 301 of the Act.
(xvi) To the best of our knowledge and according to the information and explanations given to us, no fraud by the Company and no fraud on the Company has been noticed or reported during the year.
For DELOITTE HASKINS & SELLS Chartered Accountants (Registration No.008072S) V. SrikumarPlace: Bangalore Partner Date: May 27, 2011 Membership No.84494
Standalone AUDITORS’ REPORT
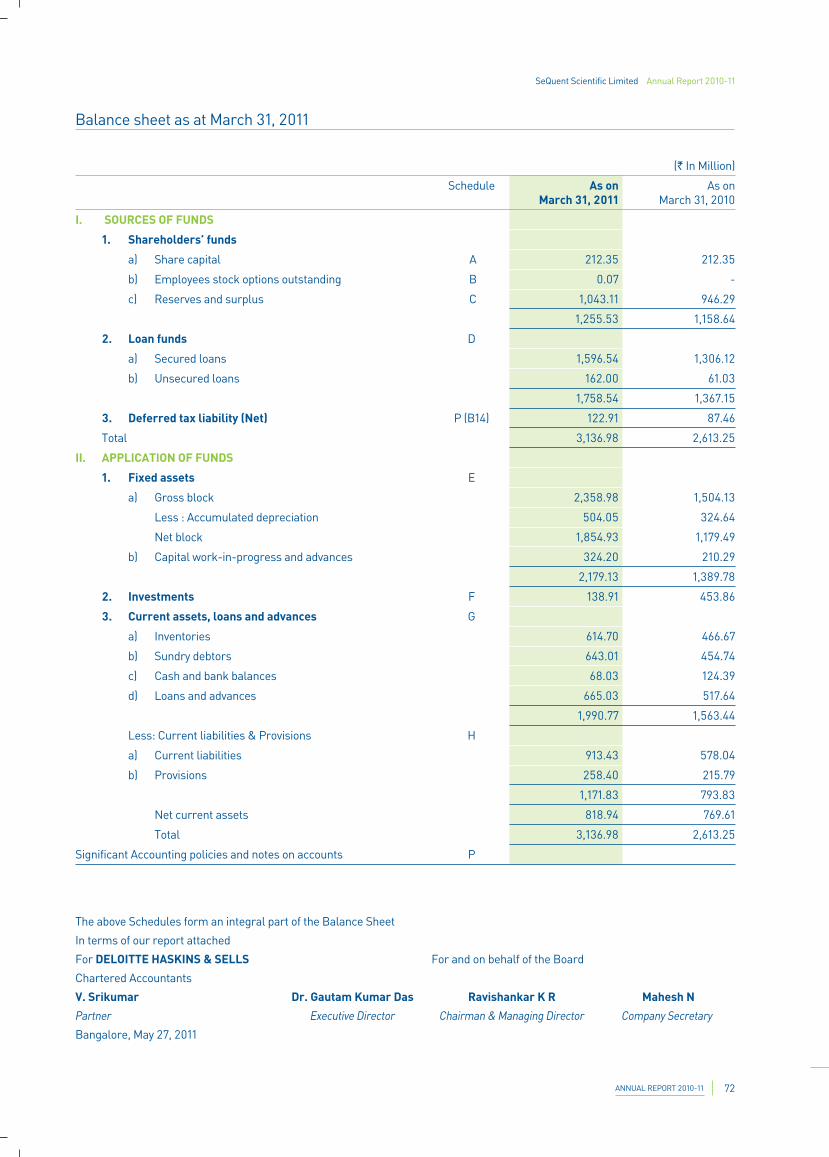
SeQuent Scientific Limited Annual Report 2010-11
ANNUAL REPORT 2010-11 72
Balance sheet as at March 31, 2011
(` In Million)
Schedule As on March 31, 2011
As on March 31, 2010
I. SOURCES OF FUNDS
1. Shareholders’ funds
a) Share capital A 212.35 212.35
b) Employees stock options outstanding B 0.07 -
c) Reserves and surplus C 1,043.11 946.29
1,255.53 1,158.64
2. Loan funds D
a) Secured loans 1,596.54 1,306.12
b) Unsecured loans 162.00 61.03
1,758.54 1,367.15
3. Deferred tax liability (Net) P (B14) 122.91 87.46
Total 3,136.98 2,613.25
II. APPLICATION OF FUNDS
1. Fixed assets E
a) Gross block 2,358.98 1,504.13
Less : Accumulated depreciation 504.05 324.64
Net block 1,854.93 1,179.49
b) Capital work-in-progress and advances 324.20 210.29
2,179.13 1,389.78
2. Investments F 138.91 453.86
3. Current assets, loans and advances G
a) Inventories 614.70 466.67
b) Sundry debtors 643.01 454.74
c) Cash and bank balances 68.03 124.39
d) Loans and advances 665.03 517.64
1,990.77 1,563.44
Less: Current liabilities & Provisions H
a) Current liabilities 913.43 578.04
b) Provisions 258.40 215.79
1,171.83 793.83
Net current assets 818.94 769.61
Total 3,136.98 2,613.25
Significant Accounting policies and notes on accounts P
The above Schedules form an integral part of the Balance Sheet
In terms of our report attached
For DELOITTE HASKINS & SELLS For and on behalf of the Board
Chartered Accountants
V. Srikumar Dr. Gautam Kumar Das Ravishankar K R Mahesh N
Partner Executive Director Chairman & Managing Director Company Secretary
Bangalore, May 27, 2011
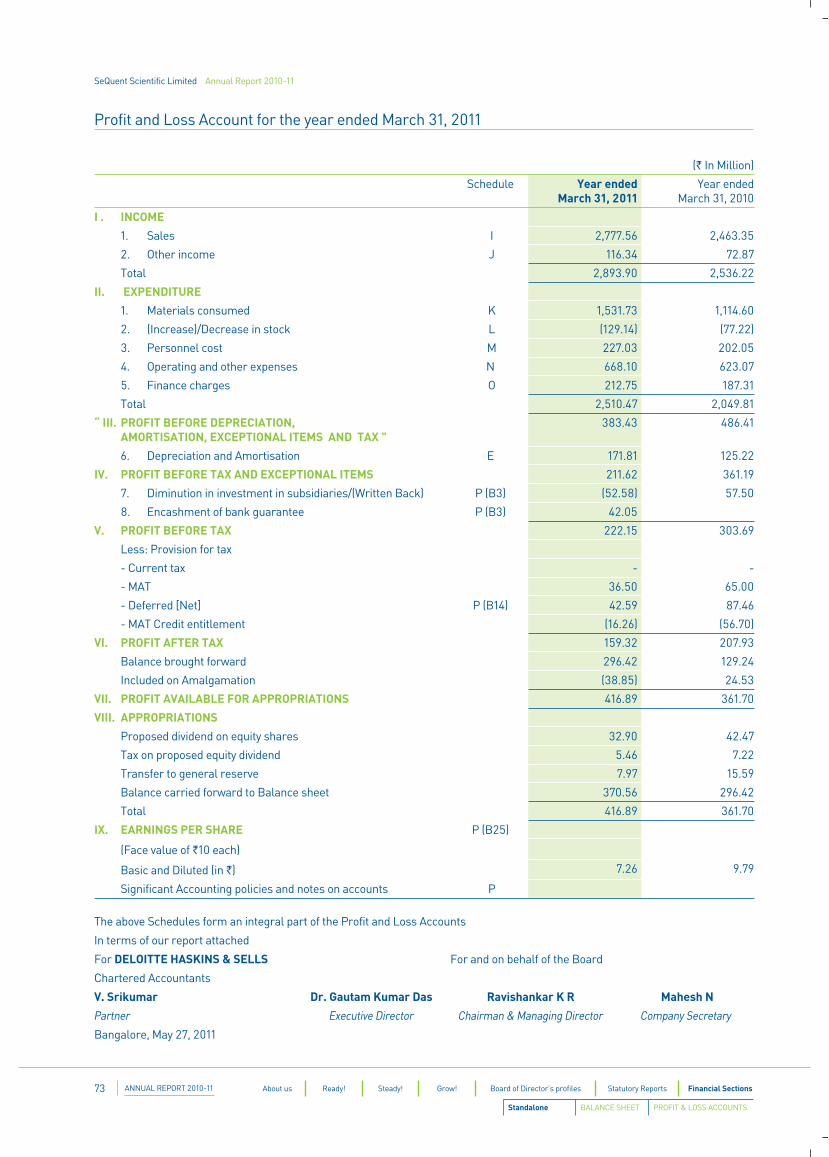
SeQuent Scientific Limited Annual Report 2010-11
ANNUAL REPORT 2010-1173 About us Ready! Steady! Grow! Board of Director’s profiles Statutory Reports Financial Sections
Profit and Loss Account for the year ended March 31, 2011
(` In Million)
Schedule Year endedMarch 31, 2011
Year endedMarch 31, 2010
I . INCOME
1. Sales I 2,777.56 2,463.35
2. Other income J 116.34 72.87
Total 2,893.90 2,536.22
II. EXPENDITURE
1. Materials consumed K 1,531.73 1,114.60
2. (Increase)/Decrease in stock L (129.14) (77.22)
3. Personnel cost M 227.03 202.05
4. Operating and other expenses N 668.10 623.07
5. Finance charges O 212.75 187.31
Total 2,510.47 2,049.81
“ III. PROFIT BEFORE DEPRECIATION, AMORTISATION, EXCEPTIONAL ITEMS AND TAX "
383.43 486.41
6. Depreciation and Amortisation E 171.81 125.22
IV. PROFIT BEFORE TAX AND EXCEPTIONAL ITEMS 211.62 361.19
7. Diminution in investment in subsidiaries/(Written Back) P (B3) (52.58) 57.50
8. Encashment of bank guarantee P (B3) 42.05
V. PROFIT BEFORE TAX 222.15 303.69
Less: Provision for tax
- Current tax - -
- MAT 36.50 65.00
- Deferred [Net] P (B14) 42.59 87.46
- MAT Credit entitlement (16.26) (56.70)
VI. PROFIT AFTER TAX 159.32 207.93
Balance brought forward 296.42 129.24
Included on Amalgamation (38.85) 24.53
VII. PROFIT AVAILABLE FOR APPROPRIATIONS 416.89 361.70
VIII. APPROPRIATIONS
Proposed dividend on equity shares 32.90 42.47
Tax on proposed equity dividend 5.46 7.22
Transfer to general reserve 7.97 15.59
Balance carried forward to Balance sheet 370.56 296.42
Total 416.89 361.70
IX. EARNINGS PER SHARE P (B25)
(Face value of `10 each)
Basic and Diluted (in `) 7.26 9.79
Significant Accounting policies and notes on accounts P
The above Schedules form an integral part of the Profit and Loss Accounts
In terms of our report attached
For DELOITTE HASKINS & SELLS For and on behalf of the Board
Chartered Accountants
V. Srikumar Dr. Gautam Kumar Das Ravishankar K R Mahesh N
Partner Executive Director Chairman & Managing Director Company Secretary
Bangalore, May 27, 2011
Standalone BALANCE SHEET PROFIT & LOSS ACCOUNTS
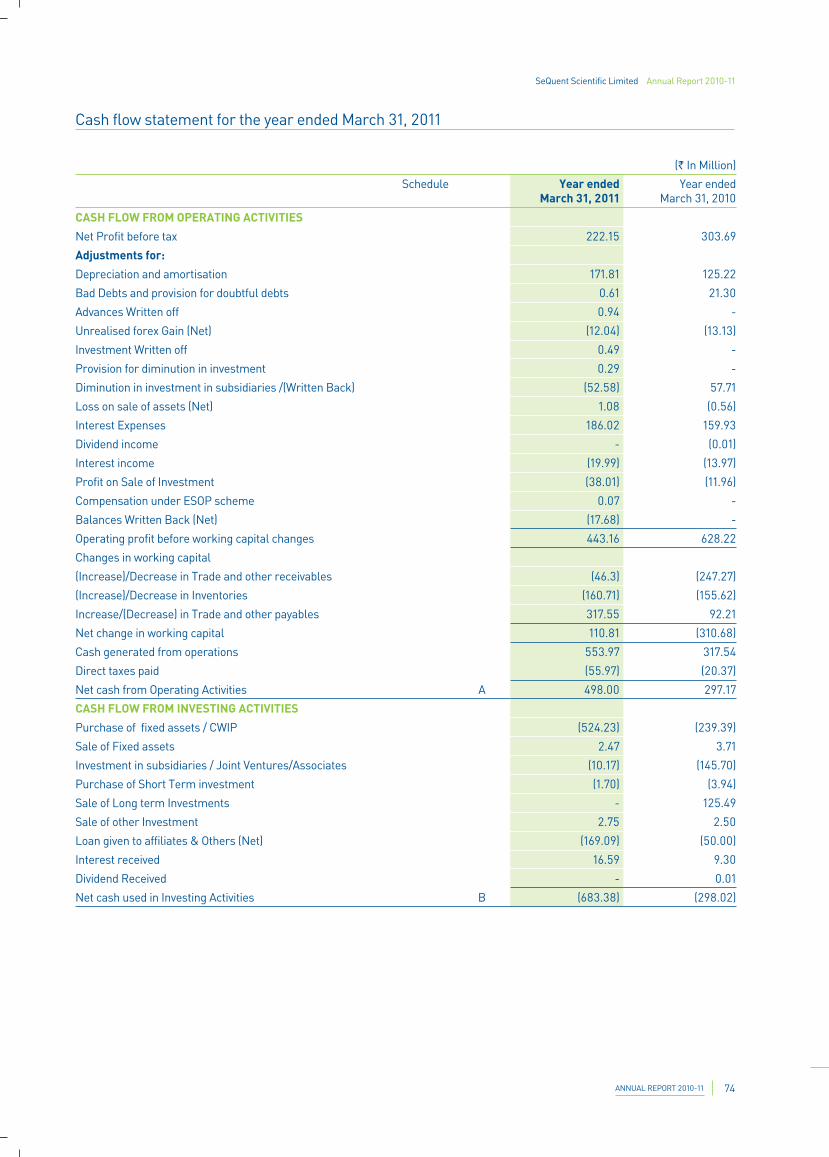
SeQuent Scientific Limited Annual Report 2010-11
ANNUAL REPORT 2010-11 74
Cash flow statement for the year ended March 31, 2011
(` In Million)
Schedule Year ended March 31, 2011
Year ended March 31, 2010
CASH FLOW FROM OPERATING ACTIVITIES
Net Profit before tax 222.15 303.69
Adjustments for:
Depreciation and amortisation 171.81 125.22
Bad Debts and provision for doubtful debts 0.61 21.30
Advances Written off 0.94 -
Unrealised forex Gain (Net) (12.04) (13.13)
Investment Written off 0.49 -
Provision for diminution in investment 0.29 -
Diminution in investment in subsidiaries /(Written Back) (52.58) 57.71
Loss on sale of assets (Net) 1.08 (0.56)
Interest Expenses 186.02 159.93
Dividend income - (0.01)
Interest income (19.99) (13.97)
Profit on Sale of Investment (38.01) (11.96)
Compensation under ESOP scheme 0.07 -
Balances Written Back (Net) (17.68) -
Operating profit before working capital changes 443.16 628.22
Changes in working capital
(Increase)/Decrease in Trade and other receivables (46.3) (247.27)
(Increase)/Decrease in Inventories (160.71) (155.62)
Increase/(Decrease) in Trade and other payables 317.55 92.21
Net change in working capital 110.81 (310.68)
Cash generated from operations 553.97 317.54
Direct taxes paid (55.97) (20.37)
Net cash from Operating Activities A 498.00 297.17
CASH FLOW FROM INVESTING ACTIVITIES
Purchase of fixed assets / CWIP (524.23) (239.39)
Sale of Fixed assets 2.47 3.71
Investment in subsidiaries / Joint Ventures/Associates (10.17) (145.70)
Purchase of Short Term investment (1.70) (3.94)
Sale of Long term Investments - 125.49
Sale of other Investment 2.75 2.50
Loan given to affiliates & Others (Net) (169.09) (50.00)
Interest received 16.59 9.30
Dividend Received - 0.01
Net cash used in Investing Activities B (683.38) (298.02)
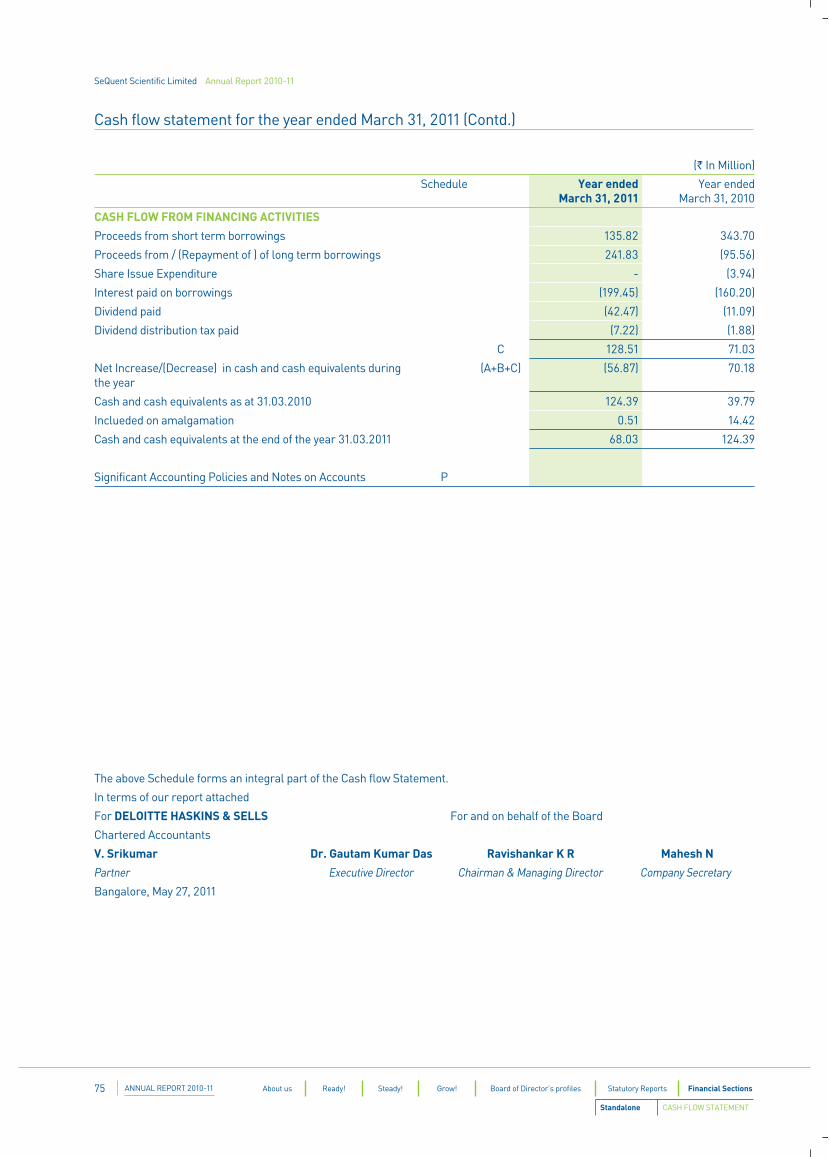
SeQuent Scientific Limited Annual Report 2010-11
ANNUAL REPORT 2010-1175 About us Ready! Steady! Grow! Board of Director’s profiles Statutory Reports Financial Sections
CASH FLOW FROM FINANCING ACTIVITIES
Proceeds from short term borrowings 135.82 343.70
Proceeds from / (Repayment of ) of long term borrowings 241.83 (95.56)
Share Issue Expenditure - (3.94)
Interest paid on borrowings (199.45) (160.20)
Dividend paid (42.47) (11.09)
Dividend distribution tax paid (7.22) (1.88)
C 128.51 71.03
Net Increase/(Decrease) in cash and cash equivalents during the year
(A+B+C) (56.87) 70.18
Cash and cash equivalents as at 31.03.2010 124.39 39.79
Inclueded on amalgamation 0.51 14.42
Cash and cash equivalents at the end of the year 31.03.2011 68.03 124.39
Significant Accounting Policies and Notes on Accounts P
Cash flow statement for the year ended March 31, 2011 (Contd.)
(` In Million)
Schedule Year ended March 31, 2011
Year ended March 31, 2010
The above Schedule forms an integral part of the Cash flow Statement.
In terms of our report attached
For DELOITTE HASKINS & SELLS For and on behalf of the Board
Chartered Accountants
V. Srikumar Dr. Gautam Kumar Das Ravishankar K R Mahesh N
Partner Executive Director Chairman & Managing Director Company Secretary
Bangalore, May 27, 2011
Standalone CASH FLOW STATEMENT
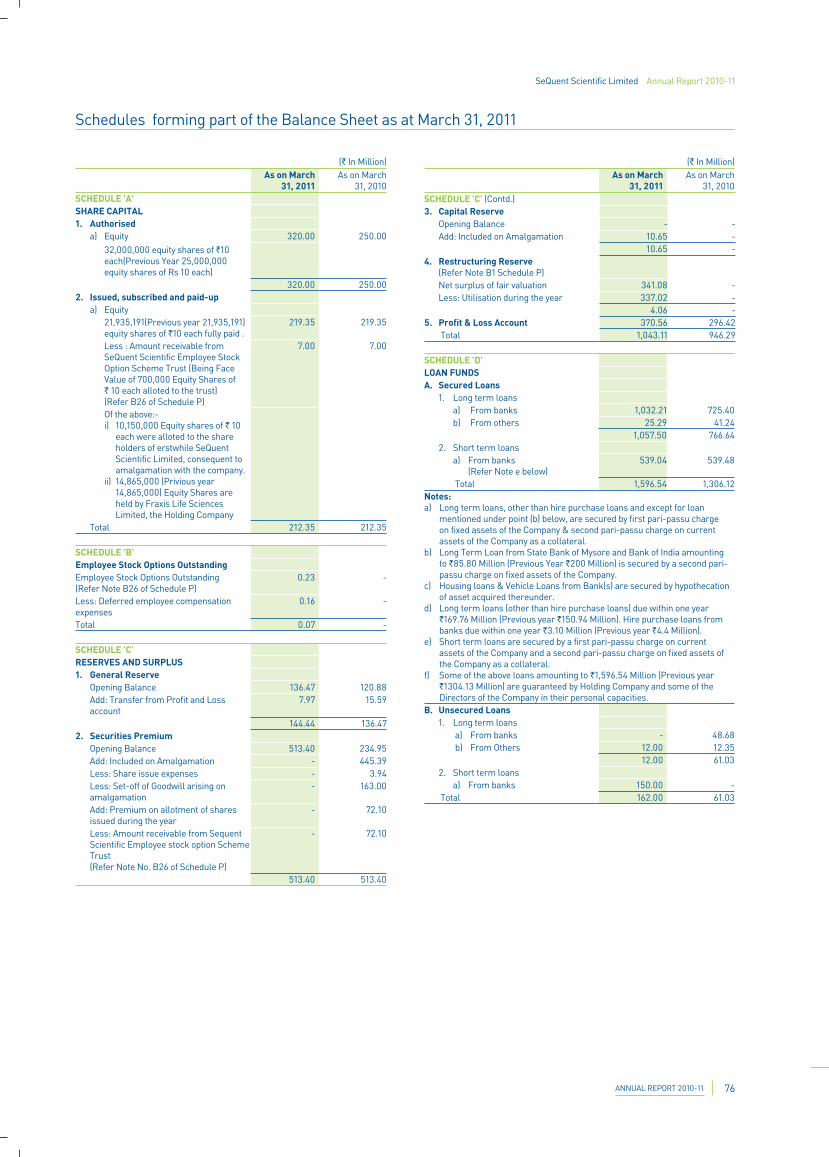
SeQuent Scientific Limited Annual Report 2010-11
ANNUAL REPORT 2010-11 76
Schedules forming part of the Balance Sheet as at March 31, 2011
(` In Million) As on March
31, 2011 As on March
31, 2010 SCHEDULE 'A' SHARE CAPITAL 1. Authorised
a) Equity 320.00 250.00 32,000,000 equity shares of `10 each(Previous Year 25,000,000 equity shares of Rs 10 each)
320.00 250.00 2. Issued, subscribed and paid-up
a) Equity 21,935,191(Previous year 21,935,191) equity shares of `10 each fully paid .
219.35 219.35
Less : Amount receivable from SeQuent Scientific Employee Stock Option Scheme Trust (Being Face Value of 700,000 Equity Shares of ` 10 each alloted to the trust)(Refer B26 of Schedule P)
7.00 7.00
Of the above:-i) 10,150,000 Equity shares of ` 10
each were alloted to the share holders of erstwhile SeQuent Scientific Limited, consequent to amalgamation with the company.
ii) 14,865,000 (Privious year 14,865,000) Equity Shares are held by Fraxis Life Sciences Limited, the Holding Company
Total 212.35 212.35
SCHEDULE 'B' Employee Stock Options OutstandingEmployee Stock Options Outstanding (Refer Note B26 of Schedule P)
0.23 -
Less: Deferred employee compensation expenses
0.16 -
Total 0.07 -
SCHEDULE 'C' RESERVES AND SURPLUS1. General Reserve
Opening Balance 136.47 120.88 Add: Transfer from Profit and Loss account
7.97 15.59
144.44 136.47 2. Securities Premium
Opening Balance 513.40 234.95 Add: Included on Amalgamation - 445.39 Less: Share issue expenses - 3.94 Less: Set-off of Goodwill arising on amalgamation
- 163.00
Add: Premium on allotment of shares issued during the year
- 72.10
Less: Amount receivable from Sequent Scientific Employee stock option Scheme Trust (Refer Note No. B26 of Schedule P)
- 72.10
513.40 513.40
(` In Million)As on March
31, 2011 As on March
31, 2010
SCHEDULE 'D' LOAN FUNDSA. Secured Loans 1. Long term loans
a) From banks 1,032.21 725.40 b) From others 25.29 41.24
1,057.50 766.64 2. Short term loans
a) From banks (Refer Note e below)
539.04 539.48
Total 1,596.54 1,306.12 Notes: a) Long term loans, other than hire purchase loans and except for loan
mentioned under point (b) below, are secured by first pari-passu charge on fixed assets of the Company & second pari-passu charge on current assets of the Company as a collateral.
b) Long Term Loan from State Bank of Mysore and Bank of India amounting to `85.80 Million (Previous Year `200 Million) is secured by a second pari-passu charge on fixed assets of the Company.
c) Housing loans & Vehicle Loans from Bank(s) are secured by hypothecation of asset acquired thereunder.
d) Long term loans (other than hire purchase loans) due within one year `169.76 Million (Previous year `150.94 Million). Hire purchase loans from banks due within one year `3.10 Million (Previous year `4.4 Million).
e) Short term loans are secured by a first pari-passu charge on current assets of the Company and a second pari-passu charge on fixed assets of the Company as a collateral.
f) Some of the above loans amounting to `1,596.54 Million (Previous year `1304.13 Million) are guaranteed by Holding Company and some of the Directors of the Company in their personal capacities.
B. Unsecured Loans 1. Long term loans
a) From banks - 48.68 b) From Others 12.00 12.35
12.00 61.03 2. Short term loans
a) From banks 150.00 - Total 162.00 61.03
SCHEDULE 'C' (Contd.)3. Capital Reserve
Opening Balance - - Add: Included on Amalgamation 10.65 -
10.65 - 4. Restructuring Reserve
(Refer Note B1 Schedule P)Net surplus of fair valuation 341.08 - Less: Utilisation during the year 337.02 -
4.06 - 5. Profit & Loss Account 370.56 296.42
Total 1,043.11 946.29
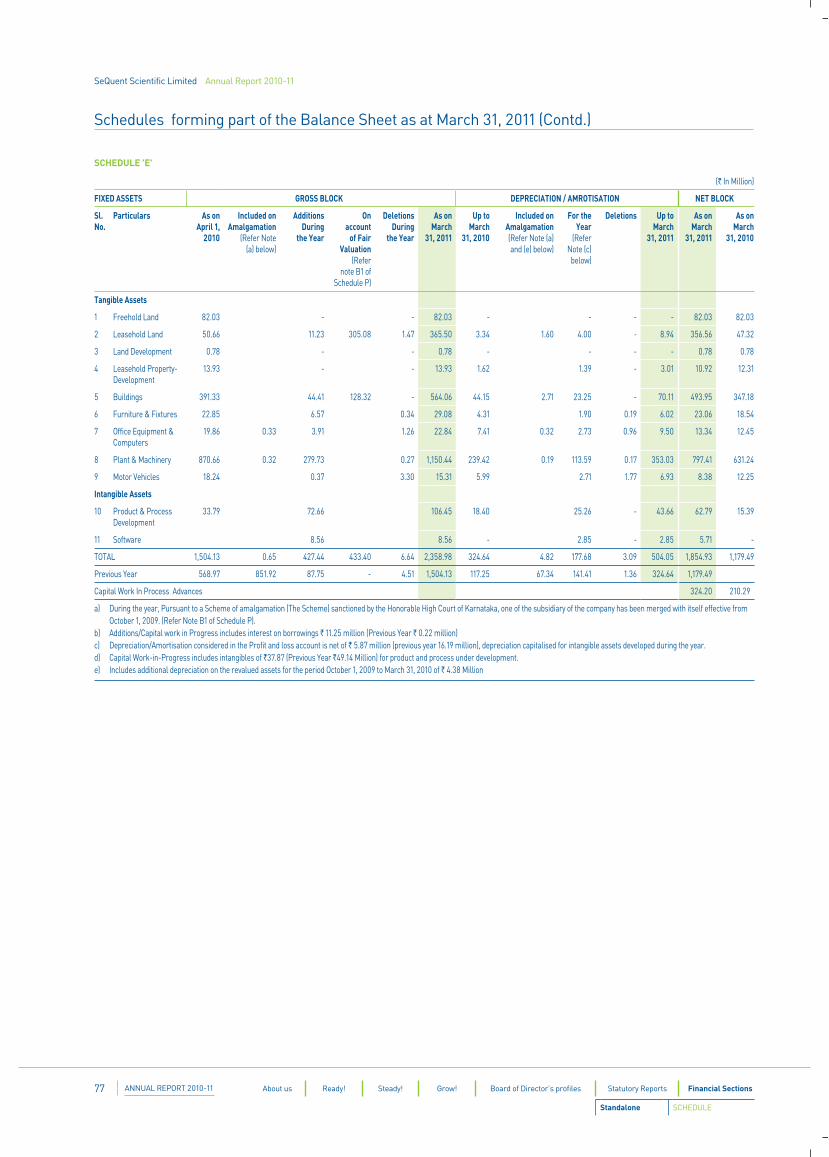
SeQuent Scientific Limited Annual Report 2010-11
ANNUAL REPORT 2010-1177 About us Ready! Steady! Grow! Board of Director’s profiles Statutory Reports Financial Sections
Schedules forming part of the Balance Sheet as at March 31, 2011 (Contd.)
SCHEDULE 'E'
(` In Million)
FIXED ASSETS GROSS BLOCK DEPRECIATION / AMROTISATION NET BLOCK
Sl. No.
Particulars As on April 1,
2010
Included on Amalgamation
(Refer Note (a) below)
Additions During
the Year
On account
of Fair Valuation
(Refer note B1 of
Schedule P)
Deletions During
the Year
As on March
31, 2011
Up toMarch
31, 2010
Included on Amalgamation (Refer Note (a) and (e) below)
For the Year
(Refer Note (c)
below)
Deletions Up to March
31, 2011
As on March
31, 2011
As on March
31, 2010
Tangible Assets
1 Freehold Land 82.03 - - 82.03 - - - - 82.03 82.03
2 Leasehold Land 50.66 11.23 305.08 1.47 365.50 3.34 1.60 4.00 - 8.94 356.56 47.32
3 Land Development 0.78 - - 0.78 - - - - 0.78 0.78
4 Leasehold Property- Development
13.93 - - 13.93 1.62 1.39 - 3.01 10.92 12.31
5 Buildings 391.33 44.41 128.32 - 564.06 44.15 2.71 23.25 - 70.11 493.95 347.18
6 Furniture & Fixtures 22.85 6.57 0.34 29.08 4.31 1.90 0.19 6.02 23.06 18.54
7 Office Equipment & Computers
19.86 0.33 3.91 1.26 22.84 7.41 0.32 2.73 0.96 9.50 13.34 12.45
8 Plant & Machinery 870.66 0.32 279.73 0.27 1,150.44 239.42 0.19 113.59 0.17 353.03 797.41 631.24
9 Motor Vehicles 18.24 0.37 3.30 15.31 5.99 2.71 1.77 6.93 8.38 12.25
Intangible Assets
10 Product & Process Development
33.79 72.66 106.45 18.40 25.26 - 43.66 62.79 15.39
11 Software 8.56 8.56 - 2.85 - 2.85 5.71 -
TOTAL 1,504.13 0.65 427.44 433.40 6.64 2,358.98 324.64 4.82 177.68 3.09 504.05 1,854.93 1,179.49
Previous Year 568.97 851.92 87.75 - 4.51 1,504.13 117.25 67.34 141.41 1.36 324.64 1,179.49
Capital Work In Process Advances 324.20 210.29
a) During the year, Pursuant to a Scheme of amalgamation (The Scheme) sanctioned by the Honorable High Court of Karnataka, one of the subsidiary of the company has been merged with itself effective from October 1, 2009. (Refer Note B1 of Schedule P).
b) Additions/Capital work in Progress includes interest on borrowings ` 11.25 million (Previous Year ` 0.22 million)c) Depreciation/Amortisation considered in the Profit and loss account is net of ` 5.87 million (previous year 16.19 million), depreciation capitalised for intangible assets developed during the year.d) Capital Work-in-Progress includes intangibles of `37.87 (Previous Year `49.14 Million) for product and process under development.e) Includes additional depreciation on the revalued assets for the period October 1, 2009 to March 31, 2010 of ` 4.38 Million
Standalone SCHEDULE
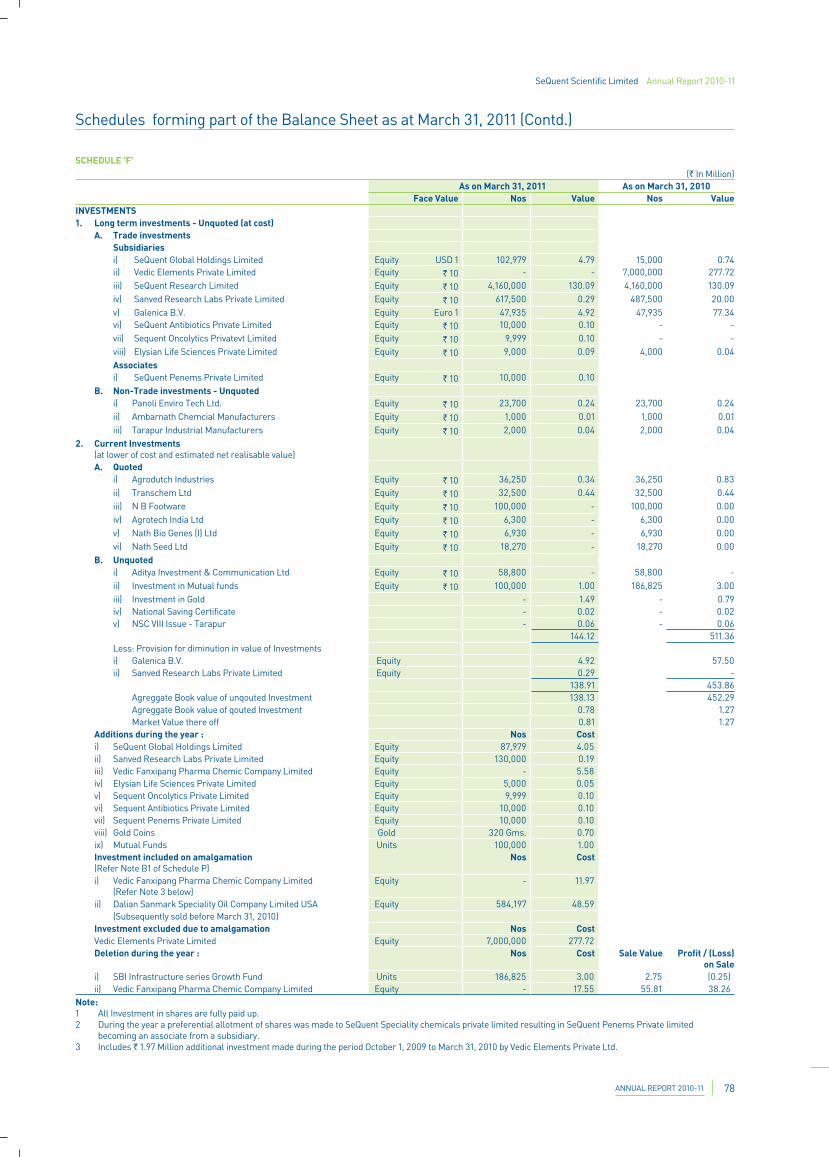
SeQuent Scientific Limited Annual Report 2010-11
ANNUAL REPORT 2010-11 78
Schedules forming part of the Balance Sheet as at March 31, 2011 (Contd.)
SCHEDULE 'F'(` In Million)
As on March 31, 2011 As on March 31, 2010 Face Value Nos Value Nos Value
INVESTMENTS 1. Long term investments - Unquoted (at cost)
A. Trade investments Subsidiaries i) SeQuent Global Holdings Limited Equity USD 1 102,979 4.79 15,000 0.74 ii) Vedic Elements Private Limited Equity ` 10 - - 7,000,000 277.72 iii) SeQuent Research Limited Equity ` 10 4,160,000 130.09 4,160,000 130.09 iv) Sanved Research Labs Private Limited Equity ` 10 617,500 0.29 487,500 20.00 v) Galenica B.V. Equity Euro 1 47,935 4.92 47,935 77.34 vi) SeQuent Antibiotics Private Limited Equity ` 10 10,000 0.10 - - vii) Sequent Oncolytics Privatevt Limited Equity ` 10 9,999 0.10 - - viii) Elysian Life Sciences Private Limited Equity ` 10 9,000 0.09 4,000 0.04 Associates i) SeQuent Penems Private Limited Equity ` 10 10,000 0.10
B. Non-Trade investments - Unquotedi) Panoli Enviro Tech Ltd. Equity ` 10 23,700 0.24 23,700 0.24 ii) Ambarnath Chemcial Manufacturers Equity ` 10 1,000 0.01 1,000 0.01 iii) Tarapur Industrial Manufacturers Equity ` 10 2,000 0.04 2,000 0.04
2. Current Investments(at lower of cost and estimated net realisable value)A. Quoted
i) Agrodutch Industries Equity ` 10 36,250 0.34 36,250 0.83 ii) Transchem Ltd Equity ` 10 32,500 0.44 32,500 0.44 iii) N B Footware Equity ` 10 100,000 - 100,000 0.00 iv) Agrotech India Ltd Equity ` 10 6,300 - 6,300 0.00 v) Nath Bio Genes (I) Ltd Equity ` 10 6,930 - 6,930 0.00 vi) Nath Seed Ltd Equity ` 10 18,270 - 18,270 0.00
B. Unquoted i) Aditya Investment & Communication Ltd Equity ` 10 58,800 - 58,800 - ii) Investment in Mutual funds Equity ` 10 100,000 1.00 186,825 3.00 iii) Investment in Gold - 1.49 - 0.79 iv) National Saving Certificate - 0.02 - 0.02 v) NSC VIII Issue - Tarapur - 0.06 - 0.06
144.12 511.36 Less: Provision for diminution in value of Investmentsi) Galenica B.V. Equity 4.92 57.50 ii) Sanved Research Labs Private Limited Equity 0.29 -
138.91 453.86 Agreggate Book value of unqouted Investment 138.13 452.29 Agreggate Book value of qouted Investment 0.78 1.27 Market Value there off 0.81 1.27
Additions during the year : Nos Cost i) SeQuent Global Holdings Limited Equity 87,979 4.05 ii) Sanved Research Labs Private Limited Equity 130,000 0.19 iii) Vedic Fanxipang Pharma Chemic Company Limited Equity - 5.58iv) Elysian Life Sciences Private Limited Equity 5,000 0.05 v) Sequent Oncolytics Private Limited Equity 9,999 0.10 vi) Sequent Antibiotics Private Limited Equity 10,000 0.10 vii) Sequent Penems Private Limited Equity 10,000 0.10 viii) Gold Coins Gold 320 Gms. 0.70 ix) Mutual Funds Units 100,000 1.00 Investment included on amalgamation (Refer Note B1 of Schedule P)
Nos Cost
i) Vedic Fanxipang Pharma Chemic Company Limited(Refer Note 3 below)
Equity - 11.97
ii) Dalian Sanmark Speciality Oil Company Limited USA Equity 584,197 48.59 (Subsequently sold before March 31, 2010)
Investment excluded due to amalgamation Nos Cost Vedic Elements Private Limited Equity 7,000,000 277.72 Deletion during the year : Nos Cost Sale Value Profit / (Loss)
on Salei) SBI Infrastructure series Growth Fund Units 186,825 3.00 2.75 (0.25)ii) Vedic Fanxipang Pharma Chemic Company Limited Equity - 17.55 55.81 38.26
Note: 1 All Investment in shares are fully paid up.2 During the year a preferential allotment of shares was made to SeQuent Speciality chemicals private limited resulting in SeQuent Penems Private limited
becoming an associate from a subsidiary.3 Includes ` 1.97 Million additional investment made during the period October 1, 2009 to March 31, 2010 by Vedic Elements Private Ltd.
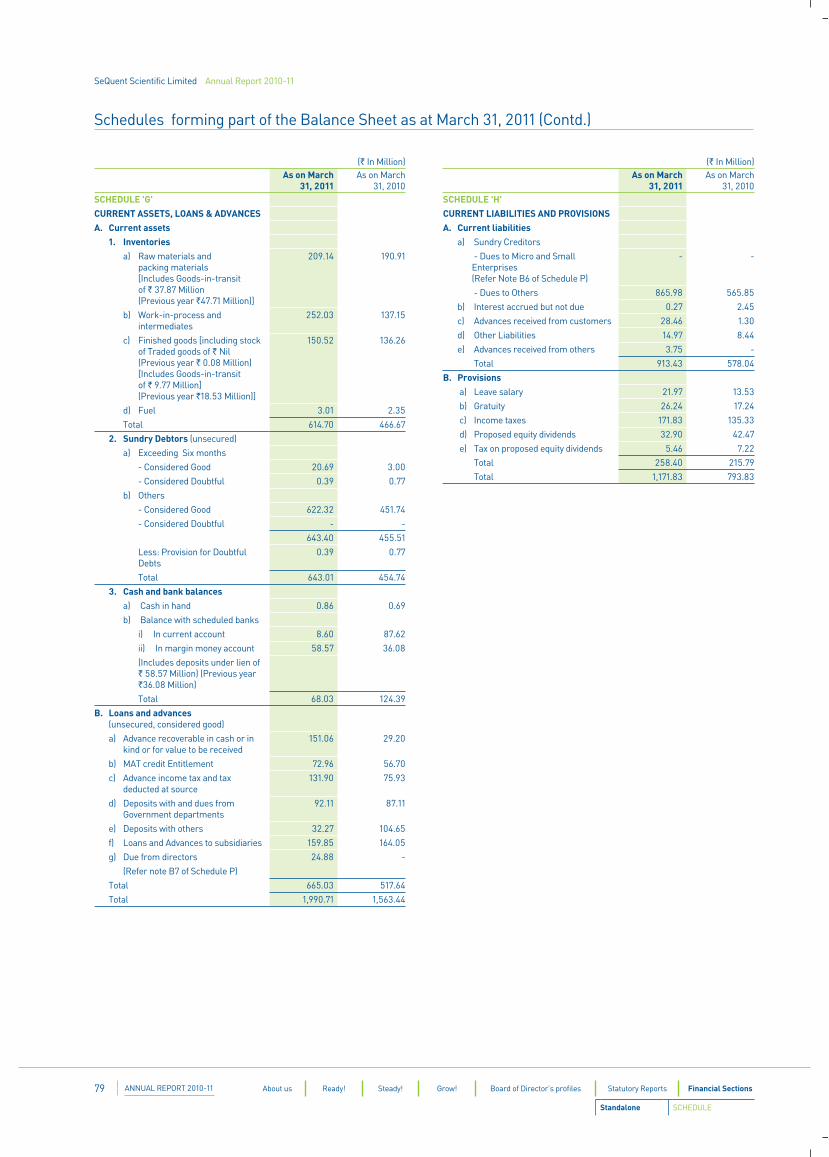
SeQuent Scientific Limited Annual Report 2010-11
ANNUAL REPORT 2010-1179 About us Ready! Steady! Grow! Board of Director’s profiles Statutory Reports Financial Sections
Schedules forming part of the Balance Sheet as at March 31, 2011 (Contd.)
(` In Million)As on March
31, 2011 As on March
31, 2010 SCHEDULE 'H' CURRENT LIABILITIES AND PROVISIONSA. Current liabilities
a) Sundry Creditors
- Dues to Micro and Small Enterprises (Refer Note B6 of Schedule P)
- -
- Dues to Others 865.98 565.85
b) Interest accrued but not due 0.27 2.45
c) Advances received from customers 28.46 1.30
d) Other Liabilities 14.97 8.44
e) Advances received from others 3.75 -
Total 913.43 578.04
B. Provisions a) Leave salary 21.97 13.53
b) Gratuity 26.24 17.24
c) Income taxes 171.83 135.33
d) Proposed equity dividends 32.90 42.47
e) Tax on proposed equity dividends 5.46 7.22
Total 258.40 215.79
Total 1,171.83 793.83
(` In Million)As on March
31, 2011 As on March
31, 2010 SCHEDULE 'G' CURRENT ASSETS, LOANS & ADVANCESA. Current assets
1. Inventoriesa) Raw materials and
packing materials[Includes Goods-in-transit of ` 37.87 Million(Previous year `47.71 Million)]
209.14 190.91
b) Work-in-process and intermediates
252.03 137.15
c) Finished goods [including stock of Traded goods of ` Nil(Previous year ` 0.08 Million)[Includes Goods-in-transit of ` 9.77 Million](Previous year `18.53 Million)]
150.52 136.26
d) Fuel 3.01 2.35
Total 614.70 466.67
2. Sundry Debtors (unsecured)
a) Exceeding Six months
- Considered Good 20.69 3.00
- Considered Doubtful 0.39 0.77
b) Others
- Considered Good 622.32 451.74
- Considered Doubtful - -
643.40 455.51
Less: Provision for Doubtful Debts
0.39 0.77
Total 643.01 454.74
3. Cash and bank balances a) Cash in hand 0.86 0.69
b) Balance with scheduled banks
i) In current account 8.60 87.62
ii) In margin money account 58.57 36.08
(Includes deposits under lien of ` 58.57 Million) (Previous year `36.08 Million)
Total 68.03 124.39
B. Loans and advances (unsecured, considered good)
a) Advance recoverable in cash or in kind or for value to be received
151.06 29.20
b) MAT credit Entitlement 72.96 56.70
c) Advance income tax and tax deducted at source
131.90 75.93
d) Deposits with and dues from Government departments
92.11 87.11
e) Deposits with others 32.27 104.65
f) Loans and Advances to subsidiaries 159.85 164.05
g) Due from directors 24.88 -
(Refer note B7 of Schedule P)
Total 665.03 517.64
Total 1,990.71 1,563.44
Standalone SCHEDULE
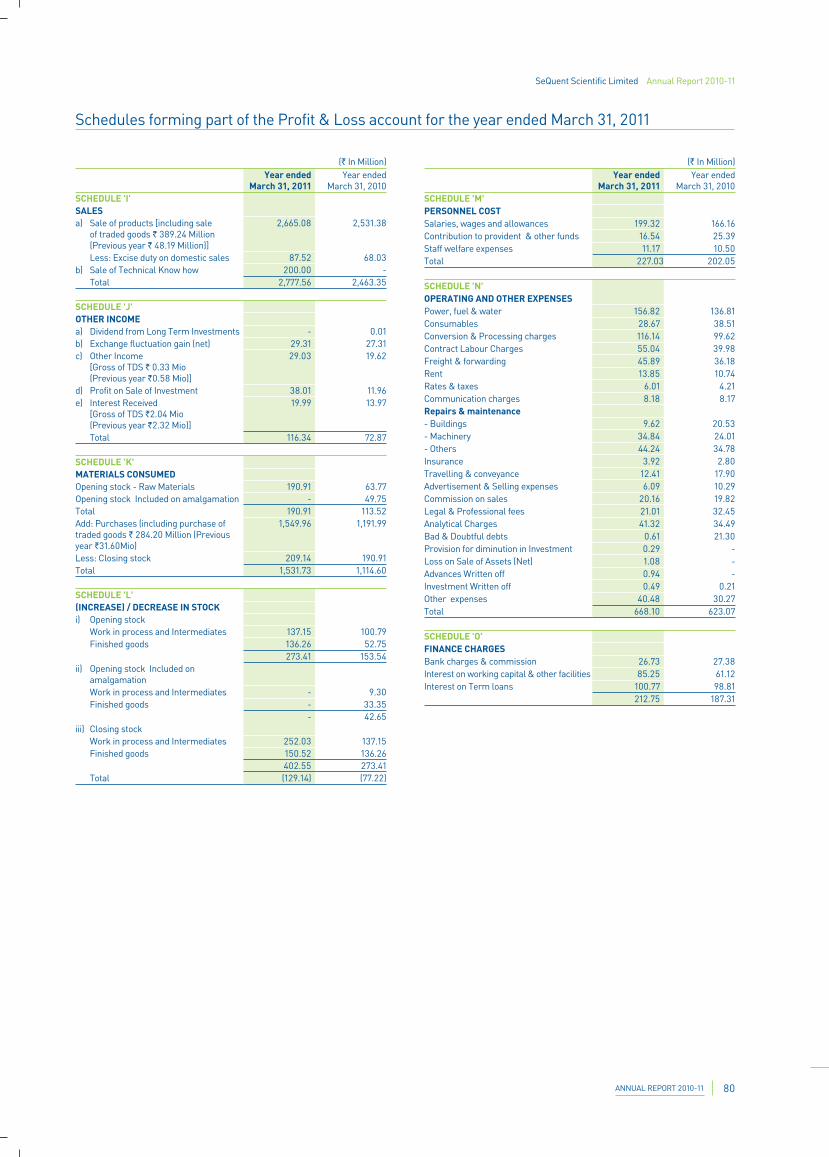
SeQuent Scientific Limited Annual Report 2010-11
ANNUAL REPORT 2010-11 80
SCHEDULE 'M' PERSONNEL COSTSalaries, wages and allowances 199.32 166.16 Contribution to provident & other funds 16.54 25.39 Staff welfare expenses 11.17 10.50 Total 227.03 202.05
SCHEDULE 'N' OPERATING AND OTHER EXPENSESPower, fuel & water 156.82 136.81 Consumables 28.67 38.51 Conversion & Processing charges 116.14 99.62 Contract Labour Charges 55.04 39.98 Freight & forwarding 45.89 36.18 Rent 13.85 10.74 Rates & taxes 6.01 4.21 Communication charges 8.18 8.17 Repairs & maintenance - Buildings 9.62 20.53 - Machinery 34.84 24.01 - Others 44.24 34.78 Insurance 3.92 2.80 Travelling & conveyance 12.41 17.90 Advertisement & Selling expenses 6.09 10.29 Commission on sales 20.16 19.82 Legal & Professional fees 21.01 32.45 Analytical Charges 41.32 34.49 Bad & Doubtful debts 0.61 21.30 Provision for diminution in Investment 0.29 -Loss on Sale of Assets (Net) 1.08 -Advances Written off 0.94 - Investment Written off 0.49 0.21 Other expenses 40.48 30.27 Total 668.10 623.07
SCHEDULE 'O' FINANCE CHARGESBank charges & commission 26.73 27.38 Interest on working capital & other facilities 85.25 61.12 Interest on Term loans 100.77 98.81
212.75 187.31
(` In Million)Year ended
March 31, 2011Year ended
March 31, 2010 SCHEDULE 'I' SALES a) Sale of products [including sale
of traded goods ` 389.24 Million (Previous year ` 48.19 Million)]
2,665.08 2,531.38
Less: Excise duty on domestic sales 87.52 68.03 b) Sale of Technical Know how 200.00 -
Total 2,777.56 2,463.35
SCHEDULE 'J' OTHER INCOMEa) Dividend from Long Term Investments - 0.01 b) Exchange fluctuation gain (net) 29.31 27.31 c) Other Income
[Gross of TDS ` 0.33 Mio (Previous year `0.58 Mio)]
29.03 19.62
d) Profit on Sale of Investment 38.01 11.96 e) Interest Received
[Gross of TDS `2.04 Mio (Previous year `2.32 Mio)]
19.99 13.97
Total 116.34 72.87
SCHEDULE 'K' MATERIALS CONSUMEDOpening stock - Raw Materials 190.91 63.77 Opening stock Included on amalgamation - 49.75 Total 190.91 113.52 Add: Purchases (including purchase of traded goods ` 284.20 Million (Previous year `31.60Mio)
1,549.96 1,191.99
Less: Closing stock 209.14 190.91 Total 1,531.73 1,114.60
SCHEDULE 'L' (INCREASE) / DECREASE IN STOCKi) Opening stock
Work in process and Intermediates 137.15 100.79 Finished goods 136.26 52.75
273.41 153.54 ii) Opening stock Included on
amalgamation Work in process and Intermediates - 9.30 Finished goods - 33.35
- 42.65 iii) Closing stock
Work in process and Intermediates 252.03 137.15 Finished goods 150.52 136.26
402.55 273.41 Total (129.14) (77.22)
(` In Million)Year ended
March 31, 2011Year ended
March 31, 2010
Schedules forming part of the Profit & Loss account for the year ended March 31, 2011
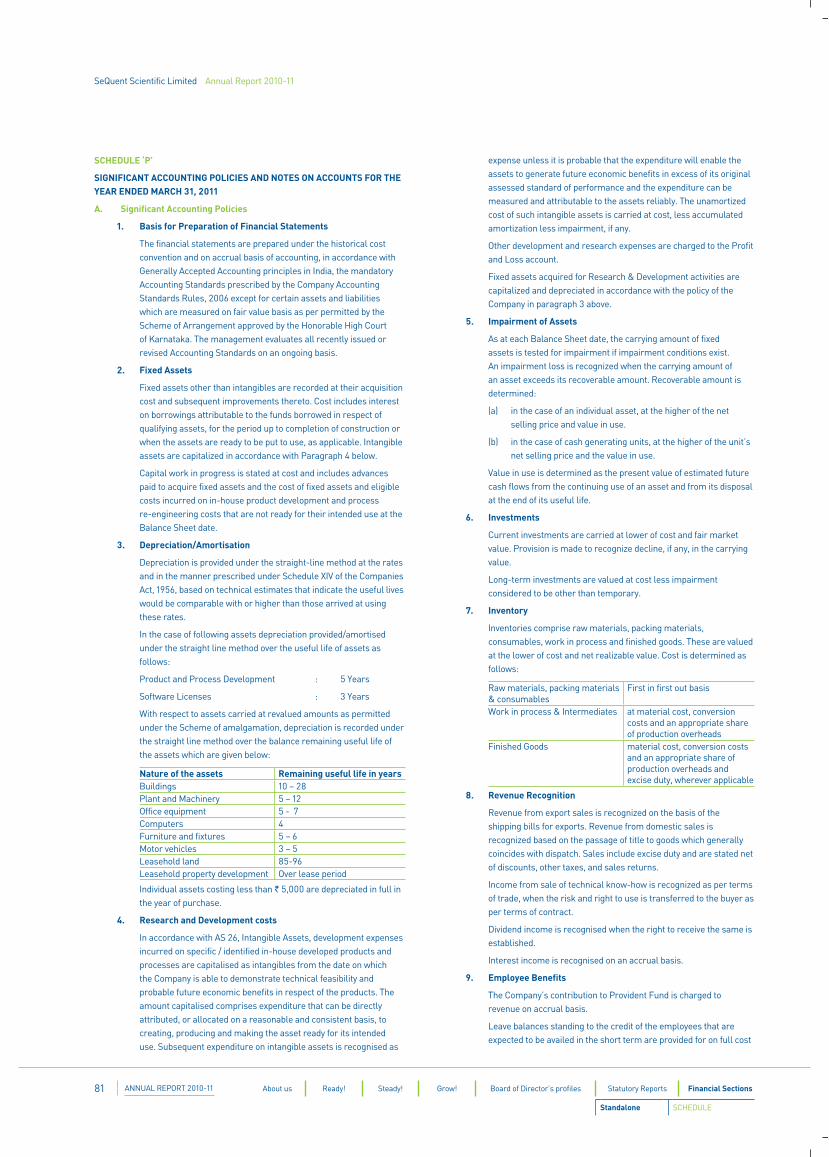
SeQuent Scientific Limited Annual Report 2010-11
ANNUAL REPORT 2010-1181 About us Ready! Steady! Grow! Board of Director’s profiles Statutory Reports Financial Sections
Standalone SCHEDULE
SCHEDULE ‘P’
SIGNIFICANT ACCOUNTING POLICIES AND NOTES ON ACCOUNTS FOR THE YEAR ENDED MARCH 31, 2011
A. Significant Accounting Policies
1. Basis for Preparation of Financial Statements
The financial statements are prepared under the historical cost convention and on accrual basis of accounting, in accordance with Generally Accepted Accounting principles in India, the mandatory Accounting Standards prescribed by the Company Accounting Standards Rules, 2006 except for certain assets and liabilities which are measured on fair value basis as per permitted by the Scheme of Arrangement approved by the Honorable High Court of Karnataka. The management evaluates all recently issued or revised Accounting Standards on an ongoing basis.
2. Fixed Assets
Fixed assets other than intangibles are recorded at their acquisition cost and subsequent improvements thereto. Cost includes interest on borrowings attributable to the funds borrowed in respect of qualifying assets, for the period up to completion of construction or when the assets are ready to be put to use, as applicable. Intangible assets are capitalized in accordance with Paragraph 4 below.
Capital work in progress is stated at cost and includes advances paid to acquire fixed assets and the cost of fixed assets and eligible costs incurred on in-house product development and process re-engineering costs that are not ready for their intended use at the Balance Sheet date.
3. Depreciation/Amortisation
Depreciation is provided under the straight-line method at the rates and in the manner prescribed under Schedule XIV of the Companies Act, 1956, based on technical estimates that indicate the useful lives would be comparable with or higher than those arrived at using these rates.
In the case of following assets depreciation provided/amortised under the straight line method over the useful life of assets as follows:
Product and Process Development : 5 Years
Software Licenses : 3 Years
With respect to assets carried at revalued amounts as permitted under the Scheme of amalgamation, depreciation is recorded under the straight line method over the balance remaining useful life of the assets which are given below:
Nature of the assets Remaining useful life in yearsBuildings 10 – 28Plant and Machinery 5 – 12Office equipment 5 - 7Computers 4Furniture and fixtures 5 – 6Motor vehicles 3 – 5Leasehold land 85-96Leasehold property development Over lease period
Individual assets costing less than ` 5,000 are depreciated in full in the year of purchase.
4. Research and Development costs
In accordance with AS 26, Intangible Assets, development expenses incurred on specific / identified in-house developed products and processes are capitalised as intangibles from the date on which the Company is able to demonstrate technical feasibility and probable future economic benefits in respect of the products. The amount capitalised comprises expenditure that can be directly attributed, or allocated on a reasonable and consistent basis, to creating, producing and making the asset ready for its intended use. Subsequent expenditure on intangible assets is recognised as
expense unless it is probable that the expenditure will enable the assets to generate future economic benefits in excess of its original assessed standard of performance and the expenditure can be measured and attributable to the assets reliably. The unamortized cost of such intangible assets is carried at cost, less accumulated amortization less impairment, if any.
Other development and research expenses are charged to the Profit and Loss account.
Fixed assets acquired for Research & Development activities are capitalized and depreciated in accordance with the policy of the Company in paragraph 3 above.
5. Impairment of Assets
As at each Balance Sheet date, the carrying amount of fixed assets is tested for impairment if impairment conditions exist. An impairment loss is recognized when the carrying amount of an asset exceeds its recoverable amount. Recoverable amount is determined:
(a) in the case of an individual asset, at the higher of the net selling price and value in use.
(b) in the case of cash generating units, at the higher of the unit’s net selling price and the value in use.
Value in use is determined as the present value of estimated future cash flows from the continuing use of an asset and from its disposal at the end of its useful life.
6. Investments
Current investments are carried at lower of cost and fair market value. Provision is made to recognize decline, if any, in the carrying value.
Long-term investments are valued at cost less impairment considered to be other than temporary.
7. Inventory
Inventories comprise raw materials, packing materials, consumables, work in process and finished goods. These are valued at the lower of cost and net realizable value. Cost is determined as follows:
Raw materials, packing materials & consumables
First in first out basis
Work in process & Intermediates at material cost, conversion costs and an appropriate share of production overheads
Finished Goods material cost, conversion costs and an appropriate share of production overheads and excise duty, wherever applicable
8. Revenue Recognition
Revenue from export sales is recognized on the basis of the shipping bills for exports. Revenue from domestic sales is recognized based on the passage of title to goods which generally coincides with dispatch. Sales include excise duty and are stated net of discounts, other taxes, and sales returns.
Income from sale of technical know-how is recognized as per terms of trade, when the risk and right to use is transferred to the buyer as per terms of contract.
Dividend income is recognised when the right to receive the same is established.
Interest income is recognised on an accrual basis.
9. Employee Benefits
The Company’s contribution to Provident Fund is charged to revenue on accrual basis.
Leave balances standing to the credit of the employees that are expected to be availed in the short term are provided for on full cost
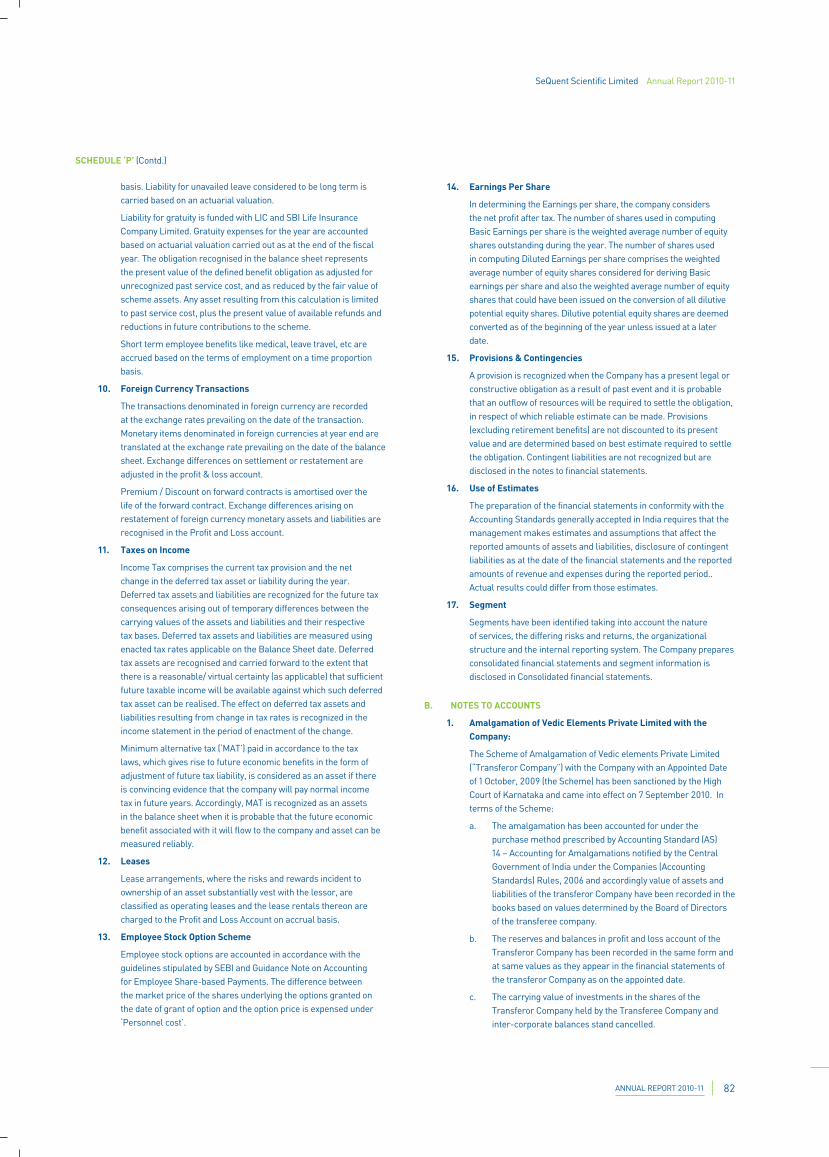
SeQuent Scientific Limited Annual Report 2010-11
ANNUAL REPORT 2010-11 82
basis. Liability for unavailed leave considered to be long term is carried based on an actuarial valuation.
Liability for gratuity is funded with LIC and SBI Life Insurance Company Limited. Gratuity expenses for the year are accounted based on actuarial valuation carried out as at the end of the fiscal year. The obligation recognised in the balance sheet represents the present value of the defined benefit obligation as adjusted for unrecognized past service cost, and as reduced by the fair value of scheme assets. Any asset resulting from this calculation is limited to past service cost, plus the present value of available refunds and reductions in future contributions to the scheme.
Short term employee benefits like medical, leave travel, etc are accrued based on the terms of employment on a time proportion basis.
10. Foreign Currency Transactions
The transactions denominated in foreign currency are recorded at the exchange rates prevailing on the date of the transaction. Monetary items denominated in foreign currencies at year end are translated at the exchange rate prevailing on the date of the balance sheet. Exchange differences on settlement or restatement are adjusted in the profit & loss account.
Premium / Discount on forward contracts is amortised over the life of the forward contract. Exchange differences arising on restatement of foreign currency monetary assets and liabilities are recognised in the Profit and Loss account.
11. Taxes on Income
Income Tax comprises the current tax provision and the net change in the deferred tax asset or liability during the year. Deferred tax assets and liabilities are recognized for the future tax consequences arising out of temporary differences between the carrying values of the assets and liabilities and their respective tax bases. Deferred tax assets and liabilities are measured using enacted tax rates applicable on the Balance Sheet date. Deferred tax assets are recognised and carried forward to the extent that there is a reasonable/ virtual certainty (as applicable) that sufficient future taxable income will be available against which such deferred tax asset can be realised. The effect on deferred tax assets and liabilities resulting from change in tax rates is recognized in the income statement in the period of enactment of the change.
Minimum alternative tax (‘MAT’) paid in accordance to the tax laws, which gives rise to future economic benefits in the form of adjustment of future tax liability, is considered as an asset if there is convincing evidence that the company will pay normal income tax in future years. Accordingly, MAT is recognized as an assets in the balance sheet when it is probable that the future economic benefit associated with it will flow to the company and asset can be measured reliably.
12. Leases
Lease arrangements, where the risks and rewards incident to ownership of an asset substantially vest with the lessor, are classified as operating leases and the lease rentals thereon are charged to the Profit and Loss Account on accrual basis.
13. Employee Stock Option Scheme
Employee stock options are accounted in accordance with the guidelines stipulated by SEBI and Guidance Note on Accounting for Employee Share-based Payments. The difference between the market price of the shares underlying the options granted on the date of grant of option and the option price is expensed under ‘Personnel cost’.
14. Earnings Per Share
In determining the Earnings per share, the company considers the net profit after tax. The number of shares used in computing Basic Earnings per share is the weighted average number of equity shares outstanding during the year. The number of shares used in computing Diluted Earnings per share comprises the weighted average number of equity shares considered for deriving Basic earnings per share and also the weighted average number of equity shares that could have been issued on the conversion of all dilutive potential equity shares. Dilutive potential equity shares are deemed converted as of the beginning of the year unless issued at a later date.
15. Provisions & Contingencies
A provision is recognized when the Company has a present legal or constructive obligation as a result of past event and it is probable that an outflow of resources will be required to settle the obligation, in respect of which reliable estimate can be made. Provisions (excluding retirement benefits) are not discounted to its present value and are determined based on best estimate required to settle the obligation. Contingent liabilities are not recognized but are disclosed in the notes to financial statements.
16. Use of Estimates
The preparation of the financial statements in conformity with the Accounting Standards generally accepted in India requires that the management makes estimates and assumptions that affect the reported amounts of assets and liabilities, disclosure of contingent liabilities as at the date of the financial statements and the reported amounts of revenue and expenses during the reported period.. Actual results could differ from those estimates.
17. Segment
Segments have been identified taking into account the nature of services, the differing risks and returns, the organizational structure and the internal reporting system. The Company prepares consolidated financial statements and segment information is disclosed in Consolidated financial statements.
B. NOTES TO ACCOUNTS
1. Amalgamation of Vedic Elements Private Limited with the Company:
The Scheme of Amalgamation of Vedic elements Private Limited (“Transferor Company”) with the Company with an Appointed Date of 1 October, 2009 (the Scheme) has been sanctioned by the High Court of Karnataka and came into effect on 7 September 2010. In terms of the Scheme:
a. The amalgamation has been accounted for under the purchase method prescribed by Accounting Standard (AS) 14 – Accounting for Amalgamations notified by the Central Government of India under the Companies (Accounting Standards) Rules, 2006 and accordingly value of assets and liabilities of the transferor Company have been recorded in the books based on values determined by the Board of Directors of the transferee company.
b. The reserves and balances in profit and loss account of the Transferor Company has been recorded in the same form and at same values as they appear in the financial statements of the transferor Company as on the appointed date.
c. The carrying value of investments in the shares of the Transferor Company held by the Transferee Company and inter-corporate balances stand cancelled.
SCHEDULE ‘P’ (Contd.)
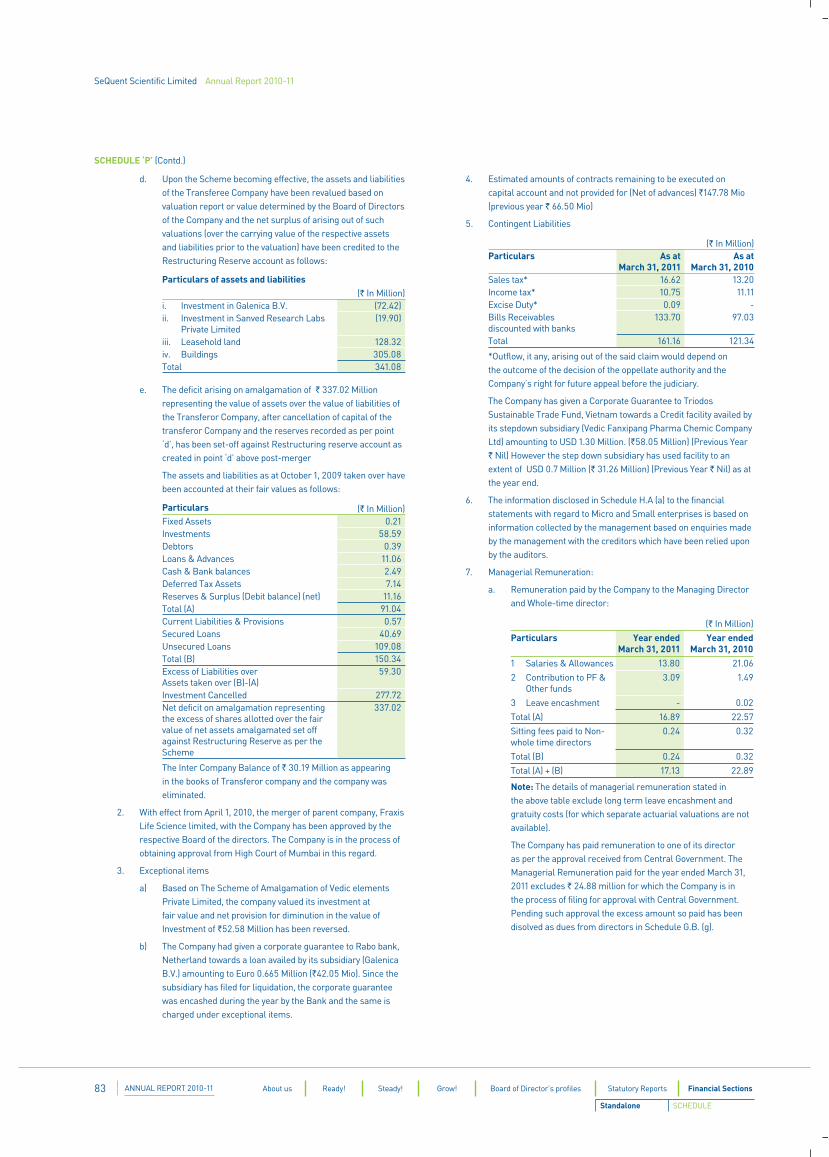
SeQuent Scientific Limited Annual Report 2010-11
ANNUAL REPORT 2010-1183 About us Ready! Steady! Grow! Board of Director’s profiles Statutory Reports Financial Sections
Standalone SCHEDULE
d. Upon the Scheme becoming effective, the assets and liabilities of the Transferee Company have been revalued based on valuation report or value determined by the Board of Directors of the Company and the net surplus of arising out of such valuations (over the carrying value of the respective assets and liabilities prior to the valuation) have been credited to the Restructuring Reserve account as follows:
Particulars of assets and liabilities(` In Million)
i. Investment in Galenica B.V. (72.42)ii. Investment in Sanved Research Labs
Private Limited(19.90)
iii. Leasehold land 128.32iv. Buildings 305.08Total 341.08
e. The deficit arising on amalgamation of ` 337.02 Million representing the value of assets over the value of liabilities of the Transferor Company, after cancellation of capital of the transferor Company and the reserves recorded as per point ‘d’, has been set-off against Restructuring reserve account as created in point ‘d’ above post-merger
The assets and liabilities as at October 1, 2009 taken over have been accounted at their fair values as follows:
Particulars (` In Million)Fixed Assets 0.21Investments 58.59Debtors 0.39Loans & Advances 11.06Cash & Bank balances 2.49Deferred Tax Assets 7.14Reserves & Surplus (Debit balance) (net) 11.16Total (A) 91.04Current Liabilities & Provisions 0.57Secured Loans 40.69Unsecured Loans 109.08Total (B) 150.34Excess of Liabilities over Assets taken over (B)-(A)
59.30
Investment Cancelled 277.72Net deficit on amalgamation representing the excess of shares allotted over the fair value of net assets amalgamated set off against Restructuring Reserve as per the Scheme
337.02
The Inter Company Balance of ` 30.19 Million as appearing in the books of Transferor company and the company was eliminated.
2. With effect from April 1, 2010, the merger of parent company, Fraxis Life Science limited, with the Company has been approved by the respective Board of the directors. The Company is in the process of obtaining approval from High Court of Mumbai in this regard.
3. Exceptional items
a) Based on The Scheme of Amalgamation of Vedic elements Private Limited, the company valued its investment at fair value and net provision for diminution in the value of Investment of `52.58 Million has been reversed.
b) The Company had given a corporate guarantee to Rabo bank, Netherland towards a loan availed by its subsidiary (Galenica B.V.) amounting to Euro 0.665 Million (`42.05 Mio). Since the subsidiary has filed for liquidation, the corporate guarantee was encashed during the year by the Bank and the same is charged under exceptional items.
4. Estimated amounts of contracts remaining to be executed on capital account and not provided for (Net of advances) `147.78 Mio (previous year ` 66.50 Mio)
5. Contingent Liabilities
(` In Million)Particulars As at
March 31, 2011As at
March 31, 2010Sales tax* 16.62 13.20Income tax* 10.75 11.11Excise Duty* 0.09 -Bills Receivables discounted with banks
133.70 97.03
Total 161.16 121.34
*Outflow, it any, arising out of the said claim would depend on the outcome of the decision of the oppellate authority and the Company’s right for future appeal before the judiciary.
The Company has given a Corporate Guarantee to Triodos Sustainable Trade Fund, Vietnam towards a Credit facility availed by its stepdown subsidiary (Vedic Fanxipang Pharma Chemic Company Ltd) amounting to USD 1.30 Million. (`58.05 Million) (Previous Year ` Nil) However the step down subsidiary has used facility to an extent of USD 0.7 Million (` 31.26 Million) (Previous Year ` Nil) as at the year end.
6. The information disclosed in Schedule H.A (a) to the financial statements with regard to Micro and Small enterprises is based on information collected by the management based on enquiries made by the management with the creditors which have been relied upon by the auditors.
7. Managerial Remuneration:
a. Remuneration paid by the Company to the Managing Director and Whole-time director:
(` In Million)
Particulars Year ended March 31, 2011
Year ended March 31, 2010
1 Salaries & Allowances 13.80 21.06
2 Contribution to PF & Other funds
3.09 1.49
3 Leave encashment - 0.02
Total (A) 16.89 22.57
Sitting fees paid to Non-whole time directors
0.24 0.32
Total (B) 0.24 0.32
Total (A) + (B) 17.13 22.89
Note: The details of managerial remuneration stated in the above table exclude long term leave encashment and gratuity costs (for which separate actuarial valuations are not available).
The Company has paid remuneration to one of its director as per the approval received from Central Government. The Managerial Remuneration paid for the year ended March 31, 2011 excludes ` 24.88 million for which the Company is in the process of filing for approval with Central Government. Pending such approval the excess amount so paid has been disolved as dues from directors in Schedule G.B. (g).
SCHEDULE ‘P’ (Contd.)
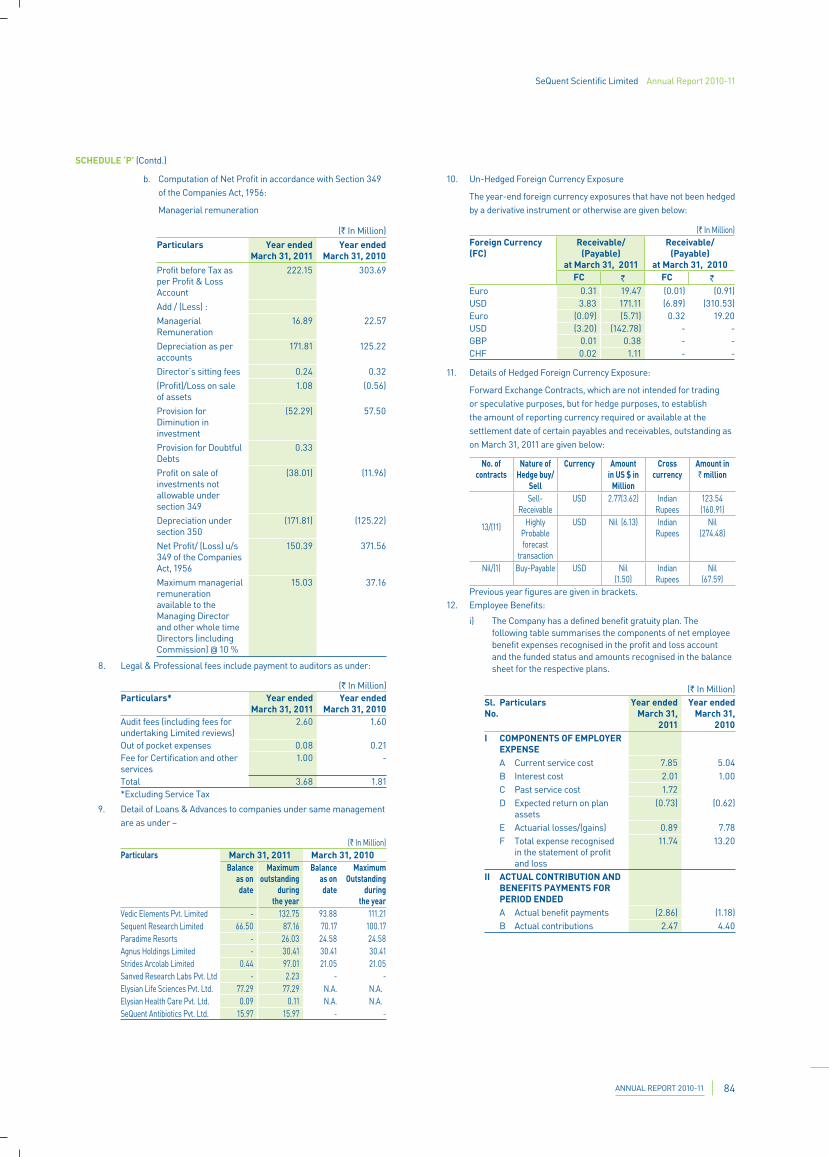
SeQuent Scientific Limited Annual Report 2010-11
ANNUAL REPORT 2010-11 84
b. Computation of Net Profit in accordance with Section 349 of the Companies Act, 1956:
Managerial remuneration
(` In Million)
Particulars Year ended March 31, 2011
Year ended March 31, 2010
Profit before Tax as per Profit & Loss Account
222.15 303.69
Add / (Less) :
Managerial Remuneration
16.89 22.57
Depreciation as per accounts
171.81 125.22
Director’s sitting fees 0.24 0.32
(Profit)/Loss on sale of assets
1.08 (0.56)
Provision for Diminution in investment
(52.29) 57.50
Provision for Doubtful Debts
0.33
Profit on sale of investments not allowable under section 349
(38.01) (11.96)
Depreciation under section 350
(171.81) (125.22)
Net Profit/ (Loss) u/s 349 of the Companies Act, 1956
150.39 371.56
Maximum managerial remuneration available to the Managing Director and other whole time Directors (including Commission) @ 10 %
15.03 37.16
8. Legal & Professional fees include payment to auditors as under:
(` In Million)Particulars* Year ended
March 31, 2011Year ended
March 31, 2010Audit fees (including fees for undertaking Limited reviews)
2.60 1.60
Out of pocket expenses 0.08 0.21Fee for Certification and other services
1.00 -
Total 3.68 1.81*Excluding Service Tax
9. Detail of Loans & Advances to companies under same management are as under –
(` In Million)Particulars March 31, 2011 March 31, 2010
Balance as on date
Maximum outstanding
during the year
Balance as on date
Maximum Outstanding
during the year
Vedic Elements Pvt. Limited - 132.75 93.88 111.21Sequent Research Limited 66.50 87.16 70.17 100.17Paradime Resorts - 26.03 24.58 24.58Agnus Holdings Limited - 30.41 30.41 30.41Strides Arcolab Limited 0.44 97.01 21.05 21.05Sanved Research Labs Pvt. Ltd - 2.23 - -Elysian Life Sciences Pvt. Ltd. 77.29 77.29 N.A. N.A.Elysian Health Care Pvt. Ltd. 0.09 0.11 N.A. N.A.SeQuent Antibiotics Pvt. Ltd. 15.97 15.97 - -
10. Un-Hedged Foreign Currency Exposure
The year-end foreign currency exposures that have not been hedged by a derivative instrument or otherwise are given below:
(` In Million)Foreign Currency (FC)
Receivable/ (Payable)
at March 31, 2011
Receivable/ (Payable)
at March 31, 2010FC ` FC `
Euro 0.31 19.47 (0.01) (0.91)USD 3.83 171.11 (6.89) (310.53)Euro (0.09) (5.71) 0.32 19.20USD (3.20) (142.78) - -GBP 0.01 0.38 - -CHF 0.02 1.11 - -
11. Details of Hedged Foreign Currency Exposure:
Forward Exchange Contracts, which are not intended for trading or speculative purposes, but for hedge purposes, to establish the amount of reporting currency required or available at the settlement date of certain payables and receivables, outstanding as on March 31, 2011 are given below:
No. of contracts
Nature of Hedge buy/
Sell
Currency Amount in US $ in
Million
Cross currency
Amount in ` million
13/(11)
Sell-Receivable
USD 2.77(3.62) Indian Rupees
123.54 (160.91)
Highly Probable forecast
transaction
USD Nil (6.13) Indian Rupees
Nil (274.48)
Nil/(1) Buy-Payable USD Nil(1.50)
Indian Rupees
Nil(67.59)
Previous year figures are given in brackets. 12. Employee Benefits:
i) The Company has a defined benefit gratuity plan. The following table summarises the components of net employee benefit expenses recognised in the profit and loss account and the funded status and amounts recognised in the balance sheet for the respective plans.
(` In Million)Sl.No.
Particulars Year ended March 31,
2011
Year ended March 31,
2010I COMPONENTS OF EMPLOYER
EXPENSEA Current service cost 7.85 5.04B Interest cost 2.01 1.00C Past service cost 1.72D Expected return on plan
assets(0.73) (0.62)
E Actuarial losses/(gains) 0.89 7.78F Total expense recognised
in the statement of profit and loss
11.74 13.20
II ACTUAL CONTRIBUTION AND BENEFITS PAYMENTS FOR PERIOD ENDEDA Actual benefit payments (2.86) (1.18)B Actual contributions 2.47 4.40
SCHEDULE ‘P’ (Contd.)
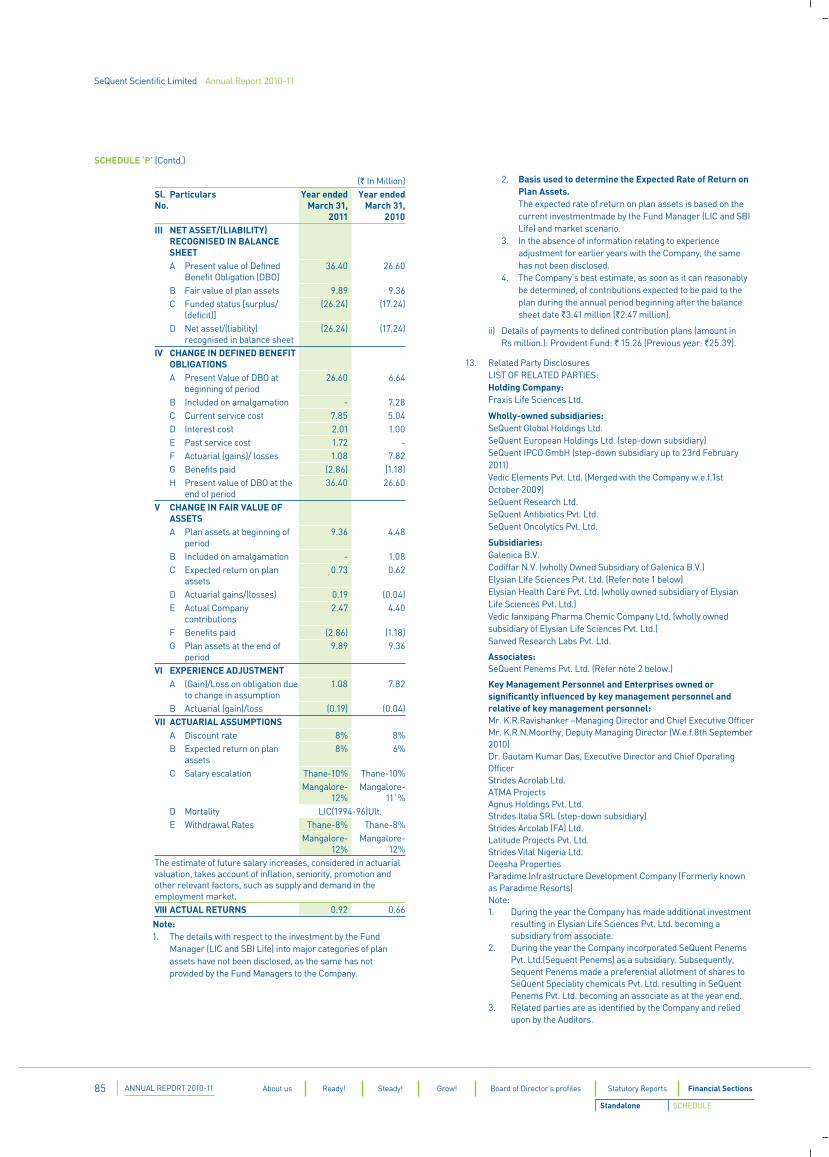
SeQuent Scientific Limited Annual Report 2010-11
ANNUAL REPORT 2010-1185 About us Ready! Steady! Grow! Board of Director’s profiles Statutory Reports Financial Sections
Standalone SCHEDULE
(` In Million)Sl.No.
Particulars Year ended March 31,
2011
Year ended March 31,
2010III NET ASSET/(LIABILITY)
RECOGNISED IN BALANCE SHEETA Present value of Defined
Benefit Obligation (DBO)36.40 26.60
B Fair value of plan assets 9.89 9.36C Funded status [surplus/
(deficit)](26.24) (17.24)
D Net asset/(liability) recognised in balance sheet
(26.24) (17.24)
IV CHANGE IN DEFINED BENEFIT OBLIGATIONSA Present Value of DBO at
beginning of period26.60 6.64
B Included on amalgamation - 7.28C Current service cost 7.85 5.04D Interest cost 2.01 1.00E Past service cost 1.72 -F Actuarial (gains)/ losses 1.08 7.82G Benefits paid (2.86) (1.18)H Present value of DBO at the
end of period36.40 26.60
V CHANGE IN FAIR VALUE OF ASSETSA Plan assets at beginning of
period9.36 4.48
B Included on amalgamation - 1.08C Expected return on plan
assets0.73 0.62
D Actuarial gains/(losses) 0.19 (0.04)E Actual Company
contributions2.47 4.40
F Benefits paid (2.86) (1.18)G Plan assets at the end of
period9.89 9.36
VI EXPERIENCE ADJUSTMENTA (Gain)/Loss on obligation due
to change in assumption1.08 7.82
B Actuarial (gain)/loss (0.19) (0.04)VII ACTUARIAL ASSUMPTIONS
A Discount rate 8% 8%B Expected return on plan
assets8% 6%
C Salary escalation Thane-10% Thane-10%Mangalore-
12%Mangalore-
11`%D Mortality LIC(1994-96)Ult.E Withdrawal Rates Thane-8% Thane-8%
Mangalore-12%
Mangalore-12%
The estimate of future salary increases, considered in actuarial valuation, takes account of inflation, seniority, promotion and other relevant factors, such as supply and demand in the employment market.VIII ACTUAL RETURNS 0.92 0.66
Note: 1. The details with respect to the investment by the Fund
Manager (LIC and SBI Life) into major categories of plan assets have not been disclosed, as the same has not provided by the Fund Managers to the Company.
2. Basis used to determine the Expected Rate of Return on Plan Assets.
The expected rate of return on plan assets is based on the current investmentmade by the Fund Manager (LIC and SBI Life) and market scenario.
3. In the absence of information relating to experience adjustment for earlier years with the Company, the same has not been disclosed.
4. The Company’s best estimate, as soon as it can reasonably be determined, of contributions expected to be paid to the plan during the annual period beginning after the balance sheet date `3.41 million (`2.47 million).
ii) Details of payments to defined contribution plans (amount in Rs million.): Provident Fund: ` 15.26 (Previous year: `25.39).
13. Related Party Disclosures LIST OF RELATED PARTIES:
Holding Company:Fraxis Life Sciences Ltd.
Wholly-owned subsidiaries:SeQuent Global Holdings Ltd. SeQuent European Holdings Ltd. (step-down subsidiary)SeQuent IPCO GmbH (step-down subsidiary up to 23rd February 2011)Vedic Elements Pvt. Ltd. (Merged with the Company w.e.f.1st October 2009)SeQuent Research Ltd.SeQuent Antibiotics Pvt. Ltd.SeQuent Oncolytics Pvt. Ltd.
Subsidiaries:Galenica B.V.Codiffar N.V. (wholly Owned Subsidiary of Galenica B.V.)Elysian Life Sciences Pvt. Ltd. (Refer note 1 below)Elysian Health Care Pvt. Ltd. (wholly owned subsidiary of Elysian Life Sciences Pvt. Ltd.)Vedic fanxipang Pharma Chemic Company Ltd. (wholly owned subsidiary of Elysian Life Sciences Pvt. Ltd.)Sanved Research Labs Pvt. Ltd.
Associates: SeQuent Penems Pvt. Ltd. (Refer note 2 below.)
Key Management Personnel and Enterprises owned or significantly influenced by key management personnel and relative of key management personnel:Mr. K.R.Ravishanker –Managing Director and Chief Executive OfficerMr. K.R.N.Moorthy, Deputy Managing Director (W.e.f.8th September 2010)Dr. Gautam Kumar Das, Executive Director and Chief Operating Officer Strides Acrolab Ltd.ATMA ProjectsAgnus Holdings Pvt. Ltd.Strides Italia SRL (step-down subsidiary)Strides Arcolab (FA) Ltd.Latitude Projects Pvt. Ltd.Strides Vital Nigeria Ltd.Deesha Properties Paradime Infrastructure Development Company (Formerly known as Paradime Resorts)Note:
1. During the year the Company has made additional investment resulting in Elysian Life Sciences Pvt. Ltd. becoming a subsidiary from associate.
2. During the year the Company incorporated SeQuent Penems Pvt. Ltd.(Sequent Penems) as a subsidiary. Subsequently, Sequent Penems made a preferential allotment of shares to SeQuent Speciality chemicals Pvt. Ltd. resulting in SeQuent Penems Pvt. Ltd. becoming an associate as at the year end.
3. Related parties are as identified by the Company and relied upon by the Auditors.
SCHEDULE ‘P’ (Contd.)
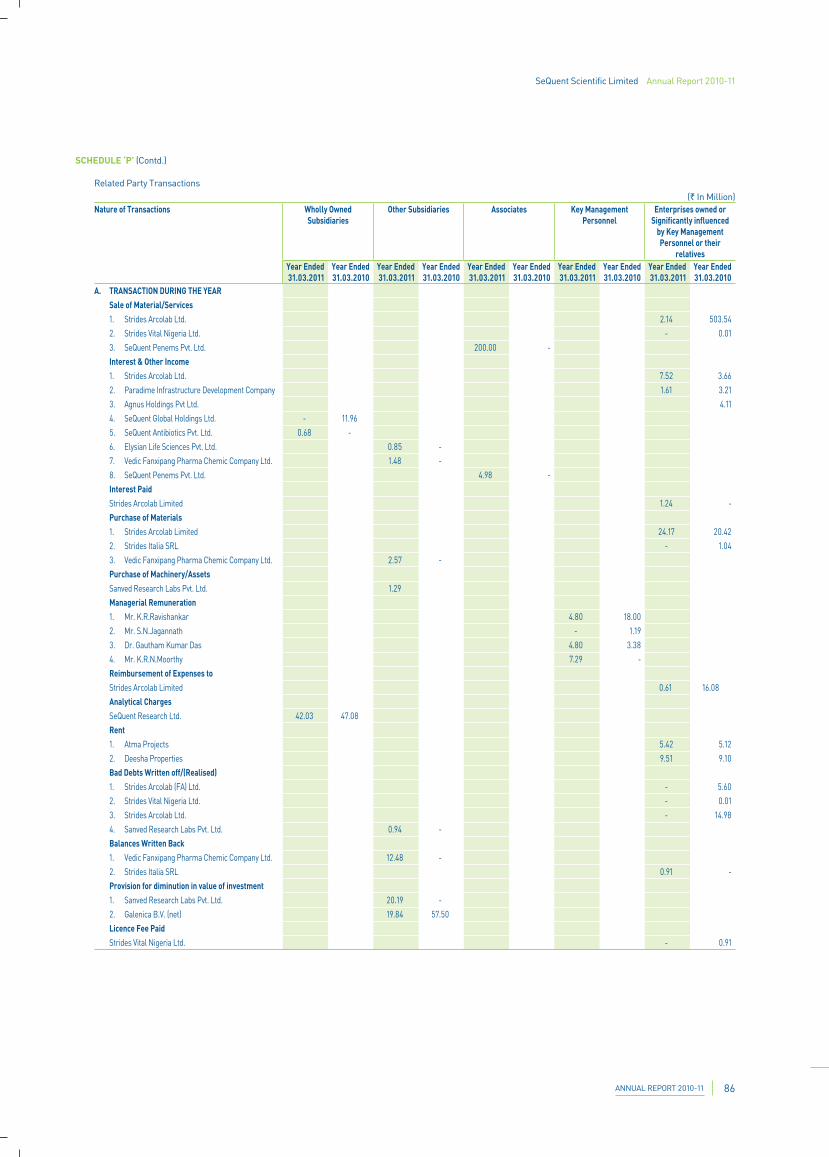
SeQuent Scientific Limited Annual Report 2010-11
ANNUAL REPORT 2010-11 86
SCHEDULE ‘P’ (Contd.)
Related Party Transactions(` In Million)
Nature of Transactions Wholly Owned Subsidiaries
Other Subsidiaries Associates Key Management Personnel
Enterprises owned or Significantly influenced
by Key Management Personnel or their
relatives Year Ended 31.03.2011
Year Ended 31.03.2010
Year Ended 31.03.2011
Year Ended 31.03.2010
Year Ended 31.03.2011
Year Ended 31.03.2010
Year Ended 31.03.2011
Year Ended 31.03.2010
Year Ended 31.03.2011
Year Ended 31.03.2010
A. TRANSACTION DURING THE YEARSale of Material/Services1. Strides Arcolab Ltd. 2.14 503.54
2. Strides Vital Nigeria Ltd. - 0.01
3. SeQuent Penems Pvt. Ltd. 200.00 -
Interest & Other Income1. Strides Arcolab Ltd. 7.52 3.66
2. Paradime Infrastructure Development Company 1.61 3.21
3. Agnus Holdings Pvt Ltd. 4.11
4. SeQuent Global Holdings Ltd. - 11.96
5. SeQuent Antibiotics Pvt. Ltd. 0.68 -
6. Elysian Life Sciences Pvt. Ltd. 0.85 -
7. Vedic Fanxipang Pharma Chemic Company Ltd. 1.48 -
8. SeQuent Penems Pvt. Ltd. 4.98 -
Interest PaidStrides Arcolab Limited 1.24 -
Purchase of Materials1. Strides Arcolab Limited 24.17 20.42
2. Strides Italia SRL - 1.04
3. Vedic Fanxipang Pharma Chemic Company Ltd. 2.57 -
Purchase of Machinery/AssetsSanved Research Labs Pvt. Ltd. 1.29
Managerial Remuneration1. Mr. K.R.Ravishankar 4.80 18.00
2. Mr. S.N.Jagannath - 1.19
3. Dr. Gautham Kumar Das 4.80 3.38
4. Mr. K.R.N.Moorthy 7.29 -
Reimbursement of Expenses toStrides Arcolab Limited 0.61 16.08
Analytical ChargesSeQuent Research Ltd. 42.03 47.08
Rent1. Atma Projects 5.42 5.12
2. Deesha Properties 9.51 9.10
Bad Debts Written off/(Realised)1. Strides Arcolab (FA) Ltd. - 5.60
2. Strides Vital Nigeria Ltd. - 0.01
3. Strides Arcolab Ltd. - 14.98
4. Sanved Research Labs Pvt. Ltd. 0.94 -
Balances Written Back1. Vedic Fanxipang Pharma Chemic Company Ltd. 12.48 -
2. Strides Italia SRL 0.91 -
Provision for diminution in value of investment1. Sanved Research Labs Pvt. Ltd. 20.19 -
2. Galenica B.V. (net) 19.84 57.50
Licence Fee PaidStrides Vital Nigeria Ltd. - 0.91
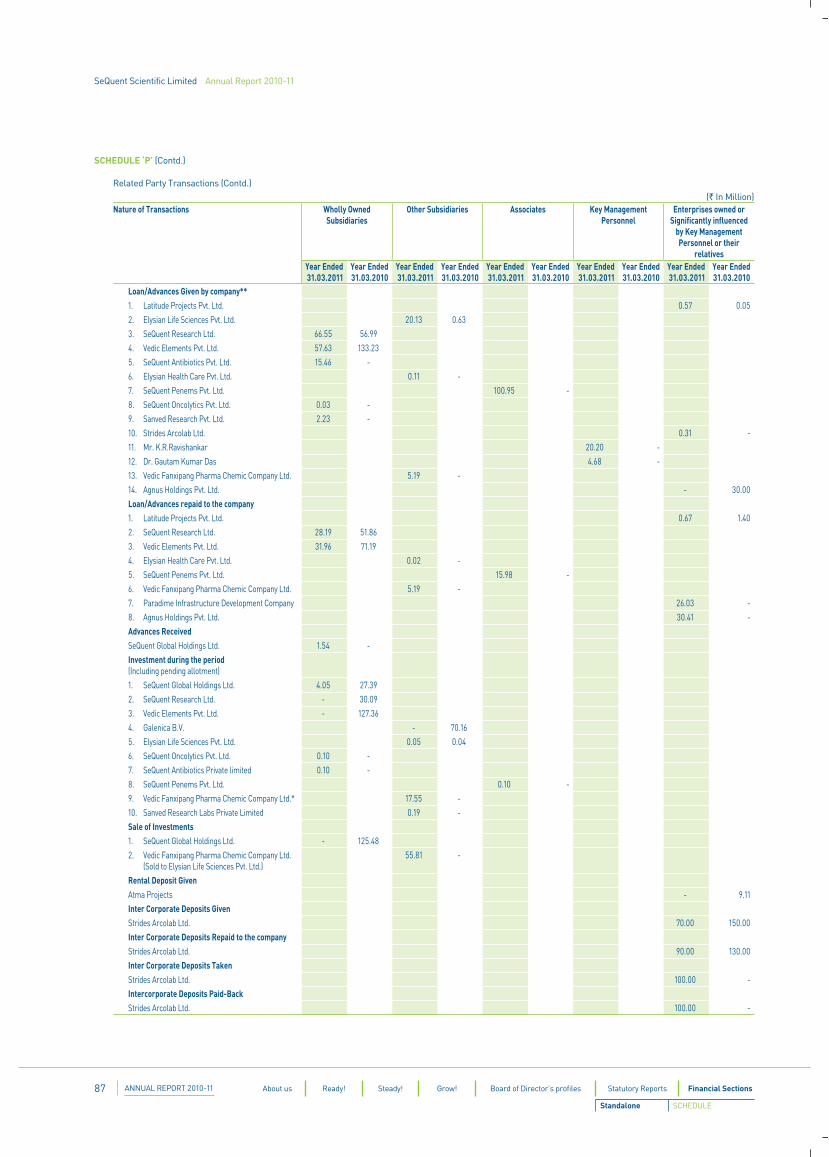
SeQuent Scientific Limited Annual Report 2010-11
ANNUAL REPORT 2010-1187 About us Ready! Steady! Grow! Board of Director’s profiles Statutory Reports Financial Sections
Standalone SCHEDULE
Loan/Advances Given by company**1. Latitude Projects Pvt. Ltd. 0.57 0.05
2. Elysian Life Sciences Pvt. Ltd. 20.13 0.63
3. SeQuent Research Ltd. 66.55 56.99
4. Vedic Elements Pvt. Ltd. 57.63 133.23
5. SeQuent Antibiotics Pvt. Ltd. 15.46 -
6. Elysian Health Care Pvt. Ltd. 0.11 -
7. SeQuent Penems Pvt. Ltd. 100.95 -
8. SeQuent Oncolytics Pvt. Ltd. 0.03 -
9. Sanved Research Pvt. Ltd. 2.23 -
10. Strides Arcolab Ltd. 0.31 -
11. Mr. K.R.Ravishankar 20.20 -
12. Dr. Gautam Kumar Das 4.68 -
13. Vedic Fanxipang Pharma Chemic Company Ltd. 5.19 -
14. Agnus Holdings Pvt. Ltd. - 30.00
Loan/Advances repaid to the company1. Latitude Projects Pvt. Ltd. 0.67 1.40
2. SeQuent Research Ltd. 28.19 51.86
3. Vedic Elements Pvt. Ltd. 31.96 71.19
4. Elysian Health Care Pvt. Ltd. 0.02 -
5. SeQuent Penems Pvt. Ltd. 15.98 -
6. Vedic Fanxipang Pharma Chemic Company Ltd. 5.19 -
7. Paradime Infrastructure Development Company 26.03 -
8. Agnus Holdings Pvt. Ltd. 30.41 -
Advances ReceivedSeQuent Global Holdings Ltd. 1.54 -
Investment during the period(Including pending allotment)
1. SeQuent Global Holdings Ltd. 4.05 27.39
2. SeQuent Research Ltd. - 30.09
3. Vedic Elements Pvt. Ltd. - 127.36
4. Galenica B.V. - 70.16
5. Elysian Life Sciences Pvt. Ltd. 0.05 0.04
6. SeQuent Oncolytics Pvt. Ltd. 0.10 -
7. SeQuent Antibiotics Private limited 0.10 -
8. SeQuent Penems Pvt. Ltd. 0.10 -
9. Vedic Fanxipang Pharma Chemic Company Ltd.* 17.55 -
10. Sanved Research Labs Private Limited 0.19 -
Sale of Investments1. SeQuent Global Holdings Ltd. - 125.48
2. Vedic Fanxipang Pharma Chemic Company Ltd. (Sold to Elysian Life Sciences Pvt. Ltd.)
55.81 -
Rental Deposit GivenAtma Projects - 9.11
Inter Corporate Deposits GivenStrides Arcolab Ltd. 70.00 150.00
Inter Corporate Deposits Repaid to the companyStrides Arcolab Ltd. 90.00 130.00
Inter Corporate Deposits TakenStrides Arcolab Ltd. 100.00 -
Intercorporate Deposits Paid-BackStrides Arcolab Ltd. 100.00 -
SCHEDULE ‘P’ (Contd.)
Related Party Transactions (Contd.)(` In Million)
Nature of Transactions Wholly Owned Subsidiaries
Other Subsidiaries Associates Key Management Personnel
Enterprises owned or Significantly influenced
by Key Management Personnel or their
relatives Year Ended 31.03.2011
Year Ended 31.03.2010
Year Ended 31.03.2011
Year Ended 31.03.2010
Year Ended 31.03.2011
Year Ended 31.03.2010
Year Ended 31.03.2011
Year Ended 31.03.2010
Year Ended 31.03.2011
Year Ended 31.03.2010
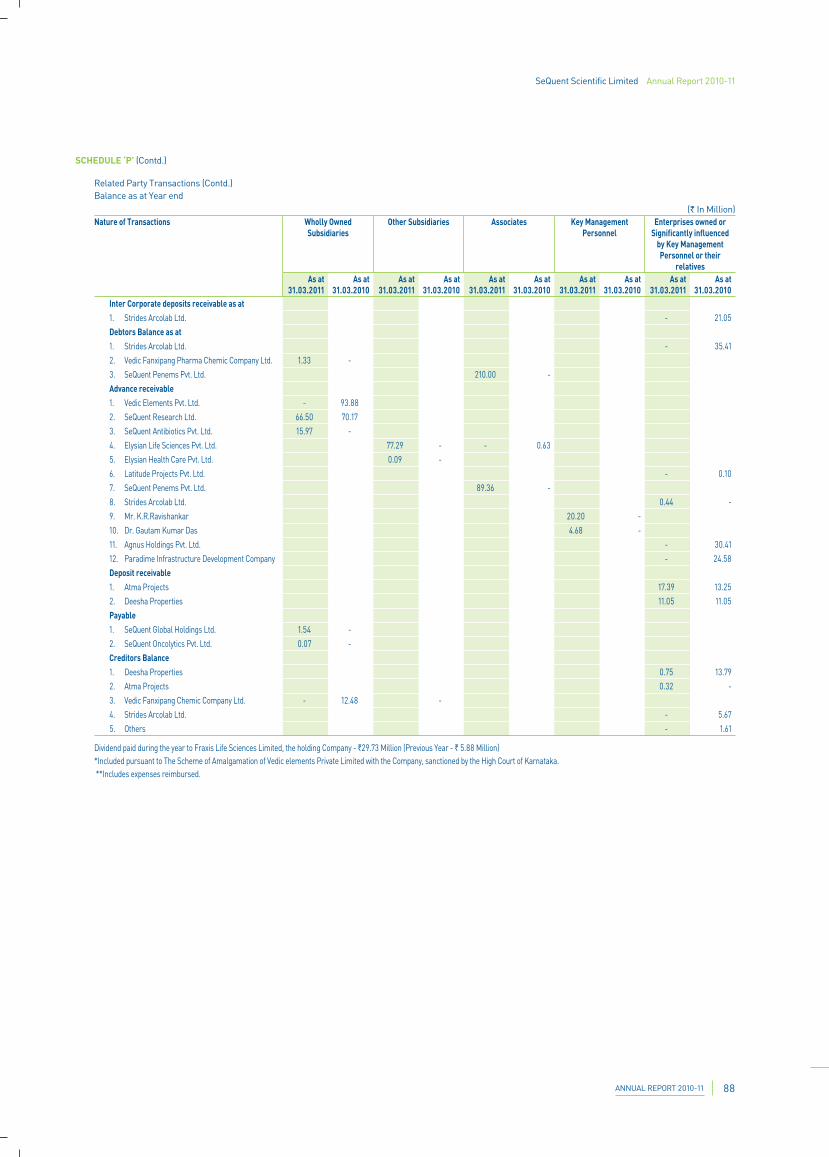
SeQuent Scientific Limited Annual Report 2010-11
ANNUAL REPORT 2010-11 88
Inter Corporate deposits receivable as at1. Strides Arcolab Ltd. - 21.05
Debtors Balance as at1. Strides Arcolab Ltd. - 35.41
2. Vedic Fanxipang Pharma Chemic Company Ltd. 1.33 -
3. SeQuent Penems Pvt. Ltd. 210.00 -
Advance receivable1. Vedic Elements Pvt. Ltd. - 93.88
2. SeQuent Research Ltd. 66.50 70.17
3. SeQuent Antibiotics Pvt. Ltd. 15.97 -
4. Elysian Life Sciences Pvt. Ltd. 77.29 - - 0.63
5. Elysian Health Care Pvt. Ltd. 0.09 -
6. Latitude Projects Pvt. Ltd. - 0.10
7. SeQuent Penems Pvt. Ltd. 89.36 -
8. Strides Arcolab Ltd. 0.44 -
9. Mr. K.R.Ravishankar 20.20 -
10. Dr. Gautam Kumar Das 4.68 -
11. Agnus Holdings Pvt. Ltd. - 30.41
12. Paradime Infrastructure Development Company - 24.58
Deposit receivable1. Atma Projects 17.39 13.25
2. Deesha Properties 11.05 11.05
Payable1. SeQuent Global Holdings Ltd. 1.54 -
2. SeQuent Oncolytics Pvt. Ltd. 0.07 -
Creditors Balance1. Deesha Properties 0.75 13.79
2. Atma Projects 0.32 -
3. Vedic Fanxipang Chemic Company Ltd. - 12.48 -
4. Strides Arcolab Ltd. - 5.67
5. Others - 1.61
Dividend paid during the year to Fraxis Life Sciences Limited, the holding Company - `29.73 Million (Previous Year - ` 5.88 Million)*Included pursuant to The Scheme of Amalgamation of Vedic elements Private Limited with the Company, sanctioned by the High Court of Karnataka. **Includes expenses reimbursed.
SCHEDULE ‘P’ (Contd.)
Related Party Transactions (Contd.)Balance as at Year end
(` In Million)Nature of Transactions Wholly Owned
SubsidiariesOther Subsidiaries Associates Key Management
PersonnelEnterprises owned or
Significantly influenced by Key Management Personnel or their
relatives As at
31.03.2011 As at
31.03.2010 As at
31.03.2011 As at
31.03.2010 As at
31.03.2011 As at
31.03.2010 As at
31.03.2011 As at
31.03.2010 As at
31.03.2011 As at
31.03.2010
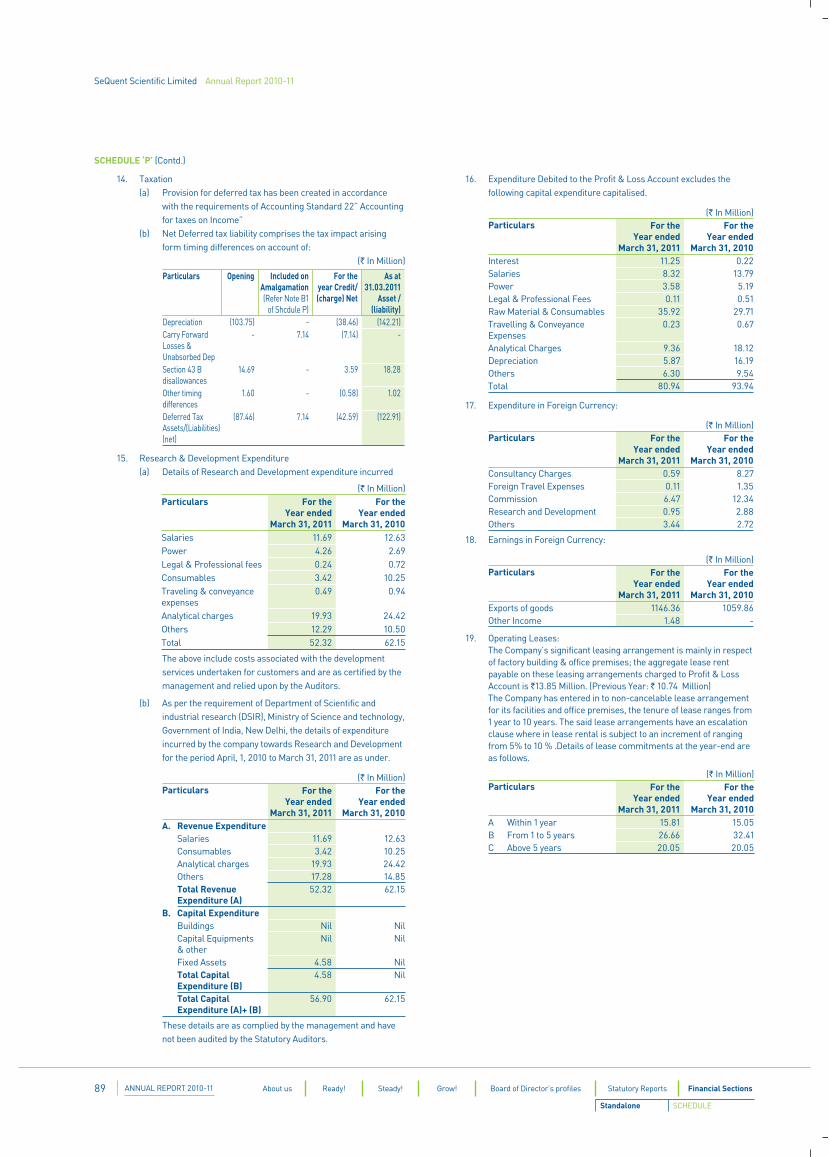
SeQuent Scientific Limited Annual Report 2010-11
ANNUAL REPORT 2010-1189 About us Ready! Steady! Grow! Board of Director’s profiles Statutory Reports Financial Sections
Standalone SCHEDULE
SCHEDULE ‘P’ (Contd.)
14. Taxation (a) Provision for deferred tax has been created in accordance
with the requirements of Accounting Standard 22” Accounting for taxes on Income”
(b) Net Deferred tax liability comprises the tax impact arising form timing differences on account of:
(` In Million)
Particulars Opening Included on Amalgamation(Refer Note B1
of Shcdule P)
For the year Credit/(charge) Net
As at 31.03.2011
Asset /(liability)
Depreciation (103.75) - (38.46) (142.21)Carry Forward Losses & Unabsorbed Dep
- 7.14 (7.14) -
Section 43 B disallowances
14.69 - 3.59 18.28
Other timing differences
1.60 - (0.58) 1.02
Deferred Tax Assets/(Liabilities) (net)
(87.46) 7.14 (42.59) (122.91)
15. Research & Development Expenditure (a) Details of Research and Development expenditure incurred
(` In Million)Particulars For the
Year endedMarch 31, 2011
For the Year ended
March 31, 2010Salaries 11.69 12.63Power 4.26 2.69Legal & Professional fees 0.24 0.72Consumables 3.42 10.25Traveling & conveyance expenses
0.49 0.94
Analytical charges 19.93 24.42Others 12.29 10.50Total 52.32 62.15
The above include costs associated with the development services undertaken for customers and are as certified by the management and relied upon by the Auditors.
(b) As per the requirement of Department of Scientific and industrial research (DSIR), Ministry of Science and technology, Government of India, New Delhi, the details of expenditure incurred by the company towards Research and Development for the period April, 1, 2010 to March 31, 2011 are as under.
(` In Million)Particulars For the
Year endedMarch 31, 2011
For the Year ended
March 31, 2010A. Revenue Expenditure
Salaries 11.69 12.63Consumables 3.42 10.25Analytical charges 19.93 24.42Others 17.28 14.85Total Revenue Expenditure (A)
52.32 62.15
B. Capital ExpenditureBuildings Nil NilCapital Equipments & other
Nil Nil
Fixed Assets 4.58 NilTotal Capital Expenditure (B)
4.58 Nil
Total Capital Expenditure (A)+ (B)
56.90 62.15
These details are as complied by the management and have not been audited by the Statutory Auditors.
16. Expenditure Debited to the Profit & Loss Account excludes the following capital expenditure capitalised.
(` In Million)Particulars For the
Year endedMarch 31, 2011
For the Year ended
March 31, 2010Interest 11.25 0.22Salaries 8.32 13.79Power 3.58 5.19Legal & Professional Fees 0.11 0.51Raw Material & Consumables 35.92 29.71Travelling & Conveyance Expenses
0.23 0.67
Analytical Charges 9.36 18.12Depreciation 5.87 16.19Others 6.30 9.54Total 80.94 93.94
17. Expenditure in Foreign Currency:
(` In Million)Particulars For the
Year endedMarch 31, 2011
For the Year ended
March 31, 2010Consultancy Charges 0.59 8.27 Foreign Travel Expenses 0.11 1.35 Commission 6.47 12.34 Research and Development 0.95 2.88 Others 3.44 2.72
18. Earnings in Foreign Currency:
(` In Million)Particulars For the
Year endedMarch 31, 2011
For the Year ended
March 31, 2010Exports of goods 1146.36 1059.86Other Income 1.48 -
19. Operating Leases: The Company’s significant leasing arrangement is mainly in respect
of factory building & office premises; the aggregate lease rent payable on these leasing arrangements charged to Profit & Loss Account is `13.85 Million. (Previous Year: ` 10.74 Million)
The Company has entered in to non-cancelable lease arrangement for its facilities and office premises, the tenure of lease ranges from 1 year to 10 years. The said lease arrangements have an escalation clause where in lease rental is subject to an increment of ranging from 5% to 10 % .Details of lease commitments at the year-end are as follows.
(` In Million)Particulars For the
Year endedMarch 31, 2011
For the Year ended
March 31, 2010A Within 1 year 15.81 15.05B From 1 to 5 years 26.66 32.41C Above 5 years 20.05 20.05
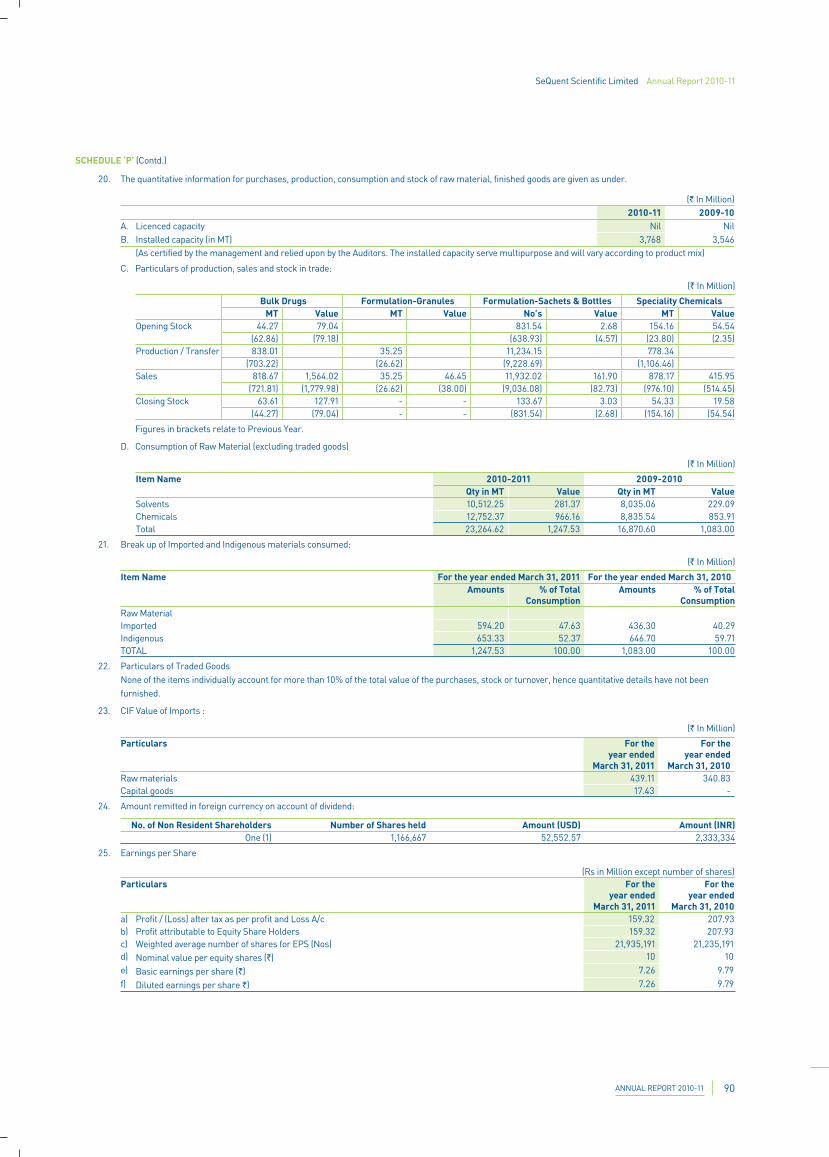
SeQuent Scientific Limited Annual Report 2010-11
ANNUAL REPORT 2010-11 90
SCHEDULE ‘P’ (Contd.)
20. The quantitative information for purchases, production, consumption and stock of raw material, finished goods are given as under.
(` In Million)2010-11 2009-10
A. Licenced capacity Nil NilB. Installed capacity (in MT) 3,768 3,546
(As certified by the management and relied upon by the Auditors. The installed capacity serve multipurpose and will vary according to product mix)
C. Particulars of production, sales and stock in trade:
(` In Million)
Bulk Drugs Formulation-Granules Formulation-Sachets & Bottles Speciality Chemicals MT Value MT Value No’s Value MT Value
Opening Stock 44.27 79.04 831.54 2.68 154.16 54.54(62.86) (79.18) (638.93) (4.57) (23.80) (2.35)
Production / Transfer 838.01 35.25 11,234.15 778.34 (703.22) (26.62) (9,228.69) (1,106.46)Sales 818.67 1,564.02 35.25 46.45 11,932.02 161.90 878.17 415.95
(721.81) (1,779.98) (26.62) (38.00) (9,036.08) (82.73) (976.10) (514.45)Closing Stock 63.61 127.91 - - 133.67 3.03 54.33 19.58
(44.27) (79.04) - - (831.54) (2.68) (154.16) (54.54)
Figures in brackets relate to Previous Year.
D. Consumption of Raw Material (excluding traded goods)
(` In Million)
Item Name 2010-2011 2009-2010Qty in MT Value Qty in MT Value
Solvents 10,512.25 281.37 8,035.06 229.09 Chemicals 12,752.37 966.16 8,835.54 853.91 Total 23,264.62 1,247.53 16,870.60 1,083.00
21. Break up of Imported and Indigenous materials consumed:
(` In Million)
Item Name For the year ended March 31, 2011 For the year ended March 31, 2010Amounts % of Total
ConsumptionAmounts % of Total
ConsumptionRaw Material Imported 594.20 47.63 436.30 40.29Indigenous 653.33 52.37 646.70 59.71TOTAL 1,247.53 100.00 1,083.00 100.00
22. Particulars of Traded Goods None of the items individually account for more than 10% of the total value of the purchases, stock or turnover, hence quantitative details have not been
furnished.
23. CIF Value of Imports :
(` In Million)
Particulars For the year ended
March 31, 2011
For the year ended
March 31, 2010Raw materials 439.11 340.83Capital goods 17.43 -
24. Amount remitted in foreign currency on account of dividend:
No. of Non Resident Shareholders Number of Shares held Amount (USD) Amount (INR)One (1) 1,166,667 52,552.57 2,333,334
25. Earnings per Share
(Rs in Million except number of shares)Particulars For the
year ended March 31, 2011
For the year ended
March 31, 2010a) Profit / (Loss) after tax as per profit and Loss A/c 159.32 207.93b) Profit attributable to Equity Share Holders 159.32 207.93c) Weighted average number of shares for EPS (Nos) 21,935,191 21,235,191d) Nominal value per equity shares (`) 10 10e) Basic earnings per share (`) 7.26 9.79f) Diluted earnings per share `) 7.26 9.79
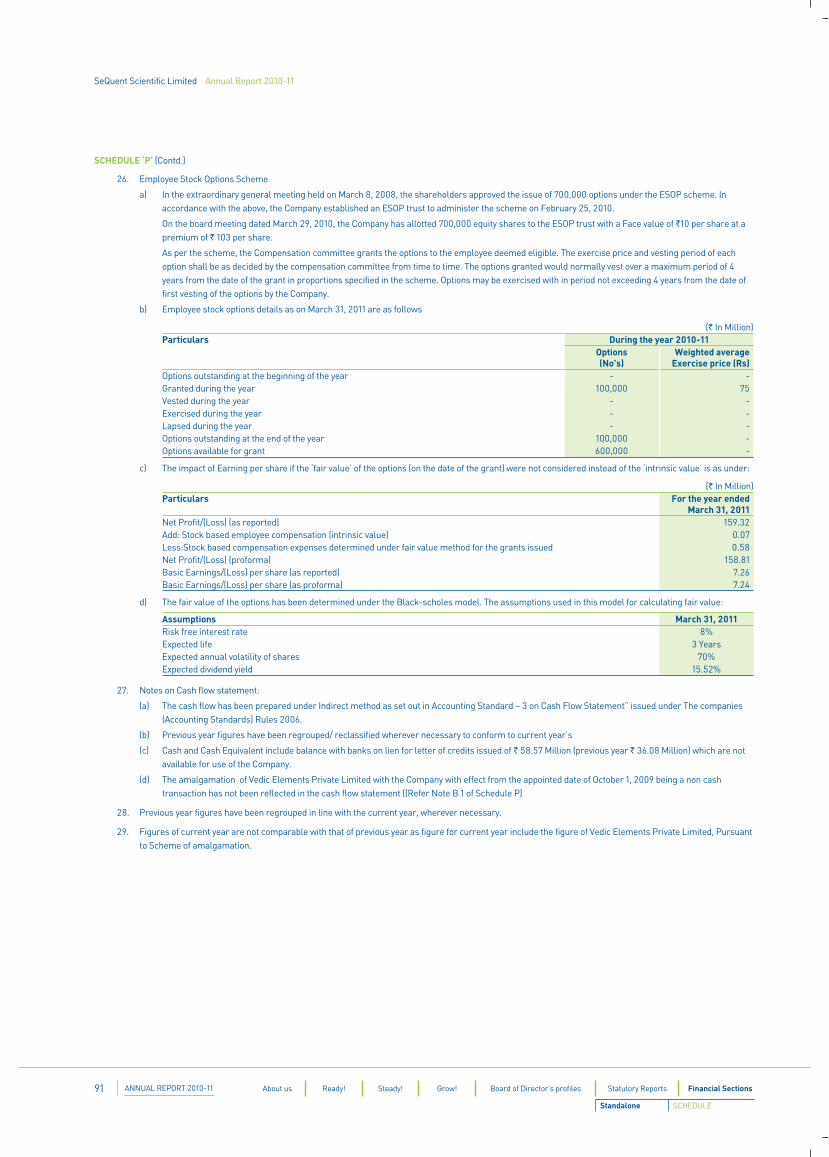
SeQuent Scientific Limited Annual Report 2010-11
ANNUAL REPORT 2010-1191 About us Ready! Steady! Grow! Board of Director’s profiles Statutory Reports Financial Sections
Standalone SCHEDULE
SCHEDULE ‘P’ (Contd.)
26. Employee Stock Options Scheme
a) In the extraordinary general meeting held on March 8, 2008, the shareholders approved the issue of 700,000 options under the ESOP scheme. In accordance with the above, the Company established an ESOP trust to administer the scheme on February 25, 2010.
On the board meeting dated March 29, 2010, the Company has allotted 700,000 equity shares to the ESOP trust with a Face value of `10 per share at a premium of ` 103 per share.
As per the scheme, the Compensation committee grants the options to the employee deemed eligible. The exercise price and vesting period of each option shall be as decided by the compensation committee from time to time. The options granted would normally vest over a maximum period of 4 years from the date of the grant in proportions specified in the scheme. Options may be exercised with in period not exceeding 4 years from the date of first vesting of the options by the Company.
b) Employee stock options details as on March 31, 2011 are as follows
(` In Million)Particulars During the year 2010-11
Options (No’s)
Weighted average Exercise price (Rs)
Options outstanding at the beginning of the year - -Granted during the year 100,000 75Vested during the year - -Exercised during the year - -Lapsed during the year - -Options outstanding at the end of the year 100,000 -Options available for grant 600,000 -
c) The impact of Earning per share if the ‘fair value’ of the options (on the date of the grant) were not considered instead of the ‘intrinsic value’ is as under:
(` In Million)Particulars For the year ended
March 31, 2011Net Profit/(Loss) (as reported) 159.32Add: Stock based employee compensation (intrinsic value) 0.07Less:Stock based compensation expenses determined under fair value method for the grants issued 0.58Net Profit/(Loss) (proforma) 158.81Basic Earnings/(Loss) per share (as reported) 7.26Basic Earnings/(Loss) per share (as proforma) 7.24
d) The fair value of the options has been determined under the Black-scholes model. The assumptions used in this model for calculating fair value:
Assumptions March 31, 2011Risk free interest rate 8%Expected life 3 YearsExpected annual volatility of shares 70%Expected dividend yield 15.52%
27. Notes on Cash flow statement:
(a) The cash flow has been prepared under Indirect method as set out in Accounting Standard – 3 on Cash Flow Statement” issued under The companies (Accounting Standards) Rules 2006.
(b) Previous year figures have been regrouped/ reclassified wherever necessary to conform to current year’s
(c) Cash and Cash Equivalent include balance with banks on lien for letter of credits issued of ` 58.57 Million (previous year ` 36.08 Million) which are not available for use of the Company.
(d) The amalgamation of Vedic Elements Private Limited with the Company with effect from the appointed date of October 1, 2009 being a non cash transaction has not been reflected in the cash flow statement ((Refer Note B 1 of Schedule P)
28. Previous year figures have been regrouped in line with the current year, wherever necessary.
29. Figures of current year are not comparable with that of previous year as figure for current year include the figure of Vedic Elements Private Limited, Pursuant to Scheme of amalgamation.
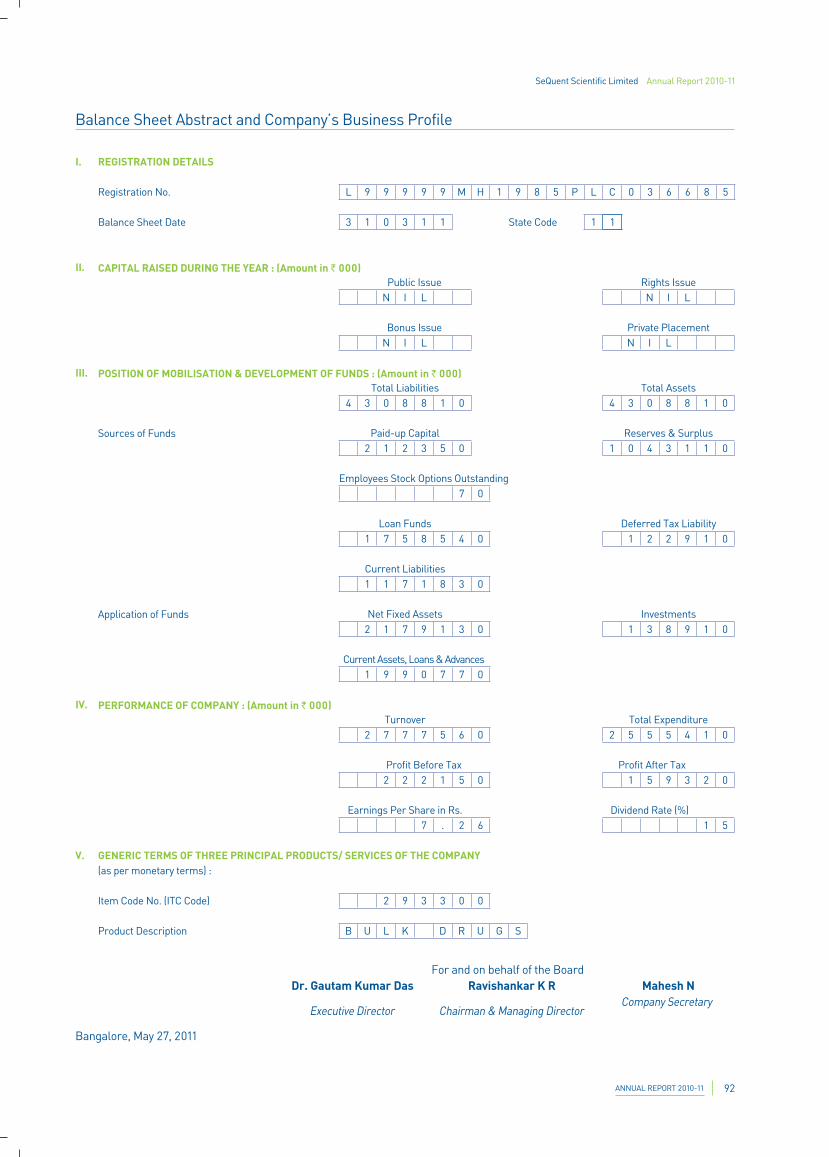
SeQuent Scientific Limited Annual Report 2010-11
ANNUAL REPORT 2010-11 92
Balance Sheet Abstract and Company’s Business Profile
I. REGISTRATION DETAILS
Registration No. L 9 9 9 9 9 M H 1 9 8 5 P L C 0 3 6 6 8 5
Balance Sheet Date 3 1 0 3 1 1 State Code 1 1
II. CAPITAL RAISED DURING THE YEAR : (Amount in ` 000)Public Issue
N I L
Bonus IssueN I L
III. POSITION OF MOBILISATION & DEVELOPMENT OF FUNDS : (Amount in ` 000)Total Liabilities
4 3 0 8 8 1 0
Sources of Funds Paid-up Capital2 1 2 3 5 0
Employees Stock Options Outstanding7 0
Loan Funds1 7 5 8 5 4 0
Current Liabilities1 1 7 1 8 3 0
Application of Funds Net Fixed Assets2 1 7 9 1 3 0
Current Assets, Loans & Advances1 9 9 0 7 7 0
IV. PERFORMANCE OF COMPANY : (Amount in ` 000)Turnover
2 7 7 7 5 6 0
Profit Before Tax2 2 2 1 5 0
Earnings Per Share in Rs.7 . 2 6
V. GENERIC TERMS OF THREE PRINCIPAL PRODUCTS/ SERVICES OF THE COMPANY(as per monetary terms) :
Item Code No. (ITC Code) 2 9 3 3 0 0
Product Description B U L K D R U G S
Rights IssueN I L
Private PlacementN I L
Total Assets4 3 0 8 8 1 0
Reserves & Surplus1 0 4 3 1 1 0
Deferred Tax Liability1 2 2 9 1 0
Investments1 3 8 9 1 0
Total Expenditure2 5 5 5 4 1 0
Profit After Tax1 5 9 3 2 0
Dividend Rate (%)1 5
For and on behalf of the BoardDr. Gautam Kumar Das Ravishankar K R Mahesh N
Executive Director Chairman & Managing DirectorCompany Secretary
Bangalore, May 27, 2011
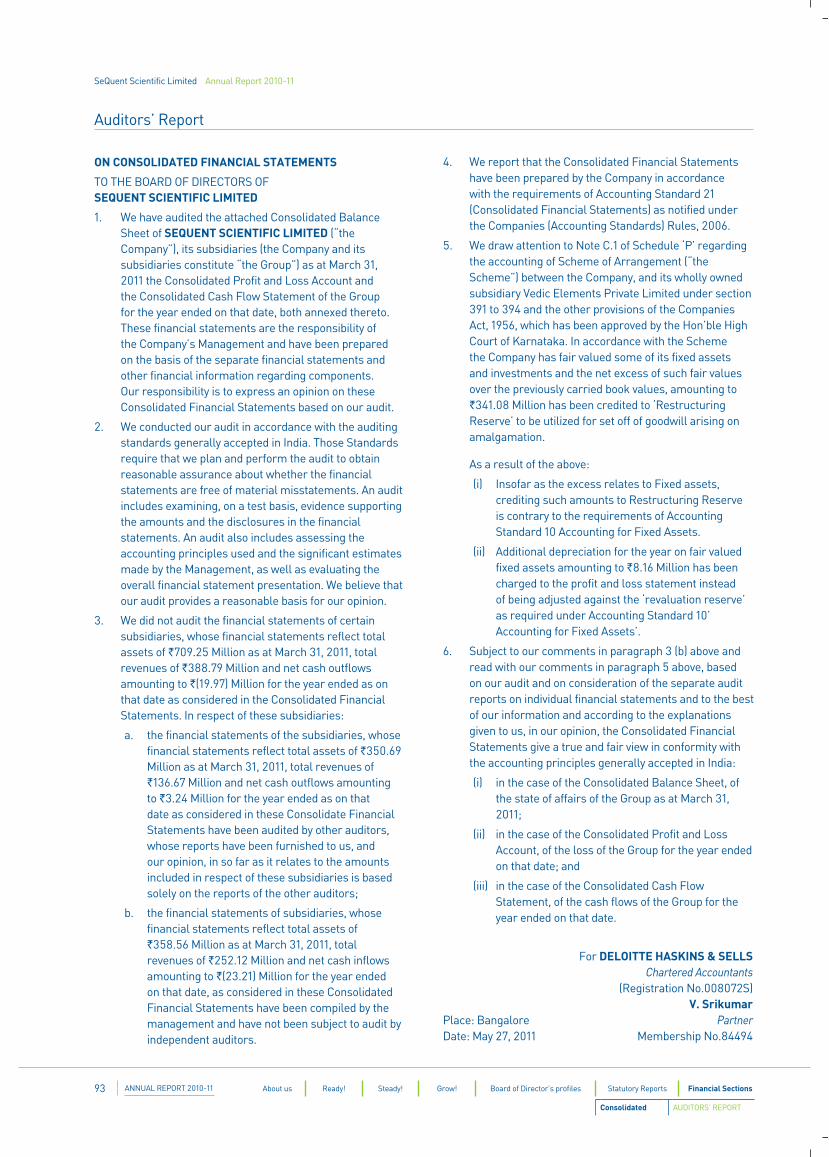
SeQuent Scientific Limited Annual Report 2010-11
ANNUAL REPORT 2010-1193 About us Ready! Steady! Grow! Board of Director’s profiles Statutory Reports Financial Sections
Auditors’ Report
ON CONSOLIDATED FINANCIAL STATEMENTS
TO THE BOARD OF DIRECTORS OF SEQUENT SCIENTIFIC LIMITED
1. We have audited the attached Consolidated Balance Sheet of SEQUENT SCIENTIFIC LIMITED (“the Company”), its subsidiaries (the Company and its subsidiaries constitute “the Group”) as at March 31, 2011 the Consolidated Profit and Loss Account and the Consolidated Cash Flow Statement of the Group for the year ended on that date, both annexed thereto. These financial statements are the responsibility of the Company’s Management and have been prepared on the basis of the separate financial statements and other financial information regarding components. Our responsibility is to express an opinion on these Consolidated Financial Statements based on our audit.
2. We conducted our audit in accordance with the auditing standards generally accepted in India. Those Standards require that we plan and perform the audit to obtain reasonable assurance about whether the financial statements are free of material misstatements. An audit includes examining, on a test basis, evidence supporting the amounts and the disclosures in the financial statements. An audit also includes assessing the accounting principles used and the significant estimates made by the Management, as well as evaluating the overall financial statement presentation. We believe that our audit provides a reasonable basis for our opinion.
3. We did not audit the financial statements of certain subsidiaries, whose financial statements reflect total assets of `709.25 Million as at March 31, 2011, total revenues of `388.79 Million and net cash outflows amounting to `(19.97) Million for the year ended as on that date as considered in the Consolidated Financial Statements. In respect of these subsidiaries:
a. the financial statements of the subsidiaries, whose financial statements reflect total assets of `350.69 Million as at March 31, 2011, total revenues of `136.67 Million and net cash outflows amounting to `3.24 Million for the year ended as on that date as considered in these Consolidate Financial Statements have been audited by other auditors, whose reports have been furnished to us, and our opinion, in so far as it relates to the amounts included in respect of these subsidiaries is based solely on the reports of the other auditors;
b. the financial statements of subsidiaries, whose financial statements reflect total assets of `358.56 Million as at March 31, 2011, total revenues of `252.12 Million and net cash inflows amounting to `(23.21) Million for the year ended on that date, as considered in these Consolidated Financial Statements have been compiled by the management and have not been subject to audit by independent auditors.
4. We report that the Consolidated Financial Statements have been prepared by the Company in accordance with the requirements of Accounting Standard 21 (Consolidated Financial Statements) as notified under the Companies (Accounting Standards) Rules, 2006.
5. We draw attention to Note C.1 of Schedule ‘P’ regarding the accounting of Scheme of Arrangement (“the Scheme”) between the Company, and its wholly owned subsidiary Vedic Elements Private Limited under section 391 to 394 and the other provisions of the Companies Act, 1956, which has been approved by the Hon’ble High Court of Karnataka. In accordance with the Scheme the Company has fair valued some of its fixed assets and investments and the net excess of such fair values over the previously carried book values, amounting to `341.08 Million has been credited to ‘Restructuring Reserve’ to be utilized for set off of goodwill arising on amalgamation.
As a result of the above:
(i) Insofar as the excess relates to Fixed assets, crediting such amounts to Restructuring Reserve is contrary to the requirements of Accounting Standard 10 Accounting for Fixed Assets.
(ii) Additional depreciation for the year on fair valued fixed assets amounting to `8.16 Million has been charged to the profit and loss statement instead of being adjusted against the ‘revaluation reserve’ as required under Accounting Standard 10’ Accounting for Fixed Assets’.
6. Subject to our comments in paragraph 3 (b) above and read with our comments in paragraph 5 above, based on our audit and on consideration of the separate audit reports on individual financial statements and to the best of our information and according to the explanations given to us, in our opinion, the Consolidated Financial Statements give a true and fair view in conformity with the accounting principles generally accepted in India:
(i) in the case of the Consolidated Balance Sheet, of the state of affairs of the Group as at March 31, 2011;
(ii) in the case of the Consolidated Profit and Loss Account, of the loss of the Group for the year ended on that date; and
(iii) in the case of the Consolidated Cash Flow Statement, of the cash flows of the Group for the year ended on that date.
For DELOITTE HASKINS & SELLS Chartered Accountants (Registration No.008072S) V. SrikumarPlace: Bangalore Partner Date: May 27, 2011 Membership No.84494
Consolidated AUDITORS’ REPORT
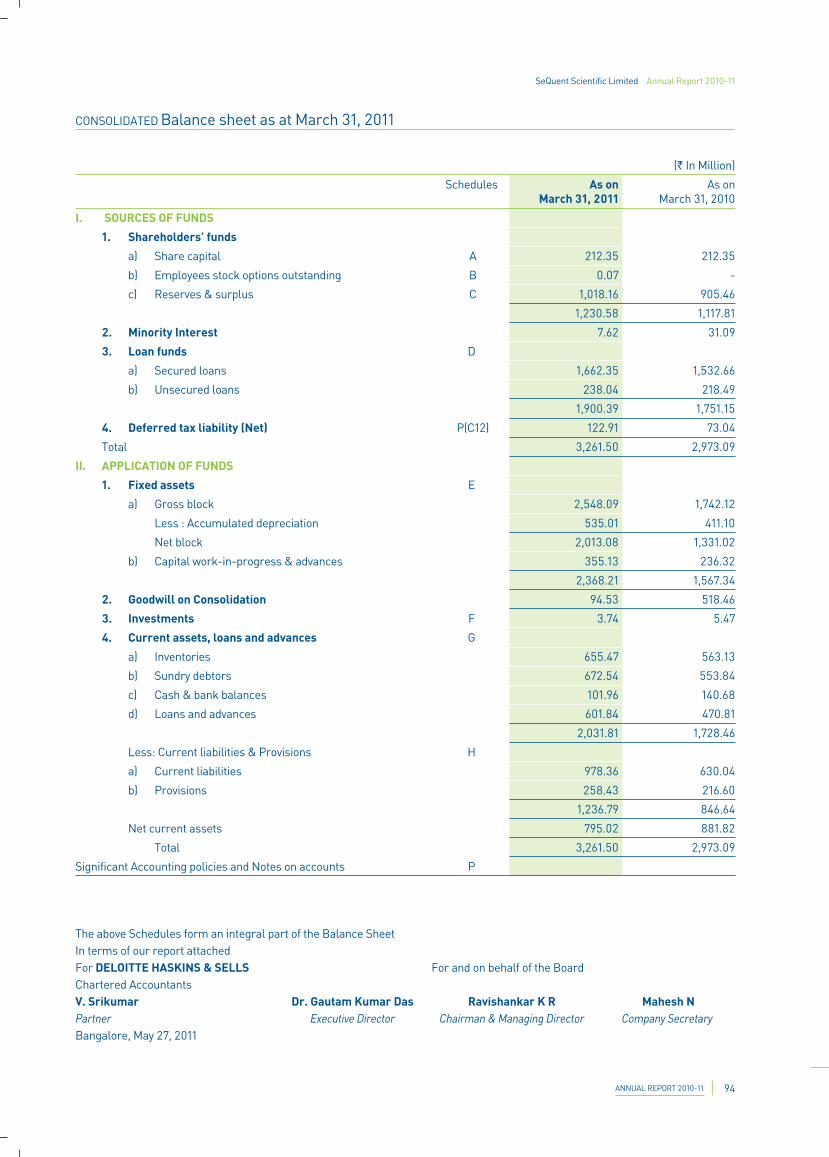
SeQuent Scientific Limited Annual Report 2010-11
ANNUAL REPORT 2010-11 94
CONSOLIDATED Balance sheet as at March 31, 2011
(` In Million)
Schedules As on March 31, 2011
As on March 31, 2010
I. SOURCES OF FUNDS
1. Shareholders’ funds
a) Share capital A 212.35 212.35
b) Employees stock options outstanding B 0.07 -
c) Reserves & surplus C 1,018.16 905.46
1,230.58 1,117.81
2. Minority Interest 7.62 31.09
3. Loan funds D
a) Secured loans 1,662.35 1,532.66
b) Unsecured loans 238.04 218.49
1,900.39 1,751.15
4. Deferred tax liability (Net) P(C12) 122.91 73.04
Total 3,261.50 2,973.09
II. APPLICATION OF FUNDS
1. Fixed assets E
a) Gross block 2,548.09 1,742.12
Less : Accumulated depreciation 535.01 411.10
Net block 2,013.08 1,331.02
b) Capital work-in-progress & advances 355.13 236.32
2,368.21 1,567.34
2. Goodwill on Consolidation 94.53 518.46
3. Investments F 3.74 5.47
4. Current assets, loans and advances G
a) Inventories 655.47 563.13
b) Sundry debtors 672.54 553.84
c) Cash & bank balances 101.96 140.68
d) Loans and advances 601.84 470.81
2,031.81 1,728.46
Less: Current liabilities & Provisions H
a) Current liabilities 978.36 630.04
b) Provisions 258.43 216.60
1,236.79 846.64
Net current assets 795.02 881.82
Total 3,261.50 2,973.09
Significant Accounting policies and Notes on accounts P
The above Schedules form an integral part of the Balance Sheet In terms of our report attachedFor DELOITTE HASKINS & SELLS For and on behalf of the BoardChartered AccountantsV. Srikumar Dr. Gautam Kumar Das Ravishankar K R Mahesh NPartner Executive Director Chairman & Managing Director Company SecretaryBangalore, May 27, 2011
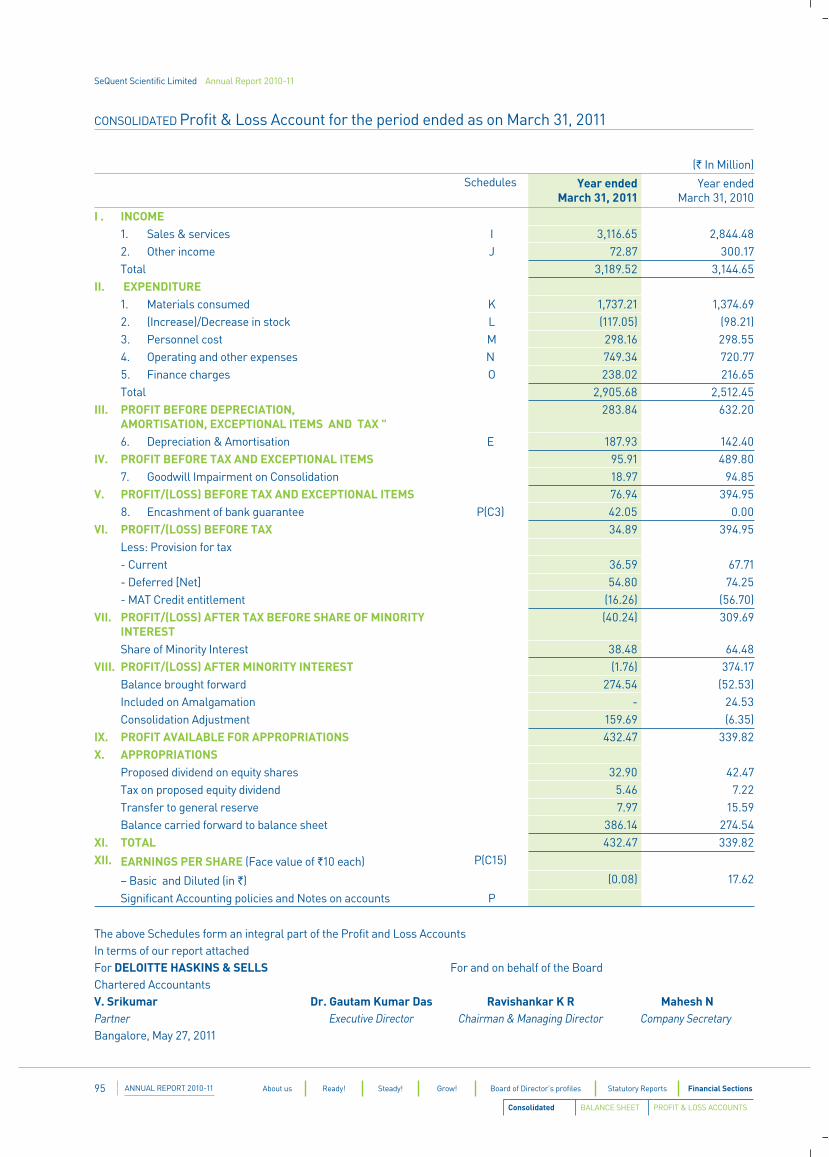
SeQuent Scientific Limited Annual Report 2010-11
ANNUAL REPORT 2010-1195 About us Ready! Steady! Grow! Board of Director’s profiles Statutory Reports Financial Sections
CONSOLIDATED Profit & Loss Account for the period ended as on March 31, 2011
(` In Million) Schedules Year ended
March 31, 2011Year ended
March 31, 2010
I . INCOME1. Sales & services I 3,116.65 2,844.48 2. Other income J 72.87 300.17 Total 3,189.52 3,144.65
II. EXPENDITURE 1. Materials consumed K 1,737.21 1,374.69 2. (Increase)/Decrease in stock L (117.05) (98.21)3. Personnel cost M 298.16 298.55 4. Operating and other expenses N 749.34 720.77 5. Finance charges O 238.02 216.65 Total 2,905.68 2,512.45
III. PROFIT BEFORE DEPRECIATION, AMORTISATION, EXCEPTIONAL ITEMS AND TAX "
283.84 632.20
6. Depreciation & Amortisation E 187.93 142.40 IV. PROFIT BEFORE TAX AND EXCEPTIONAL ITEMS 95.91 489.80
7. Goodwill Impairment on Consolidation 18.97 94.85 V. PROFIT/(LOSS) BEFORE TAX AND EXCEPTIONAL ITEMS 76.94 394.95
8. Encashment of bank guarantee P(C3) 42.05 0.00VI. PROFIT/(LOSS) BEFORE TAX 34.89 394.95
Less: Provision for tax - Current 36.59 67.71 - Deferred [Net] 54.80 74.25 - MAT Credit entitlement (16.26) (56.70)
VII. PROFIT/(LOSS) AFTER TAX BEFORE SHARE OF MINORITY INTEREST
(40.24) 309.69
Share of Minority Interest 38.48 64.48 VIII. PROFIT/(LOSS) AFTER MINORITY INTEREST (1.76) 374.17
Balance brought forward 274.54 (52.53)Included on Amalgamation - 24.53 Consolidation Adjustment 159.69 (6.35)
IX. PROFIT AVAILABLE FOR APPROPRIATIONS 432.47 339.82 X. APPROPRIATIONS
Proposed dividend on equity shares 32.90 42.47 Tax on proposed equity dividend 5.46 7.22 Transfer to general reserve 7.97 15.59 Balance carried forward to balance sheet 386.14 274.54
XI. TOTAL 432.47 339.82 XII. EARNINGS PER SHARE (Face value of `10 each) P(C15)
– Basic and Diluted (in `) (0.08) 17.62
Significant Accounting policies and Notes on accounts P
Consolidated BALANCE SHEET PROFIT & LOSS ACCOUNTS
The above Schedules form an integral part of the Profit and Loss AccountsIn terms of our report attachedFor DELOITTE HASKINS & SELLS For and on behalf of the BoardChartered AccountantsV. Srikumar Dr. Gautam Kumar Das Ravishankar K R Mahesh NPartner Executive Director Chairman & Managing Director Company SecretaryBangalore, May 27, 2011
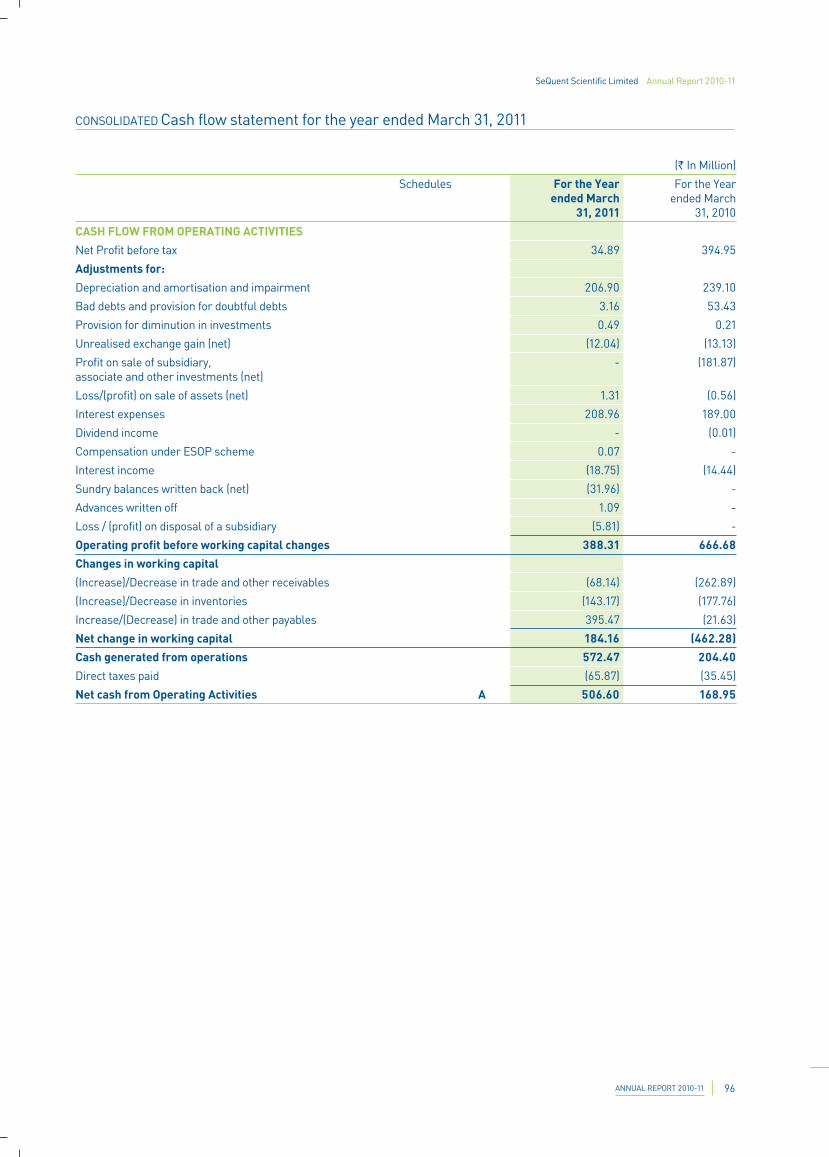
SeQuent Scientific Limited Annual Report 2010-11
ANNUAL REPORT 2010-11 96
CONSOLIDATED Cash flow statement for the year ended March 31, 2011
(` In Million)
Schedules For the Year ended March
31, 2011
For the Year ended March
31, 2010
CASH FLOW FROM OPERATING ACTIVITIES
Net Profit before tax 34.89 394.95
Adjustments for:
Depreciation and amortisation and impairment 206.90 239.10
Bad debts and provision for doubtful debts 3.16 53.43
Provision for diminution in investments 0.49 0.21
Unrealised exchange gain (net) (12.04) (13.13)
Profit on sale of subsidiary, associate and other investments (net)
- (181.87)
Loss/(profit) on sale of assets (net) 1.31 (0.56)
Interest expenses 208.96 189.00
Dividend income - (0.01)
Compensation under ESOP scheme 0.07 -
Interest income (18.75) (14.44)
Sundry balances written back (net) (31.96) -
Advances written off 1.09 -
Loss / (profit) on disposal of a subsidiary (5.81) -
Operating profit before working capital changes 388.31 666.68
Changes in working capital
(Increase)/Decrease in trade and other receivables (68.14) (262.89)
(Increase)/Decrease in inventories (143.17) (177.76)
Increase/(Decrease) in trade and other payables 395.47 (21.63)
Net change in working capital 184.16 (462.28)
Cash generated from operations 572.47 204.40
Direct taxes paid (65.87) (35.45)
Net cash from Operating Activities A 506.60 168.95
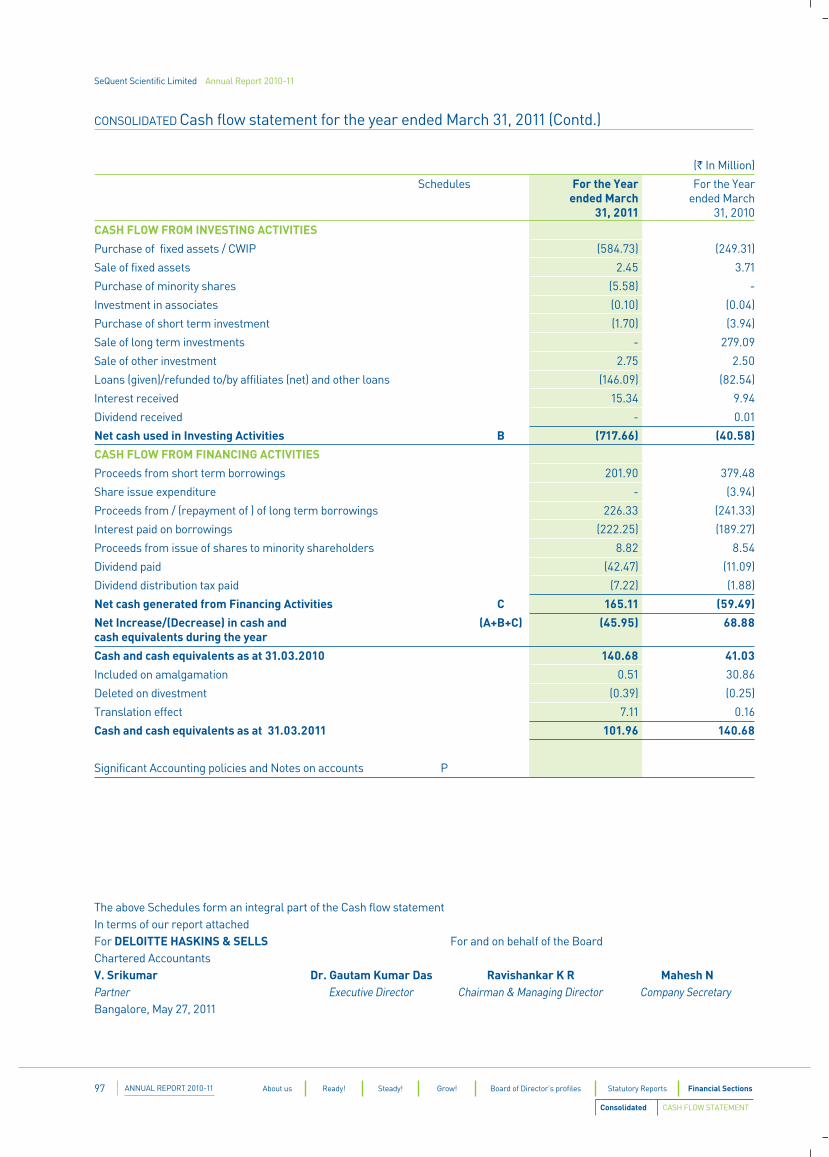
SeQuent Scientific Limited Annual Report 2010-11
ANNUAL REPORT 2010-1197 About us Ready! Steady! Grow! Board of Director’s profiles Statutory Reports Financial Sections
CONSOLIDATED Cash flow statement for the year ended March 31, 2011 (Contd.)
(` In Million)
Schedules For the Year ended March
31, 2011
For the Year ended March
31, 2010 CASH FLOW FROM INVESTING ACTIVITIES
Purchase of fixed assets / CWIP (584.73) (249.31)
Sale of fixed assets 2.45 3.71
Purchase of minority shares (5.58) -
Investment in associates (0.10) (0.04)
Purchase of short term investment (1.70) (3.94)
Sale of long term investments - 279.09
Sale of other investment 2.75 2.50
Loans (given)/refunded to/by affiliates (net) and other loans (146.09) (82.54)
Interest received 15.34 9.94
Dividend received - 0.01
Net cash used in Investing Activities B (717.66) (40.58)
CASH FLOW FROM FINANCING ACTIVITIES
Proceeds from short term borrowings 201.90 379.48
Share issue expenditure - (3.94)
Proceeds from / (repayment of ) of long term borrowings 226.33 (241.33)
Interest paid on borrowings (222.25) (189.27)
Proceeds from issue of shares to minority shareholders 8.82 8.54
Dividend paid (42.47) (11.09)
Dividend distribution tax paid (7.22) (1.88)
Net cash generated from Financing Activities C 165.11 (59.49)
Net Increase/(Decrease) in cash and cash equivalents during the year
(A+B+C) (45.95) 68.88
Cash and cash equivalents as at 31.03.2010 140.68 41.03
Included on amalgamation 0.51 30.86
Deleted on divestment (0.39) (0.25)
Translation effect 7.11 0.16
Cash and cash equivalents as at 31.03.2011 101.96 140.68
Significant Accounting policies and Notes on accounts P
Consolidated CASH FLOW STATEMENT
The above Schedules form an integral part of the Cash flow statementIn terms of our report attachedFor DELOITTE HASKINS & SELLS For and on behalf of the BoardChartered AccountantsV. Srikumar Dr. Gautam Kumar Das Ravishankar K R Mahesh NPartner Executive Director Chairman & Managing Director Company SecretaryBangalore, May 27, 2011
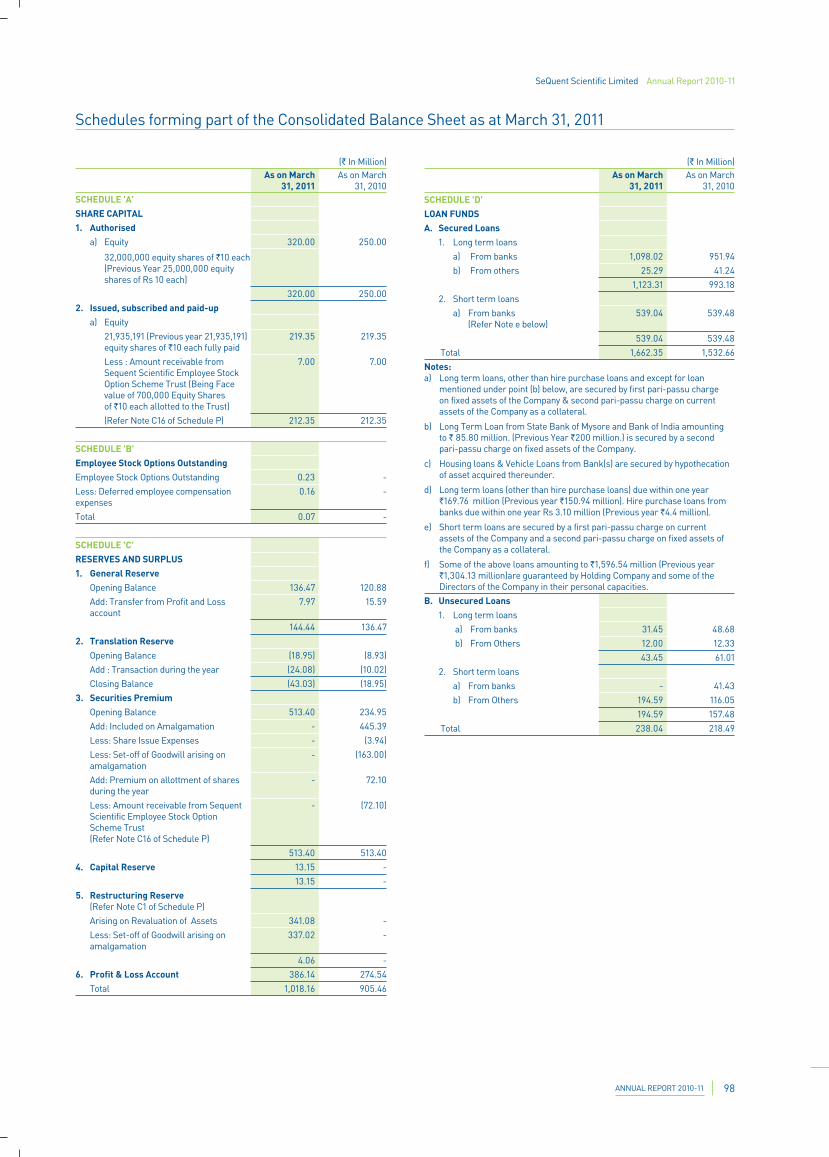
SeQuent Scientific Limited Annual Report 2010-11
ANNUAL REPORT 2010-11 98
Schedules forming part of the Consolidated Balance Sheet as at March 31, 2011
(` In Million) As on March
31, 2011 As on March
31, 2010 SCHEDULE 'A' SHARE CAPITAL 1. Authorised
a) Equity 320.00 250.00
32,000,000 equity shares of `10 each (Previous Year 25,000,000 equity shares of Rs 10 each)
320.00 250.00
2. Issued, subscribed and paid-upa) Equity
21,935,191 (Previous year 21,935,191) equity shares of `10 each fully paid
219.35 219.35
Less : Amount receivable from Sequent Scientific Employee Stock Option Scheme Trust (Being Face value of 700,000 Equity Shares of `10 each allotted to the Trust)
7.00 7.00
(Refer Note C16 of Schedule P) 212.35 212.35
SCHEDULE 'B' Employee Stock Options OutstandingEmployee Stock Options Outstanding 0.23 -
Less: Deferred employee compensation expenses
0.16 -
Total 0.07 -
SCHEDULE 'C' RESERVES AND SURPLUS1. General Reserve
Opening Balance 136.47 120.88
Add: Transfer from Profit and Loss account
7.97 15.59
144.44 136.47
2. Translation ReserveOpening Balance (18.95) (8.93)
Add : Transaction during the year (24.08) (10.02)
Closing Balance (43.03) (18.95)
3. Securities PremiumOpening Balance 513.40 234.95
Add: Included on Amalgamation - 445.39
Less: Share Issue Expenses - (3.94)
Less: Set-off of Goodwill arising on amalgamation
- (163.00)
Add: Premium on allottment of shares during the year
- 72.10
Less: Amount receivable from Sequent Scientific Employee Stock Option Scheme Trust (Refer Note C16 of Schedule P)
- (72.10)
513.40 513.40
4. Capital Reserve 13.15 -
13.15 -
5. Restructuring Reserve(Refer Note C1 of Schedule P)
Arising on Revaluation of Assets 341.08 -
Less: Set-off of Goodwill arising on amalgamation
337.02 -
4.06 -
6. Profit & Loss Account 386.14 274.54
Total 1,018.16 905.46
SCHEDULE 'D' LOAN FUNDSA. Secured Loans 1. Long term loans
a) From banks 1,098.02 951.94
b) From others 25.29 41.24
1,123.31 993.18
2. Short term loans
a) From banks (Refer Note e below)
539.04 539.48
539.04 539.48
Total 1,662.35 1,532.66
Notes: a) Long term loans, other than hire purchase loans and except for loan
mentioned under point (b) below, are secured by first pari-passu charge on fixed assets of the Company & second pari-passu charge on current assets of the Company as a collateral.
b) Long Term Loan from State Bank of Mysore and Bank of India amounting to ` 85.80 million. (Previous Year `200 million.) is secured by a second pari-passu charge on fixed assets of the Company.
c) Housing loans & Vehicle Loans from Bank(s) are secured by hypothecation of asset acquired thereunder.
d) Long term loans (other than hire purchase loans) due within one year `169.76 million (Previous year `150.94 million). Hire purchase loans from banks due within one year Rs 3.10 million (Previous year `4.4 million).
e) Short term loans are secured by a first pari-passu charge on current assets of the Company and a second pari-passu charge on fixed assets of the Company as a collateral.
f) Some of the above loans amounting to `1,596.54 million (Previous year `1,304.13 million)are guaranteed by Holding Company and some of the Directors of the Company in their personal capacities.
B. Unsecured Loans 1. Long term loans
a) From banks 31.45 48.68
b) From Others 12.00 12.33
43.45 61.01
2. Short term loans
a) From banks - 41.43
b) From Others 194.59 116.05
194.59 157.48
Total 238.04 218.49
(` In Million) As on March
31, 2011 As on March
31, 2010
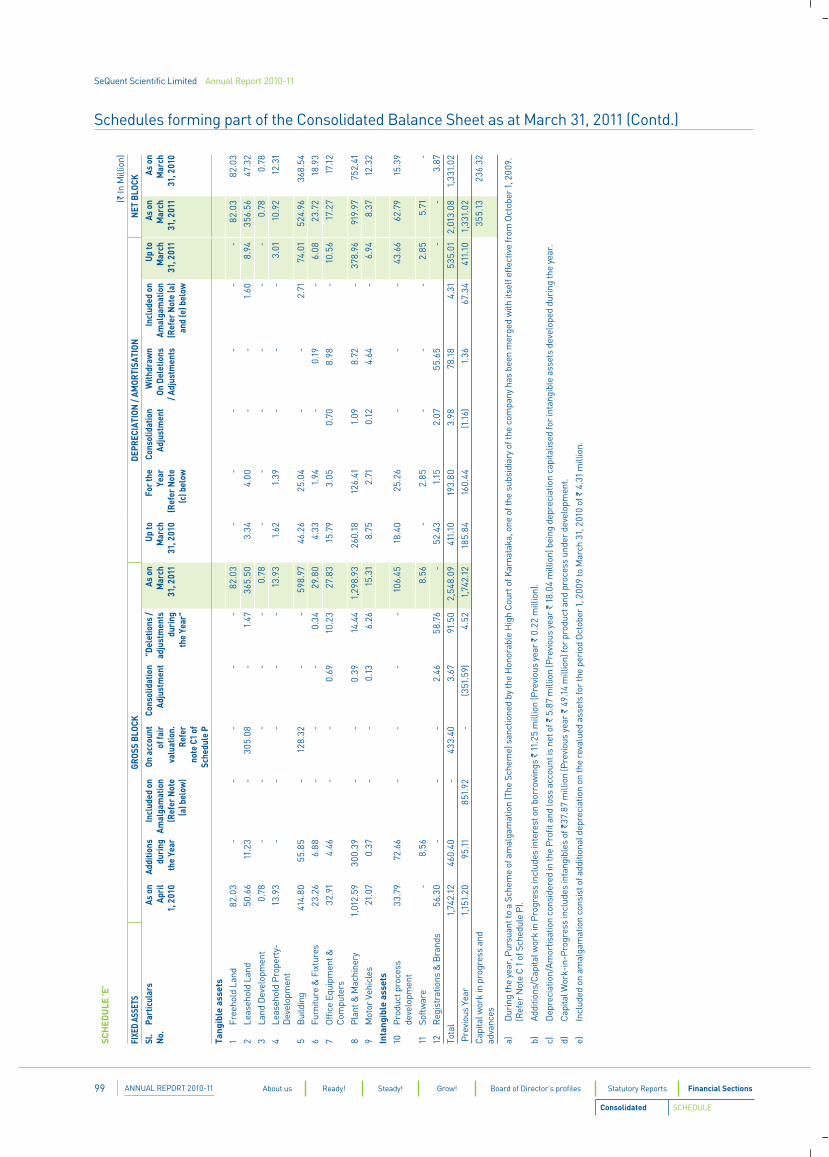
SeQuent Scientific Limited Annual Report 2010-11
ANNUAL REPORT 2010-1199 About us Ready! Steady! Grow! Board of Director’s profiles Statutory Reports Financial Sections
Schedules forming part of the Consolidated Balance Sheet as at March 31, 2011 (Contd.)
Consolidated SCHEDULE
SCH
EDU
LE 'E
'
(` In
Mill
ion)
FIXE
D AS
SETS
GROS
S BL
OCK
DEPR
ECIA
TION
/ AM
ORTI
SATI
ONN
ET B
LOCK
Sl.
No.
Part
icul
ars
As o
n Ap
ril
1, 2
010
Addi
tions
du
ring
th
e Ye
ar
Incl
uded
on
Amal
gam
atio
n (R
efer
Not
e (a
) bel
ow)
On a
ccou
nt
of fa
ir
valu
atio
n.
Refe
r no
te C
1 of
Sc
hedu
le P
Cons
olid
atio
n Ad
just
men
t"D
elet
ions
/ ad
just
men
ts
duri
ng
the
Year
"
As o
n M
arch
31
, 201
1
Up to
M
arch
31
, 201
0
For t
he
Year
(R
efer
Not
e (c
) bel
ow
Cons
olid
atio
n Ad
just
men
tW
ithdr
awn
On D
elet
ions
/ A
djus
tmen
ts
Incl
uded
on
Amal
gam
atio
n (R
efer
Not
e (a
) an
d (e
) bel
ow
Up to
M
arch
31
, 201
1
As o
n M
arch
31
, 201
1
As o
n M
arch
31
, 201
0
Tang
ible
ass
ets
1Fr
eeho
ld L
and
82.
03
-
-
-
-
-
82.
03
-
-
-
-
-
-
82.
03
82.
03
2Le
aseh
old
Land
50.
66
11.
23
-
305
.08
-
1
.47
3
65.5
0
3.3
4
4.0
0
-
-
1.6
0
8.9
4
356
.56
4
7.32
3La
nd D
evel
opm
ent
0.7
8
-
-
-
-
-
0.7
8
-
-
-
-
-
-
0.7
8
0.7
8
4Le
aseh
old
Prop
erty
- D
evel
opm
ent
13.
93
-
-
-
-
-
13.
93
1.6
2
1.3
9
-
-
-
3.0
1 1
0.92
1
2.31
5B
uild
ing
414
.80
5
5.85
-
1
28.3
2
-
-
598
.97
4
6.26
2
5.04
-
-
2
.71
74.
01
524
.96
3
68.5
4
6Fu
rnitu
re &
Fix
ture
s 2
3.26
6
.88
-
-
-
0
.34
2
9.80
4
.33
1
.94
-
0
.19
-
6
.08
2
3.72
1
8.93
7O
ffice
Equ
ipm
ent &
C
ompu
ters
32.
91
4.4
6
-
-
0.6
9
10.
23
27.
83
15.
79
3.0
5
0.7
0
8.9
8
-
10.
56
17.
27
17.
12
8Pl
ant &
Mac
hine
ry 1
,012
.59
3
00.3
9
-
-
0.3
9
14.
44
1,2
98.9
3
260
.18
1
26.4
1 1
.09
8
.72
-
3
78.9
6
919
.97
7
52.4
1
9M
otor
Veh
icle
s 2
1.07
0
.37
-
-
0
.13
6
.26
1
5.31
8
.75
2
.71
0.1
2
4.6
4
-
6.9
4
8.3
7
12.
32
Inta
ngib
le a
sset
s10
Prod
uct p
roce
ss
deve
lopm
ent
33.
79
72.
66
-
-
-
-
106
.45
1
8.40
2
5.26
-
-
-
4
3.66
6
2.79
1
5.39
11So
ftwar
e -
8
.56
8
.56
-
2
.85
-
-
-
2
.85
5
.71
-
12R
egis
trat
ions
& B
rand
s 5
6.30
-
-
-
2
.46
5
8.76
-
5
2.43
1
.15
2
.07
5
5.65
-
-
3
.87
Tota
l 1
,742
.12
4
60.4
0
-
433
.40
3
.67
9
1.50
2
,548
.09
4
11.1
0
193
.80
3
.98
7
8.18
4
.31
535
.01
2,0
13.0
8
1,3
31.0
2
Pre
viou
s Ye
ar
1,1
51.2
0
95.
11
851
.92
-
(3
51.5
9) 4
.52
1
,742
.12
1
85.8
4
160
.44
(1
.16)
1.3
6
67.
34
411
.10
1
,331
.02
Cap
ital w
ork
in p
rogr
ess
and
adva
nces
355
.13
2
36.3
2
a)
Dur
ing
the
year
, Pur
suan
t to
a Sc
hem
e of
am
alga
mat
ion
(The
Sch
eme)
san
ctio
ned
by th
e H
onor
able
Hig
h C
ourt
of K
arna
taka
, one
of t
he s
ubsi
diar
y of
the
com
pany
has
bee
n m
erge
d w
ith it
self
effe
ctiv
e fr
om O
ctob
er 1
, 200
9.
(Ref
er N
ote
C 1
of S
ched
ule
P).
b)
Addi
tions
/Cap
ital w
ork
in P
rogr
ess
incl
udes
inte
rest
on
borr
owin
gs `
11.
25 m
illio
n (P
revi
ous
year
` 0
.22
mill
ion)
.
c)
Dep
reci
atio
n/Am
ortis
atio
n co
nsid
ered
in th
e Pr
ofit
and
loss
acc
ount
is n
et o
f ` 5
.87
mill
ion
(Pre
viou
s ye
ar `
18.
04 m
illio
n) b
eing
dep
reci
atio
n ca
pita
lised
for
inta
ngib
le a
sset
s de
velo
ped
duri
ng th
e ye
ar.
d)
Cap
ital W
ork-
in-P
rogr
ess
incl
udes
inta
ngib
les
of `
37.8
7 m
illio
n (P
revi
ous
year
` 4
9.14
mill
ion)
for
prod
uct a
nd p
roce
ss u
nder
dev
elop
men
t.
e)
Incl
uded
on
amal
gam
atio
n co
nsis
t of a
dditi
onal
dep
reci
atio
n on
the
reva
lued
ass
ets
for
the
peri
od O
ctob
er 1
, 200
9 to
Mar
ch 3
1, 2
010
of `
4.3
1 m
illio
n.
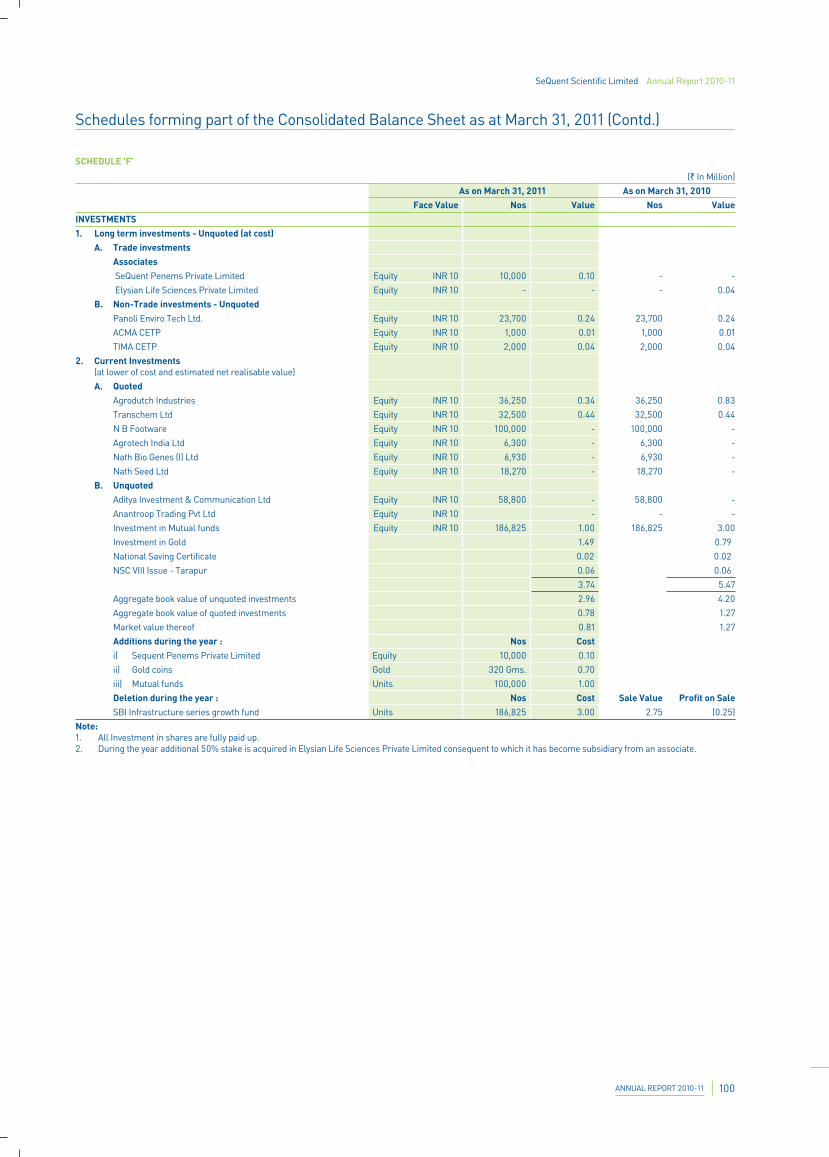
SeQuent Scientific Limited Annual Report 2010-11
ANNUAL REPORT 2010-11 100
Schedules forming part of the Consolidated Balance Sheet as at March 31, 2011 (Contd.)
SCHEDULE 'F'
(` In Million)
As on March 31, 2011 As on March 31, 2010 Face Value Nos Value Nos Value
INVESTMENTS 1. Long term investments - Unquoted (at cost)
A. Trade investments Associates SeQuent Penems Private Limited Equity INR 10 10,000 0.10 - -
Elysian Life Sciences Private Limited Equity INR 10 - - - 0.04
B. Non-Trade investments - UnquotedPanoli Enviro Tech Ltd. Equity INR 10 23,700 0.24 23,700 0.24
ACMA CETP Equity INR 10 1,000 0.01 1,000 0.01
TIMA CETP Equity INR 10 2,000 0.04 2,000 0.04
2. Current Investments(at lower of cost and estimated net realisable value)
A. QuotedAgrodutch Industries Equity INR 10 36,250 0.34 36,250 0.83
Transchem Ltd Equity INR 10 32,500 0.44 32,500 0.44
N B Footware Equity INR 10 100,000 - 100,000 -
Agrotech India Ltd Equity INR 10 6,300 - 6,300 -
Nath Bio Genes (I) Ltd Equity INR 10 6,930 - 6,930 -
Nath Seed Ltd Equity INR 10 18,270 - 18,270 -
B. Unquoted Aditya Investment & Communication Ltd Equity INR 10 58,800 - 58,800 -
Anantroop Trading Pvt Ltd Equity INR 10 - - -
Investment in Mutual funds Equity INR 10 186,825 1.00 186,825 3.00
Investment in Gold 1.49 0.79
National Saving Certificate 0.02 0.02
NSC VIII Issue - Tarapur 0.06 0.06
3.74 5.47
Aggregate book value of unquoted investments 2.96 4.20
Aggregate book value of quoted investments 0.78 1.27
Market value thereof 0.81 1.27
Additions during the year : Nos Cost i) Sequent Penems Private Limited Equity 10,000 0.10
ii) Gold coins Gold 320 Gms. 0.70
iii) Mutual funds Units 100,000 1.00
Deletion during the year : Nos Cost Sale Value Profit on SaleSBI Infrastructure series growth fund Units 186,825 3.00 2.75 (0.25)
Note: 1. All Investment in shares are fully paid up.2. During the year additional 50% stake is acquired in Elysian Life Sciences Private Limited consequent to which it has become subsidiary from an associate.
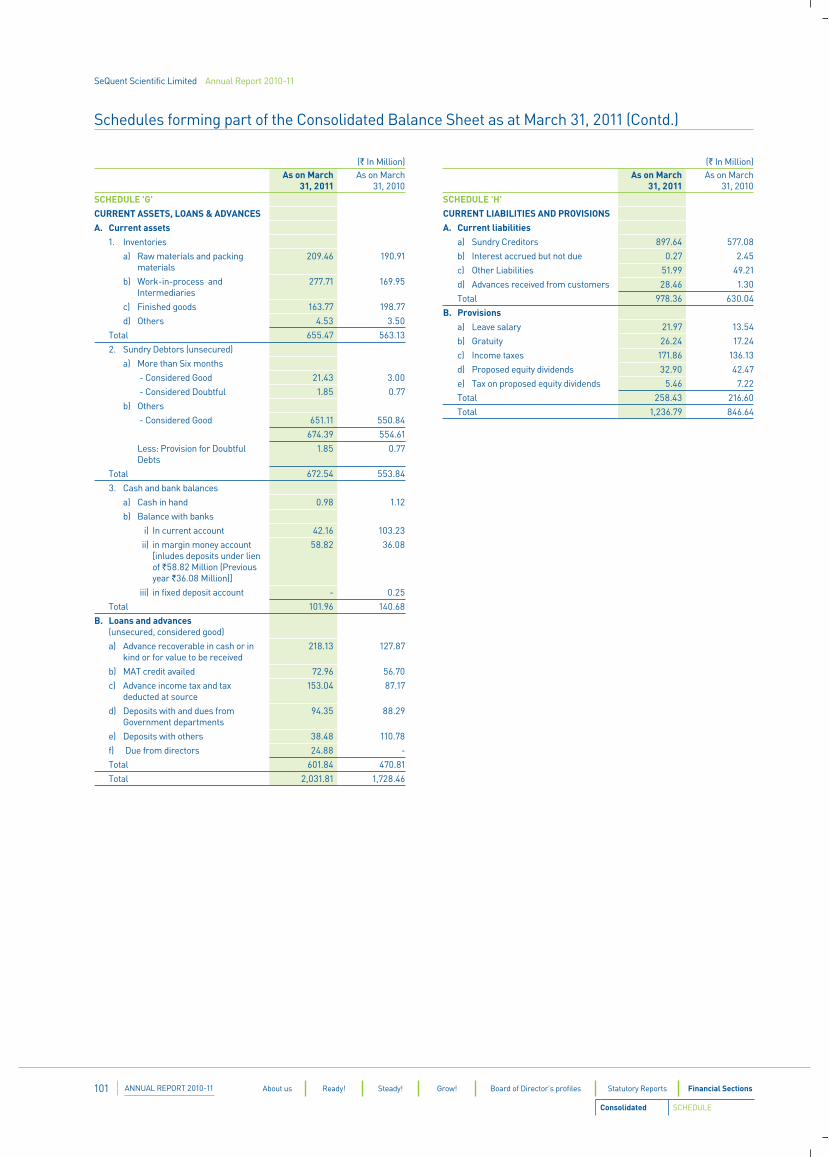
SeQuent Scientific Limited Annual Report 2010-11
ANNUAL REPORT 2010-11101 About us Ready! Steady! Grow! Board of Director’s profiles Statutory Reports Financial Sections
Schedules forming part of the Consolidated Balance Sheet as at March 31, 2011 (Contd.)
SCHEDULE 'H' CURRENT LIABILITIES AND PROVISIONSA. Current liabilities
a) Sundry Creditors 897.64 577.08
b) Interest accrued but not due 0.27 2.45
c) Other Liabilities 51.99 49.21
d) Advances received from customers 28.46 1.30
Total 978.36 630.04
B. Provisionsa) Leave salary 21.97 13.54
b) Gratuity 26.24 17.24
c) Income taxes 171.86 136.13
d) Proposed equity dividends 32.90 42.47
e) Tax on proposed equity dividends 5.46 7.22
Total 258.43 216.60
Total 1,236.79 846.64
(` In Million) As on March
31, 2011 As on March
31, 2010 SCHEDULE 'G' CURRENT ASSETS, LOANS & ADVANCESA. Current assets
1. Inventories
a) Raw materials and packing materials
209.46 190.91
b) Work-in-process and Intermediaries
277.71 169.95
c) Finished goods 163.77 198.77
d) Others 4.53 3.50
Total 655.47 563.13
2. Sundry Debtors (unsecured)
a) More than Six months
- Considered Good 21.43 3.00
- Considered Doubtful 1.85 0.77
b) Others
- Considered Good 651.11 550.84
674.39 554.61
Less: Provision for Doubtful Debts
1.85 0.77
Total 672.54 553.84
3. Cash and bank balances
a) Cash in hand 0.98 1.12
b) Balance with banks
i) In current account 42.16 103.23
ii) in margin money account [inludes deposits under lien of `58.82 Million (Previous year `36.08 Million)]
58.82 36.08
iii) in fixed deposit account - 0.25
Total 101.96 140.68
B. Loans and advances(unsecured, considered good)
a) Advance recoverable in cash or in kind or for value to be received
218.13 127.87
b) MAT credit availed 72.96 56.70
c) Advance income tax and tax deducted at source
153.04 87.17
d) Deposits with and dues from Government departments
94.35 88.29
e) Deposits with others 38.48 110.78
f) Due from directors 24.88 -
Total 601.84 470.81
Total 2,031.81 1,728.46
(` In Million) As on March
31, 2011 As on March
31, 2010
Consolidated SCHEDULE
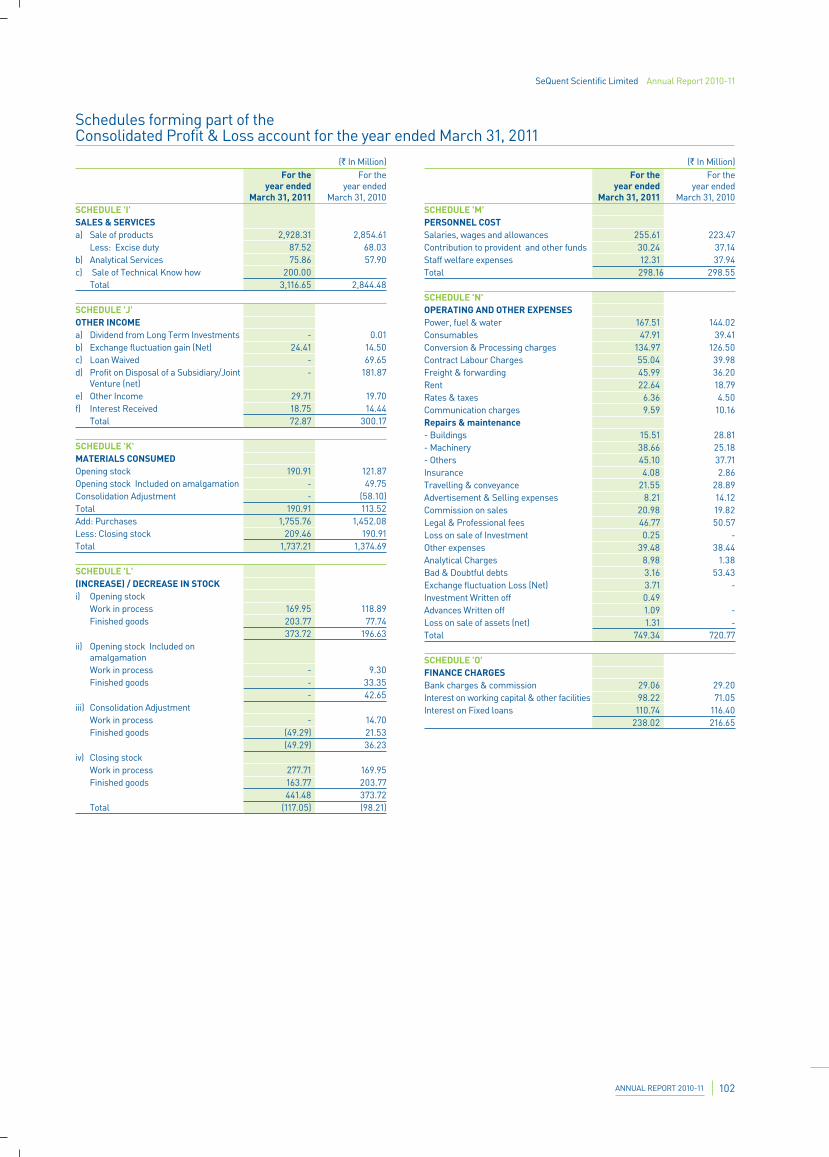
SeQuent Scientific Limited Annual Report 2010-11
ANNUAL REPORT 2010-11 102
SCHEDULE 'M' PERSONNEL COSTSalaries, wages and allowances 255.61 223.47 Contribution to provident and other funds 30.24 37.14 Staff welfare expenses 12.31 37.94 Total 298.16 298.55
SCHEDULE 'N' OPERATING AND OTHER EXPENSESPower, fuel & water 167.51 144.02 Consumables 47.91 39.41 Conversion & Processing charges 134.97 126.50 Contract Labour Charges 55.04 39.98 Freight & forwarding 45.99 36.20 Rent 22.64 18.79 Rates & taxes 6.36 4.50 Communication charges 9.59 10.16 Repairs & maintenance- Buildings 15.51 28.81 - Machinery 38.66 25.18 - Others 45.10 37.71 Insurance 4.08 2.86 Travelling & conveyance 21.55 28.89 Advertisement & Selling expenses 8.21 14.12 Commission on sales 20.98 19.82 Legal & Professional fees 46.77 50.57 Loss on sale of Investment 0.25 - Other expenses 39.48 38.44 Analytical Charges 8.98 1.38 Bad & Doubtful debts 3.16 53.43 Exchange fluctuation Loss (Net) 3.71 - Investment Written off 0.49 Advances Written off 1.09 - Loss on sale of assets (net) 1.31 - Total 749.34 720.77
SCHEDULE 'O' FINANCE CHARGESBank charges & commission 29.06 29.20 Interest on working capital & other facilities 98.22 71.05 Interest on Fixed loans 110.74 116.40
238.02 216.65
(` In Million) For the
year ended March 31, 2011
For the year ended
March 31, 2010 SCHEDULE 'I' SALES & SERVICESa) Sale of products 2,928.31 2,854.61
Less: Excise duty 87.52 68.03 b) Analytical Services 75.86 57.90 c) Sale of Technical Know how 200.00
Total 3,116.65 2,844.48
SCHEDULE 'J' OTHER INCOMEa) Dividend from Long Term Investments - 0.01 b) Exchange fluctuation gain (Net) 24.41 14.50 c) Loan Waived - 69.65 d) Profit on Disposal of a Subsidiary/Joint
Venture (net) - 181.87
e) Other Income 29.71 19.70 f) Interest Received 18.75 14.44
Total 72.87 300.17
SCHEDULE 'K' MATERIALS CONSUMEDOpening stock 190.91 121.87 Opening stock Included on amalgamation - 49.75 Consolidation Adjustment - (58.10)Total 190.91 113.52 Add: Purchases 1,755.76 1,452.08 Less: Closing stock 209.46 190.91 Total 1,737.21 1,374.69
SCHEDULE 'L' (INCREASE) / DECREASE IN STOCKi) Opening stock
Work in process 169.95 118.89 Finished goods 203.77 77.74
373.72 196.63 ii) Opening stock Included on
amalgamationWork in process - 9.30 Finished goods - 33.35
- 42.65 iii) Consolidation Adjustment
Work in process - 14.70 Finished goods (49.29) 21.53
(49.29) 36.23 iv) Closing stock
Work in process 277.71 169.95 Finished goods 163.77 203.77
441.48 373.72 Total (117.05) (98.21)
(` In Million) For the
year ended March 31, 2011
For the year ended
March 31, 2010
Schedules forming part of the Consolidated Profit & Loss account for the year ended March 31, 2011
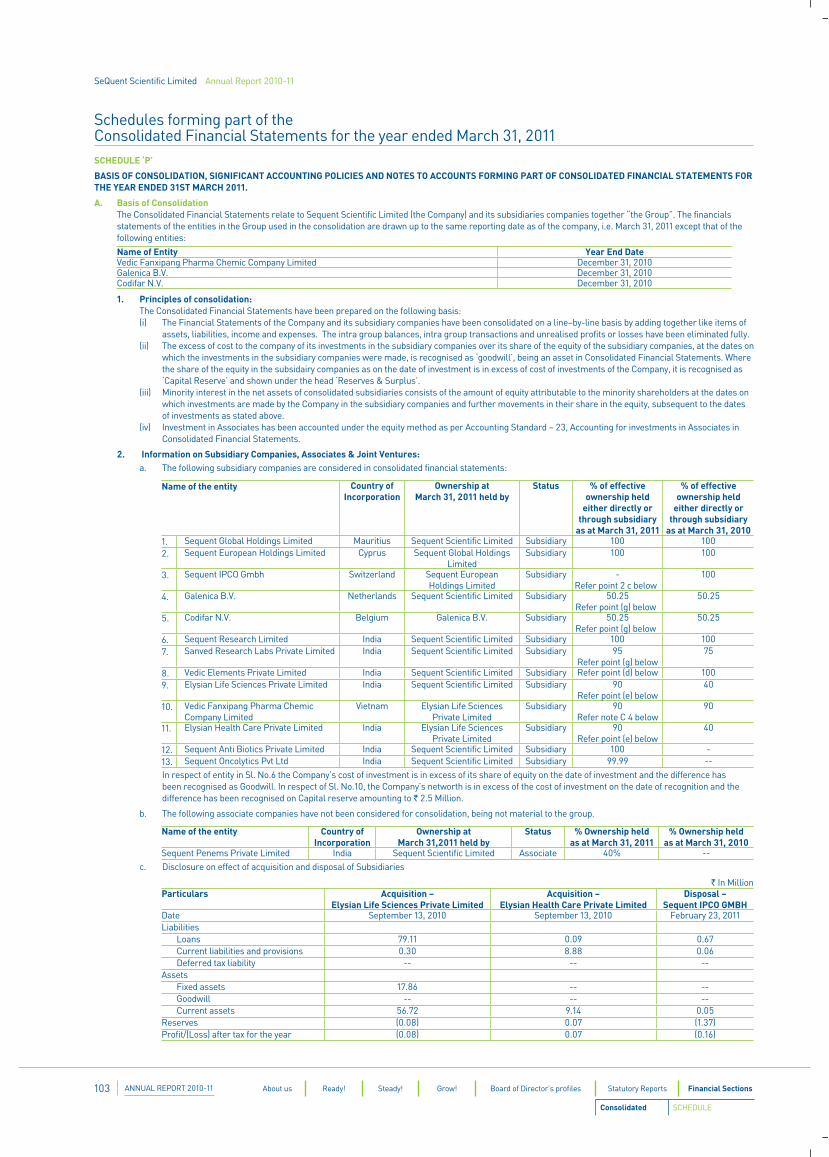
SeQuent Scientific Limited Annual Report 2010-11
ANNUAL REPORT 2010-11103 About us Ready! Steady! Grow! Board of Director’s profiles Statutory Reports Financial Sections
Schedules forming part of the Consolidated Financial Statements for the year ended March 31, 2011SCHEDULE ‘P’
BASIS OF CONSOLIDATION, SIGNIFICANT ACCOUNTING POLICIES AND NOTES TO ACCOUNTS FORMING PART OF CONSOLIDATED FINANCIAL STATEMENTS FOR THE YEAR ENDED 31ST MARCH 2011.
A. Basis of Consolidation The Consolidated Financial Statements relate to Sequent Scientific Limited (the Company) and its subsidiaries companies together “the Group”. The financials
statements of the entities in the Group used in the consolidation are drawn up to the same reporting date as of the company, i.e. March 31, 2011 except that of the following entities:
Name of Entity Year End DateVedic Fanxipang Pharma Chemic Company Limited December 31, 2010Galenica B.V. December 31, 2010Codifar N.V. December 31, 2010
1. Principles of consolidation: The Consolidated Financial Statements have been prepared on the following basis: (i) The Financial Statements of the Company and its subsidiary companies have been consolidated on a line–by-line basis by adding together like items of
assets, liabilities, income and expenses. The intra group balances, intra group transactions and unrealised profits or losses have been eliminated fully. (ii) The excess of cost to the company of its investments in the subsidiary companies over its share of the equity of the subsidiary companies, at the dates on
which the investments in the subsidiary companies were made, is recognised as ‘goodwill’, being an asset in Consolidated Financial Statements. Where the share of the equity in the subsidairy companies as on the date of investment is in excess of cost of investments of the Company, it is recognised as ‘Capital Reserve’ and shown under the head ‘Reserves & Surplus’.
(iii) Minority interest in the net assets of consolidated subsidiaries consists of the amount of equity attributable to the minority shareholders at the dates on which investments are made by the Company in the subsidiary companies and further movements in their share in the equity, subsequent to the dates of investments as stated above.
(iv) Investment in Associates has been accounted under the equity method as per Accounting Standard – 23, Accounting for investments in Associates in Consolidated Financial Statements.
2. Information on Subsidiary Companies, Associates & Joint Ventures: a. The following subsidiary companies are considered in consolidated financial statements:
Name of the entity Country of Incorporation
Ownership at March 31, 2011 held by
Status % of effective ownership held
either directly or through subsidiary
as at March 31, 2011
% of effective ownership held
either directly or through subsidiary
as at March 31, 20101. Sequent Global Holdings Limited Mauritius Sequent Scientific Limited Subsidiary 100 1002. Sequent European Holdings Limited Cyprus Sequent Global Holdings
LimitedSubsidiary 100 100
3. Sequent IPCO Gmbh Switzerland Sequent European Holdings Limited
Subsidiary -Refer point 2 c below
100
4. Galenica B.V. Netherlands Sequent Scientific Limited Subsidiary 50.25 Refer point (g) below
50.25
5. Codifar N.V. Belgium Galenica B.V. Subsidiary 50.25Refer point (g) below
50.25
6. Sequent Research Limited India Sequent Scientific Limited Subsidiary 100 1007. Sanved Research Labs Private Limited India Sequent Scientific Limited Subsidiary 95
Refer point (g) below75
8. Vedic Elements Private Limited India Sequent Scientific Limited Subsidiary Refer point (d) below 1009. Elysian Life Sciences Private Limited India Sequent Scientific Limited Subsidiary 90
Refer point (e) below40
10. Vedic Fanxipang Pharma Chemic Company Limited
Vietnam Elysian Life Sciences Private Limited
Subsidiary 90Refer note C 4 below
90
11. Elysian Health Care Private Limited India Elysian Life Sciences Private Limited
Subsidiary 90 Refer point (e) below
40
12. Sequent Anti Biotics Private Limited India Sequent Scientific Limited Subsidiary 100 -13. Sequent Oncolytics Pvt Ltd India Sequent Scientific Limited Subsidiary 99.99 --
In respect of entity in Sl. No.6 the Company’s cost of investment is in excess of its share of equity on the date of investment and the difference has been recognised as Goodwill. In respect of Sl. No.10, the Company’s networth is in excess of the cost of investment on the date of recognition and the difference has been recognised on Capital reserve amounting to ` 2.5 Million.
b. The following associate companies have not been considered for consolidation, being not material to the group.
Name of the entity Country of Incorporation
Ownership at March 31,2011 held by
Status % Ownership held as at March 31, 2011
% Ownership held as at March 31, 2010
Sequent Penems Private Limited India Sequent Scientific Limited Associate 40% -- c. Disclosure on effect of acquisition and disposal of Subsidiaries
` In MillionParticulars Acquisition –
Elysian Life Sciences Private LimitedAcquisition –
Elysian Health Care Private LimitedDisposal –
Sequent IPCO GMBHDate September 13, 2010 September 13, 2010 February 23, 2011Liabilities
Loans 79.11 0.09 0.67Current liabilities and provisions 0.30 8.88 0.06Deferred tax liability -- -- --
AssetsFixed assets 17.86 -- --Goodwill -- -- --Current assets 56.72 9.14 0.05
Reserves (0.08) 0.07 (1.37)Profit/(Loss) after tax for the year (0.08) 0.07 (0.16)
Consolidated SCHEDULE
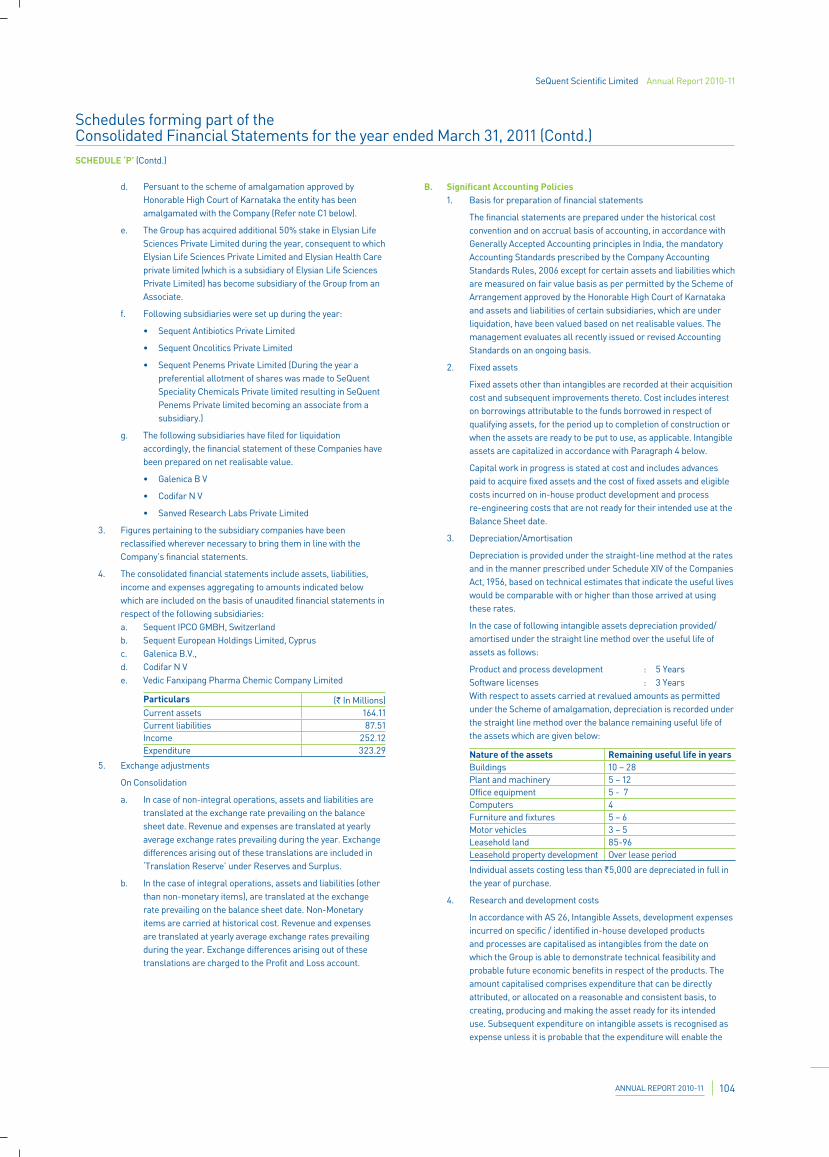
SeQuent Scientific Limited Annual Report 2010-11
ANNUAL REPORT 2010-11 104
d. Persuant to the scheme of amalgamation approved by Honorable High Court of Karnataka the entity has been amalgamated with the Company (Refer note C1 below).
e. The Group has acquired additional 50% stake in Elysian Life Sciences Private Limited during the year, consequent to which Elysian Life Sciences Private Limited and Elysian Health Care private limited (which is a subsidiary of Elysian Life Sciences Private Limited) has become subsidiary of the Group from an Associate.
f. Following subsidiaries were set up during the year:
• Sequent Antibiotics Private Limited
• Sequent Oncolitics Private Limited
• Sequent Penems Private Limited (During the year a preferential allotment of shares was made to SeQuent Speciality Chemicals Private limited resulting in SeQuent Penems Private limited becoming an associate from a subsidiary.)
g. The following subsidiaries have filed for liquidation accordingly, the financial statement of these Companies have been prepared on net realisable value.
• Galenica B V
• Codifar N V
• Sanved Research Labs Private Limited
3. Figures pertaining to the subsidiary companies have been reclassified wherever necessary to bring them in line with the Company’s financial statements.
4. The consolidated financial statements include assets, liabilities, income and expenses aggregating to amounts indicated below which are included on the basis of unaudited financial statements in respect of the following subsidiaries:
a. Sequent IPCO GMBH, Switzerland b. Sequent European Holdings Limited, Cyprus c. Galenica B.V., d. Codifar N V e. Vedic Fanxipang Pharma Chemic Company Limited
Particulars (` In Millions)Current assets 164.11Current liabilities 87.51Income 252.12Expenditure 323.29
5. Exchange adjustments
On Consolidation
a. In case of non-integral operations, assets and liabilities are translated at the exchange rate prevailing on the balance sheet date. Revenue and expenses are translated at yearly average exchange rates prevailing during the year. Exchange differences arising out of these translations are included in ‘Translation Reserve’ under Reserves and Surplus.
b. In the case of integral operations, assets and liabilities (other than non-monetary items), are translated at the exchange rate prevailing on the balance sheet date. Non-Monetary items are carried at historical cost. Revenue and expenses are translated at yearly average exchange rates prevailing during the year. Exchange differences arising out of these translations are charged to the Profit and Loss account.
B. Significant Accounting Policies 1. Basis for preparation of financial statements
The financial statements are prepared under the historical cost convention and on accrual basis of accounting, in accordance with Generally Accepted Accounting principles in India, the mandatory Accounting Standards prescribed by the Company Accounting Standards Rules, 2006 except for certain assets and liabilities which are measured on fair value basis as per permitted by the Scheme of Arrangement approved by the Honorable High Court of Karnataka and assets and liabilities of certain subsidiaries, which are under liquidation, have been valued based on net realisable values. The management evaluates all recently issued or revised Accounting Standards on an ongoing basis.
2. Fixed assets
Fixed assets other than intangibles are recorded at their acquisition cost and subsequent improvements thereto. Cost includes interest on borrowings attributable to the funds borrowed in respect of qualifying assets, for the period up to completion of construction or when the assets are ready to be put to use, as applicable. Intangible assets are capitalized in accordance with Paragraph 4 below.
Capital work in progress is stated at cost and includes advances paid to acquire fixed assets and the cost of fixed assets and eligible costs incurred on in-house product development and process re-engineering costs that are not ready for their intended use at the Balance Sheet date.
3. Depreciation/Amortisation
Depreciation is provided under the straight-line method at the rates and in the manner prescribed under Schedule XIV of the Companies Act, 1956, based on technical estimates that indicate the useful lives would be comparable with or higher than those arrived at using these rates.
In the case of following intangible assets depreciation provided/amortised under the straight line method over the useful life of assets as follows:
Product and process development : 5 Years Software licenses : 3 Years With respect to assets carried at revalued amounts as permitted
under the Scheme of amalgamation, depreciation is recorded under the straight line method over the balance remaining useful life of the assets which are given below:
Nature of the assets Remaining useful life in yearsBuildings 10 – 28Plant and machinery 5 – 12Office equipment 5 - 7Computers 4Furniture and fixtures 5 – 6Motor vehicles 3 – 5Leasehold land 85-96Leasehold property development Over lease period
Individual assets costing less than `5,000 are depreciated in full in the year of purchase.
4. Research and development costs
In accordance with AS 26, Intangible Assets, development expenses incurred on specific / identified in-house developed products and processes are capitalised as intangibles from the date on which the Group is able to demonstrate technical feasibility and probable future economic benefits in respect of the products. The amount capitalised comprises expenditure that can be directly attributed, or allocated on a reasonable and consistent basis, to creating, producing and making the asset ready for its intended use. Subsequent expenditure on intangible assets is recognised as expense unless it is probable that the expenditure will enable the
SCHEDULE ‘P’ (Contd.)
Schedules forming part of the Consolidated Financial Statements for the year ended March 31, 2011 (Contd.)
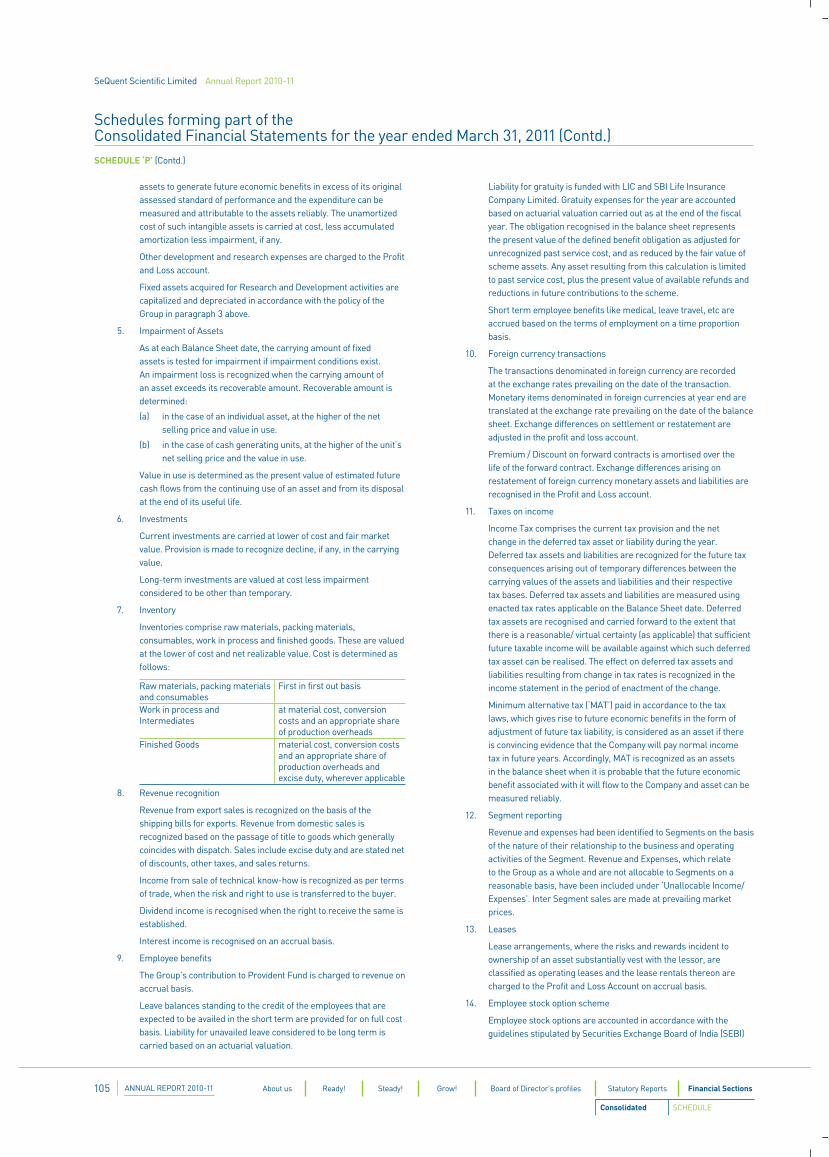
SeQuent Scientific Limited Annual Report 2010-11
ANNUAL REPORT 2010-11105 About us Ready! Steady! Grow! Board of Director’s profiles Statutory Reports Financial Sections
SCHEDULE ‘P’ (Contd.)
Schedules forming part of the Consolidated Financial Statements for the year ended March 31, 2011 (Contd.)
assets to generate future economic benefits in excess of its original assessed standard of performance and the expenditure can be measured and attributable to the assets reliably. The unamortized cost of such intangible assets is carried at cost, less accumulated amortization less impairment, if any.
Other development and research expenses are charged to the Profit and Loss account.
Fixed assets acquired for Research and Development activities are capitalized and depreciated in accordance with the policy of the Group in paragraph 3 above.
5. Impairment of Assets
As at each Balance Sheet date, the carrying amount of fixed assets is tested for impairment if impairment conditions exist. An impairment loss is recognized when the carrying amount of an asset exceeds its recoverable amount. Recoverable amount is determined:
(a) in the case of an individual asset, at the higher of the net selling price and value in use.
(b) in the case of cash generating units, at the higher of the unit’s net selling price and the value in use.
Value in use is determined as the present value of estimated future cash flows from the continuing use of an asset and from its disposal at the end of its useful life.
6. Investments
Current investments are carried at lower of cost and fair market value. Provision is made to recognize decline, if any, in the carrying value.
Long-term investments are valued at cost less impairment considered to be other than temporary.
7. Inventory
Inventories comprise raw materials, packing materials, consumables, work in process and finished goods. These are valued at the lower of cost and net realizable value. Cost is determined as follows:
Raw materials, packing materials and consumables
First in first out basis
Work in process and Intermediates
at material cost, conversion costs and an appropriate share of production overheads
Finished Goods material cost, conversion costs and an appropriate share of production overheads and excise duty, wherever applicable
8. Revenue recognition
Revenue from export sales is recognized on the basis of the shipping bills for exports. Revenue from domestic sales is recognized based on the passage of title to goods which generally coincides with dispatch. Sales include excise duty and are stated net of discounts, other taxes, and sales returns.
Income from sale of technical know-how is recognized as per terms of trade, when the risk and right to use is transferred to the buyer.
Dividend income is recognised when the right to receive the same is established.
Interest income is recognised on an accrual basis.
9. Employee benefits
The Group’s contribution to Provident Fund is charged to revenue on accrual basis.
Leave balances standing to the credit of the employees that are expected to be availed in the short term are provided for on full cost basis. Liability for unavailed leave considered to be long term is carried based on an actuarial valuation.
Liability for gratuity is funded with LIC and SBI Life Insurance Company Limited. Gratuity expenses for the year are accounted based on actuarial valuation carried out as at the end of the fiscal year. The obligation recognised in the balance sheet represents the present value of the defined benefit obligation as adjusted for unrecognized past service cost, and as reduced by the fair value of scheme assets. Any asset resulting from this calculation is limited to past service cost, plus the present value of available refunds and reductions in future contributions to the scheme.
Short term employee benefits like medical, leave travel, etc are accrued based on the terms of employment on a time proportion basis.
10. Foreign currency transactions
The transactions denominated in foreign currency are recorded at the exchange rates prevailing on the date of the transaction. Monetary items denominated in foreign currencies at year end are translated at the exchange rate prevailing on the date of the balance sheet. Exchange differences on settlement or restatement are adjusted in the profit and loss account.
Premium / Discount on forward contracts is amortised over the life of the forward contract. Exchange differences arising on restatement of foreign currency monetary assets and liabilities are recognised in the Profit and Loss account.
11. Taxes on income
Income Tax comprises the current tax provision and the net change in the deferred tax asset or liability during the year. Deferred tax assets and liabilities are recognized for the future tax consequences arising out of temporary differences between the carrying values of the assets and liabilities and their respective tax bases. Deferred tax assets and liabilities are measured using enacted tax rates applicable on the Balance Sheet date. Deferred tax assets are recognised and carried forward to the extent that there is a reasonable/ virtual certainty (as applicable) that sufficient future taxable income will be available against which such deferred tax asset can be realised. The effect on deferred tax assets and liabilities resulting from change in tax rates is recognized in the income statement in the period of enactment of the change.
Minimum alternative tax (‘MAT’) paid in accordance to the tax laws, which gives rise to future economic benefits in the form of adjustment of future tax liability, is considered as an asset if there is convincing evidence that the Company will pay normal income tax in future years. Accordingly, MAT is recognized as an assets in the balance sheet when it is probable that the future economic benefit associated with it will flow to the Company and asset can be measured reliably.
12. Segment reporting
Revenue and expenses had been identified to Segments on the basis of the nature of their relationship to the business and operating activities of the Segment. Revenue and Expenses, which relate to the Group as a whole and are not allocable to Segments on a reasonable basis, have been included under ‘Unallocable Income/Expenses’. Inter Segment sales are made at prevailing market prices.
13. Leases
Lease arrangements, where the risks and rewards incident to ownership of an asset substantially vest with the lessor, are classified as operating leases and the lease rentals thereon are charged to the Profit and Loss Account on accrual basis.
14. Employee stock option scheme
Employee stock options are accounted in accordance with the guidelines stipulated by Securities Exchange Board of India (SEBI)
Consolidated SCHEDULE
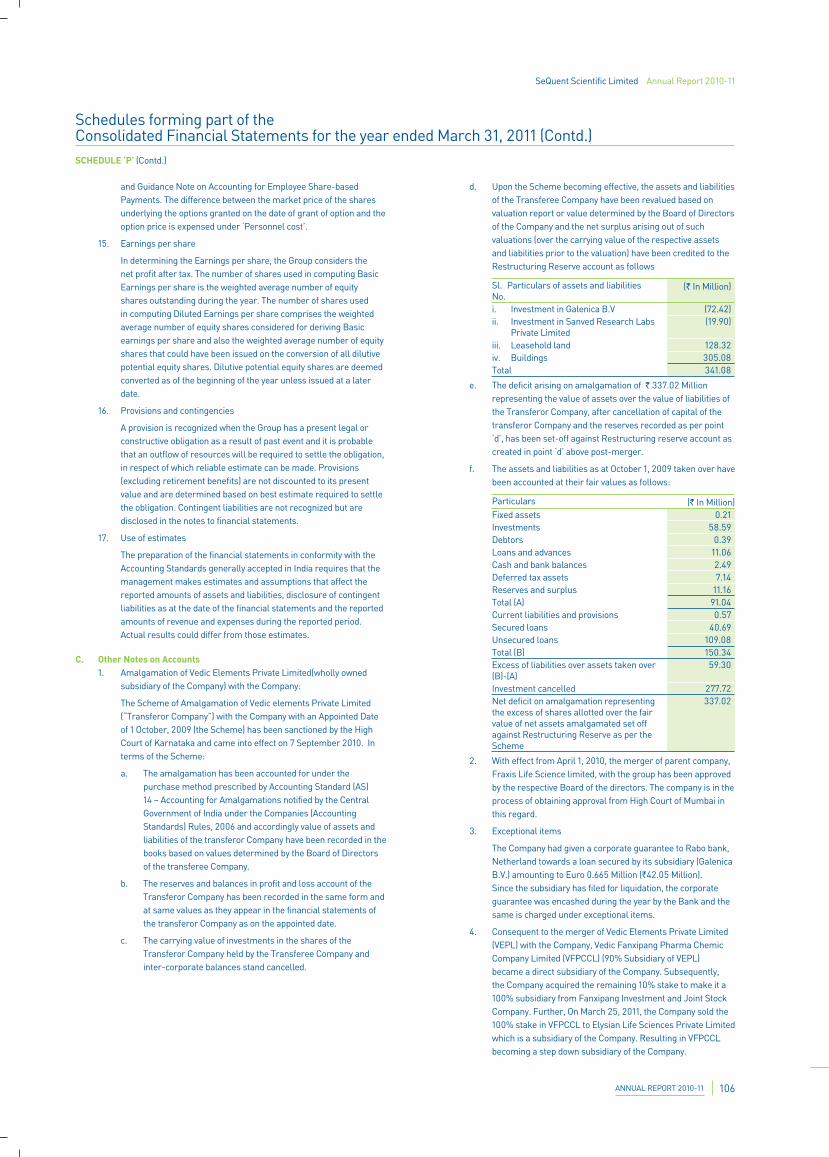
SeQuent Scientific Limited Annual Report 2010-11
ANNUAL REPORT 2010-11 106
and Guidance Note on Accounting for Employee Share-based Payments. The difference between the market price of the shares underlying the options granted on the date of grant of option and the option price is expensed under ‘Personnel cost’.
15. Earnings per share
In determining the Earnings per share, the Group considers the net profit after tax. The number of shares used in computing Basic Earnings per share is the weighted average number of equity shares outstanding during the year. The number of shares used in computing Diluted Earnings per share comprises the weighted average number of equity shares considered for deriving Basic earnings per share and also the weighted average number of equity shares that could have been issued on the conversion of all dilutive potential equity shares. Dilutive potential equity shares are deemed converted as of the beginning of the year unless issued at a later date.
16. Provisions and contingencies
A provision is recognized when the Group has a present legal or constructive obligation as a result of past event and it is probable that an outflow of resources will be required to settle the obligation, in respect of which reliable estimate can be made. Provisions (excluding retirement benefits) are not discounted to its present value and are determined based on best estimate required to settle the obligation. Contingent liabilities are not recognized but are disclosed in the notes to financial statements.
17. Use of estimates
The preparation of the financial statements in conformity with the Accounting Standards generally accepted in India requires that the management makes estimates and assumptions that affect the reported amounts of assets and liabilities, disclosure of contingent liabilities as at the date of the financial statements and the reported amounts of revenue and expenses during the reported period. Actual results could differ from those estimates.
C. Other Notes on Accounts 1. Amalgamation of Vedic Elements Private Limited(wholly owned
subsidiary of the Company) with the Company:
The Scheme of Amalgamation of Vedic elements Private Limited (“Transferor Company”) with the Company with an Appointed Date of 1 October, 2009 (the Scheme) has been sanctioned by the High Court of Karnataka and came into effect on 7 September 2010. In terms of the Scheme:
a. The amalgamation has been accounted for under the purchase method prescribed by Accounting Standard (AS) 14 – Accounting for Amalgamations notified by the Central Government of India under the Companies (Accounting Standards) Rules, 2006 and accordingly value of assets and liabilities of the transferor Company have been recorded in the books based on values determined by the Board of Directors of the transferee Company.
b. The reserves and balances in profit and loss account of the Transferor Company has been recorded in the same form and at same values as they appear in the financial statements of the transferor Company as on the appointed date.
c. The carrying value of investments in the shares of the Transferor Company held by the Transferee Company and inter-corporate balances stand cancelled.
d. Upon the Scheme becoming effective, the assets and liabilities of the Transferee Company have been revalued based on valuation report or value determined by the Board of Directors of the Company and the net surplus arising out of such valuations (over the carrying value of the respective assets and liabilities prior to the valuation) have been credited to the Restructuring Reserve account as follows
Sl. No.
Particulars of assets and liabilities (` In Million)
i. Investment in Galenica B.V (72.42)ii. Investment in Sanved Research Labs
Private Limited(19.90)
iii. Leasehold land 128.32iv. Buildings 305.08Total 341.08
e. The deficit arising on amalgamation of ` 337.02 Million representing the value of assets over the value of liabilities of the Transferor Company, after cancellation of capital of the transferor Company and the reserves recorded as per point ‘d’, has been set-off against Restructuring reserve account as created in point ‘d’ above post-merger.
f. The assets and liabilities as at October 1, 2009 taken over have been accounted at their fair values as follows:
Particulars (` In Million)Fixed assets 0.21Investments 58.59Debtors 0.39Loans and advances 11.06Cash and bank balances 2.49Deferred tax assets 7.14Reserves and surplus 11.16Total (A) 91.04Current liabilities and provisions 0.57Secured loans 40.69Unsecured loans 109.08Total (B) 150.34Excess of liabilities over assets taken over (B)-(A)
59.30
Investment cancelled 277.72Net deficit on amalgamation representing the excess of shares allotted over the fair value of net assets amalgamated set off against Restructuring Reserve as per the Scheme
337.02
2. With effect from April 1, 2010, the merger of parent company, Fraxis Life Science limited, with the group has been approved by the respective Board of the directors. The company is in the process of obtaining approval from High Court of Mumbai in this regard.
3. Exceptional items
The Company had given a corporate guarantee to Rabo bank, Netherland towards a loan secured by its subsidiary (Galenica B.V.) amounting to Euro 0.665 Million (`42.05 Million). Since the subsidiary has filed for liquidation, the corporate guarantee was encashed during the year by the Bank and the same is charged under exceptional items.
4. Consequent to the merger of Vedic Elements Private Limited (VEPL) with the Company, Vedic Fanxipang Pharma Chemic Company Limited (VFPCCL) (90% Subsidiary of VEPL) became a direct subsidiary of the Company. Subsequently, the Company acquired the remaining 10% stake to make it a 100% subsidiary from Fanxipang Investment and Joint Stock Company. Further, On March 25, 2011, the Company sold the 100% stake in VFPCCL to Elysian Life Sciences Private Limited which is a subsidiary of the Company. Resulting in VFPCCL becoming a step down subsidiary of the Company.
SCHEDULE ‘P’ (Contd.)
Schedules forming part of the Consolidated Financial Statements for the year ended March 31, 2011 (Contd.)
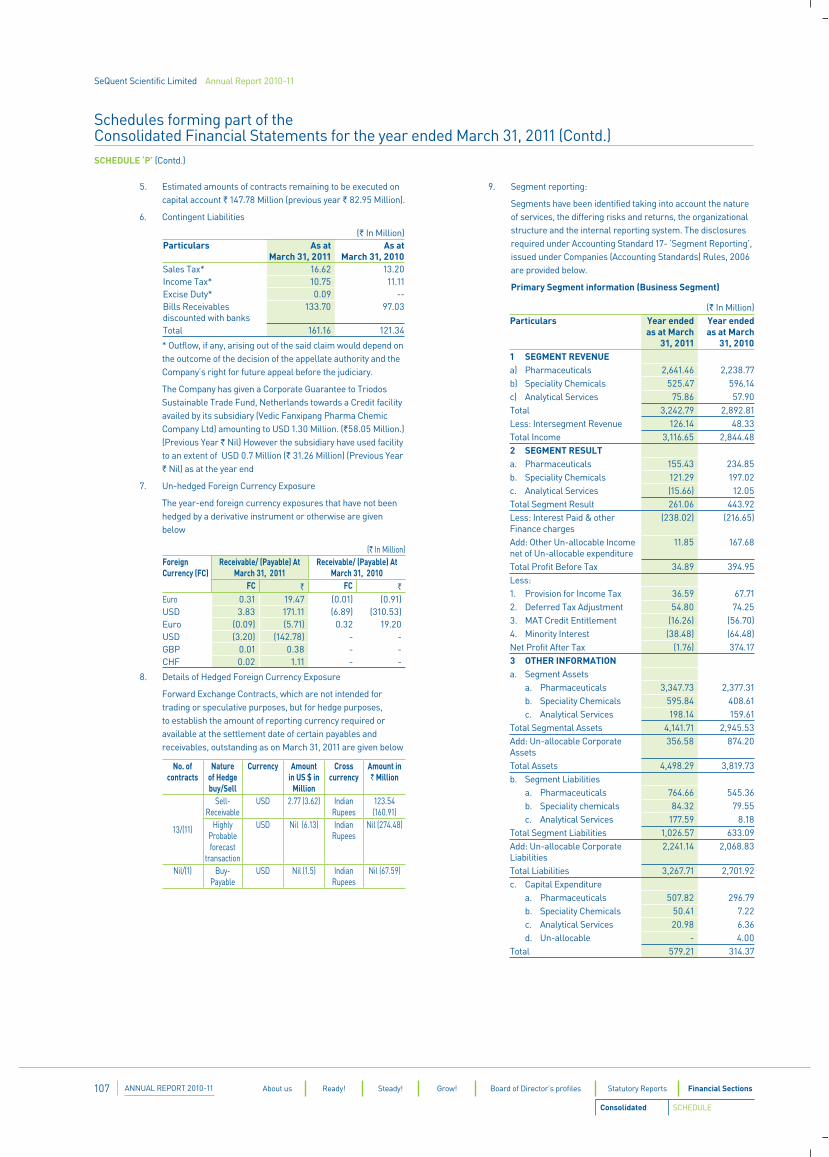
SeQuent Scientific Limited Annual Report 2010-11
ANNUAL REPORT 2010-11107 About us Ready! Steady! Grow! Board of Director’s profiles Statutory Reports Financial Sections
SCHEDULE ‘P’ (Contd.)
5. Estimated amounts of contracts remaining to be executed on capital account ` 147.78 Million (previous year ` 82.95 Million).
6. Contingent Liabilities
(` In Million)Particulars As at
March 31, 2011As at
March 31, 2010Sales Tax* 16.62 13.20Income Tax* 10.75 11.11Excise Duty* 0.09 --Bills Receivables discounted with banks
133.70 97.03
Total 161.16 121.34
* Outflow, if any, arising out of the said claim would depend on the outcome of the decision of the appellate authority and the Company’s right for future appeal before the judiciary.
The Company has given a Corporate Guarantee to Triodos Sustainable Trade Fund, Netherlands towards a Credit facility availed by its subsidiary (Vedic Fanxipang Pharma Chemic Company Ltd) amounting to USD 1.30 Million. (`58.05 Million.) (Previous Year ` Nil) However the subsidiary have used facility to an extent of USD 0.7 Million (` 31.26 Million) (Previous Year ` Nil) as at the year end
7. Un-hedged Foreign Currency Exposure
The year-end foreign currency exposures that have not been hedged by a derivative instrument or otherwise are given below
(` In Million)Foreign Currency (FC)
Receivable/ (Payable) At March 31, 2011
Receivable/ (Payable) At March 31, 2010
FC ` FC `
Euro 0.31 19.47 (0.01) (0.91)USD 3.83 171.11 (6.89) (310.53)Euro (0.09) (5.71) 0.32 19.20USD (3.20) (142.78) - -GBP 0.01 0.38 - -CHF 0.02 1.11 - -
8. Details of Hedged Foreign Currency Exposure
Forward Exchange Contracts, which are not intended for trading or speculative purposes, but for hedge purposes, to establish the amount of reporting currency required or available at the settlement date of certain payables and receivables, outstanding as on March 31, 2011 are given below
No. of contracts
Nature of Hedge buy/Sell
Currency Amount in US $ in
Million
Cross currency
Amount in ` Million
13/(11)
Sell-Receivable
USD 2.77 (3.62) Indian Rupees
123.54 (160.91)
Highly Probable forecast
transaction
USD Nil (6.13) Indian Rupees
Nil (274.48)
Nil/(1) Buy-Payable
USD Nil (1.5) Indian Rupees
Nil (67.59)
9. Segment reporting:
Segments have been identified taking into account the nature of services, the differing risks and returns, the organizational structure and the internal reporting system. The disclosures required under Accounting Standard 17- ‘Segment Reporting’, issued under Companies (Accounting Standards) Rules, 2006 are provided below.
Primary Segment information (Business Segment)
(` In Million)Particulars Year ended
as at March 31, 2011
Year ended as at March
31, 20101 SEGMENT REVENUEa) Pharmaceuticals 2,641.46 2,238.77b) Speciality Chemicals 525.47 596.14c) Analytical Services 75.86 57.90Total 3,242.79 2,892.81Less: Intersegment Revenue 126.14 48.33Total Income 3,116.65 2,844.482 SEGMENT RESULTa. Pharmaceuticals 155.43 234.85b. Speciality Chemicals 121.29 197.02c. Analytical Services (15.66) 12.05Total Segment Result 261.06 443.92Less: Interest Paid & other Finance charges
(238.02) (216.65)
Add: Other Un-allocable Income net of Un-allocable expenditure
11.85 167.68
Total Profit Before Tax 34.89 394.95Less: 1. Provision for Income Tax 36.59 67.712. Deferred Tax Adjustment 54.80 74.253. MAT Credit Entitlement (16.26) (56.70)4. Minority Interest (38.48) (64.48)Net Profit After Tax (1.76) 374.173 OTHER INFORMATIONa. Segment Assets
a. Pharmaceuticals 3,347.73 2,377.31b. Speciality Chemicals 595.84 408.61c. Analytical Services 198.14 159.61
Total Segmental Assets 4,141.71 2,945.53Add: Un-allocable Corporate Assets
356.58 874.20
Total Assets 4,498.29 3,819.73b. Segment Liabilities
a. Pharmaceuticals 764.66 545.36b. Speciality chemicals 84.32 79.55c. Analytical Services 177.59 8.18
Total Segment Liabilities 1,026.57 633.09Add: Un-allocable Corporate Liabilities
2,241.14 2,068.83
Total Liabilities 3,267.71 2,701.92c. Capital Expenditure
a. Pharmaceuticals 507.82 296.79b. Speciality Chemicals 50.41 7.22c. Analytical Services 20.98 6.36d. Un-allocable - 4.00
Total 579.21 314.37
Consolidated SCHEDULE
Schedules forming part of the Consolidated Financial Statements for the year ended March 31, 2011 (Contd.)
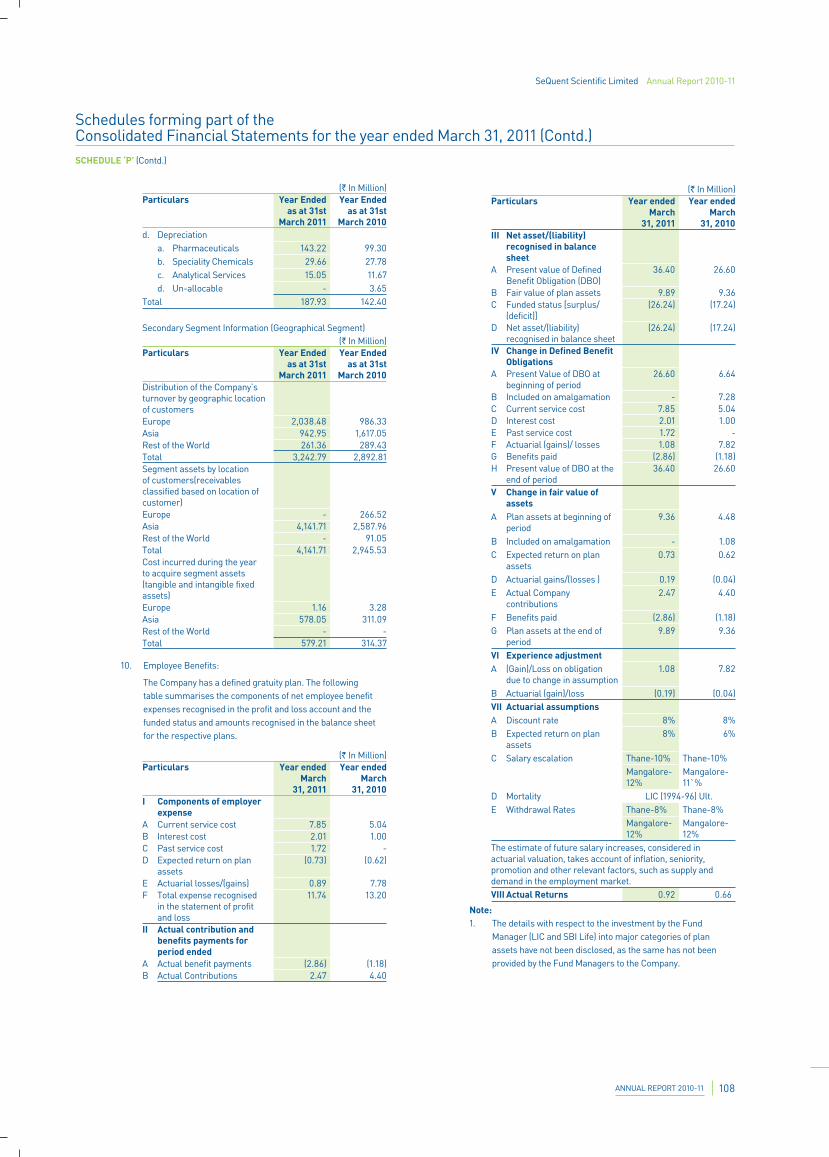
SeQuent Scientific Limited Annual Report 2010-11
ANNUAL REPORT 2010-11 108
(` In Million)Particulars Year Ended
as at 31st March 2011
Year Ended as at 31st
March 2010d. Depreciation
a. Pharmaceuticals 143.22 99.30b. Speciality Chemicals 29.66 27.78c. Analytical Services 15.05 11.67d. Un-allocable - 3.65
Total 187.93 142.40
Secondary Segment Information (Geographical Segment)(` In Million)
Particulars Year Ended as at 31st
March 2011
Year Ended as at 31st
March 2010Distribution of the Company’s turnover by geographic location of customersEurope 2,038.48 986.33Asia 942.95 1,617.05Rest of the World 261.36 289.43Total 3,242.79 2,892.81Segment assets by location of customers(receivables classified based on location of customer)Europe - 266.52Asia 4,141.71 2,587.96Rest of the World - 91.05Total 4,141.71 2,945.53Cost incurred during the year to acquire segment assets (tangible and intangible fixed assets)Europe 1.16 3.28Asia 578.05 311.09Rest of the World - -Total 579.21 314.37
10. Employee Benefits:
The Company has a defined gratuity plan. The following table summarises the components of net employee benefit expenses recognised in the profit and loss account and the funded status and amounts recognised in the balance sheet for the respective plans.
(` In Million)Particulars Year ended
March 31, 2011
Year ended March
31, 2010I Components of employer
expenseA Current service cost 7.85 5.04B Interest cost 2.01 1.00C Past service cost 1.72 -D Expected return on plan
assets(0.73) (0.62)
E Actuarial losses/(gains) 0.89 7.78F Total expense recognised
in the statement of profit and loss
11.74 13.20
II Actual contribution and benefits payments for period ended
A Actual benefit payments (2.86) (1.18)B Actual Contributions 2.47 4.40
(` In Million)Particulars Year ended
March 31, 2011
Year ended March
31, 2010III Net asset/(liability)
recognised in balance sheet
A Present value of Defined Benefit Obligation (DBO)
36.40 26.60
B Fair value of plan assets 9.89 9.36C Funded status [surplus/
(deficit)](26.24) (17.24)
D Net asset/(liability) recognised in balance sheet
(26.24) (17.24)
IV Change in Defined Benefit Obligations
A Present Value of DBO at beginning of period
26.60 6.64
B Included on amalgamation - 7.28C Current service cost 7.85 5.04D Interest cost 2.01 1.00E Past service cost 1.72 -F Actuarial (gains)/ losses 1.08 7.82G Benefits paid (2.86) (1.18)H Present value of DBO at the
end of period36.40 26.60
V Change in fair value of assets
A Plan assets at beginning of period
9.36 4.48
B Included on amalgamation - 1.08C Expected return on plan
assets0.73 0.62
D Actuarial gains/(losses ) 0.19 (0.04)E Actual Company
contributions2.47 4.40
F Benefits paid (2.86) (1.18)G Plan assets at the end of
period9.89 9.36
VI Experience adjustmentA (Gain)/Loss on obligation
due to change in assumption1.08 7.82
B Actuarial (gain)/loss (0.19) (0.04)VII Actuarial assumptionsA Discount rate 8% 8%B Expected return on plan
assets8% 6%
C Salary escalation Thane-10% Thane-10%Mangalore-12%
Mangalore-11`%
D Mortality LIC (1994-96) Ult.E Withdrawal Rates Thane-8% Thane-8%
Mangalore-12%
Mangalore-12%
The estimate of future salary increases, considered in actuarial valuation, takes account of inflation, seniority, promotion and other relevant factors, such as supply and demand in the employment market.VIII Actual Returns 0.92 0.66
Note: 1. The details with respect to the investment by the Fund
Manager (LIC and SBI Life) into major categories of plan assets have not been disclosed, as the same has not been provided by the Fund Managers to the Company.
SCHEDULE ‘P’ (Contd.)
Schedules forming part of the Consolidated Financial Statements for the year ended March 31, 2011 (Contd.)
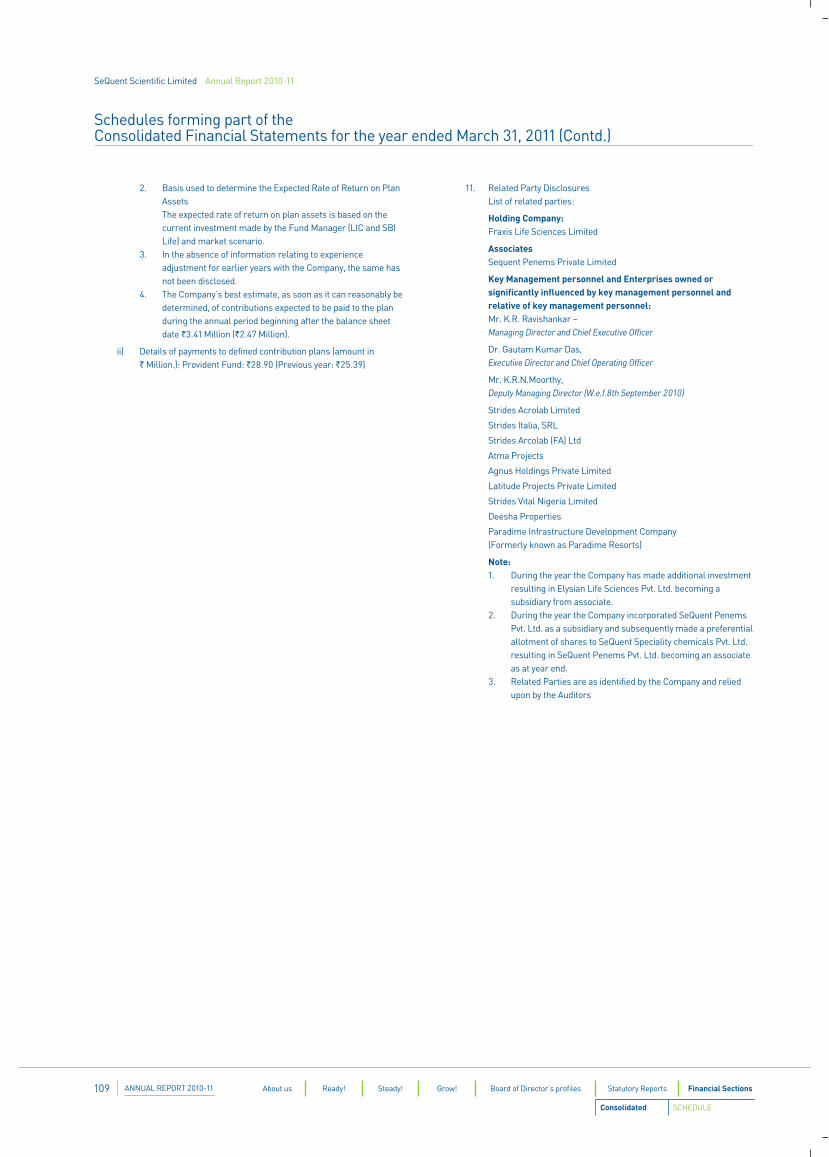
SeQuent Scientific Limited Annual Report 2010-11
ANNUAL REPORT 2010-11109 About us Ready! Steady! Grow! Board of Director’s profiles Statutory Reports Financial Sections
2. Basis used to determine the Expected Rate of Return on Plan Assets
The expected rate of return on plan assets is based on the current investment made by the Fund Manager (LIC and SBI Life) and market scenario.
3. In the absence of information relating to experience adjustment for earlier years with the Company, the same has not been disclosed.
4. The Company’s best estimate, as soon as it can reasonably be determined, of contributions expected to be paid to the plan during the annual period beginning after the balance sheet date `3.41 Million (`2.47 Million).
ii) Details of payments to defined contribution plans (amount in ` Million.): Provident Fund: `28.90 (Previous year: `25.39)
11. Related Party Disclosures List of related parties:
Holding Company: Fraxis Life Sciences Limited
Associates Sequent Penems Private Limited
Key Management personnel and Enterprises owned or significantly influenced by key management personnel and relative of key management personnel:
Mr. K.R. Ravishankar – Managing Director and Chief Executive Officer
Dr. Gautam Kumar Das, Executive Director and Chief Operating Officer
Mr. K.R.N.Moorthy, Deputy Managing Director (W.e.f.8th September 2010)
Strides Acrolab Limited
Strides Italia, SRL
Strides Arcolab (FA) Ltd
Atma Projects
Agnus Holdings Private Limited
Latitude Projects Private Limited
Strides Vital Nigeria Limited
Deesha Properties
Paradime Infrastructure Development Company (Formerly known as Paradime Resorts)
Note: 1. During the year the Company has made additional investment
resulting in Elysian Life Sciences Pvt. Ltd. becoming a subsidiary from associate.
2. During the year the Company incorporated SeQuent Penems Pvt. Ltd. as a subsidiary and subsequently made a preferential allotment of shares to SeQuent Speciality chemicals Pvt. Ltd. resulting in SeQuent Penems Pvt. Ltd. becoming an associate as at year end.
3. Related Parties are as identified by the Company and relied upon by the Auditors
Consolidated SCHEDULE
Schedules forming part of the Consolidated Financial Statements for the year ended March 31, 2011 (Contd.)
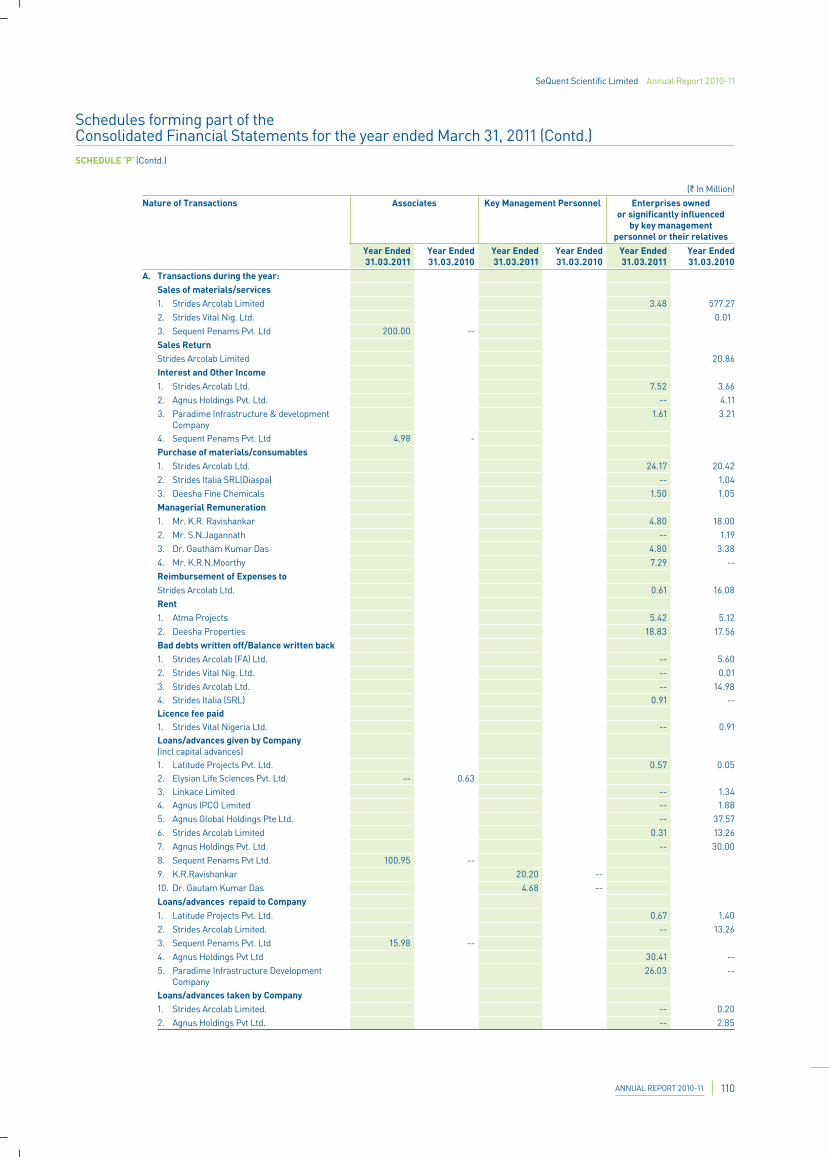
SeQuent Scientific Limited Annual Report 2010-11
ANNUAL REPORT 2010-11 110
(` In Million)
Nature of Transactions Associates Key Management Personnel Enterprises owned or significantly influenced
by key management personnel or their relatives
Year Ended 31.03.2011
Year Ended 31.03.2010
Year Ended 31.03.2011
Year Ended 31.03.2010
Year Ended 31.03.2011
Year Ended 31.03.2010
SCHEDULE ‘P’ (Contd.)
Schedules forming part of the Consolidated Financial Statements for the year ended March 31, 2011 (Contd.)
A. Transactions during the year:Sales of materials/services1. Strides Arcolab Limited 3.48 577.272. Strides Vital Nig. Ltd. 0.013. Sequent Penams Pvt. Ltd 200.00 --Sales ReturnStrides Arcolab Limited 20.86Interest and Other Income1. Strides Arcolab Ltd. 7.52 3.662. Agnus Holdings Pvt. Ltd. -- 4.113. Paradime Infrastructure & development
Company1.61 3.21
4. Sequent Penams Pvt. Ltd 4.98 -Purchase of materials/consumables1. Strides Arcolab Ltd. 24.17 20.422. Strides Italia SRL(Diaspa) -- 1.043. Deesha Fine Chemicals 1.50 1.05Managerial Remuneration1. Mr. K.R. Ravishankar 4.80 18.002. Mr. S.N.Jagannath -- 1.193. Dr. Gautham Kumar Das 4.80 3.384. Mr. K.R.N.Moorthy 7.29 --Reimbursement of Expenses toStrides Arcolab Ltd. 0.61 16.08Rent1. Atma Projects 5.42 5.122. Deesha Properties 18.83 17.56Bad debts written off/Balance written back1. Strides Arcolab (FA) Ltd. -- 5.602. Strides Vital Nig. Ltd. -- 0.013. Strides Arcolab Ltd. -- 14.98 4. Strides Italia (SRL) 0.91 --Licence fee paid1. Strides Vital Nigeria Ltd. -- 0.91Loans/advances given by Company(incl capital advances)1. Latitude Projects Pvt. Ltd. 0.57 0.05 2. Elysian Life Sciences Pvt. Ltd. -- 0.63 3. Linkace Limited -- 1.34 4. Agnus IPCO Limited -- 1.88 5. Agnus Global Holdings Pte Ltd. -- 37.57 6. Strides Arcolab Limited 0.31 13.267. Agnus Holdings Pvt. Ltd. -- 30.008. Sequent Penams Pvt Ltd. 100.95 -- 9. K.R.Ravishankar 20.20 -- 10. Dr. Gautam Kumar Das 4.68 -- Loans/advances repaid to Company1. Latitude Projects Pvt. Ltd. 0.67 1.402. Strides Arcolab Limited. -- 13.263. Sequent Penams Pvt. Ltd 15.98 --4. Agnus Holdings Pvt Ltd 30.41 --5. Paradime Infrastructure Development
Company26.03 --
Loans/advances taken by Company1. Strides Arcolab Limited. -- 0.202. Agnus Holdings Pvt Ltd. -- 2.85
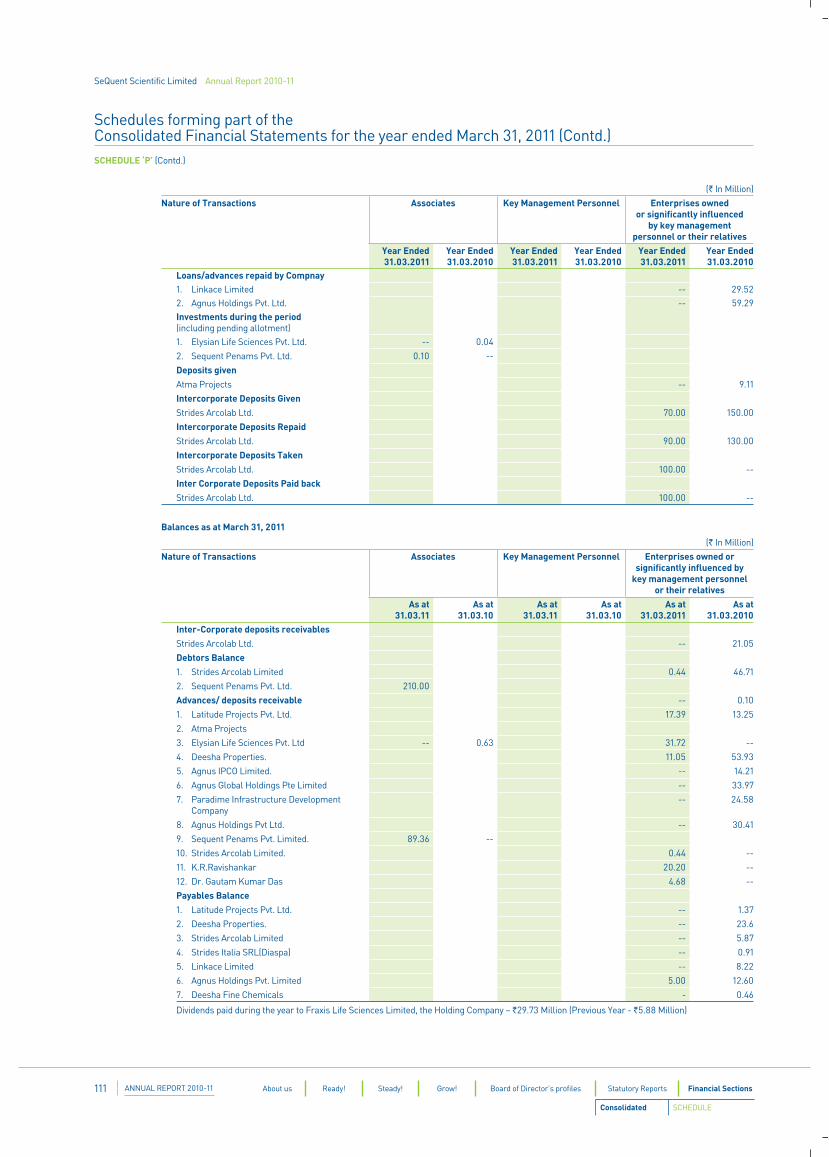
SeQuent Scientific Limited Annual Report 2010-11
ANNUAL REPORT 2010-11111 About us Ready! Steady! Grow! Board of Director’s profiles Statutory Reports Financial Sections
Loans/advances repaid by Compnay1. Linkace Limited -- 29.522. Agnus Holdings Pvt. Ltd. -- 59.29Investments during the period(including pending allotment)1. Elysian Life Sciences Pvt. Ltd. -- 0.04
2. Sequent Penams Pvt. Ltd. 0.10 --
Deposits givenAtma Projects -- 9.11
Intercorporate Deposits GivenStrides Arcolab Ltd. 70.00 150.00
Intercorporate Deposits RepaidStrides Arcolab Ltd. 90.00 130.00
Intercorporate Deposits TakenStrides Arcolab Ltd. 100.00 --
Inter Corporate Deposits Paid backStrides Arcolab Ltd. 100.00 --
(` In Million)
Nature of Transactions Associates Key Management Personnel Enterprises owned or significantly influenced
by key management personnel or their relatives
Year Ended 31.03.2011
Year Ended 31.03.2010
Year Ended 31.03.2011
Year Ended 31.03.2010
Year Ended 31.03.2011
Year Ended 31.03.2010
Inter-Corporate deposits receivablesStrides Arcolab Ltd. -- 21.05
Debtors Balance1. Strides Arcolab Limited 0.44 46.71
2. Sequent Penams Pvt. Ltd. 210.00
Advances/ deposits receivable -- 0.10
1. Latitude Projects Pvt. Ltd. 17.39 13.25
2. Atma Projects
3. Elysian Life Sciences Pvt. Ltd -- 0.63 31.72 --
4. Deesha Properties. 11.05 53.93
5. Agnus IPCO Limited. -- 14.21
6. Agnus Global Holdings Pte Limited -- 33.97
7. Paradime Infrastructure Development Company
-- 24.58
8. Agnus Holdings Pvt Ltd. -- 30.41
9. Sequent Penams Pvt. Limited. 89.36 --
10. Strides Arcolab Limited. 0.44 --
11. K.R.Ravishankar 20.20 --
12. Dr. Gautam Kumar Das 4.68 --
Payables Balance1. Latitude Projects Pvt. Ltd. -- 1.37
2. Deesha Properties. -- 23.6
3. Strides Arcolab Limited -- 5.87
4. Strides Italia SRL(Diaspa) -- 0.91
5. Linkace Limited -- 8.22
6. Agnus Holdings Pvt. Limited 5.00 12.60
7. Deesha Fine Chemicals - 0.46
Dividends paid during the year to Fraxis Life Sciences Limited, the Holding Company – `29.73 Million (Previous Year - `5.88 Million)
Balances as at March 31, 2011
(` In Million)
Nature of Transactions Associates Key Management Personnel Enterprises owned or significantly influenced by
key management personnel or their relatives
As at 31.03.11
As at 31.03.10
As at 31.03.11
As at 31.03.10
As at 31.03.2011
As at 31.03.2010
SCHEDULE ‘P’ (Contd.)
Consolidated SCHEDULE
Schedules forming part of the Consolidated Financial Statements for the year ended March 31, 2011 (Contd.)
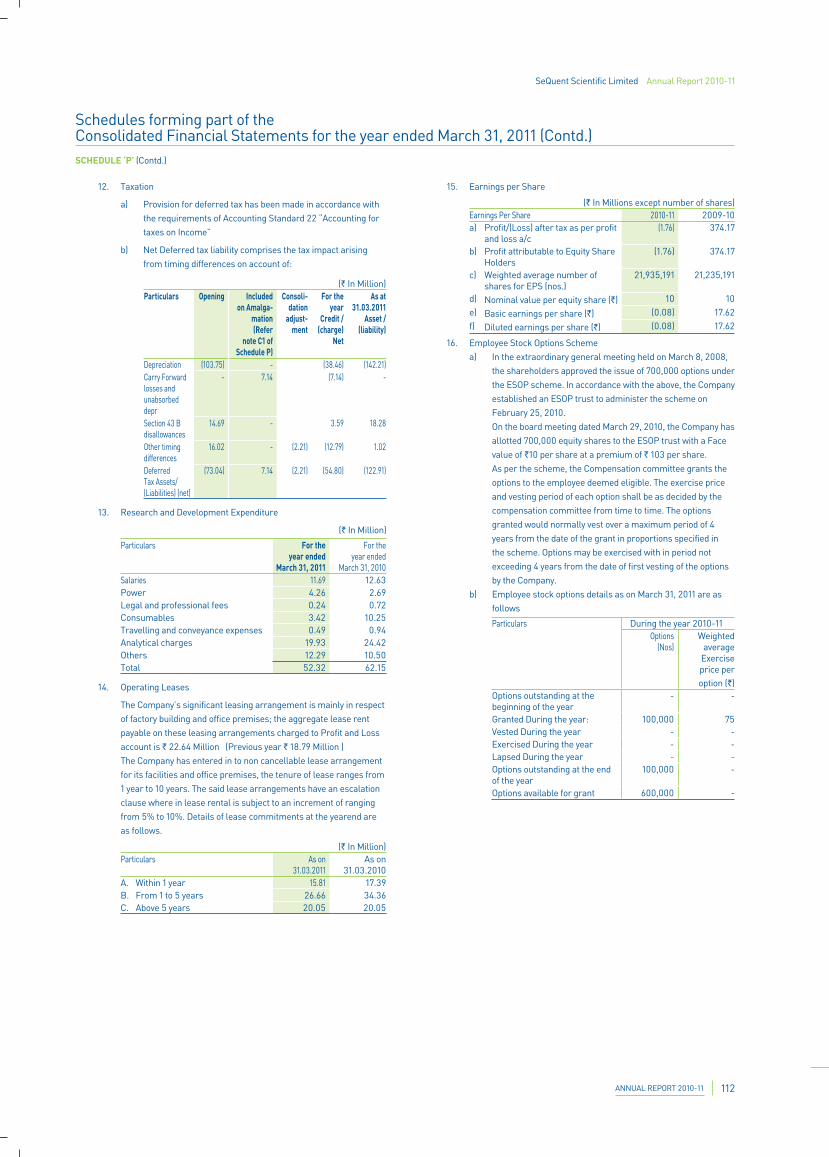
SeQuent Scientific Limited Annual Report 2010-11
ANNUAL REPORT 2010-11 112
SCHEDULE ‘P’ (Contd.)
12. Taxation
a) Provision for deferred tax has been made in accordance with the requirements of Accounting Standard 22 “Accounting for taxes on Income”
b) Net Deferred tax liability comprises the tax impact arising from timing differences on account of:
(` In Million)Particulars Opening Included
on Amalga-mation (Refer
note C1 of Schedule P)
Consoli-dation
adjust-ment
For the year
Credit / (charge)
Net
As at31.03.2011
Asset /(liability)
Depreciation (103.75) - (38.46) (142.21)Carry Forward losses and unabsorbed depr
- 7.14 (7.14) -
Section 43 B disallowances
14.69 - 3.59 18.28
Other timing differences
16.02 - (2.21) (12.79) 1.02
Deferred Tax Assets/(Liabilities) (net)
(73.04) 7.14 (2.21) (54.80) (122.91)
13. Research and Development Expenditure
(` In Million)
Particulars For the year ended
March 31, 2011
For the year ended
March 31, 2010Salaries 11.69 12.63Power 4.26 2.69Legal and professional fees 0.24 0.72Consumables 3.42 10.25Travelling and conveyance expenses 0.49 0.94Analytical charges 19.93 24.42Others 12.29 10.50Total 52.32 62.15
14. Operating Leases
The Company’s significant leasing arrangement is mainly in respect of factory building and office premises; the aggregate lease rent payable on these leasing arrangements charged to Profit and Loss account is ` 22.64 Million (Previous year ` 18.79 Million )
The Company has entered in to non cancellable lease arrangement for its facilities and office premises, the tenure of lease ranges from 1 year to 10 years. The said lease arrangements have an escalation clause where in lease rental is subject to an increment of ranging from 5% to 10%. Details of lease commitments at the yearend are as follows.
(` In Million)Particulars As on
31.03.2011As on
31.03.2010A. Within 1 year 15.81 17.39B. From 1 to 5 years 26.66 34.36C. Above 5 years 20.05 20.05
15. Earnings per Share
(` In Millions except number of shares)Earnings Per Share 2010-11 2009-10a) Profit/(Loss) after tax as per profit
and loss a/c (1.76) 374.17
b) Profit attributable to Equity Share Holders
(1.76) 374.17
c) Weighted average number of shares for EPS (nos.)
21,935,191 21,235,191
d) Nominal value per equity share (`) 10 10e) Basic earnings per share (`) (0.08) 17.62f) Diluted earnings per share (`) (0.08) 17.62
16. Employee Stock Options Scheme a) In the extraordinary general meeting held on March 8, 2008,
the shareholders approved the issue of 700,000 options under the ESOP scheme. In accordance with the above, the Company established an ESOP trust to administer the scheme on February 25, 2010.
On the board meeting dated March 29, 2010, the Company has allotted 700,000 equity shares to the ESOP trust with a Face value of `10 per share at a premium of ` 103 per share.
As per the scheme, the Compensation committee grants the options to the employee deemed eligible. The exercise price and vesting period of each option shall be as decided by the compensation committee from time to time. The options granted would normally vest over a maximum period of 4 years from the date of the grant in proportions specified in the scheme. Options may be exercised with in period not exceeding 4 years from the date of first vesting of the options by the Company.
b) Employee stock options details as on March 31, 2011 are as follows
Particulars During the year 2010-11Options
(Nos)Weighted
average Exercise price per option (`)
Options outstanding at the beginning of the year
- -
Granted During the year: 100,000 75Vested During the year - -Exercised During the year - -Lapsed During the year - -Options outstanding at the end of the year
100,000 -
Options available for grant 600,000 -
Schedules forming part of the Consolidated Financial Statements for the year ended March 31, 2011 (Contd.)
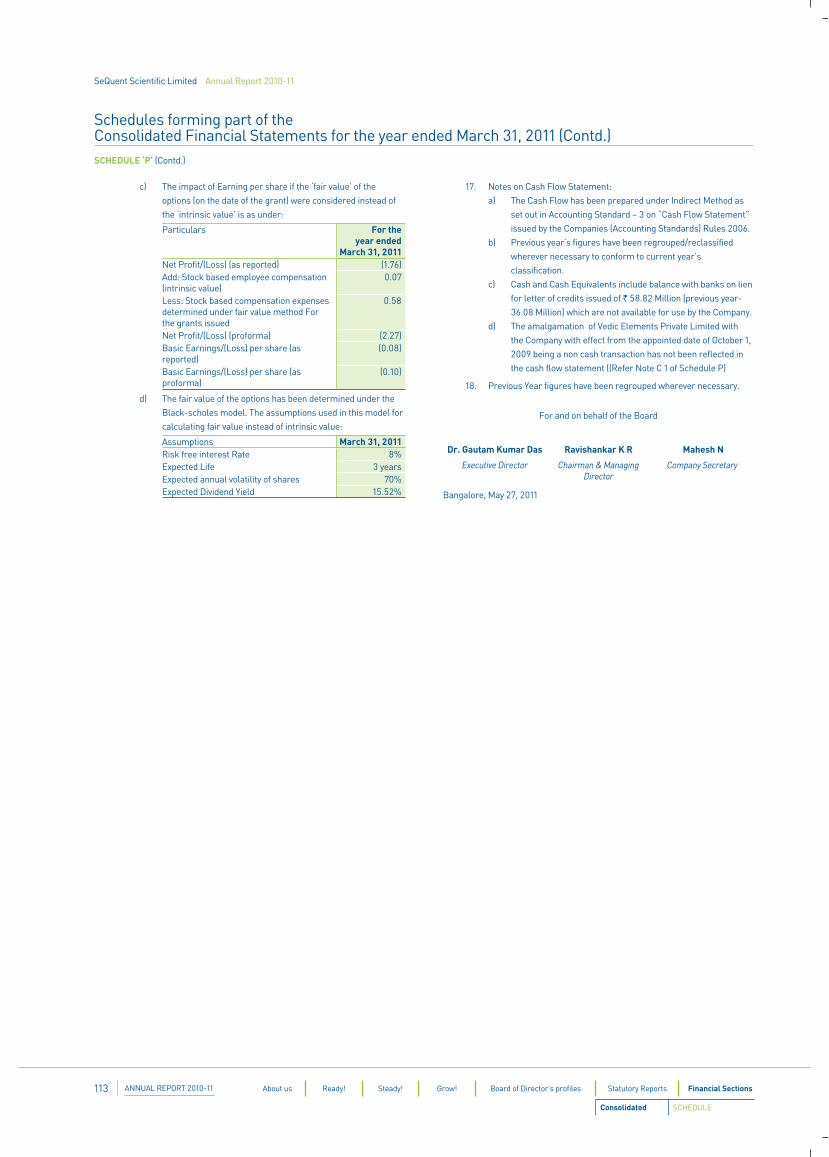
SeQuent Scientific Limited Annual Report 2010-11
ANNUAL REPORT 2010-11113 About us Ready! Steady! Grow! Board of Director’s profiles Statutory Reports Financial Sections
SCHEDULE ‘P’ (Contd.)
c) The impact of Earning per share if the ‘fair value’ of the options (on the date of the grant) were considered instead of the ‘intrinsic value’ is as under:
Particulars For the year ended
March 31, 2011Net Profit/(Loss) (as reported) (1.76)Add: Stock based employee compensation (intrinsic value)
0.07
Less: Stock based compensation expenses determined under fair value method For the grants issued
0.58
Net Profit/(Loss) (proforma) (2.27)Basic Earnings/(Loss) per share (as reported)
(0.08)
Basic Earnings/(Loss) per share (as proforma)
(0.10)
d) The fair value of the options has been determined under the Black-scholes model. The assumptions used in this model for calculating fair value instead of intrinsic value:
Assumptions March 31, 2011Risk free interest Rate 8%Expected Life 3 yearsExpected annual volatility of shares 70%Expected Dividend Yield 15.52%
17. Notes on Cash Flow Statement: a) The Cash Flow has been prepared under Indirect Method as
set out in Accounting Standard – 3 on “Cash Flow Statement” issued by the Companies (Accounting Standards) Rules 2006.
b) Previous year’s figures have been regrouped/reclassified wherever necessary to conform to current year’s classification.
c) Cash and Cash Equivalents include balance with banks on lien for letter of credits issued of ` 58.82 Million (previous year-36.08 Million) which are not available for use by the Company.
d) The amalgamation of Vedic Elements Private Limited with the Company with effect from the appointed date of October 1, 2009 being a non cash transaction has not been reflected in the cash flow statement ((Refer Note C 1 of Schedule P)
18. Previous Year figures have been regrouped wherever necessary.
For and on behalf of the Board
Dr. Gautam Kumar Das Ravishankar K R Mahesh N
Executive Director Chairman & Managing Director
Company Secretary
Bangalore, May 27, 2011
Schedules forming part of the Consolidated Financial Statements for the year ended March 31, 2011 (Contd.)
Consolidated SCHEDULE
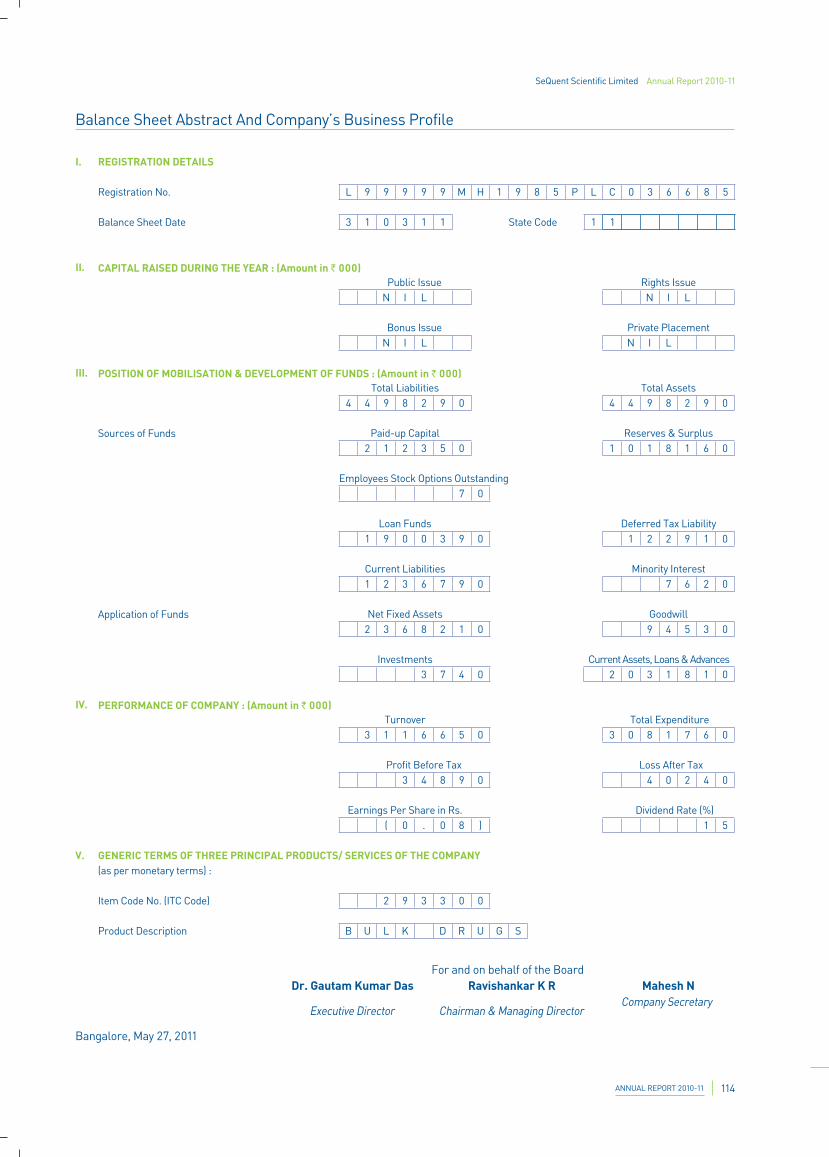
SeQuent Scientific Limited Annual Report 2010-11
ANNUAL REPORT 2010-11 114
Balance Sheet Abstract And Company’s Business Profile
I. REGISTRATION DETAILS
Registration No. L 9 9 9 9 9 M H 1 9 8 5 P L C 0 3 6 6 8 5
Balance Sheet Date 3 1 0 3 1 1 State Code 1 1
II. CAPITAL RAISED DURING THE YEAR : (Amount in ` 000)Public Issue
N I L
Bonus IssueN I L
III. POSITION OF MOBILISATION & DEVELOPMENT OF FUNDS : (Amount in ` 000)Total Liabilities
4 4 9 8 2 9 0
Sources of Funds Paid-up Capital2 1 2 3 5 0
Employees Stock Options Outstanding7 0
Loan Funds1 9 0 0 3 9 0
Current Liabilities1 2 3 6 7 9 0
Application of Funds Net Fixed Assets2 3 6 8 2 1 0
Investments3 7 4 0
IV. PERFORMANCE OF COMPANY : (Amount in ` 000)Turnover
3 1 1 6 6 5 0
Profit Before Tax3 4 8 9 0
Earnings Per Share in Rs.( 0 . 0 8 )
V. GENERIC TERMS OF THREE PRINCIPAL PRODUCTS/ SERVICES OF THE COMPANY(as per monetary terms) :
Item Code No. (ITC Code) 2 9 3 3 0 0
Product Description B U L K D R U G S
Rights IssueN I L
Private PlacementN I L
Total Assets4 4 9 8 2 9 0
Reserves & Surplus1 0 1 8 1 6 0
Deferred Tax Liability1 2 2 9 1 0
Minority Interest7 6 2 0
Goodwill9 4 5 3 0
Current Assets, Loans & Advances2 0 3 1 8 1 0
Total Expenditure3 0 8 1 7 6 0
Loss After Tax4 0 2 4 0
Dividend Rate (%)1 5
For and on behalf of the BoardDr. Gautam Kumar Das Ravishankar K R Mahesh N
Executive Director Chairman & Managing DirectorCompany Secretary
Bangalore, May 27, 2011
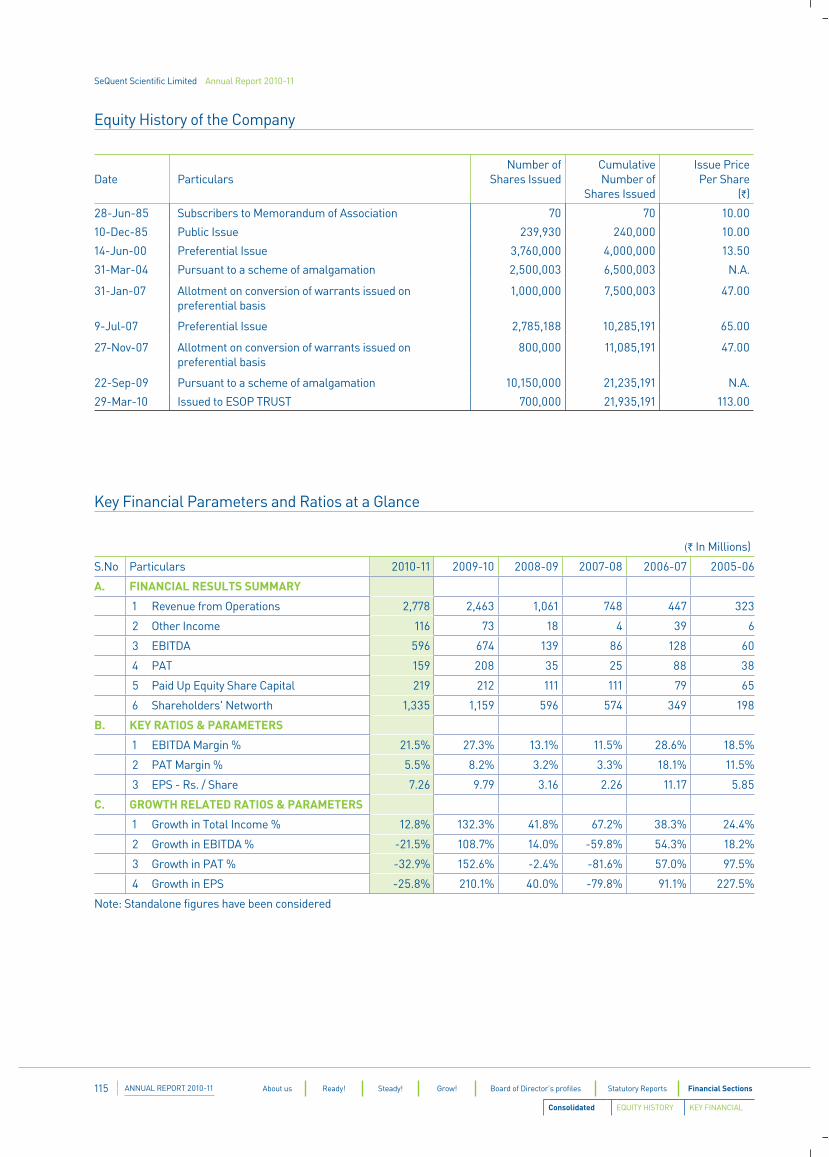
SeQuent Scientific Limited Annual Report 2010-11
ANNUAL REPORT 2010-11115 About us Ready! Steady! Grow! Board of Director’s profiles Statutory Reports Financial Sections
Date ParticularsNumber of
Shares IssuedCumulative Number of
Shares Issued
Issue Price Per Share
(`)
28-Jun-85 Subscribers to Memorandum of Association 70 70 10.00
10-Dec-85 Public Issue 239,930 240,000 10.00
14-Jun-00 Preferential Issue 3,760,000 4,000,000 13.50
31-Mar-04 Pursuant to a scheme of amalgamation 2,500,003 6,500,003 N.A.
31-Jan-07 Allotment on conversion of warrants issued on preferential basis
1,000,000 7,500,003 47.00
9-Jul-07 Preferential Issue 2,785,188 10,285,191 65.00
27-Nov-07 Allotment on conversion of warrants issued on preferential basis
800,000 11,085,191 47.00
22-Sep-09 Pursuant to a scheme of amalgamation 10,150,000 21,235,191 N.A.
29-Mar-10 Issued to ESOP TRUST 700,000 21,935,191 113.00
Equity History of the Company
(` In Millions)
S.No Particulars 2010-11 2009-10 2008-09 2007-08 2006-07 2005-06
A. FINANCIAL RESULTS SUMMARY
1 Revenue from Operations 2,778 2,463 1,061 748 447 323
2 Other Income 116 73 18 4 39 6
3 EBITDA 596 674 139 86 128 60
4 PAT 159 208 35 25 88 38
5 Paid Up Equity Share Capital 219 212 111 111 79 65
6 Shareholders' Networth 1,335 1,159 596 574 349 198
B. KEY RATIOS & PARAMETERS
1 EBITDA Margin % 21.5% 27.3% 13.1% 11.5% 28.6% 18.5%
2 PAT Margin % 5.5% 8.2% 3.2% 3.3% 18.1% 11.5%
3 EPS - Rs. / Share 7.26 9.79 3.16 2.26 11.17 5.85
C. GROWTH RELATED RATIOS & PARAMETERS
1 Growth in Total Income % 12.8% 132.3% 41.8% 67.2% 38.3% 24.4%
2 Growth in EBITDA % -21.5% 108.7% 14.0% -59.8% 54.3% 18.2%
3 Growth in PAT % -32.9% 152.6% -2.4% -81.6% 57.0% 97.5%
4 Growth in EPS -25.8% 210.1% 40.0% -79.8% 91.1% 227.5%
Note: Standalone figures have been considered
Key Financial Parameters and Ratios at a Glance
Consolidated EQUITY HISTORY KEY FINANCIAL
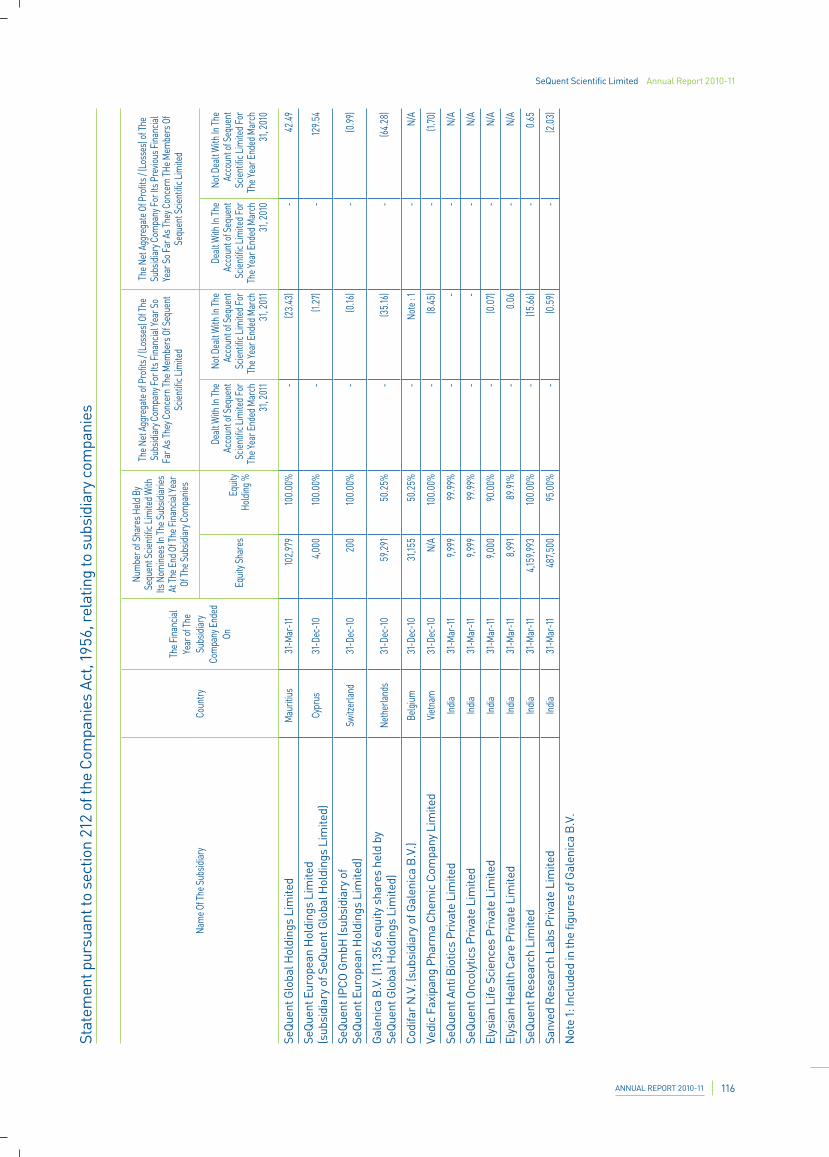
SeQuent Scientific Limited Annual Report 2010-11
ANNUAL REPORT 2010-11 116
Nam
e Of T
he S
ubsid
iary
Coun
try
The F
inan
cial
Year
of Th
e Su
bsidi
ary
Com
pany
End
ed
On
Num
ber o
f Sha
res H
eld B
y Se
quen
t Scie
ntific
Lim
ited W
ith
Its N
omin
ees I
n Th
e Sub
sidiar
ies
At Th
e End
Of T
he F
inan
cial Y
ear
Of Th
e Sub
sidiar
y Com
pani
es
The N
et A
ggre
gate
of P
rofit
s / (L
osse
s) Of
The
Subs
idiar
y Com
pany
For
Its F
inan
cial Y
ear S
o Fa
r As T
hey C
once
rn Th
e Mem
bers
Of S
eque
nt
Scien
tific
Lim
ited
The N
et A
ggre
gate
Of P
rofit
s / (L
osse
s) of
The
Subs
idiar
y Com
pany
For
Its P
revio
us F
inan
cial
Year
So F
ar A
s The
y Con
cern
THe M
embe
rs O
f Se
quen
t Scie
ntific
Lim
ited
Equi
ty Sh
ares
Equi
ty Ho
ldin
g %
Deal
t With
In Th
e Ac
coun
t of S
eque
nt
Scien
tific
Lim
ited F
or
The Y
ear E
nded
Mar
ch
31, 2
011
Not D
ealt
With
In Th
e Ac
coun
t of S
eque
nt
Scien
tific
Lim
ited F
or
The Y
ear E
nded
Mar
ch
31, 2
011
Deal
t With
In Th
e Ac
coun
t of S
eque
nt
Scien
tific
Lim
ited F
or
The Y
ear E
nded
Mar
ch
31, 2
010
Not D
ealt
With
In Th
e Ac
coun
t of S
eque
nt
Scien
tific
Lim
ited F
or
The Y
ear E
nded
Mar
ch
31, 2
010
SeQ
uent
Glo
bal H
oldi
ngs
Lim
ited
Mau
ritiu
s31
-Mar
-11
102,
979
100.
00%
- (2
3.43
)-
42.4
9
SeQ
uent
Eur
opea
n H
oldi
ngs
Lim
ited
(sub
sidi
ary
of S
eQue
nt G
loba
l Hol
ding
s Li
mite
d)Cy
prus
31-D
ec-1
0 4,
000
100.
00%
- (1
.27)
- 12
9.54
SeQ
uent
IPC
O G
mbH
(sub
sidi
ary
of
SeQ
uent
Eur
opea
n H
oldi
ngs
Lim
ited)
Switz
erla
nd31
-Dec
-10
200
10
0.00
%-
(0.16
)-
(0.99
)
Gal
enic
a B
.V. (
11,3
56 e
quity
sha
res
held
by
SeQ
uent
Glo
bal H
oldi
ngs
Lim
ited)
Neth
erla
nds
31-D
ec-1
0 5
9,291
50
.25%
- (3
5.16
)-
(64.
28)
Cod
ifar
N.V
. (su
bsid
iary
of G
alen
ica
B.V
.)Be
lgiu
m31
-Dec
-10
31,1
55
50.2
5%-
Note
: 1-
N/A
Vedi
c Fa
xipa
ng P
harm
a C
hem
ic C
ompa
ny L
imite
dVie
tnam
31-D
ec-1
0 N
/A
100.
00%
- (8
.45)
- (1
.70)
SeQ
uent
Ant
i Bio
tics
Priv
ate
Lim
ited
India
31-M
ar-1
1 9,
999
99.99
%-
- -
N/A
SeQ
uent
Onc
olyt
ics
Priv
ate
Lim
ited
India
31-M
ar-1
1 9,
999
99.99
%-
- -
N/A
Elys
ian
Life
Sci
ence
s Pr
ivat
e Li
mite
dIn
dia31
-Mar
-11
9,00
0 90
.00%
- (0
.07)
-N/
A
Elys
ian
Hea
lth C
are
Priv
ate
Lim
ited
India
31-M
ar-1
1 8
,991
89.91
%-
0.0
6 -
N/A
SeQ
uent
Res
earc
h Li
mite
dIn
dia31
-Mar
-11
4,15
9,993
10
0.00
%-
(15.
66)
- 0
.65
Sanv
ed R
esea
rch
Labs
Pri
vate
Lim
ited
India
31-M
ar-1
1 48
7,500
95
.00%
- (0
.59)
- (2
.03)
Not
e 1:
Incl
uded
in th
e fig
ures
of G
alen
ica
B.V
.
Stat
emen
t pur
suan
t to
sect
ion
212
of th
e C
ompa
nies
Act
, 195
6, r
elat
ing
to s
ubsi
diar
y co
mpa
nies
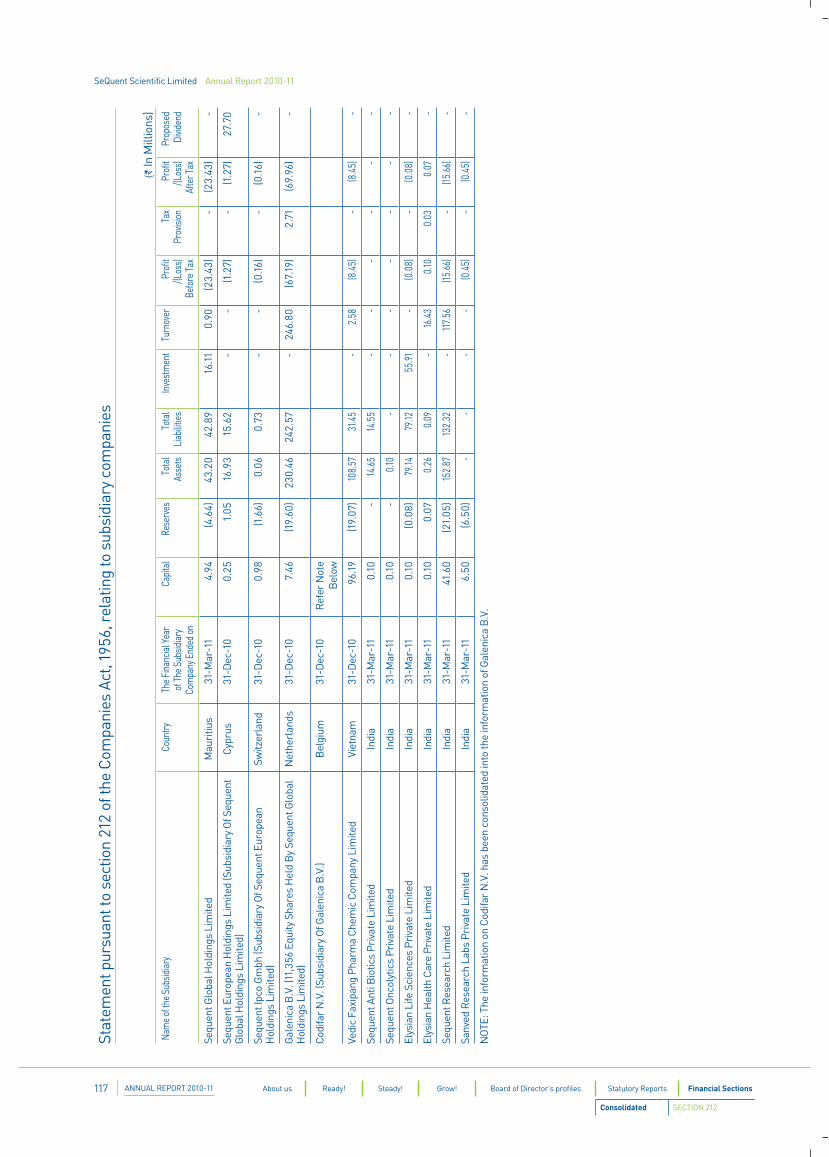
SeQuent Scientific Limited Annual Report 2010-11
ANNUAL REPORT 2010-11117 About us Ready! Steady! Grow! Board of Director’s profiles Statutory Reports Financial Sections
Stat
emen
t pur
suan
t to
sect
ion
212
of th
e C
ompa
nies
Act
, 195
6, r
elat
ing
to s
ubsi
diar
y co
mpa
nies
(` In
Mill
ions
)Na
me o
f the
Sub
sidiar
yCo
untry
The F
inan
cial Y
ear
of Th
e Sub
sidiar
y Co
mpa
ny E
nded
on
Capit
alRe
serv
esTo
tal
Asse
tsTo
tal
Liab
ilities
Inve
stm
ent
Turn
over
Prof
it /(L
oss)
Befo
re Ta
x
Tax
Prov
ision
Prof
it /(L
oss)
Afte
r Tax
Prop
osed
Di
viden
d
Sequ
ent G
loba
l Hol
ding
s Li
mite
dM
auri
tius
31-M
ar-1
1 4
.94
(4.6
4) 4
3.20
4
2.89
1
6.11
0
.90
(23.
43)
-
(23.
43)
-
Sequ
ent E
urop
ean
Hol
ding
s Li
mite
d (S
ubsi
diar
y O
f Seq
uent
G
loba
l Hol
ding
s Li
mite
d)C
ypru
s31
-Dec
-10
0.2
5 1
.05
16.
93
15.
62
-
-
(1.2
7) -
(1
.27)
27.
70
Sequ
ent I
pco
Gm
bh (S
ubsi
diar
y O
f Seq
uent
Eur
opea
n H
oldi
ngs
Lim
ited)
Switz
erla
nd31
-Dec
-10
0.9
8 (1
.66)
0.0
6 0
.73
-
-
(0.1
6) -
(0
.16)
-
Gal
enic
a B
.V. (
11,3
56 E
quity
Sha
res
Hel
d B
y Se
quen
t Glo
bal
Hol
ding
s Li
mite
d)N
ethe
rlan
ds31
-Dec
-10
7.46
(19.
60)
230.
4624
2.57
-
246
.80
(67.
19)
2.7
1 (6
9.96
) -
Cod
ifar
N.V
. (Su
bsid
iary
Of G
alen
ica
B.V
.)B
elgi
um31
-Dec
-10
Ref
er N
ote
Bel
ow
Vedi
c Fa
xipa
ng P
harm
a C
hem
ic C
ompa
ny L
imite
dVi
etna
m31
-Dec
-10
96.
19
(19.
07)
108.
57
31.4
5 -
2.5
8 (8
.45)
- (8
.45)
-
Sequ
ent A
nti B
iotic
s Pr
ivat
e Li
mite
dIn
dia
31-M
ar-1
1 0
.10
-
14.65
14
.55
- -
- -
- -
Sequ
ent O
ncol
ytic
s Pr
ivat
e Li
mite
dIn
dia
31-M
ar-1
1 0
.10
-
0.10
-
- -
- -
- -
Elys
ian
Life
Sci
ence
s Pr
ivat
e Li
mite
dIn
dia
31-M
ar-1
1 0
.10
(0.0
8) 79
.14
79.12
5
5.91
-
(0.0
8) -
(0.0
8) -
Elys
ian
Hea
lth C
are
Priv
ate
Lim
ited
Indi
a31
-Mar
-11
0.1
0 0
.07
0.2
6 0
.09
- 16
.43
0.10
0
.03
0.0
7 -
Sequ
ent R
esea
rch
Lim
ited
Indi
a31
-Mar
-11
41.
60
(21.
05)
152.
87
132.
32
- 11
7.56
(15.
66)
- (1
5.66
) -
Sanv
ed R
esea
rch
Labs
Pri
vate
Lim
ited
Indi
a31
-Mar
-11
6.5
0 (6
.50)
- -
- -
(0.4
5) -
(0.4
5) -
NO
TE: T
he in
form
atio
n on
Cod
ifar
N.V
. has
bee
n co
nsol
idat
ed in
to th
e in
form
atio
n of
Gal
enic
a B
.V.
Consolidated SECTION 212
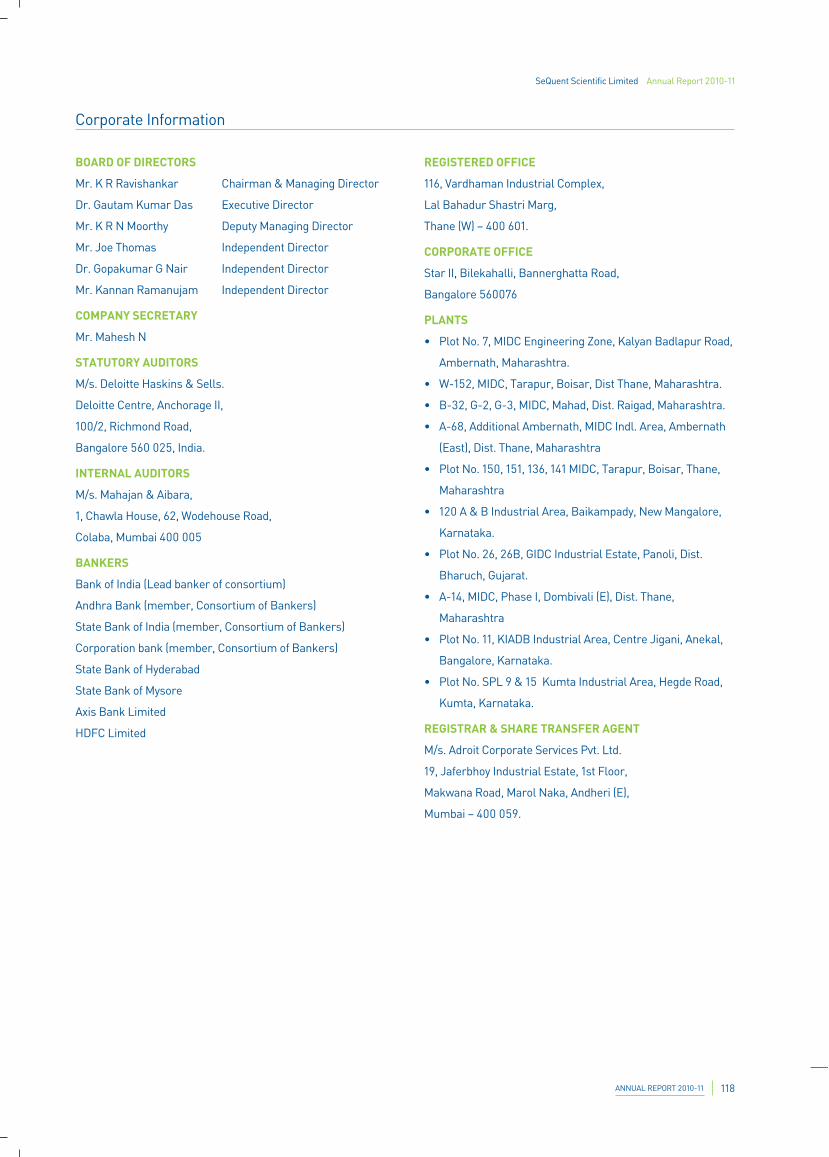
SeQuent Scientific Limited Annual Report 2010-11
ANNUAL REPORT 2010-11 118
Corporate Information
BOARD OF DIRECTORS
Mr. K R Ravishankar Chairman & Managing Director
Dr. Gautam Kumar Das Executive Director
Mr. K R N Moorthy Deputy Managing Director
Mr. Joe Thomas Independent Director
Dr. Gopakumar G Nair Independent Director
Mr. Kannan Ramanujam Independent Director
COMPANY SECRETARY
Mr. Mahesh N
STATUTORY AUDITORS
M/s. Deloitte Haskins & Sells.
Deloitte Centre, Anchorage II,
100/2, Richmond Road,
Bangalore 560 025, India.
INTERNAL AUDITORS
M/s. Mahajan & Aibara,
1, Chawla House, 62, Wodehouse Road,
Colaba, Mumbai 400 005
BANKERS
Bank of India (Lead banker of consortium)
Andhra Bank (member, Consortium of Bankers)
State Bank of India (member, Consortium of Bankers)
Corporation bank (member, Consortium of Bankers)
State Bank of Hyderabad
State Bank of Mysore
Axis Bank Limited
HDFC Limited
REGISTERED OFFICE
116, Vardhaman Industrial Complex,
Lal Bahadur Shastri Marg,
Thane (W) – 400 601.
CORPORATE OFFICE
Star II, Bilekahalli, Bannerghatta Road,
Bangalore 560076
PLANTS
• Plot No. 7, MIDC Engineering Zone, Kalyan Badlapur Road,
Ambernath, Maharashtra.
• W-152, MIDC, Tarapur, Boisar, Dist Thane, Maharashtra.
• B-32, G-2, G-3, MIDC, Mahad, Dist. Raigad, Maharashtra.
• A-68, Additional Ambernath, MIDC Indl. Area, Ambernath
(East), Dist. Thane, Maharashtra
• Plot No. 150, 151, 136, 141 MIDC, Tarapur, Boisar, Thane,
Maharashtra
• 120 A & B Industrial Area, Baikampady, New Mangalore,
Karnataka.
• Plot No. 26, 26B, GIDC Industrial Estate, Panoli, Dist.
Bharuch, Gujarat.
• A-14, MIDC, Phase I, Dombivali (E), Dist. Thane,
Maharashtra
• Plot No. 11, KIADB Industrial Area, Centre Jigani, Anekal,
Bangalore, Karnataka.
• Plot No. SPL 9 & 15 Kumta Industrial Area, Hegde Road,
Kumta, Karnataka.
REGISTRAR & SHARE TRANSFER AGENT
M/s. Adroit Corporate Services Pvt. Ltd.
19, Jaferbhoy Industrial Estate, 1st Floor,
Makwana Road, Marol Naka, Andheri (E),
Mumbai – 400 059.
Notice
Regd. Office: 116, Vardhaman Industrial Complex, L.B.S. Marg, Thane (W) 400 601
NOTICENOTICE is hereby given that the Twenty Sixth Annual General Meeting of the members of SEQUENT SCIENTIFIC LIMITED will be held
on Friday, September 23, 2011 at Hotel Fortune Park Lakecity (Jupiter Hospital Compound), Eastern Express Highway, Thane (W) 400
601 at 11.30 am
ORDINARY BUSINESS:
1. To receive, consider and to adopt the Audited Balance
Sheet of the Company as at March 31, 2011 and Profit &
loss Account for the year ended on that date along with
the reports of Directors and Auditors thereon.
2. To declare dividend on equity shares for the financial
year ended March 31, 2011.
3. To appoint a Director in place of Dr. Gopakumar Gopalan
Nair, who retires by rotation and being eligible offers
himself for re-appointment.
4. To appoint a Director in place of Dr. Gautam Kumar Das,
who retires by rotation and being eligible offers himself
for re-appointment.
5. To re-appoint M/s. Deloitte Haskins & Sells, Chartered
Accountants as Statutory Auditors to hold office from
the conclusion of this Annual General Meeting until
the conclusion of the next Annual General Meeting and
authorise the Board of Directors / Audit Committee to fix
their remuneration.
SPECIAL BUSINESS
6. To consider and if thought fit, to pass, with or without
modifications, the following resolution, as a Special
Resolution:
RESOLVED THAT Mr. Koduru Rama Narasimha
Moorthy, who was appointed as an Additional Director
and a Whole Time Director of the Company for a period
of 5 years w.e.f September 8, 2010 as per the term of
appointment and remuneration approved by the Board
of Directors on September 8, 2010 and who holds office
upto the date of ensuing Annual General Meeting of
the Company under section 260 of the Companies Act,
1956 and in respect of whom the Company has received
a notice in writing from a member proposing his
candidature for the Office of Director, be and is hereby
confirmed and appointed as Whole Time Director of
the Company for the remaining period of the tenure at
the original terms of appointment and remuneration of
Rs.1,25,00,000/- (Rupees One crore twenty five lakhs)
per annum with effect from September 8, 2010.
RESOLVED FURTHER THAT in the case of losses or
inadequacy of profits in any financial year, the above
remuneration shall be paid to Mr. Koduru Rama
Narasimha Moorthy, Whole Time Director of the
Company as the minimum remuneration.
RESOLVED FURTHER THAT Board of Directors of the
Company or any such person duly authorised by the
Board or the Company Secretary be and are hereby
authorized to sign and file the necessary application with
the Central Government and to do all other acts and
deeds as may be necessary in this regard.”
NOTES:
1. A MEMBER ENTITLED TO ATTEND AND VOTE AT
THE MEETING IS ENTITLED TO APPOINT A PROXY TO
ATTEND AND VOTE ON POLL INSTEAD OF HIMSELF.
THE PROXY NEED NOT BE A MEMBER OF THE
COMPANY. Proxies in order to be effective must be filed
with the Company at its Registered Office not later than
forty-eight hours before the commencement of the
meeting.
2. The Register of members and Share Transfer books of
the Company shall remain closed from September 20,
2011 to September 23, 2011 (both days inclusive)
3. The explanatory statement pursuant to Section 173(2) of
the Companies Act, 1956 in respect of Special Business
to be transacted in the meeting is annexed hereto.
By order of the Board of Directors
For SeQuent Scientific Limited
Place: Bangalore (Mahesh N)
Date: August 12, 2011 Company Secretary
EXPLANATORY STATEMENT PURSUANT TO SECTION
173(2) OF THE COMPANIES ACT, 1956
Item No. 6:
The Board of Directors of the Company on September 8, 2010
had appointed Mr. Koduru Rama Narasimha Moorthy as a
Whole Time Director for a period of 5 years with effect from
September 8, 2010 at the following terms of remuneration:
Components Rs. P.A.Basic Salary 30,00,000Provident Fund 3,60,000Special Allowance 21,40,000Other Allowances 43,85,000Leave Travel Allowance 1,00,000Medical 15,000Perquisites-Driver/Fuel/Car Maintenance 10,00,000Fixed Performance Pay 15,00,000Total 1,25,00,000
In terms of Section 260 of the Companies Act, 1956 Mr.
Moorthy holds office as a Director upto the date of ensuing
Annual General Meeting of the Company and is eligible for
reappointment as a Director.
The Company has received a Notice under section 257 of the
Companies Act, 1956 along with a deposit of Rs.500 from a
member proposing the candidature of Mr. Moorthy for the
office of the Director.
Mr. Moorthy has confirmed that he is not disqualified from
being appointed as Director under Section 274(1) (g) of the Act.
Mr. Moorthy has also intimated the Company in terms of
Clause 49 (IV) (E) (v) of the Listing Agreement that he does not
hold any shares in the Company (both in his own name and on
a beneficial basis by / for other persons).
The Ministry of Corporate Affairs vide their letter dated
February 24, 2011 had approved the appointment of Mr.
Moorthy as whole-time Director of the Company at a total
remuneration of Rs. 1,25,00,000 per annum w.e.f. September
8, 2010 till the ensuing Annual General Meeting. The approval
for remaining period would be considered by the Ministry
after the passing of the current resolution and submission of
a copy thereof to the Ministry. The approval of the members
will be subject to the Ministry’s approval to that extent.
INFORMATION AS REQUIRED UNDER SCHEDULE XIII
OF THE COMPANIES ACT, 1956 AND CLAUSE 49 OF THE
LISTING AGREEMENTS IS GIVEN BELOW:
I. GENERAL INFORMATION
1. Nature of Industry: Pharmaceutical Industry
2. Date or expected date of commencement of
commercial production: Not applicable (Company
is an existing Company)
3. In case of new companies, expected date of commencement of activities as per project approved by financial institutions appearing in the prospectus: Not applicable
4. Financial performance based on given indicators:
(` In Million)Particulars FY
2009-10FY
2008-09FY
2007-08Total Revenue 2,536 1,078 682Total Expenditure 2,328 1,043 662Profit / Loss after Tax 208 35 20Dividend Rate 20% 10% 12.50%
5. Export performance and net foreign exchange collaborations:
Foreign Exchange Earnings on FOB basis amounted to Rs. 1,147.84 Million as against Foreign Exchange Outgo of Rs. 468.10 Million for the financial year ending March 31, 2011.
6. Foreign investments or collaborators, if any:
The Company is listed on the Bombay Stock Exchange and as on Jun 30, 2011 the foreign holdings in the Company were 6.03 %.
There are no foreign collaborators.
II. INFORMATION ABOUT THE APPOINTEE
1. Back ground details:
Mr. Moorthy is having about 34 years of rich experience in the fields of Marketing, Finance, Projects, Supply Chain Management, Human Resources, Industrial Relations, Operations and Management.
He has worked with reputed companies like Lupin Limited, Siris Limited, Unichem Laboratories Limited, Tata Pharma Limited, Concept, Wanbury Limited and has successfully made World No. 1 products – Metformin & Ethambutol.
Notice
2. Past remuneration, recognition or rewards, job profile and his suitability:
Mr. Moorthy was drawing a remuneration of Rs.1,015 Crores (Cost to the Company) per annum during his term as Dy. Managing Director from M/s Wanbury Limited.
Mr. Moorthy would be responsible for and will oversee the entire functions of Procurement, Sales and Marketing, Business Development, Finance and Human Resources.
Mr. Moorthy’s experience in managing the operations of the Company and his understanding of the pharmaceutical industry as a whole will contribute significantly to the growth of the
Company.
3. Remuneration proposed: As stipulated in the
resolution.
4. Comparative remuneration Profile with respect to
industry, size of the Company, profile of the position
and person
Mr. Moorthy has held key positions in various
organizations he was associated with. His skill set
and his experience places him in a correspondingly
equal position to major pharmaceutical companies
in India. Considering the general industry and
the specific company profile, the proposed
remuneration is in line with the industry levels and
that of comparatively placed companies in India.
5. Pecuniary relationship directly or indirectly with
the Company, or relationship with the managerial
personnel, if any
Mr. Moorthy has pecuniary relationship with
the Company in his capacity as a Whole Time
Director. He is not related to any of the managerial
personnel in the Company.
III. OTHER INFORMATION
Reasons for loss or inadequate profits, steps taken or
proposed to be taken for improvement and expected
increase in productivity and profits in measurable terms:
Not applicable
Mr. Moorthy will be paid a remuneration of Rs.
1,25,00,000 per annum (Rupees One Crore Twenty Five
Lacs Only)
The shareholders are also requested to refer to the
Directors’ Report and Management Discussion and
Analysis Report, which forms part of the Annual Report
for the year ended March 31, 2011, which is sent with
this notice, for a detailed analysis on the Company’s
performance and outlook for future.
This disclosure is only an enabling disclosure for
payment of remuneration to Mr. Moorthy.
IV. DISCLOSURES
The proposed remuneration package of the Managerial
Personnel is detailed in the resolution. The Corporate
Governance report which forms part of the Directors’
Report contains details of remuneration paid to all
Directors.
Additional Disclosure As Required Under Clause 49
Iv (G) of the Listing Agreement With Nse/Bse Are As
Under:
a) A brief resume of the director and nature of his
expertise in specific functional areas: As given
under Section II above.
b) Shareholding of the director in the Company: Mr.
Moorthy does not hold any equity share in the
Company.
c) Companies in which directorships and committee
memberships held:
As on date of this notice, except for directorship in
the Company, Mr. Moorthy is not a director in any
other Company.
The Board considers that his association as a
Director will be beneficial to and in the interest
of the Company.The Board recommends the
resolution for approval of the shareholders.
None of the Directors except Mr. Koduru Rama
Narasimha Moorthy is concerned or interested in
this resolution.
By order of the Board of Directors
For SeQuent Scientific Limited
Place: Bangalore (Mahesh N)
Date: August 12, 2011 Company Secretary

Attendance Slip Proxy Form
Regd. Office: 116, Vardhaman Industrial Complex, L.B.S. Marg, Thane (W) 400 601
ATTENDANCE SLIP
Regd. Folio No. / Client ID : ................................................................................................................................
Name & Address of First/Sole Shareholder : ................................................................................................................................
No. of Shares held : ................................................................................................................................
I hereby record my presence at the 26th Annual General Meeting of the Company to be held on Friday, the 23rd day of September 2011 at 11:30 AM at Hotel Fortune Park Lakecity (Jupiter Hospital Compound) Eastern Express Highway, Thane (W) 400 601.
......................................................Signature of the Member/Proxy
Notes:
a) Only Member/Proxy can attend the meeting. No minors would be allowed at the meeting
b) Member / Proxy wish to attend the meeting must bring this attendance slip to the meeting and handover at the entrance duly filled in and signed
c) Member / Proxy should bring his / her copy of the Annual Report for reference at the meeting
Regd. Office: 116, Vardhaman Industrial Complex, L.B.S. Marg, Thane (W) 400 601
PROXY FORM
Regd. Folio No. / Client ID : ................................................................................................................................
Name & Address of First/Sole Shareholder : ................................................................................................................................
No. of Shares held : ................................................................................................................................
I / We ............................................................................................................................................................ of ............................................................................................................................................................ being a member / members of the above named Company, hereby appoint ................................................................................................ of or failing him / her ............................................................................................................................................................ of............................................................................................................................................................ as my / our Proxy to attend and vote for me / us on my / our behalf at the 26th Annual General Meeting of the Company to be held on Friday, the 23rd day of September 2011 at 11:30 AM at Hotel Fortune Park Lakecity (Jupiter Hospital Compound) Eastern Express Highway, Thane (W) 400 601, and at any adjournment(s) thereof.
Signed this ....................................................... day of ............................. 2011
Notes:
a) Proxy need not be a member of the Company
b) The Proxy form duly filled in and signed by the member(s) across Revenue Stamp should reach the Company’s Registered Office: 116, Vardhaman Industrial Complex, L.B.S. Marg, Thane (W) 400 601 at least 48 hours before the time fixed for the meeting.
c) Corporate members intending to send their authorized representative(s) to attend the meeting are requested to send a Certified Copy of the Board Resolution authorizing their representative(s) to attend and vote on their behalf at the meeting.
Revenue Stamp


www.sequent.in