reading skill and exposure to orthography influence speech production
TRANSCRIPT

Applied Psycholinguistics, page 1 of 24, 2015doi:10.1017/S0142716415000053
Reading skill and exposure toorthography influence speechproduction
MEREDITH SALETTAUniversity of Iowa
LISA GOFFMANPurdue University
DIANE BRENTARIUniversity of Chicago
Received: May 8, 2013 Accepted for publication: December 2, 2014
ADDRESS FOR CORRESPONDENCEMeredith Saletta, Department of Communication Sciences and Disorders, University of Iowa,Wendell Johnson Speech and Hearing Center, Iowa City, IA 52242. E-mail: [email protected]
ABSTRACTOrthographic experience during the acquisition of novel words may influence production processingin proficient readers. Previous work indicates interactivity among lexical, phonological, and articula-tory processing; we hypothesized that experience with orthography can also influence phonologicalprocessing. Phonetic accuracy and articulatory stability were measured as adult, proficient readersrepeated and read aloud nonwords, presented in auditory or written modalities and with variationsin orthographic neighborhood density. Accuracy increased when participants had read the nonwordsearlier in the session, but not when they had only heard them. Articulatory stability increased withpractice, regardless of whether nonwords were read or heard. Word attack skills, but not reading com-prehension, predicted articulatory stability. Findings indicate that kinematic and phonetic accuracyanalyses provide insight into how orthography influences implicit language processing.
It is well documented that the characteristics of a word’s phonology, including itsphonotactic frequency and phonological neighborhood density, influence the per-ception and production of that word. What is less obvious is that the characteristicsof a word’s orthography, including its grapheme–phoneme correspondences andorthographic neighborhood density, also influence its perception and production(Alario, Perre, Castel, & Ziegler, 2007; Ventura, Morais, Pattamadilok, & Kolin-sky, 2004; Ziegler & Ferrand, 1998; Ziegler, Ferrand, & Montant, 2004; Ziegler,Jacobs, & Klueppel, 2001; Ziegler, Van Orden, & Jacobs, 1997). Perceiving a wordauditorily will activate its orthographic representation even when the listener is not
© Cambridge University Press 2015 0142-7164/15

Applied Psycholinguistics 2Saletta et al.: Orthography and speech production
performing a spelling task (Miller & Swick, 2003). The degree of spelling–soundconsistency of novel words may influence speech in tasks such as picture namingand auditory lexical decision making, further suggesting that orthographic factorsare involved even when the individual is not actually reading (Rastle, McCormick,Bayliss, & Davis, 2011). This effect is known as orthographic interference; thatis, facilitation or disruption may occur as the result of phonological–orthographiccorrespondence or incongruency (Burgos, Cucchiarini, van Hout, & Strik, 2014;Weber-Fox, Spencer, Cuadrado, & Smith, 2003).
Interactive models of reading capture the relationship between a word’s phonol-ogy and orthography by positing a bidirectional flow of information: orthographicrepresentations activate phonological representations, but the reverse occurs aswell (Jacobs & Grainger, 1994). Morton’s classic model (1969) describes threetypes of information included in the representation of a word in the mental lexicon.Spelling, sound, and meaning are available when a word is recognized, regard-less of the modality in which the word was received (Miller & Swick, 2003).Furthermore, interactive models define the relationship among semantic, syntac-tic, phonological, and orthographic information as “nodes” that are triggered insequence or simultaneously (Rapp & Goldrick, 2000); these nodes can activateand mutually influence one another (Alario et al., 2007). Knowledge of orthogra-phy changes an individual’s perception of the spoken word (Pattamadilok, Perre,Dufau, & Ziegler, 2009; Ventura, Morais, & Kolinsky, 2007). Similarly, the asso-ciation of novel words with consistent or inconsistent representations of spellingand sound may create an immediate effect on participants’ picture naming (Ras-tle et al., 2011), providing evidence for the interaction between orthography andspoken language processing. These studies lead to the conclusion that experiencewith reading changes how words are produced. It is the goal of the current study todetermine how manipulations of the modality of presentation of nonword stimuli(i.e., auditory or written) influence speech production.
Specific characteristics of a word’s orthography can influence its pro-cessing. These factors include neighborhood density, consistency, and trans-parency/opacity effects. Neighborhood density effects involve the number of wordsthat are orthographically or phonologically similar to a given sequence (Coltheart,Davelaar, Jonasson, & Besner, 1977; Storkel, 2013). Consistency effects involvethe degree of grapheme–phoneme correspondence in the word’s spelling (Bolger,Hornickel, Cone, Burman, & Booth, 2008). English includes many inconsistentmappings and, consequently, is on the opaque end of the continuum (Frost, Katz,& Bentin, 1987; Ziegler & Goswami, 2005). For instance, in English, the sequence/ɚ/ can be spelled in several ways, including birch, lurch, perch, and search (Ven-tura et al., 2007). These three factors (density, consistency, and transparency)interact differently in various languages based on the languages’ orthography.For instance, the psycholinguistic grain size theory (Ziegler & Goswami, 2005)predicts that readers of English need to use both “small unit” and “large unit”recoding strategies (Brown & Deavers, 1999). This happens because the incon-sistency, or opaque characteristics, of smaller units (such as graphemes) is muchhigher than that of larger units (such as rimes). Languages that contain more trans-parent characteristics do not have this dual focus. This is important for the currentstudy because our procedures involve the manipulation of these smaller units. The

Applied Psycholinguistics 3Saletta et al.: Orthography and speech production
nonword stimuli in this study will be presented with either transparent or opaquespellings; the influence of these manipulations on speech production accuracy andstability will be assessed.
In spoken language, frequency effects such as neighborhood density influ-ence production processes, as indexed by measures such as reaction time andphonetic accuracy (e.g., Rastle et al., 2011; Vitevitch, 2002). The influence oforthographic neighborhood factors on production processes has been minimallyexplored, though there is substantial evidence that orthographic factors influencephonological organization. Frequency and transparency effects likely overlap (e.g.,the English homophones peek and pique differ in regard to both of these factors;the former spelling has a greater number of orthographic neighbors and is alsomore transparent). Neighborhood density influences spoken language processing;however, little is known about how orthographic factors, including orthographicdensity, may analogously influence language production. Therefore, we have cho-sen to manipulate orthographic neighborhood density in order to explore one wayin which orthography influences processing.
ORTHOGRAPHY INFLUENCES EXPLICIT AND METALINGUISTICPROCESSING
Influences of orthography on language processing have predominantly been in-vestigated using metalinguistic measures. These methods target an explicit levelof processing; that is, participants are asked to attend to the sound structure ofthe spoken or written stimuli and then to make mindful decisions (Snow, Burns,& Griffin, 1998). Examples of such tasks include monitoring lists for rhymingwords (Seidenberg & Tannenhaus, 1979; Zecker, 1991), counting phonemes (Ehri& Wilce, 1980) or syllables (Ventura, Kolinsky, Brito-Mendes, & Morais, 2001),or training on homonym definition and ambiguous sentence detection in order toimprove reading comprehension (Zipke, Ehri, & Smith Cairns, 2009).
However, metalinguistic judgments represent only some aspects of linguisticprocessing, and these results come with important caveats. The types of stud-ies mentioned above involve analyzing language at a high (i.e., explicit) level ofawareness and consciousness, which is not a requirement for speaking and maynot be present in all adult talkers. For example, competent speakers who are notliterate in an alphabetic system may experience difficulty in some metalinguistictasks, such as sound segmentation (Morais, Cary, Algria, & Bertelson, 1979; Read,Zhang, Nie, & Ding, 1986). Drawing conclusions based exclusively on metalin-guistic judgments presents an incomplete picture, because these same individualswould likely be proficient in tasks involving more implicit components of linguis-tic processing. Orthographic factors may have a deeper effect on speakers andreaders: one that is apparent in their implicit linguistic processing and accessiblevia the methods we will employ in this study.
DOES ORTHOGRAPHY INFLUENCE IMPLICIT LINGUISTICPROCESSING?
A different aspect of learning involves implicit processing, in which the aspectsof language usage are not available for conscious access (Poldrack, Prabhakaran,

Applied Psycholinguistics 4Saletta et al.: Orthography and speech production
Seger, & Gabrieli, 1999). Implicit learning can be described as unintentional, oroutside of the awareness that learning has occurred; it occurs over an extendedperiod; it involves the knowledge of rules or procedures rather than facts (Thomaset al., 2004); it requires no mindful judgments (Hoff, 2011); and it may not beavailable for introspective report (Berry & Broadbent, 1984). Behavioral outcomesalso differ based on the type of learning that has occurred. For instance, participantscan perform differently on a task depending upon whether or not they are givenexplicit instructions (Gebauer & Mackintosh, 2007); thus, the implicit/explicitdifference goes beyond introspective report or description (Xie, Gao, & King,2013).
Researchers have used several different methodologies, ranging from phoneticaccuracy measures to reaction time to fine-grained acoustic and kinematic analy-ses, to quantify implicit processing and provide evidence for interactions amonglexical, phonological, and phonetic levels of processing in spoken language (e.g.,Pierrehumbert, 2002). For example, studies of speech production reveal that thereare interactions between lower levels of speech output and higher levels of lan-guage processing. Slips of the tongue often have a lexical bias; that is, erroneousphoneme substitution is likely to lead to the production of real words. This indi-cates that slips of the tongue do not simply reflect problems in motor programming,but suggest that the planning of lexical components of speech production is im-plicated at this level (Goldrick, Baker, Murphy, & Baese-Berk, 2011; McMillan,Corley, & Lickley, 2009). Thus, overt and covert errors that occur at lower levels ofspeech production may reveal interactivity with higher level aspects of languageprocessing.
Beyond these interactions in spoken language, some studies demonstrate thatorthographic factors also influence implicit processing. Furthermore, orthographyinteracts with both higher level linguistic processes and lower level speech output.This occurs even in tasks that do not directly involve reading, including auditoryshadowing tasks (Rastle et al., 2011; Ventura et al., 2007), auditory lexical de-cision tasks (Dich, 2011; Zeguers et al., 2011), and semantic category judgment(Assink, van Bergen, van Teeseling, & Knuijt, 2004; Booth, Bebko, Burman, &Bitan, 2007). These effects may be modified by the specific orthographic charac-teristics of the study’s stimuli (e.g., consistent vs. inconsistent spellings) and/orparticipants’ reading skill. For instance, while phonological neighborhood densityeffects are present in all speakers, orthographic neighborhood effects emerge onlyin proficient readers (Ziegler, Muneaux, & Grainger, 2003).
The measures described above, such as phonetic accuracy and lexical decisionand shadowing, may be used to quantify implicit processing because they donot require participants to make conscious judgments about the stimuli that theyhear or read. Unlike what is assessed by metalinguistic tasks, many components ofspeaking and reading do not require conscious awareness, and thus may be viewedas automatic. This automaticity becomes established throughout the developmentof children’s reading skills, which proceeds from a visual/logographic stage, tomore segmental analysis, to the identification of written words by sight (Ehri, 1991;Kamhi & Catts, 2012; Masonheimer, Drum, & Ehri, 1984; Ventura et al., 2007).Readers at this mature level bypass phonological conversion by applying regularlyoccurring patterns such as morphemes and shared letter sequences (Kamhi & Catts,

Applied Psycholinguistics 5Saletta et al.: Orthography and speech production
2012). These implicit components of the effects of reading on global languageprocessing are the focus of the present investigation. Specifically, little is knownregarding changes in participants’ ability to speak or read aloud that occur asa function of exposure to the written word. Measuring speech production cancircumvent the limitations inherent in studies of exclusively metalinguistic tasks,in that it addresses a different level of processing that is present in all speakers, notjust those who are literate. Therefore, in the present work, we will evaluate whetherexposure to orthographic cues during learning interacts with speech productionprocesses in adult learners. Specifically, we will assess participants’ productionaccuracy and speech movement stability as they learn nonwords that vary inmodality of presentation (auditory or written) or in orthographic transparency(transparent or opaque spelling). We will also explore whether these factors aremodulated by individual differences in reading proficiency.
IMPLICIT PROCESSING AS MEASURED BY ARTICULATORYKINEMATICS AND NONWORD REPETITION
A primary methodology that has been used and will be a focus here is phoneticaccuracy, or the assessment of errors that talkers include in their productions ofnovel word forms. An additional promising methodology, which has the poten-tial to quantify implicit learning and which also targets the interaction betweenspeech motor output and language processing, involves speech kinematics (Goff-man, Gerken, & Lucchesi, 2007; Heisler, Goffman, & Younger, 2010; McMillanet al., 2009; Smith & Goffman, 1998). Analyses of speech kinematics necessitateonly that the speaker produce target words or sentences, not make metalinguisticdecisions. Measuring articulatory stability provides a direct analysis of the influ-ences of lexical, grammatical, and phonological factors on speech production. Forexample, Saletta et al. (in preparation) discovered that adults’ speech movementstability changes according to the syntactic complexity of a given sentence. Inaddition, children acquiring a novel word form showed increased speech move-ment stability when that form was paired with a meaningful referent, but notwhen it was simply heard and produced as a meaningless nonword (Gladfelter& Goffman, 2013; Heisler et al., 2010). Articulatory movement analysis has thepotential to reveal how readers’ experience with orthography may reorganize theirphonological processing.
In these sorts of studies, it is essential that nonwords be used as stimuli. Itis evident that speech production is highly sensitive to experience, and only theuse of nonwords can control an individual’s prior knowledge. Furthermore, atask involving nonwords may be useful in differentiating individuals with varyinglevels of reading proficiency. Whereas high- and low-proficiency readers havesimilar word repetition skills, they differ in their nonword repetition skills (Castro-Caldas, Petersson, Reis, Stone-Elander, & Ingvar, 1998). When repeating auditorymaterial, speakers may use any of three strategies or processing pathways. Wordrepetition predominantly engages semantic or lexical pathways, whereas nonwordrepetition predominantly engages the phonological pathway (Castro-Caldas et al.,1998). Thus, nonword production tasks enable assessment of the relationshipbetween language skills and speech motor output. More specifically, manipulating

Applied Psycholinguistics 6Saletta et al.: Orthography and speech production
the orthographic frequency of the nonword stimuli may provide further insightinto the nature of the interaction between orthography and speech production.
OBJECTIVES
To explore the influence of orthography on the production of spoken language, wecreated nonwords, which were presented with systematic variations in modality(i.e., auditory or visual) and orthographic frequency (i.e., relatively frequent orinfrequent spelling). We then measured proficient adult readers’ phonetic accuracyand their articulatory movement stability before and after they either heard andrepeated (auditory exposure) or read and repeated (orthographic exposure) thenonwords. The overarching goal was to evaluate whether experience reading asopposed to only hearing these nonword forms would influence speech production.
Specifically, we asked three questions:
1. Does exposure to a written word influence the phonetic accuracy and the ar-ticulatory movement stability of an adult talker’s production of this new wordform?
2. Do specific orthographic characteristics of this nonword, including orthographictransparency and opacity (defined as high and low orthographic neighborhooddensity) influence phonetic accuracy or articulatory movement stability?
3. Even within a relatively homogeneous group of proficient adult readers, do thoseindividuals who demonstrate better reading skills also produce nonwords withgreater articulatory stability?
METHODS
Participants
Participants included 18 adults (10 females) between the ages of 19 years, 3months (19;3) and 64;3 (M = 28;8; SD = 13). Participants had between 13 and18 years of education; all were at least college freshmen. All participants werenative speakers of English; they reported no history of speech, language, hearing,or reading problems, neurological disease, or learning delay/disability; and theypassed a hearing screening. Approval for this study was granted by the PurdueUniversity Institutional Review Board.
Equipment
High-quality audio and video recordings were obtained for the analysis of phoneticaccuracy. Simultaneously, three-dimensional kinematic data were collected at 250samples/second using a three-camera Optotrak 3020 motion capture system or 3DInvestigator motion capture system (both Northern Digital, Inc., Waterloo, ON,Canada). Small (11 mm) infrared light emitting diodes (IREDs) were attachedwith antiallergenic medical adhesive to each participant’s upper lip, lower lip, anda lightweight splint under the chin at midline to approximate jaw movement. Five

Applied Psycholinguistics 7Saletta et al.: Orthography and speech production
Figure 1. An example of an illustration of a novel character (Ohala, 1996). While viewing thispicture, participants heard the word /mɅnfik/ and then said, “Bob saw a /mɅnfik/ before.”
additional IREDs were used to create a three-dimensional head coordinate systemin order to subtract head motion artifact (Smith, Johnson, McGillem, & Goffman,2000). A time-locked acoustic signal was collected at 16,000 samples/second toconfirm that movement records aligned with target nonword productions.
Procedures and session structure
Each individual participated in one session, which was approximately 90 minlong and included behavioral testing and the collection of acoustic and kinematicdata. In the experimental component of the session, participants heard nonwords,which were described as the names of types of make-believe aliens and were eachassociated with a specific illustration of a novel character (Ohala, 1996; Figure 1).Participants were instructed to listen to each character’s name and then say itsname in the sentence “Bob saw a (insert name) before.” This carrier sentence wasused to increase complexity and provide linguistic context, and because it containsseveral labial consonants, to facilitate articulatory kinematic analysis.
There were a total of three experimental blocks. Each block was associated witha single presentation condition: high orthographic density (corresponding withtransparent) orthography, low orthographic density (corresponding with opaque)orthography, and auditory-only presentation. Each experimental block contained2 target nonwords and 10 fillers (i.e., nonwords that had phonetic characteristicssimilar to the target words and were included to increase the difficulty of the task.Participants did not know which stimuli were fillers, and fillers were not ana-lyzed). Each condition was further divided into three phases: pretest, learning, and
Applied Psycholinguistics 8Saletta et al.: Orthography and speech production
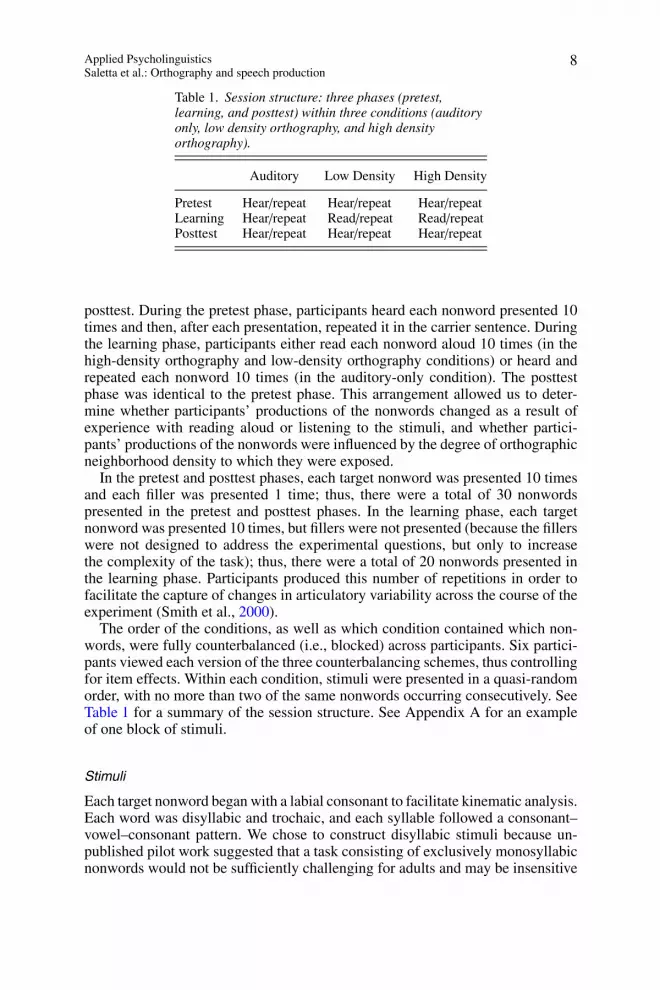
Table 1. Session structure: three phases (pretest,learning, and posttest) within three conditions (auditoryonly, low density orthography, and high densityorthography).
Auditory Low Density High Density
Pretest Hear/repeat Hear/repeat Hear/repeatLearning Hear/repeat Read/repeat Read/repeatPosttest Hear/repeat Hear/repeat Hear/repeat
posttest. During the pretest phase, participants heard each nonword presented 10times and then, after each presentation, repeated it in the carrier sentence. Duringthe learning phase, participants either read each nonword aloud 10 times (in thehigh-density orthography and low-density orthography conditions) or heard andrepeated each nonword 10 times (in the auditory-only condition). The posttestphase was identical to the pretest phase. This arrangement allowed us to deter-mine whether participants’ productions of the nonwords changed as a result ofexperience with reading aloud or listening to the stimuli, and whether partici-pants’ productions of the nonwords were influenced by the degree of orthographicneighborhood density to which they were exposed.
In the pretest and posttest phases, each target nonword was presented 10 timesand each filler was presented 1 time; thus, there were a total of 30 nonwordspresented in the pretest and posttest phases. In the learning phase, each targetnonword was presented 10 times, but fillers were not presented (because the fillerswere not designed to address the experimental questions, but only to increasethe complexity of the task); thus, there were a total of 20 nonwords presented inthe learning phase. Participants produced this number of repetitions in order tofacilitate the capture of changes in articulatory variability across the course of theexperiment (Smith et al., 2000).
The order of the conditions, as well as which condition contained which non-words, were fully counterbalanced (i.e., blocked) across participants. Six partici-pants viewed each version of the three counterbalancing schemes, thus controllingfor item effects. Within each condition, stimuli were presented in a quasi-randomorder, with no more than two of the same nonwords occurring consecutively. SeeTable 1 for a summary of the session structure. See Appendix A for an exampleof one block of stimuli.
Stimuli
Each target nonword began with a labial consonant to facilitate kinematic analysis.Each word was disyllabic and trochaic, and each syllable followed a consonant–vowel–consonant pattern. We chose to construct disyllabic stimuli because un-published pilot work suggested that a task consisting of exclusively monosyllabicnonwords would not be sufficiently challenging for adults and may be insensitive

Applied Psycholinguistics 9Saletta et al.: Orthography and speech production
to differences in the learning phase of the study. Thus, the first syllable in eachnonword was present only in order to increase its complexity, and was drawn fromthe list of 120 high-probability nonsense syllables presented by Vitevitch, Luce,Charles-Luce, and Kemmerer (1997). These syllables were defined as having seg-ments with high positional probabilities and frequent biphone probabilities. Thesecond syllable in each nonword was subjected to the relevant manipulations. Eachnonword’s second syllable was constructed based on a pair of homophones withthe initial consonant changed. For example, the homophone /pik/ (“peek/pique”)was changed to /fik/ (“feek/fique”); this syllable made up the second syllableof the nonword stimulus /mɅnfik/. The syllable’s more frequent or transparentspelling (e.g., “munfeek”) was used in the high-density condition, and its moreinfrequent or opaque spelling (e.g., “munfique”) was used in the low-densitycondition.
The degree of orthographic frequency was determined based on the numberof orthographic neighbors of each spelling (Table 2). The spelling of the non-word /fik/ as “feek” has six orthographic neighbors, while the spelling “fique” hasone orthographic neighbor; thus, “feek” has higher type frequency than “fique.”This manipulation was similar to that of Rastle et al. (2011), who created non-word stimuli that could be spelled in a regular or irregular manner (accordingto English grapheme–phoneme correspondence) and that were matched accord-ing to orthographic neighborhood density. Finally, the second syllables in thenonwords were balanced for phonological neighborhood density and phonotacticfrequency (positional segment frequency and biphone probability). These charac-teristics were calculated using the online Speech and Hearing Lab NeighborhoodDatabase of Washington University in St. Louis (Sommers, 2002). The non-word stimuli used for fillers were either one or three syllables in length, andwere created from the list of high-probability syllables in Vitevitch et al. (1997;Appendix B).
Data processing
Data were processed in Matlab (Mathworks, 2009). The sentences were segmentedout of each trial and were then sorted by condition and phase in preparationfor measurement. Because effects often appear in multimovement contexts forthe kinematic analysis, we chose to analyze the whole sentence in which thetarget word was embedded. Phonetic accuracy was measured only in the targetword.
The lip aperture variability (LA) index is a composite measure of spatial andtemporal variability that quantifies the movement of three effectors (upper lip,lower lip, and jaw) as they interact during speech to control oral opening andclosing (Smith & Zelaznik, 2004; Walsh & Smith, 2002). The LA index is derivedby subtracting upper lip from lower lip movement, resulting in a measure of lipaperture. This measure quantifies articulatory stability.
To calculate the LA index, the onsets and offsets of each sentence were selectedbased on peak velocity of lower lip and jaw movement. Head movement was cor-rected, and the data were then low-pass filtered (10 Hz cutoff). Movement onsetsand offsets were selected by visually inspecting the displacement record for local

Table 2. Characteristics of target nonwords
No. of OrthographicNeighbors
Homophone High Low No. of For High For Low Positional BiphonePairs Density Density Phonological Density Density Segment Probability of
(2nd Syllable) Transcription Spelling Spelling Neighbors Spelling Spelling Frequency Medial Consonants
“strait/straight” /fispet/ “feespait” “feespaight” 34 15 1 0.1796 .0081“peek/pique” /mɅnfik/ “munfeek” “munfique” 20 6 1 0.1318 .0022“ate/eight” /bɑɪnvet/ “binevate” “bineveight” 19 12 1 0.1176 .0113“loot/lute” /pɅlvut/ “pulvoot” “pulvute” 26 18 9 0.1305 .0015“cash/cache” /fɅlvæʃ/ “fulvash” “fulvache” 15 12 2 0.1096 .0015“side/sighed” /bispɑɪd/ “beespide” “beespighed” 5 13 0 0.1566 .0081

Applied Psycholinguistics 11Saletta et al.: Orthography and speech production
0 0.6 1.2 1.8
-5
0
5
sec
mm
0 20 40 60 80 100
-2
-1
0
1
%
z sc
ore
0 20 40 60 80 100
0
0.5
1 LA VAR=20.1338
%
SD
Figure 2. Examples of extracted movement sequences from the utterance “Bob saw a /mɅnfik/before.” The top panel represents the raw records. The middle panel represents the time- andamplitude-normalized records. The bottom panel represents the standard deviations used tocalculate the lip aperture variability index values.
minima. The minimum value was then confirmed by an algorithm, which deter-mined the point at which velocity crossed zero within a 25-point (100-ms) windowof the point selected by the experimenter. The movement trajectories were thenlinearly amplitude and time normalized. Time normalization was accomplished bysetting each record to a common time-base of 1,000 points, using a spline functionto interpolate between points. Amplitude normalization was completed by settingthe mean to 0 and the standard deviation to 1. After normalizing the data, standarddeviations were computed at 2% intervals in relative time across the 10 recordsand then summed. The sum of the 50 SD is the LA index; a higher value reflectsgreater movement variability (Figure 2; see Smith, Goffman, Zelaznik, Ying, &McGillem, 1995; Smith & Zelaznik, 2004).

Applied Psycholinguistics 12Saletta et al.: Orthography and speech production
Outcome variables
Segmental accuracy. The video recordings were used to transcribe each utter-ance and determine the percentage consonants correct (PCC). The PCC quantifiesspeech accuracy by measuring the proportion of consonants in each nonword pro-duced accurately. Reliability of phonetic transcription was established by using anindependent coder to transcribe 20% of the sessions. The phonetic transcriptionsof the first author and the independent coder were in agreement for 98% of theconsonants produced by participants (the coding of the first author was used as thedefault in cases of disagreement). Along with the raw PCC values, pretest/posttestdifference scores were calculated as a more direct index of within-individualchange.
Speech movement stability. The LA index values were evaluated separately foreach phase within each condition. As with the PCC data, pretest/posttest differencescores were calculated along with the raw LA index values.
Reading and oral language skills. To quantify reading proficiency, we ad-ministered the Woodcock Reading Mastery Tests—Revised-Normative Update(WRMT-R/NU; Woodcock, 2011). The subtests included word identification (par-ticipants’ standard score range = 87–133, SD = 10.16), word attack (standardscore range = 79–132, SD = 12.61; note that one participant scored more than astandard deviation below the test’s mean of 100), word comprehension (antonyms,synonyms, and analogies; standard score range = 87–130; SD = 11.57), and pas-sage comprehension (standard score range = 86–143; SD = 14.04). In addition, wequantified oral language skills by administering two subtests of the Test of Adoles-cent and Adult Language, Third Edition (Hammill, Brown, Larsen, & Wiederholt,2011). Because some participants were outside of the standardization group’s agerange for this test, we report raw scores rather than standard scores. The subtestsincluded listening grammar (raw score range = 8–33 out of 35) and speakinggrammar (raw score range = 14–23 out of 30). Although all of our participantshad at least some college education, they showed variation in their reading andlanguage scores.
The critical tests for our analyses of individual differences were the word at-tack and word comprehension subtests of the WRMT-R/NU. These were chosenbased on the fact that they employ two very similar tasks (i.e., reading singleitems) to measure two very different aspects of reading skills (i.e., decoding vs.comprehension). The other tests and subtests were used to confirm that partici-pants demonstrated typical reading and language skills, but were not subjected tostatistical analyses.
Statistical analyses
All variables were analyzed using a within-participant analysis of variance, withcondition (auditory only, high-density orthography, and low-density orthography),phase (pretest and posttest), and nonword (first or second nonword) as the within-participant factors. Simple effect analyses were used for pairwise comparisons
Applied Psycholinguistics 13Saletta et al.: Orthography and speech production
when main effects were present. We used an arcsine transform to compensate forthe fact that the accuracy data are not normally distributed. The α level was set to0.05. Linear regression was also used to determine whether a relationship existsbetween two aspects of reading skill (word attack and word comprehension) andoverall LA variability. For the correlations, the α level was changed to 0.025 usinga Bonferroni adjustment. This adjustment accounts for the potentially inflatedType I error inherent in conducting multiple correlations on related dependentvariables (Tabachnick & Fidell, 2007). We also report effect sizes for all results.
RESULTS
Analytic issues
Approximately 9% of the data were excluded due to disfluencies or other inter-ruptions in the speech signal, such as laughing, coughing, or omitting the article.The productions obtained during the learning phase were not analyzed (thesedata differed from the pretest and posttest data because, in the high-density andlow-density orthography conditions, the nonwords were read aloud instead ofrepeated). For the kinematic analysis, substitutions of one labial consonant foranother, as well as vowel errors, were included; these tokens were consideredcorrect for kinematic analysis. An additional 9% of the data, while amenable tophonetic accuracy analysis, were excluded from the kinematic analysis becausethe participants did not produce initial, medial, and final labial consonants or be-cause an IRED was missing from the cameras’ view. In these cases, articulatorytrajectories could not be extracted from the speech stream. We counterbalanced thenonwords across conditions, and found no significant effects of specific nonwords(i.e., that one nonword was associated with different PCC or LA index values thanthe other five nonwords). Therefore, all statistical analyses were collapsed acrossthe nonwords.
Segmental accuracy and speech movement stability
Segmental accuracy. To directly assess participants’ learning, pretest/posttestdifference scores for segmental accuracy were calculated. We found a main effectof condition, F (2, 16) = 16.70, p < .001, ηp
2 = 0.68 (Figure 3). Simple effect anal-yses indicated that participants’ PCC scores became more accurate from pretestto posttest in the high-density, t (17) = 3.25, p = .005, and low-density orthogra-phy conditions, t (17) = 3.63, p = .002, in comparison to the auditory condition.High- and low-density values did not differ from one another, t (17) = 0.46,p = .65.
Along with our analysis of difference scores, we examined the raw PCC data.Because by definition, data expressed as proportions are not normally distributed,to stabilize the variance we transformed these data using an arcsine transform(Rucker, Schwarzer, Carpenter, & Olkin, 2009). Analyses of the transformed PCCdata indicated that there was a main effect of phase. Participants were less accurate(i.e., lower PCC) in the pretest, M = 0.93, SE = 0.01, than in the posttest phase, M= 0.97, SE = 0.01; F (1, 17) = 34.67, p < .001, ηp
2 = 0.67. As shown in Figure 4,

Applied Psycholinguistics 14Saletta et al.: Orthography and speech production
Figure 3. Percentage consonants correct pretest–posttest difference scores (positive scoresindicate greater accuracy). Participants became significantly more accurate from pretest toposttest in the two written conditions, but not in the auditory condition. Error bars reflectstandard errors.
Figure 4. Percentage consonants correct raw scores in each phase within each condition (higherscores indicate greater accuracy). Participants became significantly more accurate from pretestto posttest in the two written conditions, but not in the auditory condition. Error bars reflectstandard errors.

Applied Psycholinguistics 15Saletta et al.: Orthography and speech production
Figure 5. Lip aperture index value pretest–posttest difference scores (negative scores indicategreater articulatory stability). Participants became significantly more stable from pretest toposttest in all three conditions. Error bars reflect standard errors.
condition was not significant, F (2, 16) = 1.12, p = .35, ηp2 = 0.12. There was a
significant interaction of phase by condition, F (2, 16) = 10.37, p = .001, ηp2 =
0.56. Simple effect analyses indicated that in all three conditions, participants’PCC increased from pretest to posttest: in the auditory condition, t (17) = 2.30, p= .03; in the high orthographic density condition, t (17) = 4.22, p = .001; and inthe low orthographic density condition, t (17) = 4.17, p = .001.
Speech movement stability. To directly assess participants’ learning, pretest/posttest difference scores for LA index values were calculated. While differencescores were less than zero (reflecting a move toward greater stability; Figure 5),there was no significant condition effect for LA index difference scores, F (2,16) = 0.26, p = .77, ηp
2 = .03. Along with our analysis of difference scores, weexamined the raw LA index data. There was a significant main effect of phase.Participants had significantly higher (i.e., more variable) LA index values in thepretest (M = 20.14, SE = 0.62) than in the posttest phase (M = 18.44, SE =0.62), F (1, 17) = 5.37, p = .03, ηp
2 = 0.24. The main effect of condition wasnot significant, F (2, 16) = 1.07, p = .37, ηp
2 = 0.12, and there was no significantinteraction, F (2, 16) = 0.25, p = .78, ηp
2 = 0.03 (Figure 6).
Relationship between reading skills and LA variability. The results of a linearregression indicated that word attack raw scores predicted LA variability, F (1,17) = 7.34, p = .02, R2 = .31 (Figure 7a). Given the p value of .025 based on theBonferroni type adjustment, this result was significant. In contrast, the results of a

Applied Psycholinguistics 16Saletta et al.: Orthography and speech production
Figure 6. Lip aperture index values (lower scores indicate greater articulatory stability). Par-ticipants became significantly more stable from pretest to posttest in all three conditions. Errorbars reflect standard errors.
second linear regression indicated that word comprehension w scores (a measureapplied to the WRMT-R/NU, consisting of an equal-interval scale that representsboth a person’s ability level and the difficulty level of the items; Jaffe, 2009;Woodcock, 2011) did not predict LA variability, F (1, 17) = 1.80, p = .20, R2 =.10 (Figure 7b).
DISCUSSION
We inquired whether manipulations of nonword presentation modality and or-thography impact how proficient readers produce language. In addition, we askedif individual differences in reading facility, even in these proficient adult readers,influence orthographic effects on word production. To address these questions, wecreated a nonword production task in which we systematically manipulated themodality of the presentation (auditory or written) and the degree of neighborhooddensity (transparent or opaque spellings) of the nonword stimuli.
Our data lead to several key findings. We might expect that manipulating modal-ity and orthographic density would influence participants’ phonetic accuracy andarticulatory stability. Our findings supported the first component of this prediction,that modality influences production. Participants produced nonwords more accu-rately (i.e., higher PCC in posttest compared with pretest) after reading them, butnot after just hearing them, even with the same degree of exposure. It is crucial thatviewing the written cue enabled participants to produce the nonword with greateraccuracy in the posttest phase (i.e., even when they were no longer able to read it).

Applied Psycholinguistics 17Saletta et al.: Orthography and speech production
Figure 7. (a) Regression line representing the correlation between Woodcock Reading MasteryTests—Revised-Normative Update word attack raw scores and overall lip aperture variability.(b) Regression line representing the correlation between Woodcock Reading Mastery Tests—Revised-Normative Update word comprehension w scores and overall lip aperture variability.
These data suggest that participants were able to integrate the nonword’s orthog-raphy into their lexical representations. That this occurred only when participantswere able to read the nonwords, and not when they received the same amountof exposure in the auditory modality alone, indicates that the reading process
Applied Psycholinguistics 18Saletta et al.: Orthography and speech production
contributed to this integration. These adult participants demonstrated high seg-mental accuracy even in the pretest phase (PCC average = 92%–95%). However,these are not simply ceiling effects, because participants showed systemic im-provement in production accuracy when exposed to written but not spoken wordsduring the learning phases.
Highly proficient adult readers were not influenced by neighborhood density intheir speech production processes. This was somewhat counter to expectations,because it may be predicted that mature talkers would be sensitive to neighbor-hood effects. While this frequency measure had no influence, speech movementstability did increase with learning or practice (e.g., Heisler et al., 2010; Walsh,Smith, & Weber-Fox, 2006). However, this effect occurred regardless of whetherparticipants heard or read the stimuli. While measures of production ac-curacy showed sensitivity to exposure to written versus auditory in-put, measures of articulatory stability revealed only more global practiceeffects.
These findings are not fully consistent with those from other researchers, whohave used different methodologies to assess how orthography influences speechproduction. For instance, Damian and Bowers (2003) found that orthographic con-gruency influences the facilitative effects of priming; however, Alario et al. (2007)did not replicate this result. Miller and Swick (2003), Ziegler and Muneaux (2007),and Rastle et al. (2011) showed that orthographic factors such as neighborhooddensity and spelling–sound consistency influence priming effects, spoken wordproduction and recognition, and novel picture naming. As a whole, these studiessuggest that orthographic representations exert a powerful influence on speechprocessing and production.
However, kinematic analyses did reveal that individual differences in readingproficiency interact with articulatory stability. Even among this group of adult,proficient readers, individuals with stronger word attack and word identifica-tion skills also presented with greater overall speech movement stability in theirnonword repetition. Previous work also supports the use of nonword repetitionas an index of reading skill. As noted above, poorer readers often demonstrateweaker nonword repetition skills, due to their poor development of phonologi-cal awareness (Castro-Caldas & Reis, 2003), lack of focus on sublexical units(Share, 2004; Ventura et al., 2007), and inability to access the phonologicalpathway strategically (Castro-Caldas et al., 1998). However, it is a new find-ing that even typical adult readers show differential performance in articulatorystability as a function of their decoding proficiency. This new measure providesan implicit index of the influences of experience and reading skill on speechproduction.
The above conclusions provide an affirmative answer to our question regard-ing the relationship between reading skills and articulatory stability. Furthermore,our results indicate that our experimental design using kinematic analysis was aneffective tool for assessing the effect of orthography on phonological representa-tions. Aspects of our findings are consistent with those previously obtained usingmetalinguistic tasks. Specifically, our results follow naturally from the perspec-tive established by earlier works, indicating that reading is an interactive process(Jacobs & Grainger, 1994); that perceiving a word in any modality activates its

Applied Psycholinguistics 19Saletta et al.: Orthography and speech production
orthographic representation (Miller & Swick, 2003); that manipulating a word’sspelling can impact its processing by listeners and readers (Damian & Bowers,2003; Fiez, Balota, Raichle, & Petersen, 1999; Rastle et al., 2011); and that orthog-raphy is a factor included in a word’s representation in the mental lexicon (Morton,1969). However, our experiment goes beyond these preceding studies, in that wemeasured speech production as an index of implicit processing and found thatthis type of processing is influenced by access to orthography. Kinematic analysesenable us to obtain fine-grained quantitative measures of implicit processing andlearning.
Future studies need to assess individuals with varying levels of reading skill.Perhaps adult proficient readers rely on automatic and rapid processing when ac-cessing new words regardless of whether they are orthographically high or lowdensity. This may not be true of less proficient readers, who may show moresensitivity to these orthographic distinctions. We predict that individuals whodemonstrate reduced reading proficiency, and whose reading skills are less au-tomatic, will be influenced to a greater extent by factors such as orthographicdensity. It seems likely that orthographic characteristics, such as neighborhooddensity or transparency, will have increased impact during earlier phases of learn-ing to read, when automaticity is still emerging. One expectation based on previousliterature is that of Lavidor, Johnston, and Snowling (2006), who predict that indi-viduals with reading impairment may experience difficulty creating fine-grainedgrapheme–phoneme mappings. Consequently, they may use a relatively global orcoarse coding that creates greater reliance on the visual or orthographic propertiesof words than on their phonological decoding. In contrast, it is possible that in-dividuals with poorer reading skills may benefit less from orthographic cues thanmore proficient readers, because poorer readers may be relatively insensitive tothis type of manipulation. It is therefore important to pursue this investigation inchildren who are just developing reading skills and in children and adults whodemonstrate reading difficulties.
Conclusion
This kinematic study provides an emerging picture of the relationships amongmodality, orthographic density (which corresponds to transparency), and lan-guage production that confirms and extends previous works. Our findings indicatethat modality and reading proficiency impact participants’ speech accuracy andefficiency in a nonword production task. Specifically, reading a nonword en-ables speakers to access its orthography, which facilitates their ability to produceit. Thus, we can conclude that experience with orthography may alter readers’phonological representations of new word forms. In addition, our data indicatethat higher reading proficiency is associated with greater articulatory stability ofnonword production. Collectively, these findings help us to understand how, inaddition to the way in which orthography influences perceptual/explicit process-ing and speech perception, orthography also influences implicit processing andspeech production. We conclude that quantifying speech accuracy and conductingfine-grained kinematic analyses provide insight into the influence of orthographyon language processing.

Applied Psycholinguistics 20Saletta et al.: Orthography and speech production
APPENDIX A
A sample order of a pretest phase
1. wase 11. huspevate 21. binevate2. reeglesape 12. sush 22. munfeek3. binevate 13. munfeek 23. binevate4. binevate 14. rame 24. binevate5. munfeek 15. binevate 25. munfeek6. binevate 16. gastejun 26. theen7. munfeek 17. munfeek 27. munfeek8. lale 18. chun 28. binevate9. munfeek 19. munfeek 29. cucklefees
10. binevate 10. binevate 30. munfeek
Note: In the study, the nonwords associated with eachcondition were counterbalanced across participants.
APPENDIX B
Nonword filler stimuli
Nonword Transcription
/tʃɅn//sɅʃ//ɵin//lel/
/wes//rem/
/hɅspəvet//gestədʒən//kɅkləfis//rigləsep/
ACKNOWLEDGMENTSThis research was funded by the Robert L. Ringel Research Endowment Award and by theNIH/NIDCD Grant R01 DC04826. We are grateful to Janna Berlin, Tiffany Hogan, andDaniel Miller for their contributions to this project. The content is solely the responsibilityof the authors and does not necessarily represent the official views of the University ofIowa, Purdue University, or the University of Chicago.

Applied Psycholinguistics 21Saletta et al.: Orthography and speech production
REFERENCESAlario, F. X., Perre, L., Castel, C., & Ziegler, J. C. (2007). The role of orthography in speech production
revisited. Cognition, 102, 464–475. doi:10.1016/j.cognition.2006.02.002Assink, E. M. H., van Bergen, F., van Teeseling, H., & Knuijt, P. P. N. A. (2004). Semantic priming
effects in normal versus poor readers. Journal of Genetic Psychology, 165, 67–79.Berry, D. C., & Broadbent, D. E. (1984). On the relationship between task performance and as-
sociated verbalizable knowledge. Quarterly Journal of Experimental Psychology, A: HumanExperimental Psychology, 36, 209–231.
Bolger, D. J., Hornickel, J., Cone, N. E., Burman, D. D., & Booth, J. R. (2008). Neural correlatesof orthographic and phonological consistency effects in children. Human Brain Mapping, 29,1416–1429. doi:10.1002/hbm.20476
Booth, J. R., Bebko, G., Burman, D. D., & Bitan, T. (2007). Children with reading disorder showmodality independent brain abnormalities during semantic tasks. Neuopsychologia, 45, 775–783. doi:10.1016/j.neuropsychologia.2006.08.015
Brown, G. D. A., & Deavers, R. P. (1999). Units of analysis in nonword reading: Evidence fromchildren and adults. Journal of Experimental Child Psychology, 73, 208–242.
Burgos, P., Cucchiarini, C., van Hout, R., & Strik, H. (2014). Phonology acquisition in Span-ish learners of Dutch: Error patterns in pronunciation. Language Sciences, 41, 129–142.doi:http://dx.doi.org/10.1016/j.langsci.2013.08.015
Castro-Caldas, A., Petersson, K. M., Reis, A., Stone-Elander, S., & Ingvar, M. (1998). The illiteratebrain: Learning to read and write during childhood influences the functional organization ofthe adult brain. Brain, 121, 1053–1063. doi:10.1093/brain/121.6.1053
Castro-Caldas, A., & Reis, A. (2003). The knowledge of orthography is a revolution in the brain.Reading and Writing, 16, 81–97. doi:10.1023/A:1021798106794
Coltheart, M., Devalaar, E., Jonasson, J. T., & Besner, D. (1977). Access to the internal lexicon. InS. Dornic (Ed.), Attention and performance VI (pp. 535–555). Hilldale, NJ: Erlbaum.
Damian, M., & Bowers, J. (2003). Effects of orthography on speech production in a form-preparation paradigm. Journal of Memory and Language, 49, 119–132. doi:10.1016/S0749-596X(03)00008-1
Dich, N. (2011). Individual differences in the size of orthographic effects in spoken word recog-nition: The role of listeners’ orthographic skills. Applied Psycholinguistics, 32, 169–186.doi:10.1017/S0142716410000330
Ehri, L. C. (1991). Development of the ability to read words. In R. Barr, M. Kamil, P. Mosenthal,& P. Pearson (Eds.), Handbook of reading research (Vol. 2, pp. 1–417). White Plains, NY:Longman.
Ehri, L. C., & Wilce, L. S. (1980). The influence of orthography on readers’ conceptualization of thephonemic structure of words. Applied Psycholinguistics, 1, 371–385.
Fiez, J. A., Balota, D. A., Raichle, M. E., & Petersen, S. E. (1999). Effects of lexicality, frequency,and spelling-to-sound consistency on the functional anatomy of reading. Neuron, 24, 205–218.
Frost, R., Katz, L., & Bentin, S. (1987). Strategies for visual word recognition and orthographicaldepth: A multilingual comparison. Journal of Experimental Psychology: Human Perceptionand Performance, 13, 104–115.
Gebauer, G. F., & Mackintosh, N. J. (2007). Psychometric intelligence dissociates implicit and explicitlearning. Journal of Experimental Psychology: Learning, Memory, and Cognition, 33, 34–54.
Gladfelter, A., & Goffman, L. (2013). The influence of prosodic stress patterns and semantic depth onnovel word learning in typically developing children. Language and Learning Development,9, 151–174. doi:10.1080/15475441.2012.684574
Goffman, L., Gerken, L., & Lucchesi, J. (2007). Relations between segmental and motor variabil-ity in prosodically complex nonword sequences. Journal of Speech, Language, and HearingResearch, 50, 444–458. doi:10.1044/1092-4388(2007/031)
Applied Psycholinguistics 22Saletta et al.: Orthography and speech production
Goldrick, M., Baker, H. R., Murphy, A., & Baese-Berk, M. (2011). Interaction and represen-tational integration: Evidence from speech errors. Cognition, 121, 58–72. doi:10.1016/j.cognition.2011.05.006
Hammill, D. D., Brown, V. L., Larsen, S. C., & Wiederholt, J. L. (2011). Test of adolescent and adultlanguage (3rd ed.). San Antonio, TX: Pearson.
Heisler, L., Goffman, L., & Younger, B. (2010). Lexical and articulatory interactions in children’slanguage production. Developmental Science, 13, 722–730. doi:10.1111/j.1467-7687.2009.00930.x
Hoff, E. (2001). Language development. Belmont, CA: Wadsworth.Jacobs, A. M., & Grainger, J. (1994). Models of visual word recognition: Sampling the state of
the art. Journal of Experimental Psychology, Human Perception and Performance, 20, 1311–1334.
Jaffe, L. E. (2009). Development, interpretation, and application of the W score and the relative profi-ciency index (Woodcock–Johnson III Assessment Service Bulletin No. 11). Rolling Meadows,IL: Riverside.
Kamhi, A. G., & Catts, H. W. (2012). Reading development. In A. G. Kamhi & H. W. Catts (Eds.),Language and reading disabilities (3rd ed., pp. 24–44). Boston: Pearson.
Lavidor, M., Johnston, R., & Snowling, M. J. (2006). When phonology fails: Orthographic neighbour-hood effects in dyslexia. Brain and Language, 96, 318–329. doi:10.1016/j.bandl.2005.06.009
Masonheimer, P., Drum, P., & Ehri, L. (1984). Does environmental print identification lead childreninto word learning? Journal of Reading Behavior, 16, 257–271.
Mathworks, Inc. (2009). Matlab: High performance numeric computation and visualization software[Computer software]. Natic, MA: Author.
McMillan, C. T., Corley, M., & Lickley, R. J. (2009). Articulatory evidence for feedback and com-petition in speech production. Language and Cognitive Processes, 24, 44–66. doi:10.1080/01690960801998236
Miller, K. M., & Swick, D. (2003). Orthography influences the perception of speech in alexic patients.Journal of Cognitive Neuroscience, 15, 981–990.
Morais, J., Cary, L., Alegria, J., & Bertelson, P. (1979). Does awareness of speech as a sequence ofphones arise spontaneously? Cognition, 7, 323–331.
Morton, J. (1969). Interaction of information in word recognition. Psychological Review, 76, 165–178.Ohala, D. K. (1996). Cluster reduction and constraints on acquisition. Unpublished doctoral disserta-
tion, University of Arizona, Tucson.Pattamadilok, C., Perre, L., Dufau, S., & Ziegler, J. (2009). On-line orthographic influences on spoken
language in a semantic task. Journal of Cognitive Neuroscience, 21, 169–179. doi:10.1162/jocn.2009.21014
Pierrehumbert, J. (2002). Word-specific phonetics. In C. Gussenhoven & N. Warner (Eds.), Laboratoryphonology VII (pp. 101–140). Berlin: Mouton.
Poldrack, R. A., Prabhakaran, V., Seger, C. A., & Gabrieli, J. D. (1999). Striatal activation duringacquisition of a cognitive skill. Neuropsychology, 13, 564–574.
Rapp, B., & Goldrick, M. (2000). Discreteness and interactivity in spoken word production. Psycho-logical Review, 107, 460–499.
Rastle, K., McCormick, S. F., Bayliss, L., & Davis, C. J. (2011). Orthography influences the percep-tion and production of speech. Journal of Experimental Psychology: Learning, Memory, andCognition, 37, 1588–1594. doi:10.1037/a0024833
Read, C., Zhang, Y. F., Nie, H. Y., & Ding, B. Q. (1986). The ability to manipulate speech soundsdepends on knowing alphabetic spelling. Cognition, 24, 31–44.
Rucker, G., Schwarzer, G., Carpenter, J., & Olkin, I. (2009). Why add anything to nothing? The arcsinedifference as a measure of treatment in a meta-analysis with zero cells. Statistics in Medicine,28, 721–738. doi:10.1002/sim.3511

Applied Psycholinguistics 23Saletta et al.: Orthography and speech production
Saletta, M., Darling White, M., Ryu, J. H., Haddad, J. M., Goffman, L., Francis, E. J., et al. (2014). Therelationship between speech and balance in individuals with Parkinson’s disease. Manuscriptin preparation.
Seidenberg, M. S., & Tanenhaus, M. K. (1979). Orthographic effects on rhyme monitoring. Journal ofExperimental Psychology: Human Learning and Memory, 5, 546–554.
Share, D. L. (2004). Orthographic learning at a glance: On the time course and developmental onsetof self-teaching. Journal of Experimental Child Psychology, 87, 267–298. doi:10.1016/j.jecp.2004.01.001
Smith, A., & Goffman, L. (1998). Stability and patterning of speech movement sequences in childrenand adults. Journal of Speech, Language, and Hearing Research, 41, 18–30.
Smith, A., Goffman, L., Zelaznik, H. N., Ying, G., & McGillem, C. (1995). Spatiotemporal stabilityand patterning of movement sequences. Experimental Brain Research, 104, 493–501.
Smith, A., Johnson, M., McGillem, C., & Goffman, L. (2000). On the assessment of stability andpatterning of speech movements. Journal of Speech, Language, and Hearing Research, 43,277–286. doi:1092-4388/00/4301-0277
Smith, A., & Zelaznik, H. N. (2004). Development of functional synergies for speech motor co-ordination in childhood and adolescence. Developmental Psychobiology, 45, 22–33. doi:10.1002/dev.20009
Snow, C. E., Burns, M. S., & Griffin, P. (Eds.). (1998). Preventing reading difficulties in young children.Washington, DC: National Academy Press.
Sommers, M. (2002). Washington University in St. Louis Speech and Hearing Lab NeighborhoodDatabase. Retrieved from http://128.252.27.56/neighborhood/Home.asp on April 28, 2014.
Storkel, H. (2013). A corpus of consonant-vowel-consonant real words and nonwords: Comparison ofphonotactic probability, neighborhood density, and consonant age of acquisition. BehavioralResearch, 44, 1159–1167. doi:10.3758/s13428-012-0309-7
Tabachnick, B. G., & Fidell, L. S. (2007). Using multivariate statistics (5th ed.). Boston: PearsonEducation.
Thomas, K. M., Hunt, R. H., Vizueta, N., Sommer, T., Durston, S., Yang, Y., et al. (2004). Evidenceof developmental differences in implicit sequence learning: An fMRI study of children andadults. Journal of Cognitive Neuroscience, 16, 1339–1351.
Ventura, P., Kolinsky, R., Brito-Mendes, C., & Morais, J. (2001). Mental representations of the syllableinternal structure are influenced by orthography. Language and Cognitive Processes, 16, 393–418. doi:10.1080/01690960042000184
Ventura, P., Morais, J., & Kolinsky, R. (2007). The development of the orthographic consistencyeffect in speech recognition: From sublexical to lexical involvement. Cognition, 105, 547–576.doi:10.1016/j.cognition.2006.12.005
Ventura, P., Morais, J., Pattamadilok, C., & Kolinsky, R. (2004). The locus of the orthographicconsistency effect in auditory word recognition. Language and Cognitive Processes, 19, 57–95.
Vitevitch, M. S. (2002). The influence of phonological similarity neighborhoods on speech produc-tion. Journal of Experimental Psychology: Learning, Memory, and Cognition, 28, 735–747.doi:10.1037//0278-7393.28.4.735
Vitevitch, M. S., Luce, P. A., Charles-Luce, J., & Kemmerer, D. (1997). Phonotactics and syllablestress: Implications for the processing of spoken nonsense words. Language and Speech, 40,47–62.
Walsh, B., & Smith, A. (2002). Articulatory movements in adolescents: Evidence for protracteddevelopment of speech motor control processes. Journal of Speech, Language, and HearingResearch, 45, 1119–1133. doi:1092-4388/02/4506-1119
Walsh, B., Smith, A., & Weber-Fox, C. (2006). Short-term plasticity in children’s speech motorsystems. Developmental Psychobiology, 48, 660–674. doi:10.1002/dev.20185

Applied Psycholinguistics 24Saletta et al.: Orthography and speech production
Weber-Fox, C., Spencer, R., Cuadrado, E., & Smith, A. (2003). Development of neural processesmediating rhyme judgments: Phonological and orthographic interactions. Developmental Psy-chobiology, 43, 128–145. doi:10.1002/dev.10128
Woodcock, R. W. (2011). Woodcock Reading Mastery Tests—Revised-Normative update. San Antonio,TX: Pearson.
Xie, Q., Gao, X., & King, R. B. (2013). Thinking styles in implicit and explicit learning. Learning andIndividual Differences, 23, 267–271. doi:10.1016/j.lindif.2012.10.014
Zecker, S. G. (1991). The orthographic code: Developmental trends in reading-disabled and normally-achieving children. Annals of Dyslexia, 41, 178–192. doi:10.1007/BF02648085
Zeguers, M. H. T., Snellings, P., Tijms, J., Weeda, W. D., Tamboer, P., Bexkens, A., et al. (2011).Specifying theories of developmental dyslexia: A diffusion model analysis of word recognition.Developmental Science, 14, 1340–1354. doi:10.1111/j.1467-7687.2011.01091.x
Ziegler, J. C., & Ferrand, L. (1998). Orthography shapes the perception of speech: The consistencyeffect in auditory word recognition. Psychonomic Bulletin & Review, 5, 683–689.
Ziegler, J. C., Ferrand, L., & Montant, M. (2004). Visual phonology: The effects of orthographicconsistency on different auditory word recognition tasks. Memory & Cognition, 32, 732–741.
Ziegler, J. C., & Goswami, U. (2005). Reading acquisition, developmental dyslexia, and skilled readingacross languages: A psycholinguistic grain size theory. Psychological Bulletin, 131, 3–29.
Ziegler, J. C., Jacobs, A. M., & Klueppel, D. (2001). Pseudohomophone effects in lexical decision:Still a challenge for current word recognition models. Journal of Experimental Psychology:Human Perception and Performance, 27, 547–559.
Ziegler, J. C., & Muneaux, M. (2007). Orthographic facilitation and phonological inhibition in spokenword recognition: A developmental study. Psychonomic Bulletin and Review, 14, 75–80.
Ziegler, J. C., Muneaux, M., & Grainger, J. (2003). Neighborhood effects in auditory word recognition:Phonological competition and orthographic facilitation. Journal of Memory and Language, 48,779–793.
Ziegler, J. C., Van Orden, G. C., & Jacobs, A. M. (1997). Phonology can help or hurt the perception ofprint. Journal of Experimental Psychology: Human Perception and Performance, 23, 845–860.
Zipke, M., Ehri, L. C., & Smith Cairns, H. (2009). Using semantic ambiguity instruction to improvethird graders’ metalinguistic awareness and reading comprehension: An experimental study.Reading Research Quarterly, 44, 300–321. doi:10.1598/RRQ.44.3.4