rating the audience: the business of media - bloomsbury
TRANSCRIPT

Balnaves, Mark, Tom O'Regan, and Ben Goldsmith. "The Networks (and Other MediaProviders)." Rating the Audience: The Business of Media. London: BloomsburyAcademic, 2011. 145–171. Bloomsbury Collections. Web. 24 Jan. 2022. <http://dx.doi.org/10.5040/9781849664622.ch-007>.
Downloaded from Bloomsbury Collections, www.bloomsburycollections.com, 24 January2022, 23:43 UTC.
Copyright © Mark Balnaves, Tom O'Regan and Ben Goldsmith 2011. You may share this workfor non-commercial purposes only, provided you give attribution to the copyright holder and thepublisher, and provide a link to the Creative Commons licence.
[ 145 ]
7 The Networks (and Other Media Providers)
Dear Cecil
I don’t understand TV scheduling. I would assume that since a greater number of the Teeming Millions is awake from 9 to 10 p.m. than from 10 to 11 p.m., more of them are ogling the idiot box during the earlier hour. This means that during the last hour of prime time (10–11 p.m. in New York, 9–10 p.m. in Chicago), many more people are watching in the Central zone than in the Eastern zone, allowing a far great number of Buttoneers, Popeil Pocket Fishermen, and tubes of Tickle Deodorant to be sold in the Midwest than on the East Coast. Accepting this, which any sensitive and thoughtful individual would, why on earth does West Coast TV operate under the East Coast schedule?
As an addendum, Cecil, if you are called upon to destroy my assumptions, please be merciful and don’t employ your laserlike wit to grind me into pulp.
Allan S., Evanston, Illinois
The media providers – the networks, other broadcasters, later joined by the subscription television services, and now online portals and channels – have become the fulcrum of the ratings convention. The ratings were integral to radio displacing print as the main medium for advertising, and then television displacing radio as the main medium for advertising, to broadcasters becoming vendors of audiences, to their winning control of their schedules from advertisers in the early 1960s, to the development of in-programme advertising by a variety of advertisers, to allowing networks to schedule better and therefore make better offers to advertisers, and to the development of a stable currency permitting systematic strategic planning. But the vehicle that got them to the top is the same one that is taking them down. Pay-TV, internet protocol television (IPTV) and online providers are attempting to dislodge the dominance of traditional syndicated ratings and are setting up alternative ways of measuring.
In this chapter the authors chart the trajectory of ratings from the perspective of media providers. Although media providers – particularly larger and more dominant broadcasters – benefi ted signifi cantly from systematic audience measurement their initial response to the ratings was mixed. We will explore how the ratings entered into the calculation of broadcasters and other media providers and how they used
BOOK.indb 145BOOK.indb 145 07/10/11 11:46 AM07/10/11 11:46 AM
[ 146 ] Rating the Audience
the ratings to ‘sell audiences’, to construct fl ow through schedules, and to analyse, develop, anticipate and chart the programming cycle. In particular, we will show how the ratings became critical to the advertising offers of media providers and their corporate and competitive market strategies. The chapter will also explore international differences in the evolution of audience ratings. In the United Kingdom public service management actively resisted the development of systematic ratings, preferring self-selecting listener panels. In the end, however, audience ratings became central to all broadcasters – commercial, public service providers and later pay television networks.
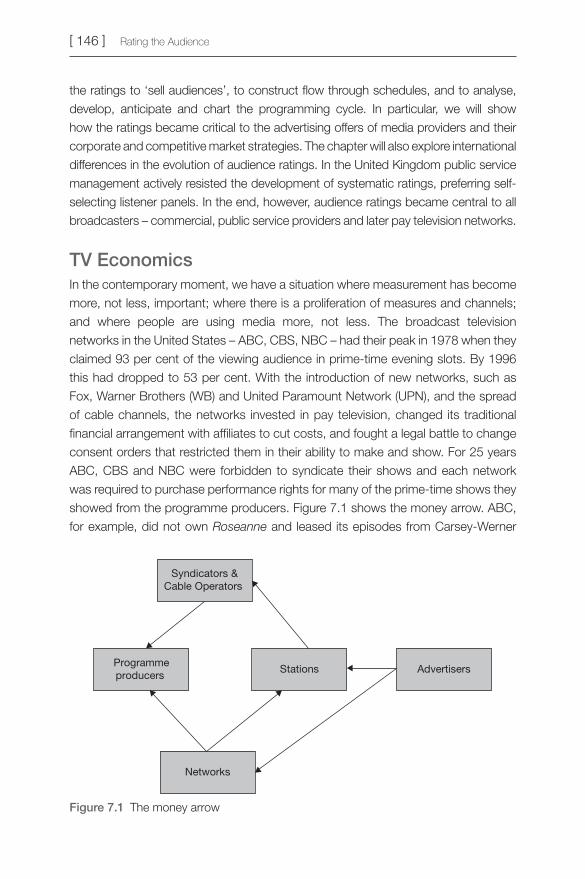
TV Economics In the contemporary moment, we have a situation where measurement has become more, not less, important; where there is a proliferation of measures and channels; and where people are using media more, not less. The broadcast television networks in the United States – ABC, CBS, NBC – had their peak in 1978 when they claimed 93 per cent of the viewing audience in prime-time evening slots. By 1996 this had dropped to 53 per cent. With the introduction of new networks, such as Fox, Warner Brothers (WB) and United Paramount Network (UPN), and the spread of cable channels, the networks invested in pay television, changed its traditional fi nancial arrangement with affi liates to cut costs, and fought a legal battle to change consent orders that restricted them in their ability to make and show. For 25 years ABC, CBS and NBC were forbidden to syndicate their shows and each network was required to purchase performance rights for many of the prime-time shows they showed from the programme producers. Figure 7.1 shows the money arrow. ABC, for example, did not own Roseanne and leased its episodes from Carsey-Werner
Advertisers
Networks
StationsProgrammeproducers
Syndicators &Cable Operators
Figure 7.1 The money arrow
BOOK.indb 146BOOK.indb 146 07/10/11 11:46 AM07/10/11 11:46 AM
The Networks (and Other Media Providers) [ 147 ]
Company. In the resulting court case Hollywood studios argued that a half-hour show cost around US$500,000 and the money they received from the networks did not even cover the cost of production – a TV series needed to run for at least fi ve years in order to provide a reasonable return. The US Court of Appeals, however, allowed the consent order to lapse, allowing the networks to hold fi nancial interests in syndicated television programming and to syndicate their own programmes. Free-to-air, advertiser-supported television networks had four major benefi ts:
1 Networks reduce transaction costs by creating effi ciencies in procurement of programme and advertising time.
2 Networks offer advertisers an effi cient way to distribute advertising budget risk.
3 Networks provide effi ciencies in programming schedules.
4 Networks reduce transmission costs by transmitting programmes simultaneously to all affi liates within a time zone. (Owen and Wildman 1992: 53–4)
Ratings in this context are essential because they demonstrate the existence of large audiences. However, a decline in audience viewing brings the whole profi t process undone. Subscription (cable) television by contrast does not have the same economics. Indeed, early subscription television in the United States was able to make a profi t even when its audience economics were not necessarily healthy. The success of a subscription television business lies in the relationship between profi t per subscriber, churn (the number of people who come and go) and subscriber acquisition costs. US subscription television was booming up until the 1970s. Cable systems did not fail because the value of the service kept rising. Cable television services generated income from installation charges, US$100 to US$300 a customer, and monthly service fees of US$5 to US$20:
Most of the money was ploughed back into the companies, with hardly anything going to pay dividends to shareholders. This high cash fl ow could service an immense amount of debt, which was used to buy more systems. So the actual value of the acquired systems was always growing. Moreover, the companies paid hardly any tax because of the high depreciation of the equipment. The average cable system enjoyed a profi t margin of 57 per cent, far fatter than most businesses. (Robichaux 2002: 14–15)
Cable television, of course, has to plan for provision of programming to audiences, or subscribers, in the same way as networks – understanding demand and who its audience is. The global mediascape give a sense of what the future holds, or at least what major media strategists say the future holds. Australian incumbent free-to-air
BOOK.indb 147BOOK.indb 147 07/10/11 11:46 AM07/10/11 11:46 AM
[ 148 ] Rating the Audience
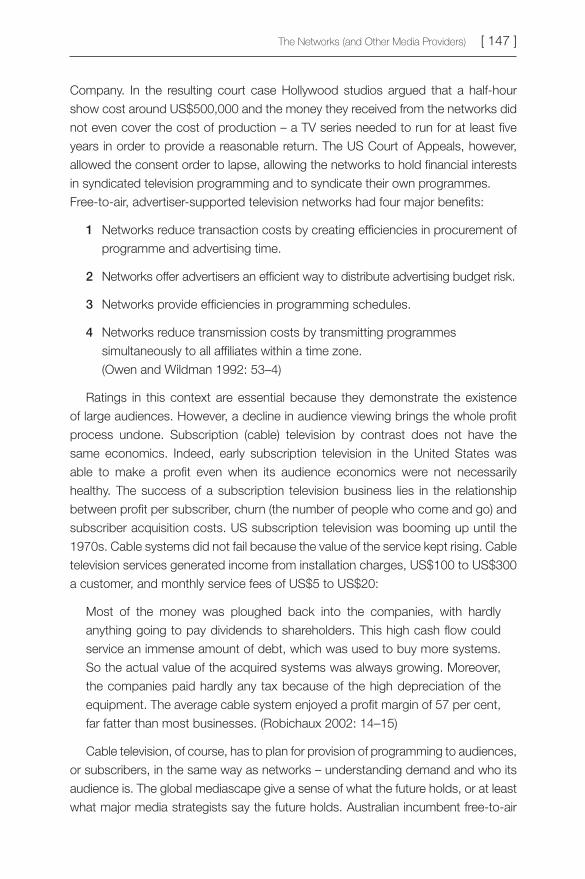
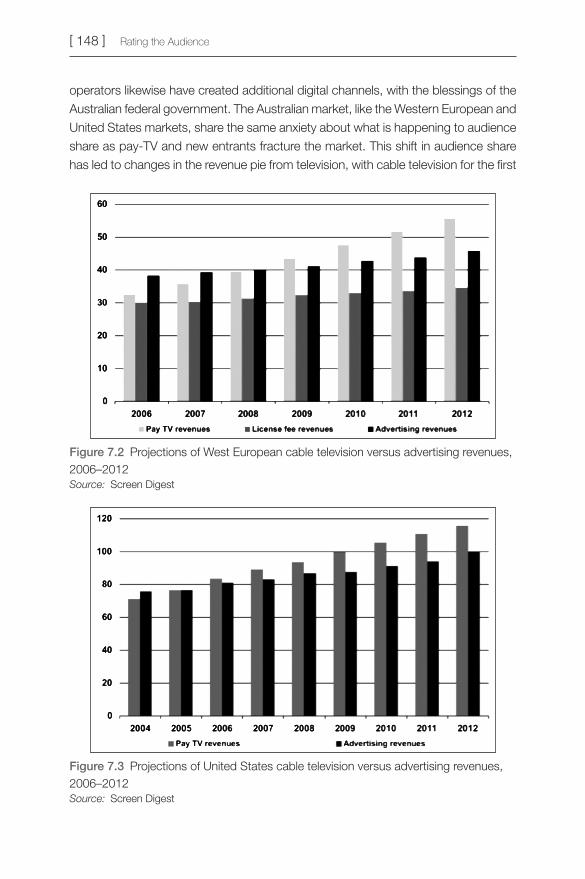
operators likewise have created additional digital channels, with the blessings of the Australian federal government. The Australian market, like the Western European and United States markets, share the same anxiety about what is happening to audience share as pay-TV and new entrants fracture the market. This shift in audience share has led to changes in the revenue pie from television, with cable television for the fi rst
Figure 7.2 Projections of West European cable television versus advertising revenues, 2006–2012 Source: Screen Digest
Figure 7.3 Projections of United States cable television versus advertising revenues, 2006–2012 Source: Screen Digest
BOOK.indb 148BOOK.indb 148 07/10/11 11:46 AM07/10/11 11:46 AM
The Networks (and Other Media Providers) [ 149 ]
time overtaking traditional advertising revenues from broadcasting. Figures 7.2 and 7.3 provide an overview of these changes, together with projections to 2012.
Within this complex media mix, there are revenue streams by content (a growing demand for specialized and paid content), advertising shifting to the internet and interactive transactions on television. You can see clearly, however, why there is debate over what is going to happen next. There is a range of possibilities:
1 There is the possibility that television may become the super-premium service for advertising because it will be the only medium able to get access to large audiences in spectaculars like the Super Bowl, the Olympics and the World Cup.
2 There is also the possibility of converged media delivery to television, computer and mobile where a person subscribes to a single converged service and gets a single bill – a world of subscribers. Buyer graphics linked to subscriber services would then be the main marketing research tool, with proprietary media research within each media vehicle.
3 Traditional audience ratings will as a consequence only be used for calibration of other media offerings and their associated research and super-premium advertising.
All this assumes, of course, that the audience concept has no public interest component and that media trade requires no intervention, and has had none, from the public or governments. This, as the authors have argued, is far from the case. Federal Communications Commission (FCC) consent orders in the United States had effects on ratings agencies and media providers after the Congressional hearings on ratings. Anti-monopoly laws attempt to ensure diversifi cation. Minority groups have been vocal in expressing their concerns about representation in ratings in courts and public hearings. Moreover, as we have seen, setting up audience ratings is a very expensive business and advertisers have not been the majority funders of this type of enterprise. And, as we witnessed with Saatchi & Saatchi in the case of China, the demand for transparency remains fundamental in media markets.
Standardization When advertisers set up the Cooperative Analysis of Broadcasting (CAB) ratings they excluded the radio broadcasters from the distribution of the results. The radio broadcasters bootlegged the CAB results up until 1936 when CAB relented and added them to the syndicate list. Television broadcasting never had this problem and Arthur C. Nielsen developed an intimate relationship with advertisers
BOOK.indb 149BOOK.indb 149 07/10/11 11:46 AM07/10/11 11:46 AM
[ 150 ] Rating the Audience
and broadcasters in radio and television. Looking back now, the whole process for organizing audience research and audience ratings might look linear and the innovations and organizational structures obvious. However, this was far from the case. Many audiences and media were not measured at all and there were many measurement companies competing for media business. As we found in Chapters 2 and 3, there was confusion about how to decide which method of counting was superior in or across the different audience markets until the Advertising Research Foundation in 1954 settled on Nielsen’s technology as the best. There was also confusion, however, about accountability for the dollar spend. Even when television emerged in the market there was still signifi cant advertising money directed to unmeasured media and accountability was often by virtue of personal acquaintance rather than metrics (Hurwitz 1983).
There was another problem that emerged in the 1950s mediascape. Television’s rise in the market had unanticipated effects on radio management and retention of its strategic expertise. Between 1948 and 1958 television stations increased in number from 15 to 520 and television homes from 200,000 to 42 million. The average television set use was between fi ve and six hours per day. Between 1946 and 1950 1,800 new radio stations had opened for business, raising problems of fragmentation of the radio audience and the audience market generally. The experts who might have addressed this problem for radio had been sent by networks to television. Radio’s income and the expenditures put into its development declined (Hurwitz 1983). These former radio executives, however, had learnt that audience ratings provided an insight into how to get an overall picture of the audience and how audience habits could be tracked across time. They also recognized that appropriate metrics could assist in accountability of the dollar spend.
To create, order and schedule programmes, network executives drew on their radio experience and audience knowledge that they had learned in radio and adapted radio block-programming strategies to television as a fast way to build audiences and sell time to advertisers. Blocks included westerns for children, soap operas for mothers, sports for men, and situation comedies and variety specials built around stars for the whole family. With the TV networks assuming the costs and risks of programming, advertisers were put in the position of buying audiences ready-made rather than building them for themselves. For the networks, unsold minutes became an unaffordable vice. Measurement needs became paramount.
By the beginning of the 1950s in the United States there were twenty-two research organizations dedicated to television research. The call from network executives was to ‘centralize, standardize, validate’ as fi gures for set-ownership,
BOOK.indb 150BOOK.indb 150 07/10/11 11:46 AM07/10/11 11:46 AM
The Networks (and Other Media Providers) [ 151 ]
coverage, ratings and sales effectives of the new medium became paramount. Television had massive start-up costs and the limited amount of channel space available made it a high-risk endeavour. Programming, sales and promotion were interdependent and required a planned approached. Broadcasters were looking for programmes that would sell receivers and by extension expand the audience. Expanded audiences would at the same time increase advertiser interest. There were high potential returns to networks if they took back control of shows from advertisers. Good standardized research metrics promised to reduce the risk posed by high programming costs by providing a clear picture of audiences over time and the success of the programming.
Arthur C. Nielsen was well aware of the television network executives’ push to centralize, standardize and validate audience research in the management and economics of modern television. Measuring the entire audience throughout the full broadcast schedule brought with it the opportunity to show more clearly return on investment (ROI). But Nielsen, in his dealings with both broadcasters and advertisers, also recognized another, important, element in the standardization mix – the role of professionalism. Nielsen argued that television and advertising managers were scientifi c business specialists. Nielsen himself purposefully created an aura of technical expertise and professionalism in his own behaviour. Market research, in particular, provided the foundations for this professional status. The effect of this process of professionalization and reliance on metrics was that personal acquaintance was slowly displaced as a means of demonstrating ROI. The advertising executive could no longer simply say to a client at an expensive lunch, ‘Everything is going well,’ without actual justifi cation.
The use of meters provided them with an authoritative research audit possessing the apparent thoroughness and accuracy of twenty-four hour, minute-by-minute information that was detailed, recorded, and projectable. The cost of mechanization was controlled by the use of a small, continuing sample yielding voluminous data, and by the syndication of results. Together, the meters and panels defi nitively secured the primacy of listeners and viewers above programs or stations. The adoption of households as the unit of measurement served to stabilize fi ndings to allow broadcasting to be more conveniently compared with print media. The information supplied allowed for the diagnosis and prescription of both programming and advertising plans. Nielsen’s advice and his precise, schematic writing helped to make his procedures appear understandable, and his success freed him to devote his efforts to increasing the speed with which he could deliver. (Hurwitz 1983: 196–7)
BOOK.indb 151BOOK.indb 151 07/10/11 11:46 AM07/10/11 11:46 AM
[ 152 ] Rating the Audience
It was not only the senior management ranks that got increased status by linking themselves to the aura of scientifi c market research and the black-box technology of Nielsen. Time-buyers in television now embodied the effi ciency expert and sought recognition for their work.
Though purchase of spot time may not require as much creative strategy as campaign planning or as much executive ability as campaign management, it demands more technical knowledge than either and as much judgement … Media buying has become a big, complicated maze of innumerable possibilities. It has become, more than ever, a job for professionals. (Hull cited in Hurwitz 1983: 169)
Following the lead of Proctor & Gamble and Lever Brothers, advertisers started to pay closer attention to the components of the whole economics of the media buying and planning process and to costs, rather than continuing to simply aggregate homes in order to maximize coverage. Broadcast time-buyers had to be familiar with a range of markets, audiences, programmes, stations and talent.
On the one hand, what this required was large, projectable research numbers, the production of which involved time buyers ever more deeply in interpretive social science. On the other hand, it called forth a new group of management-oriented media specialists who could fi t all the pieces together into media ‘strategies’ and then explain them to agency and advertiser alike. (Hurwitz 1983: 179)
The changes in programme control altered the cycle of the business of broadcasting. James Aubrey president of CBS during the early 60s said that: ‘With the elimination of “individual advertiser” program association, pure circulation becomes the only criterion for the purchase of network television time … and those programs which give diversity and balance while delivering smaller or more qualitative circulation would inevitably … be forced out of the networks schedules’ (Hurwtiz 1983: 87).
As audience tastes became known they were rapidly transformed into habits via rationalized programming procedures. Scheduling of television programmes was refi ned to take account of an ever more imposing edifi ce of audience constituents. The television networks are, therefore, central to the audience-ratings convention as the party that brought, with Nielsen as collaborator, standardization to ratings as selling and buying currency and forged a professional media class with improved social status. This enhanced status included advertisers who could now not only be ‘salesman’, and they were men at that time, but manager-scientists, familiar with the black arts of audience and media economics.
BOOK.indb 152BOOK.indb 152 07/10/11 11:46 AM07/10/11 11:46 AM
The Networks (and Other Media Providers) [ 153 ]
Television network dominance of the mediascape was possible by virtue of its social status, regulation and the nature of network affi liation. CBS-TV was established in 1951 and dominated the audience market with a half-hour television format and an increased number of sponsors. NBC-TV was given its own president and company standing equal to that of radio. ABC was formed in 1943 when the US Supreme Court upheld the FCC’s chain broadcasting rules and forced NBC to divest itself of its Blue Network. ABC was late on the radio scene and struck a deal with Paramount Pictures for a transfusion of funds and programmes and a pipeline to Hollywood talent, but did not become viable in the television market until the 1970s.
In the United States, there are rules governing how many stations a single business organization is allowed to own. Prior to 1985 the FCC permitted one corporation to own a maximum of seven AM and seven FM radio stations and a maximum of fi ve VHF (Very High Frequency) television stations, plus two UHFs (Ultra High Frequency). Deregulation lifted the limit to 12 stations each, as long as the total audience did not exceed 25 per cent of the national TV audience. Newspaper and cable concerns are forbidden to buy television and radio stations in the same area; a single company is prohibited from holding two broadcast properties in a market. Television networks, like radio networks before them, attracted independently owned affi liates to carry regularly scheduled series, news, drama sports and other programming produced by the network itself. Each of the three networks had about 200 affi liates in 1985.
Advertising in the television network system is also not a simple animal. There is a difference between national network advertisements, national spot advertisements and local advertisements. Large brand-name companies with national distribution often fi nd that purchases of national network time through agencies are the most effi cient means of communicating with potential customers. However, for some nationally distributed products a particular local audience can often be reached more effectively through national spot purchases on local outlets, as arranged with station representatives (reps). Reps know the various rate cards and demographics and are conduits for time sales for their own broadcasting companies for groups of other stations. In 1984, commissionable spot billings for the 15 national TV rep fi rms were over US$4 billion, or more than 90 per cent of all spot time sales. At an average commission rate of 7 to 8 per cent, estimated rep fi rm revenues approached US$350 million in that year.
The television network ratings leader can command higher prices because advertising campaign managers, who buy upfront large quantities of time well in advance of use, bid aggressively to gain optimum spots. The remaining spots are sold on a scatter basis and are normally lower priced, primarily because they are sold closer to broadcast time and may not provide advertisers with optimal reach
BOOK.indb 153BOOK.indb 153 07/10/11 11:46 AM07/10/11 11:46 AM
[ 154 ] Rating the Audience
or frequency. A network ratings leader may also, of course, attract new affi liates and these new affi liates in turn boost the audience size. There is big money riding on even one ratings point. In network television a prime-time ratings point won or lost was worth at least US$50 million in pretax profi ts in 1985: ‘To place that in perspective, according to estimates by Television Digest, in 1984 the ABC network had billings of US$2.64 billion, and pretax profi t of US$260 million. Comparable billings and profi ts for DBS were $2.24 billion and $280 million, and for NBC $1.93 billion and $55 million’ (Vogel 1986: 171).
Broadcast networks use ratings in a variety of other ways. Given that they provide an assessment of the makeup of the audience on the basis of gender, age, income, cultural background and location, they can be used as a public accountability tool. Ratings are routinely used by public service broadcasters to demonstrate their social reach, to justify their public funding, and to meet various governmental equity and other initiatives. If they are a public service broadcaster wholly or mostly reliant upon public funding they are also interested in the ratings as a way of being publicly accountable to the whole of society and to particular groups within it. They use ratings as a way of demonstrating their public remit.
Broadcasters also use the ratings to develop their schedule, paying particular attention to the makeup of the schedules, the fl ow of programmes, and variations in television usage in summer and winter (which in the 1960s was an hour’s difference). They not only use the ratings to construct a schedule that would optimize audience fl ow over a week’s programming but they also use it as a tool to identify weaknesses which would permit counterprogramming against their competitors. They use the ratings to schedule a line-up and to win evening segments.
Like individual programme producers they also use the ratings to analyse and develop programmes, as Ehrenberg and Twyman put it, ‘to help program originators to gauge public response to their programs and to plan accordingly’ (Ehrenberg and Twyman 1967: 1). They use it as a way to monitor the progress of a programme – and use it iteratively to help them renovate a programme by working with producers to ‘keep a programme’ alive. They also use the ratings to identify areas of weakness in a programme line-up to construct and inform the selection and development of the individual programmes they will screen. Independent programme producers likewise use the ratings in a complementary way to identify and pitch aspects of their proposed programme’s appeal to broadcasting networks as meeting their objectives and interests in reaching particular audiences they might be weak or strong on.
Finally, as public companies broadcasters have an interest in the ratings as a proxy for the company’s share price, its return on investment and overall fi nancial health. In this case the ratings are part of fi nancial accountabilities and part of the
BOOK.indb 154BOOK.indb 154 07/10/11 11:46 AM07/10/11 11:46 AM
The Networks (and Other Media Providers) [ 155 ]
very business reporting of commercial broadcasters. They are integral to shareholder accountabilities and company forecasting. Senior management are therefore a crucial audience for the ratings and the literature we have on senior management points strongly to their desire for favourable portrayals of ratings performance often being an important factor shaping their ratings reporting.
Broadcast networks have an interconnected but nonetheless distinct set of interests in ‘guiding general and social programming policies’ and in facilitating ‘the increasingly sophisticated usage by the advertising industry’ (Ehrenberg and Twyman 1967: 35). Ratings are therefore a decision tool which is integral to: the audience market for the buying and selling of audiences; the operation of the broadcast schedule; the content market for the commissioning, continuation and cancellation of programmes in the programme production market; the performance of accountability of public service broadcasters; and shareholder value of media properties.
Small Audiences and Set-top Boxes So, in the real nitty gritty world of, can we produce a product that is viable and unproblematic from the standpoint of all the consumers who are spending billions of dollars in advertising? It’s not a slam dunk, so it might be that TNS or Nielsen or some other company with a brand name who has a reputation for providing a currency and perhaps has a probability sample that it can use to marry to digital set top box data, can offer a currency that takes advantage of some of the good attributes of that potential way of harvesting data. And I know Nielsen, and this is no secret, Neilson is trying to fi gure out exactly how to do that. James Webster, 2008
As Leo Bogart once put it, ‘The bigger the media vehicle, the more economical its rates are apt to be in terms of impressions or exposures delivered’ (Bogart 1967: 93). The television network system had other advantages in that it was able to generate ‘huge audiences at the same moment in time’; it came ‘closest to the intensity of interpersonal confrontation’; and it permitted ‘the advertiser to encounter the consumer in a relaxed frame of mind, ready for whatever light entertainment the magic box will bring him, eyes and ears simultaneously engaged’ (Bogart 1967: 99).
The same phenomenon that shored up traditional network revenue, primacy in providing massive audiences, also works against the networks, of course, if the audience ratings fi gures go down, as they have done so continuously in the United States since 1978. The opening up of the US mediascape to new networks and the rise of pay-TV and cable provided the television viewer with far more choices.
BOOK.indb 155BOOK.indb 155 07/10/11 11:46 AM07/10/11 11:46 AM
[ 156 ] Rating the Audience
This meant that there emerged a ‘long tail’ of medium and smaller channels of different kinds that delivered much smaller audiences.
‘At a time of rapid technological change in the television industry’ is a common phrase in the contemporary moment, although the same phrase could be found in Crossley’s time and Nielsen’s time. It is one of those rhetorical statements that are taken for granted, but signal that something is going wrong. In this case, the television networks as space provider for advertising and content provider for audiences were losing audience share. Their effect in the audience-ratings convention had been to standardize the role of audience ratings within the mediascape, providing an orderly infrastructure for the delivery of programme schedules, a professional workforce for analysis of audience ratings, and a system for forecasting and planning. The rise of cable and pay-TV services fractured the market much in the same way that the expansion of radio fractured the market at the time of the rise of television. The difference between the 1940s and today, however, is that all media are measured and there is an expectation that all audiences will be covered. Advertisers are unwilling to commit precious dollars to anything unmeasured, unlike in earlier history where they had little choice. Television networks are still part of the audience-ratings convention, but its relative disposition in the market has changed.
Television programmes broadcast by Fox were hard hit in test runs of local peoplemeters in New York City. Rupert Murdoch’s News Corporation spent nearly US$7 million stirring public opinion against Nielsen’s local peoplemeters. Nielsen spent the same on defending its technology:
Each media faction that stood to lose ground relative to its competitors would likely be encouraged to engage in public relations efforts to infl uence the accreditation outcome, or at least to slow down acceptance of the new method. Delaying the process of accreditation could produce substantial economic gains for certain businesses. (Furchtgott-Roth et al. 2006: 29)
Television ratings methods, in this context, are not being questioned. They remain gilt-edged, gold standard means for delivery of a reliable currency. The issue with fractured media and measurement using traditional ratings is one of cost-benefi t in increasing the size of the sample or panel to cope with measurement of smaller groups. It is worthwhile reading at length the industry debate recorded at the 1996 Advertising Research Foundation (ARF)/European Society for Opinion and Marketing Research (ESOMAR) conference on broadcast research, held in San Francisco. The key themes of single source and fusion continue. As Sue Elms (Elms 1996) pointed out, Gesellschaft für Konsumforschung (GfK, the German ‘Society for Consumer Research’) gave single source a thumbs down as the future of television panels, due to the knock-on effects of trying to measure both sales and television
BOOK.indb 156BOOK.indb 156 07/10/11 11:46 AM07/10/11 11:46 AM
The Networks (and Other Media Providers) [ 157 ]
viewing from the same homes. GfK, in an expensive and robust test, found that only 50 per cent of the television meter panel could be expected to convert, and that the mortality rate of the panel goes up by 10 per cent. The experimental panel no longer exists and GfK did not plan to use single source in its panel.
Roger Godbeer from Colgate Palmolive said at this 1996 conference that fusion is the only hope in the future for a primary source of information:
AGB UK proposed an alternative to today’s 4,300 ‘regional’ meter panel as a model for future research set-ups – the objective being to measure ratings as accurately as we do today with the added necessity of stable data (i.e. minimise fl uctuations caused by design). Obviously the ideal solution is to increase the panel size, but this is too expensive, so the challenge is to fi nd ways of affordably maximising sample sizes. AGB has conducted numerous analyses that lead it to believe that a region’s viewing can be accurately predicted by (a) homes ratings from set meters, and (b) an audience profi le factor derived from a national panel of peoplemeters. If it concentrated its resources on getting good household ratings it could provide (at the same cost as today) 3,000 households reporting in the same way as now, but on a network basis, and a further 7,000 set meters recording homes ratings. The audience were quick to raise issues such as the need for higher sample sizes to get accurate profi les for channels too. However, we must face the awful truth that tomorrow’s world will demand ‘less than perfect’ solutions. (Elms 1996)
The ratings providers have been active therefore in addressing the expansion of channels and their measurement. This continues. Nielsen in 2007 established a multi-year, strategic relationship with Google’s TV Ads advertising platform to combine Nielsen demographic data with aggregated set-top box data. Google could then, it is argued, provide advertisers and agencies with comprehensive information to help them create better advertisements for viewers and maximize the return on their advertising spending. Google TV Ads is an online platform for buying, selling, measuring and delivering television advertisements. Its advertising inventory includes hundreds of channels and all day-parts. Data derived from Nielsen’s representative television ratings panels are intended to provide Google TV Ads advertisers with the demographic composition of the audience.
In 2008 Nielsen struck a deal with Charter Communications to analyse set-top box data from 330,000 homes in the Los Angeles area. Nielsen has similar agreements with other cable Multiple System Operators (MSOs) but the Charter deal goes a step further because it licenses the ratings company to create ratings reports from the data that it can then sell to clients. Charter struck a similar deal in November 2006 with Nielsen competitor TNS Media Research, which sells reports
BOOK.indb 157BOOK.indb 157 07/10/11 11:46 AM07/10/11 11:46 AM
[ 158 ] Rating the Audience
based on the Charter set-top box data to clients via a syndicated package it calls TotalView. Publicis Groupe’s Starcom was the fi rst media agency to sign up and other buyers and sellers of television time have signed up since then.
One shortcoming of the set-top box data is that it does not provide the demographic data that the Nielsen ratings provide, although various companies including TNS, TiVo, Google and Nielsen itself are looking at developing algorithms and other techniques that could apply demographic estimates to the set-top numbers. The set-top box data has raised issues, taken up in court in the United States:
Let me sketch out what are some of the limitations of the digital set top box in the current environment. Number 1, many sets are not connected to digital boxes. Many households do not have, even if they’ve got cable, don’t necessarily have digital set-top boxes capable of downloading the software that can record and report back upstream the kind of information or intelligence you need in order to pull off audience measurement. You don’t know who in the household is watching, although there are certainly ways you could impute that. You’ve got, because not all sets and not all households are hooked up to digital set-top boxes, you’ve got another analogous problem to non-response. So are the people who have got digital set top boxes systematically different from those who don’t? And the answer is, yeah, it looks like they are. They’re more affl uent, they’re probably better educated, there are a number of things so the question is, can you infer from that group what the other group is doing. So, as I said it’s an analogous non-response to the problem of non-response. You’ve got a problem of being able to fi gure out what’s on the television set, which is not inconsequential. So, with current peoplemeter technology you’ve got active passive measurement that at the point of the set can capture information about what’s actually being displayed and sometimes it’s not even linear television, sometimes it’s a video game. Well, our digital set-top box is going to be programmed with suffi cient power to make that kind of discrimination so how do you fi gure out what’s actually on the screen when you’ve identifi ed that person is watching that screen? Or that household is watching that screen.
In a nutshell my argument was the system that ErinMedia had described would fall far short of what would be expected of any company offering a full fl edged alternative to what Nielsen now offers. And some of that’s inherent problems with digital set-top boxes and some of it was the way ErinMedia was proposing to solve problems or problems that they hadn’t even really given any serious thought to. (Webster 2008)
BOOK.indb 158BOOK.indb 158 07/10/11 11:46 AM07/10/11 11:46 AM
The Networks (and Other Media Providers) [ 159 ]
The media providers are a critical strut of the ratings convention. In this chapter we look at the ratings from their point of view. The ratings enter into the calculation of broadcasters and other media providers in diverse ways. They are part and parcel of the armoury of information to be used strategically to ‘sell audiences’; to analyse and develop the broadcast schedule and individual programs; to perform public accountability; and to report media outlet profi tability to shareholders. They are not the only information and data source for doing these things. But the ratings have proven to be important to the performance of these diverse tasks. And a great deal of knowledge in and facility with the ratings has typically resided in the broadcast television networks. There is probably no other user of the ratings which routinely performs such a range of tasks with them. Nor has there been any other party to the convention beside the ratings provider itself with such an interest in the performance of the ratings and the ratings providers.
These diverse uses and therefore purposes behind the broadcast networks working with and working through ratings data means that the ratings are best considered not as one thing but several different things depending upon the purposes and uses being made of them. The information ratings provide is certainly substitutable by other information sources and data; and broadcasters would immediately cease to rely on the ratings if the information they provided was not relevant to their operations and if less costly alternative data were available to collect the same information. But historically the ratings have been and continue to be resilient information sources for broadcasters and their clients in the audience and content markets in which they operate, and in scheduling and programming. Ratings also have the advantage of a single information source which allows broadcasters to make a variety of calculations touching several areas of their operation. The ratings data is also an effective proxy for other information such as engagement. And it has all the advantages of incumbency over other alternative measures in that people are used to working with it, they understand its operations and set-up, appreciate its checks and balances, and know its weaknesses.
There is certainly evidence of such a proliferation of measures happening for television. There is a certain way in which the ratings as they currently stand can be seen as primarily serving the interests of free-to-air, advertiser-supported television. There is a certain path dependency in the ratings here as they evolved primarily as an instrument for coverage in depth and detail of free-to-air television. In this context the new extension of ratings to cover and analyse timeshifted viewing through ‘fetch TV’ and TiVo is simply a means of extending the ratings as an effective measure for advertiser-supported television. The ratings are here continuing to provide large-audience media outlets with lots of useful data in developing and analysing their schedules. They are in the business of constructing fl ow through schedules,
BOOK.indb 159BOOK.indb 159 07/10/11 11:46 AM07/10/11 11:46 AM
[ 160 ] Rating the Audience
analysing, developing, anticipating and charting the programming cycle. Broadcast networks want information from ratings in a form which promotes the value of the sale of commercial time for their programmes. They in turn want to promote their value proposition: network TV as a mass medium still able to command signifi cant audiences, to provide viewers and able to be described by robust audience data which is not as readily available for programming with smaller audiences. This recognizes that the ratings are still able to provide the most authoritative source of such information.
At the same time, because of the proliferation of subscription television and its ‘long tail’ of channels only ever registering small ratings, and sometimes with ratings that are not even reported publicly, the ratings system is a congenitally failing operation. Its sample sizes are simply not big enough to capture data on small audiences: to do so the samples would have to be so extensive as to put the ratings beyond the scope of the media system and small providers to pay for it. With the ratings not being good for the ‘long tail’, and therefore the lower ends of the market, these media providers do not have the same interest as free-to-air broadcasters in the ratings as a preferred instrument. Unlike free-to-air broadcasters operating almost wholly in an audience market (that is, depending on advertising revenue), these broadcasters are reliant upon subscriptions and are consequently more sensitive to factors affecting churn of subscribers. Thus, for broadcasters reliant upon subscription the ratings can be less important to the selling proposition on individual channels – their audiences are so small that ratings data are not able to provide the kind of demographic rich data, with lower sample errors, that are available for large audiences. In practice this has meant that these media providers have become interested in alternative audience measures capable of generating large samples and more information on their particular broadcasting universe. The contemporary interest in set-top box data as an alternative source of audience measurement information is a case in point.
United Kingdom The introduction of competition into the British television market with the commencement of the ITV service in London on 22 September 1955 posed a number of questions about audience research methods and uses. Because the Independent Television Authority (ITA)’s and the ITV programme contractors’ purposes in knowing and measuring audiences were different from the BBC’s purposes, and because the BBC research under Robert Silvey did not provide all the information or detail the independents needed, a new market for audience research was created. The competition between ratings providers particularly in
BOOK.indb 160BOOK.indb 160 07/10/11 11:46 AM07/10/11 11:46 AM
The Networks (and Other Media Providers) [ 161 ]
the period before the contracting of Television Audience Measurement (TAM) as preferred supplier in January 1957, produced a range of new information about the availability and reception of ITV across the United Kingdom. The competition between companies like Gallup, TAM, ACNielsen and Pulse to provide research services, and especially that between TAM and Nielsen to supply the industry service, highlighted and hinged on differences in methodology and reporting. Broadcasters, and especially the ITA, used comparisons between different services – including Silvey’s work for the BBC – to inform themselves about the total number of sets and households able to receive ITV, the share of overall viewing versus the BBC, patterns of national use and top-rating programmes. In the fi rst years of commercial television, the ITA was also embroiled in a controversy about the designation of service boundaries, with ITA, TAM, Nielsen and the BBC all differing in their defi nitions of particular service areas, with implications for the calculation of the audience universe and for the reach of advertising and programmes.
The creation of the ITA in 1954 stimulated the development of audience research in the United Kingdom. Up to this time, the BBC’s studies of its own audiences were the only television audience research. In the run-up to the launch of ITV in September 1955, several companies entered the fi eld of television audience research in the UK. The costly competition between these fi rms for the attention of the ITA, the ITV programme companies and advertisers in the period before the awarding of the industry contract to TAM in 1957 has much to tell us about methodology, process and approach in the design and development of ratings services. It is also revealing of the ways in which broadcasters (and broadcasting authorities) use ratings and audience research in different ways than other subscribers.
The prospect of commercial television in Britain was raised in a white paper on broadcasting policy in May 1952 and, after vigorous political debate, the Bill to create the Independent Television Authority was introduced into Parliament in March 1954, becoming law on 30 July. The Television Act of 1954 established the ITA for a period of ten years, empowering it to build and operate transmitters and contract with programme companies to provide programmes. Although the ITA was not offi cially created until after the Act passed into law at the end of July, with great foresight Arthur C. Nielsen met with Sir Robert Fraser, the fi rst Director General of the ITA, in April 1954, and gave him a memorandum entitled ‘Present and Future Position of the ITA with Respect to TV Audience Research’. In September, Nielsen sent ITA a series of reports that his company had conducted in the United States to give an indication of what could be done in Britain, and the following February, Nielsen produced a detailed booklet, ‘Television Audience Research for Great Britain’, which was sent to ITA Chairman, Sir Kenneth Clark. In particular, the Nielsen company took it upon itself to promote the benefi ts of television advertising
BOOK.indb 161BOOK.indb 161 07/10/11 11:46 AM07/10/11 11:46 AM
[ 162 ] Rating the Audience
and audience measurement to advertising agencies and large fi rms. A rival British company, Television Audience Measurement (TAM), was set up in April 1955. Both TAM and Nielsen used meters to measure audiences, with both having small panels in place in London in time to begin reporting as soon as ITV broadcasting began in September 1955.
Once the meter system had been accepted by the programme companies and advertisers as the most appropriate for regular, ongoing audience research, TAM and Nielsen were left as the only competitors for the fi rst industry contract. Despite a vigorous campaign by Nielsen, TAM was awarded the fi rst fi ve-year contract by Television Audience Research Advisory Council (TARAC) in January 1956. The following month, Arthur C. Nielsen wrote a long letter to Sir Robert Fraser criticizing the committee’s decision and labelling the original specifi cations ‘little short of ridiculous’; the committee had initially specifi ed a panel of 100 homes in the London area, and 100 for the whole of the rest of the country. Nielsen felt that TAM had been given preferential treatment, including being given the opportunity to submit a revised bid, and sought to convince Fraser to pressure the ITV programme companies to reject the ‘Committee service’ and sign up with Nielsen, thus killing off the TAM service. Fraser politely declined.
Nielsen continued to operate a competing meter service in parallel with TAM’s until the two companies merged in June 1959.
But ratings was only one of the sets of data produced by Gallup, TAM and Nielsen, and bought by the ITV companies and the ITA, which also subscribed to BBC research for a short period after the launch of ITV. Calculations of the number of homes able to receive ITV and the overall split of viewing between ITV Broadcasters’ Audience Research Board and the BBC were most important in the very early period. The ITA also initiated assessments of programme quality and public attitudes to television in 1957; following the Pilkington Committee’s inquiry into broadcasting, the 1964 Television Act made the conduct of such surveys a statutory duty of the ITA.
From the fi rst public BBC television broadcast in 1932 until 1955 in London and later in other parts of the country, viewers could only receive one station: the BBC. Many of the televisions sold in the United Kingdom until the mid-1950s were only capable of being tuned to VHF Band I, the frequency used by the BBC, so when ITV commenced broadcasting on the higher frequency Band III, viewers needed a new aerial and set-top converter, or a new television set, in order to receive the new service. For many years, a critical measurement for ITA was the proportion of total sets able to receive an ITV service as it was progressively rolled out across the country. Gallup, TAM, Nielsen and the BBC all researched these fi gures, but from even before the launch of ITV there were many discrepancies
BOOK.indb 162BOOK.indb 162 07/10/11 11:46 AM07/10/11 11:46 AM
The Networks (and Other Media Providers) [ 163 ]
between the data produced by the competing services. These discrepancies were due in part to methodology; they opened the space for comparison and contest both between aided recall (favoured by Gallup and the BBC) and meters (used by TAM and Nielsen), as well as between the two competing meter systems. But they also had implications for a variety of calculations and defi nitions: the ITA’s concern with the placement of transmitters and the defi nition of ‘acceptable reception’, the contours and boundaries of service areas, the construction of a regional advertising campaign, the constitution of a panel and programme ratings.
In August 1955, the British arm of Gallup published the fi rst provisional results of what was intended to be a regular survey entitled ‘The Potential ITA Audience’. The survey of 1,000 households was conducted in the London region, where Gallup estimated there were 1.5 million sets in use and 2.1 million non-television homes. At that point, a month before the launch of ITV, Gallup found that only 22 per cent of homes with television contained sets that were fi tted with a station selector switch, and therefore were ready to receive ITV. While the survey also found that a further 48 per cent of households with television were planning either to adapt their existing set or buy a new one, 30 per cent of households with television were either reluctant to change or stated fi rmly that they did not want commercial television. Only 8 per cent of households without television were expecting to buy a television within the next six months, meaning that out of 3.6 million households, the potential ITV audience amounted to only slightly more than 1 million households, or just under 3 million people out of a total potential population of around 10 million. In the seventeen days after the fi rst broadcast in London by Associated Rediffusion on 22 September 1955, Gallup conducted over 20,000 interviews on patterns of viewing and attitudes to commercial television. The company continued to monitor the total number of ITV homes on a regular basis through interviews drawn from a random sample of households.
In the fi rst months of the London ITV service, the ITA received contradictory data from the BBC Audience Research unit, Gallup, Nielsen and TAM about the total number of homes with television, the numbers able to receive ITV and the share of viewing with the BBC. The correspondence of the Director General of the ITA, Sir Robert Fraser, in November 1955, two months after the commencement of the London service, charts the issue of comparing audience estimates. On 15 November, Fraser wrote to Mark Abrams, chairman of Research Services Ltd:
We are now almost a fortnight past the middle day of the week of this Silvey [BBC] measurement, so that it would look as if the number of ITA homes, on his fi gures, must now be of the order of 600,000. The Nielsen fi gure for a mean date of Oct 8th – that is to say, over 5 weeks ago, was 346,000. Dowson
BOOK.indb 163BOOK.indb 163 07/10/11 11:46 AM07/10/11 11:46 AM
[ 164 ] Rating the Audience
[of ACNielsen] told me, about a fortnight ago, that he thought the fi gure had risen by then to rather more than 450,000, and that the rate of growth was somewhere between 25,000 and 50,000 homes a week. I know that the early Nielsen fi gs were underestimates, because they had not allowed for the quite frequent reception of ITA programmes in homes without Band II aerials. On the lowest basis, the Nielsen fi gure, for today, could not be less than 500k. I think Silvey is our best bet, for he codes it every day and his returns are so steady. I suppose the margin of error in the 12.5 fi gure might be one per cent, but even so … (Fraser to Abrams, 15 November 1955, ITA Archive)
On 17 November, Fraser wrote to Graham Dowson, the Director of Nielsen TV Index, highlighting his concerns about the discrepancies between BBC and Nielsen fi gures:
As you know, the BBC carries out fairly large scale daily interviews in the course of which those questioned are asked whether they live in homes in which the ITA programmes can be seen. The percentage of those interviewed claiming to live in ITA homes is monthly and steadily rising, and in the week which ended on Nov 5th the percentage was 12.5%. The BBC interviews are a random sample of 14,980,000 people, so that in the week mentioned, and if the sample was accurate, 1,870,000 people must be assumed as the population of the ITA homes. The average number of people per home in the area covered by the BBC research is 3.3, so giving us a fi gure of no less than 565,000 ITA homes. A fortnight has passed since the mean date of the week to which the fi gure of 12.5% relates, so that the number of ITA homes today, on any calculation, should exceed 600,000. Surely there is something very wrong indeed somewhere – but where is it? (Fraser to Dowson, 17 November 1955, ITA Archive)
Three weeks later, Dowson replied with new data that differed again from earlier estimates:
A new estimate of ITA homes in the London area. This estimate is based upon a survey, the mean date of which was Nov 17th, which showed the ITA universe at that date to be 449,000 homes. The evidence we obtained from this survey has also enabled us to provide an estimate of the rate of increase in ITA homes. In fact, that rate of increase we estimate as being 26,000 ITA homes each week. We have, therefore, applied this rate of increase to the period since the mean date of our latest survey, and have arrived a fi gure of 501,000 homes relating to a mean date of Dec 1. (Dowson to Fraser, 8 December 1955, ITA Archive)
BOOK.indb 164BOOK.indb 164 07/10/11 11:46 AM07/10/11 11:46 AM
The Networks (and Other Media Providers) [ 165 ]
In reply, Fraser questioned Silvey’s measurement of total viewers and failure to break this down to the household level, ITV’s (and the meter operators’) preferred category. Fraser also noted that Silvey was counting viewers beyond the ‘secondary service area’, or the area of acceptable transmission strength, thus potentially skewing the results. Dowson agreed:
I would be inclined to believe that you have hit the nail on the head when you mention the difference in the size of ITA homes and the fact that in any event people tend to give misleading information when asked for interviews. On the basis of the information we have on this subject, ITA households tend to be somewhat larger than ordinary BBC households. In fact we are using privately a fi gure of 3.9 persons per ITA home. Thus it would seem quite likely that any interview method which disclosed fi gures which were then divided by the lower estimates of persons in TV households would certainly give you a very much larger ‘apparent’ number of ITA homes. (Dowson to Fraser, 14 December 1955, ITA Archive)
In a booklet published on 1 January 1956 comparing the Nielsen Television Index and the aided recall methods used by the BBC, Nielsen confi rmed the issue of service/research areas as a factor in differences in estimates (and as a reason why the mechanized service was more effi cient than aided recall). The booklet noted:
The London area as defi ned by BBC for its research is considerably larger than the London area as defi ned by ITA and measured by Nielsen. If there could be absolute assurance that the latter covered 100% of the homes capable of receiving ITA broadcasts, no material difference would result from this factor … However it is known that certain persons living beyond the Nielsen London area can receive ITA broadcasts to some extent and under certain conditions, but in some of these cases the reception may be so poor that the ITA share of audience in such homes will be abnormally low, causing the BBC research to report lower shares for ITA than would be true if BBC confi ned its research to the area used by Nielsen. (ACNielsen, ‘A Comparison of Television Audience Measurements: Nielsen Television Index (a wholly mechanized audience research system) versus Aided Recall (personal interviews, prompted by programme logs), as conducted by the BBC’, Oxford, 1 January 1956)
The issue would arise again at various times before the awarding of the industry contract to TAM in early 1957. For example, Sir Robert Fraser wrote to Major George Harrison of the London Press exchange in November 1956 about signifi cant discrepancies between TAM and Nielsen fi gures for Band III homes (i.e. those able to receive ITV) for the fi rst week of November 1956. Where Nielsen calculated the
BOOK.indb 165BOOK.indb 165 07/10/11 11:46 AM07/10/11 11:46 AM
[ 166 ] Rating the Audience
total number of homes receiving ITV as 1,907,000, TAM put the fi gure at almost 500,000 higher. Fraser wrote:
Differences of this magnitude bring TV research into disrepute, and that is in no one’s interest. It seems to me that some authoritative body should call on the 2 agencies for an explanation of their own fi gures and for their comment on the differences, and might then see whether, perhaps in discussion with the 2 agencies, it could not bring about a closer approximation, not of course by suggesting the suppression of fi gures in which either of them believes, but by examining whether the inconsistencies may not be due to the collection of the fi gures at different times, or from areas that do not exactly coincide, or by the use of different criteria about what constitutes a Band III home. I cannot think of anybody so proper or so competent as the Steering committee to look into the matter, and I therefore write in the hope that you may feel able to pursue it. (Fraser to Harrison, 9 November 1956, ITA Archive)
As ITV became available in other regions – the Midlands and North 1956, Central Scotland in 1957, Wales and West, and Southern in 1958, North East, East and Ulster in 1959, South-West, the Borders and North-east Scotland in 1961, the Channel Islands in 1962 – disputes continued over the size of the universe, and the lack of coincidence between areas mapped by the ratings providers and the ITA’s broadcast transmission maps. Discrepancies in mapping of this kind had commercial consequences in the problems created for advertisers and buyers in calculating CPM (cost per mille [thousand]). They also had implications for the representativeness of the panel, and subsequently for the ratings. In 1958, the Television Audience Research Advisory Council asked TAM to approach the ITA about publishing maps that would coincide with TAM areas in order to end the confusion, but the ITA was concerned that it would be supplying misleading information if it issued maps that might suggest that there was adequate ITV reception in an area when ITA’s own surveys show that substantially less than 50 per cent of homes would be able to receive the ITV signal with a normal set and aerial. The ITA published three maps showing the fi eld strength of its transmitters, which defi ned the ITV service area. The fi rst map showed the ‘primary area’ of service, that within the 2,000 microvolts per metre contour, within which almost 100 per cent of homes would be capable of receiving a satisfactory signal if they had a Band III set and a normal aerial. The second map showed the 500 microvolts per meter contour, within which less than 75 per cent of homes could receive a satisfactory signal (‘the secondary area’), and the third map showed the 250 microvolts per meter contour, within which less than 50 per cent of homes would be receive a satisfactory signal (‘the fringe area’). TAM undertook boundary surveys in order to establish the limits of the effective
BOOK.indb 166BOOK.indb 166 07/10/11 11:46 AM07/10/11 11:46 AM
The Networks (and Other Media Providers) [ 167 ]
marketing area covered by particular ITA transmitters, but these were wider than the ITA fringe areas, and so well beyond the ITA’s limit of adequate reception. TAM’s inclusion of the fringe area within its boundary meant that areas where only 10–15 per cent of houses were able to receive the signal became part of its calculation; TAM was reluctant to discount these (potential) viewers because this would mean that a substantial number of homes that could receive television advertising would not be accounted for. An internal ITA memo dated 29 April 1958 explained the issues at hand and the concerns of the industry:
The present TAM areas are very different from ours … An increase in the TAM estimates is going to make more and more people damn our fi gures as conservative, or alternatively doubt the TAM estimates because they are so optimistic. Nielsen for their part, have been extremely worried about this problem for a considerable time as it presents them with a choice between professional honesty on the one hand and satisfaction for their clients, the advertising agencies and the programme companies, on the other. Naturally the programme companies want to be able to claim the ‘biggest circulation’ they can and agencies are particularly interested in the cost per thousand. One can, of course, extend ones [ sic ] survey at will (and produce arguments to justify the boundaries taken) but to give an accurate picture of viewing habits one must place meters in homes which will give a representative picture of the area as a whole including of course those people who are in the extremes of the survey area. Such a distribution of meters can, however, add considerably to the cost of operation of an audience research service and can also slow down the collection of tapes each week. There is, therefore, a tendency to centralise meters and if this is done large numbers of viewers with poor reception are not represented in the sample. However, most people in the companies and the agencies are happy as (a) the ‘circulation areas’ are large, (b) there is a small cost per thousand and (c) there is also a comparatively high percentage of ITA viewing to BBC … there seems to be a strong feeling in certain quarters that the ITA should do something to establish a service area boundary which will be acceptable to all … We can, of course, easily argue that this problem has nothing to do with us but on the other hand there is a danger that the research methods used by the two companies on whose fi gures we rely may be thrown into disrepute. (J. Cuthbert to Director General, 29 April 1958, ITA Archive)
Boundary or establishment surveys are still routinely and regularly carried out to ensure the representativeness of the panel. TAM carried out establishment surveys in the United Kingdom to support its service from the mid-1950s. When TAM’s
BOOK.indb 167BOOK.indb 167 07/10/11 11:46 AM07/10/11 11:46 AM
[ 168 ] Rating the Audience
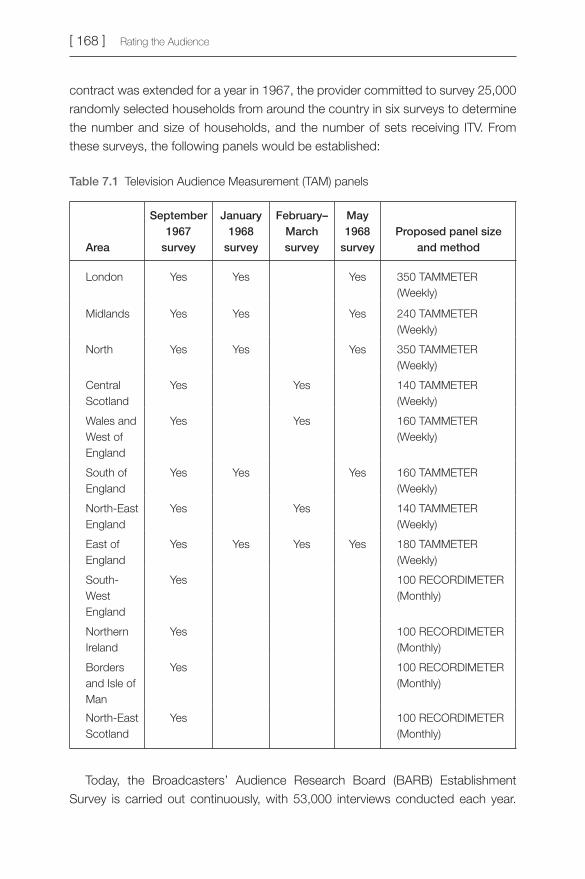
contract was extended for a year in 1967, the provider committed to survey 25,000 randomly selected households from around the country in six surveys to determine the number and size of households, and the number of sets receiving ITV. From these surveys, the following panels would be established:
Table 7.1 Television Audience Measurement (TAM) panels
Area
September 1967
survey
January 1968
survey
February–March survey
May 1968
surveyProposed panel size
and method
London Yes Yes Yes 350 TAMMETER (Weekly)
Midlands Yes Yes Yes 240 TAMMETER (Weekly)
North Yes Yes Yes 350 TAMMETER (Weekly)
Central Scotland
Yes Yes 140 TAMMETER (Weekly)
Wales and West of England
Yes Yes 160 TAMMETER (Weekly)
South of England
Yes Yes Yes 160 TAMMETER (Weekly)
North-East England
Yes Yes 140 TAMMETER (Weekly)
East of England
Yes Yes Yes Yes 180 TAMMETER (Weekly)
South-West England
Yes 100 RECORDIMETER (Monthly)
Northern Ireland
Yes 100 RECORDIMETER (Monthly)
Borders and Isle of Man
Yes 100 RECORDIMETER (Monthly)
North-East Scotland
Yes 100 RECORDIMETER (Monthly)
Today, the Broadcasters’ Audience Research Board (BARB) Establishment Survey is carried out continuously, with 53,000 interviews conducted each year.
BOOK.indb 168BOOK.indb 168 07/10/11 11:46 AM07/10/11 11:46 AM
The Networks (and Other Media Providers) [ 169 ]
The issue of the number of households able to receive ITV gradually declined in importance as the ITA’s national coverage and the number of new or converted sets rose, although the issue of the share of total audience between the BBC and ITV continued to be contested, with the BBC Audience Research unit regularly recording higher shares for BBC than those recorded by Nielsen and TAM. The appointment in 1960 of a committee of inquiry into broadcasting under Lord Pilkington turned the question of share of viewing into a political issue. Unlike the BBC, which regularly made viewing fi gures public, the only data published regularly by TAM (which by that time held the industry contract for ratings research) was a weekly ‘Top Ten’ programmes. Figures on audience composition and share of audience were only published when they were newsworthy rather than as a matter of routine, although such fi gures were a regular part of the weekly National Tamratings Report that was issued to subscribers. Concern within the ITA over discrepancies between the BBC’s published fi gures for share of audiences and the private fi gures recorded by TAM welled up in 1962. Mike Hallett, the ITA’s Information Offi cer, wrote to Charles D. Harris of TAM in April requesting that the company make some data public:
The BBC fi gures, naturally I suppose, favour the BBC and it is, from our point of view, unfortunate that the BBC should get this favourable publicity easily and regularly. The only way to counteract it is to arrange for the regular publication of TAM statistics comparable to those of the BBC. A form of words could be devised that would show the different bases of the two sets of fi gures, for instance that TAM fi gures are based on two-channel sets whereas the BBC fi gures include single channel sets. This would avoid the appearance of a head-on contradiction of the BBC fi gures. Would you take this up and see if TAM can be persuaded to issue regular statements? The position may be strengthened by the report of the Pilkington Committee. It considered TAM and may well, it seems to me, make some favourable comments in its report that could judiciously be quoted, thereby reinforcing TAM’s position. (Hallett to Harris, 25 April 1962, ITA Archive)
Ever quick to seek a return for TAM’s research, Harris wrote back that while the company felt that the issuing of regular press releases ‘would be incompatible with our position as an independent research organisation’ (something that had never troubled Nielsen or Gallup), they would ‘co-operate by providing, at cost price’ the information that the ITA would need to issue its own press releases (Harris to Hallett, 2 May 1962, ITA Archive). Hallett replied immediately, stating that the ITA could not publish TAM fi gures ‘unless it [the ITA] were prepared to guarantee the statistics, which it could only do if their production was under its own control. It is not that we doubt TAM results’. Hallett continued, somewhat disingenuously since TAM’s
BOOK.indb 169BOOK.indb 169 07/10/11 11:46 AM07/10/11 11:46 AM
[ 170 ] Rating the Audience
results had been repeatedly questioned over the years by ITA staff, ‘it is simply that they are yours and not ours’ (Hallett to Harris 3 May 1962, ITA Archive). The ITA suspected that TAM’s reluctance to publicize its fi gures stemmed from a fear that when TAM results disagreed with BBC results, the latter would be believed thus damaging TAM’s image. TAM eventually agreed to publish monthly share of audience fi gures for each area and for the ITV network, and a ‘Quarterly Account of Viewing’, beginning in July 1962, which would list the network share fi gures for each month in the quarter compared with the previous year and include a special study of audiences for ‘serious’ programmes. This last study was a response to the Pilkington Committee’s concern with the balance of ‘light’ and ‘serious’ programmes on ITV and BBC, and to the perception – reinforced by data released by the BBC – that the ITV companies’ schedules were weighted too heavily towards ‘light’ programmes (Briggs 1995: 280–1).
Concerns about the quality of programmes on ITV had been voiced by politicians and other commentators since the beginning of the service, prompting another research path. Following the recommendations of the Pilkington Report, the 1964 Television Act made it a statutory duty of the ITA to conduct audience research into public opinion on programmes and advertisements, and to encourage the public to make suggestions and comments, although in practice the ITA, along with several private companies, had already begun similar programmes of research. Before the requirement in the 1964 Act was imposed, the ITA had commissioned a series of general surveys and special inquiries to gauge audience attitudes, including parents’ attitudes to children’s television (July 1958), attitudes to advertising (October 1960) and attitudes to religious programmes (July 1961). Once the requirement was announced, the ITA received proposals from fi ve companies to supply appreciation data: TAM, which had secured the rights to use the American TvQ system of AGB Research Ltd, the company that would win the industry contract from TAM in 1968, proposed ‘a continuous research operation collecting data on all widely networked programmes’ in order to record audience appreciation; Schwerin Research Corporation proposed to conduct studies into the effects of violence on television, and tests of the ‘communicative power of programmes and advertisements’; Social Surveys (Gallup Poll) proposed a ‘Television Quality Index’; and Research Services Ltd, the supplier of many of the ITA-commissioned reports on attitudes to programming, offered to continue its work.
At this time the ITA had already committed to funding the work of the Television Research Committee (known as the Noble Committee) into the use of television as a means of fostering ‘moral concepts and attitudes’ for a period of fi ve years at an annual cost of £50,000, £7,000 more than its entire annual Audience Research Programme budget. In December 1964, the ITA subscribed to the TAM TvQ service
BOOK.indb 170BOOK.indb 170 07/10/11 11:46 AM07/10/11 11:46 AM
The Networks (and Other Media Providers) [ 171 ]
despite the Independent Television Companies Association (ITCA)’s Research Liaison Committee counselling against such a move on the grounds that the formula used to determine the appreciation of programmes was unreliable. The ITCA’s committee was also concerned that other subscribers to the TvQ service included advertising agencies, and within a year had put forward an alternative scheme. The ITA rejected the alternative and maintained its subscription to TvQ principally on the grounds of cost, although the service was discontinued later in the 1960s. These surveys were the precursors of contemporary research on engagement, which we discuss elsewhere in this book.
Summary Ratings have been so core to broadcast network operations that they have since the 1940s provided the bulk of the funding for ratings services. The networks and ratings providers set the scene for the standardization of audience ratings and the professionalization of those involved in key components of its operation. This refl ects the networks own interests in audience measurement as a market organization tool and their commitment to a single coordination rule which allows the systematic examination on an ongoing basis of both their and rival networks’ audiences establishing relative standing among competing media outlets. It also marks out the terrain of their often testy engagement with the ratings and ratings providers, and their vital interest in the conduct of audience measurement by ratings providers.
Audience ratings still provide television networks with the most robust data with the best systems of overview and checks and balances. This extends to every level from the smallest component – how things are installed in the home, how people are recruited, organization of the sample, viewing areas and so on. It also provides as near as possible a total picture of media outlets in television and radio. It is the only available research for which a systematic comparison of media alternatives for buying and selling is possible. The competitor audience measurements based on set-top box subscription television lists provide only partial overviews of the total television media market but they also represent, like ITV’s contest with BBC, fascinating insights into how coordination of different measurements is occurring.
Converged media delivery raises the possibility of new business models for delivery of content to audiences and for its payment, bringing together different technology and media platforms. However, these models will still have to deliver what television networks have long recognized – publicly acceptable ways of measuring audiences and strong auditing regimes.
BOOK.indb 171BOOK.indb 171 07/10/11 11:46 AM07/10/11 11:46 AM