rates of change in the visual field and optic disc in patients with distinct patterns of...
TRANSCRIPT
Rates of Change in the VisualField and Optic Disc in Patients withDistinct Patterns of GlaucomatousOptic Disc Damage
Alexandre S. C. Reis, MD,1,2 Paul H. Artes, PhD,1 Anne C. Belliveau, BSc,1 Raymond P. LeBlanc, MD,1
Lesya M. Shuba, MD, PhD,1 Balwantray C. Chauhan, PhD,1 Marcelo T. Nicolela, MD1
Purpose: To investigate the rate of visual field and optic disc change in patients with distinct patterns ofglaucomatous optic disc damage.
Design: Prospective longitudinal study.Participants: A total of 131 patients with open-angle glaucoma with focal (n � 45), diffuse (n � 42), and
sclerotic (n � 44) optic disc damage.Methods: Patients were examined every 4 months with standard automated perimetry (SAP, SITA Standard,
24-2 test, Humphrey Field Analyzer, Carl Zeiss Meditec, Dublin, CA) and confocal scanning laser tomography(CSLT, Heidelberg Retina Tomograph, Heidelberg Engineering GmbH, Heidelberg, Germany) for a period of 4years. During this time, patients were treated according to a predefined protocol to achieve a target intraocularpressure (IOP). Rates of change were estimated by robust linear regression of visual field mean deviation (MD)and global optic disc neuroretinal rim area with follow-up time.
Main Outcome Measures: Rates of change in MD and rim area.Results: Rates of visual field change in patients with focal optic disc damage (mean �0.34, standard
deviation [SD] 0.69 dB/year) were faster than in patients with sclerotic (mean �0.14, SD 0.77 dB/year) and diffuse(mean �0.01, SD 0.37 dB/year) optic disc damage (P � 0.003, Kruskal–Wallis). Rates of optic disc change inpatients with focal optic disc damage (mean �11.70, SD 25.5 �10�3 mm2/year) were faster than in patients withdiffuse (mean �9.16, SD 14.9 �10�3 mm2/year) and sclerotic (mean �0.45, SD 20.6 �10�3 mm2/year) optic discdamage, although the differences were not statistically significant (P � 0.11). Absolute IOP reduction fromuntreated levels was similar among the groups (P � 0.59).
Conclusions: Patients with focal optic disc damage had faster rates of visual field change and a tendencytoward faster rates of optic disc deterioration when compared with patients with diffuse and sclerotic optic discdamage, despite similar IOP reductions during follow-up.
Financial Disclosure(s): Proprietary or commercial disclosure may be found after the references.
Ophthalmology 2012;119:294–303 © 2012 by the American Academy of Ophthalmology.dvoinheticcmss
Rates of visual field and optic disc change are among themost relevant clinical parameters in the management ofglaucoma, providing an indication of the adequacy of treat-ment and overall prognosis.1–3 Most patients with glaucomashow evidence of change if observed sufficiently longenough. In some patients, these changes are detectable onlyafter many years or even decades and may have minimalimpact on quality of life. Other patients have rapid rates ofchange that cause a substantial risk of visual impairment.
Glaucoma is a progressive optic neuropathy with a wideclinical spectrum, and patients vary with respect to thesensitivity to intraocular pressure (IOP), presence of otherocular and systemic risk factors, and overall prognosis ofthe disease.4–7 Although this diversity has been widelyrecognized, there have been relatively few attempts to iden-tify subgroups of open-angle glaucoma (OAG) that have a
more or less aggressive course of the disease.8–11 c294 © 2012 by the American Academy of OphthalmologyPublished by Elsevier Inc.
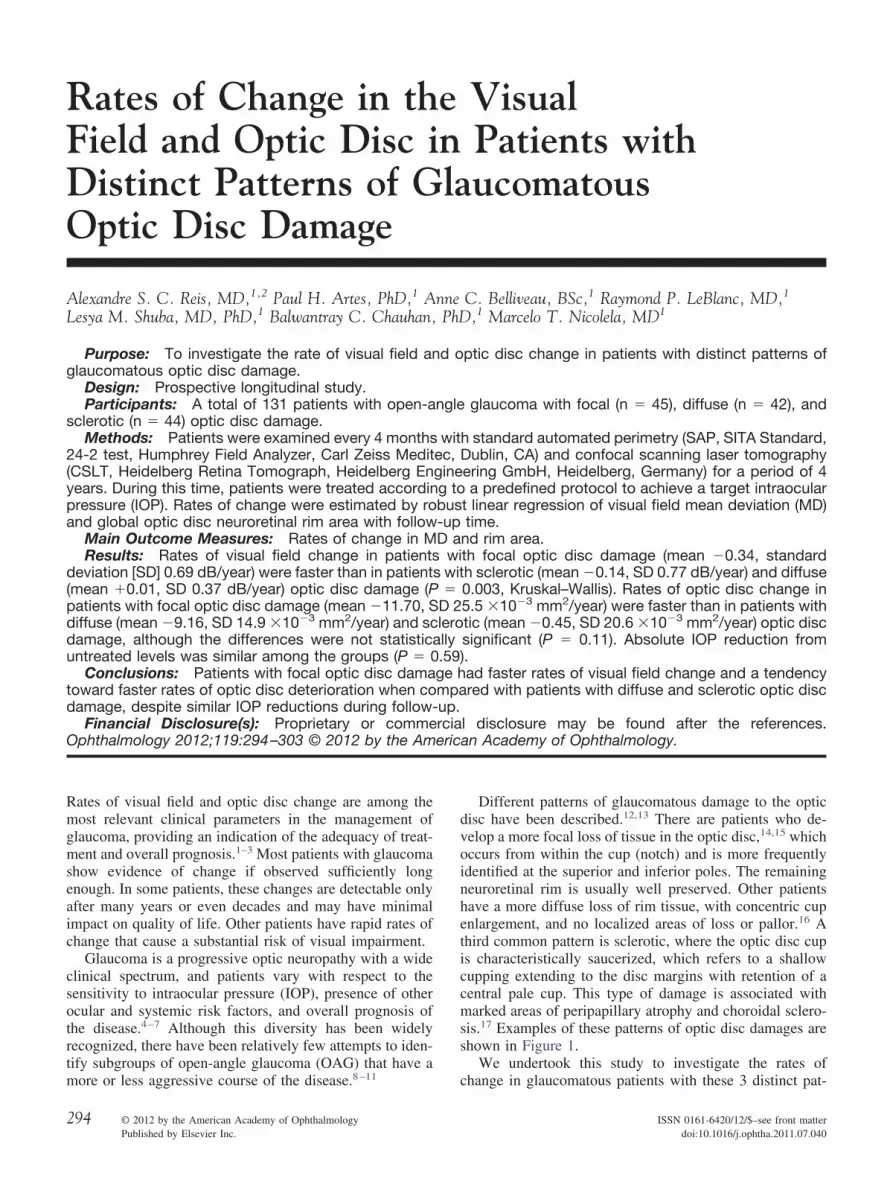
Different patterns of glaucomatous damage to the opticisc have been described.12,13 There are patients who de-elop a more focal loss of tissue in the optic disc,14,15 whichccurs from within the cup (notch) and is more frequentlydentified at the superior and inferior poles. The remainingeuroretinal rim is usually well preserved. Other patientsave a more diffuse loss of rim tissue, with concentric cupnlargement, and no localized areas of loss or pallor.16 Ahird common pattern is sclerotic, where the optic disc cups characteristically saucerized, which refers to a shallowupping extending to the disc margins with retention of aentral pale cup. This type of damage is associated witharked areas of peripapillary atrophy and choroidal sclero-
is.17 Examples of these patterns of optic disc damages arehown in Figure 1.
We undertook this study to investigate the rates of
hange in glaucomatous patients with these 3 distinct pat-ISSN 0161-6420/12/$–see front matterdoi:10.1016/j.ophtha.2011.07.040
twt
M
SPaHsBOibodid
pcaddlcktc
lt(oseadtlwfspp
C
ImKrfiacu
pibagfirounded by peripapillary atrophy and with signs of choroidal sclerosis.
Reis et al � Rates of Change in Different Disc Phenotypes
erns of optic disc damage (i.e., focal, diffuse, and sclerotic)hen treated according to current Canadian guidelines for
he management of glaucoma.18–20
aterials and Methods
tudy Design and Materialatients with OAG were recruited from the practices of 2 of theuthors (M.T.N. and R.P.L). In accordance with the Declaration ofelsinki, all subjects gave informed consent to participate in the
tudy, and the study was approved by the Research Ethics Reviewoard of the QEII Health Sciences Centre in Halifax, Nova Scotia.ne author (M.T.N.), masked to patients’ identity and clinical
nformation, reviewed optic disc stereo photographs of patientsefore their clinical visits and consecutively selected patients withptic disc damage characteristic of focal, diffuse, or scleroticamage (Fig 1). The patterns of optic disc damage, as well as thentra- and interobserver agreement of its classification, have beeniscussed in detail elsewhere.13,21,22
Other inclusion criteria were a diagnosis of OAG, includingrimary, pseudoexfoliative, or pigmentary glaucoma; best-orrected visual acuity �0.3 (20/40) logarithm of the minimumngle of resolution in the study eye; refraction within �6.00iopters sphere and �3.00 diopters astigmatism; and visual fieldamage, defined as a Glaucoma Hemifield Test outside normalimits or a mean deviation (MD) worse than �2.0 dB. Exclusionriteria were concomitant ocular disease, systemic medicationnown to affect the optic nerve or visual field, and an MD worsehan �20.0 dB. If both eyes were eligible, 1 eye was randomlyhosen as the study eye.
Each selected patient underwent a comprehensive ophthalmo-ogic examination during a baseline visit, including standard au-omated perimetry (SAP), confocal scanning laser tomographyCSLT), IOP measurement, corneal pachymetry, and stereoscopicptic disc photography. The baseline visit was followed by aecond visit 1 month later, after which patients were examinedvery 4 months for a period of 4 years. Patients were treatedccording to a predefined study protocol based on current Cana-ian guidelines for the management of glaucoma.18–20 The goal ofhe therapy was to decrease IOP by at least 30% from untreatedevels or �21 mmHg, whichever was the lowest. Initially, the IOPas reduced by medical topical treatment. Subsequently, other
orms of treatment, including laser trabeculoplasty and filtrationurgery, could also be used. If, during the study, the disease hadrogressed according to the physician’s judgment, a new targetressure was set.
linical Tests Included in this Current Analysis
ntraocular Pressure Measurements. Intraocular pressure waseasured with Goldmann applanation tonometry (Haag-Streit,öniz, Switzerland). The mean of 2 consecutive readings was
ecorded for analysis. The IOP measurements performed afterltration surgery were excluded from comparative analysis of IOPmong the 3 groups. Untreated IOP, obtained from the clinicalharts, was recorded for analysis. Reduction of IOP was defined asntreated IOP minus mean IOP during follow-up.
Visual Field Assessment. Standard automated perimetry waserformed using the Humphrey Field Analyzer (Carl Zeiss Med-tec, Dublin, CA), SITA standard strategy, program 24-2. Twoaseline visual fields were performed (baseline and 1-month visit)nd at each follow-up visit thereafter. We used the MD to evaluatelobal rates of visual field change. Only eyes with at least 5 visual
Figure 1. A, Focal optic disc damage with localized inferotemporal neu-roretinal rim loss (notch), with the remaining neuroretinal rim relativelywell preserved. B, Diffuse optic disc damage with uniformly enlarged andround cup, with no localized areas of neuroretinal rim tissue loss. C,Sclerotic optic disc damage with shallow and gently sloping cup, sur-
eld tests were included in this analysis.
295
ct
DAsWavpAf
R
Asdvipb
dsPfdafd
Ophthalmology Volume 119, Number 2, February 2012
Confocal Scanning Laser Tomography. Confocal scanninglaser tomography of the optic nerve head was performed with theHeidelberg Retina Tomograph II (Heidelberg Engineering GmbH,Heidelberg, Germany). Examinations were performed at baselineand at every visit during the follow-up period. One observer(ASCR) drew the contour lines in the baseline image. Imagesobtained after filtration surgery were excluded from the analysis toavoid artifactual increases in rim area induced by filtration sur-gery.23 To evaluate rates of optic disc change, we computed theglobal rim areas for each image using the fixed standard referenceplane.24 Only eyes with at least 5 scans were included in thisanalysis.
Analysis of Rate of Change
Linear regression of MD and global rim area was performed withfollow-up time as the independent variable, separately for eachpatient. Rates of change over the follow-up period (dB/year withMD and mm2�10�3/year with rim area) were estimated from theslope coefficient of the regression equation. Because ordinaryleast-squares regression is highly sensitive to outliers often presentin clinical data,25,26 we used a recently developed robust regres-sion technique that combines a high tolerance to outliers with highstatistical efficiency (MM estimation).27–30 In brief, the methoditeratively down-weights data points that appear inconsistent withthe relationship between dependent and independent variablessuggested by most other data points.30
Rapid rates of visual field and optic disc change weredefined as slopes more negative than �0.5 dB/year and �10.0mm2�10�3/year with MD and rim area, respectively, statisticallydifferent from zero at a P value less than 0.05. These rates ofchange are approximately 5 times worse than the mean rate of
Table 1. Demographic and Clinical Data from
Total (n � 131) Foca
Female gender, n (%) 67 (51%) 2Age (y), mean (SD) 68.1 (11.3) 69.Diagnosis (POAG/PG/PXFG), n 106/7/18Follow-up (mos), mean (range) 43.7 (13–56) 42.Untreated IOP (mm Hg), mean (SD) 24.8 (7.2) 24.Baseline IOP (mm Hg), mean (SD) 16.0 (3.9) 15.
IOP � intraocular pressure; PG � pigmentary glaucoma; POAG � primadeviation.*Pearson’s chi-square test for categoric data and Kruskal–Wallis test for c†Refers to PXFG difference among the groups.
Table 2. Intraocular Pressure (mm Hg) Characteristics, NumbDisc Dam
Total (n � 131)
Mean IOP during follow-up (mm Hg), mean (SD) 14.8 (2.8)Absolute reduction of IOP (mm Hg), mean (SD) 10.0 (7.0)Relative reduction of IOP (%), mean (SD) 37% (16%)Laser, n (%)† 15 (11%)Filtration surgery, n (%) 22 (17%)
IOP � intraocular pressure; SD � standard deviation.*Pearson’s chi-square test for categoric data, Kruskal–Wallis for continuo
†Argon laser trabeculoplasty and selective laser trabeculoplasty.296
hange observed in patients with glaucoma followed overime.31,32
ata Analysisnalyses of categoric data were performed using Pearson chi-
quare tests, and continuous data were compared with Kruskal–allis nonparametric analysis of variance. Multiple regression
nalyses were carried out to investigate the effects of baselineisual field damage, baseline rim area, and age. Analyses wereerformed in R (R Foundation for Statistical Computing, Vienna,ustria, 2005). Robust regressions were computed with the lmrob
unction (R package robustbase, version 0.7-6).
esults
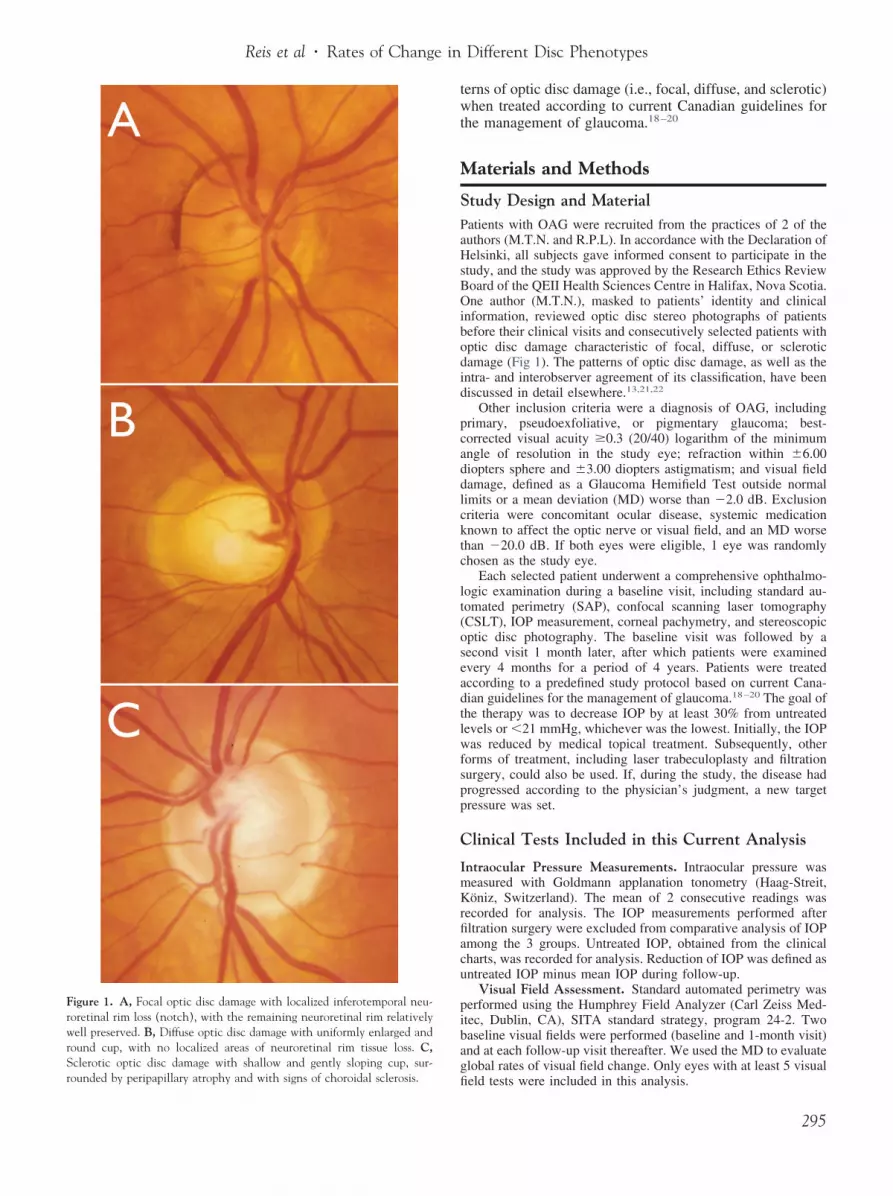
total of 131 eyes of 131 patients with OAG were enrolled in thistudy (45 with focal, 42 with diffuse, and 44 with sclerotic opticisc damage). Of these patients, 131 (100%) were included inisual field analysis (at least 5 SAP tests) and 126 (96%) werencluded in the optic disc analysis (at least 5 CSLT tests). The 5atients excluded from the optic disc analysis had filtration surgeryefore 5 scans were acquired.
Table 1 summarizes the baseline information. Patients withiffuse optic disc damage were younger than those with focal andclerotic damage (63.3 years vs. 69.3 and 71.4 years, respectively,
� 0.003). Patients in the 3 groups had similar IOP reductionsrom untreated levels (38%, 37%, and 35%, in patients with focal,iffuse, and sclerotic optic disc damage, respectively, P � 0.64),lthough patients with focal damage had lower mean IOP duringollow-up (14.0 mm Hg vs. 15.5 and 15.1 mm Hg in patients withiffuse and sclerotic damage, respectively, P � 0.02, Table 2).
ients in Different Optic Disc Damage Groups
45) Diffuse (n � 42) Sclerotic (n � 44) P value*
) 16 (38%) 24 (54%) 0.118) 63.3 (11.5) 71.4 (8.9) 0.0034 34/1/7 35/2/7 0.54†
56) 44.8 (13–55) 43.8 (23–52) 0.81) 26.6 (8.0) 24.0 (5.7) 0.11) 16.7 (4.3) 16.3 (3.7) 0.16
n-angle glaucoma; PXFG � pseudoexfoliative glaucoma; SD � standard
uous data.
Laser, and Filtration Surgery from Patients in Different OpticGroups
cal (n � 45) Diffuse (n � 42) Sclerotic (n � 44) P value*
14.0 (2.6) 15.5 (2.5) 15.1 (2.9) 0.0210.0 (7.2) 11.0 (8.5) 8.9 (5.0) 0.5938% (18%) 37% (16%) 35% (13%) 0.64
8 (18%) 4 (9%) 3 (7%) 0.249 (20%) 5 (12%) 8 (20%) 0.55
a.
Pat
l (n �
7 (60%3 (11.37/4/6 (16–0 (7.62 (3.8
ry ope
ontin
er ofage
Fo
us dat

C
Fsg(amdc
D
PaAs
Fo0fr
Reis et al � Rates of Change in Different Disc Phenotypes
Patients with focal optic disc damage had worse baseline MD(�6.7 dB), followed by those with sclerotic (�4.2 dB) and diffusedamage (�3.6 dB, P � 0.001). Patients with focal optic discdamage had smaller disc areas (2.03 mm2) compared with theothers (2.21 and 2.26 mm2 for diffuse and sclerotic groups, re-spectively, P � 0.04). In addition, the global rim area was largerin patients with sclerotic optic disc damage (1.27 mm2 vs. 1.14 and1.12 mm2 for focal and diffuse groups, respectively, P � 0.05,Table 3).
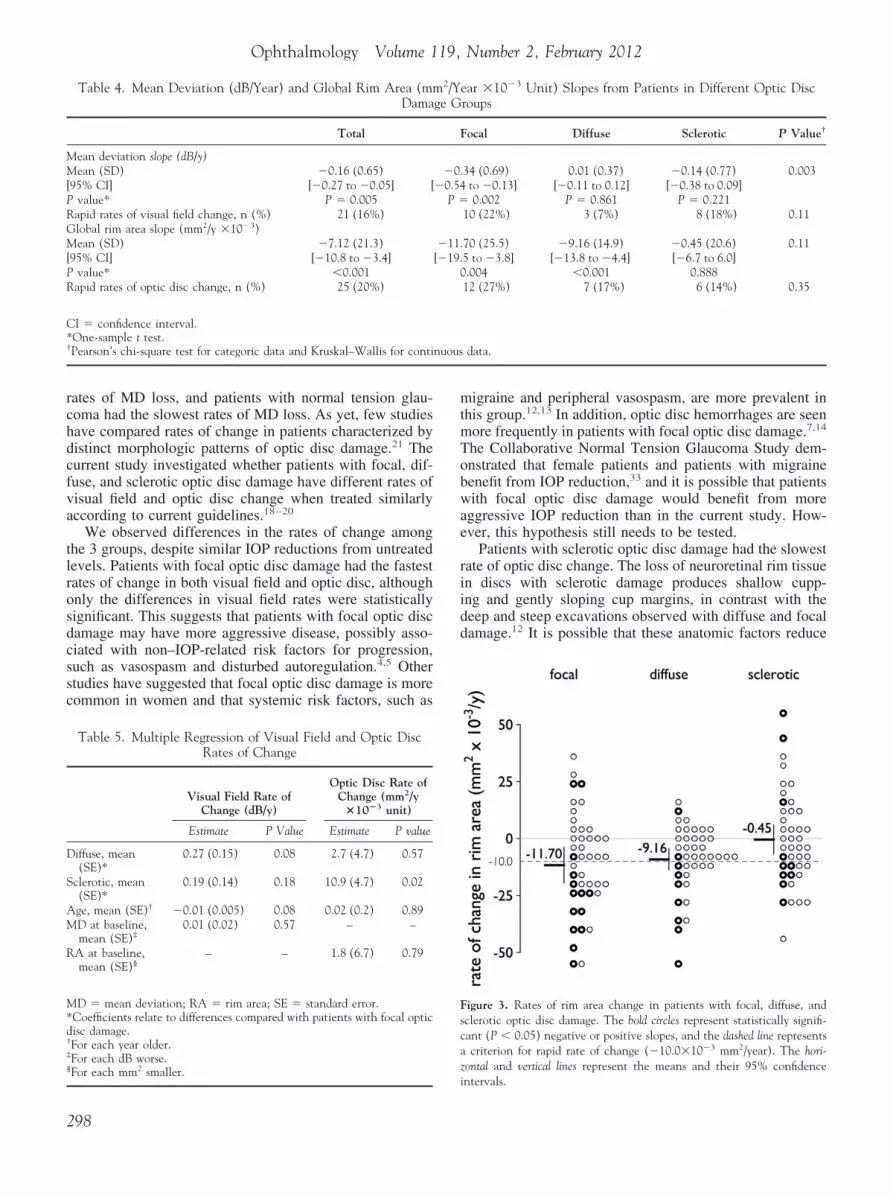
Figure 2 and Table 4 show the rates of visual field change inthe 3 groups. The mean rate of visual field change was fastestin patients with focal optic disc damage (mean �0.34, standarddeviation [SD] 0.69 dB/year), followed by patients with scle-rotic and diffuse optic disc damage (mean �0.14, SD 0.77dB/year and mean �0.01, SD 0.37 dB/year, respectively, P �0.003). More patients with focal optic disc damage had rapidvisual field change (22% vs. 18% and 7% for sclerotic anddiffuse, respectively, P � 0.11), particularly compared withpatients with diffuse damage. Because patients with diffusedamage were younger and had less advanced visual field dam-age at baseline, age and baseline MD were entered as covariatesin a multiple regression analysis to minimize potentially con-founding effects (Table 5). This did not alter the findings. Ratesof visual field change were not related to baseline MD (P �0.57) but were weakly related to age (P � 0.08). However,given the small effect of age on the rates of change (Table 5),the difference in age between patients with focal damage andthose with diffuse damage (6.0 years) did not fully explain themore negative slopes in patients with focal damage (meandifference between those with focal and diffuse damage, �0.35dB/year).
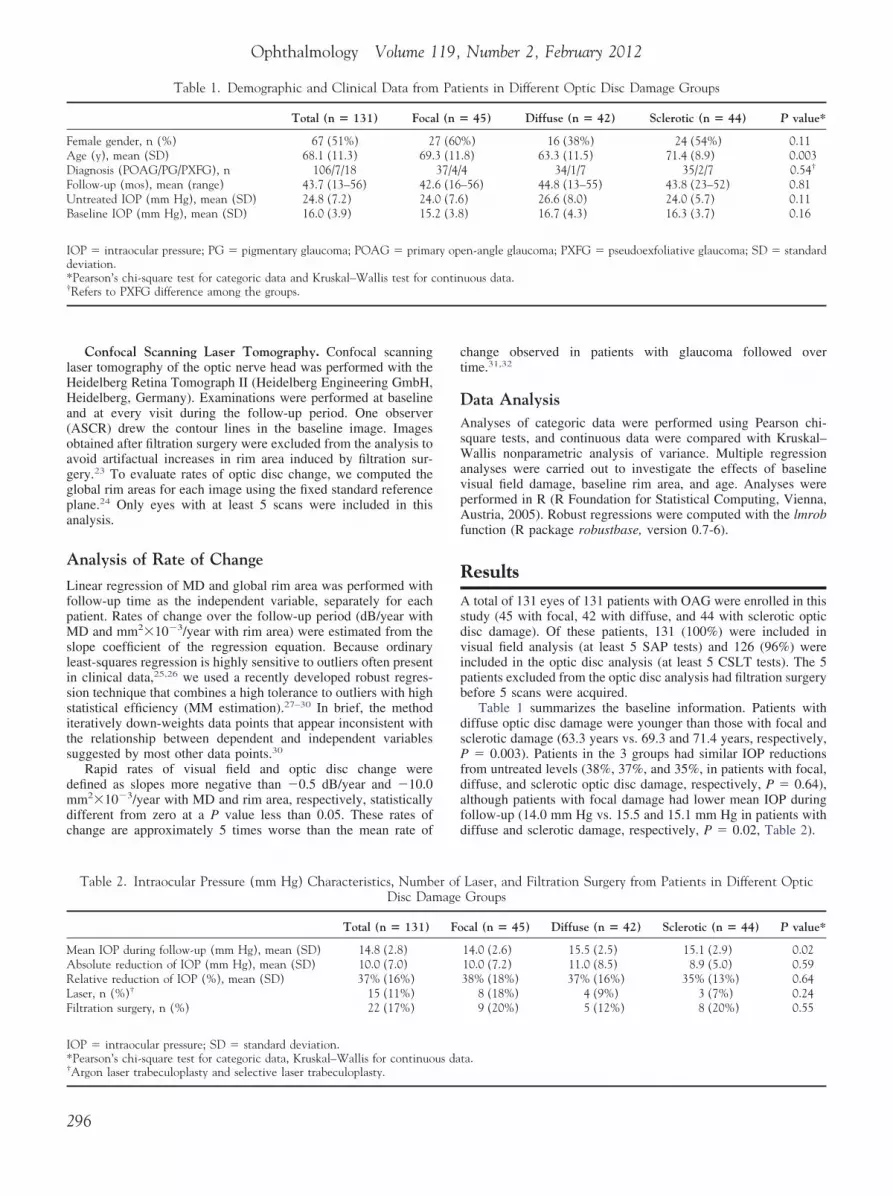
Figure 3 and Table 4 show the rates of optic disc change in the3 groups. The rate of optic disc change was fastest in patients withfocal optic disc damage (mean �11.70, SD 25.5 �10�3 mm2/year), followed by patients with diffuse and sclerotic optic discdamage (mean �9.16, SD 14.9 �10�3 mm2/year and mean�0.45, SD 20.6 �10�3 mm2/year, respectively), although thedifferences among the 3 groups did not achieve statistical signif-icance (P � 0.11). More patients with focal damage had rapid rimarea change (27% vs. 17% and 14% for diffuse and scleroticdamage, respectively, P � 0.35). Rates of rim area change werenot related to age (P � 0.89) or baseline rim area (P � 0.79), andthe differences among the 3 groups remained similar when thesevariables were entered as covariates in a multiple regression, withsignificant differences particularly when comparing the rates of
Table 3. Characteristics of Standard Automated Per
Total
SAPEyes (n) 131SAP examinations (n), median (range) 13 (5–16)MD baseline (dB), mean � SD �4.9 (3.8)CSLTEyes (n) 126CSLT examinations (n), median (range) 11 (5–14)Disc area baseline (mm2), mean (SD) 2.16 (0.40)Rim area baseline (mm2), mean (SD) 1.18 (0.28)
CSLT � confocal scanning laser tomography; MD � mean deviation; SA*Kruskal–Wallis test.
change from the focal and sclerotic groups (Table 5). M
ase Examples
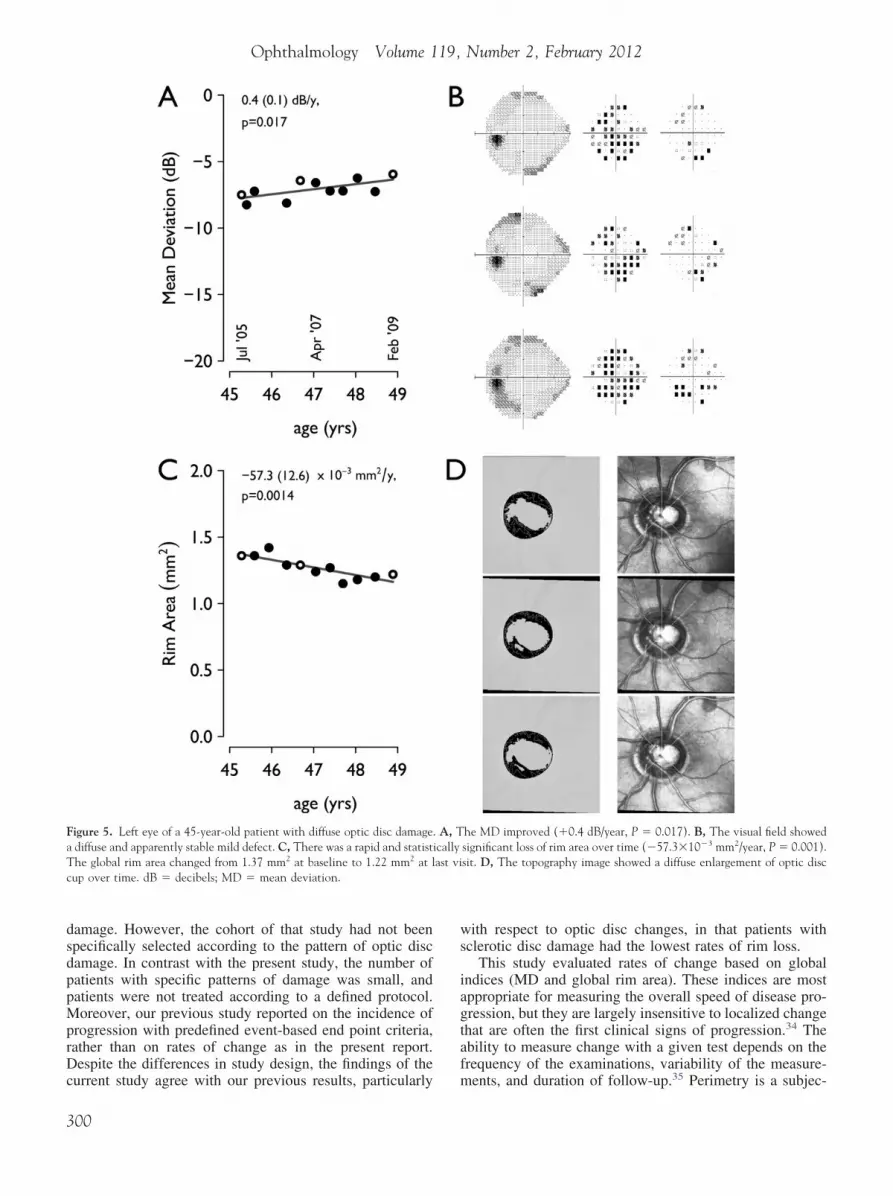
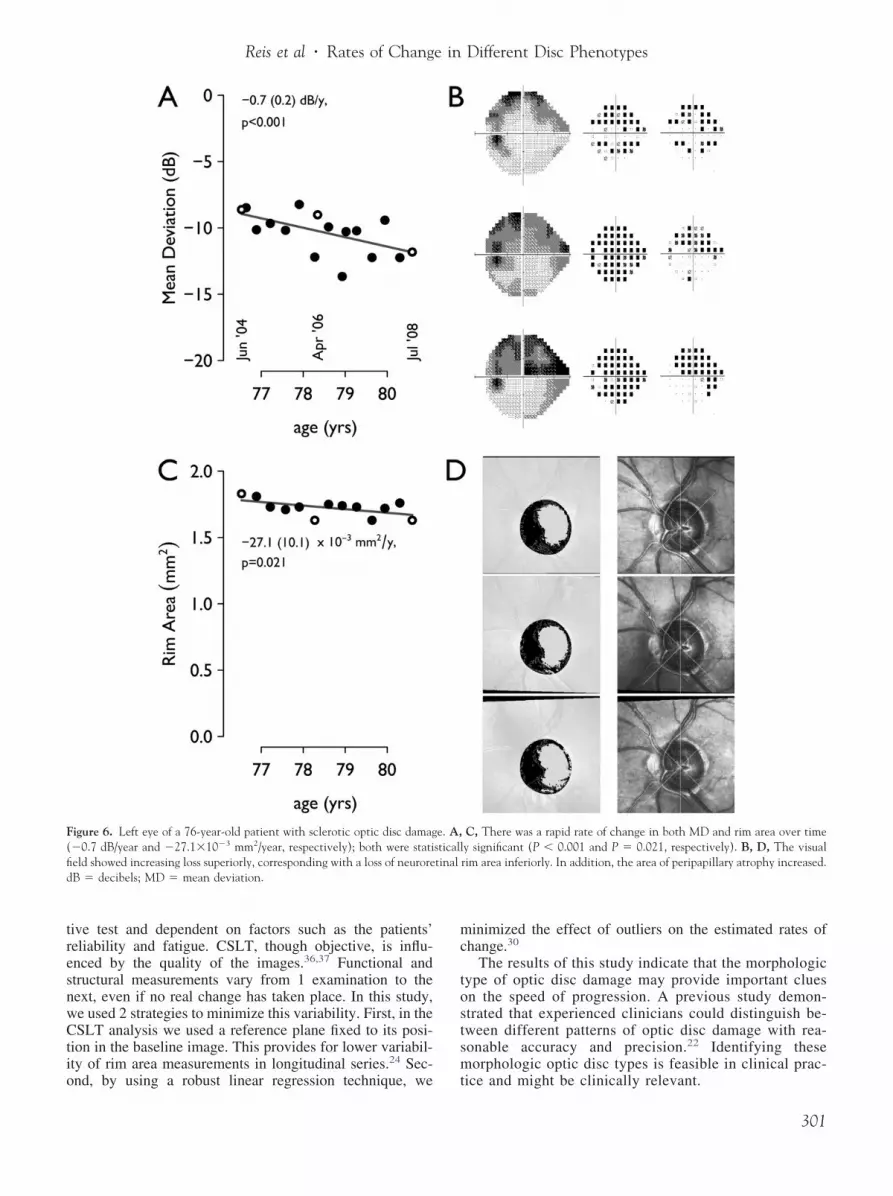
igures 4 to 6 illustrate visual field and optic disc change in 3elected cases. Each example consists of plots of MD (dB) andlobal rim area (mm2) over time (years). In addition, visual fieldsgray scale, total deviation, and pattern deviation probability maps)nd CSLT (topography and reflectance images) from the baseline,id follow-up, and final visits are presented. The corresponding
ates are shown on the x-axis of the plots and indicated by openircles.
iscussion
revious studies have shown that particular types of OAGre characterized by more rapid rates of change than others.
recent report from the Early Manifest Glaucoma Trial3
howed that patients with pseudoexfoliation had the fastest
igure 2. Rates of MD change in patients with focal, diffuse, and scleroticptic disc damage. The bold circles represent statistically significant (P �.05) negative or positive slopes, and the dashed line represents a criterionor rapid negative change (�0.5 dB/year). The horizontal and vertical linesepresent the means and their 95% confidence intervals. dB � decibels;
y and Confocal Scanning Laser Tomography Series
ocal Diffuse Sclerotic P value*
45 42 44(5–15) 13 (5–14) 13 (8–16)(4.4) �3.6 (3.0) �4.2 (3.2) �0.001
43 41 42(5–13) 11 (7–14) 11 (5–13)(0.39) 2.21 (0.38) 2.26 (0.40) 0.04(0.26) 1.12 (0.28) 1.27 (0.29) 0.05
standard automated perimetry; SD � standard deviation.
imetr
F
13�6.7
112.031.14
P �
D � mean deviation.
297
mtmTobwae
riidd
nuous
Fscaz
Ophthalmology Volume 119, Number 2, February 2012
rates of MD loss, and patients with normal tension glau-coma had the slowest rates of MD loss. As yet, few studieshave compared rates of change in patients characterized bydistinct morphologic patterns of optic disc damage.21 Thecurrent study investigated whether patients with focal, dif-fuse, and sclerotic optic disc damage have different rates ofvisual field and optic disc change when treated similarlyaccording to current guidelines.18–20
We observed differences in the rates of change amongthe 3 groups, despite similar IOP reductions from untreatedlevels. Patients with focal optic disc damage had the fastestrates of change in both visual field and optic disc, althoughonly the differences in visual field rates were statisticallysignificant. This suggests that patients with focal optic discdamage may have more aggressive disease, possibly asso-ciated with non–IOP-related risk factors for progression,such as vasospasm and disturbed autoregulation.4,5 Otherstudies have suggested that focal optic disc damage is morecommon in women and that systemic risk factors, such as
Table 4. Mean Deviation (dB/Year) and Global Rim Area (mmDama
Total
Mean deviation slope (dB/y)Mean (SD) �0.16 (0.65)[95% CI] [�0.27 to �0.05] [P value* P � 0.005Rapid rates of visual field change, n (%) 21 (16%)Global rim area slope (mm2/y �10�3)Mean (SD) �7.12 (21.3)[95% CI] [�10.8 to �3.4]P value* �0.001Rapid rates of optic disc change, n (%) 25 (20%)
CI � confidence interval.*One-sample t test.†Pearson’s chi-square test for categoric data and Kruskal–Wallis for conti
Table 5. Multiple Regression of Visual Field and Optic DiscRates of Change
Visual Field Rate ofChange (dB/y)
Optic Disc Rate ofChange (mm2/y
�10�3 unit)
Estimate P Value Estimate P value
Diffuse, mean(SE)*
0.27 (0.15) 0.08 2.7 (4.7) 0.57
Sclerotic, mean(SE)*
0.19 (0.14) 0.18 10.9 (4.7) 0.02
Age, mean (SE)† �0.01 (0.005) 0.08 0.02 (0.2) 0.89MD at baseline,
mean (SE)‡0.01 (0.02) 0.57 – –
RA at baseline,mean (SE)§
– – 1.8 (6.7) 0.79
MD � mean deviation; RA � rim area; SE � standard error.*Coefficients relate to differences compared with patients with focal opticdisc damage.†For each year older.‡For each dB worse.
§For each mm2 smaller.i
298
igraine and peripheral vasospasm, are more prevalent inhis group.12,13 In addition, optic disc hemorrhages are seenore frequently in patients with focal optic disc damage.7,14
he Collaborative Normal Tension Glaucoma Study dem-nstrated that female patients and patients with migraineenefit from IOP reduction,33 and it is possible that patientsith focal optic disc damage would benefit from more
ggressive IOP reduction than in the current study. How-ver, this hypothesis still needs to be tested.
Patients with sclerotic optic disc damage had the slowestate of optic disc change. The loss of neuroretinal rim tissuen discs with sclerotic damage produces shallow cupp-ng and gently sloping cup margins, in contrast with theeep and steep excavations observed with diffuse and focalamage.12 It is possible that these anatomic factors reduce
ar �10�3 Unit) Slopes from Patients in Different Optic Discroups
ocal Diffuse Sclerotic P Value†
34 (0.69) 0.01 (0.37) �0.14 (0.77) 0.003to �0.13] [�0.11 to 0.12] [�0.38 to 0.09]0.002 P � 0.861 P � 0.221
10 (22%) 3 (7%) 8 (18%) 0.11
70 (25.5) �9.16 (14.9) �0.45 (20.6) 0.115 to �3.8] [�13.8 to �4.4] [�6.7 to 6.0].004 �0.001 0.888
12 (27%) 7 (17%) 6 (14%) 0.35
data.
igure 3. Rates of rim area change in patients with focal, diffuse, andclerotic optic disc damage. The bold circles represent statistically signifi-ant (P � 0.05) negative or positive slopes, and the dashed line representscriterion for rapid rate of change (�10.0�10�3 mm2/year). The hori-
ontal and vertical lines represent the means and their 95% confidence
2/Yege G
F
�0.�0.54
P �
�11.[�19.
0
ntervals.

oecrhi
wv
dev
Reis et al � Rates of Change in Different Disc Phenotypes
the ability of CSLT to detect structural change in patientswith sclerotic optic disc damage.
Patients in this study were recruited consecutively, andtherefore the groups were not identical in age, baselinevisual field loss, and baseline rim area. Because these dif-ferences might have influenced the subsequent rates ofchange, we performed multiple regression analyses to min-imize confounding effects on our analysis. Age marginallyaffected the rate of MD change (P � 0.08) such that MD
Figure 4. Left eye of a 59-year-old patient with focal optic disc damage. A(P � 0.001) despite large variability. B, The visual field showed enlargemeC, The rate of change in rim area was slow (�9.4�10�3 mm2/year) andconsistent with a loss of rim tissue inferiorly. dB � decibels; MD � mean
slopes were more negative by �0.01 dB/year for each year d
f increasing age. By itself, this effect was too small toxplain the substantial differences between the rates ofhange observed in this study. Rates of change with MD andim area were not related to baseline values, and the latterad no meaningful effect on our results when they werencluded in a multiple regression analysis.
In a previous study,21 our group reported that patientsith sclerotic optic disc damage had the lowest incidence ofisual field and optic disc progression, with no apparent
MD changed rapidly (�0.8 dB/year), and this was statistically significantd deepening of existing scotomas in both superior and inferior hemifields.atistically different from zero (P � 0.32). D, The topography image wasiation.
, Thent annot st
ifference between patients with focal and diffuse optic disc
299
ws
iagtaf
Ophthalmology Volume 119, Number 2, February 2012
damage. However, the cohort of that study had not beenspecifically selected according to the pattern of optic discdamage. In contrast with the present study, the number ofpatients with specific patterns of damage was small, andpatients were not treated according to a defined protocol.Moreover, our previous study reported on the incidence ofprogression with predefined event-based end point criteria,rather than on rates of change as in the present report.Despite the differences in study design, the findings of the
Figure 5. Left eye of a 45-year-old patient with diffuse optic disc damage.a diffuse and apparently stable mild defect. C, There was a rapid and statistiThe global rim area changed from 1.37 mm2 at baseline to 1.22 mm2 at lcup over time. dB � decibels; MD � mean deviation.
current study agree with our previous results, particularly m
300
ith respect to optic disc changes, in that patients withclerotic disc damage had the lowest rates of rim loss.
This study evaluated rates of change based on globalndices (MD and global rim area). These indices are mostppropriate for measuring the overall speed of disease pro-ression, but they are largely insensitive to localized changehat are often the first clinical signs of progression.34 Thebility to measure change with a given test depends on therequency of the examinations, variability of the measure-
he MD improved (�0.4 dB/year, P � 0.017). B, The visual field showedsignificant loss of rim area over time (�57.3�10�3 mm2/year, P � 0.001).sit. D, The topography image showed a diffuse enlargement of optic disc
A, Tcallyast vi
ents, and duration of follow-up.35 Perimetry is a subjec-
mc
tostsm
Reis et al � Rates of Change in Different Disc Phenotypes
tive test and dependent on factors such as the patients’reliability and fatigue. CSLT, though objective, is influ-enced by the quality of the images.36,37 Functional andstructural measurements vary from 1 examination to thenext, even if no real change has taken place. In this study,we used 2 strategies to minimize this variability. First, in theCSLT analysis we used a reference plane fixed to its posi-tion in the baseline image. This provides for lower variabil-ity of rim area measurements in longitudinal series.24 Sec-
Figure 6. Left eye of a 76-year-old patient with sclerotic optic disc damag(�0.7 dB/year and �27.1�10�3 mm2/year, respectively); both were statifield showed increasing loss superiorly, corresponding with a loss of neuroredB � decibels; MD � mean deviation.
ond, by using a robust linear regression technique, we t
inimized the effect of outliers on the estimated rates ofhange.30
The results of this study indicate that the morphologicype of optic disc damage may provide important cluesn the speed of progression. A previous study demon-trated that experienced clinicians could distinguish be-ween different patterns of optic disc damage with rea-onable accuracy and precision.22 Identifying theseorphologic optic disc types is feasible in clinical prac-
C, There was a rapid rate of change in both MD and rim area over timey significant (P � 0.001 and P � 0.021, respectively). B, D, The visualrim area inferiorly. In addition, the area of peripapillary atrophy increased.
e. A,sticalltinal
ice and might be clinically relevant.
301
1
2
2
2
2
2
2
2
2
2
2
3
3
3
3
3
3
3
3
Ophthalmology Volume 119, Number 2, February 2012
In conclusion, the present study demonstrated that pa-tients with focal damage show significantly more rapidvisual field deterioration and a trend toward faster optic discdeterioration. Patients with diffuse optic disc damage hadthe slowest rate of visual field change, and patients withsclerotic optic disc damage had the slowest rate of optic discchange. These differences are likely to translate into differ-ent prognoses for patients with these distinct patterns ofoptic disc damage. Further work is needed to establish themechanisms that cause different rates of functional andstructural change in glaucoma in these patients.
References
1. Artes PH, Chauhan BC. Longitudinal changes in the visual field andoptic disc in glaucoma. Prog Retin Eye Res 2005;24:333–54.
2. Zeyen TG, Caprioli J. Progression of disc and field damage inearly glaucoma. Arch Ophthalmol 1993;111:62–5.
3. Heijl A, Bengtsson B, Hyman L, Leske MC, Early ManifestGlaucoma Trial Group. Natural history of open-angle glau-coma. Ophthalmology 2009;116:2271–6.
4. Fechtner RD, Weinreb RN. Mechanisms of optic nerve dam-age in primary open angle glaucoma. Surv Ophthalmol 1994;39:23–42.
5. Harris A, Rechtman E, Siesky B, et al. The role of optic nerveblood flow in the pathogenesis of glaucoma. Ophthalmol ClinNorth Am 2005;18:345–53, v.
6. Levin LA. Pathophysiology of the progressive optic neuropathy ofglaucoma. Ophthalmol Clin North Am 2005;18:355–64, v.
7. Shields MB. Normal-tension glaucoma: is it different fromprimary open-angle glaucoma? Curr Opin Ophthalmol 2008;19:85–8.
8. Hitchings RA, Spaeth GL. The optic disc in glaucoma. I:Classification. Br J Ophthalmol 1976;60:778–85.
9. Spaeth GL, Hitchings RA, Sivalingam E. The optic disc inglaucoma: pathogenetic correlation of five patterns of cuppingin chronic open-angle glaucoma. Trans Sect Ophthalmol AmAcad Ophthalmol Otolaryngol 1976;81:217–23.
10. Rahman R, Casson RJ, Gouveia SM, Salmon JF. Optic discmorphology on presentation of chronic glaucoma [letter]. Eye(Lond) 2002;16:665–7.
11. Nakazawa T, Fuse N, Omodaka K, et al. Different types ofoptic disc shape in patients with advanced open-angle glau-coma. Jpn J Ophthalmol 2010;54:291–5.
12. Broadway DC, Nicolela MT, Drance SM. Optic disk appear-ances in primary open-angle glaucoma. Surv Ophthalmol1999;43(Suppl):S223–43.
13. Nicolela MT, Drance SM. Various glaucomatous optic nerveappearances: clinical correlations. Ophthalmology 1996;103:640–9.
14. Geijssen HC, Greve EL. Focal ischaemic normal pressureglaucoma versus high pressure glaucoma. Doc Ophthalmol1990;75:291–301.
15. Spaeth GL. A new classification of glaucoma including focalglaucoma. Surv Ophthalmol 1994;38(Suppl):S9–17.
16. Pederson JE, Anderson DR. The mode of progressive disccupping in ocular hypertension and glaucoma. Arch Ophthal-mol 1980;98:490–5.
17. Geijssen HC, Greve EL. The spectrum of primary open angleglaucoma. I: Senile sclerotic glaucoma versus high tensionglaucoma. Ophthalmic Surg 1987;18:207–13.
18. Canadian Ophthalmological Society Glaucoma Clinical Prac-tice Guideline Expert Committee. Canadian Ophthalmological
Society evidence-based clinical practice guidelines for the302
management of glaucoma in the adult eye. Can J Ophthalmol2009;44(Suppl):S7–93.
9. LeBlanc RP. A Canadian glaucoma strategy. Can J Ophthal-mol 2007;42:60–5.
0. Damji KF, Behki R, Wang L, Target IOP Workshop partici-pants. Canadian perspectives in glaucoma management: set-ting target intraocular pressure range. Can J Ophthalmol 2003;38:189–97.
1. Nicolela MT, McCormick TA, Drance SM, et al. Visual fieldand optic disc progression in patients with different types ofoptic disc damage: a longitudinal prospective study. Ophthal-mology 2003;110:2178–84.
2. Nicolela MT, Drance SM, Broadway DC, et al. Agreementamong clinicians in the recognition of patterns of optic diskdamage in glaucoma. Am J Ophthalmol 2001;132:836–44.
3. Lesk MR, Spaeth GL, Azuara-Blanco A, et al. Reversal ofoptic disc cupping after glaucoma surgery analyzed with ascanning laser tomograph. Ophthalmology 1999;106:1013–8.
4. Poli A, Strouthidis NG, Ho TA, Garway-Heath DF. Analysisof HRT images: comparison of reference planes. Invest Oph-thalmol Vis Sci 2008;49:3970–5.
5. Owen VM, Strouthidis NG, Garway-Heath DF, Crabb DP.Measurement variability in Heidelberg Retina Tomograph im-aging of neuroretinal rim area. Invest Ophthalmol Vis Sci2006;47:5322–30.
6. Liu X, Cheng G, Wu JX. Identifying the measurement noise inglaucomatous testing: an artificial neural network approach.Artif Intell Med 1994;6:401–16.
7. Rousseeuw PJ, Yohai VJ. Robust regression by means ofS-estimators. In: Franke J, Hardle W, Martin RD, eds. Robustand Nonlinear Time Series Analysis: proceedings of a work-shop organized by the Sonderforschungsbereich 123 “Stochas-tische Mathematische Modelle,” Heidelberg 1983. New York:Springer-Verlag; 1984:256–76. Lecture Notes in Statistics,vol. 26. Available at: ftp://ftp.win.ua.ac.be/pub/preprints/84/Robreg84.pdf. Accessed May 7, 2011.
8. Salibian-Barrera M, Yohai VJ. A fast algorithm for S-regres-sion estimates. J Comput Graph Stat 2006;15:414–27.
9. Yohai VJ. High breakdown-point and high efficiency esti-mates for regression. Ann Stat 1987;15:642–56.
0. Hubert M, Rousseeuw PJ, van Aelst S. High-breakdown ro-bust multivariate methods. Stat Sci 2008;23:92–119.
1. See JL, Nicolela MT, Chauhan BC. Rates of neuroretinal rimand peripapillary atrophy area change: a comparative study ofglaucoma patients and normal controls. Ophthalmology 2009;116:840–7.
2. Chauhan BC, Mikelberg FS, Artes PH, et al, Canadian Glau-coma Study Group. Canadian Glaucoma Study: 3. Impact ofrisk factors and intraocular pressure reduction on the rates ofvisual field change. Arch Ophthalmol 2010;128:1249–55.
3. Drance S, Anderson DR, Schulzer M. Risk factors for pro-gression of visual field abnormalities in normal-tension glau-coma. Am J Ophthalmol 2001;131:699–708.
4. Wild JM, Hussey MK, Flanagan JG, Trope GE. Pointwisetopographical and longitudinal modeling of the visual field inglaucoma. Invest Ophthalmol Vis Sci 1993;34:1907–16.
5. Chauhan BC, Garway-Heath DF, Goni FJ, et al. Practicalrecommendations for measuring rates of visual field change inglaucoma. Br J Ophthalmol 2008;92:569–73.
6. Tattersall CL, Vernon SA, Menon GJ. Mean deviation fluc-tuation in eyes with stable Humphrey 24-2 visual fields. Eye(Lond) 2007;21:362–6.
7. Strouthidis NG, White ET, Owen VM, et al. Factors affectingthe test-retest variability of Heidelberg retina tomograph andHeidelberg retina tomograph II measurements. Br J Ophthal-
mol 2005;89:1427–32.
Reis et al � Rates of Change in Different Disc Phenotypes
Footnotes and Financial Disclosures
FTb
SR(
CMS
Originally received: January 12, 2011.Final revision: July 11, 2011.Accepted: July 21, 2011.Available online: November 30, 2011. Manuscript no. 2011-57.1 Department of Ophthalmology and Visual Sciences, Dalhousie Univer-sity, Halifax, Nova Scotia, Canada.2 Department of Ophthalmology, University of Sao Paulo, Sao Paulo,Brazil.
Presented in part at: the annual meeting of the Association for Research in
Vision and Ophthalmology, Fort Lauderdale, Florida, April 11, 2010. Hinancial Disclosure(s):he author(s) have made the following disclosure(s): Dr. Chauhan, Heidel-erg Engineering (research support).
upported by grant MOP200309 from the Canadian Institute of Healthesearch (MTN); and Capes Foundation, Ministry of Educational of Brazil
ASCR).
orrespondence:arcelo T. Nicolela, MD, Department of Ophthalmology and Visual
ciences, Dalhousie University, 1276 South Park Street, Room 2035,
alifax, NS, Canada, B3H 2Y9. E-mail: [email protected].303