rapid assessment of avoidable blindness- india report
TRANSCRIPT
1
National Program for Control of Blindness
Rapid Assessment of Avoidable Blindness- INDIA
Report
2006-2007
Ophthalmology Section, Directorate General of Health Services Ministry of Health and Family Welfare
Government of India New Delhi-110001
2
Rapid Assessment of Avoidable Blindness 2006-2007
Report
Data Warehousing & Mining
Community Ophthalmology Unit, Dr. R. P. Centre Mukund Software, Delhi
Data Analysis and Report Writing
Neena John GVS Murthy
Editors
G V S Murthy Rachel Jose
Praveen Vashist Neena John
3
Technical Advisory Group
Rachel Jose G V S Murthy
Praveen Vashist Neena John A K Shukla
Uday Gajiwala K. Vishwanath
Nitin Batra Anil Tara
Kuldeep Dole Navratan Dhanuka
Asim Sil Noela Prasad
Bharat Balasubramaniam D. Subramanyam
Amod Kumar Srinivas Murthy
M A Hasan Anil Kumar Kaul
4
1. BACKGROUND
India is the first country to have launched a National Program for Control of
Blindness. Due to the increasing prevalence of cataract related blindness, in 1994,
the World Bank provided a soft loan to the Government of India for the
implementation of the Cataract Blindness Control Program in the seven States in the
country which had the highest prevalence of cataract blindness. The program turned
out to be one of the most cost effective health interventions ever supported by the
World Bank.
In 1999-2000, the WHO and the IAPB (the umbrella organization for all the
international eye NGO’s) embarked on a global initiative to eliminate avoidable
blindness, globally by 2020. India is committed to realization of the goal of
Vision2020: The Right to Sight.
India has a strong tradition of evidence based practice in eye care. Over the past
three decades, the implementation of activities under the National Program have
been guided by a series of population based surveys. Results of the various surveys
have helped in identification of need-based strategies which is one of the reasons for
the success of the National Program for Control of Blindness. India is also the first
country in the world to have identified a rapid assessment technique for blindness/
cataract blindness. The technique has been widely used in many countries over the
last decade. Modifications in the initial methodology were incorporated to improve
the technique.
Rapid Assessment of Blindness and Cataract Surgical Services (RACSS) is a simple
survey technique to assess the prevalence of blindness, surgical coverage of cataract
blind and visual outcomes following cataract surgery. This has found universal
acceptance with locally relevant modifications.
Due to the cost involved in conducting detailed surveys for blindness in the country
and the rigorous methods that are needed for such surveys, the country has used
rapid assessment of blindness to document changes in the prevalence of blindness in
India. The first set of rapid assessment for blindness was carried out in 1994 in
Karnataka where all the districts in the State were covered. This was followed by
similar assessments being carried out in all districts in Gujarat in 1996. The
Government of India initiated rapid assessments in the 7 World Bank Assisted States
for the first time in 1998. This was quickly followed by a second round of rapid
surveys in other States also in 2002 and 2004. During the period 1999-2001,
detailed surveys were carried out in 15 States in the country. All these studies
provided accurate estimates of the blindness situation in India.
Recently efforts have been made to develop rapid methods for assessment of
avoidable blindness. In addition, modified detailed surveys have also been
commissioned in Gujarat. In view of the global initiative for the elimination of
avoidable blindness, it is imperative that surveys should document the status in the
country in relation to the avoidable causes of blindness.
The present set of rapid surveys will therefore concentrate on avoidable blindness.
For this purpose a modified RAAB protocol has been developed, tailored to the needs
of the country. It is proposed to conduct the surveys in 16 districts where blindness
surveys were earlier undertaken over the period 1998-2001. This will enable
comparison of trends in the prevalence of blindness in the same population and will
be a good indicator of the impact of the blindness control activities in the country.
5
2. METHODOLOGY
OBJECTIVES
1. To assess the prevalence of blindness among the 50+ population in India
2. To assess the proportion of avoidable to total blindness in 50+ population
3. To ascertain trends in the prevalence of blindness among 50+ over the past
five years
4. To estimate the prevalence of blindness in the general population in India
5. To identify the major causes of blindness and avoidable blindness in India
6. To document the surgical trends in India
7. To ascertain the visual outcomes after cataract surgery
8. To estimate the cataract surgical rate in different States
9. To study the barriers to cataract surgery
10. To assess the Cataract Surgical Coverage
11. To assess the effect of socio-demographic factors on the prevalence of
blindness.
12. To estimate the total number of blind in India in 2006
13. To identify future strategies for successful implementation of Vision2020
objectives.
2.1.2 EXPECTED OUTCOME
1. Identify the trends in blindness, cataract blindness and avoidable blindness in
India over the past five years.
2. Information will help to document what has happened in the country after World
Bank assisted Cataract Blindness Control Project ended.
3. Provide information on the future support required from Govt. of India and
INGO’s for blindness control.
4. Assess the current situation and status with regard to progress towards
Vision2020
2.2 SAMPLING STRATEGY
2.2.1 SAMPLING FRAME
1. Stratified cluster random sampling used
2. Two strata – Urban and Rural
3. Separate sampling frame for urban and rural areas.
4. In each district, 80% (20) clusters from rural areas and 20% (5) from urban
areas
2.2.2 SAMPLE SIZE
Prevalence of blindness : As per 2001- 02 Survey
Prevalence of avoidable blindness : 8.0% (Assuming 80% of all blindness is
due to avoidable causes)
Power : 80%
Relative précision : 20%
Confidence Level : 95%
Design effect : 2
6
The sample size for each district was 2500 subjects aged 50years and above. A
total of 25 clusters (20 rural and 5 urban) will be covered in each district. 100
individuals aged 50+ will be examined in each cluster.
Villages with a population less than 1000 have been clubbed together to yield a
cluster where 100 individuals aged 50+ will be available. This was keeping in view
that the proportion of population aged 50+ was estimated to be 13% in the 2001
census. The estimated population in 2006 was derived by adding 10% to the
population in 2001 (assuming an annual growth rate of approximately 2%).
2.3 SURVEY DESIGN
The survey was undertaken in 16 districts where blindness surveys were earlier
undertaken over the period 1998- 2001. This enabled comparison of trends in the
prevalence of blindness in the same population and was a good indicator of the
impact of the blindness control activities in the country. Since the survey
concentrated on avoidable blindness, a modified protocol for Rapid Assessment of
Avoidable Blindness (RAAB) have been developed (Annexure- I).
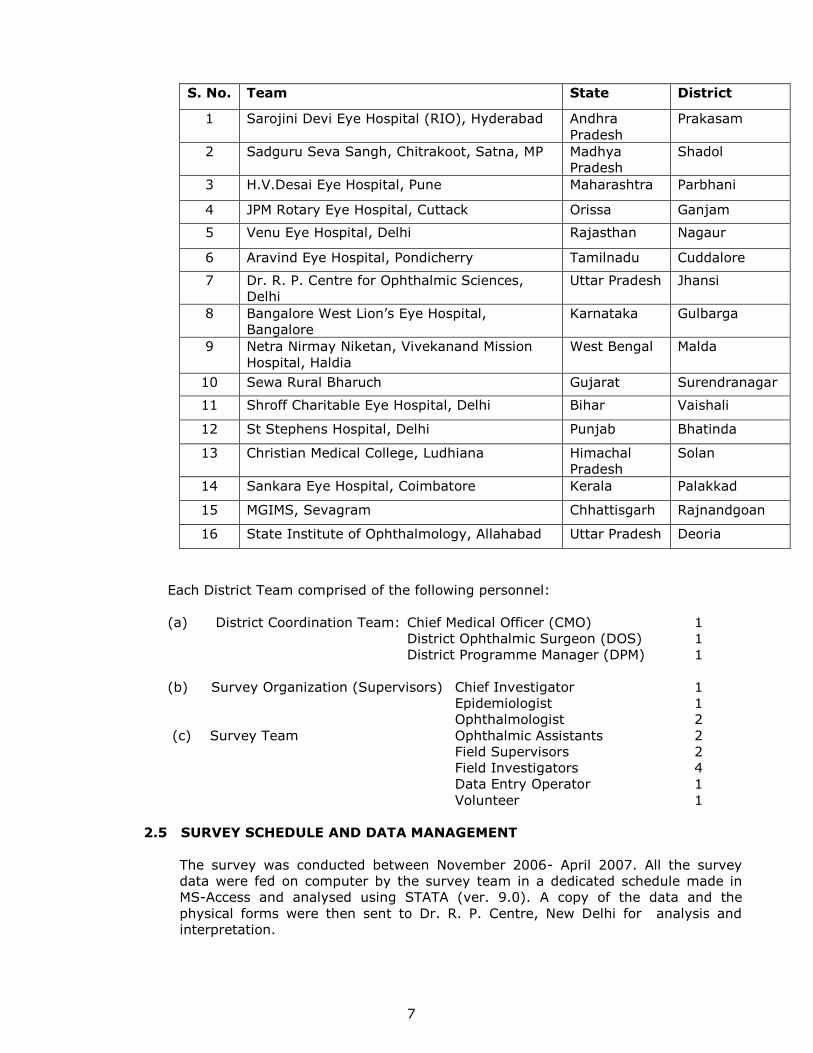
2.4 SURVEY TEAMS
The rapid survey for avoidable blindness were carried out in the following States/
districts by the identified survey teams. All survey teams covered one district in
each state 15 states, except in UP were two districts were covered because of its
populous.
The following criteria were adopted to identify the survey teams:
a) Experience of having conducted similar surveys on blindness or eye diseases.
b) Availability of adequate resources for conducting surveys, which requires
identifying blind persons on the basis of visual acuity & identifying causes of
blindness.
c) Have access to epidemiologist and ophthalmologist to monitor and support the
survey.
All the survey teams were contacted prior to the sampling process and taken
consensus to participate in survey. A workshop on training of survey methodology
and guidelines for conducting survey was conducted by the NPCB in Dr. R. P.
Centre for Ophthalmic Sciences.
7
S. No. Team State District
1 Sarojini Devi Eye Hospital (RIO), Hyderabad Andhra
Pradesh
Prakasam
2 Sadguru Seva Sangh, Chitrakoot, Satna, MP Madhya
Pradesh
Shadol
3 H.V.Desai Eye Hospital, Pune Maharashtra Parbhani
4 JPM Rotary Eye Hospital, Cuttack Orissa Ganjam
5 Venu Eye Hospital, Delhi Rajasthan Nagaur
6 Aravind Eye Hospital, Pondicherry Tamilnadu Cuddalore
7 Dr. R. P. Centre for Ophthalmic Sciences,
Delhi
Uttar Pradesh Jhansi
8 Bangalore West Lion’s Eye Hospital,
Bangalore
Karnataka Gulbarga
9 Netra Nirmay Niketan, Vivekanand Mission
Hospital, Haldia
West Bengal Malda
10 Sewa Rural Bharuch Gujarat Surendranagar
11 Shroff Charitable Eye Hospital, Delhi Bihar Vaishali
12 St Stephens Hospital, Delhi Punjab Bhatinda
13 Christian Medical College, Ludhiana Himachal
Pradesh
Solan
14 Sankara Eye Hospital, Coimbatore Kerala Palakkad
15 MGIMS, Sevagram Chhattisgarh Rajnandgoan
16 State Institute of Ophthalmology, Allahabad Uttar Pradesh Deoria
Each District Team comprised of the following personnel:
(a) District Coordination Team: Chief Medical Officer (CMO) 1
District Ophthalmic Surgeon (DOS) 1
District Programme Manager (DPM) 1
(b) Survey Organization (Supervisors) Chief Investigator 1
Epidemiologist 1
Ophthalmologist 2
(c) Survey Team Ophthalmic Assistants 2
Field Supervisors 2
Field Investigators 4
Data Entry Operator 1
Volunteer 1
2.5 SURVEY SCHEDULE AND DATA MANAGEMENT
The survey was conducted between November 2006- April 2007. All the survey
data were fed on computer by the survey team in a dedicated schedule made in
MS-Access and analysed using STATA (ver. 9.0). A copy of the data and the
physical forms were then sent to Dr. R. P. Centre, New Delhi for analysis and
interpretation.
8
2.6 INSTRUCTIONS FOR THE SURVEY TEAMS
A. RReessppoonnssiibbiilliittiieess ooff tthhee OOpphhtthhaallmmoollooggiisstt && EEppiiddeemmiioollooggiisstt::
1. Operational planning for the survey in the allocated clusters in consultation with
the Chief Medical Officer (CMO), District Ophthalmic Surgeon (DOS), District
Programme Manager (DPM) etc.
2. Training of the Field Supervisor & Ophthalmic Assistants (OA) on procedure for
carrying out the survey.
3. Field training of the survey team on selection of the first household in the cluster
to be surveyed; filling up performa and cross-checking a 10% sample of those
recorded as normal vision by the OA to ensure quality of data.
4. Supervision of the survey work in the selected clusters and accompanying the OA
in the house-to-house visit.
5. Making sure that all the 25 selected 'clusters' in each district have been surveyed
and dispatching all the 25 survey books along with the data base to RP Centre for
data analysis.
6. Managing unforeseen problems encountered during the field-work.
7. Maintaining close liaison with the Programme Office (NPCB), New Delhi for any
major alteration/decision required.
8. The ophthalmologist will examine all individuals with vision < 6/18 and record all
relevant findings.
9. The epidemiologist will liaise with the community, select the segment for the
survey, identify the central location for clinical examination, ensure that all
identified personnel reach the examination site and verify all records before
leaving the village, in addition to all the other responsibilities stated above.
The other responsibilities to be handled by the epidemiologist include:
10. Preparing day-wise schedule for carrying out the survey in the selected clusters
and
arranging the vehicles for the survey teams
11. Organizing materials required for the survey - books, 'E' charts, measuring tapes,
torch, batteries, patient referral slips, pencils/erasers and hard board.
12. Providing advance information to the residents in the selected clusters through
the
Local Health Worker to ensure better coverage of the eligible persons.
BB.. RReessppoonnssiibbiilliittiieess ooff tthhee FFiieelldd SSuuppeerrvviissoorrss::
1. Participation in training programme organized by Surveyors on procedure.
2. Identification of first household in the selected cluster.
3. Supervision of the survey work in the selected clusters.
4. Making sure that all the 100 persons above the age of 50 years have been
covered by the survey team.
5. Ensuring that quality and reliability of information collected is maintained by the
survey teams.
6. Managing unforeseen problems encountered during the field-work.
CC.. RReessppoonnssiibbiilliittiieess ooff tthhee OOpphhtthhaallmmiicc AAssssiissttaannttss::
1. Participating in the training programme organized by Chief Surveyors covering the
methodology of the survey, filling up the performa and procedures for visual
acuity testing.
9
2. Carrying out the actual survey in the selected clusters under the supervision of
the Field Supervisor/Chief Surveyors.
3. Following the instructions and guidelines given by the Field Supervisor and
starting the survey once the first household has been selected by him/her. This
includes confirmation of the age of the person to be included, carrying out the
visual acuity testing using simplified `ETDRS' chart & measuring tape and filling
up the performa.
4. Completing the survey in the allotted cluster by covering 100 persons aged 50+
with the assistance of the local helpers.
DD.. RReessppoonnssiibbiilliittiieess ooff SSuurrvveeyy AAssssiissttaannttss ((llooccaall HHeeaalltthh WWoorrkkeerr oorr vvoolluunntteeeerr))::
1. Visiting all the households and introducing the OA to the family members.
2. Identifying individuals aged 50+.
3. Helping vision testing by explaining the procedure to the person, by holding the
measuring-tape and covering the other eye while one is being examined.
3. RESULTS
3.1 Basic Demographic Characteristics of Survey Population
The rapid assessment of avoidable blindness covered 16 districts, from 15 of the
most populated States in India, over the period Nov 2006- Mar 2007. 11 of these
districts were covered under the detailed national level blindness survey in 2001 and
another 5 were covered under the Rapid Assessment in 1998. One district was
covered in 1998, 2001 and again in 2007.
Overall 42722 individuals aged 50 or more years were enumerated across the
country, of whom 40447 (94.7%) were examined. The response rate was above 85%
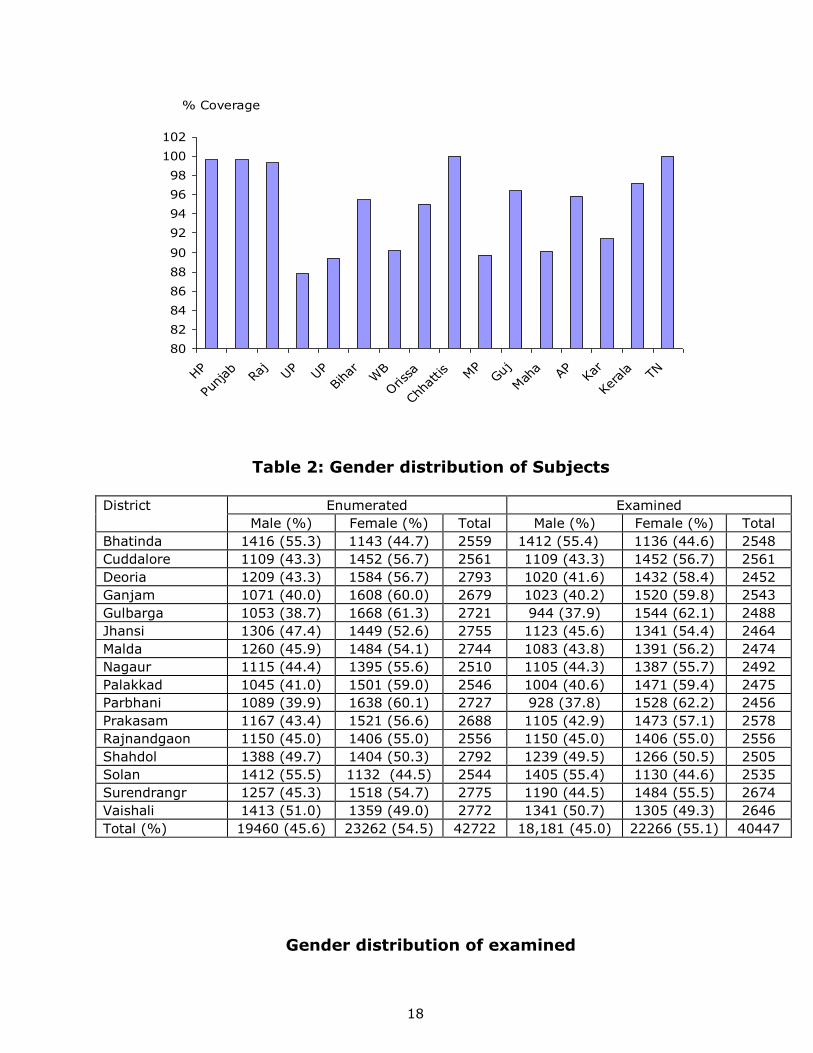
in all districts of which 8 had response rate above 95% (Table 1).
Amongst the enumerated, 54.5% were females while 55.1% of the examined were
females (Table 2). Only in three districts (Bhatinda, Solan and Vaishali) males
outnumbered females among the enumerated as well as among the examined.
Amongst the enumerated, a fifth of all respondents were aged 50-54 years, 55-59
years and 60-64 years (22.8%, 21.5% and 20.6% respectively) (Table 3). 44.6% of
the examined were aged 50-59 years (Table 4). In Ganjam and Parbhani districts,
less individuals were enumerated and examined at the younger ages (50-59 years)
compared to the other age groups.
The mean age of the respondents was 61.5 years (Range: 50-110) across the
country. The mean age of male respondents was 62.4 years compared to 60.9 years
amongst the females. The mean age of respondents was lowest in Shahdol district
(59.7 years) in Madhya Pradesh while the highest was 63.9 years in Ganjam district
in Orissa.
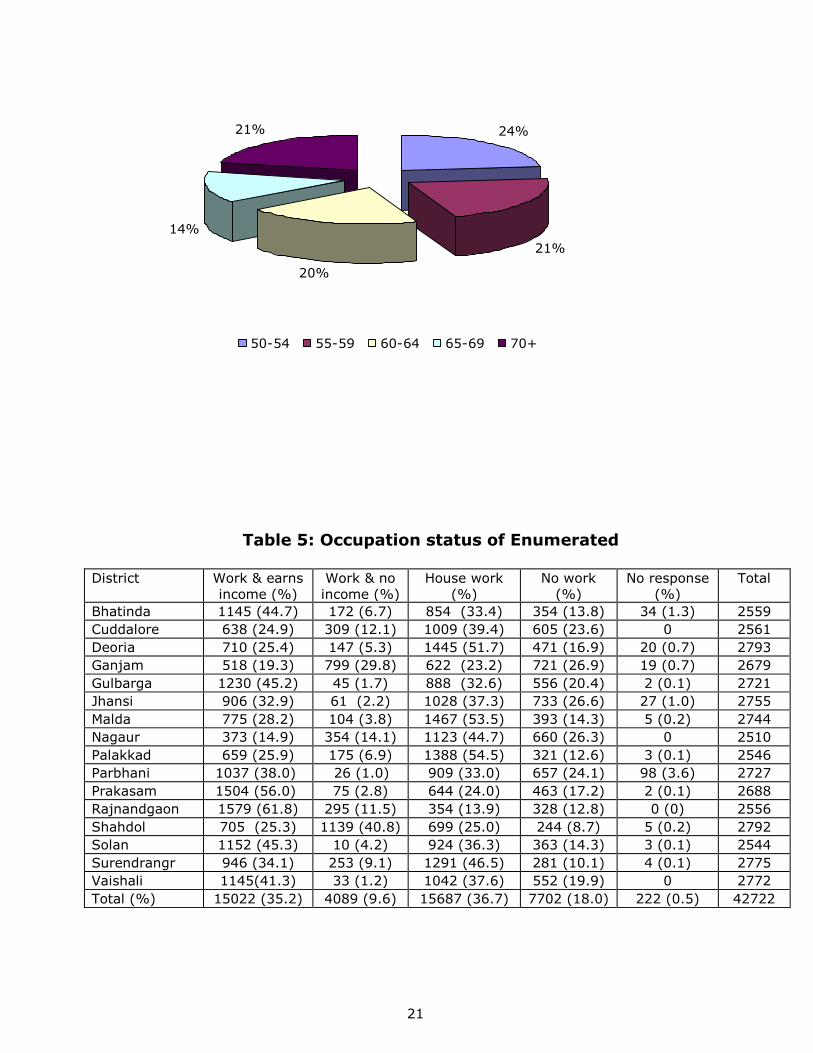
Amongst the enumerated, 35.2% were working and earning an income while 18%
had no work (Table 5). Proportion not working was highest in Ganjam (26.9%) and
the lowest in Shahdol (8.7%).
3.2 Visual Acuity and Prevalence of Blindness
10
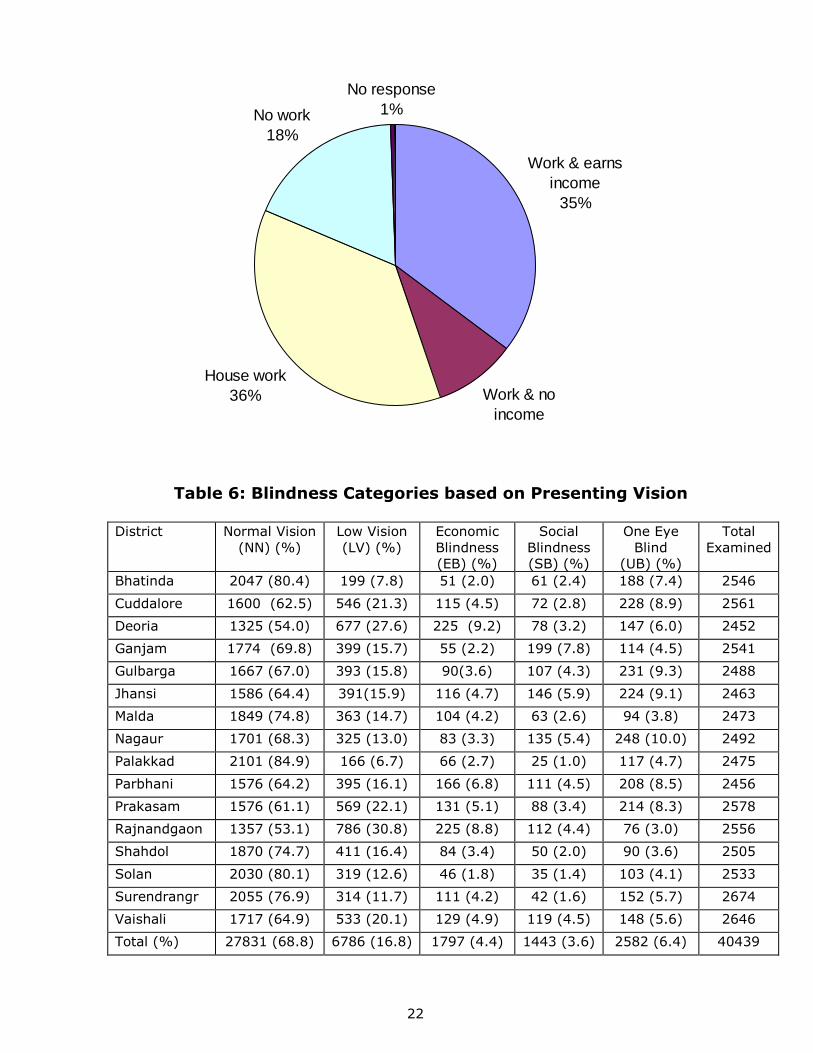
Based on bilateral presenting vision, 68.8% of the examined individuals could be
categorized as having ‘normal’ vision (> 6/18 in both eyes) (Table 6). The proportion
of ‘normal’ category was highest in Palakkad (84.9%) while the lowest was in
Rajnandgaon (53.1%).
The prevalence of low vision (< 6/18 – 6/60 in the better eye) was 16.8% based on
presenting vision. This varied from a low of 6.7% in Palakkad to a high of 30.8% in
Rajnandgaon.
The prevalence of economic blindness (Vision < 6/60 – 3/60 in the better eye) was
4.4% pooling data from all districts together with a low of 2% in Bhatinda to a high
of 9.2% in Deoria.
The prevalence of social blindness (vision < 3/60 in the better eye) was 3.6% across
all districts with a low of 1% in Palakkad and a high of 7.8% in Ganjam district. This
level of blindness corresponds to the WHO definition of blindness based on
presenting vision.
The prevalence of one-eye blind (vision < 6/60 in one eye and better than 6/18 in
the fellow eye) was 6.4%, with a low of 3% in Rajnandgaon and a high of 10% in
Nagaur.
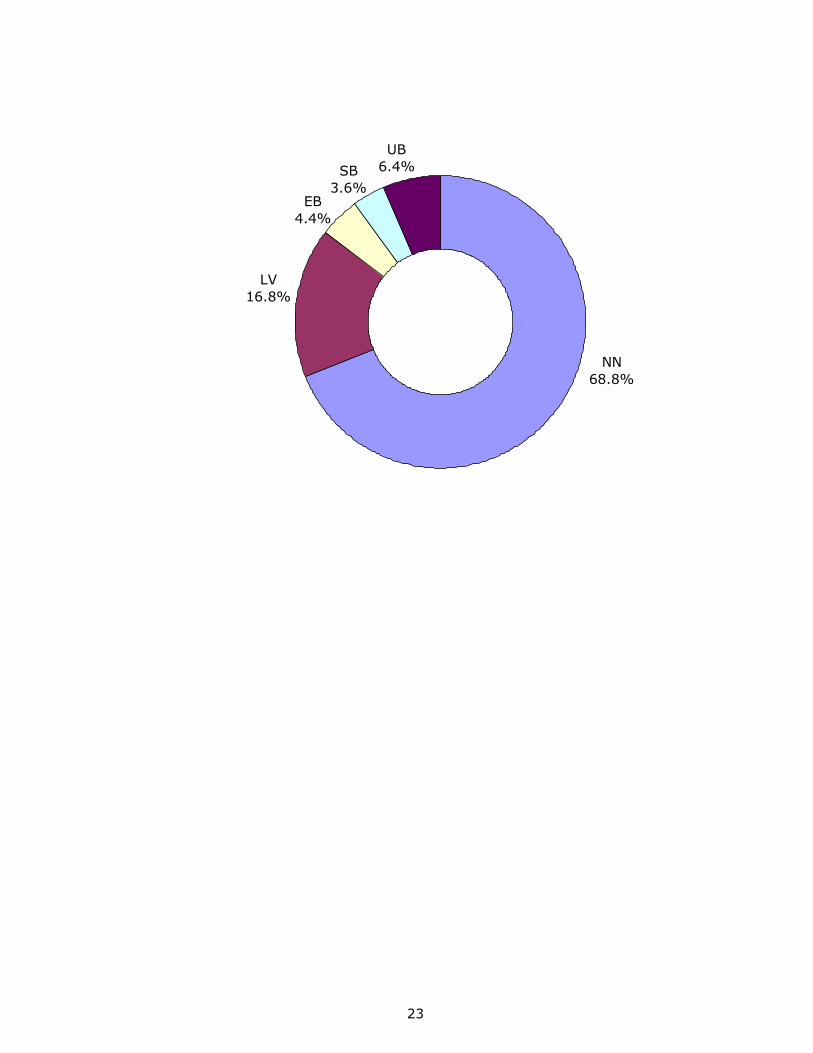
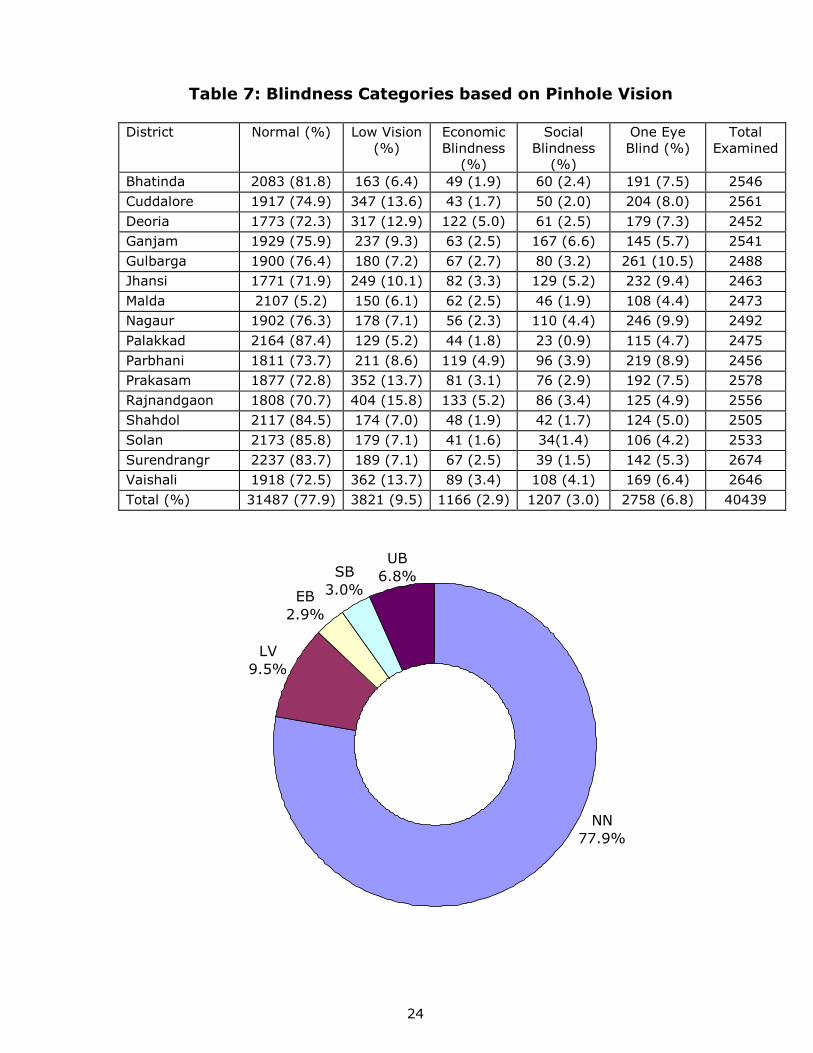
The vision of all individuals was also tested with a pinhole if their presenting vision
was less than 6/18 in any eye. The proportion of individuals who could be
categorized as normal increased to 77.9% (Table 7). The prevalence of low vision,
economic blindness, social blindness and one-eye blindness were 9.5%, 2.9%, 3%
and 6.8% respectively.
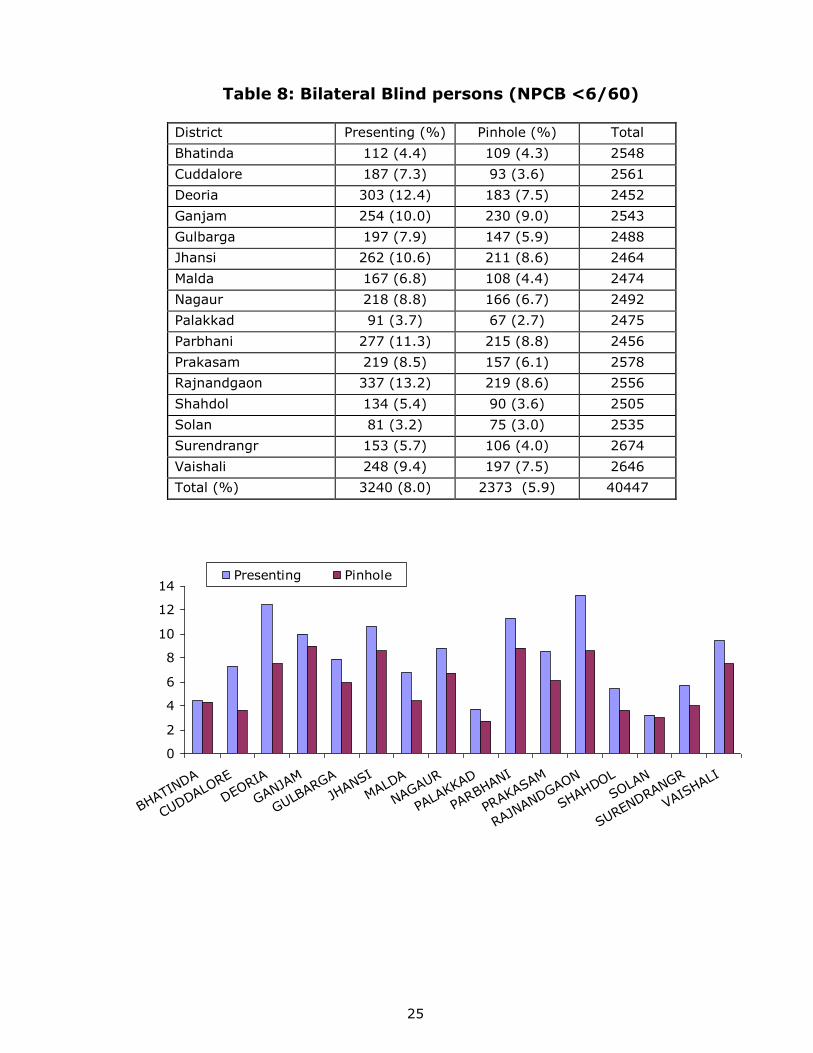
The National Program for Control of Blindness defines individuals with a vision less
than 6/60 in the better eye as blind. Using this cut off, the prevalence of blindness
was observed to be 8.0% among the 50+ population across the country, based on
presenting vision (Table 8). Using pinhole vision, the prevalence of blindness was
5.9%. The lowest prevalences based on presenting vision were observed in Solan
(3.2%), Palakkad (3.7%) and Bhatinda (4.4%). The highest prevalence was
observed in Rajnandgaon (13.2%), Deoria (12.4%) and Parbhani(11.3%). The
lowest prevalence using pinhole vision was in Palakkad (2.7%) and the highest was
in Ganjam (9%).
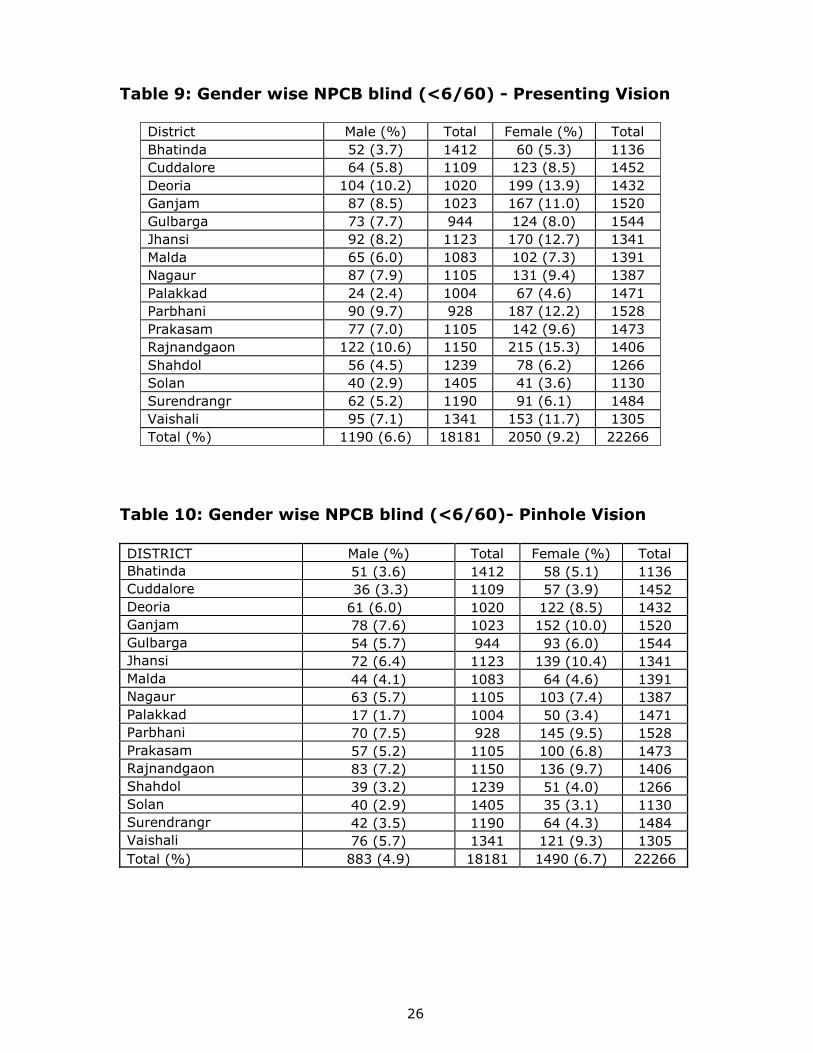
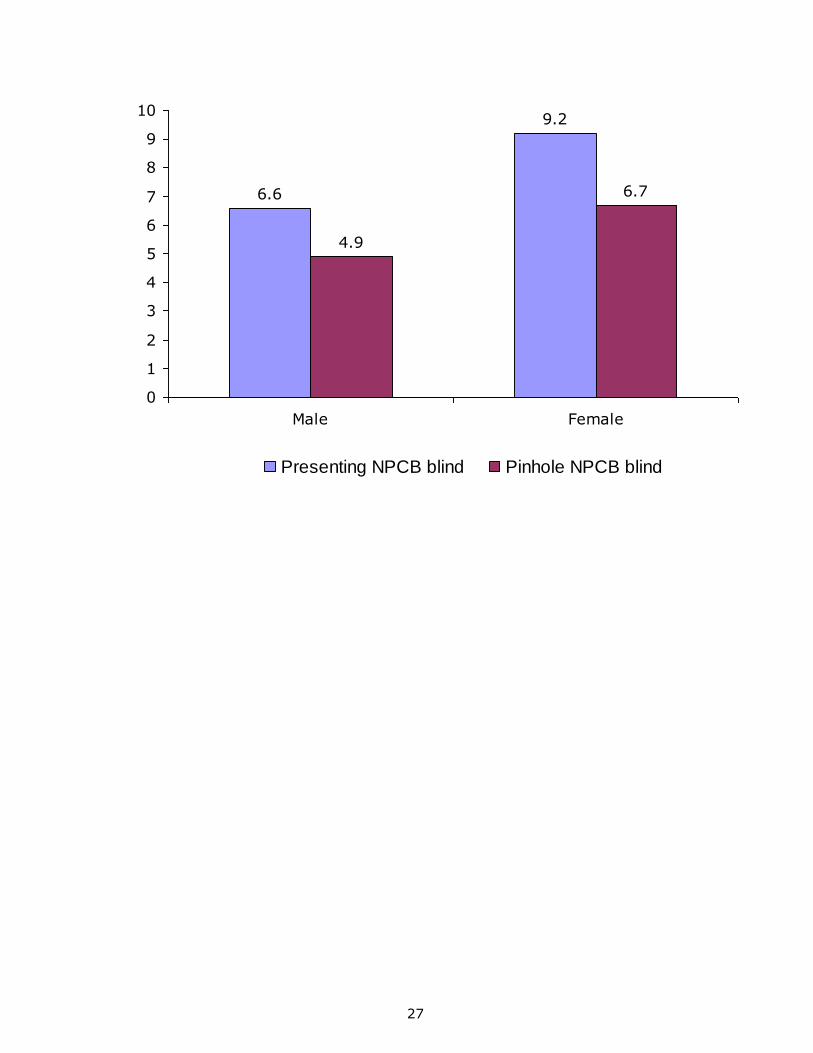
3.2.1 Association of Blindness with Gender
Using the NPCB cut-off, based on presenting vision, the prevalence of blindness
among women was 1.34 times higher compared to men. The prevalence of blindness
among males was 6.6% and among females it was 9.2% (Table 9). The trend of
higher prevalence among females was observed in all districts. Based on pinhole
vision, the prevalence of blindness was 4.9% among males and 6.7% among females
(Table 10).
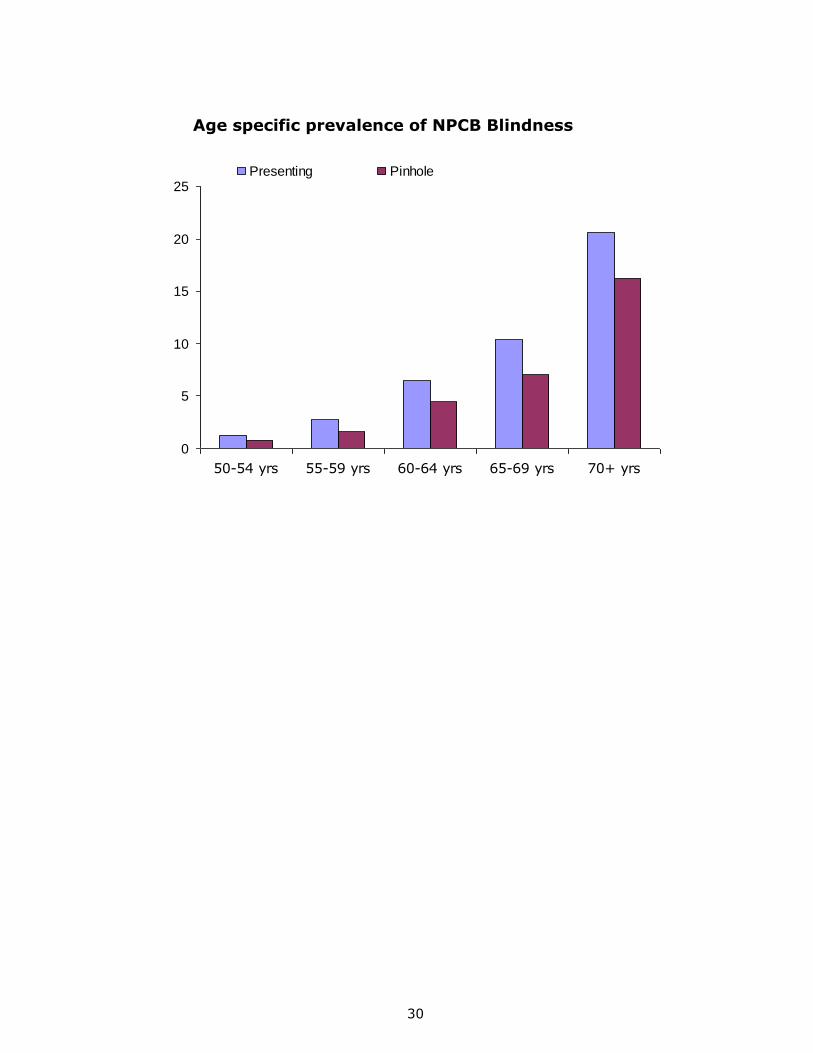
3.2.2. Association of Blindness with Age
It was observed that the prevalence of blindness (vision < 6/60 in the better eye)
based on presenting vision increased with increasing age. The prevalence was 1.3%
at 50-54 years of age and increased to 20.6 above the age of 70 years which is a 16
fold increase (Table 11). The prevalence at 50-54 years was lowest in Solan (0.1%)
11
while above the age of 70 years, the prevalence was the highest in Rajnandgoan
(38.7%).
With pinhole, the prevalence in the age group of 50-54 years was 0.8% while it was
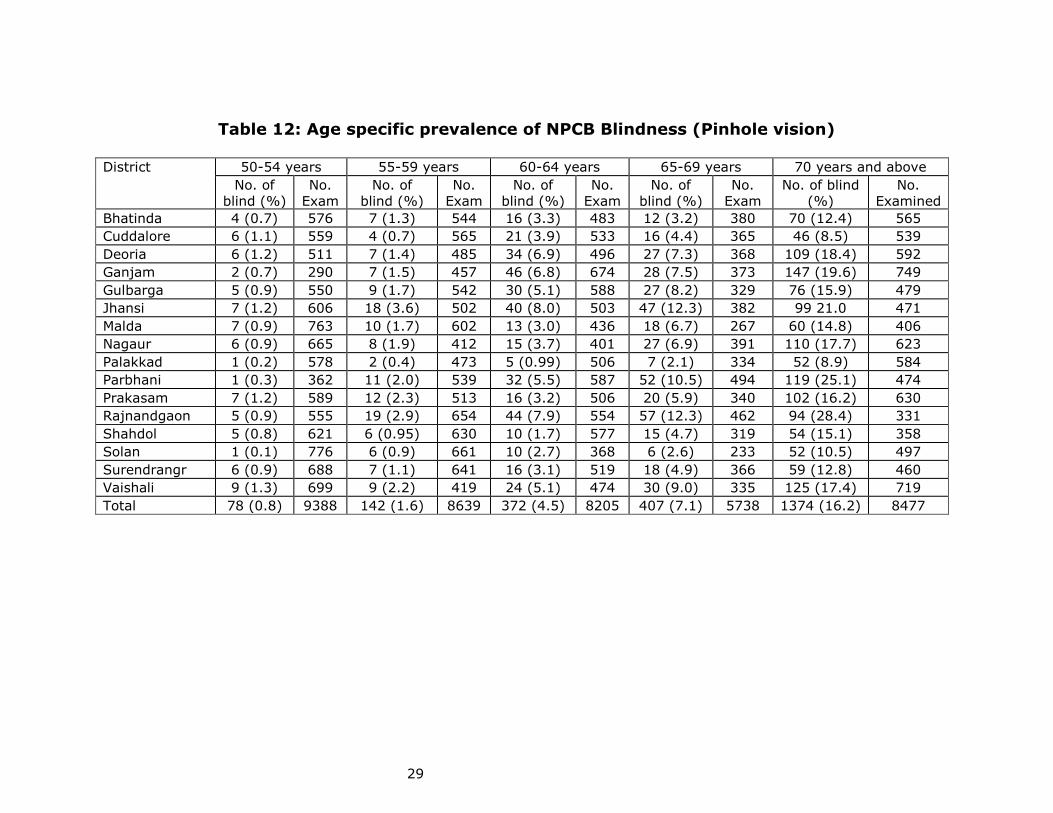
16.2% above the age of 70 years (Table 12).
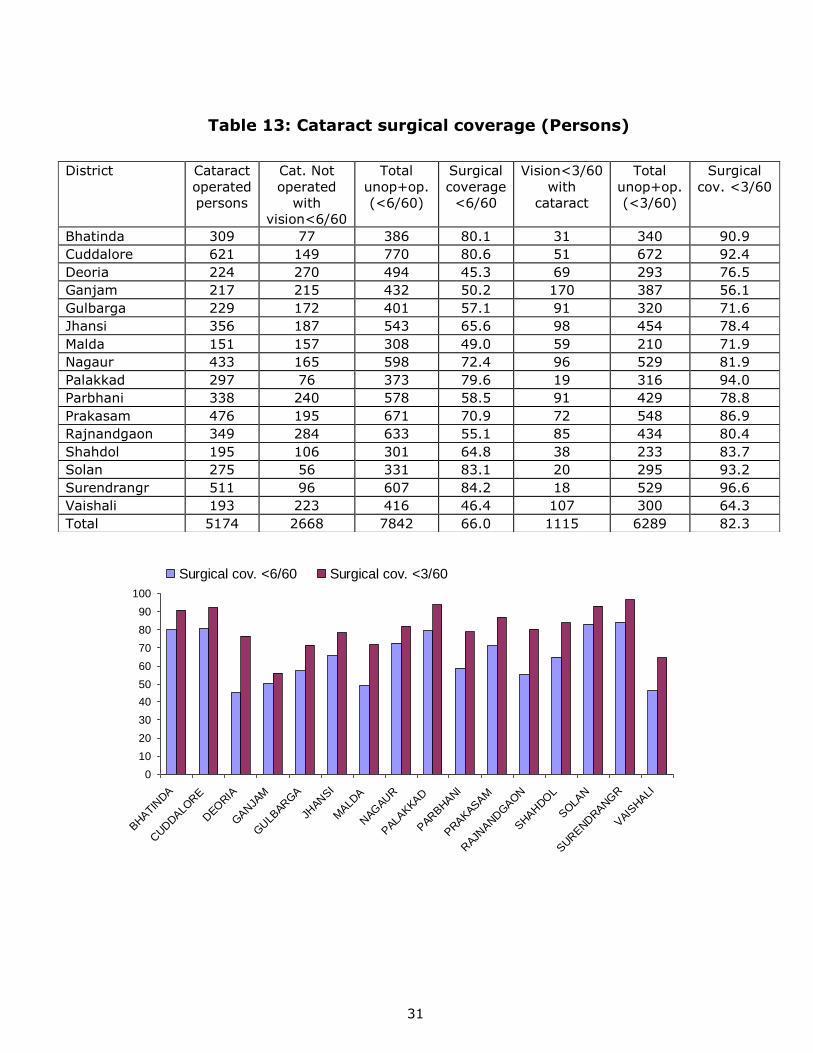
3.3 Cataract Surgical Coverage
3.3.1 Surgical Coverage (Persons)
The cataract surgical coverage among persons was calculated as follows:
Coverage (Persons) = No. of persons operated in one/both eyes x 100
No. of persons operated + No. of unoperated cataract blind persons
The cataract surgical rates was calculated separately for cataract blind persons with
vision < 3/60 in the better eye and for persons with vision < 6/60 in the better eye.
Using < 3/60 to define the cataract blind persons, 82.3% of persons needing
cataract surgery were covered by surgery (Table 13) while using < 6/60 to define
the cataract blind, 66% of persons had one or both eyes operated. It is well known
that the definition of the cataract blind influences surgical coverage rates. The
coverage rates were low in Ganjam and Vaishali where only half the persons needing
cataract surgery had access to surgery compared to districts like Bhatinda,
Cuddalore, Palakkad, Solan and Surndranagar where more than 90% of those blind
due to cataract (vision < 3/60 in the better eye) had been operated in at least one
eye.
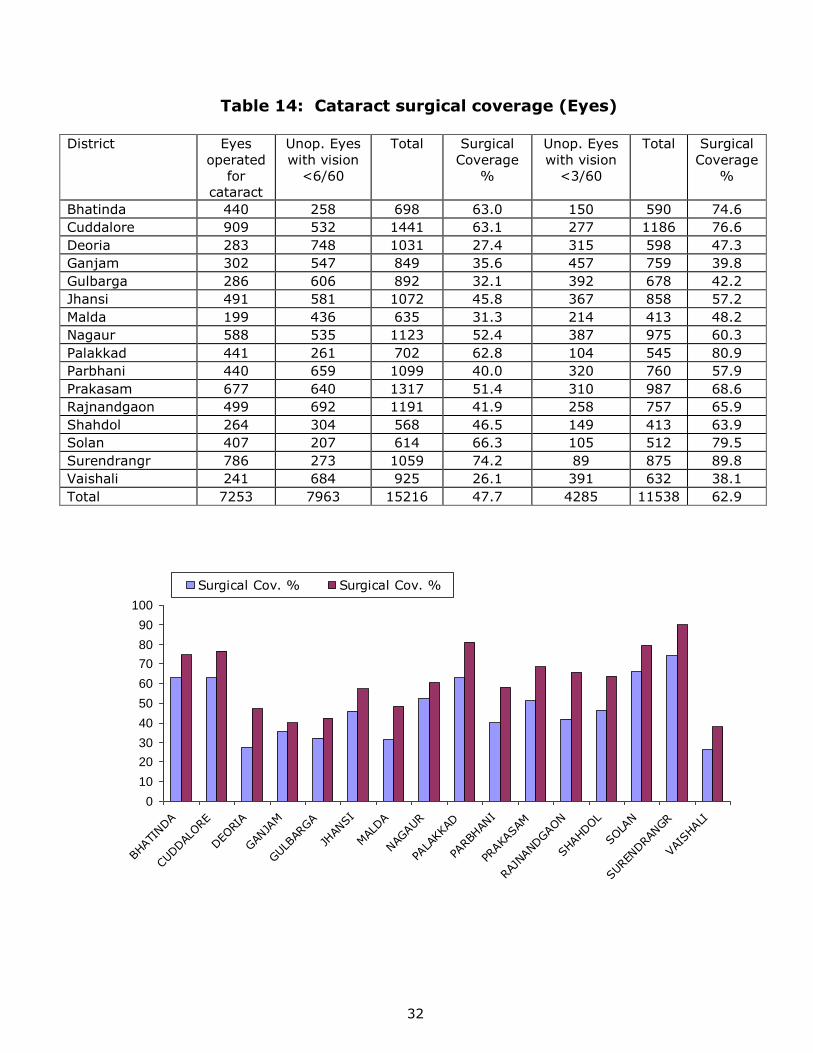
3.3.2 Surgical Coverage (Eyes)
The cataract surgical coverage foe individual eyes was calculated as follows:
Coverage (Persons) = Eyes operated for cataract x 100
Operated eyes + Unoperated cataract blind eyes
The coverage was 62.9% using < 3/60 to define cataract blindness and 47.7% using
< 6/60 to define cataract blindness (Table 14). These results show that a significant
proportion of the cataract blind in the country still get operated at a vision worse
than 3/60 in the affected eye.
3.4 Profile of Cataract Operated Individuals
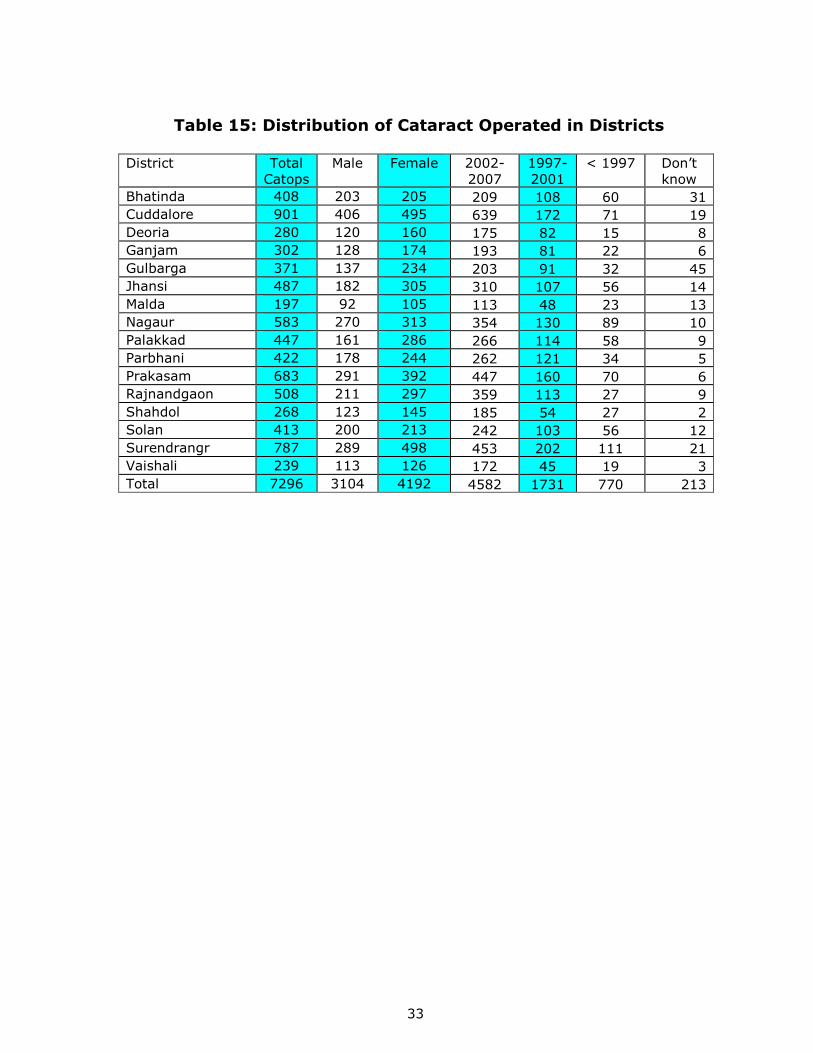
A total of 7296 cataract surgeries were reported from the 16 districts (Table 15). 901
cataract surgeries (12.3% of all districts) were reported from Cuddalore, while 787
(10.8%) were reported from Surendranagar and 683 (9.4%) were reported from
Prakasam district. Thus a third of all surgeries (32.5%) were from just three districts
in the 16 districts. Malda, Shahdol and Deoria reported the least surgeries. More
females reported surgery (4192) compared to males(3104) and more surgeries were
reported in the last 5 years(4582) which was responsible for 62.8% of all surgeries
reported. As mortality increases with age, it is logical that most surgeries would be
reported by survivors (the most recently operated).
12
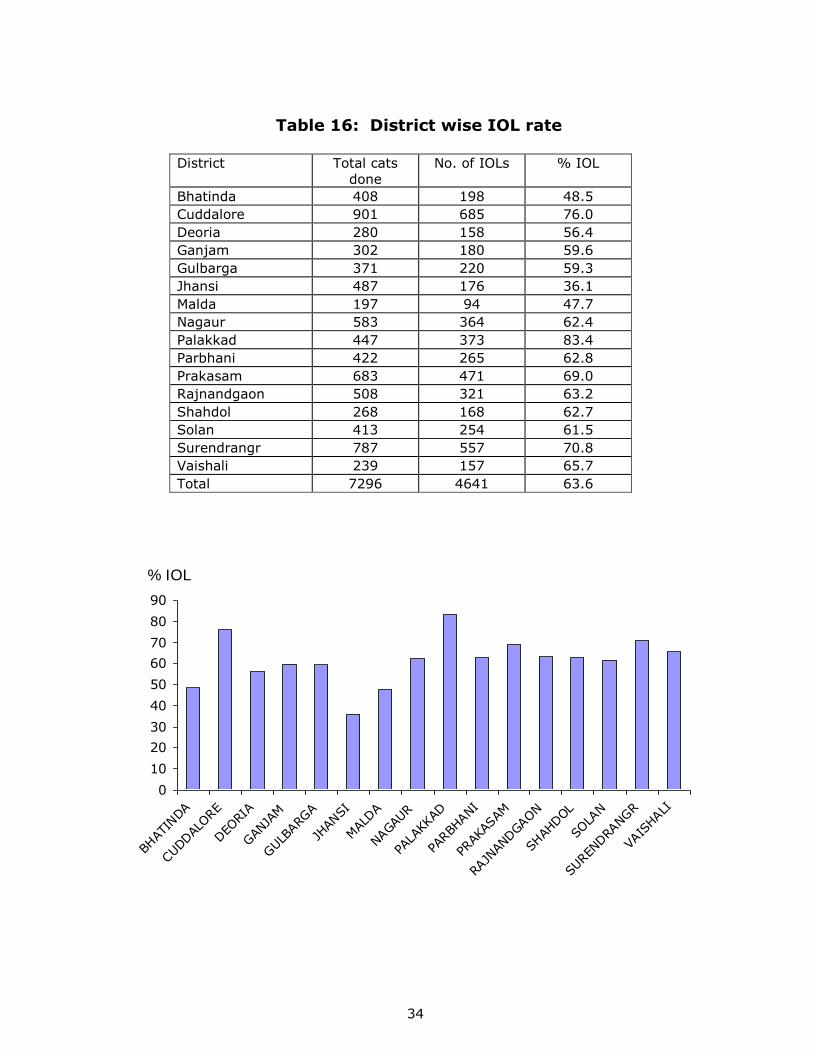
The proportion of surgeries with an IOL implant was 63.6% (Table 16). The
proportion of IOL surgery was highest in Palakkad district (83.4%) and lowest in
Jhansi district (36.1%). It was observed that districts with access to NGO hospitals
and private surgeons reported higher proportion of IOL surgeries.
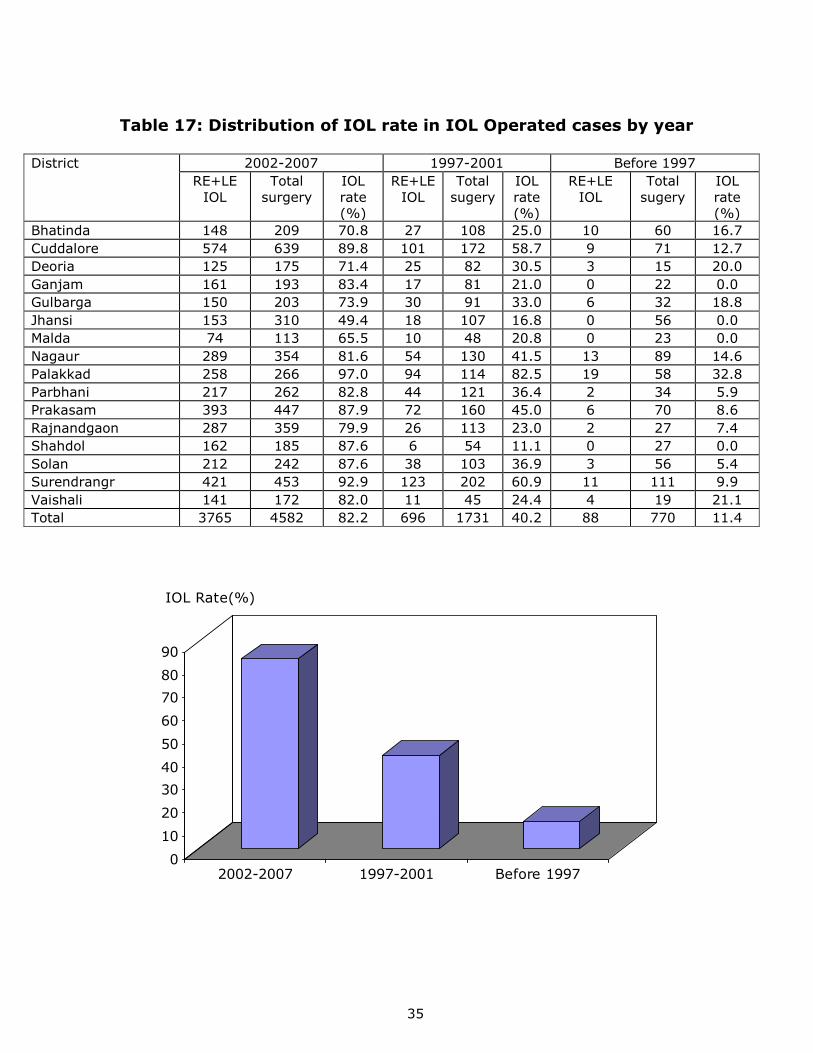
The IOL surgery rate was only 11.4% in surgeries reported before 1997 compared to
82.2% among surgeries in the last 5 years (Table 17). In Palakkad and
Surendranagar, more than 90% of surgeries in the recent five years were IOL
surgeries.
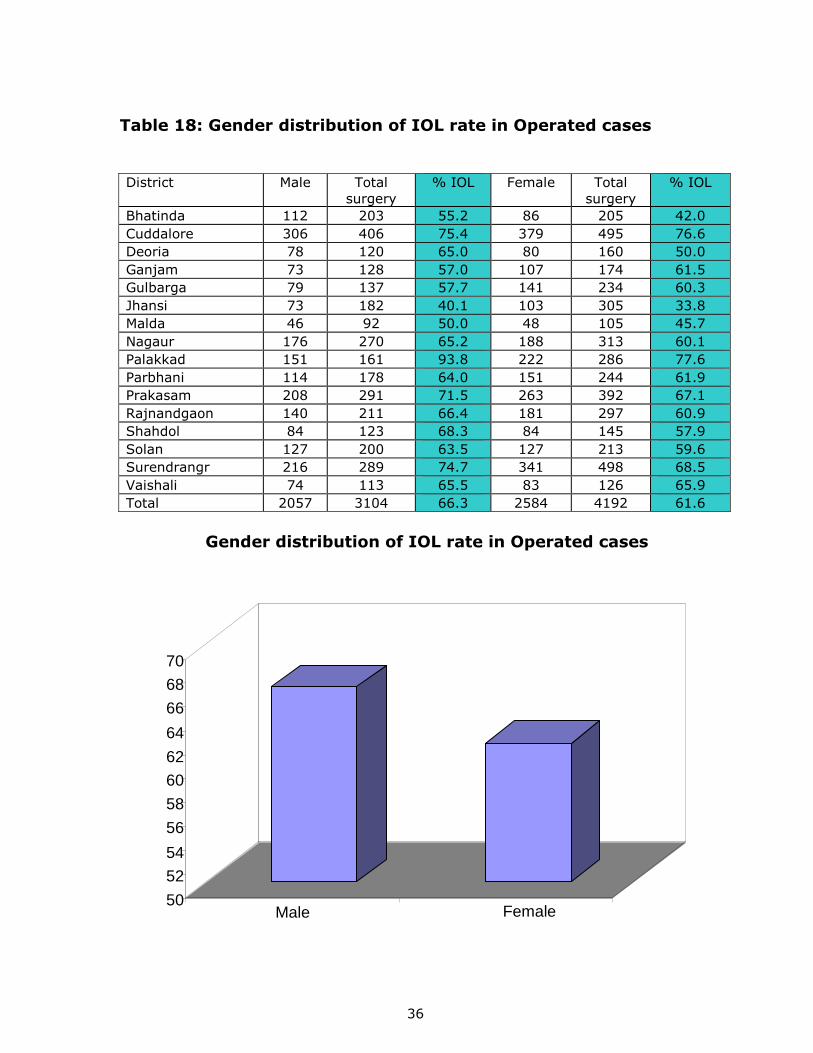
Amongst the males, 66.3% surgeries were done with an IOL implant compared to
61.6% among the females. The male-female differentials were significant in some
districts like Palakkad and Bhatinda (Table 18).
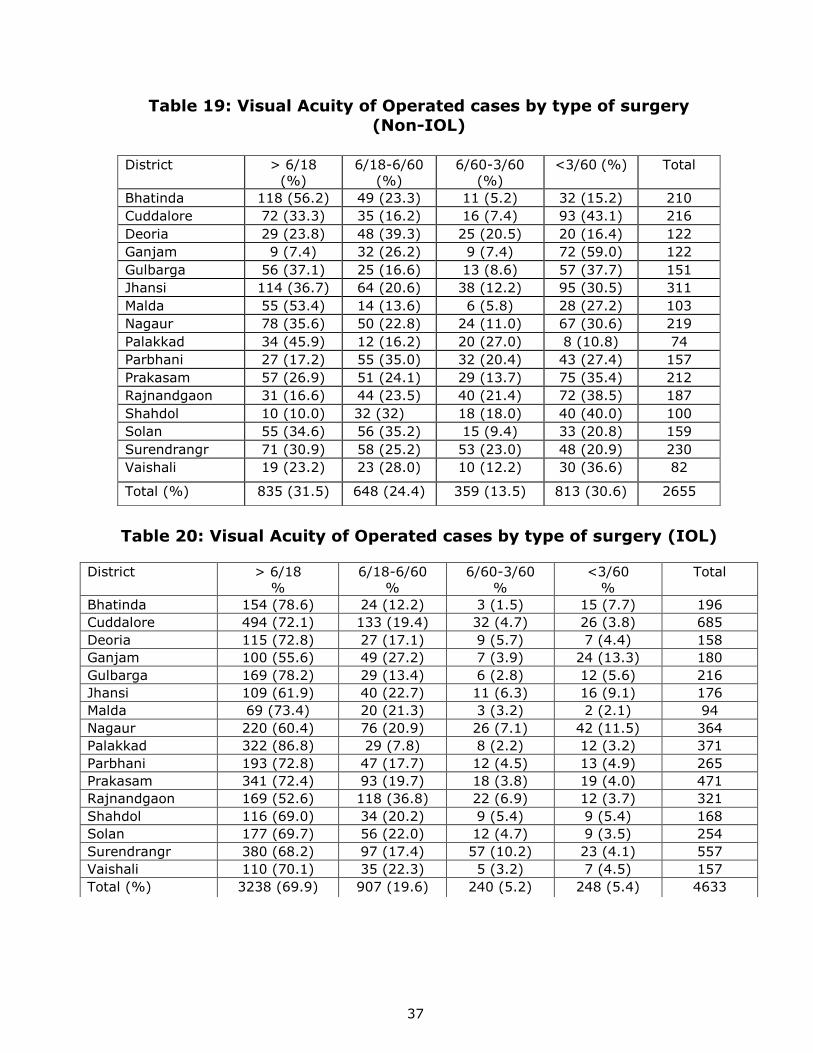
3.5 Visual Outcome after Surgery
Visual acuity after surgery was analyzed separately for non IOL and IOL surgery.
When no IOL was used, 31.5% had a vision better than 6/18 in the operated eye
while 30.6% had vision less than 3/60 (Table 19). In Ganjam district, 59% of
surgeries resulted in a vision less than 3/60 in the operated eye. Based on
presenting vision, one third to half the operated eyes had vision less than 6/60 in the
operated eye.
With IOL surgery, 89.5% had vision better than 6/60 in the operated eye while only
5.4% had vision less than 3/60 (Table 20). There was significant difference in visual
outcome after IOL surgery compared to non-IOL surgery, in all districts surveyed.
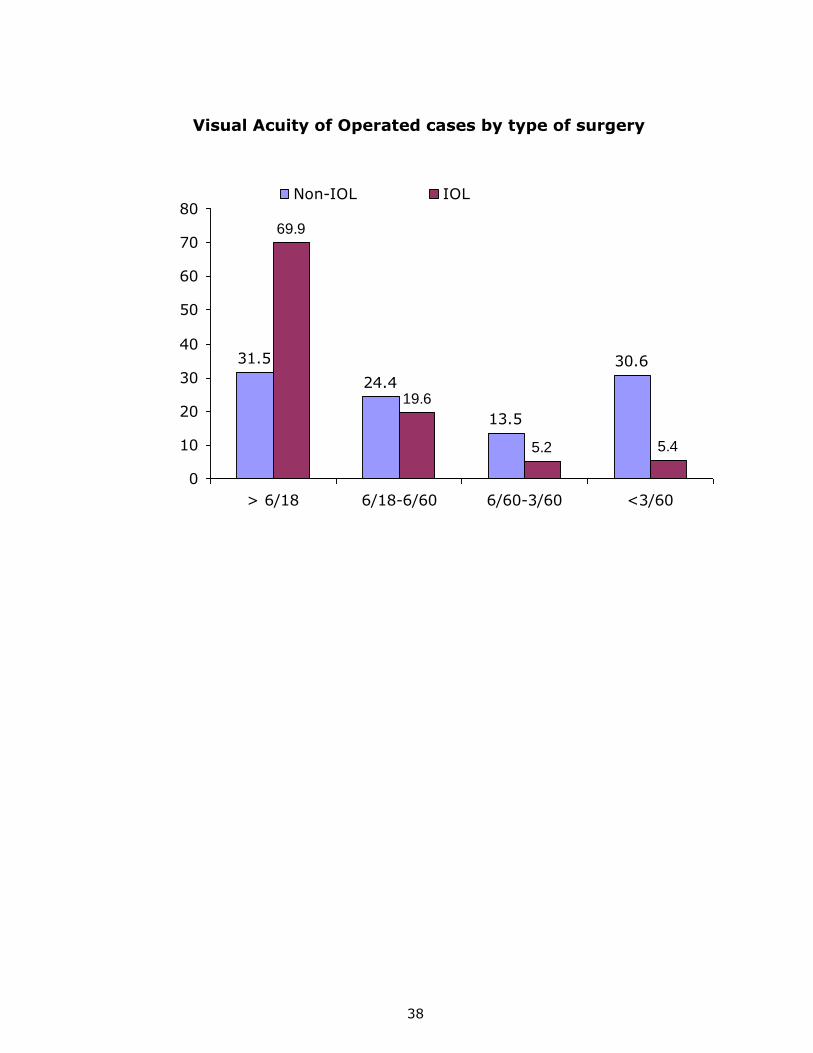
3.5.1 Spectacle Usage After Cataract Surgery
Amongst operated persons, 59.3% were not using spectacles at the time of the
examination (Table 21). The proportion not using spectacles currently was higher in
some districts like Cuddalore, Ganjam, Rajnandgaon, Surendranagar and Shahdol
where more than 70% were not using spectacles.
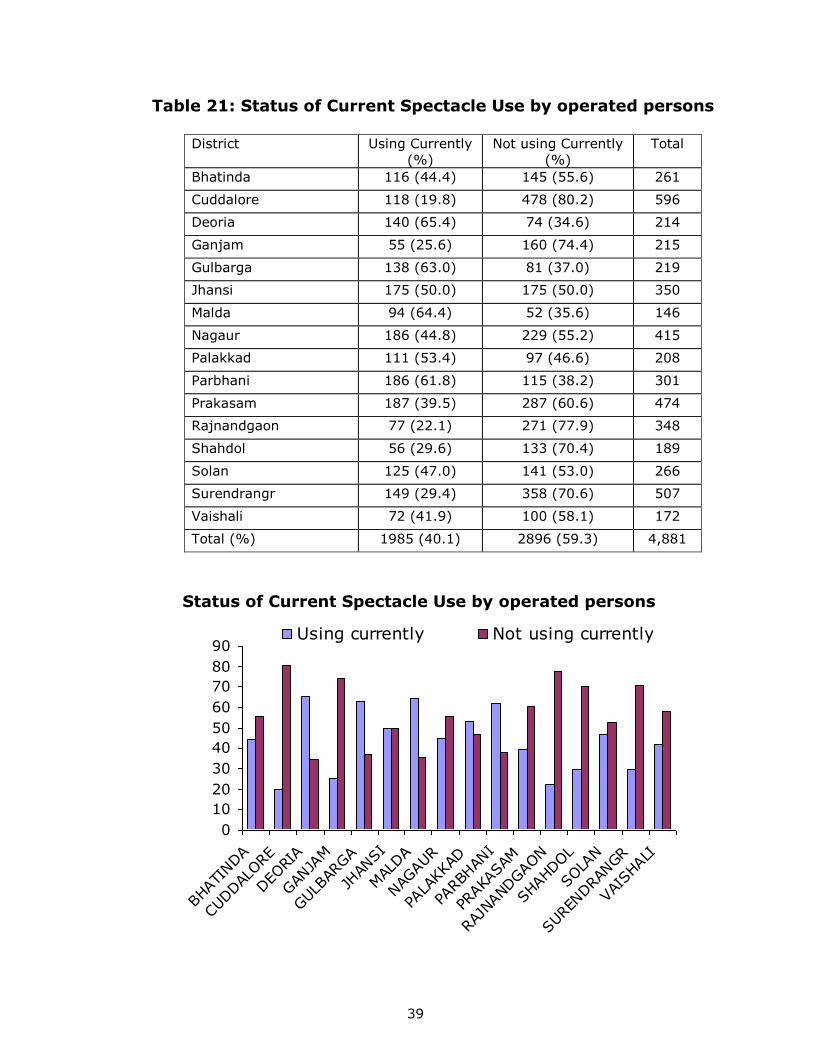
The condition of spectacles that were used currently varied widely across the districts
(Table 22). Overall only half the aphakic spectacles and a third of spectacles used
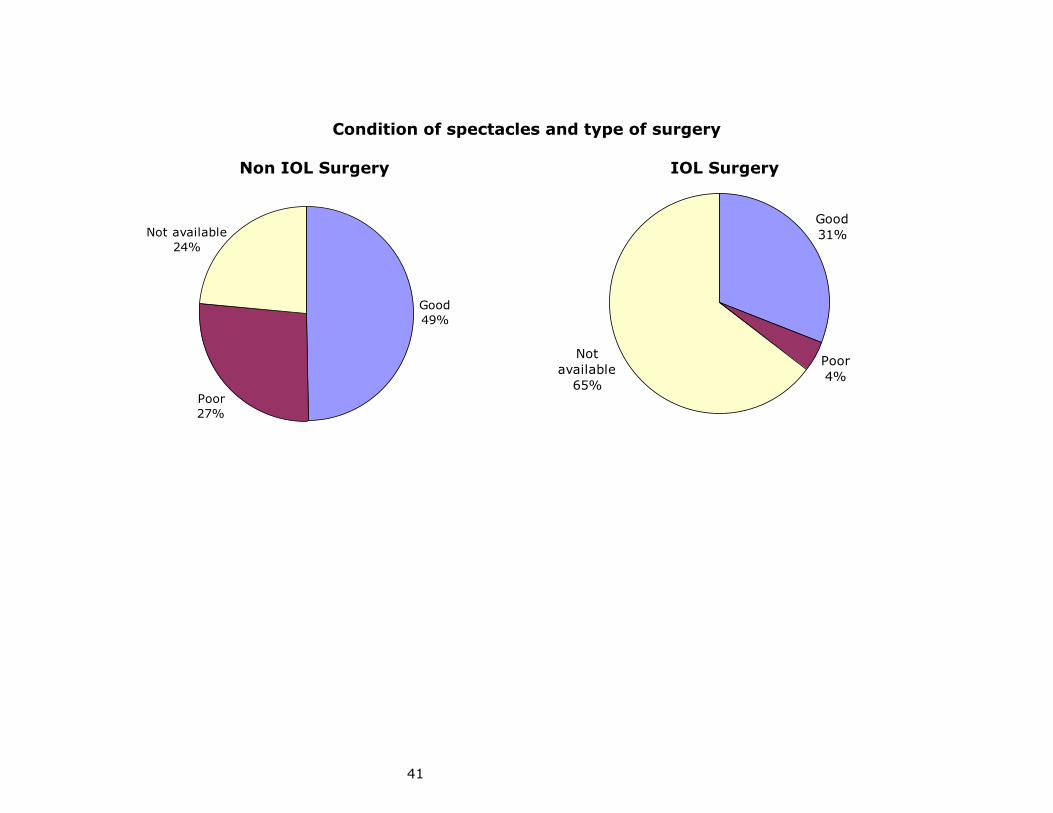
after IOL surgery were found to be of good quality.
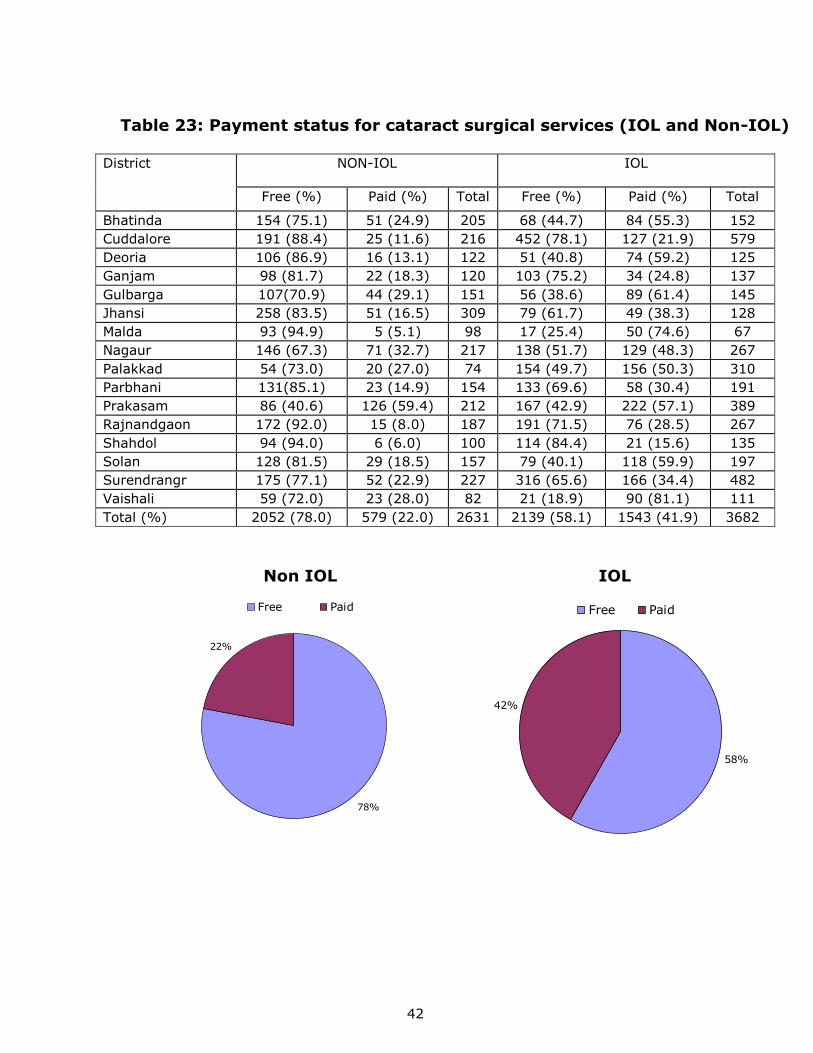
3.5.2 Payment for Cataract Surgery
It was observed that 78% of the non-IOL and 58.1% of the IOL surgery was
provided at no cost to the client (Table 23). In Prakasam district, 59.4% of non-IOL
surgeries, were paid for, by the clients. A higher proportion paid for IOL surgery
compared to non-IOL surgery.
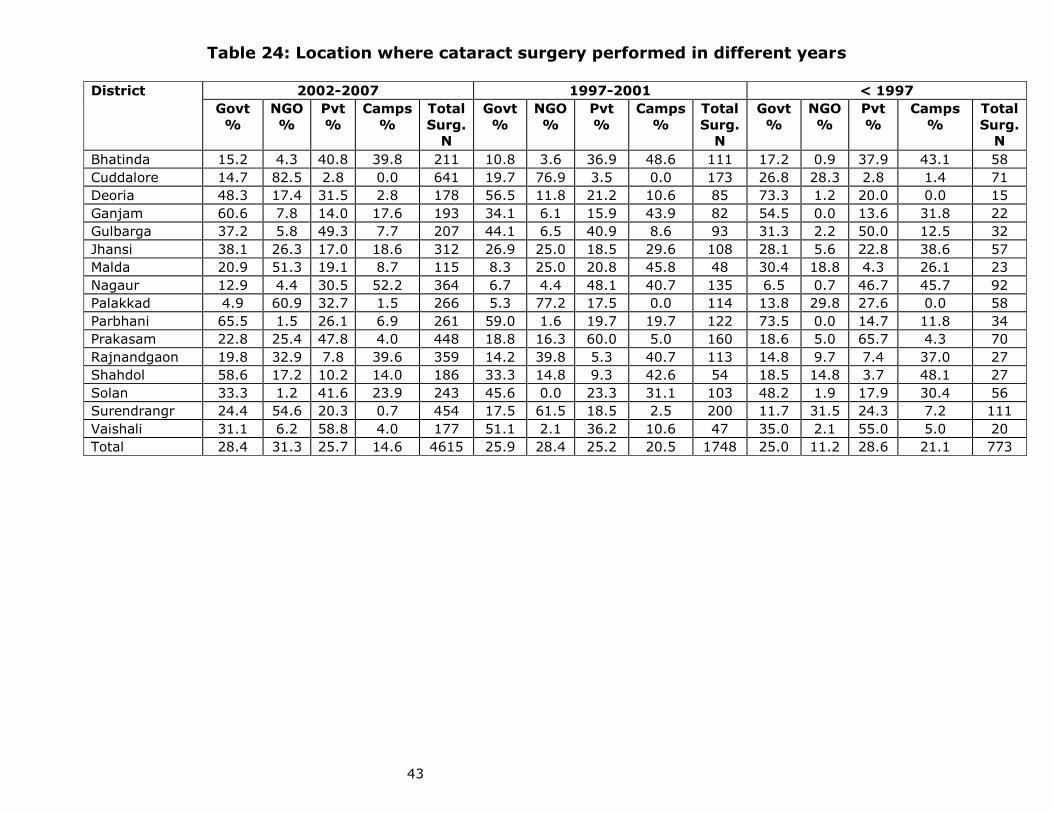
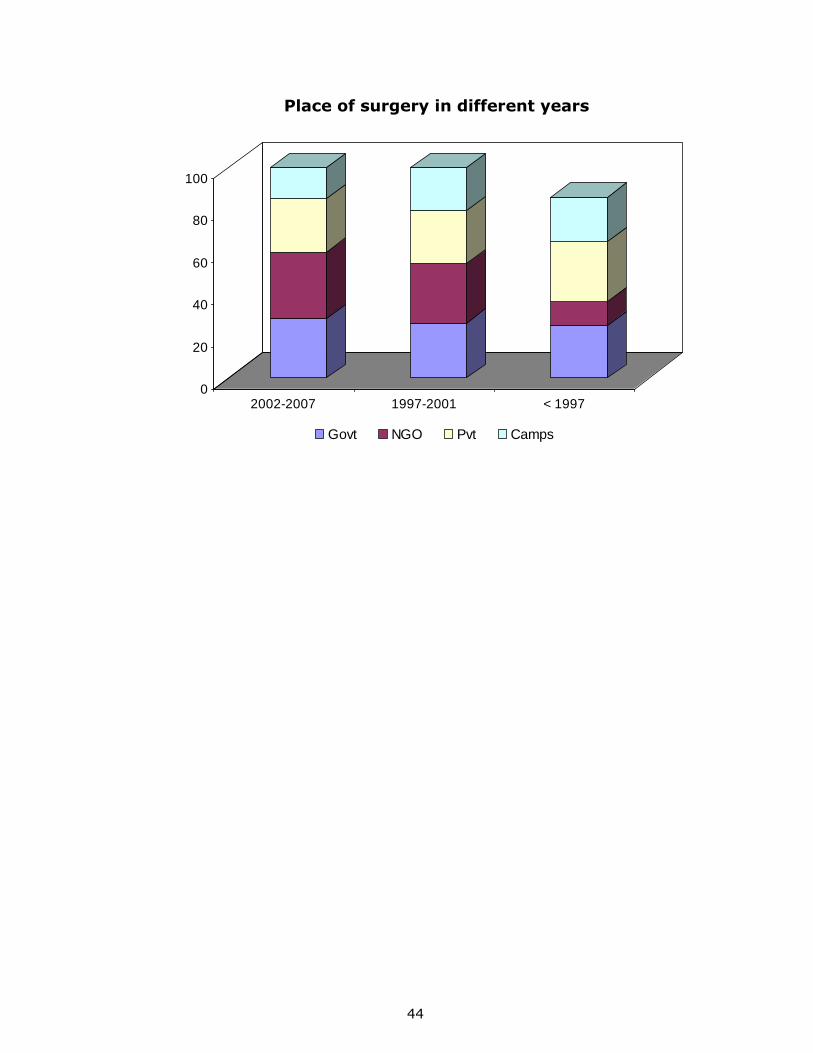
3.5.3 Place of Surgery
The proportion of cataract surgeries performed in make shift camps or outreach
locations has decreased over the last five years (Table 24). Over the period 2002-
2007, only 14.6% surgeries were performed in such locations. About a quarter of all
surgeries were performed at private facilities while another quarter were at
Government facilities. The largest provider of surgical services was the NGO sector.
In Ganjam, Parbhani and Shahdol districts, even in recent years, the government
13
sector was the most prominent while in Cuddalore, Palakkad, Surendranagar and
Rajnandgaon, the NGO sector was the predominant partner. In Bhatinda, Gulbarga,
Prakasam and Vaishali, the private surgeons were the predominant source for
cataract surgery.
In Cuddalore, only 2.8% went to private facilities.
3.5.4 Causes of Blindness and Visual Impairment
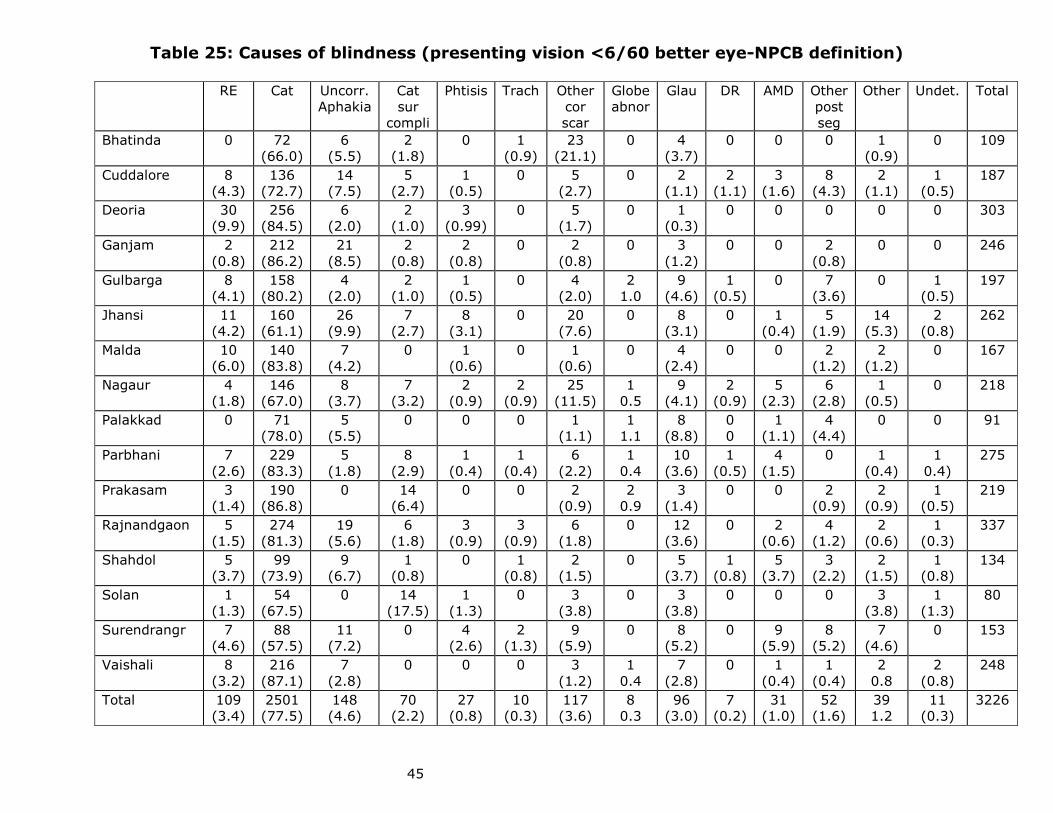
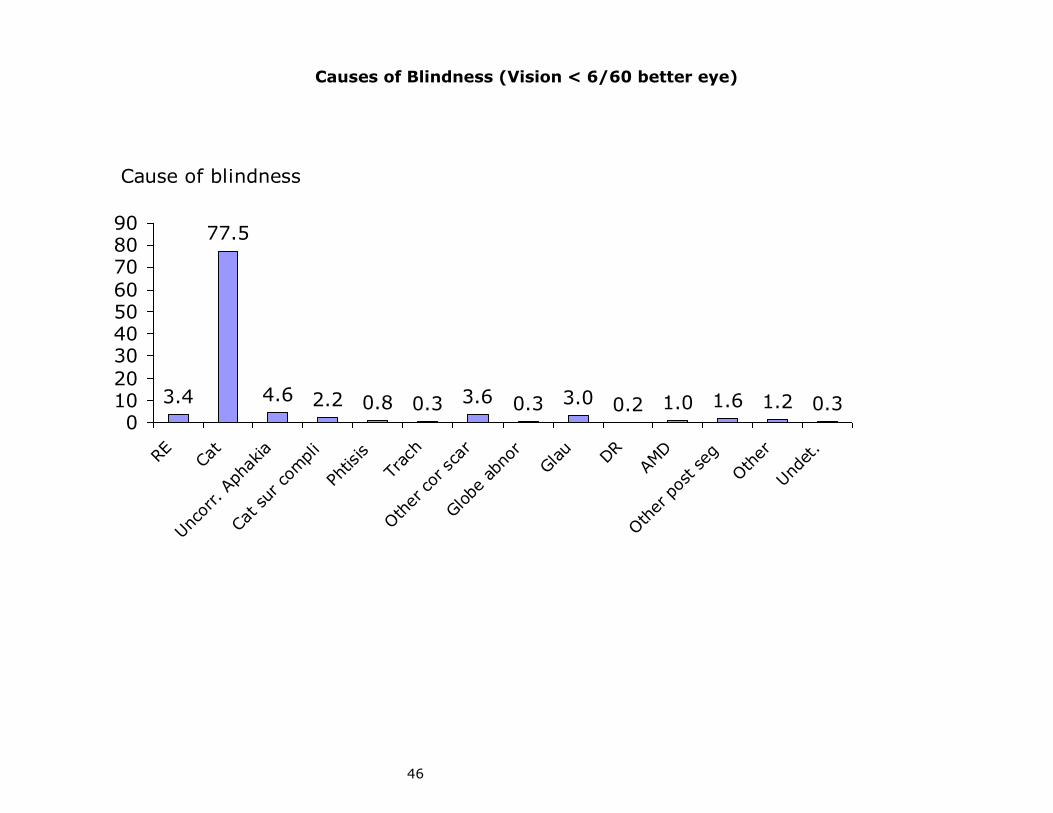
Cataract continues to be the single largest cause of bilateral blindness in India (Table
25). Among all the blind, 77.5% were blind due to cataract. Uncorrected aphakia was
responsible for 4.6% of blindness. Trachoma and other corneal scarring was
responsible for 3.9% of blindness, uncorrected refractive errors for 3.4% and
glaucoma for 3%. Posterior segment pathology was responsible for 2.8% of all
bilateral blindness. There was no district in the country where cataract was not
responsible for more than half the blindness.
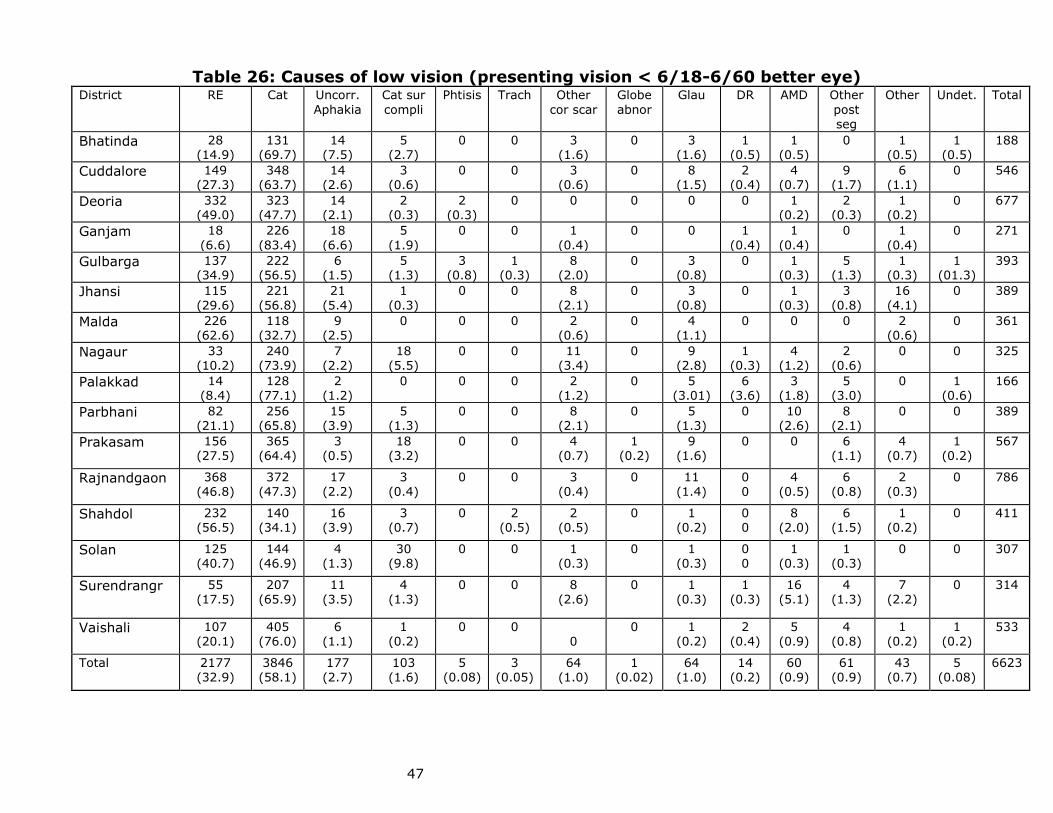
When causes of low vision were analyzed, it was observed that cataract was
responsible for 58.1% of low vision (vision < 6/18 – 6/60 in the better eye) while
uncorrected refractive errors were responsible for 32.9% (Table 26). In Deorai and
Malda districts, refractive errors were more important causes of low vision than
cataract.
More than half of all one eye blind were due to Cataract (Table 27). Uncorrected
aphakia and cataract surgical complications together were responsible for more than
10% of one eye blindness across the country. Corneal scarring was another
important cause of one eye blindness with 8% suffering due to corneal pathology
other than trachoma.
3.5.5 Comparison of Presenting and Pinhole Vision
Even though best correction was not done as part of the survey, all individuals with a
presenting vision < 6/18 in any eye were examined with a pinhole. It was observed
that with a pinhole, more than half (54.7%) the individuals with low vision could
improve to better than 6/18 (Table 28). However those with a presenting vision <
3/60 would not benefit much from correction as 88.6% of them did not improve with
pinhole. Even among the economically blind, less than half improved with pinhole.
3.5.6 Comparison of Presenting and Pinhole Vision among Cataract
Operated
Presenting and pinhole vision was also compared among the cataract operated. Even
among those with an IOL implant, 60% could improve from < 6/18 to better than
6/18 with pinhole while 46% of those with a presenting vision of < 6/60-3/60 could
be improved by pinhole. This signifies that many individuals need spectacles even
after IOL surgery as standard power IOLs may be in vogue in many districts (Table
29). At the same time those who had an IOL implant and a presenting vision < 3/60
hardly improved as 87.2% continued to have a vision < 3/60 after pinhole.
Individuals who had a non-IOL cataract surgery did not seem to benefit much by
correction as the proportion whose vision could improve with pinhole was much
14
smaller than with IOL (Table 30). 65.9% of those with a presenting vision < 3/60 did
not improve with pinhole.
3.5.7 Comparison of Blindness Prevalence With Previous Surveys
Observations from the Rapid Assessment of Blindness in 2006-2007 were compared
with the observations from the same districts which were surveyed over the period
1998-2001 (Table 31). It was observed that overall there was a significant decrease
in the prevalence of blindness when results were compared with earlier rapid
assessments. Even in comparison to the earlier comprehensive detailed surveys,
there was a 0.5% reduction in the prevalence of blindness (vision < 6/60 in the
better eye) among the 50+ population. Since 90% of blindness is seen among the
50+ population and this segment of the population is steadily increasing due to
increased life expectancy, a decrease of 0.5% is significant. Only in two districts
(Rajnandgaon and Parbhani) was the prevalence higher than in 2001. The increase in
Rajnandgaon was marginal but the increase in Parbhani was significant.
3.5.8 Barriers to Cataract Surgery
The barriers to cataract surgery among the cataract blind (vision < 6/60 in the better
eye with cataract as the cause of blindness in one or both eyes) were also studied.
The barriers were categorized as awareness related, service related and other
barriers.
Among the awareness related barriers, 22.3% did not get operated as they were
unaware of their cataract (Table 32). Fear was stated by 6.8% while 8% stated that
they were asked to wait for the cataract to mature before surgery. There were wide
variations across the different districts in relation to the awareness related barriers.
Affordability was a barrier reported by 11.9% across the country (Table 33) while in
another 15% either age or the fact that they did not feel the need for surgery were
important barriers reported. The proportion who stated that they could not afford
surgery was the highest in Malda district (28.5%).
Lack of escorts, adequate vision in the fellow eye and lack of time were other
barriers reported (Table 34). Only 0.2% stated that they did not go for surgery as
they were using other anti-cataract medications.
4. Extrapolating Blindness Prevalence to General Population
Most literature available in India and other parts of the world show that 90% of
blindness is concentrated among the 50+ population as most blindness is age
related. This assumption has been used to extrapolate the prevalence of blindness
among the 50+ population to the population of all ages. As there has been a
reduction in blindness in the 50+ population, it would lead to a decrease in the
blindness load in the country.
Using the assumptions mentioned above, it is estimated that the prevalence of
blindness in the total population would be 1.36% if presenting vision is considered
and 1% if pinhole vision is considered (using a vision of < 6/60 in the better eye)
(Table 35).
15
Using the WHO definition of vision < 3.60 in the better eye, the prevalence of
blindness in the general population would be 0.61% with presenting vision and
0.51% with pinhole vision (Table 36).
5. Conclusions and Recommendations
The National Program for Control of Blindness has consistently based its projections
and program implementation on evidence collected by reputed eye care institutions
through population based surveys over the past three decades. For the first time in
the country, a Rapid Assessment of Avoidable Blindness was undertaken. This
methodology improves upon the methodology used in Rapid Assessment and allows
causes of blindness to be established. This is achieved by coupling an eye
examination by an ophthalmologist to the methodology used in rapid assessments.
Therefore data can be comparable to both the rapid assessment as well as the
detailed surveys conducted earlier.
It was observed that overall, the prevalence of low vision, economic blindness and
social blindness had decreased in the districts covered compared to the earlier
surveys. Lowest prevalence of all blindness (social + economic) was seen in Solan
(Himachal Pradesh), Bhatinda (Punjab) and Palakkad (Kerala). Pooling data of all
districts together the prevalence of blindness as defined by the National Program for
Control of Blindness has shown a reduction of 6% in overall prevalence of blindness
above the age of 50 years. This reduction is significant as there is an increasing life
expectancy in India which translates into more and more people living beyond 50
years of age. Since a significant proportion of blindness in India is age related, any
reduction above the age of 50 years is a direct gain from the strategies adopted by
the National Program in the country.
The prevalence of blindness was observed to be 1.34 times higher in females
compared to males. It is difficult to state whether this is due to a true rate of higher
incidence among females or because of lack of access to services. Though a larger
number of surgeries were reported by women this would be expected as 55% of the
respondents were female.
The prevalence of blindness increased with age, with those above 70 years having a
16 times higher risk of being blind compared to those aged 50-54 years.
Cataract surgical coverage showed a significant increase compared to the previous
surveys with 82.3% having at least one eye operated among those who had a vision
< 3/60 and were blind from cataract. This is much higher than the previous surveys.
In RAAB, analysis was also presented for cataract surgical coverage using the NPCB
definition of blindness. For the first time this is being used in the country as it was
felt that this would act as a baseline for future surveys as more and more people
would get operated before they reach a stage of vision < 3/60.
16
The survey showed that the gains in Southern States (Andhra Pradesh, Kerala and
Tamilnadu) and in high performing States like Gujarat continued to improve over the
years. The biggest turnaround can be seen in the districts of Prakasam in Andhra
Pradesh and Gulbarga in Karnataka compared to the earlier surveys. In fact three
districts (Cuddalore, Prakasam and Surendranagar) were together responsible for a
third of all surgeries reported in the country. Public-private partnership seems to be
the key to the future as all three districts had a strong presence of NGO/private
institutions in addition to the Government facilities.
Performance in the States of Orissa (Ganjam district) and West Bengal (Malda
district) needs to be augmented so that the gains of the technological revolution in
eye care can be effectively harnessed across the country.
There is a distinct increase in IOL surgeries in the past five years when results are
compared to the earlier surveys. This is a welcome sign as more and more
ophthalmologists are now adept at IOL implants than previously. Most of the survey
districts have achieved more than 80% IOL rate in the past five years. However,
though the total number of surgeries was higher among women, the IOL rate was
5% higher among men. This gender disparity needs to be addressed through
innovative approaches.
A large proportion of individuals were not using spectacles after surgery and there
were many who in-spite of an IOL implant needed correction as they showed
significant improvement with a pinhole.
Cataract remains the single largest cause of blindness, low vision and one eye
blindness in India if the data of the 16 districts are pooled together. The trend is
observed across all districts also. Results indicate that the country should continue to
prioritize cataract surgical services and their augmentation. The support to other
blinding conditions should not be at the cost of cataract as any slackening may prove
catastrophic in the long run.
Lack of awareness and affordability still continue to be barriers to the uptake of
cataract surgery in many parts of the country and efforts need to be made to
surmount these barriers so that no person needlessly remains blind because of lack
of knowledge or the lack of access due to financial constraints.
Extrapolating the results to the population of all ages across the country, it is evident
that there has been a perceptible reduction in the prevalence of blindness in the
country inspite of increased life expectancy. The country seems headed in the right
direction and attention to problem regions on a priority basis will provide a further
impetus to blindness control efforts in India.
17
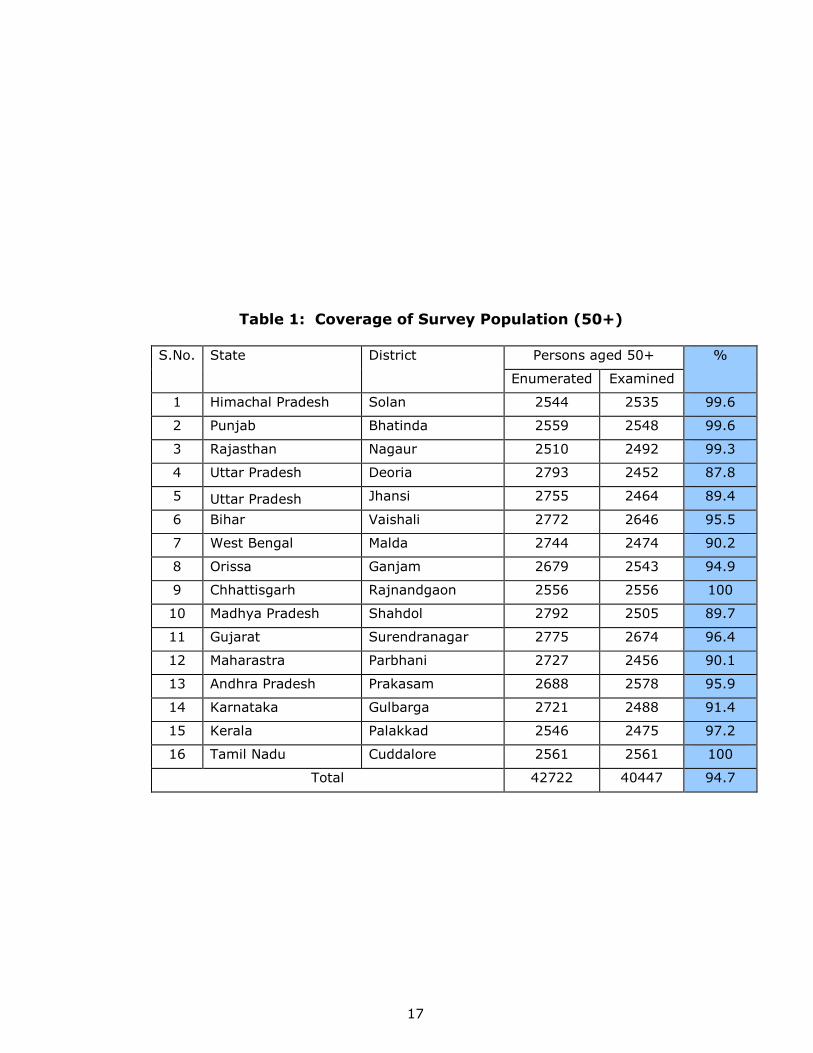
Table 1: Coverage of Survey Population (50+)
S.No. State District Persons aged 50+ %
Enumerated Examined
1 Himachal Pradesh Solan 2544 2535 99.6
2 Punjab Bhatinda 2559 2548 99.6
3 Rajasthan Nagaur 2510 2492 99.3
4 Uttar Pradesh Deoria 2793 2452 87.8
5 Uttar Pradesh Jhansi 2755 2464 89.4
6 Bihar Vaishali 2772 2646 95.5
7 West Bengal Malda 2744 2474 90.2
8 Orissa Ganjam 2679 2543 94.9
9 Chhattisgarh Rajnandgaon 2556 2556 100
10 Madhya Pradesh Shahdol 2792 2505 89.7
11 Gujarat Surendranagar 2775 2674 96.4
12 Maharastra Parbhani 2727 2456 90.1
13 Andhra Pradesh Prakasam 2688 2578 95.9
14 Karnataka Gulbarga 2721 2488 91.4
15 Kerala Palakkad 2546 2475 97.2
16 Tamil Nadu Cuddalore 2561 2561 100
Total 42722 40447 94.7
18
% Coverage
80
82
84
86
88
90
92
94
96
98
100
102
HP
Punjab Ra
jUP
UP
Biha
r W
B
Oris
sa
Chha
ttis M
PGuj
Mah
a AP Kar
Kera
la TN
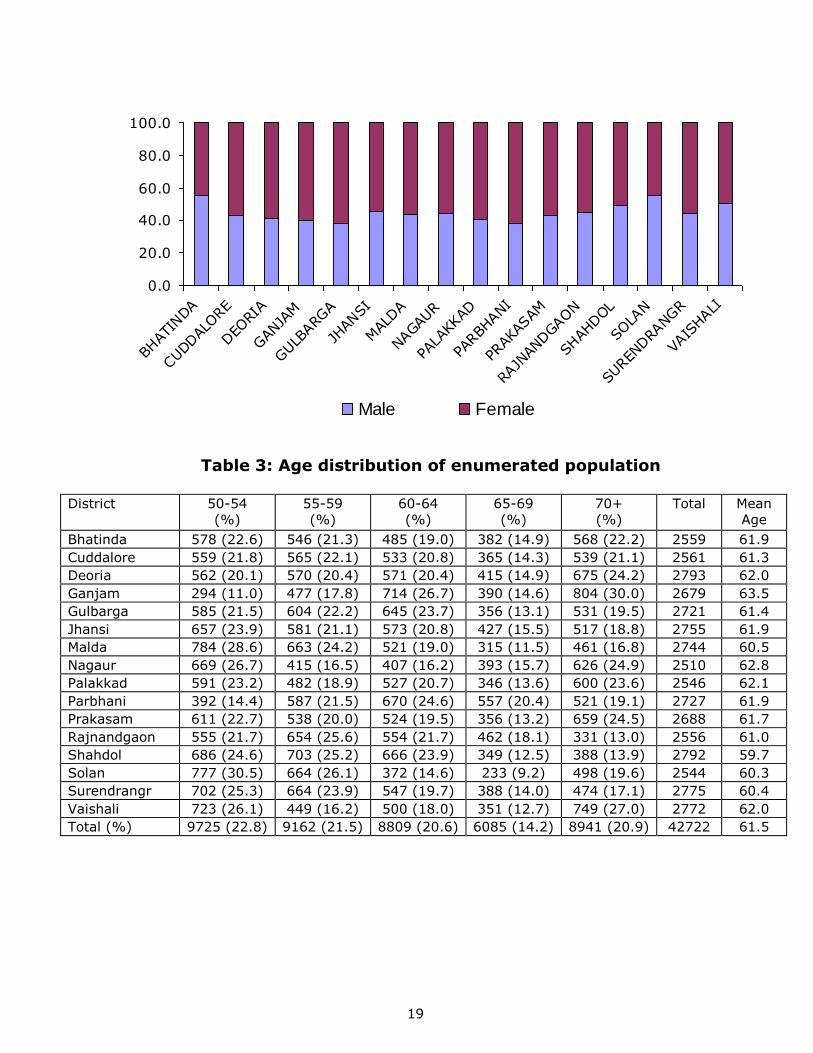
Table 2: Gender distribution of Subjects
District Enumerated Examined
Male (%) Female (%) Total Male (%) Female (%) Total
Bhatinda 1416 (55.3) 1143 (44.7) 2559 1412 (55.4) 1136 (44.6) 2548
Cuddalore 1109 (43.3) 1452 (56.7) 2561 1109 (43.3) 1452 (56.7) 2561
Deoria 1209 (43.3) 1584 (56.7) 2793 1020 (41.6) 1432 (58.4) 2452
Ganjam 1071 (40.0) 1608 (60.0) 2679 1023 (40.2) 1520 (59.8) 2543
Gulbarga 1053 (38.7) 1668 (61.3) 2721 944 (37.9) 1544 (62.1) 2488
Jhansi 1306 (47.4) 1449 (52.6) 2755 1123 (45.6) 1341 (54.4) 2464
Malda 1260 (45.9) 1484 (54.1) 2744 1083 (43.8) 1391 (56.2) 2474
Nagaur 1115 (44.4) 1395 (55.6) 2510 1105 (44.3) 1387 (55.7) 2492
Palakkad 1045 (41.0) 1501 (59.0) 2546 1004 (40.6) 1471 (59.4) 2475
Parbhani 1089 (39.9) 1638 (60.1) 2727 928 (37.8) 1528 (62.2) 2456
Prakasam 1167 (43.4) 1521 (56.6) 2688 1105 (42.9) 1473 (57.1) 2578
Rajnandgaon 1150 (45.0) 1406 (55.0) 2556 1150 (45.0) 1406 (55.0) 2556
Shahdol 1388 (49.7) 1404 (50.3) 2792 1239 (49.5) 1266 (50.5) 2505
Solan 1412 (55.5) 1132 (44.5) 2544 1405 (55.4) 1130 (44.6) 2535
Surendrangr 1257 (45.3) 1518 (54.7) 2775 1190 (44.5) 1484 (55.5) 2674
Vaishali 1413 (51.0) 1359 (49.0) 2772 1341 (50.7) 1305 (49.3) 2646
Total (%) 19460 (45.6) 23262 (54.5) 42722 18,181 (45.0) 22266 (55.1) 40447
Gender distribution of examined
19
0.0
20.0
40.0
60.0
80.0
100.0
BHAT
INDA
CUDDAL
ORE
DEO
RIA
GAN
JAM
GULB
ARG
A
JHAN
SI
MAL
DA
NAGAU
R
PALA
KKAD
PARBH
ANI
PRAK
ASAM
RAJN
ANDGAON
SHAH
DOL
SOLA
N
SUREN
DRA
NGR
VAIS
HALI
Male Female
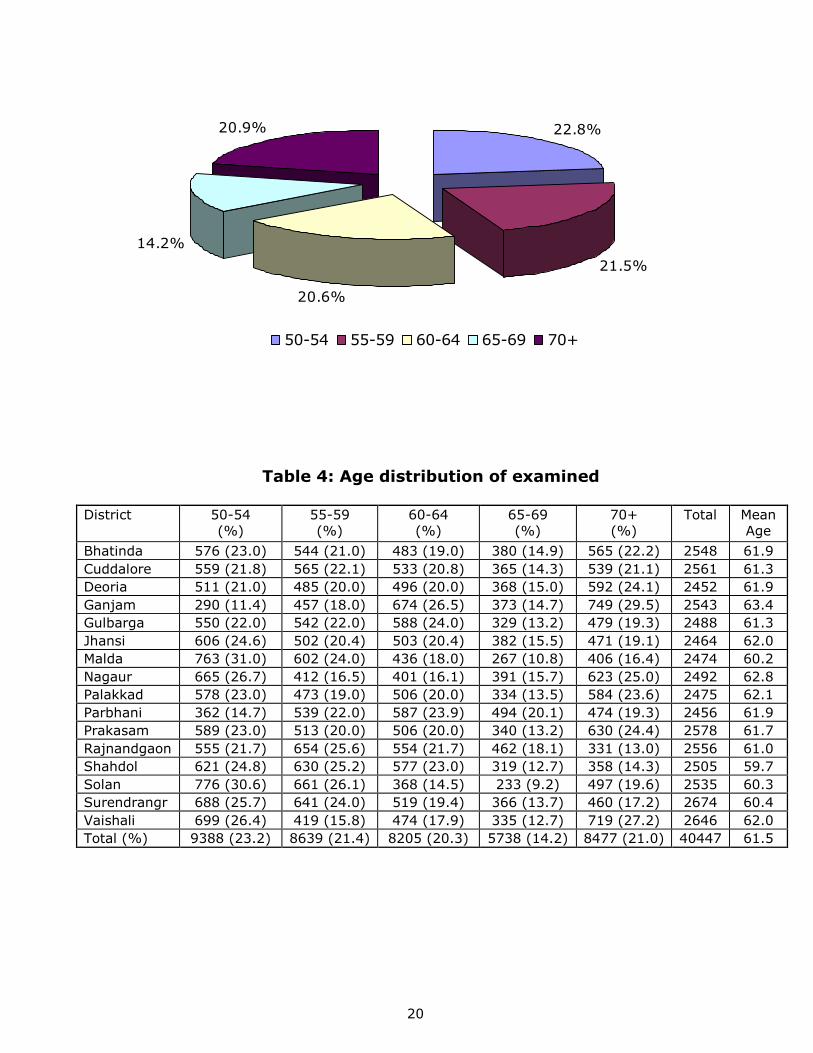
Table 3: Age distribution of enumerated population
District 50-54
(%)
55-59
(%)
60-64
(%)
65-69
(%)
70+
(%)
Total Mean
Age
Bhatinda 578 (22.6) 546 (21.3) 485 (19.0) 382 (14.9) 568 (22.2) 2559 61.9
Cuddalore 559 (21.8) 565 (22.1) 533 (20.8) 365 (14.3) 539 (21.1) 2561 61.3
Deoria 562 (20.1) 570 (20.4) 571 (20.4) 415 (14.9) 675 (24.2) 2793 62.0
Ganjam 294 (11.0) 477 (17.8) 714 (26.7) 390 (14.6) 804 (30.0) 2679 63.5
Gulbarga 585 (21.5) 604 (22.2) 645 (23.7) 356 (13.1) 531 (19.5) 2721 61.4
Jhansi 657 (23.9) 581 (21.1) 573 (20.8) 427 (15.5) 517 (18.8) 2755 61.9
Malda 784 (28.6) 663 (24.2) 521 (19.0) 315 (11.5) 461 (16.8) 2744 60.5
Nagaur 669 (26.7) 415 (16.5) 407 (16.2) 393 (15.7) 626 (24.9) 2510 62.8
Palakkad 591 (23.2) 482 (18.9) 527 (20.7) 346 (13.6) 600 (23.6) 2546 62.1
Parbhani 392 (14.4) 587 (21.5) 670 (24.6) 557 (20.4) 521 (19.1) 2727 61.9
Prakasam 611 (22.7) 538 (20.0) 524 (19.5) 356 (13.2) 659 (24.5) 2688 61.7
Rajnandgaon 555 (21.7) 654 (25.6) 554 (21.7) 462 (18.1) 331 (13.0) 2556 61.0
Shahdol 686 (24.6) 703 (25.2) 666 (23.9) 349 (12.5) 388 (13.9) 2792 59.7
Solan 777 (30.5) 664 (26.1) 372 (14.6) 233 (9.2) 498 (19.6) 2544 60.3
Surendrangr 702 (25.3) 664 (23.9) 547 (19.7) 388 (14.0) 474 (17.1) 2775 60.4
Vaishali 723 (26.1) 449 (16.2) 500 (18.0) 351 (12.7) 749 (27.0) 2772 62.0
Total (%) 9725 (22.8) 9162 (21.5) 8809 (20.6) 6085 (14.2) 8941 (20.9) 42722 61.5
20
20.6%
14.2%
20.9% 22.8%
21.5%
50-54 55-59 60-64 65-69 70+
Table 4: Age distribution of examined
District 50-54
(%)
55-59
(%)
60-64
(%)
65-69
(%)
70+
(%)
Total Mean
Age
Bhatinda 576 (23.0) 544 (21.0) 483 (19.0) 380 (14.9) 565 (22.2) 2548 61.9
Cuddalore 559 (21.8) 565 (22.1) 533 (20.8) 365 (14.3) 539 (21.1) 2561 61.3
Deoria 511 (21.0) 485 (20.0) 496 (20.0) 368 (15.0) 592 (24.1) 2452 61.9
Ganjam 290 (11.4) 457 (18.0) 674 (26.5) 373 (14.7) 749 (29.5) 2543 63.4
Gulbarga 550 (22.0) 542 (22.0) 588 (24.0) 329 (13.2) 479 (19.3) 2488 61.3
Jhansi 606 (24.6) 502 (20.4) 503 (20.4) 382 (15.5) 471 (19.1) 2464 62.0
Malda 763 (31.0) 602 (24.0) 436 (18.0) 267 (10.8) 406 (16.4) 2474 60.2
Nagaur 665 (26.7) 412 (16.5) 401 (16.1) 391 (15.7) 623 (25.0) 2492 62.8
Palakkad 578 (23.0) 473 (19.0) 506 (20.0) 334 (13.5) 584 (23.6) 2475 62.1
Parbhani 362 (14.7) 539 (22.0) 587 (23.9) 494 (20.1) 474 (19.3) 2456 61.9
Prakasam 589 (23.0) 513 (20.0) 506 (20.0) 340 (13.2) 630 (24.4) 2578 61.7
Rajnandgaon 555 (21.7) 654 (25.6) 554 (21.7) 462 (18.1) 331 (13.0) 2556 61.0
Shahdol 621 (24.8) 630 (25.2) 577 (23.0) 319 (12.7) 358 (14.3) 2505 59.7
Solan 776 (30.6) 661 (26.1) 368 (14.5) 233 (9.2) 497 (19.6) 2535 60.3
Surendrangr 688 (25.7) 641 (24.0) 519 (19.4) 366 (13.7) 460 (17.2) 2674 60.4
Vaishali 699 (26.4) 419 (15.8) 474 (17.9) 335 (12.7) 719 (27.2) 2646 62.0
Total (%) 9388 (23.2) 8639 (21.4) 8205 (20.3) 5738 (14.2) 8477 (21.0) 40447 61.5
21
24%
21%
20%
14%
21%
50-54 55-59 60-64 65-69 70+
Table 5: Occupation status of Enumerated
District Work & earns
income (%)
Work & no
income (%)
House work
(%)
No work
(%)
No response
(%)
Total
Bhatinda 1145 (44.7) 172 (6.7) 854 (33.4) 354 (13.8) 34 (1.3) 2559
Cuddalore 638 (24.9) 309 (12.1) 1009 (39.4) 605 (23.6) 0 2561
Deoria 710 (25.4) 147 (5.3) 1445 (51.7) 471 (16.9) 20 (0.7) 2793
Ganjam 518 (19.3) 799 (29.8) 622 (23.2) 721 (26.9) 19 (0.7) 2679
Gulbarga 1230 (45.2) 45 (1.7) 888 (32.6) 556 (20.4) 2 (0.1) 2721
Jhansi 906 (32.9) 61 (2.2) 1028 (37.3) 733 (26.6) 27 (1.0) 2755
Malda 775 (28.2) 104 (3.8) 1467 (53.5) 393 (14.3) 5 (0.2) 2744
Nagaur 373 (14.9) 354 (14.1) 1123 (44.7) 660 (26.3) 0 2510
Palakkad 659 (25.9) 175 (6.9) 1388 (54.5) 321 (12.6) 3 (0.1) 2546
Parbhani 1037 (38.0) 26 (1.0) 909 (33.0) 657 (24.1) 98 (3.6) 2727
Prakasam 1504 (56.0) 75 (2.8) 644 (24.0) 463 (17.2) 2 (0.1) 2688
Rajnandgaon 1579 (61.8) 295 (11.5) 354 (13.9) 328 (12.8) 0 (0) 2556
Shahdol 705 (25.3) 1139 (40.8) 699 (25.0) 244 (8.7) 5 (0.2) 2792
Solan 1152 (45.3) 10 (4.2) 924 (36.3) 363 (14.3) 3 (0.1) 2544
Surendrangr 946 (34.1) 253 (9.1) 1291 (46.5) 281 (10.1) 4 (0.1) 2775
Vaishali 1145(41.3) 33 (1.2) 1042 (37.6) 552 (19.9) 0 2772
Total (%) 15022 (35.2) 4089 (9.6) 15687 (36.7) 7702 (18.0) 222 (0.5) 42722
22
Work & earns
income
35%
Work & no
income
10%
House work
36%
No work
18%
No response
1%
Table 6: Blindness Categories based on Presenting Vision
District Normal Vision
(NN) (%)
Low Vision
(LV) (%)
Economic
Blindness
(EB) (%)
Social
Blindness
(SB) (%)
One Eye
Blind
(UB) (%)
Total
Examined
Bhatinda 2047 (80.4) 199 (7.8) 51 (2.0) 61 (2.4) 188 (7.4) 2546
Cuddalore 1600 (62.5) 546 (21.3) 115 (4.5) 72 (2.8) 228 (8.9) 2561
Deoria 1325 (54.0) 677 (27.6) 225 (9.2) 78 (3.2) 147 (6.0) 2452
Ganjam 1774 (69.8) 399 (15.7) 55 (2.2) 199 (7.8) 114 (4.5) 2541
Gulbarga 1667 (67.0) 393 (15.8) 90(3.6) 107 (4.3) 231 (9.3) 2488
Jhansi 1586 (64.4) 391(15.9) 116 (4.7) 146 (5.9) 224 (9.1) 2463
Malda 1849 (74.8) 363 (14.7) 104 (4.2) 63 (2.6) 94 (3.8) 2473
Nagaur 1701 (68.3) 325 (13.0) 83 (3.3) 135 (5.4) 248 (10.0) 2492
Palakkad 2101 (84.9) 166 (6.7) 66 (2.7) 25 (1.0) 117 (4.7) 2475
Parbhani 1576 (64.2) 395 (16.1) 166 (6.8) 111 (4.5) 208 (8.5) 2456
Prakasam 1576 (61.1) 569 (22.1) 131 (5.1) 88 (3.4) 214 (8.3) 2578
Rajnandgaon 1357 (53.1) 786 (30.8) 225 (8.8) 112 (4.4) 76 (3.0) 2556
Shahdol 1870 (74.7) 411 (16.4) 84 (3.4) 50 (2.0) 90 (3.6) 2505
Solan 2030 (80.1) 319 (12.6) 46 (1.8) 35 (1.4) 103 (4.1) 2533
Surendrangr 2055 (76.9) 314 (11.7) 111 (4.2) 42 (1.6) 152 (5.7) 2674
Vaishali 1717 (64.9) 533 (20.1) 129 (4.9) 119 (4.5) 148 (5.6) 2646
Total (%) 27831 (68.8) 6786 (16.8) 1797 (4.4) 1443 (3.6) 2582 (6.4) 40439
23
UB
6.4%SB
3.6%EB
4.4%
LV
16.8%
NN
68.8%
24
Table 7: Blindness Categories based on Pinhole Vision
District Normal (%) Low Vision
(%)
Economic
Blindness
(%)
Social
Blindness
(%)
One Eye
Blind (%)
Total
Examined
Bhatinda 2083 (81.8) 163 (6.4) 49 (1.9) 60 (2.4) 191 (7.5) 2546
Cuddalore 1917 (74.9) 347 (13.6) 43 (1.7) 50 (2.0) 204 (8.0) 2561
Deoria 1773 (72.3) 317 (12.9) 122 (5.0) 61 (2.5) 179 (7.3) 2452
Ganjam 1929 (75.9) 237 (9.3) 63 (2.5) 167 (6.6) 145 (5.7) 2541
Gulbarga 1900 (76.4) 180 (7.2) 67 (2.7) 80 (3.2) 261 (10.5) 2488
Jhansi 1771 (71.9) 249 (10.1) 82 (3.3) 129 (5.2) 232 (9.4) 2463
Malda 2107 (5.2) 150 (6.1) 62 (2.5) 46 (1.9) 108 (4.4) 2473
Nagaur 1902 (76.3) 178 (7.1) 56 (2.3) 110 (4.4) 246 (9.9) 2492
Palakkad 2164 (87.4) 129 (5.2) 44 (1.8) 23 (0.9) 115 (4.7) 2475
Parbhani 1811 (73.7) 211 (8.6) 119 (4.9) 96 (3.9) 219 (8.9) 2456
Prakasam 1877 (72.8) 352 (13.7) 81 (3.1) 76 (2.9) 192 (7.5) 2578
Rajnandgaon 1808 (70.7) 404 (15.8) 133 (5.2) 86 (3.4) 125 (4.9) 2556
Shahdol 2117 (84.5) 174 (7.0) 48 (1.9) 42 (1.7) 124 (5.0) 2505
Solan 2173 (85.8) 179 (7.1) 41 (1.6) 34(1.4) 106 (4.2) 2533
Surendrangr 2237 (83.7) 189 (7.1) 67 (2.5) 39 (1.5) 142 (5.3) 2674
Vaishali 1918 (72.5) 362 (13.7) 89 (3.4) 108 (4.1) 169 (6.4) 2646
Total (%) 31487 (77.9) 3821 (9.5) 1166 (2.9) 1207 (3.0) 2758 (6.8) 40439
LV
9.5%
EB
2.9%
SB
3.0%
UB
6.8%
NN
77.9%
25
Table 8: Bilateral Blind persons (NPCB <6/60)
District Presenting (%) Pinhole (%) Total
Bhatinda 112 (4.4) 109 (4.3) 2548
Cuddalore 187 (7.3) 93 (3.6) 2561
Deoria 303 (12.4) 183 (7.5) 2452
Ganjam 254 (10.0) 230 (9.0) 2543
Gulbarga 197 (7.9) 147 (5.9) 2488
Jhansi 262 (10.6) 211 (8.6) 2464
Malda 167 (6.8) 108 (4.4) 2474
Nagaur 218 (8.8) 166 (6.7) 2492
Palakkad 91 (3.7) 67 (2.7) 2475
Parbhani 277 (11.3) 215 (8.8) 2456
Prakasam 219 (8.5) 157 (6.1) 2578
Rajnandgaon 337 (13.2) 219 (8.6) 2556
Shahdol 134 (5.4) 90 (3.6) 2505
Solan 81 (3.2) 75 (3.0) 2535
Surendrangr 153 (5.7) 106 (4.0) 2674
Vaishali 248 (9.4) 197 (7.5) 2646
Total (%) 3240 (8.0) 2373 (5.9) 40447
0
2
4
6
8
10
12
14
BHATINDA
CUDDALORE
DEORIA
GANJAM
GULBARGA
JHANSI
MALDA
NAGAUR
PALA
KKAD
PARBHANI
PRAKASAM
RAJNANDGAON
SHAHDOL
SOLAN
SURENDRANGR
VAISHALI
Presenting Pinhole
26
Table 9: Gender wise NPCB blind (<6/60) - Presenting Vision
District Male (%) Total Female (%) Total
Bhatinda 52 (3.7) 1412 60 (5.3) 1136
Cuddalore 64 (5.8) 1109 123 (8.5) 1452
Deoria 104 (10.2) 1020 199 (13.9) 1432
Ganjam 87 (8.5) 1023 167 (11.0) 1520
Gulbarga 73 (7.7) 944 124 (8.0) 1544
Jhansi 92 (8.2) 1123 170 (12.7) 1341
Malda 65 (6.0) 1083 102 (7.3) 1391
Nagaur 87 (7.9) 1105 131 (9.4) 1387
Palakkad 24 (2.4) 1004 67 (4.6) 1471
Parbhani 90 (9.7) 928 187 (12.2) 1528
Prakasam 77 (7.0) 1105 142 (9.6) 1473
Rajnandgaon 122 (10.6) 1150 215 (15.3) 1406
Shahdol 56 (4.5) 1239 78 (6.2) 1266
Solan 40 (2.9) 1405 41 (3.6) 1130
Surendrangr 62 (5.2) 1190 91 (6.1) 1484
Vaishali 95 (7.1) 1341 153 (11.7) 1305
Total (%) 1190 (6.6) 18181 2050 (9.2) 22266
Table 10: Gender wise NPCB blind (<6/60)- Pinhole Vision DISTRICT Male (%) Total Female (%) Total
Bhatinda 51 (3.6) 1412 58 (5.1) 1136
Cuddalore 36 (3.3) 1109 57 (3.9) 1452
Deoria 61 (6.0) 1020 122 (8.5) 1432
Ganjam 78 (7.6) 1023 152 (10.0) 1520
Gulbarga 54 (5.7) 944 93 (6.0) 1544
Jhansi 72 (6.4) 1123 139 (10.4) 1341
Malda 44 (4.1) 1083 64 (4.6) 1391
Nagaur 63 (5.7) 1105 103 (7.4) 1387
Palakkad 17 (1.7) 1004 50 (3.4) 1471
Parbhani 70 (7.5) 928 145 (9.5) 1528
Prakasam 57 (5.2) 1105 100 (6.8) 1473
Rajnandgaon 83 (7.2) 1150 136 (9.7) 1406
Shahdol 39 (3.2) 1239 51 (4.0) 1266
Solan 40 (2.9) 1405 35 (3.1) 1130
Surendrangr 42 (3.5) 1190 64 (4.3) 1484
Vaishali 76 (5.7) 1341 121 (9.3) 1305
Total (%) 883 (4.9) 18181 1490 (6.7) 22266
27
6.6
9.2
4.9
6.7
0
1
2
3
4
5
6
7
8
9
10
Male Female
Presenting NPCB blind Pinhole NPCB blind
28
Table 11: Age specific prevalence of NPCB Blindness (Presenting)
District 50-54 years 55-59 years 60-64 years 65-69 years 70 years and above
No. of
blind (%)
No.
Exam
No. of
blind (%)
No.
Exam
No. of
blind (%)
No.
Exam
No. of blind
(%)
No.
Exam
No. of
blind (%)
No.
Exam
Bhatinda 4 (0.7) 576 7 (1.3) 544 17 (3.5) 483 12 (3.2) 380 72 (12.7) 565
Cuddalore 16 (2.9) 559 22 (3.9) 565 42 (7.9) 533 36 (9.9) 365 71 (13.2) 539
Deoria 11 (2.2) 511 22 (4.5) 485 55 (11.1) 496 51 (13.9) 368 164 (27.7) 592
Ganjam 2 (0.7) 290 9 (2.0) 457 52 (7.8) 674 31 (8.3) 373 160 (21.4) 749
Gulbarga 7 (1.3) 550 15 (2.8) 542 41 (7.0) 588 40 (12.2) 329 94 (19.6) 479
Jhansi 9 (1.5) 606 23 (4.6) 502 52 (10.3) 503 54 (14.1) 382 124 (26.3) 471
Malda 9 (1.2) 763 14 (2.3) 602 21 (4.8) 436 32 (12.0) 267 91 (22.4) 406
Nagaur 10 (1.5) 665 11 (2.7) 412 23 (5.7) 401 41 (10.5) 391 133 (21.4) 623
Palakkad 1 (0.2) 578 3 (0.6) 473 8 (1.6) 506 9 (2.7) 334 70 (12.0) 584
Parbhani 2 (0.6) 362 19 (3.5) 539 48 (8.2) 587 70 (14.2) 494 138 (29.1) 474
Prakasam 11 (1.9) 589 23 (4.5) 513 29 (5.7) 506 28 (8.2) 340 128 (20.3) 630
Rajnandgaon 12 (2.2) 555 33 (5.1) 654 73 (13.2) 554 91 (19.7) 462 128 (38.7) 331
Shahdol 6 (0.97) 621 7 (1.1) 630 15 (2.6) 577 25 (7.8) 319 81 (22.6) 358
Solan 1 (0.1) 776 7 (1.1) 661 10 (2.7) 368 7 (3.0) 233 56 (11.3) 497
Surendrangr 9 (1.3) 688 12 (1.9) 641 20 (3.9) 519 31 (8.5) 366 81 (17.6) 460
Vaishali 13 (1.9) 699 13 (3.1) 419 31 (6.5) 474 39 (11.6) 335 152 (21.1) 719
Total 123 (1.3) 9388 240 (2.8) 8639 537 (6.5) 8205 597 (10.4) 5738 1743(20.6) 8477
29
Table 12: Age specific prevalence of NPCB Blindness (Pinhole vision)
District 50-54 years 55-59 years 60-64 years 65-69 years 70 years and above
No. of
blind (%)
No.
Exam
No. of
blind (%)
No.
Exam
No. of
blind (%)
No.
Exam
No. of
blind (%)
No.
Exam
No. of blind
(%)
No.
Examined
Bhatinda 4 (0.7) 576 7 (1.3) 544 16 (3.3) 483 12 (3.2) 380 70 (12.4) 565
Cuddalore 6 (1.1) 559 4 (0.7) 565 21 (3.9) 533 16 (4.4) 365 46 (8.5) 539
Deoria 6 (1.2) 511 7 (1.4) 485 34 (6.9) 496 27 (7.3) 368 109 (18.4) 592
Ganjam 2 (0.7) 290 7 (1.5) 457 46 (6.8) 674 28 (7.5) 373 147 (19.6) 749
Gulbarga 5 (0.9) 550 9 (1.7) 542 30 (5.1) 588 27 (8.2) 329 76 (15.9) 479
Jhansi 7 (1.2) 606 18 (3.6) 502 40 (8.0) 503 47 (12.3) 382 99 21.0 471
Malda 7 (0.9) 763 10 (1.7) 602 13 (3.0) 436 18 (6.7) 267 60 (14.8) 406
Nagaur 6 (0.9) 665 8 (1.9) 412 15 (3.7) 401 27 (6.9) 391 110 (17.7) 623
Palakkad 1 (0.2) 578 2 (0.4) 473 5 (0.99) 506 7 (2.1) 334 52 (8.9) 584
Parbhani 1 (0.3) 362 11 (2.0) 539 32 (5.5) 587 52 (10.5) 494 119 (25.1) 474
Prakasam 7 (1.2) 589 12 (2.3) 513 16 (3.2) 506 20 (5.9) 340 102 (16.2) 630
Rajnandgaon 5 (0.9) 555 19 (2.9) 654 44 (7.9) 554 57 (12.3) 462 94 (28.4) 331
Shahdol 5 (0.8) 621 6 (0.95) 630 10 (1.7) 577 15 (4.7) 319 54 (15.1) 358
Solan 1 (0.1) 776 6 (0.9) 661 10 (2.7) 368 6 (2.6) 233 52 (10.5) 497
Surendrangr 6 (0.9) 688 7 (1.1) 641 16 (3.1) 519 18 (4.9) 366 59 (12.8) 460
Vaishali 9 (1.3) 699 9 (2.2) 419 24 (5.1) 474 30 (9.0) 335 125 (17.4) 719
Total 78 (0.8) 9388 142 (1.6) 8639 372 (4.5) 8205 407 (7.1) 5738 1374 (16.2) 8477
30
Age specific prevalence of NPCB Blindness
0
5
10
15
20
25
50-54 yrs 55-59 yrs 60-64 yrs 65-69 yrs 70+ yrs
Presenting Pinhole
31
Table 13: Cataract surgical coverage (Persons)
0
10
20
30
40
50
60
70
80
90
100
BHATIN
DA
CUDDALO
RE
DEO
RIA
GANJA
M
GULB
ARGA
JHAN
SI
MALD
A
NAG
AUR
PALA
KKA
D
PAR
BHANI
PRAKAS
AM
RAJN
ANDGAON
SHAHDO
L
SOLA
N
SURENDRANG
R
VAIS
HALI
Surgical cov. <6/60 Surgical cov. <3/60
District Cataract
operated
persons
Cat. Not
operated
with
vision<6/60
Total
unop+op.
(<6/60)
Surgical
coverage
<6/60
Vision<3/60
with
cataract
Total
unop+op.
(<3/60)
Surgical
cov. <3/60
Bhatinda 309 77 386 80.1 31 340 90.9
Cuddalore 621 149 770 80.6 51 672 92.4
Deoria 224 270 494 45.3 69 293 76.5
Ganjam 217 215 432 50.2 170 387 56.1
Gulbarga 229 172 401 57.1 91 320 71.6
Jhansi 356 187 543 65.6 98 454 78.4
Malda 151 157 308 49.0 59 210 71.9
Nagaur 433 165 598 72.4 96 529 81.9
Palakkad 297 76 373 79.6 19 316 94.0
Parbhani 338 240 578 58.5 91 429 78.8
Prakasam 476 195 671 70.9 72 548 86.9
Rajnandgaon 349 284 633 55.1 85 434 80.4
Shahdol 195 106 301 64.8 38 233 83.7
Solan 275 56 331 83.1 20 295 93.2
Surendrangr 511 96 607 84.2 18 529 96.6
Vaishali 193 223 416 46.4 107 300 64.3
Total 5174 2668 7842 66.0 1115 6289 82.3
32
Table 14: Cataract surgical coverage (Eyes)
District Eyes
operated
for
cataract
Unop. Eyes
with vision
<6/60
Total Surgical
Coverage
%
Unop. Eyes
with vision
<3/60
Total Surgical
Coverage
%
Bhatinda 440 258 698 63.0 150 590 74.6
Cuddalore 909 532 1441 63.1 277 1186 76.6
Deoria 283 748 1031 27.4 315 598 47.3
Ganjam 302 547 849 35.6 457 759 39.8
Gulbarga 286 606 892 32.1 392 678 42.2
Jhansi 491 581 1072 45.8 367 858 57.2
Malda 199 436 635 31.3 214 413 48.2
Nagaur 588 535 1123 52.4 387 975 60.3
Palakkad 441 261 702 62.8 104 545 80.9
Parbhani 440 659 1099 40.0 320 760 57.9
Prakasam 677 640 1317 51.4 310 987 68.6
Rajnandgaon 499 692 1191 41.9 258 757 65.9
Shahdol 264 304 568 46.5 149 413 63.9
Solan 407 207 614 66.3 105 512 79.5
Surendrangr 786 273 1059 74.2 89 875 89.8
Vaishali 241 684 925 26.1 391 632 38.1
Total 7253 7963 15216 47.7 4285 11538 62.9
0
10
20
30
40
50
60
70
80
90
100
BHATI
NDA
CUDDAL
ORE
DEO
RIA
GAN
JAM
GULB
ARGA
JHAN
SI
MAL
DA
NAG
AUR
PALA
KKAD
PARBH
ANI
PRAKA
SAM
RAJ
NANDGAON
SHAHDOL
SOLA
N
SUREN
DRAN
GR
VAI
SHALI
Surgical Cov. % Surgical Cov. %
33
Table 15: Distribution of Cataract Operated in Districts
District Total
Catops
Male Female 2002-
2007
1997-
2001
< 1997 Don’t
know
Bhatinda 408 203 205 209 108 60 31
Cuddalore 901 406 495 639 172 71 19
Deoria 280 120 160 175 82 15 8
Ganjam 302 128 174 193 81 22 6
Gulbarga 371 137 234 203 91 32 45
Jhansi 487 182 305 310 107 56 14
Malda 197 92 105 113 48 23 13
Nagaur 583 270 313 354 130 89 10
Palakkad 447 161 286 266 114 58 9
Parbhani 422 178 244 262 121 34 5
Prakasam 683 291 392 447 160 70 6
Rajnandgaon 508 211 297 359 113 27 9
Shahdol 268 123 145 185 54 27 2
Solan 413 200 213 242 103 56 12
Surendrangr 787 289 498 453 202 111 21
Vaishali 239 113 126 172 45 19 3
Total 7296 3104 4192 4582 1731 770 213
34
Table 16: District wise IOL rate
District Total cats
done
No. of IOLs % IOL
Bhatinda 408 198 48.5
Cuddalore 901 685 76.0
Deoria 280 158 56.4
Ganjam 302 180 59.6
Gulbarga 371 220 59.3
Jhansi 487 176 36.1
Malda 197 94 47.7
Nagaur 583 364 62.4
Palakkad 447 373 83.4
Parbhani 422 265 62.8
Prakasam 683 471 69.0
Rajnandgaon 508 321 63.2
Shahdol 268 168 62.7
Solan 413 254 61.5
Surendrangr 787 557 70.8
Vaishali 239 157 65.7
Total 7296 4641 63.6
% IOL
0
10
20
30
40
50
60
70
80
90
BHAT
INDA
CUDDAL
ORE
DEO
RIA
GAN
JAM
GULB
ARG
A
JHAN
SI
MAL
DA
NAGAU
R
PALA
KKAD
PARBH
ANI
PRAK
ASAM
RAJN
ANDGAON
SHAH
DOL
SOLA
N
SUREN
DRA
NGR
VAIS
HALI
35
Table 17: Distribution of IOL rate in IOL Operated cases by year
District 2002-2007 1997-2001 Before 1997
RE+LE
IOL
Total
surgery
IOL
rate
(%)
RE+LE
IOL
Total
sugery
IOL
rate
(%)
RE+LE
IOL
Total
sugery
IOL
rate
(%)
Bhatinda 148 209 70.8 27 108 25.0 10 60 16.7
Cuddalore 574 639 89.8 101 172 58.7 9 71 12.7
Deoria 125 175 71.4 25 82 30.5 3 15 20.0
Ganjam 161 193 83.4 17 81 21.0 0 22 0.0
Gulbarga 150 203 73.9 30 91 33.0 6 32 18.8
Jhansi 153 310 49.4 18 107 16.8 0 56 0.0
Malda 74 113 65.5 10 48 20.8 0 23 0.0
Nagaur 289 354 81.6 54 130 41.5 13 89 14.6
Palakkad 258 266 97.0 94 114 82.5 19 58 32.8
Parbhani 217 262 82.8 44 121 36.4 2 34 5.9
Prakasam 393 447 87.9 72 160 45.0 6 70 8.6
Rajnandgaon 287 359 79.9 26 113 23.0 2 27 7.4
Shahdol 162 185 87.6 6 54 11.1 0 27 0.0
Solan 212 242 87.6 38 103 36.9 3 56 5.4
Surendrangr 421 453 92.9 123 202 60.9 11 111 9.9
Vaishali 141 172 82.0 11 45 24.4 4 19 21.1
Total 3765 4582 82.2 696 1731 40.2 88 770 11.4
0
10
20
30
40
50
60
70
80
90
2002-2007 1997-2001 Before 1997
IOL Rate(%)
36
Table 18: Gender distribution of IOL rate in Operated cases
District Male Total
surgery
% IOL Female Total
surgery
% IOL
Bhatinda 112 203 55.2 86 205 42.0
Cuddalore 306 406 75.4 379 495 76.6
Deoria 78 120 65.0 80 160 50.0
Ganjam 73 128 57.0 107 174 61.5
Gulbarga 79 137 57.7 141 234 60.3
Jhansi 73 182 40.1 103 305 33.8
Malda 46 92 50.0 48 105 45.7
Nagaur 176 270 65.2 188 313 60.1
Palakkad 151 161 93.8 222 286 77.6
Parbhani 114 178 64.0 151 244 61.9
Prakasam 208 291 71.5 263 392 67.1
Rajnandgaon 140 211 66.4 181 297 60.9
Shahdol 84 123 68.3 84 145 57.9
Solan 127 200 63.5 127 213 59.6
Surendrangr 216 289 74.7 341 498 68.5
Vaishali 74 113 65.5 83 126 65.9
Total 2057 3104 66.3 2584 4192 61.6
Gender distribution of IOL rate in Operated cases
50
52
54
56
58
60
62
64
66
68
70
Male Female
37
Table 19: Visual Acuity of Operated cases by type of surgery
(Non-IOL)
Table 20: Visual Acuity of Operated cases by type of surgery (IOL)
District > 6/18
(%)
6/18-6/60
(%)
6/60-3/60
(%)
<3/60 (%) Total
Bhatinda 118 (56.2) 49 (23.3) 11 (5.2) 32 (15.2) 210
Cuddalore 72 (33.3) 35 (16.2) 16 (7.4) 93 (43.1) 216
Deoria 29 (23.8) 48 (39.3) 25 (20.5) 20 (16.4) 122
Ganjam 9 (7.4) 32 (26.2) 9 (7.4) 72 (59.0) 122
Gulbarga 56 (37.1) 25 (16.6) 13 (8.6) 57 (37.7) 151
Jhansi 114 (36.7) 64 (20.6) 38 (12.2) 95 (30.5) 311
Malda 55 (53.4) 14 (13.6) 6 (5.8) 28 (27.2) 103
Nagaur 78 (35.6) 50 (22.8) 24 (11.0) 67 (30.6) 219
Palakkad 34 (45.9) 12 (16.2) 20 (27.0) 8 (10.8) 74
Parbhani 27 (17.2) 55 (35.0) 32 (20.4) 43 (27.4) 157
Prakasam 57 (26.9) 51 (24.1) 29 (13.7) 75 (35.4) 212
Rajnandgaon 31 (16.6) 44 (23.5) 40 (21.4) 72 (38.5) 187
Shahdol 10 (10.0) 32 (32) 18 (18.0) 40 (40.0) 100
Solan 55 (34.6) 56 (35.2) 15 (9.4) 33 (20.8) 159
Surendrangr 71 (30.9) 58 (25.2) 53 (23.0) 48 (20.9) 230
Vaishali 19 (23.2) 23 (28.0) 10 (12.2) 30 (36.6) 82
Total (%) 835 (31.5) 648 (24.4) 359 (13.5) 813 (30.6) 2655
District > 6/18
%
6/18-6/60
%
6/60-3/60
%
<3/60
%
Total
Bhatinda 154 (78.6) 24 (12.2) 3 (1.5) 15 (7.7) 196
Cuddalore 494 (72.1) 133 (19.4) 32 (4.7) 26 (3.8) 685
Deoria 115 (72.8) 27 (17.1) 9 (5.7) 7 (4.4) 158
Ganjam 100 (55.6) 49 (27.2) 7 (3.9) 24 (13.3) 180
Gulbarga 169 (78.2) 29 (13.4) 6 (2.8) 12 (5.6) 216
Jhansi 109 (61.9) 40 (22.7) 11 (6.3) 16 (9.1) 176
Malda 69 (73.4) 20 (21.3) 3 (3.2) 2 (2.1) 94
Nagaur 220 (60.4) 76 (20.9) 26 (7.1) 42 (11.5) 364
Palakkad 322 (86.8) 29 (7.8) 8 (2.2) 12 (3.2) 371
Parbhani 193 (72.8) 47 (17.7) 12 (4.5) 13 (4.9) 265
Prakasam 341 (72.4) 93 (19.7) 18 (3.8) 19 (4.0) 471
Rajnandgaon 169 (52.6) 118 (36.8) 22 (6.9) 12 (3.7) 321
Shahdol 116 (69.0) 34 (20.2) 9 (5.4) 9 (5.4) 168
Solan 177 (69.7) 56 (22.0) 12 (4.7) 9 (3.5) 254
Surendrangr 380 (68.2) 97 (17.4) 57 (10.2) 23 (4.1) 557
Vaishali 110 (70.1) 35 (22.3) 5 (3.2) 7 (4.5) 157
Total (%) 3238 (69.9) 907 (19.6) 240 (5.2) 248 (5.4) 4633
38
Visual Acuity of Operated cases by type of surgery
31.5
24.4
13.5
30.6
69.9
19.6
5.2 5.4
0
10
20
30
40
50
60
70
80
> 6/18 6/18-6/60 6/60-3/60 <3/60
Non-IOL IOL
39
Table 21: Status of Current Spectacle Use by operated persons
District Using Currently
(%)
Not using Currently
(%)
Total
Bhatinda 116 (44.4) 145 (55.6) 261
Cuddalore 118 (19.8) 478 (80.2) 596
Deoria 140 (65.4) 74 (34.6) 214
Ganjam 55 (25.6) 160 (74.4) 215
Gulbarga 138 (63.0) 81 (37.0) 219
Jhansi 175 (50.0) 175 (50.0) 350
Malda 94 (64.4) 52 (35.6) 146
Nagaur 186 (44.8) 229 (55.2) 415
Palakkad 111 (53.4) 97 (46.6) 208
Parbhani 186 (61.8) 115 (38.2) 301
Prakasam 187 (39.5) 287 (60.6) 474
Rajnandgaon 77 (22.1) 271 (77.9) 348
Shahdol 56 (29.6) 133 (70.4) 189
Solan 125 (47.0) 141 (53.0) 266
Surendrangr 149 (29.4) 358 (70.6) 507
Vaishali 72 (41.9) 100 (58.1) 172
Total (%) 1985 (40.1) 2896 (59.3) 4,881
Status of Current Spectacle Use by operated persons
0
10
20
30
40
50
60
70
80
90
BHATI
NDA
CUDDAL
ORE
DEO
RIA
GAN
JAM
GULB
ARGA
JHAN
SI
MAL
DA
NAG
AUR
PALA
KKAD
PARBH
ANI
PRAKA
SAM
RAJ
NANDGAON
SHAHDOL
SOLA
N
SUREN
DRAN
GR
VAI
SHALI
Using currently Not using currently
40
Table 22: Condition of spectacles and type of surgery
District NON-IOL IOL
Good (%) Poor (%) Not available
(%)
Total Good (%) Poor
(%)
Not
available
(%)
Total
Bhatinda 118 (62.1) 22 (11.6) 50 (26.3) 190 29(19.9) 6 (4.1) 111(76.0) 146
Cuddalore 86 (62.8) 50 (36.5) 1 (0.7) 137 56(81.2) 13(18.8) 0 69
Deoria 23 (26.4) 55 (63.2) 9 (10.3) 87 46(41.1) 28(25.0) 38(33.9) 112
Ganjam 33 (31.7) 21(20.2) 50 (48.1) 104 11(8.1) 0 124(91.9) 135
Gulbarga 85 (59.0) 28(19.4) 31 (21.5) 144 98(61.3) 3(1.9) 59(36.9) 160
Jhansi 146 (52.7) 56(20.2) 75 (27.1) 277 35(22.7) 3(1.9) 116(75.3) 154
Malda 50 (80.6) 12(19.4) 0 62 36(94.7) 0 2(5.3) 38
Nagaur 70 (32.3) 99(45.6) 48(22.1) 217 94(26.3) 28(7.8) 235(65.8) 357
Palakkad 45 (68.2) 8(12.1) 13(19.7) 66 126(48.1) 13(5.0) 123(46.9) 262
Parbhani 59 (50.9) 35(30.2) 22(19.0) 116 95(53.1) 20(11.2) 64(35.8) 179
Prakasam 101 (55.5) 30(16.5) 51(28.0) 182 140(31.4) 9(2.0) 297(66.6) 446
Rajnandgaon 61 (37.9) 35(21.7) 65(40.4) 161 13(6.0) 2(0.9) 201(93.1) 216
Shahdol 18 (20.7) 46(52.9) 23(26.4) 87 21(15.3) 2(1.5) 114(83.2) 137
Solan 96 (65.3) 35(23.8) 16(10.9) 147 47(23.7) 4(2.0) 147(74.2) 198
Surendrangr 112 (52.6) 41(19.2) 60(28.2) 213 103(20.7) 2(0.4) 393(78.9) 498
Vaishali 16 (26.7) 29(48.3) 15(25.0) 60 23(45.1) 5(9.8) 23(45.1) 51
Total (%) 1119 (49.7) 602(26.8) 529(23.5) 2250 973(30.8) 138(4.4) 2047(64.8) 3158
41
Condition of spectacles and type of surgery
Non IOL Surgery IOL Surgery
Good
49%
Poor
27%
Not available
24%
Good
31%
Poor
4%
Not
available
65%
42
Table 23: Payment status for cataract surgical services (IOL and Non-IOL)
District NON-IOL
IOL
Free (%) Paid (%) Total Free (%) Paid (%) Total
Bhatinda 154 (75.1) 51 (24.9) 205 68 (44.7) 84 (55.3) 152
Cuddalore 191 (88.4) 25 (11.6) 216 452 (78.1) 127 (21.9) 579
Deoria 106 (86.9) 16 (13.1) 122 51 (40.8) 74 (59.2) 125
Ganjam 98 (81.7) 22 (18.3) 120 103 (75.2) 34 (24.8) 137
Gulbarga 107(70.9) 44 (29.1) 151 56 (38.6) 89 (61.4) 145
Jhansi 258 (83.5) 51 (16.5) 309 79 (61.7) 49 (38.3) 128
Malda 93 (94.9) 5 (5.1) 98 17 (25.4) 50 (74.6) 67
Nagaur 146 (67.3) 71 (32.7) 217 138 (51.7) 129 (48.3) 267
Palakkad 54 (73.0) 20 (27.0) 74 154 (49.7) 156 (50.3) 310
Parbhani 131(85.1) 23 (14.9) 154 133 (69.6) 58 (30.4) 191
Prakasam 86 (40.6) 126 (59.4) 212 167 (42.9) 222 (57.1) 389
Rajnandgaon 172 (92.0) 15 (8.0) 187 191 (71.5) 76 (28.5) 267
Shahdol 94 (94.0) 6 (6.0) 100 114 (84.4) 21 (15.6) 135
Solan 128 (81.5) 29 (18.5) 157 79 (40.1) 118 (59.9) 197
Surendrangr 175 (77.1) 52 (22.9) 227 316 (65.6) 166 (34.4) 482
Vaishali 59 (72.0) 23 (28.0) 82 21 (18.9) 90 (81.1) 111
Total (%) 2052 (78.0) 579 (22.0) 2631 2139 (58.1) 1543 (41.9) 3682
Non IOL IOL
78%
22%
Free Paid
58%
42%
Free Paid
43
Table 24: Location where cataract surgery performed in different years
District 2002-2007 1997-2001 < 1997
Govt
%
NGO
%
Pvt
%
Camps
%
Total
Surg.
N
Govt
%
NGO
%
Pvt
%
Camps
%
Total
Surg.
N
Govt
%
NGO
%
Pvt
%
Camps
%
Total
Surg.
N
Bhatinda 15.2 4.3 40.8 39.8 211 10.8 3.6 36.9 48.6 111 17.2 0.9 37.9 43.1 58
Cuddalore 14.7 82.5 2.8 0.0 641 19.7 76.9 3.5 0.0 173 26.8 28.3 2.8 1.4 71
Deoria 48.3 17.4 31.5 2.8 178 56.5 11.8 21.2 10.6 85 73.3 1.2 20.0 0.0 15
Ganjam 60.6 7.8 14.0 17.6 193 34.1 6.1 15.9 43.9 82 54.5 0.0 13.6 31.8 22
Gulbarga 37.2 5.8 49.3 7.7 207 44.1 6.5 40.9 8.6 93 31.3 2.2 50.0 12.5 32
Jhansi 38.1 26.3 17.0 18.6 312 26.9 25.0 18.5 29.6 108 28.1 5.6 22.8 38.6 57
Malda 20.9 51.3 19.1 8.7 115 8.3 25.0 20.8 45.8 48 30.4 18.8 4.3 26.1 23
Nagaur 12.9 4.4 30.5 52.2 364 6.7 4.4 48.1 40.7 135 6.5 0.7 46.7 45.7 92
Palakkad 4.9 60.9 32.7 1.5 266 5.3 77.2 17.5 0.0 114 13.8 29.8 27.6 0.0 58
Parbhani 65.5 1.5 26.1 6.9 261 59.0 1.6 19.7 19.7 122 73.5 0.0 14.7 11.8 34
Prakasam 22.8 25.4 47.8 4.0 448 18.8 16.3 60.0 5.0 160 18.6 5.0 65.7 4.3 70
Rajnandgaon 19.8 32.9 7.8 39.6 359 14.2 39.8 5.3 40.7 113 14.8 9.7 7.4 37.0 27
Shahdol 58.6 17.2 10.2 14.0 186 33.3 14.8 9.3 42.6 54 18.5 14.8 3.7 48.1 27
Solan 33.3 1.2 41.6 23.9 243 45.6 0.0 23.3 31.1 103 48.2 1.9 17.9 30.4 56
Surendrangr 24.4 54.6 20.3 0.7 454 17.5 61.5 18.5 2.5 200 11.7 31.5 24.3 7.2 111
Vaishali 31.1 6.2 58.8 4.0 177 51.1 2.1 36.2 10.6 47 35.0 2.1 55.0 5.0 20
Total 28.4 31.3 25.7 14.6 4615 25.9 28.4 25.2 20.5 1748 25.0 11.2 28.6 21.1 773
44
Place of surgery in different years
0
20
40
60
80
100
2002-2007 1997-2001 < 1997
Govt NGO Pvt Camps
45
Table 25: Causes of blindness (presenting vision <6/60 better eye-NPCB definition)
RE Cat Uncorr.
Aphakia
Cat
sur
compli
Phtisis Trach Other
cor
scar
Globe
abnor
Glau DR AMD Other
post
seg
Other Undet. Total
Bhatinda 0
72
(66.0)
6
(5.5)
2
(1.8)
0
1
(0.9)
23
(21.1)
0 4
(3.7)
0 0 0 1
(0.9)
0 109
Cuddalore 8
(4.3)
136
(72.7)
14
(7.5)
5
(2.7)
1
(0.5)
0 5
(2.7)
0 2
(1.1)
2
(1.1)
3
(1.6)
8
(4.3)
2
(1.1)
1
(0.5)
187
Deoria 30
(9.9)
256
(84.5)
6
(2.0)
2
(1.0)
3
(0.99)
0 5
(1.7)
0 1
(0.3)
0 0 0 0
0 303
Ganjam 2
(0.8)
212
(86.2)
21
(8.5)
2
(0.8)
2
(0.8)
0 2
(0.8)
0 3
(1.2)
0 0 2
(0.8)
0 0 246
Gulbarga 8
(4.1)
158
(80.2)
4
(2.0)
2
(1.0)
1
(0.5)
0 4
(2.0)
2
1.0
9
(4.6)
1
(0.5)
0 7
(3.6)
0 1
(0.5)
197
Jhansi 11
(4.2)
160
(61.1)
26
(9.9)
7
(2.7)
8
(3.1)
0 20
(7.6)
0 8
(3.1)
0 1
(0.4)
5
(1.9)
14
(5.3)
2
(0.8)
262
Malda 10
(6.0)
140
(83.8)
7
(4.2)
0
1
(0.6)
0 1
(0.6)
0
4
(2.4)
0 0 2
(1.2)
2
(1.2)
0 167
Nagaur 4
(1.8)
146
(67.0)
8
(3.7)
7
(3.2)
2
(0.9)
2
(0.9)
25
(11.5)
1
0.5
9
(4.1)
2
(0.9)
5
(2.3)
6
(2.8)
1
(0.5)
0 218
Palakkad 0
71
(78.0)
5
(5.5)
0 0 0 1
(1.1)
1
1.1
8
(8.8)
0
0
1
(1.1)
4
(4.4)
0 0 91
Parbhani 7
(2.6)
229
(83.3)
5
(1.8)
8
(2.9)
1
(0.4)
1
(0.4)
6
(2.2)
1
0.4
10
(3.6)
1
(0.5)
4
(1.5)
0
1
(0.4)
1
0.4)
275
Prakasam 3
(1.4)
190
(86.8)
0
14
(6.4)
0
0
2
(0.9)
2
0.9
3
(1.4)
0 0 2
(0.9)
2
(0.9)
1
(0.5)
219
Rajnandgaon 5
(1.5)
274
(81.3)
19
(5.6)
6
(1.8)
3
(0.9)
3
(0.9)
6
(1.8)
0 12
(3.6)
0 2
(0.6)
4
(1.2)
2
(0.6)
1
(0.3)
337
Shahdol 5
(3.7)
99
(73.9)
9
(6.7)
1
(0.8)
0 1
(0.8)
2
(1.5)
0 5
(3.7)
1
(0.8)
5
(3.7)
3
(2.2)
2
(1.5)
1
(0.8)
134
Solan 1
(1.3)
54
(67.5)
0 14
(17.5)
1
(1.3)
0 3
(3.8)
0
3
(3.8)
0 0 0 3
(3.8)
1
(1.3)
80
Surendrangr 7
(4.6)
88
(57.5)
11
(7.2)
0 4
(2.6)
2
(1.3)
9
(5.9)
0 8
(5.2)
0 9
(5.9)
8
(5.2)
7
(4.6)
0 153
Vaishali 8
(3.2)
216
(87.1)
7
(2.8)
0
0 0 3
(1.2)
1
0.4
7
(2.8)
0 1
(0.4)
1
(0.4)
2
0.8
2
(0.8)
248
Total 109
(3.4)
2501
(77.5)
148
(4.6)
70
(2.2)
27
(0.8)
10
(0.3)
117
(3.6)
8
0.3
96
(3.0)
7
(0.2)
31
(1.0)
52
(1.6)
39
1.2
11
(0.3)
3226
46
Causes of Blindness (Vision < 6/60 better eye)
Cause of blindness
3.4
77.5
4.6 2.2 0.8 0.3 3.6 0.3 3.0 0.2 1.0 1.6 1.2 0.30
102030405060708090
RE Cat
Unc
orr. A
phak
ia
Cat su
r co
mpli
Phtis
is
Trac
h
Oth
er cor
sca
r
Globe
abn
or
Glau
DR
AMD
Oth
er p
ost se
g
Oth
er
Und
et.
47
Table 26: Causes of low vision (presenting vision < 6/18-6/60 better eye) District RE Cat Uncorr.
Aphakia
Cat sur
compli
Phtisis Trach Other
cor scar
Globe
abnor
Glau DR AMD Other
post seg
Other Undet. Total
Bhatinda 28 (14.9)
131 (69.7)
14 (7.5)
5 (2.7)
0 0 3 (1.6)
0 3 (1.6)
1 (0.5)
1 (0.5)
0 1 (0.5)
1 (0.5)
188
Cuddalore 149 (27.3)
348 (63.7)
14 (2.6)
3 (0.6)
0 0 3 (0.6)
0 8 (1.5)
2 (0.4)
4 (0.7)
9 (1.7)
6 (1.1)
0 546
Deoria 332 (49.0)
323 (47.7)
14 (2.1)
2 (0.3)
2 (0.3)
0 0 0 0 0 1 (0.2)
2 (0.3)
1 (0.2)
0 677
Ganjam 18
(6.6)
226
(83.4)
18
(6.6)
5
(1.9)
0 0 1
(0.4)
0 0 1
(0.4)
1
(0.4)
0 1
(0.4)
0 271
Gulbarga 137 (34.9)
222 (56.5)
6 (1.5)
5 (1.3)
3 (0.8)
1 (0.3)
8 (2.0)
0 3 (0.8)
0 1 (0.3)
5 (1.3)
1 (0.3)
1 (01.3)
393
Jhansi 115
(29.6)
221
(56.8)
21
(5.4)
1
(0.3)
0 0 8
(2.1)
0 3
(0.8)
0 1
(0.3)
3
(0.8)
16
(4.1)
0 389
Malda 226 (62.6)
118 (32.7)
9 (2.5)
0 0 0 2 (0.6)
0 4 (1.1)
0 0 0 2 (0.6)
0 361
Nagaur 33 (10.2)
240 (73.9)
7 (2.2)
18 (5.5)
0 0 11 (3.4)
0 9 (2.8)
1 (0.3)
4 (1.2)
2 (0.6)
0 0 325
Palakkad 14 (8.4)
128 (77.1)
2 (1.2)
0 0 0 2 (1.2)
0 5 (3.01)
6 (3.6)
3 (1.8)
5 (3.0)
0 1 (0.6)
166
Parbhani 82 (21.1)
256 (65.8)
15 (3.9)
5 (1.3)
0 0 8 (2.1)
0 5 (1.3)
0 10 (2.6)
8 (2.1)
0 0 389
Prakasam 156 (27.5)
365 (64.4)
3 (0.5)
18 (3.2)
0 0 4 (0.7)
1 (0.2)
9 (1.6)
0 0 6 (1.1)
4 (0.7)
1 (0.2)
567
Rajnandgaon 368 (46.8)
372 (47.3)
17 (2.2)
3 (0.4)
0 0 3 (0.4)
0 11 (1.4)
0 0
4 (0.5)
6 (0.8)
2 (0.3)
0 786
Shahdol 232 (56.5)
140 (34.1)
16 (3.9)
3 (0.7)
0 2 (0.5)
2 (0.5)
0 1 (0.2)
0 0
8 (2.0)
6 (1.5)
1 (0.2)
0 411
Solan 125 (40.7)
144 (46.9)
4 (1.3)
30 (9.8)
0 0 1 (0.3)
0 1 (0.3)
0 0
1 (0.3)
1 (0.3)
0 0 307
Surendrangr 55 (17.5)
207 (65.9)
11 (3.5)
4 (1.3)
0 0 8 (2.6)
0 1 (0.3)
1 (0.3)
16 (5.1)
4 (1.3)
7 (2.2)
0 314
Vaishali 107 (20.1)
405 (76.0)
6 (1.1)
1 (0.2)
0 0 0
0 1 (0.2)
2 (0.4)
5 (0.9)
4 (0.8)
1 (0.2)
1 (0.2)
533
Total 2177 (32.9)
3846 (58.1)
177 (2.7)
103 (1.6)
5 (0.08)
3 (0.05)
64 (1.0)
1 (0.02)
64 (1.0)
14 (0.2)
60 (0.9)
61 (0.9)
43 (0.7)
5 (0.08)
6623
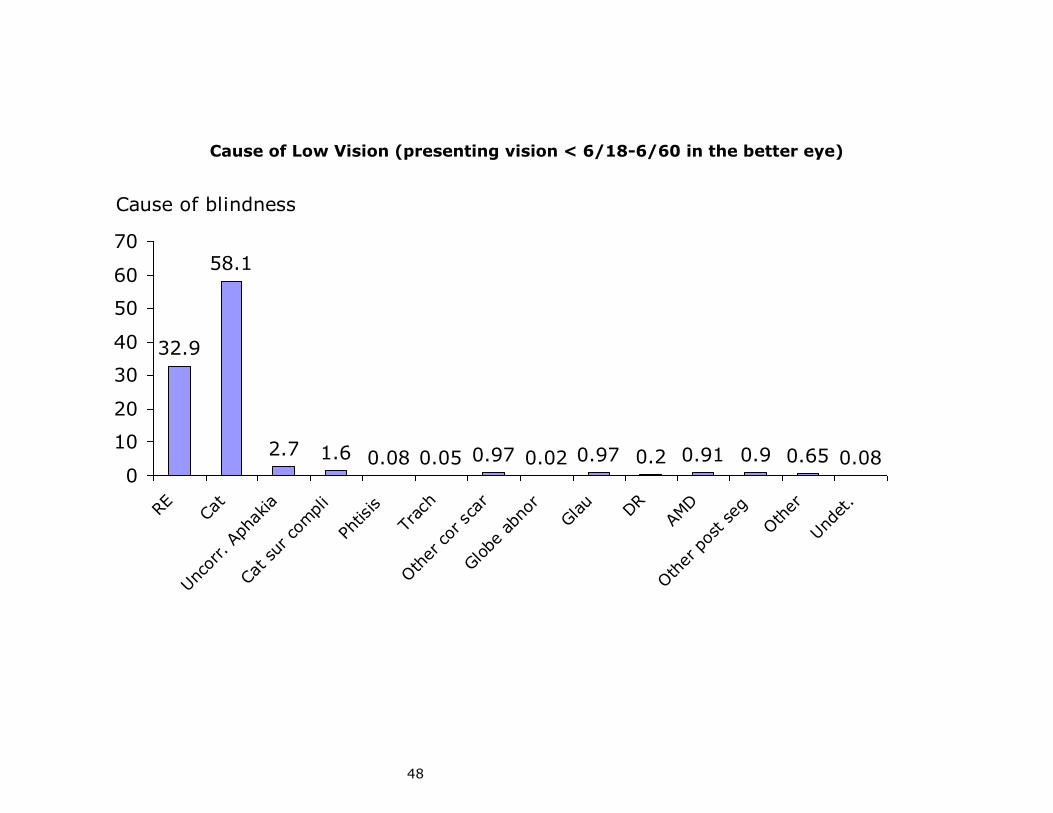
48
Cause of Low Vision (presenting vision < 6/18-6/60 in the better eye)
Cause of blindness
32.9
58.1
2.7 1.6 0.08 0.05 0.97 0.02 0.97 0.2 0.91 0.9 0.65 0.080
10
20
30
40
50
60
70
RE Cat
Unc
orr. A
phak
ia
Cat su
r co
mpli
Phtis
is
Trac
h
Oth
er cor
sca
r
Globe
abn
or
Glau
DR
AMD
Oth
er p
ost se
g
Oth
er
Und
et.
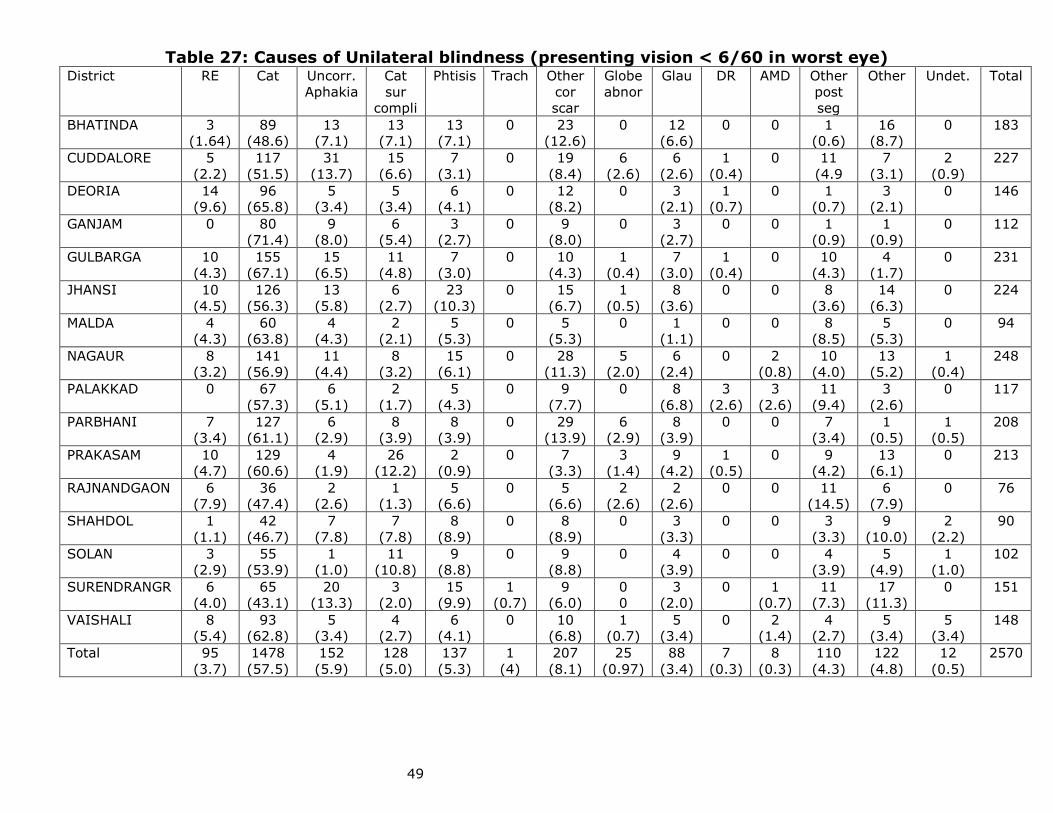
49
Table 27: Causes of Unilateral blindness (presenting vision < 6/60 in worst eye) District RE Cat Uncorr.
Aphakia
Cat
sur
compli
Phtisis Trach Other
cor
scar
Globe
abnor
Glau DR AMD Other
post
seg
Other Undet. Total
BHATINDA 3
(1.64)
89
(48.6)
13
(7.1)
13
(7.1)
13
(7.1)
0 23
(12.6)
0 12
(6.6)
0 0 1
(0.6)
16
(8.7)
0 183
CUDDALORE 5
(2.2)
117
(51.5)
31
(13.7)
15
(6.6)
7
(3.1)
0 19
(8.4)
6
(2.6)
6
(2.6)
1
(0.4)
0 11
(4.9
7
(3.1)
2
(0.9)
227
DEORIA 14
(9.6)
96
(65.8)
5
(3.4)
5
(3.4)
6
(4.1)
0 12
(8.2)
0 3
(2.1)
1
(0.7)
0 1
(0.7)
3
(2.1)
0 146
GANJAM 0 80
(71.4)
9
(8.0)
6
(5.4)
3
(2.7)
0 9
(8.0)
0 3
(2.7)
0 0 1
(0.9)
1
(0.9)
0 112
GULBARGA 10
(4.3)
155
(67.1)
15
(6.5)
11
(4.8)
7
(3.0)
0 10
(4.3)
1
(0.4)
7
(3.0)
1
(0.4)
0 10
(4.3)
4
(1.7)
0 231
JHANSI 10
(4.5)
126
(56.3)
13
(5.8)
6
(2.7)
23
(10.3)
0 15
(6.7)
1
(0.5)
8
(3.6)
0 0 8
(3.6)
14
(6.3)
0 224
MALDA 4
(4.3)
60
(63.8)
4
(4.3)
2
(2.1)
5
(5.3)
0 5
(5.3)
0 1
(1.1)
0 0 8
(8.5)
5
(5.3)
0 94
NAGAUR 8
(3.2)
141
(56.9)
11
(4.4)
8
(3.2)
15
(6.1)
0 28
(11.3)
5
(2.0)
6
(2.4)
0 2
(0.8)
10
(4.0)
13
(5.2)
1
(0.4)
248
PALAKKAD 0 67
(57.3)
6
(5.1)
2
(1.7)
5
(4.3)
0 9
(7.7)
0 8
(6.8)
3
(2.6)
3
(2.6)
11
(9.4)
3
(2.6)
0 117
PARBHANI 7
(3.4)
127
(61.1)
6
(2.9)
8
(3.9)
8
(3.9)
0 29
(13.9)
6
(2.9)
8
(3.9)
0 0 7
(3.4)
1
(0.5)
1
(0.5)
208
PRAKASAM 10
(4.7)
129
(60.6)
4
(1.9)
26
(12.2)
2
(0.9)
0 7
(3.3)
3
(1.4)
9
(4.2)
1
(0.5)
0 9
(4.2)
13
(6.1)
0 213
RAJNANDGAON 6
(7.9)
36
(47.4)
2
(2.6)
1
(1.3)
5
(6.6)
0 5
(6.6)
2
(2.6)
2
(2.6)
0 0 11
(14.5)
6
(7.9)
0 76
SHAHDOL 1
(1.1)
42
(46.7)
7
(7.8)
7
(7.8)
8
(8.9)
0 8
(8.9)
0 3
(3.3)
0 0 3
(3.3)
9
(10.0)
2
(2.2)
90
SOLAN 3
(2.9)
55
(53.9)
1
(1.0)
11
(10.8)
9
(8.8)
0 9
(8.8)
0 4
(3.9)
0 0 4
(3.9)
5
(4.9)
1
(1.0)
102
SURENDRANGR 6
(4.0)
65
(43.1)
20
(13.3)
3
(2.0)
15
(9.9)
1
(0.7)
9
(6.0)
0
0
3
(2.0)
0 1
(0.7)
11
(7.3)
17
(11.3)
0 151
VAISHALI 8
(5.4)
93
(62.8)
5
(3.4)
4
(2.7)
6
(4.1)
0 10
(6.8)
1
(0.7)
5
(3.4)
0 2
(1.4)
4
(2.7)
5
(3.4)
5
(3.4)
148
Total 95
(3.7)
1478
(57.5)
152
(5.9)
128
(5.0)
137
(5.3)
1
(4)
207
(8.1)
25
(0.97)
88
(3.4)
7
(0.3)
8
(0.3)
110
(4.3)
122
(4.8)
12
(0.5)
2570
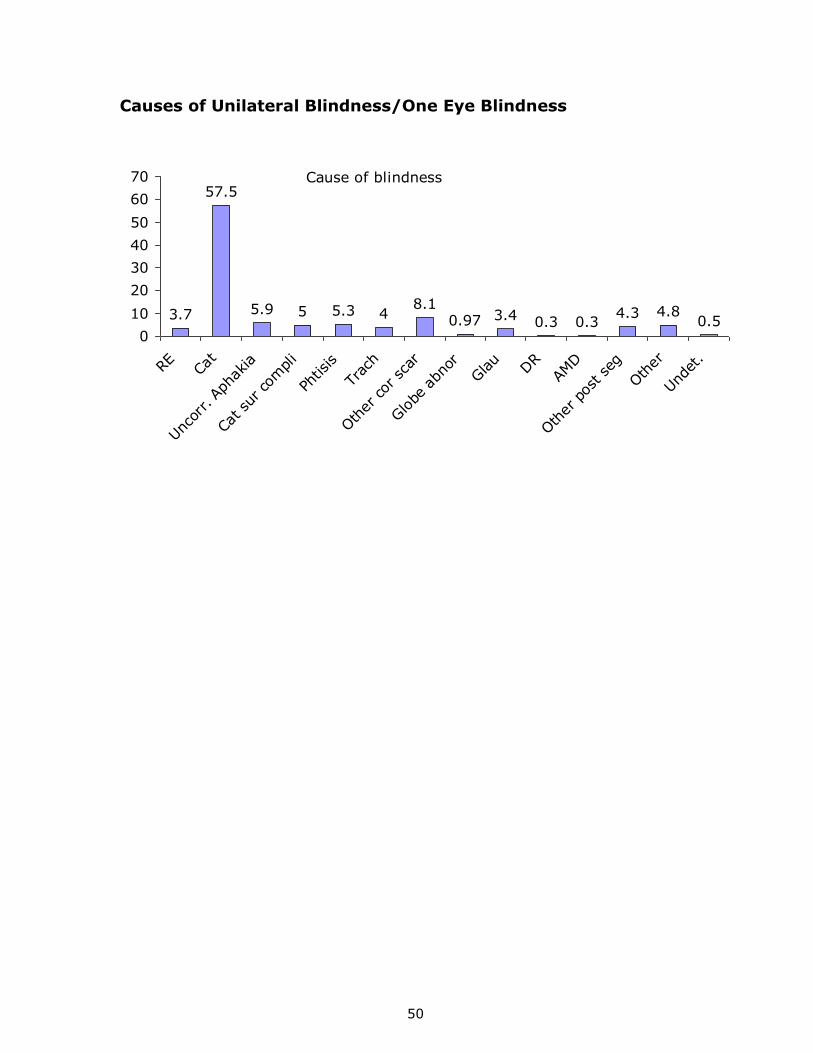
50
Causes of Unilateral Blindness/One Eye Blindness
Cause of blindness
3.7
57.5
5.9 5 5.3 48.1
0.97 3.4 0.3 0.34.3 4.8
0.50
10
20
30
40
50
60
70
RE Cat
Unc
orr. A
phak
ia
Cat su
r co
mpli
Phtis
is
Trac
h
Oth
er cor
sca
r
Globe
abn
or
Glau
DR
AMD
Oth
er pos
t se
g
Oth
er
Und
et.
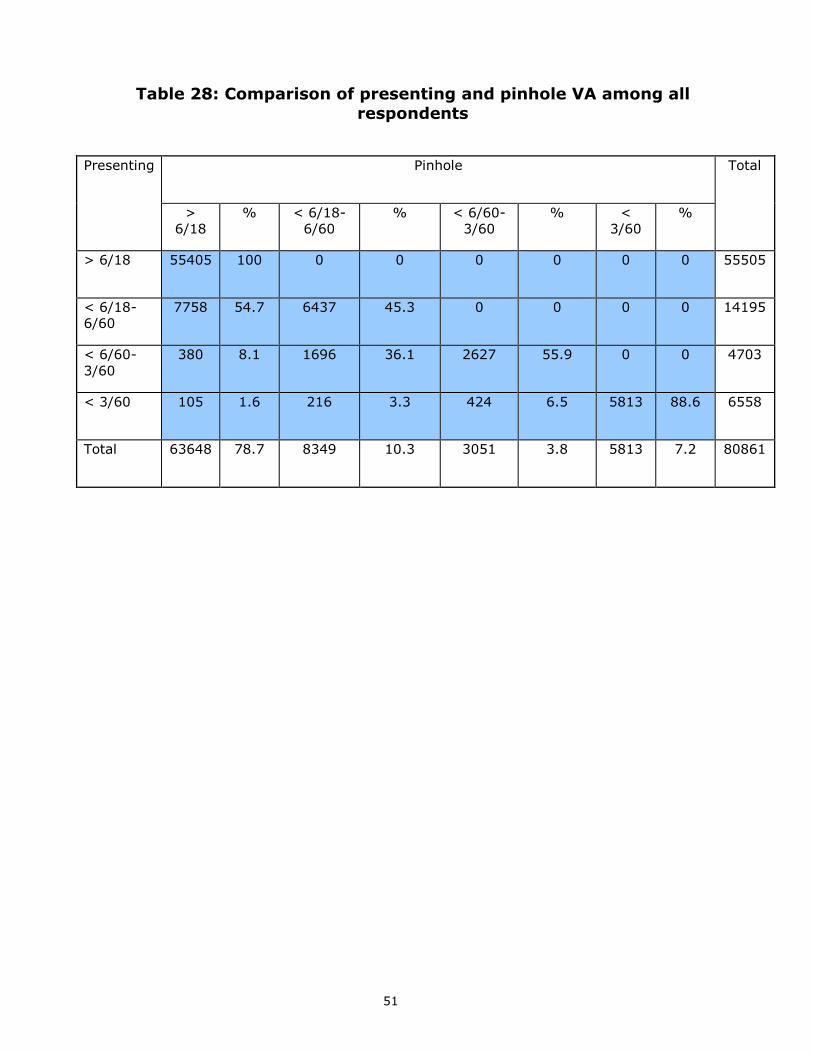
51
Table 28: Comparison of presenting and pinhole VA among all
respondents
Presenting Pinhole Total
>
6/18
% < 6/18-
6/60
%
< 6/60-
3/60
% <
3/60
%
> 6/18 55405 100 0 0 0 0 0 0 55505
< 6/18-
6/60
7758 54.7 6437 45.3 0 0 0 0 14195
< 6/60-
3/60
380 8.1 1696 36.1 2627 55.9 0 0 4703
< 3/60 105 1.6 216 3.3 424 6.5 5813 88.6 6558
Total 63648 78.7 8349 10.3 3051 3.8 5813 7.2 80861
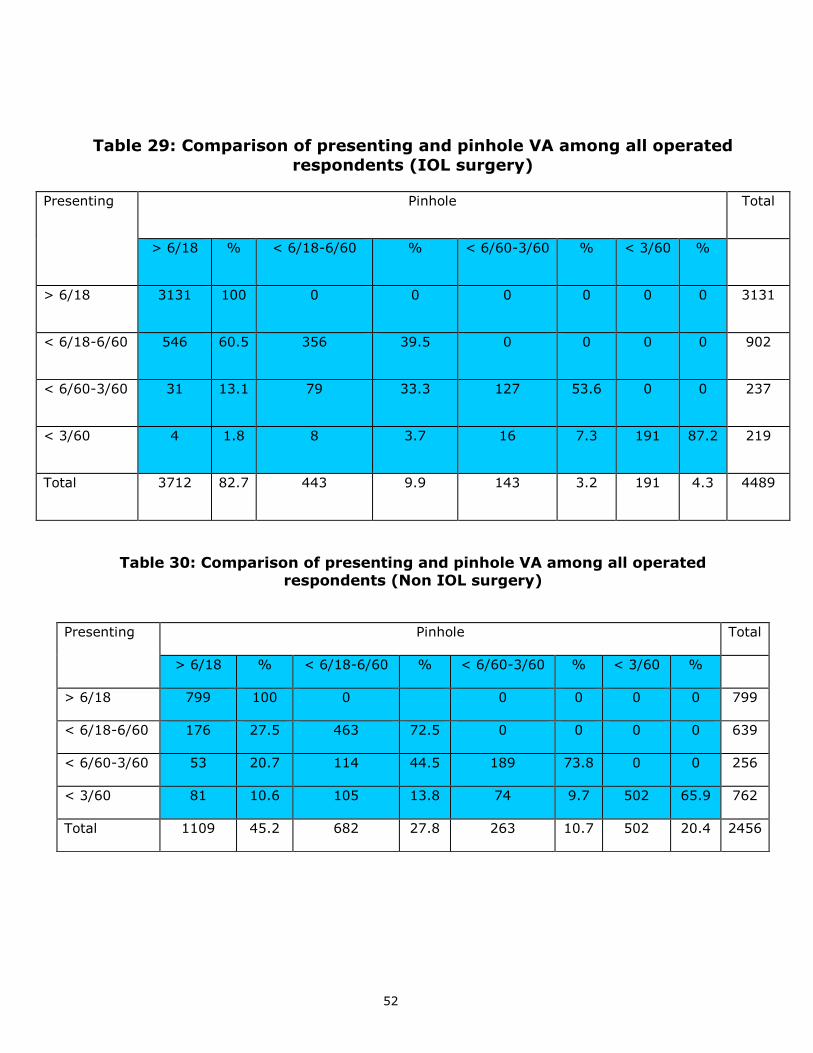
52
Table 29: Comparison of presenting and pinhole VA among all operated
respondents (IOL surgery)
Table 30: Comparison of presenting and pinhole VA among all operated respondents (Non IOL surgery)
Presenting Pinhole Total
> 6/18 % < 6/18-6/60 % < 6/60-3/60 % < 3/60 %
> 6/18 799 100 0 0 0 0 0 799
< 6/18-6/60 176 27.5 463 72.5 0 0 0 0 639
< 6/60-3/60 53 20.7 114 44.5 189 73.8 0 0 256
< 3/60 81 10.6 105 13.8 74 9.7 502 65.9 762
Total 1109 45.2 682 27.8 263 10.7 502 20.4 2456
Presenting Pinhole Total
> 6/18 % < 6/18-6/60 % < 6/60-3/60 % < 3/60 %
> 6/18 3131 100 0 0 0 0 0 0 3131
< 6/18-6/60 546 60.5 356 39.5 0 0 0 0 902
< 6/60-3/60 31 13.1 79 33.3 127 53.6 0 0 237
< 3/60 4 1.8 8 3.7 16 7.3 191 87.2 219
Total 3712 82.7 443 9.9 143 3.2 191 4.3 4489
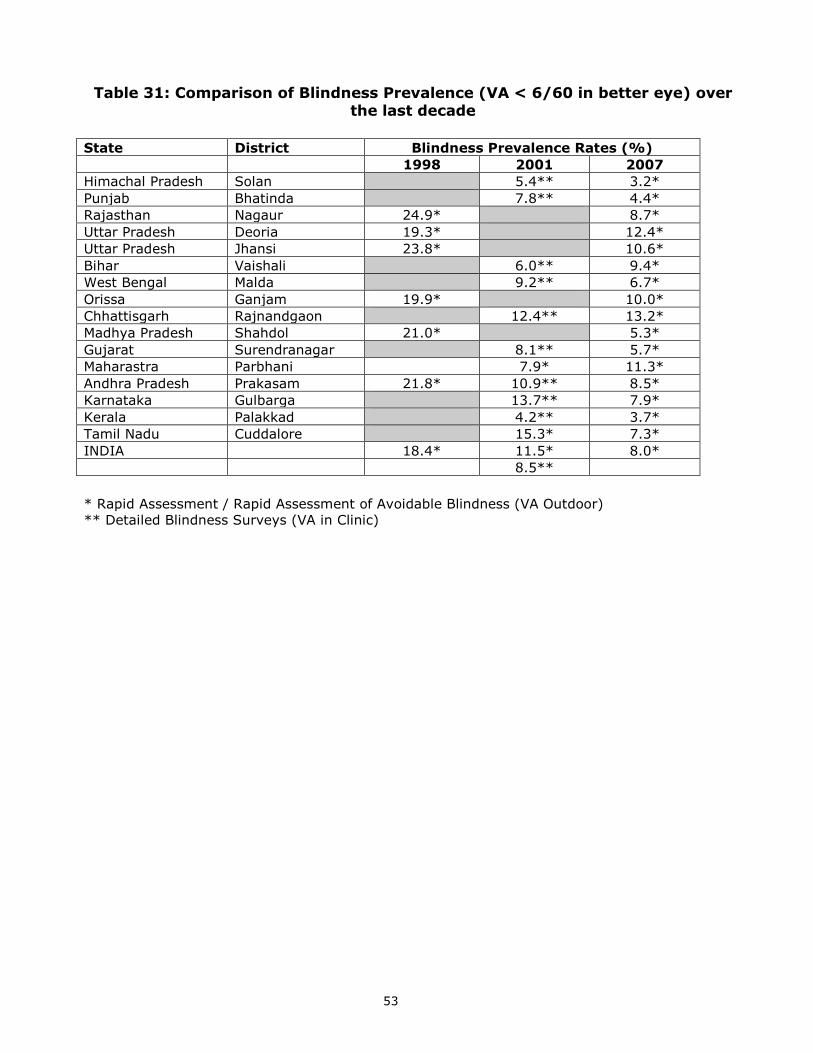
53
Table 31: Comparison of Blindness Prevalence (VA < 6/60 in better eye) over the last decade
State District Blindness Prevalence Rates (%)
1998 2001 2007
Himachal Pradesh Solan 5.4** 3.2*
Punjab Bhatinda 7.8** 4.4*
Rajasthan Nagaur 24.9* 8.7*
Uttar Pradesh Deoria 19.3* 12.4*
Uttar Pradesh Jhansi 23.8* 10.6*
Bihar Vaishali 6.0** 9.4*
West Bengal Malda 9.2** 6.7*
Orissa Ganjam 19.9* 10.0*
Chhattisgarh Rajnandgaon 12.4** 13.2*
Madhya Pradesh Shahdol 21.0* 5.3*
Gujarat Surendranagar 8.1** 5.7*
Maharastra Parbhani 7.9* 11.3*
Andhra Pradesh Prakasam 21.8* 10.9** 8.5*
Karnataka Gulbarga 13.7** 7.9*
Kerala Palakkad 4.2** 3.7*
Tamil Nadu Cuddalore 15.3* 7.3*
INDIA 18.4* 11.5* 8.0*
8.5**
* Rapid Assessment / Rapid Assessment of Avoidable Blindness (VA Outdoor)
** Detailed Blindness Surveys (VA in Clinic)
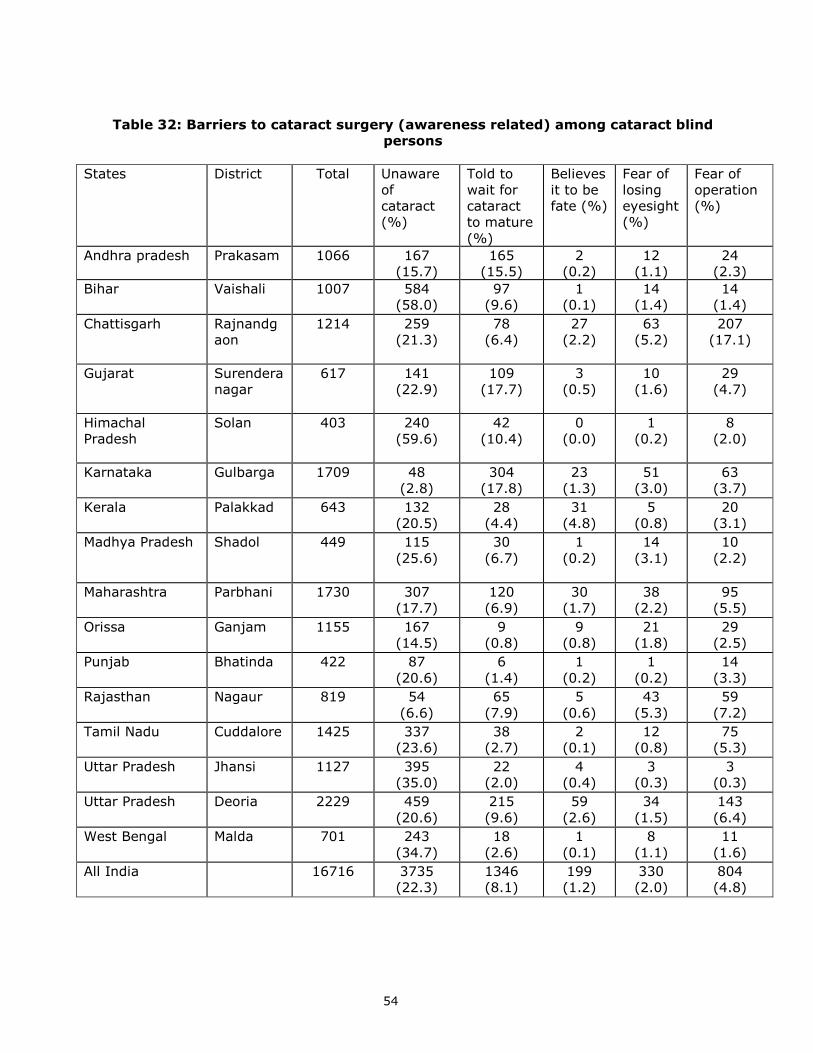
54
Table 32: Barriers to cataract surgery (awareness related) among cataract blind
persons
States District Total Unaware
of
cataract
(%)
Told to
wait for
cataract
to mature
(%)
Believes
it to be
fate (%)
Fear of
losing
eyesight
(%)
Fear of
operation
(%)
Andhra pradesh
Prakasam
1066
167
(15.7)
165
(15.5)
2
(0.2)
12
(1.1)
24
(2.3)
Bihar
Vaishali
1007
584
(58.0)
97
(9.6)
1
(0.1)
14
(1.4)
14
(1.4)
Chattisgarh
Rajnandg
aon
1214
259
(21.3)
78
(6.4)
27
(2.2)
63
(5.2)
207
(17.1)
Gujarat
Surendera
nagar
617
141
(22.9)
109
(17.7)
3
(0.5)
10
(1.6)
29
(4.7)
Himachal
Pradesh
Solan
403
240
(59.6)
42
(10.4)
0
(0.0)
1
(0.2)
8
(2.0)
Karnataka
Gulbarga
1709
48
(2.8)
304
(17.8)
23
(1.3)
51
(3.0)
63
(3.7)
Kerala
Palakkad
643
132
(20.5)
28
(4.4)
31
(4.8)
5
(0.8)
20
(3.1)
Madhya Pradesh
Shadol
449
115
(25.6)
30
(6.7)
1
(0.2)
14
(3.1)
10
(2.2)
Maharashtra
Parbhani
1730
307
(17.7)
120
(6.9)
30
(1.7)
38
(2.2)
95
(5.5)
Orissa
Ganjam
1155
167
(14.5)
9
(0.8)
9
(0.8)
21
(1.8)
29
(2.5)
Punjab
Bhatinda
422
87
(20.6)
6
(1.4)
1
(0.2)
1
(0.2)
14
(3.3)
Rajasthan
Nagaur
819
54
(6.6)
65
(7.9)
5
(0.6)
43
(5.3)
59
(7.2)
Tamil Nadu
Cuddalore
1425
337
(23.6)
38
(2.7)
2
(0.1)
12
(0.8)
75
(5.3)
Uttar Pradesh
Jhansi
1127
395
(35.0)
22
(2.0)
4
(0.4)
3
(0.3)
3
(0.3)
Uttar Pradesh
Deoria
2229
459
(20.6)
215
(9.6)
59
(2.6)
34
(1.5)
143
(6.4)
West Bengal
Malda
701
243
(34.7)
18
(2.6)
1
(0.1)
8
(1.1)
11
(1.6)
All India
16716
3735
(22.3)
1346
(8.1)
199
(1.2)
330
(2.0)
804
(4.8)
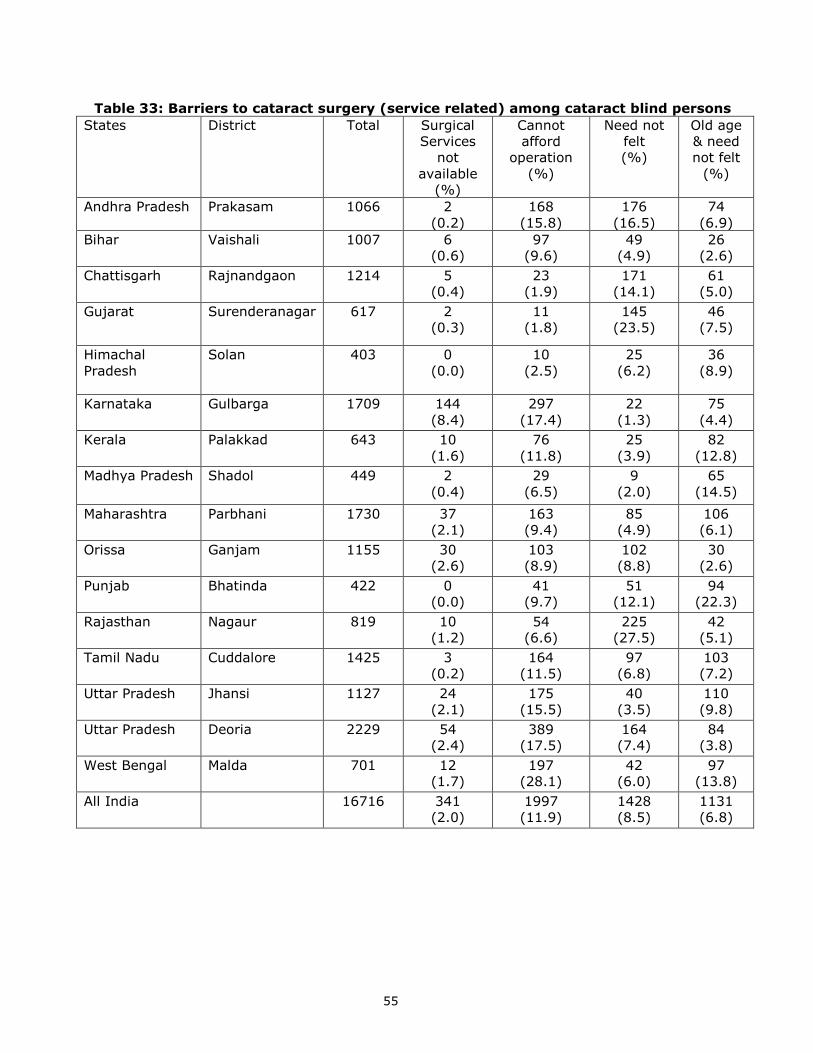
55
Table 33: Barriers to cataract surgery (service related) among cataract blind persons
States District Total Surgical
Services
not
available
(%)
Cannot
afford
operation
(%)
Need not
felt
(%)
Old age
& need
not felt
(%)
Andhra Pradesh Prakasam
1066
2
(0.2)
168
(15.8)
176
(16.5)
74
(6.9)
Bihar
Vaishali
1007
6
(0.6)
97
(9.6)
49
(4.9)
26
(2.6)
Chattisgarh
Rajnandgaon
1214
5
(0.4)
23
(1.9)
171
(14.1)
61
(5.0)
Gujarat
Surenderanagar
617
2
(0.3)
11
(1.8)
145
(23.5)
46
(7.5)
Himachal
Pradesh
Solan
403
0
(0.0)
10
(2.5)
25
(6.2)
36
(8.9)
Karnataka
Gulbarga
1709
144
(8.4)
297
(17.4)
22
(1.3)
75
(4.4)
Kerala
Palakkad
643
10
(1.6)
76
(11.8)
25
(3.9)
82
(12.8)
Madhya Pradesh
Shadol
449
2
(0.4)
29
(6.5)
9
(2.0)
65
(14.5)
Maharashtra
Parbhani
1730
37
(2.1)
163
(9.4)
85
(4.9)
106
(6.1)
Orissa
Ganjam
1155
30
(2.6)
103
(8.9)
102
(8.8)
30
(2.6)
Punjab
Bhatinda
422
0
(0.0)
41
(9.7)
51
(12.1)
94
(22.3)
Rajasthan
Nagaur
819
10
(1.2)
54
(6.6)
225
(27.5)
42
(5.1)
Tamil Nadu
Cuddalore
1425
3
(0.2)
164
(11.5)
97
(6.8)
103
(7.2)
Uttar Pradesh
Jhansi
1127
24
(2.1)
175
(15.5)
40
(3.5)
110
(9.8)
Uttar Pradesh
Deoria
2229
54
(2.4)
389
(17.5)
164
(7.4)
84
(3.8)
West Bengal
Malda
701
12
(1.7)
197
(28.1)
42
(6.0)
97
(13.8)
All India
16716
341
(2.0)
1997
(11.9)
1428
(8.5)
1131
(6.8)
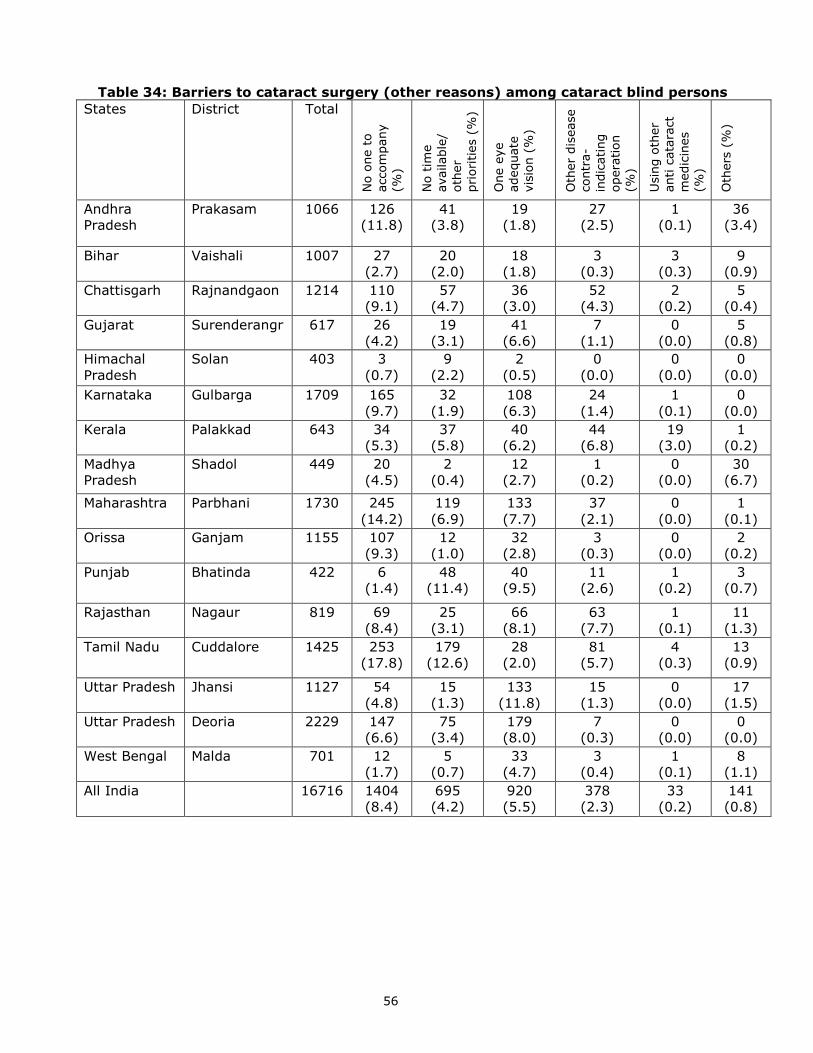
56
Table 34: Barriers to cataract surgery (other reasons) among cataract blind persons
States District Total
No o
ne t
o
accom
pany
(%)
No t
ime
available
/
oth
er
pri
orities (
%)
One e
ye
adequate
vis
ion (
%)
Oth
er
dis
ease
contr
a-
indic
ating
opera
tion
(%)
Usin
g o
ther
anti c
ata
ract
medic
ines
(%)
Oth
ers
(%
)
Andhra
Pradesh
Prakasam
1066
126
(11.8)
41
(3.8)
19
(1.8)
27
(2.5)
1
(0.1)
36
(3.4)
Bihar
Vaishali
1007
27
(2.7)
20
(2.0)
18
(1.8)
3
(0.3)
3
(0.3)
9
(0.9)
Chattisgarh
Rajnandgaon
1214
110
(9.1)
57
(4.7)
36
(3.0)
52
(4.3)
2
(0.2)
5
(0.4)
Gujarat
Surenderangr
617
26
(4.2)
19
(3.1)
41
(6.6)
7
(1.1)
0
(0.0)
5
(0.8)
Himachal
Pradesh
Solan
403
3
(0.7)
9
(2.2)
2
(0.5)
0
(0.0)
0
(0.0)
0
(0.0)
Karnataka
Gulbarga
1709
165
(9.7)
32
(1.9)
108
(6.3)
24
(1.4)
1
(0.1)
0
(0.0)
Kerala
Palakkad
643
34
(5.3)
37
(5.8)
40
(6.2)
44
(6.8)
19
(3.0)
1
(0.2)
Madhya
Pradesh
Shadol 449 20
(4.5)
2
(0.4)
12
(2.7)
1
(0.2)
0
(0.0)
30
(6.7)
Maharashtra
Parbhani
1730
245
(14.2)
119
(6.9)
133
(7.7)
37
(2.1)
0
(0.0)
1
(0.1)
Orissa
Ganjam
1155
107
(9.3)
12
(1.0)
32
(2.8)
3
(0.3)
0
(0.0)
2
(0.2)
Punjab
Bhatinda
422
6
(1.4)
48
(11.4)
40
(9.5)
11
(2.6)
1
(0.2)
3
(0.7)
Rajasthan
Nagaur
819
69
(8.4)
25
(3.1)
66
(8.1)
63
(7.7)
1
(0.1)
11
(1.3)
Tamil Nadu
Cuddalore
1425
253
(17.8)
179
(12.6)
28
(2.0)
81
(5.7)
4
(0.3)
13
(0.9)
Uttar Pradesh
Jhansi
1127
54
(4.8)
15
(1.3)
133
(11.8)
15
(1.3)
0
(0.0)
17
(1.5)
Uttar Pradesh
Deoria
2229
147
(6.6)
75
(3.4)
179
(8.0)
7
(0.3)
0
(0.0)
0
(0.0)
West Bengal
Malda
701
12
(1.7)
5
(0.7)
33
(4.7)
3
(0.4)
1
(0.1)
8
(1.1)
All India
16716
1404
(8.4)
695
(4.2)
920
(5.5)
378
(2.3)
33
(0.2)
141
(0.8)
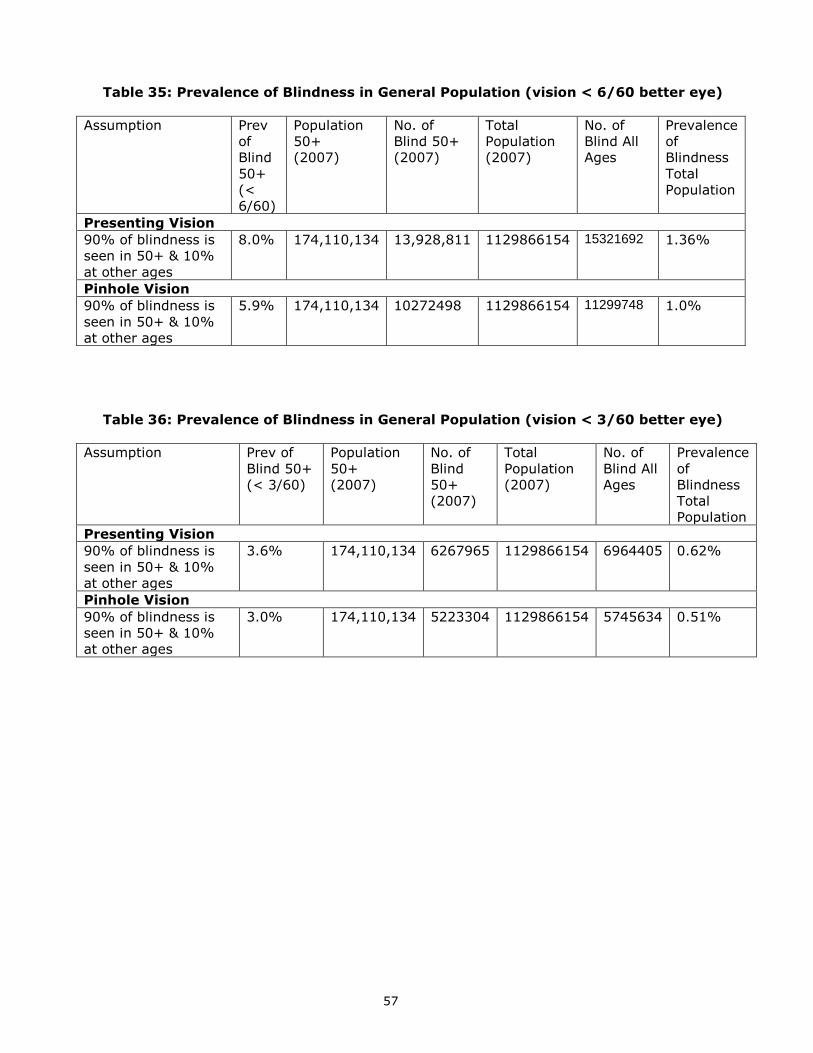
57
Table 35: Prevalence of Blindness in General Population (vision < 6/60 better eye)
Assumption Prev
of
Blind
50+
(<
6/60)
Population
50+
(2007)
No. of
Blind 50+
(2007)
Total
Population
(2007)
No. of
Blind All
Ages
Prevalence
of
Blindness
Total
Population
Presenting Vision
90% of blindness is
seen in 50+ & 10%
at other ages
8.0% 174,110,134
13,928,811
1129866154 15321692
1.36%
Pinhole Vision
90% of blindness is
seen in 50+ & 10%
at other ages
5.9% 174,110,134
10272498 1129866154 11299748
1.0%
Table 36: Prevalence of Blindness in General Population (vision < 3/60 better eye)
Assumption Prev of
Blind 50+
(< 3/60)
Population
50+
(2007)
No. of
Blind
50+
(2007)
Total
Population
(2007)
No. of
Blind All
Ages
Prevalence
of
Blindness
Total
Population
Presenting Vision
90% of blindness is
seen in 50+ & 10%
at other ages
3.6% 174,110,134
6267965
1129866154 6964405 0.62%
Pinhole Vision
90% of blindness is
seen in 50+ & 10%
at other ages
3.0% 174,110,134
5223304 1129866154 5745634 0.51%